0000912036 afiv:C000194568Member afiv:OtherAssetsLessLiabilitiesMember 2024-10-31
UNITED STATES
SECURITIES AND EXCHANGE COMMISSION
Washington, D.C. 20549
FORM N-CSR
CERTIFIED SHAREHOLDER REPORT OF REGISTERED MANAGEMENT INVESTMENT COMPANIES
Investment Company Act file number
(Exact name of registrant as specified in charter)
680 Washington Boulevard, Suite 500, Stamford, Connecticut 06901
(Address of principal executive offices) (Zip code)
AMG Funds LLC
680 Washington Boulevard, Suite 500, Stamford, Connecticut 06901
(Name and address of agent for service)
Registrant's telephone number, including area code:
Date of reporting period:
November 01, 2023 - October 31, 2024
(Annual Shareholder Report)
Item 1. Reports to Shareholders
(a)
AMG Beutel Goodman Core Plus Bond Fund
Class N/ADBLX
ANNUAL SHAREHOLDER REPORT | October 31, 2024
This annual shareholder report contains important information about AMG Beutel Goodman Core Plus Bond Fund (the “Fund”) for the period of November 1, 2023 to October 31, 2024. You can find additional information about the Fund at https://wealth.amg.com/resources/order-literature. You can also request this information by contacting us at 800.548.4539.
Fund Expenses
What were the Fund costs for the last year?
(Based on a hypothetical $10,000 investment)
| Fund (Class) | Costs of a $10,000 investment | Costs paid as a percentage of a $10,000 investment |
AMG Beutel Goodman Core Plus Bond Fund
(Class N/ADBLX) | $72 | 0.68% |
Management's Discussion of Fund Performance
Performance Overview
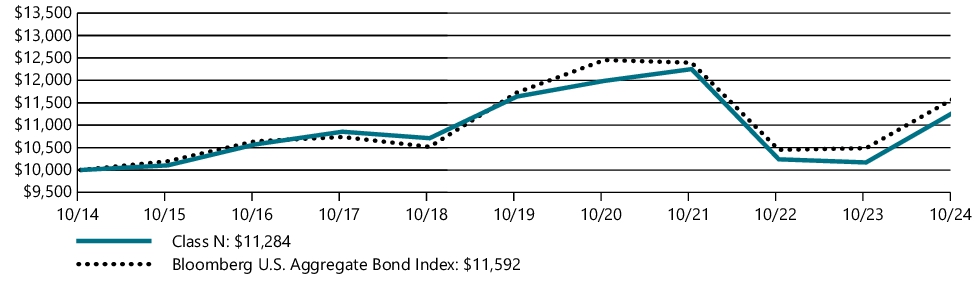
• The Fund’s Class N shares advanced by 10.97% for the fiscal year that ended October 31, 2024, led by strong performance in corporate bonds and the portfolio’s duration positioning.
• The Fund outperformed the Bloomberg U.S. Aggregate Bond Index, which returned 10.55% during the period.
Top Contributors and Detractors
• At the beginning of the reporting period, interest rates were at their highest levels since the 1980s, but as inflation began to normalize, the U.S. Federal Reserve followed many of its global peers by reducing its policy rate.
• Amid this backdrop, corporate security selection was the main contributor to performance for the Fund, while duration and curve positioning added value. Government security selection was also positive for performance.
• In contrast, securitized security selection was the main detractor over the period.
Positioning Update
• Given the uncertain investment landscape, we remain defensively positioned in the Fund. The Fund is overweight credit, but is focused on higher-rated securities in less cyclical sectors; we are ready to pivot if the economy slows and spreads move wider.
• The higher-beta investment grade and high-yield credits in the Fund are concentrated in the front end of the curve in shorter maturities (one-to five-year terms to maturity). This has the effect of increasing the average yield of the Fund, while not materially increasing the credit risk due to the lower credit duration.
• We expect interest rates will continue to fall, so we are watching for potential opportunities to increase our duration position. We also believe that the yield curve will continue to steepen.
• The Fund is therefore positioned with an overweight in the mid part of the curve, which tends to perform best during steepening environments.
Fund Performance
The performance line graph below shows the performance of a hypothetical $10,000 investment in the class of shares noted over a ten year period, as compared to the performance of a broad based index. The performance table below shows the average annual total returns of the class of shares noted for the past one-, five-, and ten-year periods ended as of October 31, 2024. It also shows the average total returns of a broad based index over the same periods.
Performance for other share classes will vary. The Fund’s past performance is not a good predictor of the Fund’s future performance.
The graph and table do not reflect the deduction of taxes that a shareholder would pay on fund distributions or redemption of fund shares.
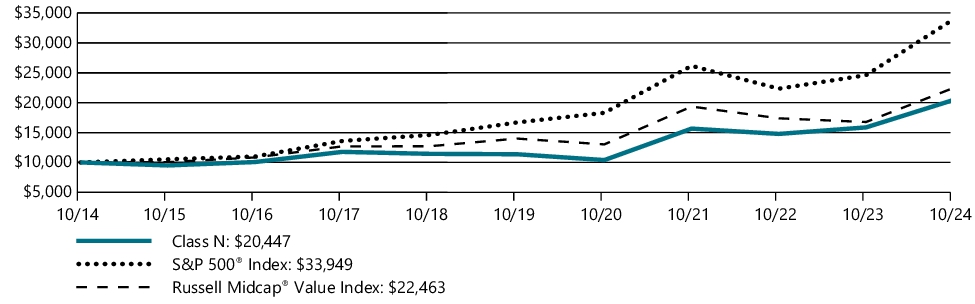
GROWTH OF $10,000
| AVERAGE ANNUAL TOTAL RETURNS | 1 Year | 5 Years | 10 Years |
| Class N | 10.97% | (0.62%) | 1.22% |
| Bloomberg U.S. Aggregate Bond Index | 10.55% | (0.23%) | 1.49% |
As of March 24, 2021, the Fund's Subadviser was changed to Beutel, Goodman & Company Ltd. Prior to March 24, 2021, the Fund had different principal investment strategies and corresponding risks. The Fund's performance before March 24, 2021, might be less pertinent for investors considering whether to purchase shares of the Fund.
"Bloomberg®" and any Bloomberg index described herein are service marks of Bloomberg Finance L. P. and its affiliates, including Bloomberg Index Services Limited ("BISL"), the administrator of the index (collectively, "Bloomberg") and have been licensed for use for certain purposes by AMG Funds LLC. Bloomberg is not affiliated with AMG Funds LLC, and Bloomberg does not approve, endorse, review, or recommend the fund described herein. Bloomberg does not guarantee the timeliness, accurateness, or completeness of any data or information relating to such fund.
For updated Fund performance information, please visit: https://wealth.amg.com/.
Key Fund Statistics (as of October 31, 2024)
| Fund net assets | $121,038,761 |
| Total number of portfolio holdings | 110 |
| Net advisory fees paid | $141,598 |
| Portfolio turnover rate as of the end of the reporting period | 83% |
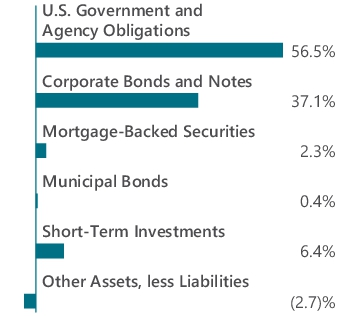
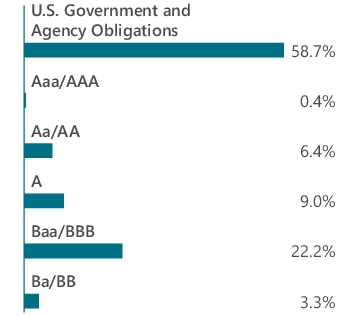
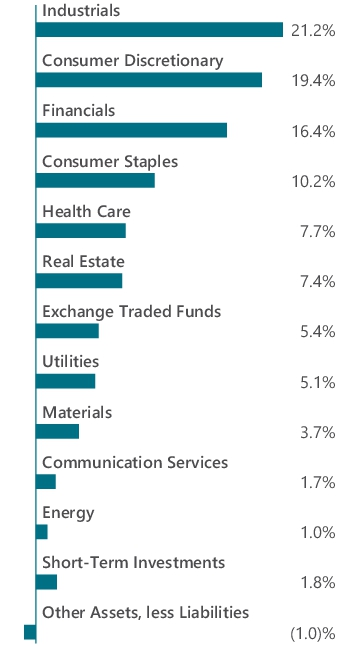
Graphical Representation of Holdings (as of October 31, 2024)
Top ten holdings and portfolio breakdown are shown as a percentage of net assets of the Fund and ratings are shown as a percentage of total long-term investments of the Fund.
| U.S. Treasury Notes, 4.500%, 11/15/33 | 9.4% |
| U.S. Treasury Bonds, 4.250%, 02/15/54 | 4.4% |
| U.S. Treasury Notes, 3.500%, 09/30/29 | 3.5% |
| FNMA, 2.140%, 10/01/29 | 3.5% |
| FNMA, 3.000%, 06/01/52 | 3.5% |
| U.S. Treasury Bonds, 3.000%, 08/15/52 | 2.8% |
| U.S. Treasury Bonds, 1.875%, 02/15/41 | 2.8% |
| Bank of America Corp., 4.376%, 04/27/28 | 2.5% |
| FNMA, 2.260%, 01/01/30 | 2.4% |
| U.S. Treasury Notes, 3.500%, 02/15/33 | 2.2% |
| Top Ten as a Group | 37.0% |
Availability of Additional Information
You can find additional information about the Fund such as the prospectus, financial information, fund holdings and proxy voting information at https://wealth.amg.com/resources/order-literature. You can also request this information by contacting us at 800.548.4539.
Householding
In order to reduce expenses, we will deliver a single copy of prospectuses, proxies, financial reports and other communication to shareholders with the same residential address, provided they have the same last name or we reasonably believe them to be members of the same family. Unless we are notified otherwise, we will continue to send recipients only one copy of these materials for as long as they remain a shareholder of the Fund. If you would like to receive individual mailings, please call 800.548.4539 and we will begin sending you separate copies of these materials within 30 days after receiving your request.
For additional information, please navigate to the additional material at https://wealth.amg.com/resources/order-literature.
AMG Beutel Goodman Core Plus Bond Fund
Class I/ADLIX
ANNUAL SHAREHOLDER REPORT | October 31, 2024
This annual shareholder report contains important information about AMG Beutel Goodman Core Plus Bond Fund (the “Fund”) for the period of November 1, 2023 to October 31, 2024. You can find additional information about the Fund at https://wealth.amg.com/resources/order-literature. You can also request this information by contacting us at 800.548.4539.
Fund Expenses
What were the Fund costs for the last year?
(Based on a hypothetical $10,000 investment)
| Fund (Class) | Costs of a $10,000 investment | Costs paid as a percentage of a $10,000 investment |
AMG Beutel Goodman Core Plus Bond Fund
(Class I/ADLIX) | $51 | 0.48% |
Management's Discussion of Fund Performance
Performance Overview
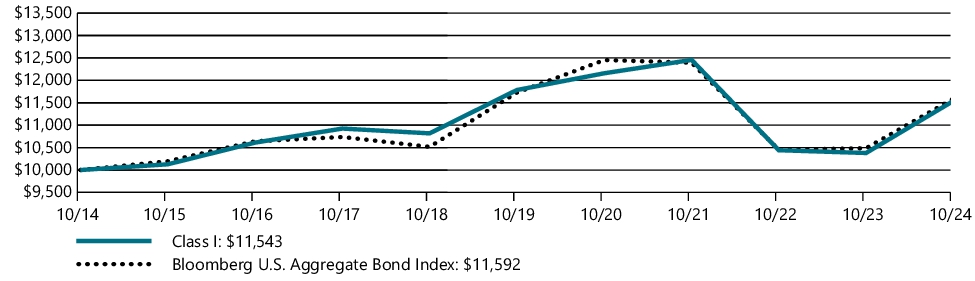
• The Fund’s Class I shares advanced by 11.21% for the fiscal year that ended October 31, 2024, led by strong performance in corporate bonds and the portfolio’s duration positioning.
• The Fund outperformed the Bloomberg U.S. Aggregate Bond Index, which returned 10.55% during the period.
Top Contributors and Detractors
• At the beginning of the reporting period, interest rates were at their highest levels since the 1980s, but as inflation began to normalize, the U.S. Federal Reserve followed many of its global peers by reducing its policy rate.
• Amid this backdrop, corporate security selection was the main contributor to performance for the Fund, while duration and curve positioning added value. Government security selection was also positive for performance.
• In contrast, securitized security selection was the main detractor over the period.
Positioning Update
• Given the uncertain investment landscape, we remain defensively positioned in the Fund. The Fund is overweight credit, but is focused on higher-rated securities in less cyclical sectors; we are ready to pivot if the economy slows and spreads move wider.
• The higher-beta investment grade and high-yield credits in the Fund are concentrated in the front end of the curve in shorter maturities (one-to five-year terms to maturity). This has the effect of increasing the average yield of the Fund, while not materially increasing the credit risk due to the lower credit duration.
• We expect interest rates will continue to fall, so we are watching for potential opportunities to increase our duration position. We also believe that the yield curve will continue to steepen.
• The Fund is therefore positioned with an overweight in the mid part of the curve, which tends to perform best during steepening environments.
Fund Performance
The performance line graph below shows the performance of a hypothetical $10,000 investment in the class of shares noted over a ten year period, as compared to the performance of a broad based index. The performance table below shows the average annual total returns of the class of shares noted for the past one-, five-, and ten-year periods ended as of October 31, 2024. It also shows the average total returns of a broad based index over the same periods.
Performance for other share classes will vary. The Fund’s past performance is not a good predictor of the Fund’s future performance.
The graph and table do not reflect the deduction of taxes that a shareholder would pay on fund distributions or redemption of fund shares.
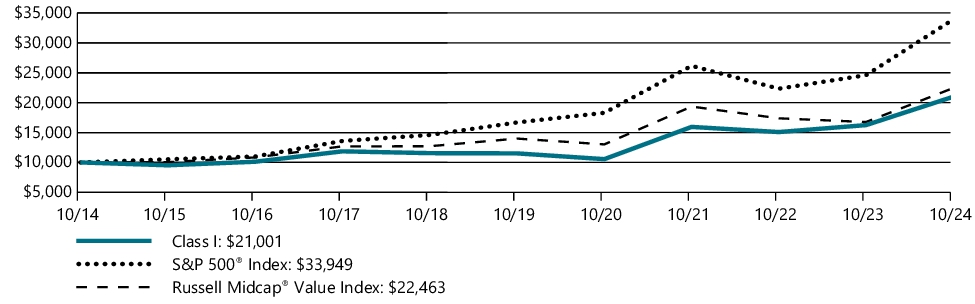
GROWTH OF $10,000
| AVERAGE ANNUAL TOTAL RETURNS | 1 Year | 5 Years | 10 Years |
| Class I | 11.21% | (0.42%) | 1.45% |
| Bloomberg U.S. Aggregate Bond Index | 10.55% | (0.23%) | 1.49% |
As of March 24, 2021, the Fund's Subadviser was changed to Beutel, Goodman & Company Ltd. Prior to March 24, 2021, the Fund had different principal investment strategies and corresponding risks. The Fund's performance before March 24, 2021, might be less pertinent for investors considering whether to purchase shares of the Fund.
"Bloomberg®" and any Bloomberg index described herein are service marks of Bloomberg Finance L. P. and its affiliates, including Bloomberg Index Services Limited ("BISL"), the administrator of the index (collectively, "Bloomberg") and have been licensed for use for certain purposes by AMG Funds LLC. Bloomberg is not affiliated with AMG Funds LLC, and Bloomberg does not approve, endorse, review, or recommend the fund described herein. Bloomberg does not guarantee the timeliness, accurateness, or completeness of any data or information relating to such fund.
For updated Fund performance information, please visit: https://wealth.amg.com/.
Key Fund Statistics (as of October 31, 2024)
| Fund net assets | $121,038,761 |
| Total number of portfolio holdings | 110 |
| Net advisory fees paid | $141,598 |
| Portfolio turnover rate as of the end of the reporting period | 83% |
Graphical Representation of Holdings (as of October 31, 2024)
Top ten holdings and portfolio breakdown are shown as a percentage of net assets of the Fund and ratings are shown as a percentage of total long-term investments of the Fund.
| U.S. Treasury Notes, 4.500%, 11/15/33 | 9.4% |
| U.S. Treasury Bonds, 4.250%, 02/15/54 | 4.4% |
| U.S. Treasury Notes, 3.500%, 09/30/29 | 3.5% |
| FNMA, 2.140%, 10/01/29 | 3.5% |
| FNMA, 3.000%, 06/01/52 | 3.5% |
| U.S. Treasury Bonds, 3.000%, 08/15/52 | 2.8% |
| U.S. Treasury Bonds, 1.875%, 02/15/41 | 2.8% |
| Bank of America Corp., 4.376%, 04/27/28 | 2.5% |
| FNMA, 2.260%, 01/01/30 | 2.4% |
| U.S. Treasury Notes, 3.500%, 02/15/33 | 2.2% |
| Top Ten as a Group | 37.0% |
Availability of Additional Information
You can find additional information about the Fund such as the prospectus, financial information, fund holdings and proxy voting information at https://wealth.amg.com/resources/order-literature. You can also request this information by contacting us at 800.548.4539.
Householding
In order to reduce expenses, we will deliver a single copy of prospectuses, proxies, financial reports and other communication to shareholders with the same residential address, provided they have the same last name or we reasonably believe them to be members of the same family. Unless we are notified otherwise, we will continue to send recipients only one copy of these materials for as long as they remain a shareholder of the Fund. If you would like to receive individual mailings, please call 800.548.4539 and we will begin sending you separate copies of these materials within 30 days after receiving your request.
For additional information, please navigate to the additional material at https://wealth.amg.com/resources/order-literature.
AMG Beutel Goodman Core Plus Bond Fund
Class Z/ADZIX
ANNUAL SHAREHOLDER REPORT | October 31, 2024
This annual shareholder report contains important information about AMG Beutel Goodman Core Plus Bond Fund (the “Fund”) for the period of November 1, 2023 to October 31, 2024. You can find additional information about the Fund at https://wealth.amg.com/resources/order-literature. You can also request this information by contacting us at 800.548.4539.
Fund Expenses
What were the Fund costs for the last year?
(Based on a hypothetical $10,000 investment)
| Fund (Class) | Costs of a $10,000 investment | Costs paid as a percentage of a $10,000 investment |
AMG Beutel Goodman Core Plus Bond Fund
(Class Z/ADZIX) | $45 | 0.43% |
Management's Discussion of Fund Performance
Performance Overview
• The Fund’s Class Z shares advanced by 11.25% for the fiscal year that ended October 31, 2024, led by strong performance in corporate bonds and the portfolio’s duration positioning.
• The Fund outperformed the Bloomberg U.S. Aggregate Bond Index, which returned 10.55% during the period.
Top Contributors and Detractors
• At the beginning of the reporting period, interest rates were at their highest levels since the 1980s, but as inflation began to normalize, the U.S. Federal Reserve followed many of its global peers by reducing its policy rate.
• Amid this backdrop, corporate security selection was the main contributor to performance for the Fund, while duration and curve positioning added value. Government security selection was also positive for performance.
• In contrast, securitized security selection was the main detractor over the period.
Positioning Update
• Given the uncertain investment landscape, we remain defensively positioned in the Fund. The Fund is overweight credit, but is focused on higher-rated securities in less cyclical sectors; we are ready to pivot if the economy slows and spreads move wider.
• The higher-beta investment grade and high-yield credits in the Fund are concentrated in the front end of the curve in shorter maturities (one-to five-year terms to maturity). This has the effect of increasing the average yield of the Fund, while not materially increasing the credit risk due to the lower credit duration.
• We expect interest rates will continue to fall, so we are watching for potential opportunities to increase our duration position. We also believe that the yield curve will continue to steepen.
• The Fund is therefore positioned with an overweight in the mid part of the curve, which tends to perform best during steepening environments.
Fund Performance
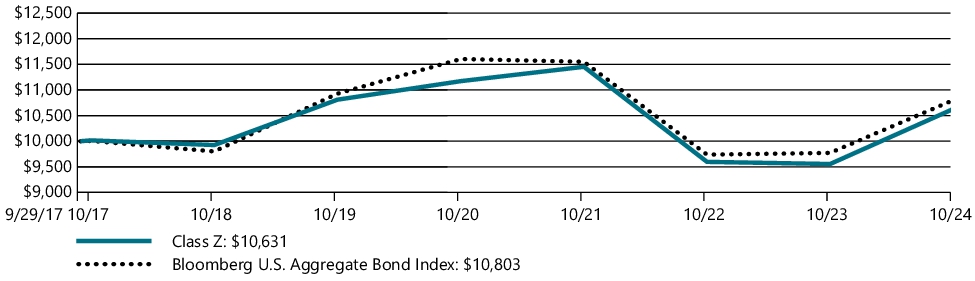
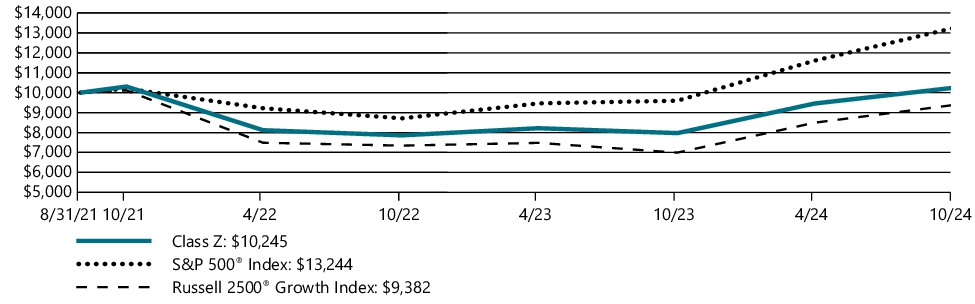
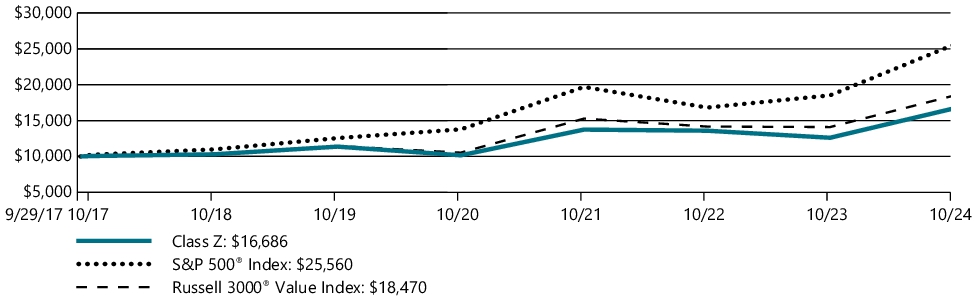
The performance line graph below shows the performance of a hypothetical $10,000 investment in the class of shares noted since the class's inception on September 29, 2017, as compared to the performance of a broad based index. The performance table below shows the average annual total returns of the class of shares noted for the past one-year and five-year periods and the period from the class's inception through October 31, 2024. It also shows the average total returns of a broad based index over the same periods.
Performance for other share classes will vary. The Fund’s past performance is not a good predictor of the Fund’s future performance.
The graph and table do not reflect the deduction of taxes that a shareholder would pay on fund distributions or redemption of fund shares.
GROWTH OF $10,000
| AVERAGE ANNUAL TOTAL RETURNS | 1 Year | 5 Years | Since Inception |
| Class Z | 11.25% | (0.34%) | 0.87% |
| Bloomberg U.S. Aggregate Bond Index | 10.55% | (0.23%) | 1.10% |
As of March 24, 2021, the Fund's Subadviser was changed to Beutel, Goodman & Company Ltd. Prior to March 24, 2021, the Fund had different principal investment strategies and corresponding risks. The Fund's performance before March 24, 2021, might be less pertinent for investors considering whether to purchase shares of the Fund.
"Bloomberg®" and any Bloomberg index described herein are service marks of Bloomberg Finance L. P. and its affiliates, including Bloomberg Index Services Limited ("BISL"), the administrator of the index (collectively, "Bloomberg") and have been licensed for use for certain purposes by AMG Funds LLC. Bloomberg is not affiliated with AMG Funds LLC, and Bloomberg does not approve, endorse, review, or recommend the fund described herein. Bloomberg does not guarantee the timeliness, accurateness, or completeness of any data or information relating to such fund.
For updated Fund performance information, please visit: https://wealth.amg.com/.
Key Fund Statistics (as of October 31, 2024)
| Fund net assets | $121,038,761 |
| Total number of portfolio holdings | 110 |
| Net advisory fees paid | $141,598 |
| Portfolio turnover rate as of the end of the reporting period | 83% |
Graphical Representation of Holdings (as of October 31, 2024)
Top ten holdings and portfolio breakdown are shown as a percentage of net assets of the Fund and ratings are shown as a percentage of total long-term investments of the Fund.
| U.S. Treasury Notes, 4.500%, 11/15/33 | 9.4% |
| U.S. Treasury Bonds, 4.250%, 02/15/54 | 4.4% |
| U.S. Treasury Notes, 3.500%, 09/30/29 | 3.5% |
| FNMA, 2.140%, 10/01/29 | 3.5% |
| FNMA, 3.000%, 06/01/52 | 3.5% |
| U.S. Treasury Bonds, 3.000%, 08/15/52 | 2.8% |
| U.S. Treasury Bonds, 1.875%, 02/15/41 | 2.8% |
| Bank of America Corp., 4.376%, 04/27/28 | 2.5% |
| FNMA, 2.260%, 01/01/30 | 2.4% |
| U.S. Treasury Notes, 3.500%, 02/15/33 | 2.2% |
| Top Ten as a Group | 37.0% |
Availability of Additional Information
You can find additional information about the Fund such as the prospectus, financial information, fund holdings and proxy voting information at https://wealth.amg.com/resources/order-literature. You can also request this information by contacting us at 800.548.4539.
Householding
In order to reduce expenses, we will deliver a single copy of prospectuses, proxies, financial reports and other communication to shareholders with the same residential address, provided they have the same last name or we reasonably believe them to be members of the same family. Unless we are notified otherwise, we will continue to send recipients only one copy of these materials for as long as they remain a shareholder of the Fund. If you would like to receive individual mailings, please call 800.548.4539 and we will begin sending you separate copies of these materials within 30 days after receiving your request.
For additional information, please navigate to the additional material at https://wealth.amg.com/resources/order-literature.
AMG GW&K Small/Mid Cap Growth Fund
Class N/ACWDX
ANNUAL SHAREHOLDER REPORT | October 31, 2024
This annual shareholder report contains important information about AMG GW&K Small/Mid Cap Growth Fund (the “Fund”) for the period of November 1, 2023 to October 31, 2024. You can find additional information about the Fund at https://wealth.amg.com/resources/order-literature. You can also request this information by contacting us at 800.548.4539.
Fund Expenses
What were the Fund costs for the last year?
(Based on a hypothetical $10,000 investment)
| Fund (Class) | Costs of a $10,000 investment | Costs paid as a percentage of a $10,000 investment |
AMG GW&K Small/Mid Cap Growth Fund
(Class N/ACWDX) | $115 | 1.01% |
Management's Discussion of Fund Performance
Performance Overview
• The Fund’s Class N shares returned 28.36% for the fiscal year that ended October 31, 2024, underperforming the Russell 2500® Growth Index, which returned 34.21% for the period. The S&P 500® Index returned 38.02% for the period.
• The economic backdrop was favorable for U.S. equities as economic growth remained resilient, inflation declined, the job market stayed healthy, and the U.S. Federal Reserve Board (the Fed) initiated a rate cutting cycle. Areas of concern centered on the weakness in manufacturing activity, the shift in consumer spending to value-driven purchasing, market concentration in a handful of mega-cap companies, and escalating global geopolitical tensions.
Top Contributors and Detractors
• The health care sector was a leading contributor, led by biopharma holdings that announced favorable drug trials and excellent sales results.
• Financials benefited from rising capital markets activity that lifted investment banking positions.
• In materials, each of the Fund’s holdings delivered strong operating results in difficult market conditions.
• Industrials was a detractor from relative performance, where soft-end market demand restrained the Fund’s holdings in the industrial machinery and distributors segments.
• Consumer discretionary experienced a detraction from a position in specialty retail, which announced results that fell short of expectations.
• In energy, the Fund’s holdings were pressured by a weak price environment for natural gas and oil.
Fund Performance
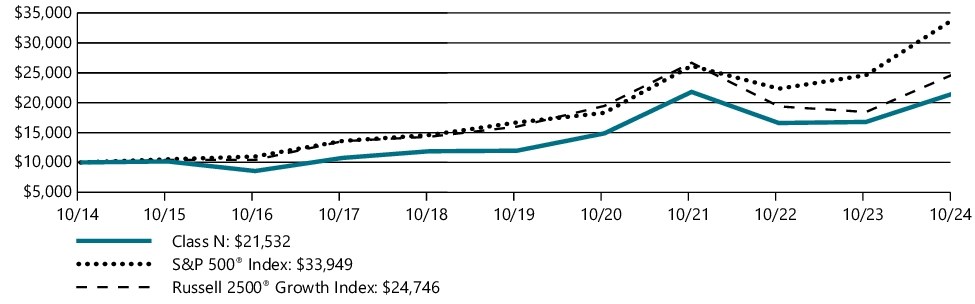
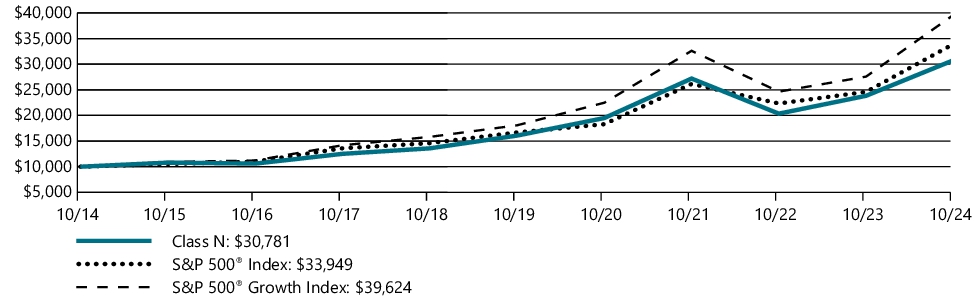
The performance line graph below shows the performance of a hypothetical $10,000 investment in the class of shares noted over a ten year period, as compared to the performance of (i) a broad based index and (ii) an additional index reflecting the market segment(s) in which the Fund invests. The performance table below shows the average annual total returns of the class of shares noted for the past one-, five-, and ten-year periods ended as of October 31, 2024. It also shows the average total returns of (i) a broad based index and (ii) an additional index reflecting the market segment(s) in which the Fund invests over the same periods.
Performance for other share classes will vary. The Fund’s past performance is not a good predictor of the Fund’s future performance.
The graph and table do not reflect the deduction of taxes that a shareholder would pay on fund distributions or redemption of fund shares.
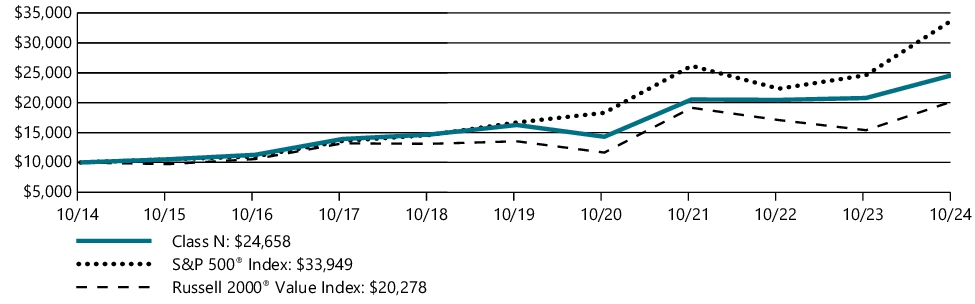
GROWTH OF $10,000
| AVERAGE ANNUAL TOTAL RETURNS | 1 Year | 5 Years | 10 Years |
| Class N | 28.36% | 12.48% | 7.97% |
| S&P 500® Index | 38.02% | 15.27% | 13.00% |
| Russell 2500® Growth Index | 34.21% | 9.14% | 9.48% |
Effective October 31, 2024, the S&P 500® Index was added as a broad measure of market performance in accordance with recent changes to regulatory disclosure requirements. The Fund continues to use the Russell 2500® Growth Index as an additional benchmark that reflects the market segment(s) in which the Fund invests.
As of March 19, 2021, the Fund's Subadviser was changed to GW&K Investment Management, LLC. Prior to March 19, 2021, the Fund had different principal investment strategies and corresponding risks. The Fund's performance before March 19, 2021, might be less pertinent for investors considering whether to purchase shares of the Fund.
The S&P Index is proprietary data of Standard & Poor’s, a division of McGraw-Hill Companies, Inc. All rights reserved.
The Russell Index is a trademark of the London Stock Exchange Group companies.
For updated Fund performance information, please visit: https://wealth.amg.com/.
Key Fund Statistics (as of October 31, 2024)
| Fund net assets | $41,834,206 |
| Total number of portfolio holdings | 77 |
| Net advisory fees paid | $157,451 |
| Portfolio turnover rate as of the end of the reporting period | 19% |
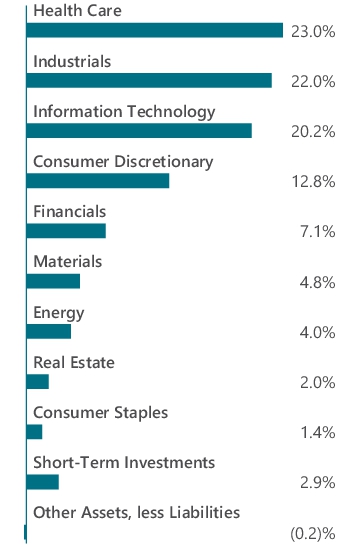
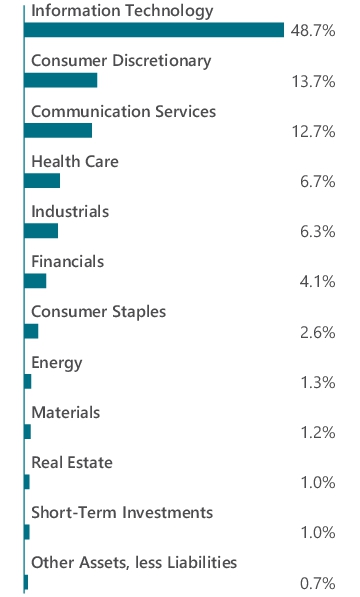
Graphical Representation of Holdings (as of October 31, 2024)
Top ten holdings and portfolio breakdown are shown as a percentage of net assets of the Fund.
| CyberArk Software, Ltd. (Israel) | 2.5% |
| Texas Roadhouse, Inc. | 2.2% |
| Tyler Technologies, Inc. | 2.1% |
| Houlihan Lokey, Inc. | 2.1% |
| ITT, Inc. | 1.9% |
| CACI International, Inc., Class A | 1.9% |
| Burlington Stores, Inc. | 1.9% |
| Entegris, Inc. | 1.9% |
| Globant SA (Uruguay) | 1.9% |
| Manhattan Associates, Inc. | 1.8% |
| Top Ten as a Group | 20.2% |
Availability of Additional Information
You can find additional information about the Fund such as the prospectus, financial information, fund holdings and proxy voting information at https://wealth.amg.com/resources/order-literature. You can also request this information by contacting us at 800.548.4539.
Householding
In order to reduce expenses, we will deliver a single copy of prospectuses, proxies, financial reports and other communication to shareholders with the same residential address, provided they have the same last name or we reasonably believe them to be members of the same family. Unless we are notified otherwise, we will continue to send recipients only one copy of these materials for as long as they remain a shareholder of the Fund. If you would like to receive individual mailings, please call 800.548.4539 and we will begin sending you separate copies of these materials within 30 days after receiving your request.
For additional information, please navigate to the additional material at https://wealth.amg.com/resources/order-literature.
AMG GW&K Small/Mid Cap Growth Fund
Class I/ACWIX
ANNUAL SHAREHOLDER REPORT | October 31, 2024
This annual shareholder report contains important information about AMG GW&K Small/Mid Cap Growth Fund (the “Fund”) for the period of November 1, 2023 to October 31, 2024. You can find additional information about the Fund at https://wealth.amg.com/resources/order-literature. You can also request this information by contacting us at 800.548.4539.
Fund Expenses
What were the Fund costs for the last year?
(Based on a hypothetical $10,000 investment)
| Fund (Class) | Costs of a $10,000 investment | Costs paid as a percentage of a $10,000 investment |
AMG GW&K Small/Mid Cap Growth Fund
(Class I/ACWIX) | $99 | 0.87% |
Management's Discussion of Fund Performance
Performance Overview
• The Fund’s Class I shares returned 28.43% for the fiscal year that ended October 31, 2024, underperforming the Russell 2500® Growth Index, which returned 34.21% for the period. The S&P 500® Index returned 38.02% for the period.
• The economic backdrop was favorable for U.S. equities as economic growth remained resilient, inflation declined, the job market stayed healthy, and the U.S. Federal Reserve Board (the Fed) initiated a rate cutting cycle. Areas of concern centered on the weakness in manufacturing activity, the shift in consumer spending to value-driven purchasing, market concentration in a handful of mega-cap companies, and escalating global geopolitical tensions.
Top Contributors and Detractors
• The health care sector was a leading contributor, led by biopharma holdings that announced favorable drug trials and excellent sales results.
• Financials benefited from rising capital markets activity that lifted investment banking positions.
• In materials, each of the Fund’s holdings delivered strong operating results in difficult market conditions.
• Industrials was a detractor from relative performance, where soft-end market demand restrained the Fund’s holdings in the industrial machinery and distributors segments.
• Consumer discretionary experienced a detraction from a position in specialty retail, which announced results that fell short of expectations.
• In energy, the Fund’s holdings were pressured by a weak price environment for natural gas and oil.
Fund Performance
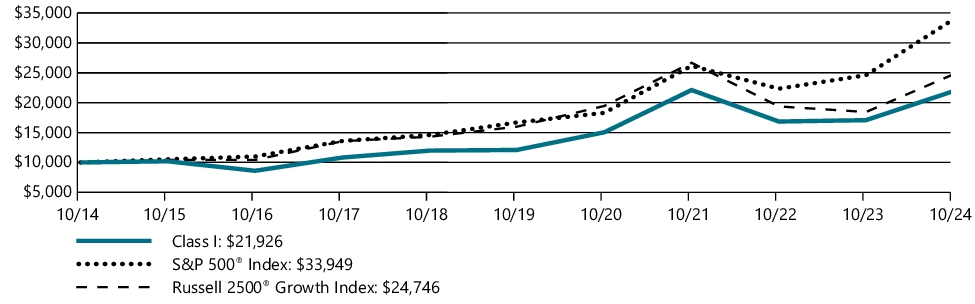
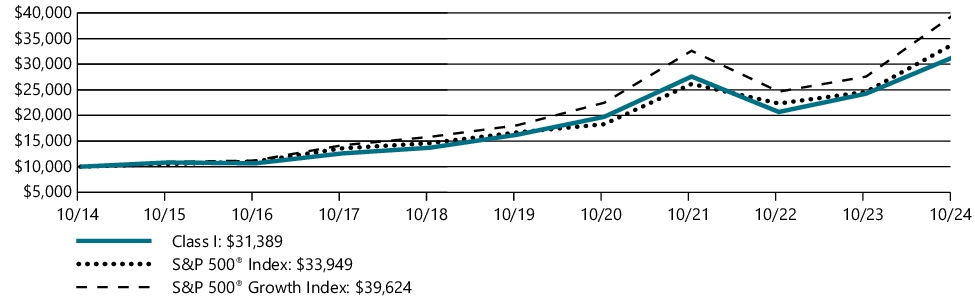
The performance line graph below shows the performance of a hypothetical $10,000 investment in the class of shares noted over a ten year period, as compared to the performance of (i) a broad based index and (ii) an additional index reflecting the market segment(s) in which the Fund invests. The performance table below shows the average annual total returns of the class of shares noted for the past one-, five-, and ten-year periods ended as of October 31, 2024. It also shows the average total returns of (i) a broad based index and (ii) an additional index reflecting the market segment(s) in which the Fund invests over the same periods.
Performance for other share classes will vary. The Fund’s past performance is not a good predictor of the Fund’s future performance.
The graph and table do not reflect the deduction of taxes that a shareholder would pay on fund distributions or redemption of fund shares.
GROWTH OF $10,000
| AVERAGE ANNUAL TOTAL RETURNS | 1 Year | 5 Years | 10 Years |
| Class I | 28.43% | 12.65% | 8.17% |
| S&P 500® Index | 38.02% | 15.27% | 13.00% |
| Russell 2500® Growth Index | 34.21% | 9.14% | 9.48% |
Effective October 31, 2024, the S&P 500® Index was added as a broad measure of market performance in accordance with recent changes to regulatory disclosure requirements. The Fund continues to use the Russell 2500® Growth Index as an additional benchmark that reflects the market segment(s) in which the Fund invests.
As of March 19, 2021, the Fund's Subadviser was changed to GW&K Investment Management, LLC. Prior to March 19, 2021, the Fund had different principal investment strategies and corresponding risks. The Fund's performance before March 19, 2021, might be less pertinent for investors considering whether to purchase shares of the Fund.
The S&P Index is proprietary data of Standard & Poor’s, a division of McGraw-Hill Companies, Inc. All rights reserved.
The Russell Index is a trademark of the London Stock Exchange Group companies.
For updated Fund performance information, please visit: https://wealth.amg.com/.
Key Fund Statistics (as of October 31, 2024)
| Fund net assets | $41,834,206 |
| Total number of portfolio holdings | 77 |
| Net advisory fees paid | $157,451 |
| Portfolio turnover rate as of the end of the reporting period | 19% |
Graphical Representation of Holdings (as of October 31, 2024)
Top ten holdings and portfolio breakdown are shown as a percentage of net assets of the Fund.
| CyberArk Software, Ltd. (Israel) | 2.5% |
| Texas Roadhouse, Inc. | 2.2% |
| Tyler Technologies, Inc. | 2.1% |
| Houlihan Lokey, Inc. | 2.1% |
| ITT, Inc. | 1.9% |
| CACI International, Inc., Class A | 1.9% |
| Burlington Stores, Inc. | 1.9% |
| Entegris, Inc. | 1.9% |
| Globant SA (Uruguay) | 1.9% |
| Manhattan Associates, Inc. | 1.8% |
| Top Ten as a Group | 20.2% |
Availability of Additional Information
You can find additional information about the Fund such as the prospectus, financial information, fund holdings and proxy voting information at https://wealth.amg.com/resources/order-literature. You can also request this information by contacting us at 800.548.4539.
Householding
In order to reduce expenses, we will deliver a single copy of prospectuses, proxies, financial reports and other communication to shareholders with the same residential address, provided they have the same last name or we reasonably believe them to be members of the same family. Unless we are notified otherwise, we will continue to send recipients only one copy of these materials for as long as they remain a shareholder of the Fund. If you would like to receive individual mailings, please call 800.548.4539 and we will begin sending you separate copies of these materials within 30 days after receiving your request.
For additional information, please navigate to the additional material at https://wealth.amg.com/resources/order-literature.
AMG GW&K Small/Mid Cap Growth Fund
Class Z/ACWZX
ANNUAL SHAREHOLDER REPORT | October 31, 2024
This annual shareholder report contains important information about AMG GW&K Small/Mid Cap Growth Fund (the “Fund”) for the period of November 1, 2023 to October 31, 2024. You can find additional information about the Fund at https://wealth.amg.com/resources/order-literature. You can also request this information by contacting us at 800.548.4539.
Fund Expenses
What were the Fund costs for the last year?
(Based on a hypothetical $10,000 investment)
| Fund (Class) | Costs of a $10,000 investment | Costs paid as a percentage of a $10,000 investment |
AMG GW&K Small/Mid Cap Growth Fund
(Class Z/ACWZX) | $94 | 0.82% |
Management's Discussion of Fund Performance
Performance Overview
• The Fund’s Class Z shares returned 28.53% for the fiscal year that ended October 31, 2024, underperforming the Russell 2500® Growth Index, which returned 34.21% for the period. The S&P 500® Index returned 38.02% for the period.
• The economic backdrop was favorable for U.S. equities as economic growth remained resilient, inflation declined, the job market stayed healthy, and the U.S. Federal Reserve Board (the Fed) initiated a rate cutting cycle. Areas of concern centered on the weakness in manufacturing activity, the shift in consumer spending to value-driven purchasing, market concentration in a handful of mega-cap companies, and escalating global geopolitical tensions.
Top Contributors and Detractors
• The health care sector was a leading contributor, led by biopharma holdings that announced favorable drug trials and excellent sales results.
• Financials benefited from rising capital markets activity that lifted investment banking positions.
• In materials, each of the Fund’s holdings delivered strong operating results in difficult market conditions.
• Industrials was a detractor from relative performance, where soft-end market demand restrained the Fund’s holdings in the industrial machinery and distributors segments.
• Consumer discretionary experienced a detraction from a position in specialty retail, which announced results that fell short of expectations.
• In energy, the Fund’s holdings were pressured by a weak price environment for natural gas and oil.
Fund Performance
The performance line graph below shows the performance of a hypothetical $10,000 investment in the class of shares noted since the class's inception on August 31, 2021, as compared to the performance of (i) a broad based index and (ii) an additional index reflecting the market segment(s) in which the Fund invests. The performance table below shows the average annual total returns of the class of shares noted for the past one-year period and the period from the class's inception through October 31, 2024. It also shows the average total returns of (i) a broad based index and (ii) an additional index reflecting the market segment(s) in which the Fund invests over the same periods.
Performance for other share classes will vary. The Fund’s past performance is not a good predictor of the Fund’s future performance.
The graph and table do not reflect the deduction of taxes that a shareholder would pay on fund distributions or redemption of fund shares.
GROWTH OF $10,000
| AVERAGE ANNUAL TOTAL RETURNS | 1 Year | Since Inception |
| Class Z | 28.53% | 0.77% |
| S&P 500® Index | 38.02% | 9.28% |
| Russell 2500® Growth Index | 34.21% | (1.99%) |
Effective October 31, 2024, the S&P 500® Index was added as a broad measure of market performance in accordance with recent changes to regulatory disclosure requirements. The Fund continues to use the Russell 2500® Growth Index as an additional benchmark that reflects the market segment(s) in which the Fund invests.
As of March 19, 2021, the Fund's Subadviser was changed to GW&K Investment Management, LLC. Prior to March 19, 2021, the Fund had different principal investment strategies and corresponding risks. The Fund's performance before March 19, 2021, might be less pertinent for investors considering whether to purchase shares of the Fund.
The S&P Index is proprietary data of Standard & Poor’s, a division of McGraw-Hill Companies, Inc. All rights reserved.
The Russell Index is a trademark of the London Stock Exchange Group companies.
For updated Fund performance information, please visit: https://wealth.amg.com/.
Key Fund Statistics (as of October 31, 2024)
| Fund net assets | $41,834,206 |
| Total number of portfolio holdings | 77 |
| Net advisory fees paid | $157,451 |
| Portfolio turnover rate as of the end of the reporting period | 19% |
Graphical Representation of Holdings (as of October 31, 2024)
Top ten holdings and portfolio breakdown are shown as a percentage of net assets of the Fund.
| CyberArk Software, Ltd. (Israel) | 2.5% |
| Texas Roadhouse, Inc. | 2.2% |
| Tyler Technologies, Inc. | 2.1% |
| Houlihan Lokey, Inc. | 2.1% |
| ITT, Inc. | 1.9% |
| CACI International, Inc., Class A | 1.9% |
| Burlington Stores, Inc. | 1.9% |
| Entegris, Inc. | 1.9% |
| Globant SA (Uruguay) | 1.9% |
| Manhattan Associates, Inc. | 1.8% |
| Top Ten as a Group | 20.2% |
Availability of Additional Information
You can find additional information about the Fund such as the prospectus, financial information, fund holdings and proxy voting information at https://wealth.amg.com/resources/order-literature. You can also request this information by contacting us at 800.548.4539.
Householding
In order to reduce expenses, we will deliver a single copy of prospectuses, proxies, financial reports and other communication to shareholders with the same residential address, provided they have the same last name or we reasonably believe them to be members of the same family. Unless we are notified otherwise, we will continue to send recipients only one copy of these materials for as long as they remain a shareholder of the Fund. If you would like to receive individual mailings, please call 800.548.4539 and we will begin sending you separate copies of these materials within 30 days after receiving your request.
For additional information, please navigate to the additional material at https://wealth.amg.com/resources/order-literature.
AMG Montrusco Bolton Large Cap Growth Fund
Class N/MCGFX
ANNUAL SHAREHOLDER REPORT | October 31, 2024
This annual shareholder report contains important information about AMG Montrusco Bolton Large Cap Growth Fund (the “Fund”) for the period of November 1, 2023 to October 31, 2024. You can find additional information about the Fund at https://wealth.amg.com/resources/order-literature. You can also request this information by contacting us at 800.548.4539.
Fund Expenses
What were the Fund costs for the last year?
(Based on a hypothetical $10,000 investment)
| Fund (Class) | Costs of a $10,000 investment | Costs paid as a percentage of a $10,000 investment |
AMG Montrusco Bolton Large Cap Growth Fund
(Class N/MCGFX) | $104 | 0.91% |
Management's Discussion of Fund Performance
Market Overview
• U.S. stocks performed well during an election year amidst strong job growth and moderating inflation. This occurred despite a tense geopolitical environment and a relatively tight U.S. Federal Reserve monetary policy stance which slightly shifted to an easing monetary policy with a 0.50% interest rate cut in the third quarter.
Performance review
• For the 12 months ended October 31, 2024, the Fund’s Class N shares generated a return of 29.13%, compared to the S&P 500® Index which generated a return of 38.02%. The underperformance came predominantly from stock selection.
Top Contributors and Detractors
• The top contributing sectors to the Fund’s relative performance included health care and communication services.
• The top detracting sectors included consumer discretionary, financials, and information technology.
• The top three contributors to the Fund’s return were NVIDIA, Meta, and Charles River Laboratories. NVIDIA continued its dominance in the artificial intelligence (AI) and GPU (graphics processing unit) markets while Meta’s success can be attributed to its significant investments in AI, its pivot towards the metaverse and augmented reality technologies. Charles River delivered strong performance due to its central role in the biotech and pharmaceutical industries. The Fund exited its position in Charles River Laboratories during the period.
• The top three detractors were Five Below, Adobe, and Lululemon®. Five Below faced numerous challenges that included: rising inflation, which put pressure on consumer spending and increased supply chain and labor costs, which impacted profitability. The Fund exited its position in Five Below. Adobe struggled because of shifts in demand and increasing competition in the creative software and digital marketing space while Lululemon faced a mix of economic pressures and changing consumer behaviors, which impacted demand for its premium athletic apparel.
Positioning
• The Fund’s top ten holdings at the end of October 2024 represented 67.3% of the Fund’s net assets.
Fund Performance
The performance line graph below shows the performance of a hypothetical $10,000 investment in the class of shares noted over a ten year period, as compared to the performance of (i) a broad based index and (ii) an additional index reflecting the market segment(s) in which the Fund invests. The performance table below shows the average annual total returns of the class of shares noted for the past one-, five-, and ten-year periods ended as of October 31, 2024. It also shows the average total returns of (i) a broad based index and (ii) an additional index reflecting the market segment(s) in which the Fund invests over the same periods.
Performance for other share classes will vary. The Fund’s past performance is not a good predictor of the Fund’s future performance.
The graph and table do not reflect the deduction of taxes that a shareholder would pay on fund distributions or redemption of fund shares.
GROWTH OF $10,000
| AVERAGE ANNUAL TOTAL RETURNS | 1 Year | 5 Years | 10 Years |
| Class N | 29.13% | 13.89% | 11.90% |
| S&P 500® Index | 38.02% | 15.27% | 13.00% |
| S&P 500® Growth Index | 43.67% | 17.01% | 14.76% |
Effective October 31, 2024, the S&P 500® Index was added as a broad measure of market performance in accordance with recent changes to regulatory disclosure requirements. The Fund continues to use the S&P 500® Growth Index as an additional benchmark that reflects the market segment(s) in which the Fund invests.
As of March 19, 2021, the Fund's Subadviser was changed to Montrusco Bolton Investments, Inc. Prior to March 19, 2021, the Fund had different principal investment strategies and corresponding risks. The Fund's performance before March 19, 2021, might be less pertinent for investors considering whether to purchase shares of the Fund.
The S&P Index is proprietary data of Standard & Poor’s, a division of McGraw-Hill Companies, Inc. All rights reserved.
For updated Fund performance information, please visit: https://wealth.amg.com/.
Key Fund Statistics (as of October 31, 2024)
| Fund net assets | $208,325,570 |
| Total number of portfolio holdings | 27 |
| Net advisory fees paid | $899,126 |
| Portfolio turnover rate as of the end of the reporting period | 83% |
Graphical Representation of Holdings (as of October 31, 2024)
Top ten holdings and portfolio breakdown are shown as a percentage of net assets of the Fund.
| Apple, Inc. | 9.6% |
| NVIDIA Corp. | 9.3% |
| Microsoft Corp. | 9.2% |
| Adobe, Inc. | 8.9% |
| Alphabet, Inc., Class A | 8.3% |
| Amazon.com, Inc. | 4.8% |
| Texas Instruments, Inc. | 4.8% |
| Meta Platforms, Inc., Class A | 4.4% |
| Workday, Inc., Class A | 4.4% |
| Mastercard, Inc., Class A | 3.6% |
| Top Ten as a Group | 67.3% |
Availability of Additional Information
You can find additional information about the Fund such as the prospectus, financial information, fund holdings and proxy voting information at https://wealth.amg.com/resources/order-literature. You can also request this information by contacting us at 800.548.4539.
Householding
In order to reduce expenses, we will deliver a single copy of prospectuses, proxies, financial reports and other communication to shareholders with the same residential address, provided they have the same last name or we reasonably believe them to be members of the same family. Unless we are notified otherwise, we will continue to send recipients only one copy of these materials for as long as they remain a shareholder of the Fund. If you would like to receive individual mailings, please call 800.548.4539 and we will begin sending you separate copies of these materials within 30 days after receiving your request.
For additional information, please navigate to the additional material at https://wealth.amg.com/resources/order-literature.
AMG Montrusco Bolton Large Cap Growth Fund
Class I/MCGIX
ANNUAL SHAREHOLDER REPORT | October 31, 2024
This annual shareholder report contains important information about AMG Montrusco Bolton Large Cap Growth Fund (the “Fund”) for the period of November 1, 2023 to October 31, 2024. You can find additional information about the Fund at https://wealth.amg.com/resources/order-literature. You can also request this information by contacting us at 800.548.4539.
Fund Expenses
What were the Fund costs for the last year?
(Based on a hypothetical $10,000 investment)
| Fund (Class) | Costs of a $10,000 investment | Costs paid as a percentage of a $10,000 investment |
AMG Montrusco Bolton Large Cap Growth Fund
(Class I/MCGIX) | $84 | 0.73% |
Management's Discussion of Fund Performance
Market Overview
• U.S. stocks performed well during an election year amidst strong job growth and moderating inflation. This occurred despite a tense geopolitical environment and a relatively tight U.S. Federal Reserve monetary policy stance which slightly shifted to an easing monetary policy with a 0.50% interest rate cut in the third quarter.
Performance review
• For the 12 months ended October 31, 2024, the Fund’s Class I shares generated a return of 29.43%, compared to the S&P 500® Index which generated a return of 38.02%. The underperformance came predominantly from stock selection.
Top Contributors and Detractors
• The top contributing sectors to the Fund’s relative performance included health care and communication services.
• The top detracting sectors included consumer discretionary, financials, and information technology.
• The top three contributors to the Fund’s return were NVIDIA, Meta, and Charles River Laboratories. NVIDIA continued its dominance in the artificial intelligence (AI) and GPU (graphics processing unit) markets while Meta’s success can be attributed to its significant investments in AI, its pivot towards the metaverse and augmented reality technologies. Charles River delivered strong performance due to its central role in the biotech and pharmaceutical industries. The Fund exited its position in Charles River Laboratories during the period.
• The top three detractors were Five Below, Adobe, and Lululemon®. Five Below faced numerous challenges that included: rising inflation, which put pressure on consumer spending and increased supply chain and labor costs, which impacted profitability. The Fund exited its position in Five Below. Adobe struggled because of shifts in demand and increasing competition in the creative software and digital marketing space while Lululemon faced a mix of economic pressures and changing consumer behaviors, which impacted demand for its premium athletic apparel.
Positioning
• The Fund’s top ten holdings at the end of October 2024 represented 67.3% of the Fund’s net assets.
Fund Performance
The performance line graph below shows the performance of a hypothetical $10,000 investment in the class of shares noted over a ten year period, as compared to the performance of (i) a broad based index and (ii) an additional index reflecting the market segment(s) in which the Fund invests. The performance table below shows the average annual total returns of the class of shares noted for the past one-, five-, and ten-year periods ended as of October 31, 2024. It also shows the average total returns of (i) a broad based index and (ii) an additional index reflecting the market segment(s) in which the Fund invests over the same periods.
Performance for other share classes will vary. The Fund’s past performance is not a good predictor of the Fund’s future performance.
The graph and table do not reflect the deduction of taxes that a shareholder would pay on fund distributions or redemption of fund shares.
GROWTH OF $10,000
| AVERAGE ANNUAL TOTAL RETURNS | 1 Year | 5 Years | 10 Years |
| Class I | 29.43% | 14.10% | 12.12% |
| S&P 500® Index | 38.02% | 15.27% | 13.00% |
| S&P 500® Growth Index | 43.67% | 17.01% | 14.76% |
Effective October 31, 2024, the S&P 500® Index was added as a broad measure of market performance in accordance with recent changes to regulatory disclosure requirements. The Fund continues to use the S&P 500® Growth Index as an additional benchmark that reflects the market segment(s) in which the Fund invests.
As of March 19, 2021, the Fund's Subadviser was changed to Montrusco Bolton Investments, Inc. Prior to March 19, 2021, the Fund had different principal investment strategies and corresponding risks. The Fund's performance before March 19, 2021, might be less pertinent for investors considering whether to purchase shares of the Fund.
The S&P Index is proprietary data of Standard & Poor’s, a division of McGraw-Hill Companies, Inc. All rights reserved.
For updated Fund performance information, please visit: https://wealth.amg.com/.
Key Fund Statistics (as of October 31, 2024)
| Fund net assets | $208,325,570 |
| Total number of portfolio holdings | 27 |
| Net advisory fees paid | $899,126 |
| Portfolio turnover rate as of the end of the reporting period | 83% |
Graphical Representation of Holdings (as of October 31, 2024)
Top ten holdings and portfolio breakdown are shown as a percentage of net assets of the Fund.
| Apple, Inc. | 9.6% |
| NVIDIA Corp. | 9.3% |
| Microsoft Corp. | 9.2% |
| Adobe, Inc. | 8.9% |
| Alphabet, Inc., Class A | 8.3% |
| Amazon.com, Inc. | 4.8% |
| Texas Instruments, Inc. | 4.8% |
| Meta Platforms, Inc., Class A | 4.4% |
| Workday, Inc., Class A | 4.4% |
| Mastercard, Inc., Class A | 3.6% |
| Top Ten as a Group | 67.3% |
Availability of Additional Information
You can find additional information about the Fund such as the prospectus, financial information, fund holdings and proxy voting information at https://wealth.amg.com/resources/order-literature. You can also request this information by contacting us at 800.548.4539.
Householding
In order to reduce expenses, we will deliver a single copy of prospectuses, proxies, financial reports and other communication to shareholders with the same residential address, provided they have the same last name or we reasonably believe them to be members of the same family. Unless we are notified otherwise, we will continue to send recipients only one copy of these materials for as long as they remain a shareholder of the Fund. If you would like to receive individual mailings, please call 800.548.4539 and we will begin sending you separate copies of these materials within 30 days after receiving your request.
For additional information, please navigate to the additional material at https://wealth.amg.com/resources/order-literature.
AMG River Road Dividend All Cap Value Fund
Class N/ARDEX
ANNUAL SHAREHOLDER REPORT | October 31, 2024
This annual shareholder report contains important information about AMG River Road Dividend All Cap Value Fund (the “Fund”) for the period of November 1, 2023 to October 31, 2024. You can find additional information about the Fund at https://wealth.amg.com/resources/order-literature. You can also request this information by contacting us at 800.548.4539.
Fund Expenses
What were the Fund costs for the last year?
(Based on a hypothetical $10,000 investment)
| Fund (Class) | Costs of a $10,000 investment | Costs paid as a percentage of a $10,000 investment |
AMG River Road Dividend All Cap Value Fund
(Class N/ARDEX) | $112 | 0.97% |
Management's Discussion of Fund Performance
Performance Overview
• The Fund’s Class N shares returned 31.94% for the fiscal year ended October 31, 2024.
• As of October 31, 2024, the dividend yield of the Fund was 3.01%, which is more than double the 1.31% yield of the S&P 500® Index.
Relative Performance
• The Fund underperformed the S&P 500® Index, which returned 38.02% for the period due to the Fund’s focus on value and high yielding stocks. The benchmark is heavily weighted to growth stocks, which have outperformed value during the year.
Top Contributors and Detractors
• Both sector allocation and stock selection had a negative impact on relative results.
• Utilities and energy were the top performing sectors in the Fund on a relative basis whereas communications services and industrials were the largest relative detractors.
• The positions with the highest contribution to relative return were Vistra, Corning, and Oracle.
• The positions with the lowest contribution to relative return were United Parcel Service, Comcast, and AES.
Positioning
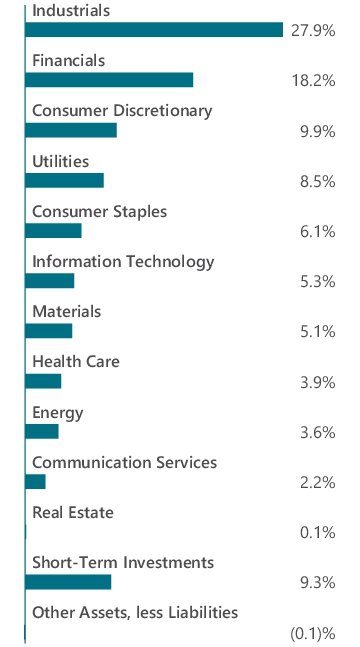
• As of October 31, 2024, the Fund is meaningfully overweight (greater than 5%) in three sectors (energy, consumer staples, and utilities) and meaningfully underweight (greater than -5%) in two: information technology and consumer discretionary. The Fund also has no exposure to the materials sector.
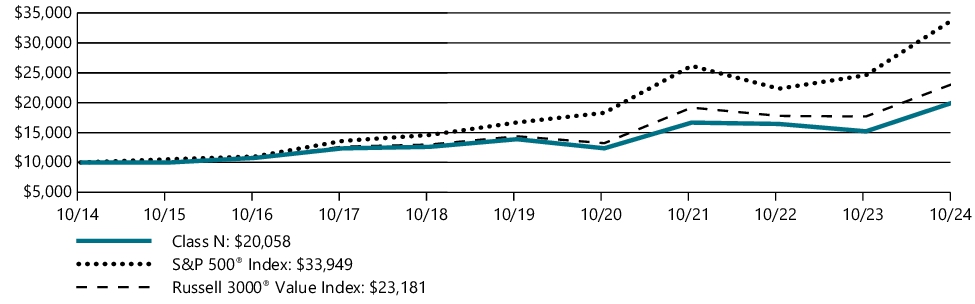
Fund Performance
The performance line graph below shows the performance of a hypothetical $10,000 investment in the class of shares noted over a ten year period, as compared to the performance of (i) a broad based index and (ii) an additional index reflecting the market segment(s) in which the Fund invests. The performance table below shows the average annual total returns of the class of shares noted for the past one-, five-, and ten-year periods ended as of October 31, 2024. It also shows the average total returns of (i) a broad based index and (ii) an additional index reflecting the market segment(s) in which the Fund invests over the same periods.
Performance for other share classes will vary. The Fund’s past performance is not a good predictor of the Fund’s future performance.
The graph and table do not reflect the deduction of taxes that a shareholder would pay on fund distributions or redemption of fund shares.
GROWTH OF $10,000
| AVERAGE ANNUAL TOTAL RETURNS | 1 Year | 5 Years | 10 Years |
| Class N | 31.94% | 7.64% | 7.21% |
| S&P 500® Index | 38.02% | 15.27% | 13.00% |
| Russell 3000® Value Index | 31.02% | 10.04% | 8.77% |
Effective October 31, 2024, the S&P 500® Index was added as a broad measure of market performance in accordance with recent changes to regulatory disclosure requirements. The Fund continues to use the Russell 3000® Value Index as an additional benchmark that reflects the market segment(s) in which the Fund invests.
The S&P Index is proprietary data of Standard & Poor’s, a division of McGraw-Hill Companies, Inc. All rights reserved.
The Russell Index is a trademark of the London Stock Exchange Group companies.
For updated Fund performance information, please visit: https://wealth.amg.com/.
Key Fund Statistics (as of October 31, 2024)
| Fund net assets | $85,304,165 |
| Total number of portfolio holdings | 57 |
| Net advisory fees paid | $519,687 |
| Portfolio turnover rate as of the end of the reporting period | 26% |
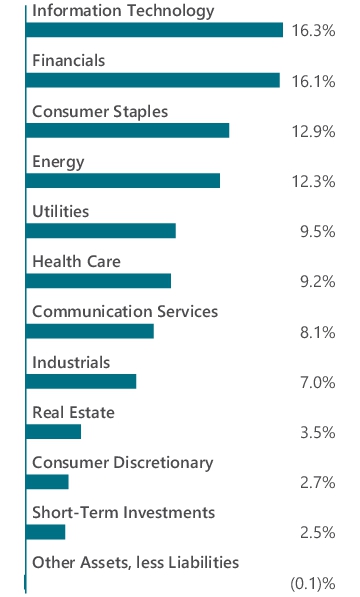
Graphical Representation of Holdings (as of October 31, 2024)
Top ten holdings and portfolio breakdown are shown as a percentage of net assets of the Fund.
| Oracle Corp. | 4.6% |
| The Williams Cos., Inc. | 4.3% |
| Kinder Morgan, Inc. | 3.8% |
| The Progressive Corp. | 3.6% |
| The PNC Financial Services Group, Inc. | 3.2% |
| Comcast Corp., Class A | 3.2% |
| Unilever PLC, Sponsored ADR (United Kingdom) | 3.1% |
| Corning, Inc. | 3.1% |
| Cogent Communications Holdings, Inc. | 3.1% |
| American Tower Corp., REIT | 2.7% |
| Top Ten as a Group | 34.7% |
Availability of Additional Information
You can find additional information about the Fund such as the prospectus, financial information, fund holdings and proxy voting information at https://wealth.amg.com/resources/order-literature. You can also request this information by contacting us at 800.548.4539.
Householding
In order to reduce expenses, we will deliver a single copy of prospectuses, proxies, financial reports and other communication to shareholders with the same residential address, provided they have the same last name or we reasonably believe them to be members of the same family. Unless we are notified otherwise, we will continue to send recipients only one copy of these materials for as long as they remain a shareholder of the Fund. If you would like to receive individual mailings, please call 800.548.4539 and we will begin sending you separate copies of these materials within 30 days after receiving your request.
For additional information, please navigate to the additional material at https://wealth.amg.com/resources/order-literature.
AMG River Road Dividend All Cap Value Fund
Class I/ARIDX
ANNUAL SHAREHOLDER REPORT | October 31, 2024
This annual shareholder report contains important information about AMG River Road Dividend All Cap Value Fund (the “Fund”) for the period of November 1, 2023 to October 31, 2024. You can find additional information about the Fund at https://wealth.amg.com/resources/order-literature. You can also request this information by contacting us at 800.548.4539.
Fund Expenses
What were the Fund costs for the last year?
(Based on a hypothetical $10,000 investment)
| Fund (Class) | Costs of a $10,000 investment | Costs paid as a percentage of a $10,000 investment |
AMG River Road Dividend All Cap Value Fund
(Class I/ARIDX) | $84 | 0.72% |
Management's Discussion of Fund Performance
Performance Overview
• The Fund’s Class I shares returned 32.19% for the fiscal year ended October 31, 2024.
• As of October 31, 2024, the dividend yield of the Fund was 3.01%, which is more than double the 1.31% yield of the S&P 500® Index.
Relative Performance
• The Fund underperformed the S&P 500® Index, which returned 38.02% for the period due to the Fund’s focus on value and high yielding stocks. The benchmark is heavily weighted to growth stocks, which have outperformed value during the year.
Top Contributors and Detractors
• Both sector allocation and stock selection had a negative impact on relative results.
• Utilities and energy were the top performing sectors in the Fund on a relative basis whereas communications services and industrials were the largest relative detractors.
• The positions with the highest contribution to relative return were Vistra, Corning, and Oracle.
• The positions with the lowest contribution to relative return were United Parcel Service, Comcast, and AES.
Positioning
• As of October 31, 2024, the Fund is meaningfully overweight (greater than 5%) in three sectors (energy, consumer staples, and utilities) and meaningfully underweight (greater than -5%) in two: information technology and consumer discretionary. The Fund also has no exposure to the materials sector.
Fund Performance
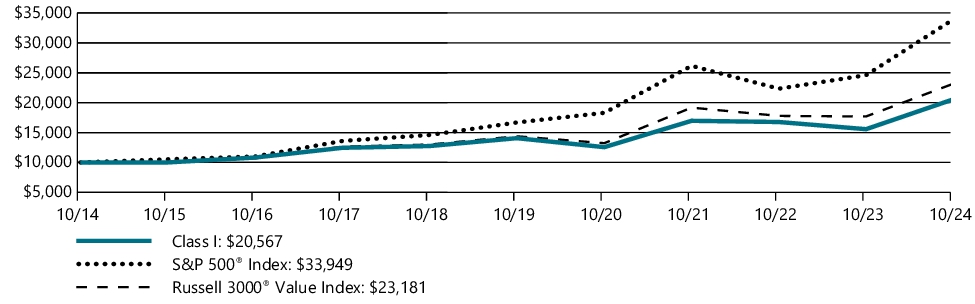
The performance line graph below shows the performance of a hypothetical $10,000 investment in the class of shares noted over a ten year period, as compared to the performance of (i) a broad based index and (ii) an additional index reflecting the market segment(s) in which the Fund invests. The performance table below shows the average annual total returns of the class of shares noted for the past one-, five-, and ten-year periods ended as of October 31, 2024. It also shows the average total returns of (i) a broad based index and (ii) an additional index reflecting the market segment(s) in which the Fund invests over the same periods.
Performance for other share classes will vary. The Fund’s past performance is not a good predictor of the Fund’s future performance.
The graph and table do not reflect the deduction of taxes that a shareholder would pay on fund distributions or redemption of fund shares.
GROWTH OF $10,000
| AVERAGE ANNUAL TOTAL RETURNS | 1 Year | 5 Years | 10 Years |
| Class I | 32.19% | 7.91% | 7.48% |
| S&P 500® Index | 38.02% | 15.27% | 13.00% |
| Russell 3000® Value Index | 31.02% | 10.04% | 8.77% |
Effective October 31, 2024, the S&P 500® Index was added as a broad measure of market performance in accordance with recent changes to regulatory disclosure requirements. The Fund continues to use the Russell 3000® Value Index as an additional benchmark that reflects the market segment(s) in which the Fund invests.
The S&P Index is proprietary data of Standard & Poor’s, a division of McGraw-Hill Companies, Inc. All rights reserved.
The Russell Index is a trademark of the London Stock Exchange Group companies.
For updated Fund performance information, please visit: https://wealth.amg.com/.
Key Fund Statistics (as of October 31, 2024)
| Fund net assets | $85,304,165 |
| Total number of portfolio holdings | 57 |
| Net advisory fees paid | $519,687 |
| Portfolio turnover rate as of the end of the reporting period | 26% |
Graphical Representation of Holdings (as of October 31, 2024)
Top ten holdings and portfolio breakdown are shown as a percentage of net assets of the Fund.
| Oracle Corp. | 4.6% |
| The Williams Cos., Inc. | 4.3% |
| Kinder Morgan, Inc. | 3.8% |
| The Progressive Corp. | 3.6% |
| The PNC Financial Services Group, Inc. | 3.2% |
| Comcast Corp., Class A | 3.2% |
| Unilever PLC, Sponsored ADR (United Kingdom) | 3.1% |
| Corning, Inc. | 3.1% |
| Cogent Communications Holdings, Inc. | 3.1% |
| American Tower Corp., REIT | 2.7% |
| Top Ten as a Group | 34.7% |
Availability of Additional Information
You can find additional information about the Fund such as the prospectus, financial information, fund holdings and proxy voting information at https://wealth.amg.com/resources/order-literature. You can also request this information by contacting us at 800.548.4539.
Householding
In order to reduce expenses, we will deliver a single copy of prospectuses, proxies, financial reports and other communication to shareholders with the same residential address, provided they have the same last name or we reasonably believe them to be members of the same family. Unless we are notified otherwise, we will continue to send recipients only one copy of these materials for as long as they remain a shareholder of the Fund. If you would like to receive individual mailings, please call 800.548.4539 and we will begin sending you separate copies of these materials within 30 days after receiving your request.
For additional information, please navigate to the additional material at https://wealth.amg.com/resources/order-literature.
AMG River Road Dividend All Cap Value Fund
Class Z/ARZDX
ANNUAL SHAREHOLDER REPORT | October 31, 2024
This annual shareholder report contains important information about AMG River Road Dividend All Cap Value Fund (the “Fund”) for the period of November 1, 2023 to October 31, 2024. You can find additional information about the Fund at https://wealth.amg.com/resources/order-literature. You can also request this information by contacting us at 800.548.4539.
Fund Expenses
What were the Fund costs for the last year?
(Based on a hypothetical $10,000 investment)
| Fund (Class) | Costs of a $10,000 investment | Costs paid as a percentage of a $10,000 investment |
AMG River Road Dividend All Cap Value Fund
(Class Z/ARZDX) | $79 | 0.68% |
Management's Discussion of Fund Performance
Performance Overview
• The Fund’s Class Z shares returned 32.37% for the fiscal year ended October 31, 2024.
• As of October 31, 2024, the dividend yield of the Fund was 3.01%, which is more than double the 1.31% yield of the S&P 500® Index.
Relative Performance
• The Fund underperformed the S&P 500® Index, which returned 38.02% for the period due to the Fund’s focus on value and high yielding stocks. The benchmark is heavily weighted to growth stocks, which have outperformed value during the year.
Top Contributors and Detractors
• Both sector allocation and stock selection had a negative impact on relative results.
• Utilities and energy were the top performing sectors in the Fund on a relative basis whereas communications services and industrials were the largest relative detractors.
• The positions with the highest contribution to relative return were Vistra, Corning, and Oracle.
• The positions with the lowest contribution to relative return were United Parcel Service, Comcast, and AES.
Positioning
• As of October 31, 2024, the Fund is meaningfully overweight (greater than 5%) in three sectors (energy, consumer staples, and utilities) and meaningfully underweight (greater than -5%) in two: information technology and consumer discretionary. The Fund also has no exposure to the materials sector.
Fund Performance
The performance line graph below shows the performance of a hypothetical $10,000 investment in the class of shares noted since the class's inception on September 29, 2017, as compared to the performance of (i) a broad based index and (ii) an additional index reflecting the market segment(s) in which the Fund invests. The performance table below shows the average annual total returns of the class of shares noted for the past one-year and five-year periods and the period from the class's inception through October 31, 2024. It also shows the average total returns of (i) a broad based index and (ii) an additional index reflecting the market segment(s) in which the Fund invests over the same periods.
Performance for other share classes will vary. The Fund’s past performance is not a good predictor of the Fund’s future performance.
The graph and table do not reflect the deduction of taxes that a shareholder would pay on fund distributions or redemption of fund shares.
GROWTH OF $10,000
| AVERAGE ANNUAL TOTAL RETURNS | 1 Year | 5 Years | Since Inception |
| Class Z | 32.37% | 7.98% | 7.49% |
| S&P 500® Index | 38.02% | 15.27% | 14.16% |
| Russell 3000® Value Index | 31.02% | 10.04% | 9.05% |
Effective October 31, 2024, the S&P 500® Index was added as a broad measure of market performance in accordance with recent changes to regulatory disclosure requirements. The Fund continues to use the Russell 3000® Value Index as an additional benchmark that reflects the market segment(s) in which the Fund invests.
The S&P Index is proprietary data of Standard & Poor’s, a division of McGraw-Hill Companies, Inc. All rights reserved.
The Russell Index is a trademark of the London Stock Exchange Group companies.
For updated Fund performance information, please visit: https://wealth.amg.com/.
Key Fund Statistics (as of October 31, 2024)
| Fund net assets | $85,304,165 |
| Total number of portfolio holdings | 57 |
| Net advisory fees paid | $519,687 |
| Portfolio turnover rate as of the end of the reporting period | 26% |
Graphical Representation of Holdings (as of October 31, 2024)
Top ten holdings and portfolio breakdown are shown as a percentage of net assets of the Fund.
| Oracle Corp. | 4.6% |
| The Williams Cos., Inc. | 4.3% |
| Kinder Morgan, Inc. | 3.8% |
| The Progressive Corp. | 3.6% |
| The PNC Financial Services Group, Inc. | 3.2% |
| Comcast Corp., Class A | 3.2% |
| Unilever PLC, Sponsored ADR (United Kingdom) | 3.1% |
| Corning, Inc. | 3.1% |
| Cogent Communications Holdings, Inc. | 3.1% |
| American Tower Corp., REIT | 2.7% |
| Top Ten as a Group | 34.7% |
Availability of Additional Information
You can find additional information about the Fund such as the prospectus, financial information, fund holdings and proxy voting information at https://wealth.amg.com/resources/order-literature. You can also request this information by contacting us at 800.548.4539.
Householding
In order to reduce expenses, we will deliver a single copy of prospectuses, proxies, financial reports and other communication to shareholders with the same residential address, provided they have the same last name or we reasonably believe them to be members of the same family. Unless we are notified otherwise, we will continue to send recipients only one copy of these materials for as long as they remain a shareholder of the Fund. If you would like to receive individual mailings, please call 800.548.4539 and we will begin sending you separate copies of these materials within 30 days after receiving your request.
For additional information, please navigate to the additional material at https://wealth.amg.com/resources/order-literature.
AMG River Road Focused Absolute Value Fund
Class N/ARRFX
ANNUAL SHAREHOLDER REPORT | October 31, 2024
This annual shareholder report contains important information about AMG River Road Focused Absolute Value Fund (the “Fund”) for the period of November 1, 2023 to October 31, 2024. You can find additional information about the Fund at https://wealth.amg.com/resources/order-literature. You can also request this information by contacting us at 800.548.4539.
Fund Expenses
What were the Fund costs for the last year?
(Based on a hypothetical $10,000 investment)
| Fund (Class) | Costs of a $10,000 investment | Costs paid as a percentage of a $10,000 investment |
AMG River Road Focused Absolute Value Fund
(Class N/ARRFX) | $121 | 1.06% |
Management's Discussion of Fund Performance
Performance Overview
• The Fund’s Class N shares returned 28.70% for the fiscal year ended October 31, 2024, underperforming the S&P 500® Index, which returned 38.02% for the period.
• As an all-cap portfolio, the relative performance was impacted by the Fund’s positioning in mid-cap and small-cap stocks, which underperformed large-cap stocks. The benchmark is heavily weighted in large-cap stocks, which outperformed small- and mid-cap stocks during the year.
Top Contributors and Detractors
• Both stock selection and sector allocation had a negative impact on relative results.
• The sectors with the highest contribution to relative return were utilities and materials. Utilities benefited from positive stock selection and an overweight allocation. Materials benefited from positive stock selection, partially offset by an overweight allocation.
• The holdings with the highest contribution to relative return were Talen Energy, CRH, and Expedia Group.
• The sectors with the lowest contribution to relative return were financials and information technology. Financials suffered from negative stock selection, partially offset by an overweight allocation. Information technology suffered from an underweight allocation, partially offset by positive stock selection.
• The holdings with the lowest contribution to relative return were LKQ, Delek, and Patterson Companies. The Fund exited its position in Patterson Companies during the period.
Positioning
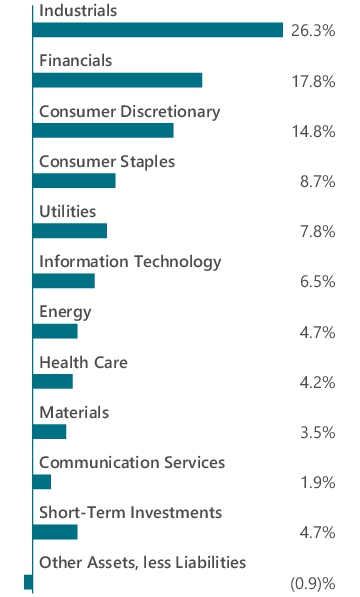
• As of October 31, 2024, the Fund is meaningfully overweight (greater than 5%) in four sectors and meaningfully underweight (greater than -5%) in three. The largest overweight allocations were consumer discretionary and consumer staples. The largest underweight allocations were information technology and communication services.
• From a market cap perspective, the Fund remains significantly underweight larger cap stocks (greater than $45B) and overweight smaller cap stocks (less than $10B) and mid cap stocks ($10B-$45B).
Fund Performance
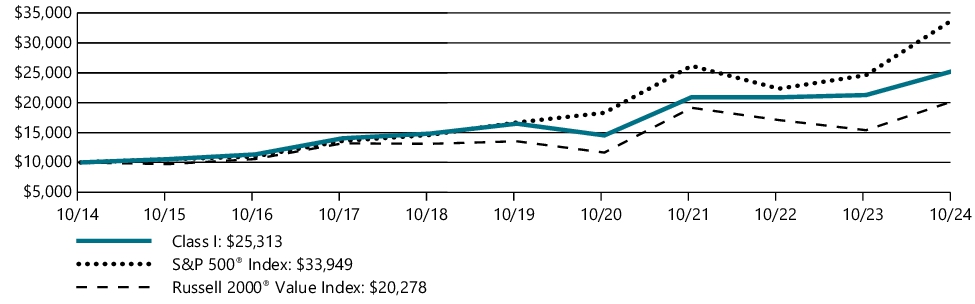
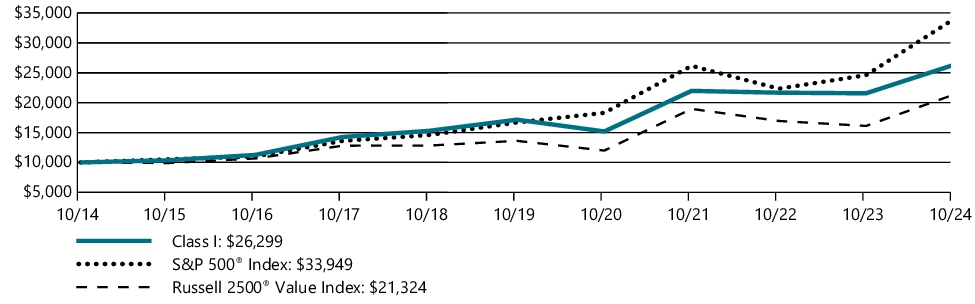
The performance line graph below shows the performance of a hypothetical $10,000 investment in the class of shares noted since the class's inception on November 02, 2015, as compared to the performance of (i) a broad based index and (ii) an additional index reflecting the market segment(s) in which the Fund invests. The performance table below shows the average annual total returns of the class of shares noted for the past one-year and five-year periods and the period from the class's inception through October 31, 2024. It also shows the average total returns of (i) a broad based index and (ii) an additional index reflecting the market segment(s) in which the Fund invests over the same periods.
Performance for other share classes will vary. The Fund’s past performance is not a good predictor of the Fund’s future performance.
The graph and table do not reflect the deduction of taxes that a shareholder would pay on fund distributions or redemption of fund shares.
GROWTH OF $10,000
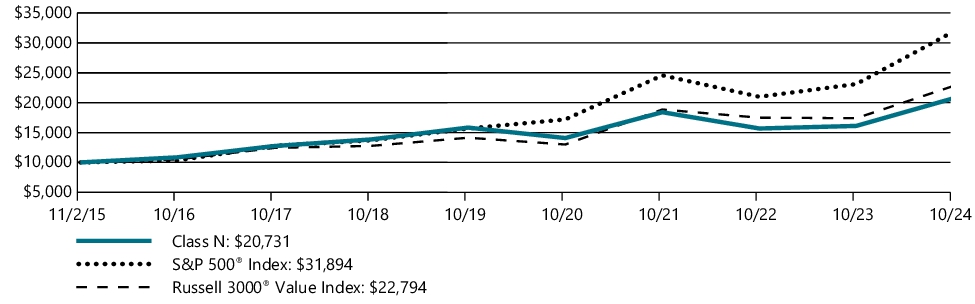
| AVERAGE ANNUAL TOTAL RETURNS | 1 Year | 5 Years | Since Inception |
| Class N | 28.70% | 5.55% | 8.44% |
| S&P 500® Index | 38.02% | 15.27% | 13.75% |
| Russell 3000® Value Index | 31.02% | 10.04% | 9.59% |
Effective October 31, 2024, the S&P 500® Index was added as a broad measure of market performance in accordance with recent changes to regulatory disclosure requirements. The Fund continues to use the Russell 3000® Value Index as an additional benchmark that reflects the market segment(s) in which the Fund invests.
The S&P Index is proprietary data of Standard & Poor’s, a division of McGraw-Hill Companies, Inc. All rights reserved.
The Russell Index is a trademark of the London Stock Exchange Group companies.
For updated Fund performance information, please visit: https://wealth.amg.com/.
Key Fund Statistics (as of October 31, 2024)
| Fund net assets | $49,054,320 |
| Total number of portfolio holdings | 33 |
| Net advisory fees paid | $192,000 |
| Portfolio turnover rate as of the end of the reporting period | 86% |
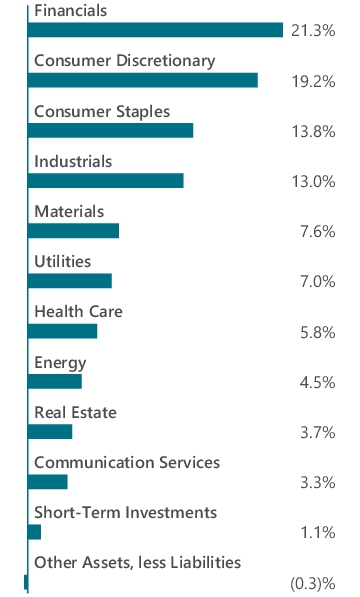
Graphical Representation of Holdings (as of October 31, 2024)
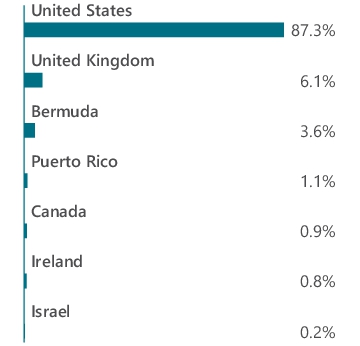
Top ten holdings and portfolio breakdown are shown as a percentage of net assets of the Fund.
| Fairfax Financial Holdings, Ltd. (Canada) | 6.6% |
| Berkshire Hathaway, Inc., Class B | 6.0% |
| BJ's Wholesale Club Holdings, Inc. | 5.0% |
| The Kroger Co. | 4.9% |
| CRH PLC | 4.5% |
| Papa John's International, Inc. | 3.7% |
| Mid-America Apartment Communities, Inc., REIT | 3.7% |
| Talen Energy Corp. | 3.6% |
| Northwestern Energy Group, Inc. | 3.4% |
| SS&C Technologies Holdings, Inc. | 3.4% |
| Top Ten as a Group | 44.8% |
Availability of Additional Information
You can find additional information about the Fund such as the prospectus, financial information, fund holdings and proxy voting information at https://wealth.amg.com/resources/order-literature. You can also request this information by contacting us at 800.548.4539.
Householding
In order to reduce expenses, we will deliver a single copy of prospectuses, proxies, financial reports and other communication to shareholders with the same residential address, provided they have the same last name or we reasonably believe them to be members of the same family. Unless we are notified otherwise, we will continue to send recipients only one copy of these materials for as long as they remain a shareholder of the Fund. If you would like to receive individual mailings, please call 800.548.4539 and we will begin sending you separate copies of these materials within 30 days after receiving your request.
For additional information, please navigate to the additional material at https://wealth.amg.com/resources/order-literature.
AMG River Road Focused Absolute Value Fund
Class I/AFAVX
ANNUAL SHAREHOLDER REPORT | October 31, 2024
This annual shareholder report contains important information about AMG River Road Focused Absolute Value Fund (the “Fund”) for the period of November 1, 2023 to October 31, 2024. You can find additional information about the Fund at https://wealth.amg.com/resources/order-literature. You can also request this information by contacting us at 800.548.4539.
Fund Expenses
What were the Fund costs for the last year?
(Based on a hypothetical $10,000 investment)
| Fund (Class) | Costs of a $10,000 investment | Costs paid as a percentage of a $10,000 investment |
AMG River Road Focused Absolute Value Fund
(Class I/AFAVX) | $94 | 0.82% |
Management's Discussion of Fund Performance
Performance Overview
• The Fund’s Class I shares returned 28.90% for the fiscal year ended October 31, 2024, underperforming the S&P 500® Index, which returned 38.02% for the period.
• As an all-cap portfolio, the relative performance was impacted by the Fund’s positioning in mid-cap and small-cap stocks, which underperformed large-cap stocks. The benchmark is heavily weighted in large-cap stocks, which outperformed small- and mid-cap stocks during the year.
Top Contributors and Detractors
• Both stock selection and sector allocation had a negative impact on relative results.
• The sectors with the highest contribution to relative return were utilities and materials. Utilities benefited from positive stock selection and an overweight allocation. Materials benefited from positive stock selection, partially offset by an overweight allocation.
• The holdings with the highest contribution to relative return were Talen Energy, CRH, and Expedia Group.
• The sectors with the lowest contribution to relative return were financials and information technology. Financials suffered from negative stock selection, partially offset by an overweight allocation. Information technology suffered from an underweight allocation, partially offset by positive stock selection.
• The holdings with the lowest contribution to relative return were LKQ, Delek, and Patterson Companies. The Fund exited its position in Patterson Companies during the period.
Positioning
• As of October 31, 2024, the Fund is meaningfully overweight (greater than 5%) in four sectors and meaningfully underweight (greater than -5%) in three. The largest overweight allocations were consumer discretionary and consumer staples. The largest underweight allocations were information technology and communication services.
• From a market cap perspective, the Fund remains significantly underweight larger cap stocks (greater than $45B) and overweight smaller cap stocks (less than $10B) and mid cap stocks ($10B-$45B).
Fund Performance
The performance line graph below shows the performance of a hypothetical $10,000 investment in the class of shares noted since the class's inception on November 02, 2015, as compared to the performance of (i) a broad based index and (ii) an additional index reflecting the market segment(s) in which the Fund invests. The performance table below shows the average annual total returns of the class of shares noted for the past one-year and five-year periods and the period from the class's inception through October 31, 2024. It also shows the average total returns of (i) a broad based index and (ii) an additional index reflecting the market segment(s) in which the Fund invests over the same periods.
Performance for other share classes will vary. The Fund’s past performance is not a good predictor of the Fund’s future performance.
The graph and table do not reflect the deduction of taxes that a shareholder would pay on fund distributions or redemption of fund shares.
GROWTH OF $10,000
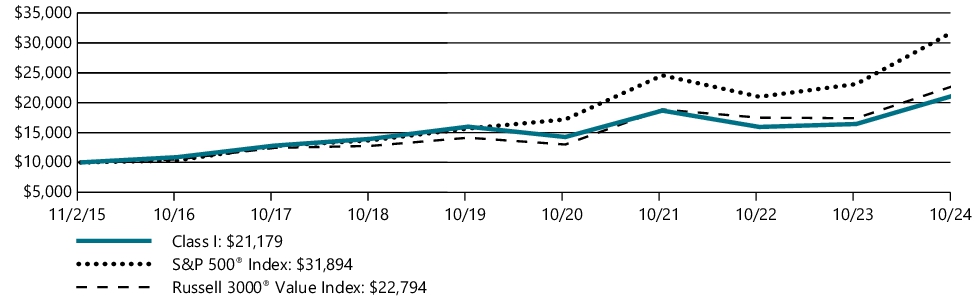
| AVERAGE ANNUAL TOTAL RETURNS | 1 Year | 5 Years | Since Inception |
| Class I | 28.90% | 5.80% | 8.70% |
| S&P 500® Index | 38.02% | 15.27% | 13.75% |
| Russell 3000® Value Index | 31.02% | 10.04% | 9.59% |
Effective October 31, 2024, the S&P 500® Index was added as a broad measure of market performance in accordance with recent changes to regulatory disclosure requirements. The Fund continues to use the Russell 3000® Value Index as an additional benchmark that reflects the market segment(s) in which the Fund invests.
The S&P Index is proprietary data of Standard & Poor’s, a division of McGraw-Hill Companies, Inc. All rights reserved.
The Russell Index is a trademark of the London Stock Exchange Group companies.
For updated Fund performance information, please visit: https://wealth.amg.com/.
Key Fund Statistics (as of October 31, 2024)
| Fund net assets | $49,054,320 |
| Total number of portfolio holdings | 33 |
| Net advisory fees paid | $192,000 |
| Portfolio turnover rate as of the end of the reporting period | 86% |
Graphical Representation of Holdings (as of October 31, 2024)
Top ten holdings and portfolio breakdown are shown as a percentage of net assets of the Fund.
| Fairfax Financial Holdings, Ltd. (Canada) | 6.6% |
| Berkshire Hathaway, Inc., Class B | 6.0% |
| BJ's Wholesale Club Holdings, Inc. | 5.0% |
| The Kroger Co. | 4.9% |
| CRH PLC | 4.5% |
| Papa John's International, Inc. | 3.7% |
| Mid-America Apartment Communities, Inc., REIT | 3.7% |
| Talen Energy Corp. | 3.6% |
| Northwestern Energy Group, Inc. | 3.4% |
| SS&C Technologies Holdings, Inc. | 3.4% |
| Top Ten as a Group | 44.8% |
Availability of Additional Information
You can find additional information about the Fund such as the prospectus, financial information, fund holdings and proxy voting information at https://wealth.amg.com/resources/order-literature. You can also request this information by contacting us at 800.548.4539.
Householding
In order to reduce expenses, we will deliver a single copy of prospectuses, proxies, financial reports and other communication to shareholders with the same residential address, provided they have the same last name or we reasonably believe them to be members of the same family. Unless we are notified otherwise, we will continue to send recipients only one copy of these materials for as long as they remain a shareholder of the Fund. If you would like to receive individual mailings, please call 800.548.4539 and we will begin sending you separate copies of these materials within 30 days after receiving your request.
For additional information, please navigate to the additional material at https://wealth.amg.com/resources/order-literature.
AMG River Road Focused Absolute Value Fund
Class Z/ARRZX
ANNUAL SHAREHOLDER REPORT | October 31, 2024
This annual shareholder report contains important information about AMG River Road Focused Absolute Value Fund (the “Fund”) for the period of November 1, 2023 to October 31, 2024. You can find additional information about the Fund at https://wealth.amg.com/resources/order-literature. You can also request this information by contacting us at 800.548.4539.
Fund Expenses
What were the Fund costs for the last year?
(Based on a hypothetical $10,000 investment)
| Fund (Class) | Costs of a $10,000 investment | Costs paid as a percentage of a $10,000 investment |
AMG River Road Focused Absolute Value Fund
(Class Z/ARRZX) | $89 | 0.78% |
Management's Discussion of Fund Performance
Performance Overview
• The Fund’s Class Z shares returned 29.04% for the fiscal year ended October 31, 2024, underperforming the S&P 500® Index, which returned 38.02% for the period.
• As an all-cap portfolio, the relative performance was impacted by the Fund’s positioning in mid-cap and small-cap stocks, which underperformed large-cap stocks. The benchmark is heavily weighted in large-cap stocks, which outperformed small- and mid-cap stocks during the year.
Top Contributors and Detractors
• Both stock selection and sector allocation had a negative impact on relative results.
• The sectors with the highest contribution to relative return were utilities and materials. Utilities benefited from positive stock selection and an overweight allocation. Materials benefited from positive stock selection, partially offset by an overweight allocation.
• The holdings with the highest contribution to relative return were Talen Energy, CRH, and Expedia Group.
• The sectors with the lowest contribution to relative return were financials and information technology. Financials suffered from negative stock selection, partially offset by an overweight allocation. Information technology suffered from an underweight allocation, partially offset by positive stock selection.
• The holdings with the lowest contribution to relative return were LKQ, Delek, and Patterson Companies. The Fund exited its position in Patterson Companies during the period.
Positioning
• As of October 31, 2024, the Fund is meaningfully overweight (greater than 5%) in four sectors and meaningfully underweight (greater than -5%) in three. The largest overweight allocations were consumer discretionary and consumer staples. The largest underweight allocations were information technology and communication services.
• From a market cap perspective, the Fund remains significantly underweight larger cap stocks (greater than $45B) and overweight smaller cap stocks (less than $10B) and mid cap stocks ($10B-$45B).
Fund Performance
The performance line graph below shows the performance of a hypothetical $10,000 investment in the class of shares noted since the class's inception on September 29, 2017, as compared to the performance of (i) a broad based index and (ii) an additional index reflecting the market segment(s) in which the Fund invests. The performance table below shows the average annual total returns of the class of shares noted for the past one-year and five-year periods and the period from the class's inception through October 31, 2024. It also shows the average total returns of (i) a broad based index and (ii) an additional index reflecting the market segment(s) in which the Fund invests over the same periods.
Performance for other share classes will vary. The Fund’s past performance is not a good predictor of the Fund’s future performance.
The graph and table do not reflect the deduction of taxes that a shareholder would pay on fund distributions or redemption of fund shares.
GROWTH OF $10,000
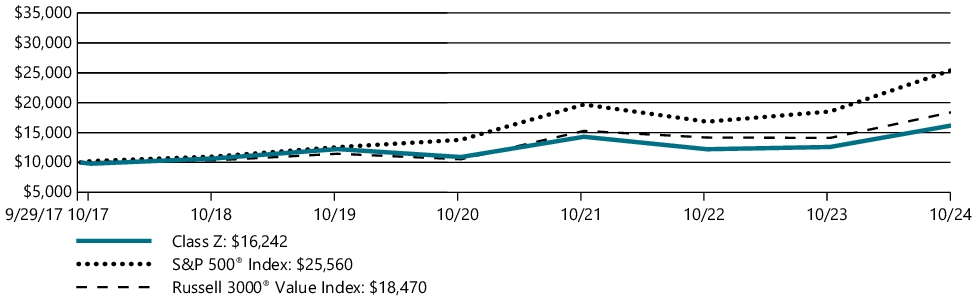
| AVERAGE ANNUAL TOTAL RETURNS | 1 Year | 5 Years | Since Inception |
| Class Z | 29.04% | 5.84% | 7.08% |
| S&P 500® Index | 38.02% | 15.27% | 14.16% |
| Russell 3000® Value Index | 31.02% | 10.04% | 9.05% |
Effective October 31, 2024, the S&P 500® Index was added as a broad measure of market performance in accordance with recent changes to regulatory disclosure requirements. The Fund continues to use the Russell 3000® Value Index as an additional benchmark that reflects the market segment(s) in which the Fund invests.
The S&P Index is proprietary data of Standard & Poor’s, a division of McGraw-Hill Companies, Inc. All rights reserved.
The Russell Index is a trademark of the London Stock Exchange Group companies.
For updated Fund performance information, please visit: https://wealth.amg.com/.
Key Fund Statistics (as of October 31, 2024)
| Fund net assets | $49,054,320 |
| Total number of portfolio holdings | 33 |
| Net advisory fees paid | $192,000 |
| Portfolio turnover rate as of the end of the reporting period | 86% |
Graphical Representation of Holdings (as of October 31, 2024)
Top ten holdings and portfolio breakdown are shown as a percentage of net assets of the Fund.
| Fairfax Financial Holdings, Ltd. (Canada) | 6.6% |
| Berkshire Hathaway, Inc., Class B | 6.0% |
| BJ's Wholesale Club Holdings, Inc. | 5.0% |
| The Kroger Co. | 4.9% |
| CRH PLC | 4.5% |
| Papa John's International, Inc. | 3.7% |
| Mid-America Apartment Communities, Inc., REIT | 3.7% |
| Talen Energy Corp. | 3.6% |
| Northwestern Energy Group, Inc. | 3.4% |
| SS&C Technologies Holdings, Inc. | 3.4% |
| Top Ten as a Group | 44.8% |
Availability of Additional Information
You can find additional information about the Fund such as the prospectus, financial information, fund holdings and proxy voting information at https://wealth.amg.com/resources/order-literature. You can also request this information by contacting us at 800.548.4539.
Householding
In order to reduce expenses, we will deliver a single copy of prospectuses, proxies, financial reports and other communication to shareholders with the same residential address, provided they have the same last name or we reasonably believe them to be members of the same family. Unless we are notified otherwise, we will continue to send recipients only one copy of these materials for as long as they remain a shareholder of the Fund. If you would like to receive individual mailings, please call 800.548.4539 and we will begin sending you separate copies of these materials within 30 days after receiving your request.
For additional information, please navigate to the additional material at https://wealth.amg.com/resources/order-literature.
AMG River Road Mid Cap Value Fund
Class N/CHTTX
ANNUAL SHAREHOLDER REPORT | October 31, 2024
This annual shareholder report contains important information about AMG River Road Mid Cap Value Fund (the “Fund”) for the period of November 1, 2023 to October 31, 2024. You can find additional information about the Fund at https://wealth.amg.com/resources/order-literature. You can also request this information by contacting us at 800.548.4539.
Fund Expenses
What were the Fund costs for the last year?
(Based on a hypothetical $10,000 investment)
| Fund (Class) | Costs of a $10,000 investment | Costs paid as a percentage of a $10,000 investment |
AMG River Road Mid Cap Value Fund
(Class N/CHTTX) | $127 | 1.11% |
Management's Discussion of Fund Performance
Performance Overview
• The Fund’s Class N shares returned 28.92% for the fiscal year ended October 31, 2024, underperforming the S&P 500® Index, which returned 38.02% for the period.
Top Contributors and Detractors
• Both sector allocation and stock selection had a negative impact on relative results.
• The sectors with the highest contribution to relative return were financials and utilities. Both sectors benefited from positive stock selection and an overweight allocation.
• The holdings with the highest contribution to active return were Talen Energy, Apollo Global Management, and Brookfield Asset Management. The Fund exited its position in Apollo Global Management during the period.
• The sectors with the lowest contribution to relative return were information technology and consumer discretionary. Information technology suffered from lack of exposure. Consumer discretionary suffered from negative stock selection and an overweight allocation.
• The holdings with the lowest contribution to active return were LKQ, Valaris Limited, and Centene. The Fund exited its position in Valaris Limited during the period.
Positioning
• As of October 31, 2024, the Fund is meaningfully overweight (greater than 5%) in three sectors and meaningfully underweight (greater than -5%) in two. The largest overweight allocations were industrials and consumer discretionary. The largest underweight allocations were information technology and communication services.
Fund Performance
The performance line graph below shows the performance of a hypothetical $10,000 investment in the class of shares noted over a ten year period, as compared to the performance of (i) a broad based index and (ii) an additional index reflecting the market segment(s) in which the Fund invests. The performance table below shows the average annual total returns of the class of shares noted for the past one-, five-, and ten-year periods ended as of October 31, 2024. It also shows the average total returns of (i) a broad based index and (ii) an additional index reflecting the market segment(s) in which the Fund invests over the same periods.
Performance for other share classes will vary. The Fund’s past performance is not a good predictor of the Fund’s future performance.
The graph and table do not reflect the deduction of taxes that a shareholder would pay on fund distributions or redemption of fund shares.
GROWTH OF $10,000
| AVERAGE ANNUAL TOTAL RETURNS | 1 Year | 5 Years | 10 Years |
| Class N | 28.92% | 12.45% | 7.41% |
| S&P 500® Index | 38.02% | 15.27% | 13.00% |
| Russell Midcap® Value Index | 34.03% | 9.93% | 8.43% |
Effective October 31, 2024, the S&P 500® Index was added as a broad measure of market performance in accordance with recent changes to regulatory disclosure requirements. The Fund continues to use the Russell Midcap® Value Index as an additional benchmark that reflects the market segment(s) in which the Fund invests.
As of March 19, 2021, the Fund's Subadviser was changed to River Road Asset Management, LLC. Prior to March 19, 2021, the Fund had different principal investment strategies and corresponding risks. The Fund's performance before March 19, 2021, might be less pertinent for investors considering whether to purchase shares of the Fund.
The S&P Index is proprietary data of Standard & Poor’s, a division of McGraw-Hill Companies, Inc. All rights reserved.
The Russell Index is a trademark of the London Stock Exchange Group companies.
For updated Fund performance information, please visit: https://wealth.amg.com/.
Key Fund Statistics (as of October 31, 2024)
| Fund net assets | $337,940,393 |
| Total number of portfolio holdings | 46 |
| Net advisory fees paid | $1,803,356 |
| Portfolio turnover rate as of the end of the reporting period | 77% |
Graphical Representation of Holdings (as of October 31, 2024)
Top ten holdings and portfolio breakdown are shown as a percentage of net assets of the Fund and country allocation is shown as a percentage of total long-term investments of the Fund.
| iShares Russell Mid-Cap Value ETF | 5.4% |
| Fairfax Financial Holdings, Ltd. (Canada) | 4.6% |
| Willis Towers Watson PLC (United Kingdom) | 4.5% |
| Talen Energy Corp. | 4.2% |
| Lululemon Athletica, Inc. (Canada) | 3.9% |
| Lithia Motors, Inc. | 3.9% |
| Labcorp Holdings, Inc. | 3.5% |
| BJ's Wholesale Club Holdings, Inc. | 3.5% |
| The Kroger Co. | 3.2% |
| Expedia Group, Inc. | 2.6% |
| Top Ten as a Group | 39.3% |
Availability of Additional Information
You can find additional information about the Fund such as the prospectus, financial information, fund holdings and proxy voting information at https://wealth.amg.com/resources/order-literature. You can also request this information by contacting us at 800.548.4539.
Householding
In order to reduce expenses, we will deliver a single copy of prospectuses, proxies, financial reports and other communication to shareholders with the same residential address, provided they have the same last name or we reasonably believe them to be members of the same family. Unless we are notified otherwise, we will continue to send recipients only one copy of these materials for as long as they remain a shareholder of the Fund. If you would like to receive individual mailings, please call 800.548.4539 and we will begin sending you separate copies of these materials within 30 days after receiving your request.
For additional information, please navigate to the additional material at https://wealth.amg.com/resources/order-literature.
AMG River Road Mid Cap Value Fund
Class I/ABMIX
ANNUAL SHAREHOLDER REPORT | October 31, 2024
This annual shareholder report contains important information about AMG River Road Mid Cap Value Fund (the “Fund”) for the period of November 1, 2023 to October 31, 2024. You can find additional information about the Fund at https://wealth.amg.com/resources/order-literature. You can also request this information by contacting us at 800.548.4539.
Fund Expenses
What were the Fund costs for the last year?
(Based on a hypothetical $10,000 investment)
| Fund (Class) | Costs of a $10,000 investment | Costs paid as a percentage of a $10,000 investment |
AMG River Road Mid Cap Value Fund
(Class I/ABMIX) | $93 | 0.81% |
Management's Discussion of Fund Performance
Performance Overview
• The Fund’s Class I shares returned 29.27% for the fiscal year ended October 31, 2024, underperforming the S&P 500® Index, which returned 38.02% for the period.
Top Contributors and Detractors
• Both sector allocation and stock selection had a negative impact on relative results.
• The sectors with the highest contribution to relative return were financials and utilities. Both sectors benefited from positive stock selection and an overweight allocation.
• The holdings with the highest contribution to active return were Talen Energy, Apollo Global Management, and Brookfield Asset Management. The Fund exited its position in Apollo Global Management during the period.
• The sectors with the lowest contribution to relative return were information technology and consumer discretionary. Information technology suffered from lack of exposure. Consumer discretionary suffered from negative stock selection and an overweight allocation.
• The holdings with the lowest contribution to active return were LKQ, Valaris Limited, and Centene. The Fund exited its position in Valaris Limited during the period.
Positioning
• As of October 31, 2024, the Fund is meaningfully overweight (greater than 5%) in three sectors and meaningfully underweight (greater than -5%) in two. The largest overweight allocations were industrials and consumer discretionary. The largest underweight allocations were information technology and communication services.
Fund Performance
The performance line graph below shows the performance of a hypothetical $10,000 investment in the class of shares noted over a ten year period, as compared to the performance of (i) a broad based index and (ii) an additional index reflecting the market segment(s) in which the Fund invests. The performance table below shows the average annual total returns of the class of shares noted for the past one-, five-, and ten-year periods ended as of October 31, 2024. It also shows the average total returns of (i) a broad based index and (ii) an additional index reflecting the market segment(s) in which the Fund invests over the same periods.
Performance for other share classes will vary. The Fund’s past performance is not a good predictor of the Fund’s future performance.
The graph and table do not reflect the deduction of taxes that a shareholder would pay on fund distributions or redemption of fund shares.
GROWTH OF $10,000
| AVERAGE ANNUAL TOTAL RETURNS | 1 Year | 5 Years | 10 Years |
| Class I | 29.27% | 12.77% | 7.70% |
| S&P 500® Index | 38.02% | 15.27% | 13.00% |
| Russell Midcap® Value Index | 34.03% | 9.93% | 8.43% |
Effective October 31, 2024, the S&P 500® Index was added as a broad measure of market performance in accordance with recent changes to regulatory disclosure requirements. The Fund continues to use the Russell Midcap® Value Index as an additional benchmark that reflects the market segment(s) in which the Fund invests.
As of March 19, 2021, the Fund's Subadviser was changed to River Road Asset Management, LLC. Prior to March 19, 2021, the Fund had different principal investment strategies and corresponding risks. The Fund's performance before March 19, 2021, might be less pertinent for investors considering whether to purchase shares of the Fund.
The S&P Index is proprietary data of Standard & Poor’s, a division of McGraw-Hill Companies, Inc. All rights reserved.
The Russell Index is a trademark of the London Stock Exchange Group companies.
For updated Fund performance information, please visit: https://wealth.amg.com/.
Key Fund Statistics (as of October 31, 2024)
| Fund net assets | $337,940,393 |
| Total number of portfolio holdings | 46 |
| Net advisory fees paid | $1,803,356 |
| Portfolio turnover rate as of the end of the reporting period | 77% |
Graphical Representation of Holdings (as of October 31, 2024)
Top ten holdings and portfolio breakdown are shown as a percentage of net assets of the Fund and country allocation is shown as a percentage of total long-term investments of the Fund.
| iShares Russell Mid-Cap Value ETF | 5.4% |
| Fairfax Financial Holdings, Ltd. (Canada) | 4.6% |
| Willis Towers Watson PLC (United Kingdom) | 4.5% |
| Talen Energy Corp. | 4.2% |
| Lululemon Athletica, Inc. (Canada) | 3.9% |
| Lithia Motors, Inc. | 3.9% |
| Labcorp Holdings, Inc. | 3.5% |
| BJ's Wholesale Club Holdings, Inc. | 3.5% |
| The Kroger Co. | 3.2% |
| Expedia Group, Inc. | 2.6% |
| Top Ten as a Group | 39.3% |
Availability of Additional Information
You can find additional information about the Fund such as the prospectus, financial information, fund holdings and proxy voting information at https://wealth.amg.com/resources/order-literature. You can also request this information by contacting us at 800.548.4539.
Householding
In order to reduce expenses, we will deliver a single copy of prospectuses, proxies, financial reports and other communication to shareholders with the same residential address, provided they have the same last name or we reasonably believe them to be members of the same family. Unless we are notified otherwise, we will continue to send recipients only one copy of these materials for as long as they remain a shareholder of the Fund. If you would like to receive individual mailings, please call 800.548.4539 and we will begin sending you separate copies of these materials within 30 days after receiving your request.
For additional information, please navigate to the additional material at https://wealth.amg.com/resources/order-literature.
AMG River Road Mid Cap Value Fund
Class Z/ABIZX
ANNUAL SHAREHOLDER REPORT | October 31, 2024
This annual shareholder report contains important information about AMG River Road Mid Cap Value Fund (the “Fund”) for the period of November 1, 2023 to October 31, 2024. You can find additional information about the Fund at https://wealth.amg.com/resources/order-literature. You can also request this information by contacting us at 800.548.4539.
Fund Expenses
What were the Fund costs for the last year?
(Based on a hypothetical $10,000 investment)
| Fund (Class) | Costs of a $10,000 investment | Costs paid as a percentage of a $10,000 investment |
AMG River Road Mid Cap Value Fund
(Class Z/ABIZX) | $87 | 0.76% |
Management's Discussion of Fund Performance
Performance Overview
• The Fund’s Class Z shares returned 29.37% for the fiscal year ended October 31, 2024, underperforming the S&P 500® Index, which returned 38.02% for the period.
Top Contributors and Detractors
• Both sector allocation and stock selection had a negative impact on relative results.
• The sectors with the highest contribution to relative return were financials and utilities. Both sectors benefited from positive stock selection and an overweight allocation.
• The holdings with the highest contribution to active return were Talen Energy, Apollo Global Management, and Brookfield Asset Management. The Fund exited its position in Apollo Global Management during the period.
• The sectors with the lowest contribution to relative return were information technology and consumer discretionary. Information technology suffered from lack of exposure. Consumer discretionary suffered from negative stock selection and an overweight allocation.
• The holdings with the lowest contribution to active return were LKQ, Valaris Limited, and Centene. The Fund exited its position in Valaris Limited during the period.
Positioning
• As of October 31, 2024, the Fund is meaningfully overweight (greater than 5%) in three sectors and meaningfully underweight (greater than -5%) in two. The largest overweight allocations were industrials and consumer discretionary. The largest underweight allocations were information technology and communication services.
Fund Performance
The performance line graph below shows the performance of a hypothetical $10,000 investment in the class of shares noted since the class's inception on September 29, 2017, as compared to the performance of (i) a broad based index and (ii) an additional index reflecting the market segment(s) in which the Fund invests. The performance table below shows the average annual total returns of the class of shares noted for the past one-year and five-year periods and the period from the class's inception through October 31, 2024. It also shows the average total returns of (i) a broad based index and (ii) an additional index reflecting the market segment(s) in which the Fund invests over the same periods.
Performance for other share classes will vary. The Fund’s past performance is not a good predictor of the Fund’s future performance.
The graph and table do not reflect the deduction of taxes that a shareholder would pay on fund distributions or redemption of fund shares.
GROWTH OF $10,000
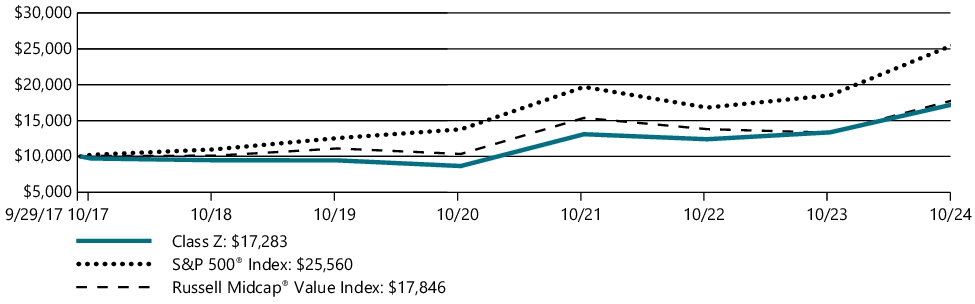
| AVERAGE ANNUAL TOTAL RETURNS | 1 Year | 5 Years | Since Inception |
| Class Z | 29.37% | 12.83% | 8.03% |
| S&P 500® Index | 38.02% | 15.27% | 14.16% |
| Russell Midcap® Value Index | 34.03% | 9.93% | 8.52% |
Effective October 31, 2024, the S&P 500® Index was added as a broad measure of market performance in accordance with recent changes to regulatory disclosure requirements. The Fund continues to use the Russell Midcap® Value Index as an additional benchmark that reflects the market segment(s) in which the Fund invests.
As of March 19, 2021, the Fund's Subadviser was changed to River Road Asset Management, LLC. Prior to March 19, 2021, the Fund had different principal investment strategies and corresponding risks. The Fund's performance before March 19, 2021, might be less pertinent for investors considering whether to purchase shares of the Fund.
The S&P Index is proprietary data of Standard & Poor’s, a division of McGraw-Hill Companies, Inc. All rights reserved.
The Russell Index is a trademark of the London Stock Exchange Group companies.
For updated Fund performance information, please visit: https://wealth.amg.com/.
Key Fund Statistics (as of October 31, 2024)
| Fund net assets | $337,940,393 |
| Total number of portfolio holdings | 46 |
| Net advisory fees paid | $1,803,356 |
| Portfolio turnover rate as of the end of the reporting period | 77% |
Graphical Representation of Holdings (as of October 31, 2024)
Top ten holdings and portfolio breakdown are shown as a percentage of net assets of the Fund and country allocation is shown as a percentage of total long-term investments of the Fund.
| iShares Russell Mid-Cap Value ETF | 5.4% |
| Fairfax Financial Holdings, Ltd. (Canada) | 4.6% |
| Willis Towers Watson PLC (United Kingdom) | 4.5% |
| Talen Energy Corp. | 4.2% |
| Lululemon Athletica, Inc. (Canada) | 3.9% |
| Lithia Motors, Inc. | 3.9% |
| Labcorp Holdings, Inc. | 3.5% |
| BJ's Wholesale Club Holdings, Inc. | 3.5% |
| The Kroger Co. | 3.2% |
| Expedia Group, Inc. | 2.6% |
| Top Ten as a Group | 39.3% |
Availability of Additional Information
You can find additional information about the Fund such as the prospectus, financial information, fund holdings and proxy voting information at https://wealth.amg.com/resources/order-literature. You can also request this information by contacting us at 800.548.4539.
Householding
In order to reduce expenses, we will deliver a single copy of prospectuses, proxies, financial reports and other communication to shareholders with the same residential address, provided they have the same last name or we reasonably believe them to be members of the same family. Unless we are notified otherwise, we will continue to send recipients only one copy of these materials for as long as they remain a shareholder of the Fund. If you would like to receive individual mailings, please call 800.548.4539 and we will begin sending you separate copies of these materials within 30 days after receiving your request.
For additional information, please navigate to the additional material at https://wealth.amg.com/resources/order-literature.
AMG River Road Small Cap Value Fund
Class N/ARSVX
ANNUAL SHAREHOLDER REPORT | October 31, 2024
This annual shareholder report contains important information about AMG River Road Small Cap Value Fund (the “Fund”) for the period of November 1, 2023 to October 31, 2024. You can find additional information about the Fund at https://wealth.amg.com/resources/order-literature. You can also request this information by contacting us at 800.548.4539.
Fund Expenses
What were the Fund costs for the last year?
(Based on a hypothetical $10,000 investment)
| Fund (Class) | Costs of a $10,000 investment | Costs paid as a percentage of a $10,000 investment |
AMG River Road Small Cap Value Fund
(Class N/ARSVX) | $150 | 1.37% |
Management's Discussion of Fund Performance
Performance Overview
• The Fund’s Class N shares returned 18.69% for the fiscal year ended October 31, 2024, underperforming the S&P 500® Index, which returned 38.02% for the period.
Top Contributors and Detractors
• Both stock selection and sector allocation had a negative impact on relative results.
• The sectors with the highest contribution to relative return were utilities and real estate. Utilities benefited from positive stock selection and an overweight allocation. Real estate benefited from positive stock selection and an underweight allocation.
• The holdings with the highest contribution to active return were Talen Energy, Argan, and ACI Worldwide.
• The sectors with the lowest contribution to relative return were industrials and information technology. Industrials suffered from negative stock selection, partially offset by an overweight allocation. Information technology suffered from an underweight allocation and negative stock selection.
• The holdings with the lowest contribution to active return were Atkore, Air Transport Services, and Delek.
Positioning
• As of October 31, 2024, the Fund is meaningfully overweight (greater than 5%) in two sectors and meaningfully underweight (greater than -5%) in three. The largest overweight allocations were industrials and utilities. The largest underweight allocations were information technology and health care.
Fund Performance
The performance line graph below shows the performance of a hypothetical $10,000 investment in the class of shares noted over a ten year period, as compared to the performance of (i) a broad based index and (ii) an additional index reflecting the market segment(s) in which the Fund invests. The performance table below shows the average annual total returns of the class of shares noted for the past one-, five-, and ten-year periods ended as of October 31, 2024. It also shows the average total returns of (i) a broad based index and (ii) an additional index reflecting the market segment(s) in which the Fund invests over the same periods.
Performance for other share classes will vary. The Fund’s past performance is not a good predictor of the Fund’s future performance.
The graph and table do not reflect the deduction of taxes that a shareholder would pay on fund distributions or redemption of fund shares.
GROWTH OF $10,000
| AVERAGE ANNUAL TOTAL RETURNS | 1 Year | 5 Years | 10 Years |
| Class N | 18.69% | 8.69% | 9.45% |
| S&P 500® Index | 38.02% | 15.27% | 13.00% |
| Russell 2000® Value Index | 31.77% | 8.42% | 7.33% |
Effective October 31, 2024, the S&P 500® Index was added as a broad measure of market performance in accordance with recent changes to regulatory disclosure requirements. The Fund continues to use the Russell 2000® Value Index as an additional benchmark that reflects the market segment(s) in which the Fund invests.
The S&P Index is proprietary data of Standard & Poor’s, a division of McGraw-Hill Companies, Inc. All rights reserved.
The Russell Index is a trademark of the London Stock Exchange Group companies.
For updated Fund performance information, please visit: https://wealth.amg.com/.
Key Fund Statistics (as of October 31, 2024)
| Fund net assets | $1,085,780,399 |
| Total number of portfolio holdings | 63 |
| Net advisory fees paid | $8,114,815 |
| Portfolio turnover rate as of the end of the reporting period | 42% |
Graphical Representation of Holdings (as of October 31, 2024)
Top ten holdings and portfolio breakdown are shown as a percentage of net assets of the Fund.
| White Mountains Insurance Group, Ltd. | 4.1% |
| McGrath RentCorp | 3.6% |
| Talen Energy Corp. | 3.3% |
| Murphy USA, Inc. | 3.0% |
| UniFirst Corp. | 2.9% |
| Summit Materials, Inc., Class A | 2.9% |
| Axis Capital Holdings, Ltd. (Bermuda) | 2.7% |
| CoreCivic, Inc. | 2.4% |
| The GEO Group Inc. | 2.4% |
| Genworth Financial, Inc., Class A | 2.3% |
| Top Ten as a Group | 29.6% |
Availability of Additional Information
You can find additional information about the Fund such as the prospectus, financial information, fund holdings and proxy voting information at https://wealth.amg.com/resources/order-literature. You can also request this information by contacting us at 800.548.4539.
Householding
In order to reduce expenses, we will deliver a single copy of prospectuses, proxies, financial reports and other communication to shareholders with the same residential address, provided they have the same last name or we reasonably believe them to be members of the same family. Unless we are notified otherwise, we will continue to send recipients only one copy of these materials for as long as they remain a shareholder of the Fund. If you would like to receive individual mailings, please call 800.548.4539 and we will begin sending you separate copies of these materials within 30 days after receiving your request.
For additional information, please navigate to the additional material at https://wealth.amg.com/resources/order-literature.
AMG River Road Small Cap Value Fund
Class I/ARSIX
ANNUAL SHAREHOLDER REPORT | October 31, 2024
This annual shareholder report contains important information about AMG River Road Small Cap Value Fund (the “Fund”) for the period of November 1, 2023 to October 31, 2024. You can find additional information about the Fund at https://wealth.amg.com/resources/order-literature. You can also request this information by contacting us at 800.548.4539.
Fund Expenses
What were the Fund costs for the last year?
(Based on a hypothetical $10,000 investment)
| Fund (Class) | Costs of a $10,000 investment | Costs paid as a percentage of a $10,000 investment |
AMG River Road Small Cap Value Fund
(Class I/ARSIX) | $122 | 1.11% |
Management's Discussion of Fund Performance
Performance Overview
• The Fund’s Class I shares returned 19.02% for the fiscal year ended October 31, 2024, underperforming the S&P 500® Index, which returned 38.02% for the period.
Top Contributors and Detractors
• Both stock selection and sector allocation had a negative impact on relative results.
• The sectors with the highest contribution to relative return were utilities and real estate. Utilities benefited from positive stock selection and an overweight allocation. Real estate benefited from positive stock selection and an underweight allocation.
• The holdings with the highest contribution to active return were Talen Energy, Argan, and ACI Worldwide.
• The sectors with the lowest contribution to relative return were industrials and information technology. Industrials suffered from negative stock selection, partially offset by an overweight allocation. Information technology suffered from an underweight allocation and negative stock selection.
• The holdings with the lowest contribution to active return were Atkore, Air Transport Services, and Delek.
Positioning
• As of October 31, 2024, the Fund is meaningfully overweight (greater than 5%) in two sectors and meaningfully underweight (greater than -5%) in three. The largest overweight allocations were industrials and utilities. The largest underweight allocations were information technology and health care.
Fund Performance
The performance line graph below shows the performance of a hypothetical $10,000 investment in the class of shares noted over a ten year period, as compared to the performance of (i) a broad based index and (ii) an additional index reflecting the market segment(s) in which the Fund invests. The performance table below shows the average annual total returns of the class of shares noted for the past one-, five-, and ten-year periods ended as of October 31, 2024. It also shows the average total returns of (i) a broad based index and (ii) an additional index reflecting the market segment(s) in which the Fund invests over the same periods.
Performance for other share classes will vary. The Fund’s past performance is not a good predictor of the Fund’s future performance.
The graph and table do not reflect the deduction of taxes that a shareholder would pay on fund distributions or redemption of fund shares.
GROWTH OF $10,000
| AVERAGE ANNUAL TOTAL RETURNS | 1 Year | 5 Years | 10 Years |
| Class I | 19.02% | 8.96% | 9.73% |
| S&P 500® Index | 38.02% | 15.27% | 13.00% |
| Russell 2000® Value Index | 31.77% | 8.42% | 7.33% |
Effective October 31, 2024, the S&P 500® Index was added as a broad measure of market performance in accordance with recent changes to regulatory disclosure requirements. The Fund continues to use the Russell 2000® Value Index as an additional benchmark that reflects the market segment(s) in which the Fund invests.
The S&P Index is proprietary data of Standard & Poor’s, a division of McGraw-Hill Companies, Inc. All rights reserved.
The Russell Index is a trademark of the London Stock Exchange Group companies.
For updated Fund performance information, please visit: https://wealth.amg.com/.
Key Fund Statistics (as of October 31, 2024)
| Fund net assets | $1,085,780,399 |
| Total number of portfolio holdings | 63 |
| Net advisory fees paid | $8,114,815 |
| Portfolio turnover rate as of the end of the reporting period | 42% |
Graphical Representation of Holdings (as of October 31, 2024)
Top ten holdings and portfolio breakdown are shown as a percentage of net assets of the Fund.
| White Mountains Insurance Group, Ltd. | 4.1% |
| McGrath RentCorp | 3.6% |
| Talen Energy Corp. | 3.3% |
| Murphy USA, Inc. | 3.0% |
| UniFirst Corp. | 2.9% |
| Summit Materials, Inc., Class A | 2.9% |
| Axis Capital Holdings, Ltd. (Bermuda) | 2.7% |
| CoreCivic, Inc. | 2.4% |
| The GEO Group Inc. | 2.4% |
| Genworth Financial, Inc., Class A | 2.3% |
| Top Ten as a Group | 29.6% |
Availability of Additional Information
You can find additional information about the Fund such as the prospectus, financial information, fund holdings and proxy voting information at https://wealth.amg.com/resources/order-literature. You can also request this information by contacting us at 800.548.4539.
Householding
In order to reduce expenses, we will deliver a single copy of prospectuses, proxies, financial reports and other communication to shareholders with the same residential address, provided they have the same last name or we reasonably believe them to be members of the same family. Unless we are notified otherwise, we will continue to send recipients only one copy of these materials for as long as they remain a shareholder of the Fund. If you would like to receive individual mailings, please call 800.548.4539 and we will begin sending you separate copies of these materials within 30 days after receiving your request.
For additional information, please navigate to the additional material at https://wealth.amg.com/resources/order-literature.
AMG River Road Small Cap Value Fund
Class Z/ARZMX
ANNUAL SHAREHOLDER REPORT | October 31, 2024
This annual shareholder report contains important information about AMG River Road Small Cap Value Fund (the “Fund”) for the period of November 1, 2023 to October 31, 2024. You can find additional information about the Fund at https://wealth.amg.com/resources/order-literature. You can also request this information by contacting us at 800.548.4539.
Fund Expenses
What were the Fund costs for the last year?
(Based on a hypothetical $10,000 investment)
| Fund (Class) | Costs of a $10,000 investment | Costs paid as a percentage of a $10,000 investment |
AMG River Road Small Cap Value Fund
(Class Z/ARZMX) | $112 | 1.02% |
Management's Discussion of Fund Performance
Performance Overview
• The Fund’s Class Z shares returned 19.07% for the fiscal year ended October 31, 2024, underperforming the S&P 500® Index, which returned 38.02% for the period.
Top Contributors and Detractors
• Both stock selection and sector allocation had a negative impact on relative results.
• The sectors with the highest contribution to relative return were utilities and real estate. Utilities benefited from positive stock selection and an overweight allocation. Real estate benefited from positive stock selection and an underweight allocation.
• The holdings with the highest contribution to active return were Talen Energy, Argan, and ACI Worldwide.
• The sectors with the lowest contribution to relative return were industrials and information technology. Industrials suffered from negative stock selection, partially offset by an overweight allocation. Information technology suffered from an underweight allocation and negative stock selection.
• The holdings with the lowest contribution to active return were Atkore, Air Transport Services, and Delek.
Positioning
• As of October 31, 2024, the Fund is meaningfully overweight (greater than 5%) in two sectors and meaningfully underweight (greater than -5%) in three. The largest overweight allocations were industrials and utilities. The largest underweight allocations were information technology and health care.
Fund Performance
The performance line graph below shows the performance of a hypothetical $10,000 investment in the class of shares noted since the class's inception on September 29, 2017, as compared to the performance of (i) a broad based index and (ii) an additional index reflecting the market segment(s) in which the Fund invests. The performance table below shows the average annual total returns of the class of shares noted for the past one-year and five-year periods and the period from the class's inception through October 31, 2024. It also shows the average total returns of (i) a broad based index and (ii) an additional index reflecting the market segment(s) in which the Fund invests over the same periods.
Performance for other share classes will vary. The Fund’s past performance is not a good predictor of the Fund’s future performance.
The graph and table do not reflect the deduction of taxes that a shareholder would pay on fund distributions or redemption of fund shares.
GROWTH OF $10,000
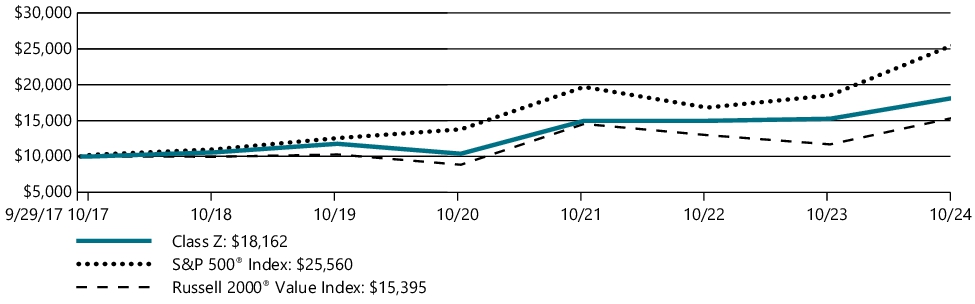
| AVERAGE ANNUAL TOTAL RETURNS | 1 Year | 5 Years | Since Inception |
| Class Z | 19.07% | 9.07% | 8.78% |
| S&P 500® Index | 38.02% | 15.27% | 14.16% |
| Russell 2000® Value Index | 31.77% | 8.42% | 6.28% |
Effective October 31, 2024, the S&P 500® Index was added as a broad measure of market performance in accordance with recent changes to regulatory disclosure requirements. The Fund continues to use the Russell 2000® Value Index as an additional benchmark that reflects the market segment(s) in which the Fund invests.
The S&P Index is proprietary data of Standard & Poor’s, a division of McGraw-Hill Companies, Inc. All rights reserved.
The Russell Index is a trademark of the London Stock Exchange Group companies.
For updated Fund performance information, please visit: https://wealth.amg.com/.
Key Fund Statistics (as of October 31, 2024)
| Fund net assets | $1,085,780,399 |
| Total number of portfolio holdings | 63 |
| Net advisory fees paid | $8,114,815 |
| Portfolio turnover rate as of the end of the reporting period | 42% |
Graphical Representation of Holdings (as of October 31, 2024)
Top ten holdings and portfolio breakdown are shown as a percentage of net assets of the Fund.
| White Mountains Insurance Group, Ltd. | 4.1% |
| McGrath RentCorp | 3.6% |
| Talen Energy Corp. | 3.3% |
| Murphy USA, Inc. | 3.0% |
| UniFirst Corp. | 2.9% |
| Summit Materials, Inc., Class A | 2.9% |
| Axis Capital Holdings, Ltd. (Bermuda) | 2.7% |
| CoreCivic, Inc. | 2.4% |
| The GEO Group Inc. | 2.4% |
| Genworth Financial, Inc., Class A | 2.3% |
| Top Ten as a Group | 29.6% |
Availability of Additional Information
You can find additional information about the Fund such as the prospectus, financial information, fund holdings and proxy voting information at https://wealth.amg.com/resources/order-literature. You can also request this information by contacting us at 800.548.4539.
Householding
In order to reduce expenses, we will deliver a single copy of prospectuses, proxies, financial reports and other communication to shareholders with the same residential address, provided they have the same last name or we reasonably believe them to be members of the same family. Unless we are notified otherwise, we will continue to send recipients only one copy of these materials for as long as they remain a shareholder of the Fund. If you would like to receive individual mailings, please call 800.548.4539 and we will begin sending you separate copies of these materials within 30 days after receiving your request.
For additional information, please navigate to the additional material at https://wealth.amg.com/resources/order-literature.
AMG River Road Small-Mid Cap Value Fund
Class N/ARSMX
ANNUAL SHAREHOLDER REPORT | October 31, 2024
This annual shareholder report contains important information about AMG River Road Small-Mid Cap Value Fund (the “Fund”) for the period of November 1, 2023 to October 31, 2024. You can find additional information about the Fund at https://wealth.amg.com/resources/order-literature. You can also request this information by contacting us at 800.548.4539.
Fund Expenses
What were the Fund costs for the last year?
(Based on a hypothetical $10,000 investment)
| Fund (Class) | Costs of a $10,000 investment | Costs paid as a percentage of a $10,000 investment |
AMG River Road Small-Mid Cap Value Fund
(Class N/ARSMX) | $143 | 1.29% |
Management's Discussion of Fund Performance
Performance Overview
• The Fund’s Class N shares returned 21.83% for the fiscal year ended October 31, 2024, underperforming the S&P 500® Index, which returned 38.02% for the period.
Top Contributors and Detractors
• Both stock selection and sector allocation had a negative impact on relative results.
• The sectors with the highest contribution to relative return were utilities and real estate. Utilities benefited from positive stock selection and an overweight allocation. Real estate benefited from positive stock selection and an underweight allocation.
• The holdings with the highest contribution to active return were Vistra, Talen Energy, and ACI Worldwide. The Fund exited its position in Vistra during the period.
• The sectors with the lowest contribution to relative return were industrials and financials. Both sectors suffered from negative stock selection, partially offset by overweight allocations.
• The holdings with the lowest contribution to active return were LKQ, Atkore, and Air Transport Services.
Positioning Update
• As of October 31, 2024, the Fund is meaningfully overweight (greater than 5%) in two sectors and meaningfully underweight (greater than -5%) in three sectors. The largest overweight allocations were industrials and utilities. The largest underweight allocations were Information technology and communication services.
Fund Performance
The performance line graph below shows the performance of a hypothetical $10,000 investment in the class of shares noted over a ten year period, as compared to the performance of (i) a broad based index and (ii) an additional index reflecting the market segment(s) in which the Fund invests. The performance table below shows the average annual total returns of the class of shares noted for the past one-, five-, and ten-year periods ended as of October 31, 2024. It also shows the average total returns of (i) a broad based index and (ii) an additional index reflecting the market segment(s) in which the Fund invests over the same periods.
Performance for other share classes will vary. The Fund’s past performance is not a good predictor of the Fund’s future performance.
The graph and table do not reflect the deduction of taxes that a shareholder would pay on fund distributions or redemption of fund shares.
GROWTH OF $10,000
| AVERAGE ANNUAL TOTAL RETURNS | 1 Year | 5 Years | 10 Years |
| Class N | 21.83% | 8.67% | 9.89% |
| S&P 500® Index | 38.02% | 15.27% | 13.00% |
| Russell 2500® Value Index | 32.42% | 9.39% | 7.87% |
Effective October 31, 2024, the S&P 500® Index was added as a broad measure of market performance in accordance with recent changes to regulatory disclosure requirements. The Fund continues to use the Russell 2500® Value Index as an additional benchmark that reflects the market segment(s) in which the Fund invests.
The S&P Index is proprietary data of Standard & Poor’s, a division of McGraw-Hill Companies, Inc. All rights reserved.
The Russell Index is a trademark of the London Stock Exchange Group companies.
For updated Fund performance information, please visit: https://wealth.amg.com/.
Key Fund Statistics (as of October 31, 2024)
| Fund net assets | $319,835,913 |
| Total number of portfolio holdings | 72 |
| Net advisory fees paid | $2,250,580 |
| Portfolio turnover rate as of the end of the reporting period | 42% |
Graphical Representation of Holdings (as of October 31, 2024)
Top ten holdings and portfolio breakdown are shown as a percentage of net assets of the Fund and country allocation is shown as a percentage of total long-term investments of the Fund.
| BJ's Wholesale Club Holdings, Inc. | 3.8% |
| White Mountains Insurance Group, Ltd. | 3.6% |
| Murphy USA, Inc. | 3.2% |
| McGrath RentCorp | 3.2% |
| Talen Energy Corp. | 3.0% |
| Lithia Motors, Inc. | 2.8% |
| UniFirst Corp. | 2.8% |
| TD SYNNEX Corp. | 2.5% |
| WEX, Inc. | 2.4% |
| LKQ Corp. | 2.2% |
| Top Ten as a Group | 29.5% |
Availability of Additional Information
You can find additional information about the Fund such as the prospectus, financial information, fund holdings and proxy voting information at https://wealth.amg.com/resources/order-literature. You can also request this information by contacting us at 800.548.4539.
Householding
In order to reduce expenses, we will deliver a single copy of prospectuses, proxies, financial reports and other communication to shareholders with the same residential address, provided they have the same last name or we reasonably believe them to be members of the same family. Unless we are notified otherwise, we will continue to send recipients only one copy of these materials for as long as they remain a shareholder of the Fund. If you would like to receive individual mailings, please call 800.548.4539 and we will begin sending you separate copies of these materials within 30 days after receiving your request.
For additional information, please navigate to the additional material at https://wealth.amg.com/resources/order-literature.
AMG River Road Small-Mid Cap Value Fund
Class I/ARIMX
ANNUAL SHAREHOLDER REPORT | October 31, 2024
This annual shareholder report contains important information about AMG River Road Small-Mid Cap Value Fund (the “Fund”) for the period of November 1, 2023 to October 31, 2024. You can find additional information about the Fund at https://wealth.amg.com/resources/order-literature. You can also request this information by contacting us at 800.548.4539.
Fund Expenses
What were the Fund costs for the last year?
(Based on a hypothetical $10,000 investment)
| Fund (Class) | Costs of a $10,000 investment | Costs paid as a percentage of a $10,000 investment |
AMG River Road Small-Mid Cap Value Fund
(Class I/ARIMX) | $114 | 1.03% |
Management's Discussion of Fund Performance
Performance Overview
• The Fund’s Class I shares returned 21.97% for the fiscal year ended October 31, 2024, underperforming the S&P 500® Index, which returned 38.02% for the period.
Top Contributors and Detractors
• Both stock selection and sector allocation had a negative impact on relative results.
• The sectors with the highest contribution to relative return were utilities and real estate. Utilities benefited from positive stock selection and an overweight allocation. Real estate benefited from positive stock selection and an underweight allocation.
• The holdings with the highest contribution to active return were Vistra, Talen Energy, and ACI Worldwide. The Fund exited its position in Vistra during the period.
• The sectors with the lowest contribution to relative return were industrials and financials. Both sectors suffered from negative stock selection, partially offset by overweight allocations.
• The holdings with the lowest contribution to active return were LKQ, Atkore, and Air Transport Services.
Positioning Update
• As of October 31, 2024, the Fund is meaningfully overweight (greater than 5%) in two sectors and meaningfully underweight (greater than -5%) in three sectors. The largest overweight allocations were industrials and utilities. The largest underweight allocations were Information technology and communication services.
Fund Performance
The performance line graph below shows the performance of a hypothetical $10,000 investment in the class of shares noted over a ten year period, as compared to the performance of (i) a broad based index and (ii) an additional index reflecting the market segment(s) in which the Fund invests. The performance table below shows the average annual total returns of the class of shares noted for the past one-, five-, and ten-year periods ended as of October 31, 2024. It also shows the average total returns of (i) a broad based index and (ii) an additional index reflecting the market segment(s) in which the Fund invests over the same periods.
Performance for other share classes will vary. The Fund’s past performance is not a good predictor of the Fund’s future performance.
The graph and table do not reflect the deduction of taxes that a shareholder would pay on fund distributions or redemption of fund shares.
GROWTH OF $10,000
| AVERAGE ANNUAL TOTAL RETURNS | 1 Year | 5 Years | 10 Years |
| Class I | 21.97% | 8.93% | 10.15% |
| S&P 500® Index | 38.02% | 15.27% | 13.00% |
| Russell 2500® Value Index | 32.42% | 9.39% | 7.87% |
Effective October 31, 2024, the S&P 500® Index was added as a broad measure of market performance in accordance with recent changes to regulatory disclosure requirements. The Fund continues to use the Russell 2500® Value Index as an additional benchmark that reflects the market segment(s) in which the Fund invests.
The S&P Index is proprietary data of Standard & Poor’s, a division of McGraw-Hill Companies, Inc. All rights reserved.
The Russell Index is a trademark of the London Stock Exchange Group companies.
For updated Fund performance information, please visit: https://wealth.amg.com/.
Key Fund Statistics (as of October 31, 2024)
| Fund net assets | $319,835,913 |
| Total number of portfolio holdings | 72 |
| Net advisory fees paid | $2,250,580 |
| Portfolio turnover rate as of the end of the reporting period | 42% |
Graphical Representation of Holdings (as of October 31, 2024)
Top ten holdings and portfolio breakdown are shown as a percentage of net assets of the Fund and country allocation is shown as a percentage of total long-term investments of the Fund.
| BJ's Wholesale Club Holdings, Inc. | 3.8% |
| White Mountains Insurance Group, Ltd. | 3.6% |
| Murphy USA, Inc. | 3.2% |
| McGrath RentCorp | 3.2% |
| Talen Energy Corp. | 3.0% |
| Lithia Motors, Inc. | 2.8% |
| UniFirst Corp. | 2.8% |
| TD SYNNEX Corp. | 2.5% |
| WEX, Inc. | 2.4% |
| LKQ Corp. | 2.2% |
| Top Ten as a Group | 29.5% |
Availability of Additional Information
You can find additional information about the Fund such as the prospectus, financial information, fund holdings and proxy voting information at https://wealth.amg.com/resources/order-literature. You can also request this information by contacting us at 800.548.4539.
Householding
In order to reduce expenses, we will deliver a single copy of prospectuses, proxies, financial reports and other communication to shareholders with the same residential address, provided they have the same last name or we reasonably believe them to be members of the same family. Unless we are notified otherwise, we will continue to send recipients only one copy of these materials for as long as they remain a shareholder of the Fund. If you would like to receive individual mailings, please call 800.548.4539 and we will begin sending you separate copies of these materials within 30 days after receiving your request.
For additional information, please navigate to the additional material at https://wealth.amg.com/resources/order-literature.
AMG River Road Small-Mid Cap Value Fund
Class Z/ARSZX
ANNUAL SHAREHOLDER REPORT | October 31, 2024
This annual shareholder report contains important information about AMG River Road Small-Mid Cap Value Fund (the “Fund”) for the period of November 1, 2023 to October 31, 2024. You can find additional information about the Fund at https://wealth.amg.com/resources/order-literature. You can also request this information by contacting us at 800.548.4539.
Fund Expenses
What were the Fund costs for the last year?
(Based on a hypothetical $10,000 investment)
| Fund (Class) | Costs of a $10,000 investment | Costs paid as a percentage of a $10,000 investment |
AMG River Road Small-Mid Cap Value Fund
(Class Z/ARSZX) | $109 | 0.98% |
Management's Discussion of Fund Performance
Performance Overview
• The Fund’s Class Z shares returned 22.13% for the fiscal year ended October 31, 2024, underperforming the S&P 500® Index, which returned 38.02% for the period.
Top Contributors and Detractors
• Both stock selection and sector allocation had a negative impact on relative results.
• The sectors with the highest contribution to relative return were utilities and real estate. Utilities benefited from positive stock selection and an overweight allocation. Real estate benefited from positive stock selection and an underweight allocation.
• The holdings with the highest contribution to active return were Vistra, Talen Energy, and ACI Worldwide. The Fund exited its position in Vistra during the period.
• The sectors with the lowest contribution to relative return were industrials and financials. Both sectors suffered from negative stock selection, partially offset by overweight allocations.
• The holdings with the lowest contribution to active return were LKQ, Atkore, and Air Transport Services.
Positioning Update
• As of October 31, 2024, the Fund is meaningfully overweight (greater than 5%) in two sectors and meaningfully underweight (greater than -5%) in three sectors. The largest overweight allocations were industrials and utilities. The largest underweight allocations were Information technology and communication services.
Fund Performance
The performance line graph below shows the performance of a hypothetical $10,000 investment in the class of shares noted since the class's inception on September 29, 2017, as compared to the performance of (i) a broad based index and (ii) an additional index reflecting the market segment(s) in which the Fund invests. The performance table below shows the average annual total returns of the class of shares noted for the past one-year and five-year periods and the period from the class's inception through October 31, 2024. It also shows the average total returns of (i) a broad based index and (ii) an additional index reflecting the market segment(s) in which the Fund invests over the same periods.
Performance for other share classes will vary. The Fund’s past performance is not a good predictor of the Fund’s future performance.
The graph and table do not reflect the deduction of taxes that a shareholder would pay on fund distributions or redemption of fund shares.
GROWTH OF $10,000
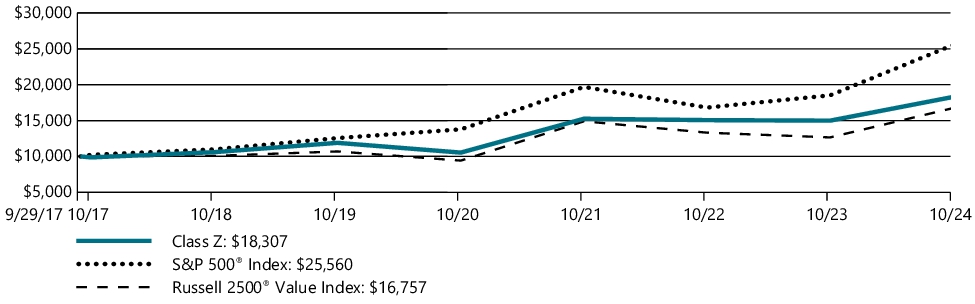
| AVERAGE ANNUAL TOTAL RETURNS | 1 Year | 5 Years | Since Inception |
| Class Z | 22.13% | 9.00% | 8.91% |
| S&P 500® Index | 38.02% | 15.27% | 14.16% |
| Russell 2500® Value Index | 32.42% | 9.39% | 7.56% |
Effective October 31, 2024, the S&P 500® Index was added as a broad measure of market performance in accordance with recent changes to regulatory disclosure requirements. The Fund continues to use the Russell 2500® Value Index as an additional benchmark that reflects the market segment(s) in which the Fund invests.
The S&P Index is proprietary data of Standard & Poor’s, a division of McGraw-Hill Companies, Inc. All rights reserved.
The Russell Index is a trademark of the London Stock Exchange Group companies.
For updated Fund performance information, please visit: https://wealth.amg.com/.
Key Fund Statistics (as of October 31, 2024)
| Fund net assets | $319,835,913 |
| Total number of portfolio holdings | 72 |
| Net advisory fees paid | $2,250,580 |
| Portfolio turnover rate as of the end of the reporting period | 42% |
Graphical Representation of Holdings (as of October 31, 2024)
Top ten holdings and portfolio breakdown are shown as a percentage of net assets of the Fund and country allocation is shown as a percentage of total long-term investments of the Fund.
| BJ's Wholesale Club Holdings, Inc. | 3.8% |
| White Mountains Insurance Group, Ltd. | 3.6% |
| Murphy USA, Inc. | 3.2% |
| McGrath RentCorp | 3.2% |
| Talen Energy Corp. | 3.0% |
| Lithia Motors, Inc. | 2.8% |
| UniFirst Corp. | 2.8% |
| TD SYNNEX Corp. | 2.5% |
| WEX, Inc. | 2.4% |
| LKQ Corp. | 2.2% |
| Top Ten as a Group | 29.5% |
Availability of Additional Information
You can find additional information about the Fund such as the prospectus, financial information, fund holdings and proxy voting information at https://wealth.amg.com/resources/order-literature. You can also request this information by contacting us at 800.548.4539.
Householding
In order to reduce expenses, we will deliver a single copy of prospectuses, proxies, financial reports and other communication to shareholders with the same residential address, provided they have the same last name or we reasonably believe them to be members of the same family. Unless we are notified otherwise, we will continue to send recipients only one copy of these materials for as long as they remain a shareholder of the Fund. If you would like to receive individual mailings, please call 800.548.4539 and we will begin sending you separate copies of these materials within 30 days after receiving your request.
For additional information, please navigate to the additional material at https://wealth.amg.com/resources/order-literature.
(b) Not applicable.
Item 2. CODE OF ETHICS
Registrant has adopted a code of ethics (the “Code of Ethics”) that applies to the Registrant’s principal executive officer, principal financial officer, principal accounting officer or controller, or persons performing similar functions, regardless of whether these individuals are employed by the registrant or a third party. During the period covered by this report, there were not any amendments to a provision of the Code of Ethics that relates to any element of the code of ethics definition enumerated in paragraph (c) of Item 2 of Form N-CSR. During the period covered by this report, there were no waivers, including any implicit waivers, from a provision of the Code that relates to one or more of the items set forth in paragraph (d) of Item 2 of Form N-CSR. See attached Exhibit (a)(1).
Item 3. AUDIT COMMITTEE FINANCIAL EXPERT
Registrant’s Board of Trustees (the “Board”) has determined that the Registrant has at least one Audit Committee Financial Expert serving on its audit committee. The Board has determined that independent Trustee Mr. Steven J. Paggioli qualifies as the Audit Committee Financial Expert. Mr. Paggioli is “independent” as such term is defined in paragraph (a)(2) of Item 3 of Form N-CSR.
Item 4. PRINCIPAL ACCOUNTANT FEES AND SERVICES
The aggregate fees billed by the Funds’ independent registered public accounting firm, PricewaterhouseCoopers LLP (“PwC”), to the Funds for the Funds’ two most recent fiscal years for professional services rendered for audits of annual financial statements, or services that are normally provided in connection with statutory and regulatory filings or engagements (“Audit Fees”) were $248,073 for fiscal 2024 and $288,178 for fiscal 2023.
There were no fees billed by PwC to the Funds in their two recent fiscal years for services rendered for assurance and related services that are reasonably related to the performance of the audit or review of the Funds’ financial statements, but are not reported as Audit Fees (“Audit-Related Fees”).
For the Funds’ two most recent fiscal years, there were no Audit-Related Fees billed by PwC for engagements related directly to the operations and financial reporting of one or more Funds by a Fund Service Provider. A Fund Service Provider is (a) any investment adviser to a Fund (not including any Subadviser whose role is primarily portfolio management and is subcontracted with or overseen by another investment adviser) or (b) any entity that provides ongoing services to a Fund and is controlling, controlled by or under common control with a Fund investment adviser described in (a).
The aggregate fees billed by PwC to the Funds for the two most recent fiscal years for professional services rendered for tax compliance, tax advice, and tax planning (“Tax Fees”) were $50,195 for fiscal 2024 and $62,805 for fiscal 2023.
For the Funds’ two most recent fiscal years, Tax Fees billed by PwC for engagements by Fund Service Providers that related directly to the operations and financial reporting of the Funds were $0 for fiscal 2024 and $0 for fiscal 2023, respectively.
The services for which Tax Fees were charged comprise all services performed by professional staff in PwC’s tax division except those services related to the audit. Typically, this category would include fees for tax compliance, tax planning, and tax advice. Tax compliance, tax advice, and tax planning services include preparation of original and amended tax returns, claims for refund and tax payment-planning services, assistance with tax audits and appeals, tax advice related to mergers and acquisitions and requests for rulings or technical advice from taxing authorities.
There were no other fees billed by PwC to the Funds for all other non-audit services (“Other Fees”) during the Funds’ two most recent fiscal years. During the same period, there were no Other Fees billed by PwC for engagements by Fund Service Providers that related directly to the operations and financial reporting of the Funds.
(e)(1) According to policies adopted by the Audit Committee, services provided by PwC to the Funds must be pre-approved by the Audit Committee. On an annual basis, the Audit Committee reviews and pre-approves various types of services that PwC may perform for the Funds without specific approval of each engagement, subject to specified budget limitations. As contemplated by the Sarbanes-Oxley Act of 2002 and related SEC rules, the Audit Committee also pre-approves non-audit services provided by PwC to any Fund Service Provider for any engagement that relates directly to the operations and financial reporting of the Funds. Any engagement that is not already pre-approved or that will exceed a pre-approved budget must be submitted to the Audit Committee for pre-approval. The Chairman of the Audit Committee is authorized on behalf of the Board of Trustees and the Audit Committee to approve the engagement of PwC to perform non-audit services subject to certain conditions, including notification to the Audit Committee of such pre-approval not later than the next meeting of the Audit Committee following the date of such pre-approval.
(e)(2) None.
(f) Not applicable.
(g) The aggregate fees billed by PwC in 2024 and 2023 for non-audit services rendered to the Funds and Fund Service Providers were $90,195 and $102,138, respectively. For the fiscal year ended October 31, 2024, this amount reflects the amounts disclosed above in Item 4(b),(c),(d), plus $40,000 in fees billed to the Fund Service Providers for non-audit services that did not relate directly to the operations and financial reporting of the Funds. For the fiscal year ended October 31, 2023, this amount reflects the amounts disclosed above in Item 4(b),(c),(d), plus $39,333 in fees billed to the Fund Service Providers for non-audit services that did not relate directly to the operations and financial reporting of the Funds.
(h) The Trust’s Audit Committee has considered whether the provision of non-audit services by registrant’s independent registered public accounting firm to the registrant’s investment adviser, and any entity controlling, controlled by, or under common control with the investment adviser that provided ongoing services to the registrant that were not pre-approved by the Committee (because such services did not relate directly to the operations and financial reporting of the registrant) was compatible with maintaining the independence of the independent registered public accounting firm.
Item 5. AUDIT COMMITTEE OF LISTED REGISTRANTS
Not applicable.
Item 6. INVESTMENTS
The schedule of investments in securities of unaffiliated issuers as of the close of the reporting period is included in the financial statements filed under Item 7 hereof.
Item 7. FINANCIAL STATEMENTS AND FINANCIAL HIGHLIGHTS FOR OPEN-END MANAGEMENT INVESTMENT COMPANIES.
| | |
 | | ANNUAL FINANCIAL STATEMENTS |
| | | | | | |
| | | AMG Funds |
| | | | |
| | | October 31, 2024 | | | | |
| | |
| | |  |
| | |
| | | AMG Beutel Goodman Core Plus Bond Fund |
| | | | |
| | | Class N: ADBLX | | Class I: ADLIX | | Class Z: ADZIX |
| | | | |
| | | | | | | |
| | | | | | |
| | | | | | | |
| | | |
| wealth.amg.com | | 103124 | | | AR086 | |
| | |
| | AMG Funds Annual Financial Statements — October 31, 2024 |
Nothing contained herein is to be considered an offer, sale or solicitation of an offer to buy shares of any series of the AMG Funds Family of Funds. Such offering is made only by prospectus, which includes details as to offering price and other material information.
| | |
| | AMG Beutel Goodman Core Plus Bond Fund Schedule of Portfolio Investments October 31, 2024 |
| | | | | | | | |
| | | Principal
Amount | | | Value | |
| |
Corporate Bonds and Notes - 37.1% | | | | | |
| |
Communications - 3.3% | | | | | |
| | |
Charter Communications Operating LLC/Charter Communications Operating Capital
6.150%, 11/10/26 | | $ | 1,000,000 | | | $ | 1,021,332 | |
| | |
Rogers Communications, Inc. (Canada)
5.300%, 02/15/341 | | | 1,000,000 | | | | 992,069 | |
| | |
Videotron, Ltd. (Canada)
3.625%, 06/15/292 | | | 998,000 | | | | 931,679 | |
5.125%, 04/15/272 | | | 998,000 | | | | 991,083 | |
| | |
Vodafone Group PLC (United Kingdom)
7.875%, 02/15/301 | | | 44,000 | | | | 50,336 | |
| | |
Total Communications | | | | | | | 3,986,499 | |
| | |
Consumer, Cyclical - 5.8% | | | | | | | | |
| | |
American Airlines Inc /AAdvantage Loyalty IP, Ltd.
5.500%, 04/20/262 | | | 1,250,000 | | | | 1,246,244 | |
| | |
Delta Air Lines, Inc.
7.000%, 05/01/252 | | | 500,000 | | | | 504,073 | |
| | |
7.375%, 01/15/261 | | | 1,000,000 | | | | 1,024,435 | |
| | |
Delta Air Lines, Inc./SkyMiles IP, Ltd.
4.750%, 10/20/282 | | | 1,000,000 | | | | 988,847 | |
| | |
Ford Motor Credit Co. LLC
5.303%, 09/06/29 | | | 500,000 | | | | 489,443 | |
| | |
General Motors Financial Co., Inc. 5.550%, 07/15/29 | | | 500,000 | | | | 506,478 | |
| | |
Mileage Plus Holdings LLC/Mileage Plus Intellectual Property Assets, Ltd.
6.500%, 06/20/272 | | | 2,275,167 | | | | 2,297,623 | |
| | |
Total Consumer, Cyclical | | | | | | | 7,057,143 | |
| | |
Consumer, Non-cyclical - 4.6% | | | | | | | | |
| | |
Albertsons Cos. Inc./Safeway, Inc./New Albertsons LP/Albertsons LLC
6.500%, 02/15/281,2 | | | 1,000,000 | | | | 1,023,312 | |
| | |
Element Fleet Management Corp. (Canada)
6.271%, 06/26/262 | | | 1,000,000 | | | | 1,019,679 | |
| | |
JBS USA LUX, S.A./JBS USA Food Co./JBS Luxembourg S.A.R.L (Luxembourg)
6.750%, 03/15/342 | | | 500,000 | | | | 537,672 | |
| | |
The Kroger Co.
5.000%, 09/15/341 | | | 1,000,000 | | | | 983,611 | |
| | |
Solventum Corp.
5.450%, 03/13/312 | | | 2,000,000 | | | | 2,016,802 | |
| | |
Total Consumer, Non-cyclical | | | | | | | 5,581,076 | |
| | |
Energy - 5.0% | | | | | | | | |
| | |
Cheniere Energy, Inc.
5.650%, 04/15/34 | | | 500,000 | | | | 503,181 | |
| | |
Columbia Pipelines Holding Co. LLC
5.681%, 01/15/342 | | | 2,000,000 | | | | 1,995,585 | |
| | |
Columbia Pipelines Operating Co. LLC
6.544%, 11/15/532 | | | 500,000 | | | | 537,487 | |
| | | | | | | | |
| | | Principal
Amount | | | Value | |
| | |
Enbridge, Inc. (Canada)
Series NC5
(8.250% to 01/15/29 then U.S. Treasury Yield Curve CMT 5 year + 3.785%), 8.250%, 01/15/843,4 | | $ | 2,000,000 | | | $ | 2,112,656 | |
| | |
South Bow Canadian Infrastructure Holdings, Ltd. (Canada)
(7.625% to 03/01/30 then U.S. Treasury Yield Curve CMT 5 year + 3.949%), 7.625%, 03/01/552,3,4 | | | 500,000 | | | | 514,843 | |
| | |
Suncor Energy, Inc. (Canada)
7.150%, 02/01/32 | | | 400,000 | | | | 444,000 | |
| | |
Total Energy | | | | | | | 6,107,752 | |
| | |
Financials - 14.0% | | | | | | | | |
| | |
Air Lease Corp.
5.850%, 12/15/27 | | | 1,000,000 | | | | 1,029,284 | |
| | |
Bank of America Corp. | | | | | | | | |
| | |
(4.376% to 04/27/27 then SOFR + 1.580%), 4.376%, 04/27/283,4 | | | 3,000,000 | | | | 2,970,223 | |
| | |
(5.872% to 09/15/33 then SOFR + 1.840%), 5.872%, 09/15/343,4 | | | 1,000,000 | | | | 1,042,226 | |
| | |
The Bank of Nova Scotia (Canada)
(8.625% to 10/27/27 then U.S. Treasury Yield Curve CMT 5 year + 4.389%), 8.625%, 10/27/823,4 | | | 2,000,000 | | | | 2,142,450 | |
| | |
Federation des Caisses Desjardins du Quebec (Canada)
5.250%, 04/26/291,2 | | | 2,000,000 | | | | 2,017,767 | |
| | |
The Goldman Sachs Group, Inc.
(5.851% to 04/25/34 then SOFR + 1.552%), 5.851%, 04/25/353,4 | | | 2,000,000 | | | | 2,072,239 | |
| | |
Intact Financial Corp. (Canada)
5.459%, 09/22/322 | | | 2,000,000 | | | | 2,011,474 | |
| | |
Morgan Stanley
(6.296% to 10/18/27 then SOFR + 2.240%), 6.296%, 10/18/283,4 | | | 1,500,000 | | | | 1,562,791 | |
| | |
Synchrony Bank
5.400%, 08/22/25 | | | 1,000,000 | | | | 1,000,436 | |
| | |
The Toronto-Dominion Bank (Canada)
(8.125% to 10/31/27 then U.S. Treasury Yield Curve CMT 5 year + 4.075%), 8.125%, 10/31/823,4 | | | 1,000,000 | | | | 1,053,655 | |
| | |
Total Financials | | | | | | | 16,902,545 | |
| | |
Industrials - 2.7% | | | | | | | | |
| | |
Canadian Pacific Railway Co. (Canada)
7.125%, 10/15/31 | | | 600,000 | | | | 676,106 | |
| | |
GFL Environmental, Inc. (Canada)
6.750%, 01/15/312 | | | 1,000,000 | | | | 1,029,617 | |
| | |
OAS Finance, Ltd. (Virgin Islands, British)
8.875%, 11/24/244,5,6,7 | | | 600,000 | | | | 0 | |
8.875%, 11/25/242,4,5,6,7 | | | 400,000 | | | | 0 | |
The accompanying notes are an integral part of these financial statements.
2
| | |
| | AMG Beutel Goodman Core Plus Bond Fund Schedule of Portfolio Investments (continued) |
| | | | | | | | |
| | | Principal
Amount | | | Value | |
| |
Industrials - 2.7% (continued) | | | | | |
| | |
TTX Co.
5.500%, 09/25/262 | | $ | 1,500,000 | | | $ | 1,519,092 | |
| | |
Total Industrials | | | | | | | 3,224,815 | |
| | |
Utilities - 1.7% | | | | | | | | |
| | |
Consolidated Edison Co. of New York, Inc.
6.150%, 11/15/52 | | | 1,000,000 | | | | 1,093,148 | |
| | |
Duke Energy Progress LLC
5.350%, 03/15/53 | | | 1,000,000 | | | | 983,020 | |
| | |
Total Utilities | | | | | | | 2,076,168 | |
| | |
Total Corporate Bonds and Notes | | | | | | | | |
(Cost $45,036,214) | | | | | | | 44,935,998 | |
| |
Mortgage-Backed Securities - 2.3% | | | | | |
| | |
Citigroup Commercial Mortgage Trust
Series 2019-GC43, Class A2 2.982%, 11/10/52 | | | 449,002 | | | | 448,203 | |
| | |
Commercial Mortgage Pass Through Certificates | | | | | | | | |
Series 2016-CR28, Class C
4.586%, 02/10/494 | | | 726,000 | | | | 641,742 | |
| | |
CSAIL Commercial Mortgage Trust | | | | | | | | |
Series 2017-CX10, Class B
3.892%, 11/15/504 | | | 506,000 | | | | 451,200 | |
| | |
GSCG Trust | | | | | | | | |
Series 2019-600C, Class D
3.764%, 09/06/342 | | | 862,000 | | | | 64,650 | |
| | |
JPMBB Commercial Mortgage Securities Trust | | | | | | | | |
Series 2014-C23, Class C
4.554%, 09/15/474 | | | 330,824 | | | | 319,357 | |
Series 2015-C33, Class C
4.636%, 12/15/484 | | | 670,000 | | | | 589,525 | |
| | |
JPMDB Commercial Mortgage Securities Trust | | | | | | | | |
Series 2020-COR7, Class C
3.722%, 05/13/534 | | | 496,000 | | | | 269,876 | |
| | |
Total Mortgage-Backed Securities | | | | | | | | |
(Cost $4,030,262) | | | | | | | 2,784,553 | |
| | |
Municipal Bonds - 0.4% | | | | | | | | |
| | |
California State General Obligation, School Improvements, Build America Bonds
7.550%, 04/01/39 | | | 330,000 | | | | 399,998 | |
| | |
Total Municipal Bonds | | | | | | | | |
(Cost $458,702) | | | | | | | 399,998 | |
| |
| U.S. Government and Agency Obligations - 56.5% | | | | | |
| | |
Fannie Mae - 18.3% | | | | | | | | |
| | |
FNMA,
1.500%, 12/01/50 | | | 2,391,139 | | | | 1,808,228 | |
2.000%, 03/01/52 | | | 1,566,949 | | | | 1,244,746 | |
2.140%, 10/01/29 | | | 7,000,000 | | | | 6,275,582 | |
2.260%, 01/01/30 | | | 3,200,000 | | | | 2,855,726 | |
3.000%, 03/01/45 to 06/01/52 | | | 5,429,230 | | | | 4,703,143 | |
3.500%, 12/01/31 to 01/01/32 | | | 162,343 | | | | 157,216 | |
4.000%, 09/01/31 to 06/01/42 | | | 53,157 | | | | 51,321 | |
| | | | | | | | |
| | | Principal
Amount | | | Value | |
| | |
FNMA,
4.500%, 08/01/52 | | $ | 1,242,139 | | | $ | 1,181,032 | |
5.000%, 02/01/53 | | | 1,212,177 | | | | 1,179,197 | |
| | |
FNMA REMICS, | | | | | | | | |
Series 2010-156, Class ZC
4.000%, 01/25/41 | | | 458,544 | | | | 385,240 | |
Series 2011-121, Class JP
4.500%, 12/25/41 | | | 43,900 | | | | 42,241 | |
Series 2012-127, Class PA
2.750%, 11/25/42 | | | 508,577 | | | | 466,680 | |
Series 2012-31, Class Z
4.000%, 04/25/42 | | | 659,411 | | | | 627,680 | |
Series 2015-9, Class HA
3.000%, 01/25/45 | | | 1,247,808 | | | | 1,177,002 | |
| | |
Total Fannie Mae | | | | | | | 22,155,034 | |
| | |
Freddie Mac - 8.9% | | | | | | | | |
| | |
FHLMC,
1.500%, 11/01/50 to 12/01/50 | | | 5,167,741 | | | | 3,911,892 | |
3.000%, 04/01/47 | | | 753,205 | | | | 666,513 | |
4.500%, 07/01/52 to 09/01/52 | | | 3,740,532 | | | | 3,552,425 | |
5.500%, 07/01/53 | | | 602,080 | | | | 596,654 | |
| | |
FHLMC Gold,
3.000%, 07/01/45 to 08/01/45 | | | 1,608,833 | | | | 1,428,014 | |
3.500%, 10/01/42 | | | 197,911 | | | | 180,179 | |
4.000%, 10/01/41 | | | 16,721 | | | | 15,638 | |
5.000%, 07/01/35 | | | 5,719 | | | | 5,715 | |
| | |
FHLMC REMICS, | | | | | | | | |
Series 2909, Class Z
5.000%, 12/15/34 | | | 60,676 | | | | 61,223 | |
Series 3626, Class AZ
5.500%, 08/15/36 | | | 39,275 | | | | 40,504 | |
Series 3792, Class SE
(9.631% minus 2 times 1 month SOFR, Cap 9.860%, Floor 0.000%), 0.000%, 01/15/41*,4 | | | 18,652 | | | | 11,457 | |
Series 3872, Class BA
4.000%, 06/15/41 | | | 10,158 | | | | 9,807 | |
Series 3894, Class ZA
4.500%, 07/15/41 | | | 22,086 | | | | 21,459 | |
Series 3957, Class HZ
4.000%, 11/15/41 | | | 308,156 | | | | 291,335 | |
| | |
Total Freddie Mac | | | | | | | 10,792,815 | |
| | |
Ginnie Mae - 0.6% | | | | | | | | |
| | |
GNMA, | | | | | | | | |
Series 2004-35, Class SA
(31.756% minus 6.5 times 1 month SOFR, Cap 32.500%, Floor 0.000%), 0.821%, 03/20/344 | | | 6,254 | | | | 6,246 | |
Series 2009-32, Class ZE
4.500%, 05/16/39 | | | 73,886 | | | | 72,415 | |
Series 2009-35, Class DZ
4.500%, 05/20/39 | | | 82,546 | | | | 81,360 | |
Series 2009-75, Class GZ
4.500%, 09/20/39 | | | 79,826 | | | | 78,835 | |
| | |
GNMA II Pool,
6.500%, 12/20/53 | | | 469,325 | | | | 477,031 | |
| | |
Total Ginnie Mae | | | | | | | 715,887 | |
The accompanying notes are an integral part of these financial statements.
3
| | |
| | AMG Beutel Goodman Core Plus Bond Fund Schedule of Portfolio Investments (continued) |
| | | | | | | | |
| | | Principal
Amount | | | Value | |
| |
U.S. Treasury Obligations - 28.7% | | | | | |
| | |
U.S. Treasury Notes,
1.875%, 02/15/32 | | | $400 | | | | $341 | |
3.500%, 09/30/29 to 02/15/33 | | | 7,277,000 | | | | 6,998,726 | |
3.875%, 08/15/33 | | | 1,397,000 | | | | 1,356,454 | |
4.500%, 11/15/33 | | | 11,226,000 | | | | 11,412,808 | |
4.875%, 04/30/26 | | | 475,000 | | | | 479,416 | |
| | |
U.S. Treasury Bonds,
1.875%, 02/15/41 | | | 4,855,000 | | | | 3,370,432 | |
3.000%, 08/15/52 | | | 4,484,000 | | | | 3,400,133 | |
4.125%, 08/15/53 | | | 320,000 | | | | 300,700 | |
4.250%, 02/15/54 | | | 5,585,000 | | | | 5,368,581 | |
4.750%, 11/15/53 | | | 1,975,000 | | | | 2,059,555 | |
| |
Total U.S. Treasury Obligations | | | | 34,747,146 | |
| |
Total U.S. Government and Agency Obligations | | | | | |
(Cost $71,411,481) | | | | | | | 68,410,882 | |
| | |
| | | Shares | | | | | |
| | |
Common Stocks - 0.0%# | | | | | | | | |
| |
Energy - 0.0%# | | | | | |
| | |
Foresight Energy, LLC*,2,6
(Cost $165,689) | | | 202 | | | | 2,939 | |
| | |
| |
| Principal
Amount |
| | | | |
| |
Short-Term Investments - 6.4% | | | | | |
| |
Commercial Paper - 3.7% | | | | | |
| | |
Enbridge Pipelines, Inc.,
5.049%, 11/21/248 | | | $165,000 | | | | 164,539 | |
| | |
Enbridge, Inc., 5.099%, 11/05/248 | | | 660,000 | | | | 659,628 | |
| | |
Enbridge, Inc., 5.083%, 11/07/248 | | | 3,640,000 | | | | 3,636,945 | |
| | |
Total Commercial Paper | | | | | | | 4,461,112 | |
| |
Joint Repurchase Agreements - 2.6%9 | | | | | |
| | |
Cantor Fitzgerald Securities, Inc., dated 10/31/24, due 11/01/24, 4.930% total to be received $1,000,137 (collateralized by various U.S. Government Agency Obligations and U.S. Treasuries, 0.000% - 6.500%, 02/25/25 -02/01/57, totaling $1,020,000) | | | 1,000,000 | | | | 1,000,000 | |
| | | | | | | | |
| | | Principal
Amount | | | Value | |
| | |
Citigroup Global Markets, Inc., dated 10/31/24, due 11/01/24, 4.860% total to be received $1,000,135 (collateralized by various U.S. Government Agency Obligations, 2.000% - 7.964%, 02/01/36 - 08/20/67, totaling $1,020,000) | | | $1,000,000 | | | | $1,000,000 | |
| | |
Daiwa Capital Markets America, dated 10/31/24, due 11/01/24, 4.890% total to be received $188,553 (collateralized by various U.S. Government Agency Obligations and U.S. Treasuries, 0.625% - 7.500%, 05/15/25 -11/01/54, totaling $192,298) | | | 188,527 | | | | 188,527 | |
| | |
HSBC Securities USA, Inc., dated 10/31/24, due 11/01/24, 4.860% total to be received $1,000,135 (collateralized by various U.S. Government Agency Obligations, 2.000% -7.500%, 05/01/28 - 10/01/54, totaling $1,020,000) | | | 1,000,000 | | | | 1,000,000 | |
| |
Total Joint Repurchase Agreements | | | | 3,188,527 | |
| | |
| | | Shares | | | | | |
| |
Other Investment Companies - 0.1% | | | | | |
| | |
Dreyfus Government Cash Management Fund, Institutional Shares, 4.76%10 | | | 48,673 | | | | 48,673 | |
| | |
Dreyfus Institutional Preferred Government Money Market Fund, Institutional Shares, 4.82%10 | | | 73,009 | | | | 73,009 | |
| |
Total Other Investment Companies | | | | 121,682 | |
| | |
Total Short-Term Investments
(Cost $7,771,321) | | | | | | | 7,771,321 | |
| | |
Total Investments - 102.7%
(Cost $128,873,669) | | | | | | | 124,305,691 | |
| |
Other Assets, less Liabilities - (2.7)% | | | | (3,266,930 | ) |
| |
Net Assets - 100.0% | | | | $121,038,761 | |
| | * | Non-income producing security. |
| | 1 | Some of these securities, amounting to $4,058,146 or 3.4% of net assets, were out on loan to various borrowers and are collateralized by cash and various U.S. Treasury Obligations. See Note 4 of Notes to Financial Statements. |
| | 2 | Security exempt from registration under Rule 144A of the Securities Act of 1933. These securities may be resold in transactions exempt from registration, normally to qualified institutional buyers. At October 31, 2024, the value of these securities amounted to $21,250,468 or 17.6% of net assets. |
| | 3 | Fixed to variable rate investment. The rate shown reflects the fixed rate in effect at October 31, 2024. Rate will reset at a future date. |
| | 4 | Variable rate security. The rate shown is based on the latest available information as of October 31, 2024. Certain variable rate securities are not based on a published reference rate and spread but are determined by the issuer or agent and are based on current market conditions. These securities do not indicate a reference rate and spread in their description above. |
| | 5 | Security is in default. Issuer has failed to make a timely payment of either principal or either interest or has failed to comply with some provision of the bond indenture. |
| | 6 | Security’s value was determined by using significant unobservable inputs. |
| | 7 | Perpetuity Bond. The date shown represents the next call date. |
| | 8 | Represents yield to maturity at October 31, 2024. |
| | 9 | Cash collateral received for securities lending activity was invested in these joint repurchase agreements. |
The accompanying notes are an integral part of these financial statements.
4
| | |
| | AMG Beutel Goodman Core Plus Bond Fund Schedule of Portfolio Investments (continued) |
| | 10 | Yield shown represents the October 31, 2024, seven day average yield, which refers to the sum of the previous seven days’ dividends paid, expressed as an annual percentage. |
CMT Constant Maturity Treasury
FHLMC Freddie Mac
FNMA Fannie Mae
GNMA Ginnie Mae
REMICS Real Estate Mortgage Investment Conduit
SOFR Secured Overnight Financing Rate
The following table summarizes the inputs used to value the Fund’s investments by the fair value hierarchy levels as of October 31, 2024:
| | | | | | | | | | | | | | | | | | | | | | | | | | | | | | |
| | | Level 1 | | Level 2 | | Level 3 | | Total |
Investments in Securities | | | | | | | | | | | | | | | | | | | | | | | | | | | | | | |
| | | | | | |
Corporate Bonds and Notes | | | | | | | | | | | | | | | | | | | | | | | | | | | | | | |
| | | | | | |
Financials | | | | — | | | | | | | | | | $16,902,545 | | | | | — | | | | | | | | | | $16,902,545 | |
| | | | | | |
Consumer, Cyclical | | | | — | | | | | | | | | | 7,057,143 | | | | | — | | | | | | | | | | 7,057,143 | |
| | | | | | |
Energy | | | | — | | | | | | | | | | 6,107,752 | | | | | — | | | | | | | | | | 6,107,752 | |
| | | | | | |
Consumer, Non-cyclical | | | | — | | | | | | | | | | 5,581,076 | | | | | — | | | | | | | | | | 5,581,076 | |
| | | | | | |
Communications | | | | — | | | | | | | | | | 3,986,499 | | | | | — | | | | | | | | | | 3,986,499 | |
| | | | | | |
Industrials | | | | — | | | | | | | | | | 3,224,815 | | | | | $0 | | | | | | | | | | 3,224,815 | |
| | | | | | |
Utilities | | | | — | | | | | | | | | | 2,076,168 | | | | | — | | | | | | | | | | 2,076,168 | |
| | | | | | |
Mortgage-Backed Securities | | | | — | | | | | | | | | | 2,784,553 | | | | | — | | | | | | | | | | 2,784,553 | |
| | | | | | |
Municipal Bonds | | | | — | | | | | | | | | | 399,998 | | | | | — | | | | | | | | | | 399,998 | |
| | | | | | |
U.S. Government and Agency Obligations† | | | | — | | | | | | | | | | 68,410,882 | | | | | — | | | | | | | | | | 68,410,882 | |
| | | | | | |
Common Stocks | | | | | | | | | | | | | | | | | | | | | | | | | | | | | | |
| | | | | | |
Energy | | | | — | | | | | | | | | | — | | | | | 2,939 | | | | | | | | | | 2,939 | |
| | | | | | |
Short-Term Investments | | | | | | | | | | | | | | | | | | | | | | | | | | | | | | |
| | | | | | |
Commercial Paper | | | | — | | | | | | | | | | 4,461,112 | | | | | — | | | | | | | | | | 4,461,112 | |
| | | | | | |
Joint Repurchase Agreements | | | | — | | | | | | | | | | 3,188,527 | | | | | — | | | | | | | | | | 3,188,527 | |
| | | | | | |
Other Investment Companies | | | | $121,682 | | | | | | | | | | — | | | | | — | | | | | | | | | | 121,682 | |
| | | | | | | | | | | | | | | | | | | | | | | | | | | | | | |
| | | | | | |
Total Investments in Securities | | | | $121,682 | | | | | | | | | | $124,181,070 | | | | | $2,939 | | | | | | | | | | $124,305,691 | |
| | | | | | | | | | | | | | | | | | | | | | | | | | | | | | |
| | † | All U.S. government and agency obligations held in the Fund are Level 2 securities. For a detailed breakout of U.S. government and agency obligations by major industry or agency classification, please refer to the Fund’s Schedule of Portfolio Investments. |
The accompanying notes are an integral part of these financial statements.
5
| | |
| | AMG Beutel Goodman Core Plus Bond Fund Schedule of Portfolio Investments (continued) |
The following table below is a reconciliation of investments in which significant unobservable inputs (Level 3) were used in determining fair value at October 31, 2024:
| | | | | | | | |
| | | Corporate
Bond and Notes | | | Common
Stock | |
| | |
Balance as of October 31, 2023 | | | $0 | | | | $2,939 | |
Accrued discounts (premiums) | | | – | | | | – | |
Realized gain (loss) | | | – | | | | – | |
Change in unrealized appreciation/depreciation | | | – | | | | – | |
Purchases | | | – | | | | – | |
Sales | | | – | | | | – | |
Transfers in to Level 3 | | | – | | | | – | |
Transfers out of Level 3 | | | – | | | | – | |
| | |
Balance as of October 31, 2024 | | | $0 | | | | $2,939 | |
| | | | | | | | |
| | |
Net change in unrealized appreciation/depreciation on investments still held at October 31, 2024 | | | – | | | | – | |
The following table summarizes the quantitative inputs and assumptions used for investments categorized in Level 3 of the fair value hierarchy as of October 31, 2024. The table below is not intended to be all-inclusive, but rather provides information on the significant Level 3 inputs as they relate to the Fund’s fair value measurements:
| | | | | | | | | | | | | | |
| | | | | | Quantitative Information about Level 3 Fair Value Measurements | | |
| | | | | | |
| | | Fair Value as of
October 31, 2024 | | | Valuation Technique(s) | | Unobservable
Input(s) | | Range | | Median | | Impact to Valuation from an Increase in Input(a) |
| | | | | | |
Common Stock | | | $2,939 | | | Market Approach | | EV/Sale Multiple | | $17.98 | | N/A | | Increase |
| | | | | | |
| | | | | | | | Comparable Peer Mark | | $11.16 | | N/A | | Increase |
| | | | | | |
| | | | | | Market Approach - Bid Price | | | | | | | | |
| | | | | | |
Corporate Bonds and Notes | | | 0 | | | in open market | | Discount Rate | | 100% | | 100% | | Decrease |
| | | | | | | | | | | | | | |
| | | $2,939 | | | | | | | | | | | |
| | | | | | | | | | | | | | |
(a) Represents the directional change in the fair value of the Level 3 investments that could have resulted from an increase in the corresponding input as of period end. A decrease to the unobservable input would have had the opposite effect. Significant changes in these inputs may have resulted in a significantly higher or lower fair value measurement at period end.
For the fiscal year ended October 31, 2024, the effect of derivative instruments on the Statement of Operations for the Fund and the amount of realized gain/loss and unrealized appreciation/depreciation on derivatives recognized in income were as follows:
| | | | | | | | | | | | |
| | | Realized Gain/(Loss) | | | Change in Unrealized Appreciation/Depreciation | |
Derivatives not accounted for as hedging instruments | | Statement of Operations Location | | Realized
Gain/
(Loss) | | | Statement of Operations Location | | Change in Unrealized Appreciation/ Depreciation | |
Forward foreign currency exchange contracts | | Net realized gain on forward foreign currency exchange contracts | | | $29,766 | | | Net change in unrealized appreciation/ depreciation on forward foreign currency exchange contracts | | | $(36,483) | |
The accompanying notes are an integral part of these financial statements.
6
| | |
| | Statement of Assets and Liabilities October 31, 2024 |
| | | | | |
| | | AMG
Beutel Goodman
Core Plus
Bond Fund |
| |
Assets: | | | | | |
| |
Investments at value 1 (including securities on loan valued at $4,058,146) | | | | $124,305,691 | |
| |
Dividend and interest receivables | | | | 975,348 | |
| |
Securities lending income receivable | | | | 1,127 | |
| |
Receivable for Fund shares sold | | | | 23,502 | |
| |
Receivable from affiliate | | | | 17,147 | |
| |
Prepaid expenses and other assets | | | | 12,377 | |
| |
Total assets | | | | 125,335,192 | |
| |
Liabilities: | | | | | |
| |
Payable upon return of securities loaned | | | | 3,188,527 | |
| |
Payable for investments purchased | | | | 913,419 | |
| |
Payable for Fund shares repurchased | | | | 40,576 | |
| |
Accrued expenses: | | | | | |
| |
Investment advisory and management fees | | | | 23,875 | |
| |
Administrative fees | | | | 15,571 | |
| |
Distribution fees | | | | 2,705 | |
| |
Shareholder service fees | | | | 4,576 | |
| |
Other | | | | 107,182 | |
| |
Total liabilities | | | | 4,296,431 | |
|
Commitments and Contingencies (Notes 2 & 5) | |
| |
Net Assets | | | | $121,038,761 | |
| |
1 Investments at cost | | | | $128,873,669 | |
The accompanying notes are an integral part of these financial statements.
7
| | |
| | Statement of Assets and Liabilities (continued) |
| | | | | |
| | | AMG
Beutel Goodman
Core Plus
Bond Fund |
| |
Net Assets Represent: | | | | | |
| |
Paid-in capital | | | | $169,024,517 | |
| |
Total distributable loss | | | | (47,985,756 | ) |
| |
Net Assets | | | | $121,038,761 | |
| |
Class N: | | | | | |
| |
Net Assets | | | | $12,493,058 | |
| |
Shares outstanding | | | | 1,418,836 | |
| |
Net asset value, offering and redemption price per share | | | | $8.81 | |
| |
Class I: | | | | | |
| |
Net Assets | | | | $106,825,778 | |
| |
Shares outstanding | | | | 12,145,677 | |
| |
Net asset value, offering and redemption price per share | | | | $8.80 | |
| |
Class Z: | | | | | |
| |
Net Assets | | | | $1,719,925 | |
| |
Shares outstanding | | | | 195,314 | |
| |
Net asset value, offering and redemption price per share | | | | $8.81 | |
The accompanying notes are an integral part of these financial statements.
8
| | |
| | Statement of Operations For the fiscal year ended October 31, 2024 |
| | | | |
| | | AMG
Beutel Goodman
Core Plus
Bond Fund |
| |
Investment Income: | | | | |
| |
Dividend income | | | $8,031 | |
| |
Interest income | | | 5,978,851 | |
| |
Securities lending income | | | 5,606 | |
| |
Total investment income | | | 5,992,488 | |
| |
Expenses: | | | | |
| |
Investment advisory and management fees | | | 286,505 | |
| |
Administrative fees | | | 186,851 | |
| |
Distribution fees - Class N | | | 35,060 | |
| |
Shareholder servicing fees - Class I | | | 54,407 | |
| |
Professional fees | | | 81,479 | |
| |
Reports to shareholders | | | 39,312 | |
| |
Registration fees | | | 33,060 | |
| |
Custodian fees | | | 31,360 | |
| |
Trustee fees and expenses | | | 10,629 | |
| |
Transfer agent fees | | | 4,421 | |
| |
Interest expense | | | 3,649 | |
| |
Miscellaneous | | | 6,931 | |
| |
Total expenses before offsets | | | 773,664 | |
| |
Expense reimbursements | | | (144,907 | ) |
| |
Net expenses | | | 628,757 | |
| | | | |
| |
Net investment income | | | 5,363,731 | |
| |
Net Realized and Unrealized Gain: | | | | |
| |
Net realized loss on investments | | | (2,678,149 | ) |
| |
Net realized gain on forward foreign currency exchange contracts | | | 29,766 | |
| |
Net realized gain on foreign currency transactions | | | 4,849 | |
| |
Net change in unrealized appreciation/depreciation on investments | | | 10,485,454 | |
| |
Net change in unrealized appreciation/depreciation on forward foreign currency exchange contracts | | | (36,483 | ) |
| |
Net change in unrealized appreciation/depreciation on foreign currency translations | | | 452 | |
| |
Net realized and unrealized gain | | | 7,805,889 | |
| | | | |
| |
Net increase in net assets resulting from operations | | | $13,169,620 | |
The accompanying notes are an integral part of these financial statements.
9
| | |
| | Statements of Changes in Net Assets For the fiscal years ended October 31, |
| | | | | | | | |
| | | AMG
Beutel Goodman
Core Plus Bond Fund |
| | |
| | | 2024 | | 2023 |
| | |
Increase in Net Assets Resulting From Operations: | | | | | | | | |
| | |
Net investment income | | | $5,363,731 | | | | $4,822,696 | |
| | |
Net realized loss on investments | | | (2,643,534 | ) | | | (18,223,702 | ) |
| | |
Net change in unrealized appreciation/depreciation on investments | | | 10,449,423 | | | | 14,852,243 | |
| | |
Net increase in net assets resulting from operations | | | 13,169,620 | | | | 1,451,237 | |
| | |
Distributions to Shareholders: | | | | | | | | |
| | |
Class N | | | (601,552 | ) | | | (824,507 | ) |
| | |
Class I | | | (4,915,819 | ) | | | (4,464,223 | ) |
| | |
Class Z | | | (78,971 | ) | | | (112,682 | ) |
| | |
Total distributions to shareholders | | | (5,596,342 | ) | | | (5,401,412 | ) |
| | |
Capital Share Transactions:1 | | | | | | | | |
| | |
Net decrease from capital share transactions | | | (9,428,378 | ) | | | (44,019,609 | ) |
| | | | | | | | |
| | |
Total decrease in net assets | | | (1,855,100 | ) | | | (47,969,784 | ) |
| | |
Net Assets: | | | | | | | | |
| | |
Beginning of year | | | 122,893,861 | | | | 170,863,645 | |
| | |
End of year | | | $121,038,761 | | | | $122,893,861 | |
| 1 | See Note 1(g) of the Notes to Financial Statements. |
The accompanying notes are an integral part of these financial statements.
10
| | |
| | AMG Beutel Goodman Core Plus Bond Fund Financial Highlights For a share outstanding throughout each fiscal year |
| | | | | | | | | | | | | | | | | | | | | | | | | | | | | |
| | |
| | | | | For the fiscal years ended October 31, |
| | | | | | | |
| Class N | | | | 2024 | | 2023 | | 2022 | | 2021 | | 2020 | | |
| | | | | | | |
Net Asset Value, Beginning of Year | | | | | | $8.29 | | | | | $8.69 | | | | | $10.72 | | | | | $10.76 | | | | | $10.74 | | | |
| | | | | | | |
Income (loss) from Investment Operations: | | | | | | | | | | | | | | | | | | | | | | | | | | | | | |
| | | | | | | |
Net investment income1,2 | | | | | | 0.36 | | | | | 0.32 | | | | | 0.24 | | | | | 0.20 | | | | | 0.27 | | | |
| | | | | | | |
Net realized and unrealized gain (loss) on investments | | | | | | 0.54 | | | | | (0.36 | ) | | | | (1.97 | ) | | | | 0.03 | | | | | 0.05 | | | |
| | | | | | | |
Total income (loss) from investment operations | | | | | | 0.90 | | | | | (0.04 | ) | | | | (1.73 | ) | | | | 0.23 | | | | | 0.32 | | | |
| | | | | | | |
Less Distributions to Shareholders from: | | | | | | | | | | | | | | | | | | | | | | | | | | | | | |
| | | | | | | |
Net investment income | | | | | | (0.38 | ) | | | | (0.36 | ) | | | | (0.30 | ) | | | | (0.27 | ) | | | | (0.30 | ) | | |
| | | | | | | |
Net Asset Value, End of Year | | | | | | $8.81 | | | | | $8.29 | | | | | $8.69 | | | | | $10.72 | | | | | $10.76 | | | |
| | | | | | | |
Total Return2,3 | | | | | | 10.97 | % | | | | (0.68 | )% | | | | (16.41 | )% | | | | 2.19 | % | | | | 3.01 | % | | |
| | | | | | | |
Ratio of net expenses to average net assets | | | | | | 0.68 | %4 | | | | 0.68 | % | | | | 0.68 | % | | | | 0.83 | % | | | | 0.94 | % | | |
| | | | | | | |
Ratio of gross expenses to average net assets5 | | | | | | 0.80 | % | | | | 0.77 | % | | | | 0.72 | % | | | | 0.90 | % | | | | 1.01 | % | | |
| | | | | | | |
Ratio of net investment income to average net assets2 | | | | | | 4.13 | % | | | | 3.56 | % | | | | 2.47 | % | | | | 1.85 | % | | | | 2.54 | % | | |
| | | | | | | |
Portfolio turnover | | | | | | 83 | % | | | | 114 | % | | | | 76 | % | | | | 174 | % | | | | 96 | % | | |
| | | | | | | |
Net assets end of year (000’s) omitted | | | | | | $12,493 | | | | | $15,787 | | | | | $22,706 | | | | | $37,301 | | | | | $56,175 | | | |
| | | | | | | | | | | | | | | | | | | | | | | | | | | | | | |
The accompanying notes are an integral part of these financial statements.
11
| | |
| | AMG Beutel Goodman Core Plus Bond Fund Financial Highlights For a share outstanding throughout each fiscal year |
| | | | | | | | | | | | | | | | | | | | | | | | | | | |
| | |
| | | | | For the fiscal years ended October 31, |
| | | | | | |
| Class I | | | | 2024 | | 2023 | | 2022 | | 2021 | | 2020 |
| | | | | | |
Net Asset Value, Beginning of Year | | | | | | $8.28 | | | | | $8.69 | | | | | $10.71 | | | | | $10.75 | | | | | $10.74 | |
| | | | | | |
Income (loss) from Investment Operations: | | | | | | | | | | | | | | | | | | | | | | | | | | | |
| | | | | | |
Net investment income1,2 | | | | | | 0.38 | | | | | 0.33 | | | | | 0.26 | | | | | 0.22 | | | | | 0.30 | |
| | | | | | |
Net realized and unrealized gain (loss) on investments | | | | | | 0.54 | | | | | (0.36 | ) | | | | (1.96 | ) | | | | 0.04 | | | | | 0.03 | |
| | | | | | |
Total income (loss) from investment operations | | | | | | 0.92 | | | | | (0.03 | ) | | | | (1.70 | ) | | | | 0.26 | | | | | 0.33 | |
| | | | | | |
Less Distributions to Shareholders from: | | | | | | | | | | | | | | | | | | | | | | | | | | | |
| | | | | | |
Net investment income | | | | | | (0.40 | ) | | | | (0.38 | ) | | | | (0.32 | ) | | | | (0.30 | ) | | | | (0.32 | ) |
| | | | | | |
Net Asset Value, End of Year | | | | | | $8.80 | | | | | $8.28 | | | | | $8.69 | | | | | $10.71 | | | | | $10.75 | |
| | | | | | |
Total Return2,3 | | | | | | 11.21 | % | | | | (0.60 | )% | | | | (16.17 | )% | | | | 2.44 | % | | | | 3.17 | % |
| | | | | | |
Ratio of net expenses to average net assets | | | | | | 0.48 | %4 | | | | 0.48 | % | | | | 0.48 | % | | | | 0.60 | % | | | | 0.69 | % |
| | | | | | |
Ratio of gross expenses to average net assets5 | | | | | | 0.60 | % | | | | 0.57 | % | | | | 0.52 | % | | | | 0.67 | % | | | | 0.76 | % |
| | | | | | |
Ratio of net investment income to average net assets2 | | | | | | 4.33 | % | | | | 3.76 | % | | | | 2.67 | % | | | | 2.08 | % | | | | 2.79 | % |
| | | | | | |
Portfolio turnover | | | | | | 83 | % | | | | 114 | % | | | | 76 | % | | | | 174 | % | | | | 96 | % |
| | | | | | |
Net assets end of year (000’s) omitted | | | | | | $106,826 | | | | | $105,483 | | | | | $137,592 | | | | | $218,278 | | | | | $433,881 | |
| | | | | | | | | | | | | | | | | | | | | | | | | | | | |
The accompanying notes are an integral part of these financial statements.
12
| | |
| | AMG Beutel Goodman Core Plus Bond Fund Financial Highlights For a share outstanding throughout each fiscal year |
| | | | | | | | | | | | | | | | | | | | | | | | | | | |
| | |
| | | | | For the fiscal years ended October 31, |
| | | | | | |
| Class Z | | | | 2024 | | 2023 | | 2022 | | 2021 | | 2020 |
| | | | | | |
Net Asset Value, Beginning of Year | | | | | | $8.29 | | | | | $8.69 | | | | | $10.72 | | | | | $10.76 | | | | | $10.74 | |
| | | | | | |
Income (loss) from Investment Operations: | | | | | | | | | | | | | | | | | | | | | | | | | | | |
| | | | | | |
Net investment income1,2 | | | | | | 0.39 | | | | | 0.34 | | | | | 0.27 | | | | | 0.23 | | | | | 0.31 | |
| | | | | | |
Net realized and unrealized gain (loss) on investments | | | | | | 0.53 | | | | | (0.36 | ) | | | | (1.98 | ) | | | | 0.04 | | | | | 0.04 | |
| | | | | | |
Total income (loss) from investment operations | | | | | | 0.92 | | | | | (0.02 | ) | | | | (1.71 | ) | | | | 0.27 | | | | | 0.35 | |
| | | | | | |
Less Distributions to Shareholders from: | | | | | | | | | | | | | | | | | | | | | | | | | | | |
| | | | | | |
Net investment income | | | | | | (0.40 | ) | | | | (0.38 | ) | | | | (0.32 | ) | | | | (0.31 | ) | | | | (0.33 | ) |
| | | | | | |
Net Asset Value, End of Year | | | | | | $8.81 | | | | | $8.29 | | | | | $8.69 | | | | | $10.72 | | | | | $10.76 | |
| | | | | | |
Total Return2,3 | | | | | | 11.25 | % | | | | (0.43 | )% | | | | (16.20 | )% | | | | 2.51 | % | | | | 3.35 | % |
| | | | | | |
Ratio of net expenses to average net assets | | | | | | 0.43 | %4 | | | | 0.43 | % | | | | 0.43 | % | | | | 0.53 | % | | | | 0.61 | % |
| | | | | | |
Ratio of gross expenses to average net assets5 | | | | | | 0.55 | % | | | | 0.52 | % | | | | 0.47 | % | | | | 0.60 | % | | | | 0.68 | % |
| | | | | | |
Ratio of net investment income to average net assets2 | | | | | | 4.38 | % | | | | 3.81 | % | | | | 2.72 | % | | | | 2.15 | % | | | | 2.87 | % |
| | | | | | |
Portfolio turnover | | | | | | 83 | % | | | | 114 | % | | | | 76 | % | | | | 174 | % | | | | 96 | % |
| | | | | | |
Net assets end of year (000’s) omitted | | | | | | $1,720 | | | | | $1,624 | | | | | $10,566 | | | | | $11,864 | | | | | $10,684 | |
| | | | | | | | | | | | | | | | | | | | | | | | | | | | |
| 1 | Per share numbers have been calculated using average shares. |
| 2 | Total returns and net investment income would have been lower had certain expenses not been offset. |
| 3 | The total return is calculated using the published Net Asset Value as of fiscal year end. |
| 4 | Includes interest expense of less than 0.01% related to participation in the interfund lending program. |
| 5 | Excludes the impact of expense reimbursement or fee waivers and expense reductions such as brokerage credits, but includes expense repayments and non-reimbursable expenses, if any, such as interest, taxes, and extraordinary expenses. (See Note 1(c) and 2 in the Notes to Financial Statements.) |
The accompanying notes are an integral part of these financial statements.
13
| | |
| | Notes to Financial Statements October 31, 2024 |
1. ORGANIZATION AND SUMMARY OF SIGNIFICANT ACCOUNTING POLICIES
AMG Funds IV (the “Trust”) is an open-end management investment company, organized as a Delaware Statutory Trust, and registered under the Investment Company Act of 1940, as amended (the “1940 Act”). Currently, the Trust consists of a number of different funds, each having distinct investment management objectives, strategies, risks, and policies. Included in this report is AMG Beutel Goodman Core Plus Bond Fund (the “Fund”).
The Fund offers Class N, Class I and Class Z shares. Each class represents an interest in the same assets of the Fund. Although all share classes generally have identical voting rights, each share class votes separately when required by law. Different share classes may have different net asset values per share to the extent the share classes pay different distribution amounts and/or the expenses of such share classes differ. Each share class has its own expense structure. Please refer to a current prospectus for additional information on each share class.
The Fund’s financial statements are prepared in accordance with accounting principles generally accepted in the United States of America (“U.S. GAAP”), including accounting and reporting guidance pursuant to Accounting Standards Codification Topic 946 applicable to investment companies. U.S. GAAP requires management to make estimates and assumptions that affect the reported amounts of assets and liabilities and disclosure of contingent assets and liabilities at the date of the financial statements and the reported amounts of income and expenses during the reporting period. Actual results could differ from those estimates and such differences could be material. The following is a summary of significant accounting policies followed by the Fund in the preparation of its financial statements:
a. VALUATION OF INVESTMENTS
Fixed income securities purchased with a remaining maturity exceeding 60 days are valued at the evaluated bid price provided by an authorized pricing service or, if an evaluated price is not available, by reference to other securities which are considered comparable in credit rating, interest rate, due date and other features (generally referred to as “matrix pricing”) or other similar pricing methodologies. Investments in certain mortgage-backed and stripped mortgage-backed securities, convertible securities, derivatives and other debt securities not traded on an organized securities market are valued on the basis of valuations provided by dealers or by a pricing service which uses information with respect to transactions in such securities and various relationships between such securities and yield to maturity in determining value.
Fixed income securities purchased with a remaining maturity of 60 days or less are valued at amortized cost, provided that the amortized cost value is approximately the same as the fair value of the security valued without the use of amortized cost. Investments in other open-end registered investment companies are valued at their end of day net asset value per share.
The Fund’s portfolio investments are generally valued based on independent market quotations or prices or, if none, “evaluative” or other market based valuations provided by third party pricing services. Pursuant to Rule 2a-5 under the 1940 Act, the Fund’s Board of Trustees (the “Board”) designated AMG Funds LLC (the “Investment Manager”) as the Fund’s Valuation Designee to perform the Fund’s fair value determinations. Such determinations are subject to Board oversight and certain reporting and other requirements intended to ensure that
the Board receives the information it needs to oversee the Investment Manager’s fair value determinations.
Under certain circumstances, the value of certain Fund portfolio investments may be based on an evaluation of fair value, pursuant to procedures established by the Investment Manager and under the general supervision of the Board. The Fund may use the fair value of a portfolio investment to calculate its net asset value (“NAV”) in the event that the market quotation, price or market based valuation for the portfolio investment is not readily available or otherwise not determinable pursuant to the Fund’s valuation procedures, if the Investment Manager believes the quotation, price or market based valuation to be unreliable, or in certain other circumstances. When determining the fair value of an investment, the Investment Manager seeks to determine the price that the Fund might reasonably expect to receive from current sale of that portfolio investment in an arms-length transaction. Fair value determinations shall be based upon consideration of all available facts and information, including, but not limited to (i) attributes specific to the investment; (ii) fundamental and analytical data relating to the investment; and (iii) the value of other comparable securities or relevant financial instruments, including derivative securities, traded on other markets or among dealers.
The values assigned to fair value portfolio investments are based on available information and do not necessarily represent amounts that might ultimately be realized in the future, since such amounts depend on future developments inherent in long-term investments. Because of the inherent uncertainty of valuation, those estimated values may differ significantly from the values that would have been used had a ready market for the investments existed, and the differences could be material. The Board will be presented with quarterly reports, as of the most recent quarter end, summarizing all fair value activity, material fair value matters that occurred during the quarter, and all outstanding securities fair valued by the Fund. Additionally, the Board will be presented with an annual report that assesses the adequacy and effectiveness of the Investment Manager’s process for determining the fair value of the Fund’s investments.
U.S. GAAP defines fair value as the price that a fund would receive to sell an asset or pay to transfer a liability in an orderly transaction between market participants at the measurement date. U.S. GAAP also establishes a framework for measuring fair value, and a three level hierarchy for fair value measurements based upon the transparency of inputs to the valuation of an asset or liability. Inputs may be observable or unobservable and refer broadly to the assumptions that market participants would use in pricing the asset or liability. Observable inputs reflect the assumptions market participants would use in pricing the asset or liability based on market data obtained from sources independent of the Fund. Unobservable inputs reflect the Fund’s own assumptions about the assumptions that market participants would use in pricing the asset or liability developed based on the best information available in the circumstances. Each investment is assigned a level based upon the observability of the inputs which are significant to the overall valuation.
The three-tier hierarchy of inputs is summarized below:
Level 1 – inputs are quoted prices in active markets for identical investments (e.g., equity securities, open-end investment companies)
Level 2 – other observable inputs (including, but not limited to: quoted prices for similar assets or liabilities in markets that are active, quoted prices for identical or similar assets or liabilities in markets that are not active, inputs other than quoted prices that are observable for the assets or liabilities (such as interest rates, yield curves, volatilities, prepayment speeds, loss severities, credit risks and default rates) or other market corroborated inputs) (e.g., debt securities, government
14
| | |
| | Notes to Financial Statements (continued) |
securities, forward foreign currency exchange contracts, fair valued securities with observable inputs)
Level 3 – inputs are significant unobservable inputs (including the Fund’s own assumptions used to determine the fair value of investments) (e.g., fair valued securities with unobservable inputs)
Changes in inputs or methodologies used for valuing investments may result in a transfer in or out of levels within the fair value hierarchy. The inputs or methodologies used for valuing investments may not necessarily be an indication of the risk associated with investing in those investments.
b. SECURITY TRANSACTIONS
Security transactions are accounted for as of trade date. Realized gains and losses on securities sold are determined on the basis of identified cost.
c. INVESTMENT INCOME AND EXPENSES
Dividend income is recorded on the ex-dividend date. Interest income, which includes amortization of premium and accretion of discount on debt securities, is accrued as earned. Dividend and interest income on foreign securities is recorded gross of any withholding tax. Non-cash dividends included in dividend income, if any, are reported at the fair market value of the securities received. Other income and expenses are recorded on an accrual basis. Expenses that cannot be directly attributed to the Fund are apportioned among the funds in the Trust and other trusts or funds within the AMG Funds Family of Funds (collectively, the “AMG Funds Family”) based upon their relative average net assets or number of shareholders. Investment income, realized and unrealized capital gains and losses, the common expenses of the Fund, and certain fund level expense reductions, if any, are allocated on a pro-rata basis to each class based on the relative net assets of each class to the total net assets of the Fund.
d. DIVIDENDS AND DISTRIBUTIONS
Fund distributions resulting from net investment income will normally be declared and paid monthly. Realized net capital gains distribution, if any, will normally be declared and paid at least annually in December. Distributions to shareholders are recorded on the ex-dividend date. Distributions are determined in accordance with federal income tax law, which may differ from net investment income and net realized capital gains for financial statement purposes (U.S. GAAP). Differences may be permanent or temporary. Permanent differences are reclassified among capital accounts in the financial statements to reflect their tax character. Permanent book and tax basis differences, if any, relating to shareholder distributions will result in reclassifications to paid-in capital. Temporary differences arise when certain items of income, expense and gain or loss are recognized in different periods for financial statement and tax purposes; these differences will reverse at some time in the future. The Fund had no permanent differences. Temporary differences are primarily due to wash sale loss deferrals and premium amortization on callable bonds.
The tax character of distributions paid during the fiscal years ended October 31, 2024 and October 31, 2023 was as follows:
| | | | | | | | |
| | |
| Distributions paid from: | | 2024 | | | 2023 | |
| | |
Ordinary income * | | | $5,596,342 | | | | $5,401,412 | |
| * | For tax purposes, short-term capital gain distributions, if any, are considered ordinary income distributions. |
As of October 31, 2024, the components of distributable earnings (excluding unrealized appreciation/depreciation) on a tax basis consisted of:
| | | | |
| |
Capital loss carryforward | | | $43,084,072 | |
| |
Undistributed ordinary income | | | 58,747 | |
At October 31, 2024, the cost of investments and the aggregate gross unrealized appreciation and depreciation for federal income tax purposes were as follows:
| | | | | | | | | | | | | | |
Cost | | | Appreciation | | | Depreciation | | | Net Depreciation | |
| | | |
| | $129,244,761 | | | | $1,171,990 | | | | $(6,110,562) | | | | $(4,938,572) | |
e. FEDERAL TAXES
The Fund currently qualifies as an investment company and intends to comply with the requirements under Subchapter M of the Internal Revenue Code of 1986, as amended (the “Code”), and to distribute substantially all of its taxable income and gains to its shareholders and to meet certain diversification and income requirements with respect to investment companies. The Investment Manager has analyzed the Fund’s tax positions taken on federal income tax returns as of October 31, 2024, and for all open tax years (generally, the three prior taxable years), and has concluded that no provision for federal income tax is required in the Fund’s financial statements. Additionally, the Investment Manager is not aware of any tax position for which it is reasonably possible that the total amounts of unrecognized tax benefit/detriment will change materially in the next twelve months.
Furthermore, based on the Fund’s understanding of the tax rules and rates related to income, gains and transactions for the foreign jurisdictions in which it invests, the Fund will provide for foreign taxes, and where appropriate, deferred foreign taxes.
f. CAPITAL LOSS CARRYOVERS AND DEFERRALS
As of October 31, 2024, the Fund had capital loss carryovers for federal income tax purposes as shown in the following chart. These amounts may be used to offset future realized capital gains indefinitely, and retain their character as short-term and/or long-term.
| | | | | | | | |
Short-Term | | Long-Term | | | Total | |
| | |
| $11,900,224 | | | $31,183,848 | | | | $43,084,072 | |
For the fiscal year ended October 31, 2024, the Fund did not utilize capital loss carryovers.
15
| | |
| | Notes to Financial Statements (continued) |
g. CAPITAL STOCK
The Trust’s Trust Instrument authorizes for the Fund the issuance of an unlimited number of shares of beneficial interest, without par value. The Fund records sales and repurchases of its capital stock on the trade date.
For the fiscal years ended October 31, 2024 and October 31, 2023, the capital stock transactions by class for the Fund were as follows:
| | | | | | | | | | | | | | | | |
| | | October 31, 2024 | | | October 31, 2023 | |
| | | | |
| | | Shares | | | | Amount | | | | Shares | | | | Amount | |
| | | | |
Class N: | | | | | | | | | | | | | | | | |
| | | | |
Shares sold | | | 34,898 | | | | $307,674 | | | | 44,667 | | | | $397,948 | |
| | | | |
Shares issued in reinvestment of distributions | | | 68,182 | | | | 598,491 | | | | 92,415 | | | | 819,979 | |
| | | | |
Shares redeemed | | | (588,058 | ) | | | (5,155,394 | ) | | | (844,903 | ) | | | (7,415,735 | ) |
| | | | | | | | | | | | | | | | |
| | | | |
Net decrease | | | (484,978 | ) | | | $(4,249,229 | ) | | | (707,821 | ) | | | $(6,197,808 | ) |
| | | | | | | | | | | | | | | | |
| | | | |
Class I: | | | | | | | | | | | | | | | | |
| | | | |
Shares sold | | | 1,575,665 | | | | $13,822,569 | | | | 2,930,686 | | | | $25,013,383 | |
| | | | |
Shares issued in reinvestment of distributions | | | 142,097 | | | | 1,245,460 | | | | 208,633 | | | | 1,850,456 | |
| | | | |
Shares redeemed | | | (2,306,608 | ) | | | (20,242,290 | ) | | | (6,246,321 | ) | | | (55,406,353 | ) |
| | | | | | | | | | | | | | | | |
| | | | |
Net decrease | | | (588,846 | ) | | | $(5,174,261) | | | | (3,107,002 | ) | | | $(28,542,514) | |
| | | | | | | | | | | | | | | | |
| | | | |
Class Z: | | | | | | | | | | | | | | | | |
| | | | |
Shares sold | | | — | | | | — | | | | 30,788 | | | | $277,047 | |
| | | | |
Shares issued in reinvestment of distributions | | | 8,625 | | | | $75,726 | | | | 12,686 | | | | 112,682 | |
| | | | |
Shares redeemed | | | (9,167 | ) | | | (80,614 | ) | | | (1,062,852 | ) | | | (9,669,016 | ) |
| | | | | | | | | | | | | | | | |
| | | | |
Net decrease | | | (542 | ) | | | $(4,888) | | | | (1,019,378 | ) | | | $(9,279,287) | |
| | | | | | | | | | | | | | | | |
h. REPURCHASE AGREEMENTS AND JOINT REPURCHASE AGREEMENTS
The Fund may enter into third-party and bilateral repurchase agreements for temporary cash management purposes and for reinvestment of cash collateral on securities lending transactions under the securities lending program offered by The Bank of New York Mellon (“BNYM”) (the “Securities Lending Program”) (collectively, “Repurchase Agreements”). The value of the underlying collateral, including accrued interest, must equal or exceed the value of the Repurchase Agreements during the term of the agreement. For joint repurchase agreements, the Fund participates on a pro rata basis with other clients of BNYM in its share of the underlying collateral under such joint repurchase agreements and in its share of proceeds from any repurchase or other disposition of the underlying collateral. The underlying collateral for all Repurchase Agreements is held by the Fund’s custodian or at the Federal Reserve Bank. If the seller defaults and the value of the collateral declines, or if bankruptcy proceedings commence with respect to the seller of the security, realization of the collateral by the Fund may be delayed or limited. Pursuant to the Securities Lending Program, the Fund is indemnified for such losses by BNYM on joint repurchase agreements.
At October 31, 2024, the market value of Repurchase Agreements outstanding was $3,188,527.
i. FOREIGN CURRENCY TRANSLATION
The books and records of the Fund are maintained in U.S. Dollars. The value of investments, assets and liabilities denominated in currencies other than U.S. Dollars are translated into U.S. Dollars based upon current foreign exchange rates. Purchases and sales of foreign investments, income and expenses are converted into U.S. Dollars based on currency exchange rates prevailing on the respective dates of such transactions. Net realized and unrealized gain (loss) on foreign currency transactions represent: (1) foreign exchange gains and losses from the sale and holdings of foreign currencies; (2) gains and losses between trade date and settlement date on investment securities transactions and foreign currency exchange contracts; and (3) gains and losses from the difference between amounts of interest and dividends recorded and the amounts actually received.
The Fund does not isolate the net realized and unrealized gain or loss resulting from changes in exchange rates from the fluctuations in market prices of securities held. Such fluctuations are included with the net realized and unrealized gain or loss on investments.
2. AGREEMENTS AND TRANSACTIONS WITH AFFILIATES
The Trust has entered into an investment advisory agreement under which the Investment Manager, a subsidiary and the U.S. wealth platform of Affiliated Managers Group, Inc. (“AMG”), serves as investment manager to the Fund and is
16
| | |
| | Notes to Financial Statements (continued) |
responsible for the Fund’s overall administration and operations. The Investment Manager selects and recommends, subject to the approval of the Board and, in certain circumstances, shareholders, the subadviser for the Fund and monitors the subadviser’s investment performance, security holdings and investment strategies. The Fund’s investment portfolio is managed by Beutel, Goodman & Company Ltd. (“Beutel Goodman”), who serves pursuant to a subadvisory agreement with the Investment Manager.
Investment management fees are paid directly by the Fund to the Investment Manager based on average daily net assets. For the fiscal year ended October 31, 2024, the Fund paid an investment management fee at the annual rate of 0.23% of the average daily net assets of the Fund. The fee paid to Beutel Goodman for its services as subadviser is paid out of the fee the Investment Manager receives from the Fund and does not increase the expenses of the Fund.
The Investment Manager has contractually agreed, through at least March 1, 2025, to waive management fees and/or pay or reimburse fund expenses in order to limit total annual Fund operating expenses after fee waiver and expense reimbursements (exclusive of taxes, interest (including interest incurred in connection with bank and custody overdrafts, and in connection with securities sold short), shareholder servicing fees, distribution and service (12b-1) fees, brokerage commissions and other transaction costs, dividends payable with respect to securities sold short, acquired fund fees and expenses and extraordinary expenses) to 0.43% of the Fund’s average daily net assets (this annual rate or such other annual rate that may be in effect from time to time, the “Expense Cap”), subject to later reimbursement by the Fund in certain circumstances.
In general, for a period of up to 36 months after the date any amounts are paid, waived or reimbursed by the Investment Manager, the Investment Manager may recover such amounts from the Fund, provided that such repayment would not cause the Fund’s total annual operating expenses after fee waiver and expense reimbursements (exclusive of the items noted in the parenthetical above) to exceed either (i) the Expense Cap in effect at the time such amounts were paid, waived or reimbursed, or (ii) the Expense Cap in effect at the time of such repayment by the Fund.
The contractual expense limitation may only be terminated in the event the Investment Manager or a successor ceases to be the investment manager of the Fund or a successor fund, by mutual agreement between the Investment Manager and the Board, or in the event of the Fund’s liquidation unless the Fund is reorganized or is a party to a merger in which the surviving entity is successor to the accounting and performance information of the Fund.
For the fiscal year ended October 31, 2024, the Investment Manager reimbursed the Fund $144,907, and did not recoup any previously reimbursed expenses. At October 31, 2024, the Fund’s expiration of reimbursements subject to recoupment is as follows:
| | | | |
Expiration Period | | | |
| |
Less than 1 year | | | $98,353 | |
| |
1-2 years | | | 118,067 | |
| |
2-3 years | | | 144,907 | |
| | | | |
| |
Total | | $ | 361,327 | |
| | | | |
The Trust, on behalf of the Fund, has entered into an amended and restated Administration Agreement under which the Investment Manager serves as the Fund’s administrator (the “Administrator”) and is responsible for certain aspects of managing the Fund’s operations, including administration and shareholder services to the Fund. The Fund pays a fee to the Administrator at the rate of 0.15% per annum of the Fund’s average daily net assets for this service.
The Fund is distributed by AMG Distributors, Inc. (the “Distributor”), a wholly-owned subsidiary of the Investment Manager. The Distributor serves as the distributor and underwriter for the Fund and is a registered broker-dealer and member of the Financial Industry Regulatory Authority, Inc. (“FINRA”). Shares of the Fund will be continuously offered and will be sold directly to prospective purchasers and through brokers, dealers or other financial intermediaries who have executed selling agreements with the Distributor. Generally, the Distributor bears all or a portion of the expenses of providing services pursuant to the distribution agreement, including the payment of the expenses relating to the distribution of prospectuses for sales purposes and any advertising or sales literature.
The Trust has adopted a distribution and service plan (the “Plan”) with respect to the Class N shares, in accordance with the requirements of Rule 12b-1 under the 1940 Act and the requirements of the applicable rules of FINRA regarding asset-based sales charges. Pursuant to the Plan, the Fund may make payments to the Distributor for its expenditures in financing any activity primarily intended to result in the sale of the Fund’s Class N shares and for maintenance and personal service provided to existing shareholders of that class. The Plan authorizes payments to the Distributor up to 0.25% annually of the Fund’s average daily net assets attributable to the Class N shares.
For Class I shares, the Board has approved reimbursement payments to the Investment Manager for shareholder servicing expenses (“shareholder servicing fees”) incurred. Shareholder servicing fees include payments to financial intermediaries, such as broker-dealers (including fund supermarket platforms), banks, and trust companies who provide shareholder recordkeeping, account servicing and other services. The Class I shares may reimburse the Investment Manager for the actual amount incurred up to a maximum annual rate of the Class’s average daily net assets as shown in the table below.
The impact on the annualized expense ratios for the fiscal year ended October 31, 2024, was as follows:
| | | | |
| | |
| | Maximum Annual
Amount Approved | | Actual
Amount
Incurred |
| | |
| Class I | | 0.05% | | 0.05% |
The Board provides supervision of the affairs of the Trust and other trusts within the AMG Funds Family. The Trustees of the Trust who are not affiliated with the Investment Manager receive an annual retainer and per meeting fees for regular, special and telephonic meetings, and they are reimbursed for out-of-pocket expenses incurred while carrying out their duties as Board members. The Chairman of the Board and the Audit Committee Chair receive additional annual retainers. Certain Trustees and Officers of the Fund are Officers and/or Directors of the Investment Manager, AMG and/or the Distributor.
The Securities and Exchange Commission (the “SEC”) granted an exemptive order that permits certain eligible funds in the AMG Funds Family to lend and borrow money for certain temporary purposes directly to and from other eligible funds in the AMG Funds Family. Participation in this interfund lending program is voluntary for both the borrowing and lending funds, and an interfund loan is only made if it
17
| | |
| | Notes to Financial Statements (continued) |
benefits each participating fund. The Administrator manages the program according to procedures approved by the Board, and the Board monitors the operation of the program. An interfund loan must comply with certain conditions set out in the exemptive order, which are designed to assure fairness and protect all participating funds. The interest earned and interest paid on interfund loans are included on the Statement of Operations as interest income and interest expense, respectively. At October 31, 2024, the Fund had no interfund loans outstanding. The Fund did not lend during the fiscal year ended October 31, 2024.
The Fund utilized the interfund lending program during the fiscal year ended October 31, 2024 as follows:
| | | | | | | | | | | | | | |
Average Borrowed | | | Number of Days | | | Interest Paid | | | Average Interest Rate | |
| | | |
| | $3,059,927 | | | | 7 | | | | $3,649 | | | | 6.219% | |
3. PURCHASES AND SALES OF SECURITIES
Purchases and sales of securities (excluding short-term securities and U.S. Government Obligations) for the fiscal year ended October 31, 2024, were $25,754,987 and $33,498,888, respectively.
The Fund’s purchases and sales of U.S. Government Obligations for the fiscal year ended October 31, 2024 were $73,313,370 and $78,814,591, respectively.
4. PORTFOLIO SECURITIES LOANED
The Fund participates in the Securities Lending Program providing for the lending of securities to qualified borrowers. Securities lending income includes earnings of such temporary cash investments, plus or minus any rebate to a borrower. These earnings (after any rebate) are then divided between BNYM, as a fee for its services under the Securities Lending Program, and the Fund, according to agreed-upon rates. Collateral on all securities loaned is accepted in cash, U.S. Treasury Obligations or U.S. Government Agency Obligations. Collateral is maintained at a minimum level of 102% (105% in the case of certain foreign securities) of the market value, plus interest, if applicable, of investments on loan. It is the Fund’s policy to obtain additional collateral from or return excess collateral to the borrower by the end of the next business day, following the valuation date of the securities loaned. Therefore, the value of the collateral held may be temporarily less than the value of the securities on loan. Lending securities entails a risk of loss to the Fund if and to the extent that the market value of the securities loaned were to increase and the borrower did not increase the collateral accordingly, and the borrower fails to return the securities. Under the terms of the Securities Lending Program, the Fund is indemnified for such losses by BNYM. Cash collateral is held in separate omnibus accounts managed by BNYM, who is authorized to exclusively enter into joint repurchase agreements for that cash collateral. Securities collateral is held in separate omnibus accounts managed by BNYM and cannot be sold or pledged. BNYM bears the risk of any deficiency in the amount of the cash collateral available for return to the borrower due to any loss on the collateral invested. Loans of securities are terminable at any time and the borrower, after notice, is required to return borrowed securities as soon as practical, which is normally within three business days.
The value of securities loaned on positions held, cash collateral and securities collateral received at October 31, 2024, was as follows:
| | | | | | |
Securities
Loaned | | Cash
Collateral
Received | | Securities
Collateral
Received | | Total
Collateral
Received |
| | | |
| $4,058,146 | | $3,188,527 | | $1,017,774 | | $4,206,301 |
The following table summarizes the securities received as collateral for securities lending at October 31, 2024:
| | | | | | | | | | |
Collateral
Type | | Coupon
Range | | Maturity
Date Range | |
| | | |
| U.S. Treasury Obligations | | | 0.125 | %-5.000% | | | | | 01/15/25-08/15/49 | |
5. COMMITMENTS AND CONTINGENCIES
Under the Trust’s organizational documents, its Trustees and Officers are indemnified against certain liabilities arising out of the performance of their duties to the Trust. In addition, in the normal course of business, the Fund may enter into contracts and agreements that contain a variety of representations and warranties, which provide general indemnifications. The maximum exposure to the Fund under these arrangements is unknown, as this would involve future claims that may be made against the Fund that have not yet occurred. However, based on experience, the Fund had no prior claims or losses and expects the risks of loss to be remote.
6. DERIVATIVE INSTRUMENTS
The following disclosures contain information on how and why the Fund uses derivative instruments, the credit risk and how derivative instruments affect the Fund’s financial position, and results of operations. The location and fair value amounts of these instruments on the Statement of Assets and Liabilities, and the realized gains and losses and changes in unrealized appreciation and depreciation on the Statement of Operations, each categorized by type of derivative contract, are included in a table at the end of the Fund’s Schedule of Portfolio Investments.
For the fiscal year ended October 31, 2024, the average monthly balances of derivative financial instruments outstanding were as follows:
| | | | |
| |
Forward Foreign Currency Exchange Contracts | | | | |
| |
Average U.S. Dollar notional value | | | $909,224 | |
7. FORWARD FOREIGN CURRENCY CONTRACTS
During the fiscal year ended October 31, 2024, the Fund invested in forward foreign currency contracts. The Fund may enter into forward foreign currency contracts for any purpose, including to attempt to hedge currency exposure or to enhance return. A forward foreign currency contract is an agreement between a fund and another party to buy or sell a currency at a set price at a future date. The market value of the contract will fluctuate with changes in currency exchange rates. The contract is marked-to-market daily, and the change in market value is recorded as an unrealized appreciation or depreciation. Risks may arise upon entering into these contracts from the potential inability of counterparties to meet the terms of their contracts and from unanticipated movements in the value of a foreign currency relative to the U.S. Dollar. At October 31, 2024, there were no open forward foreign currency contracts.
18
| | |
| | Notes to Financial Statements (continued) |
8. MORTGAGE-BACKED SECURITIES
The Fund may invest in mortgage-backed securities (“MBS”). These securities represent interests in pools of mortgage loans and they provide holders with payments consisting of both principal and interest as the mortgages in the underlying mortgage pools are paid. The timely payment of principal and interest on MBS issued or guaranteed by Government National Mortgage Association (“Ginnie Mae”) is backed by Ginnie Mae and the full faith and credit of the U.S. government. MBS issued by U.S. government agencies or instrumentalities other than Ginnie Mae are not full faith and credit obligations of the U.S. government. Certain obligations, such as those issued by the Federal Home Loan Banks, Federal National Mortgage Association (“Fannie Mae”) and Federal Home Loan Mortgage Corporation (“Freddie Mac”) are supported only by the credit of the issuer. MBS issued by private issuers are not government securities and are not guaranteed by any government agency. They are secured by the underlying collateral of the private issuer. Yields on privately issued MBS tend to be higher than those of government-backed issues. However, risk of loss due to default and sensitivity to interest rate fluctuations are also higher. The Fund invests in collateralized mortgage obligations (“CMOs”), collateralized loan obligations (“CLOs”) and real estate mortgage investment conduits (“REMICs”). CMOs are obligations that are fully collateralized by a portfolio of mortgages or mortgage-related securities. REMIC Certificates represent beneficial ownership interests in a REMIC trust, which generally holds mortgages or mortgage-related securities. A CLO is a trust typically collateralized by a pool of loans. These MBS
pools are divided into classes with each class having its own characteristics. The different classes are retired in sequence as the underlying mortgages or loans are repaid.
At October 31, 2024, the Fund held $2,784,553 in Mortgage-Backed Securities, which is 2.3% of the net assets of the Fund.
9. FLOATING RATE SENIOR LOAN INTERESTS
The Fund may invest in Floating Rate Senior Loan Interests (“Senior Loans”). These are senior, secured loans made to companies whose debt is below investment grade as well as investments with similar economic characteristics. Senior Loans typically hold a first lien priority and, unless otherwise indicated, are required to pay interest at floating rates that are periodically reset by reference to a base lending rate plus a spread. These base lending rates are primarily the Secured Overnight Financing Rate (SOFR) and secondarily the prime rate offered by one or more major U.S. banks (“Prime”). Senior Loans are generally not registered under the Securities Act of 1933 and often incorporate certain restrictions on resale and cannot be sold publicly. Senior Loans often require prepayments from excess cash flow or permit the borrower to repay at its election. The degree to which borrowers repay, whether as a contractual requirement or at their election, cannot be predicted. As a result, the actual maturity may be substantially less than the stated maturity.
10. MASTER NETTING AGREEMENTS
The Fund may enter into master netting agreements with its counterparties for the Securities Lending Program and Repurchase Agreements, which provide the right, in the event of default (including bankruptcy or insolvency) for the non-defaulting party to liquidate the collateral and calculate net exposure to the defaulting party or request additional collateral. For financial reporting purposes, the Fund does not offset financial assets and financial liabilities that are subject to master netting agreements in the Statement of Assets and Liabilities. For securities lending transactions and derivatives transactions, see Note 4 and Note 6, respectively.
The following table is a summary of the Fund’s open Repurchase Agreements that are subject to a master netting agreement as of October 31, 2024:
| | | | | | | | | | | | | | | | | | | | |
| | | | | | Gross Amount Not Offset in the
Statement of Assets and Liabilities | | | | | | | |
| | | | | |
| | | Gross Amounts of
Assets Presented in
the Statement of
Assets and Liabilities | | | Offset
Amount | | | Net Asset Balance | | | Collateral
Received | | | Net
Amount | |
| | | | | | | | | | | | | | | | | | | | |
| | | | | |
| | | | | | | | | | | | | | | | | | | | |
| | | | | |
Cantor Fitzgerald Securities, Inc. | | | $1,000,000 | | | | — | | | | $1,000,000 | | | | $1,000,000 | | | | — | |
| | | | | |
Citigroup Global Markets, Inc. | | | 1,000,000 | | | | — | | | | 1,000,000 | | | | 1,000,000 | | | | — | |
| | | | | |
Daiwa Capital Markets America | | | 188,527 | | | | — | | | | 188,527 | | | | 188,527 | | | | — | |
| | | | | |
HSBC Securities USA, Inc. | | | 1,000,000 | | | | — | | | | 1,000,000 | | | | 1,000,000 | | | | — | |
| | | | | | | | | | | | | | | | | | | | |
| | | | | |
Total | | | $3,188,527 | | | | — | | | | $3,188,527 | | | | $3,188,527 | | | | — | |
| | | | | | | | | | | | | | | | | | | | |
11. FUND RISKS
In the normal course of business, the Fund invests in securities or other instruments and may enter into certain transactions, and such activities subject the Fund to various risks. The value of securities or other instruments may also be affected by various factors, including, without limitation: (i) the general economy; (ii) the overall market as well as local, regional or global political and/or social
instability; or (iii) currency and price fluctuations. Please refer to the Fund’s current prospectus for additional information about the Fund’s principal risks.
Market Risk: Market prices of investments held by the Fund may fall rapidly or unpredictably due to a variety of factors, including economic, political, or market conditions, or other factors including terrorism, war, natural disasters and the
19
| | |
| | Notes to Financial Statements (continued) |
spread of infectious illness or other public health issues, including epidemics or pandemics, or in response to events that affect particular industries or companies.
Management Risk: Because the Fund is an actively managed investment portfolio, security selection or focus on securities in a particular style, market sector or group of companies may cause the Fund to incur losses or underperform relative to its benchmarks or other funds with a similar investment objective. There can be no guarantee that Beutel Goodman’s investment techniques and risk analysis will produce the desired result.
Debt Securities Risk: The value of a debt security changes in response to various factors, including, for example, market-related factors, such as changes in interest rates or changes in the actual or perceived ability of an issuer to meet its obligations. Investments in debt securities are subject to, among other risks, credit risk, interest rate risk, extension risk, prepayment risk and liquidity risk.
Credit and Counterparty Risk: The issuer of bonds or other debt securities or a counterparty to a derivatives contract (including over-the-counter counterparties as well as brokers and clearinghouses in respect of exchange-traded and/or cleared products) may be unable or unwilling, or may be perceived as unable or unwilling, to make timely interest, principal or settlement payments or otherwise honor its obligations.
U.S. Government Securities Risk: Obligations issued by some U.S. Government agencies, authorities, instrumentalities, or sponsored enterprises such as Government National Mortgage Association (“GNMA”) are backed by the full faith and credit of the U.S. Government, while obligations issued by others, such as Federal National Mortgage Association (“FNMA”), Federal Home Loan Mortgage Corporation (“FHLMC”), and Federal Home Loan Banks (“FHLBs”), are not backed by the full faith and credit of the U.S. Government and are backed solely by the entity’s own resources or by the ability of the entity to borrow from the U.S. Treasury. If one of these agencies defaults on a loan, there is no guarantee that the U.S. Government will provide financial support.
Asset-Backed and Mortgage-Backed Securities Risk: Investments in asset-backed and mortgage-backed securities involve risk of severe credit downgrades, loss due to prepayments that occur earlier or later than expected, illiquidity and default.
Municipal Market Risk: Factors unique to the municipal bond market may negatively affect the value of municipal bonds.
Interest Rate Risk: Fixed coupon payments (cash flows) of bonds and debt securities may become less competitive with the market in periods of rising interest rates and cause bond prices to decline. During periods of increasing interest rates, the Fund may experience high levels of volatility and shareholder redemptions, and may have to sell securities at times when it would otherwise not do so, and at unfavorable prices, which could reduce the returns of the Fund.
High Yield Risk: Below investment grade debt securities and unrated securities of similar credit quality (commonly known as “junk bonds” or “high yield securities”) may be subject to greater levels of interest rate, credit, liquidity, and market risk than higher-rated securities. These securities are considered predominately speculative with respect to the issuer’s continuing ability to make principal and interest payments.
Extension Risk: During periods of rising interest rates, a debtor may pay back a bond or other fixed income security slower than expected or required, and the value of such security may fall.
Prepayment Risk: A debtor may exercise its right to pay back a bond or other debt security earlier than expected or required during periods of decreasing interest rates.
Call Risk: Call risk is the possibility that an issuer may redeem a fixed income security before maturity (a call). The increased likelihood of a call may reduce the security’s price and may result in the Fund reinvesting at lower interest rates in securities with greater credit risk.
Reinvestment Risk: The Fund may have difficulty reinvesting payments from debtors and may receive lower rates than from its original investments.
Changing Distribution Level Risk: The Fund will normally receive income which may include interest, dividends and/or capital gains, depending upon its investments. The distribution amount paid by the Fund will vary and generally depends on the amount of income the Fund earns (less expenses) on its portfolio holdings, and capital gains or losses it recognizes. A decline in the Fund’s income or net capital gains arising from its investments may reduce its distribution level.
Foreign Investment Risk: Investments in foreign issuers involve additional risks (such as risks arising from less frequent trading, changes in political or social conditions, and less publicly available information about non-U.S. issuers) that differ from those associated with investments in U.S. issuers and may result in greater price volatility.
Emerging Markets Risk: Investments in emerging markets are subject to the general risks of foreign investments, as well as additional risks which can result in greater price volatility. Such additional risks include the risk that markets in emerging market countries are typically less developed and less liquid than markets in developed countries and such markets are subjected to increased economic, political, or regulatory uncertainties.
Inflation/Deflation Risk: Inflation risk is the risk that the value of assets or income from investments will be worth less in the future. Inflation rates may change frequently and drastically as a result of various factors and the Fund’s investments may not keep pace with inflation, which may result in losses to Fund investors or adversely affect the real value of shareholders’ investments in the Fund. As inflation rates increase, fixed income securities markets may experience heightened levels of interest rate volatility and liquidity risk. Deflation risk is the risk that the prices throughout the economy decline over time – the opposite of inflation. Deflation may have an adverse effect on the creditworthiness of issuers and may make issuer default more likely, which may result in a decline in the value of the Fund’s portfolio.
Policy Risk: The withdrawal of U.S. and other government support to stabilize and support financial markets, including an increase in interest rates in the U.S. or elsewhere, or investor perceptions that this support may be withdrawn, could cause an increase in volatility in certain financial markets or constrict the availability of credit and liquidity, which could adversely affect the value and liquidity of certain securities.
Currency Risk: Fluctuations in exchange rates may affect the total loss or gain on a non-U.S. dollar investment when converted back to U.S. dollars and exposure to non-U.S. currencies may subject the Fund to the risk that those currencies will decline in value relative to the U.S. dollar.
Environmental, Social and Governance (“ESG”) Investing Risk: Beutel Goodman incorporates ESG criteria into its investment process, which may result in the selection or exclusion of securities of certain issuers for reasons other than financial performance, and carries the risk that the Fund’s investment returns may
20
| | |
| | Notes to Financial Statements (continued) |
underperform funds that do not incorporate ESG factors into their investment process. The incorporation of ESG criteria into the investment process may affect the Fund’s investment exposure to certain companies, sectors, regions, countries or types of investments, which could negatively impact the Fund’s performance depending on whether such investments are in or out of favor. Applying ESG criteria to investment decisions is qualitative and subjective by nature, and there is no guarantee that the criteria utilized by Beutel Goodman or any judgment exercised by Beutel Goodman will improve the financial performance of the Fund or reflect the beliefs or values of any particular investor. ESG standards differ by region and industry, and a company’s ESG practices or Beutel Goodman’s assessment of a company’s ESG practices may change over time.
Derivatives Risk: The use of derivatives involves costs, the risk that the value of derivatives may not correlate perfectly with their underlying assets, rates or indices, liquidity risk, and the risk of mispricing or improper valuation. The use of derivatives may not succeed for various reasons, and the complexity and rapidly changing structure of derivatives markets may increase the possibility of market losses.
Hedging Risk: There is no guarantee that hedging strategies will be successful. For example, changes in the value of a hedging transaction may not completely offset changes in the value of the assets and liabilities being hedged. Hedging transactions involve costs and may result in losses.
Model and Data Risk: When a quantitative model (“Model”) or information or data (“Data”) used in managing the Fund contains an error, or is incorrect or incomplete, any investment decision made in reliance on the Model or Data may not produce the desired results and the Fund may realize losses. In addition, any hedging based on a faulty Model or Data may prove to be unsuccessful. Furthermore, the success of a Model that is predictive in nature is dependent largely on the accuracy and reliability of the supplied historical data. All Models are susceptible to input errors or errors in design, which may cause the resulting output to be faulty.
Restricted Securities Risk: Investing in restricted securities (including, without limitation, Rule 144A securities) may reduce the liquidity of the Fund’s investments in the event that an adequate trading market does not exist for these securities. Limitations on the resale of restricted securities could adversely affect the marketability of the securities, and the Fund may be unable to sell the security at the desired time or price, if at all. The purchase price and subsequent valuation of restricted securities normally reflect a discount, which may be significant, from the market price of comparable unrestricted securities for which a liquid trading market exists.
Liquidity Risk: The Fund may not be able to dispose of particular investments, such as illiquid securities, readily at favorable times or prices or the Fund may have to sell them at a loss.
High Portfolio Turnover Risk: Higher portfolio turnover may adversely affect Fund performance by increasing Fund transaction costs and may increase a shareholder’s tax liability.
12. RECENT ACCOUNTING STANDARDS UPDATE
In November 2023, the Financial Accounting Standards Board issued ASU No. 2023-07, Segment Reporting (Topic 280), which improves reportable segment disclosure requirements, primarily through enhanced disclosures about significant segment expenses. The amendments are effective for fiscal years beginning after December 15, 2023, and interim periods within fiscal years beginning after December 15, 2024. The Fund is currently evaluating the requirements and does not expect this guidance to materially impact the Fund’s financial statements.
13. SUBSEQUENT EVENTS
The Fund has determined that no material events or transactions occurred through the issuance date of the Fund’s financial statements which require an additional disclosure in or adjustment of the Fund’s financial statements.
21
| | |
| | Report of Independent Registered Public Accounting Firm |
To the Board of Trustees of AMG Funds IV and Shareholders of AMG Beutel Goodman Core Plus Bond Fund
Opinion on the Financial Statements
We have audited the accompanying statement of assets and liabilities, including the schedule of portfolio investments, of AMG Beutel Goodman Core Plus Bond Fund (one of the funds constituting AMG Funds IV, hereafter collectively referred to as the “Fund”) as of October 31, 2024, the related statement of operations for the year ended October 31, 2024, the statements of changes in net assets for each of the two years in the period ended October 31, 2024, including the related notes, and the financial highlights for each of the five years in the period ended October 31, 2024 (collectively referred to as the “financial statements”). In our opinion, the financial statements present fairly, in all material respects, the financial position of the Fund as of October 31, 2024, the results of its operations for the year then ended, the changes in its net assets for each of the two years in the period ended October 31, 2024 and the financial highlights for each of the five years in the period ended October 31, 2024 in conformity with accounting principles generally accepted in the United States of America.
Basis for Opinion
These financial statements are the responsibility of the Fund’s management. Our responsibility is to express an opinion on the Fund’s financial statements based on our audits. We are a public accounting firm registered with the Public Company Accounting Oversight Board (United States) (PCAOB) and are required to be independent with respect to the Fund in accordance with the U.S. federal securities laws and the applicable rules and regulations of the Securities and Exchange Commission and the PCAOB.
We conducted our audits of these financial statements in accordance with the standards of the PCAOB. Those standards require that we plan and perform the audit to obtain reasonable assurance about whether the financial statements are free of material misstatement, whether due to error or fraud.
Our audits included performing procedures to assess the risks of material misstatement of the financial statements, whether due to error or fraud, and performing procedures that respond to those risks. Such procedures included examining, on a test basis, evidence regarding the amounts and disclosures in the financial statements. Our audits also included evaluating the accounting principles used and significant estimates made by management, as well as evaluating the overall presentation of the financial statements. Our procedures included confirmation of securities owned as of October 31, 2024 by correspondence with the custodian, transfer agent and brokers; when replies were not received from the transfer agent and brokers, we performed other auditing procedures. We believe that our audits provide a reasonable basis for our opinion.
/s/PricewaterhouseCoopers LLP
Boston, Massachusetts
December 23, 2024
We have served as the auditor of one or more investment companies in the AMG Funds Family since 1993.
22
| | |
| | Other Information (unaudited) |
TAX INFORMATION
AMG Beutel Goodman Core Plus Bond Fund hereby designates the maximum amount allowable of its net taxable income as qualified dividends as provided in the Jobs and Growth Tax Relief Reconciliation Act of 2003. The 2023/2024 Form 1099-DIV you receive for the Fund will show the tax status of all distributions paid to you during the year.
Pursuant to section 852 of the Internal Revenue Code of 1986, as amended, AMG Beutel Goodman Core Plus Bond Fund hereby designates $0 as a capital gain distribution with respect to the taxable period ended October 31, 2024, or if subsequently determined to be different, the net capital gains of such fiscal year.
ITEM 8. CHANGES IN AND DISAGREEMENTS WITH ACCOUNTANTS FOR OPEN-END MANAGEMENT INVESTMENT COMPANIES
During the fiscal year ended October 31, 2024, there were no changes in and/or disagreements with accountants.
ITEM 9. PROXY DISCLOSURES FOR OPEN-END MANAGEMENT INVESTMENT COMPANIES
Not applicable.
ITEM 10. REMUNERATION PAID TO DIRECTORS, OFFICERS, AND OTHERS OF OPEN-END MANAGEMENT INVESTMENT COMPANIES
The remuneration paid to the Trustees during the fiscal year ended October 31, 2024, was $10,629, which is reflected as “Trustee fees and expenses” on the Statement of Operations. There was no remuneration paid to any Fund officer or to any affiliated person of any Fund Trustee or officer during the fiscal year ended October 31, 2024.
23
| | |
| | ITEM 11. STATEMENT REGARDING BASIS FOR APPROVAL OF INVESTMENT ADVISORY CONTRACT |
| | | | | | | | |
AMG Beutel Goodman Core Plus Bond Fund: Approval of Investment Advisory Agreement and Subadvisory Agreement on June 12, 2024 At an in-person meeting held on June 12, 2024, the Board of Trustees (the “Board” or the “Trustees”), and separately a majority of the Trustees who are not “interested persons” of AMG Funds IV (the “Trust”) (the “Independent Trustees”), approved (i) the Investment Advisory Agreement, as amended pursuant to letter agreements at any time prior to the date of the meeting, with AMG Funds LLC (the “Investment Manager”) for AMG Beutel Goodman Core Plus Bond Fund (the “Fund”) and separately Amendment No. 1 thereto dated October 1, 2016 (collectively, the “Investment Advisory Agreement”); and (ii) the Subadvisory Agreement with respect to the Fund, as amended at any time prior to the date of the meeting (the “Subadvisory Agreement”), with Beutel, Goodman & Company Ltd., the Fund’s subadviser (the “Subadviser”). The Independent Trustees were separately represented by independent legal counsel in connection with their consideration of the approval of these agreements. In considering the Investment Advisory Agreement and the Subadvisory Agreement, the Trustees reviewed a variety of materials relating to the Fund, the Investment Manager and the Subadviser, including the nature, extent and quality of services, comparative performance, fee and expense information for an appropriate peer group of similar mutual funds for the Fund (each, a “Peer Group”), performance information for the relevant benchmark index for the Fund (each, a “Fund Benchmark”), other relevant matters, including management fees, the profitability of the Investment Manager and the Subadviser, and the potential for economies of scale that may be shared with the Fund, and other information provided to them on a periodic basis throughout the year. Prior to voting, the Independent Trustees: (a) reviewed the foregoing information with their independent legal counsel; (b) received materials from their independent legal counsel discussing the legal standards applicable to their consideration of the Investment Advisory Agreement and the Subadvisory Agreement; and (c) met with their independent legal counsel in private sessions at which no representatives of management were present. NATURE, EXTENT AND QUALITY OF SERVICES In considering the nature, extent and quality of the services provided by the Investment Manager, the Trustees reviewed information provided by the Investment Manager at the June 12, 2024 meeting and prior meetings relating to the Investment | | | | Manager’s operations and personnel. Among other things, the Investment Manager provided financial information, information about its supervisory and professional staff and descriptions of its organizational and management structure. The Trustees also took into account information provided periodically throughout the previous year by the Investment Manager in Board meetings relating to the performance of its duties with respect to the Fund and the Trustees’ knowledge of the Investment Manager’s management and the quality of the performance of the Investment Manager’s duties under the Investment Advisory Agreement and Administration Agreement. In the course of their deliberations regarding the Investment Manager, the Trustees evaluated, among other things: (a) the extent and quality of the Investment Manager’s oversight of the operation and management of the Fund; (b) the quality of the Investment Manager’s oversight of the performance by the Subadviser of its portfolio management duties; (c) the Investment Manager’s ability to supervise the Fund’s other service providers; and (d) the Investment Manager’s compliance program. The Trustees also took into account that, in performing its functions under the Investment Advisory Agreement and supervising the Subadviser, the Investment Manager: performs periodic detailed analyses and reviews of the performance by the Subadviser of its obligations to the Fund, including without limitation, analysis and review of portfolio and other compliance matters and review of the Subadviser’s investment performance with respect to the Fund; prepares and presents periodic reports to the Board regarding the investment performance of the Subadviser and other information regarding the Subadviser, at such times and in such forms as the Board may reasonably request; reviews and considers any changes in the personnel of the Subadviser responsible for performing the Subadviser’s obligations and makes appropriate reports to the Board; reviews and considers any changes in the ownership or senior management of the Subadviser and makes appropriate reports to the Board; performs periodic in-person, telephonic or videoconference diligence meetings, including with respect to compliance matters, with representatives of the Subadviser; assists the Board and management of the Trust in developing and reviewing information with respect to the initial approval of the Subadvisory Agreement and annual consideration of the Subadvisory Agreement thereafter; prepares recommendations with respect to the continued retention of the Subadviser or the replacement of the Subadviser, including at the request of the Board; identifies potential successors to, or replacements of, the | | | | Subadviser or potential additional subadvisers, including performing appropriate due diligence, and developing and presenting to the Board a recommendation as to any such successor, replacement, or additional subadviser, including at the request of the Board; designates and compensates from its own resources such personnel as the Investment Manager may consider necessary or appropriate to the performance of its services; and performs such other review and reporting functions as the Board shall reasonably request consistent with the Investment Advisory Agreement and applicable law. The Trustees noted the affiliation of the Subadviser with the Investment Manager, noting any potential conflicts of interest. The Trustees also took into account the financial condition of the Investment Manager with respect to its ability to provide the services required under the Investment Advisory Agreement and the Investment Manager’s undertaking to maintain a contractual expense limitation for the Fund. The Trustees also considered the Investment Manager’s risk management processes. The Trustees also reviewed information relating to the Subadviser’s operations and personnel and the investment philosophy, strategies and techniques (its “Investment Strategy”) used in managing the Fund. Among other things, the Trustees reviewed information on portfolio management and other professional staff, information regarding the Subadviser’s organizational and management structure and the Subadviser’s brokerage policies and practices. The Trustees considered specific information provided regarding the experience of the individuals at the Subadviser with portfolio management responsibility for the Fund, including the information set forth in the Fund’s prospectus and statement of additional information. In the course of their deliberations, the Trustees evaluated, among other things: (a) the services rendered by the Subadviser in the past; (b) the qualifications and experience of the Subadviser’s personnel; and (c) the Subadviser’s compliance program. The Trustees also took into account the financial condition of the Subadviser with respect to its ability to provide the services required under the Subadvisory Agreement. The Trustees also considered the Subadviser’s risk management processes. PERFORMANCE The Board considered the Fund’s net performance during relevant time periods as compared to the Fund’s Peer Group and Fund Benchmark, considered the gross performance of the Fund as compared to the Subadviser’s relevant performance composite |
24
| | |
| | ITEM 11. STATEMENT REGARDING BASIS FOR APPROVAL OF INVESTMENT ADVISORY CONTRACT (continued) |
| | | | | | | | |
that utilizes a similar investment strategy and approach, and noted that the Board reviews on a quarterly basis detailed information about both the Fund’s performance results and portfolio composition, as well as the Subadviser’s Investment Strategy. The Board was mindful of the Investment Manager’s expertise, resources and attention to monitoring the Subadviser’s performance, investment style and risk-adjusted performance with respect to the Fund and its discussions with the management of the Fund’s subadviser during the period regarding the factors that contributed to the performance of the Fund. Among other information relating to the Fund’s performance, the Trustees noted that the Fund’s performance for Class I shares (which share class has one of the earliest inception dates and the largest amount of assets of all the share classes of the Fund) for the 1-year, 3-year, 5-year and 10-year periods ended March 31, 2024, was below the median performance of the Peer Group and below, below, below, and above, respectively, the performance of the Fund Benchmark, the Bloomberg U.S. Aggregate Bond Index. The Trustees took into account management’s discussion of the Fund’s performance, including the reasons for the Fund’s underperformance. The Trustees also took into account the fact that the Fund’s subadviser and investment strategy changed effective March 24, 2021, and that the performance information prior to that date reflected that of the Fund’s prior subadviser and investment strategy. The Trustees considered management’s discussion that the Fund’s performance has been within management’s expectations since the current Subadviser assumed subadvisory responsibilities. The Trustees concluded that the Fund’s overall performance has been satisfactory in light of the Fund’s investment objective, strategies, and policies. ADVISORY AND SUBADVISORY FEES; FUND EXPENSES; PROFITABILITY; AND ECONOMIES OF SCALE In considering the reasonableness of the advisory fee payable to the Investment Manager, the Trustees reviewed information provided by the Investment Manager at the June 12, 2024 meeting and prior meetings setting forth all revenues and other benefits, both direct and indirect (including any so-called “fallout benefits” such as reputational value derived from the Investment Manager serving as Investment Manager to the Fund), received by the Investment Manager and its affiliates attributable to managing the Fund and all the mutual funds in the AMG Funds Family of Funds; the cost of providing such services; the significant risks undertaken as | | | | Investment Manager and sponsor of the Fund, including investment, operational, enterprise, entrepreneurial, litigation, regulatory and compliance risks; and the resulting profitability to the Investment Manager and its affiliates from these relationships. The Trustees also considered the amount of the advisory fee retained by the Investment Manager after payment of the subadvisory fee with respect to the Fund. The Trustees also noted payments are made from the Subadviser to the Investment Manager, and other payments are made from the Investment Manager to the Subadviser. The Trustees also considered management’s discussion of the current asset level of the Fund, and the impact on profitability of both the current asset level and any future growth of assets of the Fund. In considering the cost of services to be provided by the Investment Manager under the Investment Advisory Agreement and the profitability to the Investment Manager of its relationship with the Fund, the Trustees noted the undertaking by the Investment Manager to maintain a contractual expense limitation for the Fund. The Board also took into account management’s discussion of the advisory fee structure and the services the Investment Manager provides in performing its functions under the Investment Advisory Agreement and supervising the Subadviser. Based on the foregoing, the Trustees concluded that the profitability to the Investment Manager is reasonable and that the Investment Manager is not realizing material benefits from economies of scale that would warrant adjustments to the advisory fee at this time. Also, with respect to economies of scale, the Trustees noted that as the Fund’s assets increase over time, the Fund may realize other economies of scale to the extent the increase in assets is proportionally greater than the increase in certain other expenses. In considering the reasonableness of the subadvisory fees payable by the Investment Manager to the Subadviser, the Trustees reviewed information regarding the cost to the Subadviser of providing subadvisory services to the Fund and the resulting profitability from the relationship. The Trustees noted that, because the Subadviser is an affiliate of the Investment Manager, a portion of the Subadviser’s revenues or profits might be shared directly or indirectly with the Investment Manager. The Trustees also noted that the subadvisory fees are paid by the Investment Manager out of its advisory fee. The Board also took into account management’s discussion of the subadvisory fee structure, and the services the Subadviser provides in performing its functions under the Subadvisory Agreement. Based on the foregoing, the Trustees concluded that the profitability to the Subadviser is reasonable and that | | | | the Subadviser is not realizing material benefits from economies of scale that would warrant adjustments to the subadvisory fees at this time. Also, with respect to economies of scale, the Trustees noted that as the Fund’s assets increase over time, the Fund may realize other economies of scale to the extent the increase in assets is proportionally greater than the increase in certain other expenses. The Trustees noted that the management fees (which include both the advisory and administration fees) and total expenses (net of applicable expense waivers/reimbursements) of Class I shares (the class of shares which is the primary focus of the Fund’s distribution) of the Fund as of March 31, 2024, were rated in the Below Average and the Average rating level, respectively, of the Fund’s Peer Group. The Trustees noted that the rating levels corresponded to the Fund’s quintile ranking in its Peer Group. The Trustees took into account the fact that the Investment Manager has contractually agreed, through March 1, 2025, to limit the Fund’s net annual operating expenses (subject to certain excluded expenses) to 0.43%. The Trustees concluded that, in light of the nature, extent and quality of the services provided by the Investment Manager and the Subadviser (which is an affiliate of the Investment Manager), the foregoing expense limitation and the considerations noted above with respect to the Investment Manager and the Subadviser, the Fund’s advisory and subadvisory fees are reasonable. * * * * * After consideration of the foregoing, the Trustees also reached the following conclusions (in addition to the conclusions discussed above) regarding the Investment Advisory Agreement and the Subadvisory Agreement: (a) the Investment Manager and the Subadviser have demonstrated that they possess the capability and resources to perform the duties required of them under the Investment Advisory Agreement and the Subadvisory Agreement and (b) the Investment Manager and Subadviser maintain appropriate compliance programs. Based on all of the above-mentioned factors and their related conclusions, with no single factor or conclusion being determinative and with each Trustee not necessarily attributing the same weight to each factor, the Trustees concluded that approval of the Investment Advisory Agreement and the Subadvisory Agreement would be in the best interests of the Fund and its shareholders. Accordingly, on June 12, 2024, the Trustees, and separately a majority of the Independent Trustees, voted to approve the Investment Advisory Agreement and the Subadvisory Agreement for the Fund. |
25
THIS PAGE INTENTIONALLY LEFT BLANK
THIS PAGE INTENTIONALLY LEFT BLANK
THIS PAGE INTENTIONALLY LEFT BLANK
| | |
| | |
| | | | | | | | |
INVESTMENT MANAGER AND ADMINISTRATOR AMG Funds LLC 680 Washington Blvd., Suite 500 Stamford, CT 06901 800.548.4539 DISTRIBUTOR AMG Distributors, Inc. 680 Washington Blvd., Suite 500 Stamford, CT 06901 800.548.4539 SUBADVISER Beutel, Goodman & Company Ltd. 20 Eglinton Ave. West, Suite 2000 Toronto, Ontario, M4R 1K8 Canada | | | | CUSTODIAN The Bank of New York Mellon Mutual Funds Custody 240 Greenwich Street New York, NY 10286 LEGAL COUNSEL Ropes & Gray LLP Prudential Tower, 800 Boylston Street Boston, MA 02199-3600 TRANSFER AGENT BNY Mellon Investment Servicing (US) Inc. AMG Funds Attn: 534426 AIM 154-0520 500 Ross Street Pittsburgh, PA 15262 800.548.4539 | | | | This report is prepared for the Fund’s shareholders. It is authorized for distribution to prospective investors only when preceded or accompanied by an effective prospectus. To receive a free copy of the prospectus or Statement of Additional Information, which includes additional information about Fund Trustees, please contact us by calling 800.548.4539. Distributed by AMG Distributors, Inc., member FINRA/SIPC. Current net asset values per share for the Fund are available on the Fund’s website at wealth.amg.com. A description of the policies and procedures the Fund uses to vote its proxies is available: (i) without charge, upon request, by calling 800.548.4539, or (ii) on the Securities and Exchange Commission’s (SEC) website at sec.gov. For information regarding the Fund’s proxy voting record for the 12-month period ended June 30, call 800.548.4539 or visit the SEC website at sec.gov. The Fund files its complete schedule of portfolio holdings with the SEC for the first and third quarters of each fiscal year as an exhibit to its reports on Form N-PORT. The Fund’s portfolio holdings on Form N-PORT are available on the SEC’s website at sec.gov and the Fund’s website at wealth.amg.com. To review a complete list of the Fund’s portfolio holdings, or to view the most recent semi-annual report or annual report, please visit wealth.amg.com. |
| | |
| | |
| | | | | | | | | | |
EQUITY FUNDS AMG Boston Common Global Impact Boston Common Asset Management, LLC AMG Frontier Small Cap Growth Frontier Capital Management Co., LLC AMG GW&K Small Cap Core AMG GW&K Small Cap Value AMG GW&K Small/Mid Cap Core AMG GW&K Small/Mid Cap Growth AMG GW&K International Small Cap GW&K Investment Management, LLC AMG Montrusco Bolton Large Cap Growth Montrusco Bolton Investments, Inc. AMG Renaissance Large Cap Growth The Renaissance Group LLC | | | | AMG River Road Dividend All Cap Value AMG River Road Focused Absolute Value AMG River Road Large Cap Value Select AMG River Road Mid Cap Value AMG River Road Small-Mid Cap Value AMG River Road Small Cap Value River Road Asset Management, LLC AMG TimesSquare International Small Cap AMG TimesSquare Mid Cap Growth AMG TimesSquare Small Cap Growth TimesSquare Capital Management, LLC AMG Veritas Asia Pacific AMG Veritas China AMG Veritas Global Focus AMG Veritas Global Real Return Veritas Asset Management LLP AMG Yacktman AMG Yacktman Focused AMG Yacktman Global AMG Yacktman Special Opportunities Yacktman Asset Management LP | | | | FIXED INCOME FUNDS AMG Beutel Goodman Core Plus Bond Beutel, Goodman & Company Ltd. AMG GW&K Core Bond ESG AMG GW&K ESG Bond AMG GW&K Municipal Bond AMG GW&K Municipal Enhanced Yield GW&K Investment Management, LLC ALTERNATIVE FUNDS AMG Systematica Managed Futures Strategy Systematica Investments Limited, acting as general partner of Systematica Investments LP | | |
| | | | | | |
| | | | | | | |
| | | |
| wealth.amg.com | | 103124 | | | AR086 | |
| | |
| | ANNUAL FINANCIAL STATEMENTS |
| | | | | | |
| | | AMG Funds |
| | | | |
| | | October 31, 2024 | | | | |
| | |
| | |  |
| | |
| | | AMG Montrusco Bolton Large Cap Growth Fund |
| | | | |
| | | Class N: MCGFX | | Class I: MCGIX | | |
| | | | |
| | | | | | | |
| | | | | | |
| | | | | | | |
| | | |
| wealth.amg.com | | 103124 | | | AR087 | |
| | |
| | AMG Funds Annual Financial Statements — October 31, 2024 |
Nothing contained herein is to be considered an offer, sale or solicitation of an offer to buy shares of any series of the AMG Funds Family of Funds. Such offering is made only by prospectus, which includes details as to offering price and other material information.
| | |
| | AMG Montrusco Bolton Large Cap Growth Fund Schedule of Portfolio Investments October 31, 2024 |
| | | | | | | | |
| | | Shares | | | Value | |
| | |
Common Stocks - 98.3% | | | | | | | | |
| |
Communication Services - 12.7% | | | | | |
| | |
Alphabet, Inc., Class A | | | 101,180 | | | | $17,312,910 | |
| | |
Meta Platforms, Inc., Class A | | | 16,270 | | | | 9,234,526 | |
| | |
Total Communication Services | | | | | | | 26,547,436 | |
| |
Consumer Discretionary - 13.7% | | | | | |
| | |
Amazon.com, Inc.* | | | 53,508 | | | | 9,973,891 | |
| | |
Booking Holdings, Inc. | | | 1,053 | | | | 4,924,091 | |
| | |
Chipotle Mexican Grill, Inc.* | | | 72,664 | | | | 4,052,471 | |
| | |
Garmin, Ltd. (Switzerland) | | | 29,822 | | | | 5,915,194 | |
| | |
Lululemon Athletica, Inc. (Canada)* | | | 12,193 | | | | 3,632,295 | |
| | |
Total Consumer Discretionary | | | | | | | 28,497,942 | |
| |
Consumer Staples - 2.6% | | | | | |
| | |
Monster Beverage Corp.* | | | 103,520 | | | | 5,453,434 | |
| |
Energy - 1.3% | | | | | |
| | |
Valero Energy Corp. | | | 20,235 | | | | 2,625,694 | |
| |
Financials - 4.1% | | | | | |
| | |
Blackrock, Inc. | | | 953 | | | | 934,921 | |
| | |
Mastercard, Inc., Class A | | | 15,230 | | | | 7,608,756 | |
| | |
Total Financials | | | | | | | 8,543,677 | |
| |
Health Care - 6.7% | | | | | |
| | |
Amgen, Inc. | | | 17,372 | | | | 5,561,819 | |
| | |
Danaher Corp. | | | 24,124 | | | | 5,926,302 | |
| | |
Mettler-Toledo International, Inc.* | | | 1,976 | | | | 2,552,498 | |
| | |
Total Health Care | | | | | | | 14,040,619 | |
| |
Industrials - 6.3% | | | | | |
| | |
Rollins, Inc. | | | 161,135 | | | | 7,595,904 | |
| | |
Waste Connections, Inc. (Canada) | | | 31,079 | | | | 5,493,213 | |
| | |
Total Industrials | | | | | | | 13,089,117 | |
| | |
| | | | | | | | |
| * | Non-income producing security. |
| 1 | Yield shown represents the October 31, 2024, seven day average yield, which refers to the sum of the previous seven days’ dividends paid, expressed as an annual percentage. |
| | | | | | | | |
| | | Shares | | | Value | |
| |
Information Technology - 48.7% | | | | | |
| | |
Adobe, Inc.* | | | 38,748 | | | | $18,524,644 | |
| | |
Apple, Inc. | | | 88,420 | | | | 19,974,962 | |
| | |
Enphase Energy, Inc.* | | | 63,430 | | | | 5,267,227 | |
| | |
Microsoft Corp. | | | 47,101 | | | | 19,139,491 | |
| | |
NVIDIA Corp. | | | 145,490 | | | | 19,315,252 | |
| | |
Texas Instruments, Inc. | | | 49,085 | | | | 9,972,109 | |
| | |
Workday, Inc., Class A* | | | 39,297 | | | | 9,189,604 | |
| | |
Total Information Technology | | | | | | | 101,383,289 | |
| |
Materials - 1.2% | | | | | |
| | |
The Sherwin-Williams Co. | | | 7,033 | | | | 2,523,230 | |
| |
Real Estate - 1.0% | | | | | |
| | |
Public Storage, REIT | | | 6,713 | | | | 2,208,980 | |
| |
Total Common Stocks
(Cost $150,406,546) | | | | 204,913,418 | |
| |
Short-Term Investments - 1.0% | | | | | |
| |
Other Investment Companies - 1.0% | | | | | |
| | |
Dreyfus Government Cash Management Fund, | | | | | | | | |
| | |
Institutional Shares, 4.76%1 | | | 815,868 | | | | 815,868 | |
| | |
Dreyfus Institutional Preferred Government | | | | | | | | |
| | |
Money Market Fund, Institutional Shares, 4.82%1 | | | 1,223,801 | | | | 1,223,801 | |
| |
Total Short-Term Investments
(Cost $2,039,669) | | | | 2,039,669 | |
| |
Total Investments - 99.3%
(Cost $152,446,215) | | | | 206,953,087 | |
| |
Other Assets, less Liabilities - 0.7% | | | | 1,372,483 | |
| | |
Net Assets - 100.0% | | | | | | | $208,325,570 | |
| | |
| | | | | | | | |
| | REIT | Real Estate Investment Trust |
The accompanying notes are an integral part of these financial statements.
2
| | |
| | AMG Montrusco Bolton Large Cap Growth Fund Schedule of Portfolio Investments (continued) |
The following table summarizes the inputs used to value the Fund’s investments by the fair value hierarchy levels as of October 31, 2024:
| | | | | | | | | | | | | | | | | | | | | | | | | | | | |
| | | Level 1 | | | | | | Level 2 | | | | | | Level 3 | | | | | | Total | |
| | | | | | | |
Investments in Securities | | | | | | | | | | | | | | | | | | | | | | | | | | | | |
| | | | | | | |
Common Stocks† | | $ | 204,913,418 | | | | | | | | — | | | | | | | | — | | | | | | | $ | 204,913,418 | |
| | | | | | | |
Short-Term Investments | | | | | | | | | | | | | | | | | | | | | | | | | | | | |
| | | | | | | |
Other Investment Companies | | | 2,039,669 | | | | | | | | — | | | | | | | | — | | | | | | | | 2,039,669 | |
| | | | | | | | | | | | | | | | | | | | | | | | | | | | |
| | | | | | | |
Total Investments in Securities | | $ | 206,953,087 | | | | | | | | — | | | | | | | | — | | | | | | | $ | 206,953,087 | |
| | | | | | | | | | | | | | | | | | | | | | | | | | | | |
| | † | All common stocks held in the Fund are Level 1 securities. For a detailed breakout of common stocks by major industry classification, please refer to the Fund’s Schedule of Portfolio Investments. |
For the fiscal year ended October 31, 2024, there were no transfers in or out of Level 3.
The accompanying notes are an integral part of these financial statements.
3
| | |
| | Statement of Assets and Liabilities October 31, 2024 |
| | | | |
| | | AMG
Montrusco Bolton
Large Cap
Growth Fund |
| |
Assets: | | | | |
| |
Investments at value1 | | | $206,953,087 | |
| |
Receivable for investments sold | | | 5,744,809 | |
| |
Dividend and interest receivables | | | 109,978 | |
| |
Receivable for Fund shares sold | | | 10,027 | |
| |
Receivable from affiliate | | | 9,890 | |
| |
Prepaid expenses and other assets | | | 16,158 | |
| |
Total assets | | | 212,843,949 | |
| |
Liabilities: | | | | |
| |
Payable for investments purchased | | | 4,091,696 | |
| |
Payable for Fund shares repurchased | | | 186,840 | |
| |
Accrued expenses: | | | | |
| |
Investment advisory and management fees | | | 86,294 | |
| |
Administrative fees | | | 26,967 | |
| |
Distribution fees | | | 13,473 | |
| |
Shareholder service fees | | | 11,797 | |
| |
Other | | | 101,312 | |
| |
Total liabilities | | | 4,518,379 | |
|
Commitments and Contingencies (Notes 2 & 6) | |
| |
Net Assets | | | $208,325,570 | |
| |
1 Investments at cost | | | $152,446,215 | |
The accompanying notes are an integral part of these financial statements.
4
| | |
| | Statement of Assets and Liabilities (continued) |
| | | | |
| | | AMG
Montrusco Bolton
Large Cap
Growth Fund |
| |
Net Assets Represent: | | | | |
| |
Paid-in capital | | | $136,605,573 | |
| |
Total distributable earnings | | | 71,719,997 | |
| |
Net Assets | | | $208,325,570 | |
| |
Class N: | | | | |
| |
Net Assets | | | $130,107,973 | |
| |
Shares outstanding | | | 9,879,571 | |
| |
Net asset value, offering and redemption price per share | | | $13.17 | |
| |
Class I: | | | | |
| |
Net Assets | | | $78,217,597 | |
| |
Shares outstanding | | | 5,778,108 | |
| |
Net asset value, offering and redemption price per share | | | $13.54 | |
The accompanying notes are an integral part of these financial statements.
5
| | |
| | Statement of Operations For the fiscal year ended October 31, 2024 |
| | | | |
| | | AMG
Montrusco Bolton
Large Cap
Growth Fund |
| |
Investment Income: | | | | |
| |
Dividend income | | | $1,838,791 | |
| |
Securities lending income | | | 652 | |
| |
Foreign withholding tax | | | (10,313 | ) |
| |
Total investment income | | | 1,829,130 | |
| |
Expenses: | | | | |
| |
Investment advisory and management fees | | | 1,026,472 | |
| |
Administrative fees | | | 320,773 | |
| |
Distribution fees - Class N | | | 202,250 | |
| |
Shareholder servicing fees - Class N | | | 99,168 | |
| |
Shareholder servicing fees - Class I | | | 40,892 | |
| |
Professional fees | | | 57,294 | |
| |
Reports to shareholders | | | 42,617 | |
| |
Registration fees | | | 37,866 | |
| |
Custodian fees | | | 31,621 | |
| |
Transfer agent fees | | | 31,192 | |
| |
Trustee fees and expenses | | | 18,140 | |
| |
Miscellaneous | | | 15,540 | |
| |
Total expenses before offsets | | | 1,923,825 | |
| |
Expense reimbursements | | | (127,346 | ) |
| |
Net expenses | | | 1,796,479 | |
| | | | |
| |
Net investment income | | | 32,651 | |
| |
Net Realized and Unrealized Gain: | | | | |
| |
Net realized gain on investments | | | 22,609,128 | |
| |
Net change in unrealized appreciation/depreciation on investments | | | 30,720,901 | |
| |
Net realized and unrealized gain | | | 53,330,029 | |
| | | | |
| |
Net increase in net assets resulting from operations | | | $53,362,680 | |
The accompanying notes are an integral part of these financial statements.
6
| | |
| | Statements of Changes in Net Assets For the fiscal years ended October 31, |
| | | | | | | | |
| | | AMG
Montrusco Bolton
Large Cap Growth Fund |
| | |
| | | 2024 | | 2023 |
| | |
Increase in Net Assets Resulting From Operations: | | | | | | | | |
| | |
Net investment income | | | $32,651 | | | | $525,289 | |
| | |
Net realized gain on investments | | | 22,609,128 | | | | 5,679,761 | |
| | |
Net change in unrealized appreciation/depreciation on investments | | | 30,720,901 | | | | 27,244,653 | |
| | |
Net increase in net assets resulting from operations | | | 53,362,680 | | | | 33,449,703 | |
| | |
Distributions to Shareholders: | | | | | | | | |
| | |
Class N | | | (4,618,783 | ) | | | (11,004,682 | ) |
| | |
Class I | | | (3,027,190 | ) | | | (8,647,836 | ) |
| | |
Total distributions to shareholders | | | (7,645,973 | ) | | | (19,652,518 | ) |
| | |
Capital Share Transactions:1 | | | | | | | | |
| | |
Net decrease from capital share transactions | | | (26,808,107 | ) | | | (27,065,036 | ) |
| | | | | | | | |
| | |
Total increase (decrease) in net assets | | | 18,908,600 | | | | (13,267,851 | ) |
| | |
Net Assets: | | | | | | | | |
| | |
Beginning of year | | | 189,416,970 | | | | 202,684,821 | |
| | |
End of year | | | $208,325,570 | | | | $189,416,970 | |
| 1 | See Note 1(g) of the Notes to Financial Statements. |
The accompanying notes are an integral part of these financial statements.
7
| | |
| | AMG Montrusco Bolton Large Cap Growth Fund Financial Highlights For a share outstanding throughout each fiscal year |
| | | | | | | | | | | | | | | | | | | | | | |
| | |
| | | | | For the fiscal years ended October 31, | |
| | | | | | |
| Class N | | | | 2024 | | | 2023 | | | 2022 | | | 2021 | | | 2020 | |
| | | | | | |
Net Asset Value, Beginning of Year | | | | | $10.58 | | | | $10.00 | | | | $17.05 | | | | $21.50 | | | | $19.34 | |
| | | | | | |
Income (loss) from Investment Operations: | | | | | | | | | | | | | | | | | | | | | | |
| | | | | | |
Net investment income (loss)1,2 | | | | | (0.01 | ) | | | 0.02 | | | | (0.00 | )3 | | | (0.07 | ) | | | (0.06 | ) |
| | | | | | |
Net realized and unrealized gain (loss) on investments | | | | | 3.03 | | | | 1.55 | | | | (3.26 | ) | | | 6.17 | | | | 3.92 | |
| | | | | | |
Total income (loss) from investment operations | | | | | 3.02 | | | | 1.57 | | | | (3.26 | ) | | | 6.10 | | | | 3.86 | |
| | | | | | |
Less Distributions to Shareholders from: | | | | | | | | | | | | | | | | | | | | | | |
| | | | | | |
Net investment income | | | | | (0.02 | ) | | | (0.00 | )3 | | | — | | | | — | | | | — | |
| | | | | | |
Net realized gain on investments | | | | | (0.41 | ) | | | (0.99 | ) | | | (3.79 | ) | | | (10.55 | ) | | | (1.70 | ) |
| | | | | | |
Total distributions to shareholders | | | | | (0.43 | ) | | | (0.99 | ) | | | (3.79 | ) | | | (10.55 | ) | | | (1.70 | ) |
| | | | | | |
Net Asset Value, End of Year | | | | | $13.17 | | | | $10.58 | | | | $10.00 | | | | $17.05 | | | | $21.50 | |
| | | | | | |
Total Return2,4 | | | | | 29.13 | % | | | 17.14 | % | | | (25.18 | )% | | | 39.50 | % | | | 21.36 | % |
| | | | | | |
Ratio of net expenses to average net assets | | | | | 0.91 | % | | | 0.92 | %5 | | | 0.91 | % | | | 1.07 | %6 | | | 1.16 | %6 |
| | | | | | |
Ratio of gross expenses to average net assets7 | | | | | 0.97 | % | | | 0.98 | % | | | 0.94 | % | | | 1.09 | % | | | 1.16 | % |
| | | | | | |
Ratio of net investment income (loss) to average net assets2 | | | | | (0.05 | )% | | | 0.18 | % | | | (0.02 | )% | | | (0.39 | )% | | | (0.30 | )% |
| | | | | | |
Portfolio turnover | | | | | 83 | % | | | 77 | % | | | 68 | % | | | 109 | % | | | 30 | % |
| | | | | | |
Net assets end of year (000’s) omitted | | | | | $130,108 | | | | $115,248 | | | | $113,790 | | | | $175,468 | | | | $166,051 | |
| | | | | | | | | | | | | | | | | | | | | | | |
The accompanying notes are an integral part of these financial statements.
8
| | |
| | AMG Montrusco Bolton Large Cap Growth Fund Financial Highlights For a share outstanding throughout each fiscal year |
| | | | | | | | | | | | | | | | | | | | | | | | |
| | |
| | | | | | For the fiscal years ended October 31, | |
| | | | | | |
| Class I | | | | | 2024 | | | 2023 | | | 2022 | | | 2021 | | | 2020 | |
| | | | | | |
Net Asset Value, Beginning of Year | | | | | | | $10.86 | | | | $10.25 | | | | $17.36 | | | | $21.69 | | | | $19.46 | |
| | | | | | |
Income (loss) from Investment Operations: | | | | | | | | | | | | | | | | | | | | | | | | |
| | | | | | |
Net investment income (loss)1,2 | | | | | | | 0.02 | | | | 0.04 | | | | 0.02 | | | | (0.04 | ) | | | (0.03 | ) |
| | | | | | |
Net realized and unrealized gain (loss) on investments | | | | | | | 3.11 | | | | 1.59 | | | | (3.34 | ) | | | 6.26 | | | | 3.96 | |
| | | | | | |
Total income (loss) from investment operations | | | | | | | 3.13 | | | | 1.63 | | | | (3.32 | ) | | | 6.22 | | | | 3.93 | |
| | | | | | |
Less Distributions to Shareholders from: | | | | | | | | | | | | | | | | | | | | | | | | |
| | | | | | |
Net investment income | | | | | | | (0.04 | ) | | | (0.03 | ) | | | — | | | | — | | | | — | |
| | | | | | |
Net realized gain on investments | | | | | | | (0.41 | ) | | | (0.99 | ) | | | (3.79 | ) | | | (10.55 | ) | | | (1.70 | ) |
| | | | | | |
Total distributions to shareholders | | | | | | | (0.45 | ) | | | (1.02 | ) | | | (3.79 | ) | | | (10.55 | ) | | | (1.70 | ) |
| | | | | | |
Net Asset Value, End of Year | | | | | | | $13.54 | | | | $10.86 | | | | $10.25 | | | | $17.36 | | | | $21.69 | |
| | | | | | |
Total Return2,4 | | | | | | | 29.43 | % | | | 17.27 | % | | | (25.05 | )% | | | 39.78 | % | | | 21.60 | % |
| | | | | | |
Ratio of net expenses to average net assets | | | | | | | 0.73 | % | | | 0.74 | %5 | | | 0.73 | % | | | 0.92 | %6 | | | 0.99 | %6 |
| | | | | | |
Ratio of gross expenses to average net assets7 | | | | | | | 0.79 | % | | | 0.80 | % | | | 0.76 | % | | | 0.94 | % | | | 0.99 | % |
| | | | | | |
Ratio of net investment income (loss) to average net assets2 | | | | | | | 0.13 | % | | | 0.36 | % | | | 0.16 | % | | | (0.24 | )% | | | (0.13 | )% |
| | | | | | |
Portfolio turnover | | | | | | | 83 | % | | | 77 | % | | | 68 | % | | | 109 | % | | | 30 | % |
| | | | | | |
Net assets end of year (000’s) omitted | | | | | | | $78,218 | | | | $74,169 | | | | $88,895 | | | | $167,415 | | | | $309,638 | |
| | | | | | | | | | | | | | | | | | | | | | | | | |
| 1 | Per share numbers have been calculated using average shares. |
| 2 | Total returns and net investment income (loss) would have been lower had certain expenses not been offset. |
| 3 | Less than $(0.005) per share. |
| 4 | The total return is calculated using the published Net Asset Value as of fiscal year end. |
| 5 | Includes interest expense of less than 0.01% related to participation in the interfund lending program. |
| 6 | Includes reduction from broker recapture amounting to less than 0.01% for the fiscal years ended 2021 and 2020. |
| 7 | Excludes the impact of expense reimbursement or fee waivers and expense reductions such as brokerage credits, but includes expense repayments and non-reimbursable expenses, if any, such as interest, taxes, and extraordinary expenses. (See Note 1(c) and 2 in the Notes to Financial Statements.) |
The accompanying notes are an integral part of these financial statements.
9
| | |
| | Notes to Financial Statements October 31, 2024 |
1. ORGANIZATION AND SUMMARY OF SIGNIFICANT ACCOUNTING POLICIES
AMG Funds IV (the “Trust”) is an open-end management investment company, organized as a Delaware Statutory Trust, and registered under the Investment Company Act of 1940, as amended (the “1940 Act”). Currently, the Trust consists of a number of different funds, each having distinct investment management objectives, strategies, risks, and policies. Included in this report is AMG Montrusco Bolton Large Cap Growth Fund (the “Fund”).
The Fund offers Class N and Class I shares. Each class represents an interest in the same assets of the Fund. Although all share classes generally have identical voting rights, each share class votes separately when required by law. Different share classes may have different net asset values per share to the extent the share classes pay different distribution amounts and/or the expenses of such share classes differ. Each share class has its own expense structure. Please refer to a current prospectus for additional information on each share class.
The Fund is non-diversified.
The Fund’s financial statements are prepared in accordance with accounting principles generally accepted in the United States of America (“U.S. GAAP”), including accounting and reporting guidance pursuant to Accounting Standards Codification Topic 946 applicable to investment companies. U.S. GAAP requires management to make estimates and assumptions that affect the reported amounts of assets and liabilities and disclosure of contingent assets and liabilities at the date of the financial statements and the reported amounts of income and expenses during the reporting period. Actual results could differ from those estimates and such differences could be material. The following is a summary of significant accounting policies followed by the Fund in the preparation of its financial statements:
a. VALUATION OF INVESTMENTS
Equity securities traded on a national securities exchange or reported on the NASDAQ national market system (“NMS”) are valued at the last quoted sales price on the primary exchange or, if applicable, the NASDAQ official closing price or the official closing price of the relevant exchange or, lacking any sales, at the last quoted bid price. Equity securities held by the Fund that are traded in the over-the-counter market (other than NMS securities) are valued at the bid price. Foreign equity securities (securities principally traded in markets other than U.S. markets) held by the Fund are valued at the official closing price on the primary exchange or, for markets that either do not offer an official closing price or where the official closing price may not be representative of the overall market, the last quoted sale price.
Fixed income securities purchased with a remaining maturity of 60 days or less are valued at amortized cost, provided that the amortized cost value is approximately the same as the fair value of the security valued without the use of amortized cost. Investments in other open-end registered investment companies are valued at their end of day net asset value per share.
The Fund’s portfolio investments are generally valued based on independent market quotations or prices or, if none, “evaluative” or other market based valuations provided by third party pricing services. Pursuant to Rule 2a-5 under the 1940 Act, the Fund’s Board of Trustees (the “Board”) designated AMG Funds LLC (the “Investment Manager”) as the Fund’s Valuation Designee to perform the Fund’s fair value determinations. Such determinations are subject to Board oversight and certain reporting and other requirements intended to ensure that
the Board receives the information it needs to oversee the Investment Manager’s fair value determinations.
Under certain circumstances, the value of certain Fund portfolio investments may be based on an evaluation of fair value, pursuant to procedures established by the Investment Manager and under the general supervision of the Board. The Fund may use the fair value of a portfolio investment to calculate its net asset value (“NAV”) in the event that the market quotation, price or market based valuation for the portfolio investment is not readily available or otherwise not determinable pursuant to the Fund’s valuation procedures, if the Investment Manager believes the quotation, price or market based valuation to be unreliable, or in certain other circumstances. When determining the fair value of an investment, the Investment Manager seeks to determine the price that the Fund might reasonably expect to receive from current sale of that portfolio investment in an arms-length transaction. Fair value determinations shall be based upon consideration of all available facts and information, including, but not limited to (i) attributes specific to the investment; (ii) fundamental and analytical data relating to the investment; and (iii) the value of other comparable securities or relevant financial instruments, including derivative securities, traded on other markets or among dealers.
The values assigned to fair value portfolio investments are based on available information and do not necessarily represent amounts that might ultimately be realized in the future, since such amounts depend on future developments inherent in long-term investments. Because of the inherent uncertainty of valuation, those estimated values may differ significantly from the values that would have been used had a ready market for the investments existed, and the differences could be material. The Board will be presented with quarterly reports, as of the most recent quarter end, summarizing all fair value activity, material fair value matters that occurred during the quarter, and all outstanding securities fair valued by the Fund. Additionally, the Board will be presented with an annual report that assesses the adequacy and effectiveness of the Investment Manager’s process for determining the fair value of the Fund’s investments.
With respect to foreign equity securities and certain foreign fixed income securities, securities held in the Fund that can be fair valued by the applicable fair value pricing service are fair valued on each business day provided that each individual price exceeds a pre-established confidence level.
U.S. GAAP defines fair value as the price that a fund would receive to sell an asset or pay to transfer a liability in an orderly transaction between market participants at the measurement date. U.S. GAAP also establishes a framework for measuring fair value, and a three level hierarchy for fair value measurements based upon the transparency of inputs to the valuation of an asset or liability. Inputs may be observable or unobservable and refer broadly to the assumptions that market participants would use in pricing the asset or liability. Observable inputs reflect the assumptions market participants would use in pricing the asset or liability based on market data obtained from sources independent of the Fund. Unobservable inputs reflect the Fund’s own assumptions about the assumptions that market participants would use in pricing the asset or liability developed based on the best information available in the circumstances. Each investment is assigned a level based upon the observability of the inputs which are significant to the overall valuation.
The three-tier hierarchy of inputs is summarized below:
Level 1 – inputs are quoted prices in active markets for identical investments (e.g., equity securities, open-end investment companies)
10
| | |
| | Notes to Financial Statements (continued) |
Level 2 – other observable inputs (including, but not limited to: quoted prices for similar assets or liabilities in markets that are active, quoted prices for identical or similar assets or liabilities in markets that are not active, inputs other than quoted prices that are observable for the assets or liabilities (such as interest rates, yield curves, volatilities, prepayment speeds, loss severities, credit risks and default rates) or other market corroborated inputs) (e.g., debt securities, government securities, foreign securities utilizing international fair value pricing, fair valued securities with observable inputs)
Level 3 – inputs are significant unobservable inputs (including the Fund’s own assumptions used to determine the fair value of investments) (e.g., fair valued securities with unobservable inputs)
Changes in inputs or methodologies used for valuing investments may result in a transfer in or out of levels within the fair value hierarchy. The inputs or methodologies used for valuing investments may not necessarily be an indication of the risk associated with investing in those investments.
b. SECURITY TRANSACTIONS
Security transactions are accounted for as of trade date. Realized gains and losses on securities sold are determined on the basis of identified cost.
c. INVESTMENT INCOME AND EXPENSES
Dividend income is recorded on the ex-dividend date. Interest income, which includes amortization of premium and accretion of discount on debt securities, is accrued as earned. Dividend and interest income on foreign securities is recorded gross of any withholding tax. Non-cash dividends included in dividend income, if any, are reported at the fair market value of the securities received. Upon notification from the issuer, distributions received from a real estate investment trust (REIT) may be redesignated as a reduction of cost of investments and/or realized gain. Other income and expenses are recorded on an accrual basis. Expenses that cannot be directly attributed to the Fund are apportioned among the funds in the Trust and other trusts or funds within the AMG Funds Family of Funds (collectively, the “AMG Funds Family”) based upon their relative average net assets or number of shareholders. Investment income, realized and unrealized capital gains and losses, the common expenses of the Fund, and certain fund level expense reductions, if any, are allocated on a pro-rata basis to each class based on the relative net assets of each class to the total net assets of the Fund.
d. DIVIDENDS AND DISTRIBUTIONS
Fund distributions resulting from either net investment income or realized net capital gains, if any, will normally be declared and paid at least annually in December. Distributions to shareholders are recorded on the ex-dividend date. Distributions are determined in accordance with federal income tax law, which may differ from net investment income and net realized capital gains for financial statement purposes (U.S. GAAP). Differences may be permanent or temporary. Permanent differences are reclassified among capital accounts in the financial statements to reflect their tax character. Permanent book and tax basis differences, if any, relating to shareholder distributions will result in reclassifications to paid-in capital. Temporary differences arise when certain items of income, expense and gain or loss are recognized in different periods for financial statement and tax purposes; these differences will reverse at some time in the future. Permanent differences are primarily due to tax equalization utilized. Temporary differences are due to wash sale loss deferrals.
The tax character of distributions paid during the fiscal years ended October 31, 2024 and October 31, 2023 was as follows:
| | | | | | | | |
| | |
| Distributions paid from: | | 2024 | | | 2023 | |
| | | | | | | | |
| | |
Ordinary income * | | | $2,689,042 | | | | $111,073 | |
| | |
Long-term capital gains | | | 4,956,931 | | | | 19,541,445 | |
| | | | | | | | |
| | |
| | | $7,645,973 | | | | $19,652,518 | |
| | | | | | | | |
| * | For tax purposes, short-term capital gain distributions, if any, are considered ordinary income distributions. |
As of October 31, 2024, the components of distributable earnings (excluding unrealized appreciation/depreciation) on a tax basis consisted of:
| | | | | | | | |
Undistributed ordinary income | | | | | | | $4,146,163 | |
| | |
Undistributed long-term capital gains | | | | | | | 15,252,244 | |
At October 31, 2024, the cost of investments and the aggregate gross unrealized appreciation and depreciation for federal income tax purposes were as follows:
| | | | | | | | | | | | |
| Cost | | Appreciation | | | Depreciation | | | Net Appreciation | |
| | | |
| $154,631,497 | | | $59,070,045 | | | | $(6,748,455) | | | | $52,321,590 | |
e. FEDERAL TAXES
The Fund currently qualifies as an investment company and intends to comply with the requirements under Subchapter M of the Internal Revenue Code of 1986, as amended (the “Code”), and to distribute substantially all of its taxable income and gains to its shareholders and to meet certain diversification and income requirements with respect to investment companies. The Investment Manager has analyzed the Fund’s tax positions taken on federal income tax returns as of October 31, 2024, and for all open tax years (generally, the three prior taxable years), and has concluded that no provision for federal income tax is required in the Fund’s financial statements. Additionally, the Investment Manager is not aware of any tax position for which it is reasonably possible that the total amounts of unrecognized tax benefit/detriment will change materially in the next twelve months.
Furthermore, based on the Fund’s understanding of the tax rules and rates related to income, gains and transactions for the foreign jurisdictions in which it invests, the Fund will provide for foreign taxes, and where appropriate, deferred foreign taxes.
f. CAPITAL LOSS CARRYOVERS AND DEFERRALS
As of October 31, 2024, the Fund had no capital loss carryovers for federal income tax purposes. Should the Fund incur net capital losses for the fiscal year ended October 31, 2025, such amounts may be used to offset future realized capital gains indefinitely, and retain their character as short-term and/or long-term.
For the fiscal year ended October 31, 2024, the Fund did not utilize capital loss carryovers.
11
| | |
| | Notes to Financial Statements (continued) |
g. CAPITAL STOCK
The Trust’s Trust Instrument authorizes for the Fund the issuance of an unlimited number of shares of beneficial interest, without par value. The Fund records sales and repurchases of its capital stock on the trade date.
For the fiscal years ended October 31, 2024 and October 31, 2023, the capital stock transactions by class for the Fund were as follows:
| | | | | | | | | | | | | | | | |
| | | October 31, 2024 | | | October 31, 2023 | |
| | | | |
| | | Shares | | | | Amount | | | | Shares | | | | Amount | |
| | | | |
Class N: | | | | | | | | | | | | | | | | |
| | | | |
Shares sold | | | 152,794 | | | $ | 1,936,009 | | | | 200,256 | | | $ | 2,064,170 | |
| | | | |
Shares issued in reinvestment of distributions | | | 394,193 | | | | 4,541,102 | | | | 1,163,123 | | | | 10,828,671 | |
| | | | |
Shares redeemed | | | (1,564,082 | ) | | | (19,540,710 | ) | | | (1,846,942 | ) | | | (19,001,168 | ) |
| | | | | | | | | | | | | | | | |
| | | | |
Net decrease | | | (1,017,095 | ) | | $ | (13,063,599) | | | | (483,563 | ) | | $ | (6,108,327) | |
| | | | | | | | | | | | | | | | |
| | | | |
Class I: | | | | | | | | | | | | | | | | |
| | | | |
Shares sold | | | 133,056 | | | $ | 1,727,460 | | | | 515,793 | | | $ | 5,156,022 | |
| | | | |
Shares issued in reinvestment of distributions | | | 247,384 | | | | 2,924,083 | | | | 880,781 | | | | 8,402,646 | |
| | | | |
Shares redeemed | | | (1,431,931 | ) | | | (18,396,051 | ) | | | (3,243,436 | ) | | | (34,515,377 | ) |
| | | | | | | | | | | | | | | | |
| | | | |
Net decrease | | | (1,051,491 | ) | | $ | (13,744,508) | | | | (1,846,862 | ) | | $ | (20,956,709) | |
| | | | | | | | | | | | | | | | |
h. REPURCHASE AGREEMENTS AND JOINT REPURCHASE AGREEMENTS
The Fund may enter into third-party and bilateral repurchase agreements for temporary cash management purposes and for reinvestment of cash collateral on securities lending transactions under the securities lending program offered by The Bank of New York Mellon (“BNYM”) (the “Securities Lending Program”) (collectively, “Repurchase Agreements”). The value of the underlying collateral, including accrued interest, must equal or exceed the value of the Repurchase Agreements during the term of the agreement. For joint repurchase agreements, the Fund participates on a pro rata basis with other clients of BNYM in its share of the underlying collateral under such joint repurchase agreements and in its share of proceeds from any repurchase or other disposition of the underlying collateral. The underlying collateral for all Repurchase Agreements is held by the Fund’s custodian or at the Federal Reserve Bank. If the seller defaults and the value of the collateral declines, or if bankruptcy proceedings commence with respect to the seller of the security, realization of the collateral by the Fund may be delayed or limited. Pursuant to the Securities Lending Program, the Fund is indemnified for such losses by BNYM on joint repurchase agreements.
At October 31, 2024, the Fund had no Repurchase Agreements outstanding.
2. AGREEMENTS AND TRANSACTIONS WITH AFFILIATES
The Trust has entered into an investment advisory agreement under which the Investment Manager, a subsidiary and the U.S. wealth platform of Affiliated Managers Group, Inc. (“AMG”), serves as investment manager to the Fund and is responsible for the Fund’s overall administration and operations. The Investment Manager selects and recommends, subject to the approval of the Board and, in certain circumstances, shareholders, the subadviser for the Fund and monitors the subadviser’s investment performance, security holdings and investment strategies. The Fund’s investment portfolio is managed by Montrusco Bolton Investments, Inc.
(“Montrusco Bolton”) who serves pursuant to a subadvisory agreement with the Investment Manager. AMG indirectly owns a majority interest in Montrusco Bolton.
Investment management fees are paid directly by the Fund to the Investment Manager based on average daily net assets. For the fiscal year ended October 31, 2024, the Fund paid an investment management fee at the annual rate of 0.48% of the average daily net assets of the Fund. The fee paid to Montrusco Bolton for its services as subadviser is paid out of the fee the Investment Manager receives from the Fund and does not increase the expenses of the Fund.
The Investment Manager has contractually agreed, through at least March 1, 2025, to waive management fees and/or pay or reimburse fund expenses in order to limit total annual Fund operating expenses after fee waiver and expense reimbursements (exclusive of taxes, interest (including interest incurred in connection with bank and custody overdrafts, and in connection with securities sold short), shareholder servicing fees, distribution and service (12b-1) fees, brokerage commissions and other transaction costs, dividends payable with respect to securities sold short, acquired fund fees and expenses and extraordinary expenses) to 0.68% of the Fund’s average daily net assets (this annual rate or such other annual rate that may be in effect from time to time, the “Expense Cap”), subject to later reimbursement by the Fund in certain circumstances.
In general, for a period of up to 36 months after the date any amounts are paid, waived or reimbursed by the Investment Manager, the Investment Manager may recover such amounts from the Fund, provided that such repayment would not cause the Fund’s total annual operating expenses after fee waiver and expense reimbursements (exclusive of the items noted in the parenthetical above) to exceed either (i) the Expense Cap in effect at the time such amounts were paid, waived or reimbursed, or (ii) the Expense Cap in effect at the time of such repayment by the Fund.
12
| | |
| | Notes to Financial Statements (continued) |
The contractual expense limitation may only be terminated in the event the Investment Manager or a successor ceases to be the investment manager of the Fund or a successor fund, by mutual agreement between the Investment Manager and the Board, or in the event of the Fund’s liquidation unless the Fund is reorganized or is a party to a merger in which the surviving entity is successor to the accounting and performance information of the Fund.
For the fiscal year ended October 31, 2024, the Investment Manager reimbursed the Fund $127,346, and did not recoup any previously reimbursed expenses. At October 31, 2024, the Fund’s expiration of reimbursements subject to recoupment is as follows:
| | | | |
Expiration Period | | | |
| |
Less than 1 year | | | $86,244 | |
| |
1-2 years | | | 122,005 | |
| |
2-3 years | | | 127,346 | |
| | | | |
| |
Total | | | $335,595 | |
| | | | |
The Trust, on behalf of the Fund, has entered into an amended and restated Administration Agreement under which the Investment Manager serves as the Fund’s administrator (the “Administrator”) and is responsible for certain aspects of managing the Fund’s operations, including administration and shareholder services to the Fund. The Fund pays a fee to the Administrator at the rate of 0.15% per annum of the Fund’s average daily net assets for this service.
The Fund is distributed by AMG Distributors, Inc. (the “Distributor”), a wholly-owned subsidiary of the Investment Manager. The Distributor serves as the distributor and underwriter for the Fund and is a registered broker-dealer and member of the Financial Industry Regulatory Authority, Inc. (“FINRA”). Shares of the Fund will be continuously offered and will be sold directly to prospective purchasers and through brokers, dealers or other financial intermediaries who have executed selling agreements with the Distributor. Generally, the Distributor bears all or a portion of the expenses of providing services pursuant to the distribution agreement, including the payment of the expenses relating to the distribution of prospectuses for sales purposes and any advertising or sales literature.
The Trust has adopted a distribution and service plan (the “Plan”) with respect to the Class N shares, in accordance with the requirements of Rule 12b-1 under the 1940 Act and the requirements of the applicable rules of FINRA regarding asset-based sales charges. Pursuant to the Plan, the Fund may make payments to the Distributor for its expenditures in financing any activity primarily intended to result in the sale of the Fund’s Class N shares and for maintenance and personal service provided to existing shareholders of that class. The Plan authorizes payments to the Distributor up to 0.25% annually of the Fund’s average daily net assets attributable to the Class N shares. The Plan is characterized as a reimbursement plan and is directly tied to expenses incurred by the Distributor; the payments the Distributor receives during any year may not exceed its actual expenses. The impact on the annualized expense ratios for the fiscal year ended October 31, 2024, was 0.15%.
For each of the Class N and Class I shares, the Board has approved reimbursement payments to the Investment Manager for shareholder servicing expenses (“shareholder servicing fees”) incurred. Shareholder servicing fees include payments to financial intermediaries, such as broker-dealers (including fund supermarket platforms), banks, and trust companies who provide shareholder
recordkeeping, account servicing and other services. The Class N and Class I shares may reimburse the Investment Manager for the actual amount incurred up to a maximum annual rate of each Class’s average daily net assets as shown in the table.
The impact on the annualized expense ratios for the fiscal year ended October 31, 2024, was as follows:
| | | | | | |
| | | Maximum Annual
Amount
Approved | | | Actual
Amount
Incurred |
| | |
Class N | | | 0.15% | | | 0.08% |
| | |
Class I | | | 0.05% | | | 0.05% |
The Board provides supervision of the affairs of the Trust and other trusts within the AMG Funds Family. The Trustees of the Trust who are not affiliated with the Investment Manager receive an annual retainer and per meeting fees for regular, special and telephonic meetings, and they are reimbursed for out-of-pocket expenses incurred while carrying out their duties as Board members. The Chairman of the Board and the Audit Committee Chair receive additional annual retainers. Certain Trustees and Officers of the Fund are Officers and/or Directors of the Investment Manager, AMG and/or the Distributor.
The Securities and Exchange Commission (the “SEC”) granted an exemptive order that permits certain eligible funds in the AMG Funds Family to lend and borrow money for certain temporary purposes directly to and from other eligible funds in the AMG Funds Family. Participation in this interfund lending program is voluntary for both the borrowing and lending funds, and an interfund loan is only made if it benefits each participating fund. The Administrator manages the program according to procedures approved by the Board, and the Board monitors the operation of the program. An interfund loan must comply with certain conditions set out in the exemptive order, which are designed to assure fairness and protect all participating funds. The interest earned and interest paid on interfund loans are included on the Statement of Operations as interest income and interest expense, respectively. At October 31, 2024, the Fund had no interfund loans outstanding.
The Fund did not utilize the interfund lending program during the fiscal year ended October 31, 2024.
3. PURCHASES AND SALES OF SECURITIES
Purchases and sales of securities (excluding short-term securities and U.S. Government Obligations) for the fiscal year ended October 31, 2024, were $173,791,614 and $210,138,819, respectively.
The Fund had no purchases or sales of U.S. Government Obligations during the fiscal year ended October 31, 2024.
4. PORTFOLIO SECURITIES LOANED
The Fund participates in the Securities Lending Program providing for the lending of securities to qualified borrowers. Securities lending income includes earnings of such temporary cash investments, plus or minus any rebate to a borrower. These earnings (after any rebate) are then divided between BNYM, as a fee for its services under the Securities Lending Program, and the Fund, according to agreed-upon rates. Collateral on all securities loaned is accepted in cash, U.S. Treasury Obligations or U.S. Government Agency Obligations. Collateral is maintained at a minimum level of 102% (105% in the case of certain foreign
13
| | |
| | Notes to Financial Statements (continued) |
securities) of the market value, plus interest, if applicable, of investments on loan. It is the Fund’s policy to obtain additional collateral from or return excess collateral to the borrower by the end of the next business day, following the valuation date of the securities loaned. Therefore, the value of the collateral held may be temporarily less than the value of the securities on loan. Lending securities entails a risk of loss to the Fund if and to the extent that the market value of the securities loaned were to increase and the borrower did not increase the collateral accordingly, and the borrower fails to return the securities. Under the terms of the Securities Lending Program, the Fund is indemnified for such losses by BNYM. Cash collateral is held in separate omnibus accounts managed by BNYM, who is authorized to exclusively enter into joint repurchase agreements for that cash collateral. Securities collateral is held in separate omnibus accounts managed by BNYM and cannot be sold or pledged. BNYM bears the risk of any deficiency in the amount of the cash collateral available for return to the borrower due to any loss on the collateral invested. Loans of securities are terminable at any time and the borrower, after notice, is required to return borrowed securities as soon as practical, which is normally within three business days.
The Fund did not have any securities on loan at October 31, 2024.
5. FUND RISKS
In the normal course of business, the Fund invests in securities or other instruments and may enter into certain transactions, and such activities subject the Fund to various risks. The value of securities or other instruments may also be affected by various factors, including, without limitation: (i) the general economy; (ii) the overall market; or (iii) price fluctuations. Please refer to the Fund’s current prospectus for additional information about the Fund’s principal risks.
Market Risk: Market prices of investments held by the Fund may fall rapidly or unpredictably due to a variety of factors, including economic, political, or market conditions, or other factors including terrorism, war, natural disasters and the spread of infectious illness or other public health issues, including epidemics or pandemics, or in response to events that affect particular industries or companies.
Management Risk: Because the Fund is an actively managed investment portfolio, security selection or focus on securities in a particular style, market sector or group of companies may cause the Fund to incur losses or underperform relative to its benchmarks or other funds with a similar investment objective. There can be no guarantee that Montrusco Bolton’s investment techniques and risk analysis will produce the desired result.
Non-Diversified Fund Risk: The Fund is non-diversified and therefore a greater percentage of holdings may be focused in a small number of issuers or a single issuer, which can place the Fund at greater risk. Notwithstanding the Fund’s status as a “non-diversified” investment company under the 1940 Act, the Fund intends to qualify as a regulated investment company accorded favorable tax treatment under the Code, which imposes its own diversification requirements that are less restrictive than the requirements applicable to “diversified” investment companies under the 1940 Act. The Fund’s intention to qualify as a regulated investment company may limit its pursuit of its investment strategy and its investment strategy could limit its ability to so qualify.
Focused Investment Risk: To the extent the Fund invests a substantial portion of its assets in a relatively small number of securities or a particular market, industry, group of industries, country, region, group of countries, asset class or sector, it generally will be subject to greater risk than a fund that invests in a more diverse investment portfolio. In addition, the value of the Fund would be more susceptible
to any single economic, market, political or regulatory occurrence affecting, for example, that particular market, industry, region or sector.
Sector Risk: Issuers and companies that are in similar industry sectors may be similarly affected by particular economic or market events; to the extent the Fund has substantial holdings within a particular sector, the risks associated with that sector increase.
Environmental, Social and Governance (“ESG”) Investing Risk: Montrusco Bolton incorporates ESG criteria into its investment process, which may result in the selection or exclusion of securities of certain issuers for reasons other than financial performance, and carries the risk that the Fund’s investment returns may underperform funds that do not incorporate ESG factors into their investment process. The incorporation of ESG criteria into the investment process may affect the Fund’s investment exposure to certain companies, sectors, regions, countries or types of investments, which could negatively impact the Fund’s performance depending on whether such investments are in or out of favor. Applying ESG criteria to investment decisions is qualitative and subjective by nature, and there is no guarantee that the criteria utilized by Montrusco Bolton or any judgment exercised by Montrusco Bolton will improve the financial performance of the Fund or reflect the beliefs or values of any particular investor. ESG standards differ by region and industry, and a company’s ESG practices or Montrusco Bolton’s assessment of a company’s ESG practices may change over time.
Large-Capitalization Stock Risk: The stocks of large-capitalization companies are generally more mature and may not be able to reach the same levels of growth as the stocks of small- or mid-capitalization companies.
Value Stock Risk: Value stocks may perform differently from the market as a whole and may be undervalued by the market for a long period of time.
Growth Stock Risk: The prices of equity securities of companies that are expected to experience relatively rapid earnings growth, or “growth stocks,” may be more sensitive to market movements because the prices tend to reflect future investor expectations rather than just current profits.
Growth at a Reasonable Price (“GARP”) Style Risk: GARP investing involves buying stocks that have a reasonable price/earnings ratio in relationship to a company’s earnings growth rate. The Fund’s performance may be adversely affected when stocks preferred by a GARP investing strategy underperform or are not favored by investors in prevailing market and economic conditions.
6. COMMITMENTS AND CONTINGENCIES
Under the Trust’s organizational documents, its Trustees and Officers are indemnified against certain liabilities arising out of the performance of their duties to the Trust. In addition, in the normal course of business, the Fund may enter into contracts and agreements that contain a variety of representations and warranties, which provide general indemnifications. The maximum exposure to the Fund under these arrangements is unknown, as this would involve future claims that may be made against the Fund that have not yet occurred. However, based on experience, the Fund had no prior claims or losses and expects the risks of loss to be remote.
7. MASTER NETTING AGREEMENTS
The Fund may enter into master netting agreements with its counterparties for the Securities Lending Program and Repurchase Agreements, which provide the right, in the event of default (including bankruptcy or insolvency) for the non-defaulting
14
| | |
| | Notes to Financial Statements (continued) |
party to liquidate the collateral and calculate net exposure to the defaulting party or request additional collateral. For financial reporting purposes, the Fund does not offset financial assets and financial liabilities that are subject to master netting agreements in the Statement of Assets and Liabilities. At October 31, 2024, the Fund had no securities on loan and no Repurchase Agreements outstanding.
8. RECENT ACCOUNTING STANDARDS UPDATE
In November 2023, the Financial Accounting Standards Board issued ASU No. 2023-07, Segment Reporting (Topic 280), which improves reportable segment disclosure requirements, primarily through enhanced disclosures about significant
segment expenses. The amendments are effective for fiscal years beginning after December 15, 2023, and interim periods within fiscal years beginning after December 15, 2024. The Fund is currently evaluating the requirements and does not expect this guidance to materially impact the Fund’s financial statements.
9. SUBSEQUENT EVENTS
The Fund has determined that no material events or transactions occurred through the issuance date of the Fund’s financial statements which require an additional disclosure in or adjustment of the Fund’s financial statements.
15
| | |
| | Report of Independent Registered Public Accounting Firm |
To the Board of Trustees of AMG Funds IV and Shareholders of AMG Montrusco Bolton Large Cap Growth Fund
Opinion on the Financial Statements
We have audited the accompanying statement of assets and liabilities, including the schedule of portfolio investments, of AMG Montrusco Bolton Large Cap Growth Fund (one of the funds constituting AMG Funds IV, referred to hereafter as the “Fund”) as of October 31, 2024, the related statement of operations for the year ended October 31, 2024, the statements of changes in net assets for each of the two years in the period ended October 31, 2024, including the related notes, and the financial highlights for each of the five years in the period ended October 31, 2024 (collectively referred to as the “financial statements”). In our opinion, the financial statements present fairly, in all material respects, the financial position of the Fund as of October 31, 2024, the results of its operations for the year then ended, the changes in its net assets for each of the two years in the period ended October 31, 2024 and the financial highlights for each of the five years in the period ended October 31, 2024 in conformity with accounting principles generally accepted in the United States of America.
Basis for Opinion
These financial statements are the responsibility of the Fund’s management. Our responsibility is to express an opinion on the Fund’s financial statements based on our audits. We are a public accounting firm registered with the Public Company Accounting Oversight Board (United States) (PCAOB) and are required to be independent with respect to the Fund in accordance with the U.S. federal securities laws and the applicable rules and regulations of the Securities and Exchange Commission and the PCAOB.
We conducted our audits of these financial statements in accordance with the standards of the PCAOB. Those standards require that we plan and perform the audit to obtain reasonable assurance about whether the financial statements are free of material misstatement, whether due to error or fraud.
Our audits included performing procedures to assess the risks of material misstatement of the financial statements, whether due to error or fraud, and performing procedures that respond to those risks. Such procedures included examining, on a test basis, evidence regarding the amounts and disclosures in the financial statements. Our audits also included evaluating the accounting principles used and significant estimates made by management, as well as evaluating the overall presentation of the financial statements. Our procedures included confirmation of securities owned as of October 31, 2024 by correspondence with the custodian and brokers; when replies were not received from brokers, we performed other auditing procedures. We believe that our audits provide a reasonable basis for our opinion.
/s/PricewaterhouseCoopers LLP
Boston, Massachusetts
December 23, 2024
We have served as the auditor of one or more investment companies in the AMG Funds Family since 1993.
16
| | |
| | Other Information (unaudited) |
TAX INFORMATION
AMG Montrusco Bolton Large Cap Growth Fund hereby designates the maximum amount allowable of its net taxable income as qualified dividends as provided in the Jobs and Growth Tax Relief Reconciliation Act of 2003. The 2023/2024 Form 1099-DIV you receive for the Fund will show the tax status of all distributions paid to you during the year.
Pursuant to section 852 of the Internal Revenue Code of 1986, as amended, AMG Montrusco Bolton Large Cap Growth Fund hereby designates $6,841,048 as a capital gain distribution with respect to the taxable year ended October 31, 2024, or if subsequently determined to be different, the net capital gains of such fiscal year.
ITEM 8. CHANGES IN AND DISAGREEMENTS WITH ACCOUNTANTS FOR OPEN-END MANAGEMENT INVESTMENT COMPANIES
During the fiscal year ended October 31, 2024, there were no changes in and/or disagreements with accountants.
ITEM 9. PROXY DISCLOSURES FOR OPEN-END MANAGEMENT INVESTMENT COMPANIES
Not applicable.
ITEM 10. REMUNERATION PAID TO DIRECTORS, OFFICERS, AND OTHERS OF OPEN-END MANAGEMENT INVESTMENT COMPANIES
The remuneration paid to the Trustees during the fiscal year ended October 31, 2024, was $18,140, which is reflected as “Trustee fees and expenses” on the Statement of Operations. There was no remuneration paid to any Fund officer or to any affiliated person of any Fund Trustee or officer during the fiscal year ended October 31, 2024.
17
| | |
| | ITEM 11. STATEMENT REGARDING BASIS FOR APPROVAL OF INVESTMENT ADVISORY CONTRACT |
| | | | | | | | |
AMG Montrusco Bolton Large Cap Growth Fund: Approval of Investment Advisory Agreement and Subadvisory Agreement on June 12, 2024 At an in-person meeting held on June 12, 2024, the Board of Trustees (the “Board” or the “Trustees”), and separately a majority of the Trustees who are not “interested persons” of AMG Funds IV (the “Trust”) (the “Independent Trustees”), approved (i) the Investment Advisory Agreement, as amended pursuant to letter agreements at any time prior to the date of the meeting, with AMG Funds LLC (the “Investment Manager”) for AMG Montrusco Bolton Large Cap Growth Fund (the “Fund”) and separately Amendment No. 1 thereto dated October 1, 2016 (collectively, the “Investment Advisory Agreement”); and (ii) the Subadvisory Agreement with respect to the Fund, as amended at any time prior to the date of the meeting (the “Subadvisory Agreement”), with Montrusco Bolton Investments, Inc., the Fund’s subadviser (the “Subadviser”). The Independent Trustees were separately represented by independent legal counsel in connection with their consideration of the approval of these agreements. In considering the Investment Advisory Agreement and Subadvisory Agreement, the Trustees reviewed a variety of materials relating to the Fund, the Investment Manager and the Subadviser, including the nature, extent and quality of services, comparative performance, fee and expense information for an appropriate peer group of similar mutual funds for the Fund (the “Peer Group”), performance information for the relevant benchmark index for the Fund (the “Fund Benchmark”), other relevant matters, including management fees, the profitability of the Investment Manager and the Subadviser, and the potential for economies of scale that may be shared with the Fund, and other information provided to them on a periodic basis throughout the year. Prior to voting, the Independent Trustees: (a) reviewed the foregoing information with their independent legal counsel; (b) received materials from their independent legal counsel discussing the legal standards applicable to their consideration of the Investment Advisory Agreement and the Subadvisory Agreement; and (c) met with their independent legal counsel in private sessions at which no representatives of management were present. NATURE, EXTENT AND QUALITY OF SERVICES In considering the nature, extent and quality of the services provided by the Investment Manager, the Trustees reviewed information provided by the Investment Manager at the June 12, 2024 meeting | | | | and prior meetings relating to the Investment Manager’s operations and personnel. Among other things, the Investment Manager provided financial information, information about its supervisory and professional staff and descriptions of its organizational and management structure. The Trustees also took into account information provided periodically throughout the previous year by the Investment Manager in Board meetings relating to the performance of its duties with respect to the Fund and the Trustees’ knowledge of the Investment Manager’s management and the quality of the performance of the Investment Manager’s duties under the Investment Advisory Agreement and Administration Agreement. In the course of their deliberations regarding the Investment Manager, the Trustees evaluated, among other things: (a) the extent and quality of the Investment Manager’s oversight of the operation and management of the Fund; (b) the quality of the Investment Manager’s oversight of the performance by the Subadviser of its portfolio management duties; (c) the Investment Manager’s ability to supervise the Fund’s other service providers; and (d) the Investment Manager’s compliance program. The Trustees also took into account that, in performing its functions under the Investment Advisory Agreement and supervising the Subadviser, the Investment Manager: performs periodic detailed analyses and reviews of the performance by the Subadviser of its obligations to the Fund, including without limitation, analysis and review of portfolio and other compliance matters and review of the Subadviser’s investment performance with respect to the Fund; prepares and presents periodic reports to the Board regarding the investment performance of the Subadviser and other information regarding the Subadviser, at such times and in such forms as the Board may reasonably request; reviews and considers any changes in the personnel of the Subadviser responsible for performing the Subadviser’s obligations and makes appropriate reports to the Board; reviews and considers any changes in the ownership or senior management of the Subadviser and makes appropriate reports to the Board; performs periodic in-person, telephonic or videoconference diligence meetings, including with respect to compliance matters, with representatives of the Subadviser; assists the Board and management of the Trust in developing and reviewing information with respect to the initial approval of the Subadvisory Agreement and annual consideration of the Subadvisory Agreement thereafter; prepares recommendations with respect to the continued retention of the Subadviser or the replacement of the Subadviser, including at the request of the Board; identifies | | | | potential successors to, or replacements of, the Subadviser or potential additional subadvisers, including performing appropriate due diligence, and developing and presenting to the Board a recommendation as to any such successor, replacement, or additional subadviser, including at the request of the Board; designates and compensates from its own resources such personnel as the Investment Manager may consider necessary or appropriate to the performance of its services; and performs such other review and reporting functions as the Board shall reasonably request consistent with the Investment Advisory Agreement and applicable law. The Trustees noted the affiliation of the Subadviser with the Investment Manager, noting any potential conflicts of interest. The Trustees also took into account the financial condition of the Investment Manager with respect to its ability to provide the services required under the Investment Advisory Agreement and the Investment Manager’s undertaking to maintain a contractual expense limitation for the Fund. The Trustees also considered the Investment Manager’s risk management processes. The Trustees also reviewed information relating to the Subadviser’s operations and personnel and the investment philosophy, strategies and techniques (its “Investment Strategy”) used in managing the Fund. Among other things, the Trustees reviewed information on portfolio management and other professional staff, information regarding the Subadviser’s organizational and management structure and the Subadviser’s brokerage policies and practices. The Trustees considered specific information provided regarding the experience of the individuals at the Subadviser with portfolio management responsibility for the Fund, including the information set forth in the Fund’s prospectus and statement of additional information. In the course of their deliberations, the Trustees evaluated, among other things: (a) the services rendered by the Subadviser in the past; (b) the qualifications and experience of the Subadviser’s personnel; and (c) the Subadviser’s compliance program. The Trustees also took into account the financial condition of the Subadviser with respect to its ability to provide the services required under the Subadvisory Agreement. The Trustees also considered the Subadviser’s risk management processes. PERFORMANCE The Board considered the Fund’s net performance during relevant time periods as compared to the Fund’s Peer Group and Fund Benchmark, considered the gross performance of the Fund as compared to |
18
| | |
| | ITEM 11. STATEMENT REGARDING BASIS FOR APPROVAL OF INVESTMENT ADVISORY CONTRACT (continued) |
| | | | | | | | |
the Subadviser’s relevant performance composite that utilizes a similar investment strategy and approach, and noted that the Board reviews on a quarterly basis detailed information about both the Fund’s performance results and portfolio composition, as well as the Subadviser’s Investment Strategy. The Board was mindful of the Investment Manager’s expertise, resources and attention to monitoring the Subadviser’s performance, investment style and risk-adjusted performance with respect to the Fund and its discussions with the management of the Fund’s subadviser during the period regarding the factors that contributed to the performance of the Fund. Among other information relating to the Fund’s performance, the Trustees noted that the Fund’s performance for Class N shares (which share class has the earliest inception date and the largest amount of assets of all the share classes of the Fund) for the 1-year, 3-year, 5-year and 10-year periods ended March 31, 2024 was below, above, above, and below, respectively, the median performance of the Peer Group and below the performance of the Fund Benchmark, the S&P 500 Growth Index. The Trustees took into account management’s discussion of the Fund’s performance, including the reasons for the Fund’s more recent underperformance. The Trustees also noted that the Fund ranked in the top third relative to the Peer Group for the 2021 calendar year and ranked in the top half of the Peer Group for the 3-year and 5-year periods ended March 31, 2024 and the 2022 calendar year. The Trustees also took into account the fact that the Fund’s subadviser, investment strategy, and Fund Benchmark changed effective March 19, 2021, and that the performance information prior to that date reflected that of the Fund’s prior subadviser and investment strategy. The Trustees considered management’s discussion that the Fund’s performance has been within management’s expectations since the current Subadviser assumed subadvisory responsibilities. The Trustees concluded that the Fund’s overall performance has been satisfactory in light of the Fund’s investment objective, strategies, and policies. ADVISORY AND SUBADVISORY FEES; FUND EXPENSES; PROFITABILITY; AND ECONOMIES OF SCALE In considering the reasonableness of the advisory fee payable to the Investment Manager, the Trustees reviewed information provided by the Investment Manager at the June 12, 2024 meeting and prior meetings setting forth all revenues and other benefits, both direct and indirect (including any | | | | so-called “fallout benefits” such as reputational value derived from the Investment Manager serving as Investment Manager to the Fund), received by the Investment Manager and its affiliates attributable to managing the Fund and all the mutual funds in the AMG Funds Family of Funds; the cost of providing such services; the significant risks undertaken as Investment Manager and sponsor of the Fund, including investment, operational, enterprise, entrepreneurial, litigation, regulatory and compliance risks; and the resulting profitability to the Investment Manager and its affiliates from these relationships. The Trustees also considered the amount of the advisory fee retained by the Investment Manager after payment of the subadvisory fee with respect to the Fund. The Trustees also noted payments are made from the Subadviser to the Investment Manager, and other payments are made from the Investment Manager to the Subadviser. The Trustees also considered management’s discussion of the current asset level of the Fund, and the impact on profitability of both the current asset level and any future growth of assets of the Fund. In considering the cost of services to be provided by the Investment Manager under the Investment Advisory Agreement and the profitability to the Investment Manager of its relationship with the Fund, the Trustees noted the undertaking by the Investment Manager to maintain a contractual expense limitation for the Fund. The Board also took into account management’s discussion of the advisory fee structure and the services the Investment Manager provides in performing its functions under the Investment Advisory Agreement and supervising the Subadviser. Based on the foregoing, the Trustees concluded that the profitability to the Investment Manager is reasonable and that the Investment Manager is not realizing material benefits from economies of scale that would warrant adjustments to the advisory fee at this time. Also, with respect to economies of scale, the Trustees noted that as the Fund’s assets increase over time, the Fund may realize other economies of scale to the extent the increase in assets is proportionally greater than the increase in certain other expenses. In considering the reasonableness of the subadvisory fee payable by the Investment Manager to the Subadviser, the Trustees reviewed information regarding the cost to the Subadviser of providing subadvisory services to the Fund and the resulting profitability from the relationship. The Trustees noted that, because the Subadviser is an affiliate of the Investment Manager, a portion of the Subadviser’s | | | | revenues or profits might be shared directly or indirectly with the Investment Manager. The Trustees also noted that the subadvisory fees are paid by the Investment Manager out of its advisory fee. The Board also took into account management’s discussion of the subadvisory fee structure, and the services the Subadviser provides in performing its functions under the Subadvisory Agreement. Based on the foregoing, the Trustees concluded that the profitability to the Subadviser is reasonable and that the Subadviser is not realizing material benefits from economies of scale that would warrant adjustments to the subadvisory fees at this time. Also, with respect to economies of scale, the Trustees noted that as the Fund’s assets increase over time, the Fund may realize other economies of scale to the extent the increase in assets is proportionally greater than the increase in certain other expenses. The Trustees noted that the management fees (which include both the advisory and administration fees) and total expenses (net of applicable expense waivers/reimbursements) of Class I shares (the class of shares which is the primary focus of the Fund’s distribution) of the Fund as of March 31, 2024, were both rated in the Average rating level of the Fund’s Peer Group. The Trustees noted that the rating level corresponded to the Fund’s quintile ranking in its Peer Group. The Trustees took into account the fact that the Investment Manager has contractually agreed, through March 1, 2025, to limit the Fund’s net annual operating expenses (subject to certain excluded expenses) to 0.68%. The Trustees concluded that, in light of the nature, extent and quality of the services provided by the Investment Manager and the Subadviser (which is an affiliate of the Investment Manager), the foregoing expense limitation and the considerations noted above with respect to the Investment Manager and the Subadviser, the Fund’s advisory and subadvisory fees are reasonable. * * * * * After consideration of the foregoing, the Trustees also reached the following conclusions (in addition to the conclusions discussed above) regarding the Investment Advisory Agreement and the Subadvisory Agreement: (a) the Investment Manager and the Subadviser have demonstrated that they possess the capability and resources to perform the duties required of them under the Investment Advisory Agreement and the Subadvisory Agreement and (b) the Investment Manager and Subadviser maintain appropriate compliance programs. |
19
| | |
| | ITEM 11. STATEMENT REGARDING BASIS FOR APPROVAL OF INVESTMENT ADVISORY CONTRACT (continued) |
| | | | | | | | |
Based on all of the above-mentioned factors and their related conclusions, with no single factor or conclusion being determinative and with each Trustee not necessarily attributing the same weight | | | | to each factor, the Trustees concluded that approval of the Investment Advisory Agreement and the Subadvisory Agreement would be in the best interests of the Fund and its shareholders. | | | | Accordingly, on June 12, 2024, the Trustees, and separately a majority of the Independent Trustees, voted to approve the Investment Advisory Agreement and the Subadvisory Agreement for the Fund. |
20
| | |
| | |
| | | | |
INVESTMENT MANAGER AND ADMINISTRATOR AMG Funds LLC 680 Washington Blvd., Suite 500 Stamford, CT 06901 800.548.4539 DISTRIBUTOR AMG Distributors, Inc. 680 Washington Blvd., Suite 500 Stamford, CT 06901 800.548.4539 SUBADVISER Montrusco Bolton Investments, Inc. 1501 McGill College Avenue Suite 1200 Montreal, QC H3A 3M8 Canada | | CUSTODIAN The Bank of New York Mellon Mutual Funds Custody 240 Greenwich Street New York, NY 10286 LEGAL COUNSEL Ropes & GrayLLP Prudential Tower, 800 Boylston Street Boston, MA 02199-3600 TRANSFER AGENT BNY Mellon Investment Servicing (US) Inc. AMG Funds Attn: 534426 AIM 154-0520 500 Ross Street Pittsburgh, PA 15262 800.548.4539 | | This report is prepared for the Fund’s shareholders. It is authorized for distribution to prospective investors only when preceded or accompanied by an effective prospectus. To receive a free copy of the prospectus or Statement of Additional Information, which includes additional information about Fund Trustees, please contact us by calling 800.548.4539. Distributed by AMG Distributors, Inc., member FINRA/SIPC. Current net asset values per share for the Fund are available on the Fund’s website at wealth.amg.com. A description of the policies and procedures the Fund uses to vote its proxies is available: (i) without charge, upon request, by calling 800.548.4539, or (ii) on the Securities and Exchange Commission’s (SEC) website at sec.gov. For information regarding the Fund’s proxy voting record for the 12-month period ended June 30, call 800.548.4539 or visit the SEC website at sec.gov. The Fund files its complete schedule of portfolio holdings with the SEC for the first and third quarters of each fiscal year as an exhibit to its reports on Form N-PORT. The Fund’s portfolio holdings on Form N-PORT are available on the SEC’s website at sec.gov and the Fund’s website at wealth.amg.com. To review a complete list of the Fund’s portfolio holdings, or to view the most recent semi-annual report or annual report, please visit wealth.amg.com. |
| | |
| | |
| | | | |
EQUITY FUNDS AMG Boston Common Global Impact Boston Common Asset Management, LLC AMG Frontier Small Cap Growth Frontier Capital Management Co., LLC AMG GW&K Small Cap Core AMG GW&K Small Cap Value AMG GW&K Small/Mid Cap Core AMG GW&K Small/Mid Cap Growth AMG GW&K International Small Cap GW&K Investment Management, LLC AMG Montrusco Bolton Large Cap Growth Montrusco Bolton Investments, Inc. AMG Renaissance Large Cap Growth The Renaissance Group LLC | | AMG River Road Dividend All Cap Value AMG River Road Focused Absolute Value AMG River Road Large Cap Value Select AMG River Road Mid Cap Value AMG River Road Small-Mid Cap Value AMG River Road Small Cap Value River Road Asset Management, LLC AMG TimesSquare International Small Cap AMG TimesSquare Mid Cap Growth AMG TimesSquare Small Cap Growth TimesSquare Capital Management, LLC AMG Veritas Asia Pacific AMG Veritas China AMG Veritas Global Focus AMG Veritas Global Real Return Veritas Asset Management LLP AMG Yacktman AMG Yacktman Focused AMG Yacktman Global AMG Yacktman Special Opportunities Yacktman Asset Management LP | | FIXED INCOME FUNDS AMG Beutel Goodman Core Plus Bond Beutel, Goodman & Company Ltd. AMG GW&K Core Bond ESG AMG GW&K ESG Bond AMG GW&K Municipal Bond AMG GW&K Municipal Enhanced Yield GW&K Investment Management, LLC ALTERNATIVE FUNDS AMG Systematica Managed Futures Strategy Systematica Investments Limited, acting as general partner of Systematica Investments LP |
| | | | | | |
| | | | | | | |
| | | |
| wealth.amg.com | | 103124 | | | AR087 | |
| | |

| | ANNUAL FINANCIAL STATEMENTS |
| | | | | | |
| | | AMG Funds |
| | | |
| | | October 31, 2024 | | |
| | |
| | |  |
| | |
| | | AMG GW&K Core Bond ESG Fund |
| | | Class N: MBGVX | | Class I: MBDFX | | Class Z: MBDLX |
| | |
| | | AMG GW&K Small/Mid Cap Growth Fund |
| | | | |
| | | Class N: ACWDX | | Class I: ACWIX | | Class Z: ACWZX |
| | | | |
| | | | | | | |
| | | | | | |
| | | | | | | |
| | | |
| wealth.amg.com | | 103124 | | | AR069 | |
| | |
| | AMG Funds Annual Financial Statements — October 31, 2024 |
Nothing contained herein is to be considered an offer, sale or solicitation of an offer to buy shares of any series of the AMG Funds Family of Funds. Such offering is made only by prospectus, which includes details as to offering price and other material information.
| | |
| | AMG GW&K Core Bond ESG Fund Schedule of Portfolio Investments October 31, 2024 |
| | | | | | | | |
| | | Principal
Amount | | | Value | |
| | |
Corporate Bonds and Notes - 40.5% | | | | | | | | |
| |
Basic Materials - 1.1% | | | | | |
| | |
Air Products and Chemicals, Inc.
4.800%, 03/03/33 | | | $780,000 | | | | $777,723 | |
| | |
Steel Dynamics, Inc.
5.375%, 08/15/34 | | | 460,000 | | | | 463,287 | |
| | |
Total Basic Materials | | | | | | | 1,241,010 | |
| |
Communications - 2.9% | | | | | |
| | |
AT&T, Inc.
1.650%, 02/01/28 | | | 331,000 | | | | 300,672 | |
4.300%, 02/15/30 | | | 700,000 | | | | 681,440 | |
| | |
Comcast Corp.
4.650%, 02/15/331 | | | 915,000 | | | | 900,426 | |
| | |
Verizon Communications, Inc.
3.875%, 02/08/291 | | | 1,553,000 | | | | 1,502,644 | |
| | |
Total Communications | | | | | | | 3,385,182 | |
| |
Consumer, Cyclical - 3.1% | | | | | |
| | |
Hasbro, Inc.
3.900%, 11/19/291 | | | 980,000 | | | | 923,651 | |
| | |
Hyatt Hotels Corp.
5.250%, 06/30/29 | | | 610,000 | | | | 613,527 | |
| | |
Mattel, Inc.
3.750%, 04/01/292 | | | 975,000 | | | | 917,375 | |
| | |
PulteGroup, Inc.
6.375%, 05/15/33 | | | 573,000 | | | | 613,201 | |
| | |
United Airlines, Inc. Pass-Through Trust
Series 2024-1, AA, 5.450%, 02/15/37 | | | 585,000 | | | | 593,593 | |
| | |
Total Consumer, Cyclical | | | | | | | 3,661,347 | |
| |
Consumer, Non-cyclical - 8.0% | | | | | |
| | |
Ashtead Capital, Inc.
1.500%, 08/12/261,2 | | | 986,000 | | | | 928,549 | |
| | |
Campbell Soup Co.
2.375%, 04/24/30 | | | 1,578,000 | | | | 1,384,854 | |
| | |
CommonSpirit Health
3.347%, 10/01/29 | | | 1,737,000 | | | | 1,615,833 | |
| | |
The Ford Foundation
Series 2020, 2.415%, 06/01/50 | | | 2,207,000 | | | | 1,363,901 | |
| | |
HCA, Inc.
4.125%, 06/15/29 | | | 950,000 | | | | 914,936 | |
| | |
Kraft Heinz Foods Co.
3.875%, 05/15/27 | | | 918,000 | | | | 900,318 | |
| | |
Smith & Nephew PLC (United Kingdom)
2.032%, 10/14/30 | | | 1,010,000 | | | | 853,126 | |
| | |
Sysco Corp.
2.400%, 02/15/301 | | | 1,759,000 | | | | 1,555,360 | |
| | |
Total Consumer, Non-cyclical | | | | | | | 9,516,877 | |
| | | | | | | | |
| | | Principal
Amount | | | Value | |
| |
Financials - 15.4% | | | | | |
| | |
AerCap Ireland Capital DAC/AerCap Global Aviation Trust (Ireland)
6.450%, 04/15/271 | | | $1,098,000 | | | | $1,136,679 | |
| | |
Air Lease Corp., MTN
5.200%, 07/15/31 | | | 315,000 | | | | 313,846 | |
| | |
Aircastle, Ltd./Aircastle Ireland DAC (Bermuda)
5.750%, 10/01/312 | | | 1,025,000 | | | | 1,040,695 | |
| | |
American Homes 4 Rent LP
3.625%, 04/15/32 | | | 685,000 | | | | 618,764 | |
| | |
American Tower Corp.
3.600%, 01/15/28 | | | 1,280,000 | | | | 1,233,239 | |
| | |
Bank of America Corp. MTN, (4.330% to 03/15/49 then 3 month SOFR + 1.782%), 4.330%, 03/15/503,4 | | | 1,300,000 | | | | 1,114,966 | |
| | |
The Bank of New York Mellon Corp. | | | | | | | | |
Series H, (3.700% to 03/20/26 then U.S. Treasury Yield Curve CMT 5 year + 3.352%), 3.700%, 03/20/263,4,5 | | | 985,000 | | | | 951,019 | |
| | |
The Charles Schwab Corp. | | | | | | | | |
Series G, (5.375% to 06/01/25 then U.S. Treasury Yield Curve CMT 5 year + 4.971%), 5.375%, 06/01/253,4,5 | | | 1,190,000 | | | | 1,183,850 | |
| | |
Citigroup, Inc. | | | | | | | | |
(3.980% to 03/20/29 then 3 month SOFR + 1.600%), 3.980%, 03/20/303,4 | | | 1,502,000 | | | | 1,439,677 | |
| | |
Crown Castle, Inc.
4.000%, 03/01/27 | | | 1,250,000 | | | | 1,228,141 | |
| | |
Equinix, Inc.
3.200%, 11/18/29 | | | 663,000 | | | | 612,538 | |
| | |
JPMorgan Chase & Co. | | | | | | | | |
(6.254% to 10/23/33 then SOFR + 1.810%), 6.254%, 10/23/343,4 | | | 818,000 | | | | 879,006 | |
| | |
MetLife, Inc. | | | | | | | | |
Series G, (3.850% to 09/15/25 then U.S. Treasury Yield Curve CMT 5 year + 3.576%), 3.850%, 09/15/253,4,5 | | | 959,000 | | | | 938,445 | |
| | |
Morgan Stanley | | | | | | | | |
(4.431% to 01/23/29 then 3 month SOFR + 1.890%), 4.431%, 01/23/303,4 | | | 1,374,000 | | | | 1,346,646 | |
| | |
The PNC Financial Services Group, Inc. | | | | | | | | |
(5.068% to 01/24/33 then SOFR + 1.933%), 5.068%, 01/24/343,4 | | | 1,226,000 | | | | 1,209,092 | |
| | |
Truist Financial Corp., MTN | | | | | | | | |
(4.873% to 01/26/28 then SOFR + 1.435%), 4.873%, 01/26/293,4 | | | 610,000 | | | | 607,704 | |
| | |
US Bancorp | | | | | | | | |
(5.775% to 06/12/28 then SOFR + 2.020%), 5.775%, 06/12/293,4 | | | 615,000 | | | | 632,694 | |
| | |
Wells Fargo & Co. | | | | | | | | |
MTN, (5.013% to 04/04/50 then 3 month SOFR + 4.502%), 5.013%, 04/04/513,4 | | | 1,261,000 | | | | 1,178,274 | |
The accompanying notes are an integral part of these financial statements.
2
| | |
| | AMG GW&K Core Bond ESG Fund Schedule of Portfolio Investments (continued) |
| | | | | | | | |
| | | Principal
Amount | | | Value | |
| | |
Financials - 15.4% (continued) | | | | | | | | |
| | |
Wells Fargo & Co. | | | | | | | | |
Series U, 5.875%, 06/15/254,5 | | | $636,000 | | | | $634,512 | |
| | |
Total Financials | | | | | | | 18,299,787 | |
| | |
Industrials - 3.8% | | | | | | | | |
| | |
Jacobs Engineering Group, Inc.
5.900%, 03/01/33 | | | 1,141,000 | | | | 1,170,410 | |
| | |
L3Harris Technologies, Inc.
5.050%, 06/01/29 | | | 1,233,000 | | | | 1,242,763 | |
| | |
Packaging Corp. of America
5.700%, 12/01/331 | | | 640,000 | | | | 663,482 | |
| | |
Parker-Hannifin Corp.
3.250%, 06/14/29 | | | 1,573,000 | | | | 1,477,151 | |
| | |
Total Industrials | | | | | | | 4,553,806 | |
| | |
Technology - 4.1% | | | | | | | | |
| | |
Broadcom, Inc.
4.150%, 11/15/30 | | | 1,347,000 | | | | 1,292,605 | |
| | |
Dell International LLC/EMC Corp.
6.200%, 07/15/30 | | | 1,112,000 | | | | 1,178,706 | |
| | |
Kyndryl Holdings, Inc.
3.150%, 10/15/31 | | | 691,000 | | | | 591,247 | |
| | |
Microsoft Corp.
2.525%, 06/01/50 | | | 1,890,000 | | | | 1,209,947 | |
| | |
Roper Technologies, Inc.
4.750%, 02/15/32 | | | 612,000 | | | | 602,677 | |
| | |
Total Technology | | | | | | | 4,875,182 | |
| | |
Utilities - 2.1% | | | | | | | | |
| | |
Duke Energy Corp.
2.550%, 06/15/31 | | | 1,392,000 | | | | 1,196,674 | |
| | |
National Rural Utilities Cooperative Finance Corp.
1.350%, 03/15/31 | | | 1,649,000 | | | | 1,334,080 | |
| | |
Total Utilities | | | | | | | 2,530,754 | |
| |
Total Corporate Bonds and Notes
(Cost $51,418,765) | | | | 48,063,945 | |
| |
| Asset-Backed Securities - 3.4% | | | | | |
| | |
American Express Credit Account Master Trust
Series 2022-4, Class A 4.950%, 10/15/27 | | | 630,000 | | | | 632,143 | |
| | |
Compass Datacenters Issuer II LLC | | | | | | | | |
Series 2024-1A, Class A1 5.250%, 02/25/492 | | | 950,000 | | | | 942,259 | |
| | |
Ford Credit Auto Owner Trust | | | | | | | | |
Series 2022-B, Class A4 3.930%, 08/15/27 | | | 697,000 | | | | 690,598 | |
| | |
John Deere Owner Trust | | | | | | | | |
Series 2022-A, Class A4 2.490%, 01/16/29 | | | 650,000 | | | | 637,581 | |
| | |
Santander Drive Auto Receivables Trust | | | | | | | | |
Series 2020-4, Class D 1.480%, 01/15/27 | | | 135,574 | | | | 134,924 | |
| | | | | | | | |
| | | Principal
Amount | | | Value | |
| | |
Santander Drive Auto Receivables Trust | | | | | | | | |
Series 2022-7, Class B 5.950%, 01/17/28 | | | $625,000 | | | | $629,816 | |
| | |
Toyota Auto Receivables Owner Trust | | | | | | | | |
Series 2021-B, Class A3 0.260%, 11/17/25 | | | 8,610 | | | | 8,592 | |
Series 2021-B, Class A4 0.530%, 10/15/26 | | | 317,000 | | | | 311,019 | |
| |
Total Asset-Backed Securities
(Cost $3,984,590) | | | | 3,986,932 | |
| |
| Mortgage-Backed Securities - 2.8% | | | | | |
| | |
Chase Home Lending Mortgage Trust Series | | | | | | | | |
Series 2024-1, Class A6 6.500%, 01/25/552,4 | | | 393,766 | | | | 396,061 | |
| | |
DATA Mortgage Trust | | | | | | | | |
Series 2023-CNTR, Class A 5.728%, 08/12/432,4 | | | 600,000 | | | | 614,001 | |
| | |
FREMF Mortgage Trust | | | | | | | | |
Series 2016-K53, Class B 4.024%, 03/25/492,4 | | | 700,000 | | | | 688,964 | |
| | |
GS Mortgage-Backed Securities Corp. Trust | | | | | | | | |
Series 2021-PJ4, Class A6 2.500%, 09/25/512,4 | | | 806,677 | | | | 739,929 | |
Series 2021-PJ9, Class A8 2.500%, 02/26/522,4 | | | 475,272 | | | | 415,287 | |
| | |
JP Morgan Mortgage Trust | | | | | | | | |
Series 2021-7, Class A6 2.500%, 11/25/512,4 | | | 586,671 | | | | 536,891 | |
| |
Total Mortgage-Backed Securities
(Cost $3,386,234) | | | | 3,391,133 | |
| |
| Municipal Bonds - 3.3% | | | | | |
| | |
California Health Facilities Financing Authority
4.190%, 06/01/37 | | | 775,000 | | | | 720,305 | |
| | |
California State General Obligation, School Improvements, Build America Bonds
7.550%, 04/01/39 | | | 1,460,000 | | | | 1,769,687 | |
| | |
JobsOhio Beverage System, Series B Build America Bonds,
4.532%, 01/01/35 | | | 1,505,000 | | | | 1,489,134 | |
| |
Total Municipal Bonds
(Cost $4,478,419) | | | | 3,979,126 | |
| |
| U.S. Government and Agency Obligations - 49.1% | | | | | |
| | |
Fannie Mae - 21.3% | | | | | | | | |
| | |
FNMA | | | | | | | | |
2.000%, 02/01/36 | | | 631,330 | | | | 568,477 | |
3.000%, 06/01/38 to 12/01/50 | | | 1,187,800 | | | | 1,098,769 | |
3.500%, 03/01/30 to 07/01/50 | | | 6,540,600 | | | | 6,038,838 | |
4.000%, 03/01/44 to 01/01/51 | | | 6,767,347 | | | | 6,375,061 | |
4.500%, 04/01/39 to 08/01/52 | | | 6,918,852 | | | | 6,752,391 | |
5.000%, 07/01/47 to 02/01/49 | | | 1,613,057 | | | | 1,611,334 | |
5.500%, 07/01/53 | | | 1,749,313 | | | | 1,733,547 | |
6.500%, 02/01/54 | | | 1,089,545 | | | | 1,130,056 | |
| | |
Total Fannie Mae | | | | | | | 25,308,473 | |
The accompanying notes are an integral part of these financial statements.
3
| | |
| | AMG GW&K Core Bond ESG Fund Schedule of Portfolio Investments (continued) |
| | | | | | | | |
| | | Principal
Amount | | | Value | |
| |
Freddie Mac - 14.4% | | | | | |
| | |
FHLMC
2.500%, 10/01/34 | | | $2,042,825 | | | | $1,884,913 | |
3.000%, 11/01/49 to 03/01/50 | | | 3,543,136 | | | | 3,113,475 | |
3.500%, 10/01/45 | | | 3,126,234 | | | | 2,856,486 | |
4.000%, 07/01/48 to 09/01/50 | | | 1,913,354 | | | | 1,797,515 | |
5.000%, 07/01/44 | | | 945,669 | | | | 948,274 | |
5.500%, 06/01/53 | | | 2,387,294 | | | | 2,383,451 | |
| | |
FHLMC Gold Pool
3.500%, 07/01/32 to 05/01/44 | | | 940,392 | | | | 893,908 | |
| | |
Freddie Mac REMICS | | | | | | | | |
Series 5106, Class KA
2.000%, 03/25/41 | | | 1,283,142 | | | | 1,187,122 | |
Series 5297, Class DA
5.000%, 12/25/52 | | | 589,366 | | | | 578,908 | |
| | |
Freddie Mac STACR REMIC Trust | | | | | | | | |
Series 2022-DNA1, Class M1A 5.857%, 01/25/422,4 | | | 879,329 | | | | 879,328 | |
Series 2024-DNA1, Class M1 6.207%, 02/25/442,4 | | | 574,802 | | | | 575,513 | |
| | |
Total Freddie Mac | | | | | | | 17,098,893 | |
| |
Ginnie Mae - 0.5% | | | | | |
| | |
GNMA | | | | | | | | |
Series 2023-111, Class FD
(1 month SOFR + 1.000%, Cap 7.000%, Floor 1.000%), 5.890%, 08/20/534 | | | 592,133 | | | | 592,137 | |
| |
U.S. Treasury Obligations - 12.9% | | | | | |
| | |
U.S. Treasury Bonds
1.875%, 02/15/51 | | | 3,558,000 | | | | 2,096,440 | |
2.250%, 05/15/41 | | | 7,147,000 | | | | 5,252,208 | |
| 1 | Some of these securities, amounting to $5,395,413 or 4.5% of net assets, were out on loan to various borrowers and are collateralized by cash and various U.S. Treasury Obligations. See Note 4 of Notes to Financial Statements. |
| 2 | Security exempt from registration under Rule 144A of the Securities Act of 1933. These securities may be resold in transactions exempt from registration, normally to qualified institutional buyers. At October 31, 2024, the value of these securities amounted to $8,674,852 or 7.3% of net assets. |
| 3 | Fixed to variable rate investment. The rate shown reflects the fixed rate in effect at October 31, 2024. Rate will reset at a future date. |
| 4 | Variable rate security. The rate shown is based on the latest available information as of October 31, 2024. Certain variable rate securities are not based on a published reference rate and spread but are determined by the issuer or agent and are based on current market conditions. These securities do not indicate a reference rate and spread in their description above. |
| 5 | Perpetuity Bond. The date shown represents the next call date. |
| | | | | | | | |
| | | Principal
Amount | | | Value | |
| | |
U.S. Treasury Bonds
3.125%, 05/15/48 | | | $4,369,000 | | | | $3,426,081 | |
3.500%, 02/15/39 | | | 3,037,000 | | | | 2,756,315 | |
3.625%, 02/15/53 | | | 1,500,000 | | | | 1,287,363 | |
| | |
U.S. Treasury Notes
4.000%, 02/28/30 | | | 456,000 | | | | 452,170 | |
| | |
Total U.S. Treasury Obligations | | | | | | | 15,270,577 | |
| |
Total U.S. Government and Agency Obligations
(Cost $65,862,854) | | | | 58,270,080 | |
| |
Short-Term Investments - 1.1% | | | | | |
| |
Joint Repurchase Agreements - 0.8%6 | | | | | |
| | |
Daiwa Capital Markets America, dated 10/31/24, due 11/01/24, 4.890% total to be received $966,642 (collateralized by various U.S. Government Agency Obligations and U.S. Treasuries, 0.625% - 7.500%, 05/15/25 - 11/01/54, totaling $985,841) | | | 966,511 | | | | 966,511 | |
| |
Repurchase Agreements - 0.3% | | | | | |
| | |
Fixed Income Clearing Corp., dated 10/31/24, due 11/01/24, 4.650% total to be received $371,048 (collateralized by a U.S. Treasury Note, 3.375%, 05/15/33, totaling $378,491) | | | 371,000 | | | | 371,000 | |
| | |
Total Short-Term Investments
(Cost $1,337,511) | | | | | | | 1,337,511 | |
| | |
Total Investments - 100.2%
(Cost $130,468,373) | | | | | | | 119,028,727 | |
| |
Other Assets, less Liabilities - (0.2)% | | | | (249,151 | ) |
| | |
Net Assets - 100.0% | | | | | | | $118,779,576 | |
| 6 | Cash collateral received for securities lending activity was invested in these joint repurchase agreements. |
| | |
| CMT | | Constant Maturity Treasury |
| |
| DAC | | Designated Activity Co. |
| |
| FHLMC | | Freddie Mac |
| |
| FNMA | | Fannie Mae |
| |
| GNMA | | Ginnie Mae |
| |
| MTN | | Medium-Term Note |
| |
| REMICS | | Real Estate Mortgage Investment Conduit |
| |
| SOFR | | Secured Overnight Financing Rate |
| |
| STACR | | Structured Agency Credit Risk |
The accompanying notes are an integral part of these financial statements.
4
| | |
| | AMG GW&K Core Bond ESG Fund Schedule of Portfolio Investments (continued) |
The following table summarizes the inputs used to value the Fund’s investments by the fair value hierarchy levels as of October 31, 2024:
| | | | | | | | | | | | | | | | | | | | | | | | | | | | |
| | | Level 1 | | | | | | Level 2 | | | | | | Level 3 | | | | | | Total | |
Investments in Securities | | | | | | | | | | | | | | | | | | | | | | | | | | | | |
| | | | | | | |
Corporate Bonds and Notes† | | | — | | | | | | | | $48,063,945 | | | | | | | | — | | | | | | | | $48,063,945 | |
| | | | | | | |
Asset-Backed Securities | | | — | | | | | | | | 3,986,932 | | | | | | | | — | | | | | | | | 3,986,932 | |
| | | | | | | |
Mortgage-Backed Securities | | | — | | | | | | | | 3,391,133 | | | | | | | | — | | | | | | | | 3,391,133 | |
| | | | | | | |
Municipal Bonds | | | — | | | | | | | | 3,979,126 | | | | | | | | — | | | | | | | | 3,979,126 | |
| | | | | | | |
U.S. Government and Agency Obligations† | | | — | | | | | | | | 58,270,080 | | | | | | | | — | | | | | | | | 58,270,080 | |
| | | | | | | |
Short-Term Investments | | | | | | | | | | | | | | | | | | | | | | | | | | | | |
| | | | | | | |
Joint Repurchase Agreements | | | — | | | | | | | | 966,511 | | | | | | | | — | | | | | | | | 966,511 | |
| | | | | | | |
Repurchase Agreements | | | — | | | | | | | | 371,000 | | | | | | | | — | | | | | | | | 371,000 | |
| | | | | | | | | | | | | | | | | | | | | | | | | | | | |
| | | | | | | |
Total Investments in Securities | | | — | | | | | | | | $119,028,727 | | | | | | | | — | | | | | | | | $119,028,727 | |
| | | | | | | | | | | | | | | | | | | | | | | | | | | | |
| | † | All corporate bonds and notes and U.S. government and agency obligations held in the Fund are Level 2 securities. For a detailed breakout of corporate bonds and notes and U.S. government and agency obligations by major industry or agency classification, please refer to the Fund’s Schedule of Portfolio Investments. |
For the fiscal year ended October 31, 2024, there were no transfers in or out of Level 3.
The accompanying notes are an integral part of these financial statements.
5
| | |
| | AMG GW&K Small/Mid Cap Growth Fund Schedule of Portfolio Investments October 31, 2024 |
| | | | | | | | |
| | | Shares | | | Value | |
| |
Common Stocks - 97.3% | | | | | |
| |
Consumer Discretionary - 12.8% | | | | | |
| | |
Asbury Automotive Group, Inc.* | | | 1,841 | | | | $419,454 | |
| | |
Bright Horizons Family Solutions, Inc.* | | | 1,983 | | | | 264,671 | |
| | |
Burlington Stores, Inc.* | | | 3,195 | | | | 791,625 | |
| | |
Churchill Downs, Inc. | | | 4,714 | | | | 660,431 | |
| | |
Grand Canyon Education, Inc.* | | | 4,799 | | | | 657,991 | |
| | |
Krispy Kreme, Inc.1 | | | 21,510 | | | | 244,569 | |
| | |
LKQ Corp. | | | 10,159 | | | | 373,750 | |
| | |
Pool Corp. | | | 1,324 | | | | 478,811 | |
| | |
Revolve Group, Inc.*,1 | | | 13,870 | | | | 344,253 | |
| | |
Texas Roadhouse, Inc. | | | 4,885 | | | | 933,621 | |
| | |
Vail Resorts, Inc. | | | 990 | | | | 164,033 | |
| | |
Total Consumer Discretionary | | | | | | | 5,333,209 | |
| |
Consumer Staples - 1.4% | | | | | |
| | |
Performance Food Group Co.* | | | 7,434 | | | | 604,013 | |
| |
Energy - 4.0% | | | | | |
| | |
ChampionX Corp. | | | 10,280 | | | | 290,102 | |
| | |
Matador Resources Co. | | | 13,110 | | | | 683,162 | |
| | |
Ovintiv, Inc. | | | 9,062 | | | | 355,230 | |
| | |
Permian Resources Corp. | | | 24,700 | | | | 336,661 | |
| | |
Total Energy | | | | | | | 1,665,155 | |
| |
Financials - 7.1% | | | | | |
| | |
Evercore, Inc., Class A | | | 2,814 | | | | 743,374 | |
| | |
Houlihan Lokey, Inc. | | | 4,955 | | | | 856,075 | |
| | |
MarketAxess Holdings, Inc. | | | 1,485 | | | | 429,789 | |
| | |
Pinnacle Financial Partners, Inc. | | | 5,099 | | | | 537,690 | |
| | |
RLI Corp. | | | 2,600 | | | | 405,522 | |
| | |
Total Financials | | | | | | | 2,972,450 | |
| |
Health Care - 23.0% | | | | | |
| | |
Acadia Healthcare Co., Inc.* | | | 9,695 | | | | 413,880 | |
| | |
Agios Pharmaceuticals, Inc.* | | | 12,454 | | | | 553,331 | |
| | |
Azenta, Inc.* | | | 11,992 | | | | 492,751 | |
| | |
Bio-Rad Laboratories, Inc., Class A* | | | 1,031 | | | | 369,294 | |
| | |
Chemed Corp. | | | 859 | | | | 464,066 | |
| | |
Crinetics Pharmaceuticals, Inc.* | | | 12,455 | | | | 696,982 | |
| | |
Globus Medical, Inc., Class A* | | | 8,673 | | | | 637,813 | |
| | |
Halozyme Therapeutics, Inc.* | | | 9,735 | | | | 492,299 | |
| | |
HealthEquity, Inc.* | | | 7,036 | | | | 599,819 | |
| | |
Insmed, Inc.* | | | 8,630 | | | | 580,626 | |
| | |
Intra-Cellular Therapies, Inc.* | | | 7,643 | | | | 647,744 | |
| | |
Medpace Holdings, Inc.* | | | 1,439 | | | | 452,163 | |
| | |
Natera, Inc.* | | | 4,751 | | | | 574,681 | |
| | | | | | | | |
| | | Shares | | | Value | |
| | |
Neurocrine Biosciences, Inc.* | | | 4,233 | | | | $509,103 | |
| | |
Phathom Pharmaceuticals, Inc.*,1 | | | 33,153 | | | | 568,574 | |
| | |
SpringWorks Therapeutics, Inc.*,1 | | | 13,310 | | | | 401,030 | |
| | |
Ultragenyx Pharmaceutical, Inc.* | | | 11,764 | | | | 599,846 | |
| | |
Veracyte, Inc.* | | | 16,515 | | | | 557,216 | |
| | |
Total Health Care | | | | | | | 9,611,218 | |
| |
Industrials - 22.0% | | | | | |
| | |
API Group Corp.* | | | 20,096 | | | | 686,077 | |
| | |
Applied Industrial Technologies, Inc. | | | 1,852 | | | | 428,905 | |
| | |
Booz Allen Hamilton Holding Corp. | | | 3,666 | | | | 665,966 | |
| | |
CACI International, Inc., Class A* | | | 1,433 | | | | 791,819 | |
| | |
Chart Industries, Inc.*,1 | | | 4,085 | | | | 493,141 | |
| | |
Graco, Inc. | | | 5,081 | | | | 413,848 | |
| | |
IDEX Corp. | | | 2,914 | | | | 625,461 | |
| | |
ITT, Inc. | | | 5,741 | | | | 804,429 | |
| | |
Knight-Swift Transportation Holdings, Inc. | | | 5,802 | | | | 302,168 | |
| | |
Nordson Corp. | | | 1,542 | | | | 382,246 | |
| | |
Paylocity Holding Corp.* | | | 3,704 | | | | 683,647 | |
| | |
RBC Bearings, Inc.* | | | 2,364 | | | | 662,747 | |
| | |
SiteOne Landscape Supply, Inc.* | | | 4,788 | | | | 669,075 | |
| | |
SS&C Technologies Holdings, Inc. | | | 4,094 | | | | 286,293 | |
| | |
Sterling Infrastructure, Inc.* | | | 3,217 | | | | 496,866 | |
| | |
The Toro Co. | | | 4,627 | | | | 372,381 | |
| | |
Trex Co., Inc.* | | | 6,288 | | | | 445,505 | |
| | |
Total Industrials | | | | | | | 9,210,574 | |
| |
Information Technology - 20.2% | | | | | |
| | |
CCC Intelligent Solutions Holdings, Inc.* | | | 53,565 | | | | 557,612 | |
| | |
Cognex Corp. | | | 16,590 | | | | 667,416 | |
| | |
CyberArk Software, Ltd. (Israel)* | | | 3,721 | | | | 1,028,931 | |
| | |
The Descartes Systems Group, Inc. (Canada)* | | | 5,177 | | | | 538,046 | |
| | |
Entegris, Inc. | | | 7,512 | | | | 786,582 | |
| | |
Globant SA (Uruguay)* | | | 3,705 | | | | 777,642 | |
| | |
MACOM Technology Solutions Holdings, Inc.* | | | 6,651 | | | | 747,572 | |
| | |
Manhattan Associates, Inc.* | | | 2,898 | | | | 763,217 | |
| | |
Power Integrations, Inc.1 | | | 4,194 | | | | 253,443 | |
| | |
Procore Technologies, Inc.* | | | 8,469 | | | | 555,990 | |
| | |
Silicon Laboratories, Inc.* | | | 2,819 | | | | 292,781 | |
| | |
Tyler Technologies, Inc.* | | | 1,479 | | | | 895,668 | |
| | |
Zebra Technologies Corp., Class A* | | | 1,520 | | | | 580,594 | |
| | |
Total Information Technology | | | | | | | 8,445,494 | |
| |
Materials - 4.8% | | | | | |
| | |
AptarGroup, Inc. | | | 2,975 | | | | 499,532 | |
| | |
Avient Corp. | | | 9,499 | | | | 442,748 | |
The accompanying notes are an integral part of these financial statements.
6
| | |
| | AMG GW&K Small/Mid Cap Growth Fund Schedule of Portfolio Investments (continued) |
| | | | | | | | |
| | | Shares | | | Value | |
| | |
Materials - 4.8% (continued) | | | | | | | | |
| | |
Eagle Materials, Inc. | | | 1,710 | | | | $488,137 | |
| | |
RPM International, Inc. | | | 4,575 | | | | 581,528 | |
| | |
Total Materials | | | | | | | 2,011,945 | |
| |
Real Estate - 2.0% | | | | | |
| | |
EastGroup Properties, Inc., REIT | | | 2,816 | | | | 482,324 | |
| | |
Sun Communities, Inc., REIT | | | 2,792 | | | | 370,443 | |
| | |
Total Real Estate | | | | | | | 852,767 | |
| | |
Total Common Stocks | | | | | | | | |
(Cost $34,816,133) | | | | | | | 40,706,825 | |
| | |
Rights - 0.0% | | | | | | | | |
| |
Health Care - 0.0% | | | | | |
| | |
Abiomed, Inc.*,2,3 | | | | | | | | |
(Cost $0) | | | 1,175 | | | | 0 | |
| * | Non-income producing security. |
| 1 | Some of these securities, amounting to $1,950,912 or 4.7% of net assets, were out on loan to various borrowers and are collateralized by various U.S. Treasury Obligations. See Note 4 of Notes to Financial Statements. |
| 2 | Security’s value was determined by using significant unobservable inputs. |
| 3 | This security is restricted and not available for re-sale. The Fund received Contingent Value Rights (“CVRs”) of Abiomed Inc (“ABIOMED”) from a corporate action where Johnson & Johnson acquired ABIOMED on December 23, 2022. The total value of this restricted security held is $0 which represents 0% of net assets. |
| | | | | | | | |
| | |
| | | Principal
Amount | | | Value | |
| |
Short-Term Investments - 2.9% | | | | | |
| |
Repurchase Agreements - 2.9% | | | | | |
| | |
Fixed Income Clearing Corp., dated 10/31/24, due 11/01/24, 4.650% total to be received $1,194,154 (collateralized by a U.S. Treasury Note, 3.375%, 05/15/33, totaling $1,217,888) | | | $1,194,000 | | | | $1,194,000 | |
| | |
Total Short-Term Investments | | | | | | | | |
(Cost $1,194,000) | | | | | | | 1,194,000 | |
| |
Total Investments - 100.2% | | | | | |
(Cost $36,010,133) | | | | | | | 41,900,825 | |
| |
Other Assets, less Liabilities - (0.2)% | | | | (66,619 | ) |
| | |
Net Assets - 100.0% | | | | | | | $41,834,206 | |
REIT Real Estate Investment Trust
The accompanying notes are an integral part of these financial statements.
7
| | |
| | AMG GW&K Small/Mid Cap Growth Fund Schedule of Portfolio Investments (continued) |
The following table summarizes the inputs used to value the Fund’s investments by the fair value hierarchy levels as of October 31, 2024:
| | | | | | | | | | | | | | | | | | | | | | | | | | | | | | | | |
| | | | | | Level 1 | | | | | | Level 2 | | | | | | Level 3 | | | | | | Total | |
Investments in Securities | | | | | | | | | | | | | | | | | | | | | | | | | | | | | | | | |
| | | | | | | | |
Common Stocks† | | | | | | | $40,706,825 | | | | | | | | — | | | | | | | | — | | | | | | | | $40,706,825 | |
| | | | | | | | |
Rights | | | | | | | | | | | | | | | | | | | | | | | | | | | | | | | | |
| | | | | | | | |
Health Care | | | | | | | — | | | | | | | | — | | | | | | | | $0 | | | | | | | | — | |
| | | | | | | | |
Short-Term Investments | | | | | | | | | | | | | | | | | | | | | | | | | | | | | | | | |
| | | | | | | | |
Repurchase Agreements | | | | | | | — | | | | | | | | $1,194,000 | | | | | | | | — | | | | | | | | 1,194,000 | |
| | | | | | | | | | | | | | | | | | | | | | | | | | | | | | | | |
| | | | | | | | |
Total Investments in Securities | | | | | | | $40,706,825 | | | | | | | | $1,194,000 | | | | | | | | $0 | | | | | | | | $41,900,825 | |
| | | | | | | | | | | | | | | | | | | | | | | | | | | | | | | | |
| † | All common stocks held in the Fund are Level 1 securities. For a detailed breakout of common stocks by major industry classification, please refer to the Fund’s Schedule of Portfolio Investments. |
For the fiscal year ended October 31, 2024, there were no transfers in or out of Level 3. The Fund did not have any purchases and sales of Level 3 securities for the same period. The Level 3 rights were received as a result of a corporate action. The security’s value was determined by using significant unobservable inputs. For the fiscal year ended October 31, 2024, the change in unrealized appreciation (depreciation) was $0.
The accompanying notes are an integral part of these financial statements.
8
| | |
| | Statement of Assets and Liabilities October 31, 2024 |
| | | | | | | | |
| | | AMG GW&K
Core Bond
ESG Fund | | | AMG GW&K
Small/Mid Cap
Growth Fund | |
| | |
Assets: | | | | | | | | |
| | |
Investments at value1 (including securities on loan valued at $5,395,413, and $1,950,912, respectively) | | | $119,028,727 | | | | $41,900,825 | |
| | |
Cash | | | 939 | | | | 863 | |
| | |
Dividend and interest receivables | | | 915,849 | | | | 4,293 | |
| | |
Securities lending income receivable | | | 1,895 | | | | 1,452 | |
| | |
Receivable for Fund shares sold | | | 824 | | | | 1,507 | |
| | |
Receivable from affiliate | | | 23,610 | | | | 10,246 | |
| | |
Prepaid expenses and other assets | | | 13,164 | | | | 9,305 | |
| | |
Total assets | | | 119,985,008 | | | | 41,928,491 | |
| | |
Liabilities: | | | | | | | | |
| | |
Payable upon return of securities loaned | | | 966,511 | | | | — | |
| | |
Payable for Fund shares repurchased | | | 75,393 | | | | 5,445 | |
| | |
Accrued expenses: | | | | | | | | |
| | |
Investment advisory and management fees | | | 30,766 | | | | 22,179 | |
| | |
Administrative fees | | | 15,383 | | | | 5,366 | |
| | |
Distribution fees | | | 478 | | | | 5,386 | |
| | |
Shareholder service fees | | | 8,755 | | | | 399 | |
| | |
Other | | | 108,146 | | | | 55,510 | |
| | |
Total liabilities | | | 1,205,432 | | | | 94,285 | |
|
Commitments and Contingencies (Notes 2 & 6) | |
| | |
Net Assets | | | $118,779,576 | | | | $41,834,206 | |
| | |
1 Investments at cost | | | $130,468,373 | | | | $36,010,133 | |
The accompanying notes are an integral part of these financial statements.
9
| | |
| | Statement of Assets and Liabilities (continued) |
| | | | | | | | |
| | | AMG GW&K
Core Bond
ESG Fund | | | AMG GW&K
Small/Mid Cap
Growth Fund |
| | |
Net Assets Represent: | | | | | | | | |
| | |
Paid-in capital | | | $142,074,915 | | | | $35,796,714 | |
| | |
Total distributable earnings (loss) | | | (23,295,339 | ) | | | 6,037,492 | |
| | |
Net Assets | | | $118,779,576 | | | | $41,834,206 | |
| | |
Class N: | | | | | | | | |
| | |
Net Assets | | | $2,229,091 | | | | $32,462,605 | |
| | |
Shares outstanding | | | 249,253 | | | | 1,897,147 | |
| | |
Net asset value, offering and redemption price per share | | | $8.94 | | | | $17.11 | |
| | |
Class I: | | | | | | | | |
| | |
Net Assets | | | $115,231,786 | | | | $9,341,074 | |
| | |
Shares outstanding | | | 12,877,492 | | | | 522,032 | |
| | |
Net asset value, offering and redemption price per share | | | $8.95 | | | | $17.89 | |
| | |
Class Z: | | | | | | | | |
| | |
Net Assets | | | $1,318,699 | | | | $30,527 | |
| | |
Shares outstanding | | | 147,470 | | | | 1,703 | |
| | |
Net asset value, offering and redemption price per share | | | $8.94 | | | | $17.93 | |
The accompanying notes are an integral part of these financial statements.
10
| | |
| | Statement of Operations For the fiscal year ended October 31, 2024 |
| | | | | | | | | | |
| | | AMG GW&K
Core Bond
ESG Fund | | AMG GW&K
Small/Mid Cap
Growth Fund |
| | |
Investment Income: | | | | | | | | | | |
| | |
Dividend income | | | | — | | | | | $225,555 | |
| | |
Interest income | | | | $4,887,574 | | | | | 41,805 | |
| | |
Securities lending income | | | | 6,918 | | | | | 9,780 | |
| | |
Foreign withholding tax | | | | — | | | | | (1,696 | ) |
| | |
Total investment income | | | | 4,894,492 | | | | | 275,444 | |
| | |
Expenses: | | | | | | | | | | |
| | |
Investment advisory and management fees | | | | 370,276 | | | | | 246,740 | |
| | |
Administrative fees | | | | 185,138 | | | | | 59,695 | |
| | |
Distribution fees - Class N | | | | 5,346 | | | | | 60,376 | |
| | |
Shareholder servicing fees - Class N | | | | 3,207 | | | | | — | |
| | |
Shareholder servicing fees - Class I | | | | 81,439 | | | | | 4,271 | |
| | |
Professional fees | | | | 66,576 | | | | | 29,735 | |
| | |
Reports to shareholders | | | | 49,125 | | | | | 18,179 | |
| | |
Registration fees | | | | 33,944 | | | | | 23,623 | |
| | |
Custodian fees | | | | 28,182 | | | | | 21,597 | |
| | |
Transfer agent fees | | | | 14,697 | | | | | 7,101 | |
| | |
Trustee fees and expenses | | | | 10,544 | | | | | 3,347 | |
| | |
Interest expense | | | | 1,518 | | | | | 426 | |
| | |
Miscellaneous | | | | 9,581 | | | | | 5,606 | |
| | |
Total expenses before offsets | | | | 859,573 | | | | | 480,696 | |
| | |
Expense reimbursements | | | | (175,621 | ) | | | | (89,289 | ) |
| | |
Expense reductions | | | | — | | | | | (1,441 | ) |
| | |
Net expenses | | | | 683,952 | | | | | 389,966 | |
| | |
| | | | | | | | | | |
| | |
Net investment income (loss) | | | | 4,210,540 | | | | | (114,522 | ) |
| | |
Net Realized and Unrealized Gain: | | | | | | | | | | |
| | |
Net realized gain (loss) on investments | | | | (2,662,819 | ) | | | | 545,745 | |
| | |
Net change in unrealized appreciation/depreciation on investments | | | | 11,526,621 | | | | | 9,064,856 | |
| | |
Net realized and unrealized gain | | | | 8,863,802 | | | | | 9,610,601 | |
| | |
| | | | | | | | | | |
| | |
Net increase in net assets resulting from operations | | | | $13,074,342 | | | | | $9,496,079 | |
The accompanying notes are an integral part of these financial statements.
11
| | |
| | Statements of Changes in Net Assets For the fiscal years ended October 31, |
| | | | | | | | | | | | | | | | |
| | | AMG GW&K
Core Bond ESG Fund | | AMG GW&K
Small/Mid Cap
Growth Fund |
| | | | |
| | | 2024 | | 2023 | | 2024 | | 2023 |
| | | | |
Increase in Net Assets Resulting From Operations: | | | | | | | | | | | | | | | | |
| | | | |
Net investment income (loss) | | | $4,210,540 | | | | $4,046,025 | | | | $(114,522 | ) | | | $(90,598 | ) |
| | | | |
Net realized gain (loss) on investments | | | (2,662,819 | ) | | | (5,580,179 | ) | | | 545,745 | | | | (174,467 | ) |
| | | | |
Net change in unrealized appreciation/depreciation on investments | | | 11,526,621 | | | | 2,763,863 | | | | 9,064,856 | | | | 436,818 | |
| | | | |
Net increase in net assets resulting from operations | | | 13,074,342 | | | | 1,229,709 | | | | 9,496,079 | | | | 171,753 | |
| | | | |
Distributions to Shareholders: | | | | | | | | | | | | | | | | |
| | | | |
Class N | | | (65,847 | ) | | | (51,357 | ) | | | — | | | | (496,550 | ) |
| | | | |
Class I | | | (4,094,887 | ) | | | (3,948,393 | ) | | | — | | | | (126,577 | ) |
| | | | |
Class Z | | | (46,940 | ) | | | (47,130 | ) | | | — | | | | (448 | ) |
| | | | |
Total distributions to shareholders | | | (4,207,674 | ) | | | (4,046,880 | ) | | | — | | | | (623,575 | ) |
| | | | |
Capital Share Transactions:1 | | | | | | | | | | | | | | | | |
| | | | |
Net increase (decrease) from capital share transactions | | | (12,493,997 | ) | | | (16,492,501 | ) | | | (2,366,458 | ) | | | 3,611,251 | |
| | | | | | | | | | | | | | | | |
| | | | |
Total increase (decrease) in net assets | | | (3,627,329 | ) | | | (19,309,672 | ) | | | 7,129,621 | | | | 3,159,429 | |
| | | | |
Net Assets: | | | | | | | | | | | | | | | | |
| | | | |
Beginning of year | | | 122,406,905 | | | | 141,716,577 | | | | 34,704,585 | | | | 31,545,156 | |
| | | | |
End of year | | | $118,779,576 | | | | $122,406,905 | | | | $41,834,206 | | | | $34,704,585 | |
1 See Note 1(g) of the Notes to Financial Statements.
The accompanying notes are an integral part of these financial statements.
12
| | |
| | AMG GW&K Core Bond ESG Fund Financial Highlights For a share outstanding throughout each fiscal year |
| | | | | | | | | | | | | | | | | | | | | | | | | |
| | | For the fiscal years ended October 31, |
| | | | | |
| Class N | | 2024 | | 2023 | | 2022 | | 2021 | | 2020 |
| | | | | |
Net Asset Value, Beginning of Year | | | | $8.33 | | | | | $8.56 | | | | | $10.75 | | | | | $10.90 | | | | | $10.53 | |
| | | | | |
Income (loss) from Investment Operations: | | | | | | | | | | | | | | | | | | | | | | | | | |
| | | | | |
Net investment income1,2 | | | | 0.28 | | | | | 0.23 | | | | | 0.14 | | | | | 0.12 | | | | | 0.18 | |
| | | | | |
Net realized and unrealized gain (loss) on investments | | | | 0.61 | | | | | (0.23 | ) | | | | (1.93 | ) | | | | (0.15 | ) | | | | 0.37 | |
| | | | | |
Total income (loss) from investment operations | | | | 0.89 | | | | | — | | | | | (1.79 | ) | | | | (0.03 | ) | | | | 0.55 | |
| | | | | |
Less Distributions to Shareholders from: | | | | | | | | | | | | | | | | | | | | | | | | | |
| | | | | |
Net investment income | | | | (0.28 | ) | | | | (0.23 | ) | | | | (0.15 | ) | | | | (0.12 | ) | | | | (0.18 | ) |
| | | | | |
Net realized gain on investments | | | | — | | | | | — | | | | | (0.25 | ) | | | | — | | | | | — | |
| | | | | |
Total distributions to shareholders | | | | (0.28 | ) | | | | (0.23 | ) | | | | (0.40 | ) | | | | (0.12 | ) | | | | (0.18 | ) |
| | | | | |
Net Asset Value, End of Year | | | | $8.94 | | | | | $8.33 | | | | | $8.56 | | | | | $10.75 | | | | | $10.90 | |
| | | | | |
Total Return2,3 | | | | 10.70 | % | | | | (0.15 | )% | | | | (17.18 | )% | | | | (0.27 | )% | | | | 5.31 | % |
| | | | | |
Ratio of net expenses to average net assets | | | | 0.88 | %4 | | | | 0.88 | % | | | | 0.88 | % | | | | 0.88 | % | | | | 0.88 | % |
| | | | | |
Ratio of gross expenses to average net assets5 | | | | 1.02 | % | | | | 0.99 | % | | | | 0.95 | % | | | | 0.94 | % | | | | 0.96 | % |
| | | | | |
Ratio of net investment income to average net assets2 | | | | 3.08 | % | | | | 2.55 | % | | | | 1.49 | % | | | | 1.12 | % | | | | 1.69 | % |
| | | | | |
Portfolio turnover | | | | 34 | % | | | | 25 | % | | | | 34 | % | | | | 62 | % | | | | 56 | % |
| | | | | |
Net assets end of year (000’s) omitted | | | | $2,229 | | | | | $1,937 | | | | | $1,716 | | | | | $2,125 | | | | | $1,905 | |
| | | | | | | | | | | | | | | | | | | | | | | | | | |
The accompanying notes are an integral part of these financial statements.
13
| | |
| | AMG GW&K Core Bond ESG Fund Financial Highlights For a share outstanding throughout each fiscal year |
| | | | | | | | | | | | | | | | | | | | | | | | | |
| | | For the fiscal years ended October 31, |
| | | | | |
| Class I | | 2024 | | 2023 | | 2022 | | 2021 | | 2020 |
| | | | | |
Net Asset Value, Beginning of Year | | | | $8.34 | | | | | $8.56 | | | | | $10.76 | | | | | $10.90 | | | | | $10.54 | |
| | | | | |
Income (loss) from Investment Operations: | | | | | | | | | | | | | | | | | | | | | | | | | |
| | | | | |
Net investment income1,2 | | | | 0.30 | | | | | 0.25 | | | | | 0.18 | | | | | 0.16 | | | | | 0.22 | |
| | | | | |
Net realized and unrealized gain (loss) on investments | | | | 0.62 | | | | | (0.21 | ) | | | | (1.95 | ) | | | | (0.14 | ) | | | | 0.36 | |
| | | | | |
Total income (loss) from investment operations | | | | 0.92 | | | | | 0.04 | | | | | (1.77 | ) | | | | 0.02 | | | | | 0.58 | |
| | | | | |
Less Distributions to Shareholders from: | | | | | | | | | | | | | | | | | | | | | | | | | |
| | | | | |
Net investment income | | | | (0.31 | ) | | | | (0.26 | ) | | | | (0.18 | ) | | | | (0.16 | ) | | | | (0.22 | ) |
| | | | | |
Net realized gain on investments | | | | — | | | | | — | | | | | (0.25 | ) | | | | — | | | | | — | |
| | | | | |
Total distributions to shareholders | | | | (0.31 | ) | | | | (0.26 | ) | | | | (0.43 | ) | | | | (0.16 | ) | | | | (0.22 | ) |
| | | | | |
Net Asset Value, End of Year | | | | $8.95 | | | | | $8.34 | | | | | $8.56 | | | | | $10.76 | | | | | $10.90 | |
| | | | | |
Total Return2,3 | | | | 11.06 | % | | | | 0.30 | % | | | | (16.99 | )% | | | | 0.15 | % | | | | 5.55 | % |
| | | | | |
Ratio of net expenses to average net assets | | | | 0.55 | %4 | | | | 0.55 | % | | | | 0.55 | % | | | | 0.56 | % | | | | 0.55 | % |
| | | | | |
Ratio of gross expenses to average net assets5 | | | | 0.69 | % | | | | 0.66 | % | | | | 0.62 | % | | | | 0.62 | % | | | | 0.63 | % |
| | | | | |
Ratio of net investment income to average net assets2 | | | | 3.41 | % | | | | 2.88 | % | | | | 1.82 | % | | | | 1.44 | % | | | | 2.01 | % |
| | | | | |
Portfolio turnover | | | | 34 | % | | | | 25 | % | | | | 34 | % | | | | 62 | % | | | | 56 | % |
| | | | | |
Net assets end of year (000’s) omitted | | | | $115,232 | | | | | $119,191 | | | | | $137,806 | | | | | $190,306 | | | | | $202,363 | |
| | | | | | | | | | | | | | | | | | | | | | | | | | |
The accompanying notes are an integral part of these financial statements.
14
| | |
| | AMG GW&K Core Bond ESG Fund Financial Highlights For a share outstanding throughout each fiscal year |
| | | | | | | | | | | | | | | | | | | | | | | | | |
| | | For the fiscal years ended October 31, |
| | | | | |
| Class Z | | 2024 | | 2023 | | 2022 | | 2021 | | 2020 |
| | | | | |
Net Asset Value, Beginning of Year | | | | $8.33 | | | | | $8.56 | | | | | $10.75 | | | | | $10.90 | | | | | $10.53 | |
| | | | | |
Income (loss) from Investment Operations: | | | | | | | | | | | | | | | | | | | | | | | | | |
| | | | | |
Net investment income1,2 | | | | 0.31 | | | | | 0.26 | | | | | 0.18 | | | | | 0.16 | | | | | 0.22 | |
| | | | | |
Net realized and unrealized gain (loss) on investments | | | | 0.61 | | | | | (0.23 | ) | | | | (1.94 | ) | | | | (0.15 | ) | | | | 0.38 | |
| | | | | |
Total income (loss) from investment operations | | | | 0.92 | | | | | 0.03 | | | | | (1.76 | ) | | | | 0.01 | | | | | 0.60 | |
| | | | | |
Less Distributions to Shareholders from: | | | | | | | | | | | | | | | | | | | | | | | | | |
| | | | | |
Net investment income | | | | (0.31 | ) | | | | (0.26 | ) | | | | (0.18 | ) | | | | (0.16 | ) | | | | (0.23 | ) |
| | | | | |
Net realized gain on investments | | | | — | | | | | — | | | | | (0.25 | ) | | | | — | | | | | — | |
| | | | | |
Total distributions to shareholders | | | | (0.31 | ) | | | | (0.26 | ) | | | | (0.43 | ) | | | | (0.16 | ) | | | | (0.23 | ) |
| | | | | |
Net Asset Value, End of Year | | | | $8.94 | | | | | $8.33 | | | | | $8.56 | | | | | $10.75 | | | | | $10.90 | |
| | | | | |
Total Return2,3 | | | | 11.15 | % | | | | 0.25 | % | | | | (16.85 | )% | | | | 0.13 | % | | | | 5.73 | % |
| | | | | |
Ratio of net expenses to average net assets | | | | 0.48 | %4 | | | | 0.48 | % | | | | 0.48 | % | | | | 0.48 | % | | | | 0.48 | % |
| | | | | |
Ratio of gross expenses to average net assets5 | | | | 0.62 | % | | | | 0.59 | % | | | | 0.55 | % | | | | 0.54 | % | | | | 0.56 | % |
| | | | | |
Ratio of net investment income to average net assets2 | | | | 3.48 | % | | | | 2.95 | % | | | | 1.89 | % | | | | 1.52 | % | | | | 2.09 | % |
| | | | | |
Portfolio turnover | | | | 34 | % | | | | 25 | % | | | | 34 | % | | | | 62 | % | | | | 56 | % |
| | | | | |
Net assets end of year (000’s) omitted | | | | $1,319 | | | | | $1,279 | | | | | $2,195 | | | | | $3,724 | | | | | $3,812 | |
| | | | | | | | | | | | | | | | | | | | | | | | | | |
| 1 | Per share numbers have been calculated using average shares. |
| 2 | Total returns and net investment income would have been lower had certain expenses not been offset. |
| 3 | The total return is calculated using the published Net Asset Value as of fiscal year end. |
| 4 | Includes interest expense of less than 0.01% related to participation in the interfund lending program. |
| 5 | Excludes the impact of expense reimbursement or fee waivers and expense reductions such as brokerage credits, but includes expense repayments and non-reimbursable expenses, if any, such as interest, taxes, and extraordinary expenses. (See Note 1(c) and 2 in the Notes to Financial Statements.) |
The accompanying notes are an integral part of these financial statements.
15
| | |
| | AMG GW&K Small/Mid Cap Growth Fund Financial Highlights For a share outstanding throughout each fiscal year |
| | | | | | | | | | | | | | | | | | | | | | | | | |
| | | For the fiscal years ended October 31, |
| | | | | |
| Class N | | 2024 | | 2023 | | 2022 | | 2021 | | 2020 |
| | | | | |
Net Asset Value, Beginning of Year | | | | $13.33 | | | | | $13.45 | | | | | $17.67 | | | | | $21.14 | | | | | $17.02 | |
| | | | | |
Income (loss) from Investment Operations: | | | | | | | | | | | | | | | | | | | | | | | | | |
| | | | | |
Net investment loss1,2 | | | | (0.05 | ) | | | | (0.04 | ) | | | | (0.08 | ) | | | | (0.17 | ) | | | | (0.17 | ) |
| | | | | |
Net realized and unrealized gain (loss) on investments | | | | 3.83 | | | | | 0.19 | | | | | (4.14 | ) | | | | 7.74 | | | | | 4.29 | |
| | | | | |
Total income (loss) from investment operations | | | | 3.78 | | | | | 0.15 | | | | | (4.22 | ) | | | | 7.57 | | | | | 4.12 | |
| | | | | |
Less Distributions to Shareholders from: | | | | | | | | | | | | | | | | | | | | | | | | | |
| | | | | |
Net realized gain on investments | | | | — | | | | | (0.27 | ) | | | | — | | | | | (10.55 | ) | | | | — | |
| | | | | |
Paid in capital | | | | — | | | | | — | | | | | — | | | | | (0.49 | ) | | | | — | |
| | | | | |
Total distributions to shareholders | | | | — | | | | | (0.27 | ) | | | | — | | | | | (11.04 | ) | | | | — | |
| | | | | |
Net Asset Value, End of Year | | | | $17.11 | | | | | $13.33 | | | | | $13.45 | | | | | $17.67 | | | | | $21.14 | |
| | | | | |
Total Return2,3 | | | | 28.36 | % | | | | 1.12 | % | | | | (23.88 | )%4 | | | | 46.66 | % | | | | 24.27 | % |
| | | | | |
Ratio of net expenses to average net assets5 | | | | 1.01 | %6 | | | | 1.00 | % | | | | 1.00 | % | | | | 1.17 | % | | | | 1.29 | %6 |
| | | | | |
Ratio of gross expenses to average net assets7 | | | | 1.24 | % | | | | 1.24 | % | | | | 1.25 | % | | | | 1.42 | % | | | | 1.60 | % |
| | | | | |
Ratio of net investment loss to average net assets2 | | | | (0.32 | )% | | | | (0.28 | )% | | | | (0.56 | )% | | | | (0.91 | )% | | | | (0.92 | )% |
| | | | | |
Portfolio turnover | | | | 19 | % | | | | 25 | % | | | | 23 | % | | | | 158 | % | | | | 126 | % |
| | | | | |
Net assets end of year (000’s) omitted | | | | $32,463 | | | | | $27,120 | | | | | $24,994 | | | | | $37,471 | | | | | $28,908 | |
| | | | | | | | | | | | | | | | | | | | | | | | | | |
The accompanying notes are an integral part of these financial statements.
16
| | |
| | AMG GW&K Small/Mid Cap Growth Fund Financial Highlights For a share outstanding throughout each fiscal year |
| | | | | | | | | | | | | | | | | | | | | | | | | |
| | | For the fiscal years ended October 31, |
| | | | | |
| Class I | | 2024 | | 2023 | | 2022 | | 2021 | | 2020 |
| | | | | |
Net Asset Value, Beginning of Year | | | | $13.93 | | | | | $14.01 | | | | | $18.39 | | | | | $21.60 | | | | | $17.35 | |
| | | | | |
Income (loss) from Investment Operations: | | | | | | | | | | | | | | | | | | | | | | | | | |
| | | | | |
Net investment loss1,2 | | | | (0.03 | ) | | | | (0.02 | ) | | | | (0.06 | ) | | | | (0.15 | ) | | | | (0.14 | ) |
| | | | | |
Net realized and unrealized gain (loss) on investments | | | | 3.99 | | | | | 0.21 | | | | | (4.32 | ) | | | | 7.98 | | | | | 4.39 | |
| | | | | |
Total income (loss) from investment operations | | | | 3.96 | | | | | 0.19 | | | | | (4.38 | ) | | | | 7.83 | | | | | 4.25 | |
| | | | | |
Less Distributions to Shareholders from: | | | | | | | | | | | | | | | | | | | | | | | | | |
| | | | | |
Net realized gain on investments | | | | — | | | | | (0.27 | ) | | | | — | | | | | (10.55 | ) | | | | — | |
| | | | | |
Paid in capital | | | | — | | | | | — | | | | | — | | | | | (0.49 | ) | | | | — | |
| | | | | |
Total distributions to shareholders | | | | — | | | | | (0.27 | ) | | | | — | | | | | (11.04 | ) | | | | — | |
| | | | | |
Net Asset Value, End of Year | | | | $17.89 | | | | | $13.93 | | | | | $14.01 | | | | | $18.39 | | | | | $21.60 | |
| | | | | |
Total Return2,3 | | | | 28.43 | % | | | | 1.36 | % | | | | (23.82 | )%4 | | | | 46.94 | % | | | | 24.48 | % |
| | | | | |
Ratio of net expenses to average net assets5 | | | | 0.87 | %6 | | | | 0.86 | % | | | | 0.86 | % | | | | 1.02 | % | | | | 1.10 | %6 |
| | | | | |
Ratio of gross expenses to average net assets7 | | | | 1.10 | % | | | | 1.10 | % | | | | 1.11 | % | | | | 1.27 | % | | | | 1.41 | % |
| | | | | |
Ratio of net investment loss to average net assets2 | | | | (0.18 | )% | | | | (0.14 | )% | | | | (0.42 | )% | | | | (0.76 | )% | | | | (0.73 | )% |
| | | | | |
Portfolio turnover | | | | 19 | % | | | | 25 | % | | | | 23 | % | | | | 158 | % | | | | 126 | % |
| | | | | |
Net assets end of year (000’s) omitted | | | | $9,341 | | | | | $7,561 | | | | | $6,540 | | | | | $6,612 | | | | | $6,483 | |
| | | | | | | | | | | | | | | | | | | | | | | | | | |
The accompanying notes are an integral part of these financial statements.
17
| | |
| | AMG GW&K Small/Mid Cap Growth Fund Financial Highlights For a share outstanding throughout each fiscal period |
| | | | | | | | | | | | | | | | | | | | |
| | | For the fiscal year ended October 31, | | For the fiscal
period ended
October 31, |
| | | | |
| Class Z | | 2024 | | 2023 | | 2022 | | 20218 |
| | | | |
Net Asset Value, Beginning of Period | | | | $13.95 | | | | | $14.02 | | | | | $18.39 | | | | | $17.84 | |
| | | | |
Income (loss) from Investment Operations: | | | | | | | | | | | | | | | | | | | | |
| | | | |
Net investment loss1,2 | | | | (0.02 | ) | | | | (0.01 | ) | | | | (0.06 | ) | | | | (0.01 | ) |
| | | | |
Net realized and unrealized gain (loss) on investments | | | | 4.00 | | | | | 0.21 | | | | | (4.31 | ) | | | | 0.56 | |
| | | | |
Total income (loss) from investment operations | | | | 3.98 | | | | | 0.20 | | | | | (4.37 | ) | | | | 0.55 | |
| | | | |
Less Distributions to Shareholders from: | | | | | | | | | | | | | | | | | | | | |
| | | | |
Net realized gain on investments | | | | — | | | | | (0.27 | ) | | | | — | | | | | — | |
| | | | |
Net Asset Value, End of Period | | | | $17.93 | | | | | $13.95 | | | | | $14.02 | | | | | $18.39 | |
| | | | |
Total Return2,3 | | | | 28.53 | % | | | | 1.43 | % | | | | (23.76 | )%4 | | | | 3.08 | %9 |
| | | | |
Ratio of net expenses to average net assets10 | | | | 0.82 | %6 | | | | 0.81 | % | | | | 0.81 | % | | | | 0.82 | %11 |
| | | | |
Ratio of gross expenses to average net assets7 | | | | 1.05 | % | | | | 1.05 | % | | | | 1.06 | % | | | | 1.13 | %11 |
| | | | |
Ratio of net investment loss to average net assets2 | | | | (0.13 | )% | | | | (0.09 | )% | | | | (0.37 | )% | | | | (0.49 | )%11 |
| | | | |
Portfolio turnover | | | | 19 | % | | | | 25 | % | | | | 23 | % | | | | 158 | % |
| | | | |
Net assets end of period (000’s) omitted | | | | $31 | | | | | $24 | | | | | $12 | | | | | $15 | |
| | | | | | | | | | | | | | | | | | | | | |
| 1 | Per share numbers have been calculated using average shares. |
| 2 | Total returns and net investment loss would have been lower had certain expenses not been offset. |
| 3 | The total return is calculated using the published Net Asset Value as of fiscal year end. |
| 4 | Includes a non-recurring securities litigation gain. Had the Fund not received the payment total return would have been (24.68%), (24.53%) and (24.53%) for Class N, Class I and Class Z, respectively. |
| 5 | Includes reduction from broker recapture amounting to less than 0.01%, 0.01%, 0.01%, less than 0.01% and 0.01% for the fiscal years ended 2024, 2023, 2022, 2021 and 2020, respectively. |
| 6 | Includes interest expense of less than 0.01% related to participation in the interfund lending program. |
| 7 | Excludes the impact of expense reimbursement or fee waivers and expense reductions such as brokerage credits, but includes expense repayments and non-reimbursable expenses, if any, such as interest, taxes, and extraordinary expenses. (See Note 1(c) and 2 in the Notes to Financial Statements.) |
| 8 | Commencement of operations was on August 31, 2021. |
| 10 | Includes reduction from broker recapture amounting to less than 0.01%, 0.01% and 0.01% for the fiscal years ended 2024, 2023 and 2022, respectively, and less than 0.01% for the fiscal period ended October 31, 2021. |
The accompanying notes are an integral part of these financial statements.
18
| | |
| | Notes to Financial Statements October 31, 2024 |
1. ORGANIZATION AND SUMMARY OF SIGNIFICANT ACCOUNTING POLICIES
AMG Funds I and AMG Funds IV (the “Trusts”) are open-end management investment companies. AMG Funds I is organized as a Massachusetts business trust, while AMG Funds IV is organized as a Delaware Statutory Trust. The Trusts are registered under the Investment Company Act of 1940, as amended (the “1940 Act”). Currently, the Trusts consist of a number of different funds, each having distinct investment management objectives, strategies, risks, and policies. Included in this report are AMG Funds I: AMG GW&K Core Bond ESG Fund (“Core Bond ESG”) and AMG Funds IV: AMG GW&K Small/Mid Cap Growth Fund (“Small/Mid Cap Growth”), each a “Fund” and collectively, the “Funds”.
Each Fund offers Class N, Class I and Class Z shares. Each class represents an interest in the same assets of the respective Fund. Although all share classes generally have identical voting rights, each share class votes separately when required by law. Different share classes may have different net asset values per share to the extent the share classes pay different distribution amounts and/or the expenses of such share classes differ. Each share class has its own expense structure. Please refer to a current prospectus for additional information on each share class.
The Funds’ financial statements are prepared in accordance with accounting principles generally accepted in the United States of America (“U.S. GAAP”), including accounting and reporting guidance pursuant to Accounting Standards Codification Topic 946 applicable to investment companies. U.S. GAAP requires management to make estimates and assumptions that affect the reported amounts of assets and liabilities and disclosure of contingent assets and liabilities at the date of the financial statements and the reported amounts of income and expenses during the reporting period. Actual results could differ from those estimates and such differences could be material. The following is a summary of significant accounting policies followed by the Funds in the preparation of their financial statements:
a. VALUATION OF INVESTMENTS
Equity securities traded on a national securities exchange or reported on the NASDAQ national market system (“NMS”) are valued at the last quoted sales price on the primary exchange or, if applicable, the NASDAQ official closing price or the official closing price of the relevant exchange or, lacking any sales, at the last quoted bid price. Equity securities held by the Funds that are traded in the over-the-counter market (other than NMS securities) are valued at the bid price. Foreign equity securities (securities principally traded in markets other than U.S. markets) held by the Funds are valued at the official closing price on the primary exchange or, for markets that either do not offer an official closing price or where the official closing price may not be representative of the overall market, the last quoted sale price.
Fixed income securities purchased with a remaining maturity exceeding 60 days are valued at the evaluated bid price provided by an authorized pricing service or, if an evaluated price is not available, by reference to other securities which are considered comparable in credit rating, interest rate, due date and other features (generally referred to as “matrix pricing”) or other similar pricing methodologies.
Fixed income securities purchased with a remaining maturity of 60 days or less are valued at amortized cost, provided that the amortized cost value is approximately the same as the fair value of the security valued without the use of amortized cost.
The Funds’ portfolio investments are generally valued based on independent market quotations or prices or, if none, “evaluative” or other market based valuations provided by third party pricing services. Pursuant to Rule 2a-5 under the 1940 Act, the Funds’ Boards of Trustees (the “Board”) designated AMG Funds LLC (the “Investment Manager”) as the Funds’ Valuation Designee to perform the Funds’ fair value determinations. Such determinations are subject to Board oversight and certain reporting and other requirements intended to ensure that the Board receives the information it needs to oversee the Investment Manager’s fair value determinations.
Under certain circumstances, the value of certain Fund portfolio investments may be based on an evaluation of fair value, pursuant to procedures established by the Investment Manager and under the general supervision of the Board. The Funds may use the fair value of a portfolio investment to calculate its net asset value (“NAV”) in the event that the market quotation, price or market based valuation for the portfolio investment is not readily available or otherwise not determinable pursuant to the Funds’ valuation procedures, if the Investment Manager believes the quotation, price or market based valuation to be unreliable, or in certain other circumstances. When determining the fair value of an investment, the Investment Manager seeks to determine the price that the Funds might reasonably expect to receive from current sale of that portfolio investment in an arms-length transaction. Fair value determinations shall be based upon consideration of all available facts and information, including, but not limited to (i) attributes specific to the investment; (ii) fundamental and analytical data relating to the investment; and (iii) the value of other comparable securities or relevant financial instruments, including derivative securities, traded on other markets or among dealers.
The values assigned to fair value portfolio investments are based on available information and do not necessarily represent amounts that might ultimately be realized in the future, since such amounts depend on future developments inherent in long-term investments. Because of the inherent uncertainty of valuation, those estimated values may differ significantly from the values that would have been used had a ready market for the investments existed, and the differences could be material. The Board will be presented with quarterly reports, as of the most recent quarter end, summarizing all fair value activity, material fair value matters that occurred during the quarter, and all outstanding securities fair valued by the Funds. Additionally, the Board will be presented with an annual report that assesses the adequacy and effectiveness of the Investment Manager’s process for determining the fair value of the Funds’ investments.
With respect to foreign equity securities and certain foreign fixed income securities, securities held in the Funds that can be fair valued by the applicable fair value pricing service are fair valued on each business day provided that each individual price exceeds a pre-established confidence level.
U.S. GAAP defines fair value as the price that a fund would receive to sell an asset or pay to transfer a liability in an orderly transaction between market participants at the measurement date. U.S. GAAP also establishes a framework for measuring fair value, and a three level hierarchy for fair value measurements based upon the transparency of inputs to the valuation of an asset or liability. Inputs may be observable or unobservable and refer broadly to the assumptions that market participants would use in pricing the asset or liability. Observable inputs reflect the assumptions market participants would use in pricing the asset or liability based on market data obtained from sources independent of the Funds. Unobservable inputs reflect the Funds’ own assumptions about the assumptions that market participants would use in pricing the asset or liability developed based on the best information available in the circumstances. Each investment is
19
| | |
| | Notes to Financial Statements (continued) |
assigned a level based upon the observability of the inputs which are significant to the overall valuation.
The three-tier hierarchy of inputs is summarized below:
Level 1 – inputs are quoted prices in active markets for identical investments (e.g., equity securities, open-end investment companies)
Level 2 – other observable inputs (including, but not limited to: quoted prices for similar assets or liabilities in markets that are active, quoted prices for identical or similar assets or liabilities in markets that are not active, inputs other than quoted prices that are observable for the assets or liabilities (such as interest rates, yield curves, volatilities, prepayment speeds, loss severities, credit risks and default rates) or other market corroborated inputs) (e.g., debt securities, government securities, foreign securities utilizing international fair value pricing, fair valued securities with observable inputs)
Level 3 – inputs are significant unobservable inputs (including the Fund’s own assumptions used to determine the fair value of investments) (e.g., fair valued securities with unobservable inputs)
Changes in inputs or methodologies used for valuing investments may result in a transfer in or out of levels within the fair value hierarchy. The inputs or methodologies used for valuing investments may not necessarily be an indication of the risk associated with investing in those investments.
b. SECURITY TRANSACTIONS
Security transactions are accounted for as of trade date. Realized gains and losses on securities sold are determined on the basis of identified cost.
c. INVESTMENT INCOME AND EXPENSES
Dividend income is recorded on the ex-dividend date. Interest income, which includes amortization of premium and accretion of discount on debt securities, is accrued as earned. Dividend and interest income on foreign securities is recorded gross of any withholding tax. Non-cash dividends included in dividend income, if any, are reported at the fair market value of the securities received. Upon notification from the issuer, distributions received from a real estate investment trust (REIT) may be redesignated as a reduction of cost of investments and/or realized gain. Other income and expenses are recorded on an accrual basis. Expenses that cannot be directly attributed to a Fund are apportioned among the funds in the Trusts and other trusts or funds within the AMG Funds Family of Funds (collectively, the “AMG Funds Family”) based upon their relative average net assets or number of shareholders. Investment income, realized and unrealized capital gains and losses, the common expenses of each Fund, and certain fund level expense reductions, if any, are allocated on a pro-rata basis to each class based on the relative net assets of each class to the total net assets of each Fund.
Small/Mid Cap Growth had certain portfolio trades directed to various brokers under a brokerage recapture program. Credits received from the brokerage recapture program are earned and paid on a monthly basis, and are recorded as expense offsets, which serve to reduce the Fund’s overall expense ratio. For the fiscal year ended October 31, 2024, the impact on the expenses and expense ratios was $1,441 or less than 0.01%.
d. DIVIDENDS AND DISTRIBUTIONS
Fund distributions resulting from net investment income will normally be declared and paid monthly for Core Bond ESG and annually for Small/Mid Cap Growth. Realized net capital gains distributions, if any, will normally be declared and paid at least annually in December. Distributions to shareholders are recorded on the ex-dividend date. Distributions are determined in accordance with federal income tax law, which may differ from net investment income and net realized capital gains for financial statement purposes (U.S. GAAP). Differences may be permanent or temporary. Permanent differences are reclassified among capital accounts in the financial statements to reflect their tax character. Permanent book and tax basis differences, if any, relating to shareholder distributions will result in reclassifications to paid-in capital. Temporary differences arise when certain items of income, expense and gain or loss are recognized in different periods for financial statement and tax purposes; these differences will reverse at some time in the future. There were no permanent differences during the year for Core Bond ESG. Permanent differences are primarily due to net operating losses and tax equalization utilized for Small/Mid Cap Growth. Temporary differences for Small/Mid Cap Growth are due to qualified late-year ordinary loss deferrals and return of capital from REITs. In addition, temporary differences for each fund are due to wash sale loss deferrals.
The tax character of distributions paid during the fiscal years ended October 31, 2024 and October 31, 2023 was as follows:
| | | | | | | | | | | | | | | | |
| | | Core Bond ESG | | | | Small/Mid Cap Growth | |
| | | | |
Distributions paid from: | | | 2024 | | | | 2023 | | | | 2024 | | | | 2023 | |
| | | | |
Ordinary income * | | | $4,207,674 | | | | $4,046,880 | | | | — | | | | — | |
| | | | |
Long-term capital gains | | | — | | | | — | | | | — | | | | $623,575 | |
| | | | | | | | | | | | | | | | |
| | | $4,207,674 | | | | $4,046,880 | | | | — | | | | $623,575 | |
| | | | | | | | | | | | | | | | |
* For tax purposes, short-term capital gain distributions, if any, are considered ordinary income distributions.
20
| | |
| | Notes to Financial Statements (continued) |
As of October 31, 2024, the components of distributable earnings (excluding unrealized appreciation/depreciation) on a tax basis consisted of:
| | | | | | | | |
| | | Core Bond ESG | | | Small/Mid Cap Growth | |
| | |
Capital loss carryforward | | | $11,837,838 | | | | — | |
| | |
Undistributed ordinary income | | | 41,685 | | | | — | |
| | |
Undistributed long-term capital gains | | | — | | | | $303,465 | |
| | |
Late-year ordinary loss deferral | | | — | | | | 110,433 | |
At October 31, 2024, the cost of investments and the aggregate gross unrealized appreciation and depreciation for federal income tax purposes were as follows:
| | | | | | | | | | | | | | | | |
| Fund | | Cost | | | Appreciation | | | Depreciation | | | Net Appreciation
(Depreciation) | |
| | | | |
Core Bond ESG | | | $130,527,913 | | | | $506,445 | | | | $(12,005,631 | ) | | | $(11,499,186 | ) |
| | | | |
Small/Mid Cap Growth | | | 36,055,966 | | | | 8,758,043 | | | | (2,913,184 | ) | | | 5,844,859 | |
e. FEDERAL TAXES
Each Fund currently qualifies as an investment company and intends to comply with the requirements under Subchapter M of the Internal Revenue Code of 1986, as amended (the “Code”), and to distribute substantially all of its taxable income and gains to its shareholders and to meet certain diversification and income requirements with respect to investment companies. The Investment Manager has analyzed the Funds’ tax positions taken on federal income tax returns as of October 31, 2024, and for all open tax years (generally, the three prior taxable years), and has concluded that no provision for federal income tax is required in the Funds’ financial statements. Additionally, the Investment Manager is not aware of any tax position for which it is reasonably possible that the total amounts of unrecognized tax benefit/detriment will change materially in the next twelve months.
Furthermore, based on each Fund’s understanding of the tax rules and rates related to income, gains and transactions for the foreign jurisdictions in which it invests, each Fund will provide for foreign taxes, and where appropriate, deferred foreign taxes.
f. CAPITAL LOSS CARRYOVERS AND DEFERRALS
As of October 31, 2024, the following Fund had capital loss carryovers for federal income tax purposes as shown in the following chart. These amounts may be used to offset future realized capital gains indefinitely, and retain their character as short-term and/or long-term.
| | | | | | |
| Fund | | Short-Term | | Long-Term | | Total |
| | | |
Core Bond ESG | | $2,801,748 | | $9,036,090 | | $11,837,838 |
For the fiscal year ended October 31, 2024, the following Fund utilized capital loss carryovers in the amount of:
| | | | | | |
| Fund | | Short-Term | | Long-Term |
| | |
Small/Mid Cap Growth | | $114,896 | | $82,363 |
g. CAPITAL STOCK
Each Trust’s Amended and Restated Agreement and Declaration of Trust or Trust Instrument, as applicable, authorizes for each Fund the issuance of an unlimited number of shares of beneficial interest, without par value. Each Fund records sales and repurchases of its capital stock on the trade date.
For the fiscal years ended October 31, 2024 and October 31, 2023, the capital stock transactions by class for the Funds were as follows:
| | | | | | | | | | | | | | | | |
| | | Core Bond ESG | |
| | |
| | | October 31, 2024 | | | October 31, 2023 | |
| | | | |
| | | Shares | | | Amount | | | Shares | | | Amount | |
| | | | |
Class N: | | | | | | | | | | | | | | | | |
| | | | |
Shares sold | | | 71,326 | | | | $636,906 | | | | 38,736 | | | | $343,128 | |
| | | | |
Shares issued in reinvestment of distributions | | | 7,393 | | | | 65,847 | | | | 5,818 | | | | 51,356 | |
| | | | |
Shares redeemed | | | (61,929) | | | | (547,022) | | | | (12,581) | | | | (108,577) | |
| | | | | | | | | | | | | | | | |
| | | | |
Net increase | | | 16,790 | | | | $155,731 | | | | 31,973 | | | | $285,907 | |
| | | | | | | | | | | | | | | | |
21
| | |
| | Notes to Financial Statements (continued) |
| | | | | | | | | | | | | | | | |
| |
| | | Core Bond ESG | |
| | |
| | | October 31, 2024 | | | October 31, 2023 | |
| | | | |
| | | Shares | | | Amount | | | Shares | | | Amount | |
| | | | |
Class I: | | | | | | | | | | | | | | | | |
| | | | |
Shares sold | | | 1,420,819 | | | | $12,678,644 | | | | 1,161,567 | | | | $10,219,195 | |
| | | | |
Shares issued in reinvestment of distributions | | | 442,345 | | | | 3,939,940 | | | | 428,813 | | | | 3,793,245 | |
| | | | |
Shares redeemed | | | (3,281,551) | | | | (29,214,653) | | | | (3,389,263) | | | | (29,861,655) | |
| | | | | | | | | | | | | | | | |
| | | | |
Net decrease | | | (1,418,387) | | | | $(12,596,069) | | | | (1,798,883) | | | | $(15,849,215) | |
| | | | | | | | | | | | | | | | |
| | | | |
Class Z: | | | | | | | | | | | | | | | | |
| | | | |
Shares sold | | | 4,881 | | | | $43,769 | | | | 21,349 | | | | $186,192 | |
| | | | |
Shares issued in reinvestment of distributions | | | 5,273 | | | | 46,940 | | | | 5,322 | | | | 47,130 | |
| | | | |
Shares redeemed | | | (16,155) | | | | (144,368) | | | | (129,774) | | | | (1,162,515) | |
| | | | | | | | | | | | | | | | |
| | | | |
Net decrease | | | (6,001) | | | | $(53,659) | | | | (103,103) | | | | $(929,193) | |
| | | | | | | | | | | | | | | | |
| | | | | | | | | | | | | | | | |
| | | Small/Mid Cap Growth | |
| | |
| | | October 31, 2024 | | | October 31, 2023 | |
| | | | |
| | | Shares | | | Amount | | | Shares | | | Amount | |
| | | | |
Class N: | | | | | | | | | | | | | | | | |
| | | | |
Shares sold | | | 123,098 | | | | $2,059,438 | | | | 437,431 | | | | $6,245,304 | |
| | | | |
Shares issued in reinvestment of distributions | | | — | | | | — | | | | 36,604 | | | | 484,632 | |
| | | | |
Shares redeemed | | | (259,725) | | | | (4,175,433) | | | | (298,744) | | | | (4,248,267) | |
| | | | | | | | | | | | | | | | |
| | | | |
Net increase (decrease) | | | (136,627) | | | | $(2,115,995) | | | | 175,291 | | | | $2,481,669 | |
| | | | | | | | | | | | | | | | |
| | | | |
Class I: | | | | | | | | | | | | | | | | |
| | | | |
Shares sold | | | 136,909 | | | | $2,393,314 | | | | 122,572 | | | | $1,800,280 | |
| | | | |
Shares issued in reinvestment of distributions | | | — | | | | — | | | | 8,963 | | | | 123,780 | |
| | | | |
Shares redeemed | | | (157,840) | | | | (2,643,777) | | | | (55,284) | | | | (806,677) | |
| | | | | | | | | | | | | | | | |
| | | | |
Net increase (decrease) | | | (20,931) | | | | $(250,463) | | | | 76,251 | | | | $1,117,383 | |
| | | | | | | | | | | | | | | | |
| | | | |
Class Z: | | | | | | | | | | | | | | | | |
| | | | |
Shares sold | | | — | | | | — | | | | 829 | | | | $11,751 | |
| | | | |
Shares issued in reinvestment of distributions | | | — | | | | — | | | | 32 | | | | 448 | |
| | | | | | | | | | | | | | | | |
| | | | |
Net increase | | | — | | | | — | | | | 861 | | | | $12,199 | |
| | | | | | | | | | | | | | | | |
h. REPURCHASE AGREEMENTS AND JOINT REPURCHASE AGREEMENTS
The Funds may enter into third-party and bilateral repurchase agreements for temporary cash management purposes and for reinvestment of cash collateral on securities lending transactions under the securities lending program offered by The Bank of New York Mellon (“BNYM”) (the “Securities Lending Program”) (collectively, “Repurchase Agreements”). The value of the underlying collateral, including accrued interest, must equal or exceed the value of the Repurchase Agreements during the term of the agreement. For joint repurchase agreements, the Funds participate on a pro rata basis with other clients of BNYM in their share of the underlying collateral under such joint repurchase agreements and in their share of proceeds from any repurchase or other disposition of the underlying collateral. The underlying collateral for all Repurchase Agreements is held by the
Funds’ custodian or at the Federal Reserve Bank. If the seller defaults and the value of the collateral declines, or if bankruptcy proceedings commence with respect to the seller of the security, realization of the collateral by the Funds may be delayed or limited. Pursuant to the Securities Lending Program, the Funds are indemnified for such losses by BNYM on joint repurchase agreements.
At October 31, 2024, the market value of Repurchase Agreements outstanding for Core Bond ESG and Small/Mid Cap Growth was $1,337,511 and $1,194,000, respectively.
22
| | |
| | Notes to Financial Statements (continued) |
2. AGREEMENTS AND TRANSACTIONS WITH AFFILIATES
For each of the Funds, the Trusts have entered into an investment advisory agreement under which the Investment Manager, a subsidiary and the U.S. wealth platform of Affiliated Managers Group, Inc. (“AMG”), serves as investment manager to the Funds and is responsible for the Funds’ overall administration and operations. The Investment Manager selects and recommends, subject to the approval of the Board and, in certain circumstances, shareholders, the subadviser for the Funds and monitors the subadviser’s investment performance, security holdings and investment strategies. Each Fund’s investment portfolio is managed by GW&K Investment Management, LLC (“GW&K”), who serves pursuant to a subadvisory agreement with the Investment Manager. AMG indirectly owns a majority interest in GW&K.
Investment management fees are paid directly by the Funds to the Investment Manager based on average daily net assets. For the fiscal year ended October 31, 2024, the Funds’ investment management fees were paid at the following annual rate of each Fund’s respective average daily net assets:
| | | | |
| |
Core Bond ESG | | | 0.30% | |
| |
Small/Mid Cap Growth | | | 0.62% | |
| | | | | |
The fee paid to GW&K for its services as subadviser is paid out of the fee the Investment Manager receives from each Fund and does not increase the expenses of each Fund.
The Investment Manager has contractually agreed, through at least March 1, 2025, to waive management fees and/or pay or reimburse fund expenses in order to limit total annual Fund operating expenses after fee waiver and expense reimbursements (exclusive of taxes, interest (including interest incurred in connection with bank and custody overdrafts, and in connection with securities sold short), shareholder servicing fees, distribution and service (12b-1) fees, brokerage commissions and other transaction costs, dividends payable with respect to securities sold short, acquired fund fees and expenses and extraordinary expenses) of Core Bond ESG and Small/Mid Cap Growth to 0.48% and 0.82%, respectively, of each Fund’s average daily net assets (this annual rate or such other annual rate that may be in effect from time to time, the “Expense Cap”), subject to later reimbursement by the Funds in certain circumstances.
In general, for a period of up to 36 months after the date any amounts are paid, waived or reimbursed by the Investment Manager, the Investment Manager may recover such amounts from a Fund, provided that such repayment would not cause the Fund’s total annual operating expenses after fee waiver and expense reimbursements (exclusive of the items noted in the parenthetical above) to exceed either (i) the Expense Cap in effect at the time such amounts were paid, waived or reimbursed, or (ii) the Expense Cap in effect at the time of such repayment by the Fund.
The contractual expense limitation may only be terminated in the event the Investment Manager or a successor ceases to be the investment manager of a Fund or a successor fund, by mutual agreement between the Investment Manager and the Board, or in the event of a Fund’s liquidation unless the Fund is reorganized or is a party to a merger in which the surviving entity is successor to the accounting and performance information of a Fund.
For the fiscal year ended October 31, 2024, the Investment Manager’s expense reimbursements, and repayments of prior reimbursements by the Funds to the Investment Manager, if any, are as follows:
| | | | |
| | | Expense
Reimbursements | | Repayment of
Prior Reimbursements |
| | |
Core Bond ESG | | $175,621 | | — |
| | |
Small/Mid Cap Growth | | 89,289 | | — |
At October 31, 2024, the Funds’ expiration of reimbursements subject to recoupment is as follows:
| | | | | | | | |
Expiration Period | | Core Bond ESG | | | Small/Mid Cap Growth | |
| | |
Less than 1 year | | | $121,994 | | | | $89,139 | |
| | |
1-2 years | | | 156,088 | | | | 82,386 | |
| | |
2-3 years | | | 175,621 | | | | 89,289 | |
| | | | | | | | |
| | |
Total | | | $453,703 | | | | $260,814 | |
| | | | | | | | |
The Trusts, on behalf of the Funds, have entered into an amended and restated Administration Agreement under which the Investment Manager serves as the Funds’ administrator (the “Administrator”) and is responsible for certain aspects of managing the Funds’ operations, including administration and shareholder services to each Fund. Each Fund pays a fee to the Administrator at the rate of 0.15% per annum of the Fund’s average daily net assets for this service.
The Funds are distributed by AMG Distributors, Inc. (the “Distributor”), a wholly-owned subsidiary of the Investment Manager. The Distributor serves as the distributor and underwriter for each Fund and is a registered broker-dealer and member of the Financial Industry Regulatory Authority, Inc. (“FINRA”). Shares of each Fund will be continuously offered and will be sold directly to prospective purchasers and through brokers, dealers or other financial intermediaries who have executed selling agreements with the Distributor. Generally, the Distributor bears all or a portion of the expenses of providing services pursuant to the distribution agreement, including the payment of the expenses relating to the distribution of prospectuses for sales purposes and any advertising or sales literature.
The Trusts have adopted a distribution and service plan (the “Plan”) with respect to the Class N shares of each Fund, in accordance with the requirements of Rule 12b-1 under the 1940 Act and the requirements of the applicable rules of FINRA regarding asset-based sales charges. Pursuant to the Plan, each Fund may make payments to the Distributor for its expenditures in financing any activity primarily intended to result in the sale of each Fund’s Class N shares and for maintenance and personal service provided to existing shareholders of that class. The Plan authorizes payments to the Distributor up to 0.25% annually of each Fund’s average daily net assets attributable to the Class N shares. For Small/Mid Cap Growth, the Plan is characterized as a reimbursement plan and is directly tied to expenses incurred by the Distributor; the payments the Distributor receives during any year may not exceed its actual expenses. The impact on the Class N annualized expense ratios for the fiscal year ended October 31, 2024, was 0.25% for Core Bond ESG and 0.19% for Small/Mid Cap Growth.
For Class N of Core Bond ESG and for each of the Class I shares, the Board has approved reimbursement payments to the Investment Manager for shareholder
23
| | |
| | Notes to Financial Statements (continued) |
servicing expenses (“shareholder servicing fees”) incurred. Shareholder servicing fees include payments to financial intermediaries, such as broker-dealers (including fund supermarket platforms), banks, and trust companies who provide shareholder recordkeeping, account servicing and other services. The Class N and Class I shares may reimburse the Investment Manager for the actual amount incurred up to a maximum annual rate of each Class’s average daily net assets as shown in the table below.
The impact on the annualized expense ratios for the fiscal year ended October 31, 2024, was as follows:
| | | | | | | | |
Fund | | Maximum Annual
Amount
Approved | | | Actual
Amount Incurred | |
| | |
Core Bond ESG | | | | | | | | |
| | |
Class N | | | 0.15% | | | | 0.15% | |
| | |
Class I | | | 0.10% | | | | 0.07% | |
| | |
Small/Mid Cap Growth | | | | | | | | |
| | |
Class I | | | 0.05% | | | | 0.05% | |
| | | | | | | | | |
The Board provides supervision of the affairs of the Trusts and other trusts within the AMG Funds Family. The Trustees of the Trusts who are not affiliated with the Investment Manager receive an annual retainer and per meeting fees for regular, special and telephonic meetings, and they are reimbursed for out-of-pocket expenses incurred while carrying out their duties as Board members. The Chairman of the Board and the Audit Committee Chair receive additional annual retainers. Certain Trustees and Officers of the Funds are Officers and/or Directors of the Investment Manager, AMG and/or the Distributor.
The Securities and Exchange Commission (the “SEC”) granted an exemptive order that permits certain eligible funds in the AMG Funds Family to lend and borrow money for certain temporary purposes directly to and from other eligible funds in the AMG Funds Family. Participation in this interfund lending program is voluntary for both the borrowing and lending funds, and an interfund loan is only made if it benefits each participating fund. The Administrator manages the program according to procedures approved by the Board, and the Board monitors the operation of the program. An interfund loan must comply with certain conditions set out in the exemptive order, which are designed to assure fairness and protect all participating funds. The interest earned and interest paid on interfund loans are included on the Statement of Operations as interest income and interest expense, respectively. At October 31, 2024, the Funds had no interfund loans outstanding. The Funds did not lend during the fiscal year ended October 31, 2024.
The following Funds utilized the interfund lending program during the fiscal year ended October 31, 2024 as follows:
| | | | | | | | | | | | | | | | |
| Fund | | Average Borrowed | | | Number of Days | | | Interest Paid | | | Average
Interest Rate | |
| | | | |
Core Bond ESG | | | $1,780,275 | | | | 5 | | | | $1,518 | | | | 6.225% | |
| | | | |
Small/Mid Cap Growth | | | 1,250,266 | | | | 2 | | | | 426 | | | | 6.225% | |
| | | | | | | | | | | | | | | | | |
3. PURCHASES AND SALES OF SECURITIES
Purchases and sales of securities (excluding short-term securities and U.S. Government Obligations) for the fiscal year ended October 31, 2024, were as follows:
| | | | | | | | |
| | | Long Term Securities | |
| | |
| Fund | | Purchases | | | Sales | |
| | |
Core Bond ESG | | | $30,880,033 | | | | $31,627,721 | |
| | |
Small/Mid Cap Growth | | | 7,503,056 | | | | 9,900,572 | |
| | | | | | | | | |
Core Bond ESG purchases and sales of U.S. Government obligations for the fiscal year ended October 31, 2024 were $10,684,544 and $19,171,550, respectively.
4. PORTFOLIO SECURITIES LOANED
The Funds participate in the Securities Lending Program providing for the lending of securities to qualified borrowers. Securities lending income includes earnings of such temporary cash investments, plus or minus any rebate to a borrower. These earnings (after any rebate) are then divided between BNYM, as a fee for its services under the Securities Lending Program, and the Funds, according to agreed-upon rates. Collateral on all securities loaned is accepted in cash, U.S. Treasury Obligations or U.S. Government Agency Obligations. Collateral is maintained at a minimum level of 102% (105% in the case of certain foreign securities) of the market value, plus interest, if applicable, of investments on loan. It is the Funds’ policy to obtain additional collateral from or return excess collateral to the borrower by the end of the next business day, following the valuation date of the securities loaned. Therefore, the value of the collateral held may be temporarily less than the value of the securities on loan. Lending securities entails a risk of loss to the Funds if and to the extent that the market value of the securities loaned were to increase and the borrower did not increase the collateral accordingly, and the borrower fails to return the securities. Under the terms of the Securities Lending Program, the Funds are indemnified for such losses by BNYM. Cash collateral is held in separate omnibus accounts managed by BNYM, who is authorized to exclusively enter into joint repurchase agreements for that cash collateral. Securities collateral is held in separate omnibus accounts managed by BNYM and cannot be sold or pledged. BNYM bears the risk of any deficiency in the amount of the cash collateral available for return to the borrower due to any loss on the collateral invested. Loans of securities are terminable at any time and the borrower, after notice, is required to return borrowed securities as soon as practical, which is normally within three business days.
The value of securities loaned on positions held, cash collateral and securities collateral received at October 31, 2024, was as follows:
| | | | | | | | | | | | | | | | |
| Fund | | Securities
Loaned | | | Cash
Collateral
Received | | | Securities
Collateral Received | | | Total
Collateral Received | |
| | | | |
Core Bond ESG | | | $5,395,413 | | | | $966,511 | | | | $4,601,813 | | | | $5,568,324 | |
| | | | |
Small/Mid Cap Growth | | | 1,950,912 | | | | — | | | | 2,020,739 | | | | 2,020,739 | |
| | | | | | | | | | | | | | | | | |
The following table summarizes the securities received as collateral for securities lending at October 31, 2024:
| | | | | | | | | | |
| Fund | | Collateral Type | | Coupon Range | | | Maturity Date Range | |
| | | |
Core Bond ESG | | U.S. Treasury Obligations | | | 0.125%-5.000% | | | | 01/15/25-08/15/49 | |
| | | |
Small/Mid Cap Growth | | U.S. Treasury Obligations | | | 0.125%-7.625% | | | | 11/15/24-11/15/52 | |
| | | | | | | | | | | |
24
| | |
| | Notes to Financial Statements (continued) |
5. FUND RISKS
In the normal course of business, the Funds invest in securities or other instruments and may enter into certain transactions, and such activities subject the Funds to various risks. Below is a summary of some, but not all, of those risks. Each risk described below does not necessarily apply to each Fund. Please refer to each Fund’s prospectus for a description of the principal risks associated with investing in a particular Fund. The value of securities or other instruments may also be affected by various factors, including, without limitation: (i) the general economy; (ii) the overall market as well as local, regional or global political and/or social instability; or (iii) price fluctuations.
Market Risk: Market prices of investments held by the Funds may fall rapidly or unpredictably due to a variety of factors, including economic, political, or market conditions, or other factors including terrorism, war, natural disasters and the spread of infectious illness or other public health issues, including epidemics or pandemics, or in response to events that affect particular industries or companies.
Management Risk: Because the Funds are actively managed investment portfolios, security selection or focus on securities in a particular style, market sector or group of companies may cause the Funds to incur losses or underperform relative to their benchmarks or other funds with a similar investment objective. There can be no guarantee that GW&K’s investment techniques and risk analysis will produce the desired result.
Sector Risk: Issuers and companies that are in similar industry sectors may be similarly affected by particular economic or market events; to the extent the Funds have substantial holdings within a particular sector, the risks associated with that sector increase.
Liquidity Risk: The Funds may not be able to dispose of particular investments, such as illiquid securities, readily at favorable times or prices or the Funds may have to sell them at a loss.
Debt Securities Risk: The value of a debt security changes in response to various factors, including, for example, market related factors, such as changes in interest rates or changes in the actual or perceived ability of an issuer to meet its obligations. Investments in debt securities are subject to, among other risks, credit risk, interest rate risk, extension risk, prepayment risk and liquidity risk.
Interest Rate Risk: Fixed coupon payments (cash flows) of bonds and debt securities may become less competitive with the market in periods of rising interest rates and cause bond prices to decline.
Credit Risk: The issuer of bonds or other debt securities may be unable or unwilling, or may be perceived as unable or unwilling, to make timely interest or principal payments or otherwise honor its obligations.
Extension Risk: During periods of rising interest rates, a debtor may pay back a bond or other fixed income security slower than expected or required, and the value of such security may fall.
Prepayment Risk: A debtor may exercise its right to pay back a bond or other debt security earlier than expected or required during periods of decreasing interest rates.
Inflation/Deflation Risk: Inflation risk is the risk that the value of assets or income from investments will be worth less in the future. Inflation rates may change frequently and drastically as a result of various factors and a Fund’s investments may not keep pace with inflation, which may result in losses to Fund investors or adversely affect the real value of shareholders’ investments in the
Fund. As inflation rates increase, fixed income securities markets may experience heightened levels of interest rate volatility and liquidity risk. Deflation risk is the risk that the prices throughout the economy decline over time – the opposite of inflation. Deflation may have an adverse effect on the creditworthiness of issuers and may make issuer default more likely, which may result in a decline in the value of a Fund’s portfolio.
Reinvestment Risk: A Fund may have difficulty reinvesting payments from debtors and may receive lower rates than from its original investments.
U.S. Government Securities Risk: Obligations issued by some U.S. Government agencies, authorities, instrumentalities, or sponsored enterprises such as Government National Mortgage Association (“GNMA”) are backed by the full faith and credit of the U.S. Government, while obligations issued by others, such as Federal National Mortgage Association (“FNMA”), Federal Home Loan Mortgage Corporation (“FHLMC”), and Federal Home Loan Banks (“FHLBs”), are not backed by the full faith and credit of the U.S. Government and are backed solely by the entity’s own resources or by the ability of the entity to borrow from the U.S. Treasury. If one of these agencies defaults on a loan, there is no guarantee that the U.S. Government will provide financial support.
Asset-Backed and Mortgage-Backed Securities Risk: Investments in asset-backed and mortgage-backed securities involve risk of severe credit downgrades, loss due to prepayments that occur earlier or later than expected, illiquidity and default.
Municipal Market Risk: Factors unique to the municipal bond market may negatively affect the value of a Fund’s investment in municipal bonds. These factors include political or legislative changes, and uncertainties related to the tax status of the securities and the rights of investors in the securities. A Fund may invest in a group of municipal obligations that are related in such a way that an economic, business, or political development affecting one would also affect the others.
Environmental, Social and Governance (“ESG”) Investing Risk: Because applying a Fund’s ESG investment criteria may result in the selection or exclusion of securities of certain issuers for reasons other than financial performance, a Fund’s investment returns may underperform funds that do not incorporate ESG factors into their investment process. The incorporation of ESG criteria into the investment process may affect a Fund’s investment exposure to certain companies, sectors, regions, countries or types of investments, which could negatively impact a Fund’s performance depending on whether such investments are in or out of favor. Applying ESG criteria to investment decisions is qualitative and subjective by nature, and there is no guarantee that the criteria utilized by GW&K or any judgment exercised by GW&K will improve the financial performance of a Fund or reflect the beliefs or values of any particular investor. ESG standards differ by region and industry, and a company’s ESG practices or GW&K’s assessment of a company’s ESG practices may change over time.
Small- and Mid-Capitalization Stock Risk: The stocks of small- and mid-capitalization companies often have greater price volatility, lower trading volume, and less liquidity than the stocks of larger, more established companies.
Growth Stock Risk: The prices of equity securities of companies that are expected to experience relatively rapid earnings growth, or “growth stocks,” may be more sensitive to market movements because the prices tend to reflect future investor expectations rather than just current profits.
25
| | |
| | Notes to Financial Statements (continued) |
6. COMMITMENTS AND CONTINGENCIES
Under the Trusts’ organizational documents, their Trustees and Officers are indemnified against certain liabilities arising out of the performance of their duties to the Trusts. In addition, in the normal course of business, the Funds may enter into contracts and agreements that contain a variety of representations and
warranties, which provide general indemnifications. The maximum exposure to the Funds under these arrangements is unknown, as this would involve future claims that may be made against a Fund that have not yet occurred. However, based on experience, the Funds had no prior claims or losses and expect the risks of loss to be remote.
7. MASTER NETTING AGREEMENTS
The Funds may enter into master netting agreements with their counterparties for the Securities Lending Program and Repurchase Agreements, which provide the right, in the event of default (including bankruptcy or insolvency) for the non-defaulting party to liquidate the collateral and calculate net exposure to the defaulting party or request additional collateral. For financial reporting purposes, the Funds do not offset financial assets and financial liabilities that are subject to master netting agreements in the Statement of Assets and Liabilities. For securities lending transactions, see Note 4.
The following table is a summary of the Funds’ open Repurchase Agreements that are subject to a master netting agreement as of October 31, 2024:
| | | | | | | | | | | | | | | | | | | | |
| | | | | | Gross Amount Not Offset in the
Statement of Assets and Liabilities | | | | | | | |
| Fund | | Gross Amounts of Assets Presented in the Statement of Assets and Liabilities | | | Offset Amount | | | Net Asset Balance | | | Collateral
Received | | | Net Amount | |
| | | | | | | | | | | | | | | | | | | | | |
| | | | | |
Core Bond ESG | | | | | | | | | | | | | | | | | | | | |
| | | | | |
Daiwa Capital Markets America | | | $966,511 | | | | — | | | | $966,511 | | | | $966,511 | | | | — | |
| | | | | |
Fixed Income Clearing Corp. | | | 371,000 | | | | — | | | | 371,000 | | | | 371,000 | | | | — | |
| | | | | | | | | | | | | | | | | | | | |
| | | | | |
Total | | | $1,337,511 | | | | — | | | | $1,337,511 | | | | $1,337,511 | | | | — | |
| | | | | | | | | | | | | | | | | | | | |
| | | | | |
Small/Mid Cap Growth | | | | | | | | | | | | | | | | | | | | |
| | | | | |
Fixed Income Clearing Corp. | | | $1,194,000 | | | | — | | | | $1,194,000 | | | | $1,194,000 | | | | — | |
8. RECENT ACCOUNTING STANDARDS UPDATE
In November 2023, the Financial Accounting Standards Board issued ASU No. 2023-07, Segment Reporting (Topic 280), which improves reportable segment disclosure requirements, primarily through enhanced disclosures about significant segment expenses. The amendments are effective for fiscal years beginning after December 15, 2023, and interim periods within fiscal years beginning after December 15, 2024. The Funds are currently evaluating the requirements and do not expect this guidance to materially impact the Funds’ financial statements.
9. SUBSEQUENT EVENTS
The Funds have determined that no material events or transactions occurred through the issuance date of the Funds’ financial statements which require an additional disclosure in or adjustment of the Funds’ financial statements.
26
| | |
| | Report of Independent Registered Public Accounting Firm |
| | |
| To the Board of Trustees of AMG Funds I and AMG Funds IV and Shareholders of AMG GW&K Core Bond ESG Fund and AMG GW&K Small/Mid Cap Growth Fund | | |
| |
| Opinions on the Financial Statements | | |
| |
| We have audited the accompanying statements of assets and liabilities, including the schedules of portfolio investments, of AMG GW&K Core Bond ESG Fund (one of the funds constituting AMG Funds I) and AMG GW&K Small/Mid Cap Growth Fund (one of the funds constituting AMG Funds IV) (hereafter collectively referred to as the “Funds”) as of October 31, 2024, the related statements of operations for the year ended October 31, 2024, the statements of changes in net assets for each of the two years in the period ended October 31, 2024, including the related notes, and the financial highlights for each the periods indicated therein (collectively referred to as the “financial statements”). In our opinion, the financial statements present fairly, in all material respects, the financial position of each of the Funds as of October 31, 2024, the results of each of their operations for the year then ended, the changes in each of their net assets for each of the two years in the period ended October 31, 2024 and each of the financial highlights for each of the periods indicated therein in conformity with accounting principles generally accepted in the United States of America. | | |
| |
| Basis for Opinions | | |
| |
| These financial statements are the responsibility of the Funds’ management. Our responsibility is to express an opinion on the Funds’ financial statements based on our audits. We are a public accounting firm registered with the Public Company Accounting Oversight Board (United States) (PCAOB) and are required to be independent with respect to the Funds in accordance with the U.S. federal securities laws and the applicable rules and regulations of the Securities and Exchange Commission and the PCAOB. | | |
| |
| We conducted our audits of these financial statements in accordance with the standards of the PCAOB. Those standards require that we plan and perform the audit to obtain reasonable assurance about whether the financial statements are free of material misstatement, whether due to error or fraud. | | |
| |
| Our audits included performing procedures to assess the risks of material misstatement of the financial statements, whether due to error or fraud, and performing procedures that respond to those risks. Such procedures included examining, on a test basis, evidence regarding the amounts and disclosures in the financial statements. Our audits also included evaluating the accounting principles used and significant estimates made by management, as well as evaluating the overall presentation of the financial statements. Our procedures included confirmation of securities owned as of October 31, 2024 by correspondence with the custodian. We believe that our audits provide a reasonable basis for our opinions. | | |
/s/PricewaterhouseCoopers LLP
Boston, Massachusetts
December 23, 2024
We have served as the auditor of one or more investment companies in the AMG Funds Family since 1993.
27
| | |
| | Other Information (unaudited) |
TAX INFORMATION
AMG GW&K Core Bond ESG Fund and AMG GW&K Small/Mid Cap Growth Fund each hereby designates the maximum amount allowable of their net taxable income as qualified dividends as provided in the Jobs and Growth Tax Relief Reconciliation Act of 2003. The 2023/2024 Form 1099-DIV you receive for each Fund will show the tax status of all distributions paid to you during the year.
Pursuant to section 852 of the Internal Revenue Code of 1986, as amended, AMG GW&K Core Bond ESG Fund and AMG GW&K Small/Mid Cap Growth Fund each hereby designates as a capital gain distribution with respect to the taxable period ended October 31, 2024, $0 and $309,001, respectively, or, if subsequently determined to be different, the net capital gains of such period.
ITEM 8. CHANGES IN AND DISAGREEMENTS WITH ACCOUNTANTS FOR OPEN-END MANAGEMENT INVESTMENT COMPANIES
During the fiscal year ended October 31, 2024, there were no changes in and/or disagreements with accountants.
ITEM 9. PROXY DISCLOSURES FOR OPEN-END MANAGEMENT INVESTMENT COMPANIES
Not applicable.
ITEM 10. REMUNERATION PAID TO DIRECTORS, OFFICERS, AND OTHERS OF OPEN-END MANAGEMENT INVESTMENT COMPANIES
The remuneration paid to the Trustees during the fiscal year ended October 31, 2024, is reflected as “Trustee fees and expenses” on the Statement of Operations and is set forth in the table below. There was no remuneration paid to any Fund officer or to any affiliated person of any Fund Trustee or officer during the fiscal year ended October 31, 2024.
| | | | |
| | | Trustee fees and expenses | |
| |
AMG GW&K Core Bond ESG Fund | | | $10,544 | |
| |
AMG GW&K Small/Mid Cap Growth Fund | | | 3,347 | |
| | | | | |
28
| | |
| | ITEM 11. STATEMENT REGARDING BASIS FOR APPROVAL OF INVESTMENT ADVISORY CONTRACT |
| | | | | | | | |
AMG GW&K Core Bond ESG Fund and AMG GW&K Small/Mid Cap Growth Fund: Approval of Investment Management and Subadvisory Agreements on June 12, 2024 At an in-person meeting held on June 12, 2024, the Board of Trustees (the “Board” or the “Trustees”) of each of AMG Funds I and AMG Funds IV (each, a “Trust” and collectively, the “Trusts”), and separately a majority of the Trustees who are not “interested persons” of the Trusts (the “Independent Trustees”), approved (i) the Fund Management Agreement, as amended pursuant to letter agreements at any time prior to the date of the meeting, with AMG Funds LLC (the “Investment Manager”) and AMG Funds I for AMG GW&K Core Bond ESG Fund, and separately each of Amendment No. 1 thereto dated July 1, 2015, and Amendment No. 2 thereto dated October 1, 2016; and the Investment Advisory Agreement, as amended pursuant to letter agreements at any time prior to the date of the meeting, with the Investment Manager and AMG Funds IV for AMG GW&K Small/Mid Cap Growth Fund, and separately Amendment No. 1 thereto dated October 1, 2016 (collectively, the “Investment Management Agreements”); and (ii) the Subadvisory Agreement with respect to each of AMG GW&K Core Bond ESG Fund and AMG GW&K Small/Mid Cap Growth Fund (each, a “Fund,” and collectively, the “Funds”), as amended at any time prior to the date of the meeting (collectively, the “Subadvisory Agreements”), with GW&K Investment Management, LLC, the Funds’ subadviser (the “Subadviser”). The Independent Trustees were separately represented by independent legal counsel in connection with their consideration of the approval of these agreements. In considering the Investment Management Agreements and the Subadvisory Agreements, the Trustees reviewed a variety of materials relating to each Fund, the Investment Manager and the Subadviser, including the nature, extent and quality of services, comparative performance, fee and expense information for an appropriate peer group of similar mutual funds for each Fund (each, a “Peer Group”), performance information for the relevant benchmark index for each Fund (each, a “Fund Benchmark”), other relevant matters, including management fees, the profitability of the Investment Manager and the Subadviser, and the potential for economies of scale that may be shared with the Funds, and other information provided to them on a periodic basis throughout the year. Prior to voting, the Independent Trustees: (a) reviewed the foregoing information with their independent legal counsel; (b) received materials from their independent legal counsel discussing the legal standards applicable to | | | | their consideration of the Investment Management Agreements and the Subadvisory Agreements; and (c) met with their independent legal counsel in private sessions at which no representatives of management were present. NATURE, EXTENT AND QUALITY OF SERVICES In considering the nature, extent and quality of the services provided by the Investment Manager, the Trustees reviewed information provided by the Investment Manager at the June 12, 2024 meeting and prior meetings relating to the Investment Manager’s operations and personnel. Among other things, the Investment Manager provided financial information, information about its supervisory and professional staff and descriptions of its organizational and management structure. The Trustees also took into account information provided periodically throughout the previous year by the Investment Manager in Board meetings relating to the performance of its duties with respect to the Funds and the Trustees’ knowledge of the Investment Manager’s management and the quality of the performance of the Investment Manager’s duties under the Investment Management Agreements and Administration Agreement. In the course of their deliberations regarding the Investment Manager, the Trustees evaluated, among other things: (a) the extent and quality of the Investment Manager’s oversight of the operation and management of the Funds; (b) the quality of the Investment Manager’s oversight of the performance by the Subadviser of its portfolio management duties; (c) the Investment Manager’s ability to supervise the Funds’ other service providers; and (d) the Investment Manager’s compliance program. The Trustees also took into account that, in performing its functions under the Investment Management Agreements and supervising the Subadviser, the Investment Manager: performs periodic detailed analyses and reviews of the performance by the Subadviser of its obligations to each Fund, including without limitation, analysis and review of portfolio and other compliance matters and review of the Subadviser’s investment performance with respect to each Fund; prepares and presents periodic reports to the Board regarding the investment performance of the Subadviser and other information regarding the Subadviser, at such times and in such forms as the Board may reasonably request; reviews and considers any changes in the personnel of the Subadviser responsible for performing the Subadviser’s obligations and makes appropriate reports to the Board; reviews and considers any changes in the ownership or senior management of | | | | the Subadviser and makes appropriate reports to the Board; performs periodic in-person, telephonic or videoconference diligence meetings, including with respect to compliance matters, with representatives of the Subadviser; assists the Board and management of the Trusts in developing and reviewing information with respect to the initial approval of each Subadvisory Agreement and annual consideration of each Subadvisory Agreement thereafter; prepares recommendations with respect to the continued retention of the Subadviser or the replacement of the Subadviser, including at the request of the Board; identifies potential successors to, or replacements of, the Subadviser or potential additional subadvisers, including performing appropriate due diligence, and developing and presenting to the Board a recommendation as to any such successor, replacement, or additional subadviser, including at the request of the Board; designates and compensates from its own resources such personnel as the Investment Manager may consider necessary or appropriate to the performance of its services; and performs such other review and reporting functions as the Board shall reasonably request consistent with the Investment Management Agreements and applicable law. The Trustees noted the affiliation of the Subadviser with the Investment Manager, noting any potential conflicts of interest. The Trustees also took into account the financial condition of the Investment Manager with respect to its ability to provide the services required under the Investment Management Agreements and the Investment Manager’s undertaking to maintain contractual expense limitations for the Funds. The Trustees also considered the Investment Manager’s risk management processes. The Trustees also reviewed information relating to the Subadviser’s operations and personnel and the investment philosophy, strategies and techniques (its “Investment Strategy”) used in managing each Fund. Among other things, the Trustees reviewed information on portfolio management and other professional staff, information regarding the Subadviser’s organizational and management structure and the Subadviser’s brokerage policies and practices. The Trustees considered specific information provided regarding the experience of the individuals at the Subadviser with portfolio management responsibility for each Fund, including the information set forth in the Fund’s prospectus and statement of additional information. In the course of their deliberations, the Trustees evaluated, among other things: (a) the services rendered by the Subadviser in the past; (b) the qualifications and |
| | | | | | | | |
| | | | | | | | |
29
| | |
| | ITEM 11. STATEMENT REGARDING BASIS FOR APPROVAL OF INVESTMENT ADVISORY CONTRACT (continued) |
| | | | | | | | |
experience of the Subadviser’s personnel; and (c) the Subadviser’s compliance program. The Trustees also took into account the financial condition of the Subadviser with respect to its ability to provide the services required under each Subadvisory Agreement. The Trustees also considered the Subadviser’s risk management processes. PERFORMANCE The Board considered each Fund’s net performance during relevant time periods as compared to the Fund’s Peer Group and Fund Benchmark, considered the gross performance of each Fund as compared to the Subadviser’s relevant performance composite that utilizes a similar investment strategy and approach, and noted that the Board reviews on a quarterly basis detailed information about both a Fund’s performance results and portfolio composition, as well as the Subadviser’s Investment Strategy. The Board was mindful of the Investment Manager’s expertise, resources and attention to monitoring the Subadviser’s performance, investment style and risk-adjusted performance with respect to the Funds and its discussions with the management of the Funds’ subadviser during the period regarding the factors that contributed to the performance of the Funds. With respect to AMG GW&K Core Bond ESG Fund, among other information relating to the Fund’s performance, the Trustees noted that the Fund’s performance for Class I shares (which share class has the earliest inception date and the largest amount of assets of all the share classes of the Fund) for the 1-year, 3-year, 5-year and 10-year periods ended March 31, 2024, was below the median performance of the Peer Group and below the performance of the Fund Benchmark, the Bloomberg U.S. Aggregate Bond Index. The Trustees took into account management’s discussion of the Fund’s performance, including the reasons for the Fund’s underperformance relative to the Peer Group and the Fund Benchmark. The Trustees also took into account the fact that Class I shares of the Fund ranked in the top half relative to its Peer Group for the 2023 calendar year. The Trustees concluded that the Fund’s overall performance has been satisfactory in light of the Fund’s investment objective, strategies and policies. With respect to AMG GW&K Small/Mid Cap Growth Fund, among other information relating to the Fund’s performance, the Trustees noted that the Fund’s performance for Class N shares (which share class has the earliest inception date and the largest amount of assets of all the share classes of the | | | | Fund) for the 1-year, 3-year, 5-year, and 10-year periods ended March 31, 2024, was below, above, below, and below, respectively, the median performance of the Peer Group and above, above, above, and below, respectively, the performance of the Fund Benchmark, the Russell 2500 Growth Index. The Trustees took into account management’s discussion of the Fund’s performance, including the reasons for the Fund’s more recent and longer-term underperformance relative to the Peer Group and its more recent outperformance relative to the Fund Benchmark. The Trustees noted that the Fund ranked in the top quartile relative to its Peer Group for the 3-year period. The Trustees also took into account the fact that the Fund’s subadviser changed effective March 19, 2021, that the Fund’s investment strategy changed effective March 19, 2021 and further on May 21, 2021, that the Fund Benchmark changed effective May 21, 2021, and that the performance information prior to those dates reflected that of the Fund’s prior subadviser and investment strategy. The Trustees concluded that the Fund’s overall performance has been satisfactory in light of the Fund’s investment objective, strategies and policies. ADVISORY AND SUBADVISORY FEES; FUND EXPENSES; PROFITABILITY; AND ECONOMIES OF SCALE In considering the reasonableness of the advisory fee payable to the Investment Manager, the Trustees reviewed information provided by the Investment Manager at the June 12, 2024 meeting and prior meetings setting forth all revenues and other benefits, both direct and indirect (including any so-called “fallout benefits” such as reputational value derived from the Investment Manager serving as Investment Manager to a Fund), received by the Investment Manager and its affiliates attributable to managing each Fund and all the mutual funds in the AMG Funds Family of Funds; the cost of providing such services; the significant risks undertaken as Investment Manager and sponsor of the Funds, including investment, operational, enterprise, entrepreneurial, litigation, regulatory and compliance risks; and the resulting profitability to the Investment Manager and its affiliates from these relationships. The Trustees also considered the amount of the advisory fee retained by the Investment Manager after payment of the subadvisory fee with respect to each Fund. The Trustees also noted payments are made from the Subadviser to the Investment Manager, and other payments are made from the Investment Manager to the Subadviser. The Trustees also considered management’s discussion of the | | | | current asset levels of the Funds, and the impact on profitability of both the current asset levels and any future growth of assets of the Funds. In considering the cost of services to be provided by the Investment Manager under each Investment Management Agreement and the profitability to the Investment Manager of its relationship with each Fund, the Trustees noted the undertaking by the Investment Manager to maintain contractual expense limitations for the Funds. The Board also took into account management’s discussion of the advisory fee structure, and the services the Investment Manager provides in performing its functions under each Investment Management Agreement and supervising the Subadviser. Based on the foregoing, the Trustees concluded that the profitability to the Investment Manager is reasonable and that the Investment Manager is not realizing material benefits from economies of scale that would warrant adjustments to the advisory fee at this time. Also, with respect to economies of scale, the Trustees noted that as each Fund’s assets increase over time, the Fund may realize other economies of scale to the extent the increase in assets is proportionally greater than the increase in certain other expenses. In considering the reasonableness of the subadvisory fees payable by the Investment Manager to the Subadviser, the Trustees reviewed information regarding the cost to the Subadviser of providing subadvisory services to each Fund and the resulting profitability from these relationships. The Trustees noted that, because the Subadviser is an affiliate of the Investment Manager, a portion of the Subadviser’s revenues or profits might be shared directly or indirectly with the Investment Manager. The Trustees also noted that the subadvisory fees are paid by the Investment Manager out of its advisory fee. The Board also took into account management’s discussion of the subadvisory fee structure, and the services the Subadviser provides in performing its functions under each Subadvisory Agreement. Based on the foregoing, the Trustees concluded that the profitability to the Subadviser is reasonable and that the Subadviser is not realizing material benefits from economies of scale that would warrant adjustments to the subadvisory fees at this time. Also, with respect to economies of scale, the Trustees noted that as a Fund’s assets increase over time, the Fund may realize other economies of scale to the extent the increase in assets is proportionally greater than the increase in certain other expenses. With respect to AMG GW&K Core Bond ESG Fund, the Trustees noted that the management fees (which include both the advisory and administration fees) |
| | | | | | | | |
| | | | | | | | |
30
| | |
| | ITEM 11. STATEMENT REGARDING BASIS FOR APPROVAL OF INVESTMENT ADVISORY CONTRACT (continued) |
| | | | | | | | |
and total expenses (net of applicable expense waivers/reimbursements) of Class I shares (the class of shares which is the primary focus of the Fund’s distribution) of the Fund as of March 31, 2024, were rated in the Average and the Above Average rating level, respectively, of the Fund’s Peer Group. The Trustees noted that the rating levels corresponded to the Fund’s quintile ranking in its Peer Group. The Trustees took into account the fact that the Investment Manager has contractually agreed, through March 1, 2025, to limit the Fund’s net annual operating expenses (subject to certain excluded expenses) to 0.48%. The Trustees also took into account management’s discussion of the Fund’s expenses and competitiveness with comparably sized funds and select competitors. The Trustees concluded that, in light of the nature, extent and quality of the services provided by the Investment Manager and the Subadviser (which is an affiliate of the Investment Manager), the foregoing expense limitation and the considerations noted above with respect to the Investment Manager and the Subadviser, the Fund’s advisory and subadvisory fees are reasonable. With respect to AMG GW&K Small/Mid Cap Growth Fund, the Trustees noted that the management fees | | | | (which include both the advisory and administration fees) and total expenses (net of applicable expense waivers/reimbursements) of Class I shares (the class of shares which is the primary focus of the Fund’s distribution) of the Fund as of March 31, 2024, were both rated in the Average rating level of the Fund’s Peer Group. The Trustees noted that the rating levels corresponded to the Fund’s quintile ranking in its Peer Group. The Trustees took into account the fact that the Investment Manager has contractually agreed, through March 1, 2025, to limit the Fund’s net annual operating expenses (subject to certain excluded expenses) to 0.82%. The Trustees concluded that, in light of the nature, extent and quality of the services provided by the Investment Manager and the Subadviser (which is an affiliate of the Investment Manager), the foregoing expense limitation and the considerations noted above with respect to the Investment Manager and the Subadviser, the Fund’s advisory and subadvisory fees are reasonable. * * * * * After consideration of the foregoing, the Trustees also reached the following conclusions (in addition to the | | | | conclusions discussed above) regarding the Investment Management and Subadvisory Agreements: (a) the Investment Manager and the Subadviser have demonstrated that they possess the capability and resources to perform the duties required of them under each Investment Management Agreement and each Subadvisory Agreement and (b) the Investment Manager and Subadviser maintain appropriate compliance programs. Based on all of the above-mentioned factors and their related conclusions, with no single factor or conclusion being determinative and with each Trustee not necessarily attributing the same weight to each factor, the Trustees concluded that approval of each Investment Management Agreement and each Subadvisory Agreement would be in the best interests of the applicable Fund and its shareholders. Accordingly, on June 12, 2024, the Trustees, and separately a majority of the Independent Trustees, voted to approve the Investment Management Agreement and the Subadvisory Agreement for each Fund. |
| | | | | | | | |
| | | | | | | | |
31
THIS PAGE INTENTIONALLY LEFT BLANK
| | |
| | |
| | | | |
INVESTMENT MANAGER AND ADMINISTRATOR AMG Funds LLC 680 Washington Blvd., Suite 500 Stamford, CT 06901 800.548.4539 DISTRIBUTOR AMG Distributors, Inc. 680 Washington Blvd., Suite 500 Stamford, CT 06901 800.548.4539 SUBADVISER GW&K Investment Management, LLC 222 Berkeley St. Boston, MA 02116 | | CUSTODIAN The Bank of New York Mellon Mutual Funds Custody 240 Greenwich Street New York, NY 10286 LEGAL COUNSEL Ropes & Gray LLP Prudential Tower, 800 Boylston Street Boston, MA 02199-3600 TRANSFER AGENT BNY Mellon Investment Servicing (US) Inc. AMG Funds Attn: 534426 AIM 154-0520 500 Ross Street Pittsburgh, PA 15262 800.548.4539 | | This report is prepared for the Funds’ shareholders. It is authorized for distribution to prospective investors only when preceded or accompanied by an effective prospectus. To receive a free copy of the prospectus or Statement of Additional Information, which includes additional information about Fund Trustees, please contact us by calling 800.548.4539. Distributed by AMG Distributors, Inc., member FINRA/SIPC. Current net asset values per share for each Fund are available on the Funds’ website at wealth.amg.com. A description of the policies and procedures each Fund uses to vote its proxies is available: (i) without charge, upon request, by calling 800.548.4539, or (ii) on the Securities and Exchange Commission’s (SEC) website at sec.gov. For information regarding each Fund’s proxy voting record for the 12-month period ended June 30, call 800.548.4539 or visit the SEC website at sec.gov. The Funds file their complete schedule of portfolio holdings with the SEC for the first and third quarters of each fiscal year as an exhibit to their reports on Form N-PORT. The Funds’ portfolio holdings on Form N-PORT are available on the SEC’s website at sec.gov and the Funds’ website at wealth.amg.com. To review a complete list of the Funds’ portfolio holdings, or to view the most recent semi-annual report or annual report, please visit wealth.amg.com. |
| | |
| | |
| | | | | | |
EQUITY FUNDS AMG Boston Common Global Impact Boston Common Asset Management, LLC AMG Frontier Small Cap Growth Frontier Capital Management Co., LLC AMG GW&K Small Cap Core AMG GW&K Small Cap Value AMG GW&K Small/Mid Cap Core AMG GW&K Small/Mid Cap Growth AMG GW&K International Small Cap GW&K Investment Management, LLC AMG Montrusco Bolton Large Cap Growth Montrusco Bolton Investments, Inc. AMG Renaissance Large Cap Growth The Renaissance Group LLC | | | | AMG River Road Dividend All Cap Value AMG River Road Focused Absolute Value AMG River Road Large Cap Value Select AMG River Road Mid Cap Value AMG River Road Small-Mid Cap Value AMG River Road Small Cap Value River Road Asset Management, LLC AMG TimesSquare International Small Cap AMG TimesSquare Mid Cap Growth AMG TimesSquare Small Cap Growth TimesSquare Capital Management, LLC AMG Veritas Asia Pacific AMG Veritas China AMG Veritas Global Focus AMG Veritas Global Real Return Veritas Asset Management LLP AMG Yacktman AMG Yacktman Focused AMG Yacktman Global AMG Yacktman Special Opportunities Yacktman Asset Management LP | | FIXED INCOME FUNDS AMG Beutel Goodman Core Plus Bond Beutel, Goodman & Company Ltd. AMG GW&K Core Bond ESG AMG GW&K ESG Bond AMG GW&K Municipal Bond AMG GW&K Municipal Enhanced Yield GW&K Investment Management, LLC ALTERNATIVE FUNDS AMG Systematica Managed Futures Strategy Systematica Investments Limited, acting as general partner of Systematica Investments LP |
| | | | | | |
| | | | | | | |
| | | |
| wealth.amg.com | | 103124 | | | AR069 | |
| | |
 | | ANNUAL FINANCIAL STATEMENTS |
| | | | | | |
| | | AMG Funds |
| | | | |
| | | October 31, 2024 | | | | |
| | |
| | |  |
| | |
| | | AMG River Road Mid Cap Value Fund |
| | | Class N: CHTTX | | Class I: ABMIX | | Class Z: ABIZX |
| | |
| | | AMG River Road Large Cap Value Select Fund |
| | | | |
| | | Class N: FQUAX | | Class I: MEQFX | | |
| | |
| | | AMG River Road Small Cap Value Fund |
| | | | |
| | | Class N: ARSVX | | Class I: ARSIX | | Class Z: ARZMX |
| | |
| | | AMG River Road Dividend All Cap Value Fund |
| | | | |
| | | Class N: ARDEX | | Class I: ARIDX | | Class Z: ARZDX |
| | |
| | | AMG River Road Small-Mid Cap Value Fund |
| | | | |
| | | Class N: ARSMX | | Class I: ARIMX | | Class Z: ARSZX |
| | |
| | | AMG River Road Focused Absolute Value Fund |
| | | | |
| | | Class N: ARRFX | | Class I: AFAVX | | Class Z: ARRZX |
| | | | |
| | | | | | | |
| | | | | | |
| | | | | | | |
| | | |
| wealth.amg.com | | 103124 | | | AR082 | |
| | |
| | AMG Funds Annual Financial Statements — October 31, 2024 |
Nothing contained herein is to be considered an offer, sale or solicitation of an offer to buy shares of any series of the AMG Funds Family of Funds. Such offering is made only by prospectus, which includes details as to offering price and other material information.
| | |
| | AMG River Road Mid Cap Value Fund Schedule of Portfolio Investments October 31, 2024 |
| | | | | | | | |
| | | Shares | | | Value | |
| | |
Common Stocks - 93.8% | | | | | | | | |
| | |
Communication Services - 1.7% | | | | | | | | |
| | |
Atlanta Braves Holdings, Inc., Class C* | | | 75,874 | | | | $2,997,782 | |
| | |
Madison Square Garden Sports Corp.* | | | 11,708 | | | | 2,607,371 | |
| | |
Total Communication Services | | | | | | | 5,605,153 | |
| | |
Consumer Discretionary - 19.4% | | | | | | | | |
| | |
Expedia Group, Inc.* | | | 57,101 | | | | 8,925,457 | |
| | |
Genuine Parts Co. | | | 58,341 | | | | 6,691,713 | |
| | |
LGI Homes, Inc.* | | | 33,415 | | | | 3,393,627 | |
| | |
Lithia Motors, Inc. | | | 39,892 | | | | 13,258,904 | |
| | |
LKQ Corp. | | | 227,918 | | | | 8,385,103 | |
| | |
Lululemon Athletica, Inc. (Canada)* | | | 44,586 | | | | 13,282,170 | |
| | |
MGM Resorts International* | | | 147,837 | | | | 5,450,750 | |
| | |
Ulta Beauty, Inc.* | | | 16,426 | | | | 6,060,866 | |
| | |
Total Consumer Discretionary | | | | | | | 65,448,590 | |
| | |
Consumer Staples - 10.2% | | | | | | | | |
| | |
Albertsons Cos., Inc., Class A | | | 268,296 | | | | 4,856,158 | |
| | |
BJ’s Wholesale Club Holdings, Inc.* | | | 138,450 | | | | 11,730,868 | |
| | |
Casey’s General Stores, Inc. | | | 17,991 | | | | 7,088,814 | |
| | |
The Kroger Co. | | | 191,640 | | | | 10,687,763 | |
| | |
Total Consumer Staples | | | | | | | 34,363,603 | |
| | |
Energy - 1.0% | | | | | | | | |
| | |
Tidewater, Inc.* | | | 57,101 | | | | 3,430,057 | |
| | |
Financials - 16.4% | | | | | | | | |
| | |
Ares Management Corp., Class A | | | 16,426 | | | | 2,754,312 | |
| | |
Brookfield Asset Management, Ltd., | | | | | | | | |
| | |
Class A (Canada) | | | 144,541 | | | | 7,666,455 | |
| | |
Fairfax Financial Holdings, Ltd. (Canada) | | | 12,447 | | | | 15,502,987 | |
| | |
Global Payments, Inc. | | | 65,705 | | | | 6,814,265 | |
| | |
WEX, Inc.* | | | 45,368 | | | | 7,830,517 | |
| | |
Willis Towers Watson PLC (United Kingdom) | | | 49,735 | | | | 15,029,420 | |
| | |
Total Financials | | | | | | | 55,597,956 | |
| | |
Health Care - 7.7% | | | | | | | | |
| | |
Centene Corp.* | | | 104,815 | | | | 6,525,782 | |
| | |
GE HealthCare Technologies, Inc. | | | 46,932 | | | | 4,099,510 | |
| | |
Humana, Inc. | | | 14,080 | | | | 3,630,246 | |
| | |
Labcorp Holdings, Inc. | | | 52,066 | | | | 11,885,106 | |
| | |
Total Health Care | | | | | | | 26,140,644 | |
| | |
Industrials - 21.2% | | | | | | | | |
| | |
AerCap Holdings, N.V. (Ireland) | | | 72,271 | | | | 6,760,952 | |
| | |
API Group Corp.* | | | 240,137 | | | | 8,198,277 | |
| | |
Carlisle Cos., Inc. | | | 7,822 | | | | 3,302,683 | |
| | | | | | | | |
| | | Shares | | | Value | |
| | |
CNH Industrial N.V. (United Kingdom) | | | 624,199 | | | | $7,009,755 | |
| | |
Delta Air Lines, Inc. | | | 128,282 | | | | 7,340,296 | |
| | |
Expeditors International of Washington, Inc. | | | 54,754 | | | | 6,515,726 | |
| | |
Ferguson Enterprises, Inc. | | | 20,337 | | | | 4,001,101 | |
| | |
McGrath RentCorp | | | 73,898 | | | | 8,402,203 | |
| | |
Robert Half, Inc. | | | 121,349 | | | | 8,265,080 | |
| | |
SS&C Technologies Holdings, Inc. | | | 121,242 | | | | 8,478,453 | |
| | |
Valmont Industries, Inc. | | | 10,951 | | | | 3,413,208 | |
| | |
Total Industrials | | | | | | | 71,687,734 | |
| | |
Materials - 3.7% | | | | | | | | |
| | |
Summit Materials, Inc., Class A* | | | 152,530 | | | | 7,231,447 | |
| | |
Warrior Met Coal, Inc. | | | 81,349 | | | | 5,135,563 | |
| | |
Total Materials | | | | | | | 12,367,010 | |
| | |
Real Estate - 7.4% | | | | | | | | |
| | |
Alexandria Real Estate Equities, Inc., REIT | | | 55,537 | | | | 6,195,152 | |
| | |
Howard Hughes Holdings, Inc.* | | | 91,518 | | | | 6,959,029 | |
| | |
Mid-America Apartment Communities, Inc., REIT | | | 41,457 | | | | 6,274,102 | |
| | |
The St. Joe Co. | | | 104,815 | | | | 5,418,936 | |
| | |
Total Real Estate | | | | | | | 24,847,219 | |
| | |
Utilities - 5.1% | | | | | | | | |
| | |
IDACORP, Inc. | | | 32,070 | | | | 3,318,603 | |
| | |
Talen Energy Corp.* | | | 77,438 | | | | 14,044,156 | |
| | |
Total Utilities | | | | | | | 17,362,759 | |
| | |
Total Common Stocks | | | | | | | | |
(Cost $271,391,400) | | | | | | | 316,850,725 | |
| |
Exchange Traded Funds - 5.4% | | | | | |
| | |
iShares Russell Mid-Cap Value ETF | | | | | | | | |
(Cost $18,426,204) | | | 140,643 | | | | 18,351,099 | |
| | |
| | | Principal
Amount | | | | |
| |
Short-Term Investments - 1.8% | | | | | |
| |
Repurchase Agreements - 1.8% | | | | | |
| | |
Fixed Income Clearing Corp., dated 10/31/24, due 11/01/24, 4.650% total to be received $6,164,796 (collateralized by a U.S. Treasury Note, 3.375%, 05/15/33, totaling $6,287,364) | | | $6,164,000 | | | | 6,164,000 | |
| | |
Total Short-Term Investments | | | | | | | | |
| | |
(Cost $6,164,000) | | | | | | | 6,164,000 | |
| | |
Total Investments - 101.0% | | | | | | | | |
| | |
(Cost $295,981,604) | | | | | | | 341,365,824 | |
| |
Other Assets, less Liabilities - (1.0)% | | | | (3,425,431 | ) |
| | |
Net Assets - 100.0% | | | | | | | $337,940,393 | |
The accompanying notes are an integral part of these financial statements.
2
| | |
| | AMG River Road Mid Cap Value Fund Schedule of Portfolio Investments (continued) |
| | |
* Non-income producing security. | | REIT Real Estate Investment Trust |
ETF Exchange Traded Fund
The following table summarizes the inputs used to value the Fund’s investments by the fair value hierarchy levels as of October 31, 2024:
| | | | | | | | | | | | | | | | |
| | | Level 1 | | | Level 2 | | | Level 3 | | | Total | |
| | | | |
Investments in Securities | | | | | | | | | | | | | | | | |
| | | | |
Common Stocks† | | $ | 316,850,725 | | | | — | | | | — | | | $ | 316,850,725 | |
| | | | |
Exchange Traded Funds | | | 18,351,099 | | | | — | | | | — | | | | 18,351,099 | |
| | | | |
Short-Term Investments | | | | | | | | | | | | | | | | |
| | | | |
Repurchase Agreements | | | — | | | $ | 6,164,000 | | | | — | | | | 6,164,000 | |
| | | | | | | | | | | | | | | | |
| | | | |
Total Investments in Securities | | $ | 335,201,824 | | | $ | 6,164,000 | | | | — | | | $ | 341,365,824 | |
| | | | | | | | | | | | | | | | |
| | † | All common stocks held in the Fund are Level 1 securities. For a detailed breakout of common stocks by major industry classification, please refer to the Fund’s Schedule of Portfolio Investments. |
For the fiscal year ended October 31, 2024, there were no transfers in or out of Level 3.
The accompanying notes are an integral part of these financial statements.
3
| | |
| | AMG River Road Large Cap Value Select Fund Schedule of Portfolio Investments October 31, 2024 |
| | | | | | | | |
| | | Shares | | | Value | |
| | |
Common Stocks - 98.1% | | | | | | | | |
| |
Communication Services - 3.0% | | | | | |
| | |
Alphabet, Inc., Class C | | | 8,100 | | | | $1,398,789 | |
| |
Consumer Discretionary - 18.1% | | | | | |
| | |
Lennar Corp., Class A | | | 12,469 | | | | 2,123,471 | |
| | |
LKQ Corp. | | | 37,497 | | | | 1,379,514 | |
| | |
Lululemon Athletica, Inc. (Canada)* | | | 7,920 | | | | 2,359,368 | |
| | |
LVMH Moet Hennessy Louis Vuitton SE, ADR (France) | | | 8,971 | | | | 1,189,465 | |
| | |
Starbucks Corp. | | | 4,770 | | | | 466,029 | |
| | |
Vail Resorts, Inc. | | | 4,903 | | | | 812,378 | |
| | |
Total Consumer Discretionary | | | | | | | 8,330,225 | |
| |
Consumer Staples - 19.1% | | | | | |
| | |
BJ’s Wholesale Club Holdings, Inc.* | | | 34,351 | | | | 2,910,560 | |
| | |
Casey’s General Stores, Inc. | | | 5,074 | | | | 1,999,257 | |
| | |
The Kroger Co. | | | 41,158 | | | | 2,295,382 | |
| | |
Nestle SA, Sponsored ADR (Switzerland) | | | 16,909 | | | | 1,598,239 | |
| | |
Total Consumer Staples | | | | | | | 8,803,438 | |
| |
Energy - 5.0% | | | | | |
| | |
Suncor Energy, Inc. (Canada) | | | 36,250 | | | | 1,369,162 | |
| | |
Valaris, Ltd.* | | | 18,390 | | | | 930,534 | |
| | |
Total Energy | | | | | | | 2,299,696 | |
| |
Financials - 23.2% | | | | | |
| | |
Berkshire Hathaway, Inc., Class B* | | | 3,940 | | | | 1,776,625 | |
| | |
Fairfax Financial Holdings, Ltd. (Canada) | | | 2,101 | | | | 2,616,837 | |
| | |
Global Payments, Inc. | | | 14,421 | | | | 1,495,602 | |
| | |
KKR & Co., Inc. | | | 14,940 | | | | 2,065,306 | |
| | |
Willis Towers Watson PLC (United Kingdom) | | | 9,104 | | | | 2,751,138 | |
| | |
Total Financials | | | | | | | 10,705,508 | |
| |
Health Care - 10.6% | | | | | |
| | |
Elevance Health, Inc. | | | 3,680 | | | | 1,493,197 | |
| | | | | | | | |
| | | Shares | | | Value | |
| | |
Labcorp Holdings, Inc. | | | 9,915 | | | | $2,263,297 | |
| | |
UnitedHealth Group, Inc. | | | 2,014 | | | | 1,136,903 | |
| | |
Total Health Care | | | | | | | 4,893,397 | |
| |
Industrials - 4.1% | | | | | |
| | |
Carlisle Cos., Inc. | | | 987 | | | | 416,741 | |
| | |
CSX Corp. | | | 24,120 | | | | 811,397 | |
| | |
United Parcel Service, Inc., Class B | | | 5,130 | | | | 687,728 | |
| | |
Total Industrials | | | | | | | 1,915,866 | |
| |
Materials - 8.1% | | | | | |
| | |
CRH PLC | | | 39,051 | | | | 3,726,637 | |
| |
Real Estate - 2.7% | | | | | |
| | |
Mid-America Apartment Communities, Inc., REIT | | | 8,124 | | | | 1,229,486 | |
| |
Utilities - 4.2% | | | | | |
| | |
Talen Energy Corp.* | | | 10,771 | | | | 1,953,429 | |
| | |
Total Common Stocks | | | | | | | | |
(Cost $39,335,262) | | | | | | | 45,256,471 | |
| | |
| | | Principal
Amount | | | | |
Short-Term Investments - 2.9% | | | | | | | | |
| |
Repurchase Agreements - 2.9% | | | | | |
| | |
Fixed Income Clearing Corp., dated 10/31/24, due 11/01/24, 4.650% total to be received $1,331,172 (collateralized by a U.S. Treasury Note, 3.375%, 05/15/33, totaling $1,357,628) | | | $1,331,000 | | | | 1,331,000 | |
| | |
Total Short-Term Investments | | | | | | | | |
(Cost $1,331,000) | | | | | | | 1,331,000 | |
| | |
Total Investments - 101.0% | | | | | | | | |
(Cost $40,666,262) | | | | | | | 46,587,471 | |
| |
Other Assets, less Liabilities - (1.0)% | | | | (475,967 | ) |
| | |
Net Assets - 100.0% | | | | | | | $46,111,504 | |
* Non-income producing security.
ADR American Depositary Receipt
REIT Real Estate Investment Trust
The accompanying notes are an integral part of these financial statements.
4
| | |
| | AMG River Road Large Cap Value Select Fund Schedule of Portfolio Investments (continued) |
The following table summarizes the inputs used to value the Fund’s investments by the fair value hierarchy levels as of October 31, 2024:
| | | | | | | | | | | | | | | | |
| | | Level 1 | | | Level 2 | | | Level 3 | | | Total | |
| | | | |
Investments in Securities | | | | | | | | | | | | | | | | |
| | | | |
Common Stocks† | | $ | 45,256,471 | | | | — | | | | — | | | $ | 45,256,471 | |
| | | | |
Short-Term Investments | | | | | | | | | | | | | | | | |
| | | | |
Repurchase Agreements | | | — | | | $ | 1,331,000 | | | | — | | | | 1,331,000 | |
| | | | | | | | | | | | | | | | |
| | | | |
Total Investments in Securities | | $ | 45,256,471 | | | $ | 1,331,000 | | | | — | | | $ | 46,587,471 | |
| | | | | | | | | | | | | | | | |
| | † | All common stocks held in the Fund are Level 1 securities. For a detailed breakout of common stocks by major industry classification, please refer to the Fund’s Schedule of Portfolio Investments. |
For the fiscal year ended October 31, 2024, there were no transfers in or out of Level 3.
The accompanying notes are an integral part of these financial statements.
5
| | |
| | AMG River Road Small Cap Value Fund Schedule of Portfolio Investments October 31, 2024 |
| | | | | | | | |
| | | Shares | | | Value | |
| | |
Common Stocks - 90.8% | | | | | | | | |
| |
Communication Services - 2.2% | | | | | |
| | |
TripAdvisor, Inc.* | | | 880,243 | | | | $14,119,098 | |
| | |
Yelp, Inc.* | | | 299,951 | | | | 10,240,327 | |
| | |
Total Communication Services | | | | | | | 24,359,425 | |
| |
Consumer Discretionary - 9.9% | | | | | |
| | |
Advance Auto Parts, Inc.1 | | | 194,716 | | | | 6,949,414 | |
| | |
Asbury Automotive Group, Inc.* | | | 36,501 | | | | 8,316,388 | |
| | |
LGI Homes, Inc.* | | | 159,589 | | | | 16,207,859 | |
| | |
Murphy USA, Inc. | | | 67,057 | | | | 32,753,992 | |
| | |
Papa John’s International, Inc.1 | | | 432,363 | | | | 22,651,497 | |
| | |
United Parks & Resorts, Inc.*,1 | | | 381,309 | | | | 20,068,293 | |
| | |
Total Consumer Discretionary | | | | | | | 106,947,443 | |
| |
Consumer Staples - 6.1% | | | | | |
| | |
Dole PLC (Ireland) | | | 1,320,566 | | | | 21,327,141 | |
| | |
The Duckhorn Portfolio, Inc.*,1 | | | 950,718 | | | | 10,419,869 | |
| | |
Ingles Markets, Inc., Class A | | | 284,356 | | | | 18,158,974 | |
| | |
Nomad Foods, Ltd. (United Kingdom) | | | 953,461 | | | | 16,733,241 | |
| | |
Total Consumer Staples | | | | | | | 66,639,225 | |
| |
Energy - 3.6% | | | | | |
| | |
Delek US Holdings, Inc. | | | 723,354 | | | | 11,334,957 | |
| | |
Evolution Petroleum Corp.1 | | | 832,335 | | | | 4,286,525 | |
| | |
SM Energy Co.1 | | | 494,426 | | | | 20,751,059 | |
| | |
World Kinect Corp.1 | | | 105,342 | | | | 2,754,694 | |
| | |
Total Energy | | | | | | | 39,127,235 | |
| |
Financials - 18.2% | | | | | |
| | |
Assured Guaranty, Ltd. (Bermuda) | | | 205,853 | | | | 17,180,491 | |
| | |
Axis Capital Holdings, Ltd. (Bermuda) | | | 374,620 | | | | 29,317,761 | |
| | |
Cannae Holdings, Inc. | | | 1,110,351 | | | | 22,040,467 | |
| | |
EVERTEC, Inc. (Puerto Rico) | | | 454,742 | | | | 14,897,348 | |
| | |
Genworth Financial, Inc., Class A* | | | 3,748,018 | | | | 25,261,641 | |
| | |
P10, Inc., Class A | | | 2,036,591 | | | | 22,504,331 | |
| | |
Radian Group, Inc. | | | 323,540 | | | | 11,294,782 | |
| | |
Repay Holdings Corp.* | | | 1,295,547 | | | | 10,306,076 | |
| | |
White Mountains Insurance Group, Ltd. | | | 24,814 | | | | 44,594,232 | |
| | |
Total Financials | | | | | | | 197,397,129 | |
| |
Health Care - 3.9% | | | | | |
| | |
Embecta Corp. | | | 871,294 | | | | 12,267,820 | |
| | |
Enovis Corp.* | | | 381,420 | | | | 15,741,203 | |
| | |
Inmode, Ltd. (Israel)* | | | 307,656 | | | | 5,254,764 | |
| | |
Patterson Cos., Inc.1 | | | 427,711 | | | | 8,986,208 | |
| | |
Total Health Care | | | | | | | 42,249,995 | |
| | | | | | | | |
| | | Shares | | | Value | |
| |
Industrials - 27.9% | | | | | |
| | |
Air Transport Services Group, Inc.* | | | 1,426,480 | | | | $24,592,515 | |
| | |
Alight, Inc., Class A* | | | 2,041,046 | | | | 14,144,449 | |
| | |
Argan, Inc. | | | 120,362 | | | | 15,892,598 | |
| | |
Armstrong World Industries, Inc. | | | 104,136 | | | | 14,532,179 | |
| | |
Atkore, Inc. | | | 225,713 | | | | 19,357,147 | |
| | |
BlueLinx Holdings, Inc.* | | | 40,343 | | | | 4,415,945 | |
| | |
Brady Corp., Class A | | | 80,228 | | | | 5,707,420 | |
| | |
CoreCivic, Inc.* | | | 1,882,400 | | | | 25,995,944 | |
| | |
DNOW, Inc.* | | | 367,344 | | | | 4,345,679 | |
| | |
The GEO Group Inc.* | | | 1,702,280 | | | | 25,840,610 | |
| | |
Hub Group Inc. , Class A | | | 193,169 | | | | 8,381,603 | |
| | |
Janus International Group, Inc.*,1 | | | 1,353,245 | | | | 9,959,883 | |
| | |
Kelly Services, Inc., Class A | | | 230,019 | | | | 4,598,080 | |
| | |
McGrath RentCorp | | | 342,628 | | | | 38,956,804 | |
| | |
MSC Industrial Direct Co., Inc., Class A1 | | | 93,031 | | | | 7,355,961 | |
| | |
OPENLANE, Inc.* | | | 1,161,211 | | | | 18,347,134 | |
| | |
Park Aerospace Corp. | | | 756,768 | | | | 10,239,071 | |
| | |
UniFirst Corp. | | | 175,326 | | | | 31,525,368 | |
| | |
Viad Corp.* | | | 508,499 | | | | 19,038,203 | |
| | |
Total Industrials | | | | | | | 303,226,593 | |
| |
Information Technology - 5.3% | | | | | |
| | |
ACI Worldwide, Inc.* | | | 221,449 | | | | 10,895,291 | |
| | |
ePlus, Inc.* | | | 138,886 | | | | 12,353,910 | |
| | |
Ituran Location and Control, Ltd. (Israel) | | | 230,417 | | | | 6,159,046 | |
| | |
NCR Voyix, Corp.*,1 | | | 505,727 | | | | 6,478,363 | |
| | |
Vontier Corp. | | | 589,739 | | | | 21,867,522 | |
| | |
Total Information Technology | | | | | | | 57,754,132 | |
| |
Materials - 5.1% | | | | | |
| | |
Summit Materials, Inc., Class A* | | | 657,042 | | | | 31,150,361 | |
| | |
TriMas Corp.1 | | | 431,568 | | | | 11,587,601 | |
| | |
Warrior Met Coal, Inc. | | | 192,054 | | | | 12,124,369 | |
| | |
Total Materials | | | | | | | 54,862,331 | |
| |
Real Estate - 0.1% | | | | | |
| | |
Howard Hughes Holdings, Inc.* | | | 18,070 | | | | 1,374,043 | |
| |
Utilities - 8.5% | | | | | |
| | |
Northwestern Energy Group, Inc. | | | 375,339 | | | | 20,065,623 | |
| | |
Southwest Gas Holdings, Inc. | | | 232,845 | | | | 17,055,896 | |
| | |
Talen Energy Corp.* | | | 197,545 | | | | 35,826,761 | |
| | |
TXNM Energy, Inc. | | | 445,589 | | | | 19,400,945 | |
| | |
Total Utilities | | | | | | | 92,349,225 | |
| | |
Total Common Stocks | | | | | | | | |
(Cost $794,010,198) | | | | | | | 986,286,776 | |
The accompanying notes are an integral part of these financial statements.
6
| | |
| | AMG River Road Small Cap Value Fund Schedule of Portfolio Investments (continued) |
| | | | | | | | |
| | | Principal
Amount | | | Value | |
| |
Short-Term Investments - 9.3% | | | | | |
| |
Joint Repurchase Agreements - 0.0%#,2 | | | | | |
| | |
Daiwa Capital Markets America, dated 10/31/24, due 11/01/24, 4.890% total to be received $136,991 (collateralized by various U.S. Government Agency Obligations and U.S. Treasuries, 0.625% - 7.500%, 05/15/25 - 11/01/54, totaling $139,711) | | | $136,972 | | | | $136,972 | |
| |
Repurchase Agreements - 9.3% | | | | | |
| | |
Fixed Income Clearing Corp., dated 10/31/24, due 11/01/24, 4.650% total to be received $100,233,945 (collateralized by a U.S. Treasury Note, 3.375%, 05/15/33, totaling $102,225,485) | | | 100,221,000 | | | | 100,221,000 | |
| |
Total Short-Term Investments | | | | | |
(Cost $100,357,972) | | | | | | | 100,357,972 | |
| | | | | | | | |
| | | | | | Value | |
| | |
Total Investments - 100.1% | | | | | | | | |
(Cost $894,368,170) | | | | | | | $1,086,644,748 | |
| |
Other Assets, less Liabilities - (0.1)% | | | | (864,349 | ) |
| | |
Net Assets - 100.0% | | | | | | | $1,085,780,399 | |
| | * | Non-income producing security. |
| | 1 | Some of these securities, amounting to $65,950,074 or 6.1% of net assets, were out on loan to various borrowers and are collateralized by cash and various U.S. Treasury Obligations. See Note 4 of Notes to Financial Statements. |
| | 2 | Cash collateral received for securities lending activity was invested in these joint repurchase agreements. |
The following table summarizes the inputs used to value the Fund’s investments by the fair value hierarchy levels as of October 31, 2024:
| | | | | | | | | | | | | | | | |
| | | Level 1 | | | Level 2 | | | Level 3 | | | Total | |
| | | | |
Investments in Securities | | | | | | | | | | | | | | | | |
| | | | |
Common Stocks† | | $ | 986,286,776 | | | | — | | | | — | | | | $986,286,776 | |
| | | | |
Short-Term Investments | | | | | | | | | | | | | | | | |
| | | | |
Joint Repurchase Agreements | | | — | | | | $136,972 | | | | — | | | | 136,972 | |
| | | | |
Repurchase Agreements | | | — | | | | 100,221,000 | | | | — | | | | 100,221,000 | |
| | | | | | | | | | | | | | | | |
| | | | |
Total Investments in Securities | | $ | 986,286,776 | | | $ | 100,357,972 | | | | — | | | $ | 1,086,644,748 | |
| | | | | | | | | | | | | | | | |
| | † | All common stocks held in the Fund are Level 1 securities. For a detailed breakout of common stocks by major industry classification, please refer to the Fund’s Schedule of Portfolio Investments. |
For the fiscal year ended October 31, 2024, there were no transfers in or out of Level 3.
The accompanying notes are an integral part of these financial statements.
7
| | |
| | AMG River Road Dividend All Cap Value Fund Schedule of Portfolio Investments October 31, 2024 |
| | | | | | | | |
| | | Shares | | | Value | |
| | |
Common Stocks - 97.1% | | | | | | | | |
| | |
Communication Services - 8.1% | | | | | | | | |
| | |
Cogent Communications Holdings, Inc.1 | | | 32,514 | | | | $2,609,899 | |
| | |
Comcast Corp., Class A | | | 62,652 | | | | 2,736,013 | |
| | |
The Interpublic Group of Cos., Inc. | | | 29,796 | | | | 876,002 | |
| | |
Warner Music Group Corp., Class A | | | 22,340 | | | | 713,986 | |
| | |
Total Communication Services | | | | | | | 6,935,900 | |
| |
Consumer Discretionary - 2.7% | | | | | |
| | |
Genuine Parts Co. | | | 6,374 | | | | 731,098 | |
| | |
NIKE, Inc., Class B | | | 5,676 | | | | 437,790 | |
| | |
Starbucks Corp. | | | 11,146 | | | | 1,088,964 | |
| | |
Total Consumer Discretionary | | | | | | | 2,257,852 | |
| |
Consumer Staples - 12.9% | | | | | |
| | |
Kimberly-Clark Corp. | | | 12,456 | | | | 1,671,346 | |
| | |
The Kroger Co. | | | 37,523 | | | | 2,092,658 | |
| | |
PepsiCo, Inc. | | | 6,833 | | | | 1,134,825 | |
| | |
Primo Water Corp. | | | 31,972 | | | | 838,625 | |
| | |
Sysco Corp. | | | 12,567 | | | | 941,897 | |
| | |
Target Corp. | | | 10,883 | | | | 1,632,885 | |
| | |
Unilever PLC, Sponsored ADR (United Kingdom)1 | | | 43,914 | | | | 2,674,802 | |
| | |
Total Consumer Staples | | | | | | | 10,987,038 | |
| |
Energy - 12.3% | | | | | |
| | |
Chesapeake Energy Corp. | | | 7,582 | | | | 642,347 | |
| | |
Enterprise Products Partners LP, MLP | | | 70,342 | | | | 2,016,002 | |
| | |
EOG Resources, Inc. | | | 7,956 | | | | 970,314 | |
| | |
Kinder Morgan, Inc. | | | 130,622 | | | | 3,201,545 | |
| | |
The Williams Cos., Inc. | | | 69,913 | | | | 3,661,344 | |
| | |
Total Energy | | | | | | | 10,491,552 | |
| |
Financials - 16.1% | | | | | |
| | |
Axis Capital Holdings, Ltd. (Bermuda) | | | 20,092 | | | | 1,572,400 | |
| | |
Chubb, Ltd. (Switzerland) | | | 6,919 | | | | 1,954,202 | |
| | |
CNA Financial Corp. | | | 12,960 | | | | 620,914 | |
| | |
Fidelity National Financial, Inc. | | | 13,703 | | | | 824,510 | |
| | |
The PNC Financial Services Group, Inc. | | | 14,698 | | | | 2,767,192 | |
| | |
The Progressive Corp. | | | 12,817 | | | | 3,112,352 | |
| | |
U.S. Bancorp | | | 43,388 | | | | 2,096,074 | |
| | |
Willis Towers Watson PLC (United Kingdom) | | | 2,559 | | | | 773,304 | |
| | |
Total Financials | | | | | | | 13,720,948 | |
| |
Health Care - 9.2% | | | | | |
| | |
AbbVie, Inc. | | | 6,300 | | | | 1,284,381 | |
| | |
Amgen, Inc. | | | 5,489 | | | | 1,757,358 | |
| | |
Bristol-Myers Squibb Co. | | | 24,741 | | | | 1,379,806 | |
| | |
Johnson & Johnson | | | 5,714 | | | | 913,440 | |
| | | | | | | | |
| | | Shares | | | Value | |
| | |
Pfizer, Inc. | | | 37,023 | | | | $1,047,751 | |
| | |
Royalty Pharma PLC, Class A | | | 54,241 | | | | 1,464,507 | |
| | |
Total Health Care | | | | | | | 7,847,243 | |
| |
Industrials - 7.0% | | | | | |
| | |
CSG Systems International, Inc. | | | 10,040 | | | | 467,964 | |
| | |
Dun & Bradstreet Holdings, Inc. | | | 57,083 | | | | 678,717 | |
| | |
Lockheed Martin Corp. | | | 1,062 | | | | 579,905 | |
| | |
Paycom Software, Inc. | | | 7,233 | | | | 1,511,914 | |
| | |
United Parcel Service, Inc., Class B | | | 14,977 | | | | 2,007,817 | |
| | |
Watsco, Inc.1 | | | 1,585 | | | | 749,721 | |
| | |
Total Industrials | | | | | | | 5,996,038 | |
| |
Information Technology - 15.8% | | | | | |
| | |
Avnet, Inc. | | | 19,112 | | | | 1,036,062 | |
| | |
Cisco Systems, Inc. | | | 16,343 | | | | 895,106 | |
| | |
Corning, Inc. | | | 55,377 | | | | 2,635,391 | |
| | |
Micron Technology, Inc. | | | 21,354 | | | | 2,127,926 | |
| | |
Oracle Corp. | | | 23,445 | | | | 3,935,009 | |
| | |
QUALCOMM, Inc. | | | 3,162 | | | | 514,679 | |
| | |
Salesforce, Inc. | | | 4,120 | | | | 1,200,444 | |
| | |
Texas Instruments, Inc. | | | 5,656 | | | | 1,149,073 | |
| | |
Total Information Technology | | | | | | | 13,493,690 | |
| |
Real Estate - 3.5% | | | | | |
| | |
American Tower Corp., REIT | | | 10,695 | | | | 2,283,810 | |
| | |
Crown Castle, Inc., REIT | | | 6,776 | | | | 728,352 | |
| | |
Total Real Estate | | | | | | | 3,012,162 | |
| |
Utilities - 9.5% | | | | | |
| | |
The AES Corp. | | | 117,206 | | | | 1,932,727 | |
| | |
Duke Energy Corp. | | | 13,204 | | | | 1,522,025 | |
| | |
IDACORP, Inc. | | | 15,599 | | | | 1,614,185 | |
| | |
Northwestern Energy Group, Inc. | | | 19,540 | | | | 1,044,608 | |
| | |
TXNM Energy, Inc. | | | 29,358 | | | | 1,278,247 | |
| | |
Vistra Corp. | | | 5,484 | | | | 685,281 | |
| | |
Total Utilities | | | | | | | 8,077,073 | |
| | |
Total Common Stocks | | | | | | | | |
(Cost $52,862,960) | | | | | | | 82,819,496 | |
| | |
Preferred Stock - 0.5% | | | | | | | | |
| |
Information Technology - 0.5% | | | | | |
| | |
Hewlett Packard Enterprise Co. | | | 7,476 | | | | 432,487 | |
| | |
Total Preferred Stock | | | | | | | | |
(Cost $453,782) | | | | | | | 432,487 | |
The accompanying notes are an integral part of these financial statements.
8
| | |
| | AMG River Road Dividend All Cap Value Fund Schedule of Portfolio Investments (continued) |
| | | | | | | | |
| | | Principal
Amount | | | Value | |
| | |
Short-Term Investments - 2.5% | | | | | | | | |
| |
Repurchase Agreements - 2.5% | | | | | |
| | |
Fixed Income Clearing Corp., dated 10/31/24, due 11/01/24, 4.650% total to be received $2,127,275 (collateralized by a U.S. Treasury Note, 3.375%, 05/15/33, totaling $2,169,553) | | | $2,127,000 | | | | $2,127,000 | |
| | |
Total Short-Term Investments | | | | | | | | |
(Cost $2,127,000) | | | | | | | 2,127,000 | |
| | | | |
| | | | | Value |
| | |
Total Investments - 100.1% | | | | |
(Cost $55,443,742) | | | | $85,378,983 |
| | |
Other Assets, less Liabilities - (0.1)% | | | | (74,818) |
| | |
Net Assets - 100.0% | | | | $85,304,165 |
| | 1 | Some of these securities, amounting to $ 3,415,359 or 4.0% of net assets, were out on loan to various borrowers and are collateralized by various U.S. Treasury Obligations. See Note 4 of Notes to Financial Statements. |
ADR American Depositary Receipt
MLP Master Limited Partnership
REIT Real Estate Investment Trust
The following table summarizes the inputs used to value the Fund’s investments by the fair value hierarchy levels as of October 31, 2024:
| | | | | | | | | | | | | | | | |
| | | Level 1 | | | Level 2 | | | Level 3 | | | Total | |
| | | | |
Investments in Securities | | | | | | | | | | | | | | | | |
| | | | |
Common Stocks† | | $ | 82,819,496 | | | | — | | | | — | | | $ | 82,819,496 | |
| | | | |
Preferred Stock† | | | 432,487 | | | | — | | | | — | | | | 432,487 | |
| | | | |
Short-Term Investments | | | | | | | | | | | | | | | | |
| | | | |
Repurchase Agreements | | | — | | | $ | 2,127,000 | | | | — | | | | 2,127,000 | |
| | | | | | | | | | | | | | | | |
Total Investments in Securities | | $ | 83,251,983 | | | $ | 2,127,000 | | | | — | | | $ | 85,378,983 | |
| | | | | | | | | | | | | | | | |
| | † | All common stocks and preferred stocks held in the Fund are Level 1 securities. For a detailed breakout of common stocks and preferred stocks by major industry classification, please refer to the Fund’s Schedule of Portfolio Investments. |
For the fiscal year ended October 31, 2024, there were no transfers in or out of Level 3.
The accompanying notes are an integral part of these financial statements.
9
| | |
| | AMG River Road Small-Mid Cap Value Fund Schedule of Portfolio Investments October 31, 2024 |
| | | | | | | | |
| | | Shares | | | Value | |
| | |
Common Stocks - 96.2% | | | | | | | | |
| |
Communication Services - 1.9% | | | | | |
| | |
GCI Liberty, Inc. Escrow Share*,1,2 | | | 79,662 | | | | $0 | |
| | |
TripAdvisor, Inc.* | | | 211,918 | | | | 3,399,165 | |
| | |
Yelp, Inc.* | | | 77,534 | | | | 2,647,011 | |
| | |
Total Communication Services | | | | | | | 6,046,176 | |
| |
Consumer Discretionary - 14.8% | | | | | |
| | |
LGI Homes, Inc.* | | | 42,477 | | | | 4,313,964 | |
| | |
Lithia Motors, Inc. | | | 26,792 | | | | 8,904,857 | |
| | |
LKQ Corp. | | | 196,351 | | | | 7,223,753 | |
| | |
Murphy USA, Inc. | | | 20,999 | | | | 10,256,962 | |
| | |
Papa John’s International, Inc.3 | | | 98,493 | | | | 5,160,048 | |
| | |
Polaris, Inc.3 | | | 39,325 | | | | 2,749,211 | |
| | |
United Parks & Resorts, Inc.* | | | 76,205 | | | | 4,010,669 | |
| | |
Vail Resorts, Inc. | | | 28,699 | | | | 4,755,138 | |
| | |
Total Consumer Discretionary | | | | | | | 47,374,602 | |
| | |
Consumer Staples - 8.7% | | | | | | | | |
| | |
BJ’s Wholesale Club Holdings, Inc.* | | | 142,233 | | | | 12,051,402 | |
| | |
Dole PLC (Ireland) | | | 146,154 | | | | 2,360,387 | |
| | |
Ingles Markets, Inc., Class A | | | 49,976 | | | | 3,191,467 | |
| | |
Molson Coors Beverage Co., Class B | | | 117,357 | | | | 6,392,436 | |
| | |
Nomad Foods, Ltd. (United Kingdom) | | | 213,882 | | | | 3,753,629 | |
| | |
Total Consumer Staples | | | | | | | 27,749,321 | |
| | |
Energy - 4.7% | | | | | | | | |
| | |
Delek US Holdings, Inc. | | | 152,023 | | | | 2,382,200 | |
| | |
HF Sinclair Corp. | | | 61,111 | | | | 2,359,496 | |
| | |
Ovintiv, Inc. | | | 27,318 | | | | 1,070,866 | |
| | |
Permian Resources Corp. | | | 422,615 | | | | 5,760,242 | |
| | |
SM Energy Co. | | | 81,811 | | | | 3,433,608 | |
| | |
Total Energy | | | | | | | 15,006,412 | |
| | |
Financials - 17.8% | | | | | | | | |
| | |
Assured Guaranty, Ltd. (Bermuda) | | | 48,665 | | | | 4,061,581 | |
| | |
Axis Capital Holdings, Ltd. (Bermuda) | | | 90,635 | | | | 7,093,095 | |
| | |
Cannae Holdings, Inc. | | | 278,778 | | | | 5,533,743 | |
| | |
CNA Financial Corp. | | | 73,537 | | | | 3,523,158 | |
| | |
EVERTEC, Inc. (Puerto Rico) | | | 99,024 | | | | 3,244,026 | |
| | |
Genworth Financial, Inc., Class A* | | | 937,834 | | | | 6,321,001 | |
| | |
P10, Inc., Class A | | | 389,948 | | | | 4,308,925 | |
| | |
Radian Group, Inc. | | | 100,538 | | | | 3,509,782 | |
| | |
WEX, Inc.* | | | 43,823 | | | | 7,563,850 | |
| | |
White Mountains Insurance Group, Ltd. | | | 6,515 | | | | 11,708,367 | |
| | |
Total Financials | | | | | | | 56,867,528 | |
| | | | | | | | |
| | | Shares | | | Value | |
| | |
Health Care - 4.2% | | | | | | | | |
| | |
Bausch + Lomb Corp. (Canada)* | | | 136,529 | | | | $2,768,808 | |
| | |
Embecta Corp. | | | 158,633 | | | | 2,233,553 | |
| | |
Enovis Corp.* | | | 51,966 | | | | 2,144,637 | |
| | |
Patterson Cos., Inc. | | | 94,321 | | | | 1,981,684 | |
| | |
Smith & Nephew PLC, ADR (United Kingdom)3 | | | 169,063 | | | | 4,241,791 | |
| | |
Total Health Care | | | | | | | 13,370,473 | |
| | |
Industrials - 26.3% | | | | | | | | |
| | |
Air Transport Services Group, Inc.* | | | 404,675 | | | | 6,976,597 | |
| | |
Alight, Inc., Class A* | | | 509,406 | | | | 3,530,183 | |
| | |
Argan, Inc. | | | 21,744 | | | | 2,871,078 | |
| | |
Armstrong World Industries, Inc. | | | 24,228 | | | | 3,381,017 | |
| | |
Atkore, Inc. | | | 60,003 | | | | 5,145,857 | |
| | |
Clarivate PLC (United Kingdom)*,3 | | | 380,989 | | | | 2,514,527 | |
| | |
CNH Industrial N.V. (United Kingdom) | | | 292,947 | | | | 3,289,795 | |
| | |
CoreCivic, Inc.* | | | 492,853 | | | | 6,806,300 | |
| | |
Dun & Bradstreet Holdings, Inc. | | | 334,608 | | | | 3,978,489 | |
| | |
GXO Logistics, Inc.* | | | 83,259 | | | | 4,979,721 | |
| | |
Janus International Group, Inc.* | | | 82,647 | | | | 608,282 | |
| | |
McGrath RentCorp | | | 89,357 | | | | 10,159,891 | |
| | |
OPENLANE, Inc.* | | | 271,897 | | | | 4,295,973 | |
| | |
Rentokil Initial PLC, | | | | | | | | |
| | |
Sponsored ADR (United Kingdom)3 | | | 195,958 | | | | 4,967,535 | |
| | |
UniFirst Corp. | | | 49,357 | | | | 8,874,882 | |
| | |
Viad Corp.* | | | 122,072 | | | | 4,570,376 | |
| | |
WESCO International, Inc. | | | 18,475 | | | | 3,546,646 | |
| | |
WillScot Holdings Corp.* | | | 107,929 | | | | 3,576,767 | |
| | |
Total Industrials | | | | | | | 84,073,916 | |
| | |
Information Technology - 6.5% | | | | | | | | |
| | |
ACI Worldwide, Inc.* | | | 47,945 | | | | 2,358,894 | |
| | |
ePlus, Inc.* | | | 30,663 | | | | 2,727,474 | |
| | |
Ituran Location and Control, Ltd. (Israel) | | | 26,666 | | | | 712,782 | |
| | |
NCR Voyix, Corp.* | | | 141,412 | | | | 1,811,488 | |
| | |
TD SYNNEX Corp. | | | 69,362 | | | | 8,000,906 | |
| | |
Vontier Corp. | | | 143,784 | | | | 5,331,511 | |
| | |
Total Information Technology | | | | | | | 20,943,055 | |
| | |
Materials - 3.5% | | | | | | | | |
| | |
Summit Materials, Inc., Class A* | | | 146,356 | | | | 6,938,738 | |
| | |
TriMas Corp. | | | 58,742 | | | | 1,577,223 | |
| | |
Warrior Met Coal, Inc. | | | 40,618 | | | | 2,564,214 | |
| | |
Total Materials | | | | | | | 11,080,175 | |
| | |
Utilities - 7.8% | | | | | | | | |
| | |
Northwestern Energy Group, Inc. | | | 99,297 | | | | 5,308,418 | |
The accompanying notes are an integral part of these financial statements.
10
| | |
| | AMG River Road Small-Mid Cap Value Fund Schedule of Portfolio Investments (continued) |
| | | | | | | | |
| | | Shares | | | Value | |
| | |
Utilities - 7.8% (continued) | | | | | | | | |
| | |
Southwest Gas Holdings, Inc. | | | 69,529 | | | | $5,092,999 | |
| | |
Talen Energy Corp.* | | | 52,415 | | | | 9,505,984 | |
| | |
TXNM Energy, Inc. | | | 118,015 | | | | 5,138,373 | |
| | |
Total Utilities | | | | | | | 25,045,774 | |
| | |
Total Common Stocks | | | | | | | | |
(Cost $258,854,823) | | | | | | | 307,557,432 | |
| | |
| |
| Principal
Amount |
| | | | |
| |
Short-Term Investments - 4.7% | | | | | |
| |
Joint Repurchase Agreements - 1.0%4 | | | | | |
| | |
Cantor Fitzgerald Securities, Inc., dated 10/31/24, due 11/01/24, 4.930% total to be received $1,000,137 (collateralized by various U.S. Government Agency Obligations and U.S. Treasuries, 0.000% - 6.500%, 02/25/25 -02/01/57, totaling $1,020,000) | | | $1,000,000 | | | | 1,000,000 | |
| | |
Citigroup Global Markets, Inc., dated 10/31/24, due 11/01/24, 4.860% total to be received $1,000,135 (collateralized by various U.S. Government Agency Obligations, 2.000% -7.964%, 02/01/36 - 08/20/67, totaling $1,020,000) | | | 1,000,000 | | | | 1,000,000 | |
| |
| | | | | |
| | | | | | | | |
| | | Principal Amount | | | Value | |
| | |
Daiwa Capital Markets America, dated 10/31/24, due 11/01/24, 4.890% total to be received $202,687 (collateralized by various U.S. Government Agency Obligations and U.S. Treasuries, 0.625% - 7.500%, 05/15/25 - 11/01/54, totaling $206,712) | | | $202,659 | | | | $202,659 | |
| | |
HSBC Securities USA, Inc., dated 10/31/24, due 11/01/24, 4.860% total to be received $1,000,135 (collateralized by various U.S. Government Agency Obligations, 2.000% -7.500%, 05/01/28 - 10/01/54, totaling $1,020,000) | | | 1,000,000 | | | | 1,000,000 | |
| | |
Total Joint Repurchase Agreements | | | | | | | 3,202,659 | |
| |
Repurchase Agreements - 3.7% | | | | | |
| | |
Fixed Income Clearing Corp., dated 10/31/24, due 11/01/24, 4.650% total to be received $11,805,525 (collateralized by a U.S. Treasury Note, 3.375%, 05/15/33, totaling $12,040,089) | | | 11,804,000 | | | | 11,804,000 | |
| | |
Total Short-Term Investments | | | | | | | | |
(Cost $15,006,659) | | | | | | | 15,006,659 | |
| | |
Total Investments - 100.9% | | | | | | | | |
(Cost $273,861,482) | | | | | | | 322,564,091 | |
| |
Other Assets, less Liabilities - (0.9)% | | | | (2,728,178 | ) |
| | |
Net Assets - 100.0% | | | | | | | $319,835,913 | |
| | |
| | | | | | | | |
| | * | Non-income producing security. |
| | 1 | Security’s value was determined by using significant unobservable inputs. |
| | 2 | This security is restricted and not available for re-sale. Liberty Broadband Corp. (“Liberty”) acquired GCI Liberty, Inc. on December 21, 2020. On May 24, 2023, Liberty shareholders received GCI Liberty, Inc. Escrow Shares for potential proceeds from a pending class action lawsuit. The market value of the escrow shares was $0 on the date of the distribution. At October 31, 2024, the cost and market value of the escrow shares is $0, which represents 0% of net assets. |
| | 3 | Some of these securities, amounting to $18,262,258 or 5.7% of net assets, were out on loan to various borrowers and are collateralized by cash and various U.S. Treasury Obligations. See Note 4 of Notes to Financial Statements. |
| | 4 | Cash collateral received for securities lending activity was invested in these joint repurchase agreements. |
ADR American Depositary Receipt
The accompanying notes are an integral part of these financial statements.
11
| | |
| | AMG River Road Small-Mid Cap Value Fund Schedule of Portfolio Investments (continued) |
The following table summarizes the inputs used to value the Fund’s investments by the fair value hierarchy levels as of October 31, 2024:
| | | | | | | | | | | | | | | | |
| | | Level 1 | | | Level 2 | | | Level 3 | | | Total | |
| | | | |
Investments in Securities | | | | | | | | | | | | | | | | |
| | | | |
Common Stocks | | | | | | | | | | | | | | | | |
| | | | |
Industrials | | | $84,073,916 | | | | — | | | | — | | | | $84,073,916 | |
| | | | |
Financials | | | 56,867,528 | | | | — | | | | — | | | | 56,867,528 | |
| | | | |
Consumer Discretionary | | | 47,374,602 | | | | — | | | | — | | | | 47,374,602 | |
| | | | |
Consumer Staples | | | 27,749,321 | | | | — | | | | — | | | | 27,749,321 | |
| | | | |
Utilities | | | 25,045,774 | | | | — | | | | — | | | | 25,045,774 | |
| | | | |
Information Technology | | | 20,943,055 | | | | — | | | | — | | | | 20,943,055 | |
| | | | |
Energy | | | 15,006,412 | | | | — | | | | — | | | | 15,006,412 | |
| | | | |
Health Care | | | 13,370,473 | | | | — | | | | — | | | | 13,370,473 | |
| | | | |
Materials | | | 11,080,175 | | | | — | | | | — | | | | 11,080,175 | |
| | | | |
Communication Services | | | 6,046,176 | | | | — | | | | $0 | | | | 6,046,176 | |
| | | | |
Short-Term Investments | | | | | | | | | | | | | | | | |
| | | | |
Joint Repurchase Agreements | | | — | | | | $3,202,659 | | | | — | | | | 3,202,659 | |
| | | | |
Repurchase Agreements | | | — | | | | 11,804,000 | | | | — | | | | 11,804,000 | |
| | | | | | | | | | | | | | | | |
| | | | |
Total Investments in Securities | | | $307,557,432 | | | | $15,006,659 | | | | $0 | | | | $322,564,091 | |
| | | | | | | | | | | | | | | | |
The Level 3 common stock held by the Fund at October 31, 2024 was received as a result of a corporate action. The security’s value of $0 was determined by using significant unobservable inputs, which generated a change in unrealized depreciation of $0.
For the fiscal year ended October 31, 2024, there were no transfers in or out of Level 3. The Fund did not have any purchases and sales of Level 3 securities for the same period.
The accompanying notes are an integral part of these financial statements.
12
| | |
| | AMG River Road Focused Absolute Value Fund Schedule of Portfolio Investments October 31, 2024 |
| | | | | | | | |
| | | Shares | | | Value | |
| | |
Common Stocks - 99.2% | | | | | | | | |
| |
Communication Services - 3.3% | | | | | |
| | |
Comcast Corp., Class A | | | 37,507 | | | | $1,637,931 | |
| | |
GCI Liberty, Inc. Escrow Share*,1,2 | | | 108,700 | | | | 0 | |
| | |
Total Communication Services | | | | | | | 1,637,931 | |
| |
Consumer Discretionary - 19.2% | | | | | |
| | |
Expedia Group, Inc.* | | | 7,184 | | | | 1,122,931 | |
| | |
Genuine Parts Co. | | | 10,095 | | | | 1,157,897 | |
| | |
Lennar Corp., Class A | | | 9,786 | | | | 1,666,556 | |
| | |
LKQ Corp. | | | 27,131 | | | | 998,149 | |
| | |
Lululemon Athletica, Inc. (Canada)* | | | 5,534 | | | | 1,648,579 | |
| | |
MGM Resorts International* | | | 26,253 | | | | 967,948 | |
| | |
Papa John’s International, Inc.3 | | | 35,137 | | | | 1,840,827 | |
| | |
Total Consumer Discretionary | | | | | | | 9,402,887 | |
| |
Consumer Staples - 13.8% | | | | | |
| | |
BJ’s Wholesale Club Holdings, Inc.* | | | 28,805 | | | | 2,440,648 | |
| | |
The Kroger Co. | | | 42,720 | | | | 2,382,494 | |
| | |
Molson Coors Beverage Co., Class B | | | 20,867 | | | | 1,136,625 | |
| | |
Unilever PLC, Sponsored ADR (United Kingdom)3 | | | 13,102 | | | | 798,043 | |
| | |
Total Consumer Staples | | | | | | | 6,757,810 | |
| |
Energy - 4.5% | | | | | |
| | |
Delek US Holdings, Inc. | | | 54,282 | | | | 850,599 | |
| | |
Kinder Morgan, Inc. | | | 54,445 | | | | 1,334,447 | |
| | |
Total Energy | | | | | | | 2,185,046 | |
| |
Financials - 21.3% | | | | | |
| | |
Berkshire Hathaway, Inc., Class B* | | | 6,496 | | | | 2,929,176 | |
| | |
Fairfax Financial Holdings, Ltd. (Canada) | | | 2,613 | | | | 3,254,544 | |
| | |
Global Payments, Inc. | | | 10,329 | | | | 1,071,220 | |
| | |
WEX, Inc.* | | | 9,108 | | | | 1,572,041 | |
| | |
Willis Towers Watson PLC (United Kingdom) | | | 5,348 | | | | 1,616,112 | |
| | |
Total Financials | | | | | | | 10,443,093 | |
| |
Health Care - 5.8% | | | | | |
| | |
Elevance Health, Inc. | | | 3,895 | | | | 1,580,435 | |
| | |
Labcorp Holdings, Inc. | | | 5,498 | | | | 1,255,029 | |
| | |
Total Health Care | | | | | | | 2,835,464 | |
| |
Industrials - 13.0% | | | | | |
| | |
CNH Industrial N.V. (United Kingdom) | | | 148,707 | | | | 1,669,980 | |
| | * | Non-income producing security. |
| | 1 | Security’s value was determined by using significant unobservable inputs. |
| | | | | | | | |
| | | Shares | | | Value | |
| | |
McGrath RentCorp | | | 13,577 | | | | $1,543,705 | |
| | |
Rentokil Initial PLC, | | | | | | | | |
| | |
Sponsored ADR (United Kingdom)3 | | | 58,848 | | | | 1,491,797 | |
| | |
SS&C Technologies Holdings, Inc. | | | 23,992 | | | | 1,677,760 | |
| | |
Total Industrials | | | | | | | 6,383,242 | |
| |
Materials - 7.6% | | | | | |
| | |
CRH PLC | | | 23,036 | | | | 2,198,325 | |
| | |
Summit Materials, Inc., Class A* | | | 32,697 | | | | 1,550,165 | |
| | |
Total Materials | | | | | | | 3,748,490 | |
| |
Real Estate - 3.7% | | | | | |
| | |
Mid-America Apartment Communities, Inc., REIT | | | 11,993 | | | | 1,815,021 | |
| |
Utilities - 7.0% | | | | | |
| | |
Northwestern Energy Group, Inc. | | | 31,689 | | | | 1,694,094 | |
| | |
Talen Energy Corp.* | | | 9,633 | | | | 1,747,041 | |
| | |
Total Utilities | | | | | | | 3,441,135 | |
| | |
Total Common Stocks | | | | | | | | |
(Cost $40,267,254) | | | | | | | 48,650,119 | |
| | |
| | | Principal
Amount | | | | |
| | |
Short-Term Investments - 1.1% | | | | | | | | |
| |
Joint Repurchase Agreements - 0.2%4 | | | | | |
| | |
Daiwa Capital Markets America, dated 10/31/24, due 11/01/24, 4.890% total to be received $124,910 (collateralized by various U.S. Government Agency Obligations and U.S. Treasuries, 0.625% - 7.500%, 05/15/25 - 11/01/54, totaling $127,391) | | $ | 124,893 | | | | 124,893 | |
| |
Repurchase Agreements - 0.9% | | | | | |
| | |
Fixed Income Clearing Corp., dated 10/31/24, due 11/01/24, 4.650% total to be received $448,058 (collateralized by a U.S. Treasury Note, 3.375%, 05/15/33, totaling $456,994) | | | 448,000 | | | | 448,000 | |
| | |
Total Short-Term Investments | | | | | | | | |
(Cost $572,893) | | | | | | | 572,893 | |
Total Investments - 100.3% | | | | | | | | |
(Cost $40,840,147) | | | | | | | 49,223,012 | |
Other Assets, less Liabilities - (0.3)% | | | | (168,692 | ) |
| | |
Net Assets - 100.0% | | | | | | | $49,054,320 | |
| | 2 | This security is restricted and not available for re-sale. Liberty Broadband Corp. (“Liberty”) acquired GCI Liberty, Inc. on December 21, 2020. On May 24, 2023, Liberty shareholders received GCI Liberty, Inc. Escrow Shares for potential proceeds from a pending class action lawsuit. The market value of the escrow shares was $0 on the date of the distribution. At October 31, 2024, the cost and market value of the escrow shares is $0, which represents 0% of net assets. |
The accompanying notes are an integral part of these financial statements.
13
| | |
| | AMG River Road Focused Absolute Value Fund Schedule of Portfolio Investments (continued) |
| | 3 | Some of these securities, amounting to $3,705,525 or 7.6% of net assets, were out on loan to various borrowers and are collateralized by cash and various U.S. Treasury Obligations. See Note 4 of Notes to Financial Statements. |
| | 4 | Cash collateral received for securities lending activity was invested in these joint repurchase agreements. |
ADR American Depositary Receipt
REIT Real Estate Investment Trust
The following table summarizes the inputs used to value the Fund’s investments by the fair value hierarchy levels as of October 31, 2024:
| | | | | | | | | | | | | | | | |
| | | Level 1 | | | Level 2 | | | Level 3 | | | Total | |
| | | | |
Investments in Securities | | | | | | | | | | | | | | | | |
| | | | |
Common Stocks | | | | | | | | | | | | | | | | |
| | | | |
Financials | | | $10,443,093 | | | | — | | | | — | | | | $10,443,093 | |
| | | | |
Consumer Discretionary | | | 9,402,887 | | | | — | | | | — | | | | 9,402,887 | |
| | | | |
Consumer Staples | | | 6,757,810 | | | | — | | | | — | | | | 6,757,810 | |
| | | | |
Industrials | | | 6,383,242 | | | | — | | | | — | | | | 6,383,242 | |
| | | | |
Materials | | | 3,748,490 | | | | — | | | | — | | | | 3,748,490 | |
| | | | |
Utilities | | | 3,441,135 | | | | — | | | | — | | | | 3,441,135 | |
| | | | |
Health Care | | | 2,835,464 | | | | — | | | | — | | | | 2,835,464 | |
| | | | |
Energy | | | 2,185,046 | | | | — | | | | — | | | | 2,185,046 | |
| | | | |
Real Estate | | | 1,815,021 | | | | — | | | | — | | | | 1,815,021 | |
| | | | |
Communication Services | | | 1,637,931 | | | | — | | | | $0 | | | | 1,637,931 | |
| | | | |
Short-Term Investments | | | | | | | | | | | | | | | | |
| | | | |
Joint Repurchase Agreements | | | — | | | | $124,893 | | | | — | | | | 124,893 | |
| | | | |
Repurchase Agreements | | | — | | | | 448,000 | | | | — | | | | 448,000 | |
| | | | | | | | | | | | | | | | |
| | | | |
Total Investments in Securities | | | $48,650,119 | | | | $572,893 | | | | $0 | | | | $49,223,012 | |
| | | | | | | | | | | | | | | | |
The Level 3 common stock held by the Fund at October 31, 2024 was received as a result of a corporate action. The security’s value of $0 was determined by using significant unobservable inputs, which generated a change in unrealized depreciation of $0.
For the fiscal year ended October 31, 2024, there were no transfers in or out of Level 3. The Fund did not have any purchases and sales of Level 3 securities for the same period.
The accompanying notes are an integral part of these financial statements.
14
| | |
| | Statement of Assets and Liabilities October 31, 2024 |
| | | | | | | | | | | | | | | |
| | | AMG
River Road
Mid Cap
Value Fund | | AMG
River Road Large
Cap Value
Select Fund | | AMG
River Road
Small Cap
Value Fund |
| | | |
Assets: | | | | | | | | | | | | | | | |
| | | |
Investments at value1 (including securities on loan valued at $0, $0, and $65,950,074, respectively) | | | | $341,365,824 | | | | | $46,587,471 | | | | | $1,086,644,748 | |
| | | |
Cash | | | | 629 | | | | | 769 | | | | | 2,163 | |
| | | |
Receivable for investments sold | | | | 7,217,745 | | | | | 271,322 | | | | | 2,397,186 | |
| | | |
Dividend and interest receivables | | | | 128,722 | | | | | 14,351 | | | | | 513,034 | |
| | | |
Securities lending income receivable | | | | 731 | | | | | 138 | | | | | 4,861 | |
| | | |
Receivable for Fund shares sold | | | | 49,718 | | | | | 4,277 | | | | | 534,876 | |
| | | |
Receivable from affiliate | | | | 16,547 | | | | | 8,563 | | | | | — | |
| | | |
Prepaid expenses and other assets | | | | 20,743 | | | | | 11,917 | | | | | 20,552 | |
| | | |
Total assets | | | | 348,800,659 | | | | | 46,898,808 | | | | | 1,090,117,420 | |
| | | |
Liabilities: | | | | | | | | | | | | | | | |
| | | |
Payable upon return of securities loaned | | | | — | | | | | — | | | | | 136,972 | |
| | | |
Payable for investments purchased | | | | 10,401,463 | | | | | 700,059 | | | | | 2,788,637 | |
| | | |
Payable for Fund shares repurchased | | | | 83,287 | | | | | 1,345 | | | | | 292,389 | |
| | | |
Accrued expenses: | | | | | | | | | | | | | | | |
| | | |
Investment advisory and management fees | | | | 160,938 | | | | | 13,661 | | | | | 738,665 | |
| | | |
Administrative fees | | | | 43,108 | | | | | 5,855 | | | | | 138,500 | |
| | | |
Distribution fees | | | | 53,450 | | | | | 1,100 | | | | | 9,899 | |
| | | |
Shareholder service fees | | | | 24,410 | | | | | 1,479 | | | | | 79,039 | |
| | | |
Other | | | | 93,610 | | | | | 63,805 | | | | | 152,920 | |
| | | |
Total liabilities | | | | 10,860,266 | | | | | 787,304 | | | | | 4,337,021 | |
| | | |
Commitments and Contingencies (Notes 2 & 6) | | | | | | | | | | | | | | | |
| | | |
Net Assets | | | | $337,940,393 | | | | | $46,111,504 | | | | | $1,085,780,399 | |
| | | |
1 Investments at cost | | | | $295,981,604 | | | | | $40,666,262 | | | | | $894,368,170 | |
The accompanying notes are an integral part of these financial statements.
15
| | |
| | Statement of Assets and Liabilities (continued) |
| | | | | | | | | | | | | | | |
| | | |
| | | AMG
River Road
Mid Cap
Value Fund | | AMG
River Road Large
Cap Value
Select Fund | | AMG
River Road
Small Cap
Value Fund |
| | | |
Net Assets Represent: | | | | | | | | | | | | | | | |
| | | |
Paid-in capital | | | | $250,549,904 | | | | | $38,320,893 | | | | | $806,806,538 | |
| | | |
Total distributable earnings | | | | 87,390,489 | | | | | 7,790,611 | | | | | 278,973,861 | |
| | | |
Net Assets | | | | $337,940,393 | | | | | $46,111,504 | | | | | $1,085,780,399 | |
| | | |
Class N: | | | | | | | | | | | | | | | |
| | | |
Net Assets | | | | $244,184,364 | | | | | $5,291,117 | | | | | $46,396,314 | |
| | | |
Shares outstanding | | | | 10,911,779 | | | | | 257,312 | | | | | 2,940,281 | |
| | | |
Net asset value, offering and redemption price per share | | | | $22.38 | | | | | $20.56 | | | | | $15.78 | |
| | | |
Class I: | | | | | | | | | | | | | | | |
| | | |
Net Assets | | | | $85,569,169 | | | | | $40,820,387 | | | | | $1,035,498,194 | |
| | | |
Shares outstanding | | | | 3,536,804 | | | | | 1,970,881 | | | | | 62,915,305 | |
| | | |
Net asset value, offering and redemption price per share | | | | $24.19 | | | | | $20.71 | | | | | $16.46 | |
| | | |
Class Z: | | | | | | | | | | | | | | | |
| | | |
Net Assets | | | | $8,186,860 | | | | | — | | | | | $3,885,891 | |
| | | |
Shares outstanding | | | | 340,573 | | | | | — | | | | | 235,467 | |
| | | |
Net asset value, offering and redemption price per share | | | | $24.04 | | | | | — | | | | | $16.50 | |
The accompanying notes are an integral part of these financial statements.
16
| | |
| | Statement of Assets and Liabilities (continued) |
| | | | | | | | | | | | | | | |
| | | |
| | | AMG
River Road
Dividend All Cap
Value Fund | | AMG
River Road
Small-Mid Cap
Value Fund | | AMG
River Road
Focused Absolute
Value Fund |
| | | |
Assets: | | | | | | | | | | | | | | | |
| | | |
Investments at value1 (including securities on loan valued at $3,415,359, $18,262,258, and $3,705,525, respectively) | | | | $85,378,983 | | | | | $322,564,091 | | | | | $49,223,012 | |
| | | |
Cash | | | | 228 | | | | | 332 | | | | | 386 | |
| | | |
Receivable for investments sold | | | | 639,543 | | | | | 1,355,974 | | | | | — | |
| | | |
Dividend and interest receivables | | | | 177,796 | | | | | 123,309 | | | | | 30,824 | |
| | | |
Securities lending income receivable | | | | 685 | | | | | 9,202 | | | | | 621 | |
| | | |
Receivable for Fund shares sold | | | | 1,810 | | | | | 33,314 | | | | | 2,398 | |
| | | |
Receivable from affiliate | | | | 17,024 | | | | | — | | | | | 11,517 | |
| | | |
Prepaid expenses and other assets | | | | 13,411 | | | | | 12,213 | | | | | 15,626 | |
| | | |
Total assets | | | | 86,229,480 | | | | | 324,098,435 | | | | | 49,284,384 | |
| | | |
Liabilities: | | | | | | | | | | | | | | | |
| | | |
Payable upon return of securities loaned | | | | — | | | | | 3,202,659 | | | | | 124,893 | |
| | | |
Payable for investments purchased | | | | 645,802 | | | | | 564,760 | | | | | — | |
| | | |
Payable for Fund shares repurchased | | | | 139,040 | | | | | 154,576 | | | | | 16,572 | |
| | | |
Accrued expenses: | | | | | | | | | | | | | | | |
| | | |
Investment advisory and management fees | | | | 39,140 | | | | | 204,318 | | | | | 25,263 | |
| | | |
Administrative fees | | | | 11,742 | | | | | 40,864 | | | | | 6,316 | |
| | | |
Distribution fees | | | | 5,071 | | | | | 5,275 | | | | | 405 | |
| | | |
Shareholder service fees | | | | 3,040 | | | | | 13,203 | | | | | 1,613 | |
| | | |
Other | | | | 81,480 | | | | | 76,867 | | | | | 55,002 | |
| | | |
Total liabilities | | | | 925,315 | | | | | 4,262,522 | | | | | 230,064 | |
| | | |
Commitments and Contingencies (Notes 2 & 6) | | | | | | | | | | | | | | | |
| | | |
Net Assets | | | | $85,304,165 | | | | | $319,835,913 | | | | | $49,054,320 | |
| | | |
1 Investments at cost | | | | $55,443,742 | | | | | $273,861,482 | | | | | $40,840,147 | |
The accompanying notes are an integral part of these financial statements.
17
| | |
| | Statement of Assets and Liabilities (continued) |
| | | | | | | | | | | | | | | |
| | | |
| | | AMG
River Road
Dividend All Cap
Value Fund | | AMG
River Road
Small-Mid Cap
Value Fund | | AMG
River Road
Focused Absolute
Value Fund |
| | | |
Net Assets Represent: | | | | | | | | | | | | | | | |
| | | |
Paid-in capital | | | | $22,568,642 | | | | | $243,671,269 | | | | | $34,164,396 | |
| | | |
Total distributable earnings | | | | 62,735,523 | | | | | 76,164,644 | | | | | 14,889,924 | |
| | | |
Net Assets | | | | $85,304,165 | | | | | $319,835,913 | | | | | $49,054,320 | |
| | | |
Class N: | | | | | | | | | | | | | | | |
| | | |
Net Assets | | | | $26,733,692 | | | | | $21,263,419 | | | | | $1,949,129 | |
| | | |
Shares outstanding | | | | 2,473,062 | | | | | 2,108,365 | | | | | 132,426 | |
| | | |
Net asset value, offering and redemption price per share | | | | $10.81 | | | | | $10.09 | | | | | $14.72 | |
| | | |
Class I: | | | | | | | | | | | | | | | |
| | | |
Net Assets | | | | $54,673,669 | | | | | $263,399,410 | | | | | $45,021,813 | |
| | | |
Shares outstanding | | | | 5,065,849 | | | | | 25,124,114 | | | | | 3,055,544 | |
| | | |
Net asset value, offering and redemption price per share | | | | $10.79 | | | | | $10.48 | | | | | $14.73 | |
| | | |
Class Z: | | | | | | | | | | | | | | | |
| | | |
Net Assets | | | | $3,896,804 | | | | | $35,173,084 | | | | | $2,083,378 | |
| | | |
Shares outstanding | | | | 360,904 | | | | | 3,349,313 | | | | | 141,382 | |
| | | |
Net asset value, offering and redemption price per share | | | | $10.80 | | | | | $10.50 | | | | | $14.74 | |
The accompanying notes are an integral part of these financial statements.
18
| | |
| | Statement of Operations For the fiscal year ended October 31, 2024 |
| | | | | | | | | | | | | | | |
| | | |
| | | AMG
River Road
Mid Cap
Value Fund | | AMG
River Road Large
Cap Value
Select Fund | | AMG
River Road
Small Cap
Value Fund |
| | | |
Investment Income: | | | | | | | | | | | | | | | |
| | | |
Dividend income | | | | $4,554,298 | | | | | $605,361 | | | | | $10,997,574 | |
| | | |
Interest income | | | | 280,474 | | | | | 44,229 | | | | | 4,766,186 | |
| | | |
Securities lending income | | | | 39,906 | | | | | 599 | | | | | 41,807 | |
| | | |
Foreign withholding tax | | | | (65,082 | ) | | | | (41,339 | ) | | | | (81,222 | ) |
| | | |
Total investment income | | | | 4,809,596 | | | | | 608,850 | | | | | 15,724,345 | |
| | | |
Expenses: | | | | | | | | | | | | | | | |
| | | |
Investment advisory and management fees | | | | 1,923,753 | | | | | 137,354 | | | | | 8,114,815 | |
| | | |
Administrative fees | | | | 515,291 | | | | | 58,866 | | | | | 1,521,528 | |
| | | |
Distribution fees - Class N | | | | 614,101 | | | | | 10,073 | | | | | 111,365 | |
| | | |
Shareholder servicing fees - Class N | | | | 246,792 | | | | | 4,029 | | | | | 45,013 | |
| | | |
Shareholder servicing fees - Class I | | | | 44,374 | | | | | 10,387 | | | | | 844,517 | |
| | | |
Reports to shareholders | | | | 64,586 | | | | | 13,531 | | | | | 161,673 | |
| | | |
Registration fees | | | | 59,735 | | | | | 27,383 | | | | | 65,796 | |
| | | |
Professional fees | | | | 53,156 | | | | | 39,064 | | | | | 127,517 | |
| | | |
Custodian fees | | | | 40,821 | | | | | 21,506 | | | | | 79,865 | |
| | | |
Trustee fees and expenses | | | | 29,158 | | | | | 3,283 | | | | | 86,677 | |
| | | |
Transfer agent fees | | | | 26,404 | | | | | 8,193 | | | | | 25,297 | |
| | | |
Interest expense | | | | 2,600 | | | | | 180 | | | | | — | |
| | | |
Miscellaneous | | | | 18,301 | | | | | 4,792 | | | | | 154,688 | |
| | | |
Total expenses before offsets | | | | 3,639,072 | | | | | 338,641 | | | | | 11,338,751 | |
| | | |
Expense reimbursements | | | | (120,397 | ) | | | | (78,508 | ) | | | | — | |
| | | |
Expense reductions | | | | (4,364 | ) | | | | (694 | ) | | | | (34,970 | ) |
| | | |
Net expenses | | | | 3,514,311 | | | | | 259,439 | | | | | 11,303,781 | |
| | | | | | | | | | | | | | | |
| | | |
Net investment income | | | | 1,295,285 | | | | | 349,411 | | | | | 4,420,564 | |
| | | |
Net Realized and Unrealized Gain: | | | | | | | | | | | | | | | |
| | | |
Net realized gain on investments | | | | 47,038,162 | | | | | 7,665,900 | | | | | 91,033,375 | |
| | | |
Net change in unrealized appreciation/depreciation on investments | | | | 36,639,022 | | | | | 3,931,192 | | | | | 72,674,060 | |
| | | |
Net realized and unrealized gain | | | | 83,677,184 | | | | | 11,597,092 | | | | | 163,707,435 | |
| | | | | | | | | | | | | | | |
| | | |
Net increase in net assets resulting from operations | | | | $84,972,469 | | | | | $11,946,503 | | | | | $168,127,999 | |
The accompanying notes are an integral part of these financial statements.
19
| | |
| | Statement of Operations (continued) |
| | | | | | | | | | | | | | | |
| | | |
| | | AMG
River Road
Dividend All Cap
Value Fund | | AMG
River Road
Small-Mid Cap
Value Fund | | AMG
River Road
Focused Absolute
Value Fund |
| | | |
Investment Income: | | | | | | | | | | | | | | | |
| | | |
Dividend income | | | | $3,387,533 | | | | | $3,953,605 | | | | | $930,085 | |
| | | |
Interest income | | | | 32,901 | | | | | 557,316 | | | | | 27,314 | |
| | | |
Securities lending income | | | | 6,488 | | | | | 45,927 | | | | | 2,003 | |
| | | |
Foreign withholding tax | | | | (15,250 | ) | | | | (9,400 | ) | | | | (8,271 | ) |
| | | |
Total investment income | | | | 3,411,672 | | | | | 4,547,448 | | | | | 951,131 | |
| | | |
Expenses: | | | | | | | | | | | | | | | |
| | | |
Investment advisory and management fees | | | | 696,724 | | | | | 2,250,580 | | | | | 289,960 | |
| | | |
Administrative fees | | | | 209,017 | | | | | 450,116 | | | | | 72,490 | |
| | | |
Distribution fees - Class N | | | | 69,154 | | | | | 50,950 | | | | | 5,077 | |
| | | |
Shareholder servicing fees - Class N | | | | 11,205 | | | | | 12,365 | | | | | 839 | |
| | | |
Shareholder servicing fees - Class I | | | | 43,208 | | | | | 132,914 | | | | | 17,287 | |
| | | |
Professional fees | | | | 55,762 | | | | | 58,131 | | | | | 37,220 | |
| | | |
Reports to shareholders | | | | 45,662 | | | | | 34,023 | | | | | 10,541 | |
| | | |
Registration fees | | | | 38,887 | | | | | 47,284 | | | | | 30,695 | |
| | | |
Custodian fees | | | | 36,324 | | | | | 37,826 | | | | | 22,428 | |
| | | |
Trustee fees and expenses | | | | 11,767 | | | | | 25,489 | | | | | 4,144 | |
| | | |
Transfer agent fees | | | | 5,097 | | | | | 8,307 | | | | | 1,496 | |
| | | |
Interest expense | | | | 25,825 | | | | | — | | | | | 492 | |
| | | |
Miscellaneous | | | | 25,342 | | | | | 32,010 | | | | | 5,934 | |
| | | |
Total expenses before offsets | | | | 1,273,974 | | | | | 3,139,995 | | | | | 498,603 | |
| | | |
Expense reimbursements | | | | (177,037 | ) | | | | — | | | | | (97,960 | ) |
| | | |
Expense reductions | | | | (24,739 | ) | | | | (5,393 | ) | | | | (1,661 | ) |
| | | |
Net expenses | | | | 1,072,198 | | | | | 3,134,602 | | | | | 398,982 | |
| | | | | | | | | | | | | | | |
| | | |
Net investment income | | | | 2,339,474 | | | | | 1,412,846 | | | | | 552,149 | |
| | | |
Net Realized and Unrealized Gain: | | | | | | | | | | | | | | | |
| | | |
Net realized gain on investments | | | | 58,266,342 | | | | | 28,254,972 | | | | | 7,253,837 | |
| | | |
Net change in unrealized appreciation/depreciation on investments | | | | (15,944,244 | ) | | | | 27,922,392 | | | | | 4,637,938 | |
| | | |
Net realized and unrealized gain | | | | 42,322,098 | | | | | 56,177,364 | | | | | 11,891,775 | |
| | | | | | | | | | | | | | | |
| | | |
Net increase in net assets resulting from operations | | | | $44,661,572 | | | | | $57,590,210 | | | | | $12,443,924 | |
The accompanying notes are an integral part of these financial statements.
20
| | |
| | Statements of Changes in Net Assets For the fiscal years ended October 31, |
| | | | | | | | | | | | | | | | | | | | | | | | |
| | | |
| | | AMG
River Road
Mid Cap Value Fund | | | AMG
River Road Large
Cap Value Select Fund | | | AMG
River Road
Small Cap Value Fund | |
| | | | | | |
| | | 2024 | | | 2023 | | | 2024 | | | 2023 | | | 2024 | | | 2023 | |
| | | | | | |
Increase in Net Assets Resulting From Operations: | | | | | | | | | | | | | | | | | | | | | | | | |
| | | | | | |
Net investment income | | | $1,295,285 | | | | $665,399 | | | | $349,411 | | | | $310,281 | | | | $4,420,564 | | | | $2,057,052 | |
| | | | | | |
Net realized gain on investments | | | 47,038,162 | | | | 901,364 | | | | 7,665,900 | | | | 952,984 | | | | 91,033,375 | | | | 46,717,796 | |
| | | | | | |
Net change in unrealized appreciation/depreciation on investments | | | 36,639,022 | | | | 21,147,317 | | | | 3,931,192 | | | | 1,954,790 | | | | 72,674,060 | | | | (33,287,036 | ) |
| | | | | | |
Net increase in net assets resulting from operations | | | 84,972,469 | | | | 22,714,080 | | | | 11,946,503 | | | | 3,218,055 | | | | 168,127,999 | | | | 15,487,812 | |
| | | | | | |
Distributions to Shareholders: | | | | | | | | | | | | | | | | | | | | | | | | |
| | | | | | |
Class N | | | (998,862 | ) | | | (19,489,451 | ) | | | (23,168 | ) | | | (65,123 | ) | | | (2,038,957 | ) | | | (1,388,209 | ) |
| | | | | | |
Class I | | | (570,426 | ) | | | (5,976,906 | ) | | | (314,623 | ) | | | (618,612 | ) | | | (40,327,619 | ) | | | (28,767,483 | ) |
| | | | | | |
Class Z | | | (53,192 | ) | | | (608,991 | ) | | | — | | | | — | | | | (526,135 | ) | | | (343,645 | ) |
| | | | | | |
Total distributions to shareholders | | | (1,622,480 | ) | | | (26,075,348 | ) | | | (337,791 | ) | | | (683,735 | ) | | | (42,892,711 | ) | | | (30,499,337 | ) |
| | | | | | |
Capital Share Transactions:1 | | | | | | | | | | | | | | | | | | | | | | | | |
| | | | | | |
Net increase (decrease) from capital share transactions | | | (51,305,217 | ) | | | 428,469 | | | | 2,299,376 | | | | (4,532,536 | ) | | | 78,139,109 | | | | 30,420,185 | |
| | | | | | | | | | | | | | | | | | | | | | | | |
| | | | | | |
Total increase (decrease) in net assets | | | 32,044,772 | | | | (2,932,799 | ) | | | 13,908,088 | | | | (1,998,216 | ) | | | 203,374,397 | | | | 15,408,660 | |
| | | | | | |
Net Assets: | | | | | | | | | | | | | | | | | | | | | | | | |
| | | | | | |
Beginning of year | | | 305,895,621 | | | | 308,828,420 | | | | 32,203,416 | | | | 34,201,632 | | | | 882,406,002 | | | | 866,997,342 | |
| | | | | | |
End of year | | | $337,940,393 | | | | $305,895,621 | | | | $46,111,504 | | | | $32,203,416 | | | | $1,085,780,399 | | | | $882,406,002 | |
| 1 | See Note 1(g) of the Notes to Financial Statements. |
The accompanying notes are an integral part of these financial statements.
21
| | |
| | Statements of Changes in Net Assets (continued) For the fiscal years ended October 31, |
| | | | | | | | | | | | | | | | | | | | | | | | |
| | | |
| | | AMG
River Road
Dividend All Cap
Value Fund | | | AMG
River Road
Small-Mid Cap
Value Fund | | | AMG
River Road
Focused Absolute
Value Fund | |
| | | | | | |
| | | 2024 | | | 2023 | | | 2024 | | | 2023 | | | 2024 | | | 2023 | |
| | | | | | |
Increase (Decrease) in Net Assets Resulting From Operations: | | | | | | | | | | | | | | | | | | | | | | | | |
| | | | | | |
Net investment income | | | $2,339,474 | | | | $6,797,921 | | | | $1,412,846 | | | | $894,783 | | | | $552,149 | | | | $653,739 | |
| | | | | | |
Net realized gain on investments | | | 58,266,342 | | | | 9,443,458 | | | | 28,254,972 | | | | 11,328,295 | | | | 7,253,837 | | | | 1,333,699 | |
| | | | | | |
Net change in unrealized appreciation/depreciation on investments | | | (15,944,244 | ) | | | (35,081,495 | ) | | | 27,922,392 | | | | (14,491,664 | ) | | | 4,637,938 | | | | 38,458 | |
| | | | | | |
Net increase (decrease) in net assets resulting from operations | | | 44,661,572 | | | | (18,840,116 | ) | | | 57,590,210 | | | | (2,268,586 | ) | | | 12,443,924 | | | | 2,025,896 | |
| | | | | | |
Distributions to Shareholders: | | | | | | | | | | | | | | | | | | | | | | | | |
| | | | | | |
Class N | | | (1,488,716 | ) | | | (4,683,046 | ) | | | (765,228 | ) | | | (841,013 | ) | | | (51,351 | ) | | | (16,781 | ) |
| | | | | | |
Class I | | | (7,827,414 | ) | | | (37,442,154 | ) | | | (9,009,615 | ) | | | (8,300,606 | ) | | | (1,205,279 | ) | | | (521,709 | ) |
| | | | | | |
Class Z | | | (176,926 | ) | | | (451,503 | ) | | | (1,277,335 | ) | | | (1,508,182 | ) | | | (146,167 | ) | | | (81,036 | ) |
| | | | | | |
Total distributions to shareholders | | | (9,493,056 | ) | | | (42,576,703 | ) | | | (11,052,178 | ) | | | (10,649,801 | ) | | | (1,402,797 | ) | | | (619,526 | ) |
| | | | | | |
Capital Share Transactions:1 | | | | | | | | | | | | | | | | | | | | | | | | |
| | | | | | |
Net increase (decrease) from capital share transactions | | | (183,444,327 | ) | | | (35,265,575 | ) | | | 11,163,606 | | | | 33,451,833 | | | | (10,551,496 | ) | | | (16,381,325 | ) |
| | | | | | | | | | | | | | | | | | | | | | | | |
| | | | | | |
Total increase (decrease) in net assets | | | (148,275,811 | ) | | | (96,682,394 | ) | | | 57,701,638 | | | | 20,533,446 | | | | 489,631 | | | | (14,974,955 | ) |
| | | | | | |
Net Assets: | | | | | | | | | | | | | | | | | | | | | | | | |
| | | | | | |
Beginning of year | | | 233,579,976 | | | | 330,262,370 | | | | 262,134,275 | | | | 241,600,829 | | | | 48,564,689 | | | | 63,539,644 | |
| | | | | | |
End of year | | | $85,304,165 | | | | $233,579,976 | | | | $319,835,913 | | | | $262,134,275 | | | | $49,054,320 | | | | $48,564,689 | |
| 1 | See Note 1(g) of the Notes to Financial Statements. |
The accompanying notes are an integral part of these financial statements.
22
| | |
| | AMG River Road Mid Cap Value Fund Financial Highlights For a share outstanding throughout each fiscal year |
| | | | | | | | | | | | | | | | | | | | | | | | | | | |
| |
| | | For the fiscal years ended October 31, |
| | | | | | |
| Class N | | 2024 | | | | 2023 | | 2022 | | 2021 | | 2020 |
| | | | | | |
Net Asset Value, Beginning of Year | | | | $17.43 | | | | | | | $17.74 | | | | | $19.43 | | | | | $29.75 | | | | | $34.95 | |
| | | | | | |
Income (loss) from Investment Operations: | | | | | | | | | | | | | | | | | | | | | | | | | | | |
| | | | | | |
Net investment income1,2 | | | | 0.06 | | | | | | | 0.02 | | | | | 0.17 | 3 | | | | 0.02 | 4 | | | | 0.16 | |
| | | | | | |
Net realized and unrealized gain (loss) on investments | | | | 4.97 | | | | | | | 1.21 | | | | | (1.22 | ) | | | | 11.69 | | | | | (2.85 | ) |
| | | | | | |
Total income (loss) from investment operations | | | | 5.03 | | | | | | | 1.23 | | | | | (1.05 | ) | | | | 11.71 | | | | | (2.69 | ) |
| | | | | | |
Less Distributions to Shareholders from: | | | | | | | | | | | | | | | | | | | | | | | | | | | |
| | | | | | |
Net investment income | | | | (0.03 | ) | | | | | | (0.16 | ) | | | | (0.04 | ) | | | | (0.02 | ) | | | | (0.33 | ) |
| | | | | | |
Net realized gain on investments | | | | (0.05 | ) | | | | | | (1.38 | ) | | | | (0.60 | ) | | | | (22.01 | ) | | | | (2.18 | ) |
| | | | | | |
Total distributions to shareholders | | | | (0.08 | ) | | | | | | (1.54 | ) | | | | (0.64 | ) | | | | (22.03 | ) | | | | (2.51 | ) |
| | | | | | |
Net Asset Value, End of Year | | | | $22.38 | | | | | | | $17.43 | | | | | $17.74 | | | | | $19.43 | | | | | $29.75 | |
| | | | | | |
Total Return2,5 | | | | 28.92 | % | | | | | | 7.39 | % | | | | (5.67 | )% | | | | 50.65 | % | | | | (8.62 | )% |
| | | | | | |
Ratio of net expenses to average net assets | | | | 1.11 | %6,7 | | | | | | 1.10 | %6 | | | | 1.09 | %6 | | | | 1.13 | %6 | | | | 1.14 | % |
| | | | | | |
Ratio of gross expenses to average net assets8 | | | | 1.14 | % | | | | | | 1.13 | % | | | | 1.11 | % | | | | 1.18 | % | | | | 1.16 | % |
| | | | | | |
Ratio of net investment income to average net assets2 | | | | 0.29 | % | | | | | | 0.13 | % | | | | 0.90 | % | | | | 0.08 | % | | | | 0.52 | % |
| | | | | | |
Portfolio turnover | | | | 77 | % | | | | | | 75 | % | | | | 71 | % | | | | 149 | % | | | | 50 | % |
| | | | | | |
Net assets end of year (000’s) omitted | | | | $244,184 | | | | | | | $220,480 | | | | | $227,513 | | | | | $287,165 | | | | | $259,561 | |
| | | | | | | | | | | | | | | | | | | | | | | | | | | | |
The accompanying notes are an integral part of these financial statements.
23
| | |
| | AMG River Road Mid Cap Value Fund Financial Highlights For a share outstanding throughout each fiscal year |
| | | | | | | | | | | | | | | | | | | | | | | | | | | |
| |
| | | For the fiscal years ended October 31, |
| | | | | | |
| Class I | | 2024 | | | | 2023 | | 2022 | | 2021 | | 2020 |
| | | | | | |
Net Asset Value, Beginning of Year | | | | $18.84 | | | | | | | $19.05 | | | | | $20.82 | | | | | $30.68 | | | | | $35.96 | |
| | | | | | |
Income (loss) from Investment Operations: | | | | | | | | | | | | | | | | | | | | | | | | | | | |
| | | | | | |
Net investment income1,2 | | | | 0.13 | | | | | | | 0.08 | | | | | 0.24 | 3 | | | | 0.09 | 4 | | | | 0.25 | |
| | | | | | |
Net realized and unrealized gain (loss) on investments | | | | 5.35 | | | | | | | 1.31 | | | | | (1.32 | ) | | | | 12.16 | | | | | (2.94 | ) |
| | | | | | |
Total income (loss) from investment operations | | | | 5.48 | | | | | | | 1.39 | | | | | (1.08 | ) | | | | 12.25 | | | | | (2.69 | ) |
| | | | | | |
Less Distributions to Shareholders from: | | | | | | | | | | | | | | | | | | | | | | | | | | | |
| | | | | | |
Net investment income | | | | (0.08 | ) | | | | | | (0.22 | ) | | | | (0.09 | ) | | | | (0.10 | ) | | | | (0.41 | ) |
| | | | | | |
Net realized gain on investments | | | | (0.05 | ) | | | | | | (1.38 | ) | | | | (0.60 | ) | | | | (22.01 | ) | | | | (2.18 | ) |
| | | | | | |
Total distributions to shareholders | | | | (0.13 | ) | | | | | | (1.60 | ) | | | | (0.69 | ) | | | | (22.11 | ) | | | | (2.59 | ) |
| | | | | | |
Net Asset Value, End of Year | | | | $24.19 | | | | | | | $18.84 | | | | | $19.05 | | | | | $20.82 | | | | | $30.68 | |
| | | | | | |
Total Return2,5 | | | | 29.27 | % | | | | | | 7.72 | % | | | | (5.41 | )% | | | | 51.11 | % | | | | (8.38 | )% |
| | | | | | |
Ratio of net expenses to average net assets | | |
| 0.81
| %6,7
| | | | | | 0.80 | %6 | | | | 0.80 | %6 | | | | 0.87 | %6 | | | | 0.90 | % |
| | | | | | |
Ratio of gross expenses to average net assets8 | | | | 0.84 | % | | | | | | 0.83 | % | | | | 0.82 | % | | | | 0.92 | % | | | | 0.92 | % |
| | | | | | |
Ratio of net investment income to average net assets2 | | | | 0.59 | % | | | | | | 0.43 | % | | | | 1.19 | % | | | | 0.34 | % | | | | 0.76 | % |
| | | | | | |
Portfolio turnover | | | | 77 | % | | | | | | 75 | % | | | | 71 | % | | | | 149 | % | | | | 50 | % |
| | | | | | |
Net assets end of year (000’s) omitted | | | | $85,569 | | | | | | | $78,562 | | | | | $74,094 | | | | | $112,741 | | | | | $176,807 | |
| | | | | | | | | | | | | | | | | | | | | | | | | | | | |
The accompanying notes are an integral part of these financial statements.
24
| | |
| | AMG River Road Mid Cap Value Fund Financial Highlights For a share outstanding throughout each fiscal year |
| | | | | | | | | | | | | | | | | | | | | | | | | | | |
| |
| | | For the fiscal years ended October 31, |
| | | | | | |
| Class Z | | 2024 | | | | 2023 | | 2022 | | 2021 | | 2020 |
| | | | | | |
Net Asset Value, Beginning of Year | | | | $18.71 | | | | | | | $18.94 | | | | | $20.71 | | | | | $30.63 | | | | | $35.95 | |
| | | | | | |
Income (loss) from Investment Operations: | | | | | | | | | | | | | | | | | | | | | | | | | | | |
| | | | | | |
Net investment income1,2 | | | | 0.14 | | | | | | | 0.09 | | | | | 0.24 | 3 | | | | 0.10 | 4 | | | | 0.28 | |
| | | | | | |
Net realized and unrealized gain (loss) on investments | | | | 5.33 | | | | | | | 1.29 | | | | | (1.29 | ) | | | | 12.13 | | | | | (2.94 | ) |
| | | | | | |
Total income (loss) from investment operations | | | | 5.47 | | | | | | | 1.38 | | | | | (1.05 | ) | | | | 12.23 | | | | | (2.66 | ) |
| | | | | | |
Less Distributions to Shareholders from: | | | | | | | | | | | | | | | | | | | | | | | | | | | |
| | | | | | |
Net investment income | | | | (0.09 | ) | | | | | | (0.23 | ) | | | | (0.12 | ) | | | | (0.14 | ) | | | | (0.48 | ) |
| | | | | | |
Net realized gain on investments | | | | (0.05 | ) | | | | | | (1.38 | ) | | | | (0.60 | ) | | | | (22.01 | ) | | | | (2.18 | ) |
| | | | | | |
Total distributions to shareholders | | | | (0.14 | ) | | | | | | (1.61 | ) | | | | (0.72 | ) | | | | (22.15 | ) | | | | (2.66 | ) |
| | | | | | |
Net Asset Value, End of Year | | | | $24.04 | | | | | | | $18.71 | | | | | $18.94 | | | | | $20.71 | | | | | $30.63 | |
| | | | | | |
Total Return2,5 | | | | 29.37 | % | | | | | | 7.73 | % | | | | (5.34 | )% | | | | 51.18 | % | | | | (8.32 | )% |
| | | | | | |
Ratio of net expenses to average net assets | | |
| 0.76
| %6,7
| | | | | | 0.75 | %6 | | | | 0.75 | %6 | | | | 0.80 | %6 | | | | 0.82 | % |
| | | | | | |
Ratio of gross expenses to average net assets8 | | | | 0.79 | % | | | | | | 0.78 | % | | | | 0.77 | % | | | | 0.85 | % | | | | 0.84 | % |
| | | | | | |
Ratio of net investment income to average net assets2 | | | | 0.64 | % | | | | | | 0.48 | % | | | | 1.24 | % | | | | 0.41 | % | | | | 0.84 | % |
| | | | | | |
Portfolio turnover | | | | 77 | % | | | | | | 75 | % | | | | 71 | % | | | | 149 | % | | | | 50 | % |
| | | | | | |
Net assets end of year (000’s) omitted | | | | $8,187 | | | | | | | $6,853 | | | | | $7,221 | | | | | $8,237 | | | | | $9,786 | |
| | | | | | | | | | | | | | | | | | | | | | | | | | | | |
| 1 | Per share numbers have been calculated using average shares. |
| 2 | Total returns and net investment income would have been lower had certain expenses not been offset. |
| 3 | Includes non-recurring dividends. Without these dividends, net investment income per share would have been $0.05, $0.11 and $0.11 for Class N, Class I and Class Z, respectively. |
| 4 | Includes non-recurring dividends. Without these dividends, net investment income (loss) per share would have been $(0.02), $0.05 and $0.06 for Class N, Class I and Class Z, respectively. |
| 5 | The total return is calculated using the published Net Asset Value as of fiscal year end. |
| 6 | Includes reduction from brokerage recapture amounting to less than 0.01%, 0.01%, 0.01% and less than 0.01% for the fiscal years ended October 31, 2024, 2023, 2022 and 2021, respectively. |
| 7 | Includes interest expense of less than 0.01% related to participation in the interfund lending program. |
| 8 | Excludes the impact of expense reimbursement or fee waivers and expense reductions such as brokerage credits, but includes expense repayments and non-reimbursable expenses, if any, such as interest, taxes, and extraordinary expenses. (See Note 1(c) and 2 in the Notes to Financial Statements.) |
The accompanying notes are an integral part of these financial statements.
25
| | |
| | AMG River Road Large Cap Value Select Fund Financial Highlights For a share outstanding throughout each fiscal year |
| | | | | | | | | | | | | | | | | | | | | | | | | | | |
| |
| | | For the fiscal years ended October 31, |
| | | | | | |
| Class N | | 2024 | | | | 2023 | | 2022 | | 2021 | | 2020 |
| | | | | | |
Net Asset Value, Beginning of Year | | | | $15.15 | | | | | | | $14.08 | | | | | $15.45 | | | | | $13.73 | | | | | $16.22 | |
| | | | | | |
Income (loss) from Investment Operations: | | | | | | | | | | | | | | | | | | | | | | | | | | | |
| | | | | | |
Net investment income1,2 | | | | 0.11 | | | | | | | 0.10 | | | | | 0.22 | 3 | | | | 0.01 | | | | | 0.04 | 4 |
| | | | | | | |
Net realized and unrealized gain (loss) on investments | | | | 5.41 | | | | | | | 1.22 | | | | | (1.59 | ) | | | | 4.27 | | | | | (1.84 | ) |
| | | | | | |
Total income (loss) from investment operations | | | | 5.52 | | | | | | | 1.32 | | | | | (1.37 | ) | | | | 4.28 | | | | | (1.80 | ) |
| | | | | | |
Less Distributions to Shareholders from: | | | | | | | | | | | | | | | | | | | | | | | | | | | |
| | | | | | |
Net investment income | | | | (0.11 | ) | | | | | | (0.25 | ) | | | | — | | | | | (2.56 | ) | | | | — | |
| | | | | | |
Net realized gain on investments | | | | — | | | | | | | — | | | | | — | | | | | — | | | | | (0.69 | ) |
| | | | | | |
Total distributions to shareholders | | | | (0.11 | ) | | | | | | (0.25 | ) | | | | — | | | | | (2.56 | ) | | | | (0.69 | ) |
| | | | | | |
Net Asset Value, End of Year | | | | $20.56 | | | | | | | $15.15 | | | | | $14.08 | | | | | $15.45 | | | | | $13.73 | |
| | | | | | |
Total Return2,5 | | | | 36.62 | % | | | | | | 9.50 | % | | | | (8.87 | )% | | | | 33.53 | % | | | | (11.66 | )% |
| | | | | | |
Ratio of net expenses to average net assets | | |
| 0.95
| %6,7
| | | | |
| 0.95
| %6
| | |
| 0.95
| %6
| | |
| 1.00
| %6
| | | | 1.04 | % |
| | | | | | |
Ratio of gross expenses to average net assets8 | | | | 1.15 | % | | | | | | 1.18 | % | | | | 1.07 | % | | | | 1.14 | % | | | | 1.08 | % |
| | | | | | |
Ratio of net investment income to average net assets2 | | | | 0.60 | % | | | | | | 0.64 | % | | | | 1.51 | % | | | | 0.08 | % | | | | 0.25 | % |
| | | | | | |
Portfolio turnover | | | | 106 | % | | | | | | 77 | % | | | | 91 | % | | | | 256 | % | | | | 750 | % |
| | | | | | |
Net assets end of year (000’s) omitted | | | | $5,291 | | | | | | | $3,373 | | | | | $3,683 | | | | | $4,623 | | | | | $4,716 | |
| | | | | | | | | | | | | | | | | | | | | | | | | | | | |
The accompanying notes are an integral part of these financial statements.
26
| | |
| | AMG River Road Large Cap Value Select Fund Financial Highlights For a share outstanding throughout each fiscal year |
| | | | | | | | | | | | | | | | | | | | | | | | | | | |
| |
| | | For the fiscal years ended October 31, |
| | | | | | |
| Class I | | 2024 | | | | 2023 | | 2022 | | 2021 | | 2020 |
| | | | | | |
Net Asset Value, Beginning of Year | | | | $15.26 | | | | | | | $14.19 | | | | | $15.58 | | | | | $13.80 | | | | | $16.25 | |
| | | | | | |
Income (loss) from Investment Operations: | | | | | | | | | | | | | | | | | | | | | | | | | | | |
| | | | | | |
Net investment income1,2 | | | | 0.17 | | | | | | | 0.14 | | | | | 0.27 | 3 | | | | 0.06 | | | | | 0.08 | 4 |
| | | | | | | |
Net realized and unrealized gain (loss) on investments | | | | 5.44 | | | | | | | 1.23 | | | | | (1.60 | ) | | | | 4.29 | | | | | (1.84 | ) |
| | | | | | |
Total income (loss) from investment operations | | | | 5.61 | | | | | | | 1.37 | | | | | (1.33 | ) | | | | 4.35 | | | | | (1.76 | ) |
| | | | | | |
Less Distributions to Shareholders from: | | | | | | | | | | | | | | | | | | | | | | | | | | | |
| | | | | | |
Net investment income | | | | (0.16 | ) | | | | | | (0.30 | ) | | | | (0.06 | ) | | | | (2.57 | ) | | | | — | |
| | | | | | |
Net realized gain on investments | | | | — | | | | | | | — | | | | | — | | | | | — | | | | | (0.69 | ) |
| | | | | | |
Total distributions to shareholders | | | | (0.16 | ) | | | | | | (0.30 | ) | | | | (0.06 | ) | | | | (2.57 | ) | | | | (0.69 | ) |
| | | | | | |
Net Asset Value, End of Year | | | | $20.71 | | | | | | | $15.26 | | | | | $14.19 | | | | | $15.58 | | | | | $13.80 | |
| | | | | | |
Total Return2,5 | | | | 37.06 | % | | | | | | 9.83 | % | | | | (8.55 | )% | | | | 33.93 | % | | | | (11.38 | )% |
| | | | | | |
Ratio of net expenses to average net assets | | |
| 0.63
| %6,7
| | | | | | 0.63 | %6 | | | | 0.63 | %6 | | | | 0.69 | %6 | | | | 0.76 | % |
| | | | | | |
Ratio of gross expenses to average net assets8 | | | | 0.83 | % | | | | | | 0.86 | % | | | | 0.75 | % | | | | 0.83 | % | | | | 0.80 | % |
| | | | | | |
Ratio of net investment income to average net assets2 | | | | 0.92 | % | | | | | | 0.96 | % | | | | 1.83 | % | | | | 0.39 | % | | | | 0.53 | % |
| | | | | | |
Portfolio turnover | | | | 106 | % | | | | | | 77 | % | | | | 91 | % | | | | 256 | % | | | | 750 | % |
| | | | | | |
Net assets end of year (000’s) omitted | | | | $40,820 | | | | | | | $28,831 | | | | | $30,519 | | | | | $36,900 | | | | | $38,990 | |
| | | | | | | | | | | | | | | | | | | | | | | | | | | | |
| 1 | Per share numbers have been calculated using average shares. |
| 2 | Total returns and net investment income would have been lower had certain expenses not been offset. |
| 3 | Includes non-recurring dividends. Without these dividends, net investment income per share would have been $0.08 and $0.13 for Class N and Class I, respectively. |
| 4 | Includes non-recurring dividends. Without these dividends, net investment income (loss) per share would have been $(0.01) and $0.03 for Class N and Class I, respectively. |
| 5 | The total return is calculated using the published Net Asset Value as of fiscal year end. |
| 6 | Includes reduction from broker recapture amounting to less than 0.01% for the each of the fiscal years ended October 31, 2024, 2023, 2022, and 2021. |
| 7 | Includes interest expense of less than 0.01% related to participation in the interfund lending program. |
| 8 | Excludes the impact of expense reimbursement or fee waivers and expense reductions such as brokerage credits, but includes expense repayments and non-reimbursable expenses, if any, such as interest, taxes, and extraordinary expenses. (See Note 1(c) and 2 in the Notes to Financial Statements.) |
The accompanying notes are an integral part of these financial statements.
27
| | |
| | AMG River Road Small Cap Value Fund Financial Highlights For a share outstanding throughout each fiscal year |
| | | | | | | | | | | | | | | | | | | | | | | | | | | |
| |
| | | For the fiscal years ended October 31, |
| | | | | | |
| Class N | | 2024 | | | | 2023 | | 2022 | | 2021 | | 2020 |
| | | | | | |
Net Asset Value, Beginning of Year | | | | $13.94 | | | | | | | $14.26 | | | | | $15.45 | | | | | $10.76 | | | | | $13.00 | |
| | | | | | |
Income (loss) from Investment Operations: | | | | | | | | | | | | | | | | | | | | | | | | | | | |
| | | | | | |
Net investment income (loss)1,2 | | | | 0.03 | | | | | | | (0.00 | )3 | | | | (0.09 | ) | | | | (0.09 | ) | | | | (0.02 | ) |
| | | | | | |
Net realized and unrealized gain (loss) on investments | | | | 2.51 | | | | | | | 0.20 | | | | | 0.06 | | | | | 4.78 | | | | | (1.43 | ) |
| | | | | | |
Total income (loss) from investment operations | | | | 2.54 | | | | | | | 0.20 | | | | | (0.03 | ) | | | | 4.69 | | | | | (1.45 | ) |
| | | | | | |
Less Distributions to Shareholders from: | | | | | | | | | | | | | | | | | | | | | | | | | | | |
| | | | | | |
Net realized gain on investments | | | | (0.70 | ) | | | | | | (0.52 | ) | | | | (1.16 | ) | | | | — | | | | | (0.79 | ) |
| | | | | | |
Net Asset Value, End of Year | | | | $15.78 | | | | | | | $13.94 | | | | | $14.26 | | | | | $15.45 | | | | | $10.76 | |
| | | | | | |
Total Return2,4 | | | | 18.69 | % | | | | | | 1.58 | % | | | | (0.35 | )% | | | | 43.59 | % | | | | (12.09 | )% |
| | | | | | |
Ratio of net expenses to average net assets5 | | | | 1.37 | % | | | | | | 1.35 | % | | | | 1.35 | % | | | | 1.33 | % | | | | 1.34 | % |
| | | | | | |
Ratio of gross expenses to average net assets6 | | | | 1.37 | % | | | | | | 1.35 | % | | | | 1.35 | % | | | | 1.35 | % | | | | 1.36 | % |
| | | | | | |
Ratio of net investment income (loss) to average net assets2 | | | | 0.19 | % | | | | | | (0.01 | )% | | | | (0.60 | )% | | | | (0.61 | )% | | | | (0.19 | )% |
| | | | | | |
Portfolio turnover | | | | 42 | % | | | | | | 25 | % | | | | 33 | % | | | | 39 | % | | | | 42 | % |
| | | | | | |
Net assets end of year (000’s) omitted | | | | $46,396 | | | | | | | $41,927 | | | | | $37,265 | | | | | $34,246 | | | | | $25,920 | |
| | | | | | | | | | | | | | | | | | | | | | | | | | | | |
The accompanying notes are an integral part of these financial statements.
28
| | |
| | AMG River Road Small Cap Value Fund Financial Highlights For a share outstanding throughout each fiscal year |
| | | | | | | | | | | | | | | | | | | | | | | | | | | |
| |
| | | For the fiscal years ended October 31, |
| | | | | | |
| Class I | | 2024 | | | | 2023 | | 2022 | | 2021 | | 2020 |
| | | | | | |
Net Asset Value, Beginning of Year | | | | $14.48 | | | | | | | $14.76 | | | | | $15.91 | | | | | $11.05 | | | | | $13.30 | |
| | | | | | |
Income (loss) from Investment Operations: | | | | | | | | | | | | | | | | | | | | | | | | | | | |
| | | | | | |
Net investment income (loss)1,2 | | | | 0.07 | | | | | | | 0.04 | | | | | (0.05 | ) | | | | (0.05 | ) | | | | 0.01 | |
| | | | | | |
Net realized and unrealized gain (loss) on investments | | | | 2.62 | | | | | | | 0.20 | | | | | 0.06 | | | | | 4.91 | | | | | (1.46 | ) |
| | | | | | |
Total income (loss) from investment operations | | | | 2.69 | | | | | | | 0.24 | | | | | 0.01 | | | | | 4.86 | | | | | (1.45 | ) |
| | | | | | |
Less Distributions to Shareholders from: | | | | | | | | | | | | | | | | | | | | | | | | | | | |
| | | | | | |
Net investment income | | | | (0.01 | ) | | | | | | — | | | | | — | | | | | (0.00 | )3 | | | | (0.01 | ) |
| | | | | | |
Net realized gain on investments | | | | (0.70 | ) | | | | | | (0.52 | ) | | | | (1.16 | ) | | | | — | | | | | (0.79 | ) |
| | | | | | |
Total distributions to shareholders | | | | (0.71 | ) | | | | | | (0.52 | ) | | | | (1.16 | ) | | | | (0.00 | )3 | | | | (0.80 | ) |
| | | | | | |
Net Asset Value, End of Year | | | | $16.46 | | | | | | | $14.48 | | | | | $14.76 | | | | | $15.91 | | | | | $11.05 | |
| | | | | | |
Total Return2,4 | | | | 19.02 | % | | | | | | 1.81 | % | | | | (0.07 | )% | | | | 43.99 | % | | | | (11.91 | )% |
| | | | | | |
Ratio of net expenses to average net assets5 | | | | 1.11 | % | | | | | | 1.09 | % | | | | 1.09 | % | | | | 1.07 | % | | | | 1.07 | % |
| | | | | | |
Ratio of gross expenses to average net assets6 | | | | 1.11 | % | | | | | | 1.09 | % | | | | 1.09 | % | | | | 1.09 | % | | | | 1.09 | % |
| | | | | | |
Ratio of net investment income (loss) to average net assets2 | | | | 0.45 | % | | | | | | 0.25 | % | | | | (0.34 | )% | | | | (0.35 | )% | | | | 0.07 | % |
| | | | | | |
Portfolio turnover | | | | 42 | % | | | | | | 25 | % | | | | 33 | % | | | | 39 | % | | | | 42 | % |
| | | | | | |
Net assets end of year (000’s) omitted | | | | $1,035,498 | | | | | | | $830,022 | | | | | $819,940 | | | | | $835,473 | | | | | $487,637 | |
| | | | | | | | | | | | | | | | | | | | | | | | | | | | |
The accompanying notes are an integral part of these financial statements.
29
| | |
| | AMG River Road Small Cap Value Fund Financial Highlights For a share outstanding throughout each fiscal year |
| | | | | | | | | | | | | | | | | | | | | | | | | | | |
| |
| | | For the fiscal years ended October 31, |
| | | | | | |
| Class Z | | 2024 | | | | 2023 | | 2022 | | 2021 | | 2020 |
| | | | | | |
Net Asset Value, Beginning of Year | | | | $14.52 | | | | | | | $14.78 | | | | | $15.92 | | | | | $11.05 | | | | | $13.30 | |
| | | | | | |
Income (loss) from Investment Operations: | | | | | | | | | | | | | | | | | | | | | | | | | | | |
| | | | | | |
Net investment income (loss)1,2 | | | | 0.08 | | | | | | | 0.05 | | | | | (0.04 | ) | | | | (0.04 | ) | | | | 0.02 | |
| | | | | | |
Net realized and unrealized gain (loss) on investments | | | | 2.62 | | | | | | | 0.21 | | | | | 0.06 | | | | | 4.92 | | | | | (1.46 | ) |
| | | | | | |
Total income (loss) from investment operations | | | | 2.70 | | | | | | | 0.26 | | | | | 0.02 | | | | | 4.88 | | | | | (1.44 | ) |
| | | | | | |
Less Distributions to Shareholders from: | | | | | | | | | | | | | | | | | | | | | | | | | | | |
| | | | | | |
Net investment income | | | | (0.02 | ) | | | | | | — | | | | | — | | | | | (0.01 | ) | | | | (0.02 | ) |
| | | | | | |
Net realized gain on investments | | | | (0.70 | ) | | | | | | (0.52 | ) | | | | (1.16 | ) | | | | — | | | | | (0.79 | ) |
| | | | | | |
Total distributions to shareholders | | | | (0.72 | ) | | | | | | (0.52 | ) | | | | (1.16 | ) | | | | (0.01 | ) | | | | (0.81 | ) |
| | | | | | |
Net Asset Value, End of Year | | | | $16.50 | | | | | | | $14.52 | | | | | $14.78 | | | | | $15.92 | | | | | $11.05 | |
| | | | | | |
Total Return2,4 | | | | 19.07 | % | | | | | | 1.94 | % | | | | (0.00 | )%7 | | | | 44.17 | % | | | | (11.78 | )% |
| | | | | | |
Ratio of net expenses to average net assets5 | | | | 1.02 | % | | | | | | 1.00 | % | | | | 1.00 | % | | | | 0.98 | % | | | | 0.99 | % |
| | | | | | |
Ratio of gross expenses to average net assets6 | | | | 1.02 | % | | | | | | 1.00 | % | | | | 1.00 | % | | | | 1.00 | % | | | | 1.01 | % |
| | | | | | |
Ratio of net investment income (loss) to average net assets2 | | | | 0.54 | % | | | | | | 0.34 | % | | | | (0.25 | )% | | | | (0.26 | )% | | | | 0.16 | % |
| | | | | | |
Portfolio turnover | | | | 42 | % | | | | | | 25 | % | | | | 33 | % | | | | 39 | % | | | | 42 | % |
| | | | | | |
Net assets end of year (000’s) omitted | | | | $3,886 | | | | | | | $10,457 | | | | | $9,792 | | | | | $7,911 | | | | | $1,025 | |
| | | | | | | | | | | | | | | | | | | | | | | | | | | | |
| 1 | Per share numbers have been calculated using average shares. |
| 2 | Total returns and net investment income (loss) would have been lower had certain expenses not been offset. |
| 3 | Less than $(0.005) per share. |
| 4 | The total return is calculated using the published Net Asset Value as of fiscal year end. |
| 5 | Includes reduction from broker recapture amounting to less than 0.01%, less than 0.01%, less than 0.01%, 0.02% and 0.02% for the fiscal years ended October 31, 2024, 2023, 2022, 2021 and 2020, respectively. |
| 6 | Excludes the impact of expense reimbursement or fee waivers and expense reductions such as brokerage credits, but includes expense repayments and non-reimbursable expenses, if any, such as interest, taxes, and extraordinary expenses. (See Note 1(c) and 2 in the Notes to Financial Statements.) |
The accompanying notes are an integral part of these financial statements.
30
| | |
| | AMG River Road Dividend All Cap Value Fund Financial Highlights For a share outstanding throughout each fiscal year |
| | | | | | | | | | | | | | | | | | | | | | | | | | | |
| |
| | | For the fiscal years ended October 31, |
| | | | | | |
| Class N | | 2024 | | | | 2023 | | 2022 | | 2021 | | 2020 |
| | | | | | |
Net Asset Value, Beginning of Year | | | | $8.63 | | | | | | | $10.70 | | | | | $13.28 | | | | | $10.02 | | | | | $12.34 | |
| | | | | | |
Income (loss) from Investment Operations: | | | | | | | | | | | | | | | | | | | | | | | | | | | |
| | | | | | |
Net investment income1,2 | | | | 0.14 | | | | | | | 0.20 | | | | | 0.18 | | | | | 0.19 | | | | | 0.25 | |
| | | | | | |
Net realized and unrealized gain (loss) on investments | | | | 2.55 | | | | | | | (0.88 | ) | | | | (0.29 | ) | | | | 3.27 | | | | | (1.49 | ) |
| | | | | | |
Total income (loss) from investment operations | | | | 2.69 | | | | | | | (0.68 | ) | | | | (0.11 | ) | | | | 3.46 | | | | | (1.24 | ) |
| | | | | | |
Less Distributions to Shareholders from: | | | | | | | | | | | | | | | | | | | | | | | | | | | |
| | | | | | |
Net investment income | | | | (0.26 | ) | | | | | | (0.23 | ) | | | | (0.27 | ) | | | | (0.20 | ) | | | | (0.34 | ) |
| | | | | | |
Net realized gain on investments | | | | (0.25 | ) | | | | | | (1.16 | ) | | | | (2.20 | ) | | | | — | | | | | (0.74 | ) |
| | | | | | |
Total distributions to shareholders | | | | (0.51 | ) | | | | | | (1.39 | ) | | | | (2.47 | ) | | | | (0.20 | ) | | | | (1.08 | ) |
| | | | | | |
Net Asset Value, End of Year | | | | $10.81 | | | | | | | $8.63 | | | | | $10.70 | | | | | $13.28 | | | | | $10.02 | |
| | | | | | |
Total Return2,3 | | | | 31.94 | % | | | | | | (7.50 | )% | | | | (1.34 | )% | | | | 34.74 | % | | | | (10.96 | )% |
| | | | | | |
Ratio of net expenses to average net assets4 | | | | 0.97 | %5 | | | | | | 0.97 | %6 | | | | 1.03 | % | | | | 1.06 | % | | | | 1.13 | % |
| | | | | | |
Ratio of gross expenses to average net assets7 | | | | 1.12 | % | | | | | | 1.02 | % | | | | 1.07 | % | | | | 1.09 | % | | | | 1.13 | % |
| | | | | | |
Ratio of net investment income to average net assets2 | | | | 1.48 | % | | | | | | 2.10 | % | | | | 1.61 | % | | | | 1.51 | % | | | | 2.38 | % |
| | | | | | |
Portfolio turnover | | | | 26 | % | | | | | | 25 | % | | | | 30 | % | | | | 20 | % | | | | 35 | % |
| | | | | | |
Net assets end of year (000’s) omitted | | | | $26,734 | | | | | | | $28,325 | | | | | $36,432 | | | | | $43,430 | | | | | $41,358 | |
| | | | | | | | | | | | | | | | | | | | | | | | | | | | |
The accompanying notes are an integral part of these financial statements.
31
| | |
| | AMG River Road Dividend All Cap Value Fund Financial Highlights For a share outstanding throughout each fiscal year |
| | | | | | | | | | | | | | | | | | | | | | | | | | | |
| |
| | | For the fiscal years ended October 31, |
| | | | | | |
| Class I | | 2024 | | | | 2023 | | 2022 | | 2021 | | 2020 |
| | | | | | |
Net Asset Value, Beginning of Year | | | | $8.62 | | | | | | | $10.68 | | | | | $13.27 | | | | | $10.01 | | | | | $12.33 | |
| | | | | | |
Income (loss) from Investment Operations: | | | | | | | | | | | | | | | | | | | | | | | | | | | |
| | | | | | |
Net investment income1,2 | | | | 0.16 | | | | | | | 0.23 | | | | | 0.21 | | | | | 0.22 | | | | | 0.28 | |
| | | | | | |
Net realized and unrealized gain (loss) on investments | | | | 2.54 | | | | | | | (0.88 | ) | | | | (0.30 | ) | | | | 3.27 | | | | | (1.49 | ) |
| | | | | | |
Total income (loss) from investment operations | | | | 2.70 | | | | | | | (0.65 | ) | | | | (0.09 | ) | | | | 3.49 | | | | | (1.21 | ) |
| | | | | | |
Less Distributions to Shareholders from: | | | | | | | | | | | | | | | | | | | | | | | | | | | |
| | | | | | |
Net investment income | | | | (0.28 | ) | | | | | | (0.25 | ) | | | | (0.30 | ) | | | | (0.23 | ) | | | | (0.37 | ) |
| | | | | | |
Net realized gain on investments | | | | (0.25 | ) | | | | | | (1.16 | ) | | | | (2.20 | ) | | | | — | | | | | (0.74 | ) |
| | | | | | |
Total distributions to shareholders | | | | (0.53 | ) | | | | | | (1.41 | ) | | | | (2.50 | ) | | | | (0.23 | ) | | | | (1.11 | ) |
| | | | | | |
Net Asset Value, End of Year | | | | $10.79 | | | | | | | $8.62 | | | | | $10.68 | | | | | $13.27 | | | | | $10.01 | |
| | | | | | |
Total Return2,3 | | | | 32.19 | % | | | | | | (7.17 | )% | | | | (1.18 | )% | | | | 35.10 | % | | | | (10.69 | )% |
| | | | | | |
Ratio of net expenses to average net assets4 | | | | 0.72 | %5 | | | | | | 0.72 | %6 | | | | 0.78 | % | | | | 0.81 | % | | | | 0.86 | % |
| | | | | | |
Ratio of gross expenses to average net assets7 | | | | 0.87 | % | | | | | | 0.77 | % | | | | 0.82 | % | | | | 0.84 | % | | | | 0.86 | % |
| | | | | | |
Ratio of net investment income to average net assets2 | | | | 1.73 | % | | | | | | 2.35 | % | | | | 1.86 | % | | | | 1.76 | % | | | | 2.65 | % |
| | | | | | |
Portfolio turnover | | | | 26 | % | | | | | | 25 | % | | | | 30 | % | | | | 20 | % | | | | 35 | % |
| | | | | | |
Net assets end of year (000’s) omitted | | | | $54,674 | | | | | | | $202,039 | | | | | $290,632 | | | | | $382,571 | | | | | $408,844 | |
| | | | | | | | | | | | | | | | | | | | | | | | | | | | |
The accompanying notes are an integral part of these financial statements.
32
| | |
| | AMG River Road Dividend All Cap Value Fund Financial Highlights For a share outstanding throughout each fiscal year |
| | | | | | | | | | | | | | | | | | | | | | | | | | | |
| |
| | | For the fiscal years ended October 31, |
| | | | | | |
| Class Z | | 2024 | | | | 2023 | | 2022 | | 2021 | | 2020 |
| | | | | | |
Net Asset Value, Beginning of Year | | | | $8.62 | | | | | | | $10.69 | | | | | $13.28 | | | | | $10.01 | | | | | $12.33 | |
| | | | | | |
Income (loss) from Investment Operations: | | | | | | | | | | | | | | | | | | | | | | | | | | | |
| | | | | | |
Net investment income1,2 | | | | 0.17 | | | | | | | 0.23 | | | | | 0.21 | | | | | 0.22 | | | | | 0.27 | |
| | | | | | |
Net realized and unrealized gain (loss) on investments | | | | 2.55 | | | | | | | (0.88 | ) | | | | (0.29 | ) | | | | 3.29 | | | | | (1.47 | ) |
| | | | | | |
Total income (loss) from investment operations | | | | 2.72 | | | | | | | (0.65 | ) | | | | (0.08 | ) | | | | 3.51 | | | | | (1.20 | ) |
| | | | | | |
Less Distributions to Shareholders from: | | | | | | | | | | | | | | | | | | | | | | | | | | | |
| | | | | | |
Net investment income | | | | (0.29 | ) | | | | | | (0.26 | ) | | | | (0.31 | ) | | | | (0.24 | ) | | | | (0.38 | ) |
| | | | | | |
Net realized gain on investments | | | | (0.25 | ) | | | | | | (1.16 | ) | | | | (2.20 | ) | | | | — | | | | | (0.74 | ) |
| | | | | | |
Total distributions to shareholders | | | | (0.54 | ) | | | | | | (1.42 | ) | | | | (2.51 | ) | | | | (0.24 | ) | | | | (1.12 | ) |
| | | | | | |
Net Asset Value, End of Year | | | | $10.80 | | | | | | | $8.62 | | | | | $10.69 | | | | | $13.28 | | | | | $10.01 | |
| | | | | | |
Total Return2,3 | | | | 32.37 | % | | | | | | (7.22 | )% | | | | (1.12 | )% | | | | 35.26 | % | | | | (10.65 | )% |
| | | | | | |
Ratio of net expenses to average net assets4 | | | | 0.68 | %5 | | | | | | 0.68 | %6 | | | | 0.74 | % | | | | 0.77 | % | | | | 0.81 | % |
| | | | | | |
Ratio of gross expenses to average net assets7 | | | | 0.83 | % | | | | | | 0.73 | % | | | | 0.78 | % | | | | 0.80 | % | | | | 0.81 | % |
| | | | | | |
Ratio of net investment income to average net assets2 | | | | 1.77 | % | | | | | | 2.39 | % | | | | 1.90 | % | | | | 1.80 | % | | | | 2.69 | % |
| | | | | | |
Portfolio turnover | | | | 26 | % | | | | | | 25 | % | | | | 30 | % | | | | 20 | % | | | | 35 | % |
| | | | | | |
Net assets end of year (000’s) omitted | | | | $3,897 | | | | | | | $3,216 | | | | | $3,199 | | | | | $2,430 | | | | | $1,901 | |
| | | | | | | | | | | | | | | | | | | | | | | | | | | | |
| 1 | Per share numbers have been calculated using average shares. |
| 2 | Total returns and net investment income would have been lower had certain expenses not been offset. |
| 3 | The total return is calculated using the published Net Asset Value as of fiscal year end. |
| 4 | Includes reduction from broker recapture amounting to 0.02%, 0.01%, 0.01%, 0.01%, and less than 0.01% for the fiscal years ended October 31, 2024, 2023, 2022, 2021 and 2020, respectively. |
| 5 | Includes interest expense of 0.02% related to participation in the interfund lending program. |
| 6 | Includes interest expense totaling 0.01% related to utilization of the line of credit. |
| 7 | Excludes the impact of expense reimbursement or fee waivers and expense reductions such as brokerage credits, but includes expense repayments and non-reimbursable expenses, if any, such as interest, taxes, and extraordinary expenses. (See Note 1(c) and 2 in the Notes to Financial Statements.) |
The accompanying notes are an integral part of these financial statements.
33
| | |
| | AMG River Road Small-Mid Cap Value Fund Financial Highlights For a share outstanding throughout each fiscal year |
| | | | | | | | | | | | | | | | | | | | | | | | | | | |
| |
| | | For the fiscal years ended October 31, |
| | | | | | |
| Class N | | 2024 | | | | 2023 | | 2022 | | 2021 | | 2020 |
| | | | | | |
Net Asset Value, Beginning of Year | | | | $8.61 | | | | | | | $9.10 | | | | | $9.81 | | | | | $6.80 | | | | | $7.84 | |
| | | | | | |
Income (loss) from Investment Operations: | | | | | | | | | | | | | | | | | | | | | | | | | | | |
| | | | | | |
Net investment income (loss)1,2 | | | | 0.02 | | | | | | | 0.01 | | | | | (0.03 | ) | | | | (0.04 | ) | | | | (0.01 | )3 |
| | | | | | |
Net realized and unrealized gain (loss) on investments | | | | 1.82 | | | | | | | (0.09 | ) | | | | (0.11 | ) | | | | 3.05 | | | | | (0.88 | ) |
| | | | | | |
Total income (loss) from investment operations | | | | 1.84 | | | | | | | (0.08 | ) | | | | (0.14 | ) | | | | 3.01 | | | | | (0.89 | ) |
| | | | | | |
Less Distributions to Shareholders from: | | | | | | | | | | | | | | | | | | | | | | | | | | | |
| | | | | | |
Net investment income | | | | (0.01 | ) | | | | | | (0.00 | )4 | | | | — | | | | | — | | | | | (0.01 | ) |
| | | | | | |
Net realized gain on investments | | | | (0.35 | ) | | | | | | (0.41 | ) | | | | (0.57 | ) | | | | — | | | | | (0.14 | ) |
| | | | | | |
Total distributions to shareholders | | | | (0.36 | ) | | | | | | (0.41 | ) | | | | (0.57 | ) | | | | — | | | | | (0.15 | ) |
| | | | | | |
Net Asset Value, End of Year | | | | $10.09 | | | | | | | $8.61 | | | | | $9.10 | | | | | $9.81 | | | | | $6.80 | |
| | | | | | |
Total Return2,5 | | | | 21.83 | % | | | | | | (0.77 | )% | | | | (1.64 | )% | | | | 44.27 | % | | | | (11.65 | )% |
| | | | | | |
Ratio of net expenses to average net assets6 | | | | 1.29 | % | | | | | | 1.27 | % | | | | 1.28 | % | | | | 1.25 | % | | | | 1.31 | % |
| | | | | | |
Ratio of gross expenses to average net assets7 | | | | 1.29 | % | | | | | | 1.28 | % | | | | 1.28 | % | | | | 1.27 | % | | | | 1.33 | % |
| | | | | | |
Ratio of net investment income (loss) to average net assets2 | | | | 0.23 | % | | | | | | 0.10 | % | | | | (0.28 | )% | | | | (0.38 | )% | | | | (0.16 | )% |
| | | | | | |
Portfolio turnover | | | | 42 | % | | | | | | 30 | % | | | | 32 | % | | | | 44 | % | | | | 47 | % |
| | | | | | |
Net assets end of year (000’s) omitted | | | | $21,263 | | | | | | | $18,655 | | | | | $18,961 | | | | | $22,702 | | | | | $21,618 | |
| | | | | | | | | | | | | | | | | | | | | | | | | | | | |
The accompanying notes are an integral part of these financial statements.
34
| | |
| | AMG River Road Small-Mid Cap Value Fund Financial Highlights For a share outstanding throughout each fiscal year |
| | | | | | | | | | | | | | | | | | | | | | | | | | | |
| |
| | | For the fiscal years ended October 31, |
| | | | | | |
| Class I | | 2024 | | | | 2023 | | 2022 | | 2021 | | 2020 |
| | | | | | |
Net Asset Value, Beginning of Year | | | | $8.94 | | | | | | | $9.41 | | | | | $10.10 | | | | | $6.98 | | | | | $8.04 | |
| | | | | | |
Income (loss) from Investment Operations: | | | | | | | | | | | | | | | | | | | | | | | | | | | |
| | | | | | |
Net investment income (loss)1,2 | | | | 0.05 | | | | | | | 0.03 | | | | | (0.00 | )4 | | | | (0.01 | ) | | | | 0.01 | 3 |
| | | | | | | |
Net realized and unrealized gain (loss) on investments | | | | 1.87 | | | | | | | (0.09 | ) | | | | (0.12 | ) | | | | 3.13 | | | | | (0.91 | ) |
| | | | | | |
Total income (loss) from investment operations | | | | 1.92 | | | | | | | (0.06 | ) | | | | (0.12 | ) | | | | 3.12 | | | | | (0.90 | ) |
| | | | | | |
Less Distributions to Shareholders from: | | | | | | | | | | | | | | | | | | | | | | | | | | | |
| | | | | | |
Net investment income | | | | (0.03 | ) | | | | | | (0.00 | )4 | | | | — | | | | | (0.00 | )4 | | | | (0.02 | ) |
| | | | | | |
Net realized gain on investments | | | | (0.35 | ) | | | | | | (0.41 | ) | | | | (0.57 | ) | | | | — | | | | | (0.14 | ) |
| | | | | | |
Total distributions to shareholders | | | | (0.38 | ) | | | | | | (0.41 | ) | | | | (0.57 | ) | | | | (0.00 | )4 | | | | (0.16 | ) |
| | | | | | |
Net Asset Value, End of Year | | | | $10.48 | | | | | | | $8.94 | | | | | $9.41 | | | | | $10.10 | | | | | $6.98 | |
| | | | | | |
Total Return2,5 | | | | 21.97 | % | | | | | | (0.48 | )% | | | | (1.38 | )% | | | | 44.70 | % | | | | (11.47 | )% |
| | | | | | |
Ratio of net expenses to average net assets6 | | | | 1.03 | % | | | | | | 1.02 | % | | | | 1.02 | % | | | | 1.00 | % | | | | 1.05 | % |
| | | | | | |
Ratio of gross expenses to average net assets7 | | | | 1.03 | % | | | | | | 1.03 | % | | | | 1.02 | % | | | | 1.02 | % | | | | 1.07 | % |
| | | | | | |
Ratio of net investment income (loss) to average net assets2 | | | | 0.49 | % | | | | | | 0.35 | % | | | | (0.02 | )% | | | | (0.13 | )% | | | | 0.09 | % |
| | | | | | |
Portfolio turnover | | | | 42 | % | | | | | | 30 | % | | | | 32 | % | | | | 44 | % | | | | 47 | % |
| | | | | | |
Net assets end of year (000’s) omitted | | | | $263,399 | | | | | | | $214,093 | | | | | $188,163 | | | | | $218,698 | | | | | $156,350 | |
| | | | | | | | | | | | | | | | | | | | | | | | | | | | |
The accompanying notes are an integral part of these financial statements.
35
| | |
| | AMG River Road Small-Mid Cap Value Fund Financial Highlights For a share outstanding throughout each fiscal year |
| | | | | | | | | | | | | | | | | | | | | | | | | | | |
| |
| | | For the fiscal years ended October 31, |
| | | | | | |
| Class Z | | 2024 | | | | 2023 | | 2022 | | 2021 | | 2020 |
| | | | | | |
Net Asset Value, Beginning of Year | | | | $8.95 | | | | | | | $9.42 | | | | | $10.10 | | | | | $6.98 | | | | | $8.04 | |
| | | | | | |
Income (loss) from Investment Operations: | | | | | | | | | | | | | | | | | | | | | | | | | | | |
| | | | | | |
Net investment income (loss)1,2 | | | | 0.05 | | | | | | | 0.04 | | | | | 0.00 | 8 | | | | (0.01 | ) | | | | 0.01 | 3 |
| | | | | | | |
Net realized and unrealized gain (loss) on investments | | | | 1.89 | | | | | | | (0.10 | ) | | | | (0.11 | ) | | | | 3.13 | | | | | (0.91 | ) |
| | | | | | |
Total income (loss) from investment operations | | | | 1.94 | | | | | | | (0.06 | ) | | | | (0.11 | ) | | | | 3.12 | | | | | (0.90 | ) |
| | | | | | |
Less Distributions to Shareholders from: | | | | | | | | | | | | | | | | | | | | | | | | | | | |
| | | | | | |
Net investment income | | | | (0.04 | ) | | | | | | (0.00 | )4 | | | | (0.00 | )4 | | | | (0.00 | )4 | | | | (0.02 | ) |
| | | | | | |
Net realized gain on investments | | | | (0.35 | ) | | | | | | (0.41 | ) | | | | (0.57 | ) | | | | — | | | | | (0.14 | ) |
| | | | | | |
Total distributions to shareholders | | | | (0.39 | ) | | | | | | (0.41 | ) | | | | (0.57 | ) | | | | (0.00 | )4 | | | | (0.16 | ) |
| | | | | | |
Net Asset Value, End of Year | | | | $10.50 | | | | | | | $8.95 | | | | | $9.42 | | | | | $10.10 | | | | | $6.98 | |
| | | | | | |
Total Return2,5 | | | | 22.13 | % | | | | | | (0.47 | )% | | | | (1.26 | )% | | | | 44.77 | % | | | | (11.43 | )% |
| | | | | | |
Ratio of net expenses to average net assets6 | | | | 0.98 | % | | | | | | 0.97 | % | | | | 0.97 | % | | | | 0.95 | % | | | | 1.00 | % |
| | | | | | |
Ratio of gross expenses to average net assets7 | | | | 0.98 | % | | | | | | 0.98 | % | | | | 0.97 | % | | | | 0.97 | % | | | | 1.02 | % |
| | | | | | |
Ratio of net investment income (loss) to average net assets2 | | | | 0.54 | % | | | | | | 0.40 | % | | | | 0.03 | % | | | | (0.08 | )% | | | | 0.14 | % |
| | | | | | |
Portfolio turnover | | | | 42 | % | | | | | | 30 | % | | | | 32 | % | | | | 44 | % | | | | 47 | % |
| | | | | | |
Net assets end of year (000’s) omitted | | | | $35,173 | | | | | | | $29,387 | | | | | $34,477 | | | | | $35,766 | | | | | $553 | |
| | | | | | | | | | | | | | | | | | | | | | | | | | | | |
| 1 | Per share numbers have been calculated using average shares. |
| 2 | Total returns and net investment income (loss) would have been lower had certain expenses not been offset. |
| 3 | Includes non-recurring dividends. Without these dividends, net investment income (loss) per share would have been $(0.02), $(0.00) and $0.00 for Class N, Class I and Class Z, respectively. |
| 4 | Less than $(0.005) per share. |
| 5 | The total return is calculated using the published Net Asset Value as of fiscal year end. |
| 6 | Includes reduction from broker recapture amounting to less than 0.01%, 0.01%, 0.01%, 0.02% and 0.02% for the fiscal years ended October 31, 2024, 2023, 2022, 2021 and 2020, respectively. |
| 7 | Excludes the impact of expense reimbursement or fee waivers and expense reductions such as brokerage credits, but includes expense repayments and non-reimbursable expenses, if any, such as interest, taxes, and extraordinary expenses. (See Note 1(c) and 2 in the Notes to Financial Statements.) |
| 8 | Less than $0.005 per share. |
The accompanying notes are an integral part of these financial statements.
36
| | |
| | AMG River Road Focused Absolute Value Fund Financial Highlights For a share outstanding throughout each fiscal year |
| | | | | | | | | | | | | | | | | | | | | | | | | | | |
| |
| | | For the fiscal years ended October 31, |
| | | | | | |
| Class N | | 2024 | | | | 2023 | | 2022 | | 2021 | | 2020 |
| | | | | | |
Net Asset Value, Beginning of Year | | | | $11.73 | | | | | | | $11.50 | | | | | $14.44 | | | | | $11.05 | | | | | $12.65 | |
| | | | | | |
Income (loss) from Investment Operations: | | | | | | | | | | | | | | | | | | | | | | | | | | | |
| | | | | | |
Net investment income1,2 | | | | 0.12 | | | | | | | 0.11 | | | | | 0.04 | | | | | 0.01 | | | | | 0.04 | 3 |
| | | | | | | |
Net realized and unrealized gain (loss) on investments | | | | 3.19 | | | | | | | 0.21 | | | | | (2.03 | ) | | | | 3.38 | | | | | (1.39 | ) |
| | | | | | |
Total income (loss) from investment operations | | | | 3.31 | | | | | | | 0.32 | | | | | (1.99 | ) | | | | 3.39 | | | | | (1.35 | ) |
| | | | | | |
Less Distributions to Shareholders from: | | | | | | | | | | | | | | | | | | | | | | | | | | | |
| | | | | | |
Net investment income | | | | (0.13 | ) | | | | | | (0.02 | ) | | | | — | | | | | — | | | | | (0.02 | ) |
| | | | | | |
Net realized gain on investments | | | | (0.19 | ) | | | | | | (0.07 | ) | | | | (0.95 | ) | | | | — | | | | | (0.23 | ) |
| | | | | | |
Total distributions to shareholders | | | | (0.32 | ) | | | | | | (0.09 | ) | | | | (0.95 | ) | | | | — | | | | | (0.25 | ) |
| | | | | | |
Net Asset Value, End of Year | | | | $14.72 | | | | | | | $11.73 | | | | | $11.50 | | | | | $14.44 | | | | | $11.05 | |
| | | | | | |
Total Return2,4 | | | | 28.70 | % | | | | | | 2.76 | % | | | | (14.80 | )% | | | | 30.68 | % | | | | (11.03 | )% |
| | | | | | |
Ratio of net expenses to average net assets5 | | |
| 1.06
| %6
| | | | | | 1.05 | % | | | | 1.05 | % | | | | 1.06 | % | | | | 1.03 | % |
| | | | | | |
Ratio of gross expenses to average net assets7 | | | | 1.26 | % | | | | | | 1.22 | % | | | | 1.14 | % | | | | 1.12 | % | | | | 1.15 | % |
| | | | | | |
Ratio of net investment income to average net assets2 | | | | 0.91 | % | | | | | | 0.93 | % | | | | 0.30 | % | | | | 0.10 | % | | | | 0.34 | % |
| | | | | | |
Portfolio turnover | | | | 86 | % | | | | | | 63 | % | | | | 113 | % | | | | 83 | % | | | | 103 | % |
| | | | | | |
Net assets end of year (000’s) omitted | | | | $1,949 | | | | | | | $1,910 | | | | | $2,243 | | | | | $3,666 | | | | | $12,466 | |
| | | | | | | | | | | | | | | | | | | | | | | | | | | | |
The accompanying notes are an integral part of these financial statements.
37
| | |
| | AMG River Road Focused Absolute Value Fund Financial Highlights For a share outstanding throughout each fiscal year |
| | | | | | | | | | | | | | | | | | | | | | | | | | | |
| |
| | | For the fiscal years ended October 31, |
| | | | | | |
| Class I | | 2024 | | | | 2023 | | 2022 | | 2021 | | 2020 |
| | | | | | |
Net Asset Value, Beginning of Year | | | | $11.75 | | | | | | | $11.51 | | | | | $14.48 | | | | | $11.12 | | | | | $12.72 | |
| | | | | | |
Income (loss) from Investment Operations: | | | | | | | | | | | | | | | | | | | | | | | | | | | |
| | | | | | |
Net investment income1,2 | | | | 0.16 | | | | | | | 0.14 | | | | | 0.07 | | | | | 0.05 | | | | | 0.07 | 3 |
| | | | | | | |
Net realized and unrealized gain (loss) on investments | | | | 3.18 | | | | | | | 0.22 | | | | | (2.04 | ) | | | | 3.39 | | | | | (1.40 | ) |
| | | | | | |
Total income (loss) from investment operations | | | | 3.34 | | | | | | | 0.36 | | | | | (1.97 | ) | | | | 3.44 | | | | | (1.33 | ) |
| | | | | | |
Less Distributions to Shareholders from: | | | | | | | | | | | | | | | | | | | | | | | | | | | |
| | | | | | |
Net investment income | | | | (0.17 | ) | | | | | | (0.05 | ) | | | | (0.05 | ) | | | | (0.08 | ) | | | | (0.04 | ) |
| | | | | | |
Net realized gain on investments | | | | (0.19 | ) | | | | | | (0.07 | ) | | | | (0.95 | ) | | | | — | | | | | (0.23 | ) |
| | | | | | |
Total distributions to shareholders | | | | (0.36 | ) | | | | | | (0.12 | ) | | | | (1.00 | ) | | | | (0.08 | ) | | | | (0.27 | ) |
| | | | | | |
Net Asset Value, End of Year | | | | $14.73 | | | | | | | $11.75 | | | | | $11.51 | | | | | $14.48 | | | | | $11.12 | |
| | | | | | |
Total Return2,4 | | | | 28.90 | % | | | | | | 3.11 | % | | | | (14.64 | )% | | | | 30.98 | % | | | | (10.81 | )% |
| | | | | | |
Ratio of net expenses to average net assets5 | | | | 0.82 | %6 | | | | | | 0.81 | % | | | | 0.80 | % | | | | 0.81 | % | | | | 0.78 | % |
| | | | | | |
Ratio of gross expenses to average net assets7 | | | | 1.02 | % | | | | | | 0.98 | % | | | | 0.89 | % | | | | 0.87 | % | | | | 0.90 | % |
| | | | | | |
Ratio of net investment income to average net assets2 | | | | 1.15 | % | | | | | | 1.17 | % | | | | 0.55 | % | | | | 0.35 | % | | | | 0.59 | % |
| | | | | | |
Portfolio turnover | | | | 86 | % | | | | | | 63 | % | | | | 113 | % | | | | 83 | % | | | | 103 | % |
| | | | | | |
Net assets end of year (000’s) omitted | | | | $45,022 | | | | | | | $40,205 | | | | | $53,620 | | | | | $176,460 | | | | | $130,758 | |
| | | | | | | | | | | | | | | | | | | | | | | | | | | | |
The accompanying notes are an integral part of these financial statements.
38
| | |
| | AMG River Road Focused Absolute Value Fund Financial Highlights For a share outstanding throughout each fiscal year |
| | | | | | | | | | | | | | | | | | | | | | | | | | | |
| |
| | | For the fiscal years ended October 31, |
| | | | | | |
| Class Z | | 2024 | | | | 2023 | | 2022 | | 2021 | | 2020 |
| | | | | | |
Net Asset Value, Beginning of Year | | | | $11.75 | | | | | | | $11.52 | | | | | $14.49 | | | | | $11.12 | | | | | $12.73 | |
| | | | | | |
Income (loss) from Investment Operations: | | | | | | | | | | | | | | | | | | | | | | | | | | | |
| | | | | | |
Net investment income1,2 | | | | 0.16 | | | | | | | 0.15 | | | | | 0.08 | | | | | 0.06 | | | | | 0.07 | 3 |
| | | | | | | |
Net realized and unrealized gain (loss) on investments | | | | 3.19 | | | | | | | 0.21 | | | | | (2.04 | ) | | | | 3.39 | | | | | (1.41 | ) |
| | | | | | |
Total income (loss) from investment operations | | | | 3.35 | | | | | | | 0.36 | | | | | (1.96 | ) | | | | 3.45 | | | | | (1.34 | ) |
| | | | | | |
Less Distributions to Shareholders from: | | | | | | | | | | | | | | | | | | | | | | | | | | | |
| | | | | | |
Net investment income | | | | (0.17 | ) | | | | | | (0.06 | ) | | | | (0.06 | ) | | | | (0.08 | ) | | | | (0.04 | ) |
| | | | | | |
Net realized gain on investments | | | | (0.19 | ) | | | | | | (0.07 | ) | | | | (0.95 | ) | | | | — | | | | | (0.23 | ) |
| | | | | | |
Total distributions to shareholders | | | | (0.36 | ) | | | | | | (0.13 | ) | | | | (1.01 | ) | | | | (0.08 | ) | | | | (0.27 | ) |
| | | | | | |
Net Asset Value, End of Year | | | | $14.74 | | | | | | | $11.75 | | | | | $11.52 | | | | | $14.49 | | | | | $11.12 | |
| | | | | | |
Total Return2,4 | | | | 29.04 | % | | | | | | 3.10 | % | | | | (14.59 | )% | | | | 31.12 | % | | | | (10.86 | )% |
| | | | | | |
Ratio of net expenses to average net assets5 | | | | 0.78 | %6 | | | | | | 0.77 | % | | | | 0.76 | % | | | | 0.77 | % | | | | 0.74 | % |
| | | | | | |
Ratio of gross expenses to average net assets7 | | | | 0.98 | % | | | | | | 0.94 | % | | | | 0.85 | % | | | | 0.83 | % | | | | 0.86 | % |
| | | | | | |
Ratio of net investment income to average net assets2 | | | | 1.19 | % | | | | | | 1.21 | % | | | | 0.59 | % | | | | 0.39 | % | | | | 0.63 | % |
| | | | | | |
Portfolio turnover | | | | 86 | % | | | | | | 63 | % | | | | 113 | % | | | | 83 | % | | | | 103 | % |
| | | | | | |
Net assets end of year (000’s) omitted | | | | $2,083 | | | | | | | $6,450 | | | | | $7,677 | | | | | $13,323 | | | | | $2,462 | |
| | | | | | | | | | | | | | | | | | | | | | | | | | | | |
| 1 | Per share numbers have been calculated using average shares. |
| 2 | Total returns and net investment income would have been lower had certain expenses not been offset. |
| 3 | Includes non-recurring dividends. Without these dividends, net investment income per share would have been $0.02, $0.05 and $0.05 for Class N, Class I and Class Z, respectively. |
| 4 | The total return is calculated using the published Net Asset Value as of fiscal year end. |
| 5 | Includes reduction from broker recapture amounting to less than 0.01%, 0.01%, 0.02%, 0.01% and 0.01%, for the fiscal years ended October 31, 2024, 2023, 2022, 2021 and 2020, respectively. |
| 6 | Includes interest expense of less than 0.01% related to participation in the interfund lending program. |
| 7 | Excludes the impact of expense reimbursement or fee waivers and expense reductions such as brokerage credits, but includes expense repayments and non-reimbursable expenses, if any, such as interest, taxes, and extraordinary expenses. (See Note 1(c) and 2 in the Notes to Financial Statements.) |
The accompanying notes are an integral part of these financial statements.
39
| | |
| | Notes to Financial Statements October 31, 2024 |
1. ORGANIZATION AND SUMMARY OF SIGNIFICANT ACCOUNTING POLICIES
AMG Funds I and AMG Funds IV (the “Trusts”) are open-end management investment companies. AMG Funds I is organized as a Massachusetts business trust, while AMG Funds IV is organized as a Delaware Statutory Trust. The Trusts are registered under the Investment Company Act of 1940, as amended (the “1940 Act”). Currently, the Trusts consist of a number of different funds, each having distinct investment management objectives, strategies, risks, and policies. Included in this report are AMG Funds I: AMG River Road Large Cap Value Select Fund (“Large Cap Value Select”), and AMG Funds IV: AMG River Road Mid Cap Value Fund (“Mid Cap Value”), AMG River Road Small Cap Value Fund (“Small Cap Value”), AMG River Road Dividend All Cap Value Fund (“Dividend All Cap Value”), AMG River Road Small-Mid Cap Value Fund (“Small-Mid Cap Value”), and AMG River Road Focused Absolute Value Fund (“Focused Absolute Value”), each a “Fund” and collectively, the “Funds”.
Each Fund is authorized to issue Class N and Class I shares. The Funds, except for Large Cap Value Select, are also authorized to issue Class Z shares. Each class represents an interest in the same assets of the respective Fund. Although all share classes generally have identical voting rights, each share class votes separately when required by law. Different share classes may have different net asset values per share to the extent the share classes pay different distribution amounts and/or the expenses of such share classes differ. Each share class has its own expense structure. Please refer to a current prospectus for additional information on each share class.
Large Cap Value Select and Focused Absolute Value are non-diversified funds.
The Funds’ financial statements are prepared in accordance with accounting principles generally accepted in the United States of America (“U.S. GAAP”), including accounting and reporting guidance pursuant to Accounting Standards Codification Topic 946 applicable to investment companies. U.S. GAAP requires management to make estimates and assumptions that affect the reported amounts of assets and liabilities and disclosure of contingent assets and liabilities at the date of the financial statements and the reported amounts of income and expenses during the reporting period. Actual results could differ from those estimates and such differences could be material. The following is a summary of significant accounting policies followed by the Funds in the preparation of their financial statements:
a. VALUATION OF INVESTMENTS
Equity securities traded on a national securities exchange or reported on the NASDAQ national market system (“NMS”) are valued at the last quoted sales price on the primary exchange or, if applicable, the NASDAQ official closing price or the official closing price of the relevant exchange or, lacking any sales, at the last quoted bid price. Equity securities held by the Funds that are traded in the over-the-counter market (other than NMS securities) are valued at the bid price. Foreign equity securities (securities principally traded in markets other than U.S. markets) held by the Funds are valued at the official closing price on the primary exchange or, for markets that either do not offer an official closing price or where the official closing price may not be representative of the overall market, the last quoted sale price.
Fixed income securities purchased with a remaining maturity of 60 days or less are valued at amortized cost, provided that the amortized cost value is approximately the same as the fair value of the security valued without the use of
amortized cost. Investments in other open-end registered investment companies are valued at their end of day net asset value per share.
The Funds’ portfolio investments are generally valued based on independent market quotations or prices or, if none, “evaluative” or other market based valuations provided by third party pricing services. Pursuant to Rule 2a-5 under the 1940 Act, the Funds’ Boards of Trustees (the “Board”) designated AMG Funds LLC (the “Investment Manager”) as the Funds’ Valuation Designee to perform the Funds’ fair value determinations. Such determinations are subject to Board oversight and certain reporting and other requirements intended to ensure that the Board receives the information it needs to oversee the Investment Manager’s fair value determinations.
Under certain circumstances, the value of certain Fund portfolio investments may be based on an evaluation of fair value, pursuant to procedures established by the Investment Manager and under the general supervision of the Board. The Funds may use the fair value of a portfolio investment to calculate its net asset value (“NAV”) in the event that the market quotation, price or market based valuation for the portfolio investment is not readily available or otherwise not determinable pursuant to the Funds’ valuation procedures, if the Investment Manager believes the quotation, price or market based valuation to be unreliable, or in certain other circumstances. When determining the fair value of an investment, the Investment Manager seeks to determine the price that the Funds might reasonably expect to receive from current sale of that portfolio investment in an arms-length transaction. Fair value determinations shall be based upon consideration of all available facts and information, including, but not limited to (i) attributes specific to the investment; (ii) fundamental and analytical data relating to the investment; and (iii) the value of other comparable securities or relevant financial instruments, including derivative securities, traded on other markets or among dealers.
The values assigned to fair value portfolio investments are based on available information and do not necessarily represent amounts that might ultimately be realized in the future, since such amounts depend on future developments inherent in long-term investments. Because of the inherent uncertainty of valuation, those estimated values may differ significantly from the values that would have been used had a ready market for the investments existed, and the differences could be material. The Board will be presented with quarterly reports, as of the most recent quarter end, summarizing all fair value activity, material fair value matters that occurred during the quarter, and all outstanding securities fair valued by the Funds. Additionally, the Board will be presented with an annual report that assesses the adequacy and effectiveness of the Investment Manager’s process for determining the fair value of the Funds’ investments.
With respect to foreign equity securities and certain foreign fixed income securities, securities held in the Funds that can be fair valued by the applicable fair value pricing service are fair valued on each business day provided that each individual price exceeds a pre-established confidence level.
U.S. GAAP defines fair value as the price that a fund would receive to sell an asset or pay to transfer a liability in an orderly transaction between market participants at the measurement date. U.S. GAAP also establishes a framework for measuring fair value, and a three level hierarchy for fair value measurements based upon the transparency of inputs to the valuation of an asset or liability. Inputs may be observable or unobservable and refer broadly to the assumptions that market participants would use in pricing the asset or liability. Observable inputs reflect the assumptions market participants would use in pricing the asset or liability based on market data obtained from sources independent of the Funds. Unobservable inputs reflect the Funds’ own assumptions about the assumptions
40
| | |
| | Notes to Financial Statements (continued) |
that market participants would use in pricing the asset or liability developed based on the best information available in the circumstances. Each investment is assigned a level based upon the observability of the inputs which are significant to the overall valuation.
The three-tier hierarchy of inputs is summarized below:
Level 1 – inputs are quoted prices in active markets for identical investments (e.g., equity securities, open-end investment companies)
Level 2 – other observable inputs (including, but not limited to: quoted prices for similar assets or liabilities in markets that are active, quoted prices for identical or similar assets or liabilities in markets that are not active, inputs other than quoted prices that are observable for the assets or liabilities (such as interest rates, yield curves, volatilities, prepayment speeds, loss severities, credit risks and default rates) or other market corroborated inputs) (e.g., debt securities, government securities, foreign securities utilizing international fair value pricing, fair valued securities with observable inputs)
Level 3 – inputs are significant unobservable inputs (including the Fund’s own assumptions used to determine the fair value of investments) (e.g., fair valued securities with unobservable inputs)
Changes in inputs or methodologies used for valuing investments may result in a transfer in or out of levels within the fair value hierarchy. The inputs or methodologies used for valuing investments may not necessarily be an indication of the risk associated with investing in those investments.
b. SECURITY TRANSACTIONS
Security transactions are accounted for as of trade date. Realized gains and losses on securities sold are determined on the basis of identified cost.
c. INVESTMENT INCOME AND EXPENSES
Dividend income is recorded on the ex-dividend date. Interest income, which includes amortization of premium and accretion of discount on debt securities, is accrued as earned. Dividend and interest income on foreign securities is recorded gross of any withholding tax. Non-cash dividends included in dividend income, if any, are reported at the fair market value of the securities received. Upon notification from the issuer, distributions received from a real estate investment trust (REIT) may be redesignated as a reduction of cost of investments and/or realized gain. Other income and expenses are recorded on an accrual basis. Expenses that cannot be directly attributed to a Fund are apportioned among the funds in the Trusts and other trusts or funds within the AMG Funds Family of Funds (collectively, the “AMG Funds Family”) based upon their relative average net assets or number of shareholders. Investment income, realized and unrealized capital
gains and losses, the common expenses of each Fund, and certain fund level expense reductions, if any, are allocated on a pro-rata basis to each class based on the relative net assets of each class to the total net assets of each Fund.
The following Funds had certain portfolio trades directed to various brokers under a brokerage recapture program. Credits received from the brokerage recapture program are earned and paid on a monthly basis, and are recorded as expense offsets, which serve to reduce the Funds’ overall expense ratio.
For the fiscal year ended October 31, 2024, the impact on the expenses and expense ratios was as follows:
| | | | | | | | |
| | | Amount | | | Percentage Reduction |
| | |
Mid Cap Value | | | $4,364 | | | | 0.00% | 1 |
| | |
Large Cap Value Select | | | 694 | | | | 0.00% | 1 |
| | |
Small Cap Value | | | 34,970 | | | | 0.00% | 1 |
| | |
Dividend All Cap Value | | | 24,739 | | | | 0.02% | |
| | |
Small-Mid Cap Value | | | 5,393 | | | | 0.00% | 1 |
| | |
Focused Absolute Value | | | 1,661 | | | | 0.00% | 1 |
1 Less than 0.005%
d. DIVIDENDS AND DISTRIBUTIONS
Fund distributions, except those of Dividend All Cap Value, resulting from net investment income will normally be declared and paid at least annually. Dividend All Cap Value will declare and pay net investment income distributions quarterly. Each Fund will normally declare and pay realized net capital gains, if any, at least annually in December. Distributions to shareholders are recorded on the ex-dividend date. Distributions are determined in accordance with federal income tax regulations, which may differ from net investment income and net realized capital gains for financial statement purposes (U.S. GAAP). Differences may be permanent or temporary. Permanent differences are reclassified among capital accounts in the financial statements to reflect their tax character. Permanent book and tax basis differences, if any, relating to shareholder distributions will result in reclassification to paid-in capital. Temporary differences arise when certain items of income, expense and gain or loss are recognized in different periods for financial statement and tax purposes; these differences will reverse at some time in the future. Permanent differences are primarily due to tax equalization utilized for all of the Funds. Temporary differences are primarily due to wash sale loss deferrals for all of the Funds, and investments in partnerships for Dividend All Cap Value.
The tax character of distributions paid during the fiscal years ended October 31, 2024 and October 31, 2023 was as follows:
| | | | | | | | | | | | | | | | | | | | | | | | |
| | | Mid Cap Value | | | | Large Cap Value Select | | | | Small Cap Value | |
| | | | | | |
Distributions paid from: | | | 2024 | | | | 2023 | | | | 2024 | | | | 2023 | | | | 2024 | | | | 2023 | |
| | | | | | |
Ordinary income * | | | $1,622,480 | | | | $19,216,056 | | | | $337,791 | | | | $683,735 | | | | $2,863,576 | | | | — | |
| | | | | | |
Long-term capital gains | | | — | | | | 6,859,292 | | | | — | | | | — | | | | 40,029,135 | | | | $30,499,337 | |
| | | | | | |
| | | | | | | | | | | | | | | | | | | | | | | | |
| | | | | | |
| | | $1,622,480 | | | | $26,075,348 | | | | $337,791 | | | | $683,735 | | | | $42,892,711 | | | | $30,499,337 | |
| | | | | | | | | | | | | | | | | | | | | | | | |
41
| | |
| | Notes to Financial Statements (continued) |
| | | | | | | | | | | | | | | | | | | | | | | | |
| | | |
| | | Dividend All Cap Value | | | | Small-Mid Cap Value | | | | Focused Absolute Value | |
| | | | | | |
Distributions paid from: | | | 2024 | | | | 2023 | | | | 2024 | | | | 2023 | | | | 2024 | | | | 2023 | |
| | | | | | |
Ordinary income * | | | $3,413,275 | | | | $7,069,532 | | | | $3,895,589 | | | | $98,109 | | | | $900,127 | | | | $249,051 | |
| | | | | | |
Long-term capital gains | | | 6,079,781 | | | | 35,507,171 | | | | 7,156,589 | | | | 10,551,692 | | | | 502,670 | | | | 370,475 | |
| | | | | | | | | | | | | | | | | | | | | | | | |
| | | | | | |
| | | $9,493,056 | | | | $42,576,703 | | | | $11,052,178 | | | | $10,649,801 | | | | $1,402,797 | | | | $619,526 | |
| | | | | | | | | | | | | | | | | | | | | | | | |
* For tax purposes, short-term capital gain distributions, if any, are considered ordinary income distributions.
As of October 31, 2024, the components of distributable earnings (excluding unrealized appreciation/depreciation) on a tax basis consisted of:
| | | | | | | | | | | | | | | | | | | | | | | | |
| | | | | | | | | | | | | | | | | | Focused | |
| | | | | | Large Cap | | | Small Cap | | | Dividend All | | | Small-Mid | | | Absolute | |
| | | Mid Cap Value | | | Value Select | | | Value | | | Cap Value | | | Cap Value | | | Value | |
| | | | | | |
Undistributed ordinary income | | | $4,761,991 | | | | $273,824 | | | | $4,407,774 | | | | $277,549 | | | | $2,416,227 | | | | $3,661,008 | |
| | | | | | |
Undistributed long-term capital gains | | | 37,655,382 | | | | 1,680,081 | | | | 82,825,137 | | | | 36,275,249 | | | | 25,457,127 | | | | 3,043,377 | |
At October 31, 2024, the cost of investments and the aggregate gross unrealized appreciation and depreciation for federal income tax purposes were as follows:
| | | | | | | | | | | | | | | | |
| Fund | | Cost | | | Appreciation | | | Depreciation | | | Net Appreciation | |
| | | | |
Mid Cap Value | | | $296,392,708 | | | | $50,277,117 | | | | $(5,304,001) | | | | $44,973,116 | |
| | | | |
Large Cap Value Select | | | 40,750,765 | | | | 7,415,409 | | | | (1,578,703) | | | | 5,836,706 | |
| | | | |
Small Cap Value | | | 894,903,798 | | | | 241,330,431 | | | | (49,589,481) | | | | 191,740,950 | |
| | | | |
Dividend All Cap Value | | | 59,194,392 | | | | 32,361,834 | | | | (6,177,243) | | | | 26,184,591 | |
| | | | |
Small-Mid Cap Value | | | 274,272,801 | | | | 64,512,773 | | | | (16,221,483) | | | | 48,291,290 | |
| | | | |
Focused Absolute Value | | | 41,036,339 | | | | 10,029,567 | | | | (1,842,894) | | | | 8,186,673 | |
e. FEDERAL TAXES
Each Fund currently qualifies as an investment company and intends to comply with the requirements under Subchapter M of the Internal Revenue Code of 1986, as amended (the “Code”), and to distribute substantially all of its taxable income and gains to its shareholders and to meet certain diversification and income requirements with respect to investment companies. The Investment Manager has analyzed the Funds’ tax positions taken on federal income tax returns as of October 31, 2024, and for all open tax years (generally, the three prior taxable years), and has concluded that no provision for federal income tax is required in the Funds’ financial statements. Additionally, the Investment Manager is not aware of any tax position for which it is reasonably possible that the total amounts of unrecognized tax benefit/detriment will change materially in the next twelve months.
Furthermore, based on each Fund’s understanding of the tax rules and rates related to income, gains and transactions for the foreign jurisdictions in which it
invests, each Fund will provide for foreign taxes, and where appropriate, deferred foreign taxes.
f. CAPITAL LOSS CARRYOVERS AND DEFERRALS
As of October 31, 2024, the Funds had no capital loss carryovers for federal income tax purposes. Should the Funds incur net capital losses for the fiscal year ended October 31, 2025, such amounts may be used to offset future realized capital gains indefinitely, and retain their character as short-term and/or long-term.
For the fiscal year ended October 31, 2024, the following Fund utilized capital loss carryovers in the amount of:
| | | | | | |
Fund | | Short-Term | | | | Long-Term |
| | | |
Large Cap Value Select | | $4,768,092 | | | | $1,223,833 |
42
| | |
| | Notes to Financial Statements (continued) |
g. CAPITAL STOCK
Each Trust’s Amended and Restated Agreement and Declaration of Trust or Trust Instrument, as applicable, authorizes for each Fund the issuance of an unlimited number of shares of beneficial interest, without par value. Each Fund records sales and repurchases of its capital stock on the trade date.
For the fiscal years ended October 31, 2024 and October 31, 2023, the capital stock transactions by class for the Funds were as follows:
| | $ | | | | $ | | | | $ | | | | $ | | | | $ | | | | $ | | | | $ | | | | $ | | |
| | | Mid Cap Value | | | | Large Cap Value Select | |
| | | | |
| | | October 31, 2024 | | | October 31, 2023 | | | October 31, 2024 | | | October 31, 2023 | |
| | | | | | | | |
| | | Shares | | | | Amount | | | | Shares | | | | Amount | | | | Shares | | | | Amount | | | | Shares | | | | Amount | |
| | | | | | | | |
Class N: | | | | | | | | | | | | | | | | | | | | | | | | | | | | | | | | |
| | | | | | | | |
Shares sold | | | 794,989 | | | | $16,506,109 | | | | 949,737 | | | | $16,906,043 | | | | 88,174 | | | | $1,696,217 | | | | 9,777 | | | | $149,655 | |
| | | | | | | | |
Shares issued in reinvestment of distributions | | | 49,240 | | | | 980,863 | | | | 1,150,594 | | | | 19,157,394 | | | | 1,090 | | | | 18,011 | | | | 3,502 | | | | 49,510 | |
| | | | | | | | |
Shares redeemed | | | (2,579,753) | | | | (53,819,568) | | | | (2,275,505) | | | | (40,543,318) | | | | (54,577) | | | | (969,498) | | | | (52,163) | | | | (782,760) | |
| | | | | | | | | | | | | | | | | | | | | | | | | | | | | | | | |
| | | | | | | | |
Net increase (decrease) | | | (1,735,524) | | | | $(36,332,596) | | | | (175,174) | | | | $(4,479,881) | | | | 34,687 | | | | $744,730 | | | | (38,884) | | | | $(583,595) | |
| | | | | | | | | | | | | | | | | | | | | | | | | | | | | | | | |
| | | | | | | | |
Class I: | | | | | | | | | | | | | | | | | | | | | | | | | | | | | | | | |
| | | | | | | | |
Shares sold | | | 635,833 | | | | $13,909,133 | | | | 1,247,002 | | | | $24,317,449 | | | | 408,352 | | | | $7,383,448 | | | | 41,393 | | | | $607,275 | |
| | | | | | | | |
Shares issued in reinvestment of distributions | | | 26,111 | | | | 560,867 | | | | 323,884 | | | | 5,813,710 | | | | 17,865 | | | | 296,371 | | | | 41,467 | | | | 589,249 | |
| | | | | | | | |
Shares redeemed | | | (1,296,168) | | | | (28,843,362) | | | | (1,289,620) | | | | (24,891,173) | | | | (344,558) | | | | (6,125,173) | | | | (344,500) | | | | (5,145,465) | |
| | | | | | | | | | | | | | | | | | | | | | | | | | | | | | | | |
| | | | | | | | |
Net increase (decrease) | | | (634,224) | | | | $(14,373,362) | | | | 281,266 | | | | $5,239,986 | | | | 81,659 | | | | $1,554,646 | | | | (261,640) | | | | $(3,948,941) | |
| | | | | | | | | | | | | | | | | | | | | | | | | | | | | | | | |
| | | | | | | | |
Class Z: | | | | | | | | | | | | | | | | | | | | | | | | | | | | | | | | |
| | | | | | | | |
Shares sold | | | 25,647 | | | | $572,080 | | | | 24,038 | | | | $462,371 | | | | — | | | | — | | | | — | | | | — | |
| | | | | | | | |
Shares issued in reinvestment of distributions | | | 2,494 | | | | 53,192 | | | | 34,175 | | | | 608,992 | | | | — | | | | — | | | | — | | | | — | |
| | | | | | | | |
Shares redeemed | | | (53,789) | | | | (1,224,531) | | | | (73,280) | | | | (1,402,999) | | | | — | | | | — | | | | — | | | | — | |
| | | | | | | | | | | | | | | | | | | | | | | | | | | | | | | | |
| | | | | | | | |
Net decrease | | | (25,648) | | | | $(599,259) | | | | (15,067) | | | | $(331,636) | | | | — | | | | — | | | | — | | | | — | |
| | | | | | | | | | | | | | | | | | | | | | | | | | | | | | | | |
| | | | | | | | | | | | | | | | | | | | | | | | | | | | | | | | |
| | | Small Cap Value | | | Dividend All Cap Value | |
| | | | |
| | | October 31, 2024 | | | October 31, 2023 | | | October 31, 2024 | | | October 31, 2023 | |
| | | | | | | | |
| | | Shares | | | | Amount | | | | Shares | | | | Amount | | | | Shares | | | | Amount | | | | Shares | | | | Amount | |
| | | | | | | | |
Class N: | | | | | | | | | | | | | | | | | | | | | | | | | | | | | | | | |
| | | | | | | | |
Shares sold | | | 452,751 | | | | $6,795,883 | | | | 764,537 | | | | $10,743,123 | | | | 26,514 | | | | $260,617 | | | | 46,461 | | | | $442,670 | |
| | | | | | | | |
Shares issued in reinvestment of distributions | | | 138,739 | | | | 2,008,947 | | | | 102,870 | | | | 1,367,145 | | | | 153,303 | | | | 1,472,882 | | | | 484,141 | | | | 4,635,571 | |
| | | | | | | | |
Shares redeemed | | | (658,414) | | | | (9,822,095) | | | | (473,354) | | | | (6,575,876) | | | | (988,208) | | | | (9,611,700) | | | | (655,492) | | | | (6,218,758) | |
| | | | | | | | | | | | | | | | | | | | | | | | | | | | | | | | |
| | | | | | | | |
Net increase (decrease) | | | (66,924) | | | | $(1,017,265) | | | | 394,053 | | | | $5,534,392 | | | | (808,391) | | | | $(7,878,201) | | | | (124,890) | | | | $(1,140,517) | |
| | | | | | | | | | | | | | | | | | | | | | | | | | | | | | | | |
| | | | | | | | |
Class I: | | | | | | | | | | | | | | | | | | | | | | | | | | | | | | | | |
| | | | | | | | |
Shares sold | | | 16,351,743 | | | | $256,882,837 | | | | 11,870,466 | | | | $172,416,580 | | | | 666,381 | | | | $6,289,704 | | | | 4,314,310 | | | | $42,038,542 | |
| | | | | | | | |
Shares issued in reinvestment of distributions | | | 2,410,433 | | | | 36,325,218 | | | | 1,896,970 | | | | 26,121,284 | | | | 807,218 | | | | 7,602,496 | | | | 3,845,260 | | | | 36,735,160 | |
| | | | | | | | |
Shares redeemed | | | (13,149,676) | | | | (206,488,350) | | | | (12,026,638) | | | | (174,467,625) | | | | (19,847,712) | | | | (189,367,166) | | | | (11,920,574) | | | | (113,621,232) | |
| | | | | | | | | | | | | | | | | | | | | | | | | | | | | | | | |
| | | | | | | | |
Net increase (decrease) | | | 5,612,500 | | | | $86,719,705 | | | | 1,740,798 | | | | $24,070,239 | | | | (18,374,113) | | | | $(175,474,966) | | | | (3,761,004) | | | | $(34,847,530) | |
| | | | | | | | | | | | | | | | | | | | | | | | | | | | | | | | |
| | | | | | | | |
Class Z: | | | | | | | | | | | | | | | | | | | | | | | | | | | | | | | | |
| | | | | | | | |
Shares sold | | | 33,809 | | | | $527,171 | | | | 52,181 | | | | $757,394 | | | | 144,668 | | | | $1,537,514 | | | | 62,411 | | | | $597,509 | |
| | | | | | | | |
Shares issued in reinvestment of distributions | | | 34,843 | | | | 526,134 | | | | 24,902 | | | | 343,645 | | | | 18,481 | | | | 176,926 | | | | 47,325 | | | | 451,503 | |
| | | | | | | | |
Shares redeemed | | | (553,274) | | | | (8,616,636) | | | | (19,520) | | | | (285,485) | | | | (175,284) | | | | (1,805,600) | | | | (36,056) | | | | (326,540) | |
| | | | | | | | | | | | | | | | | | | | | | | | | | | | | | | | |
| | | | | | | | |
Net increase (decrease) | | | (484,622) | | | | $(7,563,331) | | | | 57,563 | | | | $815,554 | | | | (12,135) | | | | $(91,160) | | | | 73,680 | | | | $722,472 | |
| | | | | | | | | | | | | | | | | | | | | | | | | | | | | | | | |
43
| | |
| | Notes to Financial Statements (continued) |
| | | | | | | | | | | | | | | | | | | | | | | | | | | | | | | | |
| | | Small-Mid Cap Value | | | Focused Absolute Value | |
| | | | |
| | | October 31, 2024 | | | October 31, 2023 | | | October 31, 2024 | | | October 31, 2023 | |
| | | | | | | | |
| | | Shares | | | | Amount | | | | Shares | | | | Amount | | | | Shares | | | | Amount | | | | Shares | | | | Amount | |
| | | | | | | | |
Class N: | | | | | | | | | | | | | | | | | | | | | | | | | | | | | | | | |
| | | | | | | | |
Shares sold | | | 281,895 | | | | $2,672,905 | | | | 338,659 | | | | $3,001,785 | | | | 3,938 | | | | $52,645 | | | | 3,416 | | | | $41,517 | |
| | | | | | | | |
Shares issued in reinvestment of distributions | | | 78,401 | | | | 717,368 | | | | 98,766 | | | | 829,638 | | | | 4,056 | | | | 51,307 | | | | 1,436 | | | | 16,781 | |
| | | | | | | | |
Shares redeemed | | | (418,232) | | | | (3,948,636) | | | | (355,139) | | | | (3,097,453) | | | | (38,348) | | | | (540,479) | | | | (37,148) | | | | (450,738) | |
| | | | | | | | | | | | | | | | | | | | | | | | | | | | | | | | |
| | | | | | | | |
Net increase (decrease) | | | (57,936) | | | | $(558,363) | | | | 82,286 | | | | $733,970 | | | | (30,354) | | | | $(436,527) | | | | (32,296) | | | | $(392,440) | |
| | | | | | | | | | | | | | | | | | | | | | | | | | | | | | | | |
| | | | | | | | |
Class I: | | | | | | | | | | | | | | | | | | | | | | | | | | | | | | | | |
| | | | | | | | |
Shares sold | | | 5,749,023 | | | | $56,371,157 | | | | 9,330,366 | | | | $85,230,959 | | | | 117,808 | | | | $1,618,737 | | | | 629,484 | | | | $7,592,330 | |
| | | | | | | | |
Shares issued in reinvestment of distributions | | | 866,026 | | | | 8,218,589 | | | | 881,405 | | | | 7,668,227 | | | | 95,245 | | | | 1,202,944 | | | | 44,601 | | | | 520,939 | |
| | | | | | | | |
Shares redeemed | | | (5,446,610) | | | | (53,478,130) | | | | (6,257,178) | | | | (56,859,310) | | | | (579,333) | | | | (7,654,640) | | | | (1,909,131) | | | | (22,710,674) | |
| | | | | | | | | | | | | | | | | | | | | | | | | | | | | | | | |
| | | | | | | | |
Net increase (decrease) | | | 1,168,439 | | | | $11,111,616 | | | | 3,954,593 | | | | $36,039,876 | | | | (366,280) | | | | $(4,832,959) | | | | (1,235,046) | | | | $(14,597,405) | |
| | | | | | | | | | | | | | | | | | | | | | | | | | | | | | | | |
| | | | | | | | |
Class Z: | | | | | | | | | | | | | | | | | | | | | | | | | | | | | | | | |
| | | | | | | | |
Shares sold | | | 41,382 | | | | $413,912 | | | | 183,363 | | | | $1,632,341 | | | | 9,773 | | | | $130,782 | | | | 17,596 | | | | $209,361 | |
| | | | | | | | |
Shares issued in reinvestment of distributions | | | 89,801 | | | | 853,113 | | | | 114,008 | | | | 993,011 | | | | 6,796 | | | | 85,836 | | | | 2,706 | | | | 31,583 | |
| | | | | | | | |
Shares redeemed | | | (64,802) | | | | (656,672) | | | | (675,110) | | | | (5,947,365) | | | | (424,107) | | | | (5,498,628) | | | | (137,875) | | | | (1,632,424) | |
| | | | | | | | | | | | | | | | | | | | | | | | | | | | | | | | |
| | | | | | | | |
Net increase (decrease) | | | 66,381 | | | | $610,353 | | | | (377,739) | | | | $(3,322,013) | | | | (407,538) | | | | $(5,282,010) | | | | (117,573) | | | | $(1,391,480) | |
| | | | | | | | | | | | | | | | | | | | | | | | | | | | | | | | |
h. REPURCHASE AGREEMENTS AND JOINT REPURCHASE AGREEMENTS
The Funds may enter into third-party and bilateral repurchase agreements for temporary cash management purposes and for reinvestment of cash collateral on securities lending transactions under the securities lending program offered by The Bank of New York Mellon (“BNYM”) (the “Securities Lending Program”) (collectively, “Repurchase Agreements”). The value of the underlying collateral, including accrued interest, must equal or exceed the value of the Repurchase Agreements during the term of the agreement. For joint repurchase agreements, the Funds participate on a pro rata basis with other clients of BNYM in their share of the underlying collateral under such joint repurchase agreements and in their share of proceeds from any repurchase or other disposition of the underlying collateral. The underlying collateral for all Repurchase Agreements is held by the Funds’ custodian or at the Federal Reserve Bank. If the seller defaults and the value of the collateral declines, or if bankruptcy proceedings commence with respect to the seller of the security, realization of the collateral by the Funds may be delayed or limited. Pursuant to the Securities Lending Program, the Funds are indemnified for such losses by BNYM on joint repurchase agreements.
At October 31, 2024, the market value of Repurchase Agreements outstanding is as follows:
| | | | |
| | | Market Value | |
| |
Mid Cap Value | | | $6,164,000 | |
| |
Large Cap Value Select | | | 1,331,000 | |
| |
Small Cap Value | | | 100,357,972 | |
| |
Dividend All Cap Value | | | 2,127,000 | |
| |
Small-Mid Cap Value | | | 15,006,659 | |
| |
Focused Absolute Value | | | 572,893 | |
2. AGREEMENTS AND TRANSACTIONS WITH AFFILIATES
For each of the Funds, the Trusts have entered into an investment advisory agreement under which the Investment Manager, a subsidiary and the U.S. wealth platform of Affiliated Managers Group, Inc. (“AMG”), serves as investment manager to the Funds and is responsible for the Funds’ overall administration and operations. The Investment Manager selects and recommends, subject to the approval of the Board and, in certain circumstances, shareholders, the Funds’ subadviser and monitors the subadviser’s investment performance, security holdings and investment strategies. Each Fund’s investment portfolio is managed by River Road Asset Management, LLC (“River Road”) who serves pursuant to a subadvisory agreement with the Investment Manager. AMG indirectly owns a majority interest in River Road.
44
| | |
| | Notes to Financial Statements (continued) |
Investment management fees are paid directly by the Funds to the Investment Manager based on average daily net assets. For the fiscal year ended October 31, 2024, the Funds’ investment management fees were paid at the following annual rate of each Fund’s respective average daily net assets:
| | | | |
Mid Cap Value | | | 0.56% | |
| |
Large Cap Value Select | | | 0.35% | |
| |
Small Cap Value | | | 0.80% | |
| |
Dividend All Cap Value | | | 0.50% | |
| |
Small-Mid Cap Value | | | 0.75% | |
| |
Focused Absolute Value | | | 0.60% | |
The fee paid to River Road for its services as subadviser is paid out of the fee the Investment Manager receives from each Fund and does not increase the expenses of each Fund.
The Investment Manager has contractually agreed, through at least March 1, 2025, to waive management fees and/or reimburse fund expenses in order to limit total annual Fund operating expenses after fee waiver and expense reimbursements (exclusive of taxes, interest (including interest incurred in connection with bank and custody overdrafts and in connection with securities sold short), shareholder servicing fees, distribution and service 12b-1 fees, brokerage commissions and other transaction costs, dividends payable with respect to securities sold short, acquired fund fees and expenses and extraordinary expenses) of the Funds other than Small Cap Value to the below percentages of each such Fund’s average daily net assets (this annual rate or such other annual rate that may be in effect from time to time, the “Expense Cap”), subject to later reimbursement by such Funds in certain circumstances.
| | | | |
Mid Cap Value | | | 0.76% | |
| |
Large Cap Value Select | | | 0.60% | |
| |
Small Cap Value | | | N/A | |
| |
Dividend All Cap Value | | | 0.68% | |
| |
Small-Mid Cap Value | | | 1.04% | |
| |
Focused Absolute Value | | | 0.78% | |
In general, for a period of up to 36 months after the date any amounts are paid, waived or reimbursed by the Investment Manager, the Investment Manager may recover such amounts from a Fund, provided that such repayment would not cause the Fund’s total annual operating expenses after fee waiver and expense reimbursements (exclusive of the items noted in the parenthetical above) to exceed either (i) the Expense Cap in effect at the time such amounts were paid, waived or reimbursed, or (ii) the Expense Cap in effect at the time of such repayment by the Fund.
The contractual expense limitation may only be terminated in the event the Investment Manager or a successor ceases to be the investment manager of the Fund or a successor fund, by mutual agreement between the Investment Manager and the Board, or in the event of the Fund’s liquidation unless the Fund is reorganized or is a party to a merger in which the surviving entity is successor to the accounting and performance information of the Fund.
For the fiscal year ended October 31, 2024, the Investment Manager’s expense reimbursements, and repayments of prior reimbursements by the Funds to the Investment Manager, if any, are as follows:
| | | | |
| | | Expense Reimbursements | | Repayment of Prior Reimbursements |
| | |
Mid Cap Value | | $120,397 | | — |
| | |
Large Cap Value Select | | 78,508 | | — |
| | |
Dividend All Cap Value | | 177,037 | | — |
| | |
Focused Absolute Value | | 97,960 | | — |
At October 31, 2024, the Funds’ expiration of reimbursements subject to recoupment, if any, is as follows:
| | | | | | | | |
Expiration Period | | Mid Cap Value | | | Large Cap Value Select | |
| | |
Less than 1 year | | | $27,037 | | | | $46,891 | |
| | |
1-2 years | | | 79,604 | | | | 77,427 | |
| | |
2-3 years | | | 120,397 | | | | 78,508 | |
| | | | | | | | |
| | |
Total | | | $227,038 | | | | $202,826 | |
| | | | | | | | |
| | | | | | | | |
Expiration Period | | Dividend All Cap Value | | | Focused Absolute Value | |
| | |
Less than 1 year | | | $117,693 | | | | $98,288 | |
| | |
1-2 years | | | 132,074 | | | | 89,807 | |
| | |
2-3 years | | | 177,037 | | | | 97,960 | |
| | | | | | | | |
| | |
Total | | | $426,804 | | | | $286,055 | |
| | | | | | | | |
The Trusts, on behalf of the Funds, have entered into an amended and restated Administration Agreement under which the Investment Manager serves as the Funds’ administrator (the “Administrator”) and is responsible for certain aspects of managing the Funds’ operations, including administration and shareholder services to each Fund. Each Fund pays a fee to the Administrator at the rate of 0.15% per annum of the Fund’s average daily net assets for this service.
The Funds are distributed by AMG Distributors, Inc. (the “Distributor”), a wholly-owned subsidiary of the Investment Manager. The Distributor serves as the distributor and underwriter for each Fund and is a registered broker-dealer and member of the Financial Industry Regulatory Authority, Inc. (“FINRA”). Shares of each Fund will be continuously offered and will be sold directly to prospective purchasers and through brokers, dealers or other financial intermediaries who have executed selling agreements with the Distributor. Generally, the Distributor bears all or a portion of the expenses of providing services pursuant to the distribution agreement, including the payment of the expenses relating to the distribution of prospectuses for sales purposes and any advertising or sales literature.
45
| | |
| | Notes to Financial Statements (continued) |
The Trusts have adopted a distribution and service plan (the “Plan”) with respect to the Class N shares of each Fund in accordance with the requirements of Rule 12b-1 under the 1940 Act and the requirements of the applicable rules of FINRA regarding asset based sales charges. Pursuant to the Plan, each Fund may make payments to the Distributor for its expenditures in financing any activity primarily intended to result in the sale of each Fund’s Class N shares and for maintenance and personal service provided to existing shareholders of that class. The Plan authorizes payments to the Distributor of up to 0.25% annually of each Fund’s average daily net assets attributable to the Class N shares. For all Funds, except Large Cap Value Select, the Plan is characterized as a reimbursement plan and is directly tied to expenses incurred by the Distributor; the payments the Distributor receives during any year may not exceed its actual expenses.
The impact on the annualized expense ratios for the fiscal year ended October 31, 2024, was as follows:
| | | | |
Fund | | Actual Amount Incurred | |
| |
Mid Cap Value | | | | |
| |
Class N | | | 0.25% | |
| |
Large Cap Value Select | | | | |
| |
Class N | | | 0.25% | |
| |
Small Cap Value | | | | |
| |
Class N | | | 0.25% | |
| |
Dividend All Cap Value | | | | |
| |
Class N | | | 0.25% | |
| |
Small-Mid Cap Value | | | | |
| |
Class N | | | 0.25% | |
| |
Focused Absolute Value | | | | |
| |
Class N | | | 0.24% | |
For each of the Class N and Class I shares, the Board has approved reimbursement payments to the Investment Manager for shareholder servicing expenses (“shareholder servicing fees”) incurred. Shareholder servicing fees include payments to financial intermediaries, such as broker-dealers (including fund supermarket platforms), banks, and trust companies who provide shareholder record keeping, account servicing and other services. The Class N and Class I shares may reimburse the Investment Manager for the actual amount incurred up to a maximum annual rate of each Class’s average daily net assets as shown in the table below.
The impact on the annualized expense ratios for the fiscal year ended October 31, 2024, was as follows:
| | | | | | | | |
| Fund | | Maximum Annual
Amount
Approved | | | Actual
Amount
Incurred | |
| | |
Mid Cap Value | | | | | | | | |
| | |
Class N | | | 0.10% | | | | 0.10% | |
| | |
Class I | | | 0.05% | | | | 0.05% | |
| | |
Large Cap Value Select | | | | | | | | |
| | |
Class N | | | 0.10% | | | | 0.10% | |
| | |
Class I | | | 0.05% | | | | 0.03% | |
| | |
Small Cap Value | | | | | | | | |
| | |
Class N | | | 0.15% | | | | 0.10% | |
| | |
Class I | | | 0.15% | | | | 0.09% | |
| | |
Dividend All Cap Value | | | | | | | | |
| | |
Class N | | | 0.04% | | | | 0.04% | |
| | |
Class I | | | 0.04% | | | | 0.04% | |
| | |
Small-Mid Cap Value | | | | | | | | |
| | |
Class N | | | 0.15% | | | | 0.06% | |
| | |
Class I | | | 0.15% | | | | 0.05% | |
| | |
Focused Absolute Value | | | | | | | | |
| | |
Class N | | | 0.15% | | | | 0.04% | |
| | |
Class I | | | 0.15% | | | | 0.04% | |
The Board provides supervision of the affairs of the Trusts and other trusts within the AMG Funds Family. The Trustees of the Trusts who are not affiliated with the Investment Manager receive an annual retainer and per meeting fees for regular, special and telephonic meetings, and they are reimbursed for out-of-pocket expenses incurred while carrying out their duties as Board members. The Chairman of the Board and the Audit Committee Chair receive additional annual retainers. Certain Trustees and Officers of the Funds are Officers and/or Directors of the Investment Manager, AMG and/or the Distributor.
The Securities and Exchange Commission (the “SEC”) granted an exemptive order that permits certain eligible funds in the AMG Funds Family to lend and borrow money for certain temporary purposes directly to and from other eligible funds in the AMG Funds Family. Participation in this interfund lending program is voluntary for both the borrowing and lending funds, and an interfund loan is only made if it benefits each participating fund. The Administrator manages the program according to procedures approved by the Board, and the Board monitors the operation of the program. An interfund loan must comply with certain conditions set out in the exemptive order, which are designed to assure fairness and protect all participating funds. The interest earned and interest paid on interfund loans are included on the Statement of Operations as interest income and interest expense, respectively. At October 31, 2024, the Funds had no interfund loans outstanding.
46
| | |
| | Notes to Financial Statements (continued) |
The following Funds utilized the interfund lending program during the fiscal year ended October 31, 2024 as follows:
| | | | | | | | | | | | | | | | |
| Fund | | Average
Lent | | | Number
of Days | | | Interest
Earned | | | Average
Interest Rate | |
| | | | |
Mid Cap Value | | | $2,192,974 | | | | 1 | | | | $344 | | | | 5.730% | |
| | | | |
Small Cap Value | | | 2,824,954 | | | | 26 | | | | 12,184 | | | | 6.055% | |
| | | | |
Small-Mid Cap Value | | | 1,557,433 | | | | 11 | | | | 2,790 | | | | 5.944% | |
| | | | | | | | | | | | | | | | |
| Fund | | Average
Borrowed | | | Number
of Days | | | Interest
Paid | | | Average
Interest Rate | |
| | | | |
Mid Cap Value | | | $5,069,227 | | | | 3 | | | | $2,600 | | | | 6.240% | |
| | | | |
Large Cap Value Select | | | 1,053,427 | | | | 1 | | | | 180 | | | | 6.238% | |
| | | | |
Dividend All Cap Value | | | 6,906,308 | | | | 22 | | | | 25,825 | | | | 6.196% | |
| | | | |
Focused Absolute Value | | | 1,443,711 | | | | 2 | | | | 492 | | | | 6.215% | |
3. PURCHASES AND SALES OF SECURITIES
Purchases and sales of securities (excluding short-term securities and U.S. Government Obligations) for the fiscal year ended October 31, 2024, were as follows:
| | | | | | | | |
| | | Long Term Securities | |
| | |
| Fund | | Purchases | | | Sales | |
| | |
Mid Cap Value | | $ | 258,638,554 | | | $ | 302,558,803 | |
| | |
Large Cap Value Select | | | 42,702,656 | | | | 40,716,067 | |
| | |
Small Cap Value | | | 413,180,267 | | | | 388,460,594 | |
| | |
Dividend All Cap Value | | | 36,107,108 | | | | 224,724,874 | |
| | |
Small-Mid Cap Value | | | 121,955,399 | | | | 123,424,063 | |
| | |
Focused Absolute Value | | | 41,345,534 | | | | 52,977,600 | |
The Funds had no purchases or sales of U.S. Government Obligations during the fiscal year ended October 31, 2024.
4. PORTFOLIO SECURITIES LOANED
The Funds participate in the Securities Lending Program providing for the lending of securities to qualified borrowers. Securities lending income includes earnings of such temporary cash investments, plus or minus any rebate to a borrower. These earnings (after any rebate) are then divided between BNYM, as a fee for its services under the Securities Lending Program, and the Funds, according to agreed-upon rates. Collateral on all securities loaned is accepted in cash, U.S. Treasury Obligations or U.S. Government Agency Obligations. Collateral is maintained at a minimum level of 102% (105% in the case of certain foreign securities) of the market value, plus interest, if applicable, of investments on loan. It is the Funds’ policy to obtain additional collateral from or return excess collateral to the borrower by the end of the next business day, following the valuation date of the securities loaned. Therefore, the value of the collateral held may be temporarily less than the value of the securities on loan. Lending securities entails a risk of loss to the Funds if and to the extent that the market value of the securities loaned were to increase and the borrower did not increase the collateral accordingly, and the borrower fails to return the securities. Under the terms of the Securities Lending Program, the Funds are indemnified for such losses by BNYM. Cash
collateral is held in separate omnibus accounts managed by BNYM, who is authorized to exclusively enter into joint repurchase agreements for that cash collateral. Securities collateral is held in separate omnibus accounts managed by BNYM and cannot be sold or pledged. BNYM bears the risk of any deficiency in the amount of the cash collateral available for return to the borrower due to any loss on the collateral invested. Loans of securities are terminable at any time and the borrower, after notice, is required to return borrowed securities as soon as practical, which is normally within three business days.
The value of securities loaned on positions held, cash collateral and securities collateral received at October 31, 2024, was as follows:
| | | | | | | | | | | | | | | | |
| Fund | | Securities
Loaned | | | Cash
Collateral
Received | | | Securities
Collateral Received | | | Total Collateral Received | |
| | | | |
Small Cap Value | | | $65,950,074 | | | | $136,972 | | | | $67,441,354 | | | | $67,578,326 | |
| | | | |
Dividend All Cap Value | | | 3,415,359 | | | | — | | | | 3,520,958 | | | | 3,520,958 | |
| | | | |
Small-Mid Cap Value | | | 18,262,258 | | | | 3,202,659 | | | | 16,067,297 | | | | 19,269,956 | |
| | | | |
Focused Absolute Value | | | 3,705,525 | | | | 124,893 | | | | 3,631,353 | | | | 3,756,246 | |
The following table summarizes the securities received as collateral for securities lending at October 31, 2024:
| | | | | | | | |
| Fund | | Collateral Type | | Coupon
Range | | Maturity Date Range | |
| | | |
Small Cap Value | | U.S. Treasury
Obligations | | 0.125%-7.625% | | | 11/15/24-02/15/52 | |
| | | |
Dividend All Cap Value | | U.S. Treasury
Obligations | | 0.125%-7.625% | | | 11/15/24-02/15/52 | |
| | | |
Small-Mid Cap Value | | U.S. Treasury
Obligations | | 0.000%-5.000% | | | 11/15/24-08/15/49 | |
| | | |
Focused Absolute Value | | U.S. Treasury
Obligations | | 0.125%-5.000% | | | 11/15/24-08/15/49 | |
5. FUND RISKS
In the normal course of business, the Funds invest in securities or other instruments and may enter into certain transactions, and such activities subject the Funds to various risks. Below is a summary of some, but not all, of those risks. Each risk described below does not necessarily apply to each Fund. Please refer to each Fund’s prospectus for a description of the principal risks associated with investing in a particular Fund. The value of securities or other instruments may also be affected by various factors, including, without limitation: (i) the general economy; (ii) the overall market as well as local, regional or global political and/or social instability; or (iii) price fluctuations.
Market Risk: Market prices of investments held by the Funds may fall rapidly or unpredictably due to a variety of factors, including economic, political, or market conditions, or other factors including terrorism, war, natural disasters and the spread of infectious illness or other public health issues, including epidemics or pandemics, or in response to events that affect particular industries or companies.
Management Risk: Because the Funds are actively managed investment portfolios, security selection or focus on securities in a particular style, market sector or group of companies may cause the Funds to incur losses or underperform relative to their benchmarks or other funds with a similar investment objective. There can be no guarantee that River Road’s investment techniques and risk analysis will produce the desired result.
47
| | |
| | Notes to Financial Statements (continued) |
Non-Diversified Fund Risk: Large Cap Value Select and Focused Absolute Value are non-diversified and therefore a greater percentage of holdings may be focused in a small number of issuers or a single issuer, which can place Large Cap Value Select and Focused Absolute Value at greater risk. Notwithstanding each Fund’s status as a “non-diversified” investment company under the 1940 Act, each Fund intends to qualify as a regulated investment company accorded favorable tax treatment under the Code, which imposes its own diversification requirements that are less restrictive than the requirements applicable to “diversified” investment companies under the 1940 Act. Each Fund’s intention to qualify as a regulated investment company may limit its pursuit of its investment strategy and its investment strategy could limit its ability to so qualify.
Focused Investment Risk: To the extent a Fund invests a substantial portion of its assets in a relatively small number of securities or a particular market, industry, group of industries, country, region, group of countries, asset class or sector, it generally will be subject to greater risk than a fund that invests in a more diverse investment portfolio. In addition, the value of a Fund would be more susceptible to any single economic, market, political or regulatory occurrence affecting, for example, that particular market, industry, region or sector.
Sector Risk: Issuers and companies that are in similar industry sectors may be similarly affected by particular economic or market events; to the extent the Funds have substantial holdings within a particular sector, the risks associated with that sector increase.
Large-Capitalization Stock Risk: The stocks of large-capitalization companies are generally more mature and may not be able to reach the same levels of growth as the stocks of small-or mid-capitalization companies.
Small- and Mid-Capitalization Stock Risk: The stocks of small- and mid-capitalization companies often have greater price volatility, lower trading volume, and less liquidity than the stocks of larger, more established companies.
Value Stock Risk: Value stocks may perform differently from the market as a whole and may be undervalued by the market for a long period of time.
Liquidity Risk: The Funds may not be able to dispose of particular investments, such as illiquid securities, readily at favorable times or prices or the Funds may have to sell them at a loss.
Real Estate Industry Risk: Investments in certain Funds may be subject to many of the same risks as a direct investment in real estate. The stock prices of companies in the real estate industry, including REITs, are typically sensitive to changes in real estate values, property taxes, interest rates, cash flow of underlying real estate assets, occupancy rates, government regulations affecting zoning, land use, and rents, as well as the management skill and creditworthiness
of the issuer. REITs also depend generally on their ability to generate cash flow to make distributions to shareholders or unitholders and are subject to the risk of failing to qualify for favorable tax treatment under the Code.
High Portfolio Turnover Risk: Higher portfolio turnover may adversely affect Fund performance by increasing Fund transaction costs and may increase a shareholder’s tax liability.
6. COMMITMENTS AND CONTINGENCIES
Under the Trusts’ organizational documents, their Trustees and Officers are indemnified against certain liabilities arising out of the performance of their duties to the Trusts. In addition, in the normal course of business, the Funds may enter into contracts and agreements that contain a variety of representations and warranties, which provide general indemnifications. The maximum exposure to the Funds under these arrangements is unknown, as this would involve future claims that may be made against a Fund that have not yet occurred. However, based on experience, the Funds had no prior claims or losses and expect the risks of loss to be remote.
7. CREDIT AGREEMENT
Through December 31, 2023, Small Cap Value, Dividend All Cap Value, Small-Mid Cap Value, Focused Absolute Value, and certain other funds in AMG Funds II and AMG Funds III (the “Participating Funds”) were subject to a Credit Agreement among BNYM, AMG Funds II, AMG Funds III, and AMG Funds IV (the “Credit Agreement”) that provided a revolving line of credit of up to $50 million to the Participating Funds. On December 31, 2023, the Credit Agreement was terminated. The facility was shared by the Participating Funds, and was available for temporary, emergency purposes including liquidity needs in meeting redemptions. The interest rate on outstanding Alternate Base Rate Loans was equal to the greater of the Prime Rate plus 1.25%, or 0.50% plus the Federal Funds Effective Rate plus 1.25%. The interest rate on outstanding Overnight Loans was equal to the greater of the Federal Funds Effective Rate plus 1.25%, or the Adjusted Daily Simple SOFR plus 1.25%. The aforementioned Adjusted Daily Simple SOFR was the sum of Daily Simple SOFR plus 0.10% plus a floor rate of 0.00%. The Participating Funds paid a commitment fee on the unutilized commitment amount of 0.175% per annum, which was allocated to the Participating Funds based on average daily net assets and is included in miscellaneous expense on the Participating Funds’ Statement of Operations. Interest incurred on loans utilized, if any, is included in the Statement of Operations as interest expense.
The Funds did not utilize the line of credit during the fiscal year ended October 31, 2024.
8. MASTER NETTING AGREEMENTS
The Funds may enter into master netting agreements with their counterparties for the Securities Lending Program and Repurchase Agreements, which provide the right, in the event of default (including bankruptcy or insolvency) for the non-defaulting party to liquidate the collateral and calculate net exposure to the defaulting party or request additional collateral. For financial reporting purposes, the Funds do not offset financial assets and financial liabilities that are subject to master netting agreements in the Statement of Assets and Liabilities. For securities lending transactions, see Note 4.
48
| | |
| | Notes to Financial Statements (continued) |
| | | | | | | | | | | | | | | | | | |
| | | | | | Gross Amount Not Offset in the
Statement of Assets and Liabilities | | | | | | | |
| Fund | | Gross Amounts of Assets Presented in
the Statement of Assets and Liabilities | | | Offset Amount | | Net Asset Balance | | | Collateral Received | | | Net
Amount | |
| | | | | |
Mid Cap Value | | | | | | | | | | | | | | | | | | |
| | | | | |
Fixed Income Clearing Corp. | | | $6,164,000 | | | — | | | $6,164,000 | | | | $6,164,000 | | | | — | |
| | | | | |
Large Cap Value Select | | | | | | | | | | | | | | | | | | |
| | | | | |
Fixed Income Clearing Corp. | | | $1,331,000 | | | — | | | $1,331,000 | | | | $1,331,000 | | | | — | |
| | | | | |
Small Cap Value | | | | | | | | | | | | | | | | | | |
| | | | | |
Daiwa Capital Markets America | | | $136,972 | | | — | | | $136,972 | | | | $136,972 | | | | — | |
| | | | | |
Fixed Income Clearing Corp. | | | 100,221,000 | | | — | | | 100,221,000 | | | | 100,221,000 | | | | — | |
| | | | | | | | | | | | | | | | | | |
| | | | | |
Total | | | $100,357,972 | | | — | | | $100,357,972 | | | | $100,357,972 | | | | — | |
| | | | | | | | | | | | | | | | | | |
| | | | | |
Dividend All Cap Value | | | | | | | | | | | | | | | | | | |
| | | | | |
Fixed Income Clearing Corp. | | | $2,127,000 | | | — | | | $2,127,000 | | | | $2,127,000 | | | | — | |
| | | | | |
Small-Mid Cap Value | | | | | | | | | | | | | | | | | | |
| | | | | |
Cantor Fitzgerald Securities, Inc. | | | $1,000,000 | | | — | | | $1,000,000 | | | | $1,000,000 | | | | — | |
| | | | | |
Citigroup Global Markets, Inc. | | | 1,000,000 | | | — | | | 1,000,000 | | | | 1,000,000 | | | | — | |
| | | | | |
Daiwa Capital Markets America | | | 202,659 | | | — | | | 202,659 | | | | 202,659 | | | | — | |
| | | | | |
HSBC Securities USA, Inc. | | | 1,000,000 | | | — | | | 1,000,000 | | | | 1,000,000 | | | | — | |
| | | | | |
Fixed Income Clearing Corp. | | | 11,804,000 | | | — | | | 11,804,000 | | | | 11,804,000 | | | | — | |
| | | | | | | | | | | | | | | | | | |
| | | | | |
Total | | | $15,006,659 | | | — | | | $15,006,659 | | | | $15,006,659 | | | | — | |
| | | | | | | | | | | | | | | | | | |
| | | | | |
Focused Absolute Value | | | | | | | | | | | | | | | | | | |
| | | | | |
Daiwa Capital Markets America | | | $124,893 | | | — | | | $124,893 | | | | $124,893 | | | | — | |
| | | | | |
Fixed Income Clearing Corp. | | | 448,000 | | | — | | | 448,000 | | | | 448,000 | | | | — | |
| | | | | | | | | | | | | | | | | | |
| | | | | |
Total | | | $572,893 | | | — | | | $572,893 | | | | $572,893 | | | | — | |
| | | | | | | | | | | | | | | | | | |
9. RECENT ACCOUNTING STANDARDS UPDATE
In November 2023, the Financial Accounting Standards Board issued ASU No. 2023-07, Segment Reporting (Topic 280), which improves reportable segment disclosure requirements, primarily through enhanced disclosures about significant segment expenses. The amendments are effective for fiscal years beginning after December 15, 2023, and interim periods within fiscal years beginning after December 15, 2024. The Funds are currently evaluating the requirements and do not expect this guidance to materially impact the Funds’ financial statements.
10. SUBSEQUENT EVENTS
The Funds have determined that no material events or transactions occurred
through the issuance date of the Funds’ financial statements which require an
additional disclosure in or adjustment of the Funds’ financial statements.
49
| | |
| | Report of Independent Registered Public Accounting Firm |
To the Board of Trustees of AMG Funds I and AMG Funds IV and Shareholders of AMG River Road Large Cap Value Select Fund, AMG River Road Mid Cap Value Fund, AMG River Road Small Cap Value Fund, AMG River Road Dividend All Cap Value Fund, AMG River Road Small-Mid Cap Value Fund and AMG River Road Focused Absolute Value Fund
Opinions on the Financial Statements
We have audited the accompanying statements of assets and liabilities, including the schedules of portfolio investments of AMG River Road Large Cap Value Select Fund (one of the funds constituting AMG Funds I), AMG River Road Mid Cap Value Fund, AMG River Road Small Cap Value Fund, AMG River Road Dividend All Cap Value Fund, AMG River Road Small-Mid Cap Value Fund and AMG River Road Focused Absolute Value Fund (five of the funds constituting AMG Funds IV) (hereafter collectively referred to as the “Funds”) as of October 31, 2024, the related statements of operations for the year ended October 31, 2024, the statements of changes in net assets for each of the two years in the period ended October 31, 2024, including the related notes, and the financial highlights for each of the five years in the period ended October 31, 2024 (collectively referred to as the “financial statements”). In our opinion, the financial statements present fairly, in all material respects, the financial position of each of the Funds as of October 31, 2024, the results of each of their operations for the year then ended, the changes in each of their net assets for each of the two years in the period ended October 31, 2024 and each of the financial highlights for each of the five years in the period ended October 31, 2024 in conformity with accounting principles generally accepted in the United States of America.
Basis for Opinions
These financial statements are the responsibility of the Funds’ management. Our responsibility is to express an opinion on the Funds’ financial statements based on our audits. We are a public accounting firm registered with the Public Company Accounting Oversight Board (United States) (PCAOB) and are required to be independent with respect to the Funds in accordance with the U.S. federal securities laws and the applicable rules and regulations of the Securities and Exchange Commission and the PCAOB.
We conducted our audits of these financial statements in accordance with the standards of the PCAOB. Those standards require that we plan and perform the audit to obtain reasonable assurance about whether the financial statements are free of material misstatement, whether due to error or fraud.
Our audits included performing procedures to assess the risks of material misstatement of the financial statements, whether due to error or fraud, and performing procedures that respond to those risks. Such procedures included examining, on a test basis, evidence regarding the amounts and disclosures in the financial statements. Our audits also included evaluating the accounting principles used and significant estimates made by management, as well as evaluating the overall presentation of the financial statements. Our procedures included confirmation of securities owned as of October 31, 2024 by correspondence with the custodian and brokers; when replies were not received from brokers, we performed other auditing procedures. We believe that our audits provide a reasonable basis for our opinions.
/s/PricewaterhouseCoopers LLP
Boston, Massachusetts
December 23, 2024
We have served as the auditor of one or more investment companies in the AMG Funds Family since 1993.
50
| | |
| | Other Information (unaudited) |
TAX INFORMATION
AMG River Road Mid Cap Value Fund, AMG River Road Large Cap Value Select Fund, AMG River Road Small Cap Value Fund, AMG River Road Dividend All Cap Value Fund, AMG River Road Small-Mid Cap Value Fund and AMG River Road Focused Absolute Value Fund each hereby designates the maximum amount allowable of its net taxable income as qualified dividends as provided in the Jobs and Growth Tax Relief Reconciliation Act of 2003. The 2023/2024 Form 1099-DIV you receive for each Fund will show the tax status of all distributions paid to you during the year.
Pursuant to section 852 of the Internal Revenue Code, the Funds each hereby designate the amounts in the below table as a capital gain distribution with respect to the taxable period ended October 31, 2024, or if subsequently determined to be different, the net capital gains of such period.
| | | | |
| Fund | | Amount | |
| |
AMG River Road Mid Cap Value Fund | | | $5,012,833 | |
| |
AMG River Road Large Cap Value Select Fund | | | 22,776 | |
| |
AMG River Road Small Cap Value Fund | | | 47,679,921 | |
| |
AMG River Road Dividend All Cap Value Fund | | | 25,188,216 | |
| |
AMG River Road Small-Mid Cap Value Fund | | | 8,525,506 | |
| |
AMG River Road Focused Absolute Value Fund | | | 819,247 | |
ITEM 8. CHANGES IN AND DISAGREEMENTS WITH ACCOUNTANTS FOR OPEN-END MANAGEMENT INVESTMENT COMPANIES
During the fiscal year ended October 31, 2024, there were no changes in and/or disagreements with accountants.
ITEM 9. PROXY DISCLOSURES FOR OPEN-END MANAGEMENT INVESTMENT COMPANIES
Not applicable.
ITEM 10. REMUNERATION PAID TO DIRECTORS, OFFICERS, AND OTHERS OF OPEN-END MANAGEMENT INVESTMENT COMPANIES
The remuneration paid to the Trustees during the fiscal year ended October 31, 2024, is reflected as “Trustee fees and expenses” on the Statement of Operations and is set forth in the table below. There was no remuneration paid to any Fund officer or to any affiliated person of any Fund Trustee or officer during the fiscal year ended October 31, 2024.
| | | | |
| | | Trustee fees and expenses | |
| |
AMG River Road Mid Cap Value Fund | | | $29,158 | |
| |
AMG River Road Large Cap Value Select Fund | | | 3,283 | |
| |
AMG River Road Small Cap Value Fund | | | 86,677 | |
| |
AMG River Road Dividend All Cap Value Fund | | | 11,767 | |
| |
AMG River Road Small-Mid Cap Value Fund | | | 25,489 | |
| |
AMG River Road Focused Absolute Value Fund | | | 4,144 | |
51
| | |
| | ITEM 11. STATEMENT REGARDING BASIS FOR APPROVAL OF INVESTMENT ADVISORY CONTRACT |
| | | | | | | | |
AMG River Road Dividend All Cap Value Fund, AMG River Road Focused Absolute Value Fund, AMG River Road Large Cap Value Select Fund, AMG River Road Mid Cap Value Fund, AMG River Road Small-Mid Cap Value Fund, and AMG River Road Small Cap Value Fund: Approval of Investment Management and Subadvisory Agreements on June 12, 2024 At an in-person meeting held on June 12, 2024, the Board of Trustees (the “Board” or the “Trustees”) of each of AMG Funds I and AMG Funds IV (each, a “Trust” and collectively, the “Trusts”), and separately a majority of the Trustees who are not “interested persons” of the Trusts (the “Independent Trustees”), approved (i) the Fund Management Agreement, as amended pursuant to letter agreements at any time prior to the date of the meeting, with AMG Funds LLC (the “Investment Manager”) and AMG Funds I for AMG River Road Large Cap Value Select Fund and separately each of Amendment No. 1 thereto dated July 1, 2015, and Amendment No. 2 thereto dated October 1, 2016; and the Investment Advisory Agreement, as amended pursuant to letter agreements at any time prior to the date of the meeting, with the Investment Manager and AMG Funds IV for each of AMG River Road Dividend All Cap Value Fund, AMG River Road Focused Absolute Value Fund, AMG River Road Mid Cap Value Fund, AMG River Road Small-Mid Cap Value Fund, and AMG River Road Small Cap Value Fund, and separately Amendment No. 1 thereto dated October 1, 2016 (collectively, the “Investment Management Agreements”); and (ii) the Sub-Investment Advisory Agreement (or, in the case of AMG River Road Large Cap Value Select Fund and AMG River Road Mid Cap Value Fund, the Subadvisory Agreement) with respect to each of AMG River Road Dividend All Cap Value Fund, AMG River Road Focused Absolute Value Fund, AMG River Road Large Cap Value Select Fund, AMG River Road Mid Cap Value Fund, AMG River Road Small-Mid Cap Value Fund, and AMG River Road Small Cap Value Fund (each, a “Fund,” and collectively, the “Funds”), as amended at any time prior to the date of the meeting (collectively, the “Subadvisory Agreements”), with River Road Asset Management, LLC, the Funds’ subadviser (the “Subadviser”). The Independent Trustees were separately represented by independent legal counsel in connection with their consideration of the approval of these agreements. In considering the Investment Management Agreements and the Subadvisory Agreements, the Trustees reviewed a variety of materials relating to each Fund, the Investment Manager and the Subadviser, including the nature, extent and quality of services, | | | | comparative performance, fee and expense information for an appropriate peer group of similar mutual funds for each Fund (each, a “Peer Group”), performance information for the relevant benchmark index for each Fund (each, a “Fund Benchmark”), other relevant matters, including management fees, the profitability of the Investment Manager and the Subadviser, and the potential for economies of scale that may be shared with the Funds, and other information provided to them on a periodic basis throughout the year. Prior to voting, the Independent Trustees: (a) reviewed the foregoing information with their independent legal counsel; (b) received materials from their independent legal counsel discussing the legal standards applicable to their consideration of the Investment Management Agreements and the Subadvisory Agreements; and (c) met with their independent legal counsel in private sessions at which no representatives of management were present. NATURE, EXTENT AND QUALITY OF SERVICES In considering the nature, extent and quality of the services provided by the Investment Manager, the Trustees reviewed information provided by the Investment Manager at the June 12, 2024 meeting and prior meetings relating to the Investment Manager’s operations and personnel. Among other things, the Investment Manager provided financial information, information about its supervisory and professional staff and descriptions of its organizational and management structure. The Trustees also took into account information provided periodically throughout the previous year by the Investment Manager in Board meetings relating to the performance of its duties with respect to the Funds and the Trustees’ knowledge of the Investment Manager’s management and the quality of the performance of the Investment Manager’s duties under the Investment Management Agreements and Administration Agreement. In the course of their deliberations regarding the Investment Manager, the Trustees evaluated, among other things: (a) the extent and quality of the Investment Manager’s oversight of the operation and management of the Funds; (b) the quality of the Investment Manager’s oversight of the performance by the Subadviser of its portfolio management duties; (c) the Investment Manager’s ability to supervise the Funds’ other service providers; and (d) the Investment Manager’s compliance program. The Trustees also took into account that, in performing its functions under the Investment Management Agreements and supervising the Subadviser, the Investment | | | | Manager: performs periodic detailed analyses and reviews of the performance by the Subadviser of its obligations to each Fund, including without limitation, analysis and review of portfolio and other compliance matters and review of the Subadviser’s investment performance with respect to each Fund; prepares and presents periodic reports to the Board regarding the investment performance of the Subadviser and other information regarding the Subadviser, at such times and in such forms as the Board may reasonably request; reviews and considers any changes in the personnel of the Subadviser responsible for performing the Subadviser’s obligations and makes appropriate reports to the Board; reviews and considers any changes in the ownership or senior management of the Subadviser and makes appropriate reports to the Board; performs periodic in-person, telephonic or videoconference diligence meetings, including with respect to compliance matters, with representatives of the Subadviser; assists the Board and management of the Trusts in developing and reviewing information with respect to the initial approval of each Subadvisory Agreement and annual consideration of each Subadvisory Agreement thereafter; prepares recommendations with respect to the continued retention of the Subadviser or the replacement of the Subadviser, including at the request of the Board; identifies potential successors to, or replacements of, the Subadviser or potential additional subadvisers, including performing appropriate due diligence, and developing and presenting to the Board a recommendation as to any such successor, replacement, or additional subadviser, including at the request of the Board; designates and compensates from its own resources such personnel as the Investment Manager may consider necessary or appropriate to the performance of its services; and performs such other review and reporting functions as the Board shall reasonably request consistent with the Investment Management Agreements and applicable law. The Trustees noted the affiliation of the Subadviser with the Investment Manager, noting any potential conflicts of interest. The Trustees also took into account the financial condition of the Investment Manager with respect to its ability to provide the services required under the Investment Management Agreements and the Investment Manager’s undertaking to maintain contractual expense limitations for each Fund other than AMG River Road Small Cap Value Fund, as described below. The Trustees also considered the Investment Manager’s risk management processes. |
52
| | |
| | ITEM 11. STATEMENT REGARDING BASIS FOR APPROVAL OF INVESTMENT ADVISORY CONTRACT (continued) |
| | | | | | | | |
The Trustees also reviewed information relating to the Subadviser’s operations and personnel and the investment philosophy, strategies and techniques (its “Investment Strategy”) used in managing each Fund. Among other things, the Trustees reviewed information on portfolio management and other professional staff, information regarding the Subadviser’s organizational and management structure and the Subadviser’s brokerage policies and practices. The Trustees considered specific information provided regarding the experience of the individuals at the Subadviser with portfolio management responsibility for each Fund, including the information set forth in each Fund’s prospectus and statement of additional information. In the course of their deliberations, the Trustees evaluated, among other things: (a) the services rendered by the Subadviser in the past; (b) the qualifications and experience of the Subadviser’s personnel; and (c) the Subadviser’s compliance program. The Trustees also took into account the financial condition of the Subadviser with respect to its ability to provide the services required under each Subadvisory Agreement. The Trustees also considered the Subadviser’s risk management processes. PERFORMANCE The Board considered each Fund’s net performance during relevant time periods as compared to the Fund’s Peer Group and Fund Benchmark, considered the gross performance of each Fund as compared to the Subadviser’s relevant performance composite that utilizes a similar investment strategy and approach, and noted that the Board reviews on a quarterly basis detailed information about both a Fund’s performance results and portfolio composition, as well as the Subadviser’s Investment Strategy. The Board was mindful of the Investment Manager’s expertise, resources and attention to monitoring the Subadviser’s performance, investment style and risk-adjusted performance with respect to the Funds and its discussions with the management of the Funds’ subadviser during the period regarding the factors that contributed to the performance of the Funds. With respect to AMG River Road Dividend All Cap Value Fund, among other information relating to the Fund’s performance, the Trustees noted that the Fund’s performance for Class N shares (which share class has the earliest inception date of all the share classes of the Fund) for the 1-year, 3-year, 5-year and 10-year periods ended March 31, 2024, was below the median performance of the Peer Group and below the performance of the Fund Benchmark, the Russell 3000 Value Index. The Trustees took into account | | | | management’s discussion of the Fund’s performance, including the reasons for the Fund’s underperformance relative to the Fund Benchmark and the Peer Group. The Trustees also took into account the fact that the Fund ranked in top third relative to its Peer Group for the 2022 calendar year. The Trustees concluded that the Fund’s overall performance has been satisfactory in light of the Fund’s investment objective, strategies and policies. With respect to AMG River Road Focused Absolute Value Fund, among other information relating to the Fund’s performance, the Trustees noted that the Fund’s performance for Class I shares (which share class has one of the earliest inception dates and the largest amount of assets of all the share classes of the Fund) for the 1-year, 3-year, and 5-year periods ended March 31, 2024 and for the period from the Fund’s inception on November 3, 2015 through March 31, 2024, was above, below, below, and below, respectively, the median performance of the Peer Group and above, below, below, and below, respectively, the performance of the Fund Benchmark, the Russell 3000 Value Index. The Trustees also took into account management’s discussion of the Fund’s performance, including the reasons for the Fund’s more recent outperformance and longer-term underperformance, and the fact that the Fund ranked in the top third relative to its Peer Group for the 1-year period. The Trustees concluded that the Fund’s overall performance has been satisfactory in light of the Fund’s investment objective, strategies and policies. With respect to AMG River Road Large Cap Value Select Fund, among other information relating to the Fund’s performance, the Trustees noted that the Fund’s performance for Class I shares (which share class has the earliest inception date and the largest amount of assets of all the share classes of the Fund) for the 1-year, 3-year, 5-year and 10-year periods ended March 31, 2024, was above, above, below, and below, respectively, the median performance of the Peer Group and above, above, below, and below, respectively, the performance of the Fund Benchmark, the Russell 1000 Value Index. The Trustees took into account management’s discussion of the Fund’s performance, including the reasons for the Fund’s recent outperformance and longer-term underperformance and the fact that the Fund ranked in the top decile relative to the Peer Group for the 1-year and 3-year periods. The Trustees also took into account the fact that the Fund’s subadviser, investment strategy, and Fund Benchmark changed effective March 22, 2021, and that the performance information prior to that date reflected that of the Fund’s prior subadviser and | | | | investment strategy. The Trustees considered management’s discussion that the Fund’s performance has been in line with management’s expectations since the current Subadviser assumed subadvisory responsibilities. The Trustees concluded that the Fund’s overall performance has been satisfactory in light of the Fund’s investment objective, strategies and policies. With respect to AMG River Road Mid Cap Value Fund, among other information relating to the Fund’s performance, the Trustees noted that the Fund’s performance for Class N shares (which share class has the earliest inception date and the largest amount of assets of all the share classes of the Fund) for the 1-year, 3-year, 5-year and 10-year periods ended March 31, 2024, was above, above, above, and below, respectively, the median performance of the Peer Group and above, above, above, and below, respectively, the performance of the Fund Benchmark, the Russell Midcap Value Index. The Trustees took into account management’s discussion of the Fund’s performance, including the reasons for the Fund’s recent outperformance relative to the Peer Group and the Fund Benchmark. The Trustees also noted that the Fund ranked in the top decile relative to the Peer Group for the 3-year period and in the top quintile relative to the Peer Group for the 1-year period. The Trustees also took into account the fact that the Fund’s subadviser, investment strategy, and Fund Benchmark changed effective March 19, 2021, and that the performance information prior to that date reflected that of the Fund’s prior subadviser and investment strategy. The Trustees considered management’s discussion that the Fund’s performance has been in line with management’s expectations since the current Subadviser assumed subadvisory responsibilities. The Trustees concluded that the Fund’s overall performance has been satisfactory. With respect to AMG River Road Small-Mid Cap Value Fund, among other information relating to the Fund’s performance, the Trustees noted that the Fund’s performance for Class N shares (which share class has the earliest inception date of all the share classes of the Fund) for the 1-year, 3-year, 5-year and 10-year periods ended March 31, 2024, was above the median performance of the Peer Group and above the performance of the Fund Benchmark, the Russell 2500 Value Index. The Trustees also took into account management’s discussion of the Fund’s performance, noting that Class N shares of the Fund ranked in the top decile relative to its Peer Group for the 10-year period and the Fund ranked in the top |
53
| | |
| | ITEM 11. STATEMENT REGARDING BASIS FOR APPROVAL OF INVESTMENT ADVISORY CONTRACT (continued) |
| | | | | | | | |
third relative to its Peer Group for the 3-year period. The Trustees concluded that the Fund’s overall performance has been satisfactory. With respect to AMG River Road Small Cap Value Fund, among other information relating to the Fund’s performance, the Trustees noted that the Fund’s performance for Class N shares (which share class has the earliest inception date of all the share classes of the Fund) for the 1-year, 3-year, 5-year and 10-year periods ended March 31, 2024, was above the median performance of the Peer Group and above the performance of the Fund Benchmark, the Russell 2000 Value Index. The Trustees also took into account management’s discussion of the Fund’s performance, including the fact that Class N shares of the Fund ranked in the top quintile relative to its Peer Group for the 10-year period and the Fund ranked in the top third relative to its Peer Group for the 3-year period. The Trustees concluded that the Fund’s overall performance has been satisfactory. ADVISORY AND SUBADVISORY FEES; FUND EXPENSES; PROFITABILITY; AND ECONOMIES OF SCALE In considering the reasonableness of the advisory fee payable to the Investment Manager, the Trustees reviewed information provided by the Investment Manager at the June 12, 2024 meeting and prior meetings setting forth all revenues and other benefits, both direct and indirect (including any so-called “fallout benefits” such as reputational value derived from the Investment Manager serving as Investment Manager to a Fund), received by the Investment Manager and its affiliates attributable to managing each Fund and all the mutual funds in the AMG Funds Family of Funds; the cost of providing such services; the significant risks undertaken as Investment Manager and sponsor of the Funds, including investment, operational, enterprise, entrepreneurial, litigation, regulatory and compliance risks; and the resulting profitability to the Investment Manager and its affiliates from these relationships. The Trustees also considered the amount of the advisory fee retained by the Investment Manager after payment of the subadvisory fee with respect to each Fund. The Trustees also noted payments are made from the Subadviser to the Investment Manager, and other payments are made from the Investment Manager to the Subadviser. The Trustees also considered management’s discussion of the current asset levels of the Funds, and the impact on profitability of both the current asset levels and any future growth of assets of the Funds. | | | | In considering the cost of services to be provided by the Investment Manager under each Investment Management Agreement and the profitability to the Investment Manager of its relationship with each Fund, the Trustees noted the undertaking by the Investment Manager to maintain contractual expense limitations for each Fund other than AMG River Road Small Cap Value Fund. The Board also took into account management’s discussion of the advisory fee structure, and the services the Investment Manager provides in performing its functions under each Investment Management Agreement and supervising the Subadviser. Based on the foregoing, the Trustees concluded that the profitability to the Investment Manager is reasonable and that the Investment Manager is not realizing material benefits from economies of scale that would warrant adjustments to the advisory fee at this time. Also, with respect to economies of scale, the Trustees noted that as each Fund’s assets increase over time, the Fund may realize other economies of scale to the extent the increase in assets is proportionally greater than the increase in certain other expenses. In considering the reasonableness of the subadvisory fees payable by the Investment Manager to the Subadviser, the Trustees reviewed information regarding the cost to the Subadviser of providing subadvisory services to each Fund and the resulting profitability from these relationships. The Trustees noted that, because the Subadviser is an affiliate of the Investment Manager, a portion of the Subadviser’s revenues or profits might be shared directly or indirectly with the Investment Manager. The Trustees also noted that the subadvisory fees are paid by the Investment Manager out of its advisory fee. The Board also took into account management’s discussion of the subadvisory fee structure, and the services the Subadviser provides in performing its functions under each Subadvisory Agreement. Based on the foregoing, the Trustees concluded that the profitability to the Subadviser is reasonable and that the Subadviser is not realizing material benefits from economies of scale that would warrant adjustments to the subadvisory fees at this time. Also, with respect to economies of scale, the Trustees noted that as a Fund’s assets increase over time, the Fund may realize other economies of scale to the extent the increase in assets is proportionally greater than the increase in certain other expenses. With respect to AMG River Road Dividend All Cap Value Fund, the Trustees noted that the management fees (which include both the advisory and administration fees) and total expenses (net of applicable expense waivers/reimbursements) of Class I shares (the class of shares which is the primary focus of the Fund’s distribution) of the Fund | | | | as of March 31, 2024, were both rated in the Average rating level of the Fund’s Peer Group. The Trustees noted that the rating level corresponded to the Fund’s quintile ranking in its Peer Group. The Trustees took into account the fact that the Investment Manager has contractually agreed, through March 1, 2025, to limit the Fund’s net annual operating expenses (subject to certain excluded expenses) to 0.68%. The Trustees concluded that, in light of the nature, extent and quality of the services provided by the Investment Manager and the Subadviser (which is an affiliate of the Investment Manager), the foregoing expense limitation and the considerations noted above with respect to the Investment Manager and the Subadviser, the Fund’s advisory and subadvisory fees are reasonable. With respect to AMG River Road Focused Absolute Value Fund, the Trustees noted that the management fees (which include both the advisory and administration fees) and total expenses (net of applicable expense waivers/reimbursements) of Class I shares (the class of shares which is the primary focus of the Fund’s distribution) of the Fund as of March 31, 2024, were both rated in the Average rating level of Fund’s Peer Group. The Trustees noted that the rating level corresponded to the Fund’s quintile ranking in its Peer Group. The Trustees took into account the fact that the Investment Manager has contractually agreed, through March 1, 2025, to limit the Fund’s net annual operating expenses (subject to certain excluded expenses) to 0.78%. The Trustees concluded that, in light of the nature, extent and quality of the services provided by the Investment Manager and the Subadviser (which is an affiliate of the Investment Manager), the foregoing expense limitation and the considerations noted above with respect to the Investment Manager and the Subadviser, the Fund’s advisory and subadvisory fees are reasonable. With respect to AMG River Road Large Cap Value Select Fund, the Trustees noted that the management fees (which include both the advisory and administration fees) and total expenses (net of applicable expense waivers/reimbursements) of Class I shares (the class of shares which is the primary focus of the Fund’s distribution) of the Fund as of March 31, 2024, were both rated in the Below Average rating level of the Fund’s Peer Group. The Trustees noted that the rating level corresponded to the Fund’s quintile ranking in its Peer Group. The Trustees took into account the fact that the Investment Manager has contractually agreed, through March 1, 2025, to limit the Fund’s net annual operating expenses (subject to certain excluded expenses) to 0.60%. The Trustees concluded that, in light of the nature, extent and quality of the services |
54
| | |
| | ITEM 11. STATEMENT REGARDING BASIS FOR APPROVAL OF INVESTMENT ADVISORY CONTRACT (continued) |
| | | | | | | | |
provided by the Investment Manager and the Subadviser (which is an affiliate of the Investment Manager), the foregoing expense limitation and the considerations noted above with respect to the Investment Manager and the Subadviser, the Fund’s advisory and subadvisory fees are reasonable. With respect to AMG River Road Mid Cap Value Fund, the Trustees noted that the management fees (which include both the advisory and administration fees) and total expenses (net of applicable expense waivers/reimbursements) of Class I shares (the class of shares which is the primary focus of the Fund’s distribution) of the Fund as of March 31, 2024, were rated in the Below Average and the Average rating level, respectively, of the Fund’s Peer Group. The Trustees noted that the rating level corresponded to the Fund’s quintile ranking in its Peer Group. The Trustees took into account the fact that the Investment Manager has contractually agreed, through March 1, 2025, to limit the Fund’s net annual operating expenses (subject to certain excluded expenses) to 0.76%. The Trustees concluded that, in light of the nature, extent and quality of the services provided by the Investment Manager and the Subadviser (which is an affiliate of the Investment Manager), the foregoing expense limitation and the considerations noted above with respect to the Investment Manager and the Subadviser, the Fund’s advisory and subadvisory fees are reasonable. With respect to AMG River Road Small-Mid Cap Value Fund, the Trustees noted that the management fees (which include both the advisory and administration fees) and total expenses (net of applicable expense waivers/reimbursements) of Class I shares (the class | | | | of shares which is the primary focus of the Fund’s distribution) of the Fund as of March 31, 2024, were both rated in the Above Average rating level of the Fund’s Peer Group. The Trustees noted that the rating level corresponded to the Fund’s quintile ranking in its Peer Group. The Trustees took into account the fact that the Investment Manager has contractually agreed, through March 1, 2025, to limit the Fund’s net annual operating expenses (subject to certain excluded expenses) to 1.04%. The Trustees also took into account management’s discussion of the Fund’s expenses, including fees and expenses relative to comparably sized funds and select competitors. The Trustees concluded that, in light of the nature, extent and quality of the services provided by the Investment Manager and the Subadviser (which is an affiliate of the Investment Manager), the foregoing expense limitation and the considerations noted above with respect to the Investment Manager and the Subadviser, the Fund’s advisory and subadvisory fees are reasonable. With respect to AMG River Road Small Cap Value Fund, the Trustees noted that the management fees (which include both the advisory and administration fees) and total expenses of Class I shares (the class of shares which is the primary focus of the Fund’s distribution) of the Fund as of March 31, 2024, were rated in the Above Average and the High rating level, respectively, of the Fund’s Peer Group. The Trustees noted that the rating levels corresponded to the Fund’s quintile ranking in its Peer Group. The Trustees took into account management’s discussion of the Fund’s expenses, including fees and expenses relative to comparably sized funds and select competitors. The Trustees concluded that, in light of | | | | the nature, extent and quality of the services provided by the Investment Manager and the Subadviser (which is an affiliate of the Investment Manager) and the considerations noted above with respect to the Investment Manager and the Subadviser, the Fund’s advisory and subadvisory fees are reasonable. * * * * * After consideration of the foregoing, the Trustees also reached the following conclusions (in addition to the conclusions discussed above) regarding the Investment Management Agreements and Subadvisory Agreements: (a) the Investment Manager and the Subadviser have demonstrated that they possess the capability and resources to perform the duties required of them under the Investment Management Agreements and each Subadvisory Agreement and (b) the Investment Manager and Subadviser maintain appropriate compliance programs. Based on all of the above-mentioned factors and their related conclusions, with no single factor or conclusion being determinative and with each Trustee not necessarily attributing the same weight to each factor, the Trustees concluded that approval of each Investment Management Agreement and each Subadvisory Agreement would be in the best interests of the applicable Fund and its shareholders. Accordingly, on June 12, 2024, the Trustees, and separately a majority of the Independent Trustees, voted to approve the Investment Management Agreement and the Subadvisory Agreement for each Fund. |
55
THIS PAGE INTENTIONALLY LEFT BLANK
| | |
| | |
| | | | | | | | | | |
| | | INVESTMENT MANAGER AND ADMINISTRATOR AMG Funds LLC 680 Washington Blvd., Suite 500 Stamford, CT 06901 800.548.4539 DISTRIBUTOR AMG Distributors, Inc. 680 Washington Blvd., Suite 500 Stamford, CT 06901 800.548.4539 SUBADVISER River Road Asset Management, LLC Meidinger Tower 462 South Fourth Street, Suite 2000 Louisville, KY 40202 | | | | CUSTODIAN The Bank of New York Mellon Mutual Funds Custody 240 Greenwich Street New York, NY 10286 LEGAL COUNSEL Ropes & Gray LLP Prudential Tower, 800 Boylston Street Boston, MA 02199-3600 TRANSFER AGENT BNY Mellon Investment Servicing (US) Inc. AMG Funds Attn: 534426 AIM 154-0520 500 Ross Street Pittsburgh, PA 15262 800.548.4539 | | | | This report is prepared for the Funds’ shareholders. It is authorized for distribution to prospective investors only when preceded or accompanied by an effective prospectus. To receive a free copy of the prospectus or Statement of Additional Information, which includes additional information about Fund Trustees, please contact us by calling 800.548.4539. Distributed by AMG Distributors, Inc., member FINRA/SIPC. Current net asset values per share for each Fund are available on the Funds’ website at wealth.amg.com. A description of the policies and procedures each Fund uses to vote its proxies is available: (i) without charge, upon request, by calling 800.548.4539, or (ii) on the Securities and Exchange Commission’s (SEC) website at sec.gov. For information regarding each Fund’s proxy voting record for the 12-month period ended June 30, call 800.548.4539 or visit the SEC website at sec.gov. The Funds file their complete schedule of portfolio holdings with the SEC for the first and third quarters of each fiscal year as an exhibit to their reports on Form N-PORT. The Funds’ portfolio holdings on Form N-PORT are available on the SEC’s website at sec.gov and the Funds’ website at wealth.amg.com. To review a complete list of the Funds’ portfolio holdings, or to view the most recent semi-annual report or annual report, please visit wealth.amg.com. |
| | |
| | |
| | | | | | | | | | |
| | | EQUITY FUNDS AMG Boston Common Global Impact Boston Common Asset Management, LLC AMG Frontier Small Cap Growth Frontier Capital Management Co., LLC AMG GW&K Small Cap Core AMG GW&K Small Cap Value AMG GW&K Small/Mid Cap Core AMG GW&K Small/Mid Cap Growth AMG GW&K International Small Cap GW&K Investment Management, LLC AMG Montrusco Bolton Large Cap Growth Montrusco Bolton Investments, Inc. AMG Renaissance Large Cap Growth The Renaissance Group LLC | | | | AMG River Road Dividend All Cap Value AMG River Road Focused Absolute Value AMG River Road Large Cap Value Select AMG River Road Mid Cap Value AMG River Road Small-Mid Cap Value AMG River Road Small Cap Value River Road Asset Management, LLC AMG TimesSquare International Small Cap AMG TimesSquare Mid Cap Growth AMG TimesSquare Small Cap Growth TimesSquare Capital Management, LLC AMG Veritas Asia Pacific AMG Veritas China AMG Veritas Global Focus AMG Veritas Global Real Return Veritas Asset Management LLP AMG Yacktman AMG Yacktman Focused AMG Yacktman Global AMG Yacktman Special Opportunities Yacktman Asset Management LP | | | | FIXED INCOME FUNDS AMG Beutel Goodman Core Plus Bond Beutel, Goodman & Company Ltd. AMG GW&K Core Bond ESG AMG GW&K ESG Bond AMG GW&K Municipal Bond AMG GW&K Municipal Enhanced Yield GW&K Investment Management, LLC ALTERNATIVE FUNDS AMG Systematica Managed Futures Strategy Systematica Investments Limited, acting as general partner of Systematica Investments LP |
| | | | | | | | | | | |
| | | | | | |
| | | | | | | |
| | | |
| wealth.amg.com | | 103124 | | | AR082 | |
Item 12. DISCLOSURE OF PROXY VOTING POLICIES AND PROCEDURES FOR CLOSED-END MANAGEMENT INVESTMENT COMPANIES.
Not applicable.
Item 13. PORTFOLIO MANAGERS OF CLOSED-END MANAGEMENT INVESTMENT COMPANIES.
Not applicable.
Item 14. PURCHASES OF EQUITY SECURITIES BY CLOSED-END MANAGEMENT INVESTMENT COMPANIES AND AFFILIATED PURCHASERS.
Not applicable.
Item 15. SUBMISSION OF MATTERS TO A VOTE OF SECURITY HOLDERS.
Not applicable.
Item 16. CONTROLS AND PROCEDURES.
(a) The Registrant’s principal executive and principal financial officers have concluded, based on their evaluation of the Registrant’s disclosure controls and procedures as of a date within 90 days of the filing of this report, that the Registrant’s disclosure controls and procedures are reasonably designed to ensure that information required to be disclosed by the Registrant on Form N-CSR is recorded, processed, summarized and reported within the required time periods and that information required to be disclosed by the Registrant in the reports that it files or submits on Form N-CSR is accumulated and communicated to the Registrant’s management, including its principal executive and principal financial officers, as appropriate to allow timely decisions regarding required disclosure.
(b) There were no changes in the Registrant’s internal control over financial reporting during the period covered by this report that have materially affected, or are reasonably likely to materially affect, the internal control over financial reporting.
Item 17. DISCLOSURE OF SECURITIES LENDING ACTIVITIES FOR CLOSED-END MANAGEMENT INVESTMENT COMPANIES.
Not applicable.
Item 18. RECOVERY OF ERRONEOUSLY AWARDED COMPENSATION.
Not applicable.
Item 19. EXHIBITS
SIGNATURES
Pursuant to the requirements of the Securities Exchange Act of 1934 and the Investment Company Act of 1940, the registrant has duly caused this report to be signed on its behalf by the undersigned, thereunto duly authorized.
AMG FUNDS IV
| | |
| By: | | /s/ Keitha L. Kinne |
| | Keitha L. Kinne, Principal Executive Officer |
Date: January 3, 2025
Pursuant to the requirements of the Securities Exchange Act of 1934 and the Investment Company Act of 1940, this report has been signed below by the following persons on behalf of the registrant and in the capacities and on the dates indicated.
| | |
| By: | | /s/ Keitha L. Kinne |
| | Keitha L. Kinne, Principal Executive Officer |
Date: January 3, 2025
| | |
| By: | | /s/ Thomas Disbrow |
| | Thomas Disbrow, Principal Financial Officer |
Date: January 3, 2025