UNITED STATES
SECURITIES AND EXCHANGE COMMISSION
Washington, D.C. 20549
FORM N-CSR
CERTIFIED SHAREHOLDER REPORT OF REGISTERED
MANAGEMENT INVESTMENT COMPANIES
Investment Company Act file number 811-08004
AMG Funds IV
(Exact name of registrant as specified in charter)
680 Washington Boulevard, Suite 500, Stamford, Connecticut 06901
(Address of principal executive offices) (Zip code)
AMG Funds LLC
680 Washington Boulevard, Suite 500, Stamford, Connecticut 06901
(Name and address of agent for service)
Registrant’s telephone number, including area code: (203) 299-3500
Date of fiscal year end: October 31
Date of reporting period: November 1, 2022 - October 31, 2023
(Annual Shareholder Report)
Item 1. Reports to Stockholders.
| | |
 | | ANNUAL REPORT |
| | | | | | | | | | | | |
| | | | AMG Funds October 31, 2023 | | |
| | | | 
| | |
| | | | AMG GW&K Core Bond ESG Fund |
| | | | Class N: MBGVX | | | | Class I: MBDFX | | | | Class Z: MBDLX |
| | |
| | | | AMG GW&K Emerging Markets Equity Fund |
| | | | Class N: TLEVX | | | | Class I: TLESX | | | | Class Z: TLEIX |
| | |
| | | | AMG GW&K Emerging Wealth Equity Fund |
| | | | Class N: TYWVX | | | | Class I: TYWSX | | | | Class Z: TYWIX |
| | |
| | | | AMG GW&K Small/Mid Cap Growth Fund |
| | | | Class N: ACWDX | | | | Class I: ACWIX | | | | Class Z: ACWZX |
| | | | | | | | | | | | |
| | | | | | | | | | | | |
| | | | | | | | | | | | |
| | | | |
| | | |
| wealth.amg.com | | | | 103123 AR069 |
| | |
| | | AMG Funds Annual Report — October 31, 2023 |
| | | | | | |
| | | |
| | | | | | | |
| | | TABLE OF CONTENTS | | PAGE | |
| | | | |
| | | |
| | | LETTER TO SHAREHOLDERS | | | 2 | |
| | | |
| | | ABOUT YOUR FUND’S EXPENSES | | | 3 | |
| | | |
| | | PORTFOLIO MANAGER’S COMMENTS, FUND SNAPSHOTS AND SCHEDULES OF PORTFOLIO INVESTMENTS | | | | |
| | | |
| | | AMG GW&K Core Bond ESG Fund | | | 4 | |
| | | |
| | | AMG GW&K Emerging Markets Equity Fund | | | 12 | |
| | | |
| | | AMG GW&K Emerging Wealth Equity Fund | | | 19 | |
| | | |
| | | AMG GW&K Small/Mid Cap Growth Fund | | | 25 | |
| | | |
| | | FINANCIAL STATEMENTS | | | | |
| | | |
| | | Statement of Assets and Liabilities | | | 32 | |
| | | |
| | | Balance sheets, net asset value (NAV) per share computations
and cumulative distributable earnings (loss) | | | | |
| | | |
| | | Statement of Operations | | | 34 | |
| | | |
| | | Detail of sources of income, expenses, and realized and
unrealized gains (losses) during the fiscal year | | | | |
| | | |
| | | Statements of Changes in Net Assets | | | 35 | |
| | | |
| | | Detail of changes in assets for the past two fiscal years | | | | |
| | | |
| | | Financial Highlights | | | 37 | |
| | | |
| | | Historical net asset values per share, distributions, total returns, income
and expense ratios, turnover ratios and net assets | | | | |
| | | |
| | | Notes to Financial Statements | | | 49 | |
| | | |
| | | Accounting and distribution policies, details of agreements and
transactions with Fund management and affiliates, and descriptions of
certain investment risks | | | | |
| | | |
| | | REPORT OF INDEPENDENT REGISTERED PUBLIC ACCOUNTING FIRM | | | 58 | |
| | | |
| | | OTHER INFORMATION | | | 59 | |
| | | |
| | | TRUSTEES AND OFFICERS | | | 61 | |
| | | |
| | | ANNUAL RENEWAL OF INVESTMENT MANAGEMENT AND SUBADVISORY AGREEMENTS | | | 64 | |
| | | | | | | |
|
| |
Nothing contained herein is to be considered an offer, sale or solicitation of an offer to buy shares of any series of the AMG Funds Family of Funds. Such offering is made only by prospectus, which includes details as to offering price and other material information.
| | |
| | Letter to Shareholders |
Dear Shareholder:
We are pleased to provide this annual report for your investment with AMG Funds. Our foremost goal is to provide investment solutions that help our shareholders successfully achieve their long-term investment goals. We appreciate the privilege of providing you with investment tools.
The most recent fiscal year ended October 31, 2023, resulted in mixed returns for risk assets as global equity markets wrestled with tighter monetary policy, increased geopolitical tension, instability in the regional banking sector, and political handwringing over the U.S. debt ceiling. Bonds struggled to move higher as global central banks raised interest rates to cool the economy and bring down inflation. Relative to the prior year, 2023 brought a more favorable environment based on the optimism that easing inflation would allow the U.S. Federal Reserve (the “Fed”) to pause the interest rate hiking cycle and deliver an economic soft landing.
The S&P 500® Index gained 10.14% for the fiscal year, despite experiencing a pullback in the final three months of the period. Large-cap stocks diverged meaningfully from small-cap stocks, particularly driven by a handful of mega-cap technology and consumer discretionary stocks. The Russell 1000® Index gained 9.48% compared to the -8.56% return for the Russell 2000® Index. Only five of eleven sectors posted positive returns, with communications services (+36.06%), information technology (+33.15%), and consumer discretionary (+8.87%) leading the way. The weakest sectors were utilities (-7.72%), real estate (-6.57%), and health care (-4.64%). The strength in information technology drove Growth stocks to strongly outperform Value stocks with the Russell 1000® Growth Index gaining 18.95% compared to a 0.13% return for the Russell 1000® Value Index. Outside the U.S., foreign equity markets outperformed domestic equities, delivering a 12.07% return, as measured by the MSCI All Country World Index (ACWI) ex USA benchmark.
The Bloomberg U.S. Aggregate Bond Index, a broad measure of U.S. bond market performance, managed to generate a modest 0.36% return over the period as the Fed raised interest rates and the 10-year Treasury yield reached its highest point since 2008, resulting in longer-duration bonds underperforming. Investment-grade corporate bonds gained 2.77% for the year, while agency mortgage-backed securities fell -0.82%. High yield bonds were the best performing sector with a 6.23% return as measured by the return of the Bloomberg U.S. Corporate High Yield Bond Index. Municipal bonds outperformed the broader market with a 2.64% gain for the Bloomberg Municipal Bond Index.
AMG Funds provides access to a distinctive array of actively managed return-oriented investment strategies. You can rest assured that under all market conditions our team is focused on delivering excellent investment management services for your benefit. For more information about AMG Funds’ wide range of products and resources, please visit wealth.amg.com. We thank you for your investment and continued trust in AMG Funds.
|
Respectfully, |
 |
| Keitha Kinne |
| President |
| AMG Funds |
| | | | | | | | | | | | | | |
| | | | | Periods ended | |
| Average Annual Total Returns | | October 31, 2023* | |
| | | | |
| Stocks: | | | | 1 Year | | | 3 Years | | | 5 Years | |
| | | | |
Large Cap | | (S&P 500® Index) | | | 10.14 | % | | | 10.36 | % | | | 11.01 | % |
| | | | |
Small Cap | | (Russell 2000® Index) | | | (8.56 | )% | | | 3.95 | % | | | 3.31 | % |
| | | | |
International | | (MSCI ACWI ex USA) | | | 12.07 | % | | | 3.03 | % | | | 3.46 | % |
| | | | |
Bonds: | | | | | | | | | | | | | | |
| | | | |
Investment Grade | | (Bloomberg U.S. Aggregate Bond Index) | | | 0.36 | % | | | (5.57 | )% | | | (0.06 | )% |
| | | | |
High Yield | | (Bloomberg U.S. Corporate High Yield Bond Index) | | | 6.23 | % | | | 1.19 | % | | | 3.05 | % |
| | | | |
Tax-exempt | | (Bloomberg Municipal Bond Index) | | | 2.64 | % | | | (2.48 | )% | | | 1.00 | % |
| | | | |
Treasury Bills | | (ICE BofAML U.S. 6-Month Treasury Bill Index) | | | 4.88 | % | | | 1.83 | % | | | 1.90 | % |
*Source: FactSet. Past performance is no guarantee of future results.
2
| | |
| | | About Your Fund’s Expenses |
| | | |
| | | |
| | | | | | | | |
As a shareholder of a Fund, you may incur two types of costs: (1) transaction costs, which may include sales charges (loads) on purchase payments; redemption fees; and exchange fees; and (2) ongoing costs, including management fees; distribution (12b-1) fees; and other Fund expenses. This example is intended to help you understand your ongoing costs (in dollars) of investing in the Fund and to compare these costs with the ongoing costs of investing in other mutual funds. The example is based on $1,000 invested at the beginning of the period and held for the entire period as indicated below. ACTUAL EXPENSES The first section of the following table provides information about the actual account values and | | | | actual expenses. You may use the information in this section, together with the amount you invested, to estimate the expenses that you paid over the period. Simply divide your account value by $1,000 (for example, an $8,600 account value divided by $1,000 = 8.6), then multiply the result by the number in the first section under the heading entitled “Expenses Paid During the Period” to estimate the expenses you paid on your account during this period. HYPOTHETICAL EXAMPLE FOR COMPARISON PURPOSES The second section of the following table provides information about hypothetical account values and hypothetical expenses based on the Fund’s actual expense ratio and an assumed annual rate of return of 5% before expenses, which is not the Fund’s | | | | actual return. The hypothetical account values and expenses may not be used to estimate the actual ending account balance or expenses you paid for the period. You may use this information to compare the ongoing costs of investing in the Fund and other funds by comparing this 5% hypothetical example with the 5% hypothetical examples that appear in the shareholder reports of other funds. Please note that the expenses shown in the table are meant to highlight your ongoing costs only and do not reflect any transactional costs, such as sales charges (loads), redemption fees, or exchange fees. Therefore, the second section of the table is useful in comparing ongoing costs only, and will not help you determine the relative total costs of owning different funds. |
| | | | | | | | |
| | | | | | | | |
Six Months Ended October 31, 2023 | | Expense
Ratio for
the Period | | Beginning
Account
Value
05/01/23 | | Ending
Account
Value
10/31/23 | | Expenses
Paid
During
the Period* |
AMG GW&K Core Bond ESG Fund |
Based on Actual Fund Return |
| | | | |
Class N | | 0.88% | | $1,000 | | $930 | | $4.28 |
| | | | |
Class I | | 0.56% | | $1,000 | | $933 | | $2.73 |
| | | | |
Class Z | | 0.48% | | $1,000 | | $932 | | $2.34 |
|
Based on Hypothetical 5% Annual Return |
| | | | |
Class N | | 0.88% | | $1,000 | | $1,021 | | $4.48 |
| | | | |
Class I | | 0.56% | | $1,000 | | $1,022 | | $2.85 |
| | | | |
Class Z | | 0.48% | | $1,000 | | $1,023 | | $2.45 |
| | | | |
| | | | | | | | |
AMG GW&K Emerging Markets Equity Fund |
|
Based on Actual Fund Return |
| | | | |
Class N | | 1.27% | | $1,000 | | $932 | | $6.18 |
| | | | |
Class I | | 0.96% | | $1,000 | | $932 | | $4.68 |
| | | | |
Class Z | | 0.87% | | $1,000 | | $934 | | $4.24 |
|
Based on Hypothetical 5% Annual Return |
| | | | |
Class N | | 1.27% | | $1,000 | | $1,019 | | $6.46 |
| | | | |
Class I | | 0.96% | | $1,000 | | $1,020 | | $4.89 |
| | | | |
Class Z | | 0.87% | | $1,000 | | $1,021 | | $4.43 |
| | | | |
| | | | | | | | |
AMG GW&K Emerging Wealth Equity Fund |
|
Based on Actual Fund Return |
| | | | |
Class N | | 1.30% | | $1,000 | | $874 | | $6.14 |
| | | | |
Class I | | 0.99% | | $1,000 | | $875 | | $4.68 |
| | | | |
Class Z | | 0.90% | | $1,000 | | $875 | | $4.25 |
|
Based on Hypothetical 5% Annual Return |
| | | | |
Class N | | 1.30% | | $1,000 | | $1,019 | | $6.61 |
| | | | |
Class I | | 0.99% | | $1,000 | | $1,020 | | $5.04 |
| | | | |
Class Z | | 0.90% | | $1,000 | | $1,021 | | $4.58 |
| | | | | | | | |
Six Months Ended October 31, 2023 | | Expense
Ratio for
the Period | | Beginning
Account
Value
05/01/23 | | Ending
Account
Value
10/31/23 | | Expenses
Paid
During
the Period* |
AMG GW&K Small/Mid Cap Growth Fund |
|
Based on Actual Fund Return |
| | | | |
Class N | | 1.02% | | $1,000 | | $968 | | $5.06 |
| | | | |
Class I | | 0.87% | | $1,000 | | $969 | | $4.32 |
| | | | |
Class Z | | 0.82% | | $1,000 | | $970 | | $4.07 |
|
Based on Hypothetical 5% Annual Return |
| | | | |
Class N | | 1.02% | | $1,000 | | $1,020 | | $5.19 |
| | | | |
Class I | | 0.87% | | $1,000 | | $1,021 | | $4.43 |
| | | | |
Class Z | | 0.82% | | $1,000 | | $1,021 | | $4.18 |
| * | Expenses are equal to the Fund’s annualized expense ratio multiplied by the average account value over the period, multiplied by the number of days in the most recent fiscal half-year (184), then divided by 365. |
3
| | |
| | | AMG GW&K Core Bond ESG Fund Portfolio Manager’s Comments (unaudited) |
| | | |
| | | |
| | | | | | | | |
THE YEAR IN REVIEW For the 12 months ended October 31, 2023, AMG GW&K Core Bond ESG Fund’s (the “Fund”) Class I shares returned 0.30%, compared to the return of 0.36% for the Bloomberg U.S. Aggregate Bond Index. MARKET OVERVIEW Fixed income markets rose in the fourth quarter of 2022 amid growing confidence that central banks succeeded in slowing inflation and would be able to pursue less restrictive policy. This modest rally nevertheless ended up being too little, too late to help the bond market avoid its worst annual performance on record and an unprecedented second consecutive year of losses. Sentiment among both investors and consumers may have reached an inflection point, but data continued to justify some measure of caution: inflation was still stubbornly above the U.S. Federal Reserve (the “Fed”) target, the labor market showed few signs of loosening, and corporations had yet to see a meaningful deterioration in earnings. Only the rate-sensitive housing market really stood out as a casualty of the Fed’s tightening campaign to this point. Whether the end of the cycle is imminent remained an open question, especially as investors awaited the realization of the “long and variable lag” that had yet to be fully reflected across so many segments of the economy. Fixed income experienced a solid rally in the first quarter of 2023 as it rebounded from its worst year on record. Much of the period saw a continuation of the tension that drove trading in 2022: inflation continued to slow, but at a glacial pace; a moribund housing market and downbeat consumer had yet to manifest as a slowdown in spending; and a record pace of rate hikes was unable to cool a stubbornly hot labor market. Investors also struggled to anticipate the Fed’s reaction function amid the various crosscurrents, while Chair Powell’s commentary offered few concrete insights beyond a firm resolve and data dependence. But the narrative shifted abruptly in the final weeks, as signs of systemic instability flared up amid a flurry of bank failures. The implications of this turmoil for financial conditions were not evident at the time, but the stress in the banking sector was clearly a complicating factor for both the Fed and the bond market. | | | | The fixed income market posted a small loss in the second quarter of 2023 as it gave back a portion of the banking crisis-inspired rally that occurred in the closing days of March. Sentiment was cautious at the outset and investors sought haven assets on the possibility of contagion in the financial sector. But as it became clear that fallout from the failure of several regional lenders was likely to be contained, attention returned to the underlying strength of the economy and the stubborn persistence of inflation. The labor market gave only the slightest indications of softening, the buoyant housing sector continued to defy higher mortgage rates, and consumer spending once again proved irrepressible. Inflation showed limited progress on its path lower, plateauing at a level solidly above the Fed’s 2% target. Against this backdrop, the Federal Open Market Committee (FOMC) endeavored to maintain restrictive financial conditions by raising rates and providing hawkish guidance. There had nevertheless been scant evidence of the Fed’s success in curbing aggregate demand away from some narrow segments of the commercial real estate and consumer finance markets. The fixed income market posted a significant loss in the third quarter of 2023 that more than offset the gains achieved in the first half of the year. The higher-for-longer Fed narrative increasingly took center stage, driven by a surprisingly resilient economy, surging oil prices, and inflation that persisted well above the Fed’s 2% target. While there were subtle signs that the labor market and consumer credit metrics might be softening, the unemployment rate remained near cycle lows and the consumer continued to spend robustly. The undeniably strong cadence of the economy left economists upgrading their third-quarter Gross Domestic Product (GDP) growth estimates and recharging optimism for a soft landing. Fed officials held rates steady at the September FOMC meeting, but thwarted hopes for a pivot by signaling the possibility of one more hike during the year and projecting less easing in 2024/2025. Markets assimilated a great deal in October—the news out of the Middle East, rising rates, and third quarter earnings. The spike in yields drove the bond market to its sixth consecutive month of negative returns. The economy remained stronger than expected, inflation stayed above the Fed’s target, the government sold a hefty amount of bonds into the market to fund large deficits, and the central bank’s | | | | theme of higher for longer remained in place. By mid-month yields had advanced to multi-year highs, with the 10-year’s 5% handle the most elevated since 2007. Rates staged a rally during the back half of the month, however. FUND REVIEW The Fund modestly underperformed the Bloomberg U.S. Aggregate Bond Index for the year ended October 31, 2023. The Fund’s overweight to spread product was the main positive driver, particularly our overweight to Corporates. The overweight to Taxable Municipals also contributed along with sector allocation within BBB-rated Corporates, particularly the underweights to the banking and energy sectors. The out-of-benchmark allocation to Preferreds was a beneficial factor. The Fund’s overweight to Agency MBS detracted but was entirely offset by our higher coupon and specified pool bias which were pluses. Security selection was a detractor, mostly from within the BBB-rated communications, consumer non-cyclical, and consumer cyclical sectors. Duration and yield curve positioning were contributors, mostly from our modest overweight to duration and overweight to the 10-year part of the curve. The corporate bond market remains in a transition period with respect to environmental, social, and governance (ESG) and sustainability. Many companies have set sustainability targets and are now shifting into the implementation phase, at times supported by public funds and incentives. However, higher inflation and increased regulatory costs of reporting have kept progress slow. Still, despite a sometimes-downbeat portrayal in media, investors continue to show a strong interest in ESG and sustainability, with fund flows and ESG bond issuance remaining roughly steady from last year. 2024 promises to be another important year for global ESG topics with many important regions poised for elections that could have a meaningful impact on the direction of ESG initiatives globally. Overall, we believe ESG and sustainability concerns will remain key issues for both companies and investors in the coming year. We continue to integrate ESG as a core part of our fundamental investment process and will closely monitor regulatory and policy actions that could influence the ESG investing landscape. |
4
| | |
| | | AMG GW&K Core Bond ESG Fund Portfolio Manager’s Comments (continued) |
| | | |
| | | |
| | | | | | | | |
We conducted the following trades based on ESG factors over the period: • We purchased a Comcast green bond; focus on renewable energy projects, energy efficiency improvements to offices and operations and clean transportation. • We bought a Jacobs Engineering sustainability bond; gender diversity and greenhouse gas emissions targets in place with coupon steps if both are not met. • We added an Eastman Chemical green bond; proceeds used to refinance current and future green projects determined by the Green Finance Committee (the bond was subsequently sold in October). • We purchased an Air Products & Chemicals green bond; proceeds to fund large scale green and blue hydrogen and sustainable aviation fuel projects to support energy transition. • We bought an auto asset-backed green bond; finances hybrid autos. • We added Campbell Soup: strong credit with well-established brands and leading market share; leads peers in sustainable agricultural practices, specifically water conservation efforts. | | | | OUTLOOK We witnessed a mind-numbing period where the market’s expectations for multiple interest rate cuts this year were in complete opposition to the Fed’s well telegraphed guidance for rate hikes. But inflation is the Fed’s predominant concern. The higher-for-longer message drove 10-year yields to within striking distance of 5% and the bond market toward a potential third straight annual loss. It is uncertain whether this higher level of yields represents the new normal or a rate move gone too far. While the economy continues to exhibit surprising strength, formidable headwinds lie ahead, including tighter credit conditions, dwindling excess consumer savings, slowing global growth, and rising energy prices. These economic challenges could shift the narrative from an economy that is impervious to rapid rate hikes to one that is susceptible to below-trend growth next year. The torrid rise in rates to multi-year highs makes the value proposition for bonds more compelling. These higher levels of yields can provide a significant cushion should rates continue to rise and are often a good indicator of forward returns. We continue to favor higher quality intermediate-duration bonds. Locking in these maturities diminishes reinvestment risk while still offering the potential for significant | | | | price appreciation when the Fed finally signals a pivot. We remain underweight the long end of the yield curve, which is most vulnerable to losses in this higher-for-longer regime. We are overweight corporates but cautiously positioned in higher quality investment grade issuers. Strong fundamentals and higher yields continue to anchor the sector, driving inflows. However, spreads appear fully valued and may face heightened volatility as issuers confront higher borrowing costs and an elevated number of upcoming maturities. This stress could be compounded by the prospect of slower economic growth and potentially lead to de-risking and an uptick in defaults. We are finding value in blue chip companies and stay particularly selective in the consumer space, especially as post-pandemic savings dwindle. We continue to be overweight Agency MBS, which is far less cyclically exposed and offers the widest spread differential relative to investment grade corporate bonds since 2003. The views expressed represent the opinions of GW&K Investment Management, LLC as of October 31, 2023, and are not intended as a forecast or guarantee of future results, and are subject to change without notice. |
| | | | | | | | |
| | | | | | | | |
5
| | |
| | | AMG GW&K Core Bond ESG Fund Portfolio Manager’s Comments (continued) |
| | | |
| | | |
CUMULATIVE TOTAL RETURN PERFORMANCE
AMG GW&K Core Bond ESG Fund’s cumulative total return is based on the daily change in net asset value (NAV), and assumes that all dividends and distributions were reinvested. This graph compares a hypothetical $10,000 investment made in the AMG GW&K Core Bond ESG Fund’s Class I shares on October 31, 2013, to a $10,000 investment made in the Bloomberg U.S. Aggregate Bond Index for the same time period. The graph and table do not reflect the deduction of taxes that a shareholder would pay on a Fund distribution or redemption of shares. The listed returns for the Fund are net of expenses and the returns for the index exclude expenses. Total returns would have been lower had certain expenses not been reduced.
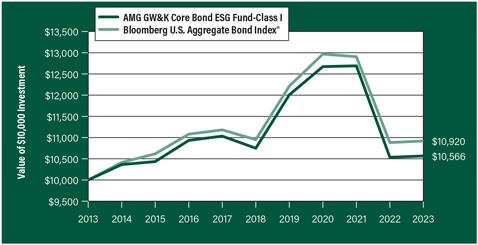
The table below shows the average annual total returns for the AMG GW&K Core Bond ESG Fund and the Bloomberg U.S. Aggregate Bond Index for the same time periods ended October 31, 2023.
| | | | | | | | | | | | | | | | | | | | |
| Average Annual Total Returns1 | | One
Year | | | Five
Years | | | Ten
Years | | | Since
Inception | | | Inception
Date | |
| |
AMG GW&K Core Bond ESG Fund2, 3, 4, 5, 6, 7, 8, 9, 10, 11, 12, 13, 14, 15, 16 | | | | | |
| | | | | |
Class N | | | (0.15%) | | | | (0.69%) | | | | — | | | | (0.25%) | | | | 05/08/15 | |
Class I | | | 0.30% | | | | (0.34%) | | | | 0.55% | | | | 4.63% | | | | 04/30/93 | |
Class Z | | | 0.25% | | | | (0.29%) | | | | — | | | | 0.15% | | | | 05/08/15 | |
| | | | | |
Bloomberg U.S. Aggregate Bond Index17 | | | 0.36% | | | | (0.06%) | | | | 0.88% | | | | 4.21% | | | | 04/30/93 | † |
The performance data shown represents past performance. Past performance is not a guarantee of future results. Current performance may be lower or higher than the performance data quoted. The investment return and principal value of an investment will fluctuate so that an investor’s shares, when redeemed, may be worth more or less than their original cost.
Investors should carefully consider the Fund’s investment objectives, risks, charges and expenses before investing. For performance information through the most recent month end, current net asset values per share for the Fund and other information, please call 800.548.4539 or visit our website at wealth.amg.com for a free prospectus. Read it carefully before investing or sending money.
Distributed by AMG Distributors, Inc., member FINRA/SIPC.
| † | Date reflects inception date of the Fund, not the index. |
| 1 | Total return equals income yield plus share price change and assumes reinvestment of all dividends and capital gain distributions. Returns are net of fees and may reflect offsets of Fund expenses as described in the prospectus. No adjustment has been made for taxes payable by shareholders on their reinvested dividends and |
|
capital gain distributions. Returns for periods greater than one year are annualized. The listed returns on the Fund are net of expenses and based on the published NAV as of October 31, 2023. All returns are in U.S. Dollars($). 2 From time to time, the Fund’s adviser has waived its fees and/or absorbed Fund expenses, which has resulted in higher returns. 3 Market prices of investments held by the Fund may fall rapidly or unpredictably due to a variety of factors, including economic, political, or market conditions, or other factors including terrorism, war, natural disasters and the spread of infectious illness or other public health issues, including epidemics or pandemics, or in response to events that affect particular industries or companies. 4 Because the Fund is an actively managed investment portfolio, security selection or focus on securities in a particular style, market sector or group of companies may cause the Fund to incur losses or underperform relative to its benchmark or other funds with a similar investment objective. There can be no guarantee that the Subadviser’s investment techniques and risk analysis will produce the desired result. 5 The value of a debt security changes in response to various factors, including, for example, market-related factors, such as changes in interest rates or changes in the actual or perceived ability of an issuer to meet its obligations. Investments in debt securities are subject to, among other risks, credit risk, interest rate risk, extension risk, prepayment risk and liquidity risk. 6 Because applying the Fund’s ESG investment criteria may result in the selection or exclusion of securities of certain issuers for reasons other than financial performance, the Fund’s investment returns may underperform funds that do not incorporate ESG factors into their investment process. The incorporation of ESG criteria into the investment process may affect the Fund’s investment exposure to certain companies, sectors, regions, countries or types of investments, which could negatively impact the Fund’s performance depending on whether such investments are in or out of favor. Applying ESG criteria to investment decisions is qualitative and subjective by nature, and there is no guarantee that the criteria utilized by the Subadviser or any judgment exercised by the Subadviser will improve the financial performance of the Fund or reflect the beliefs or values of any particular investor. ESG standards differ by region and industry, and a company’s ESG practices or the Subadviser’s assessment of a company’s ESG practices may change over time. 7 Fixed coupon payments (cash flows) of bonds and debt securities may become less competitive with |
6
| | |
| | | AMG GW&K Core Bond ESG Fund Portfolio Manager’s Comments (continued) |
| | | |
| | | |
| | | | | | | | |
the market in periods of rising interest rates and cause bond prices to decline. 8 The issuer of bonds or other debt securities may be unable or unwilling, or may be perceived as unable or unwilling, to make timely interest or principal payments or otherwise honor its obligations. 9 Investments in asset-backed and mortgage-backed securities involve risk of severe credit downgrades, loss due to prepayments that occur earlier or later than expected, illiquidity and default. 10 During periods of rising interest rates, a debtor may pay back a bond or other fixed income security slower than expected or required, and the value of such security may fall. 11 Inflation risk is the risk that the value of assets or income from investments will be worth less in the future. Inflation rates may change frequently and drastically as a result of various factors and the Fund’s investments may not keep pace with inflation, which may result in losses to Fund investors or adversely affect the real value of shareholders’ investments in the Fund. Recently, inflation levels have been at their highest point in nearly 40 years, and the U.S. Federal Reserve has begun an aggressive campaign to raise certain benchmark interest rates in an effort to combat inflation. As such, fixed income securities markets may experience heightened levels of interest rate volatility and liquidity risk. Deflation risk is the risk that the prices throughout the economy decline | | | | over time – the opposite of inflation. Deflation may have an adverse effect on the creditworthiness of issuers and may make issuer default more likely, which may result in a decline in the value of the Fund’s portfolio. 12 Factors unique to the municipal bond market may negatively affect the value of municipal bonds. 13 A debtor may exercise its right to pay back a bond or other debt security earlier than expected or required during periods of decreasing interest rates. 14 The Fund may have difficulty reinvesting payments from debtors and may receive lower rates than from its original investments. 15 Obligations issued by some U.S. Government agencies, authorities, instrumentalities, or sponsored enterprises such as Government National Mortgage Association (“GNMA”) are backed by the full faith and credit of the U.S. Government, while obligations issued by others, such as Federal National Mortgage Association (“FNMA”), Federal Home Loan Mortgage Corporation (“FHLMC”), and Federal Home Loan Banks (“FHLBs”), are not backed by the full faith and credit of the U.S. Government and are backed solely by the entity’s own resources or by the ability of the entity to borrow from the U.S. Treasury. If one of these agencies defaults on a loan, there is no guarantee that the U.S. Government will provide financial support. | | | | 16 The Fund may not be able to dispose of particular investments, such as illiquid securities, readily at favorable times or prices or the Fund may have to sell them at a loss. 17 The Bloomberg U.S. Aggregate Bond Index is an index of the U.S. investment-grade fixed-rate bond market, including both government and corporate bonds. Unlike the Fund, the Bloomberg U.S. Aggregate Bond Index is unmanaged, is not available for investment and does not incur expenses. “Bloomberg®” and any Bloomberg index described herein are service marks of Bloomberg Finance L.P. and its affiliates, including Bloomberg Index Services Limited (“BISL”), the administrator of the index (collectively, “Bloomberg”) and have been licensed for use for certain purposes by AMG Funds LLC. Bloomberg is not affiliated with AMG Funds LLC, and Bloomberg does not approve, endorse, review, or recommend the fund described herein. Bloomberg does not guarantee the timeliness, accurateness, or completeness of any data or information relating to such fund. Not FDIC insured, nor bank guaranteed. May lose value. |
| | | | | | | | |
7
| | |
| | | AMG GW&K Core Bond ESG Fund Fund Snapshots (unaudited) |
| | | October 31, 2023 |
| | | |
| | | |
PORTFOLIO BREAKDOWN
| | | | |
| Category | | % of
Net Assets |
| | |
U.S. Government and Agency Obligations | | | 50.9 | |
| | |
Corporate Bonds and Notes | | | 36.6 | |
| | |
Municipal Bonds | | | 8.3 | |
| | |
Asset-Backed Securities | | | 0.7 | |
| | |
Short-Term Investments | | | 4.4 | |
| | |
Other Assets, less Liabilities | | | (0.9) | |
| | | | |
| Rating | | % of Market Value1 |
| | |
U.S. Government and Agency Obligations | | | 52.7 | |
| | |
Aaa/AAA | | | 4.8 | |
| | |
Aa/AA | | | 10.0 | |
| | |
A | | | 13.9 | |
| | |
Baa/BBB | | | 18.6 | |
| 1 | Includes market value of long-term fixed-income securities only. |
TOP TEN HOLDINGS
| | | | |
| Security Name | | % of
Net Assets | |
| | |
U.S. Treasury Bonds, 2.250%, 05/15/41 | | | 3.8 | |
| | |
U.S. Treasury Bonds, 3.500%, 02/15/39 | | | 2.6 | |
| | |
FHLMC, 3.500%, 10/01/45 | | | 2.4 | |
| | |
Verizon Communications, Inc., 3.875%, 02/08/29 | | | 2.2 | |
| | |
California State General Obligation, School Improvements, Build America Bonds, 7.550%, 04/01/39 | | | 2.2 | |
| | |
FNMA, 3.500%, 02/01/47 | | | 2.1 | |
| | |
FHLMC, 5.500%, 06/01/53 | | | 2.0 | |
| | |
Freddie Mac Multifamily Structured Pass Through Certificates, Series K134, Class A2, 2.243%, 10/25/31 | | | 2.0 | |
| | |
FHLMC, 3.000%, 11/01/49 | | | 2.0 | |
| | |
The Goldman Sachs Group, Inc. , 3.500%, 11/16/26 | | | 1.9 | |
| | | | | |
| | |
Top Ten as a Group | | | 23.2 | |
| | | | |
Credit quality ratings shown above reflect the highest rating assigned by either Standard & Poor’s (“S&P”) or Moody’s Investors Service, Inc. (“Moody’s”). These rating agencies are independent, nationally recognized statistical rating organizations and are widely used. Investment grade ratings are credit ratings of BBB- or higher. Below investment grade ratings are credit ratings of BB+ or lower. Investments designated N/R are not rated by any of the rating agencies. Unrated investments do not necessarily indicate low credit quality. Credit quality ratings are subject to change.
Because a fund’s strategy may result in multiple investments in particular sectors of the economy, its performance may depend on the performance of those sectors and may fluctuate more widely than investments diversified across more sectors. For additional information on these and other risk considerations, please see the Fund’s prospectus.
Any sectors, industries, or securities discussed should not be perceived as investment recommendations. Mention of a specific security should not be considered a recommendation to buy or solicitation to sell that security. Specific securities mentioned in this report may have been sold from the Fund’s portfolio of investments by the time you receive this report.
8
| | |
| | | AMG GW&K Core Bond ESG Fund Schedule of Portfolio Investments |
| | | October 31, 2023 |
| | | |
| | | |
| | | | | | | | |
| | | Principal
Amount | | | Value | |
| |
Corporate Bonds and Notes - 36.6% | | | | | |
| | |
Financials - 16.3% | | | | | | | | |
| | |
AerCap Ireland Capital DAC/AerCap Global Aviation Trust (Ireland) 1.650%, 10/29/24 | | | $1,650,000 | | | | $1,573,352 | |
| | |
Aircastle, Ltd. (Bermuda)
4.250%, 06/15/26 | | | 1,562,000 | | | | 1,464,749 | |
| | |
American Tower Corp.
3.600%, 01/15/28 | | | 1,680,000 | | | | 1,510,241 | |
| | |
Bank of America Corp.
| | | | | | | | |
MTN, (4.330% to 03/15/49 then 3 month SOFR + 1.782%), 4.330%, 03/15/501,2 | | | 1,300,000 | | | | 954,409 | |
Series X, (6.250% to 09/05/24 then 3 month SOFR + 3.967%), 6.250%, 09/05/241,2,3 | | | 265,000 | | | | 260,450 | |
| | |
The Bank of New York Mellon Corp.
MTN, 2.450%, 08/17/26 | | | 937,000 | | | | 860,177 | |
Series G, (4.700% to 09/20/25 then U.S. Treasury Yield Curve CMT 5 year + 4.358%), 4.700%, 09/20/251,2,3 | | | 795,000 | | | | 752,444 | |
| | |
Citigroup, Inc.
| | | | | | | | |
(3.980% to 03/20/29 then 3 month SOFR + 1.600%), 3.980%, 03/20/301,2 | | | 1,677,000 | | | | 1,483,674 | |
| | |
Crown Castle, Inc.
4.000%, 03/01/27 | | | 1,800,000 | | | | 1,676,359 | |
| | |
The Goldman Sachs Group, Inc.
3.500%, 11/16/26 | | | 2,526,000 | | | | 2,342,637 | |
| | |
JPMorgan Chase & Co.
| | | | | | | | |
(1.470% to 09/22/26 then SOFR + 0.765%), 1.470%, 09/22/271,2 | | | 1,877,000 | | | | 1,635,121 | |
Series X, (6.100% to 10/01/24 then 3 month SOFR + 3.592%), 6.100%, 10/01/241,2,3 | | | 275,000 | | | | 271,253 | |
| | |
MetLife, Inc.
| | | | | | | | |
Series G, (3.850% to 09/15/25 then U.S. Treasury Yield Curve CMT 5 year + 3.576%), 3.850%, 09/15/251,2,3 | | | 1,409,000 | | | | 1,281,060 | |
| | |
Morgan Stanley
| | | | | | | | |
(4.431% to 01/23/29 then 3 month SOFR + 1.890%), 4.431%, 01/23/301,2 | | | 1,624,000 | | | | 1,478,691 | |
| | |
The PNC Financial Services Group, Inc.
| | | | | | | | |
(5.068% to 01/24/33 then SOFR + 1.933%), 5.068%, 01/24/341,2 | | | 1,426,000 | | | | 1,254,799 | |
| | |
Wells Fargo & Co.
| | | | | | | | |
MTN, (5.013% to 04/04/50 then 3 month SOFR + 4.502%), 5.013%, 04/04/511,2 | | | 1,411,000 | | | | 1,119,009 | |
| | |
Total Financials | | | | | | | 19,918,425 | |
| | |
Industrials - 18.8% | | | | | | | | |
| | |
Air Products and Chemicals, Inc.
4.800%, 03/03/334 | | | 1,030,000 | | | | 963,295 | |
| | |
Alcoa Nederland Holding, B.V. (Netherlands)
4.125%, 03/31/295 | | | 1,275,000 | | | | 1,110,439 | |
| | |
Ashtead Capital, Inc.
1.500%, 08/12/265 | | | 1,786,000 | | | | 1,569,632 | |
| | |
| | | | | | | | |
| | | | | | | | |
| | | Principal
Amount | | | Value | |
| | |
AT&T, Inc.
4.300%, 02/15/30 | | | $700,000 | | | | $627,770 | |
| | |
Broadcom, Inc.
4.150%, 11/15/30 | | | 717,000 | | | | 624,108 | |
| | |
Campbell Soup Co.
2.375%, 04/24/30 | | | 1,578,000 | | | | 1,250,949 | |
| | |
Comcast Corp.
4.650%, 02/15/334 | | | 1,115,000 | | | | 1,009,014 | |
| | |
CommonSpirit Health
3.347%, 10/01/29 | | | 1,737,000 | | | | 1,490,627 | |
| | |
Dell International LLC/EMC Corp.
6.200%, 07/15/30 | | | 1,512,000 | | | | 1,498,790 | |
| | |
The Ford Foundation
Series 2020, 2.415%, 06/01/50 | | | 2,207,000 | | | | 1,205,644 | |
| | |
Jacobs Engineering Group, Inc.
5.900%, 03/01/33 | | | 1,291,000 | | | | 1,195,703 | |
| | |
Kraft Heinz Foods Co.
3.875%, 05/15/27 | | | 1,518,000 | | | | 1,423,067 | |
| | |
Merck & Co., Inc.
1.900%, 12/10/28 | | | 1,547,000 | | | | 1,308,931 | |
| | |
Microsoft Corp.
2.525%, 06/01/50 | | | 2,090,000 | | | | 1,196,361 | |
| | |
Parker-Hannifin Corp.
3.250%, 06/14/29 | | | 1,573,000 | | | | 1,381,994 | |
| | |
Smith & Nephew PLC (United Kingdom)
2.032%, 10/14/30 | | | 1,010,000 | | | | 759,815 | |
| | |
Sysco Corp.
2.400%, 02/15/30 | | | 2,209,000 | | | | 1,778,735 | |
| | |
Verizon Communications, Inc.
3.875%, 02/08/29 | | | 2,953,000 | | | | 2,680,979 | |
| | |
Total Industrials | | | | | | | 23,075,853 | |
| | |
Utilities - 1.5% | | | | | | | | |
| | |
National Rural Utilities Cooperative Finance Corp.
1.350%, 03/15/31 | | | 1,749,000 | | | | 1,252,057 | |
| | |
Northern States Power Co.
2.900%, 03/01/50 | | | 1,000,000 | | | | 575,124 | |
| | |
Total Utilities | | | | | | | 1,827,181 | |
| | |
Total Corporate Bonds and Notes
(Cost $52,648,806) | | | | | | | 44,821,459 | |
| |
Asset-Backed Securities - 0.7% | | | | | |
| | |
American Express Credit Account Master Trust
Series 2022-4, Class A
4.950%, 10/15/27 | | | 630,000 | | | | 621,924 | |
| | |
Toyota Auto Receivables Owner Trust
Series 2021-B, Class A4
0.530%, 10/15/26 | | | 297,000 | | | | 276,139 | |
| | |
Total Asset-Backed Securities
(Cost $900,471) | | | | | | | 898,063 | |
| | |
| | | | | | | | |
The accompanying notes are an integral part of these financial statements.
9
| | |
| | | AMG GW&K Core Bond ESG Fund Schedule of Portfolio Investments (continued) |
| | | |
| | | |
| | | | | | | | |
| | |
| | | Principal
Amount | | | Value | |
| |
Municipal Bonds - 8.3% | | | | | |
| | |
California Health Facilities Financing Authority 4.190%, 06/01/37 | | | $775,000 | | | | $654,842 | |
| | |
California State General Obligation, School Improvements, Build America Bonds 7.550%, 04/01/39 | | | 2,310,000 | | | | 2,635,916 | |
| | |
Commonwealth of Massachusetts, Series B 4.110%, 07/15/31 | | | 783,520 | | | | 752,492 | |
| | |
JobsOhio Beverage System, Series B Build America Bonds, 4.532%, 01/01/35 | | | 1,705,000 | | | | 1,565,873 | |
| | |
Los Angeles Unified School District, School Improvements, Build America Bonds 5.750%, 07/01/34 | | | 1,775,000 | | | | 1,758,448 | |
| | |
Massachusetts School Building Authority, Series B, 1.753%, 08/15/30 | | | 2,017,000 | | | | 1,631,725 | |
| | |
University of California, University & College Improvements, Series BD 3.349%, 07/01/29 | | | 1,310,000 | | | | 1,171,861 | |
| | |
Total Municipal Bonds
(Cost $12,086,738) | | | | | | | 10,171,157 | |
| |
| U.S. Government and Agency Obligations - 50.9% | | | | | |
| | |
Fannie Mae - 22.9% | | | | | | | | |
| | |
FNMA | | | | | | | | |
2.000%, 02/01/36 | | | 776,450 | | | | 665,616 | |
3.000%, 06/01/38 to 12/01/50 | | | 1,376,082 | | | | 1,212,041 | |
3.500%, 03/01/30 to 07/01/50 | | | 10,903,631 | | | | 9,549,900 | |
4.000%, 03/01/44 to 01/01/51 | | | 7,634,324 | | | | 6,741,196 | |
4.500%, 04/01/39 to 08/01/52 | | | 7,875,335 | | | | 7,249,100 | |
5.000%, 07/01/47 to 02/01/49 | | | 1,806,468 | | | | 1,722,524 | |
5.500%, 11/01/52 | | | 949,082 | | | | 908,911 | |
| | |
Total Fannie Mae | | | | | | | 28,049,288 | |
| | |
Freddie Mac - 14.8% | | | | | | | | |
| | |
FHLMC | | | | | | | | |
2.500%, 10/01/34 | | | 2,353,969 | | | | 2,099,127 | |
3.000%, 11/01/49 to 03/01/50 | | | 3,943,676 | | | | 3,221,923 | |
3.500%, 10/01/45 | | | 3,470,060 | | | | 2,995,109 | |
4.000%, 07/01/48 to 09/01/50 | | | 2,104,942 | | | | 1,851,508 | |
4.500%, 05/01/48 | | | 265,192 | | | | 244,698 | |
5.000%, 07/01/44 | | | 1,084,484 | | | | 1,040,186 | |
5.500%, 06/01/53 | | | 2,624,014 | | | | 2,496,542 | |
| | |
FHLMC Gold Pool
3.500%, 07/01/32 to 05/01/44 | | | 1,108,106 | | | | 1,012,314 | |
| | |
Freddie Mac Multifamily Structured Pass Through Certificates | | | | | | | | |
Series K134, Class A2
2.243%, 10/25/312 | | | 3,175,000 | | | | 2,490,062 | |
| | |
Freddie Mac REMICS | | | | | | | | |
Series 5297, Class DA
5.000%, 12/25/52 | | | 656,524 | | | | 623,926 | |
| | |
Total Freddie Mac | | | | | | | 18,075,395 | |
| | |
| | | | | | | | |
| | | | | | | | |
| | |
| | | Principal
Amount | | | Value | |
| | |
Ginnie Mae - 0.5% | | | | | | | | |
| | |
GNMA | | | | | | | | |
Series 2023-111, Class FD
(1-month SOFR + 1.000%, Cap 7.000%, Floor 1.000%), 6.321%, 08/20/532 | | | $645,580 | | | | $627,087 | |
| | |
U.S. Treasury Obligations - 12.7% | | | | | | | | |
| | |
U.S. Treasury Bonds | | | | | | | | |
1.875%, 02/15/51 | | | 3,558,000 | | | | 1,867,533 | |
2.250%, 05/15/41 | | | 7,080,000 | | | | 4,642,655 | |
3.125%, 05/15/48 | | | 3,234,000 | | | | 2,285,529 | |
3.500%, 02/15/39 | | | 3,777,000 | | | | 3,122,664 | |
3.625%, 02/15/53 | | | 500,000 | | | | 389,609 | |
5.000%, 05/15/37 | | | 328,000 | | | | 328,448 | |
6.750%, 08/15/26 | | | 1,339,000 | | | | 1,402,080 | |
| | |
U.S. Treasury Notes
2.375%, 05/15/27 | | | 1,641,000 | | | | 1,507,925 | |
| | |
Total U.S. Treasury Obligations | | | | | | | 15,546,443 | |
| | |
Total U.S. Government and Agency Obligations
(Cost $75,519,144) | | | | | | | 62,298,213 | |
| |
Short-Term Investments - 4.4% | | | | | |
| | |
Joint Repurchase
Agreements - 1.7%6 | | | | | | | | |
| | |
Bank of America Securities, Inc., dated 10/31/23, due 11/01/23, 5.310% total to be received $1,000,148 (collateralized by various U.S. Government Agency Obligations, 2.000% - 6.500%, 04/01/48 - 10/01/53, totaling $1,020,000) | | | 1,000,000 | | | | 1,000,000 | |
| | |
Industrial and Commercial Bank of China Financial Services LLC, dated 10/31/23, due 11/01/23, 5.340% total to be received $1,000,148 (collateralized by various U.S. Treasuries, 0.000% - 7.625%, 11/02/23 - 08/15/53, totaling $1,020,000) | | | 1,000,000 | | | | 1,000,000 | |
| | |
RBC Capital Markets LLC, dated 10/31/23, due 11/01/23, 5.310% total to be received $21,231 (collateralized by various U.S. Government Agency Obligations and U.S. Treasuries, 0.000% - 6.500%, 11/07/23 - 08/20/53, totaling $21,653) | | | 21,228 | | | | 21,228 | |
| | |
Total Joint Repurchase Agreements | | | | | | | 2,021,228 | |
| |
Repurchase Agreements - 2.7% | | | | | |
| | |
Fixed Income Clearing Corp., dated 10/31/23, due 11/01/23, 5.150% total to be received $1,679,240 (collateralized by a U.S. Treasury, 4.125%, 06/15/26, totaling $1,712,635) | | | 1,679,000 | | | | 1,679,000 | |
| | |
Fixed Income Clearing Corp., dated 10/31/23, due 11/01/23, 5.150% total to be received $1,640,235 (collateralized by a U.S. Treasury, 3.500%, 04/30/30, totaling $1,672,883) | | | 1,640,000 | | | | 1,640,000 | |
| | |
Total Repurchase Agreements | | | | | | | 3,319,000 | |
| | |
Total Short-Term Investments
(Cost $5,340,228) | | | | | | | 5,340,228 | |
| | |
| | | | | | | | |
The accompanying notes are an integral part of these financial statements.
10
| | |
| | | AMG GW&K Core Bond ESG Fund Schedule of Portfolio Investments (continued) |
| | | |
| | | |
| | | | | | | | |
| | | | | | Value | |
| | |
Total Investments - 100.9%
(Cost $146,495,387) | | | | | | | $123,529,120 | |
| | |
Other Assets, less Liabilities - (0.9)% | | | | | | | (1,122,215 | ) |
| | |
Net Assets - 100.0% | | | | | | | $122,406,905 | |
| 1 | Fixed to variable rate investment. The rate shown reflects the fixed rate in effect at October 31, 2023. Rate will reset at a future date. |
| 2 | Variable rate security. The rate shown is based on the latest available information as of October 31, 2023. Certain variable rate securities are not based on a published reference rate and spread but are determined by the issuer or agent and are based on current market conditions. These securities do not indicate a reference rate and spread in their description above. |
| 3 | Perpetuity Bond. The date shown represents the next call date. |
| 4 | Some of these securities, amounting to $1,952,586 or 1.6% of net assets, were out on loan to various borrowers and are collateralized by cash. See Note 4 of Notes to Financial Statements. |
| 5 | Security exempt from registration under Rule 144A of the Securities Act of 1933. This security may be resold in transactions exempt from registration, normally to qualified institutional buyers. At October 31, 2023, the value of these securities amounted to $2,680,071 or 2.2% of net assets. |
| 6 | Cash collateral received for securities lending activity was invested in these joint repurchase agreements. |
| | |
CMT | | Constant Maturity Treasury |
FHLMC | | Freddie Mac |
FNMA | | Fannie Mae |
GNMA | | Ginnie Mae |
MTN | | Medium-Term Note |
REMICS | | Real Estate Mortgage Investment Conduit |
SOFR | | Secured Overnight Financing Rate |
The following table summarizes the inputs used to value the Fund’s investments by the fair value hierarchy levels as of October 31, 2023:
| | | | | | | | | | | | | | | | |
| | | Level 1 | | | Level 2 | | | Level 3 | | | Total | |
Investments in Securities | | | | | | | | | | | | | | | | |
| | | | |
Corporate Bonds and Notes† | | | — | | | | $44,821,459 | | | | — | | | | $44,821,459 | |
| | | | |
Asset-Backed Securities | | | — | | | | 898,063 | | | | — | | | | 898,063 | |
| | | | |
Municipal Bonds† | | | — | | | | 10,171,157 | | | | — | | | | 10,171,157 | |
| | | | |
U.S. Government and Agency Obligations† | | | — | | | | 62,298,213 | | | | — | | | | 62,298,213 | |
| | | | |
Short-Term Investments | | | | | | | | | | | | | | | | |
| | | | |
Joint Repurchase Agreements | | | — | | | | 2,021,228 | | | | — | | | | 2,021,228 | |
| | | | |
Repurchase Agreements | | | — | | | | 3,319,000 | | | | — | | | | 3,319,000 | |
| | | | | | | | | | | | | | | | |
| | | | |
Total Investments in Securities | | | — | | | | $123,529,120 | | | | — | | | | $123,529,120 | |
| | | | | | | | | | | | | | | | |
| | † | All corporate bonds and notes, municipal bonds, U.S. government and agency obligations held in the Fund are Level 2 securities. For a detailed breakout of corporate bonds and notes, municipal bonds, U.S. government and agency obligations by major industry or agency classification, please refer to the Fund’s Schedule of Portfolio Investments. |
For the fiscal year ended October 31, 2023, there were no transfers in or out of Level 3.
The accompanying notes are an integral part of these financial statements.
11
| | |
| | | AMG GW&K Emerging Markets Equity Fund Portfolio Manager’s Comments (unaudited) |
| | | |
| | | |
| | | | | | | | |
MARKET OVERVIEW Emerging markets advanced in choppy trading during the fiscal year ended October 31, 2023. The period started on a positive note, as China abandoned its restrictive zero-COVID policy and Eastern Europe rallied on the Continent’s improving energy security situation despite sanctions on Russian gas imports. Sentiment shifted later in the fiscal year, however, due to mounting problems in China’s property market, elevated U.S. yields, and volatile energy prices. The MSCI Emerging Markets Index gained 10.80%, slightly ahead of the MSCI World Index of developed markets, which was up 10.50%. Asia was the standout performer regionally led by tech heavy Taiwan, which rose sharply on an artificially intelligence (AI) hype-driven rally in semiconductors and hardware. China surged early in the period as the abrupt end to its zero-COVID policy drove investment flows back into the market, and the government softened its regulatory offensive targeting several industries. But the country’s macro challenges were deeper than expected and the rally faded as the year progressed. A short seller report on Indian conglomerate Adani Enterprises Ltd. (not held in the Fund), which forced the company to abandon a follow-on public share offering, capped gains in the country’s equity indexes. Mexico delivered surprisingly good Gross Domestic Product (GDP) and earnings growth throughout the period, driven by local consumption and US exports. Brazilian equities were volatile as investors weighed the impact of policy changes under President Lula against the potential for aggressive interest rate cuts. The Europe, Middle East and Africa (EMEA) region declined modestly due to weakness across the Persian Gulf oil and gas producers, though Eastern Europe remained well bid as the threat of an energy shortage eased considerably. Turkey gained substantially on easing geopolitical tensions with its NATO allies and a marked shift to more orthodox economic policies following President Erdogan’s reelection. The sector leaders were information technology, with semiconductors a key contributor, | | | | communication services and consumer discretionary, which gained on China reopening optimism. Utilities declined due to steep losses in Adani Enterprises’ listed subsidiaries in India. Materials and industrials were also notable underperformers. FUND REVIEW For the fiscal year ending October 31, 2023, the AMG GW&K Emerging Markets Equity Fund’s (the “Fund”) Class N shares returned 15.96%, outperforming the Fund’s benchmark, MSCI Emerging Markets Index, which returned 10.80%. Strong stock selection in Asia and no exposure to either materials or utilities were key contributors to the Fund’s relative performance. Individual stock highlights included Taiwan Semiconductor Manufacturing Co., Ltd., the world’s leading semiconductor foundry, which rose on better-than-expected second quarter and third quarter 2023 earnings. China’s Tencent Holdings, Ltd. finished the period higher on easing regulatory scrutiny and the surprise approval of several new video games. Online travel platform Trip.com Group, Ltd. rallied on the resumption of leisure activity following elimination of COVID-related restrictions in China. AI enthusiasm and a potential trough in memory chip prices drove gains in SK Hynix, Inc. Conversely, sporting goods specialist Li Ning Co., Ltd. reported disappointing third-quarter sales and reduced full-year guidance. European discount retailer Pepco Group, N.V. also lowered fiscal year guidance due to weakening demand for key clothing and merchandising categories. Following its recent merger with consumer finance subsidiary HDFC, India’s HDFC Bank, Ltd. provided proforma financial guidance, which will initially result in slightly lower returns and net interest margins. MultiChoice Group, a South African video entertainment platform, lowered guidance due to the negative impact of power rationing on consumer engagement. OUTLOOK We remain optimistic about the extended outlook for emerging markets but are mindful of the near-term risks facing capital markets globally, including the | | | | impact of aggressive interest rate hikes across developed markets, economic challenges facing China, and geopolitical tension. This is balanced against several factors that support our positive view of the longer-term growth and performance potential of emerging markets. China’s compelling valuation combined with the government’s renewed focus on domestically driven growth make it one of the more attractive markets globally. Additionally, many emerging markets have relatively high real interest rates and have already begun to pivot policy to support credit expansion. Other structural tailwinds include intraregional trade and diversification of supply chains, which should benefit countries like India and Mexico. At the end of October, the MSCI Emerging Markets Index traded at 11.0 times forward earnings, which represented a notable 37% discount relative to the MSCI USA Index. Although further bouts of volatility are possible, we believe emerging markets will reward investors willing to take the long-term view. With respect to the Fund’s structure, trading and market activity during the fiscal year resulted in increased exposure to communication services, energy, and consumer staples, while our weights in health care, industrials, and consumer discretionary decreased. At the close of the period, the Fund had overweight positions in the financials, consumer discretionary, consumer staples, communication services, and information technology sectors and underweight positions in the materials, industrials, utilities, health care, real estate, and energy sectors relative to the benchmark. Geographically, the portfolio finished the fiscal year with 82% in Asia, 13% in Latin America, and 5% in the EMEA region. The views expressed represent the opinions of GW&K Investment Management, LLC as of October 31, 2023, and are not intended as a forecast or guarantee of future results, and are subject to change without notice. |
12
| | |
| | | AMG GW&K Emerging Markets Equity Fund Portfolio Manager’s Comments (continued) |
| | | |
| | | |
CUMULATIVE TOTAL RETURN PERFORMANCE
AMG GW&K Emerging Markets Equity Fund’s cumulative total return is based on the daily change in net asset value (NAV), and assumes that all dividends and distributions were reinvested. This graph compares a hypothetical $10,000 investment made in the AMG GW&K Emerging Markets Equity Fund’s Class N shares on October 31, 2013, to a $10,000 investment made in the MSCI Emerging Markets Index for the same time period. The graph and table do not reflect the deduction of taxes that a shareholder would pay on a Fund distribution or redemption of shares. The listed returns for the Fund are net of expenses and the returns for the index exclude expenses. Total returns would have been lower had certain expenses not been reduced.
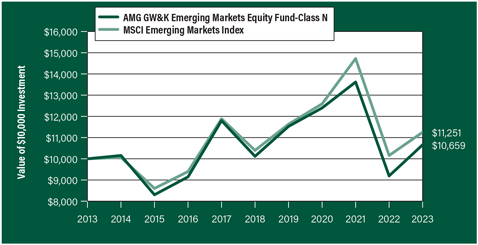
The table below shows the average annual total returns for the AMG GW&K Emerging Markets Equity Fund and the MSCI Emerging Markets Index for the same time periods ended October 31, 2023.
| | | | | | |
| | | One | | Five | | Ten |
| Average Annual Total Returns1 | | Year | | Years | | Years |
|
AMG GW&K Emerging Markets Equity Fund2, 3, 4, 5, 6, 7, 8, 9, 10, 11, 12, 13, 14, 15, 16, 17, 18, 19, 20 |
| | | |
Class N | | 15.96% | | 1.05% | | 0.64% |
| | | |
Class I | | 16.28% | | 1.36% | | 0.97% |
| | | |
Class Z | | 16.56% | | 1.47% | | 1.08% |
| | | |
MSCI Emerging Markets Index21 | | 10.80% | | 1.59% | | 1.19% |
The performance data shown represents past performance. Past performance is not a guarantee of future results. Current performance may be lower or higher than the performance data quoted. The investment return and principal value of an investment will fluctuate so that an investor’s shares, when redeemed, may be worth more or less than their original cost.
Investors should carefully consider the Fund’s investment objectives, risks, charges and expenses before investing. For performance information through the most recent month end, current net asset values per share for the Fund and other information, please call 800.548.4539 or visit our website at wealth.amg.com for a free prospectus. Read it carefully before investing or sending money.
Distributed by AMG Distributors, Inc., member FINRA/SIPC.
| 1 | Total return equals income yield plus share price change and assumes reinvestment of all dividends and capital gain distributions. Returns are net of fees and may reflect offsets of Fund expenses as described in the prospectus. No adjustment has been made for taxes payable by shareholders on their reinvested dividends and capital gain distributions. Returns for periods greater than one year are annualized. The listed returns on the Fund are net of expenses and based on the published NAV as of October 31, 2023. All returns are in U.S. Dollars ($). |
|
2 From time to time, the Fund’s adviser has waived its fees and/or absorbed Fund expenses, which has resulted in higher returns. 3 Market prices of investments held by the Fund may fall rapidly or unpredictably due to a variety of factors, including economic, political, or market conditions, or other factors including terrorism, war, natural disasters and the spread of infectious illness or other public health issues, including epidemics or pandemics, or in response to events that affect particular industries or companies. 4 Because the Fund is an actively managed investment portfolio, security selection or focus on securities in a particular style, market sector or group of companies may cause the Fund to incur losses or underperform relative to its benchmark or other funds with a similar investment objective. There can be no guarantee that the Subadviser’s investment techniques and risk analysis will produce the desired result. 5 Investments in foreign issuers involve additional risks (such as risks arising from less frequent trading, changes in political or social conditions, and less publicly available information about non-U.S. issuers) that differ from those associated with investments in U.S. issuers and may result in greater price volatility. 6 Investments in emerging markets are subject to the general risks of foreign investments, as well as additional risks which can result in greater price volatility. Such additional risks include the risk that markets in emerging market countries are typically less developed and less liquid than markets in developed countries and such markets are subjected to increased economic, political, or regulatory uncertainties. 7 Changes in the general political and social environment of a country can have substantial effects on the value of investments exposed to that country. 8 To the extent the Fund focuses its investments in a particular country, group of countries or geographic region, the Fund is particularly susceptible to economic, political, regulatory or other events or conditions affecting such countries or region, and the Fund’s NAV may be more volatile than the NAV of a more geographically diversified fund and may result in losses. The Fund is particularly susceptible to risks in the Greater China region, which consists of Hong Kong, The People’s Republic of China and Taiwan, among other countries. Economies in the Greater China region are dependent on the economies of other countries and can be significantly affected by currency fluctuations and increasing competition from other emerging economies in Asia with lower costs. Adverse events in any one country within the |
13
| | |
| | | AMG GW&K Emerging Markets Equity Fund Portfolio Manager’s Comments (continued) |
| | | |
| | | |
| | | | | | | | |
region may impact the other countries in the region or Asia as a whole. Markets in the Greater China region can experience significant volatility due to social, economic, regulatory and political uncertainties. Significant portions of the Chinese securities markets may become rapidly illiquid, as Chinese issuers have the ability to suspend the trading of their equity securities, and have shown a willingness to exercise that option in response to market volatility and other events. U.S. or foreign government restrictions or intervention could negatively affect the implementation of the Fund’s investment strategies, for example by precluding the Fund from making certain investments or causing the Fund to sell investments at disadvantageous times. China has yet to develop comprehensive securities, corporate, or commercial laws, its market is relatively new and less developed, and its economy may be adversely impacted by a slowdown in export growth. 9 The Fund may gain investment exposure to certain Chinese companies through variable interest entity (“VIE”) structures. A VIE structure enables foreign investors, such as the Fund, to obtain investment exposure to a Chinese company in situations in which the Chinese government has limited or prohibited non-Chinese ownership of such company. A VIE does not have equity ownership in its corresponding China-based company but has claims to the China-based company’s profits and control of its assets through contractual arrangements. VIEs are a common industry practice and well known to officials and regulators in China; however, VIEs are not formally recognized under Chinese law. If the Chinese government takes action adversely affecting VIEs, the market value of the Fund’s associated portfolio holdings would likely suffer significant, detrimental, and possibly permanent consequences, which could result in substantial investment losses. 10 Fluctuations in exchange rates may affect the total | | | | loss or gain on a non-U.S. dollar investment when converted back to U.S. dollars and exposure to non-U.S. currencies may subject the Fund to the risk that those currencies will decline in value relative to the U.S. dollar. 11 The use of derivatives involves costs, the risk that the value of derivatives may not correlate perfectly with their underlying assets, rates or indices, liquidity risk, and the risk of mispricing or improper valuation. The use of derivatives may not succeed for various reasons, and the complexity and rapidly changing structure of derivatives markets may increase the possibility of market losses. 12 The counterparty to a derivatives contract may be unable or unwilling, or may be perceived as unable or unwilling, to make timely interest, principal or settlement payments or otherwise honor its obligations. 13 Borrowing and some derivative investments such as futures, forward commitment transactions and swaps may magnify smaller adverse market movements into relatively larger losses. 14 The prices of equity securities of companies that are expected to experience relatively rapid earnings growth, or “growth stocks,” may be more sensitive to market movements because the prices tend to reflect future investor expectations rather than just current profits. 15 The prices of stocks purchased in initial public offerings (“IPOs”) can be very volatile and tend to fluctuate more widely than stocks of companies that have been publicly traded for a longer period of time. The effect of IPOs on the Fund’s performance depends on a variety of factors. 16 The stocks of large-capitalization companies are generally more mature and may not be able to reach the same levels of growth as the stocks of small- or mid-capitalization companies. 17 The stocks of small-and mid-capitalization | | | | companies often have greater price volatility, lower trading volume, and less liquidity than the stocks of larger, more established companies. 18 An investment in participatory notes is subject to market risk. The performance results of participatory notes may not exactly replicate the performance of the underlying securities. An investment in participatory notes is also subject to counterparty risk, relating to the non-U.S. bank or broker-dealer that issues the participatory notes, and may be subject to liquidity risk. 19 Issuers and companies that are in similar industry sectors may be similarly affected by particular economic or market events; to the extent the Fund has substantial holdings within a particular sector, the risks associated with that sector increase. 20 The Fund may not be able to dispose of particular investments, such as illiquid securities, readily at favorable times or prices or the Fund may have to sell them at a loss. 21 The MSCI Emerging Markets Index is a free float-adjusted market capitalization index that is designed to measure equity market performance of emerging markets. Please go to msci.com for most current list of countries represented by the index. Unlike the Fund, the MSCI Emerging Markets Index is unmanaged, is not available for investment and does not incur expenses. All MSCI data is provided “as is.” The products described herein are not sponsored or endorsed and have not been reviewed or passed on by MSCI. In no event shall MSCI, its affiliates or any MSCI data provider have any liability of any kind in connection with the MSCI data or the products described herein. Copying or redistributing the MSCI data is strictly prohibited. Not FDIC insured, nor bank guaranteed. May lose value. |
14
| | |
| | | AMG GW&K Emerging Markets Equity Fund Fund Snapshots (unaudited) |
| | | October 31, 2023 |
| | | |
| | | |
PORTFOLIO BREAKDOWN
| | | | |
| Sector | | % of Net Assets |
| | |
Financials | | | 27.4 | |
| | |
Information Technology | | | 22.4 | |
| | |
Consumer Discretionary | | | 17.6 | |
| | |
Communication Services | | | 11.6 | |
| | |
Consumer Staples | | | 9.1 | |
| | |
Energy | | | 4.7 | |
| | |
Industrials | | | 3.7 | |
| | |
Health Care | | | 1.8 | |
| | |
Short-Term Investments | | | 1.8 | |
| | |
Other Assets, less Liabilities | | | (0.1 | ) |
TOP TEN HOLDINGS
| | | | |
| Security Name | | % of
Net Assets | |
| | |
Taiwan Semiconductor Manufacturing Co., Ltd. (Taiwan) | | | 8.8 | |
| | |
HDFC Bank, Ltd. (India) | | | 6.8 | |
| | |
Samsung Electronics Co., Ltd. (South Korea) | | | 5.5 | |
| | |
Tencent Holdings, Ltd. (China) | | | 3.6 | |
| | |
Reliance Industries, Ltd. (India) | | | 2.9 | |
| | |
Baidu, Inc., Class A (China) | | | 2.8 | |
| | |
Yum China Holdings, Inc. (China) | | | 2.7 | |
| | |
Bank Mandiri Persero Tbk PT (Indonesia) | | | 2.6 | |
| | |
Trip.com Group, Ltd., ADR (China) | | | 2.6 | |
| | |
SK Hynix, Inc. (South Korea) | | | 2.6 | |
| | | | | |
| | |
Top Ten as a Group | | | 40.9 | |
| | | | |
Because a fund’s strategy may result in multiple investments in particular sectors of the economy, its performance may depend on the performance of those sectors and may fluctuate more widely than investments diversified across more sectors. For additional information on these and other risk considerations, please see the Fund’s prospectus.
Any sectors, industries, or securities discussed should not be perceived as investment recommendations. Mention of a specific security should not be considered a recommendation to buy or solicitation to sell that security. Specific securities mentioned in this report may have been sold from the Fund’s portfolio of investments by the time you receive this report.
15
| | |
| | | AMG GW&K Emerging Markets Equity Fund Schedule of Portfolio Investments October 31, 2023 |
| | | |
| | | |
| | | | | | | | |
| | | Shares | | | Value | |
| | |
Common Stocks - 98.3% | | | | | | | | |
| | |
Communication Services - 11.6% | | | | | | | | |
| | |
Baidu, Inc., Class A (China)* | | | 42,316 | | | | $555,559 | |
| | |
Kanzhun, Ltd., ADR (China)* | | | 18,600 | | | | 275,280 | |
| | |
Kingsoft Corp., Ltd. (China) | | | 55,800 | | | | 194,713 | |
| | |
Kuaishou Technology (China)*,1 | | | 29,500 | | | | 189,975 | |
| | |
MultiChoice Group (South Africa)* | | | 13,958 | | | | 52,282 | |
| | |
NetEase, Inc. (China) | | | 10,425 | | | | 223,111 | |
| | |
Tencent Holdings, Ltd. (China) | | | 19,106 | | | | 707,089 | |
| | |
Tencent Music Entertainment Group, ADR (China)* | | | 14,772 | | | | 107,245 | |
| | |
Total Communication Services | | | | | | | 2,305,254 | |
| | |
Consumer Discretionary - 17.6% | | | | | | | | |
| | |
Alibaba Group Holding, Ltd. (China)* | | | 48,928 | | | | 503,718 | |
| | |
Americana Restaurants International PLC (United Arab Emirates) | | | 91,300 | | | | 92,234 | |
| | |
Feng TAY Enterprise Co., Ltd. (Taiwan) | | | 47,437 | | | | 261,939 | |
| | |
H World Group Ltd., ADR (China)* | | | 5,150 | | | | 193,949 | |
| | |
Haidilao International Holding, Ltd. (China)1 | | | 47,000 | | | | 117,679 | |
| | |
Li Ning Co., Ltd. (China) | | | 63,000 | | | | 193,057 | |
| | |
MakeMyTrip, Ltd. (India)* | | | 11,748 | | | | 455,000 | |
| | |
Mitra Adiperkasa Tbk PT (Indonesia) | | | 947,099 | | | | 103,445 | |
| | |
Pepco Group, N.V. (United Kingdom)* | | | 13,230 | | | | 53,623 | |
| | |
Sands China, Ltd. (Macau)* | | | 128,750 | | | | 346,601 | |
| | |
Shenzhou International Group Holdings, Ltd. (China) | | | 10,460 | | | | 102,743 | |
| | |
Trip.com Group, Ltd., ADR (China)* | | | 15,177 | | | | 516,018 | |
| | |
Yum China Holdings, Inc. (China) | | | 10,367 | | | | 544,889 | |
| | |
Total Consumer Discretionary | | | | | | | 3,484,895 | |
| | |
Consumer Staples - 9.1% | | | | | | | | |
| | |
Angel Yeast Co., Ltd., Class A (China) | | | 14,100 | | | | 67,416 | |
| | |
Bid Corp., Ltd. (South Africa) | | | 10,593 | | | | 224,728 | |
| | |
By-health Co., Ltd., Class A (China) | | | 55,400 | | | | 138,705 | |
| | |
CP All PCL (Thailand) | | | 48,168 | | | | 74,028 | |
| | |
CP All PCL, Foreign Shares (Thailand) | | | 4,900 | | | | 7,486 | |
| | |
Dino Polska, S.A. (Poland)*,1,2 | | | 926 | | | | 87,743 | |
| | |
Fomento Economico Mexicano, S.A.B de CV (Mexico) | | | 35,096 | | | | 396,803 | |
| | |
Orion Corp. (South Korea) | | | 1,735 | | | | 153,556 | |
| | |
Proya Cosmetics Co., Ltd., Class A (China) | | | 10,800 | | | | 153,346 | |
| | |
Sumber Alfaria Trijaya Tbk PT (Indonesia) | | | 568,600 | | | | 103,447 | |
| | |
Vietnam Dairy Products JSC (Vietnam) | | | 23,700 | | | | 65,640 | |
| | |
Wal-Mart de Mexico, S.A.B. de CV (Mexico) | | | 72,973 | | | | 261,471 | |
| | |
| | | | | | | | |
| | | | | | | | |
| | | Shares | | | Value | |
| | |
Wuliangye Yibin Co., Ltd., Class A (China) | | | 3,100 | | | | $66,081 | |
| | |
Total Consumer Staples | | | | | | | 1,800,450 | |
| | |
Energy - 4.7% | | | | | | | | |
| | |
ADNOC Drilling Co. PJSC (United Arab Emirates) | | | 163,900 | | | | 162,427 | |
| | |
Arabian Drilling Co. (Saudi Arabia)* | | | 4,000 | | | | 187,014 | |
| | |
Reliance Industries, Ltd. (India) | | | 20,988 | | | | 577,124 | |
| | |
Total Energy | | | | | | | 926,565 | |
| | |
Financials - 27.4% | | | | | | | | |
| | |
AIA Group, Ltd. (Hong Kong) | | | 47,368 | | | | 411,335 | |
| | |
Al Rajhi Bank (Saudi Arabia) | | | 4,350 | | | | 77,868 | |
| | |
B3, S.A. - Brasil Bolsa Balcao (Brazil) | | | 32,600 | | | | 72,096 | |
| | |
Banco Bradesco, S.A., ADR (Brazil) | | | 72,583 | | | | 202,507 | |
| | |
Bank Mandiri Persero Tbk PT (Indonesia) | | | 1,463,432 | | | | 522,814 | |
| | |
Bank Rakyat Indonesia Persero Tbk PT (Indonesia) | | | 777,236 | | | | 243,029 | |
| | |
BDO Unibank, Inc. (Philippines) | | | 158,488 | | | | 356,752 | |
| | |
China International Capital Corp., Ltd., Class H (China)1 | | | 204,800 | | | | 326,197 | |
| | |
Cholamandalam Investment and Finance Co., Ltd. (India) | | | 9,450 | | | | 129,141 | |
| | |
Grupo Financiero Banorte, S.A.B de CV, Class O (Mexico) | | | 41,842 | | | | 338,955 | |
| | |
HDFC Asset Management Co., Ltd. (India)1 | | | 8,809 | | | | 289,351 | |
| | |
HDFC Bank, Ltd. (India) | | | 75,879 | | | | 1,346,438 | |
| | |
HDFC Life Insurance Co., Ltd. (India)1 | | | 20,200 | | | | 150,059 | |
| | |
Hong Kong Exchanges & Clearing, Ltd. (Hong Kong) | | | 5,000 | | | | 174,913 | |
| | |
Jio Financial Services, Ltd. (India)* | | | 21,588 | | | | 56,784 | |
| | |
NU Holdings, Ltd., Class A (Brazil)* | | | 16,800 | | | | 137,760 | |
| | |
One 97 Communications, Ltd. (India)* | | | 12,500 | | | | 138,339 | |
| | |
Pagseguro Digital, Ltd., Class A (Brazil)* | | | 4,288 | | | | 30,273 | |
| | |
Ping An Insurance Group Co. of China, Ltd., Class H (China) | | | 32,000 | | | | 162,319 | |
| | |
XP, Inc., Class A (Brazil) | | | 13,206 | | | | 264,120 | |
| | |
Total Financials | | | | | | | 5,431,050 | |
| | |
Health Care - 1.8% | | | | | | | | |
| | |
China Resources Sanjiu Medical & Pharmaceutical Co., Ltd., Class A (China) | | | 16,500 | | | | 97,267 | |
| | |
Fleury, S.A. (Brazil) | | | 41,463 | | | | 123,030 | |
| | |
Lepu Medical Technology Beijing Co., Ltd., Class A (China) | | | 36,300 | | | | 85,515 | |
| | |
Syngene International, Ltd. (India)1 | | | 6,460 | | | | 52,796 | |
| | |
Total Health Care | | | | | | | 358,608 | |
| | |
| | | | | | | | |
The accompanying notes are an integral part of these financial statements.
16
| | |
| | | AMG GW&K Emerging Markets Equity Fund Schedule of Portfolio Investments (continued) |
| | | |
| | | |
| | | | | | | | |
| | |
| | | Shares | | | Value | |
| | |
Industrials - 3.7% | | | | | | | | |
| | |
Contemporary Amperex Technology Co., Ltd., Class A (China) | | | 11,160 | | | | $283,373 | |
| | |
Copa Holdings, S.A., Class A (Panama) | | | 2,350 | | | | 191,877 | |
| | |
International Container Terminal Services, Inc. (Philippines) | | | 47,000 | | | | 166,522 | |
| | |
Shenzhen Inovance Technology Co., Ltd., Class A (China) | | | 12,300 | | | | 101,672 | |
| | |
Total Industrials | | | | | | | 743,444 | |
| | |
Information Technology - 22.4% | | | | | | | | |
| | |
Advantech Co., Ltd. (Taiwan) | | | 11,898 | | | | 122,190 | |
| | |
Delta Electronics, Inc. (Taiwan) | | | 24,100 | | | | 217,187 | |
| | |
FPT Corp. (Vietnam) | | | 23,000 | | | | 77,791 | |
| | |
Globant SA (Uruguay)* | | | 1,600 | | | | 272,464 | |
| | |
Infosys, Ltd., Sponsored ADR (India) | | | 6,226 | | | | 102,231 | |
| | |
Samsung Electronics Co., Ltd. (South Korea) | | | 21,867 | | | | 1,088,427 | |
| | |
SK Hynix, Inc. (South Korea) | | | 5,884 | | | | 510,979 | |
| | |
Taiwan Semiconductor Manufacturing Co., Ltd. (Taiwan) | | | 106,632 | | | | 1,741,569 | |
| | |
Tata Consultancy Services, Ltd. (India) | | | 2,434 | | | | 98,537 | |
| | |
TOTVS, S.A. (Brazil) | | | 42,000 | | | | 210,927 | |
| | |
Total Information Technology | | | | | | | 4,442,302 | |
| | |
Total Common Stocks
(Cost $16,882,279) | | | | | | | 19,492,568 | |
| | |
| | | | | | | | |
| * | Non-income producing security. |
| 1 | Security exempt from registration under Rule 144A of the Securities Act of 1933. This security may be resold in transactions exempt from registration, normally to qualified institutional buyers. At October 31, 2023, the value of these securities amounted to $1,213,800 or 6.1% of net assets. |
| 2 | Some of these securities, amounting to $65,760 or 0.3% of net assets, were out on loan to various borrowers and are collateralized by cash. See Note 4 of Notes to Financial Statements. |
| | | | | | | | |
| | |
| | | Principal
Amount | | | Value | |
| |
Short-Term Investments - 1.8% | | | | | |
| |
Joint Repurchase Agreements - 0.3%3 | | | | | |
| | |
Industrial and Commercial Bank of China Financial Services LLC, dated 10/31/23, due 11/01/23, 5.340% total to be received $68,062 (collateralized by various U.S. Treasuries, 0.000% - 7.625%, 11/02/23 - 08/15/53, totaling $69,413) | | | $68,052 | | | | $68,052 | |
| | |
Repurchase Agreements - 1.5% | | | | | | | | |
| | |
Fixed Income Clearing Corp., dated 10/31/23 due 11/01/23, 5.150% total to be received $291,042 (collateralized by a U.S. Treasury, 3.500%, 04/30/30, totaling $296,827) | | | 291,000 | | | | 291,000 | |
| | |
Total Short-Term Investments
(Cost $359,052) | | | | | | | 359,052 | |
| | |
Total Investments - 100.1%
(Cost $17,241,331) | | | | | | | 19,851,620 | |
| |
Other Assets, less Liabilities - (0.1)% | | | | (18,618 | ) |
| | |
Net Assets - 100.0% | | | | | | | $19,833,002 | |
| | |
| | | | | | | | |
| 3 | Cash collateral received for securities lending activity was invested in these joint repurchase agreements. |
ADR American Depositary Receipt
The accompanying notes are an integral part of these financial statements.
17
| | |
| | | AMG GW&K Emerging Markets Equity Fund Schedule of Portfolio Investments (continued) |
| | | |
| | | |
The following table summarizes the inputs used to value the Fund’s investments by the fair value hierarchy levels as of October 31, 2023:
| | | | | | | | | | | | | | | | |
| | | Level 1 | | | Level 21 | | | Level 3 | | | Total | |
| | | | |
Investments in Securities | | | | | | | | | | | | | | | | |
| | | | |
Common Stocks | | | | | | | | | | | | | | | | |
| | | | |
Financials | | | $1,102,495 | | | | $4,328,555 | | | | — | | | | $5,431,050 | |
| | | | |
Information Technology | | | 585,622 | | | | 3,856,680 | | | | — | | | | 4,442,302 | |
| | | | |
Consumer Discretionary | | | 1,905,535 | | | | 1,579,360 | | | | — | | | | 3,484,895 | |
| | | | |
Communication Services | | | 434,807 | | | | 1,870,447 | | | | — | | | | 2,305,254 | |
| | | | |
Consumer Staples | | | 986,449 | | | | 814,001 | | | | — | | | | 1,800,450 | |
| | | | |
Energy | | | 349,441 | | | | 577,124 | | | | — | | | | 926,565 | |
| | | | |
Industrials | | | 191,877 | | | | 551,567 | | | | — | | | | 743,444 | |
| | | | |
Health Care | | | 305,812 | | | | 52,796 | | | | — | | | | 358,608 | |
| | | | |
Short-Term Investments | | | | | | | | | | | | | | | | |
| | | | |
Joint Repurchase Agreements | | | — | | | | 68,052 | | | | — | | | | 68,052 | |
| | | | |
Repurchase Agreements | | | — | | | | 291,000 | | | | — | | | | 291,000 | |
| | | | | | | | | | | | | | | | |
Total Investments in Securities | | $ | 5,862,038 | | | $ | 13,989,582 | | | | — | | | $ | 19,851,620 | |
| | | | | | | | | | | | | | | | |
| 1 | An external pricing service is used to reflect any impact on security value due to market movements between the time the Fund valued such foreign securities and the earlier closing of foreign markets. |
For the fiscal year ended October 31, 2023, there were no transfers in or out of Level 3.
The country allocation in the Schedule of Portfolio Investments at October 31, 2023, was as follows:
| | |
| Country | | % of Long-Term
Investments |
| |
Brazil | | 5.3 |
| |
China | | 30.3 |
| |
Hong Kong | | 3.0 |
| |
India | | 17.4 |
| |
Indonesia | | 5.0 |
| |
Macau | | 1.8 |
| |
Mexico | | 5.1 |
| |
Panama | | 1.0 |
| |
Philippines | | 2.7 |
| |
Poland | | 0.5 |
| |
Saudi Arabia | | 1.4 |
| | |
| Country | | % of Long-Term
Investments |
| |
South Africa | | 1.4 |
| |
South Korea | | 9.0 |
| |
Taiwan | | 12.0 |
| |
Thailand | | 0.4 |
| |
United Arab Emirates | | 1.3 |
| |
United Kingdom | | 0.3 |
| |
Uruguay | | 1.4 |
| |
Vietnam | | 0.7 |
| | |
| |
| | 100.0 |
| | |
The accompanying notes are an integral part of these financial statements.
18
| | |
| | | AMG GW&K Emerging Wealth Equity Fund Portfolio Manager’s Comments (unaudited) |
| | | |
| | | |
| | | | | | | | |
MARKET OVERVIEW Emerging markets advanced in choppy trading during the fiscal year ended October 31, 2023. The period started on a positive note, as China abandoned its restrictive zero-COVID policy and Eastern Europe rallied on the Continent’s improving energy security situation despite sanctions on Russian gas imports. Sentiment shifted later in the fiscal year, however, due to mounting problems in China’s property market, elevated U.S. yields, and volatile energy prices. The MSCI Emerging Markets Index gained 10.80%, slightly ahead of the MSCI World Index of developed markets, which was up 10.50%. Asia was the standout performer regionally led by tech heavy Taiwan, which rose sharply on an artificial intelligence (AI) hype-driven rally in semiconductors and hardware. China surged early in the period as the abrupt end to its zero-COVID policy drove investment flows back into the market, and the government softened its regulatory offensive targeting several industries. But the country’s macro challenges were deeper than expected and the rally faded as the year progressed. A short seller report on Indian conglomerate Adani Enterprises Ltd. (not held in the Fund), which forced the company to abandon a follow-on public share offering, capped gains in the country’s equity indexes. Mexico delivered surprisingly good Gross Domestic Product (GDP) and earnings growth throughout the period, driven by local consumption and U.S. exports. Brazilian equities were volatile as investors weighed the impact of policy changes under President Lula against the potential for aggressive interest rate cuts. The Europe, Middle East and Africa (EMEA) region declined modestly due to weakness across the Persian Gulf oil and gas producers, though Eastern Europe remained well bid as the threat of an energy shortage eased considerably. Turkey gained substantially on easing geopolitical tensions with its NATO allies and marked shift to more orthodox economic policies following President Erdogan’s reelection. The sector leaders were information technology, with semiconductors a key contributor, | | | | communication services and consumer discretionary, which gained on China reopening optimism. Utilities declined due to steep losses in Adani Enterprises’ listed subsidiaries in India. Materials and industrials were also notable underperformers. FUND REVIEW For the fiscal year ending October 31, 2023, the AMG GW&K Emerging Wealth Equity Fund’s (the “Fund”) Class N Shares returned 14.50%, outperforming the MSCI Emerging Markets Index, which returned 10.80%. This was primarily due to our strategic focus on the benefits of wealth creation in emerging markets, which generally leads to higher portfolio exposure in consumer-related industries and China. Both market segments outperformed materially over the past 12 months, causing sector and country allocation to positively impact the Fund’s relative performance. In addition, the Fund generated strong stock selection relative to the index. Macau resort operator Sands China, Ltd. soared on the elimination of most COVID-related travel restrictions and the long-awaited renewal of its casino license. Online travel platform Trip.com Group, Ltd. also rallied on the resumption of leisure activity in mainland China, while hotel operator H World Group, Ltd. reported that preliminary second quarter revenue per room reached 121% of 2019 levels. Tencent Holdings, Ltd. finished the period higher on easing regulatory scrutiny, the surprise approval of several new video games, and improved advertising revenue growth. Conversely, fading demand for certain products in China had a negative impact on sporting goods specialist Li Ning Co., Ltd. and cosmetic company Estee Lauder Cos., Inc. Both reported disappointing third-quarter results and reduced 2023 full-year guidance. The Adani Enterprises saga weighed on the portfolio’s financial holdings in India. Kotak Mahindra Bank, Ltd. declined on the news despite strong fourth quarter earnings and a favorable outlook for loan growth. QUALCOMM, Inc., a specialist in mobile device semiconductors, declined on slowing handset orders globally. | | | | OUTLOOK We remain optimistic about the extended outlook for emerging markets but are mindful of the near-term risks facing capital markets globally, including the impact of aggressive interest rate hikes across developed markets, economic challenges facing China, and geopolitical tension. This is balanced against several factors that support our positive view of the longer-term growth and performance potential of emerging markets. China’s compelling valuation combined with the government’s renewed focus on domestically driven growth make it one of the more attractive markets globally. Additionally, many emerging markets have relatively high real interest rates and have already begun to pivot policy to support credit expansion. Other structural tailwinds include intraregional trade and diversification of supply chains, which should benefit countries like India and Mexico. At the end of October, the MSCI Emerging Markets Index traded at 11.0 times forward earnings, which represented a notable 37% discount relative to the MSCI USA Index. Although further bouts of volatility are possible, we believe emerging markets will reward investors willing to take the long-term view. With respect to the Fund’s structure, trading and market activity during the fiscal year resulted in increased exposure to consumer discretionary, financials, information technology, communication services, and consumer staples, while industrials, materials, and health care declined. Geographically, the portfolio finished the fiscal year with exposures of 82% in emerging markets Asia, 14% in developed markets, 4% in emerging markets Latin America, and 0% in EM EMEA. The views expressed represent the opinions of GW&K Investment Management, LLC as of October 31, 2023, and are not intended as a forecast or guarantee of future results, and are subject to change without notice. |
19
| | |
| | | AMG GW&K Emerging Wealth Equity Fund Portfolio Manager’s Comments (continued) |
| | | |
| | | |
CUMULATIVE TOTAL RETURN PERFORMANCE
AMG GW&K Emerging Wealth Equity Fund’s cumulative total return is based on the daily change in net asset value (NAV), and assumes that all dividends and distributions were reinvested. This graph compares a hypothetical $10,000 investment made in the AMG GW&K Emerging Wealth Equity Fund’s Class N shares on March 19, 2015 (inception date), to a $10,000 investment made in the MSCI Emerging Markets Index for the same time period. The graph and table do not reflect the deduction of taxes that a shareholder would pay on a Fund distribution or redemption of shares. The listed returns for the Fund are net of expenses and the returns for the index exclude expenses. Total returns would have been lower had certain expenses not been reduced.
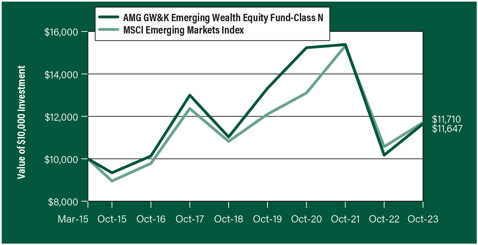
The table below shows the average annual total returns for the AMG GW&K Emerging Wealth Equity Fund and the MSCI Emerging Markets Index for the same time periods ended October 31, 2023.
| | | | | | | | |
| | | One | | Five | | Since | | Inception |
| Average Annual Total Returns1 | | Year | | Years | | Inception | | Date |
|
AMG GW&K Emerging Wealth Equity Fund2, 3, 4, 5, 6, 7, 8, 9, 10, 11, 12, 13, 14, 15, 16, 17, 18, 19 |
| | | | |
Class N | | 14.50% | | 1.10% | | 1.79% | | 03/19/15 |
| | | | |
Class I | | 14.75% | | 1.37% | | 2.05% | | 03/19/15 |
| | | | |
Class Z | | 14.88% | | 1.49% | | 2.16% | | 03/19/15 |
| | | | |
MSCI Emerging Markets Index20 | | 10.80% | | 1.59% | | 1.85% | | 03/19/15† |
The performance data shown represents past performance. Past performance is not a guarantee of future results. Current performance may be lower or higher than the performance data quoted. The investment return and principal value of an investment will fluctuate so that an investor’s shares, when redeemed, may be worth more or less than their original cost.
Investors should carefully consider the Fund’s investment objectives, risks, charges and expenses before investing. For performance information through the most recent month end, current net asset values per share for the Fund and other information, please call 800.548.4539 or visit our website at wealth.amg.com for a free prospectus. Read it carefully before investing or sending money.
Distributed by AMG Distributors, Inc., member FINRA/SIPC.
| † | Date reflects inception date of the Fund, not the index. |
| 1 | Total return equals income yield plus share price change and assumes reinvestment of all dividends and capital gain distributions. Returns are net of fees and may reflect offsets of Fund expenses as described in the prospectus. No adjustment has been made for taxes payable by shareholders on their reinvested dividends and |
|
capital gain distributions. Returns for periods greater than one year are annualized. The listed returns on the Fund are net of expenses and based on the published NAV as of October 31, 2023. All returns are in U.S. Dollars ($). 2 Market prices of investments held by the Fund may fall rapidly or unpredictably due to a variety of factors, including economic, political, or market conditions, or other factors including terrorism, war, natural disasters and the spread of infectious illness or other public health issues, including epidemics or pandemics, or in response to events that affect particular industries or companies. 3 Because the Fund is an actively managed investment portfolio, security selection or focus on securities in a particular style, market sector or group of companies may cause the Fund to incur losses or underperform relative to its benchmark or other funds with a similar investment objective. There can be no guarantee that the Subadviser’s investment techniques and risk analysis will produce the desired result. 4 Investments in foreign issuers involve additional risks (such as risks arising from less frequent trading, changes in political or social conditions, and less publicly available information about non-U.S. issuers) that differ from those associated with investments in U.S. issuers and may result in greater price volatility. 5 Investments in emerging markets are subject to the general risks of foreign investments, as well as additional risks which can result in greater price volatility. Such additional risks include the risk that markets in emerging market countries are typically less developed and less liquid than markets in developed countries and such markets are subjected to increased economic, political, or regulatory uncertainties. 6 Changes in the general political and social environment of a country can have substantial effects on the value of investments exposed to that country. 7 To the extent the Fund focuses its investments in a particular country, group of countries or geographic region, the Fund is particularly susceptible to economic, political, regulatory or other events or conditions affecting such countries or region, and the Fund’s NAV may be more volatile than the NAV of a more geographically diversified fund and may result in losses. The Fund is particularly susceptible to risks in the Greater China region, which consists of Hong Kong, The People’s Republic of China and Taiwan, among other countries. Economies in the Greater China region are dependent on the economies of other countries and can be significantly affected by currency fluctuations and increasing competition |
20
| | |
| | | AMG GW&K Emerging Wealth Equity Fund Portfolio Manager’s Comments (continued) |
| | | |
| | | |
| | | | | | | | |
from other emerging economies in Asia with lower costs. Adverse events in any one country within the region may impact the other countries in the region or Asia as a whole. Markets in the Greater China region can experience significant volatility due to social, economic, regulatory and political uncertainties. Significant portions of the Chinese securities markets may become rapidly illiquid, as Chinese issuers have the ability to suspend the trading of their equity securities, and have shown a willingness to exercise that option in response to market volatility and other events. U.S. or foreign government restrictions or intervention could negatively affect the implementation of the Fund’s investment strategies, for example by precluding the Fund from making certain investments or causing the Fund to sell investments at disadvantageous times. China has yet to develop comprehensive securities, corporate, or commercial laws, its market is relatively new and less developed, and its economy may be adversely impacted by a slowdown in export growth. 8 The Fund may gain investment exposure to certain Chinese companies through variable interest entity (“VIE”) structures. A VIE structure enables foreign investors, such as the Fund, to obtain investment exposure to a Chinese company in situations in which the Chinese government has limited or prohibited non-Chinese ownership of such company. A VIE does not have equity ownership in its corresponding China-based company but has claims to the China-based company’s profits and control of its assets through contractual arrangements. VIEs are a common industry practice and well known to officials and regulators in China; however, VIEs are not formally recognized under Chinese law. If the Chinese government takes action adversely affecting VIEs, the market value of the Fund’s associated portfolio holdings would likely suffer significant, detrimental, and possibly permanent consequences, which could result in substantial investment losses. | | | | 9 Fluctuations in exchange rates may affect the total loss or gain on a non-U.S. dollar investment when converted back to U.S. dollars and exposure to non-U.S. currencies may subject the Fund to the risk that those currencies will decline in value relative to the U.S. dollar. 10 The use of derivatives involves costs, the risk that the value of derivatives may not correlate perfectly with their underlying assets, rates or indices, liquidity risk, and the risk of mispricing or improper valuation. The use of derivatives may not succeed for various reasons, and the complexity and rapidly changing structure of derivatives markets may increase the possibility of market losses. 11 The counterparty to a derivatives contract may be unable or unwilling, or may be perceived as unable or unwilling, to make timely interest, principal or settlement payments or otherwise honor its obligations. 12 Borrowing and some derivative investments such as futures, forward commitment transactions and swaps may magnify smaller adverse market movements into relatively larger losses. 13 The prices of equity securities of companies that are expected to experience relatively rapid earnings growth, or “growth stocks,” may be more sensitive to market movements because the prices tend to reflect future investor expectations rather than just current profits. 14 The prices of stocks purchased in initial public offerings (“IPOs”) can be very volatile and tend to fluctuate more widely than stocks of companies that have been publicly traded for a longer period of time. The effect of IPOs on the Fund’s performance depends on a variety of factors. 15 The stocks of large-capitalization companies are generally more mature and may not be able to reach the same levels of growth as the stocks of small- or mid-capitalization companies. | | | | 16 The stocks of small- and mid-capitalization companies often have greater price volatility, lower trading volume, and less liquidity than the stocks of larger, more established companies. 17 An investment in participatory notes is subject to market risk. The performance results of participatory notes may not exactly replicate the performance of the underlying securities. An investment in participatory notes is also subject to counterparty risk, relating to the non-U.S. bank or broker-dealer that issues the participatory notes, and may be subject to liquidity risk. 18 Issuers and companies that are in similar industry sectors may be similarly affected by particular economic or market events; to the extent the Fund has substantial holdings within a particular sector, the risks associated with that sector increase. 19 The Fund may not be able to dispose of particular investments, such as illiquid securities, readily at favorable times or prices or the Fund may have to sell them at a loss. 20 The MSCI Emerging Markets Index is a free float-adjusted market capitalization index that is designed to measure equity market performance of emerging markets. Please go to msci.com for most current list of countries represented by the index. Unlike the Fund, the MSCI Emerging Markets Index is unmanaged, is not available for investment and does not incur expenses. All MSCI data is provided “as is.” The products described herein are not sponsored or endorsed and have not been reviewed or passed on by MSCI. In no event shall MSCI, its affiliates or any MSCI data provider have any liability of any kind in connection with the MSCI data or the products described herein. Copying or redistributing the MSCI data is strictly prohibited. Not FIDC insured, nor bank guaranteed. May lose value. |
21
| | |
| | | AMG GW&K Emerging Wealth Equity Fund Fund Snapshots (unaudited) |
| | | October 31, 2023 |
| | | |
| | | |
PORTFOLIO BREAKDOWN
| | | | | |
| Sector | | % of
Net Assets |
| | |
Consumer Discretionary | | 34.3 |
| | |
Financials | | 28.7 |
| | |
Information Technology | | 14.6 |
| | |
Communication Services | | 10.7 |
| | |
Consumer Staples | | 10.1 |
| | |
Industrials | | 3.0 |
| | |
Materials | | 2.0 |
| | |
Health Care | | 0.5 |
| | |
Other Assets, less Liabilities | | (3.9) |
TOP TEN HOLDINGS
| | | | |
| Security Name | | % of
Net Assets | |
| | |
Taiwan Semiconductor Manufacturing Co., Ltd. (Taiwan) | | | 6.2 | |
| | |
Sands China, Ltd. (Macau) | | | 5.9 | |
| | |
Trip.com Group, Ltd. (China) | | | 5.1 | |
| | |
Alibaba Group Holding, Ltd. (China) | | | 4.6 | |
| | |
AIA Group, Ltd. (Hong Kong) | | | 4.5 | |
| | |
Kotak Mahindra Bank, Ltd. (India) | | | 4.5 | |
| | |
Tencent Holdings, Ltd. (China) | | | 4.4 | |
| | |
QUALCOMM, Inc. | | | 4.1 | |
| | |
Infineon Technologies AG (Germany) | | | 4.1 | |
| | |
HDFC Bank, Ltd., ADR (India) | | | 4.0 | |
| | | | | |
| | |
Top Ten as a Group | | | 47.4 | |
| | | | |
Because a fund’s strategy may result in multiple investments in particular sectors of the economy, its performance may depend on the performance of those sectors and may fluctuate more widely than investments diversified across more sectors. For additional information on these and other risk considerations, please see the Fund’s prospectus.
Any sectors, industries, or securities discussed should not be perceived as investment recommendations. Mention of a specific security should not be considered a recommendation to buy or solicitation to sell that security. Specific securities mentioned in this report may have been sold from the Fund’s portfolio of investments by the time you receive this report.
22
| | |
| | | AMG GW&K Emerging Wealth Equity Fund Schedule of Portfolio Investments October 31, 2023 |
| | | |
| | | |
| | | | | | | | |
| | | Shares | | | Value | |
| | |
Common Stocks - 103.9% | | | | | | | | |
| | |
Communication Services - 10.7% | | | | | | | | |
| | |
Baidu, Inc., Class A (China)* | | | 171,000 | | | | $2,245,026 | |
| | |
Kanzhun, Ltd., ADR (China)* | | | 55,000 | | | | 814,000 | |
| | |
Kuaishou Technology (China)*,1 | | | 22,100 | | | | 142,321 | |
| | |
Tencent Holdings, Ltd. (China) | | | 74,740 | | | | 2,766,034 | |
| | |
The Walt Disney Co. (United States)* | | | 9,603 | | | | 783,509 | |
| | |
Total Communication Services | | | | | | | 6,750,890 | |
| | |
Consumer Discretionary - 34.3% | | | | | | | | |
| | |
Alibaba Group Holding, Ltd. (China)* | | | 285,148 | | | | 2,935,621 | |
| | |
Eicher Motors, Ltd. (India) | | | 5,810 | | | | 229,948 | |
| | |
H World Group Ltd., ADR (China)* | | | 55,759 | | | | 2,099,884 | |
| | |
Haidilao International Holding, Ltd. (China)1 | | | 718,000 | | | | 1,797,733 | |
| | |
Hermes International SCA (France) | | | 225 | | | | 419,811 | |
| | |
Jubilant Foodworks, Ltd. (India) | | | 126,410 | | | | 760,621 | |
| | |
Li Ning Co., Ltd. (China) | | | 352,000 | | | | 1,078,670 | |
| | |
LVMH Moet Hennessy Louis Vuitton SE (France) | | | 393 | | | | 281,361 | |
| | |
MakeMyTrip, Ltd. (India)* | | | 41,509 | | | | 1,607,644 | |
| | |
Moncler SpA (Italy) | | | 7,203 | | | | 374,103 | |
| | |
Sands China, Ltd. (Macau)* | | | 1,382,890 | | | | 3,722,808 | |
| | |
Titan Co., Ltd. (India) | | | 21,760 | | | | 834,186 | |
| | |
Trip.com Group, Ltd. (China)* | | | 94,642 | | | | 3,225,553 | |
| | |
Tube Investments of India, Ltd. (India) | | | 13,100 | | | | 495,595 | |
| | |
Yum China Holdings, Inc. (China) | | | 35,778 | | | | 1,880,492 | |
| | |
Total Consumer Discretionary | | | | | | | 21,744,030 | |
| | |
Consumer Staples - 10.1% | | | | | | | | |
| | |
By-health Co., Ltd., Class A (China) | | | 207,061 | | | | 518,419 | |
| | |
The Estee Lauder Cos., Inc., Class A (United States) | | | 6,890 | | | | 887,914 | |
| | |
Foshan Haitian Flavouring & Food Co., Ltd., Class A (China) | | | 122,052 | | | | 628,142 | |
| | |
Kweichow Moutai Co., Ltd., Class A (China) | | | 4,900 | | | | 1,128,489 | |
| | |
Proya Cosmetics Co., Ltd., Class A (China) | | | 37,200 | | | | 528,191 | |
| | |
Wal-Mart de Mexico, S.A.B. de CV (Mexico) | | | 125,070 | | | | 448,140 | |
| | |
Wuliangye Yibin Co., Ltd., Class A (China) | | | 104,853 | | | | 2,235,092 | |
| | |
Total Consumer Staples | | | | | | | 6,374,387 | |
| | |
Financials - 28.7% | | | | | | | | |
| | |
AIA Group, Ltd. (Hong Kong) | | | 331,130 | | | | 2,875,469 | |
| | |
Banco Bradesco, S.A., ADR (Brazil) | | | 256,600 | | | | 715,914 | |
| | |
Bank Central Asia Tbk PT (Indonesia) | | | 617,800 | | | | 340,359 | |
| | |
| | | | | | | | |
| | | | | | | | |
| | | Shares | | | Value | |
| | |
China International Capital Corp., Ltd., Class H (China)1 | | | 1,442,500 | | | | $2,297,551 | |
| | |
Cholamandalam Investment and Finance Co., Ltd. (India) | | | 38,500 | | | | 526,131 | |
| | |
HDFC Asset Management Co., Ltd. (India)1 | | | 28,217 | | | | 926,850 | |
| | |
HDFC Bank, Ltd., ADR (India) | | | 44,773 | | | | 2,531,913 | |
| | |
HDFC Life Insurance Co., Ltd. (India)1 | | | 157,320 | | | | 1,168,679 | |
| | |
Hong Kong Exchanges & Clearing, Ltd. (Hong Kong) | | | 37,850 | | | | 1,324,093 | |
| | |
Kotak Mahindra Bank, Ltd. (India) | | | 137,226 | | | | 2,868,686 | |
| | |
Mastercard, Inc., Class A (United States) | | | 2,670 | | | | 1,004,854 | |
| | |
NU Holdings, Ltd., Class A (Brazil)* | | | 115,400 | | | | 946,280 | |
| | |
One 97 Communications, Ltd. (India)* | | | 57,500 | | | | 636,357 | |
| | |
Total Financials | | | | | | | 18,163,136 | |
| | |
Health Care - 0.5% | | | | | | | | |
| | |
China Resources Sanjiu Medical & Pharmaceutical Co., Ltd., Class A (China) | | | 55,612 | | | | 327,831 | |
| | |
Industrials - 3.0% | | | | | | | | |
| | |
Contemporary Amperex Technology Co., Ltd., Class A (China) | | | 42,880 | | | | 1,088,801 | |
| | |
Copa Holdings, S.A., Class A (Panama) | | | 2,595 | | | | 211,882 | |
| | |
Shenzhen Inovance Technology Co., Ltd., Class A (China) | | | 69,000 | | | | 570,354 | |
| | |
Total Industrials | | | | | | | 1,871,037 | |
| | |
Information Technology - 14.6% | | | | | | | | |
| | |
Beijing Kingsoft Office Software, Inc., Class A (China) | | | 5,675 | | | | 223,213 | |
| | |
Infineon Technologies AG (Germany) | | | 87,795 | | | | 2,564,511 | |
| | |
QUALCOMM, Inc. (United States) | | | 23,624 | | | | 2,574,780 | |
| | |
Taiwan Semiconductor Manufacturing Co., Ltd. (Taiwan) | | | 239,500 | | | | 3,911,638 | |
| | |
Total Information Technology | | | | | | | 9,274,142 | |
| | |
Materials - 2.0% | | | | | | | | |
| | |
Asian Paints, Ltd. (India) | | | 20,028 | | | | 721,433 | |
| | |
Skshu Paint Co., Ltd., Class A (China)* | | | 67,938 | | | | 553,003 | |
| | |
Total Materials | | | | | | | 1,274,436 | |
| | |
Total Common Stocks
(Cost $64,562,694) | | | | | | | 65,779,889 | |
| | |
Total Investments - 103.9%
(Cost $64,562,694) | | | | | | | 65,779,889 | |
| |
Other Assets, less Liabilities - (3.9)% | | | | (2,483,342 | ) |
| | |
Net Assets - 100.0% | | | | | | | $63,296,547 | |
| | |
| | | | | | | | |
The accompanying notes are an integral part of these financial statements.
23
| | |
| | | AMG GW&K Emerging Wealth Equity Fund Schedule of Portfolio Investments (continued) |
| | | |
| | | |
| * | Non-income producing security. |
| 1 | Security exempt from registration under Rule 144A of the Securities Act of 1933. This security may be resold in transactions exempt from registration, normally to qualified institutional buyers. At October 31, 2023, the value of these securities amounted to $6,333,134 or 10.0% of net assets. |
ADR American Depositary Receipt
The following table summarizes the inputs used to value the Fund’s investments by the fair value hierarchy levels as of October 31, 2023:
| | | | | | | | | | | | | | | | |
| | | Level 1 | | | Level 21 | | | Level 3 | | | Total | |
Investments in Securities | | | | | | | | | | | | | | | | |
| | | | |
Common Stocks | | | | | | | | | | | | | | | | |
| | | | |
Consumer Discretionary | | | $5,588,020 | | | | $16,156,010 | | | | — | | | | $21,744,030 | |
| | | | |
Financials | | | 5,198,961 | | | | 12,964,175 | | | | — | | | | 18,163,136 | |
| | | | |
Information Technology | | | 2,574,780 | | | | 6,699,362 | | | | — | | | | 9,274,142 | |
| | | | |
Communication Services | | | 1,597,509 | | | | 5,153,381 | | | | — | | | | 6,750,890 | |
| | | | |
Consumer Staples | | | 1,336,054 | | | | 5,038,333 | | | | — | | | | 6,374,387 | |
| | | | |
Industrials | | | 211,882 | | | | 1,659,155 | | | | — | | | | 1,871,037 | |
| | | | |
Materials | | | — | | | | 1,274,436 | | | | — | | | | 1,274,436 | |
| | | | |
Health Care | | | 327,831 | | | | — | | | | — | | | | 327,831 | |
| | | | | | | | | | | | | | | | |
Total Investments in Securities | | $ | 16,835,037 | | | $ | 48,944,852 | | | | — | | | $ | 65,779,889 | |
| | | | | | | | | | | | | | | | |
| 1 | An external pricing service is used to reflect any impact on security value due to market movements between the time the Fund valued such foreign securities and the earlier closing of foreign markets. |
For the fiscal year ended October 31, 2023, there were no transfers in or out of Level 3.
The country allocation in the Schedule of Portfolio Investments at October 31, 2023, was as follows:
| | |
| Country | | % of Long-Term
Investments |
| |
Brazil | | 2.5 |
| |
China | | 44.2 |
| |
France | | 1.1 |
| |
Germany | | 3.9 |
| |
Hong Kong | | 6.4 |
| |
India | | 20.2 |
| |
Indonesia | | 0.5 |
| |
Italy | | 0.6 |
| |
Macau | | 5.7 |
| |
Mexico | | 0.7 |
| |
Panama | | 0.3 |
| |
Taiwan | | 5.9 |
| |
United States | | 8.0 |
| | |
| |
| | 100.0 |
| | |
The accompanying notes are an integral part of these financial statements.
24
| | |
| | | AMG GW&K Small/Mid Cap Growth Fund Portfolio Manager’s Comments (unaudited) |
| | | |
| | | |
| | | | | | | | |
AMG GW&K Small/Mid Cap Growth Fund (the “Fund”) Class N shares outperformed its benchmark for the 12 months ended October 31, 2023, returning 1.12% vs. the Russell 2500® Growth Index (the “Index”) return of -4.80%. MARKET OVERVIEW For the year ending October 31, 2023, U.S. equity markets saw bifurcated performance results that were heavily influenced by market capitalization. Recession fears driven by the U.S. Federal Reserve’s (the “Fed”) higher-for-longer policy, geopolitical tensions, and artificial intelligence (AI) excitement concentrated investor focus on the Magnificent Seven mega cap growth stocks, positioning the broader domestic equity universe to provide mixed performance results. In the narrow market environment, Alphabet, Amazon, Apple, Meta, Microsoft, NVIDIA, and Tesla provided 8.2% of the 10.1% increase in the S&P 500® Index while small/mid cap equities in the Russell 2500® Index moved -4.6%. Over the one-year period, small/mid cap growth and value stocks showed a similar decline, with growth outperforming value by 14 basis points. Long-duration companies in health care put the most pressure on growth while the turmoil in financials led value equities lower. Information technology was the brightest contributor for growth, while industrials provided the most positive support in value. FUND REVIEW The Fund produced a modest positive return and outperformed its benchmark during the fiscal year due primarily to strong stock selection. Health care | | | | was the largest contributor with a broad number of holdings providing meaningful gains. In biopharma, a focus on companies with promising new products and late-stage clinical pipelines saw Crinetics Pharmaceuticals, Inc. rise 50.7% on favorable trial results, and attracted takeover bids for Albireo Pharma, Horizon Therapeutics, and Oyster Point Pharma. Steady sales growth in proprietary products ex COVID lifted West Pharmaceutical Services 48.2% while its peer group fell -23.4%. The stock was sold during the fiscal year. Abiomed, Inc., a leading provider of heart pumps, was acquired by Johnson & Johnson at an attractive premium. In materials, good organic growth from AptarGroup, Inc.’s high-margin pharma division and a favorable pricing environment for Eagle Materials, Inc.’s construction products drove sector outperformance. Software was the star performer in information technology, with Manhattan Associates, Inc., the Fund’s largest position, and Hubspot delivering better-than-anticipated results and guidance. HubSpot was sold during the fiscal year. Fund sectors lagging the Russell 2500® Growth Index were concentrated in the consumer area. In consumer discretionary, Revolve Group, Inc., an e-commerce retailer focused on the aspirational millennial and Gen Z customer, faced difficult comparisons and experienced results that fell short of expectations. In consumer staples, a positive | | | | contribution from each of our two holdings was offset by an underweight allocation. Looking at relative performance through a factor lens, the allocation in the Fund tilted toward higher quality stocks helped results by about 158 basis points based on an average of seven factors, with earnings stability being the most prominent. OUTLOOK Since the yield curve inverted last year, there has been a great deal of anticipation of a recession. But a funny thing happened along the way: continued economic strength. As we look toward the final months of 2023 and beyond, the question remains whether that strength can continue amid tighter financial conditions. On a positive note, compression in Price to Equity (P/E) multiples for small/mid cap growth stocks has created more attractive valuations during this narrow market leadership. As investors, we aim to be prepared for a range of economic outcomes and remain watchful for opportunities to add high quality, well managed small/mid cap growth companies to the Fund. The views expressed represent the opinions of GW&K Investment Management, LLC, as of October 31, 2023, and are not intended as a forecast or guarantee of future results and are subject to change without notice. |
25
| | |
| | | AMG GW&K Small/Mid Cap Growth Fund Portfolio Manager’s Comments (continued) |
| | | |
| | | |
CUMULATIVE TOTAL RETURN PERFORMANCE
AMG GW&K Small/Mid Cap Growth Fund’s cumulative total return is based on the daily change in net asset value (NAV), and assumes that all dividends and distributions were reinvested. The graph compares a hypothetical $10,000 investment made in the AMG GW&K Small/Mid Cap Growth Fund’s Class N shares on October 31, 2013, to a $10,000 investment made in the Russell 2500® Growth Index for the same time period. The graph and table do not reflect the deduction of taxes that a shareholder would pay on a Fund distribution or redemption of shares. The listed returns for the Fund are net of expenses and the returns for the index exclude expenses. Total returns would have been lower had certain expenses not been reduced.
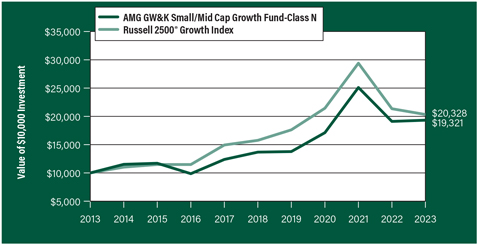
The table below shows the average annual total returns for the AMG GW&K Small/Mid Cap Growth Fund and the Russell 2500® Growth Index for the same time periods ended October 31, 2023.
| | | | | | | | | | |
| | | One | | Five | | Ten | | Since | | Inception |
| Average Annual Total Returns1 | | Year | | Years | | Years | | Inception | | Date |
|
AMG GW&K Small/Mid Cap Growth Fund2, 3, 4, 5, 6, 7, 8, 9 |
| | | | | |
Class N | | 1.12% | | 7.16% | | 6.81% | | 9.03% | | 11/03/10 |
| | | | | |
Class I | | 1.36% | | 7.35% | | 7.03% | | 7.82% | | 06/01/11 |
| | | | | |
Class Z | | 1.43% | | — | | — | | (9.93%) | | 08/31/21 |
| | | | | |
Russell 2500® Growth Index10 | | (4.80%) | | 5.22% | | 7.35% | | 9.88% | | 11/03/10† |
The performance data shown represents past performance. Past performance is not a guarantee of future results. Current performance may be lower or higher than the performance data quoted. The investment return and principal value of an investment will fluctuate so that an investor’s shares, when redeemed, may be worth more or less than their original cost.
Investors should carefully consider the Fund’s investment objectives, risks, charges and expenses before investing. For performance information through the most recent month end, current net asset values per share for the Fund and other information, please call 800.548.4539 or visit our website at wealth.amg.com for a free prospectus. Read it carefully before investing or sending money.
Distributed by AMG Distributors, Inc., member FINRA/SIPC.
† Date reflects the inception date of the Fund, not the index.
| 1 | Total return equals income yield plus share price change and assumes reinvestment of all dividends and capital gain distributions. Returns are net of fees and may reflect offsets of Fund expenses as described in the prospectus. No adjustment has been made for taxes payable by shareholders on their reinvested dividends and |
|
capital gain distributions. Returns for periods greater than one year are annualized. The listed returns on the Fund are net of expenses and based on the published NAV as of October 31, 2023. All returns are in U.S. Dollars ($). 2 As of March 19, 2021, the Fund’s subadviser was changed to GW&K Investment Management, LLC. Prior to March 19, 2021, the Fund was known as the AMG Managers LMCG Small Cap Growth Fund and had different principal investment strategies and corresponding risks. Effective March 19, 2021, the Fund changed its name to AMG GW&K Small Cap Fund II. Effective May 21, 2021, the Fund changed its name to AMG GW&K Small/Mid Cap Growth Fund and made changes to its principal investment strategies. Performance shown for periods prior to March 19, 2021, reflects the performance and investment strategies of the Fund’s previous subadviser, LMCG Investments, LLC. The Fund’s past performance would have been different if the Fund were managed by the current subadviser and strategy, and the Fund’s prior performance record might be less pertinent for investors considering whether to purchase shares of the Fund. 3 From time to time, the Fund’s adviser has waived its fees and/or absorbed Fund expenses, which has resulted in higher returns. 4 Market prices of investments held by the Fund may fall rapidly or unpredictably due to a variety of factors, including economic, political, or market conditions, or other factors including terrorism, war, natural disasters and the spread of infectious illness or other public health issues, including epidemics or pandemics, or in response to events that affect particular industries or companies. 5 Because the Fund is an actively managed investment portfolio, security selection or focus on securities in a particular style, market sector or group of companies may cause the Fund to incur losses or underperform relative to its benchmark or other funds with a similar investment objective. There can be no guarantee that the Subadviser’s investment techniques and risk analysis will produce the desired result. 6 The stocks of small- and mid-capitalization companies often have greater price volatility, lower trading volume, and less liquidity than the stocks of larger, more established companies. 7 The prices of equity securities of companies that are expected to experience relatively rapid earnings growth, or “growth stocks,” may be more sensitive to market movements because the prices tend to reflect future investor expectations rather than just current profits. 8 Issuers and companies that are in similar industry sectors may be similarly affected by particular economic or market events; to the extent the Fund |
26
| | |
| | | AMG GW&K Small/Mid Cap Growth Fund Portfolio Manager’s Comments (continued) |
| | | |
| | | |
| | | | | | | | |
has substantial holdings within a particular sector, the risks associated with that sector increase. 9 The Fund may not be able to dispose of particular investments, such as illiquid securities, readily at favorable times or prices or the Fund may have to sell them at a loss. | | | | 10 The Russell 2500® Growth Index measures the performance of the small- to mid-cap growth segment of the U.S. equity universe. It includes those Russell 2500® companies with higher price-to-book ratios and higher forecasted growth values. Unlike the Fund, the Russell 2500® Growth Index is unmanaged, is not available for investment and does not incur expenses. | | | | The Russell Indices are a trademark of the London Stock Exchange Group companies. Not FDIC insured, nor bank guaranteed. May lose value. |
27
| | |
| | | AMG GW&K Small/Mid Cap Growth Fund Fund Snapshots (unaudited) |
| | | October 31, 2023 |
| | | |
| | | |
PORTFOLIO BREAKDOWN
| | | | |
| Sector | | %of
Net Assets |
| | |
Industrials | | | 22.1 | |
| | |
Health Care | | | 21.2 | |
| | |
Information Technology | | | 18.8 | |
| | |
Consumer Discretionary | | | 15.1 | |
| | |
Energy | | | 5.7 | |
| | |
Financials | | | 5.7 | |
| | |
Materials | | | 4.2 | |
| | |
Real Estate | | | 2.4 | |
| | |
Consumer Staples | | | 1.3 | |
| | |
Short-Term Investments | | | 4.9 | |
| | |
Other Assets, less Liabilities | | | (1.4 | ) |
TOP TEN HOLDINGS
| | | | |
| Security Name | | %of
Net Assets | |
| | |
Manhattan Associates, Inc. | | | 3.5 | |
| | |
Five Below, Inc. | | | 2.3 | |
| | |
Atkore, Inc. | | | 2.2 | |
| | |
RBC Bearings, Inc. | | | 2.1 | |
| | |
Paylocity Holding Corp. | | | 2.1 | |
| | |
SiteOne Landscape Supply, Inc. | | | 2.1 | |
| | |
Matador Resources Co. | | | 2.0 | |
| | |
Texas Roadhouse, Inc. | | | 2.0 | |
| | |
Entegris, Inc. | | | 2.0 | |
| | |
Globant SA (Uruguay) | | | 2.0 | |
| | | | | |
| | |
Top Ten as a Group | | | 22.3 | |
| | | | |
Because a fund’s strategy may result in multiple investments in particular sectors of the economy, its performance may depend on the performance of those sectors and may fluctuate more widely than investments diversified across more sectors. For additional information on these and other risk considerations, please see the Fund’s prospectus.
Any sectors, industries, or securities discussed should not be perceived as investment recommendations. Mention of a specific security should not be considered a recommendation to buy or solicitation to sell that security. Specific securities mentioned in this report may have been sold from the Fund’s portfolio of investments by the time you receive this report.
28
| | |
| | | AMG GW&K Small/Mid Cap Growth Fund Schedule of Portfolio Investments October 31, 2023 |
| | | |
| | | |
| | | | | | | | |
| | | Shares | | | Value | |
| | |
Common Stocks - 96.5% | | | | | | | | |
| | |
Consumer Discretionary - 15.1% | | | | | | | | |
| | |
Bright Horizons Family Solutions, Inc.* | | | 2,168 | | | | $160,562 | |
| | |
Burlington Stores, Inc.* | | | 3,448 | | | | 417,311 | |
| | |
Churchill Downs, Inc. | | | 5,038 | | | | 553,374 | |
| | |
Five Below, Inc.* | | | 4,579 | | | | 796,654 | |
| | |
Grand Canyon Education, Inc.* | | | 5,148 | | | | 609,163 | |
| | |
Krispy Kreme, Inc.1 | | | 23,670 | | | | 306,053 | |
| | |
Lithia Motors, Inc. | | | 1,326 | | | | 321,171 | |
| | |
LKQ Corp. | | | 10,859 | | | | 476,927 | |
| | |
Pool Corp. | | | 1,423 | | | | 449,341 | |
| | |
Revolve Group, Inc.*,1 | | | 14,840 | | | | 204,050 | |
| | |
Texas Roadhouse, Inc. | | | 6,993 | | | | 710,069 | |
| | |
Vail Resorts, Inc. | | | 1,070 | | | | 227,108 | |
| | |
Total Consumer Discretionary | | | | | | | 5,231,783 | |
| | |
Consumer Staples - 1.3% | | | | | | | | |
| | |
Performance Food Group Co.* | | | 8,009 | | | | 462,600 | |
| | |
Energy - 5.7% | | | | | | | | |
| | |
ChampionX Corp. | | | 18,305 | | | | 563,794 | |
| | |
Matador Resources Co. | | | 11,515 | | | | 710,360 | |
| | |
Ovintiv, Inc. | | | 7,190 | | | | 345,120 | |
| | |
SM Energy Co. | | | 9,200 | | | | 370,944 | |
| | |
Total Energy | | | | | | | 1,990,218 | |
| | |
Financials - 5.7% | | | | | | | | |
| | |
Evercore, Inc., Class A | | | 3,015 | | | | 392,493 | |
| | |
Houlihan Lokey, Inc. | | | 5,330 | | | | 535,772 | |
| | |
MarketAxess Holdings, Inc. | | | 1,630 | | | | 348,412 | |
| | |
Pinnacle Financial Partners, Inc. | | | 5,425 | | | | 338,303 | |
| | |
RLI Corp. | | | 2,800 | | | | 373,072 | |
| | |
Total Financials | | | | | | | 1,988,052 | |
| | |
Health Care - 21.2% | | | | | | | | |
| | |
Acadia Healthcare Co., Inc.* | | | 8,460 | | | | 621,895 | |
| | |
Azenta, Inc.*,1 | | | 12,802 | | | | 581,851 | |
| | |
Bio-Rad Laboratories, Inc., Class A* | | | 1,086 | | | | 298,954 | |
| | |
Chemed Corp. | | | 699 | | | | 393,292 | |
| | |
Crinetics Pharmaceuticals, Inc.* | | | 17,205 | | | | 503,934 | |
| | |
CryoPort, Inc.*,1 | | | 7,678 | | | | 74,477 | |
| | |
Globus Medical, Inc., Class A* | | | 9,280 | | | | 424,189 | |
| | |
Halozyme Therapeutics, Inc.* | | | 12,369 | | | | 418,938 | |
| | |
HealthEquity, Inc.* | | | 7,497 | | | | 537,385 | |
| | |
ICU Medical, Inc.*,1 | | | 918 | | | | 90,019 | |
| | |
Insmed, Inc.* | | | 21,505 | | | | 538,915 | |
| | |
Integra LifeSciences Holdings Corp.* | | | 7,174 | | | | 257,977 | |
| | |
| | | | | | | | |
| | | | | | | | |
| | | Shares | | | Value | |
| | |
Intra-Cellular Therapies, Inc.* | | | 8,637 | | | | $429,777 | |
| | |
Medpace Holdings, Inc.* | | | 2,058 | | | | 499,415 | |
| | |
Natera, Inc.* | | | 7,750 | | | | 305,893 | |
| | |
Neurocrine Biosciences, Inc.* | | | 4,642 | | | | 514,984 | |
| | |
Phathom Pharmaceuticals, Inc.* | | | 19,948 | | | | 185,516 | |
| | |
Ultragenyx Pharmaceutical, Inc.* | | | 9,021 | | | | 319,343 | |
| | |
Veracyte, Inc.* | | | 17,600 | | | | 364,672 | |
| | |
Total Health Care | | | | | | | 7,361,426 | |
| | |
Industrials - 22.1% | | | | | | | | |
| | |
Atkore, Inc.* | | | 6,075 | | | | 755,001 | |
| | |
Booz Allen Hamilton Holding Corp. | | | 3,922 | | | | 470,365 | |
| | |
CACI International, Inc., Class A* | | | 1,527 | | | | 495,908 | |
| | |
Chart Industries, Inc.* | | | 3,000 | | | | 348,690 | |
| | |
Gibraltar Industries, Inc.* | | | 6,959 | | | | 423,525 | |
| | |
Graco, Inc. | | | 5,419 | | | | 402,903 | |
| | |
IDEX Corp. | | | 3,116 | | | | 596,434 | |
| | |
ITT, Inc. | | | 4,374 | | | | 408,313 | |
| | |
Knight-Swift Transportation Holdings, Inc. | | | 6,357 | | | | 310,794 | |
| | |
Nordson Corp. | | | 1,600 | | | | 340,144 | |
| | |
Paycor HCM, Inc.*,1 | | | 15,020 | | | | 324,132 | |
| | |
Paylocity Holding Corp.* | | | 3,998 | | | | 717,241 | |
| | |
RBC Bearings, Inc.*,1 | | | 3,319 | | | | 729,649 | |
| | |
SiteOne Landscape Supply, Inc.* | | | 5,163 | | | | 711,306 | |
| | |
SS&C Technologies Holdings, Inc. | | | 4,465 | | | | 224,366 | |
| | |
The Toro Co. | | | 4,988 | | | | 403,230 | |
| | |
Total Industrials | | | | | | | 7,662,001 | |
| | |
Information Technology - 18.8% | | | | | | | | |
| | |
CCC Intelligent Solutions Holdings, Inc.* | | | 25,341 | | | | 272,923 | |
| | |
Cognex Corp. | | | 15,540 | | | | 559,285 | |
| | |
CyberArk Software, Ltd. (Israel)* | | | 3,977 | | | | 650,796 | |
| | |
The Descartes Systems Group, Inc. (Canada)* | | | 6,247 | | | | 451,096 | |
| | |
Entegris, Inc. | | | 8,050 | | | | 708,722 | |
| | |
Globant SA (Uruguay)* | | | 3,986 | | | | 678,776 | |
| | |
MACOM Technology Solutions Holdings, Inc.* | | | 7,110 | | | | 501,539 | |
| | |
Manhattan Associates, Inc.* | | | 6,257 | | | | 1,219,990 | |
| | |
Power Integrations, Inc. | | | 4,591 | | | | 318,294 | |
| | |
Rapid7, Inc.* | | | 5,413 | | | | 251,650 | |
| | |
Silicon Laboratories, Inc.* | | | 2,345 | | | | 216,162 | |
| | |
Tyler Technologies, Inc.* | | | 931 | | | | 347,170 | |
| | |
Zebra Technologies Corp., Class A* | | | 1,653 | | | | 346,188 | |
| | |
Total Information Technology | | | | | | | 6,522,591 | |
| | |
Materials - 4.2% | | | | | | | | |
| | |
AptarGroup, Inc. | | | 3,177 | | | | 388,452 | |
| | |
| | | | | | | | |
The accompanying notes are an integral part of these financial statements.
29
| | |
| | | AMG GW&K Small/Mid Cap Growth Fund Schedule of Portfolio Investments (continued) |
| | | |
| | | |
| | | | | | | | |
| | |
| | | Shares | | | Value | |
| |
Materials - 4.2% (continued) | | | | | |
| | |
Avient Corp. | | | 13,357 | | | | $422,348 | |
| | |
Eagle Materials, Inc. | | | 1,281 | | | | 197,159 | |
| | |
RPM International, Inc. | | | 4,935 | | | | 450,417 | |
| | |
Total Materials | | | | | | | 1,458,376 | |
| |
Real Estate - 2.4% | | | | | |
| | |
EastGroup Properties, Inc., REIT | | | 3,017 | | | | 492,525 | |
| | |
Sun Communities, Inc., REIT | | | 3,043 | | | | 338,503 | |
| | |
Total Real Estate | | | | | | | 831,028 | |
| | |
Total Common Stocks
(Cost $36,682,239) | | | | | | | 33,508,075 | |
| | |
Rights - 0.0% | | | | | | | | |
| | |
Health Care - 0.0% | | | | | | | | |
| | |
Abiomed, Inc.*,2,3
(Cost $0) | | | 1,175 | | | | 0 | |
| | |
| | | Principal
Amount | | | | |
| | |
Short-Term Investments - 4.9% | | | | | | | | |
| |
Joint Repurchase Agreements - 1.1%4 | | | | | |
| | |
Industrial and Commercial Bank of China
Financial Services LLC, dated 10/31/23, due 11/01/23, 5.340% total to be received $372,223 (collateralized by various U.S. Treasuries, 0.000% - 7.625%, 11/02/23 - 08/15/53, totaling $379,611) | | | $372,168 | | | | 372,168 | |
| | |
| | | | | | | | |
| * | Non-income producing security. |
| 1 | Some of these securities, amounting to $2,268,368 or 6.5% of net assets, were out on loan to various borrowers and are collateralized by cash and various U.S. Treasury Obligations. See Note 4 of Notes to Financial Statements. |
| 2 | Security’s value was determined by using significant unobservable inputs. |
| 3 | This security is restricted and not available for re-sale. The Fund received Contingent Value Rights (“CVRs”) of Abiomed Inc (“ABIOMED”) from a corporate action where Johnson & Johnson acquired ABIOMED on December 23, 2022. The total value of this restricted security held is $0 which represents 0% of net assets. |
| | | | | | | | |
| | | Principal
Amount | | | Value | |
| | |
Repurchase Agreements - 3.8% | | | | | | | | |
| | |
Fixed Income Clearing Corp., dated 10/31/23 due 11/01/23, 5.150% total to be received $1,317,188 (collateralized by a U.S. Treasury, 3.500%, 04/30/30, totaling $1,343,383) | | | $1,317,000 | | | | $1,317,000 | |
| | |
Total Short-Term Investments
(Cost $1,689,168) | | | | | | | 1,689,168 | |
| |
Total Investments - 101.4%
(Cost $38,371,407) | | | | 35,197,243 | |
| |
Other Assets, less Liabilities - (1.4)% | | | | (492,658 | ) |
| | |
Net Assets - 100.0% | | | | | | | $34,704,585 | |
| | |
| | | | | | | | |
| 4 | Cash collateral received for securities lending activity was invested in these joint repurchase agreements. |
REIT Real Estate Investment Trust
The accompanying notes are an integral part of these financial statements.
30
| | |
| | | AMG GW&K Small/Mid Cap Growth Fund Schedule of Portfolio Investments (continued) |
| | | |
| | | |
The following table summarizes the inputs used to value the Fund’s investments by the fair value hierarchy levels as of October 31, 2023:
| | | | | | | | | | | | | | | | |
| | | Level 1 | | | Level 2 | | | Level 3 | | | Total | |
Investments in Securities | | | | | | | | | | | | | | | | |
| | | | | |
Common Stocks† | | | $33,508,075 | | | | — | | | | — | | | | $33,508,075 | |
| | | | | |
Rights | | | | | | | | | | | | | | | | |
| | | | | |
Health Care | | | — | | | | — | | | | $0 | | | | 0 | |
| | | | | |
Short-Term Investments | | | | | | | | | | | | | | | | |
| | | | | |
Joint Repurchase Agreements | | | — | | | | $372,168 | | | | — | | | | 372,168 | |
| | | | | |
Repurchase Agreements | | | — | | | | 1,317,000 | | | | — | | | | 1,317,000 | |
| | | | | | | | | | | | | | | | | |
Total Investments in Securities | | | $33,508,075 | | | | $1,689,168 | | | | $0 | | | | $35,197,243 | |
| | | | | | | | | | | | | | | | | |
| † | All common stocks held in the Fund are Level 1 securities. For a detailed breakout of common stocks by major industry classification, please refer to the Fund’s Schedule of Portfolio Investments. |
For the fiscal year ended October 31, 2023, there were no transfers in or out of Level 3. The Fund did not have any purchases and sales of Level 3 securities for the same period. The Level 3 rights were received as a result of a corporate action. The security’s value was determined by using significant unobservable inputs. For the current period ended October 31, 2023, the change in unrealized appreciation (depreciation) was $0.
The accompanying notes are an integral part of these financial statements.
31
| | |
| | | Statement of Assets and Liabilities October 31, 2023 |
| | | |
| | | |
| | | | | | | | | | | | | | | | |
| | AMG GW&K
Core Bond
ESG Fund | | | AMG GW&K
Emerging Markets
Equity Fund | | | AMG GW&K
Emerging Wealth
Equity Fund | | | AMG GW&K
Small/Mid Cap
Growth Fund | |
| | | | | |
Assets: | | | | | | | | | | | | | | | | |
| | | | | |
Investments at value1 (including securities on loan valued at $1,952,586, $65,760, $0, and $2,268,368, respectively) | | | $123,529,120 | | | | $19,851,620 | | | | $65,779,889 | | | | $35,197,243 | |
| | | | | |
Cash | | | 143,050 | | | | 24,798 | | | | — | | | | 658 | |
| | | | | |
Foreign currency2 | | | — | | | | 71,846 | | | | 218,702 | | | | — | |
| | | | | |
Receivable for investments sold | | | — | | | | — | | | | 1,156,709 | | | | — | |
| | | | | |
Dividend and interest receivables | | | 923,085 | | | | 9,012 | | | | 90,007 | | | | 7,473 | |
| | | | | |
Securities lending income receivable | | | 112 | | | | 13 | | | | 46 | | | | 341 | |
| | | | | |
Receivable for Fund shares sold | | | 829 | | | | — | | | | 28 | | | | 317 | |
| | | | | |
Receivable from affiliate | | | 23,147 | | | | 15,959 | | | | — | | | | 10,512 | |
| | | | | |
Prepaid expenses and other assets | | | 14,038 | | | | 2,809 | | | | 8,876 | | | | 9,790 | |
| | | | | |
Total assets | | | 124,633,381 | | | | 19,976,057 | | | | 67,254,257 | | | | 35,226,334 | |
| | | | | |
Liabilities: | | | | | | | | | | | | | | | | |
| | | | | |
Payable upon return of securities loaned | | | 2,021,228 | | | | 68,052 | | | | — | | | | 372,168 | |
| | | | | |
Payable for investments purchased | | | — | | | | — | | | | 222,292 | | | | 80,996 | |
| | | | | |
Payable for Fund shares repurchased | | | 67,902 | | | | — | | | | 1,240,399 | | | | — | |
| | | | | |
Payable for foreign capital gains tax | | | — | | | | — | | | | 102,335 | | | | — | |
| | | | | |
Interfund loan payable | | | — | | | | — | | | | 2,273,250 | | | | — | |
| | | | | |
Accrued expenses: | | | | | | | | | | | | | | | | |
| | | | | |
Investment advisory and management fees | | | 31,635 | | | | 9,551 | | | | 35,291 | | | | 18,879 | |
| | | | | |
Administrative fees | | | 15,818 | | | | 2,605 | | | | 8,975 | | | | 4,568 | |
| | | | | |
Distribution fees | | | 414 | | | | 51 | | | | 83 | | | | 6,598 | |
| | | | | |
Shareholder service fees | | | 11,648 | | | | 1,192 | | | | 2,045 | | | | 331 | |
| | | | | |
Other | | | 77,831 | | | | 61,604 | | | | 73,040 | | | | 38,209 | |
| | | | | |
Total liabilities | | | 2,226,476 | | | | 143,055 | | | | 3,957,710 | | | | 521,749 | |
| | | | | |
Commitments and Contingencies (Notes 2 & 7) | | | | | | | | | | | | | | | | |
| | | | | |
Net Assets | | | $122,406,905 | | | | $19,833,002 | | | | $63,296,547 | | | | $34,704,585 | |
| | | | | |
1 Investments at cost | | | $146,495,387 | | | | $17,241,331 | | | | $64,562,694 | | | | $38,371,407 | |
| | | | | |
2 Foreign currency at cost | | | — | | | | $72,106 | | | | $229,400 | | | | — | |
The accompanying notes are an integral part of these financial statements.
32
| | |
| | | Statement of Assets and Liabilities (continued) |
| | | |
| | | |
| | | | | | | | | | | | | | | | |
| | AMG GW&K
Core Bond
ESG Fund | | | AMG GW&K
Emerging Markets
Equity Fund | | | AMG GW&K
Emerging Wealth
Equity Fund | | | AMG GW&K
Small/Mid Cap
Growth Fund | |
| | | | | |
Net Assets Represent: | | | | | | | | | | | | | | | | |
| | | | | |
Paid-in capital | | | $154,568,912 | | | | $22,648,451 | | | | $87,159,394 | | | | $38,198,188 | |
| | | | | |
Total distributable loss | | | (32,162,007 | ) | | | (2,815,449 | ) | | | (23,862,847 | ) | | | (3,493,603 | ) |
| | | | | |
Net Assets | | | $122,406,905 | | | | $19,833,002 | | | | $63,296,547 | | | | $34,704,585 | |
| | | | | |
Class N: | | | | | | | | | | | | | | | | |
| | | | | |
Net Assets | | | $1,937,190 | | | | $220,572 | | | | $377,270 | | | | $27,120,018 | |
| | | | | |
Shares outstanding | | | 232,463 | | | | 28,712 | | | | 37,633 | | | | 2,033,774 | |
| | | | | |
Net asset value, offering and redemption price per share | | | $8.33 | | | | $7.68 | | | | $10.02 | | | | $13.33 | |
| | | | | |
Class I: | | | | | | | | | | | | | | | | |
| | | | | |
Net Assets | | | $119,191,009 | | | | $11,902,268 | | | | $43,482,624 | | | | $7,560,818 | |
| | | | | |
Shares outstanding | | | 14,295,879 | | | | 1,567,248 | | | | 4,267,595 | | | | 542,963 | |
| | | | | |
Net asset value, offering and redemption price per share | | | $8.34 | | | | $7.59 | | | | $10.19 | | | | $13.93 | |
| | | | | |
Class Z: | | | | | | | | | | | | | | | | |
| | | | | |
Net Assets | | | $1,278,706 | | | | $7,710,162 | | | | $19,436,653 | | | | $23,749 | |
| | | | | |
Shares outstanding | | | 153,471 | | | | 1,021,824 | | | | 1,907,420 | | | | 1,703 | |
| | | | | |
Net asset value, offering and redemption price per share | | | $8.33 | | | | $7.55 | | | | $10.19 | | | | $13.95 | |
The accompanying notes are an integral part of these financial statements.
33
| | |
| | | Statement of Operations For the fiscal year ended October 31, 2023 |
| | | |
| | | |
| | | | | | | | | | | | | | | | |
| | AMG GW&K
Core Bond
ESG Fund | | AMG GW&K
Emerging Markets
Equity Fund | | AMG GW&K
Emerging Wealth
Equity Fund | | AMG GW&K
Small/Mid Cap
Growth Fund |
| | | | | |
Investment Income: | | | | | | | | | | | | | | | | |
| | | | | |
Dividend income | | | — | | | | $401,823 | | | | $888,590 | | | | $206,270 | |
| | | | | |
Interest income | | | $4,824,704 | | | | 21,939 | | | | 46,708 | | | | 52,538 | |
| | | | | |
Securities lending income | | | 7,246 | | | | 1,845 | | | | 921 | | | | 2,602 | |
| | | | | |
Foreign withholding tax | | | — | | | | (53,841 | ) | | | (68,687 | ) | | | — | |
| | | | | |
Total investment income | | | 4,831,950 | | | | 371,766 | | | | 867,532 | | | | 261,410 | |
| | | | | |
Expenses: | | | | | | | | | | | | | | | | |
| | | | | |
Investment advisory and management fees | | | 422,900 | | | | 117,341 | | | | 453,810 | | | | 223,958 | |
| | | | | |
Administrative fees | | | 211,450 | | | | 32,002 | | | | 123,766 | | | | 54,184 | |
| | | | | |
Distribution fees - Class N | | | 4,974 | | | | 637 | | | | 1,428 | | | | 55,058 | |
| | | | | |
Shareholder servicing fees - Class N | | | 2,984 | | | | 383 | | | | 856 | | | | — | |
| | | | | |
Shareholder servicing fees - Class I | | | 101,327 | | | | 11,128 | | | | 45,843 | | | | 3,730 | |
| | | | | |
Professional fees | | | 58,550 | | | | 53,116 | | | | 53,397 | | | | 28,798 | |
| | | | | |
Reports to shareholders | | | 43,559 | | | | 6,890 | | | | 21,038 | | | | 10,831 | |
| | | | | |
Registration fees | | | 31,466 | | | | 12,605 | | | | 33,213 | | | | 24,909 | |
| | | | | |
Custodian fees | | | 28,340 | | | | 60,661 | | | | 64,059 | | | | 22,035 | |
| | | | | |
Transfer agent fees | | | 16,532 | | | | 1,336 | | | | 3,008 | | | | 7,512 | |
| | | | | |
Trustee fees and expenses | | | 9,835 | | | | 1,292 | | | | 5,607 | | | | 2,467 | |
| | | | | |
Interest expense | | | — | | | | 108 | | | | 386 | | | | — | |
| | | | | |
Miscellaneous | | | 10,096 | | | | 3,347 | | | | 5,782 | | | | 3,895 | |
| | | | | |
Repayment of prior reimbursements | | | ��� | | | | — | | | | 11,356 | | | | — | |
| | | | | |
Total expenses before offsets | | | 942,013 | | | | 300,846 | | | | 823,549 | | | | 437,377 | |
| | | | | |
Expense reimbursements | | | (156,088 | ) | | | (102,622 | ) | | | (31,418 | ) | | | (82,386 | ) |
| | | | | |
Expense reductions | | | — | | | | — | | | | — | | | | (2,983 | ) |
| | | | | |
Net expenses | | | 785,925 | | | | 198,224 | | | | 792,131 | | | | 352,008 | |
| | | | | | | | | | | | | | | | | |
| | | | | |
Net investment income (loss) | | | 4,046,025 | | | | 173,542 | | | | 75,401 | | | | (90,598 | ) |
| | | | | |
Net Realized and Unrealized Gain (Loss): | | | | | | | | | | | | | | | | |
| | | | | |
Net realized gain (loss) on investments | | | (5,580,179 | ) | | | 711,815 | | | | 2,362,112 | | | | (174,467 | ) |
| | | | | |
Net realized loss on foreign currency transactions | | | — | | | | (10,987 | ) | | | (24,031 | ) | | | — | |
| | | | | |
Net change in unrealized appreciation/depreciation on investments | | | 2,763,863 | | | | 1,660,068 | | | | 8,906,080 | | | | 436,818 | |
| | | | | |
Net change in unrealized appreciation/depreciation on foreign currency translations | | | — | | | | 1,376 | | | | (37,166 | ) | | | — | |
| | | | | |
Net realized and unrealized gain (loss) | | | (2,816,316 | ) | | | 2,362,272 | | | | 11,206,995 | | | | 262,351 | |
| | | | | | | | | | | | | | | | | |
| | | | | |
Net increase in net assets resulting from operations | | | $1,229,709 | | | | $2,535,814 | | | | $11,282,396 | | | | $171,753 | |
The accompanying notes are an integral part of these financial statements.
34
| | |
| | | Statements of Changes in Net Assets For the fiscal years ended October 31, |
| | | |
| | | |
| | | | | | | | | | | | | | | | |
| | AMG GW&K
Core Bond ESG Fund | | | AMG GW&K
Emerging Markets
Equity Fund | |
| | | | | |
| | 2023 | | | 2022 | | | 2023 | | | 2022 | |
| | | | | |
Increase (Decrease) in Net Assets Resulting From Operations: | | | | | | | | | | | | | | | | |
| | | | | |
Net investment income | | | $4,046,025 | | | | $3,058,570 | | | | $173,542 | | | | $373,577 | |
| | | | | |
Net realized gain (loss) on investments | | | (5,580,179 | ) | | | (3,645,263 | ) | | | 700,828 | | | | (4,979,831 | ) |
| | | | | |
Net change in unrealized appreciation/depreciation on investments | | | 2,763,863 | | | | (30,052,410 | ) | | | 1,661,444 | | | | (11,629,398 | ) |
| | | | | |
Net increase (decrease) in net assets resulting from operations | | | 1,229,709 | | | | (30,639,103 | ) | | | 2,535,814 | | | | (16,235,652 | ) |
| | | | | |
Distributions to Shareholders: | | | | | | | | | | | | | | | | |
| | | | | |
Class N | | | (51,357 | ) | | | (76,235 | ) | | | (8,907 | ) | | �� | (2,402 | ) |
| | | | | |
Class I | | | (3,948,393 | ) | | | (7,327,695 | ) | | | (449,110 | ) | | | (249,212 | ) |
| | | | | |
Class Z | | | (47,130 | ) | | | (112,920 | ) | | | (413,188 | ) | | | (382,214 | ) |
| | | | | |
Total distributions to shareholders | | | (4,046,880 | ) | | | (7,516,850 | ) | | | (871,205 | ) | | | (633,828 | ) |
| | | | | |
Capital Share Transactions:1 | | | | | | | | | | | | | | | | |
| | | | | |
Net increase (decrease) from capital share transactions | | | (16,492,501 | ) | | | (16,283,055 | ) | | | 2,058,203 | | | | (25,653,747 | ) |
| | | | | |
| | | | | | | | | | | | | | | | | |
| | | | | |
Total increase (decrease) in net assets | | | (19,309,672 | ) | | | (54,439,008 | ) | | | 3,722,812 | | | | (42,523,227 | ) |
| | | | | |
Net Assets: | | | | | | | | | | | | | | | | |
| | | | | |
Beginning of year | | | 141,716,577 | | | | 196,155,585 | | | | 16,110,190 | | | | 58,633,417 | |
| | | | | |
End of year | | | $122,406,905 | | | | $141,716,577 | | | | $19,833,002 | | | | $16,110,190 | |
1 See Note 1(g) of the Notes to Financial Statements.
The accompanying notes are an integral part of these financial statements.
35
| | |
| | | Statements of Changes in Net Assets (continued) For the fiscal years ended October 31, |
| | | |
| | | |
| | | | | | | | | | | | | | | | |
| | AMG GW&K
Emerging Wealth
Equity Fund | | | AMG GW&K
Small/Mid Cap
Growth Fund | |
| | | | | |
| | 2023 | | | 2022 | | | 2023 | | | 2022 | |
| | | | | |
Increase (Decrease) in Net Assets Resulting From Operations: | | | | | | | | | | | | | | | | |
| | | | | |
Net investment income (loss) | | | $75,401 | | | | $(99,452 | ) | | | $(90,598 | ) | | | $(187,651 | ) |
| | | | | |
Net realized gain (loss) on investments | | | 2,338,081 | | | | (25,435,619 | ) | | | (174,467 | ) | | | 687,666 | |
| | | | | |
Net change in unrealized appreciation/depreciation on investments | | | 8,868,914 | | | | (37,885,410 | ) | | | 436,818 | | | | (10,773,348 | ) |
| | | | | |
Net increase (decrease) in net assets resulting from operations | | | 11,282,396 | | | | (63,420,481 | ) | | | 171,753 | | | | (10,273,333 | ) |
| | | | | |
Distributions to Shareholders: | | | | | | | | | | | | | | | | |
| | | | | |
Class N | | | — | | | | (10,519 | ) | | | (496,550 | ) | | | — | |
| | | | | |
Class I | | | — | | | | (417,335 | ) | | | (126,577 | ) | | | — | |
| | | | | |
Class Z | | | — | | | | (1,915,232 | ) | | | (448 | ) | | | — | |
| | | | | |
Total distributions to shareholders | | | — | | | | (2,343,086 | ) | | | (623,575 | ) | | | — | |
| | | | | |
Capital Share Transactions:1 | | | | | | | | | | | | | | | | |
| | | | | |
Net increase (decrease) from capital share transactions | | | (20,109,514 | ) | | | (87,822,351 | ) | | | 3,611,251 | | | | (2,280,329 | ) |
| | | | | |
| | | | | | | | | | | | | | | | | |
| | | | | |
Total increase (decrease) in net assets | | | (8,827,118 | ) | | | (153,585,918 | ) | | | 3,159,429 | | | | (12,553,662 | ) |
| | | | | |
Net Assets: | | | | | | | | | | | | | | | | |
| | | | | |
Beginning of year | | | 72,123,665 | | | | 225,709,583 | | | | 31,545,156 | | | | 44,098,818 | |
| | | | | |
End of year | | | $63,296,547 | | | | $72,123,665 | | | | $34,704,585 | | | | $31,545,156 | |
1 See Note 1(g) of the Notes to Financial Statements.
The accompanying notes are an integral part of these financial statements.
36
| | |
| | | AMG GW&K Core Bond ESG Fund Financial Highlights For a share outstanding throughout each fiscal year |
| | | |
| | | |
| | | | | | | | | | | | | | | | | | | | |
| | | For the fiscal years ended October 31, | |
| | | | | | |
| Class N | | 2023 | | | 2022 | | | 2021 | | | 2020 | | | 2019 | |
| | | | | | |
Net Asset Value, Beginning of Year | | | $8.56 | | | | $10.75 | | | | $10.90 | | | | $10.53 | | | | $9.67 | |
| | | | | | |
Income (loss) from Investment Operations: | | | | | | | | | | | | | | | | | | | | |
| | | | | | |
Net investment income1,2 | | | 0.23 | | | | 0.14 | | | | 0.12 | | | | 0.18 | | | | 0.21 | |
| | | | | | |
Net realized and unrealized gain (loss) on investments | | | (0.23 | ) | | | (1.93 | ) | | | (0.15 | ) | | | 0.37 | | | | 0.86 | |
| | | | | | |
Total income (loss) from investment operations | | | — | | | | (1.79 | ) | | | (0.03 | ) | | | 0.55 | | | | 1.07 | |
| | | | | | |
Less Distributions to Shareholders from: | | | | | | | | | | | | | | | | | | | | |
| | | | | | |
Net investment income | | | (0.23 | ) | | | (0.15 | ) | | | (0.12 | ) | | | (0.18 | ) | | | (0.21 | ) |
| | | | | | |
Net realized gain on investments | | | — | | | | (0.25 | ) | | | — | | | | — | | | | — | |
| | | | | | |
Total distributions to shareholders | | | (0.23 | ) | | | (0.40 | ) | | | (0.12 | ) | | | (0.18 | ) | | | (0.21 | ) |
| | | | | | |
Net Asset Value, End of Year | | | $8.33 | | | | $8.56 | | | | $10.75 | | | | $10.90 | | | | $10.53 | |
| | | | | | |
Total Return2,3 | | | (0.15 | )% | | | (17.18 | )% | | | (0.27 | )% | | | 5.31 | % | | | 11.20 | % |
| | | | | | |
Ratio of net expenses to average net assets | | | 0.88 | % | | | 0.88 | % | | | 0.88 | % | | | 0.88 | % | | | 0.88 | % |
| | | | | | |
Ratio of gross expenses to average net assets4 | | | 0.99 | % | | | 0.95 | % | | | 0.94 | % | | | 0.96 | % | | | 0.95 | % |
| | | | | | |
Ratio of net investment income to average net assets2 | | | 2.55 | % | | | 1.49 | % | | | 1.12 | % | | | 1.69 | % | | | 2.10 | % |
| | | | | | |
Portfolio turnover | | | 25 | % | | | 34 | % | | | 62 | % | | | 56 | % | | | 48 | % |
| | | | | | |
Net assets end of year (000’s) omitted | | | $1,937 | | | | $1,716 | | | | $2,125 | | | | $1,905 | | | | $1,255 | |
| | | | | | | | | | | | | | | | | | | | | |
37
| | |
| | | AMG GW&K Core Bond ESG Fund Financial Highlights For a share outstanding throughout each fiscal year |
| | | |
| | | |
| | | | | | | | | | | | | | | | | | | | |
| | | For the fiscal years ended October 31, | |
| | | | | | |
| Class I | | 2023 | | | 2022 | | | 2021 | | | 2020 | | | 2019 | |
| | | | | | |
Net Asset Value, Beginning of Year | | | $8.56 | | | | $10.76 | | | | $10.90 | | | | $10.54 | | | | $9.67 | |
| | | | | | |
Income (loss) from Investment Operations: | | | | | | | | | | | | | | | | | | | | |
| | | | | | |
Net investment income1,2 | | | 0.25 | | | | 0.18 | | | | 0.16 | | | | 0.22 | | | | 0.24 | |
| | | | | | |
Net realized and unrealized gain (loss) on investments | | | (0.21 | ) | | | (1.95 | ) | | | (0.14 | ) | | | 0.36 | | | | 0.88 | |
| | | | | | |
Total income (loss) from investment operations | | | 0.04 | | | | (1.77 | ) | | | 0.02 | | | | 0.58 | | | | 1.12 | |
| | | | | | |
Less Distributions to Shareholders from: | | | | | | | | | | | | | | | | | | | | |
| | | | | | |
Net investment income | | | (0.26 | ) | | | (0.18 | ) | | | (0.16 | ) | | | (0.22 | ) | | | (0.25 | ) |
| | | | | | |
Net realized gain on investments | | | — | | | | (0.25 | ) | | | — | | | | — | | | | — | |
| | | | | | |
Total distributions to shareholders | | | (0.26 | ) | | | (0.43 | ) | | | (0.16 | ) | | | (0.22 | ) | | | (0.25 | ) |
| | | | | | |
Net Asset Value, End of Year | | | $8.34 | | | | $8.56 | | | | $10.76 | | | | $10.90 | | | | $10.54 | |
| | | | | | |
Total Return2,3 | | | 0.30 | % | | | (16.99 | )% | | | 0.15 | % | | | 5.55 | % | | | 11.70 | % |
| | | | | | |
Ratio of net expenses to average net assets | | | 0.55 | % | | | 0.55 | % | | | 0.56 | % | | | 0.55 | % | | | 0.55 | % |
| | | | | | |
Ratio of gross expenses to average net assets4 | | | 0.66 | % | | | 0.62 | % | | | 0.62 | % | | | 0.63 | % | | | 0.62 | % |
| | | | | | |
Ratio of net investment income to average net assets2 | | | 2.88 | % | | | 1.82 | % | | | 1.44 | % | | | 2.01 | % | | | 2.42 | % |
| | | | | | |
Portfolio turnover | | | 25 | % | | | 34 | % | | | 62 | % | | | 56 | % | | | 48 | % |
| | | | | | |
Net assets end of year (000’s) omitted | | | $119,191 | | | | $137,806 | | | | $190,306 | | | | $202,363 | | | | $212,801 | |
| | | | | | | | | | | | | | | | | | | | | |
38
| | |
| | | AMG GW&K Core Bond ESG Fund Financial Highlights For a share outstanding throughout each fiscal year |
| | | |
| | | |
| | | | | | | | | | | | | | | | | | | | |
| | | For the fiscal years ended October 31, | |
| | | | | | |
| Class Z | | 2023 | | | 2022 | | | 2021 | | | 2020 | | | 2019 | |
| | | | | | |
Net Asset Value, Beginning of Year | | | $8.56 | | | | $10.75 | | | | $10.90 | | | | $10.53 | | | | $9.67 | |
| | | | | | |
Income (loss) from Investment Operations: | | | | | | | | | | | | | | | | | | | | |
| | | | | | |
Net investment income1,2 | | | 0.26 | | | | 0.18 | | | | 0.16 | | | | 0.22 | | | | 0.25 | |
| | | | | | |
Net realized and unrealized gain (loss) on investments | | | (0.23 | ) | | | (1.94 | ) | | | (0.15 | ) | | | 0.38 | | | | 0.87 | |
| | | | | | |
Total income (loss) from investment operations | | | 0.03 | | | | (1.76 | ) | | | 0.01 | | | | 0.60 | | | | 1.12 | |
| | | | | | |
Less Distributions to Shareholders from: | | | | | | | | | | | | | | | | | | | | |
| | | | | | |
Net investment income | | | (0.26 | ) | | | (0.18 | ) | | | (0.16 | ) | | | (0.23 | ) | | | (0.26 | ) |
| | | | | | |
Net realized gain on investments | | | — | | | | (0.25 | ) | | | — | | | | — | | | | — | |
| | | | | | |
Total distributions to shareholders | | | (0.26 | ) | | | (0.43 | ) | | | (0.16 | ) | | | (0.23 | ) | | | (0.26 | ) |
| | | | | | |
Net Asset Value, End of Year | | | $8.33 | | | | $8.56 | | | | $10.75 | | | | $10.90 | | | | $10.53 | |
| | | | | | |
Total Return2,3 | | | 0.25 | % | | | (16.85 | )% | | | 0.13 | % | | | 5.73 | % | | | 11.71 | % |
| | | | | | |
Ratio of net expenses to average net assets | | | 0.48 | % | | | 0.48 | % | | | 0.48 | % | | | 0.48 | % | | | 0.48 | % |
| | | | | | |
Ratio of gross expenses to average net assets4 | | | 0.59 | % | | | 0.55 | % | | | 0.54 | % | | | 0.56 | % | | | 0.55 | % |
| | | | | | |
Ratio of net investment income to average net assets2 | | | 2.95 | % | | | 1.89 | % | | | 1.52 | % | | | 2.09 | % | | | 2.50 | % |
| | | | | | |
Portfolio turnover | | | 25 | % | | | 34 | % | | | 62 | % | | | 56 | % | | | 48 | % |
| | | | | | |
Net assets end of year (000’s) omitted | | | $1,279 | | | | $2,195 | | | | $3,724 | | | | $3,812 | | | | $3,208 | |
| | | | | | | | | | | | | | | | | | | | | |
| 1 | Per share numbers have been calculated using average shares. |
| 2 | Total returns and net investment income would have been lower had certain expenses not been offset. |
| 3 | The total return is calculated using the published Net Asset Value as of fiscal year end. |
| 4 | Excludes the impact of expense reimbursement or fee waivers and expense reductions such as brokerage credits, but includes expense repayments and non-reimbursable expenses, if any, such as interest, taxes, and extraordinary expenses. (See Note 1(c) and 2 in the Notes to Financial Statements.) |
39
| | |
| | | AMG GW&K Emerging Markets Equity Fund Financial Highlights For a share outstanding throughout each fiscal year |
| | | |
| | | |
| | | | | | | | | | | | | | | | | | | | |
| | | For the fiscal years ended October 31, | |
| | | | | | |
| Class N | | 2023 | | | 2022 | | | 2021 | | | 2020 | | | 2019 | |
| | | | | | |
Net Asset Value, Beginning of Year | | | $6.91 | | | | $10.30 | | | | $9.73 | | | | $9.52 | | | | $8.61 | |
| | | | | | |
Income (loss) from Investment Operations: | | | | | | | | | | | | | | | | | | | | |
| | | | | | |
Net investment income1,2 | | | 0.04 | | | | 0.04 | | | | 0.02 | | | | 0.01 | | | | 0.14 | |
| | | | | | |
Net realized and unrealized gain (loss) on investments | | | 1.07 | | | | (3.37 | ) | | | 0.96 | | | | 0.70 | | | | 1.04 | |
| | | | | | |
Total income (loss) from investment operations | | | 1.11 | | | | (3.33 | ) | | | 0.98 | | | | 0.71 | | | | 1.18 | |
| | | | | | |
Less Distributions to Shareholders from: | | | | | | | | | | | | | | | | | | | | |
| | | | | | |
Net investment income | | | (0.34 | ) | | | (0.02 | ) | | | (0.07 | ) | | | (0.06 | ) | | | (0.17 | ) |
| | | | | | |
Net realized gain on investments | | | — | | | | (0.04 | ) | | | (0.34 | ) | | | (0.44 | ) | | | (0.10 | ) |
| | | | | | |
Total distributions to shareholders | | | (0.34 | ) | | | (0.06 | ) | �� | | (0.41 | ) | | | (0.50 | ) | | | (0.27 | ) |
| | | | | | |
Net Asset Value, End of Year | | | $7.68 | | | | $6.91 | | | | $10.30 | | | | $9.73 | | | | $9.52 | |
| | | | | | |
Total Return2,3 | | | 15.96 | % | | | (32.50 | )% | | | 9.85 | % | | | 7.55 | % | | | 13.94 | % |
| | | | | | |
Ratio of net expenses to average net assets | | | 1.27 | % | | | 1.29 | %4 | | | 1.27 | %5 | | | 1.34 | % | | | 1.30 | % |
| | | | | | |
Ratio of gross expenses to average net assets6 | | | 1.75 | % | | | 1.46 | % | | | 1.37 | %5 | | | 1.52 | % | | | 1.30 | % |
| | | | | | |
Ratio of net investment income to average net assets2 | | | 0.47 | % | | | 0.47 | % | | | 0.20 | % | | | 0.13 | % | | | 1.52 | % |
| | | | | | |
Portfolio turnover | | | 34 | % | | | 46 | % | | | 36 | % | | | 40 | % | | | 123 | % |
| | | | | | |
Net assets end of year (000’s) omitted | | | $221 | | | | $180 | | | | $414 | | | | $412 | | | | $520 | |
| | | | | | | | | | | | | | | | | | | | | |
40
| | |
| | | AMG GW&K Emerging Markets Equity Fund Financial Highlights For a share outstanding throughout each fiscal year |
| | | |
| | | |
| | | | | | | | | | | | | | | | | | | | |
| | | For the fiscal years ended October 31, | |
| | | | | | |
| Class I | | 2023 | | | 2022 | | | 2021 | | | 2020 | | | 2019 | |
| | | | | | |
Net Asset Value, Beginning of Year | | | $6.84 | | | | $10.21 | | | | $9.69 | | | | $9.48 | | | | $8.60 | |
| | | | | | |
Income (loss) from Investment Operations: | | | | | | | | | | | | | | | | | | | | |
| | | | | | |
Net investment income1,2 | | | 0.06 | | | | 0.07 | | | | 0.06 | | | | 0.04 | | | | 0.17 | |
| | | | | | |
Net realized and unrealized gain (loss) on investments | | | 1.06 | | | | (3.33 | ) | | | 0.95 | | | | 0.69 | | | | 1.04 | |
| | | | | | |
Total income (loss) from investment operations | | | 1.12 | | | | (3.26 | ) | | | 1.01 | | | | 0.73 | | | | 1.21 | |
| | | | | | |
Less Distributions to Shareholders from: | | | | | | | | | | | | | | | | | | | | |
| | | | | | |
Net investment income | | | (0.37 | ) | | | (0.07 | ) | | | (0.15 | ) | | | (0.08 | ) | | | (0.23 | ) |
| | | | | | |
Net realized gain on investments | | | — | | | | (0.04 | ) | | | (0.34 | ) | | | (0.44 | ) | | | (0.10 | ) |
| | | | | | |
Total distributions to shareholders | | | (0.37 | ) | | | (0.11 | ) | | | (0.49 | ) | | | (0.52 | ) | | | (0.33 | ) |
| | | | | | |
Net Asset Value, End of Year | | | $7.59 | | | | $6.84 | | | | $10.21 | | | | $9.69 | | | | $9.48 | |
| | | | | | |
Total Return2,3 | | | 16.28 | % | | | (32.28 | )% | | | 10.13 | % | | | 7.91 | % | | | 14.34 | % |
| | | | | | |
Ratio of net expenses to average net assets | | | 0.96 | % | | | 0.99 | %4 | | | 0.95 | %5 | | | 1.01 | % | | | 0.97 | % |
| | | | | | |
Ratio of gross expenses to average net assets6 | | | 1.44 | % | | | 1.16 | % | | | 1.05 | %5 | | | 1.19 | % | | | 0.97 | % |
| | | | | | |
Ratio of net investment income to average net assets2 | | | 0.78 | % | | | 0.77 | % | | | 0.52 | % | | | 0.47 | % | | | 1.85 | % |
| | | | | | |
Portfolio turnover | | | 34 | % | | | 46 | % | | | 36 | % | | | 40 | % | | | 123 | % |
| | | | | | |
Net assets end of year (000’s) omitted | | | $11,902 | | | | $8,520 | | | | $24,571 | | | | $19,251 | | | | $24,100 | |
| | | | | | | | | | | | | | | | | | | | | |
41
| | |
| | | AMG GW&K Emerging Markets Equity Fund Financial Highlights For a share outstanding throughout each fiscal year |
| | | |
| | | |
| | | | | | | | | | | | | | | | | | | | |
| | | For the fiscal years ended October 31, | |
| | | | | | |
| Class Z | | 2023 | | | 2022 | | | 2021 | | | 2020 | | | 2019 | |
| | | | | | |
Net Asset Value, Beginning of Year | | | $6.80 | | | | $10.15 | | | | $9.64 | | | | $9.43 | | | | $8.56 | |
| | | | | | |
Income (loss) from Investment Operations: | | | | | | | | | | | | | | | | | | | | |
| | | | | | |
Net investment income1,2 | | | 0.07 | | | | 0.08 | | | | 0.07 | | | | 0.05 | | | | 0.18 | |
| | | | | | |
Net realized and unrealized gain (loss) on investments | | | 1.06 | | | | (3.31 | ) | | | 0.93 | | | | 0.69 | | | | 1.02 | |
| | | | | | |
Total income (loss) from investment operations | | | 1.13 | | | | (3.23 | ) | | | 1.00 | | | | 0.74 | | | | 1.20 | |
| | | | | | |
Less Distributions to Shareholders from: | | | | | | | | | | | | | | | | | | | | |
| | | | | | |
Net investment income | | | (0.38 | ) | | | (0.08 | ) | | | (0.15 | ) | | | (0.09 | ) | | | (0.23 | ) |
| | | | | | |
Net realized gain on investments | | | — | | | | (0.04 | ) | | | (0.34 | ) | | | (0.44 | ) | | | (0.10 | ) |
| | | | | | |
Total distributions to shareholders | | | (0.38 | ) | | | (0.12 | ) | | | (0.49 | ) | | | (0.53 | ) | | | (0.33 | ) |
| | | | | | |
Net Asset Value, End of Year | | | $7.55 | | | | $6.80 | | | | $10.15 | | | | $9.64 | | | | $9.43 | |
| | | | | | |
Total Return2,3 | | | 16.56 | % | | | (32.20 | )% | | | 10.15 | % | | | 8.01 | % | | | 14.39 | % |
| | | | | | |
Ratio of net expenses to average net assets | | | 0.87 | % | | | 0.89 | %4 | | | 0.87 | %5 | | | 0.94 | % | | | 0.90 | % |
| | | | | | |
Ratio of gross expenses to average net assets6 | | | 1.35 | % | | | 1.06 | % | | | 0.97 | %5 | | | 1.12 | % | | | 0.90 | % |
| | | | | | |
Ratio of net investment income to average net assets2 | | | 0.87 | % | | | 0.87 | % | | | 0.60 | % | | | 0.53 | % | | | 1.92 | % |
| | | | | | |
Portfolio turnover | | | 34 | % | | | 46 | % | | | 36 | % | | | 40 | % | | | 123 | % |
| | | | | | |
Net assets end of year (000’s) omitted | | | $7,710 | | | | $7,410 | | | | $33,648 | | | | $24,191 | | | | $31,727 | |
| | | | | | | | | | | | | | | | | | | | | |
| 1 | Per share numbers have been calculated using average shares. |
| 2 | Total returns and net investment income would have been lower had certain expenses not been offset. |
| 3 | The total return is calculated using the published Net Asset Value as of fiscal year end. |
| 4 | Includes interest expense of 0.02% related to participation in the interfund lending program. |
| 5 | Such ratio includes recapture of waived/reimbursed fees from a prior period amounting to 0.01% for the fiscal year ended October 31, 2021. |
| 6 | Excludes the impact of expense reimbursement or fee waivers and expense reductions such as brokerage credits, but includes expense repayments and non-reimbursable expenses, if any, such as interest, taxes, and extraordinary expenses. (See Note 1(c) and 2 in the Notes to Financial Statements.) |
42
| | |
| | | AMG GW&K Emerging Wealth Equity Fund Financial Highlights For a share outstanding throughout each fiscal year |
| | | |
| | | |
| | | | | | | | | | | | | | | | | | | | |
| | | For the fiscal years ended October 31, | |
| | | | | | |
| Class N | | 2023 | | | 2022 | | | 2021 | | | 2020 | | | 2019 | |
| | | | | | |
Net Asset Value, Beginning of Year | | | $8.76 | | | | $13.41 | | | | $13.28 | | | | $11.93 | | | | $10.38 | |
| | | | | | |
Income (loss) from Investment Operations: | | | | | | | | | | | | | | | | | | | | |
| | | | | | |
Net investment income (loss)1,2 | | | (0.03 | ) | | | (0.05 | ) | | | (0.09 | ) | | | (0.04 | ) | | | 0.10 | |
| | | | | | |
Net realized and unrealized gain (loss) on investments | | | 1.29 | | | | (4.45 | ) | | | 0.22 | | | | 1.72 | | | | 1.95 | |
| | | | | | |
Total income (loss) from investment operations | | | 1.26 | | | | (4.50 | ) | | | 0.13 | | | | 1.68 | | | | 2.05 | |
| | | | | | |
Less Distributions to Shareholders from: | | | | | | | | | | | | | | | | | | | | |
| | | | | | |
Net investment income | | | — | | | | — | | | | — | | | | (0.06 | ) | | | (0.06 | ) |
| | | | | | |
Net realized gain on investments | | | — | | | | (0.15 | ) | | | — | | | | (0.27 | ) | | | (0.44 | ) |
| | | | | | |
Total distributions to shareholders | | | — | | | | (0.15 | ) | | | — | | | | (0.33 | ) | | | (0.50 | ) |
| | | | | | |
Net Asset Value, End of Year | | | $10.02 | | | | $8.76 | | | | $13.41 | | | | $13.28 | | | | $11.93 | |
| | | | | | |
Total Return2,3 | | | 14.50 | % | | | (33.89 | )% | | | 0.98 | % | | | 14.37 | % | | | 20.82 | % |
| | | | | | |
Ratio of net expenses to average net assets | | | 1.30 | % | | | 1.30 | %4 | | | 1.22 | % | | | 1.26 | % | | | 1.37 | %5 |
| | | | | | |
Ratio of gross expenses to average net assets6 | | | 1.33 | % | | | 1.31 | % | | | 1.22 | % | | | 1.26 | % | | | 1.37 | %5 |
| | | | | | |
Ratio of net investment income (loss) to average net assets2 | | | (0.25 | )% | | | (0.43 | )% | | | (0.59 | )% | | | (0.35 | )% | | | 0.93 | % |
| | | | | | |
Portfolio turnover | | | 27 | % | | | 63 | % | | | 57 | % | | | 37 | % | | | 40 | % |
| | | | | | |
Net assets end of year (000’s) omitted | | | $377 | | | | $330 | | | | $967 | | | | $1,716 | | | | $2,007 | |
| | | | | | | | | | | | | | | | | | | | | |
43
| | |
| | | AMG GW&K Emerging Wealth Equity Fund Financial Highlights For a share outstanding throughout each fiscal year |
| | | |
| | | |
| | | | | | | | | | | | | | | | | | | | |
| | | For the fiscal years ended October 31, | |
| | | | | | |
| Class I | | 2023 | | | 2022 | | | 2021 | | | 2020 | | | 2019 | |
| | | | | | |
Net Asset Value, Beginning of Year | | | $8.88 | | | | $13.55 | | | | $13.38 | | | | $12.03 | | | | $10.44 | |
| | | | | | |
Income (loss) from Investment Operations: | | | | | | | | | | | | | | | | | | | | |
| | | | | | |
Net investment income (loss)1,2 | | | 0.01 | | | | (0.01 | ) | | | (0.05 | ) | | | (0.01 | ) | | | 0.14 | |
| | | | | | |
Net realized and unrealized gain (loss) on investments | | | 1.30 | | | | (4.51 | ) | | | 0.22 | | | | 1.73 | | | | 1.96 | |
| | | | | | |
Total income (loss) from investment operations | | | 1.31 | | | | (4.52 | ) | | | 0.17 | | | | 1.72 | | | | 2.10 | |
| | | | | | |
Less Distributions to Shareholders from: | | | | | | | | | | | | | | | | | | | | |
| | | | | | |
Net investment income | | | — | | | | — | | | | — | | | | (0.10 | ) | | | (0.07 | ) |
| | | | | | |
Net realized gain on investments | | | — | | | | (0.15 | ) | | | — | | | | (0.27 | ) | | | (0.44 | ) |
| | | | | | |
Total distributions to shareholders | | | — | | | | (0.15 | ) | | | — | | | | (0.37 | ) | | | (0.51 | ) |
| | | | | | |
Net Asset Value, End of Year | | | $10.19 | | | | $8.88 | | | | $13.55 | | | | $13.38 | | | | $12.03 | |
| | | | | | |
Total Return2,3 | | | 14.75 | % | | | (33.68 | )% | | | 1.27 | % | | | 14.63 | % | | | 21.15 | % |
| | | | | | |
Ratio of net expenses to average net assets | | | 0.99 | % | | | 1.00 | %4 | | | 0.93 | % | | | 0.97 | % | | | 1.08 | %5 |
| | | | | | |
Ratio of gross expenses to average net assets6 | | | 1.02 | % | | | 1.01 | % | | | 0.93 | % | | | 0.97 | % | | | 1.08 | %5 |
| | | | | | |
Ratio of net investment income (loss) to average net assets2 | | | 0.06 | % | | | (0.13 | )% | | | (0.30 | )% | | | (0.06 | )% | | | 1.22 | % |
| | | | | | |
Portfolio turnover | | | 27 | % | | | 63 | % | | | 57 | % | | | 37 | % | | | 40 | % |
| | | | | | |
Net assets end of year (000’s) omitted | | | $43,483 | | | | $39,367 | | | | $41,453 | | | | $22,813 | | | | $6,328 | |
| | | | | | | | | | | | | | | | | | | | | |
44
| | |
| | | AMG GW&K Emerging Wealth Equity Fund Financial Highlights For a share outstanding throughout each fiscal year |
| | | |
| | | |
| | | | | | | | | | | | | | | | | | | | |
| | | For the fiscal years ended October 31, | |
| | | | | | |
| Class Z | | 2023 | | | 2022 | | | 2021 | | | 2020 | | | 2019 | |
| | | | | | |
Net Asset Value, Beginning of Year | | | $8.87 | | | | $13.52 | | | | $13.34 | | | | $11.99 | | | | $10.41 | |
| | | | | | |
Income (loss) from Investment Operations: | | | | | | | | | | | | | | | | | | | | |
| | | | | | |
Net investment income (loss)1,2 | | | 0.02 | | | | (0.00 | )7 | | | (0.03 | ) | | | 0.01 | | | | 0.15 | |
| | | | | | |
Net realized and unrealized gain (loss) on investments | | | 1.30 | | | | (4.50 | ) | | | 0.21 | | | | 1.72 | | | | 1.96 | |
| | | | | | |
Total income (loss) from investment operations | | | 1.32 | | | | (4.50 | ) | | | 0.18 | | | | 1.73 | | | | 2.11 | |
| | | | | | |
Less Distributions to Shareholders from: | | | | | | | | | | | | | | | | | | | | |
| | | | | | |
Net investment income | | | — | | | | — | | | | (0.00 | )7 | | | (0.11 | ) | | | (0.09 | ) |
| | | | | | |
Net realized gain on investments | | | — | | | | (0.15 | ) | | | — | | | | (0.27 | ) | | | (0.44 | ) |
| | | | | | |
Total distributions to shareholders | | | — | | | | (0.15 | ) | | | (0.00 | )7 | | | (0.38 | ) | | | (0.53 | ) |
| | | | | | |
Net Asset Value, End of Year | | | $10.19 | | | | $8.87 | | | | $13.52 | | | | $13.34 | | | | $11.99 | |
| | | | | | |
Total Return2,3 | | | 14.88 | % | | | (33.61 | )% | | | 1.37 | % | | | 14.75 | % | | | 21.34 | % |
| | | | | | |
Ratio of net expenses to average net assets | | | 0.90 | % | | | 0.90 | %4 | | | 0.82 | % | | | 0.86 | % | | | 0.97 | %5 |
| | | | | | |
Ratio of gross expenses to average net assets6 | | | 0.93 | % | | | 0.91 | % | | | 0.82 | % | | | 0.86 | % | | | 0.97 | %5 |
| | | | | | |
Ratio of net investment income (loss) to average net assets2 | | | 0.15 | % | | | (0.03 | )% | | | (0.19 | )% | | | 0.05 | % | | | 1.33 | % |
| | | | | | |
Portfolio turnover | | | 27 | % | | | 63 | % | | | 57 | % | | | 37 | % | | | 40 | % |
| | | | | | |
Net assets end of year (000’s) omitted | | | $19,437 | | | | $32,427 | | | | $183,290 | | | | $185,755 | | | | $105,069 | |
| | | | | | | | | | | | | | | | | | | | | |
| 1 | Per share numbers have been calculated using average shares. |
| 2 | Total returns and net investment income (loss) would have been lower had certain expenses not been offset. |
| 3 | The total return is calculated using the published Net Asset Value as of fiscal year end. |
| 4 | Includes interest expense of less than 0.01% related to participation in the interfund lending program. |
| 5 | Such ratio includes recapture of waived/reimbursed fees from a prior period amounting to 0.02% for the fiscal year ended October 31, 2019. |
| 6 | Excludes the impact of expense reimbursement or fee waivers and expense reductions such as brokerage credits, but includes expense repayments and non-reimbursable expenses, if any, such as interest, taxes, and extraordinary expenses. (See Note 1(c) and 2 in the Notes to Financial Statements.) |
| 7 | Less than $(0.005) per share. |
45
| | |
| | | AMG GW&K Small/Mid Cap Growth Fund Financial Highlights For a share outstanding throughout each fiscal year |
| | | |
| | | |
| | | | | | | | | | | | | | | | | | | | |
| | | For the fiscal years ended October 31, | |
| | | | | | |
| Class N | | 2023 | | | 2022 | | | 2021 | | | 2020 | | | 2019 | |
| | | | | | |
Net Asset Value, Beginning of Year | | | $13.45 | | | | $17.67 | | | | $21.14 | | | | $17.02 | | | | $16.90 | |
| | | | | | |
Income (loss) from Investment Operations: | | | | | | | | | | | | | | | | | | | | |
| | | | | | |
Net investment loss1,2 | | | (0.04 | ) | | | (0.08 | ) | | | (0.17 | ) | | | (0.17 | ) | | | (0.08 | ) |
| | | | | | |
Net realized and unrealized gain (loss) on investments | | | 0.19 | | | | (4.14 | ) | | | 7.74 | | | | 4.29 | | | | 0.20 | |
| | | | | | |
Total income (loss) from investment operations | | | 0.15 | | | | (4.22 | ) | | | 7.57 | | | | 4.12 | | | | 0.12 | |
| | | | | | |
Less Distributions to Shareholders from: | | | | | | | | | | | | | | | | | | | | |
| | | | | | |
Net realized gain on investments | | | (0.27 | ) | | | — | | | | (10.55 | ) | | | — | | | | — | |
| | | | | | |
Paid in capital | | | — | | | | — | | | | (0.49 | ) | | | — | | | | — | |
| | | | | | |
Total distributions to shareholders | | | (0.27 | ) | | | — | | | | (11.04 | ) | | | — | | | | — | |
| | | | | | |
Net Asset Value, End of Year | | | $13.33 | | | | $13.45 | | | | $17.67 | | | | $21.14 | | | | $17.02 | |
| | | | | | |
Total Return2,3 | | | 1.12 | % | | | (23.88 | )%4 | | | 46.66 | % | | | 24.27 | % | | | 0.71 | % |
| | | | | | |
Ratio of net expenses to average net assets5 | | | 1.00 | % | | | 1.00 | % | | | 1.17 | % | | | 1.29 | %6 | | | 1.30 | % |
| | | | | | |
Ratio of gross expenses to average net assets7 | | | 1.24 | % | | | 1.25 | % | | | 1.42 | % | | | 1.60 | % | | | 1.47 | % |
| | | | | | |
Ratio of net investment loss to average net assets2 | | | (0.28 | )% | | | (0.56 | )% | | | (0.91 | )% | | | (0.92 | )% | | | (0.48 | )% |
| | | | | | |
Portfolio turnover | | | 25 | % | | | 23 | % | | | 158 | % | | | 126 | % | | | 138 | % |
| | | | | | |
Net assets end of year (000’s) omitted | | | $27,120 | | | | $24,994 | | | | $37,471 | | | | $28,908 | | | | $30,717 | |
| | | | | | | | | | | | | | | | | | | | | |
46
| | |
| | | AMG GW&K Small/Mid Cap Growth Fund Financial Highlights For a share outstanding throughout each fiscal year |
| | | |
| | | |
| | | | | | | | | | | | | | | | | | | | |
| | | For the fiscal years ended October 31, | |
| | | | | | |
| Class I | | 2023 | | | 2022 | | | 2021 | | | 2020 | | | 2019 | |
| | | | | | |
Net Asset Value, Beginning of Year | | | $14.01 | | | | $18.39 | | | | $21.60 | | | | $17.35 | | | | $17.20 | |
| | | | | | |
Income (loss) from Investment Operations: | | | | | | | | | | | | | | | | | | | | |
| | | | | | |
Net investment loss1,2 | | | (0.02 | ) | | | (0.06 | ) | | | (0.15 | ) | | | (0.14 | ) | | | (0.05 | ) |
| | | | | | |
Net realized and unrealized gain (loss) on investments | | | 0.21 | | | | (4.32 | ) | | | 7.98 | | | | 4.39 | | | | 0.20 | |
| | | | | | |
Total income (loss) from investment operations | | | 0.19 | | | | (4.38 | ) | | | 7.83 | | | | 4.25 | | | | 0.15 | |
| | | | | | |
Less Distributions to Shareholders from: | | | | | | | | | | | | | | | | | | | | |
| | | | | | |
Net realized gain on investments | | | (0.27 | ) | | | — | | | | (10.55 | ) | | | — | | | | — | |
| | | | | | |
Paid in capital | | | — | | | | — | | | | (0.49 | ) | | | — | | | | — | |
| | | | | | |
Total distributions to shareholders | | | (0.27 | ) | | | — | | | | (11.04 | ) | | | — | | | | — | |
| | | | | | |
Net Asset Value, End of Year | | | $13.93 | | | | $14.01 | | | | $18.39 | | | | $21.60 | | | | $17.35 | |
| | | | | | |
Total Return2,3 | | | 1.36 | % | | | (23.82 | )%4 | | | 46.94 | % | | | 24.48 | % | | | 0.93 | % |
| | | | | | |
Ratio of net expenses to average net assets5 | | | 0.86 | % | | | 0.86 | % | | | 1.02 | % | | | 1.10 | %6 | | | 1.10 | % |
| | | | | | |
Ratio of gross expenses to average net assets7 | | | 1.10 | % | | | 1.11 | % | | | 1.27 | % | | | 1.41 | % | | | 1.27 | % |
| | | | | | |
Ratio of net investment loss to average net assets2 | | | (0.14 | )% | | | (0.42 | )% | | | (0.76 | )% | | | (0.73 | )% | | | (0.28 | )% |
| | | | | | |
Portfolio turnover | | | 25 | % | | | 23 | % | | | 158 | % | | | 126 | % | | | 138 | % |
| | | | | | |
Net assets end of year (000’s) omitted | | | $7,561 | | | | $6,540 | | | | $6,612 | | | | $6,483 | | | | $14,608 | |
| | | | | | | | | | | | | | | | | | | | | |
47
| | |
| | | AMG GW&K Small/Mid Cap Growth Fund Financial Highlights For a share outstanding throughout each fiscal period |
| | | |
| | | |
| | | | | | | | | | | | |
| | | For the fiscal year ended
October 31, | | | For the fiscal
period ended
October 31, |
| | | | |
| Class Z | | 2023 | | | 2022 | | | 20218 |
| | | | |
Net Asset Value, Beginning of Period | | | $14.02 | | | | $18.39 | | | | $17.84 | |
| | | | |
Income (loss) from Investment Operations: | | | | | | | | | | | | |
| | | | |
Net investment loss1,2 | | | (0.01 | ) | | | (0.06 | ) | | | (0.01 | ) |
| | | | |
Net realized and unrealized gain (loss) on investments | | | 0.21 | | | | (4.31 | ) | | | 0.56 | |
| | | | |
Total income (loss) from investment operations | | | 0.20 | | | | (4.37 | ) | | | 0.55 | |
| | | | |
Less Distributions to Shareholders from: | | | | | | | | | | | | |
| | | | |
Net realized gain on investments | | | (0.27 | ) | | | — | | | | — | |
| | | | |
Net Asset Value, End of Period | | | $13.95 | | | | $14.02 | | | | $18.39 | |
| | | | |
Total Return2,3 | | | 1.43 | % | | | (23.76 | )%4 | | | 3.08 | %9 |
| | | | |
Ratio of net expenses to average net assets10 | | | 0.81 | % | | | 0.81 | % | | | 0.82 | %11 |
| | | | |
Ratio of gross expenses to average net assets7 | | | 1.05 | % | | | 1.06 | % | | | 1.13 | %11 |
| | | | |
Ratio of net investment loss to average net assets2 | | | (0.09 | )% | | | (0.37 | )% | | | (0.49 | )%11 |
| | | | |
Portfolio turnover | | | 25 | % | | | 23 | % | | | 158 | % |
| | | | |
Net assets end of period (000’s) omitted | | | $24 | | | | $12 | | | | $15 | |
| | | | | | | | | | | | | |
| 1 | Per share numbers have been calculated using average shares. |
| 2 | Total returns and net investment loss would have been lower had certain expenses not been offset. |
| 3 | The total return is calculated using the published Net Asset Value as of fiscal year end. |
| 4 | Includes a non-recurring securities litigation gain. Had the Fund not received the payment total return would have been (24.68%), (24.53%) and (24.53%) for Class N, Class I and Class Z respectively. |
| 5 | Includes reduction from broker recapture amounting to 0.01%, 0.01%, less than 0.01%, 0.01% and less than 0.01% for the fiscal years ended 2023, 2022, 2021, 2020 and 2019, respectively. |
| 6 | Includes interest expense of less than 0.01% related to participation in the interfund lending program. |
| 7 | Excludes the impact of expense reimbursement or fee waivers and expense reductions such as brokerage credits, but includes expense repayments and non-reimbursable expenses, if any, such as interest, taxes, and extraordinary expenses. (See Note 1(c) and 2 in the Notes to Financial Statements.) |
| 8 | Commencement of operations was on August 31, 2021. |
| 10 | Includes reduction from broker recapture amounting to 0.01% and 0.01% for the fiscal years ended 2023 and 2022, respectively, and less than 0.01% for the fiscal period ended October 31, 2021. |
48
| | |
| | | Notes to Financial Statements October 31, 2023 |
| | | |
| | | |
1. ORGANIZATION AND SUMMARY OF SIGNIFICANT ACCOUNTING POLICIES
AMG Funds, AMG Funds I and AMG Funds IV (the “Trusts”) are open-end management investment companies. AMG Funds and AMG Funds I are organized as Massachusetts business trusts, while AMG Funds IV is organized as a Delaware Statutory Trust. The Trusts are registered under the Investment Company Act of 1940, as amended (the “1940 Act”). Currently, the Trusts consist of a number of different funds, each having distinct investment management objectives, strategies, risks, and policies. Included in this report are AMG Funds I: AMG GW&K Core Bond ESG Fund (“Core Bond ESG”), AMG Funds: AMG GW&K Emerging Markets Equity Fund (“Emerging Markets Equity”) and AMG GW&K Emerging Wealth Equity Fund (“Emerging Wealth Equity”) and AMG Funds IV: AMG GW&K Small/Mid Cap Growth Fund (“Small/Mid Cap Growth”), each a “Fund” and collectively, the “Funds”.
Each Fund offers Class N, Class I and Class Z shares. Each class represents an interest in the same assets of the respective Fund. Although all share classes generally have identical voting rights, each share class votes separately when required by law. Different share classes may have different net asset values per share to the extent the share classes pay different distribution amounts and/or the expenses of such share classes differ. Each share class has its own expense structure. Please refer to a current prospectus for additional information on each share class.
Market prices of investments held by the Funds may fall rapidly or unpredictably due to a variety of economic or political factors, market conditions, disasters or public health issues, or in response to events that affect particular industries or companies.
The Funds’ financial statements are prepared in accordance with accounting principles generally accepted in the United States of America (“U.S. GAAP”), including accounting and reporting guidance pursuant to Accounting Standards Codification Topic 946 applicable to investment companies. U.S. GAAP requires management to make estimates and assumptions that affect the reported amounts of assets and liabilities and disclosure of contingent assets and liabilities at the date of the financial statements and the reported amounts of income and expenses during the reporting period. Actual results could differ from those estimates and such differences could be material. The following is a summary of significant accounting policies followed by the Funds in the preparation of their financial statements:
a. VALUATION OF INVESTMENTS
Equity securities traded on a national securities exchange or reported on the NASDAQ national market system (“NMS”) are valued at the last quoted sales price on the primary exchange or, if applicable, the NASDAQ official closing price or the official closing price of the relevant exchange or, lacking any sales, at the last quoted bid price. Equity securities held by the Funds that are traded in the over-the-counter market (other than NMS securities) are valued at the bid price. Foreign equity securities (securities principally traded in markets other than U.S. markets) held by the Funds are valued at the official closing price on the primary exchange or, for markets that either do not offer an official closing price or where the official closing price may not be representative of the overall market, the last quoted sale price.
Fixed income securities purchased with a remaining maturity exceeding 60 days are valued at the evaluated bid price provided by an authorized pricing service or,
if an evaluated price is not available, by reference to other securities which are considered comparable in credit rating, interest rate, due date and other features (generally referred to as “matrix pricing”) or other similar pricing methodologies.
Fixed income securities purchased with a remaining maturity of 60 days or less are valued at amortized cost, provided that the amortized cost value is approximately the same as the fair value of the security valued without the use of amortized cost. Investments in other open-end registered investment companies are valued at their end of day net asset value per share.
The Funds’ portfolio investments are generally valued based on independent market quotations or prices or, if none, “evaluative” or other market based valuations provided by third party pricing services. Pursuant to Rule 2a-5 under the 1940 Act, the Funds’ Boards of Trustees (the “Board”) designated AMG Funds LLC (the “Investment Manager”) as the Funds’ Valuation Designee to perform the Funds’ fair value determinations. Such determinations are subject to Board oversight and certain reporting and other requirements intended to ensure that the Board receives the information it needs to oversee the Investment Manager’s fair value determinations.
Under certain circumstances, the value of certain Fund portfolio investments may be based on an evaluation of fair value, pursuant to procedures established by the Investment Manager and under the general supervision of the Board. The Funds may use the fair value of a portfolio investment to calculate its net asset value (“NAV”) in the event that the market quotation, price or market based valuation for the portfolio investment is not readily available or otherwise not determinable pursuant to the Funds’ valuation procedures, if the Investment Manager believes the quotation, price or market based valuation to be unreliable, or in certain other circumstances. When determining the fair value of an investment, the Investment Manager seeks to determine the price that the Funds might reasonably expect to receive from current sale of that portfolio investment in an arms-length transaction. Fair value determinations shall be based upon consideration of all available facts and information, including, but not limited to (i) attributes specific to the investment; (ii) fundamental and analytical data relating to the investment; and (iii) the value of other comparable securities or relevant financial instruments, including derivative securities, traded on other markets or among dealers.
The values assigned to fair value portfolio investments are based on available information and do not necessarily represent amounts that might ultimately be realized in the future, since such amounts depend on future developments inherent in long-term investments. Because of the inherent uncertainty of valuation, those estimated values may differ significantly from the values that would have been used had a ready market for the investments existed, and the differences could be material. The Board will be presented with quarterly reports, as of the most recent quarter end, summarizing all fair value activity, material fair value matters that occurred during the quarter, and all outstanding securities fair valued by the Funds. Additionally, the Board will be presented with an annual report that assesses the adequacy and effectiveness of the Investment Manager’s process for determining the fair value of the Funds’ investments.
With respect to foreign equity securities and certain foreign fixed income securities, securities held in the Funds that can be fair valued by the applicable fair value pricing service are fair valued on each business day provided that each individual price exceeds a pre-established confidence level.
U.S. GAAP defines fair value as the price that a fund would receive to sell an asset or pay to transfer a liability in an orderly transaction between market participants at the measurement date. U.S. GAAP also establishes a framework for measuring fair value, and a three level hierarchy for fair value measurements based upon the
49
| | |
| | | Notes to Financial Statements (continued) |
| | | |
| | | |
transparency of inputs to the valuation of an asset or liability. Inputs may be observable or unobservable and refer broadly to the assumptions that market participants would use in pricing the asset or liability. Observable inputs reflect the assumptions market participants would use in pricing the asset or liability based on market data obtained from sources independent of the Funds. Unobservable inputs reflect the Funds’ own assumptions about the assumptions that market participants would use in pricing the asset or liability developed based on the best information available in the circumstances. Each investment is assigned a level based upon the observability of the inputs which are significant to the overall valuation.
The three-tier hierarchy of inputs is summarized below:
Level 1 – inputs are quoted prices in active markets for identical investments (e.g., equity securities, open-end investment companies)
Level 2 – other observable inputs (including, but not limited to: quoted prices for similar assets or liabilities in markets that are active, quoted prices for identical or similar assets or liabilities in markets that are not active, inputs other than quoted prices that are observable for the assets or liabilities (such as interest rates, yield curves, volatilities, prepayment speeds, loss severities, credit risks and default rates) or other market corroborated inputs) (e.g., debt securities, government securities, foreign currency exchange contracts, foreign securities utilizing international fair value pricing, fair valued securities with observable inputs)
Level 3 – inputs are significant unobservable inputs (including the Fund’s own assumptions used to determine the fair value of investments) (e.g., fair valued securities with unobservable inputs)
Changes in inputs or methodologies used for valuing investments may result in a transfer in or out of levels within the fair value hierarchy. The inputs or methodologies used for valuing investments may not necessarily be an indication of the risk associated with investing in those investments.
b. SECURITY TRANSACTIONS
Security transactions are accounted for as of trade date. Realized gains and losses on securities sold are determined on the basis of identified cost.
c. INVESTMENT INCOME AND EXPENSES
Dividend income is recorded on the ex-dividend date. Dividends from foreign securities are recorded on the ex-dividend date, and if after the fact, as soon as the Funds become aware of the ex-dividend date, except for Korean securities where dividends are recorded on confirmation date. Interest income, which includes amortization of premium and accretion of discount on debt securities, is accrued as earned. Dividend and interest income on foreign securities is recorded gross of
any withholding tax. Non-cash dividends included in dividend income, if any, are reported at the fair market value of the securities received. Upon notification from the issuer, distributions received from a real estate investment trust (REIT) may be redesignated as a reduction of cost of investments and/or realized gain. Other income and expenses are recorded on an accrual basis. Expenses that cannot be directly attributed to a Fund are apportioned among the funds in the Trusts and other trusts or funds within the AMG Funds Family of Funds (collectively, the “AMG Funds Family”) based upon their relative average net assets or number of shareholders. Investment income, realized and unrealized capital gains and losses, the common expenses of each Fund, and certain fund level expense reductions, if any, are allocated on a pro-rata basis to each class based on the relative net assets of each class to the total net assets of each Fund.
Small/Mid Cap Growth had certain portfolio trades directed to various brokers under a brokerage recapture program. Credits received from the brokerage recapture program are earned and paid on a monthly basis, and are recorded as expense offsets, which serve to reduce the Fund’s overall expense ratio. For the fiscal year ended October 31, 2023, the impact on the expenses and expense ratios was $2,983 or 0.01%.
d. DIVIDENDS AND DISTRIBUTIONS
Fund distributions resulting from net investment income will normally be declared and paid monthly for Core Bond ESG and annually for Emerging Markets Equity, Emerging Wealth Equity and Small/Mid Cap Growth. Realized net capital gains distributions, if any, will normally be declared and paid at least annually in December. Distributions to shareholders are recorded on the ex-dividend date. Distributions are determined in accordance with federal income tax regulations, which may differ from net investment income and net realized capital gains for financial statement purposes (U.S. GAAP). Differences may be permanent or temporary. Permanent differences are reclassified among capital accounts in the financial statements to reflect their tax character. Permanent book and tax basis differences, if any, relating to shareholder distributions will result in reclassifications to paid-in capital. Temporary differences arise when certain items of income, expense and gain or loss are recognized in different periods for financial statement and tax purposes; these differences will reverse at some time in the future. Permanent differences are primarily due to net operating losses for Small/Mid Cap Growth. There were no permanent differences during the year for Core Bond ESG, Emerging Markets Equity, and Emerging Wealth Equity. Temporary differences are primarily due to mark to market on passive foreign investment companies for Emerging Markets Equity and Emerging Wealth Equity. Temporary differences for Small/Mid Cap Growth are due to qualified late-year ordinary loss deferrals. Temporary differences for Emerging Markets Equity are due to cost adjustments on dividend income received from spinoffs. In addition, temporary differences for each Fund are due to wash sale loss deferrals.
The tax character of distributions paid during the fiscal years ended October 31, 2023 and October 31, 2022 was as follows:
| | | | | | | | | | | | | | | | |
| | | Core Bond ESG | | | Emerging Markets Equity | |
| | | | |
| Distributions paid from: | | 2023 | | | 2022 | | | 2023 | | | 2022 | |
| | | | |
Ordinary income * | | | $4,046,880 | | | | $3,496,989 | | | | $871,205 | | | | $422,590 | |
| | | | |
Long-term capital gains | | | — | | | | 4,019,861 | | | | — | | | | 211,238 | |
| | | | | | | | | | | | | | | | |
| | | | |
| | | $4,046,880 | | | | $7,516,850 | | | | $871,205 | | | | $633,828 | |
| | | | | | | | | | | | | | | | |
50
| | |
| | | Notes to Financial Statements (continued) |
| | | |
| | | |
| | | | | | | | | | | | | | | | |
| | | Emerging Wealth Equity | | | Small/Mid Cap Growth | |
| | | | |
| Distributions paid from: | | 2023 | | | 2022 | | | 2023 | | | 2022 | |
| | | | |
Ordinary income * | | | — | | | | — | | | | — | | | | — | |
| | | | |
Long-term capital gains | | | — | | | | $2,343,086 | | | | $623,575 | | | | — | |
| | | | | | | | | | | | | | | | |
| | | | |
| | | — | | | | $2,343,086 | | | | $623,575 | | | | — | |
| | | | | | | | | | | | | | | | |
| * | For tax purposes, short-term capital gain distributions, if any, are considered ordinary income distributions. |
As of October 31, 2023, the components of distributable earnings (excluding unrealized appreciation/depreciation) on a tax basis consisted of:
| | | | | | | | | | | | | | | | |
| | | Core Bond ESG | | | Emerging Markets Equity | | | Emerging Wealth Equity | | | Small/Mid Cap Growth | |
| | | | |
Capital loss carryforward | | | $9,150,522 | | | | $5,405,453 | | | | $23,078,345 | | | | $197,289 | |
| | | | |
Undistributed ordinary income | | | 38,819 | | | | 388,869 | | | | 428,257 | | | | — | |
| | | | |
Late-year ordinary loss deferral | | | — | | | | — | | | | — | | | | 79,917 | |
At October 31, 2023, the cost of investments and the aggregate gross unrealized appreciation and depreciation for federal income tax purposes were as follows:
| | | | | | | | | | | | | | | | |
Fund | | Cost | | | Appreciation | | | Depreciation | | | Net Appreciation
(Depreciation) | |
| | | | |
Core Bond ESG | | | $146,579,424 | | | | — | | | | $(23,050,304 | ) | | | $(23,050,304 | ) |
| | | | |
Emerging Markets Equity | | | 17,650,469 | | | | $4,063,056 | | | | (1,861,921 | ) | | | 2,201,135 | |
| | | | |
Emerging Wealth Equity | | | 66,873,501 | | | | 11,040,632 | | | | (12,252,860 | ) | | | (1,212,228 | ) |
| | | | |
Small/Mid Cap Growth | | | 38,412,843 | | | | 2,842,929 | | | | (6,058,529 | ) | | | (3,215,600 | ) |
e. FEDERAL TAXES
Each Fund currently qualifies as an investment company and intends to comply with the requirements under Subchapter M of the Internal Revenue Code of 1986, as amended, and to distribute substantially all of its taxable income and gains to its shareholders and to meet certain diversification and income requirements with respect to investment companies. The Investment Manager has analyzed the Funds’ tax positions taken on federal income tax returns as of October 31, 2023, and for all open tax years (generally, the three prior taxable years), and has concluded that no provision for federal income tax is required in the Funds’ financial statements. Additionally, the Investment Manager is not aware of any tax position for which it is reasonably possible that the total amounts of unrecognized tax benefit/detriment will change materially in the next twelve months.
Furthermore, based on each Fund’s understanding of the tax rules and rates related to income, gains and transactions for the foreign jurisdictions in which it invests, each Fund will provide for foreign taxes, and where appropriate, deferred foreign taxes.
f. CAPITAL LOSS CARRYOVERS AND DEFERRALS
As of October 31, 2023, the Funds had capital loss carryovers for federal income tax purposes as shown in the following chart. These amounts may be used to offset future realized capital gains indefinitely, and retain their character as short-term and/or long-term.
| | | | | | | | | | | | |
Fund | | Short-Term | | | Long-Term | | | Total | |
| | | |
Core Bond ESG | | | $2,928,115 | | | | $6,222,407 | | | | $9,150,522 | |
| | | |
Emerging Markets Equity | | | 5,392,068 | | | | 13,385 | | | | 5,405,453 | |
| | | |
Emerging Wealth Equity | | | 23,078,345 | | | | — | | | | 23,078,345 | |
| | | |
Small/Mid Cap Growth | | | 114,926 | | | | 82,363 | | | | 197,289 | |
For the fiscal year ended October 31, 2023, the following Funds utilized capital loss carryovers in the amount of:
| | | | | | | | |
| | | Capital Loss Carryover Utilized | |
| | |
Fund | | Short-Term | | | Long-Term | |
| | |
Emerging Market Equity | | | — | | | | $456,581 | |
| | |
Emerging Wealth Equity | | | $2,006,337 | | | | — | |
51
| | |
| | | Notes to Financial Statements (continued) |
| | | |
| | | |
g. CAPITAL STOCK
Each Trust’s Amended and Restated Agreement and Declaration of Trust or Trust Instrument, as applicable, authorizes for each Fund the issuance of an unlimited number of shares of beneficial interest, without par value. Each Fund records sales and repurchases of its capital stock on the trade date.
For the fiscal years ended October 31, 2023 and October 31, 2022, the capital stock transactions by class for the Funds were as follows:
| | | | | | | | | | | | | | | | | | | | | | | | | | | | | | | | | | | | | | | | | | | | |
| | | |
| | | Core Bond ESG | | | | | | Emerging Markets Equity | |
| | | | | | | |
| | | October 31, 2023 | | | | | | October 31, 2022 | | | | | | October 31, 2023 | | | | | | October 31, 2022 | |
| | | | | | | | | | | |
| | | Shares | | | Amount | | | | | | Shares | | | Amount | | | | | | Shares | | | Amount | | | | | | Shares | | | Amount | |
| | | | | | | | | | | |
Class N: | | | | | | | | | | | | | | | | | | | | | | | | | | | | | | | | | | | | | | | | | | | | |
| | | | | | | | | | | |
Shares sold | | | 38,736 | | | | $343,128 | | | | | | | | 22,776 | | | | $217,694 | | | | | | | | 7,865 | | | | $67,159 | | | | | | | | 4,865 | | | | $42,095 | |
| | | | | | | | | | | |
Shares issued in reinvestment of distributions | | | 5,818 | | | | 51,356 | | | | | | | | 7,601 | | | | 76,235 | | | | | | | | 1,148 | | | | 8,907 | | | | | | | | 247 | | | | 2,401 | |
| | | | | | | | | | | |
Shares redeemed | | | (12,581 | ) | | | (108,577 | ) | | | | | | | (27,512 | ) | | | (279,182 | ) | | | | | | | (6,375 | ) | | | (52,426 | ) | | | | | | | (19,283 | ) | | | (154,135 | ) |
| | | | | | | | | | | | | | | | | | | | | | | | | | | | | | | | | | | | | | | | | | | | |
| | | | | | | | | | | |
Net increase (decrease) | | | 31,973 | | | | $285,907 | | | | | | | | 2,865 | | | | $14,747 | | | | | | | | 2,638 | | | | $23,640 | | | | | | | | (14,171 | ) | | | $(109,639 | ) |
| | | | | | | | | | | | | | | | | | | | | | | | | | | | | | | | | | | | | | | | | | | | |
| | | | | | | | | | | |
Class I: | | | | | | | | | | | | | | | | | | | | | | | | | | | | | | | | | | | | | | | | | | | | |
| | | | | | | | | | | |
Shares sold | | | 1,161,567 | | | | $10,219,195 | | | | | | | | 1,103,881 | | | | $10,593,164 | | | | | | | | 528,767 | | | | $4,259,448 | | | | | | | | 1,148,293 | | | | $10,979,868 | |
| | | | | | | | | | | |
Shares issued in reinvestment of distributions | | | 428,813 | | | | 3,793,245 | | | | | | | | 700,717 | | | | 7,022,680 | | | | | | | | 55,983 | | | | 428,270 | | | | | | | | 9,086 | | | | 87,225 | |
| | | | | | | | | | | |
Shares redeemed | | | (3,389,263 | ) | | | (29,861,655 | ) | | | | | | | (3,401,399 | ) | | | (32,959,317 | ) | | | | | | | (263,743 | ) | | | (2,125,064 | ) | | | | | | | (2,318,478 | ) | | | (18,580,334 | ) |
| | | | | | | | | | | | | | | | | | | | | | | | | | | | | | | | | | | | | | | | | | | | |
| | | | | | | | | | | |
Net increase (decrease) | | | (1,798,883 | ) | | | $(15,849,215 | ) | | | | | | | (1,596,801 | ) | | | $(15,343,473 | ) | | | | | | | 321,007 | | | | $2,562,654 | | | | | | | | (1,161,099 | ) | | | $(7,513,241 | ) |
| | | | | | | | | | | | | | | | | | | | | | | | | | | | | | | | | | | | | | | | | | | | |
| | | | | | | | | | | |
Class Z: | | | | | | | | | | | | | | | | | | | | | | | | | | | | | | | | | | | | | | | | | | | | |
| | | | | | | | | | | |
Shares sold | | | 21,349 | | | | $186,192 | | | | | | | | 14,006 | | | | $139,190 | | | | | | | | 201,969 | | | | $1,658,566 | | | | | | | | 52,545 | | | | $454,281 | |
| | | | | | | | | | | |
Shares issued in reinvestment of distributions | | | 5,322 | | | | 47,130 | | | | | | | | 11,298 | | | | 112,920 | | | | | | | | 54,430 | | | | 413,125 | | | | | | | | 40,063 | | | | 382,197 | |
| | | | | | | | | | | |
Shares redeemed | | | (129,774 | ) | | | (1,162,515 | ) | | | | | | | (115,151 | ) | | | (1,206,439 | ) | | | | | | | (324,565 | ) | | | (2,599,782 | ) | | | | | | | (2,316,286 | ) | | | (18,867,345 | ) |
| | | | | | | | | | | | | | | | | | | | | | | | | | | | | | | | | | | | | | | | | | | | |
| | | | | | | | | | | |
Net decrease | | | (103,103 | ) | | | $(929,193 | ) | | | | | | | (89,847 | ) | | | $(954,329 | ) | | | | | | | (68,166 | ) | | | $(528,091 | ) | | | | | | | (2,223,678 | ) | | | $(18,030,867 | ) |
| | | | | | | | | | | | | | | | | | | | | | | | | | | | | | | | | | | | | | | | | | | | |
| | | | | | | | | | | | | | | | | | | | | | | | | | | | | | | | | | | | | | | | | | | | |
| | | |
| | | Emerging Wealth Equity | | | | | | Small/Mid Cap Growth | |
| | | | | | | |
| | | October 31, 2023 | | | | | | October 31, 2022 | | | | | | October 31, 2023 | | | | | | October 31, 2022 | |
| | | | | | | | | | | |
| | | Shares | | | Amount | | | | | | Shares | | | Amount | | | | | | Shares | | | Amount | | | | | | Shares | | | Amount | |
| | | | | | | | | | | |
Class N: | | | | | | | | | | | | | | | | | | | | | | | | | | | | | | | | | | | | | | | | | | | | |
| | | | | | | | | | | |
Shares sold | | | 21,984 | | | | $246,945 | | | | | | | | 3,331 | | | | $38,813 | | | | | | | | 437,431 | | | | $6,245,304 | | | | | | | | 50,329 | | | | $758,167 | |
| | | | | | | | | | | |
Shares issued in reinvestment of distributions | | | — | | | | — | | | | | | | | 832 | | | | 10,519 | | | | | | | | 36,604 | | | | 484,632 | | | | | | | | — | | | | — | |
| | | | | | | | | | | |
Shares redeemed | | | (21,964 | ) | | | (245,553 | ) | | | | | | | (38,704 | ) | | | (443,345 | ) | | | | | | | (298,744 | ) | | | (4,248,267 | ) | | | | | | | (311,956 | ) | | | (4,746,914 | ) |
| | | | | | | | | | | | | | | | | | | | | | | | | | | | | | | | | | | | | | | | | | | | |
| | | | | | | | | | | |
Net increase (decrease) | | | 20 | | | | $1,392 | | | | | | | | (34,541 | ) | | | $(394,013 | ) | | | | | | | 175,291 | | | | $2,481,669 | | | | | | | | (261,627 | ) | | | $(3,988,747 | ) |
| | | | | | | | | | | | | | | | | | | | | | | | | | | | | | | | | | | | | | | | | | | | |
| | | | | | | | | | | |
Class I: | | | | | | | | | | | | | | | | | | | | | | | | | | | | | | | | | | | | | | | | | | | | |
| | | | | | | | | | | |
Shares sold | | | 1,114,445 | | | | $13,014,443 | | | | | | | | 4,020,886 | | | | $51,172,610 | | | | | | | | 122,572 | | | | $1,800,280 | | | | | | | | 168,904 | | | | $2,592,371 | |
| | | | | | | | | | | |
Shares issued in reinvestment of distributions | | | — | | | | — | | | | | | | | 32,510 | | | | 415,801 | | | | | | | | 8,963 | | | | 123,780 | | | | | | | | — | | | | — | |
| | | | | | | | | | | |
Shares redeemed | | | (1,280,358 | ) | | | (13,821,248 | ) | | | | | | | (2,679,906 | ) | | | (30,270,347 | ) | | | | | | | (55,284 | ) | | | (806,677 | ) | | | | | | | (61,724 | ) | | | (883,953 | ) |
| | | | | | | | | | | | | | | | | | | | | | | | | | | | | | | | | | | | | | | | | | | | |
| | | | | | | | | | | |
Net increase (decrease) | | | (165,913 | ) | | | $(806,805 | ) | | | | | | | 1,373,490 | | | | $21,318,064 | | | | | | | | 76,251 | | | | $1,117,383 | | | | | | | | 107,180 | | | | $1,708,418 | |
| | | | | | | | | | | | | | | | | | | | | | | | | | | | | | | | | | | | | | | | | | | | |
| | | | | | | | | | | |
Class Z: | | | | | | | | | | | | | | | | | | | | | | | | | | | | | | | | | | | | | | | | | | | | |
| | | | | | | | | | | |
Shares sold | | | 23,279 | | | | $273,569 | | | | | | | | 574,616 | | | | $7,156,896 | | | | | | | | 829 | | | | $11,751 | | | | | | | | — | | | | — | |
| | | | | | | | | | | |
Shares issued in reinvestment of distributions | | | — | | | | — | | | | | | | | 8,097 | | | | 103,399 | | | | | | | | 32 | | | | 448 | | | | | | | | — | | | | — | |
| | | | | | | | | | | |
Shares redeemed | | | (1,770,412 | ) | | | (19,577,670 | ) | | | | | | | (10,481,116 | ) | | | (116,006,697 | ) | | | | | | | — | | | | — | | | | | | | | — | | | | — | |
| | | | | | | | | | | | | | | | | | | | | | | | | | | | | | | | | | | | | | | | | | | | |
| | | | | | | | | | | |
Net increase (decrease) | | | (1,747,133 | ) | | | $(19,304,101 | ) | | | | | | | (9,898,403 | ) | | | $(108,746,402 | ) | | | | | | | 861 | | | | $12,199 | | | | | | | | — | | | | — | |
| | | | | | | | | | | | | | | | | | | | | | | | | | | | | | | | | | | | | | | | | | | | |
52
| | |
| | | Notes to Financial Statements (continued) |
| | | |
| | | |
At October 31, 2023, certain affiliated and unaffiliated shareholders of record individually or collectively held greater than 5% of the net assets of the Funds as follows: Emerging Markets Equity - two own 19%. Transactions by these shareholders may have a material impact on the Fund.
h. REPURCHASE AGREEMENTS AND JOINT REPURCHASE AGREEMENTS
The Funds may enter into third-party and bilateral repurchase agreements for temporary cash management purposes and for reinvestment of cash collateral on securities lending transactions under the securities lending program offered by The Bank of New York Mellon (“BNYM”) (the “Securities Lending Program”) (collectively, “Repurchase Agreements”). The value of the underlying collateral, including accrued interest, must equal or exceed the value of the Repurchase Agreements during the term of the agreement. For joint repurchase agreements, the Funds participate on a pro rata basis with other clients of BNYM in their share of the underlying collateral under such joint repurchase agreements and in their share of proceeds from any repurchase or other disposition of the underlying collateral. The underlying collateral for all Repurchase Agreements is held by the Funds’ custodian or at the Federal Reserve Bank. If the seller defaults and the value of the collateral declines, or if bankruptcy proceedings commence with respect to the seller of the security, realization of the collateral by the Funds may be delayed or limited. Pursuant to the Securities Lending Program, the Funds are indemnified for such losses by BNYM on joint repurchase agreements.
At October 31, 2023, the market value of Repurchase Agreements outstanding for Core Bond ESG, Emerging Markets Equity, Emerging Wealth Equity and Small/Mid Cap Growth were $5,340,228, $359,052, $0 and $1,689,168, respectively.
i. FOREIGN CURRENCY TRANSLATION
The books and records of the Funds are maintained in U.S. Dollars. The value of investments, assets and liabilities denominated in currencies other than U.S. Dollars are translated into U.S. Dollars based upon current foreign exchange rates. Purchases and sales of foreign investments, income and expenses are converted into U.S. Dollars based on currency exchange rates prevailing on the respective dates of such transactions. Net realized and unrealized gain (loss) on foreign currency transactions represent: (1) foreign exchange gains and losses from the sale and holdings of foreign currencies; (2) gains and losses between trade date and settlement date on investment securities transactions and foreign currency exchange contracts; and (3) gains and losses from the difference between amounts of interest and dividends recorded and the amounts actually received.
The Funds do not isolate the net realized and unrealized gain or loss resulting from changes in exchange rates from the fluctuations in market prices of securities held. Such fluctuations are included with the net realized and unrealized gain or loss on investments.
2. AGREEMENTS AND TRANSACTIONS WITH AFFILIATES
For each of the Funds, the Trusts have entered into an investment advisory agreement under which the Investment Manager, a subsidiary and the U.S. wealth platform of Affiliated Managers Group, Inc. (“AMG”), serves as investment manager to the Funds and is responsible for the Funds’ overall administration and operations. The Investment Manager selects and recommends, subject to the approval of the Board and, in certain circumstances, shareholders, the Funds’ subadviser and monitors the subadviser’s investment performance, security holdings and investment strategies. Each Fund’s investment portfolio is managed by GW&K Investment Management, LLC (“GW&K”), who serves pursuant to a
subadvisory agreement with the Investment Manager. AMG indirectly owns a majority interest in GW&K.
Investment management fees are paid directly by the Funds to the Investment Manager based on average daily net assets. For the fiscal year ended October 31, 2023, the Funds’ investment management fees were paid at the following annual rate of each Fund’s respective average daily net assets:
| | | | |
| |
Core Bond ESG | | | 0.30 | % |
| |
Emerging Markets Equity | | | 0.55 | % |
| |
Emerging Wealth Equity | | | 0.55 | % |
| |
Small/Mid Cap Growth | | | 0.62 | % |
The fee paid to GW&K for its services as subadviser is paid out of the fee the Investment Manager receives from each Fund and does not increase the expenses of each Fund.
The Investment Manager has contractually agreed, through at least March 1, 2024, to waive management fees and/or pay or reimburse fund expenses in order to limit total annual Fund operating expenses after fee waiver and expense reimbursements (exclusive of taxes, interest (including interest incurred in connection with bank and custody overdrafts, and in connection with securities sold short), shareholder servicing fees, distribution and service (12b-1) fees, brokerage commissions and other transaction costs, dividends payable with respect to securities sold short, acquired fund fees and expenses and extraordinary expenses) of Core Bond ESG, Emerging Markets Equity, Emerging Wealth Equity, and Small/Mid Cap Growth to 0.48%, 0.87%, 0.90%, and 0.82%, respectively, of each Fund’s average daily net assets (this annual rate or such other annual rate that may be in effect from time to time, the “Expense Cap”), subject to later reimbursement by the Funds in certain circumstances.
In general, for a period of up to 36 months after the date any amounts are paid, waived or reimbursed by the Investment Manager, the Investment Manager may recover such amounts from a Fund, provided that such repayment would not cause the Fund’s total annual operating expenses after fee waiver and expense reimbursements (exclusive of the items noted in the parenthetical above) to exceed either (i) the Expense Cap in effect at the time such amounts were paid, waived or reimbursed, or (ii) the Expense Cap in effect at the time of such repayment by the Fund.
The contractual expense limitation may only be terminated in the event the Investment Manager or a successor ceases to be the investment manager of a Fund or a successor fund, by mutual agreement between the Investment Manager and the Board, or in the event of a Fund’s liquidation unless the Fund is reorganized or is a party to a merger in which the surviving entity is successor to the accounting and performance information of a Fund.
For the fiscal year ended October 31, 2023, the Investment Manager’s expense reimbursements, and repayments of prior reimbursements by the Funds to the Investment Manager, if any, are as follows:
53
| | |
| | | Notes to Financial Statements (continued) |
| | | |
| | | |
| | | | |
| | | Expense
Reimbursements | | Repayment of
Prior Reimbursements |
| | |
Core Bond ESG | | $156,088 | | — |
| | |
Emerging Markets Equity | | 102,622 | | — |
| | |
Emerging Wealth Equity | | 31,418 | | $11,356 |
| | |
Small/Mid Cap Growth | | 82,386 | | — |
At October 31, 2023, the Funds’ expiration of reimbursements subject to recoupment is as follows:
| | | | | | | | |
Expiration Period | | Core Bond ESG | | | Emerging Markets Equity | |
| | |
Less than 1 year | | | $129,634 | | | | $58,087 | |
| | |
1-2 years | | | 121,994 | | | | 77,630 | |
| | |
2-3 years | | | 156,088 | | | | 102,622 | |
| | | | | | | | |
| | |
Total | | | $407,716 | | | | $238,339 | |
| | | | | | | | |
| | |
Expiration
Period | | Emerging Wealth Equity | | | Small/Mid Cap Growth | |
| | |
Less than 1 year | | | — | | | | $103,778 | |
| | |
1-2 years | | | — | | | | 89,139 | |
| | |
2-3 years | | | $31,418 | | | | 82,386 | |
| | | | | | | | |
| | |
Total | | | $31,418 | | | | $275,303 | |
| | | | | | | | |
The Trusts, on behalf of the Funds, have entered into an amended and restated Administration Agreement under which the Investment Manager serves as the Funds’ administrator (the “Administrator”) and is responsible for certain aspects of managing the Funds’ operations, including administration and shareholder services to each Fund. Each Fund pays a fee to the Administrator at the rate of 0.15% per annum of the Fund’s average daily net assets for this service.
The Funds are distributed by AMG Distributors, Inc. (the “Distributor”), a wholly-owned subsidiary of the Investment Manager. The Distributor serves as the distributor and underwriter for each Fund and is a registered broker-dealer and member of the Financial Industry Regulatory Authority, Inc. (“FINRA”). Shares of each Fund will be continuously offered and will be sold directly to prospective purchasers and through brokers, dealers or other financial intermediaries who have executed selling agreements with the Distributor. Generally, the Distributor bears all or a portion of the expenses of providing services pursuant to the distribution agreement, including the payment of the expenses relating to the distribution of prospectuses for sales purposes and any advertising or sales literature.
The Trusts have adopted a distribution and service plan (the “Plan”) with respect to the Class N shares of each Fund, in accordance with the requirements of Rule 12b-1 under the 1940 Act and the requirements of the applicable rules of FINRA regarding asset-based sales charges. Pursuant to the Plan, each Fund may make payments to the Distributor for its expenditures in financing any activity primarily intended to result in the sale of each Fund’s Class N shares and for maintenance and personal service provided to existing shareholders of that class. The Plan authorizes payments to the Distributor up to 0.25% annually of each Fund’s average daily net assets attributable to the Class N shares. For Small/Mid
Cap Growth, the Plan is characterized as a reimbursement plan and is directly tied to expenses incurred by the Distributor; the payments the Distributor receives during any year may not exceed its actual expenses. The impact on the Class N annualized expense ratios for the fiscal year ended October 31, 2023, was 0.25% for Core Bond ESG, Emerging Markets Equity, and Emerging Wealth Equity and 0.19% for Small/Mid Cap Growth.
For Class N of Core Bond ESG, Emerging Markets Equity and Emerging Wealth Equity and for each of the Class I shares, the Board has approved reimbursement payments to the Investment Manager for shareholder servicing expenses (“shareholder servicing fees”) incurred. Shareholder servicing fees include payments to financial intermediaries, such as broker-dealers (including fund supermarket platforms), banks, and trust companies who provide shareholder recordkeeping, account servicing and other services. The Class N and Class I shares may reimburse the Investment Manager for the actual amount incurred up to a maximum annual rate of each Class’s average daily net assets as shown in the table below.
The impact on the annualized expense ratios for the fiscal year ended October 31, 2023, was as follows:
| | | | | | | | |
| Fund | | Maximum Annual
Amount
Approved | | | Actual
Amount
Incurred | |
| | |
Core Bond ESG | | | | | | | | |
| | |
Class N | | | 0.15% | | | | 0.15% | |
| | |
Class I | | | 0.10% | | | | 0.07% | |
| | |
Emerging Markets Equity | | | | | | | | |
| | |
Class N | | | 0.15% | | | | 0.15% | |
| | |
Class I | | | 0.15% | | | | 0.09% | |
| | |
Emerging Wealth Equity | | | | | | | | |
| | |
Class N | | | 0.15% | | | | 0.15% | |
| | |
Class I | | | 0.15% | | | | 0.09% | |
| | |
Small/Mid Cap Growth | | | | | | | | |
| | |
Class I | | | 0.05% | | | | 0.05% | |
The Board provides supervision of the affairs of the Trusts and other trusts within the AMG Funds Family. The Trustees of the Trusts who are not affiliated with the Investment Manager receive an annual retainer and per meeting fees for regular, special and telephonic meetings, and they are reimbursed for out-of-pocket expenses incurred while carrying out their duties as Board members. The Chairman of the Board and the Audit Committee Chair receive additional annual retainers. On October 10, 2023, the shareholders of the Trusts elected Trustees, including two new Trustees who are not “interested persons” of the Funds within the meaning of the 1940 Act. Certain Trustees and Officers of the Funds are Officers and/or Directors of the Investment Manager, AMG and/or the Distributor.
The Securities and Exchange Commission (the “SEC”) granted an exemptive order that permits certain eligible funds in the AMG Funds Family to lend and borrow money for certain temporary purposes directly to and from other eligible funds in the AMG Funds Family. Participation in this interfund lending program is voluntary for both the borrowing and lending funds, and an interfund loan is only made if it benefits each participating fund. The Administrator manages the program according to procedures approved by the Board, and the Board monitors the
54
| | |
| | | Notes to Financial Statements (continued) |
| | | |
| | | |
operation of the program. An interfund loan must comply with certain conditions set out in the exemptive order, which are designed to assure fairness and protect all participating funds. The interest earned and interest paid on interfund loans are included on the Statement of Operations as interest income and interest expense, respectively. At October 31, 2023, Emerging Wealth Equity had an interfund loan payable outstanding of $2,273,250.
The following Funds utilized the interfund loan program during the fiscal year ended October 31, 2023 as follows:
| | | | | | | | | | | | | | | | |
| Fund | | Average
Lent | | | Number
of Days | | | Interest
Earned | | | Average
Interest Rate | |
| | | | |
Core Bond ESG | | | $2,092,995 | | | | 7 | | | | $1,887 | | | | 4.702% | |
| | | | |
Emerging Markets Equity | | | 379,215 | | | | 1 | | | | 54 | | | | 5.200% | |
| | | | |
Small/Mid Cap Growth | | | 14,036 | | | | 5 | | | | 11 | | | | 5.965% | |
| | | | |
| Fund | | Average
Borrowed | | | Number
of Days | | | Interest
Paid | | | Average
Interest Rate | |
| | | | |
Emerging Markets Equity | | | $707,027 | | | | 1 | | | | $108 | | | | 5.585% | |
| | | | |
Emerging Wealth Equity | | | 2,273,250 | | | | 1 | | | | 386 | | | | 6.205% | |
3. PURCHASES AND SALES OF SECURITIES
Purchases and sales of securities (excluding short-term securities and U.S. Government Obligations) for the fiscal year ended October 31, 2023, were as follows:
| | | | | | | | |
| | | Long Term Securities | |
| | |
| Fund | | Purchases | | | Sales | |
| | |
Core Bond ESG | | $ | 17,119,052 | | | $ | 24,309,316 | |
| | |
Emerging Markets Equity | | | 8,204,641 | | | | 6,999,198 | |
| | |
Emerging Wealth Equity | | | 21,207,168 | | | | 37,642,020 | |
| | |
Small/Mid Cap Growth | | | 11,594,379 | | | | 8,855,441 | |
Core Bond ESG purchases and sales of U.S. Government obligations for the fiscal year ended October 31, 2023 were $16,973,815 and $24,711,125, respectively.
4. PORTFOLIO SECURITIES LOANED
The Funds participate in the Securities Lending Program providing for the lending of securities to qualified borrowers. Securities lending income includes earnings of such temporary cash investments, plus or minus any rebate to a borrower. These earnings (after any rebate) are then divided between BNYM, as a fee for its services under the Securities Lending Program, and the Funds, according to agreed-upon rates. Collateral on all securities loaned is accepted in cash, U.S. Treasury Obligations or U.S. Government Agency Obligations. Collateral is maintained at a minimum level of 102% (105% in the case of certain foreign securities) of the market value, plus interest, if applicable, of investments on loan. It is the Funds’ policy to obtain additional collateral from or return excess collateral to the borrower by the end of the next business day, following the valuation date of the securities loaned. Therefore, the value of the collateral held may be temporarily less than the value of the securities on loan. Lending securities entails a risk of loss to the Funds if and to the extent that the market value of the securities loaned were to increase and the borrower did not increase the collateral accordingly, and
the borrower fails to return the securities. Under the terms of the Securities Lending Program, the Funds are indemnified for such losses by BNYM. Cash collateral is held in separate omnibus accounts managed by BNYM, who is authorized to exclusively enter into joint repurchase agreements for that cash collateral. Securities collateral is held in separate omnibus accounts managed by BNYM and cannot be sold or pledged. BNYM bears the risk of any deficiency in the amount of the cash collateral available for return to the borrower due to any loss on the collateral invested. Loans of securities are terminable at any time and the borrower, after notice, is required to return borrowed securities as soon as practical, which is normally within three business days.
The value of securities loaned on positions held, cash collateral and securities collateral received at October 31, 2023, was as follows:
| | | | | | | | | | | | | | | | |
| Fund | | Securities
Loaned | | | Cash
Collateral
Received | | | Securities
Collateral
Received | | | Total
Collateral
Received | |
| | | | |
Core Bond ESG | | $ | 1,952,586 | | | $ | 2,021,228 | | | | — | | | $ | 2,021,228 | |
| | | | |
Emerging Markets Equity | | | 65,760 | | | | 68,052 | | | | — | | | | 68,052 | |
| | | | |
Small/Mid Cap Growth | | | 2,268,368 | | | | 372,168 | | | $ | 1,920,107 | | | | 2,292,275 | |
The following table summarizes the securities received as collateral for securities lending at October 31, 2023:
| | | | | | | | | | |
| Fund | | Collateral Type | | | Coupon
Range | | Maturity
Date Range | |
| | | |
Small/Mid Cap Growth | | | U.S. Treasury Obligations | | | 0.125%-5.367% | | | 01/15/24-02/15/53 | |
5. FOREIGN SECURITIES
Certain Funds may invest in securities of foreign entities and in instruments denominated in foreign currencies which involve risks not typically associated with investments in domestic securities, such as exposure to currency fluctuations, less developed or less efficient trading markets, political instability, a lack of company information, differing auditing and legal standards, and, potentially, less liquidity. A Fund’s performance will be influenced by political, social and economic factors affecting companies in emerging market countries. Emerging market countries generally have economic structures that are less diverse and mature, and political systems that are less stable, than those of developed countries. Realized gains in certain countries may be subject to foreign taxes at the Fund level and the Fund would pay such foreign taxes at the appropriate rate for each jurisdiction.
6. RISKS ASSOCIATED WITH INVESTMENT IN GREATER CHINA REGION
Emerging Markets Equity and Emerging Wealth Equity are particularly susceptible to risks in the Greater China region, which consists of the People’s Republic of China, Hong Kong, and Taiwan, among other countries. Economies in the Greater China region are dependent on the economies of other countries and can be significantly affected by currency fluctuations and increasing competition from other emerging economies in Asia with lower costs. Adverse events in any one country within the region may impact the other countries in the region or Asia as a whole. Markets in the Greater China region can experience significant volatility due to social, economic, regulatory and political uncertainties. Significant portions of the Chinese securities markets may become rapidly illiquid, as Chinese issuers have the ability to suspend the trading of their equity securities, and have shown a willingness to exercise that option in response to market volatility and other
55
| | |
| | | Notes to Financial Statements (continued) |
| | | |
| | | |
events. U.S. or foreign government restrictions or intervention could negatively affect the implementation of each Fund’s investment strategies, for example by precluding the Funds from making certain investments or causing the Funds to sell investments at disadvantageous times. China has yet to develop comprehensive securities, corporate, or commercial laws, its market is relatively new and less developed, and its economy may be adversely impacted by a slowdown in export growth. Each Fund’s NAV may be more volatile than the NAV of a more geographically diversified fund and may result in losses.
7. COMMITMENTS AND CONTINGENCIES
Under the Trusts’ organizational documents, its Trustees and Officers are indemnified against certain liabilities arising out of the performance of their duties to the Trusts. In addition, in the normal course of business, the Funds may enter into contracts and agreements that contain a variety of representations and warranties, which provide general indemnifications. The maximum exposure to the Funds under these arrangements is unknown, as this would involve future claims that may be made against a Fund that have not yet occurred. However, based on experience, the Funds had no prior claims or losses and expect the risks of loss to be remote.
8. MASTER NETTING AGREEMENTS
The Funds may enter into master netting agreements with their counterparties for the Securities Lending Program and Repurchase Agreements, which provide the right, in the event of default (including bankruptcy or insolvency) for the non-defaulting party to liquidate the collateral and calculate net exposure to the defaulting party or request additional collateral. For financial reporting purposes, the Funds do not offset financial assets and financial liabilities that are subject to master netting agreements in the Statement of Assets and Liabilities. For securities lending transactions, see Note 4.
The following table is a summary of the Funds’ open Repurchase Agreements that are subject to a master netting agreement as of October 31, 2023:
| | | | | | | | | | | | | | | | | | | | |
| | | | | Gross Amount Not Offset in the
Statement of Assets and Liabilities | | | | |
| | | | | |
| Fund | | Gross Amounts of
Assets Presented in
the Statement of
Assets and Liabilities | | Offset
Amount | | Net
Asset
Balance | | Collateral
Received | | Net
Amount |
| | | | | | |
| | | | | | | | | | | | | | | | | | | | |
| | | | | |
Core Bond ESG | | | | | | | | | | | | | | | | | | | | |
| | | | | |
Bank of America Securities, Inc. | | | $1,000,000 | | | | — | | | | $1,000,000 | | | | $1,000,000 | | | | — | |
| | | | | |
Industrial and Commercial Bank of
China Financial Services LLC | | | 1,000,000 | | | | — | | | | 1,000,000 | | | | 1,000,000 | | | | — | |
| | | | | |
RBC Capital Markets LLC | | | 21,228 | | | | — | | | | 21,228 | | | | 21,228 | | | | — | |
| | | | | |
Fixed Income Clearing Corp. | | | 1,679,000 | | | | — | | | | 1,679,000 | | | | 1,679,000 | | | | — | |
| | | | | |
Fixed Income Clearing Corp. | | | 1,640,000 | | | | — | | | | 1,640,000 | | | | 1,640,000 | | | | — | |
| | | | | |
| | | | | | | | | | | | | | | | | | | | |
| | | | | |
Total | | | $5,340,228 | | | | — | | | | $5,340,228 | | | | $5,340,228 | | | | — | |
| | | | | |
| | | | | | | | | | | | | | | | | | | | |
| | | | | |
Emerging Markets Equity | | | | | | | | | | | | | | | | | | | | |
| | | | | |
Industrial and Commercial Bank of | | | | | | | | | | | | | | | | | | | | |
| | | | | |
China Financial Services LLC | | | $68,052 | | | | — | | | | $68,052 | | | | $68,052 | | | | — | |
| | | | | |
Fixed Income Clearing Corp. | | | 291,000 | | | | — | | | | 291,000 | | | | 291,000 | | | | — | |
| | | | | |
| | | | | | | | | | | | | | | | | | | | |
| | | | | |
Total | | | $359,052 | | | | — | | | | $359,052 | | | | $359,052 | | | | — | |
| | | | | |
| | | | | | | | | | | | | | | | | | | | |
| | | | | |
Small/Mid Cap Growth | | | | | | | | | | | | | | | | | | | | |
| | | | | |
Industrial and Commercial Bank of
China Financial Services LLC | | | $372,168 | | | | — | | | | $372,168 | | | | $372,168 | | | | — | |
| | | | | |
Fixed Income Clearing Corp. | | | 1,317,000 | | | | — | | | | 1,317,000 | | | | 1,317,000 | | | | — | |
| | | | | |
| | | | | | | | | | | | | | | | | | | | |
| | | | | |
Total | | | $1,689,168 | | | | — | | | | $1,689,168 | | | | $1,689,168 | | | | — | |
| | | | | | | | | | | | | | | | | | | | |
56
| | |
| | | Notes to Financial Statements (continued) |
| | | |
| | | |
9. SUBSEQUENT EVENTS
The Funds have determined that no material events or transactions occurred through the issuance date of the Funds’ financial statements which require an additional disclosure in or adjustment of the Funds’ financial statements, except that, on December 7, 2023, the Board approved a plan to liquidate and terminate Emerging Markets Equity and Emerging Wealth Equity; the liquidation is expected
to occur on or about February 9, 2024 (the “Liquidation Date”). Additionally, effective December 12, 2023, Emerging Markets Equity and Emerging Wealth Equity will discontinue accruing 12b-1 distribution fees through the Liquidation Date and effective December 18, 2023, and through the Liquidation Date, the Investment Manager will waive its management fee and will waive the right to recoup any prior reimbursed expenses under each Fund’s Expense Limitation Agreement.
57
| | |
| | | Report of Independent Registered Public Accounting Firm |
| | | |
| | | |
To the Board of Trustees of AMG Funds, AMG Funds I and AMG Funds IV and Shareholders of AMG GW&K Core Bond ESG Fund, AMG GW&K Emerging Markets Equity Fund, AMG GW&K Emerging Wealth Equity Fund and AMG GW&K Small/Mid Cap Growth Fund
Opinions on the Financial Statements
We have audited the accompanying statements of assets and liabilities, including the schedules of portfolio investments, of AMG GW&K Core Bond ESG Fund (one of the funds constituting AMG Funds I), AMG GW&K Emerging Markets Equity Fund and AMG GW&K Emerging Wealth Equity Fund (two of the funds constituting AMG Funds), and AMG GW&K Small/Mid Cap Growth Fund (one of the funds constituting AMG Funds IV) (hereafter collectively referred to as the “Funds”) as of October 31, 2023, the related statements of operations for the year ended October 31, 2023, the statements of changes in net assets for each of the two years in the period ended October 31, 2023, including the related notes, and the financial highlights for each the periods indicated therein (collectively referred to as the “financial statements”). In our opinion, the financial statements present fairly, in all material respects, the financial position of each of the Funds as of October 31, 2023, the results of each of their operations for the year then ended, the changes in each of their net assets for each of the two years in the period ended October 31, 2023 and each of the financial highlights for each of the periods indicated therein in conformity with accounting principles generally accepted in the United States of America.
Basis for Opinions
These financial statements are the responsibility of the Funds’ management. Our responsibility is to express an opinion on the Funds’ financial statements based on our audits. We are a public accounting firm registered with the Public Company Accounting Oversight Board (United States) (PCAOB) and are required to be independent with respect to the Funds in accordance with the U.S. federal securities laws and the applicable rules and regulations of the Securities and Exchange Commission and the PCAOB.
We conducted our audits of these financial statements in accordance with the standards of the PCAOB. Those standards require that we plan and perform the audit to obtain reasonable assurance about whether the financial statements are free of material misstatement, whether due to error or fraud.
Our audits included performing procedures to assess the risks of material misstatement of the financial statements, whether due to error or fraud, and performing procedures that respond to those risks. Such procedures included examining, on a test basis, evidence regarding the amounts and disclosures in the financial statements. Our audits also included evaluating the accounting principles used and significant estimates made by management, as well as evaluating the overall presentation of the financial statements. Our procedures included confirmation of securities owned as of October 31, 2023 by correspondence with the custodian and brokers; when replies were not received from brokers, we performed other auditing procedures. We believe that our audits provide a reasonable basis for our opinions.
/s/ PricewaterhouseCoopers LLP
Boston, Massachusetts
December 22, 2023
We have served as the auditor of one or more investment companies in the AMG Funds Family since 1993.
58
| | |
| | | Other Information (unaudited) |
| | | |
| | | |
TAX INFORMATION
AMG GW&K Core Bond ESG Fund, AMG GW&K Emerging Markets Equity Fund, AMG GW&K Emerging Wealth Equity Fund and AMG GW&K Small/Mid Cap Growth Fund each hereby designates the maximum amount allowable of their net taxable income as qualified dividends as provided in the Jobs and Growth Tax Relief Reconciliation Act of 2003. The 2022/2023 Form 1099-DIV you receive for each Fund will show the tax status of all distributions paid to you during the year.
In accordance with federal tax law, the following Funds elect to provide foreign taxes paid and the income sourced from foreign countries. Accordingly, the Funds hereby make the following designations regarding their taxable period ended October 31, 2023:
AMG GW&K Emerging Markets Equity Fund
uThe total amount of taxes paid and income sourced from foreign countries was $50,860 and $496,854, respectively.
AMG GW&K Emerging Wealth Equity Fund
uThe total amount of taxes paid and income sourced from foreign countries was $124,320 and $959,488, respectively.
Pursuant to section 852 of the Internal Revenue Code, AMG GW&K Core Bond ESG Fund, AMG GW&K Emerging Markets Equity Fund, AMG GW&K Emerging Wealth Equity Fund and AMG GW&K Small/Mid Cap Growth Fund, each hereby designates as a capital gain distribution with respect to the taxable period ended October 31, 2023, $0, $0, $0 and $623,575, respectively, or, if subsequently determined to be different, the net capital gains of such period.
PROXY VOTE
A special meeting of the shareholders of AMG Funds, AMG Funds I and AMG Funds IV (the “Trusts”) was held on October 10, 2023, to vote on a proposal to elect trustees to the Boards of Trustees of the Trusts. The proposal and results of the vote are described below. Jill R. Cuniff, Kurt A. Keilhacker, Peter W. MacEwen, Steven J. Paggioli, Eric Rakowski, Victoria L. Sassine and Garret W. Weston were elected by shareholders at the special meeting on October 10, 2023. Bruce B. Bingham, an incumbent Trustee, will continue to serve as a Trustee of the Trust until his retirement on December 31, 2023.
| | | | | | | | |
AMG Funds | | All Funds in Trust* | |
| | |
Election of Trustees 1 | | | For | | | | Withheld | |
| | |
Jill R. Cuniff | | | 523,453,201 | | | | 50,330,270 | |
| | |
Kurt A. Keilhacker | | | 563,642,997 | | | | 10,140,474 | |
| | |
Peter W. MacEwen | | | 523,551,974 | | | | 50,231,497 | |
| | |
Steven J. Paggioli | | | 561,225,673 | | | | 12,557,798 | |
| | |
Eric Rakowski | | | 561,230,560 | | | | 12,552,911 | |
| | |
Victoria L. Sassine | | | 563,668,874 | | | | 10,114,597 | |
| | |
Garret W. Weston | | | 564,280,150 | | | | 9,503,321 | |
| |
AMG Funds I | | All Funds in Trust* | |
| | |
Election of Trustees 1 | | | For | | | | Withheld | |
| | |
Jill R. Cuniff | | | 20,441,009 | | | | 1,294,070 | |
| | |
Kurt A. Keilhacker | | | 20,299,049 | | | | 1,436,030 | |
| | |
Peter W. MacEwen | | | 20,123,172 | | | | 1,611,908 | |
| | |
Steven J. Paggioli | | | 20,290,868 | | | | 1,444,211 | |
| | |
Eric Rakowski | | | 20,424,987 | | | | 1,310,092 | |
| | |
Victoria L. Sassine | | | 20,650,180 | | | | 1,084,900 | |
| | |
Garret W. Weston | | | 20,348,384 | | | | 1,386,695 | |
59
| | | | | | | | |
AMG Funds IV | | All Funds in Trust* | |
| | |
Election of Trustees 1 | | | For | | | | Withheld | |
| | |
Jill R. Cuniff | | | 123,476,732 | | | | 9,260,973 | |
| | |
Kurt A. Keilhacker | | | 131,677,070 | | | | 1,060,634 | |
| | |
Peter W. MacEwen | | | 123,401,874 | | | | 9,335,830 | |
| | |
Steven J. Paggioli | | | 130,832,753 | | | | 1,904,951 | |
| | |
Eric Rakowski | | | 130,620,379 | | | | 2,117,325 | |
| | |
Victoria L. Sassine | | | 131,755,717 | | | | 981,987 | |
| | |
Garret W. Weston | | | 131,970,391 | | | | 767,313 | |
1 Ms. Cuniff and Mr. MacEwen were newly elected to the Boards of Trustees on October 10, 2023; Messrs. Keilhacker, Paggioli, Rakowski, and Weston and Ms. Sassine are incumbent Trustees.
*Rounded to the nearest share.
60
| | |
| | | AMG Funds Trustees and Officers |
| | | |
| | | |
| | | | | | | | |
| The Trustees and Officers of the Trusts, their business addresses, principal occupations for the past five years and ages are listed below. The Trustees provide broad supervision over the affairs of the Trusts and the Funds. The Trustees are experienced executives who meet periodically throughout the year to oversee the Funds’ activities, review contractual arrangements with companies that provide services to the Funds, and | | | | review the Funds’ performance. Unless otherwise noted, the address of each Trustee or Officer is the address of the Trusts: 680 Washington Blvd., Suite 500, Stamford, CT. 06901. There is no stated term of office for Trustees. Trustees serve until their resignation, retirement or removal in accordance with the Trusts’ organizational documents and policies adopted by the Board from time to time. | | | | The Chairman of the Board, the President, the Treasurer and the Secretary and such other Officers as the Trustees may in their discretion from time to time elect each hold office until his or her successor is elected and qualified, or until he or she sooner dies, resigns, is removed or becomes disqualified. Each Officer holds office at the pleasure of the Trustees. |
| | | | | | | | | |
Independent Trustees
The following Trustees are not “interested persons” of the Trust within the meaning of the 1940 Act:
| | |
Number of Funds Overseen in Fund Complex | | Name, Age, Principal Occupation(s) During Past 5 Years and Other Directorships Held by Trustee |
| |
• Trustee since 2012 - AMG Funds • Trustee since 2012 - AMG Funds I • Trustee since 2014 - AMG Funds IV • Oversees 41 Funds in Fund Complex | | Bruce B. Bingham, 75* Partner, Hamilton Partners (real estate development firm) (1987-Present); Director of The Yacktman Funds, Inc. (2 portfolios) (2000-2012). |
| |
• Trustee since 2023 - AMG Funds, • AMG Funds I, AMG Funds IV • Oversees 41 Funds in Fund Complex | | Jill R. Cuniff, 59** Director of Harding, Loevner Funds, Inc. (12 portfolios) (2018-Present); Retired (2016-Present); President & Portfolio Manager, Edge Asset Management (2009-2016); President & Chief Investment Officer, Morley Financial Services (2001-2009); President, Union Bond & Trust Company (2001-2009). |
| |
• Trustee since 2013- AMG Funds • Trustee since 2013 - AMG Funds I • Trustee since 2014 - AMG Funds IV • Chairman of the Audit Committee since 2021 - AMG Funds, AMG Funds I • Chairman of the Audit Committee since 2020 - AMG Funds IV • Oversees 43 Funds in Fund Complex | | Kurt A. Keilhacker, 60 Managing Partner, Elementum Ventures (2013-Present); Managing Partner, TechFund Europe (2000-Present); Managing Partner, TechFund Capital (1997-Present); Adjunct Professor, University of San Francisco (2022-Present); Trustee, Wheaton College (2018-Present); Director, Wheaton College Trust Company, N.A. (2018-Present). |
| |
• Trustee since 2023 - AMG Funds, AMG Funds I, AMG Funds IV • Oversees 41 Funds in Fund Complex | | Peter W. MacEwen, 59** Private investor (2019-Present); Affiliated Managers Group, Inc. (2003-2018): Chief Administrative Officer, Office of the CEO (2013-2018); Senior Vice President, Finance (2007-2013); Vice President, Finance (2003-2007). |
| |
• Trustee since 2000- AMG Funds I • Trustee since 2004 - AMG Funds • Trustee since 2010 - AMG Funds IV • Oversees 41 Funds in Fund Complex | | Steven J. Paggioli, 73 Independent Consultant (2002-Present); Trustee, Professionally Managed Portfolios (28 portfolios); Independent Director, Muzinich BDC, Inc. (business development company) (2019-Present); Director, The Wadsworth Group; Independent Director, Chase Investment Counsel (2008–2019); Executive Vice President, Secretary and Director, Investment Company Administration, LLC and First Fund Distributors, INC. (1990-2001). |
61
| | |
| | | AMG Funds Trustees and Officers (continued) |
| | | |
| | | |
| | |
• Independent Chairman of the Board of Trustees since 2017 • Chairman of the Governance Committee since 2017 • Trustee since 1999 - AMG Funds • Trustee since 2000 - AMG Funds I • Trustee since 2010 - AMG Funds IV • Oversees 43 Funds in Fund Complex | | Eric Rakowski, 65 Professor of Law, University of California at Berkeley School of Law (1990-Present); Tax Attorney at Davis Polk & Wardwell and clerked for Judge Harry T. Edwards of the U.S. Court of Appeals for the District of Columbia Circuit and for Justice William J. Brennan Jr. of the U.S. Supreme Court; Trustee of Parnassus Funds (4 portfolios) (2021-Present); Trustee of Parnassus Income Funds (2 portfolios) (2021-Present); Director of Harding, Loevner Funds, Inc. (10 portfolios); Trustee of Third Avenue Trust (3 portfolios) (2002-2019); Trustee of Third Avenue Variable Trust (1 portfolio) (2002-2019). |
| | |
• Trustee since 2013 - AMG Funds • Trustee since 2013 - AMG Funds I • Trustee since 2014 - AMG Funds IV • Oversees 43 Funds in Fund Complex | | Victoria L. Sassine, 58 Adjunct Professor, Babson College (2007–Present); Director, Board of Directors, PRG Group (2017-Present); CEO, Founder, Scale Smarter Partners, LLC (2018-Present); Adviser, EVOFEM Biosciences (2019-Present); Chairperson of the Board of Directors of Business Management Associates (2018-2019). |
*Mr. Bingham will retire from the Boards of Trustees of the Trusts on December 31, 2023.
**Ms. Cuniff and Mr. MacEwen were elected to the Boards of Trustees by the shareholders of the Trusts on October 10, 2023.
Interested Trustee
The Trustee in the following table is an “interested person” of the Trusts within the meaning of the 1940 Act.
| | |
Number of Funds Overseen in Fund Complex | | Name, Age, Principal Occupation(s) During Past 5 Years and Other Directorships Held by Trustee |
| |
• Trustee since 2021 - AMG Funds, AMG Funds I, AMG Funds IV • Oversees 43 Funds in Fund Complex | | Garret W. Weston, 42 Affiliated Managers Group, Inc. (2008-Present): Managing Director, Head of Affiliate Product Strategy and Development (2023-Present), Managing Director, Co-Head of Affiliate Engagement, Distribution (2021-2022), Senior Vice President, Office of the CEO (2019-2021), Senior Vice President, Affiliate Development (2016-2019), Vice President, Office of the CEO (2015-2016), Vice President, New Investments (2008-2015); Associate, Madison Dearborn Partners (2006-2008); Analyst, Merrill Lynch (2004-2006). |
| | |
| |
| Officers | | |
Position(s) Held with Fund and Length of Time Served | | Name, Age, Principal Occupation(s) During Past 5 Years |
| |
• President since 2018 • Principal Executive Officer since 2018 • Chief Executive Officer since 2018 • Chief Operating Officer since 2007 (2016 for AMG Funds IV) | | Keitha L. Kinne, 65 Managing Director, Head of Platform and Operations, AMG Funds LLC (2023-Present); Chief Operating Officer, AMG Funds LLC (2007-Present); Chief Investment Officer, AMG Funds LLC (2008-Present); President and Principal, AMG Distributors, Inc. (2018-Present); Chief Operating Officer, AMG Distributors, Inc. (2007-Present); President, Chief Executive Officer and Principal Executive Officer, AMG Funds, AMG Funds I, AMG Funds II, AMG Funds III and AMG Funds IV (2018-Present); Chief Operating Officer, AMG Funds, AMG Funds I, AMG Funds II, and AMG Funds III (2007-Present); Chief Operating Officer, AMG Funds IV (2016-Present); Chief Operating Officer and Chief Investment Officer, Aston Asset Management, LLC (2016); President and Principal Executive Officer, AMG Funds, AMG Funds I, AMG Funds II and AMG Funds III (2012-2014); Managing Partner, AMG Funds LLC (2007-2014); President and Principal, AMG Distributors, Inc. (2012-2014); Managing Director, Legg Mason & Co., LLC (2006-2007); Managing Director, Citigroup Asset Management (2004-2006). |
| |
• Secretary since 2015 • Chief Legal Officer since 2015 | | Mark J. Duggan, 58 Managing Director and Senior Counsel, AMG Funds LLC (2021-Present); Senior Vice President and Senior Counsel, AMG Funds LLC (2015-2021); Secretary and Chief Legal Officer, AMG Funds, AMG Funds I, AMG Funds II, AMG Funds III and AMG Funds IV (2015-Present); Attorney, K&L Gates, LLP (2009-2015). |
| |
• Chief Financial Officer since 2017 • Treasurer since 2017 • Principal Financial Officer since 2017 • Principal Accounting Officer since 2017 | | Thomas G. Disbrow, 57 Vice President, Mutual Fund Treasurer & CFO, AMG Funds, AMG Funds LLC (2017-Present); Chief Financial Officer, Principal Financial Officer, Treasurer and Principal Accounting Officer, AMG Funds, AMG Funds I, AMG Funds II, AMG Funds III and AMG Funds IV (2017-Present); Managing Director - Global Head of Traditional Funds Product Control, UBS Asset Management (Americas), Inc. (2015-2017); Managing Director - Head of North American Funds Treasury, UBS Asset Management (Americas), Inc. (2011-2015). |
62
| | |
| | | AMG Funds Trustees and Officers (continued) |
| | | |
| | | |
| | |
Position(s) Held with Fund and Length of Time Served | | Name, Age, Principal Occupation(s) During Past 5 Years |
| |
• Deputy Treasurer since 2017 | | John A. Starace, 53 Vice President, Mutual Fund Accounting, AMG Funds LLC (2021-Present); Director, Mutual Fund Accounting, AMG Funds LLC (2017-2021); Vice President, Deputy Treasurer of Mutual Funds Services, AMG Funds LLC (2014-2017); Deputy Treasurer, AMG Funds, AMG Funds I, AMG Funds II, AMG Funds III and AMG Funds IV (2017-Present); Vice President, Citi Hedge Fund Services (2010-2014); Audit Senior Manager (2005-2010) and Audit Manager (2001-2005), Deloitte & Touche LLP. |
| |
• Chief Compliance Officer and Sarbanes-Oxley Code of Ethics Compliance Officer since 2019 • Anti-Money Laundering Compliance Officer since 2022 | | Patrick J. Spellman, 49 Vice President, Chief Compliance Officer, AMG Funds LLC (2017-Present); Chief Compliance Officer, AMG Distributors, Inc. (2010-Present); Chief Compliance Officer and Sarbanes-Oxley Code of Ethics Compliance Officer, AMG Funds, AMG Funds I, AMG Funds II, AMG Funds III and AMG Funds IV (2019-Present); Anti-Money Laundering Compliance Officer, AMG Funds, AMG Funds I, AMG Funds II, and AMG Funds III (2014-2019; 2022-Present); Anti-Money Laundering Compliance Officer, AMG Funds IV (2016-2019; 2022-Present); Senior Vice President, Chief Compliance Officer, AMG Funds LLC (2011-2017); Compliance Manager, Legal and Compliance, Affiliated Managers Group, Inc. (2005-2011). |
| |
• Assistant Secretary since 2016 | | Maureen M. Kerrigan, 38 Vice President, Senior Counsel, AMG Funds LLC (2021-Present); Vice President, Counsel, AMG Funds LLC (2019-2021); Director, Counsel, AMG Funds LLC (2017-2018); Vice President, Counsel, AMG Funds LLC (2015-2017); Assistant Secretary, AMG Funds, AMG Funds I, AMG Funds II, AMG Funds III and AMG Funds IV (2016-Present); Associate, Ropes & Gray LLP (2011-2015); Law Fellow, Massachusetts Appleseed Center for Law and Justice (2010-2011). |
63
| | |
| | | Annual Renewal of Investment Management and Subadvisory Agreements |
| | | |
| | | |
| | | | | | | | | | | | |
AMG GW&K Emerging Markets Equity Fund, AMG GW&K Emerging Wealth Equity Fund, AMG GW&K Core Bond ESG Fund, and AMG GW&K Small/Mid Cap Growth Fund: Approval of Investment Management and Subadvisory Agreements on June 21, 2023 At an in-person meeting held on June 21, 2023, the Board of Trustees (the “Board” or the “Trustees”) of each of AMG Funds, AMG Funds I, and AMG Funds IV (each, a “Trust” and collectively, the “Trusts”), and separately a majority of the Trustees who are not “interested persons” of the Trusts (the “Independent Trustees”), approved (i) the Investment Management Agreement, as amended pursuant to letter agreements at any time prior to the date of the meeting, with AMG Funds LLC (the “Investment Manager”) and AMG Funds for each of AMG GW&K Emerging Markets Equity Fund and AMG GW&K Emerging Wealth Equity Fund, and separately each of Amendment No. 1 thereto dated July 1, 2015, and Amendment No. 2 thereto dated October 1, 2016; the Fund Management Agreement, as amended pursuant to letter agreements at any time prior to the date of the meeting, with the Investment Manager and AMG Funds I for AMG GW&K Core Bond ESG Fund, and separately each of Amendment No. 1 thereto dated July 1, 2015, and Amendment No. 2 thereto dated October 1, 2016; and the Investment Advisory Agreement, as amended pursuant to letter agreements at any time prior to the date of the meeting, with the Investment Manager and AMG Funds IV for AMG GW&K Small/Mid Cap Growth Fund, and separately Amendment No. 1 thereto dated October 1, 2016 (collectively, the “Investment Management Agreements”); and (ii) the Subadvisory Agreements, as amended at any time prior to the date of the meeting (collectively, the “Subadvisory Agreements”), with the Subadviser for each of AMG GW&K Emerging Markets Equity Fund, AMG GW&K Emerging Wealth Equity Fund, AMG GW&K Core Bond ESG Fund, and AMG GW&K Small/Mid Cap Growth Fund (each, a “Fund,” and collectively, the “Funds”). The Independent Trustees were separately represented by independent legal counsel in connection with their consideration of the approval of these agreements. In considering the Investment Management Agreements and the Subadvisory Agreements, the Trustees reviewed a variety of materials relating to each Fund, the Investment Manager and the Subadviser, including the nature, extent and quality of services, comparative performance, fee and expense information for an appropriate peer group of similar mutual funds for each Fund (each, a “Peer Group”), performance information for the relevant benchmark index for | | | | | | each Fund (each, a “Fund Benchmark”), other relevant matters, and other information provided to them on a periodic basis throughout the year. Prior to voting, the Independent Trustees: (a) reviewed the foregoing information with their independent legal counsel; (b) received materials from their independent legal counsel discussing the legal standards applicable to their consideration of the Investment Management Agreements and the Subadvisory Agreements; and (c) met with their independent legal counsel in private sessions at which no representatives of management were present. NATURE, EXTENT AND QUALITY OF SERVICES In considering the nature, extent and quality of the services provided by the Investment Manager, the Trustees reviewed information provided by the Investment Manager at the June 21, 2023 and prior meetings relating to the Investment Manager’s operations and personnel. Among other things, the Investment Manager provided financial information, information about its supervisory and professional staff and descriptions of its organizational and management structure. The Trustees also took into account information provided periodically throughout the previous year by the Investment Manager in Board meetings relating to the performance of its duties with respect to the Funds and the Trustees’ knowledge of the Investment Manager’s management and the quality of the performance of the Investment Manager’s duties under the Investment Management Agreements and Administration Agreement. In the course of their deliberations regarding the Investment Manager, the Trustees evaluated, among other things: (a) the extent and quality of the Investment Manager’s oversight of the operation and management of the Funds; (b) the quality of the Investment Manager’s oversight of the performance by the Subadviser of its portfolio management duties; (c) the Investment Manager’s ability to supervise the Funds’ other service providers; and (d) the Investment Manager’s compliance program. The Trustees also took into account that, in performing its functions under the Investment Management Agreements and supervising the Subadviser, the Investment Manager: performs periodic detailed analyses and reviews of the performance by the Subadviser of its obligations to each Fund, including without limitation, analysis and review of portfolio and other compliance matters and review of the Subadviser’s investment performance with respect to each Fund; prepares and presents periodic reports to the Board regarding the investment performance of the | | | | | | Subadviser and other information regarding the Subadviser, at such times and in such forms as the Board may reasonably request; reviews and considers any changes in the personnel of the Subadviser responsible for performing the Subadviser’s obligations and makes appropriate reports to the Board; reviews and considers any changes in the ownership or senior management of the Subadviser and makes appropriate reports to the Board; performs periodic in-person, telephonic or videoconference diligence meetings, including with respect to compliance matters, with representatives of the Subadviser; assists the Board and management of the Trusts in developing and reviewing information with respect to the initial approval of each Subadvisory Agreement and annual consideration of each Subadvisory Agreement thereafter; prepares recommendations with respect to the continued retention of the Subadviser or the replacement of the Subadviser, including at the request of the Board; identifies potential successors to, or replacements of, the Subadviser or potential additional subadvisers, including performing appropriate due diligence, and developing and presenting to the Board a recommendation as to any such successor, replacement, or additional subadviser, including at the request of the Board; designates and compensates from its own resources such personnel as the Investment Manager may consider necessary or appropriate to the performance of its services; and performs such other review and reporting functions as the Board shall reasonably request consistent with the Investment Management Agreements and applicable law. The Trustees noted the affiliation of the Subadviser with the Investment Manager, noting any potential conflicts of interest. The Trustees also took into account the financial condition of the Investment Manager with respect to its ability to provide the services required under the Investment Management Agreements and the Investment Manager’s undertaking to maintain contractual expense limitations for the Funds. The Trustees also considered the Investment Manager’s risk management processes. The Trustees also reviewed information relating to the Subadviser’s operations and personnel and the investment philosophy, strategies and techniques (its “Investment Strategy”) used in managing each Fund. Among other things, the Trustees reviewed information on portfolio management and other professional staff, information regarding the Subadviser’s organizational and management structure and the Subadviser’s brokerage policies and practices. The Trustees considered specific |
| | | | | | | | | | | | |
64
| | |
| | | Annual Renewal of Investment Management and Subadvisory Agreements (continued) |
| | | |
| | | |
| | | | | | | | | | | | |
information provided regarding the experience of the individuals at the Subadviser with portfolio management responsibility for each Fund, including the information set forth in the Fund’s prospectus and statement of additional information. In the course of their deliberations, the Trustees evaluated, among other things: (a) the services rendered by the Subadviser in the past; (b) the qualifications and experience of the Subadviser’s personnel; and (c) the Subadviser’s compliance program. The Trustees also took into account the financial condition of the Subadviser with respect to its ability to provide the services required under each Subadvisory Agreement. The Trustees also considered the Subadviser’s risk management processes. PERFORMANCE The Board considered each Fund’s net performance during relevant time periods as compared to the Fund’s Peer Group and Fund Benchmark, considered the gross performance of each Fund as compared to the Subadviser’s relevant performance composite that utilizes a similar investment strategy and approach, and noted that the Board reviews on a quarterly basis detailed information about both a Fund’s performance results and portfolio composition, as well as the Subadviser’s Investment Strategy. The Board was mindful of the Investment Manager’s expertise, resources and attention to monitoring the Subadviser’s performance, investment style and risk-adjusted performance with respect to the Funds and its discussions with the management of the Funds’ subadviser during the period regarding the factors that contributed to the performance of the Funds. With respect to AMG GW&K Emerging Markets Equity Fund, among other information relating to the Fund’s performance, the Trustees noted that the Fund’s performance for Class I shares (which share class has one of the earliest inception dates and the largest amount of assets of all the share classes of the Fund) for the 1-year, 3-year, 5-year, and 10-year periods ended March 31, 2023 was above, below, above, and at, respectively, the median performance of the Peer Group and above, above, above, and below, respectively, the performance of the Fund Benchmark, the MSCI Emerging Markets Index. The Trustees took into account management’s discussion of the Fund’s performance, including the reasons for the Fund’s recent outperformance and the fact that the Fund ranked in the top decile relative to its Peer Group for the 1-year period. The Trustees concluded that the Fund’s overall performance has been satisfactory. | | | | | | With respect to AMG GW&K Emerging Wealth Equity Fund, among other information relating to the Fund’s performance, the Trustees noted that the Fund’s performance for Class I shares (which share class has the largest amount of assets of all the share classes of the Fund) for the 1-year, 3-year, and 5-year periods ended March 31, 2023 and for the period from the Fund’s inception on March 19, 2015 through March 31, 2023 was above, below, above, and above, respectively, the median performance of the Peer Group and above, below, above, and above, respectively, the performance of the Fund Benchmark, the MSCI Emerging Markets Index. The Trustees took into account management’s discussion of the Fund’s performance, including the reasons for the Fund’s recent outperformance and the fact that the Fund ranked in the top percentile relative to its Peer Group for the 1-year period, the top quintile relative to its Peer Group for the period from inception through March 31, 2023, and the top third relative to its Peer Group for the 5-year period. The Trustees concluded that the Fund’s overall performance has been satisfactory. With respect to AMG GW&K Core Bond ESG Fund, among other information relating to the Fund’s performance, the Trustees noted that the Fund’s performance for Class I shares (which share class has the earliest inception date and the largest amount of assets of all the share classes of the Fund) for the 1-year, 3-year, 5-year and 10-year periods ended March 31, 2023 was below, above, below, and below, respectively, the median performance of the Peer Group and below, above, below, and below, respectively, the performance of the Fund Benchmark, the Bloomberg U.S. Aggregate Bond Index. The Trustees took into account management’s discussion of the Fund’s performance, including the reasons for the Fund’s more recent and longer-term underperformance relative to the Peer Group and the Fund Benchmark. The Trustees also noted the change in the Fund’s Subadviser in February 2015 and that the performance record prior to that time reflects that of the prior Subadviser. The Trustees also took into account the fact that the Fund’s investment strategy was changed in 2019. The Trustees concluded that the Fund’s overall performance has been satisfactory in light of the Fund’s investment objective, strategies and policies. With respect to AMG GW&K Small/Mid Cap Growth Fund, among other information relating to the Fund’s performance, the Trustees noted that the Fund’s performance for Class N shares (which share class has the earliest inception date and the largest amount of assets of all the share classes of the | | | | | | Fund) for the 1-year, 3-year, 5-year, and 10-year periods ended March 31, 2023 was above, above, above, and below, respectively, the median performance of the Peer Group and above, above, above, and below, respectively, the performance of the Fund Benchmark, the Russell 2500 Growth Index. The Trustees took into account management’s discussion of the Fund’s performance, including the reasons for the Fund’s outperformance relative to the Peer Group and the Fund Benchmark for recent and intermediate-term periods. The Trustees noted that the Fund ranked in the top decile relative to its Peer Group for the 3-year period and in the top quintile relative to its Peer Group for the 1-year period. The Trustees also took into account the fact that the Fund’s subadviser changed effective March 19, 2021, that the Fund’s investment strategy changed effective March 19, 2021 and further on May 21, 2021, that the Fund Benchmark changed effective May 21, 2021, and that the performance information prior to those dates reflected that of the Fund’s prior subadviser and investment strategy. The Trustees concluded that the Fund’s overall performance has been satisfactory. ADVISORY AND SUBADVISORY FEES; FUND EXPENSES; PROFITABILITY; AND ECONOMIES OF SCALE In considering the reasonableness of the advisory fee payable to the Investment Manager, the Trustees reviewed information provided by the Investment Manager at the June 21, 2023 and prior meetings setting forth all revenues and other benefits, both direct and indirect (including any so-called “fallout benefits” such as reputational value derived from the Investment Manager serving as Investment Manager to a Fund), received by the Investment Manager and its affiliates attributable to managing each Fund and all the mutual funds in the AMG Funds Family of Funds; the cost of providing such services; the significant risks undertaken as Investment Manager and sponsor of the Funds, including investment, operational, enterprise, entrepreneurial, litigation, regulatory and compliance risks; and the resulting profitability to the Investment Manager and its affiliates from these relationships. The Trustees also considered the amount of the advisory fee retained by the Investment Manager after payment of the subadvisory fee with respect to each Fund. The Trustees also noted payments are made from the Subadviser to the Investment Manager, and other payments are made from the Investment Manager to the Subadviser. The Trustees also considered management’s discussion of the current asset levels |
| | | | | | | | | | | | |
65
| | |
| | | Annual Renewal of Investment Management and Subadvisory Agreements (continued) |
| | | |
| | | |
| | | | | | | | |
of the Funds, and the impact on profitability of both the current asset levels and any future growth of assets of the Funds. In considering the cost of services to be provided by the Investment Manager under each Investment Management Agreement and the profitability to the Investment Manager of its relationship with each Fund, the Trustees noted the undertaking by the Investment Manager to maintain contractual expense limitations for the Funds. The Board also took into account management’s discussion of the advisory fee structure, and the services the Investment Manager provides in performing its functions under each Investment Management Agreement and supervising the Subadviser. Based on the foregoing, the Trustees concluded that the profitability to the Investment Manager is reasonable and that the Investment Manager is not realizing material benefits from economies of scale that would warrant adjustments to the advisory fee at this time. Also with respect to economies of scale, the Trustees noted that as each Fund’s assets increase over time, the Fund may realize other economies of scale to the extent the increase in assets is proportionally greater than the increase in certain other expenses. In considering the reasonableness of the subadvisory fees payable by the Investment Manager to the Subadviser, the Trustees reviewed information regarding the cost to the Subadviser of providing subadvisory services to each Fund and the resulting profitability from these relationships. The Trustees noted that, because the Subadviser is an affiliate of the Investment Manager, a portion of the Subadviser’s revenues or profits might be shared directly or indirectly with the Investment Manager. The Trustees also noted that the subadvisory fees are paid by the Investment Manager out of its advisory fee. The Board also took into account management’s discussion of the subadvisory fee structure, and the services the Subadviser provides in performing its functions under each Subadvisory Agreement. Based on the foregoing, the Trustees concluded that the profitability to the Subadviser is reasonable and that the Subadviser is not realizing material benefits from economies of scale that would warrant adjustments to the subadvisory fees at this time. Also with respect to economies of scale, the Trustees noted that as a Fund’s assets increase over time, the Fund may realize other economies of scale to the extent the increase in assets is proportionally greater than the increase in certain other expenses. With respect to AMG GW&K Emerging Markets Equity Fund, the Trustees noted that the management fees (which include both the advisory and administration | | | | fees) and total expenses (net of applicable expense waivers/reimbursements) of Class I shares (the class of shares which is the primary focus of the Fund’s distribution) of the Fund as of March 31, 2023 were rated in the Low and the Below Average rating level, respectively, of the Fund’s Peer Group. The Trustees noted that the rating levels corresponded to the Fund’s quintile ranking in its Peer Group. The Trustees took into account the fact that the Investment Manager has contractually agreed, through March 1, 2024, to limit the Fund’s net annual operating expenses (subject to certain excluded expenses) to 0.87%. The Trustees concluded that, in light of the nature, extent and quality of the services provided by the Investment Manager and the Subadviser (which is an affiliate of the Investment Manager), the foregoing expense limitation and the considerations noted above with respect to the Investment Manager and the Subadviser, the Fund’s advisory and subadvisory fees are reasonable. With respect to AMG GW&K Emerging Wealth Equity Fund, the Trustees noted that the management fees (which include both the advisory and administration fees) and total expenses (net of applicable expense waivers/reimbursements) of Class I shares (the class of shares which is the primary focus of the Fund’s distribution) of the Fund as of March 31, 2023 were rated in the Low and the Average rating level, respectively, of the Fund’s Peer Group. The Trustees noted that the rating levels corresponded to the Fund’s quintile ranking in its Peer Group. The Trustees took into account the fact that the Investment Manager has contractually agreed, through March 1, 2024, to limit the Fund’s net annual operating expenses (subject to certain excluded expenses) to 0.90%. The Trustees concluded that, in light of the nature, extent and quality of the services provided by the Investment Manager and the Subadviser (which is an affiliate of the Investment Manager), the foregoing expense limitation and the considerations noted above with respect to the Investment Manager and the Subadviser, the Fund’s advisory and subadvisory fees are reasonable. With respect to AMG GW&K Core Bond ESG Fund, the Trustees noted that the management fees (which include both the advisory and administration fees) and total expenses (net of applicable expense waivers/reimbursements) of Class I shares (the class of shares which is the primary focus of the Fund’s distribution) of the Fund as of March 31, 2023 were rated in the Average and the Above Average rating level, respectively, of the Fund’s Peer Group. The | | | | Trustees noted that the rating levels corresponded to the Fund’s quintile ranking in its Peer Group. The Trustees took into account the fact that the Investment Manager has contractually agreed, through March 1, 2024, to limit the Fund’s net annual operating expenses (subject to certain excluded expenses) to 0.48%. The Trustees also took into account management’s discussion of the Fund’s expenses and competitiveness with comparably sized funds and select competitors. The Trustees concluded that, in light of the nature, extent and quality of the services provided by the Investment Manager and the Subadviser (which is an affiliate of the Investment Manager), the foregoing expense limitation and the considerations noted above with respect to the Investment Manager and the Subadviser, the Fund’s advisory and subadvisory fees are reasonable. With respect to AMG GW&K Small/Mid Cap Growth Fund, the Trustees noted that the management fees (which include both the advisory and administration fees) and total expenses (net of applicable expense waivers/reimbursements) of Class I shares (the class of shares which is the primary focus of the Fund’s distribution) of the Fund as of March 31, 2023 were both rated in the Average rating level of the Fund’s Peer Group. The Trustees noted that the rating levels corresponded to the Fund’s quintile ranking in its Peer Group. The Trustees took into account the fact that the Investment Manager has contractually agreed, through March 1, 2024, to limit the Fund’s net annual operating expenses (subject to certain excluded expenses) to 0.82%. The Trustees concluded that, in light of the nature, extent and quality of the services provided by the Investment Manager and the Subadviser (which is an affiliate of the Investment Manager), the foregoing expense limitation and the considerations noted above with respect to the Investment Manager and the Subadviser, the Fund’s advisory and subadvisory fees are reasonable. * * * * * After consideration of the foregoing, the Trustees also reached the following conclusions (in addition to the conclusions discussed above) regarding the Investment Management and Subadvisory Agreements: (a) the Investment Manager and the Subadviser have demonstrated that they possess the capability and resources to perform the duties required of them under each Investment Management Agreement and each Subadvisory |
| | | | | | | | |
66
| | |
| | | Annual Renewal of Investment Management and Subadvisory Agreements (continued) |
| | | |
| | | |
| | | | | | | | | | | | |
Agreement and (b) the Investment Manager and Subadviser maintain appropriate compliance programs. Based on all of the above-mentioned factors and their related conclusions, with no single factor or | | | | | | conclusion being determinative and with each Trustee not necessarily attributing the same weight to each factor, the Trustees concluded that approval of each Investment Management Agreement and each Subadvisory Agreement would be in the best interests of the applicable Fund and its shareholders. | | | | | | Accordingly, on June 21, 2023, the Trustees, and separately a majority of the Independent Trustees, voted to approve the Investment Management Agreement and the Subadvisory Agreement for each Fund. |
| | | | | | | | | | | | |
67
THIS PAGE INTENTIONALLY LEFT BLANK
| | |
| | |
| | | | | | | | |
INVESTMENT MANAGER AND ADMINISTRATOR AMG Funds LLC 680 Washington Blvd., Suite 500 Stamford, CT 06901 800.548.4539 DISTRIBUTOR AMG Distributors, Inc. 680 Washington Blvd., Suite 500 Stamford, CT 06901 800.548.4539 SUBADVISER GW&K Investment Management, LLC 222 Berkeley St. Boston, MA 02116 | | | | CUSTODIAN The Bank of New York Mellon Mutual Funds Custody 6023 Airport Road Oriskany, NY 13424 LEGAL COUNSEL Ropes & Gray LLP Prudential Tower, 800 Boylston Street Boston, MA 02199-3600 TRANSFER AGENT BNY Mellon Investment Servicing (US) Inc. AMG Funds Attn: 534426 AIM 154-0520 500 Ross Street Pittsburgh, PA 15262 800.548.4539 | | | | This report is prepared for the Funds’ shareholders. It is authorized for distribution to prospective investors only when preceded or accompanied by an effective prospectus. To receive a free copy of the prospectus or Statement of Additional Information, which includes additional information about Fund Trustees, please contact us by calling 800.548.4539. Distributed by AMG Distributors, Inc., member FINRA/SIPC. Current net asset values per share for each Fund are available on the Funds’ website at wealth.amg.com. A description of the policies and procedures each Fund uses to vote its proxies is available: (i) without charge, upon request, by calling 800.548.4539, or (ii) on the Securities and Exchange Commission’s (SEC) website at sec.gov. For information regarding each Fund’s proxy voting record for the 12-month period ended June 30, call 800.548.4539 or visit the SEC website at sec.gov. The Funds file their complete schedule of portfolio holdings with the SEC for the first and third quarters of each fiscal year as an exhibit to their reports on Form N-PORT. The Funds’ portfolio holdings on Form N-PORT are available on the SEC’s website at sec.gov and the Funds’ website at wealth.amg.com. To review a complete list of the Funds’ portfolio holdings, or to view the most recent semi-annual report or annual report, please visit wealth.amg.com. |
| | | | | | | | | |
| | |
| | |
| | | | | | | | |
BALANCED FUNDS AMG GW&K Global Allocation GW&K Investment Management, LLC EQUITY FUNDS AMG Beutel Goodman International Equity Beutel, Goodman & Company Ltd. AMG Boston Common Global Impact Boston Common Asset Management, LLC AMG Frontier Small Cap Growth Frontier Capital Management Co., LLC AMG GW&K Small Cap Core AMG GW&K Small Cap Value AMG GW&K Small/Mid Cap Core AMG GW&K Small/Mid Cap Growth AMG GW&K Emerging Markets Equity AMG GW&K Emerging Wealth Equity AMG GW&K International Small Cap GW&K Investment Management, LLC AMG Montrusco Bolton Large Cap Growth Montrusco Bolton Investments, Inc. AMG Renaissance Large Cap Growth The Renaissance Group LLC | | | | AMG River Road Dividend All Cap Value AMG River Road Focused Absolute Value AMG River Road International Value Equity AMG River Road Large Cap Value Select AMG River Road Mid Cap Value AMG River Road Small-Mid Cap Value AMG River Road Small Cap Value River Road Asset Management, LLC AMG TimesSquare Emerging Markets Small Cap AMG TimesSquare Global Small Cap AMG TimesSquare International Small Cap AMG TimesSquare Mid Cap Growth TimesSquare Capital Management, LLC AMG Veritas Asia Pacific AMG Veritas China AMG Veritas Global Focus AMG Veritas Global Real Return Veritas Asset Management LLP AMG Yacktman AMG Yacktman Focused AMG Yacktman Global AMG Yacktman Special Opportunities Yacktman Asset Management LP | | | | FIXED INCOME FUNDS AMG Beutel Goodman Core Plus Bond Beutel, Goodman & Company Ltd. AMG GW&K Core Bond ESG AMG GW&K Enhanced Core Bond ESG AMG GW&K ESG Bond AMG GW&K High Income AMG GW&K Municipal Bond AMG GW&K Municipal Enhanced Yield GW&K Investment Management, LLC |
| | | | | | | | | |
| | | | | | | | | |
| | | | | | | | | |
| | | | | | | | | |
| | | | | | | | | |
| | | | | | | | | |
| | | | | | | | | |
| | | | | | | | | |
| | | | |
| | | |
| wealth.amg.com | | 103123 | | AR069 |
| | |
 | | ANNUAL REPORT |
| | | | | | |
| | | | AMG Funds October 31, 2023 
AMG River Road Mid Cap Value Fund |
| | | |
| | | | | Class N: CHTTX | Class I: ABMIX | Class Z: ABIZX |
| | | |
| | | | | AMG River Road Large Cap Value Select Fund |
| | | |
| | | | | Class N: FQUAX | Class I: MEQFX |
| | | |
| | | | | AMG River Road Small Cap Value Fund |
| | | |
| | | | | Class N: ARSVX |Class I: ARSIX | Class Z: ARZMX |
| | | |
| | | | | AMG River Road Dividend All Cap Value Fund |
| | | |
| | | | | Class N: ARDEX | Class I: ARIDX | Class Z: ARZDX |
| | | |
| | | | | AMG River Road Small-Mid Cap Value Fund |
| | | |
| | | | | Class N: ARSMX | Class I: ARIMX | Class Z: ARSZX |
| | | |
| | | | | AMG River Road International Value Equity Fund |
| | | |
| | | | | Class N: ARLSX | Class I: ALSIX | Class Z: ARLZX |
| | | |
| | | | | AMG River Road Focused Absolute Value Fund |
| | | |
| | | | | Class N: ARRFX | Class I: AFAVX | Class Z: ARRZX |
| | | | |
| | | | | | | |
| | | | |
| wealth.amg.com | | | | 103123 AR082 |
| | |
| | | AMG Funds Annual Report — October 31, 2023 |
| | | | | | |
| | | |
| | | | | | | |
| | | TABLE OF CONTENTS | | PAGE | |
| | | | |
| | | |
| | | LETTER TO SHAREHOLDERS | | | 2 | |
| | | |
| | | ABOUT YOUR FUND’S EXPENSES | | | 3 | |
| | | |
| | | PORTFOLIO MANAGER’S COMMENTS, FUND SNAPSHOTS AND SCHEDULES OF PORTFOLIO INVESTMENTS | | | | |
| | | |
| | | AMG River Road Mid Cap Value Fund | | | 5 | |
| | | |
| | | AMG River Road Large Cap Value Select Fund | | | 11 | |
| | | |
| | | AMG River Road Small Cap Value Fund | | | 17 | |
| | | |
| | | AMG River Road Dividend All Cap Value Fund | | | 23 | |
| | | |
| | | AMG River Road Small-Mid Cap Value Fund | | | 29 | |
| | | |
| | | AMG River Road International Value Equity Fund | | | 36 | |
| | | |
| | | AMG River Road Focused Absolute Value Fund | | | 42 | |
| | | |
| | | FINANCIAL STATEMENTS | | | | |
| | | |
| | | Statement of Assets and Liabilities | | | 49 | |
| | | |
| | | Balance sheets, net asset value (NAV) per share computations
and cumulative distributable earnings (loss) | | | | |
| | | |
| | | Statement of Operations | | | 53 | |
| | | |
| | | Detail of sources of income, expenses, and realized and
unrealized gains (losses) during the fiscal year | | | | |
| | | |
| | | Statements of Changes in Net Assets | | | 55 | |
| | | |
| | | Detail of changes in assets for the past two fiscal years | | | | |
| | | |
| | | Financial Highlights | | | 58 | |
| | | |
| | | Historical net asset values per share, distributions, total returns, income
and expense ratios, turnover ratios and net assets | | | | |
| | | |
| | | Notes to Financial Statements | | | 78 | |
| | | |
| | | Accounting and distribution policies, details of agreements and
transactions with Fund management and affiliates, and descriptions of
certain investment risks | | | | |
| | | |
| | | REPORT OF INDEPENDENT REGISTERED PUBLIC ACCOUNTING FIRM | | | 90 | |
| | | |
| | | OTHER INFORMATION | | | 91 | |
| | | |
| | | TRUSTEES AND OFFICERS | | | 93 | |
| | | |
| | | ANNUAL RENEWAL OF INVESTMENT MANAGEMENT AND SUBADVISORY AGREEMENTS | | | 96 | |
| | | | | | | |
Nothing contained herein is to be considered an offer, sale or solicitation of an offer to buy shares of any series of the AMG Funds Family of Funds. Such offering is made only by prospectus, which includes details as to offering price and other material information.
| | |
| | Letter to Shareholders |
| | | |
Dear Shareholder:
We are pleased to provide this annual report for your investment with AMG Funds. Our foremost goal is to provide investment solutions that help our shareholders successfully achieve their long-term investment goals. We appreciate the privilege of providing you with investment tools.
The most recent fiscal year ended October 31, 2023, resulted in mixed returns for risk assets as global equity markets wrestled with tighter monetary policy, increased geopolitical tension, instability in the regional banking sector, and political handwringing over the U.S. debt ceiling. Bonds struggled to move higher as global central banks raised interest rates to cool the economy and bring down inflation. Relative to the prior year, 2023 brought a more favorable environment based on the optimism that easing inflation would allow the U.S. Federal Reserve (the “Fed”) to pause the interest rate hiking cycle and deliver an economic soft landing.
The S&P 500® Index gained 10.14% for the fiscal year, despite experiencing a pullback in the final three months of the period. Large-cap stocks diverged meaningfully from small-cap stocks, particularly driven by a handful of mega-cap technology and consumer discretionary stocks. The Russell 1000® Index gained 9.48% compared to the -8.56% return for the Russell 2000® Index. Only five of eleven sectors posted positive returns, with communications services (+36.06%), information technology (+33.15%), and consumer discretionary (+8.87%) leading the way. The weakest sectors were utilities (-7.72%), real estate (-6.57%), and health care (-4.64%). The strength in information technology drove Growth stocks to strongly outperform Value stocks with the Russell 1000® Growth Index gaining 18.95% compared to a 0.13% return for the Russell 1000® Value Index. Outside the U.S., foreign equity markets outperformed domestic equities, delivering a 12.07% return, as measured by the MSCI All Country World Index (ACWI) ex USA benchmark.
The Bloomberg U.S. Aggregate Bond Index, a broad measure of U.S. bond market performance, managed to generate a modest 0.36% return over the period as the Fed raised interest rates and the 10-year Treasury yield reached its highest point since 2008, resulting in longer-duration bonds underperforming. Investment-grade corporate bonds gained 2.77% for the year, while agency mortgage-backed securities fell -0.82%. High yield bonds were the best performing sector with a 6.23% return as measured by the return of the Bloomberg U.S. Corporate High Yield Bond Index. Municipal bonds outperformed the broader market with a 2.64% gain for the Bloomberg Municipal Bond Index.
AMG Funds provides access to a distinctive array of actively managed return-oriented investment strategies. You can rest assured that under all market conditions our team is focused on delivering excellent investment management services for your benefit. For more information about AMG Funds’ wide range of products and resources, please visit wealth.amg.com. We thank you for your investment and continued trust in AMG Funds.
Respectfully,

Keitha Kinne
President
AMG Funds
| | | | | | | | | | | | | | |
| Average Annual Total Returns | | Periods ended
October 31, 2023* | |
| | | | |
| Stocks: | | | | 1 Year | | | 3 Years | | | 5 Years | |
| | | | |
| Large Cap | | (S&P 500® Index) | | | 10.14 | % | | | 10.36 | % | | | 11.01 | % |
| | | | |
| Small Cap | | (Russell 2000® Index) | | | (8.56 | )% | | | 3.95 | % | | | 3.31 | % |
| | | | |
| International | | (MSCI ACWI ex USA) | | | 12.07 | % | | | 3.03 | % | | | 3.46 | % |
| | | | |
| Bonds: | | | | | | | | | | | |
| | | | |
| Investment Grade | | (Bloomberg U.S. Aggregate Bond Index) | | | 0.36 | % | | | (5.57 | )% | | | (0.06 | )% |
| | | | |
| High Yield | | (Bloomberg U.S. Corporate High Yield Bond Index) | | | 6.23 | % | | | 1.19 | % | | | 3.05 | % |
| | | | |
| Tax-exempt | | (Bloomberg Municipal Bond Index) | | | 2.64 | % | | | (2.48 | )% | | | 1.00 | % |
| | | | |
| Treasury Bills | | (ICE BofAML U.S. 6-Month Treasury Bill Index) | | | 4.88 | % | | | 1.83 | % | | | 1.90 | % |
*Source: FactSet. Past performance is no guarantee of future results.
2
| | |
| | | About Your Fund’s Expenses |
| | | |
| | | |
| | | | | | | | |
As a shareholder of a Fund, you may incur two types of costs: (1) transaction costs, which may include sales charges (loads) on purchase payments; redemption fees; and exchange fees; and (2) ongoing costs, including management fees; distribution (12b-1) fees; and other Fund expenses. This example is intended to help you understand your ongoing costs (in dollars) of investing in the Fund and to compare these costs with the ongoing costs of investing in other mutual funds. The example is based on $1,000 invested at the beginning of the period and held for the entire period as indicated below. ACTUAL EXPENSES The first section of the following table provides information about the actual account values and | | | | actual expenses. You may use the information in this section, together with the amount you invested, to estimate the expenses that you paid over the period. Simply divide your account value by $1,000 (for example, an $8,600 account value divided by $1,000 = 8.6), then multiply the result by the number in the first section under the heading entitled “Expenses Paid During the Period” to estimate the expenses you paid on your account during this period. HYPOTHETICAL EXAMPLE FOR COMPARISON PURPOSES The second section of the following table provides information about hypothetical account values and hypothetical expenses based on the Fund’s actual expense ratio and an assumed annual rate of return of 5% before expenses, which is not the Fund’s | | | | actual return. The hypothetical account values and expenses may not be used to estimate the actual ending account balance or expenses you paid for the period. You may use this information to compare the ongoing costs of investing in the Fund and other funds by comparing this 5% hypothetical example with the 5% hypothetical examples that appear in the shareholder reports of other funds. Please note that the expenses shown in the table are meant to highlight your ongoing costs only and do not reflect any transactional costs, such as sales charges (loads), redemption fees, or exchange fees. Therefore, the second section of the table is useful in comparing ongoing costs only, and will not help you determine the relative total costs of owning different funds. |
| | | | | | | | |
| | | | | | | | |
Six Months Ended October 31, 2023 | | Expense
Ratio for
the Period | | Beginning
Account
Value
05/01/23 | | Ending
Account
Value
10/31/23 | | Expenses
Paid
During
the Period* |
|
AMG River Road Mid Cap Value Fund |
|
Based on Actual Fund Return |
| | | | |
Class N | | 1.11% | | $1,000 | | $998 | | $5.59 |
| | | | |
Class I | | 0.81% | | $1,000 | | $1,000 | | $4.08 |
| | | | |
Class Z | | 0.76% | | $1,000 | | $1,000 | | $3.83 |
|
Based on Hypothetical 5% Annual Return |
| | | | |
Class N | | 1.11% | | $1,000 | | $1,020 | | $5.65 |
| | | | |
Class I | | 0.81% | | $1,000 | | $1,021 | | $4.13 |
| | | | |
Class Z | | 0.76% | | $1,000 | | $1,021 | | $3.87 |
|
AMG River Road Large Cap Value Select Fund |
|
Based on Actual Fund Return |
| | | | |
Class N | | 0.95% | | $1,000 | | $1,012 | | $4.82 |
| | | | |
Class I | | 0.63% | | $1,000 | | $1,014 | | $3.20 |
|
Based on Hypothetical 5% Annual Return |
| | | | |
Class N | | 0.95% | | $1,000 | | $1,020 | | $4.84 |
| | | | |
Class I | | 0.63% | | $1,000 | | $1,022 | | $3.21 |
| | | | | | | | |
Six Months Ended October 31, 2023 | | Expense
Ratio for
the Period | | Beginning
Account
Value
05/01/23 | | Ending
Account
Value
10/31/23 | | Expenses
Paid
During
the Period* |
|
AMG River Road Small Cap Value Fund |
|
Based on Actual Fund Return |
| | | | |
Class N | | 1.35% | | $1,000 | | $1,027 | | $6.90 |
| | | | |
Class I | | 1.09% | | $1,000 | | $1,029 | | $5.57 |
| | | | |
Class Z | | 1.00% | | $1,000 | | $1,030 | | $5.12 |
|
Based on Hypothetical 5% Annual Return |
| | | | |
Class N | | 1.35% | | $1,000 | | $1,018 | | $6.87 |
| | | | |
Class I | | 1.09% | | $1,000 | | $1,020 | | $5.55 |
| | | | |
Class Z | | 1.00%
| | $1,000
| | $1,020
| | $5.09
|
|
AMG River Road Dividend All Cap Value Fund |
|
Based on Actual Fund Return |
| | | | |
Class N | | 0.98% | | $1,000 | | $912 | | $4.72 |
| | | | |
Class I | | 0.73% | | $1,000 | | $913 | | $3.52 |
| | | | |
Class Z | | 0.69% | | $1,000 | | $913 | | $3.33 |
|
Based on Hypothetical 5% Annual Return |
| | | | |
Class N | | 0.98% | | $1,000 | | $1,020 | | $4.99 |
| | | | |
Class I | | 0.73% | | $1,000 | | $1,022 | | $3.72 |
| | | | |
Class Z | | 0.69% | | $1,000 | | $1,022 | | $3.52 |
3
| | |
| | | About Your Fund’s Expenses (continued) |
| | | |
| | | |
| | | | | | | | |
Six Months Ended October 31, 2023 | | Expense
Ratio for
the Period | | Beginning
Account
Value
05/01/23 | | Ending
Account
Value
10/31/23 | | Expenses
Paid
During
the Period* |
|
AMG River Road Small-Mid Cap Value Fund |
|
Based on Actual Fund Return |
| | | | |
Class N | | 1.28% | | $1,000 | | $1,014 | | $6.50 |
| | | | |
Class I | | 1.03% | | $1,000 | | $1,016 | | $5.23 |
| | | | |
Class Z | | 0.98% | | $1,000 | | $1,016 | | $4.98 |
|
Based on Hypothetical 5% Annual Return |
| | | | |
Class N | | 1.28% | | $1,000 | | $1,019 | | $6.51 |
| | | | |
Class I | | 1.03% | | $1,000 | | $1,020 | | $5.24 |
| | | | |
Class Z | | 0.98% | | $1,000 | | $1,020 | | $4.99 |
|
AMG River Road International Value Equity Fund |
|
Based on Actual Fund Return |
| | | | |
Class N | | 1.00% | | $1,000 | | $951 | | $4.92 |
| | | | |
Class I | | 0.78% | | $1,000 | | $952 | | $3.84 |
| | | | |
Class Z | | 0.73% | | $1,000 | | $952 | | $3.59 |
|
Based on Hypothetical 5% Annual Return |
| | | | |
Class N | | 1.00% | | $1,000 | | $1,020 | | $5.09 |
| | | | |
Class I | | 0.78% | | $1,000 | | $1,021 | | $3.97 |
| | | | |
Class Z | | 0.73% | | $1,000 | | $1,022 | | $3.72 |
| | | | | | | | |
Six Months Ended October 31, 2023 | | Expense
Ratio for
the Period | | Beginning
Account
Value
05/01/23 | | Ending
Account
Value
10/31/23 | | Expenses
Paid
During
the Period* |
|
AMG River Road Focused Absolute Value Fund |
|
Based on Actual Fund Return |
| | | | |
Class N | | 1.06% | | $1,000 | | $985 | | $5.30 |
| | | | |
Class I | | 0.82% | | $1,000 | | $987 | | $4.11 |
| | | | |
Class Z | | 0.78% | | $1,000 | | $987 | | $3.91 |
|
Based on Hypothetical 5% Annual Return |
| | | | |
Class N | | 1.06% | | $1,000 | | $1,020 | | $5.40 |
| | | | |
Class I | | 0.82% | | $1,000 | | $1,021 | | $4.18 |
| | | | |
Class Z | | 0.78% | | $1,000 | | $1,021 | | $3.97 |
| * | Expenses are equal to the Fund’s annualized expense ratio multiplied by the average account value over the period, multiplied by the number of days in the most recent fiscal half-year (184), then divided by 365. |
4
| | |
| | | AMG River Road Mid Cap Value Fund Portfolio Manager’s Comments (unaudited) |
| | | |
| | | |
| | | | | | | | |
OVERVIEW For the fiscal year ended October 31, 2023, AMG River Road Mid Cap Value Fund (the “Fund”) Class N shares returned 7.39%, outpacing the -3.56% return for the Russell Midcap® Value Index, the Fund’s benchmark. MARKET AND PERFORMANCE REVIEW The sector with the largest positive contribution to relative return was financials, which benefited from positive stock selection and an overweight allocation. The sector with the largest negative contribution to relative return was consumer discretionary, which suffered from negative stock selection partially offset by an overweight position. The top contributors to the Fund’s active return were Fairfax Financial Holdings, Ltd. (“FRFHF”) and API Group Corp. (“APG”). FRFHF is a Canadian holding company focused on Property and Casualty (P&C) insurance and the reinsurance industry. Like the more famous Berkshire Hathaway, FRFHF follows a disciplined approach to underwriting insurance; historically the company has not chased market share and focuses on writing profitable insurance policies in addition to generating attractive investment returns with the float. FRFHF is firing on all cylinders as both the underwriting and investment results continue to impress. More importantly, the company achieved solid growth (10%) while maintaining its high underwriting standards with a combined ratio of 93.9% (91.5% excluding catastrophes) compared to industry losses as the P&C industry registered a combined ratio of 102.7% in Q2. On the investment front, FRFHF continues to monetize its undervalued assets and capitalize on the higher interest rate environment by deploying its low duration fixed income portfolio into higher yielding U.S. and Canadian government bonds. Another top contributor was APG, an industrial company focused on fire safety and specialty services. With more than a 90-year history centered | | | | around steady growth and recurring revenues, APG presented an opportunity for legendary investors, Co-Chairmen Martin Franklin and James Lillie, who are well known for having compounded Jarden, a consumer products company, at a 33% compound annual growth rate (CAGR) for 15 years), to apply their transactional skills. The company quickly announced its intention to purchase Chubb’s Fire & Security in a $3.1 billion deal in mid-2021, which we believe strengthens the company’s moat, adds scale, and provides accretive synergies. We expect consistent and accretive mergers and acquisitions (M&A), margin expansion, and debt paydown to result in growing free cash flows and intrinsic value. The company has produced strong organic growth in its Safety Services segment, expanded margins towards its medium-term goal of a 13% adjusted EBITDA margin as pricing and more disciplined project selection have been tailwinds. Moreover, free cash flow (FCF) conversion continues to improve, and management expects to reach its 2.5x leverage target by year end. The bottom contributing holdings to the Fund’s active return were Advanced Auto Parts Inc. (“AAP”) and Air Transport Services Group Inc. (ATSG). AAP is a retailer of aftermarket auto replacement parts, accessories, batteries, and maintenance items. In the U.S. auto parts aftermarket, the top four national retailers have a ~30% share, with AAP controlling ~7% of the market. We had thought targeted improvements in the company’s supply chain, pricing, and streamlined selling, general and administrative expenses (SG&A) would further close the notable margin gap with its key competitors, O’Reilly Automotive (ORLY) and AutoZone (AZO). AAP shares declined significantly after its Q1 2023 earnings results severely missed expectations and management reduced guidance. Same-store sales declined -0.4% year-over-year, lagging peers ORLY and AZO, suggesting continued competitive | | | | pressures and market share losses for AAP in the do-it-for-me segment. We eliminated the position as our thesis did not materialize. ATSG is the premier lessor of the Boeing 767 freighter aircraft, which is essential to support e-commerce. ATSG issued its 2023 outlook for growth capital expenditures that exceeded market and River Road expectations. The disconnect stems from ATSG’s plan to accelerate fleet growth to meet long-term secular demand in 2024, thus unexpectedly increasing net leverage from 2.3x to 3.0x. We eliminated the position as our thesis did not materialize. POSITIONING AND OUTLOOK The discount to value of the portfolio’s top 20 holdings approached the range indicating a highly unattractive valuation environment. Subsequently, the discount to value improved and moved closer to its longer-term average due to a combination of price declines and higher assessed values as we finished rolling out assessed values to 2024. However, we would not categorize this discount as attractive. In conclusion, we think companies with attractive return on equity (ROE) and return on invested capital (ROIC), reasonable growth rates, expanding and/or defensible margins, and attractive valuations will continue to be well-positioned. This is reflected in our positioning, with a portfolio valuation (as measured by EV/EBITDA in FactSet) of 10.2x versus 11.2x for the benchmark, a five-year average ROE of 13.6% versus just 12.8%, and a long-term growth forecast of 9.3% versus 8.6%. The views expressed represent the opinions of River Road Asset Management, LLC as of October 31, 2023, and are not intended as a forecast or guarantee of future results, and are subject to change without notice. |
| | | | | | | | |
5
|
AMG River Road Mid Cap Value Fund Portfolio Manager’s Comments (continued) |
|
CUMULATIVE TOTAL RETURN PERFORMANCE
AMG River Road Mid Cap Value Fund’s cumulative total return is based on the daily change in net asset value (NAV), and assumes that all dividends and distributions were reinvested. The graph compares a hypothetical $10,000 investment made in the AMG River Road Mid Cap Value Fund’s Class N shares on October 31, 2013, to a $10,000 investment made in the Russell Midcap® Value Index for the same time period. The graph and table do not reflect the deduction of taxes that a shareholder would pay on a Fund distribution or redemption of shares. The listed returns for the Fund are net of expenses and the returns for the index exclude expenses. Total returns would have been lower had certain expenses not been reduced.
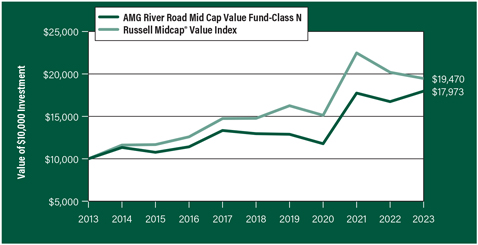
The table below shows the average annual total returns for the AMG River Road Mid Cap Value Fund and the Russell Midcap® Value Index for the same time periods ended October 31, 2023.
| | | | | | | | | | | | | | |
| Average Annual Total Returns1 | | One
Year | | Five
Years | | Ten
Years | | | Since
Inception | | | Inception
Date |
| | |
AMG River Road Mid Cap Value Fund2, 3, 4, 5, 6, 7, 8, 9, 10, 11, 12, 13 | | | | | | | |
| | | | | |
Class N | | 7.39% | | 6.76% | | | 6.04% | | | | 10.65% | | | 09/19/94 |
| | | | | |
Class I | | 7.72% | | 7.06% | | | 6.32% | | | | 8.49% | | | 07/06/04 |
| | | | | |
Class Z | | 7.73% | | 7.11% | | | — | | | | 4.87% | | | 09/29/17 |
| | | | | |
Russell Midcap® Value Index14 | | (3.56%) | | 5.69% | | | 6.89% | | | | — | | | 09/19/94† |
The performance data shown represents past performance. Past performance is not a guarantee of future results. Current performance may be lower or higher than the performance data quoted. The investment return and principal value of an investment will fluctuate so that an investor’s shares, when redeemed, may be worth more or less than their original cost.
Investors should carefully consider the Fund’s investment objectives, risks, charges and expenses before investing. For performance information through the most recent month end, current net asset values per share for the Fund and other information, please call 800.548.4539 or visit our website at wealth.amg.com for a free prospectus. Read it carefully before investing or sending money.
Distributed by AMG Distributors, Inc., member FINRA/SIPC.
† Date reflects the inception date of the Fund, not the index.
| 1 | Total return equals income yield plus share price change and assumes reinvestment of all dividends and capital gain distributions. Returns are net of fees and may reflect offsets of Fund expenses as described in the prospectus. No adjustment has been made for taxes payable by shareholders on their reinvested dividends and |
|
capital gain distributions. Returns for periods greater than one year are annualized. The listed returns on the Fund are net of expenses and based on the published NAV as of October 31, 2023. All returns are in U.S. Dollars ($). 2 As of March 19, 2021, the Fund’s Subadviser was changed to River Road Asset Management, LLC. Prior to March 19, 2021, the Fund was known as the AMG Managers Fairpointe Mid Cap Fund and had different principal investment strategies and corresponding risks. Performance shown for periods prior to March 19, 2021, reflects the performance and investment strategies of the Fund’s previous Subadviser, Fairpointe Capital LLC. The Fund’s past performance would have been different if the Fund were managed by the current Subadviser and strategy, and the Fund’s prior performance record might be less pertinent for investors considering whether to purchase shares of the Fund. 3 From time to time, the Fund’s adviser has waived its fees and/or absorbed Fund expenses, which has resulted in higher returns. 4 Market prices of investments held by the Fund may fall rapidly or unpredictably due to a variety of factors, including economic, political, or market conditions, or other factors including terrorism, war, natural disasters and the spread of infectious illness or other public health issues, including epidemics or pandemics, or in response to events that affect particular industries or companies. 5 Because the Fund is an actively managed investment portfolio, security selection or focus on securities in a particular style, market sector or group of companies may cause the Fund to incur losses or underperform relative to its benchmark or other funds with a similar investment objective. There can be no guarantee that the Subadviser’s investment techniques and risk analysis will produce the desired result. 6 The stocks of small- and mid-capitalization companies often have greater price volatility, lower trading volume, and less liquidity than the stocks of larger, more established companies. 7 Value stocks may perform differently from the market as a whole and may be undervalued by the market for a long period of time. 8 Issuers and companies that are in similar industry sectors may be similarly affected by particular economic or market events; to the extent the Fund has substantial holdings within a particular sector, the risks associated with that sector increase. 9 Investments in foreign issuers involve additional risks (such as risks arising from less frequent trading, changes in political or social conditions, and less publicly available information about non-U.S. issuers) that differ from those associated |
6
| | |
| | | AMG River Road Mid Cap Value Fund Portfolio Manager’s Comments (continued) |
| | | |
| | | |
| | | | | | | | |
with investments in U.S. issuers and may result in greater price volatility. 10 Fluctuations in exchange rates may affect the total loss or gain on a non-U.S. dollar investment when converted back to U.S. dollars and exposure to non-U.S. currencies may subject the Fund to the risk that those currencies will decline in value relative to the U.S. dollar. 11 The Fund may not be able to dispose of particular investments, such as illiquid securities, readily at favorable times or prices or the Fund may have to sell them at a loss. 12 Convertible preferred stocks, which are convertible into shares of the issuer’s common stock and pay regular dividends, and convertible debt securities, which are convertible into shares of the issuer’s common stock and bear interest, are subject to the risks of equity securities and fixed income securities. The lower the conversion premium, the | | | | more likely the price of the convertible security will follow the price of the underlying common stock. Conversely, higher premium convertible securities are more likely to exhibit the behavior of bonds because the likelihood of conversion is lower, which may cause their prices to fall as interest rates rise. There is the risk that the issuer of convertible preferred stock will not be able to make dividend payments or that the issuer of a convertible bond will not be able to make principal and/or interest payments. 13 Investments in the Fund may be subject to many of the same risks as a direct investment in real estate. The stock prices of companies in the real estate industry, including real estate investment trusts (“REITs”), are typically sensitive to changes in real estate values, property taxes, interest rates, cash flow of underlying real estate assets, occupancy rates, government regulations affecting zoning, land use, and rents, as well as the management skill and creditworthiness of the issuer. REITs also | | | | depend generally on their ability to generate cash flow to make distributions to shareholders or unitholders and are subject to the risk of failing to qualify for favorable tax treatment under the Internal Revenue Code of 1986, as amended. 14 The Russell Midcap® Value Index measures the performance of those Russell Midcap® companies with lower price-to-book ratios and lower forecasted growth values. The stocks are also members of the Russell 1000® Value Index. Unlike the Fund, the Russell Midcap® Value Index is unmanaged, is not available for investment and does not incur expenses. The Russell Midcap® Value Index is a trademark of the London Stock Exchange Group companies. Not FDIC insured, nor bank guaranteed. May lose value. |
7
| | |
| | | AMG River Road Mid Cap Value Fund Fund Snapshots (unaudited) October 31, 2023 |
| | | |
| | | |
PORTFOLIO BREAKDOWN
| | |
| Sector | | % of
Net Assets |
| | |
| Industrials | | 22.2 |
| | |
| Financials | | 17.4 |
| | |
| Consumer Discretionary | | 13.5 |
| | |
| Consumer Staples | | 10.6 |
| | |
| Energy | | 8.6 |
| | |
| Health Care | | 6.6 |
| | |
| Materials | | 4.8 |
| | |
| Utilities | | 4.7 |
| | |
| Communication Services | | 4.5 |
| | |
| Real Estate | | 4.2 |
| | |
| Short-Term Investments | | 4.2 |
| | |
| Other Assets, less Liabilities | | (1.3) |
TOP TEN HOLDINGS
| | | | |
| Security Name | | % of
Net Assets |
| | | |
LKQ Corp. | | | | 4.0 |
| | | |
Carlisle Cos., Inc. | | | | 3.9 |
| | | |
Fairfax Financial Holdings, Ltd. (Canada) | | | | 3.7 |
| | | |
BJ’s Wholesale Club Holdings, Inc. | | | | 3.4 |
| | | |
The Kroger Co. | | | | 3.3 |
| | | |
Core & Main, Inc., Class A | | | | 2.7 |
| | | |
IDACORP, Inc. | | | | 2.7 |
| | | |
Global Payments, Inc. | | | | 2.6 |
| | | |
Willis Towers Watson PLC (United Kingdom) | | | | 2.6 |
| | | |
Centene Corp. | | | | 2.5 |
| | | | |
| | | |
Top Ten as a Group | | | | 31.4 |
| | | | |
Because a fund’s strategy may result in multiple investments in particular sectors of the economy, its performance may depend on the performance of those sectors and may fluctuate more widely than investments diversified across more sectors. For additional information on these and other risk considerations, please see the Fund’s prospectus.
Any sectors, industries, or securities discussed should not be perceived as investment recommendations. Mention of a specific security should not be considered a recommendation to buy or solicitation to sell that security. Specific securities mentioned in this report may have been sold from the Fund’s portfolio of investments by the time you receive this report.
8
| | |
| | | AMG River Road Mid Cap Value Fund Schedule of Portfolio Investments October 31, 2023 |
| | | |
| | | |
| | | | | | | | |
| | | Shares | | | Value | |
| | |
Common Stocks - 97.1% | | | | | | | | |
| | |
Communication Services - 4.5% | | | | | | | | |
| | |
Atlanta Braves Holdings, Inc., Class C* | | | 132,018 | | | | $4,591,586 | |
| | |
Endeavor Group Holdings, Inc., Class A | | | 148,294 | | | | 3,375,171 | |
| | |
Madison Square Garden Sports Corp.* | | | 35,265 | | | | 5,929,457 | |
| | |
Total Communication Services | | | | | | | 13,896,214 | |
| | |
Consumer Discretionary - 13.5% | | | | | | | | |
| | |
Bath & Body Works, Inc. | | | 110,317 | | | | 3,270,899 | |
| | |
Expedia Group, Inc.* | | | 45,212 | | | | 4,308,251 | |
| | |
Lithia Motors, Inc.1 | | | 18,085 | | | | 4,380,368 | |
| | |
LKQ Corp. | | | 280,292 | | | | 12,310,425 | |
| | |
MGM Resorts International | | | 170,900 | | | | 5,967,828 | |
| | |
NVR, Inc.* | | | 904 | | | | 4,893,008 | |
| | |
Ulta Beauty, Inc.* | | | 16,276 | | | | 6,206,202 | |
| | |
Total Consumer Discretionary | | | | | | | 41,336,981 | |
| | |
Consumer Staples - 10.6% | | | | | | | | |
| | |
Albertsons Cos., Inc., Class A | | | 310,152 | | | | 6,730,298 | |
| | |
BJ’s Wholesale Club Holdings, Inc.* | | | 153,720 | | | | 10,471,406 | |
| | |
Dollar Tree, Inc.* | | | 45,212 | | | | 5,022,601 | |
| | |
The Kroger Co. | | | 221,512 | | | | 10,050,000 | |
| | |
Total Consumer Staples | | | | | | | 32,274,305 | |
| | |
Energy - 8.6% | | | | | | | | |
| | |
Chesapeake Energy Corp.1 | | | 42,499 | | | | 3,658,314 | |
| | |
Delek US Holdings, Inc. | | | 108,508 | | | | 2,859,186 | |
| | |
Texas Pacific Land Corp. | | | 2,713 | | | | 5,008,062 | |
| | |
Tidewater, Inc.* | | | 77,764 | | | | 5,315,170 | |
| | |
Valaris, Ltd.* | | | 91,328 | | | | 6,031,301 | |
| | |
The Williams Cos., Inc. | | | 103,083 | | | | 3,546,055 | |
| | |
Total Energy | | | | | | | 26,418,088 | |
| | |
Financials - 17.4% | | | | | | | | |
| | |
Apollo Global Management, Inc. | | | 53,350 | | | | 4,131,424 | |
| | |
Ares Management Corp., Class A | | | 52,446 | | | | 5,170,651 | |
| | |
Brookfield Asset Management, Ltd., Class A (Canada)1 | | | 157,337 | | | | 4,510,852 | |
| | |
Fairfax Financial Holdings, Ltd. (Canada) | | | 13,564 | | | | 11,284,071 | |
| | |
Global Payments, Inc. | | | 75,956 | | | | 8,068,046 | |
| | |
KKR & Co., Inc. | | | 89,519 | | | | 4,959,353 | |
| | |
WEX, Inc.* | | | 43,403 | | | | 7,225,731 | |
| | |
Willis Towers Watson PLC (United Kingdom) | | | 33,457 | | | | 7,892,172 | |
| | |
Total Financials | | | | | | | 53,242,300 | |
| | |
Health Care - 6.6% | | | | | | | | |
| | |
Centene Corp.* | | | 110,317 | | | | 7,609,667 | |
| | |
GE HealthCare Technologies, Inc. | | | 84,094 | | | | 5,598,138 | |
| | | | | | | | |
| | | Shares | | | Value | |
| | |
Laboratory Corp. of America Holdings | | | 34,361 | | | | $6,862,922 | |
| | |
Total Health Care | | | | | | | 20,070,727 | |
| | |
Industrials - 22.2% | | | | | | | | |
| | |
API Group Corp.* | | | 238,718 | | | | 6,175,635 | |
| | |
Armstrong World Industries, Inc. | | | 99,466 | | | | 7,548,475 | |
| | |
CACI International, Inc., Class A* | | | 14,468 | | | | 4,698,628 | |
| | |
Carlisle Cos., Inc. | | | 47,020 | | | | 11,947,312 | |
| | |
Clarivate PLC (United Kingdom)*,1 | | | 620,305 | | | | 3,957,546 | |
| | |
Core & Main, Inc., Class A* | | | 278,504 | | | | 8,377,400 | |
| | |
Delta Air Lines, Inc. | | | 174,517 | | | | 5,453,656 | |
| | |
Expeditors International of Washington, Inc. | | | 45,212 | | | | 4,939,411 | |
| | |
Ferguson PLC (United Kingdom) | | | 50,637 | | | | 7,605,677 | |
| | |
SS&C Technologies Holdings, Inc. | | | 140,156 | | | | 7,042,839 | |
| | |
Total Industrials | | | | | | | 67,746,579 | |
| | |
Materials - 4.8% | | | | | | | | |
| | |
AptarGroup, Inc. | | | 40,691 | | | | 4,975,288 | |
| | |
Arch Resources, Inc. | | | 24,414 | | | | 3,682,364 | |
| | |
Royal Gold, Inc. | | | 57,867 | | | | 6,037,264 | |
| | |
Total Materials | | | | | | | 14,694,916 | |
| | |
Real Estate - 4.2% | | | | | | | | |
| | |
Alexandria Real Estate Equities, Inc., REIT | | | 48,825 | | | | 4,547,072 | |
| | |
Howard Hughes Holdings, Inc.* | | | 59,679 | | | | 3,958,508 | |
| | |
The St Joe Co. | | | 95,849 | | | | 4,470,398 | |
| | |
Total Real Estate | | | | | | | 12,975,978 | |
| | |
Utilities - 4.7% | | | | | | | | |
| | |
Entergy Corp. | | | 64,196 | | | | 6,136,496 | |
| | |
IDACORP, Inc. | | | 85,902 | | | | 8,135,778 | |
| | |
Total Utilities | | | | | | | 14,272,274 | |
| | |
Total Common Stocks
(Cost $288,183,164) | | | | | | | 296,928,362 | |
| | |
| | | Principal
Amount | | | | |
Short-Term Investments - 4.2% | | | | | | | | |
| |
Joint Repurchase Agreements - 1.5%2 | | | | | |
Bank of America Securities, Inc., dated 10/31/23, due 11/01/23, 5.310% total to be received $1,120,731 (collateralized by various U.S. Government Agency Obligations, 2.000% - 6.500%, 04/01/48 - 10/01/53, totaling $1,142,977) | | $ | 1,120,566 | | | | 1,120,566 | |
Deutsche Bank Securities, Inc., dated 10/31/23, due 11/01/23, 5.310% total to be received $1,120,731 (collateralized by various U.S. Government Agency Obligations, 1.000% - 7.000%, 09/01/28 - 01/01/61, totaling $1,142,977) | | | 1,120,566 | | | | 1,120,566 | |
The accompanying notes are an integral part of these financial statements.
9
| | |
| | | AMG River Road Mid Cap Value Fund Schedule of Portfolio Investments (continued) |
| | | |
| | | |
| | | | | | | | |
| | | Principal
Amount | | | Value | |
| |
Joint Repurchase Agreements - 1.5%2 | | | | | |
(continued) | | | | | | | | |
| | |
Industrial and Commercial Bank of China Financial Services LLC, dated 10/31/23, due 11/01/23, 5.340% total to be received $1,120,732 (collateralized by various U.S. Treasuries, 0.000% - 7.625%, 11/02/23 - 08/15/53, totaling $1,142,978) | | $ | 1,120,566 | | | | $1,120,566 | |
| | |
RBC Capital Markets LLC, dated 10/31/23, due 11/01/23, 5.310% total to be received $1,120,731 (collateralized by various U.S. Government Agency Obligations and U.S. Treasuries, 0.000% - 6.500%, 11/07/23 - 08/20/53, totaling $1,142,977) | | | 1,120,566 | | | | 1,120,566 | |
| |
Total Joint Repurchase Agreements | | | | 4,482,264 | |
| |
Repurchase Agreements - 2.7% | | | | | |
| | |
Fixed Income Clearing Corp., dated 10/31/23 due 11/01/23, 5.150% total to be received $4,784,684 (collateralized by a U.S. Treasury, 4.125%, 06/15/26, totaling $4,879,694) | | | 4,784,000 | | | | 4,784,000 | |
| | | | | | | | |
| | | | | | | | |
| | | Principal
Amount | | | Value | |
| | |
Fixed Income Clearing Corp., dated 10/31/23 due 11/01/23, 5.150% total to be received $3,559,509 (collateralized by a U.S. Treasury, 3.500%, 04/30/30, totaling $3,630,226) | | $ | 3,559,000 | | | | $3,559,000 | |
| |
Total Repurchase Agreements | | | | 8,343,000 | |
| | |
Total Short-Term Investments
(Cost $12,825,264) | | | | | | | 12,825,264 | |
| | |
Total Investments - 101.3%
(Cost $301,008,428) | | | | | | | 309,753,626 | |
| |
Other Assets, less Liabilities - (1.3)% | | | | (3,858,005 | ) |
| | |
Net Assets - 100.0% | | | | | | | $305,895,621 | |
| | | | | | | | |
| * | Non-income producing security. |
| 1 | Some of these securities, amounting to $10,357,118 or 3.4% of net assets, were out on loan to various borrowers and are collateralized by cash and various U.S. Treasury Obligations. See Note 4 of Notes to Financial Statements. |
| 2 | Cash collateral received for securities lending activity was invested in these joint repurchase agreements. |
| REIT | Real Estate Investment Trust |
The following table summarizes the inputs used to value the Fund’s investments by the fair value hierarchy levels as of October 31, 2023:
| | | | | | | | | | | | | | | | |
| | | Level 1 | | | Level 2 | | | Level 3 | | | Total | |
Investments in Securities | | | | | | | | | | | | | | | | |
| | | | |
Common Stocks† | | $ | 296,928,362 | | | | — | | | | — | | | | $296,928,362 | |
| | | | |
Short-Term Investments | | | | | | | | | | | | | | | | |
Joint Repurchase Agreements | | | — | | | | $4,482,264 | | | | — | | | | 4,482,264 | |
| | | | |
Repurchase Agreements | | | — | | | | 8,343,000 | | | | — | | | | 8,343,000 | |
| | | | | | | | | | | | | | | | |
| | | | |
Total Investments in Securities | | $ | 296,928,362 | | | | $12,825,264 | | | | — | | | | $309,753,626 | |
| | | | | | | | | | | | | | | | |
| † | All common stocks held in the Fund are Level 1 securities. For a detailed breakout of common stocks by major industry classification, please refer to the Fund’s Schedule of Portfolio Investments. |
For the fiscal year ended October 31, 2023, there were no transfers in or out of Level 3.
The accompanying notes are an integral part of these financial statements.
10
| | |
| | | AMG River Road Large Cap Value Select Fund Portfolio Manager’s Comments (unaudited) |
| | | |
| | | |
| | | | | | | | |
OVERVIEW For the fiscal year ended October 31, 2023, AMG River Road Large Cap Value Select Fund (the “Fund”) Class N shares returned 9.50%, notably outpacing the 0.13% return for the Russell 1000® Value Index, the Fund’s benchmark. PERFORMANCE REVIEW The sector with the largest positive contribution to relative return was financials, which benefited from positive stock selection. The sector with the largest negative contribution to relative return was communication services, which suffered from negative stock selection partially offset by an overweight allocation. The top contributors to the Fund’s active return were Fairfax Financial Holdings, Ltd. (“FRFHF”) and Ferguson PLC (“FERG”). FRFHF is a Canadian holding company focused on Property and Casualty (P&C) insurance and the reinsurance industry. Like the more famous Berkshire Hathaway, FRFHF follows a disciplined approach to underwriting insurance; historically the company has not chased market share and focuses on writing profitable insurance policies in addition to generating attractive investment returns with the float. FRFHF is firing on all cylinders as both the underwriting and investment results continue to impress. More importantly, the company achieved solid growth (10%) while maintaining its high underwriting standards with a combined ratio of 93.9% (91.5% excluding catastrophes) compared to industry losses as the P&C industry registered a combined ratio of 102.7% in Q2. On the investment front, FRFHF continues to monetize its undervalued assets and capitalize on the higher interest rate environment by deploying its low duration fixed income portfolio into higher yielding U.S. and Canadian government bonds. Another top contributor was FERG, one of the largest distributors of a broad range of plumbing and heating products in the U.S. and Canada. The company generates 75% of its revenues from market segments in which FERG is the #1 or #2 player. FERG leverages its relationship with 34,000 suppliers for pricing discounts on more than 3.5 million products that it can then pass along to its one million+ customers. We expect the company’s 20%+ return on invested capital (ROIC) to expand over time as the company uses its consistent free cash flow (FCF) to | | | | consolidate the highly fragmented industry (10,000+ mom-and-pop competitors) and further entrench its scale advantages. The stock, which listed its shares in the U.S. in 2021 and has yet to be included in most indexes like the S&P 500®, remains under-owned by U.S. investors as the company is headquartered in the U.K. and is primarily followed by European sell-side analysts. FERG is nicely split between residential construction (54% of U.S. sales) and non-residential construction (46%). We believe the long-term outlook is bright for both segments, but the near-term view is more mixed. After exploding during the pandemic, the residential segment is slowing down. When distribution businesses slow down, cash is freed as working capital is released and FCF increases. We believe the non-residential segment is particularly well-positioned over the next several years as multiple infrastructure bills flow through the broader economy. In our view, FERG’s scale and one-stop-shop offering, positions the company to gain market share in the megaproject arena. The bottom contributing holdings to the Fund’s active return were CVS Health Corp. (“CVS”) and Keurig Dr Pepper, Inc. (“KDP”). CVS is the largest pharmacy service provider in the U.S. CVS generates profits equally between its Aetna insurance segment (purchased in 2018), Caremark pharmacy benefits manager (purchased in 2007), and nearly 10,000 retail stores. CVS is attempting to transform itself into a leading integrated healthcare provider by combining three business lines (managed care organizations (MCO), pharmacy benefit managers (PBM), and pharmacy). Unfortunately, the execution of this strategy fell short of expectations. The PBM segment lost business to an emerging competitor, the MCO business (Aetna) received a lower star rating, negatively affecting government reimbursements, and the retail pharmacy faces challenges in managing difficult comps and elevated retail shrinkage. Additionally, several government investigations and ill-timed, overpriced acquisitions heightened CVS’ risk profile. We decided to exit the position as our investment thesis failed to materialize. KDP is the third-largest beverage company in the world. The business is split between cold beverages (60% of operating profit), namely Dr Pepper and Canada Dry, and hot beverages (40%), which includes the company’s Keurig coffee business in the cold segment. KDP has gained volume share in | | | | U.S. carbonated soft drinks (CSDs) consistently for the past two decades and now boasts a 25% market share, which is approaching long-time #2 Pepsi’s CSD market share. In the hot segment, KDP dominates the at-home, single-serve coffee market with an 80% market share. The carbonated business continues to share with market share gains in 90% of its key products. The coffee segment, however, has stumbled coming out of the pandemic. The company reported revenue declines as increased mobility (Omicron surge last year kept some customers at home), softer discretionary spending, and a challenged specialty retailer’s landscape have been key issues for the segment. KDP’s management remains convinced that the coffee segment will bounce back in the second half of 2023. POSITIONING AND OUTLOOK We believe the Fund’s portfolio reflects a balanced mix of value, defensive high quality, attractive growth, and financially strong positions. According to FactSet, the portfolio trades at 9.7x EV/EBITDA compared to the Russell 1000® Value’s multiple of 11.5x. The Fund’s portfolio also demonstrates attractive quality (as measured by the five-year average return on equity (ROE)) with an average ROE of 14.0% versus 15.1% for the benchmark. Furthermore, the portfolio’s expected long-term growth (as measured by published long-term estimates) is healthy at 12.7% versus the benchmark’s 7.3%. In terms of the financial strength, as measured by net debt/EBITDA, the portfolio is slightly more levered at 2.47x versus 2.26x for the benchmark. However, the FactSet calculation excludes some financials (22.1% of 30.0% of the portfolio) and data is not available for some American Depositary Receipts (“ADR”) (5.7%), and we believe our financials and ADRs represent some of the most financially strong holdings in the Fund. For example, the average financial conviction rating for the excluded financials and ADR holdings is 1.75 (1.0=highest, 5.0=lowest). We believe the strategy is well-positioned to navigate a challenging economic environment. The views expressed represent the opinions of River Road Asset Management, LLC as of October 31, 2023, and are not intended as a forecast or guarantee of future results, and are subject to change without notice. |
| | | | | | | | |
11
| | |
| | | AMG River Road Large Cap Value Select Fund Portfolio Manager’s Comments (continued) |
| | | |
| | | |
CUMULATIVE TOTAL RETURN PERFORMANCE
AMG River Road Large Cap Value Select Fund’s cumulative total return is based on the daily change in net asset value (NAV), and assumes that all dividends and distributions were reinvested. The graph compares a hypothetical $10,000 investment made in the AMG River Road Large Cap Value Select Fund’s Class N shares on October 31, 2013, to a $10,000 investment made in the Russell 1000® Value Index for the same time period. The graph and table do not reflect the deduction of taxes that a shareholder would pay on a Fund distribution or redemption of shares. The listed returns for the Fund are net of expenses and the returns for the index exclude expenses. Total returns would have been lower had certain expenses not been reduced.
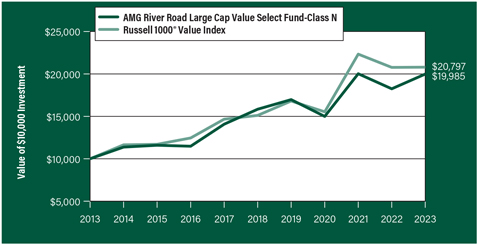
The table below shows the average annual total returns for the AMG River Road Large Cap Value Select Fund and the Russell 1000® Value Index for the same time periods ended October 31, 2023.
| | | | | | |
| | | One | | Five | | Ten |
| Average Annual Total Returns1 | | Year | | Years | | Years |
|
AMG River Road Large Cap Value Select Fund2, 3, 4, 5, 6, 7, 8, 9, 10, 11, 12, 13, 14, 15, 16 |
| | | |
Class N | | 9.50% | | 4.76% | | 7.17% |
| | | |
Class I | | 9.83% | | 5.07% | | 7.48% |
| | | |
Russell 1000® Value Index17 | | 0.13% | | 6.60% | | 7.60% |
The performance data shown represents past performance. Past performance is not a guarantee of future results. Current performance may be lower or higher than the performance data quoted. The investment return and principal value of an investment will fluctuate so that an investor’s shares, when redeemed, may be worth more or less than their original cost.
Investors should carefully consider the Fund’s investment objectives, risks, charges and expenses before investing. For performance information through the most recent month end, current net asset values per share for the Fund and other information, please call 800.548.4539 or visit our website at wealth.amg.com for a free prospectus. Read it carefully before investing or sending money.
Distributed by AMG Distributors, Inc., member FINRA/SIPC.
| 1 | Total return equals income yield plus share price change and assumes reinvestment of all dividends and capital gain distributions. Returns are net of fees and may reflect offsets of Fund expenses as described in the prospectus. No adjustment has been made for taxes payable by shareholders on their reinvested dividends and capital gain distributions. Returns for periods greater than one year are annualized. The listed returns on the Fund are net of expenses and based on the published NAV as of October 31, 2023. All returns are in U.S. Dollars ($). |
| 2 | As of March 22, 2021, the Fund’s Subadviser was changed to River Road Asset Management, LLC. Prior to March 22, 2021, the Fund was known as the AMG FQ Long-Short Equity Fund and had different principal |
|
investmentstrategies and corresponding risks. Performance shown for periods prior to March 22, 2021, reflects the performance and investment strategies of the Fund’s previous Subadviser, First Quadrant, LLC. The Fund’s past performance would have been different if the Fund were managed by the current Subadviser and strategy, and the Fund’s prior performance record might be less pertinent for investors considering whether to purchase shares of the Fund. 3 From time to time, the Fund’s adviser has waived its fees and/or absorbed Fund expenses, which has resulted in higher returns. 4 Market prices of investments held by the Fund may fall rapidly or unpredictably due to a variety of factors, including economic, political, or market conditions, or other factors including terrorism, war, natural disasters and the spread of infectious illness or other public health issues, including epidemics or pandemics, or in response to events that affect particular industries or companies. 5 Because the Fund is an actively managed investment portfolio, security selection or focus on securities in a particular style, market sector or group of companies may cause the Fund to incur losses or underperform relative to its benchmark or other funds with a similar investment objective. There can be no guarantee that the Subadviser’s investment techniques and risk analysis will produce the desired result. 6 Value stocks may perform differently from the market as a whole and may be undervalued by the market for a long period of time. 7 The Fund is non-diversified and therefore a greater percentage of holdings may be focused in a small number of issuers or a single issuer, which can place the Fund at greater risk. Notwithstanding the Fund’s status as a “non-diversified” investment company under the Investment Company Act of 1940 (the “1940 Act”), the Fund intends to qualify as a regulated investment company accorded favorable tax treatment under the Internal Revenue Code of 1986, as amended (the “Internal Revenue Code”), which imposes its own diversification requirements that are less restrictive than the requirements applicable to “diversified” investment companies under the 1940 Act. The Fund’s intention to qualify as a regulated investment company may limit its pursuit of its investment strategy and its investment strategy could limit its ability to so qualify. 8 To the extent the Fund invests a substantial portion of its assets in a relatively small number of securities or a particular market, industry, group of industries, country, region, group of countries, asset class or sector, it generally will be subject to greater risk than a fund that invests in a more |
12
| | |
| | | AMG River Road Large Cap Value Select Fund Portfolio Manager’s Comments (continued) |
| | | |
| | | |
| | | | | | | | |
diverseinvestment portfolio. In addition, the value of the Fund would be more susceptible to any single economic, market, political or regulatory occurrence affecting, for example, that particular market, industry, region or sector. 9 Issuers and companies that are in similar industry sectors may be similarly affected by particular economic or market events; to the extent the Fund has substantial holdings within a particular sector, the risks associated with that sector increase. 10 Investments in foreign issuers involve additional risks (such as risks arising from less frequent trading, changes in political or social conditions, and less publicly available information about non-U.S. issuers) that differ from those associated with investments in U.S. issuers and may result in greater price volatility. 11 Fluctuations in exchange rates may affect the total loss or gain on a non-U.S. dollar investment when converted back to U.S. dollars and exposure to non-U.S. currencies may subject the Fund to the risk that those currencies will decline in value relative to the U.S. dollar. 12 Convertible preferred stocks, which are convertible into shares of the issuer’s common stock and pay regular dividends, and convertible debt securities, which are convertible into shares of the issuer’s common stock and bear interest, are subject to the risks of equity securities and fixed income securities. The lower the conversion premium, the more likely the price of the convertible security will follow the price of the underlying common stock. Conversely, higher premium convertible securities are more likely to exhibit the behavior of bonds because the likelihood of conversion is lower, | | | | whichmay cause their prices to fall as interest rates rise. There is the risk that the issuer of convertible preferred stock will not be able to make dividend payments or that the issuer of a convertible bond will not be able to make principal and/or interest payments. 13 Investments in the Fund may be subject to many of the same risks as a direct investment in real estate. The stock prices of companies in the real estate industry, including real estate investment trusts (“REITs”), are typically sensitive to changes in real estate values, property taxes, interest rates, cash flow of underlying real estate assets, occupancy rates, government regulations affecting zoning, land use, and rents, as well as the management skill and creditworthiness of the issuer. REITs also depend generally on their ability to generate cash flow to make distributions to shareholders or unitholders and are subject to the risk of failing to qualify for favorable tax treatment under the Internal Revenue Code. 14 Investments in master limited partnerships (“MLPs”) are subject to similar risks to those associated with the specific industry or industries in which the partnership invests, such as the risk of investing in the real estate or oil and gas industries. In addition, investments in MLPs are subject to the risks of investing in a partnership, including limited control and voting rights on matters affecting the partnership and fewer investor protections compared to corporations. 15 Investing in publicly traded partnerships (“PTPs”) (including master limited partnerships) involves special risks in addition to those typically associated with publicly traded companies. PTPs are exposed to the risks of their underlying assets, | | | | whichin many cases includes the same types of risks as energy and natural resources companies, such as commodity pricing risk, supply and demand risk and depletion and exploration risk. PTPs are also subject to capital markets risk, which is the risk that they may be unable to raise capital to execute their growth strategies. PTPs are also subject to tax risk, which is the risk that PTPs may lose their partnership status for tax purposes. The Fund’s ability to make investments in certain PTPs, including master limited partnerships, can be limited by the Fund’s intention to qualify as a regulated investment company accorded favorable tax treatment under the Internal Revenue Code, and if the Fund does not appropriately limit such investments or if such investments are recharacterized for U.S. federal income tax purposes, the Fund’s status as a regulated investment company may be jeopardized. 16 The stocks of large-capitalization companies are generally more mature and may not be able to reach the same levels of growth as the stocks of small- or mid-capitalization companies. 17 The Russell 1000® Value Index is a market capitalization weighted index that measures the performance of those Russell 1000® companies with lower price-to-book ratios and lower forecasted growth values. Unlike the Fund, the Russell 1000® Value Index is unmanaged, is not available for investment and does not incur expenses. The Russell 1000® Value Index is a trademark of the London Stock Exchange Group companies. Not FDIC insured, nor bank guaranteed. May lose value. |
13
| | |
| | | AMG River Road Large Cap Value Select Fund Fund Snapshots (unaudited) October 31, 2023 |
| | | |
| | | |
PORTFOLIO BREAKDOWN
| | | | | |
| Sector | | % of
Net Assets |
| | |
Financials | | | | 29.9 | |
| | |
Consumer Staples | | | | 22.6 | |
| | |
Industrials | | | | 12.9 | |
| | |
Energy | | | | 8.6 | |
| | |
Communication Services | | | | 7.4 | |
| | |
Health Care | | | | 5.3 | |
| | |
Consumer Discretionary | | | | 4.9 | |
| | |
Utilities | | | | 4.3 | |
| | |
Materials | | | | 2.5 | |
| | |
Short-Term Investments | | | | 1.2 | |
| | |
Other Assets, less Liabilities | | | | 0.4 | |
TOP TEN HOLDINGS
| | | | | | | | | | |
| Security Name | | % of Net Assets |
| | | |
Berkshire Hathaway, Inc., Class B | | | | | | | 8.0 | |
| | | |
Fairfax Financial Holdings, Ltd. (Canada) | | | | | | | 5.8 |
| | | |
Nestle SA, Sponsored ADR (Switzerland) | | | | | | | 5.7 |
| | | |
T-Mobile US, Inc. | | | | | | | 5.4 |
| | | |
Keurig Dr Pepper, Inc. | | | | | | | 5.4 |
| | | |
UnitedHealth Group, Inc. | | | | | | | 5.3 |
| | | |
Carlisle Cos., Inc. | | | | | | | 5.0 |
| | | |
BJ’s Wholesale Club Holdings, Inc. | | | | | | | 5.0 |
| | | |
Fiserv, Inc. | | | | | | | 4.9 |
| | | |
LKQ Corp. | | | | | | | 4.9 |
| | | | | | | | | | |
| | | |
Top Ten as a Group | | | | | | | 55.4 |
| | | | | | | | | |
Because a fund’s strategy may result in multiple investments in particular sectors of the economy, its performance may depend on the performance of those sectors and may fluctuate more widely than investments diversified across more sectors. For additional information on these and other risk considerations, please see the Fund’s prospectus.
Any sectors, industries, or securities discussed should not be perceived as investment recommendations. Mention of a specific security should not be considered a recommendation to buy or solicitation to sell that security. Specific securities mentioned in this report may have been sold from the Fund’s portfolio of investments by the time you receive this report.
14
| | |
| | | AMG River Road Large Cap Value Select Fund Schedule of Portfolio Investments October 31, 2023 |
| | | |
| | | |
| | | | | | | | |
| | |
| | | Shares | | | Value | |
| | |
Common Stocks - 98.4% | | | | | | | | |
| |
Communication Services - 7.4% | | | | | |
| | |
Alphabet, Inc., Class C* | | | 5,238 | | | | $656,321 | |
| | |
T-Mobile US, Inc.* | | | 12,040 | | | | 1,732,075 | |
| | |
Total Communication Services | | | | | | | 2,388,396 | |
| | |
Consumer Discretionary - 4.9% | | | | | | | | |
| | |
LKQ Corp. | | | 35,542 | | | | 1,561,005 | |
| | |
Consumer Staples - 22.6% | | | | | | | | |
| | |
BJ’s Wholesale Club Holdings, Inc.* | | | 23,660 | | | | 1,611,719 | |
| | |
Dollar Tree, Inc.* | | | 5,509 | | | | 611,995 | |
| | |
Keurig Dr Pepper, Inc. | | | 57,034 | | | | 1,729,841 | |
| | |
The Kroger Co. | | | 33,105 | | | | 1,501,974 | |
| | |
Nestle SA, Sponsored ADR (Switzerland) | | | 16,902 | | | | 1,821,360 | |
| | |
Total Consumer Staples | | | | | | | 7,276,889 | |
| | |
Energy - 8.6% | | | | | | | | |
| | |
EOG Resources, Inc. | | | 7,891 | | | | 996,239 | |
| | |
Suncor Energy, Inc. (Canada) | | | 32,669 | | | | 1,058,475 | |
| | |
Valaris, Ltd.* | | | 11,006 | | | | 726,836 | |
| | |
Total Energy | | | | | | | 2,781,550 | |
| | |
Financials - 29.9% | | | | | | | | |
| | |
Berkshire Hathaway, Inc., Class B* | | | 7,517 | | | | 2,565,778 | |
| | |
Fairfax Financial Holdings, Ltd. (Canada) | | | 2,238 | | | | 1,861,822 | |
| | |
Fiserv, Inc.* | | | 13,975 | | | | 1,589,656 | |
| | |
KKR & Co., Inc. | | | 18,664 | | | | 1,033,985 | |
| | |
The Progressive Corp. | | | 6,989 | | | | 1,104,891 | |
| | |
Willis Towers Watson PLC (United Kingdom) | | | 6,292 | | | | 1,484,220 | |
| | |
Total Financials | | | | | | | 9,640,352 | |
| | | | | | | | |
| * | Non-income producing security. |
| | | | | | | | |
| | |
| | | Shares | | | Value | |
| |
Health Care - 5.3% | | | | | |
| | |
UnitedHealth Group, Inc. | | | 3,196 | | | | $1,711,650 | |
| |
Industrials - 12.9% | | | | | |
| | |
Armstrong World Industries, Inc. | | | 14,735 | | | | 1,118,239 | |
| | |
Carlisle Cos., Inc. | | | 6,360 | | | | 1,616,012 | |
| | |
Delta Air Lines, Inc. | | | 20,411 | | | | 637,844 | |
| | |
Ferguson PLC (United Kingdom) | | | 5,150 | | | | 773,530 | |
| | |
Total Industrials | | | | | | | 4,145,625 | |
| |
Materials - 2.5% | | | | | |
| | |
CRH PLC (Ireland) | | | 14,972 | | | | 802,050 | |
| |
Utilities - 4.3% | | | | | |
| | |
IDACORP, Inc. | | | 14,614 | | | | 1,384,092 | |
| | |
Total Common Stocks
(Cost $29,701,592) | | | | | | | 31,691,609 | |
| | |
| | | Principal
Amount | | | | |
| | |
| Short-Term Investments - 1.2% | | | | | | | | |
| |
Repurchase Agreements - 1.2% | | | | | |
| | |
Fixed Income Clearing Corp., dated 10/31/23 due 11/01/23, 5.150% total to be received $369,053 (collateralized by a U.S. Treasury, 3.500%, 04/30/30, totaling $376,387) | | $ | 369,000 | | | | 369,000 | |
| | |
Total Short-Term Investments
(Cost $369,000) | | | | | | | 369,000 | |
| | |
Total Investments - 99.6%
(Cost $30,070,592) | | | | | | | 32,060,609 | |
| |
Other Assets, less Liabilities - 0.4% | | | | 142,807 | |
| | |
Net Assets - 100.0% | | | | | | $ | 32,203,416 | |
| | | | | | | | |
ADR American Depositary Receipt
The accompanying notes are an integral part of these financial statements.
15
| | |
| | | AMG River Road Large Cap Value Select Fund Schedule of Portfolio Investments (continued) |
| | | |
| | | |
The following table summarizes the inputs used to value the Fund’s investments by the fair value hierarchy levels as of October 31, 2023:
| | | | | | | | | | | | | | |
| | | Level 1 | | | Level 2 | | | Level 3 | | | Total |
Investments in Securities | | | | | | | | | | | | | | |
| | | | |
Common Stocks† | | $ | 31,691,609 | | | | – | | | | – | | | $31,691,609 |
| | | | |
Short-Term Investments | | | | | | | | | | | | | | |
| | | | |
Repurchase Agreements | | | – | | | $ | 369,000 | | | | – | | | 369,000 |
| | | | | | | | | | | | | | |
Total Investments in Securities | | $ | 31,691,609 | | | $ | 369,000 | | | | – | | | $32,060,609 |
| | | | | | | | | | | | | | |
| † | All common stocks held in the Fund are Level 1 securities. For a detailed breakout of common stocks by major industry classification, please refer to the Fund’s Schedule of Portfolio Investments. |
For the fiscal year ended October 31, 2023, there were no transfers in or out of Level 3.
The accompanying notes are an integral part of these financial statements.
16
| | |
| | | AMG River Road Small Cap Value Fund Portfolio Manager’s Comments (unaudited) |
| | | |
| | | |
| | | | | | | | |
OVERVIEW For the fiscal year ended October 31, 2023, AMG River Road Small Cap Value Fund (the “Fund”) Class N shares returned 1.58%, outperforming the -9.93% return for the Russell 2000® Value Index, the Fund’s benchmark. PERFORMANCE REVIEW The sector with the largest positive contribution to relative return was financials, which benefited from positive stock selection (no bank exposure) and an underweight allocation. The sector with the largest negative contribution to relative return was consumer discretionary, which suffered from negative stock selection and an underweight allocation. The Fund’s cash position, which averaged 8.66% during the period, was a positive contributor to relative performance by +154 basis points (bps). The top contributing holdings to the Fund’s active return were SP Plus Corp. (“SP”) and Permian Resources Corp. (Cl A) (“PR”). SP provides outsourced parking lot management and ancillary services in the U.S. and Canada. It utilizes proprietary technology to handle gate operations and payments, and also leases parking lots. In October 2023, SP signed a deal to be acquired by Metropolis Technologies for $54/share in cash, which was a 52% premium to its previous day’s closing price and a 4% premium to our $52/share assessed value. PR is an independent oil and gas exploration and production company concentrated in the Delaware basin. In August, PR announced an all-stock acquisition of Earthstone Energy for $4.5 billion, or | | | | 2.9x 2024 estimated EBITDAX, the lowest multiple of publicly traded Permian E&P (exploration and production) peers. The deal adds acreage in the Delaware and Midland basins within the Permian and almost doubles existing production. PR expects $175 million in synergies by year-end 2024 from operational efficiencies associated with drilling, completions, and facilities savings. Given the successful integration and cost savings achieved from PR’s previous merger with Colgate, these targets appear achievable and should reduce PR’s cash costs. The transaction is projected to have over 30% free cash flow (FCF) accretion in the first two years. We believe PR will remain well capitalized with net leverage less than 1.0x and liquidity of more than $1.0 billion. The bottom contributing holdings to the Fund’s active return were Air Transport Services Group, Inc. (“ATSG”) and Leslie’s, Inc. (“LESL”). ATSG is the premier lessor of the Boeing 767 freighter aircraft, which is essential to support e-commerce. Earlier in the year, ATSG announced plans to increase capital expenditures to accelerate growth in its fleet and expected to take its net leverage from 2.3x to 3.0x over the next 18 to 24 months in an environment of high interest rates. After investor feedback, management subsequently dialed back its growth plans. However, the company lowered 2023 EBITDA guidance by -7% late in the year due to operational mishaps and an unexpected negative impact from the Israel/Hamas conflict. LESL is the largest direct-to-consumer pool supply retailer in the U.S. The company has had weak year to date results following two strong years benefiting from | | | | COVID-19-related industry supply chain problems. Pool owners entered the season with elevated chemical inventories caused by overbuying in previous years. Early summer temperatures were the coolest in a decade, which hurt demand for chemicals in key markets (California, Texas, and Arizona). Consumers also exhibited increased price sensitivity after a prolonged period of elevated price inflation, which forced LESL to lower prices to move product. OUTLOOK AND POSITIONING We are skeptical that this cycle has marked the ultimate bottom for small cap stocks given a looming recession, falling earnings expectations, and the U.S. Federal Reserve resolving to maintain high interest rates until inflation is under control. Additionally, we think it could be years, not quarters, before investors see sustainable and meaningful new highs in stocks as markets struggle with valuations in an era of higher interest rates and geopolitical uncertainty. We believe high quality companies with attractive growth rates and attractive valuations are a wonderful place to invest in the current environment. We believe the Fund is attractively positioned compared to the benchmark based on EV/EBITDA, return on equity (ROE), and long-term growth outlook. The views expressed represent the opinions of River Road Asset Management, LLC as of October 31, 2023, and are not intended as a forecast or guarantee of future results, and are subject to change without notice. |
17
| | |
| | | AMG River Road Small Cap Value Fund Portfolio Manager’s Comments (continued) |
| | | |
| | | |
CUMULATIVE TOTAL RETURN PERFORMANCE
AMG River Road Small Cap Value Fund’s cumulative total return is based on the daily change in net asset value (NAV), and assumes that all dividends and distributions were reinvested. The graph compares a hypothetical $10,000 investment made in the AMG River Road Small Cap Value Fund’s Class N shares on October 31, 2013, to a $10,000 investment made in the Russell 2000® Value Index for the same time period. The graph and table do not reflect the deduction of taxes that a shareholder would pay on a Fund distribution or redemption of shares. The listed returns for the Fund are net of expenses and the returns for the index exclude expenses. Total returns would have been lower had certain expenses not been reduced.
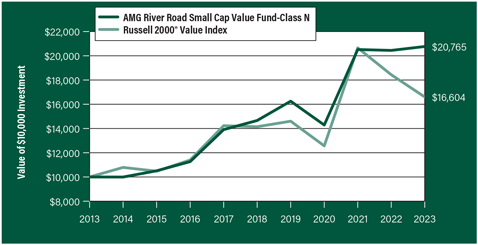
The table below shows the average annual total returns for the AMG River Road Small Cap Value Fund and the Russell 2000® Value Index for the same time periods ended October 31, 2023.
| | | | | | | | | | | | |
| | | One | | Five | | Ten | | | Since | | Inception |
| Average Annual Total Returns1 | | Year | | Years | | Years | | | Inception | | Date |
| | |
AMG River Road Small Cap Value Fund2, 3, 4, 5, 6, 7, 8, 9, 10, 11, 12 | | | | | |
| | | | | |
Class N | | 1.58% | | 7.21% | | | 7.58% | | | 7.77% | | 06/28/05 |
| | | | | |
Class I | | 1.81% | | 7.50% | | | 7.86% | | | 6.58% | | 12/13/06 |
| | | | | |
Class Z | | 1.94% | | 7.61% | | | – | | | 7.18% | | 09/29/17 |
| | | | | |
Russell 2000® Value Index13 | | (9.93%) | | 3.26% | | | 5.20% | | | 5.96% | | 06/28/05† |
The performance data shown represents past performance. Past performance is not a guarantee of future results. Current performance may be lower or higher than the performance data quoted. The investment return and principal value of an investment will fluctuate so that an investor’s shares, when redeemed, may be worth more or less than their original cost.
Investors should carefully consider the Fund’s investment objectives, risks, charges and expenses before investing. For performance information through the most recent month end, current net asset values per share for the Fund and other information, please call 800.548.4539 or visit our website at wealth.amg.com for a free prospectus. Read it carefully before investing or sending money.
Distributed by AMG Distributors, Inc., member FINRA/SIPC.
| † | Date reflects the inception date of the Fund, not the index. |
| 1 | Total return equals income yield plus share price change and assumes reinvestment of all dividends and capital gain distributions. Returns are net of fees and may reflect offsets of Fund expenses as described in the prospectus. No adjustment has been made for taxes payable by shareholders on their reinvested dividends and capital gain distributions. Returns for periods greater than one year are annualized. The listed returns on the Fund are net of expenses and based on the published NAV as of October 31, 2023. All returns are in U.S. Dollars ($). |
|
2 From time to time, the Fund’s adviser has waived its fees and/or absorbed Fund expenses, which has resulted in higher returns. 3 Market prices of investments held by the Fund may fall rapidly or unpredictably due to a variety of factors, including economic, political, or market conditions, or other factors including terrorism, war, natural disasters and the spread of infectious illness or other public health issues, including epidemics or pandemics, or in response to events that affect particular industries or companies. 4 Because the Fund is an actively managed investment portfolio, security selection or focus on securities in a particular style, market sector or group of companies may cause the Fund to incur losses or underperform relative to its benchmark or other funds with a similar investment objective. There can be no guarantee that the Subadviser’s investment techniques and risk analysis will produce the desired result. 5 The stocks of small- and mid-capitalization companies often have greater price volatility, lower trading volume, and less liquidity than the stocks of larger, more established companies. 6 Value stocks may perform differently from the market as a whole and may be undervalued by the market for a long period of time. 7 Issuers and companies that are in similar industry sectors may be similarly affected by particular economic or market events; to the extent the Fund has substantial holdings within a particular sector, the risks associated with that sector increase. 8 Investments in foreign issuers involve additional risks (such as risks arising from less frequent trading, changes in political or social conditions, and less publicly available information about non-U.S. issuers) that differ from those associated with investments in U.S. issuers and may result in greater price volatility. 9 Fluctuations in exchange rates may affect the total loss or gain on a non-U.S. dollar investment when converted back to U.S. dollars and exposure to non-U.S. currencies may subject the Fund to the risk that those currencies will decline in value relative to the U.S. dollar. 10 The Fund may not be able to dispose of particular investments, such as illiquid securities, readily at favorable times or prices or the Fund may have to sell them at a loss. 11 Convertible preferred stocks, which are convertible into shares of the issuer’s common stock and pay regular dividends, and convertible debt securities, which are convertible into shares of the issuer’s common stock and bear interest, are subject to the risks of equity securities and fixed income securities. The lower the conversion premium, the more likely the price of the convertible security will follow the price of the underlying common stock. |
18
| | |
| | | AMG River Road Small Cap Value Fund Portfolio Manager’s Comments (continued) |
| | | |
| | | |
| | | | | | | | |
Conversely, higher premium convertible securities are more likely to exhibit the behavior of bonds because the likelihood of conversion is lower, which may cause their prices to fall as interest rates rise. There is the risk that the issuer of convertible preferred stock will not be able to make dividend payments or that the issuer of a convertible bond will not be able to make principal and/or interest payments. 12 Investments in the Fund may be subject to many of the same risks as a direct investment in real estate. The stock prices of companies in the real estate industry, including real estate investment trusts | | | | (“REITs”), are typically sensitive to changes in real estate values, property taxes, interest rates, cash flow of underlying real estate assets, occupancy rates, government regulations affecting zoning, land use, and rents, as well as the management skill and creditworthiness of the issuer. REITs also depend generally on their ability to generate cash flow to make distributions to shareholders or unitholders and are subject to the risk of failing to qualify for favorable tax treatment under the Internal Revenue Code of 1986, as amended. 13 The Russell 2000® Value Index is an unmanaged, market-value weighted, value-oriented index | | | | comprised of small stocks that have relatively low price-to-book ratios and lower forecasted growth values. Unlike the Fund, the Russell 2000® Value Index is unmanaged, is not available for investment and does not incur expenses. The Russell 2000® Value Index is a trademark of the London Stock Exchange Group companies. Not FDIC insured, nor bank guaranteed. May lose value. |
19
| | |
| | | AMG River Road Small Cap Value Fund Fund Snapshots (unaudited) October 31, 2023 |
| | | |
| | | |
PORTFOLIO BREAKDOWN
| | | | | |
| Sector | | % of Net Assets |
| | |
Industrials | | | | 32.2 | |
| | |
Financials | | | | 15.5 | |
| | |
Information Technology | | | | 8.3 | |
| | |
Energy | | | | 7.0 | |
| | |
Consumer Staples | | | | 6.9 | |
| | |
Consumer Discretionary | | | | 4.9 | |
| | |
Communication Services | | | | 4.2 | |
| | |
Utilities | | | | 4.1 | |
| | |
Health Care | | | | 3.7 | |
| | |
Materials | | | | 3.3 | |
| | |
Real Estate | | | | 0.3 | |
| | |
Short-Term Investments | | | | 10.0 | |
| | |
Other Assets, less Liabilities | | | | (0.4 | ) |
TOP TEN HOLDINGS
| | | | | | |
| Security Name | | | | | % of Net Assets |
| | | |
White Mountains Insurance Group, Ltd. | | | | | | 3.9 |
| | | |
BJ’s Wholesale Club Holdings, Inc. | | | | | | 3.9 |
| | | |
SP Plus Corp. | | | | | | 3.6 |
| | | |
McGrath RentCorp | | | | | | 3.2 |
| | | |
Air Transport Services Group, Inc. | | | | | | 3.1 |
| | | |
UniFirst Corp. | | | | | | 3.0 |
| | | |
Atkore, Inc. | | | | | | 2.8 |
| | | |
Murphy USA, Inc. | | | | | | 2.8 |
| | | |
CoreCivic, Inc. | | | | | | 2.6 |
| | | |
ePlus, Inc. | | | | | | 2.5 |
| | | |
| | | | | | | |
| | | |
Top Ten as a Group | | | | | | 31.4 |
| | |
| | | | | | |
Because a fund’s strategy may result in multiple investments in particular sectors of the economy, its performance may depend on the performance of those sectors and may fluctuate more widely than investments diversified across more sectors. For additional information on these and other risk considerations, please see the Fund’s prospectus.
Any sectors, industries, or securities discussed should not be perceived as investment recommendations. Mention of a specific security should not be considered a recommendation to buy or solicitation to sell that security. Specific securities mentioned in this report may have been sold from the Fund’s portfolio of investments by the time you receive this report.
20
| | |
| | | AMG River Road Small Cap Value Fund Schedule of Portfolio Investments October 31, 2023 |
| | | |
| | | |
| | | | | | | | |
| | | Shares | | | Value | |
| | |
Common Stocks - 90.4% | | | | | | | | |
| |
Communication Services - 4.2% | | | | | |
| | |
Cable One, Inc. | | | 20,551 | | | | $11,300,378 | |
| | |
Liberty Latin America, Ltd., Class C* | | | 3,161 | | | | 21,653 | |
| | |
TripAdvisor, Inc.* | | | 813,784 | | | | 12,011,452 | |
| | |
WideOpenWest, Inc.* | | | 404,271 | | | | 2,846,068 | |
| | |
Yelp, Inc.* | | | 256,943 | | | | 10,840,425 | |
| | |
Total Communication Services | | | | | | | 37,019,976 | |
| | |
Consumer Discretionary - 4.9% | | | | | | | | |
| | |
Advance Auto Parts, Inc. | | | 147,757 | | | | 7,687,797 | |
| | |
Asbury Automotive Group, Inc.*,1 | | | 29,792 | | | | 5,701,295 | |
| | |
Leslie’s, Inc.*,1 | | | 1,051,989 | | | | 5,196,826 | |
| | |
Murphy USA, Inc. | | | 67,057 | | | | 24,320,903 | |
| | |
Total Consumer Discretionary | | | | | | | 42,906,821 | |
| | |
Consumer Staples - 6.9% | | | | | | | | |
| | |
BJ’s Wholesale Club Holdings, Inc.* | | | 504,391 | | | | 34,359,115 | |
| | |
Hostess Brands, Inc.* | | | 308,119 | | | | 10,291,174 | |
| | |
Ingles Markets, Inc., Class A | | | 197,817 | | | | 15,868,880 | |
| | |
Total Consumer Staples | | | | | | | 60,519,169 | |
| | |
Energy - 7.0% | | | | | | | | |
| | |
Delek US Holdings, Inc. | | | 509,918 | | | | 13,436,340 | |
| | |
Evolution Petroleum Corp. | | | 803,826 | | | | 5,168,601 | |
| | |
Permian Resources Corp. | | | 1,447,188 | | | | 21,085,529 | |
| | |
SM Energy Co. | | | 473,963 | | | | 19,110,188 | |
| | |
World Kinect Corp. | | | 181,022 | | | | 3,348,907 | |
| | |
Total Energy | | | | | | | 62,149,565 | |
| | |
Financials - 15.5% | | | | | | | | |
| | |
American Equity Investment Life Holding Co.* | | | 42,824 | | | | 2,267,959 | |
| | |
Axis Capital Holdings, Ltd. (Bermuda) | | | 362,212 | | | | 20,682,306 | |
| | |
Cannae Holdings, Inc.* | | | 1,030,332 | | | | 16,845,928 | |
| | |
EVERTEC, Inc. (Puerto Rico) | | | 534,863 | | | | 16,997,946 | |
| | |
Genworth Financial, Inc., Class A* | | | 3,579,383 | | | | 21,440,504 | |
| | |
NCR Atleos Corp.* | | | 309,751 | | | | 6,833,107 | |
| | |
NMI Holdings, Inc., Class A* | | | 321,509 | | | | 8,793,271 | |
| | |
Radian Group, Inc. | | | 328,571 | | | | 8,325,989 | |
| | |
White Mountains Insurance Group, Ltd. | | | 24,305 | | | | 34,774,379 | |
| | |
Total Financials | | | | | | | 136,961,389 | |
| | |
Health Care - 3.7% | | | | | | | | |
| | |
Computer Programs and Systems, Inc.* | | | 463,147 | | | | 6,525,741 | |
| | |
Embecta Corp. | �� | | 583,740 | | | | 8,826,149 | |
| | |
Envista Holdings Corp.* | | | 93,779 | | | | 2,182,238 | |
| | |
Patterson Cos., Inc. | | | 418,520 | | | | 12,748,119 | |
| | | | | | | | |
| | | | | | | | |
| | | Shares | | | Value | |
| | |
Premier, Inc., Class A | | | 130,291 | | | | $2,504,193 | |
| | |
Total Health Care | | | | | | | 32,786,440 | |
| | |
Industrials - 32.2% | | | | | | | | |
| | |
Air Transport Services Group, Inc.* | | | 1,379,127 | | | | 26,989,515 | |
| | |
Alight, Inc., Class A* | | | 1,739,321 | | | | 11,549,091 | |
| | |
Argan, Inc. | | | 249,847 | | | | 11,428,002 | |
| | |
Armstrong World Industries, Inc. | | | 242,695 | | | | 18,418,124 | |
| | |
Atkore, Inc.* | | | 199,312 | | | | 24,770,495 | |
| | |
Barrett Business Services, Inc. | | | 44,274 | | | | 4,049,300 | |
| | |
Core & Main, Inc., Class A* | | | 170,922 | | | | 5,141,334 | |
| | |
CoreCivic, Inc.* | | | 1,804,725 | | | | 22,920,007 | |
| | |
Forward Air Corp. | | | 73,945 | | | | 4,762,797 | |
| | |
The GEO Group Inc., REIT*,1 | | | 1,077,553 | | | | 9,417,813 | |
| | |
GMS, Inc.* | | | 130,719 | | | | 7,644,447 | |
| | |
Kelly Services, Inc., Class A | | | 553,348 | | | | 9,877,262 | |
| | |
McGrath RentCorp | | | 280,395 | | | | 28,207,737 | |
| | |
MSC Industrial Direct Co., Inc., Class A | | | 110,778 | | | | 10,496,216 | |
| | |
NOW, Inc.* | | | 472,572 | | | | 5,207,743 | |
| | |
Park Aerospace Corp. | | | 733,679 | | | | 10,770,408 | |
| | |
SP Plus Corp.* | | | 635,732 | | | | 32,123,538 | |
| | |
UniFirst Corp. | | | 161,244 | | | | 26,513,351 | |
| | |
Verra Mobility Corp.* | | | 134,062 | | | | 2,650,406 | |
| | |
Viad Corp.* | | | 451,607 | | | | 10,942,438 | |
| | |
Total Industrials | | | | | | | 283,880,024 | |
| | |
Information Technology - 8.3% | | | | | | | | |
| | |
ACI Worldwide, Inc.* | | | 672,009 | | | | 13,688,823 | |
| | |
DXC Technology Co.* | | | 230,611 | | | | 4,651,424 | |
| | |
ePlus, Inc.* | | | 357,721 | | | | 22,357,563 | |
| | |
Ituran Location and Control, Ltd. (Israel) | | | 230,417 | | | | 5,698,212 | |
| | |
NCR Voyix, Corp.* | | | 619,503 | | | | 9,472,201 | |
| | |
Vontier Corp. | | | 591,325 | | | | 17,479,567 | |
| | |
Total Information Technology | | | | | | | 73,347,790 | |
| | |
Materials - 3.3% | | | | | | | | |
| | |
American Vanguard Corp. | | | 222,225 | | | | 2,080,026 | |
| | |
Summit Materials, Inc., Class A* | | | 499,162 | | | | 16,422,430 | |
| | |
TriMas Corp. | | | 454,332 | | | | 10,999,377 | |
| | |
Total Materials | | | | | | | 29,501,833 | |
| | |
Real Estate - 0.3% | | | | | | | | |
| | |
Newmark Group, Inc., Class A | | | 495,868 | | | | 2,811,572 | |
| | |
Utilities - 4.1% | | | | | | | | |
| | |
Northwestern Energy Group, Inc. | | | 342,078 | | | | 16,423,165 | |
| | |
PNM Resources, Inc. | | | 158,768 | | | | 6,709,535 | |
| | | | | | | | |
The accompanying notes are an integral part of these financial statements.
21
|
AMG River Road Small Cap Value Fund Schedule of Portfolio Investments (continued) |
| | | | | | | | |
| | |
| | | Shares | | | Value | |
| |
Utilities-4.1% (continued) | | | | | |
Southwest Gas Holdings, Inc. | | | 219,116 | | | | $12,842,389 | |
| | |
Total Utilities | | | | | | | 35,975,089 | |
| | |
Total Common Stocks | | | | | | | | |
| | |
(Cost $678,257,150) | | | | | | | 797,859,668 | |
| | |
| | | Principal | | | | | |
| | |
| | | Amount | | | | | |
| | |
Short-Term Investments-10.0% | | | | | | | | |
| | |
Joint Repurchase Agreements -0.4%2 | | | | | | | | |
| | |
Bank of America Securities, Inc., dated 10/31/23,due 11/01/23, 5.310% total to be received $1,000,148 (collateralized by various U.S. Government Agency Obligations,2.000% -6.500%, 04/01/48 -10/01/53, totaling $1,020,000) | | | $1,000,000 | | | | 1,000,000 | |
| | |
Citigroup Global Markets, Inc., dated 10/31/23,due 11/01/23, 5.310% total to be received $1,000,148 (collateralized by various U.S. Government Agency Obligations, 2.000% -7.715%, 12/01/27—06/20/73, totaling $1,020,000) | | | 1,000,000 | | | | 1,000,000 | |
| | |
Industrial and Commercial Bank of China Financial Services LLC, dated 10/31/23, due 11/01/23, 5.340% total to be received $1,000,148 (collateralized by various U.S. Treasuries, 0.000%-7.625%, 11/02/23 -08/15/53, totaling $1,020,000) | | | 1,000,000 | | | | 1,000,000 | |
| | | | | | |
| | |
| | | Principal Amount | | Value | |
| | |
RBC Capital Markets LLC, dated 10/31/23, due 11/01/23, 5.310% total to be received $606,089(collateralized by various U.S. Government Agency Obligations and U.S. Treasuries,0.000% - 6.500%, 11/07/23 - 08/20/53, totaling $618,120) | | $606,000 | | $ | 606,000 | |
| | |
Total Joint Repurchase Agreements | | | | | 3,606,000 | |
| | |
Repurchase Agreements-9.6% | | | | | | |
| | |
Fixed Income Clearing Corp. dated 10/31/23, due 11/01/23, 5.150% total to be received $84,345,064 (collateralized by various U.S. Treasuries, 1.750%-3.500%, 04/30/30 -08/15/41, totaling $86,019,664) | | 84,333,000 | | | 84,333,000 | |
| | |
Total Short-Term Investments (Cost $87,939,000) | | | | | 87,939,000 | |
| | |
Total Investments-100.4% (Cost $766,196,150) | | | | | 885,798,668 | |
| | |
Other Assets, less Liabilities-(0.4)% | | | | | (3,392,666 | ) |
| | |
Net Assets -100.0% | | | | $ | 882,406,002 | |
| * | Non-income producing security. |
| 1 | Some of these securities, amounting to $5,495,569 or 0.6% of net assets, were out on loan to various borrowers and are collateralized by cash and various U.S. Treasury Obligations. See Note 4 of Notes to Financial Statements. |
| 2 | Cash collateral received for securities lending activity was invested in these joint repurchase agreements. |
| REIT | Real Estate Investment Trust |
The following table summarizes the inputs used to value the Fund’s investments by the fair value hierarchy levels as of October 31, 2023:
| | | | | | | | | | | | |
| | | Level 1 | | | Level 2 | | Level 3 | | | Total |
| | | | |
Investments in Securities | | | | | | | | | | | | |
| | | | |
Common Stocks† | | $ | 797,859,668 | | | — | | | — | | | $797,859,668 |
| | | | |
Short-Term Investments | | | | | | | | | | | | |
| | | | |
Joint Repurchase Agreements | | | — | | | $3,606,000 | | | — | | | 3,606,000 |
| | | | |
Repurchase Agreements | | | — | | | 84,333,000 | | | — | | | 84,333,000 |
| | | | | | | | | | | | |
Total Investments in Securities | | $ | 797,859,668 | | | $87,939,000 | | | — | | | $885,798,668 |
| | | | | | | | | | | | |
| † | All common stocks held in the Fund are Level 1 securities. For a detailed breakout of common stocks by major industry classification, please refer to the Fund’s Schedule of Portfolio Investments. |
For the fiscal year ended October 31, 2023, there were no transfers in or out of Level 3.
The accompanying notes are an integral part of these financial statements.
22
| | |
| | | AMG River Road Dividend All Cap Value Fund Portfolio Manager’s Comments (unaudited) |
| | | |
| | | |
| | | | | | | | |
OVERVIEW For the fiscal year ended October 31, 2023, the AMG River Road Dividend All Cap Value Fund (the “Fund”) Class N shares returned -7.50%, underperforming the return of -0.48% for the Russell 3000® Value Index, the Fund’s benchmark. MARKET AND PERFORMANCE REVIEW The period was dominated by rising interest rates, continued elevated inflation, conflict, and slowing economic growth. As expected, these forces contributed to continued market volatility. However, the decision by the U.S. Federal Reserve (the “Fed”) to slow the pace of interest rate increases has undercut fears of an imminent recession and equity markets have generally proved more resilient as a result. Relative to the benchmark, the Fund’s bias toward high dividend paying stocks was a significant headwind as non-payers advanced >8% in the period while companies with yields above 2% declined. Sector allocation was largely positive with the biggest contributions from the overweights in communication services and information technology, offset in part by the overweight in utilities. Reflecting the challenge for dividend payers, stock selection was broadly negative as only the positions in energy outperformed the benchmark sector in the period. The two holdings with the largest positive contribution to the Fund’s active return were Oracle Corp., a leading database provider, and Vistra Corp., an independent Texas-based utility. Oracle’s strong performance was driven by the success of its cloud services, which now account for more than one-third of revenue. The company has carved out a leading position in cloud enterprise resource planning (ERP) solutions and is quickly gaining market share in cloud infrastructure services, making Oracle a legitimate competitor to Amazon’s AWS and Microsoft’s Azure. We trimmed the position multiple times during the period as it moved above our maximum position size and remain optimistic about cloud services growth as the transition of database services to the cloud represents a third leg of growth for Oracle. Vistra Corp. benefited from robust demand growth in the dynamic Texas market. The state experienced record peak demand on numerous occasions over | | | | the summer, and the company capitalized on the strong pricing environment as they were able to meet this need. In addition, the company is set to acquire Energy Harbor Corp. and their fleet of nuclear power plants. Once they have secured regulatory approvals, the company will greatly expand their ability to provide low carbon intensity baseload power to customers in OH, PA, and WV. Following the strong outperformance, we elected to reduce the size of the position to better align the risk and reward. The two holdings with the lowest contribution to the Fund’s active return during the period were The AES Corp. (“AES”), an independent power producer and Advanced Auto Parts, Inc. (“AAP”), an auto parts distributor & retailer. After two years of strong performance, AES retreated in the period. The company has built up a backlog of over 13 gigawatts of renewable projects primarily with global technology leaders that are moving forward with their net zero aspirations. These projects represent a pathway for growth over the next couple of years, but they will require substantial capital to complete, a greater challenge in the current environment. The stock traded lower based on fears that the company would be forced to issue shares at unfavorable valuations to see these projects through, but management was able to sell non-core assets in international markets at attractive prices that cover projected equity needs. This action was consistent with our investment thesis and appeared sufficient to alleviate the broader concern, thus we retained the position. After making some inroads in their turnaround efforts in the quarters after the position was established, AAP declined sharply following the report of poor Q1 results in June. In addition to cutting their guidance for the year, the company announced a -83% reduction in their dividend. This was a realization of the key risk in our investment thesis, and we promptly eliminated the position. Fortunately, we had reduced the position in late 2022 due to accumulated unrealized losses. POSITIONING AND OUTLOOK As of October 31, 2023, the Fund is significantly overweight in the consumer staples, communication services, and information technology sectors and | | | | significantly underweight in the health care, industrials, and financials sectors relative to the Fund’s benchmark. The consumer discretionary sector had the largest increase in relative exposure in the past 12 months, going from marginally overweight in October 2022 to significantly so at the end of the period, as several large constituents moved out of the value benchmark. In contrast, the largest decrease in the relative exposure was in the Fund’s position in the health care sector as we made changes in numerous positions during the period. As would be expected amid an economic turning point, one can find plenty of data to support either a bullish or a bearish projection. The decision of the Fed to slow interest rate increases, prompted by moderating inflation and a series of major bank failures, brought optimism to U.S. equity markets—for a time. However, the labor market in the U.S. remains persistently tight, and inflation readings are stubbornly above the Fed’s 2% target. This suggests that interest rates will need to remain elevated even as consumers, particularly those on the low end, start to buckle. Additionally, CEO confidence surveys are less sanguine, and bankers are rapidly tightening lending standards. Although this year witnessed another period of strong momentum in a small group of “growth” stocks, this time for those associated with artificial intelligence, we believe that slower global economic growth, higher interest rates, war, and a general decline in trust will drive sustained outperformance for both value and dividend-focused portfolios in the long-term. However, as we have noted in the past, the journey toward this outcome will likely prove bumpy. The views expressed represent the opinions of River Road Asset Management, LLC as of October 31, 2023, and are not intended as a forecast or guarantee of future results, and are subject to change without notice. |
23
|
AMG River Road Dividend All Cap Value Fund Portfolio Manager’s Comments (continued) |
CUMULATIVE TOTAL RETURN PERFORMANCE
AMG River Road Dividend All Cap Value Fund’s cumulative total return is based on the daily change in net asset value (NAV), and assumes that all dividends and distributions were reinvested. The graph compares a hypothetical $10,000 investment made in the AMG River Road Dividend All Cap Value Fund’s Class N shares on October 31, 2013, to a $10,000 investment made in the Russell 3000® Value Index for the same time period. The graph and table do not reflect the deduction of taxes that a shareholder would pay on a Fund distribution or redemption of shares. The listed returns for the Fund are net of expenses and the returns for the index exclude expenses. Total returns would have been lower had certain expenses not been reduced.
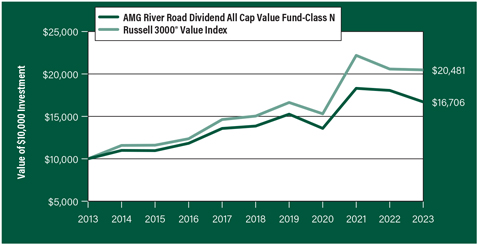
The table below shows the average annual total returns for the AMG River Road Dividend All Cap Value Fund and the Russell 3000® Value Index for the same time periods ended October 31, 2023.
| | | | | | | | | | |
| | | One | | Five | | Ten | | Since | | Inception |
| Average Annual Total Returns1 | | Year | | Years | | Years | | Inception | | Date |
| | |
AMG River Road Dividend All Cap Value Fund2, 3, 4, 5, 6, 7, 8, 9, 10, 11, 12, 13, 14, 15 | | | | |
| | | | | |
Class N | | (7.50%) | | 3.81% | | 5.27% | | 6.73% | | 06/28/05 |
| | | | | |
Class I | | (7.17%) | | 4.07% | | 5.54% | | 5.67% | | 06/28/07 |
| | | | | |
Class Z | | (7.22%) | | 4.12% | | — | | 3.88% | | 09/29/17 |
| | | | | |
Russell 3000® Value Index16 | | (0.48%) | | 6.38% | | 7.43% | | 6.89% | | 06/28/05† |
The performance data shown represents past performance. Past performance is not a guarantee of future results. Current performance may be lower or higher than the performance data quoted. The investment return and principal value of an investment will fluctuate so that an investor’s shares, when redeemed, may be worth more or less than their original cost.
Investors should carefully consider the Fund’s investment objectives, risks, charges and expenses before investing. For performance information through the most recent month end, current net asset values per share for the Fund and other information, please call 800.548.4539 or visit our website at wealth.amg.com for a free prospectus. Read it carefully before investing or sending money.
Distributed by AMG Distributors, Inc., member FINRA/SIPC.
| † | Date reflects the inception date of the Fund, not the index. |
| 1 | Total return equals income yield plus share price change and assumes reinvestment of all dividends and capital gain distributions. Returns are net of fees and may reflect offsets of Fund expenses as described in the prospectus. No adjustment has been made for taxes payable by shareholders on their reinvested dividends and capital gain distributions. Returns for periods greater than one year are annualized. The listed returns on the Fund are net of expenses and based on the published NAV as of October 31, 2023. All returns are in U.S. Dollars ($). |
| 2 | From time to time, the Fund’s adviser has waived its fees and/or absorbed Fund expenses, which has resulted in higher returns. |
| 3 | Market prices of investments held by the Fund may fall rapidly or unpredictably due to a variety of factors, including economic, political, or market conditions, or other factors including terrorism, war, natural disasters and the spread of infectious illness or other public health issues, including epidemics or pandemics, or in response to events that affect particular industries or companies. |
| 4 | Because the Fund is an actively managed investment portfolio, security selection or focus on securities in a particular style, market sector or group of companies may cause the Fund to incur losses or underperform relative to its benchmark or other funds with a similar investment objective. There can be no guarantee that the Subadviser’s investment techniques and risk analysis will produce the desired result. |
| 5 | The stocks of small- and mid-capitalization companies often have greater price volatility, lower trading volume, and less liquidity than the stocks of larger, more established companies. |
| 6 | Value stocks may perform differently from the market as a whole and may be undervalued by the market for a long period of time. |
| 7 | Issuers and companies that are in similar industry sectors may be similarly affected by particular economic or market events; to the extent the Fund has substantial holdings within a particular sector, the risks associated with that sector increase. |
| 8 | Investments in foreign issuers involve additional risks (such as risks arising from less frequent trading, changes in political or social conditions, and less publicly available information about non-U.S. issuers) that differ from those associated with investments in U.S. issuers and may result in greater price volatility. |
| 9 | Fluctuations in exchange rates may affect the total loss or gain on a non-U.S. dollar investment when converted back to U.S. dollars and exposure to non-U.S. currencies may subject the Fund to the risk that those currencies will decline in value relative to the U.S. dollar. |
| 10 | The Fund may not be able to dispose of particular investments, such as illiquid securities, readily at favorable times or prices or the Fund may have to sell them at a loss. |
| 11 | Convertible preferred stocks, which are convertible into shares of the issuer’s common stock and pay regular dividends, and convertible debt securities, which are convertible into shares of the issuer’s common stock and bear interest, are subject to the risks of equity securities and fixed income securities. The lower the conversion premium, the more likely the price of the convertible security will follow the price of the underlying common stock. |
24
| | |
| | | AMG River Road Dividend All Cap Value Fund Portfolio Manager’s Comments (continued) |
| | | |
| | | |
| | | | | | | | |
Conversely,higher premium convertible securities are more likely to exhibit the behavior of bonds because the likelihood of conversion is lower, which may cause their prices to fall as interest rates rise. There is the risk that the issuer of convertible preferred stock will not be able to make dividend payments or that the issuer of a convertible bond will not be able to make principal and/or interest payments. 12 Investments in the Fund may be subject to many of the same risks as a direct investment in real estate. The stock prices of companies in the real estate industry, including real estate investment trusts (“REITs”), are typically sensitive to changes in real estate values, property taxes, interest rates, cash flow of underlying real estate assets, occupancy rates, government regulations affecting zoning, land use, and rents, as well as the management skill and creditworthiness of the issuer. REITs also depend generally on their ability to generate cash flow to make distributions to shareholders or unitholders and are subject to the risk of failing to qualify for favorable tax treatment under the Internal Revenue Code of 1986, as amended (the “Internal Revenue Code”). 13 Investments in master limited partnerships (“MLPs”) are subject to similar risks to those associated with the specific industry or industries in which the partnership invests, such as the risk of investing in | | | | thereal estate or oil and gas industries. In addition, investments in MLPs are subject to the risks of investing in a partnership, including limited control and voting rights on matters affecting the partnership and fewer investor protections compared to corporations. 14 Investing in publicly traded partnerships (“PTPs”) (including master limited partnerships) involves special risks in addition to those typically associated with publicly traded companies. PTPs are exposed to the risks of their underlying assets, which in many cases includes the same types of risks as energy and natural resources companies, such as commodity pricing risk, supply and demand risk and depletion and exploration risk. PTPs are also subject to capital markets risk, which is the risk that they may be unable to raise capital to execute their growth strategies. PTPs are also subject to tax risk, which is the risk that PTPs may lose their partnership status for tax purposes. The Fund’s ability to make investments in certain PTPs, including master limited partnerships, can be limited by the Fund’s intention to qualify as a regulated investment company accorded favorable tax treatment under the Internal Revenue Code, and if the Fund does not appropriately limit such investments or if such investments are recharacterized for U.S. federal income tax purposes, the Fund’s status as a regulated investment company may be jeopardized. | | | | 15 Investing in royalty income trusts, which typically passively manage royalties and net working interests in oil-, gas- or mineral-producing properties and rely on outside drilling or mining companies to extract the resources, involves certain risks not typically associated with investing in publicly traded companies. Royalty income trusts generally do not guarantee minimum distributions or return of capital. Royalty income trusts are also exposed to many of the same risks as energy and natural resources companies, such as commodity pricing risk, supply and demand risk and depletion and exploration risk. 16 The Russell 3000® Value Index measures the performance of the broad value segment of the U.S. equity universe. It includes those Russell 3000® companies with lower price-to-book ratios and lower forecasted growth values. Unlike the Fund, the Russell 3000® Value Index is unmanaged, is not available for investment and does not incur expenses. The Russell 3000® Value Index is a trademark of the London Stock Exchange Group companies. Not FDIC insured, nor bank guaranteed. May lose value. |
25
| | |
| | | AMG River Road Dividend All Cap Value Fund Fund Snapshots (unaudited) October 31, 2023 |
| | | |
| | | |
PORTFOLIO BREAKDOWN
| | | | |
| Sector | | % of Net Assets | |
| | |
Financials | | | 16.1 | |
| | |
Consumer Staples | | | 15.1 | |
| | |
Information Technology | | | 13.4 | |
| | |
Energy | | | 10.0 | |
| | |
Communication Services | | | 9.7 | |
| | |
Health Care | | | 9.6 | |
| | |
Utilities | | | 9.4 | |
| | |
Industrials | | | 8.4 | |
| | |
Exchange Traded Funds | | | 3.6 | |
| | |
Consumer Discretionary | | | 1.9 | |
| | |
Real Estate | | | 1.6 | |
| | |
Short-Term Investments | | | 3.4 | |
| | |
Other Assets, less Liabilities | | | (2.2 | ) |
TOP TEN HOLDINGS
| | | | | | |
| Security Name | | | | | % of Net Assets |
| | | |
Oracle Corp. | | | | | | 4.2 |
| | | |
The Williams Cos., Inc. | | | | | | 3.9 |
| | | |
Comcast Corp., Class A | | | | | | 3.9 |
| | | |
Vistra Corp. | | | | | | 3.7 |
| | | |
iShares Russell 1000 Value ETF | | | | | | 3.6 |
| | | |
Cogent Communications Holdings, Inc. | | | | | | 3.5 |
| | | |
The Progressive Corp. | | | | | | 3.3 |
| | | |
Kinder Morgan, Inc. | | | | | | 3.3 |
| | | |
Unilever PLC, Sponsored ADR (United Kingdom) | | | | | | 3.2 |
| | | |
United Parcel Service, Inc., Class B | | | | | | 3.1 |
| | | | | | | |
| | | |
Top Ten as a Group | | | | | | 35.7 |
| | | | | | |
Because a fund’s strategy may result in multiple investments in particular sectors of the economy, its performance may depend on the performance of those sectors and may fluctuate more widely than investments diversified across more sectors. For additional information on these and other risk considerations, please see the Fund’s prospectus.
Any sectors, industries, or securities discussed should not be perceived as investment recommendations. Mention of a specific security should not be considered a recommendation to buy or solicitation to sell that security. Specific securities mentioned in this report may have been sold from the Fund’s portfolio of investments by the time you receive this report.
26
| | |
| | | AMG River Road Dividend All Cap Value Fund Schedule of Portfolio Investments October 31, 2023 |
| | | |
| | | |
| | | | | | | | |
| | |
| | | Shares | | | Value | |
| | |
Common Stocks - 95.2% | | | | | | | | |
| |
Communication Services - 9.7% | | | | | |
| | |
Cable One, Inc. | | | 3,995 | | | | $2,196,730 | |
| | |
Cogent Communications Holdings, Inc. | | | 127,565 | | | | 8,289,174 | |
| | |
Comcast Corp., Class A | | | 218,320 | | | | 9,014,433 | |
| | |
The Interpublic Group of Cos., Inc. | | | 111,740 | | | | 3,173,416 | |
| | |
Total Communication Services | | | | | | | 22,673,753 | |
| | |
Consumer Discretionary - 1.9% | | | | | | | | |
| | |
Genuine Parts Co. | | | 9,141 | | | | 1,177,909 | |
| | |
LKQ Corp. | | | 47,589 | | | | 2,090,109 | |
| | |
MDC Holdings, Inc. | | | 29,957 | | | | 1,136,868 | |
| | |
Total Consumer Discretionary | | | | | | | 4,404,886 | |
| | |
Consumer Staples - 15.1% | | | | | | | | |
| | |
Dollar General Corp. | | | 7,800 | | | | 928,512 | |
| | |
The JM Smucker Co. | | | 20,487 | | | | 2,332,240 | |
| | |
Keurig Dr Pepper, Inc. | | | 90,135 | | | | 2,733,795 | |
| | |
Kimberly-Clark Corp. | | | 46,755 | | | | 5,593,768 | |
| | |
The Kroger Co. | | | 76,298 | | | | 3,461,640 | |
| | |
PepsiCo, Inc. | | | 25,657 | | | | 4,189,275 | |
| | |
Primo Water Corp. | | | 135,066 | | | | 1,763,962 | |
| | |
Sysco Corp. | | | 33,932 | | | | 2,256,139 | |
| | |
Target Corp. | | | 40,853 | | | | 4,526,104 | |
| | |
Unilever PLC, Sponsored ADR (United Kingdom)1 | | | 159,480 | | | | 7,551,378 | |
| | |
Total Consumer Staples | | | | | | | 35,336,813 | |
| | |
Energy - 10.0% | | | | | | | | |
| | |
Enterprise Products Partners LP, MLP | | | 259,031 | | | | 6,745,167 | |
| | |
Kinder Morgan, Inc. | | | 469,405 | | | | 7,604,361 | |
| | |
The Williams Cos., Inc. | | | 262,085 | | | | 9,015,724 | |
| | |
Total Energy | | | | | | | 23,365,252 | |
| | |
Financials - 16.1% | | | | | | | | |
| | |
Axis Capital Holdings, Ltd. (Bermuda) | | | 75,439 | | | | 4,307,567 | |
| | |
Chubb, Ltd. (Switzerland) | | | 25,720 | | | | 5,520,026 | |
| | |
CNA Financial Corp. | | | 48,655 | | | | 1,965,662 | |
| | |
Fidelity National Financial, Inc. | | | 66,641 | | | | 2,604,997 | |
| | |
M&T Bank Corp. | | | 11,152 | | | | 1,257,388 | |
| | |
The PNC Financial Services Group, Inc. | | | 53,645 | | | | 6,140,743 | |
| | |
The Progressive Corp. | | | 49,116 | | | | 7,764,748 | |
| | |
U.S. Bancorp | | | 162,603 | | | | 5,183,784 | |
| | |
Willis Towers Watson PLC (United Kingdom) | | | 12,202 | | | | 2,878,330 | |
| | |
Total Financials | | | | | | | 37,623,245 | |
| | |
Health Care - 9.6% | | | | | | | | |
| | |
AbbVie, Inc. | | | 35,548 | | | | 5,018,666 | |
| | |
Amgen, Inc. | | | 20,609 | | | | 5,269,721 | |
| | | | | | | | |
| | | | | | | | |
| | |
| | | Shares | | | Value | |
| | |
Bristol-Myers Squibb Co. | | | 109,796 | | | | $5,657,788 | |
| | |
Johnson & Johnson | | | 7,899 | | | | 1,171,738 | |
| | |
Merck & Co., Inc. | | | 18,730 | | | | 1,923,571 | |
| | |
Pfizer, Inc. | | | 104,919 | | | | 3,206,325 | |
| | |
Premier, Inc., Class A | | | 12,258 | | | | 235,599 | |
| | |
Total Health Care | | | | | | | 22,483,408 | |
| | |
Industrials - 8.4% | | | | | | | | |
| | |
CSG Systems International, Inc. | | | 37,712 | | | | 1,767,184 | |
| | |
Dun & Bradstreet Holdings, Inc. | | | 298,966 | | | | 2,618,942 | |
| | |
Lockheed Martin Corp. | | | 3,992 | | | | 1,814,923 | |
| | |
United Parcel Service, Inc., Class B | | | 50,998 | | | | 7,203,468 | |
| | |
Watsco, Inc.1 | | | 17,372 | | | | 6,060,917 | |
| | |
Total Industrials | | | | | | | 19,465,434 | |
| | |
Information Technology - 13.4% | | | | | | | | |
| | |
Cisco Systems, Inc. | | | 76,859 | | | | 4,006,660 | |
| | |
Corning, Inc. | | | 243,467 | | | | 6,515,177 | |
| | |
Micron Technology, Inc. | | | 64,713 | | | | 4,327,358 | |
| | |
Oracle Corp. | | | 94,725 | | | | 9,794,565 | |
| | |
QUALCOMM, Inc. | | | 28,699 | | | | 3,127,904 | |
| | |
Texas Instruments, Inc. | | | 24,665 | | | | 3,502,677 | |
| | |
Total Information Technology | | | | | | | 31,274,341 | |
| | |
Real Estate - 1.6% | | | | | | | | |
| | |
American Tower Corp., REIT | | | 6,855 | | | | 1,221,493 | |
| | |
Crown Castle, Inc., REIT | | | 25,750 | | | | 2,394,235 | |
| | |
Total Real Estate | | | | | | | 3,615,728 | |
| | |
Utilities - 9.4% | | | | | | | | |
| | |
The AES Corp. | | | 439,684 | | | | 6,551,292 | |
| | |
Black Hills Corp. | | | 10,983 | | | | 531,028 | |
| | |
IDACORP, Inc. | | | 56,938 | | | | 5,392,598 | |
Northwestern Energy Group, Inc. | | | 19,048 | | | | 914,494 | |
Vistra Corp. | | | 262,571 | | | | 8,591,323 | |
| | |
Total Utilities | | | | | | | 21,980,735 | |
Total Common Stocks | | | | | | | | |
(Cost $176,026,366) | | | | | | | 222,223,595 | |
| | |
Exchange Traded Funds - 3.6% | | | | | | | | |
| | |
iShares Russell 1000 Value ETF
(Cost $8,811,568) | | | 58,010 | | | | 8,493,824 | |
| | | | | | | | |
The accompanying notes are an integral part of these financial statements.
27
| | |
| | | AMG River Road Dividend All Cap Value Fund Schedule of Portfolio Investments (continued) |
| | | |
| | | |
| | | | | | | | |
| | |
| | | Principal
Amount | | | Value | |
| | |
Short-Term Investments - 3.4% | | | | | | | | |
Joint Repurchase Agreements - 2.4%2 | | | | | | | | |
| | |
Bank of America Securities, Inc., dated 10/31/23,
due 11/01/23, 5.310% total to be received
$1,419,532 (collateralized by various
U.S. Government Agency Obligations, 2.000% -
6.500%, 04/01/48 - 10/01/53, totaling
$1,447,709) | | | $1,419,323 | | | | $1,419,323 | |
| | |
Citadel Securities LLC, dated 10/31/23, due
11/01/23, 5.380% total to be received $1,419,535
(collateralized by various U.S. Treasuries,
0.000% - 7.500%, 11/09/23 - 08/15/53, totaling
$1,447,926) | | | 1,419,323 | | | | 1,419,323 | |
Citigroup Global Markets, Inc., dated 10/31/23,
due 11/01/23, 5.310% total to be received
$1,419,532 (collateralized by various
U.S. Government Agency Obligations, 2.000% -
7.715%, 12/01/27 - 06/20/73, totaling $1,447,709) | | | 1,419,323 | | | | 1,419,323 | |
Industrial and Commercial Bank of China
Financial Services LLC, dated 10/31/23, due
11/01/23, 5.340% total to be received $1,419,534
(collateralized by various U.S. Treasuries,
0.000% - 7.625%, 11/02/23 - 08/15/53, totaling
$1,447,710) | | | 1,419,323 | | | | 1,419,323 | |
| |
Total Joint Repurchase Agreements | | | | 5,677,292 | |
| | | | | | | | |
| | |
| | | Principal
Amount | | | Value | |
| | |
Repurchase Agreements - 1.0% | | | | | | | | |
| | |
Fixed Income Clearing Corp., dated 10/31/23 due
11/01/23, 5.150% total to be received $1,928,276
(collateralized by a U.S. Treasury, 4.125%,
06/15/26, totaling $1,966,561) | | | $1,928,000 | | | | $1,928,000 | |
| | |
Fixed Income Clearing Corp., dated 10/31/23 due
11/01/23, 5.150% total to be received $427,061
(collateralized by a U.S. Treasury, 3.500%,
04/30/30, totaling $435,550) | | | 427,000 | | | | 427,000 | |
| | |
Total Repurchase Agreements | | | | | | | 2,355,000 | |
| | |
Total Short-Term Investments
(Cost $8,032,292) | | | | | | | 8,032,292 | |
| | |
Total Investments - 102.2%
(Cost $192,870,226) | | | | | | | 238,749,711 | |
| |
Other Assets, less Liabilities - (2.2)% | | | | (5,169,735 | ) |
| | |
Net Assets - 100.0% | | | | | | | $233,579,976 | |
| 1 | Some of these securities, amounting to $13,391,166 or 5.7% of net assets, were out on loan to various borrowers and are collateralized by cash and various U.S. Treasury Obligations. See Note 4 of Notes to Financial Statements. |
| 2 | Cash collateral received for securities lending activity was invested in these joint repurchase agreements. |
| ADR | American Depositary Receipt |
| MLP | Master Limited Partnership |
| REIT | Real Estate Investment Trust |
The following table summarizes the inputs used to value the Fund’s investments by the fair value hierarchy levels as of October 31, 2023:
| | | | | | | | | | | | |
| | | Level 1 | | | Level 2 | | Level 3 | | | Total |
| | | | |
Investments in Securities | | | | | | | | | | | | |
| | | | |
Common Stocks† | | $ | 222,223,595 | | | — | | | — | | | $222,223,595 |
| | | | |
Exchange Traded Funds | | | 8,493,824 | | | — | | | — | | | 8,493,824 |
| | | | |
Short-Term Investments | | | | | | | | | | | | |
| | | | |
Joint Repurchase Agreements | | | — | | | $5,677,292 | | | — | | | 5,677,292 |
| | | | |
Repurchase Agreements | | | — | | | 2,355,000 | | | — | | | 2,355,000 |
| | | | | | | | | | | | |
Total Investments in Securities | | $ | 230,717,419 | | | $8,032,292 | | | — | | | $238,749,711 |
| | | | | | | | | | | | |
| † | All common stocks held in the Fund are Level 1 securities. For a detailed breakout of common stocks by major industry classification, please refer to the Fund’s Schedule of Portfolio Investments. |
For the fiscal year ended October 31, 2023, there were no transfers in or out of Level 3.
The accompanying notes are an integral part of these financial statements.
28
| | |
| | | AMG River Road Small-Mid Cap Value Fund Portfolio Manager’s Comments (unaudited) |
| | | |
| | | |
| | | | | | | | |
OVERVIEW For the fiscal year ended October 31, 2023, AMG River Road Small-Mid Cap Value Fund (the “Fund”) Class N shares returned -0.77%, outperforming the Russell 2500® Value Index return of -4.94%, the Fund’s benchmark. PERFORMANCE REVIEW The sector with the largest positive contribution to relative return was financials, which benefited from positive stock selection. The sector with the largest negative contribution to relative return was consumer discretionary, which suffered from negative stock selection. The Fund’s cash position, which averaged 3.72% during the period, was a positive contributor to relative performance. The top contributing holdings to the Fund’s active return were Vistra Corp. (“VST”) and Permian Resources Corp. (Cl A) (“PR”). VST is an independent producer and retailer of electricity. The company’s cash flow growth remained robust year to date, primarily fueled by a surge in EBITDA from the generation of electricity. Vistra’s generation assets have thrived due to strong demand from the Electric Reliability Council of Texas and sustained higher margins, thanks to management’s effective execution in its comprehensive hedging program. In addition, the company’s retail operations have benefited from growth of its customer base. Shareholders are continuing to reap the rewards of the company’s substantial capital returns through dividends and share repurchases. Finally, the company is working through the regulatory approval process for its acquisition of Energy Harbor, a company with 4 gigawatts of nuclear power generation and approximately one million retail clients. | | | | PR is an independent oil and gas exploration and production company concentrated in the Delaware basin. In August, PR announced an all-stock acquisition of Earthstone Energy for $4.5 billion, or 2.9x 2024 estimated EBITDAX, the lowest multiple of publicly traded Permian E&P (exploration and production) peers. The deal adds acreage in the Delaware and Midland basins within the Permian and almost doubles existing production. PR expects $175 million in synergies by year-end 2024 from operational efficiencies associated with drilling, completions, and facilities savings. Given the successful integration and cost savings achieved from PR’s previous merger with Colgate, these targets appear achievable and should reduce PR’s cash costs. The transaction is projected to have over 30% free cash flow (FCF) accretion in the first two years. We believe PR will remain well capitalized, with net leverage less than 1.0x and liquidity of more than $1.0 billion. The bottom contributing holdings to the Fund’s active return were Advance Auto Parts, Inc. (“AAP”) and Air Transport Services Group, Inc. (“ATSG”). AAP is a retailer of aftermarket auto replacement parts, accessories, batteries, and maintenance items. AAP shares declined sharply after its Q1 2023 earnings results severely missed expectations and management reduced EBITDA guidance. AAP has been losing market share in the do-it-for-me (DIFM) segment due to poor inventory availability and aggressive pricing. Having recently completed significant improvements to its operations and supply chain, we believe AAP has the opportunity to drive material margin expansion in the coming years. New CEO Shane O’Kelly also plans to reduce the complexity of the business model by selling non-core assets, which include WorldPac and its Canadian operations. | | | | ATSG is the premier lessor of the Boeing 767 freighter aircraft, which is essential to support e-commerce. Earlier in the year, ATSG announced plans to increase capital expenditures to accelerate growth in its fleet and is expected to take its net leverage from 2.3x to 3.0x over the next 18 to 24 months in an environment of high interest rates. After investor feedback, management subsequently dialed back its growth plans. However, the company lowered 2023 EBITDA guidance by -7% late in the year due to operational mishaps and an unexpected negative impact from the Israel/Hamas conflict. OUTLOOK AND POSITIONING We are skeptical that this cycle has marked the ultimate bottom for small-mid cap stocks given a looming recession, falling earnings expectations, and the U.S. Federal Reserve resolving to maintain high interest rates until inflation is under control. Additionally, we think it could be years, not quarters, before investors see sustainable and meaningful new highs in stocks as markets struggle with valuations in an era of higher interest rates and geopolitical uncertainty. We believe high quality companies with attractive growth rates and valuations are a wonderful place to invest in the current environment. We believe the Fund is attractively positioned compared to the benchmark based on EV/EBITDA, return on equity (ROE), and long-term growth outlook. The views expressed represent the opinions of River Road Asset Management, LLC as of October 31, 2023, and are not intended as a forecast or guarantee of future results, and are subject to change without notice. |
29
| | |
| | | AMG River Road Small-Mid Cap Value Fund Portfolio Manager’s Comments (continued) |
| | | |
| | | |
CUMULATIVE TOTAL RETURN PERFORMANCE
AMG River Road Small-Mid Cap Value Fund’s cumulative total return is based on the daily change in net asset value (NAV), and assumes that all dividends and distributions were reinvested. The graph compares a hypothetical $10,000 investment made in the AMG River Road Small-Mid Cap Value Fund’s Class N shares on October 31, 2013, to a $10,000 investment made in the Russell 2500® Value Index and Russell 2000® Value Index for the same time period. The graph and table do not reflect the deduction of taxes that a shareholder would pay on a Fund distribution or redemption of shares. The listed returns for the Fund are net of expenses and the returns for the indexes exclude expenses. Total returns would have been lower had certain expenses not been reduced.
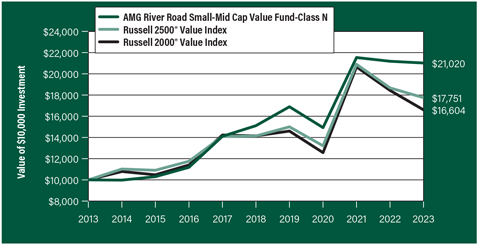
The table below shows the average annual total returns for the AMG River Road Small-Mid Cap Value Fund and the Russell 2500® Value Index and Russell 2000® Value Index for the same time periods ended October 31, 2023.
| | | | | | | | | | |
| | | One | | Five | | Ten | | Since | | Inception |
| Average Annual Total Returns1 | | Year | | Years | | Years | | Inception | | Date |
| |
AMG River Road Small-Mid Cap Value Fund2, 3, 4, 5, 6, 7, 8, 9, 10, 11, 12 | | |
| | | | | |
Class N | | (0.77%) | | 6.83% | | 7.71% | | 6.83% | | 03/29/07 |
| | | | | |
Class I | | (0.48%) | | 7.11% | | 7.99% | | 6.89% | | 06/28/07 |
| | | | | |
Class Z | | (0.47%) | | 7.18% | | — | | 6.88% | | 09/29/17 |
| | | | | |
Russell 2500® Value Index13 | | (4.94%) | | 4.65% | | 5.90% | | 5.80% | | 03/29/07† |
| | | | | |
Russell 2000® Value Index14 | | (9.93%) | | 3.26% | | 5.20% | | 4.98% | | 03/29/07† |
The performance data shown represents past performance. Past performance is not a guarantee of future results. Current performance may be lower or higher than the performance data quoted. The investment return and principal value of an investment will fluctuate so that an investor’s shares, when redeemed, may be worth more or less than their original cost.
Investors should carefully consider the Fund’s investment objectives, risks, charges and expenses before investing. For performance information through the most recent month end, current net asset values per share for the Fund and other information, please call 800.548.4539 or visit our website at wealth.amg.com for a free prospectus. Read it carefully before investing or sending money.
Distributed by AMG Distributors, Inc., member FINRA/SIPC.
† Date reflects the inception date of the Fund, not the index.
| 1 | Total return equals income yield plus share price change and assumes reinvestment of all dividends and capital gain distributions. Returns are net of fees and may reflect offsets of Fund expenses as described in the |
|
prospectus.No adjustment has been made for taxes payable by shareholders on their reinvested dividends and capital gain distributions. Returns for periods greater than one year are annualized. The listed returns on the Fund are net of expenses and based on the published NAV as of October 31, 2023. All returns are in U.S. Dollars ($). 2 From time to time, the Fund’s adviser has waived its fees and/or absorbed Fund expenses, which has resulted in higher returns. 3 Market prices of investments held by the Fund may fall rapidly or unpredictably due to a variety of factors, including economic, political, or market conditions, or other factors including terrorism, war, natural disasters and the spread of infectious illness or other public health issues, including epidemics or pandemics, or in response to events that affect particular industries or companies. 4 Because the Fund is an actively managed investment portfolio, security selection or focus on securities in a particular style, market sector or group of companies may cause the Fund to incur losses or underperform relative to its benchmarks or other funds with a similar investment objective. There can be no guarantee that the Subadviser’s investment techniques and risk analysis will produce the desired result. 5 The stocks of small- and mid-capitalization companies often have greater price volatility, lower trading volume, and less liquidity than the stocks of larger, more established companies. 6 Value stocks may perform differently from the market as a whole and may be undervalued by the market for a long period of time. 7 Issuers and companies that are in similar industry sectors may be similarly affected by particular economic or market events; to the extent the Fund has substantial holdings within a particular sector, the risks associated with that sector increase. 8 Investments in foreign issuers involve additional risks (such as risks arising from less frequent trading, changes in political or social conditions, and less publicly available information about non-U.S. issuers) that differ from those associated with investments in U.S. issuers and may result in greater price volatility. 9 Fluctuations in exchange rates may affect the total loss or gain on a non-U.S. dollar investment when converted back to U.S. dollars and exposure to non-U.S. currencies may subject the Fund to the risk that those currencies will decline in value relative to the U.S. dollar. 10 The Fund may not be able to dispose of particular investments, such as illiquid securities, readily at favorable times or prices or the Fund may have to sell them at a loss. |
30
| | |
| | | AMG River Road Small-Mid Cap Value Fund Portfolio Manager’s Comments (continued) |
| | | |
| | | |
| | | | | | | | |
11 Convertible preferred stocks, which are convertible into shares of the issuer’s common stock and pay regular dividends, and convertible debt securities, which are convertible into shares of the issuer’s common stock and bear interest, are subject to the risks of equity securities and fixed income securities. The lower the conversion premium, the more likely the price of the convertible security will follow the price of the underlying common stock. Conversely, higher premium convertible securities are more likely to exhibit the behavior of bonds because the likelihood of conversion is lower, which may cause their prices to fall as interest rates rise. There is the risk that the issuer of convertible preferred stock will not be able to make dividend payments or that the issuer of a convertible bond will not be able to make principal and/or interest payments. | | | | 12 Investments in the Fund may be subject to many of the same risks as a direct investment in real estate. The stock prices of companies in the real estate industry, including real estate investment trusts (“REITs”), are typically sensitive to changes in real estate values, property taxes, interest rates, cash flow of underlying real estate assets, occupancy rates, government regulations affecting zoning, land use, and rents, as well as the management skill and creditworthiness of the issuer. REITs also depend generally on their ability to generate cash flow to make distributions to shareholders or unitholders and are subject to the risk of failing to qualify for favorable tax treatment under the Internal Revenue Code of 1986, as amended. 13 The Russell 2500® Value Index measures the performance of the Russell 2500® companies with lower price-to-book ratios and lower forecasted | | | | growth values. Unlike the Fund, the Russell 2500® Value Index is unmanaged, is not available for investment and does not incur expenses. 14 The Russell 2000® Value Index is an unmanaged, market-value weighted, value-oriented index comprised of small stocks that have relatively low price-to-book ratios and lower forecasted growth values. Unlike the Fund, the Russell 2000® Value Index is unmanaged, is not available for investment and does not incur expenses. The Russell Indices are a trademark of the London Stock Exchange Group companies. Not FDIC insured, nor bank guaranteed. May lose value. |
31
|
AMG River Road Small-Mid Cap Value Fund Fund Snapshots (unaudited) October 31, 2023 |
PORTFOLIO BREAKDOWN
| | | | |
| Sector | | % of Net Assets | |
| | |
Industrials | | | 26.0 | |
| | |
Financials | | | 20.0 | |
| | |
Information Technology | | | 10.6 | |
| | |
Consumer Discretionary | | | 9.0 | |
| | |
Consumer Staples | | | 7.6 | |
| | |
Utilities | | | 7.1 | |
| | |
Energy | | | 6.5 | |
| | |
Communication Services | | | 4.0 | |
| | |
Health Care | | | 3.7 | |
| | |
Materials | | | 1.4 | |
| | |
Real Estate | | | 0.5 | |
| | |
Short-Term Investments | | | 4.9 | |
| | |
Other Assets, less Liabilities | | | (1.3 | ) |
TOP TEN HOLDINGS
| | | | | | |
| Security Name | | % of Net Assets |
| | | |
BJ’s Wholesale Club Holdings, Inc. | | | | | | 4.0 |
| | | |
White Mountains Insurance Group, Ltd. | | | | | | 3.9 |
| | | |
LKQ Corp. | | | | | | 3.7 |
| | | |
Vistra Corp. | | | | | | 3.2 |
| | | |
Air Transport Services Group, Inc. | | | | | | 3.2 |
| | | |
UniFirst Corp. | | | | | | 3.0 |
| | | |
Atkore, Inc. | | | | | | 3.0 |
| | | |
Murphy USA, Inc. | | | | | | 2.9 |
| | | |
TD SYNNEX Corp. | | | | | | 2.8 |
| | | |
WEX, Inc. | | | | | | 2.8 |
| | | | | | | |
| | | |
Top Ten as a Group | | | | | | 32.5 |
| | | | | | |
Because a fund’s strategy may result in multiple investments in particular sectors of the economy, its performance may depend on the performance of those sectors and may fluctuate more widely than investments diversified across more sectors. For additional information on these and other risk considerations, please see the Fund’s prospectus.
Any sectors, industries, or securities discussed should not be perceived as investment recommendations. Mention of a specific security should not be considered a recommendation to buy or solicitation to sell that security. Specific securities mentioned in this report may have been sold from the Fund’s portfolio of investments by the time you receive this report.
32
|
AMG River Road Small-Mid Cap Value Fund Schedule of Portfolio Investments October 31, 2023 |
| | | | | | | | |
| | |
| | | Shares | | | Value | |
| | |
Common Stocks - 96.4% | | | | | | | | |
| |
Communication Services - 4.0% | | | | | |
| | |
Cable One, Inc. | | | 5,048 | | | | $2,775,744 | |
| | |
GCI Liberty, Inc. Escrow Share*,1,2 | | | 79,662 | | | | 0 | |
| | |
Liberty Latin America, Ltd., Class A* | | | 87,896 | | | | 600,329 | |
| | |
Liberty Latin America, Ltd., Class C* | | | 53,088 | | | | 363,653 | |
| | |
TripAdvisor, Inc.* | | | 227,151 | | | | 3,352,749 | |
| | |
Yelp, Inc.* | | | 79,194 | | | | 3,341,195 | |
| | |
Total Communication Services | | | | | | | 10,433,670 | |
| |
Consumer Discretionary - 9.0% | | | | | |
| | |
Advance Auto Parts, Inc. | | | 26,814 | | | | 1,395,132 | |
| | |
Leslie’s, Inc.* | | | 276,230 | | | | 1,364,576 | |
| | |
Lithia Motors, Inc. | | | 5,458 | | | | 1,321,982 | |
| | |
LKQ Corp. | | | 221,165 | | | | 9,713,567 | |
| | |
Murphy USA, Inc. | | | 20,999 | | | | 7,616,127 | |
| | |
Polaris, Inc.3 | | | 26,842 | | | | 2,319,686 | |
| | |
Total Consumer Discretionary | | | | | | | 23,731,070 | |
| |
Consumer Staples - 7.6% | | | | | |
| | |
BJ’s Wholesale Club Holdings, Inc.* | | | 153,297 | | | | 10,442,592 | |
| | |
Hostess Brands, Inc.* | | | 91,914 | | | | 3,069,927 | |
| | |
Ingles Markets, Inc., Class A | | | 45,619 | | | | 3,659,556 | |
| | |
Molson Coors Beverage Co., Class B | | | 46,039 | | | | 2,659,673 | |
| | |
Total Consumer Staples | | | | | | | 19,831,748 | |
| |
Energy - 6.5% | | | | | |
| | |
Chesapeake Energy Corp.3 | | | 15,932 | | | | 1,371,427 | |
| | |
Delek US Holdings, Inc. | | | 21,530 | | | | 567,316 | |
| | |
HF Sinclair Corp. | | | 58,600 | | | | 3,245,268 | |
| | |
Ovintiv, Inc. | | | 27,318 | | | | 1,311,264 | |
| | |
Permian Resources Corp. | | | 422,615 | | | | 6,157,500 | |
| | |
SM Energy Co. | | | 81,508 | | | | 3,286,403 | |
| | |
World Kinect Corp. | | | 67,911 | | | | 1,256,353 | |
| | |
Total Energy | | | | | | | 17,195,531 | |
| |
Financials - 20.0% | | | | | |
| | |
American Equity Investment Life Holding Co.* | | | 17,949 | | | | 950,579 | |
| | |
Axis Capital Holdings, Ltd. (Bermuda) | | | 90,635 | | | | 5,175,259 | |
| | |
Cannae Holdings, Inc.* | | | 290,134 | | | | 4,743,691 | |
| | |
CNA Financial Corp. | | | 73,537 | | | | 2,970,895 | |
| | |
EVERTEC, Inc. (Puerto Rico) | | | 105,345 | | | | 3,347,864 | |
| | |
Fidelity National Financial, Inc. | | | 116,822 | | | | 4,566,572 | |
| | |
Genworth Financial, Inc., Class A* | | | 918,368 | | | | 5,501,024 | |
| | |
NCR Atleos Corp.* | | | 91,241 | | | | 2,012,776 | |
| | |
NMI Holdings, Inc., Class A* | | | 92,706 | | | | 2,535,509 | |
| | |
Radian Group, Inc. | | | 126,190 | | | | 3,197,655 | |
| | | | | | | | |
| | |
| | | Shares | | | Value | |
| | |
WEX, Inc.* | | | 43,823 | | | | $7,295,653 | |
| | |
White Mountains Insurance Group, Ltd. | | | 7,062 | | | | 10,103,956 | |
| | |
Total Financials | | | | | | | 52,401,433 | |
| |
Health Care - 3.7% | | | | | |
| | |
Bausch + Lomb Corp. (Canada)*,3 | | | 129,980 | | | | 2,097,877 | |
| | |
Computer Programs and Systems, Inc.* | | | 75,525 | | | | 1,064,147 | |
| | |
Embecta Corp. | | | 135,535 | | | | 2,049,289 | |
| | |
Envista Holdings Corp.* | | | 54,333 | | | | 1,264,329 | |
| | |
Patterson Cos., Inc. | | | 88,897 | | | | 2,707,803 | |
| | |
Premier, Inc., Class A | | | 26,172 | | | | 503,026 | |
| | |
Total Health Care | | | | | | | 9,686,471 | |
| |
Industrials - 26.0% | | | | | |
| | |
Air Transport Services Group, Inc.* | | | 428,067 | | | | 8,377,271 | |
| | |
Alight, Inc., Class A* | | | 476,892 | | | | 3,166,563 | |
| | |
Argan, Inc. | | | 63,084 | | | | 2,885,462 | |
| | |
Armstrong World Industries, Inc. | | | 73,729 | | | | 5,595,294 | |
| | |
Atkore, Inc.* | | | 62,704 | | | | 7,792,853 | |
| | |
Clarivate PLC (United Kingdom)*,3 | | | 497,669 | | | | 3,175,128 | |
| | |
CoreCivic, Inc.* | | | 492,853 | | | | 6,259,233 | |
| | |
Dun & Bradstreet Holdings, Inc. | | | 322,724 | | | | 2,827,062 | |
| | |
Forward Air Corp. | | | 22,290 | | | | 1,435,699 | |
| | |
McGrath RentCorp | | | 37,065 | | | | 3,728,739 | |
| | |
MDU Resources Group, Inc. | | | 152,826 | | | | 2,844,092 | |
| | |
MSC Industrial Direct Co., Inc., Class A | | | 18,399 | | | | 1,743,305 | |
| | |
SP Plus Corp.* | | | 111,439 | | | | 5,631,013 | |
| | |
UniFirst Corp. | | | 47,989 | | | | 7,890,832 | |
| | |
Verra Mobility Corp.* | | | 42,786 | | | | 845,879 | |
| | |
Viad Corp.* | | | 122,072 | | | | 2,957,805 | |
| | |
WESCO International, Inc. | | | 7,311 | | | | 937,270 | |
| | |
Total Industrials | | | | | | | 68,093,500 | |
| |
Information Technology - 10.6% | | | | | |
| | |
ACI Worldwide, Inc.* | | | 191,401 | | | | 3,898,838 | |
| | |
DXC Technology Co.* | | | 45,989 | | | | 927,598 | |
| | |
ePlus, Inc.* | | | 107,075 | | | | 6,692,188 | |
| | |
Ituran Location and Control, Ltd. (Israel) | | | 41,392 | | | | 1,023,624 | |
| | |
NCR Voyix, Corp.* | | | 182,482 | | | | 2,790,150 | |
| | |
TD SYNNEX Corp. | | | 80,765 | | | | 7,404,535 | |
| | |
Vontier Corp. | | | 172,158 | | | | 5,088,991 | |
| | |
Total Information Technology | | | | | | | 27,825,924 | |
| |
Materials - 1.4% | | | | | |
| | |
Summit Materials, Inc., Class A* | | | 70,460 | | | | 2,318,134 | |
| | |
TriMas Corp. | | | 58,413 | | | | 1,414,179 | |
| | |
Total Materials | | | | | | | 3,732,313 | |
The accompanying notes are an integral part of these financial statements.
33
|
AMG River Road Small-Mid Cap Value Fund Schedule of Portfolio Investments (continued) |
| | | | | | | | |
| | |
| | | Shares | | | Value | |
| |
Real Estate - 0.5% | | | | | |
| | |
Newmark Group, Inc., Class A | | | 247,261 | | | | $1,401,970 | |
| |
Utilities - 7.1% | | | | | |
| | |
Northwestern Energy Group, Inc. | | | 86,183 | | | | 4,137,646 | |
| | |
PNM Resources, Inc. | | | 46,421 | | | | 1,961,751 | |
| | |
Southwest Gas Holdings, Inc. | | | 67,969 | | | | 3,983,663 | |
| | |
Vistra Corp. | | | 257,703 | | | | 8,432,042 | |
| | |
Total Utilities | | | | | | | 18,515,102 | |
| | |
Total Common Stocks (Cost $232,068,515) | | | | | | | 252,848,732 | |
| | |
| |
| Principal
Amount |
| | | | |
| |
Short-Term Investments - 4.9% | | | | | |
| |
Joint Repurchase Agreements - 1.2%4 | | | | | |
| | |
Bank of America Securities, Inc., dated 10/31/23,due 11/01/23, 5.310% total to be received $159,566 (collateralized by various U.S. Government Agency Obligations, 2.000% -6.500%, 04/01/48-10/01/53, totaling $162,733) | | | $159,542 | | | | 159,542 | |
| | |
Citadel Securities LLC, dated 10/31/23, due 11/01/23, 5.380% total to be received $1,000,149 (collateralized by various U.S. Treasuries, 0.000%-7.500%, 11/09/23 -08/15/53, totaling $1,020,152) | | | 1,000,000 | | | | 1,000,000 | |
| * | Non-income producing security. |
| 1 | Security’s value was determined by using significant unobservable inputs. |
| 2 | This security is restricted and not available for re-sale. Liberty Broadband Corp. (“Liberty”) acquired GCI Liberty, Inc. on December 21, 2020. On May 24, 2023, Liberty shareholders received GCI Liberty, Inc. Escrow Shares for potential proceeds from a pending class action lawsuit. The market value of the escrow shares was $0 on the date of the distribution. At October 31, 2023, the cost and market value of the escrow shares is $0, which represents 0% of net assets. |
| | | | | | | | |
| | |
| | | Principal Amount | | | Value | |
| | |
Citigroup Global Markets, Inc., dated 10/31/23,due 11/01/23, 5.310% total to be received $1,000,148 (collateralized by various U.S. Government Agency Obligations, 2.000% -7.715%, 12/01/27-06/20/73, totaling $1,020,000) | | $ | 1,000,000 | | | | $1,000,000 | |
| | |
Industrial and Commercial Bank of China Financial Services LLC, dated 10/31/23, due 11/01/23, 5.340% total to be received $1,000,148 (collateralized by various U.S. Treasuries, 0.000%-7.625%, 11/02/23 -08/15/53, totaling $1,020,000) | | | 1,000,000 | | | | 1,000,000 | |
| | |
Total Joint Repurchase Agreements | | | | | | | 3,159,542 | |
| |
Repurchase Agreements - 3.7% | | | | | |
| | |
Fixed Income Clearing Corp., dated 10/31/23 due 11/01/23, 5.150% total to be received $9,638,379 (collateralized by a U.S. Treasury, 3.500%, 04/30/30, totaling $9,829,815) | | | 9,637,000 | | | | 9,637,000 | |
| | |
Total Short-Term Investments (Cost $12,796,542) | | | | | | | 12,796,542 | |
| |
Total Investments - 101.3% (Cost $244,865,057) | | | | 265,645,274 | |
| |
Other Assets, less Liabilities - (1.3)% | | | | (3,510,999 | ) |
| |
Net Assets-100.0% | | | $ | 262,134,275 | |
| 3 | Some of these securities, amounting to $7,235,210 or 2.8% of net assets, were out on loan to various borrowers and are collateralized by cash and various U.S. Treasury Obligations. See Note 4 of Notes to Financial Statements. |
| 4 | Cash collateral received for securities lending activity was invested in these joint repurchase agreements. |
The accompanying notes are an integral part of these financial statements.
34
| | |
| | | AMG River Road Small-Mid Cap Value Fund Schedule of Portfolio Investments (continued) |
| | | |
| | | |
The following table summarizes the inputs used to value the Fund’s investments by the fair value hierarchy levels as of October 31, 2023:
| | | | | | | | | | | | | | | | |
| | | Level 1 | | | Level 2 | | | Level 3 | | | Total | |
Investments in Securities | | | | | | | | | | | | | | | | |
| | | | |
Common Stocks | | | | | | | | | | | | | | | | |
| | | | |
Industrials | | | $68,093,500 | | | | — | | | | — | | | | $68,093,500 | |
| | | | |
Financials | | | 52,401,433 | | | | — | | | | — | | | | 52,401,433 | |
| | | | |
Information Technology | | | 27,825,924 | | | | — | | | | — | | | | 27,825,924 | |
| | | | |
Consumer Discretionary | | | 23,731,070 | | | | — | | | | — | | | | 23,731,070 | |
| | | | |
Consumer Staples | | | 19,831,748 | | | | — | | | | — | | | | 19,831,748 | |
| | | | |
Utilities | | | 18,515,102 | | | | — | | | | — | | | | 18,515,102 | |
| | | | |
Energy | | | 17,195,531 | | | | — | | | | — | | | | 17,195,531 | |
| | | | |
Communication Services | | | 10,433,670 | | | | — | | | | $0 | | | | 10,433,670 | |
| | | | |
Health Care | | | 9,686,471 | | | | — | | | | — | | | | 9,686,471 | |
| | | | |
Materials | | | 3,732,313 | | | | — | | | | — | | | | 3,732,313 | |
| | | | |
Real Estate | | | 1,401,970 | | | | — | | | | — | | | | 1,401,970 | |
| | | | |
Short-Term Investments | | | | | | | | | | | | | | | | |
| | | | |
Joint Repurchase Agreements | | | — | | | | $3,159,542 | | | | — | | | | 3,159,542 | |
| | | | |
Repurchase Agreements | | | — | | | | 9,637,000 | | | | — | | | | 9,637,000 | |
| | | | | | | | | | | | | | | | |
| | | | |
Total Investments in Securities | | $ | 252,848,732 | | | | $12,796,542 | | | | $0 | | | | $265,645,274 | |
| | | | | | | | | | | | | | | | |
At October 31, 2023, the Level 3 common stock was received as a result of a corporate action. The security’s value of $0 was determined by using significant unobservable inputs, which generated a change in unrealized depreciation of $0.
For the fiscal year ended October 31, 2023, there were no transfers in or out of Level 3. The Fund did not have any purchases and sales of Level 3 securities for the same period.
The accompanying notes are an integral part of these financial statements.
35
| | |
| | | AMG River Road International Value Equity Fund Portfolio Manager’s Comments (unaudited) |
| | | |
| | | |
| | | | | | | | |
OVERVIEW For the fiscal year ended October 31, 2023, AMG River Road International Value Equity Fund (the “Fund”) Class N shares returned 16.73%, outperforming the 14.40% return for the MSCI EAFE Index, the Fund’s primary benchmark. PERFORMANCE REVIEW The Fund outperformed its primary benchmark but marginally underperformed the MSCI EAFE Value Index, the Fund’s secondary benchmark, which returned 18.11% for the period. The region with the largest negative contribution to relative return was Europe (ex U.K.) due to negative stock selection and an overweight to the region. Underperformance was partially offset by positive stock selection and an underweight in the U.K. The sector with the largest negative contribution to relative return was financials, which suffered from negative stock selection and an underweight to the sector. The underperformance was partially offset by positive stock selection and an overweight in the consumer staples sector. The Fund’s cash position, which averaged 4.2% during the period, was also a negative contributor to relative performance. The top contributing holdings to the Fund’s active return were BAE Systems PLC (“BAE”) and Industria de Diseno Textil, S.A. (“Industria”). BAE, a prominent global defense company headquartered in the U.K., holds a dominant market position in its home country and serves as a key supplier to the | | | | U.S. Department of Defense. The company has consistently capitalized on increasing global defense expenditures, securing record-high orders from governments around the world. We see BAE as strategically positioned to augment its free cash flow (FCF), enhance shareholder value through dividend increases, and conduct share repurchases. Industria, a leading force in the fast fashion industry, owns renowned brands such as ZARA and Bershka. The company has thrived as consumers shift from premium brands to fast fashion alternatives. We believe Industria’s distinctive business model affords significant cost advantages and network benefits, enabling the company to achieve superior profit margins and return on invested capital (ROIC) within the industry. The bottom contributing holdings to the Fund’s active return were Roche Holding AG (“Roche”) and Kering SA (“Kering”). Roche, a leading biopharmaceutical company based in Switzerland, faced challenges due to diminishing demand for COVID-19 treatments and diagnostics in recent quarters. Additionally, the sluggish development of new drugs exerted downward pressure on the stock price. We are diligently monitoring the progress of Roche’s new drug development and will adjust our assessed value and conviction accordingly. Kering, the world’s second-largest luxury goods conglomerate behind LVMH, experienced a setback with its flagship brand, Gucci, which displayed prolonged underperformance compared to its peers due to low customer interest. Despite the | | | | appointment of a new chief designer for Gucci, we perceive the turnaround for the Gucci brand to be more challenging than initially anticipated. Consequently, we made the decision to exit the position as our investment thesis was no longer intact. POSITIONING AND OUTLOOK As of October 31, 2023, the Fund was overweight Emerging Markets and Europe (ex U.K.) while underweight Japan and Asia-Pacific (ex Japan). At the sector level, the Fund was overweight industrials and communication services while underweight the materials and financials sectors. At the factor level, the Fund remains significantly overweight high-quality companies. Non-U.S. equity markets continue to trade at a discounted valuation relative to the U.S., which may be indicative of comparatively weaker corporate earnings growth. Within the realm of non-U.S. equity, we anticipate value stocks will maintain outperformance over growth stocks, while Emerging Markets are expected to outperform Developed Markets in the coming quarters, supported by stronger corporate earnings growth and attractive valuations. The views expressed represent the opinions of River Road Asset Management, LLC as of October 31, 2023, and are not intended as a forecast or guarantee of future results, and are subject to change without notice. |
36
| | |
| | | AMG River Road International Value Equity Fund Portfolio Manager’s Comments (continued) |
| | | |
| | | |
CUMULATIVE TOTAL RETURN PERFORMANCE
AMG River Road International Value Equity Fund’s cumulative total return is based on the daily change in net asset value (NAV), and assumes that all dividends and distributions were reinvested. The graph compares a hypothetical $10,000 investment made in the AMG River Road International Value Equity Fund’s Class N shares on October 31, 2013, to a $10,000 investment made in the MSCI EAFE Index and MSCI EAFE Value Index for the same time period. The graph and table do not reflect the deduction of taxes that a shareholder would pay on a Fund distribution or redemption of shares. The listed returns for the Fund are net of expenses and the returns for the indexes exclude expenses. Total returns would have been lower had certain expenses not been reduced.
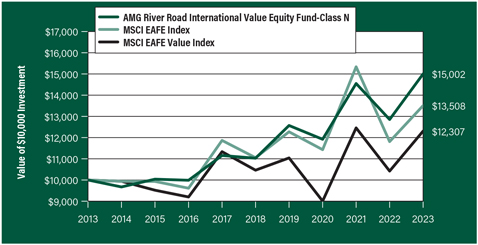
The table below shows the average annual total returns for the AMG River Road International Value Equity Fund and the MSCI EAFE Index and MSCI EAFE Value Index for the same time periods ended October 31, 2023.
| | | | | | | | | | |
| | | One | | Five | | Ten | | Since | | Inception |
| Average Annual Total Returns1 | | Year | | Years | | Years | | Inception | | Date |
| |
AMG River Road International Value Equity Fund2, 3, 4, 5, 6, 7, 8, 9, 10, 11, 12, 13, 14, 15, 16, 17 | | |
| | | | | |
Class N | | 16.73% | | 6.35% | | 4.14% | | 5.28% | | 05/04/11 |
| | | | | |
Class I | | 16.86% | | 6.60% | | 4.40% | | 5.04% | | 03/04/13 |
| | | | | |
Class Z | | 16.96% | | 6.69% | | — | | 5.26% | | 09/29/17 |
| | | | | |
MSCI EAFE Index18 | | 14.40% | | 4.10% | | 3.05% | | 3.44% | | 05/04/11† |
| | | | | |
MSCI EAFE Value Index19 | | 18.11% | | 3.30% | | 2.10% | | 2.64% | | 05/04/11† |
The performance data shown represents past performance. Past performance is not a guarantee of future results. Current performance may be lower or higher than the performance data quoted. The investment return and principal value of an investment will fluctuate so that an investor’s shares, when redeemed, may be worth more or less than their original cost.
Investors should carefully consider the Fund’s investment objectives, risks, charges and expenses before investing. For performance information through the most recent month end, current net asset values per share for the Fund and other information, please call 800.548.4539 or visit our website at wealth.amg.com for a free prospectus. Read it carefully before investing or sending money.
Distributed by AMG Distributors, Inc., member FINRA/SIPC.
| † | Date reflects the inception date of the Fund, not the index. |
| 1 | Total return equals income yield plus share price change and assumes reinvestment of all dividends and capital gain distributions. Returns are net of fees and may reflect offsets of Fund expenses as described in the prospectus. No adjustment has been made for taxes payable by shareholders on their reinvested dividends and |
|
capital gain distributions. Returns for periods greater than one year are annualized. The listed returns on the Fund are net of expenses and based on the published NAV as of October 31, 2023. All returns are in U.S. Dollars ($). 2 From time to time, the Fund’s adviser has waived its fees and/or absorbed Fund expenses, which has resulted in higher returns. 3 Market prices of investments held by the Fund may fall rapidly or unpredictably due to a variety of factors, including economic, political, or market conditions, or other factors including terrorism, war, natural disasters and the spread of infectious illness or other public health issues, including epidemics or pandemics, or in response to events that affect particular industries or companies. 4 Because the Fund is an actively managed investment portfolio, security selection or focus on securities in a particular style, market sector or group of companies may cause the Fund to incur losses or underperform relative to its benchmarks or other funds with a similar investment objective. There can be no guarantee that the Subadviser’s investment techniques and risk analysis will produce the desired result. 5 The stocks of large-capitalization companies are generally more mature and may not be able to reach the same levels of growth as the stocks of small- or mid-capitalization companies. 6 The stocks of small- and mid-capitalization companies often have greater price volatility, lower trading volume, and less liquidity than the stocks of larger, more established companies. 7 Value stocks may perform differently from the market as a whole and may be undervalued by the market for a long period of time. 8 To the extent the Fund focuses its investments in a particular country, group of countries or geographic region, the Fund is particularly susceptible to economic, political, regulatory or other events or conditions affecting such countries or region, and the Fund’s NAV may be more volatile than the NAV of a more geographically diversified fund and may result in losses. The Fund is particularly susceptible to risks in the Greater China region, which consists of Hong Kong, The People’s Republic of China and Taiwan, among other countries. Economies in the Greater China region are dependent on the economies of other countries and can be significantly affected by currency fluctuations and increasing competition from other emerging economies in Asia with lower costs. Adverse events in any one country within the region may impact the other countries in the region or Asia as a whole. Markets in the Greater China region can experience significant volatility due to social, economic, regulatory and political uncertainties. Significant portions of the Chines |
37
| | |
| | | AMG River Road International Value Equity Fund Portfolio Manager’s Comments (continued) |
| | | |
| | | |
| | | | |
securities markets may become rapidly illiquid, as Chinese issuers have the ability to suspend the trading of their equity securities, and have shown a willingness to exercise that option in response to market volatility and other events. U.S. or foreign government restrictions or intervention could negatively affect the implementation of the Fund’s investment strategies, for example by precluding the Fund from making certain investments or causing the Fund to sell investments at disadvantageous times. China has yet to develop comprehensive securities, corporate, or commercial laws, its market is relatively new and less developed, and its economy may be adversely impacted by a slowdown in export growth. The Fund may gain investment exposure to certain Chinese companies through variable interest entity (“VIE”) structures. A VIE structure enables foreign investors, such as the Fund, to obtain investment exposure to a Chinese company in situations in which the Chinese government has limited or prohibited non-Chinese ownership of such company. A VIE does not have equity ownership in its corresponding China-based company but has claims to the China-based company’s profits and control of its assets through contractual arrangements. VIEs are a common industry practice and well known to officials and regulators in China; however, VIEs are not formally recognized under Chinese law. If the Chinese government takes action adversely affecting VIEs, the market value of the Fund’s associated portfolio holdings would likely suffer significant, detrimental, and possibly permanent consequences, which could result in substantial investment losses. 9 To the extent the Fund invests a substantial portion of its assets in a relatively small number of securities or a particular market, industry, group of industries, country, region, group of countries, asset class or sector, it generally will be subject to greater risk than a fund that invests in a more diverse investment portfolio. In addition, the value of the Fund would be more susceptible to any single economic, market, political or regulatory occurrence affecting, for example, that particular market, industry, region or sector. 10 Investments in foreign issuers involve additional risks (such as risks arising from less frequent trading, changes in political or social conditions, and less publicly available information about non-U.S. issuers) that differ from those associated with investments in U.S. issuers and may result in greater price volatility. 11 Investments in emerging markets are subject to the general risks of foreign investments, as well as additional risks which can result in greater price volatility. Such additional risks include the risk that markets in emerging market countries are typically less developed and less liquid than markets in | | developed countries and such markets are subjected to increased economic, political, or regulatory uncertainties. 12 Fluctuations in exchange rates may affect the total loss or gain on a non-U.S. dollar investment when converted back to U.S. dollars and exposure to non-U.S. currencies may subject the Fund to the risk that those currencies will decline in value relative to the U.S. dollar. 13 The Fund may not be able to dispose of particular investments, such as illiquid securities, readily at favorable times or prices or the Fund may have to sell them at a loss. 14 Convertible preferred stocks, which are convertible into shares of the issuer’s common stock and pay regular dividends, and convertible debt securities, which are convertible into shares of the issuer’s common stock and bear interest, are subject to the risks of equity securities and fixed income securities. The lower the conversion premium, the more likely the price of the convertible security will follow the price of the underlying common stock. Conversely, higher premium convertible securities are more likely to exhibit the behavior of bonds because the likelihood of conversion is lower, which may cause their prices to fall as interest rates rise. There is the risk that the issuer of convertible preferred stock will not be able to make dividend payments or that the issuer of a convertible bond will not be able to make principal and/or interest payments. 15 Investments in the Fund may be subject to many of the same risks as a direct investment in real estate. The stock prices of companies in the real estate industry, including real estate investment trusts (“REITs”), are typically sensitive to changes in real estate values, property taxes, interest rates, cash flow of underlying real estate assets, occupancy rates, government regulations affecting zoning, land use, and rents, as well as the management skill and creditworthiness of the issuer. REITs also depend generally on their ability to generate cash flow to make distributions to shareholders or unitholders and are subject to the risk of failing to qualify for favorable tax treatment under the Internal Revenue Code of 1986, as amended (the “Internal Revenue Code”). 16 Investments in master limited partnerships (“MLPs”) are subject to similar risks to those associated with the specific industry or industries in which the partnership invests, such as the risk of investing in the real estate or oil and gas industries. In addition, investments in MLPs are subject to the risks of investing in a partnership, including limited control and voting rights on matters affecting the partnership and fewer investor protections compared to corporations. | | 17 Investing in publicly traded partnerships (“PTPs”) (including master limited partnerships) involves special risks in addition to those typically associated with publicly traded companies. PTPs are exposed to the risks of their underlying assets, which in many cases includes the same types of risks as energy and natural resources companies, such as commodity pricing risk, supply and demand risk and depletion and exploration risk. PTPs are also subject to capital markets risk, which is the risk that they may be unable to raise capital to execute their growth strategies. PTPs are also subject to tax risk, which is the risk that PTPs may lose their partnership status for tax purposes. The Fund’s ability to make investments in certain PTPs, including master limited partnerships, can be limited by the Fund’s intention to qualify as a regulated investment company accorded favorable tax treatment under the Internal Revenue Code, and if the Fund does not appropriately limit such investments or if such investments are recharacterized for U.S. federal income tax purposes, the Fund’s status as a regulated investment company may be jeopardized. 18 The MSCI EAFE Index (Europe, Australasia, Far East) is a free float-adjusted market capitalization index that is designed to measure the equity market performance of developed markets, excluding the U.S. & Canada. Please go to msci.com for most current list of countries represented by the index. Unlike the Fund, the MSCI EAFE Index is unmanaged, is not available for investment and does not incur expenses. 19 The Fund’s secondary benchmark, the MSCI EAFE Value Index (Europe, Australasia, Far East), captures large and mid cap securities exhibiting overall value style characteristics across Developed Markets countries around the world, excluding the U.S. and Canada. Please go to msci.com for the most current list of countries represented by the index. Unlike the Fund, the MSCI EAFE Value Index is unmanaged, is not available for investment and does not incur expenses. All MSCI data is provided “as is.” The products described herein are not sponsored or endorsed and have not been reviewed or passed on by MSCI. In no event shall MSCI, its affiliates, or any MSCI data provider have any liability of any kind in connection with the MSCI data or the products described herein. Copying or redistributing the MSCI data is strictly prohibited. Not FDIC insured, nor bank guaranteed. May lose value. |
| | | | |
38
| | |
| | | AMG River Road International Value Equity Fund Fund Snapshots (unaudited) October 31, 2023 |
PORTFOLIO BREAKDOWN
| | |
| Sector | | %of
Net Assets |
| | |
| Financials | | 22.8 |
| | |
| Industrials | | 19.0 |
| | |
| Health Care | | 11.1 |
| | |
| Consumer Discretionary | | 10.6 |
| | |
| Communication Services | | 9.8 |
| | |
| Energy | | 7.2 |
| | |
| Consumer Staples | | 6.3 |
| | |
| Information Technology | | 4.7 |
| | |
| Utilities | | 2.6 |
| | |
| Materials | | 2.0 |
| | |
| Short-Term Investments | | 3.7 |
| | |
| Other Assets, less Liabilities | | 0.2 |
TOP TEN HOLDINGS
| | |
| Security Name | | %of
Net Assets |
| | |
Deutsche Telekom AG (Germany) | | 3.8 |
| | |
BAE Systems PLC (United Kingdom) | | 3.8 |
| | |
Sony Group Corp. (Japan) | | 3.6 |
| | |
DBS Group Holdings, Ltd. (Singapore) | | 3.6 |
| | |
Axa, S.A. (France) | | 3.6 |
| | |
Shell PLC (United Kingdom) | | 3.5 |
| | |
Deutsche Boerse AG (Germany) | | 3.4 |
| | |
Thales, S.A. (France) | | 3.3 |
| | |
Ashtead Group PLC (United Kingdom) | | 3.3 |
| | |
Allianz SE (Germany) | | 3.3 |
| | | |
| | |
Top Ten as a Group | | 35.2 |
| | | |
| | | |
Because a fund’s strategy may result in multiple investments in particular sectors of the economy, its performance may depend on the performance of those sectors and may fluctuate more widely than investments diversified across more sectors. For additional information on these and other risk considerations, please see the Fund’s prospectus.
Any sectors, industries, or securities discussed should not be perceived as investment recommendations. Mention of a specific security should not be considered a recommendation to buy or solicitation to sell that security. Specific securities mentioned in this report may have been sold from the Fund’s portfolio of investments by the time you receive this report.
39
| | |
| | | AMG River Road International Value Equity Fund Schedule of Portfolio Investments October 31, 2023 |
| | | |
| | | |
| | | | | | | | |
| | | Shares | | | Value | |
| | |
Common Stocks - 96.1% | | | | | | | | |
| | |
Communication Services - 9.8% | | | | | | | | |
| | |
Deutsche Telekom AG (Germany) | | | 17,434 | | | | $378,382 | |
| | |
GCI Liberty, Inc. Escrow Share (United States)*,1,2 | | | 8,063 | | | | 0 | |
| | |
SK Telecom Co., Ltd., Sponsored ADR (South Korea) | | | 8,432 | | | | 170,832 | |
| | |
Telefonica Brasil, S.A., Sponsored ADR (Brazil) | | | 31,620 | | | | 281,734 | |
| | |
Telkom Indonesia Persero Tbk PT, ADR (Indonesia) | | | 6,554 | | | | 144,188 | |
| | |
Total Communication Services | | | | | | | 975,136 | |
| | |
Consumer Discretionary - 10.6% | | | | | | | | |
| | |
Cie Generale des Etablissements Michelin SCA (France) | | | 6,969 | | | | 207,038 | |
| | |
Industria de Diseno Textil, S.A. (Spain) | | | 8,122 | | | | 280,355 | |
| | |
Sony Group Corp. (Japan) | | | 4,352 | | | | 361,821 | |
| | |
Toyota Motor Corp. (Japan) | | | 11,494 | | | | 201,073 | |
| | |
Total Consumer Discretionary | | | | | | | 1,050,287 | |
| | |
Consumer Staples - 6.3% | | | | | | | | |
| | |
Anheuser-Busch InBev SA/NV (Belgium) | | | 3,226 | | | | 183,553 | |
| | |
Fomento Economico Mexicano SAB de CV, | | | | | | | | |
| | |
Sponsored ADR (Mexico) | | | 1,697 | | | | 192,457 | |
| | |
Unilever PLC (United Kingdom) | | | 5,360 | | | | 253,853 | |
| | |
Total Consumer Staples | | | | | | | 629,863 | |
| | |
Energy - 7.2% | | | | | | | | |
| | |
Shell PLC (United Kingdom) | | | 10,843 | | | | 349,436 | |
| | |
Suncor Energy, Inc. (Canada) | | | 4,603 | | | | 149,068 | |
| | |
TotalEnergies SE (France) | | | 3,178 | | | | 212,473 | |
| | |
Total Energy | | | | | | | 710,977 | |
| | |
Financials - 22.8% | | | | | | | | |
| | |
AIA Group, Ltd. (Hong Kong) | | | 11,859 | | | | 102,981 | |
| | |
Allianz SE (Germany) | | | 1,379 | | | | 323,020 | |
| | |
Axa, S.A. (France) | | | 12,080 | | | | 357,936 | |
| | |
DBS Group Holdings, Ltd. (Singapore) | | | 15,030 | | | | 361,071 | |
| | |
Deutsche Boerse AG (Germany) | | | 2,035 | | | | 334,954 | |
| | |
Euronext, N.V. (Netherlands)3 | | | 2,907 | | | | 202,730 | |
| | |
Prudential PLC (Hong Kong) | | | 13,854 | | | | 144,863 | |
| | |
Svenska Handelsbanken AB, Class A (Sweden) | | | 33,118 | | | | 282,354 | |
| | |
Tokio Marine Holdings, Inc. (Japan) | | | 7,138 | | | | 159,693 | |
| | |
Total Financials | | | | | | | 2,269,602 | |
| | |
Health Care - 11.1% | | | | | | | | |
| | |
GSK PLC (United Kingdom) | | | 15,860 | | | | 282,733 | |
| | | | | | | | |
| | | Shares | | | Value | |
| | |
Novartis AG (Switzerland) | | | 1,763 | | | $ | 165,051 | |
| | |
Roche Holding AG (Switzerland) | | | 825 | | | | 212,610 | |
| | |
Sanofi, S.A. (France) | | | 2,112 | | | | 191,783 | |
| | |
Takeda Pharmaceutical Co., Ltd. (Japan) | | | 9,416 | | | | 255,595 | |
| | |
Total Health Care | | | | | | | 1,107,772 | |
| | |
Industrials - 19.0% | | | | | | | | |
| | |
Ashtead Group PLC (United Kingdom) | | | 5,682 | | | | 325,877 | |
| | |
BAE Systems PLC (United Kingdom) | | | 27,853 | | | | 374,522 | |
| | |
Bouygues SA (France) | | | 4,499 | | | | 158,271 | |
| | |
CK Hutchison Holdings, Ltd. (Hong Kong) | | | 20,007 | | | | 101,281 | |
| | |
Deutsche Post AG (Germany) | | | 7,914 | | | | 308,990 | |
| | |
Thales, S.A. (France) | | | 2,230 | | | | 329,098 | |
| | |
Vinci, S.A. (France) | | | 2,645 | | | | 292,469 | |
| | |
Total Industrials | | | | | | | 1,890,508 | |
| | |
Information Technology - 4.7% | | | | | | | | |
| | |
Fujitsu, Ltd. (Japan) | | | 1,652 | | | | 214,013 | |
| | |
Murata Manufacturing Co., Ltd. (Japan) | | | 8,163 | | | | 139,827 | |
| | |
Open Text Corp. (Canada) | | | 3,374 | | | | 112,649 | |
| | |
Total Information Technology | | | | | | | 466,489 | |
| | |
Materials - 2.0% | | | | | | | | |
| | |
Shin-Etsu Chemical Co., Ltd. (Japan) | | | 6,640 | | | | 198,559 | |
| | |
Utilities - 2.6% | | | | | | | | |
| | |
EDP–Energias de Portugal, S.A. (Portugal) | | | 60,718 | | | | 255,167 | |
| | |
Total Common Stocks (Cost $9,719,102) | | | | | | | 9,554,360 | |
| | |
| | | Principal
Amount | | | | |
Short-Term Investments - 3.7% | | | | | | | | |
| |
Repurchase Agreements - 3.7% | | | | | |
| | |
Fixed Income Clearing Corp., dated 10/31/23 due 11/01/23, 5.150% total to be received $374,054 (collateralized by a U.S. Treasury, 3.500%, 04/30/30, totaling $381,556) | | $ | 374,000 | | | | 374,000 | |
| | |
Total Short-Term Investments (Cost $374,000) | | | | | | | 374,000 | |
| | |
Total Investments - 99.8% (Cost $10,093,102) | | | | | | | 9,928,360 | |
| |
Other Assets, less Liabilities - 0.2% | | | | 17,138 | |
| | |
Net Assets - 100.0% | | | | | | $ | 9,945,498 | |
| * | Non-income producing security. |
| 1 | Security’s value was determined by using significant unobservable inputs. |
The accompanying notes are an integral part of these financial statements.
40
| | |
| | | AMG River Road International Value Equity Fund Schedule of Portfolio Investments (continued) |
| | | |
| | | |
| 2 | This security is restricted and not available for re-sale. Liberty Broadband Corp. (“Liberty”) acquired GCI Liberty, Inc. on December 21, 2020. On May 24, 2023, Liberty shareholders received GCI Liberty, Inc. Escrow Shares for potential proceeds from a pending class action lawsuit. The market value of the escrow shares was $0 on the date of the distribution. At October 31, 2023, the cost and market value of the escrow shares is $0, which represents 0% of net assets. |
| 3 | Security exempt from registration under Rule 144A of the Securities Act of 1933. This security may be resold in transactions exempt from registration, normally to qualified institutional buyers. At October 31, 2023, the value of this security amounted to $202,730 or 2.0% of net assets. |
ADR American Depositary Receipt
The following table summarizes the inputs used to value the Fund’s investments by the fair value hierarchy levels as of October 31, 2023:
| | | | | | | | | | | | | | | | |
| | | Level 1 | | | Level 21 | | | Level 3 | | | Total | |
Investments in Securities | | | | | | | | | | | | | | | | |
| | | | |
Common Stocks | | | | | | | | | | | | | | | | |
| | | | |
Financials | | | — | | | $ | 2,269,602 | | | | — | | | $ | 2,269,602 | |
| | | | |
Industrials | | | — | | | | 1,890,508 | | | | — | | | | 1,890,508 | |
| | | | |
Health Care | | | — | | | | 1,107,772 | | | | — | | | | 1,107,772 | |
| | | | |
Consumer Discretionary | | | — | | | | 1,050,287 | | | | — | | | | 1,050,287 | |
| | | | |
Communication Services | | $ | 596,754 | | | | 378,382 | | | | $0 | | | | 975,136 | |
| | | | |
Energy | | | 149,068 | | | | 561,909 | | | | — | | | | 710,977 | |
| | | | |
Consumer Staples | | | 192,457 | | | | 437,406 | | | | — | | | | 629,863 | |
| | | | |
Information Technology | | | 112,649 | | | | 353,840 | | | | — | | | | 466,489 | |
| | | | |
Utilities | | | — | | | | 255,167 | | | | — | | | | 255,167 | |
| | | | |
Materials | | | — | | | | 198,559 | | | | — | | | | 198,559 | |
| | | | |
Short-Term Investments | | | | | | | | | | | | | | | | |
| | | | |
Repurchase Agreements | | | — | | | | 374,000 | | | | — | | | | 374,000 | |
| | | | | | | | | | | | | | | | |
| | | | |
Total Investments in Securities | | $ | 1,050,928 | | | | $8,877,432 | | | | $0 | | | | $9,928,360 | |
| | | | | | | | | | | | | | | | |
| 1 | An external pricing service is used to reflect any impact on security value due to market movements between the time the Fund valued such foreign securities and the earlier closing of foreign markets. |
At October 31, 2023, the Level 3 common stock was received as a result of a corporate action. The security’s value of $0 was determined by using significant unobservable inputs, which generated a change in unrealized depreciation of $0.
For the fiscal year ended October 31, 2023, there were no transfers in or out of Level 3. The Fund did not have any purchases and sales of Level 3 securities for the same period.
The country allocation in the Schedule of Portfolio Investments at October 31, 2023, was as follows:
| | |
| Country | | % of Long-Term
Investments |
| |
Belgium | | 1.9 |
| |
Brazil | | 2.9 |
| |
Canada | | 2.7 |
| |
France | | 18.3 |
| |
Germany | | 14.1 |
| |
Hong Kong | | 3.7 |
| |
Indonesia | | 1.5 |
| |
Japan | | 16.0 |
| |
Mexico | | 2.0 |
| |
Netherlands | | 2.1 |
| | |
| Country | | % of Long-Term
Investments |
| |
Portugal | | 2.7 |
| |
Singapore | | 3.8 |
| |
South Korea | | 1.8 |
| |
Spain | | 2.9 |
| |
Sweden | | 3.0 |
| |
Switzerland | | 4.0 |
| |
United Kingdom | | 16.6 |
| | |
| |
| | 100.0 |
| | |
The accompanying notes are an integral part of these financial statements.
41
| | |
| | | AMG River Road Focused Absolute Value Fund Portfolio Manager’s Comments (unaudited) |
| | | |
| | | |
| | | | | | | | |
OVERVIEW For the fiscal year ended October 31, 2023, AMG River Road Focused Absolute Value Fund (the “Fund”) Class N shares returned 2.76%, outpacing the -0.48% decline for the Russell 3000® Value Index (the “Index”), the Fund’s benchmark. PERFORMANCE REVIEW The Fund modestly outperformed the Index during the last 12 months. From a sector perspective, both stock selection and allocation effect were positive. The largest drivers of relative outperformance included positive stock selection within financials, consumer discretionary, and consumer staples. The Fund’s overweight to information technology also benefited the relative return. Negative stock selection in industrials and an underweight allocation to communication services partially offset outperformance. From a market cap perspective, stock selection was positive across all cap ranges, led by the Fund’s smaller cap holdings. The top contributing holdings to the Fund’s active return were Fairfax Financial Holdings, Ltd. (“FRFHF”) and Vistra Corp. (“VST”). FRFHF is a Canadian holding company focused on Property and Casualty (P&C) insurance and reinsurance. The management team, led by founder and CEO Prem Watsa, has taken advantage of the hard insurance market along with FRFHF’s excess statutory capital to grow premiums 14% over the last 12 months, outpacing the 9% growth of the U.S. P&C insurance industry. Over the last five years, premiums written grew at a 12.4% compound annual growth rate (CAGR), primarily from organic growth. More importantly, the company achieved this growth while maintaining its high underwriting standards earning an underwriting profit of $1.3 billion over the past year, increased 49% year-over-year with a combined ratio of 94.4% (85.6% excluding catastrophe losses). On the investment front, interest and dividend income increased 119% year-over-year as management deployed its low duration fixed income portfolio into higher yielding U.S. and Canadian government bonds. The run-rate annualized interest and dividend income grew to $2.1 billion in Q3 2023, up from $1.0 billion in Q3 2022 with further upside given the recent uptick in interest rates and the portfolio’s 11% cash position. The investment portfolio grew from $35.7 billion in 2019 to $56.8 billion in Q3 2023, almost exclusively from premium growth and favorable investment returns. Additionally, FRFHF continues to monetize its undervalued assets, selling Ambridge, a specialized insurance brokerage business, to Amynta Group for $400 million which | | | | resulted in a pre-tax gain of $259 million or $10 per share. Book value per share grew 15% year-over-year to $877, not including an additional $26 per share from the excess value of equity-accounted investments. Despite these results and an impressive return year to date, FRFHF continues to trade around 1.0x book value, significantly below peer multiples. We reduced the position over the last twelve months given the strong outperformance. Over the last 12 months, VST, an independent producer and retailer of electricity, continued to capitalize on strong electricity demand while pursuing the company’s strategic shift toward carbon-free generation and rewarding shareholders through capital returns along the way. Total EBITDA has grown 35% over the trailing 12-month period. The generation fleet benefited from a record-breaking summer where Vistra delivered its highest quarterly output in the last 10 years, driving 42% growth in generation EBITDA. Seasonal demand records persist due to tight grid conditions, with Texas consistently ranking among the top five states experiencing the fastest population growth nationwide. Retail operations also performed exceptionally well throughout the year as customer counts and increased volumes drove higher margins, leading to 14% growth in retail EBITDA. In March, Vistra announced the acquisition of Energy Harbor, which includes 4 gigawatts of nuclear generation and one million retail customers. If completed, the acquisition can lift 2024 EBITDA by ~$800 million before synergies and bring zero-carbon generation to ~50% of total EBITDA. Furthermore, in August, the company brought 350 megawatts (MWs) of battery storage online at its Moss Landing facility, solidifying its position as the largest energy storage facility globally at 750 MW. Since November 2021, management has returned a total of $2.9 billion through buybacks, resulting in a significant -24% reduction in outstanding shares. Additionally, plans are underway to utilize the current authorization, representing another ~11% of shares. We trimmed the position as shares approached our assessed value. The bottom contributing holdings to the Fund’s active return were The AES Corp. (“AES”) and Advance Auto Parts, Inc. (“AAP”). AES is an independent producer of electricity rapidly transitioning to renewable energy. Rising interest rates have weighed on the utilities sector in 2023. Adding to the pressure from rates, NextEra Partners (“NEP”) announced a cut to its distribution growth guidance in September as higher capital costs made it uneconomical for NEP to acquire renewable assets | | | | from its parent, NextEra Energy (NEE). This sparked a significant decline across renewable energy-related utilities. AES was hit particularly hard as its capital growth plans are substantial over the next four years and include plans to recycle assets and issue equity. The timing of asset sales, coupled with increasing debt to fund projects, presented a situation where AES could bump up against its parent free cash flow (FCF)-to-recourse debt ratio that credit rating agencies use to evaluate the company’s financial strength. In the event of a credit downgrade, AES would need to issue equity to fund their renewable project backlog. We exited the position during Q4 2023 as our conviction and assessed value were reduced to reflect the increased risk from higher rates and higher net debt as AES ramps up project construction. AAP is a retailer of aftermarket auto replacement parts, accessories, batteries, and maintenance items. AAP shares fell sharply after its Q3 2022 earnings report. Same-store sales declined -0.7%, lagging peers. AAP’s do-it-yourself (DIY) and do-it-for-me (DIFM) channels performed similarly, implying sequential improvement in DIY but weakness in DIFM, suggesting market share losses to AutoZone and O’Reilly, and fueling concerns of increasing competitive pressure. Management attributed much of the sales miss to narrow instances of inventory stock-outs, particularly for certain owned-brand products and high-velocity SKUs, which will require inventory investment and has drove reduced 2022 FCF guidance from ?$700 million to ?$300 million. Management also cautioned on 2023 targets which appeared overly optimistic given market conditions including higher fuel costs, wage and labor inflation, and currency headwinds, all of which are less favorable than when AAP set its three-year financial targets in 2021. AAP’s multi-year investment efforts to streamline operations and improve its supply chain systems have it poised to drive material margin expansion in the years ahead. Store growth in the untapped California market has also been ramping. However, competitive pressures and weak same-store sales growth have delayed margin expansion, which was core to our investment thesis. This led us to exit the position early in 2023 and re-enter at a more favorable valuation in 2023. POSITIONING AND OUTLOOK As always, the Fund invests in companies we believe represent the most attractive combination of risk (conviction) and reward (discount) available across the River Road universe. Although we are cautious due to weakening economic conditions resulting from long lags of U.S. Federal Reserve policy, we |
42
| | |
| | | AMG River Road Focused Absolute Value Fund Portfolio Manager’s Comments (continued) |
| | | |
| | | |
| | | | | | | | |
anticipate an exciting period for active management and our Absolute Value® philosophy. Passive index investing has played an outsized role in investor toolkits in recent years, and although we think this role has benefits, it is not clear to us that passive index investing is of low risk—especially during the regime change we suspect is ahead. With significant valuation imbalances across equity indices, attractive small cap valuations compared to large cap historically, and expected price discovery | | | | due to the return to normalized real rates, we believe the stage is set for a favorable environment for active management, especially for value-oriented, unconstrained, all cap strategies such as Focused Absolute Value®. We believe the portfolio is positioned for a range of scenarios, where our bottom-up process seeks to find value off the beaten path with attractively priced higher quality business models, strong financial strength, and shareholder-oriented management teams capable of navigating changes we see ahead. | | | | We are optimistic about the prospects of companies exhibiting robust return on equity (ROE) and return on invested capital (ROIC), sustainable growth rates, expanding or defensible margins, AND attractive valuations, particularly as we look ahead to 2024. The views expressed represent the opinions of River Road Asset Management, LLC as of October 31, 2023, and are not intended as a forecast or guarantee of future results, and are subject to change without notice. |
43
| | |
| | | AMG River Road Focused Absolute Value Fund Portfolio Manager’s Comments (continued) |
| | | |
CUMULATIVE TOTAL RETURN PERFORMANCE
AMG River Road Focused Absolute Value Fund’s cumulative total return is based on the daily change in net asset value (NAV), and assumes that all dividends and distributions were reinvested. The graph compares a hypothetical $10,000 investment made in the AMG River Road Focused Absolute Value Fund’s Class N shares on November 3, 2015, to a $10,000 investment made in the Russell 3000® Value Index for the same time period. The graph and table do not reflect the deduction of taxes that a shareholder would pay on a Fund distribution or redemption of shares. The listed returns for the Fund are net of expenses and the returns for the index exclude expenses. Total returns would have been lower had certain expenses not been reduced.
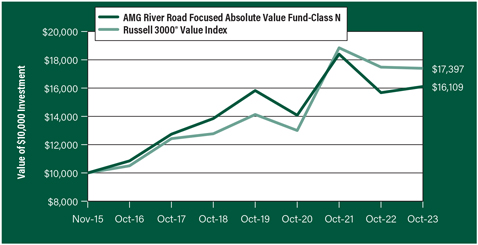
The table below shows the average annual total returns for the AMG River Road Focused Absolute Value Fund and the Russell 3000® Value Index for the same time periods ended October 31, 2023.
| | | | | | | | | | | | | | | | |
| | | One | | | Five | | | Since | | | Inception | |
| Average Annual Total Returns1 | | Year | | | Years | | | Inception | | | Date | |
|
AMG River Road Focused Absolute Value Fund2, 3, 4, 5, 6, 7, 8, 9, 10, 11, 12, 13, 14, 15, 16 | |
| | | | |
Class N | | | 2.76 | % | | | 3.07 | % | | | 6.14 | % | | | 11/03/15 | |
| | | | |
Class I | | | 3.11 | % | | | 3.33 | % | | | 6.41 | % | | | 11/03/15 | |
| | | | |
Class Z | | | 3.10 | % | | | 3.37 | % | | | 3.85 | % | | | 09/29/17 | |
| | | | |
Russell 3000® Value Index17 | | | (0.48 | %) | | | 6.38 | % | | | 7.17 | % | | | 11/03/15 | † |
The performance data shown represents past performance. Past performance is not a guarantee of future results. Current performance may be lower or higher than the performance data quoted. The investment return and principal value of an investment will fluctuate so that an investor’s shares, when redeemed, may be worth more or less than their original cost.
Investors should carefully consider the Fund’s investment objectives, risks, charges and expenses before investing. For performance information through the most recent month end, current net asset values per share for the Fund and other information, please call 800.548.4539 or visit our website at wealth.amg.com for a free prospectus. Read it carefully before investing or sending money.
Distributed by AMG Distributors, Inc., member FINRA/SIPC.
| † | Date reflects the inception date of the Fund, not the index. |
| 1 | Total return equals income yield plus share price change and assumes reinvestment of all dividends and capital gain distributions. Returns are net of fees and may reflect offsets of Fund expenses as described in the prospectus. No adjustment has been made for taxes payable by shareholders on their reinvested dividends and |
|
capital gain distributions. Returns for periods greater than one year are annualized. The listed returns on the Fund are net of expenses and based on the published NAV as of October 31, 2023. All returns are in U.S. Dollars ($). 2 From time to time, the Fund’s adviser has waived its fees and/or absorbed Fund expenses, which has resulted in higher returns. 3 Market prices of investments held by the Fund may fall rapidly or unpredictably due to a variety of factors, including economic, political, or market conditions, or other factors including terrorism, war, natural disasters and the spread of infectious illness or other public health issues, including epidemics or pandemics, or in response to events that affect particular industries or companies. 4 Because the Fund is an actively managed investment portfolio, security selection or focus on securities in a particular style, market sector or group of companies may cause the Fund to incur losses or underperform relative to its benchmark or other funds with a similar investment objective. There can be no guarantee that the Subadviser’s investment techniques and risk analysis will produce the desired result. 5 The stocks of small- and mid-capitalization companies often have greater price volatility, lower trading volume, and less liquidity than the stocks of larger, more established companies. 6 Value stocks may perform differently from the market as a whole and may be undervalued by the market for a long period of time. 7 The Fund is non-diversified and therefore a greater percentage of holdings may be focused in a small number of issuers or a single issuer, which can place the Fund at greater risk. Notwithstanding the Fund’s status as a “non-diversified” investment company under the Investment Company Act of 1940 (the “1940 Act”), the Fund intends to qualify as a regulated investment company accorded favorable tax treatment under the Internal Revenue Code of 1986, as amended (the “Internal Revenue Code”), which imposes its own diversification requirements that are less restrictive than the requirements applicable to “diversified” investment companies under the 1940 Act. The Fund’s intention to qualify as a regulated investment company may limit its pursuit of its investment strategy and its investment strategy could limit its ability to so qualify. 8 To the extent the Fund invests a substantial portion of its assets in a relatively small number of securities or a particular market, industry, group of industries, country, region, group of countries, asset class or sector, it generally will be subject to greater risk than a fund that invests in a more diverse investment portfolio. In addition, the value of the Fund would be more susceptible to any single economic, market, political or regulatory |
44
| | |
| | | AMG River Road Focused Absolute Value Fund Portfolio Manager’s Comments (continued) |
| | | |
| | | |
| | | | | | | | |
occurrence affecting, for example, that particular market, industry, region or sector. 9 Issuers and companies that are in similar industry sectors may be similarly affected by particular economic or market events; to the extent the Fund has substantial holdings within a particular sector, the risks associated with that sector increase. 10 Investments in foreign issuers involve additional risks (such as risks arising from less frequent trading, changes in political or social conditions, and less publicly available information about non-U.S. issuers) that differ from those associated with investments in U.S. issuers and may result in greater price volatility. 11 Fluctuations in exchange rates may affect the total loss or gain on a non-U.S. dollar investment when converted back to U.S. dollars and exposure to non-U.S. currencies may subject the Fund to the risk that those currencies will decline in value relative to the U.S. dollar. 12 The Fund may not be able to dispose of particular investments, such as illiquid securities, readily at favorable times or prices or the Fund may have to sell them at a loss. 13 Investments in the Fund may be subject to many of the same risks as a direct investment in real estate. The stock prices of companies in the real estate industry, including real estate investment trusts (“REITs”), are typically sensitive to changes in real | | | | estate values, property taxes, interest rates, cash flow of underlying real estate assets, occupancy rates, government regulations affecting zoning, land use, and rents, as well as the management skill and creditworthiness of the issuer. REITs also depend generally on their ability to generate cash flow to make distributions to shareholders or unitholders and are subject to the risk of failing to qualify for favorable tax treatment under the Internal Revenue Code. 14 Investments in master limited partnerships (“MLPs”) are subject to similar risks to those associated with the specific industry or industries in which the partnership invests, such as the risk of investing in the real estate or oil and gas industries. In addition, investments in MLPs are subject to the risks of investing in a partnership, including limited control and voting rights on matters affecting the partnership and fewer investor protections compared to corporations. 15 Investing in publicly traded partnerships (“PTPs”) (including master limited partnerships) involves special risks in addition to those typically associated with publicly traded companies. PTPs are exposed to the risks of their underlying assets, which in many cases includes the same types of risks as energy and natural resources companies, such as commodity pricing risk, supply and demand risk and depletion and exploration risk. PTPs are also subject to capital markets risk, which is the risk that they may be unable to raise capital | | | | to execute their growth strategies. PTPs are also subject to tax risk, which is the risk that PTPs may lose their partnership status for tax purposes. The Fund’s ability to make investments in certain PTPs, including master limited partnerships, can be limited by the Fund’s intention to qualify as a regulated investment company accorded favorable tax treatment under the Internal Revenue Code, and if the Fund does not appropriately limit such investments or if such investments are recharacterized for U.S. federal income tax purposes, the Fund’s status as a regulated investment company may be jeopardized. 16 Higher portfolio turnover may adversely affect Fund performance by increasing Fund transaction costs and may increase a shareholder’s tax liability. 17 The Russell 3000® Value Index measures the performance of the broad value segment of the U.S. equity universe. It includes those Russell 3000® companies with lower price-to-book ratios and lower forecasted growth values. Unlike the Fund, the Russell 3000® Value Index is unmanaged, is not available for investment and does not incur expenses. The Russell 3000® Value Index is a trademark of the London Stock Exchange Group companies. Not FDIC insured, nor bank guaranteed. May lose value. |
45
| | |
| | | AMG River Road Focused Absolute Value Fund Fund Snapshots (unaudited) October 31, 2023 |
| | | |
| | | |
PORTFOLIO BREAKDOWN
| | | | | |
| Sector | | % of Net Assets |
| | |
Financials | | | | 26.7 | |
| | |
Consumer Staples | | | | 17.2 | |
| | |
Consumer Discretionary | | | | 11.7 | |
| | |
Industrials | | | | 10.9 | |
| | |
Information Technology | | | | 7.3 | |
| | |
Health Care | | | | 6.6 | |
| | |
Energy | | | | 6.0 | |
| | |
Communication Services | | | | 4.2 | |
| | |
Materials | | | | 3.9 | |
| | |
Utilities | | | | 3.2 | |
| | |
Exchange Traded Funds | | | | 2.0 | |
| | |
Short-Term Investments | | | | 0.3 | |
| | |
Other Assets, less Liabilities | | | | 0.0 | 1 |
TOP TEN HOLDINGS
| | | | |
| Security Name | | % of Net Assets | |
| | |
Berkshire Hathaway, Inc., Class B | | | 7.6 | |
| | |
Fairfax Financial Holdings, Ltd. (Canada) | | | 7.1 | |
| | |
Fiserv, Inc. | | | 5.1 | |
| | |
The Kroger Co. | | | 4.9 | |
| | |
BJ’s Wholesale Club Holdings, Inc. | | | 4.7 | |
| | |
Comcast Corp., Class A | | | 4.2 | |
| | |
LKQ Corp. | | | 4.2 | |
| | |
CRH PLC (Ireland) | | | 3.9 | |
| | |
Armstrong World Industries, Inc. | | | 3.9 | |
| | |
WEX, Inc. | | | 3.8 | |
| | |
| | | | | |
| | |
Top Ten as a Group | | | 49.4 | |
| | | | |
1 Less than 0.05%
Because a fund’s strategy may result in multiple investments in particular sectors of the economy, its performance may depend on the performance of those sectors and may fluctuate more widely than investments diversified across more sectors. For additional information on these and other risk considerations, please see the Fund’s prospectus.
Any sectors, industries, or securities discussed should not be perceived as investment recommendations. Mention of a specific security should not be considered a recommendation to buy or solicitation to sell that security. Specific securities mentioned in this report may have been sold from the Fund’s portfolio of investments by the time you receive this report.
46
| | |
| | | AMG River Road Focused Absolute Value Fund Schedule of Portfolio Investments October 31, 2023 |
| | | |
| | | |
| | | | | | | | |
| | |
| | | Shares | | | Value | |
| | |
Common Stocks - 97.7% | | | | | | | | |
| |
Communication Services - 4.2% | | | | | |
| | |
Comcast Corp., Class A | | | 49,681 | | | | $2,051,329 | |
| | |
GCI Liberty, Inc. Escrow Share*,1,2 | | | 108,700 | | | | 0 | |
| | |
Total Communication Services | | | | | | | 2,051,329 | |
| |
Consumer Discretionary - 11.7% | | | | | |
| | |
Advance Auto Parts, Inc. | | | 17,676 | | | | 919,682 | |
| | |
Expedia Group, Inc.* | | | 15,994 | | | | 1,524,068 | |
| | |
LKQ Corp. | | | 46,282 | | | | 2,032,706 | |
| | |
Murphy USA, Inc. | | | 3,296 | | | | 1,195,426 | |
| | |
Total Consumer Discretionary | | | | | | | 5,671,882 | |
| | |
Consumer Staples - 17.2% | | | | | | | | |
| | |
BJ’s Wholesale Club Holdings, Inc.* | | | 33,925 | | | | 2,310,971 | |
| | |
The Kroger Co. | | | 52,045 | | | | 2,361,282 | |
| | |
Molson Coors Beverage Co., Class B | | | 20,472 | | | | 1,182,667 | |
| | |
Target Corp. | | | 10,167 | | | | 1,126,402 | |
| | |
Unilever PLC, Sponsored ADR (United Kingdom)3 | | | 29,495 | | | | 1,396,588 | |
| | |
Total Consumer Staples | | | | | | | 8,377,910 | |
| | |
Energy - 6.0% | | | | | | | | |
| | |
SM Energy Co. | | | 31,517 | | | | 1,270,765 | |
| | |
The Williams Cos., Inc. | | | 48,219 | | | | 1,658,734 | |
| | |
Total Energy | | | | | | | 2,929,499 | |
| | |
Financials - 26.7% | | | | | | | | |
| | |
Berkshire Hathaway, Inc., Class B* | | | 10,771 | | | | 3,676,466 | |
| | |
Fairfax Financial Holdings, Ltd. (Canada) | | | 4,127 | | | | 3,433,306 | |
| | |
Fiserv, Inc.* | | | 21,991 | | | | 2,501,476 | |
| | |
WEX, Inc.* | | | 10,996 | | | | 1,830,614 | |
| | |
Willis Towers Watson PLC (United Kingdom) | | | 6,443 | | | | 1,519,839 | |
| | |
Total Financials | | | | | | | 12,961,701 | |
| | |
Health Care - 6.6% | | | | | | | | |
| | |
Laboratory Corp. of America Holdings | | | 7,047 | | | | 1,407,497 | |
| | |
Patterson Cos., Inc. | | | 59,287 | | | | 1,805,882 | |
| | |
Total Health Care | | | | | | | 3,213,379 | |
| | |
| | | | | | | | |
| * | Non-income producing security. |
| 1 | Security’s value was determined by using significant unobservable inputs. |
| 2 | This security is restricted and not available for re-sale. Liberty Broadband Corp. (“Liberty”) acquired GCI Liberty, Inc. on December 21, 2020. On May 24, 2023, Liberty shareholders received GCI Liberty, Inc. Escrow Shares for potential proceeds from a pending class action lawsuit. The market value of the escrow shares was $0 on the date of the distribution. At October 31, 2023, the cost and market value of the escrow shares is $0, which represents 0% of net assets. |
| | | | | | | | |
| | |
| | | Shares | | | Value | |
| | |
Industrials - 10.9% | | | | | | | | |
| | |
Air Transport Services Group, Inc.* | | | 48,723 | | | | $953,509 | |
| | |
Armstrong World Industries, Inc. | | | 24,790 | | | | 1,881,313 | |
| | |
Dun & Bradstreet Holdings, Inc. | | | 135,297 | | | | 1,185,202 | |
| | |
United Parcel Service, Inc., Class B | | | 8,859 | | | | 1,251,334 | |
| | |
Total Industrials | | | | | | | 5,271,358 | |
| | |
Information Technology - 7.3% | | | | | | | | |
| | |
Corning, Inc. | | | 43,891 | | | | 1,174,523 | |
| | |
QUALCOMM, Inc. | | | 8,255 | | | | 899,713 | |
| | |
TD SYNNEX Corp. | | | 15,905 | | | | 1,458,170 | |
| | |
Total Information Technology | | | | | | | 3,532,406 | |
| | |
Materials - 3.9% | | | | | | | | |
| | |
CRH PLC (Ireland) | | | 35,737 | | | | 1,914,431 | |
| | |
Utilities - 3.2% | | | | | | | | |
| | |
Vistra Corp. | | | 46,825 | | | | 1,532,114 | |
| | |
Total Common Stocks | | | | | | | | |
(Cost $43,675,170) | | | | | | | 47,456,009 | |
| |
Exchange Traded Funds - 2.0% | | | | | |
| | |
iShares Russell 1000 Value ETF
(Cost $984,860) | | | 6,481 | | | | 948,948 | |
| | |
| | | Principal
Amount | | | | |
| |
Short-Term Investments - 0.3% | | | | | |
| |
Repurchase Agreements - 0.3% | | | | | |
| | |
Fixed Income Clearing Corp., dated 10/31/23 due 11/01/23, 5.150% total to be received $173,025 (collateralized by a U.S. Treasury, 3.500%, 04/30/30, totaling $176,472) | | | $173,000 | | | | 173,000 | |
| | |
Total Short-Term Investments | | | | | | | | |
(Cost $173,000) | | | | | | | 173,000 | |
| | |
Total Investments - 100.0% | | | | | | | | |
(Cost $44,833,030) | | | | | | | 48,577,957 | |
| |
Other Assets, less Liabilities - 0.0%# | | | | (13,268 | ) |
| | |
Net Assets - 100.0% | | | | | | | $48,564,689 | |
| | |
| | | | | | | | |
| 3 | Some of this security, amounting to $904,480 or 1.9% of net assets, was out on loan to various borrowers and is collateralized by various U.S. Treasury Obligations. See Note 4 of Notes to Financial Statements. |
ADR American Depositary Receipt
ETF Exchange Traded Fund
The accompanying notes are an integral part of these financial statements.
47
| | |
| | | AMG River Road Focused Absolute Value Fund Schedule of Portfolio Investments (continued) |
| | | |
| | | |
The following table summarizes the inputs used to value the Fund’s investments by the fair value hierarchy levels as of October 31, 2023:
| | | | | | | | | | | | | | | | |
| | | Level 1 | | | Level 2 | | | Level 3 | | | Total | |
Investments in Securities | | | | | | | | | | | | | | | | |
| | | | |
Common Stocks | | | | | | | | | | | | | | | | |
| | | | |
Financials | | | $12,961,701 | | | | — | | | | — | | | | $12,961,701 | |
| | | | |
Consumer Staples | | | 8,377,910 | | | | — | | | | — | | | | 8,377,910 | |
| | | | |
Consumer Discretionary | | | 5,671,882 | | | | — | | | | — | | | | 5,671,882 | |
| | | | |
Industrials | | | 5,271,358 | | | | — | | | | — | | | | 5,271,358 | |
| | | | |
Information Technology | | | 3,532,406 | | | | — | | | | — | | | | 3,532,406 | |
| | | | |
Health Care | | | 3,213,379 | | | | — | | | | — | | | | 3,213,379 | |
| | | | |
Energy | | | 2,929,499 | | | | — | | | | — | | | | 2,929,499 | |
| | | | |
Communication Services | | | 2,051,329 | | | | — | | | | $0 | | | | 2,051,329 | |
| | | | |
Materials | | | 1,914,431 | | | | — | | | | — | | | | 1,914,431 | |
| | | | |
Utilities | | | 1,532,114 | | | | — | | | | — | | | | 1,532,114 | |
| | | | |
Exchange Traded Funds | | | 948,948 | | | | — | | | | — | | | | 948,948 | |
| | | | |
Short-Term Investments | | | | | | | | | | | | | | | | |
| | | | |
Repurchase Agreements | | | — | | | | $173,000 | | | | — | | | | 173,000 | |
| | | | | | | | | | | | | | | | |
| | | | |
Total Investments in Securities | | | $48,404,957 | | | | $173,000 | | | | $0 | | | | $48,577,957 | |
| | | | | | | | | | | | | | | | |
At October 31, 2023, the Level 3 common stock was received as a result of a corporate action. The security’s value of $0 was determined by using significant unobservable inputs, which generated a change in unrealized depreciation of $0.
For the fiscal year ended October 31, 2023, there were no transfers in or out of Level 3. The Fund did not have any purchases and sales of Level 3 securities for the same period.
The accompanying notes are an integral part of these financial statements.
48
| | |
| | | Statement of Assets and Liabilities October 31, 2023 |
| | | |
| | | |
| | | | | | | | | | | | | | | | | | | | |
| | | AMG
River Road
Mid Cap
Value Fund | | AMG
River Road Large
Cap Value
Select Fund | | AMG
River Road
Small Cap
Value Fund | | AMG
River Road
Dividend All Cap
Value Fund |
| | | | |
Assets: | | | | | | | | | | | | | | | | | | | | |
| | | | |
Investments at value1 (including securities on loan valued at $10,357,118, $0, $5,495,569, and $13,391,166, respectively) | | | | $309,753,626 | | | | | $32,060,609 | | | | | $885,798,668 | | | | | $238,749,711 | |
| | | | |
Cash | | | | 348,995 | | | | | 63 | | | | | 852 | | | | | 99,425 | |
| | | | |
Receivable for investments sold | | | | 6,209,981 | | | | | 1,067,555 | | | | | 2,679,878 | | | | | 955,179 | |
| | | | |
Dividend and interest receivables | | | | 285,545 | | | | | 16,103 | | | | | 367,433 | | | | | 628,035 | |
| | | | |
Securities lending income receivable | | | | 1,133 | | | | | — | | | | | 834 | | | | | 1,369 | |
| | | | |
Receivable for Fund shares sold | | | | 51,722 | | | | | 793 | | | | | 680,133 | | | | | 68,319 | |
| | | | |
Receivable from affiliate | | | | 21,318 | | | | | 10,369 | | | | | — | | | | | 17,751 | |
| | | | |
Prepaid expenses and other assets | | | | 32,519 | | | | | 9,895 | | | | | 23,777 | | | | | 17,976 | |
| | | | |
Total assets | | | | 316,704,839 | | | | | 33,165,387 | | | | | 889,551,575 | | | | | 240,537,765 | |
| | | | |
Liabilities: | | | | | | | | | | | | | | | | | | | | |
| | | | |
Payable upon return of securities loaned | | | | 4,482,264 | | | | | — | | | | | 3,606,000 | | | | | 5,677,292 | |
| | | | |
Payable for investments purchased | | | | 5,893,298 | | | | | 897,398 | | | | | 1,430,266 | | | | | 913,959 | |
| | | | |
Payable for Fund shares repurchased | | | | 100,769 | | | | | 1,127 | | | | | 1,199,009 | | | | | 151,442 | |
| | | | |
Accrued expenses: | | | | | | | | | | | | | | | | | | | | |
| | | | |
Investment advisory and management fees | | | | 149,678 | | | | | 9,654 | | | | | 608,104 | | | | | 101,086 | |
| | | | |
Administrative fees | | | | 40,092 | | | | | 4,138 | | | | | 114,020 | | | | | 30,326 | |
| | | | |
Distribution fees | | | | 50,416 | | | | | 725 | | | | | 9,331 | | | | | 6,133 | |
| | | | |
Shareholder service fees | | | | 22,694 | | | | | 1,968 | | | | | 56,984 | | | | | 7,978 | |
| | | | |
Other | | | | 70,007 | | | | | 46,961 | | | | | 121,859 | | | | | 69,573 | |
| | | | |
Total liabilities | | | | 10,809,218 | | | | | 961,971 | | | | | 7,145,573 | | | | | 6,957,789 | |
| | | | |
Commitments and Contingencies (Notes 2 & 6) | | | | | | | | | | | | | | | | | | | | |
| | | | |
Net Assets | | | | $305,895,621 | | | | | $32,203,416 | | | | | $882,406,002 | | | | | $233,579,976 | |
| | | | |
1 Investments at cost | | | | $301,008,428 | | | | | $30,070,592 | | | | | $766,196,150 | | | | | $192,870,226 | |
The accompanying notes are an integral part of these financial statements.
49
| | |
| | | Statement of Assets and Liabilities (continued) |
| | | |
| | | |
| | | | | | | | | | | | | | | | | | | | |
| | | AMG
River Road
Mid Cap
Value Fund | | AMG
River Road Large
Cap Value
Select Fund | | AMG
River Road
Small Cap
Value Fund | | AMG
River Road
Dividend All Cap
Value Fund |
| | | | |
Net Assets Represent: | | | | | | | | | | | | | | | | | | | | |
| | | | |
Paid-in capital | | | | $296,342,592 | | | | | $35,998,741 | | | | | $720,980,775 | | | | | $186,905,754 | |
| | | | |
Total distributable earnings (loss) | | | | 9,553,029 | | | | | (3,795,325 | ) | | | | 161,425,227 | | | | | 46,674,222 | |
| | | | |
Net Assets | | | | $305,895,621 | | | | | $32,203,416 | | | | | $882,406,002 | | | | | $233,579,976 | |
| | | | |
Class N: | | | | | | | | | | | | | | | | | | | | |
| | | | |
Net Assets | | | | $220,480,342 | | | | | $3,372,783 | | | | | $41,927,381 | | | | | $28,325,203 | |
| | | | |
Shares outstanding | | | | 12,647,303 | | | | | 222,625 | | | | | 3,007,205 | | | | | 3,281,453 | |
| | | | |
Net asset value, offering and redemption price per share | | | | $17.43 | | | | | $15.15 | | | | | $13.94 | | | | | $8.63 | |
Class I: | | | | | | | | | | | | | | | | | | | | |
| | | | |
Net Assets | | | | $78,561,802 | | | | | $28,830,633 | | | | | $830,021,981 | | | | | $202,039,050 | |
| | | | |
Shares outstanding | | | | 4,171,028 | | | | | 1,889,222 | | | | | 57,302,805 | | | | | 23,439,962 | |
| | | | |
Net asset value, offering and redemption price per share | | | | $18.84 | | | | | $15.26 | | | | | $14.48 | | | | | $8.62 | |
Class Z: | | | | | | | | | | | | | | | | | | | | |
| | | | |
Net Assets | | | | $6,853,477 | | | | | — | | | | | $10,456,640 | | | | | $3,215,723 | |
| | | | |
Shares outstanding | | | | 366,221 | | | | | — | | | | | 720,089 | | | | | 373,039 | |
| | | | |
Net asset value, offering and redemption price per share | | | | $18.71 | | | | | — | | | | | $14.52 | | | | | $8.62 | |
The accompanying notes are an integral part of these financial statements.
50
| | |
| | | Statement of Assets and Liabilities (continued) |
| | | |
| | | |
| | | | | | | | | | | | | | | |
| | | AMG
River Road
Small-Mid Cap
Value Fund | | AMG
River Road
International Value
Equity Fund | | AMG
River Road
Focused Absolute
Value Fund |
| | | |
Assets: | | | | | | | | | | | | | | | |
| | | |
Investments at value1 (including securities on loan valued at $7,235,210, $0, and $904,480, respectively) | | | | $265,645,274 | | | | | $9,928,360 | | | | | $48,577,957 | |
| | | |
Cash | | | | 1,182,414 | | | | | 652 | | | | | 517 | |
| | | |
Foreign currency2 | | | | — | | | | | 2,393 | | | | | — | |
| | | |
Receivable for investments sold | | | | 634,598 | | | | | — | | | | | — | |
| | | |
Dividend and interest receivables | | | | 59,045 | | | | | 42,796 | | | | | 34,667 | |
| | | |
Securities lending income receivable | | | | 5,600 | | | | | 16 | | | | | 155 | |
| | | |
Receivable for Fund shares sold | | | | 88,196 | | | | | 1,049 | | | | | 3,693 | |
| | | |
Receivable from affiliate | | | | — | | | | | 13,823 | | | | | 7,972 | |
| | | |
Prepaid expenses and other assets | | | | 18,511 | | | | | 4,402 | | | | | 15,978 | |
| | | |
Total assets | | | | 267,633,638 | | | | | 9,993,491 | | | | | 48,640,939 | |
| | | |
Liabilities: | | | | | | | | | | | | | | | |
| | | |
Payable upon return of securities loaned | | | | 3,159,542 | | | | | — | | | | | — | |
| | | |
Payable for investments purchased | | | | 1,892,132 | | | | | — | | | | | — | |
| | | |
Payable for Fund shares repurchased | | | | 169,578 | | | | | — | | | | | 1,803 | |
| | | |
Accrued expenses: | | | | | | | | | | | | | | | |
| | | |
Investment advisory and management fees | | | | 170,702 | | | | | 4,504 | | | | | 25,219 | |
| | | |
Administrative fees | | | | 34,141 | | | | | 1,275 | | | | | 6,305 | |
| | | |
Distribution fees | | | | 4,384 | | | | | 249 | | | | | 407 | |
| | | |
Shareholder service fees | | | | 11,011 | | | | | 375 | | | | | 1,459 | |
| | | |
Other | | | | 57,873 | | | | | 41,590 | | | | | 41,057 | |
| | | |
Total liabilities | | | | 5,499,363 | | | | | 47,993 | | | | | 76,250 | |
| | | |
Commitments and Contingencies (Notes 2 & 6) | | | | | | | | | | | | | | | |
| | | |
Net Assets | | | | $262,134,275 | | | | | $9,945,498 | | | | | $48,564,689 | |
| | | |
1 Investments at cost | | | | $244,865,057 | | | | | $10,093,102 | | | | | $44,833,030 | |
| | | |
2 Foreign currency at cost | | | | — | | | | | $2,415 | | | | | — | |
The accompanying notes are an integral part of these financial statements.
51
| | |
| | | Statement of Assets and Liabilities (continued) |
| | | |
| | | |
| | | | | | | | | | | | | | | | | | | | | | | | | | | | | | | | | | | | |
| | | AMG
River Road
Small-Mid Cap
Value Fund | | | AMG
River Road
International Value
Equity Fund | | | AMG
River Road
Focused Absolute
Value Fund | |
| | | | | | | | | |
Net Assets Represent: | | | | | | | | | | | | | | | | | | | | | | | | | | | | | | | | | | | | |
| | | | | | | | | |
Paid-in capital | | | | | | | $231,071,322 | | | | | | | | | | | | $10,313,589 | | | | | | | | | | | | $44,061,976 | | | | | |
| | | | | | | | | |
Total distributable earnings (loss) | | | | | | | 31,062,953 | | | | | | | | | | | | (368,091 | ) | | | | | | | | | | | 4,502,713 | | | | | |
| | | | | | | | | |
Net Assets | | | | | | | $262,134,275 | | | | | | | | | | | | $9,945,498 | | | | | | | | | | | | $48,564,689 | | | | | |
| | | | | | | | | |
Class N: | | | | | | | | | | | | | | | | | | | | | | | | | | | | | | | | | | | | |
| | | | | | | | | |
Net Assets | | | | | | | $18,654,765 | | | | | | | | | | | | $2,291,596 | | | | | | | | | | | | $1,910,092 | | | | | |
| | | | | | | | | |
Shares outstanding | | | | | | | 2,166,301 | | | | | | | | | | | | 243,862 | | | | | | | | | | | | 162,780 | | | | | |
| | | | | | | | | |
Net asset value, offering and redemption price per share | | | | | | | $8.61 | | | | | | | | | | | | $9.40 | | | | | | | | | | | | $11.73 | | | | | |
Class I: | | | | | | | | | | | | | | | | | | | | | | | | | | | | | | | | | | | | |
| | | | | | | | | |
Net Assets | | | | | | | $214,092,965 | | | | | | | | | | | | $6,502,952 | | | | | | | | | | | | $40,204,676 | | | | | |
| | | | | | | | | |
Shares outstanding | | | | | | | 23,955,675 | | | | | | | | | | | | 666,146 | | | | | | | | | | | | 3,421,824 | | | | | |
| | | | | | | | | |
Net asset value, offering and redemption price per share | | | | | | | $8.94 | | | | | | | | | | | | $9.76 | | | | | | | | | | | | $11.75 | | | | | |
Class Z: | | | | | | | | | | | | | | | | | | | | | | | | | | | | | | | | | | | | |
| | | | | | | | | |
Net Assets | | | | | | | $29,386,545 | | | | | | | | | | | | $1,150,950 | | | | | | | | | | | | $6,449,921 | | | | | |
| | | | | | | | | |
Shares outstanding | | | | | | | 3,282,932 | | | | | | | | | | | | 117,334 | | | | | | | | | | | | 548,920 | | | | | |
| | | | | | | | | |
Net asset value, offering and redemption price per share | | | | | | | $8.95 | | | | | | | | | | | | $9.81 | | | | | | | | | | | | $11.75 | | | | | |
The accompanying notes are an integral part of these financial statements.
52
| | |
| | | Statement of Operations For the fiscal year ended October 31, 2023 |
| | | |
| | | |
| | | | | | | | | | | | | | | | | | | | | | | | | | | | | | | | | | | | | | | | | | | | | | | | |
| | | AMG
River Road
Mid Cap
Value Fund | | | AMG
River Road Large
Cap Value
Select Fund | | | AMG
River Road
Small Cap
Value Fund | | | AMG
River Road
Dividend All Cap
Value Fund | |
| | | | | | | | | | | | |
Investment Income: | | | | | | | | | | | | | | | | | | | | | | | | | | | | | | | | | | | | | | | | | | | | | | | | |
| | | | | | | | | | | | |
Dividend income | | | | | | | $3,853,704 | | | | | | | | | | | | $530,934 | | | | | | | | | | | | $9,207,575 | | | | | | | | | | | | $8,930,822 | | | | | |
| | | | | | | | | | | | |
Interest income | | | | | | | 122,426 | | | | | | | | | | | | 15,527 | | | | | | | | | | | | 2,557,058 | | | | | | | | | | | | 58,475 | | | | | |
| | | | | | | | | | | | |
Securities lending income | | | | | | | 5,691 | | | | | | | | | | | | 2,104 | | | | | | | | | | | | 18,389 | | | | | | | | | | | | 14,188 | | | | | |
| | | | | | | | | | | | |
Foreign withholding tax | | | | | | | (52,325 | ) | | | | | | | | | | | (14,022 | ) | | | | | | | | | | | (46,844 | ) | | | | | | | | | | | (2,020 | ) | | | | |
| | | | | | | | | | | | |
Total investment income | | | | | | | 3,929,496 | | | | | | | | | | | | 534,543 | | | | | | | | | | | | 11,736,178 | | | | | | | | | | | | 9,001,465 | | | | | |
| | | | | | | | | | | | |
Expenses: | | | | | | | | | | | | | | | | | | | | | | | | | | | | | | | | | | | | | | | | | | | | | | | | |
| | | | | | | | | | | | |
Investment advisory and management fees | | | | | | | 1,794,097 | | | | | | | | | | | | 118,218 | | | | | | | | | | | | 7,024,552 | | | | | | | | | | | | 1,463,990 | | | | | |
| | | | | | | | | | | | |
Administrative fees | | | | | | | 480,562 | | | | | | | | | | | | 50,665 | | | | | | | | | | | | 1,317,103 | | | | | | | | | | | | 439,197 | | | | | |
| | | | | | | | | | | | |
Distribution fees - Class N | | | | | | | 583,221 | | | | | | | | | | | | 9,131 | | | | | | | | | | | | 101,742 | | | | | | | | | | | | 83,760 | | | | | |
| | | | | | | | | | | | |
Shareholder servicing fees - Class N | | | | | | | 234,591 | | | | | | | | | | | | 3,652 | | | | | | | | | | | | 41,351 | | | | | | | | | | | | 13,402 | | | | | |
| | | | | | | | | | | | |
Shareholder servicing fees - Class I | | | | | | | 39,129 | | | | | | | | | | | | 10,088 | | | | | | | | | | | | 724,266 | | | | | | | | | | | | 102,337 | | | | | |
| | | | | | | | | | | | |
Registration fees | | | | | | | 53,666 | | | | | | | | | | | | 27,754 | | | | | | | | | | | | 70,843 | | | | | | | | | | | | 41,567 | | | | | |
| | | | | | | | | | | | |
Professional fees | | | | | | | 48,683 | | | | | | | | | | | | 37,957 | | | | | | | | | | | | 90,034 | | | | | | | | | | | | 50,189 | | | | | |
| | | | | | | | | | | | |
Reports to shareholders | | | | | | | 41,344 | | | | | | | | | | | | 10,257 | | | | | | | | | | | | 85,260 | | | | | | | | | | | | 27,815 | | | | | |
| | | | | | | | | | | | |
Custodian fees | | | | | | | 36,439 | | | | | | | | | | | | 20,869 | | | | | | | | | | | | 74,906 | | | | | | | | | | | | 34,919 | | | | | |
| | | | | | | | | | | | |
Trustee fees and expenses | | | | | | | 21,883 | | | | | | | | | | | | 2,346 | | | | | | | | | | | | 60,136 | | | | | | | | | | | | 20,565 | | | | | |
| | | | | | | | | | | | |
Transfer agent fees | | | | | | | 20,073 | | | | | | | | | | | | 8,615 | | | | | | | | | | | | 25,978 | | | | | | | | | | | | 10,074 | | | | | |
| | | | | | | | | | | | |
Interest expense | | | | | | | 141 | | | | | | | | | | | | — | | | | | | | | | | | | — | | | | | | | | | | | | 27,722 | | | | | |
| | | | | | | | | | | | |
Miscellaneous | | | | | | | 17,703 | | | | | | | | | | | | 3,406 | | | | | | | | | | | | 94,605 | | | | | | | | | | | | 34,784 | | | | | |
| | | | | | | | | | | | |
Total expenses before offsets | | | | | | | 3,371,532 | | | | | | | | | | | | 302,958 | | | | | | | | | | | | 9,710,776 | | | | | | | | | | | | 2,350,321 | | | | | |
| | | | | | | | | | | | |
Expense reimbursements | | | | | | | (79,604 | ) | | | | | | | | | | | (77,427 | ) | | | | | | | | | | | — | | | | | | | | | | | | (132,074 | ) | | | | |
| | | | | | | | | | | | |
Expense reductions | | | | | | | (27,831 | ) | | | | | | | | | | | (1,269 | ) | | | | | | | | | | | (31,650 | ) | | | | | | | | | | | (14,703 | ) | | | | |
| | | | | | | | | | | | |
Net expenses | | | | | | | 3,264,097 | | | | | | | | | | | | 224,262 | | | | | | | | | | | | 9,679,126 | | | | | | | | | | | | 2,203,544 | | | | | |
| | | | | | | | | | | | | | | | | | | | | | | | | | | | | | | | | | | | | | | | | | | | | | | | |
| | | | | | | | | | | | |
Net investment income | | | | | | | 665,399 | | | | | | | | | | | | 310,281 | | | | | | | | | | | | 2,057,052 | | | | | | | | | | | | 6,797,921 | | | | | |
| | | | | | | | | | | | |
Net Realized and Unrealized Gain (Loss): | | | | | | | | | | | | | | | | | | | | | | | | | | | | | | | | | | | | | | | | | | | | | | | | |
| | | | | | | | | | | | |
Net realized gain on investments | | | | | | | 901,364 | | | | | | | | | | | | 952,719 | | | | | | | | | | | | 46,717,796 | | | | | | | | | | | | 9,443,458 | | | | | |
| | | | | | | | | | | | |
Net realized gain on foreign currency transactions | | | | | | | — | | | | | | | | | | | | 265 | | | | | | | | | | | | — | | | | | | | | | | | | — | | | | | |
| | | | | | | | | | | | |
Net change in unrealized appreciation/depreciation on investments | | | | | | | 21,147,317 | | | | | | | | | | | | 1,954,790 | | | | | | | | | | | | (33,287,036 | ) | | | | | | | | | | | (35,081,495 | ) | | | | |
| | | | | | | | | | | | |
Net realized and unrealized gain (loss) | | | | | | | 22,048,681 | | | | | | | | | | | | 2,907,774 | | | | | | | | | | | | 13,430,760 | | | | | | | | | | | | (25,638,037 | ) | | | | |
| | | | | | | | | | | | | | | | | | | | | | | | | | | | | | | | | | | | | | | | | | | | | | | | |
| | | | | | | | | | | | |
Net increase (decrease) in net assets resulting from operations | | | | | | | $22,714,080 | | | | | | | | | | | | $3,218,055 | | | | | | | | | | | | $15,487,812 | | | | | | | | | | | | $(18,840,116) | | | | | |
The accompanying notes are an integral part of these financial statements.
53
| | |
| | | Statement of Operations (continued) |
| | | |
| | | |
| | | | | | | | | | | | | | | | | | | | | | | | | | | | | | | | | | | | |
| | | AMG
River Road
Small-Mid Cap
Value Fund | | | AMG
River Road
International Value
Equity Fund | | | AMG
River Road
Focused Absolute
Value Fund | |
| | | | | | | | | |
Investment Income: | | | | | | | | | | | | | | | | | | | | | | | | | | | | | | | | | | | | |
| | | | | | | | | |
Dividend income | | | | | | | $3,312,895 | | | | | | | | | | | | $311,925 | | | | | | | | | | | | $1,109,976 | | | | | |
| | | | | | | | | |
Interest income | | | | | | | 305,821 | | | | | | | | | | | | 12,719 | | | | | | | | | | | | 12,663 | | | | | |
| | | | | | | | | |
Securities lending income | | | | | | | 26,710 | | | | | | | | | | | | 1,230 | | | | | | | | | | | | 3,479 | | | | | |
| | | | | | | | | |
Foreign withholding tax | | | | | | | (8,088 | ) | | | | | | | | | | | (45,409 | ) | | | | | | | | | | | (13,915 | ) | | | | |
| | | | | | | | | |
Total investment income | | | | | | | 3,637,338 | | | | | | | | | | | | 280,465 | | | | | | | | | | | | 1,112,203 | | | | | |
| | | | | | | | | |
Expenses: | | | | | | | | | | | | | | | | | | | | | | | | | | | | | | | | | | | | |
| | | | | | | | | |
Investment advisory and management fees | | | | | | | 1,979,853 | | | | | | | | | | | | 48,243 | | | | | | | | | | | | 335,713 | | | | | |
| | | | | | | | | |
Administrative fees | | | | | | | 395,971 | | | | | | | | | | | | 13,654 | | | | | | | | | | | | 83,928 | | | | | |
| | | | | | | | | |
Distribution fees - Class N | | | | | | | 45,405 | | | | | | | | | | | | 3,392 | | | | | | | | | | | | 5,405 | | | | | |
| | | | | | | | | |
Shareholder servicing fees - Class N | | | | | | | 11,458 | | | | | | | | | | | | 772 | | | | | | | | | | | | 886 | | | | | |
| | | | | | | | | |
Shareholder servicing fees - Class I | | | | | | | 114,994 | | | | | | | | | | | | 3,215 | | | | | | | | | | | | 18,737 | | | | | |
| | | | | | | | | |
Registration fees | | | | | | | 47,082 | | | | | | | | | | | | 24,605 | | | | | | | | | | | | 32,753 | | | | | |
| | | | | | | | | |
Professional fees | | | | | | | 46,130 | | | | | | | | | | | | 32,381 | | | | | | | | | | | | 33,322 | | | | | |
| | | | | | | | | |
Custodian fees | | | | | | | 36,153 | | | | | | | | | | | | 41,321 | | | | | | | | | | | | 21,348 | | | | | |
| | | | | | | | | |
Reports to shareholders | | | | | | | 23,330 | | | | | | | | | | | | 4,931 | | | | | | | | | | | | 6,684 | | | | | |
| | | | | | | | | |
Trustee fees and expenses | | | | | | | 17,978 | | | | | | | | | | | | 615 | | | | | | | | | | | | 3,560 | | | | | |
| | | | | | | | | |
Transfer agent fees | | | | | | | 8,790 | | | | | | | | | | | | 547 | | | | | | | | | | | | 881 | | | | | |
| | | | | | | | | |
Interest expense | | | | | | | — | | | | | | | | | | | | — | | | | | | | | | | | | 1,615 | | | | | |
| | | | | | | | | |
Miscellaneous | | | | | | | 29,176 | | | | | | | | | | | | 2,919 | | | | | | | | | | | | 8,045 | | | | | |
| | | | | | | | | |
Total expenses before offsets | | | | | | | 2,756,320 | | | | | | | | | | | | 176,595 | | | | | | | | | | | | 552,877 | | | | | |
| | | | | | | | | |
Expense reimbursements | | | | | | | — | | | | | | | | | | | | (102,768 | ) | | | | | | | | | | | (89,807 | ) | | | | |
| | | | | | | | | |
Expense reductions | | | | | | | (13,765 | ) | | | | | | | | | | | (1,542 | ) | | | | | | | | | | | (4,606 | ) | | | | |
| | | | | | | | | |
Net expenses | | | | | | | 2,742,555 | | | | | | | | | | | | 72,285 | | | | | | | | | | | | 458,464 | | | | | |
| | | | | | | | | | | | | | | | | | | | | | | | | | | | | | | | | | | | |
| | | | | | | | | |
Net investment income | | | | | | | 894,783 | | | | | | | | | | | | 208,180 | | | | | | | | | | | | 653,739 | | | | | |
| | | | | | | | | |
Net Realized and Unrealized Gain (Loss): | | | | | | | | | | | | | | | | | | | | | | | | | | | | | | | | | | | | |
| | | | | | | | | |
Net realized gain on investments | | | | | | | 11,328,295 | | | | | | | | | | | | 77,508 | | | | | | | | | | | | 1,333,699 | | | | | |
| | | | | | | | | |
Net realized loss on foreign currency transactions | | | | | | | — | | | | | | | | | | | | (3,634 | ) | | | | | | | | | | | — | | | | | |
| | | | | | | | | |
Net change in unrealized appreciation/depreciation on investments | | | | | | | (14,491,664 | ) | | | | | | | | | | | 898,267 | | | | | | | | | | | | 38,458 | | | | | |
| | | | | | | | | |
Net change in unrealized appreciation/depreciation on foreign currency translations | | | | | | | — | | | | | | | | | | | | 405 | | | | | | | | | | | | — | | | | | |
| | | | | | | | | |
Net realized and unrealized gain (loss) | | | | | | | (3,163,369 | ) | | | | | | | | | | | 972,546 | | | | | | | | | | | | 1,372,157 | | | | | |
| | | | | | | | | | | | | | | | | | | | | | | | | | | | | | | | | | | | |
| | | | | | | | | |
Net increase (decrease) in net assets resulting from operations | | | | | | | $(2,268,586) | | | | | | | | | | | | $1,180,726 | | | | | | | | | | | | $2,025,896 | | | | | |
The accompanying notes are an integral part of these financial statements.
54
| | |
| | | Statements of Changes in Net Assets For the fiscal years ended October 31, |
| | | |
| | | |
| | | | | | | | | | | | | | | | | | | | | | | | |
| | | AMG
River Road
Mid Cap Value Fund | | | AMG
River Road Large
Cap Value Select Fund | | | AMG
River Road
Small Cap Value Fund | |
| | | 2023 | | | 2022 | | | 2023 | | | 2022 | | | 2023 | | | 2022 | |
| | | | | | |
Increase (Decrease) in Net Assets Resulting From Operations: | | | | | | | | | | | | | | | | | | | | | | | | |
| | | | | | |
Net investment income (loss) | | | $665,399 | | | | $3,450,135 | | | | $310,281 | | | | $671,385 | | | | $2,057,052 | | | | $(2,967,724 | ) |
| | | | | | |
Net realized gain (loss) on investments | | | 901,364 | | | | 26,043,244 | | | | 952,984 | | | | (991,432 | ) | | | 46,717,796 | | | | 32,053,565 | |
| | | | | | |
Net change in unrealized appreciation/depreciation on investments | | | 21,147,317 | | | | (49,642,188 | ) | | | 1,954,790 | | | | (3,078,280 | ) | | | (33,287,036 | ) | | | (29,813,692 | ) |
| | | | | | |
Net increase (decrease) in net assets resulting from operations | | | 22,714,080 | | | | (20,148,809 | ) | | | 3,218,055 | | | | (3,398,327 | ) | | | 15,487,812 | | | | (727,851 | ) |
| | | | | | |
Distributions to Shareholders: | | | | | | | | | | | | | | | | | | | | | | | | |
| | | | | | |
Class N | | | (19,489,451 | ) | | | (9,096,124 | ) | | | (65,123 | ) | | | — | | | | (1,388,209 | ) | | | (2,525,400 | ) |
| | | | | | |
Class I | | | (5,976,906 | ) | | | (3,627,499 | ) | | | (618,612 | ) | | | (148,346 | ) | | | (28,767,483 | ) | | | (60,899,554 | ) |
| | | | | | |
Class Z | | | (608,991 | ) | | | (308,106 | ) | | | — | | | | — | | | | (343,645 | ) | | | (572,964 | ) |
| | | | | | |
Total distributions to shareholders | | | (26,075,348 | ) | | | (13,031,729 | ) | | | (683,735 | ) | | | (148,346 | ) | | | (30,499,337 | ) | | | (63,997,918 | ) |
| | | | | | |
Capital Share Transactions:1 | | | | | | | | | | | | | | | | | | | | | | | | |
| | | | | | |
Net increase (decrease) from capital share transactions | | | 428,469 | | | | (66,134,751 | ) | | | (4,532,536 | ) | | | (3,775,114 | ) | | | 30,420,185 | | | | 54,093,356 | |
| | | | | | | | | | | | | | | | | | | | | | | | |
| | | | | | |
Total increase (decrease) in net assets | | | (2,932,799 | ) | | | (99,315,289 | ) | | | (1,998,216 | ) | | | (7,321,787 | ) | | | 15,408,660 | | | | (10,632,413 | ) |
| | | | | | |
Net Assets: | | | | | | | | | | | | | | | | | | | | | | | | |
| | | | | | |
Beginning of year | | | 308,828,420 | | | | 408,143,709 | | | | 34,201,632 | | | | 41,523,419 | | | | 866,997,342 | | | | 877,629,755 | |
| | | | | | |
End of year | | | $305,895,621 | | | | $308,828,420 | | | | $32,203,416 | | | | $34,201,632 | | | | $882,406,002 | | | | $866,997,342 | |
1 See Note 1(g) of the Notes to Financial Statements.
The accompanying notes are an integral part of these financial statements.
55
| | |
| | | Statements of Changes in Net Assets (continued) For the fiscal years ended October 31, |
| | | |
| | | |
| | | | | | | | | | | | | | | | | | | | | | | | |
| | | AMG
River Road
Dividend All Cap
Value Fund | | | AMG
River Road
Small-Mid Cap
Value Fund | | | AMG
River Road
International Value
Equity Fund | |
| | | 2023 | | | 2022 | | | 2023 | | | 2022 | | | 2023 | | | 2022 | |
| | | | | | |
Increase (Decrease) in Net Assets Resulting From Operations: | | | | | | | | | | | | | | | | | | | | | | | | |
| | | | | | |
Net investment income (loss) | | | $6,797,921 | | | | $6,444,266 | | | | $894,783 | | | | $(94,938 | ) | | | $208,180 | | | | $278,429 | |
| | | | | | |
Net realized gain (loss) on investments | | | 9,443,458 | | | | 43,952,790 | | | | 11,328,295 | | | | 11,600,764 | | | | 73,874 | | | | (449,151 | ) |
| | | | | | |
Net change in unrealized appreciation/depreciation on investments | | | (35,081,495 | ) | | | (51,226,403 | ) | | | (14,491,664 | ) | | | (15,124,084 | ) | | | 898,672 | | | | (781,700 | ) |
| | | | | | |
Net increase (decrease) in net assets resulting from operations | | | (18,840,116 | ) | | | (829,347 | ) | | | (2,268,586 | ) | | | (3,618,258 | ) | | | 1,180,726 | | | | (952,422 | ) |
| | | | | | |
Distributions to Shareholders: | | | | | | | | | | | | | | | | | | | | | | | | |
| | | | | | |
Class N | | | (4,683,046 | ) | | | (7,853,246 | ) | | | (841,013 | ) | | | (1,300,180 | ) | | | (41,450 | ) | | | (8,584 | ) |
| | | | | | |
Class I | | | (37,442,154 | ) | | | (67,471,975 | ) | | | (8,300,606 | ) | | | (11,974,114 | ) | | | (211,394 | ) | | | (52,305 | ) |
| | | | | | |
Class Z | | | (451,503 | ) | | | (467,570 | ) | | | (1,508,182 | ) | | | (2,022,835 | ) | | | (35,864 | ) | | | (4,607 | ) |
| | | | | | |
Total distributions to shareholders | | | (42,576,703 | ) | | | (75,792,791 | ) | | | (10,649,801 | ) | | | (15,297,129 | ) | | | (288,708 | ) | | | (65,496 | ) |
| | | | | | |
Capital Share Transactions:1 | | | | | | | | | | | | | | | | | | | | | | | | |
| | | | | | |
Net increase (decrease) from capital share transactions | | | (35,265,575 | ) | | | (21,546,543 | ) | | | 33,451,833 | | | | (16,650,233 | ) | | | 1,944,998 | | | | (1,091,145 | ) |
| | | | | | | | | | | | | | | | | | | | | | | | |
| | | | | | |
Total increase (decrease) in net assets | | | (96,682,394 | ) | | | (98,168,681 | ) | | | 20,533,446 | | | | (35,565,620 | ) | | | 2,837,016 | | | | (2,109,063 | ) |
| | | | | | |
Net Assets: | | | | | | | | | | | | | | | | | | | | | | | | |
| | | | | | |
Beginning of year | | | 330,262,370 | | | | 428,431,051 | | | | 241,600,829 | | | | 277,166,449 | | | | 7,108,482 | | | | 9,217,545 | |
| | | | | | |
End of year | | | $233,579,976 | | | | $330,262,370 | | | | $262,134,275 | | | | $241,600,829 | | | | $9,945,498 | | | | $7,108,482 | |
1 See Note 1(g) of the Notes to Financial Statements.
The accompanying notes are an integral part of these financial statements.
56
| | |
| | | Statements of Changes in Net Assets (continued) For the fiscal years ended October 31, |
| | | |
| | | |
| | | | | | | | |
| | | AMG
River Road
Focused Absolute
Value Fund | |
| | |
| | | 2023 | | | 2022 | |
| | |
Increase (Decrease) in Net Assets Resulting From Operations: | | | | | | | | |
| | |
Net investment income | | | $653,739 | | | | $716,791 | |
| | |
Net realized gain on investments | | | 1,333,699 | | | | 2,657,573 | |
| | |
Net change in unrealized appreciation/depreciation on investments | | | 38,458 | | | | (21,462,247 | ) |
| | | | | | | | |
| | |
Net increase (decrease) in net assets resulting from operations | | | 2,025,896 | | | | (18,087,883 | ) |
| | |
Distributions to Shareholders: | | | | | | | | |
| | |
Class N | | | (16,781 | ) | | | (221,233 | ) |
| | |
Class I | | | (521,709 | ) | | | (12,072,508 | ) |
| | |
Class Z | | | (81,036 | ) | | | (930,537 | ) |
| | |
Total distributions to shareholders | | | (619,526 | ) | | | (13,224,278 | ) |
| | |
Capital Share Transactions:1 | | | | | | | | |
| | |
Net decrease from capital share transactions | | | (16,381,325 | ) | | | (98,597,273 | ) |
| | | | | | | | |
| | |
Total decrease in net assets | | | (14,974,955 | ) | | | (129,909,434 | ) |
| | |
Net Assets: | | | | | | | | |
| | |
Beginning of year | | | 63,539,644 | | | | 193,449,078 | |
| | | | | | | | |
| | |
End of year | | | $48,564,689 | | | | $63,539,644 | |
1 See Note 1(g) of the Notes to Financial Statements.
The accompanying notes are an integral part of these financial statements.
57
| | |
| | | AMG River Road Mid Cap Value Fund Financial Highlights For a share outstanding throughout each fiscal year |
| | | |
| | | |
| | | | | | | | | | | | | | | | | | | | | | | | | | | | | | | | | | | | | | | | |
| | | For the fiscal years ended October 31, | |
| Class N | | | | | 2023 | | | | | | 2022 | | | | | | 2021 | | | | | | 2020 | | | | | | 2019 | |
| | | | | | | | | | |
Net Asset Value, Beginning of Year | | | | | | | $17.74 | | | | | | | | $19.43 | | | | | | | | $29.75 | | | | | | | | $34.95 | | | | | | | | $38.27 | |
| | | | | | | | | | |
Income (loss) from Investment Operations: | | | | | | | | | | | | | | | | | | | | | | | | | | | | | | | | | | | | | | | | |
| | | | | | | | | | |
Net investment income1,2 | | | | | | | 0.02 | | | | | | | | 0.17 | 3 | | | | | | | 0.02 | 4 | | | | | | | 0.16 | | | | | | | | 0.34 | 5 |
| | | | | | | | | | |
Net realized and unrealized gain (loss) on investments | | | | | | | 1.21 | | | | | | | | (1.22 | ) | | | | | | | 11.69 | | | | | | | | (2.85 | ) | | | | | | | (0.85 | ) |
| | | | | | | | | | | | | | | | | | | | | | | | | | | | | | | | | | | | | | | | |
| | | | | | | | | | |
Total income (loss) from investment operations | | | | | | | 1.23 | | | | | | | | (1.05 | ) | | | | | | | 11.71 | | | | | | | | (2.69 | ) | | | | | | | (0.51 | ) |
| | | | | | | | | | |
Less Distributions to Shareholders from: | | | | | | | | | | | | | | | | | | | | | | | | | | | | | | | | | | | | | | | | |
| | | | | | | | | | |
Net investment income | | | | | | | (0.16 | ) | | | | | | | (0.04 | ) | | | | | | | (0.02 | ) | | | | | | | (0.33 | ) | | | | | | | (0.15 | ) |
| | | | | | | | | | |
Net realized gain on investments | | | | | | | (1.38 | ) | | | | | | | (0.60 | ) | | | | | | | (22.01 | ) | | | | | | | (2.18 | ) | | | | | | | (2.66 | ) |
| | | | | | | | | | | | | | | | | | | | | | | | | | | | | | | | | | | | | | | | |
| | | | | | | | | | |
Total distributions to shareholders | | | | | | | (1.54 | ) | | | | | | | (0.64 | ) | | | | | | | (22.03 | ) | | | | | | | (2.51 | ) | | | | | | | (2.81 | ) |
| | | | | | | | | | |
Net Asset Value, End of Year | | | | | | | $17.43 | | | | | | | | $17.74 | | | | | | | | $19.43 | | | | | | | | $29.75 | | | | | | | | $34.95 | |
| | | | | | | | | | | | | | | | | | | | | | | | | | | | | | | | | | | | | | | | |
| | | | | | | | | | |
Total Return2,6 | | | | | | | 7.39 | % | | | | | | | (5.67 | )% | | | | | | | 50.65 | % | | | | | | | (8.62 | )% | | | | | | | (0.55 | )% |
| | | | | | | | | | |
Ratio of net expenses to average net assets | | | | | | | 1.10 | %7 | | | | | | | 1.09 | %7 | | | | | | | 1.13 | %7 | | | | | | | 1.14 | % | | | | | | | 1.15 | % |
| | | | | | | | | | |
Ratio of gross expenses to average net assets8 | | | | | | | 1.13 | % | | | | | | | 1.11 | % | | | | | | | 1.18 | % | | | | | | | 1.16 | % | | | | | | | 1.15 | % |
| | | | | | | | | | |
Ratio of net investment income to average net assets2 | | | | | | | 0.13 | % | | | | | | | 0.90 | % | | | | | | | 0.08 | % | | | | | | | 0.52 | % | | | | | | | 0.95 | % |
| | | | | | | | | | |
Portfolio turnover | | | | | | | 75 | % | | | | | | | 71 | % | | | | | | | 149 | % | | | | | | | 50 | % | | | | | | | 21 | % |
| | | | | | | | | | |
Net assets end of year (000’s) omitted | | | | | | | $220,480 | | | | | | | | $227,513 | | | | | | | | $287,165 | | | | | | | | $259,561 | | | | | | | | $518,354 | |
| | | | | | | | | | | | | | | | | | | | | | | | | | | | | | | |
58
| | |
| | | AMG River Road Mid Cap Value Fund Financial Highlights For a share outstanding throughout each fiscal year |
| | | |
| | | |
| | | | | | | | | | | | | | | | | | | | | | | | | | | | | | | | | | | | | | | | |
| | | For the fiscal years ended October 31, | |
| | | | | | | | | | |
| Class I | | | | | 2023 | | | | | | 2022 | | | | | | 2021 | | | | | | 2020 | | | | | | 2019 | |
| | | | | | | | | | |
Net Asset Value, Beginning of Year | | | | | | | $19.05 | | | | | | | | $20.82 | | | | | | | | $30.68 | | | | | | | | $35.96 | | | | | | | | $39.33 | |
| | | | | | | | | | |
Income (loss) from Investment Operations: | | | | | | | | | | | | | | | | | | | | | | | | | | | | | | | | | | | | | | | | |
| | | | | | | | | | |
Net investment income1,2 | | | | | | | 0.08 | | | | | | | | 0.24 | 3 | | | | | | | 0.09 | 4 | | | | | | | 0.25 | | | | | | | | 0.45 | 5 |
| | | | | | | | | | |
Net realized and unrealized gain (loss) on investments | | | | | | | 1.31 | | | | | | | | (1.32 | ) | | | | | | | 12.16 | | | | | | | | (2.94 | ) | | | | | | | (0.89 | ) |
| | | | | | | | | | | | | | | | | | | | | | | | | | | | | | | | | | | | | | | | |
| | | | | | | | | | |
Total income (loss) from investment operations | | | | | | | 1.39 | | | | | | | | (1.08 | ) | | | | | | | 12.25 | | | | | | | | (2.69 | ) | | | | | | | (0.44 | ) |
| | | | | | | | | | |
Less Distributions to Shareholders from: | | | | | | | | | | | | | | | | | | | | | | | | | | | | | | | | | | | | | | | | |
| | | | | | | | | | |
Net investment income | | | | | | | (0.22 | ) | | | | | | | (0.09 | ) | | | | | | | (0.10 | ) | | | | | | | (0.41 | ) | | | | | | | (0.27 | ) |
| | | | | | | | | | |
Net realized gain on investments | | | | | | | (1.38 | ) | | | | | | | (0.60 | ) | | | | | | | (22.01 | ) | | | | | | | (2.18 | ) | | | | | | | (2.66 | ) |
| | | | | | | | | | | | | | | | | | | | | | | | | | | | | | | | | | | | | | | | |
| | | | | | | | | | |
Total distributions to shareholders | | | | | | | (1.60 | ) | | | | | | | (0.69 | ) | | | | | | | (22.11 | ) | | | | | | | (2.59 | ) | | | | | | | (2.93 | ) |
| | | | | | | | | | |
Net Asset Value, End of Year | | | | | | | $18.84 | | | | | | | | $19.05 | | | | | | | | $20.82 | | | | | | | | $30.68 | | | | | | | | $35.96 | |
| | | | | | | | | | | | | | | | | | | | | | | | | | | | | | | | | | | | | | | | |
| | | | | | | | | | |
Total Return2,6 | | | | | | | 7.72 | % | | | | | | | (5.41 | )% | | | | | | | 51.11 | % | | | | | | | (8.38 | )% | | | | | | | (0.33 | )% |
| | | | | | | | | | |
Ratio of net expenses to average net assets | | | | | | | 0.80 | %7 | | | | | | | 0.80 | %7 | | | | | | | 0.87 | %7 | | | | | | | 0.90 | % | | | | | | | 0.90 | % |
| | | | | | | | | | |
Ratio of gross expenses to average net assets8 | | | | | | | 0.83 | % | | | | | | | 0.82 | % | | | | | | | 0.92 | % | | | | | | | 0.92 | % | | | | | | | 0.90 | % |
| | | | | | | | | | |
Ratio of net investment income to average net assets2 | | | | | | | 0.43 | % | | | | | | | 1.19 | % | | | | | | | 0.34 | % | | | | | | | 0.76 | % | | | | | | | 1.20 | % |
| | | | | | | | | | |
Portfolio turnover | | | | | | | 75 | % | | | | | | | 71 | % | | | | | | | 149 | % | | | | | | | 50 | % | | | | | | | 21 | % |
| | | | | | | | | | |
Net assets end of year (000’s) omitted | | | | | | | $78,562 | | | | | | | | $74,094 | | | | | | | | $112,741 | | | | | | | | $176,807 | | | | | | | | $1,102,479 | |
| | | | | | | | | | | | | | | | | | | | | | | | | | | | | | | |
59
| | |
| | | AMG River Road Mid Cap Value Fund Financial Highlights For a share outstanding throughout each fiscal year |
| | | |
| | | |
| | | | | | | | | | | | | | | | | | | | | | | | | | | | | | | | | | | | | | | | |
| | | For the fiscal years ended October 31, | |
| | | | | | | | | | |
| Class Z | | | | | 2023 | | | | | | 2022 | | | | | | 2021 | | | | | | 2020 | | | | | | 2019 | |
| | | | | | | | | | |
Net Asset Value, Beginning of Year | | | | | | | $18.94 | | | | | | | | $20.71 | | | | | | | | $30.63 | | | | | | | | $35.95 | | | | | | | | $39.34 | |
| | | | | | | | | | |
Income (loss) from Investment Operations: | | | | | | | | | | | | | | | | | | | | | | | | | | | | | | | | | | | | | | | | |
| | | | | | | | | | |
Net investment income1,2 | | | | | | | 0.09 | | | | | | | | 0.24 | 3 | | | | | | | 0.10 | 4 | | | | | | | 0.28 | | | | | | | | 0.48 | 5 |
| | | | | | | | | | |
Net realized and unrealized gain (loss) on investments | | | | | | | 1.29 | | | | | | | | (1.29 | ) | | | | | | | 12.13 | | | | | | | | (2.94 | ) | | | | | | | (0.89 | ) |
| | | | | | | | | | | | | | | | | | | | | | | | | | | | | | | | | | | | | | | | |
| | | | | | | | | | |
Total income (loss) from investment operations | | | | | | | 1.38 | | | | | | | | (1.05 | ) | | | | | | | 12.23 | | | | | | | | (2.66 | ) | | | | | | | (0.41 | ) |
| | | | | | | | | | |
Less Distributions to Shareholders from: | | | | | | | | | | | | | | | | | | | | | | | | | | | | | | | | | | | | | | | | |
| | | | | | | | | | |
Net investment income | | | | | | | (0.23 | ) | | | | | | | (0.12 | ) | | | | | | | (0.14 | ) | | | | | | | (0.48 | ) | | | | | | | (0.32 | ) |
| | | | | | | | | | |
Net realized gain on investments | | | | | | | (1.38 | ) | | | | | | | (0.60 | ) | | | | | | | (22.01 | ) | | | | | | | (2.18 | ) | | | | | | | (2.66 | ) |
| | | | | | | | | | | | | | | | | | | | | | | | | | | | | | | | | | | | | | | | |
| | | | | | | | | | |
Total distributions to shareholders | | | | | | | (1.61 | ) | | | | | | | (0.72 | ) | | | | | | | (22.15 | ) | | | | | | | (2.66 | ) | | | | | | | (2.98 | ) |
| | | | | | | | | | |
Net Asset Value, End of Year | | | | | | | $18.71 | | | | | | | | $18.94 | | | | | | | | $20.71 | | | | | | | | $30.63 | | | | | | | | $35.95 | |
| | | | | | | | | | | | | | | | | | | | | | | | | | | | | | | | | | | | | | | | |
| | | | | | | | | | |
Total Return2,6 | | | | | | | 7.73 | % | | | | | | | (5.34 | )% | | | | | | | 51.18 | % | | | | | | | (8.32 | )% | | | | | | | (0.25 | )% |
| | | | | | | | | | |
Ratio of net expenses to average net assets | | | | | | | 0.75 | %7 | | | | | | | 0.75 | %7 | | | | | | | 0.80 | %7 | | | | | | | 0.82 | % | | | | | | | 0.82 | % |
| | | | | | | | | | |
Ratio of gross expenses to average net assets8 | | | | | | | 0.78 | % | | | | | | | 0.77 | % | | | | | | | 0.85 | % | | | | | | | 0.84 | % | | | | | | | 0.82 | % |
| | | | | | | | | | |
Ratio of net investment income to average net assets2 | | | | | | | 0.48 | % | | | | | | | 1.24 | % | | | | | | | 0.41 | % | | | | | | | 0.84 | % | | | | | | | 1.28 | % |
| | | | | | | | | | |
Portfolio turnover | | | | | | | 75 | % | | | | | | | 71 | % | | | | | | | 149 | % | | | | | | | 50 | % | | | | | | | 21 | % |
| | | | | | | | | | |
Net assets end of year (000’s) omitted | | | | | | | $6,853 | | | | | | | | $7,221 | | | | | | | | $8,237 | | | | | | | | $9,786 | | | | | | | | $47,907 | |
| | | | | | | | | | | | | | | | | | | | | | | | | | | | | | | |
| 1 | Per share numbers have been calculated using average shares. |
| 2 | Total returns and net investment income (loss) would have been lower had certain expenses not been offset. |
| 3 | Includes non-recurring dividends. Without these dividends, net investment income per share would have been $0.05, $0.11 and $0.11 for Class N, Class I and Class Z, respectively. |
| 4 | Includes non-recurring dividends. Without these dividends, net investment income (loss) per share would have been $(0.02), $0.05 and $0.06 for Class N, Class I and Class Z, respectively. |
| 5 | Includes non-recurring dividends. Without these dividends, net investment income per share would have been $0.23, $0.33 and $0.36 for Class N, Class I and Class Z, respectively. |
| 6 | The total return is calculated using the published Net Asset Value as of fiscal year end. |
| 7 | Includes reduction from brokerage recapture amounting to 0.01%, 0.01% and less than 0.01% for the fiscal years ended October 31, 2023, 2022 and 2021, respectively. |
| 8 | Excludes the impact of expense reimbursement or fee waivers and expense reductions such as brokerage credits, but includes expense repayments and non-reimbursable expenses, if any, such as interest, taxes, and extraordinary expenses. (See Note 1(c) and 2 in the Notes to Financial Statements.) |
60
| | |
| | | AMG River Road Large Cap Value Select Fund Financial Highlights For a share outstanding throughout each fiscal year |
| | | |
| | | |
| | | | | | | | | | | | | | | | | | | | | | | | | |
| | | For the fiscal years ended October 31, |
| | | | | |
| Class N | | 2023 | | 2022 | | 2021 | | 2020 | | 2019 |
| | | | | |
Net Asset Value, Beginning of Year | | | | $14.08 | | | | | $15.45 | | | | | $13.73 | | | | | $16.22 | | | | | $15.68 | |
| | | | | |
Income (loss) from Investment Operations: | | | | | | | | | | | | | | | | | | | | | | | | | |
| | | | | |
Net investment income1,2 | | | | 0.10 | | | | | 0.22 | 3 | | | | 0.01 | | | | | 0.04 | 4 | | | | 0.12 | 5 |
| | | | | | |
Net realized and unrealized gain (loss) on investments | | | | 1.22 | | | | | (1.59 | ) | | | | 4.27 | | | | | (1.84 | ) | | | | 0.95 | |
| | | | | |
Total income (loss) from investment operations | | | | 1.32 | | | | | (1.37 | ) | | | | 4.28 | | | | | (1.80 | ) | | | | 1.07 | |
| | | | | |
Less Distributions to Shareholders from: | | | | | | | | | | | | | | | | | | | | | | | | | |
| | | | | |
Net investment income | | | | (0.25 | ) | | | | — | | | | | (2.56 | ) | | | | — | | | | | (0.02 | ) |
| | | | | |
Net realized gain on investments | | | | — | | | | | — | | | | | — | | | | | (0.69 | ) | | | | (0.51 | ) |
| | | | | |
Total distributions to shareholders | | | | (0.25 | ) | | | | — | | | | | (2.56 | ) | | | | (0.69 | ) | | | | (0.53 | ) |
| | | | | |
Net Asset Value, End of Year | | | | $15.15 | | | | | $14.08 | | | | | $15.45 | | | | | $13.73 | | | | | $16.22 | |
| | | | | |
Total Return2,6 | | | | 9.50 | % | | | | (8.87 | )% | | | | 33.53 | % | | | | (11.66 | )% | | | | 7.15 | % |
| | | | | |
Ratio of net expenses to average net assets | | | | 0.95 | %7 | | | | 0.95 | %7 | | | | 1.00 | %7 | | | | 1.04 | % | | | | 1.28 | %7,8 |
| | | | | |
Ratio of gross expenses to average net assets9 | | | | 1.18 | % | | | | 1.07 | % | | | | 1.14 | % | | | | 1.08 | % | | | | 1.30 | % |
| | | | | |
Ratio of net investment income to average net assets2 | | | | 0.64 | % | | | | 1.51 | % | | | | 0.08 | % | | | | 0.25 | % | | | | 0.74 | % |
| | | | | |
Portfolio turnover | | | | 77 | % | | | | 91 | % | | | | 256 | % | | | | 750 | % | | | | 330 | % |
| | | | | |
Net assets end of year (000’s) omitted | | | | $3,373 | | | | | $3,683 | | | | | $4,623 | | | | | $4,716 | | | | | $14,301 | |
61
| | |
| | | AMG River Road Large Cap Value Select Fund Financial Highlights For a share outstanding throughout each fiscal year |
| | | |
| | | |
| | | | | | | | | | | | | | | | | | | | | | | | | |
| | | For the fiscal years ended October 31, |
| | | | | |
| Class I | | 2023 | | 2022 | | 2021 | | 2020 | | 2019 |
| | | | | |
Net Asset Value, Beginning of Year | | | | $14.19 | | | | | $15.58 | | | | | $13.80 | | | | | $16.25 | | | | | $15.71 | |
| | | | | |
Income (loss) from Investment Operations: | | | | | | | | | | | | | | | | | | | | | | | | | |
| | | | | |
Net investment income1,2 | | | | 0.14 | | | | | 0.27 | 3 | | | | 0.06 | | | | | 0.08 | 4 | | | | 0.16 | 5 |
| | | | | | |
Net realized and unrealized gain (loss) on investments | | | | 1.23 | | | | | (1.60 | ) | | | | 4.29 | | | | | (1.84 | ) | | | | 0.95 | |
| | | | | |
Total income (loss) from investment operations | | | | 1.37 | | | | | (1.33 | ) | | | | 4.35 | | | | | (1.76 | ) | | | | 1.11 | |
| | | | | |
Less Distributions to Shareholders from: | | | | | | | | | | | | | | | | | | | | | | | | | |
| | | | | |
Net investment income | | | | (0.30 | ) | | | | (0.06 | ) | | | | (2.57 | ) | | | | — | | | | | (0.06 | ) |
| | | | | |
Net realized gain on investments | | | | — | | | | | — | | | | | — | | | | | (0.69 | ) | | | | (0.51 | ) |
| | | | | |
Total distributions to shareholders | | | | (0.30 | ) | | | | (0.06 | ) | | | | (2.57 | ) | | | | (0.69 | ) | | | | (0.57 | ) |
| | | | | |
Net Asset Value, End of Year | | | | $15.26 | | | | | $14.19 | | | | | $15.58 | | | | | $13.80 | | | | | $16.25 | |
| | | | | |
Total Return2,6 | | | | 9.83 | % | | | | (8.55 | )% | | | | 33.93 | % | | | | (11.38 | )% | | | | 7.43 | % |
| | | | | |
Ratio of net expenses to average net assets | | | | 0.63 | %7 | | | | 0.63 | %7 | | | | 0.69 | %7 | | | | 0.76 | % | | | | 0.99 | %7,8 |
| | | | | |
Ratio of gross expenses to average net assets9 | | | | 0.86 | % | | | | 0.75 | % | | | | 0.83 | % | | | | 0.80 | % | | | | 1.01 | % |
| | | | | |
Ratio of net investment income to average net assets2 | | | | 0.96 | % | | | | 1.83 | % | | | | 0.39 | % | | | | 0.53 | % | | | | 1.03 | % |
| | | | | |
Portfolio turnover | | | | 77 | % | | | | 91 | % | | | | 256 | % | | | | 750 | % | | | | 330 | % |
| | | | | |
Net assets end of year (000’s) omitted | | | | $28,831 | | | | | $30,519 | | | | | $36,900 | | | | | $38,990 | | | | | $83,323 | |
| 1 | Per share numbers have been calculated using average shares. |
| 2 | Total returns and net investment income (loss) would have been lower had certain expenses not been offset. |
| 3 | Includes non-recurring dividends. Without these dividends, net investment income per share would have been $0.08 and $0.13 for Class N and Class I, respectively. |
| 4 | Includes non-recurring dividends. Without these dividends, net investment income (loss) per share would have been $(0.01) and $0.03 for Class N and Class I, respectively. |
| 5 | Includes non-recurring dividends. Without these dividends, net investment income per share would have been $0.07 and $0.12 for Class N and Class I, respectively. |
| 6 | The total return is calculated using the published Net Asset Value as of fiscal year end. |
| 7 | Includes reduction from broker recapture amounting to less than 0.01% for the fiscal years ended October 31, 2023, 2022, 2021 and 2019, respectively. |
| 8 | Expense ratio includes dividend and interest expense related to securities sold short. Excluding such dividend and interest expense, the ratio of net expenses to average net assets would be 1.04% and 0.75% for Class N and Class I, respectively, for the fiscal year ended October 31, 2019. |
| 9 | Excludes the impact of expense reimbursement or fee waivers and expense reductions such as brokerage credits, but includes expense repayments and non-reimbursable expenses, if any, such as interest, taxes, and extraordinary expenses. (See Note 1(c) and 2 in the Notes to Financial Statements.) |
62
| | |
| | | AMG River Road Small Cap Value Fund Financial Highlights For a share outstanding throughout each fiscal year |
| | | |
| | | |
| | | | | | | | | | | | | | | | | | | | |
| |
| | | For the fiscal years ended October 31, |
| | | | | |
Class N | | 2023 | | 2022 | | 2021 | | 2020 | | 2019 |
| | | | | |
Net Asset Value, Beginning of Year | | | $14.26 | | | | $15.45 | | | | $10.76 | | | | $13.00 | | | | $13.26 | |
| | | | | |
Income (loss) from Investment Operations: | | | | | | | | | | | | | | | | | | | | |
| | | | | |
Net investment loss1,2 | | | (0.00 | )3 | | | (0.09 | ) | | | (0.09 | ) | | | (0.02 | ) | | | (0.04 | ) |
| | | | | |
Net realized and unrealized gain (loss) on investments | | | 0.20 | | | | 0.06 | | | | 4.78 | | | | (1.43 | ) | | | 1.17 | |
| | | | | |
Total income (loss) from investment operations | | | 0.20 | | | | (0.03 | ) | | | 4.69 | | | | (1.45 | ) | | | 1.13 | |
| | | | | |
Less Distributions to Shareholders from: | | | | | | | | | | | | | | | | | | | | |
| | | | | |
Net realized gain on investments | | | (0.52 | ) | | | (1.16 | ) | | | — | | | | (0.79 | ) | | | (1.39 | ) |
| | | | | |
Net Asset Value, End of Year | | | $13.94 | | | | $14.26 | | | | $15.45 | | | | $10.76 | | | | $13.00 | |
| | | | | |
Total Return2,4 | | | 1.58 | % | | | (0.35 | )% | | | 43.59 | % | | | (12.09 | )% | | | 10.86 | % |
| | | | | |
Ratio of net expenses to average net assets5 | | | 1.35 | % | | | 1.35 | % | | | 1.33 | % | | | 1.34 | % | | | 1.36 | % |
| | | | | |
Ratio of gross expenses to average net assets6 | | | 1.35 | % | | | 1.35 | % | | | 1.35 | % | | | 1.36 | % | | | 1.37 | % |
| | | | | |
Ratio of net investment loss to average net assets2 | | | (0.01 | )% | | | (0.60 | )% | | | (0.61 | )% | | | (0.19 | )% | | | (0.33 | )% |
| | | | | |
Portfolio turnover | | | 25 | % | | | 33 | % | | | 39 | % | | | 42 | % | | | 47 | % |
| | | | | |
Net assets end of year (000’s) omitted | | | $41,927 | | | | $37,265 | | | | $34,246 | | | | $25,920 | | | | $29,963 | |
| | | | | | | | | | | |
63
| | |
| | | AMG River Road Small Cap Value Fund Financial Highlights For a share outstanding throughout each fiscal year |
| | | |
| | | |
| | | | | | | | | | | | | | | | | | | | | | | | | |
| | | For the fiscal years ended October 31, |
| | | | | |
| Class I | | 2023 | | 2022 | | 2021 | | 2020 | | 2019 |
| | | | | |
Net Asset Value, Beginning of Year | | | | $14.76 | | | | | $15.91 | | | | | $11.05 | | | | | $13.30 | | | | | $13.51 | |
| | | | | |
Income (loss) from Investment Operations: | | | | | | | | | | | | | | | | | | | | | | | | | |
| | | | | |
Net investment income (loss)1,2 | | | | 0.04 | | | | | (0.05 | ) | | | | (0.05 | ) | | | | 0.01 | | | | | (0.01 | ) |
| | | | | |
Net realized and unrealized gain (loss) on investments | | | | 0.20 | | | | | 0.06 | | | | | 4.91 | | | | | (1.46 | ) | | | | 1.20 | |
| | | | | |
Total income (loss) from investment operations | | | | 0.24 | | | | | 0.01 | | | | | 4.86 | | | | | (1.45 | ) | | | | 1.19 | |
| | | | | |
Less Distributions to Shareholders from: | | | | | | | | | | | | | | | | | | | | | | | | | |
| | | | | |
Net investment income | | | | — | | | | | — | | | | | (0.00 | )3 | | | | (0.01 | ) | | | | (0.01 | ) |
| | | | | |
Net realized gain on investments | | | | (0.52 | ) | | | | (1.16 | ) | | | | — | | | | | (0.79 | ) | | | | (1.39 | ) |
| | | | | |
Total distributions to shareholders | | | | (0.52 | ) | | | | (1.16 | ) | | | | (0.00 | )3 | | | | (0.80 | ) | | | | (1.40 | ) |
| | | | | |
Net Asset Value, End of Year | | | | $14.48 | | | | | $14.76 | | | | | $15.91 | | | | | $11.05 | | | | | $13.30 | |
| | | | | |
Total Return2,4 | | | | 1.81 | % | | | | (0.07 | )% | | | | 43.99 | % | | | | (11.91 | )% | | | | 11.23 | % |
| | | | | |
Ratio of net expenses to average net assets5 | | | | 1.09 | % | | | | 1.09 | % | | | | 1.07 | % | | | | 1.07 | % | | | | 1.09 | % |
| | | | | |
Ratio of gross expenses to average net assets6 | | | | 1.09 | % | | | | 1.09 | % | | | | 1.09 | % | | | | 1.09 | % | | | | 1.10 | % |
| | | | | |
Ratio of net investment income (loss) to average net assets2 | | | | 0.25 | % | | | | (0.34 | )% | | | | (0.35 | )% | | | | 0.07 | % | | | | (0.06 | )% |
| | | | | |
Portfolio turnover | | | | 25 | % | | | | 33 | % | | | | 39 | % | | | | 42 | % | | | | 47 | % |
| | | | | |
Net assets end of year (000’s) omitted | | | | $830,022 | | | | | $819,940 | | | | | $835,473 | | | | | $487,637 | | | | | $374,344 | |
64
| | |
| | | AMG River Road Small Cap Value Fund Financial Highlights For a share outstanding throughout each fiscal year |
| | | |
| | | |
| | | | | | | | | | | | | | | | | | | | | | | | | |
| | | For the fiscal years ended October 31, |
| | | | | |
| Class Z | | 2023 | | 2022 | | 2021 | | 2020 | | 2019 |
| | | | | |
Net Asset Value, Beginning of Year | | | | $14.78 | | | | | $15.92 | | | | | $11.05 | | | | | $13.30 | | | | | $13.51 | |
| | | | | |
Income (loss) from Investment Operations: | | | | | | | | | | | | | | | | | | | | | | | | | |
| | | | | |
Net investment income (loss)1,2 | | | | 0.05 | | | | | (0.04 | ) | | | | (0.04 | ) | | | | 0.02 | | | | | 0.00 | 7 |
| | | | | | |
Net realized and unrealized gain (loss) on investments | | | | 0.21 | | | | | 0.06 | | | | | 4.92 | | | | | (1.46 | ) | | | | 1.20 | |
| | | | | |
Total income (loss) from investment operations | | | | 0.26 | | | | | 0.02 | | | | | 4.88 | | | | | (1.44 | ) | | | | 1.20 | |
| | | | | |
Less Distributions to Shareholders from: | | | | | | | | | | | | | | | | | | | | | | | | | |
| | | | | |
Net investment income | | | | — | | | | | — | | | | | (0.01 | ) | | | | (0.02 | ) | | | | (0.02 | ) |
| | | | | |
Net realized gain on investments | | | | (0.52 | ) | | | | (1.16 | ) | | | | — | | | | | (0.79 | ) | | | | (1.39 | ) |
| | | | | |
Total distributions to shareholders | | | | (0.52 | ) | | | | (1.16 | ) | | | | (0.01 | ) | | | | (0.81 | ) | | | | (1.41 | ) |
| | | | | |
Net Asset Value, End of Year | | | | $14.52 | | | | | $14.78 | | | | | $15.92 | | | | | $11.05 | | | | | $13.30 | |
| | | | | |
Total Return2,4 | | | | 1.94 | % | | | | (0.00 | )%8 | | | | 44.17 | % | | | | (11.78 | )% | | | | 11.29 | % |
| | | | | |
Ratio of net expenses to average net assets5 | | | | 1.00 | % | | | | 1.00 | % | | | | 0.98 | % | | | | 0.99 | % | | | | 1.01 | % |
| | | | | |
Ratio of gross expenses to average net assets6 | | | | 1.00 | % | | | | 1.00 | % | | | | 1.00 | % | | | | 1.01 | % | | | | 1.02 | % |
| | | | | |
Ratio of net investment income (loss) to average net assets2 | | | | 0.34 | % | | | | (0.25 | )% | | | | (0.26 | )% | | | | 0.16 | % | | | | 0.02 | % |
| | | | | |
Portfolio turnover | | | | 25 | % | | | | 33 | % | | | | 39 | % | | | | 42 | % | | | | 47 | % |
| | | | | |
Net assets end of year (000’s) omitted | | | | $10,457 | | | | | $9,792 | | | | | $7,911 | | | | | $1,025 | | | | | $186 | |
| 1 | Per share numbers have been calculated using average shares. |
| 2 | Total returns and net investment income (loss) would have been lower had certain expenses not been offset. |
| 3 | Less than $(0.005) per share. |
| 4 | The total return is calculated using the published Net Asset Value as of fiscal year end. |
| 5 | Includes reduction from broker recapture amounting to less than 0.01%, less than 0.01%, 0.02%, 0.02% and 0.01% for the fiscal years ended October 31, 2023, 2022, 2021, 2020 and 2019, respectively. |
| 6 | Excludes the impact of expense reimbursement or fee waivers and expense reductions such as brokerage credits, but includes expense repayments and non-reimbursable expenses, if any, such as interest, taxes, and extraordinary expenses. (See Note 1(c) and 2 in the Notes to Financial Statements.) |
| 7 | Less than $0.005 per share. |
65
| | |
| | | AMG River Road Dividend All Cap Value Fund Financial Highlights For a share outstanding throughout each fiscal year |
| | | |
| | | |
| | | | | | | | | | | | | | | | | | | | | | | | | |
| | | For the fiscal years ended October 31, |
| | | | | |
| Class N | | 2023 | | 2022 | | 2021 | | 2020 | | 2019 |
| | | | | |
Net Asset Value, Beginning of Year | | | | $10.70 | | | | | $13.28 | | | | | $10.02 | | | | | $12.34 | | | | | $12.29 | |
| | | | | |
Income (loss) from Investment Operations: | | | | | | | | | | | | | | | | | | | | | | | | | |
| | | | | |
Net investment income1,2 | | | | 0.20 | | | | | 0.18 | | | | | 0.19 | | | | | 0.25 | | | | | 0.27 | |
| | | | | |
Net realized and unrealized gain (loss) on investments | | | | (0.88 | ) | | | | (0.29 | ) | | | | 3.27 | | | | | (1.49 | ) | | | | 0.80 | |
| | | | | |
Total income (loss) from investment operations | | | | (0.68 | ) | | | | (0.11 | ) | | | | 3.46 | | | | | (1.24 | ) | | | | 1.07 | |
| | | | | |
Less Distributions to Shareholders from: | | | | | | | | | | | | | | | | | | | | | | | | | |
| | | | | |
Net investment income | | | | (0.23 | ) | | | | (0.27 | ) | | | | (0.20 | ) | | | | (0.34 | ) | | | | (0.30 | ) |
| | | | | |
Net realized gain on investments | | | | (1.16 | ) | | | | (2.20 | ) | | | | — | | | | | (0.74 | ) | | | | (0.72 | ) |
| | | | | |
Total distributions to shareholders | | | | (1.39 | ) | | | | (2.47 | ) | | | | (0.20 | ) | | | | (1.08 | ) | | | | (1.02 | ) |
| | | | | |
Net Asset Value, End of Year | | | | $8.63 | | | | | $10.70 | | | | | $13.28 | | | | | $10.02 | | | | | $12.34 | |
| | | | | |
Total Return2,3 | | | | (7.50 | )% | | | | (1.34 | )% | | | | 34.74 | % | | | | (10.96 | )% | | | | 10.11 | % |
| | | | | |
Ratio of net expenses to average net assets4 | | | | 0.97 | %5 | | | | 1.03 | % | | | | 1.06 | % | | | | 1.13 | % | | | | 1.11 | % |
| | | | | |
Ratio of gross expenses to average net assets6 | | | | 1.02 | % | | | | 1.07 | % | | | | 1.09 | % | | | | 1.13 | % | | | | 1.12 | % |
| | | | | |
Ratio of net investment income to average net assets2 | | | | 2.10 | % | | | | 1.61 | % | | | | 1.51 | % | | | | 2.38 | % | | | | 2.32 | % |
| | | | | |
Portfolio turnover | | | | 25 | % | | | | 30 | % | | | | 20 | % | | | | 35 | % | | | | 29 | % |
| | | | | |
Net assets end of year (000’s) omitted | | | | $28,325 | | | | | $36,432 | | | | | $43,430 | | | | | $41,358 | | | | | $79,811 | |
66
| | |
| | | AMG River Road Dividend All Cap Value Fund Financial Highlights For a share outstanding throughout each fiscal year |
| | | |
| | | |
| | | | | | | | | | | | | | | | | | | | | | | | | |
| | | For the fiscal years ended October 31, |
| | | | | |
| Class I | | 2023 | | 2022 | | 2021 | | 2020 | | 2019 |
| | | | | |
Net Asset Value, Beginning of Year | | | | $10.68 | | | | | $13.27 | | | | | $10.01 | | | | | $12.33 | | | | | $12.29 | |
| | | | | |
Income (loss) from Investment Operations: | | | | | | | | | | | | | | | | | | | | | | | | | |
| | | | | |
Net investment income1,2 | | | | 0.23 | | | | | 0.21 | | | | | 0.22 | | | | | 0.28 | | | | | 0.31 | |
| | | | | |
Net realized and unrealized gain (loss) on investments | | | | (0.88 | ) | | | | (0.30 | ) | | | | 3.27 | | | | | (1.49 | ) | | | | 0.78 | |
| | | | | |
Total income (loss) from investment operations | | | | (0.65 | ) | | | | (0.09 | ) | | | | 3.49 | | | | | (1.21 | ) | | | | 1.09 | |
| | | | | |
Less Distributions to Shareholders from: | | | | | | | | | | | | | | | | | | | | | | | | | |
| | | | | |
Net investment income | | | | (0.25 | ) | | | | (0.30 | ) | | | | (0.23 | ) | | | | (0.37 | ) | | | | (0.33 | ) |
| | | | | |
Net realized gain on investments | | | | (1.16 | ) | | | | (2.20 | ) | | | | — | | | | | (0.74 | ) | | | | (0.72 | ) |
| | | | | |
Total distributions to shareholders | | | | (1.41 | ) | | | | (2.50 | ) | | | | (0.23 | ) | | | | (1.11 | ) | | | | (1.05 | ) |
| | | | | |
Net Asset Value, End of Year | | | | $8.62 | | | | | $10.68 | | | | | $13.27 | | | | | $10.01 | | | | | $12.33 | |
| | | | | |
Total Return2,3 | | | | (7.17 | )% | | | | (1.18 | )% | | | | 35.10 | % | | | | (10.69 | )% | | | | 10.32 | % |
| | | | | |
Ratio of net expenses to average net assets4 | | | | 0.72 | %5 | | | | 0.78 | % | | | | 0.81 | % | | | | 0.86 | % | | | | 0.84 | % |
| | | | | |
Ratio of gross expenses to average net assets6 | | | | 0.77 | % | | | | 0.82 | % | | | | 0.84 | % | | | | 0.86 | % | | | | 0.85 | % |
| | | | | |
Ratio of net investment income to average net assets2 | | | | 2.35 | % | | | | 1.86 | % | | | | 1.76 | % | | | | 2.65 | % | | | | 2.59 | % |
| | | | | |
Portfolio turnover | | | | 25 | % | | | | 30 | % | | | | 20 | % | | | | 35 | % | | | | 29 | % |
| | | | | |
Net assets end of year (000’s) omitted | | | | $202,039 | | | | | $290,632 | | | | | $382,571 | | | | | $408,844 | | | | | $533,106 | |
67
| | |
| | | AMG River Road Dividend All Cap Value Fund Financial Highlights For a share outstanding throughout each fiscal year |
| | | |
| | | |
| | | | | | | | | | | | | | | | | | | | | | | | | |
| | | For the fiscal years ended October 31, |
| | | | | |
| Class Z | | 2023 | | 2022 | | 2021 | | 2020 | | 2019 |
| | | | | |
Net Asset Value, Beginning of Year | | | | $10.69 | | | | | $13.28 | | | | | $10.01 | | | | | $12.33 | | | | | $12.29 | |
| | | | | |
Income (loss) from Investment Operations: | | | | | | | | | | | | | | | | | | | | | | | | | |
| | | | | |
Net investment income1,2 | | | | 0.23 | | | | | 0.21 | | | | | 0.22 | | | | | 0.27 | | | | | 0.32 | |
| | | | | |
Net realized and unrealized gain (loss) on investments | | | | (0.88 | ) | | | | (0.29 | ) | | | | 3.29 | | | | | (1.47 | ) | | | | 0.77 | |
| | | | | |
Total income (loss) from investment operations | | | | (0.65 | ) | | | | (0.08 | ) | | | | 3.51 | | | | | (1.20 | ) | | | | 1.09 | |
| | | | | |
Less Distributions to Shareholders from: | | | | | | | | | | | | | | | | | | | | | | | | | |
| | | | | |
Net investment income | | | | (0.26 | ) | | | | (0.31 | ) | | | | (0.24 | ) | | | | (0.38 | ) | | | | (0.33 | ) |
| | | | | |
Net realized gain on investments | | | | (1.16 | ) | | | | (2.20 | ) | | | | — | | | | | (0.74 | ) | | | | (0.72 | ) |
| | | | | |
Total distributions to shareholders | | | | (1.42 | ) | | | | (2.51 | ) | | | | (0.24 | ) | | | | (1.12 | ) | | | | (1.05 | ) |
| | | | | |
Net Asset Value, End of Year | | | | $8.62 | | | | | $10.69 | | | | | $13.28 | | | | | $10.01 | | | | | $12.33 | |
| | | | | |
Total Return2,3 | | | | (7.22 | )% | | | | (1.12 | )% | | | | 35.26 | % | | | | (10.65 | )% | | | | 10.37 | % |
| | | | | |
Ratio of net expenses to average net assets4 | | | | 0.68 | %5 | | | | 0.74 | % | | | | 0.77 | % | | | | 0.81 | % | | | | 0.79 | % |
| | | | | |
Ratio of gross expenses to average net assets6 | | | | 0.73 | % | | | | 0.78 | % | | | | 0.80 | % | | | | 0.81 | % | | | | 0.80 | % |
| | | | | |
Ratio of net investment income to average net assets2 | | | | 2.39 | % | | | | 1.90 | % | | | | 1.80 | % | | | | 2.69 | % | | | | 2.64 | % |
| | | | | |
Portfolio turnover | | | | 25 | % | | | | 30 | % | | | | 20 | % | | | | 35 | % | | | | 29 | % |
| | | | | |
Net assets end of year (000’s) omitted | | | | $3,216 | | | | | $3,199 | | | | | $2,430 | | | | | $1,901 | | | | | $63 | |
| 1 | Per share numbers have been calculated using average shares. |
| 2 | Total returns and net investment income (loss) would have been lower had certain expenses not been offset. |
| 3 | The total return is calculated using the published Net Asset Value as of fiscal year end. |
| 4 | Includes reduction from broker recapture amounting to 0.01%, 0.01%, 0.01%, less than 0.01% and 0.01%, for the fiscal years ended October 31, 2023, 2022, 2021, 2020 and 2019, respectively. |
| 5 | Includes interest expense totaling 0.01% related to utilization of the line of credit. |
| 6 | Excludes the impact of expense reimbursement or fee waivers and expense reductions such as brokerage credits, but includes expense repayments and non-reimbursable expenses, if any, such as interest, taxes, and extraordinary expenses. (See Note 1(c) and 2 in the Notes to Financial Statements.) |
68
| | |
| | | AMG River Road Small-Mid Cap Value Fund Financial Highlights For a share outstanding throughout each fiscal year |
| | | |
| | | |
| | | | | | | | | | | | | | | | | | | | | | | | | |
| | | For the fiscal years ended October 31, |
| | | | | |
| Class N | | 2023 | | 2022 | | 2021 | | 2020 | | 2019 |
| | | | | |
Net Asset Value, Beginning of Year | | | | $9.10 | | | | | $9.81 | | | | | $6.80 | | | | | $7.84 | | | | | $7.62 | |
| | | | | |
Income (loss) from Investment Operations: | | | | | | | | | | | | | | | | | | | | | | | | | |
| | | | | |
Net investment income (loss)1,2 | | | | 0.01 | | | | | (0.03 | ) | | | | (0.04 | ) | | | | (0.01 | )3 | | | | (0.02 | ) |
| | | | | |
Net realized and unrealized gain (loss) on investments | | | | (0.09 | ) | | | | (0.11 | ) | | | | 3.05 | | | | | (0.88 | ) | | | | 0.78 | |
| | | | | |
Total income (loss) from investment operations | | | | (0.08 | ) | | | | (0.14 | ) | | | | 3.01 | | | | | (0.89 | ) | | | | 0.76 | |
| | | | | |
Less Distributions to Shareholders from: | | | | | | | | | | | | | | | | | | | | | | | | | |
| | | | | |
Net investment income | | | | (0.00 | )4 | | | | — | | | | | — | | | | | (0.01 | ) | | | | — | |
| | | | | |
Net realized gain on investments | | | | (0.41 | ) | | | | (0.57 | ) | | | | — | | | | | (0.14 | ) | | | | (0.54 | ) |
| | | | | |
Total distributions to shareholders | | | | (0.41 | ) | | | | (0.57 | ) | | | | — | | | | | (0.15 | ) | | | | (0.54 | ) |
| | | | | |
Net Asset Value, End of Year | | | | $8.61 | | | | | $9.10 | | | | | $9.81 | | | | | $6.80 | | | | | $7.84 | |
| | | | | |
Total Return2,5 | | | | (0.77 | )% | | | | (1.64 | )% | | | | 44.27 | % | | | | (11.65 | )% | | | | 11.82 | % |
| | | | | |
Ratio of net expenses to average net assets6 | | | | 1.27 | % | | | | 1.28 | % | | | | 1.25 | % | | | | 1.31 | % | | | | 1.31 | % |
| | | | | |
Ratio of gross expenses to average net assets7 | | | | 1.28 | % | | | | 1.28 | % | | | | 1.27 | % | | | | 1.33 | % | | | | 1.37 | % |
| | | | | |
Ratio of net investment income (loss) to average net assets2 | | | | 0.10 | % | | | | (0.28 | )% | | | | (0.38 | )% | | | | (0.16 | )% | | | | (0.27 | )% |
| | | | | |
Portfolio turnover | | | | 30 | % | | | | 32 | % | | | | 44 | % | | | | 47 | % | | | | 38 | % |
| | | | | |
Net assets end of year (000’s) omitted | | | | $18,655 | | | | | $18,961 | | | | | $22,702 | | | | | $21,618 | | | | | $24,669 | |
69
| | |
| | | AMG River Road Small-Mid Cap Value Fund Financial Highlights For a share outstanding throughout each fiscal year |
| | | |
| | | |
| | | | | | | | | | | | | | | | | | | | | | | | | |
| | | For the fiscal years ended October 31, |
| | | | | |
| Class I | | 2023 | | 2022 | | 2021 | | 2020 | | 2019 |
| | | | | |
Net Asset Value, Beginning of Year | | | | $9.41 | | | | | $10.10 | | | | | $6.98 | | | | | $8.04 | | | | | $7.78 | |
| | | | | |
Income (loss) from Investment Operations: | | | | | | | | | | | | | | | | | | | | | | | | | |
| | | | | |
Net investment income (loss)1,2 | | | | 0.03 | | | | | (0.00 | )4 | | | | (0.01 | ) | | | | 0.01 | 3 | | | | (0.00 | )4 |
| | | | | |
Net realized and unrealized gain (loss) on investments | | | | (0.09 | ) | | | | (0.12 | ) | | | | 3.13 | | | | | (0.91 | ) | | | | 0.80 | |
| | | | | |
Total income (loss) from investment operations | | | | (0.06 | ) | | | | (0.12 | ) | | | | 3.12 | | | | | (0.90 | ) | | | | 0.80 | |
| | | | | |
Less Distributions to Shareholders from: | | | | | | | | | | | | | | | | | | | | | | | | | |
| | | | | |
Net investment income | | | | (0.00 | )4 | | | | — | | | | | (0.00 | )4 | | | | (0.02 | ) | | | | — | |
| | | | | |
Net realized gain on investments | | | | (0.41 | ) | | | | (0.57 | ) | | | | — | | | | | (0.14 | ) | | | | (0.54 | ) |
| | | | | |
Total distributions to shareholders | | | | (0.41 | ) | | | | (0.57 | ) | | | | (0.00 | )4 | | | | (0.16 | ) | | | | (0.54 | ) |
| | | | | |
Net Asset Value, End of Year | | | | $8.94 | | | | | $9.41 | | | | | $10.10 | | | | | $6.98 | | | | | $8.04 | |
| | | | | |
Total Return2,5 | | | | (0.48 | )% | | | | (1.38 | )% | | | | 44.70 | % | | | | (11.47 | )% | | | | 12.12 | % |
| | | | | |
Ratio of net expenses to average net assets6 | | | | 1.02 | % | | | | 1.02 | % | | | | 1.00 | % | | | | 1.05 | % | | | | 1.06 | % |
| | | | | |
Ratio of gross expenses to average net assets7 | | | | 1.03 | % | | | | 1.02 | % | | | | 1.02 | % | | | | 1.07 | % | | | | 1.12 | % |
| | | | | |
Ratio of net investment income (loss) to average net assets2 | | | | 0.35 | % | | | | (0.02 | )% | | | | (0.13 | )% | | | | 0.09 | % | | | | (0.02 | )% |
| | | | | |
Portfolio turnover | | | | 30 | % | | | | 32 | % | | | | 44 | % | | | | 47 | % | | | | 38 | % |
| | | | | |
Net assets end of year (000’s) omitted | | | | $214,093 | | | | | $188,163 | | | | | $218,698 | | | | | $156,350 | | | | | $145,620 | |
70
| | |
| | | AMG River Road Small-Mid Cap Value Fund Financial Highlights For a share outstanding throughout each fiscal year |
| | | |
| | | |
| | | | | | | | | | | | | | | | | | | | | | | | | |
| | | For the fiscal years ended October 31, |
| | | | | |
| Class Z | | 2023 | | 2022 | | 2021 | | 2020 | | 2019 |
| | | | | |
Net Asset Value, Beginning of Year | | | | $9.42 | | | | | $10.10 | | | | | $6.98 | | | | | $8.04 | | | | | $7.77 | |
| | | | | |
Income (loss) from Investment Operations: | | | | | | | | | | | | | | | | | | | | | | | | | |
| | | | | |
Net investment income (loss)1,2 | | | | 0.04 | | | | | 0.00 | 8 | | | | (0.01 | ) | | | | 0.01 | 3 | | | | 0.00 | 8 |
| | | | | | |
Net realized and unrealized gain (loss) on investments | | | | (0.10 | ) | | | | (0.11 | ) | | | | 3.13 | | | | | (0.91 | ) | | | | 0.81 | |
| | | | | |
Total income (loss) from investment operations | | | | (0.06 | ) | | | | (0.11 | ) | | | | 3.12 | | | | | (0.90 | ) | | | | 0.81 | |
| | | | | |
Less Distributions to Shareholders from: | | | | | | | | | | | | | | | | | | | | | | | | | |
| | | | | |
Net investment income | | | | (0.00 | )4 | | | | (0.00 | )4 | | | | (0.00 | )4 | | | | (0.02 | ) | | | | — | |
| | | | | |
Net realized gain on investments | | | | (0.41 | ) | | | | (0.57 | ) | | | | — | | | | | (0.14 | ) | | | | (0.54 | ) |
| | | | | |
Total distributions to shareholders | | | | (0.41 | ) | | | | (0.57 | ) | | | | (0.00 | )4 | | | | (0.16 | ) | | | | (0.54 | ) |
| | | | | |
Net Asset Value, End of Year | | | | $8.95 | | | | | $9.42 | | | | | $10.10 | | | | | $6.98 | | | | | $8.04 | |
| | | | | |
Total Return2,5 | | | | (0.47 | )% | | | | (1.26 | )% | | | | 44.77 | % | | | | (11.43 | )% | | | | 12.26 | % |
| | | | | |
Ratio of net expenses to average net assets6 | | | | 0.97 | % | | | | 0.97 | % | | | | 0.95 | % | | | | 1.00 | % | | | | 1.01 | % |
| | | | | |
Ratio of gross expenses to average net assets7 | | | | 0.98 | % | | | | 0.97 | % | | | | 0.97 | % | | | | 1.02 | % | | | | 1.07 | % |
| | | | | |
Ratio of net investment income (loss) to average net assets2 | | | | 0.40 | % | | | | 0.03 | % | | | | (0.08 | )% | | | | 0.14 | % | | | | 0.03 | % |
| | | | | |
Portfolio turnover | | | | 30 | % | | | | 32 | % | | | | 44 | % | | | | 47 | % | | | | 38 | % |
| | | | | |
Net assets end of year (000’s) omitted | | | | $29,387 | | | | | $34,477 | | | | | $35,766 | | | | | $553 | | | | | $183 | |
| 1 | Per share numbers have been calculated using average shares. |
| 2 | Total returns and net investment income (loss) would have been lower had certain expenses not been offset. |
| 3 | Includes non-recurring dividends. Without these dividends, net investment income (loss) per share would have been $(0.02), $(0.00) and $0.00 for Class N, Class I and Class Z, respectively. |
| 4 | Less than $(0.005) per share. |
| 5 | The total return is calculated using the published Net Asset Value as of fiscal year end. |
| 6 | Includes reduction from broker recapture amounting to 0.01%, 0.01%, 0.02%, 0.02% and 0.03% for the fiscal years ended October 31, 2023, 2022, 2021, 2020 and 2019, respectively. |
| 7 | Excludes the impact of expense reimbursement or fee waivers and expense reductions such as brokerage credits, but includes expense repayments and non-reimbursable expenses, if any, such as interest, taxes, and extraordinary expenses. (See Note 1(c) and 2 in the Notes to Financial Statements.) |
| 8 | Less than $0.005 per share. |
71
| | |
| | | AMG River Road International Value Equity Fund Financial Highlights For a share outstanding throughout each fiscal year |
| | | |
| | | |
| | | | | | | | | | | | | | | | | | | | | | | | | |
| | | For the fiscal years ended October 31, |
| | | | | |
| Class N | | 2023 | | 2022 | | 2021 | | 2020 | | 2019 |
| | | | | |
Net Asset Value, Beginning of Year | | | | $8.35 | | | | | $9.51 | | | | | $11.40 | | | | | $13.06 | | | | | $12.19 | |
| | | | | |
Income (loss) from Investment Operations: | | | | | | | | | | | | | | | | | | | | | | | | | |
| | | | | |
Net investment income (loss)1,2 | | | | 0.20 | | | | | 0.29 | 3 | | | | (0.09 | ) | | | | (0.16 | ) | | | | (0.05 | ) |
| | | | | |
Net realized and unrealized gain (loss) on investments | | | | 1.17 | | | | | (1.39 | ) | | | | 2.71 | | | | | (0.42 | ) | | | | 1.63 | |
| | | | | |
Total income (loss) from investment operations | | | | 1.37 | | | | | (1.10 | ) | | | | 2.62 | | | | | (0.58 | ) | | | | 1.58 | |
| | | | | |
Less Distributions to Shareholders from: | | | | | | | | | | | | | | | | | | | | | | | | | |
| | | | | |
Net investment income | | | | (0.32 | ) | | | | — | | | | | — | | | | | — | | | | | — | |
| | | | | |
Net realized gain on investments | | | | — | | | | | (0.06 | ) | | | | (4.51 | ) | | | | (1.08 | ) | | | | (0.71 | ) |
| | | | | |
Total distributions to shareholders | | | | (0.32 | ) | | | | (0.06 | ) | | | | (4.51 | ) | | | | (1.08 | ) | | | | (0.71 | ) |
| | | | | |
Net Asset Value, End of Year | | | | $9.40 | | | | | $8.35 | | | | | $9.51 | | | | | $11.40 | | | | | $13.06 | |
| | | | | |
Total Return2,4 | | | | 16.73 | % | | | | (11.67 | )% | | | | 22.06 | % | | | | (5.17 | )% | | | | 13.98 | % |
| | | | | |
Ratio of net expenses to average net assets5 | | | | 0.98 | % | | | | 1.02 | % | | | | 2.08 | %6 | | | | 2.71 | %6 | | | | 2.41 | %6 |
| | | | | |
Ratio of gross expenses to average net assets7 | | | | 2.13 | % | | | | 2.11 | % | | | | 2.69 | % | | | | 3.23 | % | | | | 2.83 | % |
| | | | | |
Ratio of net investment income (loss) to average net assets2 | | | | 2.10 | % | | | | 3.23 | % | | | | (0.70 | )% | | | | (1.35 | )% | | | | (0.43 | )% |
| | | | | |
Portfolio turnover | | | | 62 | % | | | | 51 | % | | | | 159 | % | | | | 257 | % | | | | 264 | % |
| | | | | |
Net assets end of year (000’s) omitted | | | | $2,292 | | | | | $1,012 | | | | | $1,561 | | | | | $1,584 | | | | | $2,654 | |
72
| | |
| | | AMG River Road International Value Equity Fund Financial Highlights For a share outstanding throughout each fiscal year |
| | | |
| | | |
| | | | | | | | | | | | | | | | | | | | | | | | | |
| | | For the fiscal years ended October 31, |
| | | | | |
| Class I | | 2023 | | 2022 | | 2021 | | 2020 | | 2019 |
| | | | | |
Net Asset Value, Beginning of Year | | | | $8.67 | | | | | $9.86 | | | | | $11.65 | | | | | $13.30 | | | | | $12.37 | |
| | | | | |
Income (loss) from Investment Operations: | | | | | | | | | | | | | | | | | | | | | | | | | |
| | | | | |
Net investment income (loss)1,2 | | | | 0.23 | | | | | 0.33 | 3 | | | | (0.06 | ) | | | | (0.14 | ) | | | | (0.02 | ) |
| | | | | |
Net realized and unrealized gain (loss) on investments | | | | 1.21 | | | | | (1.44 | ) | | | | 2.78 | | | | | (0.43 | ) | | | | 1.66 | |
| | | | | |
Total income (loss) from investment operations | | | | 1.44 | | | | | (1.11 | ) | | | | 2.72 | | | | | (0.57 | ) | | | | 1.64 | |
| | | | | |
Less Distributions to Shareholders from: | | | | | | | | | | | | | | | | | | | | | | | | | |
| | | | | |
Net investment income | | | | (0.35 | ) | | | | (0.02 | ) | | | | — | | | | | — | | | | | — | |
| | | | | |
Net realized gain on investments | | | | — | | | | | (0.06 | ) | | | | (4.51 | ) | | | | (1.08 | ) | | | | (0.71 | ) |
| | | | | |
Total distributions to shareholders | | | | (0.35 | ) | | | | (0.08 | ) | | | | (4.51 | ) | | | | (1.08 | ) | | | | (0.71 | ) |
| | | | | |
Net Asset Value, End of Year | | | | $9.76 | | | | | $8.67 | | | | | $9.86 | | | | | $11.65 | | | | | $13.30 | |
| | | | | |
Total Return2,4 | | | | 16.86 | % | | | | (11.41 | )% | | | | 22.48 | % | | | | (4.98 | )% | | | | 14.28 | % |
| | | | | |
Ratio of net expenses to average net assets5 | | | | 0.76 | % | | | | 0.77 | % | | | | 1.84 | %6 | | | | 2.46 | %6 | | | | 2.16 | %6 |
| | | | | |
Ratio of gross expenses to average net assets7 | | | | 1.91 | % | | | | 1.86 | % | | | | 2.45 | % | | | | 2.98 | % | | | | 2.58 | % |
| | | | | |
Ratio of net investment income (loss) to average net assets2 | | | | 2.32 | % | | | | 3.48 | % | | | | (0.46 | )% | | | | (1.10 | )% | | | | (0.18 | )% |
| | | | | |
Portfolio turnover | | | | 62 | % | | | | 51 | % | | | | 159 | % | | | | 257 | % | | | | 264 | % |
| | | | | |
Net assets end of year (000’s) omitted | | | | $6,503 | | | | | $5,263 | | | | | $7,105 | | | | | $14,041 | | | | | $22,856 | |
73
| | |
| | | AMG River Road International Value Equity Fund Financial Highlights For a share outstanding throughout each fiscal year |
| | | |
| | | |
| | | | | | | | | | | | | | | | | | | | | | | | | |
| | | For the fiscal years ended October 31, |
| | | | | |
| Class Z | | 2023 | | 2022 | | 2021 | | 2020 | | 2019 |
| | | | | |
Net Asset Value, Beginning of Year | | | | $8.71 | | | | | $9.92 | | | | | $11.69 | | | | | $13.32 | | | | | $12.38 | |
| | | | | |
Income (loss) from Investment Operations: | | | | | | | | | | | | | | | | | | | | | | | | | |
| | | | | |
Net investment income (loss)1,2 | | | | 0.23 | | | | | 0.33 | 3 | | | | (0.05 | ) | | | | (0.12 | ) | | | | (0.01 | ) |
| | | | | |
Net realized and unrealized gain (loss) on investments | | | | 1.22 | | | | | (1.45 | ) | | | | 2.79 | | | | | (0.43 | ) | | | | 1.66 | |
| | | | | |
Total income (loss) from investment operations | | | | 1.45 | | | | | (1.12 | ) | | | | 2.74 | | | | | (0.55 | ) | | | | 1.65 | |
| | | | | |
Less Distributions to Shareholders from: | | | | | | | | | | | | | | | | | | | | | | | | | |
| | | | | |
Net investment income | | | | (0.35 | ) | | | | (0.03 | ) | | | | — | | | | | — | | | | | — | |
| | | | | |
Net realized gain on investments | | | | — | | | | | (0.06 | ) | | | | (4.51 | ) | | | | (1.08 | ) | | | | (0.71 | ) |
| | | | | |
Total distributions to shareholders | | | | (0.35 | ) | | | | (0.09 | ) | | | | (4.51 | ) | | | | (1.08 | ) | | | | (0.71 | ) |
| | | | | |
Net Asset Value, End of Year | | | | $9.81 | | | | | $8.71 | | | | | $9.92 | | | | | $11.69 | | | | | $13.32 | |
| | | | | |
Total Return2,4 | | | | 16.96 | % | | | | (11.41 | )% | | | | 22.58 | % | | | | (4.82 | )% | | | | 14.35 | % |
| | | | | |
Ratio of net expenses to average net assets5 | | | | 0.71 | % | | | | 0.72 | % | | | | 1.76 | %6 | | | | 2.38 | %6 | | | | 2.08 | %6 |
| | | | | |
Ratio of gross expenses to average net assets7 | | | | 1.86 | % | | | | 1.81 | % | | | | 2.37 | % | | | | 2.90 | % | | | | 2.50 | % |
| | | | | |
Ratio of net investment income (loss) to average net assets2 | | | | 2.37 | % | | | | 3.53 | % | | | | (0.38 | )% | | | | (1.02 | )% | | | | (0.10 | )% |
| | | | | |
Portfolio turnover | | | | 62 | % | | | | 51 | % | | | | 159 | % | | | | 257 | % | | | | 264 | % |
| | | | | |
Net assets end of year (000’s) omitted | | | | $1,151 | | | | | $833 | | | | | $552 | | | | | $660 | | | | | $84 | |
| 1 | Per share numbers have been calculated using average shares. |
| 2 | Total returns and net investment income (loss) would have been lower had certain expenses not been offset. |
| 3 | Includes non-recurring dividends. Without these dividends, net investment income per share would have been $0.15, $0.18 and $0.18 for Class N, Class I and Class Z, respectively. |
| 4 | The total return is calculated using the published Net Asset Value as of fiscal year end. |
| 5 | Includes reduction from brokerage recapture amounting to 0.02%, 0.01%, 0.04%, 0.11% and 0.01% for the fiscal years ended October 31, 2023, 2022, 2021, 2020 and 2019, respectively. |
| 6 | Expense ratio includes dividend and interest expense related to securities sold short. Excluding such dividend and interest expense, the ratio of net expenses to average net assets would be 1.32%, 1.11% and 1.01% for Class N, Class I and Class Z, respectively, for the fiscal year ended October 31, 2021, 1.34%, 1.09% and 1.01% for Class N, Class I and Class Z, respectively, for the fiscal year ended October 31, 2020, and 1.44%, 1.19% and 1.11% for Class N, Class I and Class Z, respectively, for the fiscal year ended October 31, 2019. |
| 7 | Excludes the impact of expense reimbursement or fee waivers and expense reductions such as brokerage credits, but includes expense repayments and non-reimbursable expenses, if any, such as interest, taxes, and extraordinary expenses. (See Note 1(c) and 2 in the Notes to Financial Statements.) |
74
| | |
| | | AMG River Road Focused Absolute Value Fund Financial Highlights For a share outstanding throughout each fiscal year |
| | | |
| | | |
| | | | | | | | | | | | | | | | | | | | |
| |
| | | For the fiscal years ended October 31, |
| | | | | |
Class N | | 2023 | | 2022 | | 2021 | | 2020 | | 2019 |
| | | | | |
Net Asset Value, Beginning of Year | | | $11.50 | | | | $14.44 | | | | $11.05 | | | | $12.65 | | | | $11.91 | |
| | | | | |
Income (loss) from Investment Operations: | | | | | | | | | | | | | | | | | | | | |
| | | | | |
Net investment income1,2 | | | 0.11 | | | | 0.04 | | | | 0.01 | | | | 0.04 | 3 | | | 0.04 | |
| | | | | |
Net realized and unrealized gain (loss) on investments | | | 0.21 | | | | (2.03 | ) | | | 3.38 | | | | (1.39 | ) | | | 1.45 | |
| | | | | |
Total income (loss) from investment operations | | | 0.32 | | | | (1.99 | ) | | | 3.39 | | | | (1.35 | ) | | | 1.49 | |
| | | | | |
Less Distributions to Shareholders from: | | | | | | | | | | | | | | | | | | | | |
| | | | | |
Net investment income | | | (0.02 | ) | | | — | | | | — | | | | (0.02 | ) | | | (0.05 | ) |
| | | | | |
Net realized gain on investments | | | (0.07 | ) | | | (0.95 | ) | | | — | | | | (0.23 | ) | | | (0.70 | ) |
| | | | | |
Total distributions to shareholders | | | (0.09 | ) | | | (0.95 | ) | | | — | | | | (0.25 | ) | | | (0.75 | ) |
| | | | | |
Net Asset Value, End of Year | | | $11.73 | | | | $11.50 | | | | $14.44 | | | | $11.05 | | | | $12.65 | |
| | | | | |
Total Return2,4 | | | 2.76 | % | | | (14.80 | )% | | | 30.68 | % | | | (11.03 | )% | | | 14.29 | % |
| | | | | |
Ratio of net expenses to average net assets5 | | | 1.05 | % | | | 1.05 | % | | | 1.06 | % | | | 1.03 | % | | | 0.98 | % |
| | | | | |
Ratio of gross expenses to average net assets6 | | | 1.22 | % | | | 1.14 | % | | | 1.12 | % | | | 1.15 | % | | | 1.21 | % |
| | | | | |
Ratio of net investment income to average net assets2 | | | 0.93 | % | | | 0.30 | % | | | 0.10 | % | | | 0.34 | % | | | 0.34 | % |
| | | | | |
Portfolio turnover | | | 63 | % | | | 113 | % | | | 83 | % | | | 103 | % | | | 59 | % |
| | | | | |
Net assets end of year (000’s) omitted | | | $1,910 | | | | $2,243 | | | | $3,666 | | | | $12,466 | | | | $15,284 | |
| | | | | | | | | | | |
75
| | |
| | | AMG River Road Focused Absolute Value Fund Financial Highlights For a share outstanding throughout each fiscal year |
| | | |
| | | |
| | | | | | | | | | | | | | | | | | | | | | | | | |
| | | For the fiscal years ended October 31, |
| | | | | |
| Class I | | 2023 | | 2022 | | 2021 | | 2020 | | 2019 |
| | | | | |
Net Asset Value, Beginning of Year | | | | $11.51 | | | | | $14.48 | | | | | $11.12 | | | | | $12.72 | | | | | $11.98 | |
| | | | | |
Income (loss) from Investment Operations: | | | | | | | | | | | | | | | | | | | | | | | | | |
| | | | | |
Net investment income1,2 | | | | 0.14 | | | | | 0.07 | | | | | 0.05 | | | | | 0.07 | 3 | | | | 0.07 | |
| | | | | |
Net realized and unrealized gain (loss) on investments | | | | 0.22 | | | | | (2.04 | ) | | | | 3.39 | | | | | (1.40 | ) | | | | 1.46 | |
| | | | | |
Total income (loss) from investment operations | | | | 0.36 | | | | | (1.97 | ) | | | | 3.44 | | | | | (1.33 | ) | | | | 1.53 | |
| | | | | |
Less Distributions to Shareholders from: | | | | | | | | | | | | | | | | | | | | | | | | | |
| | | | | |
Net investment income | | | | (0.05 | ) | | | | (0.05 | ) | | | | (0.08 | ) | | | | (0.04 | ) | | | | (0.09 | ) |
| | | | | |
Net realized gain on investments | | | | (0.07 | ) | | | | (0.95 | ) | | | | — | | | | | (0.23 | ) | | | | (0.70 | ) |
| | | | | |
Total distributions to shareholders | | | | (0.12 | ) | | | | (1.00 | ) | | | | (0.08 | ) | | | | (0.27 | ) | | | | (0.79 | ) |
| | | | | |
Net Asset Value, End of Year | | | | $11.75 | | | | | $11.51 | | | | | $14.48 | | | | | $11.12 | | | | | $12.72 | |
| | | | | |
Total Return2,4 | | | | 3.11 | % | | | | (14.64 | )% | | | | 30.98 | % | | | | (10.81 | )% | | | | 14.55 | % |
| | | | | |
Ratio of net expenses to average net assets5 | | | | 0.81 | % | | | | 0.80 | % | | | | 0.81 | % | | | | 0.78 | % | | | | 0.73 | % |
| | | | | |
Ratio of gross expenses to average net assets6 | | | | 0.98 | % | | | | 0.89 | % | | | | 0.87 | % | | | | 0.90 | % | | | | 0.96 | % |
| | | | | |
Ratio of net investment income to average net assets2 | | | | 1.17 | % | | | | 0.55 | % | | | | 0.35 | % | | | | 0.59 | % | | | | 0.59 | % |
| | | | | |
Portfolio turnover | | | | 63 | % | | | | 113 | % | | | | 83 | % | | | | 103 | % | | | | 59 | % |
| | | | | |
Net assets end of year (000’s) omitted | | | | $40,205 | | | | | $53,620 | | | | | $176,460 | | | | | $130,758 | | | | | $130,928 | |
76
| | |
| | | AMG River Road Focused Absolute Value Fund Financial Highlights For a share outstanding throughout each fiscal year |
| | | |
| | | |
| | | | | | | | | | | | | | | | | | | | |
| |
| | | For the fiscal years ended October 31, |
| | | | | |
Class Z | | 2023 | | 2022 | | 2021 | | 2020 | | 2019 |
| | | | | |
Net Asset Value, Beginning of Year | | | $11.52 | | | | $14.49 | | | | $11.12 | | | | $12.73 | | | | $11.98 | |
| | | | | |
Income (loss) from Investment Operations: | | | | | | | | | | | | | | | | | | | | |
| | | | | |
Net investment income1,2 | | | 0.15 | | | | 0.08 | | | | 0.06 | | | | 0.07 | 3 | | | 0.07 | |
| | | | | |
Net realized and unrealized gain (loss) on investments | | | 0.21 | | | | (2.04 | ) | | | 3.39 | | | | (1.41 | ) | | | 1.47 | |
| | | | | |
Total income (loss) from investment operations | | | 0.36 | | | | (1.96 | ) | | | 3.45 | | | | (1.34 | ) | | | 1.54 | |
| | | | | |
Less Distributions to Shareholders from: | | | | | | | | | | | | | | | | | | | | |
| | | | | |
Net investment income | | | (0.06 | ) | | | (0.06 | ) | | | (0.08 | ) | | | (0.04 | ) | | | (0.09 | ) |
| | | | | |
Net realized gain on investments | | | (0.07 | ) | | | (0.95 | ) | | | — | | | | (0.23 | ) | | | (0.70 | ) |
| | | | | |
Total distributions to shareholders | | | (0.13 | ) | | | (1.01 | ) | | | (0.08 | ) | | | (0.27 | ) | | | (0.79 | ) |
| | | | | |
Net Asset Value, End of Year | | | $11.75 | | | | $11.52 | | | | $14.49 | | | | $11.12 | | | | $12.73 | |
| | | | | |
Total Return2,4 | | | 3.10 | % | | | (14.59 | )% | | | 31.12 | % | | | (10.86 | )% | | | 14.69 | % |
| | | | | |
Ratio of net expenses to average net assets5 | | | 0.77 | % | | | 0.76 | % | | | 0.77 | % | | | 0.74 | % | | | 0.69 | % |
| | | | | |
Ratio of gross expenses to average net assets6 | | | 0.94 | % | | | 0.85 | % | | | 0.83 | % | | | 0.86 | % | | | 0.92 | % |
| | | | | |
Ratio of net investment income to average net assets2 | | | 1.21 | % | | | 0.59 | % | | | 0.39 | % | | | 0.63 | % | | | 0.63 | % |
| | | | | |
Portfolio turnover | | | 63 | % | | | 113 | % | | | 83 | % | | | 103 | % | | | 59 | % |
| | | | | |
Net assets end of year (000’s) omitted | | | $6,450 | | | | $7,677 | | | | $13,323 | | | | $2,462 | | | | $157 | |
| | | | | | | | | | | |
| 1 | Per share numbers have been calculated using average shares. |
| 2 | Total returns and net investment income (loss) would have been lower had certain expenses not been offset. |
| 3 | Includes non-recurring dividends. Without these dividends, net investment income per share would have been $0.02, $0.05 and $0.05 for Class N, Class I and Class Z, respectively. |
| 4 | The total return is calculated using the published Net Asset Value as of fiscal year end. |
| 5 | Includes reduction from broker recapture amounting to 0.01%, 0.02%, 0.01%, 0.01% and 0.02% for the fiscal years ended October 31, 2023, 2022, 2021, 2020 and 2019, respectively. |
| 6 | Excludes the impact of expense reimbursement or fee waivers and expense reductions such as brokerage credits, but includes expense repayments and non-reimbursable expenses, if any, such as interest, taxes, and extraordinary expenses. (See Note 1(c) and 2 in the Notes to Financial Statements.) |
77
| | |
| | | Notes to Financial Statements October 31, 2023 |
| | | |
| | | |
1. ORGANIZATION AND SUMMARY OF SIGNIFICANT ACCOUNTING POLICIES
AMG Funds I and AMG Funds IV (the “Trusts”) are open-end management investment companies. AMG Funds I is organized as a Massachusetts business trust, while AMG Funds IV is organized as a Delaware Statutory Trust. The Trusts are registered under the Investment Company Act of 1940, as amended (the “1940 Act”). Currently, the Trusts consist of a number of different funds, each having distinct investment management objectives, strategies, risks, and policies. Included in this report are AMG Funds I: AMG River Road Large Cap Value Select Fund (“Large Cap Value Select”), and AMG Funds IV: AMG River Road Mid Cap Value Fund (“Mid Cap Value”), AMG River Road Small Cap Value Fund (“Small Cap Value”), AMG River Road Dividend All Cap Value Fund (“Dividend All Cap Value”), AMG River Road Small-Mid Cap Value Fund (“Small-Mid Cap Value”), AMG River Road International Value Equity Fund (“International Value Equity “), and AMG River Road Focused Absolute Value Fund (“Focused Absolute Value”), each a “Fund” and collectively, the “Funds”.
Each Fund is authorized to issue Class N and Class I shares. The Funds, except for Large Cap Value Select, are also authorized to issue Class Z shares. Each class represents an interest in the same assets of the respective Fund. Although all share classes generally have identical voting rights, each share class votes separately when required by law. Different share classes may have different net asset values per share to the extent the share classes pay different distribution amounts and/or the expenses of such share classes differ. Each share class has its own expense structure. Please refer to a current prospectus for additional information on each share class.
Large Cap Value Select and Focused Absolute Value are non-diversified funds. A greater percentage of the Funds’ holdings may be focused in a smaller number of securities which may place the Funds at greater risk than a more diversified fund.
Market prices of investments held by the Funds may fall rapidly or unpredictably due to a variety of economic or political factors, market conditions, disasters or public health issues, or in response to events that affect particular industries or companies.
The Funds’ financial statements are prepared in accordance with accounting principles generally accepted in the United States of America (“U.S. GAAP”), including accounting and reporting guidance pursuant to Accounting Standards Codification Topic 946 applicable to investment companies. U.S. GAAP requires management to make estimates and assumptions that affect the reported amounts of assets and liabilities and disclosure of contingent assets and liabilities at the date of the financial statements and the reported amounts of income and expenses during the reporting period. Actual results could differ from those estimates and such differences could be material. The following is a summary of significant accounting policies followed by the Funds in the preparation of their financial statements:
a. VALUATION OF INVESTMENTS
Equity securities traded on a national securities exchange or reported on the NASDAQ national market system (“NMS”) are valued at the last quoted sales price on the primary exchange or, if applicable, the NASDAQ official closing price or the official closing price of the relevant exchange or, lacking any sales, at the last quoted bid price. Equity securities held by the Funds that are traded in the over-the-counter market (other than NMS securities) are valued at the bid price. Foreign equity securities (securities principally traded in markets other than U.S.
markets) held by the Funds are valued at the official closing price on the primary exchange or, for markets that either do not offer an official closing price or where the official closing price may not be representative of the overall market, the last quoted sale price.
Fixed income securities purchased with a remaining maturity of 60 days or less are valued at amortized cost, provided that the amortized cost value is approximately the same as the fair value of the security valued without the use of amortized cost. Investments in other open-end registered investment companies are valued at their end of day net asset value per share.
The Funds’ portfolio investments are generally valued based on independent market quotations or prices or, if none, “evaluative” or other market based valuations provided by third party pricing services. Pursuant to Rule 2a-5 under the 1940 Act, the Funds’ Boards of Trustees (the “Board”) designated AMG Funds LLC (the “Investment Manager”) as the Funds’ Valuation Designee to perform the Funds’ fair value determinations. Such determinations are subject to Board oversight and certain reporting and other requirements intended to ensure that the Board receives the information it needs to oversee the Investment Manager’s fair value determinations.
Under certain circumstances, the value of certain Fund portfolio investments may be based on an evaluation of fair value, pursuant to procedures established by the Investment Manager and under the general supervision of the Board. The Funds may use the fair value of a portfolio investment to calculate its net asset value (“NAV”) in the event that the market quotation, price or market based valuation for the portfolio investment is not readily available or otherwise not determinable pursuant to the Funds’ valuation procedures, if the Investment Manager believes the quotation, price or market based valuation to be unreliable, or in certain other circumstances. When determining the fair value of an investment, the Investment Manager seeks to determine the price that the Funds might reasonably expect to receive from current sale of that portfolio investment in an arms-length transaction. Fair value determinations shall be based upon consideration of all available facts and information, including, but not limited to (i) attributes specific to the investment; (ii) fundamental and analytical data relating to the investment; and (iii) the value of other comparable securities or relevant financial instruments, including derivative securities, traded on other markets or among dealers.
The values assigned to fair value portfolio investments are based on available information and do not necessarily represent amounts that might ultimately be realized in the future, since such amounts depend on future developments inherent in long-term investments. Because of the inherent uncertainty of valuation, those estimated values may differ significantly from the values that would have been used had a ready market for the investments existed, and the differences could be material. The Board will be presented with quarterly reports, as of the most recent quarter end, summarizing all fair value activity, material fair value matters that occurred during the quarter, and all outstanding securities fair valued by the Funds. Additionally, the Board will be presented with an annual report that assesses the adequacy and effectiveness of the Investment Manager’s process for determining the fair value of the Funds’ investments.
With respect to foreign equity securities and certain foreign fixed income securities, securities held in the Funds that can be fair valued by the applicable fair value pricing service are fair valued on each business day provided that each individual price exceeds a pre-established confidence level.
U.S. GAAP defines fair value as the price that a fund would receive to sell an asset or pay to transfer a liability in an orderly transaction between market participants at the measurement date. U.S. GAAP also establishes a framework for measuring
78
| | |
| | | Notes to Financial Statements (continued) |
| | | |
| | | |
fair value, and a three level hierarchy for fair value measurements based upon the transparency of inputs to the valuation of an asset or liability. Inputs may be observable or unobservable and refer broadly to the assumptions that market participants would use in pricing the asset or liability. Observable inputs reflect the assumptions market participants would use in pricing the asset or liability based on market data obtained from sources independent of the Funds. Unobservable inputs reflect the Funds’ own assumptions about the assumptions that market participants would use in pricing the asset or liability developed based on the best information available in the circumstances. Each investment is assigned a level based upon the observability of the inputs which are significant to the overall valuation.
The three-tier hierarchy of inputs is summarized below:
Level 1 – inputs are quoted prices in active markets for identical investments (e.g., equity securities, open-end investment companies)
Level 2 – other observable inputs (including, but not limited to: quoted prices for similar assets or liabilities in markets that are active, quoted prices for identical or similar assets or liabilities in markets that are not active, inputs other than quoted prices that are observable for the assets or liabilities (such as interest rates, yield curves, volatilities, prepayment speeds, loss severities, credit risks and default rates) or other market corroborated inputs) (e.g., debt securities, government securities, foreign currency exchange contracts, foreign securities utilizing international fair value pricing, fair valued securities with observable inputs)
Level 3 – inputs are significant unobservable inputs (including the Fund’s own assumptions used to determine the fair value of investments) (e.g., fair valued securities with unobservable inputs)
Changes in inputs or methodologies used for valuing investments may result in a transfer in or out of levels within the fair value hierarchy. The inputs or methodologies used for valuing investments may not necessarily be an indication of the risk associated with investing in those investments.
b. SECURITY TRANSACTIONS
Security transactions are accounted for as of trade date. Realized gains and losses on securities sold are determined on the basis of identified cost.
c. INVESTMENT INCOME AND EXPENSES
Dividend income is recorded on the ex-dividend date. Dividends from foreign securities are recorded on the ex-dividend date, and if after the fact, as soon as the Funds become aware of the ex-dividend date, except for Korean securities where dividends are recorded on confirmation date. Interest income, which includes amortization of premium and accretion of discount on debt securities, is accrued as earned. Dividend and interest income on foreign securities is recorded gross of any withholding tax. Non-cash dividends included in dividend income, if any, are reported at the fair market value of the securities received. Upon notification from the issuer, distributions received from a real estate investment trust (REIT) may be redesignated as a reduction of cost of investments and/or realized gain. Other income and expenses are recorded on an accrual basis. Expenses that cannot be directly attributed to a Fund are apportioned among the funds in the Trusts and other trusts or funds within the AMG Funds Family of Funds (collectively, the “AMG Funds Family”) based upon their relative average net assets or number of shareholders. Investment income, realized and unrealized capital gains and losses, the common expenses of each Fund, and certain fund level expense reductions, if
any, are allocated on a pro-rata basis to each class based on the relative net assets of each class to the total net assets of each Fund.
The following Funds had certain portfolio trades directed to various brokers under a brokerage recapture program. Credits received from the brokerage recapture program are earned and paid on a monthly basis, and are recorded as expense offsets, which serve to reduce the Funds’ overall expense ratio.
For the fiscal year ended October 31, 2023, the impact on the expenses and expense ratios was as follows:
| | | | | | | | | | | | |
| | | |
| | | Amount | | |
| Percentage
Reduction |
| | | | |
| | | |
Mid Cap Value | | | $27,831 | | | | 0.01% | | | | | |
| | | |
Large Cap Value Select | | | 1,269 | | | | 0.00%1 | | | | | |
| | | |
Small Cap Value | | | 31,650 | | | | 0.00%1 | | | | | |
| | | |
Dividend All Cap Value | | | 14,703 | | | | 0.01% | | | | | |
| | | |
Small-Mid Cap Value | | | 13,765 | | | | 0.01% | | | | | |
| | | |
International Value Equity | | | 1,542 | | | | 0.02% | | | | | |
| | | |
Focused Absolute Value | | | 4,606 | | | | 0.01% | | | | | |
d. DIVIDENDS AND DISTRIBUTIONS
Fund distributions, except those of Dividend All Cap Value, resulting from net investment income will normally be declared and paid at least annually. Dividend All Cap Value will declare and pay net investment income distributions quarterly. Each Fund will normally declare and pay realized net capital gains, if any, at least annually in December. Distributions to shareholders are recorded on the ex-dividend date. Distributions are determined in accordance with federal income tax regulations, which may differ from net investment income and net realized capital gains for financial statement purposes (U.S. GAAP). Differences may be permanent or temporary. Permanent differences are reclassified among capital accounts in the financial statements to reflect their tax character. Permanent book and tax basis differences, if any, relating to shareholder distributions will result in reclassification to paid-in capital. Temporary differences arise when certain items of income, expense and gain or loss are recognized in different periods for financial statement and tax purposes; these differences will reverse at some time in the future. Permanent differences are primarily due to tax equalization utilized for Small Cap Value, Dividend All Cap Value, and Small-Mid Cap Value. There were no permanent differences for the year for Large Cap Value Select, Mid Cap Value, International Value Equity, and Focused Absolute Value. Temporary differences are primarily due to wash sale loss deferrals for all of the Funds, and investments in partnerships for Dividend All Cap Value.
79
| | |
| | | Notes to Financial Statements (continued) |
| | | |
| | | |
The tax character of distributions paid during the fiscal years ended October 31, 2023 and October 31, 2022 was as follows:
| | | | | | | | | | | | | | | | | | | | | | | | |
| | | |
| | | Mid Cap Value | | | Large Cap Value Select | | | Small Cap Value | |
| | | | | | |
| Distributions paid from: | | 2023 | | | 2022 | | | 2023 | | | 2022 | | | 2023 | | | 2022 | |
| | | | | | |
Ordinary income * | | | $19,216,056 | | | | $13,031,729 | | | | $683,735 | | | | $148,346 | | | | — | | | | $25,727,975 | |
| | | | | | |
Long-term capital gains | | | 6,859,292 | | | | — | | | | — | | | | — | | | | $30,499,337 | | | | 38,269,943 | |
| | | | | | |
| | | | | | | | | | | | | | | | | | | | | | | | |
| | | | | | |
| | | $26,075,348 | | | | $13,031,729 | | | | $683,735 | | | | $148,346 | | | | $30,499,337 | | | | $63,997,918 | |
| | | | | | | | | | | | | | | | | | | | | | | | |
| | | |
| | | Dividend All Cap Value | | | Small-Mid Cap Value | | | International Value Equity | |
| | | | | | |
| Distributions paid from: | | 2023 | | | 2022 | | | 2023 | | | 2022 | | | 2023 | | | 2022 | |
| | | | | | |
Ordinary income * | | | $7,069,532 | | | | $9,973,050 | | | | $98,109 | | | | — | | | | $288,708 | | | | $18,274 | |
| | | | | | |
Long-term capital gains | | | 35,507,171 | | | | 65,819,741 | | | | 10,551,692 | | | | $15,297,129 | | | | — | | | | 47,222 | |
| | | | | | |
| | | | | | | | | | | | | | | | | | | | | | | | |
| | | | | | |
| | | $42,576,703 | | | | $75,792,791 | | | | $10,649,801 | | | | $15,297,129 | | | | $288,708 | | | | $65,496 | |
| | | | | | | | | | | | | | | | | | | | | | | | |
| | | | | |
| | | | | | | | | | | | | | | Focused Absolute Value | |
| | | | | | |
| Distributions paid from: | | | | | | | | | | | | | | 2023 | | | 2022 | |
| | | | | | |
Ordinary income * | | | | | | | | | | | | | | | | | | | $249,051 | | | | $706,900 | |
| | | | | | |
Long-term capital gains | | | | | | | | | | | | | | | | | | | 370,475 | | | | 12,517,378 | |
| | | | | | |
| | | | | | | | | | | | | | | | | | | | | | | | |
| | | | | | |
| | | | | | | | | | | | | | | | | | | $619,526 | | | | $13,224,278 | |
| | | | | | | | | | | | | | | | | | | | | | | | |
| * | For tax purposes, short-term capital gain distributions, if any, are considered ordinary income distributions. |
As of October 31, 2023, the components of distributable earnings (excluding unrealized appreciation/depreciation) on a tax basis consisted of:
| | | | | | | | | | | | | | | | | | | | | | | | | | | | |
| | | Mid Cap Value | | | Large Cap Value Select | | | Small Cap
Value | | | Dividend All
Cap Value | | | Small-Mid
Cap Value | | | International Value Equity | | | Focused Absolute Value | |
| | | | | | | |
Capital loss carryforward | | | — | | | | $5,999,490 | | | | — | | | | — | | | | — | | | | $273,306 | | | | — | |
| | | | | | | |
Undistributed ordinary income | | | $1,303,559 | | | | 261,964 | | | | $2,462,141 | | | | — | | | | $3,642,518 | | | | 178,204 | | | | $766,027 | |
| | | | | | | |
Undistributed long-term capital gains | | | — | | | | — | | | | 40,024,165 | | | | $6,078,010 | | | | 7,155,853 | | | | — | | | | 502,352 | |
At October 31, 2023, the cost of investments and the aggregate gross unrealized appreciation and depreciation for federal income tax purposes were as follows:
| | | | | | | | | | | | | | | | |
| Fund | | Cost | | | Appreciation | | | Depreciation | | | Net Appreciation (Depreciation) | |
| | | | |
Mid Cap Value | | | $301,504,156 | | | | $25,789,498 | | | | $(17,540,028 | ) | | | $8,249,470 | |
| | | | |
Large Cap Value Select | | | 30,118,408 | | | | 2,751,598 | | | | (809,397 | ) | | | 1,942,201 | |
| | | | |
Small Cap Value | | | 766,859,747 | | | | 187,042,198 | | | | (68,103,277 | ) | | | 118,938,921 | |
| | | | |
Dividend All Cap Value | | | 198,150,809 | | | | 54,459,289 | | | | (13,860,387 | ) | | | 40,598,902 | |
| | | | |
Small-Mid Cap Value | | | 245,380,692 | | | | 47,363,175 | | | | (27,098,593 | ) | | | 20,264,582 | |
| | | | |
International Value Equity | | | 10,194,558 | | | | 604,875 | | | | (871,771 | ) | | | (266,896 | ) |
| | | | |
Focused Absolute Value | | | 45,342,299 | | | | 6,249,429 | | | | (3,013,771 | ) | | | 3,235,658 | |
80
| | |
| | | Notes to Financial Statements (continued) |
| | | |
| | | |
e. FEDERAL TAXES
Each Fund currently qualifies as an investment company and intends to comply with the requirements under Subchapter M of the Internal Revenue Code of 1986, as amended, and to distribute substantially all of its taxable income and gains to its shareholders and to meet certain diversification and income requirements with respect to investment companies. The Investment Manager has analyzed the Funds’ tax positions taken on federal income tax returns as of October 31, 2023, and for all open tax years (generally, the three prior taxable years), and has concluded that no provision for federal income tax is required in the Funds’ financial statements. Additionally, the Investment Manager is not aware of any tax position for which it is reasonably possible that the total amounts of unrecognized tax benefit/detriment will change materially in the next twelve months.
Furthermore, based on each Fund’s understanding of the tax rules and rates related to income, gains and transactions for the foreign jurisdictions in which it invests, each Fund will provide for foreign taxes, and where appropriate, deferred foreign taxes.
f. CAPITAL LOSS CARRYOVERS AND DEFERRALS
As of October 31, 2023, the following Funds had capital loss carryovers for federal income tax purposes as shown in the following chart. These amounts may be used to offset future realized capital gains indefinitely, and retain their character as short-term and/or long-term.
| | | | | | | | |
| Fund | | Short-Term | | Long-Term | | Total | |
| | | |
Large Cap Value Select | | $4,775,657 | | $1,223,833 | | | $5,999,490 | |
| | | |
International Value Equity | | 258,961 | | 14,345 | | | 273,306 | |
As of October 31, 2023, all the Funds except for Large Cap Value Select and International Value Equity had no capital loss carryovers for federal income tax purposes. Should those Funds incur net capital losses for the fiscal year ended October 31, 2024, such amounts may be used to offset future realized capital gains indefinitely, and retain their character as short-term and/or long-term.
For the fiscal year ended October 31, 2023, the following Funds utilized capital loss carryovers in the amount of:
| | | | | | | | | | |
| | | Capital Loss Carryover Utilized |
| | |
| Fund | | Short-Term | | Long-Term |
| | |
Large Cap Value Select | | | $ | 864,967 | | | | $ | 99,302 | |
| | |
International Value Equity | | | | — | | | | | 94,006 | |
g. CAPITAL STOCK
Each Trust’s Amended and Restated Agreement and Declaration of Trust or Trust Instrument, as applicable, authorizes for each Fund the issuance of an unlimited number of shares of beneficial interest, without par value. Each Fund records sales and repurchases of its capital stock on the trade date.
For the fiscal years ended October 31, 2023 and October 31, 2022, the capital stock transactions by class for the Funds were as follows:
| | | | | | | | | | | | | | | | | | | | | | | | | | | | | | | | |
| | | Mid Cap Value | | Large Cap Value Select |
| | | | |
| | | October 31, 2023 | | October 31, 2022 | | October 31, 2023 | | October 31, 2022 |
| | | | | | | | |
| | | Shares | | Amount | | Shares | | Amount | | Shares | | Amount | | Shares | | Amount | |
| | | | | | | | |
Class N: | | | | | | | | | | | | | | | | | | | | | | | | | | | | | | | | |
| | | | | | | | |
Shares sold | | | 949,737 | | | | $16,906,043 | | | | 785,781 | | | | $14,450,856 | | | | 9,777 | | | | $149,655 | | | | 92,383 | | | | $1,426,811 | |
| | | | | | | | |
Shares issued in reinvestment of distributions | | | 1,150,594 | | | | 19,157,394 | | | | 466,296 | | | | 8,920,248 | | | | 3,502 | | | | 49,510 | | | | — | | | | — | |
| | | | | | | | |
Shares redeemed | | | (2,275,505 | ) | | | (40,543,318 | ) | | | (3,205,760 | ) | | | (59,136,700 | ) | | | (52,163 | ) | | | (782,760 | ) | | | (130,056 | ) | | | (1,921,760) | |
| | | | | | | | | | | | | | | | | | | | | | | | | | | | | | | | |
| | | | | | | | |
Net decrease | | | (175,174 | ) | | | $(4,479,881 | ) | | | (1,953,683 | ) | | | $(35,765,596 | ) | | | (38,884 | ) | | | $(583,595 | ) | | | (37,673 | ) | | | $(494,949) | |
| | | | | | | | | | | | | | | | | | | | | | | | | | | | | | | | |
| | | | | | | | |
Class I: | | | | | | | | | | | | | | | | | | | | | | | | | | | | | | | | |
| | | | | | | | |
Shares sold | | | 1,247,002 | | | | $24,317,449 | | | | 389,997 | | | | $7,669,264 | | | | 41,393 | | | | $607,275 | | | | 170,101 | | | | $2,524,908 | |
| | | | | | | | |
Shares issued in reinvestment of distributions | | | 323,884 | | | | 5,813,710 | | | | 172,599 | | | | 3,534,820 | | | | 41,467 | | | | 589,249 | | | | 9,155 | | | | 144,014 | |
| | | | | | | | |
Shares redeemed | | | (1,289,620 | ) | | | (24,891,173 | ) | | | (2,089,133 | ) | | | (41,293,790 | ) | | | (344,500 | ) | | | (5,145,465 | ) | | | (396,293 | ) | | | (5,949,087) | |
| | | | | | | | | | | | | | | | | | | | | | | | | | | | | | | | |
| | | | | | | | |
Net increase (decrease) | | | 281,266 | | | | $5,239,986 | | | | (1,526,537 | ) | | | $(30,089,706 | ) | | | (261,640 | ) | | | $(3,948,941 | ) | | | (217,037 | ) | | | $(3,280,165) | |
| | | | | | | | | | | | | | | | | | | | | | | | | | | | | | | | |
81
| | |
| | | Notes to Financial Statements (continued) |
| | | |
| | | |
| | | | | | | | | | | | | | | | | | | | | | | | | | | | | | | | |
| | |
| | | Mid Cap Value | | | Large Cap Value Select | |
| | | | |
| | | October 31, 2023 | | | October 31, 2022 | | | October 31, 2023 | | | October 31, 2022 | |
| | | | | | | | |
| | | Shares | | | Amount | | | Shares | | | Amount | | | Shares | | | Amount | | | Shares | | | Amount | |
| | | | | | | | |
Class Z: | | | | | | | | | | | | | | | | | | | | | | | | | | | | | | | | |
| | | | | | | | |
Shares sold | | | 24,038 | | | | $462,371 | | | | 57,150 | | | | $1,177,954 | | | | — | | | | — | | | | — | | | | — | |
| | | | | | | | |
Shares issued in reinvestment of distributions | | | 34,175 | | | | 608,992 | | | | 15,140 | | | | 308,105 | | | | — | | | | — | | | | — | | | | — | |
| | | | | | | | |
Shares redeemed | | | (73,280 | ) | | | (1,402,999 | ) | | | (88,736 | ) | | | (1,765,508 | ) | | | — | | | | — | | | | — | | | | — | |
| | | | | | | | | | | | | | | | | | | | | | | | | | | | | | | | |
| | | | | | | | |
Net decrease | | | (15,067 | ) | | | $(331,636 | ) | | | (16,446 | ) | | | $(279,449 | ) | | | — | | | | — | | | | — | | | | — | |
| | | | | | | | | | | | | | | | | | | | | | | | | | | | | | | | |
| | |
| | | Small Cap Value | | | Dividend All Cap Value | |
| | | | |
| | | October 31, 2023 | | | October 31, 2022 | | | October 31, 2023 | | | October 31, 2022 | |
| | | | | | | | |
| | | Shares | | | Amount | | | Shares | | | Amount | | | Shares | | | Amount | | | Shares | | | Amount | |
| | | | | | | | |
Class N: | | | | | | | | | | | | | | | | | | | | | | | | | | | | | | | | |
| | | | | | | | |
Shares sold | | | 764,537 | | | | $10,743,123 | | | | 561,747 | | | | $7,864,823 | | | | 46,461 | | | | $442,670 | | | | 125,545 | | | | $1,388,577 | |
| | | | | | | | |
Shares issued in reinvestment of distributions | | | 102,870 | | | | 1,367,145 | | | | 171,350 | | | | 2,484,577 | | | | 484,141 | | | | 4,635,571 | | | | 696,500 | | | | 7,755,566 | |
| | | | | | | | |
Shares redeemed | | | (473,354 | ) | | | (6,575,876 | ) | | | (336,442 | ) | | | (4,782,181 | ) | | | (655,492 | ) | | | (6,218,758 | ) | | | (685,187 | ) | | | (7,832,849 | ) |
| | | | | | | | | | | | | | | | | | | | | | | | | | | | | | | | |
| | | | | | | | |
Net increase (decrease) | | | 394,053 | | | | $5,534,392 | | | | 396,655 | | | | $5,567,219 | | | | (124,890 | ) | | | $(1,140,517 | ) | | | 136,858 | | | | $1,311,294 | |
| | | | | | | | | | | | | | | | | | | | | | | | | | | | | | | | |
| | | | | | | | |
Class I: | | | | | | | | | | | | | | | | | | | | | | | | | | | | | | | | |
| | | | | | | | |
Shares sold | | | 11,870,466 | | | | $172,416,580 | | | | 12,369,812 | | | | $181,304,160 | | | | 4,314,310 | | | | $42,038,542 | | | | 5,504,938 | | | | $60,820,542 | |
| | | | | | | | |
Shares issued in reinvestment of distributions | | | 1,896,970 | | | | 26,121,284 | | | | 3,784,850 | | | | 56,659,209 | | | | 3,845,260 | | | | 36,735,160 | | | | 5,979,282 | | | | 66,508,504 | |
| | | | | | | | |
Shares redeemed | | | (12,026,638 | ) | | | (174,467,625 | ) | | | (13,103,828 | ) | | | (191,877,365 | ) | | | (11,920,574 | ) | | | (113,621,232 | ) | | | (13,105,957 | ) | | | (151,468,515 | ) |
| | | | | | | | | | | | | | | | | | | | | | | | | | | | | | | | |
| | | | | | | | |
Net increase (decrease) | | | 1,740,798 | | | | $24,070,239 | | | | 3,050,834 | | | | $46,086,004 | | | | (3,761,004 | ) | | | $(34,847,530 | ) | | | (1,621,737 | ) | | | $(24,139,469 | ) |
| | | | | | | | | | | | | | | | | | | | | | | | | | | | | | | | |
| | | | | | | | |
Class Z: | | | | | | | | | | | | | | | | | | | | | | | | | | | | | | | | |
| | | | | | | | |
Shares sold | | | 52,181 | | | | $757,394 | | | | 133,388 | | | | $1,956,634 | | | | 62,411 | | | | $597,509 | | | | 97,425 | | | | $1,079,174 | |
| | | | | | | | |
Shares issued in reinvestment of distributions | | | 24,902 | | | | 343,645 | | | | 38,249 | | | | 572,964 | | | | 47,325 | | | | 451,503 | | | | 42,101 | | | | 467,571 | |
| | | | | | | | |
Shares redeemed | | | (19,520 | ) | | | (285,485 | ) | | | (5,997 | ) | | | (89,465 | ) | | | (36,056 | ) | | | (326,540 | ) | | | (23,221 | ) | | | (265,113 | ) |
| | | | | | | | | | | | | | | | | | | | | | | | | | | | | | | | |
| | | | | | | | |
Net increase | | | 57,563 | | | | $815,554 | | | | 165,640 | | | | $2,440,133 | | | | 73,680 | | | | $722,472 | | | | 116,305 | | | | $1,281,632 | |
| | | | | | | | | | | | | | | | | | | | | | | | | | | | | | | | |
| | |
| | | Small-Mid Cap Value | | | International Value Equity | |
| | | | |
| | | October 31, 2023 | | | October 31, 2022 | | | October 31, 2023 | | | October 31, 2022 | |
| | | Shares | | | Amount | | | Shares | | | Amount | | | Shares | | | Amount | | | Shares | | | Amount | |
| | | | | | | | |
Class N: | | | | | | | | | | | | | | | | | | | | | | | | | | | | | | | | |
| | | | | | | | |
Shares sold | | | 338,659 | | | | $3,001,785 | | | | 215,704 | | | | $1,962,918 | | | | 134,873 | | | | $1,305,303 | | | | 6,816 | | | | $64,007 | |
| | | | | | | | |
Shares issued in reinvestment of distributions | | | 98,766 | | | | 829,638 | | | | 136,634 | | | | 1,285,724 | | | | 4,694 | | | | 41,308 | | | | 905 | | | | 8,466 | |
| | | | | | | | |
Shares redeemed | | | (355,139 | ) | | | (3,097,453 | ) | | | (583,472 | ) | | | (5,314,555 | ) | | | (16,911 | ) | | | (161,149 | ) | | | (50,611 | ) | | | (465,849 | ) |
| | | | | | | | | | | | | | | | | | | | | | | | | | | | | | | | |
| | | | | | | | |
Net increase (decrease) | | | 82,286 | | | | $733,970 | | | | (231,134 | ) | | | $(2,065,913 | ) | | | 122,656 | | | | $1,185,462 | | | | (42,890 | ) | | | $(393,376 | ) |
| | | | | | | | | | | | | | | | | | | | | | | | | | | | | | | | |
| | | | | | | | |
Class I: | | | | | | | | | | | | | | | | | | | | | | | | | | | | | | | | |
| | | | | | | | |
Shares sold | | | 9,330,366 | | | | $85,230,959 | | | | 3,071,053 | | | | $28,932,722 | | | | 90,043 | | | | $862,553 | | | | 47,924 | | | | $450,397 | |
| | | | | | | | |
Shares issued in reinvestment of distributions | | | 881,405 | | | | 7,668,227 | | | | 1,136,001 | | | | 11,030,565 | | | | 23,179 | | | | 211,394 | | | | 5,357 | | | | 51,853 | |
| | | | | | | | |
Shares redeemed | | | (6,257,178 | ) | | | (56,859,310 | ) | | | (5,867,377 | ) | | | (55,678,643 | ) | | | (54,307 | ) | | | (516,176 | ) | | | (166,456 | ) | | | (1,563,395 | ) |
| | | | | | | | | | | | | | | | | | | | | | | | | | | | | | | | |
| | | | | | | | |
Net increase (decrease) | | | 3,954,593 | | | | $36,039,876 | | | | (1,660,323 | ) | | | $(15,715,356 | ) | | | 58,915 | | | | $557,771 | | | | (113,175 | ) | | | $(1,061,145 | ) |
| | | | | | | | | | | | | | | | | | | | | | | | | | | | | | | | |
82
| | |
| | | Notes to Financial Statements (continued) |
| | | |
| | | |
| | | | | | | | | | | | | | | | | | | | | | | | | | | | | | | | |
| | | Small-Mid Cap Value | | International Value Equity |
| | | | |
| | | October 31, 2023 | | October 31, 2022 | | October 31, 2023 | | October 31, 2022 |
| | | | | | | | |
| | | Shares | | Amount | | Shares | | Amount | | Shares | | Amount | | Shares | | Amount |
| | | | | | | | |
Class Z: | | | | | | | | | | | | | | | | | | | | | | | | | | | | | | | | |
| | | | | | | | |
Shares sold | | | 183,363 | | | | $1,632,341 | | | | 163,072 | | | | $1,535,426 | | | | 21,465 | | | | $202,946 | | | | 46,267 | | | | $424,613 | |
| | | | | | | | |
Shares issued in reinvestment of distributions | | | 114,008 | | | | 993,011 | | | | 130,979 | | | | 1,271,813 | | | | 3,915 | | | | 35,865 | | | | 474 | | | | 4,607 | |
| | | | | | | | |
Shares redeemed | | | (675,110 | ) | | | (5,947,365 | ) | | | (173,599 | ) | | | (1,676,203 | ) | | | (3,701 | ) | | | (37,046 | ) | | | (6,708 | ) | | | (65,844 | ) |
| | | | | | | | | | | | | | | | | | | | | | | | | | | | | | | | |
| | | | | | | | |
Net increase (decrease) | | | (377,739 | ) | | | $(3,322,013 | ) | | | 120,452 | | | | $1,131,036 | | | | 21,679 | | | | $201,765 | | | | 40,033 | | | | $363,376 | |
| | | | | | | | | | | | | | | | | | | | | | | | | | | | | | | | |
| | | | | | | | | | | | | | | | |
| | | Focused Absolute Value |
| | |
| | | October 31, 2023 | | October 31, 2022 |
| | | | |
| | | Shares | | Amount | | Shares | | Amount |
| | | | |
Class N: | | | | | | | | | | | | | | | | |
| | | | |
Shares sold | | | 3,416 | | | | $41,517 | | | | 3,037 | | | | $38,754 | |
| | | | |
Shares issued in reinvestment of distributions | | | 1,436 | | | | 16,781 | | | | 16,196 | | | | 221,232 | |
| | | | |
Shares redeemed | | | (37,148 | ) | | | (450,738 | ) | | | (78,016 | ) | | | (1,025,492 | ) |
| | | | | | | | | | | | | | | | |
| | | | |
Net decrease | | | (32,296 | ) | | | $(392,440 | ) | | | (58,783 | ) | | | $(765,506 | ) |
| | | | | | | | | | | | | | | | |
| | | | |
Class I: | | | | | | | | | | | | | | | | |
| | | | |
Shares sold | | | 629,484 | | | | $7,592,330 | | | | 868,513 | | | | $11,393,428 | |
| | | | |
Shares issued in reinvestment of distributions | | | 44,601 | | | | 520,939 | | | | 883,850 | | | | 12,064,555 | |
| | | | |
Shares redeemed | | | (1,909,131 | ) | | | (22,710,674 | ) | | | (9,282,307 | ) | | | (118,273,825 | ) |
| | | | | | | | | | | | | | | | |
| | | | |
Net decrease | | | (1,235,046 | ) | | | $(14,597,405 | ) | | | (7,529,944 | ) | | | $(94,815,842 | ) |
| | | | | | | | | | | | | | | | |
| | | | |
Class Z: | | | | | | | | | | | | | | | | |
| | | | |
Shares sold | | | 17,596 | | | | $209,361 | | | | 56,888 | | | | $729,942 | |
| | | | |
Shares issued in reinvestment of distributions | | | 2,706 | | | | 31,583 | | | | 25,080 | | | | 342,347 | |
| | | | |
Shares redeemed | | | (137,875 | ) | | | (1,632,424 | ) | | | (335,109 | ) | | | (4,088,214 | ) |
| | | | | | | | | | | | | | | | |
| | | | |
Net decrease | | | (117,573 | ) | | | $(1,391,480 | ) | | | (253,141 | ) | | | $(3,015,925 | ) |
| | | | | | | | | | | | | | | | |
h. REPURCHASE AGREEMENTS AND JOINT REPURCHASE AGREEMENTS
The Funds may enter into third-party and bilateral repurchase agreements for temporary cash management purposes and for reinvestment of cash collateral on securities lending transactions under the securities lending program offered by The Bank of New York Mellon (“BNYM”) (the “Securities Lending Program”) (collectively, “Repurchase Agreements”). The value of the underlying collateral, including accrued interest, must equal or exceed the value of the Repurchase Agreements during the term of the agreement. For joint repurchase agreements, the Funds participate on a pro rata basis with other clients of BNYM in their share of the underlying collateral under such joint repurchase agreements and in their share of proceeds from any repurchase or other disposition of the underlying collateral. The underlying collateral for all Repurchase Agreements is held by the Funds’ custodian or at the Federal Reserve Bank. If the seller defaults and the value of the collateral declines, or if bankruptcy proceedings commence with respect to the seller of the security, realization of the collateral by the Funds may be delayed or limited. Pursuant to the Securities Lending Program, the Funds are indemnified for such losses by BNYM on joint repurchase agreements.
At October 31, 2023, the market value of Repurchase Agreements outstanding is as follows:
| | | | |
| |
| | | Market Value | |
| |
Mid Cap Value | | | $12,825,264 | |
| |
Large Cap Value Select | | | 369,000 | |
| |
Small Cap Value | | | 87,939,000 | |
| |
Dividend All Cap Value | | | 8,032,292 | |
| |
Small-Mid Cap Value | | | 12,796,542 | |
| |
International Value Equity | | | 374,000 | |
| |
Focused Absolute Value | | | 173,000 | |
i. FOREIGN CURRENCY TRANSLATION
The books and records of the Funds are maintained in U.S. Dollars. The value of investments, assets and liabilities denominated in currencies other than U.S. Dollars are translated into U.S. Dollars based upon current foreign exchange
83
| | |
| | | Notes to Financial Statements (continued) |
| | | |
| | | |
rates. Purchases and sales of foreign investments, income and expenses are converted into U.S. Dollars based on currency exchange rates prevailing on the respective dates of such transactions. Net realized and unrealized gain (loss) on foreign currency transactions represent: (1) foreign exchange gains and losses from the sale and holdings of foreign currencies; (2) gains and losses between trade date and settlement date on investment securities transactions and foreign currency exchange contracts; and (3) gains and losses from the difference between amounts of interest and dividends recorded and the amounts actually received.
The Funds do not isolate the net realized and unrealized gain or loss resulting from changes in exchange rates from the fluctuations in market prices of securities held. Such fluctuations are included with the net realized and unrealized gain or loss on investments.
2. AGREEMENTS AND TRANSACTIONS WITH AFFILIATES
For each of the Funds, the Trusts have entered into an investment advisory agreement under which the Investment Manager, a subsidiary and the U.S. retail distribution arm of Affiliated Managers Group, Inc. (“AMG”), serves as investment manager to the Funds and is responsible for the Funds’ overall administration and operations. The Investment Manager selects and recommends, subject to the approval of the Board and, in certain circumstances, shareholders, the Funds’ subadviser and monitors the subadviser’s investment performance, security holdings and investment strategies. Each Fund’s investment portfolio is managed by River Road Asset Management, LLC (“River Road”) who serves pursuant to a subadvisory agreement with the Investment Manager. AMG indirectly owns a majority interest in River Road.
Investment management fees are paid directly by the Funds to the Investment Manager based on average daily net assets. For the fiscal year ended October 31, 2023, the Funds’ investment management fees were paid at the following annual rate of each Fund’s respective average daily net assets:
| | | | |
| |
Mid Cap Value | | | 0.56% | |
| |
Large Cap Value Select | | | 0.35% | |
| |
Small Cap Value | | | 0.80% | |
| |
Dividend All Cap Value | | | 0.50%1 | |
| |
Small-Mid Cap Value | | | 0.75% | |
| |
International Value Equity | | | 0.53% | |
| |
Focused Absolute Value | | | 0.60% | |
| 1 | Prior to July 1, 2022, the annual rate was 0.60%. |
The fee paid to River Road for its services as subadviser is paid out of the fee the Investment Manager receives from each Fund and does not increase the expenses of each Fund.
The Investment Manager has contractually agreed, through at least March 1, 2024, to waive management fees and/or reimburse fund expenses in order to limit total annual Fund operating expenses after fee waiver and expense reimbursements (exclusive of taxes, interest (including interest incurred in connection with bank and custody overdrafts and in connection with securities sold short), shareholder servicing fees, distribution and service 12b-1 fees, brokerage commissions and other transaction costs, dividends payable with respect to securities sold short,
acquired fund fees and expenses and extraordinary expenses) of the Funds other than Small Cap Value to the below percentages of each such Fund’s average daily net assets (this annual rate or such other annual rate that may be in effect from time to time, the “Expense Cap”), subject to later reimbursement by such Funds in certain circumstances.
| | | | |
| |
Mid Cap Value | | | 0.76% | |
| |
Large Cap Value Select | | | 0.60% | |
| |
Small Cap Value | | | N/A | |
| |
Dividend All Cap Value | | | 0.68%1 | |
| |
Small-Mid Cap Value | | | 1.04% | |
| |
International Value Equity | | | 0.73% | |
| |
Focused Absolute Value | | | 0.78% | |
| 1 | Prior to July 1, 2022, the limitation was 0.78%. |
In general, for a period of up to 36 months after the date any amounts are paid, waived or reimbursed by the Investment Manager, the Investment Manager may recover such amounts from a Fund, provided that such repayment would not cause the Fund’s total annual operating expenses after fee waiver and expense reimbursements (exclusive of the items noted in the parenthetical above) to exceed either (i) the Expense Cap in effect at the time such amounts were paid, waived or reimbursed, or (ii) the Expense Cap in effect at the time of such repayment by the Fund.
The contractual expense limitation may only be terminated in the event the Investment Manager or a successor ceases to be the investment manager of the Fund or a successor fund, by mutual agreement between the Investment Manager and the Board, or in the event of the Fund’s liquidation unless the Fund is reorganized or is a party to a merger in which the surviving entity is successor to the accounting and performance information of the Fund.
For the fiscal year ended October 31, 2023, the Investment Manager’s expense reimbursements, and repayments of prior reimbursements by the Funds to the Investment Manager, if any, are as follows:
| | | | |
| | |
| | | Expense Reimbursements | | Repayment of Prior Reimbursements |
| | |
Mid Cap Value | | $79,604 | | — |
| | |
Large Cap Value Select | | 77,427 | | — |
| | |
Dividend All Cap Value | | 132,074 | | — |
| | |
International Value Equity | | 102,768 | | — |
| | |
Focused Absolute Value | | 89,807 | | — |
84
| | |
| | | Notes to Financial Statements (continued) |
| | | |
| | | |
At October 31, 2023, the Funds’ expiration of reimbursements subject to recoupment, if any, is as follows:
| | | | | | | | | | | | |
Expiration
Period | | Mid Cap Value | | | Large Cap Value Select | | | Dividend All Cap Value | |
| | | |
Less than 1 year | | | $219,148 | | | | $58,404 | | | | $97,897 | |
| | | |
1-2 years | | | 27,037 | | | | 46,891 | | | | 117,693 | |
| | | |
2-3 years | | | 79,604 | | | | 77,427 | | | | 132,074 | |
| | | | | | | | | | | | |
| | | |
Total | | | $325,789 | | | | $182,722 | | | | $347,664 | |
| | | | | | | | | | | | |
| | | | | | | | |
Expiration Period | | International Value Equity | | | Focused Absolute Value | |
| | |
Less than 1 year | | | $79,873 | | | | $98,605 | |
| | |
1-2 years | | | 86,935 | | | | 98,288 | |
| | |
2-3 years | | | 102,768 | | | | 89,807 | |
| | | | | | | | |
| | |
Total | | | $269,576 | | | | $286,700 | |
| | | | | | | | |
The Trusts, on behalf of the Funds, have entered into an amended and restated Administration Agreement under which the Investment Manager serves as the Funds’ administrator (the “Administrator”) and is responsible for certain aspects of managing the Funds’ operations, including administration and shareholder services to each Fund. Each Fund pays a fee to the Administrator at the rate of 0.15% per annum of the Fund’s average daily net assets for this service.
The Funds are distributed by AMG Distributors, Inc. (the “Distributor”), a wholly-owned subsidiary of the Investment Manager. The Distributor serves as the distributor and underwriter for each Fund and is a registered broker-dealer and member of the Financial Industry Regulatory Authority, Inc. (“FINRA”). Shares of each Fund will be continuously offered and will be sold directly to prospective purchasers and through brokers, dealers or other financial intermediaries who have executed selling agreements with the Distributor. Generally, the Distributor bears all or a portion of the expenses of providing services pursuant to the distribution agreement, including the payment of the expenses relating to the distribution of prospectuses for sales purposes and any advertising or sales literature.
The Trusts have adopted a distribution and service plan (the “Plan”) with respect to the Class N shares of each Fund in accordance with the requirements of Rule 12b-1 under the 1940 Act and the requirements of the applicable rules of FINRA regarding asset based sales charges. Pursuant to the Plan, each Fund may make payments to the Distributor for its expenditures in financing any activity primarily intended to result in the sale of each Fund’s Class N shares and for maintenance and personal service provided to existing shareholders of that class. The Plan authorizes payments to the Distributor of up to 0.25% annually of each Fund’s average daily net assets attributable to the Class N shares. For all Funds, except Large Cap Value Select, the Plan is characterized as a reimbursement plan and is directly tied to expenses incurred by the Distributor; the payments the Distributor receives during any year may not exceed its actual expenses.
The impact on the annualized expense ratios for the fiscal year ended October 31, 2023, was as follows:
| | | | | | | | |
| Fund | | Actual Amount Incurred | | | | |
| | |
Mid Cap Value | | | | | | | | |
| | |
Class N | | | 0.25% | | | | | |
| | |
Large Cap Value Select | | | | | | | | |
| | |
Class N | | | 0.25% | | | | | |
| | |
Small Cap Value | | | | | | | | |
| | |
Class N | | | 0.25% | | | | | |
| | |
Dividend All Cap Value | | | | | | | | |
| | |
Class N | | | 0.25% | | | | | |
| | |
Small-Mid Cap Value | | | | | | | | |
| | |
Class N | | | 0.24% | | | | | |
| | |
International Value Equity | | | | | | | | |
| | |
Class N | | | 0.22% | | | | | |
| | |
Focused Absolute Value | | | | | | | | |
| | |
Class N | | | 0.24% | | | | | |
For each of the Class N and Class I shares, the Board has approved reimbursement payments to the Investment Manager for shareholder servicing expenses (“shareholder servicing fees”) incurred. Shareholder servicing fees include payments to financial intermediaries, such as broker-dealers (including fund supermarket platforms), banks, and trust companies who provide shareholder record keeping, account servicing and other services. The Class N and Class I shares may reimburse the Investment Manager for the actual amount incurred up to a maximum annual rate of each Class’s average daily net assets as shown in the table below.
The impact on the annualized expense ratios for the fiscal year ended October 31, 2023, was as follows:
| | | | | | | | | | | | | | | | |
| Fund | | Maximum Annual Amount Approved | | | | | | Actual Amount Incurred | | | | |
| | | | |
Mid Cap Value | | | | | | | | | | | | | | | | |
| | | | |
Class N | | | 0.10% | | | | | | | | 0.10% | | | | | |
| | | | |
Class I | | | 0.05% | | | | | | | | 0.05% | | | | | |
| | | | |
Large Cap Value Select | | | | | | | | | | | | | | | | |
| | | | |
Class N | | | 0.10% | | | | | | | | 0.10% | | | | | |
| | | | |
Class I | | | 0.05% | | | | | | | | 0.03% | | | | | |
| | | | |
Small Cap Value | | | | | | | | | | | | | | | | |
| | | | |
Class N | | | 0.15% | | | | | | | | 0.10% | | | | | |
| | | | |
Class I | | | 0.15% | | | | | | | | 0.09% | | | | | |
| | | | |
Dividend All Cap Value | | | | | | | | | | | | | | | | |
| | | | |
Class N | | | 0.04% | | | | | | | | 0.04% | | | | | |
| | | | |
Class I | | | 0.04% | | | | | | | | 0.04% | | | | | |
85
| | |
| | | Notes to Financial Statements (continued) |
| | | |
| | | |
| | | | | | | | | | | | | | | | |
| Fund | | Maximum Annual Amount Approved | | | | | | Actual Amount Incurred | | | | |
| | | | |
Small-Mid Cap Value | | | | | | | | | | | | | | | | |
| | | | |
Class N | | | 0.15% | | | | | | | | 0.06% | | | | | |
| | | | |
Class I | | | 0.15% | | | | | | | | 0.05% | | | | | |
| | | | |
International Value Equity | | | | | | | | | | | | | | | | |
| | | | |
Class N | | | 0.05% | | | | | | | | 0.05% | | | | | |
| | | | |
Class I | | | 0.05% | | | | | | | | 0.05% | | | | | |
| | | | |
Focused Absolute Value | | | | | | | | | | | | | | | | |
| | | | |
Class N | | | 0.15% | | | | | | | | 0.04% | | | | | |
| | | | |
Class I | | | 0.15% | | | | | | | | 0.04% | | | | | |
The Board provides supervision of the affairs of the Trusts and other trusts within the AMG Funds Family. The Trustees of the Trusts who are not affiliated with the Investment Manager receive an annual retainer and per meeting fees for regular, special and telephonic meetings, and they are reimbursed for out-of-pocket expenses incurred while carrying out their duties as Board members. The Chairman of the Board and the Audit Committee Chair receive additional annual retainers. On October 10, 2023, the shareholders of the Trusts elected Trustees, including two new Trustees who are not “interested persons” of the Funds within the meaning of the 1940 Act. Certain Trustees and Officers of the Funds are Officers and/or Directors of the Investment Manager, AMG and/or the Distributor.
The Securities and Exchange Commission (the “SEC”) granted an exemptive order that permits eligible funds in the AMG Funds Family to lend and borrow money for certain temporary purposes directly to and from other eligible funds in the AMG Funds Family. Participation in this interfund lending program is voluntary for both the borrowing and lending funds, and an interfund loan is only made if it benefits each participating fund. The Administrator manages the program according to procedures approved by the Board, and the Board monitors the operation of the program. An interfund loan must comply with certain conditions set out in the exemptive order, which are designed to assure fairness and protect all participating funds. The interest earned and interest paid on interfund loans are included on the Statement of Operations as interest income and interest expense, respectively. Mid Cap Value, Large Cap Value Select and International Value Equity are eligible to fully participate in the interfund lending program. Prior to October 10, 2023, Focused Absolute Value was only eligible to participate as a lending fund in the interfund lending program, while Small Cap Value, Dividend All Cap Value and Small-Mid Cap Value were not eligible to participate in the interfund lending program. On October 10, 2023, the shareholders of Focused Absolute Value, Dividend All Cap Value, and Small Cap Value approved changes that allowed such Funds to fully participate in the interfund lending program; on October 31, 2023, the shareholders of Small-Mid Cap Value approved changes that allowed such Fund to fully participate in the interfund lending program. Each Fund may participate as a borrowing and lending fund. At October 31, 2023, the Funds had no interfund loans outstanding.
The following Funds utilized the interfund loan program during the fiscal year ended October 31, 2023 as follows:
| | | | | | | | | | | | | | | | | | | | |
| Fund | | Average Lent | | | Number of Days | | | Interest Earned | | | Average Interest Rate | | | | |
| | | | | |
Mid Cap Value | | | $1,827,637 | | | | 5 | | | | $1,179 | | | | 4.710% | | | | | |
| | | | | |
Large Cap Value Select | | | 707,027 | | | | 1 | | | | 108 | | | | 5.585% | | | | | |
| | | | | |
International Value Equity | | | 104,350 | | | | 7 | | | | 94 | | | | 4.700% | | | | | |
| | | | | | | | | | | | | | | | | | | | |
| Fund | | Average Borrowed | | | Number of Days | | | Interest Paid | | | Average Interest Rate | | | | |
| | | | | |
Mid Cap Value | | | $1,091,438 | | | | 1 | | | | $141 | | | | 4.700% | | | | | |
3. PURCHASES AND SALES OF SECURITIES
Purchases and sales of securities (excluding short-term securities and U.S. Government Obligations) for the fiscal year ended October 31, 2023, were as follows:
| | | | | | | | |
| | | Long Term Securities | |
| | |
| Fund | | Purchases | | | Sales | |
| | |
Mid Cap Value | | | $233,868,403 | | | | $259,928,047 | |
| | |
Large Cap Value Select | | | 25,280,433 | | | | 30,271,738 | |
| | |
Small Cap Value | | | 199,047,403 | | | | 230,756,318 | |
| | |
Dividend All Cap Value | | | 72,238,300 | | | | 133,115,979 | |
| | |
Small-Mid Cap Value | | | 97,027,909 | | | | 76,006,890 | |
| | |
International Value Equity | | | 7,099,520 | | | | 5,377,780 | |
| | |
Focused Absolute Value | | | 35,118,464 | | | | 50,602,321 | |
The Funds had no purchases or sales of U.S. Government Obligations during the fiscal year ended October 31, 2023.
4. PORTFOLIO SECURITIES LOANED
The Funds participate in the Securities Lending Program providing for the lending of securities to qualified borrowers. Securities lending income includes earnings of such temporary cash investments, plus or minus any rebate to a borrower. These earnings (after any rebate) are then divided between BNYM, as a fee for its services under the Securities Lending Program, and the Funds, according to agreed-upon rates. Collateral on all securities loaned is accepted in cash, U.S. Treasury Obligations or U.S. Government Agency Obligations. Collateral is maintained at a minimum level of 102% (105% in the case of certain foreign securities) of the market value, plus interest, if applicable, of investments on loan. It is the Funds’ policy to obtain additional collateral from or return excess collateral to the borrower by the end of the next business day, following the valuation date of the securities loaned. Therefore, the value of the collateral held may be temporarily less than the value of the securities on loan. Lending securities entails a risk of loss to the Funds if and to the extent that the market value of the securities loaned were to increase and the borrower did not increase the collateral accordingly, and the borrower fails to return the securities. Under the terms of the Securities Lending Program, the Funds are indemnified for such losses by BNYM. Cash collateral is held in separate omnibus accounts managed by BNYM, who is authorized to exclusively enter into joint repurchase agreements for that cash collateral. Securities collateral is held in separate omnibus accounts managed by
86
| | |
| | | Notes to Financial Statements (continued) |
| | | |
| | | |
BNYM and cannot be sold or pledged. BNYM bears the risk of any deficiency in the amount of the cash collateral available for return to the borrower due to any loss on the collateral invested. Loans of securities are terminable at any time and the borrower, after notice, is required to return borrowed securities as soon as practical, which is normally within three business days.
The value of securities loaned on positions held, cash collateral and securities collateral received at October 31, 2023, was as follows:
| | | | | | | | | | | | | | | | |
| Fund | | Securities Loaned | | | Cash Collateral Received | | | Securities Collateral Received | | | Total Collateral
Received | |
| | | | |
Mid Cap Value | | $ | 10,357,118 | | | $ | 4,482,264 | | | $ | 6,218,750 | | | $ | 10,701,014 | |
| | | | |
Small Cap Value | | | 5,495,569 | | | | 3,606,000 | | | | 2,084,250 | | | | 5,690,250 | |
| | | | |
Dividend All Cap Value | | | 13,391,166 | | | | 5,677,292 | | | | 7,933,167 | | | | 13,610,459 | |
| | | | |
Small-Mid Cap Value | | | 7,235,210 | | | | 3,159,542 | | | | 4,231,172 | | | | 7,390,714 | |
| | | | |
Focused Absolute Value | | | 904,480 | | | | — | | | | 917,879 | | | | 917,879 | |
The following table summarizes the securities received as collateral for securities lending at October 31, 2023:
| | | | | | |
| Fund | | Collateral Type | | Coupon Range | | Maturity Date Range |
| | | |
Mid Cap Value | | U.S.
Treasury
Obligations | | 0.000%-7.500% | | 11/07/23-08/15/53 |
| | | |
| Small Cap Value | | U.S.
Treasury
Obligations | | 0.125%-5.419% | | 01/15/24-08/15/53 |
| | | |
Dividend All Cap Value | | U.S.
Treasury
Obligations | | 0.125%-5.367% | | 01/15/24-02/15/53 |
| | | |
Small-Mid Cap Value | | U.S.
Treasury
Obligations | | 0.125%-5.367% | | 01/15/24-02/15/53 |
| | | |
Focused Absolute Value | | U.S.
Treasury
Obligations | | 0.125%-5.367% | | 01/15/24-02/15/53 |
5. FOREIGN SECURITIES
Certain Funds may invest in securities of foreign entities and in instruments denominated in foreign currencies which involve risks not typically associated with investments in domestic securities, such as exposure to currency fluctuations, less developed or less efficient trading markets, political instability, a lack of company information, differing auditing and legal standards, and, potentially, less liquidity. A Fund’s performance will be influenced by political, social and economic factors affecting companies in emerging market countries. Emerging market countries generally have economic structures that are less diverse and mature, and political systems that are less stable, than those of developed countries. Realized gains in certain countries may be subject to foreign taxes at the Fund level and the Fund would pay such foreign taxes at the appropriate rate for each jurisdiction.
6. COMMITMENTS AND CONTINGENCIES
Under the Trusts’ organizational documents, its Trustees and Officers are indemnified against certain liabilities arising out of the performance of their duties to the Trusts. In addition, in the normal course of business, the Funds may enter into contracts and agreements that contain a variety of representations and warranties, which provide general indemnifications. The maximum exposure to the Funds under these arrangements is unknown, as this would involve future claims that may be made against a Fund that have not yet occurred. However, based on experience, the Funds had no prior claims or losses and expect the risks of loss to be remote.
7. CREDIT AGREEMENT
Effective July 6, 2010 and last amended on July 19, 2023, certain Funds in AMG Funds II, AMG Funds III, and AMG Funds IV (the “Participating Trusts”) entered into a Credit Agreement with BNYM (the “Credit Agreement”) which provides Small Cap Value, Dividend All Cap Value, Small-Mid Cap Value, Focused Absolute Value, and certain other funds in AMG Funds II and AMG Funds III (the “Participating Funds”) with a revolving line of credit of up to $50 million. The Credit Agreement runs for 364-day terms and can be renewed at the mutual agreement of the Participating Trusts and BNYM. The facility is shared by the Participating Funds, and is available for temporary, emergency purposes including liquidity needs in meeting redemptions. The interest rate on outstanding Alternate Base Rate Loans is equal to the greater of the Prime Rate plus 1.25%, or 0.50% plus the Federal Funds Effective Rate plus 1.25%. The interest rate on outstanding Overnight Loans is equal to the greater of the Federal Funds Effective Rate plus 1.25%, or the Adjusted Daily Simple SOFR plus 1.25%. The Adjusted Daily Simple SOFR is the sum of Daily Simple SOFR plus 0.10% plus a floor rate of 0.00%. The Participating Trusts pay a commitment fee on the unutilized commitment amount of 0.175% per annum, which is allocated to the Participating Funds based on average daily net assets and included in miscellaneous expense on the Statement of Operations. Interest incurred on loans utilized is included in the Statement of Operations as interest expense. At October 31, 2023, the Funds had no loans outstanding.
The following Funds utilized the line of credit during the fiscal year ended October 31, 2023:
| | | | | | | | | | | | | | | | |
| Fund | | Weighted Average Borrowed | | | Number of Days | | | Interest Paid | | | Average Interest Rate | |
| | | | |
Dividend All Cap Value | | $ | 15,925,240 | | | | 10 | | | $ | 27,722 | | | | 6.267 | % |
| | | | |
Focused Absolute Value | | | 1,600,428 | | | | 6 | | | | 1,615 | | | | 6.054 | % |
8. MASTER NETTING AGREEMENTS
The Funds may enter into master netting agreements with their counterparties for the Securities Lending Program and Repurchase Agreements, which provide the right, in the event of default (including bankruptcy or insolvency) for the non-defaulting party to liquidate the collateral and calculate net exposure to the defaulting party or request additional collateral. For financial reporting purposes, the Funds do not offset financial assets and financial liabilities that are subject to master netting agreements in the Statement of Assets and Liabilities. For securities lending transactions, see Note 4.
87
| | |
| | | Notes to Financial Statements (continued) |
| | | |
| | | |
| | | | | | | | | | | | | | | | | | | | |
| | | | | Gross Amount Not Offset in the | | | | | | |
| | | | | Statement of Assets and Liabilities | | | | | | |
| | | | | |
| Fund | | Gross Amounts of Assets Presented in the Statement of
Assets and Liabilities | | Offset Amount | | | Net Asset Balance | | Collateral Received | | Net Amount | |
| | | | | |
| | | | | | | | | | | | | | | | | | | | |
| | | | | |
Mid Cap Value | | | | | | | | | | | | | | | | | | | | |
| | | | | |
Bank of America Securities, Inc. | | | $1,120,566 | | | | — | | | | $1,120,566 | | | | $1,120,566 | | | | — | |
| | | | | |
Deutsche Bank Securities, Inc. | | | 1,120,566 | | | | — | | | | 1,120,566 | | | | 1,120,566 | | | | — | |
| | | | | |
Industrial and Commercial Bank of China Financial Services LLC | | | 1,120,566 | | | | — | | | | 1,120,566 | | | | 1,120,566 | | | | — | |
| | | | | |
RBC Capital Markets LLC | | | 1,120,566 | | | | — | | | | 1,120,566 | | | | 1,120,566 | | | | — | |
| | | | | |
Fixed Income Clearing Corp. | | | 4,784,000 | | | | — | | | | 4,784,000 | | | | 4,784,000 | | | | — | |
| | | | | |
Fixed Income Clearing Corp. | | | 3,559,000 | | | | — | | | | 3,559,000 | | | | 3,559,000 | | | | — | |
| | | | | | | | | | | | | | | | | | | | |
| | | | | |
Total | | | $12,825,264 | | | | — | | | | $12,825,264 | | | | $12,825,264 | | | | — | |
| | | | | | | | | | | | | | | | | | | | |
| | | | | |
Large Cap Value Select | | | | | | | | | | | | | | | | | | | | |
| | | | | |
Fixed Income Clearing Corp. | | | $369,000 | | | | — | | | | $369,000 | | | | $369,000 | | | | — | |
| | | | | |
Small Cap Value | | | | | | | | | | | | | | | | | | | | |
| | | | | |
Bank of America Securities, Inc. | | | $1,000,000 | | | | — | | | | $1,000,000 | | | | $1,000,000 | | | | — | |
| | | | | |
Citigroup Global Markets, Inc. | | | 1,000,000 | | | | — | | | | 1,000,000 | | | | 1,000,000 | | | | — | |
| | | | | |
Industrial and Commercial Bank of China Financial Services LLC | | | 1,000,000 | | | | — | | | | 1,000,000 | | | | 1,000,000 | | | | — | |
| | | | | |
RBC Capital Markets LLC | | | 606,000 | | | | — | | | | 606,000 | | | | 606,000 | | | | — | |
| | | | | |
Fixed Income Clearing Corp. | | | 84,333,000 | | | | — | | | | 84,333,000 | | | | 84,333,000 | | | | — | |
| | | | | | | | | | | | | | | | | | | | |
| | | | | |
Total | | | $87,939,000 | | | | — | | | | $87,939,000 | | | | $87,939,000 | | | | — | |
| | | | | | | | | | | | | | | | | | | | |
| | | | | |
Dividend All Cap Value | | | | | | | | | | | | | | | | | | | | |
| | | | | |
Bank of America Securities, Inc. | | | $1,419,323 | | | | — | | | | $1,419,323 | | | | $1,419,323 | | | | — | |
| | | | | |
Citadel Securities LLC | | | 1,419,323 | | | | — | | | | 1,419,323 | | | | 1,419,323 | | | | — | |
| | | | | |
Citigroup Global Markets, Inc. | | | 1,419,323 | | | | — | | | | 1,419,323 | | | | 1,419,323 | | | | — | |
| | | | | |
Industrial and Commercial Bank of China Financial Services LLC | | | 1,419,323 | | | | — | | | | 1,419,323 | | | | 1,419,323 | | | | — | |
| | | | | |
Fixed Income Clearing Corp. | | | 1,928,000 | | | | — | | | | 1,928,000 | | | | 1,928,000 | | | | — | |
| | | | | |
Fixed Income Clearing Corp. | | | 427,000 | | | | — | | | | 427,000 | | | | 427,000 | | | | — | |
| | | | | | | | | | | | | | | | | | | | |
| | | | | |
Total | | | $8,032,292 | | | | — | | | | $8,032,292 | | | | $8,032,292 | | | | — | |
| | | | | | | | | | | | | | | | | | | | |
| | | | | |
Small-Mid Cap Value | | | | | | | | | | | | | | | | | | | | |
| | | | | |
Bank of America Securities, Inc. | | | $159,542 | | | | — | | | | $159,542 | | | | $159,542 | | | | — | |
| | | | | |
Citadel Securities LLC | | | 1,000,000 | | | | — | | | | 1,000,000 | | | | 1,000,000 | | | | — | |
| | | | | |
Citigroup Global Markets, Inc. | | | 1,000,000 | | | | — | | | | 1,000,000 | | | | 1,000,000 | | | | — | |
| | | | | |
Industrial and Commercial Bank of China Financial Services LLC | | | 1,000,000 | | | | — | | | | 1,000,000 | | | | 1,000,000 | | | | — | |
| | | | | |
Fixed Income Clearing Corp. | | | 9,637,000 | | | | — | | | | 9,637,000 | | | | 9,637,000 | | | | — | |
| | | | | | | | | | | | | | | | | | | | |
| | | | | |
Total | | | $12,796,542 | | | | — | | | | $12,796,542 | | | | $12,796,542 | | | | — | |
| | | | | | | | | | | | | | | | | | | | |
88
| | |
| | | Notes to Financial Statements (continued) |
| | | |
| | | |
| | | | | | | | | | | | |
| | | | | Gross Amount Not Offset in the | | | | |
| | | | | Statement of Assets and Liabilities | | | | |
| | | | | |
| Fund | | Gross Amounts of Assets Presented in the Statement of Assets and Liabilities | | Offset Amount | | Net Asset Balance | | Collateral Received | | Net Amount |
| | | | | |
International Value Equity | | | | | | | | | | | | |
| | | | | |
Fixed Income Clearing Corp. | | $374,000 | | — | | $374,000 | | | $374,000 | | | — |
| | | | | |
Focused Absolute Value | | | | | | | | | | | | |
| | | | | |
Fixed Income Clearing Corp. | | $173,000 | | — | | $173,000 | | | $173,000 | | | — |
9. SUBSEQUENT EVENTS
The Funds have determined that no material events or transactions occurred through the issuance date of the Funds’ financial statements which require an additional disclosure in or adjustment of the Funds’ financial statements, except that, on December 7, 2023, the Board approved a plan to liquidate and terminate International Value Equity; the liquidation is expected to occur on or about February 9, 2024 (the “Liquidation Date”). Additionally, effective December 11, 2023,
International Value Equity discontinued accruing 12b-1 distribution fees through the Liquidation Date and effective December 18, 2023, and through the Liquidation Date, the Investment Manager waived its management fee and waived the right to recoup any prior reimbursed expenses under International Value Equity’s Expense Limitation Agreement. Also, the Credit Agreement will be terminated on or about December 31, 2023.
89
| | |
| | | Report of Independent Registered Public Accounting Firm |
| | | |
| | | |
To the Board of Trustees of AMG Funds I and AMG Funds IV and Shareholders of AMG River Road Large Cap Value Select Fund, AMG River Road Mid Cap Value Fund, AMG River Road Small Cap Value Fund, AMG River Road Dividend All Cap Value Fund, AMG River Road Small-Mid Cap Value Fund, AMG River Road International Value Equity Fund and AMG River Road Focused Absolute Value Fund
Opinions on the Financial Statements
We have audited the accompanying statements of assets and liabilities, including the schedules of portfolio investments of AMG River Road Large Cap Value Select Fund (one of the funds constituting AMG Funds I), AMG River Road Mid Cap Value Fund, AMG River Road Small Cap Value Fund, AMG River Road Dividend All Cap Value Fund, AMG River Road Small-Mid Cap Value Fund, AMG River Road International Value Equity Fund, and AMG River Road Focused Absolute Value Fund (six of the funds constituting AMG Funds IV) (hereafter collectively referred to as the “Funds”) as of October 31, 2023, the related statements of operations for the year ended October 31, 2023, the statements of changes in net assets for each of the two years in the period ended October 31, 2023, including the related notes, and the financial highlights for each of the five years in the period ended October 31, 2023 (collectively referred to as the “financial statements”). In our opinion, the financial statements present fairly, in all material respects, the financial position of each of the Funds as of October 31, 2023, the results of each of their operations for the year then ended, the changes in each of their net assets for each of the two years in the period ended October 31, 2023 and each of the financial highlights for each of the five years in the period ended October 31, 2023 in conformity with accounting principles generally accepted in the United States of America.
Basis for Opinions
These financial statements are the responsibility of the Funds’ management. Our responsibility is to express an opinion on the Funds’ financial statements based on our audits. We are a public accounting firm registered with the Public Company Accounting Oversight Board (United States) (PCAOB) and are required to be independent with respect to the Funds in accordance with the U.S. federal securities laws and the applicable rules and regulations of the Securities and Exchange Commission and the PCAOB.
We conducted our audits of these financial statements in accordance with the standards of the PCAOB. Those standards require that we plan and perform the audit to obtain reasonable assurance about whether the financial statements are free of material misstatement, whether due to error or fraud.
Our audits included performing procedures to assess the risks of material misstatement of the financial statements, whether due to error or fraud, and performing procedures that respond to those risks. Such procedures included examining, on a test basis, evidence regarding the amounts and disclosures in the financial statements. Our audits also included evaluating the accounting principles used and significant estimates made by management, as well as evaluating the overall presentation of the financial statements. Our procedures included confirmation of securities owned as of October 31, 2023 by correspondence with the custodian and brokers; when replies were not received from brokers, we performed other auditing procedures. We believe that our audits provide a reasonable basis for our opinions.
/s/ PricewaterhouseCoopers LLP
Boston, Massachusetts
December 22, 2023
We have served as the auditor of one or more investment companies in the AMG Funds Family since 1993.
90
| | |
| | | Other Information (unaudited) |
| | | |
| | | |
TAX INFORMATION
AMG River Road Mid Cap Value Fund, AMG River Road Large Cap Value Select Fund, AMG River Road Small Cap Value Fund, AMG River Road Dividend All Cap Value Fund, AMG River Road Small-Mid Cap Value Fund, AMG River Road International Value Equity Fund and AMG River Road Focused Absolute Value Fund each hereby designates the maximum amount allowable of its net taxable income as qualified dividends as provided in the Jobs and Growth Tax Relief Reconciliation Act of 2003. The 2022/2023 Form 1099-DIV you receive for each Fund will show the tax status of all distributions paid to you during the year.
In accordance with federal tax law, the following Fund elects to provide foreign taxes paid and the income sourced from foreign countries. Accordingly, the Fund hereby makes the following designations regarding its taxable period ended October 31, 2023:
AMG River Road International Value Equity Fund
▶The total amount of taxes paid and income sourced from foreign countries was $28,010 and $308,982, respectively.
Pursuant to section 852 of the Internal Revenue Code, the Funds each hereby designate as a capital gain distribution with respect to the taxable period ended October 31, 2023, or if subsequently determined to be different, the net capital gains of such period as follows:
| | | | |
| Fund | | Amount | |
| |
Mid Cap Value | | | $6,859,292 | |
| |
Large Cap Value Select | | | 0 | |
| |
Small Cap Value | | | 33,831,350 | |
| |
Dividend All Cap Value | | | 37,111,738 | |
| | | | |
| Fund | | Amount | |
| |
Small-Mid Cap Value | | | $11,820,148 | |
| |
International Value Equity | | | 0 | |
| |
Focused Absolute Value | | | 502,734 | |
PROXY VOTE
A special meeting of the shareholders of AMG Funds I and AMG Funds IV (collectively the “Trusts”) was held on October 10, 2023, to vote on proposals to elect trustees to the Boards of Trustees of the Trusts and to amend certain fundamental restrictions of AMG River Road Dividend All Cap Value Fund, AMG River Road Focused Absolute Value Fund, AMG River Road Small-Mid Cap Value Fund, and AMG River Road Small Cap Value Fund. With respect to the proposal to amend certain fundamental restrictions of AMG River Road Small-Mid Cap Value Fund, the meeting was adjourned to October 31, 2023. Jill R. Cuniff, Kurt A. Keilhacker, Peter W. MacEwen, Steven J. Paggioli, Eric Rakowski, Victoria L. Sassine and Garret W. Weston were elected by shareholders at the special meeting on October 10, 2023. Bruce B. Bingham, an incumbent Trustee, will continue to serve as a Trustee of the Trusts until his retirement on December 31, 2023. The proposals and results of the votes are described below.
| | | | | | | | | | | | | | |
| |
AMG Funds I | | All Funds in Trust* | |
| | | | |
Election of Trustees 1 | | | | | For | | | | Withheld | | | | | |
| | | | |
Jill R. Cuniff | | | | | 20,441,009 | | | | 1,294,070 | | | | | |
| | | | |
Kurt A. Keilhacker | | | | | 20,299,049 | | | | 1,436,030 | | | | | |
| | | | |
Peter W. MacEwen | | | | | 20,123,172 | | | | 1,611,908 | | | | | |
| | | | |
Steven J. Paggioli | | | | | 20,290,868 | | | | 1,444,211 | | | | | |
| | | | |
Eric Rakowski | | | | | 20,424,987 | | | | 1,310,092 | | | | | |
| | | | |
Victoria L. Sassine | | | | | 20,650,180 | | | | 1,084,900 | | | | | |
| | | | |
Garret W. Weston | | | | | 20,348,384 | | | | 1,386,695 | | | | | |
91
| | | | | | | | |
| AMG Funds IV | | All Funds in Trust* | |
| | |
| Election of Trustees1 | | For | | | Withheld |
| | |
Jill R. Cuniff | | | 123,476,732 | | | | 9,260,973 | |
| | |
Kurt A. Keilhacker | | | 131,677,070 | | | | 1,060,634 | |
| | |
Peter W. MacEwen | | | 123,401,874 | | | | 9,335,830 | |
| | |
Steven J. Paggioli | | | 130,832,753 | | | | 1,904,951 | |
| | |
Eric Rakowski | | | 130,620,379 | | | | 2,117,325 | |
| | |
Victoria L. Sassine | | | 131,755,717 | | | | 981,987 | |
| | |
Garret W. Weston | | | 131,970,391 | | | | 767,313 | |
| | | | | | | | | | | | | | |
| | | AMG River Road Small Cap Value Fund* | |
| | | | |
| To approve the amendment of the Fund’s fundamental investment restrictions | | For | | | Against | | Abstain | | | Broker Non-Vote |
| | | | |
Borrowing and Issuing Senior Securities | | | 31,417,304 | | | 4,559,008 | | | 113,757 | | | | 14,126,301 | |
| | | | |
Lending | | | 31,412,141 | | | 4,559,296 | | | 118,632 | | | | 14,126,301 | |
| |
| | | AMG River Road Dividend All Cap Value Fund* | |
| | | | |
| To approve the amendment of the Fund’s fundamental investment restrictions | | For | | | Against | | Abstain | | | Broker
Non-Vote |
| | | | |
Borrowing and Issuing Senior Securities | | | 17,862,604 | | | 29,793 | | | 29,917 | | | | 6,569,533 | |
| | | | |
Lending | | | 17,863,653 | | | 29,793 | | | 28,868 | | | | 6,569,533 | |
| |
| | | AMG River Road Small-Mid Cap Value Fund* | |
| | | | |
| To approve the amendment of the Fund’s fundamental investment restrictions | | For | | | Against | | Abstain | | | Broker
Non-Vote |
| | | | |
Borrowing and Issuing Senior Securities | | | 12,029,742 | | | 69,080 | | | 42,494 | | | | 5,469,166 | |
| | | | |
Lending | | | 12,029,742 | | | 84,214 | | | 27,360 | | | | 5,469,166 | |
| |
| | | AMG River Road Focused Absolute Value Fund* | |
| | | | |
| To approve the amendment of the Fund’s fundamental investment restrictions | | For | | | Against | | Abstain | | | Broker
Non-Vote |
| | | | |
Borrowing | | | 2,283,269 | | | 1,417 | | | — | | | | 807,120 | |
1 Ms. Cuniff and Mr. MacEwen were newly elected to the Boards of Trustees on October 10, 2023; Messrs. Keilhacker, Paggioli, Rakowski, and Weston and Ms. Sassine are incumbent Trustees.
*Rounded to the nearest share.
92
| | |
| | | AMG Funds Trustees and Officers |
| | | |
| | | |
| | | | | | | | |
| The Trustees and Officers of the Trusts, their business addresses, principal occupations for the past five years and ages are listed below. The Trustees provide broad supervision over the affairs of the Trusts and the Funds. The Trustees are experienced executives who meet periodically throughout the year to oversee the Funds’ activities, review contractual arrangements with companies that provide services to the Funds, and | | | | review the Funds’ performance. Unless otherwise noted, the address of each Trustee or Officer is the address of the Trusts: 680 Washington Blvd., Suite 500, Stamford, CT. 06901. There is no stated term of office for Trustees. Trustees serve until their resignation, retirement or removal in accordance with the Trusts’ organizational documents and policies adopted by the Board from time to time. | | | | The Chairman of the Board, the President, the Treasurer and the Secretary and such other Officers as the Trustees may in their discretion from time to time elect each hold office until his or her successor is elected and qualified, or until he or she sooner dies, resigns, is removed or becomes disqualified. Each Officer holds office at the pleasure of the Trustees. |
Independent Trustees
The following Trustees are not “interested persons” of the Trust within the meaning of the 1940 Act:
| | |
| | |
Number of Funds Overseen in Fund Complex | | Name, Age, Principal Occupation(s) During Past 5 Years and Other Directorships Held by Trustee |
| | |
• Trustee since 2012 - AMG
Funds I • Trustee since 2014 - AMG
Funds IV • Oversees 41 Funds in Fund Complex | | Bruce B. Bingham, 75* Partner, Hamilton Partners (real estate development firm) (1987-Present); Director of The Yacktman Funds, Inc. (2 portfolios) (2000-2012). |
| | |
• Trustee since 2023 - AMG
Funds I, AMG Funds IV • Oversees 41 Funds in Fund Complex | | Jill R. Cuniff, 59** Director of Harding, Loevner Funds, Inc. (12 portfolios) (2018-Present); Retired (2016-Present); President & Portfolio Manager, Edge Asset Management (2009-2016); President & Chief Investment Officer, Morley Financial Services (2001-2009); President, Union Bond & Trust Company (2001-2009). |
| | |
• Trustee since 2013 - AMG
Funds I • Trustee since 2014 - AMG
Funds IV • Chairman of the Audit Committee since 2021 - AMG
Funds I • Chairman of the Audit Committee since 2020 - AMG
Funds IV • Oversees 43 Funds in Fund Complex | | Kurt A. Keilhacker, 60 Managing Partner, Elementum Ventures (2013-Present); Managing Partner, TechFund Europe (2000-Present); Managing Partner, TechFund Capital (1997-Present); Adjunct Professor, University of San Francisco (2022-Present); Trustee, Wheaton College (2018-Present); Director, Wheaton College Trust Company, N.A. (2018-Present). |
| | |
• Trustee since 2023 - AMG
Funds I, AMG Funds IV • Oversees 41 Funds in Fund Complex | | Peter W. MacEwen, 59** Private investor (2019-Present); Affiliated Managers Group, Inc. (2003-2018): Chief Administrative Officer, Office of the CEO (2013-2018); Senior Vice President, Finance (2007-2013); Vice President, Finance (2003-2007). |
| | |
• Trustee since 2000 - AMG
Funds I • Trustee since 2010 - AMG
Funds IV • Oversees 41 Funds in Fund Complex | | Steven J. Paggioli, 73 Independent Consultant (2002-Present); Trustee, Professionally Managed Portfolios (28 portfolios); Independent Director, Muzinich BDC, Inc. (business development company) (2019-Present); Director, The Wadsworth Group; Independent Director, Chase Investment Counsel (2008–2019); Executive Vice President, Secretary and Director, Investment Company Administration, LLC and First Fund Distributors, INC. (1990-2001). |
93
| | |
| | | AMG Funds Trustees and Officers (continued) |
| | | |
| | | |
| | |
• Independent Chairman of the Board of Trustees since 2017 • Chairman of the Governance Committee since 2017 • Trustee since 2000- AMG Funds I • Trustee since 2010 - AMG Funds IV • Oversees 43 Funds in Fund Complex | | Eric Rakowski, 65 Professor of Law, University of California at Berkeley School of Law (1990-Present); Tax Attorney at Davis Polk & Wardwell and clerked for Judge Harry T. Edwards of the U.S. Court of Appeals for the District of Columbia Circuit and for Justice William J. Brennan Jr. of the U.S. Supreme Court; Trustee of Parnassus Funds (4 portfolios) (2021-Present); Trustee of Parnassus Income Funds (2 portfolios) (2021-Present); Director of Harding, Loevner Funds, Inc. (10 portfolios); Trustee of Third Avenue Trust (3 portfolios) (2002-2019); Trustee of Third Avenue Variable Trust (1 portfolio) (2002-2019). |
| | |
• Trustee since 2013 - AMG Funds I • Trustee since 2014 - AMG Funds IV • Oversees 43 Funds in Fund Complex | | Victoria L. Sassine, 58 Adjunct Professor, Babson College (2007–Present); Director, Board of Directors, PRG Group (2017-Present); CEO, Founder, Scale Smarter Partners, LLC (2018-Present); Adviser, EVOFEM Biosciences (2019-Present); Chairperson of the Board of Directors of Business Management Associates (2018-2019). |
*Mr. Bingham will retire from the Boards of Trustees of the Trusts on December 31, 2023.
**Ms. Cuniff and Mr. MacEwen were elected to the Boards of Trustees by the shareholders of the Trusts on October 10, 2023.
Interested Trustee
The Trustee in the following table is an “interested person” of the Trusts within the meaning of the 1940 Act.
| | |
Number of Funds Overseen in Fund Complex | | Name, Age, Principal Occupation(s) During Past 5 Years and Other Directorships Held by Trustee |
| | |
• Trustee since 2021 - AMG Funds I, AMG Funds IV • Oversees 43 Funds in Fund Complex | | Garret W. Weston, 42 Affiliated Managers Group, Inc. (2008-Present): Managing Director, Head of Affiliate Product Strategy and Development (2023-Present), Managing Director, Co-Head of Affiliate Engagement, Distribution (2021-2022), Senior Vice President, Office of the CEO (2019-2021), Senior Vice President, Affiliate Development (2016-2019), Vice President, Office of the CEO (2015-2016), Vice President, New Investments (2008-2015); Associate, Madison Dearborn Partners (2006-2008); Analyst, Merrill Lynch (2004-2006). |
Officers
| | |
Position(s) Held with Fund and Length of Time Served | | Name, Age, Principal Occupation(s) During Past 5 Years |
| | |
• President since 2018 • Principal Executive Officer since 2018 • Chief Executive Officer since 2018 • Chief Operating Officer since 2007 (2016 for AMG Funds IV) | | Keitha L. Kinne, 65 Managing Director, Head of Platform and Operations, AMG Funds LLC (2023-Present); Chief Operating Officer, AMG Funds LLC (2007-Present); Chief Investment Officer, AMG Funds LLC (2008-Present); President and Principal, AMG Distributors, Inc. (2018-Present); Chief Operating Officer, AMG Distributors, Inc. (2007-Present); President, Chief Executive Officer and Principal Executive Officer, AMG Funds, AMG Funds I, AMG Funds II, AMG Funds III and AMG Funds IV (2018-Present); Chief Operating Officer, AMG Funds, AMG Funds I, AMG Funds II, and AMG Funds III (2007-Present); Chief Operating Officer, AMG Funds IV (2016-Present); Chief Operating Officer and Chief Investment Officer, Aston Asset Management, LLC (2016); President and Principal Executive Officer, AMG Funds, AMG Funds I, AMG Funds II and AMG Funds III (2012-2014); Managing Partner, AMG Funds LLC (2007-2014); President and Principal, AMG Distributors, Inc. (2012-2014); Managing Director, Legg Mason & Co., LLC (2006-2007); Managing Director, Citigroup Asset Management (2004-2006). |
| | |
• Secretary since 2015 • Chief Legal Officer since 2015 | | Mark J. Duggan, 58 Managing Director and Senior Counsel, AMG Funds LLC (2021-Present); Senior Vice President and Senior Counsel, AMG Funds LLC (2015-2021); Secretary and Chief Legal Officer, AMG Funds, AMG Funds I, AMG Funds II, AMG Funds III and AMG Funds IV (2015-Present); Attorney, K&L Gates, LLP (2009-2015). |
| | |
• Chief Financial Officer since 2017 • Treasurer since 2017 • Principal Financial Officer since 2017 • Principal Accounting Officer since 2017 | | Thomas G. Disbrow, 57 Vice President, Mutual Fund Treasurer & CFO, AMG Funds, AMG Funds LLC (2017-Present); Chief Financial Officer, Principal Financial Officer, Treasurer and Principal Accounting Officer, AMG Funds, AMG Funds I, AMG Funds II, AMG Funds III and AMG Funds IV (2017-Present); Managing Director - Global Head of Traditional Funds Product Control, UBS Asset Management (Americas), Inc. (2015-2017); Managing Director - Head of North American Funds Treasury, UBS Asset Management (Americas), Inc. (2011-2015). |
94
| | |
| | | AMG Funds Trustees and Officers (continued) |
| | | |
| | | |
| | |
Position(s) Held with Fund and Length of Time Served | | Name, Age, Principal Occupation(s) During Past 5 Years |
| | |
• Deputy Treasurer since 2017 | | John A. Starace, 53 Vice President, Mutual Fund Accounting, AMG Funds LLC (2021-Present); Director, Mutual Fund Accounting, AMG Funds LLC (2017-2021); Vice President, Deputy Treasurer of Mutual Funds Services, AMG Funds LLC (2014-2017); Deputy Treasurer, AMG Funds, AMG Funds I, AMG Funds II, AMG Funds III and AMG Funds IV (2017-Present); Vice President, Citi Hedge Fund Services (2010-2014); Audit Senior Manager (2005-2010) and Audit Manager (2001-2005), Deloitte & Touche LLP. |
| | |
• Chief Compliance Officer and Sarbanes-Oxley Code of Ethics Compliance Officer since 2019 • Anti-Money Laundering Compliance Officer
since 2022 | | Patrick J. Spellman, 49 Vice President, Chief Compliance Officer, AMG Funds LLC (2017-Present); Chief Compliance Officer, AMG Distributors, Inc. (2010-Present); Chief Compliance Officer and Sarbanes-Oxley Code of Ethics Compliance Officer, AMG Funds, AMG Funds I, AMG Funds II, AMG Funds III and AMG Funds IV (2019-Present); Anti-Money Laundering Compliance Officer, AMG Funds, AMG Funds I, AMG Funds II, and AMG Funds III (2014-2019; 2022-Present); Anti-Money Laundering Compliance Officer, AMG Funds IV (2016-2019; 2022-Present); Senior Vice President, Chief Compliance Officer, AMG Funds LLC (2011-2017); Compliance Manager, Legal and Compliance, Affiliated Managers Group, Inc. (2005-2011). |
| | |
• Assistant Secretary
since 2016 | | Maureen M. Kerrigan, 38 Vice President, Senior Counsel, AMG Funds LLC (2021-Present); Vice President, Counsel, AMG Funds LLC (2019-2021); Director, Counsel, AMG Funds LLC (2017-2018); Vice President, Counsel, AMG Funds LLC (2015-2017); Assistant Secretary, AMG Funds, AMG Funds I, AMG Funds II, AMG Funds III and AMG Funds IV (2016-Present); Associate, Ropes & Gray LLP (2011-2015); Law Fellow, Massachusetts Appleseed Center for Law and Justice (2010-2011). |
95
| | |
| | | Annual Renewal of Investment Management and Subadvisory Agreements |
| | | |
| | | |
| | | | | | | | |
AMG River Road Dividend All Cap Value Fund, AMG River Road Focused Absolute Value Fund, AMG River Road International Value Equity Fund, AMG River Road Large Cap Value Select Fund, AMG River Road Mid Cap Value Fund, AMG River Road Small-Mid Cap Value Fund, and AMG River Road Small Cap Value Fund: Approval of Investment Management and Subadvisory Agreements on June 21, 2023 At an in-person meeting held on June 21, 2023, the Board of Trustees (the “Board” or the “Trustees”) of each of AMG Funds I and AMG Funds IV (each, a “Trust” and collectively, the “Trusts”), and separately a majority of the Trustees who are not “interested persons” of the Trusts (the “Independent Trustees”), approved (i) the Fund Management Agreement, as amended pursuant to letter agreements at any time prior to the date of the meeting, with AMG Funds LLC (the “Investment Manager”) and AMG Funds I for AMG River Road Large Cap Value Select Fund and separately each of Amendment No. 1 thereto dated July 1, 2015, and Amendment No. 2 thereto dated October 1, 2016; and the Investment Advisory Agreement, as amended pursuant to letter agreements at any time prior to the date of the meeting, with the Investment Manager and AMG Funds IV for each of AMG River Road Dividend All Cap Value Fund, AMG River Road Focused Absolute Value Fund, AMG River Road International Value Equity Fund, AMG River Road Mid Cap Value Fund, AMG River Road Small-Mid Cap Value Fund, and AMG River Road Small Cap Value Fund, and separately Amendment No. 1 thereto dated October 1, 2016 (collectively, the “Investment Management Agreements”); and (ii) the Sub-Investment Advisory Agreements (or, in the case of AMG River Road Large Cap Value Select Fund and AMG River Road Mid Cap Value Fund, the Subadvisory Agreements), as amended at any time prior to the date of the meeting (collectively, the “Subadvisory Agreements”), with the Subadviser for each of AMG River Road Dividend All Cap Value Fund, AMG River Road Focused Absolute Value Fund, AMG River Road International Value Equity Fund, AMG River Road Large Cap Value Select Fund, AMG River Road Mid Cap Value Fund, AMG River Road Small-Mid Cap Value Fund, and AMG River Road Small Cap Value Fund (each, a “Fund,” and collectively, the “Funds”). The Independent Trustees were separately represented by independent legal counsel in connection with their consideration of the approval of these agreements. In considering the Investment Management Agreements and the Subadvisory Agreements, the Trustees reviewed a variety of materials relating to each Fund, the Investment Manager and the Subadviser, including | | | | the nature, extent and quality of services, comparative performance, fee and expense information for an appropriate peer group of similar mutual funds for each Fund (each, a “Peer Group”), performance information for the relevant benchmark index for each Fund (each, a “Fund Benchmark”), other relevant matters, and other information provided to them on a periodic basis throughout the year. Prior to voting, the Independent Trustees: (a) reviewed the foregoing information with their independent legal counsel; (b) received materials from their independent legal counsel discussing the legal standards applicable to their consideration of the Investment Management Agreements and the Subadvisory Agreements; and (c) met with their independent legal counsel in private sessions at which no representatives of management were present. NATURE, EXTENT AND QUALITY OF SERVICES In considering the nature, extent and quality of the services provided by the Investment Manager, the Trustees reviewed information provided by the Investment Manager at the June 21, 2023 and prior meetings relating to the Investment Manager’s operations and personnel. Among other things, the Investment Manager provided financial information, information about its supervisory and professional staff and descriptions of its organizational and management structure. The Trustees also took into account information provided periodically throughout the previous year by the Investment Manager in Board meetings relating to the performance of its duties with respect to the Funds and the Trustees’ knowledge of the Investment Manager’s management and the quality of the performance of the Investment Manager’s duties under the Investment Management Agreements and Administration Agreement. In the course of their deliberations regarding the Investment Manager, the Trustees evaluated, among other things: (a) the extent and quality of the Investment Manager’s oversight of the operation and management of the Funds; (b) the quality of the Investment Manager’s oversight of the performance by the Subadviser of its portfolio management duties; (c) the Investment Manager’s ability to supervise the Funds’ other service providers; and (d) the Investment Manager’s compliance program. The Trustees also took into account that, in performing its functions under the Investment Management Agreements and supervising the Subadviser, the Investment Manager: performs periodic detailed analyses and reviews of the performance by the Subadviser of its obligations to each Fund, including without | | | | limitation, analysis and review of portfolio and other compliance matters and review of the Subadviser’s investment performance with respect to each Fund; prepares and presents periodic reports to the Board regarding the investment performance of the Subadviser and other information regarding the Subadviser, at such times and in such forms as the Board may reasonably request; reviews and considers any changes in the personnel of the Subadviser responsible for performing the Subadviser’s obligations and makes appropriate reports to the Board; reviews and considers any changes in the ownership or senior management of the Subadviser and makes appropriate reports to the Board; performs periodic in-person, telephonic or videoconference diligence meetings, including with respect to compliance matters, with representatives of the Subadviser; assists the Board and management of the Trusts in developing and reviewing information with respect to the initial approval of each Subadvisory Agreement and annual consideration of each Subadvisory Agreement thereafter; prepares recommendations with respect to the continued retention of the Subadviser or the replacement of the Subadviser, including at the request of the Board; identifies potential successors to, or replacements of, the Subadviser or potential additional subadvisers, including performing appropriate due diligence, and developing and presenting to the Board a recommendation as to any such successor, replacement, or additional subadviser, including at the request of the Board; designates and compensates from its own resources such personnel as the Investment Manager may consider necessary or appropriate to the performance of its services; and performs such other review and reporting functions as the Board shall reasonably request consistent with the Investment Management Agreements and applicable law. The Trustees noted the affiliation of the Subadviser with the Investment Manager, noting any potential conflicts of interest. The Trustees also took into account the financial condition of the Investment Manager with respect to its ability to provide the services required under the Investment Management Agreements and the Investment Manager’s undertaking to maintain contractual expense limitations for each Fund other than AMG River Road Small Cap Value Fund, as described below. The Trustees also considered the Investment Manager’s risk management processes. The Trustees also reviewed information relating to the Subadviser’s operations and personnel and the investment philosophy, strategies and techniques (its “Investment Strategy”) used in managing each |
96
| | |
| | | Annual Renewal of Investment Management and Subadvisory Agreements (continued) |
| | | |
| | | |
| | | | | | | | |
Fund. Among other things, the Trustees reviewed information on portfolio management and other professional staff, information regarding the Subadviser’s organizational and management structure and the Subadviser’s brokerage policies and practices. The Trustees considered specific information provided regarding the experience of the individuals at the Subadviser with portfolio management responsibility for each Fund, including the information set forth in each Fund’s prospectus and statement of additional information. In the course of their deliberations, the Trustees evaluated, among other things: (a) the services rendered by the Subadviser in the past; (b) the qualifications and experience of the Subadviser’s personnel; and (c) the Subadviser’s compliance program. The Trustees also took into account the financial condition of the Subadviser with respect to its ability to provide the services required under each Subadvisory Agreement. The Trustees also considered the Subadviser’s risk management processes. PERFORMANCE The Board considered each Fund’s net performance during relevant time periods as compared to the Fund’s Peer Group and Fund Benchmark, considered the gross performance of each Fund as compared to the Subadviser’s relevant performance composite that utilizes a similar investment strategy and approach, and noted that the Board reviews on a quarterly basis detailed information about both a Fund’s performance results and portfolio composition, as well as the Subadviser’s Investment Strategy. The Board was mindful of the Investment Manager’s expertise, resources and attention to monitoring the Subadviser’s performance, investment style and risk-adjusted performance with respect to the Funds and its discussions with the management of the Funds’ subadviser during the period regarding the factors that contributed to the performance of the Funds. With respect to AMG River Road Dividend All Cap Value Fund, among other information relating to the Fund’s performance, the Trustees noted that the Fund’s performance for Class N shares (which share class has the earliest inception date of all the share classes of the Fund) for the 1-year, 3-year, 5-year and 10-year periods ended March 31, 2023 was below the median performance of the Peer Group and above, below, below, and below, respectively, the performance of the Fund Benchmark, the Russell 3000 Value Index. The Trustees took into account management’s discussion of the Fund’s performance, including the reasons for the Fund’s | | | | recent outperformance relative to the Fund Benchmark and the Fund’s longer-term underperformance. The Trustees concluded that the Fund’s overall performance has been satisfactory in light of the Fund’s investment objective, strategies and policies. With respect to AMG River Road Focused Absolute Value Fund, among other information relating to the Fund’s performance, the Trustees noted that the Fund’s performance for Class I shares (which share class has one of the earliest inception dates and the largest amount of assets of all the share classes of the Fund) for the 1-year, 3-year, and 5-year periods ended March 31, 2023 and for the period from the Fund’s inception on November 3, 2015 through March 31, 2023 was below the median performance of the Peer Group and below the performance of the Fund Benchmark, the Russell 3000 Value Index. The Trustees also took into account management’s discussion of the Fund’s performance, including the reasons for the Fund’s more recent underperformance and the impact of the Fund’s recent underperformance on its longer-term performance rankings. The Trustees also took into account actions being taken to address such underperformance. The Trustees concluded that the Fund’s overall performance has been satisfactory in light of the Fund’s investment objective, strategies and policies. With respect to AMG River Road International Value Equity Fund, among other information relating to the Fund’s performance, the Trustees noted that the Fund’s performance for Class N shares (which share class has the earliest inception date of all the share classes of the Fund) for the 1-year, 3-year, 5-year and 10-year periods ended March 31, 2023 was above, below, above, and above, respectively, the median performance of the Peer Group and above, below, above, and above, respectively, the performance of the Fund Benchmark, the MSCI EAFE Index. The Trustees also took into account management’s discussion of the Fund’s performance, noting that the Fund ranked in the top decile relative to the Peer Group for the 5-year period and in the top quintile relative to the Peer Group for the 1-year period, and that Class N shares of the Fund ranked in the top quintile relative to the Peer Group for the 10-year period. The Trustees also took into account the fact that the Fund’s investment strategy and Fund Benchmark changed effective August 16, 2021, and that the performance information prior to that date reflected that of the Fund’s prior investment strategy. The Trustees considered management’s discussion that the Fund’s performance has been in line with | | | | management’s expectations since the current Subadviser assumed subadvisory responsibilities. The Trustees concluded that the Fund’s overall performance has been satisfactory. With respect to AMG River Road Large Cap Value Select Fund, among other information relating to the Fund’s performance, the Trustees noted that the Fund’s performance for Class I shares (which share class has the earliest inception date and the largest amount of assets of all the share classes of the Fund) for the 1-year, 3-year, 5-year and 10-year periods ended March 31, 2023 was above, below, below, and below, respectively, the median performance of the Peer Group and above, below, below, and below, respectively, the performance of the Fund Benchmark, the Russell 1000 Value Index. The Trustees took into account management’s discussion of the Fund’s performance, including the reasons for the Fund’s recent outperformance and longer-term underperformance and the fact that Class I shares of the Fund ranked in the top quintile relative to the Peer Group for the 1-year period. The Trustees also took into account the fact that the Fund’s subadviser, investment strategy, and Fund Benchmark changed effective March 22, 2021, and that the performance information prior to that date reflected that of the Fund’s prior subadviser and investment strategy. The Trustees considered management’s discussion that the Fund’s performance has been in line with management’s expectations since the current Subadviser assumed subadvisory responsibilities. The Trustees concluded that the Fund’s overall performance has been satisfactory in light of the Fund’s investment objective, strategies and policies. With respect to AMG River Road Mid Cap Value Fund, among other information relating to the Fund’s performance, the Trustees noted that the Fund’s performance for Class N shares (which share class has the earliest inception date and the largest amount of assets of all the share classes of the Fund) for the 1-year, 3-year, 5-year and 10-year periods ended March 31, 2023 was above, above, below, and below, respectively, the median performance of the Peer Group and above, above, below, and below, respectively, the performance of the Fund Benchmark, the Russell Midcap Value Index. The Trustees took into account management’s discussion of the Fund’s performance, including the reasons for the Fund’s recent outperformance relative to the Peer Group and the Fund Benchmark and the Fund’s longer-term underperformance. The Trustees also noted that the Fund ranked in the top decile relative to the Peer Group for the 1-year period. |
97
| | |
| | | Annual Renewal of Investment Management and Subadvisory Agreements (continued) |
| | | |
| | | |
| | | | | | | | |
The Trustees also took into account the fact that the Fund’s subadviser, investment strategy, and Fund Benchmark changed effective March 19, 2021, and that the performance information prior to that date reflected that of the Fund’s prior subadviser and investment strategy. The Trustees considered management’s discussion that the Fund’s performance has been in line with management’s expectations since the current Subadviser assumed subadvisory responsibilities. The Trustees concluded that the Fund’s overall performance has been satisfactory in light of the Fund’s investment objective, strategies and policies. With respect to AMG River Road Small-Mid Cap Value Fund, among other information relating to the Fund’s performance, the Trustees noted that the Fund’s performance for Class N shares (which share class has the earliest inception date of all the share classes of the Fund) for the 1-year, 3-year, 5-year and 10-year periods ended March 31, 2023 was above, below, above, and above, respectively, the median performance of the Peer Group and above, below, above, and above, respectively, the performance of the Fund Benchmark, the Russell 2500 Value Index. The Trustees also took into account management’s discussion of the Fund’s performance, noting that Class N shares of the Fund ranked in the top quartile relative to its Peer Group for the 1-year, 5-year and 10-year periods. The Trustees concluded that the Fund’s overall performance has been satisfactory. With respect to AMG River Road Small Cap Value Fund, among other information relating to the Fund’s performance, the Trustees noted that the Fund’s performance for Class N shares (which share class has the earliest inception date of all the share classes of the Fund) for the 1-year, 3-year, 5-year and 10-year periods ended March 31, 2023 was above, below, above, and above, respectively, the median performance of the Peer Group and above, below, above, and above, respectively, the performance of the Fund Benchmark, the Russell 2000 Value Index. The Trustees also took into account management’s discussion of the Fund’s performance, including the fact that Class N shares of the Fund ranked in the top quintile relative to its Peer Group for the 1-year period and in the top quartile relative to its Peer Group for the 5-year and 10-year periods. The Trustees concluded that the Fund’s overall performance has been satisfactory. ADVISORY AND SUBADVISORY FEES; FUND EXPENSES; PROFITABILITY; AND ECONOMIES OF SCALE In considering the reasonableness of the advisory fee payable to the Investment Manager, the Trustees reviewed information provided by the Investment | | | | Manager at the June 21, 2023 and prior meetings setting forth all revenues and other benefits, both direct and indirect (including any so-called “fallout benefits” such as reputational value derived from the Investment Manager serving as Investment Manager to a Fund), received by the Investment Manager and its affiliates attributable to managing each Fund and all the mutual funds in the AMG Funds Family of Funds; the cost of providing such services; the significant risks undertaken as Investment Manager and sponsor of the Funds, including investment, operational, enterprise, entrepreneurial, litigation, regulatory and compliance risks; and the resulting profitability to the Investment Manager and its affiliates from these relationships. The Trustees also considered the changes to the management fee, subadvisory fee and expense cap that took effect during the past year for AMG River Road Dividend All Cap Value Fund. The Trustees also considered the amount of the advisory fee retained by the Investment Manager after payment of the subadvisory fee with respect to each Fund. The Trustees also noted payments are made from the Subadviser to the Investment Manager, and other payments are made from the Investment Manager to the Subadviser. The Trustees also considered management’s discussion of the current asset levels of the Funds, and the impact on profitability of both the current asset levels and any future growth of assets of the Funds. In considering the cost of services to be provided by the Investment Manager under each Investment Management Agreement and the profitability to the Investment Manager of its relationship with each Fund, the Trustees noted the undertaking by the Investment Manager to maintain contractual expense limitations for each Fund other than AMG River Road Small Cap Value Fund. The Board also took into account management’s discussion of the advisory fee structure, and the services the Investment Manager provides in performing its functions under each Investment Management Agreement and supervising the Subadviser. Based on the foregoing, the Trustees concluded that the profitability to the Investment Manager is reasonable and that the Investment Manager is not realizing material benefits from economies of scale that would warrant adjustments to the advisory fee at this time. Also with respect to economies of scale, the Trustees noted that as each Fund’s assets increase over time, the Fund may realize other economies of scale to the extent the increase in assets is proportionally greater than the increase in certain other expenses. | | | | In considering the reasonableness of the subadvisory fees payable by the Investment Manager to the Subadviser, the Trustees reviewed information regarding the cost to the Subadviser of providing subadvisory services to each Fund and the resulting profitability from these relationships. The Trustees noted that, because the Subadviser is an affiliate of the Investment Manager, a portion of the Subadviser’s revenues or profits might be shared directly or indirectly with the Investment Manager. The Trustees also noted that the subadvisory fees are paid by the Investment Manager out of its advisory fee. The Board also took into account management’s discussion of the subadvisory fee structure, and the services the Subadviser provides in performing its functions under each Subadvisory Agreement. Based on the foregoing, the Trustees concluded that the profitability to the Subadviser is reasonable and that the Subadviser is not realizing material benefits from economies of scale that would warrant adjustments to the subadvisory fees at this time. Also with respect to economies of scale, the Trustees noted that as a Fund’s assets increase over time, the Fund may realize other economies of scale to the extent the increase in assets is proportionally greater than the increase in certain other expenses. With respect to AMG River Road Dividend All Cap Value Fund, the Trustees noted that the management fees (which include both the advisory and administration fees) and total expenses (net of applicable expense waivers/reimbursements) of Class I shares (the class of shares which is the primary focus of the Fund’s distribution) of the Fund as of March 31, 2023 were both rated in the Average rating level of the Fund’s Peer Group. The Trustees noted that the rating level corresponded to the Fund’s quintile ranking in its Peer Group. The Trustees took into account that, among other changes, effective July 1, 2022, the Investment Manager has contractually agreed, through March 1, 2024, to lower the Fund’s contractual expense limitation from 0.78% to 0.68% of the Fund’s net annual operating expenses (subject to certain excluded expenses). The Trustees also took into account the fact that, effective July 1, 2022, the Fund’s management fee rate was reduced. The Trustees concluded that, in light of the nature, extent and quality of the services provided by the Investment Manager and the Subadviser (which is an affiliate of the Investment Manager), the foregoing expense limitation and the considerations noted above with |
98
| | |
| | | Annual Renewal of Investment Management and Subadvisory Agreements (continued) |
| | | |
| | | |
| | | | | | | | |
respect to the Investment Manager and the Subadviser, the Fund’s advisory and subadvisory fees are reasonable. With respect to AMG River Road Focused Absolute Value Fund, the Trustees noted that the management fees (which include both the advisory and administration fees) and total expenses (net of applicable expense waivers/reimbursements) of Class I shares (the class of shares which is the primary focus of the Fund’s distribution) of the Fund as of March 31, 2023 were both rated in the Average rating level of Fund’s Peer Group. The Trustees noted that the rating level corresponded to the Fund’s quintile ranking in its Peer Group. The Trustees took into account the fact that the Investment Manager has contractually agreed, through March 1, 2024, to limit the Fund’s net annual operating expenses (subject to certain excluded expenses) to 0.78%. The Trustees concluded that, in light of the nature, extent and quality of the services provided by the Investment Manager and the Subadviser (which is an affiliate of the Investment Manager), the foregoing expense limitation and the considerations noted above with respect to the Investment Manager and the Subadviser, the Fund’s advisory and subadvisory fees are reasonable. With respect to AMG River Road International Value Equity Fund, the Trustees noted that the management fees (which include both the advisory and administration fees) and total expenses (net of applicable expense waivers/reimbursements) of Class I shares (the class of shares which is the primary focus of the Fund’s distribution) of the Fund as of March 31, 2023 were both rated in the Below Average rating level of the Fund’s Peer Group. The Trustees noted that the rating level corresponded to the Fund’s quintile ranking in its Peer Group. The Trustees took into account the fact that the Investment Manager has contractually agreed, through March 1, 2024, to limit the Fund’s net annual operating expenses (subject to certain excluded expenses) to 0.73%. The Trustees concluded that, in light of the nature, extent and quality of the services provided by the Investment Manager and the Subadviser (which is an affiliate of the Investment Manager), the foregoing expense limitation and the considerations noted above with respect to the Investment Manager and the Subadviser, the Fund’s advisory and subadvisory fees are reasonable. With respect to AMG River Road Large Cap Value Select Fund, the Trustees noted that the management fees (which include both the advisory and administration fees) and total expenses (net of applicable expense waivers/reimbursements) of | | | | Class I shares (the class of shares which is the primary focus of the Fund’s distribution) of the Fund as of March 31, 2023 were both rated in the Below Average rating level of the Fund’s Peer Group. The Trustees noted that the rating level corresponded to the Fund’s quintile ranking in its Peer Group. The Trustees took into account the fact that the Investment Manager has contractually agreed, through March 1, 2024, to limit the Fund’s net annual operating expenses (subject to certain excluded expenses) to 0.60%. The Trustees concluded that, in light of the nature, extent and quality of the services provided by the Investment Manager and the Subadviser (which is an affiliate of the Investment Manager), the foregoing expense limitation and the considerations noted above with respect to the Investment Manager and the Subadviser, the Fund’s advisory and subadvisory fees are reasonable. With respect to AMG River Road Mid Cap Value Fund, the Trustees noted that the management fees (which include both the advisory and administration fees) and total expenses (net of applicable expense waivers/reimbursements) of Class I shares (the class of shares which is the primary focus of the Fund’s distribution) of the Fund as of March 31, 2023 were both rated in the Average rating level of the Fund’s Peer Group. The Trustees noted that the rating level corresponded to the Fund’s quintile ranking in its Peer Group. The Trustees took into account the fact that the Investment Manager has contractually agreed, through March 1, 2024, to limit the Fund’s net annual operating expenses (subject to certain excluded expenses) to 0.76%. The Trustees concluded that, in light of the nature, extent and quality of the services provided by the Investment Manager and the Subadviser (which is an affiliate of the Investment Manager), the foregoing expense limitation and the considerations noted above with respect to the Investment Manager and the Subadviser, the Fund’s advisory and subadvisory fees are reasonable. With respect to AMG River Road Small-Mid Cap Value Fund, the Trustees noted that the management fees (which include both the advisory and administration fees) and total expenses (net of applicable expense waivers/reimbursements) of Class I shares (the class of shares which is the primary focus of the Fund’s distribution) of the Fund as of March 31, 2023 were both rated in the Above Average rating level of the Fund’s Peer Group. The Trustees noted that the rating level corresponded to the Fund’s quintile ranking in its Peer Group. The Trustees took into account the fact that the Investment Manager has contractually agreed, through March 1, 2024, to limit the Fund’s net | | | | annual operating expenses (subject to certain excluded expenses) to 1.04%. The Trustees also took into account management’s discussion of the Fund’s expenses, including fees and expenses relative to comparably sized funds and select competitors. The Trustees concluded that, in light of the nature, extent and quality of the services provided by the Investment Manager and the Subadviser (which is an affiliate of the Investment Manager), the foregoing expense limitation and the considerations noted above with respect to the Investment Manager and the Subadviser, the Fund’s advisory and subadvisory fees are reasonable. With respect to AMG River Road Small Cap Value Fund, the Trustees noted that the management fees (which include both the advisory and administration fees) and total expenses of Class I shares (the class of shares which is the primary focus of the Fund’s distribution) of the Fund as of March 31, 2023 were rated in the Above Average and the High rating level, respectively, of the Fund’s Peer Group. The Trustees noted that the rating levels corresponded to the Fund’s quintile ranking in its Peer Group. The Trustees took into account management’s discussion of the Fund’s expenses, including fees and expenses relative to comparably sized funds and select competitors. The Trustees concluded that, in light of the nature, extent and quality of the services provided by the Investment Manager and the Subadviser (which is an affiliate of the Investment Manager) and the considerations noted above with respect to the Investment Manager and the Subadviser, the Fund’s advisory and subadvisory fees are reasonable. * * * * * After consideration of the foregoing, the Trustees also reached the following conclusions (in addition to the conclusions discussed above) regarding the Investment Management Agreements and Subadvisory Agreements: (a) the Investment Manager and the Subadviser have demonstrated that they possess the capability and resources to perform the duties required of them under the Investment Management Agreements and each Subadvisory Agreement and (b) the Investment Manager and Subadviser maintain appropriate compliance programs. Based on all of the above-mentioned factors and their related conclusions, with no single factor or conclusion being determinative and with each Trustee not necessarily attributing the same weight to each factor, the Trustees concluded that approval of each Investment Management Agreement and |
99
| | |
| | | Annual Renewal of Investment Management and Subadvisory Agreements (continued) |
| | | |
| | | |
| | | | | | | | |
| each Subadvisory Agreement would be in the best interests of the applicable Fund and its shareholders. Accordingly, on June 21, 2023, the Trustees, and separately a majority of the Independent Trustees, | | | | voted to approve the Investment Management Agreement and the Subadvisory Agreement for each Fund. | | | | |
100
|
|
| |
| | | | | | | | |
INVESTMENT MANAGER AND ADMINISTRATOR AMG Funds LLC 680 Washington Blvd., Suite 500 Stamford, CT 06901 800.548.4539 DISTRIBUTOR AMG Distributors, Inc. 680 Washington Blvd., Suite 500 Stamford, CT 06901 800.548.4539 SUBADVISER River Road Asset Management, LLC Meidinger Tower 462 South Fourth Street, Suite 2000 Louisville, KY 40202 | | | | CUSTODIAN The Bank of New York Mellon Mutual Funds Custody 6023 Airport Road Oriskany, NY 13424 LEGAL COUNSEL Ropes & Gray LLP Prudential Tower, 800 Boylston Street Boston, MA 02199-3600 TRANSFER AGENT BNY Mellon Investment Servicing (US) Inc. AMG Funds Attn: 534426 AIM 154-0520 500 Ross Street Pittsburgh, PA 15262 800.548.4539 | | | | This report is prepared for the Funds’ shareholders. It is authorized for distribution to prospective investors only when preceded or accompanied by an effective prospectus. To receive a free copy of the prospectus or Statement of Additional Information, which includes additional information about Fund Trustees, please contact us by calling 800.548.4539. Distributed by AMG Distributors, Inc., member FINRA/SIPC. Current net asset values per share for each Fund are available on the Funds’ website at wealth.amg.com. A description of the policies and procedures each Fund uses to vote its proxies is available: (i) without charge, upon request, by calling 800.548.4539, or (ii) on the Securities and Exchange Commission’s (SEC) website at sec.gov. For information regarding each Fund’s proxy voting record for the 12-month period ended June 30, call 800.548.4539 or visit the SEC website at sec.gov. The Funds file their complete schedule of portfolio holdings with the SEC for the first and third quarters of each fiscal year as an exhibit to their reports on Form N-PORT. The Funds’ portfolio holdings on Form N-PORT are available on the SEC’s website at sec.gov and the Funds’ website at wealth.amg.com. To review a complete list of the Funds’ portfolio holdings, or to view the most recent semi-annual report or annual report, please visit wealth.amg.com. |
|
|
| |
| | | | | | | | |
BALANCED FUNDS AMG GW&K Global Allocation GW&K Investment Management, LLC EQUITY FUNDS AMG Beutel Goodman International Equity Beutel, Goodman & Company Ltd. AMG Boston Common Global Impact Boston Common Asset Management, LLC AMG Frontier Small Cap Growth Frontier Capital Management Co., LLC AMG GW&K Small Cap Core AMG GW&K Small Cap Value AMG GW&K Small/Mid Cap Core AMG GW&K Small/Mid Cap Growth AMG GW&K Emerging Markets Equity AMG GW&K Emerging Wealth Equity AMG GW&K International Small Cap GW&K Investment Management, LLC AMG Montrusco Bolton Large Cap Growth Montrusco Bolton Investments, Inc. AMG Renaissance Large Cap Growth The Renaissance Group LLC | | | | AMG River Road Dividend All Cap Value AMG River Road Focused Absolute Value AMG River Road International Value Equity AMG River Road Large Cap Value Select AMG River Road Mid Cap Value AMG River Road Small-Mid Cap Value AMG River Road Small Cap Value River Road Asset Management, LLC AMG TimesSquare Emerging Markets Small Cap AMG TimesSquare Global Small Cap AMG TimesSquare International Small Cap AMG TimesSquare Mid Cap Growth AMG TimesSquare Small Cap Growth TimesSquare Capital Management, LLC AMG Veritas Asia Pacific AMG Veritas China AMG Veritas Global Focus AMG Veritas Global Real Return Veritas Asset Management LLP AMG Yacktman AMG Yacktman Focused AMG Yacktman Global AMG Yacktman Special Opportunities Yacktman Asset Management LP | | | | FIXED INCOME FUNDS AMG Beutel Goodman Core Plus Bond Beutel, Goodman & Company Ltd. AMG GW&K Core Bond ESG AMG GW&K Enhanced Core Bond ESG AMG GW&K ESG Bond AMG GW&K High Income AMG GW&K Municipal Bond AMG GW&K Municipal Enhanced Yield GW&K Investment Management, LLC |
| | | | |
| wealth.amg.com | | | | 103123 AR082 |
| | |

| | ANNUAL REPORT |
| |
| | |
| | | | | | |
| | | | AMG Funds October 31, 2023 
AMG Montrusco Bolton Large Cap Growth Fund |
| | | | |
| | | | | Class N: MCGFX | | Class I: MCGIX |
| | | | |
| | | | | | | |
| | | | |
| wealth.amg.com | | | | 103123 AR087 |
| | |
| | | AMG Funds Annual Report — October 31, 2023 |
| | | | | | |
| | | |
| | | | | | | |
| | | TABLE OF CONTENTS | | PAGE | |
| | | | |
| | | |
| | | LETTER TO SHAREHOLDERS | | | 2 | |
| | | |
| | | ABOUT YOUR FUND’S EXPENSES | | | 3 | |
| | | |
| | | PORTFOLIO MANAGER’S COMMENTS, FUND SNAPSHOTS AND SCHEDULE OF PORTFOLIO INVESTMENTS | | | 4 | |
| | | |
| | | FINANCIAL STATEMENTS | | | | |
| | | |
| | | Statement of Assets and Liabilities | | | 10 | |
| | | |
| | | Balance sheet, net asset value (NAV) per share computations
and cumulative distributable earnings (loss) | | | | |
| | | |
| | | Statement of Operations | | | 12 | |
| | | |
| | | Detail of sources of income, expenses, and realized and
unrealized gains (losses) during the fiscal year | | | | |
| | | |
| | | Statements of Changes in Net Assets | | | 13 | |
| | | |
| | | Detail of changes in assets for the past two fiscal years | | | | |
| | | |
| | | Financial Highlights | | | 14 | |
| | | |
| | | Historical net asset values per share, distributions, total returns, income
and expense ratios, turnover ratios and net assets | | | | |
| | | |
| | | Notes to Financial Statements | | | 16 | |
| | | |
| | | Accounting and distribution policies, details of agreements and
transactions with Fund management and affiliates, and descriptions of
certain investment risks | | | | |
| | | |
| | | REPORT OF INDEPENDENT REGISTERED PUBLIC ACCOUNTING FIRM | | | 21 | |
| | | |
| | | OTHER INFORMATION | | | 22 | |
| | | |
| | | TRUSTEES AND OFFICERS | | | 23 | |
| | | |
| | | ANNUAL RENEWAL OF INVESTMENT MANAGEMENT AND SUBADVISORY AGREEMENTS | | | 25 | |
| | | | | | | |
Nothing contained herein is to be considered an offer, sale or solicitation of an offer to buy shares of any series of the AMG Funds Family of Funds. Such offering is made only by prospectus, which includes details as to offering price and other material information.
| | |
| | Letter to Shareholders |
| |
| | |
Dear Shareholder:
We are pleased to provide this annual report for your investment with AMG Funds. Our foremost goal is to provide investment solutions that help our shareholders successfully achieve their long-term investment goals. We appreciate the privilege of providing you with investment tools.
The most recent fiscal year ended October 31, 2023, resulted in mixed returns for risk assets as global equity markets wrestled with tighter monetary policy, increased geopolitical tension, instability in the regional banking sector, and political handwringing over the U.S. debt ceiling. Bonds struggled to move higher as global central banks raised interest rates to cool the economy and bring down inflation. Relative to the prior year, 2023 brought a more favorable environment based on the optimism that easing inflation would allow the U.S. Federal Reserve (the “Fed”) to pause the interest rate hiking cycle and deliver an economic soft landing.
The S&P 500® Index gained 10.14% for the fiscal year, despite experiencing a pullback in the final three months of the period. Large-cap stocks diverged meaningfully from small-cap stocks, particularly driven by a handful of mega-cap technology and consumer discretionary stocks. The Russell 1000® Index gained 9.48% compared to the -8.56% return for the Russell 2000® Index. Only five of eleven sectors posted positive returns, with communications services (+36.06%), information technology (+33.15%), and consumer discretionary (+8.87%) leading the way. The weakest sectors were utilities (-7.72%), real estate (-6.57%), and health care (-4.64%). The strength in information technology drove Growth stocks to strongly outperform Value stocks with the Russell 1000® Growth Index gaining 18.95% compared to a 0.13% return for the Russell 1000® Value Index. Outside the U.S., foreign equity markets outperformed domestic equities, delivering a 12.07% return, as measured by the MSCI All Country World Index (ACWI) ex USA benchmark.
The Bloomberg U.S. Aggregate Bond Index, a broad measure of U.S. bond market performance, managed to generate a modest 0.36% return over the period as the Fed raised interest rates and the 10-year Treasury yield reached its highest point since 2008, resulting in longer-duration bonds underperforming. Investment-grade corporate bonds gained 2.77% for the year, while agency mortgage-backed securities fell -0.82%. High yield bonds were the best performing sector with a 6.23% return as measured by the return of the Bloomberg U.S. Corporate High Yield Bond Index. Municipal bonds outperformed the broader market with a 2.64% gain for the Bloomberg Municipal Bond Index.
AMG Funds provides access to a distinctive array of actively managed return-oriented investment strategies. You can rest assured that under all market conditions our team is focused on delivering excellent investment management services for your benefit. For more information about AMG Funds’ wide range of products and resources, please visit wealth.amg.com. We thank you for your investment and continued trust in AMG Funds.
Respectfully,

Keitha Kinne
President
AMG Funds
| | | | | | | | | | | | | | |
| Average Annual Total Returns | | Periods ended
October 31, 2023* | |
| | | | |
| Stocks: | | | | 1 Year | | | 3 Years | | | 5 Years | |
| | | | |
| Large Cap | | (S&P 500® Index) | | | 10.14 | % | | | 10.36 | % | | | 11.01 | % |
| | | | |
| Small Cap | | (Russell 2000® Index) | | | (8.56 | )% | | | 3.95 | % | | | 3.31 | % |
| | | | |
| International | | (MSCI ACWI ex USA) | | | 12.07 | % | | | 3.03 | % | | | 3.46 | % |
| | | | |
| Bonds: | | | | | | | | | | | |
| | | | |
| Investment Grade | | (Bloomberg U.S. Aggregate Bond Index) | | | 0.36 | % | | | (5.57 | )% | | | (0.06 | )% |
| | | | |
| High Yield | | (Bloomberg U.S. Corporate High Yield Bond Index) | | | 6.23 | % | | | 1.19 | % | | | 3.05 | % |
| | | | |
| Tax-exempt | | (Bloomberg Municipal Bond Index) | | | 2.64 | % | | | (2.48 | )% | | | 1.00 | % |
| | | | |
| Treasury Bills | | (ICE BofAML U.S. 6-Month Treasury Bill Index) | | | 4.88 | % | | | 1.83 | % | | | 1.90 | % |
*Source: FactSet. Past performance is no guarantee of future results.
2
| | |
| | | About Your Fund’s Expenses |
| | | |
| | | |
| | | | | | | | |
As a shareholder of a Fund, you may incur two types of costs: (1) transaction costs, which may include sales charges (loads) on purchase payments; redemption fees; and exchange fees; and (2) ongoing costs, including management fees; distribution (12b-1) fees; and other Fund expenses. This example is intended to help you understand your ongoing costs (in dollars) of investing in the Fund and to compare these costs with the ongoing costs of investing in other mutual funds. The example is based on $1,000 invested at the beginning of the period and held for the entire period as indicated below. ACTUAL EXPENSES The first section of the following table provides information about the actual account values and | | | | actual expenses. You may use the information in this section, together with the amount you invested, to estimate the expenses that you paid over the period. Simply divide your account value by $1,000 (for example, an $8,600 account value divided by $1,000 = 8.6), then multiply the result by the number in the first section under the heading entitled “Expenses Paid During the Period” to estimate the expenses you paid on your account during this period. HYPOTHETICAL EXAMPLE FOR COMPARISON PURPOSES The second section of the following table provides information about hypothetical account values and hypothetical expenses based on the Fund’s actual expense ratio and an assumed annual rate of return of 5% before expenses, which is not the Fund’s | | | | actual return. The hypothetical account values and expenses may not be used to estimate the actual ending account balance or expenses you paid for the period. You may use this information to compare the ongoing costs of investing in the Fund and other funds by comparing this 5% hypothetical example with the 5% hypothetical examples that appear in the shareholder reports of other funds. Please note that the expenses shown in the table are meant to highlight your ongoing costs only and do not reflect any transactional costs, such as sales charges (loads), redemption fees, or exchange fees. Therefore, the second section of the table is useful in comparing ongoing costs only, and will not help you determine the relative total costs of owning different funds. |
| | | | | | | | |
| | | | | | | | |
Six Months Ended October 31, 2023 | | Expense
Ratio for
the Period | | Beginning
Account
Value
05/01/23 | | Ending
Account
Value
10/31/23 | | Expenses
Paid
During
the Period* |
AMG Montrusco Bolton Large Cap Growth Fund |
|
Based on Actual Fund Return |
| | | | |
Class N | | 0.93% | | $1,000 | | $1,029 | | $4.76 |
| | | | |
Class I | | 0.74% | | $1,000 | | $1,029 | | $3.79 |
|
Based on Hypothetical 5% Annual Return |
| | | | |
Class N | | 0.93% | | $1,000 | | $1,021 | | $4.74 |
| | | | |
Class I | | 0.74% | | $1,000 | | $1,021 | | $3.77 |
| | * | Expenses are equal to the Fund’s annualized expense ratio multiplied by the average account value over the period, multiplied by the number of days in the most recent fiscal half-year (184), then divided by 365. | |
3
|
AMG Montrusco Bolton Large Cap Growth Fund Portfolio Manager’s Comments (unaudited) |
| | | | | | | | |
For the 12 months ended October 31, 2023, AMG Montrusco Bolton Large Cap Growth Fund (the “Fund”) Class N shares returned 17.14%, outpacing the 11.90% return for the S&P 500® Growth Index, the Fund’s benchmark. MARKET OVERVIEW U.S. equities provided double-digit gains during the period, despite a pull back in the final months. Mega-cap growth stocks known as the “magnificent seven” (Apple, Microsoft, Alphabet, Amazon, Tesla, NVIDIA, and Meta) continued to dominate the market, during both the rally and the subsequent pull back during the period. Much of the late volatility was driven by increasingly tight monetary policy and spiking benchmark U.S. Treasury yields, which are putting downward pressure on earnings multiples. The U.S. Federal Reserve’s (the “Fed”) release of an updated interest rate “dot plot” projection, which it uses as a communications tool to signal future actions, appears to have been a key driver. Federal Funds officials polled regarding the expected federal funds rate for the end of 2024 increased their median estimates by 50 basis points to 5.1%. Part of the Fed’s caution may be stemming from mixed messages in inflation data. Headline inflation numbers appear to be trending down. However, the inflation expectations implied in U.S. TIPS (Treasury Inflation-Protected Securities) yields remain roughly where they were at the end of June. Of particular concern are worries that excessive upward pressures in wages, evidenced in strikes at Detroit’s “Big Three” automakers and other labor actions, may fuel an upward spiral in inflation expectations. PERFORMANCE REVIEW Top contributing sectors to the Fund’s relative performance included consumer discretionary, communication services, and consumer staples. Bottom contributing sectors to relative performance included information technology, health care, and real estate. Top individual contributors to the Fund’s relative performance during the 12 months ended October 31, 2023, included Meta Platforms, Inc., Workday, Inc., | | | | Adobe, Inc., and Tesla, Inc. Meta Platforms performed well relative to earnings expectations during the period and raised its forward guidance. Officials at the parent company of Facebook and Instagram expect that efforts to leverage artificial intelligence (AI) to improve engagement and efficiency on its platforms should reaccelerate revenue growth during the second half of the year. Workday’s shares outperformed after cleanly beating consensus earnings expectations. The systems software provider’s positive comments regarding a strong demand pipeline in a tough macro environment were well-received by investors. Adobe also had strong earnings results and raised forward guidance. Investors reacted well to strong usage data at the software provider’s generative AI product, Firefly, and to news of its strategic image creation partnership related to Google’s Bard initiative. The Fund benefited from not owning benchmark constituent stock Tesla, primarily due to concerns over valuations of the stock. Bottom relative individual contributors to the Fund’s relative performance included NVIDIA Corp., Charles River Laboratories International, Inc., Danaher Corp., and Envista Holdings Corp. The Fund’s relative performance was affected by the fact that it did not own NVIDIA until later in the period, and then at an underweight relative to the benchmark. NVIDIA performed well, as the GPU (graphics processing unit) and API (application programming interface) provider’s strength amid several generative AI deployments and intra-quarter datapoints suggest strong customer demand. Charles River Laboratories’ shares suffered following concerns regarding the quality of non-human primates sourced in Cambodia, and their import into the U.S., and persistent weak funding in the biotech sector. Danaher shares suffered as the bioprocessing equipment market is forced to absorb excess inventories that were produced during COVID-19 due to fears of supply chain disruptions. Envista Holdings missed investor volume growth metric expectations, despite the continued strength in gross margins seen in the ramp-ups of some new products. | | | | Investments in the dental equipment and supplies provider’s sales and marketing are hampering operating margins. During the past year, the Fund continued to focus on environmental, social, and governance (“ESG”) practices, both internally and at all existing and potential holdings. This process includes regular interactions with management, both informally at investor days and through targeted meetings with companies. Key priorities include management attitudes toward issues ranging from climate change to minorities and board composition. The Fund also seeks and encourages implementation of formal ESG strategies, as well as the use of tangible, independently verified metrics, certifications, and key indicators to monitor performance. OUTLOOK Lost production volumes and the effects of sanctions amid Russia’s invasion of Ukraine and the conflict between Israel and Hamas are complexifying numerous existing inflationary drivers. These include aging demographics, a labor force reassessing its work/life balance, COVID-19 production hurdles, and regionalization trends. Consequently, the Fund is focused on business models that have strong pricing power. Uncertainty surrounding changes in supply chains, consumer behaviors, digitization, and rising wages will have a lasting impact on business models. The Fund seeks to continue identifying relative valuation dislocations caused by rapidly shifting market narratives that are offering compelling opportunities to book profits and reinvest in misunderstood, and therefore, mispriced stocks. The views expressed represent the opinions of Montrusco Bolton Investments, Inc. as of October 31, 2023, and are not intended as a forecast or guarantee of future results, and are subject to change without notice. |
4
| | |
| | | AMG Montrusco Bolton Large Cap Growth Fund Portfolio Manager’s Comments (continued) |
CUMULATIVE TOTAL RETURN PERFORMANCE
AMG Montrusco Bolton Large Cap Growth Fund’s cumulative total return is based on the daily change in net asset value (NAV), and assumes that all dividends and distributions were reinvested. The graph compares a hypothetical $10,000 investment made in the AMG Montrusco Bolton Large Cap Growth Fund’s Class N shares on October 31, 2013, to a $10,000 investment made in the S&P 500® Growth Index for the same time period. The graph and table do not reflect the deduction of taxes that a shareholder would pay on a Fund distribution or redemption of shares. The listed returns for the Fund are net of expenses and the returns for the index exclude expenses. Total returns would have been lower had certain expenses not been reduced.
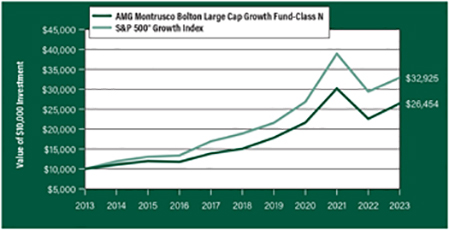
The table below shows the average annual total returns for the AMG Montrusco Bolton Large Cap Growth Fund and the S&P 500® Growth Index for the same time periods ended October 31, 2023.
| | | | | | | | |
| | | One | | Five | | Ten | |
| Average Annual Total Returns1 | | Year | | Years | | Years | |
|
AMG Montrusco Bolton Large Cap Growth Fund2, 3, 4, 5, 6, 7, 8, 9, 10, 11, 12 | |
| | | |
Class N | | 17.14% | | 11.91% | | | 10.22 | % |
| | | |
Class I | | 17.27% | | 12.10% | | | 10.43 | % |
| | | |
S&P 500® Growth Index13 | | 11.90% | | 11.77% | | | 12.66 | % |
The performance data shown represents past performance. Past performance is not a guarantee of future results. Current performance may be lower or higher than the performance data quoted. The investment return and principal value of an investment will fluctuate so that an investor’s shares, when redeemed, may be worth more or less than their original cost.
Investors should carefully consider the Fund’s investment objectives, risks, charges and expenses before investing. For performance information through the most recent month end, current net asset values per share for the Fund and other information, please call 800.548.4539 or visit our website at wealth.amg.com for a free prospectus. Read it carefully before investing or sending money.
Distributed by AMG Distributors, Inc., member FINRA/SIPC.
| 1 | Total return equals income yield plus share price change and assumes reinvestment of all dividends and capital gain distributions. Returns are net of fees and may reflect offsets of Fund expenses as described in the prospectus. No adjustment has been made for taxes payable by shareholders on their reinvested dividends and capital gain distributions. Returns for periods greater than one year are annualized. The listed returns on the Fund are net of expenses and based on the published NAV as of October 31, 2023. All returns are in U.S. Dollars ($). |
| 2 | As of March 19, 2021, the Fund’s Subadviser was changed to Montrusco Bolton Investments, Inc. Prior to |
|
March 19, 2021, the Fund was known as the AMG Managers Montag & Caldwell Growth Fund, and had different principal investment strategies and corresponding risks. Performance shown for periods prior to March 19, 2021, reflects the performance and investment strategies of the Fund’s previous subadviser, Montag & Caldwell, LLC. The Fund’s past performance would have been different if the Fund were managed by the current Subadviser and strategy, and the Fund’s prior performance record might be less pertinent for investors considering whether to purchase shares of the Fund. 3 From time to time, the Fund’s adviser has waived its fees and/or absorbed Fund expenses, which has resulted in higher returns. 4 Market prices of investments held by the Fund may fall rapidly or unpredictably due to a variety of factors, including economic, political, or market conditions, or other factors including terrorism, war, natural disasters and the spread of infectious illness or other public health issues, including epidemics or pandemics, or in response to events that affect particular industries or companies. 5 The stocks of large-capitalization companies are generally more mature and may not be able to reach the same levels of growth as the stocks of small- or mid-capitalization companies. 6 Value stocks may perform differently from the market as a whole and may be undervalued by the market for a long period of time. 7 The prices of equity securities of companies that are expected to experience relatively rapid earnings growth, or “growth stocks,” may be more sensitive to market movements because the prices tend to reflect future investor expectations rather than just current profits. 8 Because the Fund is an actively managed investment portfolio, security selection or focus on securities in a particular style, market sector or group of companies may cause the Fund to incur losses or underperform relative to its benchmarks or other funds with a similar investment objective. There can be no guarantee that the Subadviser’s investment techniques and risk analysis will produce the desired result. 9 The Fund is non-diversified and therefore a greater percentage of holdings may be focused in a small number of issuers or a single issuer, which can place the Fund at greater risk. Notwithstanding the Fund’s status as a “non-diversified” investment company under the Investment Company Act of 1940 (the “1940 Act”), the Fund intends to qualify as a regulated investment company accorded favorable tax treatment under the Internal Revenue Code of 1986, as amended, which imposes its own diversification requirements that are less restrictive than the requirements applicable to “diversified” |
5
| | |
| | | AMG Montrusco Bolton Large Cap Growth Fund Portfolio Manager’s Comments (continued) |
| | | | | | | | |
investment companies under the 1940 Act. The Fund’s intention to qualify as a regulated investment company may limit its pursuit of its investment strategy and its investment strategy could limit its ability to so qualify. 10 To the extent the Fund invests a substantial portion of its assets in a relatively small number of securities or a particular market, industry, group of industries, country, region, group of countries, asset class or sector, it generally will be subject to greater risk than a fund that invests in a more diverse investment portfolio. In addition, the value of the Fund would be more susceptible to any single economic, market, political or regulatory occurrence affecting, for example, that particular market, industry, region or sector. 11 The Subadviser incorporates ESG criteria into its investment process, which may result in the selection or exclusion of securities of certain issuers for reasons other than financial | | | | performance, and carries the risk that the Fund’s investment returns may underperform funds that do not incorporate ESG factors into their investment process. The incorporation of ESG criteria into the investment process may affect the Fund’s investment exposure to certain companies, sectors, regions, countries or types of investments, which could negatively impact the Fund’s performance depending on whether such investments are in or out of favor. Applying ESG criteria to investment decisions is qualitative and subjective by nature, and there is no guarantee that the criteria utilized by the Subadviser or any judgment exercised by the Subadviser will improve the financial performance of the Fund or reflect the beliefs or values of any particular investor. ESG standards differ by region and industry, and a company’s ESG practices or the Subadviser’s assessment of a company’s ESG practices may change over time. 12 Growth-at-a-reasonable-price (“GARP”) investing involves buying stocks that have a reasonable | | | | price/earnings ratio in relationship to a company’s earnings growth rate. The Fund’s performance may be adversely affected when stocks preferred by a GARP investing strategy underperform or are not favored by investors in prevailing market and economic conditions. 13 The S&P 500® Growth Index draws its constituents from the S&P 500® based on three growth factors: sales growth, the ratio of earnings change to price, and momentum. Unlike the Fund, the S&P 500® Growth Index is unmanaged, is not available for investment and does not incur expenses. The S&P Index is proprietary data of Standard & Poor’s, a division of McGraw-Hill Companies, Inc. All rights reserved. Not FDIC insured, nor bank guaranteed. May lose value. |
6
|
AMG Montrusco Bolton Large Cap Growth Fund Fund Snapshots (unaudited) October 31, 2023 |
PORTFOLIO BREAKDOWN
| | | | |
| Sector | | % of
Net Assets |
| | |
Information Technology | | | 36.0 | |
| | |
Health Care | | | 16.9 | |
| | |
Consumer Discretionary | | | 10.1 | |
| | |
Communication Services | | | 7.6 | |
| | |
Financials | | | 7.5 | |
| | |
Energy | | | 6.5 | |
| | |
Consumer Staples | | | 6.4 | |
| | |
Industrials | | | 5.3 | |
| | |
Materials | | | 1.9 | |
| | |
Real Estate | | | 1.1 | |
| | |
Short-Term Investments | | | 0.5 | |
| | |
Other Assets, less Liabilities | | | 0.2 | |
TOP TEN HOLDINGS
| | | | |
| Security Name | | % of
Net Assets |
| | |
Microsoft Corp. | | | 9.8 | |
| | |
Apple, Inc. | | | 9.5 | |
| | |
Amgen, Inc. | | | 6.2 | |
| | |
Alphabet, Inc., Class A | | | 5.3 | |
| | |
Walmart, Inc. | | | 5.1 | |
| | |
NVIDIA Corp. | | | 5.0 | |
| | |
Mastercard, Inc., Class A | | | 4.7 | |
| | |
Amazon.com, Inc. | | | 4.7 | |
| | |
Workday, Inc., Class A | | | 4.7 | |
| | |
Adobe, Inc. | | | 4.4 | |
| | | | | |
| | |
Top Ten as a Group | | | 59.4 | |
| | | | |
Because a fund’s strategy may result in multiple investments in particular sectors of the economy, its performance may depend on the performance of those sectors and may fluctuate more widely than investments diversified across more sectors. For additional information on these and other risk considerations, please see the Fund’s prospectus.
Any sectors, industries, or securities discussed should not be perceived as investment recommendations. Mention of a specific security should not be considered a recommendation to buy or solicitation to sell that security. Specific securities mentioned in this report may have been sold from the Fund’s portfolio of investments by the time you receive this report.
7
|
AMG Montrusco Bolton Large Cap Growth Fund Schedule of Portfolio Investments October 31, 2023 |
| | | | | | | | |
| | |
| | | Shares | | | Value | |
| | |
Common Stocks - 99.3% | | | | | | | | |
| |
Communication Services - 7.6% | | | | | |
| | |
Alphabet, Inc., Class A* | | | 80,684 | | | | $10,011,270 | |
| | |
Meta Platforms, Inc., Class A* | | | 14,636 | | | | 4,409,388 | |
| | |
Total Communication Services | | | | | | | 14,420,658 | |
| |
Consumer Discretionary - 10.1% | | | | | |
| | |
Amazon.com, Inc.* | | | 67,151 | | | | 8,937,127 | |
| | |
Five Below, Inc.* | | | 44,964 | | | | 7,822,837 | |
| | |
Lululemon Athletica, Inc. (Canada)* | | | 6,238 | | | | 2,454,528 | |
| | |
Total Consumer Discretionary | | | | | | | 19,214,492 | |
| |
Consumer Staples - 6.4% | | | | | |
| | |
Lamb Weston Holdings, Inc. | | | 27,871 | | | | 2,502,816 | |
| | |
Walmart, Inc. | | | 59,281 | | | | 9,687,108 | |
| | |
Total Consumer Staples | | | | | | | 12,189,924 | |
| |
Energy - 6.5% | | | | | |
| | |
EOG Resources, Inc. | | | 38,760 | | | | 4,893,450 | |
| | |
Valero Energy Corp. | | | 58,303 | | | | 7,404,481 | |
| | |
Total Energy | | | | | | | 12,297,931 | |
| |
Financials - 7.5% | | | | | |
| | |
CME Group, Inc. | | | 24,957 | | | | 5,327,321 | |
| | |
Mastercard, Inc., Class A | | | 23,747 | | | | 8,937,184 | |
| | |
Total Financials | | | | | | | 14,264,505 | |
| |
Health Care - 16.9% | | | | | |
| | |
Amgen, Inc. | | | 46,020 | | | | 11,767,314 | |
| | |
Charles River Laboratories International, Inc.* | | | 43,700 | | | | 7,357,332 | |
| | |
Danaher Corp. | | | 36,341 | | | | 6,978,199 | |
| | |
Envista Holdings Corp.* | | | 155,011 | | | | 3,607,106 | |
| | |
Zoetis, Inc. | | | 14,260 | | | | 2,238,820 | |
| | |
Total Health Care | | | | | | | 31,948,771 | |
| |
Industrials - 5.3% | | | | | |
| | |
Veralto Corp.* | | | 27,506 | | | | 1,897,914 | |
| | | | | | | | |
| | |
| | | Shares | | | Value | |
| | |
Waste Connections, Inc. (Canada) | | | 62,784 | | | | $8,130,528 | |
| | |
Total Industrials | | | | | | | 10,028,442 | |
| |
Information Technology - 36.0% | | | | | |
| | |
Adobe, Inc.* | | | 15,755 | | | | 8,382,605 | |
| | |
Apple, Inc. | | | 105,350 | | | | 17,990,620 | |
| | |
Microsoft Corp. | | | 54,759 | | | | 18,514,566 | |
| | |
NVIDIA Corp. | | | 23,079 | | | | 9,411,616 | |
| | |
Texas Instruments, Inc. | | | 34,546 | | | | 4,905,877 | |
| | |
Workday, Inc., Class A* | | | 42,203 | | | | 8,934,797 | |
| | |
Total Information Technology | | | | | | | 68,140,081 | |
| |
Materials - 1.9% | | | | | |
| | |
Linde PLC | | | 9,555 | | | | 3,651,539 | |
| |
Real Estate - 1.1% | | | | | |
| | |
Public Storage, REIT | | | 8,361 | | | | 1,995,854 | |
| | |
Total Common Stocks | | | | | | | | |
(Cost $164,366,226) | | | | | | | 188,152,197 | |
| | |
Short-Term Investments - 0.5% | | | | | | | | |
| |
Other Investment Companies - 0.5% | | | | | |
| | |
Dreyfus Government Cash Management Fund, Institutional Shares, 5.23%1 | | | 366,628 | | | | 366,628 | |
| | |
Dreyfus Institutional Preferred Government Money Market Fund, Institutional Shares, 5.31%1 | | | 549,943 | | | | 549,943 | |
| | |
Total Short-Term Investments | | | | | | | | |
(Cost $916,571) | | | | | | | 916,571 | |
| | |
Total Investments - 99.8% | | | | | | | | |
(Cost $165,282,797) | | | | | | | 189,068,768 | |
| | |
Other Assets, less Liabilities - 0.2% | | | | | | | 348,202 | |
| | |
Net Assets - 100.0% | | | | | | | $189,416,970 | |
| * | Non-income producing security. |
| 1 | Yield shown represents the October 31, 2023, seven day average yield, which refers to the sum of the previous seven days’ dividends paid, expressed as an annual percentage. |
| | REIT Real Estate Investment Trust |
The accompanying notes are an integral part of these financial statements.
8
|
AMG Montrusco Bolton Large Cap Growth Fund Schedule of Portfolio Investments (continued) |
The following table summarizes the inputs used to value the Fund’s investments by the fair value hierarchy levels as of October 31, 2023:
| | | | | | | | | | | | | | | | | | | | |
| | | Level 1 | | Level 2 | | Level 3 | | Total |
Investments in Securities | | | | | | | | | | | | | | | | | | | | |
| | | | |
Common Stocks† | | | $ | 188,152,197 | | | | | — | | | | | — | | | | $ | 188,152,197 | |
| | | | |
Short-Term Investments | | | | | | | | | | | | | | | | | | | | |
| | | | |
Other Investment Companies | | | | 916,571 | | | | | — | | | | | — | | | | | 916,571 | |
| | | | | | | | | | | | | | | | | | | | |
Total Investments in Securities | | | $ | 189,068,768 | | | | | — | | | | | — | | | | $ | 189,068,768 | |
| | | | | | | | | | | | | | | | | | | | |
| † | All common stocks held in the Fund are Level 1 securities. For a detailed breakout of common stocks by major industry classification, please refer to the Fund’s Schedule of Portfolio Investments. |
For the fiscal year ended October 31, 2023, there were no transfers in or out of Level 3.
The accompanying notes are an integral part of these financial statements.
9
| | |
| | | Statement of Assets and Liabilities October 31, 2023 |
| | | |
| | | |
| | | | |
| | | AMG
Montrusco Bolton
Large Cap
Growth Fund | |
| |
Assets: | | | | |
| |
Investments at value1 | | | $189,068,768 | |
| |
Receivable for investments sold | | | 1,876,963 | |
| |
Dividend and interest receivables | | | 71,347 | |
| |
Securities lending income receivable | | | 593 | |
| |
Receivable for Fund shares sold | | | 7,616 | |
| |
Receivable from affiliate | | | 18,059 | |
| |
Prepaid expenses and other assets | | | 18,331 | |
| |
Total assets | | | 191,061,677 | |
| |
Liabilities: | | | | |
| |
Payable for investments purchased | | | 1,420,889 | |
| |
Payable for Fund shares repurchased | | | 10,790 | |
| |
Accrued expenses: | | | | |
| |
Investment advisory and management fees | | | 79,464 | |
| |
Administrative fees | | | 24,833 | |
| |
Distribution fees | | | 17,930 | |
| |
Shareholder service fees | | | 12,320 | |
| |
Other | | | 78,481 | |
| |
Total liabilities | | | 1,644,707 | |
| |
Commitments and Contingencies (Notes 2 & 5) | | | | |
| |
Net Assets | | | $189,416,970 | |
| |
1 Investments at cost | | | $165,282,797 | |
The accompanying notes are an integral part of these financial statements.
10
| | |
| | | Statement of Assets and Liabilities (continued) |
| | | |
| | | |
| | | | |
| | | AMG
Montrusco Bolton
Large Cap
Growth Fund | |
| |
Net Assets Represent: | | | | |
| |
Paid-in capital | | | $161,017,385 | |
| |
Total distributable earnings | | | 28,399,585 | |
| |
Net Assets | | | $189,416,970 | |
| |
Class N: | | | | |
| |
Net Assets | | | $115,247,577 | |
| |
Shares outstanding | | | 10,896,666 | |
| |
Net asset value, offering and redemption price per share | | | $10.58 | |
| |
Class I: | | | | |
| |
Net Assets | | | $74,169,393 | |
| |
Shares outstanding | | | 6,829,599 | |
| |
Net asset value, offering and redemption price per share | | | $10.86 | |
The accompanying notes are an integral part of these financial statements.
11
| | |
| | | Statement of Operations For the fiscal year ended October 31, 2023 |
| | | |
| | | |
| | | | |
| | | AMG
Montrusco Bolton
Large Cap
Growth Fund | |
| |
Investment Income: | | | | |
| |
Dividend income | | | $2,263,433 | |
| |
Securities lending income | | | 849 | |
| |
Foreign withholding tax | | | (14,251) | |
| |
Total investment income | | | 2,250,031 | |
| |
Expenses: | | | | |
| |
Investment advisory and management fees | | | 983,613 | |
| |
Administrative fees | | | 307,379 | |
| |
Distribution fees - Class N | | | 186,585 | |
| |
Shareholder servicing fees - Class N | | | 90,894 | |
| |
Shareholder servicing fees - Class I | | | 43,094 | |
| |
Professional fees | | | 52,721 | |
| |
Reports to shareholders | | | 44,832 | |
| |
Registration fees | | | 39,160 | |
| |
Transfer agent fees | | | 32,980 | |
| |
Custodian fees | | | 29,162 | |
| |
Trustee fees and expenses | | | 14,090 | |
| |
Interest expense | | | 10,718 | |
| |
Miscellaneous | | | 11,519 | |
| |
Total expenses before offsets | | | 1,846,747 | |
| |
Expense reimbursements | | | (122,005) | |
| |
Net expenses | | | 1,724,742 | |
| | | | |
| |
Net investment income | | | 525,289 | |
| |
Net Realized and Unrealized Gain: | | | | |
| |
Net realized gain on investments | | | 5,679,761 | |
| |
Net change in unrealized appreciation/depreciation on investments | | | 27,244,653 | |
| |
Net realized and unrealized gain | | | 32,924,414 | |
| | | | |
| |
Net increase in net assets resulting from operations | | | $33,449,703 | |
The accompanying notes are an integral part of these financial statements.
12
| | |
| | | Statements of Changes in Net Assets For the fiscal years ended October 31, |
| | | |
| | | |
| | | | | | | | | | |
| | | AMG
Montrusco Bolton
Large Cap Growth Fund |
| | |
| | | 2023 | | 2022 |
| | |
Increase (Decrease) in Net Assets Resulting From Operations: | | | | | | | | | | |
| | |
Net investment income | | | | $525,289 | | | | | $167,033 | |
| | |
Net realized gain on investments | | | | 5,679,761 | | | | | 26,589,468 | |
| | |
Net change in unrealized appreciation/depreciation on investments | | | | 27,244,653 | | | | | (99,790,536 | ) |
| | |
Net increase (decrease) in net assets resulting from operations | | | | 33,449,703 | | | | | (73,034,035 | ) |
| | |
Distributions to Shareholders: | | | | | | | | | | |
| | |
Class N | | | | (11,004,682 | ) | | | | (38,003,632 | ) |
| | |
Class I | | | | (8,647,836 | ) | | | | (35,766,663 | ) |
| | |
Total distributions to shareholders | | | | (19,652,518 | ) | | | | (73,770,295 | ) |
| | |
Capital Share Transactions:1 | | | | | | | | | | |
| | |
Net increase (decrease) from capital share transactions | | | | (27,065,036 | ) | | | | 6,605,988 | |
| | | | | | | | | | |
| | |
Total decrease in net assets | | | | (13,267,851 | ) | | | | (140,198,342 | ) |
| | |
Net Assets: | | | | | | | | | | |
| | |
Beginning of year | | | | 202,684,821 | | | | | 342,883,163 | |
| | |
End of year | | | | $189,416,970 | | | | | $202,684,821 | |
1 See Note 1(g) of the Notes to Financial Statements.
The accompanying notes are an integral part of these financial statements.
13
| | |
| | | AMG Montrusco Bolton Large Cap Growth Fund Financial Highlights For a share outstanding throughout each fiscal year |
| | | |
| | | |
| | | | | | | | | | | | | | | | | | | | |
| | | For the fiscal years ended October 31, | |
| | | | | |
| Class N | | 2023 | | | 2022 | | | 2021 | | | 2020 | | | 2019 | |
| | | | | |
Net Asset Value, Beginning of Year | | | $10.00 | | | | $17.05 | | | | $21.50 | | | | $19.34 | | | | $20.52 | |
| | | | | |
Income (loss) from Investment Operations: | | | | | | | | | | | | | | | | | | | | |
| | | | | |
Net investment income (loss)1,2 | | | 0.02 | | | | (0.00 | )3 | | | (0.07 | ) | | | (0.06 | ) | | | (0.02 | ) |
| | | | | |
Net realized and unrealized gain (loss) on investments | | | 1.55 | | | | (3.26 | ) | | | 6.17 | | | | 3.92 | | | | 2.74 | |
| | | | | |
Total income (loss) from investment operations | | | 1.57 | | | | (3.26 | ) | | | 6.10 | | | | 3.86 | | | | 2.72 | |
| | | | | |
Less Distributions to Shareholders from: | | | | | | | | | | | | | | | | | | | | |
| | | | | |
Net investment income | | | (0.00 | )3 | | | — | | | | — | | | | — | | | | — | |
| | | | | |
Net realized gain on investments | | | (0.99 | ) | | | (3.79 | ) | | | (10.55 | ) | | | (1.70 | ) | | | (3.90 | ) |
| | | | | |
Total distributions to shareholders | | | (0.99 | ) | | | (3.79 | ) | | | (10.55 | ) | | | (1.70 | ) | | | (3.90 | ) |
| | | | | |
Net Asset Value, End of Year | | | $10.58 | | | | $10.00 | | | | $17.05 | | | | $21.50 | | | | $19.34 | |
| | | | | |
Total Return2,4 | | | 17.14 | % | | | (25.18 | )% | | | 39.50 | % | | | 21.36 | % | | | 18.29 | % |
| | | | | |
Ratio of net expenses to average net assets | | | 0.92 | %5 | | | 0.91 | % | | | 1.07 | %6 | | | 1.16 | %6 | | | 1.16 | %6 |
| | | | | |
Ratio of gross expenses to average net assets7 | | | 0.98 | % | | | 0.94 | % | | | 1.09 | % | | | 1.16 | % | | | 1.17 | % |
| | | | | |
Ratio of net investment income (loss) to average net assets2 | | | 0.18 | % | | | (0.02 | )% | | | (0.39 | )% | | | (0.30 | )% | | | (0.10 | )% |
| | | | | |
Portfolio turnover | | | 77 | % | | | 68 | % | | | 109 | % | | | 30 | % | | | 20 | % |
| | | | | |
Net assets end of year (000’s) omitted | | | $115,248 | | | | $113,790 | | | | $175,468 | | | | $166,051 | | | | $166,353 | |
14
| | |
| | | AMG Montrusco Bolton Large Cap Growth Fund Financial Highlights For a share outstanding throughout each fiscal year |
| | | |
| | | |
| | | | | | | | | | | | | | | | | | | | | | | | | |
| | | For the fiscal years ended October 31, |
| | | | | |
| Class I | | 2023 | | 2022 | | 2021 | | 2020 | | 2019 |
| | | | | |
Net Asset Value, Beginning of Year | | | | $10.25 | | | | | $17.36 | | | | | $21.69 | | | | | $19.46 | | | | | $20.62 | |
| | | | | |
Income (loss) from Investment Operations: | | | | | | | | | | | | | | | | | | | | | | | | | |
| | | | | |
Net investment income (loss)1,2 | | | | 0.04 | | | | | 0.02 | | | | | (0.04 | ) | | | | (0.03 | ) | | | | 0.01 | |
| | | | | |
Net realized and unrealized gain (loss) on investments | | | | 1.59 | | | | | (3.34 | ) | | | | 6.26 | | | | | 3.96 | | | | | 2.76 | |
| | | | | |
Total income (loss) from investment operations | | | | 1.63 | | | | | (3.32 | ) | | | | 6.22 | | | | | 3.93 | | | | | 2.77 | |
| | | | | |
Less Distributions to Shareholders from: | | | | | | | | | | | | | | | | | | | | | | | | | |
| | | | | |
Net investment income | | | | (0.03 | ) | | | | — | | | | | — | | | | | — | | | | | (0.03 | ) |
| | | | | |
Net realized gain on investments | | | | (0.99 | ) | | | | (3.79 | ) | | | | (10.55 | ) | | | | (1.70 | ) | | | | (3.90 | ) |
| | | | | |
Total distributions to shareholders | | | | (1.02 | ) | | | | (3.79 | ) | | | | (10.55 | ) | | | | (1.70 | ) | | | | (3.93 | ) |
| | | | | |
Net Asset Value, End of Year | | | | $10.86 | | | | | $10.25 | | | | | $17.36 | | | | | $21.69 | | | | | $19.46 | |
| | | | | |
Total Return2,4 | | | | 17.27 | % | | | | (25.05 | )% | | | | 39.78 | % | | | | 21.60 | % | | | | 18.49 | % |
| | | | | |
Ratio of net expenses to average net assets | | |
| 0.74
| %5
| | | | 0.73 | % | | |
| 0.92
| %6
| | |
| 0.99
| %6
| | |
| 0.98
| %6
|
| | | | | |
Ratio of gross expenses to average net assets7 | | | | 0.80 | % | | | | 0.76 | % | | | | 0.94 | % | | | | 0.99 | % | | | | 0.99 | % |
| | | | | |
Ratio of net investment income (loss) to average net assets2 | | | | 0.36 | % | | | | 0.16 | % | | | | (0.24 | )% | | | | (0.13 | )% | | | | 0.08 | % |
| | | | | |
Portfolio turnover | | | | 77 | % | | | | 68 | % | | | | 109 | % | | | | 30 | % | | | | 20 | % |
| | | | | |
Net assets end of year (000’s) omitted | | | | $74,169 | | | | | $88,895 | | | | | $167,415 | | | | | $309,638 | | | | | $329,225 | |
| 1 | Per share numbers have been calculated using average shares. |
| 2 | Total returns and net investment income (loss) would have been lower had certain expenses not been offset. |
| 3 | Less than $(0.005) per share. |
| 4 | The total return is calculated using the published Net Asset Value as of fiscal year end. |
| 5 | Includes interest expense totaling 0.01% related to participation in the interfund lending program. |
| 6 | Includes reduction from broker recapture amounting to less than 0.01%, less than 0.01%, and 0.01% for the fiscal years ended 2021, 2020 and 2019, respectively. |
| 7 | Excludes the impact of expense reimbursement or fee waivers and expense reductions such as brokerage credits, but includes expense repayments and non-reimbursable expenses, if any, such as interest, taxes, and extraordinary expenses. (See Note 1(c) and 2 in the Notes to Financial Statements.) |
15
| | |
| | | Notes to Financial Statements October 31, 2023 |
| | | |
| | | |
1. ORGANIZATION AND SUMMARY OF SIGNIFICANT ACCOUNTING POLICIES
AMG Funds IV (the “Trust”) is an open-end management investment company, organized as a Delaware Statutory Trust, and registered under the Investment Company Act of 1940, as amended (the “1940 Act”). Currently, the Trust consists of a number of different funds, each having distinct investment management objectives, strategies, risks, and policies. Included in this report is AMG Montrusco Bolton Large Cap Growth Fund (the “Fund”).
The Fund offers Class N and Class I shares. Each class represents an interest in the same assets of the respective Fund. Although all share classes generally have identical voting rights, each share class votes separately when required by law. Different share classes may have different net asset values per share to the extent the share classes pay different distribution amounts and/or the expenses of such share classes differ. Each share class has its own expense structure. Please refer to a current prospectus for additional information on each share class.
The Fund is non-diversified. A greater percentage of the Fund’s holdings may be focused in a smaller number of securities which may place the Fund at greater risk than a more diversified fund.
Market prices of investments held by the Fund may fall rapidly or unpredictably due to a variety of economic or political factors, market conditions, disasters or public health issues, or in response to events that affect particular industries or companies.
The Fund’s financial statements are prepared in accordance with accounting principles generally accepted in the United States of America (“U.S. GAAP”), including accounting and reporting guidance pursuant to Accounting Standards Codification Topic 946 applicable to investment companies. U.S. GAAP requires management to make estimates and assumptions that affect the reported amounts of assets and liabilities and disclosure of contingent assets and liabilities at the date of the financial statements and the reported amounts of income and expenses during the reporting period. Actual results could differ from those estimates and such differences could be material. The following is a summary of significant accounting policies followed by the Fund in the preparation of its financial statements:
a. VALUATION OF INVESTMENTS
Equity securities traded on a national securities exchange or reported on the NASDAQ national market system (“NMS”) are valued at the last quoted sales price on the primary exchange or, if applicable, the NASDAQ official closing price or the official closing price of the relevant exchange or, lacking any sales, at the last quoted bid price. Equity securities held by the Fund that are traded in the over-the-counter market (other than NMS securities) are valued at the bid price. Foreign equity securities (securities principally traded in markets other than U.S. markets) held by the Fund are valued at the official closing price on the primary exchange or, for markets that either do not offer an official closing price or where the official closing price may not be representative of the overall market, the last quoted sale price.
Fixed income securities purchased with a remaining maturity of 60 days or less are valued at amortized cost, provided that the amortized cost value is approximately the same as the fair value of the security valued without the use of amortized cost. Investments in other open-end registered investment companies are valued at their end of day net asset value per share.
The Fund’s portfolio investments are generally valued based on independent market quotations or prices or, if none, “evaluative” or other market based valuations provided by third party pricing services. Pursuant to Rule 2a-5 under the 1940 Act, the Fund’s Board of Trustees (the “Board”) designated AMG Funds LLC (the “Investment Manager”) as the Fund’s Valuation Designee to perform the Fund’s fair value determinations. Such determinations are subject to Board oversight and certain reporting and other requirements intended to ensure that the Board receives the information it needs to oversee the Investment Manager’s fair value determinations.
Under certain circumstances, the value of certain Fund portfolio investments may be based on an evaluation of fair value, pursuant to procedures established by the Investment Manager and under the general supervision of the Board. The Fund may use the fair value of a portfolio investment to calculate its net asset value (“NAV”) in the event that the market quotation, price or market based valuation for the portfolio investment is not readily available or otherwise not determinable pursuant to the Fund’s valuation procedures, if the Investment Manager believes the quotation, price or market based valuation to be unreliable, or in certain other circumstances. When determining the fair value of an investment, the Investment Manager seeks to determine the price that the Fund might reasonably expect to receive from current sale of that portfolio investment in an arms-length transaction. Fair value determinations shall be based upon consideration of all available facts and information, including, but not limited to (i) attributes specific to the investment; (ii) fundamental and analytical data relating to the investment; and (iii) the value of other comparable securities or relevant financial instruments, including derivative securities, traded on other markets or among dealers.
The values assigned to fair value portfolio investments are based on available information and do not necessarily represent amounts that might ultimately be realized in the future, since such amounts depend on future developments inherent in long-term investments. Because of the inherent uncertainty of valuation, those estimated values may differ significantly from the values that would have been used had a ready market for the investments existed, and the differences could be material. The Board will be presented with quarterly reports, as of the most recent quarter end, summarizing all fair value activity, material fair value matters that occurred during the quarter, and all outstanding securities fair valued by the Fund. Additionally, the Board will be presented with an annual report that assesses the adequacy and effectiveness of the Investment Manager’s process for determining the fair value of the Fund’s investments.
With respect to foreign equity securities and certain foreign fixed income securities, securities held in the Fund that can be fair valued by the applicable fair value pricing service are fair valued on each business day provided that each individual price exceeds a pre-established confidence level.
U.S. GAAP defines fair value as the price that a fund would receive to sell an asset or pay to transfer a liability in an orderly transaction between market participants at the measurement date. U.S. GAAP also establishes a framework for measuring fair value, and a three level hierarchy for fair value measurements based upon the transparency of inputs to the valuation of an asset or liability. Inputs may be observable or unobservable and refer broadly to the assumptions that market participants would use in pricing the asset or liability. Observable inputs reflect the assumptions market participants would use in pricing the asset or liability based on market data obtained from sources independent of the Fund.
Unobservable inputs reflect the Fund’s own assumptions about the assumptions that market participants would use in pricing the asset or liability developed based on the best information available in the circumstances. Each investment is
16
| | |
| | | Notes to Financial Statements (continued) |
| | | |
| | | |
assigned a level based upon the observability of the inputs which are significant to the overall valuation.
The three-tier hierarchy of inputs is summarized below:
Level 1 – inputs are quoted prices in active markets for identical investments (e.g., equity securities, open-end investment companies)
Level 2 – other observable inputs (including, but not limited to: quoted prices for similar assets or liabilities in markets that are active, quoted prices for identical or similar assets or liabilities in markets that are not active, inputs other than quoted prices that are observable for the assets or liabilities (such as interest rates, yield curves, volatilities, prepayment speeds, loss severities, credit risks and default rates) or other market corroborated inputs) (e.g., debt securities, government securities, foreign currency exchange contracts, foreign securities utilizing international fair value pricing, fair valued securities with observable inputs)
Level 3 – inputs are significant unobservable inputs (including the Fund’s own assumptions used to determine the fair value of investments) (e.g., fair valued securities with unobservable inputs)
Changes in inputs or methodologies used for valuing investments may result in a transfer in or out of levels within the fair value hierarchy. The inputs or methodologies used for valuing investments may not necessarily be an indication of the risk associated with investing in those investments.
b. SECURITY TRANSACTIONS
Security transactions are accounted for as of trade date. Realized gains and losses on securities sold are determined on the basis of identified cost.
c. INVESTMENT INCOME AND EXPENSES
Dividend income is recorded on the ex-dividend date. Dividends from foreign securities are recorded on the ex-dividend date, and if after the fact, as soon as the Fund becomes aware of the ex-dividend date. Interest income, which includes amortization of premium and accretion of discount on debt securities, is accrued as earned. Dividend and interest income on foreign securities is recorded gross of any withholding tax. Non-cash dividends included in dividend income, if any, are reported at the fair market value of the securities received. Upon notification from the issuer, distributions received from a real estate investment trust (REIT) may be redesignated as a reduction of cost of investments and/or realized gain. Other income and expenses are recorded on an accrual basis. Expenses that cannot be directly attributed to the Fund are apportioned among the funds in the Trust and other trusts or funds within the AMG Funds Family of Funds (collectively, the “AMG Funds Family”) based upon their relative average net assets or number of shareholders. Investment income, realized and unrealized capital gains and losses, the common expenses of the Fund, and certain fund level expense reductions, if any, are allocated on a pro-rata basis to each class based on the relative net assets of each class to the total net assets of the Fund.
d. DIVIDENDS AND DISTRIBUTIONS
Fund distributions resulting from either net investment income or realized net capital gains, if any, will normally be declared and paid at least annually in December. Distributions to shareholders are recorded on the ex-dividend date. Distributions are determined in accordance with federal income tax regulations, which may differ from net investment income and net realized capital gains for financial statement purposes (U.S. GAAP). Differences may be permanent or temporary. Permanent differences are reclassified among capital accounts in the financial statements to reflect their tax character. Permanent book and tax basis differences, if any, relating to shareholder distributions will result in reclassifications to paid-in capital. Temporary differences arise when certain items of income, expense and gain or loss are recognized in different periods for financial statement and tax purposes; these differences will reverse at some time in the future. There were no permanent differences during the year. Temporary differences are primarily due to wash sale loss deferrals.
The tax character of distributions paid during the fiscal years ended October 31, 2023 and October 31, 2022 was as follows:
| | | | | | | | |
| | |
Distributions paid from: | | | 2023 | | | | 2022 | |
| | |
Ordinary income * | | | $111,073 | | | | $33,737,529 | |
| | |
Long-term capital gains | | | 19,541,445 | | | | 40,032,766 | |
| | | | | | | | |
| | |
| | | $19,652,518 | | | | $73,770,295 | |
| | | | | | | | |
| * | For tax purposes, short-term capital gain distributions, if any, are considered ordinary income distributions. |
As of October 31, 2023, the components of distributable earnings (excluding unrealized appreciation/depreciation) on a tax basis consisted of:
| | | | |
| |
Undistributed ordinary income | | | $2,507,942 | |
| |
Undistributed long-term capital gains | | | 4,956,158 | |
At October 31, 2023, the cost of investments and the aggregate gross unrealized appreciation and depreciation for federal income tax purposes were as follows:
| | | | | | | | | | | | |
| Cost | | Appreciation | | | Depreciation | | | Net Appreciation | |
| | | |
$168,133,283 | | | $32,400,812 | | | | $(11,465,327) | | | | $20,935,485 | |
e. FEDERAL TAXES
The Fund currently qualifies as an investment company and intends to comply with the requirements under Subchapter M of the Internal Revenue Code of 1986, as amended, and to distribute substantially all of its taxable income and gains to its shareholders and to meet certain diversification and income requirements with respect to investment companies. The Investment Manager has analyzed the Fund’s tax positions taken on federal income tax returns as of October 31, 2023, and for all open tax years (generally, the three prior taxable years), and has concluded that no provision for federal income tax is required in the Fund’s financial statements. Additionally, the Investment Manager is not aware of any tax position for which it is reasonably possible that the total amounts of unrecognized tax benefit/detriment will change materially in the next twelve months.
17
| | |
| | | Notes to Financial Statements (continued) |
| | | |
| | | |
Furthermore, based on the Fund’s understanding of the tax rules and rates related to income, gains and transactions for the foreign jurisdictions in which it invests, the Fund will provide for foreign taxes, and where appropriate, deferred foreign taxes.
f. CAPITAL LOSS CARRYOVERS AND DEFERRALS
As of October 31, 2023, the Fund had no capital loss carryovers for federal income tax purposes. Should the Fund incur net capital losses for the fiscal year ended
October 31, 2024, such amounts may be used to offset future realized capital gains indefinitely, and retain their character as short-term and/or long-term.
g. CAPITAL STOCK
The Trust’s Trust Instrument authorizes for the Fund the issuance of an unlimited number of shares of beneficial interest, without par value. The Fund records sales and repurchases of its capital stock on the trade date.
For the fiscal years ended October 31, 2023 and October 31, 2022, the capital stock transactions by class for the Fund were as follows:
| | | | | | | | | | | | | | | | |
| | | October 31, 2023 | | | October 31, 2022 | |
| | | | |
| | | Shares | | | Amount | | | Shares | | | Amount | |
| | | | |
Class N: | | | | | | | | | | | | | | | | |
| | | | |
Shares sold | | | 200,256 | | | | $2,064,170 | | | | 361,555 | | | | $4,597,554 | |
| | | | |
Shares issued in reinvestment of distributions | | | 1,163,123 | | | | 10,828,671 | | | | 2,725,123 | | | | 37,415,935 | |
| | | | |
Shares redeemed | | | (1,846,942 | ) | | | (19,001,168 | ) | | | (1,995,422 | ) | | | (24,997,298 | ) |
| | | | | | | | | | | | | | | | |
| | | | |
Net increase (decrease) | | | (483,563 | ) | | | $(6,108,327 | ) | | | 1,091,256 | | | | $17,016,191 | |
| | | | | | | | | | | | | | | | |
| | | | |
Class I: | | | | | | | | | | | | | | | | |
| | | | |
Shares sold | | | 515,793 | | | | $5,156,022 | | | | 990,746 | | | | $13,094,271 | |
| | | | |
Shares issued in reinvestment of distributions | | | 880,781 | | | | 8,402,646 | | | | 2,485,116 | | | | 34,915,882 | |
| | | | |
Shares redeemed | | | (3,243,436 | ) | | | (34,515,377 | ) | | | (4,444,728 | ) | | | (58,420,356 | ) |
| | | | | | | | | | | | | | | | |
| | | | |
Net decrease | | | (1,846,862 | ) | | | $(20,956,709 | ) | | | (968,866 | ) | | | $(10,410,203 | ) |
| | | | | | | | | | | | | | | | |
h. REPURCHASE AGREEMENTS AND JOINT REPURCHASE AGREEMENTS
The Fund may enter into third-party and bilateral repurchase agreements for temporary cash management purposes and for reinvestment of cash collateral on securities lending transactions under the securities lending program offered by The Bank of New York Mellon (“BNYM”) (the “Securities Lending Program”) (collectively, “Repurchase Agreements”). The value of the underlying collateral, including accrued interest, must equal or exceed the value of the Repurchase Agreements during the term of the agreement. For joint repurchase agreements, the Fund participates on a pro rata basis with other clients of BNYM in their share of the underlying collateral under such joint repurchase agreements and in their share of proceeds from any repurchase or other disposition of the underlying collateral. The underlying collateral for all Repurchase Agreements is held by the Fund’s custodian or at the Federal Reserve Bank. If the seller defaults and the value of the collateral declines, or if bankruptcy proceedings commence with respect to the seller of the security, realization of the collateral by the Fund may be delayed or limited. Pursuant to the Securities Lending Program, the Fund is indemnified for such losses by BNYM on joint repurchase agreements.
At October 31, 2023, the Fund had no Repurchase Agreements outstanding.
2. AGREEMENTS AND TRANSACTIONS WITH AFFILIATES
The Trust has entered into an investment advisory agreement under which the Investment Manager, a subsidiary and the U.S. wealth platform of Affiliated Managers Group, Inc. (“AMG”), serves as investment manager to the Fund and is responsible for the Fund’s overall administration and operations. The Investment Manager selects and recommends, subject to the approval of the Board and, in certain circumstances, shareholders, the Fund’s subadviser and monitors the subadviser’s investment performance, security holdings and investment strategies. The Fund’s investment portfolio is managed by Montrusco Bolton Investments, Inc. (“Montrusco Bolton”) who serves pursuant to a subadvisory agreement with the Investment Manager. AMG indirectly owns a majority interest in Montrusco Bolton.
Investment management fees are paid directly by the Fund to the Investment Manager based on average daily net assets. For the fiscal year ended October 31, 2023, the Fund paid an investment management fee at the annual rate of 0.48% of the average daily net assets of the Fund. The fee paid to Montrusco Bolton for its services as subadviser is paid out of the fee the Investment Manager receives from the Fund and does not increase the expenses of the Fund.
18
| | |
| | | Notes to Financial Statements (continued) |
| | | |
| | | |
The Investment Manager has contractually agreed, through at least March 1, 2024, to waive management fees and/or pay or reimburse fund expenses in order to limit total annual Fund operating expenses after fee waiver and expense reimbursements (exclusive of taxes, interest (including interest incurred in connection with bank and custody overdrafts, and in connection with securities sold short), shareholder servicing fees, distribution and service (12b-1) fees, brokerage commissions and other transaction costs, dividends payable with respect to securities sold short, acquired fund fees and expenses and extraordinary expenses) to 0.68% of the Fund’s average daily net assets (this annual rate or such other annual rate that may be in effect from time to time, the “Expense Cap”), subject to later reimbursement by the Fund in certain circumstances.
In general, for a period of up to 36 months after the date any amounts are paid, waived or reimbursed by the Investment Manager, the Investment Manager may recover such amounts from the Fund, provided that such repayment would not cause the Fund’s total annual operating expenses after fee waiver and expense reimbursements (exclusive of the items noted in the parenthetical above) to exceed either (i) the Expense Cap in effect at the time such amounts were paid, waived or reimbursed, or (ii) the Expense Cap in effect at the time of such repayment by the Fund.
The contractual expense limitation may only be terminated in the event the Investment Manager or a successor ceases to be the investment manager of the Fund or a successor fund, by mutual agreement between the Investment Manager and the Board, or in the event of the Fund’s liquidation unless the Fund is reorganized or is a party to a merger in which the surviving entity is successor to the accounting and performance information of the Fund.
For the fiscal year ended October 31, 2023, the Investment Manager reimbursed the Fund $122,005, and did not recoup any previously reimbursed expenses. At October 31, 2023, the Fund’s expiration of reimbursements subject to recoupment is as follows:
| | | | |
Expiration Period | | | |
| |
Less than 1 year | | | $95,910 | |
| |
1-2 years | | | 86,244 | |
| |
2-3 years | | | 122,005 | |
| | | | |
| |
Total | | $ | 304,159 | |
| | | | |
The Trust, on behalf of the Fund, has entered into an amended and restated Administration Agreement under which the Investment Manager serves as the Fund’s administrator (the “Administrator”) and is responsible for certain aspects of managing the Fund’s operations, including administration and shareholder services to the Fund. The Fund pays a fee to the Administrator at the rate of 0.15% per annum of the Fund’s average daily net assets for this service.
The Fund is distributed by AMG Distributors, Inc. (the “Distributor”), a wholly-owned subsidiary of the Investment Manager. The Distributor serves as the distributor and underwriter for the Fund and is a registered broker-dealer and member of the Financial Industry Regulatory Authority, Inc. (“FINRA”). Shares of the Fund will be continuously offered and will be sold directly to prospective purchasers and through brokers, dealers or other financial intermediaries who have executed selling agreements with the Distributor. Generally, the Distributor bears all or a portion of the expenses of providing services pursuant to the distribution
agreement, including the payment of the expenses relating to the distribution of prospectuses for sales purposes and any advertising or sales literature.
The Trust has adopted a distribution and service plan (the “Plan”) with respect to the Class N shares, in accordance with the requirements of Rule 12b-1 under the 1940 Act and the requirements of the applicable rules of FINRA regarding asset-based sales charges. Pursuant to the Plan, the Fund may make payments to the Distributor for its expenditures in financing any activity primarily intended to result in the sale of the Fund’s Class N shares and for maintenance and personal service provided to existing shareholders of that class. The Plan authorizes payments to the Distributor up to 0.25% annually of the Fund’s average daily net assets attributable to the Class N shares. The Plan is characterized as a reimbursement plan and is directly tied to expenses incurred by the Distributor; the payments the Distributor receives during any year may not exceed its actual expenses. The impact on the annualized expense ratios for the fiscal year ended October 31, 2023, was 0.16%.
For each of the Class N and Class I shares, the Board has approved reimbursement payments to the Investment Manager for shareholder servicing expenses (“shareholder servicing fees”) incurred. Shareholder servicing fees include payments to financial intermediaries, such as broker-dealers (including fund supermarket platforms), banks, and trust companies who provide shareholder recordkeeping, account servicing and other services. The Class N and Class I shares may reimburse the Investment Manager for the actual amount incurred up to a maximum annual rate of each Class’s average daily net assets as shown in the table.
The impact on the annualized expense ratios for the fiscal year ended October 31, 2023, was as follows:
| | | | | | | | |
| | | Maximum Annual
Amount
Approved | | | Actual
Amount
Incurred | |
| | |
Class N | | | 0.15% | | | | 0.07% | |
| | |
Class I | | | 0.05% | | | | 0.05% | |
The Board provides supervision of the affairs of the Trust and other trusts within the AMG Funds Family. The Trustees of the Trust who are not affiliated with the Investment Manager receive an annual retainer and per meeting fees for regular, special and telephonic meetings, and they are reimbursed for out-of-pocket expenses incurred while carrying out their duties as Board members. The Chairman of the Board and the Audit Committee Chair receive additional annual retainers. On October 10, 2023, the shareholders of the Trust elected Trustees, including two new Trustees who are not “interested persons” of the Fund within the meaning of the 1940 Act. Certain Trustees and Officers of the Fund are Officers and/or Directors of the Investment Manager, AMG and/or the Distributor.
The Securities and Exchange Commission (the “SEC”) granted an exemptive order that permits certain eligible funds in the AMG Funds Family to lend and borrow money for certain temporary purposes directly to and from other eligible funds in the AMG Funds Family. Participation in this interfund lending program is voluntary for both the borrowing and lending funds, and an interfund loan is only made if it benefits each participating fund. The Administrator manages the program according to procedures approved by the Board, and the Board monitors the operation of the program. An interfund loan must comply with certain conditions set out in the exemptive order, which are designed to assure fairness and protect all participating funds. The interest earned and interest paid on interfund loans are
19
| | |
| | | Notes to Financial Statements (continued) |
| | | |
| | | |
included on the Statement of Operations as interest income and interest expense, respectively. At October 31, 2023, the Fund had no interfund loans outstanding.
The Fund utilized the interfund loan program during the fiscal year ended October 31, 2023 as follows:
| | | | | | | | | | |
Average
Borrowed | | Number
of Days | | Interest
Paid | | | Average Interest Rate | |
| | | |
| $6,050,115 | | 11 | | | $10,718 | | | | 5.878% | |
3. PURCHASES AND SALES OF SECURITIES
Purchases and sales of securities (excluding short-term securities and U.S. Government Obligations) for the fiscal year ended October 31, 2023, were $157,476,447 and $203,504,167, respectively.
The Fund had no purchases or sales of U.S. Government Obligations during the fiscal year ended October 31, 2023.
4. PORTFOLIO SECURITIES LOANED
The Fund participates in the Securities Lending Program providing for the lending of securities to qualified borrowers. Securities lending income includes earnings of such temporary cash investments, plus or minus any rebate to a borrower. These earnings (after any rebate) are then divided between BNYM, as a fee for its services under the Securities Lending Program, and the Fund, according to agreed-upon rates. Collateral on all securities loaned is accepted in cash, U.S. Treasury Obligations or U.S. Government Agency Obligations. Collateral is maintained at a minimum level of 102% (105% in the case of certain foreign securities) of the market value, plus interest, if applicable, of investments on loan. It is the Fund’s policy to obtain additional collateral from or return excess collateral to the borrower by the end of the next business day, following the valuation date of the securities loaned. Therefore, the value of the collateral held may be temporarily less than the value of the securities on loan. Lending securities entails a risk of loss to the Fund if and to the extent that the market value of the securities loaned were to increase and the borrower did not increase the collateral accordingly, and the borrower fails to return the securities. Under the terms of the Securities Lending Program, the Fund is indemnified for such losses by BNYM. Cash collateral is held in separate omnibus accounts managed by BNYM, who is authorized to exclusively enter into joint repurchase agreements for that cash collateral. Securities collateral is held in separate omnibus accounts managed by BNYM and cannot be sold or pledged. BNYM bears the risk of any deficiency in the amount of the cash collateral available for return to the borrower due to any loss on the collateral invested. Loans of securities are terminable at any time and the borrower, after notice, is required to return borrowed securities as soon as practical, which is normally within three business days.
The Fund did not have any securities on loan at October 31, 2023.
5. COMMITMENTS AND CONTINGENCIES
Under the Trust’s organizational documents, its Trustees and Officers are indemnified against certain liabilities arising out of the performance of their duties to the Trust. In addition, in the normal course of business, the Fund may enter into contracts and agreements that contain a variety of representations and warranties, which provide general indemnifications. The maximum exposure to the Fund under these arrangements is unknown, as this would involve future claims that may be made against the Fund that have not yet occurred. However, based on experience, the Fund had no prior claims or losses and expects the risks of loss to be remote.
6. MASTER NETTING AGREEMENTS
The Fund may enter into master netting agreements with its counterparties for the Securities Lending Program and Repurchase Agreements, which provide the right, in the event of default (including bankruptcy or insolvency) for the non-defaulting party to liquidate the collateral and calculate net exposure to the defaulting party or request additional collateral. For financial reporting purposes, the Fund does not offset financial assets and financial liabilities that are subject to master netting agreements in the Statement of Assets and Liabilities. At October 31, 2023, the Fund had no securities on loan and no Repurchase Agreements outstanding.
7. SUBSEQUENT EVENTS
The Fund has determined that no material events or transactions occurred through the issuance date of the Fund’s financial statements which require an additional disclosure in or adjustment of the Fund’s financial statements.
20
| | |
| | | Report of Independent Registered Public Accounting Firm |
| | | |
| | | |
To the Board of Trustees of AMG Funds IV and Shareholders of AMG Montrusco Bolton Large Cap Growth Fund
Opinion on the Financial Statements
We have audited the accompanying statement of assets and liabilities, including the schedule of portfolio investments, of AMG Montrusco Bolton Large Cap Growth Fund (one of the funds constituting AMG Funds IV, referred to hereafter as the “Fund”) as of October 31, 2023, the related statement of operations for the year ended October 31, 2023, the statements of changes in net assets for each of the two years in the period ended October 31, 2023, including the related notes, and the financial highlights for each of the five years in the period ended October 31, 2023 (collectively referred to as the “financial statements”). In our opinion, the financial statements present fairly, in all material respects, the financial position of the Fund as of October 31, 2023, the results of its operations for the year then ended, the changes in its net assets for each of the two years in the period ended October 31, 2023 and the financial highlights for each of the five years in the period ended October 31, 2023 in conformity with accounting principles generally accepted in the United States of America.
Basis for Opinion
These financial statements are the responsibility of the Fund’s management. Our responsibility is to express an opinion on the Fund’s financial statements based on our audits. We are a public accounting firm registered with the Public Company Accounting Oversight Board (United States) (PCAOB) and are required to be independent with respect to the Fund in accordance with the U.S. federal securities laws and the applicable rules and regulations of the Securities and Exchange Commission and the PCAOB.
We conducted our audits of these financial statements in accordance with the standards of the PCAOB. Those standards require that we plan and perform the audit to obtain reasonable assurance about whether the financial statements are free of material misstatement, whether due to error or fraud.
Our audits included performing procedures to assess the risks of material misstatement of the financial statements, whether due to error or fraud, and performing procedures that respond to those risks. Such procedures included examining, on a test basis, evidence regarding the amounts and disclosures in the financial statements. Our audits also included evaluating the accounting principles used and significant estimates made by management, as well as evaluating the overall presentation of the financial statements. Our procedures included confirmation of securities owned as of October 31, 2023 by correspondence with the custodian and brokers; when replies were not received from brokers, we performed other auditing procedures. We believe that our audits provide a reasonable basis for our opinion.
/s/ PricewaterhouseCoopers LLP
Boston, Massachusetts
December 22, 2023
We have served as the auditor of one or more investment companies in the AMG Funds Family since 1993.
21
| | |
| | | Other Information (unaudited) |
| | | |
| | | |
TAX INFORMATION
AMG Montrusco Bolton Large Cap Growth Fund hereby designates the maximum amount allowable of its net taxable income as qualified dividends as provided in the Jobs and Growth Tax Relief Reconciliation Act of 2003. The 2022/2023 Form 1099-DIV you receive for the Fund will show the tax status of all distributions paid to you during the year.
Pursuant to section 852 of the Internal Revenue Code, AMG Montrusco Bolton Large Cap Growth Fund hereby designates $19,541,445 as a capital gain distribution with respect to the taxable year ended October 31, 2023, or if subsequently determined to be different, the net capital gains of such fiscal year.
PROXY VOTE
A special meeting of the shareholders of AMG Funds IV (the “Trust”) was held on October 10, 2023, to vote on a proposal to elect trustees to the Board of Trustees of the Trust. The proposal and results of the vote are described below. Jill R. Cuniff, Kurt A. Keilhacker, Peter W. MacEwen, Steven J. Paggioli, Eric Rakowski, Victoria L. Sassine and Garret W. Weston were elected by shareholders at the special meeting on October 10, 2023. Bruce B. Bingham, an incumbent Trustee, will continue to serve as a Trustee of the Trust until his retirement on December 31, 2023.
| | | | | | |
| AMG Funds IV | | All Funds in Trust* | |
| | |
| Election of Trustees 1 | | For | | Withheld | |
| | |
Jill R. Cuniff | | 123,476,732 | | | 9,260,973 | |
| | |
Kurt A. Keilhacker | | 131,677,070 | | | 1,060,634 | |
| | |
Peter W. MacEwen | | 123,401,874 | | | 9,335,830 | |
| | |
Steven J. Paggioli | | 130,832,753 | | | 1,904,951 | |
| | |
Eric Rakowski | | 130,620,379 | | | 2,117,325 | |
| | |
Victoria L. Sassine | | 131,755,717 | | | 981,987 | |
| | |
Garret W. Weston | | 131,970,391 | | | 767,313 | |
1 Ms. Cuniff and Mr. MacEwen were newly elected to the Board of Trustees on October 10, 2023; Messrs. Keilhacker, Paggioli, Rakowski, and Weston and Ms. Sassine are incumbent Trustees.
*Rounded to the nearest share.
22
|
AMG Funds Trustees and Officers |
| | | | | | | | |
| The Trustees and Officers of the Trust, their business addresses, principal occupations for the past five years and ages are listed below. The Trustees provide broad supervision over the affairs of the Trust and the Funds. The Trustees are experienced executives who meet periodically throughout the year to oversee the Funds’ activities, review contractual arrangements with companies that provide services to the Funds, and | | | | review the Funds’ performance. Unless otherwise noted, the address of each Trustee or Officer is the address of the Trust: 680 Washington Blvd., Suite 500, Stamford, CT. 06901. There is no stated term of office for Trustees. Trustees serve until their resignation, retirement or removal in accordance with the Trust’s organizational documents and policies adopted by the Board from time to time. | | | | The Chairman of the Board, the President, the Treasurer and the Secretary and such other Officers as the Trustees may in their discretion from time to time elect each hold office until his or her successor is elected and qualified, or until he or she sooner dies, resigns, is removed or becomes disqualified. Each Officer holds office at the pleasure of the Trustees. |
| | | | | | | | |
Independent Trustees
The following Trustees are not “interested persons” of the Trust within the meaning of the 1940 Act:
| | |
Number of Funds Overseen in Fund Complex | | Name, Age, Principal Occupation(s) During Past 5 Years and Other Directorships Held by Trustee |
| | |
• Trustee since 2014 • Oversees 41 Funds in Fund Complex | | Bruce B. Bingham, 75* Partner, Hamilton Partners (real estate development firm) (1987-Present); Director of The Yacktman Funds, Inc. (2 portfolios) (2000-2012). |
| | |
• Trustee since 2023 • Oversees 41 Funds in Fund Complex | | Jill R. Cuniff, 59** Director of Harding, Loevner Funds, Inc. (12 portfolios) (2018-Present); Retired (2016-Present); President & Portfolio Manager, Edge Asset Management (2009-2016); President & Chief Investment Officer, Morley Financial Services (2001-2009); President, Union Bond & Trust Company (2001-2009). |
| | |
• Trustee since 2014 • Chairman of the Audit Committee since 2020 • Oversees 43 Funds in Fund Complex | | Kurt A. Keilhacker, 60 Managing Partner, Elementum Ventures (2013-Present); Managing Partner, TechFund Europe (2000-Present); Managing Partner, TechFund Capital (1997-Present); Adjunct Professor, University of San Francisco (2022-Present); Trustee, Wheaton College (2018-Present); Director, Wheaton College Trust Company, N.A. (2018-Present). |
| | |
• Trustee since 2023 • Oversees 41 Funds in Fund Complex | | Peter W. MacEwen, 59** Private investor (2019-Present); Affiliated Managers Group, Inc. (2003-2018): Chief Administrative Officer, Office of the CEO (2013-2018); Senior Vice President, Finance (2007-2013); Vice President, Finance (2003-2007). |
| | |
• Trustee since 2010 • Oversees 41 Funds in Fund Complex | | Steven J. Paggioli, 73 Independent Consultant (2002-Present); Trustee, Professionally Managed Portfolios (28 portfolios); Independent Director, Muzinich BDC, Inc. (business development company) (2019-Present); Director, The Wadsworth Group; Independent Director, Chase Investment Counsel (2008–2019); Executive Vice President, Secretary and Director, Investment Company Administration, LLC and First Fund Distributors, INC. (1990-2001). |
| | |
• Independent Chairman of the Board of Trustees since 2017; • Chairman of the Governance Committee since 2017 • Trustee since 2010 • Oversees 43 Funds in Fund Complex | | Eric Rakowski, 65 Professor of Law, University of California at Berkeley School of Law (1990-Present); Tax Attorney at Davis Polk & Wardwell and clerked for Judge Harry T. Edwards of the U.S. Court of Appeals for the District of Columbia Circuit and for Justice William J. Brennan Jr. of the U.S. Supreme Court; Trustee of Parnassus Funds (4 portfolios) (2021-Present); Trustee of Parnassus Income Funds (2 portfolios) (2021-Present); Director of Harding, Loevner Funds, Inc. (10 portfolios); Trustee of Third Avenue Trust (3 portfolios) (2002-2019); Trustee of Third Avenue Variable Trust (1 portfolio) (2002-2019). |
| | |
• Trustee since 2014 • Oversees 43 Funds in Fund Complex | | Victoria L. Sassine, 58 Adjunct Professor, Babson College (2007–Present); Director, Board of Directors, PRG Group (2017-Present); CEO, Founder, Scale Smarter Partners, LLC (2018-Present); Adviser, EVOFEM Biosciences (2019-Present); Chairperson of the Board of Directors of Business Management Associates (2018 to 2019). |
*Mr. Bingham will retire from the Board of Trustees of the Trust on December 31, 2023.
**Ms. Cuniff and Mr. MacEwen were elected to the Board of Trustees by the shareholders of the Trust on October 10, 2023.
23
| | |
| | | AMG Funds Trustees and Officers (continued) |
Interested Trustee
The Trustee in the following table is an “interested person” of the Trust within the meaning of the 1940 Act.
| | |
Number of Funds Overseen in Fund Complex | | Name, Age, Principal Occupation(s) During Past 5 Years and Other Directorships Held by Trustee |
| | |
• Trustee since 2021 • Oversees 43 Funds in Fund Complex | | Garret W. Weston, 42 Affiliated Managers Group, Inc. (2008-Present): Managing Director, Head of Affiliate Product Strategy and Development (2023-Present), Managing Director, Co-Head of Affiliate Engagement, Distribution (2021-2022), Senior Vice President, Office of the CEO (2019-2021), Senior Vice President, Affiliate Development (2016-2019), Vice President, Office of the CEO (2015-2016), Vice President, New Investments (2008-2015); Associate, Madison Dearborn Partners (2006-2008); Analyst, Merrill Lynch (2004-2006). |
| |
| Officers | | |
Position(s) Held with Fund and Length of Time Served | | Name, Age, Principal Occupation(s) During Past 5 Years |
| | |
• President since 2018 • Principal Executive Officer since 2018 • Chief Executive Officer since 2018 • Chief Operating Officer since 2016 | | Keitha L. Kinne, 65 Managing Director, Head of Platform and Operations, AMG Funds LLC (2023-Present); Chief Operating Officer, AMG Funds LLC (2007-Present); Chief Investment Officer, AMG Funds LLC (2008-Present); President and Principal, AMG Distributors, Inc. (2018-Present); Chief Operating Officer, AMG Distributors, Inc. (2007-Present); President, Chief Executive Officer and Principal Executive Officer, AMG Funds, AMG Funds I, AMG Funds II, AMG Funds III and AMG Funds IV (2018-Present); Chief Operating Officer, AMG Funds, AMG Funds I, AMG Funds II, and AMG Funds III (2007-Present); Chief Operating Officer, AMG Funds IV (2016-Present); Chief Operating Officer and Chief Investment Officer, Aston Asset Management, LLC (2016); President and Principal Executive Officer, AMG Funds, AMG Funds I, AMG Funds II and AMG Funds III (2012-2014); Managing Partner, AMG Funds LLC (2007-2014); President and Principal, AMG Distributors, Inc. (2012-2014); Managing Director, Legg Mason & Co., LLC (2006-2007); Managing Director, Citigroup Asset Management (2004-2006). |
| | |
• Secretary since 2015 • Chief Legal Officer since 2015 | | Mark J. Duggan, 58 Managing Director and Senior Counsel, AMG Funds LLC (2021-Present); Senior Vice President and Senior Counsel, AMG Funds LLC (2015-2021); Secretary and Chief Legal Officer, AMG Funds, AMG Funds I, AMG Funds II, AMG Funds III and AMG Funds IV (2015-Present); Attorney, K&L Gates, LLP (2009-2015). |
| | |
• Chief Financial Officer since 2017 • Treasurer since 2017 • Principal Financial Officer since 2017 • Principal Accounting Officer since 2017 | | Thomas G. Disbrow, 57 Vice President, Mutual Fund Treasurer & CFO, AMG Funds, AMG Funds LLC (2017-Present); Chief Financial Officer, Principal Financial Officer, Treasurer and Principal Accounting Officer, AMG Funds, AMG Funds I, AMG Funds II, AMG Funds III and AMG Funds IV (2017-Present); Managing Director - Global Head of Traditional Funds Product Control, UBS Asset Management (Americas), Inc. (2015-2017); Managing Director - Head of North American Funds Treasury, UBS Asset Management (Americas), Inc. (2011-2015). |
| | |
• Deputy Treasurer since 2017 | | John A. Starace, 53 Vice President, Mutual Fund Accounting, AMG Funds LLC (2021-Present); Director, Mutual Fund Accounting, AMG Funds LLC (2017-2021); Vice President, Deputy Treasurer of Mutual Funds Services, AMG Funds LLC (2014-2017); Deputy Treasurer, AMG Funds, AMG Funds I, AMG Funds II, AMG Funds III and AMG Funds IV (2017-Present); Vice President, Citi Hedge Fund Services (2010-2014); Audit Senior Manager (2005-2010) and Audit Manager (2001-2005), Deloitte & Touche LLP. |
| | |
• Chief Compliance Officer and Sarbanes-Oxley Code of Ethics Compliance Officer since 2019 • Anti-Money Laundering Compliance Officer since 2022 | | Patrick J. Spellman, 49 Vice President, Chief Compliance Officer, AMG Funds LLC (2017-Present); Chief Compliance Officer, AMG Distributors, Inc. (2010-Present); Chief Compliance Officer and Sarbanes-Oxley Code of Ethics Compliance Officer, AMG Funds, AMG Funds I, AMG Funds II, AMG Funds III and AMG Funds IV (2019-Present); Anti-Money Laundering Compliance Officer, AMG Funds, AMG Funds I, AMG Funds II, and AMG Funds III (2014-2019; 2022-Present); Anti-Money Laundering Compliance Officer, AMG Funds IV (2016-2019; 2022-Present); Senior Vice President, Chief Compliance Officer, AMG Funds LLC (2011-2017); Compliance Manager, Legal and Compliance, Affiliated Managers Group, Inc. (2005-2011). |
| | |
• Assistant Secretary since 2016 | | Maureen M. Kerrigan, 38 Vice President, Senior Counsel, AMG Funds LLC (2021-Present); Vice President, Counsel, AMG Funds LLC (2019-2021); Director, Counsel, AMG Funds LLC (2017-2018); Vice President, Counsel, AMG Funds LLC (2015-2017); Assistant Secretary, AMG Funds, AMG Funds I, AMG Funds II, AMG Funds III and AMG Funds IV (2016-Present); Associate, Ropes & Gray LLP (2011-2015); Law Fellow, Massachusetts Appleseed Center for Law and Justice (2010-2011). |
24
| | |
| | | Annual Renewal of Investment Management and Subadvisory Agreements |
| | | |
| | | |
| | | | | | | | |
AMG Montrusco Bolton Large Cap Growth Fund: Approval of Investment Advisory Agreement and Subadvisory Agreement on June 21, 2023 At an in-person meeting held on June 21, 2023, the Board of Trustees (the “Board” or the “Trustees”), and separately a majority of the Trustees who are not “interested persons” of AMG Funds IV (the “Trust”) (the “Independent Trustees”), approved (i) the Investment Advisory Agreement, as amended pursuant to letter agreements at any time prior to the date of the meeting, with AMG Funds LLC (the “Investment Manager”) for AMG Montrusco Bolton Large Cap Growth Fund (the “Fund”) and separately Amendment No. 1 thereto dated October 1, 2016 (collectively, the “Investment Advisory Agreement”); and (ii) the Subadvisory Agreement, as amended at any time prior to the date of the meeting, with the Subadviser for the Fund (the “Subadvisory Agreement”). The Independent Trustees were separately represented by independent legal counsel in connection with their consideration of the approval of these agreements. In considering the Investment Advisory Agreement and Subadvisory Agreement, the Trustees reviewed a variety of materials relating to the Fund, the Investment Manager and the Subadviser, including the nature, extent and quality of services, comparative performance, fee and expense information for an appropriate peer group of similar mutual funds for the Fund (the “Peer Group”), performance information for the relevant benchmark index for the Fund (the “Fund Benchmark”), other relevant matters, and other information provided to them on a periodic basis throughout the year. Prior to voting, the Independent Trustees: (a) reviewed the foregoing information with their independent legal counsel; (b) received materials from their independent legal counsel discussing the legal standards applicable to their consideration of the Investment Advisory Agreement and the Subadvisory Agreement; and (c) met with their independent legal counsel in private sessions at which no representatives of management were present. NATURE, EXTENT AND QUALITY OF SERVICES In considering the nature, extent and quality of the services provided by the Investment Manager, the Trustees reviewed information provided by the Investment Manager at the June 21, 2023 and prior meetings relating to the Investment Manager’s operations and personnel. Among other things, the Investment Manager provided financial information, information about its supervisory and professional staff and descriptions of its organizational and | | | | management structure. The Trustees also took into account information provided periodically throughout the previous year by the Investment Manager in Board meetings relating to the performance of its duties with respect to the Fund and the Trustees’ knowledge of the Investment Manager’s management and the quality of the performance of the Investment Manager’s duties under the Investment Advisory Agreement and Administration Agreement. In the course of their deliberations regarding the Investment Manager, the Trustees evaluated, among other things: (a) the extent and quality of the Investment Manager’s oversight of the operation and management of the Fund; (b) the quality of the Investment Manager’s oversight of the performance by the Subadviser of its portfolio management duties; (c) the Investment Manager’s ability to supervise the Fund’s other service providers; and (d) the Investment Manager’s compliance program. The Trustees also took into account that, in performing its functions under the Investment Advisory Agreement and supervising the Subadviser, the Investment Manager: performs periodic detailed analyses and reviews of the performance by the Subadviser of its obligations to the Fund, including without limitation, analysis and review of portfolio and other compliance matters and review of the Subadviser’s investment performance with respect to the Fund; prepares and presents periodic reports to the Board regarding the investment performance of the Subadviser and other information regarding the Subadviser, at such times and in such forms as the Board may reasonably request; reviews and considers any changes in the personnel of the Subadviser responsible for performing the Subadviser’s obligations and makes appropriate reports to the Board; reviews and considers any changes in the ownership or senior management of the Subadviser and makes appropriate reports to the Board; performs periodic in-person, telephonic or videoconference diligence meetings, including with respect to compliance matters, with representatives of the Subadviser; assists the Board and management of the Trust in developing and reviewing information with respect to the initial approval of the Subadvisory Agreement and annual consideration of the Subadvisory Agreement thereafter; prepares recommendations with respect to the continued retention of the Subadviser or the replacement of the Subadviser, including at the request of the Board; identifies potential successors to, or replacements of, the Subadviser or potential additional subadvisers, including performing appropriate due diligence, and developing and | | | | presenting to the Board a recommendation as to any such successor, replacement, or additional subadviser, including at the request of the Board; designates and compensates from its own resources such personnel as the Investment Manager may consider necessary or appropriate to the performance of its services; and performs such other review and reporting functions as the Board shall reasonably request consistent with the Investment Advisory Agreement and applicable law. The Trustees noted the affiliation of the Subadviser with the Investment Manager, noting any potential conflicts of interest. The Trustees also took into account the financial condition of the Investment Manager with respect to its ability to provide the services required under the Investment Advisory Agreement and the Investment Manager’s undertaking to maintain a contractual expense limitation for the Fund. The Trustees also considered the Investment Manager’s risk management processes. The Trustees also reviewed information relating to the Subadviser’s operations and personnel and the investment philosophy, strategies and techniques (its “Investment Strategy”) used in managing the Fund. Among other things, the Trustees reviewed information on portfolio management and other professional staff, information regarding the Subadviser’s organizational and management structure and the Subadviser’s brokerage policies and practices. The Trustees considered specific information provided regarding the experience of the individuals at the Subadviser with portfolio management responsibility for the Fund, including the information set forth in the Fund’s prospectus and statement of additional information. In the course of their deliberations, the Trustees evaluated, among other things: (a) the services rendered by the Subadviser in the past; (b) the qualifications and experience of the Subadviser’s personnel; and (c) the Subadviser’s compliance program. The Trustees also took into account the financial condition of the Subadviser with respect to its ability to provide the services required under the Subadvisory Agreement. The Trustees also considered the Subadviser’s risk management processes. PERFORMANCE The Board considered the Fund’s net performance during relevant time periods as compared to the Fund’s Peer Group and Fund Benchmark, considered the gross performance of the Fund as compared to the Subadviser’s relevant performance composite that utilizes a similar investment strategy and approach, and noted that the Board reviews on a |
| | | | | | | | | |
25
| | |
| | | Annual Renewal of Investment Management and Subadvisory Agreements (continued) |
| | | |
| | | |
| | | | | | | | |
quarterly basis detailed information about both the Fund’s performance results and portfolio composition, as well as the Subadviser’s Investment Strategy. The Board was mindful of the Investment Manager’s expertise, resources and attention to monitoring the Subadviser’s performance, investment style and risk-adjusted performance with respect to the Fund and its discussions with the management of the Fund’s subadviser during the period regarding the factors that contributed to the performance of the Fund. Among other information relating to the Fund’s performance, the Trustees noted that the Fund’s performance for Class N shares (which share class has the earliest inception date and the largest amount of assets of all the share classes of the Fund) for the 1-year, 3-year, 5-year and 10-year periods ended March 31, 2023 was above, above, above, and below, respectively, the median performance of the Peer Group and above, above, above, and below, respectively, the performance of the Fund Benchmark, the S&P 500 Growth Index. The Trustees took into account management’s discussion of the Fund’s performance, including the reasons for the Fund’s more recent outperformance relative to the Peer Group and the Fund Benchmark. The Trustees also noted that the Fund ranked in the top quartile relative to the Peer Group for the 5-year period and in the top third relative to the Peer Group for the 1-year and 3-year periods. The Trustees also took into account the fact that the Fund’s subadviser, investment strategy, and Fund Benchmark changed effective March 19, 2021, and that the performance information prior to that date reflected that of the Fund’s prior subadviser and investment strategy. The Trustees considered management’s discussion that the Fund’s performance has been in line with management’s expectations since the current Subadviser assumed subadvisory responsibilities. The Trustees concluded that the Fund’s overall performance has been satisfactory. ADVISORY AND SUBADVISORY FEES; FUND EXPENSES; PROFITABILITY; AND ECONOMIES OF SCALE In considering the reasonableness of the advisory fee payable to the Investment Manager, the Trustees reviewed information provided by the Investment Manager at the June 21, 2023 and prior meetings setting forth all revenues and other benefits, both direct and indirect (including any so-called “fallout benefits” such as reputational value derived from the Investment Manager serving as Investment Manager to the Fund), received by the Investment Manager and its affiliates attributable to managing the Fund | | | | and all the mutual funds in the AMG Funds Family of Funds; the cost of providing such services; the significant risks undertaken as Investment Manager and sponsor of the Fund, including investment, operational, enterprise, entrepreneurial, litigation, regulatory and compliance risks; and the resulting profitability to the Investment Manager and its affiliates from these relationships. The Trustees also considered the amount of the advisory fee retained by the Investment Manager after payment of the subadvisory fee with respect to the Fund. The Trustees also noted payments are made from the Subadviser to the Investment Manager, and other payments are made from the Investment Manager to the Subadviser. The Trustees also considered management’s discussion of the current asset level of the Fund, and the impact on profitability of both the current asset level and any future growth of assets of the Fund. In considering the cost of services to be provided by the Investment Manager under the Investment Advisory Agreement and the profitability to the Investment Manager of its relationship with the Fund, the Trustees noted the undertaking by the Investment Manager to maintain a contractual expense limitation for the Fund. The Board also took into account management’s discussion of the advisory fee structure and the services the Investment Manager provides in performing its functions under the Investment Advisory Agreement and supervising the Subadviser. Based on the foregoing, the Trustees concluded that the profitability to the Investment Manager is reasonable and that the Investment Manager is not realizing material benefits from economies of scale that would warrant adjustments to the advisory fee at this time. Also with respect to economies of scale, the Trustees noted that as the Fund’s assets increase over time, the Fund may realize other economies of scale to the extent the increase in assets is proportionally greater than the increase in certain other expenses. In considering the reasonableness of the subadvisory fee payable by the Investment Manager to the Subadviser, the Trustees reviewed information regarding the cost to the Subadviser of providing subadvisory services to the Fund and the resulting profitability from the relationship. The Trustees noted that, because the Subadviser is an affiliate of the Investment Manager, a portion of the Subadviser’s revenues or profits might be shared directly or indirectly with the Investment Manager. The Trustees also noted that the subadvisory fees are paid by the Investment Manager out of its advisory | | | | fee. The Board also took into account management’s discussion of the subadvisory fee structure, and the services the Subadviser provides in performing its functions under the Subadvisory Agreement. Based on the foregoing, the Trustees concluded that the profitability to the Subadviser is reasonable and that the Subadviser is not realizing material benefits from economies of scale that would warrant adjustments to the subadvisory fees at this time. Also with respect to economies of scale, the Trustees noted that as the Fund’s assets increase over time, the Fund may realize other economies of scale to the extent the increase in assets is proportionally greater than the increase in certain other expenses. The Trustees noted that the management fees (which include both the advisory and administration fees) and total expenses (net of applicable expense waivers/reimbursements) of Class I shares (the class of shares which is the primary focus of the Fund’s distribution) of the Fund as of March 31, 2023 were both rated in the Average rating level of the Fund’s Peer Group. The Trustees noted that the rating level corresponded to the Fund’s quintile ranking in its Peer Group. The Trustees took into account the fact that the Investment Manager has contractually agreed, through March 1, 2024, to limit the Fund’s net annual operating expenses (subject to certain excluded expenses) to 0.68%. The Trustees concluded that, in light of the nature, extent and quality of the services provided by the Investment Manager and the Subadviser (which is an affiliate of the Investment Manager), the foregoing expense limitation and the considerations noted above with respect to the Investment Manager and the Subadviser, the Fund’s advisory and subadvisory fees are reasonable. * * * * After consideration of the foregoing, the Trustees also reached the following conclusions (in addition to the conclusions discussed above) regarding the Investment Advisory Agreement and the Subadvisory Agreement: (a) the Investment Manager and the Subadviser have demonstrated that they possess the capability and resources to perform the duties required of them under the Investment Advisory Agreement and the Subadvisory Agreement and (b) the Investment Manager and Subadviser maintain appropriate compliance programs. Based on all of the above-mentioned factors and their related conclusions, with no single factor or conclusion being determinative and with each Trustee not necessarily attributing the same weight to each factor, the Trustees concluded that approval |
| | | | | | | | | |
26
| | |
| | | Annual Renewal of Investment Management and Subadvisory Agreements (continued) |
| | | |
| | | |
| | | | | | | | |
| of the Investment Advisory Agreement and the Subadvisory Agreement would be in the best interests of the Fund and its shareholders. | | | | Accordingly, on June 21, 2023, the Trustees, and separately a majority of the Independent Trustees, | | | | voted to approve the Investment Advisory Agreement and the Subadvisory Agreement for the Fund. |
27
THIS PAGE INTENTIONALLY LEFT BLANK
THIS PAGE INTENTIONALLY LEFT BLANK
|
|
| | | | | | | | |
INVESTMENT MANAGER AND ADMINISTRATOR AMG Funds LLC 680 Washington Blvd., Suite 500 Stamford, CT 06901 800.548.4539 DISTRIBUTOR AMG Distributors, Inc. 680 Washington Blvd., Suite 500 Stamford, CT 06901 800.548.4539 SUBADVISER Montrusco Bolton Investments, Inc. 1501 McGill College Avenue Suite 1200 Montreal, QC H3A 3M8 Canada | | | | CUSTODIAN The Bank of New York Mellon Mutual Funds Custody 6023 Airport Road Oriskany, NY 13424 LEGAL COUNSEL Ropes & Gray LLP Prudential Tower, 800 Boylston Street Boston, MA 02199-3600 TRANSFER AGENT BNY Mellon Investment Servicing (US) Inc. AMG Funds Attn: 534426 AIM 154-0520 500 Ross Street Pittsburgh, PA 15262 800.548.4539 | | | | This report is prepared for the Fund’s shareholders. It is authorized for distribution to prospective investors only when preceded or accompanied by an effective prospectus. To receive a free copy of the prospectus or Statement of Additional Information, which includes additional information about Fund Trustees, please contact us by calling 800.548.4539. Distributed by AMG Distributors, Inc., member FINRA/SIPC. Current net asset values per share for the Fund are available on the Fund’s website at wealth.amg.com. A description of the policies and procedures the Fund uses to vote its proxies is available: (i) without charge, upon request, by calling 800.548.4539, or (ii) on the Securities and Exchange Commission’s (SEC) website at sec.gov. For information regarding the Fund’s proxy voting record for the 12-month period ended June 30, call 800.548.4539 or visit the SEC website at sec.gov. The Fund files its complete schedule of portfolio holdings with the SEC for the first and third quarters of each fiscal year as an exhibit to their reports on Form N-PORT. The Fund’s portfolio holdings on Form N-PORT are available on the SEC’s website at sec.gov and the Fund’s website at wealth.amg.com. To review a complete list of the Fund’s portfolio holdings, or to view the most recent semi-annual report or annual report, please visit wealth.amg.com. |
| | | | | | | | | |
|
|
| | | | | | | | |
BALANCED FUNDS AMG GW&K Global Allocation GW&K Investment Management, LLC EQUITY FUNDS AMG Beutel Goodman International
Equity Beutel, Goodman & Company Ltd. AMG Boston Common Global Impact Boston Common Asset Management, LLC AMG Frontier Small Cap Growth Frontier Capital Management Co., LLC AMG GW&K Small Cap Core AMG GW&K Small Cap Value AMG GW&K Small/Mid Cap Core AMG GW&K Small/Mid Cap Growth AMG GW&K Emerging Markets
Equity AMG GW&K Emerging Wealth Equity AMG GW&K International Small Cap GW&K Investment Management, LLC AMG Montrusco Bolton Large Cap
Growth Montrusco Bolton Investments, Inc. AMG Renaissance Large Cap
Growth The Renaissance Group LLC | | | | AMG River Road Dividend All Cap
Value AMG River Road Focused
Absolute Value AMG River Road International
Value Equity AMG River Road Large Cap Value
Select AMG River Road Mid Cap Value AMG River Road Small-Mid Cap
Value AMG River Road Small Cap Value River Road Asset Management, LLC AMG TimesSquare Emerging
Markets Small Cap AMG TimesSquare Global Small
Cap AMG TimesSquare International
Small Cap AMG TimesSquare Mid Cap
Growth AMG TimesSquare Small Cap
Growth TimesSquare Capital Management, LLC AMG Veritas Asia Pacific AMG Veritas China AMG Veritas Global Focus AMG Veritas Global Real Return Veritas Asset Management LLP AMG Yacktman AMG Yacktman Focused AMG Yacktman Global AMG Yacktman Special
Opportunities Yacktman Asset Management LP | | | | FIXED INCOME FUNDS AMG Beutel Goodman Core Plus
Bond Beutel, Goodman & Company Ltd. AMG GW&K Core Bond ESG AMG GW&K Enhanced Core
Bond ESG AMG GW&K ESG Bond AMG GW&K High Income AMG GW&K Municipal Bond AMG GW&K Municipal Enhanced
Yield GW&K Investment Management, LLC |
| | | | | | | | | |
| | | | | | | | | |
| | | | | | | | | |
| | | | | | | | | |
| | | | | | | | | |
| | | | | | | | | |
| | | | | | | | | |
| | | | | | | | | |
| | | | | | | | | |
| | | | | | | | | |
| | | | |
| | | |
| wealth.amg.com | | | | 103123 AR087 |
| | |
| | ANNUAL REPORT |
| | | |
| | | |
| | |
| | | AMG Funds October 31, 2023 |
| | |
| | |  |
| | |
| | | AMG Beutel Goodman Core Plus Bond Fund |
| | | Class N: ADBLX | Class I: ADLIX | Class Z: ADZIX |
| | |
| | | AMG Beutel Goodman International Equity Fund |
| | | Class N: APINX | Class I: APCTX | Class Z: APCZX |
| | |
| | | |
| | | |
| | | | |
wealth.amg.com | | | | 103123 AR086 |
| | |
| | | AMG Funds Annual Report — October 31, 2023 |
| | | | | | |
| | | |
| | | | | | | |
| | | TABLE OF CONTENTS | | PAGE | |
| | | | |
| | | LETTER TO SHAREHOLDERS | | | 2 | |
| | | |
| | | ABOUT YOUR FUND’S EXPENSES | | | 3 | |
| | | |
| | | PORTFOLIO MANAGER’S COMMENTS, FUND SNAPSHOTS AND SCHEDULES OF PORTFOLIO INVESTMENTS | | | | |
| | | |
| | | AMG Beutel Goodman Core Plus Bond Fund | | | 4 | |
| | | |
| | | AMG Beutel Goodman International Equity Fund | | | 14 | |
| | | |
| | | FINANCIAL STATEMENTS | | | | |
| | | |
| | | Statement of Assets and Liabilities | | | 20 | |
| | | |
| | | Balance sheets, net asset value (NAV) per share computations
and cumulative distributable earnings (loss) | | | | |
| | | |
| | | Statement of Operations | | | 22 | |
| | | |
| | | Detail of sources of income, expenses, and realized and
unrealized gains (losses) during the fiscal year | | | | |
| | | |
| | | Statements of Changes in Net Assets | | | 23 | |
| | | |
| | | Detail of changes in assets for the past two fiscal years | | | | |
| | | |
| | | Financial Highlights | | | 24 | |
| | | |
| | | Historical net asset values per share, distributions, total returns, income
and expense ratios, turnover ratios and net assets | | | | |
| | | |
| | | Notes to Financial Statements | | | 30 | |
| | | |
| | | Accounting and distribution policies, details of agreements and
transactions with Fund management and affiliates, and descriptions of
certain investment risks | | | | |
| | | |
| | | REPORT OF INDEPENDENT REGISTERED PUBLIC ACCOUNTING FIRM | | | 37 | |
| | | |
| | | OTHER INFORMATION | | | 38 | |
| | | |
| | | TRUSTEES AND OFFICERS | | | 39 | |
| | | |
| | | ANNUAL RENEWAL OF INVESTMENT MANAGEMENT AND SUBADVISORY AGREEMENTS | | | 41 | |
| | | | | | | |
|
Nothing contained herein is to be considered an offer, sale or solicitation of an offer to buy shares of any series of the AMG Funds Family of Funds. Such offering is made only by prospectus, which includes details as to offering price and other material information. | |
| | |
| | Letter to Shareholders |
| | | |
| | | |
Dear Shareholder:
We are pleased to provide this annual report for your investment with AMG Funds. Our foremost goal is to provide investment solutions that help our shareholders successfully achieve their long-term investment goals. We appreciate the privilege of providing you with investment tools.
The most recent fiscal year ended October 31, 2023, resulted in mixed returns for risk assets as global equity markets wrestled with tighter monetary policy, increased geopolitical tension, instability in the regional banking sector, and political handwringing over the U.S. debt ceiling. Bonds struggled to move higher as global central banks raised interest rates to cool the economy and bring down inflation. Relative to the prior year, 2023 brought a more favorable environment based on the optimism that easing inflation would allow the U.S. Federal Reserve (the “Fed”) to pause the interest rate hiking cycle and deliver an economic soft landing.
The S&P 500® Index gained 10.14% for the fiscal year, despite experiencing a pullback in the final three months of the period. Large-cap stocks diverged meaningfully from small-cap stocks, particularly driven by a handful of mega-cap technology and consumer discretionary stocks. The Russell 1000® Index gained 9.48% compared to the -8.56% return for the Russell 2000® Index. Only five of eleven sectors posted positive returns, with communications services (+36.06%), information technology (+33.15%), and consumer discretionary (+8.87%) leading the way. The weakest sectors were utilities (-7.72%), real estate (-6.57%), and health care (-4.64%). The strength in information technology drove Growth stocks to strongly outperform Value stocks with the Russell 1000® Growth Index gaining 18.95% compared to a 0.13% return for the Russell 1000® Value Index. Outside the U.S., foreign equity markets outperformed domestic equities, delivering a 12.07% return, as measured by the MSCI All Country World Index (ACWI) ex USA benchmark.
The Bloomberg U.S. Aggregate Bond Index, a broad measure of U.S. bond market performance, managed to generate a modest 0.36% return over the period as the Fed raised interest rates and the 10-year Treasury yield reached its highest point since 2008, resulting in longer-duration bonds underperforming. Investment-grade corporate bonds gained 2.77% for the year, while agency mortgage-backed securities fell -0.82%. High yield bonds were the best performing sector with a 6.23% return as measured by the return of the Bloomberg U.S. Corporate High Yield Bond Index. Municipal bonds outperformed the broader market with a 2.64% gain for the Bloomberg Municipal Bond Index.
AMG Funds provides access to a distinctive array of actively managed return-oriented investment strategies. You can rest assured that under all market conditions our team is focused on delivering excellent investment management services for your benefit. For more information about AMG Funds’ wide range of products and resources, please visit wealth.amg.com. We thank you for your investment and continued trust in AMG Funds.
Respectfully,
Keitha Kinne
President
AMG Funds
| | | | | | | | | | | | | | |
| | | | | Periods ended | |
| Average Annual Total Returns | | October 31, 2023* | |
| | | | |
| Stocks: | | | | 1 Year | | | 3 Years | | | 5 Years | |
| | | | |
Large Cap | | (S&P 500® Index) | | | 10.14 | % | | | 10.36 | % | | | 11.01 | % |
| | | | |
Small Cap | | (Russell 2000® Index) | | | (8.56 | )% | | | 3.95 | % | | | 3.31 | % |
| | | | |
International | | (MSCI ACWI ex USA) | | | 12.07 | % | | | 3.03 | % | | | 3.46 | % |
| | | | |
Bonds: | | | | | | | | | | | | | | |
| | | | |
Investment Grade | | (Bloomberg U.S. Aggregate Bond Index) | | | 0.36 | % | | | (5.57 | )% | | | (0.06 | )% |
| | | | |
High Yield | | (Bloomberg U.S. Corporate High Yield Bond Index) | | | 6.23 | % | | | 1.19 | % | | | 3.05 | % |
| | | | |
Tax-exempt | | (Bloomberg Municipal Bond Index) | | | 2.64 | % | | | (2.48 | )% | | | 1.00 | % |
| | | | |
Treasury Bills | | (ICE BofAML U.S. 6-Month Treasury Bill Index) | | | 4.88 | % | | | 1.83 | % | | | 1.90 | % |
*Source: FactSet. Past performance is no guarantee of future results.
2
| | |
| | | About Your Fund’s Expenses |
| | | |
| | | |
| | | | | | | | |
As a shareholder of a Fund, you may incur two types of costs: (1) transaction costs, which may include sales charges (loads) on purchase payments; redemption fees; and exchange fees; and (2) ongoing costs, including management fees; distribution (12b-1) fees; and other Fund expenses. This example is intended to help you understand your ongoing costs (in dollars) of investing in the Fund and to compare these costs with the ongoing costs of investing in other mutual funds. The example is based on $1,000 invested at the beginning of the period and held for the entire period as indicated below. ACTUAL EXPENSES The first section of the following table provides information about the actual account values and | | | | actual expenses. You may use the information in this section, together with the amount you invested, to estimate the expenses that you paid over the period. Simply divide your account value by $1,000 (for example, an $8,600 account value divided by $1,000 = 8.6), then multiply the result by the number in the first section under the heading entitled “Expenses Paid During the Period” to estimate the expenses you paid on your account during this period. HYPOTHETICAL EXAMPLE FOR COMPARISON PURPOSES The second section of the following table provides information about hypothetical account values and hypothetical expenses based on the Fund’s actual expense ratio and an assumed annual rate of return of 5% before expenses, which is not the Fund’s | | | | actual return. The hypothetical account values and expenses may not be used to estimate the actual ending account balance or expenses you paid for the period. You may use this information to compare the ongoing costs of investing in the Fund and other funds by comparing this 5% hypothetical example with the 5% hypothetical examples that appear in the shareholder reports of other funds. Please note that the expenses shown in the table are meant to highlight your ongoing costs only and do not reflect any transactional costs, such as sales charges (loads), redemption fees, or exchange fees. Therefore, the second section of the table is useful in comparing ongoing costs only, and will not help you determine the relative total costs of owning different funds. |
| | | | | | | | |
| | | | | | | | | | |
Six Months Ended
October 31, 2023 | | Expense
Ratio for
the Period | | Beginning
Account
Value
05/01/23 | | Ending
Account
Value
10/31/23 | | Expenses
Paid
During
the Period* |
AMG Beutel Goodman Core Plus Bond Fund |
|
Based on Actual Fund Return |
| | | | |
Class N | | 0.68% | | $1,000 | | | $929 | | | $3.31 |
| | | | |
Class I | | 0.48% | | $1,000 | | | $930 | | | $2.33 |
| | | | |
Class Z | | 0.43% | | $1,000 | | | $930 | | | $2.09 |
|
Based on Hypothetical 5% Annual Return |
| | | | |
Class N | | 0.68% | | $1,000 | | | $1,022 | | | $3.47 |
| | | | |
Class I | | 0.48% | | $1,000 | | | $1,023 | | | $2.45 |
| | | | |
Class Z | | 0.43% | | $1,000 | | | $1,023 | | | $2.19 |
AMG Beutel Goodman International Equity Fund |
|
Based on Actual Fund Return |
| | | | |
Class N | | 1.16% | | $1,000 | | | $899 | | | $5.55 |
| | | | |
Class I | | 0.86% | | $1,000 | | | $901 | | | $4.12 |
| | | | |
Class Z | | 0.76% | | $1,000 | | | $901 | | | $3.64 |
|
Based on Hypothetical 5% Annual Return |
| | | | |
Class N | | 1.16% | | $1,000 | | | $1,019 | | | $5.90 |
| | | | |
Class I | | 0.86% | | $1,000 | | | $1,021 | | | $4.38 |
| | | | |
Class Z | | 0.76% | | $1,000 | | | $1,021 | | | $3.87 |
| * | Expenses are equal to the Fund’s annualized expense ratio multiplied by the average account value over the period, multiplied by the number of days in the most recent fiscal half-year (184), then divided by 365. |
3
| | |
| | | AMG Beutel Goodman Core Plus Bond Fund Portfolio Manager’s Comments (unaudited) |
| | | |
| | | |
| | | | | | | | |
For the 12 months ended October 31, 2023, AMG Beutel Goodman Core Plus Bond Fund (the “Fund”) Class N shares returned -0.68%, compared with the 0.36% return for the Bloomberg U.S. Aggregate Bond Index (the “Index”). MARKET OVERVIEW The reporting period was characterized by elevated volatility in bond markets amid the global central bank tightening cycle. Inflation is down significantly from the peaks of 2022, and further rate hikes now look relatively unlikely unless prices start to rise again. The year began with renewed optimism that bond markets would bounce back after a difficult year in 2022. For the first few months of 2023, that was the case, as the Index returned 2.09% for the six months ended June 30, 2023. However, the third quarter of 2023 was not kind to fixed income investors as bonds sold off dramatically across the curve. The Index fell into negative territory during the third quarter of 2023 with a return of (3.23)%. The extent of the decline in this period caused the year-to-date returns for the Index to turn negative, and this has increased the likelihood that bond markets could produce a third consecutive negative annual return by the end of 2023. The 2-year/10-year U.S. Treasury curve remains inverted, but in recent months has started to steepen. Since the deep inversion in early July of this | | | | year, rates have continued to rise at the front end of the curve, but also at the back end—to an even greater extent—resulting in a “bear steepener.” This occurs when long-term interest rates increase at a faster rate than short-term rates, which is a relatively rare phenomenon, particularly when an economy is slowing down. Two-year U.S. Treasury yields reached 5.08% at the end of the reporting period, the highest level since 2006, while 10-year Treasury yields increased to 4.93%, the highest point since 2007. PERFORMANCE REVIEW The Fund’s long-duration position detracted from performance over the reporting period as yields rose. Curve positioning was negative over the period, mainly due to the portfolio’s overweight in 10-year bonds, which underperformed during the third quarter bear steepening. The Fund’s overweight to corporate bonds and high yield allocation both contributed positively to performance during the reporting period. OUTLOOK In our view, bond markets have fully embraced the soft-landing scenario, as well as the prospect of higher-for-longer interest rates. There is some validity to this position; however, the extent to which markets have priced in these outcomes may be excessive. We don’t expect these narratives to fade until economic data weakens, which we expect in the fourth quarter of 2023 and to continue through the first half of 2024. It is also possible that there is | | | | continued resilience in the economy as the labor market is tight and fiscal spending remains exceptionally high. Macro forecasting has proven especially difficult in the post-pandemic period, and although a soft landing is certainly a possibility, so too is a longer economic contraction, particularly in more interest rate sensitive economies such as Canada, Europe, and the U.K. Despite the uncertainty, our current base case remains that this hiking cycle is effectively at an end and the economy is slowing down. Rate hikes historically take time to impact the consumer, and this has been a more aggressive tightening cycle than most, which could mean consumer confidence continuing to decline into 2024. The likely economic slowdown should create enough slack to bring the labor market back into balance. However, despite this slowdown, inflation will likely continue to sit at or above central banks’ 2% target. We believe investors should prepare for a new normal of higher rates, similar to levels that were prevalent before the financial crisis of 2008, which should provide fixed income investors with solid income opportunities in the years ahead. The views expressed represent the opinions of Beutel, Goodman & Company Ltd. as of October 31, 2023, and are not intended as a forecast or guarantee of future results, and are subject to change without notice. |
| | | | | | | | |
4
| | |
| | | AMG Beutel Goodman Core Plus Bond Fund Portfolio Manager’s Comments (continued) |
| | | |
| | | |
CUMULATIVE TOTAL RETURN PERFORMANCE
AMG Beutel Goodman Core Plus Bond Fund’s cumulative total return is based on the daily change in net asset value (NAV), and assumes that all dividends and distributions were reinvested. The graph compares a hypothetical $10,000 investment made in the AMG Beutel Goodman Core Plus Bond Fund’s Class N shares on October 31, 2013, to a $10,000 investment made in the Bloomberg U.S. Aggregate Bond Index for the same time period. The graph and table do not reflect the deduction of taxes that a shareholder would pay on a Fund distribution or redemption of shares. The listed returns for the Fund are net of expenses and the returns for the index exclude expenses. Total returns would have been lower had certain expenses not been reduced.
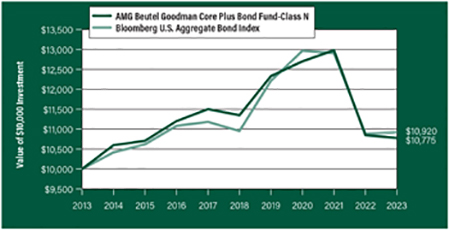
The table below shows the average annual total returns for the AMG Beutel Goodman Core Plus Bond Fund and the Bloomberg U.S. Aggregate Bond Index for the same time periods ended October 31, 2023.
| | | | | | | | | | | | |
| Average Annual Total Returns1 | | One
Year | | Five
Years | | Ten
Years | | | Since
Inception | | Inception
Date |
|
AMG Beutel Goodman Core Plus Bond Fund2, 3, 4, 5, 6, 7, 8, 9, 10, 11, 12, 13, 14, 15, 16, 17, 18, 19, 20, 21, 22, 23, 24, 25, 26, 27, 28 |
| | | | | |
Class N | | (0.68%) | | (1.03%) | | | 0.75% | | | 1.82% | | 07/18/11 |
| | | | | |
Class I | | (0.60%) | | (0.82%) | | | 0.98% | | | 2.06% | | 07/18/11 |
| | | | | |
Class Z | | (0.43%) | | (0.76%) | | | — | | | (0.74%) | | 09/29/17 |
| | | | | |
Bloomberg U.S. Aggregate Bond Index29 | | 0.36% | | (0.06%) | | | 0.88% | | | .1.29% | | 07/18/11†
|
The performance data shown represents past performance. Past performance is not a guarantee of future results. Current performance may be lower or higher than the performance data quoted. The investment return and principal value of an investment will fluctuate so that an investor’s shares, when redeemed, may be worth more or less than their original cost.
Investors should carefully consider the Fund’s investment objectives, risks, charges and expenses before investing. For performance information through the most recent month end, current net asset values per share for the Fund and other information, please call 800.548.4539 or visit our website at wealth.amg.com for a free prospectus. Read it carefully before investing or sending money.
Distributed by AMG Distributors, Inc., member FINRA/SIPC.
| † | Date reflects the inception date of the Fund, not the index. |
| 1 | Total return equals income yield plus share price change and assumes reinvestment of all dividends and capital gain distributions. Returns are net of fees and may reflect offsets of Fund expenses as described in the prospectus. No adjustment has been made for taxes payable by shareholders on their reinvested dividends and |
|
capital gain distributions. Returns for periods greater than one year are annualized. The listed returns on the Fund are net of expenses and based on the published NAV as of October 31, 2023. All returns are in U.S. Dollars ($). 2 As of March 24, 2021, the Fund’s Subadviser was changed to Beutel Goodman & Company Ltd. Prior to March 24, 2021, the Fund was known as the AMG Managers DoubleLine Core Plus Bond Fund and had different principal investment strategies and corresponding risks. Performance shown for periods prior to March 24, 2021, reflects the performance and investment strategies of the Fund’s previous Subadviser, DoubleLine Capital LP. The Fund’s past performance would have been different if the Fund were managed by the current Subadviser and strategy, and the Fund’s prior performance record might be less pertinent for investors considering whether to purchase shares of the Fund. 3 From time to time, the Fund’s adviser has waived its fees and/or absorbed Fund expenses, which has resulted in higher returns. 4 Because the Fund is an actively managed investment portfolio, security selection or focus on securities in a particular style, market sector or group of companies may cause the Fund to incur losses or underperform relative to its benchmarks or other funds with a similar investment objective. There can be no guarantee that the Subadviser’s investment techniques and risk analysis will produce the desired result. 5 The Fund will normally receive income which may include interest, dividends and/or capital gains, depending upon its investments. The distribution amount paid by the Fund will vary and generally depends on the amount of income the Fund earns (less expenses) on its portfolio holdings, and capital gains or losses it recognizes. A decline in the Fund’s income or net capital gains arising from its investments may reduce its distribution level. 6 The value of a debt security changes in response to various factors, including, for example, market-related factors, such as changes in interest rates or changes in the actual or perceived ability of an issuer to meet its obligations. Investments in debt securities are subject to, among other risks, credit risk, interest rate risk, extension risk, prepayment risk and liquidity risk. 7 Fixed coupon payments (cash flows) of bonds and debt securities may become less competitive with the market in periods of rising interest rates and cause bond prices to decline. During periods of increasing interest rates, the Fund may experience high levels of volatility and shareholder redemptions, and may have to sell securities at times when it would otherwise not do so, and at |
5
| | |
| | | AMG Beutel Goodman Core Plus Bond Fund Portfolio Manager’s Comments (continued) |
| | | |
| | | |
| | | | | | | | |
unfavorable prices, which could reduce the returns of the Fund. 8 Market prices of investments held by the Fund may fall rapidly or unpredictably due to a variety of factors, including economic, political, or market conditions, or other factors including terrorism, war, natural disasters and the spread of infectious illness or other public health issues, including epidemics or pandemics, or in response to events that affect particular industries or companies. 9 The Fund may have difficulty reinvesting payments from debtors and may receive lower rates than from its original investments. 10 Call risk is the possibility that an issuer may redeem a fixed income security before maturity (a call). The increased likelihood of a call may reduce the security’s price and may result in the Fund reinvesting at lower interest rates in securities with greater credit risk. 11 The issuer of bonds or other debt securities or a counterparty to a derivatives contract may be unable or unwilling, or may be perceived as unable or unwilling, to make timely interest, principal or settlement payments or otherwise honor its obligations. 12 The Fund may not be able to dispose of particular investments, such as illiquid securities, readily at favorable times or prices or the Fund may have to sell them at a loss. 13 Investing in restricted securities (including, without limitation, Rule 144A securities) may reduce the liquidity of the Fund’s investments in the event that an adequate trading market does not exist for these securities. Limitations on the resale of restricted securities could adversely affect the marketability of the securities, and the Fund may be unable to sell the security at the desired time or price, if at all. The purchase price and subsequent valuation of restricted securities normally reflect a discount, which may be significant, from the market price of comparable unrestricted securities for which a liquid trading market exists. 14 Below investment grade debt securities and unrated securities of similar credit quality (commonly known as “junk bonds” or “high yield securities”) may be subject to greater levels of interest rate, credit, liquidity, and market risk than higher-rated securities. These securities are considered predominately speculative with respect to the issuer’s continuing ability to make principal and interest payments. 15 Investments in asset-backed and mortgage-backed securities involve risk of severe credit downgrades, loss due to prepayments that occur earlier or later than expected, illiquidity and default. 16 Inflation risk is the risk that the value of assets or | | | | income from investments will be worth less in the future. Inflation rates may change frequently and drastically as a result of various factors and the Fund’s investments may not keep pace with inflation, which may result in losses to Fund investors or adversely affect the real value of shareholders’ investments in the Fund. Recently, inflation levels have been at their highest point in nearly 40 years, and the U.S. Federal Reserve has begun an aggressive campaign to raise certain benchmark interest rates in an effort to combat inflation. As such, fixed income securities markets may experience heightened levels of interest rate volatility and liquidity risk. Deflation risk is the risk that the prices throughout the economy decline over time – the opposite of inflation. Deflation may have an adverse effect on the creditworthiness of issuers and may make issuer default more likely, which may result in a decline in the value of the Fund’s portfolio. 17 A debtor may exercise its right to pay back a bond or other debt security earlier than expected or required during periods of decreasing interest rates. 18 During periods of rising interest rates, a debtor may pay back a bond or other fixed income security slower than expected or required, and the value of such security may fall. 19 When a quantitative model (“Model”) or information or data (“Data”) used in managing the Fund contains an error, or is incorrect or incomplete, any investment decision made in reliance on the Model or Data may not produce the desired results and the Fund may realize losses. In addition, any hedging based on a faulty Model or Data may prove to be unsuccessful. Furthermore, the success of a Model that is predictive in nature is dependent largely on the accuracy and reliability of the supplied historical data. All Models are susceptible to input errors or errors in design, which may cause the resulting output to be faulty. 20 The Subadviser incorporates ESG criteria into its investment process, which may result in the selection or exclusion of securities of certain issuers for reasons other than financial performance, and carries the risk that the Fund’s investment returns may underperform funds that do not incorporate ESG factors into their investment process. The incorporation of ESG criteria into the investment process may affect the Fund’s investment exposure to certain companies, sectors, regions, countries or types of investments, which could negatively impact the Fund’s performance depending on whether such investments are in or out of favor. Applying ESG criteria to investment decisions is qualitative and subjective by nature, and there is no guarantee that the criteria utilized by the Subadviser or any judgment exercised by the Subadviser will improve the financial | | | | performance of the Fund or reflect the beliefs or values of any particular investor. ESG standards differ by region and industry, and a company’s ESG practices or the Subadviser’s assessment of a company’s ESG practices may change over time. 21 Investments in foreign issuers involve additional risks (such as risks arising from less frequent trading, changes in political or social conditions, and less publicly available information about non-U.S. issuers) that differ from those associated with investments in U.S. issuers and may result in greater price volatility. 22 Investments in emerging markets are subject to the general risks of foreign investments, as well as additional risks which can result in greater price volatility. Such additional risks include the risk that markets in emerging market countries are typically less developed and less liquid than markets in developed countries and such markets are subjected to increased economic, political, or regulatory uncertainties. 23 Fluctuations in exchange rates may affect the total loss or gain on a non-U.S. dollar investment when converted back to U.S. dollars and exposure to non-U.S. currencies may subject the Fund to the risk that those currencies will decline in value relative to the U.S. dollar. 24 The withdrawal of U.S. and other government support to stabilize and support financial markets, including an increase in interest rates in the U.S. or elsewhere, or investor perceptions that this support may be withdrawn, could cause an increase in volatility in certain financial markets or constrict the availability of credit and liquidity, which could adversely affect the value and liquidity of certain securities. 25 The use of derivatives involves costs, the risk that the value of derivatives may not correlate perfectly with their underlying assets, rates or indices, liquidity risk, and the risk of mispricing or improper valuation. The use of derivatives may not succeed for various reasons, and the complexity and rapidly changing structure of derivatives markets may increase the possibility of market losses. 26 There is no guarantee that hedging strategies will be successful. For example, changes in the value of a hedging transaction may not completely offset changes in the value of the assets and liabilities being hedged. Hedging transactions involve costs and may result in losses. 27 Obligations issued by some U.S. Government agencies, authorities, instrumentalities, or sponsored enterprises such as Government National Mortgage Association (“GNMA”) are backed by the full faith and credit of the U.S. Government, while obligations issued by others, such as Federal National Mortgage Association (“FNMA”), Federal Home Loan Mortgage Corporation (“FHLMC”), and |
6
| | |
| | | AMG Beutel Goodman Core Plus Bond Fund Portfolio Manager’s Comments (continued) |
| | | |
| | | |
| | | | | | | | |
Federal Home Loan Banks (“FHLBs”), are not backed by the full faith and credit of the U.S. Government and are backed solely by the entity’s own resources or by the ability of the entity to borrow from the U.S. Treasury. If one of these agencies defaults on a loan, there is no guarantee that the U.S. Government will provide financial support. 28 Factors unique to the municipal bond market may negatively affect the value of municipal bonds. 29 The Bloomberg U.S. Aggregate Bond Index is an | | | | index of the U.S. investment-grade fixed-rate bond market, including both government and corporate bonds. Unlike the Fund, the Bloomberg U.S. Aggregate Bond Index is unmanaged, is not available for investment and does not incur expenses. “Bloomberg®” and any Bloomberg index described herein are service marks of Bloomberg Finance L.P. and its affiliates, including Bloomberg Index Services Limited (“BISL”), the administrator of the index (collectively, “Bloomberg”) and have been licensed | | | | for use for certain purposes by AMG Funds LLC. Bloomberg is not affiliated with AMG Funds LLC, and Bloomberg does not approve, endorse, review, or recommend the fund described herein. Bloomberg does not guarantee the timeliness, accurateness, or completeness of any data or information relating to such fund. Not FDIC insured, nor bank guaranteed. May lose value. |
7
| | |
| | | AMG Beutel Goodman Core Plus Bond Fund Fund Snapshots (unaudited) October 31, 2023 |
| | | |
| | | |
PORTFOLIO BREAKDOWN
| | | | | |
| Category | | % of
Net Assets |
| | |
U.S. Government and Agency Obligations | | | | 56.2 | |
| | |
Corporate Bonds and Notes | | | | 35.5 | |
| | |
Mortgage-Backed Securities | | | | 4.2 | |
| | |
Floating Rate Senior Loan Interests | | | | 1.9 | |
| | |
Municipal Bonds | | | | 0.3 | |
| | |
Common Stocks | | | | 0.0 | 1 |
| | |
Short-Term Investments | | | | 2.6 | |
| | |
Other Assets, less Liabilities2 | | | | (0.7 | ) |
| 2 | Includes appreciation on forwards. |
| | | | | |
| Rating | | % of Market Value1 |
| | |
U.S. Government and Agency Obligations | | | | 57.9 | |
| | |
Aaa/AAA | | | | 0.4 | |
| | |
Aa/AA | | | | 5.5 | |
| | |
A | | | | 14.1 | |
| | |
Baa/BBB | | | | 18.7 | |
| | |
Ba/BB | | | | 3.2 | |
| | |
B | | | | 0.2 | |
1 Includes market value of long-term fixed-income securities only. | |
TOP TEN HOLDINGS
| | | | | |
| Security Name | | % of
Net Assets |
| | |
U.S. Treasury Notes, 3.500%, 02/15/33 | | | | 18.5 | |
| | |
U.S. Treasury Notes, 3.875%, 08/15/33 | | | | 7.9 | |
| | |
U.S. Treasury Notes, 2.750%, 05/31/29 | | | | 6.6 | |
| | |
FNMA, 2.140%, 10/01/29 | | | | 3.2 | |
| | |
U.S. Treasury Bonds, 3.000%, 08/15/52 | | | | 3.0 | |
| | |
FHLMC REMICS, Series 4934, Class P, 2.500%, 11/15/40 | | | | 2.6 | |
| | |
Bank of America Corp., 4.376%, 04/27/28 | | | | 2.3 | |
| | |
U.S. Treasury Bonds, 1.875%, 02/15/41 | | | | 2.2 | |
| | |
FNMA, 2.260%, 01/01/30 | | | | 2.2 | |
| | |
Mileage Plus Holdings LLC, Initial Term Loan, 10.800%, 06/21/27 | | | | 1.9 | |
| | | | | | |
| | |
Top Ten as a Group | | | | 50.4 | |
| | | | | |
Credit quality ratings shown above reflect the highest rating assigned by either Standard & Poor’s (“S&P”) or Moody’s Investors Service, Inc. (“Moody’s”). These rating agencies are independent, nationally recognized statistical rating organizations and are widely used. Investment grade ratings are credit ratings of BBB- or higher. Below investment grade ratings are credit ratings of BB+ or lower. Investments designated N/R are not rated by any of the rating agencies. Unrated investments do not necessarily indicate low credit quality. Credit quality ratings are subject to change.
Because a fund’s strategy may result in multiple investments in particular sectors of the economy, its performance may depend on the performance of those sectors and may fluctuate more widely than investments diversified across more sectors. For additional information on these and other risk considerations, please see the Fund’s prospectus.
Any sectors, industries, or securities discussed should not be perceived as investment recommendations. Mention of a specific security should not be considered a recommendation to buy or solicitation to sell that security. Specific securities mentioned in this report may have been sold from the Fund’s portfolio of investments by the time you receive this report.
8
| | |
| | | AMG Beutel Goodman Core Plus Bond Fund Schedule of Portfolio Investments October 31, 2023 |
| | | |
| | | |
| | | | | | | | |
| | |
| | | Principal
Amount | | | Value | |
| |
Corporate Bonds and Notes - 35.5% | | | | | |
| |
Financials - 11.1% | | | | | |
| | |
Air Lease Corp. 5.850%, 12/15/27 | | $ | 1,000,000 | | | $ | 977,148 | |
| | |
Avolon Holdings Funding, Ltd. (Cayman Islands) 3.250%, 02/15/271 | | | 1,000,000 | | | | 880,474 | |
| | |
Bank of America Corp. (4.376% to 04/27/27 then SOFR + 1.580%), 4.376%, 04/27/282,3 | | | 3,000,000 | | | | 2,800,451 | |
(5.872% to 09/15/33 then SOFR + 1.840%), 5.872%, 09/15/342,3 | | | 1,000,000 | | | | 941,673 | |
| | |
Bank of Montreal (Canada)
(3.803% to 12/15/27 then USD Swap 5 year + 1.432%), 3.803%, 12/15/322,3 | | | 1,785,000 | | | | 1,546,979 | |
| | |
HSBC Holdings PLC (United Kingdom)
(2.206% to 08/17/28 then SOFR + 1.285%), 2.206%, 08/17/292,3 | | | 500,000 | | | | 406,810 | |
| | |
Intact Financial Corp. (Canada)
5.459%, 09/22/321 | | | 2,000,000 | | | | 1,852,227 | |
| | |
Morgan Stanley
(6.296% to 10/18/27 then SOFR + 2.240%), 6.296%, 10/18/282,3 | | | 2,000,000 | | | | 1,996,404 | |
| | |
The Toronto-Dominion Bank (Canada)
(8.125% to 10/31/27 then U.S. Treasury Yield Curve CMT 5 year + 4.075%), 8.125%, 10/31/822,3 | | | 2,325,000 | | | | 2,280,969 | |
| | |
Total Financials | | | | | | | 13,683,135 | |
| |
Industrials - 19.9% | | | | | |
| | |
Albertsons Cos. Inc./Safeway, Inc./New Albertsons LP/Albertsons LLC 6.500%, 02/15/281 | | | 1,000,000 | | | | 981,793 | |
| | |
American Airlines Inc/AAdvantage Loyalty IP, Ltd. 5.500%, 04/20/261 | | | 2,083,333 | | | | 2,025,934 | |
| | |
Burlington Northern Santa Fe LLC
4.450%, 01/15/53 | | | 500,000 | | | | 387,075 | |
| | |
Canadian National Railway Co. (Canada)
6.125%, 11/01/53 | | | 500,000 | | | | 499,234 | |
| | |
Canadian Pacific Railway Co. (Canada)
7.125%, 10/15/31 | | | 600,000 | | | | 634,139 | |
| | |
Coca-Cola Femsa SAB de CV (Mexico)
2.750%, 01/22/30 | | | 1,000,000 | | | | 841,185 | |
| | |
Columbia Pipelines Operating Co. LLC
6.036%, 11/15/331 | | | 1,989,000 | | | | 1,888,845 | |
6.544%, 11/15/531 | | | 1,000,000 | | | | 918,528 | |
| | |
Delta Air Lines, Inc. 7.000%, 05/01/251 | | | 500,000 | | | | 502,133 | |
| | |
Delta Air Lines, Inc./SkyMiles IP, Ltd. 4.750%, 10/20/281 | | | 1,000,000 | | | | 939,982 | |
| | |
Element Fleet Management Corp. (Canada)
6.271%, 06/26/261 | | | 1,000,000 | | | | 994,437 | |
| | | | | | | | |
| | |
| | | Principal
Amount | | | Value | |
| | |
Enbridge, Inc. (Canada)
Series NC5
(8.250% to 01/15/29 then U.S. Treasury Yield Curve CMT 5 year + 3.785%), 8.250%, 01/15/842,3 | | $ | 2,000,000 | | | $ | 1,917,154 | |
| | |
Ford Credit Canada Co. (Canada) 7.000%, 02/10/264 | | | 2,000,000 | | | | 1,450,326 | |
| | |
Hyundai Capital America 6.250%, 11/03/251 | | | 1,000,000 | | | | 999,854 | |
| | |
JBS USA LUX, S.A./JBS USA Food Co./JBS Luxembourg S.A.R.L 6.750%, 03/15/341 | | | 500,000 | | | | 468,540 | |
| | |
Mileage Plus Holdings LLC/Mileage Plus Intellectual Property Assets, Ltd.
6.500%, 06/20/271 | | | 1,593,750 | | | | 1,574,430 | |
| | |
OAS Finance, Ltd. (Virgin Islands, British)
8.875%, 11/30/233,5,6,7 | | | 600,000 | | | | 0 | |
8.875%, 12/01/231,3,5,6,7 | | | 400,000 | | | | 0 | |
| | |
Organon & Co/Organon Foreign Debt Co. Issuer, B.V. 4.125%, 04/30/281 | | | 1,000,000 | | | | 863,760 | |
| | |
Penske Truck Leasing Co. LP/PTL Finance Corp.
6.200%, 06/15/301 | | | 1,000,000 | | | | 975,641 | |
| | |
Pilgrim’s Pride Corp.
6.250%, 07/01/33 | | | 500,000 | | | | 459,498 | |
| | |
Smithfield Foods, Inc. 4.250%, 02/01/271 | | | 1,500,000 | | | | 1,377,117 | |
| | |
Suncor Energy, Inc. (Canada)
7.150%, 02/01/32 | | | 400,000 | | | | 412,727 | |
| | |
T-Mobile USA, Inc.
5.750%, 01/15/34 | | | 980,000 | | | | 929,770 | |
| | |
TTX Co.
5.500%, 09/25/261 | | | 2,000,000 | | | | 1,983,144 | |
| | |
Vodafone Group PLC (United Kingdom)
7.875%, 02/15/30 | | | 450,000 | | | | 483,520 | |
| | |
Total Industrials | | | | | | | 24,508,766 | |
| |
Utilities - 4.5% | | | | | |
| | |
Consolidated Edison Co. of New York, Inc.
6.150%, 11/15/52 | | | 1,000,000 | | | | 951,029 | |
| | |
Duke Energy Progress LLC
5.350%, 03/15/53 | | | 1,000,000 | | | | 851,392 | |
| | |
The East Ohio Gas Co.
3.000%, 06/15/501 | | | 1,700,000 | | | | 923,609 | |
| | |
Florida Power & Light Co.
2.875%, 12/04/51 | | | 1,500,000 | | | | 850,571 | |
| | |
Tampa Electric Co. 3.625%, 06/15/50 | | | 1,475,000 | | | | 938,038 | |
The accompanying notes are an integral part of these financial statements.
9
|
AMG Beutel Goodman Core Plus Bond Fund Schedule of Portfolio Investments (continued) |
| | | | | | | | |
| | |
| | | Principal Amount | | | Value | |
| | |
Utilities - 4.5% (continued) | | | | | | | | |
| | |
Tucson Electric Power Co.
4.000%, 06/15/50 | | | $1,425,000 | | | | $950,945 | |
| | |
Total Utilities | | | | | | | 5,465,584 | |
| | |
Total Corporate Bonds and Notes | | | | | | | | |
(Cost $49,345,542) | | | | | | | 43,657,485 | |
| | |
Mortgage-Backed Securities - 4.2% | | | | | | | | |
| | |
Citigroup Commercial Mortgage Trust | | | | | | | | |
Series 2016-GC36, Class B
4.746%, 02/10/493 | | | 763,000 | | | | 624,595 | |
Series 2019-GC43, Class A2
2.982%, 11/10/52 | | | 514,000 | | | | 488,440 | |
| | |
Commercial Mortgage Pass Through Certificates | | | | | | | | |
Series 2015-LC23, Class C
4.546%, 10/10/483 | | | 585,000 | | | | 521,250 | |
Series 2016-CR28, Class C
4.605%, 02/10/493 | | | 726,000 | | | | 623,479 | |
| | |
CSAIL Commercial Mortgage Trust | | | | | | | | |
Series 2017-CX10, Class B 3.892%, 11/15/503 | | | 506,000 | | | | 412,126 | |
| | |
GSCG Trust | | | | | | | | |
Series 2019-600C, Class D 3.764%, 09/06/341 | | | 862,000 | | | | 258,600 | |
| | |
JPMBB Commercial Mortgage Securities Trust | | | | | | | | |
Series 2014-C23, Class C
4.483%, 09/15/473 | | | 330,824 | | | | 302,175 | |
Series 2014-C25, Class C
4.433%, 11/15/473 | | | 450,000 | | | | 371,814 | |
Series 2015-C33, Class C
4.636%, 12/15/483 | | | 670,000 | | | | 543,784 | |
| | |
JPMDB Commercial Mortgage Securities Trust Series 2020-COR7, Class C
3.722%, 05/13/533 | | | 496,000 | | | | 269,098 | |
| | |
Wells Fargo Commercial Mortgage Trust | | | | | | | | |
Series 2016-C33, Class C
3.896%, 03/15/59 | | | 517,000 | | | | 425,414 | |
Series 2019-C49, Class C
4.866%, 03/15/523 | | | 350,000 | | | | 289,567 | |
| | |
Total Mortgage-Backed Securities | | | | | | | | |
(Cost $6,741,821) | | | | | | | 5,130,342 | |
| | |
Municipal Bonds - 0.3% | | | | | | | | |
California State General Obligation, School Improvements, Build America Bonds 7.550%, 04/01/39 | | | 330,000 | | | | 376,560 | |
| | |
Total Municipal Bonds | | | | | | | | |
(Cost $465,226) | | | | | | | 376,560 | |
| | |
| U.S. Government and Agency Obligations - 56.2% | | | | | | | | |
| | |
Fannie Mae - 11.5% | | | | | | | | |
| | |
FNMA,
2.140%, 10/01/29 | | | 7,000,000 | | | | 5,852,493 | |
2.260%, 01/01/30 | | | 3,200,000 | | | | 2,646,317 | |
3.000%, 03/01/45 | | | 608,330 | | | | 506,054 | |
| | | | | | | | |
| | | | | | | | |
| | |
| | | Principal Amount | | | Value | |
| | |
FNMA,
3.500%, 12/01/31 to 01/01/32 | | | $201,878 | | | | $187,844 | |
4.000%, 09/01/31 to 06/01/42 | | | 61,238 | | | | 56,242 | |
| | |
FNMA REMICS, | | | | | | | | |
Series 2010-156, Class ZC
4.000%, 01/25/41 | | | 440,593 | | | | 319,395 | |
Series 2011-121, Class JP
4.500%, 12/25/41 | | | 48,057 | | | | 44,541 | |
Series 2012-127, Class PA
2.750%, 11/25/42 | | | 555,149 | | | | 484,814 | |
Series 2012-20, Class ZT
3.500%, 03/25/42 | | | 2,313,213 | | | | 2,010,588 | |
Series 2012-31, Class Z
4.000%, 04/25/42 | | | 735,351 | | | | 664,205 | |
Series 2015-9, Class HA
3.000%, 01/25/45 | | | 1,470,278 | | | | 1,321,039 | |
| | |
Total Fannie Mae | | | | | | | 14,093,532 | |
| | |
Freddie Mac - 4.8% | | | | | | | | |
| | |
FHLMC,
3.000%, 04/01/47 | | | 827,682 | | | | 687,500 | |
| | |
FHLMC Gold,
3.000%, 07/01/45 to 08/01/45 | | | 1,754,607 | | | | 1,461,828 | |
3.500%, 10/01/42 | | | 207,765 | | | | 175,492 | |
4.000%, 10/01/41 | | | 17,379 | | | | 14,951 | |
5.000%, 07/01/35 | | | 6,723 | | �� | | 6,543 | |
| | |
FHLMC REMICS, | | | | | | | | |
Series 2909, Class Z 5.000%, 12/15/34 | | | 72,590 | | | | 70,120 | |
Series 3626, Class AZ 5.500%, 08/15/36 | | | 45,066 | | | | 43,755 | |
Series 3792, Class SE
(9.631% minus 2 times 1 month SOFR, Cap 9.860%, Floor 0.000%), 0.000%, 01/15/413 | | | 18,651 | | | | 9,308 | |
Series 3872, Class BA 4.000%, 06/15/41 | | | 11,592 | | | | 10,689 | |
Series 3894, Class ZA 4.500%, 07/15/41 | | | 22,986 | | | | 21,330 | |
Series 3957, Class HZ 4.000%, 11/15/41 | | | 319,769 | | | | 288,467 | |
Series 4934, Class P 2.500%, 11/15/40 | | | 3,790,621 | | | | 3,189,545 | |
| | |
Total Freddie Mac | | | | | | | 5,979,528 | |
| | |
Ginnie Mae - 0.2% | | | | | | | | |
| | |
GNMA, | | | | | | | | |
Series 2004-35, Class SA
(31.756% minus 6.5 times 1 month SOFR, Cap 32.500%, Floor 0.000%), 0.000%, 03/20/343 | | | 7,446 | | | | 6,979 | |
Series 2009-32, Class ZE
4.500%, 05/16/39 | | | 83,199 | | | | 79,323 | |
Series 2009-35, Class DZ
4.500%, 05/20/39 | | | 91,837 | | | | 86,355 | |
Series 2009-75, Class GZ
4.500%, 09/20/39 | | | 89,856 | | | | 85,626 | |
| | |
Total Ginnie Mae | | | | | | | 258,283 | |
| | |
| | | | | | | | |
The accompanying notes are an integral part of these financial statements.
10
|
AMG Beutel Goodman Core Plus Bond Fund Schedule of Portfolio Investments (continued) |
| | | | | | | | |
| | |
| | | Principal Amount | | | Value | |
| |
U.S. Treasury Obligations - 39.7% | | | | | |
| | |
U.S. Treasury Notes,
1.875%, 02/15/32 | | | $400 | | | | $318 | |
2.750%, 05/31/29 | | | 9,035,000 | | | | 8,089,502 | |
3.500%, 02/15/33 | | | 25,460,000 | | | | 22,790,678 | |
3.875%, 08/15/33 | | | 10,535,000 | | | | 9,697,138 | |
4.375%, 08/31/28 | | | 273,000 | | | | 267,796 | |
| | |
U.S. Treasury Bonds,
1.875%, 02/15/41 | | | 4,465,000 | | | | 2,752,080 | |
3.000%, 08/15/52 | | | 5,404,000 | | | | 3,706,806 | |
3.625%, 05/15/53 | | | 1,450,000 | | | | 1,130,320 | |
4.125%, 08/15/53 | | | 455,000 | | | | 389,238 | |
| |
Total U.S. Treasury Obligations | | | | 48,823,876 | |
| |
Total U.S. Government and Agency Obligations | | | | | |
(Cost $76,618,410) | | | | | | | 69,155,219 | |
| |
Floating Rate Senior Loan Interests - 1.9% | | | | | |
| | |
Industrials - 1.9% | | | | | | | | |
| | |
Mileage Plus Holdings LLC, Initial Term Loan, (3 month SOFR + 5.400%), 10.800%, 06/21/273 | | | 2,250,000 | | | | 2,314,688 | |
| |
Total Floating Rate Senior Loan Interests | | | | | |
(Cost $2,351,425) | | | | | | | 2,314,688 | |
| | |
| | | Shares | | | | |
| |
Common Stocks - 0.0%# | | | | | |
| | |
Energy - 0.0%# | | | | | | | | |
| | |
Foresight Energy, LLC*,6
(Cost $165,688) | | | 202 | | | | 2,939 | |
| | | | | | | | |
| | | | | | | | |
| | |
| | | Principal Amount | | | Value | |
| | |
Short-Term Investments - 2.6% | | | | | | | | |
| | |
Commercial Paper - 2.6% | | | | | | | | |
| | |
Energir LP, 5.550%, 11/06/238 | | | $60,000 | | | | $59,954 | |
| | |
PSP Capital, 5.382%, 12/15/238 | | | 135,000 | | | | 134,116 | |
| | |
PSP Capital, 5.451%, 01/16/248 | | | 250,000 | | | | 247,118 | |
| | |
PSP Capital, 5.469%, 01/19/248 | | | 120,000 | | | | 118,563 | |
| | |
Royal Bank, 5.511%, 01/25/248 | | | 2,635,000 | | | | 2,599,190 | |
| | |
Total Commercial Paper | | | | | | | 3,158,941 | |
| | |
Total Short-Term Investments | | | | | | | | |
(Cost $3,160,997) | | | | | | | 3,158,941 | |
| | |
Total Investments - 100.7% | | | | | | | | |
(Cost $138,849,109) | | | | | | | 123,796,174 | |
| | |
Derivatives - 0.0%#,9 | | | | | | | 36,483 | |
| | |
Other Assets, less Liabilities - (0.7)% | | | | | | | (938,796 | ) |
| | |
Net Assets - 100.0% | | | | | | | $122,893,861 | |
| | | | | | | | |
| * | Non-income producing security. |
| 1 | Security exempt from registration under Rule 144A of the Securities Act of 1933. These securities may be resold in transactions exempt from registration, normally to qualified institutional buyers. At October 31, 2023, the value of these securities amounted to $20,409,048 or 16.6% of net assets. |
| 2 | Fixed to variable rate investment. The rate shown reflects the fixed rate in effect at October 31, 2023. Rate will reset at a future date. |
| 3 | Variable rate security. The rate shown is based on the latest available information as of October 31, 2023. Certain variable rate securities are not based on a published reference rate and spread but are determined by the issuer or agent and are based on current market conditions. These securities do not indicate a reference rate and spread in their description above. |
| 4 | Principal amount stated in Canadian Dollars (CAD). |
| 5 | Security is in default. Issuer has failed to make a timely payment of either principal or either interest or has failed to comply with some provision of the bond indenture. |
| 6 | Security’s value was determined by using significant unobservable inputs. |
| 7 | Perpetuity Bond. The date shown represents the next call date. |
| 8 | Represents yield to maturity at October 31, 2023. |
| 9 | Includes Open Forward Foreign Currency Exchange Contracts. Please refer to the Open Forward Foreign Currency Exchange Contracts table for the details. |
| | |
| CMT | | Constant Maturity Treasury |
| FHLMC | | Freddie Mac |
| FNMA | | Fannie Mae |
| GNMA | | Ginnie Mae |
| REMICS | | Real Estate Mortgage Investment Conduit |
| SOFR | | Secured Overnight Financing Rate |
| USD | | United States Dollar |
| | | | | | | | | | | | | | |
Open Forward Foreign Currency Exchange Contracts | | | | |
| Currency | | | | | | | | | | | | Unrealized | |
| Purchased | | Amount | | Currency
Sold | | Amount | | Expiration | | Counterparty | | Appreciation | |
| | | | | | |
U.S. Dollar | | 1,413,857 | | Canadian Dollar | | 1,908,000 | | 12/28/23 | | CIBC World Markets Corp. | | | $36,483 | |
The accompanying notes are an integral part of these financial statements.
11
|
AMG Beutel Goodman Core Plus Bond Fund Schedule of Portfolio Investments (continued) |
The following table summarizes the inputs used to value the Fund’s investments by the fair value hierarchy levels as of October 31, 2023:
| | | | | | | | | | | | | | | | |
| | | Level 1 | | | Level 2 | | | Level 3 | | | Total | |
Investments in Securities | | | | | | | | | | | | | | | | |
| | | | |
Corporate Bonds and Notes | | | | | | | | | | | | | | | | |
| | | | |
Industrials | | | — | | | | $24,508,766 | | | | $0 | | | | $24,508,766 | |
| | | | |
Financials | | | — | | | | 13,683,135 | | | | — | | | | 13,683,135 | |
| | | | |
Utilities | | | — | | | | 5,465,584 | | | | — | | | | 5,465,584 | |
| | | | |
Mortgage-Backed Securities | | | — | | | | 5,130,342 | | | | — | | | | 5,130,342 | |
| | | | |
Municipal Bonds† | | | — | | | | 376,560 | | | | — | | | | 376,560 | |
| | | | |
U.S. Government and Agency Obligations† | | | — | | | | 69,155,219 | | | | — | | | | 69,155,219 | |
| | | | |
Floating Rate Senior Loan Interests† | | | — | | | | 2,314,688 | | | | — | | | | 2,314,688 | |
| | | | |
Common Stocks | | | | | | | | | | | | | | | | |
| | | | |
Energy | | | — | | | | — | | | | 2,939 | | | | 2,939 | |
| | | | |
Short-Term Investments | | | | | | | | | | | | | | | | |
| | | | |
Commercial Paper | | | — | | | | 3,158,941 | | | | — | | | | 3,158,941 | |
| | | | | | | | | | | | | | | | |
| | | | |
Total Investments in Securities | | | — | | | | $123,793,235 | | | | $2,939 | | | | $123,796,174 | |
| | | | | | | | | | | | | | | | |
| | | | |
Financial Derivative Instruments - Assets | | | | | | | | | | | | | | | | |
| | | | |
Foreign Currency Exchange Contracts | | | — | | | | $36,483 | | | | — | | | | $36,483 | |
| | | | | | | | | | | | | | | | |
| | | | |
Total Financial Derivative Instruments | | | — | | | | $36,483 | | | | — | | | | $36,483 | |
| | | | | | | | | | | | | | | | |
| † | All municipal bonds, U.S. government and agency obligations, and floating rate senior loan interests held in the Fund are Level 2 securities. For a detailed breakout of municipal bonds, U.S. government and agency obligations, and floating rate senior loan interests by major industry or agency classification, please refer to the Fund’s Schedule of Portfolio Investments. |
The following table below is a reconciliation of investments in which significant unobservable inputs (Level 3) were used in determining fair value at October 31, 2023:
| | | | | | | | |
| | | Corporate
Bonds
and Notes | | | Common
Stock | |
| | |
Balance as of October 31, 2022 | | | $0 | | | | $7,211 | |
| | |
Accrued discounts (premiums) | | | — | | | | — | |
| | |
Realized gain (loss) | | | — | | | | 8,341 | |
| | |
Change in unrealized appreciation/depreciation | | | (2,500 | ) | | | (4,272 | ) |
| | |
Purchases | | | — | | | | — | |
| | |
Sales | | | — | | | | (8,341 | )** |
| | |
Transfers in to Level 3 | | | 2,500 | * | | | — | |
| | |
Transfers out of Level 3 | | | — | | | | — | |
| | |
Balance as of October 31, 2023 | | | $0 | | | | $2,939 | |
| | |
| | | | | | | | |
| | |
Net change in unrealized appreciation/depreciation on investments still held at October 31, 2023 | | | $(2,500 | ) | | | $(688 | ) |
*A corporate bond valued at $2,500 was transferred from Level 2 to Level 3 during the fiscal year ended October 31, 2023. For the period November 1, 2022 to July 30, 2023 this security was valued using a bid price. On July 31, 2023, the security value was updated to $0 because the company that issued the bonds had declared bankruptcy and the value of the security is believed to be worthless.
**A common stock valued at $3,584 was acquired by Diversified Energy Co. and the Funds received proceeds of $8,341. Prior to the corporate action being processed, the common stock was valued using significant unobservable inputs.
The accompanying notes are an integral part of these financial statements.
12
|
AMG Beutel Goodman Core Plus Bond Fund Schedule of Portfolio Investments (continued) |
The following table summarizes the quantitative inputs and assumptions used for investments categorized in Level 3 of the fair value hierarchy as of October 31, 2023. The table below is not intended to be all-inclusive, but rather provides information on the significant Level 3 inputs as they relate to the Fund’s fair value measurements:
| | | | | | | | | | | | | | |
| Quantitative Information about Level 3 Fair Value Measurements |
| | | | | | |
| | Fair Value as of
October 31, 2023 | | | Valuation
Technique(s) | | Unobservable
Inputs | | Range | | Median | | Impact to Valuation from
an Increase in Input(a) |
| | | | | | |
Common Stock | | $ | 2,939 | | | Market Approach | | EV/Sale Multiple | | $17.98 | | N/A | | Increase |
| | | | | | |
| | | | | | | | Comparable Peer Mark | | $11.16 | | N/A | | Increase |
| | | | | | |
Corporate Bonds and Notes | | | 0 | | | Market Approach
- Bid Price in
open market | | Discount Rate | | 100% | | 100% | | Decrease |
| | | | | | | | | | | | | | |
| | | | | | |
| | $ | 2,939 | | | | | | | | | | | |
| | | | | | | | | | | | | | |
| (a) | Represents the directional change in the fair value of the Level 3 investments that could have resulted from an increase in the corresponding input as of period end. A decrease to the unobservable input would have had the opposite effect. Significant changes in these inputs may have resulted in a significantly higher or lower fair value measurement at period end. |
The following schedule shows the value of derivative instruments at October 31, 2023:
| | | | | | | | |
| | | Asset Derivatives | | Liability Derivatives |
Derivatives not accounted for as hedging instruments | | Statement of Assets and Liabilities Location | | Fair Value | | Statement of Assets and Liabilities Location | | Fair Value |
Foreign currency exchange contracts | | Unrealized appreciation on foreign currency contracts | | $36,483 | | Unrealized depreciation on foreign currency contracts | | — |
For the fiscal year ended October 31, 2023, the effect of derivative instruments on the Statement of Operations for the Fund and the amount of realized gain/loss and unrealized appreciation/depreciation on derivatives recognized in income was as follows:
| | | | | | | | |
| | | Realized Gain/(Loss) | | Change in Unrealized Appreciation/Depreciation |
Derivatives not accounted for as hedging instruments | | Statement of Operations Location | | Realized Gain/(Loss) | | Statement of Operations Location | | Change in Unrealized Appreciation/ Depreciation |
Foreign currency exchange contracts | | Net realized gain on forward contracts | | $12,205 | | Net change in unrealized appreciation/ depreciation on forward contracts | | $36,483 |
The accompanying notes are an integral part of these financial statements.
13
| | |
| | | AMG Beutel Goodman International Equity Fund Portfolio Manager’s Comments (unaudited) |
| | | |
| | | |
| | | | | | | | |
For the 12 months ended October 31, 2023, AMG Beutel Goodman International Equity Fund (the “Fund”) Class N shares returned 15.63%, compared with the 14.40% return for the MSCI EAFE Index (the “Index”). MARKET OVERVIEW Inflation, and the response to it by central banks worldwide, continued to be a major factor affecting international equity performance over the reporting period. Inflation has trended downward since peaking in the middle of 2022, and it appears likely the hiking cycle is ending, although that will depend on inflation’s downward trend continuing. The current economic picture in developed international markets is generally not as strong as in the U.S. In particular, growth in the eurozone and the U.K. has not shown the same robustness as the U.S. over the reporting period. That said, the performance of the Index has been strong over the reporting period, with all sectors delivering positive performance, led by the financials, consumer discretionary, and energy sectors. | | | | PERFORMANCE REVIEW From a sector perspective, health care, information technology, and financials were the largest detractors from the Fund’s relative performance over the period. Stock selection and an overweight in health care detracted from the Fund’s relative performance, while stock selection in information technology also detracted. Stock selection and an underweight in the financials sector also detracted from the Fund’s relative performance. Over the period, the largest individual stock detractors from Fund performance were Roche Holding AG, Gjensidige Forsikring ASA, and Smith & Nephew PLC. The Fund’s top-performing sectors during the period relative to the Index were industrials and materials. More specifically, stock selection in industrials and materials contributed to the Fund’s relative performance. Having no exposure to the underperforming real estate sector also contributed positively to relative performance. Over the period, | | | | the largest individual stock contributors to Fund performance were Konecranes Oyj, Heidelberg Materials AG, and IMI PLC. OUTLOOK Investors appear to be focused on narrow areas of the market and a handful of themes, while ignoring large parts of the market that may comprise solid but less flashy companies. We believe there is potential, particularly in areas of recent excitement, of a downside re-rating in stock prices. The Fund’s portfolio trades at a sizeable discount to the overall market, which should provide some downside mitigation if this occurs. The views expressed represent the opinions of Beutel, Goodman & Company Ltd. as of October 31, 2023, and are not intended as a forecast or guarantee of future results, and are subject to change without notice. |
14
| | |
| | | AMG Beutel Goodman International Equity Fund Portfolio Manager’s Comments (continued) |
| | | |
| | | |
CUMULATIVE TOTAL RETURN PERFORMANCE
AMG Beutel Goodman International Equity Fund’s cumulative total return is based on the daily change in net asset value (NAV), and assumes that all dividends and distributions were reinvested. The graph compares a hypothetical $10,000 investment made in the AMG Beutel Goodman International Equity Fund’s Class N shares on April 14, 2014, to a $10,000 investment made in the MSCI EAFE Index for the same time period. The graph and table do not reflect the deduction of taxes that a shareholder would pay on a Fund distribution or redemption of shares. The listed returns for the Fund are net of expenses and the returns for the index exclude expenses. Total returns would have been lower had certain expenses not been reduced.
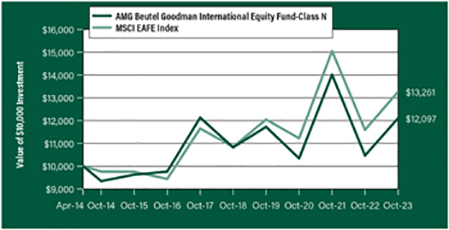
The table below shows the average annual total returns for the AMG Beutel Goodman International Equity Fund and the MSCI EAFE Index for the same time periods ended October 31, 2023.
| | | | | | | | | | | | | | | | |
| | | One | | | Five | | | Since | | | Inception | |
Average Annual Total Returns1 | | Year | | | Years | | | Inception | | | Date | |
|
AMG Beutel Goodman International Equity Fund2, 3, 4, 5, 6, 7, 8, 9, 10, 11, 12, 13, 14, 15 | |
Class N | | | 15.63 | % | | | 2.26 | % | | | 2.01 | % | | | 04/14/14 | |
Class I | | | 15.93 | % | | | 2.57 | % | | | 2.32 | % | | | 04/14/14 | |
Class Z | | | 16.04 | % | | | 2.67 | % | | | 0.61 | % | | | 09/29/17 | |
| | | | |
MSCI EAFE Index16 | | | 14.40 | % | | | 4.10 | % | | | 3.00 | % | | | 04/14/14 | † |
The performance data shown represents past performance. Past performance is not a guarantee of future results. Current performance may be lower or higher than the performance data quoted. The investment return and principal value of an investment will fluctuate so that an investor’s shares, when redeemed, may be worth more or less than their original cost.
Investors should carefully consider the Fund’s investment objectives, risks, charges and expenses before investing. For performance information through the most recent month end, current net asset values per share for the Fund and other information, please call 800.548.4539 or visit our website at wealth.amg.com for a free prospectus. Read it carefully before investing or sending money.
Distributed by AMG Distributors, Inc., member FINRA/SIPC.
| † | Date reflects the inception date of the Fund, not the index. |
| 1 | Total return equals income yield plus share price change and assumes reinvestment of all dividends and capital gain distributions. Returns are net of fees and may reflect offsets of Fund expenses as described in the prospectus. No adjustment has been made for taxes payable by shareholders on their reinvested dividends and |
|
capital gain distributions. Returns for periods greater than one year are annualized. The listed returns on the Fund are net of expenses and based on the published NAV as of October 31, 2023. All returns are in U.S. Dollars ($). 2 As of March 19, 2021, the Fund’s Subadviser was changed to Beutel Goodman & Company Ltd. Prior to March 19, 2021, the Fund was known as the AMG Managers Pictet International Fund and had different principal investment strategies and corresponding risks. Performance shown for periods prior to March 19, 2021, reflects the performance and investment strategies of the Fund’s previous Subadviser, Pictet Asset Management Limited. The Fund’s past performance would have been different if the Fund were managed by the current Subadviser and strategy, and the Fund’s prior performance record might be less pertinent for investors considering whether to purchase shares of the Fund. 3 From time to time, the Fund’s adviser has waived its fees and/or absorbed Fund expenses, which has resulted in higher returns. 4 Market prices of investments held by the Fund may fall rapidly or unpredictably due to a variety of factors, including economic, political, or market conditions, or other factors including terrorism, war, natural disasters and the spread of infectious illness or other public health issues, including epidemics or pandemics, or in response to events that affect particular industries or companies. 5 The Fund may not be able to dispose of particular investments, such as illiquid securities, readily at favorable times or prices or the Fund may have to sell them at a loss. |
|
6 Because the Fund is an actively managed investment portfolio, security selection or focus on securities in a particular style, market sector or group of companies may cause the Fund to incur losses or underperform relative to its benchmarks or other funds with a similar investment objective. There can be no guarantee that the Subadviser’s investment techniques and risk analysis will produce the desired result. 7 Investments in foreign issuers involve additional risks (such as risks arising from less frequent trading, changes in political or social conditions, and less publicly available information about non-U.S. issuers) that differ from those associated with investments in U.S. issuers and may result in greater price volatility. 8 Investments in emerging markets are subject to the general risks of foreign investments, as well as additional risks which can result in greater price volatility. Such additional risks include the risk that markets in emerging market countries are typically less developed and less liquid than markets in developed countries and such markets are |
15
| | |
| | | AMG Beutel Goodman International Equity Fund Portfolio Manager’s Comments (continued) |
| | | |
| | | |
| | | | | | | | |
subjected to increased economic, political, or regulatory uncertainties. 9 Fluctuations in exchange rates may affect the total loss or gain on a non-U.S. dollar investment when converted back to U.S. dollars and exposure to non-U.S. currencies may subject the Fund to the risk that those currencies will decline in value relative to the U.S. dollar. 10 The stocks of large-capitalization companies are generally more mature and may not be able to reach the same levels of growth as the stocks of small- or mid-capitalization companies. 11 The stocks of small- and mid-capitalization companies often have greater price volatility, lower trading volume, and less liquidity than the stocks of larger, more established companies. 12 Value stocks may perform differently from the market as a whole and may be undervalued by the market for a long period of time. 13 Issuers and companies that are in similar industry sectors may be similarly affected by particular economic or market events; to the extent the Fund has substantial holdings within a particular sector, the risks associated with that sector increase. | | | | 14 To the extent the Fund invests a substantial portion of its assets in a relatively small number of securities or a particular market, industry, group of industries, country, region, group of countries, asset class or sector, it generally will be subject to greater risk than a fund that invests in a more diverse investment portfolio. In addition, the value of the Fund would be more susceptible to any single economic, market, political or regulatory occurrence affecting, for example, that particular market, industry, region or sector. 15 The Fund is non-diversified and therefore a greater percentage of holdings may be focused in a small number of issuers or a single issuer, which can place the Fund at greater risk. Notwithstanding the Fund’s status as a “non-diversified” investment company under the Investment Company Act of 1940 (the “1940 Act”), the Fund intends to qualify as a regulated investment company accorded favorable tax treatment under the Internal Revenue Code of 1986, as amended, which imposes its own diversification requirements that are less restrictive than the requirements applicable to “diversified” investment companies under the 1940 Act. The Fund’s intention to qualify as a regulated investment company may limit its pursuit of its | | | | investment strategy and its investment strategy could limit its ability to so qualify. 16 The MSCI EAFE Index (Europe, Australasia, Far East) is a free float-adjusted market capitalization index that is designed to measure the equity market performance of developed markets, excluding the U.S. & Canada. Please go to msci.com for most current list of countries represented by the index. Unlike the Fund, the MSCI EAFE Index is unmanaged, is not available for investment and does not incur expenses. The All MSCI data is provided “as is.” The products described herein are not sponsored or endorsed and have not been reviewed or passed on by MSCI. In no event shall MSCI, its affiliates, or any MSCI data provider have any liability of any kind in connection with the MSCI data or the products described herein. Copying or redistributing the MSCI data is strictly prohibited. Not FDIC insured, nor bank guaranteed. May lose value. |
16
|
AMG Beutel Goodman International Equity Fund Fund Snapshots (unaudited) October 31, 2023 |
PORTFOLIO BREAKDOWN
| | |
| Sector | | % of
Net Assets |
| | |
| Health Care | | 18.4 |
| | |
| Industrials | | 17.9 |
| | |
| Communication Services | | 11.2 |
| | |
| Consumer Staples | | 10.8 |
| | |
| Financials | | 10.6 |
| | |
| Materials | | 10.5 |
| | |
| Energy | | 8.6 |
| | |
| Consumer Discretionary | | 4.4 |
| | |
| Information Technology | | 3.7 |
| | |
| Short-Term Investments | | 1.5 |
| | |
| Other Assets, less Liabilities | | 2.4 |
TOP TEN HOLDINGS
| | |
| Security Name | | % of
Net Assets |
| | |
Ampol, Ltd. (Australia) | | 4.8 |
| | |
Konecranes Oyj (Finland) | | 4.7 |
| | |
dormakaba Holding AG (Switzerland) | | 4.5 |
| | |
Koninklijke KPN, N.V. (Netherlands) | | 4.5 |
| | |
Cie Generale des Etablissements Michelin SCA (France) | | 4.4 |
| | |
Carlsberg AS, Class B (Denmark) | | 4.4 |
| | |
IMI PLC (United Kingdom) | | 4.3 |
| | |
Smiths Group PLC (United Kingdom) | | 4.3 |
| | |
Roche Holding AG (Switzerland) | | 4.2 |
| | |
Akzo Nobel, N.V. (Netherlands) | | 4.1 |
| | | |
| | |
Top Ten as a Group | | 44.2 |
| | |
Because a fund’s strategy may result in multiple investments in particular sectors of the economy, its performance may depend on the performance of those sectors and may fluctuate more widely than investments diversified across more sectors. For additional information on these and other risk considerations, please see the Fund’s prospectus.
Any sectors, industries, or securities discussed should not be perceived as investment recommendations. Mention of a specific security should not be considered a recommendation to buy or solicitation to sell that security. Specific securities mentioned in this report may have been sold from the Fund’s portfolio of investments by the time you receive this report.
17
|
AMG Beutel Goodman International Equity Fund Schedule of Portfolio Investments October 31, 2023 |
| | | | | | | | |
| | |
| | | Shares | | | Value | |
| | |
Common Stocks - 96.1% | | | | | | | | |
| |
Communication Services - 11.2% | | | | | |
| | |
Hakuhodo DY Holdings, Inc. (Japan) | | | 23,500 | | | | $190,707 | |
| | |
ITV PLC (United Kingdom) | | | 385,428 | | | | 300,108 | |
| | |
Koninklijke KPN, N.V. (Netherlands) | | | 140,532 | | | | 472,353 | |
| | |
Nippon Telegraph & Telephone Corp. (Japan) | | | 187,200 | | | | 220,292 | |
| | |
Total Communication Services | | | | | | | 1,183,460 | |
| |
Consumer Discretionary - 4.4% | | | | | |
| | |
Cie Generale des Etablissements Michelin SCA (France) | | | 15,544 | | | | 461,788 | |
| |
Consumer Staples - 10.8% | | | | | |
| | |
Carlsberg AS, Class B (Denmark) | | | 3,864 | | | | 460,486 | |
| | |
Essity AB, Class B (Sweden) | | | 17,366 | | | | 395,977 | |
| | |
Unilever PLC (United Kingdom) | | | 6,200 | | | | 293,636 | |
| | |
Total Consumer Staples | | | | | | | 1,150,099 | |
| |
Energy - 8.6% | | | | | |
| | |
Ampol, Ltd. (Australia) | | | 25,178 | | | | 510,553 | |
| | |
TGS ASA (Norway) | | | 29,420 | | | | 402,342 | |
| | |
Total Energy | | | | | | | 912,895 | |
| |
Financials - 10.6% | | | | | |
| | |
DBS Group Holdings, Ltd. (Singapore) | | | 8,810 | | | | 211,645 | |
| | |
Euronext, N.V. (Netherlands)1 | | | 5,070 | | | | 353,575 | |
| | |
Gjensidige Forsikring ASA (Norway) | | | 13,200 | | | | 197,957 | |
| | |
Julius Baer Group, Ltd. (Switzerland) | | | 6,067 | | | | 359,541 | |
| | |
Total Financials | | | | | | | 1,122,718 | |
| |
Health Care - 18.4% | | | | | |
| | |
GSK PLC (United Kingdom) | | | 23,100 | | | | 411,798 | |
| | |
Novartis AG (Switzerland) | | | 4,240 | | | | 396,947 | |
| | |
Roche Holding AG (Switzerland) | | | 1,729 | | | | 445,580 | |
| | |
Shionogi & Co., Ltd. (Japan) | | | 8,060 | | | | 375,311 | |
| | | | | | | | |
| | |
| | | Shares | | | Value | |
| | |
Smith & Nephew PLC (United Kingdom) | | | 28,404 | | | | $317,873 | |
| | |
Total Health Care | | | | | | | 1,947,509 | |
| |
Industrials - 17.9% | | | | | |
| | |
dormakaba Holding AG (Switzerland) | | | 1,053 | | | | 481,318 | |
| | |
IMI PLC (United Kingdom) | | | 25,705 | | | | 459,067 | |
| | |
Konecranes Oyj (Finland) | | | 15,094 | | | | 494,906 | |
| | |
Smiths Group PLC (United Kingdom) | | | 23,297 | | | | 456,986 | |
| | |
Total Industrials | | | | | | | 1,892,277 | |
| |
Information Technology - 3.7% | | | | | |
| | |
Atea ASA (Norway) | | | 38,048 | | | | 395,775 | |
| |
Materials - 10.5% | | | | | |
| | |
Akzo Nobel, N.V. (Netherlands) | | | 6,531 | | | | 438,130 | |
| | |
BASF SE (Germany) | | | 7,031 | | | | 324,883 | |
| | |
Heidelberg Materials AG (Germany) | | | 4,771 | | | | 346,343 | |
| | |
Total Materials | | | | | | | 1,109,356 | |
| | |
Total Common Stocks | | | | | | | | |
(Cost $12,280,214) | | | | | | | 10,175,877 | |
| | |
Short-Term Investments - 1.5% | | | | | | | | |
| |
Other Investment Companies - 1.5% | | | | | |
| | |
Dreyfus Government Cash Management Fund, Institutional Shares, 5.23%2 | | | 65,131 | | | | 65,131 | |
| | |
Dreyfus Institutional Preferred Government Money Market Fund, Institutional Shares, 5.31%2 | | | 97,698 | | | | 97,698 | |
| | |
Total Short-Term Investments | | | | | | | | |
(Cost $162,829) | | | | | | | 162,829 | |
| | |
Total Investments - 97.6% | | | | | | | | |
(Cost $12,443,043) | | | | | | | 10,338,706 | |
| | |
Other Assets, less Liabilities - 2.4% | | | | | | | 254,975 | |
| | |
Net Assets - 100.0% | | | | | | | $10,593,681 | |
| 1 | Security exempt from registration under Rule 144A of the Securities Act of 1933. This security may be resold in transactions exempt from registration, normally to qualified institutional buyers. At October 31, 2023, the value of this security amounted to $353,575 or 3.3% of net assets. |
| 2 | Yield shown represents the October 31, 2023, seven day average yield, which refers to the sum of the previous seven days’ dividends paid, expressed as an annual percentage. |
The accompanying notes are an integral part of these financial statements.
18
|
AMG Beutel Goodman International Equity Fund Schedule of Portfolio Investments (continued) |
The following table summarizes the inputs used to value the Fund’s investments by the fair value hierarchy levels as of October 31, 2023:
| | | | | | | | | | | | | | | | |
| | | Level 1 | | | Level 21 | | | Level 3 | | | Total | |
Investments in Securities | | | | | | | | | | | | | | | | |
| | | | |
Common Stocks | | | | | | | | | | | | | | | | |
| | | | |
Health Care | | | — | | | | $1,947,509 | | | | — | | | | $1,947,509 | |
| | | | |
Industrials | | | — | | | | 1,892,277 | | | | — | | | | 1,892,277 | |
| | | | |
Communication Services | | | — | | | | 1,183,460 | | | | — | | | | 1,183,460 | |
| | | | |
Consumer Staples | | | — | | | | 1,150,099 | | | | — | | | | 1,150,099 | |
| | | | |
Financials | | | — | | | | 1,122,718 | | | | — | | | | 1,122,718 | |
| | | | |
Materials | | | — | | | | 1,109,356 | | | | — | | | | 1,109,356 | |
| | | | |
Energy | | | — | | | | 912,895 | | | | — | | | | 912,895 | |
| | | | |
Consumer Discretionary | | | — | | | | 461,788 | | | | — | | | | 461,788 | |
| | | | |
Information Technology | | | $395,775 | | | | — | | | | — | | | | 395,775 | |
| | | | |
Short-Term Investments | | | | | | | | | | | | | | | | |
| | | | |
Other Investment Companies | | | 162,829 | | | | — | | | | — | | | | 162,829 | |
| | | | | | | | | | | | | | | | |
Total Investments in Securities | | | $558,604 | | | | $9,780,102 | | | | — | | | | $10,338,706 | |
| | | | | | | | | | | | | | | | |
| 1 | An external pricing service is used to reflect any impact on security value due to market movements between the time the Fund valued such foreign securities and the earlier closing of foreign markets. |
For the fiscal year ended October 31, 2023, there were no transfers in or out of Level 3.
The country allocation in the Schedule of Portfolio Investments at October 31, 2023, was as follows:
| | |
| Country | | % of Long-Term
Investments |
| |
Australia | | 5.0 |
| |
Denmark | | 4.5 |
| |
Finland | | 4.9 |
| |
France | | 4.5 |
| |
Germany | | 6.6 |
| |
Japan | | 7.7 |
| |
Netherlands | | 12.4 |
| |
Norway | | 9.8 |
| |
Singapore | | 2.1 |
| |
Sweden | | 3.9 |
| |
Switzerland | | 16.6 |
| |
United Kingdom | | 22.0 |
| | |
| |
| | | 100.0 |
| | |
The accompanying notes are an integral part of these financial statements.
19
|
Statement of Assets and Liabilities October 31, 2023 |
| | | | | | | | |
| | | AMG
Beutel Goodman
Core Plus
Bond Fund | | AMG
Beutel Goodman
International
Equity Fund |
Assets: | | | | | | | | |
| | |
Investments at value1 | | | $123,796,174 | | | | $10,338,706 | |
| | |
Foreign currency2 | | | — | | | | 32,047 | |
| | |
Receivable for investments sold | | | 1,366,339 | | | | — | |
| | |
Dividend and interest receivables | | | 1,043,682 | | | | 306,331 | |
| | |
Securities lending income receivable | | | 149 | | | | 45 | |
| | |
Receivable for Fund shares sold | | | 64,656 | | | | — | |
| | |
Receivable from affiliate | | | 12,500 | | | | 10,850 | |
| | |
Unrealized appreciation on foreign currency contracts | | | 36,483 | | | | — | |
| | |
Prepaid expenses and other assets | | | 13,821 | | | | 6,252 | |
| | |
Total assets | | | 126,333,804 | | | | 10,694,231 | |
| | |
Liabilities: | | | | | | | | |
| | |
Payable for investments purchased | | | 2,994,208 | | | | — | |
| | |
Payable for Fund shares repurchased | | | 57,522 | | | | 52,682 | |
| | |
Due to custodian | | | 260,222 | | | | — | |
| | |
Accrued expenses: | | | | | | | | |
| | |
Investment advisory and management fees | | | 22,128 | | | | 4,957 | |
| | |
Administrative fees | | | 14,431 | | | | 1,377 | |
| | |
Distribution fees | | | 3,540 | | | | 245 | |
| | |
Shareholder service fees | | | 4,033 | | | | 809 | |
| | |
Other | | | 83,859 | | | | 40,480 | |
| | |
Total liabilities | | | 3,439,943 | | | | 100,550 | |
| | |
Commitments and Contingencies (Notes 2 & 6) | | | | | | | | |
| | |
Net Assets | | | $122,893,861 | | | | $10,593,681 | |
| | |
1 Investments at cost | | | $138,849,109 | | | | $12,443,043 | |
| | |
2 Foreign currency at cost | | | — | | | | $32,814 | |
The accompanying notes are an integral part of these financial statements.
20
|
Statement of Assets and Liabilities (continued) |
| | | | | | | | |
| | | AMG
Beutel Goodman
Core Plus
Bond Fund | | AMG
Beutel Goodman
International
Equity Fund |
| | |
Net Assets Represent: | | | | | | | | |
| | |
Paid-in capital | | | $178,452,895 | | | | $84,859,590 | |
| | |
Total distributable loss | | | (55,559,034 | ) | | | (74,265,909 | ) |
| | |
Net Assets | | | $122,893,861 | | | | $10,593,681 | |
| | |
Class N: | | | | | | | | |
| | |
Net Assets | | | $15,786,633 | | | | $1,133,359 | |
| | |
Shares outstanding | | | 1,903,814 | | | | 122,292 | |
| | |
Net asset value, offering and redemption price per share | | | $8.29 | | | | $9.27 | |
| | |
Class I: | | | | | | | | |
| | |
Net Assets | | | $105,483,002 | | | | $7,620,204 | |
| | |
Shares outstanding | | | 12,734,523 | | | | 833,658 | |
| | |
Net asset value, offering and redemption price per share | | | $8.28 | | | | $9.14 | |
| | |
Class Z: | | | | | | | | |
| | |
Net Assets | | | $1,624,226 | | | | $1,840,118 | |
| | |
Shares outstanding | | | 195,856 | | | | 202,569 | |
| | |
Net asset value, offering and redemption price per share | | | $8.29 | | | | $9.08 | |
The accompanying notes are an integral part of these financial statements.
21
|
Statement of Operations For the fiscal year ended October 31, 2023 |
| | | | | | | | |
| | | AMG
Beutel Goodman
Core Plus
Bond Fund | | AMG
Beutel Goodman
International
Equity Fund |
| | |
Investment Income: | | | | | | | | |
| | |
Dividend income | | | $11,019 | | | | $487,305 | |
| | |
Interest income | | | 5,472,226 | | | | — | |
| | |
Securities lending income | | | 1,829 | | | | 647 | |
| | |
Foreign withholding tax | | | — | | | | (49,462 | ) |
| | |
Total investment income | | | 5,485,074 | | | | 438,490 | |
| | |
Expenses: | | | | | | | | |
| | |
Investment advisory and management fees | | | 297,605 | | | | 71,156 | |
| | |
Administrative fees | | | 194,090 | | | | 19,765 | |
| | |
Distribution fees - Class N | | | 51,325 | | | | 3,694 | |
| | |
Shareholder servicing fees - Class N | | | — | | | | 2,217 | |
| | |
Shareholder servicing fees - Class I | | | 53,108 | | | | 9,344 | |
| | |
Professional fees | | | 70,708 | | | | 31,098 | |
| | |
Registration fees | | | 32,084 | | | | 34,792 | |
| | |
Custodian fees | | | 29,981 | | | | 33,157 | |
| | |
Reports to shareholders | | | 26,520 | | | | 5,083 | |
| | |
Trustee fees and expenses | | | 9,561 | | | | 919 | |
| | |
Transfer agent fees | | | 4,457 | | | | 469 | |
| | |
Interest expense | | | 1,554 | | | | 934 | |
| | |
Miscellaneous | | | 9,452 | | | | 3,121 | |
| | |
Total expenses before offsets | | | 780,445 | | | | 215,749 | |
| | |
Expense reimbursements | | | (118,067 | ) | | | (99,415 | ) |
| | |
Net expenses | | | 662,378 | | | | 116,334 | |
| | | | | | | | |
Net investment income | | | 4,822,696 | | | | 322,156 | |
| | |
Net Realized and Unrealized Gain (Loss): | | | | | | | | |
| | |
Net realized loss on investments | | | (18,239,087 | ) | | | (675,998 | )1 |
| | |
Net realized gain on forward contracts | | | 12,205 | | | | — | |
| | |
Net realized gain (loss) on foreign currency transactions | | | 3,180 | | | | (10,295 | ) |
| | |
Net change in unrealized appreciation/depreciation on investments | | | 14,816,212 | | | | 2,772,194 | |
| | |
Net change in unrealized appreciation/depreciation on forward contracts | | | 36,483 | | | | — | |
| | |
Net change in unrealized appreciation/depreciation on foreign currency translations | | | (452 | ) | | | 29,780 | |
| | |
Net realized and unrealized gain (loss) | | | (3,371,459 | ) | | | 2,115,681 | |
| | | | | | | | |
| | |
Net increase in net assets resulting from operations | | | $1,451,237 | | | | $2,437,837 | |
| 1 | Includes a non-recurring securities litigation gain of $246,591. |
The accompanying notes are an integral part of these financial statements.
22
| | |
| | | Statements of Changes in Net Assets For the fiscal years ended October 31, |
| | | |
| | | |
| | | | | | | | | | | | | | | | |
| | | AMG
Beutel Goodman
Core Plus Bond Fund | | | AMG
Beutel Goodman
International Equity Fund | |
| | | | |
| | | 2023 | | | 2022 | | | 2023 | | | 2022 | |
| | | | |
Increase (Decrease) in Net Assets Resulting From Operations: | | | | | | | | | | | | | | | | |
| | | | |
Net investment income | | | $4,822,696 | | | | $5,832,011 | | | | $322,156 | | | | $833,625 | |
| | | | |
Net realized loss on investments | | | (18,223,702 | ) | | | (10,539,235) | | | | (686,293 | ) | | | (4,020,192) | |
| | | | |
Net change in unrealized appreciation/depreciation on investments | | | 14,852,243 | | | | (33,813,542) | | | | 2,801,974 | | | | (6,435,890) | |
| | | | | | | | | | | | | | | | |
| | | | |
Net increase (decrease) in net assets resulting from operations | | | 1,451,237 | | | | (38,520,766) | | | | 2,437,837 | | | | (9,622,457) | |
| | | | |
Distributions to Shareholders: | | | | | | | | | | | | | | | | |
| | | | |
Class N | | | (824,507 | ) | | | (876,703 | ) | | | (80,760) | | | | — | |
| | | | |
Class I | | | (4,464,223 | ) | | | (5,652,369 | ) | | | (428,061 | ) | | | (1,104,515 | ) |
| | | | |
Class Z | | | (112,682 | ) | | | (377,513 | ) | | | (110,158 | ) | | | (84,662 | ) |
| | | | | | | | | | | | | | | | |
| | | | |
Total distributions to shareholders | | | (5,401,412 | ) | | | (6,906,585 | ) | | | (618,979 | ) | | | (1,189,177 | ) |
| | | | |
Capital Share Transactions:1 | | | | | | | | | | | | | | | | |
| | | | |
Net decrease from capital share transactions | | | (44,019,609 | ) | | | (51,152,715 | ) | | | (6,211,936 | ) | | | (39,925,200 | ) |
| | | | | | | | | | | | | | | | |
| | | | |
Total decrease in net assets | | | (47,969,784 | ) | | | (96,580,066 | ) | | | (4,393,078 | ) | | | (50,736,834 | ) |
| | | | |
Net Assets: | | | | | | | | | | | | | | | | |
| | | | |
Beginning of year | | | 170,863,645 | | | | 267,443,711 | | | | 14,986,759 | | | | 65,723,593 | |
| | | | | | | | | | | | | | | | |
| | | | |
End of year | | | $122,893,861 | | | | $170,863,645 | | | | $10,593,681 | | | | $14,986,759 | |
1 See Note 1(g) of the Notes to Financial Statements.
The accompanying notes are an integral part of these financial statements.
23
| | |
| | | AMG Beutel Goodman Core Plus Bond Fund Financial Highlights For a share outstanding throughout each fiscal year |
| | | |
| | | |
| | | | | | | | | | | | | | | | | | | | |
| | | For the fiscal years ended October 31, | |
| | | | | |
| Class N | | 2023 | | | 2022 | | | 2021 | | | 2020 | | | 2019 | |
| | | | | |
Net Asset Value, Beginning of Year | | | $8.69 | | | | $10.72 | | | | $10.76 | | | | $10.74 | | | | $10.23 | |
| | | | | |
Income (loss) from Investment Operations: | | | | | | | | | | | | | | | | | | | | |
| | | | | |
Net investment income1,2 | | | 0.32 | | | | 0.24 | | | | 0.20 | | | | 0.27 | | | | 0.34 | |
| | | | | |
Net realized and unrealized gain (loss) on investments | | | (0.36 | ) | | | (1.97 | ) | | | 0.03 | | | | 0.05 | | | | 0.53 | |
| | | | | | | | | | | | | | | | | | | | |
| | | | | |
Total income (loss) from investment operations | | | (0.04 | ) | | | (1.73 | ) | | | 0.23 | | | | 0.32 | | | | 0.87 | |
| | | | | |
Less Distributions to Shareholders from: | | | | | | | | | | | | | | | | | | | | |
| | | | | |
Net investment income | | | (0.36 | ) | | | (0.30 | ) | | | (0.27 | ) | | | (0.30 | ) | | | (0.36 | ) |
| | | | | |
Net Asset Value, End of Year | | | $8.29 | | | | $8.69 | | | | $10.72 | | | | $10.76 | | | | $10.74 | |
| | | | | | | | | | | | | | | | | | | | |
| | | | | |
Total Return2,3 | | | (0.68 | )% | | | (16.41 | )% | | | 2.19 | % | | | 3.01 | % | | | 8.67 | % |
| | | | | |
Ratio of net expenses to average net assets | | | 0.68 | % | | | 0.68 | % | | | 0.83 | % | | | 0.94 | % | | | 0.94 | % |
| | | | | |
Ratio of gross expenses to average net assets4 | | | 0.77 | % | | | 0.72 | % | | | 0.90 | % | | | 1.01 | % | | | 1.02 | % |
| | | | | |
Ratio of net investment income to average net assets2 | | | 3.56 | % | | | 2.47 | % | | | 1.85 | % | | | 2.54 | % | | | 3.24 | % |
| | | | | |
Portfolio turnover | | | 114 | % | | | 76 | % | | | 174 | % | | | 96 | % | | | 47 | % |
| | | | | |
Net assets end of year (000’s) omitted | | | $15,787 | | | | $22,706 | | | | $37,301 | | | | $56,175 | | | | $82,856 | |
| | | | | |
| | | | | | | | | | | | | | | | | | | | | |
| | | | | |
| | | | | | | | | | | | | | | | | | | | | |
24
| | |
| | | AMG Beutel Goodman Core Plus Bond Fund Financial Highlights For a share outstanding throughout each fiscal year |
| | | |
| | | |
| | | | | | | | | | | | | | | | | | | | |
| | | For the fiscal years ended October 31, | |
| | | | | |
Class I | | 2023 | | | 2022 | | | 2021 | | | 2020 | | | 2019 | |
| | | | | |
Net Asset Value, Beginning of Year | | | $8.69 | | | | $10.71 | | | | $10.75 | | | | $10.74 | | | | $10.23 | |
| | | | | |
Income (loss) from Investment Operations: | | | | | | | | | | | | | | | | | | | | |
| | | | | |
Net investment income1,2 | | | 0.33 | | | | 0.26 | | | | 0.22 | | | | 0.30 | | | | 0.37 | |
| | | | | |
Net realized and unrealized gain (loss) on investments | | | (0.36 | ) | | | (1.96 | ) | | | 0.04 | | | | 0.03 | | | | 0.53 | |
| | | | | | | | | | | | | | | | | | | | |
| | | | | |
Total income (loss) from investment operations | | | (0.03 | ) | | | (1.70 | ) | | | 0.26 | | | | 0.33 | | | | 0.90 | |
| | | | | |
Less Distributions to Shareholders from: | | | | | | | | | | | | | | | | | | | | |
| | | | | |
Net investment income | | | (0.38 | ) | | | (0.32 | ) | | | (0.30 | ) | | | (0.32 | ) | | | (0.39 | ) |
| | | | | |
Net Asset Value, End of Year | | | $8.28 | | | | $8.69 | | | | $10.71 | | | | $10.75 | | | | $10.74 | |
| | | | | | | | | | | | | | | | | | | | |
| | | | | |
Total Return2,3 | | | (0.60 | )% | | | (16.17 | )% | | | 2.44 | % | | | 3.17 | % | | | 8.94 | % |
| | | | | |
Ratio of net expenses to average net assets | | | 0.48 | % | | | 0.48 | % | | | 0.60 | % | | | 0.69 | % | | | 0.69 | % |
| | | | | |
Ratio of gross expenses to average net assets4 | | | 0.57 | % | | | 0.52 | % | | | 0.67 | % | | | 0.76 | % | | | 0.77 | % |
| | | | | |
Ratio of net investment income to average net assets2 | | | 3.76 | % | | | 2.67 | % | | | 2.08 | % | | | 2.79 | % | | | 3.49 | % |
| | | | | |
Portfolio turnover | | | 114 | % | | | 76 | % | | | 174 | % | | | 96 | % | | | 47 | % |
| | | | | |
Net assets end of year (000’s) omitted | | | $105,483 | | | | $137,592 | | | | $218,278 | | | | $433,881 | | | | $585,358 | |
| | | | | |
| | | | | | | | | | | | | | | | | | | | | |
| | | | | |
| | | | | | | | | | | | | | | | | | | | | |
25
| | |
| | | AMG Beutel Goodman Core Plus Bond Fund Financial Highlights For a share outstanding throughout each fiscal year |
| | | |
| | | |
| | | | | | | | | | | | | | | | | | | | |
| | | For the fiscal years ended October 31, | |
| | | | | |
Class Z | | 2023 | | | 2022 | | | 2021 | | | 2020 | | | 2019 | |
| | | | | |
Net Asset Value, Beginning of Year | | | $8.69 | | | | $10.72 | | | | $10.76 | | | | $10.74 | | | | $10.24 | |
| | | | | |
Income (loss) from Investment Operations: | | | | | | | | | | | | | | | | | | | | |
| | | | | |
Net investment income1,2 | | | 0.34 | | | | 0.27 | | | | 0.23 | | | | 0.31 | | | | 0.38 | |
| | | | | |
Net realized and unrealized gain (loss) on investments | | | (0.36 | ) | | | (1.98 | ) | | | 0.04 | | | | 0.04 | | | | 0.52 | |
| | | | | | | | | | | | | | | | | | | | |
| | | | | |
Total income (loss) from investment operations | | | (0.02 | ) | | | (1.71 | ) | | | 0.27 | | | | 0.35 | | | | 0.90 | |
| | | | | |
Less Distributions to Shareholders from: | | | | | | | | | | | | | | | | | | | | |
| | | | | |
Net investment income | | | (0.38 | ) | | | (0.32 | ) | | | (0.31 | ) | | | (0.33 | ) | | | (0.40 | ) |
| | | | | |
Net Asset Value, End of Year | | | $8.29 | | | | $8.69 | | | | $10.72 | | | | $10.76 | | | | $10.74 | |
| | | | | | | | | | | | | | | | | | | | |
| | | | | |
Total Return2,3 | | | (0.43 | )% | | | (16.20 | )% | | | 2.51 | % | | | 3.35 | % | | | 8.91 | % |
| | | | | |
Ratio of net expenses to average net assets | | | 0.43 | % | | | 0.43 | % | | | 0.53 | % | | | 0.61 | % | | | 0.61 | % |
| | | | | |
Ratio of gross expenses to average net assets4 | | | 0.52 | % | | | 0.47 | % | | | 0.60 | % | | | 0.68 | % | | | 0.69 | % |
| | | | | |
Ratio of net investment income to average net assets2 | | | 3.81 | % | | | 2.72 | % | | | 2.15 | % | | | 2.87 | % | | | 3.57 | % |
| | | | | |
Portfolio turnover | | | 114 | % | | | 76 | % | | | 174 | % | | | 96 | % | | | 47 | % |
| | | | | |
Net assets end of year (000’s) omitted | | | $1,624 | | | | $10,566 | | | | $11,864 | | | | $10,684 | | | | $2,473 | |
| | | | | |
| | | | | | | | | | | | | | | | | | | | | |
| | | | | |
| | | | | | | | | | | | | | | | | | | | | |
| 1 | Per share numbers have been calculated using average shares. |
| 2 | Total returns and net investment income would have been lower had certain expenses not been offset. |
| 3 | The total return is calculated using the published Net Asset Value as of fiscal year end. |
| 4 | Excludes the impact of expense reimbursement or fee waivers and expense reductions such as brokerage credits, but includes expense repayments and non-reimbursable expenses, if any, such as interest, taxes, and extraordinary expenses. (See Note 1(c) and 2 in the Notes to Financial Statements.) |
26
| | |
| | | AMG Beutel Goodman International Equity Fund Financial Highlights For a share outstanding throughout each fiscal year |
| | | |
| | | |
| | | | | | | | | | | | | | | | | | | | |
| | | For the fiscal years ended October 31, | |
| | | | | |
Class N | | 2023 | | | 2022 | | | 2021 | | | 2020 | | | 2019 | |
| | | | | |
Net Asset Value, Beginning of Year | | | $8.33 | | | | $11.16 | | | | $8.23 | | | | $9.56 | | | | $9.90 | |
| | | | | |
Income (loss) from Investment Operations: | | | | | | | | | | | | | | | | | | | | |
| | | | | |
Net investment income1,2 | | | 0.21 | | | | 0.19 | | | | 0.08 | | | | 0.07 | 3 | | | 0.07 | |
| | | | | |
Net realized and unrealized gain (loss) on investments | | | 1.08 | | | | (3.02 | ) | | | 2.85 | | | | (1.17 | ) | | | 0.56 | |
| | | | | | | | | | | | | | | | | | | | |
| | | | | |
Total income (loss) from investment operations | | | 1.29 | | | | (2.83 | ) | | | 2.93 | | | | (1.10 | ) | | | 0.63 | |
| | | | | |
Less Distributions to Shareholders from: | | | | | | | | | | | | | | | | | | | | |
| | | | | |
Net investment income | | | (0.35 | ) | | | — | | | | — | | | | (0.23 | ) | | | (0.20 | ) |
| | | | | |
Net realized gain on investments | | | — | | | | — | | | | — | | | | — | | | | (0.77 | ) |
| | | | | | | | | | | | | | | | | | | | |
| | | | | |
Total distributions to shareholders | | | (0.35 | ) | | | — | | | | — | | | | (0.23 | ) | | | (0.97 | ) |
| | | | | |
Net Asset Value, End of Year | | | $9.27 | | | | $8.33 | | | | $11.16 | | | | $8.23 | | | | $9.56 | |
| | | | | | | | | | | | | | | | | | | | |
| | | | | |
Total Return2,4 | | | 15.63 | %5 | | | (25.36 | )%5 | | | 35.60 | % | | | (11.83 | )% | | | 8.34 | % |
| | | | | |
Ratio of net expenses to average net assets | | | 1.17 | %6 | | | 1.18 | %6 | | | 1.27 | % | | | 1.31 | % | | | 1.32 | % |
| | | | | |
Ratio of gross expenses to average net assets7 | | | 1.92 | % | | | 1.34 | % | | | 1.38 | % | | | 1.35 | % | | | 1.32 | % |
| | | | | |
Ratio of net investment income to average net assets2 | | | 2.16 | % | | | 1.88 | % | | | 0.73 | % | | | 0.77 | % | | | 0.78 | % |
| | | | | |
Portfolio turnover | | | 8 | % | | | 23 | % | | | 152 | % | | | 43 | % | | | 28 | % |
| | | | | |
Net assets end of year (000’s) omitted | | | $1,133 | | | | $1,988 | | | | $5,035 | | | | $6,792 | | | | $87,998 | |
| | | | | |
| | | | | | | | | | | | | | | | | | | | | |
| | | | | |
| | | | | | | | | | | | | | | | | | | | | |
27
| | |
| | | AMG Beutel Goodman International Equity Fund Financial Highlights For a share outstanding throughout each fiscal year |
| | | |
| | | |
| | | | | | | | | | | | | | | | | | | | |
| | | For the fiscal years ended October 31, | |
| | | | | |
Class I | | 2023 | | | 2022 | | | 2021 | | | 2020 | | | 2019 | |
| | | | | |
Net Asset Value, Beginning of Year | | | $8.22 | | | | $11.21 | | | | $8.28 | | | | $9.62 | | | | $9.93 | |
| | | | | |
Income (loss) from Investment Operations: | | | | | | | | | | | | | | | | | | | | |
| | | | | |
Net investment income1,2 | | | 0.23 | | | | 0.22 | | | | 0.11 | | | | 0.09 | 3 | | | 0.09 | |
| | | | | |
Net realized and unrealized gain (loss) on investments | | | 1.06 | | | | (2.98 | ) | | | 2.87 | | | | (1.16 | ) | | | 0.57 | |
| | | | | | | | | | | | | | | | | | | | |
| | | | | |
Total income (loss) from investment operations | | | 1.29 | | | | (2.76 | ) | | | 2.98 | | | | (1.07 | ) | | | 0.66 | |
| | | | | |
Less Distributions to Shareholders from: | | | | | | | | | | | | | | | | | | | | |
| | | | | |
Net investment income | | | (0.37 | ) | | | (0.23 | ) | | | (0.05 | ) | | | (0.27 | ) | | | (0.20 | ) |
| | | | | |
Net realized gain on investments | | | — | | | | — | | | | — | | | | — | | | | (0.77 | ) |
| | | | | | | | | | | | | | | | | | | | |
| | | | | |
Total distributions to shareholders | | | (0.37 | ) | | | (0.23 | ) | | | (0.05 | ) | | | (0.27 | ) | | | (0.97 | ) |
| | | | | |
Net Asset Value, End of Year | | | $9.14 | | | | $8.22 | | | | $11.21 | | | | $8.28 | | | | $9.62 | |
| | | | | | | | | | | | | | | | | | | | |
| | | | | |
Total Return2,4 | | | 15.93 | %5 | | | (25.10 | )%5 | | | 36.19 | % | | | (11.63 | )% | | | 8.65 | % |
| | | | | |
Ratio of net expenses to average net assets | | | 0.87 | %6 | | | 0.88 | %6 | | | 0.97 | % | | | 1.02 | % | | | 1.07 | % |
| | | | | |
Ratio of gross expenses to average net assets7 | | | 1.62 | % | | | 1.04 | % | | | 1.08 | % | | | 1.06 | % | | | 1.07 | % |
| | | | | |
Ratio of net investment income to average net assets2 | | | 2.46 | % | | | 2.18 | % | | | 1.03 | % | | | 1.06 | % | | | 1.03 | % |
| | | | | |
Portfolio turnover | | | 8 | % | | | 23 | % | | | 152 | % | | | 43 | % | | | 28 | % |
| | | | | |
Net assets end of year (000’s) omitted | | | $7,620 | | | | $10,686 | | | | $56,129 | | | | $166,994 | | | | $158,317 | |
| | | | | |
| | | | | | | | | | | | | | | | | | | | | |
| | | | | |
| | | | | | | | | | | | | | | | | | | | | |
28
| | |
| | | AMG Beutel Goodman International Equity Fund Financial Highlights For a share outstanding throughout each fiscal year |
| | | |
| | | |
| | | | | | | | | | | | | | | | | | | | |
| | | For the fiscal years ended October 31, | |
| | | | | |
Class Z | | 2023 | | | 2022 | | | 2021 | | | 2020 | | | 2019 | |
| | | | | |
Net Asset Value, Beginning of Year | | | $8.18 | | | | $11.18 | | | | $8.26 | | | | $9.60 | | | | $9.91 | |
| | | | | |
Income (loss) from Investment Operations: | | | | | | | | | | | | | | | | | | | | |
| | | | | |
Net investment income1,2 | | | 0.24 | | | | 0.22 | | | | 0.12 | | | | 0.10 | 3 | | | 0.10 | |
| | | | | |
Net realized and unrealized gain (loss) on investments | | | 1.05 | | | | (2.96 | ) | | | 2.86 | | | | (1.16 | ) | | | 0.57 | |
| | | | | | | | | | | | | | | | | | | | |
| | | | | |
Total income (loss) from investment operations | | | 1.29 | | | | (2.74 | ) | | | 2.98 | | | | (1.06 | ) | | | 0.67 | |
| | | | | |
Less Distributions to Shareholders from: | | | | | | | | | | | | | | | | | | | | |
| | | | | |
Net investment income | | | (0.39 | ) | | | (0.26 | ) | | | (0.06 | ) | | | (0.28 | ) | | | (0.21 | ) |
| | | | | |
Net realized gain on investments | | | — | | | | — | | | | — | | | | — | | | | (0.77 | ) |
| | | | | | | | | | | | | | | | | | | | |
| | | | | |
Total distributions to shareholders | | | (0.39 | ) | | | (0.26 | ) | | | (0.06 | ) | | | (0.28 | ) | | | (0.98 | ) |
| | | | | |
Net Asset Value, End of Year | | | $9.08 | | | | $8.18 | | | | $11.18 | | | | $8.26 | | | | $9.60 | |
| | | | | | | | | | | | | | | | | | | | |
| | | | | |
Total Return2,4 | | | 16.04 | %5 | | | (25.07 | )%5 | | | 36.28 | % | | | (11.56 | )% | | | 8.84 | % |
| | | | | |
Ratio of net expenses to average net assets | | | 0.77 | %6 | | | 0.78 | %6 | | | 0.87 | % | | | 0.92 | % | | | 0.96 | % |
| | | | | |
Ratio of gross expenses to average net assets7 | | | 1.52 | % | | | 0.94 | % | | | 0.98 | % | | | 0.96 | % | | | 0.96 | % |
| | | | | |
Ratio of net investment income to average net assets2 | | | 2.56 | % | | | 2.28 | % | | | 1.13 | % | | | 1.16 | % | | | 1.14 | % |
| | | | | |
Portfolio turnover | | | 8 | % | | | 23 | % | | | 152 | % | | | 43 | % | | | 28 | % |
| | | | | |
Net assets end of year (000’s) omitted | | | $1,840 | | | | $2,312 | | | | $4,559 | | | | $11,692 | | | | $49,054 | |
| | | | | |
| | | | | | | | | | | | | | | | | | | | | |
| | | | | |
| | | | | | | | | | | | | | | | | | | | | |
| 1 | Per share numbers have been calculated using average shares. |
| 2 | Total returns and net investment income would have been lower had certain expenses not been offset. |
| 3 | Includes non-recurring dividends. Without these dividends, net investment income per share would have been $0.04, $0.06, and $0.07 for Class N, Class I, and Class Z shares, respectively. |
| 4 | The total return is calculated using the published Net Asset Value as of fiscal year end. |
| 5 | Includes a non-recurring securities litigation gain. Had the Fund not received the payments total returns would have been 12.88%, 13.27% and 13.23%, for Class N, Class I and Class Z, respectively, for the fiscal year ended October 31, 2023, and (26.61)%, (28.11)% and (26.17)%, for Class N, Class I and Class Z, respectively, for the fiscal year ended October 31, 2022. |
| 6 | Includes interest expense totaling 0.01% and 0.02% for the fiscal years ended October 31, 2023 and 2022, respectively, related to participation in the interfund lending program. |
| 7 | Excludes the impact of expense reimbursement or fee waivers and expense reductions such as brokerage credits, but includes expense repayments and non-reimbursable expenses, if any, such as interest, taxes, and extraordinary expenses. (See Note 1(c) and 2 in the Notes to Financial Statements.) |
29
| | |
| | | Notes to Financial Statements October 31, 2023 |
1. ORGANIZATION AND SUMMARY OF SIGNIFICANT ACCOUNTING POLICIES
AMG Funds IV (the “Trust”) is an open-end management investment company, organized as a Delaware Statutory Trust, and registered under the Investment Company Act of 1940, as amended (the “1940 Act”). Currently, the Trust consists of a number of different funds, each having distinct investment management objectives, strategies, risks, and policies. Included in this report are the AMG Beutel Goodman Core Plus Bond Fund (“Core Plus Bond”) and AMG Beutel Goodman International Equity Fund (“International Equity”), each a “Fund” and collectively, the “Funds”.
Each Fund offers Class N, Class I and Class Z shares. Each class represents an interest in the same assets of the respective Fund. Although all share classes generally have identical voting rights, each share class votes separately when required by law. Different share classes may have different net asset values per share to the extent the share classes pay different distribution amounts and/or the expenses of such share classes differ. Each share class has its own expense structure. Please refer to a current prospectus for additional information on each share class.
International Equity is a non-diversified fund. A greater percentage of the Fund’s holdings may be focused in a smaller number of securities which may place the Fund at greater risk than a more diversified fund.
Market prices of investments held by the Funds may fall rapidly or unpredictably due to a variety of economic or political factors, market conditions, disasters or public health issues, or in response to events that affect particular industries or companies.
The Funds’ financial statements are prepared in accordance with accounting principles generally accepted in the United States of America (“U.S. GAAP”), including accounting and reporting guidance pursuant to Accounting Standards Codification Topic 946 applicable to investment companies. U.S. GAAP requires management to make estimates and assumptions that affect the reported amounts of assets and liabilities and disclosure of contingent assets and liabilities at the date of the financial statements and the reported amounts of income and expenses during the reporting period. Actual results could differ from those estimates and such differences could be material. The following is a summary of significant accounting policies followed by the Funds in the preparation of their financial statements:
a. VALUATION OF INVESTMENTS
Equity securities traded on a national securities exchange or reported on the NASDAQ national market system (“NMS”) are valued at the last quoted sales price on the primary exchange or, if applicable, the NASDAQ official closing price or the official closing price of the relevant exchange or, lacking any sales, at the last quoted bid price. Equity securities held by the Funds that are traded in the over-the-counter market (other than NMS securities) are valued at the bid price. Foreign equity securities (securities principally traded in markets other than U.S. markets) held by the Funds are valued at the official closing price on the primary exchange or, for markets that either do not offer an official closing price or where the official closing price may not be representative of the overall market, the last quoted sale price.
Fixed income securities purchased with a remaining maturity exceeding 60 days are valued at the evaluated bid price provided by an authorized pricing service or, if an evaluated price is not available, by reference to other securities which are
considered comparable in credit rating, interest rate, due date and other features (generally referred to as “matrix pricing”) or other similar pricing methodologies. Investments in certain mortgage-backed and stripped mortgage-backed securities, convertible securities, derivatives and other debt securities not traded on an organized securities market are valued on the basis of valuations provided by dealers or by a pricing service which uses information with respect to transactions in such securities and various relationships between such securities and yield to maturity in determining value.
Fixed income securities purchased with a remaining maturity of 60 days or less are valued at amortized cost, provided that the amortized cost value is approximately the same as the fair value of the security valued without the use of amortized cost. Investments in other open-end registered investment companies are valued at their end of day net asset value per share.
The Funds’ portfolio investments are generally valued based on independent market quotations or prices or, if none, “evaluative” or other market based valuations provided by third party pricing services. Pursuant to Rule 2a-5 under the 1940 Act, the Funds’ Board of Trustees (the “Board”) designated AMG Funds LLC (the “Investment Manager”) as the Funds’ Valuation Designee to perform the Funds’ fair value determinations. Such determinations are subject to Board oversight and certain reporting and other requirements intended to ensure that the Board receives the information it needs to oversee the Investment Manager’s fair value determinations.
Under certain circumstances, the value of certain Fund portfolio investments may be based on an evaluation of fair value, pursuant to procedures established by the Investment Manager and under the general supervision of the Board. The Funds may use the fair value of a portfolio investment to calculate its net asset value (“NAV”) in the event that the market quotation, price or market based valuation for the portfolio investment is not readily available or otherwise not determinable pursuant to the Funds’ valuation procedures, if the Investment Manager believes the quotation, price or market based valuation to be unreliable, or in certain other circumstances. When determining the fair value of an investment, the Investment Manager seeks to determine the price that the Funds might reasonably expect to receive from current sale of that portfolio investment in an arms-length transaction. Fair value determinations shall be based upon consideration of all available facts and information, including, but not limited to (i) attributes specific to the investment; (ii) fundamental and analytical data relating to the investment; and (iii) the value of other comparable securities or relevant financial instruments, including derivative securities, traded on other markets or among dealers.
The values assigned to fair value portfolio investments are based on available information and do not necessarily represent amounts that might ultimately be realized in the future, since such amounts depend on future developments inherent in long-term investments. Because of the inherent uncertainty of valuation, those estimated values may differ significantly from the values that would have been used had a ready market for the investments existed, and the differences could be material. The Board will be presented with quarterly reports, as of the most recent quarter end, summarizing all fair value activity, material fair value matters that occurred during the quarter, and all outstanding securities fair valued by the Funds. Additionally, the Board will be presented with an annual report that assesses the adequacy and effectiveness of the Investment Manager’s process for determining the fair value of the Funds’ investments.
With respect to foreign equity securities and certain foreign fixed income securities, securities held in the Funds that can be fair valued by the applicable
30
| | |
| | | Notes to Financial Statements (continued) |
| | | |
| | | |
fair value pricing service are fair valued on each business day provided that each individual price exceeds a pre-established confidence level.
U.S. GAAP defines fair value as the price that a fund would receive to sell an asset or pay to transfer a liability in an orderly transaction between market participants at the measurement date. U.S. GAAP also establishes a framework for measuring fair value, and a three level hierarchy for fair value measurements based upon the transparency of inputs to the valuation of an asset or liability. Inputs may be observable or unobservable and refer broadly to the assumptions that market participants would use in pricing the asset or liability. Observable inputs reflect the assumptions market participants would use in pricing the asset or liability based on market data obtained from sources independent of the Funds. Unobservable inputs reflect the Funds’ own assumptions about the assumptions that market participants would use in pricing the asset or liability developed based on the best information available in the circumstances. Each investment is assigned a level based upon the observability of the inputs which are significant to the overall valuation.
The three-tier hierarchy of inputs is summarized below:
Level 1 – inputs are quoted prices in active markets for identical investments (e.g., equity securities, open-end investment companies)
Level 2 – other observable inputs (including, but not limited to: quoted prices for similar assets or liabilities in markets that are active, quoted prices for identical or similar assets or liabilities in markets that are not active, inputs other than quoted prices that are observable for the assets or liabilities (such as interest rates, yield curves, volatilities, prepayment speeds, loss severities, credit risks and default rates) or other market corroborated inputs) (e.g., debt securities, government securities, foreign currency exchange contracts, foreign securities utilizing international fair value pricing, fair valued securities with observable inputs)
Level 3 – inputs are significant unobservable inputs (including the Fund’s own assumptions used to determine the fair value of investments) (e.g., fair valued securities with unobservable inputs)
Changes in inputs or methodologies used for valuing investments may result in a transfer in or out of levels within the fair value hierarchy. The inputs or methodologies used for valuing investments may not necessarily be an indication of the risk associated with investing in those investments.
b. SECURITY TRANSACTIONS
Security transactions are accounted for as of trade date. Realized gains and losses on securities sold are determined on the basis of identified cost.
c. INVESTMENT INCOME AND EXPENSES
Dividend income is recorded on the ex-dividend date. Dividends from foreign securities are recorded on the ex-dividend date, and if after the fact, as soon as the Funds become aware of the ex-dividend date. Interest income, which includes amortization of premium and accretion of discount on debt securities, is accrued as earned. Dividend and interest income on foreign securities is recorded gross of any withholding tax. Non-cash dividends included in dividend income, if any, are reported at the fair market value of the securities received. Other income and expenses are recorded on an accrual basis. Expenses that cannot be directly attributed to a Fund are apportioned among the funds in the Trust and other trusts or funds within the AMG Funds Family of Funds (collectively, the “AMG Funds Family”) based upon their relative average net assets or number of shareholders. Investment income, realized and unrealized capital gains and losses, the common expenses of each Fund, and certain fund level expense reductions, if any, are allocated on a pro-rata basis to each class based on the relative net assets of each class to the total net assets of each Fund.
d. DIVIDENDS AND DISTRIBUTIONS
Fund distributions resulting from net investment income will normally be declared and paid monthly for Core Plus Bond and annually for International Equity. Realized net capital gains distribution, if any, will normally be declared and paid at least annually in December. Distributions to shareholders are recorded on the ex-dividend date. Distributions are determined in accordance with federal income tax regulations, which may differ from net investment income and net realized capital gains for financial statement purposes (U.S. GAAP). Differences may be permanent or temporary. Permanent differences are reclassified among capital accounts in the financial statements to reflect their tax character. Permanent book and tax basis differences, if any, relating to shareholder distributions will result in reclassifications to paid-in capital. Temporary differences arise when certain items of income, expense and gain or loss are recognized in different periods for financial statement and tax purposes; these differences will reverse at some time in the future. There were no permanent differences during the year. Temporary differences are primarily due to wash sale loss deferrals for each Fund and amortization of premium for Core Plus Bond.
The tax character of distributions paid during the fiscal years ended October 31, 2023 and October 31, 2022 was as follows:
| | | | | | | | | | | | | | | | | | | | |
| | | Core Plus Bond | | | International Equity | | | | |
| | | | | |
Distributions paid from: | | | 2023 | | | | 2022 | | | | 2023 | | | | 2022 | | | | | |
| | | | | |
Ordinary income * | | | $5,401,412 | | | | $6,906,585 | | | | $618,979 | | | | $1,189,177 | | | | | |
| | | | | | | | | | | | | | | | | | | | |
| | | | | |
| | | $5,401,412 | | | | $6,906,585 | | | | $618,979 | | | | $1,189,177 | | | | | |
| | | | | | | | | | | | | | | | | | | | |
| * | For tax purposes, short-term capital gain distributions, if any, are considered ordinary income distributions. |
As of October 31, 2023, the components of distributable earnings (excluding unrealized appreciation/depreciation) on a tax basis consisted of:
| | | | | | | | |
| | | Core Plus Bond | | | International Equity | |
| | |
Capital loss carryforward | | | $39,871,579 | | | | $72,172,621 | |
| | |
Undistributed ordinary income | | | 149,964 | | | | 300,139 | |
31
| | |
| | | Notes to Financial Statements (continued) |
| | | |
| | | |
At October 31, 2023, the cost of investments and the aggregate gross unrealized appreciation and depreciation for federal income tax purposes were as follows:
| | | | | | | | | | | | | | | | |
| Fund | | Cost | | | Appreciation | | | Depreciation | | | Net Depreciation | |
| | | | |
Core Plus Bond | | | $139,600,851 | | | | $11,142 | | | | $(15,811,946 | ) | | | $(15,800,804 | ) |
| | | | |
International Equity | | | 12,704,728 | | | | 279,618 | | | | (2,664,022 | ) | | | (2,384,404 | ) |
e. FEDERAL TAXES
Each Fund currently qualifies as an investment company and intends to comply with the requirements under Subchapter M of the Internal Revenue Code of 1986, as amended, and to distribute substantially all of its taxable income and gains to its shareholders and to meet certain diversification and income requirements with respect to investment companies. The Investment Manager has analyzed the Funds’ tax positions taken on federal income tax returns as of October 31, 2023, and for all open tax years (generally, the three prior taxable years), and has concluded that no provision for federal income tax is required in the Funds’ financial statements. Additionally, the Investment Manager is not aware of any tax position for which it is reasonably possible that the total amounts of unrecognized tax benefit/detriment will change materially in the next twelve months.
Furthermore, based on each Fund’s understanding of the tax rules and rates related to income, gains and transactions for the foreign jurisdictions in which it invests, each Fund will provide for foreign taxes, and where appropriate, deferred foreign taxes.
f. CAPITAL LOSS CARRYOVERS AND DEFERRALS
As of October 31, 2023, the Funds had capital loss carryovers for federal income tax purposes as shown in the following chart. These amounts may be used to offset future realized capital gains indefinitely, and retain their character as short-term and/or long-term.
| | | | | | | | | | | | |
| Fund | | Short-Term | | | Long-Term | | | Total | |
| | | |
Core Plus Bond | | | $12,812,389 | | | | $27,059,190 | | | | $39,871,579 | |
| | | |
International Equity | | | 13,504,836 | | | | 58,667,785 | | | | 72,172,621 | |
For the fiscal year ended October 31, 2023, the Fund did not utilize capital loss carryovers.
g. CAPITAL STOCK
The Trust’s Trust Instrument authorizes for each Fund the issuance of an unlimited number of shares of beneficial interest, without par value. Each Fund records sales and repurchases of its capital stock on the trade date.
For the fiscal years ended October 31, 2023 and October 31, 2022, the capital stock transactions by class for the Funds were as follows:
| | | | | | | | | | | | | | | | | | | | | | | | | | | | | | | | |
| | | Core Plus Bond | | | International Equity | |
| | | | |
| | | October 31, 2023 | | | October 31, 2022 | | | October 31, 2023 | | | October 31, 2022 | |
| | | | | | | | |
| | | Shares | | | Amount | | | Shares | | | Amount | | | Shares | | | Amount | | | Shares | | | Amount | |
| | | | | | | | | | | | | | | | | | | | | | | | | | | | | | | | |
| | | | | | | | |
Class N: | | | | | | | | | | | | | | | | | | | | | | | | | | | | | | | | |
| | | | | | | | |
Shares sold | | | 44,667 | | | | $397,948 | | | | 63,211 | | | | $646,309 | | | | 10,575 | | | | $106,924 | | | | 1,520 | | | | $15,995 | |
| | | | | | | | |
Shares issued in reinvestment of distributions | | | 92,415 | | | | 819,979 | | | | 89,386 | | | | 865,139 | | | | 9,115 | | | | 80,760 | | | | — | | | | — | |
| | | | | | | | |
Shares redeemed | | | (844,903) | | | | (7,415,735) | | | | (1,019,201) | | | | (10,026,951) | | | | (136,049) | | | | (1,282,766) | | | | (214,158) | | | | (2,221,784) | |
| | | | | | | | | | | | | | | | | | | | | | | | | | | | | | | | |
| | | | | | | | |
Net decrease | | | (707,821) | | | | $(6,197,808) | | | | (866,604) | | | | $(8,515,503) | | | | (116,359) | | | | $(1,095,082) | | | | (212,638) | | | | $(2,205,789) | |
| | | | | | | | | | | | | | | | | | | | | | | | | | | | | | | | |
| | | | | | | | |
Class I: | | | | | | | | | | | | | | | | | | | | | | | | | | | | | | | | |
| | | | | | | | |
Shares sold | | | 2,930,686 | | | | $25,013,383 | | | | 1,780,546 | | | | $17,654,174 | | | | 41,299 | | | | $393,253 | | | | 143,741 | | | | $1,458,657 | |
| | | | | | | | |
Shares issued in reinvestment of distributions | | | 208,633 | | | | 1,850,456 | | | | 511,063 | | | | 5,000,170 | | | | 48,421 | | | | 421,744 | | | | 103,242 | | | | 1,097,464 | |
| | | | | | | | |
Shares redeemed | | | (6,246,321) | | | | (55,406,353) | | | | (6,823,930) | | | | (66,397,975) | | | | (556,414) | | | | (5,146,989) | | | | (3,955,603) | | | | (38,947,958) | |
| | | | | | | | | | | | | | | | | | | | | | | | | | | | | | | | |
| | | | | | | | |
Net decrease | | | (3,107,002) | | | | $(28,542,514) | | | | (4,532,321) | | | | $(43,743,631) | | | | (466,694) | | | | $(4,331,992) | | | | (3,708,620) | | | | $(36,391,837) | |
| | | | | | | | | | | | | | | | | | | | | | | | | | | | | | | | |
| | | | | | | | |
Class Z: | | | | | | | | | | | | | | | | | | | | | | | | | | | | | | | | |
| | | | | | | | |
Shares sold | | | 30,788 | | | | $277,047 | | | | 218,395 | | | | $2,147,015 | | | | 2 | | | | $15 | | | | — | | | | — | |
| | | | | | | | |
Shares issued in reinvestment of distributions | | | 12,686 | | | | 112,682 | | | | 39,257 | | | | 377,513 | | | | 12,589 | | | | 108,896 | | | | 7,801 | | | | $82,456 | |
| | | | | | | | |
Shares redeemed | | | (1,062,852) | | | | (9,669,016) | | | | (148,689) | | | | (1,418,109) | | | | (92,671) | | | | (893,773) | | | | (132,990) | | | | (1,410,030) | |
| | | | | | | | | | | | | | | | | | | | | | | | | | | | | | | | |
| | | | | | | | |
Net increase (decrease) | | | (1,019,378) | | | | $(9,279,287) | | | | 108,963 | | | | $1,106,419 | | | | (80,080) | | | | $(784,862) | | | | (125,189) | | | | $(1,327,574) | |
| | | | | | | | | | | | | | | | | | | | | | | | | | | | | | | | |
32
| | |
| | | Notes to Financial Statements (continued) |
| | | |
| | | |
h. REPURCHASE AGREEMENTS AND JOINT REPURCHASE AGREEMENTS
The Funds may enter into third-party and bilateral repurchase agreements for temporary cash management purposes and for reinvestment of cash collateral on securities lending transactions under the securities lending program offered by The Bank of New York Mellon (“BNYM”) (the “Securities Lending Program”) (collectively, “Repurchase Agreements”). The value of the underlying collateral, including accrued interest, must equal or exceed the value of the Repurchase Agreements during the term of the agreement. For joint repurchase agreements, the Funds participate on a pro rata basis with other clients of BNYM in their share of the underlying collateral under such joint repurchase agreements and in their share of proceeds from any repurchase or other disposition of the underlying collateral. The underlying collateral for all Repurchase Agreements is held by the Funds’ custodian or at the Federal Reserve Bank. If the seller defaults and the value of the collateral declines, or if bankruptcy proceedings commence with respect to the seller of the security, realization of the collateral by the Funds may be delayed or limited. Pursuant to the Securities Lending Program, the Funds are indemnified for such losses by BNYM on joint repurchase agreements.
At October 31, 2023, the Funds had no Repurchase Agreements outstanding.
i. FOREIGN CURRENCY TRANSLATION
The books and records of the Funds are maintained in U.S. Dollars. The value of investments, assets and liabilities denominated in currencies other than U.S. Dollars are translated into U.S. Dollars based upon current foreign exchange rates. Purchases and sales of foreign investments, income and expenses are converted into U.S. Dollars based on currency exchange rates prevailing on the respective dates of such transactions. Net realized and unrealized gain (loss) on foreign currency transactions represent: (1) foreign exchange gains and losses from the sale and holdings of foreign currencies; (2) gains and losses between trade date and settlement date on investment securities transactions and foreign currency exchange contracts; and (3) gains and losses from the difference between amounts of interest and dividends recorded and the amounts actually received.
The Funds do not isolate the net realized and unrealized gain or loss resulting from changes in exchange rates from the fluctuations in market prices of securities held. Such fluctuations are included with the net realized and unrealized gain or loss on investments.
j. DELAYED DELIVERY TRANSACTIONS AND WHEN-ISSUED SECURITIES
Core Plus Bond may enter into securities transactions on a delayed delivery or when issued basis. Payment and delivery may take place after the customary settlement period for that security. The price of the underlying securities and the date when the securities will be delivered and paid for are fixed at the time the transaction is negotiated. During the time a delayed delivery sell is outstanding, the contract is marked to market daily and equivalent deliverable securities are held for the transaction. The value of the securities purchased on a delayed delivery or when-issued basis are identified as such in each Fund’s Schedule of Portfolio Investments. With respect to purchase commitments, the Fund identifies securities as segregated in its records with a value at least equal to the amount of the commitment. Delayed delivery or when-issued securities that have been purchased from and sold to different brokers are reflected as an investment in securities and a forward sale commitment in the Fund’s Statement of Assets and Liabilities. For financial reporting purposes, the Fund does offset the receivable and payable for delayed delivery investments purchased and sold. Losses may
arise due to changes in the value of the underlying securities or if the counterparty does not perform under the contract, or if the issuer does not issue the securities due to political, economic, or other factors.
During the fiscal year ended October 31, 2023, Core Plus Bond entered into securities transactions on a delayed delivery or when issued basis. At October 31, 2023, there were no delayed delivery or when issued securities.
2. AGREEMENTS AND TRANSACTIONS WITH AFFILIATES
For each of the Funds, the Trust has entered into an investment advisory agreement under which the Investment Manager, a subsidiary and the U.S. wealth platform of Affiliated Managers Group, Inc. (“AMG”), serves as investment manager to the Funds and is responsible for the Funds’ overall administration and operations. The Investment Manager selects and recommends, subject to the approval of the Board and, in certain circumstances, shareholders, the Funds’ subadviser and monitors the subadviser’s investment performance, security holdings and investment strategies. Each Fund’s investment portfolio is managed by Beutel, Goodman & Company Ltd., who serves pursuant to a subadvisory agreement with the Investment Manager.
Investment management fees are paid directly by the Funds to the Investment Manager based on average daily net assets. For the fiscal year ended October 31, 2023, the Funds’ investment management fees were paid at the following annual rate of each Fund’s respective average daily net assets:
| | | | |
| |
Core Plus Bond | | | 0.23% | |
| |
International Equity | | | 0.54% | |
The fee paid to Beutel Goodman for its services as subadviser is paid out of the fee the Investment Manager receives from each Fund and does not increase the expenses of each Fund.
The Investment Manager has contractually agreed, through at least March 1, 2024, to waive management fees and/or pay or reimburse fund expenses in order to limit total annual Fund operating expenses after fee waiver and expense reimbursements (exclusive of taxes, interest (including interest incurred in connection with bank and custody overdrafts, and in connection with securities sold short), shareholder servicing fees, distribution and service (12b-1) fees, brokerage commissions and other transaction costs, dividends payable with respect to securities sold short, acquired fund fees and expenses and extraordinary expenses) of Core Plus Bond and International Equity to 0.43% and 0.76%, respectively, of each Fund’s average daily net assets (this annual rate or such other annual rate that may be in effect from time to time, the “Expense Cap”), subject to later reimbursement by the Funds in certain circumstances.
In general, for a period of up to 36 months after the date any amounts are paid, waived or reimbursed by the Investment Manager, the Investment Manager may recover such amounts from a Fund, provided that such repayment would not cause the Fund’s total annual operating expenses after fee waiver and expense reimbursements (exclusive of the items noted in the parenthetical above) to exceed either (i) the Expense Cap in effect at the time such amounts were paid, waived or reimbursed, or (ii) the Expense Cap in effect at the time of such repayment by the Fund.
The contractual expense limitation may only be terminated in the event the Investment Manager or a successor ceases to be the investment manager of a
33
| | |
| | | Notes to Financial Statements (continued) |
| | | |
| | | |
Fund or a successor fund, by mutual agreement between the Investment Manager and the Board, or in the event of a Fund’s liquidation unless the Fund is reorganized or is a party to a merger in which the surviving entity is successor to the accounting and performance information of a Fund.
For the fiscal year ended October 31, 2023, the Investment Manager’s expense reimbursements, and repayments of prior reimbursements by the Funds to the Investment Manager, if any, are as follows:
| | | | | | | | |
| | | Expense Reimbursements | | | Repayment of
Prior Reimbursements | |
| | |
Core Plus Bond | | | $118,067 | | | | — | |
| | |
International Equity | | | 99,415 | | | | — | |
At October 31, 2023, the Funds’ expiration of reimbursements subject to recoupment is as follows:
| | | | | | | | |
Expiration Period | | Core Plus Bond | | | International Equity | |
| | |
Less than 1 year | | | $227,438 | | | | $156,919 | |
| | |
1-2 years | | | 98,353 | | | | 63,329 | |
| | |
2-3 years | | | 118,067 | | | | 99,415 | |
| | | | | | | | |
| | |
Total | | | $443,858 | | | | $319,663 | |
| | | | | | | | |
The Trust, on behalf of the Funds, has entered into an amended and restated Administration Agreement under which the Investment Manager serves as the Funds’ administrator (the “Administrator”) and is responsible for certain aspects of managing the Funds’ operations, including administration and shareholder services to each Fund. Each Fund pays a fee to the Administrator at the rate of 0.15% per annum of the Fund’s average daily net assets for this service.
The Funds are distributed by AMG Distributors, Inc. (the “Distributor”), a wholly-owned subsidiary of the Investment Manager. The Distributor serves as the distributor and underwriter for each Fund and is a registered broker-dealer and member of the Financial Industry Regulatory Authority, Inc. (“FINRA”). Shares of each Fund will be continuously offered and will be sold directly to prospective purchasers and through brokers, dealers or other financial intermediaries who have executed selling agreements with the Distributor. Generally, the Distributor bears all or a portion of the expenses of providing services pursuant to the distribution agreement, including the payment of the expenses relating to the distribution of prospectuses for sales purposes and any advertising or sales literature.
The Trust has adopted a distribution and service plan (the “Plan”) with respect to the Class N shares of each Fund in accordance with the requirements of Rule 12b-1 under the 1940 Act and the requirements of the applicable rules of FINRA regarding asset-based sales charges. Pursuant to the Plan, each Fund may make payments to the Distributor for its expenditures in financing any activity primarily intended to result in the sale of each Fund’s Class N shares and for maintenance and personal service provided to existing shareholders of that class. The Plan authorizes payments to the Distributor of up to 0.25% annually of each Fund’s average daily net assets attributable to the Class N shares.
For the Class N shares of International Equity and for each of the Class I shares, the Board has approved reimbursement payments to the Investment Manager for shareholder servicing expenses (“shareholder servicing fees”) incurred.
Shareholder servicing fees include payments to financial intermediaries, such as broker-dealers (including fund supermarket platforms), banks, and trust companies who provide shareholder record keeping, account servicing and other services. The Class N and Class I shares may reimburse the Investment Manager for the actual amount incurred up to a maximum annual rate of each Class’s average daily net assets as shown in the table below.
The impact on the annualized expense ratios for the fiscal year ended October 31, 2023, was as follows:
| | | | | | | | |
| Fund | | Maximum Annual
Amount
Approved | | | Actual
Amount
Incurred | |
| | |
Core Plus Bond | | | | | | | | |
| | |
Class I | | | 0.05% | | | | 0.05% | |
| | |
International Equity | | | | | | | | |
| | |
Class N | | | 0.15% | | | | 0.15% | |
| | |
Class I | | | 0.10% | | | | 0.10% | |
The Board provides supervision of the affairs of the Trust and other trusts within the AMG Funds Family. The Trustees of the Trust who are not affiliated with the Investment Manager receive an annual retainer and per meeting fees for regular, special and telephonic meetings, and they are reimbursed for out-of-pocket expenses incurred while carrying out their duties as Board members. The Chairman of the Board and the Audit Committee Chair receive additional annual retainers. On October 10, 2023, the shareholders of the Trust elected Trustees, including two new Trustees who are not “interested persons” of the Funds within the meaning of the 1940 Act. Certain Trustees and Officers of the Funds are Officers and/or Directors of the Investment Manager, AMG and/or the Distributor.
The Securities and Exchange Commission (the “SEC”) granted an exemptive order that permits certain eligible funds in the AMG Funds Family to lend and borrow money for certain temporary purposes directly to and from other eligible funds in the AMG Funds Family. Participation in this interfund lending program is voluntary for both the borrowing and lending funds, and an interfund loan is only made if it benefits each participating fund. The Administrator manages the program according to procedures approved by the Board, and the Board monitors the operation of the program. An interfund loan must comply with certain conditions set out in the exemptive order, which are designed to assure fairness and protect all participating funds. The interest earned and interest paid on interfund loans are included on the Statement of Operations as interest income and interest expense, respectively. At October 31, 2023, the Funds had no interfund loans outstanding.
The following Funds utilized the interfund loan program during the fiscal year ended October 31, 2023 as follows:
| | | | | | | | | | | | | | | | |
| Fund | | Average
Lent | | | Number
of Days | | | Interest
Earned | | | Average
Interest Rate | |
| | | | |
Core Plus Bond | | | $144,834 | | | | 1 | | | | $19 | | | | 4.700% | |
| | | | |
| Fund | | Average
Borrowed | | | Number
of Days | | | Interest
Paid | | | Average
Interest Rate | |
| | | | |
Core Plus Bond | | | $1,273,312 | | | | 8 | | | | $1,554 | | | | 5.568% | |
| | | | |
International Equity | | | 537,754 | | | | 14 | | | | 934 | | | | 4.529% | |
34
| | |
| | | Notes to Financial Statements (continued) |
| | | |
| | | |
3. PURCHASES AND SALES OF SECURITIES
Purchases and sales of securities (excluding short-term securities and U.S. Government Obligations) for the fiscal year ended October 31, 2023, were as follows:
| | | | | | | | |
| | | Long Term Securities | |
| | |
| Fund | | Purchases | | | Sales | |
| | |
Core Plus Bond | | | $36,967,385 | | | | $77,729,141 | |
| | |
International Equity | | | 963,327 | | | | 7,059,354 | |
Core Plus Bond’s purchases and sales of U.S. Government Obligations for the fiscal year ended October 31, 2023 were $109,232,549 and $113,909,140, respectively. International Equity had no purchases or sales of U.S. Government Obligations for the fiscal year ended October 31, 2023.
4. PORTFOLIO SECURITIES LOANED
The Funds participate in the Securities Lending Program providing for the lending of securities to qualified borrowers. Securities lending income includes earnings of such temporary cash investments, plus or minus any rebate to a borrower. These earnings (after any rebate) are then divided between BNYM, as a fee for its services under the Securities Lending Program, and the Funds, according to agreed-upon rates. Collateral on all securities loaned is accepted in cash, U.S. Treasury Obligations or U.S. Government Agency Obligations. Collateral is maintained at a minimum level of 102% (105% in the case of certain foreign securities) of the market value, plus interest, if applicable, of investments on loan. It is the Funds’ policy to obtain additional collateral from or return excess collateral to the borrower by the end of the next business day, following the valuation date of the securities loaned. Therefore, the value of the collateral held may be temporarily less than the value of the securities on loan. Lending securities entails a risk of loss to the Funds if and to the extent that the market value of the securities loaned were to increase and the borrower did not increase the collateral accordingly, and the borrower fails to return the securities. Under the terms of the Securities Lending Program, the Funds are indemnified for such losses by BNYM. Cash collateral is held in separate omnibus accounts managed by BNYM, who is authorized to exclusively enter into joint repurchase agreements for that cash collateral. Securities collateral is held in separate omnibus accounts managed by BNYM and cannot be sold or pledged. BNYM bears the risk of any deficiency in the amount of the cash collateral available for return to the borrower due to any loss on the collateral invested. Loans of securities are terminable at any time and the borrower, after notice, is required to return borrowed securities as soon as practical, which is normally within three business days.
The Funds did not have any securities on loan at October 31, 2023.
5. FOREIGN SECURITIES
The Funds invest in securities of foreign entities and in instruments denominated in foreign currencies which involve risks not typically associated with investments in domestic securities, such as exposure to currency fluctuations, less developed or less efficient trading markets, political instability, a lack of company information, differing auditing and legal standards, and, potentially, less liquidity. A Fund’s performance will be influenced by political, social and economic factors affecting companies in emerging market countries. Emerging market countries generally have economic structures that are less diverse and mature, and political systems
that are less stable, than those of developed countries. Realized gains in certain countries may be subject to foreign taxes at the Fund level and the Fund would pay such foreign taxes at the appropriate rate for each jurisdiction.
6. COMMITMENTS AND CONTINGENCIES
Under the Trust’s organizational documents, its Trustees and Officers are indemnified against certain liabilities arising out of the performance of their duties to the Trust. In addition, in the normal course of business, the Funds may enter into contracts and agreements that contain a variety of representations and warranties, which provide general indemnifications. The maximum exposure to the Funds under these arrangements is unknown, as this would involve future claims that may be made against a Fund that have not yet occurred. However, based on experience, the Funds had no prior claims or losses and expect the risks of loss to be remote.
7. RISKS ASSOCIATED WITH HIGH YIELD SECURITIES
Investing in high yield securities involves greater risks and considerations not typically associated with U.S. Government and other high quality/investment grade securities. High yield securities are generally below investment grade securities and do not have an established retail secondary market. Economic downturns may disrupt the high yield market and impair the issuer’s ability to repay principal and interest. Also, an increase in interest rates would likely have an adverse impact on the value of such obligations and could cause the securities to become less liquid.
8. DERIVATIVE INSTRUMENTS
The following disclosures contain information on how and why the Funds use derivative instruments, the credit risk and how derivative instruments affect the Funds’ financial position, and results of operations. The location and fair value amounts of these instruments on the Statement of Assets and Liabilities, and the realized gains and losses and changes in unrealized appreciation and depreciation on the Statement of Operations, each categorized by type of derivative contract, are included in a table at the end of the applicable Fund’s Schedule of Portfolio Investments.
For the fiscal year ended October 31, 2023, the average monthly balances of derivative financial instruments outstanding were as follows:
| | | | |
| | | Core Plus Bond | |
| |
Foreign Currency Exchange Contracts | | | | |
| |
Average U.S. Dollar amount | | | $1,093,625 | |
9. FORWARD FOREIGN CURRENCY CONTRACTS
During the fiscal year ended October 31, 2023, Core Plus Bond invested in forward foreign currency contracts. The Fund may enter into forward currency contracts for any purpose, including to attempt to hedge currency exposure or to enhance return. A forward foreign currency contract is an agreement between a fund and another party to buy or sell a currency at a set price at a future date. The market value of the contract will fluctuate with changes in currency exchange rates. The contract is marked-to-market daily, and the change in market value is recorded as an unrealized appreciation or depreciation. Risks may arise upon entering into these contracts from the potential inability of counterparties to meet the terms of
35
| | |
| | | Notes to Financial Statements (continued) |
| | | |
| | | |
their contracts and from unanticipated movements in the value of a foreign currency relative to the U.S. Dollar.
10. MORTGAGE-BACKED SECURITIES
Core Plus Bond may invest in mortgage-backed securities (“MBS”). These securities represent interests in pools of mortgage loans and they provide holders with payments consisting of both principal and interest as the mortgages in the underlying mortgage pools are paid. The timely payment of principal and interest on MBS issued or guaranteed by Ginnie Mae is backed by Ginnie Mae and the full faith and credit of the U.S. government. MBS issued by U.S. government agencies or instrumentalities other than Ginnie Mae are not full faith and credit obligations of the U.S. government. Certain obligations, such as those issued by the Federal Home Loan Banks, Fannie Mae and Freddie Mac are supported only by the credit of the issuer. MBS issued by private issuers are not government securities and are not guaranteed by any government agency. They are secured by the underlying collateral of the private issuer. Yields on privately issued MBS tend to be higher than those of government-backed issues. However, risk of loss due to default and sensitivity to interest rate fluctuations are also higher. Core Plus Bond invests in collateralized mortgage obligations (“CMOs”), collateralized loan obligations (“CLOs”) and real estate mortgage investment conduits (“REMICs”). A CMO and/or REMIC is a bond that is collateralized by a pool of MBS. A CLO is a bond that is collateralized by a financial institution’s receivables from loans. These MBS pools
are divided into classes with each class having its own characteristics. The different classes are retired in sequence as the underlying mortgages or loans are repaid.
11. FLOATING RATE SENIOR LOAN INTERESTS
Core Plus Bond may invest in Floating Rate Senior Loan Interests (“Senior Loans”). These are senior, secured loans made to companies whose debt is below investment grade as well as investments with similar economic characteristics. Senior Loans typically hold a first lien priority and, unless otherwise indicated, are required to pay interest at floating rates that are periodically reset by reference to a base lending rate plus a spread. Senior Loans are generally not registered under the Securities Act of 1933 and often incorporate certain restrictions on resale and cannot be sold publicly. Senior Loans often require prepayments from excess cash flow or permit the borrower to repay at its election. The degree to which borrowers repay, whether as a contractual requirement or at their election, cannot be predicted. As a result, the actual maturity may be substantially less than the stated maturity. The interest rate on this Senior Loan is subject to a base lending rate plus a spread. These base lending rates are primarily the Secured Overnight Financing Rate (SOFR) and secondarily the prime rate offered by one or more major U.S. banks (“Prime”). As of October 31, 2023, the Senior Loans held by Core Plus Bond transitioned from LIBOR to SOFR.
12. MASTER NETTING AGREEMENTS
The Funds may enter into master netting agreements with their counterparties for the Securities Lending Program, Repurchase Agreements and derivatives, which provide the right, in the event of default (including bankruptcy or insolvency) for the non-defaulting party to liquidate the collateral and calculate net exposure to the defaulting party or request additional collateral. For financial reporting purposes, the Funds do not offset financial assets and financial liabilities that are subject to master netting agreements in the Statement of Assets and Liabilities. For derivatives transactions, see Note 8. At October 31, 2023, the Funds had no securities lending transactions and no Repurchase Agreements outstanding.
The following table is a summary of the Funds’ open derivatives that are subject to a master netting agreement as of October 31, 2023:
| | | | | | | | | | | | | | | | | | | | |
| | | | | | Gross Amount Not Offset in the
Statement of Assets and Liabilities | | | | | | | |
| | | | | |
| Fund | | Gross Amounts of Assets Presented in the Statement of Assets and Liabilities | | | Offset Amount | | | Net Asset Balance | | | Collateral Received | | | Net Amount | |
| | | | | |
| | | | | | | | | | | | | | | | | | | | |
| | | | | |
Core Plus Bond | | | | | | | | | | | | | | | | | | | | |
| | | | | |
CIBC World Markets Corp. | | | $36,483 | | | | — | | | | $36,483 | | | | — | | | | $36,483 | |
13. SUBSEQUENT EVENTS
The Funds have determined that no material events or transactions occurred through the issuance date of the Funds’ financial statements which require an additional disclosure in or adjustment of the Funds’ financial statements.
36
| | |
| | | Report of Independent Registered Public Accounting Firm |
| | | |
| | | |
To the Board of Trustees of AMG Funds IV and Shareholders of AMG Beutel Goodman Core Plus Bond Fund and AMG Beutel Goodman International Equity Fund
Opinions on the Financial Statements
We have audited the accompanying statements of assets and liabilities, including the schedules of portfolio investments, of AMG Beutel Goodman Core Plus Bond Fund and AMG Beutel Goodman International Equity Fund (two of the funds constituting AMG Funds IV, hereafter collectively referred to as the “Funds”) as of October 31, 2023, the related statements of operations for the year ended October 31, 2023, the statements of changes in net assets for each of the two years in the period ended October 31, 2023, including the related notes, and the financial highlights for each of the five years in the period ended October 31, 2023 (collectively referred to as the “financial statements”). In our opinion, the financial statements present fairly, in all material respects, the financial position of each of the Funds as of October 31, 2023, the results of each of their operations for the year then ended, the changes in each of their net assets for each of the two years in the period ended October 31, 2023 and each of the financial highlights for each of the five years in the period ended October 31, 2023 in conformity with accounting principles generally accepted in the United States of America.
Basis for Opinions
These financial statements are the responsibility of the Funds’ management. Our responsibility is to express an opinion on the Funds’ financial statements based on our audits. We are a public accounting firm registered with the Public Company Accounting Oversight Board (United States) (PCAOB) and are required to be independent with respect to the Funds in accordance with the U.S. federal securities laws and the applicable rules and regulations of the Securities and Exchange Commission and the PCAOB.
We conducted our audits of these financial statements in accordance with the standards of the PCAOB. Those standards require that we plan and perform the audit to obtain reasonable assurance about whether the financial statements are free of material misstatement, whether due to error or fraud.
Our audits included performing procedures to assess the risks of material misstatement of the financial statements, whether due to error or fraud, and performing procedures that respond to those risks. Such procedures included examining, on a test basis, evidence regarding the amounts and disclosures in the financial statements. Our audits also included evaluating the accounting principles used and significant estimates made by management, as well as evaluating the overall presentation of the financial statements. Our procedures included confirmation of securities owned as of October 31, 2023 by correspondence with the custodian, transfer agent, agent bank and brokers; when replies were not received from brokers, we performed other auditing procedures. We believe that our audits provide a reasonable basis for our opinions.
/s/ PricewaterhouseCoopers LLP
Boston, Massachusetts
December 22, 2023
We have served as the auditor of one or more investment companies in the AMG Funds Family since 1993.
37
| | |
| | | Other Information (unaudited) |
| | | |
| | | |
TAX INFORMATION
AMG Beutel Goodman Core Plus Bond Fund and AMG Beutel Goodman International Equity Fund each hereby designate the maximum amount allowable of its net taxable income as qualified dividends as provided in the Jobs and Growth Tax Relief Reconciliation Act of 2003. The 2022/2023 Form 1099-DIV you receive for each Fund will show the tax status of all distributions paid to you during the year.
In accordance with federal tax law, the following Fund elects to provide foreign taxes paid and the income sourced from foreign countries. Accordingly, the Fund hereby makes the following designations regarding its taxable period ended October 31, 2023:
AMG Beutel Goodman International Equity Fund
 The total amount of taxes paid and income sourced from foreign countries was $46,071 and $487,161, respectively.
Pursuant to section 852 of the Internal Revenue Code, AMG Beutel Goodman Core Plus Bond Fund and AMG Beutel Goodman International Equity Fund each hereby designate $0 and $0, respectively, as a capital gain distribution with respect to the taxable period ended October 31, 2023, or if subsequently determined to be different, the net capital gains of such fiscal year.
PROXY VOTE
A special meeting of the shareholders of AMG Funds IV (the “Trust”) was held on October 10, 2023, to vote on a proposal to elect trustees to the Board of Trustees of the Trust. The proposal and results of the vote are described below. Jill R. Cuniff, Kurt A. Keilhacker, Peter W. MacEwen, Steven J. Paggioli, Eric Rakowski, Victoria L. Sassine and Garret W. Weston were elected by shareholders at the special meeting on October 10, 2023. Bruce B. Bingham, an incumbent Trustee, will continue to serve as a Trustee of the Trust until his retirement on December 31, 2023.
| | | | | | | | |
| AMG Funds IV | | All Funds in Trust* |
| | |
| Election of Trustees 1 | | For | | Withheld |
| | |
Jill R. Cuniff | | | 123,476,732 | | | | 9,260,973 | |
| | |
Kurt A. Keilhacker | | | 131,677,070 | | | | 1,060,634 | |
| | |
Peter W. MacEwen | | | 123,401,874 | | | | 9,335,830 | |
| | |
Steven J. Paggioli | | | 130,832,753 | | | | 1,904,951 | |
| | |
Eric Rakowski | | | 130,620,379 | | | | 2,117,325 | |
| | |
Victoria L. Sassine | | | 131,755,717 | | | | 981,987 | |
| | |
Garret W. Weston | | | 131,970,391 | | | | 767,313 | |
1 Ms. Cuniff and Mr. MacEwen were newly elected to the Board of Trustees on October 10, 2023; Messrs. Keilhacker, Paggioli, Rakowski, and Weston and Ms. Sassine are incumbent Trustees.
*Rounded to the nearest share.
38
| | |
| | | AMG Funds Trustees and Officers |
| | | |
| | | |
| | | | |
The Trustees and Officers of the Trust, their business addresses, principal occupations for the past five years and ages are listed below. The Trustees provide broad supervision over the affairs of the Trust and the Funds. The Trustees are experienced executives who meet periodically throughout the year to oversee the Funds’ activities, review contractual arrangements with companies that provide services to the Funds, and | | review the Funds’ performance. Unless otherwise noted, the address of each Trustee or Officer is the address of the Trust: 680 Washington Blvd., Suite 500, Stamford, CT. 06901. There is no stated term of office for Trustees. Trustees serve until their resignation, retirement or removal in accordance with the Trust’s organizational documents and policies adopted by the Board from time to time. | | The Chairman of the Board, the President, the Treasurer and the Secretary and such other Officers as the Trustees may in their discretion from time to time elect each hold office until his or her successor is elected and qualified, or until he or she sooner dies, resigns, is removed or becomes disqualified. Each Officer holds office at the pleasure of the Trustees. |
Independent Trustees
The following Trustees are not “interested persons” of the Trust within the meaning of the 1940 Act:
| | |
Number of Funds Overseen in Fund Complex | | Name, Age, Principal Occupation(s) During Past 5 Years and Other Directorships Held by Trustee |
• Trustee since 2014 • Oversees 41 Funds in Fund Complex | | Bruce B. Bingham, 75* Partner, Hamilton Partners (real estate development firm) (1987-Present); Director of The Yacktman Funds, Inc. (2 portfolios) (2000-2012). |
• Trustee since 2023 • Oversees 41 Funds in Fund Complex | | Jill R. Cuniff, 59** Director of Harding, Loevner Funds, Inc. (12 portfolios) (2018-Present); Retired (2016-Present); President & Portfolio Manager, Edge Asset Management (2009-2016); President & Chief Investment Officer, Morley Financial Services (2001-2009); President, Union Bond & Trust Company (2001-2009). |
• Trustee since 2014 • Chairman of the Audit Committee since 2020 • Oversees 43 Funds in Fund Complex | | Kurt A. Keilhacker, 60 Managing Partner, Elementum Ventures (2013-Present); Managing Partner, TechFund Europe (2000-Present); Managing Partner, TechFund Capital (1997-Present); Adjunct Professor, University of San Francisco (2022-Present); Trustee, Wheaton College (2018-Present); Director, Wheaton College Trust Company, N.A. (2018-Present). |
• Trustee since 2023 • Oversees 41 Funds in Fund Complex | | Peter W. MacEwen, 59** Private investor (2019-Present); Affiliated Managers Group, Inc. (2003-2018): Chief Administrative Officer, Office of the CEO (2013-2018); Senior Vice President, Finance (2007-2013); Vice President, Finance (2003-2007). |
• Trustee since 2010 • Oversees 41 Funds in Fund Complex | | Steven J. Paggioli, 73 Independent Consultant (2002-Present); Trustee, Professionally Managed Portfolios (28 portfolios); Independent Director, Muzinich BDC, Inc. (business development company) (2019-Present); Director, The Wadsworth Group; Independent Director, Chase Investment Counsel (2008–2019); Executive Vice President, Secretary and Director, Investment Company Administration, LLC and First Fund Distributors, INC. (1990-2001). |
• Independent Chairman of the Board of Trustees since 2017; • Chairman of the Governance Committee since 2017 • Trustee since 2010 • Oversees 43 Funds in Fund Complex | | Eric Rakowski, 65 Professor of Law, University of California at Berkeley School of Law (1990-Present); Tax Attorney at Davis Polk & Wardwell and clerked for Judge Harry T. Edwards of the U.S. Court of Appeals for the District of Columbia Circuit and for Justice William J. Brennan Jr. of the U.S. Supreme Court; Trustee of Parnassus Funds (4 portfolios) (2021-Present); Trustee of Parnassus Income Funds (2 portfolios) (2021-Present); Director of Harding, Loevner Funds, Inc. (10 portfolios); Trustee of Third Avenue Trust (3 portfolios) (2002-2019); Trustee of Third Avenue Variable Trust (1 portfolio) (2002-2019). |
• Trustee since 2014 • Oversees 43 Funds in Fund Complex | | Victoria L. Sassine, 58 Adjunct Professor, Babson College (2007–Present); Director, Board of Directors, PRG Group (2017-Present); CEO, Founder, Scale Smarter Partners, LLC (2018-Present); Adviser, EVOFEM Biosciences (2019-Present); Chairperson of the Board of Directors of Business Management Associates (2018 to 2019). |
*Mr. Bingham will retire from the Board of Trustees of the Trust on December 31, 2023.
**Ms. Cuniff and Mr. MacEwen were elected to the Board of Trustees by the shareholders of the Trust on October 10, 2023.
39
| | |
| | | AMG Funds Trustees and Officers (continued) |
| | | |
| | | |
Interested Trustee
The Trustee in the following table is an “interested person” of the Trust within the meaning of the 1940 Act.
| | |
Number of Funds Overseen in
Fund Complex | | Name, Age, Principal Occupation(s) During Past 5 Years and Other Directorships Held by
Trustee |
• Trustee since 2021 • Oversees 43 Funds in Fund Complex | | Garret W. Weston, 42 Affiliated Managers Group, Inc. (2008-Present): Managing Director, Head of Affiliate Product Strategy and Development (2023-Present), Managing Director, Co-Head of Affiliate Engagement, Distribution (2021-2022), Senior Vice President, Office of the CEO (2019-2021), Senior Vice President, Affiliate Development (2016-2019), Vice President, Office of the CEO (2015-2016), Vice President, New Investments (2008-2015); Associate, Madison Dearborn Partners (2006-2008); Analyst, Merrill Lynch (2004-2006). |
Officers
| | |
Position(s) Held with Fund and Length of Time Served | | Name, Age, Principal Occupation(s) During Past 5 Years |
• President since 2018 • Principal Executive Officer since 2018 • Chief Executive Officer since 2018 • Chief Operating Officer since 2016 | | Keitha L. Kinne, 65 Managing Director, Head of Platform and Operations, AMG Funds LLC (2023-Present); Chief Operating Officer, AMG Funds LLC (2007-Present); Chief Investment Officer, AMG Funds LLC (2008-Present); President and Principal, AMG Distributors, Inc. (2018-Present); Chief Operating Officer, AMG Distributors, Inc. (2007-Present); President, Chief Executive Officer and Principal Executive Officer, AMG Funds, AMG Funds I, AMG Funds II, AMG Funds III and AMG Funds IV (2018-Present); Chief Operating Officer, AMG Funds, AMG Funds I, AMG Funds II, and AMG Funds III (2007-Present); Chief Operating Officer, AMG Funds IV (2016-Present); Chief Operating Officer and Chief Investment Officer, Aston Asset Management, LLC (2016); President and Principal Executive Officer, AMG Funds, AMG Funds I, AMG Funds II and AMG Funds III (2012-2014); Managing Partner, AMG Funds LLC (2007-2014); President and Principal, AMG Distributors, Inc. (2012-2014); Managing Director, Legg Mason & Co., LLC (2006-2007); Managing Director, Citigroup Asset Management (2004-2006). |
• Secretary since 2015 • Chief Legal Officer since 2015 | | Mark J. Duggan, 58 Managing Director and Senior Counsel, AMG Funds LLC (2021-Present); Senior Vice President and Senior Counsel, AMG Funds LLC (2015-2021); Secretary and Chief Legal Officer, AMG Funds, AMG Funds I, AMG Funds II, AMG Funds III and AMG Funds IV (2015-Present); Attorney, K&L Gates, LLP (2009-2015). |
• Chief Financial Officer since 2017 • Treasurer since 2017 • Principal Financial Officer since 2017 • Principal Accounting Officer since 2017 | | Thomas G. Disbrow, 57 Vice President, Mutual Fund Treasurer & CFO, AMG Funds, AMG Funds LLC (2017-Present); Chief Financial Officer, Principal Financial Officer, Treasurer and Principal Accounting Officer, AMG Funds, AMG Funds I, AMG Funds II, AMG Funds III and AMG Funds IV (2017-Present); Managing Director - Global Head of Traditional Funds Product Control, UBS Asset Management (Americas), Inc. (2015-2017); Managing Director - Head of North American Funds Treasury, UBS Asset Management (Americas), Inc. (2011-2015). |
• Deputy Treasurer since 2017 | | John A. Starace, 53 Vice President, Mutual Fund Accounting, AMG Funds LLC (2021-Present); Director, Mutual Fund Accounting, AMG Funds LLC (2017-2021); Vice President, Deputy Treasurer of Mutual Funds Services, AMG Funds LLC (2014-2017); Deputy Treasurer, AMG Funds, AMG Funds I, AMG Funds II, AMG Funds III and AMG Funds IV (2017-Present); Vice President, Citi Hedge Fund Services (2010-2014); Audit Senior Manager (2005-2010) and Audit Manager (2001-2005), Deloitte & Touche LLP. |
• Chief Compliance Officer and Sarbanes-Oxley Code of Ethics Compliance Officer since 2019 • Anti-Money Laundering Compliance Officer since 2022 | | Patrick J. Spellman, 49 Vice President, Chief Compliance Officer, AMG Funds LLC (2017-Present); Chief Compliance Officer, AMG Distributors, Inc. (2010-Present); Chief Compliance Officer and Sarbanes-Oxley Code of Ethics Compliance Officer, AMG Funds, AMG Funds I, AMG Funds II, AMG Funds III and AMG Funds IV (2019-Present); Anti-Money Laundering Compliance Officer, AMG Funds, AMG Funds I, AMG Funds II, and AMG Funds III (2014-2019; 2022-Present); Anti-Money Laundering Compliance Officer, AMG Funds IV (2016-2019; 2022-Present); Senior Vice President, Chief Compliance Officer, AMG Funds LLC (2011-2017); Compliance Manager, Legal and Compliance, Affiliated Managers Group, Inc. (2005-2011). |
• Assistant Secretary since 2016 | | Maureen M. Kerrigan, 38 Vice President, Senior Counsel, AMG Funds LLC (2021-Present); Vice President, Counsel, AMG Funds LLC (2019-2021); Director, Counsel, AMG Funds LLC (2017-2018); Vice President, Counsel, AMG Funds LLC (2015-2017); Assistant Secretary, AMG Funds, AMG Funds I, AMG Funds II, AMG Funds III and AMG Funds IV (2016-Present); Associate, Ropes & Gray LLP (2011-2015); Law Fellow, Massachusetts Appleseed Center for Law and Justice (2010-2011). |
40
| | |
| | | Annual Renewal of Investment Management and Subadvisory Agreements |
| | | |
| | | |
| | | | | | | | |
AMG Beutel Goodman Core Plus Bond Fund and AMG Beutel Goodman International Equity Fund: Approval of Investment Advisory and Subadvisory Agreements on June 21, 2023 At an in-person meeting held on June 21, 2023, the Board of Trustees (the “Board” or the “Trustees”), and separately a majority of the Trustees who are not “interested persons” of AMG Funds IV (the “Trust”) (the “Independent Trustees”), approved (i) the Investment Advisory Agreement, as amended pursuant to letter agreements at any time prior to the date of the meeting, with AMG Funds LLC (the “Investment Manager”) for each of AMG Beutel Goodman Core Plus Bond Fund and AMG Beutel Goodman International Equity Fund (each, a “Fund,” and collectively, the “Funds”) and separately Amendment No. 1 thereto dated October 1, 2016 (collectively, the “Investment Advisory Agreement”); and (ii) the Subadvisory Agreement, as amended at any time prior to the date of the meeting, with the Subadviser for each Fund (collectively, the “Subadvisory Agreements”). The Independent Trustees were separately represented by independent legal counsel in connection with their consideration of the approval of these agreements. In considering the Investment Advisory Agreement and the Subadvisory Agreements, the Trustees reviewed a variety of materials relating to each Fund, the Investment Manager and the Subadviser, including the nature, extent and quality of services, comparative performance, fee and expense information for an appropriate peer group of similar mutual funds for each Fund (each, a “Peer Group”), performance information for the relevant benchmark index for each Fund (each, a “Fund Benchmark”), other relevant matters, and other information provided to them on a periodic basis throughout the year. Prior to voting, the Independent Trustees: (a) reviewed the foregoing information with their independent legal counsel; (b) received materials from their independent legal counsel discussing the legal standards applicable to their consideration of the Investment Advisory Agreement and the Subadvisory Agreements; and (c) met with their independent legal counsel in private sessions at which no representatives of management were present. NATURE, EXTENT AND QUALITY OF SERVICES In considering the nature, extent and quality of the services provided by the Investment Manager, the Trustees reviewed information provided by the Investment Manager at the June 21, 2023 and prior meetings relating to the Investment Manager’s operations and personnel. Among other things, the | | | | Investment Manager provided financial information, information about its supervisory and professional staff and descriptions of its organizational and management structure. The Trustees also took into account information provided periodically throughout the previous year by the Investment Manager in Board meetings relating to the performance of its duties with respect to the Funds and the Trustees’ knowledge of the Investment Manager’s management and the quality of the performance of the Investment Manager’s duties under the Investment Advisory Agreement and Administration Agreement. In the course of their deliberations regarding the Investment Manager, the Trustees evaluated, among other things: (a) the extent and quality of the Investment Manager’s oversight of the operation and management of the Funds; (b) the quality of the Investment Manager’s oversight of the performance by the Subadviser of its portfolio management duties; (c) the Investment Manager’s ability to supervise the Funds’ other service providers; and (d) the Investment Manager’s compliance program. The Trustees also took into account that, in performing its functions under the Investment Advisory Agreement and supervising the Subadviser, the Investment Manager: performs periodic detailed analyses and reviews of the performance by the Subadviser of its obligations to each Fund, including without limitation, analysis and review of portfolio and other compliance matters and review of the Subadviser’s investment performance with respect to a Fund; prepares and presents periodic reports to the Board regarding the investment performance of the Subadviser and other information regarding the Subadviser, at such times and in such forms as the Board may reasonably request; reviews and considers any changes in the personnel of the Subadviser responsible for performing the Subadviser’s obligations and makes appropriate reports to the Board; reviews and considers any changes in the ownership or senior management of the Subadviser and makes appropriate reports to the Board; performs periodic in-person, telephonic or videoconference diligence meetings, including with respect to compliance matters, with representatives of the Subadviser; assists the Board and management of the Trust in developing and reviewing information with respect to the initial approval of each Subadvisory Agreement and annual consideration of each Subadvisory Agreement thereafter; prepares recommendations with respect to the continued retention of the Subadviser or the replacement of the Subadviser, including at the request of the Board; identifies potential successors to, or replacements of, the Subadviser or potential additional subadvisers, | | | | including performing appropriate due diligence, and developing and presenting to the Board a recommendation as to any such successor, replacement, or additional subadviser, including at the request of the Board; designates and compensates from its own resources such personnel as the Investment Manager may consider necessary or appropriate to the performance of its services; and performs such other review and reporting functions as the Board shall reasonably request consistent with the Investment Advisory Agreement and applicable law. The Trustees noted the affiliation of the Subadviser with the Investment Manager, noting any potential conflicts of interest. The Trustees also took into account the financial condition of the Investment Manager with respect to its ability to provide the services required under the Investment Advisory Agreement and the Investment Manager’s undertaking to maintain contractual expense limitations for the Funds. The Trustees also considered the Investment Manager’s risk management processes. The Trustees also reviewed information relating to the Subadviser’s operations and personnel and the investment philosophy, strategies and techniques (its “Investment Strategy”) used in managing each Fund. Among other things, the Trustees reviewed information on portfolio management and other professional staff, information regarding the Subadviser’s organizational and management structure and the Subadviser’s brokerage policies and practices. The Trustees considered specific information provided regarding the experience of the individuals at the Subadviser with portfolio management responsibility for each Fund, including the information set forth in the Fund’s prospectus and statement of additional information. In the course of their deliberations, the Trustees evaluated, among other things: (a) the services rendered by the Subadviser in the past; (b) the qualifications and experience of the Subadviser’s personnel; and (c) the Subadviser’s compliance program. The Trustees also took into account the financial condition of the Subadviser with respect to its ability to provide the services required under the Subadvisory Agreements. The Trustees also considered the Subadviser’s risk management processes. PERFORMANCE The Board considered each Fund’s net performance during relevant time periods as compared to the Fund’s Peer Group and Fund Benchmark, considered the gross performance of each Fund as compared to the Subadviser’s relevant performance composite that utilizes a similar investment strategy and |
41
| | |
| | | Annual Renewal of Investment Management and Subadvisory Agreements (continued) |
| | | |
| | | |
| | | | | | | | |
approach, and noted that the Board reviews on a quarterly basis detailed information about both a Fund’s performance results and portfolio composition, as well as the Subadviser’s Investment Strategy. The Board was mindful of the Investment Manager’s expertise, resources and attention to monitoring the Subadviser’s performance, investment style and risk-adjusted performance with respect to the Funds and its discussions with the management of the Funds’ subadviser during the period regarding the factors that contributed to the performance of the Funds. With respect to AMG Beutel Goodman Core Plus Bond Fund, among other information relating to the Fund’s performance, the Trustees noted that the Fund’s performance for Class I shares (which share class has one of the earliest inception dates and the largest amount of assets of all the share classes of the Fund) for the 1-year, 3-year, 5-year and 10-year periods ended March 31, 2023 was above, above, below, and above, respectively, the median performance of the Peer Group and below, above, below, and above, respectively, the performance of the Fund Benchmark, the Bloomberg U.S. Aggregate Bond Index. The Trustees also took into account management’s discussion of the Fund’s performance, including the reasons for the Fund’s more recent outperformance relative to the Peer Group and the fact that Class I shares of the Fund ranked in the top quartile relative to the Peer Group for the 3-year period and in the top third relative to the Peer Group for the 1-year period. The Trustees also took into account the fact that the Fund’s subadviser and investment strategy changed effective March 24, 2021, and that the performance information prior to that date reflected that of the Fund’s prior subadviser and investment strategy. The Trustees considered management’s discussion that the Fund’s performance has been in line with management’s expectations since the current Subadviser assumed subadvisory responsibilities. The Trustees concluded that the Fund’s overall performance has been satisfactory. With respect to AMG Beutel Goodman International Equity Fund, among other information relating to the Fund’s performance, the Trustees noted that the Fund’s performance for Class I shares (which share class has one of the earliest inception dates and the largest amount of assets of all the share classes of the Fund) for the 1-year, 3-year, and 5-year periods ended March 31, 2023 and for the period from the Class I shares’ inception on April 14, 2014 through March 31, 2023 was above, above, below, and below, respectively, the median performance of the Peer | | | | Group and above, above, below, and below, respectively, the performance of the Fund Benchmark, the MSCI EAFE Index. The Trustees took into account management’s discussion of the Fund’s performance, including the reasons for the Fund’s recent outperformance and longer-term underperformance relative to the Peer Group and the Fund Benchmark. The Trustees also noted that Class I shares of the Fund ranked in the top decile relative to the Peer Group for the 1-year period and in the top quartile relative to the Peer Group for the 3-year period. The Trustees also took into account the fact that the Fund’s subadviser and investment strategy changed effective March 19, 2021, and that the performance information prior to that date reflected that of the Fund’s prior subadviser and investment strategy. The Trustees considered management’s discussion that the Fund’s performance has been in line with management’s expectations since the current Subadviser assumed subadvisory responsibilities. The Trustees concluded that the Fund’s overall performance has been satisfactory in light of the Fund’s investment objective, strategies, and policies. ADVISORY AND SUBADVISORY FEES; FUND EXPENSES; PROFITABILITY; AND ECONOMIES OF SCALE In considering the reasonableness of the advisory fee payable to the Investment Manager, the Trustees reviewed information provided by the Investment Manager at the June 21, 2023 and prior meetings setting forth all revenues and other benefits, both direct and indirect (including any so-called “fallout benefits” such as reputational value derived from the Investment Manager serving as Investment Manager to a Fund), received by the Investment Manager and its affiliates attributable to managing each Fund and all the mutual funds in the AMG Funds Family of Funds; the cost of providing such services; the significant risks undertaken as Investment Manager and sponsor of the Funds, including investment, operational, enterprise, entrepreneurial, litigation, regulatory and compliance risks; and the resulting profitability to the Investment Manager and its affiliates from these relationships. The Trustees also considered the amount of the advisory fee retained by the Investment Manager after payment of the subadvisory fee with respect to each Fund. The Trustees also noted payments are made from the Subadviser to the Investment Manager, and other payments are made from the Investment Manager to the Subadviser. The Trustees also considered management’s discussion of the current asset levels of the Funds, and the impact on profitability of both the current asset levels and any future growth of assets of the Funds. | | | | In considering the cost of services to be provided by the Investment Manager under the Investment Advisory Agreement and the profitability to the Investment Manager of its relationship with each Fund, the Trustees noted the undertaking by the Investment Manager to maintain contractual expense limitations for the Funds. The Board also took into account management’s discussion of the advisory fee structure and the services the Investment Manager provides in performing its functions under the Investment Advisory Agreement and supervising the Subadviser. Based on the foregoing, the Trustees concluded that the profitability to the Investment Manager is reasonable and that the Investment Manager is not realizing material benefits from economies of scale that would warrant adjustments to the advisory fee at this time. Also with respect to economies of scale, the Trustees noted that as a Fund’s assets increase over time, the Fund may realize other economies of scale to the extent the increase in assets is proportionally greater than the increase in certain other expenses. In considering the reasonableness of the subadvisory fees payable by the Investment Manager to the Subadviser, the Trustees reviewed information regarding the cost to the Subadviser of providing subadvisory services to each Fund and the resulting profitability from these relationships. The Trustees noted that, because the Subadviser is an affiliate of the Investment Manager, a portion of the Subadviser’s revenues or profits might be shared directly or indirectly with the Investment Manager. The Trustees also noted that the subadvisory fees are paid by the Investment Manager out of its advisory fee. The Board also took into account management’s discussion of the subadvisory fee structure, and the services the Subadviser provides in performing its functions under each Subadvisory Agreement. Based on the foregoing, the Trustees concluded that the profitability to the Subadviser is reasonable and that the Subadviser is not realizing material benefits from economies of scale that would warrant adjustments to the subadvisory fees at this time. Also with respect to economies of scale, the Trustees noted that as a Fund’s assets increase over time, the Fund may realize other economies of scale to the extent the increase in assets is proportionally greater than the increase in certain other expenses. With respect to AMG Beutel Goodman Core Plus Bond Fund, the Trustees noted that the management fees (which include both the advisory and |
| | | | | | | | | |
42
| | |
| | | Annual Renewal of Investment Management and Subadvisory Agreements (continued) |
| | | |
| | | |
| | | | | | | | |
administration fees) and total expenses (net of applicable expense waivers/reimbursements) of Class I shares (the class of shares which is the primary focus of the Fund’s distribution) of the Fund as of March 31, 2023 were rated in the Below Average and the Average rating level, respectively, of the Fund’s Peer Group. The Trustees noted that the rating levels corresponded to the Fund’s quintile ranking in its Peer Group. The Trustees took into account the fact that the Investment Manager has contractually agreed, through March 1, 2024, to limit the Fund’s net annual operating expenses (subject to certain excluded expenses) to 0.43%. The Trustees concluded that, in light of the nature, extent and quality of the services provided by the Investment Manager and the Subadviser (which is an affiliate of the Investment Manager), the foregoing expense limitation and the considerations noted above with respect to the Investment Manager and the Subadviser, the Fund’s advisory and subadvisory fees are reasonable. With respect to AMG Beutel Goodman International Equity Fund, the Trustees noted that the | | | | management fees (which include both the advisory and administration fees) and total expenses (net of applicable expense waivers/reimbursements) of Class I shares (the class of shares which is the primary focus of the Fund’s distribution) of the Fund as of March 31, 2023 were rated in the Below Average and the Average rating level, respectively, of the Fund’s Peer Group. The Trustees noted that the rating levels corresponded to the Fund’s quintile ranking in its Peer Group. The Trustees also took into account that the Investment Manager has contractually agreed, through March 1, 2024, to limit the Fund’s net annual operating expenses (subject to certain excluded expenses) to 0.76%. The Trustees concluded that, in light of the nature, extent and quality of the services provided by the Investment Manager and the Subadviser (which is an affiliate of the Investment Manager), the foregoing expense limitation and the considerations noted above with respect to the Investment Manager and the Subadviser, the Fund’s advisory and subadvisory fees are reasonable. * * * * * | | | | After consideration of the foregoing, the Trustees also reached the following conclusions (in addition to the conclusions discussed above) regarding the Investment Advisory Agreement and the Subadvisory Agreements: (a) the Investment Manager and the Subadviser have demonstrated that they possess the capability and resources to perform the duties required of them under the Investment Advisory Agreement and each Subadvisory Agreement and (b) the Investment Manager and Subadviser maintain appropriate compliance programs. Based on all of the above-mentioned factors and their related conclusions, with no single factor or conclusion being determinative and with each Trustee not necessarily attributing the same weight to each factor, the Trustees concluded that approval of the Investment Advisory Agreement and the Subadvisory Agreements would be in the best interests of the applicable Fund and its shareholders. Accordingly, on June 21, 2023, the Trustees, and separately a majority of the Independent Trustees, voted to approve the Investment Advisory Agreement and the Subadvisory Agreement for each Fund. |
| | | | | | | | | |
43
THIS PAGE INTENTIONALLY LEFT BLANK
|
|
| | | | | | | | |
INVESTMENT MANAGER AND ADMINISTRATOR AMG Funds LLC 680 Washington Blvd., Suite 500 Stamford, CT 06901 800.548.4539 DISTRIBUTOR AMG Distributors, Inc. 680 Washington Blvd., Suite 500 Stamford, CT 06901 800.548.4539 SUBADVISER Beutel, Goodman & Company Ltd. 20 Eglinton Ave. West, Suite 2000 Toronto, Ontario, M4R 1K8 Canada | | | | CUSTODIAN The Bank of New York Mellon Mutual Funds Custody 6023 Airport Road Oriskany, NY 13424 LEGAL COUNSEL Ropes & Gray LLP Prudential Tower, 800 Boylston Street Boston, MA 02199-3600 TRANSFER AGENT BNY Mellon Investment Servicing (US) Inc. AMG Funds Attn: 534426 AIM 154-0520 500 Ross Street Pittsburgh, PA 15262 800.548.4539 | | | | This report is prepared for the Funds’ shareholders. It is authorized for distribution to prospective investors only when preceded or accompanied by an effective prospectus. To receive a free copy of the prospectus or Statement of Additional Information, which includes additional information about Fund Trustees, please contact us by calling 800.548.4539. Distributed by AMG Distributors, Inc., member FINRA/SIPC. Current net asset values per share for each Fund are available on the Funds’ website at wealth.amg.com. A description of the policies and procedures each Fund uses to vote its proxies is available: (i) without charge, upon request, by calling 800.548.4539, or (ii) on the Securities and Exchange Commission’s (SEC) website at sec.gov. For information regarding each Fund’s proxy voting record for the 12-month period ended June 30, call 800.548.4539 or visit the SEC website at sec.gov. The Funds file their complete schedule of portfolio holdings with the SEC for the first and third quarters of each fiscal year as an exhibit to their reports on Form N-PORT. The Funds’ portfolio holdings on Form N-PORT are available on the SEC’s website at sec.gov and the Funds’ website at wealth.amg.com. To review a complete list of the Funds’ portfolio holdings, or to view the most recent semi-annual report or annual report, please visit wealth.amg.com. |
| | | | | | | | | |
|
|
| | | | | | | | |
BALANCED FUNDS AMG GW&K Global Allocation GW&K Investment Management, LLC EQUITY FUNDS AMG Beutel Goodman International
Equity Beutel, Goodman & Company Ltd. AMG Boston Common Global Impact Boston Common Asset Management, LLC AMG Frontier Small Cap Growth Frontier Capital Management Co., LLC AMG GW&K Small Cap Core AMG GW&K Small Cap Value AMG GW&K Small/Mid Cap Core AMG GW&K Small/Mid Cap Growth AMG GW&K Emerging Markets
Equity AMG GW&K Emerging Wealth Equity AMG GW&K International Small Cap GW&K Investment Management, LLC AMG Montrusco Bolton Large Cap
Growth Montrusco Bolton Investments, Inc. AMG Renaissance Large Cap
Growth The Renaissance Group LLC | | | | AMG River Road Dividend All Cap
Value AMG River Road Focused
Absolute Value AMG River Road International
Value Equity AMG River Road Large Cap Value
Select AMG River Road Mid Cap Value AMG River Road Small-Mid Cap
Value AMG River Road Small Cap Value River Road Asset Management, LLC AMG TimesSquare Emerging
Markets Small Cap AMG TimesSquare Global Small
Cap AMG TimesSquare International
Small Cap AMG TimesSquare Mid Cap
Growth AMG TimesSquare Small Cap
Growth TimesSquare Capital Management, LLC AMG Veritas Asia Pacific AMG Veritas China AMG Veritas Global Focus AMG Veritas Global Real Return Veritas Asset Management LLP AMG Yacktman AMG Yacktman Focused AMG Yacktman Global AMG Yacktman Special
Opportunities Yacktman Asset Management LP | | | | FIXED INCOME FUNDS AMG Beutel Goodman Core Plus
Bond Beutel, Goodman & Company Ltd. AMG GW&K Core Bond ESG AMG GW&K Enhanced Core
Bond ESG AMG GW&K ESG Bond AMG GW&K High Income AMG GW&K Municipal Bond AMG GW&K Municipal Enhanced
Yield GW&K Investment Management, LLC |
| | | | | | | | | |
| | | | | | | | | |
| | | | | | | | | |
| | | | | | | | | |
| | | | | | | | | |
| | | | | | | | | |
| | | | | | | | | |
| | | | | | | | | |
| | | | | | | | | |
| | | | | | | | | |
| | | | |
| | | |
| wealth.amg.com | | | | 103123 AR086 |
Registrant has adopted a Code of Ethics. See attached exhibit (a) (1).
| Item 3. | Audit Committee Financial Expert. |
Registrant’s Board of Trustees has determined that independent Trustee Mr. Steven J. Paggioli qualifies as the Audit Committee Financial Expert. Mr. Paggioli is “independent” as such term is defined in Form N-CSR.
| Item 4. | Principal Accountant Fees and Services. |
The aggregate fees billed for each of the last two fiscal years for professional services rendered by the principal accountant for the audit of the registrant’s annual financial statements or services that are normally provided by the accountant in connection with statutory and regulatory filings or engagements for those fiscal years are $288,178 for 2023 and $277,307 for 2022.
There were no fees billed by PwC to the Funds in their two recent fiscal years for services rendered for assurance and related services that are reasonably related to the performance of the audit or review of the Funds’ financial statements, but are not reported as Audit Fees (“Audit-Related Fees”).
For the Funds’ two most recent fiscal years, there were no Audit-Related Fees billed by PwC for engagements related directly to the operations and financial reporting of one or more Funds by a Fund Service Provider. A Fund Service Provider is (a) any investment adviser to the Fund (not including any Subadviser whose role is primarily portfolio management and is subcontracted with or overseen by another investment adviser) or (b) any entity that provides ongoing services to the Funds and is controlling, controlled by or under common control with a Fund investment adviser described in (a).
The aggregate fees billed in each of the last two fiscal years for professional services rendered by the principal accountant for tax compliance, tax advice, and tax planning are $62,805 for 2023 and $66,390 for 2022.
For the Funds’ two most recent fiscal years, Tax Fees billed by PwC for engagements by Fund Service Providers that related directly to the operations and financial reporting of the Funds were $0 for fiscal 2023 and $0 for fiscal 2022, respectively.
The services for which Tax Fees were charged comprise all services performed by professional staff in PwC’s tax division except those services related to the audit. Typically, this category would include fees for tax compliance, tax planning, and tax advice. Tax compliance, tax advice, and tax planning services include preparation of original and amended tax returns, claims for refund and tax payment-planning services, assistance with tax audits and appeals, tax advice related to mergers and acquisitions and requests for rulings or technical advice from taxing authorities.
There were no other fees billed by PwC to the Funds for all other non-audit services (“Other Fees”) during the Funds’ two most recent fiscal years. During the same period, there were no Other Fees billed by PwC for engagements by Fund Service Providers that related directly to the operations and financial reporting of the Funds.
| | (e) | (1) According to policies adopted by the Audit Committee, services provided by PwC to the Funds must be pre-approved by the Audit Committee. On an annual basis, the Audit Committee reviews and pre-approves various types of services that PwC may perform for the Funds without specific approval of each engagement, subject to specified budget limitations. As contemplated by the Sarbanes-Oxley Act of 2002 and related SEC rules, the Audit Committee also pre-approves non-audit services provided by PwC to any Fund Service Provider for any engagement that relates directly to the operations and financial reporting of the Funds. Any engagement that is not already pre-approved or that will exceed a pre-approved budget must be submitted to the Audit Committee for pre-approval. The Chairman of the Audit Committee is authorized on behalf of the Board of Trustees and the Audit Committee to approve the engagement of PwC to perform non-audit services subject to certain conditions, including notification to the Audit Committee of such pre-approval not later than the next meeting of the Audit Committee following the date of such pre-approval. |
(e)(2) None.
| | (g) | The aggregate fees billed by PwC in 2023 and 2022 for non-audit services rendered to the Funds and Fund Service Providers were $102,138 for 2023 and $103,057 for 2022. For the fiscal year ended October 31, 2023, this amount reflects the amounts disclosed above in Item 4(b),(c),(d), plus $39,333 in fees billed to the Fund Service Providers for non-audit services that did not relate directly to the operations and financial reporting of the Funds. For the fiscal year ended October 31, 2022, this amount reflects the amounts disclosed above in Item 4(b),(c),(d), plus $36,667 in fees billed to the Fund Service Providers for non-audit services that did not relate directly to the operations and financial reporting of the Funds. |
| | (h) | The Trust’s Audit Committee has considered whether the provision of non-audit services by registrant’s independent registered public accounting firm to the registrant’s investment adviser, and any entity controlling, controlled by, or under common control with the investment adviser that provided ongoing services to the registrant that were not pre-approved by the Committee (because such services did not relate directly to the operations and financial reporting of the registrant) was compatible with maintaining the independence of the independent registered public accounting firm. |
| Item 5. | Audit Committee of Listed Registrants. |
Not applicable.
| Item 6. | Schedule of Investments. |
| (a) | Schedule of Investments in securities of unaffiliated issuers as of the close of the reporting period is included as part of the report to shareholders filed under Item 1 of this form. |
| Item 7. | Disclosure of Proxy Voting Policies and Procedures for Closed-End Management Investment Companies. |
Not applicable.
| Item 8. | Portfolio Managers of Closed-End Management Investment Companies. |
Not applicable.
| Item 9. | Purchases of Equity Securities by Closed-End Management Investment Company and Affiliated Purchasers. |
Not applicable.
| Item 10. | Submission of Matters to a Vote of Security Holders. |
Not applicable.
| Item 11. | Controls and Procedures. |
| (a) | The Registrant’s principal executive and principal financial officers have concluded, based on their evaluation of the registrant’s disclosure controls and procedures as of a date within 90 days of the filing of this report, that the Registrant’s disclosure controls and procedures are reasonably designed to ensure that information required to be disclosed by the Registrant on Form N-CSR is recorded, processed, summarized and reported within the required time periods and that information required to be disclosed by the registrant in the reports that it files or submits on Form N-CSR is accumulated and communicated to the Registrant’s management, including its principal executive and principal financial officers, as appropriate to allow timely decisions regarding required disclosure. |
| (b) | There were no changes in the Registrant’s internal control over financial reporting during the period covered by this report that have materially affected, or are reasonably likely to materially affect, the internal control over financial reporting. |
| Item 12. | DISCLOSURE OF SECURITIES LENDING ACTIVITIES FOR CLOSED-END MANAGEMENT INVESTMENT COMPANIES |
Not applicable.
SIGNATURES
Pursuant to the requirements of the Securities Exchange Act of 1934 and the Investment Company Act of 1940, the registrant has duly caused this report to be signed on its behalf by the undersigned, thereunto duly authorized.
| | |
| AMG FUNDS IV |
| |
| By: | | /s/ Keitha L. Kinne |
| | Keitha L. Kinne, Principal Executive Officer |
| |
| Date: | | January 5, 2024 |
Pursuant to the requirements of the Securities Exchange Act of 1934 and the Investment Company Act of 1940, this report has been signed below by the following persons on behalf of the registrant and in the capacities and on the dates indicated.
| | |
| By: | | /s/ Keitha L. Kinne |
| | Keitha L. Kinne, Principal Executive Officer |
| |
| Date: | | January 5, 2024 |
| |
| By: | | /s/ Thomas Disbrow |
| | Thomas Disbrow, Principal Financial Officer |
| |
| Date: | | January 5, 2024 |