UNITED STATES
SECURITIES AND EXCHANGE COMMISSION
Washington, D.C. 20549
FORM N-CSR
CERTIFIED SHAREHOLDER REPORT OF REGISTERED
MANAGEMENT INVESTMENT COMPANIES
Investment Company Act file number 811-08004
AMG Funds IV
(Exact name of registrant as specified in charter)
680 Washington Boulevard, Suite 500, Stamford, Connecticut 06901
(Address of principal executive offices) (Zip code)
AMG Funds LLC
680 Washington Boulevard, Suite 500, Stamford, Connecticut 06901
(Name and address of agent for service)
Registrant’s telephone number, including area code: (203) 299-3500
Date of fiscal year end: October 31
Date of reporting period: November 1, 2021 - October 31, 2022
(Annual Shareholder Report)
| Item 1. | Reports to Stockholders. |
| | |
 | | ANNUAL REPORT |
| | |
| | | AMG Funds October 31, 2022 |
| | | 
|
| | |
| | | AMG Beutel Goodman Core Plus Bond Fund |
| | | Class N: ADBLX | Class I: ADLIX | Class Z: ADZIX |
| | |
| | | AMG Beutel Goodman International Equity Fund |
| | | Class N: APINX | Class I: APCTX | Class Z: APCZX |
| | |
| | | |
| | | |
| | | | |
amgfunds.com | | | | 103122 AR086 |
| | |
| | | AMG Funds Annual Report — October 31, 2022 |
| | | | | | |
| | | |
| | | | | | | |
| | | TABLE OF CONTENTS | | PAGE | |
| | | | |
| | | LETTER TO SHAREHOLDERS | | | 2 | |
| | | |
| | | ABOUT YOUR FUND’S EXPENSES | | | 3 | |
| | | |
| | | PORTFOLIO MANAGER’S COMMENTS, FUND SNAPSHOTS AND SCHEDULES OF PORTFOLIO INVESTMENTS | | | | |
| | | |
| | | AMG Beutel Goodman Core Plus Bond Fund | | | 4 | |
| | | |
| | | AMG Beutel Goodman International Equity Fund | | | 13 | |
| | | |
| | | FINANCIAL STATEMENTS | | | | |
| | | |
| | | Statement of Assets and Liabilities | | | 19 | |
| | | |
| | | Balance sheets, net asset value (NAV) per share computations and cumulative distributable earnings (loss) | | | | |
| | | |
| | | Statement of Operations | | | 21 | |
| | | |
| | | Detail of sources of income, expenses, and realized and unrealized gains (losses) during the fiscal year | | | | |
| | | |
| | | Statements of Changes in Net Assets | | | 22 | |
| | | |
| | | Detail of changes in assets for the past two fiscal years | | | | |
| | | |
| | | Financial Highlights | | | 23 | |
| | | |
| | | Historical net asset values per share, distributions, total returns, income and expense ratios, turnover ratios and net assets | | | | |
| | | |
| | | Notes to Financial Statements | | | 29 | |
| | | |
| | | Accounting and distribution policies, details of agreements and transactions with Fund management and affiliates, and descriptions of certain investment risks | | | | |
| | | |
| | | REPORT OF INDEPENDENT REGISTERED PUBLIC ACCOUNTING FIRM | | | 37 | |
| | | |
| | | OTHER INFORMATION | | | 38 | |
| | | |
| | | TRUSTEES AND OFFICERS | | | 39 | |
| | | |
| | | ANNUAL RENEWAL OF INVESTMENT MANAGEMENT AND SUBADVISORY AGREEMENTS | | | 41 | |
| | | | | | | |
|
Nothing contained herein is to be considered an offer, sale or solicitation of an offer to buy shares of any series of the AMG Funds Family of Funds. Such offering is made only by prospectus, which includes details as to offering price and other material information. | |
| | |
| | Letter to Shareholders |
Dear Shareholder:
The fiscal year ended October 31, 2022, was a volatile period for risk assets, as uncertainties mounted about high inflation, tighter financial conditions, and the Russian invasion of Ukraine. Global equity and bond markets fell in tandem amid sharply higher interest rates and eroding investor confidence as worries of an impending recession loomed over markets. A global commodity shock caused by the war in Ukraine only made matters worse. The S&P 500® Index slipped into a bear market with the Index falling more than (24)% from its peak earlier in the year. The abrupt shift in markets this year has reset expectations around future growth, as stubbornly high inflation has necessitated that the U.S. Federal Reserve (the Fed) and other global central banks take more aggressive policy action in an effort to bring down inflation. While the outlook is uncertain given the recent negative returns across many asset classes, one silver lining is that global stock and bond valuations are now more attractive than they were at the start of the year.
There was very wide dispersion in sector performance. Energy significantly outperformed all other sectors with a gain of 64.97% as the price of oil surged during the period. Defensive-oriented sectors also outperformed with a 4.86% return from consumer staples and 2.85% gain in utilities. High growth technology and mega cap internet-related companies underperformed during the period, and real estate was impacted by higher interest rates. Communications services fell the most with a (40.67)% return during the fiscal year, followed by declines of (28.53)% for consumer discretionary, (20.64)% for real estate, and (20.23)% for information technology. Value stocks held up much better than growth stocks as the Russell 1000® Value Index returned (7.00)% compared to the (24.60)% return for the Russell 1000® Growth Index. Small cap stocks struggled as the Russell 2000® Index lost (18.54)%. Outside the U.S., foreign developed markets lagged their U.S. counterparts as the U.S. dollar surged and the MSCI EAFE Index fell (23.00)%. Emerging Markets underperformed with a (31.03)% return for the MSCI Emerging Markets Index.
The 10-year Treasury yield more than doubled during the period, surging to the highest levels since before the Great Financial Crisis. Rapidly rising rates from a very low base led to historically bad performance for bonds as the Bloomberg U.S. Aggregate Bond Index, a broad measure of U.S. bond market performance, lost (15.68)% over the period. Investment-grade corporate bonds underperformed as the Bloomberg U.S. Corporate Bond Index returned (19.57)% for the year. High yield bonds held up better with a (11.76)% return as measured by the return of the Bloomberg U.S. Corporate High Yield Bond Index. Municipal bonds suffered steep losses but outperformed the broader market with a (11.98)% return for the Bloomberg Municipal Bond Index. Non-U.S. bonds delivered weak performance and were also impacted by the stronger dollar as the Bloomberg Global Aggregate ex U.S. fell (24.60)%.
AMG Funds appreciates the privilege of providing investment tools to you and your clients. Our foremost goal is to provide investment solutions that help our shareholders successfully reach their long-term investment goals. AMG Funds provides access to a distinctive array of actively managed return-oriented investment strategies. We thank you for your continued confidence and investment in AMG Funds. You can rest assured that under all market conditions our team is focused on delivering excellent investment management services for your benefit.
Respectfully,

Keitha Kinne
President
AMG Funds
| | | | | | | | | | | | | | |
| | | | | Periods ended | |
| Average Annual Total Returns | | October 31, 2022* | |
| | | | |
| Stocks: | | | | 1 Year | | | 3 Years | | | 5 Years | |
| | | | |
Large Cap | | (S&P 500® Index) | | | (14.61 | )% | | | 10.22 | % | | | 10.44 | % |
| | | | |
Small Cap | | (Russell 2000® Index) | | | (18.54 | )% | | | 7.05 | % | | | 5.56 | % |
| | | | |
International | | (MSCI ACWI ex USA) | | | (24.73 | )% | | | (1.68 | )% | | | (0.60 | )% |
| | | | |
Bonds: | | | | | | | | | | | | | | |
| | | | |
Investment Grade | | (Bloomberg U.S. Aggregate Bond Index) | | | (15.68 | )% | | | (3.77 | )% | | | (0.54 | )% |
| | | | |
High Yield | | (Bloomberg U.S. Corporate High Yield Bond Index) | | | (11.76 | )% | | | 0.31 | % | | | 2.01 | % |
| | | | |
Tax-exempt | | (Bloomberg Municipal Bond Index) | | | (11.98 | )% | | | (2.18 | )% | | | 0.37 | % |
| | | | |
Treasury Bills | | (ICE BofAML U.S. 6-Month Treasury Bill Index) | | | 0.55 | % | | | 0.65 | % | | | 1.27 | % |
*Source: FactSet. Past performance is no guarantee of future results.
2
| | |
| | | About Your Fund’s Expenses |
| | | |
| | | |
| | | | | | | | |
As a shareholder of a Fund, you may incur two types of costs: (1) transaction costs, which may include sales charges (loads) on purchase payments; redemption fees; and exchange fees; and (2) ongoing costs, including management fees; distribution (12b-1) fees; and other Fund expenses. This example is intended to help you understand your ongoing costs (in dollars) of investing in the Fund and to compare these costs with the ongoing costs of investing in other mutual funds. The example is based on $1,000 invested at the beginning of the period and held for the entire period as indicated below. ACTUAL EXPENSES The first line of the following table provides information about the actual account values and | | | | actual expenses. You may use the information in this line, together with the amount you invested, to estimate the expenses that you paid over the period. Simply divide your account value by $1,000 (for example, an $8,600 account value divided by $1,000 = 8.6), then multiply the result by the number in the first line under the heading entitled “Expenses Paid During the Period” to estimate the expenses you paid on your account during this period. HYPOTHETICAL EXAMPLE FOR COMPARISON PURPOSES The second line of the following table provides information about hypothetical account values and hypothetical expenses based on the Fund’s actual expense ratio and an assumed annual rate of return of 5% before expenses, which is not the Fund’s | | | | actual return. The hypothetical account values and expenses may not be used to estimate the actual ending account balance or expenses you paid for the period. You may use this information to compare the ongoing costs of investing in the Fund and other funds by comparing this 5% hypothetical example with the 5% hypothetical examples that appear in the shareholder reports of other funds. Please note that the expenses shown in the table are meant to highlight your ongoing costs only and do not reflect any transactional costs, such as sales charges (loads), redemption fees, or exchange fees. Therefore, the second line of the table is useful in comparing ongoing costs only, and will not help you determine the relative total costs of owning different funds. |
| | | | | | | | |
| | | | | | | | |
Six Months Ended October 31, 2022 | | Expense
Ratio for
the Period | | Beginning
Account
Value
05/01/22 | | Ending
Account
Value
10/31/22 | | Expenses
Paid
During
the Period* |
AMG Beutel Goodman Core Plus Bond Fund |
|
Based on Actual Fund Return |
| | | | |
Class N | | 0.68% | | $1,000 | | $926 | | $3.30 |
| | | | |
Class I | | 0.48% | | $1,000 | | $928 | | $2.33 |
| | | | |
Class Z | | 0.43% | | $1,000 | | $927 | | $2.09 |
|
Based on Hypothetical 5% Annual Return |
| | | | |
Class N | | 0.68% | | $1,000 | | $1,022 | | $3.47 |
| | | | |
Class I | | 0.48% | | $1,000 | | $1,023 | | $2.45 |
| | | | |
Class Z | | 0.43% | | $1,000 | | $1,023 | | $2.19 |
| | | | |
| | | | | | | | |
AMG Beutel Goodman International Equity Fund** |
|
Based on Actual Fund Return |
| | | | |
Class N | | 1.22% | | $1,000 | | $854 | | $5.70 |
| | | | |
Class I | | 0.92% | | $1,000 | | $856 | | $4.30 |
| | | | |
Class Z | | 0.82% | | $1,000 | | $856 | | $3.84 |
|
Based on Hypothetical 5% Annual Return |
| | | | |
Class N | | 1.22% | | $1,000 | | $1,019 | | $6.21 |
| | | | |
Class I | | 0.92% | | $1,000 | | $1,021 | | $4.69 |
| | | | |
Class Z | | 0.82% | | $1,000 | | $1,021 | | $4.18 |
| * | Expenses are equal to the Fund’s annualized expense ratio multiplied by the average account value over the period, multiplied by the number of days in the most recent fiscal half-year (184), then divided by 365. |
| ** | Includes interest expense related to participation in the interfund lending program. If excluded, your annualized expense ratios would be 1.16%, 0.86% and 0.76% for Class N, Class I and Class Z, respectively, and your actual and hypothetical expenses paid during the period would be $5.42, $4.02 and $3.55, and $5.90, $4.38 and $3.87 for Class N, Class I and Class Z, respectively. |
3
| | |
| | | AMG Beutel Goodman Core Plus Bond Fund Portfolio Manager’s Comments (unaudited) |
| | | |
| | | |
| | | | | | | | |
For the 12 months ended October 31, 2022, AMG Beutel Goodman Core Plus Bond Fund (the “Fund”) Class N shares returned (16.41)%, compared with the (15.68)% return for the Bloomberg U.S. Aggregate Bond Index. MARKET OVERVIEW Inflation has been the preeminent issue over the past year as central banks finally moved away from the low rates that have characterized much of the post-Great Financial Crisis period. At the end of 2021, opinion was divided on whether the sharply rising inflation was transitory or entrenched. By the middle half of 2022, however, it was clear that rising prices were a significant problem that needed decisive action by central banks. The U.S. Federal Reserve (the “Fed”) hiked rates by 300 basis points (bps) as of October 31, 2022, with subsequent hikes expected before the end of the year. The Bank of Canada (“BoC”) has followed in the same vein, increasing its target rate by 300 bps, as central banks worldwide shifted to a hawkish stance in the face of inflation levels not seen since the 1980s. When the Fed and BoC began hiking rates at the beginning of 2022, both institutions maintained that a “soft landing” for the economy was achievable in the fight against inflation. After months of historically high Consumer Price Index readings in both countries, the tone of central banks changed midway through the year. In the Fed’s September announcement, Chair Powell made it clear that putting out the inflation fire was the bank’s primary objective, and if economic growth had to suffer to achieve that goal, then so be it. Historically, inflationary periods and tightening cycles have foreshadowed a recession. The Fed’s target range of 3.0% to 3.25%, as of October 31, 2022, is its highest level since early 2008, and it is expected that the benchmark rate will rise to 4.5% by year end, and to approximately 5.0% or higher in 2023. Current data suggests that the peak rate may be lower in Canada, at 3.75% as of October 31, 2022. Aside from lower core inflation, the impact of higher interest rates will likely be more of a factor in Canada due to its housing market — with fixed-rate mortgage terms generally for 5 years versus 30 years in the U.S. | | | | This period of aggressive rate hikes has led to historically bad performance in bond markets, but higher rates do mean higher coupons for newly issued bonds. This makes bonds more attractive as a source of income for investors going forward after years of minimal yields. PERFORMANCE REVIEW The Fund’s exposure to corporate credit contributed negatively to its relative performance. The Fund held overweight positions in high yield and subordinated bonds, as well as the senior bonds of certain higher beta investment grade issuers, as investment grade and high yield credit spreads widened by 70 bps and 178 bps, respectively. This was partially offset by the Fund’s positioning in floating-rate term loans, which outperformed materially in the period due to the rise in interest rates and their relatively stable prices. Sector and security selection in securitized assets also contributed to the Fund’s relative underperformance. The Fund was underweighted in mortgage-backed securities, which outperformed the broader index during the period, alongside several individual commercial mortgage-backed securities that underperformed their sub-sector. The Fund’s yield-curve positioning detracted from relative performance as the yield curve flattened, then inverted, over the period. This was partially offset by a positive contribution from the Fund’s duration positioning, having been short throughout much of the first half of 2022 while the Fed raised interest rates. OUTLOOK Given the obduracy of inflation, the Fed has had to increase its projections for rate hikes as the year has progressed. In Canada, economic data is weakening and that would usually mean that rate hikes are not as necessary. But with inflation still significantly above the BoC’s target, the central bank will likely continue to raise rates, though likely not as aggressively as in the U.S. Incidentally, our expectations for terminal rates in the U.S. and Canada are 5.0% to 5.25% and 4.25%, respectively. Central banks tightening interest rates usually leads to rising unemployment, restricted demand, and lower asset prices. These are all negative | | | | developments for everyday people, so it appears likely there will be pain ahead for Canada, the U.S., and most of the world. Pain is something bond markets have had to get used to this year. Fixed income investors benefited from healthy returns of 10% to 12% in 2020 when yields were at 2%. Since then, the shift from 2% to 4% in yields has been extremely painful for global bond markets, which have lost roughly 16% in value over the last two years. Fixed income investing generally has a great deal of variance between sectors; however, areas that underperform for a time tend to show the strongest returns in the future, and vice versa. The best performing fixed income asset class in 2022 is senior loans, which is typical in a rising interest rate environment. Should the economy slow down significantly in 2023, yields will likely decline, and this would mean government bonds outperforming. In this scenario, we would also expect credit spreads to continue their widening trend, albeit to what extent will depend on the duration and severity of the economic slow down. Looking at the yield curve, the 5 to 10-year part of the curve usually suffers the most in rate-hiking cycles and benefits the most when rates come down, and that has proven the case during this reporting period. The upside for fixed income investors as we approach the end of 2022 is that we should be approaching the end of bond market pain. In our view, now is the time to hold bonds after a really tough two years. We believe bonds will also act as an important hedge against equity markets in a downturn, which is vital for a well-diversified portfolio. The views expressed represent the opinions of Beutel, Goodman & Company Ltd., as of October 31, 2022, and are not intended as a forecast or guarantee of future results and are subject to change without notice. |
| | | | | | | | |
4
| | |
| | | AMG Beutel Goodman Core Plus Bond Fund Portfolio Manager’s Comments (continued) |
| | | |
| | | |
CUMULATIVE TOTAL RETURN PERFORMANCE
AMG Beutel Goodman Core Plus Bond Fund’s cumulative total return is based on the daily change in net asset value (NAV), and assumes that all dividends and distributions were reinvested. The graph compares a hypothetical $10,000 investment made in the AMG Beutel Goodman Core Plus Bond Fund’s Class N shares on October 31, 2012, to a $10,000 investment made in the Bloomberg U.S. Aggregate Bond Index for the same time period. The graph and table do not reflect the deduction of taxes that a shareholder would pay on a Fund distribution or redemption of shares. The listed returns for the Fund are net of expenses and the returns for the index excludes expenses. Total returns would have been lower had certain expenses not been reduced.
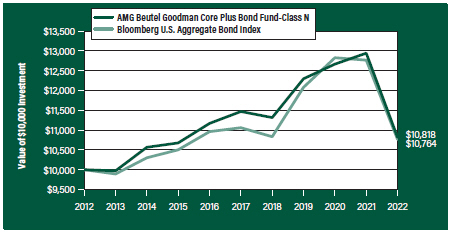
The table below shows the average annual total returns for the AMG Beutel Goodman Core Plus Bond Fund and the Bloomberg U.S. Aggregate Bond Index for the same time periods ended October 31, 2022.
| | | | | | | | | | | | |
| | | One | | Five | | Ten | | | Since | | Inception |
| Average Annual Total Returns1 | | Year | | Years | | Years | | | Inception | | Date |
|
AMG Beutel Goodman Core Plus Bond Fund2, 3, 4, 5, 6, 7, 8, 9, 10, 11, 12, 13, 14, 15, 16, 17, 18, 19 |
| | | | | |
Class N | | (16.41%) | | (1.16%) | | | 0.79% | | | 2.04% | | 07/18/11 |
| | | | | |
Class I | | (16.17%) | | (0.90%) | | | 1.04% | | | 2.29% | | 07/18/11 |
| | | | | |
Class Z | | (16.20%) | | (0.85%) | | | — | | | (0.81%) | | 09/29/17 |
| | | | | |
Bloomberg U.S. Aggregate Bond Index20 | | (15.68%) | | (0.54%) | | | 0.74% | | | 1.37% | | 07/18/11† |
The performance data shown represents past performance. Past performance is not a guarantee of future results. Current performance may be lower or higher than the performance data quoted. The investment return and principal value of an investment will fluctuate so that an investor’s shares, when redeemed, may be worth more or less than their original cost.
Investors should carefully consider the Fund’s investment objectives, risks, charges and expenses before investing. For performance information through the most recent month end, current net asset values per share for the Fund and other information, please call 800.548.4539 or visit our website at amgfunds.com for a free prospectus. Read it carefully before investing or sending money.
Distributed by AMG Distributors, Inc., member FINRA/SIPC.
| † | Date reflects the inception date of the Fund, not the index. |
| 1 | Total return equals income yield plus share price change and assumes reinvestment of all dividends and |
|
capital gain distributions. Returns are net of fees and may reflect offsets of Fund expenses as described in the prospectus. No adjustment has been made for taxes payable by shareholders on their reinvested dividends and capital gain distributions. Returns for periods greater than one year are annualized. The listed returns on the Fund are net of expenses and based on the published NAV as of October 31, 2022. All returns are in U.S. Dollars ($). 2 From time to time, the Fund’s adviser has waived its fees and/or absorbed Fund expenses, which has resulted in higher returns. 3 As of March 24, 2021, the Fund’s Subadviser was changed to Beutel Goodman & Company Ltd. Prior to March 24, 2021, the Fund was known as the AMG Managers DoubleLine Core Plus Bond Fund and had different principal investment strategies and corresponding risks. Performance shown for periods prior to March 24, 2021, reflects the performance and investment strategies of the Fund’s previous Subadviser, DoubleLine Capital LP. The Fund’s past performance would have been different if the Fund were managed by the current Subadviser and strategy, and the Fund’s prior performance record might be less pertinent for investors considering whether to purchase shares of the Fund. 4 The Fund is subject to the risks associated with investments in debt securities, such as default risk and fluctuations in the perception of the debtor’s ability to pay its creditors. Changing interest rates may adversely affect the value of an investment. An increase in interest rates typically causes the value of bonds and other fixed income securities to fall. 5 Investments in international securities are subject to certain risks of overseas investing including currency fluctuations and changes in political and economic conditions, which could result in significant market fluctuations. These risks are magnified in emerging markets. 6 To the extent that the Fund invests in asset-backed or mortgage-backed securities, its exposure to prepayment and extension risks may be greater than investments in other fixed income securities. 7 The Fund may invest in derivatives such as options and futures; the complexity and rapidly changing structure of derivatives markets may increase the possibility of market losses. 8 Bank loans are subject to the credit risk of nonpayment of principal or interest. 9 High-yield bonds (also known as “junk bonds”) may be subject to greater levels of interest rate, credit, and liquidity risk than investments in higher rated securities. These securities are considered predominantly speculative with respect to the issuer’s continuing ability to make principal and interest payments. The issuers of the Fund’s holdings may be involved in bankruptcy proceedings, reorganizations, or financial restructurings, and are not as strong financially as higher-rated issuers. |
5
| | |
| | | AMG Beutel Goodman Core Plus Bond Fund Portfolio Manager’s Comments (continued) |
| | | |
| | | |
| | | | | | | | |
10 Factors unique to the municipal bond market may negatively affect the value in municipal bonds. 11 Obligations of certain government agencies are not backed by the full faith and credit of the U.S. government. If one of these agencies defaulted on a loan, there is no guarantee that the U.S. government would provide financial support. Additionally, debt securities of the U.S. government may be affected by changing interest rates and subject to prepayment risk. 12 Active and frequent trading of a fund may result in higher transaction costs and increase tax liability. 13 Market prices of investments held by the Fund may fall rapidly or unpredictably due to a variety of economic or political factors, market conditions, disasters or public health issues, or in response to events that affect particular industries or companies. 14 During periods of rising interest rates, a debtor may pay back a bond or other fixed income security slower than expected or required, and the value of such security may fall. 15 There is no guarantee that the Fund’s hedging strategies will be successful. For example, changes in the value of a hedging transaction may not completely offset changes in the value of the assets and liabilities being hedged. Hedging transactions involve costs and may result in losses. 16 The Fund may have difficulty reinvesting payments from debtors and may receive lower rates than from its original investments. | | | | 17 Applying the Fund’s ESG investment criteria may result in the selection or exclusion of securities of certain issuers for reasons other than performance, and the Fund may underperform funds that do not utilize an ESG investment strategy. The application of this strategy may affect the Fund’s exposure to certain companies, sectors, regions, countries or types of investments, which could negatively impact the Fund’s performance depending on whether such investments are in or out of favor. Applying ESG criteria to investment decisions is qualitative and subjective by nature, and there is no guarantee that the criteria utilized by the Subadviser or any judgment exercised by the Subadviser will reflect the beliefs or values of any particular investor. 18 In managing the Fund, the Fund’s Subadviser may rely heavily on one or more quantitative models (“Model”) and information and data supplied by third parties (“Data”). When a Model or Data used in managing the Fund contains an error, or is incorrect or incomplete, any investment decision made in reliance on the Model or Data may not produce the desired results and the Fund may realize losses. In addition, any hedging based on a faulty Model or Data may prove to be unsuccessful. 19 Many bonds have call provisions which allow the debtors to pay them back before maturity. This is especially true with mortgage securities, which can be paid back anytime. Typically debtors prepay their debt when it is to their advantage (when interest rates drop making a new loan at current rates more attractive), and thus likely to the disadvantage of | | | | bondholders, who may have to reinvest prepayment proceeds in securities with lower yields. Prepayment risk will vary depending on the provisions of the security and current interest rates relative to the interest rate of the debt. 20 The Bloomberg U.S. Aggregate Bond Index is an index of the U.S. investment-grade fixed-rate bond market, including both government and corporate bonds. Unlike the Fund, the Bloomberg U.S. Aggregate Bond Index is unmanaged, is not available for investment and does not incur expenses. “Bloomberg®” and any Bloomberg index described herein are service marks of Bloomberg Finance L.P. and its affiliates, including Bloomberg Index Services Limited (“BISL”), the administrator of the index (collectively, “Bloomberg”) and have been licensed for use for certain purposes by AMG Funds LLC. Bloomberg is not affiliated with AMG Funds LLC, and Bloomberg does not approve, endorse, review, or recommend the fund described herein. Bloomberg does not guarantee the timeliness, accurateness, or completeness of any data or information relating to such fund. Not FDIC insured, nor bank guaranteed. May lose value. |
6
|
AMG Beutel Goodman Core Plus Bond Fund Fund Snapshots (unaudited) October 31, 2022 |
PORTFOLIO BREAKDOWN
| | | | | |
| Category | | % of
Net Assets |
| | |
U.S. Government and Agency Obligations | | | | 44.9 | |
| | |
Corporate Bonds and Notes | | | | 40.9 | |
| | |
Mortgage-Backed Securities | | | | 7.7 | |
| | |
Floating Rate Senior Loan Interests | | | | 3.1 | |
| | |
Asset-Backed Securities | | | | 2.2 | |
| | |
Municipal Bonds | | | | 0.4 | |
| | |
Common Stocks | | | | 0.0 | 1 |
| | |
Short-Term Investments | | | | 0.1 | |
| | |
Other Assets, Less Liabilities | | | | 0.7 | |
| | | | | |
| Rating | | % of Market Value1 |
| | |
U.S. Government and Agency Obligations | | | | 45.3 | |
| | |
Aaa/AAA | | | | 0.7 | |
| | |
Aa/AA | | | | 8.6 | |
| | |
A | | | | 17.4 | |
| | |
Baa/BBB | | | | 23.7 | |
| | |
Ba/BB | | | | 4.3 | |
| | |
Caa/CCC & lower | | | | 0.0 | 2 |
| 1 | Includes market value of long-term fixed-income securities only. |
TOP TEN HOLDINGS
| | | | | |
| Security Name | | % of
Net Assets |
| | |
U.S. Treasury Notes, 1.875%, 02/15/32 | | | | 8.2 | |
| | |
U.S. Treasury Bonds, 1.875%, 02/15/41 | | | | 3.3 | |
| | |
U.S. Treasury Bonds, 1.875%, 11/15/51 | | | | 2.8 | |
| | |
U.S. Treasury Notes, 2.750%, 05/31/29 | | | | 2.7 | |
| | |
U.S. Treasury Notes, 2.875%, 05/15/32 | | | | 2.6 | |
| | |
FNMA, 2.140%, 10/01/29 | | | | 2.3 | |
| | |
Vistra Operations Co. LLC, 4.875%, 05/13/24 | | | | 2.2 | |
| | |
New Economy Assets Phase 1 Sponsor LLC, Series 2021-1, Class A1, 1.910%, 10/20/61 | | | | 2.2 | |
| | |
FHLMC REMICS, Series 4934, Class P, 2.500%, 11/15/40 | | | | 2.2 | |
| | |
U.S. Treasury Notes, 2.750%, 02/15/28 | | | | 2.1 | |
| | | | | | |
| | |
Top Ten as a Group | | | | 30.6 | |
| | | | | |
Credit quality ratings shown above reflect the highest rating assigned by either Standard & Poor’s (“S&P”) or Moody’s Investors Service, Inc. (“Moody’s”). These rating agencies are independent, nationally recognized statistical rating organizations and are widely used. Investment grade ratings are credit ratings of BBB- or higher. Below investment grade ratings are credit ratings of BB+ or lower. Investments designated N/R are not rated by any of the rating agencies. Unrated investments do not necessarily indicate low credit quality. Credit quality ratings are subject to change.
Because a fund’s strategy may result in multiple investments in particular sectors of the economy, its performance may depend on the performance of those sectors and may fluctuate more widely than investments diversified across more sectors. For additional information on these and other risk considerations, please see the Fund’s prospectus.
Any sectors, industries, or securities discussed should not be perceived as investment recommendations. Mention of a specific security should not be considered a recommendation to buy or solicitation to sell that security. Specific securities mentioned in this report may have been sold from the Fund’s portfolio of investments by the time you receive this report.
7
|
AMG Beutel Goodman Core Plus Bond Fund Schedule of Portfolio Investments October 31, 2022 |
| | | | | | | | |
| | |
| | | Principal Amount | | | Value | |
| |
Corporate Bonds and Notes - 40.9% | | | | | |
| |
Financials - 16.1% | | | | | |
| | |
Air Lease Corp.
Series C
(4.125% to 12/15/26 then U.S. Treasury Yield Curve CMT 5 year + 3.149%), 4.125%,12/15/261,2,3 | | | $4,000,000 | | | | $2,640,359 | |
| | |
Ally Financial, Inc.
Series B
(4.700% to 05/15/26 then U.S. Treasury Yield Curve CMT 5 year + 3.868%), 4.700%, 05/15/261,2,3 | | | 3,000,000 | | | | 2,175,000 | |
| | |
Avolon Holdings Funding, Ltd. (Cayman Islands)
3.250%, 02/15/274 | | | 2,000,000 | | | | 1,633,939 | |
| | |
Bank of Montreal (Canada)
(3.803% to 12/15/27 then USD Swap 5 year + 1.432%), 3.803%, 12/15/321,3 | | | 1,285,000 | | | | 1,101,770 | |
| | |
BOC Aviation USA Corp.
1.625%, 04/29/244 | | | 3,500,000 | | | | 3,290,985 | |
| | |
Capital One Financial Corp. | | | | | | | | |
(2.636% to 03/03/25 then SOFR + 1.290%), 2.636%, 03/03/261,3 | | | 1,400,000 | | | | 1,283,465 | |
(4.985% to 07/24/25 then SOFR + 2.160%), 4.985%, 07/24/261,3 | | | 500,000 | | | | 480,407 | |
| | |
Citigroup, Inc.
(5.610% to 09/29/25 then SOFR + 1.546%), 5.610%, 09/29/261,3 | | | 1,000,000 | | | | 986,751 | |
| | |
The Goldman Sachs Group, Inc.
(1.948% to 10/21/26 then SOFR + 0.913%), 1.948%, 10/21/271,3 | | | 2,900,000 | | | | 2,463,928 | |
| | |
HSBC Holdings PLC (United Kingdom) | | | | | | | | |
(2.206% to 08/17/28 then SOFR + 1.285%), 2.206%, 08/17/291,3 | | | 2,000,000 | | | | 1,514,969 | |
(2.804% to 05/24/31 then SOFR + 1.187%), 2.804%, 05/24/321,3 | | | 1,000,000 | | | | 716,409 | |
| | |
Intact Financial Corp. (Canada)
5.459%, 09/22/324 | | | 2,000,000 | | | | 1,917,874 | |
| | |
Morgan Stanley
(2.484% to 09/16/31 then SOFR + 1.360%), 2.484%, 09/16/361,3 | | | 3,000,000 | | | | 2,123,949 | |
| | |
Royal Bank of Canada (Canada) | | | | | | | | |
5.660%, 10/25/24 | | | 3,000,000 | | | | 3,005,539 | |
| | |
SCC Power PLC (United Kingdom) | | | | | | | | |
4.000%, 05/17/324,5 | | | 222,808 | | | | 17,602 | |
8.000%, 12/31/284,5 | | | 411,339 | | | | 152,195 | |
| | |
The Toronto-Dominion Bank (Canada)
(8.125% to 10/31/27 then U.S. Treasury Yield Curve CMT 5 year + 4.075%), 8.125%, 10/31/821,3 | | | 2,000,000 | | | | 2,022,500 | |
| | |
Total Financials | | | | | | | 27,527,641 | |
| | |
Industrials - 18.5% | | | | | | | | |
| | |
American Airlines Inc/AAdvantage Loyalty IP, Ltd.
5.750%, 04/20/294 | | | 475,000 | | | | 432,250 | |
| | | | | | | | |
| | |
| | | Principal Amount | | | Value | |
| | |
Burlington Northern Santa Fe LLC | | | | | | | | |
4.450%, 01/15/53 | | | $500,000 | | | | $419,535 | |
| | |
Canadian Natural Resources, Ltd. (Canada)
3.850%, 06/01/27 | | | 1,300,000 | | | | 1,196,777 | |
| | |
Charter Communications Operating LLC/Charter Communications Operating Capital
5.250%, 04/01/53 | | | 2,000,000 | | | | 1,503,797 | |
| | |
Cheniere Corpus Christi Holdings LLC
5.125%, 06/30/27 | | | 1,000,000 | | | | 975,630 | |
| | |
Coca-Cola Femsa SAB de CV (Mexico)
2.750%, 01/22/30 | | | 2,374,000 | | | | 2,002,018 | |
| | |
Delta Air Lines, Inc. | | | | | | | | |
7.000%, 05/01/254 | | | 2,500,000 | | | | 2,534,468 | |
| | |
Delta Air Lines, Inc./SkyMiles IP, Ltd. | | | | | | | | |
4.750%, 10/20/284 | | | 1,410,000 | | | | 1,311,704 | |
| | |
Digicel Group Holdings, Ltd. (Bermuda)
8.000%, 04/01/254,5 | | | 7,003 | | | | 2,101 | |
| | |
Enbridge, Inc. (Canada)
(6.250% to 03/01/28 then 3 month LIBOR + 3.641%), 6.250%, 03/01/781,3 | | | 2,500,000 | | | | 2,210,947 | |
| | |
JBS USA LUX, S.A./JBS USA Food Co./JBS USA Finance, Inc. | | | | | | | | |
5.125%, 02/01/284 | | | 1,000,000 | | | | 929,678 | |
5.500%, 01/15/304 | | | 935,000 | | | | 852,307 | |
6.500%, 04/15/294 | | | 148,000 | | | | 147,629 | |
| | |
Kinder Morgan, Inc. | | | | | | | | |
1.750%, 11/15/26 | | | 500,000 | | | | 431,101 | |
| | |
MEG Energy Corp. (Canada) | | | | | | | | |
7.125%, 02/01/274 | | | 70,000 | | | | 71,228 | |
| | |
Mileage Plus Holdings LLC/Mileage Plus Intellectual Property Assets, Ltd.
6.500%, 06/20/274 | | | 2,375,000 | | | | 2,347,937 | |
| | |
OAS Finance, Ltd. (Virgin Islands, British) | | | | | | | | |
8.875%, 11/30/221,2,6 | | | 600,000 | | | | 1,500 | |
8.875%, 12/01/221,2,4,6 | | | 400,000 | | | | 1,000 | |
| | |
Organon & Co/Organon Foreign Debt Co. Issuer, B.V.
4.125%, 04/30/284 | | | 500,000 | | | | 440,410 | |
| | |
Paramount Global | | | | | | | | |
4.950%, 01/15/31 | | | 2,000,000 | | | | 1,745,577 | |
| | |
Penske Truck Leasing Co. LP/PTL Finance Corp. | | | | | | | | |
4.200%, 04/01/274 | | | 1,000,000 | | | | 923,884 | |
| | |
Pilgrim’s Pride Corp. | | | | | | | | |
3.500%, 03/01/324 | | | 750,000 | | | | 574,297 | |
| | |
Qatar Petroleum (Qatar) | | | | | | | | |
1.375%, 09/12/264 | | | 2,000,000 | | | | 1,758,108 | |
| | |
Rogers Communications, Inc. (Canada) | | | | | | | | |
4.550%, 03/15/524 | | | 3,000,000 | | | | 2,317,668 | |
| | |
Sabine Pass Liquefaction LLC | | | | | | | | |
5.000%, 03/15/27 | | | 1,235,000 | | | | 1,190,167 | |
The accompanying notes are an integral part of these financial statements.
8
|
AMG Beutel Goodman Core Plus Bond Fund Schedule of Portfolio Investments (continued) |
| | | | | | | | |
| | |
| | | Principal Amount | | | Value | |
| | |
Industrials - 18.5% (continued) | | | | | | | | |
| | |
Smithfield Foods, Inc. | | | | | | | | |
4.250%, 02/01/274 | | | $1,500,000 | | | | $1,356,158 | |
| | |
TTX Co. | | | | | | | | |
3.600%, 01/15/254 | | | 1,000,000 | | | | 957,372 | |
| | |
Verizon Communications, Inc. | | | | | | | | |
4.400%, 11/01/34 | | | 2,000,000 | | | | 1,731,511 | |
| | |
Vodafone Group PLC (United Kingdom)
(7.000% to 04/04/29 then USD Swap 5 year + 4.873%), 7.000%, 04/04/791,3 | | | 850,000 | | | | 807,500 | |
| | |
Warnermedia Holdings, Inc. | | | | | | | | |
3.755%, 03/15/274 | | | 500,000 | | | | 444,791 | |
| | |
Total Industrials | | | | | | | 31,619,050 | |
| | |
Utilities - 6.3% | | | | | | | | |
| | |
Consolidated Edison Co. of New York, Inc. | | | | | | | | |
5.700%, 06/15/40 | | | 800,000 | | | | 748,749 | |
| | |
Duke Energy Corp. | | | | | | | | |
3.950%, 08/15/47 | | | 1,500,000 | | | | 1,060,342 | |
| | |
Duke Energy Progress LLC | | | | | | | | |
4.150%, 12/01/44 | | | 1,390,000 | | | | 1,081,824 | |
| | |
The East Ohio Gas Co. | | | | | | | | |
3.000%, 06/15/504 | | | 1,700,000 | | | | 1,026,192 | |
| | |
Florida Power & Light Co. | | | | | | | | |
2.875%, 12/04/51 | | | 1,500,000 | | | | 956,655 | |
| | |
Tampa Electric Co. | | | | | | | | |
3.625%, 06/15/50 | | | 1,475,000 | | | | 1,012,712 | |
| | |
Tucson Electric Power Co. | | | | | | | | |
4.000%, 06/15/50 | | | 1,425,000 | | | | 1,034,527 | |
| | |
Vistra Operations Co. LLC | | | | | | | | |
4.875%, 05/13/244 | | | 3,900,000 | | | | 3,795,714 | |
Total Utilities | | | | | | | 10,716,715 | |
| | |
Total Corporate Bonds and Notes | | | | | | | | |
(Cost $85,319,625) | | | | | | | 69,863,406 | |
| | |
Asset-Backed Securities - 2.2% | | | | | | | | |
| | |
New Economy Assets Phase 1 Sponsor LLC
Series 2021-1 | | | | | | | | |
1.910%, 10/20/614 | | | | | | | | |
(Cost $4,421,495) | | | 4,500,000 | | | | 3,770,384 | |
| | |
Mortgage-Backed Securities - 7.7% | | | | | | | | |
| | |
BANK | | | | | | | | |
Series 2017-BNK5, | | | | | | | | |
4.191%, 06/15/603 | | | 300,000 | | | | 255,184 | |
Series 2020-BN28, Class AS | | | | | | | | |
2.140%, 03/15/63 | | | 524,000 | | | | 382,506 | |
Series 2020-BN28, Class B | | | | | | | | |
2.344%, 03/15/63 | | | 524,000 | | | | 376,735 | |
| | |
BBCMS Mortgage Trust | | | | | | | | |
Series 2017-DELC, Class C
(1 month LIBOR + 1.325%, Cap N/A, Floor 1.200%), 4.737%, 08/15/363,4 | | | 132,000 | | | | 126,381 | |
| | | | | | | | |
| | |
| | | Principal Amount | | | Value | |
| | |
BBCMS Mortgage Trust | | | | | | | | |
Series 2017-DELC, Class D
(1 month LIBOR + 1.825%, Cap N/A, Floor 1.700%), 5.237%, 08/15/363,4 | | | $150,000 | | | | $142,864 | |
Series 2017-DELC, Class E
(1 month LIBOR + 2.625%, Cap N/A, Floor 2.500%), 6.037%, 08/15/363,4 | | | 302,000 | | | | 284,608 | |
| | |
Benchmark Mortgage Trust | | | | | | | | |
Series 2020-B17, Class B | | | | | | | | |
2.916%, 03/15/53 | | | 340,000 | | | | 259,922 | |
Series 2020-B19, Class B | | | | | | | | |
2.351%, 09/15/53 | | | 524,000 | | | | 374,654 | |
| | |
BX Trust
Series 2019-OC11, Class E
3.944%, 12/09/413,4 | | | 709,000 | | | | 524,718 | |
| | |
Citigroup Commercial Mortgage Trust | | | | | | | | |
Series 2016-GC36, Class B | | | | | | | | |
4.749%, 02/10/493 | | | 763,000 | | | | 677,227 | |
Series 2019-GC43, Class A2 | | | | | | | | |
2.982%, 11/10/52 | | | 514,000 | | | | 484,723 | |
| | |
Commercial Mortgage Pass Through Certificates | | | | | | | | |
Series 2015-LC23, Class C | | | | | | | | |
4.566%, 10/10/483 | | | 585,000 | | | | 528,923 | |
Series 2016-CR28, Class C | | | | | | | | |
4.605%, 02/10/493 | | | 726,000 | | | | 656,087 | |
| | |
CSAIL Commercial Mortgage Trust | | | | | | | | |
Series 2017-CX10, Class B | | | | | | | | |
3.892%, 11/15/503 | | | 506,000 | | | | 433,972 | |
Series 2018-C14, Class C | | | | | | | | |
4.916%, 11/15/513 | | | 880,000 | | | | 732,752 | |
| | |
CSMC Trust | | | | | | | | |
Series 2017-CHOP, Class D
(1 month LIBOR + 1.900%, Cap N/A, Floor 1.900%), 5.312%, 07/15/323,4 | | | 261,000 | | | | 237,723 | |
| | |
DBJPM | | | | | | | | |
Series 2016-C1, Class C | | | | | | | | |
3.322%, 05/10/493 | | | 534,000 | | | | 440,407 | |
| | |
GSCG Trust | | | | | | | | |
Series 2019-600C, Class D | | | | | | | | |
3.764%, 09/06/344 | | | 862,000 | | | | 765,058 | |
| | |
JPMBB Commercial Mortgage Securities Trust | | | | | | | | |
Series 2014-C23, Class C | | | | | | | | |
4.482%, 09/15/473 | | | 330,824 | | | | 300,981 | |
Series 2014-C25, Class C | | | | | | | | |
4.436%, 11/15/473 | | | 450,000 | | | | 391,344 | |
Series 2015-C33, Class C | | | | | | | | |
4.620%, 12/15/483 | | | 670,000 | | | | 600,330 | |
| | |
JPMDB Commercial Mortgage Securities Trust | | | | | | | | |
Series 2020-COR7, Class C 3.724%, 05/13/533 | | | 496,000 | | | | 373,105 | |
| | |
UBS Commercial Mortgage Trust | | | | | | | | |
Series 2018-C8, Class C | | | | | | | | |
4.709%, 02/15/513 | | | 917,000 | | | | 781,999 | |
Series 2019-C16, Class B | | | | | | | | |
4.320%, 04/15/523 | | | 769,000 | | | | 660,824 | |
The accompanying notes are an integral part of these financial statements.
9
|
AMG Beutel Goodman Core Plus Bond Fund Schedule of Portfolio Investments (continued) |
| | | | | | | | |
| | |
| | | Principal Amount | | | Value | |
| |
Mortgage-Backed Securities - 7.7% | | | | | |
(continued) | | | | | | | | |
| | |
UBS Commercial Mortgage Trust | | | | | | | | |
Series 2019-C18, Class B | | | | | | | | |
3.681%, 12/15/523 | | | $717,000 | | | | $582,731 | |
| | |
Wells Fargo Commercial Mortgage Trust | | | | | | | | |
Series 2016-C33, Class C | | | | | | | | |
3.896%, 03/15/59 | | | 517,000 | | | | 450,556 | |
Series 2019-C49, Class C | | | | | | | | |
4.866%, 03/15/523 | | | 350,000 | | | | 295,173 | |
Series 2019-C50, Class B | | | | | | | | |
4.192%, 05/15/52 | | | 637,000 | | | | 545,333 | |
Series 2019-C50, Class C | | | | | | | | |
4.345%, 05/15/52 | | | 637,000 | | | | 516,106 | |
| |
Total Mortgage-Backed Securities | | | | | |
(Cost $15,636,370) | | | | | | | 13,182,926 | |
| | |
Municipal Bonds - 0.4% | | | | | | | | |
| | |
California State General Obligation, School Improvements, Build America Bonds
7.550%, 04/01/39 | | | 330,000 | | | | 395,081 | |
| | |
Missouri Highway & Transportation Commission, Build America Bonds 5.063%, 05/01/24 | | | 245,000 | | | | 245,766 | |
| | |
Total Municipal Bonds | | | | | | | | |
(Cost $722,810) | | | | | | | 640,847 | |
| |
| U.S. Government and Agency Obligations - 44.9% | | | | | |
| | |
Fannie Mae - 9.7% | | | | | | | | |
| | |
FNMA, | | | | | | | | |
2.140%, 10/01/29 | | | 7,000,000 | | | | 5,928,882 | |
2.260%, 01/01/30 | | | 3,200,000 | | | | 2,705,495 | |
3.000%, 03/01/45 | | | 664,660 | | | | 578,882 | |
3.500%, 12/01/31 to 01/01/32 | | | 245,191 | | | | 231,323 | |
4.000%, 09/01/31 to 06/01/42 | | | 92,344 | | | | 85,308 | |
4.500%, 03/01/42 | | | 35,683 | | | | 33,339 | |
| | |
FNMA REMICS, | | | | | | | | |
Series 2010-156, Class ZC | | | | | | | | |
4.000%, 01/25/41 | | | 423,345 | | | | 345,891 | |
Series 2011-121, Class JP | | | | | | | | |
4.500%, 12/25/41 | | | 50,221 | | | | 48,543 | |
Series 2012-105, Class Z | | | | | | | | |
3.500%, 10/25/42 | | | 1,422,482 | | | | 1,300,547 | |
Series 2012-127, Class PA | | | | | | | | |
2.750%, 11/25/42 | | | 609,543 | | | | 549,438 | |
Series 2012-20, Class ZT | | | | | | | | |
3.500%, 03/25/42 | | | 2,642,469 | | | | 2,368,586 | |
Series 2012-31, Class Z | | | | | | | | |
4.000%, 04/25/42 | | | 811,708 | | | | 761,609 | |
Series 2015-9, Class HA | | | | | | | | |
3.000%, 01/25/45 | | | 1,724,845 | | | | 1,585,675 | |
| | |
Total Fannie Mae | | | | | | | 16,523,518 | |
| | |
Freddie Mac - 7.8% | | | | | | | | |
| | |
FHLMC, | | | | | | | | |
3.000%, 04/01/47 | | | 904,971 | | | | 790,362 | |
| | | | | | | | |
| | |
| | | Principal Amount | | | Value | |
| | |
FHLMC Gold, | | | | | | | | |
3.000%, 07/01/45 to 08/01/45 | | | $1,920,693 | | | | $1,673,635 | |
3.500%, 10/01/42 | | | 255,693 | | | | 224,006 | |
4.000%, 10/01/41 | | | 18,009 | | | | 16,309 | |
5.000%, 07/01/35 | | | 7,885 | | | | 7,903 | |
| | |
FHLMC REMICS, | | | | | | | | |
Series 2909, Class Z | | | | | | | | |
5.000%, 12/15/34 | | | 82,217 | | | | 81,229 | |
Series 3626, Class AZ | | | | | | | | |
5.500%, 08/15/36 | | | 52,733 | | | | 53,206 | |
Series 3792, Class SE
(9.860 minus 2 times 1 month LIBOR, Floor 0.000%), 3.036%, 01/15/413 | | | 18,652 | | | | 11,697 | |
Series 3872, Class BA | | | | | | | | |
4.000%, 06/15/41 | | | 13,376 | | | | 12,426 | |
Series 3894, Class ZA | | | | | | | | |
4.500%, 07/15/41 | | | 23,843 | | | | 23,287 | |
Series 3957, Class HZ | | | | | | | | |
4.000%, 11/15/41 | | | 330,830 | | | | 313,695 | |
Series 4016, Class KZ | | | | | | | | |
4.000%, 03/15/42 | | | 2,673,607 | | | | 2,532,204 | |
Series 4316, Class BZ | | | | | | | | |
3.000%, 03/15/44 | | | 3,879,828 | | | | 3,315,378 | |
Series 4750, Class PA | | | | | | | | |
3.000%, 07/15/46 | | | 653,105 | | | | 607,680 | |
Series 4934, Class P | | | | | | | | |
2.500%, 11/15/40 | | | 4,240,328 | | | | 3,714,538 | |
| | |
Total Freddie Mac | | | | | | | 13,377,555 | |
| | |
Ginnie Mae - 0.2% | | | | | | | | |
| | |
GNMA, | | | | | | | | |
Series 2004-35, Class SA
(32.500% minus 6.5 times 1 month LIBOR, Cap 32.500%, Floor 0.000%),, 9.821%, 03/20/343 | | | 8,804 | | | | 8,299 | |
Series 2009-32, Class ZE | | | | | | | | |
4.500%, 05/16/39 | | | 97,149 | | | | 94,806 | |
Series 2009-35, Class DZ | | | | | | | | |
4.500%, 05/20/39 | | | 104,212 | | | | 101,330 | |
Series 2009-75, Class GZ | | | | | | | | |
4.500%, 09/20/39 | | | 102,134 | | | | 99,381 | |
| | |
Total Ginnie Mae | | | | | | | 303,816 | |
| | |
U.S. Treasury Obligations - 27.2% | | | | | | | | |
| | |
U.S. Treasury Bonds, | | | | | | | | |
1.250%, 05/15/50 | | | 2,315,000 | | | | 1,192,858 | |
1.875%, 02/15/41 to 11/15/51 | | | 16,315,000 | | | | 10,501,217 | |
2.375%, 02/15/42 | | | 890,000 | | | | 649,839 | |
2.250%, 02/15/52 | | | 1,345,000 | | | | 901,991 | |
2.875%, 05/15/52 | | | 1,135,000 | | | | 880,866 | |
| | |
U.S. Treasury Notes, | | | | | | | | |
1.625%, 05/15/26 | | | 1,975,000 | | | | 1,796,941 | |
1.875%, 02/15/32 | | | 16,797,400 | | | | 13,968,088 | |
2.750%, 02/15/28 to 05/31/29 | | | 8,840,000 | | | | 8,142,170 | |
2.875%, 05/15/25 to 05/15/32 | | | 6,940,000 | | | | 6,386,674 | |
3.000%, 07/15/25 to 07/31/27 | | | 1,670,000 | | | | 1,566,164 | |
The accompanying notes are an integral part of these financial statements.
10
|
AMG Beutel Goodman Core Plus Bond Fund Schedule of Portfolio Investments (continued) |
| | | | | | | | |
| | |
| | | Principal Amount | | | Value | |
| |
U.S. Treasury Obligations - 27.2% | | | | | |
(continued) | | | | | | | | |
| | |
U.S. Treasury Notes, | | | | | | | | |
4.250%, 09/30/24 | | | $525,000 | | | | $522,334 | |
| |
Total U.S. Treasury Obligations | | | | 46,509,142 | |
| |
Total U.S. Government and Agency Obligations | | | | | |
(Cost $87,670,502) | | | | | | | 76,714,031 | |
| |
Floating Rate Senior Loan Interests - 3.1% | | | | | |
| | |
Industrials - 3.1% | | | | | | | | |
| | |
Clean Harbors, Inc. Incremental Term Loan, (1 month LIBOR + 2.000%), 5.754%, 10/08/283 | | | 2,481,250 | | | | 2,464,192 | |
| | |
Mileage Plus Holdings LLC, Initial Term Loan, (3 month LIBOR + 5.250%), 8.777%, 06/21/273 | | | 2,850,000 | | | | 2,906,407 | |
| |
Total Floating Rate Senior Loan Interests | | | | | |
(Cost $5,477,735) | | | | | | | 5,370,599 | |
| | |
| | | Shares | | | | |
| |
Common Stocks - 0.0%# | | | | | |
| | |
Energy - 0.0%# | | | | | | | | |
| | |
Foresight Energy, LLC7 | | | 202 | | | | 3,627 | |
| | |
Tapstone Energy, LLC7 | | | 1,579 | | | | 3,584 | |
| | |
Total Energy
(Cost $165,688) | | | | | | | 7,211 | |
| | | | | | | | |
| | |
| | | Shares | | | Value | |
| | |
Short-Term Investments - 0.1% | | | | | | | | |
| | |
Commercial Paper - 0.1% | | | | | | | | |
| | |
Enbridge Pipe, 3.503%, 12/02/228 | | | 60,000 | | | | 59,994 | |
| | |
Enbridge Pipe, 3.895%, 12/02/228 | | | 135,000 | | | | 134,767 | |
| | |
Total Commercial Paper | | | | | | | 194,761 | |
| | |
| | | Shares | | | | |
| |
Other Investment Companies - 0.0%# | | | | | |
| | |
Dreyfus Government Cash Management Fund, Institutional Shares, 2.91%9 | | | 3,196 | | | | 3,197 | |
| | |
Dreyfus Institutional Preferred Government Money Market Fund, Institutional Shares, 3.09%9 | | | 4,795 | | | | 4,795 | |
| |
Total Other Investment Companies | | | | 7,992 | |
| | |
Total Short-Term Investments | | | | | | | | |
(Cost $202,753) | | | | | | | 202,753 | |
| | |
Total Investments - 99.3% | | | | | | | | |
(Cost $199,616,978) | | | | | | | 169,752,157 | |
| | |
Other Assets, less Liabilities - 0.7% | | | | | | | 1,111,488 | |
| | |
Net Assets - 100.0% | | | | | | $ | 170,863,645 | |
| 1 | Fixed to variable rate investment. The rate shown reflects the fixed rate in effect at October 31, 2022. Rate will reset at a future date. |
| 2 | Perpetuity Bond. The date shown represents the next call date. |
| 3 | Variable rate security. The rate shown is based on the latest available information as of October 31, 2022. Certain variable rate securities are not based on a published reference rate and spread but are determined by the issuer or agent and are based on current market conditions. These securities do not indicate a reference rate and spread in their description above. |
| 4 | Security exempt from registration under Rule 144A of the Securities Act of 1933. This security may be resold in transactions exempt from registration, normally to qualified institutional buyers. At October 31, 2022, the value of these securities amounted to $35,089,227 or 20.5% of net assets. |
| 5 | Payment-in-Kind Security: The security may pay interest/dividends in additional par/shares and/or in cash. Rates shown are the current rate and possible payment rates. |
| 6 | Security is in default. Issuer has failed to make a timely payment of either principal or either interest or has failed to comply with some provision of the bond indenture. |
| 7 | Security’s value was determined by using significant unobservable inputs. |
| 8 | Represents yield to maturity at October 31, 2022. |
| 9 | Yield shown represents the October 31, 2022, seven day average yield, which refers to the sum of the previous seven days’ dividends paid, expressed as an annual percentage. |
| | |
| CMT | | Constant Maturity Treasury |
| |
| FHLMC | | Freddie Mac |
| |
| FNMA | | Fannie Mae |
| |
| GNMA | | Ginnie Mae |
| |
| LIBOR | | London Interbank Offered Rate |
| |
| REMICS | | Real Estate Mortgage Investment Conduit |
| |
| SOFR | | Secured Overnight Financing Rate |
| |
| USD | | United States Dollar |
The accompanying notes are an integral part of these financial statements.
11
|
AMG Beutel Goodman Core Plus Bond Fund Schedule of Portfolio Investments (continued) |
The following table summarizes the inputs used to value the Fund’s investments by the fair value hierarchy levels as of October 31, 2022:
| | | | | | | | | | | | | | | | |
| | | Level 1 | | | Level 2 | | | Level 3 | | | Total | |
Investments in Securities | | | | | | | | | | | | | | | | |
| | | | |
Corporate Bonds and Notes† | | | — | | | | $69,863,406 | | | | — | | | | $69,863,406 | |
| | | | |
Asset-Backed Securities | | | — | | | | 3,770,384 | | | | — | | | | 3,770,384 | |
| | | | |
Mortgage-Backed Securities | | | — | | | | 13,182,926 | | | | — | | | | 13,182,926 | |
| | | | |
Municipal Bonds† | | | — | | | | 640,847 | | | | — | | | | 640,847 | |
| | | | |
U.S. Government and Agency Obligations† | | | — | | | | 76,714,031 | | | | — | | | | 76,714,031 | |
| | | | |
Floating Rate Senior Loan Interests† | | | — | | | | 5,370,599 | | | | — | | | | 5,370,599 | |
| | | | |
Common Stocks | | | | | | | | | | | | | | | | |
| | | | |
Energy | | | — | | | | — | | | | $7,211 | | | | 7,211 | |
| | | | |
Short-Term Investments | | | | | | | | | | | | | | | | |
| | | | |
Commercial Paper | | | — | | | | 194,761 | | | | — | | | | 194,761 | |
| | | | |
Other Investment Companies | | | $7,992 | | | | — | | | | — | | | | 7,992 | |
| | | | | | | | | | | | | | | | |
| | | | |
Total Investments in Securities | | | $7,992 | | | | $169,736,954 | | | | $7,211 | | | | $169,752,157 | |
| | | | | | | | | | | | | | | | |
| † | All corporate bonds and notes, municipal bonds, and U.S. government agency obligations and floating rate senior loan interests held in the Fund are Level 2 securities. For a detailed breakout of corporate bonds and notes, municipal bonds, and U.S. government agency obligations and floating rate senior loan interests by major industry or agency classification, please refer to the Fund’s Schedule of Portfolio Investments. |
The following table below is a reconciliation of investments in which significant unobservable inputs (Level 3) were used in determining fair value at October 31, 2022:
| | | | | | | | |
| | | | | | Floating Rate | |
| | | Common | | | Senior Loan | |
| | | Stock | | | Interests | |
| | |
Balance as of October 31, 2021 | | | $7,211 | | | | $1,215 | |
| | |
Accrued discounts (premiums) | | | — | | | | 11 | |
| | |
Realized gain (loss) | | | — | | | | 323 | |
| | |
Change in unrealized appreciation/depreciation | | | — | | | | (334 | ) |
| | |
Purchases | | | — | | | | — | |
| | |
Sales | | | — | | | | (1,215 | ) |
| | |
Transfers in to Level 3 | | | — | | | | — | |
| | |
Transfers out of Level 3 | | | — | | | | — | |
| | |
Balance as of October 31, 2022 | | | $7,211 | | | | $0 | |
| | |
| | | | | | | — | |
| | |
Net change in unrealized appreciation/depreciation on investments still held at October 31, 2022 | | | — | | | | — | |
The following table summarizes the quantitative inputs and assumptions used for investments categorized in Level 3 of the fair value hierarchy as of October 31, 2022. The table below is not intended to be all-inclusive, but rather provides information on the significant Level 3 inputs as they relate to the Fund’s fair value measurements:
| | | | | | | | | | | | |
| Quantitative Information about Level 3 Fair Value Measurements |
| | | | | | |
| | | Fair Value as of | | Valuation | | Unobservable | | | | | | Impact to Valuation from |
| | | October 31, 2022 | | Technique(s) | | Inputs(s) | | Range | | Median | | an Increase in Input(a) |
| | | | | | |
Common Stock | | $7,211 | | Market
Approach | | EV/Sale Multiple | | N/A | | N/A | | Increase |
| (a) | Represents the directional change in the fair value of the Level 3 investments that could have resulted from an increase in the corresponding input as of period end. A decrease to the unobservable input would have had the opposite effect. Significant changes in these inputs may have resulted in a significantly higher or lower fair value measurement at period end. |
The accompanying notes are an integral part of these financial statements.
12
| | |
| | | AMG Beutel Goodman International Equity Fund Portfolio Manager’s Comments (unaudited) |
| | | |
| | | |
| | | | | | | | |
For the 12 months ended October 31, 2022, AMG Beutel Goodman International Equity Fund Class N shares returned (25.36)%, compared with the (23.00)% return for the MSCI EAFE Index. MARKET OVERVIEW Over the fiscal year, international equity markets experienced a steep decline as many policymakers struggled with inflation levels not seen since the early 1980s. With central banks engaged in an aggressive hiking cycle, the outlook for the global economy has deteriorated throughout 2022, and a recession is forecast by many economists. Not surprisingly, this uncertainty has been felt in equity markets too, which have experienced heightened volatility during the fiscal year. In this environment, companies’ fundamentals have become a much bigger factor after a long period of in which growth stocks drove overall index performance. The only sector to provide a positive return during the period was energy, while the weakest performing sectors were information technology, consumer discretionary, and real estate. PERFORMANCE REVIEW The Fund’s top-performing sectors during the period relative to the benchmark were energy, consumer discretionary, and communications services. More specifically, an overweight position in energy and an underweight position in consumer discretionary contributed to the Fund’s relative performance. Whereas a combination of overweight positions and stock selections in the communication services sector was further additive to the Fund’s relative performance. Over the period, the largest individual contributors to Fund performance included TGS ASA, DBS Group Holdings, Ltd., and Nippon Telegraph & Telephone Corp. | | | | From a sector perspective, the Fund’s holdings in the materials, industrials, and consumer staples sectors were the largest detractors from the Fund’s relative performance over the period. Stock selection in materials detracted from the Fund’s relative performance, while a combination of an overweight and stock selection in the industrials sector also detracted from the Fund’s relative performance. Stock selection in the consumer staples sector further detracted from the Fund’s relative performance. Over the period, the largest individual detractors from Fund performance were dormakaba Holding AG, Atea ASA, and Akzo Nobel, N.V. OUTLOOK The market has seen many crises over the years—the inflation and commodity shocks of the 1970s, the currency-driven emerging markets crisis of the late 1990s, the Tech Wreck in 2000, and the hidden leverage (real estate) issues that led to the Great Financial Crisis in 2008. The difference between the lead up to each of these events, and whatever is going on today, is that we are starting to see parallels for all of them happening at the same time. And after more than a decade of growth in equities, the market is unprepared for surprises. We don’t profess to know how any of this will play out; the correlation between making a macro call and a stock call is fraught with risk. We have been watching as valuations have derated, starting with a handful of tech companies earlier in the year to a much more broad-based derating as of the end of Q3 2022. Many investors are learning what we have always practiced through our investment process: growth is important, but what you pay for that growth is just as important. What gives us confidence at times like these is that our portfolios | | | | are not the market. As bottom-up investors, we buy strong franchises when they are trading at a minimum one-third discount to our calculation of intrinsic value. We believe this process can help provide our clients with downside protection. Further, the signs of indiscriminate selling that we are starting to see is, in our opinion, a very positive signal for the long term. In their rush to exit equity markets, panicked investors aren’t paying attention to the fundamentals, and the prices at which they’re selling good businesses. Thus, while the market frets about recession risks, we are taking the opportunity to pick up what we believe are the best businesses at attractive valuations. While there is still room for disappointment with respect to earnings and valuation multiples in the months ahead, the businesses we own in the Fund (such as Carlsberg AS, Roche Holding AG, and Shionogi & Co., Ltd.) tend to be less economically sensitive, and valuations are attractive. In fact, we are seeing dominant franchises that are involved in sales of almost any type of capital goods (especially within our industrials and consumer discretionary holdings) already reflect deep recession scenarios into earnings outlooks and valuations. We expect volatility in these segments of the market to remain high, but in our view, with valuations and expectations for earnings are already very low, our ultimate downside should be limited relative to significant upside capture potential. The views expressed represent the opinions of Beutel, Goodman & Company Ltd., as of October 31, 2022, and are not intended as a forecast or guarantee of future results and are subject to change without notice. |
13
| | |
| | | AMG Beutel Goodman International Equity Fund Portfolio Manager’s Comments (continued) |
| | | |
| | | |
CUMULATIVE TOTAL RETURN PERFORMANCE
AMG Beutel Goodman International Equity Fund’s cumulative total return is based on the daily change in net asset value (NAV), and assumes that all dividends and distributions were reinvested. The graph compares a hypothetical $10,000 investment made in the AMG Beutel Goodman International Equity Fund’s Class N shares on April 14, 2014, to a $10,000 investment made in the MSCI EAFE Index for the same time period. The graph and table do not reflect the deduction of taxes that a shareholder would pay on a Fund distribution or redemption of shares. The listed returns for the Fund are net of expenses and the returns for the index excludes expenses. Total returns would have been lower had certain expenses not been reduced.
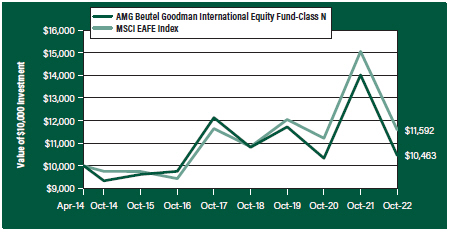
The table below shows the average annual total returns for the AMG Beutel Goodman International Equity Fund and the MSCI EAFE Index for the same time periods ended October 31, 2022.
| | | | | | | | | | | | | | | | |
| | | One | | | Five | | | Since | | | Inception | |
| Average Annual Total Returns1 | | Year | | | Years | | | Inception | | | Date | |
| |
AMG Beutel Goodman International Equity Fund2, 3, 4, 5, 6, 7, 8, 9, 10, 11 | | | | | |
| | | | |
Class N | | | (25.36 | %) | | | (2.91 | %) | | | 0.53% | | | | 04/14/14 | |
| | | | |
Class I | | | (25.10 | %) | | | (2.62 | %) | | | 0.84% | | | | 04/14/14 | |
| | | | |
Class Z | | | (25.07 | %) | | | (2.54 | %) | | | (2.18%) | | | | 09/29/17 | |
| | | | |
MSCI EAFE Index12 | | | (23.00 | %) | | | (0.09 | %) | | | 1.75% | | | | 04/14/14 | † |
The performance data shown represents past performance. Past performance is not a guarantee of future results. Current performance may be lower or higher than the performance data quoted. The investment return and principal value of an investment will fluctuate so that an investor’s shares, when redeemed, may be worth more or less than their original cost.
Investors should carefully consider the Fund’s investment objectives, risks, charges and expenses before investing. For performance information through the most recent month end, current net asset values per share for the Fund and other information, please call 800.548.4539 or visit our website at amgfunds.com for a free prospectus. Read it carefully before investing or sending money.
Distributed by AMG Distributors, Inc., member FINRA/SIPC.
| † | Date reflects the inception date of the Fund, not the index. |
| 1 | Total return equals income yield plus share price change and assumes reinvestment of all dividends and capital gain distributions. Returns are net of fees and may reflect offsets of Fund expenses as described in the prospectus. No adjustment has been made for taxes payable by shareholders on their reinvested dividends and |
|
capital gain distributions. Returns for periods greater than one year are annualized. The listed returns on the Fund are net of expenses and based on the published NAV as of October 31, 2022. All returns are in U.S. Dollars ($). 2 From time to time, the Fund’s adviser has waived its fees and/or absorbed Fund expenses, which has resulted in higher returns. 3 As of March 19, 2021, the Fund’s Subadviser was changed to Beutel Goodman & Company Ltd. Prior to March 19, 2021, the Fund was known as the AMG Managers Pictet International Fund and had different principal investment strategies and corresponding risks. Performance shown for periods prior to March 19, 2021, reflects the performance and investment strategies of the Fund’s previous Subadviser, Pictet Asset Management Limited. The Fund’s past performance would have been different if the Fund were managed by the current Subadviser and strategy, and the Fund’s prior performance record might be less pertinent for investors considering whether to purchase shares of the Fund. 4 Investments in international securities are subject to certain risks of overseas investing including currency fluctuations and changes in political and economic conditions, which could result in significant market fluctuations. These risks are magnified in emerging markets. 5 The Fund is subject to the risks associated with investments in emerging markets, such as erratic earnings patterns, economic and political instability, changing exchange controls, limitations on repatriation of foreign capital and changes in local governmental attitudes toward private investment, possibly leading to nationalization or confiscation of investor assets. 6 The Fund is subject to risks associated with investments in mid-capitalization companies such as greater price volatility, lower trading volume, and less liquidity than the stocks of larger, more established companies. 7 The Fund is subject to risks associated with investments in small-capitalization companies, such as erratic earnings patterns, competitive conditions, limited earnings history and a reliance on one or a limited number of products. 8 Market prices of investments held by the Fund may fall rapidly or unpredictably due to a variety of economic or political factors, market conditions, disasters or public health issues, or in response to events that affect particular industries or companies. 9 A greater percentage of the Fund’s holdings may be focused in a smaller number of securities which may place the Fund at greater risk than a more diversified fund. |
14
| | |
| | | AMG Beutel Goodman International Equity Fund Portfolio Manager’s Comments (continued) |
| | | |
| | | |
| | | | |
10 The Fund invests in large-capitalization companies that may underperform other stock funds (such as funds that focus on small-and medium-capitalization companies) when stocks of large-capitalization companies are out of favor. 11 Companies that are in similar industry sectors may be similarly affected by particular economic or market events; to the extent the Fund has substantial holdings within a particular sector, the risks associated with that sector increase. | | 12 The MSCI EAFE Index (Europe, Australasia, Far East) is a free float-adjusted market capitalization index that is designed to measure the equity market performance of developed markets, excluding the U.S. & Canada. Please go to msci.com for most current list of countries represented by the index. Unlike the Fund, the MSCI EAFE Index is unmanaged, is not available for investment and does not incur expenses. The All MSCI data is provided “as is.” The products described herein are not sponsored or endorsed and | | have not been reviewed or passed on by MSCI. In no event shall MSCI, its affiliates, or any MSCI data provider have any liability of any kind in connection with the MSCI data or the products described herein. Copying or redistributing the MSCI data is strictly prohibited. Not FDIC insured, nor bank guaranteed. May lose value. |
15
|
AMG Beutel Goodman International Equity Fund Fund Snapshots (unaudited) October 31, 2022 |
PORTFOLIO BREAKDOWN
| | | | |
| Sector | | % of
Net Assets | |
| | |
Health Care | | | 18.6 | |
| | |
Industrials | | | 18.0 | |
| | |
Communication Services | | | 13.7 | |
| | |
Consumer Staples | | | 11.8 | |
| | |
Materials | | | 9.8 | |
| | |
Energy | | | 8.2 | |
| | |
Financials | | | 7.3 | |
| | |
Information Technology | | | 4.7 | |
| | |
Consumer Discretionary | | | 4.2 | |
| | |
Short-Term Investments | | | 2.9 | |
| | |
Other Assets, Less Liabilities | | | 0.8 | |
TOP TEN HOLDINGS
| | | | |
| Security Name | | % of Net Assets | |
| | |
Carlsberg AS, Class B (Denmark) | | | 5.0 | |
| | |
Smiths Group PLC (United Kingdom) | | | 5.0 | |
| | |
Konecranes Oyj (Finland) | | | 4.9 | |
| | |
Roche Holding AG (Switzerland) | | | 4.8 | |
| | |
Ampol, Ltd. (Australia) | | | 4.7 | |
| | |
Atea ASA (Norway) | | | 4.7 | |
| | |
IMI PLC (United Kingdom) | | | 4.6 | |
| | |
Nippon Telegraph & Telephone Corp. (Japan) | | | 4.3 | |
| | |
Cie Generale des Etablissements Michelin SCA (France) | | | 4.1 | |
| | |
Koninklijke KPN, N.V. (Netherlands) | | | 4.1 | |
| | | | | |
| | |
Top Ten as a Group | | | 46.2 | |
| | | | | |
Because a fund’s strategy may result in multiple investments in particular sectors of the economy, its performance may depend on the performance of those sectors and may fluctuate more widely than investments diversified across more sectors. For additional information on these and other risk considerations, please see the Fund’s prospectus.
Any sectors, industries, or securities discussed should not be perceived as investment recommendations. Mention of a specific security should not be considered a recommendation to buy or solicitation to sell that security. Specific securities mentioned in this report may have been sold from the Fund’s portfolio of investments by the time you receive this report.
16
|
AMG Beutel Goodman International Equity Fund Schedule of Portfolio Investments October 31, 2022 |
| | | | | | | | |
| | |
| | | Shares | | | Value | |
| | |
Common Stocks - 96.3% | | | | | | | | |
| |
Communication Services - 13.7% | | | | | |
| | |
Hakuhodo DY Holdings, Inc. (Japan) | | | 37,790 | | | | $318,409 | |
| | |
ITV PLC (United Kingdom) | | | 604,248 | | | | 465,246 | |
| | |
Koninklijke KPN, N.V. (Netherlands) | | | 220,392 | | | | 616,460 | |
| | |
Nippon Telegraph & Telephone Corp. (Japan) | | | 23,540 | | | | 649,250 | |
| | |
Total Communication Services | | | | | | | 2,049,365 | |
| |
Consumer Discretionary - 4.2% | | | | | |
| | |
Cie Generale des Etablissements Michelin SCA (France) | | | 24,374 | | | | 621,148 | |
| |
Consumer Staples - 11.8% | | | | | |
| | |
Carlsberg AS, Class B (Denmark) | | | 6,404 | | | | 754,044 | |
| | |
Essity AB, Class B (Sweden) | | | 27,216 | | | | 575,029 | |
| | |
Unilever PLC (United Kingdom) | | | 9,730 | | | | 442,271 | |
| | |
Total Consumer Staples | | | | | | | 1,771,344 | |
| |
Energy - 8.2% | | | | | |
| | |
Ampol, Ltd. (Australia) | | | 40,648 | | | | 708,975 | |
| | |
TGS ASA (Norway)1 | | | 38,420 | | | | 523,082 | |
| | |
Total Energy | | | | | | | 1,232,057 | |
| |
Financials - 7.3% | | | | | |
| | |
DBS Group Holdings, Ltd. (Singapore) | | | 8,450 | | | | 204,290 | |
| | |
Euronext, N.V. (Netherlands)2 | | | 5,810 | | | | 368,754 | |
| | |
Julius Baer Group, Ltd. (Switzerland) | | | 10,827 | | | | 519,467 | |
| | |
Total Financials | | | | | | | 1,092,511 | |
| |
Health Care - 18.6% | | | | | |
| | |
GSK PLC (United Kingdom) | | | 30,070 | | | | 492,580 | |
| | |
Novartis AG (Switzerland) | | | 5,630 | | | | 455,415 | |
| | |
Roche Holding AG (Switzerland) | | | 2,149 | | | | 713,034 | |
| | |
Shionogi & Co., Ltd. (Japan) | | | 13,010 | | | | 604,149 | |
| | |
Smith & Nephew PLC (United Kingdom) | | | 44,584 | | | | 526,845 | |
| | |
Total Health Care | | | | | | | 2,792,023 | |
| | | | | | | | |
| | |
| | | Shares | | | Value | |
| |
Industrials - 18.0% | | | | | |
| | |
dormakaba Holding AG (Switzerland) | | | 1,653 | | | | $524,688 | |
| | |
IMI PLC (United Kingdom) | | | 49,165 | | | | 692,581 | |
| | |
Konecranes Oyj (Finland) | | | 29,034 | | | | 730,509 | |
| | |
Smiths Group PLC (United Kingdom) | | | 41,587 | | | | 744,929 | |
| | |
Total Industrials | | | | | | | 2,692,707 | |
| |
Information Technology - 4.7% | | | | | |
| | |
Atea ASA (Norway) | | | 63,198 | | | | 703,237 | |
| |
Materials - 9.8% | | | | | |
| | |
Akzo Nobel, N.V. (Netherlands) | | | 9,371 | | | | 578,523 | |
| | |
BASF SE (Germany) | | | 9,971 | | | | 447,406 | |
| | |
HeidelbergCement AG (Germany) | | | 9,611 | | | | 441,979 | |
| | |
Total Materials | | | | | | | 1,467,908 | |
| | |
Total Common Stocks | | | | | | | | |
(Cost $19,298,831) | | | | | | | 14,422,300 | |
| | |
| | | Principal Amount | | | | |
| | |
Short-Term Investments - 2.9% | | | | | | | | |
| |
Joint Repurchase Agreements - 2.9%3 | | | | | |
| | |
Citigroup Global Markets, Inc., dated 10/31/22,due 11/01/22, 3.000% total to be received $439,192 (collateralized by various U.S. Treasuries, 0.125% - 4.375%, 11/15/31 - 02/15/52, totaling $448,201) | | | $439,155 | | | | 439,155 | |
| | |
Total Short-Term Investments | | | | | | | | |
(Cost $439,155) | | | | | | | 439,155 | |
| | |
Total Investments - 99.2% | | | | | | | | |
(Cost $19,737,986) | | | | | | | 14,861,455 | |
| | |
Other Assets, less Liabilities - 0.8% | | | | | | | 125,304 | |
| | |
Net Assets - 100.0% | | | | | | | $14,986,759 | |
| 1 | Some of this security, amounting to $403,843 or 2.7% of net assets, was out on loan to various borrowers and is collateralized by cash. See Note 4 of Notes to Financial Statements. |
| 2 | Security exempt from registration under Rule 144A of the Securities Act of 1933. This security may be resold in transactions exempt from registration, normally to qualified institutional buyers. At October 31, 2022, the value of these securities amounted to $368,754 or 2.5% of net assets. |
| 3 | Cash collateral received for securities lending activity was invested in these joint repurchase agreements. |
The accompanying notes are an integral part of these financial statements.
17
|
AMG Beutel Goodman International Equity Fund Schedule of Portfolio Investments (continued) |
The following table summarizes the inputs used to value the Fund’s investments by the fair value hierarchy levels as of October 31, 2022:
| | | | | | | | | | | | | | | | |
| | | Level 1 | | | Level 21 | | | Level 3 | | | Total | |
Investments in Securities | | | | | | | | | | | | | | | | |
| | | | |
Common Stocks† | | | — | | | | $14,422,300 | | | | — | | | | $14,422,300 | |
| | | | |
Short-Term Investments | | | | | | | | | | | | | | | | |
| | | | |
Joint Repurchase Agreements | | | — | | | | 439,155 | | | | — | | | | 439,155 | |
| | | | | | | | | | | | | | | | |
Total Investments in Securities | | | — | | | | $14,861,455 | | | | — | | | | $14,861,455 | |
| | | | | | | | | | | | | | | | |
| † | All common stocks held in the Fund are Level 2 securities. For a detailed breakout of common stocks by major industry classification, please refer to the Fund’s Schedule of Portfolio Investments. |
| 1 | An external pricing service is used to reflect any impact on security value due to market movements between the time the Fund valued such foreign securities and the earlier closing of foreign markets. |
For the fiscal year ended October 31, 2022, there were no transfers in or out of Level 3.
The country allocation in the Schedule of Portfolio Investments at October 31, 2022, was as follows:
| | |
| Country | | % of Long-Term
Investments |
| |
Australia | | 4.9 |
| |
Denmark | | 5.2 |
| |
Finland | | 5.1 |
| |
France | | 4.3 |
| |
Germany | | 6.2 |
| |
Japan | | 10.9 |
| |
Netherlands | | 10.9 |
| |
Norway | | 8.5 |
| |
Singapore | | 1.4 |
| |
Sweden | | 4.0 |
| |
Switzerland | | 15.3 |
| |
United Kingdom | | 23.3 |
| | |
| |
| | | 100.0 |
| | |
The accompanying notes are an integral part of these financial statements.
18
|
Statement of Assets and Liabilities October 31, 2022 |
| | | | | | | | |
| | | AMG
Beutel Goodman
Core Plus
Bond Fund | | AMG
Beutel Goodman
International
Equity Fund |
Assets: | | | | | | | | |
| | |
Investments at value1 (including securities on loan valued at $0, and $403,843, respectively) | | | $169,752,157 | | | | $14,861,455 | |
| | |
Foreign currency2 | | | — | | | | 837,596 | |
| | |
Receivable for investments sold | | | 1,799,250 | | | | 346,733 | |
| | |
Dividend and interest receivables | | | 1,366,963 | | | | 306,260 | |
| | |
Securities lending income receivable | | | 70 | | | | 16 | |
| | |
Receivable for Fund shares sold | | | 77,351 | | | | — | |
| | |
Prepaid expenses and other assets | | | 13,817 | | | | 10,009 | |
| | |
Total assets | | | 173,009,608 | | | | 16,362,069 | |
| | |
Liabilities: | | | | | | | | |
| | |
Payable upon return of securities loaned | | | — | | | | 439,155 | |
| | |
Payable for investments purchased | | | 1,794,838 | | | | — | |
| | |
Payable for Fund shares repurchased | | | 169,057 | | | | 1,695 | |
| | |
Interfund loan payable | | | — | | | | 616,220 | |
| | |
Due to custodian | | | — | | | | 205,421 | |
| | |
Accrued expenses: | | | | | | | | |
| | |
Investment advisory and management fees | | | 38,993 | | | | 51,715 | |
| | |
Administrative fees | | | 22,257 | | | | 1,871 | |
| | |
Distribution fees | | | 4,909 | | | | 410 | |
| | |
Shareholder service fees | | | 5,984 | | | | 1,138 | |
| | |
Other | | | 109,925 | | | | 57,685 | |
| | |
Total liabilities | | | 2,145,963 | | | | 1,375,310 | |
| | | | | | | | |
| | |
Net Assets | | | $170,863,645 | | | | $14,986,759 | |
| | |
1 Investments at cost | | | $199,616,978 | | | | $19,737,986 | |
| | |
2 Foreign currency at cost | | | — | | | | $845,854 | |
The accompanying notes are an integral part of these financial statements.
19
|
Statement of Assets and Liabilities (continued) |
| | | | | | | | |
| | | AMG
Beutel Goodman
Core Plus
Bond Fund | | AMG
Beutel Goodman
International
Equity Fund |
| | |
Net Assets Represent: | | | | | | | | |
| | |
Paid-in capital | | | $222,472,504 | | | | $91,071,526 | |
| | |
Total distributable loss | | | (51,608,859 | ) | | | (76,084,767 | ) |
| | |
Net Assets | | | $170,863,645 | | | | $14,986,759 | |
| | |
Class N: | | | | | | | | |
| | |
Net Assets | | | $22,705,669 | | | | $1,987,960 | |
| | |
Shares outstanding | | | 2,611,635 | | | | 238,651 | |
| | |
Net asset value, offering and redemption price per share | | | $8.69 | | | | $8.33 | |
| | |
Class I: | | | | | | | | |
| | |
Net Assets | | | $137,592,412 | | | | $10,686,313 | |
| | |
Shares outstanding | | | 15,841,525 | | | | 1,300,352 | |
| | |
Net asset value, offering and redemption price per share | | | $8.69 | | | | $8.22 | |
| | |
Class Z: | | | | | | | | |
| | |
Net Assets | | | $10,565,564 | | | | $2,312,486 | |
| | |
Shares outstanding | | | 1,215,234 | | | | 282,649 | |
| | |
Net asset value, offering and redemption price per share | | | $8.69 | | | | $8.18 | |
The accompanying notes are an integral part of these financial statements.
20
|
Statement of Operations For the fiscal year ended October 31, 2022 |
| | | | | | | | |
| | | AMG
Beutel Goodman
Core Plus
Bond Fund | | AMG
Beutel Goodman
International
Equity Fund |
| | |
Investment Income: | | | | | | | | |
| | |
Dividend income | | | $14,353 | | | | $1,305,480 | |
| | |
Interest income | | | 6,924,943 | | | | — | |
| | |
Securities lending income | | | 4,759 | | | | 1,433 | |
| | |
Foreign withholding tax | | | (495 | ) | | | (128,819 | ) |
| | |
Total investment income | | | 6,943,560 | | | | 1,178,094 | |
| | |
Expenses: | | | | | | | | |
| | |
Investment advisory and management fees | | | 506,292 | | | | 208,008 | |
| | |
Administrative fees | | | 330,191 | | | | 57,780 | |
| | |
Distribution fees - Class N | | | 74,267 | | | | 8,005 | |
| | |
Shareholder servicing fees - Class N | | | — | | | | 4,803 | |
| | |
Shareholder servicing fees - Class I | | | 89,454 | | | | 32,291 | |
| | |
Professional fees | | | 83,938 | | | | 31,024 | |
| | |
Registration fees | | | 38,470 | | | | 37,330 | |
| | |
Reports to shareholders | | | 27,538 | | | | (8,334 | ) |
| | |
Custodian fees | | | 26,193 | | | | 22,956 | |
| | |
Trustee fees and expenses | | | 14,972 | | | | 2,559 | |
| | |
Transfer agent fees | | | 7,757 | | | | 875 | |
| | |
Interest expense | | | 1,281 | | | | 6,618 | |
| | |
Miscellaneous | | | 9,549 | | | | 3,883 | |
| | | | | | | | |
| | |
Total expenses before offsets | | | 1,209,902 | | | | 407,798 | |
| | |
Expense reimbursements | | | (98,353 | ) | | | (63,329 | ) |
| | | | | | | | |
Net expenses | | | 1,111,549 | | | | 344,469 | |
| | | | | | | | |
| | |
Net investment income | | | 5,832,011 | | | | 833,625 | |
| | |
Net Realized and Unrealized Loss: | | | | | | | | |
| | |
Net realized loss on investments | | | (10,539,235 | ) | | | (3,842,430 | )1 |
| | |
Net realized loss on foreign currency transactions | | | — | | | | (177,762 | ) |
| | |
Net change in unrealized appreciation/depreciation on investments | | | (33,813,542 | ) | | | (6,392,981 | ) |
| | |
Net change in unrealized appreciation/depreciation on foreign currency translations | | | — | | | | (42,909 | ) |
| | | | | | | | |
| | |
Net realized and unrealized loss | | | (44,352,777 | ) | | | (10,456,082 | ) |
| | | | | | | | |
| | |
Net decrease in net assets resulting from operations | | | $(38,520,766 | ) | | | $(9,622,457 | ) |
| 1 | Includes a non-recurring securities litigation gain of $491,944. |
The accompanying notes are an integral part of these financial statements.
21
| | |
| | | Statements of Changes in Net Assets For the fiscal years ended October 31, |
| | | |
| | | |
| | | | | | | | | | | | | | | | |
| | | AMG
Beutel Goodman
Core Plus Bond Fund | | | AMG
Beutel Goodman
International Equity Fund | |
| | | | |
| | | 2022 | | | 2021 | | | 2022 | | | 2021 | |
| | | | |
Increase (Decrease) in Net Assets Resulting From Operations: | | | | | | | | | | | | | | | | |
| | | | |
Net investment income | | | $5,832,011 | | | | $8,646,160 | | | | $833,625 | | | | $1,417,312 | |
| | | | |
Net realized gain (loss) on investments | | | (10,539,235 | ) | | | 367,557 | | | | (4,020,192 | ) | | | 47,182,596 | |
| | | | |
Net change in unrealized appreciation/depreciation on investments | | | (33,813,542 | ) | | | 1,081,961 | | | | (6,435,890 | ) | | | 13,761,786 | |
| | | | | | | | | | | | | | | | |
| | | | |
Net increase (decrease) in net assets resulting from operations | | | (38,520,766 | ) | | | 10,095,678 | | | | (9,622,457 | ) | | | 62,361,694 | |
| | | | |
Distributions to Shareholders: | | | | | | | | | | | | | | | | |
| | | | |
Class N | | | (876,703 | ) | | | (1,214,389 | ) | | | — | | | | — | |
| | | | |
Class I | | | (5,652,369 | ) | | | (10,144,027 | ) | | | (1,104,515 | ) | | | (947,027 | ) |
| | | | |
Class Z | | | (377,513 | ) | | | (322,282 | ) | | | (84,662 | ) | | | (73,113 | ) |
| | | | | | | | | | | | | | | | |
| | | | |
Total distributions to shareholders | | | (6,906,585 | ) | | | (11,680,698 | ) | | | (1,189,177 | ) | | | (1,020,140 | ) |
| | | | |
Capital Share Transactions:1 | | | | | | | | | | | | | | | | |
| | | | |
Net decrease from capital share transactions | | | (51,152,715 | ) | | | (231,711,141 | ) | | | (39,925,200 | ) | | | (181,095,830 | ) |
| | | | | | | | | | | | | | | | |
| | | | |
Total decrease in net assets | | | (96,580,066 | ) | | | (233,296,161 | ) | | | (50,736,834 | ) | | | (119,754,276 | ) |
| | | | |
Net Assets: | | | | | | | | | | | | | | | | |
| | | | |
Beginning of year | | | 267,443,711 | | | | 500,739,872 | | | | 65,723,593 | | | | 185,477,869 | |
| | | | | | | | | | | | | | | | |
| | | | |
End of year | | | $170,863,645 | | | | $267,443,711 | | | | $14,986,759 | | | | $65,723,593 | |
1 See Note 1(g) of the Notes to Financial Statements.
The accompanying notes are an integral part of these financial statements.
22
| | |
| | | AMG Beutel Goodman Core Plus Bond Fund Financial Highlights For a share outstanding throughout each fiscal year |
| | | |
| | | |
| | | | | | | | | | | | | | | | | | | | |
| | | For the fiscal years ended October 31, | |
| | | | | |
Class N | | 2022 | | | 2021 | | | 2020 | | | 2019 | | | 2018 | |
| | | | | |
Net Asset Value, Beginning of Year | | | $10.72 | | | | $10.76 | | | | $10.74 | | | | $10.23 | | | | $10.68 | |
| | | | | |
Income (loss) from Investment Operations: | | | | | | | | | | | | | | | | | | | | |
| | | | | |
Net investment income1,2 | | | 0.24 | | | | 0.20 | | | | 0.27 | | | | 0.34 | | | | 0.29 | |
| | | | | |
Net realized and unrealized gain (loss) on investments | | | (1.97 | ) | | | 0.03 | | | | 0.05 | | | | 0.53 | | | | (0.43 | ) |
| | | | | | | | | | | | | | | | | | | | |
| | | | | |
Total income (loss) from investment operations | | | (1.73 | ) | | | 0.23 | | | | 0.32 | | | | 0.87 | | | | (0.14 | ) |
| | | | | |
Less Distributions to Shareholders from: | | | | | | | | | | | | | | | | | | | | |
| | | | | |
Net investment income | | | (0.30 | ) | | | (0.27 | ) | | | (0.30 | ) | | | (0.36 | ) | | | (0.31 | ) |
| | | | | |
Net Asset Value, End of Year | | | $8.69 | | | | $10.72 | | | | $10.76 | | | | $10.74 | | | | $10.23 | |
| | | | | | | | | | | | | | | | | | | | |
| | | | | |
Total Return2,3 | | | (16.41 | )% | | | 2.19 | % | | | 3.01 | % | | | 8.67 | % | | | (1.33 | )% |
| | | | | |
Ratio of net expenses to average net assets | | | 0.68 | % | | | 0.83 | % | | | 0.94 | % | | | 0.94 | % | | | 0.94 | % |
| | | | | |
Ratio of gross expenses to average net assets4 | | | 0.72 | % | | | 0.90 | % | | | 1.01 | % | | | 1.02 | % | | | 1.01 | % |
| | | | | |
Ratio of net investment income to average net assets2 | | | 2.47 | % | | | 1.85 | % | | | 2.54 | % | | | 3.24 | % | | | 2.80 | % |
| | | | | |
Portfolio turnover | | | 76 | % | | | 174 | % | | | 96 | % | | | 47 | % | | | 69 | % |
| | | | | |
Net assets end of year (000’s) omitted | | | $22,706 | | | | $37,301 | | | | $56,175 | | | | $82,856 | | | | $102,138 | |
| | | | | |
| | | | | | | | | | | | | | | | | | | | | |
| | | | | |
| | | | | | | | | | | | | | | | | | | | | |
23
| | |
| | | AMG Beutel Goodman Core Plus Bond Fund Financial Highlights For a share outstanding throughout each fiscal year |
| | | |
| | | |
| | | | | | | | | | | | | | | | | | | | |
| | | For the fiscal years ended October 31, | |
| | | | | |
Class I | | 2022 | | | 2021 | | | 2020 | | | 2019 | | | 2018 | |
| | | | | |
Net Asset Value, Beginning of Year | | | $10.71 | | | | $10.75 | | | | $10.74 | | | | $10.23 | | | | $10.67 | |
| | | | | |
Income (loss) from Investment Operations: | | | | | | | | | | | | | | | | | | | | |
| | | | | |
Net investment income1,2 | | | 0.26 | | | | 0.22 | | | | 0.30 | | | | 0.37 | | | | 0.32 | |
| | | | | |
Net realized and unrealized gain (loss) on investments | | | (1.96 | ) | | | 0.04 | | | | 0.03 | | | | 0.53 | | | | (0.42 | ) |
| | | | | | | | | | | | | | | | | | | | |
| | | | | |
Total income (loss) from investment operations | | | (1.70 | ) | | | 0.26 | | | | 0.33 | | | | 0.90 | | | | (0.10 | ) |
| | | | | |
Less Distributions to Shareholders from: | | | | | | | | | | | | | | | | | | | | |
| | | | | |
Net investment income | | | (0.32 | ) | | | (0.30 | ) | | | (0.32 | ) | | | (0.39 | ) | | | (0.34 | ) |
| | | | | |
Net Asset Value, End of Year | | | $8.69 | | | | $10.71 | | | | $10.75 | | | | $10.74 | | | | $10.23 | |
| | | | | | | | | | | | | | | | | | | | |
| | | | | |
Total Return2,3 | | | (16.17 | )% | | | 2.44 | % | | | 3.17 | % | | | 8.94 | % | | | (0.98 | )% |
| | | | | |
Ratio of net expenses to average net assets | | | 0.48 | % | | | 0.60 | % | | | 0.69 | % | | | 0.69 | % | | | 0.69 | % |
| | | | | |
Ratio of gross expenses to average net assets4 | | | 0.52 | % | | | 0.67 | % | | | 0.76 | % | | | 0.77 | % | | | 0.76 | % |
| | | | | |
Ratio of net investment income to average net assets2 | | | 2.67 | % | | | 2.08 | % | | | 2.79 | % | | | 3.49 | % | | | 3.05 | % |
| | | | | |
Portfolio turnover | | | 76 | % | | | 174 | % | | | 96 | % | | | 47 | % | | | 69 | % |
| | | | | |
Net assets end of year (000’s) omitted | | | $137,592 | | | | $218,278 | | | | $433,881 | | | | $585,358 | | | | $467,024 | |
| | | | | |
| | | | | | | | | | | | | | | | | | | | | |
| | | | | |
| | | | | | | | | | | | | | | | | | | | | |
24
| | |
| | | AMG Beutel Goodman Core Plus Bond Fund Financial Highlights For a share outstanding throughout each fiscal year |
| | | |
| | | |
| | | | | | | | | | | | | | | | | | | | |
| | | For the fiscal years ended October 31, | |
| | | | | |
Class Z | | 2022 | | | 2021 | | | 2020 | | | 2019 | | | 2018 | |
| | | | | |
Net Asset Value, Beginning of Year | | | $10.72 | | | | $10.76 | | | | $10.74 | | | | $10.24 | | | | $10.68 | |
| | | | | |
Income (loss) from Investment Operations: | | | | | | | | | | | | | | | | | | | | |
| | | | | |
Net investment income1,2 | | | 0.27 | | | | 0.23 | | | | 0.31 | | | | 0.38 | | | | 0.33 | |
| | | | | |
Net realized and unrealized gain (loss) on investments | | | (1.98 | ) | | | 0.04 | | | | 0.04 | | | | 0.52 | | | | (0.43 | ) |
| | | | | | | | | | | | | | | | | | | | |
| | | | | |
Total income (loss) from investment operations | | | (1.71 | ) | | | 0.27 | | | | 0.35 | | | | 0.90 | | | | (0.10 | ) |
| | | | | |
Less Distributions to Shareholders from: | | | | | | | | | | | | | | | | | | | | |
| | | | | |
Net investment income | | | (0.32 | ) | | | (0.31 | ) | | | (0.33 | ) | | | (0.40 | ) | | | (0.34 | ) |
| | | | | |
Net Asset Value, End of Year | | | $8.69 | | | | $10.72 | | | | $10.76 | | | | $10.74 | | | | $10.24 | |
| | | | | | | | | | | | | | | | | | | | |
| | | | | |
Total Return2,3 | | | (16.20 | )% | | | 2.51 | % | | | 3.35 | % | | | 8.91 | % | | | (0.91 | )% |
| | | | | |
Ratio of net expenses to average net assets | | | 0.43 | % | | | 0.53 | % | | | 0.61 | % | | | 0.61 | % | | | 0.61 | % |
| | | | | |
Ratio of gross expenses to average net assets4 | | | 0.47 | % | | | 0.60 | % | | | 0.68 | % | | | 0.69 | % | | | 0.68 | % |
| | | | | |
Ratio of net investment income to average net assets2 | | | 2.72 | % | | | 2.15 | % | | | 2.87 | % | | | 3.57 | % | | | 3.13 | % |
| | | | | |
Portfolio turnover | | | 76 | % | | | 174 | % | | | 96 | % | | | 47 | % | | | 69 | % |
| | | | | |
Net assets end of year (000’s) omitted | | | $10,566 | | | | $11,864 | | | | $10,684 | | | | $2,473 | | | | $1,955 | |
| | | | | |
| | | | | | | | | | | | | | | | | | | | | |
| | | | | |
| | | | | | | | | | | | | | | | | | | | | |
| 1 | Per share numbers have been calculated using average shares. |
| 2 | Total returns and net investment income would have been lower had certain expenses not been offset. |
| 3 | The total return is calculated using the published Net Asset Value as of fiscal year end. |
| 4 | Excludes the impact of expense reimbursement or fee waivers and expense reductions such as brokerage credits, but includes expense repayments and non-reimbursable expenses, if any, such as interest, taxes, and extraordinary expenses. (See Note 1(c) and 2 in the Notes to Financial Statements.) |
25
| | |
| | | AMG Beutel Goodman International Equity Fund Financial Highlights For a share outstanding throughout each fiscal year |
| | | |
| | | |
| | | | | | | | | | | | | | | | | | | | |
| | | For the fiscal years ended October 31, | |
| | | | | |
Class N | | 2022 | | | 2021 | | | 2020 | | | 2019 | | | 2018 | |
| | | | | |
Net Asset Value, Beginning of Year | | | $11.16 | | | | $8.23 | | | | $9.56 | | | | $9.90 | | | | $11.60 | |
| | | | | |
Income (loss) from Investment Operations: | | | | | | | | | | | | | | | | | | | | |
| | | | | |
Net investment income1,2 | | | 0.19 | | | | 0.08 | | | | 0.07 | 3 | | | 0.07 | | | | 0.12 | |
| | | | | |
Net realized and unrealized gain (loss) on investments | | | (3.02 | ) | | | 2.85 | | | | (1.17 | ) | | | 0.56 | | | | (1.31 | ) |
| | | | | | | | | | | | | | | | | | | | |
| | | | | |
Total income (loss) from investment operations | | | (2.83 | ) | | | 2.93 | | | | (1.10 | ) | | | 0.63 | | | | (1.19 | ) |
| | | | | |
Less Distributions to Shareholders from: | | | | | | | | | | | | | | | | | | | | |
| | | | | |
Net investment income | | | — | | | | — | | | | (0.23 | ) | | | (0.20 | ) | | | (0.18 | ) |
| | | | | |
Net realized gain on investments | | | — | | | | — | | | | — | | | | (0.77 | ) | | | (0.33 | ) |
| | | | | | | | | | | | | | | | | | | | |
| | | | | |
Total distributions to shareholders | | | — | | | | — | | | | (0.23 | ) | | | (0.97 | ) | | | (0.51 | ) |
| | | | | |
Net Asset Value, End of Year | | | $8.33 | | | | $11.16 | | | | $8.23 | | | | $9.56 | | | | $9.90 | |
| | | | | | | | | | | | | | | | | | | | |
| | | | | |
Total Return2,4 | | | (25.36 | )%5 | | | 35.60 | % | | | (11.83 | )% | | | 8.34 | % | | | (10.80 | )% |
| | | | | |
Ratio of net expenses to average net assets | | | 1.18 | %6 | | | 1.27 | % | | | 1.31 | % | | | 1.32 | % | | | 1.27 | % |
| | | | | |
Ratio of gross expenses to average net assets7 | | | 1.34 | % | | | 1.38 | % | | | 1.35 | % | | | 1.32 | % | | | 1.28 | % |
| | | | | |
Ratio of net investment income to average net assets2 | | | 1.88 | % | | | 0.73 | % | | | 0.77 | % | | | 0.78 | % | | | 1.10 | % |
| | | | | |
Portfolio turnover | | | 23 | % | | | 152 | % | | | 43 | % | | | 28 | % | | | 51 | % |
| | | | | |
Net assets end of year (000’s) omitted | | | $1,988 | | | | $5,035 | | | | $6,792 | | | | $87,998 | | | | $82,839 | |
| | | | | |
| | | | | | | | | | | | | | | | | | | | | |
| | | | | |
| | | | | | | | | | | | | | | | | | | | | |
26
| | |
| | | AMG Beutel Goodman International Equity Fund Financial Highlights For a share outstanding throughout each fiscal year |
| | | |
| | | |
| | | | | | | | | | | | | | | | | | | | |
| | | For the fiscal years ended October 31, | |
| | | | | |
Class I | | 2022 | | | 2021 | | | 2020 | | | 2019 | | | 2018 | |
| | | | | |
Net Asset Value, Beginning of Year | | | $11.21 | | | | $8.28 | | | | $9.62 | | | | $9.93 | | | | $11.59 | |
| | | | | |
Income (loss) from Investment Operations: | | | | | | | | | | | | | | | | | | | | |
| | | | | |
Net investment income1,2 | | | 0.22 | | | | 0.11 | | | | 0.09 | 3 | | | 0.09 | | | | 0.16 | |
| | | | | |
Net realized and unrealized gain (loss) on investments | | | (2.98 | ) | | | 2.87 | | | | (1.16 | ) | | | 0.57 | | | | (1.32 | ) |
| | | | | | | | | | | | | | | | | | | | |
| | | | | |
Total income (loss) from investment operations | | | (2.76 | ) | | | 2.98 | | | | (1.07 | ) | | | 0.66 | | | | (1.16 | ) |
| | | | | |
Less Distributions to Shareholders from: | | | | | | | | | | | | | | | | | | | | |
| | | | | |
Net investment income | | | (0.23 | ) | | | (0.05 | ) | | | (0.27 | ) | | | (0.20 | ) | | | (0.17 | ) |
| | | | | |
Net realized gain on investments | | | — | | | | — | | | | — | | | | (0.77 | ) | | | (0.33 | ) |
| | | | | | | | | | | | | | | | | | | | |
| | | | | |
Total distributions to shareholders | | | (0.23 | ) | | | (0.05 | ) | | | (0.27 | ) | | | (0.97 | ) | | | (0.50 | ) |
| | | | | |
Net Asset Value, End of Year | | | $8.22 | | | | $11.21 | | | | $8.28 | | | | $9.62 | | | | $9.93 | |
| | | | | | | | | | | | | | | | | | | | |
| | | | | |
Total Return2,4 | | | (25.10 | )%5 | | | 36.19 | % | | | (11.63 | )% | | | 8.65 | % | | | (10.57 | )% |
| | | | | |
Ratio of net expenses to average net assets | | | 0.88 | %6 | | | 0.97 | % | | | 1.02 | % | | | 1.07 | % | | | 1.00 | % |
| | | | | |
Ratio of gross expenses to average net assets7 | | | 1.04 | % | | | 1.08 | % | | | 1.06 | % | | | 1.07 | % | | | 1.01 | % |
| | | | | |
Ratio of net investment income to average net assets2 | | | 2.18 | % | | | 1.03 | % | | | 1.06 | % | | | 1.03 | % | | | 1.38 | % |
| | | | | |
Portfolio turnover | | | 23 | % | | | 152 | % | | | 43 | % | | | 28 | % | | | 51 | % |
| | | | | |
Net assets end of year (000’s) omitted | | | $10,686 | | | | $56,129 | | | | $166,994 | | | | $158,317 | | | | $208,184 | |
| | | | | |
| | | | | | | | | | | | | | | | | | | | | |
| | | | | |
| | | | | | | | | | | | | | | | | | | | | |
27
| | |
| | | AMG Beutel Goodman International Equity Fund Financial Highlights For a share outstanding throughout each fiscal year |
| | | |
| | | |
| | | | | | | | | | | | | | | | | | | | |
| | | For the fiscal years ended October 31, | |
| | | | | |
Class Z | | 2022 | | | 2021 | | | 2020 | | | 2019 | | | 2018 | |
| | | | | |
Net Asset Value, Beginning of Year | | | $11.18 | | | | $8.26 | | | | $9.60 | | | | $9.91 | | | | $11.59 | |
| | | | | |
Income (loss) from Investment Operations: | | | | | | | | | | | | | | | | | | | | |
| | | | | |
Net investment income1,2 | | | 0.22 | | | | 0.12 | | | | 0.10 | 3 | | | 0.10 | | | | 0.16 | |
| | | | | |
Net realized and unrealized gain (loss) on investments | | | (2.96 | ) | | | 2.86 | | | | (1.16 | ) | | | 0.57 | | | | (1.31 | ) |
| | | | | | | | | | | | | | | | | | | | |
| | | | | |
Total income (loss) from investment operations | | | (2.74 | ) | | | 2.98 | | | | (1.06 | ) | | | 0.67 | | | | (1.15 | ) |
| | | | | |
Less Distributions to Shareholders from: | | | | | | | | | | | | | | | | | | | | |
| | | | | |
Net investment income | | | (0.26 | ) | | | (0.06 | ) | | | (0.28 | ) | | | (0.21 | ) | | | (0.20 | ) |
| | | | | |
Net realized gain on investments | | | — | | | | — | | | | — | | | | (0.77 | ) | | | (0.33 | ) |
| | | | | | | | | | | | | | | | | | | | |
| | | | | |
Total distributions to shareholders | | | (0.26 | ) | | | (0.06 | ) | | | (0.28 | ) | | | (0.98 | ) | | | (0.53 | ) |
| | | | | |
Net Asset Value, End of Year | | | $8.18 | | | | $11.18 | | | | $8.26 | | | | $9.60 | | | | $9.91 | |
| | | | | | | | | | | | | | | | | | | | |
| | | | | |
Total Return2,4 | | | (25.07 | )%5 | | | 36.28 | % | | | (11.56 | )% | | | 8.84 | % | | | (10.52 | )% |
| | | | | |
Ratio of net expenses to average net assets | | | 0.78 | %6 | | | 0.87 | % | | | 0.92 | % | | | 0.96 | % | | | 0.91 | % |
| | | | | |
Ratio of gross expenses to average net assets7 | | | 0.94 | % | | | 0.98 | % | | | 0.96 | % | | | 0.96 | % | | | 0.92 | % |
| | | | | |
Ratio of net investment income to average net assets2 | | | 2.28 | % | | | 1.13 | % | | | 1.16 | % | | | 1.14 | % | | | 1.46 | % |
| | | | | |
Portfolio turnover | | | 23 | % | | | 152 | % | | | 43 | % | | | 28 | % | | | 51 | % |
| | | | | |
Net assets end of year (000’s) omitted | | | $2,312 | | | | $4,559 | | | | $11,692 | | | | $49,054 | | | | $1,289,369 | |
| | | | | |
| | | | | | | | | | | | | | | | | | | | | |
| | | | | |
| | | | | | | | | | | | | | | | | | | | | |
| 1 | Per share numbers have been calculated using average shares. |
| 2 | Total returns and net investment income would have been lower had certain expenses not been offset. |
| 3 | Includes non-recurring dividends. Without these dividends, net investment income per share would have been $0.04, $0.06, and $0.07 for Class N, Class I, and Class Z shares, respectively. |
| 4 | The total return is calculated using the published Net Asset Value as of fiscal year end. |
| 5 | Includes a non-recurring securities litigation gain. Had the Fund not received the payment total return would have been (26.61)%, (28.11)% and (26.17)% for Class N, Class I and Class Z, respectively. |
| 6 | Includes interest expense totaling 0.02% related to participation in the interfund lending program. |
| 7 | Excludes the impact of expense reimbursement or fee waivers and expense reductions such as brokerage credits, but includes expense repayments and non-reimbursable expenses, if any, such as interest, taxes, and extraordinary expenses. (See Note 1(c) and 2 in the Notes to Financial Statements.) |
28
| | |
| | | Notes to Financial Statements |
| | | October 31, 2022 |
| | | |
1. ORGANIZATION AND SUMMARY OF SIGNIFICANT ACCOUNTING POLICIES
AMG Funds IV (the “Trust”) is an open-end management investment company, organized as a Delaware Statutory Trust, and registered under the Investment Company Act of 1940, as amended (the “1940 Act”). Currently, the Trust consists of a number of different funds, each having distinct investment management objectives, strategies, risks, and policies. Included in this report are the AMG Beutel Goodman Core Plus Bond Fund (“Core Plus Bond”) and AMG Beutel Goodman International Equity Fund (“International Equity”), each a “Fund” and collectively, the “Funds”.
Each Fund offers Class N, Class I and Class Z shares. Each class represents an interest in the same assets of the respective Fund. Although all share classes generally have identical voting rights, each share class votes separately when required by law. Different share classes may have different net asset values per share to the extent the share classes pay different distribution amounts and/or the expenses of such share classes differ. Each share class has its own expense structure. Please refer to a current prospectus for additional information on each share class.
International Equity is a non-diversified fund. A greater percentage of the Fund’s holdings may be focused in a smaller number of securities which may place the Fund at greater risk than a more diversified fund.
Market disruptions associated with the COVID-19 pandemic have had a global impact, and uncertainty exists as to the long-term implications. Such disruptions can adversely affect assets of the Funds and thus Fund performance.
The Funds’ financial statements are prepared in accordance with accounting principles generally accepted in the United States of America (“U.S. GAAP”), including accounting and reporting guidance pursuant to Accounting Standards Codification Topic 946 applicable to investment companies. U.S. GAAP requires management to make estimates and assumptions that affect the reported amounts of assets and liabilities and disclosure of contingent assets and liabilities at the date of the financial statements and the reported amounts of income and expenses during the reporting period. Actual results could differ from those estimates and such differences could be material. The following is a summary of significant accounting policies followed by the Funds in the preparation of their financial statements:
a. VALUATION OF INVESTMENTS
For the Funds, equity securities traded on a national securities exchange or reported on the NASDAQ national market system (“NMS”) are valued at the last quoted sales price on the primary exchange or, if applicable, the NASDAQ official closing price or the official closing price of the relevant exchange or, lacking any sales, at the last quoted bid price. Equity securities held by the Funds that are traded in the over-the-counter market (other than NMS securities) are valued at the bid price. Foreign equity securities (securities principally traded in markets other than U.S. markets) held by the Funds are valued at the official closing price on the primary exchange or, for markets that either do not offer an official closing price or where the official closing price may not be representative of the overall market, the last quoted sale price.
Fixed income securities purchased with a remaining maturity exceeding 60 days are valued at the evaluated bid price provided by an authorized pricing service or, if an evaluated price is not available, by reference to other securities which are considered comparable in credit rating, interest rate, due date and other features
(generally referred to as “matrix pricing”) or other similar pricing methodologies. Investments in certain mortgage-backed and stripped mortgage-backed securities, convertible securities, derivatives and other debt securities not traded on an organized securities market are valued on the basis of valuations provided by dealers or by a pricing service which uses information with respect to transactions in such securities and various relationships between such securities and yield to maturity in determining value.
Fixed income securities purchased with a remaining maturity of 60 days or less are valued at amortized cost, provided that the amortized cost value is approximately the same as the fair value of the security valued without the use of amortized cost. Investments in other open-end registered investment companies are valued at their end of day net asset value per share.
The Funds’ portfolio investments are generally valued based on independent market quotations or prices or, if none, “evaluative” or other market based valuations provided by third party pricing services approved by the Board of Trustees of the Trust (the “Board”). Under certain circumstances, the value of certain Fund portfolio investments may be based on an evaluation of fair value, pursuant to procedures established by and under the general supervision of the Board. The Valuation Committee, which is comprised of the Independent Trustees of the Board, and the Pricing Committee, which is comprised of representatives from AMG Funds LLC (the “Investment Manager”) are the committees appointed by the Board to make fair value determinations. Each Fund may use the fair value of a portfolio investment to calculate its net asset value (“NAV”) in the event that the market quotation, price or market based valuation for the portfolio investment is not readily available or otherwise not determinable pursuant to the Board’s valuation procedures, if the Investment Manager or the Pricing Committee believes the quotation, price or market based valuation to be unreliable, or in certain other circumstances. When determining the fair value of an investment, the Pricing Committee and, if required under the Trust’s securities valuation procedures, the Valuation Committee, seeks to determine the price that a Fund might reasonably expect to receive from current sale of that portfolio investment in an arms-length transaction. Fair value determinations shall be based upon consideration of all available facts and information, including, but not limited to (i) attributes specific to the investment; (ii) fundamental and analytical data relating to the investment; and (iii) the value of other comparable securities or relevant financial instruments, including derivative securities, traded on other markets or among dealers.
The values assigned to fair value portfolio investments are based on available information and do not necessarily represent amounts that might ultimately be realized in the future, since such amounts depend on future developments inherent in long-term investments. Because of the inherent uncertainty of valuation, those estimated values may differ significantly from the values that would have been used had a ready market for the investments existed, and the differences could be material. The Board will be presented with a quarterly report showing as of the most recent quarter end, all outstanding securities fair valued by the Funds, including a comparison with the prior quarter end and the percentage of the Funds that the security represents at each quarter end.
With respect to foreign equity securities and certain foreign fixed income securities, the Board has adopted a policy that securities held in the Funds that can be fair valued by the applicable fair value pricing service are fair valued on each business day provided that each individual price exceeds a pre-established confidence level.
Effective September 8, 2022, the Funds adopted the requirements of Rule 2a-5 under the 1940 Act (“Rule 2a-5”), which the Funds’ Board designated the Funds’
29
| | |
| | | Notes to Financial Statements (continued) |
| | | |
| | | |
Investment Manager as the Funds’ Valuation Designee to perform the Funds’ fair value determinations. Such determinations are subject to Board oversight and certain reporting and other requirements intended to ensure that the Board receives the information it needs to oversee the Investment Manager’s fair value determinations. Other than the designation of the Investment Manager as the Valuation Designee, the Funds’ adoption of Rule 2-a5 did not impact how the Funds determine fair value or the carrying amount of investments held in the Funds.
U.S. GAAP defines fair value as the price that a fund would receive to sell an asset or pay to transfer a liability in an orderly transaction between market participants at the measurement date. U.S. GAAP also establishes a framework for measuring fair value, and a three level hierarchy for fair value measurements based upon the transparency of inputs to the valuation of an asset or liability. Inputs may be observable or unobservable and refer broadly to the assumptions that market participants would use in pricing the asset or liability. Observable inputs reflect the assumptions market participants would use in pricing the asset or liability based on market data obtained from sources independent of the Funds. Unobservable inputs reflect the Funds’ own assumptions about the assumptions that market participants would use in pricing the asset or liability developed based on the best information available in the circumstances. Each investment is assigned a level based upon the observability of the inputs which are significant to the overall valuation.
The three-tier hierarchy of inputs is summarized below:
Level 1 – inputs are quoted prices in active markets for identical investments (e.g., equity securities, open-end investment companies)
Level 2 – other observable inputs (including, but not limited to: quoted prices for similar assets or liabilities in markets that are active, quoted prices for identical or similar assets or liabilities in markets that are not active, inputs other than quoted prices that are observable for the assets or liabilities (such as interest rates, yield curves, volatilities, prepayment speeds, loss severities, credit risks and default rates) or other market corroborated inputs) (e.g., debt securities, government securities, foreign currency exchange contracts, foreign securities utilizing international fair value pricing, fair valued securities with observable inputs)
Level 3 – inputs are significant unobservable inputs (including the Fund’s own assumptions used to determine the fair value of investments) (e.g., fair valued securities with unobservable inputs)
Changes in inputs or methodologies used for valuing investments may result in a transfer in or out of levels within the fair value hierarchy. The inputs or methodologies used for valuing investments may not necessarily be an indication of the risk associated with investing in those investments.
b. SECURITY TRANSACTIONS
Security transactions are accounted for as of trade date. Realized gains and losses on securities sold are determined on the basis of identified cost.
c. INVESTMENT INCOME AND EXPENSES
Dividend income is recorded on the ex-dividend date. Dividends from foreign securities are recorded on the ex-dividend date, and if after the fact, as soon as the Funds become aware of the ex-dividend date. Interest income, which includes amortization of premium and accretion of discount on debt securities, is accrued as earned. Dividend and interest income on foreign securities is recorded gross of any withholding tax. Non-cash dividends included in dividend income, if any, are reported at the fair market value of the securities received. Other income and expenses are recorded on an accrual basis. Expenses that cannot be directly attributed to a Fund are apportioned among the funds in the Trust and other trusts or funds within the AMG Funds Family of Funds (collectively the “AMG Funds Family”) based upon their relative average net assets or number of shareholders. Investment income, realized and unrealized capital gains and losses, the common expenses of each Fund, and certain fund level expense reductions, if any, are allocated on a pro-rata basis to each class based on the relative net assets of each class to the total net assets of each Fund.
d. DIVIDENDS AND DISTRIBUTIONS
Fund distributions resulting from net investment income will normally be declared and paid monthly for Core Plus Bond and annually for International Equity. Realized net capital gains distribution, if any, will normally be declared and paid at least annually in December. Distributions to shareholders are recorded on the ex-dividend date. Distributions are determined in accordance with federal income tax regulations, which may differ from net investment income and net realized capital gains for financial statement purposes (U.S. GAAP). Differences may be permanent or temporary. Permanent differences are reclassified among capital accounts in the financial statements to reflect their tax character. Permanent book and tax basis differences, if any, relating to shareholder distributions will result in reclassifications to paid-in capital. Temporary differences arise when certain items of income, expense and gain or loss are recognized in different periods for financial statement and tax purposes; these differences will reverse at some time in the future. There were no permanent differences during the year. Temporary differences are due to wash sale loss deferrals and amortization of premium outstanding.
30
| | |
| | | Notes to Financial Statements (continued) |
| | | |
| | | |
The tax character of distributions paid during the fiscal years ended October 31, 2022 and October 31, 2021 were as follows:
| | | | | | | | | | | | | | | | | | | | |
| | | Core Plus Bond | | | International Equity | | | | |
| | | | | |
Distributions paid from: | | | 2022 | | | | 2021 | | | | 2022 | | | | 2021 | | | | | |
| | | | | |
Ordinary income * | | | $6,906,585 | | | | $11,680,698 | | | | $1,189,177 | | | | $1,020,140 | | | | | |
| * | For tax purposes, short-term capital gain distributions, if any, are considered ordinary income distributions. |
As of October 31, 2022, the components of distributable earnings (excluding unrealized appreciation/depreciation) on a tax basis consisted of:
| | | | | | | | |
| | | Core Plus Bond | | | International Equity | |
| | |
Capital loss carryforward | | | $20,717,030 | | | | $71,419,202 | |
| | |
Undistributed ordinary income | | | 339,175 | | | | 608,805 | |
At October 31, 2022, the cost of investments and the aggregate gross unrealized appreciation and depreciation for federal income tax purposes were as follows:
| | | | | | | | | | | | | | | | |
| Fund | | Cost | | | Appreciation | | | Depreciation | | | Net Depreciation | |
| | | | |
Core Plus Bond | | | $200,939,943 | | | | $204,432 | | | | $(31,413,104 | ) | | | $(31,208,672 | ) |
| | | | |
International Equity | | | 20,077,092 | | | | 209,056 | | | | (5,472,855 | ) | | | (5,263,799 | ) |
e. FEDERAL TAXES
Each Fund currently qualifies as an investment company and intends to comply with the requirements under Subchapter M of the Internal Revenue Code of 1986, as amended, and to distribute substantially all of its taxable income and gains to its shareholders and to meet certain diversification and income requirements with respect to investment companies. Therefore, no provision for federal income or excise tax is included in the accompanying financial statements.
Additionally, based on each Fund’s understanding of the tax rules and rates related to income, gains and transactions for the foreign jurisdictions in which it invests, each Fund will provide for foreign taxes, and where appropriate, deferred foreign taxes.
Management has analyzed the Funds’ tax positions taken on federal income tax returns as of October 31, 2022, and for all open tax years (generally, the three prior taxable years), and has concluded that no provision for federal income tax is
required in the Funds’ financial statements. Additionally, Management is not aware of any tax position for which it is reasonably possible that the total amounts of unrecognized tax benefits will change materially in the next twelve months.
f. CAPITAL LOSS CARRYOVERS AND DEFERRALS
As of October 31, 2022, the following Funds had capital loss carryovers for federal income tax purposes as shown in the following chart. These amounts may be used to offset future realized capital gains indefinitely, and retain their character as short-term and/or long-term.
| | | | | | | | | | | | |
| Fund | | Short-Term | | | Long-Term | | | Total | |
| | | |
Core Plus Bond | | | $8,570,292 | | | | $12,146,738 | | | | $20,717,030 | |
| | | |
International Equity | | | 13,419,395 | | | | 57,999,807 | | | | 71,419,202 | |
g. CAPITAL STOCK
The Trust’s Declaration of Trust authorizes for each Fund the issuance of an unlimited number of shares of beneficial interest, without par value. Each Fund records sales and repurchases of its capital stock on the trade date.
For the fiscal years ended October 31, 2022 and October 31, 2021, the capital stock transactions by class for the Funds were as follows:
| | | | | | | | | | | | | | | | | | | | | | | | | | | | | | | | |
| | | Core Plus Bond | | | International Equity | |
| | | | |
| | | October 31, 2022 | | | October 31, 2021 | | | October 31, 2022 | | | October 31, 2021 | |
| | | | | | | | |
| | | Shares | | | Amount | | | Shares | | | Amount | | | Shares | | | Amount | | | Shares | | | Amount | |
| | | | | | | | | | | | | | | | | | | | | | | | | | | | | | | | |
| | | | | | | | |
Class N: | | | | | | | | | | | | | | | | | | | | | | | | | | | | | | | | |
| | | | | | | | |
Shares sold | | | 63,211 | | | | $646,309 | | | | 197,333 | | | | $2,137,458 | | | | 1,520 | | | | $15,995 | | | | 47,042 | | | | $498,089 | |
| | | | | | | | |
Shares issued in reinvestment of distributions | | | 89,386 | | | | 865,139 | | | | 110,060 | | | | 1,190,218 | | | | — | | | | — | | | | — | | | | — | |
| | | | | | | | |
Shares redeemed | | | (1,019,201) | | | | (10,026,951) | | | | (2,051,116) | | | | (22,142,769) | | | | (214,158) | | | | (2,221,784) | | | | (421,063) | | | | (4,687,131) | |
| | | | | | | | | | | | | | | | | | | | | | | | | | | | | | | | |
| | | | | | | | |
Net decrease | | | (866,604) | | | | $(8,515,503) | | | | (1,743,723) | | | | $(18,815,093) | | | | (212,638) | | | | $(2,205,789) | | | | (374,021) | | | | $(4,189,042) | |
| | | | | | | | | | | | | | | | | | | | | | | | | | | | | | | | |
31
| | |
| | | Notes to Financial Statements (continued) |
| | | |
| | | |
| | | | | | | | | | | | | | | | | | | | | | | | | | | | | | | | |
| | | Core Plus Bond | | | International Equity | |
| | | | |
| | | October 31, 2022 | | | October 31, 2021 | | | October 31, 2022 | | | October 31, 2021 | |
| | | | | | | | |
| | | Shares | | | Amount | | | Shares | | | Amount | | | Shares | | | Amount | | | Shares | | | Amount | |
| | | | | | | | | | | | | | | | | | | | | | | | | | | | | | | | |
| | | | | | | | |
Class I: | | | | | | | | | | | | | | | | | | | | | | | | | | | | | | | | |
| | | | | | | | |
Shares sold | | | 1,780,546 | | | | $17,654,174 | | | | 6,619,412 | | | | $71,617,649 | | | | 143,741 | | | | $1,458,657 | | | | 983,851 | | | | $10,565,317 | |
| | | | | | | | |
Shares issued in reinvestment of distributions | | | 511,063 | | | | 5,000,170 | | | | 741,067 | | | | 8,009,455 | | | | 103,242 | | | | 1,097,464 | | | | 92,397 | | | | 946,149 | |
| | | | | | | | |
Shares redeemed | | | (6,823,930) | | | | (66,397,975) | | | | (27,346,258) | | | | (293,750,919) | | | | (3,955,603) | | | | (38,947,958) | | | | (16,239,856) | | | | (177,616,704) | |
| | | | | | | | | | | | | | | | | | | | | | | | | | | | | | | | |
| | | | | | | | |
Net decrease | | | (4,532,321) | | | | $(43,743,631) | | | | (19,985,779) | | | | $(214,123,815) | | | | (3,708,620) | | | | $(36,391,837) | | | | (15,163,608) | | | | $(166,105,238) | |
| | | | | | | | | | | | | | | | | | | | | | | | | | | | | | | | |
| | | | | | | | |
Class Z: | | | | | | | | | | | | | | | | | | | | | | | | | | | | | | | | |
| | | | | | | | |
Shares sold | | | 218,395 | | | | $2,147,015 | | | | 252,014 | | | | $2,733,081 | | | | — | | | | — | | | | — | | | | — | |
| | | | | | | | |
Shares issued in reinvestment of distributions | | | 39,257 | | | | 377,513 | | | | 29,815 | | | | 322,282 | | | | 7,801 | | | | $82,456 | | | | 6,962 | | | | $71,075 | |
| | | | | | | | |
Shares redeemed | | | (148,689) | | | | (1,418,109) | | | | (168,380) | | | | (1,827,596) | | | | (132,990) | | | | (1,410,030) | | | | (1,014,822) | | | | (10,872,625) | |
| | | | | | | | | | | | | | | | | | | | | | | | | | | | | | | | |
| | | | | | | | |
Net increase (decrease) | | | 108,963 | | | | $1,106,419 | | | | 113,449 | | | | $1,227,767 | | | | (125,189) | | | | $(1,327,574) | | | | (1,007,860) | | | | $(10,801,550) | |
| | | | | | | | | | | | | | | | | | | | | | | | | | | | | | | | |
h. REPURCHASE AGREEMENTS AND JOINT REPURCHASE AGREEMENTS
The Funds may enter into third-party and bilateral repurchase agreements for temporary cash management purposes and third-party or bilateral joint repurchase agreements for reinvestment of cash collateral on securities lending transactions under the securities lending program offered by The Bank of New York Mellon (“BNYM”) (the “Program”) (collectively, “Repurchase Agreements”). The value of the underlying collateral, including accrued interest, must equal or exceed the value of the Repurchase Agreements during the term of the agreement. For joint repurchase agreements, the Funds participate on a pro rata basis with other clients of BNYM in its share of the underlying collateral under such joint repurchase agreements and in its share of proceeds from any repurchase or other disposition of the underlying collateral. The underlying collateral for all Repurchase Agreements is held in safekeeping by the Funds’ custodian or at the Federal Reserve Bank. If the seller defaults and the value of the collateral declines, or if bankruptcy proceedings commence with respect to the seller of the security, realization of the collateral by the Funds may be delayed or limited. Pursuant to the Program, the Funds are indemnified for such losses by BNYM on joint repurchase agreements.
At October 31, 2022, the market value of Repurchase Agreements outstanding for Core Plus Bond and International Equity were $0 and $439,155, respectively.
i. FOREIGN CURRENCY TRANSLATION
The books and records of the Funds are maintained in U.S. Dollars. The value of investments, assets and liabilities denominated in currencies other than U.S. Dollars are translated into U.S. Dollars based upon current foreign exchange rates. Purchases and sales of foreign investments, income and expenses are converted into U.S. Dollars based on currency exchange rates prevailing on the respective dates of such transactions. Net realized and unrealized gain (loss) on foreign currency transactions represent: (1) foreign exchange gains and losses from the sale and holdings of foreign currencies; (2) gains and losses between trade date and settlement date on investment securities transactions and foreign currency exchange contracts; and (3) gains and losses from the difference between amounts of interest and dividends recorded and the amounts actually received.
The Funds do not isolate the net realized and unrealized gain or loss resulting from changes in exchange rates from the fluctuations in market prices of securities held. Such fluctuations are included with the net realized and unrealized gain or loss on investments.
j. SECURITIES TRANSACTED ON A WHEN ISSUED BASIS
Core Plus Bond may enter into To-Be-Announced (“TBA”) sale commitments to hedge their portfolio positions or to sell mortgage-backed securities they own under delayed delivery arrangements. Proceeds of TBA sale commitments are not received until the contractual settlement date. During the time a TBA sale commitment is outstanding, equivalent deliverable securities, with the same counterparty, or an offsetting TBA purchase commitment deliverable on or before the sale commitment date, are held as “cover” for the transaction. Unsettled TBA sale commitments are valued at the current market value of the underlying securities according to the procedures described under “Valuation of Investments,” in Footnote 1a above.
Each TBA contract is marked-to-market daily and the change in market value is recorded by the Fund as an unrealized gain or loss. If the TBA sale commitment is closed through the acquisition of an offsetting purchase commitment with the same broker, the Fund realizes a gain or loss. If the Fund delivers securities under the commitment, the Fund realizes a gain or a loss from the sale of the securities based upon the unit price established at the date the commitment was entered into.
During the fiscal year ended October 31, 2022, Core Plus Bond did not invest in TBA commitment transactions.
k. DELAYED DELIVERY TRANSACTIONS AND WHEN-ISSUED SECURITIES
Core Plus Bond may enter into securities transactions on a delayed delivery or when issued basis. Payment and delivery may take place after the customary settlement period for that security. The price of the underlying securities and the date when the securities will be delivered and paid for are fixed at the time the transaction is negotiated. During the time a delayed delivery sell is outstanding, the contract is marked to market daily and equivalent deliverable securities are held for the transaction. The value of the securities purchased on a delayed
32
| | |
| | | Notes to Financial Statements (continued) |
| | | |
| | | |
delivery or when-issued basis are identified as such in each Fund’s Schedule of Portfolio Investments. With respect to purchase commitments, the Fund identifies securities as segregated in its records with a value at least equal to the amount of the commitment. Delayed delivery or when-issued securities that have been purchased from and sold to different brokers are reflected as an investment in securities and a forward sale commitment in the Fund’s Statement of Assets and Liabilities. For financial reporting purposes, the Fund does offset the receivable and payable for delayed delivery investments purchased and sold on TBA commitments. Losses may arise due to changes in the value of the underlying securities or if the counterparty does not perform under the contract, or if the issuer does not issue the securities due to political, economic, or other factors.
During the fiscal year ended October 31, 2022, Core Plus Bond did not enter into securities transactions on a delayed delivery or when issued basis.
2. AGREEMENTS AND TRANSACTIONS WITH AFFILIATES
For each of the Funds, the Trust has entered into an investment advisory agreement under which the Investment Manager, a subsidiary and the U.S. retail distribution arm of Affiliated Managers Group, Inc. (“AMG”), serves as investment manager to the Funds and is responsible for the Funds’ overall administration and operations. The Investment Manager selects one or more subadvisers for the Funds (subject to Board approval) and monitors each subadviser’s investment performance, security holdings and investment strategies. Each Fund’s investment portfolio is managed by Beutel, Goodman & Company Ltd., who serves pursuant to a subadvisory agreement with the Investment Manager.
Investment management fees are paid directly by the Funds to the Investment Manager based on average daily net assets. For the fiscal year ended October 31, 2022, the Funds’ investment management fees were paid at the following annual rate of each Fund’s respective average daily net assets:
| | | | |
| |
Core Plus Bond1 | | | 0.23% | |
| |
International Equity2 | | | 0.54% | |
| 1 | Prior to June 3, 2021, the annual rate for the investment management fees for Core Plus Bond was 0.45% of the Fund’s average daily net assets. |
| 2 | Prior to July 2, 2021, the annual rate for the investment management fees for International Equity was 0.67% of the Fund’s average daily net assets. |
The fee paid to Beutel Goodman for its services as subadviser is paid out of the fee the Investment Manager receives from each Fund and does not increase the expenses of each Fund.
The Investment Manager has contractually agreed, through at least March 1, 2023, to waive management fees and/or pay or reimburse fund expenses in order to limit total annual Fund operating expenses after fee waiver and expense reimbursements (exclusive of taxes, interest (including interest incurred in connection with bank and custody overdrafts and in connection with securities sold short), shareholder servicing fees, distribution and service (12b-1) fees, brokerage commissions and other transaction costs, dividends payable with respect to securities sold short, acquired fund fees and expenses and extraordinary expenses) of Core Plus Bond and International Equity to 0.43% and 0.76%, respectively of each Fund’s average daily net assets (this annual rate or such other annual rate that may be in effect from time to time, the “Expense Cap”), subject to later reimbursement by the Funds in certain circumstances. Prior to
June 3, 2021, the expense limitation was 0.61% for Core Plus Bond and prior to July 2, 2021, the expense limitation was 0.89% for International Equity.
In general, for a period of up to 36 months after the date any amounts are paid, waived or reimbursed by the Investment Manager, the Investment Manager may recover such amounts from a Fund, provided that such repayment would not cause the Fund’s total annual operating expenses after fee waiver and expense reimbursements (exclusive of the items noted in the parenthetical above) to exceed either (i) the Expense Cap in effect at the time such amounts were paid, waived or reimbursed, or (ii) the Expense Cap in effect at the time of such repayment by the Fund.
The contractual expense limitation may only be terminated in the event the Investment Manager or a successor ceases to be the investment manager of a Fund or a successor fund, by mutual agreement between the Investment Manager and the Board, or in the event of a Fund’s liquidation unless the Fund is reorganized or is a party to a merger in which the surviving entity is successor to the accounting and performance information of a Fund.
At October 31, 2022, the Funds’ expiration of reimbursements subject to recoupment is as follows:
| | | | | | | | |
Expiration Period | | Core Plus Bond | | | International Equity | |
| | |
Less than 1 year | | | $236,714 | | | | $102,321 | |
| | |
1-2 years | | | 227,438 | | | | 156,919 | |
| | |
2-3 years | | | 98,353 | | | | 63,329 | |
| | | | | | | | |
| | |
Total | | | $562,505 | | | | $322,569 | |
| | | | | | | | |
The Trust, on behalf of the Funds, has entered into an amended and restated Administration Agreement under which the Investment Manager serves as the Funds’ administrator (the “Administrator”) and is responsible for all non-portfolio management aspects of managing the Funds’ operations, including administration and shareholder services to each Fund. Each Fund pays a fee to the Administrator at the rate of 0.15% per annum of the Fund’s average daily net assets for this service.
The Funds are distributed by AMG Distributors, Inc. (the “Distributor”), a wholly-owned subsidiary of the Investment Manager. The Distributor serves as the distributor and underwriter for each Fund and is a registered broker-dealer and member of the Financial Industry Regulatory Authority, Inc. (“FINRA”). Shares of each Fund will be continuously offered and will be sold directly to prospective purchasers and through brokers, dealers or other financial intermediaries who have executed selling agreements with the Distributor. Generally the Distributor bears all or a portion of the expenses of providing services pursuant to the distribution agreement, including the payment of the expenses relating to the distribution of prospectuses for sales purposes and any advertising or sales literature.
The Trust has adopted a distribution and service plan (the “Plan”) with respect to the Class N shares, of each Fund in accordance with the requirements of Rule 12b-1 under the 1940 Act and the requirements of the applicable rules of FINRA regarding asset based sales charges. Pursuant to the Plan, each Fund may make payments to the Distributor for its expenditures in financing any activity primarily intended to result in the sale of each Fund’s Class N shares and for maintenance and personal service provided to existing shareholders of that class. The Plan authorizes payments to the Distributor of up to 0.25% annually of each
33
| | |
| | | Notes to Financial Statements (continued) |
| | | |
| | | |
Fund’s average daily net assets attributable to the Class N shares. Pursuant to the Plan, each Fund may make payments to the Distributor for its expenditures in financing any activity primarily intended to result in the sale of each Fund’s Class N shares and for maintenance and personal service provided to existing shareholders of that class. The Plan authorized payments to the Distributor up to 0.25% annually of each Fund’s average daily net assets attributable to the Class N shares. Prior to June 30, 2021, for Core Plus Bond and July 2, 2021, for International Equity, the plan was characterized as a reimbursement plan and was directly tied to the expenses incurred by the Distributor; the payments the Distributor received during any year may not exceed its actual expenses.
For the Class N shares of International Equity and for each of the Class I shares, the Board has approved reimbursement payments to the Investment Manager for shareholder servicing expenses (“shareholder servicing fees”) incurred. Shareholder servicing fees include payments to financial intermediaries, such as broker-dealers (including fund supermarket platforms), banks, and trust companies who provide shareholder record keeping, account servicing and other services. The Class N and Class I shares may reimburse the Investment Manager for the actual amount incurred up to a maximum annual rate of each Class’s average daily net assets as shown in the table below.
The impact on the annualized expense ratios for the fiscal year ended October 31, 2022, were as follows:
| | | | | | | | |
| Fund | | Maximum Annual
Amount
Approved | | | Actual Amount Incurred | |
| | |
Core Plus Bond1 | | | | | | | | |
| | |
Class I2 | | | 0.05% | | | | 0.05% | |
| | |
International Equity | | | | | | | | |
| | |
Class N | | | 0.15% | | | | 0.15% | |
| | |
Class I | | | 0.10% | | | | 0.10% | |
| 1 | Effective June 3, 2021, the shareholder servicing fees for Class N were eliminated. |
| 2 | Prior to June 3, 2021, the maximum annual amount approved was 0.15% |
The Board provides supervision of the affairs of the Trust and other trusts within the AMG Funds Family. The Trustees of the Trust who are not affiliated with the Investment Manager receive an annual retainer and per meeting fees for regular, special and telephonic meetings, and they are reimbursed for out-of-pocket expenses incurred while carrying out their duties as Board members. The Chairman of the Board and the Audit Committee Chair receive additional annual retainers. Certain Trustees and Officers of the Funds are Officers and/or Directors of the Investment Manager, AMG and/or the Distributor.
The Securities and Exchange Commission (the “SEC”) granted an exemptive order that permits certain eligible funds in the AMG Funds Family to lend and borrow money for certain temporary purposes directly to and from other eligible funds in the AMG Funds Family. Participation in this interfund lending program is voluntary for both the borrowing and lending funds, and an interfund loan is only made if it benefits each participating fund. The Administrator manages the program according to procedures approved by the Board, and the Board monitors the operation of the program. An interfund loan must comply with certain conditions set out in the exemptive order, which are designed to assure fairness and protect all participating funds. The interest earned and interest paid on interfund loans are included on the Statement of Operations as interest income and interest expense,
respectively. At October 31, 2022, International Equity had an interfund loan borrowing of $616,220 outstanding.
The following Funds utilized the interfund loan program during the fiscal year ended October 31, 2022 as follows:
| | | | | | | | | | | | | | | | |
| Fund | | Average
Borrowed | | | Number
of Days | | | Interest
Paid | | | Average
Interest Rate | |
| | | | |
Core Plus Bond | | | $3,956,731 | | | | 7 | | | | $1,281 | | | | 1.689% | |
| | | | |
International Equity | | | 853,374 | | | | 110 | | | | 6,618 | | | | 2.573% | |
3. PURCHASES AND SALES OF SECURITIES
Purchases and sales of securities (excluding short-term securities and U.S. Government Obligations) for the fiscal year ended October 31, 2022, were as follows:
| | | | | | | | |
| | | Long Term Securities | |
| | |
| Fund | | Purchases | | | Sales | |
| | |
Core Plus Bond | | | $51,164,931 | | | | $98,755,595 | |
| | |
International Equity | | | 8,367,157 | | | | 46,138,274 | |
Core Plus Bond purchases and sales of U.S. Government Obligations for the fiscal year ended October 31, 2022 were $110,482,057 and $106,829,229, respectively. International Equity had no purchases or sales of U.S. Government Obligations for the fiscal year ended October 31, 2022.
4. PORTFOLIO SECURITIES LOANED
The Funds participate in the Program providing for the lending of securities to qualified borrowers. Securities lending income includes earnings of such temporary cash investments, plus or minus any rebate to a borrower. These earnings (after any rebate) are then divided between BNYM, as a fee for its services under the Program, and the Funds, according to agreed-upon rates. Collateral on all securities loaned is accepted in cash, U.S. Treasury Obligations or U.S. Government Agency Obligations. Collateral is maintained at a minimum level of 102% (105% in the case of certain foreign securities) of the market value, plus interest, if applicable, of investments on loan. It is the Funds’ policy to obtain additional collateral from or return excess collateral to the borrower by the end of the next business day, following the valuation date of the securities loaned. Therefore, the value of the collateral held may be temporarily less than the value of the securities on loan. Lending securities entails a risk of loss to the Funds if and to the extent that the market value of the securities loaned were to increase and the borrower did not increase the collateral accordingly, and the borrower fails to return the securities. Under the terms of the Program, the Funds are indemnified for such losses by BNYM. Cash collateral is held in separate omnibus accounts managed by BNYM, who is authorized to exclusively enter into joint repurchase agreements for that cash collateral. Securities collateral is held in separate omnibus accounts managed by BNYM and cannot be sold or pledged. BNYM bears the risk of any deficiency in the amount of the cash collateral available for return to the borrower due to any loss on the collateral invested. Loans of securities are terminable at any time and the borrower, after notice, is required to return borrowed securities as soon as practical, which is normally within three business days.
34
| | |
| | | Notes to Financial Statements (continued) |
| | | |
| | | |
The value of securities loaned on positions held, cash collateral and securities collateral received at October 31, 2022, were as follows:
| | | | | | | | | | | | | | | | |
| Fund | | Securities Loaned | | | Cash Collateral Received | | | Securities Collateral Received | | | Total Collateral Received | |
| | | | |
International Equity | | | $403,843 | | | | $439,155 | | | | — | | | | $439,155 | |
5. FOREIGN SECURITIES
The Funds invest in securities of foreign entities and in instruments denominated in foreign currencies which involve risks not typically associated with investments in domestic securities. Non-domestic securities carry special risks, such as exposure to currency fluctuations, less developed or less efficient trading markets, political instability, a lack of company information, differing auditing and legal standards, and, potentially, less liquidity. Realized gains in certain countries may be subject to foreign taxes at the Fund level and the Fund would pay such foreign taxes at the appropriate rate for each jurisdiction.
6. COMMITMENTS AND CONTINGENCIES
Under the Trust’s organizational documents, its Trustees and Officers are indemnified against certain liabilities arising out of the performance of their duties to the Trust. In addition, in the normal course of business, the Funds may enter into contracts and agreements that contain a variety of representations and warranties, which provide general indemnifications. The maximum exposure to the Funds under these arrangements is unknown, as this would involve future claims that may be made against a Fund that have not yet occurred. However, based on experience, the Funds had no prior claims or losses and expect the risks of loss to be remote.
7. RISKS ASSOCIATED WITH HIGH YIELD SECURITIES
Investing in high yield securities involves greater risks and considerations not typically associated with U.S. Government and other high quality/investment grade securities. High yield securities are generally below investment grade securities and do not have an established retail secondary market. Economic downturns may disrupt the high yield market and impair the issuer’s ability to repay principal and interest. Also, an increase in interest rates would likely have an adverse impact on the value of such obligations and could cause the securities to become less liquid.
8. MORTGAGE-BACKED SECURITIES
Core Plus Bond may invest in mortgage-backed securities (“MBS”). These securities represent interests in pools of mortgage loans and they provide holders
with payments consisting of both principal and interest as the mortgages in the underlying mortgage pools are paid. The timely payment of principal and interest on MBS issued or guaranteed by Ginnie Mae is backed by Ginnie Mae and the full faith and credit of the U.S. government. MBS issued by U.S. government agencies or instrumentalities other than Ginnie Mae are not full faith and credit obligations of the U.S. government. Certain obligations, such as those issued by the Federal Home Loan Banks, Fannie Mae and Freddie Mac are supported only by the credit of the issuer. MBS issued by private issuers are not government securities and are not guaranteed by any government agency. They are secured by the underlying collateral of the private issuer. Yields on privately issued MBS tend to be higher than those of government-backed issues. However, risk of loss due to default and sensitivity to interest rate fluctuations are also higher. Core Plus Bond invests in collateralized mortgage obligations (“CMOs”), collateralized loan obligations (“CLOs”) and real estate mortgage investment conduits (“REMICs”). A CMO and/or REMIC is a bond that is collateralized by a pool of MBS. A CLO is a bond that is collateralized by a financial institution’s receivables from loans. These MBS pools are divided into classes with each class having its own characteristics. The different classes are retired in sequence as the underlying mortgages or loans are repaid.
9. FLOATING RATE SENIOR LOAN INTERESTS
Core Plus Bond may invest in Floating Rate Senior Loan Interests (“Senior Loans”). These are senior, secured loans made to companies whose debt is below investment grade as well as investments with similar economic characteristics. Senior Loans typically hold a first lien priority and, unless otherwise indicated, are required to pay interest at floating rates that are periodically reset by reference to a base lending rate plus a spread. Senior Loans are generally not registered under the Securities Act of 1933 and often incorporate certain restrictions on resale and cannot be sold publicly. Senior Loans often require prepayments from excess cash flow or permit the borrower to repay at its election. The degree to which borrowers repay, whether as a contractual requirement or at their election, cannot be predicted. As a result, the actual maturity may be substantially less than the stated maturity. The interest rate on this Senior Loan is subject to a base lending rate plus a spread. These base lending rates are primarily London Interbank Offered Rate (LIBOR) and secondarily the prime rate offered by one or more major U.S. banks (“Prime”). The interest rate is subject to a minimum floor, which may be less than or greater than the prevailing period end LIBOR/Prime rate. As of October 31, 2022, the Senior Loans held by Core Plus Bond still accrue interest based on LIBOR. Upon notification from the issuer of the Senior Loans, Core Plus Bond will transition from LIBOR to another index determined by the Senior Loan issuers.
10. MASTER NETTING AGREEMENTS
The Funds may enter into master netting agreements with their counterparties for the Program and Repurchase Agreements, which provide the right, in the event of default (including bankruptcy or insolvency) for the non-defaulting party to liquidate the collateral and calculate net exposure to the defaulting party or request additional collateral. For financial reporting purposes, the Funds do not offset financial assets and financial liabilities that are subject to master netting agreements in the Statement of Assets and Liabilities. For securities lending transactions, see Note 4.
35
| | |
| | | Notes to Financial Statements (continued) |
| | | |
| | | |
The following table is a summary of the Funds’ open Repurchase Agreements that are subject to a master netting agreement as of October 31, 2022:
| | | | | | | | | | | | | | | | | | | | |
| | | | | | Gross Amount Not Offset in the
Statement of Assets and Liabilities | | | | | | | |
| | | | | |
| Fund | | Gross Amounts of Assets Presented in the Statement of Assets and Liabilities | | | Offset Amount | | | Net Asset Balance | | | Collateral Received | | | Net Amount | |
| | | | | |
| | | | | | | | | | | | | | | | | | | | |
| | | | | |
International Equity | | | | | | | | | | | | | | | | | | | | |
| | | | | |
Citigroup Global Markets, Inc. | | | $439,155 | | | | — | | | | $439,155 | | | | $439,155 | | | | — | |
11. REGULATORY UPDATES
On October 28, 2020, the SEC adopted regulations governing the use of derivatives by registered investment companies (“Rule 18f-4”), which came into effect on August 19, 2022. Rule 18f-4 imposes limits on the amount of derivatives a fund can enter into, eliminates the asset segregation framework previously used by funds to comply with Section 18 of the 1940 Act, treats derivatives as senior securities, requires funds whose use of derivatives is more than a limited specified exposure amount to establish and maintain a comprehensive derivatives risk management program and appoint a derivatives risk manager. The Funds have adopted the requirements of Rule 18f-4 and appointed the Investment Manager as the derivatives risk manager of the Funds. There was no significant impact on the financial statements and accompanying notes or the Funds’ operations upon the adoption of requirements of Rule 18f-4.
12. SUBSEQUENT EVENTS
The Funds have determined that no material events or transactions occurred through the issuance date of the Funds’ financial statements which require an additional disclosure in or adjustment of the Funds’ financial statements.
36
| | |
| | | Report of Independent Registered Public Accounting Firm |
| | | |
| | | |
TO THE BOARD OF TRUSTEES OF AMG FUNDS IV AND SHAREHOLDERS OF AMG BEUTEL GOODMAN CORE PLUS BOND FUND AND AMG BEUTEL GOODMAN INTERNATIONAL EQUITY FUND
OPINIONS ON THE FINANCIAL STATEMENTS
We have audited the accompanying statements of assets and liabilities, including the schedules of portfolio investments, of AMG Beutel Goodman Core Plus Bond Fund and AMG Beutel Goodman International Equity Fund (two of the funds constituting AMG Funds IV, hereafter collectively referred to as the “Funds”) as of October 31, 2022, the related statements of operations for the year ended October 31, 2022, the statements of changes in net assets for each of the two years in the period ended October 31, 2022, including the related notes, and the financial highlights for each of the five years in the period ended October 31, 2022 (collectively referred to as the “financial statements”). In our opinion, the financial statements present fairly, in all material respects, the financial position of each of the Funds as of October 31, 2022, the results of each of their operations for the year then ended, the changes in each of their net assets for each of the two years in the period ended October 31, 2022 and each of the financial highlights for each of the five years in the period ended October 31, 2022 in conformity with accounting principles generally accepted in the United States of America.
BASIS FOR OPINIONS
These financial statements are the responsibility of the Funds’ management. Our responsibility is to express an opinion on the Funds’ financial statements based on our audits. We are a public accounting firm registered with the Public Company Accounting Oversight Board (United States) (PCAOB) and are required to be independent with respect to the Funds in accordance with the U.S. federal securities laws and the applicable rules and regulations of the Securities and Exchange Commission and the PCAOB.
We conducted our audits of these financial statements in accordance with the standards of the PCAOB. Those standards require that we plan and perform the audit to obtain reasonable assurance about whether the financial statements are free of material misstatement, whether due to error or fraud.
Our audits included performing procedures to assess the risks of material misstatement of the financial statements, whether due to error or fraud, and performing procedures that respond to those risks. Such procedures included examining, on a test basis, evidence regarding the amounts and disclosures in the financial statements. Our audits also included evaluating the accounting principles used and significant estimates made by management, as well as evaluating the overall presentation of the financial statements. Our procedures included confirmation of securities owned as of October 31, 2022 by correspondence with the custodian, transfer agent, agent banks and brokers; when replies were not received from brokers, we performed other auditing procedures. We believe that our audits provide a reasonable basis for our opinions.
/s/PricewaterhouseCoopers LLP
Boston, Massachusetts
December 22, 2022
We have served as the auditor of one or more investment companies in the AMG Funds Family since 1993.
37
| | |
| | | Other Information (unaudited) |
| | | |
| | | |
TAX INFORMATION
AMG Beutel Goodman Core Plus Bond Fund and AMG Beutel Goodman International Equity Fund each hereby designate the maximum amount allowable of its net taxable income as qualified dividends as provided in the Jobs and Growth Tax Relief Reconciliation Act of 2003. The 2021/2022 Form 1099-DIV you receive for each Fund will show the tax status of all distributions paid to you during the year.
In accordance with federal tax law, the following Fund elects to provide foreign taxes paid and the income sourced from foreign countries. Accordingly, the Fund hereby makes the following designations regarding its taxable period ended October 31, 2022:
AMG Beutel Goodman International Equity Fund
 The total amount of taxes paid and income sourced from foreign countries was $95,989 and $1,299,561, respectively.
Pursuant to section 852 of the Internal Revenue Code, AMG Beutel Goodman Core Plus Bond Fund and AMG Beutel Goodman International Equity Fund each hereby designate $0 and $0, respectively, as a capital gain distribution with respect to the taxable period ended October 31, 2022, or if subsequently determined to be different, the net capital gains of such fiscal year.
38
| | |
| | | AMG Funds Trustees and Officers |
| | | |
| | | |
| | | | |
The Trustees and Officers of the Trust, their business addresses, principal occupations for the past five years and ages are listed below. The Trustees provide broad supervision over the affairs of the Trust and the Funds. The Trustees are experienced executives who meet periodically throughout the year to oversee the Funds’ activities, review contractual arrangements with companies that provide services to the Funds, and | | review the Funds’ performance. Unless otherwise noted, the address of each Trustee or Officer is the address of the Trust: 680 Washington Blvd., Suite 500, Stamford, CT. 06901. There is no stated term of office for Trustees. Trustees serve until their resignation, retirement or removal in | | accordance with the Trust’s organizational documents and policies adopted by the Board from time to time. The Chairman of the Trustees, President, Treasurer and Secretary of the Trust are elected by the Trustees annually. Other officers hold office at the pleasure of the Trustees. |
Independent Trustees
The following Trustees are not “interested persons” of the Trust within the meaning of the 1940 Act:
| | |
Number of Funds Overseen in Fund Complex | | Name, Age, Principal Occupation(s) During Past 5 Years and Other Directorships Held by Trustee |
• Trustee since 2014 • Oversees 40 Funds in Fund Complex | | Bruce B. Bingham, 73 Partner, Hamilton Partners (real estate development firm) (1987-Present); Director of The Yacktman Funds, Inc. (2 portfolios) (2000-2012). |
• Trustee since 2014 • Chairman of the Audit Committee since 2020 • Oversees 44 Funds in Fund Complex | | Kurt A. Keilhacker, 59 Managing Partner, TechFund Europe (2000-Present); Managing Partner, TechFund Capital (1997-Present); Managing Partner, Elementum Ventures (2013-Present); Director, MetricStory, Inc. (2017-Present); Trustee, Wheaton College (2018-Present); Trustee, Gordon College (2001-2016); Board Member, 6wind SA (2002-2019). |
• Trustee since 2010 • Oversees 40 Funds in Fund Complex | | Steven J. Paggioli, 72 Independent Consultant (2002-Present); Trustee, Professionally Managed Portfolios (28 portfolios); Advisory Board Member, Sustainable Growth Advisors, LP; Independent Director, Muzinich BDC, Inc. (business development company) (2019-Present); Director, The Wadsworth Group; Independent Director, Chase Investment Counsel (2008–2019); Executive Vice President, Secretary and Director, Investment Company Administration, LLC and First Fund Distributors, INC. (1990-2001). |
• Independent Chairman of the Board of Trustees since 2017; Chairman of the Governance Committee since 2017 • Trustee since 2010 • Oversees 44 Funds in Fund Complex | | Eric Rakowski, 64 Professor of Law, University of California at Berkeley School of Law (1990-Present); Tax Attorney at Davis Polk & Wardwell and clerked for Judge Harry T. Edwards of the U.S. Court of Appeals for the District of Columbia Circuit and for Justice William J. Brennan Jr. of the U.S. Supreme Court; Director of Harding, Loevner Funds, Inc. (10 portfolios); Trustee of Third Avenue Trust (3 portfolios) (2002-2019); Trustee of Third Avenue Variable Trust (1 portfolio) (2002-2019). |
• Trustee since 2014 • Oversees 44 Funds in Fund Complex | | Victoria L. Sassine, 57 Adjunct Professor, Babson College (2007–Present); Director, Board of Directors, PRG Group (2017-Present); CEO, Founder, Scale Smarter Partners, LLC (2018-Present); Adviser, EVOFEM Biosciences (2019-Present); Chairperson of the Board of Directors of Business Management Associates (2018 to 2019). |
• Trustee since 2010 • Oversees 40 Funds in Fund Complex | | Thomas R. Schneeweis, 75* Professor Emeritus, University of Massachusetts (2013-Present); President, TRS Associates (1982-Present); Board Member, Chartered Alternative Investment Association (“CAIA”) (2002-Present); Co-Founder and Director, Institute for Global Asset and Risk Management (Education) (2010-Present); Co-Owner, Quantitative Investment Technologies (2014-Present); Co-Owner, Yes Wealth Management (2018-Present); Director, CAIA Foundation (2010-2019); Partner, S Capital Wealth Advisors (2015-2018); Partner, S Capital Management, LLC (2007-2015); President, Alternative Investment Analytics, LLC (formerly Schneeweis Partners, LLC) (2001-2013). |
*Mr. Schneeweis retired from the Board of Trustees of AMG Funds IV as of October 31, 2022.
39
| | |
| | | AMG Funds Trustees and Officers (continued) |
| | | |
| | | |
Interested Trustee
The Trustee in the following table is an “interested person” of the Trust within the meaning of the 1940 Act.
| | |
Number of Funds Overseen in
Fund Complex | | Name, Age, Principal Occupation(s) During Past 5 Years and Other Directorships Held by
Trustee |
• Trustee since 2021 • Oversees 44 Funds in Fund Complex | | Garret W. Weston, 41 Affiliated Managers Group, Inc. (2008-Present): Managing Director, Co-Head of Affiliate Engagement (2021-Present), Senior Vice President, Affiliate Development (2016-2021), Vice President, Office of the CEO (2015-2016), Vice President, New Investments (2012-2015), Senior Associate, New Investments (2008-2012); Associate, Madison Dearborn Partners (2006-2008); Analyst, Merrill Lynch (2004-2006). |
Officers
| | |
Position(s) Held with Fund and Length of Time Served | | Name, Age, Principal Occupation(s) During Past 5 Years |
• President since 2018 • Principal Executive Officer since 2018 • Chief Executive Officer since 2018 • Chief Operating Officer since 2016 | | Keitha L. Kinne, 64 Chief Operating Officer, AMG Funds LLC (2007-Present); Chief Investment Officer, AMG Funds LLC (2008-Present); President and Principal, AMG Distributors, Inc. (2018-Present); Chief Operating Officer, AMG Distributors, Inc. (2007-Present); President, Chief Executive Officer and Principal Executive Officer, AMG Funds, AMG Funds I, AMG Funds II, AMG Funds III and AMG Funds IV (2018-Present); Chief Operating Officer, AMG Funds, AMG Funds I, AMG Funds II, and AMG Funds III (2007-Present); Chief Operating Officer, AMG Funds IV (2016-Present); Chief Operating Officer and Chief Investment Officer, Aston Asset Management, LLC (2016); President and Principal Executive Officer, AMG Funds, AMG Funds I, AMG Funds II and AMG Funds III (2012-2014); Managing Partner, AMG Funds LLC (2007-2014); President and Principal, AMG Distributors, Inc. (2012-2014); Managing Director, Legg Mason & Co., LLC (2006-2007); Managing Director, Citigroup Asset Management (2004-2006). |
• Secretary since 2015 • Chief Legal Officer since 2015 | | Mark J. Duggan, 57 Managing Director and Senior Counsel, AMG Funds LLC (2021-Present); Senior Vice President and Senior Counsel, AMG Funds LLC (2015-2021); Secretary and Chief Legal Officer, AMG Funds, AMG Funds I, AMG Funds II, AMG Funds III and AMG Funds IV (2015-Present); Attorney, K&L Gates, LLP (2009-2015). |
• Chief Financial Officer since 2017 • Treasurer since 2017 • Principal Financial Officer since 2017 • Principal Accounting Officer since 2017 | | Thomas G. Disbrow, 56 Vice President, Mutual Fund Treasurer & CFO, AMG Funds, AMG Funds LLC (2017-Present); Chief Financial Officer, Principal Financial Officer, Treasurer and Principal Accounting Officer, AMG Funds, AMG Funds I, AMG Funds II, AMG Funds III and AMG Funds IV (2017-Present); Managing Director - Global Head of Traditional Funds Product Control, UBS Asset Management (Americas), Inc. (2015-2017); Managing Director - Head of North American Funds Treasury, UBS Asset Management (Americas), Inc. (2011-2015). |
• Deputy Treasurer since 2017 | | John A. Starace, 51 Vice President, Mutual Fund Accounting, AMG Funds LLC (2021-Present); Director, Mutual Fund Accounting, AMG Funds LLC (2017-2021); Vice President, Deputy Treasurer of Mutual Funds Services, AMG Funds LLC (2014-2017); Deputy Treasurer, AMG Funds, AMG Funds I, AMG Funds II, AMG Funds III and AMG Funds IV (2017-Present); Vice President, Citi Hedge Fund Services (2010-2014); Audit Senior Manager (2005-2010) and Audit Manager (2001-2005), Deloitte & Touche LLP. |
• Chief Compliance Officer and Sarbanes-Oxley Code of Ethics Compliance Officer since 2019 • Anti-Money Laundering Compliance Officer since 2022 | | Patrick J. Spellman, 48 Vice President, Chief Compliance Officer, AMG Funds LLC (2017-Present); Chief Compliance Officer, AMG Distributors, Inc. (2010-Present); Chief Compliance Officer and Sarbanes-Oxley Code of Ethics Compliance Officer, AMG Funds, AMG Funds I, AMG Funds II, AMG Funds III and AMG Funds IV (2019-Present); Anti-Money Laundering Compliance Officer, AMG Funds, AMG Funds I, AMG Funds II, and AMG Funds III (2014-2019; 2022-Present); Anti-Money Laundering Compliance Officer, AMG Funds IV (2016-2019; 2022-Present); Senior Vice President, Chief Compliance Officer, AMG Funds LLC (2011-2017); Compliance Manager, Legal and Compliance, Affiliated Managers Group, Inc. (2005-2011). |
• Assistant Secretary since 2016 | | Maureen M. Kerrigan, 37 Vice President, Senior Counsel, AMG Funds LLC (2021-Present); Vice President, Counsel, AMG Funds LLC (2019-2021); Director, Counsel, AMG Funds LLC (2017-2018); Vice President, Counsel, AMG Funds LLC (2015-2017); Assistant Secretary, AMG Funds, AMG Funds I, AMG Funds II, AMG Funds III and AMG Funds IV (2016-Present); Associate, Ropes & Gray LLP (2011-2015); Law Fellow, Massachusetts Appleseed Center for Law and Justice (2010-2011). |
40
| | |
| | | Annual Renewal of Investment Management and Subadvisory Agreements |
| | | |
| | | |
| | | | | | | | |
AMG Beutel Goodman Core Plus Bond Fund and AMG Beutel Goodman International Equity Fund: Approval of Investment Advisory and Subadvisory Agreements on June 22, 2022 At an in-person meeting held on June 22, 2022, the Board of Trustees (the “Board” or the “Trustees”), and separately a majority of the Trustees who are not “interested persons” of AMG Funds IV (the “Trust”) (the “Independent Trustees”), approved (i) the Investment Advisory Agreement, as amended pursuant to letter agreements at any time prior to the date of the meeting, with AMG Funds LLC (the “Investment Manager”) for each of AMG Beutel Goodman Core Plus Bond Fund and AMG Beutel Goodman International Equity Fund (each, a “Fund,” and collectively, the “Funds”) and separately Amendment No. 1 thereto dated October 1, 2016 (collectively, the “Investment Advisory Agreement”); and (ii) the Subadvisory Agreement, as amended at any time prior to the date of the meeting, with the Subadviser for each Fund (collectively, the “Subadvisory Agreements”). The Independent Trustees were separately represented by independent legal counsel in connection with their consideration of the approval of these agreements. In considering the Investment Advisory Agreement and the Subadvisory Agreements, the Trustees reviewed a variety of materials relating to each Fund, the Investment Manager and the Subadviser, including the nature, extent and quality of services, comparative performance, fee and expense information for an appropriate peer group of similar mutual funds for each Fund (each, a “Peer Group”), performance information for the relevant benchmark index for each Fund (each, a “Fund Benchmark”), other relevant matters, and other information provided to them on a periodic basis throughout the year. Prior to voting, the Independent Trustees: (a) reviewed the foregoing information with their independent legal counsel; (b) received materials from their independent legal counsel discussing the legal standards applicable to their consideration of the Investment Advisory Agreement and the Subadvisory Agreements; and (c) met with their independent legal counsel in private sessions at which no representatives of management were present. NATURE, EXTENT AND QUALITY OF SERVICES In considering the nature, extent and quality of the services provided by the Investment Manager, the Trustees reviewed information relating to the Investment Manager’s operations and personnel. Among other things, the Investment Manager provided financial information, information about its | | | | supervisory and professional staff and descriptions of its organizational and management structure. The Trustees also took into account information provided periodically throughout the previous year by the Investment Manager in Board meetings relating to the performance of its duties with respect to the Funds and the Trustees’ knowledge of the Investment Manager’s management and the quality of the performance of the Investment Manager’s duties under the Investment Advisory Agreement and Administration Agreement. In the course of their deliberations regarding the Investment Manager, the Trustees evaluated, among other things: (a) the extent and quality of the Investment Manager’s oversight of the operation and management of the Funds; (b) the quality of the Investment Manager’s oversight of the performance by the Subadviser of its portfolio management duties; (c) the Investment Manager’s ability to supervise the Funds’ other service providers; and (d) the Investment Manager’s compliance program. The Trustees also took into account that, in performing its functions under the Investment Advisory Agreement and supervising the Subadviser, the Investment Manager: performs periodic detailed analyses and reviews of the performance by the Subadviser of its obligations to each Fund, including without limitation, analysis and review of portfolio and other compliance matters and review of the Subadviser’s investment performance with respect to a Fund; prepares and presents periodic reports to the Board regarding the investment performance of the Subadviser and other information regarding the Subadviser, at such times and in such forms as the Board may reasonably request; reviews and considers any changes in the personnel of the Subadviser responsible for performing the Subadviser’s obligations and makes appropriate reports to the Board; reviews and considers any changes in the ownership or senior management of the Subadviser and makes appropriate reports to the Board; performs periodic in-person, telephonic or videoconference diligence meetings, including with respect to compliance matters, with representatives of the Subadviser; assists the Board and management of the Trust in developing and reviewing information with respect to the initial approval of each Subadvisory Agreement and annual consideration of each Subadvisory Agreement thereafter; prepares recommendations with respect to the continued retention of the Subadviser or the replacement of the Subadviser, including at the request of the Board; identifies potential successors to, or replacements of, the Subadviser or potential additional subadvisers, including performing appropriate due diligence, and developing and presenting to the Board a | | | | recommendation as to any such successor, replacement, or additional subadviser, including at the request of the Board; designates and compensates from its own resources such personnel as the Investment Manager may consider necessary or appropriate to the performance of its services; and performs such other review and reporting functions as the Board shall reasonably request consistent with the Investment Advisory Agreement and applicable law. The Trustees noted the affiliation of the Subadviser with the Investment Manager, noting any potential conflicts of interest. The Trustees also took into account the financial condition of the Investment Manager with respect to its ability to provide the services required under the Investment Advisory Agreement and the Investment Manager’s undertaking to maintain contractual expense limitations for the Funds. The Trustees also considered the Investment Manager’s risk management processes. The Trustees also reviewed information relating to the Subadviser’s operations and personnel and the investment philosophy, strategies and techniques (its “Investment Strategy”) used in managing each Fund. Among other things, the Trustees reviewed information on portfolio management and other professional staff, information regarding the Subadviser’s organizational and management structure and the Subadviser’s brokerage policies and practices. The Trustees considered specific information provided regarding the experience of the individuals at the Subadviser with portfolio management responsibility for each Fund, including the information set forth in the Fund’s prospectus and statement of additional information. In the course of their deliberations, the Trustees evaluated, among other things: (a) the services rendered by the Subadviser in the past; (b) the qualifications and experience of the Subadviser’s personnel; and (c) the Subadviser’s compliance program. The Trustees also took into account the financial condition of the Subadviser with respect to its ability to provide the services required under the Subadvisory Agreements. The Trustees also considered the Subadviser’s risk management processes. PERFORMANCE The Board considered each Fund’s net performance during relevant time periods as compared to the Fund’s Peer Group and Fund Benchmark, considered the gross performance of AMG Beutel Goodman International Equity Fund as compared to the Subadviser’s relevant performance composite that utilizes a similar investment strategy and approach, and noted that the Board reviews on a quarterly |
41
| | |
| | | Annual Renewal of Investment Management and Subadvisory Agreements (continued) |
| | | |
| | | |
| | | | | | | | |
basis detailed information about both a Fund’s performance results and portfolio composition, as well as the Subadviser’s Investment Strategy. The Board was mindful of the Investment Manager’s expertise, resources and attention to monitoring the Subadviser’s performance, investment style and risk-adjusted performance with respect to the Funds and its discussions with the management of the Funds’ subadviser during the period regarding the factors that contributed to the performance of the Funds. With respect to AMG Beutel Goodman Core Plus Bond Fund, among other information relating to the Fund’s performance, the Trustees noted that the Fund’s performance for Class I shares (which share class has one of the earliest inception dates and the largest amount of assets of all the share classes of the Fund) for the 1-year, 3-year, 5-year and 10-year periods ended March 31, 2022 was below, below, below, and above, respectively, the median performance of the Peer Group and above, below, below, and above, respectively, the performance of the Fund Benchmark, the Bloomberg U.S. Aggregate Bond Index. The Trustees also took into account management’s discussion of the Fund’s performance, including the reasons for the Fund’s more recent underperformance relative to the Peer Group and the fact that Class I shares of the Fund outperformed the Peer Group for the 10-year period. The Trustees also took into account the fact that the Fund’s subadviser and investment strategy changed effective March 24, 2021, and that the performance information prior to that date reflected that of the Fund’s prior subadviser and investment strategy. The Trustees concluded that the Fund’s overall performance has been satisfactory in light of the Fund’s investment objective, strategies, and policies. With respect to AMG Beutel Goodman International Equity Fund, among other information relating to the Fund’s performance, the Trustees noted that the Fund’s performance for Class I shares (which share class has one of the earliest inception dates and the largest amount of assets of all the share classes of the Fund) for the 1-year, 3-year, and 5-year periods ended March 31, 2022 and for the period from the Class I shares’ inception on April 14, 2014 through March 31, 2022 was below the median performance of the Peer Group and below the performance of the Fund Benchmark, the MSCI EAFE Index. The Trustees took into account management’s discussion of the Fund’s performance, including the reasons for the Fund’s underperformance. The Trustees also took into account the fact that the Fund’s subadviser and investment strategy changed effective March 19, 2021, and that the performance information prior to | | | | that date reflected that of the Fund’s prior subadviser and investment strategy. The Trustees concluded that the Fund’s overall performance has been satisfactory in light of the Fund’s investment objective, strategies, and policies. ADVISORY AND SUBADVISORY FEES; FUND EXPENSES; PROFITABILITY; AND ECONOMIES OF SCALE In considering the reasonableness of the advisory fee payable to the Investment Manager, the Trustees reviewed information provided by the Investment Manager at the June 22, 2022 and prior meetings setting forth all revenues and other benefits, both direct and indirect (including any so-called “fallout benefits” such as reputational value derived from the Investment Manager serving as Investment Manager to a Fund), received by the Investment Manager and its affiliates attributable to managing each Fund and all the mutual funds in the AMG Funds Family of Funds; the cost of providing such services; the significant risks undertaken as Investment Manager and sponsor of the Funds, including investment, operational, enterprise, entrepreneurial, litigation, regulatory and compliance risks; and the resulting profitability to the Investment Manager and its affiliates from these relationships. The Trustees also considered the changes to the management fee and subadvisory fee rates and the change to the expense cap that took effect during the past year for AMG Beutel Goodman International Equity Fund. The Trustees also considered the amount of the advisory fee retained by the Investment Manager after payment of the subadvisory fee with respect to each Fund. The Trustees also noted payments are made from the Subadviser to the Investment Manager, and other payments are made from the Investment Manager to the Subadviser. The Trustees also considered management’s discussion of the current asset levels of the Funds, and the impact on profitability of both the current asset levels and any future growth of assets of the Funds. In considering the cost of services to be provided by the Investment Manager under the Investment Advisory Agreement and the profitability to the Investment Manager of its relationship with each Fund, the Trustees noted the undertaking by the Investment Manager to maintain contractual expense limitations for the Funds. The Board also took into account management’s discussion of the advisory fee structure and the services the Investment Manager provides in performing its functions under the Investment Advisory Agreement and supervising the Subadviser. Based on the foregoing, the Trustees concluded that the | | | | profitability to the Investment Manager is reasonable and that the Investment Manager is not realizing material benefits from economies of scale that would warrant adjustments to the advisory fee at this time. Also with respect to economies of scale, the Trustees noted that as a Fund’s assets increase over time, the Fund may realize other economies of scale to the extent the increase in assets is proportionally greater than the increase in certain other expenses. In considering the reasonableness of the subadvisory fees payable by the Investment Manager to the Subadviser, the Trustees reviewed information regarding the cost to the Subadviser of providing subadvisory services to each Fund and the resulting profitability from these relationships. The Trustees noted that, because the Subadviser is an affiliate of the Investment Manager, a portion of the Subadviser’s revenues or profits might be shared directly or indirectly with the Investment Manager. The Trustees also noted that the subadvisory fees are paid by the Investment Manager out of its advisory fee. The Board also took into account management’s discussion of the subadvisory fee structure, and the services the Subadviser provides in performing its functions under each Subadvisory Agreement. Based on the foregoing, the Trustees concluded that the profitability to the Subadviser is reasonable and that the Subadviser is not realizing material benefits from economies of scale that would warrant adjustments to the subadvisory fees at this time. Also with respect to economies of scale, the Trustees noted that as a Fund’s assets increase over time, the Fund may realize other economies of scale to the extent the increase in assets is proportionally greater than the increase in certain other expenses. With respect to AMG Beutel Goodman Core Plus Bond Fund, the Trustees noted that the management fees (which include both the advisory and administration fees) and total expenses (net of applicable expense waivers/reimbursements) of Class I shares of the Fund as of March 31, 2022 were lower and higher, respectively, than the average for the Fund’s Peer Group. The Trustees took into account the fact that the Investment Manager has contractually agreed, through March 1, 2023, to limit the Fund’s net annual operating expenses (subject to certain excluded expenses) to 0.43%. The Trustees also took into account management’s discussion of the Fund’s expenses, including fees and expenses relative to comparably sized funds and select peers. The Trustees concluded that, in light of the nature, extent and quality of the services provided by the Investment Manager and the Subadviser (which is an affiliate of the Investment Manager), the foregoing expense limitation and the considerations noted |
42
| | |
| | | Annual Renewal of Investment Management and Subadvisory Agreements (continued) |
| | | |
| | | |
| | | | | | | | |
above with respect to the Investment Manager and the Subadviser, the Fund’s advisory and subadvisory fees are reasonable. With respect to AMG Beutel Goodman International Equity Fund, the Trustees noted that the management fees (which include both the advisory and administration fees) and total expenses (net of applicable expense waivers/reimbursements) of Class I shares of the Fund as of March 31, 2022 were lower and higher, respectively, than the average for the Fund’s Peer Group. The Trustees also took into account that, effective July 2, 2021, the Investment Manager has contractually agreed, through March 1, 2023, to lower the Fund’s contractual expense limitation from 0.89% to 0.76% of the Fund’s net annual operating expenses (subject to certain excluded expenses). The Trustees also noted that, effective July 2, 2021, the Fund’s management fee | | | | rate was reduced. The Trustees also took into account management’s discussion of the Fund’s expenses, including fees and expenses relative to comparably sized funds and select peers. The Trustees concluded that, in light of the nature, extent and quality of the services provided by the Investment Manager and the Subadviser (which is an affiliate of the Investment Manager), the foregoing expense limitation and the considerations noted above with respect to the Investment Manager and the Subadviser, the Fund’s advisory and subadvisory fees are reasonable. * * * * * After consideration of the foregoing, the Trustees also reached the following conclusions (in addition to the conclusions discussed above) regarding the Investment Advisory Agreement and the Subadvisory Agreements: (a) the Investment Manager and the | | | | Subadviser have demonstrated that they possess the capability and resources to perform the duties required of them under the Investment Advisory Agreement and each Subadvisory Agreement and (b) the Investment Manager and Subadviser maintain appropriate compliance programs. Based on all of the above-mentioned factors and their related conclusions, with no single factor or conclusion being determinative and with each Trustee not necessarily attributing the same weight to each factor, the Trustees concluded that approval of the Investment Advisory Agreement and the Subadvisory Agreements would be in the best interests of the applicable Fund and its shareholders. Accordingly, on June 22, 2022, the Trustees, and separately a majority of the Independent Trustees, voted to approve the Investment Advisory Agreement and the Subadvisory Agreement for each Fund. |
43
THIS PAGE INTENTIONALLY LEFT BLANK
|
|
| | | | | | | | |
INVESTMENT MANAGER AND ADMINISTRATOR AMG Funds LLC 680 Washington Blvd., Suite 500 Stamford, CT 06901 800.548.4539 DISTRIBUTOR AMG Distributors, Inc. 680 Washington Blvd., Suite 500 Stamford, CT 06901 800.548.4539 SUBADVISER Beutel, Goodman & Company Ltd. 20 Eglinton Ave. West, Suite 2000 Toronto, Ontario, M4R 1K8 Canada | | | | CUSTODIAN The Bank of New York Mellon Mutual Funds Custody 6023 Airport Road Oriskany, NY 13424 LEGAL COUNSEL Ropes & Gray LLP Prudential Tower, 800 Boylston Street Boston, MA 02199-3600 TRANSFER AGENT BNY Mellon Investment Servicing (US) Inc. Attn: AMG Funds 4400 Computer Drive Westborough, MA 01581 800.548.4539 | | | | This report is prepared for the Funds’ shareholders. It is authorized for distribution to prospective investors only when preceded or accompanied by an effective prospectus. To receive a free copy of the prospectus or Statement of Additional Information, which includes additional information about Fund Trustees, please contact us by calling 800.548.4539. Distributed by AMG Distributors, Inc., member FINRA/SIPC. Current net asset values per share for each Fund are available on the Funds’ website at amgfunds.com. A description of the policies and procedures each Fund uses to vote its proxies is available: (i) without charge, upon request, by calling 800.548.4539, or (ii) on the Securities and Exchange Commission’s (SEC) website at sec.gov. For information regarding each Fund’s proxy voting record for the 12-month period ended June 30, call 800.548.4539 or visit the SEC website at sec.gov. The Funds file their complete schedule of portfolio holdings with the SEC for the first and third quarters of each fiscal year as an exhibit to their reports on Form N-PORT. The Funds’ portfolio holdings on Form N-PORT are available on the SEC’s website at sec.gov and the Funds’ website at amgfunds.com. To review a complete list of the Funds’ portfolio holdings, or to view the most recent semiannual report or annual report, please visit amgfunds.com. |
| | | | | | | | | |
|
|
| | | | | | | | | | |
BALANCED FUNDS AMG GW&K Global Allocation GW&K Investment Management, LLC EQUITY FUNDS AMG Beutel Goodman International Equity Beutel, Goodman & Company Ltd. AMG Boston Common Global Impact Boston Common Asset Management, LLC AMG Frontier Small Cap Growth Frontier Capital Management Co., LLC AMG GW&K Small Cap Core AMG GW&K Small Cap Value AMG GW&K Small/Mid Cap AMG GW&K Small/Mid Cap Growth AMG GW&K Emerging Markets Equity AMG GW&K Emerging Wealth Equity AMG GW&K International Small Cap GW&K Investment Management, LLC AMG Montrusco Bolton Large Cap Growth Montrusco Bolton Investments, Inc. AMG Renaissance Large Cap Growth The Renaissance Group LLC | | | | AMG River Road Dividend All Cap Value AMG River Road Focused Absolute Value AMG River Road International Value Equity AMG River Road Large Cap Value Select AMG River Road Mid Cap Value AMG River Road Small-Mid Cap Value AMG River Road Small Cap Value River Road Asset Management, LLC AMG TimesSquare Emerging Markets Small Cap AMG TimesSquare Global Small Cap AMG TimesSquare International Small Cap AMG TimesSquare Mid Cap Growth AMG TimesSquare Small Cap Growth TimesSquare Capital Management, LLC AMG Veritas Asia Pacific AMG Veritas China AMG Veritas Global Focus AMG Veritas Global Real Return Veritas Asset Management LLP AMG Yacktman AMG Yacktman Focused AMG Yacktman Global AMG Yacktman Special Opportunities Yacktman Asset Management LP | | | | FIXED INCOME FUNDS AMG Beutel Goodman Core Plus Bond Beutel, Goodman & Company Ltd. AMG GW&K Core Bond ESG AMG GW&K Enhanced Core Bond ESG AMG GW&K ESG Bond AMG GW&K High Income AMG GW&K Municipal Bond AMG GW&K Municipal Enhanced Yield GW&K Investment Management, LLC | | |
| | | | | | | | | | | |
| | | | | | | | | | | |
| | | | | | | | | | | |
| | | | | | | | | | | |
| | | | | | | | | | | |
| | | | | | | | | | | |
| | | | | | | | | | | |
| | | | | | | | | | | |
| | | | | | | | | | | |
| | | | | | | | | | | |
| | | | | | | | | | | |
| | | | |
| amgfunds.com | | | | 103122 AR086 |
| | |
| | | ANNUAL REPORT |
| |
| | |
| | | | | | |
| | | | AMG Funds October 31, 2022 
AMG Montrusco Bolton Large Cap Growth Fund |
| | | | |
| | | | | Class N: MCGFX | | Class I: MCGIX |
| | | | |
| | | | | | | |
| | | | |
amgfunds.com | | | | 103122 AR087 |
| | |
| | | AMG Funds Annual Report — October 31, 2022 |
| | | | | | |
| | | |
| | | | | | | |
| | | TABLE OF CONTENTS | | PAGE | |
| | | | |
| | | |
| | | LETTER TO SHAREHOLDERS | | | 2 | |
| | | |
| | | ABOUT YOUR FUND’S EXPENSES | | | 3 | |
| | | |
| | | PORTFOLIO MANAGER’S COMMENTS, FUND SNAPSHOTS AND SCHEDULE OF PORTFOLIO INVESTMENTS | | | 4 | |
| | | |
| | | FINANCIAL STATEMENTS | | | | |
| | | |
| | | Statement of Assets and Liabilities | | | 10 | |
| | | |
| | | Balance sheet, net asset value (NAV) per share computations
and cumulative distributable earnings (loss) | | | | |
| | | |
| | | Statement of Operations | | | 12 | |
| | | |
| | | Detail of sources of income, expenses, and realized and
unrealized gains (losses) during the fiscal year | | | | |
| | | |
| | | Statements of Changes in Net Assets | | | 13 | |
| | | |
| | | Detail of changes in assets for the past two fiscal years | | | | |
| | | |
| | | Financial Highlights | | | 14 | |
| | | |
| | | Historical net asset values per share, distributions, total returns, income
and expense ratios, turnover ratios and net assets | | | | |
| | | |
| | | Notes to Financial Statements | | | 16 | |
| | | |
| | | Accounting and distribution policies, details of agreements and
transactions with Fund management and affiliates, and descriptions of
certain investment risks | | | | |
| | | |
| | | REPORT OF INDEPENDENT REGISTERED PUBLIC ACCOUNTING FIRM | | | 21 | |
| | | |
| | | OTHER INFORMATION | | | 22 | |
| | | |
| | | TRUSTEES AND OFFICERS | | | 23 | |
| | | |
| | | ANNUAL RENEWAL OF INVESTMENT MANAGEMENT AND SUBADVISORY AGREEMENTS | | | 25 | |
| | | | | | | |
Nothing contained herein is to be considered an offer, sale or solicitation of an offer to buy shares of any series of the AMG Funds Family of Funds. Such offering is made only by prospectus, which includes details as to offering price and other material information.
| | |
| | | Letter to Shareholders |
| |
| | |
Dear Shareholder:
The fiscal year ended October 31, 2022, was a volatile period for risk assets, as uncertainties mounted about high inflation, tighter financial conditions, and the Russian invasion of Ukraine. Global equity and bond markets fell in tandem amid sharply higher interest rates and eroding investor confidence as worries of an impending recession loomed over markets. A global commodity shock caused by the war in Ukraine only made matters worse. The S&P 500® Index slipped into a bear market with the Index falling more than (24)% from its peak earlier in the year. The abrupt shift in markets this year has reset expectations around future growth, as stubbornly high inflation has necessitated that the U.S. Federal Reserve (the Fed) and other global central banks take more aggressive policy action in an effort to bring down inflation. While the outlook is uncertain given the recent negative returns across many asset classes, one silver lining is that global stock and bond valuations are now more attractive than they were at the start of the year.
There was very wide dispersion in sector performance. Energy significantly outperformed all other sectors with a gain of 64.97% as the price of oil surged during the period. Defensive-oriented sectors also outperformed with a 4.86% return from consumer staples and 2.85% gain in utilities. High growth technology and mega cap internet-related companies underperformed during the period, and real estate was impacted by higher interest rates. Communications services fell the most with a (40.67)% return during the fiscal year, followed by declines of (28.53)% for consumer discretionary, (20.64)% for real estate, and (20.23)% for information technology. Value stocks held up much better than growth stocks as the Russell 1000® Value Index returned (7.00)% compared to the (24.60)% return for the Russell 1000® Growth Index. Small cap stocks struggled as the Russell 2000® Index lost (18.54)%. Outside the U.S., foreign developed markets lagged their U.S. counterparts as the U.S. dollar surged and the MSCI EAFE Index fell (23.00)%. Emerging Markets underperformed with a (31.03)% return for the MSCI Emerging Markets Index.
The 10-year Treasury yield more than doubled during the period, surging to the highest levels since before the Great Financial Crisis. Rapidly rising rates from a very low base led to historically bad performance for bonds as the Bloomberg U.S. Aggregate Bond Index, a broad measure of U.S. bond market performance, lost (15.68)% over the period. Investment-grade corporate bonds underperformed as the Bloomberg U.S. Corporate Bond Index returned (19.57)% for the year. High yield bonds held up better with a (11.76)% return as measured by the return of the Bloomberg U.S. Corporate High Yield Bond Index. Municipal bonds suffered steep losses but outperformed the broader market with a (11.98)% return for the Bloomberg Municipal Bond Index. Non-U.S. bonds delivered weak performance and were also impacted by the stronger dollar as the Bloomberg Global Aggregate ex U.S. fell (24.60)%.
AMG Funds appreciates the privilege of providing investment tools to you and your clients. Our foremost goal is to provide investment solutions that help our shareholders successfully reach their long-term investment goals. AMG Funds provides access to a distinctive array of actively managed return-oriented investment strategies. We thank you for your continued confidence and investment in AMG Funds. You can rest assured that under all market conditions our team is focused on delivering excellent investment management services for your benefit.
Respectfully,
Keitha Kinne
President
AMG Funds
| | | | | | | | | | | | | | |
| Average Annual Total Returns | | Periods ended
October 31, 2022* | |
| | | | |
| Stocks: | | | | 1 Year | | | 3 Years | | | 5 Years | |
| | | | |
| Large Cap | | (S&P 500® Index) | | | (14.61 | )% | | | 10.22% | | | | 10.44% | |
| | | | |
| Small Cap | | (Russell 2000® Index) | | | (18.54 | )% | | | 7.05% | | | | 5.56% | |
| | | | |
| International | | (MSCI ACWI ex USA) | | | (24.73 | )% | | | (1.68)% | | | | (0.60)% | |
| | | | |
| Bonds: | | | | | | | | | | | |
| | | | |
| Investment Grade | | (Bloomberg U.S. Aggregate Bond Index) | | | (15.68 | )% | | | (3.77)% | | | | (0.54)% | |
| | | | |
| High Yield | | (Bloomberg U.S. Corporate High Yield Bond Index) | | | (11.76 | )% | | | 0.31% | | | | 2.01% | |
| | | | |
| Tax-exempt | | (Bloomberg Municipal Bond Index) | | | (11.98 | )% | | | (2.18)% | | | | 0.37% | |
| | | | |
| Treasury Bills | | (ICE BofAML U.S. 6-Month Treasury Bill Index) | | | 0.55 | % | | | 0.65% | | | | 1.27% | |
*Source: FactSet. Past performance is no guarantee of future results.
2
| | |
| | | About Your Fund’s Expenses |
| | | |
| | | |
| | | | | | | | |
As a shareholder of a Fund, you may incur two types of costs: (1) transaction costs, which may include sales charges (loads) on purchase payments; redemption fees; and exchange fees; and (2) ongoing costs, including management fees; distribution (12b-1) fees; and other Fund expenses. This example is intended to help you understand your ongoing costs (in dollars) of investing in the Fund and to compare these costs with the ongoing costs of investing in other mutual funds. The example is based on $1,000 invested at the beginning of the period and held for the entire period as indicated below. ACTUAL EXPENSES The first line of the following table provides information about the actual account values and | | | | actual expenses. You may use the information in this line, together with the amount you invested, to estimate the expenses that you paid over the period. Simply divide your account value by $1,000 (for example, an $8,600 account value divided by $1,000 = 8.6), then multiply the result by the number in the first line under the heading entitled “Expenses Paid During the Period” to estimate the expenses you paid on your account during this period. HYPOTHETICAL EXAMPLE FOR COMPARISON PURPOSES The second line of the following table provides information about hypothetical account values and hypothetical expenses based on the Fund’s actual expense ratio and an assumed annual rate of return of 5% before expenses, which is not the Fund’s | | | | actual return. The hypothetical account values and expenses may not be used to estimate the actual ending account balance or expenses you paid for the period. You may use this information to compare the ongoing costs of investing in the Fund and other funds by comparing this 5% hypothetical example with the 5% hypothetical examples that appear in the shareholder reports of other funds. Please note that the expenses shown in the table are meant to highlight your ongoing costs only and do not reflect any transactional costs, such as sales charges (loads), redemption fees, or exchange fees. Therefore, the second line of the table is useful in comparing ongoing costs only, and will not help you determine the relative total costs of owning different funds. |
| | | | | | | | |
| | | | | | | | |
Six Months Ended October 31, 2022 | | Expense
Ratio for
the Period | | Beginning
Account
Value
05/01/22 | | Ending
Account
Value
10/31/22 | | Expenses
Paid
During
the Period* |
|
AMG Montrusco Bolton Large Cap Growth Fund |
|
Based on Actual Fund Return |
| | | | |
Class N | | 0.91% | | $1,000 | | $904 | | $4.37 |
| | | | |
Class I | | 0.73% | | $1,000 | | $906 | | $3.51 |
|
Based on Hypothetical 5% Annual Return |
| | | | |
Class N | | 0.91% | | $1,000 | | $1,021 | | $4.63 |
| | | | |
Class I | | 0.73% | | $1,000 | | $1,022 | | $3.72 |
| | * | Expenses are equal to the Fund’s annualized expense ratio multiplied by the average account value over the period, multiplied by the number of days in the most recent fiscal half-year (184), then divided by 365. | |
3
|
AMG Montrusco Bolton Large Cap Growth Fund Portfolio Manager’s Comments (unaudited) |
| | | | | | | | |
For the 12 months ended October 31, 2022, AMG Montrusco Bolton Large Cap Growth Fund (the “Fund”) Class N shares returned (25.18)%, compared with the (24.43)% return for the S&P 500® Growth Index, the Fund’s primary benchmark. MARKET OVERVIEW North American stock prices bounced back during October 2022, cutting tough losses that affected all major asset classes over the past twelve months. During this time, U.S. growth companies faced a range of headwinds. These included negative economic growth during the first two quarters of 2022, moderating government fiscal stimulus following massive injections during the height of the COVID pandemic, conflict between Russia and the United States over Ukraine and resulting turmoil for many of their allies, who are the source of a significant portion of U.S. corporate earnings. The U.S. Federal Reserve’s (the Fed) monetary policy tightening, which was implemented to fight inflation spikes that had initially been thought to be transitory, has been by far the biggest hurdle. Tough messaging, threats of selloffs in central bank assets, and a rapidly spiking federal funds rate, particularly in relative terms, hit consumers, businesses, and government borrowers hard. These increases are gradually shifting investor interest toward fixed income instruments and have cut earnings multiples of stocks on major indexes. The rising borrowing costs have also hit demand for housing and automotive products, and the relative attractiveness of long-term capital investments. U.S. tech stocks, which profited handsomely while the public was locked down or barred from entering offices, lagged as the pandemic shifted to endemic. U.S. job growth has remained strong, and voter balance in mid-term elections suggested some movement toward stability. PERFORMANCE REVIEW Top contributing sectors to the Fund’s relative performance included financials, consumer discretionary, and consumer staples. Bottom contributing sectors to relative performance included information technology, healthcare, and communication services. | | | | Top individual contributors to the Fund’s relative performance during the twelve months ended October 31, 2022, included Lamb Weston Holdings, Inc., Amgen Inc., Mastercard, Inc. Class A, The TJX Cos., Inc., and Interactive Brokers Group, Inc. Class A. Lamb Weston, a U.S.-based food processor, provided better-than-expected margin guidance stemming from an improved weather outlook for potato crops, which are an important input in its frozen products line. Amgen’s shares performed well after management provided better-than-expected long-term guidance amid its leadership in biosimilars and its growing portfolio of differentiated drugs across unmet indications. Mastercard’s stock outperformed as the company delivered above-consensus revenue growth as its network-of-network approach makes its business more resilient to fluctuations in the global economy and to changes in the payment landscape as they increase exposure and diversify across various types of payment flows. TJX Companies outperformed after reporting improving foot traffic at its fashion and apparel discount retail outlets and a strong sales pipeline. Investors noted the company’s favorable inventory position and buying power backed by a strong U.S. dollar in international markets, which generates savings it can pass along to consumers. Interactive Brokers benefited because the company’s fundamentals were not reflected in its valuation. During the past few months, Interactive Brokers’ shares have been repriced to reflect the new market dynamics (and its subsequently higher growth and quality improvement potential). Bottom relative individual contributors to the Fund’s relative performance included Adobe, Inc., Workday, Inc. Class A, Apple, Inc., Charles River Laboratories International, Inc., and Eli Lilly, Inc. Adobe’s shares lagged recently after delivering mixed results. The company also lowered its full-year guidance due to greater than expected impacts emanating from the Russia and Ukraine conflict. Workday shares have lagged after the software and back-office provider’s management noted that some customers are stretching out deal implementations due to a weakening economy. Since the Fund holds an underweight position in Apple, the stock’s recent gains negatively impacted the relative performance. Apple reported strong growth in its higher margin services businesses, which enabled the tech giant to use its strong balance sheet and cash generation | | | | potential to buy back shares. Charles River shares have underperformed despite the recent release of strong results. Investors worry that the American pharmaceutical services provider’s need to reinvest in the business could impact near-term margins. The Fund was negatively impacted on a relative basis by not owning shares in Eli Lilly, a key holding in its benchmark index, which outperformed during the period. During the past year, the Fund increased its focus on environmental, social and governance (“ESG”) practices, both internally, and at all existing and potential holdings. This process includes regular interactions with management, both informally, at investor days and through targeted meetings at companies ranging from Danaher Corp., to Adobe, Five Below Inc., Analog Devices Inc., and many others. Key priorities include management attitudes toward issues ranging from climate change to minorities and board composition. The Fund also seeks and encourages implementation of formal ESG strategies, as well as use of tangible, independently verified metrics, certifications, and key performance indicators to monitor performance. OUTLOOK Lost production volumes and the effects of sanctions amid Russia’s invasion of Ukraine are complexifying numerous existing inflationary drivers. These include aging demographics, a labor force reassessing its work/life balance, COVID-19 production hurdles, and regionalization trends. Consequently, the Fund is focused on business models that have strong pricing power. Uncertainty surrounding changes in supply chains, consumer behaviors, digitization and rising wages will have a lasting impact on business models. The Fund seeks to continue identifying relative valuation dislocations caused by rapidly shifting market narratives that are offering compelling opportunities to book profits and reinvest in misunderstood and therefore mispriced stocks. This commentary reflects the viewpoints of Montrusco Bolton Investments, Inc. as of October 31, 2022, and is not intended as a forecast or guarantee of future results. |
4
| | |
| | | AMG Montrusco Bolton Large Cap Growth Fund Portfolio Manager’s Comments (continued) |
| | | |
| | | |
CUMULATIVE TOTAL RETURN PERFORMANCE
AMG Montrusco Bolton Large Cap Growth Fund’s cumulative total return is based on the daily change in net asset value (NAV), and assumes that all dividends and distributions were reinvested. The graph compares a hypothetical $10,000 investment made in the AMG Montrusco Bolton Large Cap Growth Fund’s Class N shares on October 31, 2012, to a $10,000 investment made in the S&P 500® Growth Index for the same time period. The graph and table do not reflect the deduction of taxes that a shareholder would pay on a Fund distribution or redemption of shares. The listed returns for the Fund are net of expenses and the returns for the index excludes expenses. Total returns would have been lower had certain expenses not been reduced.
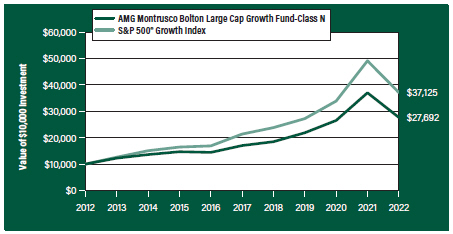
The table below shows the average annual total returns for the AMG Montrusco Bolton Large Cap Growth Fund and the S&P 500® Growth Index for the same time periods ended October 31, 2022.
| | | | | | |
| | | One | | Five | | Ten |
Average Annual Total Returns1 | | Year | | Years | | Years |
|
AMG Montrusco Bolton Large Cap Growth Fund2, 3, 4, 5, 6, 7, 8, 9 |
| | | |
Class N | | (25.18%) | | 10.22% | | 10.72% |
| | | |
Class I | | (25.05%) | | 10.42% | | 10.96% |
| | | |
S&P 500® Growth Index10 | | (24.43%) | | 11.68% | | 14.02% |
The performance data shown represents past performance. Past performance is not a guarantee of future results. Current performance may be lower or higher than the performance data quoted. The investment return and principal value of an investment will fluctuate so that an investor’s shares, when redeemed, may be worth more or less than their original cost.
Investors should carefully consider the Fund’s investment objectives, risks, charges and expenses before investing. For performance information through the most recent month end, current net asset values per share for the Fund and other information, please call 800.548.4539 or visit our website at amgfunds.com for a free prospectus. Read it carefully before investing or sending money.
Distributed by AMG Distributors, Inc., member FINRA/SIPC.
| 1 | Total return equals income yield plus share price change and assumes reinvestment of all dividends and capital gain distributions. Returns are net of fees and may reflect offsets of Fund expenses as described in the prospectus. No adjustment has been made for taxes payable by shareholders on their reinvested dividends and capital gain distributions. Returns for periods greater than one year are annualized. The listed returns on the Fund are net of expenses and based on the published NAV as of October 31, 2022. All returns are in U.S. Dollars ($). |
| 2 | The Fund invests in growth stocks, which may be more sensitive to market movements because their prices |
|
tend to reflect future investor expectations rather than just current profits. Growth stocks may underperform value stocks during given periods. 3 As of March 19, 2021, the Fund’s Subadviser was changed to Montrusco Bolton Investments, Inc. Prior to March 19, 2021, the Fund was known as the AMG Managers Montag & Caldwell Growth Fund, and had different principal investment strategies and corresponding risks. Performance shown for periods prior to March 19, 2021, reflects the performance and investment strategies of the Fund’s previous subadviser, Montag & Caldwell, LLC. The Fund’s past performance would have been different if the Fund were managed by the current Subadviser and strategy, and the Fund’s prior performance record might be less pertinent for investors considering whether to purchase shares of the fund. 4 Market prices of investments held by the Fund may fall rapidly or unpredictably due to a variety of economic or political factors, market conditions, disasters or public health issues, or in response to events that affect particular industries or companies. 5 The Fund’s performance may be adversely affected when stocks preferred by a Growth at a Reasonable Price (GARP) investing strategy underperform or are not favored by investors in prevailing market and economic conditions. 6 Applying the Fund’s ESG investment criteria may result in the selection or exclusion of securities of certain issuers for reasons other than performance, and the Fund may underperform funds that do not utilize an ESG investment strategy. The application of this strategy may affect the Fund’s exposure to certain companies, sectors, regions, countries or types of investments, which could negatively impact the Fund’s performance depending on whether such investments are in or out of favor. Applying ESG criteria to investment decisions is qualitative and subjective by nature, and there is no guarantee that the criteria utilized by the Subadviser or any judgment exercised by the Subadviser will reflect the beliefs or values of any particular investor. |
|
7 A greater percentage of the Fund’s holdings may be focused in a smaller number of securities which may place the Fund at greater risk than a more diversified fund. 8 The Fund invests in large-capitalization companies that may underperform other stock funds (such as funds that focus on small-and medium-capitalization companies) when stocks of large-capitalization companies are out of favor. 9 The Fund invests in value stocks, which may perform differently from the market as a whole and may be undervalued by the market for a long period of time. |
5
| | |
| | | AMG Montrusco Bolton Large Cap Growth Fund Portfolio Manager’s Comments (continued) |
| | | |
| | | |
| | | | | | | | |
10 The S&P 500® Growth Index draws its constituents from the S&P 500® based on three growth factors: sales growth, the ratio of earnings change to price, and momentum. Unlike the Fund, the S&P 500® Growth Index is unmanaged, is not available for investment and does not incur expenses. | | | | The S&P Index is proprietary data of Standard & Poor’s, a division of McGraw-Hill Companies, Inc. All rights reserved. Not FDIC insured, nor bank guaranteed. May lose value. | | | | |
6
|
AMG Montrusco Bolton Large Cap Growth Fund Fund Snapshots (unaudited) October 31, 2022 |
PORTFOLIO BREAKDOWN
| | |
| Sector | | % of
Net Assets |
| | |
| Information Technology | | 44.0 |
| | |
| Consumer Discretionary | | 15.9 |
| | |
| Health Care | | 12.9 |
| | |
| Communication Services | | 9.8 |
| | |
| Financials | | 7.4 |
| | |
| Industrials | | 3.5 |
| | |
| Real Estate | | 2.4 |
| | |
| Consumer Staples | | 2.0 |
| | |
| Materials | | 1.5 |
| | |
| Short-Term Investments | | 0.4 |
| | |
| Other Assets, Less Liabilities | | 0.2 |
TOP TEN HOLDINGS
| | |
| Security Name | | % of
Net Assets |
| | |
Apple, Inc. | | 9.6 |
| | |
Microsoft Corp. | | 9.4 |
| | |
Amazon.com, Inc. | | 8.1 |
| | |
Texas Instruments, Inc. | | 7.4 |
| | |
Mastercard, Inc., Class A | | 7.2 |
| | |
Alphabet, Inc., Class A | | 6.2 |
| | |
Danaher Corp. | | 4.7 |
| | |
Analog Devices, Inc. | | 4.5 |
| | |
Envista Holdings Corp. | | 4.3 |
| | |
The TJX Cos., Inc. | | 4.0 |
| | | |
| | |
Top Ten as a Group | | 65.4 |
| | |
Because a fund’s strategy may result in multiple investments in particular sectors of the economy, its performance may depend on the performance of those sectors and may fluctuate more widely than investments diversified across more sectors. For additional information on these and other risk considerations, please see the Fund’s prospectus.
Any sectors, industries, or securities discussed should not be perceived as investment recommendations. Mention of a specific security should not be considered a recommendation to buy or solicitation to sell that security. Specific securities mentioned in this report may have been sold from the Fund’s portfolio of investments by the time you receive this report.
7
| | |
| | | AMG Montrusco Bolton Large Cap Growth Fund Schedule of Portfolio Investments October 31, 2022 |
| | | |
| | | |
| | | | | | | | |
| | | Shares | | | Value | |
Common Stocks - 99.4% | | | | | | | | |
| | |
Communication Services - 9.8% | | | | | | | | |
| | |
Alphabet, Inc., Class A* | | | 132,579 | | | $ | 12,530,041 | |
| | |
Meta Platforms, Inc., Class A* | | | 48,410 | | | | 4,509,876 | |
| | |
Netflix, Inc.* | | | 9,646 | | | | 2,815,474 | |
| | |
Total Communication Services | | | | | | | 19,855,391 | |
| | |
Consumer Discretionary - 15.9% | | | | | | | | |
| | |
Amazon.com, Inc.* | | | 159,585 | | | | 16,347,887 | |
| | |
Five Below, Inc.* | | | 52,328 | | | | 7,658,203 | |
| | |
The TJX Cos., Inc. | | | 113,117 | | | | 8,155,736 | |
| | |
Total Consumer Discretionary | | | | | | | 32,161,826 | |
| | |
Consumer Staples - 2.0% | | | | | | | | |
| | |
Lamb Weston Holdings, Inc. | | | 45,791 | | | | 3,948,100 | |
| | |
Financials - 7.4% | | | | | | | | |
| | |
CME Group, Inc. | | | 31,644 | | | | 5,483,905 | |
| | |
Interactive Brokers Group, Inc., Class A | | | 75,093 | | | | 6,018,704 | |
| | |
Marsh & McLennan Cos., Inc. | | | 21,988 | | | | 3,550,842 | |
| | |
Total Financials | | | | | | | 15,053,451 | |
| | |
Health Care - 12.9% | | | | | | | | |
| | |
Amgen, Inc. | | | 19,673 | | | | 5,318,596 | |
| | |
Charles River Laboratories International, Inc.* | | | 12,486 | | | | 2,650,153 | |
| | |
Danaher Corp. | | | 37,737 | | | | 9,497,271 | |
| | |
Envista Holdings Corp.* | | | 264,749 | | | | 8,739,364 | |
| | |
Total Health Care | | | | | | | 26,205,384 | |
| | |
Industrials - 3.5% | | | | | | | | |
| | |
Nordson Corp. | | | 31,118 | | | | 7,001,550 | |
| | |
Information Technology - 44.0% | | | | | | | | |
| | |
Adobe, Inc.* | | | 17,193 | | | | 5,475,970 | |
| | | | | | | | |
| | | Shares | | | Value | |
Analog Devices, Inc. | | | 64,264 | | | | $9,165,332 | |
| | |
Apple, Inc. | | | 126,990 | | | | 19,472,647 | |
| | |
Mastercard, Inc., Class A | | | 44,723 | | | | 14,677,194 | |
| | |
Microsoft Corp. | | | 81,871 | | | | 19,004,715 | |
| | |
NVIDIA Corp. | | | 19,561 | | | | 2,640,148 | |
| | |
Texas Instruments, Inc. | | | 94,000 | | | | 15,099,220 | |
| | |
Workday, Inc., Class A* | | | 23,729 | | | | 3,697,453 | |
| | |
Total Information Technology | | | | | | | 89,232,679 | |
| | |
Materials - 1.5% | | | | | | | | |
| | |
Linde PLC (United Kingdom) | | | 10,527 | | | | 3,130,204 | |
| | |
Real Estate - 2.4% | | | | | | | | |
| | |
Public Storage, REIT | | | 15,607 | | | | 4,834,268 | |
| | |
Total Common Stocks
(Cost $204,881,535) | | | | | | | 201,422,853 | |
| | |
Short-Term Investments - 0.4% | | | | | | | | |
| |
Other Investment Companies - 0.4% | | | | | |
| | |
Dreyfus Government Cash Management Fund, Institutional Shares, 2.91%1 | | | 327,081 | | | | 327,081 | |
| | |
Dreyfus Institutional Preferred Government Money Market Fund, Institutional Shares, 3.09%1 | | | 490,622 | | | | 490,622 | |
| | |
Total Short-Term Investments
(Cost $817,703) | | | | | | | 817,703 | |
| | |
Total Investments - 99.8%
(Cost $205,699,238) | | | | | | | 202,240,556 | |
| |
Other Assets, less Liabilities - 0.2% | | | | 444,265 | |
| | |
Net Assets - 100.0% | | | | | | $ | 202,684,821 | |
| | |
| | | | | | | | |
| * | Non-income producing security. |
| 1 | Yield shown represents the October 31, 2022, seven day average yield, which refers to the sum of the previous seven days’ dividends paid, expressed as an annual percentage. |
REIT Real Estate Investment Trust
The accompanying notes are an integral part of these financial statements.
8
| | |
| | | AMG Montrusco Bolton Large Cap Growth Fund Schedule of Portfolio Investments (continued) |
| | | |
| | | |
The following table summarizes the inputs used to value the Fund’s investments by the fair value hierarchy levels as of October 31, 2022:
| | | | | | | | | | | | | | | | | | | | |
| | | Level 1 | | Level 2 | | Level 3 | | Total |
Investments in Securities | | | | | | | | | | | | | | | | | | | | |
| | | | |
Common Stocks† | | | $ | 201,422,853 | | | | | — | | | | | — | | | | $ | 201,422,853 | |
| | | | |
Short-Term Investments | | | | | | | | | | | | | | | | | | | | |
| | | | |
Other Investment Companies | | | | 817,703 | | | | | — | | | | | — | | | | | 817,703 | |
| | | | | | | | | | | | | | | | | | | | |
| | | | |
Total Investments in Securities | | | $ | 202,240,556 | | | | | — | | | | | — | | | | $ | 202,240,556 | |
| | | | | | | | | | | | | | | | | | | | |
| † | All common stocks held in the Fund are Level 1 securities. For a detailed breakout of common stocks by major industry classification, please refer to the Fund’s Schedule of Portfolio Investments. |
For the fiscal year ended October 31, 2022, there were no transfers in or out of Level 3.
The accompanying notes are an integral part of these financial statements.
9
| | |
| | | Statement of Assets and Liabilities October 31, 2022 |
| | | |
| | | |
| | | | |
| | | AMG
Montrusco Bolton
Large Cap
Growth Fund | |
| |
Assets: | | | | |
| |
Investments at value1 | | | $202,240,556 | |
| |
Receivable for investments sold | | | 713,758 | |
| |
Dividend and interest receivables | | | 149,276 | |
| |
Securities lending income receivable | | | 100 | |
| |
Receivable for Fund shares sold | | | 208,967 | |
| |
Prepaid expenses and other assets | | | 19,467 | |
| |
Total assets | | | 203,332,124 | |
| |
Liabilities: | | | | |
| |
Payable for investments purchased | | | 306,565 | |
| |
Payable for Fund shares repurchased | | | 83,875 | |
| |
Accrued expenses: | | | | |
| |
Investment advisory and management fees | | | 106,002 | |
| |
Administrative fees | | | 25,692 | |
| |
Distribution fees | | | 14,282 | |
| |
Shareholder service fees | | | 6,304 | |
| |
Other | | | 104,583 | |
| |
Total liabilities | | | 647,303 | |
| | | | |
| |
Net Assets | | | $202,684,821 | |
| |
1 Investments at cost | | | $205,699,238 | |
The accompanying notes are an integral part of these financial statements.
10
| | |
| | | Statement of Assets and Liabilities (continued) |
| | | |
| | | |
| | | | |
| | | AMG
Montrusco Bolton
Large Cap
Growth Fund | |
| |
Net Assets Represent: | | | | |
| |
Paid-in capital | | | $188,125,492 | |
| |
Total distributable earnings | | | 14,559,329 | |
| |
Net Assets | | | $202,684,821 | |
| |
Class N: | | | | |
| |
Net Assets | | | $113,789,936 | |
| |
Shares outstanding | | | 11,380,229 | |
| |
Net asset value, offering and redemption price per share | | | $10.00 | |
| |
Class I: | | | | |
| |
Net Assets | | | $88,894,885 | |
| |
Shares outstanding | | | 8,676,461 | |
| |
Net asset value, offering and redemption price per share | | | $10.25 | |
The accompanying notes are an integral part of these financial statements.
11
| | |
| | | Statement of Operations For the fiscal year ended October 31, 2022 |
| | | |
| | | |
| | | | |
| | | AMG
Montrusco Bolton
Large Cap
Growth Fund | |
| |
Investment Income: | | | | |
| |
Dividend income | | | $2,320,468 | |
| |
Securities lending income | | | 1,896 | |
| |
Foreign withholding tax | | | (2,486) | |
| |
Total investment income | | | 2,319,878 | |
| |
Expenses: | | | | |
| |
Investment advisory and management fees | | | 1,245,919 | |
| |
Administrative fees | | | 389,350 | |
| |
Distribution fees - Class N | | | 218,879 | |
| |
Shareholder servicing fees - Class N | | | 108,148 | |
| |
Shareholder servicing fees - Class I | | | 58,975 | |
| |
Professional fees | | | 59,060 | |
| |
Registration fees | | | 40,527 | |
| |
Transfer agent fees | | | 37,453 | |
| |
Custodian fees | | | 30,898 | |
| |
Reports to shareholders | | | 19,443 | |
| |
Trustee fees and expenses | | | 17,791 | |
| |
Interest expense | | | 1,790 | |
| |
Miscellaneous | | | 10,856 | |
| |
Total expenses before offsets | | | 2,239,089 | |
| |
Expense reimbursements | | | (86,244) | |
| |
Net expenses | | | 2,152,845 | |
| | | | |
| |
Net investment income | | | 167,033 | |
| |
Net Realized and Unrealized Loss: | | | | |
| |
Net realized gain on investments | | | 26,589,468 | |
| |
Net change in unrealized appreciation/depreciation on investments | | | (99,790,536) | |
| |
Net realized and unrealized loss | | | (73,201,068) | |
| | | | |
| |
Net decrease in net assets resulting from operations | | | $(73,034,035) | |
The accompanying notes are an integral part of these financial statements.
12
| | |
| | | Statements of Changes in Net Assets For the fiscal years ended October 31, |
| | | |
| | | |
| | | | | | | | |
| | | AMG
Montrusco Bolton
Large Cap Growth Fund | |
| | |
| | | 2022 | | | 2021 | |
| | |
Increase (Decrease) in Net Assets Resulting From Operations: | | | | | | | | |
| | |
Net investment income (loss) | | | $167,033 | | | | $(1,314,675 | ) |
| | |
Net realized gain on investments | | | 26,589,468 | | | | 250,179,986 | |
| | |
Net change in unrealized appreciation/depreciation on investments | | | (99,790,536 | ) | | | (95,816,306 | ) |
| | |
Net increase (decrease) in net assets resulting from operations | | | (73,034,035 | ) | | | 153,049,005 | |
| | |
Distributions to Shareholders: | | | | | | | | |
| | |
Class N | | | (38,003,632 | ) | | | (86,153,904 | ) |
| | |
Class I | | | (35,766,663 | ) | | | (151,058,809 | ) |
| | |
Total distributions to shareholders | | | (73,770,295 | ) | | | (237,212,713 | ) |
| | |
Capital Share Transactions:1 | | | | | | | | |
| | |
Net increase (decrease) from capital share transactions | | | 6,605,988 | | | | (48,641,532 | ) |
| | | | | | | | |
| | |
Total decrease in net assets | | | (140,198,342 | ) | | | (132,805,240 | ) |
| | |
Net Assets: | | | | | | | | |
| | |
Beginning of year | | | 342,883,163 | | | | 475,688,403 | |
| | |
End of year | | | $202,684,821 | | | | $342,883,163 | |
1 See Note 1(g) of the Notes to Financial Statements.
The accompanying notes are an integral part of these financial statements.
13
| | |
| | | AMG Montrusco Bolton Large Cap Growth Fund Financial Highlights For a share outstanding throughout each fiscal year |
| | | |
| | | |
| | | | | | | | | | | | | | | | | | | | | | | | | |
| | | For the fiscal years ended October 31, |
| | | | | |
| Class N | | 2022 | | 2021 | | 2020 | | 2019 | | 2018 |
| | | | | |
Net Asset Value, Beginning of Year | | | | $17.05 | | | | | $21.50 | | | | | $19.34 | | | | | $20.52 | | | | | $20.76 | |
| | | | | |
Income (loss) from Investment Operations: | | | | | | | | | | | | | | | | | | | | | | | | | |
| | | | | |
Net investment loss1,2 | | | | (0.00 | )3 | | | | (0.07 | ) | | | | (0.06 | ) | | | | (0.02 | ) | | | | (0.01 | ) |
| | | | | |
Net realized and unrealized gain (loss) on investments | | | | (3.26 | ) | | | | 6.17 | | | | | 3.92 | | | | | 2.74 | | | | | 1.71 | |
| | | | | |
Total income (loss) from investment operations | | | | (3.26 | ) | | | | 6.10 | | | | | 3.86 | | | | | 2.72 | | | | | 1.70 | |
| | | | | |
Less Distributions to Shareholders from: | | | | | | | | | | | | | | | | | | | | | | | | | |
| | | | | |
Net realized gain on investments | | | | (3.79 | ) | | | | (10.55 | ) | | | | (1.70 | ) | | | | (3.90 | ) | | | | (1.94 | ) |
| | | | | |
Net Asset Value, End of Year | | | | $10.00 | | | | | $17.05 | | | | | $21.50 | | | | | $19.34 | | | | | $20.52 | |
| | | | | |
Total Return2,4 | | | | (25.18 | )% | | | | 39.50 | % | | | | 21.36 | % | | | | 18.29 | % | | | | 8.58 | % |
| | | | | |
Ratio of net expenses to average net assets | | | | 0.91 | % | | | | 1.07 | %5 | | | | 1.16 | %5 | | | | 1.16 | %5 | | | | 1.15 | %5 |
| | | | | |
Ratio of gross expenses to average net assets6 | | | | 0.94 | % | | | | 1.09 | % | | | | 1.16 | % | | | | 1.17 | % | | | | 1.16 | % |
| | | | | |
Ratio of net investment loss to average net assets2 | | | | (0.02 | )% | | | | (0.39 | )% | | | | (0.30 | )% | | | | (0.10 | )% | | | | (0.03 | )% |
| | | | | |
Portfolio turnover | | | | 68 | % | | | | 109 | % | | | | 30 | % | | | | 20 | % | | | | 33 | % |
| | | | | |
Net assets end of year (000’s) omitted | | | | $113,790 | | | | | $175,468 | | | | | $166,051 | | | | | $166,353 | | | | | $179,434 | |
14
| | |
| | | AMG Montrusco Bolton Large Cap Growth Fund Financial Highlights For a share outstanding throughout each fiscal year |
| | | |
| | | |
| | | | | | | | | | | | | | | | | | | | | | | | | |
| | | For the fiscal years ended October 31, |
| | | | | |
| Class I | | 2022 | | 2021 | | 2020 | | 2019 | | 2018 |
| | | | | |
Net Asset Value, Beginning of Year | | | | $17.36 | | | | | $21.69 | | | | | $19.46 | | | | | $20.62 | | | | | $20.84 | |
| | | | | |
Income (loss) from Investment Operations: | | | | | | | | | | | | | | | | | | | | | | | | | |
| | | | | |
Net investment income (loss)1,2 | | | | 0.02 | | | | | (0.04 | ) | | | | (0.03 | ) | | | | 0.01 | | | | | 0.03 | |
| | | | | |
Net realized and unrealized gain (loss) on investments | | | | (3.34 | ) | | | | 6.26 | | | | | 3.96 | | | | | 2.76 | | | | | 1.71 | |
| | | | | |
Total income (loss) from investment operations | | | | (3.32 | ) | | | | 6.22 | | | | | 3.93 | | | | | 2.77 | | | | | 1.74 | |
| | | | | |
Less Distributions to Shareholders from: | | | | | | | | | | | | | | | | | | | | | | | | | |
| | | | | |
Net investment income | | | | — | | | | | — | | | | | — | | | | | (0.03 | ) | | | | (0.02 | ) |
| | | | | |
Net realized gain on investments | | | | (3.79 | ) | | | | (10.55 | ) | | | | (1.70 | ) | | | | (3.90 | ) | | | | (1.94 | ) |
| | | | | |
Total distributions to shareholders | | | | (3.79 | ) | | | | (10.55 | ) | | | | (1.70 | ) | | | | (3.93 | ) | | | | (1.96 | ) |
| | | | | |
Net Asset Value, End of Year | | | | $10.25 | | | | | $17.36 | | | | | $21.69 | | | | | $19.46 | | | | | $20.62 | |
| | | | | |
Total Return2,4 | | | | (25.05 | )% | | | | 39.78 | % | | | | 21.60 | % | | | | 18.49 | % | | | | 8.75 | % |
| | | | | |
Ratio of net expenses to average net assets | | | | 0.73 | % | | | | 0.92 | %5 | | | | 0.99 | %5 | | | | 0.98 | %5 | | | | 0.96 | %5 |
| | | | | |
Ratio of gross expenses to average net assets6 | | | | 0.76 | % | | | | 0.94 | % | | | | 0.99 | % | | | | 0.99 | % | | | | 0.97 | % |
| | | | | |
Ratio of net investment income (loss) to average net assets2 | | | | 0.16 | % | | | | (0.24 | )% | | | | (0.13 | )% | | | | 0.08 | % | | | | 0.16 | % |
| | | | | |
Portfolio turnover | | | | 68 | % | | | | 109 | % | | | | 30 | % | | | | 20 | % | | | | 33 | % |
| | | | | |
Net assets end of year (000’s) omitted | | | | $88,895 | | | | | $167,415 | | | | | $309,638 | | | | | $329,225 | | | | | $416,208 | |
| 1 | Per share numbers have been calculated using average shares. |
| 2 | Total returns and net investment income (loss) would have been lower had certain expenses not been offset. |
| 3 | Less than $(0.005) per share. |
| 4 | The total return is calculated using the published Net Asset Value as of fiscal year end. |
| 5 | Includes reduction from broker recapture amounting to less than 0.01%, less than 0.01%, 0.01% and less than 0.01% for the fiscal years ended 2021, 2020, 2019 and 2018, respectively. |
| 6 | Excludes the impact of expense reimbursement or fee waivers and expense reductions such as brokerage credits, but includes expense repayments and non-reimbursable expenses, if any, such as interest, taxes, and extraordinary expenses. (See Note 1(c) and 2 in the Notes to Financial Statements.) |
15
| | |
| | | Notes to Financial Statements October 31, 2022 |
| | | |
| | | |
1. ORGANIZATION AND SUMMARY OF SIGNIFICANT ACCOUNTING POLICIES
AMG Funds IV (the “Trust”) is an open-end management investment company, organized as a Delaware Statutory Trust, and registered under the Investment Company Act of 1940, as amended (the “1940 Act”). Currently, the Trust consists of a number of different funds, each having distinct investment management objectives, strategies, risks, and policies. Included in this report is AMG Montrusco Bolton Large Cap Growth Fund (the “Fund”).
The Fund offers Class N and Class I shares. Each class represents an interest in the same assets of the respective Fund. Although all share classes generally have identical voting rights, each share class votes separately when required by law. Different share classes may have different net asset values per share to the extent the share classes pay different distribution amounts and/or the expenses of such share classes differ. Each share class has its own expense structure. Please refer to a current prospectus for additional information on each share class.
The Fund is non-diversified. A greater percentage of the Fund’s holdings may be focused in a smaller number of securities which may place the Fund at greater risk than a more diversified fund.
Market disruptions associated with the COVID-19 pandemic have had a global impact, and uncertainty exists as to the long-term implications. Such disruptions can adversely affect assets of the Fund and thus Fund performance.
The Fund’s financial statements are prepared in accordance with accounting principles generally accepted in the United States of America (“U.S. GAAP”), including accounting and reporting guidance pursuant to Accounting Standards Codification Topic 946 applicable to investment companies. U.S. GAAP requires management to make estimates and assumptions that affect the reported amounts of assets and liabilities and disclosure of contingent assets and liabilities at the date of the financial statements and the reported amounts of income and expenses during the reporting period. Actual results could differ from those estimates and such differences could be material. The following is a summary of significant accounting policies followed by the Fund in the preparation of its financial statements:
a. VALUATION OF INVESTMENTS
Equity securities traded on a national securities exchange or reported on the NASDAQ national market system (“NMS”) are valued at the last quoted sales price on the primary exchange or, if applicable, the NASDAQ official closing price or the official closing price of the relevant exchange or, lacking any sales, at the last quoted bid price. Equity securities held by the Fund that are traded in the over-the-counter market (other than NMS securities) are valued at the bid price. Foreign equity securities (securities principally traded in markets other than U.S. markets) held by the Fund are valued at the official closing price on the primary exchange or, for markets that either do not offer an official closing price or where the official closing price may not be representative of the overall market, the last quoted sale price.
Fixed income securities purchased with a remaining maturity of 60 days or less are valued at amortized cost, provided that the amortized cost value is approximately the same as the fair value of the security valued without the use of amortized cost. Investments in other open-end registered investment companies are valued at their end of day net asset value per share.
The Fund’s portfolio investments are generally valued based on independent market quotations or prices or, if none, “evaluative” or other market based valuations provided by third party pricing services approved by the Board of Trustees of the Trust (the “Board”). Under certain circumstances, the value of certain Fund portfolio investments may be based on an evaluation of fair value, pursuant to procedures established by and under the general supervision of the Board. The Valuation Committee, which is comprised of the Independent Trustees of the Board, and the Pricing Committee, which is comprised of representatives from AMG Funds LLC (the “Investment Manager”) are the committees appointed by the Board to make fair value determinations. The Fund may use the fair value of a portfolio investment to calculate its net asset value (“NAV”) in the event that the market quotation, price or market based valuation for the portfolio investment is not readily available or otherwise not determinable pursuant to the Board’s valuation procedures, if the Investment Manager or the Pricing Committee believes the quotation, price or market based valuation to be unreliable, or in certain other circumstances. When determining the fair value of an investment, the Pricing Committee and, if required under the Trust’s securities valuation procedures, the Valuation Committee, seeks to determine the price that the Fund might reasonably expect to receive from current sale of that portfolio investment in an arms-length transaction. Fair value determinations shall be based upon consideration of all available facts and information, including, but not limited to (i) attributes specific to the investment; (ii) fundamental and analytical data relating to the investment; and (iii) the value of other comparable securities or relevant financial instruments, including derivative securities, traded on other markets or among dealers.
The values assigned to fair value portfolio investments are based on available information and do not necessarily represent amounts that might ultimately be realized in the future, since such amounts depend on future developments inherent in long-term investments. Because of the inherent uncertainty of valuation, those estimated values may differ significantly from the values that would have been used had a ready market for the investments existed, and the differences could be material. The Board will be presented with a quarterly report showing as of the most recent quarter end, all outstanding securities fair valued by the Fund, including a comparison with the prior quarter end and the percentage of the Fund that the security represents at each quarter end.
With respect to foreign equity securities and certain foreign fixed income securities, the Board has adopted a policy that securities held in the Fund that can be fair valued by the applicable fair value pricing service are fair valued on each business day provided that each individual price exceeds a pre-established confidence level.
Effective September 8, 2022, the Fund adopted the requirements of Rule 2a-5 under the 1940 Act (“Rule 2a-5”), which the Fund’s Board designated the Fund’s Investment Manager as the Fund’s Valuation Designee to perform the Fund’s fair value determinations. Such determinations are subject to Board oversight and certain reporting and other requirements intended to ensure that the Board receives the information it needs to oversee the Investment Manager’s fair value determinations. Other than the designation of the Investment Manager as the Valuation Designee, the Fund’s adoption of Rule 2-a5 did not impact how the Fund determines fair value or the carrying amount of investments held in the Fund.
U.S. GAAP defines fair value as the price that a fund would receive to sell an asset or pay to transfer a liability in an orderly transaction between market participants at the measurement date. U.S. GAAP also establishes a framework for measuring fair value, and a three level hierarchy for fair value measurements based upon the transparency of inputs to the valuation of an asset or liability. Inputs may be observable or unobservable and refer broadly to the assumptions that market
16
| | |
| | | Notes to Financial Statements (continued) |
| | | |
| | | |
participants would use in pricing the asset or liability. Observable inputs reflect the assumptions market participants would use in pricing the asset or liability based on market data obtained from sources independent of the Fund. Unobservable inputs reflect the Fund’s own assumptions about the assumptions that market participants would use in pricing the asset or liability developed based on the best information available in the circumstances. Each investment is assigned a level based upon the observability of the inputs which are significant to the overall valuation.
The three-tier hierarchy of inputs is summarized below:
Level 1 – inputs are quoted prices in active markets for identical investments (e.g., equity securities, open-end investment companies)
Level 2 – other observable inputs (including, but not limited to: quoted prices for similar assets or liabilities in markets that are active, quoted prices for identical or similar assets or liabilities in markets that are not active, inputs other than quoted prices that are observable for the assets or liabilities (such as interest rates, yield curves, volatilities, prepayment speeds, loss severities, credit risks and default rates) or other market corroborated inputs) (e.g., debt securities, government securities, foreign currency exchange contracts, foreign securities utilizing international fair value pricing, fair valued securities with observable inputs)
Level 3 – inputs are significant unobservable inputs (including the Fund’s own assumptions used to determine the fair value of investments) (e.g., fair valued securities with unobservable inputs)
Changes in inputs or methodologies used for valuing investments may result in a transfer in or out of levels within the fair value hierarchy. The inputs or methodologies used for valuing investments may not necessarily be an indication of the risk associated with investing in those investments.
b. SECURITY TRANSACTIONS
Security transactions are accounted for as of trade date. Realized gains and losses on securities sold are determined on the basis of identified cost.
c. INVESTMENT INCOME AND EXPENSES
Dividend income is recorded on the ex-dividend date. Dividends from foreign securities are recorded on the ex-dividend date, and if after the fact, as soon as the Fund becomes aware of the ex-dividend date. Interest income, which includes amortization of premium and accretion of discount on debt securities, is accrued as earned. Dividend and interest income on foreign securities is recorded gross of any withholding tax. Non-cash dividends included in dividend income, if any, are reported at the fair market value of the securities received. Upon notification from the issuer, distributions received from a real estate investment trust (“REIT”) may be redesignated as a reduction of cost of investments and/or realized gain. Other income and expenses are recorded on an accrual basis. Expenses that cannot be directly attributed to the Fund are apportioned among the funds in the Trust and other trusts or funds within the AMG Funds Family of Funds (collectively the “AMG Funds Family”) based upon their relative average net assets or number of shareholders. Investment income, realized and unrealized capital gains and losses, the common expenses of the Fund, and certain fund level expense reductions, if any, are allocated on a pro-rata basis to each class based on the relative net assets of each class to the total net assets of the Fund.
The Fund is eligible to direct certain portfolio trades to various brokers under a brokerage recapture program. Credits received from the brokerage recapture
program are earned and paid on a monthly basis, and are recorded as expense offsets, which serve to reduce the Fund’s overall expense ratio. For the fiscal year ended October 31, 2022, the Fund had no reductions from the broker recapture program.
d. DIVIDENDS AND DISTRIBUTIONS
Fund distributions resulting from either net investment income or realized net capital gains, if any, will normally be declared and paid at least annually in December. Distributions to shareholders are recorded on the ex-dividend date. Distributions are determined in accordance with federal income tax regulations, which may differ from net investment income and net realized capital gains for financial statement purposes (U.S. GAAP). Differences may be permanent or temporary. Permanent differences are reclassified among capital accounts in the financial statements to reflect their tax character. Permanent book and tax basis differences, if any, relating to shareholder distributions will result in reclassifications to paid-in capital. Temporary differences arise when certain items of income, expense and gain or loss are recognized in different periods for financial statement and tax purposes; these differences will reverse at some time in the future. Permanent differences are primarily due to tax equalization utilized. Temporary differences are primarily due to wash sale loss deferrals.
The tax character of distributions paid during the fiscal years ended October 31, 2022 and October 31, 2021 were as follows:
| | | | | | | | |
| | |
Distributions paid from: | | | 2022 | | | | 2021 | |
| | |
Ordinary income * | | | $33,737,529 | | | | $1,451,872 | |
| | |
Long-term capital gains | | | 40,032,766 | | | | 235,760,841 | |
| | | | | | | | |
| | |
| | | $73,770,295 | | | | $237,212,713 | |
| | | | | | | | |
| * | For tax purposes, short-term capital gain distributions, if any, are considered ordinary income distributions. |
As of October 31, 2022, the components of distributable earnings (excluding unrealized appreciation/depreciation) on a tax basis consisted of:
| | | | |
| |
Undistributed ordinary income | | | $110,370 | |
| |
Undistributed long-term capital gains | | | 19,388,004 | |
At October 31, 2022, the cost of investments and the aggregate gross unrealized appreciation and depreciation for federal income tax purposes were as follows:
| | | | | | | | | | | | |
| Cost | | Appreciation | | | Depreciation | | | Net Depreciation | |
| | | |
$207,179,601 | | | $16,145,548 | | | | $(21,084,593) | | | | $(4,939,045) | |
e. FEDERAL TAXES
The Fund currently qualifies as an investment company and intends to comply with the requirements under Subchapter M of the Internal Revenue Code of 1986, as amended, and to distribute substantially all of its taxable income and gains to its shareholders and to meet certain diversification and income requirements with respect to investment companies. Therefore, no provision for federal income or excise tax is included in the accompanying financial statements.
17
| | |
| | | Notes to Financial Statements (continued) |
| | | |
| | | |
Additionally, based on the Fund’s understanding of the tax rules and rates related to income, gains and transactions for the foreign jurisdictions in which it invests, the Fund will provide for foreign taxes, and where appropriate, deferred foreign taxes.
Management has analyzed the Fund’s tax positions taken on federal income tax returns as of October 31, 2022, and for all open tax years (generally, the three prior taxable years), and has concluded that no provision for federal income tax is required in the Fund’s financial statements. Additionally, Management is not aware of any tax position for which it is reasonably possible that the total amounts of unrecognized tax benefits will change materially in the next twelve months.
f. CAPITAL LOSS CARRYOVERS AND DEFERRALS
As of October 31, 2022, the Fund had no capital loss carryovers for federal income tax purposes. Should the Fund incur net capital losses for the fiscal year ended October 31, 2023, such amounts may be used to offset future realized capital gains indefinitely, and retain their character as short-term and/or long-term.
g. CAPITAL STOCK
The Trust’s Declaration of Trust authorizes for the Fund the issuance of an unlimited number of shares of beneficial interest, without par value. The Fund records sales and repurchases of its capital stock on the trade date.
For the fiscal years ended October 31, 2022 and October 31, 2021, the capital stock transactions by class for the Fund were as follows:
| | | | | | | | | | | | | | | | |
| | | October 31, 2022 | | | October 31, 2021 | |
| | | | |
| | | Shares | | | Amount | | | Shares | | | Amount | |
| | | | | | | | | | | | | | | | |
| | | | |
Class N: | | | | | | | | | | | | | | | | |
| | | | |
Shares sold | | | 361,555 | | | | $4,597,554 | | | | 832,620 | | | | $14,385,924 | |
| | | | |
Shares issued in reinvestment of distributions | | | 2,725,123 | | | | 37,415,935 | | | | 5,203,398 | | | | 80,947,251 | |
| | | | |
Shares redeemed | | | (1,995,422 | ) | | | (24,997,298 | ) | | | (3,471,115 | ) | | | (58,151,586 | ) |
| | | | | | | | | | | | | | | | |
| | | | |
Net increase | | | 1,091,256 | | | | $17,016,191 | | | | 2,564,903 | | | | $37,181,589 | |
| | | | | | | | | | | | | | | | |
| | | | |
Class I: | | | | | | | | | | | | | | | | |
| | | | |
Shares sold | | | 990,746 | | | | $13,094,271 | | | | 2,627,841 | | | | $41,726,537 | |
| | | | |
Shares issued in reinvestment of distributions | | | 2,485,116 | | | | 34,915,882 | | | | 9,380,870 | | | | 148,835,803 | |
| | | | |
Shares redeemed | | | (4,444,728 | ) | | | (58,420,356 | ) | | | (16,639,756 | ) | | | (276,385,461 | ) |
| | | | | | | | | | | | | | | | |
| | | | |
Net decrease | | | (968,866 | ) | | | $(10,410,203 | ) | | | (4,631,045 | ) | | | $(85,823,121 | ) |
| | | | | | | | | | | | | | | | |
h. REPURCHASE AGREEMENTS AND JOINT REPURCHASE AGREEMENTS
The Fund may enter into third-party and bilateral repurchase agreements for temporary cash management purposes and third-party or bilateral joint repurchase agreements for reinvestment of cash collateral on securities lending transactions under the securities lending program offered by The Bank of New York Mellon (“BNYM”) (the “Program”) (collectively, “Repurchase Agreements”). The value of the underlying collateral, including accrued interest, must equal or exceed the value of the Repurchase Agreements during the term of the agreement. For joint repurchase agreements, the Fund participates on a pro rata basis with other clients of BNYM in its share of the underlying collateral under such joint repurchase agreements and in its share of proceeds from any repurchase or other disposition of the underlying collateral. The underlying collateral for all Repurchase Agreements is held in safekeeping by the Fund’s custodian or at the Federal Reserve Bank. If the seller defaults and the value of the collateral declines, or if bankruptcy proceedings commence with respect to the seller of the security, realization of the collateral by the Fund may be delayed or limited. Pursuant to the
Program, the Fund is indemnified for such losses by BNYM on joint repurchase agreements. At October 31, 2022, the Fund had no Repurchase Agreements outstanding.
2. AGREEMENTS AND TRANSACTIONS WITH AFFILIATES
The Trust has entered into an investment advisory agreement under which the Investment Manager, a subsidiary and the U.S. retail distribution arm of Affiliated Managers Group, Inc. (“AMG”), serves as investment manager to the Fund and is responsible for the Fund’s overall administration and operations. The Investment Manager selects one or more subadvisers for the Fund (subject to Board approval) and monitors each subadviser’s investment performance, security holdings and investment strategies. The Fund’s investment portfolio is managed by Montrusco Bolton Investments, Inc. (“Montrusco Bolton”) who serves pursuant to a subadvisory agreement with the Investment Manager. AMG indirectly owns a majority interest in Montrusco Bolton.
Investment management fees are paid directly by the Fund to the Investment Manager based on average daily net assets. For the fiscal year ended October 31, 2022, the Fund paid an investment management fee at the annual rate of 0.48% of
18
| | |
| | | Notes to Financial Statements (continued) |
| | | |
| | | |
the average daily net assets of the Fund. Prior to June 18, 2021, the Fund paid an investment management fee at the annual rate of 0.70% on the first $800 million, 0.50% on the next $5.2 billion, 0.45% on the next $6 billion, 0.40% in excess of $12 billion of the average daily net assets of the Fund. The fee paid to Montrusco Bolton for its services as subadviser is paid out of the fee the Investment Manager receives from the Fund and does not increase the expenses of the Fund.
The Investment Manager has contractually agreed, through at least March 1, 2023, to waive management fees and/or pay or reimburse fund expenses in order to limit total annual Fund operating expenses after fee waiver and expense reimbursements (exclusive of taxes, interest (including interest incurred in connection with bank and custody overdrafts and in connection with securities sold short), shareholder servicing fees, distribution and service (12b-1) fees, brokerage commissions and other transaction costs, dividends payable with respect to securities sold short, acquired fund fees and expenses and extraordinary expenses) to 0.68% of the Fund’s average daily net assets (this annual rate or such other annual rate that may be in effect from time to time, the “Expense Cap”), subject to later reimbursement by the Fund in certain circumstances. Prior to June 18, 2021, the total annual Fund operating expense limitation was 0.92% of the average daily net assets.
In general, for a period of up to 36 months after the date any amounts are paid, waived or reimbursed by the Investment Manager, the Investment Manager may recover such amounts from the Fund, provided that such repayment would not cause the Fund’s total annual operating expenses after fee waiver and expense reimbursements (exclusive of the items noted in the parenthetical above) to exceed either (i) the Expense Cap in effect at the time such amounts were paid, waived or reimbursed, or (ii) the Expense Cap in effect at the time of such repayment by the Fund.
The contractual expense limitation may only be terminated in the event the Investment Manager or a successor ceases to be the investment manager of the Fund or a successor fund, by mutual agreement between the Investment Manager and the Board, or in the event of the Fund’s liquidation unless the Fund is reorganized or is a party to a merger in which the surviving entity is successor to the accounting and performance information of the Fund.
At October 31, 2022, the Fund’s expiration of reimbursements subject to recoupment is as follows:
| | | | |
Expiration Period | | | |
| |
1-2 years | | | $95,910 | |
| |
2-3 years | | | 86,244 | |
| | | | |
| |
Total | | $ | 182,154 | |
| | | | |
| | | | |
The Trust, on behalf of the Fund, has entered into an amended and restated Administration Agreement under which the Investment Manager serves as the Fund’s administrator (the “Administrator”) and is responsible for all non-portfolio management aspects of managing the Fund’s operations, including administration and shareholder services to the Fund. The Fund pays a fee to the Administrator at the rate of 0.15% per annum of the Fund’s average daily net assets for this service.
The Fund is distributed by AMG Distributors, Inc. (the “Distributor”), a wholly-owned subsidiary of the Investment Manager. The Distributor serves as the distributor and underwriter for the Fund and is a registered broker-dealer and member of the Financial Industry Regulatory Authority, Inc. (“FINRA”). Shares of the Fund will be
continuously offered and will be sold directly to prospective purchasers and through brokers, dealers or other financial intermediaries who have executed selling agreements with the Distributor. Generally the Distributor bears all or a portion of the expenses of providing services pursuant to the distribution agreement, including the payment of the expenses relating to the distribution of prospectuses for sales purposes and any advertising or sales literature.
The Trust has adopted a distribution and service plan (the “Plan”) with respect to the Class N shares, in accordance with the requirements of Rule 12b-1 under the 1940 Act and the requirements of the applicable rules of FINRA regarding asset-based sales charges. Pursuant to the Plan, the Fund may make payments to the Distributor for its expenditures in financing any activity primarily intended to result in the sale of the Fund’s Class N shares and for maintenance and personal service provided to existing shareholders of that class. The Plan authorized payments to the Distributor up to 0.25% annually of the Fund’s average daily net assets attributable to the Class N shares. The Plan is characterized as a reimbursement plan and is directly tied to expenses incurred by the Distributor; the payments the Distributor receives during any year may not exceed its actual expenses. The impact on the annualized expense ratios for the year ended October 31, 2022, was 0.15%.
For each of the Class N and Class I shares, the Board has approved reimbursement payments to the Investment Manager for shareholder servicing expenses (“shareholder servicing fees”) incurred. Shareholder servicing fees include payments to financial intermediaries, such as broker-dealers (including fund supermarket platforms), banks, and trust companies who provide shareholder recordkeeping, account servicing and other services. The Class N and Class I shares may reimburse the Investment Manager for the actual amount incurred up to a maximum annual rate of each Class’s average daily net assets as shown in the table.
The impact on the annualized expense ratios for the fiscal year ended October 31, 2022, were as follows:
| | | | | | | | |
| | | Maximum Annual
Amount
Approved | | | Actual
Amount
Incurred | |
| | |
Class N | | | 0.15% | | | | 0.08% | |
| | |
Class I | | | 0.05% | | | | 0.05% | |
The Board provides supervision of the affairs of the Trust and other trusts within the AMG Funds Family. The Trustees of the Trust who are not affiliated with the Investment Manager receive an annual retainer and per meeting fees for regular, special and telephonic meetings, and they are reimbursed for out-of-pocket expenses incurred while carrying out their duties as Board members. The Chairman of the Board and the Audit Committee Chair receive additional annual retainers. Certain Trustees and Officers of the Fund are Officers and/or Directors of the Investment Manager, AMG and/or the Distributor.
The Securities and Exchange Commission (the “SEC”) granted an exemptive order that permits certain eligible funds in the AMG Funds Family to lend and borrow money for certain temporary purposes directly to and from other eligible funds in the AMG Funds Family. Participation in this interfund lending program is voluntary for both the borrowing and lending funds, and an interfund loan is only made if it benefits each participating fund. The Administrator manages the program according to procedures approved by the Board, and the Board monitors the operation of the program. An interfund loan must comply with certain conditions
19
| | |
| | | Notes to Financial Statements (continued) |
| | | |
| | | |
set out in the exemptive order, which are designed to assure fairness and protect all participating funds. The interest earned and interest paid on interfund loans are included on the Statement of Operations as interest income and interest expense, respectively. At October 31, 2022, the Fund had no interfund loans outstanding.
The Fund utilized the interfund loan program during the fiscal year ended October 31, 2022 as follows:
| | | | | | | | | | |
Average
Borrowed | | Number
of Days | | Interest
Paid | | | Average Interest Rate | |
| | | |
| $6,993,076 | | 10 | | | $1,790 | | | | 0.934% | |
3. PURCHASES AND SALES OF SECURITIES
Purchases and sales of securities (excluding short-term securities and U.S. Government Obligations) for the fiscal year ended October 31, 2022, were $176,889,929 and $243,406,581, respectively.
The Fund had no purchases or sales of U.S. Government Obligations during the fiscal year ended October 31, 2022.
4. PORTFOLIO SECURITIES LOANED
The Fund participates in the Program providing for the lending of securities to qualified borrowers. Securities lending income includes earnings of such temporary cash investments, plus or minus any rebate to a borrower. These earnings (after any rebate) are then divided between BNYM, as a fee for its services under the Program, and the Fund, according to agreed-upon rates. Collateral on all securities loaned is accepted in cash, U.S. Treasury Obligations or U.S. Government Agency Obligations. Collateral is maintained at a minimum level of 102% (105% in the case of certain foreign securities) of the market value, plus interest, if applicable, of investments on loan. It is the Fund’s policy to obtain additional collateral from or return excess collateral to the borrower by the end of the next business day, following the valuation date of the securities loaned. Therefore, the value of the collateral held may be temporarily less than the value of the securities on loan. Lending securities entails a risk of loss to the Fund if and to the extent that the market value of the securities loaned were to increase and the borrower did not increase the collateral accordingly, and the borrower fails to return the securities. Under the terms of the Program, the Fund is indemnified for such losses by BNYM. Cash collateral is held in separate omnibus accounts
managed by BNYM, who is authorized to exclusively enter into joint repurchase agreements for that cash collateral. Securities collateral is held in separate omnibus accounts managed by BNYM and cannot be sold or pledged. BNYM bears the risk of any deficiency in the amount of the cash collateral available for return to the borrower due to any loss on the collateral invested. Loans of securities are terminable at any time and the borrower, after notice, is required to return borrowed securities as soon as practical, which is normally within three business days.
The Fund did not have any securities on loan at October 31, 2022.
5. COMMITMENTS AND CONTINGENCIES
Under the Trust’s organizational documents, its Trustees and Officers are indemnified against certain liabilities arising out of the performance of their duties to the Trust. In addition, in the normal course of business, the Fund may enter into contracts and agreements that contain a variety of representations and warranties, which provide general indemnifications. The maximum exposure to the Fund under these arrangements is unknown, as this would involve future claims that may be made against the Fund that have not yet occurred. However, based on experience, the Fund had no prior claims or losses and expects the risks of loss to be remote.
6. MASTER NETTING AGREEMENTS
The Fund may enter into master netting agreements with its counterparties for the Program and Repurchase Agreements, which provide the right, in the event of default (including bankruptcy or insolvency) for the non-defaulting party to liquidate the collateral and calculate net exposure to the defaulting party or request additional collateral. For financial reporting purposes, the Fund does not offset financial assets and financial liabilities that are subject to master netting agreements in the Statement of Assets and Liabilities. At October 31, 2022, the Fund had no securities on loan and no repurchase agreements outstanding.
7. SUBSEQUENT EVENTS
The Fund has determined that no material events or transactions occurred through the issuance date of the Fund’s financial statements which require an additional disclosure in or adjustment of the Fund’s financial statements.
20
| | |
| | | Report of Independent Registered Public Accounting Firm |
| | | |
| | | |
TO THE BOARD OF TRUSTEES OF AMG FUNDS IV AND SHAREHOLDERS OF AMG MONTRUSCO BOLTON LARGE CAP GROWTH FUND
Opinion on the Financial Statements
We have audited the accompanying statement of assets and liabilities, including the schedule of portfolio investments, of AMG Montrusco Bolton Large Cap Growth Fund (one of the funds constituting AMG Funds IV, referred to hereafter as the “Fund”) as of October 31, 2022, the related statement of operations for the year ended October 31, 2022, the statements of changes in net assets for each of the two years in the period ended October 31, 2022, including the related notes, and the financial highlights for each of the five years in the period ended October 31, 2022 (collectively referred to as the “financial statements”). In our opinion, the financial statements present fairly, in all material respects, the financial position of the Fund as of October 31, 2022, the results of its operations for the year then ended, the changes in its net assets for each of the two years in the period ended October 31, 2022 and the financial highlights for each of the five years in the period ended October 31, 2022 in conformity with accounting principles generally accepted in the United States of America.
Basis for Opinion
These financial statements are the responsibility of the Fund’s management. Our responsibility is to express an opinion on the Fund’s financial statements based on our audits. We are a public accounting firm registered with the Public Company Accounting Oversight Board (United States) (PCAOB) and are required to be independent with respect to the Fund in accordance with the U.S. federal securities laws and the applicable rules and regulations of the Securities and Exchange Commission and the PCAOB.
We conducted our audits of these financial statements in accordance with the standards of the PCAOB. Those standards require that we plan and perform the audit to obtain reasonable assurance about whether the financial statements are free of material misstatement, whether due to error or fraud.
Our audits included performing procedures to assess the risks of material misstatement of the financial statements, whether due to error or fraud, and performing procedures that respond to those risks. Such procedures included examining, on a test basis, evidence regarding the amounts and disclosures in the financial statements. Our audits also included evaluating the accounting principles used and significant estimates made by management, as well as evaluating the overall presentation of the financial statements. Our procedures included confirmation of securities owned as of October 31, 2022 by correspondence with the custodian and brokers; when replies were not received from brokers, we performed other auditing procedures. We believe that our audits provide a reasonable basis for our opinion.
/s/PricewaterhouseCoopers LLP
Boston, Massachusetts
December 22, 2022
We have served as the auditor of one or more investment companies in the AMG Funds Family since 1993.
21
| | |
| | | Other Information (unaudited) |
| | | |
| | | |
TAX INFORMATION
AMG Montrusco Bolton Large Cap Growth Fund hereby designates the maximum amount allowable of its net taxable income as qualified dividends as provided in the Jobs and Growth Tax Relief Reconciliation Act of 2003. The 2021/2022 Form 1099-DIV you receive for the Fund will show the tax status of all distributions paid to you during the year.
Pursuant to section 852 of the Internal Revenue Code, AMG Montrusco Bolton Large Cap Growth Fund hereby designates $47,730,078 as a capital gain distribution with respect to the taxable year ended October 31, 2022, or if subsequently determined to be different, the net capital gains of such fiscal year.
22
| | |
| | | AMG Funds Trustees and Officers |
| | | |
| | | |
| | | | | | | | |
| The Trustees and Officers of the Trust, their business addresses, principal occupations for the past five years and ages are listed below. The Trustees provide broad supervision over the affairs of the Trust and the Funds. The Trustees are experienced executives who meet periodically throughout the year to oversee the Funds’ activities, review contractual arrangements with companies that provide services to the Funds, and | | | | review the Funds’ performance. Unless otherwise noted, the address of each Trustee or Officer is the address of the Trust: 680 Washington Blvd., Suite 500, Stamford, CT. 06901. There is no stated term of office for Trustees. Trustees serve until their resignation, retirement or removal in | | | | accordance with the Trust’s organizational documents and policies adopted by the Board from time to time. The Chairman of the Trustees, President, Treasurer and Secretary of the Trust are elected by the Trustees annually. Other officers hold office at the pleasure of the Trustees. |
| | | | | | | | | |
Independent Trustees
The following Trustees are not “interested persons” of the Trust within the meaning of the 1940 Act:
| | |
Number of Funds Overseen in Fund Complex | | Name, Age, Principal Occupation(s) During Past 5 Years and Other Directorships Held by Trustee |
| | |
• Trustee since 2014 • Oversees 40 Funds in Fund Complex | | Bruce B. Bingham, 73 Partner, Hamilton Partners (real estate development firm) (1987-Present); Director of The Yacktman Funds, Inc. (2 portfolios) (2000-2012). |
| | |
• Trustee since 2014 • Chairman of Audit Committee since 2020 • Oversees 44 Funds in Fund Complex | | Kurt A. Keilhacker, 59 Managing Partner, TechFund Europe (2000-Present); Managing Partner, TechFund Capital (1997-Present); Managing Partner, Elementum Ventures (2013-Present); Director, MetricStory, Inc. (2017-Present); Trustee, Wheaton College (2018-Present); Trustee, Gordon College (2001-2016); Board Member, 6wind SA (2002-2019). |
| | |
• Trustee since 2010 • Oversees 40 Funds in Fund Complex | | Steven J. Paggioli, 72 Independent Consultant (2002-Present); Trustee, Professionally Managed Portfolios (28 portfolios); Advisory Board Member, Sustainable Growth Advisors, LP; Independent Director, Muzinich BDC, Inc. (business development company) (2019-Present); Director, The Wadsworth Group; Independent Director, Chase Investment Counsel (2008–2019); Executive Vice President, Secretary and Director, Investment Company Administration, LLC and First Fund Distributors, INC. (1990-2001). |
| | |
• Independent Chairman of the Board of Trustees since 2017; Chairman of the Governance Committee since 2017 • Trustee since 2010 • Oversees 44 Funds in Fund Complex | | Eric Rakowski, 64 Professor of Law, University of California at Berkeley School of Law (1990-Present); Tax Attorney at Davis Polk & Wardwell and clerked for Judge Harry T. Edwards of the U.S. Court of Appeals for the District of Columbia Circuit and for Justice William J. Brennan Jr. of the U.S. Supreme Court; Director of Harding, Loevner Funds, Inc. (10 portfolios); Trustee of Third Avenue Trust (3 portfolios) (2002-2019); Trustee of Third Avenue Variable Trust (1 portfolio) (2002-2019). |
| | |
• Trustee since 2014 • Oversees 44 Funds in Fund Complex | | Victoria L. Sassine, 57 Adjunct Professor, Babson College (2007–Present); Director, Board of Directors, PRG Group (2017-Present); CEO, Founder, Scale Smarter Partners, LLC (2018-Present); Adviser, EVOFEM Biosciences (2019-Present); Chairperson of the Board of Directors of Business Management Associates (2018 to 2019). |
| | |
• Trustee since 2010 • Oversees 40 Funds in Fund Complex | | Thomas R. Schneeweis, 75* Professor Emeritus, University of Massachusetts (2013-Present); President, TRS Associates (1982-Present); Board Member, Chartered Alternative Investment Association (“CAIA”) (2002-Present); Co-Founder and Director, Institute for Global Asset and Risk Management (Education) (2010-Present); Co-Owner, Quantitative Investment Technologies (2014-Present); Co-Owner, Yes Wealth Management (2018-Present); Director, CAIA Foundation (2010-2019); Partner, S Capital Wealth Advisors (2015-2018); Partner, S Capital Management, LLC (2007-2015); President, Alternative Investment Analytics, LLC (formerly Schneeweis Partners, LLC) (2001-2013). |
*Mr. Schneeweis retired from the Board of Trustees of AMG Funds IV as of October 31, 2022.
23
| | |
| | | AMG Funds Trustees and Officers (continued) |
| | | |
| | | |
Interested Trustee
The Trustee in the following table is an “interested person” of the Trust within the meaning of the 1940 Act.
| | |
Number of Funds Overseen in Fund Complex | | Name, Age, Principal Occupation(s) During Past 5 Years and Other Directorships Held by Trustee |
| | |
• Trustee since 2021 • Oversees 44 Funds in Fund Complex | | Garret W. Weston, 41 Affiliated Managers Group, Inc. (2008-Present): Managing Director, Co-Head of Affiliate Engagement (2021-Present), Senior Vice President, Affiliate Development (2016-2021), Vice President, Office of the CEO (2015-2016), Vice President, New Investments (2012-2015), Senior Associate, New Investments (2008-2012); Associate, Madison Dearborn Partners (2006-2008); Analyst, Merrill Lynch (2004-2006). |
| |
| Officers | | |
Position(s) Held with Fund and Length of Time Served | | Name, Age, Principal Occupation(s) During Past 5 Years |
| | |
• President since 2018 • Principal Executive Officer since 2018 • Chief Executive Officer since 2018 • Chief Operating Officer since 2016 | | Keitha L. Kinne, 64 Chief Operating Officer, AMG Funds LLC (2007-Present); Chief Investment Officer, AMG Funds LLC (2008-Present); President and Principal, AMG Distributors, Inc. (2018-Present); Chief Operating Officer, AMG Distributors, Inc. (2007-Present); President, Chief Executive Officer and Principal Executive Officer, AMG Funds, AMG Funds I, AMG Funds II, AMG Funds III and AMG Funds IV (2018-Present); Chief Operating Officer, AMG Funds, AMG Funds I, AMG Funds II, and AMG Funds III (2007-Present); Chief Operating Officer, AMG Funds IV (2016-Present); Chief Operating Officer and Chief Investment Officer, Aston Asset Management, LLC (2016); President and Principal Executive Officer, AMG Funds, AMG Funds I, AMG Funds II and AMG Funds III (2012-2014); Managing Partner, AMG Funds LLC (2007-2014); President and Principal, AMG Distributors, Inc. (2012-2014); Managing Director, Legg Mason & Co., LLC (2006-2007); Managing Director, Citigroup Asset Management (2004-2006). |
| | |
• Secretary since 2015 • Chief Legal Officer since 2015 | | Mark J. Duggan, 57 Managing Director and Senior Counsel, AMG Funds LLC (2021-Present); Senior Vice President and Senior Counsel, AMG Funds LLC (2015-2021); Secretary and Chief Legal Officer, AMG Funds, AMG Funds I, AMG Funds II, AMG Funds III and AMG Funds IV (2015-Present); Attorney, K&L Gates, LLP (2009-2015). |
| | |
• Chief Financial Officer since 2017 • Treasurer since 2017 • Principal Financial Officer since 2017 • Principal Accounting Officer since 2017 | | Thomas G. Disbrow, 56 Vice President, Mutual Fund Treasurer & CFO, AMG Funds, AMG Funds LLC (2017-Present); Chief Financial Officer, Principal Financial Officer, Treasurer and Principal Accounting Officer, AMG Funds, AMG Funds I, AMG Funds II, AMG Funds III and AMG Funds IV (2017-Present); Managing Director - Global Head of Traditional Funds Product Control, UBS Asset Management (Americas), Inc. (2015-2017); Managing Director - Head of North American Funds Treasury, UBS Asset Management (Americas), Inc. (2011-2015). |
| | |
• Deputy Treasurer since 2017 | | John A. Starace, 51 Vice President, Mutual Fund Accounting, AMG Funds LLC (2021-Present); Director, Mutual Fund Accounting, AMG Funds LLC (2017-2021); Vice President, Deputy Treasurer of Mutual Funds Services, AMG Funds LLC (2014-2017); Deputy Treasurer, AMG Funds, AMG Funds I, AMG Funds II, AMG Funds III and AMG Funds IV (2017-Present); Vice President, Citi Hedge Fund Services (2010-2014); Audit Senior Manager (2005-2010) and Audit Manager (2001-2005), Deloitte & Touche LLP. |
| | |
• Chief Compliance Officer and Sarbanes-Oxley Code of Ethics Compliance Officer since 2019 • Anti-Money Laundering Compliance Officer since 2022 | | Patrick J. Spellman, 48 Vice President, Chief Compliance Officer, AMG Funds LLC (2017-Present); Chief Compliance Officer, AMG Distributors, Inc. (2010-Present); Chief Compliance Officer and Sarbanes-Oxley Code of Ethics Compliance Officer, AMG Funds, AMG Funds I, AMG Funds II, AMG Funds III and AMG Funds IV (2019-Present); Anti-Money Laundering Compliance Officer, AMG Funds, AMG Funds I, AMG Funds II, and AMG Funds III (2014-2019; 2022-Present); Anti-Money Laundering Compliance Officer, AMG Funds IV (2016-2019; 2022-Present); Senior Vice President, Chief Compliance Officer, AMG Funds LLC (2011-2017); Compliance Manager, Legal and Compliance, Affiliated Managers Group, Inc. (2005-2011). |
| | |
• Assistant Secretary since 2016 | | Maureen M. Kerrigan, 37 Vice President, Senior Counsel, AMG Funds LLC (2021-Present); Vice President, Counsel, AMG Funds LLC (2019-2021); Director, Counsel, AMG Funds LLC (2017-2018); Vice President, Counsel, AMG Funds LLC (2015-2017); Assistant Secretary, AMG Funds, AMG Funds I, AMG Funds II, AMG Funds III and AMG Funds IV (2016-Present); Associate, Ropes & Gray LLP (2011-2015); Law Fellow, Massachusetts Appleseed Center for Law and Justice (2010-2011). |
24
| | |
| | | Annual Renewal of Investment Management and Subadvisory Agreements |
| | | |
| | | |
| | | | | | | | |
AMG Montrusco Bolton Large Cap Growth Fund: Approval of Investment Advisory Agreement and Subadvisory Agreement on June 22, 2022 At an in-person meeting held on June 22, 2022, the Board of Trustees (the “Board” or the “Trustees”), and separately a majority of the Trustees who are not “interested persons” of AMG Funds IV (the “Trust”) (the “Independent Trustees”), approved (i) the Investment Advisory Agreement, as amended pursuant to letter agreements at any time prior to the date of the meeting, with AMG Funds LLC (the “Investment Manager”) for AMG Montrusco Bolton Large Cap Growth Fund (the “Fund”) and separately Amendment No. 1 thereto dated October 1, 2016 (collectively, the “Investment Advisory Agreement”); and (ii) the Subadvisory Agreement, as amended at any time prior to the date of the meeting, with the Subadviser for the Fund (the “Subadvisory Agreement”). The Independent Trustees were separately represented by independent legal counsel in connection with their consideration of the approval of these agreements. In considering the Investment Advisory Agreement and Subadvisory Agreement, the Trustees reviewed a variety of materials relating to the Fund, the Investment Manager and the Subadviser, including the nature, extent and quality of services, comparative performance, fee and expense information for an appropriate peer group of similar mutual funds for the Fund (the “Peer Group”), performance information for the relevant benchmark index for the Fund (the “Fund Benchmark”), other relevant matters, and other information provided to them on a periodic basis throughout the year. Prior to voting, the Independent Trustees: (a) reviewed the foregoing information with their independent legal counsel; (b) received materials from their independent legal counsel discussing the legal standards applicable to their consideration of the Investment Advisory Agreement and the Subadvisory Agreement; and (c) met with their independent legal counsel in private sessions at which no representatives of management were present. NATURE, EXTENT AND QUALITY OF SERVICES In considering the nature, extent and quality of the services provided by the Investment Manager, the Trustees reviewed information relating to the Investment Manager’s operations and personnel. Among other things, the Investment Manager provided financial information, information about its supervisory and professional staff and descriptions of its organizational and management structure. The Trustees also took into account information provided | | | | periodically throughout the previous year by the Investment Manager in Board meetings relating to the performance of its duties with respect to the Fund and the Trustees’ knowledge of the Investment Manager’s management and the quality of the performance of the Investment Manager’s duties under the Investment Advisory Agreement and Administration Agreement. In the course of their deliberations regarding the Investment Manager, the Trustees evaluated, among other things: (a) the extent and quality of the Investment Manager’s oversight of the operation and management of the Fund; (b) the quality of the Investment Manager’s oversight of the performance by the Subadviser of its portfolio management duties; (c) the Investment Manager’s ability to supervise the Fund’s other service providers; and (d) the Investment Manager’s compliance program. The Trustees also took into account that, in performing its functions under the Investment Advisory Agreement and supervising the Subadviser, the Investment Manager: performs periodic detailed analyses and reviews of the performance by the Subadviser of its obligations to the Fund, including without limitation, analysis and review of portfolio and other compliance matters and review of the Subadviser’s investment performance with respect to the Fund; prepares and presents periodic reports to the Board regarding the investment performance of the Subadviser and other information regarding the Subadviser, at such times and in such forms as the Board may reasonably request; reviews and considers any changes in the personnel of the Subadviser responsible for performing the Subadviser’s obligations and makes appropriate reports to the Board; reviews and considers any changes in the ownership or senior management of the Subadviser and makes appropriate reports to the Board; performs periodic in-person, telephonic or videoconference diligence meetings, including with respect to compliance matters, with representatives of the Subadviser; assists the Board and management of the Trust in developing and reviewing information with respect to the initial approval of the Subadvisory Agreement and annual consideration of the Subadvisory Agreement thereafter; prepares recommendations with respect to the continued retention of the Subadviser or the replacement of the Subadviser, including at the request of the Board; identifies potential successors to, or replacements of, the Subadviser or potential additional subadvisers, including performing appropriate due diligence, and developing and presenting to the Board a recommendation as to any such successor, replacement, or additional subadviser, including at the request of the Board; designates and | | | | compensates from its own resources such personnel as the Investment Manager may consider necessary or appropriate to the performance of its services; and performs such other review and reporting functions as the Board shall reasonably request consistent with the Investment Advisory Agreement and applicable law. The Trustees noted the affiliation of the Subadviser with the Investment Manager, noting any potential conflicts of interest. The Trustees also took into account the financial condition of the Investment Manager with respect to its ability to provide the services required under the Investment Advisory Agreement and the Investment Manager’s undertaking to maintain a contractual expense limitation for the Fund. The Trustees also considered the Investment Manager’s risk management processes. The Trustees also reviewed information relating to the Subadviser’s operations and personnel and the investment philosophy, strategies and techniques (its “Investment Strategy”) used in managing the Fund. Among other things, the Trustees reviewed information on portfolio management and other professional staff, information regarding the Subadviser’s organizational and management structure and the Subadviser’s brokerage policies and practices. The Trustees considered specific information provided regarding the experience of the individuals at the Subadviser with portfolio management responsibility for the Fund, including the information set forth in the Fund’s prospectus and statement of additional information. In the course of their deliberations, the Trustees evaluated, among other things: (a) the services rendered by the Subadviser in the past; (b) the qualifications and experience of the Subadviser’s personnel; and (c) the Subadviser’s compliance program. The Trustees also took into account the financial condition of the Subadviser with respect to its ability to provide the services required under the Subadvisory Agreement. The Trustees also considered the Subadviser’s risk management processes. PERFORMANCE The Board considered the Fund’s net performance during relevant time periods as compared to the Fund’s Peer Group and Fund Benchmark, considered the gross performance of the Fund as compared to the Subadviser’s relevant performance composite that utilizes a similar investment strategy and approach, and noted that the Board reviews on a quarterly basis detailed information about both the Fund’s performance results and portfolio composition, as well as the Subadviser’s Investment Strategy. The Board was mindful of the Investment |
| | | | | | | | | |
25
| | |
| | | Annual Renewal of Investment Management and Subadvisory Agreements (continued) |
| | | |
| | | |
| | | | | | | | |
Manager’s expertise, resources and attention to monitoring the Subadviser’s performance, investment style and risk-adjusted performance with respect to the Fund and its discussions with the management of the Fund’s subadviser during the period regarding the factors that contributed to the performance of the Fund. Among other information relating to the Fund’s performance, the Trustees noted that the Fund’s performance for Class N shares (which share class has the earliest inception date and the largest amount of assets of all the share classes of the Fund) for the 1-year, 3-year, 5-year and 10-year periods ended March 31, 2022 was above, above, above, and below, respectively, the median performance of the Peer Group and below the performance of the Fund Benchmark, the S&P 500® Growth Index. The Trustees took into account management’s discussion of the Fund’s performance, including the reasons for the Fund’s underperformance relative to the Fund Benchmark. The Trustees also noted that the Fund ranked in the top quartile relative to the Peer Group for the 1-year period and in the top third relative to the Peer Group for the 3-year period. The Trustees also took into account the fact that the Fund’s subadviser, investment strategy, and Fund Benchmark changed effective March 19, 2021, and that the performance information prior to that date reflected that of the Fund’s prior subadviser and investment strategy. The Trustees concluded that the Fund’s overall performance has been satisfactory in light of the Fund’s investment objective, strategies, and policies. ADVISORY AND SUBADVISORY FEES; FUND EXPENSES; PROFITABILITY; AND ECONOMIES OF SCALE In considering the reasonableness of the advisory fee payable to the Investment Manager, the Trustees reviewed information provided by the Investment Manager at the June 22, 2022 and prior meetings setting forth all revenues and other benefits, both direct and indirect (including any so-called “fallout benefits” such as reputational value derived from the Investment Manager serving as Investment Manager to the Fund), received by the Investment Manager and its affiliates attributable to managing the Fund and all the mutual funds in the AMG Funds Family of Funds; the cost of providing such services; the significant risks undertaken as Investment Manager and sponsor of the Fund, including investment, operational, enterprise, entrepreneurial, litigation, regulatory and compliance risks; and the resulting profitability to the Investment Manager and its affiliates from these relationships. The Trustees also | | | | considered the amount of the advisory fee retained by the Investment Manager after payment of the subadvisory fee with respect to the Fund. The Trustees also noted payments are made from the Subadviser to the Investment Manager, and other payments are made from the Investment Manager to the Subadviser. The Trustees also considered management’s discussion of the current asset level of the Fund, and the impact on profitability of both the current asset level and any future growth of assets of the Fund. In considering the cost of services to be provided by the Investment Manager under the Investment Advisory Agreement and the profitability to the Investment Manager of its relationship with the Fund, the Trustees noted the undertaking by the Investment Manager to maintain a contractual expense limitation for the Fund. The Board also took into account management’s discussion of the advisory fee structure and the services the Investment Manager provides in performing its functions under the Investment Advisory Agreement and supervising the Subadviser. Based on the foregoing, the Trustees concluded that the profitability to the Investment Manager is reasonable and that the Investment Manager is not realizing material benefits from economies of scale that would warrant adjustments to the advisory fee at this time. Also with respect to economies of scale, the Trustees noted that as the Fund’s assets increase over time, the Fund may realize other economies of scale to the extent the increase in assets is proportionally greater than the increase in certain other expenses. In considering the reasonableness of the subadvisory fee payable by the Investment Manager to the Subadviser, the Trustees reviewed information regarding the cost to the Subadviser of providing subadvisory services to the Fund and the resulting profitability from the relationship. The Trustees noted that, because the Subadviser is an affiliate of the Investment Manager, a portion of the Subadviser’s revenues or profits might be shared directly or indirectly with the Investment Manager. The Trustees also noted that the subadvisory fees are paid by the Investment Manager out of its advisory fee. The Board also took into account management’s discussion of the subadvisory fee structure, and the services the Subadviser provides in performing its functions under the Subadvisory Agreement. Based on the foregoing, the Trustees concluded that the profitability to the Subadviser is reasonable and that the Subadviser is not realizing material benefits from economies of scale that would warrant adjustments to the subadvisory fees at this time. Also with respect to economies of scale, the Trustees noted | | | | that as the Fund’s assets increase over time, the Fund may realize other economies of scale to the extent the increase in assets is proportionally greater than the increase in certain other expenses. The Trustees noted that the management fees (which include both the advisory and administration fees) and total expenses (net of applicable expense waivers/reimbursements) of Class I shares (the class of shares which is the primary focus of the Fund’s distribution) of the Fund as of March 31, 2022 were lower and higher, respectively, than the average for the Fund’s Peer Group. The Trustees took into account the fact that the Investment Manager has contractually agreed, through March 1, 2023, to limit the Fund’s net annual operating expenses (subject to certain excluded expenses) to 0.68%. The Trustees also took into account management’s discussion of the Fund’s expenses and competitiveness with comparably sized funds and select competitors. The Trustees concluded that, in light of the nature, extent and quality of the services provided by the Investment Manager and the Subadviser (which is an affiliate of the Investment Manager), the foregoing expense limitation and the considerations noted above with respect to the Investment Manager and the Subadviser, the Fund’s advisory and subadvisory fees are reasonable. * * * * After consideration of the foregoing, the Trustees also reached the following conclusions (in addition to the conclusions discussed above) regarding the Investment Advisory Agreement and the Subadvisory Agreement: (a) the Investment Manager and the Subadviser have demonstrated that they possess the capability and resources to perform the duties required of them under the Investment Advisory Agreement and the Subadvisory Agreement and (b) the Investment Manager and Subadviser maintain appropriate compliance programs. Based on all of the above-mentioned factors and their related conclusions, with no single factor or conclusion being determinative and with each Trustee not necessarily attributing the same weight to each factor, the Trustees concluded that approval of the Investment Advisory Agreement and the Subadvisory Agreement would be in the best interests of the Fund and its shareholders. Accordingly, on June 22, 2022, the Trustees, and separately a majority of the Independent Trustees, voted to approve the Investment Advisory Agreement and the Subadvisory Agreement for the Fund. |
| | | | | | | | | |
26
THIS PAGE INTENTIONALLY LEFT BLANK
THIS PAGE INTENTIONALLY LEFT BLANK
|
|
| | | | | | | | |
INVESTMENT MANAGER AND ADMINISTRATOR AMG Funds LLC 680 Washington Blvd., Suite 500 Stamford, CT 06901 800.548.4539 DISTRIBUTOR AMG Distributors, Inc. 680 Washington Blvd., Suite 500 Stamford, CT 06901 800.548.4539 SUBADVISER Montrusco Bolton Investments, Inc. 1501 McGill College Avenue Suite 1200 Montreal, QC H3A 3M8 Canada | | | | CUSTODIAN The Bank of New York Mellon Mutual Funds Custody 6023 Airport Road Oriskany, NY 13424 LEGAL COUNSEL Ropes & Gray LLP Prudential Tower, 800 Boylston Street Boston, MA 02199-3600 TRANSFER AGENT BNY Mellon Investment Servicing (US) Inc. Attn: AMG Funds 4400 Computer Drive Westborough, MA 01581 800.548.4539 | | | | This report is prepared for the Fund’s shareholders. It is authorized for distribution to prospective investors only when preceded or accompanied by an effective prospectus. To receive a free copy of the prospectus or Statement of Additional Information, which includes additional information about Fund Trustees, please contact us by calling 800.548.4539. Distributed by AMG Distributors, Inc., member FINRA/SIPC. Current net asset values per share for the Fund are available on the Fund’s website at amgfunds.com. A description of the policies and procedures the Fund uses to vote its proxies is available: (i) without charge, upon request, by calling 800.548.4539, or (ii) on the Securities and Exchange Commission’s (SEC) website at sec.gov. For information regarding the Fund’s proxy voting record for the 12-month period ended June 30, call 800.548.4539 or visit the SEC website at sec.gov. The Fund files its complete schedule of portfolio holdings with the SEC for the first and third quarters of each fiscal year as an exhibit to their reports on Form N-PORT. The Fund’s portfolio holdings on Form N-PORT are available on the SEC’s website at sec.gov and the Fund’s website at amgfunds.com. To review a complete list of the Fund’s portfolio holdings, or to view the most recent semiannual report or annual report, please visit amgfunds.com. |
| | | | | | | | | |
|
|
| | | | | | | | |
BALANCED FUNDS AMG GW&K Global Allocation GW&K Investment Management, LLC EQUITY FUNDS AMG Beutel Goodman International
Equity Beutel, Goodman & Company Ltd. AMG Boston Common Global Impact Boston Common Asset Management, LLC AMG Frontier Small Cap Growth Frontier Capital Management Co., LLC AMG GW&K Small Cap Core AMG GW&K Small Cap Value AMG GW&K Small/Mid Cap AMG GW&K Small/Mid Cap Growth AMG GW&K Emerging Markets
Equity AMG GW&K Emerging Wealth Equity AMG GW&K International Small Cap GW&K Investment Management, LLC AMG Montrusco Bolton Large Cap
Growth Montrusco Bolton Investments, Inc. AMG Renaissance Large Cap
Growth The Renaissance Group LLC | | | | AMG River Road Dividend All Cap
Value AMG River Road Focused
Absolute Value AMG River Road International
Value Equity AMG River Road Large Cap Value
Select AMG River Road Mid Cap Value AMG River Road Small-Mid Cap
Value AMG River Road Small Cap Value River Road Asset Management, LLC AMG TimesSquare Emerging
Markets Small Cap AMG TimesSquare Global Small
Cap AMG TimesSquare International
Small Cap AMG TimesSquare Mid Cap
Growth AMG TimesSquare Small Cap
Growth TimesSquare Capital Management, LLC AMG Veritas Asia Pacific AMG Veritas China AMG Veritas Global Focus AMG Veritas Global Real Return Veritas Asset Management LLP AMG Yacktman AMG Yacktman Focused AMG Yacktman Global AMG Yacktman Special
Opportunities Yacktman Asset Management LP | | | | FIXED INCOME FUNDS AMG Beutel Goodman Core Plus
Bond Beutel, Goodman & Company Ltd. AMG GW&K Core Bond ESG AMG GW&K Enhanced Core
Bond ESG AMG GW&K ESG Bond AMG GW&K High Income AMG GW&K Municipal Bond AMG GW&K Municipal Enhanced
Yield GW&K Investment Management, LLC |
| | | | | | | | | |
| | | | | | | | | |
| | | | | | | | | |
| | | | | | | | | |
| | | | | | | | | |
| | | | | | | | | |
| | | | | | | | | |
| | | | | | | | | |
| | | | | | | | | |
| | | | | | | | | |
| | | | |
| | | |
| amgfunds.com | | | | 103122 AR087 |
| | |
 | | ANNUAL REPORT |
| | |
| | | AMG Funds October 31, 2022 |
| | |
| | | 
|
| | |
| | | AMG GW&K Core Bond ESG Fund |
| | |
| | | Class N: MBGVX | Class I: MBDFX | �� Class Z: MBDLX |
| | |
| | | AMG GW&K Emerging Markets Equity Fund |
| | |
| | | Class N: TLEVX | Class I: TLESX | Class Z: TLEIX |
| | |
| | | AMG GW&K Emerging Wealth Equity Fund |
| | |
| | | Class N: TYWVX | Class I: TYWSX | Class Z: TYWIX |
| | |
| | | AMG GW&K Small/Mid Cap Growth Fund |
| | |
| | | Class N: ACWDX | Class I: ACWIX | Class Z: ACWZX |
| | |
| | | |
| | |
| | | |
| | | | |
| amgfunds.com | | | | 103122 AR069 |
| | |
| | | AMG Funds Annual Report — October 31, 2022 |
| | | | | | |
| | | |
| | | | | | |
| | | TABLE OF CONTENTS | | PAGE | |
| | | | |
| | | LETTER TO SHAREHOLDERS | | | 2 | |
| | | |
| | | ABOUT YOUR FUND’S EXPENSES | | | 3 | |
| | | |
| | | PORTFOLIO MANAGER’S COMMENTS, FUND SNAPSHOTS AND SCHEDULES OF PORTFOLIO INVESTMENTS | | | | |
| | | |
| | | AMG GW&K Core Bond ESG Fund | | | 4 | |
| | | |
| | | AMG GW&K Emerging Markets Equity Fund | | | 12 | |
| | | |
| | | AMG GW&K Emerging Wealth Equity Fund | | | 19 | |
| | | |
| | | AMG GW&K Small/Mid Cap Growth Fund | | | 26 | |
| | | |
| | | FINANCIAL STATEMENTS | | | | |
| | | |
| | | Statement of Assets and Liabilities | | | 32 | |
| | | |
| | | Balance sheets, net asset value (NAV) per share computations
and cumulative distributable earnings (loss) | | | | |
| | | |
| | | Statement of Operations | | | 34 | |
| | | |
| | | Detail of sources of income, expenses, and realized and
unrealized gains (losses) during the fiscal year | | | | |
| | | |
| | | Statements of Changes in Net Assets | | | 35 | |
| | | |
| | | Detail of changes in assets for the past two fiscal years | | | | |
| | | |
| | | Financial Highlights | | | 37 | |
| | | |
| | | Historical net asset values per share, distributions, total returns, income
and expense ratios, turnover ratios and net assets | | | | |
| | | |
| | | Notes to Financial Statements | | | 49 | |
| | | |
| | | Accounting and distribution policies, details of agreements and
transactions with Fund management and affiliates, and descriptions of
certain investment risks | | | | |
| | | |
| | | REPORT OF INDEPENDENT REGISTERED PUBLIC ACCOUNTING FIRM | | | 58 | |
| | | |
| | | OTHER INFORMATION | | | 59 | |
| | | |
| | | TRUSTEES AND OFFICERS | | | 60 | |
| | | |
| | | ANNUAL RENEWAL OF INVESTMENT MANAGEMENT AND SUBADVISORY AGREEMENTS | | | 63 | |
| | | | | | | |
|
Nothing contained herein is to be considered an offer, sale or solicitation of an offer to buy shares of any series of the AMG Funds Family of Funds. Such offering is made only by prospectus, which includes details as to offering price and other material information. | |
| | |
| | Letter to Shareholders |
Dear Shareholder:
The fiscal year ended October 31, 2022, was a volatile period for risk assets, as uncertainties mounted about high inflation, tighter financial conditions, and the Russian invasion of Ukraine. Global equity and bond markets fell in tandem amid sharply higher interest rates and eroding investor confidence as worries of an impending recession loomed over markets. A global commodity shock caused by the war in Ukraine only made matters worse. The S&P 500® Index slipped into a bear market with the Index falling more than (24)% from its peak earlier in the year. The abrupt shift in markets this year has reset expectations around future growth, as stubbornly high inflation has necessitated that the U.S. Federal Reserve (the Fed) and other global central banks take more aggressive policy action in an effort to bring down inflation. While the outlook is uncertain given the recent negative returns across many asset classes, one silver lining is that global stock and bond valuations are now more attractive than they were at the start of the year.
There was very wide dispersion in sector performance. Energy significantly outperformed all other sectors with a gain of 64.97% as the price of oil surged during the period. Defensive-oriented sectors also outperformed with a 4.86% return from consumer staples and 2.85% gain in utilities. High growth technology and mega cap internet-related companies underperformed during the period, and real estate was impacted by higher interest rates. Communications services fell the most with a (40.67)% return during the fiscal year, followed by declines of (28.53)% for consumer discretionary, (20.64)% for real estate, and (20.23)% for information technology. Value stocks held up much better than growth stocks as the Russell 1000® Value Index returned (7.00)% compared to the (24.60)% return for the Russell 1000® Growth Index. Small cap stocks struggled as the Russell 2000® Index lost (18.54)%. Outside the U.S., foreign developed markets lagged their U.S. counterparts as the U.S. dollar surged and the MSCI EAFE Index fell (23.00)%. Emerging Markets underperformed with a (31.03)% return for the MSCI Emerging Markets Index.
The 10-year Treasury yield more than doubled during the period, surging to the highest levels since before the Great Financial Crisis. Rapidly rising rates from a very low base led to historically bad performance for bonds as the Bloomberg U.S. Aggregate Bond Index, a broad measure of U.S. bond market performance, lost (15.68)% over the period. Investment-grade corporate bonds underperformed as the Bloomberg U.S. Corporate Bond Index returned (19.57)% for the year. High yield bonds held up better with a (11.76)% return as measured by the return of the Bloomberg U.S. Corporate High Yield Bond Index. Municipal bonds suffered steep losses but outperformed the broader market with a (11.98)% return for the Bloomberg Municipal Bond Index. Non-U.S. bonds delivered weak performance and were also impacted by the stronger dollar as the Bloomberg Global Aggregate ex U.S. fell (24.60)%.
AMG Funds appreciates the privilege of providing investment tools to you and your clients. Our foremost goal is to provide investment solutions that help our shareholders successfully reach their long-term investment goals. AMG Funds provides access to a distinctive array of actively managed return-oriented investment strategies. We thank you for your continued confidence and investment in AMG Funds. You can rest assured that under all market conditions our team is focused on delivering excellent investment management services for your benefit.
Respectfully,

Keitha Kinne
President
AMG Funds
| | | | | | | | | | | | | | |
| | | | | Periods ended | |
| Average Annual Total Returns | | October 31, 2022* | |
| | | | |
| Stocks: | | | | 1 Year | | | 3 Years | | | 5 Years | |
| | | | |
Large Cap | | (S&P 500® Index) | | | (14.61 | )% | | | 10.22 | % | | | 10.44 | % |
| | | | |
Small Cap | | (Russell 2000® Index) | | | (18.54 | )% | | | 7.05 | % | | | 5.56 | % |
| | | | |
International | | (MSCI ACWI ex USA) | | | (24.73 | )% | | | (1.68 | )% | | | (0.60 | )% |
| | | | |
Bonds: | | | | | | | | | | | | | | |
| | | | |
Investment Grade | | (Bloomberg U.S. Aggregate Bond Index) | | | (15.68 | )% | | | (3.77 | )% | | | (0.54 | )% |
| | | | |
High Yield | | (Bloomberg U.S. Corporate High Yield Bond Index) | | | (11.76 | )% | | | 0.31 | % | | | 2.01 | % |
| | | | |
Tax-exempt | | (Bloomberg Municipal Bond Index) | | | (11.98 | )% | | | (2.18 | )% | | | 0.37 | % |
| | | | |
Treasury Bills | | (ICE BofAML U.S. 6-Month Treasury Bill Index) | | | 0.55 | % | | | 0.65 | % | | | 1.27 | % |
*Source: FactSet. Past performance is no guarantee of future results.
2
| | |
| | | About Your Fund’s Expenses |
| | | |
| | | |
| | | | | | | | |
As a shareholder of a Fund, you may incur two types of costs: (1) transaction costs, which may include sales charges (loads) on purchase payments; redemption fees; and exchange fees; and (2) ongoing costs, including management fees; distribution (12b-1) fees; and other Fund expenses. This example is intended to help you understand your ongoing costs (in dollars) of investing in the Fund and to compare these costs with the ongoing costs of investing in other mutual funds. The example is based on $1,000 invested at the beginning of the period and held for the entire period as indicated below. ACTUAL EXPENSES The first line of the following table provides information about the actual account values and | | | | actual expenses. You may use the information in this line, together with the amount you invested, to estimate the expenses that you paid over the period. Simply divide your account value by $1,000 (for example, an $8,600 account value divided by $1,000 = 8.6), then multiply the result by the number in the first line under the heading entitled “Expenses Paid During the Period” to estimate the expenses you paid on your account during this period. HYPOTHETICAL EXAMPLE FOR COMPARISON PURPOSES The second line of the following table provides information about hypothetical account values and hypothetical expenses based on the Fund’s actual expense ratio and an assumed annual rate of return of 5% before expenses, which is not the Fund’s | | | | actual return. The hypothetical account values and expenses may not be used to estimate the actual ending account balance or expenses you paid for the period. You may use this information to compare the ongoing costs of investing in the Fund and other funds by comparing this 5% hypothetical example with the 5% hypothetical examples that appear in the shareholder reports of other funds. Please note that the expenses shown in the table are meant to highlight your ongoing costs only and do not reflect any transactional costs, such as sales charges (loads), redemption fees, or exchange fees. Therefore, the second line of the table is useful in comparing ongoing costs only, and will not help you determine the relative total costs of owning different funds. |
| | | | | | | | |
| | | | | | | | | | |
Six Months Ended October 31, 2022 | | Expense Ratio for the Period | | Beginning Account Value 05/01/22 | | Ending Account Value 10/31/22 | | | Expenses Paid During the Period* |
AMG GW&K Core Bond ESG Fund |
|
Based on Actual Fund Return |
Class N | | 0.88% | | $1,000 | | | $922 | | | $4.26 |
Class I | | 0.54% | | $1,000 | | | $923 | | | $2.62 |
Class Z | | 0.48% | | $1,000 | | | $924 | | | $2.33 |
|
Based on Hypothetical 5% Annual Return |
Class N | | 0.88% | | $1,000 | | | $1,021 | | | $4.48 |
Class I | | 0.54% | | $1,000 | | | $1,022 | | | $2.75 |
Class Z | | 0.48% | | $1,000 | | | $1,023 | | | $2.45 |
AMG GW&K Emerging Markets Equity Fund** |
|
Based on Actual Fund Return |
Class N | | 1.32% | | $1,000 | | | $830 | | | $6.09 |
Class I | | 1.03% | | $1,000 | | | $832 | | | $4.76 |
Class Z | | 0.92% | | $1,000 | | | $831 | | | $4.25 |
|
Based on Hypothetical 5% Annual Return |
Class N | | 1.32% | | $1,000 | | | $1,019 | | | $6.72 |
Class I | | 1.03% | | $1,000 | | | $1,020 | | | $5.24 |
Class Z | | 0.92% | | $1,000 | | | $1,021 | | | $4.69 |
AMG GW&K Emerging Wealth Equity Fund |
|
Based on Actual Fund Return |
Class N | | 1.42% | | $1,000 | | | $838 | | | $6.58 |
Class I | | 1.12% | | $1,000 | | | $839 | | | $5.19 |
Class Z | | 1.02% | | $1,000 | | | $838 | | | $4.73 |
|
Based on Hypothetical 5% Annual Return |
Class N | | 1.42% | | $1,000 | | | $1,018 | | | $7.22 |
Class I | | 1.12% | | $1,000 | | | $1,020 | | | $5.70 |
Class Z | | 1.02% | | $1,000 | | | $1,020 | | | $5.19 |
| | | | | | | | | | |
Six Months Ended October 31, 2022 | | Expense
Ratio for
the Period | | Beginning
Account
Value
05/01/22 | | Ending
Account
Value
10/31/22 | | | Expenses
Paid
During
the Period* |
AMG GW&K Small/Mid Cap Growth Fund |
|
Based on Actual Fund Return |
Class N | | 1.02% | | $1,000 | | | $968 | | | $5.06 |
Class I | | 0.87% | | $1,000 | | | $968 | | | $4.32 |
Class Z | | 0.82% | | $1,000 | | | $968 | | | $4.07 |
|
Based on Hypothetical 5% Annual Return |
Class N | | 1.02% | | $1,000 | | | $1,020 | | | $5.19 |
Class I | | 0.87% | | $1,000 | | | $1,021 | | | $4.43 |
Class Z | | 0.82% | | $1,000 | | | $1,021 | | | $4.18 |
| * | Expenses are equal to the Fund’s annualized expense ratio multiplied by the average account value over the period, multiplied by the number of days in the most recent fiscal half-year (184), then divided by 365. |
| ** | Includes interest expense related to participation in the interfund lending program. If excluded, your annualized expense ratios would be 1.27%, 0.98% and 0.87% for Class N, Class I and Class Z, respectively, and your actual and hypothetical expenses paid during the period would be $5.86, $4.53 and $4.02, and $6.46, $4.99 and $4.43 for Class N, Class I and Class Z, respectively. |
3
| | |
| | | AMG GW&K Core Bond ESG Fund Portfolio Manager’s Comments (unaudited) |
| | | |
| | | |
| | | | | | | | |
THE YEAR IN REVIEW For the 12 months ended October 31, 2022, AMG GW&K Core Bond ESG Fund’s (the “Fund”) Class I shares returned (16.99)%, compared to the return of (15.68)% for the Bloomberg U.S. Aggregate Bond Index (the “Index”). MARKET OVERVIEW Fixed income markets were effectively flat in late 2021, despite major narrative shifts with respect to inflation, monetary policy, and COVID-19. Signs of easing supply-chain pressures and continued labor market normalization were not enough to quell concerns about rising inflation, which printed at its highest level in almost 40 years. The U.S. Federal Reserve (the “Fed”) executed a “hawkish pivot” in acknowledging more persistent inflationary forces and signaled its intention to respond accordingly. The extremely contagious Omicron variant rapidly established itself as the dominant strain around the globe, forcing a reappraisal of reopening timelines and reviving the specter of lockdowns and healthcare rationing. Ironically, the combined effect of these various forces essentially netted to zero; solid economic data and a broadly constructive outlook from the Fed were met with the prospect of tightening financial conditions and growth fears posed by Omicron. But trading overall was orderly, and after the prior two years investors seemed well practiced at looking past near-term volatility toward the next stage of a return to normalcy. For the first quarter of 2022, fixed income markets experienced their worst period in more than four decades amid an extraordinary confluence of economic and geopolitical shocks. Core inflation jumped to 5.4%, its highest level since 1983, on a broad-based rise in consumer prices. The Fed responded in kind, intensifying its hawkish rhetoric and laying out an aggressive course of hikes to bring inflation back to target. In addition to exacting a tragic human toll, Russia’s invasion of Ukraine exacerbated already strained supply chains and commodity markets, threatening acute and prolonged shortages of materials vital to the basic functioning of the global economy. But for all this uncertainty and turmoil, there was a notable divergence between the performance of rates and credit; the former extended a historically severe downdraft, while the latter continued to enjoy a remarkably benign trading environment. How this disconnect was to be resolved was the central question before investors, though policy uncertainty and heightened tensions were deemed unlikely to subside anytime soon. | | | | In the second quarter of 2022, fixed income markets experienced another extremely volatile period, trading in a wide range and struggling to commit to a consistent narrative. The central question remained how persistent inflation would be and what policy measures would be necessary to quell it. A natural deceleration would allow the Fed to pursue less aggressive policy and possibly achieve a soft landing; more recalcitrant price pressure would require the Fed to mount a harsher response and invite a potential recession. The implications of these two different paths were starkly at odds, leading to a broad lack of conviction with no clear market direction. Similarly puzzling was a consumer with a strong proclivity to spend but a deeply pessimistic outlook and a corporate sector earning solid profits but starting to announce layoffs. Additionally, China offered a potential bright spot as it emerged from recent shutdowns, but the Ukraine conflict lingered as a major threat to global energy and commodity markets. An imminent resolution to any of these tensions seemed unlikely, so disciplined risk management and careful analysis of relative value were of particular importance for the months ahead. Fixed income markets were under extraordinary pressure in the third quarter of 2022, as investors continued to adapt to restrictive monetary policy after more than a decade of accommodation. Stubbornly rising prices, hawkish central banks, and various geopolitical forces combined to tighten financial conditions and raise the cost of borrowing around the world. Defying expectations that it had peaked, inflation remained elevated and manifested across a broader and more entrenched collection of goods and services. The Federal also confounded expectations by projecting a more cautious outlook and a more aggressive path of hikes than most economists had anticipated. International pressures escalated as well, as currency market dislocations, political leadership changes in Europe and Asia, and multiple energy crises collectively drove a heightened sense of uncertainty. The variety and momentum of these forces suggested no near-term end to volatility, especially against a backdrop of increasingly expensive capital. Fixed income markets were once again under pressure to end the fiscal year in October. Inflation continued to rise as the Fed reiterated its commitment to subduing it. The housing sector deteriorated further, and consumer sentiment | | | | remained dour, while the labor market showed few signs of weakening. Minutes from the September meeting made clear that the Fed will raise rates aggressively and keep them high until it sees evidence that inflation is coming down. Yields across the curve were higher on the month, briefly touching new cyclical peaks before retreating. The front end sold off in response to increased Fed hawkishness, while long rates reflected rising confidence that the end of the hiking cycle is near. FUND REVIEW The Fund underperformed its benchmark as an above-benchmark allocation to spread sectors was one of the main detractors from returns. Specifically, an overweight to investment grade corporate bonds was the largest negative, but also hurting performance were overweights to both taxable municipals and agency mortgage-backed securities (“MBS”). On the other hand, an out of benchmark allocation to fixed-to-floating preferreds aided returns. The Fund’s notable underweight was to the Treasury sector contributed to relative return. Security selection also lagged, with the largest affect coming from investment grade corporates. Consumer cyclicals was a notable detractor while communications contributed positively. Security selection in MBS was also a negative. The Fund’s duration positioning was its top contributor. Rates rose during the period and the Fund’s shorter duration compared to the benchmark proved favorable. Due to the Fund’s generally neutral yield curve positioning, the affect here was minimal. Environmental, social and governance practices (“ESG”) remained an important area of focus for the corporate bond market in what could be viewed as a transition year in 2022. A growing list of companies have moved beyond publishing sustainability reports to set emissions reduction and net zero targets over the past year. Investors shook off an overall difficult market environment, from geopolitical turmoil to interest rate volatility, to demonstrate continued strong interest in ESG. This was also a landmark year for global sustainability regulation, with regulators across Europe, North America, and Asia introducing new rules and proposals related to reporting for both corporations and investors. In the U.S., the Inflation Reduction Act is poised to provide policy support for many companies of interest to ESG investors. We continue to integrate ESG as a core part of our |
4
| | |
| | | AMG GW&K Core Bond ESG Fund Portfolio Manager’s Comments (continued) |
| | | |
| | | |
| | | | | | | | |
fundamental investment process, while monitoring regulatory and policy actions that could influence the ESG investing landscape in the coming years. We conducted the following trades based on ESG factors over the period: • We purchased Merck & Co., a high-quality investment grade sustainable bond • We bought Sonoco Products Co., a recent green bond new issue • We added a California State Health Facilities bond OUTLOOK Expectations of a Fed “pivot” have been relegated to the closing months of 2023, suggesting investors have become more comfortable with | | | | higher-for-longer monetary policy. Additionally, investors seem to have registered acceptance of the “pain” that Chairman Powell has warned might be necessary to quell inflation. Rate volatility has consequently risen to levels last seen at the outset of the pandemic and, prior to that, the global financial crisis. With such an uncertain fundamental backdrop and a wide dispersion of possible paths for both the level and shape of the yield curve, we have maintained essentially neutral duration and curve positioning. While our outlook for corporate credit is constructive from a bottom-up perspective–given years of prudent balance sheet management and robust profitability–we recognize the rising risks that macroeconomic factors pose to the sector. As such, our exposure is at the lower end of its historical | | | | range. Within corporates, we continue to prefer higher quality names with less exposure to cyclical industries. We remain opportunistic with respect to idiosyncratic stories and have been active in credits that we expect to improve their leverage profiles or which have sold off unduly. Our outlook for mortgages has informed a neutral exposure, given potential event risk surrounding quantitative tightening and elevated rate volatility, even as recent underperformance has brought spreads to the wider end of their recent range. The views expressed represent the opinions of GW&K Investment Management, LLC as of October 31, 2022, and are not intended as a forecast or guarantee of future results, and are subject to change without notice. |
5
| | |
| | | AMG GW&K Core Bond ESG Fund Portfolio Manager’s Comments (continued) |
CUMULATIVE TOTAL RETURN PERFORMANCE
AMG GW&K Core Bond ESG Fund’s cumulative total return is based on the daily change in net asset value (NAV), and assumes that all dividends and distributions were reinvested. This graph compares a hypothetical $10,000 investment made in the AMG GW&K Core Bond ESG Fund’s Class I shares on October 31, 2012, to a $10,000 investment made in the Bloomberg U.S. Aggregate Bond Index for the same time period. The graph and table do not reflect the deduction of taxes that a shareholder would pay on a Fund distribution or redemption of shares. The listed returns for the Fund are net of expenses and the returns for the index excludes expenses. Total returns would have been lower had certain expenses not been reduced.
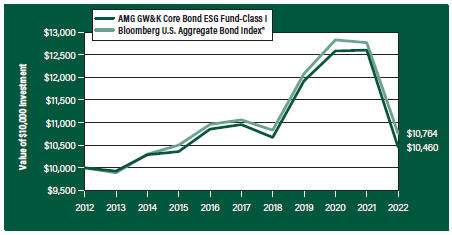
The table below shows the average annual total returns for the AMG GW&K Core Bond ESG Fund and the Bloomberg U.S. Aggregate Bond Index for the same time periods ended October 31, 2022.
| | | | | | | | | | | | | | | | | | | | |
| | | One | | | Five | | | Ten | | | Since | | | Inception | |
| Average Annual Total Returns1 | | Year | | | Years | | | Years | | | Inception | | | Date | |
AMG GW&K Core Bond ESG Fund2, 3, 4, 5, 6, 7, 8, 9 | |
| | | | | |
Class N | | | (17.18 | %) | | | (1.22 | %) | | | — | | | | (0.27 | %) | | | 05/08/15 | |
| | | | | |
Class I | | | (16.99 | %) | | | (0.92 | %) | | | 0.45% | | | | 4.78 | % | | | 04/30/93 | |
| | | | | |
Class Z | | | (16.85 | %) | | | (0.82 | %) | | | — | | | | 0.14 | % | | | 05/08/15 | |
| | | | | |
Bloomberg U.S. Aggregate Bond Index10 | | | (15.68 | %) | | | (0.54 | %) | | | 0.74% | | | | 4.35 | % | | | 04/30/93 | † |
The performance data shown represents past performance. Past performance is not a guarantee of future results. Current performance may be lower or higher than the performance data quoted. The investment return and principal value of an investment will fluctuate so that an investor’s shares, when redeemed, may be worth more or less than their original cost.
Investors should carefully consider the Fund’s investment objectives, risks, charges and expenses before investing. For performance information through the most recent month end, current net asset values per share for the Fund and other information, please call 800.548.4539 or visit our website at amgfunds.com for a free prospectus. Read it carefully before investing or sending money.
Distributed by AMG Distributors, Inc., member FINRA/SIPC.
| † | Date reflects inception date of the Fund, not the index. |
| 1 | Total return equals income yield plus share price change and assumes reinvestment of all dividends and capital gain distributions. Returns are net of fees and may reflect offsets of Fund expenses as described in the prospectus. No adjustment has been made for taxes payable by shareholders on their reinvested dividends and |
|
capital gain distributions. Returns for periods greater than one year are annualized. The listed returns on the Fund are net of expenses and based on the published NAV as of October 31, 2022. All returns are in U.S. Dollars($). 2 From time to time, the Fund’s adviser has waived its fees and/or absorbed Fund expenses, which has resulted in higher returns. 3 To the extent that the Fund invests in asset-backed or mortgage-backed securities, its exposure to prepayment and extension risks may be greater than investments in other fixed income securities. 4 Active and frequent trading of a fund may result in higher transaction costs and increased tax liability. 5 The Fund is subject to the risks associated with investments in debt securities, such as default risk and fluctuations in the perception of the debtor’s ability to pay its creditors. Changing interest rates may adversely affect the value of an investment. An increase in interest rates typically causes the value of bonds and other fixed income securities to fall. 6 The Fund may invest in derivatives such as options and futures; the complexity and rapidly changing structure of derivatives markets may increase the possibility of market losses. 7 Many bonds have call provisions which allow the debtors to pay them back before maturity. This is especially true with mortgage securities, which can be paid back anytime. Typically debtors prepay their debt when it is to their advantage (when interest rates drop making a new loan at current rates more attractive), and thus likely to the disadvantage of bondholders, who may have to reinvest prepayment proceeds in securities with lower yields. Prepayment risk will vary depending on the provisions of the security and current interest rates relative to the interest rate of the debt. 8 Market prices of investments held by the Fund may fall rapidly or unpredictably due to a variety of economic or political factors, market conditions, disasters or public health issues, or in response to events that affect particular industries or companies. 9 Applying the Fund’s ESG investment criteria may result in the selection or exclusion of securities of certain issuers for reasons other than performance, and the Fund may underperform funds that do not utilize an ESG investment strategy. The application of this strategy may affect the Fund’s exposure to certain companies, sectors, regions, countries or types of investments, which could negatively impact the Fund’s performance depending on whether such investments are in or out of favor. Applying ESG criteria to investment decisions is qualitative and subjective by nature, and there is no guarantee that the criteria utilized by the Subadviser or any judgment exercised by the |
6
| | |
| | | AMG GW&K Core Bond ESG Fund Portfolio Manager’s Comments (continued) |
| | | |
| | | |
| | | | | | | | |
Subadviser will reflect the beliefs or values of any particular investor. 10 The Bloomberg U.S. Aggregate Bond Index is an index of the U.S. investment-grade fixed-rate bond market, including both government and corporate bonds. Unlike the Fund, the Bloomberg U.S. Aggregate Bond Index is unmanaged, is not available for investment and does not incur expenses. | | | | “Bloomberg®” and any Bloomberg index described herein are service marks of Bloomberg Finance L.P. and its affiliates, including Bloomberg Index Services Limited (“BISL”), the administrator of the index (collectively, “Bloomberg”) and have been licensed for use for certain purposes by AMG Funds LLC. Bloomberg is not affiliated with AMG Funds LLC, and Bloomberg does not approve, endorse, review, or recommend the fund described herein. Bloomberg | | | | does not guarantee the timeliness, accurateness, or completeness of any data or information relating to such fund. Not FDIC insured, nor bank guaranteed. May lose value. |
7
| | |
| | | AMG GW&K Core Bond ESG Fund Fund Snapshots (unaudited) October 31, 2022 |
PORTFOLIO BREAKDOWN
| | |
| Category | | % of Net Assets |
| | |
U.S. Government and Agency Obligations | | 51.9 |
| | |
Corporate Bonds and Notes | | 36.0 |
| | |
Municipal Bonds | | 7.5 |
| | |
Foreign Government Obligations | | 0.9 |
| | |
Short-Term Investments | | 2.7 |
| | |
Other Assets, Less Liabilities | | 1.0 |
| | |
| Rating | | % of Market Value1 |
| | |
U.S. Government and Agency Obligations | | 53.8 |
| | |
Aaa/AAA | | 3.9 |
| | |
Aa/AA | | 9.4 |
| | |
A | | 10.4 |
| | |
Baa/BBB | | 22.5 |
| 1 | Includes market value of long-term fixed-income securities only. |
TOP TEN HOLDINGS
| | |
| Security Name | | % of Net Assets |
| | |
U.S. Treasury Notes, 2.000%, 06/30/24 | | 4.2 |
| | |
U.S. Treasury Bonds, 2.250%, 05/15/41 | | 3.7 |
| | |
FHLMC, 3.500%, 10/01/45 | | 2.5 |
| | |
Verizon Communications, Inc., 3.875%, 02/08/29 | | 2.2 |
| | |
U.S. Treasury Bonds, 6.250%, 08/15/23 | | 2.1 |
| | |
FNMA, 3.500%, 02/01/47 | | 2.1 |
| | |
U.S. Treasury Notes, 2.375%, 05/15/27 | | 2.0 |
| | |
California State General Obligation, School Improvements, 7.550%, 04/01/39 | | 2.0 |
| | |
FHLMC, 3.000%, 11/01/49 | | 2.0 |
| | |
U.S. Treasury Bonds, 3.500% , 02/15/39 | | 1.9 |
| | | |
| | |
Top Ten as a Group | | 24.7 |
| | |
Credit quality ratings shown above reflect the highest rating assigned by either Standard & Poor’s (“S&P”) or Moody’s Investors Service, Inc. (“Moody’s”). These rating agencies are independent, nationally recognized statistical rating organizations and are widely used. Investment grade ratings are credit ratings of BBB- or higher. Below investment grade ratings are credit ratings of BB+ or lower. Investments designated N/R are not rated by any of the rating agencies. Unrated investments do not necessarily indicate low credit quality. Credit quality ratings are subject to change.
Because a fund’s strategy may result in multiple investments in particular sectors of the economy, its performance may depend on the performance of those sectors and may fluctuate more widely than investments diversified across more sectors. For additional information on these and other risk considerations, please see the Fund’s prospectus.
Any sectors, industries, or securities discussed should not be perceived as investment recommendations. Mention of a specific security should not be considered a recommendation to buy or solicitation to sell that security. Specific securities mentioned in this report may have been sold from the Fund’s portfolio of investments by the time you receive this report.
8
| | |
| | | AMG GW&K Core Bond ESG Fund Schedule of Portfolio Investments October 31, 2022 |
| | | | | | | | |
| | |
| | | Principal Amount | | | Value | |
| |
Corporate Bonds and Notes - 36.0% | | | | | |
| |
Financials - 12.7% | | | | | |
| | |
AerCap Ireland Capital DAC/AerCap Global Aviation Trust (Ireland) 1.650%, 10/29/24 | | | $1,650,000 | | | | $1,497,600 | |
| | |
American Express Co. | | | | | | | | |
(3.550% to 09/15/26 then U.S. Treasury Yield Curve CMT 5 year + 2.854%), 3.550%, 09/15/261,2,3 | | | 973,000 | | | | 750,426 | |
| | |
American Tower Corp.
3.600%, 01/15/28 | | | 1,680,000 | | | | 1,488,749 | |
| | |
Bank of America Corp. | | | | | | | | |
MTN, (4.330% to 03/15/49 then 3 month LIBOR + 1.520%), 4.330%, 03/15/501,3 | | | 1,600,000 | | | | 1,244,374 | |
| | |
The Bank of New York Mellon Corp. | | | | | | | | |
MTN, 2.450%, 08/17/26 | | | 937,000 | | | | 849,517 | |
Series G, (4.700% to 09/20/25 then U.S. Treasury Yield Curve CMT 5 year + 4.358%), 4.700%, 09/20/251,2,3 | | | 460,000 | | | | 440,450 | |
| | |
Boston Properties, LP | | | | | | | | |
3.400%, 06/21/29 | | | 1,841,000 | | | | 1,522,076 | |
| | |
Citigroup, Inc. | | | | | | | | |
(3.980% to 03/20/29 then 3 month LIBOR + 1.338%), 3.980%, 03/20/301,3 | | | 1,677,000 | | | | 1,477,577 | |
| | |
Crown Castle, Inc. | | | | | | | | |
4.000%, 03/01/27 | | | 1,800,000 | | | | 1,665,268 | |
| | |
The Goldman Sachs Group, Inc. | | | | | | | | |
3.500%, 11/16/26 | | | 2,676,000 | | | | 2,453,984 | |
| | |
JPMorgan Chase & Co. | | | | | | | | |
(1.470% to 09/22/26 then SOFR + 0.765%), 1.470%, 09/22/271,3 | | | 871,000 | | | | 731,742 | |
| | |
MetLife, Inc. | | | | | | | | |
Series G, (3.850% to 09/15/25 then U.S. Treasury Yield Curve CMT 5 year + 3.576%), 3.850%, 09/15/251,2,3 | | | 1,409,000 | | | | 1,238,143 | |
| | |
Morgan Stanley | | | | | | | | |
(4.431% to 01/23/29 then 3 month LIBOR + 1.628%), 4.431%, 01/23/301,3 | | | 1,624,000 | | | | 1,481,905 | |
| | |
Wells Fargo & Co. | | | | | | | | |
MTN, (5.013% to 04/04/50 then SOFR + 4.502%), 5.013%, 04/04/511,3 | | | 1,411,000 | | | | 1,195,980 | |
| | |
Total Financials | | | | | | | 18,037,791 | |
| | |
Industrials - 21.2% | | | | | | | | |
| | |
Alcoa Nederland Holding, B.V. (Netherlands) | | | | | | | | |
4.125%, 03/31/294 | | | 1,275,000 | | | | 1,079,705 | |
| | |
Anglo American Capital PLC (United Kingdom)
2.875%, 03/17/314 | | | 919,000 | | | | 706,376 | |
| | |
Ashtead Capital, Inc.
1.500%, 08/12/264 | | | 1,786,000 | | | | 1,481,645 | |
AT&T, Inc.
4.300%, 12/15/42 | | | 1,710,000 | | | | 1,317,214 | |
| | | | | | | | |
| | |
| | | Principal Amount | | | Value | |
| | |
Block Financial LLC
3.875%, 08/15/30 | | | $1,667,000 | | | | $1,400,118 | |
| | |
Broadcom Corp./Broadcom Cayman Finance, Ltd.
3.875%, 01/15/27 | | | 1,808,000 | | | | 1,661,501 | |
| | |
Charter Communications Operating LLC/Charter Communications Operating Capital
2.250%, 01/15/29 | | | 2,000,000 | | | | 1,578,274 | |
| | |
CommonSpirit Health
3.347%, 10/01/29 | | | 1,737,000 | | | | 1,457,627 | |
| | |
Dell International LLC/EMC Corp. 6.200%, 07/15/30 | | | 1,512,000 | | | | 1,481,158 | |
| | |
Discovery Communications LLC 3.950%, 03/20/28 | | | 1,766,000 | | | | 1,532,843 | |
| | |
The Ford Foundation
Series 2020, 2.415%, 06/01/50 | | | 2,207,000 | | | | 1,274,092 | |
| | |
HCA, Inc. | | | | | | | | |
4.125%, 06/15/29 | | | 842,000 | | | | 742,988 | |
4.500%, 02/15/27 | | | 874,000 | | | | 818,257 | |
| | |
Merck & Co., Inc. | | | | | | | | |
1.900%, 12/10/28 | | | 1,897,000 | | | | 1,589,602 | |
| | |
Microsoft Corp.
2.525%, 06/01/50 | | | 2,165,000 | | | | 1,358,165 | |
| | |
Parker-Hannifin Corp.
3.250%, 06/14/29 | | | 1,623,000 | | | | 1,407,678 | |
| | |
PulteGroup, Inc.
5.000%, 01/15/27 | | | 761,000 | | | | 730,861 | |
| | |
Smith & Nephew PLC (United Kingdom)
2.032%, 10/14/30 | | | 1,010,000 | | | | 741,981 | |
| | |
Sonoco Products Co.
2.850%, 02/01/325 | | | 1,852,000 | | | | 1,443,393 | |
| | |
Sysco Corp.
2.400%, 02/15/30 | | | 2,284,000 | | | | 1,847,932 | |
| | |
Verizon Communications, Inc.
3.875%, 02/08/29 | | | 3,403,000 | | | | 3,093,150 | |
| | |
Walgreens Boots Alliance, Inc.
4.800%, 11/18/44 | | | 1,593,000 | | | | 1,249,355 | |
| | |
Total Industrials | | | | | | | 29,993,915 | |
| | |
Utilities - 2.1% | | | | | | | | |
| | |
Dominion Energy, Inc. | | | | | | | | |
Series B, (4.650% to 12/15/24 then U.S. Treasury Yield Curve CMT 5 year + 2.993%), 4.650%, 12/15/241,2,3 | | | 978,000 | | | | 846,476 | |
| | |
National Rural Utilities Cooperative Finance Corp.
1.350%, 03/15/31 | | | 2,024,000 | | | | 1,454,910 | |
| | |
Northern States Power Co.
2.900%, 03/01/50 | | | 1,000,000 | | | | 635,228 | |
| | |
Total Utilities | | | | | | | 2,936,614 | |
| | |
Total Corporate Bonds and Notes
(Cost $62,975,896) | | | | | | | 50,968,320 | |
The accompanying notes are an integral part of these financial statements.
9
| | |
| | | AMG GW&K Core Bond ESG Fund Schedule of Portfolio Investments (continued) |
| | | | | | | | |
| | | Principal
Amount | | | Value | |
| |
Municipal Bonds - 7.5% | | | | | |
| | |
California Health Facilities Financing Authority
4.190%, 06/01/37 | | | $775,000 | | | | $653,272 | |
| | |
California State General Obligation, School Improvements Build America Bonds, 7.550%, 04/01/39 | | | 2,410,000 | | | | 2,885,290 | |
| | |
Commonwealth of Massachusetts Series B, 4.110%, 07/15/31 | | | 1,040,000 | | | | 992,202 | |
| | |
JobsOhio Beverage System
Series B, 4.532%, 01/01/35 | | | 1,705,000 | | | | 1,571,841 | |
| | |
Los Angeles Unified School District, School Improvements
5.750%, 07/01/34 | | | 1,775,000 | | | | 1,801,304 | |
| | |
Massachusetts School Building Authority
Series B, 1.753%, 08/15/30 | | | 2,017,000 | | | | 1,637,975 | |
| | |
University of California, University & College Improvements
Series BD, 3.349%, 07/01/29 | | | 1,310,000 | | | | 1,169,005 | |
| |
Total Municipal Bonds | | | | | |
(Cost $12,564,216) | | | | | | | 10,710,889 | |
| |
| U.S. Government and Agency Obligations - 51.9% | | | | | |
| | |
Fannie Mae - 22.9% | | | | | | | | |
| | |
FNMA | | | | | | | | |
2.000%, 02/01/36 to 10/01/50 | | | 2,017,188 | | | | 1,682,847 | |
3.000%, 06/01/38 | | | 1,180,482 | | | | 1,079,662 | |
3.500%, 03/01/30 to 07/01/50 | | | 12,394,645 | | | | 11,286,818 | |
4.000%, 03/01/44 to 01/01/51 | | | 8,422,706 | | | | 7,812,991 | |
4.500%, 04/01/39 to 08/01/52 | | | 8,777,950 | | | | 8,470,612 | |
5.000%, 07/01/47 to 02/01/49 | | | 2,085,049 | | | | 2,068,894 | |
| | |
Total Fannie Mae | | | | | | | 32,401,824 | |
| | |
Freddie Mac - 10.4% | | | | | | | | |
| | |
FHLMC | | | | | | | | |
2.500%, 10/01/34 to 08/01/50 | | | 4,160,413 | | | | 3,658,775 | |
3.000%, 11/01/49 to 03/01/50 | | | 4,101,498 | | | | 3,547,704 | |
3.500%, 10/01/45 | | | 3,856,151 | | | | 3,473,611 | |
4.000%, 07/01/48 to 09/01/50 | | | 1,289,177 | | | | 1,190,472 | |
4.500%, 05/01/48 | | | 301,073 | | | | 291,367 | |
5.000%, 07/01/44 | | | 1,323,752 | | | | 1,325,131 | |
| | |
FHLMC Gold Pool | | | | | | | | |
3.500%, 07/01/32 to 05/01/44 | | | 1,316,512 | | | | 1,230,880 | |
| | |
Total Freddie Mac | | | | | | | 14,717,940 | |
| | | | | | | | |
| | | Principal
Amount | | | Value | |
| |
U.S. Treasury Obligations - 18.6% | | | | | |
| | |
U.S. Treasury Bonds | | | | | | | | |
1.875%, 02/15/51 | | | $3,958,000 | | | | $2,423,193 | |
2.250%, 05/15/41 | | | 7,180,000 | | | | 5,177,173 | |
3.125%, 05/15/48 | | | 1,998,000 | | | | 1,620,799 | |
3.500%, 02/15/39 | | | 3,044,000 | | | | 2,763,619 | |
5.000%, 05/15/37 | | | 978,000 | | | | 1,062,620 | |
6.250%, 08/15/23 | | | 2,968,000 | | | | 3,003,941 | |
6.750%, 08/15/26 | | | 1,339,000 | | | | 1,448,683 | |
| | |
U.S. Treasury Notes | | | | | | | | |
2.000%, 06/30/24 | | | 6,268,000 | | | | 6,006,262 | |
2.375%, 05/15/27 | | | 3,141,000 | | | | 2,892,296 | |
| | |
Total U.S. Treasury Obligations | | | | | | | 26,398,586 | |
| |
Total U.S. Government and Agency Obligations | | | | | |
(Cost $85,331,985) | | | | | | | 73,518,350 | |
| |
Foreign Government Obligation - 0.9% | | | | | |
The Korea Development Bank (South Korea)
0.500%, 10/27/23
(Cost $1,383,846) | | | 1,385,000 | | | | 1,328,254 | |
| |
Short-Term Investments - 2.7% | | | | | |
| |
Joint Repurchase Agreements - 0.1%6 | | | | | |
| | |
HSBC Securities USA, Inc., dated 10/31/22, due 11/01/22, 3.010% total to be received $157,617 (collateralized by various U.S. Treasuries, 0.000% - 7.625%, 01/15/23 - 08/15/52, totaling $160,756) | | | 157,604 | | | | 157,604 | |
| |
Repurchase Agreements - 2.6% | | | | | |
| | |
Fixed Income Clearing Corp., dated 10/31/22, due 11/01/22, 2.900% total to be received $3,645,294 (collateralized by a U.S. Treasury, 1.625%, 05/15/31, totaling $3,717,974) | | | 3,645,000 | | | | 3,645,000 | |
| |
Total Short-Term Investments | | | | | |
(Cost $3,802,604) | | | | | | | 3,802,604 | |
| |
Total Investments - 99.0% | | | | | |
(Cost $166,058,547) | | | | | | | 140,328,417 | |
| |
Other Assets, less Liabilities - 1.0% | | | | 1,388,160 | |
| |
Net Assets - 100.0% | | | | $141,716,577 | |
| 1 | Fixed to variable rate investment. The rate shown reflects the fixed rate in effect at October 31, 2022. Rate will reset at a future date. |
| 2 | Perpetuity Bond. The date shown represents the next call date. |
| 3 | Variable rate security. The rate shown is based on the latest available information as of October 31, 2022. Certain variable rate securities are not based on a published reference rate and spread but are determined by the issuer or agent and are based on current market conditions. These securities do not indicate a reference rate and spread in their description above. |
| 4 | Security exempt from registration under Rule 144A of the Securities Act of 1933. This security may be resold in transactions exempt from registration, normally to qualified institutional buyers. At October 31, 2022, the value of these securities amounted to $3,267,726 or 2.3% of net assets. |
| 5 | Some of this security, amounting to $151,198 or 0.1% of net assets, was out on loan to various borrowers and is collateralized by cash. See Note 4 of Notes to Financial Statements. |
| 6 | Cash collateral received for securities lending activity was invested in the joint repurchase agreement. |
The accompanying notes are an integral part of these financial statements.
10
| | |
| | | AMG GW&K Core Bond ESG Fund Schedule of Portfolio Investments (continued) |
| | | | | | |
| CMT | | Constant Maturity Treasury | | LIBOR | | London Interbank Offered Rate |
| | | |
| FHLMC | | Freddie Mac | | MTN | | Medium-Term Note |
| | | |
| FNMA | | Fannie Mae | | SOFR | | Secured Overnight Financing Rate |
The following table summarizes the inputs used to value the Fund’s investments by the fair value hierarchy levels as of October 31, 2022:
| | | | | | | | | | | | | | | | |
| | | Level 1 | | | Level 2 | | | Level 3 | | | Total | |
Investments in Securities | | | | | | | | | | | | | | | | |
| | | | |
Corporate Bonds and Notes† | | | — | | | $ | 50,968,320 | | | | — | | | $ | 50,968,320 | |
| | | | |
Municipal Bonds† | | | — | | | | 10,710,889 | | | | — | | | | 10,710,889 | |
| | | | |
U.S. Government and Agency Obligations† | | | — | | | | 73,518,350 | | | | — | | | | 73,518,350 | |
| | | | |
Foreign Government Obligation† | | | — | | | | 1,328,254 | | | | — | | | | 1,328,254 | |
| | | | |
Short-Term Investments | | | | | | | | | | | | | | | | |
| | | | |
Joint Repurchase Agreements | | | — | | | | 157,604 | | | | — | | | | 157,604 | |
| | | | |
Repurchase Agreements | | | — | | | | 3,645,000 | | | | — | | | | 3,645,000 | |
| | | | | | | | | | | | | | | | |
| | | | |
Total Investments in Securities | | | — | | | $ | 140,328,417 | | | | — | | | $ | 140,328,417 | |
| | | | | | | | | | | | | | | | |
| † | All corporate bonds and notes, municipal bonds, U.S. government and agency obligations, and foreign government obligations held in the Fund are Level 2 securities. For a detailed breakout of corporate bonds and notes, municipal bonds, U.S. government and agency obligations, and foreign government obligations by major industry or agency classification, please refer to the Fund’s Schedule of Portfolio Investments. |
For the fiscal year ended October 31, 2022, there were no transfers in or out of Level 3.
The accompanying notes are an integral part of these financial statements.
11
| | |
| | | AMG GW&K Emerging Markets Equity Fund Portfolio Manager’s Comments (unaudited) |
| | | |
| | | |
| | | | | | | | |
MARKET OVERVIEW Emerging markets fell sharply during the fiscal year ended October 31, 2022 amid Russia’s invasion of Ukraine, numerous headwinds in China, and a challenging inflation backdrop that saw several countries aggressively tighten monetary policy. Brent Crude oil initially traded above the $100/barrel level for the first time in seven years on U.S. sanctions targeting Russia’s energy industry. Other commodity prices were mixed; grains were well supported, but metals dropped on recession concerns. The MSCI Emerging Markets (“EM”) Index declined (31.0)%, while the MSCI EM ex China Index declined (21.9)%. This compares to an (18.5)% loss for the MSCI World Index of developed markets. Performance was mixed geographically, with commodity rich Latin America a standout performer, gaining 16.1% led by Brazil. The region is expected to benefit from the conflict driven surge in energy and agricultural commodity prices. EMEA oil producers in the Persian Gulf posted respectable gains—but Russia’s elimination from the MSCI EM Index weighed on the region’s aggregate performance. Eastern European countries with proximity to the conflict and trade ties to Russia also capped gains in the EMEA region. North Asia was particularly weak due to external demand worries and ongoing market pressure in China. South Korea and Taiwan both fell sharply on the backup in U.S. interest rates and slowing demand in the IT hardware and semiconductor industries. Foreign investors shed Chinese equities en masse due to the country’s growth-stifling zero-COVID policy, ongoing real estate industry turmoil, and President Xi’s consolidation of power at the National Party Congress. The MSCI China Index declined (47.9)%, bringing its Index weight down to 27% from 35% at the beginning of the period. Indonesia bucked the negative trend in Asia, rising modestly on positive earnings momentum. Sector performance was broadly negative, with utilities down modestly compared to the broader group. Financials also outperformed on a relative basis as investors looked to banks as proxies for several commodity producing countries including South Africa, UAE, and Brazil. | | | | Consumer discretionary, communication services, health care declined on China concerns, while slowing orders weighed on information technology. FUND REVIEW For the fiscal year ended October 31, 2022, AMG GW&K Emerging Markets Equity Fund (the “Fund”) Class N shares returned (32.5)%, underperforming the (31.0)% return for the MSCI EM Index. Stock selection within financials was the main source of the performance shortfall. For example, the portfolio had less exposure to banks in commodity-rich countries, such as South Africa and the Middle East oil markets, which were up sharply on investment inflows. In addition, though we exited the position immediately after the invasion, Sberbank Russia also weighed on the sector return, as did OTP Bank, a Hungarian bank with operations in Russia and Ukraine. OTB was subsequently sold later in the year. There was also weakness in Taiwan Semiconductor Manufacturing due to slowing orders and challenging comparable earnings from the prior year. Although, the Fund outperformed in China, regulatory changes hit internet giant Tencent Holdings and Prosus, a holding company with a stake in Tencent. Finally, sector allocation was negative, mainly due to a higher weight in consumer discretionary and no exposure to utilities. Encouragingly, stock selection was positive in several sectors and markets, with health care China, and Mexico key contributors. China Resources Sanjiu Medical & Pharmaceutical, a branded OTC drug and traditional Chinese medicine (TCM) specialist, gained on solid earnings due to market share gains and cost optimization. In Mexico, Grupo Financiero Banorte reported good earnings backed by both net interest and fee income growth, and airport operator Grupo Aeroportuario del Pacífico reported strong revenue growth compared to pre-pandemic periods driven by increased volumes and pricing. OUTLOOK Emerging markets are now at levels not seen since early in the pandemic or, looking further back, 2015. Although there are several pressing issues circulating in world capital markets that won’t | | | | immediately be resolved, emerging market valuations are clearly compelling, even when factoring in lower near-term growth. The 40% decline since their February 2021 peak brings the 2023 and 2024 estimated PE ratios to 10.5x and 9.3x, respectively. To be sure, the global backdrop remains turbulent, as developed market central banks continue to hike interest rates and China remains entangled in multiple layers of economic and political uncertainty. Still, this presents a unique opportunity for us to invest in quality businesses that are benefiting from the ongoing economic development of emerging markets but are often fully priced. In addition, history shows that MSCI EM Index has troughed ahead of the S&P 500® Index in four of the 10 prior bear markets and on the same date as the S&P 500® Index on three occasions. Given that China is more likely to be stimulating their economy when other major nations are still curbing growth, we suspect that MSCI EM Index will trough ahead of developed markets in this cycle. With respect to the Fund’s structure, trading and market activity during the fiscal year resulted in increased exposures to the industrials, health care, and consumer staples, while our weights in consumer discretionary, energy, and communication services decreased. At the close of the period, the Fund had overweight positions in the consumer discretionary, information technology, financials, consumer staples, health care, and communication services sectors and underweight positions in the materials, utilities, energy, real estate, and industrials sectors relative to the benchmark. Geographically, the portfolio finished the fiscal year with 75% in Asia, 14% in the EMEA region, and 8% in Latin America. The views expressed represent the opinions of GW&K Investment Management, LLC as of October 31, 2022, and are not intended as a forecast or guarantee of future results, and are subject to change without notice. |
12
| | |
| | | AMG GW&K Emerging Markets Equity Fund Portfolio Manager’s Comments (continued) |
| | | |
| | | |
CUMULATIVE TOTAL RETURN PERFORMANCE
AMG GW&K Emerging Markets Equity Fund’s cumulative total return is based on the daily change in net asset value (NAV), and assumes that all dividends and distributions were reinvested. This graph compares a hypothetical $10,000 investment made in the AMG GW&K Emerging Markets Equity Fund’s Class N shares on October 31, 2012, to a $10,000 investment made in the MSCI Emerging Markets Index for the same time period. The graph and table do not reflect the deduction of taxes that a shareholder would pay on a Fund distribution or redemption of shares. The listed returns for the Fund are net of expenses and the returns for the index excludes expenses. Total returns would have been lower had certain expenses not been reduced.
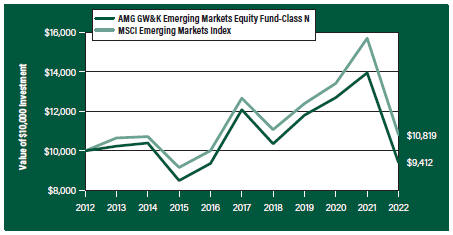
The table below shows the average annual total returns for the AMG GW&K Emerging Markets Equity Fund and the MSCI Emerging Markets Index for the same time periods ended October 31, 2022.
| | | | | | | | |
| | | One | | Five | | Ten | |
| Average Annual Total Returns1 | | Year | | Years | | Years | |
|
AMG GW&K Emerging Markets Equity Fund2, 3, 4, 5, 6, 7, 8, 9, 10, 11, 12 | |
| | | |
Class N | | (32.50%) | | (4.87%) | | | (0.61%) | |
| | | |
Class I | | (32.28%) | | (4.56%) | | | (0.26%) | |
| | | |
Class Z | | (32.20%) | | (4.49%) | | | (0.17%) | |
| | | |
MSCI Emerging Markets Index13 | | (31.03%) | | (3.09%) | | | 0.79% | |
The performance data shown represents past performance. Past performance is not a guarantee of future results. Current performance may be lower or higher than the performance data quoted. The investment return and principal value of an investment will fluctuate so that an investor’s shares, when redeemed, may be worth more or less than their original cost.
Investors should carefully consider the Fund’s investment objectives, risks, charges and expenses before investing. For performance information through the most recent month end, current net asset values per share for the Fund and other information, please call 800.548.4539 or visit our website at amgfunds.com for a free prospectus. Read it carefully before investing or sending money.
Distributed by AMG Distributors, Inc., member FINRA/SIPC.
| 1 | Total return equals income yield plus share price change and assumes reinvestment of all dividends and capital gain distributions. Returns are net of fees and may reflect offsets of Fund expenses as described in the prospectus. No adjustment has been made for taxes payable by shareholders on their reinvested dividends and capital gain distributions. Returns for periods greater than one year are annualized. The listed returns on the Fund are net of expenses and based on the published NAV as of October 31, 2022. All returns are in U.S. Dollars ($). |
|
2 From time to time, the Fund’s adviser has waived its fees and/or absorbed Fund expenses, which has resulted in higher returns. 3 The Fund is subject to currency risk resulting from fluctuations in exchange rates that may affect the total loss or gain on a non-U.S. Dollar investment when converted back to U.S. Dollars. 4 Investments in international securities are subject to certain risks of overseas investing including currency fluctuations and changes in political and economic conditions, which could result in significant market fluctuations. These risks are magnified in emerging markets. 5 The Fund is subject to the risks associated with investments in emerging markets, such as erratic earnings patterns, economic and political instability, changing exchange controls, limitations on repatriation of foreign capital and changes in local governmental attitudes toward private investment, possibly leading to nationalization or confiscation of investor assets. 6 Market prices of investments held by the Fund may fall rapidly or unpredictably due to a variety of economic or political factors, market conditions, disasters or public health issues, or in response to events that affect particular industries or companies. 7 The Fund may invest in derivatives such as options and futures; the complexity and rapidly changing structure of derivatives markets may increase the possibility of market losses. 8 The Fund invests in growth stocks, which may be more sensitive to market movements because their prices tend to reflect future investor expectations rather than just current profits. Growth stocks may underperform value stocks during given periods. 9 Investing in initial public offerings (IPOs) is risky and the prices of stocks purchased in IPOs tend to fluctuate more widely than stocks of companies that have been publicly traded for a longer period of time. Stocks purchased in IPOs generally do not have a trading history, and information about the companies may be available for very limited periods. 10 The Fund is subject to risks associated with investments in mid-capitalization companies such as greater price volatility, lower trading volume, and less liquidity than the stocks of larger, more established companies. 11 Companies that are in similar industry sectors may be similarly affected by particular economic or market events; to the extent the Fund has substantial holdings within a particular sector, the risks associated with that sector increase. |
13
| | |
| | | AMG GW&K Emerging Markets Equity Fund Portfolio Manager’s Comments (continued) |
| | | |
| | | |
| | | | | | | | |
12 The Fund is subject to risks associated with investments in small-capitalization companies, such as erratic earnings patterns, competitive conditions, limited earnings history and a reliance on one or a limited number of products. 13 The MSCI Emerging Markets Index is a free float-adjusted market capitalization index that is designed to measure equity market performance of emerging markets. Please go to msci.com for most current list of countries represented by the index. Unlike the Fund, the MSCI Emerging Markets Index is unmanaged, is not available for investment and does not incur expenses. | | | | All MSCI data is provided “as is.” The products described herein are not sponsored or endorsed and have not been reviewed or passed on by MSCI. In no event shall MSCI, its affiliates or any MSCI data provider have any liability of any kind in connection with the MSCI data or the products described herein. Copying or redistributing the MSCI data is strictly prohibited. Not FDIC insured, nor bank guaranteed. May lose value. | | | | |
14
| | |
| | | AMG GW&K Emerging Markets Equity Fund Fund Snapshots (unaudited) October 31, 2022 |
PORTFOLIO BREAKDOWN
| | | | | |
| Sector | | % of Net Assets |
| | |
Financials | | | | 27.5 | |
| | |
Information Technology | | | | 22.7 | |
| | |
Consumer Discretionary | | | | 18.3 | |
| | |
Communication Services | | | | 8.6 | |
| | |
Consumer Staples | | | | 8.1 | |
| | |
Industrials | | | | 5.6 | |
| | |
Health Care | | | | 4.9 | |
| | |
Energy | | | | 3.7 | |
| | |
Short-Term Investments | | | | 2.9 | |
| | |
Other Assets, Less Liabilities | | | | (2.3 | ) |
TOP TEN HOLDINGS
| | | | | |
| Security Name | | % of
Net Assets |
| | |
Taiwan Semiconductor Manufacturing Co., Ltd. (Taiwan) | | | | 7.4 | |
| | |
Samsung Electronics Co., Ltd. (South Korea) | | | | 5.7 | |
| | |
HDFC Bank, Ltd. (India) | | | | 4.7 | |
| | |
Housing Development Finance Corp., Ltd. (India) | | | | 4.3 | |
| | |
Reliance Industries, Ltd. (India) | | | | 3.7 | |
| | |
Bank Mandiri Persero Tbk PT (Indonesia) | | | | 2.9 | |
| | |
Alibaba Group Holding, Ltd. (China) | | | | 2.8 | |
| | |
Grupo Financiero Banorte, S.A.B de CV, Class O (Mexico) | | | | 2.7 | |
| | |
Yum China Holdings, Inc. (China) | | | | 2.4 | |
| | |
Grupo Aeroportuario del Pacifico, S.A.B de CV, Class B (Mexico) | | | | 2.2 | |
| | | | | | |
| | |
Top Ten as a Group | | | | 38.8 | |
| | | | | |
Because a fund’s strategy may result in multiple investments in particular sectors of the economy, its performance may depend on the performance of those sectors and may fluctuate more widely than investments diversified across more sectors. For additional information on these and other risk considerations, please see the Fund’s prospectus.
Any sectors, industries, or securities discussed should not be perceived as investment recommendations. Mention of a specific security should not be considered a recommendation to buy or solicitation to sell that security. Specific securities mentioned in this report may have been sold from the Fund’s portfolio of investments by the time you receive this report.
15
| | |
| | | AMG GW&K Emerging Markets Equity Fund Schedule of Portfolio Investments October 31, 2022 |
| | | | | | | | |
| | |
| | | Shares | | | Value | |
| | |
Common Stocks - 99.4% | | | | | | | | |
| |
Communication Services - 8.6% | | | | | |
| | |
Baidu, Inc., Class A (China)* | | | 29,816 | | | | $285,846 | |
| | |
Kingsoft Corp., Ltd. (China) | | | 71,200 | | | | 215,604 | |
| | |
Kuaishou Technology (China)*,1 | | | 26,000 | | | | 107,376 | |
| | |
MultiChoice Group (South Africa) | | | 32,058 | | | | 209,482 | |
| | |
NetEase, Inc. (China) | | | 12,425 | | | | 137,859 | |
| | |
Tencent Holdings, Ltd. (China) | | | 13,506 | | | | 354,894 | |
| | |
Tencent Music Entertainment Group, ADR (China)* | | | 19,872 | | | | 71,738 | |
| | |
Total Communication Services | | | | | | | 1,382,799 | |
| | |
Consumer Discretionary - 18.3% | | | | | | | | |
| | |
Alibaba Group Holding, Ltd. (China)* | | | 58,428 | | | | 454,272 | |
| | |
Feng TAY Enterprise Co., Ltd. (Taiwan) | | | 39,355 | | | | 195,448 | |
| | |
H World Group Ltd., ADR (China) | | | 5,750 | | | | 155,710 | |
| | |
Haidilao International Holding, Ltd. (China)*,1 | | | 49,000 | | | | 72,757 | |
| | |
JD.com, Inc., Class A (China) | | | 7,652 | | | | 139,347 | |
| | |
Li Ning Co., Ltd. (China) | | | 46,000 | | | | 237,954 | |
| | |
MakeMyTrip, Ltd. (India)* | | | 10,648 | | | | 296,334 | |
| | |
Midea Group Co., Ltd., Class A (China) | | | 33,385 | | | | 183,914 | |
| | |
Pepco Group, N.V. (United Kingdom)*,1,2 | | | 10,017 | | | | 70,378 | |
| | |
Prosus, N.V. (Netherlands) | | | 4,562 | | | | 197,269 | |
| | |
Sands China, Ltd. (Macau)* | | | 97,950 | | | | 171,239 | |
| | |
Shenzhou International Group Holdings, Ltd. (China) | | | 4,160 | | | | 28,883 | |
| | |
Trip.com Group, Ltd., ADR (China)* | | | 15,677 | | | | 354,770 | |
| | |
Yum China Holdings, Inc. (China) | | | 9,467 | | | | 391,460 | |
| | |
Total Consumer Discretionary | | | | | | | 2,949,735 | |
| | |
Consumer Staples - 8.1% | | | | | | | | |
| | |
Angel Yeast Co., Ltd., Class A (China) | | | 13,600 | | | | 67,634 | |
| | |
Bid Corp., Ltd. (South Africa) | | | 15,193 | | | | 244,461 | |
| | |
CP All PCL (Thailand) | | | 52,668 | | | | 83,074 | |
| | |
Dino Polska, S.A. (Poland)*,1 | | | 3,001 | | | | 195,882 | |
| | |
Fomento Economico Mexicano, S.A.B de CV (Mexico)2 | | | 27,996 | | | | 200,845 | |
| | |
Orion Corp. (South Korea) | | | 2,785 | | | | 198,186 | |
| | |
Vietnam Dairy Products JSC (Vietnam) | | | 23,700 | | | | 74,808 | |
| | |
Wal-Mart de Mexico, S.A.B. de CV (Mexico) | | | 60,873 | | | | 235,160 | |
| | |
Total Consumer Staples | | | | | | | 1,300,050 | |
| | |
Energy - 3.7% | | | | | | | | |
| | |
Reliance Industries, Ltd. (India) | | | 19,188 | | | | 592,080 | |
| | |
Financials - 27.5% | | | | | | | | |
| | |
AIA Group, Ltd. (Hong Kong) | | | 42,768 | | | | 323,959 | |
| | |
B3, S.A. - Brasil Bolsa Balcao (Brazil) | | | 32,300 | | | | 93,795 | |
| | | | | | | | |
| | |
| | | Shares | | | Value | |
| | |
Banco Bradesco, S.A., ADR (Brazil)2 | | | 66,983 | | | | $253,866 | |
| | |
Bank Mandiri Persero Tbk PT (Indonesia) | | | 685,216 | | | | 462,900 | |
| | |
Bank Rakyat Indonesia Persero Tbk PT (Indonesia) | | | 834,336 | | | | 248,910 | |
| | |
BDO Unibank, Inc. (Philippines) | | | 144,490 | | | | 319,379 | |
| | |
China International Capital Corp., Ltd., Class H (China)1 | | | 184,800 | | | | 256,820 | |
| | |
East Money Information Co., Ltd., Class A (China) | | | 45,600 | | | | 97,753 | |
| | |
Grupo Financiero Banorte, S.A.B de CV, Class O (Mexico) | | | 53,742 | | | | 437,493 | |
| | |
HDFC Bank, Ltd. (India) | | | 41,340 | | | | 750,257 | |
| | |
HDFC Life Insurance Co., Ltd. (India)1 | | | 18,500 | | | | 120,900 | |
| | |
Housing Development Finance Corp., Ltd. (India) | | | 22,969 | | | | 686,745 | |
| | |
Ping An Insurance Group Co. of China, Ltd., Class H (China) | | | 29,000 | | | | 116,098 | |
| | |
XP, Inc., Class A (Brazil)*,2 | | | 14,106 | | | | 258,563 | |
| | |
Total Financials | | | | | | | 4,427,438 | |
| | |
Health Care - 4.9% | | | | | | | | |
| | |
China Resources Sanjiu Medical & Pharmaceutical Co., Ltd., Class A (China) | | | 25,800 | | | | 192,970 | |
| | |
CSPC Pharmaceutical Group, Ltd. (China) | | | 103,408 | | | | 106,217 | |
| | |
Fleury, S.A. (Brazil) | | | 57,322 | | | | 205,851 | |
| | |
Jinxin Fertility Group, Ltd. (China)1 | | | 39,500 | | | | 19,471 | |
| | |
Lepu Medical Technology Beijing Co., Ltd., Class A (China) | | | 23,800 | | | | 82,516 | |
| | |
Odontoprev, S.A. (Brazil) | | | 85,461 | | | | 136,327 | |
| | |
Syngene International, Ltd. (India)1 | | | 6,010 | | | | 45,857 | |
| | |
Total Health Care | | | | | | | 789,209 | |
| | |
Industrials - 5.6% | | | | | | | | |
| | |
Contemporary Amperex Technology Co., Ltd., Class A (China) | | | 4,100 | | | | 210,411 | |
| | |
Copa Holdings, S.A., Class A (Panama)* | | | 2,550 | | | | 191,837 | |
| | |
Grupo Aeroportuario del Pacifico, S.A.B de CV, Class B (Mexico) | | | 22,955 | | | | 356,044 | |
| | |
International Container Terminal Services, Inc. (Philippines) | | | 32,100 | | | | 96,225 | |
| | |
Shenzhen Inovance Technology Co., Ltd., Class A (China) | | | 5,900 | | | | 54,055 | |
| | |
Total Industrials | | | | | | | 908,572 | |
| | |
Information Technology - 22.7% | | | | | | | | |
| | |
Advantech Co., Ltd. (Taiwan) | | | 10,727 | | | | 97,183 | |
| | |
Delta Electronics, Inc. (Taiwan) | | | 28,100 | | | | 223,587 | |
| | |
FPT Corp. (Vietnam) | | | 20,000 | | | | 60,857 | |
| | |
Globant SA (Uruguay)* | | | 800 | | | | 150,944 | |
| | |
Infosys, Ltd., Sponsored ADR (India) | | | 5,676 | | | | 106,311 | |
| | |
MediaTek, Inc. (Taiwan) | | | 12,000 | | | | 218,738 | |
The accompanying notes are an integral part of these financial statements.
16
| | |
| | | AMG GW&K Emerging Markets Equity Fund Schedule of Portfolio Investments (continued) |
| | | | | | | | |
| | |
| | | Shares | | | Value | |
| | |
Information Technology - 22.7%
(continued) | | | | | | | | |
| | |
Pagseguro Digital, Ltd., Class A (Brazil)* | | | 3,838 | | | | $52,504 | |
| | |
Samsung Electronics Co., Ltd. (South Korea) | | | 22,067 | | | | 918,425 | |
| | |
Silergy Corp. (China) | | | 4,000 | | | | 46,127 | |
| | |
SK Hynix, Inc. (South Korea) | | | 5,884 | | | | 340,634 | |
| | |
Taiwan Semiconductor Manufacturing Co., Ltd. (Taiwan) | | | 99,632 | | | | 1,197,797 | |
| | |
Tata Consultancy Services, Ltd. (India) | | | 2,184 | | | | 84,285 | |
| | |
TOTVS, S.A. (Brazil) | | | 25,300 | | | | 163,540 | |
| | |
Total Information Technology | | | | | | | 3,660,932 | |
| | |
Total Common Stocks
(Cost $15,063,802) | | | | | | | 16,010,815 | |
| |
Rights - 0.0%# | | | | | |
| | |
Health Care - 0.0%# | | | | | | | | |
| | |
Fleury, S.A., Expiration 11/25/22 (Brazil)* (Cost $0) | | | 12,746 | | | | 3,208 | |
| * | Non-income producing security. |
| 1 | Security exempt from registration under Rule 144A of the Securities Act of 1933. This security may be resold in transactions exempt from registration, normally to qualified institutional buyers. At October 31, 2022, the value of these securities amounted to $889,441 or 5.5% of net assets. |
| | | | | | | | |
| | |
| | | Principal
Amount | | | Value | |
| |
Short-Term Investments - 2.9% | | | | | |
| |
Joint Repurchase Agreements - 2.4%3 | | | | | |
| | |
National Bank Financial, dated 10/31/22, due 11/01/22, 3.090% total to be received $383,247 (collateralized by various U.S. Treasuries, 0.000% - 4.078%, 11/01/22 - 09/09/49, totaling $390,878) | | | $383,214 | | | | $383,214 | |
| |
Repurchase Agreements - 0.5% | | | | | |
| | |
Fixed Income Clearing Corp., dated 10/31/22, due 11/01/22, 2.900% total to be received $85,007 (collateralized by a U.S. Treasury, 1.625%, 05/15/31, totaling $86,772) | | | 85,000 | | | | 85,000 | |
| | |
Total Short-Term Investments
(Cost $468,214) | | | | | | | 468,214 | |
| | |
Total Investments - 102.3%
(Cost $15,532,016) | | | | | | | 16,482,237 | |
| |
Other Assets, less Liabilities - (2.3)% | | | | (372,047 | ) |
| | |
Net Assets - 100.0% | | | | | | $ | 16,110,190 | |
| 2 | Some of these securities, amounting to $637,837 or 4.0% of net assets, were out on loan to various borrowers and are collateralized by cash and various U.S. Treasury Obligations. See Note 4 of Notes to Financial Statements. |
| 3 | Cash collateral received for securities lending activity was invested in the joint repurchase agreement. |
ADR American Depositary Receipt
The accompanying notes are an integral part of these financial statements.
17
| | |
| | | AMG GW&K Emerging Markets Equity Fund Schedule of Portfolio Investments (continued) |
The following table summarizes the inputs used to value the Fund’s investments by the fair value hierarchy levels as of October 31, 2022:
| | | | | | | | | | | | | | | | |
| | | Level 1 | | | Level 21 | | | Level 3 | | | Total | |
Investments in Securities | | | | | | | | | | | | | | | | |
| | | | |
Common Stocks | | | | | | | | | | | | | | | | |
| | | | |
Financials | | | $1,043,717 | | | | $3,383,721 | | | | — | | | | $4,427,438 | |
| | | | |
Information Technology | | | 473,299 | | | | 3,187,633 | | | | — | | | | 3,660,932 | |
| | | | |
Consumer Discretionary | | | 1,198,274 | | | | 1,751,461 | | | | — | | | | 2,949,735 | |
| | | | |
Communication Services | | | 281,220 | | | | 1,101,579 | | | | — | | | | 1,382,799 | |
| | | | |
Consumer Staples | | | 680,466 | | | | 619,584 | | | | — | | | | 1,300,050 | |
| | | | |
Industrials | | | 547,881 | | | | 360,691 | | | | — | | | | 908,572 | |
| | | | |
Health Care | | | 342,178 | | | | 447,031 | | | | — | | | | 789,209 | |
| | | | |
Energy | | | — | | | | 592,080 | | | | — | | | | 592,080 | |
| | | | |
Rights | | | | | | | | | | | | | | | | |
| | | | |
Health Care | | | 3,208 | | | | — | | | | — | | | | 3,208 | |
| | | | |
Short-Term Investments | | | | | | | | | | | | | | | | |
| | | | |
Joint Repurchase Agreements | | | — | | | | 383,214 | | | | — | | | | 383,214 | |
| | | | |
Repurchase Agreements | | | — | | | | 85,000 | | | | — | | | | 85,000 | |
| | | | | | | | | | | | | | | | |
Total Investments in Securities | | $ | 4,570,243 | | | $ | 11,911,994 | | | | — | | | $ | 16,482,237 | |
| | | | | | | | | | | | | | | | |
| 1 | An external pricing service is used to reflect any impact on security value due to market movements between the time the Fund valued such foreign securities and the earlier closing of foreign markets. |
For the fiscal year ended October 31, 2022, there were no transfers in or out of Level 3.
The country allocation in the Schedule of Portfolio Investments at October 31, 2022, was as follows:
| | |
| Country | | % of Long-Term
Investments |
| |
Brazil | | 7.3 |
| |
China | | 27.7 |
| |
Hong Kong | | 2.0 |
| |
India | | 16.8 |
| |
Indonesia | | 4.5 |
| |
Macau | | 1.1 |
| |
Mexico | | 7.7 |
| |
Netherlands | | 1.2 |
| |
Panama | | 1.2 |
| |
Philippines | | 2.6 |
| | |
| Country | | % of Long-Term
Investments |
| |
Poland | | 1.2 |
| |
South Africa | | 2.8 |
| |
South Korea | | 9.1 |
| |
Taiwan | | 12.1 |
| |
Thailand | | 0.5 |
| |
United Kingdom | | 0.4 |
| |
Uruguay | | 0.9 |
| |
Vietnam | | 0.9 |
| |
| | |
| |
| | | 100.0 |
| | |
The accompanying notes are an integral part of these financial statements.
18
| | |
| | | AMG GW&K Emerging Wealth Equity Fund Portfolio Manager’s Comments (unaudited) |
| | | |
| | | |
| | | | | | | | |
MARKET OVERVIEW Emerging markets fell sharply during the fiscal year ended October 31, 2022, amid Russia’s invasion of Ukraine, numerous headwinds in China, and a challenging inflation backdrop that saw several countries aggressively tighten monetary policy. Brent Crude oil initially traded above the $100/barrel level for the first time in seven years on U.S. sanctions targeting Russia’s energy industry. Other commodity prices were mixed; grains were well supported, but metals dropped on recession concerns. The MSCI Emerging Markets (“EM”) Index declined (31.0)%, while the MSCI EM ex China Index declined (21.9)%. This compares to an (18.5)% loss for the MSCI World Index of developed markets. Performance was mixed geographically, with commodity rich Latin America a standout performer, gaining 16.1% led by Brazil. The region is expected to benefit from the conflict-driven surge in energy and agricultural commodity prices. EMEA oil producers in the Persian Gulf posted respectable gains—but Russia’s elimination from the MSCI EM Index weighed on the region’s aggregate performance. Eastern European countries with proximity to the conflict and trade ties to Russia also capped gains in the EMEA region. North Asia was particularly weak due to external demand worries and ongoing market pressure in China. South Korea and Taiwan both fell sharply on the backup in U.S. interest rates and slowing demand in the IT hardware and semiconductor industries. Foreign investors shed Chinese equities en masse due to the country’s growth stifling Covid-zero policy, ongoing real estate industry turmoil, and President Xi’s consolidation of power at the National Party Congress. The MSCI China Index declined (47.9)%, bringing its index weight down to 27% from 35% at the beginning of the period. Indonesia bucked the negative trend in Asia, rising modestly on positive earnings momentum. Sector performance was broadly negative, with utilities down modestly compared to the broader group. Financials also outperformed on a relative basis as investors looked to banks as proxies for several commodity producing countries including South Africa, UAE, and Brazil. Consumer | | | | discretionary, communication services, and health care declined on China concerns, while slowing orders weighed on information technology. FUND REVIEW For the fiscal year ended October 31, 2022, AMG GW&K Emerging Wealth Equity Fund (the “Fund”) Class N shares returned (33.9)%, underperforming the MSCI EM Index, which returned (31.0)%. This was primarily due to our strategic focus on the benefits of wealth creation in emerging markets, which generally leads to higher portfolio exposure in consumer related industries and China. Both market segments underperformed materially over the past 12 months, causing sector and country allocation to negatively impact the Fund’s relative performance. Encouragingly, stock selection in China, which averaged 54% of the Fund, and consumer discretionary, which averaged 32%, was positive. The Fund’s top performing company was China Resources Sanjiu Medical & Pharmaceutical, a branded OTC drug and traditional Chinese medicine (TCM) specialist that delivered solid earnings due to market share gains and cost optimization. Although markets proved challenging this year, there were a few companies that bucked the downward trend including India’s Eicher Motors, which reported better-than-expected margins due to improving volumes and mix benefits, and Titan Company, which benefited from resilient jewelry demand in India. Wal-Mart de Mexico, also rebounded late in the period on the company’s continued market share gains. Still, it was difficult to avoid the market turmoil and several of the portfolio’s holdings sold off as market sentiment turned more bearish. Southeast Asian internet platform, Sea Ltd. dropped sharply on mounting competition amid heavy selling of global growth stocks. Chinese ecommerce and internet platform giants Alibaba Group Holdings and Tencent Holdings were hard hit by regulatory uncertainty and slowing consumption. Power semiconductor producer, Infineon Technologies declined on near-term margin concerns as the company ramps up higher generation fabrication plants. | | | | OUTLOOK Emerging markets are now at levels not seen since early in the pandemic or, looking further back, 2015. Although there are several pressing issues circulating in world capital markets that won’t immediately be resolved, emerging market valuations are clearly compelling, even when factoring in lower near-term growth. The (40)% decline since their February 2021 peak brings the 2023 and 2024 estimated PE ratios to 10.5x and 9.3x, respectively. To be sure, the global backdrop remains turbulent, as developed market central banks continue to hike interest rates and China remains entangled in multiple layers of economic and political uncertainty. Still, this presents a unique opportunity for us to invest in quality businesses that are benefiting from the ongoing economic development of emerging markets but are often fully priced. In addition, history shows that MSCI EM Index has troughed ahead of the S&P 500® Index in four of the 10 prior bear markets and on the same date as the S&P® 500 Index on three occasions. Given that China is more likely to be stimulating their economy when other major nations are still curbing growth, we suspect that MSCI EM Index will trough ahead of developed market in this cycle. With respect to the Fund’s structure, trading and market activity during the fiscal year resulted in increased exposure to financials, consumer staples, and industrials, while consumer discretionary, health care, and communication services declined. At the close of the period, the Fund had overweight positions in the consumer discretionary, health care, and financials sectors and underweight positions in the information technology, materials, energy, and industrials sectors relative to the benchmark. Geographically, the portfolio finished the fiscal year with exposures of 78.9% in Asia, 16.0% in Developed Markets, and 3.2% in Latin America. The views expressed represent the opinions of GW&K Investment Management, LLC as of October 31, 2022, and are not intended as a forecast or guarantee of future results, and are subject to change without notice. |
19
| | |
| | | AMG GW&K Emerging Wealth Equity Fund Portfolio Manager’s Comments (continued) |
| | | |
| | | |
CUMULATIVE TOTAL RETURN PERFORMANCE
AMG GW&K Emerging Wealth Equity Fund’s cumulative total return is based on the daily change in net asset value (NAV), and assumes that all dividends and distributions were reinvested. This graph compares a hypothetical $10,000 investment made in the AMG GW&K Emerging Wealth Equity Fund’s Class N shares on March 19, 2015 (inception date), to a $10,000 investment made in the MSCI Emerging Markets Index for the same time period. The graph and table do not reflect the deduction of taxes that a shareholder would pay on a Fund distribution or redemption of shares. The listed returns for the Fund are net of expenses and the returns for the index excludes expenses. Total returns would have been lower had certain expenses not been reduced.
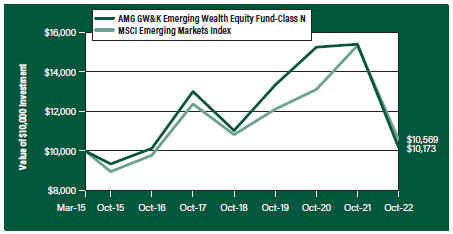
The table below shows the average annual total returns for the AMG GW&K Emerging Wealth Equity Fund and the MSCI Emerging Markets Index for the same time periods ended October 31, 2022.
| | | | | | | | |
| | | One | | Five | | Since | | Inception |
| Average Annual Total Returns1 | | Year | | Years | | Inception | | Date |
|
AMG GW&K Emerging Wealth Equity Fund2, 3, 4, 5, 6, 7, 8, 9 |
| | | | |
Class N | | (33.89%) | | (4.78%) | | 0.23% | | 03/19/15 |
| | | | |
Class I | | (33.68%) | | (4.51%) | | 0.49% | | 03/19/15 |
| | | | |
Class Z | | (33.61%) | | (4.42%) | | 0.60% | | 03/19/15 |
| | | | |
MSCI Emerging Markets Index10 | | (31.03%) | | (3.09%) | | 0.73% | | 03/19/15† |
The performance data shown represents past performance. Past performance is not a guarantee of future results. Current performance may be lower or higher than the performance data quoted. The investment return and principal value of an investment will fluctuate so that an investor’s shares, when redeemed, may be worth more or less than their original cost.
Investors should carefully consider the Fund’s investment objectives, risks, charges and expenses before investing. For performance information through the most recent month end, current net asset values per share for the Fund and other information, please call 800.548.4539 or visit our website at amgfunds.com for a free prospectus. Read it carefully before investing or sending money.
Distributed by AMG Distributors, Inc., member FINRA/SIPC.
| † | Date reflects inception date of the Fund, not the index. |
| 1 | Total return equals income yield plus share price change and assumes reinvestment of all dividends and capital gain distributions. Returns are net of fees and may reflect offsets of Fund expenses as described in the prospectus. No adjustment has been made for taxes payable by shareholders on their reinvested dividends and |
|
capital gain distributions. Returns for periods greater than one year are annualized. The listed returns on the Fund are net of expenses and based on the published NAV as of October 31, 2022. All returns are in U.S. Dollars ($). 2 Investments in international securities are subject to certain risks of overseas investing including currency fluctuations and changes in political and economic conditions, which could result in significant market fluctuations. These risks are magnified in emerging markets. 3 The Fund is subject to the risks associated with investments in emerging markets, such as erratic earnings patterns, economic and political instability, changing exchange controls, limitations on repatriation of foreign capital and changes in local governmental attitudes toward private investment, possibly leading to nationalization or confiscation of investor assets. 4 The Fund is subject to currency risk resulting from fluctuations in exchange rates that may affect the total loss or gain on a non-U.S. Dollar investment when converted back to U.S. Dollars. 5 The Fund may invest in derivatives such as options and futures; the complexity and rapidly changing structure of derivatives markets may increase the possibility of market losses. 6 The Fund is subject to risks associated with investments in mid-capitalization companies such as greater price volatility, lower trading volume, and less liquidity than the stocks of larger, more established companies. 7 The Fund is subject to risks associated with investments in small-capitalization companies, such as erratic earnings patterns, competitive conditions, limited earnings history and a reliance on one or a limited number of products. 8 Market prices of investments held by the Fund may fall rapidly or unpredictably due to a variety of economic or political factors, market conditions, disasters or public health issues, or in response to events that affect particular industries or companies. 9 Companies that are in similar industry sectors may be similarly affected by particular economic or market events; to the extent the Fund has substantial holdings within a particular sector, the risks associated with that sector increase. 10 The MSCI Emerging Markets Index is a free float-adjusted market capitalization index that is designed to measure equity market performance of emerging markets. Please go to msci.com for most current list of countries represented by the index. Unlike the Fund, the MSCI Emerging Markets Index is unmanaged, is not available for investment and does not incur expenses. |
20
| | |
| | | AMG GW&K Emerging Wealth Equity Fund Portfolio Manager’s Comments (continued) |
| | | |
| | | |
| | | | | | | | |
| All MSCI data is provided “as is.” The products described herein are not sponsored or endorsed and have not been reviewed or passed on by MSCI. In no event shall MSCI, its affiliates or any MSCI data | | | | provider have any liability of any kind in connection with the MSCI data or the products described herein. Copying or redistributing the MSCI data is strictly prohibited. | | | | Not FIDC insured, nor bank guaranteed. May lose value. |
21
| | |
| | | AMG GW&K Emerging Wealth Equity Fund Fund Snapshots (unaudited) October 31, 2022 |
PORTFOLIO BREAKDOWN
| | | | | |
| Sector | | % of Net Assets |
| | |
Consumer Discretionary | | | | 32.0 | |
| | |
Financials | | | | 24.8 | |
| | |
Information Technology | | | | 15.1 | |
| | |
Consumer Staples | | | | 7.1 | |
| | |
Communication Services | | | | 7.0 | |
| | |
Health Care | | | | 6.0 | |
| | |
Industrials | | | | 3.6 | |
| | |
Materials | | | | 3.0 | |
| | |
Short-Term Investments | | | | 1.7 | |
| | |
Other Assets, Less Liabilities | | | | (0.3 | ) |
TOP TEN HOLDINGS
| | | | | |
| Security Name | | % of
Net Assets |
| | |
HDFC Bank, Ltd., ADR (India) | | | | 5.6 | |
| | |
Kotak Mahindra Bank, Ltd. (India) | | | | 5.4 | |
| | |
Trip.com Group, Ltd., ADR (China) | | | | 5.1 | |
| | |
Yum China Holdings, Inc. (China) | | | | 4.7 | |
| | |
QUALCOMM, Inc. | | | | 4.4 | |
| | |
Taiwan Semiconductor Manufacturing Co., Ltd. (Taiwan) | | | | 4.3 | |
| | |
Sands China, Ltd. (Macau) | | | | 4.2 | |
| | |
Infineon Technologies AG (Germany) | | | | 3.9 | |
| | |
AIA Group, Ltd. (Hong Kong) | | | | 3.7 | |
| | |
Alibaba Group Holding, Ltd. (China) | | | | 3.3 | |
| | | | | | |
| | |
Top Ten as a Group | | | | 44.6 | |
| | | | | |
Because a fund’s strategy may result in multiple investments in particular sectors of the economy, its performance may depend on the performance of those sectors and may fluctuate more widely than investments diversified across more sectors. For additional information on these and other risk considerations, please see the Fund’s prospectus.
Any sectors, industries, or securities discussed should not be perceived as investment recommendations. Mention of a specific security should not be considered a recommendation to buy or solicitation to sell that security. Specific securities mentioned in this report may have been sold from the Fund’s portfolio of investments by the time you receive this report.
22
| | |
| | | AMG GW&K Emerging Wealth Equity Fund Schedule of Portfolio Investments October 31, 2022 |
| | | | | | | | |
| | |
| | | Shares | | | Value | |
| | |
Common Stocks - 98.6% | | | | | | | | |
| |
Communication Services - 7.0% | | | | | |
| | |
Baidu, Inc., Class A (China)* | | | 167,100 | | | | $1,601,988 | |
| | |
Kingsoft Corp., Ltd. (China) | | | 199,500 | | | | 604,115 | |
| | |
Sea, Ltd., ADR (Singapore)* | | | 7,000 | | | | 347,760 | |
| | |
Tencent Holdings, Ltd. (China) | | | 89,340 | | | | 2,347,569 | |
| | |
The Walt Disney Co. (United States)* | | | 1,778 | | | | 189,428 | |
| | |
Total Communication Services | | | | | | | 5,090,860 | |
| |
Consumer Discretionary - 32.0% | | | | | |
| | |
Alibaba Group Holding, Ltd. (China)* | | | 308,948 | | | | 2,402,042 | |
| | |
Eicher Motors, Ltd. (India) | | | 21,710 | | | | 1,011,544 | |
| | |
H World Group Ltd., ADR (China) | | | 86,759 | | | | 2,349,434 | |
| | |
Haidilao International Holding, Ltd. (China)*,1 | | | 681,000 | | | | 1,011,171 | |
| | |
Hermes International (France) | | | 389 | | | | 503,516 | |
| | |
JD.com, Inc., Class A (China) | | | 14,650 | | | | 266,784 | |
| | |
Jubilant Foodworks, Ltd. (India) | | | 109,610 | | | | 808,585 | |
| | |
Li Ning Co., Ltd. (China) | | | 159,500 | | | | 825,081 | |
| | |
LVMH Moet Hennessy Louis Vuitton SE (France) | | | 736 | | | | 464,412 | |
| | |
MakeMyTrip, Ltd. (India)* | | | 53,109 | | | | 1,478,024 | |
| | |
Moncler SpA (Italy)2 | | | 13,003 | | | | 561,005 | |
| | |
Sands China, Ltd. (Macau)* | | | 1,724,090 | | | | 3,014,096 | |
| | |
Titan Co., Ltd. (India) | | | 38,010 | | | | 1,268,320 | |
| | |
Trip.com Group, Ltd., ADR (China)* | | | 163,242 | | | | 3,694,166 | |
| | |
Yum China Holdings, Inc. (China) | | | 82,478 | | | | 3,410,465 | |
| | |
Total Consumer Discretionary | | | | | | | 23,068,645 | |
| | |
Consumer Staples - 7.1% | | | | | | | | |
| | |
Angel Yeast Co., Ltd., Class A (China) | | | 38,850 | | | | 193,204 | |
| | |
The Estee Lauder Cos., Inc., Class A (United States) | | | 1,465 | | | | 293,718 | |
| | |
Foshan Haitian Flavouring & Food Co., Ltd., Class A (China) | | | 96,810 | | | | 793,447 | |
| | |
Wal-Mart de Mexico, S.A.B. de CV (Mexico) | | | 381,820 | | | | 1,475,016 | |
| | |
Wuliangye Yibin Co., Ltd., Class A (China) | | | 128,203 | | | | 2,349,797 | |
| | |
Total Consumer Staples | | | | | | | 5,105,182 | |
| | |
Financials - 24.8% | | | | | | | | |
| | |
AIA Group, Ltd. (Hong Kong) | | | 354,530 | | | | 2,685,492 | |
| | |
Bank Central Asia Tbk PT (Indonesia) | | | 1,031,400 | | | | 583,027 | |
| | |
China International Capital Corp., Ltd., Class H (China)1 | | | 1,724,900 | | | | 2,397,128 | |
| | |
East Money Information Co., Ltd., Class A (China) | | | 463,174 | | | | 992,903 | |
| | |
HDFC Bank, Ltd., ADR (India) | | | 64,673 | | | | 4,029,775 | |
| | |
HDFC Life Insurance Co., Ltd. (India)1 | | | 350,320 | | | | 2,289,393 | |
| | |
Hong Kong Exchanges & Clearing, Ltd. (Hong Kong) | | | 37,650 | | | | 999,367 | |
| | | | | | | | |
| | |
| | | Shares | | | Value | |
| | |
Kotak Mahindra Bank, Ltd. (India) | | | 169,126 | | | | $3,894,145 | |
| | |
Total Financials | | | | | | | 17,871,230 | |
| | |
Health Care - 6.0% | | | | | | | | |
| | |
China Resources Sanjiu Medical & Pharmaceutical Co., Ltd., Class A (China) | | | 122,812 | | | | 918,568 | |
| | |
CSPC Pharmaceutical Group, Ltd. (China) | | | 1,437,600 | | | | 1,476,648 | |
| | |
Novo Nordisk A/S, Class B (Denmark) | | | 17,714 | | | | 1,926,066 | |
| | |
Total Health Care | | | | | | | 4,321,282 | |
| | |
Industrials - 3.6% | | | | | | | | |
| | |
Contemporary Amperex Technology Co., Ltd., Class A (China) | | | 26,100 | | | | 1,339,445 | |
| | |
Copa Holdings, S.A., Class A (Panama)* | | | 6,245 | | | | 469,811 | |
| | |
Shenzhen Inovance Technology Co., Ltd., Class A (China) | | | 84,300 | | | | 772,345 | |
| | |
Total Industrials | | | | | | | 2,581,601 | |
| |
Information Technology - 15.1% | | | | | |
| | |
Beijing Kingsoft Office Software, Inc., Class A (China) | | | 7,000 | | | | 279,616 | |
| | |
Dlocal, Ltd. (Uruguay)*,2 | | | 16,460 | | | | 367,058 | |
| | |
Infineon Technologies AG (Germany) | | | 114,945 | | | | 2,789,196 | |
| | |
Mastercard, Inc., Class A (United States) | | | 3,420 | | | | 1,122,375 | |
| | |
QUALCOMM, Inc. (United States) | | | 27,274 | | | | 3,209,059 | |
| | |
Taiwan Semiconductor Manufacturing Co., Ltd. (Taiwan) | | | 257,500 | | | | 3,095,719 | |
| | |
Total Information Technology | | | | | | | 10,863,023 | |
| | |
Materials - 3.0% | | | | | | | | |
| | |
Asian Paints, Ltd. (India) | | | 23,578 | | | | 887,548 | |
| | |
Chr Hansen Holding A/S (Denmark)2 | | | 10,833 | | | | 601,677 | |
| | |
Skshu Paint Co., Ltd., Class A (China)* | | | 59,250 | | | | 707,433 | |
| | |
Total Materials | | | | | | | 2,196,658 | |
| | |
Total Common Stocks
(Cost $78,787,366) | | | | | | | 71,098,481 | |
| | |
| | | Principal Amount | | | | |
| |
Short-Term Investments - 1.7% | | | | | |
| |
Joint Repurchase Agreements - 1.7%3 | | | | | |
| | |
Citigroup Global Markets, Inc., dated 10/31/22, due 11/01/22, 3.000% total to be received $256,679 (collateralized by various U.S. Treasuries, 0.125% - 4.375%, 11/15/31 - 02/15/52, totaling $261,945) | | | $256,658 | | | | 256,658 | |
The accompanying notes are an integral part of these financial statements.
23
| | |
| | | AMG GW&K Emerging Wealth Equity Fund Schedule of Portfolio Investments (continued) |
| | | | | | | | |
| | |
| | | Principal
Amount | | | Value | |
| |
Joint Repurchase Agreements - 1.7%3
(continued) | | | | | |
| | |
RBC Dominion Securities, Inc., dated 10/31/22, due 11/01/22, 3.050% total to be received $1,000,085 (collateralized by various U.S. Government Agency Obligations and U.S. Treasuries, 0.500% - 5.000%, 02/28/26 - 10/20/52, totaling $1,020,000) | | $ | 1,000,000 | | | | $1,000,000 | |
| | |
Total Short-Term Investments
(Cost $1,256,658) | | | | | | | 1,256,658 | |
| | | | | | | | |
| | |
| | | | | | Value | |
| | |
Total Investments - 100.3%
(Cost $80,044,024) | | | | | | $ | 72,355,139 | |
| |
Other Assets, less Liabilities - (0.3)% | | | | (231,474 | ) |
| | |
Net Assets - 100.0% | | | | | | $ | 72,123,665 | |
| * | Non-income producing security. |
| 1 | Security exempt from registration under Rule 144A of the Securities Act of 1933. This security may be resold in transactions exempt from registration, normally to qualified institutional buyers. At October 31, 2022, the value of these securities amounted to $5,697,692 or 7.9% of net assets. |
| 2 | Some of these securities, amounting to $1,183,977 or 1.6% of net assets, were out on loan to various borrowers and are collateralized by cash. See Note 4 of Notes to Financial Statements. |
| 3 | Cash collateral received for securities lending activity was invested in these joint repurchase agreements. |
ADR American Depositary Receipt
The following table summarizes the inputs used to value the Fund’s investments by the fair value hierarchy levels as of October 31, 2022:
| | | | | | | | | | | | | | | | |
| | | Level 1 | | | Level 21 | | | Level 3 | | | Total | |
Investments in Securities | | | | | | | | | | | | | | | | |
| | | | |
Common Stocks | | | | | | | | | | | | | | | | |
| | | | |
Consumer Discretionary | | $ | 10,932,089 | | | $ | 12,136,556 | | | | — | | | $ | 23,068,645 | |
| | | | |
Financials | | | 4,029,775 | | | | 13,841,455 | | | | — | | | | 17,871,230 | |
| | | | |
Information Technology | | | 4,698,492 | | | | 6,164,531 | | | | — | | | | 10,863,023 | |
| | | | |
Consumer Staples | | | 1,768,734 | | | | 3,336,448 | | | | — | | | | 5,105,182 | |
| | | | |
Communication Services | | | 537,188 | | | | 4,553,672 | | | | — | | | | 5,090,860 | |
| | | | |
Health Care | | | — | | | | 4,321,282 | | | | — | | | | 4,321,282 | |
| | | | |
Industrials | | | 469,811 | | | | 2,111,790 | | | | — | | | | 2,581,601 | |
| | | | |
Materials | | | — | | | | 2,196,658 | | | | — | | | | 2,196,658 | |
| | | | |
Short-Term Investments | | | | | | | | | | | | | | | | |
| | | | |
Joint Repurchase Agreements | | | — | | | | 1,256,658 | | | | — | | | | 1,256,658 | |
| | | | | | | | | | | | | | | | |
| | | | |
Total Investments in Securities | | $ | 22,436,089 | | | $ | 49,919,050 | | | | — | | | $ | 72,355,139 | |
| | | | | | | | | | | | | | | | |
| 1 | An external pricing service is used to reflect any impact on security value due to market movements between the time the Fund valued such foreign securities and the earlier closing of foreign markets. |
For the fiscal year ended October 31, 2022, there were no transfers in or out of Level 3.
The accompanying notes are an integral part of these financial statements.
24
| | |
| | | AMG GW&K Emerging Wealth Equity Fund Schedule of Portfolio Investments (continued) |
The country allocation in the Schedule of Portfolio Investments at October 31, 2022, was as follows:
| | |
| Country | | % of Long-Term
Investments |
| |
China | | 43.2 |
| |
Denmark | | 3.6 |
| |
France | | 1.4 |
| |
Germany | | 3.9 |
| |
Hong Kong | | 5.2 |
| |
India | | 22.0 |
| |
Indonesia | | 0.8 |
| |
Italy | | 0.8 |
| |
Macau | | 4.2 |
| |
Mexico | | 2.1 |
| |
Panama | | 0.7 |
| |
Singapore | | 0.5 |
| |
Taiwan | | 4.3 |
| |
United States | | 6.8 |
| |
Uruguay | | 0.5 |
| |
| | |
| |
| | | 100.0 |
| | |
The accompanying notes are an integral part of these financial statements.
25
| | |
| | | AMG GW&K Small/Mid Cap Growth Fund Portfolio Manager’s Comments (unaudited) |
| | | |
| | | |
| | | | |
AMG GW&K Small/Mid Cap Growth Fund (the “Fund”) Class N shares outperformed its benchmark for the 12 months ended October 31, 2022, returning (23.88)% vs. the Russell 2500® Growth Index (the “Index”) return of (27.38)%. MARKET OVERVIEW For the year ended October 31, 2022, U.S. equity markets faced several macro challenges that produced difficult performance returns. Well-known issues including surging inflation, rapidly increasing interest rates, the Russia/Ukraine war, elevated commodity prices and COVID-restrained growth in China compressed valuation multiples and challenged corporate profits. While October witnessed a strong rally, double-digit declines were posted by the major averages over the full year. Domestic small/mid cap equities slightly underperformed larger cap stocks, reflected by the Russell 2500® Index moving (17.58)% lower, compared to the (14.61)% decline in the S&P 500® Index. Cyclical and defensive stocks helped small/mid value stocks produce better relative returns while valuation compression, most noticeably in health care and information technology, caused small/mid growth stocks to give back a large portion of prior appreciation. FUND REVIEW The Fund fell sharply during the year but still outperformed its benchmark. Stock selection was the primary driver of the outperformance. Health care was the largest contributor with a broad number of holdings playing a role. Better than expected patient volumes and revenue/day metrics pushed Acadia Healthcare 31.1% higher while its peer group fell | | (22.5)%. HealthEquity, a provider of health savings account platforms, continued to increase its market share and benefited from higher interest rates. In biopharma, a focus on companies with promising new products and late-stage commercial pipelines enabled Halozyme Therapeutics and Neurocrine Biosciences to post positive returns and attracted takeover bids for Biohaven Pharmaceuticals and Arena Pharmaceuticals. Industrials saw multiple areas of performance support. The successful integration of an acquisition moved RBC Bearings into a high single-digit gain. Billings and pipelines that were above expectations lifted consulting firms Booz Allen Hamilton Holdings and CACI International. A timely purchase of IDEX resulted in respectable contribution. Although slightly lower over the year, Ritchie Bros. Auctioneers, Ingersoll Rand, and Graco added to relative returns. Shifting to consumer discretionary, Grand Canyon Education reported an inflection in new online student starts in the September quarter and raised guidance for the balance of 2022. Texas Roadhouse beat consensus earnings expectations and posted impressive comparable restaurant sales of 8.2%. Fund sectors lagging the Index included information technology and financials. Two stocks accounted for the information technology underperformance. Cerence reported disappointing earnings and turnover in the executive suite and was sold. HubSpot’s results over the past year were quite respectable, but investors fretted over the company’s meaningful exposure to overseas markets and small and medium sized businesses. In financials, most of the underperformance was explained by MarketAxess Holdings. The stock was weak due to investor concerns about market share, and the | | uptick in interest rates pressured high multiple equities like MarketAxess. Looking at relative performance through a factor lens, the Fund’s allocation toward higher quality stocks helped results by about 130 basis points based on an average of seven factors, with earnings being the most prominent factor. OUTLOOK Looking forward, we anticipate the U.S. Federal Reserve’s (the Fed) commitment to higher interest rates and their impact on U.S. economic growth and corporate profits are likely to keep market volatility in an elevated status. Our current base case is that a deeper and/or more prolonged U.S. recession can still be avoided. In our view, the steep decline in the Index would indicate that investors are certainly not ignoring the potential for lower corporate earnings power or the effects of higher interest rates. On a positive note, compression in P/E multiples for small/mid cap growth stocks has created more attractive valuations in this complex climate. Our strategy is to invest and hold companies with strengths in competitive position, financials, and management where the stocks appear reasonably priced relative to risks. This approach has served us well in the past and we will stick with it during these challenging times. The views expressed represent the opinions of GW&K Investment Management, LLC, as of October 31, 2022, and are not intended as a forecast or guarantee of future results and are subject to change without notice. |
26
| | |
| | | AMG GW&K Small/Mid Cap Growth Fund Portfolio Manager’s Comments (continued) |
| | | |
| | | |
CUMULATIVE TOTAL RETURN PERFORMANCE
AMG GW&K Small/Mid Cap Growth Fund’s cumulative total return is based on the daily change in net asset value (NAV), and assumes that all dividends and distributions were reinvested. The graph compares a hypothetical $10,000 investment made in the AMG GW&K Small/Mid Cap Growth Fund’s Class N shares on October 31, 2012, to a $10,000 investment made in the Russell 2500® Growth Index for the same time period. The graph and table do not reflect the deduction of taxes that a shareholder would pay on a Fund distribution or redemption of shares. The listed returns for the Fund are net of expenses and the returns for the index excludes expenses. Total returns would have been lower had certain expenses not been reduced.
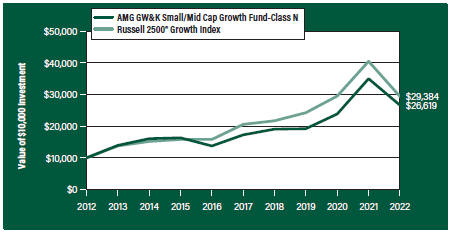
The table below shows the average annual total returns for the AMG GW&K Small/Mid Cap Growth Fund and the Russell 2500® Growth Index for the same time periods ended October 31, 2022.
| | | | | | | | | | | | | | | | | | |
| | | One | | Five | | | Ten | | | Since | | | Inception | |
| Average Annual Total Returns1 | | Year | | Years | | | Years | | | Inception | | | Date | |
|
AMG GW&K Small/Mid Cap Growth Fund2, 3, 4, 5, 6, 7, 8, 9, 10, 11 | |
| | | | | |
Class N | | (23.88%) | | | 9.06% | | | | 10.29% | | | | 9.71% | | | | 11/03/10 | |
| | | | | |
Class I | | (23.82%) | | | 9.25% | | | | 10.52% | | | | 8.40% | | | | 06/01/11 | |
| | | | | |
Class Z | | (23.76%) | | | — | | | | — | | | | (18.65%) | | | | 08/31/21 | |
| | | | | |
Russell 2500® Growth Index12 | | (27.38%) | | | 7.41% | | | | 11.38% | | | | 11.20% | | | | 11/03/10† | |
The performance data shown represents past performance. Past performance is not a guarantee of future results. Current performance may be lower or higher than the performance data quoted. The investment return and principal value of an investment will fluctuate so that an investor’s shares, when redeemed, may be worth more or less than their original cost.
Investors should carefully consider the Fund’s investment objectives, risks, charges and expenses before investing. For performance information through the most recent month end, current net asset values per share for the Fund and other information, please call 800.548.4539 or visit our website at amgfunds.com for a free prospectus. Read it carefully before investing or sending money.
Distributed by AMG Distributors, Inc., member FINRA/SIPC.
| † | Date reflects the inception date of the Fund, not the index. |
| 1 | Total return equals income yield plus share price change and assumes reinvestment of all dividends and capital gain distributions. Returns are net of fees and may reflect offsets of Fund expenses as described in the prospectus. No adjustment has been made for taxes payable by shareholders on their reinvested dividends and |
|
capital gain distributions. Returns for periods greater than one year are annualized. The listed returns on the Fund are net of expenses and based on the published NAV as of October 31, 2022. All returns are in U.S. Dollars ($). 2 As of March 19, 2021, the Fund’s subadviser was changed to GW&K Investment Management, LLC. Prior to March 19, 2021, the Fund was known as the AMG Managers LMCG Small Cap Growth Fund and had different principal investment strategies and corresponding risks. Effective March 19, 2021, the Fund changed its name to AMG GW&K Small Cap Fund II. Effective May 21, 2021, the Fund changed its name to AMG GW&K Small/Mid Cap Growth Fund and made changes to its principal investment strategies. Performance shown for periods prior to March 19, 2021, reflects the performance and investment strategies of the Fund’s previous subadviser, LMCG Investments, LLC. The Fund’s past performance would have been different if the Fund were managed by the current subadviser and strategy, and the Fund’s prior performance record might be less pertinent for investors considering whether to purchase shares of the Fund. 3 From time to time, the Fund’s adviser has waived its fees and/or absorbed Fund expenses, which has resulted in higher returns. 4 The Fund is subject to risks associated with investments in small-capitalization companies, such as erratic earnings patterns, competitive conditions, limited earnings history and a reliance on one or a limited number of products. 5 Active and frequent trading of a fund may result in higher transaction costs and increased tax liability. 6 The Fund invests in growth stocks, which may be more sensitive to market movements because their prices tend to reflect future investor expectations rather than just current profits. Growth stocks may underperform value stocks during given periods. 7 Investments in international securities are subject to certain risks of overseas investing including currency fluctuations and changes in political and economic conditions, which could result in significant market fluctuations. These risks are magnified in emerging markets. 8 Investing in initial public offerings (IPOs) is risky and the prices of stocks purchased in IPOs tend to fluctuate more widely than stocks of companies that have been publicly traded for a longer period of time. Stocks purchased in IPOs generally do not have a trading history, and information about the companies may be available for very limited periods. 9 The Fund is subject to risks associated with investments in mid-capitalization companies such as greater price volatility, lower trading volume, and |
27
| | |
| | | AMG GW&K Small/Mid Cap Growth Fund Portfolio Manager’s Comments (continued) |
| | | |
| | | |
| | | | |
less liquidity than the stocks of larger, more established companies. 10 Companies that are in similar industry sectors may be similarly affected by particular economic or market events; to the extent the Fund has substantial holdings within a particular sector, the risks associated with that sector increase. 11 Market prices of investments held by the Fund may fall rapidly or unpredictably due to a variety of | | economic or political factors, market conditions, disasters or public health issues, or in response to events that affect particular industries or companies. 12 The Russell 2500® Growth Index measures the performance of the small- to mid-cap growth segment of the U.S. equity universe. It includes those Russell 2500® companies with higher price-to-book ratios and higher forecasted growth values. Unlike the Fund, the Russell 2500® Growth | | Index is unmanaged, is not available for investment and does not incur expenses. The Russell Indices are a trademark of the London Stock Exchange Group companies. Not FDIC insured, nor bank guaranteed. May lose value. |
28
| | |
| | | AMG GW&K Small/Mid Cap Growth Fund Fund Snapshots (unaudited) October 31, 2022 |
| | | |
| | | |
PORTFOLIO BREAKDOWN
| | |
| Sector | | % of
Net Assets |
| | |
| Health Care | | 22.9 |
| | |
| Information Technology | | 22.1 |
| | |
| Industrials | | 18.7 |
| | |
| Consumer Discretionary | | 15.6 |
| | |
| Energy | | 6.1 |
| | |
| Financials | | 5.6 |
| | |
| Materials | | 3.4 |
| | |
| Consumer Staples | | 1.6 |
| | |
| Real Estate | | 1.2 |
| | |
| Short-Term Investments | | 3.7 |
| | |
| Other Assets, Less Liabilities | | (0.9) |
TOP TEN HOLDINGS
| | | | |
| Security Name | | % of
Net Assets | |
| | |
Paylocity Holding Corp. | | | 2.7 | |
| | |
RBC Bearings, Inc. | | | 2.4 | |
| | |
HubSpot, Inc. | | | 2.3 | |
| | |
Ritchie Bros. Auctioneers, Inc. (Canada) | | | 2.3 | |
| | |
Matador Resources Co. | | | 2.2 | |
| | |
Manhattan Associates, Inc. | | | 2.2 | |
| | |
Atkore, Inc. | | | 2.0 | |
| | |
Texas Roadhouse, Inc. | | | 2.0 | |
| | |
Five Below, Inc. | | | 1.9 | |
| | |
Globant SA (Uruguay) | | | 1.9 | |
| | | | |
| | |
Top Ten as a Group | | | 21.9 | |
| | | | |
Because a fund’s strategy may result in multiple investments in particular sectors of the economy, its performance may depend on the performance of those sectors and may fluctuate more widely than investments diversified across more sectors. For additional information on these and other risk considerations, please see the Fund’s prospectus.
Any sectors, industries, or securities discussed should not be perceived as investment recommendations. Mention of a specific security should not be considered a recommendation to buy or solicitation to sell that security. Specific securities mentioned in this report may have been sold from the Fund’s portfolio of investments by the time you receive this report.
29
| | |
| | | AMG GW&K Small/Mid Cap Growth Fund Schedule of Portfolio Investments October 31, 2022 |
| | | |
| | | |
| | | | | | | | |
| | | Shares | | | Value | |
| | |
Common Stocks - 97.2% | | | | | | | | |
| |
Consumer Discretionary - 15.6% | | | | | |
| | |
Bright Horizons Family Solutions, Inc.* | | | 2,006 | | | | $131,032 | |
| | |
Burlington Stores, Inc.*,1 | | | 3,129 | | | | 447,322 | |
| | |
Churchill Downs, Inc. | | | 2,280 | | | | 474,035 | |
| | |
Five Below, Inc.* | | | 4,153 | | | | 607,792 | |
| | |
Grand Canyon Education, Inc.* | | | 4,669 | | | | 469,841 | |
| | |
Holley, Inc.*,1 | | | 30,100 | | | | 119,798 | |
| | |
Krispy Kreme Inc. | | | 21,435 | | | | 307,592 | |
| | |
Lithia Motors, Inc., Class A | | | 1,194 | | | | 236,591 | |
| | |
LKQ Corp. | | | 9,899 | | | | 550,780 | |
| | |
Pool Corp. | | | 1,290 | | | | 392,457 | |
| | |
Revolve Group, Inc.*,1 | | | 13,855 | | | | 332,520 | |
| | |
Texas Roadhouse, Inc. | | | 6,403 | | | | 633,577 | |
| | |
Vail Resorts, Inc. | | | 989 | | | | 216,720 | |
| | |
Total Consumer Discretionary | | | | | | | 4,920,057 | |
| | |
Consumer Staples - 1.6% | | | | | | | | |
| | |
Performance Food Group Co.* | | | 5,475 | | | | 284,919 | |
| | |
PriceSmart, Inc. | | | 3,156 | | | | 201,889 | |
| | |
Total Consumer Staples | | | | | | | 486,808 | |
| | |
Energy - 6.1% | | | | | | | | |
| | |
ChampionX Corp. | | | 16,700 | | | | 477,954 | |
| | |
Matador Resources Co. | | | 10,650 | | | | 707,692 | |
| | |
Ovintiv, Inc. | | | 6,850 | | | | 346,953 | |
| | |
SM Energy Co. | | | 8,750 | | | | 393,575 | |
| | |
Total Energy | | | | | | | 1,926,174 | |
| | |
Financials - 5.6% | | | | | | | | |
| | |
Evercore, Inc., Class A | | | 2,748 | | | | 288,815 | |
| | |
Houlihan Lokey, Inc. | | | 4,950 | | | | 442,134 | |
| | |
MarketAxess Holdings, Inc. | | | 1,471 | | | | 358,983 | |
| | |
Pinnacle Financial Partners, Inc. | | | 5,045 | | | | 418,685 | |
| | |
Signature Bank | | | 1,680 | | | | 266,330 | |
| | |
Total Financials | | | | | | | 1,774,947 | |
| | |
Health Care - 22.9% | | | | | | | | |
| | |
ABIOMED, Inc.* | | | 1,175 | | | | 296,194 | |
| | |
Acadia Healthcare Co., Inc.* | | | 6,122 | | | | 497,719 | |
| | |
Albireo Pharma, Inc.*,1 | | | 13,484 | | | | 276,692 | |
| | |
Azenta, Inc. | | | 6,982 | | | | 310,001 | |
| | |
Bio-Rad Laboratories, Inc., Class A* | | | 607 | | | | 213,488 | |
| | |
Catalent, Inc.* | | | 5,391 | | | | 354,350 | |
| | |
Chemed Corp. | | | 636 | | | | 296,929 | |
| | |
CryoPort, Inc.* | | | 6,983 | | | | 193,848 | |
| | |
Globus Medical, Inc., Class A* | | | 8,530 | | | | 571,510 | |
| | | | | | | | |
| | | Shares | | | Value | |
| | |
Halozyme Therapeutics, Inc.* | | | 11,599 | | | | $554,548 | |
| | |
HealthEquity, Inc.* | | | 6,857 | | | | 534,229 | |
| | |
Horizon Therapeutics Plc* | | | 4,358 | | | | 271,590 | |
| | |
ICU Medical, Inc.* | | | 863 | | | | 128,078 | |
| | |
Integra LifeSciences Holdings Corp.* | | | 6,534 | | | | 328,333 | |
| | |
Intra-Cellular Therapies, Inc.* | | | 5,993 | | | | 273,700 | |
| | |
Medpace Holdings, Inc.* | | | 2,493 | | | | 553,396 | |
| | |
Neurocrine Biosciences, Inc.* | | | 4,316 | | | | 496,858 | |
| | |
Oyster Point Pharma, Inc.*,1 | | | 18,021 | | | | 141,285 | |
| | |
Phathom Pharmaceuticals, Inc.* | | | 20,238 | | | | 214,523 | |
| | |
Syneos Health, Inc.* | | | 7,160 | | | | 360,721 | |
| | |
West Pharmaceutical Services, Inc. | | | 1,599 | | | | 367,930 | |
| | |
Total Health Care | | | | | | | 7,235,922 | |
| | |
Industrials - 18.7% | | | | | | | | |
| | |
Atkore, Inc.* | | | 6,733 | | | | 641,655 | |
| | |
Booz Allen Hamilton Holding Corp. | | | 3,600 | | | | 391,860 | |
| | |
CACI International, Inc., Class A* | | | 1,418 | | | | 431,114 | |
| | |
Dycom Industries, Inc.* | | | 2,035 | | | | 240,496 | |
| | |
Gibraltar Industries, Inc.* | | | 1,893 | | | | 96,694 | |
| | |
Graco, Inc. | | | 5,932 | | | | 412,749 | |
| | |
IDEX Corp. | | | 1,800 | | | | 400,158 | |
| | |
Ingersoll Rand, Inc. | | | 9,482 | | | | 478,841 | |
| | |
Knight-Swift Transportation Holdings, Inc. | | | 5,822 | | | | 279,631 | |
| | |
RBC Bearings, Inc.* | | | 3,000 | | | | 760,590 | |
| | |
Ritchie Bros. Auctioneers, Inc. (Canada) | | | 10,983 | | | | 717,519 | |
| | |
SiteOne Landscape Supply, Inc.* | | | 4,734 | | | | 548,529 | |
| | |
The Toro Co. | | | 4,560 | | | | 480,761 | |
| | |
Total Industrials | | | | | | | 5,880,597 | |
| | |
Information Technology - 22.1% | | | | | | | | |
| | |
Cognex Corp. | | | 12,121 | | | | 560,354 | |
| | |
CyberArk Software, Ltd. (Israel)* | | | 2,060 | | | | 323,235 | |
| | |
The Descartes Systems Group, Inc. (Canada)* | | | 5,712 | | | | 394,528 | |
| | |
Entegris, Inc. | | | 5,504 | | | | 436,687 | |
| | |
Globant SA (Uruguay)* | | | 3,163 | | | | 596,795 | |
| | |
HubSpot, Inc.* | | | 2,484 | | | | 736,655 | |
| | |
MACOM Technology Solutions Holdings, Inc.* | | | 5,365 | | | | 310,472 | |
| | |
Manhattan Associates, Inc.* | | | 5,722 | | | | 696,196 | |
| | |
Paycor HCM, Inc.* | | | 13,735 | | | | 418,505 | |
| | |
Paylocity Holding Corp.* | | | 3,675 | | | | 851,828 | |
| | |
Power Integrations, Inc. | | | 4,215 | | | | 281,183 | |
| | |
Rapid7, Inc.* | | | 4,883 | | | | 221,053 | |
| | |
Silicon Laboratories, Inc.* | | | 2,132 | | | | 245,009 | |
| | |
SS&C Technologies Holdings, Inc. | | | 4,090 | | | | 210,308 | |
The accompanying notes are an integral part of these financial statements.
30
| | |
| | | AMG GW&K Small/Mid Cap Growth Fund Schedule of Portfolio Investments (continued) |
| | | |
| | | |
| | | | | | | | |
| | | Shares | | | Value | |
| | |
Information Technology - 22.1% | | | | | | | | |
(continued) | | | | | | | | |
| | |
Tyler Technologies, Inc.* | | | 851 | | | | $275,154 | |
| | |
Zebra Technologies Corp., Class A* | | | 1,494 | | | | 423,131 | |
| | |
Total Information Technology | | | | | | | 6,981,093 | |
| | |
Materials - 3.4% | | | | | | | | |
| | |
AptarGroup, Inc. | | | 2,909 | | | | 288,427 | |
| | |
Avient Corp. | | | 6,182 | | | | 213,217 | |
| | |
Eagle Materials, Inc. | | | 1,199 | | | | 146,650 | |
| | |
RPM International, Inc. | | | 4,507 | | | | 426,227 | |
| | |
Total Materials | | | | | | | 1,074,521 | |
| | |
Real Estate - 1.2% | | | | | | | | |
| | |
Sun Communities, Inc., REIT | | | 2,776 | | | | 374,344 | |
| | |
Total Common Stocks
(Cost $34,265,445) | | | | | | | 30,654,463 | |
| | |
| | | Principal
Amount | | | | |
Short-Term Investments - 3.7% | | | | | | | | |
| |
Joint Repurchase Agreements - 1.6%2 | | | | | |
| | |
Citigroup Global Markets, Inc., dated 10/31/22, due 11/01/22, 3.000% total to be received $510,000 (collateralized by various U.S. Treasuries, 0.125% - 4.375%, 11/15/31 - 02/15/52, totaling $520,462) | | | $509,958 | | | | 509,958 | |
| | | | | | | | |
| | | Principal
Amount | | | Value | |
| |
Repurchase Agreements - 2.1% | | | | | |
| | |
Fixed Income Clearing Corp., dated 10/31/22, due 11/01/22, 2.900% total to be received $670,054 (collateralized by a U.S. Treasury, 1.625%, 05/15/31, totaling $683,465) | | | $670,000 | | | | $670,000 | |
| | |
Total Short-Term Investments
(Cost $1,179,958) | | | | | | | 1,179,958 | |
| | |
Total Investments - 100.9%
(Cost $35,445,403) | | | | | | | 31,834,421 | |
| | |
Other Assets, less Liabilities - (0.9)% | | | | | | | (289,265 | ) |
| | |
Net Assets - 100.0% | | | | | | | $31,545,156 | |
| * | Non-income producing security. |
| 1 | Some of these securities, amounting to $1,104,767 or 3.5% of net assets, were out on loan to various borrowers and are collateralized by cash and various U.S. Treasury Obligations. See Note 4 of Notes to Financial Statements. |
| 2 | Cash collateral received for securities lending activity was invested in these joint repurchase agreements. |
REIT Real Estate Investment Trust
| | | | | | | | | | | | | | | | |
| | | Level 1 | | | Level 2 | | | Level 3 | | | Total | |
Investments in Securities | | | | | | | | | | | | | | | | |
| | | | |
Common Stocks† | | $ | 30,654,463 | | | | — | | | | — | | | $ | 30,654,463 | |
Short-Term Investments | | | | | | | | | | | | | | | | |
| | | | |
Joint Repurchase Agreements | | | — | | | $ | 509,958 | | | | — | | | | 509,958 | |
| | | | |
Repurchase Agreements | | | — | | | | 670,000 | | | | — | | | | 670,000 | |
| | | | | | | | | | | | | | | | |
| | | | |
Total Investments in Securities | | $ | 30,654,463 | | | $ | 1,179,958 | | | | — | | | $ | 31,834,421 | |
| | | | | | | | | | | | | | | | |
| † | All common stocks held in the Fund are Level 1 securities. For a detailed breakout of common stocks by major industry classification, please refer to the Fund’s Schedule of Portfolio Investments. |
For the fiscal year ended October 31, 2022, there were no transfers in or out of Level 3.
The accompanying notes are an integral part of these financial statements.
31
| | |
| | | Statement of Assets and Liabilities October 31, 2022 |
| | | |
| | | |
| | | | | | | | | | | | | | | | | | | | |
| | | AMG GW&K
Core Bond
ESG Fund | | AMG GW&K
Emerging Markets
Equity Fund | | AMG GW&K
Emerging Wealth
Equity Fund | | AMG GW&K
Small/Mid Cap
Growth Fund |
| | | | |
Assets: | | | | | | | | | | | | | | | | | | | | |
| | | | |
Investments at value1 (including securities on loan valued at $151,198, $637,837, $1,183,977, and $1,104,767, respectively) | | | | $140,328,417 | | | | | $16,482,237 | | | | | $72,355,139 | | | | | $31,834,421 | |
| | | | |
Cash | | | | 594,678 | | | | | 4,683 | | | | | — | | | | | 266,970 | |
| | | | |
Foreign currency2 | | | | — | | | | | 44,625 | | | | | 896,319 | | | | | — | |
| | | | |
Receivable for investments sold | | | | — | | | | | 116,197 | | | | | 807,033 | | | | | — | |
| | | | |
Dividend and interest receivables | | | | 1,093,081 | | | | | 8,828 | | | | | 86,527 | | | | | 7,104 | |
| | | | |
Securities lending income receivable | | | | — | | | | | 380 | | | | | 174 | | | | | 289 | |
| | | | |
Receivable for Fund shares sold | | | | 1,328 | | | | | 171 | | | | | 2,525 | | | | | 907 | |
| | | | |
Receivable from affiliate | | | | 163 | | | | | 18,891 | | | | | 11,356 | | | | | 9,896 | |
| | | | |
Prepaid expenses and other assets | | | | 13,788 | | | | | 3,423 | | | | | 8,528 | | | | | 7,852 | |
| | | | |
Total assets | | | | 142,031,455 | | | | | 16,679,435 | | | | | 74,167,601 | | | | | 32,127,439 | |
| | | | |
Liabilities: | | | | | | | | | | | | | | | | | | | | |
| | | | |
Payable upon return of securities loaned | | | | 157,604 | | | | | 383,214 | | | | | 1,256,658 | | | | | 509,958 | |
| | | | |
Payable for investments purchased | | | | — | | | | | 39,275 | | | | | — | | | | | — | |
| | | | |
Payable for Fund shares repurchased | | | | 13,017 | | | | | 52,417 | | | | | 325,886 | | | | | 105 | |
| | | | |
Payable for foreign capital gains tax | | | | — | | | | | — | | | | | 24,233 | | | | | — | |
| | | | |
Due to custodian | | | | — | | | | | — | | | | | 252,217 | | | | | — | |
| | | | |
Accrued expenses: | | | | | | | | | | | | | | | | | | | | |
| | | | |
Investment advisory and management fees | | | | 36,550 | | | | | 7,968 | | | | | 37,457 | | | | | 15,862 | |
| | | | |
Administrative fees | | | | 18,275 | | | | | 2,173 | | | | | 10,216 | | | | | 3,838 | |
| | | | |
Distribution fees | | | | 364 | | | | | 43 | | | | | 75 | | | | | 6,046 | |
| | | | |
Shareholder service fees | | | | — | | | | | 1,747 | | | | | 947 | | | | | 268 | |
| | | | |
Other | | | | 89,068 | | | | | 82,408 | | | | | 136,247 | | | | | 46,206 | |
| | | | |
Total liabilities | | | | 314,878 | | | | | 569,245 | | | | | 2,043,936 | | | | | 582,283 | |
| | | | | | | | | | | | | | | | | | | | |
| | | | |
Net Assets | | | | $141,716,577 | | | | | $16,110,190 | | | | | $72,123,665 | | | | | $31,545,156 | |
| | | | |
1 Investments at cost | | | | $166,058,547 | | | | | $15,532,016 | | | | | $80,044,024 | | | | | $35,445,403 | |
| | | | |
2 Foreign currency at cost | | | | — | | | | | $45,913 | | | | | $941,300 | | | | | — | |
The accompanying notes are an integral part of these financial statements.
32
| | |
| | | Statement of Assets and Liabilities (continued) |
| | | |
| | | |
| | | | | | | | | | | | | | | | | | | | |
| | | AMG GW&K
Core Bond
ESG Fund | | AMG GW&K
Emerging Markets
Equity Fund | | AMG GW&K
Emerging Wealth
Equity Fund | | AMG GW&K
Small/Mid Cap
Growth Fund |
| | | | |
Net Assets Represent: | | | | | | | | | | | | | | | | | | | | |
| | | | |
Paid-in capital | | | | $171,061,413 | | | | | $20,590,248 | | | | | $107,268,377 | | | | | $34,738,637 | |
| | | | |
Total distributable loss | | | | (29,344,836 | ) | | | | (4,480,058 | ) | | | | (35,144,712 | ) | | | | (3,193,481 | ) |
| | | | |
Net Assets | | | | $141,716,577 | | | | | $16,110,190 | | | | | $72,123,665 | | | | | $31,545,156 | |
| | | | |
Class N: | | | | | | | | | | | | | | | | | | | | |
| | | | |
Net Assets | | | | $1,715,755 | | | | | $180,081 | | | | | $329,551 | | | | | $24,993,735 | |
| | | | |
Shares outstanding | | | | 200,490 | | | | | 26,074 | | | | | 37,613 | | | | | 1,858,483 | |
| | | | |
Net asset value, offering and redemption price per share | | | | $8.56 | | | | | $6.91 | | | | | $8.76 | | | | | $13.45 | |
| | | | |
Class I: | | | | | | | | | | | | | | | | | | | | |
| | | | |
Net Assets | | | | $137,805,654 | | | | | $8,519,686 | | | | | $39,367,094 | | | | | $6,539,630 | |
| | | | |
Shares outstanding | | | | 16,094,762 | | | | | 1,246,241 | | | | | 4,433,508 | | | | | 466,712 | |
| | | | |
Net asset value, offering and redemption price per share | | | | $8.56 | | | | | $6.84 | | | | | $8.88 | | | | | $14.01 | |
| | | | |
Class Z: | | | | | | | | | | | | | | | | | | | | |
| | | | |
Net Assets | | | | $2,195,168 | | | | | $7,410,423 | | | | | $32,427,020 | | | | | $11,791 | |
| | | | |
Shares outstanding | | | | 256,574 | | | | | 1,089,990 | | | | | 3,654,553 | | | | | 841 | |
| | | | |
Net asset value, offering and redemption price per share | | | | $8.56 | | | | | $6.80 | | | | | $8.87 | | | | | $14.02 | |
The accompanying notes are an integral part of these financial statements.
33
| | |
| | | Statement of Operations For the fiscal year ended October 31, 2022 |
| | | |
| | | |
| | | | | | | | | | | | | | | | | | | | |
| | | AMG GW&K
Core Bond
ESG Fund | | AMG GW&K
Emerging Markets
Equity Fund | | AMG GW&K
Emerging Wealth
Equity Fund | | AMG GW&K
Small/Mid Cap
Growth Fund |
| | | | |
Investment Income: | | | | | | | | | | | | | | | | | | | | |
| | | | |
Dividend income | | | | — | | | | | $909,142 | | | | | $1,427,820 | | | | | $145,683 | |
| | | | |
Interest income | | | | $3,989,503 | | | | | 173 | | | | | 282 | | | | | 133 | |
| | | | |
Securities lending income | | | | 30 | | | | | 4,195 | | | | | 6,659 | | | | | 11,425 | |
| | | | |
Foreign withholding tax | | | | — | | | | | (120,540 | ) | | | | (90,387 | ) | | | | (2,854 | ) |
| | | | |
Total investment income | | | | 3,989,533 | | | | | 792,970 | | | | | 1,344,374 | | | | | 154,387 | |
| | | | |
Expenses: | | | | | | | | | | | | | | | | | | | | |
| | | | |
Investment advisory and management fees | | | | 505,313 | | | | | 247,455 | | | | | 847,647 | | | | | 217,378 | |
| | | | |
Administrative fees | | | | 252,657 | | | | | 67,488 | | | | | 231,176 | | | | | 52,592 | |
| | | | |
Distribution fees - Class N | | | | 4,705 | | | | | 770 | | | | | 1,518 | | | | | 53,569 | |
| | | | |
Shareholder servicing fees - Class N | | | | 2,823 | | | | | 462 | | | | | 911 | | | | | — | |
| | | | |
Shareholder servicing fees - Class I | | | | 114,934 | | | | | 18,550 | | | | | 53,198 | | | | | 3,164 | |
| | | | |
Professional fees | | | | 66,075 | | | | | 55,833 | | | | | 76,985 | | | | | 32,967 | |
| | | | |
Registration fees | | | | 29,382 | | | | | 10,797 | | | | | 36,153 | | | | | 26,523 | |
| | | | |
Custodian fees | | | | 26,347 | | | | | 69,061 | | | | | 155,861 | | | | | 20,104 | |
| | | | |
Transfer agent fees | | | | 19,501 | | | | | 3,238 | | | | | 8,341 | | | | | 8,065 | |
| | | | |
Reports to shareholders | | | | 11,612 | | | | | 7,981 | | | | | 23,440 | | | | | 12,441 | |
| | | | |
Trustee fees and expenses | | | | 11,592 | | | | | 3,157 | | | | | 10,807 | | | | | 2,370 | |
| | | | |
Interest expense | | | | — | | | | | 8,120 | | | | | 1,041 | | | | | — | |
| | | | |
Miscellaneous | | | | 8,016 | | | | | 4,111 | | | | | 8,104 | | | | | 4,200 | |
| | | | |
Total expenses before offsets | | | | 1,052,957 | | | | | 497,023 | | | | | 1,455,182 | | | | | 433,373 | |
| | | | |
Expense reimbursements | | | | (121,994 | ) | | | | (77,630 | ) | | | | (11,356 | ) | | | | (89,139 | ) |
| | | | |
Expense reductions | | | | — | | | | | — | | | | | — | | | | | (2,196 | ) |
| | | | |
Net expenses | | | | 930,963 | | | | | 419,393 | | | | | 1,443,826 | | | | | 342,038 | |
| | | | | | | | | | | | | | | | | | | | |
| | | | |
Net investment income (loss) | | | | 3,058,570 | | | | | 373,577 | | | | | (99,452 | ) | | | | (187,651 | ) |
| | | | |
Net Realized and Unrealized Loss: | | | | | | | | | | | | | | | | | | | | |
| | | | |
Net realized gain (loss) on investments | | | | (3,645,263 | ) | | | | (4,918,955 | ) | | | | (25,349,394 | ) | | | | 687,666 | 1 |
| | | | | |
Net realized loss on foreign currency transactions | | | | — | | | | | (60,876 | ) | | | | (86,225 | ) | | | | — | |
| | | | |
Net change in unrealized appreciation/depreciation on investments | | | | (30,052,410 | ) | | | | (11,633,429 | ) | | | | (37,837,055 | ) | | | | (10,773,348 | ) |
| | | | |
Net change in unrealized appreciation/depreciation on foreign currency translations | | | | — | | | | | 4,031 | | | | | (48,355 | ) | | | | — | |
| | | | |
Net realized and unrealized loss | | | | (33,697,673 | ) | | | | (16,609,229 | ) | | | | (63,321,029 | ) | | | | (10,085,682 | ) |
| | | | | | | | | | | | | | | | | | | | |
| | | | |
Net decrease in net assets resulting from operations | | | | $(30,639,103) | | | | | $(16,235,652) | | | | | $(63,420,481) | | | | | $(10,273,333) | |
1 Includes a non-recurring securities litigation gain of $316,570.
The accompanying notes are an integral part of these financial statements.
34
| | |
| | | Statements of Changes in Net Assets For the fiscal years ended October 31, |
| | | |
| | | |
| | | | | | | | | | | | | | | | |
| | | AMG GW&K
Core Bond ESG Fund | | AMG GW&K
Emerging Markets
Equity Fund |
| | | | |
| | | 2022 | | 2021 | | 2022 | | 2021 |
| | | | |
Increase (Decrease) in Net Assets Resulting From Operations: | | | | | | | | | | | | | | | | |
| | | | |
Net investment income | | | $3,058,570 | | | | $2,873,232 | | | | $373,577 | | | | $333,862 | |
| | | | |
Net realized gain (loss) on investments | | | (3,645,263 | ) | | | 4,909,231 | | | | (4,979,831 | ) | | | 564,430 | |
| | | | |
Net change in unrealized appreciation/depreciation on investments | | | (30,052,410 | ) | | | (7,605,124 | ) | | | (11,629,398 | ) | | | 2,359,554 | |
| | | | | | | | | | | | | | | | |
| | | | |
Net increase (decrease) in net assets resulting from operations | | | (30,639,103 | ) | | | 177,339 | | | | (16,235,652 | ) | | | 3,257,846 | |
| | | | |
Distributions to Shareholders: | | | | | | | | | | | | | | | | |
| | | | |
Class N | | | (76,235 | ) | | | (21,649 | ) | | | (2,402 | ) | | | (17,233 | ) |
| | | | |
Class I | | | (7,327,695 | ) | | | (2,789,712 | ) | | | (249,212 | ) | | | (1,069,474 | ) |
| | | | |
Class Z | | | (112,920 | ) | | | (57,930 | ) | | | (382,214 | ) | | | (1,249,608 | ) |
| | | | |
Total distributions to shareholders | | | (7,516,850 | ) | | | (2,869,291 | ) | | | (633,828 | ) | | | (2,336,315 | ) |
| | | | |
Capital Share Transactions:1 | | | | | | | | | | | | | | | | |
| | | | |
Net increase (decrease) from capital share transactions | | | (16,283,055 | ) | | | (9,231,990 | ) | | | (25,653,747 | ) | | | 13,857,527 | |
| | | | | | | | | | | | | | | | |
| | | | |
Total increase (decrease) in net assets | | | (54,439,008 | ) | | | (11,923,942 | ) | | | (42,523,227 | ) | | | 14,779,058 | |
| | | | |
Net Assets: | | | | | | | | | | | | | | | | |
| | | | |
Beginning of year | | | 196,155,585 | | | | 208,079,527 | | | | 58,633,417 | | | | 43,854,359 | |
| | | | | | | | | | | | | | | | |
| | | | |
End of year | | | $141,716,577 | | | | $196,155,585 | | | | $16,110,190 | | | | $58,633,417 | |
1 See Note 1(g) of the Notes to Financial Statements.
The accompanying notes are an integral part of these financial statements.
35
| | |
| | | Statements of Changes in Net Assets (continued) For the fiscal years ended October 31, |
| | | |
| | | |
| | | | | | | | | | | | | | | | |
| | | AMG GW&K
Emerging Wealth
Equity Fund | | | AMG GW&K
Small/Mid Cap
Growth Fund | |
| | | | |
| | | 2022 | | | 2021 | | | 2022 | | | 2021 | |
| | | | |
Increase (Decrease) in Net Assets Resulting From Operations: | | | | | | | | | | | | | | | | |
| | | | |
Net investment loss | | | $(99,452 | ) | | | $(547,863 | ) | | | $(187,651 | ) | | | $(375,973 | ) |
| | | | |
Net realized gain (loss) on investments | | | (25,435,619 | ) | | | 2,871,609 | | | | 687,666 | | | | 16,012,613 | |
| | | | |
Net change in unrealized appreciation/depreciation on investments | | | (37,885,410 | ) | | | (5,026,545 | ) | | | (10,773,348 | ) | | | (137,250 | ) |
| | | | | | | | | | | | | | | | |
| | | | |
Net increase (decrease) in net assets resulting from operations | | | (63,420,481 | ) | | | (2,702,799 | ) | | | (10,273,333 | ) | | | 15,499,390 | |
| | | | |
Distributions to Shareholders: | | | | | | | | | | | | | | | | |
| | | | |
From net investment income and/or realized gain on investments: | | | | | | | | | | | | | | | | |
| | | | |
Class N | | | (10,519 | ) | | | — | | | | — | | | | (14,397,541 | ) |
| | | | |
Class I | | | (417,335 | ) | | | — | | | | — | | | | (3,078,320 | ) |
| | | | |
Class Z | | | (1,915,232 | ) | | | (35,421 | ) | | | — | | | | — | |
| | | | |
From paid-in capital: | | | | | | | | | | | | | | | | |
| | | | |
Class N | | | — | | | | — | | | | — | | | | (674,816 | ) |
| | | | |
Class I | | | — | | | | — | | | | — | | | | (144,282 | ) |
| | | | |
Total distributions to shareholders | | | (2,343,086 | ) | | | (35,421 | ) | | | — | | | | (18,294,959 | ) |
| | | | |
Capital Share Transactions:1 | | | | | | | | | | | | | | | | |
| | | | |
Net increase (decrease) from capital share transactions | | | (87,822,351 | ) | | | 18,163,731 | | | | (2,280,329 | ) | | | 11,502,921 | |
| | | | | | | | | | | | | | | | |
| | | | |
Total increase (decrease) in net assets | | | (153,585,918 | ) | | | 15,425,511 | | | | (12,553,662 | ) | | | 8,707,352 | |
| | | | |
Net Assets: | | | | | | | | | | | | | | | | |
| | | | |
Beginning of year | | | 225,709,583 | | | | 210,284,072 | | | | 44,098,818 | | | | 35,391,466 | |
| | | | | | | | | | | | | | | | |
| | | | |
End of year | | | $72,123,665 | | | | $225,709,583 | | | | $31,545,156 | | | | $44,098,818 | |
1 See Note 1(g) of the Notes to Financial Statements.
The accompanying notes are an integral part of these financial statements.
36
| | |
| | | AMG GW&K Core Bond ESG Fund Financial Highlights For a share outstanding throughout each fiscal year |
| | | |
| | | |
| | | | | | | | | | | | | | | | | | | | |
| | | For the fiscal years ended October 31, |
| | | | | |
| Class N | | 2022 | | 2021 | | 2020 | | 2019 | | 2018 |
| | | | | |
Net Asset Value, Beginning of Year | | | $10.75 | | | | $10.90 | | | | $10.53 | | | | $9.67 | | | | $10.14 | |
| | | | | |
Income (loss) from Investment Operations: | | | | | | | | | | | | | | | | | | | | |
| | | | | |
Net investment income1,2 | | | 0.14 | | | | 0.12 | | | | 0.18 | | | | 0.21 | | | | 0.18 | |
| | | | | |
Net realized and unrealized gain (loss) on investments | | | (1.93 | ) | | | (0.15 | ) | | | 0.37 | | | | 0.86 | | | | (0.46 | ) |
| | | | | | | | | | | | | | | | | | | | |
| | | | | |
Total income (loss) from investment operations | | | (1.79 | ) | | | (0.03 | ) | | | 0.55 | | | | 1.07 | | | | (0.28 | ) |
| | | | | |
Less Distributions to Shareholders from: | | | | | | | | | | | | | | | | | | | | |
| | | | | |
Net investment income | | | (0.15 | ) | | | (0.12 | ) | | | (0.18 | ) | | | (0.21 | ) | | | (0.19 | ) |
| | | | | |
Net realized gain on investments | | | (0.25 | ) | | | — | | | | — | | | | — | | | | — | |
| | | | | | | | | | | | | | | | | | | | |
| | | | | |
Total distributions to shareholders | | | (0.40 | ) | | | (0.12 | ) | | | (0.18 | ) | | | (0.21 | ) | | | (0.19 | ) |
| | | | | |
Net Asset Value, End of Year | | | $8.56 | | | | $10.75 | | | | $10.90 | | | | $10.53 | | | | $9.67 | |
| | | | | | | | | | | | | | | | | | | | |
| | | | | |
Total Return2,3 | | | (17.18 | )% | | | (0.27 | )% | | | 5.31 | % | | | 11.20 | % | | | (2.79 | )% |
| | | | | |
Ratio of net expenses to average net assets | | | 0.88 | % | | | 0.88 | % | | | 0.88 | % | | | 0.88 | % | | | 0.88 | % |
| | | | | |
Ratio of gross expenses to average net assets4 | | | 0.95 | % | | | 0.94 | % | | | 0.96 | % | | | 0.95 | % | | | 0.93 | % |
| | | | | |
Ratio of net investment income to average net assets2 | | | 1.49 | % | | | 1.12 | % | | | 1.69 | % | | | 2.10 | % | | | 1.88 | % |
| | | | | |
Portfolio turnover | | | 34 | % | | | 62 | % | | | 56 | % | | | 48 | % | | | 17 | % |
| | | | | |
Net assets end of year (000’s) omitted | | | $1,716 | | | | $2,125 | | | | $1,905 | | | | $1,255 | | | | $502 | |
| | | | | |
| | | | | | | | | | | | | | | | | | | | | |
37
| | |
| | | AMG GW&K Core Bond ESG Fund Financial Highlights For a share outstanding throughout each fiscal year |
| | | |
| | | |
| | | | | | | | | | | | | | | | | | | | |
| | | For the fiscal years ended October 31, |
| | | | | |
| Class I | | 2022 | | 2021 | | 2020 | | 2019 | | 2018 |
| | | | | |
Net Asset Value, Beginning of Year | | | $10.76 | | | | $10.90 | | | | $10.54 | | | | $9.67 | | | | $10.15 | |
| | | | | |
Income (loss) from Investment Operations: | | | | | | | | | | | | | | | | | | | | |
| | | | | |
Net investment income1,2 | | | 0.18 | | | | 0.16 | | | | 0.22 | | | | 0.24 | | | | 0.22 | |
| | | | | |
Net realized and unrealized gain (loss) on investments | | | (1.95 | ) | | | (0.14 | ) | | | 0.36 | | | | 0.88 | | | | (0.48 | ) |
| | | | | | | | | | | | | | | | | | | | |
| | | | | |
Total income (loss) from investment operations | | | (1.77 | ) | | | 0.02 | | | | 0.58 | | | | 1.12 | | | | (0.26 | ) |
| | | | | |
Less Distributions to Shareholders from: | | | | | | | | | | | | | | | | | | | | |
| | | | | |
Net investment income | | | (0.18 | ) | | | (0.16 | ) | | | (0.22 | ) | | | (0.25 | ) | | | (0.22 | ) |
| | | | | |
Net realized gain on investments | | | (0.25 | ) | | | — | | | | — | | | | — | | | | — | |
| | | | | | | | | | | | | | | | | | | | |
| | | | | |
Total distributions to shareholders | | | (0.43 | ) | | | (0.16 | ) | | | (0.22 | ) | | | (0.25 | ) | | | (0.22 | ) |
| | | | | |
Net Asset Value, End of Year | | | $8.56 | | | | $10.76 | | | | $10.90 | | | | $10.54 | | | | $9.67 | |
| | | | | | | | | | | | | | | | | | | | |
| | | | | |
Total Return2,3 | | | (16.99 | )% | | | 0.15 | % | | | 5.55 | % | | | 11.70 | % | | | (2.59 | )% |
| | | | | |
Ratio of net expenses to average net assets | | | 0.55 | % | | | 0.56 | % | | | 0.55 | % | | | 0.55 | % | | | 0.56 | % |
| | | | | |
Ratio of gross expenses to average net assets4 | | | 0.62 | % | | | 0.62 | % | | | 0.63 | % | | | 0.62 | % | | | 0.61 | % |
| | | | | |
Ratio of net investment income to average net assets2 | | | 1.82 | % | | | 1.44 | % | | | 2.01 | % | | | 2.42 | % | | | 2.20 | % |
| | | | | |
Portfolio turnover | | | 34 | % | | | 62 | % | | | 56 | % | | | 48 | % | | | 17 | % |
| | | | | |
Net assets end of year (000’s) omitted | | | $137,806 | | | | $190,306 | | | | $202,363 | | | | $212,801 | | | | $264,795 | |
| | | | | |
| | | | | | | | | | | | | | | | | | | | | |
38
| | |
| | | AMG GW&K Core Bond ESG Fund Financial Highlights For a share outstanding throughout each fiscal year |
| | | |
| | | |
| | | | | | | | | | | | | | | | | | | | |
| | | For the fiscal years ended October 31, |
| | | | | |
| Class Z | | 2022 | | 2021 | | 2020 | | 2019 | | 2018 |
| | | | | |
Net Asset Value, Beginning of Year | | | $10.75 | | | | $10.90 | | | | $10.53 | | | | $9.67 | | | | $10.14 | |
| | | | | |
Income (loss) from Investment Operations: | | | | | | | | | | | | | | | | | | | | |
| | | | | |
Net investment income1,2 | | | 0.18 | | | | 0.16 | | | | 0.22 | | | | 0.25 | | | | 0.23 | |
| | | | | |
Net realized and unrealized gain (loss) on investments | | | (1.94 | ) | | | (0.15 | ) | | | 0.38 | | | | 0.87 | | | | (0.47 | ) |
| | | | | | | | | | | | | | | | | | | | |
| | | | | |
Total income (loss) from investment operations | | | (1.76 | ) | | | 0.01 | | | | 0.60 | | | | 1.12 | | | | (0.24 | ) |
| | | | | |
Less Distributions to Shareholders from: | | | | | | | | | | | | | | | | | | | | |
| | | | | |
Net investment income | | | (0.18 | ) | | | (0.16 | ) | | | (0.23 | ) | | | (0.26 | ) | | | (0.23 | ) |
| | | | | |
Net realized gain on investments | | | (0.25 | ) | | | — | | | | — | | | | — | | | | — | |
| | | | | | | | | | | | | | | | | | | | |
| | | | | |
Total distributions to shareholders | | | (0.43 | ) | | | (0.16 | ) | | | (0.23 | ) | | | (0.26 | ) | | | (0.23 | ) |
| | | | | |
Net Asset Value, End of Year | | | $8.56 | | | | $10.75 | | | | $10.90 | | | | $10.53 | | | | $9.67 | |
| | | | | | | | | | | | | | | | | | | | |
| | | | | |
Total Return2,3 | | | (16.85 | )% | | | 0.13 | % | | | 5.73 | % | | | 11.71 | % | | | (2.42 | )% |
| | | | | |
Ratio of net expenses to average net assets | | | 0.48 | % | | | 0.48 | % | | | 0.48 | % | | | 0.48 | % | | | 0.48 | % |
| | | | | |
Ratio of gross expenses to average net assets4 | | | 0.55 | % | | | 0.54 | % | | | 0.56 | % | | | 0.55 | % | | | 0.53 | % |
| | | | | |
Ratio of net investment income to average net assets2 | | | 1.89 | % | | | 1.52 | % | | | 2.09 | % | | | 2.50 | % | | | 2.28 | % |
| | | | | |
Portfolio turnover | | | 34 | % | | | 62 | % | | | 56 | % | | | 48 | % | | | 17 | % |
| | | | | |
Net assets end of year (000’s) omitted | | | $2,195 | | | | $3,724 | | | | $3,812 | | | | $3,208 | | | | $5,005 | |
| | | | | |
| | | | | | | | | | | | | | | | | | | | | |
| 1 | Per share numbers have been calculated using average shares. |
| 2 | Total returns and net investment income would have been lower had certain expenses not been offset. |
| 3 | The total return is calculated using the published Net Asset Value as of fiscal year end. |
| 4 | Excludes the impact of expense reimbursement or fee waivers and expense reductions such as brokerage credits, but includes expense repayments and non-reimbursable expenses, if any, such as interest, taxes, and extraordinary expenses. (See Note 1(c) and 2 in the Notes to Financial Statements.) |
39
| | |
| | | AMG GW&K Emerging Markets Equity Fund Financial Highlights For a share outstanding throughout each fiscal year |
| | | |
| | | |
| | | | | | | | | | | | | | | | | | | | |
| | | For the fiscal years ended October 31, |
| | | | | |
| Class N | | 2022 | | 2021 | | 2020 | | 2019 | | 2018 |
| | | | | |
Net Asset Value, Beginning of Year | | | $10.30 | | | | $9.73 | | | | $9.52 | | | | $8.61 | | | | $10.11 | |
| | | | | |
Income (loss) from Investment Operations: | | | | | | | | | | | | | | | | | | | | |
| | | | | |
Net investment income1,2 | | | 0.04 | | | | 0.02 | | | | 0.01 | | | | 0.14 | | | | 0.11 | |
| | | | | |
Net realized and unrealized gain (loss) on investments | | | (3.37 | ) | | | 0.96 | | | | 0.70 | | | | 1.04 | | | | (1.54 | ) |
| | | | | | | | | | | | | | | | | | | | |
| | | | | |
Total income (loss) from investment operations | | | (3.33 | ) | | | 0.98 | | | | 0.71 | | | | 1.18 | | | | (1.43 | ) |
| | | | | |
Less Distributions to Shareholders from: | | | | | | | | | | | | | | | | | | | | |
| | | | | |
Net investment income | | | (0.02 | ) | | | (0.07 | ) | | | (0.06 | ) | | | (0.17 | ) | | | (0.07 | ) |
| | | | | |
Net realized gain on investments | | | (0.04 | ) | | | (0.34 | ) | | | (0.44 | ) | | | (0.10 | ) | | | — | |
| | | | | | | | | | | | | | | | | | | | |
| | | | | |
Total distributions to shareholders | | | (0.06 | ) | | | (0.41 | ) | | | (0.50 | ) | | | (0.27 | ) | | | (0.07 | ) |
| | | | | |
Net Asset Value, End of Year | | | $6.91 | | | | $10.30 | | | | $9.73 | | | | $9.52 | | | | $8.61 | |
| | | | | | | | | | | | | | | | | | | | |
| | | | | |
Total Return2,3 | | | (32.50 | )% | | | 9.85 | % | | | 7.55 | % | | | 13.94 | % | | | (14.24 | )% |
| | | | | |
Ratio of net expenses to average net assets | | | 1.29 | %4 | | | 1.27 | %5 | | | 1.34 | % | | | 1.30 | % | | | 1.27 | % |
| | | | | |
Ratio of gross expenses to average net assets6 | | | 1.46 | % | | | 1.37 | %5 | | | 1.52 | % | | | 1.30 | % | | | 1.27 | % |
| | | | | |
Ratio of net investment income to average net assets2 | | | 0.47 | % | | | 0.20 | % | | | 0.13 | % | | | 1.52 | % | | | 1.12 | % |
| | | | | |
Portfolio turnover | | | 46 | % | | | 36 | % | | | 40 | % | | | 123 | % | | | 24 | % |
| | | | | |
Net assets end of year (000’s) omitted | | | $180 | | | | $414 | | | | $412 | | | | $520 | | | | $289 | |
| | | | | |
| | | | | | | | | | | | | | | | | | | | | |
40
| | |
| | | AMG GW&K Emerging Markets Equity Fund Financial Highlights For a share outstanding throughout each fiscal year |
| | | |
| | | |
| | | | | | | | | | | | | | | | | | | | |
| | | For the fiscal years ended October 31, |
| | | | | |
| Class I | | 2022 | | 2021 | | 2020 | | 2019 | | 2018 |
| | | | | |
Net Asset Value, Beginning of Year | | | $10.21 | | | | $9.69 | | | | $9.48 | | | | $8.60 | | | | $10.11 | |
| | | | | |
Income (loss) from Investment Operations: | | | | | | | | | | | | | | | | | | | | |
| | | | | |
Net investment income1,2 | | | 0.07 | | | | 0.06 | | | | 0.04 | | | | 0.17 | | | | 0.13 | |
| | | | | |
Net realized and unrealized gain (loss) on investments | | | (3.33 | ) | | | 0.95 | | | | 0.69 | | | | 1.04 | | | | (1.53 | ) |
| | | | | | | | | | | | | | | | | | | | |
| | | | | |
Total income (loss) from investment operations | | | (3.26 | ) | | | 1.01 | | | | 0.73 | | | | 1.21 | | | | (1.40 | ) |
| | | | | |
Less Distributions to Shareholders from: | | | | | | | | | | | | | | | | | | | | |
| | | | | |
Net investment income | | | (0.07 | ) | | | (0.15 | ) | | | (0.08 | ) | | | (0.23 | ) | | | (0.11 | ) |
| | | | | |
Net realized gain on investments | | | (0.04 | ) | | | (0.34 | ) | | | (0.44 | ) | | | (0.10 | ) | | | — | |
| | | | | | | | | | | | | | | | | | | | |
| | | | | |
Total distributions to shareholders | | | (0.11 | ) | | | (0.49 | ) | | | (0.52 | ) | | | (0.33 | ) | | | (0.11 | ) |
| | | | | |
Net Asset Value, End of Year | | | $6.84 | | | | $10.21 | | | | $9.69 | | | | $9.48 | | | | $8.60 | |
| | | | | | | | | | | | | | | | | | | | |
| | | | | |
Total Return2,3 | | | (32.28 | )% | | | 10.13 | % | | | 7.91 | % | | | 14.34 | % | | | (13.94 | )% |
| | | | | |
Ratio of net expenses to average net assets | | | 0.99 | %4 | | | 0.95 | %5 | | | 1.01 | % | | | 0.97 | % | | | 0.99 | % |
| | | | | |
Ratio of gross expenses to average net assets6 | | | 1.16 | % | | | 1.05 | %5 | | | 1.19 | % | | | 0.97 | % | | | 0.99 | % |
| | | | | |
Ratio of net investment income to average net assets2 | | | 0.77 | % | | | 0.52 | % | | | 0.47 | % | | | 1.85 | % | | | 1.40 | % |
| | | | | |
Portfolio turnover | | | 46 | % | | | 36 | % | | | 40 | % | | | 123 | % | | | 24 | % |
| | | | | |
Net assets end of year (000’s) omitted | | | $8,520 | | | | $24,571 | | | | $19,251 | | | | $24,100 | | | | $11,210 | |
| | | | | |
| | | | | | | | | | | | | | | | | | | | | |
41
| | |
| | | AMG GW&K Emerging Markets Equity Fund Financial Highlights For a share outstanding throughout each fiscal year |
| | | |
| | | |
| | | | | | | | | | | | | | | | | | | | |
| | | For the fiscal years ended October 31, |
| | | | | |
| Class Z | | 2022 | | 2021 | | 2020 | | 2019 | | 2018 |
| | | | | |
Net Asset Value, Beginning of Year | | | $10.15 | | | | $9.64 | | | | $9.43 | | | | $8.56 | | | | $10.06 | |
| | | | | |
Income (loss) from Investment Operations: | | | | | | | | | | | | | | | | | | | | |
| | | | | |
Net investment income1,2 | | | 0.08 | | | | 0.07 | | | | 0.05 | | | | 0.18 | | | | 0.15 | |
| | | | | |
Net realized and unrealized gain (loss) on investments | | | (3.31 | ) | | | 0.93 | | | | 0.69 | | | | 1.02 | | | | (1.53 | ) |
| | | | | | | | | | | | | | | | | | | | |
| | | | | |
Total income (loss) from investment operations | | | (3.23 | ) | | | 1.00 | | | | 0.74 | | | | 1.20 | | | | (1.38 | ) |
| | | | | |
Less Distributions to Shareholders from: | | | | | | | | | | | | | | | | | | | | |
| | | | | |
Net investment income | | | (0.08 | ) | | | (0.15 | ) | | | (0.09 | ) | | | (0.23 | ) | | | (0.12 | ) |
| | | | | |
Net realized gain on investments | | | (0.04 | ) | | | (0.34 | ) | | | (0.44 | ) | | | (0.10 | ) | | | — | |
| | | | | | | | | | | | | | | | | | | | |
| | | | | |
Total distributions to shareholders | | | (0.12 | ) | | | (0.49 | ) | | | (0.53 | ) | | | (0.33 | ) | | | (0.12 | ) |
| | | | | |
Net Asset Value, End of Year | | | $6.80 | | | | $10.15 | | | | $9.64 | | | | $9.43 | | | | $8.56 | |
| | | | | | | | | | | | | | | | | | | | |
| | | | | |
Total Return2,3 | | | (32.20 | )% | | | 10.15 | % | | | 8.01 | % | | | 14.39 | % | | | (13.88 | )% |
| | | | | |
Ratio of net expenses to average net assets | | | 0.89 | %4 | | | 0.87 | %5 | | | 0.94 | % | | | 0.90 | % | | | 0.87 | % |
| | | | | |
Ratio of gross expenses to average net assets6 | | | 1.06 | % | | | 0.97 | %5 | | | 1.12 | % | | | 0.90 | % | | | 0.87 | % |
| | | | | |
Ratio of net investment income to average net assets2 | | | 0.87 | % | | | 0.60 | % | | | 0.53 | % | | | 1.92 | % | | | 1.52 | % |
| | | | | |
Portfolio turnover | | | 46 | % | | | 36 | % | | | 40 | % | | | 123 | % | | | 24 | % |
| | | | | |
Net assets end of year (000’s) omitted | | | $7,410 | | | | $33,648 | | | | $24,191 | | | | $31,727 | | | | $133,688 | |
| | | | | |
| | | | | | | | | | | | | | | | | | | | | |
| 1 | Per share numbers have been calculated using average shares. |
| 2 | Total returns and net investment income would have been lower had certain expenses not been offset. |
| 3 | The total return is calculated using the published Net Asset Value as of fiscal year end. |
| 4 | Includes interest expense of 0.02% related to participation in the interfund lending program. |
| 5 | Such ratio includes recapture of waived/reimbursed fees from prior periods amounting to 0.01% for the fiscal year ended October 31, 2021. |
| 6 | Excludes the impact of expense reimbursement or fee waivers and expense reductions such as brokerage credits, but includes expense repayments and non-reimbursable expenses, if any, such as interest, taxes, and extraordinary expenses. (See Note 1(c) and 2 in the Notes to Financial Statements.) |
42
| | |
| | | AMG GW&K Emerging Wealth Equity Fund Financial Highlights For a share outstanding throughout each fiscal year |
| | | |
| | | |
| | | | | | | | | | | | | | | | | | | | |
| | | For the fiscal years ended October 31, |
| | | | | |
| Class N | | 2022 | | 2021 | | 2020 | | 2019 | | 2018 |
| | | | | |
Net Asset Value, Beginning of Year | | | $13.41 | | | | $13.28 | | | | $11.93 | | | | $10.38 | | | | $12.94 | |
| | | | | |
Income (loss) from Investment Operations: | | | | | | | | | | | | | | | | | | | | |
| | | | | |
Net investment income (loss)1,2 | | | (0.05 | ) | | | (0.09 | ) | | | (0.04 | ) | | | 0.10 | | | | 0.06 | |
| | | | | |
Net realized and unrealized gain (loss) on investments | | | (4.45 | ) | | | 0.22 | | | | 1.72 | | | | 1.95 | | | | (1.88 | ) |
| | | | | | | | | | | | | | | | | | | | |
| | | | | |
Total income (loss) from investment operations | | | (4.50 | ) | | | 0.13 | | | | 1.68 | | | | 2.05 | | | | (1.82 | ) |
| | | | | |
Less Distributions to Shareholders from: | | | | | | | | | | | | | | | | | | | | |
| | | | | |
Net investment income | | | — | | | | — | | | | (0.06 | ) | | | (0.06 | ) | | | (0.05 | ) |
| | | | | |
Net realized gain on investments | | | (0.15 | ) | | | — | | | | (0.27 | ) | | | (0.44 | ) | | | (0.69 | ) |
| | | | | | | | | | | | | | | | | | | | |
| | | | | |
Total distributions to shareholders | | | (0.15 | ) | | | — | | | | (0.33 | ) | | | (0.50 | ) | | | (0.74 | ) |
| | | | | |
Net Asset Value, End of Year | | | $8.76 | | | | $13.41 | | | | $13.28 | | | | $11.93 | | | | $10.38 | |
| | | | | | | | | | | | | | | | | | | | |
| | | | | |
Total Return2,3 | | | (33.89 | )% | | | 0.98 | % | | | 14.37 | % | | | 20.82 | % | | | (15.16 | )% |
| | | | | |
Ratio of net expenses to average net assets | | | 1.30 | %4 | | | 1.22 | % | | | 1.26 | % | | | 1.37 | %5 | | | 1.45 | %5,6 |
| | | | | |
Ratio of gross expenses to average net assets7 | | | 1.31 | % | | | 1.22 | % | | | 1.26 | % | | | 1.37 | %5 | | | 1.45 | %5 |
| | | | | |
Ratio of net investment income (loss) to average net assets2 | | | (0.43 | )% | | | (0.59 | )% | | | (0.35 | )% | | | 0.93 | % | | | 0.49 | % |
| | | | | |
Portfolio turnover | | | 63 | % | | | 57 | % | | | 37 | % | | | 40 | % | | | 37 | % |
| | | | | |
Net assets end of year (000’s) omitted | | | $330 | | | | $967 | | | | $1,716 | | | | $2,007 | | | | $1,940 | |
| | | | | |
| | | | | | | | | | | | | | | | | | | | | |
43
| | |
| | | AMG GW&K Emerging Wealth Equity Fund Financial Highlights For a share outstanding throughout each fiscal year |
| | | |
| | | |
| | | | | | | | | | | | | | | | | | | | |
| | | For the fiscal years ended October 31, |
| | | | | |
| Class I | | 2022 | | 2021 | | 2020 | | 2019 | | 2018 |
| | | | | |
Net Asset Value, Beginning of Year | | | $13.55 | | | | $13.38 | | | | $12.03 | | | | $10.44 | | | | $12.96 | |
| | | | | |
Income (loss) from Investment Operations: | | | | | | | | | | | | | | | | | | | | |
| | | | | |
Net investment income (loss)1,2 | | | (0.01 | ) | | | (0.05 | ) | | | (0.01 | ) | | | 0.14 | | | | 0.09 | |
| | | | | |
Net realized and unrealized gain (loss) on investments | | | (4.51 | ) | | | 0.22 | | | | 1.73 | | | | 1.96 | | | | (1.88 | ) |
| | | | | | | | | | | | | | | | | | | | |
| | | | | |
Total income (loss) from investment operations | | | (4.52 | ) | | | 0.17 | | | | 1.72 | | | | 2.10 | | | | (1.79 | ) |
| | | | | |
Less Distributions to Shareholders from: | | | | | | | | | | | | | | | | | | | | |
| | | | | |
Net investment income | | | — | | | | — | | | | (0.10 | ) | | | (0.07 | ) | | | (0.04 | ) |
| | | | | |
Net realized gain on investments | | | (0.15 | ) | | | — | | | | (0.27 | ) | | | (0.44 | ) | | | (0.69 | ) |
| | | | | | | | | | | | | | | | | | | | |
| | | | | |
Total distributions to shareholders | | | (0.15 | ) | | | — | | | | (0.37 | ) | | | (0.51 | ) | | | (0.73 | ) |
| | | | | |
Net Asset Value, End of Year | | | $8.88 | | | | $13.55 | | | | $13.38 | | | | $12.03 | | | | $10.44 | |
| | | | | | | | | | | | | | | | | | | | |
| | | | | |
Total Return2,3 | | | (33.68 | )% | | | 1.27 | % | | | 14.63 | % | | | 21.15 | % | | | (14.89 | )% |
| | | | | |
Ratio of net expenses to average net assets | | | 1.00 | %4 | | | 0.93 | % | | | 0.97 | % | | | 1.08 | %5 | | | 1.19 | %5,6 |
| | | | | |
Ratio of gross expenses to average net assets7 | | | 1.01 | % | | | 0.93 | % | | | 0.97 | % | | | 1.08 | %5 | | | 1.19 | %5 |
| | | | | |
Ratio of net investment income (loss) to average net assets2 | | | (0.13 | )% | | | (0.30 | )% | | | (0.06 | )% | | | 1.22 | % | | | 0.75 | % |
| | | | | |
Portfolio turnover | | | 63 | % | | | 57 | % | | | 37 | % | | | 40 | % | | | 37 | % |
| | | | | |
Net assets end of year (000’s) omitted | | | $39,367 | | | | $41,453 | | | | $22,813 | | | | $6,328 | | | | $2,539 | |
| | | | | |
| | | | | | | | | | | | | | | | | | | | | |
44
| | |
| | | AMG GW&K Emerging Wealth Equity Fund Financial Highlights For a share outstanding throughout each fiscal year |
| | | |
| | | |
| | | | | | | | | | | | | | | | | | | | |
| | | For the fiscal years ended October 31, |
| | | | | |
| Class Z | | 2022 | | 2021 | | 2020 | | 2019 | | 2018 |
| | | | | |
Net Asset Value, Beginning of Year | | | $13.52 | | | | $13.34 | | | | $11.99 | | | | $10.41 | | | | $12.97 | |
| | | | | |
Income (loss) from Investment Operations: | | | | | | | | | | | | | | | | | | | | |
| | | | | |
Net investment income (loss)1,2 | | | (0.00 | )8 | | | (0.03 | ) | | | 0.01 | | | | 0.15 | | | | 0.11 | |
| | | | | |
Net realized and unrealized gain (loss) on investments | | | (4.50 | ) | | | 0.21 | | | | 1.72 | | | | 1.96 | | | | (1.89 | ) |
| | | | | | | | | | | | | | | | | | | | |
| | | | | |
Total income (loss) from investment operations | | | (4.50 | ) | | | 0.18 | | | | 1.73 | | | | 2.11 | | | | (1.78 | ) |
| | | | | |
Less Distributions to Shareholders from: | | | | | | | | | | | | | | | | | | | | |
| | | | | |
Net investment income | | | — | | | | (0.00 | )8 | | | (0.11 | ) | | | (0.09 | ) | | | (0.09 | ) |
| | | | | |
Net realized gain on investments | | | (0.15 | ) | | | — | | | | (0.27 | ) | | | (0.44 | ) | | | (0.69 | ) |
| | | | | | | | | | | | | | | | | | | | |
| | | | | |
Total distributions to shareholders | | | (0.15 | ) | | | (0.00 | )8 | | | (0.38 | ) | | | (0.53 | ) | | | (0.78 | ) |
| | | | | |
Net Asset Value, End of Year | | | $8.87 | | | | $13.52 | | | | $13.34 | | | | $11.99 | | | | $10.41 | |
| | | | | | | | | | | | | | | | | | | | |
| | | | | |
Total Return2,3 | | | (33.61 | )% | | | 1.37 | % | | | 14.75 | % | | | 21.34 | % | | | (14.87 | )% |
| | | | | |
Ratio of net expenses to average net assets | | | 0.90 | %4 | | | 0.82 | % | | | 0.86 | % | | | 0.97 | %5 | | | 1.05 | %5,6 |
| | | | | |
Ratio of gross expenses to average net assets7 | | | 0.91 | % | | | 0.82 | % | | | 0.86 | % | | | 0.97 | %5 | | | 1.05 | %5 |
| | | | | |
Ratio of net investment income (loss) to average net assets2 | | | (0.03 | )% | | | (0.19 | )% | | | 0.05 | % | | | 1.33 | % | | | 0.89 | % |
| | | | | |
Portfolio turnover | | | 63 | % | | | 57 | % | | | 37 | % | | | 40 | % | | | 37 | % |
| | | | | |
Net assets end of year (000’s) omitted | | | $32,427 | | | | $183,290 | | | | $185,755 | | | | $105,069 | | | | $60,443 | |
| | | | | |
| | | | | | | | | | | | | | | | | | | | | |
| 1 | Per share numbers have been calculated using average shares. |
| 2 | Total returns and net investment income (loss) would have been lower had certain expenses not been offset. |
| 3 | The total return is calculated using the published Net Asset Value as of fiscal year end. |
| 4 | Includes interest expense of less than 0.01% related to participation in the interfund lending program. |
| 5 | Such ratio includes recapture of waived/reimbursed fees from prior periods amounting to 0.02% and 0.07% for the fiscal years ended October 31, 2019 and 2018, respectively. |
| 6 | Includes reduction from broker recapture amounting to less than 0.01%. |
| 7 | Excludes the impact of expense reimbursement or fee waivers and expense reductions such as brokerage credits, but includes expense repayments and non-reimbursable expenses, if any, such as interest, taxes, and extraordinary expenses. (See Note 1(c) and 2 in the Notes to Financial Statements.) |
| 8 | Less than $(0.005) per share. |
��
45
| | |
| | | AMG GW&K Small/Mid Cap Growth Fund Financial Highlights For a share outstanding throughout each fiscal year |
| | | |
| | | |
| | | | | | | | | | | | | | | | | | | | |
| | | For the fiscal years ended October 31, |
| | | | | |
| Class N | | 2022 | | 2021 | | 2020 | | 2019 | | 2018 |
| | | | | |
Net Asset Value, Beginning of Year | | | $17.67 | | | | $21.14 | | | | $17.02 | | | | $16.90 | | | | $15.30 | |
| | | | | |
Income (loss) from Investment Operations: | | | | | | | | | | | | | | | | | | | | |
| | | | | |
Net investment loss1,2 | | | (0.08 | ) | | | (0.17 | ) | | | (0.17 | ) | | | (0.08 | ) | | | (0.12 | ) |
| | | | | |
Net realized and unrealized gain (loss) on investments | | | (4.14 | ) | | | 7.74 | | | | 4.29 | | | | 0.20 | | | | 1.72 | |
| | | | | | | | | | | | | | | | | | | | |
| | | | | |
Total income (loss) from investment operations | | | (4.22 | ) | | | 7.57 | | | | 4.12 | | | | 0.12 | | | | 1.60 | |
| | | | | |
Less Distributions to Shareholders from: | | | | | | | | | | | | | | | | | | | | |
| | | | | |
Net realized gain on investments | | | — | | | | (10.55 | ) | | | — | | | | — | | | | — | |
| | | | | |
Paid in capital | | | — | | | | (0.49 | ) | | | — | | | | — | | | | — | |
| | | | | | | | | | | | | | | | | | | | |
| | | | | |
Total distributions to shareholders | | | — | | | | (11.04 | ) | | | — | | | | — | | | | — | |
| | | | | |
Net Asset Value, End of Year | | | $13.45 | | | | $17.67 | | | | $21.14 | | | | $17.02 | | | | $16.90 | |
| | | | | | | | | | | | | | | | | | | | |
| | | | | |
Total Return2,3 | | | (23.88 | )%4 | | | 46.66 | % | | | 24.27 | % | | | 0.71 | % | | | 10.46 | % |
| | | | | |
Ratio of net expenses to average net assets5 | | | 1.00 | % | | | 1.17 | % | | | 1.29 | %6 | | | 1.30 | % | | | 1.31 | % |
| | | | | |
Ratio of gross expenses to average net assets7 | | | 1.25 | % | | | 1.42 | % | | | 1.60 | % | | | 1.47 | % | | | 1.43 | % |
| | | | | |
Ratio of net investment loss to average net assets2 | | | (0.56 | )% | | | (0.91 | )% | | | (0.92 | )% | | | (0.48 | )% | | | (0.73 | )% |
| | | | | |
Portfolio turnover | | | 23 | % | | | 158 | % | | | 126 | % | | | 138 | % | | | 161 | % |
| | | | | |
Net assets end of year (000’s) omitted | | | $24,994 | | | | $37,471 | | | | $28,908 | | | | $30,717 | | | | $37,232 | |
| | | | | |
| | | | | | | | | | | | | | | | | | | | | |
46
| | |
| | | AMG GW&K Small/Mid Cap Growth Fund Financial Highlights For a share outstanding throughout each fiscal year |
| | | |
| | | |
| | | | | | | | | | | | | | | | | | | | |
| | | For the fiscal years ended October 31, |
| | | | | |
| Class I | | 2022 | | 2021 | | 2020 | | 2019 | | 2018 |
| | | | | |
Net Asset Value, Beginning of Year | | | $18.39 | | | | $21.60 | | | | $17.35 | | | | $17.20 | | | | $15.54 | |
| | | | | |
Income (loss) from Investment Operations: | | | | | | | | | | | | | | | | | | | | |
| | | | | |
Net investment loss1,2 | | | (0.06 | ) | | | (0.15 | ) | | | (0.14 | ) | | | (0.05 | ) | | | (0.09 | ) |
| | | | | |
Net realized and unrealized gain (loss) on investments | | | (4.32 | ) | | | 7.98 | | | | 4.39 | | | | 0.20 | | | | 1.75 | |
| | | | | | | | | | | | | | | | | | | | |
| | | | | |
Total income (loss) from investment operations | | | (4.38 | ) | | | 7.83 | | | | 4.25 | | | | 0.15 | | | | 1.66 | |
| | | | | |
Less Distributions to Shareholders from: | | | | | | | | | | | | | | | | | | | | |
| | | | | |
Net realized gain on investments | | | — | | | | (10.55 | ) | | | — | | | | — | | | | — | |
| | | | | |
Paid in capital | | | — | | | | (0.49 | ) | | | — | | | | — | | | | — | |
| | | | | | | | | | | | | | | | | | | | |
| | | | | |
Total distributions to shareholders | | | — | | | | (11.04 | ) | | | — | | | | — | | | | — | |
| | | | | |
Net Asset Value, End of Year | | | $14.01 | | | | $18.39 | | | | $21.60 | | | | $17.35 | | | | $17.20 | |
| | | | | | | | | | | | | | | | | | | | |
| | | | | |
Total Return2,3 | | | (23.82 | )%4 | | | 46.94 | % | | | 24.48 | % | | | 0.93 | % | | | 10.68 | % |
| | | | | |
Ratio of net expenses to average net assets5 | | | 0.86 | % | | | 1.02 | % | | | 1.10 | %6 | | | 1.10 | % | | | 1.10 | % |
| | | | | |
Ratio of gross expenses to average net assets7 | | | 1.11 | % | | | 1.27 | % | | | 1.41 | % | | | 1.27 | % | | | 1.22 | % |
| | | | | |
Ratio of net investment loss to average net assets2 | | | (0.42 | )% | | | (0.76 | )% | | | (0.73 | )% | | | (0.28 | )% | | | (0.52 | )% |
| | | | | |
Portfolio turnover | | | 23 | % | | | 158 | % | | | 126 | % | | | 138 | % | | | 161 | % |
| | | | | |
Net assets end of year (000’s) omitted | | | $6,540 | | | | $6,612 | | | | $6,483 | | | | $14,608 | | | | $65,802 | |
| | | | | |
| | | | | | | | | | | | | | | | | | | | | |
47
| | |
| | | AMG GW&K Small/Mid Cap Growth Fund Financial Highlights For a share outstanding throughout each fiscal period |
| | | |
| | | |
| | | | | | | | |
| | | For the fiscal
year ended
October 31, | | For the fiscal
period ended
October 31, |
| | |
| Class Z | | 2022 | | 20218 |
| | |
Net Asset Value, Beginning of Period | | | $18.39 | | | | $17.84 | |
| | |
Income (loss) from Investment Operations: | | | | | | | | |
| | |
Net investment loss1,2 | | | (0.06 | ) | | | (0.01 | ) |
| | |
Net realized and unrealized gain (loss) on investments | | | (4.31 | ) | | | 0.56 | |
| | | | | | | | |
| | |
Total income (loss) from investment operations | | | (4.37 | ) | | | 0.55 | |
| | |
Net Asset Value, End of Period | | | $14.02 | | | | $18.39 | |
| | | | | | | | |
| | |
Total Return2,3 | | | (23.76 | )%4 | | | 3.08 | %9 |
| | |
Ratio of net expenses to average net assets10 | | | 0.81 | % | | | 0.82 | %11 |
| | |
Ratio of gross expenses to average net assets7 | | | 1.06 | % | | | 1.13 | %11 |
| | |
Ratio of net investment loss to average net assets2 | | | (0.37 | )% | | | (0.49 | )%11 |
| | |
Portfolio turnover | | | 23 | % | | | 158 | % |
| | |
Net assets end of period (000’s) omitted | | | $12 | | | | $15 | |
| | | | | | | | | |
| 1 | Per share numbers have been calculated using average shares. |
| 2 | Total returns and net investment loss would have been lower had certain expenses not been offset. |
| 3 | The total return is calculated using the published Net Asset Value as of fiscal year end. |
| 4 | Includes a non-recurring securities litigation gain. Had the Fund not received the payment total return would have been (24.68%), (24.53%) and (24.53%) for Class N, Class I and Class Z respectively. |
| 5 | Includes reduction from broker recapture amounting to 0.01%, less than 0.01%, 0.01%, less than 0.01% and 0.01% for the fiscal years ended 2022, 2021, 2020, 2019 and 2018, respectively. |
| 6 | Includes interest expense of 0.01%. |
| 7 | Excludes the impact of expense reimbursement or fee waivers and expense reductions such as brokerage credits, but includes expense repayments and non-reimbursable expenses, if any, such as interest, taxes, and extraordinary expenses. (See Note 1(c) and 2 in the Notes to Financial Statements.) |
| 8 | Commencement of operations was on August 31, 2021. |
| 10 | Includes reduction from broker recapture amounting to 0.01% for the fiscal year ended 2022 and less than 0.01% for the fiscal period ended October 31, 2021. |
48
| | |
| | | Notes to Financial Statements October 31, 2022 |
| | | |
| | | |
1. ORGANIZATION AND SUMMARY OF SIGNIFICANT ACCOUNTING POLICIES
AMG Funds, AMG Funds I and AMG Funds IV (the “Trusts”) are open-end management investment companies. AMG Funds and AMG Funds I are organized as Massachusetts business trusts, while AMG Funds IV is organized as a Delaware Statutory Trust. The Trusts are registered under the Investment Company Act of 1940, as amended (the “1940 Act”). Currently, the Trusts consist of a number of different funds, each having distinct investment management objectives, strategies, risks, and policies. Included in this report are AMG Funds I: AMG GW&K Core Bond ESG Fund (“Core Bond ESG”), AMG Funds: AMG GW&K Emerging Markets Equity Fund (“Emerging Markets Equity”) and AMG GW&K Emerging Wealth Equity Fund (“Emerging Wealth Equity”) and AMG Funds IV: AMG GW&K Small/Mid Cap Growth Fund (“Small/Mid Cap Growth”), each a “Fund” and collectively, the “Funds”.
Each Fund offers Class N, Class I and Class Z shares. Each class represents an interest in the same assets of the respective Fund. Although all share classes generally have identical voting rights, each share class votes separately when required by law. Different share classes may have different net asset values per share to the extent the share classes pay different distribution amounts and/or the expenses of such share classes differ. Each share class has its own expense structure. Please refer to a current prospectus for additional information on each share class.
Market disruptions associated with the COVID-19 pandemic have had a global impact, and uncertainty exists as to the long-term implications. Such disruptions can adversely affect assets of the Funds and thus Fund performance.
The Funds’ financial statements are prepared in accordance with accounting principles generally accepted in the United States of America (“U.S. GAAP”), including accounting and reporting guidance pursuant to Accounting Standards Codification Topic 946 applicable to investment companies. U.S. GAAP requires management to make estimates and assumptions that affect the reported amounts of assets and liabilities and disclosure of contingent assets and liabilities at the date of the financial statements and the reported amounts of income and expenses during the reporting period. Actual results could differ from those estimates and such differences could be material. The following is a summary of significant accounting policies followed by the Funds in the preparation of their financial statements:
a. VALUATION OF INVESTMENTS
For the Funds, equity securities traded on a national securities exchange or reported on the NASDAQ national market system (“NMS”) are valued at the last quoted sales price on the primary exchange or, if applicable, the NASDAQ official closing price or the official closing price of the relevant exchange or, lacking any sales, at the last quoted bid price. Equity securities held by the Funds that are traded in the over-the-counter market (other than NMS securities) are valued at the bid price. Foreign equity securities (securities principally traded in markets other than U.S. markets) held by the Funds are valued at the official closing price on the primary exchange or, for markets that either do not offer an official closing price or where the official closing price may not be representative of the overall market, the last quoted sale price.
Fixed income securities purchased with a remaining maturity exceeding 60 days are valued at the evaluated bid price provided by an authorized pricing service or, if an evaluated price is not available, by reference to other securities which are
considered comparable in credit rating, interest rate, due date and other features (generally referred to as “matrix pricing”) or other similar pricing methodologies.
Fixed income securities purchased with a remaining maturity of 60 days or less are valued at amortized cost, provided that the amortized cost value is approximately the same as the fair value of the security valued without the use of amortized cost. Investments in other open-end registered investment companies are valued at their end of day net asset value per share.
The Funds’ portfolio investments are generally valued based on independent market quotations or prices or, if none, “evaluative” or other market based valuations provided by third party pricing services approved by the Board of Trustees of the Trust (the “Board”). Under certain circumstances, the value of certain Fund portfolio investments may be based on an evaluation of fair value, pursuant to procedures established by and under the general supervision of the Board. The Valuation Committee, which is comprised of the Independent Trustees of the Board, and the Pricing Committee, which is comprised of representatives from AMG Funds LLC (the “Investment Manager”) are the committees appointed by the Board to make fair value determinations. Each Fund may use the fair value of a portfolio investment to calculate its net asset value (“NAV”) in the event that the market quotation, price or market based valuation for the portfolio investment is not readily available or otherwise not determinable pursuant to the Board’s valuation procedures, if the Investment Manager or the Pricing Committee believes the quotation, price or market based valuation to be unreliable, or in certain other circumstances. When determining the fair value of an investment, the Pricing Committee and, if required under the Trusts’ securities valuation procedures, the Valuation Committee, seeks to determine the price that a Fund might reasonably expect to receive from current sale of that portfolio investment in an arms-length transaction. Fair value determinations shall be based upon consideration of all available facts and information, including, but not limited to (i) attributes specific to the investment; (ii) fundamental and analytical data relating to the investment; and (iii) the value of other comparable securities or relevant financial instruments, including derivative securities, traded on other markets or among dealers.
The values assigned to fair value portfolio investments are based on available information and do not necessarily represent amounts that might ultimately be realized in the future, since such amounts depend on future developments inherent in long-term investments. Because of the inherent uncertainty of valuation, those estimated values may differ significantly from the values that would have been used had a ready market for the investments existed, and the differences could be material. The Board will be presented with a quarterly report showing as of the most recent quarter end, all outstanding securities fair valued by the Funds, including a comparison with the prior quarter end and the percentage of the Funds that the security represents at each quarter end.
With respect to foreign equity securities and certain foreign fixed income securities, the Board has adopted a policy that securities held in the Funds that can be fair valued by the applicable fair value pricing service are fair valued on each business day provided that each individual price exceeds a pre-established confidence level.
Effective September 8, 2022, the Funds adopted the requirements of Rule 2a-5 under the 1940 Act (“Rule 2a-5”), which the Funds’ Board designated the Funds’ Investment Manager as the Funds’ Valuation Designee to perform the Funds’ fair value determinations. Such determinations are subject to Board oversight and certain reporting and other requirements intended to ensure that the Board receives the information it needs to oversee the Investment Manager’s fair value determinations. Other than the designation of the Investment Manager as the
49
| | |
| | | Notes to Financial Statements (continued) |
| | | |
| | | |
Valuation Designee, the Funds’ adoption of Rule 2-a5 did not impact how the Funds determine fair value or the carrying amount of investments held in the Funds.
U.S. GAAP defines fair value as the price that a fund would receive to sell an asset or pay to transfer a liability in an orderly transaction between market participants at the measurement date. U.S. GAAP also establishes a framework for measuring fair value, and a three level hierarchy for fair value measurements based upon the transparency of inputs to the valuation of an asset or liability. Inputs may be observable or unobservable and refer broadly to the assumptions that market participants would use in pricing the asset or liability. Observable inputs reflect the assumptions market participants would use in pricing the asset or liability based on market data obtained from sources independent of the Funds. Unobservable inputs reflect the Funds’ own assumptions about the assumptions that market participants would use in pricing the asset or liability developed based on the best information available in the circumstances. Each investment is assigned a level based upon the observability of the inputs which are significant to the overall valuation.
The three-tier hierarchy of inputs is summarized below:
Level 1 – inputs are quoted prices in active markets for identical investments (e.g., equity securities, open-end investment companies)
Level 2 – other observable inputs (including, but not limited to: quoted prices for similar assets or liabilities in markets that are active, quoted prices for identical or similar assets or liabilities in markets that are not active, inputs other than quoted prices that are observable for the assets or liabilities (such as interest rates, yield curves, volatilities, prepayment speeds, loss severities, credit risks and default rates) or other market corroborated inputs) (e.g., debt securities, government securities, foreign currency exchange contracts, foreign securities utilizing international fair value pricing, fair valued securities with observable inputs)
Level 3 – inputs are significant unobservable inputs (including the Fund’s own assumptions used to determine the fair value of investments) (e.g., fair valued securities with unobservable inputs)
Changes in inputs or methodologies used for valuing investments may result in a transfer in or out of levels within the fair value hierarchy. The inputs or methodologies used for valuing investments may not necessarily be an indication of the risk associated with investing in those investments.
b. SECURITY TRANSACTIONS
Security transactions are accounted for as of trade date. Realized gains and losses on securities sold are determined on the basis of identified cost.
c. INVESTMENT INCOME AND EXPENSES
Dividend income is recorded on the ex-dividend date. Dividends from foreign securities are recorded on the ex-dividend date, and if after the fact, as soon as the
Funds become aware of the ex-dividend date, except for Korean securities where dividends are recorded on confirmation date. Interest income, which includes amortization of premium and accretion of discount on debt securities, is accrued as earned. Dividend and interest income on foreign securities is recorded gross of any withholding tax. Non-cash dividends included in dividend income, if any, are reported at the fair market value of the securities received. Upon notification from the issuer, distributions received from a real estate investment trust (“REIT”) may be redesignated as a reduction of cost of investments and/or realized gain. Other income and expenses are recorded on an accrual basis. Expenses that cannot be directly attributed to a Fund are apportioned among the funds in the Trusts and other trusts or funds within the AMG Funds Family of Funds (collectively the “AMG Funds Family”) based upon their relative average net assets or number of shareholders. Investment income, realized and unrealized capital gains and losses, the common expenses of each Fund, and certain fund level expense reductions, if any, are allocated on a pro-rata basis to each class based on the relative net assets of each class to the total net assets of each Fund.
Small/Mid Cap Growth had certain portfolio trades directed to various brokers under a brokerage recapture program. Credits received from the brokerage recapture program are earned and paid on a monthly basis, and are recorded as expense offsets, which serve to reduce the Fund’s overall expense ratio. For the fiscal year ended October 31, 2022, the impact on the expenses and expense ratios was $2,196 or 0.01%.
d. DIVIDENDS AND DISTRIBUTIONS
Fund distributions resulting from net investment income will normally be declared and paid monthly for Core Bond ESG and annually for Emerging Markets Equity, Emerging Wealth Equity and Small/Mid Cap Growth. Realized net capital gains distributions, if any, will normally be declared and paid at least annually in December. Distributions to shareholders are recorded on the ex-dividend date. Distributions are determined in accordance with federal income tax regulations, which may differ from net investment income and net realized capital gains for financial statement purposes (U.S. GAAP). Differences may be permanent or temporary. Permanent differences are reclassified among capital accounts in the financial statements to reflect their tax character. Permanent book and tax basis differences, if any, relating to shareholder distributions will result in reclassifications to paid-in capital. Temporary differences arise when certain items of income, expense and gain or loss are recognized in different periods for financial statement and tax purposes; these differences will reverse at some time in the future. Permanent differences are primarily due to net operating losses. Temporary differences are primarily due to wash sale loss deferrals, the deferral of qualified late year ordinary losses and mark to market on passive foreign investment companies.
50
| | |
| | | Notes to Financial Statements (continued) |
| | | |
| | | |
The tax character of distributions paid during the fiscal years ended October 31, 2022 and October 31, 2021 were as follows:
| | | | | | | | | | | | | | | | |
| | |
| | | Core Bond ESG | | | Emerging Markets Equity | |
| | | | |
Distributions paid from: | | | 2022 | | | | 2021 | | | | 2022 | | | | 2021 | |
| | | | |
Ordinary income * | | | $3,496,989 | | | | $2,869,291 | | | | $422,590 | | | | $711,110 | |
| | | | |
Long-term capital gains | | | 4,019,861 | | | | — | | | | 211,238 | | | | 1,625,205 | |
| | | | | | | | | | | | | | | | |
| | | | |
| | | $7,516,850 | | | | $2,869,291 | | | | $633,828 | | | | $2,336,315 | |
| | | | | | | | | | | | | | | | |
| | |
| | | Emerging Wealth Equity | | | Small/Mid Cap Growth | |
| | | | |
Distributions paid from: | | | 2022 | | | | 2021 | | | | 2022 | | | | 2021 | |
| | | | |
Ordinary income * | | | — | | | | $35,159 | | | | — | | | | $9,053,185 | |
| | | | |
Long-term capital gains | | | $2,343,086 | | | | 262 | | | | — | | | | 8,422,676 | |
| | | | |
Paid-in capital | | | — | | | | — | | | | — | | | | 819,098 | |
| | | | | | | | | | | | | | | | |
| | | | |
| | | $2,343,086 | | | | $35,421 | | | | — | | | | $18,294,959 | |
| | | | | | | | | | | | | | | | |
| * | For tax purposes, short-term capital gain distributions, if any, are considered ordinary income distributions. |
As of October 31, 2022, the components of distributable earnings (excluding unrealized appreciation/depreciation) on a tax basis consisted of:
| | | | | | | | | | | | | | | | |
| | | | |
| | | Core Bond ESG | | | Emerging Markets Equity | | | Emerging Wealth Equity | | | Small/Mid Cap Growth | |
| | | | |
Capital loss carryforward | | | $3,488,405 | | | | $5,533,255 | | | | $25,084,682 | | | | — | |
| | | | |
Undistributed ordinary income | | | 39,674 | | | | 844,855 | | | | — | | | | — | |
| | | | |
Undistributed long-term capital gains | | | — | | | | — | | | | — | | | | $623,573 | |
| | | | |
Late-year ordinary loss deferral | | | — | | | | — | | | | — | | | | 142,167 | |
At October 31, 2022, the cost of investments and the aggregate gross unrealized appreciation and depreciation for federal income tax purposes were as follows:
| | | | | | | | | | | | | | | | |
| | | | |
| Fund | | Cost | | | Appreciation | | | Depreciation | | | Net Appreciation
(Depreciation) | |
| | | | |
Core Bond ESG | | | $166,224,522 | | | | — | | | | $(25,896,105 | ) | | | $(25,896,105 | ) |
| | | | |
Emerging Markets Equity | | | 16,272,503 | | | | $3,341,319 | | | | (3,132,977 | ) | | | 208,342 | |
| | | | |
Emerging Wealth Equity | | | 82,333,719 | | | | 11,491,326 | | | | (21,551,356 | ) | | | (10,060,030 | ) |
| | | | |
Small/Mid Cap Growth | | | 35,508,113 | | | | 2,632,339 | | | | (6,306,031 | ) | | | (3,673,692 | ) |
e. FEDERAL TAXES
Each Fund currently qualifies as an investment company and intends to comply with the requirements under Subchapter M of the Internal Revenue Code of 1986, as amended, and to distribute substantially all of its taxable income and gains to its shareholders and to meet certain diversification and income requirements with respect to investment companies. Therefore, no provision for federal income or excise tax is included in the accompanying financial statements.
Additionally, based on each Fund’s understanding of the tax rules and rates related to income, gains and transactions for the foreign jurisdictions in which it invests, each Fund will provide for foreign taxes, and where appropriate, deferred foreign taxes.
Management has analyzed the Funds’ tax positions taken on federal income tax returns as of October 31, 2022, and for all open tax years (generally, the three prior taxable years), and has concluded that no provision for federal income tax is required in the Funds’ financial statements. Additionally, Management is not aware
of any tax position for which it is reasonably possible that the total amounts of unrecognized tax benefits will change materially in the next twelve months.
f. CAPITAL LOSS CARRYOVERS AND DEFERRALS
As of October 31, 2022, the following Funds had capital loss carryovers for federal income tax purposes as shown in the following chart. These amounts may be used to offset future realized capital gains indefinitely, and retain their character as short-term and/or long-term.
| | | | | | | | | | | | |
| | | |
| Fund | | Short-Term | | | Long-Term | | | Total | |
| | | |
Core Bond ESG | | | $2,158,393 | | | | $1,330,012 | | | | $3,488,405 | |
| | | |
Emerging Markets Equity | | | 5,063,289 | | | | 469,966 | | | | 5,533,255 | |
| | | |
Emerging Wealth Equity | | | 25,084,682 | | | | — | | | | 25,084,682 | |
51
| | |
| | | Notes to Financial Statements (continued) |
| | | |
| | | |
As of October 31, 2022, Small/Mid Cap Growth had no capital loss carryovers for federal income tax purposes. Should the Fund incur net capital losses for the fiscal year ended October 31, 2023, such amounts may be used to offset future realized capital gains indefinitely, and retain their character as either short-term and/or long-term.
g. CAPITAL STOCK
The Trusts’ Declaration of Trust authorizes for each Fund the issuance of an unlimited number of shares of beneficial interest, without par value. Each Fund records sales and repurchases of its capital stock on the trade date.
For the fiscal years ended October 31, 2022 and October 31, 2021, the capital stock transactions by class for the Funds were as follows:
| | | | | | | | | | | | | | | | | | | | | | | | | | | | | | | | |
| | | Core Bond ESG | | | Emerging Markets Equity | |
| | | | |
| | | October 31, 2022 | | | October 31, 2021 | | | October 31, 2022 | | | October 31, 2021 | |
| | | Shares | | | Amount | | | Shares | | | Amount | | | Shares | | | Amount | | | Shares | | | Amount | |
| | | | | | | | |
Class N: | | | | | | | | | | | | | | | | | | | | | | | | | | | | | | | | |
| | | | | | | | |
Shares sold | | | 22,776 | | | | $217,694 | | | | 57,167 | | | | $617,603 | | | | 4,865 | | | | $42,095 | | | | 26,050 | | | | $301,090 | |
| | | | | | | | |
Shares issued in reinvestment of distributions | | | 7,601 | | | | 76,235 | | | | 1,982 | | | | 21,505 | | | | 247 | | | | 2,401 | | | | 1,571 | | | | 17,233 | |
| | | | | | | | |
Shares redeemed | | | (27,512 | ) | | | (279,182 | ) | | | (36,310 | ) | | | (394,283 | ) | | | (19,283 | ) | | | (154,135 | ) | | | (29,702 | ) | | | (340,566 | ) |
| | | | | | | | | | | | | | | | | | | | | | | | | | | | | | | | |
| | | | | | | | |
Net increase (decrease) | | | 2,865 | | | | $14,747 | | | | 22,839 | | | | $244,825 | | | | (14,171 | ) | | | $(109,639 | ) | | | (2,081 | ) | | | $(22,243 | ) |
| | | | | | | | | | | | | | | | | | | | | | | | | | | | | | | | |
| | | | | | | | |
Class I: | | | | | | | | | | | | | | | | | | | | | | | | | | | | | | | | |
| | | | | | | | |
Shares sold | | | 1,103,881 | | | | $10,593,164 | | | | 1,732,406 | | | | $18,782,363 | | | | 1,148,293 | | | | $10,979,868 | | | | 635,502 | | | | $7,074,008 | |
| | | | | | | | |
Shares issued in reinvestment of distributions | | | 700,717 | | | | 7,022,680 | | | | 244,961 | | | | 2,659,029 | | | | 9,086 | | | | 87,225 | | | | 35,661 | | | | 386,561 | |
| | | | | | | | |
Shares redeemed | | | (3,401,399 | ) | | | (32,959,317 | ) | | | (2,843,986 | ) | | | (30,881,158 | ) | | | (2,318,478 | ) | | | (18,580,334 | ) | | | (251,494 | ) | | | (2,698,418 | ) |
| | | | | | | | | | | | | | | | | | | | | | | | | | | | | | | | |
| | | | | | | | |
Net increase (decrease) | | | (1,596,801 | ) | | | $(15,343,473 | ) | | | (866,619 | ) | | | $(9,439,766 | ) | | | (1,161,099 | ) | | | $(7,513,241 | ) | | | 419,669 | | | | $4,762,151 | |
| | | | | | | | | | | | | | | | | | | | | | | | | | | | | | | | |
| | | | | | | | |
Class Z: | | | | | | | | | | | | | | | | | | | | | | | | | | | | | | | | |
| | | | | | | | |
Shares sold | | | 14,006 | | | | $139,190 | | | | 58,501 | | | | $638,670 | | | | 52,545 | | | | $454,281 | | | | 762,904 | | | | $8,699,676 | |
| | | | | | | | |
Shares issued in reinvestment of distributions | | | 11,298 | | | | 112,920 | | | | 5,343 | | | | 57,930 | | | | 40,063 | | | | 382,197 | | | | 115,827 | | | | 1,248,619 | |
| | | | | | | | |
Shares redeemed | | | (115,151 | ) | | | (1,206,439 | ) | | | (67,164 | ) | | | (733,649 | ) | | | (2,316,286 | ) | | | (18,867,345 | ) | | | (75,374 | ) | | | (830,676 | ) |
| | | | | | | | | | | | | | | | | | | | | | | | | | | | | | | | |
| | | | | | | | |
Net increase (decrease) | | | (89,847 | ) | | | $(954,329 | ) | | | (3,320 | ) | | | $(37,049 | ) | | | (2,223,678 | ) | | | $(18,030,867 | ) | | | 803,357 | | | | $9,117,619 | |
| | | | | | | | | | | | | | | | | | | | | | | | | | | | | | | | |
| | |
| | | Emerging Wealth Equity | | | Small/Mid Cap Growth | |
| | | | |
| | | October 31, 2022 | | | October 31, 2021 | | | October 31, 2022 | | | October 31, 2021 | |
| | | Shares | | | Amount | | | Shares | | | Amount | | | Shares | | | Amount | | | Shares | | | Amount | |
| | | | | | | | |
Class N: | | | | | | | | | | | | | | | | | | | | | | | | | | | | | | | | |
| | | | | | | | |
Shares sold | | | 3,331 | | | | $38,813 | | | | 8,974 | | | | $138,021 | | | | 50,329 | | | | $758,167 | | | | 91,217 | | | | $1,757,478 | |
| | | | | | | | |
Shares issued in reinvestment of distributions | | | 832 | | | | 10,519 | | | | — | | | | — | | | | — | | | | — | | | | 972,672 | | | | 14,770,300 | |
| | | | | | | | |
Shares redeemed | | | (38,704 | ) | | | (443,345 | ) | | | (66,077 | ) | | | (967,375 | ) | | | (311,956 | ) | | | (4,746,914 | ) | | | (311,010 | ) | | | (5,726,959 | ) |
| | | | | | | | | | | | | | | | | | | | | | | | | | | | | | | | |
| | | | | | | | |
Net increase (decrease) | | | (34,541 | ) | | | $(394,013 | ) | | | (57,103 | ) | | | $(829,354 | ) | | | (261,627 | ) | | | $(3,988,747 | ) | | | 752,879 | | | | $10,800,819 | |
| | | | | | | | | | | | | | | | | | | | | | | | | | | | | | | | |
| | | | | | | | |
Class I: | | | | | | | | | | | | | | | | | | | | | | | | | | | | | | | | |
| | | | | | | | |
Shares sold | | | 4,020,886 | | | | $51,172,610 | | | | 1,993,990 | | | | $30,549,706 | | | | 168,904 | | | | $2,592,371 | | | | 42,998 | | | | $900,118 | |
| | | | | | | | |
Shares issued in reinvestment of distributions | | | 32,510 | | | | 415,801 | | | | — | | | | — | | | | — | | | | — | | | | 202,482 | | | | 3,199,629 | |
| | | | | | | | |
Shares redeemed | | | (2,679,906 | ) | | | (30,270,347 | ) | | | (639,402 | ) | | | (9,207,782 | ) | | | (61,724 | ) | | | (883,953 | ) | | | (186,045 | ) | | | (3,412,645 | ) |
| | | | | | | | | | | | | | | | | | | | | | | | | | | | | | | | |
| | | | | | | | |
Net increase | | | 1,373,490 | | | | $21,318,064 | | | | 1,354,588 | | | | $21,341,924 | | | | 107,180 | | | | $1,708,418 | | | | 59,435 | | | | $687,102 | |
| | | | | | | | | | | | | | | | | | | | | | | | | | | | | | | | |
52
| | |
| | | Notes to Financial Statements (continued) |
| | | |
| | | |
| | | | | | | | | | | | | | | | | | | | | | | | | | | | | | | | |
| | | Emerging Wealth Equity | | | Small/Mid Cap Growth | |
| | | | |
| | | October 31, 2022 | | | October 31, 2021 | | | October 31, 2022 | | | October 31, 2021 | |
| | | | | | | | |
| | | Shares | | | Amount | | | Shares | | | Amount | | | Shares | | | Amount | | | Shares | | | Amount | |
| | | | | | | | |
Class Z:1 | | | | | | | | | | | | | | | | | | | | | | | | | | | | | | | | |
| | | | | | | | |
Shares sold | | | 574,616 | | | | $7,156,896 | | | | 3,554,557 | | | | $54,731,525 | | | | — | | | | — | | | | 841 | | | | $15,000 | |
| | | | | | | | |
Shares issued in reinvestment of distributions | | | 8,097 | | | | 103,399 | | | | 162 | | | | 2,470 | | | | — | | | | — | | | | — | | | | — | |
| | | | | | | | |
Shares redeemed | | | (10,481,116 | ) | | | (116,006,697 | ) | | | (3,925,460 | ) | | | (57,082,834 | ) | | | — | | | | — | | | | — | | | | — | |
| | | | | | | | | | | | | | | | | | | | | | | | | | | | | | | | |
| | | | | | | | |
Net increase (decrease) | | | (9,898,403 | ) | | | $(108,746,402 | ) | | | (370,741 | ) | | | $(2,348,839 | ) | | | — | | | | — | | | | 841 | | | | $15,000 | |
| | | | | | | | | | | | | | | | | | | | | | | | | | | | | | | | |
| 1 | Commencement of operations for Small/Mid Cap Growth was on August 31, 2021. |
At October 31, 2022, certain affiliated and unaffiliated shareholders of record individually or collectively held greater than 10% of the net assets of the Funds as follows: Emerging Markets Equity - two own 19%. Transactions by these shareholders may have a material impact on the Fund.
h. REPURCHASE AGREEMENTS AND JOINT REPURCHASE AGREEMENTS
The Funds may enter into third-party and bilateral repurchase agreements for temporary cash management purposes and third-party or bilateral joint repurchase agreements for reinvestment of cash collateral on securities lending transactions under the securities lending program offered by The Bank of New York Mellon (“BNYM”) (the “Program”) (collectively, “Repurchase Agreements”). The value of the underlying collateral, including accrued interest, must equal or exceed the value of the Repurchase Agreements during the term of the agreement. For joint repurchase agreements, the Funds participate on a pro rata basis with other clients of BNYM in its share of the underlying collateral under such joint repurchase agreements and in its share of proceeds from any repurchase or other disposition of the underlying collateral. The underlying collateral for all Repurchase Agreements is held in safekeeping by the Funds’ custodian or at the Federal Reserve Bank. If the seller defaults and the value of the collateral declines, or if bankruptcy proceedings commence with respect to the seller of the security, realization of the collateral by the Funds may be delayed or limited. Pursuant to the Program, the Funds are indemnified for such losses by BNYM on joint repurchase agreements.
At October 31, 2022, the market value of Repurchase Agreements outstanding for Core Bond ESG, Emerging Markets Equity, Emerging Wealth Equity and Small/Mid Cap Growth were $3,802,604, $468,214, $1,256,658 and $1,179,958, respectively.
i. FOREIGN CURRENCY TRANSLATION
The books and records of the Funds are maintained in U.S. Dollars. The value of investments, assets and liabilities denominated in currencies other than U.S. Dollars are translated into U.S. Dollars based upon current foreign exchange rates. Purchases and sales of foreign investments, income and expenses are converted into U.S. Dollars based on currency exchange rates prevailing on the respective dates of such transactions. Net realized and unrealized gain (loss) on foreign currency transactions represent: (1) foreign exchange gains and losses from the sale and holdings of foreign currencies; (2) gains and losses between trade date and settlement date on investment securities transactions and foreign currency exchange contracts; and (3) gains and losses from the difference between amounts of interest and dividends recorded and the amounts actually received.
The Funds do not isolate the net realized and unrealized gain or loss resulting from changes in exchange rates from the fluctuations in market prices of
securities held. Such fluctuations are included with the net realized and unrealized gain or loss on investments.
2. AGREEMENTS AND TRANSACTIONS WITH AFFILIATES
For each of the Funds, the Trusts have entered into an investment advisory agreement under which the Investment Manager, a subsidiary and the U.S. retail distribution arm of Affiliated Managers Group, Inc. (“AMG”), serves as investment manager to the Funds and is responsible for the Funds’ overall administration and operations. The Investment Manager selects one or more subadvisers for the Funds (subject to Board approval) and monitors each subadviser’s investment performance, security holdings and investment strategies. Each Fund’s investment portfolio is managed by GW&K, who serves pursuant to a subadvisory agreement with the Investment Manager. AMG indirectly owns a majority interest in GW&K.
Investment management fees are paid directly by the Funds to the Investment Manager based on average daily net assets. For the fiscal year ended October 31, 2022, the Funds’ investment management fees were paid at the following annual rate of each Fund’s respective average daily net assets:
| | |
| |
Core Bond ESG | | 0.30% |
| |
Emerging Markets Equity | | 0.55% |
| |
Emerging Wealth Equity | | 0.55% |
| |
Small/Mid Cap Growth1 | | 0.62% |
| 1 | Prior to June 18, 2021, the annual rate was 0.90%. |
The fee paid to GW&K for its services as subadviser is paid out of the fee the Investment Manager receives from each Fund and does not increase the expenses of each Fund.
The Investment Manager has contractually agreed, through at least March 1, 2023 for Core Bond ESG, Emerging Markets Equity, Emerging Wealth Equity, and Small/Mid Cap Growth, to waive management fees and/or pay or reimburse fund expenses in order to limit total annual Fund operating expenses after fee waiver and expense reimbursements (exclusive of taxes, interest (including interest incurred in connection with bank and custody overdrafts and in connection with securities sold short), shareholder servicing fees, distribution and service (12b-1) fees, brokerage commissions and other transaction costs, dividends payable with
53
| | |
| | | Notes to Financial Statements (continued) |
| | | |
| | | |
respect to securities sold short, acquired fund fees and expenses and extraordinary expenses) of Core Bond ESG, Emerging Markets Equity, Emerging Wealth Equity, and Small/Mid Cap Growth to 0.48%, 0.87%, 0.90%, and 0.82%, respectively, of each Fund’s average daily net assets (this annual rate or such other annual rate that may be in effect from time to time, the “Expense Cap”), subject to later reimbursement by the Funds in certain circumstances. Prior to June 18 2021, the total annual Fund operating expense limitation was 1.03% of Small/Mid Cap Growth’s average daily net assets.
In general, for a period of up to 36 months after the date any amounts are paid, waived or reimbursed by the Investment Manager, the Investment Manager may recover such amounts from a Fund, provided that such repayment would not cause the Fund’s total annual operating expenses after fee waiver and expense reimbursements (exclusive of the items noted in the parenthetical above) to exceed either (i) the Expense Cap in effect at the time such amounts were paid, waived or reimbursed, or (ii) the Expense Cap in effect at the time of such repayment by the Fund.
The contractual expense limitation may only be terminated in the event the Investment Manager or a successor ceases to be the investment manager of a Fund or a successor fund, by mutual agreement between the Investment Manager and the Board, or in the event of a Fund’s liquidation unless the Fund is reorganized or is a party to a merger in which the surviving entity is successor to the accounting and performance information of a Fund.
At October 31, 2022, the Funds’ expiration of reimbursements subject to recoupment is as follows:
| | | | | | | | | | | | |
Expiration Period | | Core Bond ESG | | | Emerging Markets Equity | | | Emerging Wealth Equity | |
| | | |
Less than 1 year | | | $159,696 | | | | $78,697 | | | | — | |
| | | |
1-2 years | | | 129,634 | | | | 58,087 | | | | — | |
| | | |
2-3 years | | | 121,994 | | | | 77,630 | | | | $11,356 | |
| | | | | | | | | | | | |
| | | |
Total | | | $411,324 | | | | $214,414 | | | | $11,356 | |
| | | | | | | | | | | | |
| | | | |
Expiration Period | | Small/Mid Cap Growth | |
| |
Less than 1 year | | | $111,190 | |
| |
1-2 years | | | 103,778 | |
| |
2-3 years | | | 89,139 | |
| | | | |
| |
Total | | | $304,107 | |
| | | | |
The Trusts, on behalf of the Funds, have entered into an amended and restated Administration Agreement under which the Investment Manager serves as the Funds’ administrator (the “Administrator”) and is responsible for all non-portfolio management aspects of managing the Funds’ operations, including administration and shareholder services to each Fund. Each Fund pays a fee to the Administrator at the rate of 0.15% per annum of the Fund’s average daily net assets for this service.
The Funds are distributed by AMG Distributors, Inc. (the “Distributor”), a wholly-owned subsidiary of the Investment Manager. The Distributor serves as the distributor and underwriter for each Fund and is a registered broker-dealer and member of the Financial Industry Regulatory Authority, Inc. (“FINRA”). Shares of
each Fund will be continuously offered and will be sold directly to prospective purchasers and through brokers, dealers or other financial intermediaries who have executed selling agreements with the Distributor. Generally the Distributor bears all or a portion of the expenses of providing services pursuant to the distribution agreement, including the payment of the expenses relating to the distribution of prospectuses for sales purposes and any advertising or sales literature.
The Trusts have adopted a distribution and service plan (the “Plan”) with respect to the Class N shares of each Fund, in accordance with the requirements of Rule 12b-1 under the 1940 Act and the requirements of the applicable rules of FINRA regarding asset-based sales charges. Pursuant to the Plan, each Fund may make payments to the Distributor for its expenditures in financing any activity primarily intended to result in the sale of each Fund’s Class N shares and for maintenance and personal service provided to existing shareholders of that class. The Plan authorized payments to the Distributor up to 0.25% annually of each Fund’s average daily net assets attributable to the Class N shares. For Small/Mid Cap Growth, the Plan is characterized as a reimbursement plan and is directly tied to expenses incurred by the Distributor; the payments the Distributor receives during any year may not exceed its actual expenses. The impact on the Class N annualized expense ratios for the fiscal year ended October 31, 2022, were 0.25% for Core Bond ESG, Emerging Markets Equity, and Emerging Wealth Equity and 0.19% for Small/Mid Cap Growth.
For Class N of Core Bond ESG, Emerging Markets Equity and Emerging Wealth Equity and for each of the Class I shares, the Board has approved reimbursement payments to the Investment Manager for shareholder servicing expenses (“shareholder servicing fees”) incurred. Shareholder servicing fees include payments to financial intermediaries, such as broker-dealers (including fund supermarket platforms), banks, and trust companies who provide shareholder recordkeeping, account servicing and other services. The Class N and Class I shares may reimburse the Investment Manager for the actual amount incurred up to a maximum annual rate of each Class’s average daily net assets as shown in the table below.
The impact on the annualized expense ratios for the fiscal year ended October 31, 2022, were as follows:
| | | | | | | | |
| | | Maximum Annual | | | Actual | |
| | | Amount | | | Amount | |
| Fund | | Approved | | | Incurred | |
| | |
Core Bond ESG | | | | | | | | |
| | |
Class N | | | 0.15% | | | | 0.15% | |
| | |
Class I | | | 0.10% | | | | 0.07% | |
|
Emerging Markets Equity | |
| | |
Class N | | | 0.15% | | | | 0.15% | |
| | |
Class I | | | 0.15% | | | | 0.10% | |
| | |
Emerging Wealth Equity | | | | | | | | |
| | |
Class N | | | 0.15% | | | | 0.15% | |
| | |
Class I | | | 0.15% | | | | 0.10% | |
| | |
Small/Mid Cap Growth | | | | | | | | |
| | |
Class I* | | | 0.05% | | | | 0.05% | |
| * | Prior to June 18, 2021, the maximum annual amount approved was 0.15%. Effective, June 18, 2021, the shareholder servicing fees for Class N was eliminated. |
54
| | |
| | | Notes to Financial Statements (continued) |
| | | |
| | | |
The Board provides supervision of the affairs of the Trusts and other trusts within the AMG Funds Family. The Trustees of the Trusts who are not affiliated with the Investment Manager receive an annual retainer and per meeting fees for regular, special and telephonic meetings, and they are reimbursed for out-of-pocket expenses incurred while carrying out their duties as Board members. The Chairman of the Board and the Audit Committee Chair receive additional annual retainers. Certain Trustees and Officers of the Funds are Officers and/or Directors of the Investment Manager, AMG and/or the Distributor.
The Securities and Exchange Commission (the “SEC”) granted an exemptive order that permits certain eligible funds in the AMG Funds Family to lend and borrow money for certain temporary purposes directly to and from other eligible funds in the AMG Funds Family. Participation in this interfund lending program is voluntary for both the borrowing and lending funds, and an interfund loan is only made if it benefits each participating fund. The Administrator manages the program according to procedures approved by the Board, and the Board monitors the operation of the program. An interfund loan must comply with certain conditions set out in the exemptive order, which are designed to assure fairness and protect all participating funds. The interest earned and interest paid on interfund loans are included on the Statement of Operations as interest income and interest expense, respectively. At October 31, 2022, the Funds had no interfund loans outstanding.
The following Funds utilized the interfund loan program during the fiscal year ended October 31, 2022 as follows:
| | | | | | | | | | | | | | | | |
| Fund | | Average
Lent | | | Number
of Days | | | Interest
Earned | | | Average
Interest Rate | |
| | | | |
Core Bond ESG | | | $1,707,714 | | | | 13 | | | | $771 | | | | 1.268 | % |
| | | | |
Emerging Markets Equity | | | 1,695,398 | | | | 4 | | | | 173 | | | | 0.930 | % |
| | | | |
Emerging Wealth Equity | | | 2,214,957 | | | | 5 | | | | 282 | | | | 0.928 | % |
| | | | |
Small/Mid Cap Growth | | | 175,689 | | | | 7 | | | | 133 | | | | 3.940 | % |
| | | | |
| Fund | | Average
Borrowed | | | Number
of Days | | | Interest
Paid | | | Average
Interest Rate | |
| | | | |
Emerging Markets Equity | | | $5,750,002 | | | | 20 | | | | $8,120 | | | | 2.577 | % |
| | | | |
Emerging Wealth Equity | | | 1,883,694 | | | | 12 | | | | 1,041 | | | | 1.681 | % |
3. PURCHASES AND SALES OF SECURITIES
Purchases and sales of securities (excluding short-term securities and U.S. Government Obligations) for the fiscal year ended October 31, 2022, were as follows:
| | | | | | | | |
| | | Long Term Securities | |
| Fund | | Purchases | | | Sales | |
| | |
Core Bond ESG | | | $23,183,411 | | | | $36,270,740 | |
| | |
Emerging Markets Equity | | | 19,825,477 | | | | 43,336,350 | |
| | |
Emerging Wealth Equity | | | 94,847,843 | | | | 183,782,480 | |
| | |
Small/Mid Cap Growth | | | 8,089,761 | | | | 10,660,698 | |
Core Bond ESG purchases and sales of U.S. Government obligations during the fiscal year ended October 31, 2022 were $32,736,095 and $34,878,482, respectively.
4. PORTFOLIO SECURITIES LOANED
The Funds participate in the Program providing for the lending of securities to qualified borrowers. Securities lending income includes earnings of such temporary cash investments, plus or minus any rebate to a borrower. These earnings (after any rebate) are then divided between BNYM, as a fee for its services under the Program, and the Funds, according to agreed-upon rates. Collateral on all securities loaned is accepted in cash, U.S. Treasury Obligations or U.S. Government Agency Obligations. Collateral is maintained at a minimum level of 102% (105% in the case of certain foreign securities) of the market value, plus interest, if applicable, of investments on loan. It is the Funds’ policy to obtain additional collateral from or return excess collateral to the borrower by the end of the next business day, following the valuation date of the securities loaned. Therefore, the value of the collateral held may be temporarily less than the value of the securities on loan. Lending securities entails a risk of loss to the Funds if and to the extent that the market value of the securities loaned were to increase and the borrower did not increase the collateral accordingly, and the borrower fails to return the securities. Under the terms of the Program, the Funds are indemnified for such losses by BNYM. Cash collateral is held in separate omnibus accounts managed by BNYM, who is authorized to exclusively enter into joint repurchase agreements for that cash collateral. Securities collateral is held in separate omnibus accounts managed by BNYM and cannot be sold or pledged. BNYM bears the risk of any deficiency in the amount of the cash collateral available for return to the borrower due to any loss on the collateral invested. Loans of securities are terminable at any time and the borrower, after notice, is required to return borrowed securities as soon as practical, which is normally within three business days.
The value of securities loaned on positions held, cash collateral and securities collateral received at October 31, 2022, were as follows:
| | | | | | | | |
| Fund | | Securities
Loaned | | Cash
Collateral
Received | | Securities
Collateral
Received | | Total Collateral Received |
| | | | |
Core Bond ESG | | $151,198 | | $157,604 | | — | | $157,604 |
| | | | |
Emerging Markets Equity | | 637,837 | | 383,214 | | $249,263 | | 632,477 |
| | | | |
Emerging Wealth Equity | | 1,183,977 | | 1,256,658 | | — | | 1,256,658 |
| | | | |
Small/Mid Cap Growth | | 1,104,767 | | 509,958 | | 630,523 | | 1,140,481 |
The following table summarizes the securities received as collateral for securities lending at October 31, 2022:
| | | | | | |
| Fund | | Collateral Type | | Coupon
Range | | Maturity
Date Range |
| | | |
Emerging Markets Equity | | U.S. Treasury Obligations | | 0.125%-4.750% | | 02/28/23-11/15/50 |
| | | |
Small/Mid Cap Growth | | U.S. Treasury Obligations | | 0.000%-4.750% | | 01/12/23-11/15/51 |
5. FOREIGN SECURITIES
Certain Funds invest in securities of foreign entities and in instruments denominated in foreign currencies which involve risks not typically associated with investments in domestic securities. Non-domestic securities carry special risks, such as exposure to currency fluctuations, less developed or less efficient trading markets, political instability, a lack of company information, differing auditing and legal standards, and, potentially, less liquidity. A Fund’s investments
55
| | |
| | | Notes to Financial Statements (continued) |
| | | |
| | | |
in emerging market countries are exposed to additional risks. A Fund’s performance will be influenced by political, social and economic factors affecting companies in emerging market countries. Emerging market countries generally have economic structures that are less diverse and mature, and political systems that are less stable, than those of developed countries. Realized gains in certain countries may be subject to foreign taxes at the Fund level and the Fund would pay such foreign taxes at the appropriate rate for each jurisdiction.
6. GEOGRAPHICAL FOCUS RISK
Emerging Markets Equity and Emerging Wealth Equity are particularly susceptible to risks in the Greater China region, which consists of the People’s Republic of China (“PRC”), Hong Kong, Taiwan or issuers that are not located in the Greater China region, but derive a majority (over 50%) of their income from the Greater China region. Economies in the Greater China region are dependent on the economies of other countries and can be significantly affected by currency fluctuations and increasing competition from other emerging economies in Asia with lower costs. Adverse events in any one country within the region may impact the other countries in the region or Asia as a whole. Markets in the Greater China region can experience significant volatility due to social, economic, regulatory and political uncertainties. Significant portions of the Chinese securities markets may become rapidly illiquid, as Chinese issuers have the ability to suspend the trading of their equity securities, and have shown a willingness to exercise that option in response to market volatility and other events. U.S. or foreign government restrictions or intervention could negatively affect the implementation of the Fund’s investment strategies, for example by precluding the Funds from making certain investments or causing the Funds to sell investments at disadvantageous times. China has yet to develop comprehensive securities, corporate, or
commercial laws, its market is relatively new and less developed, and its economy may be adversely impacted by a slowdown in export growth. Each Fund’s NAV may be more volatile than the NAV of a more geographically diversified fund and may result in losses.
7. COMMITMENTS AND CONTINGENCIES
Under the Trusts’ organizational documents, its Trustees and Officers are indemnified against certain liabilities arising out of the performance of their duties to the Trusts. In addition, in the normal course of business, the Funds may enter into contracts and agreements that contain a variety of representations and warranties, which provide general indemnifications. The maximum exposure to the Funds under these arrangements is unknown, as this would involve future claims that may be made against a Fund that have not yet occurred. However, based on experience, the Funds had no prior claims or losses and expect the risks of loss to be remote.
8. MASTER NETTING AGREEMENTS
The Funds may enter into master netting agreements with their counterparties for the Program and Repurchase Agreements, which provide the right, in the event of default (including bankruptcy or insolvency) for the non-defaulting party to liquidate the collateral and calculate net exposure to the defaulting party or request additional collateral. For financial reporting purposes, the Funds do not offset financial assets and financial liabilities that are subject to master netting agreements in the Statement of Assets and Liabilities. For securities lending transactions, see Note 4.
The following table is a summary of the Funds’ open Repurchase Agreements that are subject to a master netting agreement as of October 31, 2022:
| | | | | | | | | | | | | | | | | | | | | | | | | |
| | | | | Gross Amount Not Offset in the | | | | |
| | | | | Statement of Assets and Liabilities | | | | |
| Fund | | Gross Amounts of
Assets Presented in
the Statement of
Assets and Liabilities | | Offset Amount | | Net Asset Balance | | Collateral Received | | Net Amount |
| | | | | | | | | | | |
| | | | | |
Core Bond ESG | | | | | | | | | | | | | | | | | | | | | | | | | |
| | | | | |
HSBC Securities USA, Inc. | | | | $157,604 | | | | | — | | | | | $157,604 | | | | | $157,604 | | | | | — | |
| | | | | |
Fixed Income Clearing Corp. | | | | 3,645,000 | | | | | — | | | | | 3,645,000 | | | | | 3,645,000 | | | | | — | |
| | | | | | | | | | | | | | | | | | | | | | | | | |
| | | | | |
Total | | | | $3,802,604 | | | | | — | | | | | $3,802,604 | | | | | $3,802,604 | | | | | — | |
| | | | | | | | | | | | | | | | | | | | | | | | | |
| | | | | | | | | | | |
| | | | | |
Emerging Markets Equity | | | | | | | | | | | | | | | | | | | | | | | | | |
| | | | | |
National Bank Financial | | | | $383,214 | | | | | — | | | | | $383,214 | | | | | $383,214 | | | | | — | |
| | | | | |
Fixed Income Clearing Corp. | | | | 85,000 | | | | | — | | | | | 85,000 | | | | | 85,000 | | | | | — | |
| | | | | | | | | | | | | | | | | | | | | | | | | |
| | | | | |
Total | | | | $468,214 | | | | | — | | | | | $468,214 | | | | | $468,214 | | | | | — | |
| | | | | | | | | | | | | | | | | | | | | | | | | |
| | | | | | | | | | | |
| | | | | |
Emerging Wealth Equity | | | | | | | | | | | | | | | | | | | | | | | | | |
| | | | | |
Citigroup Global Markets, Inc. | | | | $256,658 | | | | | — | | | | | $256,658 | | | | | $256,658 | | | | | — | |
| | | | | |
RBC Dominion Securities, Inc. | | | | 1,000,000 | | | | | — | | | | | 1,000,000 | | | | | 1,000,000 | | | | | — | |
| | | | | | | | | | | | | | | | | | | | | | | | | |
| | | | | |
Total | | | | $1,256,658 | | | | | — | | | | | $1,256,658 | | | | | $1,256,658 | | | | | — | |
| | | | | | | | | | | | | | | | | | | | | | | | | |
56
| | |
| | | Notes to Financial Statements (continued) |
| | | |
| | | |
| | | | | | | | | | | | | | | | | | | | |
| | | | | | Gross Amount Not Offset in the | | | | | | | |
| | | | | | Statement of Assets and Liabilities | | | | | | | |
| Fund | | Gross Amounts of
Assets Presented in
the Statement of
Assets and Liabilities | | | Offset Amount | | | Net Asset Balance | | | Collateral Received | | | Net Amount | |
| |
| | | | | | | | | | | | | | | | |
| | | | | |
Small/Mid Cap Growth | | | | | | | | | | | | | | | | | | | | |
| | | | | |
Citigroup Global Markets, Inc. | | | $509,958 | | | | — | | | | $509,958 | | | | $509,958 | | | | — | |
| | | | | |
Fixed Income Clearing Corp. | | | 670,000 | | | | — | | | | 670,000 | | | | 670,000 | | | | — | |
| | | | | | | | | | | | | | | | | | | | |
| | | | | |
Total | | | $1,179,958 | | | | — | | | | $1,179,958 | | | | $1,179,958 | | | | — | |
| | | | | | | | | | | | | | | | | | | | |
9. SUBSEQUENT EVENTS
The Funds have determined that no material events or transactions occurred through the issuance date of the Funds’ financial statements which require an additional disclosure in or adjustment of the Funds’ financial statements.
57
| | |
| | | Report of Independent Registered Public Accounting Firm |
| | | |
| | | |
TO THE BOARD OF TRUSTEES OF AMG FUNDS, AMG FUNDS I, AND AMG FUNDS IV AND SHAREHOLDERS OF AMG GW&K CORE BOND ESG FUND, AMG GW&K EMERGING MARKETS EQUITY FUND, AMG GW&K EMERGING WEALTH EQUITY FUND, AND AMG GW&K SMALL/MID CAP GROWTH FUND
Opinions on the Financial Statements
We have audited the accompanying statements of assets and liabilities, including the schedules of portfolio investments, of AMG GW&K Core Bond ESG Fund (one of the funds constituting AMG Funds I), AMG GW&K Emerging Markets Equity Fund and AMG GW&K Emerging Wealth Equity Fund (two of the funds constituting AMG Funds), and AMG GW&K Small/Mid Cap Growth Fund (one of the funds constituting AMG Funds IV) (hereafter collectively referred to as the “Funds”) as of October 31, 2022, the related statements of operations for the year ended October 31, 2022, the statements of changes in net assets for each of the two years in the period ended October 31, 2022, including the related notes, and the financial highlights for each the periods indicated therein (collectively referred to as the “financial statements”). In our opinion, the financial statements present fairly, in all material respects, the financial position of each of the Funds as of October 31, 2022, the results of each of their operations for the year then ended, the changes in each of their net assets for each of the two years in the period ended October 31, 2022 and each of the financial highlights for each of the periods indicated therein in conformity with accounting principles generally accepted in the United States of America.
Basis for Opinions
These financial statements are the responsibility of the Funds’ management. Our responsibility is to express an opinion on the Funds’ financial statements based on our audits. We are a public accounting firm registered with the Public Company Accounting Oversight Board (United States) (PCAOB) and are required to be independent with respect to the Funds in accordance with the U.S. federal securities laws and the applicable rules and regulations of the Securities and Exchange Commission and the PCAOB.
We conducted our audits of these financial statements in accordance with the standards of the PCAOB. Those standards require that we plan and perform the audit to obtain reasonable assurance about whether the financial statements are free of material misstatement, whether due to error or fraud.
Our audits included performing procedures to assess the risks of material misstatement of the financial statements, whether due to error or fraud, and performing procedures that respond to those risks. Such procedures included examining, on a test basis, evidence regarding the amounts and disclosures in the financial statements. Our audits also included evaluating the accounting principles used and significant estimates made by management, as well as evaluating the overall presentation of the financial statements. Our procedures included confirmation of securities owned as of October 31, 2022 by correspondence with the custodian and brokers; when replies were not received from brokers, we performed other auditing procedures. We believe that our audits provide a reasonable basis for our opinions.
/s/PricewaterhouseCoopers LLP
Boston, Massachusetts
December 22, 2022
We have served as the auditor of one or more investment companies in the AMG Funds Family since 1993.
58
| | |
| | | Other Information (unaudited) |
| | | |
| | | |
TAX INFORMATION
AMG GW&K Core Bond ESG Fund, AMG GW&K Emerging Markets Equity Fund, AMG GW&K Emerging Wealth Equity Fund and AMG GW&K Small/Mid Cap Growth Fund each hereby designates the maximum amount allowable of their net taxable income as qualified dividends as provided in the Jobs and Growth Tax Relief Reconciliation Act of 2003. The 2021/2022 Form 1099-DIV you receive for each Fund will show the tax status of all distributions paid to you during the year.
In accordance with federal tax law, the following Fund elects to provide foreign taxes paid and the income sourced from foreign countries. Accordingly, the Fund hereby makes the following designations regarding its taxable period ended October 31, 2022:
AMG GW&K Emerging Markets Equity Fund
uThe total amount of taxes paid and income sourced from foreign countries was $112,101 and $902,096, respectively.
Pursuant to section 852 of the Internal Revenue Code, AMG GW&K Core Bond ESG Fund, AMG GW&K Emerging Markets Equity Fund, AMG GW&K Emerging Wealth Equity Fund and AMG GW&K Small/Mid Cap Growth Fund, each hereby designates as a capital gain distribution with respect to the taxable period ended October 31, 2022, $4,019,861, $211,238, $2,343,086 and $0, respectively, or, if subsequently determined to be different, the net capital gains of such period.
59
| | |
| | | AMG Funds Trustees and Officers |
| | | |
| | | |
| | | | |
The Trustees and Officers of the Trust, their business addresses, principal occupations for the past five years and ages are listed below. The Trustees provide broad supervision over the affairs of the Trust and the Funds. The Trustees are experienced executives who meet periodically throughout the year to oversee the Funds’ activities, review contractual arrangements with companies that provide services to the Funds, and | | review the Funds’ performance. Unless otherwise noted, the address of each Trustee or Officer is the address of the Trust: 680 Washington Blvd., Suite 500, Stamford, CT. 06901. There is no stated term of office for Trustees. Trustees serve until their resignation, retirement or removal in | | accordance with the Trust’s organizational documents and policies adopted by the Board from time to time. The Chairman of the Trustees, President, Treasurer and Secretary of the Trust are elected by the Trustees annually. Other officers hold office at the pleasure of the Trustees. |
Independent Trustees
The following Trustees are not “interested persons” of the Trust within the meaning of the 1940 Act:
| | |
Number of Funds Overseen in Fund Complex | | Name, Age, Principal Occupation(s) During Past 5 Years and Other Directorships Held by Trustee |
| | |
• Trustee since 2012 - AMG Funds • Trustee since 2012 - AMG Funds I • Trustee since 2014 - AMG Funds IV • Oversees 40 Funds in Fund Complex | | Bruce B. Bingham, 73 Partner, Hamilton Partners (real estate development firm) (1987-Present); Director of The Yacktman Funds, Inc. (2 portfolios) (2000-2012). |
| | |
• Trustee since 2013 - AMG Funds • Trustee since 2013 - AMG Funds I • Trustee since 2014 - AMG Funds IV • Chairman of the Audit Committee since 2021 - AMG Funds, AMG Funds I • Chairman of the Audit Committee since 2020 - AMG Funds IV • Oversees 44 Funds in Fund Complex | | Kurt A. Keilhacker, 59 Managing Partner, TechFund Europe (2000-Present); Managing Partner, TechFund Capital (1997-Present); Managing Partner, Elementum Ventures (2013-Present); Director, MetricStory, Inc. (2017-Present); Trustee, Wheaton College (2018-Present); Trustee, Gordon College (2001-2016); Board Member, 6wind SA (2002-2019). |
| | |
• Trustee since 2004 - AMG Funds • Trustee since 2000 - AMG Funds I • Trustee since 2010 - AMG Funds IV • Oversees 40 Funds in Fund Complex | | Steven J. Paggioli, 72 Independent Consultant (2002-Present); Trustee, Professionally Managed Portfolios (28 portfolios); Advisory Board Member, Sustainable Growth Advisors, LP; Independent Director, Muzinich BDC, Inc. (business development company) (2019-Present); Director, The Wadsworth Group; Independent Director, Chase Investment Counsel (2008–2019); Executive Vice President, Secretary and Director, Investment Company Administration, LLC and First Fund Distributors, INC. (1990-2001). |
| | |
• Independent Chairman of the Board of Trustees since 2017; Chairman of the Governance Committee since 2017 • Trustee since 1999 - AMG Funds • Trustee since 2000 - AMG Funds I • Trustee since 2010 - AMG Funds IV • Oversees 44 Funds in Fund Complex | | Eric Rakowski, 64 Professor of Law, University of California at Berkeley School of Law (1990-Present); Tax Attorney at Davis Polk & Wardwell and clerked for Judge Harry T. Edwards of the U.S. Court of Appeals for the District of Columbia Circuit and for Justice William J. Brennan Jr. of the U.S. Supreme Court; Director of Harding, Loevner Funds, Inc. (10 portfolios); Trustee of Third Avenue Trust (3 portfolios) (2002-2019); Trustee of Third Avenue Variable Trust (1 portfolio) (2002-2019). |
60
| | |
| | | AMG Funds Trustees and Officers (continued) |
| | | |
| | | |
| | |
Number of Funds Overseen in Fund Complex | | Name, Age, Principal Occupation(s) During Past 5 Years and Other Directorships Held by Trustee |
| | |
• Trustee since 2013 - AMG Funds • Trustee since 2013 - AMG Funds I • Trustee since 2014 - AMG Funds IV • Oversees 44 Funds in Fund Complex | | Victoria L. Sassine, 57 Adjunct Professor, Babson College (2007–Present); Director, Board of Directors, PRG Group (2017-Present); CEO, Founder, Scale Smarter Partners, LLC (2018-Present); Adviser, EVOFEM Biosciences (2019-Present); Chairperson of the Board of Directors of Business Management Associates (2018 to 2019). |
| | |
• Trustee since 2000 - AMG Funds I • Trustee since 2004 - AMG Funds • Trustee since 2010 - AMG Funds IV • Oversees 40 Funds in Fund Complex | | Thomas R. Schneeweis, 75* Professor Emeritus, University of Massachusetts (2013-Present); President, TRS Associates (1982-Present); Board Member, Chartered Alternative Investment Association (“CAIA”) (2002-Present); Co-Founder and Director, Institute for Global Asset and Risk Management (Education) (2010-Present); Co-Owner, Quantitative Investment Technologies (2014-Present); Co-Owner, Yes Wealth Management (2018-Present); Director, CAIA Foundation (2010-2019); Partner, S Capital Wealth Advisors (2015-2018); Partner, S Capital Management, LLC (2007-2015); President, Alternative Investment Analytics, LLC (formerly Schneeweis Partners, LLC) (2001-2013). |
*Mr. Schneeweis retired from the Board of Trustees of AMG Funds IV as of October 31, 2022 and will retire from the Board of Trustees of AMG Funds and AMG Funds I as of December 31, 2022.
Interested Trustee
The Trustee in the following table is an “interested person” of the Trust within the meaning of the 1940 Act.
| | |
Number of Funds Overseen in
Fund Complex | | Name, Age, Principal Occupation(s) During Past 5 Years and Other Directorships Held by Trustee |
| | |
• Trustee since 2021 - AMG Funds, AMG Funds I, AMG Funds IV • Oversees 44 Funds in Fund Complex | | Garret W. Weston, 41 Affiliated Managers Group, Inc. (2008-Present): Managing Director, Co-Head of Affiliate Engagement (2021-Present), Senior Vice President, Affiliate Development (2016-2021), Vice President, Office of the CEO (2015-2016), Vice President, New Investments (2012-2015), Senior Associate, New Investments (2008-2012); Associate, Madison Dearborn Partners (2006-2008); Analyst, Merrill Lynch (2004-2006). |
Officers
| | |
Position(s) Held with Fund and Length of Time Served | | Name, Age, Principal Occupation(s) During Past 5 Years |
| | |
• President since 2018 • Principal Executive Officer since 2018 • Chief Executive Officer since 2018 • Chief Operating Officer since 2007 (2016 for AMG Funds IV) | | Keitha L. Kinne, 64 Chief Operating Officer, AMG Funds LLC (2007-Present); Chief Investment Officer, AMG Funds LLC (2008-Present); President and Principal, AMG Distributors, Inc. (2018-Present); Chief Operating Officer, AMG Distributors, Inc. (2007-Present); President, Chief Executive Officer and Principal Executive Officer, AMG Funds, AMG Funds I, AMG Funds II, AMG Funds III and AMG Funds IV (2018-Present); Chief Operating Officer, AMG Funds, AMG Funds I, AMG Funds II, and AMG Funds III (2007-Present); Chief Operating Officer, AMG Funds IV (2016-Present); Chief Operating Officer and Chief Investment Officer, Aston Asset Management, LLC (2016); President and Principal Executive Officer, AMG Funds, AMG Funds I, AMG Funds II and AMG Funds III (2012-2014); Managing Partner, AMG Funds LLC (2007-2014); President and Principal, AMG Distributors, Inc. (2012-2014); Managing Director, Legg Mason & Co., LLC (2006-2007); Managing Director, Citigroup Asset Management (2004-2006). |
| | |
• Secretary since 2015 • Chief Legal Officer since 2015 | | Mark J. Duggan, 57 Managing Director and Senior Counsel, AMG Funds LLC (2021-Present); Senior Vice President and Senior Counsel, AMG Funds LLC (2015-2021); Secretary and Chief Legal Officer, AMG Funds, AMG Funds I, AMG Funds II, AMG Funds III and AMG Funds IV (2015-Present); Attorney, K&L Gates, LLP (2009-2015). |
| | |
• Chief Financial Officer since 2017 • Treasurer since 2017 • Principal Financial Officer since 2017 • Principal Accounting Officer since 2017 | | Thomas G. Disbrow, 56 Vice President, Mutual Fund Treasurer & CFO, AMG Funds, AMG Funds LLC (2017-Present); Chief Financial Officer, Principal Financial Officer, Treasurer and Principal Accounting Officer, AMG Funds, AMG Funds I, AMG Funds II, AMG Funds III and AMG Funds IV (2017-Present); Managing Director - Global Head of Traditional Funds Product Control, UBS Asset Management (Americas), Inc. (2015-2017); Managing Director - Head of North American Funds Treasury, UBS Asset Management (Americas), Inc. (2011-2015). |
61
| | |
| | | AMG Funds Trustees and Officers (continued) |
| | | |
| | | |
| | |
| Position(s) Held with Fund and Length of Time Served | | Name, Age, Principal Occupation(s) During Past 5 Years |
| | |
• Deputy Treasurer since 2017 | | John A. Starace, 51 Vice President, Mutual Fund Accounting, AMG Funds LLC (2021-Present); Director, Mutual Fund Accounting, AMG Funds LLC (2017-2021); Vice President, Deputy Treasurer of Mutual Funds Services, AMG Funds LLC (2014-2017); Deputy Treasurer, AMG Funds, AMG Funds I, AMG Funds II, AMG Funds III and AMG Funds IV (2017-Present); Vice President, Citi Hedge Fund Services (2010-2014); Audit Senior Manager (2005-2010) and Audit Manager (2001-2005), Deloitte & Touche LLP. |
| | |
• Chief Compliance Officer and Sarbanes-Oxley Code of Ethics Compliance Officer since 2019 • Anti-Money Laundering Compliance Officer since 2022 | | Patrick J. Spellman, 48 Vice President, Chief Compliance Officer, AMG Funds LLC (2017-Present); Chief Compliance Officer, AMG Distributors, Inc. (2010-Present); Chief Compliance Officer and Sarbanes-Oxley Code of Ethics Compliance Officer, AMG Funds, AMG Funds I, AMG Funds II, AMG Funds III and AMG Funds IV (2019-Present); Anti-Money Laundering Compliance Officer, AMG Funds, AMG Funds I, AMG Funds II, and AMG Funds III (2014-2019; 2022-Present); Anti-Money Laundering Compliance Officer, AMG Funds IV (2016-2019; 2022-Present); Senior Vice President, Chief Compliance Officer, AMG Funds LLC (2011-2017); Compliance Manager, Legal and Compliance, Affiliated Managers Group, Inc. (2005-2011). |
| | |
• Assistant Secretary since 2016 | | Maureen M. Kerrigan, 37 Vice President, Senior Counsel, AMG Funds LLC (2021-Present); Vice President, Counsel, AMG Funds LLC (2019-2021); Director, Counsel, AMG Funds LLC (2017-2018); Vice President, Counsel, AMG Funds LLC (2015-2017); Assistant Secretary, AMG Funds, AMG Funds I, AMG Funds II, AMG Funds III and AMG Funds IV (2016-Present); Associate, Ropes & Gray LLP (2011-2015); Law Fellow, Massachusetts Appleseed Center for Law and Justice (2010-2011). |
62
| | |
| | | Annual Renewal of Investment Management and Subadvisory Agreements |
| | | |
| | | |
| | | | | | | | |
AMG GW&K Emerging Markets Equity Fund, AMG GW&K Emerging Wealth Equity Fund, AMG GW&K Core Bond ESG Fund, and AMG GW&K Small/Mid Cap Growth Fund: Approval of Investment Management and Subadvisory Agreements on June 22, 2022 At an in-person meeting held on June 22, 2022, the Board of Trustees (the “Board” or the “Trustees”) of each of AMG Funds, AMG Funds I, and AMG Funds IV (each, a “Trust” and collectively, the “Trusts”), and separately a majority of the Trustees who are not “interested persons” of the Trusts (the “Independent Trustees”), approved (i) the Investment Management Agreement, as amended pursuant to letter agreements at any time prior to the date of the meeting, with AMG Funds LLC (the “Investment Manager”) and AMG Funds for each of AMG GW&K Emerging Markets Equity Fund and AMG GW&K Emerging Wealth Equity Fund, and separately each of Amendment No. 1 thereto dated July 1, 2015, and Amendment No. 2 thereto dated October 1, 2016; the Fund Management Agreement, as amended pursuant to letter agreements at any time prior to the date of the meeting, with the Investment Manager and AMG Funds I for AMG GW&K Core Bond ESG Fund, and separately each of Amendment No. 1 thereto dated July 1, 2015, and Amendment No. 2 thereto dated October 1, 2016; and the Investment Advisory Agreement, as amended pursuant to letter agreements at any time prior to the date of the meeting, with the Investment Manager and AMG Funds IV for AMG GW&K Small/Mid Cap Growth Fund, and separately Amendment No. 1 thereto dated October 1, 2016 (collectively, the “Investment Management Agreements”); and (ii) the Subadvisory Agreements, as amended at any time prior to the date of the meeting (collectively, the “Subadvisory Agreements”), with the Subadviser for each of AMG GW&K Emerging Markets Equity Fund, AMG GW&K Emerging Wealth Equity Fund, AMG GW&K Core Bond ESG Fund, and AMG GW&K Small/Mid Cap Growth Fund (each, a “Fund,” and collectively, the “Funds”). The Independent Trustees were separately represented by independent legal counsel in connection with their consideration of the approval of these agreements. In considering the Investment Management Agreements and the Subadvisory Agreements, the Trustees reviewed a variety of materials relating to each Fund, the Investment Manager and the Subadviser, including the nature, extent and quality of services, comparative performance, fee and expense information for an appropriate peer group of similar mutual funds for each Fund (each, a “Peer Group”), performance information for the relevant benchmark index for | | | | each Fund (each, a “Fund Benchmark”), other relevant matters, and other information provided to them on a periodic basis throughout the year. Prior to voting, the Independent Trustees: (a) reviewed the foregoing information with their independent legal counsel; (b) received materials from their independent legal counsel discussing the legal standards applicable to their consideration of the Investment Management Agreements and the Subadvisory Agreements; and (c) met with their independent legal counsel in private sessions at which no representatives of management were present. NATURE, EXTENT AND QUALITY OF SERVICES In considering the nature, extent and quality of the services provided by the Investment Manager, the Trustees reviewed information relating to the Investment Manager’s operations and personnel. Among other things, the Investment Manager provided financial information, information about its supervisory and professional staff and descriptions of its organizational and management structure. The Trustees also took into account information provided periodically throughout the previous year by the Investment Manager in Board meetings relating to the performance of its duties with respect to the Funds and the Trustees’ knowledge of the Investment Manager’s management and the quality of the performance of the Investment Manager’s duties under the Investment Management Agreements and Administration Agreement. In the course of their deliberations regarding the Investment Manager, the Trustees evaluated, among other things: (a) the extent and quality of the Investment Manager’s oversight of the operation and management of the Funds; (b) the quality of the Investment Manager’s oversight of the performance by the Subadviser of its portfolio management duties; (c) the Investment Manager’s ability to supervise the Funds’ other service providers; and (d) the Investment Manager’s compliance program. The Trustees also took into account that, in performing its functions under the Investment Management Agreements and supervising the Subadviser, the Investment Manager: performs periodic detailed analyses and reviews of the performance by the Subadviser of its obligations to each Fund, including without limitation, analysis and review of portfolio and other compliance matters and review of the Subadviser’s investment performance with respect to each Fund; prepares and presents periodic reports to the Board regarding the investment performance of the Subadviser and other information regarding the Subadviser, at such times and in such forms as the | | | | Board may reasonably request; reviews and considers any changes in the personnel of the Subadviser responsible for performing the Subadviser’s obligations and makes appropriate reports to the Board; reviews and considers any changes in the ownership or senior management of the Subadviser and makes appropriate reports to the Board; performs periodic in-person, telephonic or videoconference diligence meetings, including with respect to compliance matters, with representatives of the Subadviser; assists the Board and management of the Trusts in developing and reviewing information with respect to the initial approval of each Subadvisory Agreement and annual consideration of each Subadvisory Agreement thereafter; prepares recommendations with respect to the continued retention of the Subadviser or the replacement of the Subadviser, including at the request of the Board; identifies potential successors to, or replacements of, the Subadviser or potential additional subadvisers, including performing appropriate due diligence, and developing and presenting to the Board a recommendation as to any such successor, replacement, or additional subadviser, including at the request of the Board; designates and compensates from its own resources such personnel as the Investment Manager may consider necessary or appropriate to the performance of its services; and performs such other review and reporting functions as the Board shall reasonably request consistent with the Investment Management Agreements and applicable law. The Trustees noted the affiliation of the Subadviser with the Investment Manager, noting any potential conflicts of interest. The Trustees also took into account the financial condition of the Investment Manager with respect to its ability to provide the services required under the Investment Management Agreements and the Investment Manager’s undertaking to maintain contractual expense limitations for the Funds. The Trustees also considered the Investment Manager’s risk management processes. The Trustees also reviewed information relating to the Subadviser’s operations and personnel and the investment philosophy, strategies and techniques (its “Investment Strategy”) used in managing each Fund. Among other things, the Trustees reviewed information on portfolio management and other professional staff, information regarding the Subadviser’s organizational and management structure and the Subadviser’s brokerage policies and practices. The Trustees considered specific information provided regarding the experience of the individuals at the Subadviser with portfolio |
63
| | |
| | | Annual Renewal of Investment Management and Subadvisory Agreements (continued) |
| | | |
| | | |
| | | | | | | | |
management responsibility for each Fund, including the information set forth in the Fund’s prospectus and statement of additional information. In the course of their deliberations, the Trustees evaluated, among other things: (a) the services rendered by the Subadviser in the past; (b) the qualifications and experience of the Subadviser’s personnel; and (c) the Subadviser’s compliance program. The Trustees also took into account the financial condition of the Subadviser with respect to its ability to provide the services required under each Subadvisory Agreement. The Trustees also considered the Subadviser’s risk management processes. PERFORMANCE The Board considered each Fund’s net performance during relevant time periods as compared to the Fund’s Peer Group and Fund Benchmark, considered the gross performance of each Fund as compared to the Subadviser’s relevant performance composite that utilizes a similar investment strategy and approach, and noted that the Board reviews on a quarterly basis detailed information about both a Fund’s performance results and portfolio composition, as well as the Subadviser’s Investment Strategy. The Board was mindful of the Investment Manager’s expertise, resources and attention to monitoring the Subadviser’s performance, investment style and risk-adjusted performance with respect to the Funds and its discussions with the management of the Funds’ subadviser during the period regarding the factors that contributed to the performance of the Funds. With respect to AMG GW&K Emerging Markets Equity Fund, among other information relating to the Fund’s performance, the Trustees noted that the Fund’s performance for Class Z shares (which share class has one of the earliest inception dates and the largest amount of assets of all the share classes of the Fund) for the 1-year, 3-year, 5-year, and 10-year periods ended March 31, 2022 was below the median performance of the Peer Group and below the performance of the Fund Benchmark, the MSCI Emerging Markets Index. The Trustees took into account management’s discussion of the Fund’s performance, including the reasons for the Fund’s underperformance and the fact that the Fund’s recent underperformance has impacted the Fund’s longer-term performance. The Trustees concluded that the Fund’s overall performance has been satisfactory in light of the Fund’s investment objective, strategies and policies. With respect to AMG GW&K Emerging Wealth Equity Fund, among other information relating to the Fund’s performance, the Trustees noted that the Fund’s | | | | performance for Class Z shares (which share class has the largest amount of assets of all the share classes of the Fund) for the 1-year, 3-year, and 5-year periods ended March 31, 2022 and for the period from the Fund’s inception on March 19, 2015 through March 31, 2022 was below the median performance of the Peer Group and below the performance of the Fund Benchmark, the MSCI Emerging Markets Index. The Trustees took into account management’s discussion of the Fund’s performance, including the reasons for the Fund’s underperformance and the fact that the Fund’s recent underperformance has impacted the Fund’s longer-term performance. The Trustees concluded that the Fund’s overall performance has been satisfactory in light of the Fund’s investment objective, strategies and policies. With respect to AMG GW&K Core Bond ESG Fund, among other information relating to the Fund’s performance, the Trustees noted that the Fund’s performance for Class I shares (which share class has the earliest inception date and the largest amount of assets of all the share classes of the Fund) for the 1-year, 3-year, 5-year and 10-year periods ended March 31, 2022 was below, above, above, and above, respectively, the median performance of the Peer Group and below, at, below, and above, respectively, the performance of the Fund Benchmark, the Bloomberg U.S. Aggregate Bond Index. The Trustees took into account management’s discussion of the Fund’s performance, including the reasons for the Fund’s more recent underperformance relative to the Peer Group and the Fund Benchmark. The Trustees also noted the change in the Fund’s Subadviser in February 2015 and that the performance record prior to that time reflects that of the prior Subadviser. The Trustees also took into account the fact that the Fund’s investment strategy was changed in 2019. The Trustees concluded that the Fund’s overall performance has been satisfactory. With respect to AMG GW&K Small/Mid Cap Growth Fund, among other information relating to the Fund’s performance, the Trustees noted that the Fund’s performance for Class N shares (which share class has the earliest inception date and the largest amount of assets of all the share classes of the Fund) for the 1-year, 3-year, 5-year, and 10-year periods ended March 31, 2022 was above, below, below, and below, respectively, the median performance of the Peer Group and above, above, above, and below, respectively, the performance of the Fund Benchmark, the Russell 2500® Growth Index. The Trustees took into account management’s discussion of the Fund’s performance, including the reasons for the Fund’s recent outperformance | | | | relative to the Peer Group and the Fund Benchmark. The Trustees noted that Class N shares of the Fund ranked in the top third relative to its Peer Group for the 1-year period. The Trustees also took into account the fact that the Fund’s subadviser changed effective March 19, 2021, that the Fund’s investment strategy changed effective March 19, 2021 and further on May 21, 2021, that the Fund Benchmark changed effective May 21, 2021, and that the performance information prior to those dates reflected that of the Fund’s prior subadviser and investment strategy. The Trustees concluded that the Fund’s overall performance has been satisfactory in light of the Fund’s investment objective, strategies and policies. ADVISORY AND SUBADVISORY FEES; FUND EXPENSES; PROFITABILITY; AND ECONOMIES OF SCALE In considering the reasonableness of the advisory fee payable to the Investment Manager, the Trustees reviewed information provided by the Investment Manager at the June 22, 2022 and prior meetings setting forth all revenues and other benefits, both direct and indirect (including any so-called “fallout benefits” such as reputational value derived from the Investment Manager serving as Investment Manager to a Fund), received by the Investment Manager and its affiliates attributable to managing each Fund and all the mutual funds in the AMG Funds Family of Funds; the cost of providing such services; the significant risks undertaken as Investment Manager and sponsor of the Funds, including investment, operational, enterprise, entrepreneurial, litigation, regulatory and compliance risks; and the resulting profitability to the Investment Manager and its affiliates from these relationships. The Trustees also considered the amount of the advisory fee retained by the Investment Manager after payment of the subadvisory fee with respect to each Fund. The Trustees also noted payments are made from the Subadviser to the Investment Manager, and other payments are made from the Investment Manager to the Subadviser. The Trustees also considered management’s discussion of the current asset levels of the Funds, and the impact on profitability of both the current asset levels and any future growth of assets of the Funds. In considering the cost of services to be provided by the Investment Manager under each Investment Management Agreement and the profitability to the Investment Manager of its relationship with each Fund, the Trustees noted the undertaking by the Investment Manager to maintain contractual expense limitations for the Funds. The Board also took into account management’s discussion of the advisory fee structure, and the services the |
64
| | |
| | | Annual Renewal of Investment Management and Subadvisory Agreements (continued) |
| | | |
| | | |
| | | | | | | | |
Investment Manager provides in performing its functions under each Investment Management Agreement and supervising the Subadviser. Based on the foregoing, the Trustees concluded that the profitability to the Investment Manager is reasonable and that the Investment Manager is not realizing material benefits from economies of scale that would warrant adjustments to the advisory fee at this time. Also with respect to economies of scale, the Trustees noted that as each Fund’s assets increase over time, the Fund may realize other economies of scale to the extent the increase in assets is proportionally greater than the increase in certain other expenses. In considering the reasonableness of the subadvisory fees payable by the Investment Manager to the Subadviser, the Trustees reviewed information regarding the cost to the Subadviser of providing subadvisory services to each Fund and the resulting profitability from these relationships. The Trustees noted that, because the Subadviser is an affiliate of the Investment Manager, a portion of the Subadviser’s revenues or profits might be shared directly or indirectly with the Investment Manager. The Trustees also noted that the subadvisory fees are paid by the Investment Manager out of its advisory fee. The Board also took into account management’s discussion of the subadvisory fee structure, and the services the Subadviser provides in performing its functions under each Subadvisory Agreement. Based on the foregoing, the Trustees concluded that the profitability to the Subadviser is reasonable and that the Subadviser is not realizing material benefits from economies of scale that would warrant adjustments to the subadvisory fees at this time. Also with respect to economies of scale, the Trustees noted that as a Fund’s assets increase over time, the Fund may realize other economies of scale to the extent the increase in assets is proportionally greater than the increase in certain other expenses. With respect to AMG GW&K Emerging Markets Equity Fund, the Trustees noted that the management fees (which include both the advisory and administration fees) and total expenses (net of applicable expense waivers/reimbursements) of Class I shares (the class of shares which is the primary focus of the Fund’s distribution) of the Fund as of March 31, 2022 were both lower than the average for the Fund’s Peer Group. The Trustees took into account the fact that the Investment Manager has contractually agreed, through March 1, 2023, to limit the Fund’s net annual operating expenses (subject to certain excluded expenses) to 0.87%. The Trustees concluded that, in | | | | light of the nature, extent and quality of the services provided by the Investment Manager and the Subadviser (which is an affiliate of the Investment Manager), the foregoing expense limitation and the considerations noted above with respect to the Investment Manager and the Subadviser, the Fund’s advisory and subadvisory fees are reasonable. With respect to AMG GW&K Emerging Wealth Equity Fund, the Trustees noted that the management fees (which include both the advisory and administration fees) and total expenses (net of applicable expense waivers/reimbursements) of Class I shares (the class of shares which is the primary focus of the Fund’s distribution) of the Fund as of March 31, 2022 were both lower than the average for the Fund’s Peer Group. The Trustees took into account the fact that the Investment Manager has contractually agreed, through March 1, 2023, to limit the Fund’s net annual operating expenses (subject to certain excluded expenses) to 0.90%. The Trustees concluded that, in light of the nature, extent and quality of the services provided by the Investment Manager and the Subadviser (which is an affiliate of the Investment Manager), the foregoing expense limitation and the considerations noted above with respect to the Investment Manager and the Subadviser, the Fund’s advisory and subadvisory fees are reasonable. With respect to AMG GW&K Core Bond ESG Fund, the Trustees noted that the management fees (which include both the advisory and administration fees) and total expenses (net of applicable expense waivers/reimbursements) of Class I shares of the Fund as of March 31, 2022 were both higher than the average for the Fund’s Peer Group. The Trustees took into account the fact that the Investment Manager has contractually agreed, through March 1, 2023, to limit the Fund’s net annual operating expenses (subject to certain excluded expenses) to 0.48%. The Trustees also took into account management’s discussion of the Fund’s expenses and competitiveness with comparably sized funds and select competitors. The Trustees concluded that, in light of the nature, extent and quality of the services provided by the Investment Manager and the Subadviser (which is an affiliate of the Investment Manager), the foregoing expense limitation and the considerations noted above with respect to the Investment Manager and the Subadviser, the Fund’s advisory and subadvisory fees are reasonable. With respect to AMG GW&K Small/Mid Cap Growth Fund, the Trustees noted that the management fees | | | | (which include both the advisory and administration fees) and total expenses (net of applicable expense waivers/reimbursements) of Class I shares (the class of shares which is the primary focus of the Fund’s distribution) of the Fund as of March 31, 2022 were both higher than the average for the Fund’s Peer Group. The Trustees took into account the fact that the Investment Manager has contractually agreed, through March 1, 2023, to limit the Fund’s net annual operating expenses (subject to certain excluded expenses) to 0.82%. The Trustees also took into account management’s discussion of the Fund’s expenses, including fees and expenses relative to comparably sized funds and select competitors, and the Fund’s small size relative to its peer universe. The Trustees concluded that, in light of the nature, extent and quality of the services provided by the Investment Manager and the Subadviser (which is an affiliate of the Investment Manager), the foregoing expense limitation and the considerations noted above with respect to the Investment Manager and the Subadviser, the Fund’s advisory and subadvisory fees are reasonable. * * * * After consideration of the foregoing, the Trustees also reached the following conclusions (in addition to the conclusions discussed above) regarding the Investment Management and Subadvisory Agreements: (a) the Investment Manager and the Subadviser have demonstrated that they possess the capability and resources to perform the duties required of them under each Investment Management Agreement and each Subadvisory Agreement and (b) the Investment Manager and Subadviser maintain appropriate compliance programs. Based on all of the above-mentioned factors and their related conclusions, with no single factor or conclusion being determinative and with each Trustee not necessarily attributing the same weight to each factor, the Trustees concluded that approval of each Investment Management Agreement and each Subadvisory Agreement would be in the best interests of the applicable Fund and its shareholders. Accordingly, on June 22, 2022, the Trustees, and separately a majority of the Independent Trustees, voted to approve the Investment Management Agreement and the Subadvisory Agreement for each Fund. |
65
THIS PAGE INTENTIONALLY LEFT BLANK
THIS PAGE INTENTIONALLY LEFT BLANK
THIS PAGE INTENTIONALLY LEFT BLANK
|
|
| | | | | | | | |
INVESTMENT MANAGER AND ADMINISTRATOR AMG Funds LLC 680 Washington Blvd., Suite 500 Stamford, CT 06901 800.548.4539 DISTRIBUTOR AMG Distributors, Inc. 680 Washington Blvd., Suite 500 Stamford, CT 06901 800.548.4539 SUBADVISER GW&K Investment Management, LLC 222 Berkeley St. Boston, MA 02116 | | | | CUSTODIAN The Bank of New York Mellon Mutual Funds Custody 6023 Airport Road Oriskany, NY 13424 LEGAL COUNSEL Ropes & Gray LLP Prudential Tower, 800 Boylston Street Boston, MA 02199-3600 TRANSFER AGENT BNY Mellon Investment Servicing (US) Inc. Attn: AMG Funds 4400 Computer Drive Westborough, MA 01581 800.548.4539 | | | | This report is prepared for the Fund’s shareholders. It is authorized for distribution to prospective investors only when preceded or accompanied by an effective prospectus. To receive a free copy of the prospectus or Statement of Additional Information, which includes additional information about Fund Trustees, please contact us by calling 800.548.4539. Distributed by AMG Distributors, Inc., member FINRA/SIPC. Current net asset values per share for each Fund are available on the Fund’s website at amgfunds.com. A description of the policies and procedures each Fund uses to vote its proxies is available: (i) without charge, upon request, by calling 800.548.4539, or (ii) on the Securities and Exchange Commission’s (SEC) website at sec.gov. For information regarding each Fund’s proxy voting record for the 12-month period ended June 30, call 800.548.4539 or visit the SEC website at sec.gov. The Funds file their complete schedule of portfolio holdings with the SEC for the first and third quarters of each fiscal year as an exhibit to their reports on Form N-PORT. The Fund’s portfolio holdings on Form N-PORT are available on the SEC’s website at sec.gov and the Fund’s website at amgfunds.com. To review a complete list of the Fund’s portfolio holdings, or to view the most recent semiannual report or annual report, please visit amgfunds.com. |
| | | | | | | | | |
| | | | | | | | |
BALANCED FUNDS AMG GW&K Global Allocation GW&K Investment Management, LLC EQUITY FUNDS AMG Beutel Goodman International Equity Beutel, Goodman & Company Ltd. AMG Boston Common Global Impact Boston Common Asset Management, LLC AMG Frontier Small Cap Growth Frontier Capital Management Co., LLC AMG GW&K Small Cap Core AMG GW&K Small Cap Value AMG GW&K Small/Mid Cap AMG GW&K Small/Mid Cap Growth AMG GW&K Emerging Markets Equity AMG GW&K Emerging Wealth Equity AMG GW&K International Small Cap GW&K Investment Management, LLC AMG Montrusco Bolton Large Cap Growth Montrusco Bolton Investments, Inc. AMG Renaissance Large Cap Growth The Renaissance Group LLC | | | | AMG River Road Dividend All Cap Value AMG River Road Focused Absolute Value AMG River Road International Value Equity AMG River Road Large Cap Value Select AMG River Road Mid Cap Value AMG River Road Small-Mid Cap Value AMG River Road Small Cap Value River Road Asset Management, LLC AMG TimesSquare Emerging Markets Small Cap AMG TimesSquare Global Small Cap AMG TimesSquare International Small Cap AMG TimesSquare Mid Cap Growth AMG TimesSquare Small Cap Growth TimesSquare Capital Management, LLC AMG Veritas Asia Pacific AMG Veritas China AMG Veritas Global Focus AMG Veritas Global Real Return Veritas Asset Management LLP AMG Yacktman AMG Yacktman Focused AMG Yacktman Global AMG Yacktman Special Opportunities Yacktman Asset Management LP | | | | FIXED INCOME FUNDS AMG Beutel Goodman Core Plus Bond Beutel, Goodman & Company Ltd. AMG GW&K Core Bond ESG AMG GW&K Enhanced Core Bond ESG AMG GW&K ESG Bond AMG GW&K High Income AMG GW&K Municipal Bond AMG GW&K Municipal Enhanced Yield GW&K Investment Management, LLC |
| | | | | | | | | |
| | | | | | | | | |
| | | | | | | | | |
| | | | | | | | | |
| | | | | | | | | |
| | | | | | | | | |
| | | | | | | | | |
| | | | | | | | | |
| | | | | | | | | |
| | | | |
| amgfunds.com | | | | 103122 AR069 |
| | |
| | | ANNUAL REPORT |
| | | |
| | | | | | |
| | | | AMG Funds October 31, 2022 
AMG River Road Mid Cap Value Fund |
| | | |
| | | | | Class N: CHTTX | Class I: ABMIX | Class Z: ABIZX |
| | | |
| | | | | AMG River Road Large Cap Value Select Fund |
| | | |
| | | | | Class N: FQUAX | Class I: MEQFX |
| | | |
| | | | | AMG River Road Small Cap Value Fund |
| | | |
| | | | | Class N: ARSVX | Class I: ARSIX | Class Z: ARZMX |
| | | |
| | | | | AMG River Road Dividend All Cap Value Fund |
| | | |
| | | | | Class N: ARDEX | Class I: ARIDX | Class Z: ARZDX |
| | | |
| | | | | AMG River Road Small-Mid Cap Value Fund |
| | | |
| | | | | Class N: ARSMX | Class I: ARIMX | Class Z: ARSZX |
| | | |
| | | | | AMG River Road International Value Equity Fund |
| | | |
| | | | | Class N: ARLSX | Class I: ALSIX | Class Z: ARLZX |
| | | |
| | | | | AMG River Road Focused Absolute Value Fund |
| | | |
| | | | | Class N: ARRFX | Class I: AFAVX | Class Z: ARRZX |
| | | | |
| | | | | | | |
| | | | |
| amgfunds.com | | | | 103122 AR082 |
| | |
| | | AMG Funds Annual Report — October 31, 2022 |
| | | | | | |
| | | |
| | | | | | | |
| | | TABLE OF CONTENTS | | PAGE | |
| | | | |
| | | |
| | | LETTER TO SHAREHOLDERS | | | 2 | |
| | | |
| | | ABOUT YOUR FUND’S EXPENSES | | | 3 | |
| | | |
| | | PORTFOLIO MANAGER’S COMMENTS, FUND SNAPSHOTS AND SCHEDULES OF PORTFOLIO INVESTMENTS | | | | |
| | | |
| | | AMG River Road Mid Cap Value Fund | | | 5 | |
| | | |
| | | AMG River Road Large Cap Value Select Fund | | | 11 | |
| | | |
| | | AMG River Road Small Cap Value Fund | | | 17 | |
| | | |
| | | AMG River Road Dividend All Cap Value Fund | | | 22 | |
| | | |
| | | AMG River Road Small-Mid Cap Value Fund | | | 28 | |
| | | |
| | | AMG River Road International Value Equity Fund | | | 34 | |
| | | |
| | | AMG River Road Focused Absolute Value Fund | | | 41 | |
| | | |
| | | FINANCIAL STATEMENTS | | | | |
| | | |
| | | Statement of Assets and Liabilities | | | 48 | |
| | | |
| | | Balance sheets, net asset value (NAV) per share computations
and cumulative distributable earnings (loss) | | | | |
| | | |
| | | Statement of Operations | | | 52 | |
| | | |
| | | Detail of sources of income, expenses, and realized and
unrealized gains (losses) during the fiscal year | | | | |
| | | |
| | | Statements of Changes in Net Assets | | | 54 | |
| | | |
| | | Detail of changes in assets for the past two fiscal years | | | | |
| | | |
| | | Financial Highlights | | | 57 | |
| | | |
| | | Historical net asset values per share, distributions, total returns, income
and expense ratios, turnover ratios and net assets | | | | |
| | | |
| | | Notes to Financial Statements | | | 77 | |
| | | |
| | | Accounting and distribution policies, details of agreements and
transactions with Fund management and affiliates, and descriptions of
certain investment risks | | | | |
| | | |
| | | REPORT OF INDEPENDENT REGISTERED PUBLIC ACCOUNTING FIRM | | | 88 | |
| | | |
| | | OTHER INFORMATION | | | 89 | |
| | | |
| | | TRUSTEES AND OFFICERS | | | 90 | |
| | | |
| | | ANNUAL RENEWAL OF INVESTMENT MANAGEMENT AND SUBADVISORY AGREEMENTS | | | 93 | |
| | | | | | | |
|
| |
Nothing contained herein is to be considered an offer, sale or solicitation of an offer to buy shares of any series of the AMG Funds Family of Funds. Such offering is made only by prospectus, which includes details as to offering price and other material information.
| | |
| | Letter to Shareholders |
Dear Shareholder:
The fiscal year ended October 31, 2022, was a volatile period for risk assets, as uncertainties mounted about high inflation, tighter financial conditions, and the Russian invasion of Ukraine. Global equity and bond markets fell in tandem amid sharply higher interest rates and eroding investor confidence as worries of an impending recession loomed over markets. A global commodity shock caused by the war in Ukraine only made matters worse. The S&P 500® Index slipped into a bear market with the Index falling more than (24)% from its peak earlier in the year. The abrupt shift in markets this year has reset expectations around future growth, as stubbornly high inflation has necessitated that the U.S. Federal Reserve (the Fed) and other global central banks take more aggressive policy action in an effort to bring down inflation. While the outlook is uncertain given the recent negative returns across many asset classes, one silver lining is that global stock and bond valuations are now more attractive than they were at the start of the year.
There was very wide dispersion in sector performance. Energy significantly outperformed all other sectors with a gain of 64.97% as the price of oil surged during the period. Defensive-oriented sectors also outperformed with a 4.86% return from consumer staples and 2.85% gain in utilities. High growth technology and mega cap internet-related companies underperformed during the period, and real estate was impacted by higher interest rates. Communications services fell the most with a (40.67)% return during the fiscal year, followed by declines of (28.53)% for consumer discretionary, (20.64)% for real estate, and (20.23)% for information technology. Value stocks held up much better than growth stocks as the Russell 1000® Value Index returned (7.00)% compared to the (24.60)% return for the Russell 1000® Growth Index. Small cap stocks struggled as the Russell 2000® Index lost (18.54)%. Outside the U.S., foreign developed markets lagged their U.S. counterparts as the U.S. dollar surged and the MSCI EAFE Index fell (23.00)%. Emerging Markets underperformed with a (31.03)% return for the MSCI Emerging Markets Index.
The 10-year Treasury yield more than doubled during the period, surging to the highest levels since before the Great Financial Crisis. Rapidly rising rates from a very low base led to historically bad performance for bonds as the Bloomberg U.S. Aggregate Bond Index, a broad measure of U.S. bond market performance, lost (15.68)% over the period. Investment-grade corporate bonds underperformed as the Bloomberg U.S. Corporate Bond Index returned (19.57)% for the year. High yield bonds held up better with a (11.76)% return as measured by the return of the Bloomberg U.S. Corporate High Yield Bond Index. Municipal bonds suffered steep losses but outperformed the broader market with a (11.98)% return for the Bloomberg Municipal Bond Index. Non-U.S. bonds delivered weak performance and were also impacted by the stronger dollar as the Bloomberg Global Aggregate ex U.S. fell (24.60)%.
AMG Funds appreciates the privilege of providing investment tools to you and your clients. Our foremost goal is to provide investment solutions that help our shareholders successfully reach their long-term investment goals. AMG Funds provides access to a distinctive array of actively managed return-oriented investment strategies. We thank you for your continued confidence and investment in AMG Funds. You can rest assured that under all market conditions our team is focused on delivering excellent investment management services for your benefit.
Respectfully,
Keitha Kinne
President
AMG Funds
| | | | | | | | | | | | |
| Average Annual Total Returns | | Periods ended
October 31, 2022* |
| | | | |
| Stocks: | | | | 1 Year | | | 3 Years | | | 5 Years |
| | | | |
| Large Cap | | (S&P 500® Index) | | | (14.61 | )% | | | 10.22 | % | | 10.44% |
| | | | |
| Small Cap | | (Russell 2000® Index) | | | (18.54 | )% | | | 7.05 | % | | 5.56% |
| | | | |
| International | | (MSCI ACWI ex USA) | | | (24.73 | )% | | | (1.68 | )% | | (0.60)% |
| | | | |
| Bonds: | | | | | | | | | | |
| | | | |
| Investment Grade | | (Bloomberg U.S. Aggregate Bond Index) | | | (15.68 | )% | | | (3.77 | )% | | (0.54)% |
| | | | |
| High Yield | | (Bloomberg U.S. Corporate High Yield Bond Index) | | | (11.76 | )% | | | 0.31 | % | | 2.01% |
| | | | |
| Tax-exempt | | (Bloomberg Municipal Bond Index) | | | (11.98 | )% | | | (2.18 | )% | | 0.37% |
| | | | |
| Treasury Bills | | (ICE BofAML U.S. 6-Month Treasury Bill Index) | | | 0.55 | % | | | 0.65 | % | | 1.27% |
*Source: FactSet. Past performance is no guarantee of future results.
2
| | |
| | | About Your Fund’s Expenses |
| | | |
| | | |
| | | | | | | | |
As a shareholder of a Fund, you may incur two types of costs: (1) transaction costs, which may include sales charges (loads) on purchase payments; redemption fees; and exchange fees; and (2) ongoing costs, including management fees; distribution (12b-1) fees; and other Fund expenses. This example is intended to help you understand your ongoing costs (in dollars) of investing in the Fund and to compare these costs with the ongoing costs of investing in other mutual funds. The example is based on $1,000 invested at the beginning of the period and held for the entire period as indicated below. ACTUAL EXPENSES The first line of the following table provides information about the actual account values and | | | | actual expenses. You may use the information in this line, together with the amount you invested, to estimate the expenses that you paid over the period. Simply divide your account value by $1,000 (for example, an $8,600 account value divided by $1,000 = 8.6), then multiply the result by the number in the first line under the heading entitled “Expenses Paid During the Period” to estimate the expenses you paid on your account during this period. HYPOTHETICAL EXAMPLE FOR COMPARISON PURPOSES The second line of the following table provides information about hypothetical account values and hypothetical expenses based on the Fund’s actual expense ratio and an assumed annual rate of return of 5% before expenses, which is not the Fund’s | | | | actual return. The hypothetical account values and expenses may not be used to estimate the actual ending account balance or expenses you paid for the period. You may use this information to compare the ongoing costs of investing in the Fund and other funds by comparing this 5% hypothetical example with the 5% hypothetical examples that appear in the shareholder reports of other funds. Please note that the expenses shown in the table are meant to highlight your ongoing costs only and do not reflect any transactional costs, such as sales charges (loads), redemption fees, or exchange fees. Therefore, the second line of the table is useful in comparing ongoing costs only, and will not help you determine the relative total costs of owning different funds. |
| | | | | | | | |
Six Months Ended October 31, 2022 | | Expense
Ratio for
the Period | | Beginning
Account
Value
05/01/22 | | Ending
Account
Value
10/31/22 | | Expenses
Paid
During
the Period* |
|
AMG River Road Mid Cap Value Fund |
|
Based on Actual Fund Return |
Class N | | 1.10% | | $1,000 | | $991 | | $5.52 |
Class I | | 0.81% | | $1,000 | | $992 | | $4.07 |
Class Z | | 0.76% | | $1,000 | | $992 | | $3.82 |
|
Based on Hypothetical 5% Annual Return |
Class N | | 1.10% | | $1,000 | | $1,020 | | $5.60 |
Class I | | 0.81% | | $1,000 | | $1,021 | | $4.13 |
Class Z | | 0.76% | | $1,000 | | $1,021 | | $3.87 |
|
AMG River Road Large Cap Value Select Fund |
|
Based on Actual Fund Return |
Class N | | 0.95% | | $1,000 | | $972 | | $4.72 |
Class I | | 0.63% | | $1,000 | | $973 | | $3.13 |
|
Based on Hypothetical 5% Annual Return |
Class N | | 0.95% | | $1,000 | | $1,020 | | $4.84 |
Class I | | 0.63% | | $1,000 | | $1,022 | | $3.21 |
| | | | | | | | |
Six Months Ended October 31, 2022 | | Expense
Ratio for
the Period | | Beginning
Account
Value
05/01/22 | | Ending
Account
Value
10/31/22 | | Expenses
Paid
During
the Period* |
|
AMG River Road Small Cap Value Fund |
|
Based on Actual Fund Return |
Class N | | 1.36% | | $1,000 | | $1,033 | | $6.97 |
Class I | | 1.10% | | $1,000 | | $1,035 | | $5.64 |
Class Z | | 1.01% | | $1,000 | | $1,036 | | $5.18 |
|
Based on Hypothetical 5% Annual Return |
Class N | | 1.36% | | $1,000 | | $1,018 | | $6.92 |
Class I | | 1.10% | | $1,000 | | $1,020 | | $5.60 |
Class Z | | 1.01% | | $1,000 | | $1,020 | | $5.14 |
|
AMG River Road Dividend All Cap Value Fund |
|
Based on Actual Fund Return |
Class N | | 1.00% | | $1,000 | | $989 | | $5.01 |
Class I | | 0.75% | | $1,000 | | $990 | | $3.76 |
Class Z | | 0.71% | | $1,000 | | $991 | | $3.56 |
|
Based on Hypothetical 5% Annual Return |
Class N | | 1.00% | | $1,000 | | $1,020 | | $5.09 |
Class I | | 0.75% | | $1,000 | | $1,021 | | $3.82 |
Class Z | | 0.71% | | $1,000 | | $1,022 | | $3.62 |
3
| | |
| | | About Your Fund’s Expenses (continued) |
| | | |
| | | |
| | | | | | | | |
Six Months Ended October 31, 2022 | | Expense
Ratio for
the Period | | Beginning
Account
Value
05/01/22 | | Ending
Account
Value
10/31/22 | | Expenses
Paid
During
the Period* |
|
AMG River Road Small-Mid Cap Value Fund |
|
Based on Actual Fund Return |
Class N | | 1.29% | | $1,000 | | $1,018 | | $6.56 |
Class I | | 1.03% | | $1,000 | | $1,020 | | $5.24 |
Class Z | | 0.98% | | $1,000 | | $1,020 | | $4.99 |
|
Based on Hypothetical 5% Annual Return |
Class N | | 1.29% | | $1,000 | | $1,019 | | $6.56 |
Class I | | 1.03% | | $1,000 | | $1,020 | | $5.24 |
Class Z | | 0.98% | | $1,000 | | $1,020 | | $4.99 |
|
AMG River Road International Value Equity Fund |
|
Based on Actual Fund Return |
Class N | | 1.02% | | $1,000 | | $926 | | $4.95 |
Class I | | 0.78% | | $1,000 | | $928 | | $3.79 |
Class Z | | 0.73% | | $1,000 | | $928 | | $3.55 |
|
Based on Hypothetical 5% Annual Return |
Class N | | 1.02% | | $1,000 | | $1,020 | | $5.19 |
Class I | | 0.78% | | $1,000 | | $1,021 | | $3.97 |
Class Z | | 0.73% | | $1,000 | | $1,022 | | $3.72 |
| | | | | | | | |
Six Months Ended October 31, 2022 | | Expense
Ratio for
the Period | | Beginning
Account
Value
05/01/22 | | Ending
Account
Value
10/31/22 | | Expenses
Paid
During
the Period* |
|
AMG River Road Focused Absolute Value Fund |
|
Based on Actual Fund Return |
Class N | | 1.10% | | $1,000 | | $950 | | $5.41 |
Class I | | 0.84% | | $1,000 | | $950 | | $4.13 |
Class Z | | 0.80% | | $1,000 | | $951 | | $3.93 |
|
Based on Hypothetical 5% Annual Return |
Class N | | 1.10% | | $1,000 | | $1,020 | | $5.60 |
Class I | | 0.84% | | $1,000 | | $1,021 | | $4.28 |
Class Z | | 0.80% | | $1,000 | | $1,021 | | $4.08 |
| | * | Expenses are equal to the Fund’s annualized expense ratio multiplied by the average account value over the period, multiplied by the number of days in the most recent fiscal half-year (184), then divided by 365. |
4
| | |
| | | AMG River Road Mid Cap Value Fund Portfolio Manager’s Comments (unaudited) |
| | | |
| | | |
| | | | | | | | |
OVERVIEW For the fiscal year ended October 31, 2022, AMG River Road Mid Cap Value Fund (the “Fund”) Class N shares returned (5.67)%, outpacing the (10.18)% return for the Russell Midcap® Value Index, the Fund’s benchmark. MARKET AND PERFORMANCE REVIEW The sector with the largest positive contribution to relative return was energy, which benefited from positive stock selection and an overweight allocation. The sector with the largest negative contribution to relative return was communication services, which suffered from an overweight allocation partially offset by positive stock selection. The top contributing holdings to the Fund’s active return were Texas Pacific Land Corp. (TPL) and Devon Energy Corp. (DVN). Texas Pacific is one of the largest landowners in Texas. The trust converted to a C Corp in 2021. The company collects royalties as other exploration and production companies drill on its land and then returns the cash flow in the form of dividends and buybacks. Texas Pacific benefited from higher energy prices and more drilling activity on its land. Devon Energy is one of the largest independent onshore exploration and production (E&P) companies in North America. They led the onshore E&P industry in early 2021 to dramatically reduce production growth and, instead, returned up to 50% of the company’s free cash flow to shareholders through a fixed-plus-variable dividend policy. Devon Energy also benefited from higher energy prices. | | | | The bottom contributing holdings to the Fund’s active return were KKR & Co. Inc. (KKR) and Liberty Broadband Corp. (LBRDK). KKR is a leading global alternative asset manager. The company generates highly visible earnings (87% of AUM has a duration of at least eight years) and expects to grow at double-digit rates over the next several years. Rising interest rates and a choppy stock market have weighed on the shares over the past year. The market speculates that rising rates will weigh on AUM growth and weak market performance will impair performance fees. We believe KKR’s phenomenal long-term track record will continue to entice future investors. We maintained our position. Liberty Broadband is a holding company with a 26% stake in Charter Communications Inc. (CHTR). Charter Communications is the second-largest cable company in the United States. Domestic cable companies essentially represent local monopolies that own the most efficient method for most Americans to access the internet. Telecommunication companies have picked up their competitive efforts for broadband subscribers through increased fiber optic spending and fixed wireless opportunities. For the first time, cable companies have reported broadband subscriber losses and we are unable to predict when those losses will subside. We lowered conviction and reduced the position. POSITIONING AND OUTLOOK Stocks are much cheaper than at the beginning of 2022 but, in our view, are not yet cheap. We continue to believe enough damage has been done for | | | | investors to feel comfortable taking advantage of higher quality, but more cyclical investment opportunities. For allocators, this might mean increasing high quality and smaller cap exposure. We also view absolute valuations as reasonably attractive in the mid-cap value segment. However, neither the selloff in June nor September achieved the decline we would expect to see at the trough of a major (think regime change) bear market recession. Furthermore, we think it could be years, not quarters, before investors see sustainable and meaningful new highs in stocks as markets struggle with valuations in an era of higher rates and geopolitical uncertainty. The past few years (even decade) was one hell of a party for investors; we should not expect the hangover to pass quickly. Thus, investors should get comfortable with volatility and a range bound tape. On a more positive note, it is common for the market to struggle through the first three quarters of midterm years, before moving higher in the final quarter. Thus, we can envision a near-term rally unfolding. Additionally, volatile tapes provide ample opportunity to trade around core positions, enhancing alpha. This commentary reflects the viewpoints of River Road Asset Management, LLC as of October 31, 2022, and is not intended as a forecast or guarantee of future results. |
5
| | |
| | | AMG River Road Mid Cap Value Fund Portfolio Manager’s Comments (continued) |
| | | |
| | | |
CUMULATIVE TOTAL RETURN PERFORMANCE
AMG River Road Mid Cap Value Fund’s cumulative total return is based on the daily change in net asset value (NAV), and assumes that all dividends and distributions were reinvested. The graph compares a hypothetical $10,000 investment made in the AMG River Road Mid Cap Value Fund’s Class N shares on October 31, 2012, to a $10,000 investment made in the Russell Midcap® Value Index for the same time period. The graph and table do not reflect the deduction of taxes that a shareholder would pay on a Fund distribution or redemption of shares. The listed returns for the Fund are net of expenses and the returns for the index excludes expenses. Total returns would have been lower had certain expenses not been reduced.
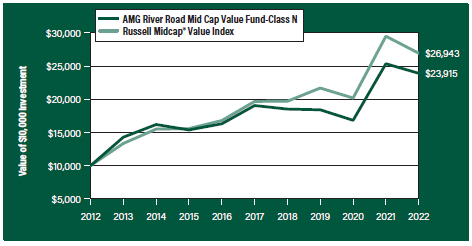
The table below shows the average annual total returns for the AMG River Road Mid Cap Value Fund and the Russell Midcap® Value Index for the same time periods ended October 31, 2022.
| | | | | | | | | | |
| Average Annual Total Returns1 | | One
Year | | Five
Years | | Ten
Years | | Since
Inception | | Inception
Date |
|
AMG River Road Mid Cap Value Fund2, 3, 4, 5, 6, 7, 8, 9, 10, 11 |
| | | | | |
Class N | | (5.67%) | | 4.65% | | 9.11% | | 10.77% | | 09/19/94 |
| | | | | |
Class I | | (5.41%) | | 4.93% | | 9.39% | | 8.53% | | 07/06/04 |
| | | | | |
Class Z | | (5.34%) | | 5.00% | | — | | 4.32% | | 09/29/17 |
| | | | | |
Russell Midcap® Value Index12 | | (10.18%) | | 6.49% | | 10.42% | | — | | 09/19/94† |
The performance data shown represents past performance. Past performance is not a guarantee of future results. Current performance may be lower or higher than the performance data quoted. The investment return and principal value of an investment will fluctuate so that an investor’s shares, when redeemed, may be worth more or less than their original cost.
Investors should carefully consider the Fund’s investment objectives, risks, charges and expenses before investing. For performance information through the most recent month end, current net asset values per share for the Fund and other information, please call 800.548.4539 or visit our website at amgfunds.com for a free prospectus. Read it carefully before investing or sending money.
Distributed by AMG Distributors, Inc., member FINRA/SIPC.
| † | Date reflects the inception date of the Fund, not the index. |
| 1 | Total return equals income yield plus share price change and assumes reinvestment of all dividends and capital gain distributions. Returns are net of fees and may reflect offsets of Fund expenses as described in the prospectus. No adjustment has been made for taxes payable by shareholders on their reinvested dividends and |
|
capital gain distributions. Returns for periods greater than one year are annualized. The listed returns on the Fund are net of expenses and based on the published NAV as of October 31, 2022. All returns are in U.S. Dollars ($). 2 From time to time, the Fund’s adviser has waived its fees and/or absorbed Fund expenses, which has resulted in higher returns. 3 As of March 19, 2021, the Fund’s Subadviser was changed to River Road Asset Management, LLC. Prior to March 19, 2021, the Fund was known as the AMG Managers Fairpointe Mid Cap Fund and had different principal investment strategies and corresponding risks. Performance shown for periods prior to March 19, 2021, reflects the performance and investment strategies of the Fund’s previous Subadviser, Fairpointe Capital LLC. The Fund’s past performance would have been different if the Fund were managed by the current Subadviser and strategy, and the Fund’s prior performance record might be less pertinent for investors considering whether to purchase shares of the Fund. 4 The Fund is subject to risks associated with investments in mid-capitalization companies such as greater price volatility, lower trading volume, and less liquidity than the stocks of larger more established companies. 5 The Fund is subject to risks associated with investments in small-capitalization companies, such as erratic earnings patterns, competitive conditions, limited earnings history and a reliance on one or a limited number of products. 6 The Fund may invest in derivatives such as options and futures; the complexity and rapidly changing structure of derivatives markets may increase the possibility of market losses. 7 Investments in international securities are subject to certain risks of overseas investing including currency fluctuations and changes in political and economic conditions, which could result in significant market fluctuations. These risks are magnified in emerging markets. 8 Companies that are in similar industry sectors may be similarly affected by particular economic or market events; to the extent the Fund has substantial holdings within a particular sector, the risks associated with that sector increase. 9 The Fund is subject to special risk considerations similar to those associated with the direct ownership of real estate. Real estate valuations may be subject to factors such as changing general and local economic, financial, competitive, and environmental conditions. |
6
| | |
| | | AMG River Road Mid Cap Value Fund Portfolio Manager’s Comments (continued) |
| | | |
| | | |
| | | | | | | | |
10 The Fund invests in value stocks, which may perform differently from the market as a whole and may be undervalued by the market for a long period of time. 11 Market prices of investments held by the Fund may fall rapidly or unpredictably due to a variety of economic or political factors, market conditions, disasters or public health issues, or in response to | | | | events that affect particular industries or companies. 12 The Russell Midcap® Value Index measures the performance of those Russell Midcap® companies with lower price-to-book ratios and lower forecasted growth values. The stocks are also members of the Russell 1000® Value Index. Unlike the Fund, the Russell Midcap® Value Index is | | | | unmanaged, is not available for investment and does not incur expenses. The Russell Midcap® Value Index is a trademark of the London Stock Exchange Group companies. Not FDIC insured, nor bank guaranteed. May lose value. |
7
| | |
| | | AMG River Road Mid Cap Value Fund Fund Snapshots (unaudited) October 31, 2022 |
| | | |
| | | |
PORTFOLIO BREAKDOWN
| | |
| Sector | | % of Net Assets |
| | |
| Industrials | | 25.4 |
| | |
| Financials | | 22.7 |
| | |
| Consumer Discretionary | | 18.8 |
| | |
| Communication Services | | 6.5 |
| | |
| Energy | | 6.0 |
| | |
| Consumer Staples | | 5.8 |
| | |
| Materials | | 4.9 |
| | |
| Information Technology | | 4.2 |
| | |
| Health Care | | 2.0 |
| | |
| Real Estate | | 1.2 |
| | |
| Short-Term Investments | | 2.6 |
| | |
| Other Assets, Less Liabilities | | (0.1) |
TOP TEN HOLDINGS
| | | | |
| Security Name | | % of
Net Assets |
| | | |
LKQ Corp. | | | | 4.2 |
| | | |
Willis Towers Watson PLC (United Kingdom) | | | | 3.6 |
| | | |
KKR & Co., Inc. | | | | 3.6 |
| | | |
SEI Investments Co. | | | | 3.5 |
| | | |
Ferguson PLC (United Kingdom) | | | | 3.3 |
| | | |
Carlisle Cos., Inc. | | | | 3.3 |
| | | |
Advance Auto Parts, Inc. | | | | 3.2 |
| | | |
Ares Management Corp., Class A | | | | 3.0 |
| | | |
Atkore, Inc. | | | | 2.8 |
| | | |
Armstrong World Industries, Inc. | | | | 2.7 |
| | | | |
| | | |
Top Ten as a Group | | | | 33.2 |
| | | | |
Because a fund’s strategy may result in multiple investments in particular sectors of the economy, its performance may depend on the performance of those sectors and may fluctuate more widely than investments diversified across more sectors. For additional information on these and other risk considerations, please see the Fund’s prospectus.
Any sectors, industries, or securities discussed should not be perceived as investment recommendations. Mention of a specific security should not be considered a recommendation to buy or solicitation to sell that security. Specific securities mentioned in this report may have been sold from the Fund’s portfolio of investments by the time you receive this report.
8
| | |
| | | AMG River Road Mid Cap Value Fund Schedule of Portfolio Investments October 31, 2022 |
| | | |
| | | |
| | | | | | | | |
| | | Shares | | | Value | |
| | |
Common Stocks - 97.5% | | | | | | | | |
| | |
Communication Services - 6.5% | | | | | | | | |
| | |
Liberty Broadband Corp., Class C* | | | 41,378 | | | | $3,493,545 | |
| | |
Liberty Media Corp.-Liberty SiriusXM, Class C* | | | 177,333 | | | | 7,481,679 | |
| | |
Madison Square Garden Sports Corp. | | | 38,422 | | | | 6,017,269 | |
| | |
News Corp., Class A | | | 186,200 | | | | 3,141,194 | |
| | |
Total Communication Services | | | | | | | 20,133,687 | |
| | |
Consumer Discretionary - 18.8% | | | | | | | | |
| | |
Advance Auto Parts, Inc. | | | 52,215 | | | | 9,916,673 | |
| | |
Bath & Body Works, Inc. | | | 120,192 | | | | 4,012,009 | |
| | |
Dollar Tree, Inc.* | | | 26,600 | | | | 4,216,100 | |
| | |
DR Horton, Inc. | | | 66,007 | | | | 5,074,618 | |
| | |
Expedia Group, Inc.* | | | 49,259 | | | | 4,604,239 | |
| | |
Lithia Motors, Inc., Class A | | | 26,600 | | | | 5,270,790 | |
| | |
LKQ Corp. | | | 234,474 | | | | 13,046,133 | |
| | |
MGM Resorts International | | | 139,896 | | | | 4,976,101 | |
| | |
NVR, Inc.* | | | 985 | | | | 4,174,184 | |
| | |
Petco Health & Wellness Co., Inc.*,1 | | | 264,029 | | | | 2,780,225 | |
| | |
Total Consumer Discretionary | | | | | | | 58,071,072 | |
| | |
Consumer Staples - 5.8% | | | | | | | | |
| | |
Albertsons Cos., Inc., Class A | | | 264,633 | | | | 5,427,623 | |
| | |
BJ’s Wholesale Club Holdings, Inc.* | | | 74,874 | | | | 5,795,248 | |
| | |
The Kroger Co. | | | 137,926 | | | | 6,522,520 | |
| | |
Total Consumer Staples | | | | | | | 17,745,391 | |
| | |
Energy - 6.0% | | | | | | | | |
| | |
Chesapeake Energy Corp.1 | | | 29,555 | | | | 3,022,590 | |
| | |
Devon Energy Corp. | | | 51,230 | | | | 3,962,641 | |
| | |
Marathon Petroleum Corp. | | | 20,689 | | | | 2,350,684 | |
| | |
Texas Pacific Land Corp. | | | 2,426 | | | | 5,589,189 | |
| | |
Weatherford International PLC* | | | 89,652 | | | | 3,736,695 | |
| | |
Total Energy | | | | | | | 18,661,799 | |
| | |
Financials - 22.7% | | | | | | | | |
| | |
American Equity Investment Life Holding Co. | | | 99,503 | | | | 4,286,589 | |
| | |
Apollo Global Management, Inc. | | | 112,311 | | | | 6,217,537 | |
| | |
Ares Management Corp., Class A | | | 121,178 | | | | 9,188,928 | |
| | |
Cannae Holdings, Inc.* | | | 220,681 | | | | 5,110,972 | |
| | |
Fairfax Financial Holdings, Ltd. (Canada) | | | 14,778 | | | | 7,270,037 | |
| | |
Genworth Financial, Inc., Class A* | | | 1,107,346 | | | | 5,171,306 | |
| | |
KKR & Co., Inc. | | | 226,592 | | | | 11,019,169 | |
| | |
SEI Investments Co. | | | 198,022 | | | | 10,752,595 | |
| | |
Willis Towers Watson PLC (United Kingdom) | | | 51,230 | | | | 11,178,898 | |
| | |
Total Financials | | | | | | | 70,196,031 | |
| | | | | | | | |
| | | | | | | | |
| | | Shares | | | Value | |
| | |
Health Care - 2.0% | | | | | | | | |
| | |
Centene Corp.* | | | 71,918 | | | | $6,122,379 | |
| | |
Industrials - 25.4% | | | | | | | | |
| | |
Air Transport Services Group, Inc.* | | | 209,844 | | | | 6,127,445 | |
| | |
API Group Corp.* | | | 343,829 | | | | 5,669,740 | |
| | |
Armstrong World Industries, Inc. | | | 108,370 | | | | 8,189,521 | |
| | |
Atkore, Inc.* | | | 89,652 | | | | 8,543,836 | |
| | |
CACI International, Inc., Class A* | | | 14,719 | | | | 4,475,017 | |
| | |
Carlisle Cos., Inc. | | | 43,214 | | | | 10,319,503 | |
| | |
Expeditors International of Washington, Inc. | | | 49,259 | | | | 4,819,993 | |
| | |
Ferguson PLC (United Kingdom) | | | 94,578 | | | | 10,333,592 | |
| | |
Grupo Aeroportuario del Centro Norte SAB de CV, ADR (Mexico) | | | 95,380 | | | | 6,082,383 | |
| | |
Owens Corning | | | 71,918 | | | | 6,156,900 | |
| | |
UniFirst Corp. | | | 42,363 | | | | 7,795,216 | |
| | |
Total Industrials | | | | | | | 78,513,146 | |
| | |
Information Technology - 4.2% | | | | | | | | |
| | |
SS&C Technologies Holdings, Inc. | | | 152,703 | | | | 7,851,988 | |
| | |
TD SYNNEX Corp. | | | 54,185 | | | | 4,958,470 | |
| | |
Total Information Technology | | | | | | | 12,810,458 | |
| | |
Materials - 4.9% | | | | | | | | |
| | |
AptarGroup, Inc. | | | 46,304 | | | | 4,591,041 | |
| | |
Axalta Coating Systems, Ltd.* | | | 189,155 | | | | 4,411,095 | |
| | |
Royal Gold, Inc. | | | 65,022 | | | | 6,174,489 | |
| | |
Total Materials | | | | | | | 15,176,625 | |
| | |
Real Estate - 1.2% | | | | | | | | |
| | |
The St Joe Co. | | | 104,429 | | | | 3,710,362 | |
| | |
Total Common Stocks
(Cost $313,543,069) | | | | | | | 301,140,950 | |
| | |
| | | Principal Amount | | | | |
Short-Term Investments - 2.6% | | | | | | | | |
| |
Joint Repurchase Agreements - 0.7%2 | | | | | |
| | |
Bank of America Securities, Inc., dated 10/31/22, due 11/01/22, 3.050% total to be received $1,000,085 (collateralized by various U.S. Government Agency Obligations, 0.010% - 5.500%, 02/25/32 - 01/01/61, totaling $1,020,000) | | | $1,000,000 | | | | 1,000,000 | |
| | |
Deutsche Bank Securities, Inc., dated 10/31/22, due 11/01/22, 3.020% total to be received $335,612 (collateralized by a U.S. Treasury, 3.250%, 06/30/27, totaling $342,296) | | | 335,584 | | | | 335,584 | |
| | | | | | | | |
The accompanying notes are an integral part of these financial statements.
9
| | |
| | | AMG River Road Mid Cap Value Fund Schedule of Portfolio Investments (continued) |
| | | |
| | | |
| | | | | | | | |
| | | Principal Amount | | | Value | |
| |
Joint Repurchase Agreements - 0.7%2 | | | | | |
(continued) | | | | | | | | |
| | |
RBC Dominion Securities, Inc., dated 10/31/22,due 11/01/22, 3.050% total to be received $1,000,085 (collateralized by various U.S. Government Agency Obligations and U.S. Treasuries, 0.500% - 5.000%, 02/28/26 - 10/20/52, totaling $1,020,000) | | $ | 1,000,000 | | | | $1,000,000 | |
| |
Total Joint Repurchase Agreements | | | | 2,335,584 | |
| | |
| | | Shares | | | | |
| |
Other Investment Companies - 1.9% | | | | | |
| | |
Dreyfus Government Cash Management Fund, Institutional Shares, 2.91%3 | | | 2,301,972 | | | | 2,301,972 | |
| | |
Dreyfus Institutional Preferred Government Money Market Fund, Institutional Shares, 3.09%3 | | | 3,452,957 | | | | 3,452,957 | |
| | |
Total Other Investment Companies | | | | | | | 5,754,929 | |
| | |
Total Short-Term Investments
(Cost $8,090,513) | | | | | | | 8,090,513 | |
| | | | | | | | |
| | | | | | | | |
| | | | | | Value | |
| | |
Total Investments - 100.1%
(Cost $321,633,582) | | | | | | | $309,231,463 | |
| |
Other Assets, less Liabilities - (0.1)% | | | | (403,043 | ) |
| | |
Net Assets - 100.0% | | | | | | | $308,828,420 | |
| | | | | | | | |
| * | Non-income producing security. |
| 1 | Some of these securities, amounting to $2,455,734 or 0.8% of net assets, were out on loan to various borrowers and are collateralized by cash and various U.S. Treasury Obligations. See Note 4 of Notes to Financial Statements. |
| 2 | Cash collateral received for securities lending activity was invested in these joint repurchase agreements. |
| 3 | Yield shown represents the October 31, 2022, seven day average yield, which refers to the sum of the previous seven days’ dividends paid, expressed as an annual percentage. |
| ADR | American Depositary Receipt |
The following table summarizes the inputs used to value the Fund’s investments by the fair value hierarchy levels as of October 31, 2022:
| | | | | | | | | | | | | | | | |
| | | Level 1 | | | Level 2 | | | Level 3 | | | Total | |
Investments in Securities | | | | | | | | | | | | | | | | |
| | | | |
Common Stocks† | | $ | 301,140,950 | | | | — | | | | — | | | | $301,140,950 | |
| | | | |
Short-Term Investments | | | | | | | | | | | | | | | | |
Joint Repurchase Agreements | | | — | | | | $2,335,584 | | | | — | | | | 2,335,584 | |
| | | | |
Other Investment Companies | | | 5,754,929 | | | | — | | | | — | | | | 5,754,929 | |
| | | | | | | | | | | | | | | | |
| | | | |
Total Investments in Securities | | $ | 306,895,879 | | | | $2,335,584 | | | | — | | | | $309,231,463 | |
| | | | | | | | | | | | | | | | |
| † | All common stocks held in the Fund are Level 1 securities. For a detailed breakout of common stocks by major industry classification, please refer to the Fund’s Schedule of Portfolio Investments. |
For the fiscal year ended October 31, 2022, there were no transfers in or out of Level 3.
The accompanying notes are an integral part of these financial statements.
10
| | |
| | | AMG River Road Large Cap Value Select Fund Portfolio Manager’s Comments (unaudited) |
| | | |
| | | |
| | | | | | | | |
OVERVIEW For the fiscal year ended October 31, 2022, AMG River Road Large Cap Value Select Fund (the “Fund”) Class N shares returned (8.87)%, trailing the (7.00)% return for the Russell 1000® Value Index, the Fund’s primary benchmark. PERFORMANCE REVIEW The sector with the largest positive contribution to relative return was information technology, which benefited from positive stock selection partially offset by an overweight allocation. The sector with the largest negative contribution to relative return was communication services, which suffered from an overweight allocation and negative stock selection. The top contributing holdings to the Fund’s active return were T-Mobile US Inc. (TMUS) and McKesson Corp. (MCK). T-Mobile is the second-largest wireless provider in the United States. The 2020 merger of T-Mobile and Sprint shrank the U.S. wireless market from four to three companies. Prior to the merger, T-Mobile succeeded despite an inferior network and subscale economics due to strong execution and savvy market segment pricing. However, with the acquisition of Sprint, we believe T-Mobile is now best positioned with a greatly enhanced 5G network, and the company expects to return $60 billion (~35% of the market cap) of its free cash flow to shareholders in the form of buybacks by 2025. The company posted excellent results that were ahead of its peers. | | | | McKesson is the largest distributor for branded, generic, and specialty pharmaceutical drugs. Older Americans require more prescription drugs. We believe the company is well positioned for the aging of America as the largest player in an oligopoly that controls ~90% of the pharmaceutical distribution market. Management has done an excellent job simplifying the investment case with a settlement in the opioid lawsuits, spinning off its technology segment, and divesting several of its European businesses. Further, the company has taken advantage of the opioid overhang to repurchase inexpensive shares, reducing the share count by 29% since 2018 at $155 per share. McKesson posted solid quarterly results with strong organic growth and operating leverage, and was sold off. The bottom contributing holdings to the Fund’s active return were Meta Platforms Inc. (META) and Alphabet Inc. (GOOG). Meta Platforms is the largest online social network company in the world with more than 3 billion active monthly users. Meta Platforms generates 80% gross margins, 20%+ ROICs (Return on Invested Capital), and has net cash. Meta Platforms significantly reduced its outlook due to recent tracking restrictions from Apple, intensifying competition from TikTok, and exposure to slowing advertising. We exited the position as our thesis did not play out. Alphabet owns the largest search engine in the world. Google.com dominates global search with ~90% market share. The search business generates | | | | significant free cash flow, which is added to the company’s Fort Knox-like balance sheet. The growth rate slowed as a result of its massive size and its economic exposure to slowing advertising dollars. We expect digital advertising to continue to gain share and Alphabet to be more aggressive with share repurchases at these lower, more attractive, valuations. We have maintained a position in Alphabet. POSITIONING AND OUTLOOK The Fund’s activity reflects a balanced approach with a mix of defensive high quality, opportunistic, and idiosyncratic positions. We continue to be interested in high quality cyclical companies if their valuations overreact to the difficult economic environment and idiosyncratic opportunities less impacted by the economic environment. According to FactSet, the Fund’s quality, as measured by the five-year average return on equity of the underlying holdings, is 19.4% versus 14.5% for the benchmark. The Fund’s potential long-term growth (as measured by published long-term estimates) is 12.8% versus 8.7% for the benchmark. This commentary reflects the viewpoints of River Road Asset Management, LLC as of October 31, 2022, and is not intended as a forecast or guarantee of future results. |
| | | | | | | | |
11
| | |
| | | AMG River Road Large Cap Value Select Fund Portfolio Manager’s Comments (continued) |
| | | |
| | | |
CUMULATIVE TOTAL RETURN PERFORMANCE
AMG River Road Large Cap Value Select Fund’s cumulative total return is based on the daily change in net asset value (NAV), and assumes that all dividends and distributions were reinvested. The graph compares a hypothetical $10,000 investment made in the AMG River Road Large Cap Value Select Fund’s Class N shares on October 31, 2012, to a $10,000 investment made in the Russell 1000® Value Index for the same time period. The graph and table do not reflect the deduction of taxes that a shareholder would pay on a Fund distribution or redemption of shares. The listed returns for the Fund are net of expenses and the returns for the index excludes expenses. Total returns would have been lower had certain expenses not been reduced.
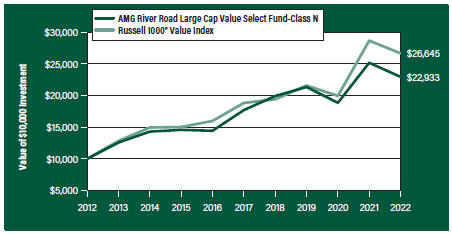
The table below shows the average annual total returns for the AMG River Road Large Cap Value Select Fund and the Russell 1000® Value Index for the same time periods ended October 31, 2022.
| | | | | | |
| | | One | | Five | | Ten |
| Average Annual Total Returns1 | | Year | | Years | | Years |
|
AMG River Road Large Cap Value Select Fund2, 3, 4, 5, 6, 7, 8, 9, 10, 11, 12, 13, 14, 15, 16 |
| | | |
Class N | | (8.87%) | | 5.33% | | 8.65% |
| | | |
Class I | | (8.55%) | | 5.64% | | 8.97% |
| | | |
Russell 1000® Value Index17 | | (7.00%) | | 7.21% | | 10.30% |
The performance data shown represents past performance. Past performance is not a guarantee of future results. Current performance may be lower or higher than the performance data quoted. The investment return and principal value of an investment will fluctuate so that an investor’s shares, when redeemed, may be worth more or less than their original cost.
Investors should carefully consider the Fund’s investment objectives, risks, charges and expenses before investing. For performance information through the most recent month end, current net asset values per share for the Fund and other information, please call 800.548.4539 or visit our website at amgfunds.com for a free prospectus. Read it carefully before investing or sending money.
Distributed by AMG Distributors, Inc., member FINRA/SIPC.
| 1 | Total return equals income yield plus share price change and assumes reinvestment of all dividends and capital gain distributions. Returns are net of fees and may reflect offsets of Fund expenses as described in the prospectus. No adjustment has been made for taxes payable by shareholders on their reinvested dividends and capital gain distributions. Returns for periods greater than one year are annualized. The listed returns on the Fund are net of expenses and based on the published NAV as of October 31, 2022. All returns are in U.S. Dollars ($). |
| 2 | From time to time, the Fund’s adviser has waived its fees and/or absorbed Fund expenses, which has resulted in higher returns. |
|
3 As of March 22, 2021, the Fund’s Subadviser was changed to River Road Asset Management, LLC. Prior to March 22, 2021, the Fund was known as the AMG FQ Long-Short Equity Fund and had different principal investment strategies and corresponding risks. Performance shown for periods prior to March 22, 2021, reflects the performance and investment strategies of the Fund’s previous Subadviser, First Quadrant, L.P. The Fund’s past performance would have been different if the Fund were managed by the current Subadviser and strategy, and the Fund’s prior performance record might be less pertinent for investors considering whether to purchase shares of the Fund. 4 Active and frequent trading of a fund may result in higher transaction costs and increased tax liability. 5 The Fund is subject to special risk considerations similar to those associated with the direct ownership of real estate. Real estate valuations may be subject to factors such as changing general and local economic, financial, competitive, and environmental conditions. 6 Investing in publicly traded partnerships (PTPs) (including master limited partnerships) involves risks in addition to those typically associated with publicly traded companies. PTPs are exposed to the risks of their underlying assets, which in many cases includes the same types of risks as energy and natural resources companies. PTPs are also subject to capital markets risk. PTPs may lose their partnership status for tax purposes. The Fund’s status as a regulated investment company may be jeopardized if it does not appropriately limit such investments in PTPs or if such investments are recharacterized for tax purposes. 7 Investments in master limited partnerships (MLPs) are subject to similar risks to those associated with the specific industry or industries in which the partnership invests, such as the risk of investing in the real estate or oil and gas industries. In addition, investments in MLPs are subject to the risks of investing in a partnership, including limited control and voting rights on matters affecting the partnership and fewer investor protections compared to corporations. 8 The Fund is subject to currency risk resulting from fluctuations in exchange rates that may affect the total loss or gain on a non-U.S. Dollar investment when converted back to U.S. Dollars. 9 Market prices of investments held by the Fund may fall rapidly or unpredictably due to a variety of economic or political factors, market conditions, disasters or public health issues, or in response to events that affect particular industries or companies. |
12
| | |
| | | AMG River Road Large Cap Value Select Fund Portfolio Manager’s Comments (continued) |
| | | |
| | | |
| | | | | | | | |
10 Convertible preferred stocks, which are convertible into shares of the common stock and pay regular dividends, and convertible debt securities, which are convertible into shares of the common stock and bear interest, are subject to the risks of equity securities and fixed income securities. 11 Because exchange-traded funds (ETFs) incur their own costs, investing in them could result in a higher cost to the investor. Additionally, the fund will be indirectly exposed to all the risks of securities held by the ETFs. 12 A greater percentage of the Fund’s holdings may be focused in a smaller number of securities which may place the Fund at greater risk than a more diversified fund. | | | | 13 Investments in international securities are subject to certain risks of overseas investing including currency fluctuations and changes in political and economic conditions, which could result in significant market fluctuations. These risks are magnified in emerging markets. 14 Companies that are in similar industry sectors may be similarly affected by particular economic or market events; to the extent the Fund has substantial holdings within a particular sector, the risks associated with that sector increase. 15 The Fund invests in large-capitalization companies that may underperform other stock funds (such as funds that focus on small-and medium-capitalization companies) when stocks of large-capitalization companies are out of favor. | | | | 16 The Fund invests in value stocks, which may perform differently from the market as a whole and may be undervalued by the market for a long period of time. 17 The Russell 1000® Value Index is a market capitalization weighted index that measures the performance of those Russell 1000® companies with lower price-to-book ratios and lower forecasted growth values. Unlike the Fund, the Russell 1000® Value Index is unmanaged, is not available for investment and does not incur expenses. The Russell 1000® Value Index is a trademark of the London Stock Exchange Group companies. Not FDIC insured, nor bank guaranteed. May lose value. |
13
| | |
| | | AMG River Road Large Cap Value Select Fund Fund Snapshots (unaudited) October 31, 2022 |
| | | |
| | | |
PORTFOLIO BREAKDOWN
| | | | | |
| Sector | | % of Net Assets |
| | |
Financials | | | | 21.5 | |
| | |
Consumer Staples | | | | 20.7 | |
| | |
Information Technology | | | | 13.5 | |
| | |
Communication Services | | | | 12.8 | |
| | |
Consumer Discretionary | | | | 10.8 | |
| | |
Industrials | | | | 7.4 | |
| | |
Energy | | | | 6.5 | |
| | |
Health Care | | | | 5.6 | |
| | |
Short-Term Investments | | | | 2.0 | |
| | |
Other Assets, Less Liabilities | | | | (0.8 | ) |
TOP TEN HOLDINGS
| | | | | | |
Security Name | | % of Net Assets |
| | | |
Berkshire Hathaway, Inc., Class B | | | | | | 8.4 |
| | | |
Nestle SA, Sponsored ADR (Switzerland) | | | | | | 8.2 |
| | | |
Visa, Inc., Class A | | | | | | 8.0 |
| | | |
Keurig Dr Pepper, Inc. | | | | | | 6.0 |
| | | |
Fiserv, Inc. | | | | | | 5.5 |
| | | |
Willis Towers Watson PLC (United Kingdom) | | | | | | 5.4 |
| | | |
LKQ Corp. | | | | | | 5.0 |
| | | |
T-Mobile US, Inc. | | | | | | 5.0 |
| | | |
Alphabet, Inc., Class C | | | | | | 4.8 |
| | | |
Unilever PLC, Sponsored ADR (United Kingdom) | | | | | | 4.6 |
| | | | | | | |
| | | |
Top Ten as a Group | | | | | | 60.9 |
| | | | | | |
Because a fund’s strategy may result in multiple investments in particular sectors of the economy, its performance may depend on the performance of those sectors and may fluctuate more widely than investments diversified across more sectors. For additional information on these and other risk considerations, please see the Fund’s prospectus.
Any sectors, industries, or securities discussed should not be perceived as investment recommendations. Mention of a specific security should not be considered a recommendation to buy or solicitation to sell that security. Specific securities mentioned in this report may have been sold from the Fund’s portfolio of investments by the time you receive this report.
14
| | |
| | | AMG River Road Large Cap Value Select Fund Schedule of Portfolio Investments October 31, 2022 |
| | | |
| | | |
| | | | | | | | |
| | |
| | | Shares | | | Value | |
| | |
Common Stocks - 98.8% | | | | | | | | |
| |
Communication Services - 12.8% | | | | | |
| | |
Alphabet, Inc., Class C* | | | 17,234 | | | | $1,631,371 | |
| | |
Madison Square Garden Sports Corp. | | | 6,617 | | | | 1,036,288 | |
| | |
T-Mobile US, Inc.* | | | 11,230 | | | | 1,702,019 | |
| | |
Total Communication Services | | | | | | | 4,369,678 | |
| | |
Consumer Discretionary - 10.8% | | | | | | | | |
| | |
LKQ Corp. | | | 30,989 | | | | 1,724,228 | |
| | |
NVR, Inc.* | | | 233 | | | | 987,396 | |
| | |
Starbucks Corp. | | | 11,439 | | | | 990,503 | |
| | |
Total Consumer Discretionary | | | | | | | 3,702,127 | |
| | |
Consumer Staples - 20.7% | | | | | | | | |
| | |
Albertsons Cos., Inc., Class A | | | 32,682 | | | | 670,308 | |
| | |
Keurig Dr Pepper, Inc. | | | 52,516 | | | | 2,039,721 | |
| | |
Nestle SA, Sponsored ADR (Switzerland) | | | 25,929 | | | | 2,818,742 | |
| | |
Unilever PLC, Sponsored ADR (United Kingdom)1 | | | 34,440 | | | | 1,567,364 | |
| | |
Total Consumer Staples | | | | | | | 7,096,135 | |
| | |
Energy - 6.5% | | | | | | | | |
| | |
EOG Resources, Inc. | | | 10,804 | | | | 1,474,962 | |
| | |
Suncor Energy, Inc. (Canada) | | | 21,349 | | | | 734,192 | |
| | |
Total Energy | | | | | | | 2,209,154 | |
| | |
Financials - 21.5% | | | | | | | | |
| | |
Berkshire Hathaway, Inc., Class B* | | | 9,718 | | | | 2,867,684 | |
| | |
KKR & Co., Inc. | | | 25,190 | | | | 1,224,990 | |
| | |
U.S. Bancorp | | | 33,580 | | | | 1,425,471 | |
| | |
Willis Towers Watson PLC (United Kingdom) | | | 8,428 | | | | 1,839,074 | |
| | |
Total Financials | | | | | | | 7,357,219 | |
| | | | | | | | |
| * | Non-income producing security. |
| 1 | Some of these securities, amounting to $4,270,431 or 12.5% of net assets, were out on loan to various borrowers and are collateralized by various U.S. Treasury Obligations. See Note 4 of Notes to Financial Statements. |
| | | | | | | | |
| | |
| | | Shares | | | Value | |
| |
Health Care - 5.6% | | | | | |
| | |
CVS Health Corp. | | | 14,063 | | | | $1,331,766 | |
| | |
UnitedHealth Group, Inc. | | | 1,053 | | | | 584,573 | |
| | |
Total Health Care | | | | | | | 1,916,339 | |
| |
Industrials - 7.4% | | | | | |
| | |
Carlisle Cos., Inc. | | | 4,269 | | | | 1,019,437 | |
| | |
Ferguson PLC (United Kingdom) | | | 13,736 | | | | 1,500,796 | |
| | |
Total Industrials | | | | | | | 2,520,233 | |
| |
Information Technology - 13.5% | | | | | |
| | |
Fiserv, Inc.* | | | 18,223 | | | | 1,872,231 | |
| | |
Visa, Inc., Class A1 | | | 13,257 | | | | 2,746,320 | |
| | |
Total Information Technology | | | | | | | 4,618,551 | |
| | |
Total Common Stocks
(Cost $33,754,209) | | | | | | | 33,789,436 | |
| | |
| Short-Term Investments - 2.0% | | | | | | | | |
| |
Other Investment Companies - 2.0% | | | | | |
| | |
Dreyfus Government Cash Management Fund, Institutional Shares, 2.91%2 | | | 276,848 | | | | 276,848 | |
| | |
Dreyfus Institutional Preferred Government Money Market Fund, Institutional Shares, 3.09%2 | | | 415,271 | | | | 415,271 | |
| | |
Total Short-Term Investments
(Cost $692,119) | | | | | | | 692,119 | |
| | |
Total Investments - 100.8%
(Cost $34,446,328) | | | | | | | 34,481,555 | |
| |
Other Assets, less Liabilities - (0.8)% | | | | (279,923 | ) |
| | |
Net Assets - 100.0% | | | | | | $ | 34,201,632 | |
| | | | | | | | |
| 2 | Yield shown represents the October 31, 2022, seven day average yield, which refers to the sum of the previous seven days’ dividends paid, expressed as an annual percentage. |
ADR American Depositary Receipt
The accompanying notes are an integral part of these financial statements.
15
| | |
| | | AMG River Road Large Cap Value Select Fund Schedule of Portfolio Investments (continued) |
| | | |
| | | |
The following table summarizes the inputs used to value the Fund’s investments by the fair value hierarchy levels as of October 31, 2022:
| | | | | | | | | | | | | | |
| | | Level 1 | | | Level 2 | | | Level 3 | | | Total |
Investments in Securities | | | | | | | | | | | | | | |
| | | | |
Common Stocks† | | $ | 33,789,436 | | | | — | | | | — | | | $33,789,436 |
| | | | |
Short-Term Investments | | | | | | | | | | | | | | |
| | | | |
Other Investment Companies | | | 692,119 | | | | — | | | | — | | | 692,119 |
| | | | | | | | | | | | | | |
Total Investments in Securities | | $ | 34,481,555 | | | | — | | | | — | | | $34,481,555 |
| | | | | | | | | | | | | | |
| † | All common stocks held in the Fund are Level 1 securities. For a detailed breakout of common stocks by major industry classification, please refer to the Fund’s Schedule of Portfolio Investments. |
For the fiscal year ended October 31, 2022, there were no transfers in or out of Level 3.
The accompanying notes are an integral part of these financial statements.
16
| | |
| | | AMG River Road Small Cap Value Fund Portfolio Manager’s Comments (unaudited) |
| | | |
| | | |
| | | | | | | | |
OVERVIEW For the fiscal year ended October 31, 2022, AMG River Road Small Cap Value Fund (the “Fund”) Class N shares returned (0.35)%, outperforming the (10.73)% return for the Russell 2000® Value Index, the Fund’s primary benchmark. PERFORMANCE REVIEW The sector with the largest negative contribution to relative return was energy, which suffered from negative stock selection and an underweight allocation. The sector with the largest positive contribution to relative return was industrials, which benefited from positive stock selection and an overweight allocation. The Fund’s cash position, which averaged 5.77% during the period, was a positive contributor to relative performance by 79 bps. The top contributing holdings to the Fund’s active return were Murphy USA, Inc. (MUSA) and BJ’s Wholesale Club Holdings, Inc. (BJ). Murphy operates 1,700 gas stations primarily in the southeastern United States. Nearly 70% of its stores are in Walmart parking lots. Given Murphy’s status as a low-cost operator, its business model is predicated on driving high fuel volumes by offering customers the lowest gas prices. Murphy has minimal labor costs due to its small in-store footprints. Most industry participants have higher labor intensity because of their focus on in-store revenue (snacks, drinks, etc.). With higher wage inflation and in-store traffic declines caused by higher fuel prices, most operators are offsetting these profitability headwinds with higher fuel margins. This industry environment allows Murphy to realize higher fuel margins and gain significant market share in fuel as customers | | | | seek the cheapest gas. Strong volumes and wide margins translated to a surge in free cash flow, much of which was returned to shareholders in the form of buybacks and a growing dividend. BJ’s is a warehouse club operator with 229 stores in the eastern United States (similar to Costco or Sam’s Club). BJ’s offers a narrow selection of only ~7,000 SKUs compared to ~100,000 for the typical grocery store, which allows BJ to maximize its bargaining power and pass the savings to its paying members. The value proposition attracts new members and new members increase scale which creates better deals. This virtuous cycle has led to solid member growth as well as record high membership retention rates. These factors have led to significant EBITDA, free cash flow, and new store growth. We trimmed both positions as they approached our assessed values. The bottom contributing holdings to the Fund’s active return were Avaya Holdings Corp. (AVYA) and NCR Corp. (NCR). Avaya provides communication networks for companies, and is transitioning from large on-premise deals to small, recurring monthly cloud subscriptions. While we knew this transition would be a revenue and cash flow headwind until the new cloud contracts fully cycled through the customer base, we misjudged the magnitude of the headwind. In May, management slashed 2022 cash flow from operations guidance. As we incorporated these lowered expectations into our multi-year model and compared the increasing working capital needs against future debt obligations, we determined the financial strength of the company was impaired. Thus, we exited the position. NCR provides transaction software, services, and hardware to banks, retailers, and restaurants. In February, management announced a strategic | | | | review and essentially put the company up for sale. However, during the strategic review, debt capital market conditions deteriorated as the U.S. Federal Reserve (the Fed) aggressively increased interest rates. In September, NCR announced that despite strong interest, potential buyers were unable to raise enough debt at attractive interest rates to reach a deal. Instead, NCR plans to split into two publicly traded companies (POS and ATM) near the end of 2023. This news disappointed the market which was hoping for a sale, and the stock sold off. We opportunistically trimmed the position on deal rumors prior to the September announcement but continue to have a position as the stock trades at a large discount to our assessed value. OUTLOOK AND POSITIONING We are skeptical October marked the ultimate bottom for small cap stocks given a looming recession, falling earnings expectations, and the Fed resolving to continue raising interest rates until inflation is under control. Additionally, we think it could be years, not quarters, before investors see sustainable and meaningful new highs in stocks as markets struggle with valuations in an era of higher interest rates and geopolitical uncertainty. We believe high quality companies with attractive growth rates and attractive valuations are a wonderful place to invest in the current environment. We believe the Fund is attractively positioned compared to the benchmark based on EV/EBITDA, Return on Equity (ROE), and long-term growth outlook. This commentary reflects the viewpoints of River Road Asset Management, LLC as of October 31, 2022, and is not intended as a forecast or guarantee of future results. |
17
|
AMG River Road Small Cap Value Fund Portfolio Manager’s Comments (continued) |
CUMULATIVE TOTAL RETURN PERFORMANCE
AMG River Road Small Cap Value Fund’s cumulative total return is based on the daily change in net asset value (NAV), and assumes that all dividends and distributions were reinvested. The graph compares a hypothetical $10,000 investment made in the AMG River Road Small Cap Value Fund’s Class N shares on October 31, 2012, to a $10,000 investment made in the Russell 2000® Value Index for the same time period. The graph and table do not reflect the deduction of taxes that a shareholder would pay on a Fund distribution or redemption of shares. The listed returns for the Fund are net of expenses and the returns for the index excludes expenses. Total returns would have been lower had certain expenses not been reduced.
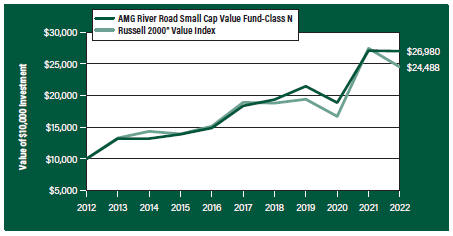
The table below shows the average annual total returns for the AMG River Road Small Cap Value Fund and the Russell 2000® Value Index for the same time periods ended October 31, 2022.
| | | | | | | | | | | | |
| | | One | | Five | | Ten | | | Since | | Inception |
| Average Annual Total Returns1 | | Year | | Years | | Years | | | Inception | | Date |
| | |
AMG River Road Small Cap Value Fund2, 3, 4, 5, 6, 7, 8, 9 | | | | | |
| | | | | |
Class N | | (0.35%) | | 8.01% | | | 10.43% | | | 8.13% | | 06/28/05 |
| | | | | |
Class I | | (0.07%) | | 8.29% | | | 10.72% | | | 6.89% | | 12/13/06 |
| | | | | |
Class Z | | (0.00%)* | | 8.39% | | | — | | | 8.24% | | 09/29/17 |
| | | | | |
Russell 2000® Value Index10 | | (10.73%) | | 5.31% | | | 9.37% | | | 6.96% | | 06/28/05† |
The performance data shown represents past performance. Past performance is not a guarantee of future results. Current performance may be lower or higher than the performance data quoted. The investment return and principal value of an investment will fluctuate so that an investor’s shares, when redeemed, may be worth more or less than their original cost.
Investors should carefully consider the Fund’s investment objectives, risks, charges and expenses before investing. For performance information through the most recent month end, current net asset values per share for the Fund and other information, please call 800.548.4539 or visit our website at amgfunds.com for a free prospectus. Read it carefully before investing or sending money.
Distributed by AMG Distributors, Inc., member FINRA/SIPC.
| † | Date reflects the inception date of the Fund, not the index. |
| 1 | Total return equals income yield plus share price change and assumes reinvestment of all dividends and capital gain distributions. Returns are net of fees and may reflect offsets of Fund expenses as described in the prospectus. No adjustment has been made for taxes payable by shareholders on their reinvested dividends and |
|
capital gain distributions. Returns for periods greater than one year are annualized. The listed returns on the Fund are net of expenses and based on the published NAV as of October 31, 2022. All returns are in U.S. Dollars ($). 2 From time to time, the Fund’s adviser has waived its fees and/or absorbed Fund expenses, which has resulted in higher returns. 3 The Fund is subject to risks associated with investments in small-capitalization companies, such as erratic earnings patterns, competitive conditions, limited earnings history and a reliance on one or a limited number of products. 4 The Fund is subject to risks associated with investments in mid-capitalization companies such as greater price volatility, lower trading volume, and less liquidity than the stocks of larger more established companies. 5 The Fund is subject to special risk considerations similar to those associated with the direct ownership of real estate. Real estate valuations may be subject to factors such as changing general and local economic, financial, competitive, and environmental conditions. 6 The Fund invests in value stocks, which may perform differently from the market as a whole and may be undervalued by the market for a long period of time. |
| |
7 Market prices of investments held by the Fund may fall rapidly or unpredictably due to a variety of economic or political factors, market conditions, disasters or public health issues, or in response to events that affect particular industries or companies. |
| |
8 Investments in international securities are subject to certain risks of overseas investing including currency fluctuations and changes in political and economic conditions, which could result in significant market fluctuations. These risks are magnified in emerging markets. |
| |
9 Companies that are in similar industry sectors may be similarly affected by particular economic or market events; to the extent the Fund has substantial holdings within a particular sector, the risks associated with that sector increase. |
| |
10 The Russell 2000® Value Index is an unmanaged, market-value weighted, value-oriented index comprised of small stocks that have relatively low price-to-book ratios and lower forecasted growth values. Unlike the Fund, the Russell 2000® Value Index is unmanaged, is not available for investment and does not incur expenses. |
| |
| The Russell 2000® Value Index is a trademark of the London Stock Exchange Group companies. |
| |
| Not FDIC insured, nor bank guaranteed. May lose value. |
18
| | |
| | | AMG River Road Small Cap Value Fund Fund Snapshots (unaudited) October 31, 2022 |
| | | |
| | | |
PORTFOLIO BREAKDOWN
| | | | | |
| Sector | | % of Net Assets |
| | |
Industrials | | | | 33.2 | |
| | |
Financials | | | | 16.0 | |
| | |
Information Technology | | | | 10.9 | |
| | |
Health Care | | | | 8.6 | |
| | |
Consumer Staples | | | | 7.0 | |
| | |
Consumer Discretionary | | | | 6.0 | |
| | |
Energy | | | | 4.7 | |
| | |
Materials | | | | 3.8 | |
| | |
Communication Services | | | | 2.1 | |
| | |
Utilities | | | | 1.5 | |
| | |
Real Estate | | | | 0.4 | |
| | |
Short-Term Investments | | | | 6.2 | |
| | |
Other Assets, Less Liabilities | | | | (0.4 | ) |
TOP TEN HOLDINGS
| | | | |
| Security Name | | % of
Net Assets |
| | | |
Air Transport Services Group, Inc. | | | | 4.4 |
| | | |
BJ’s Wholesale Club Holdings, Inc. | | | | 4.2 |
| | | |
White Mountains Insurance Group, Ltd. | | | | 4.0 |
| | | |
UniFirst Corp. | | | | 3.2 |
| | | |
McGrath RentCorp | | | | 3.1 |
| | | |
Premier, Inc., Class A | | | | 2.9 |
| | | |
Comfort Systems USA, Inc. | | | | 2.9 |
| | | |
Cannae Holdings, Inc. | | | | 2.8 |
| | | |
American Equity Investment Life Holding Co. | | | | 2.7 |
| | | |
SP Plus Corp. | | | | 2.4 |
| | | | |
| | | |
Top Ten as a Group | | | | 32.6 |
| | | | |
Because a fund’s strategy may result in multiple investments in particular sectors of the economy, its performance may depend on the performance of those sectors and may fluctuate more widely than investments diversified across more sectors. For additional information on these and other risk considerations, please see the Fund’s prospectus.
Any sectors, industries, or securities discussed should not be perceived as investment recommendations. Mention of a specific security should not be considered a recommendation to buy or solicitation to sell that security. Specific securities mentioned in this report may have been sold from the Fund’s portfolio of investments by the time you receive this report.
19
|
AMG River Road Small Cap Value Fund Schedule of Portfolio Investments October 31, 2022 |
| | | | | | | | |
| | | Shares | | | Value | |
| | |
Common Stocks - 94.2% | | | | | | | | |
| |
Communication Services - 2.1% | | | | | |
| | |
Liberty Latin America, Ltd., Class C*,1 | | | 564,577 | | | | $4,398,055 | |
| | |
Yelp, Inc.* | | | 356,647 | | | | 13,698,811 | |
| | |
Total Communication Services | | | | | | | 18,096,866 | |
| | |
Consumer Discretionary - 6.0% | | | | | | | | |
| | |
Asbury Automotive Group, Inc.*,1 | | | 81,902 | | | | 12,920,041 | |
| | |
Latham Group, Inc.* | | | 812,200 | | | | 3,589,924 | |
| | |
Leslie’s, Inc.*,1 | | | 764,842 | | | | 10,738,382 | |
| | |
Murphy USA, Inc. | | | 65,416 | | | | 20,573,986 | |
| | |
Sleep Number Corp.* | | | 142,299 | | | | 3,947,374 | |
| | |
Total Consumer Discretionary | | | | | | | 51,769,707 | |
| | |
Consumer Staples - 7.0% | | | | | | | | |
| | |
BJ’s Wholesale Club Holdings, Inc.* | | | 465,590 | | | | 36,036,666 | |
| | |
Hostess Brands, Inc.* | | | 283,850 | | | | 7,516,348 | |
| | |
Ingles Markets, Inc., Class A | | | 181,756 | | | | 17,152,314 | |
| | |
Total Consumer Staples | | | | | | | 60,705,328 | |
| | |
Energy - 4.7% | | | | | | | | |
| | |
Evolution Petroleum Corp. | | | 674,133 | | | | 5,318,910 | |
| | |
Permian Resources Corp.* | | | 1,570,199 | | | | 15,340,844 | |
| | |
SM Energy Co. | | | 324,783 | | | | 14,608,739 | |
| | |
World Fuel Services Corp. | | | 202,515 | | | | 5,162,107 | |
| | |
Total Energy | | | | | | | 40,430,600 | |
| | |
Financials - 16.0% | | | | | | | | |
| | |
American Equity Investment Life Holding Co. | | | 546,140 | | | | 23,527,711 | |
| | |
Axis Capital Holdings, Ltd. (Bermuda)1 | | | 342,914 | | | | 18,747,108 | |
| | |
Cannae Holdings, Inc.* | | | 1,055,390 | | | | 24,442,832 | |
| | |
Evercore, Inc., Class A | | | 27,997 | | | | 2,942,485 | |
| | |
Genworth Financial, Inc., Class A* | | | 3,586,030 | | | | 16,746,760 | |
| | |
NMI Holdings, Inc., Class A* | | | 391,829 | | | | 8,592,810 | |
| | |
Radian Group, Inc. | | | 433,154 | | | | 9,039,924 | |
| | |
White Mountains Insurance Group, Ltd. | | | 24,751 | | | | 35,051,129 | |
| | |
Total Financials | | | | | | | 139,090,759 | |
| | |
Health Care - 8.6% | | | | | | | | |
| | |
Computer Programs and Systems, Inc.* | | | 469,623 | | | | 15,168,823 | |
| | |
Enovis Corp.* | | | 81,087 | | | | 4,009,752 | |
| | |
ICU Medical, Inc.*,1 | | | 54,528 | | | | 8,092,500 | |
| | |
Patterson Cos., Inc. | | | 416,476 | | | | 10,815,882 | |
| | |
Pediatrix Medical Group, Inc.* | | | 586,738 | | | | 11,382,717 | |
| | |
Premier, Inc., Class A | | | 730,334 | | | | 25,474,050 | |
| | |
Total Health Care | | | | | | | 74,943,724 | |
| | |
Industrials - 33.2% | | | | | | | | |
| | |
Air Transport Services Group, Inc.* | | | 1,304,633 | | | | 38,095,283 | |
| | | | | | | | |
| | | | | | | | |
| | | Shares | | | Value | |
| | |
Alight, Inc., Class A*,1 | | | 1,735,316 | | | | $14,385,770 | |
| | |
Argan, Inc. | | | 321,179 | | | | 11,135,276 | |
| | |
Armstrong World Industries, Inc. | | | 236,101 | | | | 17,842,152 | |
| | |
Atkore, Inc.* | | | 197,703 | | | | 18,841,096 | |
| | |
Barrett Business Services, Inc. | | | 55,663 | | | | 4,854,927 | |
| | |
Comfort Systems USA, Inc. | | | 205,810 | | | | 25,372,257 | |
| | |
CoreCivic, Inc.* | | | 1,692,013 | | | | 17,715,376 | |
| | |
Esab Corp. | | | 136,752 | | | | 5,100,850 | |
| | |
GMS, Inc.* | | | 246,028 | | | | 11,612,522 | |
| | |
Kelly Services, Inc., Class A | | | 550,080 | | | | 8,988,307 | |
| | |
McGrath RentCorp | | | 281,463 | | | | 26,471,595 | |
| | |
MSC Industrial Direct Co., Inc., Class A | | | 88,244 | | | | 7,322,487 | |
| | |
Park Aerospace Corp.1 | | | 711,075 | | | | 8,845,773 | |
| | |
SP Plus Corp.* | | | 566,684 | | | | 20,984,308 | |
| | |
UniFirst Corp. | | | 150,070 | | | | 27,614,381 | |
| | |
Univar Solutions, Inc.* | | | 465,269 | | | | 11,855,054 | |
| | |
Viad Corp.* | | | 293,710 | | | | 10,949,509 | |
| | |
Total Industrials | | | | | | | 287,986,923 | |
| | |
Information Technology - 10.9% | | | | | | | | |
| | |
ACI Worldwide, Inc.* | | | 668,649 | | | | 16,268,230 | |
| | |
DXC Technology Co.* | | | 334,947 | | | | 9,629,726 | |
| | |
ePlus, Inc.* | | | 356,739 | | | | 17,380,324 | |
| | |
EVERTEC, Inc. (Puerto Rico) | | | 453,091 | | | | 16,225,189 | |
| | |
Ituran Location and Control, Ltd. (Israel) | | | 371,437 | | | | 8,907,059 | |
| | |
NCR Corp.* | | | 582,306 | | | | 12,379,826 | |
| | |
Vontier Corp. | | | 697,231 | | | | 13,317,112 | |
| | |
Total Information Technology | | | | | | | 94,107,466 | |
| | |
Materials - 3.8% | | | | | | | | |
| | |
Axalta Coating Systems, Ltd.* | | | 484,309 | | | | 11,294,086 | |
| | |
Summit Materials, Inc., Class A* | | | 426,248 | | | | 11,231,635 | |
| | |
TriMas Corp. | | | 451,980 | | | | 10,327,743 | |
| | |
Total Materials | | | | | | | 32,853,464 | |
| | |
Real Estate - 0.4% | | | | | | | | |
| | |
Newmark Group, Inc., Class A | | | 420,001 | | | | 3,439,808 | |
| | |
Utilities - 1.5% | | | | | | | | |
| | |
Southwest Gas Holdings, Inc.1 | | | 178,477 | | | | 13,041,315 | |
| | |
Total Common Stocks | | | | | | | | |
(Cost $663,576,406) | | | | | | | 816,465,960 | |
| | | | | | | | |
The accompanying notes are an integral part of these financial statements.
20
|
AMG River Road Small Cap Value Fund Schedule of Portfolio Investments (continued) |
| | | | | | | | |
| | | Principal
Amount | | | Value | |
| |
Short-Term Investments - 6.2% | | | | | |
| |
Joint Repurchase Agreements - 0.3%2 | | | | | |
| | |
Bank of America Securities, Inc., dated 10/31/22, due 11/01/22, 3.050% total to be received $1,000,085 (collateralized by various U.S. Government Agency Obligations, 0.010% - 5.500%, 02/25/32 - 01/01/61, totaling $1,020,000) | | | $1,000,000 | | | | $1,000,000 | |
| | |
Daiwa Capital Markets America, dated 10/31/22, due 11/01/22, 3.050% total to be received $1,000,085 (collateralized by various U.S. Government Agency Obligations and U.S. Treasuries, 0.000% - 6.625%, 11/01/22 - 11/01/52, totaling $1,020,000) | | | 1,000,000 | | | | 1,000,000 | |
| | |
RBC Dominion Securities, Inc., dated 10/31/22, due 11/01/22, 3.050% total to be received $1,136,359 (collateralized by various U.S. Government Agency Obligations and U.S. Treasuries, 0.500% - 5.000%, 02/28/26 - 10/20/52, totaling $1,158,988) | | | 1,136,263 | | | | 1,136,263 | |
| |
Total Joint Repurchase Agreements | | | | 3,136,263 | |
| | | | | | | | |
| | | | | | | | |
| | | Shares | | | Value | |
| |
Other Investment Companies - 5.9% | | | | | |
| | |
Dreyfus Government Cash Management Fund, Institutional Shares, 2.91%3 | | | 20,331,655 | | | | $20,331,655 | |
| | |
Dreyfus Institutional Preferred Government Money Market Fund, Institutional Shares, 3.09%3 | | | 30,497,483 | | | | 30,497,483 | |
| |
Total Other Investment Companies | | | | 50,829,138 | |
| | |
Total Short-Term Investments
(Cost $53,965,401) | | | | | | | 53,965,401 | |
| | |
Total Investments - 100.4%
(Cost $717,541,807) | | | | | | | 870,431,361 | |
| |
Other Assets, less Liabilities - (0.4)% | | | | (3,434,019 | ) |
| | |
Net Assets - 100.0% | | | | | | $ | 866,997,342 | |
| | | | | | | | |
| * | Non-income producing security. |
| 1 | Some of these securities, amounting to $10,103,979 or 1.2% of net assets, were out on loan to various borrowers and are collateralized by cash and various U.S. Treasury Obligations. See Note 4 of Notes to Financial Statements. |
| 2 | Cash collateral received for securities lending activity was invested in these joint repurchase agreements. |
| 3 | Yield shown represents the October 31, 2022, seven day average yield, which refers to the sum of the previous seven days’ dividends paid, expressed as an annual percentage. |
The following table summarizes the inputs used to value the Fund’s investments by the fair value hierarchy levels as of October 31, 2022:
| | | | | | | | | | | | |
| | | Level 1 | | | Level 2 | | Level 3 | | | Total |
Investments in Securities | | | | | | | | | | | | |
| | | | |
Common Stocks† | | $ | 816,465,960 | | | — | | | — | | | $816,465,960 |
| | | | |
Short-Term Investments | | | | | | | | | | | | |
| | | | |
Joint Repurchase Agreements | | | — | | | $3,136,263 | | | — | | | 3,136,263 |
| | | | |
Other Investment Companies | | | 50,829,138 | | | — | | | — | | | 50,829,138 |
| | | | | | | | | | | | |
Total Investments in Securities | | $ | 867,295,098 | | | $3,136,263 | | | — | | | $870,431,361 |
| | | | | | | | | | | | |
| † | All common stocks held in the Fund are Level 1 securities. For a detailed breakout of common stocks by major industry classification, please refer to the Fund’s Schedule of Portfolio Investments. |
For the fiscal year ended October 31, 2022, there were no transfers in or out of Level 3.
The accompanying notes are an integral part of these financial statements.
21
| | |
| | | AMG River Road Dividend All Cap Value Fund Portfolio Manager’s Comments (unaudited) |
| | | |
| | | |
| | | | | | | | |
OVERVIEW For the fiscal year ended October 31, 2022, the AMG River Road Dividend All Cap Value Fund (the “Fund”) Class N shares returned (1.34)%, outperforming the Russell 3000® Value Index return of (7.25)%, the Fund’s primary benchmark. MARKET AND PERFORMANCE REVIEW The period has been dominated by rising interest rates, rampant inflation, conflict, and growing concerns of recession. These forces led to a sharp uptick in market volatility and equity markets have moved through short, sharp periods of both fear and greed. Relative to the benchmark, the Fund’s bias toward cheaper, higher quality stocks was a significant tailwind. Positive stock selection in the health care, financials, and industrials sectors led them to have significant positive impacts on relative results in the period. While the holdings in the energy sector were the top performing investments in the Fund during the period, our focus on the more predictable and stable midstream areas of the sector led them to significantly underperform their more price-sensitive peers. The two holdings with the largest positive contribution to the Fund’s active return were The Progressive Corp. (PGR), the third-largest U.S. auto insurer, and Marathon Petroleum Corp. (MPC), the nation’s largest refinery system. Progressive is a best-in-class underwriter of auto insurance with a consistent track record of underwriting profits due in part to the company’s early incorporation of telematics. The combination of an excellent underwriting culture, strong brand, and dual distribution channels (direct/agency) have allowed the company to gain market share over the past 30+ years. However, the company did not anticipate the rapid acceleration in cost inflation and used car prices in 2021, which resulted in underwriting results well below management’s and the market’s expectation. In response, Progressive raised rates faster than competitors to improve underwriting results, but at the cost of policy growth. During 2022, the rate increases had their desired effect as underwriting results improved driving the stock higher. As competitors followed with their own rate increases throughout 2022, policy growth stabilized for Progressive adding to the stock’s rally. Marathon Petroleum is the largest independent oil refiner in the U.S. and the position was established in the Fund in 2017. At the time, the company was evaluating strategic options for its disparate assets, | | | | and we foresaw significant value being unlocked in the process. By 2022 this process was largely played out and successfully so. The invasion of Ukraine and the subsequent spike in oil prices drove Marathon Petroleum to a significant premium to our assessed value. Given the inherent volatility of the refining industry, we sold the position per our sell discipline, capping off a successful investment. The two holdings with the lowest contribution to the Fund’s active return during the period were Comcast Corp. (CMCSA), a cable and media conglomerate, and Target Corp. (TGT), a broadline retailer. The deployment of 5G mobile communication technology has created a surplus of available broadband bandwidth and the combined T-Mobile/Sprint is pushing pricing aggressively. These forces are creating shockwaves throughout communication providers, including cable companies, like Comcast. Comcast’s stock has struggled as analysts have focused on the decline in net new customers added to their network and overlooked the continued growth in the average revenue per user, the rapid growth in the company’s mobile phone business, and the resurgence in the company’s theme parks. Our investment thesis is focused on the vital nature of the company’s wired assets in meeting the rapid growth of data demand, both mobile and not. After two years among the best performing holdings, Target finally fell short of the very high expectations that had come to surround the company. In the spring, Target announced that the customer purchasing trends that characterized the lockdown period had rapidly shifted and that drastic action was necessary to adjust the company’s inventory. The resulting discounts and supply chain adjustments led to a sharp decline in margins but promised to better position the company going forward. Despite the sudden shift in demand trends, the company continued to see growth in traffic and same-store-sales, both in the store and digitally, e-commerce remained a key channel even as the lockdowns ended. Our investment thesis remains intact as we expect Target is leading the convergence between brick and mortar and e-commerce retailing and the margins will ultimately rebound to attractive levels as supply chains and customer demand patterns normalize. POSITIONING AND OUTLOOK As of the end of the fiscal year, the Fund is significantly overweight in the utilities, consumer staples, and information technology sectors and | | | | significantly underweight in the materials, industrials, and financials sectors. The consumer discretionary sector had the largest decrease in exposure in the past 12 months, going from modestly overweight in October 2021, to underweight at the end of the period as we reduced or eliminated several positions in the sector. In contrast, the largest increase in exposure was in the Fund’s position in the real estate sector which went from no weight to modestly underweight as we added two positions at attractive prices amid the volatility that dominated the past twelve months. The rapid tightening in monetary policy that was initiated in December 2021 is now taking a bite out of economic activity. Fiscal policy has remained a headwind as well and federal outlays have declined markedly as lockdown related handouts have come to an end. In addition, sentiment remains generally negative as both investors and CEOs are pessimistic about the near future. According to The Conference Board, 81% of CEOs are preparing for a brief, shallow recession in the next 12–18 months, but only about a quarter noted a decline in demand over the past three months. Following the retrenchment in stock prices over the past 10 months, valuations look more attractive, but uncertainty around cash flows is elevated and the rise in interest rates, if sustained, threatens to push multiples lower. Whereas inflation has been the key wildcard we have been focused on over the past year, increasingly we see the ongoing conflict in Ukraine moving forward in focus. The future path of the war could have a dramatic impact on expectations for energy availability, commodity prices, and investor risk tolerance—while the conflict could bog down as winter sets in, it also could break dramatically in either direction in a single afternoon. Given the general strength in balance sheets and expected modest increase in earnings, we continue to expect that dividend growth will remain positive during the last part of the year. With dividends in solid shape, value ascendant, and higher quality stocks set to lead, we remain positive about both the near-term and long-term relative outlook for the Fund. This commentary reflects the viewpoints of River Road Asset Management, LLC as of October 31, 2022, and is not intended as a forecast or guarantee of future results. |
22
| | |
| | | AMG River Road Dividend All Cap Value Fund Portfolio Manager’s Comments (continued) |
| | | |
| | | |
CUMULATIVE TOTAL RETURN PERFORMANCE
AMG River Road Dividend All Cap Value Fund’s cumulative total return is based on the daily change in net asset value (NAV), and assumes that all dividends and distributions were reinvested. The graph compares a hypothetical $10,000 investment made in the AMG River Road Dividend All Cap Value Fund’s Class N shares on October 31, 2012, to a $10,000 investment made in the Russell 3000® Value Index for the same time period. The graph and table do not reflect the deduction of taxes that a shareholder would pay on a Fund distribution or redemption of shares. The listed returns for the Fund are net of expenses and the returns for the index excludes expenses. Total returns would have been lower had certain expenses not been reduced.
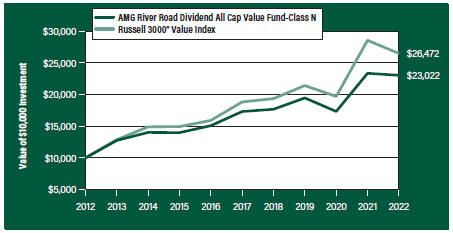
The table below shows the average annual total returns for the AMG River Road Dividend All Cap Value Fund and the Russell 3000® Value Index for the same time periods ended October 31, 2022.
| | | | | | | | | | | | |
| | | One | | Five | | Ten | | | Since | | Inception |
| Average Annual Total Returns1 | | Year | | Years | | Years | | | Inception | | Date |
|
AMG River Road Dividend All Cap Value Fund2, 3, 4, 5, 6, 7, 8, 9, 10, 11, 12, 13 |
| | | | | |
Class N | | (1.34%) | | 5.87% | | | 8.70% | | | 7.61% | | 06/28/05 |
| | | | | |
Class I | | (1.18%) | | 6.13% | | | 8.97% | | | 6.56% | | 06/28/07 |
| | | | | |
Class Z | | (1.12%) | | 6.20% | | | — | | | 6.21% | | 09/29/17 |
| | | | | |
Russell 3000® Value Index14 | | (7.25%) | | 7.07% | | | 10.22% | | | 7.33% | | 06/28/05† |
The performance data shown represents past performance. Past performance is not a guarantee of future results. Current performance may be lower or higher than the performance data quoted. The investment return and principal value of an investment will fluctuate so that an investor’s shares, when redeemed, may be worth more or less than their original cost.
Investors should carefully consider the Fund’s investment objectives, risks, charges and expenses before investing. For performance information through the most recent month end, current net asset values per share for the Fund and other information, please call 800.548.4539 or visit our website at amgfunds.com for a free prospectus. Read it carefully before investing or sending money.
Distributed by AMG Distributors, Inc., member FINRA/SIPC.
| † | Date reflects the inception date of the Fund, not the index. |
| 1 | Total return equals income yield plus share price change and assumes reinvestment of all dividends and capital gain distributions. Returns are net of fees and may reflect offsets of Fund expenses as described in the prospectus. No adjustment has been made for taxes payable by shareholders on their reinvested dividends and |
|
capital gain distributions. Returns for periods greater than one year are annualized. The listed returns on the Fund are net of expenses and based on the published NAV as of October 31, 2022. All returns are in U.S. Dollars ($). 2 From time to time, the Fund’s adviser has waived its fees and/or absorbed Fund expenses, which has resulted in higher returns. 3 An issuer of a security may be unwilling or unable to pay income on a security. Common stocks do not assure dividend payments and are paid only when declared by an issuer’s board of directors. 4 Investments in international securities are subject to certain risks of overseas investing including currency fluctuations and changes in political and economic conditions, which could result in significant market fluctuations. These risks are magnified in emerging markets. |
| |
5 Investing in publicly traded partnerships (PTPs) (including master limited partnerships) involves risks in addition to those typically associated with publicly traded companies. PTPs are exposed to the risks of their underlying assets, which in many cases includes the same types of risks as energy and natural resources companies. PTPs are also subject to capital market risk. PTPs may lose their partnership status for tax purposes. The Fund’s status as a regulated investment company may be jeopardized if it does not appropriately limit such investments in PTPs or if such investments are recharacterized for tax purposes. |
| |
6 Investments in master limited partnerships (MLPs) are subject to similar risks to those associated with the specific industry or industries in which the partnership invests, such as the risk of investing in the real estate or oil and gas industries. In addition, investments in MLPs are subject to the risks of investing in a partnership, including limited control and voting rights on matters affecting the partnership and fewer investor protections compared to corporations. |
| |
7 The Fund is subject to risks associated with investments in mid-capitalization companies such as greater price volatility, lower trading volume, and less liquidity than the stocks of larger, more established companies. |
| |
8 The Fund is subject to special risk considerations similar to those associated with the direct ownership of real estate. Real estate valuations may be subject to factors such as changing general and local economic, financial, competitive, and environmental conditions. |
| |
9 The Fund is subject to risks associated with investments in small-capitalization companies, such as erratic earnings patterns, competitive conditions, limited earnings history and a reliance on one or a limited number of products. |
23
| | |
| | | AMG River Road Dividend All Cap Value Fund Portfolio Manager’s Comments (continued) |
| | | |
| | | |
| | | | | | | | |
10 The Fund invests in value stocks, which may perform differently from the market as a whole and may be undervalued by the market for a long period of time. 11 Market prices of investments held by the Fund may fall rapidly or unpredictably due to a variety of economic or political factors, market conditions, disasters or public health issues, or in response to events that affect particular industries or companies. | | | | 12 Companies that are in similar industry sectors may be similarly affected by particular economic or market events; to the extent the Fund has substantial holdings within a particular sector, the risks associated with that sector increase. 13 Because exchange-traded funds (ETFs) incur their own costs, investing in them could result in a higher cost to the investor. Additionally, the fund will be indirectly exposed to all the risks of securities held by the ETFs. | | | | 14 The Russell 3000® Value Index measures the performance of the broad value segment of the U.S. equity universe. It includes those Russell 3000® companies with lower price-to-book ratios and lower forecasted growth values. Unlike the Fund, the Russell 3000® Value Index is unmanaged, is not available for investment and does not incur expenses. The Russell 3000® Value Index is a trademark of the London Stock Exchange Group companies. Not FDIC insured, nor bank guaranteed. May lose value. |
24
| | |
| | | AMG River Road Dividend All Cap Value Fund Fund Snapshots (unaudited) October 31, 2022 |
| | | |
| | | |
PORTFOLIO BREAKDOWN
| | | | | |
| Sector | | % of Net Assets |
| | |
Financials | | | | 17.8 | |
| | |
Health Care | | | | 13.6 | |
| | |
Information Technology | | | | 11.7 | |
| | |
Consumer Staples | | | | 10.4 | |
| | |
Utilities | | | | 10.2 | |
| | |
Energy | | | | 9.0 | |
| | |
Communication Services | | | | 7.2 | |
| | |
Industrials | | | | 6.9 | |
| | |
Consumer Discretionary | | | | 4.0 | |
| | |
Real Estate | | | | 3.2 | |
| | |
Exchange Traded Funds | | | | 2.5 | |
| | |
Short-Term Investments | | | | 5.2 | |
| | |
Other Assets, Less Liabilities | | | | (1.7 | ) |
TOP TEN HOLDINGS
| | | | | | |
| Security Name | | % of
Net Assets |
| | | |
The AES Corp. | | | | | | 4.5 |
| | | |
The Progressive Corp. | | | | | | 3.7 |
| | | |
United Parcel Service, Inc., Class B | | | | | | 3.3 |
| | | |
Bristol-Myers Squibb Co. | | | | | | 3.3 |
| | | |
Kinder Morgan, Inc. | | | | | | 3.2 |
| | | |
Corning, Inc. | | | | | | 3.1 |
| | | |
The Williams Cos., Inc. | | | | | | 3.0 |
| | | |
Oracle Corp. | | | | | | 2.6 |
| | | |
Target Corp. | | | | | | 2.6 |
| | | |
Pfizer, Inc. | | | | | | 2.5 |
| | | | | | | |
| | | |
Top Ten as a Group | | | | | | 31.8 |
| | | | | | |
Because a fund’s strategy may result in multiple investments in particular sectors of the economy, its performance may depend on the performance of those sectors and may fluctuate more widely than investments diversified across more sectors. For additional information on these and other risk considerations, please see the Fund’s prospectus.
Any sectors, industries, or securities discussed should not be perceived as investment recommendations. Mention of a specific security should not be considered a recommendation to buy or solicitation to sell that security. Specific securities mentioned in this report may have been sold from the Fund’s portfolio of investments by the time you receive this report.
25
|
AMG River Road Dividend All Cap Value Fund Schedule of Portfolio Investments October 31, 2022 |
| | | | | | | | |
| | |
| | | Shares | | | Value | |
| | |
Common Stocks - 94.0% | | | | | | | | |
| |
Communication Services - 7.2% | | | | | |
| | |
Cogent Communications Holdings, Inc. | | | 92,714 | | | | $4,868,412 | |
| | |
Comcast Corp., Class A | | | 225,241 | | | | 7,149,150 | |
| | |
The Interpublic Group of Cos., Inc. | | | 163,770 | | | | 4,878,708 | |
| | |
Verizon Communications, Inc. | | | 187,708 | | | | 7,014,648 | |
| | |
Total Communication Services | | | | | | | 23,910,918 | |
| | |
Consumer Discretionary - 4.0% | | | | | | | | |
| | |
Genuine Parts Co. | | | 15,629 | | | | 2,779,774 | |
| | |
MDC Holdings, Inc. | | | 58,371 | | | | 1,777,981 | |
| | |
Target Corp. | | | 52,513 | | | | 8,625,260 | |
| | |
Total Consumer Discretionary | | | | | | | 13,183,015 | |
| | |
Consumer Staples - 10.4% | | | | | | | | |
| | |
The JM Smucker Co. | | | 26,344 | | | | 3,968,987 | |
| | |
Kimberly-Clark Corp. | | | 60,153 | | | | 7,486,642 | |
| | |
The Kroger Co. | | | 77,960 | | | | 3,686,728 | |
| | |
PepsiCo, Inc. | | | 33,010 | | | | 5,993,956 | |
| | |
Sysco Corp. | | | 75,086 | | | | 6,499,444 | |
| | |
Unilever PLC, Sponsored ADR (United Kingdom)1 | | | 148,558 | | | | 6,760,875 | |
| | |
Total Consumer Staples | | | | | | | 34,396,632 | |
| | |
Energy - 9.0% | | | | | | | | |
| | |
Enterprise Products Partners LP, MLP 1 | | | 292,662 | | | | 7,389,715 | |
| | |
Kinder Morgan, Inc. | | | 586,339 | | | | 10,624,463 | |
| | |
Magellan Midstream Partners LP, MLP 1 | | | 28,578 | | | | 1,541,783 | |
| | |
The Williams Cos., Inc. | | | 305,141 | | | | 9,987,265 | |
| | |
Total Energy | | | | | | | 29,543,226 | |
| | |
Financials - 17.8% | | | | | | | | |
| | |
Axis Capital Holdings, Ltd. (Bermuda) | | | 97,110 | | | | 5,309,004 | |
| | |
Chubb, Ltd. (Switzerland) | | | 26,203 | | | | 5,630,763 | |
| | |
CNA Financial Corp. | | | 62,646 | | | | 2,612,338 | |
| | |
Fidelity National Financial, Inc. | | | 104,363 | | | | 4,109,815 | |
| | |
M&T Bank Corp. | | | 34,235 | | | | 5,764,147 | |
| | |
The PNC Financial Services Group, Inc. | | | 27,517 | | | | 4,453,076 | |
| | |
The Progressive Corp. | | | 94,230 | | | | 12,099,132 | |
| | |
Truist Financial Corp. | | | 183,927 | | | | 8,238,090 | |
| | |
U.S. Bancorp | | | 164,995 | | | | 7,004,038 | |
| | |
Willis Towers Watson PLC (United Kingdom) | | | 15,658 | | | | 3,416,732 | |
| | |
Total Financials | | | | | | | 58,637,135 | |
| | |
Health Care - 13.6% | | | | | | | | |
| | |
AbbVie, Inc. | | | 56,101 | | | | 8,213,187 | |
| | |
Amgen, Inc. | | | 26,504 | | | | 7,165,356 | |
| | |
Bristol-Myers Squibb Co. | | | 140,998 | | | | 10,923,115 | |
| | |
Merck & Co., Inc. | | | 33,917 | | | | 3,432,400 | |
| | | | | | | | |
| | | | | | | | |
| | |
| | | Shares | | | Value | |
| | |
Pfizer, Inc. | | | 178,915 | | | | $8,328,493 | |
| | |
Premier, Inc., Class A | | | 198,326 | | | | 6,917,611 | |
| | |
Total Health Care | | | | | | | 44,980,162 | |
| | |
Industrials - 6.9% | | | | | | | | |
| | |
Lockheed Martin Corp. | | | 12,052 | | | | 5,865,467 | |
| | |
United Parcel Service, Inc., Class B | | | 65,700 | | | | 11,022,489 | |
| | |
Watsco, Inc.1 | | | 22,312 | | | | 6,045,660 | |
| | |
Total Industrials | | | | | | | 22,933,616 | |
| | |
Information Technology - 11.7% | | | | | | | | |
| | |
Cisco Systems, Inc. | | | 98,903 | | | | 4,493,163 | |
| | |
Corning, Inc. | | | 313,354 | | | | 10,080,598 | |
| | |
CSG Systems International, Inc. | | | 49,574 | | | | 3,205,951 | |
| | |
Micron Technology, Inc. | | | 62,478 | | | | 3,380,060 | |
| | |
Oracle Corp. | | | 110,843 | | | | 8,653,513 | |
| | |
QUALCOMM, Inc. | | | 35,052 | | | | 4,124,218 | |
| | |
Texas Instruments, Inc. | | | 30,146 | | | | 4,842,352 | |
| | |
Total Information Technology | | | | | | | 38,779,855 | |
| | |
Real Estate - 3.2% | | | | | | | | |
| | |
American Tower Corp., REIT | | | 29,970 | | | | 6,209,484 | |
| | |
STORE Capital Corp., REIT | | | 133,437 | | | | 4,243,297 | |
| | |
Total Real Estate | | | | | | | 10,452,781 | |
| | |
Utilities - 10.2% | | | | | | | | |
| | |
The AES Corp. | | | 566,394 | | | | 14,816,868 | |
| | |
Black Hills Corp. | | | 76,525 | | | | 5,002,439 | |
| | |
IDACORP, Inc. | | | 55,408 | | | | 5,801,218 | |
| | |
Vistra Corp. | | | 350,363 | | | | 8,047,838 | |
| | |
Total Utilities | | | | | | | 33,668,363 | |
| | |
Total Common Stocks | | | | | | | | |
(Cost $229,938,243) | | | | | | | 310,485,703 | |
| |
Exchange Traded Funds - 2.5% | | | | | |
| | |
iShares Russell 1000 Value ETF
(Cost $7,792,981) | | | 54,805 | | | | 8,206,501 | |
| | |
| | | Principal
Amount | | | | |
| |
Short-Term Investments - 5.2% | | | | | |
| |
Joint Repurchase Agreements - 1.8%2 | | | | | |
| | |
Bank of America Securities, Inc., dated 10/31/22, due 11/01/22, 3.050% total to be received $1,453,650 (collateralized by various U.S. Government Agency Obligations, 0.010% - 5.500%, 02/25/32 - 01/01/61, totaling $1,482,598) | | $ | 1,453,527 | | | | 1,453,527 | |
| | | | | | | | |
The accompanying notes are an integral part of these financial statements.
26
|
AMG River Road Dividend All Cap Value Fund Schedule of Portfolio Investments (continued) |
| | | | | | | | |
| | |
| | | Principal
Amount | | | Value | |
| |
Joint Repurchase Agreements - 1.8%2 | | | | | |
(continued) | | | | | | | | |
| | |
Daiwa Capital Markets America, dated 10/31/22, due 11/01/22, 3.050% total to be received $1,453,650 (collateralized by various U.S. Government Agency Obligations and U.S. Treasuries, 0.000% - 6.625%, 11/01/22 - 11/01/52, totaling $1,482,598) | | | $1,453,527 | | | | $1,453,527 | |
| | |
HSBC Securities USA, Inc., dated 10/31/22, due 11/01/22, 3.010% total to be received $304,128 (collateralized by various U.S. Treasuries, 0.000% - 7.625%, 01/15/23 - 08/15/52, totaling $310,185) | | | 304,103 | | | | 304,103 | |
| | |
RBC Dominion Securities, Inc., dated 10/31/22, due 11/01/22, 3.050% total to be received $1,453,650 (collateralized by various U.S. Government Agency Obligations and U.S. Treasuries, 0.500% - 5.000%, 02/28/26 - 10/20/52, totaling $1,482,598) | | | 1,453,527 | | | | 1,453,527 | |
| | |
Truist Securities, Inc., dated 10/31/22, due 11/01/22, 3.070% total to be received $1,453,651 (collateralized by various U.S. Government Agency Obligations, 2.500% - 5.000%, 01/01/30 - 10/01/52, totaling $1,482,598) | | | 1,453,527 | | | | 1,453,527 | |
| |
Total Joint Repurchase Agreements | | | | 6,118,211 | |
| | | | | | | | |
| | |
| | | Shares | | | Value | |
| |
Other Investment Companies - 3.4% | | | | | |
| | |
Dreyfus Government Cash Management Fund, Institutional Shares, 2.91%3 | | | 4,430,706 | | | | $4,430,706 | |
| | |
Dreyfus Institutional Preferred Government Money Market Fund, Institutional Shares, 3.09%3 | | | 6,646,059 | | | | 6,646,059 | |
| | |
Total Other Investment Companies | | | | | | | 11,076,765 | |
| | |
Total Short-Term Investments
(Cost $17,194,976) | | | | | | | 17,194,976 | |
| | |
Total Investments - 101.7%
(Cost $254,926,200) | | | | | | | 335,887,180 | |
| |
Other Assets, less Liabilities - (1.7)% | | | | (5,624,810 | ) |
| | |
Net Assets - 100.0% | | | | | | $ | 330,262,370 | |
| 1 | Some of these securities, amounting to $8,546,674 or 2.6% of net assets, were out on loan to various borrowers and are collateralized by cash and various U.S. Treasury Obligations. See Note 4 of Notes to Financial Statements. |
| 2 | Cash collateral received for securities lending activity was invested in these joint repurchase agreements. |
| 3 | Yield shown represents the October 31, 2022, seven day average yield, which refers to the sum of the previous seven days’ dividends paid, expressed as an annual percentage. |
| ADR | American Depositary Receipt |
| MLP | Master Limited Partnership |
| REIT | Real Estate Investment Trust |
The following table summarizes the inputs used to value the Fund’s investments by the fair value hierarchy levels as of October 31, 2022:
| | | | | | | | | | | | |
| | | Level 1 | | | Level 2 | | Level 3 | | | Total |
| | | | |
Investments in Securities | | | | | | | | | | | | |
| | | | |
Common Stocks† | | $ | 310,485,703 | | | — | | | — | | | $310,485,703 |
| | | | |
Exchange Traded Funds† | | | 8,206,501 | | | — | | | — | | | 8,206,501 |
| | | | |
Short-Term Investments | | | | | | | | | | | | |
| | | | |
Joint Repurchase Agreements | | | — | | | $6,118,211 | | | — | | | 6,118,211 |
| | | | |
Other Investment Companies | | | 11,076,765 | | | — | | | — | | | 11,076,765 |
| | | | | | | | | | | | |
Total Investments in Securities | | $ | 329,768,969 | | | $6,118,211 | | | — | | | $335,887,180 |
| | | | | | | | | | | | |
| † | All common stocks and exchange traded funds held in the Fund are Level 1 securities. For a detailed breakout of common stocks and exchange traded funds by major industry classification, please refer to the Fund’s Schedule of Portfolio Investments. |
For the fiscal year ended October 31, 2022, there were no transfers in or out of Level 3.
The accompanying notes are an integral part of these financial statements.
27
| | |
| | | AMG River Road Small-Mid Cap Value Fund Portfolio Manager’s Comments (unaudited) |
| | | |
| | | |
| | | | | | | | |
OVERVIEW For the fiscal year ended October 31, 2022, AMG River Road Small-Mid Cap Value Fund (the “Fund”) Class N shares returned (1.64)%, outperforming the Russell 2500® Value Index return of (10.66)%, the Fund’s primary benchmark. PERFORMANCE REVIEW The sector with the largest negative contribution to relative return was information technology, which suffered from negative stock selection and an overweight allocation. The sector with the largest positive contribution to relative return was consumer discretionary, which benefited from positive stock selection. The Fund’s cash position, which averaged 2.38% during the period, was a positive contributor to relative performance by 36 bps. The top contributing holdings to the Fund’s active return were Murphy USA, Inc. (MUSA) and White Mountains Insurance Group, Ltd. (WTM) Murphy operates 1,700 gas stations primarily in the southeastern United States. Nearly 70% of its stores are in Walmart parking lots. Given Murphy’s status as a low-cost operator, its business model is predicated on driving high fuel volumes by offering customers the lowest gas prices. Murphy has minimal labor costs due to its small in-store footprints. Most industry participants have higher labor intensity because of their focus on in-store revenue (snacks, drinks, etc.). With higher wage inflation and in-store traffic declines caused by higher fuel prices, most operators are offsetting these profitability headwinds with higher fuel margins. This industry environment allows Murphy to realize higher fuel margins and gain significant market share in fuel as customers seek out the cheapest gas. Strong volumes and wide margins translated to a surge in free cash flow, much of which was returned to shareholders in the | | | | form of buybacks and a growing dividend. White Mountains is a financial services holding company consisting of a municipal bond reinsurer, various insurance and insurance service operations, asset managers, and a significant portfolio of fixed income and alternative investments. In August, White Mountains sold its 87% stake in NSM Insurance Group to Carlyle at a $1.78 billion valuation (24x trailing EBITDA). White Mountains earned 2.7x on its invested capital in less than five years and increased its adjusted book value 23%. This transaction is consistent with management’s track record of selling assets at attractive prices late in the cycle. White Mountains subsequently completed a modified Dutch tender and repurchased 11.3% of its outstanding shares for $549 million ($1,400 per share). After these two transactions, White Mountains’ undeployed capital increased from ~$400 million to ~$1.1 billion. We trimmed both positions as they approached our assessed values. The bottom contributing holdings to the Fund’s active return were Avaya Holdings Corp. (AVYA) and NCR Corp. (NCR). Avaya provides communication networks for companies, and is transitioning from large on-premise deals to small, recurring monthly cloud subscriptions. While we knew this transition would be a revenue and cash flow headwind until the new cloud contracts fully cycled through the customer base, we misjudged the magnitude of the headwind. In May, management slashed 2022 cash flow from operations guidance. As we incorporated these lowered expectations into our multiyear model and compared the increasing working capital needs against future debt obligations, we determined the financial strength of the company was impaired. Thus, we exited the position. NCR provides transaction software, services, and hardware to banks, retailers, and restaurants. In February, management announced a strategic review and | | | | essentially put the company up for sale. However, during the strategic review, debt capital market conditions deteriorated as the U.S. Federal Reserve (the Fed) aggressively increased interest rates. In September, NCR announced that despite strong interest, potential buyers were unable to raise enough debt at attractive interest rates to reach a deal. Instead, NCR plans to split into two publicly traded companies (POS and ATM) near the end of 2023. This news disappointed the market which was hoping for a sale, and the stock sold off. We opportunistically trimmed the position on deal rumors prior to the September announcement but continue to have a position as the stock trades at a large discount to our assessed value. OUTLOOK AND POSITIONING We are skeptical October marked the ultimate bottom for small-mid cap stocks given a looming recession, falling earnings expectations, and the Fed resolving to continue raising interest rates until inflation is under control. Additionally, we think it could be years, not quarters, before investors see sustainable and meaningful new highs in stocks as markets struggle with valuations in an era of higher interest rates and geopolitical uncertainty. We believe high quality companies with attractive growth rates and attractive valuations are a wonderful place to invest in the current environment. We believe the Fund is attractively positioned compared to the benchmark based on EV/EBITDA, Return on Equity (ROE), and long-term growth outlook. This commentary reflects the viewpoints of River Road Asset Management, LLC as of October 31, 2022, and is not intended as a forecast or guarantee of future results. |
28
|
AMG River Road Small-Mid Cap Value Fund Portfolio Manager’s Comments (continued) |
CUMULATIVE TOTAL RETURN PERFORMANCE
AMG River Road Small-Mid Cap Value Fund’s cumulative total return is based on the daily change in net asset value (NAV), and assumes that all dividends and distributions were reinvested. The graph compares a hypothetical $10,000 investment made in the AMG River Road Small-Mid Cap Value Fund’s Class N shares on October 31, 2012, to a $10,000 investment made in the Russell 2500® Value Index and Russell 2000® Value Index for the same time period. The graph and table do not reflect the deduction of taxes that a shareholder would pay on a Fund distribution or redemption of shares. The listed returns for the Fund are net of expenses and the returns for the index excludes expenses. Total returns would have been lower had certain expenses not been reduced.
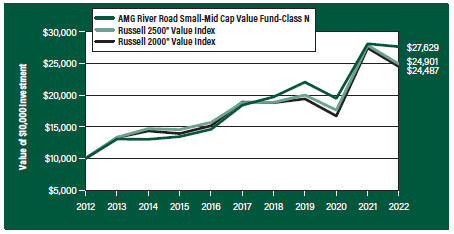
The table below shows the average annual total returns for the AMG River Road Small-Mid Cap Value Fund and the Russell 2500® Value Index and Russell 2000® Value Index for the same time periods ended October 31, 2022.
| | | | | | | | | | |
| | | One | | Five | | Ten | | Since | | Inception |
| Average Annual Total Returns1 | | Year | | Years | | Years | | Inception | | Date |
| | |
AMG River Road Small-Mid Cap Value Fund2, 3, 4, 5, 6, 7, 8, 9 | | | | |
| | | | | |
Class N | | (1.64%) | | 8.47% | | 10.70% | | 7.34% | | 03/29/07 |
| | | | | |
Class I | | (1.38%) | | 8.74% | | 10.97% | | 7.38% | | 06/28/07 |
| | | | | |
Class Z | | (1.26%) | | 8.82% | | — | | 8.38% | | 09/29/17 |
| | | | | |
Russell 2500® Value Index10 | | (10.66%) | | 5.77% | | 9.55% | | 6.52% | | 03/29/07† |
| | | | | |
Russell 2000® Value Index11 | | (10.73%) | | 5.31% | | 9.37% | | 6.01% | | 03/29/07† |
The performance data shown represents past performance. Past performance is not a guarantee of future results. Current performance may be lower or higher than the performance data quoted. The investment return and principal value of an investment will fluctuate so that an investor’s shares, when redeemed, may be worth more or less than their original cost.
Investors should carefully consider the Fund’s investment objectives, risks, charges and expenses before investing. For performance information through the most recent month end, current net asset values per share for the Fund and other information, please call 800.548.4539 or visit our website at amgfunds.com for a free prospectus. Read it carefully before investing or sending money.
Distributed by AMG Distributors, Inc., member FINRA/SIPC.
| † | Date reflects the inception date of the Fund, not the index. |
| 1 | Total return equals income yield plus share price change and assumes reinvestment of all dividends and capital gain distributions. Returns are net of fees and may reflect offsets of Fund expenses as described in the |
|
prospectus. No adjustment has been made for taxes payable by shareholders on their reinvested dividends and capital gain distributions. Returns for periods greater than one year are annualized. The listed returns on the Fund are net of expenses and based on the published NAV as of October 31, 2022. All returns are in U.S. Dollars ($). 2 From time to time, the Fund’s adviser has waived its fees and/or absorbed Fund expenses, which has resulted in higher returns. 3 The Fund is subject to special risk considerations similar to those associated with the direct ownership of real estate. Real estate valuations may be subject to factors such as changing general and local economic, financial, competitive, and environmental conditions. 4 The Fund is subject to risks associated with investments in small-capitalization companies, such as erratic earnings patterns, competitive conditions, limited earnings history and a reliance on one or a limited number of products. 5 The Fund is subject to risks associated with investments in mid-capitalization companies such as greater price volatility, lower trading volume, and less liquidity than the stocks of larger, more established companies. 6 Market prices of investments held by the Fund may fall rapidly or unpredictably due to a variety of economic or political factors, market conditions, disasters or public health issues, or in response to events that affect particular industries or companies. 7 Investments in international securities are subject to certain risks of overseas investing including currency fluctuations and changes in political and economic conditions, which could result in significant market fluctuations. These risks are magnified in emerging markets. 8 The Fund invests in value stocks, which may perform differently from the market as a whole and may be undervalued by the market for a long period of time. 9 Companies that are in similar industry sectors may be similarly affected by particular economic or market events; to the extent the Fund has substantial holdings within a particular sector, the risks associated with that sector increase. 10 The Russell 2500® Value Index measures the performance of the Russell 2500® companies with lower price-to-book ratios and lower forecasted growth values. Unlike the Fund, the Russell 2500® Value Index is unmanaged, is not available for investment and does not incur expenses. |
29
| | |
| | | AMG River Road Small-Mid Cap Value Fund Portfolio Manager’s Comments (continued) |
| | | |
| | | |
| | | | | | | | |
11 The Russell 2000® Value Index is an unmanaged, market-value weighted, value-oriented index comprised of small stocks that have relatively low price-to-book ratios and lower forecasted growth values. Unlike the Fund, the Russell 2000® Value Index is unmanaged, is not available for investment and does not incur expenses. | | | | The Russell Indices are a trademark of the London Stock Exchange Group companies. Not FDIC insured, nor bank guaranteed. May lose value. | | | | |
30
|
AMG River Road Small-Mid Cap Value Fund Fund Snapshots (unaudited) October 31, 2022 |
PORTFOLIO BREAKDOWN
| | | | | |
| Sector | | % of Net Assets |
| | |
Industrials | | | | 29.0 | |
| | |
Financials | | | | 15.2 | |
| | |
Information Technology | | | | 13.5 | |
| | |
Consumer Discretionary | | | | 12.8 | |
| | |
Health Care | | | | 7.5 | |
| | |
Consumer Staples | | | | 6.4 | |
| | |
Energy | | | | 5.9 | |
| | |
Utilities | | | | 2.6 | |
| | |
Communication Services | | | | 2.2 | |
| | |
Materials | | | | 1.5 | |
| | |
Real Estate | | | | 0.8 | |
| | |
Short-Term Investments | | | | 2.5 | |
| | |
Other Assets, Less Liabilities | | | | 0.1 | |
TOP TEN HOLDINGS
| | | | | | |
| Security Name | | % of
Net Assets |
| | | |
Air Transport Services Group, Inc. | | | | | | 4.6 |
| | | |
LKQ Corp. | | | | | | 4.1 |
| | | |
White Mountains Insurance Group, Ltd. | | | | | | 3.8 |
| | | |
Advance Auto Parts, Inc. | | | | | | 3.5 |
| | | |
Premier, Inc., Class A | | | | | | 3.1 |
| | | |
BJ’s Wholesale Club Holdings, Inc. | | | | | | 3.0 |
| | | |
UniFirst Corp. | | | | | | 2.9 |
| | | |
Cannae Holdings, Inc. | | | | | | 2.8 |
| | | |
TD SYNNEX Corp. | | | | | | 2.7 |
| | | |
American Equity Investment Life Holding Co. | | | | | | 2.6 |
| | | | | | | |
| | | |
Top Ten as a Group | | | | | | 33.1 |
| | | | | | |
Because a fund’s strategy may result in multiple investments in particular sectors of the economy, its performance may depend on the performance of those sectors and may fluctuate more widely than investments diversified across more sectors. For additional information on these and other risk considerations, please see the Fund’s prospectus.
Any sectors, industries, or securities discussed should not be perceived as investment recommendations. Mention of a specific security should not be considered a recommendation to buy or solicitation to sell that security. Specific securities mentioned in this report may have been sold from the Fund’s portfolio of investments by the time you receive this report.
31
|
AMG River Road Small-Mid Cap Value Fund Schedule of Portfolio Investments October 31, 2022 |
| | | | | | | | |
| | |
| | | Shares | | | Value | |
| | |
Common Stocks - 97.4% | | | | | | | | |
| |
Communication Services - 2.2% | | | | | |
| | |
Liberty Latin America, Ltd., Class A* | | | 101,626 | | | | $790,650 | |
| | |
Liberty Latin America, Ltd., Class C* | | | 97,326 | | | | 758,170 | |
| | |
Yelp, Inc.* | | | 98,115 | | | | 3,768,597 | |
| | |
Total Communication Services | | | | | | | 5,317,417 | |
| |
Consumer Discretionary - 12.8% | | | | | |
| | |
Advance Auto Parts, Inc. | | | 44,473 | | | | 8,446,312 | |
| | |
Asbury Automotive Group, Inc.* | | | 18,980 | | | | 2,994,095 | |
| | |
Leslie’s, Inc.*,1 | | | 92,088 | | | | 1,292,915 | |
| | |
LKQ Corp. | | | 178,042 | | | | 9,906,257 | |
| | |
Murphy USA, Inc. | | | 13,902 | | | | 4,372,318 | |
| | |
Polaris, Inc. | | | 32,393 | | | | 3,291,129 | |
| | |
Sleep Number Corp.* | | | 26,454 | | | | 733,834 | |
| | |
Total Consumer Discretionary | | | | | | | 31,036,860 | |
| |
Consumer Staples - 6.4% | | | | | |
| | |
BJ’s Wholesale Club Holdings, Inc.* | | | 92,286 | | | | 7,142,936 | |
| | |
Hostess Brands, Inc.* | | | 18,789 | | | | 497,533 | |
| | |
Ingles Markets, Inc., Class A | | | 38,649 | | | | 3,647,306 | |
| | |
Molson Coors Beverage Co., Class B | | | 80,667 | | | | 4,068,037 | |
| | |
Total Consumer Staples | | | | | | | 15,355,812 | |
| |
Energy - 5.9% | | | | | |
| | |
Chesapeake Energy Corp. | | | 14,350 | | | | 1,467,574 | |
| | |
HF Sinclair Corp. | | | 40,645 | | | | 2,486,255 | |
| | |
Ovintiv, Inc. | | | 24,067 | | | | 1,218,994 | |
| | |
Permian Resources Corp.* | | | 418,830 | | | | 4,091,969 | |
| | |
SM Energy Co. | | | 73,601 | | | | 3,310,573 | |
| | |
World Fuel Services Corp. | | | 61,186 | | | | 1,559,631 | |
| | |
Total Energy | | | | | | | 14,134,996 | |
| |
Financials - 15.2% | | | | | |
| | |
American Equity Investment Life Holding Co. | | | 143,146 | | | | 6,166,730 | |
| | |
Axis Capital Holdings, Ltd. (Bermuda) | | | 76,325 | | | | 4,172,688 | |
| | |
Cannae Holdings, Inc.* | | | 291,480 | | | | 6,750,677 | |
| | |
CNA Financial Corp. | | | 63,176 | | | | 2,634,439 | |
| | |
Evercore, Inc., Class A | | | 7,783 | | | | 817,993 | |
| | |
Genworth Financial, Inc., Class A* | | | 787,335 | | | | 3,676,854 | |
| | |
NMI Holdings, Inc., Class A* | | | 56,225 | | | | 1,233,014 | |
| | |
Radian Group, Inc. | | | 103,118 | | | | 2,152,073 | |
| | |
White Mountains Insurance Group, Ltd. | | | 6,470 | | | | 9,162,491 | |
| | |
Total Financials | | | | | | | 36,766,959 | |
| |
Health Care - 7.5% | | | | | |
| | |
Bausch + Lomb Corp. (Canada)* | | | 122,572 | | | | 1,747,877 | |
| | |
Computer Programs and Systems, Inc.* | | | 56,737 | | | | 1,832,605 | |
| | | | | | | | |
| | | | | | | | |
| | |
| | | Shares | | | Value | |
| | |
ICU Medical, Inc.* | | | 14,962 | | | | $2,220,511 | |
| | |
Patterson Cos., Inc. | | | 81,286 | | | | 2,110,998 | |
| | |
Pediatrix Medical Group, Inc.* | | | 141,371 | | | | 2,742,597 | |
| | |
Premier, Inc., Class A | | | 215,339 | | | | 7,511,024 | |
| | |
Total Health Care | | | | | | | 18,165,612 | |
| |
Industrials - 29.0% | | | | | |
| | |
Air Transport Services Group, Inc.* | | | 384,291 | | | | 11,221,297 | |
| | |
Alight, Inc., Class A* | | | 459,632 | | | | 3,810,349 | |
| | |
Argan, Inc. | | | 87,169 | | | | 3,022,149 | |
| | |
Armstrong World Industries, Inc. | | | 66,084 | | | | 4,993,968 | |
| | |
Atkore, Inc.* | | | 57,067 | | | | 5,438,485 | |
| | |
Comfort Systems USA, Inc. | | | 49,361 | | | | 6,085,224 | |
| | |
CoreCivic, Inc.* | | | 426,609 | | | | 4,466,596 | |
| | |
Dun & Bradstreet Holdings, Inc. | | | 290,814 | | | | 3,736,960 | |
| | |
Esab Corp. | | | 25,861 | | | | 964,615 | |
| | |
IAA, Inc.* | | | 90,005 | | | | 3,413,890 | |
| | |
McGrath RentCorp | | | 34,064 | | | | 3,203,719 | |
| | |
MDU Resources Group, Inc. | | | 137,247 | | | | 3,908,795 | |
| | |
SP Plus Corp.* | | | 103,657 | | | | 3,838,419 | |
| | |
UniFirst Corp. | | | 38,596 | | | | 7,102,050 | |
| | |
Univar Solutions, Inc.* | | | 130,279 | | | | 3,319,509 | |
| | |
Viad Corp.* | | | 40,968 | | | | 1,527,287 | |
| | |
Total Industrials | | | | | | | 70,053,312 | |
| |
Information Technology - 13.5% | | | | | |
| | |
ACI Worldwide, Inc.* | | | 187,337 | | | | 4,557,909 | |
| | |
DXC Technology Co.* | | | 67,135 | | | | 1,930,131 | |
| | |
ePlus, Inc.* | | | 99,839 | | | | 4,864,156 | |
| | |
EVERTEC, Inc. (Puerto Rico) | | | 79,740 | | | | 2,855,490 | |
| | |
Ituran Location and Control, Ltd. (Israel) | | | 43,040 | | | | 1,032,099 | |
| | |
NCR Corp.* | | | 167,879 | | | | 3,569,108 | |
| | |
TD SYNNEX Corp. | | | 72,451 | | | | 6,629,991 | |
| | |
Vontier Corp. | | | 169,622 | | | | 3,239,780 | |
| | |
WEX, Inc.* | | | 24,491 | | | | 4,019,953 | |
| | |
Total Information Technology | | | | | | | 32,698,617 | |
| |
Materials - 1.5% | | | | | |
| | |
Axalta Coating Systems, Ltd.* | | | 105,177 | | | | 2,452,727 | |
| | |
TriMas Corp. | | | 55,202 | | | | 1,261,366 | |
| | |
Total Materials | | | | | | | 3,714,093 | |
| |
Real Estate - 0.8% | | | | | |
| | |
Newmark Group, Inc., Class A | | | 221,547 | | | | 1,814,470 | |
| |
Utilities - 2.6% | | | | | |
| | |
OGE Energy Corp. | | | 27,351 | | | | 1,001,867 | |
| | |
Southwest Gas Holdings, Inc. | | | 16,583 | | | | 1,211,720 | |
| | | | | | | | |
The accompanying notes are an integral part of these financial statements.
32
|
AMG River Road Small-Mid Cap Value Fund Schedule of Portfolio Investments (continued) |
| | | | | | | | |
| | |
| | | Shares | | | Value | |
| |
Utilities - 2.6% (continued) | | | | | |
| | |
Vistra Corp. | | | 175,961 | | | | $4,041,824 | |
| | |
Total Utilities | | | | | | | 6,255,411 | |
| | |
Total Common Stocks
(Cost $200,041,678) | | | | | | | 235,313,559 | |
| |
Short-Term Investments - 2.5% | | | | | |
| |
Other Investment Companies - 2.5% | | | | | |
| | |
Dreyfus Government Cash Management Fund, Institutional Shares, 2.91%2 | | | 2,390,949 | | | | 2,390,949 | |
| | |
Dreyfus Institutional Preferred Government Money Market Fund, Institutional Shares, 3.09%2 | | | 3,586,424 | | | | 3,586,424 | |
| | |
Total Short-Term Investments (Cost $5,977,373) | | | | | | | 5,977,373 | |
| | | | | | | | |
| * | Non-income producing security. |
| 1 | Some of this security, amounting to $115,718 or less than 0.05% of net assets, was out on loan to various borrowers and is collateralized by various U.S. Treasury Obligations. See Note 4 of Notes to Financial Statements. |
| | | | | | | | |
| |
| | | | Value | |
| |
Total Investments - 99.9%
(Cost $206,019,051) | | | $ | 241,290,932 | |
| |
Other Assets, less Liabilities - 0.1% | | | | 309,897 | |
| |
Net Assets - 100.0% | | | $ | 241,600,829 | |
| | | | | | | | |
| 2 | Yield shown represents the October 31, 2022, seven day average yield, which refers to the sum of the previous seven days’ dividends paid, expressed as an annual percentage. |
The following table summarizes the inputs used to value the Fund’s investments by the fair value hierarchy levels as of October 31, 2022:
| | | | | | | | | | | | | | |
| | | Level 1 | | | Level 2 | | | Level 3 | | | Total |
Investments in Securities | | | | | | | | | | | | | | |
| | | | |
Common Stocks† | | $ | 235,313,559 | | | | — | | | | — | | | $235,313,559 |
| | | | |
Short-Term Investments | | | | | | | | | | | | | | |
| | | | |
Other Investment Companies | | | 5,977,373 | | | | — | | | | — | | | 5,977,373 |
| | | | | | | | | | | | | | |
Total Investments in Securities | | $ | 241,290,932 | | | | — | | | | — | | | $241,290,932 |
| | | | | | | | | | | | | | |
| † | All common stocks held in the Fund are Level 1 securities. For a detailed breakout of common stocks by major industry classification, please refer to the Fund’s Schedule of Portfolio Investments. |
For the fiscal year ended October 31, 2022, there were no transfers in or out of Level 3.
The accompanying notes are an integral part of these financial statements.
33
| | |
| | | AMG River Road International Value Equity Fund Portfolio Manager’s Comments (unaudited) |
| | | |
| | | |
| | | | | | | | |
OVERVIEW For the fiscal year ended October 31, 2022, AMG River Road International Value Equity Fund (the “Fund”) Class N shares returned (11.67)%, outperforming the (23.00)% return for the MSCI EAFE Index, the Fund’s primary benchmark. PERFORMANCE REVIEW The Fund outperformed its primary benchmark, as well as the MSCI EAFE Value secondary benchmark, which returned (16.35)% for the period. The region with the largest positive contribution to relative return was Europe (ex U.K.) due to positive stock selection and an underweight exposure to the region. Outperformance was partially offset by negative stock selection within Japan and the U.K. The sector with the largest positive contribution to relative return was industrials, which benefited from positive stock selection. The outperformance was partially offset by negative stock selection within the consumer staples sector. The Fund’s cash position, which averaged 3.8% during the period, was also a positive contributor to relative performance. The top contributing holdings to the Fund’s active return were BAE Systems PLC (BA-GB) and TIM SA (TIMB-US), a Brazilian Sponsored ADR. BAE Systems is a U.K. based global defense company with a dominant position in the U.K. and a top supplier to the U.S. Department of Defense. The company released solid earnings and free cash flow growth | | | | driven by surging defense spending following Russia’s invasion of Ukraine. We view BAE Systems as a stable business model with a high level of recurring revenue from support services, which should continue to benefit from rising defense budgets in coming years. TIM is one of the top three wireless carriers in Brazil with approximately 51 million subscribers. TIM delivered solid top line and EPS growth with substantial subscriber gains for both the wireless and fixed line businesses. We believe TIM could be “the next T-Mobile” for Brazil due to its reputation as an innovative and disruptive competitor. We expect to see market share gains and margin improvement in coming quarters. The bottom contributing holdings to the Fund’s active return were Sony Group Corp. (6758-JP) and Coca-Cola HBC AG (CCH-GB). Sony is a Japan-based multinational conglomerate with consumer electronic roots and various well-known brand names. Sony reported disappointing earnings results due to weak PlayStation 5 shipments and rising manufacturing costs. However, we expect to see improving profitability driven by strong music, pictures, and ET&S segment performance. We also believe Sony could benefit from the weak Japanese yen and expect to see rising PlayStation 5 shipments in the coming quarters. Coca-Cola HBC is the world’s third-largest Coca-Cola bottler. The company’s earnings result suffered from the Russia/Ukraine war, as approximately 23% of its sales come from the Russia and Ukraine markets. We exited the position as our investment thesis was no longer intact. | | | | POSITIONING AND OUTLOOK At the regional level, the Fund is overweight Emerging Markets and Europe (ex UK) while underweight Japan and the U.K. At the sector level, the Fund is overweight in the industrials and information technology sectors while underweight in the materials and consumer discretionary sectors. At the factor level, the Fund remains significantly overweight in high-quality companies. Global equity market valuations, especially non-U.S. valuations, became cheaper during the period. However, with a looming recession, deteriorating corporate earnings expectations, ongoing global interest rate hikes, and a prolonged Russia/Ukraine war, we expect to see further downside ahead. Cheap valuations could help limit market downside, and the prospect of a quick bear market rally remains. In conclusion, we believe the equity markets and economy will get worse before getting better. We believe the Fund’s focus on attractively valued, high-quality companies could help investors weather the current market environment. This commentary reflects the viewpoints of River Road Asset Management, LLC as of October 31, 2022, and is not intended as a forecast or guarantee of future results. |
| | | | | | | | |
| | | | | | | | |
34
| | |
| | | AMG River Road International Value Equity Fund Portfolio Manager’s Comments (continued) |
| | | |
| | | |
CUMULATIVE TOTAL RETURN PERFORMANCE
AMG River Road International Value Equity Fund’s cumulative total return is based on the daily change in net asset value (NAV), and assumes that all dividends and distributions were reinvested. The graph compares a hypothetical $10,000 investment made in the AMG River Road International Value Equity Fund’s Class N shares on October 31, 2012, to a $10,000 investment made in the MSCI EAFE Index and MSCI EAFE Value Index for the same time period. The graph and table do not reflect the deduction of taxes that a shareholder would pay on a Fund distribution or redemption of shares. The listed returns for the Fund are net of expenses and the returns for the indexes exclude expenses. Total returns would have been lower had certain expenses not been reduced.
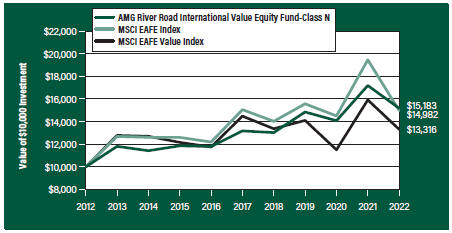
The table below shows the average annual total returns for the AMG River Road International Value Equity Fund and the MSCI EAFE Index and MSCI EAFE Value Index for the same time periods ended October 31, 2022.
| | | | | | | | | | |
| | | One | | Five | | Ten | | Since | | Inception |
| Average Annual Total Returns1 | | Year | | Years | | Years | | Inception | | Date |
| |
AMG River Road International Value Equity Fund2, 3, 4, 5, 6, 7, 8, 9, 10 | | |
| | | | | |
Class N | | (11.67%) | | 2.88% | | 4.27% | | 4.34% | | 05/04/11 |
| | | | | |
Class I | | (11.41%) | | 3.15% | | — | | 3.89% | | 03/04/13 |
| | | | | |
Class Z | | (11.41%) | | 3.22% | | — | | 3.10% | | 09/29/17 |
| | | | | |
MSCI EAFE Index11 | | (23.00%) | | (0.09%) | | 4.13% | | 2.54% | | 05/04/11† |
| | | | | |
MSCI EAFE Value Index12 | | (16.35%) | | (1.67%) | | 2.91% | | 1.40% | | 05/04/11† |
The performance data shown represents past performance. Past performance is not a guarantee of future results. Current performance may be lower or higher than the performance data quoted. The investment return and principal value of an investment will fluctuate so that an investor’s shares, when redeemed, may be worth more or less than their original cost.
Investors should carefully consider the Fund’s investment objectives, risks, charges and expenses before investing. For performance information through the most recent month end, current net asset values per share for the Fund and other information, please call 800.548.4539 or visit our website at amgfunds.com for a free prospectus. Read it carefully before investing or sending money.
Distributed by AMG Distributors, Inc., member FINRA/SIPC.
| † | Date reflects the inception date of the Fund, not the index. |
| 1 | Total return equals income yield plus share price change and assumes reinvestment of all dividends and capital gain distributions. Returns are net of fees and may reflect offsets of Fund expenses as described in the prospectus. No adjustment has been made for taxes payable by shareholders on their reinvested dividends and |
|
capital gain distributions. Returns for periods greater than one year are annualized. The listed returns on the Fund are net of expenses and based on the published NAV as of October 31, 2022. All returns are in U.S. Dollars ($). 2 From time to time, the Fund’s adviser has waived its fees and/or absorbed Fund expenses, which has resulted in higher returns. 3 The Fund is subject to special risk considerations similar to those associated with the direct ownership of real estate. Real estate valuations may be subject to factors such as changing general and local economic, financial, competitive, and environmental conditions. 4 Investments in international securities are subject to certain risks of overseas investing including currency fluctuations and changes in political and economic conditions, which could result in significant market fluctuations. These risks are magnified in emerging markets. 5 Investing in publicly traded partnerships (PTPs) (including master limited partnerships) involves risks in addition to those typically associated with publicly traded companies. PTPs are exposed to the risks of their underlying assets, which in many cases includes the same types of risks as energy and natural resources companies. PTPs are also subject to capital markets risk. PTPs may lose their partnership status for tax purposes. The Fund’s status as a regulated investment company may be jeopardized if it does not appropriately limit such investments in PTPs or if such investments are recharacterized for tax purposes. 6 Market prices of investments held by the Fund may fall rapidly or unpredictably due to a variety of economic or political factors, market conditions, disasters or public health issues, or in response to events that affect particular industries or companies. 7 Companies that are in similar industry sectors may be similarly affected by particular economic or market events; to the extent the Fund has substantial holdings within a particular sector, the risks associated with that sector increase. 8 The Fund invests in value stocks, which may perform differently from the market as a whole and may be undervalued by the market for a long period of time. |
35
| | |
| | | AMG River Road International Value Equity Fund Portfolio Manager’s Comments (continued) |
| | | |
| | | |
| | | | |
9 The Fund is subject to currency risk resulting from fluctuations in exchange rates that may affect the total loss or gain on a non-U.S. Dollar investment when converted back to U.S. Dollars. 10 The Fund is subject to the risks associated with investments in emerging markets, such as erratic earnings patterns, economic and political instability, changing exchange controls, limitations on repatriation of foreign capital and changes in local governmental attitudes toward private investment, possibly leading to nationalization or confiscation of investor assets. | | 11 The MSCI EAFE Index (Europe, Australasia, Far East) is a free float-adjusted market capitalization index that is designed to measure the equity market performance of developed markets, excluding the U.S. & Canada. Please go to msci.com for most current list of countries represented by the index. Unlike the Fund, the MSCI EAFE Index is unmanaged, is not available for investment and does not incur expenses. 12 The Fund’s secondary benchmark, the MSCI EAFE Value Index (Europe, Australasia, Far East), captures large and mid cap securities exhibiting overall value style characteristics across Developed Markets countries around the world, excluding the U.S. and Canada. Please go to msci.com for the most current list of countries represented by the | | index. Unlike the Fund, the MSCI EAFE Value Index is unmanaged, is not available for investment and does not incur expenses. All MSCI data is provided “as is.” The products described herein are not sponsored or endorsed and have not been reviewed or passed on by MSCI. In no event shall MSCI, its affiliates, or any MSCI data provider have any liability of any kind in connection with the MSCI data or the products described herein. Copying or redistributing the MSCI data is strictly prohibited. Not FDIC insured, nor bank guaranteed. May lose value. |
| | | | |
36
| | |
| | | AMG River Road International Value Equity Fund Fund Snapshots (unaudited) October 31, 2022 |
| | | |
| | | |
PORTFOLIO BREAKDOWN
| | | | | |
| Sector | | % of
Net Assets |
| | |
| Financials | | 24.8 |
| | |
| Industrials | | 16.9 |
| | |
| Communication Services | | 11.8 |
| | |
| Health Care | | 10.5 |
| | |
| Information Technology | | 9.2 |
| | |
| Consumer Staples | | 8.5 |
| | |
| Energy | | 6.3 |
| | |
| Consumer Discretionary | | 4.0 |
| | |
| Utilities | | 2.8 |
| | |
| Materials | | 1.8 |
| | |
| Short-Term Investments | | 5.9 |
| | |
| Other Assets, Less Liabilities | | (2.5) |
TOP TEN HOLDINGS
| | |
| Security Name | | % of
Net Assets |
| | |
Check Point Software Technologies, Ltd. (Israel) | | 3.7 |
| | |
Deutsche Boerse AG (Germany) | | 3.6 |
| | |
Vinci, S.A. (France) | | 3.6 |
| | |
DBS Group Holdings, Ltd. (Singapore) | | 3.6 |
| | |
Axa, S.A. (France) | | 3.5 |
| | |
Nintendo Co., Ltd. (Japan) | | 3.5 |
| | |
BAE Systems PLC (United Kingdom) | | 3.5 |
| | |
Deutsche Telekom AG (Germany) | | 3.4 |
| | |
Roche Holding AG (Switzerland) | | 3.3 |
| | |
Smiths Group PLC (United Kingdom) | | 3.3 |
| | |
| | |
Top Ten as a Group | | 35.0 |
| | |
Because a fund’s strategy may result in multiple investments in particular sectors of the economy, its performance may depend on the performance of those sectors and may fluctuate more widely than investments diversified across more sectors. For additional information on these and other risk considerations, please see the Fund’s prospectus.
Any sectors, industries, or securities discussed should not be perceived as investment recommendations. Mention of a specific security should not be considered a recommendation to buy or solicitation to sell that security. Specific securities mentioned in this report may have been sold from the Fund’s portfolio of investments by the time you receive this report.
37
| | |
| | | AMG River Road International Value Equity Fund Schedule of Portfolio Investments October 31, 2022 |
| | | |
| | | |
| | | | | | | | |
| | | Shares | | | Value | |
| | |
Common Stocks - 95.6% | | | | | | | | |
| | |
Communication Services - 11.8% | | | | | | | | |
| | |
Deutsche Telekom AG (Germany) | | | 12,697 | | | | $239,662 | |
| | |
Nintendo Co., Ltd. (Japan) | | | 6,099 | | | | 247,614 | |
| | |
SK Telecom Co., Ltd., Sponsored ADR (South Korea) | | | 7,069 | | | | 138,270 | |
| | |
TIM, S.A., ADR (Brazil) | | | 16,718 | | | | 213,154 | |
| | |
Total Communication Services | | | | | | | 838,700 | |
| | |
Consumer Discretionary - 3.0% | | | | | | | | |
| | |
Sony Group Corp. (Japan) | | | 3,155 | | | | 212,756 | |
| | |
Consumer Staples - 8.5% | | | | | | | | |
| | |
Anheuser-Busch InBev SA/NV (Belgium)1 | | | 2,663 | | | | 133,204 | |
| | |
Fomento Economico Mexicano SAB de CV, | | | | | | | | |
| | |
Sponsored ADR (Mexico) | | | 1,436 | | | | 102,846 | |
| | |
Nestle, S.A. (Switzerland) | | | 1,850 | | | | 201,389 | |
| | |
Unilever PLC (United Kingdom) | | | 3,752 | | | | 170,545 | |
| | |
Total Consumer Staples | | | | | | | 607,984 | |
| | |
Energy - 6.3% | | | | | | | | |
| | |
Shell PLC (United Kingdom) | | | 7,933 | | | | 219,757 | |
| | |
TotalEnergies SE (France) | | | 4,125 | | | | 225,033 | |
| | |
Total Energy | | | | | | | 444,790 | |
| | |
Financials - 24.8% | | | | | | | | |
| | |
AIA Group, Ltd. (Hong Kong) | | | 18,567 | | | | 140,641 | |
| | |
Allianz SE (Germany) | | | 944 | | | | 169,830 | |
| | |
Axa, S.A. (France) | | | 10,126 | | | | 250,061 | |
| | |
DBS Group Holdings, Ltd. (Singapore) | | | 10,586 | | | | 255,930 | |
| | |
Deutsche Boerse AG (Germany) | | | 1,597 | | | | 259,704 | |
| | |
Itau Unibanco Holding, S.A., Sponsored ADR | | | | | | | | |
| | |
(Brazil) | | | 11,221 | | | | 65,306 | |
| | |
Muenchener Rueckversicherungs-Gesellschaft | | | | | | | | |
| | |
AG in Muenchen (Germany) | | | 735 | | | | 194,022 | |
| | |
Prudential PLC (United Kingdom) | | | 7,706 | | | | 71,586 | |
| | |
Tokio Marine Holdings, Inc. (Japan) | | | 7,949 | | | | 143,918 | |
| | |
UBS Group AG (Switzerland) | | | 13,189 | | | | 209,101 | |
| | |
Total Financials | | | | | | | 1,760,099 | |
| | |
Health Care - 10.5% | | | | | | | | |
| | |
Novartis AG (Switzerland) | | | 2,715 | | | | 219,618 | |
| | |
Roche Holding AG (Switzerland) | | | 715 | | | | 237,236 | |
| | |
Sanofi (France) | | | 2,099 | | | | 180,635 | |
| | |
Takeda Pharmaceutical Co., Ltd. (Japan) | | | 4,060 | | | | 107,221 | |
| | |
Total Health Care | | | | | | | 744,710 | |
| | |
Industrials - 16.9% | | | | | | | | |
| | |
Ashtead Group PLC (United Kingdom) | | | 2,180 | | | | 113,563 | |
| | |
BAE Systems PLC (United Kingdom) | | | 26,306 | | | | 246,055 | |
| | |
| | | | | | | | |
| | | | | | | | |
| | | Shares | | | Value | |
| | |
CK Hutchison Holdings, Ltd. (Hong Kong) | | | 31,075 | | | $ | 154,686 | |
| | |
Smiths Group PLC (United Kingdom) | | | 12,920 | | | | 231,430 | |
| | |
Thales, S.A. (France) | | | 1,554 | | | | 197,638 | |
| | |
Vinci, S.A. (France) | | | 2,781 | | | | 255,955 | |
| | |
Total Industrials | | | | | | | 1,199,327 | |
| | |
Information Technology - 9.2% | | | | | | | | |
| | |
Check Point Software Technologies, Ltd. (Israel)* | | | 2,059 | | | | 266,085 | |
| | |
Murata Manufacturing Co., Ltd. (Japan) | | | 2,486 | | | | 117,686 | |
| | |
Open Text Corp. (Canada) | | | 2,853 | | | | 82,636 | |
| | |
SAP SE (Germany) | | | 1,935 | | | | 186,249 | |
| | |
Total Information Technology | | | | | | | 652,656 | |
| | |
Materials - 1.8% | | | | | | | | |
| | |
Shin-Etsu Chemical Co., Ltd. (Japan) | | | 1,259 | | | | 130,848 | |
| | |
Utilities - 2.8% | | | | | | | | |
| | |
EDP - Energias de Portugal, S.A. (Portugal) | | | 46,245 | | | | 202,059 | |
| | |
Total Common Stocks
(Cost $7,811,786) | | | | | | | 6,793,929 | |
| | |
Preferred Stock - 1.0% | | | | | | | | |
| |
Consumer Discretionary - 1.0% | | | | | |
| | |
Volkswagen AG (Germany) | | | 551 | | | | 70,529 | |
| | |
Total Preferred Stock
(Cost $115,681) | | | | | | | 70,529 | |
| | |
| | | Principal
Amount | | | | |
Short-Term Investments - 5.9% | | | | | | | | |
| |
Joint Repurchase Agreements - 1.9%2 | | | | | |
| | |
RBC Dominion Securities, Inc., dated 10/31/22,due 11/01/22, 3.050% total to be received $138,909 (collateralized by various U.S. Government Agency Obligations and U.S. Treasuries, 0.500% - 5.000%, 02/28/26 - 10/20/52, totaling $141,675) | | | $138,897 | | | | 138,897 | |
| | |
| | | Shares | | | | |
| |
Other Investment Companies - 4.0% | | | | | |
| | |
Dreyfus Government Cash Management Fund, Institutional Shares, 2.91%3 | | | 113,234 | | | | 113,234 | |
| | |
Dreyfus Institutional Preferred Government Money Market Fund, Institutional Shares, 3.09%3 | | | 169,851 | | | | 169,851 | |
| | |
Total Other Investment Companies | | | | | | | 283,085 | |
| | |
Total Short-Term Investments
(Cost $421,982) | | | | | | | 421,982 | |
| | |
Total Investments - 102.5%
(Cost $8,349,449) | | | | | | | 7,286,440 | |
| |
Other Assets, less Liabilities - (2.5)% | | | | (177,958 | ) |
| | |
Net Assets - 100.0% | | | | | | $ | 7,108,482 | |
| | |
| | | | | | | | |
The accompanying notes are an integral part of these financial statements.
38
| | |
| | | AMG River Road International Value Equity Fund Schedule of Portfolio Investments (continued) |
| | | |
| | | |
| * | Non-income producing security. |
| 1 | Some of this security, amounting to $132,554 or 1.9% of net assets, was out on loan to various borrowers and is collateralized by cash. See Note 4 of Notes to Financial Statements. |
| 2 | Cash collateral received for securities lending activity was invested in these joint repurchase agreements. |
| 3 | Yield shown represents the October 31, 2022, seven day average yield, which refers to the sum of the previous seven days’ dividends paid, expressed as an annual percentage. |
ADR American Depositary Receipt
The following table summarizes the inputs used to value the Fund’s investments by the fair value hierarchy levels as of October 31, 2022:
| | | | | | | | | | | | | | | | |
| | | Level 1 | | | Level 21 | | | Level 3 | | | Total | |
Investments in Securities | | | | | | | | | | | | | | | | |
| | | | |
Common Stocks | | | | | | | | | | | | | | | | |
| | | | |
Financials | | | $65,306 | | | | $1,694,793 | | | | — | | | | $1,760,099 | |
| | | | |
Industrials | | | — | | | | 1,199,327 | | | | — | | | | 1,199,327 | |
| | | | |
Communication Services | | | 351,424 | | | | 487,276 | | | | — | | | | 838,700 | |
| | | | |
Health Care | | | — | | | | 744,710 | | | | — | | | | 744,710 | |
| | | | |
Information Technology | | | 348,721 | | | | 303,935 | | | | — | | | | 652,656 | |
| | | | |
Consumer Staples | | | 102,846 | | | | 505,138 | | | | — | | | | 607,984 | |
| | | | |
Energy | | | — | | | | 444,790 | | | | — | | | | 444,790 | |
| | | | |
Consumer Discretionary | | | — | | | | 212,756 | | | | — | | | | 212,756 | |
| | | | |
Utilities | | | — | | | | 202,059 | | | | — | | | | 202,059 | |
| | | | |
Materials | | | — | | | | 130,848 | | | | — | | | | 130,848 | |
| | | | |
Preferred Stock | | | | | | | | | | | | | | | | |
| | | | |
Consumer Discretionary | | | — | | | | 70,529 | | | | — | | | | 70,529 | |
| | | | |
Short-Term Investments | | | | | | | | | | | | | | | | |
| | | | |
Joint Repurchase Agreements | | | — | | | | 138,897 | | | | — | | | | 138,897 | |
| | | | |
Other Investment Companies | | | 283,085 | | | | — | | | | — | | | | 283,085 | |
| | | | | | | | | | | | | | | | |
| | | | |
Total Investments in Securities | | | $1,151,382 | | | | $6,135,058 | | | | — | | | | $7,286,440 | |
| | | | | | | | | | | | | | | | |
| 1 | An external pricing service is used to reflect any impact on security value due to market movements between the time the Fund valued such foreign securities and the earlier closing of foreign markets. |
For the fiscal year ended October 31, 2022, there were no transfers in or out of Level 3.
The accompanying notes are an integral part of these financial statements.
39
| | |
| | | AMG River Road International Value Equity Fund Schedule of Portfolio Investments (continued) |
| | | |
| | | |
The country allocation in the Schedule of Portfolio Investments at October 31, 2022, was as follows:
| | |
| Country | | % of Long-Term
Investments |
| |
Belgium | | 1.9 |
| |
Brazil | | 4.1 |
| |
Canada | | 1.2 |
| |
France | | 16.2 |
| |
Germany | | 16.3 |
| |
Hong Kong | | 4.3 |
| |
Israel | | 3.9 |
| |
Japan | | 14.0 |
| |
Mexico | | 1.5 |
| |
Portugal | | 3.0 |
| |
Singapore | | 3.7 |
| |
South Korea | | 2.0 |
| |
Switzerland | | 12.6 |
| |
United Kingdom | | 15.3 |
| | |
| |
| | 100.0 |
| | |
The accompanying notes are an integral part of these financial statements.
40
| | |
| | | AMG River Road Focused Absolute Value Fund Portfolio Manager’s Comments (unaudited) |
| | | |
| | | |
| | | | | | | | |
OVERVIEW For the fiscal year ended October 31, 2022, AMG River Road Focused Absolute Value Fund (the “Fund”) Class N shares returned (14.80)%, trailing the (7.25)% return for the Russell 3000® Value Index, the Fund’s primary benchmark. PERFORMANCE REVIEW The Fund significantly underperformed the Russell 3000® Value during the last 12 months. From a sector perspective, allocation effect was negative while stock selection was positive. The largest driver of relative underperformance was communication services, where both allocation and stock selection were negative. The underweight to energy was a significant headwind, as the sector surged 63.18% over the past 12 months, while stock selection in the sector was positive. Underperformance was partially offset by positive stock selection in financials, information technology, and consumer discretionary. The top contributing holdings to the Fund’s active return were Berkshire Hathaway, Inc. Class B (BRK.B) and BJ’s Wholesale Club Holdings, Inc. (BJ). Berkshire is a conglomerate with a diverse group of wholly owned operating companies and other public/private investments. Over the past 12 months, most of Berkshire’s operating businesses have delivered solid and improving results. Additionally, the company made headlines as it deployed some of its large cash balance to acquire new businesses and expand its investment portfolio at attractive prices. In insurance, Berkshire has seen very strong performance in its property and casualty (“P&C”) and reinsurance operations, which have grown significantly in the past year with high underwriting profits, adjusting for recent catastrophic events (i.e., Hurricane Ian). In recent years, favorable pricing conditions have helped insurers achieve pricing in excess of loss cost trends in many lines. Berkshire continues to take advantage of this “hard market” particularly evidenced by Primary Group (its P&C segment) having grown year to date earned premiums by 18% and net written premiums 15%. Beyond insurance, Berkshire’s three operating segments, Burlington Northern, Berkshire Hathaway Energy, and Manufacturing, Service and Retail (“MSR”), have each grown operating profits this year as the economy slowly emerges from pandemic-related shutdowns. This is particularly clear in Manufacturing, Service and Retail, which has seen pretax earnings increase 14% so far in 2022 despite impressive comparisons in 2021. Berkshire’s consolidated book value per share has declined (3.6)% in the last 12 months, primarily due to market | | | | declines in the investment portfolio. However, investors are encouraged by the company’s ability to buy new assets during this period. Recent capital deployments include Chevron Corp., Occidental Petroleum Corp., HP Inc., and the acquisition of Alleghany Corp., an insurance business Berkshire acquired for $11.6 billion on October 19, 2022. We reduced the position over the last 12 months given the strong outperformance. Over the last 12 months, BJ’s, a warehouse club retailer with more than 200 stores primarily located in the eastern United States, reported strong top-line results supported by continued above-average membership trends. In the third quarter, same-store sales grew 7.6%, excluding fuel, driven by higher traffic. Same-store fuel gallons increased 18%, significantly outpacing the industry, which experienced a decline in volumes year over year. Membership fees rose 11% while the membership base grew 6% year over year (1% sequentially) as new membership, price, renewals, and membership mix all improved. EBITDA increased 23% with sales growth and fuel contribution overcoming higher supply chain costs and price investments for club members, consistent with BJ’s strategy to provide value to its club members through low-cost merchandise. In addition to impressive results, management raised its same-store sales, fuel, and EPS guidance and provided a much more bullish outlook on 2H 2022 than it had at the start of the year. We trimmed the position during the quarter as shares approached our assessed value. The bottom contributing holdings to the Fund’s active return were Liberty Broadband Corp. (LBRDK) and Meta Platforms Inc. (META). Liberty Broadband Corp., a holding company with a 26% ownership stake in Charter Communications (CHTR), experienced subscriber growth well above historical levels through the first half of 2021 as the pandemic highlighted the importance of connectivity for work, school, and entertainment. Considering these high comparisons, we expected subscriber growth trends to revert to more normalized pre-pandemic levels. However, the market also attributed intensifying competitive pressures to reported subscriber growth that was below expectations over the last 12 months. The market appears to be attributing the softness to fixed wireless and fiber competition and extrapolating those fears into the future. Management blamed the weakness on fewer people moving (fewer opportunities to win) as well as COVID-19 pulling growth forward. While we believe management’s points are valid, we are not dismissing the threat of competition. The team | | | | continues to closely monitor subscriber additions at Charter Communications along with many other industry players to gain a complete understanding of the competitive landscape. While subscriber growth has underwhelmed, quarterly revenue, EBITDA, and free cash flow continue to grow at mid-single digit to low double-digit rates. Additionally, Charter Communications continues to retire shares at a rate of 2% or more per quarter at significant discounts to assessed value. Liberty Broadband is also actively repurchasing shares, we believe at a 15% to 20% discount to Charter Communications’s market price. Despite the stock’s attractive valuation, we exited the position to manage underperformance and overall exposure to cable and initiate other attractive risk/reward opportunities that developed during the quarter. In February, Meta Platforms, the largest online social network company in the world with billions of active monthly users across several products including Facebook, Instagram, Messenger, and WhatsApp, saw shares decline dramatically when the company reported largely in-line Q4 2021 results but surprised the market (and us) with significantly lower-than-expected quarterly revenue guidance and a cautious full year outlook, primarily due to recent tracking restrictions from Apple and increasing competition for user attention. Meta Platforms is simultaneously investing massive sums to build capabilities in the metaverse, its new namesake, magnifying the margin impact of these recent revenue and cost headwinds. After a thorough review, we elected to reduce the conviction rating and assessed value for Meta Platforms reflecting lower near-term revenue and higher expense outlook, as well as an elevated risk profile as the company works to resolve these challenges. We exited the position due to declining conviction, valuation, and unrealized losses. POSITIONING AND OUTLOOK As always, the Fund invests in companies we believe represent the most attractive combination of risk (conviction) and reward (discount) available across the River Road universe of U.S. equity portfolio holdings. We expect further downside for stocks but continue to believe high quality smaller cap and value stocks are well positioned. We think it could be years, not quarters, before investors see sustainable and meaningful new highs in stocks as markets struggle with valuations in an era of higher rates and geopolitical uncertainty. The past few years (or decade) was one hell of a party for investors; we should not expect the hangover to pass quickly. Thus, investors should get comfortable with volatility |
41
| | |
| | | AMG River Road Focused Absolute Value Fund Portfolio Manager’s Comments (continued) |
| | | |
| | | |
| | | | | | | | |
| and a range bound tape. On a more positive note, it is common for the market to struggle through the first three quarters of midterm years, before moving higher in the final quarter. We can see such a rally unfolding, although given it is so widely expected probably decreases the probability and/or magnitude. | | | | Lastly, we think high quality companies with attractive growth rates and attractive valuations are a wonderful place to be positioned in the current environment. While recent performance has been challenging, we view the recovery in relative performance since its May trough as the result of improved positioning. We continue to refine our watchlists to take advantage of any opportunities that volatility presents and remain steadfast in our resolve to end the year in a much better position. | | | | This commentary reflects the viewpoints of River Road Asset Management, LLC as of October 31, 2022, and is not intended as a forecast or guarantee of future results. |
42
| | |
| | | AMG River Road Focused Absolute Value Fund Portfolio Manager’s Comments (continued) |
| | | |
| | | |
CUMULATIVE TOTAL RETURN PERFORMANCE
AMG River Road Focused Absolute Value Fund’s cumulative total return is based on the daily change in net asset value (NAV), and assumes that all dividends and distributions were reinvested. The graph compares a hypothetical $10,000 investment made in the AMG River Road Focused Absolute Value Fund’s Class N shares on November 3, 2015, to a $10,000 investment made in the Russell 3000® Value Index for the same time period. The graph and table do not reflect the deduction of taxes that a shareholder would pay on a Fund distribution or redemption of shares. The listed returns for the Fund are net of expenses and the returns for the index excludes expenses. Total returns would have been lower had certain expenses not been reduced.
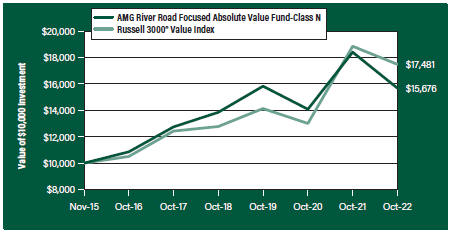
The table below shows the average annual total returns for the AMG River Road Focused Absolute Value Fund and the Russell 3000® Value Index for the same time periods ended October 31, 2022.
| | | | | | | | | | | | | | | | |
| | | One | | | Five | | | Since | | | Inception | |
| Average Annual Total Returns1 | | Year | | | Years | | | Inception | | | Date | |
|
AMG River Road Focused Absolute Value Fund2, 3, 4, 5, 6, 7, 8, 9, 10, 11, 12, 13 | |
| | | | |
Class N | | | (14.80 | %) | | | 4.23 | % | | | 6.64 | % | | | 11/03/15 | |
| | | | |
Class I | | | (14.64 | %) | | | 4.47 | % | | | 6.89 | % | | | 11/03/15 | |
| | | | |
Class Z | | | (14.59 | %) | | | 4.52 | % | | | 4.00 | % | | | 09/29/17 | |
| | | | |
Russell 3000® Value Index14 | | | (7.25 | %) | | | 7.07 | % | | | 8.31 | % | | | 11/03/15 | † |
The performance data shown represents past performance. Past performance is not a guarantee of future results. Current performance may be lower or higher than the performance data quoted. The investment return and principal value of an investment will fluctuate so that an investor’s shares, when redeemed, may be worth more or less than their original cost.
Investors should carefully consider the Fund’s investment objectives, risks, charges and expenses before investing. For performance information through the most recent month end, current net asset values per share for the Fund and other information, please call 800.548.4539 or visit our website at amgfunds.com for a free prospectus. Read it carefully before investing or sending money.
Distributed by AMG Distributors, Inc., member FINRA/SIPC.
| † | Date reflects the inception date of the Fund, not the index. |
| 1 | Total return equals income yield plus share price change and assumes reinvestment of all dividends and capital gain distributions. Returns are net of fees and may reflect offsets of Fund expenses as described in the prospectus. No adjustment has been made for taxes payable by shareholders on their reinvested dividends and |
|
capital gain distributions. Returns for periods greater than one year are annualized. The listed returns on the Fund are net of expenses and based on the published NAV as of October 31, 2022. All returns are in U.S. Dollars ($). 2 From time to time, the Fund’s adviser has waived its fees and/or absorbed Fund expenses, which has resulted in higher returns. 3 Investing in publicly traded partnerships (PTPs) (including master limited partnerships) involves risks in addition to those typically associated with publicly traded companies. PTPs are exposed to the risks of their underlying assets, which in many cases includes the same types of risks as energy and natural resources companies. PTPs are also subject to capital market risk. PTPs may lose their partnership status for tax purposes. The Fund’s status as a regulated investment company may be jeopardized if it does not appropriately limit such investments in PTPs or if such investments are recharacterized for tax purposes. 4 The Fund is subject to risks associated with investments in small-capitalization companies, such as erratic earnings patterns, competitive conditions, limited earnings history and a reliance on one or a limited number of products. 5 The Fund is subject to risks associated with investments in mid-capitalization companies such as greater price volatility, lower trading volume, and less liquidity than the stocks of larger, more established companies. 6 Active and frequent trading of a fund may result in higher transaction costs and increased tax liability. 7 A greater percentage of the Fund’s holdings may be focused in a smaller number of securities which may place the Fund at greater risk than a more diversified fund. 8 Investments in international securities are subject to certain risks of overseas investing including currency fluctuations and changes in political and economic conditions, which could result in significant market fluctuations. These risks are magnified in emerging markets. 9 The Fund is subject to the risks associated with investments in emerging markets, such as erratic earnings patterns, economic and political instability, changing exchange controls, limitations on repatriation of foreign capital and changes in local governmental attitudes toward private investment, possibly leading to nationalization or confiscation of investor assets. 10 The Fund is subject to special risk considerations similar to those associated with the direct ownership of real estate. Real estate valuations may be subject to factors such as changing general and local economic, financial, competitive, and environmental conditions. |
43
| | |
| | | AMG River Road Focused Absolute Value Fund Portfolio Manager’s Comments (continued) |
| | | |
| | | |
| | | | | | | | |
11 The Fund invests in value stocks, which may perform differently from the market as a whole and may be undervalued by the market for a long period of time. 12 Companies that are in similar industry sectors may be similarly affected by particular economic or market events; to the extent the Fund has substantial holdings within a particular sector, the risks associated with that sector increase. | | | | 13 Market prices of investments held by the Fund may fall rapidly or unpredictably due to a variety of economic or political factors, market conditions, disasters or public health issues, or in response to events that affect particular industries or companies. 14 The Russell 3000® Value Index measures the performance of the broad value segment of the U.S. equity universe. It includes those Russell 3000® companies with lower price-to-book ratios | | | | and lower forecasted growth values. Unlike the Fund, the Russell 3000® Value Index is unmanaged, is not available for investment and does not incur expenses. The Russell 3000® Value Index is a trademark of the London Stock Exchange Group companies. Not FDIC insured, nor bank guaranteed. May lose value. |
44
| | |
| | | AMG River Road Focused Absolute Value Fund Fund Snapshots (unaudited) October 31, 2022 |
PORTFOLIO BREAKDOWN
| | | | | |
| Sector | | % of
Net Assets |
| | |
Financials | | | | 19.8 | |
| | |
Consumer Discretionary | | | | 15.5 | |
| | |
Information Technology | | | | 14.5 | |
| | |
Consumer Staples | | | | 12.7 | |
| | |
Health Care | | | | 11.5 | |
| | |
Industrials | | | | 9.4 | |
| | |
Utilities | | | | 7.6 | |
| | |
Communication Services | | | | 5.1 | |
| | |
Energy | | | | 2.5 | |
| | |
Short-Term Investments | | | | 1.6 | |
| | |
Other Assets, Less Liabilities | | | | (0.2 | ) |
TOP TEN HOLDINGS
| | | | |
| Security Name | | % of
Net Assets | |
| | |
Berkshire Hathaway, Inc., Class B | | | 7.3 | |
| | |
LKQ Corp. | | | 4.6 | |
| | |
The AES Corp. | | | 4.4 | |
| | |
The Kroger Co. | | | 4.2 | |
| | |
Starbucks Corp. | | | 4.2 | |
| | |
Pfizer, Inc. | | | 4.2 | |
| | |
Fiserv, Inc. | | | 3.9 | |
| | |
Advance Auto Parts, Inc. | | | 3.9 | |
| | |
Premier, Inc., Class A | | | 3.8 | |
| | |
Oracle Corp. | | | 3.6 | |
| | | | |
| | |
Top Ten as a Group | | | 44.1 | |
| | | | |
Because a fund’s strategy may result in multiple investments in particular sectors of the economy, its performance may depend on the performance of those sectors and may fluctuate more widely than investments diversified across more sectors. For additional information on these and other risk considerations, please see the Fund’s prospectus.
Any sectors, industries, or securities discussed should not be perceived as investment recommendations. Mention of a specific security should not be considered a recommendation to buy or solicitation to sell that security. Specific securities mentioned in this report may have been sold from the Fund’s portfolio of investments by the time you receive this report.
45
| | |
| | | AMG River Road Focused Absolute Value Fund Schedule of Portfolio Investments October 31, 2022 |
| | | |
| | | |
| | | | | | | | |
| | |
| | | Shares | | | Value | |
| | |
Common Stocks - 98.6% | | | | | | | | |
| |
Communication Services - 5.1% | | | | | |
| | |
Alphabet, Inc., Class C* | | | 18,248 | | | | $1,727,355 | |
| | |
Comcast Corp., Class A | | | 48,112 | | | | 1,527,075 | |
| | |
Total Communication Services | | | | | | | 3,254,430 | |
| |
Consumer Discretionary - 15.5% | | | | | |
| | |
Advance Auto Parts, Inc. | | | 12,920 | | | | 2,453,766 | |
| | |
Asbury Automotive Group, Inc.*,1 | | | 11,455 | | | | 1,807,026 | |
| | |
LKQ Corp. | | | 52,498 | | | | 2,920,989 | |
| | |
Starbucks Corp. | | | 30,901 | | | | 2,675,718 | |
| | |
Total Consumer Discretionary | | | | | | | 9,857,499 | |
| | |
Consumer Staples - 12.7% | | | | | | | | |
| | |
BJ’s Wholesale Club Holdings, Inc.* | | | 13,291 | | | | 1,028,723 | |
| | |
The Kroger Co. | | | 56,741 | | | | 2,683,282 | |
| | |
Molson Coors Beverage Co., Class B | | | 43,688 | | | | 2,203,186 | |
| | |
Unilever PLC, Sponsored ADR (United Kingdom)1 | | | 47,580 | | | | 2,165,366 | |
| | |
Total Consumer Staples | | | | | | | 8,080,557 | |
| | |
Energy - 2.5% | | | | | | | | |
| | |
SM Energy Co. | | | 35,430 | | | | 1,593,641 | |
| | |
Financials - 19.8% | | | | | | | | |
| | |
Berkshire Hathaway, Inc., Class B* | | | 15,683 | | | | 4,627,896 | |
| | |
Fairfax Financial Holdings, Ltd. (Canada) | | | 4,529 | | | | 2,228,042 | |
| | |
U.S. Bancorp | | | 53,399 | | | | 2,266,787 | |
| | |
White Mountains Insurance Group, Ltd. | | | 799 | | | | 1,131,504 | |
| | |
Willis Towers Watson PLC (United Kingdom) | | | 10,522 | | | | 2,296,006 | |
| | |
Total Financials | | | | | | | 12,550,235 | |
| | |
Health Care - 11.5% | | | | | | | | |
| | |
Patterson Cos., Inc. | | | 87,376 | | | | 2,269,155 | |
| | |
Pfizer, Inc. | | | 56,881 | | | | 2,647,811 | |
| | |
Premier, Inc., Class A | | | 68,463 | | | | 2,387,989 | |
| | |
Total Health Care | | | | | | | 7,304,955 | |
| | | | | | | | |
| * | Non-income producing security. |
| 1 | Some of these securities, amounting to $2,663,174 or 4.2% of net assets, were out on loan to various borrowers and are collateralized by various U.S. Treasury Obligations. See Note 4 of Notes to Financial Statements. |
| | | | | | | | |
| | |
| | | Shares | | | Value | |
| | |
Industrials - 9.4% | | | | | | | | |
| | |
Air Transport Services Group, Inc.* | | | 58,213 | | | $ | 1,699,820 | |
| | |
UniFirst Corp. | | | 11,829 | | | | 2,176,654 | |
| | |
United Parcel Service, Inc., Class B | | | 12,654 | | | | 2,122,961 | |
| | |
Total Industrials | | | | | | | 5,999,435 | |
| | |
Information Technology - 14.5% | | | | | | | | |
| | |
Corning, Inc. | | | 39,026 | | | | 1,255,466 | |
| | |
Fiserv, Inc.* | | | 24,455 | | | | 2,512,507 | |
| | |
Oracle Corp. | | | 29,638 | | | | 2,313,839 | |
| | |
QUALCOMM, Inc. | | | 10,922 | | | | 1,285,083 | |
| | |
TD SYNNEX Corp. | | | 19,846 | | | | 1,816,107 | |
| | |
Total Information Technology | | | | | | | 9,183,002 | |
| | |
Utilities - 7.6% | | | | | | | | |
| | |
The AES Corp. | | | 106,557 | | | | 2,787,531 | |
| | |
Vistra Corp. | | | 87,376 | | | | 2,007,027 | |
| | |
Total Utilities | | | | | | | 4,794,558 | |
| | |
Total Common Stocks | | | | | | | | |
(Cost $58,911,843) | | | | | | | 62,618,312 | |
| |
Short-Term Investments - 1.6% | | | | | |
| |
Other Investment Companies - 1.6% | | | | | |
| | |
Dreyfus Government Cash Management Fund, Institutional Shares, 2.91%2 | | | 412,456 | | | | 412,456 | |
| | |
Dreyfus Institutional Preferred Government Money Market Fund, Institutional Shares, 3.09%2 | | | 618,685 | | | | 618,685 | |
| | |
Total Short-Term Investments
(Cost $1,031,141) | | | | | | | 1,031,141 | |
| | |
Total Investments - 100.2%
(Cost $59,942,984) | | | | | | | 63,649,453 | |
| |
Other Assets, less Liabilities - (0.2)% | | | | (109,809 | ) |
| | |
Net Assets - 100.0% | | | | | | $ | 63,539,644 | |
| | | | | | | | |
| 2 | Yield shown represents the October 31, 2022, seven day average yield, which refers to the sum of the previous seven days’ dividends paid, expressed as an annual percentage. |
ADR American Depositary Receipt
The accompanying notes are an integral part of these financial statements.
46
| | |
| | | AMG River Road Focused Absolute Value Fund Schedule of Portfolio Investments (continued) |
| | | |
| | | |
The following table summarizes the inputs used to value the Fund’s investments by the fair value hierarchy levels as of October 31, 2022:
| | | | | | | | | | | | | | |
| | | Level 1 | | | Level 2 | | | Level 3 | | | Total |
Investments in Securities | | | | | | | | | | | | | | |
| | | | |
Common Stocks† | | $ | 62,618,312 | | | | — | | | | — | | | $62,618,312 |
| | | | |
Short-Term Investments | | | | | | | | | | | | | | |
| | | | |
Other Investment Companies | | | 1,031,141 | | | | — | | | | — | | | 1,031,141 |
| | | | | | | | | | | | | | |
Total Investments in Securities | | $ | 63,649,453 | | | | — | | | | — | | | $63,649,453 |
| | | | | | | | | | | | | | |
| † | All common stocks held in the Fund are Level 1 securities. For a detailed breakout of common stocks by major industry classification, please refer to the Fund’s Schedule of Portfolio Investments. |
For the fiscal year ended October 31, 2022, there were no transfers in or out of Level 3.
The accompanying notes are an integral part of these financial statements.
47
| | |
| | | Statement of Assets and Liabilities October 31, 2022 |
| | | |
| | | |
| | | | | | | | | | | | | | | | | | | | |
| | | AMG
River Road
Mid Cap
Value Fund | | AMG River
Road Large Cap
Value Select
Fund | | AMG
River Road
Small Cap
Value Fund | | AMG
River Road
Dividend All Cap
Value Fund |
| | | | |
Assets: | | | | | | | | | | | | | | | | | | | | |
| | | | |
Investments at value1 (including securities on loan valued at $2,455,734, $4,270,431, $10,103,979, and $8,546,674, respectively) | | | | $309,231,463 | | | | | $34,481,555 | | | | | $870,431,361 | | | | | $335,887,180 | |
| | | | |
Receivable for investments sold | | | | 2,272,662 | | | | | 934,599 | | | | | — | | | | | — | |
| | | | |
Dividend and interest receivables | | | | 2,730,466 | | | | | 402,423 | | | | | 346,966 | | | | | 822,556 | |
| | | | |
Securities lending income receivable | | | | 447 | | | | | 440 | | | | | 1,692 | | | | | 2,269 | |
| | | | |
Receivable for Fund shares sold | | | | 87,968 | | | | | 108 | | | | | 1,049,421 | | | | | 147,231 | |
| | | | |
Receivable from affiliate | | | | — | | | | | — | | | | | — | | | | | 6,587 | |
| | | | |
Prepaid expenses and other assets | | | | 23,217 | | | | | 9,985 | | | | | 30,200 | | | | | 17,816 | |
| | | | |
Total assets | | | | 314,346,223 | | | | | 35,829,110 | | | | | 871,859,640 | | | | | 336,883,639 | |
| | | | |
Liabilities: | | | | | | | | | | | | | | | | | | | | |
| | | | |
Payable upon return of securities loaned | | | | 2,335,584 | | | | | — | | | | | 3,136,263 | | | | | 6,118,211 | |
| | | | |
Payable for investments purchased | | | | 2,334,180 | | | | | 1,539,719 | | | | | — | | | | | — | |
| | | | |
Payable for Fund shares repurchased | | | | 446,166 | | | | | 12,600 | | | | | 850,276 | | | | | 214,652 | |
| | | | |
Accrued expenses: | | | | | | | | | | | | | | | | | | | | |
| | | | |
Investment advisory and management fees | | | | 205,319 | | | | | 16,874 | | | | | 554,740 | | | | | 132,746 | |
| | | | |
Administrative fees | | | | 37,473 | | | | | 4,204 | | | | | 104,014 | | | | | 39,824 | |
| | | | |
Distribution fees | | | | 42,554 | | | | | 770 | | | | | 7,973 | | | | | 7,405 | |
| | | | |
Shareholder service fees | | | | 21,377 | | | | | 567 | | | | | 47,149 | | | | | 10,518 | |
| | | | |
Other | | | | 95,150 | | | | | 52,744 | | | | | 161,883 | | | | | 97,913 | |
| | | | |
Total liabilities | | | | 5,517,803 | | | | | 1,627,478 | | | | | 4,862,298 | | | | | 6,621,269 | |
| | | | | | | | | | | | | | | | | | | | |
| | | | |
Net Assets | | | | $308,828,420 | | | | | $34,201,632 | | | | | $866,997,342 | | | | | $330,262,370 | |
| | | | |
1 Investments at cost | | | | $321,633,582 | | | | | $34,446,328 | | | | | $717,541,807 | | | | | $254,926,200 | |
The accompanying notes are an integral part of these financial statements.
48
| | |
| | | Statement of Assets and Liabilities (continued) |
| | | |
| | | |
| | | | | | | | | | | | | | | | | | | | |
| | | AMG
River Road
Mid Cap
Value Fund | | AMG
River Road Large
Cap Value
Select Fund | | AMG
River Road
Small Cap
Value Fund | | AMG
River Road
Dividend All Cap
Value Fund |
| | | | |
Net Assets Represent: | | | | | | | | | | | | | | | | | | | | |
| | | | |
Paid-in capital | | | | $295,914,123 | | | | | $40,531,277 | | | | | $687,228,577 | | | | | $220,568,225 | |
| | | | |
Total distributable earnings (loss) | | | | 12,914,297 | | | | | (6,329,645 | ) | | | | 179,768,765 | | | | | 109,694,145 | |
| | | | |
Net Assets | | | | $308,828,420 | | | | | $34,201,632 | | | | | $866,997,342 | | | | | $330,262,370 | |
| | | | |
Class N: | | | | | | | | | | | | | | | | | | | | |
| | | | |
Net Assets | | | | $227,512,828 | | | | | $3,682,560 | | | | | $37,264,829 | | | | | $36,431,931 | |
| | | | |
Shares outstanding | | | | 12,822,477 | | | | | 261,509 | | | | | 2,613,152 | | | | | 3,406,343 | |
| | | | |
Net asset value, offering and redemption price per share | | | | $17.74 | | | | | $14.08 | | | | | $14.26 | | | | | $10.70 | |
Class I: | | | | | | | | | | | | | | | | | | | | |
| | | | |
Net Assets | | | | $74,094,348 | | | | | $30,519,072 | | | | | $819,940,183 | | | | | $290,631,758 | |
| | | | |
Shares outstanding | | | | 3,889,762 | | | | | 2,150,862 | | | | | 55,562,007 | | | | | 27,200,966 | |
| | | | |
Net asset value, offering and redemption price per share | | | | $19.05 | | | | | $14.19 | | | | | $14.76 | | | | | $10.68 | |
Class Z: | | | | | | | | | | | | | | | | | | | | |
| | | | |
Net Assets | | | | $7,221,244 | | | | | — | | | | | $9,792,330 | | | | | $3,198,681 | |
| | | | |
Shares outstanding | | | | 381,288 | | | | | — | | | | | 662,526 | | | | | 299,359 | |
| | | | |
Net asset value, offering and redemption price per share | | | | $18.94 | | | | | — | | | | | $14.78 | | | | | $10.69 | |
The accompanying notes are an integral part of these financial statements.
49
| | |
| | | Statement of Assets and Liabilities (continued) |
| | | |
| | | |
| | | | | | | | | | | | | | | |
| | | AMG
River Road
Small-Mid Cap
Value Fund | | AMG
River Road
International Value
Equity Fund | | AMG
River Road
Focused Absolute
Value Fund |
| | | |
Assets: | | | | | | | | | | | | | | | |
| | | |
Investments at value1 (including securities on loan valued at $115,718, $132,554, and $2,663,174, respectively) | | | | $241,290,932 | | | | | $7,286,440 | | | | | $63,649,453 | |
| | | |
Foreign currency2 | | | | — | | | | | 2,230 | | | | | — | |
| | | |
Receivable for investments sold | | | | 1,351,794 | | | | | — | | | | | — | |
| | | |
Dividend and interest receivables | | | | 47,609 | | | | | 32,969 | | | | | 47,648 | |
| | | |
Securities lending income receivable | | | | 413 | | | | | 54 | | | | | 260 | |
| | | |
Receivable for Fund shares sold | | | | 356,939 | | | | | — | | | | | — | |
| | | |
Receivable from affiliate | | | | — | | | | | 8,857 | | | | | 6,279 | |
| | | |
Prepaid expenses and other assets | | | | 13,129 | | | | | 4,626 | | | | | 17,919 | |
| | | |
Total assets | | | | 243,060,816 | | | | | 7,335,176 | | | | | 63,721,559 | |
| | | |
Liabilities: | | | | | | | | | | | | | | | |
| | | |
Payable upon return of securities loaned | | | | — | | | | | 138,897 | | | | | — | |
| | | |
Payable for investments purchased | | | | 963,347 | | | | | — | | | | | — | |
| | | |
Payable for Fund shares repurchased | | | | 235,988 | | | | | 36,157 | | | | | 80,341 | |
| | | |
Accrued expenses: | | | | | | | | | | | | | | | |
| | | |
Investment advisory and management fees | | | | 144,729 | | | | | 3,099 | | | | | 31,002 | |
| | | |
Administrative fees | | | | 28,946 | | | | | 877 | | | | | 7,751 | |
| | | |
Distribution fees | | | | 3,698 | | | | | 209 | | | | | 710 | |
| | | |
Shareholder service fees | | | | 9,027 | | | | | 258 | | | | | 1,819 | |
| | | |
Other | | | | 74,252 | | | | | 47,197 | | | | | 60,292 | |
| | | |
Total liabilities | | | | 1,459,987 | | | | | 226,694 | | | | | 181,915 | |
| | | | | | | | | | | | | | | |
| | | |
Net Assets | | | | $241,600,829 | | | | | $7,108,482 | | | | | $63,539,644 | |
| | | |
1 Investments at cost | | | | $206,019,051 | | | | | $8,349,449 | | | | | $59,942,984 | |
| | | |
2 Foreign currency at cost | | | | — | | | | | $2,167 | | | | | — | |
The accompanying notes are an integral part of these financial statements.
50
| | |
| | | Statement of Assets and Liabilities (continued) |
| | | |
| | | |
| | | | | | | | | | | | | | | | | | | | | | | | | | | | | | | | | | | | |
| | | AMG
River Road
Small-Mid Cap
Value Fund | | | AMG
River Road
International Value
Equity Fund | | | AMG
River Road
Focused Absolute
Value Fund | |
| | | | | | | | | |
Net Assets Represent: | | | | | | | | | | | | | | | | | | | | | | | | | | | | | | | | | | | | |
| | | | | | | | | |
Paid-in capital | | | | | | | $196,351,033 | | | | | | | | | | | | $8,368,591 | | | | | | | | | | | | $60,443,301 | | | | | |
| | | | | | | | | |
Total distributable earnings (loss) | | | | | | | 45,249,796 | | | | | | | | | | | | (1,260,109 | ) | | | | | | | | | | | 3,096,343 | | | | | |
| | | | | | | | | |
Net Assets | | | | | | | $241,600,829 | | | | | | | | | | | | $7,108,482 | | | | | | | | | | | | $63,539,644 | | | | | |
| | | | | | | | | |
Class N: | | | | | | | | | | | | | | | | | | | | | | | | | | | | | | | | | | | | |
| | | | | | | | | |
Net Assets | | | | | | | $18,960,677 | | | | | | | | | | | | $1,012,434 | | | | | | | | | | | | $2,242,852 | | | | | |
| | | | | | | | | |
Shares outstanding | | | | | | | 2,084,015 | | | | | | | | | | | | 121,206 | | | | | | | | | | | | 195,076 | | | | | |
| | | | | | | | | |
Net asset value, offering and redemption price per share | | | | | | | $9.10 | | | | | | | | | | | | $8.35 | | | | | | | | | | | | $11.50 | | | | | |
Class I: | | | | | | | | | | | | | | | | | | | | | | | | | | | | | | | | | | | | |
| | | | | | | | | |
Net Assets | | | | | | | $188,163,366 | | | | | | | | | | | | $5,263,101 | | | | | | | | | | | | $53,619,660 | | | | | |
| | | | | | | | | |
Shares outstanding | | | | | | | 20,001,082 | | | | | | | | | | | | 607,231 | | | | | | | | | | | | 4,656,870 | | | | | |
| | | | | | | | | |
Net asset value, offering and redemption price per share | | | | | | | $9.41 | | | | | | | | | | | | $8.67 | | | | | | | | | | | | $11.51 | | | | | |
Class Z: | | | | | | | | | | | | | | | | | | | | | | | | | | | | | | | | | | | | |
| | | | | | | | | |
Net Assets | | | | | | | $34,476,786 | | | | | | | | | | | | $832,947 | | | | | | | | | | | | $7,677,132 | | | | | |
| | | | | | | | | |
Shares outstanding | | | | | | | 3,660,671 | | | | | | | | | | | | 95,655 | | | | | | | | | | | | 666,493 | | | | | |
| | | | | | | | | |
Net asset value, offering and redemption price per share | | | | | | | $9.42 | | | | | | | | | | | | $8.71 | | | | | | | | | | | | $11.52 | | | | | |
The accompanying notes are an integral part of these financial statements.
51
| | |
| | | Statement of Operations For the fiscal year ended October 31, 2022 |
| | | |
| | | |
| | | | | | | | | | | | | | | | | | | | | | | | | | | | | | | | | | | | | | | | | | | | | | | | |
| | | AMG
River Road
Mid Cap
Value Fund | | | AMG
River Road Large
Cap Value
Select Fund | | | AMG
River Road
Small Cap
Value Fund | | | AMG
River Road
Dividend All Cap
Value Fund | |
| | | | | | | | | | | | |
Investment Income: | | | | | | | | | | | | | | | | | | | | | | | | | | | | | | | | | | | | | | | | | | | | | | | | |
| | | | | | | | | | | | |
Dividend income | | | | | | | $6,995,476 | 1 | | | | | | | | | | | $924,108 | 2 | | | | | | | | | | | $6,395,592 | | | | | | | | | | | | $9,304,819 | | | | | |
| | | | | | | | | | | | |
Interest income | | | | | | | 324 | | | | | | | | | | | | 85 | | | | | | | | | | | | — | | | | | | | | | | | | — | | | | | |
| | | | | | | | | | | | |
Securities lending income | | | | | | | 2,551 | | | | | | | | | | | | 3,480 | | | | | | | | | | | | 16,738 | | | | | | | | | | | | 16,794 | | | | | |
| | | | | | | | | | | | |
Foreign withholding tax | | | | | | | — | | | | | | | | | | | | (8,078 | ) | | | | | | | | | | | (56,881 | ) | | | | | | | | | | | (19,502 | ) | | | | |
| | | | | | | | | | | | |
Total investment income | | | | | | | 6,998,351 | | | | | | | | | | | | 919,595 | | | | | | | | | | | | 6,355,449 | | | | | | | | | | | | 9,302,111 | | | | | |
| | | | | | | | | | | | |
Expenses: | | | | | | | | | | | | | | | | | | | | | | | | | | | | | | | | | | | | | | | | | | | | | | | | |
| | | | | | | | | | | | |
Investment advisory and management fees | | | | | | | 1,960,465 | | | | | | | | | | | | 131,250 | | | | | | | | | | | | 6,802,408 | | | | | | | | | | | | 2,005,238 | | | | | |
| | | | | | | | | | | | |
Administrative fees | | | | | | | 525,124 | | | | | | | | | | | | 56,250 | | | | | | | | | | | | 1,275,452 | | | | | | | | | | | | 528,864 | | | | | |
| | | | | | | | | | | | |
Distribution fees - Class N | | | | | | | 609,063 | | | | | | | | | | | | 10,925 | | | | | | | | | | | | 83,932 | | | | | | | | | | | | 98,590 | | | | | |
| | | | | | | | | | | | |
Shareholder servicing fees - Class N | | | | | | | 251,383 | | | | | | | | | | | | 4,370 | | | | | | | | | | | | 33,643 | | | | | | | | | | | | 15,774 | | | | | |
| | | | | | | | | | | | |
Shareholder servicing fees - Class I | | | | | | | 45,394 | | | | | | | | | | | | 9,449 | | | | | | | | | | | | 710,749 | | | | | | | | | | | | 124,150 | | | | | |
| | | | | | | | | | | | |
Registration fees | | | | | | | 53,743 | | | | | | | | | | | | 25,218 | | | | | | | | | | | | 60,806 | | | | | | | | | | | | 40,017 | | | | | |
| | | | | | | | | | | | |
Professional fees | | | | | | | 52,263 | | | | | | | | | | | | 30,118 | | | | | | | | | | | | 96,543 | | | | | | | | | | | | 61,481 | | | | | |
| | | | | | | | | | | | |
Custodian fees | | | | | | | 38,788 | | | | | | | | | | | | 18,460 | | | | | | | | | | | | 76,261 | | | | | | | | | | | | 42,873 | | | | | |
| | | | | | | | | | | | |
Transfer agent fees | | | | | | | 24,986 | | | | | | | | | | | | 9,300 | | | | | | | | | | | | 32,017 | | | | | | | | | | | | 13,791 | | | | | |
| | | | | | | | | | | | |
Trustee fees and expenses | | | | | | | 23,662 | | | | | | | | | | | | 2,576 | | | | | | | | | | | | 57,147 | | | | | | | | | | | | 23,725 | | | | | |
| | | | | | | | | | | | |
Reports to shareholders | | | | | | | (5,723 | ) | | | | | | | | | | | (4,159 | ) | | | | | | | | | | | 55,396 | | | | | | | | | | | | 9,252 | | | | | |
| | | | | | | | | | | | |
Interest expense | | | | | | | 891 | | | | | | | | | | | | — | | | | | | | | | | | | — | | | | | | | | | | | | 1,641 | | | | | |
| | | | | | | | | | | | |
Miscellaneous | | | | | | | 14,360 | | | | | | | | | | | | 2,879 | | | | | | | | | | | | 77,055 | | | | | | | | | | | | 32,326 | | | | | |
| | | | | | | | | | | | |
Total expenses before offsets | | | | | | | 3,594,399 | | | | | | | | | | | | 296,636 | | | | | | | | | | | | 9,361,409 | | | | | | | | | | | | 2,997,722 | | | | | |
| | | | | | | | | | | | |
Expense reimbursements | | | | | | | (27,037 | ) | | | | | | | | | | | (46,891 | ) | | | | | | | | | | | — | | | | | | | | | | | | (117,693 | ) | | | | |
| | | | | | | | | | | | |
Expense reductions | | | | | | | (19,146 | ) | | | | | | | | | | | (1,535 | ) | | | | | | | | | | | (38,236 | ) | | | | | | | | | | | (22,184 | ) | | | | |
| | | | | | | | | | | | |
Net expenses | | | | | | | 3,548,216 | | | | | | | | | | | | 248,210 | | | | | | | | | | | | 9,323,173 | | | | | | | | | | | | 2,857,845 | | | | | |
| | | | | | | | | | | | | | | | | | | | | | | | | | | | | | | | | | | | | | | | | | | | | | | | |
| | | | | | | | | | | | |
Net investment income (loss) | | | | | | | 3,450,135 | | | | | | | | | | | | 671,385 | | | | | | | | | | | | (2,967,724 | ) | | | | | | | | | | | 6,444,266 | | | | | |
| | | | | | | | | | | | |
Net Realized and Unrealized Gain (Loss): | | | | | | | | | | | | | | | | | | | | | | | | | | | | | | | | | | | | | | | | | | | | | | | | |
| | | | | | | | | | | | |
Net realized gain (loss) on investments | | | | | | | 26,043,244 | | | | | | | | | | | | (991,432 | ) | | | | | | | | | | | 32,053,565 | | | | | | | | | | | | 43,952,790 | | | | | |
| | | | | | | | | | | | |
Net change in unrealized appreciation/depreciation on investments | | | | | | | (49,642,188 | ) | | | | | | | | | | | (3,078,280 | ) | | | | | | | | | | | (29,813,692 | ) | | | | | | | | | | | (51,226,403 | ) | | | | |
| | | | | | | | | | | | |
Net realized and unrealized gain (loss) | | | | | | | (23,598,944 | ) | | | | | | | | | | | (4,069,712 | ) | | | | | | | | | | | 2,239,873 | | | | | | | | | | | | (7,273,613 | ) | | | | |
| | | | | | | | | | | | | | | | | | | | | | | | | | | | | | | | | | | | | | | | | | | | | | | | |
| | | | | | | | | | | | |
Net decrease in net assets resulting from operations | | | | | | | $(20,148,809) | | | | | | | | | | | | $(3,398,327) | | | | | | | | | | | | $(727,851) | | | | | | | | | | | | $(829,347) | | | | | |
1 Includes non-recurring dividends of $2,341,727.
2 Includes non-recurring dividends of $362,824.
The accompanying notes are an integral part of these financial statements.
52
| | |
| | | Statement of Operations (continued) |
| | | |
| | | |
| | | | | | | | | | | | | | | | | | | | | | | | | | | | | | | | | | | | |
| | | AMG
River Road
Small-Mid Cap
Value Fund | | | AMG
River Road
International Value
Equity Fund | | | AMG
River Road
Focused Absolute
Value Fund | |
| | | | | | | | | |
Investment Income: | | | | | | | | | | | | | | | | | | | | | | | | | | | | | | | | | | | | |
| | | | | | | | | |
Dividend income | | | | | | | $2,514,057 | | | | | | | | | | | | $370,681 | 1 | | | | | | | | | | | $1,782,188 | | | | | |
| | | | | | | | | |
Interest income | | | | | | | — | | | | | | | | | | | | — | | | | | | | | | | | | 675 | | | | | |
| | | | | | | | | |
Securities lending income | | | | | | | 16,322 | | | | | | | | | | | | 274 | | | | | | | | | | | | 3,050 | | | | | |
| | | | | | | | | |
Foreign withholding tax | | | | | | | (6,896 | ) | | | | | | | | | | | (27,646 | ) | | | | | | | | | | | — | | | | | |
| | | | | | | | | |
Total investment income | | | | | | | 2,523,483 | | | | | | | | | | | | 343,309 | | | | | | | | | | | | 1,785,913 | | | | | |
| | | | | | | | | |
Expenses: | | | | | | | | | | | | | | | | | | | | | | | | | | | | | | | | | | | | |
| | | | | | | | | |
Investment advisory and management fees | | | | | | | 1,896,998 | | | | | | | | | | | | 42,852 | | | | | | | | | | | | 788,816 | | | | | |
| | | | | | | | | |
Administrative fees | | | | | | | 379,400 | | | | | | | | | | | | 12,128 | | | | | | | | | | | | 197,204 | | | | | |
| | | | | | | | | |
Distribution fees - Class N | | | | | | | 50,993 | | | | | | | | | | | | 3,052 | | | | | | | | | | | | 6,955 | | | | | |
| | | | | | | | | |
Shareholder servicing fees - Class N | | | | | | | 12,268 | | | | | | | | | | | | 617 | | | | | | | | | | | | 1,116 | | | | | |
| | | | | | | | | |
Shareholder servicing fees - Class I | | | | | | | 106,975 | | | | | | | | | | | | 3,108 | | | | | | | | | | | | 47,164 | | | | | |
| | | | | | | | | |
Professional fees | | | | | | | 46,131 | | | | | | | | | | | | 31,159 | | | | | | | | | | | | 39,362 | | | | | |
| | | | | | | | | |
Registration fees | | | | | | | 41,045 | | | | | | | | | | | | 23,300 | | | | | | | | | | | | 34,051 | | | | | |
| | | | | | | | | |
Custodian fees | | | | | | | 36,066 | | | | | | | | | | | | 30,575 | | | | | | | | | | | | 29,924 | | | | | |
| | | | | | | | | |
Trustee fees and expenses | | | | | | | 17,024 | | | | | | | | | | | | 554 | | | | | | | | | | | | 9,130 | | | | | |
| | | | | | | | | |
Reports to shareholders | | | | | | | 11,701 | | | | | | | | | | | | 2,177 | | | | | | | | | | | | 4,530 | | | | | |
| | | | | | | | | |
Transfer agent fees | | | | | | | 10,745 | | | | | | | | | | | | 486 | | | | | | | | | | | | 5,828 | | | | | |
| | | | | | | | | |
Interest expense | | | | | | | — | | | | | | | | | | | | — | | | | | | | | | | | | 10,170 | | | | | |
| | | | | | | | | |
Miscellaneous | | | | | | | 24,501 | | | | | | | | | | | | 2,728 | | | | | | | | | | | | 14,904 | | | | | |
| | | | | | | | | |
Total expenses before offsets | | | | | | | 2,633,847 | | | | | | | | | | | | 152,736 | | | | | | | | | | | | 1,189,154 | | | | | |
| | | | | | | | | |
Expense reimbursements | | | | | | | — | | | | | | | | | | | | (86,935 | ) | | | | | | | | | | | (98,288 | ) | | | | |
| | | | | | | | | |
Expense reductions | | | | | | | (15,426 | ) | | | | | | | | | | | (921 | ) | | | | | | | | | | | (21,744 | ) | | | | |
| | | | | | | | | |
Net expenses | | | | | | | 2,618,421 | | | | | | | | | | | | 64,880 | | | | | | | | | | | | 1,069,122 | | | | | |
| | | | | | | | | | | | | | | | | | | | | | | | | | | | | | | | | | | | |
| | | | | | | | | |
Net investment income (loss) | | | | | | | (94,938 | ) | | | | | | | | | | | 278,429 | | | | | | | | | | | | 716,791 | | | | | |
| | | | | | | | | |
Net Realized and Unrealized Loss: | | | | | | | | | | | | | | | | | | | | | | | | | | | | | | | | | | | | |
| | | | | | | | | |
Net realized gain (loss) on investments | | | | | | | 11,600,764 | | | | | | | | | | | | (445,365 | ) | | | | | | | | | | | 2,657,573 | | | | | |
| | | | | | | | | |
Net realized loss on foreign currency transactions | | | | | | | — | | | | | | | | | | | | (3,786 | ) | | | | | | | | | | | — | | | | | |
| | | | | | | | | |
Net change in unrealized appreciation/depreciation on investments | | | | | | | (15,124,084 | ) | | | | | | | | | | | (780,988 | ) | | | | | | | | | | | (21,462,247 | ) | | | | |
| | | | | | | | | |
Net change in unrealized appreciation/depreciation on foreign currency translations | | | | | | | — | | | | | | | | | | | | (712 | ) | | | | | | | | | | | — | | | | | |
| | | | | | | | | |
Net realized and unrealized loss | | | | | | | (3,523,320 | ) | | | | | | | | | | | (1,230,851 | ) | | | | | | | | | | | (18,804,674 | ) | | | | |
| | | | | | | | | | | | | | | | | | | | | | | | | | | | | | | | | | | | |
| | | | | | | | | |
Net decrease in net assets resulting from operations | | | | | | | $(3,618,258) | | | | | | | | | | | | $(952,422) | | | | | | | | | | | | $(18,087,883) | | | | | |
1 Includes non-recurring dividends of $124,873.
The accompanying notes are an integral part of these financial statements.
53
| | |
| | | Statements of Changes in Net Assets For the fiscal years ended October 31, |
| | | |
| | | |
| | | | | | | | | | | | | | | | | | | | | | | | |
| | | AMG
River Road
Mid Cap Value Fund | | | AMG
River Road Large
Cap Value Select Fund | | | AMG
River Road
Small Cap Value Fund | |
| | | 2022 | | | 2021 | | | 2022 | | | 2021 | | | 2022 | | | 2021 | |
| | | | | | |
Increase (Decrease) in Net Assets Resulting From Operations: | | | | | | | | | | | | | | | | | | | | | | | | |
| | | | | | |
Net investment income (loss) | | | $3,450,135 | | | | $803,269 | | | | $671,385 | | | | $148,514 | | | | $(2,967,724 | ) | | | $(2,778,893 | ) |
| | | | | | |
Net realized gain (loss) on investments | | | 26,043,244 | | | | 258,272,570 | | | | (991,432 | ) | | | 8,380,167 | | | | 32,053,565 | | | | 77,730,613 | |
| | | | | | |
Net change in unrealized appreciation/depreciation on investments | | | (49,642,188 | ) | | | (64,506,569 | ) | | | (3,078,280 | ) | | | 3,843,506 | | | | (29,813,692 | ) | | | 163,130,688 | |
| | | | | | |
Net increase (decrease) in net assets resulting from operations | | | (20,148,809 | ) | | | 194,569,270 | | | | (3,398,327 | ) | | | 12,372,187 | | | | (727,851 | ) | | | 238,082,408 | |
| | | | | | |
Distributions to Shareholders: | | | | | | | | | | | | | | | | | | | | | | | | |
| | | | | | |
Class N | | | (9,096,124 | ) | | | (178,403,401 | ) | | | — | | | | (667,556 | ) | | | (2,525,400 | ) | | | — | |
| | | | | | |
Class I | | | (3,627,499 | ) | | | (89,340,284 | ) | | | (148,346 | ) | | | (5,854,852 | ) | | | (60,899,554 | ) | | | (32,321 | ) |
| | | | | | |
Class Z | | | (308,106 | ) | | | (6,230,574 | ) | | | — | | | | — | | | | (572,964 | ) | | | (824 | ) |
| | | | | | |
Total distributions to shareholders | | | (13,031,729 | ) | | | (273,974,259 | ) | | | (148,346 | ) | | | (6,522,408 | ) | | | (63,997,918 | ) | | | (33,145 | ) |
| | | | | | |
Capital Share Transactions:1 | | | | | | | | | | | | | | | | | | | | | | | | |
| | | | | | |
Net increase (decrease) from capital share transactions | | | (66,134,751 | ) | | | 41,394,175 | | | | (3,775,114 | ) | | | (8,032,778 | ) | | | 54,093,356 | | | | 124,998,329 | |
| | | | | | | | | | | | | | | | | | | | | | | | |
| | | | | | |
Total increase (decrease) in net assets | | | (99,315,289 | ) | | | (38,010,814 | ) | | | (7,321,787 | ) | | | (2,182,999 | ) | | | (10,632,413 | ) | | | 363,047,592 | |
| | | | | | |
Net Assets: | | | | | | | | | | | | | | | | | | | | | | | | |
| | | | | | |
Beginning of year | | | 408,143,709 | | | | 446,154,523 | | | | 41,523,419 | | | | 43,706,418 | | | | 877,629,755 | | | | 514,582,163 | |
| | | | | | |
End of year | | | $308,828,420 | | | | $408,143,709 | | | | $34,201,632 | | | | $41,523,419 | | | | $866,997,342 | | | | $877,629,755 | |
1 See Note 1(g) of the Notes to Financial Statements.
The accompanying notes are an integral part of these financial statements.
54
| | |
| | | Statements of Changes in Net Assets (continued) For the fiscal years ended October 31, |
| | | |
| | | |
| | | | | | | | | | | | | | | | | | | | | | | | |
| | | AMG
River Road
Dividend All Cap
Value Fund | | | AMG
River Road
Small-Mid Cap
Value Fund | | | AMG
River Road
International Value
Equity Fund | |
| | | 2022 | | | 2021 | | | 2022 | | | 2021 | | | 2022 | | | 2021 | |
| | | | | | |
Increase (Decrease) in Net Assets Resulting From Operations: | | | | | | | | | | | | | | | | | | | | | | | | |
| | | | | | |
Net investment income (loss) | | | $6,444,266 | | | | $8,836,861 | | | | $(94,938 | ) | | | $(387,573 | ) | | | $278,429 | | | | $(73,726 | ) |
| | | | | | |
Net realized gain (loss) on investments | | | 43,952,790 | | | | 74,356,959 | | | | 11,600,764 | | | | 24,570,939 | | | | (449,151 | ) | | | 4,384,536 | |
| | | | | | |
Net change in unrealized appreciation/depreciation on investments | | | (51,226,403 | ) | | | 67,143,423 | | | | (15,124,084 | ) | | | 54,476,017 | | | | (781,700 | ) | | | (620,449 | ) |
| | | | | | |
Net increase (decrease) in net assets resulting from operations | | | (829,347 | ) | | | 150,337,243 | | | | (3,618,258 | ) | | | 78,659,383 | | | | (952,422 | ) | | | 3,690,361 | |
| | | | | | |
Distributions to Shareholders: | | | | | | | | | | | | | | | | | | | | | | | | |
| | | | | | |
Class N | | | (7,853,246 | ) | | | (727,705 | ) | | | (1,300,180 | ) | | | — | | | | (8,584 | ) | | | (532,006 | ) |
| | | | | | |
Class I | | | (67,471,975 | ) | | | (8,517,604 | ) | | | (11,974,114 | ) | | | (4,398 | ) | | | (52,305 | ) | | | (2,364,560 | ) |
| | | | | | |
Class Z | | | (467,570 | ) | | | (45,063 | ) | | | (2,022,835 | ) | | | (318 | ) | | | (4,607 | ) | | | (146,169 | ) |
| | | | | | |
Total distributions to shareholders | | | (75,792,791 | ) | | | (9,290,372 | ) | | | (15,297,129 | ) | | | (4,716 | ) | | | (65,496 | ) | | | (3,042,735 | ) |
| | | | | | |
Capital Share Transactions:1 | | | | | | | | | | | | | | | | | | | | | | | | |
| | | | | | |
Net increase (decrease) from capital share transactions | | | (21,546,543 | ) | | | (164,718,707 | ) | | | (16,650,233 | ) | | | 19,990,348 | | | | (1,091,145 | ) | | | (7,714,823 | ) |
| | | | | | | | | | | | | | | | | | | | | | | | |
| | | | | | |
Total increase (decrease) in net assets | | | (98,168,681 | ) | | | (23,671,836 | ) | | | (35,565,620 | ) | | | 98,645,015 | | | | (2,109,063 | ) | | | (7,067,197 | ) |
| | | | | | |
Net Assets: | | | | | | | | | | | | | | | | | | | | | | | | |
| | | | | | |
Beginning of year | | | 428,431,051 | | | | 452,102,887 | | | | 277,166,449 | | | | 178,521,434 | | | | 9,217,545 | | | | 16,284,742 | |
| | | | | | |
End of year | | | $330,262,370 | | | | $428,431,051 | | | | $241,600,829 | | | | $277,166,449 | | | | $7,108,482 | | | | $9,217,545 | |
1 See Note 1(g) of the Notes to Financial Statements.
The accompanying notes are an integral part of these financial statements.
55
| | |
| | | Statements of Changes in Net Assets (continued) For the fiscal years ended October 31, |
| | | |
| | | |
| | | | | | | | |
| | | AMG
River Road
Focused Absolute
Value Fund | |
| | |
| | | 2022 | | | 2021 | |
| | |
Increase (Decrease) in Net Assets Resulting From Operations: | | | | | | | | |
| | |
Net investment income | | | $716,791 | | | | $663,151 | |
| | |
Net realized gain on investments | | | 2,657,573 | | | | 32,121,761 | |
| | |
Net change in unrealized appreciation/depreciation on investments | | | (21,462,247 | ) | | | 14,157,205 | |
| | | | | | | | |
| | |
Net increase (decrease) in net assets resulting from operations | | | (18,087,883 | ) | | | 46,942,117 | |
| | |
Distributions to Shareholders: | | | | | | | | |
| | |
Class N | | | (221,233 | ) | | | — | |
| | |
Class I | | | (12,072,508 | ) | | | (950,327 | ) |
| | |
Class Z | | | (930,537 | ) | | | (18,026 | ) |
| | |
Total distributions to shareholders | | | (13,224,278 | ) | | | (968,353 | ) |
| | |
Capital Share Transactions:1 | | | | | | | | |
| | |
Net increase (decrease) from capital share transactions | | | (98,597,273 | ) | | | 1,789,489 | |
| | | | | | | | |
| | |
Total increase (decrease) in net assets | | | (129,909,434 | ) | | | 47,763,253 | |
| | |
Net Assets: | | | | | | | | |
| | |
Beginning of year | | | 193,449,078 | | | | 145,685,825 | |
| | | | | | | | |
| | |
End of year | | | $63,539,644 | | | | $193,449,078 | |
1 See Note 1(g) of the Notes to Financial Statements.
The accompanying notes are an integral part of these financial statements.
56
| | |
| | | AMG River Road Mid Cap Value Fund Financial Highlights For a share outstanding throughout each fiscal year |
| | | |
| | | |
| | | | | | | | | | | | | | | | | | | | | | | | | | | | | | | | | | | | | | | | |
| | | For the fiscal years ended October 31, | |
| | | | | | | | | | |
| Class N | | | | | 2022 | | | | | | 2021 | | | | | | 2020 | | | | | | 2019 | | | | | | 2018 | |
| | | | | | | | | | |
Net Asset Value, Beginning of Year | | | | | | | $19.43 | | | | | | | | $29.75 | | | | | | | | $34.95 | | | | | | | | $38.27 | | | | | | | | $41.95 | |
| | | | | | | | | | |
Income (loss) from Investment Operations: | | | | | | | | | | | | | | | | | | | | | | | | | | | | | | | | | | | | | | | | |
| | | | | | | | | | |
Net investment income1,2 | | | | | | | 0.17 | 3 | | | | | | | 0.02 | 4 | | | | | | | 0.16 | | | | | | | | 0.34 | 5 | | | | | | | 0.08 | |
| | | | | | | | | | |
Net realized and unrealized gain (loss) on investments | | | | | | | (1.22 | ) | | | | | | | 11.69 | | | | | | | | (2.85 | ) | | | | | | | (0.85 | ) | | | | | | | (0.95 | ) |
| | | | | | | | | | | | | | | | | | | | | | | | | | | | | | | | | | | | | | | | |
| | | | | | | | | | |
Total income (loss) from investment operations | | | | | | | (1.05 | ) | | | | | | | 11.71 | | | | | | | | (2.69 | ) | | | | | | | (0.51 | ) | | | | | | | (0.87 | ) |
| | | | | | | | | | |
Less Distributions to Shareholders from: | | | | | | | | | | | | | | | | | | | | | | | | | | | | | | | | | | | | | | | | |
| | | | | | | | | | |
Net investment income | | | | | | | (0.04 | ) | | | | | | | (0.02 | ) | | | | | | | (0.33 | ) | | | | | | | (0.15 | ) | | | | | | | — | |
| | | | | | | | | | |
Net realized gain on investments | | | | | | | (0.60 | ) | | | | | | | (22.01 | ) | | | | | | | (2.18 | ) | | | | | | | (2.66 | ) | | | | | | | (2.81 | ) |
| | | | | | | | | | | | | | | | | | | | | | | | | | | | | | | | | | | | | | | | |
| | | | | | | | | | |
Total distributions to shareholders | | | | | | | (0.64 | ) | | | | | | | (22.03 | ) | | | | | | | (2.51 | ) | | | | | | | (2.81 | ) | | | | | | | (2.81 | ) |
| | | | | | | | | | |
Net Asset Value, End of Year | | | | | | | $17.74 | | | | | | | | $19.43 | | | | | | | | $29.75 | | | | | | | | $34.95 | | | | | | | | $38.27 | |
| | | | | | | | | | | | | | | | | | | | | | | | | | | | | | | | | | | | | | | | |
| | | | | | | | | | |
Total Return2,6 | | | | | | | (5.67 | )% | | | | | | | 50.65 | % | | | | | | | (8.62 | )% | | | | | | | (0.55 | )% | | | | | | | (2.82 | )% |
| | | | | | | | | | |
Ratio of net expenses to average net assets | | | | | | | 1.09 | %7 | | | | | | | 1.13 | %7 | | | | | | | 1.14 | % | | | | | | | 1.15 | % | | | | | | | 1.12 | % |
| | | | | | | | | | |
Ratio of gross expenses to average net assets8 | | | | | | | 1.11 | % | | | | | | | 1.18 | % | | | | | | | 1.16 | % | | | | | | | 1.15 | % | | | | | | | 1.13 | % |
| | | | | | | | | | |
Ratio of net investment income to average net assets2 | | | | | | | 0.90 | % | | | | | | | 0.08 | % | | | | | | | 0.52 | % | | | | | | | 0.95 | % | | | | | | | 0.19 | % |
| | | | | | | | | | |
Portfolio turnover | | | | | | | 71 | % | | | | | | | 149 | % | | | | | | | 50 | % | | | | | | | 21 | % | | | | | | | 18 | % |
| | | | | | | | | | |
Net assets end of year (000’s) omitted | | | | | | | $227,513 | | | | | | | | $287,165 | | | | | | | | $259,561 | | | | | | | | $518,354 | | | | | | | | $893,685 | |
| | | | | | | | | | | | | | | | | | | | | | | | | | | | | | | |
57
| | |
| | | AMG River Road Mid Cap Value Fund Financial Highlights For a share outstanding throughout each fiscal year |
| | | |
| | | |
| | | | | | | | | | | | | | | | | | | | | | | | | | | | | | | | | | | | | | | | |
| | | For the fiscal years ended October 31, | |
| | | | | | | | | | |
| Class I | | | | | 2022 | | | | | | 2021 | | | | | | 2020 | | | | | | 2019 | | | | | | 2018 | |
| | | | | | | | | | |
Net Asset Value, Beginning of Year | | | | | | | $20.82 | | | | | | | | $30.68 | | | | | | | | $35.96 | | | | | | | | $39.33 | | | | | | | | $42.97 | |
| | | | | | | | | | |
Income (loss) from Investment Operations: | | | | | | | | | | | | | | | | | | | | | | | | | | | | | | | | | | | | | | | | |
| | | | | | | | | | |
Net investment income1,2 | | | | | | | 0.24 | 3 | | | | | | | 0.09 | 4 | | | | | | | 0.25 | | | | | | | | 0.45 | 5 | | | | | | | 0.19 | |
| | | | | | | | | | |
Net realized and unrealized gain (loss) on investments | | | | | | | (1.32 | ) | | | | | | | 12.16 | | | | | | | | (2.94 | ) | | | | | | | (0.89 | ) | | | | | | | (0.99 | ) |
| | | | | | | | | | | | | | | | | | | | | | | | | | | | | | | | | | | | | | | | |
| | | | | | | | | | |
Total income (loss) from investment operations | | | | | | | (1.08 | ) | | | | | | | 12.25 | | | | | | | | (2.69 | ) | | | | | | | (0.44 | ) | | | | | | | (0.80 | ) |
| | | | | | | | | | |
Less Distributions to Shareholders from: | | | | | | | | | | | | | | | | | | | | | | | | | | | | | | | | | | | | | | | | |
| | | | | | | | | | |
Net investment income | | | | | | | (0.09 | ) | | | | | | | (0.10 | ) | | | | | | | (0.41 | ) | | | | | | | (0.27 | ) | | | | | | | (0.03 | ) |
| | | | | | | | | | |
Net realized gain on investments | | | | | | | (0.60 | ) | | | | | | | (22.01 | ) | | | | | | | (2.18 | ) | | | | | | | (2.66 | ) | | | | | | | (2.81 | ) |
| | | | | | | | | | | | | | | | | | | | | | | | | | | | | | | | | | | | | | | | |
| | | | | | | | | | |
Total distributions to shareholders | | | | | | | (0.69 | ) | | | | | | | (22.11 | ) | | | | | | | (2.59 | ) | | | | | | | (2.93 | ) | | | | | | | (2.84 | ) |
| | | | | | | | | | |
Net Asset Value, End of Year | | | | | | | $19.05 | | | | | | | | $20.82 | | | | | | | | $30.68 | | | | | | | | $35.96 | | | | | | | | $39.33 | |
| | | | | | | | | | | | | | | | | | | | | | | | | | | | | | | | | | | | | | | | |
| | | | | | | | | | |
Total Return2,6 | | | | | | | (5.41 | )% | | | | | | | 51.11 | % | | | | | | | (8.38 | )% | | | | | | | (0.33 | )% | | | | | | | (2.56 | )% |
| | | | | | | | | | |
Ratio of net expenses to average net assets | | | | | | | 0.80 | %7 | | | | | | | 0.87 | %7 | | | | | | | 0.90 | % | | | | | | | 0.90 | % | | | | | | | 0.87 | % |
| | | | | | | | | | |
Ratio of gross expenses to average net assets8 | | | | | | | 0.82 | % | | | | | | | 0.92 | % | | | | | | | 0.92 | % | | | | | | | 0.90 | % | | | | | | | 0.88 | % |
| | | | | | | | | | |
Ratio of net investment income to average net assets2 | | | | | | | 1.19 | % | | | | | | | 0.34 | % | | | | | | | 0.76 | % | | | | | | | 1.20 | % | | | | | | | 0.44 | % |
| | | | | | | | | | |
Portfolio turnover | | | | | | | 71 | % | | | | | | | 149 | % | | | | | | | 50 | % | | | | | | | 21 | % | | | | | | | 18 | % |
| | | | | | | | | | |
Net assets end of year (000’s) omitted | | | | | | | $74,094 | | | | | | | | $112,741 | | | | | | | | $176,807 | | | | | | | | $1,102,479 | | | | | | | | $1,754,203 | |
| | | | | | | | | | | | | | | | | | | | | | | | | | | | | | | |
58
| | |
| | | AMG River Road Mid Cap Value Fund Financial Highlights For a share outstanding throughout each fiscal year |
| | | |
| | | |
| | | | | | | | | | | | | | | | | | | | | | | | | | | | | | | | | | | | | | | | |
| | | For the fiscal years ended October 31, | |
| | | | | | | | | | |
| Class Z | | | | | 2022 | | | | | | 2021 | | | | | | 2020 | | | | | | 2019 | | | | | | 2018 | |
| | | | | | | | | | |
Net Asset Value, Beginning of Year | | | | | | | $20.71 | | | | | | | | $30.63 | | | | | | | | $35.95 | | | | | | | | $39.34 | | | | | | | | $42.98 | |
| | | | | | | | | | |
Income (loss) from Investment Operations: | | | | | | | | | | | | | | | | | | | | | | | | | | | | | | | | | | | | | | | | |
| | | | | | | | | | |
Net investment income1,2 | | | | | | | 0.24 | 3 | | | | | | | 0.10 | 4 | | | | | | | 0.28 | | | | | | | | 0.48 | 5 | | | | | | | 0.22 | |
| | | | | | | | | | |
Net realized and unrealized gain (loss) on investments | | | | | | | (1.29 | ) | | | | | | | 12.13 | | | | | | | | (2.94 | ) | | | | | | | (0.89 | ) | | | | | | | (0.98 | ) |
| | | | | | | | | | | | | | | | | | | | | | | | | | | | | | | | | | | | | | | | |
| | | | | | | | | | |
Total income (loss) from investment operations | | | | | | | (1.05 | ) | | | | | | | 12.23 | | | | | | | | (2.66 | ) | | | | | | | (0.41 | ) | | | | | | | (0.76 | ) |
| | | | | | | | | | |
Less Distributions to Shareholders from: | | | | | | | | | | | | | | | | | | | | | | | | | | | | | | | | | | | | | | | | |
| | | | | | | | | | |
Net investment income | | | | | | | (0.12 | ) | | | | | | | (0.14 | ) | | | | | | | (0.48 | ) | | | | | | | (0.32 | ) | | | | | | | (0.07 | ) |
| | | | | | | | | | |
Net realized gain on investments | | | | | | | (0.60 | ) | | | | | | | (22.01 | ) | | | | | | | (2.18 | ) | | | | | | | (2.66 | ) | | | | | | | (2.81 | ) |
| | | | | | | | | | | | | | | | | | | | | | | | | | | | | | | | | | | | | | | | |
| | | | | | | | | | |
Total distributions to shareholders | | | | | | | (0.72 | ) | | | | | | | (22.15 | ) | | | | | | | (2.66 | ) | | | | | | | (2.98 | ) | | | | | | | (2.88 | ) |
| | | | | | | | | | |
Net Asset Value, End of Year | | | | | | | $18.94 | | | | | | | | $20.71 | | | | | | | | $30.63 | | | | | | | | $35.95 | | | | | | | | $39.34 | |
| | | | | | | | | | | | | | | | | | | | | | | | | | | | | | | | | | | | | | | | |
| | | | | | | | | | |
Total Return2,6 | | | | | | | (5.34 | )% | | | | | | | 51.18 | % | | | | | | | (8.32 | )% | | | | | | | (0.25 | )% | | | | | | | (2.48 | )% |
| | | | | | | | | | |
Ratio of net expenses to average net assets | | | | | | | 0.75 | %7 | | | | | | | 0.80 | %7 | | | | | | | 0.82 | % | | | | | | | 0.82 | % | | | | | | | 0.79 | % |
| | | | | | | | | | |
Ratio of gross expenses to average net assets8 | | | | | | | 0.77 | % | | | | | | | 0.85 | % | | | | | | | 0.84 | % | | | | | | | 0.82 | % | | | | | | | 0.80 | % |
| | | | | | | | | | |
Ratio of net investment income to average net assets2 | | | | | | | 1.24 | % | | | | | | | 0.41 | % | | | | | | | 0.84 | % | | | | | | | 1.28 | % | | | | | | | 0.52 | % |
| | | | | | | | | | |
Portfolio turnover | | | | | | | 71 | % | | | | | | | 149 | % | | | | | | | 50 | % | | | | | | | 21 | % | | | | | | | 18 | % |
| | | | | | | | | | |
Net assets end of year (000’s) omitted | | | | | | | $7,221 | | | | | | | | $8,237 | | | | | | | | $9,786 | | | | | | | | $47,907 | | | | | | | | $205,203 | |
| | | | | | | | | | | | | | | | | | | | | | | | | | | | | | | |
| 1 | Per share numbers have been calculated using average shares. |
| 2 | Total returns and net investment income (loss) would have been lower had certain expenses not been offset. |
| 3 | Includes non-recurring dividends. Without these dividends, net investment income per share would have been $0.05, $0.11 and $0.11 for Class N, Class I and Class Z, respectively. |
| 4 | Includes non-recurring dividends. Without these dividends, net investment income (loss) per share would have been $(0.02), $0.05 and $0.06 for Class N, Class I and Class Z, respectively. |
| 5 | Includes non-recurring dividends. Without these dividends, net investment income per share would have been $0.23, $0.33 and $0.36 for Class N, Class I and Class Z, respectively. |
| 6 | The total return is calculated using the published Net Asset Value as of fiscal year end. |
| 7 | Includes reduction from brokerage recapture amounting to 0.01% and less than 0.01% for the fiscal years ended October 31, 2022 and 2021, respectively. |
| 8 | Excludes the impact of expense reimbursement or fee waivers and expense reductions such as brokerage credits, but includes expense repayments and non-reimbursable expenses, if any, such as interest, taxes, and extraordinary expenses. (See Note 1(c) and 2 in the Notes to Financial Statements.) |
59
| | |
| | | AMG River Road Large Cap Value Select Fund Financial Highlights For a share outstanding throughout each fiscal year |
| | | |
| | | |
| | | | | | | | | | | | | | | | | | | | | | | | | | | | | | | | | | | | | | | | |
| | | For the fiscal years ended October 31, | |
| | | | | | | | | | |
| Class N | | | | | 2022 | | | | | | 2021 | | | | | | 2020 | | | | | | 2019 | | | | | | 2018 | |
| | | | | | | | | | |
Net Asset Value, Beginning of Year | | | | | | | $15.45 | | | | | | | | $13.73 | | | | | | | | $16.22 | | | | | | | | $15.68 | | | | | | | | $17.97 | |
| | | | | | | | | | |
Income (loss) from Investment Operations: | | | | | | | | | | | | | | | | | | | | | | | | | | | | | | | | | | | | | | | | |
| | | | | | | | | | |
Net investment income (loss)1,2 | | | | | | | 0.22 | 3 | | | | | | | 0.01 | | | | | | | | 0.04 | 4 | | | | | | | 0.12 | 5 | | | | | | | (0.07 | ) |
| | | | | | | | | | |
Net realized and unrealized gain (loss) on investments | | | | | | | (1.59 | ) | | | | | | | 4.27 | | | | | | | | (1.84 | ) | | | | | | | 0.95 | | | | | | | | 1.94 | |
| | | | | | | | | | | | | | | | | | | | | | | | | | | | | | | | | | | | | | | | |
| | | | | | | | | | |
Total income (loss) from investment operations | | | | | | | (1.37 | ) | | | | | | | 4.28 | | | | | | | | (1.80 | ) | | | | | | | 1.07 | | | | | | | | 1.87 | |
| | | | | | | | | | |
Less Distributions to Shareholders from: | | | | | | | | | | | | | | | | | | | | | | | | | | | | | | | | | | | | | | | | |
| | | | | | | | | | |
Net investment income | | | | | | | — | | | | | | | | (2.56 | ) | | | | | | | — | | | | | | | | (0.02 | ) | | | | | | | — | |
| | | | | | | | | | |
Net realized gain on investments | | | | | | | — | | | | | | | | — | | | | | | | | (0.69 | ) | | | | | | | (0.51 | ) | | | | | | | (4.16 | ) |
| | | | | | | | | | | | | | | | | | | | | | | | | | | | | | | | | | | | | | | | |
| | | | | | | | | | |
Total distributions to shareholders | | | | | | | — | | | | | | | | (2.56 | ) | | | | | | | (0.69 | ) | | | | | | | (0.53 | ) | | | | | | | (4.16 | ) |
| | | | | | | | | | |
Net Asset Value, End of Year | | | | | | | $14.08 | | | | | | | | $15.45 | | | | | | | | $13.73 | | | | | | | | $16.22 | | | | | | | | $15.68 | |
| | | | | | | | | | | | | | | | | | | | | | | | | | | | | | | | | | | | | | | | |
| | | | | | | | | | |
Total Return2,6 | | | | | | | (8.87 | )% | | | | | | | 33.53 | % | | | | | | | (11.66 | )% | | | | | | | 7.15 | % | | | | | | | 12.54 | % |
| | | | | | | | | | |
Ratio of net expenses to average net assets | | | | | | | 0.95 | %7 | | | | | | | 1.00 | %7 | | | | | | | 1.04 | % | | | | | | | 1.28 | %7,8 | | | | | | | 2.24 | %7,8 |
| | | | | | | | | | |
Ratio of gross expenses to average net assets9 | | | | | | | 1.07 | % | | | | | | | 1.14 | % | | | | | | | 1.08 | % | | | | | | | 1.30 | % | | | | | | | 2.36 | % |
| | | | | | | | | | |
Ratio of net investment income (loss) to average net assets2 | | | | | | | 1.51 | % | | | | | | | 0.08 | % | | | | | | | 0.25 | % | | | | | | | 0.74 | % | | | | | | | (0.43 | )% |
| | | | | | | | | | |
Portfolio turnover | | | | | | | 91 | % | | | | | | | 256 | % | | | | | | | 750 | % | | | | | | | 330 | % | | | | | | | 240 | % |
| | | | | | | | | | |
Net assets end of year (000’s) omitted | | | | | | | $3,683 | | | | | | | | $4,623 | | | | | | | | $4,716 | | | | | | | | $14,301 | | | | | | | | $24,536 | |
| | | | | | | | | | | | | | | | | | | | | | | | | | | | | | |
60
| | |
| | | AMG River Road Large Cap Value Select Fund Financial Highlights For a share outstanding throughout each fiscal year |
| | | |
| | | |
| | | | | | | | | | | | | | | | | | | | | | | | | | | | | | | | | | | | | | | | |
| | | For the fiscal years ended October 31, | |
| | | | | | | | | | |
| Class I | | | | | 2022 | | | | | | 2021 | | | | | | 2020 | | | | | | 2019 | | | | | | 2018 | |
| | | | | | | | | | |
Net Asset Value, Beginning of Year | | | | | | | $15.58 | | | | | | | | $13.80 | | | | | | | | $16.25 | | | | | | | | $15.71 | | | | | | | | $17.97 | |
| | | | | | | | | | |
Income (loss) from Investment Operations: | | | | | | | | | | | | | | | | | | | | | | | | | | | | | | | | | | | | | | | | |
| | | | | | | | | | |
Net investment income (loss)1,2 | | | | | | | 0.27 | 3 | | | | | | | 0.06 | | | | | | | | 0.08 | 4 | | | | | | | 0.16 | 5 | | | | | | | (0.02 | ) |
| | | | | | | | | | |
Net realized and unrealized gain (loss) on investments | | | | | | | (1.60 | ) | | | | | | | 4.29 | | | | | | | | (1.84 | ) | | | | | | | 0.95 | | | | | | | | 1.92 | |
| | | | | | | | | | | | | | | | | | | | | | | | | | | | | | | | | | | | | | | | |
| | | | | | | | | | |
Total income (loss) from investment operations | | | | | | | (1.33 | ) | | | | | | | 4.35 | | | | | | | | (1.76 | ) | | | | | | | 1.11 | | | | | | | | 1.90 | |
| | | | | | | | | | |
Less Distributions to Shareholders from: | | | | | | | | | | | | | | | | | | | | | | | | | | | | | | | | | | | | | | | | |
| | | | | | | | | | |
Net investment income | | | | | | | (0.06 | ) | | | | | | | (2.57 | ) | | | | | | | — | | | | | | | | (0.06 | ) | | | | | | | — | |
| | | | | | | | | | |
Net realized gain on investments | | | | | | | — | | | | | | | | — | | | | | | | | (0.69 | ) | | | | | | | (0.51 | ) | | | | | | | (4.16 | ) |
| | | | | | | | | | | | | | | | | | | | | | | | | | | | | | | | | | | | | | | | |
| | | | | | | | | | |
Total distributions to shareholders | | | | | | | (0.06 | ) | | | | | | | (2.57 | ) | | | | | | | (0.69 | ) | | | | | | | (0.57 | ) | | | | | | | (4.16 | ) |
| | | | | | | | | | |
Net Asset Value, End of Year | | | | | | | $14.19 | | | | | | | | $15.58 | | | | | | | | $13.80 | | | | | | | | $16.25 | | | | | | | | $15.71 | |
| | | | | | | | | | | | | | | | | | | | | | | | | | | | | | | | | | | | | | | | |
| | | | | | | | | | |
Total Return2,6 | | | | | | | (8.55 | )% | | | | | | | 33.93 | % | | | | | | | (11.38 | )% | | | | | | | 7.43 | % | | | | | | | 12.82 | % |
| | | | | | | | | | |
Ratio of net expenses to average net assets | | | | | | | 0.63 | %7 | | | | | | | 0.69 | %7 | | | | | | | 0.76 | % | | | | | | | 0.99 | %7,8 | | | | | | | 1.92 | %7,8 |
| | | | | | | | | | |
Ratio of gross expenses to average net assets9 | | | | | | | 0.75 | % | | | | | | | 0.83 | % | | | | | | | 0.80 | % | | | | | | | 1.01 | % | | | | | | | 2.04 | % |
| | | | | | | | | | |
Ratio of net investment income (loss) to average net assets2 | | | | | | | 1.83 | % | | | | | | | 0.39 | % | | | | | | | 0.53 | % | | | | | | | 1.03 | % | | | | | | | (0.11 | )% |
| | | | | | | | | | |
Portfolio turnover | | | | | | | 91 | % | | | | | | | 256 | % | | | | | | | 750 | % | | | | | | | 330 | % | | | | | | | 240 | % |
| | | | | | | | | | |
Net assets end of year (000’s) omitted | | | | | | | $30,519 | | | | | | | | $36,900 | | | | | | | | $38,990 | | | | | | | | $83,323 | | | | | | | | $55,590 | |
| | | | | | | | | | | | | | | | | | | | | | | | | | | | | | |
| 1 | Per share numbers have been calculated using average shares. |
| 2 | Total returns and net investment income (loss) would have been lower had certain expenses not been offset. |
| 3 | Includes non-recurring dividends. Without these dividends, net investment income per share would have been $0.08 and $0.13 for Class N and Class I, respectively. |
| 4 | Includes non-recurring dividends. Without these dividends, net investment income (loss) per share would have been $(0.01) and $0.03 for Class N and Class I, respectively. |
| 5 | Includes non-recurring dividends. Without these dividends, net investment income per share would have been $0.07 and $0.12 for Class N and Class I, respectively. |
| 6 | The total return is calculated using the published Net Asset Value as of fiscal year end. |
| 7 | Includes reduction from broker recapture amounting to less than 0.01%, less than 0.01%, less than 0.01% and 0.01% for the fiscal years ended October 31, 2022, 2021, 2019, and 2018, respectively. |
| 8 | Expense ratio includes dividend and interest expense related to securities sold short. Excluding such dividend and interest expense, the ratio of net expenses to average net assets would be 1.04% and 0.75%, 1.04% and 0.72% for Class N and Class I, respectively, for the fiscal years ended October 31, 2019, and 2018, respectively. |
| 9 | Excludes the impact of expense reimbursement or fee waivers and expense reductions such as brokerage credits, but includes expense repayments and non-reimbursable expenses, if any, such as interest, taxes, and extraordinary expenses. (See Note 1(c) and 2 in the Notes to Financial Statements.) |
61
| | |
| | | AMG River Road Small Cap Value Fund Financial Highlights For a share outstanding throughout each fiscal year |
| | | |
| | | |
| | | | | | | | | | | | | | | | | | | | | | | | | | | | | | | | | | | | | | | | |
| | | For the fiscal years ended October 31, | |
| | | | | | | | | | |
| Class N | | | | | 2022 | | | | | | 2021 | | | | | | 2020 | | | | | | 2019 | | | | | | 2018 | |
| | | | | | | | | | |
Net Asset Value, Beginning of Year | | | | | | | $15.45 | | | | | | | | $10.76 | | | | | | | | $13.00 | | | | | | | | $13.26 | | | | | | | | $14.46 | |
| | | | | | | | | | |
Income (loss) from Investment Operations: | | | | | | | | | | | | | | | | | | | | | | | | | | | | | | | | | | | | | | | | |
| | | | | | | | | | |
Net investment loss1,2 | | | | | | | (0.09 | ) | | | | | | | (0.09 | ) | | | | | | | (0.02 | ) | | | | | | | (0.04 | ) | | | | | | | (0.05 | ) |
| | | | | | | | | | |
Net realized and unrealized gain (loss) on investments | | | | | | | 0.06 | | | | | | | | 4.78 | | | | | | | | (1.43 | ) | | | | | | | 1.17 | | | | | | | | 0.79 | |
| | | | | | | | | | | | | | | | | | | | | | | | | | | | | | | | | | | | | | | | |
| | | | | | | | | | |
Total income (loss) from investment operations | | | | | | | (0.03 | ) | | | | | | | 4.69 | | | | | | | | (1.45 | ) | | | | | | | 1.13 | | | | | | | | 0.74 | |
| | | | | | | | | | |
Less Distributions to Shareholders from: | | | | | | | | | | | | | | | | | | | | | | | | | | | | | | | | | | | | | | | | |
| | | | | | | | | | |
Net realized gain on investments | | | | | | | (1.16 | ) | | | | | | | — | | | | | | | | (0.79 | ) | | | | | | | (1.39 | ) | | | | | | | (1.94 | ) |
| | | | | | | | | | |
Net Asset Value, End of Year | | | | | | | $14.26 | | | | | | | | $15.45 | | | | | | | | $10.76 | | | | | | | | $13.00 | | | | | | | | $13.26 | |
| | | | | | | | | | | | | | | | | | | | | | | | | | | | | | | | | | | | | | | | |
| | | | | | | | | | |
Total Return2,3 | | | | | | | (0.35 | )% | | | | | | | 43.59 | % | | | | | | | (12.09 | )% | | | | | | | 10.86 | % | | | | | | | 5.41 | % |
| | | | | | | | | | |
Ratio of net expenses to average net assets4 | | | | | | | 1.35 | % | | | | | | | 1.33 | % | | | | | | | 1.34 | % | | | | | | | 1.36 | % | | | | | | | 1.35 | % |
| | | | | | | | | | |
Ratio of gross expenses to average net assets5 | | | | | | | 1.35 | % | | | | | | | 1.35 | % | | | | | | | 1.36 | % | | | | | | | 1.37 | % | | | | | | | 1.36 | % |
| | | | | | | | | | |
Ratio of net investment loss to average net assets2 | | | | | | | (0.60 | )% | | | | | | | (0.61 | )% | | | | | | | (0.19 | )% | | | | | | | (0.33 | )% | | | | | | | (0.34 | )% |
| | | | | | | | | | |
Portfolio turnover | | | | | | | 33 | % | | | | | | | 39 | % | | | | | | | 42 | % | | | | | | | 47 | % | | | | | | | 41 | % |
| | | | | | | | | | |
Net assets end of year (000’s) omitted | | | | | | | $37,265 | | | | | | | | $34,246 | | | | | | | | $25,920 | | | | | | | | $29,963 | | | | | | | | $28,444 | |
| | | | | | | | | | | | | | | | | | | | | | | | | | | | | | |
62
| | |
| | | AMG River Road Small Cap Value Fund Financial Highlights For a share outstanding throughout each fiscal year |
| | | |
| | | |
| | | | | | | | | | | | | | | | | | | | | | | | | | | | | | | | | | | | | | | | |
| | | For the fiscal years ended October 31, | |
| | | | | | | | | | |
| Class I | | | | | 2022 | | | | | | 2021 | | | | | | 2020 | | | | | | 2019 | | | | | | 2018 | |
| | | | | | | | | | |
Net Asset Value, Beginning of Year | | | | | | | $15.91 | | | | | | | | $11.05 | | | | | | | | $13.30 | | | | | | | | $13.51 | | | | | | | | $14.68 | |
| | | | | | | | | | |
Income (loss) from Investment Operations: | | | | | | | | | | | | | | | | | | | | | | | | | | | | | | | | | | | | | | | | |
| | | | | | | | | | |
Net investment income (loss)1,2 | | | | | | | (0.05 | ) | | | | | | | (0.05 | ) | | | | | | | 0.01 | | | | | | | | (0.01 | ) | | | | | | | (0.01 | ) |
| | | | | | | | | | |
Net realized and unrealized gain (loss) on investments | | | | | | | 0.06 | | | | | | | | 4.91 | | | | | | | | (1.46 | ) | | | | | | | 1.20 | | | | | | | | 0.79 | |
| | | | | | | | | | | | | | | | | | | | | | | | | | | | | | | | | | | | | | | | |
| | | | | | | | | | |
Total income (loss) from investment operations | | | | | | | 0.01 | | | | | | | | 4.86 | | | | | | | | (1.45 | ) | | | | | | | 1.19 | | | | | | | | 0.78 | |
| | | | | | | | | | |
Less Distributions to Shareholders from: | | | | | | | | | | | | | | | | | | | | | | | | | | | | | | | | | | | | | | | | |
| | | | | | | | | | |
Net investment income | | | | | | | — | | | | | | | | (0.00 | )6 | | | | | | | (0.01 | ) | | | | | | | (0.01 | ) | | | | | | | (0.01 | ) |
| | | | | | | | | | |
Net realized gain on investments | | | | | | | (1.16 | ) | | | | | | | — | | | | | | | | (0.79 | ) | | | | | | | (1.39 | ) | | | | | | | (1.94 | ) |
| | | | | | | | | | | | | | | | | | | | | | | | | | | | | | | | | | | | | | | | |
| | | | | | | | | | |
Total distributions to shareholders | | | | | | | (1.16 | ) | | | | | | | (0.00 | )6 | | | | | | | (0.80 | ) | | | | | | | (1.40 | ) | | | | | | | (1.95 | ) |
| | | | | | | | | | |
Net Asset Value, End of Year | | | | | | | $14.76 | | | | | | | | $15.91 | | | | | | | | $11.05 | | | | | | | | $13.30 | | | | | | | | $13.51 | |
| | | | | | | | | | | | | | | | | | | | | | | | | | | | | | | | | | | | | | | | |
| | | | | | | | | | |
Total Return2,3 | | | | | | | (0.07 | )% | | | | | | | 43.99 | % | | | | | | | (11.91 | )% | | | | | | | 11.23 | % | | | | | | | 5.60 | % |
| | | | | | | | | | |
Ratio of net expenses to average net assets4 | | | | | | | 1.09 | % | | | | | | | 1.07 | % | | | | | | | 1.07 | % | | | | | | | 1.09 | % | | | | | | | 1.10 | % |
| | | | | | | | | | |
Ratio of gross expenses to average net assets5 | | | | | | | 1.09 | % | | | | | | | 1.09 | % | | | | | | | 1.09 | % | | | | | | | 1.10 | % | | | | | | | 1.11 | % |
| | | | | | | | | | |
Ratio of net investment income (loss) to average net assets2 | | | | | | | (0.34 | )% | | | | | | | (0.35 | )% | | | | | | | 0.07 | % | | | | | | | (0.06 | )% | | | | | | | (0.09 | )% |
| | | | | | | | | | |
Portfolio turnover | | | | | | | 33 | % | | | | | | | 39 | % | | | | | | | 42 | % | | | | | | | 47 | % | | | | | | | 41 | % |
| | | | | | | | | | |
Net assets end of year (000’s) omitted | | | | | | | $819,940 | | | | | | | | $835,473 | | | | | | | | $487,637 | | | | | | | | $374,344 | | | | | | | | $330,245 | |
| | | | | | | | | | | | | | | | | | | | | | | | | | | | | | |
63
| | |
| | | AMG River Road Small Cap Value Fund Financial Highlights For a share outstanding throughout each fiscal year |
| | | |
| | | |
| | | | | | | | | | | | | | | | | | | | | | | | | | | | | | | | | | | | | | | | |
| | | For the fiscal years ended October 31, | |
| | | | | | | | | | |
| Class Z | | | | | 2022 | | | | | | 2021 | | | | | | 2020 | | | | | | 2019 | | | | | | 2018 | |
| | | | | | | | | | |
Net Asset Value, Beginning of Year | | | | | | | $15.92 | | | | | | | | $11.05 | | | | | | | | $13.30 | | | | | | | | $13.51 | | | | | | | | $14.68 | |
| | | | | | | | | | |
Income (loss) from Investment Operations: | | | | | | | | | | | | | | | | | | | | | | | | | | | | | | | | | | | | | | | | |
| | | | | | | | | | |
Net investment income (loss)1,2 | | | | | | | (0.04 | ) | | | | | | | (0.04 | ) | | | | | | | 0.02 | | | | | | | | 0.00 | 7 | | | | | | | 0.00 | 7 |
| | | | | | | | | | |
Net realized and unrealized gain (loss) on investments | | | | | | | 0.06 | | | | | | | | 4.92 | | | | | | | | (1.46 | ) | | | | | | | 1.20 | | | | | | | | 0.79 | |
| | | | | | | | | | | | | | | | | | | | | | | | | | | | | | | | | | | | | | | | |
| | | | | | | | | | |
Total income (loss) from investment operations | | | | | | | 0.02 | | | | | | | | 4.88 | | | | | | | | (1.44 | ) | | | | | | | 1.20 | | | | | | | | 0.79 | |
| | | | | | | | | | |
Less Distributions to Shareholders from: | | | | | | | | | | | | | | | | | | | | | | | | | | | | | | | | | | | | | | | | |
| | | | | | | | | | |
Net investment income | | | | | | | — | | | | | | | | (0.01 | ) | | | | | | | (0.02 | ) | | | | | | | (0.02 | ) | | | | | | | (0.02 | ) |
| | | | | | | | | | |
Net realized gain on investments | | | | | | | (1.16 | ) | | | | | | | — | | | | | | | | (0.79 | ) | | | | | | | (1.39 | ) | | | | | | | (1.94 | ) |
| | | | | | | | | | | | | | | | | | | | | | | | | | | | | | | | | | | | | | | | |
| | | | | | | | | | |
Total distributions to shareholders | | | | | | | (1.16 | ) | | | | | | | (0.01 | ) | | | | | | | (0.81 | ) | | | | | | | (1.41 | ) | | | | | | | (1.96 | ) |
| | | | | | | | | | |
Net Asset Value, End of Year | | | | | | | $14.78 | | | | | | | | $15.92 | | | | | | | | $11.05 | | | | | | | | $13.30 | | | | | | | | $13.51 | |
| | | | | | | | | | | | | | | | | | | | | | | | | | | | | | | | | | | | | | | | |
| | | | | | | | | | |
Total Return2,3 | | | | | | | (0.00 | )%8 | | | | | | | 44.17 | % | | | | | | | (11.78 | )% | | | | | | | 11.29 | % | | | | | | | 5.71 | % |
| | | | | | | | | | |
Ratio of net expenses to average net assets4 | | | | | | | 1.00 | % | | | | | | | 0.98 | % | | | | | | | 0.99 | % | | | | | | | 1.01 | % | | | | | | | 1.00 | % |
| | | | | | | | | | |
Ratio of gross expenses to average net assets5 | | | | | | | 1.00 | % | | | | | | | 1.00 | % | | | | | | | 1.01 | % | | | | | | | 1.02 | % | | | | | | | 1.01 | % |
| | | | | | | | | | |
Ratio of net investment income (loss) to average net assets2 | | | | | | | (0.25 | )% | | | | | | | (0.26 | )% | | | | | | | 0.16 | % | | | | | | | 0.02 | % | | | | | | | 0.01 | % |
| | | | | | | | | | |
Portfolio turnover | | | | | | | 33 | % | | | | | | | 39 | % | | | | | | | 42 | % | | | | | | | 47 | % | | | | | | | 41 | % |
| | | | | | | | | | |
Net assets end of year (000’s) omitted | | | | | | | $9,792 | | | | | | | | $7,911 | | | | | | | | $1,025 | | | | | | | | $186 | | | | | | | | $163 | |
| | | | | | | | | | | | | | | | | | | | | | | | | | | | | | |
| 1 | Per share numbers have been calculated using average shares. |
| 2 | Total returns and net investment income (loss) would have been lower had certain expenses not been offset. |
| 3 | The total return is calculated using the published Net Asset Value as of fiscal year end. |
| 4 | Includes reduction from broker recapture amounting to less than 0.01%, 0.02%, 0.02%, 0.01%, and 0.01% for the fiscal years ended October 31, 2022, 2021, 2020, 2019, and 2018, respectively. |
| 5 | Excludes the impact of expense reimbursement or fee waivers and expense reductions such as brokerage credits, but includes expense repayments and non-reimbursable expenses, if any, such as interest, taxes, and extraordinary expenses. (See Note 1(c) and 2 in the Notes to Financial Statements.) |
| 6 | Less than $(0.005) per share. |
| 7 | Less than $0.005 per share. |
64
| | |
| | | AMG River Road Dividend All Cap Value Fund Financial Highlights For a share outstanding throughout each fiscal year |
| | | |
| | | |
| | | | | | | | | | | | | | | | | | | | | | | | | | | | | | | | | | | | | | | | |
| | | For the fiscal years ended October 31, | |
| | | | | | | | | | |
| Class N | | | | | 2022 | | | | | | 2021 | | | | | | 2020 | | | | | | 2019 | | | | | | 2018 | |
| | | | | | | | | | |
Net Asset Value, Beginning of Year | | | | | | | $13.28 | | | | | | | | $10.02 | | | | | | | | $12.34 | | | | | | | | $12.29 | | | | | | | | $12.87 | |
| | | | | | | | | | |
Income (loss) from Investment Operations: | | | | | | | | | | | | | | | | | | | | | | | | | | | | | | | | | | | | | | | | |
| | | | | | | | | | |
Net investment income1,2 | | | | | | | 0.18 | | | | | | | | 0.19 | | | | | | | | 0.25 | | | | | | | | 0.27 | | | | | | | | 0.22 | |
| | | | | | | | | | |
Net realized and unrealized gain (loss) on investments | | | | | | | (0.29 | ) | | | | | | | 3.27 | | | | | | | | (1.49 | ) | | | | | | | 0.80 | | | | | | | | 0.06 | |
| | | | | | | | | | | | | | | | | | | | | | | | | | | | | | | | | | | | | | | | |
| | | | | | | | | | |
Total income (loss) from investment operations | | | | | | | (0.11 | ) | | | | | | | 3.46 | | | | | | | | (1.24 | ) | | | | | | | 1.07 | | | | | | | | 0.28 | |
| | | | | | | | | | |
Less Distributions to Shareholders from: | | | | | | | | | | | | | | | | | | | | | | | | | | | | | | | | | | | | | | | | |
| | | | | | | | | | |
Net investment income | | | | | | | (0.27 | ) | | | | | | | (0.20 | ) | | | | | | | (0.34 | ) | | | | | | | (0.30 | ) | | | | | | | (0.28 | ) |
| | | | | | | | | | |
Net realized gain on investments | | | | | | | (2.20 | ) | | | | | | | — | | | | | | | | (0.74 | ) | | | | | | | (0.72 | ) | | | | | | | (0.58 | ) |
| | | | | | | | | | | | | | | | | | | | | | | | | | | | | | | | | | | | | | | | |
| | | | | | | | | | |
Total distributions to shareholders | | | | | | | (2.47 | ) | | | | | | | (0.20 | ) | | | | | | | (1.08 | ) | | | | | | | (1.02 | ) | | | | | | | (0.86 | ) |
| | | | | | | | | | |
Net Asset Value, End of Year | | | | | | | $10.70 | | | | | | | | $13.28 | | | | | | | | $10.02 | | | | | | | | $12.34 | | | | | | | | $12.29 | |
| | | | | | | | | | | | | | | | | | | | | | | | | | | | | | | | | | | | | | | | |
| | | | | | | | | | |
Total Return2,3 | | | | | | | (1.34 | )% | | | | | | | 34.74 | % | | | | | | | (10.96 | )% | | | | | | | 10.11 | % | | | | | | | 2.06 | % |
| | | | | | | | | | |
Ratio of net expenses to average net assets4 | | | | | | | 1.03 | % | | | | | | | 1.06 | % | | | | | | | 1.13 | % | | | | | | | 1.11 | % | | | | | | | 1.10 | % |
| | | | | | | | | | |
Ratio of gross expenses to average net assets5 | | | | | | | 1.07 | % | | | | | | | 1.09 | % | | | | | | | 1.13 | % | | | | | | | 1.12 | % | | | | | | | 1.11 | % |
| | | | | | | | | | |
Ratio of net investment income to average net assets2 | | | | | | | 1.61 | % | | | | | | | 1.51 | % | | | | | | | 2.38 | % | | | | | | | 2.32 | % | | | | | | | 1.78 | % |
| | | | | | | | | | |
Portfolio turnover | | | | | | | 30 | % | | | | | | | 20 | % | | | | | | | 35 | % | | | | | | | 29 | % | | | | | | | 27 | % |
| | | | | | | | | | |
Net assets end of year (000’s) omitted | | | | | | | $36,432 | | | | | | | | $43,430 | | | | | | | | $41,358 | | | | | | | | $79,811 | | | | | | | | $100,420 | |
| | | | | | | | | | | | | | | | | | | | | | | | | | | | | | |
65
| | |
| | | AMG River Road Dividend All Cap Value Fund Financial Highlights For a share outstanding throughout each fiscal year |
| | | |
| | | |
| | | | | | | | | | | | | | | | | | | | | | | | | | | | | | | | | | | | | | | | |
| | | For the fiscal years ended October 31, |
| | | | | | | | | | |
Class I | | | | 2022 | | | | 2021 | | | | 2020 | | | | 2019 | | | | 2018 |
| | | | | | | | | | |
Net Asset Value, Beginning of Year | | | | | | | $13.27 | | | | | | | | $10.01 | | | | | | | | $12.33 | | | | | | | | $12.29 | | | | | | | | $12.86 | |
| | | | | | | | | | |
Income (loss) from Investment Operations: | | | | | | | | | | | | | | | | | | | | | | | | | | | | | | | | | | | | | | | | |
| | | | | | | | | | |
Net investment income1,2 | | | | | | | 0.21 | | | | | | | | 0.22 | | | | | | | | 0.28 | | | | | | | | 0.31 | | | | | | | | 0.26 | |
| | | | | | | | | | |
Net realized and unrealized gain (loss) on investments | | | | | | | (0.30 | ) | | | | | | | 3.27 | | | | | | | | (1.49 | ) | | | | | | | 0.78 | | | | | | | | 0.06 | |
| | | | | | | | | | |
Total income (loss) from investment operations | | | | | | | (0.09 | ) | | | | | | | 3.49 | | | | | | | | (1.21 | ) | | | | | | | 1.09 | | | | | | | | 0.32 | |
| | | | | | | | | | |
Less Distributions to Shareholders from: | | | | | | | | | | | | | | | | | | | | | | | | | | | | | | | | | | | | | | | | |
| | | | | | | | | | |
Net investment income | | | | | | | (0.30 | ) | | | | | | | (0.23 | ) | | | | | | | (0.37 | ) | | | | | | | (0.33 | ) | | | | | | | (0.31 | ) |
| | | | | | | | | | |
Net realized gain on investments | | | | | | | (2.20 | ) | | | | | | | — | | | | | | | | (0.74 | ) | | | | | | | (0.72 | ) | | | | | | | (0.58 | ) |
| | | | | | | | | | |
Total distributions to shareholders | | | | | | | (2.50 | ) | | | | | | | (0.23 | ) | | | | | | | (1.11 | ) | | | | | | | (1.05 | ) | | | | | | | (0.89 | ) |
| | | | | | | | | | |
Net Asset Value, End of Year | | | | | | | $10.68 | | | | | | | | $13.27 | | | | | | | | $10.01 | | | | | | | | $12.33 | | | | | | | | $12.29 | |
| | | | | | | | | | |
Total Return2,3 | | | | | | | (1.18 | )% | | | | | | | 35.10 | % | | | | | | | (10.69 | )% | | | | | | | 10.32 | % | | | | | | | 2.38 | % |
| | | | | | | | | | |
Ratio of net expenses to average net assets4 | | | | | | | 0.78 | % | | | | | | | 0.81 | % | | | | | | | 0.86 | % | | | | | | | 0.84 | % | | | | | | | 0.84 | % |
| | | | | | | | | | |
Ratio of gross expenses to average net assets5 | | | | | | | 0.82 | % | | | | | | | 0.84 | % | | | | | | | 0.86 | % | | | | | | | 0.85 | % | | | | | | | 0.85 | % |
| | | | | | | | | | |
Ratio of net investment income to average net assets2 | | | | | | | 1.86 | % | | | | | | | 1.76 | % | | | | | | | 2.65 | % | | | | | | | 2.59 | % | | | | | | | 2.04 | % |
| | | | | | | | | | |
Portfolio turnover | | | | | | | 30 | % | | | | | | | 20 | % | | | | | | | 35 | % | | | | | | | 29 | % | | | | | | | 27 | % |
| | | | | | | | | | |
Net assets end of year (000’s) omitted | | | | | | | $290,632 | | | | | | | | $382,571 | | | | | | | | $408,844 | | | | | | | | $533,106 | | | | | | | | $743,984 | |
| | | | | | | | | | | | | | | | | | | | |
66
| | |
| | | AMG River Road Dividend All Cap Value Fund Financial Highlights For a share outstanding throughout each fiscal year |
| | | |
| | | |
| | | | | | | | | | | | | | | | | | | | | | | | | | | | | | | | | | | | | | | | |
| | | For the fiscal years ended October 31, |
| | | | | | | | | | |
Class Z | | | | 2022 | | | | 2021 | | | | 2020 | | | | 2019 | | | | 2018 |
| | | | | | | | | | |
Net Asset Value, Beginning of Year | | | | | | | $13.28 | | | | | | | | $10.01 | | | | | | | | $12.33 | | | | | | | | $12.29 | | | | | | | | $12.86 | |
| | | | | | | | | | |
Income (loss) from Investment Operations: | | | | | | | | | | | | | | | | | | | | | | | | | | | | | | | | | | | | | | | | |
| | | | | | | | | | |
Net investment income1,2 | | | | | | | 0.21 | | | | | | | | 0.22 | | | | | | | | 0.27 | | | | | | | | 0.32 | | | | | | | | 0.26 | |
| | | | | | | | | | |
Net realized and unrealized gain (loss) on investments | | | | | | | (0.29 | ) | | | | | | | 3.29 | | | | | | | | (1.47 | ) | | | | | | | 0.77 | | | | | | | | 0.06 | |
| | | | | | | | | | |
Total income (loss) from investment operations | | | | | | | (0.08 | ) | | | | | | | 3.51 | | | | | | | | (1.20 | ) | | | | | | | 1.09 | | | | | | | | 0.32 | |
| | | | | | | | | | |
Less Distributions to Shareholders from: | | | | | | | | | | | | | | | | | | | | | | | | | | | | | | | | | | | | | | | | |
| | | | | | | | | | |
Net investment income | | | | | | | (0.31 | ) | | | | | | | (0.24 | ) | | | | | | | (0.38 | ) | | | | | | | (0.33 | ) | | | | | | | (0.31 | ) |
| | | | | | | | | | |
Net realized gain on investments | | | | | | | (2.20 | ) | | | | | | | — | | | | | | | | (0.74 | ) | | | | | | | (0.72 | ) | | | | | | | (0.58 | ) |
| | | | | | | | | | |
Total distributions to shareholders | | | | | | | (2.51 | ) | | | | | | | (0.24 | ) | | | | | | | (1.12 | ) | | | | | | | (1.05 | ) | | | | | | | (0.89 | ) |
| | | | | | | | | | |
Net Asset Value, End of Year | | | | | | | $10.69 | | | | | | | | $13.28 | | | | | | | | $10.01 | | | | | | | | $12.33 | | | | | | | | $12.29 | |
| | | | | | | | | | |
Total Return2,3 | | | | | | | (1.12 | )% | | | | | | | 35.26 | % | | | | | | | (10.65 | )% | | | | | | | 10.37 | % | | | | | | | 2.42 | % |
| | | | | | | | | | |
Ratio of net expenses to average net assets4 | | | | | | | 0.74 | % | | | | | | | 0.77 | % | | | | | | | 0.81 | % | | | | | | | 0.79 | % | | | | | | | 0.78 | % |
| | | | | | | | | | |
Ratio of gross expenses to average net assets5 | | | | | | | 0.78 | % | | | | | | | 0.80 | % | | | | | | | 0.81 | % | | | | | | | 0.80 | % | | | | | | | 0.79 | % |
| | | | | | | | | | |
Ratio of net investment income to average net assets2 | | | | | | | 1.90 | % | | | | | | | 1.80 | % | | | | | | | 2.69 | % | | | | | | | 2.64 | % | | | | | | | 2.10 | % |
| | | | | | | | | | |
Portfolio turnover | | | | | | | 30 | % | | | | | | | 20 | % | | | | | | | 35 | % | | | | | | | 29 | % | | | | | | | 27 | % |
| | | | | | | | | | |
Net assets end of year (000’s) omitted | | | | | | | $3,199 | | | | | | | | $2,430 | | | | | | | | $1,901 | | | | | | | | $63 | | | | | | | | $619 | |
| | | | | | | | | | | | | | | | | | | | | |
| 1 | Per share numbers have been calculated using average shares. |
| 2 | Total returns and net investment income (loss) would have been lower had certain expenses not been offset. |
| 3 | The total return is calculated using the published Net Asset Value as of fiscal year end. |
| 4 | Includes reduction from broker recapture amounting to 0.01%, 0.01%, less than 0.01%, 0.01%, and less than 0.01%, for the fiscal years ended October 31, 2022, 2021, 2020, 2019, 2018, respectively. |
| 5 | Excludes the impact of expense reimbursement or fee waivers and expense reductions such as brokerage credits, but includes expense repayments and non-reimbursable expenses, if any, such as interest, taxes, and extraordinary expenses. (See Note 1(c) and 2 in the Notes to Financial Statements.) |
67
| | |
| | | AMG River Road Small-Mid Cap Value Fund Financial Highlights For a share outstanding throughout each fiscal year |
| | | |
| | | |
| | | | | | | | | | | | | | | | | | | | | | | | | | | | | | | | | | | | | | | | |
| | | For the fiscal years ended October 31, |
| | | | | | | | | | |
Class N | | | | 2022 | | | | 2021 | | | | 2020 | | | | 2019 | | | | 2018 |
| | | | | | | | | | |
Net Asset Value, Beginning of Year | | | | | | | $9.81 | | | | | | | | $6.80 | | | | | | | | $7.84 | | | | | | | | $7.62 | | | | | | | | $8.23 | |
| | | | | | | | | | |
Income (loss) from Investment Operations: | | | | | | | | | | | | | | | | | | | | | | | | | | | | | | | | | | | | | | | | |
| | | | | | | | | | |
Net investment loss1,2 | | | | | | | (0.03 | ) | | | | | | | (0.04 | ) | | | | | | | (0.01 | )3 | | | | | | | (0.02 | ) | | | | | | | (0.03 | ) |
| | | | | | | | | | |
Net realized and unrealized gain (loss) on investments | | | | | | | (0.11 | ) | | | | | | | 3.05 | | | | | | | | (0.88 | ) | | | | | | | 0.78 | | | | | | | | 0.57 | |
| | | | | | | | | | |
Total income (loss) from investment operations | | | | | | | (0.14 | ) | | | | | | | 3.01 | | | | | | | | (0.89 | ) | | | | | | | 0.76 | | | | | | | | 0.54 | |
| | | | | | | | | | |
Less Distributions to Shareholders from: | | | | | | | | | | | | | | | | | | | | | | | | | | | | | | | | | | | | | | | | |
| | | | | | | | | | |
Net investment income | | | | | | | — | | | | | | | | — | | | | | | | | (0.01 | ) | | | | | | | — | | | | | | | | (0.02 | ) |
| | | | | | | | | | |
Net realized gain on investments | | | | | | | (0.57 | ) | | | | | | | — | | | | | | | | (0.14 | ) | | | | | | | (0.54 | ) | | | | | | | (1.13 | ) |
| | | | | | | | | | |
Total distributions to shareholders | | | | | | | (0.57 | ) | | | | | | | — | | | | | | | | (0.15 | ) | | | | | | | (0.54 | ) | | | | | | | (1.15 | ) |
| | | | | | | | | | |
Net Asset Value, End of Year | | | | | | | $9.10 | | | | | | | | $9.81 | | | | | | | | $6.80 | | | | | | | | $7.84 | | | | | | | | $7.62 | |
| | | | | | | | | | |
Total Return2,4 | | | | | | | (1.64 | )% | | | | | | | 44.27 | % | | | | | | | (11.65 | )% | | | | | | | 11.82 | % | | | | | | | 7.09 | % |
| | | | | | | | | | |
Ratio of net expenses to average net assets5 | | | | | | | 1.28 | % | | | | | | | 1.25 | % | | | | | | | 1.31 | % | | | | | | | 1.31 | % | | | | | | | 1.32 | % |
| | | | | | | | | | |
Ratio of gross expenses to average net assets6 | | | | | | | 1.28 | % | | | | | | | 1.27 | % | | | | | | | 1.33 | % | | | | | | | 1.37 | % | | | | | | | 1.36 | % |
| | | | | | | | | | |
Ratio of net investment loss to average net assets2 | | | | | | | (0.28 | )% | | | | | | | (0.38 | )% | | | | | | | (0.16 | )% | | | | | | | (0.27 | )% | | | | | | | (0.35 | )% |
| | | | | | | | | | |
Portfolio turnover | | | | | | | 32 | % | | | | | | | 44 | % | | | | | | | 47 | % | | | | | | | 38 | % | | | | | | | 46 | % |
| | | | | | | | | | |
Net assets end of year (000’s) omitted | | | | | | | $18,961 | | | | | | | | $22,702 | | | | | | | | $21,618 | | | | | | | | $24,669 | | | | | | | | $17,840 | |
| | | | | | | | | | | | | | | | | | | | | |
68
| | |
| | | AMG River Road Small-Mid Cap Value Fund Financial Highlights For a share outstanding throughout each fiscal year |
| | | |
| | | |
| | | | | | | | | | | | | | | | | | | | | | | | | | | | | | | | | | | | | | | | |
| | | For the fiscal years ended October 31, |
| | | | | | | | | | |
| Class I | | | | 2022 | | | | 2021 | | | | 2020 | | | | 2019 | | | | 2018 |
| | | | | | | | | | |
Net Asset Value, Beginning of Year | | | | | | | $10.10 | | | | | | | | $6.98 | | | | | | | | $8.04 | | | | | | | | $7.78 | | | | | | | | $8.38 | |
| | | | | | | | | | |
Income (loss) from Investment Operations: | | | | | | | | | | | | | | | | | | | | | | | | | | | | | | | | | | | | | | | | |
| | | | | | | | | | |
Net investment income (loss)1,2 | | | | | | | (0.00 | )7 | | | | | | | (0.01 | ) | | | | | | | 0.01 | 3 | | | | | | | (0.00 | )7 | | | | | | | (0.01 | ) |
| | | | | | | | | | |
Net realized and unrealized gain (loss) on investments | | | | | | | (0.12 | ) | | | | | | | 3.13 | | | | | | | | (0.91 | ) | | | | | | | 0.80 | | | | | | | | 0.57 | |
| | | | | | | | | | |
Total income (loss) from investment operations | | | | | | | (0.12 | ) | | | | | | | 3.12 | | | | | | | | (0.90 | ) | | | | | | | 0.80 | | | | | | | | 0.56 | |
| | | | | | | | | | |
Less Distributions to Shareholders from: | | | | | | | | | | | | | | | | | | | | | | | | | | | | | | | | | | | | | | | | |
| | | | | | | | | | |
Net investment income | | | | | | | — | | | | | | | | (0.00 | )7 | | | | | | | (0.02 | ) | | | | | | | — | | | | | | | | (0.03 | ) |
| | | | | | | | | | |
Net realized gain on investments | | | | | | | (0.57 | ) | | | | | | | — | | | | | | | | (0.14 | ) | | | | | | | (0.54 | ) | | | | | | | (1.13 | ) |
| | | | | | | | | | |
Total distributions to shareholders | | | | | | | (0.57 | ) | | | | | | | (0.00 | )7 | | | | | | | (0.16 | ) | | | | | | | (0.54 | ) | | | | | | | (1.16 | ) |
| | | | | | | | | | |
Net Asset Value, End of Year | | | | | | | $9.41 | | | | | | | | $10.10 | | | | | | | | $6.98 | | | | | | | | $8.04 | | | | | | | | $7.78 | |
| | | | | | | | | | |
Total Return2,4 | | | | | | | (1.38 | )% | | | | | | | 44.70 | % | | | | | | | (11.47 | )% | | | | | | | 12.12 | % | | | | | | | 7.32 | % |
| | | | | | | | | | |
Ratio of net expenses to average net assets5 | | | | | | | 1.02 | % | | | | | | | 1.00 | % | | | | | | | 1.05 | % | | | | | | | 1.06 | % | | | | | | | 1.08 | % |
| | | | | | | | | | |
Ratio of gross expenses to average net assets6 | | | | | | | 1.02 | % | | | | | | | 1.02 | % | | | | | | | 1.07 | % | | | | | | | 1.12 | % | | | | | | | 1.12 | % |
| | | | | | | | | | |
Ratio of net investment income (loss) to average net assets2 | | | | | | | (0.02 | )% | | | | | | | (0.13 | )% | | | | | | | 0.09 | % | | | | | | | (0.02 | )% | | | | | | | (0.11 | )% |
| | | | | | | | | | |
Portfolio turnover | | | | | | | 32 | % | | | | | | | 44 | % | | | | | | | 47 | % | | | | | | | 38 | % | | | | | | | 46 | % |
| | | | | | | | | | |
Net assets end of year (000’s) omitted | | | | | | | $188,163 | | | | | | | | $218,698 | | | | | | | | $156,350 | | | | | | | | $145,620 | | | | | | | | $51,400 | |
| | | | | | | | | | | | | | | | | | | | | |
69
| | |
| | | AMG River Road Small-Mid Cap Value Fund Financial Highlights For a share outstanding throughout each fiscal year |
| | | |
| | | |
| | | | | | | | | | | | | | | | | | | | | | | | | | | | | | | | | | | | | | | | |
| | | For the fiscal years ended October 31, |
| | | | | | | | | | |
| Class Z | | | | 2022 | | | | 2021 | | | | 2020 | | | | 2019 | | | | 2018 |
| | | | | | | | | | |
Net Asset Value, Beginning of Year | | | | | | | $10.10 | | | | | | | | $6.98 | | | | | | | | $8.04 | | | | | | | | $7.77 | | | | | | | | $8.37 | |
| | | | | | | | | | |
Income (loss) from Investment Operations: | | | | | | | | | | | | | | | | | | | | | | | | | | | | | | | | | | | | | | | | |
| | | | | | | | | | |
Net investment income (loss)1,2 | | | | | | | 0.00 | 8 | | | | | | | (0.01 | ) | | | | | | | 0.01 | 3 | | | | | | | 0.00 | 8 | | | | | | | (0.01 | ) |
| | | | | | | | | | |
Net realized and unrealized gain (loss) on investments | | | | | | | (0.11 | ) | | | | | | | 3.13 | | | | | | | | (0.91 | ) | | | | | | | 0.81 | | | | | | | | 0.58 | |
| | | | | | | | | | |
Total income (loss) from investment operations | | | | | | | (0.11 | ) | | | | | | | 3.12 | | | | | | | | (0.90 | ) | | | | | | | 0.81 | | | | | | | | 0.57 | |
| | | | | | | | | | |
Less Distributions to Shareholders from: | | | | | | | | | | | | | | | | | | | | | | | | | | | | | | | | | | | | | | | | |
| | | | | | | | | | |
Net investment income | | | | | | | (0.00 | )7 | | | | | | | (0.00 | )7 | | | | | | | (0.02 | ) | | | | | | | — | | | | | | | | (0.04 | ) |
| | | | | | | | | | |
Net realized gain on investments | | | | | | | (0.57 | ) | | | | | | | — | | | | | | | | (0.14 | ) | | | | | | | (0.54 | ) | | | | | | | (1.13 | ) |
| | | | | | | | | | |
Total distributions to shareholders | | | | | | | (0.57 | ) | | | | | | | (0.00 | )7 | | | | | | | (0.16 | ) | | | | | | | (0.54 | ) | | | | | | | (1.17 | ) |
| | | | | | | | | | |
Net Asset Value, End of Year | | | | | | | $9.42 | | | | | | | | $10.10 | | | | | | | | $6.98 | | | | | | | | $8.04 | | | | | | | | $7.77 | |
| | | | | | | | | | |
Total Return2,4 | | | | | | | (1.26 | )% | | | | | | | 44.77 | % | | | | | | | (11.43 | )% | | | | | | | 12.26 | % | | | | | | | 7.37 | % |
| | | | | | | | | | |
Ratio of net expenses to average net assets5 | | | | | | | 0.97 | % | | | | | | | 0.95 | % | | | | | | | 1.00 | % | | | | | | | 1.01 | % | | | | | | | 1.03 | % |
| | | | | | | | | | |
Ratio of gross expenses to average net assets6 | | | | | | | 0.97 | % | | | | | | | 0.97 | % | | | | | | | 1.02 | % | | | | | | | 1.07 | % | | | | | | | 1.07 | % |
| | | | | | | | | | |
Ratio of net investment income (loss) to average net assets2 | | | | | | | 0.03 | % | | | | | | | (0.08 | )% | | | | | | | 0.14 | % | | | | | | | 0.03 | % | | | | | | | (0.06 | )% |
| | | | | | | | | | |
Portfolio turnover | | | | | | | 32 | % | | | | | | | 44 | % | | | | | | | 47 | % | | | | | | | 38 | % | | | | | | | 46 | % |
| | | | | | | | | | |
Net assets end of year (000’s) omitted | | | | | | | $34,477 | | | | | | | | $35,766 | | | | | | | | $553 | | | | | | | | $183 | | | | | | | | $136 | |
| | | | | | | | | | | | | | | | | | | | | |
| 1 | Per share numbers have been calculated using average shares. |
| 2 | Total returns and net investment income (loss) would have been lower had certain expenses not been offset. |
| 3 | Includes non-recurring dividends. Without these dividends, net investment (loss) income per share would have been $(0.02), $(0.00), and $0.00 for Class N, Class I, and Class Z shares, respectively. |
| 4 | The total return is calculated using the published Net Asset Value as of fiscal year end. |
| 5 | Includes reduction from broker recapture amounting to 0.01%, 0.02%, 0.02%, 0.03%, and 0.01% for the fiscal years ended October 31, 2022, 2021, 2020, 2019, and 2018, respectively. |
| 6 | Excludes the impact of expense reimbursement or fee waivers and expense reductions such as brokerage credits, but includes expense repayments and non-reimbursable expenses, if any, such as interest, taxes, and extraordinary expenses. (See Note 1(c) and 2 in the Notes to Financial Statements.) |
| 7 | Less than $(0.005) per share. |
| 8 | Less than $0.005 per share. |
70
| | |
| | | AMG River Road International Value Equity Fund Financial Highlights For a share outstanding throughout each fiscal year |
| | | |
| | | |
| | | | | | | | | | | | | | | | | | | | | | | | | | | | | | | | | | | | | | | | |
| | | For the fiscal years ended October 31, |
| | | | | | | | | | |
| Class N | | | | 2022 | | | | 2021 | | | | 2020 | | | | 2019 | | | | 2018 |
| | | | | | | | | | |
Net Asset Value, Beginning of Year | | | | | | | $9.51 | | | | | | | | $11.40 | | | | | | | | $13.06 | | | | | | | | $12.19 | | | | | | | | $12.33 | |
| | | | | | | | | | |
Income (loss) from Investment Operations: | | | | | | | | | | | | | | | | | | | | | | | | | | | | | | | | | | | | | | | | |
| | | | | | | | | | |
Net investment income (loss)1,2 | | | | | | | 0.29 | 3 | | | | | | | (0.09 | ) | | | | | | | (0.16 | ) | | | | | | | (0.05 | ) | | | | | | | (0.03 | )4 |
| | | | | | | | | | |
Net realized and unrealized gain (loss) on investments | | | | | | | (1.39 | ) | | | | | | | 2.71 | | | | | | | | (0.42 | ) | | | | | | | 1.63 | | | | | | | | (0.11 | ) |
| | | | | | | | | | |
Total income (loss) from investment operations | | | | | | | (1.10 | ) | | | | | | | 2.62 | | | | | | | | (0.58 | ) | | | | | | | 1.58 | | | | | | | | (0.14 | ) |
| | | | | | | | | | |
Less Distributions to Shareholders from: | | | | | | | | | | | | | | | | | | | | | | | | | | | | | | | | | | | | | | | | |
| | | | | | | | | | |
Net realized gain on investments | | | | | | | (0.06 | ) | | | | | | | (4.51 | ) | | | | | | | (1.08 | ) | | | | | | | (0.71 | ) | | | | | | | — | |
| | | | | | | | | | |
Net Asset Value, End of Year | | | | | | | $8.35 | | | | | | | | $9.51 | | | | | | | | $11.40 | | | | | | | | $13.06 | | | | | | | | $12.19 | |
| | | | | | | | | | |
Total Return2,5 | | | | | | | (11.67 | )% | | | | | | | 22.06 | % | | | | | | | (5.17 | )% | | | | | | | 13.98 | % | | | | | | | (1.14 | )% |
| | | | | | | | | | |
Ratio of net expenses to average net assets6 | | | | | | | 1.02 | % | | | | | | | 2.08 | %7 | | | | | | | 2.71 | %7 | | | | | | | 2.41 | %7 | | | | | | | 3.12 | %7 |
| | | | | | | | | | |
Ratio of gross expenses to average net assets8 | | | | | | | 2.11 | % | | | | | | | 2.69 | % | | | | | | | 3.23 | % | | | | | | | 2.83 | % | | | | | | | 3.41 | % |
| | | | | | | | | | |
Ratio of net investment income (loss) to average net assets2 | | | | | | | 3.23 | % | | | | | | | (0.70 | )% | | | | | | | (1.35 | )% | | | | | | | (0.43 | )% | | | | | | | (0.25 | )% |
| | | | | | | | | | |
Portfolio turnover | | | | | | | 51 | % | | | | | | | 159 | % | | | | | | | 257 | % | | | | | | | 264 | % | | | | | | | 189 | % |
| | | | | | | | | | |
Net assets end of year (000’s) omitted | | | | | | | $1,012 | | | | | | | | $1,561 | | | | | | | | $1,584 | | | | | | | | $2,654 | | | | | | | | $3,749 | |
| | | | | | | | | | | | | | | | | | | | | |
71
| | |
| | | AMG River Road International Value Equity Fund Financial Highlights For a share outstanding throughout each fiscal year |
| | | |
| | | |
| | | | | | | | | | | | | | | | | | | | |
| | | For the fiscal years ended October 31, |
| | | | | |
| Class I | | 2022 | | 2021 | | 2020 | | 2019 | | 2018 |
| | | | | |
Net Asset Value, Beginning of Year | | | $9.86 | | | | $11.65 | | | | $13.30 | | | | $12.37 | | | | $12.48 | |
| | | | | |
Income (loss) from Investment Operations: | | | | | | | | | | | | | | | | | | | | |
| | | | | |
Net investment income (loss)1,2 | | | 0.33 | 3 | | | (0.06 | ) | | | (0.14 | ) | | | (0.02 | ) | | | 0.00 | 4,9 |
| | | | | |
Net realized and unrealized gain (loss) on investments | | | (1.44 | ) | | | 2.78 | | | | (0.43 | ) | | | 1.66 | | | | (0.11 | ) |
| | | | | |
Total income (loss) from investment operations | | | (1.11 | ) | | | 2.72 | | | | (0.57 | ) | | | 1.64 | | | | (0.11 | ) |
| | | | | |
Less Distributions to Shareholders from: | | | | | | | | | | | | | | | | | | | | |
| | | | | |
Net investment income | | | (0.02 | ) | | | — | | | | — | | | | — | | | | — | |
| | | | | |
Net realized gain on investments | | | (0.06 | ) | | | (4.51 | ) | | | (1.08 | ) | | | (0.71 | ) | | | — | |
| | | | | |
Total distributions to shareholders | | | (0.08 | ) | | | (4.51 | ) | | | (1.08 | ) | | | (0.71 | ) | | | — | |
| | | | | |
Net Asset Value, End of Year | | | $8.67 | | | | $9.86 | | | | $11.65 | | | | $13.30 | | | | $12.37 | |
| | | | | |
Total Return2,5 | | | (11.41 | )% | | | 22.48 | % | | | (4.98 | )% | | | 14.28 | % | | | (0.88 | )% |
| | | | | |
Ratio of net expenses to average net assets6 | | | 0.77 | % | | | 1.84 | %7 | | | 2.46 | %7 | | | 2.16 | %7 | | | 2.87 | %7 |
| | | | | |
Ratio of gross expenses to average net assets8 | | | 1.86 | % | | | 2.45 | % | | | 2.98 | % | | | 2.58 | % | | | 3.16 | % |
| | | | | |
Ratio of net investment income (loss) to average net assets2 | | | 3.48 | % | | | (0.46 | )% | | | (1.10 | )% | | | (0.18 | )% | | | 0.00 | %10 |
| | | | | |
Portfolio turnover | | | 51 | % | | | 159 | % | | | 257 | % | | | 264 | % | | | 189 | % |
| | | | | |
Net assets end of year (000’s) omitted | | | $5,263 | | | | $7,105 | | | | $14,041 | | | | $22,856 | | | | $24,925 | |
| | | | | | | | | | | |
72
| | |
| | | AMG River Road International Value Equity Fund Financial Highlights For a share outstanding throughout each fiscal year |
| | | |
| | | |
| | | | | | | | | | | | | | | | | | | | |
| | | For the fiscal years ended October 31, |
| | | | | |
| Class Z | | 2022 | | 2021 | | 2020 | | 2019 | | 2018 |
| | | | | |
Net Asset Value, Beginning of Year | | | $9.92 | | | | $11.69 | | | | $13.32 | | | | $12.38 | | | | $12.49 | |
| | | | | |
Income (loss) from Investment Operations: | | | | | | | | | | | | | | | | | | | | |
| | | | | |
Net investment income (loss)1,2 | | | 0.33 | 3 | | | (0.05 | ) | | | (0.12 | ) | | | (0.01 | ) | | | 0.01 | 4 |
| | | | | |
Net realized and unrealized gain (loss) on investments | | | (1.45 | ) | | | 2.79 | | | | (0.43 | ) | | | 1.66 | | | | (0.12 | ) |
| | | | | |
Total income (loss) from investment operations | | | (1.12 | ) | | | 2.74 | | | | (0.55 | ) | | | 1.65 | | | | (0.11 | ) |
| | | | | |
Less Distributions to Shareholders from: | | | | | | | | | | | | | | | | | | | | |
| | | | | |
Net investment income | | | (0.03 | ) | | | — | | | | — | | | | — | | | | — | |
| | | | | |
Net realized gain on investments | | | (0.06 | ) | | | (4.51 | ) | | | (1.08 | ) | | | (0.71 | ) | | | — | |
| | | | | |
Total distributions to shareholders | | | (0.09 | ) | | | (4.51 | ) | | | (1.08 | ) | | | (0.71 | ) | | | — | |
| | | | | |
Net Asset Value, End of Year | | | $8.71 | | | | $9.92 | | | | $11.69 | | | | $13.32 | | | | $12.38 | |
| | | | | |
Total Return2,5 | | | (11.41 | )% | | | 22.58 | % | | | (4.82 | )% | | | 14.35 | % | | | (0.88 | )% |
| | | | | |
Ratio of net expenses to average net assets6 | | | 0.72 | % | | | 1.76 | %7 | | | 2.38 | %7 | | | 2.08 | %7 | | | 2.79 | %7 |
| | | | | |
Ratio of gross expenses to average net assets8 | | | 1.81 | % | | | 2.37 | % | | | 2.90 | % | | | 2.50 | % | | | 3.08 | % |
| | | | | |
Ratio of net investment income (loss) to average net assets2 | | | 3.53 | % | | | (0.38 | )% | | | (1.02 | )% | | | (0.10 | )% | | | 0.09 | % |
| | | | | |
Portfolio turnover | | | 51 | % | | | 159 | % | | | 257 | % | | | 264 | % | | | 189 | % |
| | | | | |
Net assets end of year (000’s) omitted | | | $833 | | | | $552 | | | | $660 | | | | $84 | | | | $73 | |
| | | | | | | | | | | |
| 1 | Per share numbers have been calculated using average shares. |
| 2 | Total returns and net investment income (loss) would have been lower had certain expenses not been offset. |
| 3 | Includes non-recurring dividends. Without these dividends, net investment income per share would have been $0.15, $0.18, and $0.18 for Class N, Class I and Class Z shares, respectively. |
| 4 | Includes non-recurring dividends. Without these dividends, net investment loss per share would have been $(0.17), $(0.14), and $(0.13) for Class N, Class I and Class Z shares, respectively. |
| 5 | The total return is calculated using the published Net Asset Value as of fiscal year end. |
| 6 | Includes reduction from brokerage recapture amounting to 0.01%, 0.04%, 0.11%, 0.01% and 0.02% for the fiscal years ended October 31, 2022, 2021, 2020, 2019,and 2018, respectively. |
| 7 | Expense ratio includes dividend and interest expense related to securities sold short. Excluding such dividend and interest expense, the ratio of net expenses to average net assets would be 1.32%, 1.11%, and 1.01% for Class N, Class I and Class Z, respectively, for the fiscal year ended October 31, 2021, 1.34%, 1.09% and 1.01% for Class N, Class I and Class Z, respectively, for the fiscal year ended October 31, 2020, 1.44%, 1.19% and 1.11% for Class N, Class I and Class Z, respectively, for the fiscal year ended October 31, 2019, 1.45%, 1.20% and 1.12% for Class N, Class I and Class Z, respectively, for the fiscal year ended October 31, 2018. |
| 8 | Excludes the impact of expense reimbursement or fee waivers and expense reductions such as brokerage credits, but includes expense repayments and non-reimbursable expenses, if any, such as interest, taxes, and extraordinary expenses. (See Note 1(c) and 2 in the Notes to Financial Statements.) |
| 9 | Less than $0.005 per share. |
73
| | |
| | | AMG River Road Focused Absolute Value Fund Financial Highlights For a share outstanding throughout each fiscal year |
| | | |
| | | |
| | | | | | | | | | | | | | | | | | | | |
| |
| | | For the fiscal years ended October 31, |
| | | | | |
| Class N | | 2022 | | 2021 | | 2020 | | 2019 | | 2018 |
| | | | | |
Net Asset Value, Beginning of Year | | | $14.44 | | | | $11.05 | | | | $12.65 | | | | $11.91 | | | | $11.87 | |
| | | | | |
Income (loss) from Investment Operations: | | | | | | | | | | | | | | | | | | | | |
| | | | | |
Net investment income1,2 | | | 0.04 | | | | 0.01 | | | | 0.04 | 3 | | | 0.04 | | | | 0.05 | |
| | | | | |
Net realized and unrealized gain (loss) on investments | | | (2.03 | ) | | | 3.38 | | | | (1.39 | ) | | | 1.45 | | | | 0.93 | |
| | | | | |
Total income (loss) from investment operations | | | (1.99 | ) | | | 3.39 | | | | (1.35 | ) | | | 1.49 | | | | 0.98 | |
| | | | | |
Less Distributions to Shareholders from: | | | | | | | | | | | | | | | | | | | | |
| | | | | |
Net investment income | | | — | | | | — | | | | (0.02 | ) | | | (0.05 | ) | | | (0.07 | ) |
| | | | | |
Net realized gain on investments | | | (0.95 | ) | | | — | | | | (0.23 | ) | | | (0.70 | ) | | | (0.87 | ) |
| | | | | |
Total distributions to shareholders | | | (0.95 | ) | | | — | | | | (0.25 | ) | | | (0.75 | ) | | | (0.94 | ) |
| | | | | |
Net Asset Value, End of Year | | | $11.50 | | | | $14.44 | | | | $11.05 | | | | $12.65 | | | | $11.91 | |
| | | | | |
Total Return2,4 | | | (14.80 | )% | | | 30.68 | % | | | (11.03 | )% | | | 14.29 | % | | | 8.69 | % |
| | | | | |
Ratio of net expenses to average net assets5 | | | 1.05 | % | | | 1.06 | % | | | 1.03 | % | | | 0.98 | % | | | 0.99 | % |
| | | | | |
Ratio of gross expenses to average net assets6 | | | 1.14 | % | | | 1.12 | % | | | 1.15 | % | | | 1.21 | % | | | 1.32 | % |
| | | | | |
Ratio of net investment income to average net assets2 | | | 0.30 | % | | | 0.10 | % | | | 0.34 | % | | | 0.34 | % | | | 0.43 | % |
| | | | | |
Portfolio turnover | | | 113 | % | | | 83 | % | | | 103 | % | | | 59 | % | | | 88 | % |
| | | | | |
Net assets end of year (000’s) omitted | | | $2,243 | | | | $3,666 | | | | $12,466 | | | | $15,284 | | | | $9,184 | |
| | | | | | | | | | | |
74
| | |
| | | AMG River Road Focused Absolute Value Fund Financial Highlights For a share outstanding throughout each fiscal year |
| | | |
| | | |
| | | | | | | | | | | | | | | | | | | | |
| |
| | | For the fiscal years ended October 31, |
| | | | | |
| Class I | | 2022 | | 2021 | | 2020 | | 2019 | | 2018 |
| | | | | |
Net Asset Value, Beginning of Year | | | $14.48 | | | | $11.12 | | | | $12.72 | | | | $11.98 | | | | $11.92 | |
| | | | | |
Income (loss) from Investment Operations: | | | | | | | | | | | | | | | | | | | | |
| | | | | |
Net investment income1,2 | | | 0.07 | | | | 0.05 | | | | 0.07 | 3 | | | 0.07 | | | | 0.08 | |
| | | | | |
Net realized and unrealized gain (loss) on investments | | | (2.04 | ) | | | 3.39 | | | | (1.40 | ) | | | 1.46 | | | | 0.93 | |
| | | | | |
Total income (loss) from investment operations | | | (1.97 | ) | | | 3.44 | | | | (1.33 | ) | | | 1.53 | | | | 1.01 | |
| | | | | |
Less Distributions to Shareholders from: | | | | | | | | | | | | | | | | | | | | |
| | | | | |
Net investment income | | | (0.05 | ) | | | (0.08 | ) | | | (0.04 | ) | | | (0.09 | ) | | | (0.08 | ) |
| | | | | |
Net realized gain on investments | | | (0.95 | ) | | | — | | | | (0.23 | ) | | | (0.70 | ) | | | (0.87 | ) |
| | | | | |
Total distributions to shareholders | | | (1.00 | ) | | | (0.08 | ) | | | (0.27 | ) | | | (0.79 | ) | | | (0.95 | ) |
| | | | | |
Net Asset Value, End of Year | | | $11.51 | | | | $14.48 | | | | $11.12 | | | | $12.72 | | | | $11.98 | |
| | | | | |
Total Return2,4 | | | (14.64 | )% | | | 30.98 | % | | | (10.81 | )% | | | 14.55 | % | | | 8.91 | % |
| | | | | |
Ratio of net expenses to average net assets5 | | | 0.80 | % | | | 0.81 | % | | | 0.78 | % | | | 0.73 | % | | | 0.74 | % |
| | | | | |
Ratio of gross expenses to average net assets6 | | | 0.89 | % | | | 0.87 | % | | | 0.90 | % | | | 0.96 | % | | | 1.07 | % |
| | | | | |
Ratio of net investment income to average net assets2 | | | 0.55 | % | | | 0.35 | % | | | 0.59 | % | | | 0.59 | % | | | 0.68 | % |
| | | | | |
Portfolio turnover | | | 113 | % | | | 83 | % | | | 103 | % | | | 59 | % | | | 88 | % |
| | | | | |
Net assets end of year (000’s) omitted | | | $53,620 | | | | $176,460 | | | | $130,758 | | | | $130,928 | | | | $20,928 | |
| | | | | | | | | | | |
75
| | |
| | | AMG River Road Focused Absolute Value Fund Financial Highlights For a share outstanding throughout each fiscal year |
| | | |
| | | |
| | | | | | | | | | | | | | | | | | | | |
| |
| | | For the fiscal years ended October 31, |
| | | | | |
| Class Z | | 2022 | | 2021 | | 2020 | | 2019 | | 2018 |
| | | | | |
Net Asset Value, Beginning of Year | | | $14.49 | | | | $11.12 | | | | $12.73 | | | | $11.98 | | | | $11.92 | |
| | | | | |
Income (loss) from Investment Operations: | | | | | | | | | | | | | | | | | | | | |
| | | | | |
Net investment income1,2 | | | 0.08 | | | | 0.06 | | | | 0.07 | 3 | | | 0.07 | | | | 0.08 | |
| | | | | |
Net realized and unrealized gain (loss) on investments | | | (2.04 | ) | | | 3.39 | | | | (1.41 | ) | | | 1.47 | | | | 0.93 | |
| | | | | |
Total income (loss) from investment operations | | | (1.96 | ) | | | 3.45 | | | | (1.34 | ) | | | 1.54 | | | | 1.01 | |
| | | | | |
Less Distributions to Shareholders from: | | | | | | | | | | | | | | | | | | | | |
| | | | | |
Net investment income | | | (0.06 | ) | | | (0.08 | ) | | | (0.04 | ) | | | (0.09 | ) | | | (0.08 | ) |
| | | | | |
Net realized gain on investments | | | (0.95 | ) | | | — | | | | (0.23 | ) | | | (0.70 | ) | | | (0.87 | ) |
| | | | | |
Total distributions to shareholders | | | (1.01 | ) | | | (0.08 | ) | | | (0.27 | ) | | | (0.79 | ) | | | (0.95 | ) |
| | | | | |
Net Asset Value, End of Year | | | $11.52 | | | | $14.49 | | | | $11.12 | | | | $12.73 | | | | $11.98 | |
| | | | | |
Total Return2,4 | | | (14.59 | )% | | | 31.12 | % | | | (10.86 | )% | | | 14.69 | % | | | 8.96 | % |
| | | | | |
Ratio of net expenses to average net assets5 | | | 0.76 | % | | | 0.77 | % | | | 0.74 | % | | | 0.69 | % | | | 0.70 | % |
| | | | | |
Ratio of gross expenses to average net assets6 | | | 0.85 | % | | | 0.83 | % | | | 0.86 | % | | | 0.92 | % | | | 1.03 | % |
| | | | | |
Ratio of net investment income to average net assets2 | | | 0.59 | % | | | 0.39 | % | | | 0.63 | % | | | 0.63 | % | | | 0.72 | % |
| | | | | |
Portfolio turnover | | | 113 | % | | | 83 | % | | | 103 | % | | | 59 | % | | | 88 | % |
| | | | | |
Net assets end of year (000’s) omitted | | | $7,677 | | | | $13,323 | | | | $2,462 | | | | $157 | | | | $66 | |
| | | | | | | | | | | |
| 1 | Per share numbers have been calculated using average shares. |
| 2 | Total returns and net investment income (loss) would have been lower had certain expenses not been offset. |
| 3 | Includes non-recurring dividends. Without these dividends, net investment income per share would have been $0.02, $0.05, and $0.05 for Class N, Class I, and Class Z shares, respectively. |
| 4 | The total return is calculated using the published Net Asset Value as of fiscal year end. |
| 5 | Includes reduction from broker recapture amounting to 0.02%, 0.01%, 0.01%, 0.02%, and 0.01% for the fiscal years ended October 31, 2022, 2021, 2020, 2019, and 2018, respectively. |
| 6 | Excludes the impact of expense reimbursement or fee waivers and expense reductions such as brokerage credits, but includes expense repayments and non-reimbursable expenses, if any, such as interest, taxes, and extraordinary expenses. (See Note 1(c) and 2 in the Notes to Financial Statements.) |
76
| | |
| | | Notes to Financial Statements October 31, 2022 |
| | | |
| | | |
1. ORGANIZATION AND SUMMARY OF SIGNIFICANT ACCOUNTING POLICIES
AMG Funds I and AMG Funds IV (the “Trusts”) are open-end management investment companies. AMG Funds I is organized as a Massachusetts business trust, while AMG Funds IV is organized as a Delaware Statutory Trust. The Trusts are registered under the Investment Company Act of 1940, as amended (the “1940 Act”). Currently, the Trusts consist of a number of different funds, each having distinct investment management objectives, strategies, risks, and policies. Included in this report are AMG Funds I: AMG River Road Large Cap Value Select Fund (“Large Cap Value Select”), and AMG Trust IV: AMG River Road Mid Cap Value Fund (“Mid Cap Value”), AMG River Road Small Cap Value Fund (“Small Cap Value”), AMG River Road Dividend All Cap Value Fund (“Dividend All Cap Value”), AMG River Road Small-Mid Cap Value Fund (“Small-Mid Cap Value”), AMG River Road International Value Equity Fund (“International Value Equity “), and AMG River Road Focused Absolute Value Fund (“Focused Absolute Value”), each a “Fund” and collectively, the “Funds”.
Each Fund is authorized to issue Class N and Class I shares. The Funds, except for Large Cap Value Select, are also authorized to issue Class Z shares. Each class represents an interest in the same assets of the respective Fund. Although all share classes generally have identical voting rights, each share class votes separately when required by law. Different share classes may have different net asset values per share to the extent the share classes pay different distribution amounts and/or the expenses of such share classes differ. Each share class has its own expense structure. Please refer to a current prospectus for additional information on each share class.
Large Cap Value Select and Focused Absolute Value are non-diversified funds. A greater percentage of the Funds’ holdings may be focused in a smaller number of securities which may place the Funds at greater risk than a more diversified fund.
Market disruptions associated with the COVID-19 pandemic have had a global impact, and uncertainty exists as to the long-term implications. Such disruptions can adversely affect assets of the Funds and thus Fund performance.
The Funds’ financial statements are prepared in accordance with accounting principles generally accepted in the United States of America (“U.S. GAAP”), including accounting and reporting guidance pursuant to Accounting Standards Codification Topic 946 applicable to investment companies. U.S. GAAP requires management to make estimates and assumptions that affect the reported amounts of assets and liabilities and disclosure of contingent assets and liabilities at the date of the financial statements and the reported amounts of income and expenses during the reporting period. Actual results could differ from those estimates and such differences could be material. The following is a summary of significant accounting policies followed by the Funds in the preparation of their financial statements:
a. VALUATION OF INVESTMENTS
For the Funds, equity securities traded on a national securities exchange or reported on the NASDAQ national market system (“NMS”) are valued at the last quoted sales price on the primary exchange or, if applicable, the NASDAQ official closing price or the official closing price of the relevant exchange or, lacking any sales, at the last quoted bid price. Equity securities held by the Funds that are traded in the over-the-counter market (other than NMS securities) are valued at the bid price. Foreign equity securities (securities principally traded in markets other than U.S. markets) held by the Funds are valued at the official closing price
on the primary exchange or, for markets that either do not offer an official closing price or where the official closing price may not be representative of the overall market, the last quoted sale price.
Fixed income securities purchased with a remaining maturity of 60 days or less are valued at amortized cost, provided that the amortized cost value is approximately the same as the fair value of the security valued without the use of amortized cost. Investments in other open-end registered investment companies are valued at their end of day net asset value per share.
The Funds’ portfolio investments are generally valued based on independent market quotations or prices or, if none, “evaluative” or other market based valuations provided by third party pricing services approved by the Board of Trustees of the Trust (the “Board”). Under certain circumstances, the value of certain Fund portfolio investments may be based on an evaluation of fair value, pursuant to procedures established by and under the general supervision of the Board. The Valuation Committee, which is comprised of the Independent Trustees of the Board, and the Pricing Committee, which is comprised of representatives from AMG Funds LLC (the “Investment Manager”) are the committees appointed by the Board to make fair value determinations. Each Fund may use the fair value of a portfolio investment to calculate its net asset value (“NAV”) in the event that the market quotation, price or market based valuation for the portfolio investment is not readily available or otherwise not determinable pursuant to the Board’s valuation procedures, if the Investment Manager or the Pricing Committee believes the quotation, price or market based valuation to be unreliable, or in certain other circumstances. When determining the fair value of an investment, the Pricing Committee and, if required under the Trusts’ securities valuation procedures, the Valuation Committee, seeks to determine the price that a Fund might reasonably expect to receive from current sale of that portfolio investment in an arms-length transaction. Fair value determinations shall be based upon consideration of all available facts and information, including, but not limited to (i) attributes specific to the investment; (ii) fundamental and analytical data relating to the investment; and (iii) the value of other comparable securities or relevant financial instruments, including derivative securities, traded on other markets or among dealers.
The values assigned to fair value portfolio investments are based on available information and do not necessarily represent amounts that might ultimately be realized in the future, since such amounts depend on future developments inherent in long-term investments. Because of the inherent uncertainty of valuation, those estimated values may differ significantly from the values that would have been used had a ready market for the investments existed, and the differences could be material. The Board will be presented with a quarterly report showing as of the most recent quarter end, all outstanding securities fair valued by the Funds, including a comparison with the prior quarter end and the percentage of the Funds that the security represents at each quarter end.
With respect to foreign equity securities and certain foreign fixed income securities, the Board has adopted a policy that securities held in the Funds that can be fair valued by the applicable fair value pricing service are fair valued on each business day provided that each individual price exceeds a pre-established confidence level.
Effective September 8, 2022, the Funds adopted the requirements of Rule 2a-5 under the 1940 Act (“Rule 2a-5”), which the Funds’ Board designated the Funds’ Investment Manager as the Funds’ Valuation Designee to perform the Funds’ fair value determinations. Such determinations are subject to Board oversight and certain reporting and other requirements intended to ensure that the Board receives the information it needs to oversee the Investment Manager’s fair value
77
| | |
| | | Notes to Financial Statements (continued) |
| | | |
| | | |
determinations. Other than the designation of the Investment Manager as the Valuation Designee, the Funds’ adoption of Rule 2-a5 did not impact how the Funds determine fair value or the carrying amount of investments held in the Funds.
U.S. GAAP defines fair value as the price that a fund would receive to sell an asset or pay to transfer a liability in an orderly transaction between market participants at the measurement date. U.S. GAAP also establishes a framework for measuring fair value, and a three level hierarchy for fair value measurements based upon the transparency of inputs to the valuation of an asset or liability. Inputs may be observable or unobservable and refer broadly to the assumptions that market participants would use in pricing the asset or liability. Observable inputs reflect the assumptions market participants would use in pricing the asset or liability based on market data obtained from sources independent of the Funds. Unobservable inputs reflect the Funds’ own assumptions about the assumptions that market participants would use in pricing the asset or liability developed based on the best information available in the circumstances. Each investment is assigned a level based upon the observability of the inputs which are significant to the overall valuation.
The three-tier hierarchy of inputs is summarized below:
Level 1 – inputs are quoted prices in active markets for identical investments (e.g., equity securities, open-end investment companies)
Level 2 – other observable inputs (including, but not limited to: quoted prices for similar assets or liabilities in markets that are active, quoted prices for identical or similar assets or liabilities in markets that are not active, inputs other than quoted prices that are observable for the assets or liabilities (such as interest rates, yield curves, volatilities, prepayment speeds, loss severities, credit risks and default rates) or other market corroborated inputs) (e.g., debt securities, government securities, foreign currency exchange contracts, foreign securities utilizing international fair value pricing, fair valued securities with observable inputs)
Level 3 – inputs are significant unobservable inputs (including the Fund’s own assumptions used to determine the fair value of investments) (e.g., fair valued securities with unobservable inputs)
Changes in inputs or methodologies used for valuing investments may result in a transfer in or out of levels within the fair value hierarchy. The inputs or methodologies used for valuing investments may not necessarily be an indication of the risk associated with investing in those investments.
b. SECURITY TRANSACTIONS
Security transactions are accounted for as of trade date. Realized gains and losses on securities sold are determined on the basis of identified cost.
c. INVESTMENT INCOME AND EXPENSES
Dividend income is recorded on the ex-dividend date. Dividends from foreign securities are recorded on the ex-dividend date, and if after the fact, as soon as the Funds become aware of the ex-dividend date, except for Korean securities where dividends are recorded on confirmation date. Interest income, which includes amortization of premium and accretion of discount on debt securities, is accrued as earned. Dividend and interest income on foreign securities is recorded gross of any withholding tax. Non-cash dividends included in dividend income, if any, are reported at the fair market value of the securities received. Upon notification from the issuer, distributions received from a real estate investment trust (“REIT”)
may be redesignated as a reduction of cost of investments and/or realized gain. Other income and expenses are recorded on an accrual basis. Expenses that cannot be directly attributed to a Fund are apportioned among the funds in the Trusts and other trusts or funds within the AMG Funds Family of Funds (collectively the “AMG Funds Family”) based upon their relative average net assets or number of shareholders. Investment income, realized and unrealized capital gains and losses, the common expenses of each Fund, and certain fund level expense reductions, if any, are allocated on a pro-rata basis to each class based on the relative net assets of each class to the total net assets of each Fund.
The following Funds had certain portfolio trades directed to various brokers under a brokerage recapture program. Credits received from the brokerage recapture program are earned and paid on a monthly basis, and are recorded as expense offsets, which serve to reduce the Funds’ overall expense ratio.
For the fiscal year ended October 31, 2022, the impact on the expenses and expense ratios were as follows:
| | | | | | | | | | | | |
| | | |
| | | Amount | | |
| Percentage
Reduction |
| | | | |
| | | |
Mid Cap Value | | | $19,146 | | | | 0.01% | | | | | |
| | | |
Large Cap Value Select | | | 1,535 | | | | 0.00%1 | | | | | |
| | | |
Small Cap Value | | | 38,236 | | | | 0.00%1 | | | | | |
| | | |
Dividend All Cap Value | | | 22,184 | | | | 0.01% | | | | | |
| | | |
Small-Mid Cap Value | | | 15,426 | | | | 0.01% | | | | | |
| | | |
International Value Equity | | | 921 | | | | 0.01% | | | | | |
| | | |
Focused Absolute Value | | | 21,744 | | | | 0.02% | | | | | |
d. DIVIDENDS AND DISTRIBUTIONS
Fund distributions, except Dividend All Cap Value, resulting from net investment income will normally be declared and paid at least annually. Dividend All Cap Value will declare and pay net investment income distributions quarterly. Each Fund will normally declare and pay realized net capital gains, if any, at least annually in December. Distributions to shareholders are recorded on the ex-dividend date. Distributions are determined in accordance with federal income tax regulations, which may differ from net investment income and net realized capital gains for financial statement purposes (U.S. GAAP). Differences may be permanent or temporary. Permanent differences are reclassified among capital accounts in the financial statements to reflect their tax character. Permanent book and tax basis differences, if any, relating to shareholder distributions will result in reclassification to paid-in capital. Temporary differences arise when certain items of income, expense and gain or loss are recognized in different periods for financial statement and tax purposes; these differences will reverse at some time in the future. Permanent differences are due to the write off of net operating losses and equalization utilized. Temporary differences are due to wash sale loss deferrals, investments in partnerships, and the deferral of qualified late year ordinary losses.
78
| | |
| | | Notes to Financial Statements (continued) |
| | | |
| | | |
The tax character of distributions paid during the fiscal years ended October 31, 2022 and October 31, 2021 were as follows:
| | | | | | | | | | | | | | | | | | | | | | | | |
| | | |
| | | Mid Cap Value | | | Large Cap Value Select | | | Small Cap Value | |
| | | | | | |
| Distributions paid from: | | 2022 | | | 2021 | | | 2022 | | | 2021 | | | 2022 | | | 2021 | |
| | | | | | |
Ordinary income * | | | $13,031,729 | | | | $26,955,595 | | | | $148,346 | | | | $6,522,408 | | | | $25,727,975 | | | | $29,406 | |
| | | | | | |
Long-term capital gains | | | — | | | | 247,018,664 | | | | — | | | | — | | | | 38,269,943 | | | | 3,739 | |
| | | | | | |
| | | | | | | | | | | | | | | | | | | | | | | | |
| | | | | | |
| | | $13,031,729 | | | | $273,974,259 | | | | $148,346 | | | | $6,522,408 | | | | $63,997,918 | | | | $33,145 | |
| | | | | | | | | | | | | | | | | | | | | | | | |
| | | |
| | | Dividend All Cap Value | | | Small-Mid Cap Value | | | International Value Equity | |
| | | | | | |
| Distributions paid from: | | 2022 | | | 2021 | | | 2022 | | | 2021 | | | 2022 | | | 2021 | |
| | | | | | |
Ordinary income * | | | $9,973,050 | | | | $9,290,372 | | | | — | | | | — | | | | $18,274 | | | | $1,587,930 | |
| | | | | | |
Long-term capital gains | | | 65,819,741 | | | | — | | | | $15,297,129 | | | | $4,716 | | | | 47,222 | | | | 1,454,805 | |
| | | | | | |
| | | | | | | | | | | | | | | | | | | | | | | | |
| | | | | | |
| | | $75,792,791 | | | | $9,290,372 | | | | $15,297,129 | | | | $4,716 | | | | $65,496 | | | | $3,042,735 | |
| | | | | | | | | | | | | | | | | | | | | | | | |
| | | | | |
| | | | | | | | | | | | | | | Focused Absolute Value | |
| | | | | | |
| Distributions paid from: | | | | | | | | | | | | | | 2022 | | | 2021 | |
| | | | | | |
Ordinary income * | | | | | | | | | | | | | | | | | | | $706,900 | | | | $968,353 | |
| | | | | | |
Long-term capital gains | | | | | | | | | | | | | | | | | | | 12,517,378 | | | | — | |
| | | | | | |
| | | | | | | | | | | | | | | | | | | | | | | | |
| | | | | | |
| | | | | | | | | | | | | | | | | | | $13,224,278 | | | | $968,353 | |
| | | | | | | | | | | | | | | | | | | | | | | | |
| * | For tax purposes, short-term capital gain distributions, if any, are considered ordinary income distributions. |
As of October 31, 2022, the components of distributable earnings (excluding unrealized appreciation/depreciation) on a tax basis consisted of:
| | | | | | | | | | | | | | | | | | | | | | | | | | | | |
| | | Mid Cap Value | | | Large Cap Value Select | | | Small Cap Value | | | Dividend All Cap Value | | | Small-Mid Cap Value | | | International Value Equity | | | Focused Absolute Value | |
| | | | | | | |
Capital loss carryforward | | | — | | | | $6,974,920 | | | | — | | | | — | | | | — | | | | $349,441 | | | | — | |
| | | | | | | |
Undistributed ordinary income | | | $18,944,960 | | | | 635,153 | | | | — | | | | $1,847,875 | | | | — | | | | 264,508 | | | | $108,401 | |
| | | | | | | |
Undistributed long-term capital gains | | | 6,839,765 | | | | — | | | | $30,497,723 | | | | 35,122,242 | | | | $10,550,029 | | | | — | | | | 370,093 | |
| | | | | | | |
Late-year ordinary loss deferral | | | — | | | | — | | | | 2,517,595 | | | | — | | | | 125,539 | | | | — | | | | — | |
At October 31, 2022, the cost of investments and the aggregate gross unrealized appreciation and depreciation for federal income tax purposes were as follows:
| | | | | | | | | | | | | | | | |
| Fund | | Cost | | | Appreciation | | | Depreciation | | | Net Appreciation
(Depreciation) | |
| | | | |
Mid Cap Value | | | $322,101,891 | | | | $22,494,786 | | | | $(35,365,214 | ) | | | $(12,870,428 | ) |
| | | | |
Large Cap Value Select | | | 34,471,433 | | | | 1,509,893 | | | | (1,499,771 | ) | | | 10,122 | |
| | | | |
Small Cap Value | | | 718,642,724 | | | | 190,864,950 | | | | (39,076,313 | ) | | | 151,788,637 | |
| | | | |
Dividend All Cap Value | | | 263,159,638 | | | | 84,668,503 | | | | (11,940,961 | ) | | | 72,727,542 | |
| | | | |
Small-Mid Cap Value | | | 206,465,626 | | | | 48,721,717 | | | | (13,896,411 | ) | | | 34,825,306 | |
| | | | |
International Value Equity | | | 8,452,278 | | | | 226,606 | | | | (1,393,547 | ) | | | (1,166,941 | ) |
| | | | |
Focused Absolute Value | | | 61,030,090 | | | | 6,564,898 | | | | (3,945,535 | ) | | | 2,619,363 | |
79
| | |
| | | Notes to Financial Statements (continued) |
| | | |
| | | |
e. FEDERAL TAXES
Each Fund currently qualifies as an investment company and intends to comply with the requirements under Subchapter M of the Internal Revenue Code of 1986, as amended, and to distribute substantially all of its taxable income and gains to its shareholders and to meet certain diversification and income requirements with respect to investment companies. Therefore, no provision for federal income or excise tax is included in the accompanying financial statements.
Additionally, based on each Fund’s understanding of the tax rules and rates related to income, gains and transactions for the foreign jurisdictions in which it invests, each Fund will provide for foreign taxes, and where appropriate, deferred foreign taxes.
Management has analyzed the Funds’ tax positions taken on federal income tax returns as of October 31, 2022, and for all open tax years (generally, the three prior taxable years), and has concluded that no provision for federal income tax is required in the Funds’ financial statements. Additionally, Management is not aware of any tax position for which it is reasonably possible that the total amounts of unrecognized tax benefits will change materially in the next twelve months.
f. CAPITAL LOSS CARRYOVERS AND DEFERRALS
As of October 31, 2022, the following Funds had capital loss carryovers for federal income tax purposes as shown in the following chart. These amounts may be used to offset future realized capital gains indefinitely, and retain their character as short-term and/or long-term.
| | | | | | | | | | | | | | | | |
| Fund | | Short-Term | | | Long-Term | | | Total | | | | |
| | | | |
Large Cap Value Select | | | $5,651,785 | | | | $1,323,135 | | | | $6,974,920 | | | | | |
| | | | |
International Value Equity | | | 241,090 | | | | 108,351 | | | | 349,441 | | | | | |
As of October 31, 2022, all the Funds except for Large Cap Value Select and International Value Equity had no capital loss carryovers for federal income tax purposes. Should the Funds incur net capital losses for the fiscal year ended October 31, 2023, such amounts may be used to offset future realized capital gains indefinitely, and retain their character as either short-term and/or long-term.
g. CAPITALSTOCK
The Trust’s Declaration of Trust authorizes for each Fund the issuance of an unlimited number of shares of beneficial interest, without par value. Each Fund records sales and repurchases of its capital stock on the trade date.
For the fiscal years ended October 31, 2022 and October 31, 2021, the capital stock transactions by class for the Funds were as follows:
| | | | | | | | | | | | | | | | | | | | | | | | | | | | | | | | |
| | |
| | | Mid Cap Value | | | Large Cap Value Select | |
| | | | |
| | | October 31, 2022 | | | October 31, 2021 | | | October 31, 2022 | | | October 31, 2021 | |
| | | | | | | | |
| | | Shares | | | Amount | | | Shares | | | Amount | | | Shares | | | Amount | | | Shares | | | Amount | |
| | | | | | | | |
Class N: | | | | | | | | | | | | | | | | | | | | | | | | | | | | | | | | |
| | | | | | | | |
Shares sold | | | 785,781 | | | | $14,450,856 | | | | 1,000,186 | | | | $21,108,563 | | | | 92,383 | | | | $1,426,811 | | | | 164,567 | | | | $2,473,353 | |
| | | | | | | | |
Shares issued in reinvestment of distributions | | | 466,296 | | | | 8,920,248 | | | | 9,762,503 | | | | 173,639,301 | | | | — | | | | — | | | | 46,486 | | | | 636,854 | |
| | | | | | | | |
Shares redeemed | | | (3,205,760) | | | | (59,136,700) | | | | (4,709,879) | | | | (107,167,675) | | | | (130,056) | | | | (1,921,760) | | | | (255,444) | | | | (3,802,758) | |
| | | | | | | | | | | | | | | | | | | | | | | | | | | | | | | | |
| | | | | | | | |
Net increase (decrease) | | | (1,953,683) | | | | $(35,765,596) | | | | 6,052,810 | | | | $87,580,189 | | | | (37,673) | | | | $(494,949) | | | | (44,391) | | | | $(692,551) | |
| | | | | | | | | | | | | | | | | | | | | | | | | | | | | | | | |
| | | | | | | | |
Class I: | | | | | | | | | | | | | | | | | | | | | | | | | | | | | | | | |
| | | | | | | | |
Shares sold | | | 389,997 | | | | $7,669,264 | | | | 555,161 | | | | $14,772,271 | | | | 170,101 | | | | $2,524,908 | | | | 181,073 | | | | $2,751,837 | |
| | | | | | | | |
Shares issued in reinvestment of distributions | | | 172,599 | | | | 3,534,820 | | | | 4,458,635 | | | | 86,006,601 | | | | 9,155 | | | | 144,014 | | | | 419,365 | | | | 5,783,038 | |
| | | | | | | | |
Shares redeemed | | | (2,089,133) | | | | (41,293,790) | | | | (5,360,001) | | | | (147,242,762) | | | | (396,293) | | | | (5,949,087) | | | | (1,058,936) | | | | (15,875,102) | |
| | | | | | | | | | | | | | | | | | | | | | | | | | | | | | | | |
| | | | | | | | |
Net decrease | | | (1,526,537) | | | | $(30,089,706) | | | | (346,205) | | | | $(46,463,890) | | | | (217,037) | | | | $(3,280,165) | | | | (458,498) | | | | $(7,340,227) | |
| | | | | | | | | | | | | | | | | | | | | | | | | | | | | | | | |
| | | | | | | | |
Class Z: | | | | | | | | | | | | | | | | | | | | | | | | | | | | | | | | |
| | | | | | | | |
Shares sold | | | 57,150 | | | | $1,177,954 | | | | 442,478 | | | | $8,605,426 | | | | — | | | | — | | | | — | | | | — | |
| | | | | | | | |
Shares issued in reinvestment of distributions | | | 15,140 | | | | 308,105 | | | | 327,778 | | | | 6,230,541 | | | | — | | | | — | | | | — | | | | — | |
| | | | | | | | |
Shares redeemed | | | (88,736) | | | | (1,765,508) | | | | (691,958) | | | | (14,558,091) | | | | — | | | | — | | | | — | | | | — | |
| | | | | | | | | | | | | | | | | | | | | | | | | | | | | | | | |
| | | | | | | | |
Net increase (decrease) | | | (16,446) | | | | $(279,449) | | | | 78,298 | | | | $277,876 | | | | — | | | | — | | | | — | | | | — | |
| | | | | | | | | | | | | | | | | | | | | | | | | | | | | | | | |
80
| | |
| | | Notes to Financial Statements (continued) |
| | | |
| | | |
| | | | | | | | | | | | | | | | | | | | | | | | | | | | | | | | |
| | |
| | | Small Cap Value | | | Dividend All Cap Value | |
| | | | |
| | | October 31, 2022 | | | October 31, 2021 | | | October 31, 2022 | | | October 31, 2021 | |
| | | | | | | | |
| | | Shares | | | Amount | | | Shares | | | Amount | | | Shares | | | Amount | | | Shares | | | Amount | |
| | | | | | | | |
Class N: | | | | | | | | | | | | | | | | | | | | | | | | | | | | | | | | |
| | | | | | | | |
Shares sold | | | 561,747 | | | | $7,864,823 | | | | 454,023 | | | | $6,674,412 | | | | 125,545 | | | | $1,388,577 | | | | 98,286 | | | | $1,183,126 | |
| | | | | | | | |
Shares issued in reinvestment of distributions | | | 171,350 | | | | 2,484,577 | | | | — | | | | — | | | | 696,500 | | | | 7,755,566 | | | | 58,595 | | | | 717,232 | |
| | | | | | | | |
Shares redeemed | | | (336,442) | | | | (4,782,181) | | | | (647,219) | | | | (9,299,010) | | | | (685,187) | | | | (7,832,849) | | | | (1,016,227) | | | | (12,362,195) | |
| | | | | | | | | | | | | | | | | | | | | | | | | | | | | | | | |
| | | | | | | | |
Net increase (decrease) | | | 396,655 | | | | $5,567,219 | | | | (193,196) | | | | $(2,624,598) | | | | 136,858 | | | | $1,311,294 | | | | (859,346) | | | | $(10,461,837) | |
| | | | | | | | | | | | | | | | | | | | | | | | | | | | | | | | |
| | | | | | | | |
Class I: | | | | | | | | | | | | | | | | | | | | | | | | | | | | | | | | |
| | | | | | | | |
Shares sold | | | 12,369,812 | | | | $181,304,160 | | | | 18,321,840 | | | | $268,489,956 | | | | 5,504,938 | | | | $60,820,542 | | | | 3,534,890 | | | | $43,183,255 | |
| | | | | | | | |
Shares issued in reinvestment of distributions | | | 3,784,850 | | | | 56,659,209 | | | | 1,899 | | | | 25,529 | | | | 5,979,282 | | | | 66,508,504 | | | | 683,668 | | | | 8,379,202 | |
| | | | | | | | |
Shares redeemed | | | (13,103,828) | | | | (191,877,365) | | | | (9,949,460) | | | | (147,247,886) | | | | (13,105,957) | | | | (151,468,515) | | | | (16,246,669) | | | | (205,721,380) | |
| | | | | | | | | | | | | | | | | | | | | | | | | | | | | | | | |
| | | | | | | | |
Net increase (decrease) | | | 3,050,834 | | | | $46,086,004 | | | | 8,374,279 | | | | $121,267,599 | | | | (1,621,737) | | | | $(24,139,469) | | | | (12,028,111) | | | | $(154,158,923) | |
| | | | | | | | | | | | | | | | | | | | | | | | | | | | | | | | |
| | | | | | | | |
Class Z: | | | | | | | | | | | | | | | | | | | | | | | | | | | | | | | | |
| | | | | | | | |
Shares sold | | | 133,388 | | | | $1,956,634 | | | | 427,783 | | | | $6,713,310 | | | | 97,425 | | | | $1,079,174 | | | | 10,627 | | | | $130,295 | |
| | | | | | | | |
Shares issued in reinvestment of distributions | | | 38,249 | | | | 572,964 | | | | 61 | | | | 824 | | | | 42,101 | | | | 467,571 | | | | 3,663 | | | | 45,064 | |
| | | | | | | | |
Shares redeemed | | | (5,997) | | | | (89,465) | | | | (23,740) | | | | (358,806) | | | | (23,221) | | | | (265,113) | | | | (21,172) | | | | (273,306) | |
| | | | | | | | | | | | | | | | | | | | | | | | | | | | | | | | |
| | | | | | | | |
Net increase (decrease) | | | 165,640 | | | | $2,440,133 | | | | 404,104 | | | | $6,355,328 | | | | 116,305 | | | | $1,281,632 | | | | (6,882) | | | | $(97,947) | |
| | | | | | | | | | | | | | | | | | | | | | | | | | | | | | | | |
| | |
| | | Small-Mid Cap Value | | | International Value Equity | |
| | | | |
| | | October 31, 2022 | | | October 31, 2021 | | | October 31, 2022 | | | October 31, 2021 | |
| | | | | | | | |
| | | Shares | | | Amount | | | Shares | | | Amount | | | Shares | | | Amount | | | Shares | | | Amount | |
| | | | | | | | |
Class N: | | | | | | | | | | | | | | | | | | | | | | | | | | | | | | | | |
| | | | | | | | |
Shares sold | | | 215,704 | | | | $1,962,918 | | | | 462,130 | | | | $4,299,141 | | | | 6,816 | | | | $64,007 | | | | 16,199 | | | | $193,637 | |
| | | | | | | | |
Shares issued in reinvestment of distributions | | | 136,634 | | | | 1,285,724 | | | | — | | | | — | | | | 905 | | | | 8,466 | | | | 53,951 | | | | 525,479 | |
| | | | | | | | |
Shares redeemed | | | (583,472) | | | | (5,314,555) | | | | (1,326,562) | | | | (11,825,814) | | | | (50,611) | | | | (465,849) | | | | (45,025) | | | | (546,815) | |
| | | | | | | | | | | | | | | | | | | | | | | | | | | | | | | | |
| | | | | | | | |
Net increase (decrease) | | | (231,134) | | | | $(2,065,913) | | | | (864,432) | | | | $(7,526,673) | | | | (42,890) | | | | $(393,376) | | | | 25,125 | | | | $172,301 | |
| | | | | | | | | | | | | | | | | | | | | | | | | | | | | | | | |
| | | | | | | | |
Class I: | | | | | | | | | | | | | | | | | | | | | | | | | | | | | | | | |
| | | | | | | | |
Shares sold | | | 3,071,053 | | | | $28,932,722 | | | | 6,623,387 | | | | $63,170,204 | | | | 47,924 | | | | $450,397 | | | | 90,642 | | | | $1,154,827 | |
| | | | | | | | |
Shares issued in reinvestment of distributions | | | 1,136,001 | | | | 11,030,565 | | | | 455 | | | | 3,854 | | | | 5,357 | | | | 51,853 | | | | 233,034 | | | | 2,351,316 | |
| | | | | | | | |
Shares redeemed | | | (5,867,377) | | | | (55,678,643) | | | | (7,353,482) | | | | (71,259,285) | | | | (166,456) | | | | (1,563,395) | | | | (808,059) | | | | (11,285,954) | |
| | | | | | | | | | | | | | | | | | | | | | | | | | | | | | | | |
| | | | | | | | |
Net decrease | | | (1,660,323) | | | | $(15,715,356) | | | | (729,640) | | | | $(8,085,227) | | | | (113,175) | | | | $(1,061,145) | | | | (484,383) | | | | $(7,779,811) | |
| | | | | | | | | | | | | | | | | | | | | | | | | | | | | | | | |
| | | | | | | |
Class Z: | | | | | | | | | | | | | | | | | | | | | | | | | | | | | |
| | | | | | | | |
Shares sold | | | 163,072 | | | | $1,535,426 | | | | 3,492,412 | | | | $35,894,795 | | | | 46,267 | | | | $424,613 | | | | 13,162 | | | | $137,741 | |
| | | | | | | | |
Shares issued in reinvestment of distributions | | | 130,979 | | | | 1,271,813 | | | | 37 | | | | 318 | | | | 474 | | | | 4,607 | | | | 14,400 | | | | 146,170 | |
| | | | | | | | |
Shares redeemed | | | (173,599) | | | | (1,676,203) | | | | (31,459) | | | | (292,865) | | | | (6,708) | | | | (65,844) | | | | (28,403) | | | | (391,224) | |
| | | | | | | | | | | | | | | | | | | | | | | | | | | | | | | | |
| | | | | | | | |
Net increase (decrease) | | | 120,452 | | | | $1,131,036 | | | | 3,460,990 | | | | $35,602,248 | | | | 40,033 | | | | $363,376 | | | | (841) | | | | $(107,313) | |
| | | | | | | | | | | | | | | | | | | | | | | | | | | | | | | | |
81
| | |
| | | Notes to Financial Statements (continued) |
| | | |
| | | |
| | | | | | | | | | | | | | | | |
| |
| | | Focused Absolute Value | |
| | |
| | | October 31, 2022 | | | October 31, 2021 | |
| | | | |
| | | Shares | | | Amount | | | Shares | | | Amount | |
| | | | |
Class N: | | | | | | | | | | | | | | | | |
| | | | |
Shares sold | | | 3,037 | | | | $38,754 | | | | 30,865 | | | | $396,447 | |
| | | | |
Shares issued in reinvestment of distributions | | | 16,196 | | | | 221,232 | | | | — | | | | — | |
| | | | |
Shares redeemed | | | (78,016) | | | | (1,025,492) | | | | (905,026) | | | | (11,851,733) | |
| | | | | | | | | | | | | | | | |
| | | | |
Net decrease | | | (58,783) | | | | $(765,506) | | | | (874,161) | | | | $(11,455,286) | |
| | | | | | | | | | | | | | | | |
| | | | |
Class I: | | | | | | | | | | | | | | | | |
| | | | |
Shares sold | | | 868,513 | | | | $11,393,428 | | | | 3,567,469 | | | | $47,793,216 | |
| | | | |
Shares issued in reinvestment of distributions | | | 883,850 | | | | 12,064,555 | | | | 69,096 | | | | 901,014 | |
| | | | |
Shares redeemed | | | (9,282,307) | | | | (118,273,825) | | | | (3,210,925) | | | | (45,922,762) | |
| | | | | | | | | | | | | | | | |
| | | | |
Net increase (decrease) | | | (7,529,944) | | | | $(94,815,842) | | | | 425,640 | | | | $2,771,468 | |
| | | | | | | | | | | | | | | | |
| | | | |
Class Z: | | | | | | | | | | | | | | | | |
| | | | |
Shares sold | | | 56,888 | | | | $729,942 | | | | 768,873 | | | | $11,515,688 | |
| | | | |
Shares issued in reinvestment of distributions | | | 25,080 | | | | 342,347 | | | | 1,382 | | | | 18,026 | |
| | | | |
Shares redeemed | | | (335,109) | | | | (4,088,214) | | | | (71,919) | | | | (1,060,407) | |
| | | | | | | | | | | | | | | | |
| | | | |
Net increase (decrease) | | | (253,141) | | | | $(3,015,925) | | | | 698,336 | | | | $10,473,307 | |
| | | | | | | | | | | | | | | | |
h. REPURCHASE AGREEMENTS AND JOINT REPURCHASE AGREEMENTS
The Funds may enter into third-party and bilateral repurchase agreements for temporary cash management purposes and third-party or bilateral joint repurchase agreements for reinvestment of cash collateral on securities lending transactions under the securities lending program offered by The Bank of New York Mellon (“BNYM”) (the “Program”) (collectively, “Repurchase Agreements”). The value of the underlying collateral, including accrued interest, must equal or exceed the value of the Repurchase Agreements during the term of the agreement. For joint repurchase agreements, the Funds participate on a pro rata basis with other clients of BNYM in its share of the underlying collateral under such joint repurchase agreements and in its share of proceeds from any repurchase or other disposition of the underlying collateral. The underlying collateral for all Repurchase Agreements is held in safekeeping by the Funds’ custodian or at the Federal Reserve Bank. If the seller defaults and the value of the collateral declines, or if bankruptcy proceedings commence with respect to the seller of the security, realization of the collateral by the Funds may be delayed or limited. Pursuant to the Program, the Funds are indemnified for such losses by BNYM on joint repurchase agreements.
At October 31, 2022, the market value of Repurchase Agreements outstanding is as follows:
| | | | | | | | |
| | |
| | | Market Value | | | | |
| | |
Mid Cap Value | | | $2,335,584 | | | | | |
| | |
Small Cap Value | | | 3,136,263 | | | | | |
| | |
Dividend All Cap Value | | | 6,118,211 | | | | | |
| | |
International Value Equity | | | 138,897 | | | | | |
i. FOREIGN CURRENCY TRANSLATION
The books and records of the Funds are maintained in U.S. Dollars. The value of investments, assets and liabilities denominated in currencies other than U.S. Dollars are translated into U.S. Dollars based upon current foreign exchange rates. Purchases and sales of foreign investments, income and expenses are converted into U.S. Dollars based on currency exchange rates prevailing on the respective dates of such transactions. Net realized and unrealized gain (loss) on foreign currency transactions represent: (1) foreign exchange gains and losses from the sale and holdings of foreign currencies; (2) gains and losses between trade date and settlement date on investment securities transactions and foreign currency exchange contracts; and (3) gains and losses from the difference between amounts of interest and dividends recorded and the amounts actually received.
The Funds do not isolate the net realized and unrealized gain or loss resulting from changes in exchange rates from the fluctuations in market prices of securities held. Such fluctuations are included with the net realized and unrealized gain or loss on investments.
2. AGREEMENTS AND TRANSACTIONS WITH AFFILIATES
For each of the Funds, the Trusts have entered into an investment advisory agreement under which the Investment Manager, a subsidiary and the U.S. retail distribution arm of Affiliated Managers Group, Inc. (“AMG”), serves as investment manager to the Funds and is responsible for the Funds’ overall administration and operations. The Investment Manager selects one or more subadvisors for the Funds (subject to Board approval) and monitors each subadvisor’s investment performance, security holdings and investment strategies. Each Fund’s investment portfolio is managed by River Road Asset Management, LLC (“River Road”) who
82
| | |
| | | Notes to Financial Statements (continued) |
| | | |
| | | |
serves pursuant to a subadvisory agreement with the Investment Manager. AMG indirectly owns a majority interest in River Road.
Investment management fees are paid directly by the Funds to the Investment Manager based on average daily net assets. For the fiscal year ended October 31, 2022, the Funds’ investment management fees were paid at the following annual rate of each Fund’s respective average daily net assets:
| | | | | | | | |
| | |
Mid Cap Value | | | 0.56 | %1 | | | | |
| | |
Large Cap Value Select | | | 0.35 | % | | | | |
| | |
Small Cap Value | | | 0.80 | % | | | | |
| | |
Dividend All Cap Value | | | 0.50 | %2 | | | | |
| | |
Small-Mid Cap Value | | | 0.75 | % | | | | |
| | |
International Value Equity | | | 0.53 | %3 | | | | |
| | |
Focused Absolute Value | | | 0.60 | % | | | | |
| 1 | Prior to June 14, 2021, the fee was 0.70% on the first $100 million, 0.65% on next $300 million, 0.60% in excess of $400 million. |
| 2 | Prior to July 1, 2022, the annual rate was 0.60%. |
| 3 | Prior to August 16, 2021, the annual rate was 0.85%. |
The fee paid to River Road for its services as subadviser is paid out of the fee the Investment Manager receives from each Fund and does not increase the expenses of each Fund.
The Investment Manager has contractually agreed, through at least March 1, 2023, for Mid Cap Value, Large Cap Value, Small Cap Value, Small-Mid Cap Value, International Value Equity, and Focused Absolute Value and through March 1, 2024, for Dividend All Cap Value to waive management fees and/or reimburse fund expenses in order to limit total annual Fund operating expenses after fee waiver and expense reimbursements (exclusive of taxes, interest (including interest incurred in connection with bank and custody overdrafts and in connection with securities sold short), shareholder servicing fees, distribution and service 12b-1 fees, brokerage commissions and other transaction costs, dividends payable with respect to securities sold short, acquired fund fees and expenses and extraordinary expenses). The annual rate of the Funds’ average daily net assets subject to later reimbursement by the Funds in certain circumstances (this annual rate or such other annual rate that may be in effect from time to time, the “Expense Cap”) are as follows:
| | | | | | | | |
| | |
Mid Cap Value | | | 0.76% | 1 | | | | |
| | |
Large Cap Value Select | | | 0.60% | 2 | | | | |
| | |
Small Cap Value | | | N/A | | | | | |
| | |
Dividend All Cap Value | | | 0.68% | 3 | | | | |
| | |
Small-Mid Cap Value | | | 1.04% | | | | | |
| | |
International Value Equity | | | 0.73% | 4 | | | | |
| | |
Focused Absolute Value | | | 0.78% | | | | | |
| 1 | Prior to June 14, 2021, the limitation was 0.82%. |
| 2 | Prior to June 11, 2021, the limitation was 0.69%. |
| 3 | Prior to July 1, 2022, the limitation was 0.78%. |
| 4 | Prior to August 16, 2021, the limitation was 1.12%. |
In general, for a period of up to 36 months after the date any amounts are paid, waived or reimbursed by the Investment Manager, the Investment Manager may recover such amounts from a Fund, provided that such repayment would not cause the Fund’s total annual operating expenses after fee waiver and expense reimbursements (exclusive of the items noted in the parenthetical above) to exceed either (i) the Expense Cap in effect at the time such amounts were paid, waived or reimbursed, or (ii) the Expense Cap in effect at the time of such repayment by the Fund.
The contractual expense limitation may only be terminated in the event the Investment Manager or a successor ceases to be the investment manager of the Fund or a successor fund, by mutual agreement between the Investment Manager and the Board, or in the event of the Fund’s liquidation unless the Fund is reorganized or is a party to a merger in which the surviving entity is successor to the accounting and performance information of the Fund.
At October 31, 2022, each Fund’s expiration of recoupment are as follows:
| | | | | | | | | | | | |
Expiration Period | | Mid Cap Value | | | Large Cap Value Select | | | Dividend All Cap Value | |
| | | |
Less than 1 year | | | $176,021 | | | | $24,885 | | | | — | |
| | | |
1-2 years | | | 219,148 | | | | 58,404 | | | | $97,897 | |
| | | |
2-3 years | | | 27,037 | | | | 46,891 | | | | 117,693 | |
| | | | | | | | | | | | |
| | | |
Total | | | $422,206 | | | | $130,180 | | | | $215,590 | |
| | | | | | | | | | | | |
| | | | | | | | |
Expiration Period | | International Value Equity | | | Focused Absolute Value | |
| | |
Less than 1 year | | | $84,419 | | | | $176,679 | |
| | |
1-2 years | | | 79,873 | | | | 98,605 | |
| | |
2-3 years | | | 86,935 | | | | 98,288 | |
| | | | | | | | |
| | |
Total | | | $251,227 | | | | $373,572 | |
| | | | | | | | |
The Trusts, on behalf of the Funds, have entered into an amended and restated Administration Agreement under which the Investment Manager serves as the Funds’ administrator (the “Administrator”) and is responsible for all non-portfolio management aspects of managing the Funds’ operations, including administration and shareholder services to each Fund. Each Fund pays a fee to the Administrator at the rate of 0.15% per annum of the Fund’s average daily net assets for this service.
The Funds are distributed by AMG Distributors, Inc. (the “Distributor”), a wholly-owned subsidiary of the Investment Manager. The Distributor serves as the distributor and underwriter for each Fund and is a registered broker-dealer and member of the Financial Industry Regulatory Authority, Inc. (“FINRA”). Shares of each Fund will be continuously offered and will be sold directly to prospective purchasers and through brokers, dealers or other financial intermediaries who have executed selling agreements with the Distributor. Generally the Distributor bears all or a portion of the expenses of providing services pursuant to the distribution agreement, including the payment of the expenses relating to the distribution of prospectuses for sales purposes and any advertising or sales literature.
The Trusts have adopted a distribution and service plan (the “Plan”) with respect to the Class N shares, of each Fund in accordance with the requirements of Rule 12b-1 under the 1940 Act and the requirements of the applicable rules of
83
| | |
| | | Notes to Financial Statements (continued) |
| | | |
| | | |
FINRA regarding asset based sales charges. Pursuant to the Plan, each Fund may make payments to the Distributor for its expenditures in financing any activity primarily intended to result in the sale of each Fund’s Class N shares and for maintenance and personal service provided to existing shareholders of that class. The Plan authorizes payments to the Distributor of up to 0.25% annually of each Fund’s average daily net assets attributable to the Class N shares. For all Funds, except Large Cap Value Select, the Plan is characterized as a reimbursement plan and is directly tied to expenses incurred by the Distributor; the payments the Distributor receives during any year may not exceed its actual expenses.
The impact on the annualized expense ratios for the fiscal year ended October 31, 2022, were as follows:
| | | | | | | | |
| Fund | | Actual Amount Incurred | | | | |
| | |
Mid Cap Value | | | | | | | | |
| | |
Class N | | | 0.24% | | | | | |
| | |
Large Cap Value Select | | | | | | | | |
| | |
Class N | | | 0.25% | | | | | |
| | |
Small Cap Value | | | | | | | | |
| | |
Class N | | | 0.25% | | | | | |
| | |
Dividend All Cap Value | | | | | | | | |
| | |
Class N | | | 0.25% | | | | | |
| | |
Small-Mid Cap Value | | | | | | | | |
| | |
Class N | | | 0.25% | | | | | |
| | |
International Value Equity | | | | | | | | |
| | |
Class N | | | 0.25% | | | | | |
| | |
Focused Absolute Value | | | | | | | | |
| | |
Class N | | | 0.25% | | | | | |
For each of the Class N and Class I shares, the Board has approved reimbursement payments to the Investment Manager for shareholder servicing expenses (“shareholder servicing fees”) incurred. Shareholder servicing fees include payments to financial intermediaries, such as broker-dealers (including fund supermarket platforms), banks, and trust companies who provide shareholder record keeping, account servicing and other services. The Class N and Class I shares may reimburse the Investment Manager for the actual amount incurred up to a maximum annual rate of each Class’s average daily net assets as shown in the table below.
The impact on the annualized expense ratios for the fiscal year ended October 31, 2022, were as follows:
| | | | | | | | | | | | | | | | |
| Fund | | Maximum Annual
Amount
Approved | | | | | | Actual
Amount
Incurred | | | | |
| | | | |
Mid Cap Value | | | | | | | | | | | | | | | | |
| | | | |
Class N1 | | | 0.10% | | | | | | | | 0.10% | | | | | |
| | | | |
Class I1 | | | 0.05% | | | | | | | | 0.05% | | | | | |
| | | | |
Large Cap Value Select | | | | | | | | | | | | | | | | |
| | | | |
Class N | | | 0.10% | | | | | | | | 0.10% | | | | | |
| | | | |
Class I2 | | | 0.05% | | | | | | | | 0.03% | | | | | |
| | | | | | | | | | | | | | | | |
| Fund | | Maximum Annual
Amount
Approved | | | | | | Actual
Amount
Incurred | | | | |
| | | | |
Small Cap Value | | | | | | | | | | | | | | | | |
| | | | |
Class N | | | 0.15% | | | | | | | | 0.10% | | | | | |
| | | | |
Class I | | | 0.15% | | | | | | | | 0.09% | | | | | |
| | | | |
Dividend All Cap Value | | | | | | | | | | | | | | | | |
| | | | |
Class N3 | | | 0.04% | | | | | | | | 0.04% | | | | | |
| | | | |
Class I3 | | | 0.04% | | | | | | | | 0.04% | | | | | |
| | | | |
Small-Mid Cap Value | | | | | | | | | | | | | | | | |
| | | | |
Class N | | | 0.15% | | | | | | | | 0.06% | | | | | |
| | | | |
Class I | | | 0.15% | | | | | | | | 0.05% | | | | | |
| | | | |
International Value Equity | | | | | | | | | | | | | | | | |
| | | | |
Class N4 | | | 0.05% | | | | | | | | 0.05% | | | | | |
| | | | |
Class I4 | | | 0.05% | | | | | | | | 0.05% | | | | | |
| | | | |
Focused Absolute Value | | | | | | | | | | | | | | | | |
| | | | |
Class N | | | 0.15% | | | | | | | | 0.04% | | | | | |
| | | | |
Class I | | | 0.15% | | | | | | | | 0.04% | | | | | |
| 1 | Prior to June 14, 2021, the maximum annual amount approved was 0.15%. |
| 2 | Prior to June 11, 2021, the maximum annual amount approved was 0.10%. |
| 3 | Prior to January 1, 2021, the maximum annual amount approved was 0.15%. |
| 4 | Prior to August 16, 2021, the maximum annual amount approved was 0.15%. |
The Board provides supervision of the affairs of the Trusts and other trusts within the AMG Funds Family. The Trustees of the Trusts who are not affiliated with the Investment Manager receive an annual retainer and per meeting fees for regular, special and telephonic meetings, and they are reimbursed for out-of-pocket expenses incurred while carrying out their duties as Board members. The Chairman of the Board and the Audit Committee Chair receive additional annual retainers. Certain Trustees and Officers of the Funds are Officers and/or Directors of the Investment Manager, AMG and/or the Distributor.
The Securities and Exchange Commission (the “SEC”) granted an exemptive order that permits certain eligible funds in the AMG Funds Family to lend and borrow money for certain temporary purposes directly to and from other eligible funds in the AMG Funds Family. Participation in this interfund lending program is voluntary for both the borrowing and lending funds, and an interfund loan is only made if it benefits each participating fund. The Administrator manages the program according to procedures approved by the Board, and the Board monitors the operation of the program. An interfund loan must comply with certain conditions set out in the exemptive order, which are designed to assure fairness and protect all participating funds. The interest earned and interest paid on interfund loans are included on the Statement of Operations as interest income and interest expense, respectively. Mid Cap Value, Large Cap Value Select, and International Value Equity may participate as borrowing and lending funds; Focused Absolute Value may participate as a lending fund. At October 31, 2022, the Funds had no interfund loans outstanding.
84
| | |
| | | Notes to Financial Statements (continued) |
| | | |
| | | |
The following Funds utilized the interfund loan program during the fiscal year ended October 31, 2022 as follows:
| | | | | | | | | | | | | | | | | | | | |
| Fund | | Average
Lent | | | Number
of Days | | | Interest
Earned | | | Average
Interest Rate | | | | |
| | | | | |
Mid Cap Value | | | $1,237,435 | | | | 3 | | | | $324 | | | | 3.188% | | | | | |
| | | | | |
Large Cap Value Select | | | 635,353 | | | | 2 | | | | 85 | | | | 2.435% | | | | | |
| | | | | |
Focused Absolute Value | | | 546,400 | | | | 14 | | | | 675 | | | | 3.219% | | | | | |
| | | | | | | | | | | | | | | | | | | | |
| Fund | | Average
Borrowed | | | Number
of Days | | | Interest
Paid | | | Average
Interest Rate | | | | |
| | | | | |
Mid Cap Value | | | $3,834,448 | | | | 9 | | | | $891 | | | | 0.942% | | | | | |
3. PURCHASES AND SALES OF SECURITIES
Purchases and sales of securities (excluding short-term securities and U.S. Government Obligations) for the fiscal year ended October 31, 2022, were as follows:
| | | | | | | | |
| | | Long Term Securities | |
| | |
| Fund | | Purchases | | | Sales | |
| | |
Mid Cap Value | | | $245,996,282 | | | | $325,517,236 | |
| | |
Large Cap Value Select | | | 33,632,899 | | | | 36,520,207 | |
| | |
Small Cap Value | | | 276,477,903 | | | | 265,819,663 | |
| | |
Dividend All Cap Value | | | 102,640,939 | | | | 198,427,931 | |
| | |
Small-Mid Cap Value | | | 79,051,325 | | | | 109,415,308 | |
| | |
International Value Equity | | | 3,992,783 | | | | 4,729,787 | |
| | |
Focused Absolute Value | | | 147,110,611 | | | | 258,048,809 | |
The Fund had no purchases or sales of U.S. Government Obligations during the fiscal year ended October 31, 2022.
4. PORTFOLIO SECURITIES LOANED
The Funds participate in the Program providing for the lending of securities to qualified borrowers. Securities lending income includes earnings of such temporary cash investments, plus or minus any rebate to a borrower. These earnings (after any rebate) are then divided between BNYM, as a fee for its services under the Program, and the Funds, according to agreed-upon rates. Collateral on all securities loaned is accepted in cash, U.S. Treasury Obligations or U.S. Government Agency Obligations. Collateral is maintained at a minimum level of 102% (105% in the case of certain foreign securities) of the market value, plus interest, if applicable, of investments on loan. It is the Funds’ policy to obtain additional collateral from or return excess collateral to the borrower by the end of the next business day, following the valuation date of the securities loaned. Therefore, the value of the collateral held may be temporarily less than the value of the securities on loan. Lending securities entails a risk of loss to the Funds if and to the extent that the market value of the securities loaned were to increase and the borrower did not increase the collateral accordingly, and the borrower fails to return the securities. Under the terms of the Program, the Funds are indemnified for such losses by BNYM. Cash collateral is held in separate omnibus accounts managed by BNYM, who is authorized to exclusively enter into joint repurchase agreements for that cash collateral. Securities collateral is held in separate omnibus accounts managed by BNYM and cannot be sold or pledged. BNYM bears
the risk of any deficiency in the amount of the cash collateral available for return to the borrower due to any loss on the collateral invested. Loans of securities are terminable at any time and the borrower, after notice, is required to return borrowed securities as soon as practical, which is normally within three business days.
The value of securities loaned on positions held, cash collateral and securities collateral received at October 31, 2022, were as follows:
| | | | | | | | | | | | | | | | |
| Fund | | Securities
Loaned | | | Cash
Collateral
Received | | | Securities
Collateral
Received | | | Total Collateral
Received | |
| | | | |
Mid Cap Value | | | $2,455,734 | | | | $2,335,584 | | | | $191,462 | | | | $2,527,046 | |
| | | | |
Large Cap Value Select | | | 4,270,431 | | | | — | | | | 4,394,146 | | | | 4,394,146 | |
| | | | |
Small Cap Value | | | 10,103,979 | | | | 3,136,263 | | | | 7,373,777 | | | | 10,510,040 | |
| | | | |
Dividend All Cap Value | | | 8,546,674 | | | | 6,118,211 | | | | 2,551,781 | | | | 8,669,992 | |
| | | | |
Small-Mid Cap Value | | | 115,718 | | | | — | | | | 121,236 | | | | 121,236 | |
| | | | |
International Value Equity | | | 132,554 | | | | 138,897 | | | | — | | | | 138,897 | |
| | | | |
Focused Absolute Value | | | 2,663,174 | | | | — | | | | 2,730,063 | | | | 2,730,063 | |
The following table summarizes the securities received as collateral for securities lending at October 31, 2022:
| | | | | | |
| Fund | | Collateral Type | | Coupon
Range | | Maturity
Date Range |
| | | |
Mid Cap Value | | U.S. Treasury
Obligations | | 0.000%-7.500% | | 11/15/22-11/15/51 |
| | | |
Large Cap Value Select | | U.S. Treasury
Obligations | | 0.000%-7.500% | | 11/15/22-11/15/51 |
| | | |
Small Cap Value | | U.S. Treasury
Obligations | | 0.000%-4.750% | | 01/12/23-08/15/51 |
| | | |
Dividend All Cap Value | | U.S. Treasury
Obligations | | 0.125%-4.750% | | 02/28/23-08/15/51 |
| | | |
Small-Mid Cap Value | | U.S. Treasury
Obligations | | 0.000%-4.750% | | 01/12/23-11/15/50 |
| | | |
Focused Absolute Value | | U.S. Treasury
Obligations | | 0.130%-4.750% | | 02/28/23-08/15/51 |
5. FOREIGN SECURITIES
Certain Funds invest in securities of foreign entities and in instruments denominated in foreign currencies which involve risks not typically associated with investments in domestic securities. Non-domestic securities carry special risks, such as exposure to currency fluctuations, less developed or less efficient trading markets, political instability, a lack of company information, differing auditing and legal standards, and, potentially, less liquidity. A Fund’s investments in emerging market countries are exposed to additional risks. A Fund’s performance will be influenced by political, social and economic factors affecting companies in emerging market countries. Emerging market countries generally have economic structures that are less diverse and mature, and political systems that are less stable, than those of developed countries. Realized gains in certain countries may be subject to foreign taxes at the Fund level and the Fund would pay such foreign taxes at the appropriate rate for each jurisdiction.
85
| | |
| | | Notes to Financial Statements (continued) |
| | | |
| | | |
6. COMMITMENTS AND CONTINGENCIES
Under the Trusts’ organizational documents, its Trustees and Officers are indemnified against certain liabilities arising out of the performance of their duties to the Trusts. In addition, in the normal course of business, the Funds may enter into contracts and agreements that contain a variety of representations and warranties, which provide general indemnifications. The maximum exposure to the Funds under these arrangements is unknown, as this would involve future claims that may be made against a Fund that have not yet occurred. However, based on experience, the Funds had no prior claims or losses and expect the risks of loss to be remote.
7. CREDIT AGREEMENT
Effective July 6, 2010, and amended and restated on July 21, 2021, and last amended on July 20, 2022, AMG Funds IV entered into a Credit Agreement with BNYM (the “Credit Agreement”) which provides Small Cap Value, Dividend All Cap Value, Small-Mid Cap Value, and Focused Absolute Value (the “Participating Funds”) with a revolving line of credit of up to $50 million. The Credit Agreement expires in 365 days and can be renewed at the mutual agreement of AMG Funds IV and BNYM. The facility is shared by Participating Funds, and is available for temporary, emergency purposes including liquidity needs in meeting redemptions. The
interest rate on outstanding Alternate Base Rate Loans is equal to the greater of the Prime Rate plus 1.25%, or 0.50% plus the Federal Funds Effective Rate plus 1.25%. The interest rate on outstanding Overnight Loans is equal to the greater of the Federal Funds Effective Rate plus 1.25%, or the Adjusted Daily Simple SOFR plus 1.25%. The aforementioned Adjusted Daily Simple SOFR is the sum of Daily Simple SOFR plus 0.10% plus a floor rate of 0.00%. AMG Funds IV pays a commitment fee on the unutilized commitment amount of 0.175% per annum, which is allocated to the Participating Funds based on average daily net assets and included in miscellaneous expense on the Statement of Operations. Interest incurred on loans utilized is included in the Statement of Operations as interest expense. At October 31, 2022, the Funds had no loans outstanding.
The following Funds utilized the line of credit during the fiscal year ended October 31, 2022:
| | | | | | | | | | | | | | | | |
| Fund | | Weighted
Average
Borrowed | | | Number
of Days | | | Interest
Paid | | | Average
Interest Rate | |
| | | | |
Dividend All Cap Value | | | $3,355,833 | | | | 13 | | | | $1,641 | | | | 1.354% | |
| | | | |
Focused Absolute Value | | | 5,153,069 | | | | 24 | | | | 10,170 | | | | 2.960% | |
8. MASTER NETTING AGREEMENTS
The Funds may enter into master netting agreements with their counterparties for the Program and Repurchase Agreements, which provide the right, in the event of default (including bankruptcy or insolvency) for the non-defaulting party to liquidate the collateral and calculate net exposure to the defaulting party or request additional collateral. For financial reporting purposes, the Funds do not offset financial assets and financial liabilities that are subject to master netting agreements in the Statement of Assets and Liabilities. For securities lending transactions, see Note 4.
| | | | | | | | | | | | | | | | | | | | |
| | | | | | Gross Amount Not Offset in the | | | | | | | |
| | | | | | Statement of Assets and Liabilities | | | | | | | |
| | | | | |
| Fund | | Gross Amounts of Assets Presented in the Statement of Assets and Liabilities | | | Offset Amount | | | Net Asset Balance | | | Collateral Received | | | Net Amount | |
| | | | | |
| | | | | | | | | | | | | | | | | | | | |
| | | | | |
Mid Cap Value | | | | | | | | | | | | | | | | | | | | |
| | | | | |
Bank of America Securities, Inc. | | | $1,000,000 | | | | — | | | | $1,000,000 | | | | $1,000,000 | | | | — | |
| | | | | |
Deutsche Bank Securities, Inc. | | | 335,584 | | | | — | | | | 335,584 | | | | 335,584 | | | | — | |
| | | | | |
RBC Dominion Securities, Inc. | | | 1,000,000 | | | | — | | | | 1,000,000 | | | | 1,000,000 | | | | — | |
| | | | | | | | | | | | | | | | | | | | |
| | | | | |
Total | | | $2,335,584 | | | | — | | | | $2,335,584 | | | | $2,335,584 | | | | — | |
| | | | | | | | | | | | | | | | | | | | |
| | | | | |
Small Cap Value | | | | | | | | | | | | | | | | | | | | |
| | | | | |
Bank of America Securities, Inc. | | | $1,000,000 | | | | — | | | | $1,000,000 | | | | $1,000,000 | | | | — | |
| | | | | |
Daiwa Capital Markets America | | | 1,000,000 | | | | — | | | | 1,000,000 | | | | 1,000,000 | | | | — | |
| | | | | |
RBC Dominion Securities, Inc. | | | 1,136,263 | | | | — | | | | 1,136,263 | | | | 1,136,263 | | | | — | |
| | | | | | | | | | | | | | | | | | | | |
| | | | | |
Total | | | $3,136,263 | | | | — | | | | $3,136,263 | | | | $3,136,263 | | | | — | |
| | | | | | | | | | | | | | | | | | | | |
86
| | |
| | | Notes to Financial Statements (continued) |
| | | |
| | | |
| | | | | | | | | | | | |
| | | | | Gross Amount Not Offset in the | | | | | |
| | | | | Statement of Assets and Liabilities | | | | | |
| | | | | |
| Fund | | Gross Amounts of Assets Presented in the Statement of Assets and Liabilities | | Offset Amount | | Net Asset Balance | | Collateral Received | | | Net Amount |
| | | | | |
Dividend All Cap Value | | | | | | | | | | | | |
| | | | | |
Bank of America Securities, Inc. | | $1,453,527 | | — | | $1,453,527 | | | $1,453,527 | | | — |
| | | | | |
Daiwa Capital Markets America | | 1,453,527 | | — | | 1,453,527 | | | 1,453,527 | | | — |
| | | | | |
HSBC Securities USA, Inc. | | 304,103 | | — | | 304,103 | | | 304,103 | | | — |
| | | | | |
RBC Dominion Securities, Inc. | | 1,453,527 | | — | | 1,453,527 | | | 1,453,527 | | | — |
| | | | | |
Truist Securities, Inc. | | 1,453,527 | | — | | 1,453,527 | | | 1,453,527 | | | — |
| | | | | | | | | | | | |
| | | | | |
Total | | $6,118,211 | | — | | $6,118,211 | | | $6,118,211 | | | — |
| | | | | | | | | | | | |
| | | | | |
International Value Equity | | | | | | | | | | | | |
| | | | | |
RBC Dominion Securities, Inc. | | $ 138,897 | | — | | $ 138,897 | | | $ 138,897 | | | — |
9. SUBSEQUENT EVENTS
The Funds have determined that no material events or transactions occurred through the issuance date of the Funds’ financial statements which require an additional disclosure in or adjustment of the Funds’ financial statements.
87
| | |
| | | Report of Independent Registered Public Accounting Firm |
| | | |
| | | |
TO THE BOARD OF TRUSTEES OF AMG FUNDS I AND AMG FUNDS IV AND SHAREHOLDERS OF AMG RIVER ROAD LARGE CAP VALUE SELECT FUND, AMG RIVER ROAD MID CAP VALUE FUND, AMG RIVER ROAD SMALL CAP VALUE FUND, AMG RIVER ROAD DIVIDEND ALL CAP VALUE FUND, AMG RIVER ROAD SMALL-MID CAP VALUE FUND, AMG RIVER ROAD INTERNATIONAL VALUE EQUITY FUND, AND AMG RIVER ROAD FOCUSED ABSOLUTE VALUE FUND
OPINIONS ON THE FINANCIAL STATEMENTS
We have audited the accompanying statements of assets and liabilities, including the schedules of portfolio investments of AMG River Road Large Cap Value Select Fund (one of the funds constituting AMG Funds I), AMG River Road Mid Cap Value Fund, AMG River Road Small Cap Value Fund, AMG River Road Dividend All Cap Value Fund, AMG River Road Small-Mid Cap Value Fund, AMG River Road International Value Equity Fund, and AMG River Road Focused Absolute Value Fund (six of the funds constituting AMG Funds IV) (hereafter collectively referred to as the “Funds”) as of October 31, 2022, the related statements of operations for the year ended October 31, 2022, the statements of changes in net assets for each of the two years in the period ended October 31, 2022, including the related notes, and the financial highlights for each of the five years in the period ended October 31, 2022 (collectively referred to as the “financial statements”). In our opinion, the financial statements present fairly, in all material respects, the financial position of each of the Funds as of October 31, 2022, the results of each of their operations for the year then ended, the changes in each of their net assets for each of the two years in the period ended October 31, 2022 and each of the financial highlights for each of the five years in the period ended October 31, 2022 in conformity with accounting principles generally accepted in the United States of America.
BASIS FOR OPINIONS
These financial statements are the responsibility of the Funds’ management. Our responsibility is to express an opinion on the Funds’ financial statements based on our audits. We are a public accounting firm registered with the Public Company Accounting Oversight Board (United States) (PCAOB) and are required to be independent with respect to the Funds in accordance with the U.S. federal securities laws and the applicable rules and regulations of the Securities and Exchange Commission and the PCAOB.
We conducted our audits of these financial statements in accordance with the standards of the PCAOB. Those standards require that we plan and perform the audit to obtain reasonable assurance about whether the financial statements are free of material misstatement, whether due to error or fraud.
Our audits included performing procedures to assess the risks of material misstatement of the financial statements, whether due to error or fraud, and performing procedures that respond to those risks. Such procedures included examining, on a test basis, evidence regarding the amounts and disclosures in the financial statements. Our audits also included evaluating the accounting principles used and significant estimates made by management, as well as evaluating the overall presentation of the financial statements. Our procedures included confirmation of securities owned as of October 31, 2022 by correspondence with the custodian and brokers; when replies were not received from brokers, we performed other auditing procedures. We believe that our audits provide a reasonable basis for our opinions.
/s/PricewaterhouseCoopers LLP
Boston, Massachusetts
December 22, 2022
We have served as the auditor of one or more investment companies in the AMG Funds Family since 1993.
88
| | |
| | | Other Information (unaudited) |
| | | |
| | | |
TAX INFORMATION
AMG River Road Mid Cap Value Fund, AMG River Road Large Cap Value Select Fund, AMG River Road Small Cap Value Fund, AMG River Road Dividend All Cap Value Fund, AMG River Road Small-Mid Cap Value Fund, AMG River Road International Value Equity Fund and AMG River Road Focused Absolute Value Fund each hereby designates the maximum amount allowable of its net taxable income as qualified dividends as provided in the Jobs and Growth Tax Relief Reconciliation Act of 2003. The 2021/2022 Form 1099-DIV you receive for each Fund will show the tax status of all distributions paid to you during the year.
In accordance with federal tax law, the following Fund elects to provide foreign taxes paid and the income sourced from foreign countries. Accordingly, the Fund hereby makes the following designations regarding its taxable period ended October 31, 2022:
AMG River Road International Value Equity Fund
▶The total amount of taxes paid and income sourced from foreign countries was $16,365 and $369,775, respectively.
Pursuant to section 852 of the Internal Revenue Code, the Funds each hereby designates as a capital gain distribution with respect to the taxable period ended October 31, 2022, or if subsequently determined to be different, the net capital gains of such period as follows:
| | | | |
| Fund | | Amount | |
| |
Mid Cap Value | | | $838,902 | |
| |
Small Cap Value | | | 39,608,969 | |
| |
Dividend All Cap Value | | | 73,689,375 | |
| | | | |
| Fund | | Amount | |
| |
Small-Mid Cap Value | | | $15,852,056 | |
| |
International Value Equity | | | 47,222 | |
| |
Focused Absolute Value | | | 13,640,150 | |
89
| | |
| | | AMG Funds Trustees and Officers |
| | | |
| | | |
| | | | |
| The Trustees and Officers of the Trust, their business addresses, principal occupations for the past five years and ages are listed below. The Trustees provide broad supervision over the affairs of the Trust and the Funds. The Trustees are experienced executives who meet periodically throughout the year to oversee the Funds’ activities, review contractual arrangements with companies that provide services to the Funds, and | | review the Funds’ performance. Unless otherwise noted, the address of each Trustee or Officer is the address of the Trust: 680 Washington Blvd., Suite 500, Stamford, CT. 06901. There is no stated term of office for Trustees. Trustees serve until their resignation, retirement or removal in | | accordance with the Trust’s organizational documents and policies adopted by the Board from time to time. The Chairman of the Trustees, President, Treasurer and Secretary of the Trust are elected by the Trustees annually. Other officers hold office at the pleasure of the Trustees. |
Independent Trustees
The following Trustees are not “interested persons” of the Trust within the meaning of the 1940 Act:
| | |
Number of Funds Overseen in Fund Complex | | Name, Age, Principal Occupation(s) During Past 5 Years and Other Directorships Held by Trustee |
| | |
• Trustee since 2012 - AMG Funds I • Trustee since 2014 - AMG Funds IV • Oversees 40 Funds in Fund Complex | | Bruce B. Bingham, 73 Partner, Hamilton Partners (real estate development firm) (1987-Present); Director of The Yacktman Funds, Inc. (2 portfolios) (2000-2012). |
| | |
• Trustee since 2013 - AMG Funds I • Trustee since 2014 - AMG Funds IV • Chairman of the Audit Committee since 2021 - AMG Funds I • Chairman of the Audit Committee since 2020 - AMG Funds IV • Oversees 44 Funds in Fund Complex | | Kurt A. Keilhacker, 59 Managing Partner, TechFund Europe (2000-Present); Managing Partner, TechFund Capital (1997-Present); Managing Partner, Elementum Ventures (2013-Present); Director, MetricStory, Inc. (2017-Present); Trustee, Wheaton College (2018-Present); Trustee, Gordon College (2001-2016); Board Member, 6wind SA (2002-2019). |
| | |
• Trustee since 2000 - AMG Funds I • Trustee since 2010 - AMG Funds IV • Oversees 40 Funds in Fund Complex | | Steven J. Paggioli, 72 Independent Consultant (2002-Present); Trustee, Professionally Managed Portfolios (28 portfolios); Advisory Board Member, Sustainable Growth Advisors, LP; Independent Director, Muzinich BDC, Inc. (business development company) (2019-Present); Director, The Wadsworth Group; Independent Director, Chase Investment Counsel (2008–2019); Executive Vice President, Secretary and Director, Investment Company Administration, LLC and First Fund Distributors, INC. (1990-2001). |
| | |
• Independent Chairman of the Board of Trustees since 2017; Chairman of the Governance Committee since 2017 • Trustee since 2000 - AMG Funds I • Trustee since 2010 - AMG Funds IV • Oversees 44 Funds in Fund Complex | | Eric Rakowski, 64 Professor of Law, University of California at Berkeley School of Law (1990-Present); Tax Attorney at Davis Polk & Wardwell and clerked for Judge Harry T. Edwards of the U.S. Court of Appeals for the District of Columbia Circuit and for Justice William J. Brennan Jr. of the U.S. Supreme Court; Director of Harding, Loevner Funds, Inc. (10 portfolios); Trustee of Third Avenue Trust (3 portfolios) (2002-2019); Trustee of Third Avenue Variable Trust (1 portfolio) (2002-2019). |
| | |
• Trustee since 2013 - AMG Funds I • Trustee since 2014 - AMG Funds IV • Oversees 44 Funds in Fund Complex | | Victoria L. Sassine, 57 Adjunct Professor, Babson College (2007–Present); Director, Board of Directors, PRG Group (2017-Present); CEO, Founder, Scale Smarter Partners, LLC (2018-Present); Adviser, EVOFEM Biosciences (2019-Present); Chairperson of the Board of Directors of Business Management Associates (2018 to 2019). |
90
| | |
| | | AMG Funds Trustees and Officers (continued) |
| | | |
| | | |
| | |
Number of Funds Overseen in Fund Complex | | Name, Age, Principal Occupation(s) During Past 5 Years and Other Directorships Held by Trustee |
| | |
• Trustee since 2000 - AMG Funds I • Trustee since 2010 - AMG Funds IV • Oversees 40 Funds in Fund Complex | | Thomas R. Schneeweis, 75* Professor Emeritus, University of Massachusetts (2013-Present); President, TRS Associates (1982-Present); Board Member, Chartered Alternative Investment Association (“CAIA”) (2002-Present); Co-Founder and Director, Institute for Global Asset and Risk Management (Education) (2010-Present); Co-Owner, Quantitative Investment Technologies (2014-Present); Co-Owner, Yes Wealth Management (2018-Present); Director, CAIA Foundation (2010-2019); Partner, S Capital Wealth Advisors (2015-2018); Partner, S Capital Management, LLC (2007-2015); President, Alternative Investment Analytics, LLC (formerly Schneeweis Partners, LLC) (2001-2013). |
*Mr. Schneeweis retired from the Board of Trustees of AMG Funds IV as of October 31, 2022, and will retire from the Board of Trustees of AMG Funds I as of December 31, 2022.
Interested Trustee
The Trustee in the following table is an “interested person” of the Trust within the meaning of the 1940 Act.
| | |
Number of Funds Overseen in Fund Complex | | Name, Age, Principal Occupation(s) During Past 5 Years and Other Directorships Held by Trustee |
| | |
• Trustee since 2021 - AMG Funds I, AMG Funds IV • Oversees 44 Funds in Fund Complex | | Garret W. Weston, 41 Affiliated Managers Group, Inc. (2008-Present): Managing Director, Co-Head of Affiliate Engagement (2021-Present), Senior Vice President, Affiliate Development (2016-2021), Vice President, Office of the CEO (2015-2016), Vice President, New Investments (2012-2015), Senior Associate, New Investments (2008-2012); Associate, Madison Dearborn Partners (2006-2008); Analyst, Merrill Lynch (2004-2006). |
Officers
| | |
Position(s) Held with Fund and Length of Time Served | | Name, Age, Principal Occupation(s) During Past 5 Years |
| | |
• President since 2018 • Principal Executive Officer since 2018 • Chief Executive Officer since 2018 • Chief Operating Officer since 2007 (2016 for AMG Funds IV) | | Keitha L. Kinne, 64 Chief Operating Officer, AMG Funds LLC (2007-Present); Chief Investment Officer, AMG Funds LLC (2008-Present); President and Principal, AMG Distributors, Inc. (2018-Present); Chief Operating Officer, AMG Distributors, Inc. (2007-Present); President, Chief Executive Officer and Principal Executive Officer, AMG Funds, AMG Funds I, AMG Funds II, AMG Funds III and AMG Funds IV (2018-Present); Chief Operating Officer, AMG Funds, AMG Funds I, AMG Funds II, and AMG Funds III (2007-Present); Chief Operating Officer, AMG Funds IV (2016-Present); Chief Operating Officer and Chief Investment Officer, Aston Asset Management, LLC (2016); President and Principal Executive Officer, AMG Funds, AMG Funds I, AMG Funds II and AMG Funds III (2012-2014); Managing Partner, AMG Funds LLC (2007-2014); President and Principal, AMG Distributors, Inc. (2012-2014); Managing Director, Legg Mason & Co., LLC (2006-2007); Managing Director, Citigroup Asset Management (2004-2006). |
| | |
• Secretary since 2015 • Chief Legal Officer since 2015 | | Mark J. Duggan, 57 Managing Director and Senior Counsel, AMG Funds LLC (2021-Present); Senior Vice President and Senior Counsel, AMG Funds LLC (2015-2021); Secretary and Chief Legal Officer, AMG Funds, AMG Funds I, AMG Funds II, AMG Funds III and AMG Funds IV (2015-Present); Attorney, K&L Gates, LLP (2009-2015). |
| | |
• Chief Financial Officer since 2017 • Treasurer since 2017 • Principal Financial Officer since 2017 • Principal Accounting Officer since 2017 | | Thomas G. Disbrow, 56 Vice President, Mutual Fund Treasurer & CFO, AMG Funds, AMG Funds LLC (2017-Present); Chief Financial Officer, Principal Financial Officer, Treasurer and Principal Accounting Officer, AMG Funds, AMG Funds I, AMG Funds II, AMG Funds III and AMG Funds IV (2017-Present); Managing Director - Global Head of Traditional Funds Product Control, UBS Asset Management (Americas), Inc. (2015-2017); Managing Director - Head of North American Funds Treasury, UBS Asset Management (Americas), Inc. (2011-2015). |
| | |
• Deputy Treasurer since 2017 | | John A. Starace, 51 Vice President, Mutual Fund Accounting, AMG Funds LLC (2021-Present); Director, Mutual Fund Accounting, AMG Funds LLC (2017-2021); Vice President, Deputy Treasurer of Mutual Funds Services, AMG Funds LLC (2014-2017); Deputy Treasurer, AMG Funds, AMG Funds I, AMG Funds II, AMG Funds III and AMG Funds IV (2017-Present); Vice President, Citi Hedge Fund Services (2010-2014); Audit Senior Manager (2005-2010) and Audit Manager (2001-2005), Deloitte & Touche LLP. |
| | |
• Chief Compliance Officer and Sarbanes-Oxley Code of Ethics Compliance Officer since 2019 • Anti-Money Laundering Compliance Officer since 2022 | | Patrick J. Spellman, 48 Vice President, Chief Compliance Officer, AMG Funds LLC (2017-Present); Chief Compliance Officer, AMG Distributors, Inc. (2010-Present); Chief Compliance Officer and Sarbanes-Oxley Code of Ethics Compliance Officer, AMG Funds, AMG Funds I, AMG Funds II, AMG Funds III and AMG Funds IV (2019-Present); Anti-Money Laundering Compliance Officer, AMG Funds, AMG Funds I, AMG Funds II, and AMG Funds III (2014-2019; 2022-Present); Anti-Money Laundering Compliance Officer, AMG Funds IV (2016-2019; 2022-Present); Senior Vice President, Chief Compliance Officer, AMG Funds LLC (2011-2017); Compliance Manager, Legal and Compliance, Affiliated Managers Group, Inc. (2005-2011). |
91
| | |
| | | AMG Funds Trustees and Officers (continued) |
| | | |
| | | |
| | |
Position(s) Held with Fund and Length of Time Served | | Name, Age, Principal Occupation(s) During Past 5 Years |
| | |
• Assistant Secretary since 2016 | | Maureen M. Kerrigan, 37 Vice President, Senior Counsel, AMG Funds LLC (2021-Present); Vice President, Counsel, AMG Funds LLC (2019-2021); Director, Counsel, AMG Funds LLC (2017-2018); Vice President, Counsel, AMG Funds LLC (2015-2017); Assistant Secretary, AMG Funds, AMG Funds I, AMG Funds II, AMG Funds III and AMG Funds IV (2016-Present); Associate, Ropes & Gray LLP (2011-2015); Law Fellow, Massachusetts Appleseed Center for Law and Justice (2010-2011). |
92
| | |
| | | Annual Renewal of Investment Management and Subadvisory Agreements |
| | | |
| | | |
| | | | | | | | |
AMG River Road Dividend All Cap Value Fund, AMG River Road Focused Absolute Value Fund, AMG River Road International Value Equity Fund, AMG River Road Large Cap Value Select Fund, AMG River Road Mid Cap Value Fund, AMG River Road Small-Mid Cap Value Fund, and AMG River Road Small Cap Value Fund: Approval of Investment Management and Subadvisory Agreements on June 22, 2022 At an in-person meeting held on June 22, 2022, the Board of Trustees (the “Board” or the “Trustees”) of each of AMG Funds I and AMG Funds IV (each, a “Trust” and collectively, the “Trusts”), and separately a majority of the Trustees who are not “interested persons” of the Trusts (the “Independent Trustees”), approved (i) the Fund Management Agreement, as amended pursuant to letter agreements at any time prior to the date of the meeting, with AMG Funds LLC (the “Investment Manager”) and AMG Funds I for AMG River Road Large Cap Value Select Fund and separately each of Amendment No. 1 thereto dated July 1, 2015, and Amendment No. 2 thereto dated October 1, 2016; and the Investment Advisory Agreement, as amended pursuant to letter agreements at any time prior to the date of the meeting, with the Investment Manager and AMG Funds IV for each of AMG River Road Dividend All Cap Value Fund, AMG River Road Focused Absolute Value Fund, AMG River Road International Value Equity Fund (formerly AMG River Road Long-Short Fund), AMG River Road Mid Cap Value Fund, AMG River Road Small-Mid Cap Value Fund, and AMG River Road Small Cap Value Fund, and separately Amendment No. 1 thereto dated October 1, 2016 (collectively, the “Investment Management Agreements”); and (ii) the Sub-Investment Advisory Agreements (or, in the case of AMG River Road Large Cap Value Select Fund and AMG River Road Mid Cap Value Fund, the Subadvisory Agreements), as amended at any time prior to the date of the meeting (collectively, the “Subadvisory Agreements”), with the Subadviser for each of AMG River Road Dividend All Cap Value Fund, AMG River Road Focused Absolute Value Fund, AMG River Road International Value Equity Fund, AMG River Road Large Cap Value Select Fund, AMG River Road Mid Cap Value Fund, AMG River Road Small-Mid Cap Value Fund, and AMG River Road Small Cap Value Fund (each, a “Fund,” and collectively, the “Funds”). The Independent Trustees were separately represented by independent legal counsel in connection with their consideration of the approval of these agreements. In considering the Investment Management Agreements and the Subadvisory Agreements, the Trustees reviewed a variety of materials relating to each Fund, the | | | | Investment Manager and the Subadviser, including the nature, extent and quality of services, comparative performance, fee and expense information for an appropriate peer group of similar mutual funds for each Fund (each, a “Peer Group”), performance information for the relevant benchmark index for each Fund (each, a “Fund Benchmark”), other relevant matters, and other information provided to them on a periodic basis throughout the year. Prior to voting, the Independent Trustees: (a) reviewed the foregoing information with their independent legal counsel; (b) received materials from their independent legal counsel discussing the legal standards applicable to their consideration of the Investment Management Agreements and the Subadvisory Agreements; and (c) met with their independent legal counsel in private sessions at which no representatives of management were present. NATURE, EXTENT AND QUALITY OF SERVICES In considering the nature, extent and quality of the services provided by the Investment Manager, the Trustees reviewed information relating to the Investment Manager’s operations and personnel. Among other things, the Investment Manager provided financial information, information about its supervisory and professional staff and descriptions of its organizational and management structure. The Trustees also took into account information provided periodically throughout the previous year by the Investment Manager in Board meetings relating to the performance of its duties with respect to the Funds and the Trustees’ knowledge of the Investment Manager’s management and the quality of the performance of the Investment Manager’s duties under the Investment Management Agreements and Administration Agreement. In the course of their deliberations regarding the Investment Manager, the Trustees evaluated, among other things: (a) the extent and quality of the Investment Manager’s oversight of the operation and management of the Funds; (b) the quality of the Investment Manager’s oversight of the performance by the Subadviser of its portfolio management duties; (c) the Investment Manager’s ability to supervise the Funds’ other service providers; and (d) the Investment Manager’s compliance program. The Trustees also took into account that, in performing its functions under the Investment Management Agreements and supervising the Subadviser, the Investment Manager: performs periodic detailed analyses and reviews of the performance by the Subadviser of its obligations to each Fund, including without limitation, analysis and review of portfolio and other | | | | compliance matters and review of the Subadviser’s investment performance with respect to each Fund; prepares and presents periodic reports to the Board regarding the investment performance of the Subadviser and other information regarding the Subadviser, at such times and in such forms as the Board may reasonably request; reviews and considers any changes in the personnel of the Subadviser responsible for performing the Subadviser’s obligations and makes appropriate reports to the Board; reviews and considers any changes in the ownership or senior management of the Subadviser and makes appropriate reports to the Board; performs periodic in-person, telephonic or videoconference diligence meetings, including with respect to compliance matters, with representatives of the Subadviser; assists the Board and management of the Trusts in developing and reviewing information with respect to the initial approval of each Subadvisory Agreement and annual consideration of each Subadvisory Agreement thereafter; prepares recommendations with respect to the continued retention of the Subadviser or the replacement of the Subadviser, including at the request of the Board; identifies potential successors to, or replacements of, the Subadviser or potential additional subadvisers, including performing appropriate due diligence, and developing and presenting to the Board a recommendation as to any such successor, replacement, or additional subadviser, including at the request of the Board; designates and compensates from its own resources such personnel as the Investment Manager may consider necessary or appropriate to the performance of its services; and performs such other review and reporting functions as the Board shall reasonably request consistent with the Investment Management Agreements and applicable law. The Trustees noted the affiliation of the Subadviser with the Investment Manager, noting any potential conflicts of interest. The Trustees also took into account the financial condition of the Investment Manager with respect to its ability to provide the services required under the Investment Management Agreements and the Investment Manager’s undertaking to maintain contractual expense limitations for certain Funds, as described below. The Trustees also considered the Investment Manager’s risk management processes. The Trustees also reviewed information relating to the Subadviser’s operations and personnel and the investment philosophy, strategies and techniques (its “Investment Strategy”) used in managing each Fund. Among other things, the Trustees reviewed information on portfolio management and other |
93
| | |
| | | Annual Renewal of Investment Management and Subadvisory Agreements (continued) |
| | | |
| | | |
| | | | | | | | |
professional staff, information regarding the Subadviser’s organizational and management structure and the Subadviser’s brokerage policies and practices. The Trustees considered specific information provided regarding the experience of the individuals at the Subadviser with portfolio management responsibility for each Fund, including the information set forth in each Fund’s prospectus and statement of additional information. In the course of their deliberations, the Trustees evaluated, among other things: (a) the services rendered by the Subadviser in the past; (b) the qualifications and experience of the Subadviser’s personnel; and (c) the Subadviser’s compliance program. The Trustees also took into account the financial condition of the Subadviser with respect to its ability to provide the services required under each Subadvisory Agreement. The Trustees also considered the Subadviser’s risk management processes. PERFORMANCE The Board considered each Fund’s net performance during relevant time periods as compared to the Fund’s Peer Group and Fund Benchmark, considered the gross performance of each Fund other than AMG River Road International Value Equity Fund as compared to the Subadviser’s relevant performance composite that utilizes a similar investment strategy and approach, and noted that the Board reviews on a quarterly basis detailed information about both a Fund’s performance results and portfolio composition, as well as the Subadviser’s Investment Strategy. The Board was mindful of the Investment Manager’s expertise, resources and attention to monitoring the Subadviser’s performance, investment style and risk-adjusted performance with respect to the Funds and its discussions with the management of the Funds’ subadviser during the period regarding the factors that contributed to the performance of the Funds. With respect to AMG River Road Dividend All Cap Value Fund, among other information relating to the Fund’s performance, the Trustees noted that the Fund’s performance for Class N shares (which share class has the earliest inception date of all the share classes of the Fund) for the 1-year, 3-year, 5-year and 10-year periods ended March 31, 2022 was at, below, below, and below, respectively, the median performance of the Peer Group and above, below, below, and below, respectively, the performance of the Fund Benchmark, the Russell 3000 Value Index. The Trustees took into account management’s discussion of the Fund’s performance, including the reasons for the Fund’s recent outperformance relative to the Fund Benchmark and the Fund’s | | | | longer-term underperformance. The Trustees concluded that the Fund’s overall performance has been satisfactory in light of the Fund’s investment objective, strategies and policies. With respect to AMG River Road Focused Absolute Value Fund, among other information relating to the Fund’s performance, the Trustees noted that the Fund’s performance for Class I shares (which share class has one of the earliest inception dates and the largest amount of assets of all the share classes of the Fund) for the 1-year, 3-year, and 5-year periods ended March 31, 2022 and for the period from the Fund’s inception on November 3, 2015 through March 31, 2022 was below the median performance of the Peer Group and below the performance of the Fund Benchmark, the Russell 3000 Value Index. The Trustees also took into account management’s discussion of the Fund’s performance, including the reasons for the Fund’s more recent underperformance and the impact of the Fund’s recent underperformance on its longer-term performance rankings. The Trustees concluded that the Fund’s overall performance has been satisfactory in light of the Fund’s investment objective, strategies and policies. With respect to AMG River Road International Value Equity Fund, among other information relating to the Fund’s performance, the Trustees noted that the Fund’s performance for Class N shares (which share class has the earliest inception date of all the share classes of the Fund) for the 1-year, 3-year, 5-year and 10-year periods ended March 31, 2022 was above the median performance of the Peer Group and above, below, above, and below, respectively, the performance of the Fund Benchmark, the MSCI EAFE Index. The Trustees also took into account management’s discussion of the Fund’s performance, noting that Class N shares of the Fund ranked in the top decile relative to the Peer Group for the 5-year period, in the top quartile relative to the Peer Group for the 1-year and 10-year periods, and in the top third relative to the Peer Group for the 3-year period. The Trustees also took into account the fact that the Fund’s investment strategy and Fund Benchmark changed effective August 16, 2021, and that the performance information prior to that date reflected that of the Fund’s prior investment strategy. The Trustees concluded that the Fund’s overall performance has been satisfactory. With respect to AMG River Road Large Cap Value Select Fund, among other information relating to the Fund’s performance, the Trustees noted that the Fund’s performance for Class I shares (which share class has the earliest inception date and the largest | | | | amount of assets of all the share classes of the Fund) for the 1-year, 3-year, 5-year and 10-year periods ended March 31, 2022 was below the median performance of the Peer Group and above, below, below, and below, respectively, the performance of the Fund Benchmark, the Russell 1000 Value Index. The Trustees took into account management’s discussion of the Fund’s performance, including the reasons for the Fund’s recent outperformance relative to the Fund Benchmark and the reasons for the Fund’s longer-term underperformance. The Trustees also took into account the fact that the Fund’s subadviser, investment strategy, and Fund Benchmark changed effective March 22, 2021, and that the performance information prior to that date reflected that of the Fund’s prior subadviser and investment strategy. The Trustees concluded that the Fund’s overall performance has been satisfactory in light of the Fund’s investment objective, strategies and policies. With respect to AMG River Road Mid Cap Value Fund, among other information relating to the Fund’s performance, the Trustees noted that the Fund’s performance for Class N shares (which share class has the earliest inception date and the largest amount of assets of all the share classes of the Fund) for the 1-year, 3-year, 5-year and 10-year periods ended March 31, 2022 was above, below, below, and below, respectively, the median performance of the Peer Group and above, below, below, and below, respectively, the performance of the Fund Benchmark, the Russell Midcap Value Index. The Trustees took into account management’s discussion of the Fund’s performance, including the reasons for the Fund’s recent outperformance relative to the Peer Group and the Fund Benchmark and the Fund’s longer-term underperformance. The Trustees also noted that the Fund ranked in the top quartile relative to the Peer Group for the 1-year period. The Trustees also took into account the fact that the Fund’s subadviser, investment strategy, and Fund Benchmark changed effective March 19, 2021, and that the performance information prior to that date reflected that of the Fund’s prior subadviser and investment strategy. The Trustees concluded that the Fund’s overall performance has been satisfactory in light of the Fund’s investment objective, strategies and policies. With respect to AMG River Road Small-Mid Cap Value Fund, among other information relating to the Fund’s performance, the Trustees noted that the Fund’s performance for Class N shares (which share class has the earliest inception date of all the share classes of the Fund) for the 1-year, 3-year, 5-year and 10-year periods ended March 31, 2022 was below, |
94
| | |
| | | Annual Renewal of Investment Management and Subadvisory Agreements (continued) |
| | | |
| | | |
| | | | | | | | |
below, above, and above, respectively, the median performance of the Peer Group and below, below, above, and above, respectively, the performance of the Fund Benchmark, the Russell 2500 Value Index. The Trustees also took into account management’s discussion of the Fund’s performance, including the reasons for the Fund’s more recent underperformance. The Trustees also took into account the fact that Class N shares of the Fund ranked in the top quintile relative to its Peer Group for the 5-year and 10-year periods. The Trustees concluded that the Fund’s overall performance has been satisfactory in light of the Fund’s investment objective, strategies and policies. With respect to AMG River Road Small Cap Value Fund, among other information relating to the Fund’s performance, the Trustees noted that the Fund’s performance for Class N shares (which share class has the earliest inception date of all the share classes of the Fund) for the 1-year, 3-year, 5-year and 10-year periods ended March 31, 2022 was below, below, above, and above, respectively, the median performance of the Peer Group and above, below, above, and above, respectively, the performance of the Fund Benchmark, the Russell 2000 Value Index. The Trustees also took into account management’s discussion of the Fund’s performance, including the reasons for the Fund’s more recent underperformance relative to the Peer Group. The Trustees also took into account the fact that Class N shares of the Fund ranked in the top quartile relative to its Peer Group for the 5-year period and in the top third relative to its Peer Group for the 10-year period. The Trustees concluded that the Fund’s overall performance has been satisfactory. ADVISORY AND SUBADVISORY FEES; FUND EXPENSES; PROFITABILITY; AND ECONOMIES OF SCALE In considering the reasonableness of the advisory fee payable to the Investment Manager, the Trustees reviewed information provided by the Investment Manager at the June 22, 2022 and prior meetings setting forth all revenues and other benefits, both direct and indirect (including any so-called “fallout benefits” such as reputational value derived from the Investment Manager serving as Investment Manager to a Fund), received by the Investment Manager and its affiliates attributable to managing each Fund and all the mutual funds in the AMG Funds Family of Funds; the cost of providing such services; the significant risks undertaken as Investment Manager and sponsor of the Funds, including investment, operational, enterprise, entrepreneurial, litigation, regulatory and compliance risks; and the resulting | | | | profitability to the Investment Manager and its affiliates from these relationships. The Trustees also considered the changes to the management fee, subadvisory fee and shareholder servicing fee rates and the change to the expense cap that took effect during the past year for AMG River Road International Value Equity Fund. The Trustees also considered the amount of the advisory fee retained by the Investment Manager after payment of the subadvisory fee with respect to each Fund. The Trustees also noted payments are made from the Subadviser to the Investment Manager, and other payments are made from the Investment Manager to the Subadviser. The Trustees also considered management’s discussion of the current asset levels of the Funds, and the impact on profitability of both the current asset levels and any future growth of assets of the Funds. In considering the cost of services to be provided by the Investment Manager under each Investment Management Agreement and the profitability to the Investment Manager of its relationship with each Fund, the Trustees noted the undertaking by the Investment Manager to maintain contractual expense limitations for each Fund other than AMG River Road Small Cap Value Fund. The Board also took into account management’s discussion of the advisory fee structure, and the services the Investment Manager provides in performing its functions under each Investment Management Agreement and supervising the Subadviser. Based on the foregoing, the Trustees concluded that the profitability to the Investment Manager is reasonable and that the Investment Manager is not realizing material benefits from economies of scale that would warrant adjustments to the advisory fee at this time. Also with respect to economies of scale, the Trustees noted that as each Fund’s assets increase over time, the Fund may realize other economies of scale to the extent the increase in assets is proportionally greater than the increase in certain other expenses. In considering the reasonableness of the subadvisory fees payable by the Investment Manager to the Subadviser, the Trustees reviewed information regarding the cost to the Subadviser of providing subadvisory services to each Fund and the resulting profitability from these relationships. The Trustees noted that, because the Subadviser is an affiliate of the Investment Manager, a portion of the Subadviser’s revenues or profits might be shared directly or indirectly with the Investment Manager. The Trustees also noted that the subadvisory fees are paid by the Investment Manager out of its advisory fee. The Board also took into account | | | | management’s discussion of the subadvisory fee structure, and the services the Subadviser provides in performing its functions under each Subadvisory Agreement. Based on the foregoing, the Trustees concluded that the profitability to the Subadviser is reasonable and that the Subadviser is not realizing material benefits from economies of scale that would warrant adjustments to the subadvisory fees at this time. Also with respect to economies of scale, the Trustees noted that as a Fund’s assets increase over time, the Fund may realize other economies of scale to the extent the increase in assets is proportionally greater than the increase in certain other expenses. With respect to AMG River Road Dividend All Cap Value Fund, the Trustees noted that the management fees (which include both the advisory and administration fees) and total expenses (net of applicable expense waivers/reimbursements) of Class I shares (the class of shares which is the primary focus of the Fund’s distribution) of the Fund as of March 31, 2022 were both higher than the average for the Fund’s Peer Group. The Trustees took into account the fact that the Investment Manager has contractually agreed, through March 1, 2023, to limit the Fund’s net annual operating expenses (subject to certain excluded expenses) to 0.78%. The Trustees also took into account that the Investment Manager proposed, effective July 1, 2022 through March 1, 2024, to lower the Fund’s contractual expense limitation to 0.68% of the Fund’s net annual operating expenses (subject to certain excluded expenses), and that this proposal was approved by the Board. The Trustees also noted that the Investment Manager proposed, effective July 1, 2022, to reduce the Fund’s management fee rate, and that this proposal was approved by the Board. The Trustees also took into account management’s discussion of the Fund’s expenses, including fees and expenses relative to comparably sized funds and key competitors. The Trustees concluded that, in light of the nature, extent and quality of the services provided by the Investment Manager and the Subadviser (which is an affiliate of the Investment Manager), the foregoing expense limitation and the considerations noted above with respect to the Investment Manager and the Subadviser, the Fund’s advisory and subadvisory fees are reasonable. With respect to AMG River Road Focused Absolute Value Fund, the Trustees noted that the management fees (which include both the advisory and administration fees) and total expenses (net of applicable expense waivers/reimbursements) of Class I shares of the Fund as of March 31, 2022 were both higher than the average for the Fund’s Peer Group. The Trustees took into account the fact that |
95
| | |
| | | Annual Renewal of Investment Management and Subadvisory Agreements (continued) |
| | | |
| | | |
| | | | | | | | |
the Investment Manager has contractually agreed, through March 1, 2023, to limit the Fund’s net annual operating expenses (subject to certain excluded expenses) to 0.78%. The Trustees also took into account management’s discussion of the Fund’s expenses, including the fact that the total expenses of Class I shares of the Fund as of March 31, 2022 were lower than the median of the Peer Group. The Trustees concluded that, in light of the nature, extent and quality of the services provided by the Investment Manager and the Subadviser (which is an affiliate of the Investment Manager), the foregoing expense limitation and the considerations noted above with respect to the Investment Manager and the Subadviser, the Fund’s advisory and subadvisory fees are reasonable. With respect to AMG River Road International Value Equity Fund, the Trustees noted that the management fees (which include both the advisory and administration fees) and total expenses (net of applicable expense waivers/reimbursements) of Class I shares (the class of shares which is the primary focus of the Fund’s distribution) of the Fund as of March 31, 2022 were both lower than the average for the Fund’s Peer Group. The Trustees took into account the fact that, among other changes, effective August 16, 2021, the Investment Manager has contractually agreed, through March 1, 2023, to lower the Fund’s contractual expense limitation from 1.12% to 0.73% of the Fund’s net annual operating expenses (subject to certain excluded expenses). The Trustees also took into account the fact that, effective August 16, 2021, the Fund’s management fee rate was reduced. The Trustees concluded that, in light of the nature, extent and quality of the services provided by the Investment Manager and the Subadviser (which is an affiliate of the Investment Manager), the foregoing expense limitation and the considerations noted above with respect to the Investment Manager and the Subadviser, the Fund’s advisory and subadvisory fees are reasonable. With respect to AMG River Road Large Cap Value Select Fund, the Trustees noted that the management fees (which include both the advisory and administration fees) and total expenses (net of applicable expense waivers/reimbursements) of Class I shares of the Fund as of March 31, 2022 were both lower than the average for the Fund’s Peer Group. The Trustees took into account the fact that the Investment Manager has contractually agreed, through March 1, 2023, to limit the Fund’s net annual operating expenses (subject to certain excluded | | | | expenses) to 0.60%. The Trustees concluded that, in light of the nature, extent and quality of the services provided by the Investment Manager and the Subadviser (which is an affiliate of the Investment Manager), the foregoing expense limitation and the considerations noted above with respect to the Investment Manager and the Subadviser, the Fund’s advisory and subadvisory fees are reasonable. With respect to AMG River Road Mid Cap Value Fund, the Trustees noted that the management fees (which include both the advisory and administration fees) and total expenses (net of applicable expense waivers/reimbursements) of Class I shares (the class of shares which is the primary focus of the Fund’s distribution) of the Fund as of March 31, 2022 were lower and higher, respectively, than the average for the Fund’s Peer Group. The Trustees took into account the fact that the Investment Manager has contractually agreed, through March 1, 2023, to limit the Fund’s net annual operating expenses (subject to certain excluded expenses) to 0.76%. The Trustees also took into account management’s discussion of the Fund’s expenses, including the fact that the total expenses of Class I shares of the Fund as of March 31, 2022 were lower than the median of the Peer Group. The Trustees concluded that, in light of the nature, extent and quality of the services provided by the Investment Manager and the Subadviser (which is an affiliate of the Investment Manager), the foregoing expense limitation and the considerations noted above with respect to the Investment Manager and the Subadviser, the Fund’s advisory and subadvisory fees are reasonable. With respect to AMG River Road Small-Mid Cap Value Fund, the Trustees noted that the management fees (which include both the advisory and administration fees) and total expenses (net of applicable expense waivers/reimbursements) of Class I shares (the class of shares which is the primary focus of the Fund’s distribution) of the Fund as of March 31, 2022 were both higher than the average for the Fund’s Peer Group. The Trustees took into account the fact that the Investment Manager has contractually agreed, through March 1, 2023, to limit the Fund’s net annual operating expenses (subject to certain excluded expenses) to 1.04%. The Trustees also took into account management’s discussion of the Fund’s expenses, including fees and expenses relative to comparably sized funds and select competitors. The Trustees concluded that, in light of the nature, extent and quality of the services provided by the Investment Manager and the Subadviser (which is | | | | an affiliate of the Investment Manager), the foregoing expense limitation and the considerations noted above with respect to the Investment Manager and the Subadviser, the Fund’s advisory and subadvisory fees are reasonable. With respect to AMG River Road Small Cap Value Fund, the Trustees noted that the management fees (which include both the advisory and administration fees) and total expenses of Class I shares (the class of shares which is the primary focus of the Fund’s distribution) of the Fund as of March 31, 2022 were both higher than the average for the Fund’s Peer Group. The Trustees took into account management’s discussion of the Fund’s expenses, including fees and expenses relative to comparably sized funds and select competitors. The Trustees concluded that, in light of the nature, extent and quality of the services provided by the Investment Manager and the Subadviser (which is an affiliate of the Investment Manager) and the considerations noted above with respect to the Investment Manager and the Subadviser, the Fund’s advisory and subadvisory fees are reasonable. * * * * * After consideration of the foregoing, the Trustees also reached the following conclusions (in addition to the conclusions discussed above) regarding the Investment Management Agreements and Subadvisory Agreements: (a) the Investment Manager and the Subadviser have demonstrated that they possess the capability and resources to perform the duties required of them under the Investment Management Agreements and each Subadvisory Agreement and (b) the Investment Manager and Subadviser maintain appropriate compliance programs. Based on all of the above-mentioned factors and their related conclusions, with no single factor or conclusion being determinative and with each Trustee not necessarily attributing the same weight to each factor, the Trustees concluded that approval of each Investment Management Agreement and each Subadvisory Agreement would be in the best interests of the applicable Fund and its shareholders. Accordingly, on June 22, 2022, the Trustees, and separately a majority of the Independent Trustees, voted to approve the Investment Management Agreement and the Subadvisory Agreement for each Fund. |
96
|
|
| |
| | | | | | | | | | |
| | | INVESTMENT MANAGER AND ADMINISTRATOR AMG Funds LLC 680 Washington Blvd., Suite 500 Stamford, CT 06901 800.548.4539 DISTRIBUTOR AMG Distributors, Inc. 680 Washington Blvd., Suite 500 Stamford, CT 06901 800.548.4539 SUBADVISER River Road Asset Management, LLC Meidinger Tower 462 South Fourth Street, Suite 2000 Louisville, KY 40202 | | | | CUSTODIAN The Bank of New York Mellon Mutual Funds Custody 6023 Airport Road Oriskany, NY 13424 LEGAL COUNSEL Ropes & Gray LLP Prudential Tower, 800 Boylston Street Boston, MA 02199-3600 TRANSFER AGENT BNY Mellon Investment Servicing (US) Inc. Attn: AMG Funds 4400 Computer Drive Westborough, MA 01581 800.548.4539 | | | | This report is prepared for the Funds’ shareholders. It is authorized for distribution to prospective investors only when preceded or accompanied by an effective prospectus. To receive a free copy of the prospectus or Statement of Additional Information, which includes additional information about Fund Trustees, please contact us by calling 800.548.4539. Distributed by AMG Distributors, Inc., member FINRA/SIPC. Current net asset values per share for each Fund are available on the Funds’ website at amgfunds.com. A description of the policies and procedures each Fund uses to vote its proxies is available: (i) without charge, upon request, by calling 800.548.4539, or (ii) on the Securities and Exchange Commission’s (SEC) website at sec.gov. For information regarding each Fund’s proxy voting record for the 12-month period ended June 30, call 800.548.4539 or visit the SEC website at sec.gov. The Funds file their complete schedule of portfolio holdings with the SEC for the first and third quarters of each fiscal year as an exhibit to their reports on Form N-PORT. The Funds’ portfolio holdings on Form N-PORT are available on the SEC’s website at sec.gov and the Funds’ website at amgfunds.com. To review a complete list of the Funds’ portfolio holdings, or to view the most recent semiannual report or annual report, please visit amgfunds.com. |
|
|
| |
| | | | | | | | | | |
| | | BALANCED FUNDS AMG GW&K Global Allocation GW&K Investment Management, LLC EQUITY FUNDS AMG Beutel Goodman International Equity Beutel, Goodman & Company Ltd. AMG Boston Common Global Impact Boston Common Asset Management, LLC AMG Frontier Small Cap Growth Frontier Capital Management Co., LLC AMG GW&K Small Cap Core AMG GW&K Small Cap Value AMG GW&K Small/Mid Cap AMG GW&K Small/Mid Cap Growth AMG GW&K Emerging Markets Equity AMG GW&K Emerging Wealth Equity AMG GW&K International Small Cap GW&K Investment Management, LLC AMG Montrusco Bolton Large Cap Growth Montrusco Bolton Investments, Inc. AMG Renaissance Large Cap Growth The Renaissance Group LLC | | | | AMG River Road Dividend All Cap Value AMG River Road Focused Absolute Value AMG River Road International Value Equity AMG River Road Large Cap Value Select AMG River Road Mid Cap Value AMG River Road Small-Mid Cap Value AMG River Road Small Cap Value River Road Asset Management, LLC AMG TimesSquare Emerging Markets Small Cap AMG TimesSquare Global Small Cap AMG TimesSquare International Small Cap AMG TimesSquare Mid Cap Growth AMG TimesSquare Small Cap Growth TimesSquare Capital Management, LLC AMG Veritas Asia Pacific AMG Veritas China AMG Veritas Global Focus AMG Veritas Global Real Return Veritas Asset Management LLP AMG Yacktman AMG Yacktman Focused AMG Yacktman Global AMG Yacktman Special Opportunities Yacktman Asset Management LP | | | | FIXED INCOME FUNDS AMG Beutel Goodman Core Plus Bond Beutel, Goodman & Company Ltd. AMG GW&K Core Bond ESG AMG GW&K Enhanced Core Bond ESG AMG GW&K ESG Bond AMG GW&K High Income AMG GW&K Municipal Bond AMG GW&K Municipal Enhanced Yield GW&K Investment Management, LLC |
| | | | |
| | | | |
| amgfunds.com | | | | 103122 AR082 |
Registrant has adopted a Code of Ethics. See attached exhibit (a) (1).
| Item 3. | Audit Committee Financial Expert. |
Registrant’s Board of Trustees has determined that independent Trustee Mr. Steven J. Paggioli qualifies as the Audit Committee Financial Expert. Mr. Paggioli is “independent” as such term is defined in Form N-CSR.
| Item 4. | Principal Accountant Fees and Services. |
The aggregate fees billed for each of the last two fiscal years for professional services rendered by the principal accountant for the audit of the registrant’s annual financial statements or services that are normally provided by the accountant in connection with statutory and regulatory filings or engagements for those fiscal years are $275,328 for 2022 and $302,435 for 2021.
There were no fees billed by PwC to the Funds in its two recent fiscal years for services rendered for assurance and related services that are reasonably related to the performance of the audit or review of the Fund’s financial statements, but are not reported as Audit Fees (“Audit-Related Fees”).
For the Funds’ two most recent fiscal years, there were no Audit-Related Fees billed by PwC for engagements related directly to the operations and financial reporting of one or more Funds by a Fund Service Provider. A Fund Service Provider is (a) any investment adviser to the Fund (not including any Subadvisor whose role is primarily portfolio management and is subcontracted with or overseen by another investment adviser) or (b) any entity that provides ongoing services to the Fund and is controlling, controlled by or under common control with a Fund investment adviser described in (a).
The aggregate fees billed in each of the last two fiscal years for professional services rendered by the principal accountant for tax compliance, tax advice, and tax planning are $60,390 for 2022 and $56,800 for 2021.
For the Funds’ two most recent fiscal years, Tax Fees billed by PwC for engagements by Fund Service Providers that related directly to the operations and financial reporting of the Funds were $0 for fiscal 2022 and $0 for fiscal 2021, respectively.
The services for which Tax Fees were charged comprise all services performed by professional staff in PwC’s tax division except those services related to the audit. Typically, this category would include fees for tax compliance, tax planning, and tax advice. Tax compliance, tax advice, and tax planning services include preparation of original and amended tax returns, claims for refund and tax payment-planning services, assistance with tax audits and appeals, tax advice related to mergers and acquisitions and requests for rulings or technical advice from taxing authorities.
There were no other fees billed by PwC to the Funds for all other non-audit services (“Other Fees”) during the Funds’ two most recent fiscal years. During the same period, there were no Other Fees billed by PwC for engagements by Fund Service Providers that related directly to the operations and financial reporting of the Funds.
| | (e) | (1) According to policies adopted by the Audit Committee, services provided by PwC to the Funds must be pre-approved by the Audit Committee. On an annual basis, the Audit Committee reviews and pre-approves various types of services that PwC may perform for the Funds without specific approval of each engagement, subject to specified budget limitations. As contemplated by the Sarbanes-Oxley Act of 2002 and related SEC rules, the Audit Committee also pre-approves non-audit services provided by PwC to any Fund Service Provider for any engagement that relates directly to the operations and financial reporting of the Funds. Any engagement that is not already pre-approved or that will exceed a pre-approved budget must be submitted to the Audit Committee for pre-approval. The Chairman of the Audit Committee is authorized on behalf of the Board of Trustees and the Audit Committee to approve the engagement of PwC to perform non-audit services subject to certain conditions, including notification to the Audit Committee of such pre-approval not later than the next meeting of the Audit Committee following the date of such pre-approval. |
| | (g) | The aggregate fees billed by PwC in 2022 and 2021 for non-audit services rendered to the Funds and Fund Service Providers were $97,057 for 2022 and $98,383 for 2021. For the fiscal year ended October 31, 2022, this amount reflects the amounts disclosed above in Item 4(b),(c),(d), plus $36,667 in fees billed to the Fund Service Providers for non-audit services that did not relate directly to the operations and financial reporting of the Funds. For the fiscal year ended October 31, 2021, this amount reflects the amounts disclosed above in Item 4(b),(c),(d), plus $41,583 in fees billed to the Fund Service Providers for non-audit services that did not relate directly to the operations and financial reporting of the Funds. |
| | (h) | The Trust’s Audit Committee has considered whether the provision of non-audit services by registrant’s independent registered public accounting firm to the registrant’s investment adviser, and any entity controlling, controlled by, or under common control with the investment adviser that provided ongoing services to the registrant that were not pre-approved by the Committee (because such services did not relate directly to the operations and financial reporting of the registrant) was compatible with maintaining the independence of the independent registered public accounting firm. |
| Item 5. | Audit Committee of Listed Registrants. |
Not applicable.
| Item 6. | Schedule of Investments. |
| (a) | Schedule of Investments in securities of unaffiliated issuers as of the close of the reporting period is included as part of the report to shareholders filed under Item 1 of this form. |
| Item 7. | Disclosure of Proxy Voting Policies and Procedures for Closed-End Management Investment Companies. |
Not applicable.
| Item 8. | Portfolio Managers of Closed-End Management Investment Companies. |
Not applicable.
| Item 9. | Purchases of Equity Securities by Closed-End Management Investment Company and Affiliated Purchasers. |
Not applicable.
| Item 10. | Submission of Matters to a Vote of Security Holders. |
Not applicable.
| Item 11. | Controls and Procedures. |
| | (a) | The Registrant’s principal executive and principal financial officers have concluded, based on their evaluation of the registrant’s disclosure controls and procedures as of a date within 90 days of the filing of this report, that the Registrant’s disclosure controls and procedures are reasonably designed to ensure that information required to be disclosed by the Registrant on Form N-CSR is recorded, processed, summarized and reported within the required time periods and that information required to be disclosed by the registrant in the reports that it files or submits on Form N-CSR is accumulated and communicated to the Registrant’s management, including its principal executive and principal financial officers, as appropriate to allow timely decisions regarding required disclosure. |
| | (b) | There were no changes in the Registrant’s internal control over financial reporting during the period covered by this report that have materially affected, or are reasonably likely to materially affect, the internal control over financial reporting. |
| Item 12. | DISCLOSURE OF SECURITIES LENDING ACTIVITIES FOR CLOSED-END MANAGEMENT INVESTMENT COMPANIES |
Not applicable.
SIGNATURES
Pursuant to the requirements of the Securities Exchange Act of 1934 and the Investment Company Act of 1940, the registrant has duly caused this report to be signed on its behalf by the undersigned, thereunto duly authorized.
AMG FUNDS IV
| | |
| By: | | /s/ Keitha L. Kinne |
| | Keitha L. Kinne, Principal Executive Officer |
| |
| Date: | | January 6, 2023 |
Pursuant to the requirements of the Securities Exchange Act of 1934 and the Investment Company Act of 1940, this report has been signed below by the following persons on behalf of the registrant and in the capacities and on the dates indicated.
| | |
| By: | | /s/ Keitha L. Kinne |
| | Keitha L. Kinne, Principal Executive Officer |
| |
| Date: | | January 6, 2023 |
| |
| By: | | /s/ Thomas Disbrow |
| | Thomas Disbrow, Principal Financial Officer |
| |
| Date: | | January 6, 2023 |