Table of Contents
UNITED STATES
SECURITIES AND EXCHANGE COMMISSION
Washington, D.C. 20549
FORM N-CSR
CERTIFIED SHAREHOLDER REPORT OF REGISTERED
MANAGEMENT INVESTMENT COMPANIES
Investment Company Act file number 811-08004
AMG Funds IV
(Exact name of registrant as specified in charter)
600 Steamboat Road, Suite 300, Greenwich, Connecticut 06830
(Address of principal executive offices) (Zip code)
AMG Funds LLC
600 Steamboat Road, Suite 300, Greenwich, Connecticut 06830
(Name and address of agent for service)
Registrant’s telephone number, including area code: (203) 299-3500
Date of fiscal year end: October 31
Date of reporting period: November 1, 2019 - October 31, 2020
(Annual Shareholder Report)
Table of Contents
| Item 1. | Reports to Stockholders. |
Table of Contents
 | ANNUAL REPORT |
AMG Funds
October 31, 2020
AMG Funds IV | ||||||||
| Class N, I, & Z Shares | ||||||||
| Equity
Fixed Income
International | |||||||
| ||||||||
Beginning on January 1, 2021, as permitted by regulations adopted by the Securities and Exchange Commission, paper copies of the Funds’ shareholder reports like this one will no longer be sent by mail, unless you specifically request paper copies of the reports from the Funds or from your financial intermediary, such as a broker-dealer or bank. Instead, the reports will be made available on the Funds’ website (https://www.amgfunds.com/resources/order_literature.html), and you will be notified by mail each time a report is posted and provided with a website link to access the report.
If you already elected to receive shareholder reports electronically, you will not be affected by this change and you need not take any action. You may elect to receive shareholder reports and other communications from the Funds electronically at any time by contacting your financial intermediary or, if you invest directly with the Funds, by logging into your account at www.amgfunds.com.
You may elect to receive all future reports in paper free of charge. If you invest through a financial intermediary, you can contact your financial intermediary to request that you continue to receive paper copies of your shareholder reports. If you invest directly with the Funds, you can call 1.800.548.4539 to inform the Funds that you wish to continue receiving paper copies of your shareholder reports. Your election to receive reports in paper will apply to all funds in the AMG Funds Family of Funds held in your account if you invest through your financial intermediary or all funds in the AMG Funds Family of Funds held with the fund complex if you invest directly with the Funds.
amgfunds.com
|
103120 AR082
|
Table of Contents
Table of Contents
AMG Funds Annual Report — October 31, 2020 |
| TABLE OF CONTENTS | PAGE | |||||||||||||||
| ||||||||||||||||
| LETTER TO SHAREHOLDERS | 2 | |||||||||||||||
| ABOUT YOUR FUND’S EXPENSES | 3 | |||||||||||||||
| PORTFOLIO MANAGER’S COMMENTS, FUND SNAPSHOTS AND SCHEDULES OF PORTFOLIO INVESTMENTS |
| |||||||||||||||
| 5 | AMG River Road Small Cap Value Fund | 42 | ||||||||||||||
| 11 | AMG Managers Silvercrest Small Cap Fund | 47 | ||||||||||||||
| 16 | AMG Managers DoubleLine Core Plus Bond Fund | 52 | ||||||||||||||
| 24 | AMG River Road Long-Short Fund | 81 | ||||||||||||||
| 30 | AMG Managers Pictet International Fund | 88 | ||||||||||||||
AMG River Road Small-Mid Cap Value Fund
|
| 36
|
|
| ||||||||||||
| FINANCIAL STATEMENTS | ||||||||||||||||
| 96 | ||||||||||||||||
Balance sheets, net asset value (NAV) per share computations and cumulative distributable earnings (loss) | ||||||||||||||||
| 102 | ||||||||||||||||
Detail of sources of income, expenses, and realized and unrealized gains (losses) during the fiscal year | ||||||||||||||||
| 105 | ||||||||||||||||
Detail of changes in assets for the past two fiscal years | ||||||||||||||||
| 109 | ||||||||||||||||
Historical net asset values per share, distributions, total returns, income and expense ratios, turnover ratios and net assets | ||||||||||||||||
| 140 | ||||||||||||||||
Accounting and distribution policies, details of agreements and transactions with Fund management and affiliates, and descriptions of certain investment risks | ||||||||||||||||
| REPORT OF INDEPENDENT REGISTERED PUBLIC ACCOUNTING FIRM | 156 | |||||||||||||||
| OTHER INFORMATION | 157 | |||||||||||||||
| TRUSTEES AND OFFICERS | 158 | |||||||||||||||
| ANNUAL RENEWAL OF INVESTMENT MANAGEMENT AND SUBADVISORY AGREEMENTS | 160 | |||||||||||||||
| Nothing contained herein is to be considered an offer, sale or solicitation of an offer to buy shares of any series of the AMG Funds Family of Funds. Such offering is made only by prospectus, which includes details as to offering price and other material information. |
| |||||||||||||||
Table of Contents

Dear Shareholder:
The fiscal year ending October 31, 2020, was a volatile period for financial markets marked by a dramatic selloff and extraordinary rebound amid the unprecedented global effort to stop the COVID-19 pandemic. During the first half of the fiscal year, equities achieved new record highs against the backdrop of a healthy economy and strong investor sentiment. However, a broad-based selloff occurred amid a global flight to quality as investors assessed the scope of the unfolding COVID-19 health care crisis, a deteriorating economy, and skyrocketing unemployment. An oil price war initiated between Saudi Arabia and Russia only made matters worse. From its peak in mid-February 2020, the S&P 500® Index declined (33.79)% over the span of a few weeks, bringing the eleven-year bull market to an abrupt end. In response to the crisis, global central banks and governments were quick to flood the market with massive fiscal and monetary stimulus which helped to stabilize the market and led to an impressive recovery in risk assets, albeit a very uneven one. So despite the volatility, the S&P 500® Index still achieved a 9.71% return for the fiscal year.
During the year there was very wide dispersion in performance across sectors, with information technology and consumer discretionary sectors leading the market with returns of 34.47% and 24.69%, respectively. On the other hand, companies in the energy sector fell (45.24)%, and financials, real estate, and industrials also produced negative returns. Growth stocks significantly outperformed value stocks for the period with returns of 29.22% and (7.57)% for the Russell 1000® Growth and Russell 1000® Value Indexes, respectively. Large caps also outperformed small caps as measured by the 9.71% return for the S&P 500® Index compared to (0.14)% for the Russell 2000® Index. Outside the U.S., emerging markets outperformed developed markets with the 8.25% return for the MSCI Emerging Markets Index compared to the (6.86)% return for the MSCI EAFE Index.
Interest rates fell dramatically and led to strong returns for bond investors as the U.S. Federal Reserve slashed short-term rates in response to the slowing economy. The 10-year Treasury yield ended the year near a historic low yield of 0.88%. The Bloomberg Barclays U.S. Aggregate Bond Index®, a broad measure of U.S. bond market performance, returned 6.19% over the period. Riskier high yield bonds lagged the broader bond market with a 3.49% return as measured by the return of the Bloomberg Barclays U.S. Corporate High Yield Bond Index®.
AMG Funds appreciates the privilege of providing investment tools to you and your clients. Our foremost goal is to provide investment solutions that help our shareholders successfully reach their long-term investment goals. AMG Funds
provides access to a distinctive array of actively managed return-oriented investment strategies. We thank you for your continued confidence and investment in AMG Funds. You can rest assured that under all market conditions our team is focused on delivering excellent investment management services for your benefit.
Respectfully,

Keitha Kinne
President
AMG Funds
| Average Annual Total Returns | Periods ended October 31, 2020* | |||||||||||||||||
| Stocks: | 1 Year | 3 Years | 5 Years | |||||||||||||||
Large Cap | (S&P 500® Index) | 9.71 | % | 10.42% | 11.71% | |||||||||||||
Small Cap | (Russell 2000® Index) | (0.14 | )% | 2.19% | 7.27% | |||||||||||||
International | (MSCI All Country World Index ex USA) | (2.61 | )% | (0.19)% | 4.26% | |||||||||||||
| Bonds: | ||||||||||||||||||
Investment Grade | (Bloomberg Barclays U.S. Aggregate Bond Index) | 6.19 | % | 5.06% | 4.08% | |||||||||||||
High Yield | (Bloomberg Barclays U.S. Corporate High Yield Bond Index) | 3.49 | % | 4.24% | 6.32% | |||||||||||||
Tax-exempt | (Bloomberg Barclays Municipal Bond Index) | 3.59 | % | 4.09% | 3.70% | |||||||||||||
Treasury Bills | (ICE BofAML U.S. 6-Month Treasury Bill Index) | 1.30 | % | 1.89% | 1.43% | |||||||||||||
*Source: FactSet. Past performance is no guarantee of future results.
2
Table of Contents
As a shareholder of a Fund, you may incur two types of costs: (1) transaction costs, which may include sales charges (loads) on purchase payments; redemption fees; and exchange fees; and (2) ongoing costs, including management fees; distribution (12b-1) fees; and other Fund expenses. This example is intended to help you understand your ongoing costs (in dollars) of investing in the Fund and to compare these costs with the ongoing costs of investing in other mutual funds. The example is based on $1,000 invested at the beginning of the period and held for the entire period as indicated below.
ACTUAL EXPENSES
The first line of the following table provides information about the actual account values and | actual expenses. You may use the information in this line, together with the amount you invested, to estimate the expenses that you paid over the period. Simply divide your account value by $1,000 (for example, an $8,600 account value divided by $1,000 = 8.6), then multiply the result by the number in the first line under the heading entitled “Expenses Paid During Period” to estimate the expenses you paid on your account during this period.
HYPOTHETICAL EXAMPLE FOR COMPARISON PURPOSES
The second line of the following table provides information about hypothetical account values and hypothetical expenses based on the Fund’s actual expense ratio and an assumed annual rate of return of 5% before expenses, which is not the Fund’s | actual return. The hypothetical account values and expenses may not be used to estimate the actual ending account balance or expenses you paid for the period. You may use this information to compare the ongoing costs of investing in the Fund and other funds by comparing this 5% hypothetical example with the 5% hypothetical examples that appear in the shareholder reports of other funds.
Please note that the expenses shown in the table are meant to highlight your ongoing costs only and do not reflect any transactional costs, such as sales charges (loads), redemption fees, or exchange fees. Therefore, the second line of the table is useful in comparing ongoing costs only, and will not help you determine the relative total costs of owning different funds. | ||||||
Six Months Ended October 31, 2020 | Expense Ratio for the Period | Beginning Account Value 05/01/20 | Ending Account Value 10/31/20 | Expenses Paid During the Period* | ||||||||||||||||
AMG River Road Focused Absolute Value Fund |
| |||||||||||||||||||
Based on Actual Fund Return |
| |||||||||||||||||||
Class N | 1.05 | % | $1,000 | $1,100 | $5.54 | |||||||||||||||
Class I | 0.78 | % | $1,000 | $1,101 | $4.12 | |||||||||||||||
Class Z | 0.77 | % | $1,000 | $1,101 | $4.07 | |||||||||||||||
Based on Hypothetical 5% Annual Return |
| |||||||||||||||||||
Class N | 1.05 | % | $1,000 | $1,020 | $5.33 | |||||||||||||||
Class I | 0.78 | % | $1,000 | $1,021 | $3.96 | |||||||||||||||
Class Z | 0.77 | % | $1,000 | $1,021 | $3.91 | |||||||||||||||
AMG Managers Montag & Caldwell Growth Fund |
| |||||||||||||||||||
Based on Actual Fund Return |
| |||||||||||||||||||
Class N | 1.15 | % | $1,000 | $1,184 | $6.31 | |||||||||||||||
Class I | 0.99 | % | $1,000 | $1,185 | $5.44 | |||||||||||||||
Based on Hypothetical 5% Annual Return |
| |||||||||||||||||||
Class N | 1.15 | % | $1,000 | $1,019 | $5.84 | |||||||||||||||
Class I | 0.99 | % | $1,000 | $1,020 | $5.03 | |||||||||||||||
AMG River Road Dividend All Cap Value Fund |
| |||||||||||||||||||
Based on Actual Fund Return |
| |||||||||||||||||||
Class N | 1.13 | % | $1,000 | $1,101 | $5.97 | |||||||||||||||
Class I | 0.86 | % | $1,000 | $1,103 | $4.55 | |||||||||||||||
Class Z | 0.81 | % | $1,000 | $1,103 | $4.28 | |||||||||||||||
Based on Hypothetical 5% Annual Return |
| |||||||||||||||||||
Class N | 1.13 | % | $1,000 | $1,019 | $5.74 | |||||||||||||||
Class I | 0.86 | % | $1,000 | $1,021 | $4.37 | |||||||||||||||
Class Z | 0.81 | % | $1,000 | $1,021 | $4.12 | |||||||||||||||
Six Months Ended October 31, 2020 | Expense Ratio for the Period | Beginning Account Value 05/01/20 | Ending Account Value 10/31/20 | Expenses Paid During the Period* | ||||||||||||||||
AMG Managers Fairpointe Mid Cap Fund |
| |||||||||||||||||||
Based on Actual Fund Return |
| |||||||||||||||||||
Class N | 1.14 | % | $1,000 | $1,113 | $6.05 | |||||||||||||||
Class I | 0.90 | % | $1,000 | $1,114 | $4.78 | |||||||||||||||
Class Z | 0.82 | % | $1,000 | $1,115 | $4.36 | |||||||||||||||
Based on Hypothetical 5% Annual Return |
| |||||||||||||||||||
Class N | 1.14 | % | $1,000 | $1,019 | $5.79 | |||||||||||||||
Class I | 0.90 | % | $1,000 | $1,021 | $4.57 | |||||||||||||||
Class Z | 0.82 | % | $1,000 | $1,021 | $4.17 | |||||||||||||||
AMG Managers LMCG Small Cap Growth Fund |
| |||||||||||||||||||
Based on Actual Fund Return |
| |||||||||||||||||||
Class N | 1.29 | % | $1,000 | $1,287 | $7.42 | |||||||||||||||
Class I | 1.10 | % | $1,000 | $1,289 | $6.33 | |||||||||||||||
Based on Hypothetical 5% Annual Return |
| |||||||||||||||||||
Class N | 1.29 | % | $1,000 | $1,019 | $6.55 | |||||||||||||||
Class I | 1.10 | % | $1,000 | $1,020 | $5.58 | |||||||||||||||
AMG River Road Small-Mid Cap Value Fund |
| |||||||||||||||||||
Based on Actual Fund Return |
| |||||||||||||||||||
Class N | 1.32 | % | $1,000 | $1,131 | $7.07 | |||||||||||||||
Class I | 1.07 | % | $1,000 | $1,131 | $5.73 | |||||||||||||||
Class Z | 1.02 | % | $1,000 | $1,133 | $5.47 | |||||||||||||||
Based on Hypothetical 5% Annual Return |
| |||||||||||||||||||
Class N | 1.32 | % | $1,000 | $1,019 | $6.70 | |||||||||||||||
Class I | 1.07 | % | $1,000 | $1,020 | $5.43 | |||||||||||||||
Class Z | 1.02 | % | $1,000 | $1,020 | $5.18 | |||||||||||||||
3
Table of Contents
About Your Fund’s Expenses (continued) |
Six Months Ended October 31, 2020 | Expense Ratio for the Period | Beginning Account Value 05/01/20 | Ending Account Value 10/31/20 | Expenses Paid During the Period* | ||||||||||||||||
AMG River Road Small Cap Value Fund |
| |||||||||||||||||||
Based on Actual Fund Return |
| |||||||||||||||||||
Class N | 1.37 | % | $1,000 | $1,115 | $7.28 | |||||||||||||||
Class I | 1.10 | % | $1,000 | $1,117 | $5.85 | |||||||||||||||
Class Z | 1.02 | % | $1,000 | $1,117 | $5.43 | |||||||||||||||
Based on Hypothetical 5% Annual Return |
| |||||||||||||||||||
Class N | 1.37 | % | $1,000 | $1,018 | $6.95 | |||||||||||||||
Class I | 1.10 | % | $1,000 | $1,020 | $5.58 | |||||||||||||||
Class Z | 1.02 | % | $1,000 | $1,020 | $5.18 | |||||||||||||||
AMG Managers Silvercrest Small Cap Fund |
| |||||||||||||||||||
Based on Actual Fund Return |
| |||||||||||||||||||
Class N | 1.39 | % | $1,000 | $1,104 | $7.35 | |||||||||||||||
Class I | 1.15 | % | $1,000 | $1,106 | $6.09 | |||||||||||||||
Class Z | 1.08 | % | $1,000 | $1,106 | $5.72 | |||||||||||||||
Based on Hypothetical 5% Annual Return |
| |||||||||||||||||||
Class N | 1.39 | % | $1,000 | $1,018 | $7.05 | |||||||||||||||
Class I | 1.15 | % | $1,000 | $1,019 | $5.84 | |||||||||||||||
Class Z | 1.08 | % | $1,000 | $1,020 | $5.48 | |||||||||||||||
AMG Managers DoubleLine Core Plus Bond Fund |
| |||||||||||||||||||
Based on Actual Fund Return |
| |||||||||||||||||||
Class N | 0.94 | % | $1,000 | $1,059 | $4.86 | |||||||||||||||
Class I | 0.69 | % | $1,000 | $1,060 | $3.57 | |||||||||||||||
Class Z | 0.61 | % | $1,000 | $1,060 | $3.16 | |||||||||||||||
Based on Hypothetical 5% Annual Return |
| |||||||||||||||||||
Class N | 0.94 | % | $1,000 | $1,020 | $4.77 | |||||||||||||||
Class I | 0.69 | % | $1,000 | $1,022 | $3.51 | |||||||||||||||
Class Z | 0.61 | % | $1,000 | $1,022 | $3.10 | |||||||||||||||
Six Months Ended October 31, 2020 | Expense Ratio for the Period | Beginning Account Value 05/01/20 | Ending Account Value 10/31/20 | Expenses Paid During the Period* | ||||||||||||||||
AMG River Road Long-Short Fund** |
| |||||||||||||||||||
Based on Actual Fund Return |
| |||||||||||||||||||
Class N | 1.45 | % | $1,000 | $1,003 | $7.30 | |||||||||||||||
Class I | 1.20 | % | $1,000 | $1,004 | $6.04 | |||||||||||||||
Class Z | 1.12 | % | $1,000 | $1,004 | $5.64 | |||||||||||||||
Based on Hypothetical 5% Annual Return |
| |||||||||||||||||||
Class N | 1.45 | % | $1,000 | $1,018 | $7.35 | |||||||||||||||
Class I | 1.20 | % | $1,000 | $1,019 | $6.09 | |||||||||||||||
Class Z | 1.12 | % | $1,000 | $1,020 | $5.69 | |||||||||||||||
AMG Managers Pictet International Fund |
| |||||||||||||||||||
Based on Actual Fund Return |
| |||||||||||||||||||
Class N | 1.31 | % | $1,000 | $1,109 | $6.95 | |||||||||||||||
Class I | 1.00 | % | $1,000 | $1,112 | $5.31 | |||||||||||||||
Class Z | 0.92 | % | $1,000 | $1,112 | $4.88 | |||||||||||||||
Based on Hypothetical 5% Annual Return |
| |||||||||||||||||||
Class N | 1.31 | % | $1,000 | $1,019 | $6.65 | |||||||||||||||
Class I | 1.00 | % | $1,000 | $1,020 | $5.08 | |||||||||||||||
Class Z | 0.92 | % | $1,000 | $1,021 | $4.67 | |||||||||||||||
| * | Expenses are equal to the Fund’s annualized expense ratio multiplied by the average account value over the period, multiplied by the number of days in the most recent fiscal half-year (184), then divided by 366. |
| ** | Excludes interest expense and dividends on short positions. If included, your annualized expense ratios would be 2.82%, 2.57% and 2.49% for Class N, Class I and Class Z, respectively, and your actual and hypothetical expenses paid during the period would be $14.20, $12.94 and $12.54, and $14.25, $13.00 and $12.60 for Class N, Class I and Class Z, respectively. |
4
Table of Contents
OVERVIEW
For the fiscal year ended October 31, 2020, the AMG River Road Focused Absolute Value Fund (the “Fund”) Class N shares returned (11.03%), trailing the (8.00%) return for the Russell 3000® Value Index.
PERFORMANCE REVIEW
The sectors with the largest negative contribution to relative return were consumer discretionary, industrials, and information technology, with each underperforming primarily due to poor stock selection. A material portion of poor stock selection within these sectors, as well as others, can be characterized by industries adversely affected by the COVID-19 pandemic, particularly stocks with exposure to travel and hospitality markets. These factors were partially offset by strong stock selection in financials, which was the largest positive contributing sector during the period. Relative return also benefited from our lack of exposure in the real estate sector.
The top contributing holdings in the Fund were Alphabet Inc. (Cl C) (“Alphabet”) and Progressive Corp. (“Progressive”). Progressive is an insurance holding company that primarily focuses on personal and commercial auto insurance. In mid-July, Progressive reported quarterly results that were better than expected as top-line growth (net premium written +11%, net premium earned +9%) accelerated throughout the quarter with June’s results reflecting growth above pre-COVID-19 levels. These results represented a reacceleration of growth after net premiums written growth softened in April as COVID-19 disrupted renewal/new customer activity. This performance continued in Q3 2020 aligned with our thesis that Progressive would grow policies in force at an above market rate. However, Progressive’s underwriting profitability was strong throughout the year as stay-at-home orders and a shift to work from home (WFH) resulted in a lower frequency of accidents across the country. We believe Progressive’s dual sales channel approach of using the direct and agency model will continue to | drive market share gains, while its differentiated data and underwriting practices will support superior underwriting profitability versus the industry moving forward.
Alphabet owns the largest internet search engine in the world, Google.com, which dominates global search with ~90% market share. In October, Alphabet reported results significantly above consensus as Search revenue recovered from Q2 2020 lows as digital advertising budgets were reinstated and operating margins improved year over year. Search should continue to grow as more individuals access the internet (roughly half the world has access to the internet), and digital advertising continues to steal market share from traditional advertising markets. The Search business generates significant free cash flow, which is added to the firm’s fortress-like balance sheet (~10% of the market cap is in cash). Management has proven to be excellent capital allocators with eye-popping returns in businesses such as Android, YouTube, and Waymo and the potential to further increase shareholder returns through larger buybacks.
The bottom contributing holdings in the Fund were Expedia Group Inc. (“Expedia”) and Marathon Petroleum Corp. (“Marathon”). Expedia is an online travel agency (OTA) that helps consumers book flights, hotel rooms, and attractions. In the beginning of March, Expedia’s assessed valuation and conviction were lowered as we incorporated the potential impact of the COVID-19 pandemic. Shortly thereafter, airlines began reducing capacity and hotels reported significantly lower year-over-year occupancy rates, providing tangible data points to the direct impact COVID-19 was having on the travel industry and Expedia. In mid-March, the Fund exited Expedia because of liquidity concerns emanating from the working capital headwinds the company would face in the short term given the high rate of refunded flights and hotel rooms associated with cancellations.
Marathon is the largest independent petroleum refining, retail, and transportation business in the United States. Marathon’s stock price began a violent | downward spiral early in the year as demand and margins for gasoline and jet fuel fell precipitously due to the COVID-19 pandemic, which was worsened by a feud between Russia and Saudi Arabia earlier in the year. The team debated the potential impacts of various factors across Marathon’s operating segments, but decided the likely depth and duration of losses in refining would overwhelm other potential positive developments, including M&A. Given the wide range of possible outcomes and significant unrealized loss, the position was eliminated from the Fund for better risk-to-reward opportunities.
POSITIONING AND OUTLOOK
As always, the Fund invests in companies we believe represent the most attractive combination of risk (conviction) and reward (discount) available across the River Road universe of U.S. equity portfolio holdings. Trying to forecast market trends in 2020 has proven exceptionally challenging, and history provides limited precedent for the current environment. At this stage, we are seeking to maintain balance between more defensive, stable companies and those with greater risk but more upside potential as the economy recovers. As of October 31, 2020, more than 75% of the Fund’s holdings were concentrated in higher conviction stocks within the River Road universe and were trading at compelling discounts to assessed values, while the remaining positions maintain relatively attractive convictions but far deeper discounts, providing significantly more upside. We believe the Fund’s opportunistic benchmark independent style is positioned to take advantage of even fleeting price dislocations created by rising volatility, a likely factor in the year ahead.
This commentary reflects the viewpoints of River Road Asset Management as of November 24, 2020, and is not intended as a forecast or guarantee of future results. |
5
Table of Contents
AMG River Road Focused Absolute Value Fund Portfolio Manager’s Comments (continued) |
CUMULATIVE TOTAL RETURN PERFORMANCE
AMG River Road Focused Absolute Value Fund’s cumulative total return is based on the daily change in net asset value (NAV), and assumes that all dividends and distributions were reinvested. The graph compares a hypothetical $10,000 investment made in the AMG River Road Focused Absolute Value Fund’s Class N shares on November 3, 2015, to a $10,000 investment made in the Russell 3000® Value Index for the same time period. The graph and table do not reflect the deduction of taxes that a shareholder would pay on a Fund distribution or redemption of shares. The listed returns for the Fund are net of expenses and the returns for the index exclude expenses. Total returns would have been lower had certain expenses not been reduced.
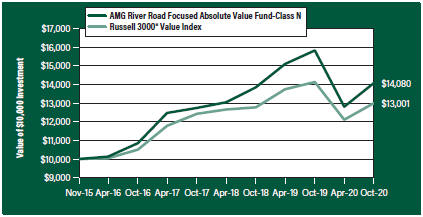
The table below shows the average annual total returns for the AMG River Road Focused Absolute Value Fund and the Russell 3000® Value Index for the same time periods ended October 31, 2020.
| Average Annual Total Returns1 | One Year | Since Inception | Inception Date | |||||||||
AMG River Road Focused Absolute Value Fund2, 3, 4, 5, 6, 7, 8, 9, 10, 11, 12 |
| |||||||||||
Class N | (11.03 | %) | 7.09 | % | 11/03/15 | |||||||
Class I | (10.81 | %) | 7.35 | % | 11/03/15 | |||||||
Class Z | (10.86 | %) | 2.83 | % | 09/29/17 | |||||||
Russell 3000® Value Index13 | (8.00 | %) | 5.39 | % | 11/03/15 | † | ||||||
The performance data shown represents past performance. Past performance is not a guarantee of future results. Current performance may be lower or higher than the performance data quoted. The investment return and principal value of an investment will fluctuate so that an investor’s shares, when redeemed, may be worth more or less than their original cost.
Investors should carefully consider the Fund’s investment objectives, risks, charges and expenses before investing. For performance information through the most recent month end, current net asset values per share for the Fund and other information, please call 800.548.4539 or visit our website at amgfunds.com for a free prospectus. Read it carefully before investing or sending money.
Distributed by AMG Distributors, Inc., member FINRA/SIPC.
| † | Date reflects the inception date of the Fund, not the index. |
| 1 | Total return equals income yield plus share price change and assumes reinvestment of all dividends and capital gain distributions. Returns are net of fees and may reflect offsets of Fund expenses as described in the prospectus. No adjustment has been made for taxes payable by shareholders on their reinvested dividends and |
capital gain distributions. Returns for periods greater than one year are annualized. The listed returns on the Fund are net of expenses and based on the published NAV as of October 31, 2020. All returns are in U.S. dollars ($).
2 Investing in Publicly Traded Partnerships (PTPs) (including master limited partnerships) involves risks in addition to those typically associated with publicly traded companies. PTPs are exposed to the risks of their underlying assets, which in many cases includes the same types of risks as energy and natural resources companies. PTPs are also subject to capital market risk. PTPs may lose their partnership status for tax purposes. The Fund’s status as a regulated investment company may be jeopardized if it does not appropriately limit such investments in PTPs or if such investments are recharacterized for tax purposes.
3 The Fund is subject to risks associated with investments in small-capitalization companies, such as erratic earnings patterns, competitive conditions, limited earnings history and a reliance on one or a limited number of products.
4 The Fund is subject to risks associated with investments in mid-capitalization companies such as greater price volatility, lower trading volume, and less liquidity than the stocks of larger, more established companies.
5 Active and frequent trading of a fund may result in higher transaction costs and increased tax liability.
6 A greater percentage of the Fund’s holdings may be focused in a smaller number of securities which may place the Fund at greater risk than a more diversified fund. | ||
7 Investments in international securities are subject to certain risks of overseas investing including currency fluctuations and changes in political and economic conditions, which could result in significant market fluctuations. These risks are magnified in emerging markets.
8 The Fund is subject to the risks associated with investments in emerging markets, such as erratic earnings patterns, economic and political instability, changing exchange controls, limitations on repatriation of foreign capital and changes in local governmental attitudes toward private investment, possibly leading to nationalization or confiscation of investor assets.
9 The Fund is subject to special risk considerations similar to those associated with the direct ownership of real estate. Real estate valuations may be subject to factors such as changing general and local economic, financial, competitive, and environmental conditions.
10 The Fund invests in value stocks, which may perform differently from the market as a whole and may be undervalued by the market for a long period of time. | ||
6
Table of Contents
AMG River Road Focused Absolute Value Fund Portfolio Manager’s Comments (continued) |
11 Companies that are in similar businesses may be similarly affected by particular economic or market events; to the extent the Fund has substantial holdings within a particular sector, the risks associated with that sector increase.
12 Market prices of investments held by the Fund may fall rapidly or unpredictably due to a variety of economic or political factors, market conditions, disasters or public health issues, or in response to events that affect particular industries or companies. | 13 The Russell 3000® Value Index measures the performance of the broad value segment of the U.S. equity universe. It includes those Russell 3000® companies with lower price-to-book ratios and lower forecasted growth values. Unlike the Fund, the Russell 3000® Value Index is unmanaged, is not available for investment and does not incur expenses. | The Russell Indices are a trademark of the London Stock Exchange Group companies.
Not FDIC insured, nor bank guaranteed. May lose value. | ||||||
|
7
Table of Contents
AMG River Road Focused Absolute Value Fund Fund Snapshots (unaudited) October 31, 2020 |
PORTFOLIO BREAKDOWN
| Sector | % of Net Assets | |
Communication Services | 27.2 | |
Financials | 25.5 | |
Health Care | 15.3 | |
Industrials | 11.2 | |
Consumer Discretionary | 9.3 | |
Information Technology | 6.2 | |
Utilities | 4.1 | |
Short-Term Investments | 1.1 | |
Other Assets Less Liabilities | 0.1 | |
TOP TEN HOLDINGS
| Security Name | % of Net Assets | |
Berkshire Hathaway, Inc., Class B | 9.4 | |
Comcast Corp., Class A | 6.5 | |
GCI Liberty, Inc., Class A | 6.2 | |
Chubb, Ltd. (Switzerland) | 5.0 | |
LKQ Corp. | 5.0 | |
Fidelity National Financial, Inc. | 4.8 | |
Premier, Inc., Class A | 4.8 | |
Liberty Broadband Corp., Class C | 4.7 | |
Bristol-Myers Squibb Co. | 4.4 | |
Alphabet, Inc., Class C | 4.3 | |
| ||
Top Ten as a Group | 55.1 | |
| ||
Because a fund’s strategy may result in multiple investments in particular sectors of the economy, its performance may depend on the performance of those sectors and may fluctuate more widely than investments diversified across more sectors. For additional information on these and other risk considerations, please see the Fund’s prospectus.
Any sectors, industries, or securities discussed should not be perceived as investment recommendations. Mention of a specific security should not be considered a recommendation to buy or solicitation to sell that security. Specific securities mentioned in this report may have been sold from the Fund’s portfolio of investments by the time you receive this report.
8
Table of Contents
AMG River Road Focused Absolute Value Fund Schedule of Portfolio Investments October 31, 2020 |
| Shares | Value | |||||||
Common Stocks - 98.8% | ||||||||
Communication Services - 27.2% |
| |||||||
Alphabet, Inc., Class C* | 3,856 | $6,250,614 | ||||||
Comcast Corp., Class A | 222,658 | 9,405,074 | ||||||
Discovery, Inc., Class C* | 189,455 | 3,470,816 | ||||||
GCI Liberty, Inc., Class A* | 110,432 | 8,970,391 | ||||||
Liberty Broadband Corp., Class C* | 48,767 | 6,910,772 | ||||||
Liberty Media Corp.-Liberty SiriusXM, Class C* | 133,311 | 4,612,561 | ||||||
Total Communication Services | 39,620,228 | |||||||
Consumer Discretionary - 9.3% | ||||||||
Advance Auto Parts, Inc. | 42,312 | 6,231,711 | ||||||
LKQ Corp.* | 227,052 | 7,263,394 | ||||||
Total Consumer Discretionary | 13,495,105 | |||||||
Financials - 25.5% | ||||||||
Axis Capital Holdings, Ltd. (Bermuda) | 93,476 | 3,990,490 | ||||||
Berkshire Hathaway, Inc., Class B* | 67,713 | 13,671,255 | ||||||
Chubb, Ltd. (Switzerland) | 56,211 | 7,302,371 | ||||||
Fidelity National Financial, Inc. | 224,961 | 7,039,030 | ||||||
The Progressive Corp. | 55,803 | 5,128,296 | ||||||
Total Financials | 37,131,442 | |||||||
Health Care - 15.3% | ||||||||
Bristol-Myers Squibb Co. | 110,422 | 6,454,166 | ||||||
McKesson Corp. | 33,021 | 4,870,267 | ||||||
Premier, Inc., Class A | 214,738 | 7,028,375 | ||||||
UnitedHealth Group, Inc. | 12,882 | 3,930,813 | ||||||
Total Health Care | 22,283,621 | |||||||
Industrials - 11.2% | ||||||||
Armstrong World Industries, Inc.
|
| 89,039
|
|
| 5,333,436
|
| ||
| Shares | Value | |||||||
Huntington Ingalls Industries, Inc. | 35,975 | $ | 5,305,593 | |||||
UniFirst Corp. | 35,046 | 5,740,885 | ||||||
Total Industrials | 16,379,914 | |||||||
Information Technology - 6.2% |
| |||||||
Cisco Systems, Inc. | 158,827 | 5,701,889 | ||||||
NCR Corp.* | 166,723 | 3,387,812 | ||||||
Total Information Technology | 9,089,701 | |||||||
Utilities - 4.1% | ||||||||
The AES Corp. | 305,206 | 5,951,517 | ||||||
Total Common Stocks | 143,951,528 | |||||||
Short-Term Investments - 1.1% | ||||||||
Other Investment Companies - 1.1% |
| |||||||
Dreyfus Government Cash Management Fund, Institutional Shares, 0.02%1 | 542,657 | 542,657 | ||||||
Dreyfus Institutional Preferred Government Money Market Fund, Institutional Shares, 0.04%1 | 542,657 | 542,657 | ||||||
JPMorgan U.S. Government Money Market Fund, IM Shares, 0.04%1 | 559,102 | 559,102 | ||||||
Total Short-Term Investments | 1,644,416 | |||||||
Total Investments - 99.9% | 145,595,944 | |||||||
Other Assets, less Liabilities - 0.1% |
| 89,881 | ||||||
Net Assets - 100.0%
| $
| 145,685,825
|
| |||||
| * | Non-income producing security. |
| 1 | Yield shown represents the October 31, 2020, seven day average yield, which refers to the sum of the previous seven days’ dividends paid, expressed as an annual percentage. |
The accompanying notes are an integral part of these financial statements.
9
Table of Contents
AMG River Road Focused Absolute Value Fund Schedule of Portfolio Investments (continued) |
The following table summarizes the inputs used to value the Fund’s investments by the fair value hierarchy levels as of October 31, 2020:
Level 1
| Level 2
| Level 3
| Total
| |||||||||||||
Investments in Securities | ||||||||||||||||
Common Stocks† | $ | 143,951,528 | — | — | $ | 143,951,528 | ||||||||||
Short-Term Investments | ||||||||||||||||
Other Investment Companies | 1,644,416 | — | — | 1,644,416 | ||||||||||||
|
|
|
|
|
|
|
| |||||||||
Total Investments in Securities | $ | 145,595,944 | — | — | $ | 145,595,944 | ||||||||||
|
|
|
|
|
|
|
| |||||||||
| † | All common stocks held in the Fund are Level 1 securities. For a detailed breakout of common stocks by major industry classification, please refer to the Fund’s Schedule of Portfolio Investments. |
For the fiscal year ended October 31, 2020, there were no transfers in or out of Level 3.
The accompanying notes are an integral part of these financial statements.
10
Table of Contents
For the fiscal year ended October 31, 2020, the AMG Managers Montag & Caldwell Growth Fund (the “Fund”) Class N shares returned 21.36%, compared to the 29.22% return for its benchmark, the Russell 1000® Growth Index, but well ahead of the broader S&P 500® Index’s return of 9.71%. The Fund is managed using fundamental valuation techniques that focus on a company’s future earnings and dividend growth rates. The process is primarily bottom up and utilizes a present valuation model in which the current price of the stock is related to the risk adjusted present value of the company’s estimated future earnings stream. The Fund seeks to invest in growth stocks selling at a discount to our estimate of fair value and at a time when relative earnings per share growth is above median and/or accelerating.
MARKET ENVIRONMENT
U.S. stocks were mixed during the highly volatile fiscal year ended October 31, 2020. Growth stocks experienced strong absolute returns while value stocks were in negative territory. The Russell 1000® Index (large cap stocks) was up 10.87%, the Russell Midcap® Index (mid cap stocks) returned 4.12%, and the Russell 2000® Index (small cap stocks) was down -0.14% for the 12 months ended October 31, 2020. Among all capitalization categories, growth was the dominant theme with an unprecedented concentration of position size and sector allocation for technology stocks in the Russell 1000® Growth Index. For the full 12 months, growth significantly outperformed value in each size segment, with the widest (and historically largest) spread in returns between large cap growth and large cap value (29.22% vs. -7.57%). The performance advantage of growth over value in the mid and small cap areas was similar, though less pronounced than in large cap.
PERFORMANCE REVIEW
The reporting period began with an optimistic growth outlook. The probability of a trade deal with China improved the prospects for manufacturing activity and capital expenditures. Consumer spending was on solid footing and the housing market was strong thanks to lower interest rates. Inflation measures remained below the U.S. Federal
| Reserve’s (the Fed’s) 2% target, allowing monetary policy to remain accommodative. Altogether, this suggested that the economy could accelerate in 2020, perhaps closer to a 2.5% growth rate. The market responded accordingly with strong returns from October 31, 2019, until the pre-COVID-19 peak on February 19, 2020. Momentum growth stocks led the way during this period, and as a result the Fund’s underweight to the technology sector coupled with smaller position sizes in the largest growth names detracted from relative performance. The momentum in the market was interrupted by the spread of the COVID-19 virus, which registered the quickest contraction on record and the worst day of losses in the market since the 1987 crash. The S&P 500 fell more than -30% from its all-time high on February 19, 2020, to its closing low on March 23. This was the first official bear market since the global financial crisis. The Fund held up much better than the benchmark during this period, in part due to the high quality portfolio of cash-rich secular and cyclical growth stocks, despite the rapid pace of decline which led to highly correlated and indiscriminate selling. The Fund also benefited from an underweight in the industrial sector combined with strong stock selection in communication services and financials. Policy makers responded quickly to buffer the economy. The Fed committed to doing “whatever it takes” and immediately slashed the federal funds rate to 0%. This was in addition to unlimited quantitative easing and emergency lending facilities. Congress passed a $2 trillion stimulus package known as the CARES (Coronavirus Aid, Relief, and Economic Security) Act to support workers and businesses. The financial markets responded with a “V”-shaped recovery fueled by this unprecedented fiscal and monetary stimulus in addition to staged re-openings. However, for the most part the positive returns were driven by growth stocks, whose earnings proved to be more resilient this year in the face of COVID-19, and in particular many of the big technology companies viewed as long-term winners due to their strong balance sheets, dominant market positions, and disproportionate exposure to secular trends that the pandemic further accelerated. While the Fund includes many of these growth stocks, underweight positions for some of the largest tech companies relative to the benchmark due to our strict | risk-control measures that limit individual position sizes constituted a headwind to relative performance, as did a modest cash position. Large cap technology and other secular growers propelled the S&P 500 past its pre-COVID-19 market highs by late summer, which set the stage for a market correction in early September. The S&P 500 declined -10%, which allowed the market to work off some of the valuation and sentiment excesses that had built up in growth stocks. Market volatility continued through the end of October as an uptick in virus infections along with election and fiscal stimulus uncertainties remained prevalent in investors’ minds. The Fund outperformed during this period with strong stock selection in discretionary, health care, and technology stocks.
OUTLOOK
Investors continue to look for indications that support a move toward more normalized activity in 2021. Profit forecasts for next year are optimistic, with the 2021 consensus S&P 500 EPS (earnings per share) estimates exceeding the prior 2019 profit peak. Even so, the market will likely be choppier, and possibly range-bound, as investors grapple with uncertainties surrounding COVID-19, the election, questions surrounding additional fiscal stimulus measures, and elevated market valuations. September’s market correction worked off much of the aforementioned excessive enthusiasm that had built up, particularly among market leaders, which should allow growth stocks to resume their market leadership in what we believe will continue to be a low-inflation environment. These secular growers have been rewarded for their more certain earnings outlook and superior financial strength. We don’t see that changing until we see a durable rise in inflation expectations and long-term bond yields. Importantly, however, as we are in the early stages of a new economic cycle, one that is supported by ample liquidity and fiscal stimulus, we believe market setbacks, much like September’s, are likely to be limited for the time being.
This commentary reflects the viewpoints of Montag & Caldwell, LLC as of November 19, 2020, and is not intended as a forecast or guarantee of future results. | ||||||
11
Table of Contents
AMG Managers Montag & Caldwell Growth Fund Portfolio Manager’s Comments (continued) |
CUMULATIVE TOTAL RETURN PERFORMANCE
AMG Managers Montag & Caldwell Growth Fund’s cumulative total return is based on the daily change in net asset value (NAV), and assumes that all dividends and distributions were reinvested. The graph compares a hypothetical $10,000 investment made in the AMG Managers Montag & Caldwell Growth Fund’s Class N shares on October 31, 2010, to a $10,000 investment made in the Russell 1000® Growth Index for the same time period. The graph and table do not reflect the deduction of taxes that a shareholder would pay on a Fund distribution or redemption of shares. The listed returns for the Fund are net of expenses and the returns for the index exclude expenses. Total returns would have been lower had certain expenses not been reduced.
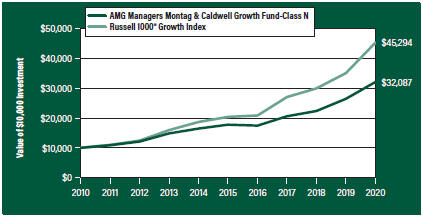
The table below shows the average annual total returns for the AMG Managers Montag & Caldwell Growth Fund and the Russell 1000® Growth Index for the same time periods ended October 31, 2020.
| Average Annual Total Returns1 | One Year | Five Years | Ten Years | |||||||||
AMG Managers Montag & Caldwell Growth Fund2, 3, 4, 5, 6 |
| |||||||||||
Class N | 21.36 | % | 12.55 | % | 12.37 | % | ||||||
Class I | 21.60 | % | 12.78 | % | 12.62 | % | ||||||
Russell 1000® Growth Index7 | 29.22 | % | 17.32 | % | 16.31 | % | ||||||
The performance data shown represents past performance. Past performance is not a guarantee of future results. Current performance may be lower or higher than the performance data quoted. The investment return and principal value of an investment will fluctuate so that an investor’s shares, when redeemed, may be worth more or less than their original cost.
Investors should carefully consider the Fund’s investment objectives, risks, charges and expenses before investing. For performance information through the most recent month end, current net asset values per share for the Fund and other information, please call 800.548.4539 or visit our website at amgfunds.com for a free prospectus. Read it carefully before investing or sending money.
Distributed by AMG Distributors, Inc., member FINRA/SIPC.
| 1 | Total return equals income yield plus share price change and assumes reinvestment of all dividends and capital gain distributions. Returns are net of fees and may reflect offsets of Fund expenses as described in the prospectus. No adjustment has been made for taxes payable by shareholders on their reinvested dividends and capital gain distributions. Returns for periods greater than one year are annualized. The listed returns on the Fund are net of expenses and based on the published NAV as of October 31, 2020. All returns are in U.S. dollars ($). |
| 2 | The Fund invests in growth stocks, which may be more sensitive to market movements because their prices tend to reflect future investor expectations rather than just current profits. Growth stocks may underperform value stocks during given periods. | |
| 3 | Investments in international securities are subject to certain risks of overseas investing including currency fluctuations and changes in political and economic conditions, which could result in significant market fluctuations. These risks are magnified in emerging markets. | |
| 4 | Market prices of investments held by the Fund may fall rapidly or unpredictably due to a variety of economic or political factors, market conditions, disasters or public health issues, or in response to events that affect particular industries or companies. | |
| 5 | The Fund invests in large-capitalization companies that may underperform other stock funds (such as funds that focus on small- and medium-capitalization companies) when stocks of large-capitalization companies are out of favor. | |
| 6 | Companies that are in similar businesses may be similarly affected by particular economic or market events; to the extent the Fund has substantial holdings within a particular sector, the risks associated with that sector increase. | |
| 7 | The Russell 1000® Growth Index is a market capitalization weighted index that measures the performance of those Russell 1000® companies with higher price-to-book ratios and higher forecasted growth values. Unlike the Fund, the Russell 1000® Growth Index is unmanaged, is not available for investment and does not incur expenses. | |
| The Russell Indices are a trademark of the London Stock Exchange Group companies. | ||
Not FDIC insured, nor bank guaranteed. May lose value.
| ||
12
Table of Contents
AMG Managers Montag & Caldwell Growth Fund Fund Snapshots (unaudited) October 31, 2020 |
PORTFOLIO BREAKDOWN
| Sector | % of Net Assets | |
Information Technology | 39.3 | |
Health Care | 18.2 | |
Consumer Discretionary | 16.6 | |
Communication Services | 13.5 | |
Financials | 3.2 | |
Materials | 2.7 | |
Consumer Staples | 2.6 | |
Industrials | 2.5 | |
Short-Term Investments | 1.5 | |
Other Assets Less Liabilities
| (0.1)
| |
TOP TEN HOLDINGS
| Security Name | % of Net Assets | |
Microsoft Corp. | 5.7 | |
Alphabet, Inc., Class A | 5.5 | |
Facebook, Inc., Class A | 5.2 | |
Thermo Fisher Scientific, Inc. | 4.9 | |
Visa, Inc., Class A | 4.1 | |
Abbott Laboratories | 4.1 | |
Apple, Inc. | 3.9 | |
Amazon.com, Inc. | 3.9 | |
salesforce.com, Inc. | 3.8 | |
UnitedHealth Group, Inc. | 3.7 | |
| ||
Top Ten as a Group | 44.8 | |
| ||
Because a fund’s strategy may result in multiple investments in particular sectors of the economy, its performance may depend on the performance of those sectors and may fluctuate more widely than investments diversified across more sectors. For additional information on these and other risk considerations, please see the Fund’s prospectus.
Any sectors, industries, or securities discussed should not be perceived as investment recommendations. Mention of a specific security should not be considered a recommendation to buy or solicitation to sell that security. Specific securities mentioned in this report may have been sold from the Fund’s portfolio of investments by the time you receive this report.
13
Table of Contents
AMG Managers Montag & Caldwell Growth Fund Schedule of Portfolio Investments October 31, 2020 |
| Shares | Value | |||||||
Common Stocks - 98.6% | ||||||||
Communication Services - 13.5% |
| |||||||
Activision Blizzard, Inc. | 173,734 | $13,156,876 | ||||||
Alphabet, Inc., Class A* | 16,199 | 26,179,366 | ||||||
Facebook, Inc., Class A* | 94,403 | 24,838,373 | ||||||
Total Communication Services | 64,174,615 | |||||||
Consumer Discretionary - 16.6% |
| |||||||
Amazon.com, Inc.* | 6,125 | 18,596,419 | ||||||
Aptiv PLC (Ireland) | 86,900 | 8,384,981 | ||||||
Lowe’s Cos., Inc. | 109,483 | 17,309,262 | ||||||
NIKE, Inc., Class B | 87,243 | 10,476,139 | ||||||
Ross Stores, Inc. | 116,100 | 9,888,237 | ||||||
Starbucks Corp. | 166,153 | 14,448,665 | ||||||
Total Consumer Discretionary | 79,103,703 | |||||||
Consumer Staples - 2.6% | ||||||||
Monster Beverage Corp.* | 162,861 | 12,470,267 | ||||||
Financials - 3.2% | ||||||||
Intercontinental Exchange, Inc. | 99,900 | 9,430,560 | ||||||
S&P Global, Inc. | 17,556 | 5,665,848 | ||||||
Total Financials | 15,096,408 | |||||||
Health Care - 18.2% | ||||||||
Abbott Laboratories | 182,753 | 19,209,168 | ||||||
Edwards Lifesciences Corp.* | 125,277 | 8,981,108 | ||||||
Stryker Corp. | 34,700 | 7,009,747 | ||||||
Teleflex, Inc. | 32,149 | 10,230,776 | ||||||
Thermo Fisher Scientific, Inc. | 49,438 | 23,390,107 | ||||||
UnitedHealth Group, Inc. | 57,327 | 17,492,761 | ||||||
Total Health Care | 86,313,667 | |||||||
Industrials - 2.5% | ||||||||
IHS Markit, Ltd. (United Kingdom) | 149,317 | 12,075,266 | ||||||
Information Technology - 39.3% | ||||||||
Accenture PLC, Class A (Ireland)
|
| 53,992
|
|
| 11,711,405
|
| ||
| Shares | Value | |||||||
Amphenol Corp., Class A | 133,312 | $15,042,926 | ||||||
Analog Devices, Inc. | 93,600 | 11,094,408 | ||||||
Apple, Inc. | 170,896 | 18,603,739 | ||||||
Arista Networks, Inc.* | 16,700 | 3,488,630 | ||||||
Fidelity National Information Services, Inc. | 102,929 | 12,823,924 | ||||||
FleetCor Technologies, Inc.* | 48,933 | 10,809,789 | ||||||
Mastercard, Inc., Class A | 31,774 | 9,171,247 | ||||||
Microsoft Corp. | 133,271 | 26,983,379 | ||||||
PayPal Holdings, Inc.* | 75,702 | 14,090,413 | ||||||
QUALCOMM, Inc. | 124,443 | 15,351,288 | ||||||
salesforce.com, Inc.* | 78,021 | 18,121,938 | ||||||
Visa, Inc., Class A | 107,197 | 19,478,767 | ||||||
Total Information Technology | 186,771,853 | |||||||
Materials - 2.7% |
| |||||||
Air Products & Chemicals, Inc. | 46,262 | 12,779,415 | ||||||
Total Common Stocks | ||||||||
(Cost $276,637,034) | 468,785,194 | |||||||
Short-Term Investments - 1.5% | ||||||||
Other Investment Companies - 1.5% |
| |||||||
Dreyfus Government Cash Management Fund, Institutional Shares, 0.02%1 | 2,682,798 | 2,682,798 | ||||||
Dreyfus Institutional Preferred Government Money Market Fund, Institutional Shares, 0.04%1 | 2,294,867 | 2,294,867 | ||||||
JPMorgan U.S. Government Money Market Fund, IM Shares, 0.04%1 | 2,364,408 | 2,364,408 | ||||||
Total Short-Term Investments | 7,342,073 | |||||||
Total Investments - 100.1% | 476,127,267 | |||||||
Other Assets, less Liabilities - (0.1)% | (438,864 | ) | ||||||
Net Assets - 100.0%
|
| $475,688,403
|
| |||||
| * | Non-income producing security. |
| 1 | Yield shown represents the October 31, 2020, seven day average yield, which refers to the sum of the previous seven days’ dividends paid, expressed as an annual percentage. |
The accompanying notes are an integral part of these financial statements.
14
Table of Contents
AMG Managers Montag & Caldwell Growth Fund Schedule of Portfolio Investments (continued) |
The following table summarizes the inputs used to value the Fund’s investments by the fair value hierarchy levels as of October 31, 2020:
Level 1
| Level 2
| Level 3
| Total
| |||||||||||||
Investments in Securities | ||||||||||||||||
Common Stocks† | $ | 468,785,194 | — | — | $ | 468,785,194 | ||||||||||
Short-Term Investments | ||||||||||||||||
Other Investment Companies |
| 7,342,073
|
|
| —
|
|
| —
|
|
| 7,342,073
|
| ||||
|
|
|
|
|
|
|
| |||||||||
Total Investments in Securities | $
| 476,127,267
|
|
| —
|
|
| —
|
| $
| 476,127,267
|
| ||||
|
|
|
|
|
|
|
| |||||||||
| † | All common stocks held in the Fund are Level 1 securities. For a detailed breakout of common stocks by major industry classification, please refer to the Fund’s Schedule of Portfolio Investments. |
For the fiscal year ended October 31, 2020, there were no transfers in or out of Level 3.
The accompanying notes are an integral part of these financial statements.
15
Table of Contents
OVERVIEW
For the fiscal year ended October 31, 2020, the AMG River Road Dividend All Cap Value Fund (the “Fund”) Class N shares returned (10.96%), while the Russell 3000® Value Index returned (8.00%).
MARKET AND PERFORMANCE REVIEW
The disruption of the U.S. economy and corporate earnings had a significant impact on the Fund performance in the period. Relative to the benchmark, the Fund’s yield objective was a notable headwind as stocks with high dividend yields underperformed. Additionally, the Fund’s all-cap structure had an adverse impact on relative results as small cap stocks have generally lagged in the period. The information technology sector had the most significant positive impact on relative results in the period, due to strong stock selection and an overweight allocation. The energy sector had the most significant negative impact as the overweight allocation was only offset in part by the strong stock selection.
The two holdings with the largest positive contribution to the Fund’s total return were discount retailer Target Corp. (“Target”) and package delivery company United Parcel Service Inc. (Cl B) (“UPS”). In May Target reported Q1 results, which highlighted the success of management’s omni-channel strategy during the quarantine with comparable sales up 10.8%, driven by 140% growth in digital sales. The company leveraged its store base to fulfill approximately 80% of the growth in digital sales, which reduced costs and improved customer service. In Q3, Target reported comparable sales up 24%, the strongest ever reported, as the company capitalized on its omni-channel strategy and digital sales grew a staggering 195%. In addition, the firm was able to grow its same-day fulfillment services by 273%, highlighting the value of the firm’s existing store base in this key area. Most importantly, despite this rapid shift in the business mix, operating profit grew 73% driven by strength in higher margin discretionary categories and strong fixed cost leverage. This appears to be the culmination of our investment thesis, as Target demonstrated the wherewithal to profitably compete, gather market share, and reward shareholders as e-commerce demand accelerates. In the wake of the strong results, the stock began trading at a significant premium to our assessed value, the yield slipped below 2%, and the position was nearing our 5% maximum limit, so we elected to trim the position.
In July, UPS reported very strong results as the pandemic accelerated the secular shift in consumer behavior toward e-commerce. This behavioral shift | led to 65% growth in business-to-consumer shipments for UPS, which improved route density and drove a 2.7% reduction in the cost per piece shipped. The firm’s new CEO, Carol B. Tomé, articulated a shift in strategy centered on driving proper value for UPS’s infrastructure that should result in higher margins and returns on invested capital (ROIC) moving forward. The team obviously intends to capitalize on the firm’s renewed pricing power following the surge in shipping demand and will focus on imposing surcharges on high volume, low margin customers like Amazon, especially in times of peak volume while reserving capacity for higher margin, smaller and medium-sized customers. While management tempered the expectation for near-term margin expansion, the expected recovery of business-to-business and freight volumes will likely provide additional pricing power and fuel optimism for UPS’s earnings power in the coming quarters. The firm increased the dividend 5% in February 2020 and both free cash flow and liquidity should support the continued growth of the dividend in 2021. Our assessed value for the position increased 38% over the span of the quarter as the dramatic acceleration in volume prompted upward revisions in both margin assumptions and the multiple employed. We remain holders of this position.
The two holdings with the lowest contribution to the Fund’s total return during the period were Kinder Morgan Inc. (Cl P) (“Kinder”), an energy infrastructure that transports approximately 40% of natural gas consumed in the United States, and Ventas Inc. (“Ventas”), a real estate investment trust (REIT) focused on owning healthcare real estate such as senior housing, medical office, and life science centers. In Q3, Kinder reported weak results following the disruption in oil markets that started in March with the collapse in demand for gasoline and the surge in supply from OPEC nations. Management now expects full year EBITDA (earnings before interest, taxes, depreciation, and amortization) and distributable cash flow will decline by a manageable 8% and 10%, respectively. While we suspect that the company’s oil producing business will remain depressed for an extended period of time, this division is responsible for only 10% of profits. More important is the firm’s natural gas business which is benefiting from a surge in pricing as the flood of associated gas coming out of the Permian recedes. We believe that investors are overlooking the underlying stability of this firm and have lost sight of the fact that Kinder’s business has limited commodity price risk with 90% of overall profits | being fee based and 66% of profits from take-or-pay contracts. Given the accumulated unrealized losses, we will continue to monitor the position, but to date we have elected to trim/eliminate other, riskier holdings in the sector.
In March as COVID-19 headlines gained steam, Ventas’s Senior Housing segment became at risk and the stock price fell sharply. Although very little is firewalled from COVID-19 risk, rent from Medical Office and Life Science Centers typically holds up well throughout most bearish pandemic scenarios. However, Senior Housing, which accounts for about one-third of EBITDA, faced near- and intermediate-term risk due to the prospect of lower occupancy at its properties driven by increased tenant mortality and reduced tenant move-ins. Management reacted quickly to the pandemic, increasing liquidity by drawing $2.8 billion on its credit facility in mid-March and issuing $500 million in 10-year notes in late March. Ventas is now incredibly liquid with limited debt maturities, which should make it well positioned to weather the storm. However, as the duration of the lockdown was drawn out and the impact spread deeper into the health care sector, the Board elected to move aggressively and cut the dividend substantially. Given the reduction and the unrealized losses, we elected to eliminate the position in the period.
POSITIONING AND OUTLOOK
As of October 31, 2020, the Fund is significantly overweight in information technology, utilities, and energy and significantly underweight in industrials, financials, and materials. The health care sector had the largest change in the past 12 months, going from substantially underweight in October 2019 to modestly overweight at the end of the period as we seek to capitalize on the expected recovery of discretionary healthcare spending in the post-COVID-19 environment. In contrast, the industrials sector went from a modest overweight to a substantial underweight as the valuations of several holdings surged over the summer and we elected to reposition into cheaper securities.
Despite the sharp rally in the wake of the 2020 election, significant headwinds could arise in the weeks and months to come. Not only is there a threat of renewed COVID-19-related lockdowns, both in the U.S. and abroad, but there is less political consensus surrounding stimulus. The potential of a split in leadership in Washington D.C. is considered a positive by many market prognosticators due to | ||||||
16
Table of Contents
AMG River Road Dividend All Cap Value Fund Portfolio Manager’s Comments (continued) |
reduced uncertainty surrounding policy changes. However, that logic also points toward a reduced outlook for stimulus in 2021. We expect that U.S. Treasury rates will remain low over the next couple years, and assuming the economy continues to rebound, it is unlikely that broader interest rates | will expand significantly either. We believe persistently low rates and a recovering economy are a recipe for increased demand for dividends, especially rising dividends, and we feel the outlook for dividend stocks, and the Fund, is increasingly positive in the period ahead.
| This commentary reflects the viewpoints of River Road Asset Management as of November 24, 2020, and is not intended as a forecast or guarantee of future results. |
17
Table of Contents
AMG River Road Dividend All Cap Value Fund Portfolio Manager’s Comments (continued) |
CUMULATIVE TOTAL RETURN PERFORMANCE
AMG River Road Dividend All Cap Value Fund’s cumulative total return is based on the daily change in net asset value (NAV), and assumes that all dividends and distributions were reinvested. The graph compares a hypothetical $10,000 investment made in the AMG River Road Dividend All Cap Value Fund’s Class N shares on October 31, 2010, to a $10,000 investment made in the Russell 3000® Value Index for the same time period. The graph and table do not reflect the deduction of taxes that a shareholder would pay on a Fund distribution or redemption of shares. The listed returns for the Fund are net of expenses and the returns for the index exclude expenses. Total returns would have been lower had certain expenses not been reduced.
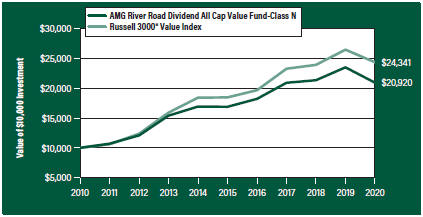
The table below shows the average annual total returns for the AMG River Road Dividend All Cap Value Fund and the Russell 3000® Value Index for the same time periods ended October 31, 2020.
| Average Annual Total Returns1 | One Year | Five Years | Ten Years | Since Inception | Inception Date | ||||||||||||||||||||
AMG River Road Dividend All Cap Value Fund2, 3, 4, 5, 6, 7, 8, 9, 10 |
| ||||||||||||||||||||||||
Class N | (10.96 | %) | 4.38 | % | 7.66 | % | 6.65 | % | 06/28/05 | ||||||||||||||||
Class I | (10.69 | %) | 4.65 | % | 7.94 | % | 5.28 | % | 06/28/07 | ||||||||||||||||
Class Z | (10.65 | %) | — | — | 0.52 | % | 09/29/17 | ||||||||||||||||||
Russell 3000® Value Index11 | (8.00 | %) | 5.69 | % | 9.30 | % | 6.25 | % | 06/28/05 | † | |||||||||||||||
The performance data shown represents past performance. Past performance is not a guarantee of future results. Current performance may be lower or higher than the performance data quoted. The investment return and principal value of an investment will fluctuate so that an investor’s shares, when redeemed, may be worth more or less than their original cost.
Investors should carefully consider the Fund’s investment objectives, risks, charges and expenses before investing. For performance information through the most recent month end, current net asset values per share for the Fund and other information, please call 800.548.4539 or visit our website at amgfunds.com for a free prospectus. Read it carefully before investing or sending money.
Distributed by AMG Distributors, Inc., member FINRA/SIPC.
| † | Date reflects the inception date of the Fund, not the index. |
| 1 | Total return equals income yield plus share price change and assumes reinvestment of all dividends and capital gain distributions. Returns are net of fees and may reflect offsets of Fund expenses as described in the prospectus. No adjustment has been made for taxes payable by shareholders on their reinvested dividends and |
capital gain distributions. Returns for periods greater than one year are annualized. The listed returns on the Fund are net of expenses and based on the published NAV as of October 31, 2020. All returns are in U.S. dollars ($).
2 Investing in Publicly Traded Partnerships (PTPs) (including master limited partnerships) involves risks in addition to those typically associated with publicly traded companies. PTPs are exposed to the risks of their underlying assets, which in many cases includes the same types of risks as energy and natural resources companies. PTPs are also subject to capital market risk. PTPs may lose their partnership status for tax purposes. The Fund’s status as a regulated investment company may be jeopardized if it does not appropriately limit such investments in PTPs or if such investments are recharacterized for tax purposes.
3 An issuer of a security may be unwilling or unable to pay income on a security. Common stocks do not assure dividend payments and are paid only when declared by an issuer’s board of directors.
4 Investments in international securities are subject to certain risks of overseas investing including currency fluctuations and changes in political and economic conditions, which could result in significant market fluctuations. These risks are magnified in emerging markets.
5 The Fund is subject to risks associated with investments in mid-capitalization companies such as greater price volatility, lower trading volume, and less liquidity than the stocks of larger, more established companies.
| ||
6 The Fund is subject to special risk considerations similar to those associated with the direct ownership of real estate. Real estate valuations may be subject to factors such as changing general and local economic, financial, competitive, and environmental conditions.
| ||
7 The Fund is subject to risks associated with investments in small-capitalization companies, such as erratic earnings patterns, competitive conditions, limited earnings history and a reliance on one or a limited number of products.
| ||
8 The Fund invests in value stocks, which may perform differently from the market as a whole and may be undervalued by the market for a long period of time.
| ||
9 Market prices of investments held by the Fund may fall rapidly or unpredictably due to a variety of economic or political factors, market conditions, disasters or public health issues, or in response to events that affect particular industries or companies. |
18
Table of Contents
AMG River Road Dividend All Cap Value Fund Portfolio Manager’s Comments (continued) |
10 Companies that are in similar businesses may be similarly affected by particular economic or market events; to the extent the Fund has substantial holdings within a particular sector, the risks associated with that sector increase.
11 The Russell 3000® Value Index measures the performance of the broad value segment of the U.S.
|
| equity universe. It includes those Russell 3000® companies with lower price-to-book ratios and lower forecasted growth values. Unlike the Fund, the Russell 3000® Value Index is unmanaged, is not available for investment and does not incur expenses. | The Russell Indices are a trademark of the London Stock Exchange Group companies.
Not FDIC insured, nor bank guaranteed. May lose value. |
19
Table of Contents
AMG River Road Dividend All Cap Value Fund Fund Snapshots (unaudited) October 31, 2020 |
PORTFOLIO BREAKDOWN
| Sector | % of Net Assets | |
Financials | 15.3 | |
Health Care | 15.1 | |
Information Technology | 13.6 | |
Utilities | 10.3 | |
Consumer Staples | 8.7 | |
Communication Services | 8.5 | |
Industrials | 8.2 | |
Consumer Discretionary | 7.7 | |
Energy | 7.5 | |
Real Estate | 2.2 | |
Materials | 1.4 | |
Short-Term Investments | 4.1 | |
Other Assets Less Liabilities | (2.6) | |
TOP TEN HOLDINGS
| Security Name | % of Net Assets | |
United Parcel Service, Inc., Class B | 4.3 | |
Corning, Inc. | 4.2 | |
Target Corp. | 3.8 | |
Verizon Communications, Inc. | 3.7 | |
The AES Corp. | 3.6 | |
Comcast Corp., Class A | 3.5 | |
Bristol-Myers Squibb Co. | 3.3 | |
Unilever PLC, Sponsored ADR (United Kingdom) | 3.1 | |
Truist Financial Corp. | 3.0 | |
Kimberly-Clark Corp. | 2.6 | |
| ||
Top Ten as a Group | 35.1 | |
| ||
Because a fund’s strategy may result in multiple investments in particular sectors of the economy, its performance may depend on the performance of those sectors and may fluctuate more widely than investments diversified across more sectors. For additional information on these and other risk considerations, please see the Fund’s prospectus.
Any sectors, industries, or securities discussed should not be perceived as investment recommendations. Mention of a specific security should not be considered a recommendation to buy or solicitation to sell that security. Specific securities mentioned in this report may have been sold from the Fund’s portfolio of investments by the time you receive this report.
20
Table of Contents
AMG River Road Dividend All Cap Value Fund Schedule of Portfolio Investments October 31, 2020 |
| Shares | Value | |||||||
Common Stocks - 98.5% | ||||||||
Communication Services - 8.5% | ||||||||
Comcast Corp., Class A | 375,630 | $15,866,611 | ||||||
The Interpublic Group of Cos., Inc. | 324,748 | 5,874,691 | ||||||
Verizon Communications, Inc. | 296,038 | 16,871,206 | ||||||
Total Communication Services | 38,612,508 | |||||||
Consumer Discretionary - 7.7% |
| |||||||
Genuine Parts Co. | 74,415 | 6,729,348 | ||||||
The Home Depot, Inc. | 21,576 | 5,754,535 | ||||||
Magna International, Inc. (Canada) | 99,061 | 5,063,008 | ||||||
Target Corp. | 113,393 | 17,260,683 | ||||||
Total Consumer Discretionary | 34,807,574 | |||||||
Consumer Staples - 8.7% |
| |||||||
Kimberly-Clark Corp. | 89,299 | 11,840,155 | ||||||
PepsiCo, Inc. | 75,663 | 10,085,121 | ||||||
Unilever PLC, Sponsored ADR (United Kingdom)1 | 242,524 | 13,782,639 | ||||||
Walgreens Boots Alliance, Inc. | 100,975 | 3,437,189 | ||||||
Total Consumer Staples | 39,145,104 | |||||||
Energy - 7.5% |
| |||||||
Enterprise Products Partners LP, MLP | 527,064 | 8,733,450 | ||||||
Kinder Morgan, Inc. | 847,093 | 10,080,407 | ||||||
Magellan Midstream Partners LP, MLP | 80,284 | 2,853,293 | ||||||
Marathon Petroleum Corp. | 147,345 | 4,346,678 | ||||||
The Williams Cos., Inc. | 407,390 | 7,817,814 | ||||||
Total Energy | 33,831,642 | |||||||
Financials - 15.3% |
| |||||||
Axis Capital Holdings, Ltd. (Bermuda) | 143,598 | 6,130,199 | ||||||
Chubb, Ltd. (Switzerland) | 62,558 | 8,126,910 | ||||||
CNA Financial Corp.1 | 205,850 | �� | 6,132,272 | |||||
Fidelity National Financial, Inc. | 264,672 | 8,281,587 | ||||||
Lazard, Ltd., Class A | 107,544 | 3,621,006 | ||||||
The PNC Financial Services Group, Inc. | 77,190 | 8,636,017 | ||||||
Stock Yards Bancorp, Inc. | 88,324 | 3,375,743 | ||||||
Truist Financial Corp. | 324,237 | 13,656,862 | ||||||
U.S. Bancorp | 289,770 | 11,286,542 | ||||||
Total Financials | 69,247,138 | |||||||
Health Care - 15.1% |
| |||||||
AbbVie, Inc. | 119,321 | 10,154,217 | ||||||
Amgen, Inc. | 48,668 | 10,558,036 | ||||||
Bristol-Myers Squibb Co. | 256,380 | 14,985,411 | ||||||
Medtronic PLC (Ireland) | 57,909 | 5,823,908 | ||||||
Merck & Co., Inc. | 69,659 | 5,239,053 | ||||||
Pfizer, Inc.
|
| 284,794
|
|
| 10,104,491
|
| ||
| Shares | Value | |||||||
Premier, Inc., Class A | 184,591 | $6,041,664 | ||||||
Quest Diagnostics, Inc. | 44,395 | 5,422,405 | ||||||
Total Health Care | 68,329,185 | |||||||
Industrials - 8.2% |
| |||||||
3M Co. | 50,641 | 8,100,535 | ||||||
General Dynamics Corp. | 48,601 | 6,382,769 | ||||||
Insperity, Inc. | 44,464 | 3,405,053 | ||||||
United Parcel Service, Inc., Class B | 122,229 | 19,203,398 | ||||||
Total Industrials | 37,091,755 | |||||||
Information Technology - 13.6% |
| |||||||
Cass Information Systems, Inc. | 92,497 | 3,627,732 | ||||||
Cisco Systems, Inc. | 315,422 | 11,323,650 | ||||||
Corning, Inc. | 595,645 | 19,042,771 | ||||||
CSG Systems International, Inc. | 79,820 | 3,023,582 | ||||||
The Hackett Group, Inc. | 158,401 | 2,046,541 | ||||||
NortonLifeLock, Inc. | 267,443 | 5,501,302 | ||||||
Oracle Corp. | 129,448 | 7,263,327 | ||||||
QUALCOMM, Inc. | 76,525 | 9,440,124 | ||||||
Total Information Technology | 61,269,029 | |||||||
Materials - 1.4% |
| |||||||
Sensient Technologies Corp. | 95,741 | 6,264,334 | ||||||
Real Estate - 2.2% |
| |||||||
Iron Mountain, Inc., REIT 1 | 383,638 | 9,997,606 | ||||||
Utilities - 10.3% |
| |||||||
The AES Corp. | 841,195 | 16,403,303 | ||||||
Atlantica Sustainable Infrastructure PLC (United Kingdom) | 320,703 | 9,457,531 | ||||||
Black Hills Corp. | 106,549 | 6,037,066 | ||||||
Dominion Resources, Inc. | 84,284 | 6,771,377 | ||||||
IDACORP, Inc. | 90,480 | 7,937,810 | ||||||
Total Utilities | 46,607,087 | |||||||
Total Common Stocks | ||||||||
(Cost $380,159,002) | 445,202,962 | |||||||
| ||||||||
| Principal Amount | ||||||||
Short-Term Investments - 4.1% | ||||||||
Joint Repurchase Agreements - 2.6%2 |
| |||||||
Cantor Fitzgerald Securities, Inc., dated 10/30/20,due 11/02/20, 0.120% total to be received $2,805,728 (collateralized by various U.S. Government Agency Obligations, 0.160% - 9.500%, 12/01/20 - 09/20/70, totaling $2,861,814)
|
| $2,805,700
|
|
| 2,805,700
|
| ||
The accompanying notes are an integral part of these financial statements.
21
Table of Contents
AMG River Road Dividend All Cap Value Fund Schedule of Portfolio Investments (continued) |
| Principal Amount | Value | |||||||
Joint Repurchase Agreements - 2.6%2 (continued) |
| |||||||
Citadel Securities LLC, dated 10/30/20, due 11/02/20, 0.150% total to be received $2,439,365 (collateralized by various U.S. Treasuries, 0.000% - 8.125%, 10/31/20 - 02/15/50, totaling $2,489,227) | $ | 2,439,335 | $2,439,335 | |||||
JVB Financial Group LLC, dated 10/30/20, due 11/02/20, 0.150% total to be received $1,595,839 (collateralized by various U.S. Government Agency Obligations and U.S. Treasuries, 0.000% - 7.000%, 01/28/21 - 10/01/50, totaling $1,627,736) | 1,595,819 | 1,595,819 | ||||||
Mirae Asset Securities, Inc., dated 10/30/20, due 11/02/20, 0.150% total to be received $1,960,631 (collateralized by various U.S. Government Agency Obligations and U.S. Treasuries, 0.125% - 7.500%, 04/15/21 - 03/15/63, totaling $1,999,843) | 1,960,606 | 1,960,606 | ||||||
Morgan, Stanley & Co. LLC, dated 10/30/20, due 11/02/20, 0.090% total to be received $237,490 (collateralized by various U.S. Government Agency Obligations, 2.000% - 6.500%, 10/01/21 - 09/01/50, totaling $242,238) | 237,488 | 237,488 | ||||||
South Street Securities LLC, dated 10/30/20, due 11/02/20, 0.140% total to be received $2,774,572 (collateralized by various U.S. Government Agency Obligations and U.S. Treasuries, 0.125% - 6.500%, 01/13/22 - 04/15/60, totaling $2,830,032) | 2,774,540 | 2,774,540 | ||||||
Total Joint Repurchase Agreements |
| 11,813,488
|
| |||||
Shares | Value | |||||||
Other Investment Companies - 1.5% |
| |||||||
Dreyfus Government Cash Management Fund, Institutional Shares, 0.02%3 | 2,202,916 | $2,202,916 | ||||||
Dreyfus Institutional Preferred Government Money Market Fund, Institutional Shares, 0.04%3 | 2,202,916 | 2,202,916 | ||||||
JPMorgan U.S. Government Money Market Fund, IM Shares, 0.04%3 | 2,269,671 | 2,269,671 | ||||||
Total Other Investment Companies | 6,675,503 | |||||||
Total Short-Term Investments | ||||||||
(Cost $18,488,991) | 18,488,991 | |||||||
Total Investments - 102.6% | ||||||||
(Cost $398,647,993) | 463,691,953 | |||||||
Other Assets, less Liabilities - (2.6)% | (11,589,066 | ) | ||||||
Net Assets - 100.0% | $
| 452,102,887
|
| |||||
| 1 | Some of these securities, amounting to $23,567,198 or 5.2% of net assets, were out on loan to various borrowers and are collateralized by cash and various U.S. Treasury Obligations. See Note 4 of Notes to Financial Statements. |
| 2 | Cash collateral received for securities lending activity was invested in these joint repurchase agreements. |
| 3 | Yield shown represents the October 31, 2020, seven day average yield, which refers to the sum of the previous seven days’ dividends paid, expressed as an annual percentage. |
ADR American Depositary Receipt
MLP Master Limited Partnership
REIT Real Estate Investment Trust
The accompanying notes are an integral part of these financial statements.
22
Table of Contents
AMG River Road Dividend All Cap Value Fund Schedule of Portfolio Investments (continued) |
The following table summarizes the inputs used to value the Fund’s investments by the fair value hierarchy levels as of October 31, 2020:
Level 1
| Level 2
| Level 3
| Total
| |||||||||||||
Investments in Securities | ||||||||||||||||
Common Stocks† | $ | 445,202,962 | — | — | $ | 445,202,962 | ||||||||||
Short-Term Investments | ||||||||||||||||
Joint Repurchase Agreements | — | $ | 11,813,488 | — | 11,813,488 | |||||||||||
Other Investment Companies | 6,675,503 | — | — | 6,675,503 | ||||||||||||
|
|
|
|
|
|
|
| |||||||||
Total Investments in Securities | $ | 451,878,465 | $ | 11,813,488 | — | $ | 463,691,953 | |||||||||
|
|
|
|
|
|
|
| |||||||||
| † | All common stocks held in the Fund are Level 1 securities. For a detailed breakout of common stocks by major industry classification, please refer to the Fund’s Schedule of Portfolio Investments. |
For the fiscal year ended October 31, 2020, there were no transfers in or out of Level 3.
The accompanying notes are an integral part of these financial statements.
23
Table of Contents
OVERVIEW
For the fiscal year ended October 31, 2020, the AMG Managers Fairpointe Mid Cap Fund (the “Fund”) Class N shares returned (8.62%), while the S&P MidCap 400® Index returned (1.15%) and the Russell Midcap® Index returned 4.12%.
OVERVIEW
Over the past year the world faced the epic challenge of confronting a global pandemic. The pervasive effects of COVID-19 on most every facet of life cannot be overstated. We at Fairpointe feel fortunate to continue to have the opportunity to invest on behalf of our clients.
2020 continued a multi-year trend characterized by divergence in performance of value and growth stocks. The current valuation discrepancy between value and growth was last observed during the peak of the tech bubble in 2000. As we have written previously, we continue to increase our exposure to companies with higher growth prospects and returns on equity (ROE), while retaining a focus on valuation.
PERFORMANCE REVIEW
The five largest contributors to performance were Cree, Inc. (“Cree”), Agilent Technologies, Inc. (“Agilent”), Cooper Tire & Rubber Company (“Cooper Tire”), Varian Medical Systems, Inc., and Mattel, Inc. |
| and analysis. We expect continued demand from academic and government labs, as well as the food industry, to drive results.
Cooper Tire is a leading producer of replacement tires in the value category. Results have been driven by its relationship with Walmart and a stronger-than-expected rebound in tire demand. We expect the company to achieve historical operating margins and continue to expand its relationship with Walmart and Mercedes Benz.
The five largest detractors to performance were Meredith Corporation (“Meredith”), Hexcel Corporation (“Hexcel”), Scholastic Corporation (“Scholastic”), Copa Holdings SA, and Molson Coors Beverage Company (“Molson Coors”).
Meredith, a media company, was impacted by lower-than-expected synergies from its Time acquisition and a COVID-related advertising slowdown. We expect continued growth from its digital business and debt paydown in the coming year. We consider the stock undervalued, as the market is ignoring the strong cash flows from the broadcasting assets.
Scholastic is a leading publisher of children’s books. The company has been hurt by near-term, COVID-19 related school disruptions. We expect earnings to improve due to upcoming |
| profitable due to effective cost management and demand in the defense and wind energy markets. Hexcel’s competitive position is intact, and the company retains a strong balance sheet to withstand the pandemic.
PORTOFOLIO ACTIVITY
The Fund added nine new ideas and eliminated fourteen in the past year. We believe the net result of these changes is a stronger balance sheet, higher profit margin, higher return on equity, and growth for the overall Fund.
POSITIONING AND OUTLOOK
We believe a vaccine to treat COVID-19 is the most important development that will impact the markets and the economy heading into 2021. Pfizer’s recent announcement that its vaccine has a greater than 90% efficacy rate will enable society to gradually return to normal in 2021. This forecasts above-trend economic growth and outlook for fundamental investing next year.
In terms of themes, the Fund has a mix of stocks that should benefit from a gradual return to normal, including LKQ, Hexcel, Donaldson, Molson Coors, and Scholastic. Another theme we anticipate is continued investment in 5G, internet capacity, and security. Fund holdings that may benefit from this include Akamai, Juniper, Check Point, Corning, and Nokia. | ||||
Shares of Cree were driven by demand for its semiconductors utilized in electric vehicles. The company is in the process of selling its LED components business for $300 million. The transaction is expected to close in the first quarter of 2021. Going forward, the company will be a focused semiconductor company with growth opportunities in electric vehicles, 5G, and industrial applications.
The resilience of Agilent’s business has been apparent in the past year with over 60% of revenue generated from consumables and services. The company provides laboratories with instruments, services, consumables, and applications for research | releases, including a new book from J.K. Rowling and the eventual reopening of schools for in-person learning, post-COVID-19. The company maintains a strong balance sheet with net cash equal to 15% of its market cap.
Hexcel holds the number one position in carbon fiber composites for the aerospace, defense, and energy markets. Carbon fiber is lighter and stronger than aluminum and helps customers achieve energy efficiency targets. All three markets offer secular growth and increasing content per application over an economic cycle. The commercial aerospace business accounts for more than 60% of the company’s revenue, and demand is depressed in the near term due to COVID-19. The company remains |
As we look past COVID-19, we see the Fund as well positioned for the long term given the changes highlighted above. Recent moves in the market have favored fundamental, value stocks. We expect this trend to continue next year with the rebound in economic activity.
Thank you for your support and stay safe!
Fairpointe Investment Team
This commentary reflects the viewpoints of Fairpointe Capital as of November 18, 2020, and is not intended as a forecast or guarantee of future results. |
24
Table of Contents
AMG Managers Fairpointe Mid Cap Fund Portfolio Manager’s Comments (continued) |
CUMULATIVE TOTAL RETURN PERFORMANCE
AMG Managers Fairpointe Mid Cap Fund’s cumulative total return is based on the daily change in net asset value (NAV), and assumes that all dividends and distributions were reinvested. The graph compares a hypothetical $10,000 investment made in the AMG Managers Fairpointe Mid Cap Fund’s Class N shares on October 31, 2010, to a $10,000 investment made in the S&P MidCap 400® Index and Russell Midcap® Index for the same time period. The graph and table do not reflect the deduction of taxes that a shareholder would pay on a Fund distribution or redemption of shares. The listed returns for the Fund are net of expenses and the returns for the index exclude expenses. Total returns would have been lower had certain expenses not been reduced.
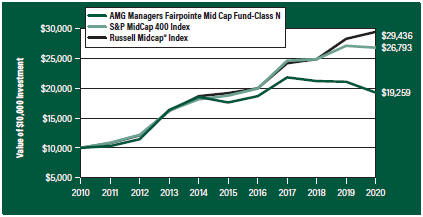
The table below shows the average annual total returns for the AMG Managers Fairpointe Mid Cap Fund and the S&P MidCap 400® Index and Russell Midcap® Index for the same time periods ended October 31, 2020.
| Average Annual Total Returns1 | One Year | Five Years | Ten Years | Since Inception | Inception Date | |||||||||||||||
AMG Managers Fairpointe Mid Cap Fund2, 3, 4, 5, 6, 7, 8, 9 |
| |||||||||||||||||||
Class N | (8.62 | %) | 1.82% | 6.77% | 10.15 | % | 09/19/94 | |||||||||||||
Class I | (8.38 | %) | 2.07% | 7.04% | 7.25 | % | 07/06/04 | |||||||||||||
Class Z | (8.32 | %) | — | — | (4.54 | %) | 09/29/17 | |||||||||||||
S&P MidCap 400® Index10 | (1.15 | %) | 7.39% | 10.36% | 8.94 | % | 09/19/94 | † | ||||||||||||
Russell Midcap® Index11 | 4.12 | % | 8.95% | 11.40% | 9.45 | % | 09/19/94 | † | ||||||||||||
The performance data shown represents past performance. Past performance is not a guarantee of future results. Current performance may be lower or higher than the performance data quoted. The investment return and principal value of an investment will fluctuate so that an investor’s shares, when redeemed, may be worth more or less than their original cost.
Investors should carefully consider the Fund’s investment objectives, risks, charges and expenses before investing. For performance information through the most recent month end, current net asset values per share for the Fund and other information, please call 800.548.4539 or visit our website at amgfunds.com for a free prospectus. Read it carefully before investing or sending money.
Distributed by AMG Distributors, Inc., member FINRA/SIPC.
| † | Date reflects the inception date of the Fund, not the index. |
| 1 | Total return equals income yield plus share price change and assumes reinvestment of all dividends and capital gain distributions. Returns are net of fees and may reflect offsets of Fund expenses as described in the prospectus. No adjustment has been made for taxes payable by shareholders on their reinvested dividends and |
capital gain distributions. Returns for periods greater than one year are annualized. The listed returns on the Fund are net of expenses and based on the published NAV as of October 31, 2020. All returns are in U.S. dollars ($). | ||
2 The Fund is subject to risks associated with investments in mid-capitalization companies such as greater price volatility, lower trading volume, and less liquidity than the stocks of larger, more established companies. | ||
3 The Fund is subject to risks associated with investments in small-capitalization companies, such as erratic earnings patterns, competitive conditions, limited earnings history and a reliance on one or a limited number of products. | ||
4 The Fund may invest in derivatives such as options and futures; the complexity and rapidly changing structure of derivatives markets may increase the possibility of market losses. | ||
5 Investments in international securities are subject to certain risks of overseas investing including currency fluctuations and changes in political and economic conditions, which could result in significant market fluctuations. These risks are magnified in emerging markets. | ||
6 Companies that are in similar businesses may be similarly affected by particular economic or market events; to the extent the Fund has substantial holdings within a particular sector, the risks associated with that sector increase. | ||
7 The fund invests in growth stocks, which may be more sensitive to market movements because their prices tend to reflect future investor expectations rather than just current profits. Growth stocks may underperform value stocks during given periods. | ||
8 The fund invests in value stocks, which may perform differently from the market as a whole and may be undervalued by the market for a long period of time. | ||
9 Market prices of investments held by the Fund may fall rapidly or unpredictably due to a variety of economic or political factors, market conditions, disasters or public health issues, or in response to events that affect particular industries or companies. | ||
10 The S&P MidCap 400® Index provides investors with a benchmark for mid-sized companies. The Index, which is distinct from the large-cap S&P 500®, measures the performance of mid-sized companies, reflecting the distinctive risk and return characteristics of this market segment. Unlike the Fund, the S&P MidCap 400® Index is unmanaged, is not available for investment and does not incur expenses. | ||
25
Table of Contents
AMG Managers Fairpointe Mid Cap Fund Portfolio Manager’s Comments (continued) |
11 The Russell Midcap® Index measures the performance of the 800 smallest companies in the Russell 1000® Index, which represent approximately 25% of the total market capitalization of the Russell 1000® Index. Unlike the Fund, the Russell Midcap® Index is unmanaged, is not available for investment and does not incur expenses. | The S&P Index is proprietary data of Standard & Poor’s, a division of McGraw-Hill Companies, Inc.
The Russell Indices are a trademark of the London Stock Exchange Group companies. | Not FDIC insured, nor bank guaranteed. May lose value. |
26
Table of Contents
AMG Managers Fairpointe Mid Cap Fund Fund Snapshots (unaudited) October 31, 2020 |
PORTFOLIO BREAKDOWN
| Sector | % of Net Assets | |
Information Technology | 20.0 | |
Consumer Discretionary | 16.3 | |
Health Care | 14.1 | |
Industrials | 11.4 | |
Financials | 11.2 | |
Communication Services | 10.7 | |
Consumer Staples | 6.3 | |
Short-Term Investments | 7.0 | |
Other Assets Less Liabilities | 3.0 | |
TOP TEN HOLDINGS
| Security Name | % of Net Assets | |
TEGNA, Inc. | 4.2 | |
Corning, Inc. | 3.8 | |
Juniper Networks, Inc. | 3.7 | |
Mattel, Inc. | 3.5 | |
Agilent Technologies, Inc. | 3.4 | |
Northern Trust Corp. | 3.2 | |
The Charles Schwab Corp. | 3.1 | |
Cooper Tire & Rubber Co. | 3.0 | |
Varian Medical Systems, Inc. | 3.0 | |
Donaldson Co., Inc. | 3.0 | |
| ||
Top Ten as a Group | 33.9 | |
| ||
Because a fund’s strategy may result in multiple investments in particular sectors of the economy, its performance may depend on the performance of those sectors and may fluctuate more widely than investments diversified across more sectors. For additional information on these and other risk considerations, please see the Fund’s prospectus.
Any sectors, industries, or securities discussed should not be perceived as investment recommendations. Mention of a specific security should not be considered a recommendation to buy or solicitation to sell that security. Specific securities mentioned in this report may have been sold from the Fund’s portfolio of investments by the time you receive this report.
27
Table of Contents
AMG Managers Fairpointe Mid Cap Fund Schedule of Portfolio Investments October 31, 2020 |
| Shares | Value | |||||||
Common Stocks - 90.0% | ||||||||
Communication Services - 10.7% |
| |||||||
Cars.com, Inc.* | 1,400,833 | $10,352,156 | ||||||
Lions Gate Entertainment Corp., Class A* | 250,800 | 1,680,360 | ||||||
Meredith Corp. | 35,200 | 387,200 | ||||||
The New York Times Co., Class A | 214,895 | 8,522,736 | ||||||
Scholastic Corp. | 391,400 | 7,734,064 | ||||||
TEGNA, Inc. | 1,574,400 | 18,940,032 | ||||||
Total Communication Services | 47,616,548 | |||||||
Consumer Discretionary - 16.3% |
| |||||||
Adtalem Global Education, Inc.* | 93,070 | 2,181,561 | ||||||
Cooper Tire & Rubber Co. | 396,500 | 13,635,635 | ||||||
Lear Corp. | 104,900 | 12,672,969 | ||||||
LKQ Corp.* | 370,000 | 11,836,300 | ||||||
Magna International, Inc. (Canada) | 257,100 | 13,140,381 | ||||||
Mattel, Inc.* | 1,125,700 | 15,500,889 | ||||||
Whirlpool Corp. | 19,900 | 3,680,704 | ||||||
Total Consumer Discretionary | 72,648,439 | |||||||
Consumer Staples - 6.3% |
| |||||||
Bunge, Ltd. | 154,100 | 8,742,093 | ||||||
Hormel Foods Corp. | 221,700 | 10,794,573 | ||||||
Molson Coors Beverage Co., Class B | 246,800 | 8,702,168 | ||||||
Total Consumer Staples | 28,238,834 | |||||||
Financials - 11.2% |
| |||||||
The Charles Schwab Corp. | 335,400 | 13,788,294 | ||||||
Cincinnati Financial Corp. | 146,910 | 10,392,413 | ||||||
Northern Trust Corp. | 180,100 | 14,096,427 | ||||||
Raymond James Financial, Inc. | 154,700 | 11,825,268 | ||||||
Total Financials | 50,102,402 | |||||||
Health Care - 14.1% |
| |||||||
Agilent Technologies, Inc. | 148,200 | 15,129,738 | ||||||
Quest Diagnostics, Inc. | 76,600 | 9,355,924 | ||||||
ResMed, Inc. | 54,000 | 10,364,760 | ||||||
Smith & Nephew PLC, ADR (United Kingdom) | 38,000 | 1,332,660 | ||||||
Varex Imaging Corp.* | 418,860 | 5,612,724 | ||||||
Varian Medical Systems, Inc.*
|
| 77,900
|
|
| 13,461,120
|
| ||
| Shares | Value | |||||||
Waters Corp.* | 34,500 | $7,687,290 | ||||||
Total Health Care | 62,944,216 | |||||||
Industrials - 11.4% |
| |||||||
Copa Holdings, S.A., Class A (Panama) | 160,300 | 7,899,584 | ||||||
Donaldson Co., Inc. | 282,515 | 13,419,462 | ||||||
Hexcel Corp. | 39,600 | 1,325,808 | ||||||
Pentair PLC (United Kingdom) | 267,800 | 13,325,728 | ||||||
Werner Enterprises, Inc. | 112,700 | 4,284,854 | ||||||
Westinghouse Air Brake Technologies Corp. | 178,309 | 10,573,724 | ||||||
Total Industrials | 50,829,160 | |||||||
Information Technology - 20.0% |
| |||||||
Akamai Technologies, Inc.* | 128,000 | 12,175,360 | ||||||
Check Point Software Technologies, Ltd. (Israel)* | 106,250 | 12,065,750 | ||||||
Corning, Inc. | 527,000 | 16,848,190 | ||||||
Cree, Inc.* | 144,305 | 9,177,798 | ||||||
Juniper Networks, Inc. | 831,500 | 16,397,180 | ||||||
National Instruments Corp. | 276,500 | 8,648,920 | ||||||
Nokia Oyj ADR (Finland)* | 3,265,900 | 11,006,083 | ||||||
Unisys Corp.* | 222,278 | 2,920,733 | ||||||
Total Information Technology | 89,240,014 | |||||||
Total Common Stocks | 401,619,613 | |||||||
Short-Term Investments - 7.0% | ||||||||
Other Investment Companies - 7.0% |
| |||||||
Dreyfus Government Cash Management Fund, Institutional Shares, 0.02%1 | 10,312,156 | 10,312,156 | ||||||
Dreyfus Institutional Preferred Government Money Market Fund, Institutional Shares, 0.04%1 | 10,312,156 | 10,312,156 | ||||||
JPMorgan U.S. Government Money Market Fund, IM Shares, 0.04%1 | 10,624,645 | 10,624,645 | ||||||
Total Short-Term Investments (Cost $31,248,957) | 31,248,957 | |||||||
Total Investments - 97.0% | 432,868,570 | |||||||
Other Assets, less Liabilities - 3.0% |
| 13,285,953 | ||||||
Net Assets - 100.0%
|
| $446,154,523
|
| |||||
| * | Non-income producing security. |
| 1 | Yield shown represents the October 31, 2020, seven day average yield, which refers to the sum of the previous seven days’ dividends paid, expressed as an annual percentage. |
| ADR | American Depositary Receipt |
The accompanying notes are an integral part of these financial statements.
28
Table of Contents
AMG Managers Fairpointe Mid Cap Fund Schedule of Portfolio Investments (continued) |
The following table summarizes the inputs used to value the Fund’s investments by the fair value hierarchy levels as of October 31, 2020:
Level 1
| Level 2
| Level 3
| Total
| |||||||||||||
Investments in Securities | ||||||||||||||||
Common Stocks† | $ | 401,619,613 | — | — | $ | 401,619,613 | ||||||||||
Short-Term Investments | ||||||||||||||||
Other Investment Companies | 31,248,957 | — | — | 31,248,957 | ||||||||||||
|
|
|
|
|
|
|
| |||||||||
Total Investments in Securities | $ | 432,868,570 | — | — | $ | 432,868,570 | ||||||||||
|
|
|
|
|
|
|
| |||||||||
| † | All common stocks held in the Fund are Level 1 securities. For a detailed breakout of common stocks by major industry classification, please refer to the Fund’s Schedule of Portfolio Investments. |
For the fiscal year ended October 31, 2020, there were no transfers in or out of Level 3.
The accompanying notes are an integral part of these financial statements.
29
Table of Contents
Strong absolute market performance through the end of 2019 was swiftly reversed in early 2020, with the first quarter marked by significant upheaval on the onset of the COVID-19 pandemic. Markets rebounded in Q2 and into Q3. U.S. small-cap equities continued to rotate toward growth, with widening disparity between the Russell 2000® Growth and Value indices; year to date, growth is outperforming value by over 20% through October 31. We have commented on the growth-over-value trend in the past and continue to see many structural earnings reasons for it to persist.
The AMG Managers LMCG Small Cap Growth Fund (the “Fund”) Class N shares outperformed its benchmark for the 12 months ended October 31, 2020, returning 24.27% vs. the Russell 2000® Growth Index return of 13.37%. Positive stock selection drove returns, although allocation among sectors was positive and added to performance as well. The portfolio outperformed the Index in all sectors during the period with the exception of communication services. Information technology was the best performing sector on a relative basis, primarily due to stock selection in software and semiconductors. A notable outperformer in IT was Everbridge, a software company that provides communications services for emergency response that was well positioned for increased business as states and | countries sought better emergency notification tools due to COVID-19. Outperformance in consumer discretionary was a result of good stock selection in hotels and restaurants along with the portfolio’s overweight to retail. Automotive retailer Lithia Motors returned over 140% in the period on renewed strength in the automotive market later in 2020. In financials, strong selection in insurance companies along with very modest exposure to banks & thrifts drove relative returns. Palomar Holdings was a standout performer in the period, as the company continues to see solid growth as it gains share in the California earthquake insurance business.
As an offset to strong performance elsewhere, the portfolio’s media holdings weighed on returns in the period. EW Scripps and Sinclair Broadcasting were down (31%) and (56%) in the period, respectively. Sinclair had a difficult Q1 2020. While Q1 started off strong for local TV broadcasters, with core advertising doing well in a strong economy and political ads very strong because of the short-lived Bloomberg candidacy, the end-of-quarter stock drop on recession fear spared no one—even larger cap TV stocks were down (50%) in Q1. However, the local TV broadcast model and Sinclair’s model in particular have positively evolved over the past 10 years. Now, retransmission revenue that is contractually guaranteed and still growing is 40% larger than | revenues from advertising, which are highly cyclical. Additionally, Sinclair’s acquisition of regional sports networks from Fox has not gone well; carriage disputes that arose before Sinclair took over were capped off with the COVID-19 crisis, which suspended all pro sports for several months. Though shares of Scripps traded lower early in 2020, the stock moved higher in Q3 2020 after announcing the sale of its podcasting unit, Stitcher, to Spotify in a $325 million deal which both increases EBITDA (earnings before interest, taxes, depreciation, and amortization) and sharply lowers its debt levels.
As we enter the last two months of 2020, we continue to rigorously evaluate the Fund’s holdings, focusing as always on our upside and downside scenarios. We have been taking advantage of opportunities created by the volatility in 2020, and have found several new investments that should add to results in the future and are in line with the disciplined process that has resulted in long-term results for our clients. These new stocks have come across multiple industry sectors, and we are confident in our companies going forward.
The views expressed represent the opinions of LMCG Investments LLC, as of October 31, 2020, and are not intended as a forecast or guarantee of future results and are subject to change without notice. |
30
Table of Contents
AMG Managers LMCG Small Cap Growth Fund Portfolio Manager’s Comments (continued) |
CUMULATIVE TOTAL RETURN PERFORMANCE
AMG Managers LMCG Small Cap Growth Fund’s cumulative total return is based on the daily change in net asset value (NAV), and assumes that all dividends and distributions were reinvested. The graph compares a hypothetical $10,000 investment made in the AMG Managers LMCG Small Cap Growth Fund’s Class N shares on November 3, 2010, to a $10,000 investment made in the Russell 2000® Growth Index for the same time period. The graph and table do not reflect the deduction of taxes that a shareholder would pay on a Fund distribution or redemption of shares. The listed returns for the Fund are net of expenses and the returns for the index exclude expenses. Total returns would have been lower had certain expenses not been reduced.
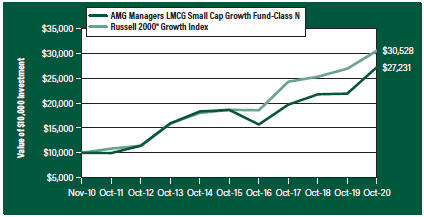
The table below shows the average annual total returns for the AMG Managers LMCG Small Cap Growth Fund and the Russell 2000® Growth Index for the same time periods ended October 31, 2020.
| Average Annual Total Returns1 | One Year | Five Years | Since Inception | Inception Date | ||||||||||||
AMG Managers LMCG Small Cap Growth Fund2, 3, 4, 5, 6, 7, 8, 9, 10 |
| |||||||||||||||
Class N | 24.27 | % | 7.89 | % | 10.54 | % | 11/03/10 | |||||||||
Class I | 24.48 | % | 8.10 | % | 8.96 | % | 06/01/11 | |||||||||
Russell 2000® Growth Index11 | 13.37 | % | 10.36 | % | 11.81 | % | 11/03/10 | † | ||||||||
The performance data shown represents past performance. Past performance is not a guarantee of future results. Current performance may be lower or higher than the performance data quoted. The investment return and principal value of an investment will fluctuate so that an investor’s shares, when redeemed, may be worth more or less than their original cost.
Investors should carefully consider the Fund’s investment objectives, risks, charges and expenses before investing. For performance information through the most recent month end, current net asset values per share for the Fund and other information, please call 800.548.4539 or visit our website at amgfunds.com for a free prospectus. Read it carefully before investing or sending money.
Distributed by AMG Distributors, Inc., member FINRA/SIPC.
| † | Date reflects the inception date of the Fund, not the index. |
| 1 | Total return equals income yield plus share price change and assumes reinvestment of all dividends and capital gain distributions. Returns are net of fees and may reflect offsets of Fund expenses as described in the prospectus. No adjustment has been made for taxes payable by shareholders on their reinvested dividends and capital gain distributions. Returns for periods greater than one year are annualized. The listed returns on the Fund are net of expenses and based on the published NAV as of October 31, 2020. All returns are in U.S. dollars ($). |
2 The Fund is subject to risks associated with investments in small-capitalization companies, such as erratic earnings patterns, competitive conditions, limited earnings history and a reliance on one or a limited number of products. | ||
3 Active and frequent trading of a fund may result in higher transaction costs and increased tax liability. | ||
4 The Fund invests in growth stocks, which may be more sensitive to market movements because their prices tend to reflect future investor expectations rather than just current profits. Growth stocks may underperform value stocks during given periods. | ||
5 Investments in international securities are subject to certain risks of overseas investing including currency fluctuations and changes in political and economic conditions, which could result in significant market fluctuations. These risks are magnified in emerging markets. | ||
6 Investing in initial public offerings (IPOs) is risky and the prices of stocks purchased in IPOs tend to fluctuate more widely than stocks of companies that have been publicly traded for a longer period of time. Stocks purchased in IPOs generally do not have a trading history, and information about the companies may be available for very limited periods. | ||
7 The Fund is subject to risks associated with investments in mid-capitalization companies such as greater price volatility, lower trading volume, and less liquidity than the stocks of larger, more established companies. | ||
8 Companies that are in similar businesses may be similarly affected by particular economic or market events; to the extent the Fund has substantial holdings within a particular sector, the risks associated with that sector increase. | ||
9 The Fund is subject to special risk considerations similar to those associated with the direct ownership of real estate. Real estate valuations may be subject to factors such as changing general and local economic, financial, competitive, and environmental conditions. | ||
10 Market prices of investments held by the Fund may fall rapidly or unpredictably due to a variety of economic or political factors, market conditions, disasters or public health issues, or in response to events that affect particular industries or companies. | ||
11 The Russell 2000® Growth Index measures the performance of the Russell 2000® companies with higher price-to-book ratios and higher forecasted growth values. Unlike the Fund, the Russell 2000® Growth Index is unmanaged, is not available for investment and does not incur expenses. | ||
The Russell Indices are a trademark of the London Stock Exchange Group companies.
Not FDIC insured, nor bank guaranteed. May lose value. | ||
31
Table of Contents
AMG Managers LMCG Small Cap Growth Fund Fund Snapshots (unaudited) October 31, 2020 |
PORTFOLIO BREAKDOWN
| Sector | % of Net Assets | |
Health Care | 35.1 | |
Information Technology | 22.1 | |
Consumer Discretionary | 14.6 | |
Financials | 7.6 | |
Industrials | 7.6 | |
Communication Services | 3.0 | |
Consumer Staples | 2.2 | |
Exchange Traded Funds | 2.1 | |
Utilities | 1.5 | |
Materials | 1.1 | |
Short-Term Investments | 9.2 | |
Other Assets Less Liabilities | (6.1) | |
TOP TEN HOLDINGS
| Security Name | % of Net Assets | |
Addus HomeCare Corp. | 3.6 | |
Asbury Automotive Group, Inc. | 3.4 | |
LivePerson, Inc. | 3.2 | |
LHC Group, Inc. | 3.2 | |
Casella Waste Systems, Inc., Class A | 3.1 | |
Silicon Laboratories, Inc. | 2.9 | |
AdaptHealth Corp. | 2.8 | |
Q2 Holdings, Inc. | 2.8 | |
R1 RCM, Inc. | 2.7 | |
Catalent, Inc. | 2.7 | |
| ||
Top Ten as a Group | 30.4 | |
| ||
Because a fund’s strategy may result in multiple investments in particular sectors of the economy, its performance may depend on the performance of those sectors and may fluctuate more widely than investments diversified across more sectors. For additional information on these and other risk considerations, please see the Fund’s prospectus.
Any sectors, industries, or securities discussed should not be perceived as investment recommendations. Mention of a specific security should not be considered a recommendation to buy or solicitation to sell that security. Specific securities mentioned in this report may have been sold from the Fund’s portfolio of investments by the time you receive this report.
32
Table of Contents
AMG Managers LMCG Small Cap Growth Fund Schedule of Portfolio Investments October 31, 2020 |
| Shares | Value | |||||||
Common Stocks - 94.8% | ||||||||
Communication Services - 3.0% |
| |||||||
The EW Scripps Co., Class A | 77,754 | $706,007 | ||||||
Gray Television, Inc.* | 28,824 | 365,488 | ||||||
Total Communication Services | 1,071,495 | |||||||
Consumer Discretionary - 14.6% |
| |||||||
Asbury Automotive Group, Inc.* | 11,578 | 1,192,302 | ||||||
Bright Horizons Family Solutions, Inc.* | 3,068 | 484,897 | ||||||
Caesars Entertainment, Inc.* | 20,661 | 926,026 | ||||||
Chegg, Inc.*,1 | 1,945 | 142,841 | ||||||
Churchill Downs, Inc. | 1,825 | 272,199 | ||||||
Lithia Motors, Inc., Class A1 | 3,022 | 693,761 | ||||||
National Vision Holdings, Inc.*,1 | 6,470 | 260,935 | ||||||
The Cheesecake Factory, Inc.1 | 27,616 | 820,748 | ||||||
Vroom, Inc.*,1 | 8,682 | 356,830 | ||||||
Total Consumer Discretionary | 5,150,539 | |||||||
Consumer Staples - 2.2% | ||||||||
BJ’s Wholesale Club Holdings, Inc.* | 20,659 | 791,033 | ||||||
Financials - 7.6% | ||||||||
Assetmark Financial Holdings, Inc.*,1 | 8,145 | 172,267 | ||||||
First Horizon National Corp. | 39,946 | 415,838 | ||||||
Focus Financial Partners, Inc., Class A* | 14,226 | 519,391 | ||||||
Kinsale Capital Group, Inc. | 1,788 | 335,196 | ||||||
Palomar Holdings, Inc.* | 8,623 | 768,913 | ||||||
Primerica, Inc. | 4,335 | 477,890 | ||||||
Total Financials | 2,689,495 | |||||||
Health Care - 35.1% | ||||||||
ACADIA Pharmaceuticals, Inc.* | 15,213 | 706,644 | ||||||
AdaptHealth Corp.* | 36,389 | 993,420 | ||||||
Addus HomeCare Corp.* | 13,147 | 1,282,753 | ||||||
Agios Pharmaceuticals, Inc.* | 2,301 | 92,201 | ||||||
Arrowhead Pharmaceuticals, Inc.*,1 | 2,478 | 141,989 | ||||||
Biohaven Pharmaceutical Holding Co., Ltd.*,1 | 1,777 | 137,647 | ||||||
Blueprint Medicines Corp.* | 5,501 | 562,642 | ||||||
Catalent, Inc.* | 10,668 | 936,330 | ||||||
Encompass Health Corp. | 13,490 | 827,072 | ||||||
Global Blood Therapeutics, Inc.* | 8,984 | 475,074 | ||||||
Haemonetics Corp.* | 8,656 | 875,035 | ||||||
iRhythm Technologies, Inc.*,1 | 573 | 121,161 | ||||||
Kodiak Sciences, Inc.*,1 | 6,337 | 575,463 | ||||||
LHC Group, Inc.* | 5,233 | 1,133,206 | ||||||
Mirati Therapeutics, Inc.* | 2,443 | 530,473 | ||||||
NeoGenomics, Inc.*
|
| 9,562
|
|
| 375,117
|
| ||
| Shares | Value | |||||||
R1 RCM, Inc.* | 54,093 | $969,347 | ||||||
Syneos Health, Inc.* | 16,176 | 858,622 | ||||||
Tandem Diabetes Care, Inc.* | 2,801 | 305,309 | ||||||
Turning Point Therapeutics, Inc.*,1 | 5,506 | 507,598 | ||||||
Total Health Care | 12,407,103 | |||||||
Industrials - 7.6% | ||||||||
ASGN, Inc.* | 11,685 | 779,156 | ||||||
The AZEK Co., Inc.* | 15,080 | 504,275 | ||||||
Casella Waste Systems, Inc., Class A* | 20,589 | 1,111,600 | ||||||
Sunrun, Inc.*,1 | 5,655 | 294,173 | ||||||
Total Industrials | 2,689,204 | |||||||
Information Technology - 22.1% |
| |||||||
Domo, Inc., Class B* | 9,822 | 312,044 | ||||||
Enphase Energy, Inc.* | 2,838 | 278,379 | ||||||
Everbridge, Inc.*,1 | 1,687 | 176,612 | ||||||
Five9, Inc.* | 2,580 | 391,438 | ||||||
Inphi Corp.* | 2,233 | 312,084 | ||||||
Lattice Semiconductor Corp.* | 13,371 | 466,648 | ||||||
LivePerson, Inc.*,1 | 21,213 | 1,134,047 | ||||||
Medallia, Inc.*,1 | 15,114 | 429,993 | ||||||
Q2 Holdings, Inc.*,1 | 10,883 | 992,965 | ||||||
Rapid7, Inc.*,1 | 7,501 | 464,537 | ||||||
RealPage, Inc.* | 8,774 | 488,624 | ||||||
SailPoint Technologies Holdings, Inc.* | 18,027 | 748,301 | ||||||
Semtech Corp.* | 7,618 | 418,152 | ||||||
Silicon Laboratories, Inc.* | 10,002 | 1,024,805 | ||||||
Tenable Holdings, Inc.* | 5,324 | 181,602 | ||||||
Total Information Technology | 7,820,231 | |||||||
Materials - 1.1% | ||||||||
Summit Materials, Inc., Class A* | 22,523 | 398,432 | ||||||
Utilities - 1.5% | ||||||||
Sunnova Energy International, Inc.* | 22,708 | 546,354 | ||||||
Total Common Stocks | 33,563,886 | |||||||
| Exchange Traded Funds - 2.1% | ||||||||
iShares Russell 2000 Growth ETF
|
| 3,264
|
|
| 728,427
|
| ||
The accompanying notes are an integral part of these financial statements.
33
Table of Contents
AMG Managers LMCG Small Cap Growth Fund Schedule of Portfolio Investments (continued) |
| Principal Amount | Value | |||||||
Short-Term Investments - 9.2% | ||||||||
Joint Repurchase Agreements - 3.6%2 |
| |||||||
Citigroup Global Markets, Inc., dated 10/30/20,due 11/02/20, 0.090% total to be received $290,675 (collateralized by various U.S. Government Agency Obligations and U.S. Treasuries, 0.000% - 6.500%, 10/31/20 - 08/20/70, totaling $296,486) | $290,673 | $290,673 | ||||||
RBC Dominion Securities, Inc., dated 10/30/20,due 11/02/20, 0.090% total to be received $1,000,008 (collateralized by various U.S. Government Agency Obligations and U.S. Treasuries, 0.000% - 5.000%, 02/04/21 - 11/01/50, totaling $1,020,000) | 1,000,000 | 1,000,000 | ||||||
Total Joint Repurchase Agreements |
| 1,290,673 | ||||||
| Shares | ||||||||
Other Investment Companies - 5.6% |
| |||||||
Dreyfus Government Cash Management Fund, Institutional Shares, 0.02%3 | 648,125 | 648,125 | ||||||
Dreyfus Institutional Preferred Government Money Market Fund, Institutional Shares, 0.04%3 | 648,125 | 648,125 | ||||||
JPMorgan U.S. Government Money Market Fund, IM Shares, 0.04%3 | 667,765 | 667,765 | ||||||
| Total Other Investment Companies |
| 1,964,015 | ||||||
Total Short-Term Investments (Cost $3,254,688)
|
| 3,254,688
|
| |||||
Value | ||||||||
Total Investments - 106.1% (Cost $30,247,385) | $37,547,001 | |||||||
Other Assets, less Liabilities - (6.1)% |
| (2,155,535 | ) | |||||
Net Assets - 100.0%
|
| $35,391,466
|
| |||||
| * | Non-income producing security. |
| 1 | Some of these securities, amounting to $5,732,071 or 16.2% of net assets, were out on loan to various borrowers and are collateralized by cash and various U.S. Treasury Obligations. See Note 4 of Notes to Financial Statements. |
| 2 | Cash collateral received for securities lending activity was invested in these joint repurchase agreements. |
| 3 | Yield shown represents the October 31, 2020, seven day average yield, which refers to the sum of the previous seven days’ dividends paid, expressed as an annual percentage. |
ETF Exchange Traded Fund
The accompanying notes are an integral part of these financial statements.
34
Table of Contents
AMG Managers LMCG Small Cap Growth Fund Schedule of Portfolio Investments (continued) |
The following table summarizes the inputs used to value the Fund’s investments by the fair value hierarchy levels as of October 31, 2020:
Level 1
| Level 2
| Level 3
| Total
| |||||||||||||
Investments in Securities | ||||||||||||||||
Common Stocks† | $ | 33,563,886 | — | — | $ | 33,563,886 | ||||||||||
Exchange Traded Funds† | 728,427 | — | — | 728,427 | ||||||||||||
Short-Term Investments | ||||||||||||||||
Joint Repurchase Agreements | — | $ | 1,290,673 | — | 1,290,673 | |||||||||||
Other Investment Companies | 1,964,015 | — | — | 1,964,015 | ||||||||||||
|
|
|
|
|
|
|
| |||||||||
Total Investments in Securities | $ | 36,256,328 | $ | 1,290,673 | — | $ | 37,547,001 | |||||||||
|
|
|
|
|
|
|
| |||||||||
| † | All common stocks and exchange traded funds held or shorted in the Fund are Level 1 securities. For a detailed breakout of common stocks and exchange traded funds by major industry classification, please refer to the Fund’s Schedule of Portfolio Investments. |
For the fiscal year ended October 31, 2020, there were no transfers in or out of Level 3.
The accompanying notes are an integral part of these financial statements.
35
Table of Contents
OVERVIEW
For the fiscal year ended October 31, 2020, the AMG River Road Small-Mid Cap Value Fund (the “Fund”) Class N shares returned (11.65%), compared to the Russell 2500® Value Index return of (11.92%).
PERFORMANCE REVIEW
The sector with the largest positive contribution to relative return was financials, which benefited from strong stock selection and an underweight allocation to banks. The sector with the largest negative contribution to relative return was information technology, which suffered from poor stock selection and an overweight allocation. The Fund’s cash position, which averaged 3% during the period, was a relative benefit of 1.15%.
The top contributing holdings in the Fund were Air Transport Services Group Inc. (“Air Transport) and BJ’s Wholesale Club Holdings Inc. (“BJ’s”). Air Transport is the premier lessor of widebody freighter aircraft, primarily the Boeing 767. Air Transport grew revenue and EBITDA (earnings before interest, taxes, depreciation, and amortization) throughout the year by expanding its fleet, including leasing 12 new aircraft under 10-year leases to Amazon. COVID-19 accelerated the transition toward e-commerce which should continue to drive demand for Air Transport’s unique cargo and logistics assets. We opportunistically added as COVID-19 fears intensified.
BJ’s is a warehouse club retailer with more than 200 stores primarily located in the eastern United States. Increased work-from-home activity plus school closures from COVID-19 caused surging demand for grocery items. In its latest two quarters, BJ’s reported same store sales growth of 27% and 24%. Free cash flow production in those two quarters easily exceeded free cash flow for the fiscal years 2018 and 2019 combined, which has greatly improved BJ’s | balance sheet. New membership growth should also support sales growth beyond the pandemic. We trimmed the position as it approached our assessed value.
The bottom contributing holdings in the Fund were Sabre Corp. (“Sabre”) and Viad Corp. (“Viad”). Sabre is a leader in technology and software solutions for global air travel and hospitality with dominant market share in North America. Sabre’s business model earns a fixed fee in each instance an airline ticket is booked, regardless of the price charged by the airline to the customer. This feature enables Sabre to earn consistent margins and cash flows in periods of traditional economic weakness as airlines typically reduce ticket prices to keep volumes and utilization relatively stable to avoid losing perishable seat inventory. However, the benefit fails when airlines stop flying routes en masse, a scenario well outside of our bear case analysis. In response, we trimmed the position and later exited following a dilutive capital raise which lowered the potential upside in a recovery.
Viad is a small conglomerate with an exhibition/conference services segment (GES) and a travel/hotel/attractions segment (Pursuit). Both of Viad’s business segments were directly impacted by COVID-19. GES experienced conference and event cancellations and deferrals while Pursuit was challenged by low levels of tourism. The company raised capital via a convertible preferred stock offering, which should provide adequate liquidity to navigate the pandemic. Although visibility for a rebound at GES remains exceptionally murky, we are encouraged by management’s ability to dramatically reduce variable costs, essentially placing GES in “hibernation” until demand returns. We believe Pursuit’s collection of valuable assets in and around North American national parks is well positioned for a strong rebound during the 2021 high season, especially if consumers favor road travel over air travel. We maintained our position.
| OUTLOOK AND POSITIONING
Through the first three quarters of 2020, the performance of small caps has lagged large caps by the widest margin since 1999, after which small caps went on to outperform large caps for the next seven years. Given that small caps AND value tend to lead in the early stages of a recovery, we believe investors who missed the opportunity to increase their exposure to small caps at the market bottom are being provided a highly attractive opportunity to increase their small cap value exposure despite the growth-to-value rotation increasingly becoming the consensus trade following Pfizer’s and Moderna’s promising COVID-19 vaccine developments. Additionally, we believe the valuation disparity between small cap value and small cap growth presents an exceptional opportunity to lean into value.
Individual stock picking and effective portfolio management remain critical to the performance of the Fund. During the market selloff caused by COVID-19, we aggressively improved the quality of the Fund and eliminated many investments with lower conviction business models. Cash balances rose during the subsequent rally as stock prices hit our assessed values. We are seeking to maintain a balance between more defensive, stable companies and those with greater risk but more upside potential as the economy fully recovers. Additionally, we believe the Fund’s positioning remains a highly attractive balance of value and quality.
This commentary reflects the viewpoints of River Road Asset Management as of November 24, 2020, and is not intended as a forecast or guarantee of future results. |
36
Table of Contents
AMG River Road Small-Mid Cap Value Fund Portfolio Manager’s Comments (continued) |
CUMULATIVE TOTAL RETURN PERFORMANCE
AMG River Road Small-Mid Cap Value Fund’s cumulative total return is based on the daily change in net asset value (NAV), and assumes that all dividends and distributions were reinvested. The graph compares a hypothetical $10,000 investment made in the AMG River Road Small-Mid Cap Value Fund’s Class N shares on October 31, 2010, to a $10,000 investment made in the Russell 2500® Value Index and Russell 2000® Value Index for the same time period. The graph and table do not reflect the deduction of taxes that a shareholder would pay on a Fund distribution or redemption of shares. The listed returns for the Fund are net of expenses and the returns for the index exclude expenses. Total returns would have been lower had certain expenses not been reduced.
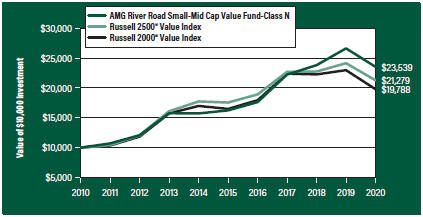
The table below shows the average annual total returns for the AMG River Road Small-Mid Cap Value Fund and the Russell 2500® Value Index and Russell 2000® Value Index for the same time periods ended October 31, 2020.
| Average Annual Total Returns1 | One Year | Five Years | Ten Years | Since Inception | Inception Date | |||||||||||||||
AMG River Road Small-Mid Cap Value Fund2, 3, 4, 5, 6, 7,8 |
| |||||||||||||||||||
Class N | (11.65% | ) | 7.70% | 8.94% | 5.70% | 03/29/07 | ||||||||||||||
Class I | (11.47% | ) | 7.94% | 9.22% | 5.68% | 06/28/07 | ||||||||||||||
Class Z | (11.43% | ) | — | — | 1.71% | 09/29/17 | ||||||||||||||
Russell 2500® Value Index9 | (11.92% | ) | 3.91% | 7.84% | 4.82% | 03/29/07 | † | |||||||||||||
Russell 2000® Value Index10 | (13.92% | ) | 3.71% | 7.06% | 3.96% | 03/29/07 | † | |||||||||||||
The performance data shown represents past performance. Past performance is not a guarantee of future results. Current performance may be lower or higher than the performance data quoted. The investment return and principal value of an investment will fluctuate so that an investor’s shares, when redeemed, may be worth more or less than their original cost.
Investors should carefully consider the Fund’s investment objectives, risks, charges and expenses before investing. For performance information through the most recent month end, current net asset values per share for the Fund and other information, please call 800.548.4539 or visit our website at amgfunds.com for a free prospectus. Read it carefully before investing or sending money.
Distributed by AMG Distributors, Inc., member FINRA/SIPC.
| † | Date reflects the inception date of the Fund, not the index. |
| 1 | Total return equals income yield plus share price change and assumes reinvestment of all dividends and capital gain distributions. Returns are net of fees and may reflect offsets of Fund expenses as described in the |
prospectus. No adjustment has been made for taxes payable by shareholders on their reinvested dividends and capital gain distributions. Returns for periods greater than one year are annualized. The listed returns on the Fund are net of expenses and based on the published NAV as of October 31, 2020. All returns are in U.S. dollars ($). | ||
2 Investments in international securities are subject to certain risks of overseas investing including currency fluctuations and changes in political and economic conditions, which could result in significant market fluctuations. These risks are magnified in emerging markets. | ||
3 The Fund is subject to risks associated with investments in mid-capitalization companies such as greater price volatility, lower trading volume, and less liquidity than the stocks of larger, more established companies. | ||
4 The Fund is subject to special risk considerations similar to those associated with the direct ownership of real estate. Real estate valuations may be subject to factors such as changing general and local economic, financial, competitive, and environmental conditions. | ||
5 The Fund is subject to risks associated with investments in small-capitalization companies, such as erratic earnings patterns, competitive conditions, limited earnings history and a reliance on one or a limited number of products. | ||
6 The Fund invests in value stocks, which may perform differently from the market as a whole and may be undervalued by the market for a long period of time. | ||
7 Market prices of investments held by the Fund may fall rapidly or unpredictably due to a variety of economic or political factors, market conditions, disasters or public health issues, or in response to events that affect particular industries or companies. | ||
8 Companies that are in similar businesses may be similarly affected by particular economic or market events; to the extent the Fund has substantial holdings within a particular sector, the risks associated with that sector increase. | ||
9 The Russell 2500® Value Index measures the performance of the Russell 2500® companies with lower price-to-book ratios and lower forecasted growth values. Unlike the Fund, the Russell 2500® Value Index is unmanaged, is not available for investment and does not incur expenses. | ||
37
Table of Contents
AMG River Road Small-Mid Cap Value Fund Portfolio Manager’s Comments (continued) |
10 The Russell 2000® Value Index is an unmanaged, market-value weighted, value-oriented index comprised of small stocks that have relatively low price-to-book ratios and lower forecasted growth values. Unlike the Fund, the Russell 2000® Value | Index is unmanaged, is not available for investment and does not incur expenses.
The Russell Indices are a trademark of the London Stock Exchange Group companies.
| Not FDIC insured, nor bank guaranteed. May lose value. |
38
Table of Contents
AMG River Road Small-Mid Cap Value Fund Fund Snapshots (unaudited) October 31, 2020 |
PORTFOLIO BREAKDOWN
| Sector | % of Net Assets | ||||
Industrials | 32.0 | ||||
Communication Services | 13.4 | ||||
Financials | 13.3 | ||||
Information Technology | 12.5 | ||||
Consumer Discretionary | 9.0 | ||||
Consumer Staples | 8.2 | ||||
Health Care | 5.1 | ||||
Real Estate | 2.1 | ||||
Energy | 2.1 | ||||
Materials | 0.9 | ||||
Short-Term Investments | 1.6 | ||||
Other Assets Less Liabilities | (0.2) | ||||
TOP TEN HOLDINGS
| Security Name | % of Net Assets | |
GCI Liberty, Inc., Class A | 5.2 | |
Air Transport Services Group, Inc. | 5.0 | |
Cannae Holdings, Inc. | 4.2 | |
White Mountains Insurance Group, Ltd. | 4.1 | |
LKQ Corp. | 3.8 | |
Premier, Inc., Class A | 3.8 | |
Hostess Brands, Inc. | 3.7 | |
UniFirst Corp. | 3.3 | |
BJ’s Wholesale Club Holdings, Inc. | 3.1 | |
Cubic Corp. | 2.9 | |
| ||
Top Ten as a Group | 39.1 | |
| ||
Because a fund’s strategy may result in multiple investments in particular sectors of the economy, its performance may depend on the performance of those sectors and may fluctuate more widely than investments diversified across more sectors. For additional information on these and other risk considerations, please see the Fund’s prospectus.
Any sectors, industries, or securities discussed should not be perceived as investment recommendations. Mention of a specific security should not be considered a recommendation to buy or solicitation to sell that security. Specific securities mentioned in this report may have been sold from the Fund’s portfolio of investments by the time you receive this report.
39
Table of Contents
AMG River Road Small-Mid Cap Value Fund Schedule of Portfolio Investments October 31, 2020 |
| Shares | Value | |||||||
Common Stocks - 98.6% | ||||||||
Communication Services - 13.4% |
| |||||||
Cinemark Holdings, Inc.1 | 49,105 | $402,170 | ||||||
Discovery, Inc., Class C* | 152,363 | 2,791,290 | ||||||
GCI Liberty, Inc., Class A* | 115,517 | 9,383,446 | ||||||
Liberty Broadband Corp., Class C* | 29,172 | 4,133,964 | ||||||
Liberty Latin America, Ltd., Class A* | 126,852 | 1,243,150 | ||||||
Liberty Latin America, Ltd., Class C* | 206,335 | 2,005,576 | ||||||
Vonage Holdings Corp.* | 218,582 | 2,312,598 | ||||||
Yelp, Inc.* | 88,160 | 1,734,107 | ||||||
Total Communication Services | 24,006,301 | |||||||
Consumer Discretionary -9.0% |
| |||||||
Advance Auto Parts, Inc. | 23,394 | 3,445,468 | ||||||
Core-Mark Holding Co., Inc. | 18,067 | 494,133 | ||||||
Extended Stay America, Inc. | 355,629 | 4,036,389 | ||||||
LKQ Corp.* | 213,261 | 6,822,219 | ||||||
Murphy USA, Inc.* | 10,314 | 1,261,299 | ||||||
Total Consumer Discretionary | 16,059,508 | |||||||
Consumer Staples - 8.2% | ||||||||
BJ’s Wholesale Club Holdings, Inc.*,1 | 143,881 | 5,509,203 | ||||||
Hostess Brands, Inc.* | 517,595 | 6,542,401 | ||||||
Ingles Markets, Inc., Class A | 41,356 | 1,483,026 | ||||||
Whole Earth Brands, Inc.* | 127,431 | 1,043,660 | ||||||
Total Consumer Staples | 14,578,290 | |||||||
Energy - 2.1% | ||||||||
HollyFrontier Corp. | 94,946 | 1,757,451 | ||||||
PBF Energy, Inc., Class A1 | 73,300 | 342,311 | ||||||
World Fuel Services Corp. | 76,546 | 1,611,293 | ||||||
Total Energy | 3,711,055 | |||||||
Financials - 13.3% | ||||||||
American Equity Investment Life Holding Co. | 53,591 | 1,330,129 | ||||||
Axis Capital Holdings, Ltd. (Bermuda) | 69,519 | 2,967,766 | ||||||
Cannae Holdings, Inc.* | 202,364 | 7,483,421 | ||||||
Fidelity National Financial, Inc. | 153,167 | 4,792,595 | ||||||
White Mountains Insurance Group, Ltd. | 7,995 | 7,262,098 | ||||||
Total Financials | 23,836,009 | |||||||
Health Care - 5.1% | ||||||||
Computer Programs and Systems, Inc. | 81,386 | 2,269,856 | ||||||
Premier, Inc., Class A | 206,732 | 6,766,338 | ||||||
Total Health Care | 9,036,194 | |||||||
Industrials - 32.0% | ||||||||
Air Transport Services Group, Inc.* | 317,017 | 8,889,157 | ||||||
Argan, Inc.
|
| 107,631
|
|
| 4,433,321
|
| ||
| Shares | Value | |||||||
Armstrong World Industries, Inc. | 60,360 | $3,615,564 | ||||||
Atkore International Group, Inc.* | 78,580 | 1,625,820 | ||||||
Colfax Corp.*,1 | 44,360 | 1,206,149 | ||||||
Comfort Systems USA, Inc. | 79,798 | 3,654,749 | ||||||
Cubic Corp. | 88,702 | 5,243,175 | ||||||
GrafTech International, Ltd. | 471,299 | 3,181,268 | ||||||
Harsco Corp.* | 170,237 | 2,196,057 | ||||||
Huntington Ingalls Industries, Inc. | 16,083 | 2,371,921 | ||||||
Insperity, Inc. | 41,276 | 3,160,916 | ||||||
MSC Industrial Direct Co., Inc., Class A | 21,612 | 1,505,492 | ||||||
Nielsen Holdings PLC | 177,960 | 2,404,240 | ||||||
nVent Electric PLC (United Kingdom) | 74,047 | 1,336,548 | ||||||
SP Plus Corp.* | 57,977 | 1,068,516 | ||||||
TPI Composites, Inc.* | 34,773 | 1,151,682 | ||||||
TriMas Corp.* | 39,304 | 956,266 | ||||||
UniFirst Corp. | 35,762 | 5,858,173 | ||||||
US Ecology, Inc. | 52,033 | 1,588,047 | ||||||
Viad Corp. | 82,267 | 1,645,340 | ||||||
Total Industrials | 57,092,401 | |||||||
Information Technology - 12.5% |
| |||||||
ACI Worldwide, Inc.* | 127,715 | 3,725,447 | ||||||
Avaya Holdings Corp.*,1 | 271,931 | 4,677,213 | ||||||
CDK Global, Inc. | 76,517 | 3,297,883 | ||||||
DXC Technology Co. | 83,855 | 1,544,609 | ||||||
ePlus, Inc.* | 41,705 | 2,815,505 | ||||||
Ituran Location and Control, Ltd. (Israel) | 46,256 | 654,522 | ||||||
NCR Corp.* | 172,781 | 3,510,910 | ||||||
Perspecta, Inc. | 119,864 | 2,149,161 | ||||||
Total Information Technology | 22,375,250 | |||||||
Materials - 0.9% | ||||||||
Axalta Coating Systems, Ltd.* | 65,384 | 1,641,792 | ||||||
Real Estate - 2.1% | ||||||||
Jones Lang LaSalle, Inc. | 28,249 | 3,188,182 | ||||||
Newmark Group, Inc., Class A | 114,499 | 542,153 | ||||||
Total Real Estate | 3,730,335 | |||||||
Total Common Stocks (Cost $180,147,187)
|
| 176,067,135
|
| |||||
The accompanying notes are an integral part of these financial statements.
40
Table of Contents
AMG River Road Small-Mid Cap Value Fund Schedule of Portfolio Investments (continued) |
| Shares | Value | |||||||
Short-Term Investments - 1.6% | ||||||||
Other Investment Companies - 1.6% |
| |||||||
Dreyfus Government Cash Management Fund, | 956,764 | $956,764 | ||||||
Dreyfus Institutional Preferred Government Money Market Fund, Institutional Shares, 0.04%2 | 956,764 | 956,764 | ||||||
JPMorgan U.S. Government Money Market Fund, IM Shares, 0.04%2 | 985,757 | 985,757 | ||||||
Total Short-Term Investments
|
| 2,899,285
|
| |||||
| Value | ||||||||
Total Investments - 100.2% | $178,966,420 | |||||||
Other Assets, less Liabilities - (0.2)% |
| (444,986 | ) | |||||
Net Assets - 100.0%
|
| $178,521,434
|
| |||||
| * | Non-income producing security. |
| 1 | Some of these securities, amounting to $5,929,845 or 3.3% of net assets, were out on loan to various borrowers and are collateralized by various U.S. Treasury Obligations. See Note 4 of Notes to Financial Statements. |
| 2 | Yield shown represents the October 31, 2020, seven day average yield, which refers to the sum of the previous seven days’ dividends paid, expressed as an annual percentage. |
The following table summarizes the inputs used to value the Fund’s investments by the fair value hierarchy levels as of October 31, 2020:
Level 1
| Level 2
| Level 3
| Total
| |||||||||||||
Investments in Securities | ||||||||||||||||
Common Stocks† | $ | 176,067,135 | — | — | $ | 176,067,135 | ||||||||||
Short-Term Investments | ||||||||||||||||
Other Investment Companies | 2,899,285 | — | — | 2,899,285 | ||||||||||||
|
|
|
|
|
|
|
| |||||||||
Total Investments in Securities | $ | 178,966,420 | — | — | $ | 178,966,420 | ||||||||||
|
|
|
|
|
|
|
| |||||||||
| † | All common stocks held in the Fund are Level 1 securities. For a detailed breakout of common stocks by major industry classification, please refer to the Fund’s Schedule of Portfolio Investments. |
For the fiscal year ended October 31, 2020, there were no transfers in or out of Level 3.
The accompanying notes are an integral part of these financial statements.
41
Table of Contents
OVERVIEW
For the fiscal year ended October 31, 2020, the AMG River Road Small Cap Value Fund (the “Fund”) Class N shares returned (12.09%), outperforming the (13.92%) return for the Russell 2000® Value Index.
PERFORMANCE REVIEW
The sector with the largest positive contribution to relative return was financials, which benefited from strong stock selection and an underweight allocation to banks. The sector with the largest negative contribution to relative return was consumer discretionary, which suffered from an underweight allocation and poor stock selection. The Fund’s cash position, which averaged 8% during the period, was a relative benefit of 1.75%.
The top contributing holdings in the Fund were Air Transport Services Group Inc. (“Air Transport”) and BJ’s Wholesale Club Holdings Inc. (“BJ’s”). Air Transport is the premier lessor of widebody freighter aircraft, primarily the Boeing 767. Air Transport grew revenue and EBITDA (earnings before interest, taxes, depreciation, and amortization) throughout the year by expanding its fleet, including leasing 12 new aircraft under 10-year leases to Amazon. COVID-19 accelerated the transition toward e-commerce which should continue to drive demand for Air Transport’s unique cargo and logistics assets. We opportunistically added to the position as COVID-19 fears intensified.
BJ’s is a warehouse club retailer with more than 200 stores primarily located in the eastern United States. Increased work-from-home activity plus school closures from COVID-19 caused surging demand for grocery items. In its latest two quarters, BJ’s reported same-store-sales growth of 27% and 24%. Free cash flow production in those two quarters easily exceeded free cash flow for the fiscal years 2018 and | 2019 combined, which has greatly improved BJ’s balance sheet. New membership growth should also support sales growth beyond the pandemic. We trimmed the position as it approached our assessed value.
The bottom contributing holdings in the Fund were Viad Corp. (“Viad”) and Liberty Latin America Ltd. (Cl C) (“Liberty Latin”). Viad is a small conglomerate with an exhibition/conference services segment (GES) and a travel/hotel/attractions segment (Pursuit). Both of Viad’s business segments were directly impacted by COVID-19. GES experienced conference and event cancellations and deferrals while Pursuit was challenged by low levels of tourism. The company raised capital via a convertible preferred stock offering, which should provide adequate liquidity to navigate the pandemic. Although visibility for a rebound at GES remains exceptionally murky, we are encouraged by management’s ability to dramatically reduce variable costs, essentially placing GES in “hibernation” until demand returns. We believe Pursuit’s collection of valuable assets in and around North American national parks is well positioned for a strong rebound during the 2021 high season, especially if consumers favor road travel over air travel. We maintained our position.
Liberty Latin is a provider of broadband, TV, fixed voice, and mobile services in Chile, Puerto Rico, Costa Rica, and the Caribbean. Although COVID-19 drove strong growth in broadband subs, the benefit was more than offset by Chilean peso depreciation and mobile weakness as customers were unable to “top up” their plans due to lockdown rules. Fears related to the company’s leverage level (4.1x as of September 30, 2020) and exposure to markets reliant on tourism likely weighed on the stock as well. However, the company still expects to generate positive free cash flow in 2020 and insiders have aggressively purchased stock in the open market. We also maintained the position. |
OUTLOOK AND POSITIONING
Through the first three quarters of 2020, the performance of small caps has lagged large caps by the widest margin since 1999, after which small caps went on to outperform large caps for the next seven years. Given that small caps AND value tend to lead in the early stages of a recovery, we believe investors who missed the opportunity to increase their exposure to small caps at the market bottom are being provided a highly attractive opportunity to increase their small cap value exposure despite the growth to value rotation increasingly becoming the consensus trade following Pfizer’s and Moderna’s promising COVID-19 vaccine developments. Additionally, we believe the valuation disparity between small cap value and small cap growth presents an exceptional opportunity to lean into value.
Individual stock picking and effective portfolio management remain critical to the performance of the Fund. After having elevated levels of cash prior to the pandemic, we took advantage of attractive opportunities amid the COVID-19 selloff by getting the Fund fully invested. Cash balances rose during the subsequent rally as stock prices hit our assessed values. We are seeking to maintain a balance between more defensive, stable companies and those with greater risk but more upside potential as the economy fully recovers. Additionally, we believe portfolio positioning remains a highly attractive balance of value and quality.
This commentary reflects the viewpoints of River Road Asset Management as of November 24, 2020, and is not intended as a forecast or guarantee of future results. |
42
Table of Contents
AMG River Road Small Cap Value Fund Portfolio Manager’s Comments (continued) |
CUMULATIVE TOTAL RETURN PERFORMANCE
AMG River Road Small Cap Value Fund’s cumulative total return is based on the daily change in net asset value (NAV), and assumes that all dividends and distributions were reinvested. The graph compares a hypothetical $10,000 investment made in the AMG River Road Small Cap Value Fund’s Class N shares on October 31, 2010, to a $10,000 investment made in the Russell 2000® Value Index for the same time period. The graph and table do not reflect the deduction of taxes that a shareholder would pay on a Fund distribution or redemption of shares. The listed returns for the Fund are net of expenses and the returns for the index exclude expenses. Total returns would have been lower had certain expenses not been reduced.
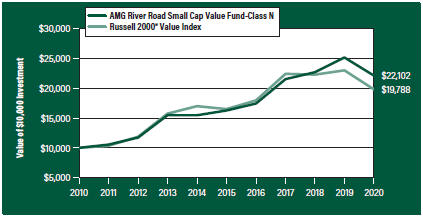
The table below shows the average annual total returns for the AMG River Road Small Cap Value Fund and the Russell 2000® Value Index for the same time periods ended October 31, 2020.
| Average Annual Total Returns1 | One Year | Five Years | Ten Years | Since Inception | Inception Date | |||||||||||||||
AMG River Road Small Cap Value Fund2, 3, 4, 5, 6, 7, 8 |
| |||||||||||||||||||
Class N | (12.09 | %) | 6.33% | 8.25% | 6.72 | % | 06/28/05 | |||||||||||||
Class I | (11.91 | %) | 6.61% | 8.53% | 5.12 | % | 12/13/06 | |||||||||||||
Class Z | (11.78 | %) | — | — | 1.21 | % | 09/29/17 | |||||||||||||
Russell 2000® Value Index9
| (13.92 | %) | 3.71% | 7.06% | 5.24 | % | 06/28/05 | † | ||||||||||||
The performance data shown represents past performance. Past performance is not a guarantee of future results. Current performance may be lower or higher than the performance data quoted. The investment return and principal value of an investment will fluctuate so that an investor’s shares, when redeemed, may be worth more or less than their original cost.
Investors should carefully consider the Fund’s investment objectives, risks, charges and expenses before investing. For performance information through the most recent month end, current net asset values per share for the Fund and other information, please call 800.548.4539 or visit our website at amgfunds.com for a free prospectus. Read it carefully before investing or sending money.
Distributed by AMG Distributors, Inc., member FINRA/SIPC.
| † | Date reflects the inception date of the Fund, not the index. |
| 1 | Total return equals income yield plus share price change and assumes reinvestment of all dividends and capital gain distributions. Returns are net of fees and may reflect offsets of Fund expenses as described in the prospectus. No adjustment has been made for taxes payable by shareholders on their reinvested dividends and |
capital gain distributions. Returns for periods greater than one year are annualized. The listed returns on the Fund are net of expenses and based on the published NAV as of October 31, 2020. All returns are in U.S. dollars ($). | ||
2 Investments in international securities are subject to certain risks of overseas investing including currency fluctuations and changes in political and economic conditions, which could result in significant market fluctuations. These risks are magnified in emerging markets. | ||
3 The Fund is subject to risks associated with investments in small-capitalization companies, such as erratic earnings patterns, competitive conditions, limited earnings history and a reliance on one or a limited number of products. | ||
4 The Fund is subject to risks associated with investments in mid-capitalization companies such as greater price volatility, lower trading volume, and less liquidity than the stocks of larger, more established companies. | ||
5 The Fund is subject to special risk considerations similar to those associated with the direct ownership of real estate. Real estate valuations may be subject to factors such as changing general and local economic, financial, competitive, and environmental conditions. | ||
6 The Fund invests in value stocks, which may perform differently from the market as a whole and may be undervalued by the market for a long period of time. | ||
7 Market prices of investments held by the Fund may fall rapidly or unpredictably due to a variety of economic or political factors, market conditions, disasters or public health issues, or in response to events that affect particular industries or companies. | ||
8 Companies that are in similar businesses may be similarly affected by particular economic or market events; to the extent the Fund has substantial holdings within a particular sector, the risks associated with that sector increase. | ||
9 The Russell 2000® Value Index is an unmanaged, market-value weighted, value-oriented index comprised of small stocks that have relatively low price-to-book ratios and lower forecasted growth values. Unlike the Fund, the Russell 2000® Value Index is unmanaged, is not available for investment and does not incur expenses. | ||
The Russell Indices are a trademark of the London Stock Exchange Group companies.
Not FDIC insured, nor bank guaranteed. May lose value.
| ||
43
Table of Contents
AMG River Road Small Cap Value Fund Fund Snapshots (unaudited) October 31, 2020 |
PORTFOLIO BREAKDOWN
| Sector | % of Net Assets | |
Industrials | 35.0 | |
Information Technology | 16.6 | |
Financials | 11.9 | |
Consumer Staples | 8.8 | |
Communication Services | 6.1 | |
Health Care | 5.1 | |
Consumer Discretionary | 3.9 | |
Energy | 2.5 | |
Real Estate | 2.1 | |
Materials | 0.9 | |
Short-Term Investments | 7.2 | |
Other Assets Less Liabilities | (0.1) | |
TOP TEN HOLDINGS
| Security Name | % of Net Assets | |
Air Transport Services Group, Inc. | 5.0 | |
Cannae Holdings, Inc. | 4.2 | |
White Mountains Insurance Group, Ltd. | 4.1 | |
UniFirst Corp. | 3.5 | |
Premier, Inc., Class A | 3.4 | |
Hostess Brands, Inc. | 3.0 | |
Cubic Corp. | 2.9 | |
BJ’s Wholesale Club Holdings, Inc. | 2.9 | |
Axis Capital Holdings, Ltd. (Bermuda) | 2.6 | |
Avaya Holdings Corp. | 2.5 | |
| ||
Top Ten as a Group | 34.1 | |
| ||
Because a fund’s strategy may result in multiple investments in particular sectors of the economy, its performance may depend on the performance of those sectors and may fluctuate more widely than investments diversified across more sectors. For additional information on these and other risk considerations, please see the Fund’s prospectus.
Any sectors, industries, or securities discussed should not be perceived as investment recommendations. Mention of a specific security should not be considered a recommendation to buy or solicitation to sell that security. Specific securities mentioned in this report may have been sold from the Fund’s portfolio of investments by the time you receive this report.
44
Table of Contents
AMG River Road Small Cap Value Fund Schedule of Portfolio Investments October 31, 2020 |
| Shares | Value | |||||||
Common Stocks - 92.9% | ||||||||
Communication Services - 6.1% |
| |||||||
Cinemark Holdings, Inc.1 | 183,031 | $1,499,024 | ||||||
Liberty Latin America, Ltd., Class C* | 978,301 | 9,509,086 | ||||||
Liberty TripAdvisor Holdings, Inc., Class A* | 367,391 | 653,956 | ||||||
ORBCOMM, Inc.* | 1,426,612 | 6,134,432 | ||||||
Vonage Holdings Corp.* | 712,663 | 7,539,974 | ||||||
Yelp, Inc.* | 304,086 | 5,981,372 | ||||||
Total Communication Services | 31,317,844 | |||||||
Consumer Discretionary - 3.9% |
| |||||||
Core-Mark Holding Co., Inc. | 49,881 | 1,364,245 | ||||||
Extended Stay America, Inc. | 958,161 | 10,875,128 | ||||||
J Alexander’s Holdings, Inc.* | 485,527 | 2,699,530 | ||||||
Murphy USA, Inc.* | 41,587 | 5,085,674 | ||||||
Total Consumer Discretionary | 20,024,577 | |||||||
Consumer Staples - 8.8% |
| |||||||
BJ’s Wholesale Club Holdings, Inc.* | 386,486 | 14,798,549 | ||||||
Hostess Brands, Inc.* | 1,228,004 | 15,521,970 | ||||||
Ingles Markets, Inc., Class A | 212,579 | 7,623,083 | ||||||
Whole Earth Brands, Inc.* | 882,378 | 7,226,676 | ||||||
Total Consumer Staples | 45,170,278 | |||||||
Energy - 2.5% |
| |||||||
Evolution Petroleum Corp. | 674,068 | 1,489,690 | ||||||
HollyFrontier Corp. | 268,340 | 4,966,974 | ||||||
PBF Energy, Inc., Class A1 | 226,639 | 1,058,404 | ||||||
World Fuel Services Corp. | 245,680 | 5,171,564 | ||||||
Total Energy | 12,686,632 | |||||||
Financials - 11.9% |
| |||||||
American Equity Investment Life Holding Co. | 214,619 | 5,326,844 | ||||||
Axis Capital Holdings, Ltd. (Bermuda) | 310,445 | 13,252,897 | ||||||
Cannae Holdings, Inc.* | 578,883 | 21,407,093 | ||||||
White Mountains Insurance Group, Ltd. | 23,443 | 21,293,980 | ||||||
Total Financials | 61,280,814 | |||||||
Health Care - 5.1% |
| |||||||
Computer Programs and Systems, Inc. | 299,307 | 8,347,672 | ||||||
Premier, Inc., Class A | 541,433 | 17,721,102 | ||||||
Total Health Care | 26,068,774 | |||||||
Industrials - 35.0% |
| |||||||
Air Transport Services Group, Inc.* | 915,935 | 25,682,817 | ||||||
Argan, Inc. | 296,320 | 12,205,421 | ||||||
Armstrong World Industries, Inc. | 183,142 | 10,970,206 | ||||||
Atkore International Group, Inc.* | 223,784 | 4,630,091 | ||||||
Barrett Business Services, Inc.
|
| 84,869
|
|
| 5,028,488
|
| ||
| Shares | Value | |||||||
Colfax Corp.*,1 | 131,746 | $3,582,174 | ||||||
Comfort Systems USA, Inc. | 248,467 | 11,379,789 | ||||||
Cubic Corp. | 255,678 | 15,113,127 | ||||||
GMS, Inc.* | 167,539 | 3,786,381 | ||||||
GrafTech International, Ltd. | 1,324,977 | 8,943,595 | ||||||
Harsco Corp.* | 470,322 | 6,067,154 | ||||||
Insperity, Inc. | 136,288 | 10,436,935 | ||||||
MSC Industrial Direct Co., Inc., Class A | 109,901 | 7,655,704 | ||||||
nVent Electric PLC (United Kingdom) | 211,373 | 3,815,283 | ||||||
Park Aerospace Corp. | 427,833 | 4,530,751 | ||||||
SP Plus Corp.* | 268,678 | 4,951,736 | ||||||
TPI Composites, Inc.* | 112,279 | 3,718,680 | ||||||
TriMas Corp.* | 338,267 | 8,230,036 | ||||||
UniFirst Corp. | 108,325 | 17,744,718 | ||||||
US Ecology, Inc. | 215,370 | 6,573,092 | ||||||
Viad Corp. | 258,247 | 5,164,940 | ||||||
Total Industrials | 180,211,118 | |||||||
Information Technology - 16.6% |
| |||||||
ACI Worldwide, Inc.* | 373,436 | 10,893,128 | ||||||
Avaya Holdings Corp.*,1 | 748,388 | 12,872,274 | ||||||
CDK Global, Inc. | 287,596 | 12,395,388 | ||||||
Computer Services, Inc. | 179,199 | 10,751,940 | ||||||
DXC Technology Co. | 303,168 | 5,584,354 | ||||||
ePlus, Inc.* | 146,267 | 9,874,485 | ||||||
Ituran Location and Control, Ltd. (Israel) | 298,781 | 4,227,751 | ||||||
NCR Corp.* | 497,693 | 10,113,122 | ||||||
Perspecta, Inc. | 343,872 | 6,165,625 | ||||||
Sabre Corp. | 437,943 | 2,855,388 | ||||||
Total Information Technology | 85,733,455 | |||||||
Materials - 0.9% |
| |||||||
Axalta Coating Systems, Ltd.* | 188,789 | 4,740,492 | ||||||
Real Estate - 2.1% |
| |||||||
Cushman & Wakefield PLC*,1 | 490,516 | 5,748,848 | ||||||
Marcus & Millichap, Inc.* | 88,080 | 2,750,738 | ||||||
Newmark Group, Inc., Class A | 447,853 | 2,120,584 | ||||||
Total Real Estate | 10,620,170 | |||||||
Total Common Stocks (Cost $458,281,596)
|
| 477,854,154
|
| |||||
The accompanying notes are an integral part of these financial statements.
45
Table of Contents
AMG River Road Small Cap Value Fund Schedule of Portfolio Investments (continued) |
| Shares | Value | |||||||
Short-Term Investments - 7.2% |
| |||||||
Other Investment Companies - 7.2% |
| |||||||
Dreyfus Government Cash Management Fund, Institutional Shares, 0.02%2 | 12,331,847 | $ | 12,331,847 | |||||
Dreyfus Institutional Preferred Government Money Market Fund, Institutional Shares, 0.04%2 | 12,331,846 | 12,331,846 | ||||||
JPMorgan U.S. Government Money Market Fund, IM Shares, 0.04%2 | 12,705,538 | 12,705,538 | ||||||
Total Short-Term Investments (Cost $37,369,231)
|
| 37,369,231
|
| |||||
| Value | ||||||||
Total Investments - 100.1% | $ | 515,223,385 | ||||||
Other Assets, less Liabilities - (0.1)% |
| (641,222 | ) | |||||
Net Assets - 100.0%
| $
| 514,582,163
|
| |||||
| * | Non-income producing security. |
| 1 | Some of these securities, amounting to $13,281,878 or 2.6% of net assets, were out on loan to various borrowers and are collateralized by various U.S. Treasury Obligations. See Note 4 of Notes to Financial Statements. |
| 2 | Yield shown represents the October 31, 2020, seven day average yield, which refers to the sum of the previous seven days’ dividends paid, expressed as an annual percentage. |
The following table summarizes the inputs used to value the Fund’s investments by the fair value hierarchy levels as of October 31, 2020:
Level 1
| Level 2
| Level 3
| Total
| |||||||||||||
Investments in Securities | ||||||||||||||||
Common Stocks† | $ | 477,854,154 | — | — | $ | 477,854,154 | ||||||||||
Short-Term Investments | ||||||||||||||||
Other Investment Companies | 37,369,231 | — | — | 37,369,231 | ||||||||||||
|
|
|
|
|
|
|
| |||||||||
Total Investments in Securities | $ | 515,223,385 | — | — | $ | 515,223,385 | ||||||||||
|
|
|
|
|
|
|
| |||||||||
| † | All common stocks held in the Fund are Level 1 securities. For a detailed breakout of common stocks by major industry classification, please refer to the Fund’s Schedule of Portfolio Investments. |
For the fiscal year ended October 31, 2020, there were no transfers in or out of Level 3.
The accompanying notes are an integral part of these financial statements.
46
Table of Contents
REVIEW AND OUTLOOK
The AMG Managers Silvercrest Small Cap Fund (the “Fund”) Class N shares returned (13.25%) for the fiscal year ended October 31, 2020, compared to a (13.92%) return for its benchmark, the Russell 2000® Value Index. The Russell 2000® Index returned (0.14%) over the same period.
The Fund’s various sector overweights/underweights had a larger-than-usual positive impact for the fiscal year at over 200 bps. An overweight in technology had a better than 100 basis point contribution to return, followed by an underweight in the underperforming real estate sector—a newly minted sector by FTSE Russell, broken out from financials. On the downside, underweights in the outperforming consumer discretionary and basic materials sectors had the greatest negative impact. Within sectors, we added value in the aggregate, outperforming in five of the ten sectors the Fund had exposure to, with no current holdings in the other newly minted sector, telecommunications, a sub-2% weighting in the index. The Fund performed extremely well in real estate (-6% vs. -29%), paced by data center REIT QTS
| Realty (+19%), participating in a robust environment for data management. The Fund also did relatively well in the large financials sector (-19% vs. -23%), where a diversified collection of regional banks collectively outperformed (-18% vs. -25%). The Fund struggled in consumer discretionary (-24% vs. -2%) where it was hurt by some companies dislocated due to COVID-19, including restaurant operator Dine Brands (-64%) and media company Meredith Corp. (-70%), the two worst contributors to return for the year. In health care (-10% vs. +15%) the lack of exposure to pharmaceuticals, particularly biotech, hindered performance. With generally lofty valuation levels in the sector, we struggle to find palatable exposure.
The Fund’s largest individual contributors to return, included BMC Stock Holdings (+47%) benefiting from robust housing demand and a well-received merger of equals announcement with Builders FirstSource. Cerence Inc. (+121%, and the largest percentage gainer for the fiscal year) is a leader in automotive voice recognition and control and has seen robust growth. | The Fund’s worst percentage decliner was Callon Petroleum (-86%) which, along with the Fund’s other E&P companies, Magnolia Oil & Gas (-56%) and Matador Resources (-49%), struggled in a weak commodity environment.
We are pleased to be modestly ahead of the Russell 2000® Value benchmark in what has been a very challenging environment. Optimism over a potential COVID-19 vaccine has rekindled interest in the downtrodden value space. We are hopeful that a normalizing environment will be beneficial to our style and we continue to focus on building what we believe is a portfolio of above average companies selling at below average prices.
This commentary reflects the viewpoints of Silvercrest Asset Management Group as of October 31, 2020, and is not intended as a forecast or guarantee of future results. |
47
Table of Contents
AMG Managers Silvercrest Small Cap Fund Portfolio Manager’s Comments (continued) |
CUMULATIVE TOTAL RETURN PERFORMANCE
AMG Managers Silvercrest Small Cap Fund’s cumulative total return is based on the daily change in net asset value (NAV), and assumes that all dividends and distributions were reinvested. The graph compares a hypothetical $10,000 investment made in the AMG Managers Silvercrest Small Cap Fund’s Class N shares on December 27, 2011, to a $10,000 investment made in the Russell 2000® Value Index and Russell 2000® Index for the same time period. The graph and table do not reflect the deduction of taxes that a shareholder would pay on a Fund distribution or redemption of shares. The listed returns for the Fund are net of expenses and the returns for the index exclude expenses. Total returns would have been lower had certain expenses not been reduced.
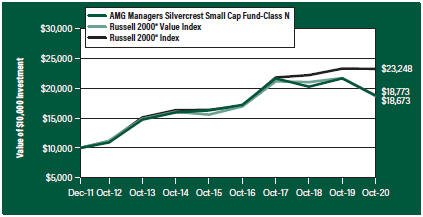
The table below shows the average annual total returns for the AMG Managers Silvercrest Small Cap Fund and the Russell 2000® Value Index and Russell 2000® Index for the same time periods ended October 31, 2020.
Average Annual Total Returns1
| One Year | Five Years | Since Inception | Inception Date | ||||||||||||
AMG Managers Silvercrest Small Cap Fund2, 3, 4, 5, 6, 7 |
| |||||||||||||||
Class N | (13.25% | ) | 2.91% | 7.38% | 12/27/11 | |||||||||||
Class I | (13.04% | ) | 3.17% | 7.65% | 12/27/11 | |||||||||||
Class Z | (12.99% | ) | — | (3.88% | ) | 09/29/17 | ||||||||||
Russell 2000® Value Index8 | (13.92% | ) | 3.71% | 7.31% | 12/27/11 | † | ||||||||||
Russell 2000® Index9 | (0.14% | ) | 7.27% | 10.00% | 12/27/11 | † | ||||||||||
The performance data shown represents past performance. Past performance is not a guarantee of future results. Current performance may be lower or higher than the performance data quoted. The investment return and principal value of an investment will fluctuate so that an investor’s shares, when redeemed, may be worth more or less than their original cost.
Investors should carefully consider the Fund’s investment objectives, risks, charges and expenses before investing. For performance information through the most recent month end, current net asset values per share for the Fund and other information, please call 800.548.4539 or visit our website at amgfunds.com for a free prospectus. Read it carefully before investing or sending money.
Distributed by AMG Distributors, Inc., member FINRA/SIPC.
| † | Date reflects the inception date of the Fund, not the index. |
| 1 | Total return equals income yield plus share price change and assumes reinvestment of all dividends and capital gain distributions. Returns are net of fees and may reflect offsets of Fund expenses as described in the prospectus. No adjustment has been made for taxes payable by shareholders on their reinvested dividends and |
capital gain distributions. Returns for periods greater than one year are annualized. The listed returns on the Fund are net of expenses and based on the published NAV as of October 31, 2020. All returns are in U.S. dollars ($). | ||
2 The Fund is subject to risks associated with investments in small-capitalization companies, such as erratic earnings patterns, competitive conditions, limited earnings history and a reliance on one or a limited number of products.
3 The Fund is subject to risks associated with investments in mid-capitalization companies such as greater price volatility, lower trading volume, and less liquidity than the stocks of larger, more established companies.
4 The Fund is subject to special risk considerations similar to those associated with the direct ownership of real estate. Real estate valuations may be subject to factors such as changing general and local economic, financial, competitive, and environmental conditions.
5 The Fund invests in value stocks, which may perform differently from the market as a whole and may be undervalued by the market for a long period of time.
6 Companies that are in similar businesses may be similarly affected by particular economic or market events; to the extent the Fund has substantial holdings within a particular sector, the risks associated with that sector increase.
7 Market prices of investments held by the Fund may fall rapidly or unpredictably due to a variety of economic or political factors, market conditions, disasters or public health issues, or in response to events that affect particular industries or companies.
8 The Russell 2000® Value Index is an unmanaged, market-value weighted, value-oriented index comprised of small stocks that have relatively low price-to-book ratios and lower forecasted growth values. Unlike the Fund, the Russell 2000® Value Index is unmanaged, is not available for investment and does not incur expenses.
9 The Russell 2000® Index is composed of the 2,000 smallest stocks in the Russell 3000® Index and is widely regarded in the industry as the premier measure of small-cap stock performance. Unlike the Fund, the Russell 2000® Index is unmanaged, is not available for investment and does not incur expenses. | ||
The Russell Indices are a trademark of the London Stock Exchange Group companies.
Not FDIC insured, nor bank guaranteed. May lose value.
| ||
48
Table of Contents
AMG Managers Silvercrest Small Cap Fund Fund Snapshots (unaudited) October 31, 2020 |
PORTFOLIO BREAKDOWN
| Sector | % of Net Assets | |
Industrials | 25.6 | |
Financials | 19.5 | |
Information Technology | 16.0 | |
Health Care | 11.4 | |
Consumer Discretionary | 6.4 | |
Real Estate | 6.2 | |
Consumer Staples | 4.6 | |
Materials | 4.0 | |
Utilities | 3.2 | |
Energy | 1.8 | |
Communication Services | 0.4 | |
Other Assets Less Liabilities | 0.9 | |
TOP TEN HOLDINGS
| Security Name | % of Net Assets | |
BancorpSouth Bank | 2.7 | |
La-Z-Boy, Inc. | 2.7 | |
Independent Bank Corp. | 2.6 | |
Glacier Bancorp, Inc. | 2.6 | |
QTS Realty Trust, Inc., Class A | 2.6 | |
Altra Industrial Motion Corp. | 2.5 | |
Brooks Automation, Inc. | 2.5 | |
AMN Healthcare Services, Inc. | 2.5 | |
Gibraltar Industries, Inc. | 2.4 | |
ESCO Technologies, Inc. | 2.4 | |
| ||
Top Ten as a Group | 25.5 | |
| ||
Because a fund’s strategy may result in multiple investments in particular sectors of the economy, its performance may depend on the performance of those sectors and may fluctuate more widely than investments diversified across more sectors. For additional information on these and other risk considerations, please see the Fund’s prospectus.
Any sectors, industries, or securities discussed should not be perceived as investment recommendations. Mention of a specific security should not be considered a recommendation to buy or solicitation to sell that security. Specific securities mentioned in this report may have been sold from the Fund’s portfolio of investments by the time you receive this report.
49
Table of Contents
AMG Managers Silvercrest Small Cap Fund Schedule of Portfolio Investments October 31, 2020 |
| Shares | Value | |||||||
Common Stocks - 99.1% | ||||||||
Communication Services - 0.4% | ||||||||
Meredith Corp.1 | 63,010 | $693,110 | ||||||
Consumer Discretionary - 6.4% | ||||||||
Carter’s, Inc. | 23,710 | 1,931,179 | ||||||
La-Z-Boy, Inc. | 137,965 | 4,722,542 | ||||||
Oxford Industries, Inc. | 42,410 | 1,746,020 | ||||||
Wolverine World Wide, Inc.1 | 112,900 | 3,011,043 | ||||||
Total Consumer Discretionary | 11,410,784 | |||||||
Consumer Staples - 4.6% | ||||||||
Central Garden & Pet Co., Class A* | 76,250 | 2,698,488 | ||||||
Lancaster Colony Corp. | 16,437 | 2,730,843 | ||||||
The Simply Good Foods Co.* | 149,820 | 2,816,616 | ||||||
Total Consumer Staples | 8,245,947 | |||||||
Energy - 1.8% | ||||||||
Callon Petroleum Co.* | 27,709 | 144,918 | ||||||
Magnolia Oil & Gas Corp., Class A*,1 | 325,845 | 1,414,167 | ||||||
Matador Resources Co.* | 221,655 | 1,567,101 | ||||||
Total Energy | 3,126,186 | |||||||
Financials - 19.5% | ||||||||
BancorpSouth Bank | 203,200 | 4,756,912 | ||||||
CVB Financial Corp. | 218,990 | 3,832,325 | ||||||
First Horizon National Corp. | 299,501 | 3,117,805 | ||||||
Glacier Bancorp, Inc. | 128,270 | 4,592,066 | ||||||
Horace Mann Educators Corp. | 73,859 | 2,504,559 | ||||||
Independent Bank Corp. | 81,873 | 4,690,504 | ||||||
Lakeland Financial Corp.1 | 68,680 | 3,511,608 | ||||||
Selective Insurance Group, Inc. | 73,780 | 3,840,987 | ||||||
South State Corp. | 60,840 | 3,735,576 | ||||||
Total Financials | 34,582,342 | |||||||
Health Care - 11.4% | ||||||||
AdaptHealth Corp.* | 99,920 | 2,727,816 | ||||||
Allscripts Healthcare Solutions, Inc.*,1 | 54,260 | 546,941 | ||||||
AMN Healthcare Services, Inc.* | 67,630 | 4,414,886 | ||||||
Envista Holdings Corp.* | 134,140 | 3,543,979 | ||||||
ICU Medical, Inc.* | 18,912 | 3,362,364 | ||||||
Integer Holdings Corp.* | 53,690 | 3,138,180 | ||||||
The Providence Service Corp.* | 21,650 | 2,544,958 | ||||||
Total Health Care | 20,279,124 | |||||||
Industrials - 25.6% | ||||||||
ABM Industries, Inc. | 86,640 | 3,008,141 | ||||||
Altra Industrial Motion Corp. | 105,785 | 4,523,367 | ||||||
Arcosa, Inc. | 49,310 | 2,276,643 | ||||||
| ||||||||
| Shares | Value | |||||||
BMC Stock Holdings, Inc.* | 41,135 | $1,628,535 | ||||||
The Brink’s Co. | 61,490 | 2,633,617 | ||||||
Casella Waste Systems, Inc., Class A* | 73,390 | 3,962,326 | ||||||
CBIZ, Inc.* | 92,860 | 2,105,136 | ||||||
ESCO Technologies, Inc. | 51,080 | 4,274,885 | ||||||
Forward Air Corp. | 55,850 | 3,516,874 | ||||||
Gibraltar Industries, Inc.* | 74,510 | 4,280,599 | ||||||
Harsco Corp.* | 153,470 | 1,979,763 | ||||||
ICF International, Inc. | 48,610 | 3,178,608 | ||||||
Knoll, Inc. | 118,435 | 1,357,265 | ||||||
Standex International Corp. | 37,395 | 2,321,856 | ||||||
US Ecology, Inc. | 59,604 | 1,819,114 | ||||||
WillScot Mobile Mini Holdings Corp.* | 143,650 | 2,669,017 | ||||||
Total Industrials | 45,535,746 | |||||||
Information Technology - 16.0% | ||||||||
ACI Worldwide, Inc.* | 105,652 | 3,081,869 | ||||||
Brooks Automation, Inc. | 96,605 | 4,511,454 | ||||||
Cerence, Inc.*,1 | 49,690 | 2,712,080 | ||||||
Methode Electronics, Inc. | 100,495 | 3,092,231 | ||||||
Plexus Corp.* | 39,365 | 2,737,442 | ||||||
Rambus, Inc.* | 159,660 | 2,201,711 | ||||||
Rogers Corp.* | 16,952 | 2,054,922 | ||||||
Semtech Corp.* | 40,290 | 2,211,518 | ||||||
SYNNEX Corp. | 30,425 | 4,005,147 | ||||||
Verra Mobility Corp.* | 184,180 | 1,769,970 | ||||||
Total Information Technology | 28,378,344 | |||||||
Materials - 4.0% | ||||||||
Glatfelter Corp. | 125,028 | 1,784,150 | ||||||
HB Fuller Co. | 79,925 | 3,616,606 | ||||||
Kaiser Aluminum Corp. | 27,780 | 1,748,195 | ||||||
Total Materials | 7,148,951 | |||||||
Real Estate - 6.2% | ||||||||
EastGroup Properties, Inc., REIT | 11,636 | 1,548,519 | ||||||
Pebblebrook Hotel Trust, REIT | 123,490 | 1,479,410 | ||||||
Physicians Realty Trust, REIT | 203,885 | 3,437,501 | ||||||
QTS Realty Trust, Inc., Class A, REIT 1 | 74,110 | 4,558,506 | ||||||
Total Real Estate | 11,023,936 | |||||||
Utilities - 3.2% | ||||||||
MGE Energy, Inc. | 33,728 | 2,192,995 | ||||||
ONE Gas, Inc. | 51,075 | 3,526,218 | ||||||
Total Utilities | 5,719,213 | |||||||
Total Common Stocks | ||||||||
(Cost $178,501,303) | 176,143,683 | |||||||
| ||||||||
The accompanying notes are an integral part of these financial statements.
50
Table of Contents
AMG Managers Silvercrest Small Cap Fund Schedule of Portfolio Investments (continued) |
| Value | ||||||||
Total Investments - 99.1% | ||||||||
(Cost $178,501,303) | $176,143,683 | |||||||
Other Assets, less Liabilities - 0.9% | 1,649,801 | |||||||
Net Assets - 100.0% | $177,793,484 | |||||||
REIT Real Estate Investment Trust |
| * | Non-income producing security. |
| 1 | Some of these securities, amounting to $12,791,387 or 7.2% of net assets, were out on loan to various borrowers and are collateralized by various U.S. Treasury Obligations. See Note 4 of Notes to Financial Statements. |
The following table summarizes the inputs used to value the Fund’s investments by the fair value hierarchy levels as of October 31, 2020:
Level 1
| Level 2
| Level 3
| Total
| |||||||||||||
Investments in Securities | ||||||||||||||||
Common Stocks† | $ | 176,143,683 | — | — | $ | 176,143,683 | ||||||||||
|
|
|
|
|
|
|
| |||||||||
Total Investments in Securities | $ | 176,143,683 | — | — | $ | 176,143,683 | ||||||||||
|
|
|
|
|
|
|
| |||||||||
| † | All common stocks held in the Fund are Level 1 securities. For a detailed breakout of common stocks by major industry classification, please refer to the Fund’s Schedule of Portfolio Investments. |
For the fiscal year ended October 31, 2020, there were no transfers in or out of Level 3.
The accompanying notes are an integral part of these financial statements.
51
Table of Contents
OVERVIEW
For the fiscal year ended October 31, 2020, the AMG Managers DoubleLine Core Plus Bond Fund (the “Fund”) Class N shares returned 3.01%, while the Bloomberg Barclays U.S. Aggregate Bond Index returned 6.19%.
MARKET REVIEW AND OUTLOOK
The primary catalysts of market performance over the past 12 months have been the coronavirus pandemic and the markets’ response to the economic disruption. Investors were supportive of risk assets at the end of 2019 and beginning of 2020 as domestic risk markets largely disregarded headlines surrounding the coronavirus outbreak and the S&P 500® Index hit an all-time high in February. The narrative quickly changed once the virus crept into parts of the western hemisphere, however, fueling risk-off sentiment across markets for the rest of the first quarter of 2020. In their efforts to combat the COVID-19 pandemic, the U.S. Federal Reserve (the Fed) cut their policy rate by 150 bps and returned to the zero-lower-bound. Over the twelve-month period, the 2-year yield decreased -137 basis points (bps) and the 10-year yield fell -82 bps. In addition, through the installment of QE4, the Fed launched a number of different market intervention programs aimed at helping everything from commercial paper to agency | MBS and even corporate bonds. Up to this point, their actions appear to have generated the intended outcomes: corporate borrowers have access to liquidity and risk asset prices have stabilized.
We note that structured product spreads have lagged the recovery of corporate spreads in recent months, and we believe the portfolio is well positioned to take advantage of outperformance in securitized credit as the economy continues to improve. The Fed has signaled it will keep its borrowing rate unchanged through 2023 while continuing its quantitative easing program, which we believe will foster a constructive environment for risk assets. As the U.S. budget deficit continues to reach new all-time highs, we remain concerned that additional fiscal stimulus and Fed support will put downward pressure on the dollar and upward pressure on the intermediate to long tenors of the U.S. Treasury curve in the long run.
PERFORMANCE AND POSITIONING
The Fund underperformed the Bloomberg Barclays U.S. Aggregate Bond Index’s return of 6.19% over the trailing one-year period. Relative underperformance was driven by the Fund’s short duration positioning and overweight credit positioning relative to the benchmark as the COVID-19 pandemic led to a steep drop in U.S. Treasury yields and a blowout in risk | asset spreads. U.S. Treasuries were the best performing sector of the Fund over the period and benefited from having a longer duration profile than other assets in the Fund as rates decreased significantly across all tenors of the U.S. Treasury curve. Commercial MBS and asset-backed Securities were two of the largest detractors from relative performance as economic sectors such as retail, hospitality, and aircraft were more acutely impacted by the coronavirus pandemic. Bank loans also underperformed as investors fled to safety in the midst of the global pandemic while experiencing headwinds such as retail outflows, an influx of new issue supply, and lower perceived income due to their floating rate coupons. Despite posting positive returns over the period amidst a strong summer rally in risk assets, the remainder of sectors in the Fund underperformed the benchmark. Overall, we continue to believe yields across the intermediate to long tenors of the U.S. Treasury curve are biased upward, and we have positioned the Fund with a shorter duration than the benchmark.
This commentary reflects the viewpoints of DoubleLine Capital as of November 24, 2020, and is not intended as a forecast or guarantee of future results. | ||||||
52
Table of Contents
AMG Managers DoubleLine Core Plus Bond Fund Portfolio Manager’s Comments (continued) |
CUMULATIVE TOTAL RETURN PERFORMANCE
AMG Managers Doubleline Core Plus Bond Fund’s cumulative total return is based on the daily change in net asset value (NAV), and assumes that all dividends and distributions were reinvested. The graph compares a hypothetical $10,000 investment made in the AMG Managers Doubleline Core Plus Bond Fund’s Class N shares on July 18, 2011, to a $10,000 investment made in the Bloomberg Barclays U.S. Aggregate Bond Index for the same time period. The graph and table do not reflect the deduction of taxes that a shareholder would pay on a Fund distribution or redemption of shares. The listed returns for the Fund are net of expenses and the returns for the index exclude expenses. Total returns would have been lower had certain expenses not been reduced.
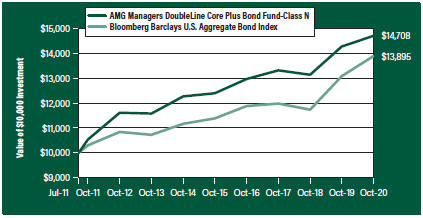
The table below shows the average annual total returns for the AMG Managers Doubleline Core Plus Bond Fund and the Bloomberg Barclays U.S. Aggregate Bond Index for the same time periods ended October 31, 2020.
Average Annual Total Returns1
| One Year | Five Years | Since Inception | Inception Date | ||||||||||||
AMG Managers DoubleLine Core Plus Bond Fund2, 3, 4, 5, 6, 7, 8, 9, 10, 11, 12 |
| |||||||||||||||
Class N | 3.01 | % | 3.48 | % | 4.24 | % | 07/18/11 | |||||||||
Class I | 3.17 | % | 3.72 | % | 4.49 | % | 07/18/11 | |||||||||
Class Z | 3.35 | % | — | 3.65 | % | 09/29/17 | ||||||||||
Bloomberg Barclays U.S. Aggregate Bond Index13 | 6.19 | % | 4.08 | % | 3.60 | % | 07/18/11 | † | ||||||||
The performance data shown represents past performance. Past performance is not a guarantee of future results. Current performance may be lower or higher than the performance data quoted. The investment return and principal value of an investment will fluctuate so that an investor’s shares, when redeemed, may be worth more or less than their original cost.
Investors should carefully consider the Fund’s investment objectives, risks, charges and expenses before investing. For performance information through the most recent month end, current net asset values per share for the Fund and other information, please call 800.548.4539 or visit our website at amgfunds.com for a free prospectus. Read it carefully before investing or sending money.
Distributed by AMG Distributors, Inc., member FINRA/SIPC.
| † | Date reflects the inception date of the Fund, not the index. |
| 1 | Total return equals income yield plus share price change and assumes reinvestment of all dividends and capital gain distributions. Returns are net of fees and may reflect offsets of Fund expenses as described in the prospectus. No adjustment has been made for taxes payable by shareholders on their reinvested dividends and |
capital gain distributions. Returns for periods greater than one year are annualized. The listed returns on the Fund are net of expenses and based on the published NAV as of October 31, 2020. All returns are in U.S. dollars ($). | ||
2 The Fund is subject to the risks associated with investments in debt securities, such as default risk and fluctuations in the perception of the debtor’s ability to pay its creditors. Changing interest rates may adversely affect the value of an investment. An increase in interest rates typically causes the value of bonds and other fixed income securities to fall. | ||
3 Investments in international securities are subject to certain risks of overseas investing including currency fluctuations and changes in political and economic conditions, which could result in significant market fluctuations. These risks are magnified in emerging markets.
4 The Fund is subject to the risks associated with investments in emerging markets, such as erratic earnings patterns, economic and political instability, changing exchange controls, limitations on repatriation of foreign capital and changes in local governmental attitudes toward private investment, possibly leading to nationalization or confiscation of investor assets.
5 To the extent that the Fund invests in asset-backed or mortgage-backed securities, its exposure to prepayment and extension risks may be greater than investments in other fixed income securities.
6 The Fund may invest in derivatives such as options and futures; the complexity and rapidly changing structure of derivatives markets may increase the possibility of market losses.
7 Bank loans are subject to the credit risk of nonpayment of principal or interest. | ||
8 High-yield bonds (also known as “junk bonds”) may be subject to greater levels of interest rate, credit, and liquidity risk than investments in higher rated securities. These securities are considered predominantly speculative with respect to the issuer’s continuing ability to make principal and interest payments. The issuers of the Fund’s holdings may be involved in bankruptcy proceedings, reorganizations, or financial restructurings, and are not as strong financially as higher-rated issuers. | ||
9 Factors unique to the municipal bond market may negatively affect the value in municipal bonds. | ||
53
Table of Contents
AMG Managers DoubleLine Core Plus Bond Fund Portfolio Manager’s Comments (continued) |
10 Obligations of certain government agencies are not backed by the full faith and credit of the U.S. government. If one of these agencies defaulted on a loan, there is no guarantee that the U.S. government would provide financial support. Additionally, debt securities of the U.S. government may be affected by changing interest rates and subject to prepayment risk.
11 Active and frequent trading of a fund may result in higher transaction costs and increase tax liability.
12 Market prices of investments held by the Fund may fall rapidly or unpredictably due to a variety of economic or political factors, market conditions, disasters or public health issues, or in response to | events that affect particular industries or companies.
13 The Bloomberg Barclays U.S. Aggregate Bond Index is an index of the U.S. investment-grade fixed-rate bond market, including both government and corporate bonds. Unlike the Fund, the Bloomberg Barclays U.S. Aggregate Bond Index is unmanaged, is not available for investment and does not incur expenses.
Source: Bloomberg Index Services Limited. BLOOMBERG® is a trademark and service mark of Bloomberg Finance L.P. and its affiliates (collectively “Bloomberg”). BARCLAYS® is a trademark and service mark of Barclays Bank PLC (collectively with its | affiliates, “Barclays”), used under license. Bloomberg or Bloomberg’s licensors, including Barclays, own all proprietary rights in the Bloomberg Barclays Indices. Neither Bloomberg nor Barclays approves or endorses this material, or guarantees the accuracy or completeness of any information herein, or makes any warranty, express or implied, as to the results to be obtained therefrom and, to the maximum extent allowed by law, neither shall have any liability or responsibility for injury or damages arising in connection therewith.
Not FDIC insured, nor bank guaranteed. May lose value. | ||||||
54
Table of Contents
AMG Managers DoubleLine Core Plus Bond Fund Fund Snapshots (unaudited) October 31, 2020 |
PORTFOLIO BREAKDOWN
| Category | % of Net Assets | |
U.S. Government and Agency Obligations | 33.8 | |
Corporate Bonds and Notes | 26.6 | |
Mortgage-Backed Securities | 17.4 | |
Asset-Backed Securities | 9.9 | |
Investment Companies | 4.8 | |
Floating Rate Senior Loan Interests | 3.0 | |
Foreign Government Obligations | 1.3 | |
Municipal Bonds | 0.2 | |
Common Stocks | 0.01 | |
Short-Term Investments | 4.2 | |
Other Assets Less Liabilities2 | (1.2) | |
| 1 | Less than 0.05% |
| 2 | Includes payable for delayed delivery securities. |
| Rating | % of Market Value1 |
U.S. Government and Agency Obligations | 38.1 | |
Aaa/AAA | 2.2 | |
Aa/AA | 3.9 | |
A | 14.2 | |
Baa/BBB | 21.2 | |
Ba/BB | 6.5 | |
B | 6.9 | |
Caa/CCC & lower | 7.0 | |
| 1 | Includes market value of long-term fixed-income securities only. |
TOP TEN HOLDINGS
| Security Name | % of Net Assets | |
DoubleLine Global Bond Fund, Class I | 4.8 | |
U.S. Treasury Notes, 0.500%, 10/31/27 | 2.2 | |
FNMA, 2.500%, 12/01/39 | 1.8 | |
U.S. Treasury Notes, 0.250%, 10/31/25 | 1.5 | |
FHLMC REMICS, Series 4934, Class P, 2.500%, 11/15/40 | 1.3 | |
Headlands Residential LLC, Series 2019-RPL1, Class NOTE, 3.967%, 06/25/24 | 1.2 | |
U.S. Treasury Notes, 1.750%, 11/30/21 | 1.1 | |
FNMA REMICS, Series 2012-20, Class ZT, 3.500%, 03/25/42 | 1.1 | |
Seasoned Credit Risk Transfer Trust, Series 2018-2, Class HV, 3.000%, 11/25/57 | 1.0 | |
FHLMC, 2.000%, 08/01/50 | 1.0 | |
| ||
Top Ten as a Group | 17.0 | |
| ||
Credit quality ratings shown above reflect the highest rating assigned by either Standard & Poor’s (“S&P”) or Moody’s Investors Service, Inc. (“Moody’s”). These rating agencies are independent, nationally recognized statistical rating organizations and are widely used. Investment grade ratings are credit ratings of BBB/Baa or higher. Below investment grade ratings are credit ratings of BB/Ba or lower. Investments designated N/R are not rated by either rating agency. Unrated investments do not necessarily indicate low credit quality. Credit quality ratings are subject to change.
Because a fund’s strategy may result in multiple investments in particular sectors of the economy, its performance may depend on the performance of those sectors and may fluctuate more widely than investments diversified across more sectors. For additional information on these and other risk considerations, please see the Fund’s prospectus.
Any sectors, industries, or securities discussed should not be perceived as investment recommendations. Mention of a specific security should not be considered a recommendation to buy or solicitation to sell that security. Specific securities mentioned in this report may have been sold from the Fund’s portfolio of investments by the time you receive this report.
55
Table of Contents
AMG Managers DoubleLine Core Plus Bond Fund Schedule of Portfolio Investments October 31, 2020 |
| Principal | ||||||||
| Amount | Value | |||||||
Corporate Bonds and Notes - 26.6% |
| |||||||
Financials - 7.7% | ||||||||
AerCap Ireland Capital DAC/AerCap Global Aviation Trust (Ireland) | ||||||||
3.500%, 01/15/25 | $485,000 | $478,207 | ||||||
Air Lease Corp. | ||||||||
3.750%, 02/01/22 | 465,000 | 475,694 | ||||||
Air Methods Corp. | ||||||||
8.000%, 05/15/251,2 | 53,000 | 38,883 | ||||||
Alexandria Real Estate Equities, Inc. | ||||||||
4.000%, 01/15/24 | 360,000 | 395,535 | ||||||
Alliant Holdings Intermediate LLC/Alliant Holdings Co-Issuer | ||||||||
6.750%, 10/15/271 | 65,000 | 68,360 | ||||||
Allied Universal Holdco LLC/Allied Universal Finance Corp. | ||||||||
6.625%, 07/15/261 | 55,000 | 57,613 | ||||||
9.750%, 07/15/271 | 105,000 | 112,167 | ||||||
American Tower Corp. | ||||||||
3.600%, 01/15/28 | 425,000 | 474,937 | ||||||
4.400%, 02/15/26 | 1,300,000 | 1,486,999 | ||||||
AssuredPartners, Inc. | ||||||||
7.000%, 08/15/251 | 180,000 | 184,161 | ||||||
Athene Global Funding | ||||||||
3.000%, 07/01/221 | 470,000 | 484,426 | ||||||
Avolon Holdings Funding, Ltd. (Cayman Islands) | ||||||||
3.250%, 02/15/271 | 440,000 | 402,381 | ||||||
Banco de Credito del Peru (Peru) | ||||||||
(3.125% to 07/01/25 then U.S. Treasury Yield Curve CMT 5 year + 3.000%), 3.125%, 07/01/301,3,4 | 200,000 | 202,552 | ||||||
Banco de Credito del Peru/Panama (Peru) | ||||||||
(6.125% to 04/24/22 then 3 month LIBOR + 7.043%), 6.125%, 04/24/273,4 | 150,000 | 158,475 | ||||||
Banco de Reservas de la Republica Dominicana (Dominican Republic) | ||||||||
7.000%, 02/01/231 | 300,000 | 310,500 | ||||||
7.000%, 02/01/23 | 200,000 | 207,000 | ||||||
Banco Internacional del Peru SAA Interbank (Peru) | ||||||||
(6.625% to 03/19/24 then 3 month LIBOR + 5.760%), 6.625%, 03/19/293,4 | 50,000 | 55,373 | ||||||
Banco Macro SA (Argentina) | ||||||||
(6.750% to 11/04/21 then USD Swap 5 year + 5.463%), 6.750%, 11/04/261,3,4 | 200,000 | 132,002 | ||||||
Banco Mercantil del Norte SA/Grand Cayman (Mexico) | ||||||||
(7.500% to 06/27/29 then U.S. Treasury Yield Curve CMT 10 year + 5.470%), 7.500%, 06/27/291,3,4,5 | 200,000 | 197,788 | ||||||
| Principal | ||||||||
| Amount | Value | |||||||
Banco Mercantil del Norte SA/Grand Cayman (Mexico) | ||||||||
(7.625% to 01/10/28 then U.S. Treasury Yield Curve CMT 10 year + 5.353%), 7.625%, 01/10/283,4,5 | $600,000 | $600,000 | ||||||
Banco Santander SA (Spain) | ||||||||
(3 month LIBOR + 1.090%), 1.346%, 02/23/234 | 600,000 | 602,318 | ||||||
Bank of America Corp., MTN | ||||||||
(3.974% to 02/07/29 then 3 month LIBOR + 1.210%), 3.974%, 02/07/303,4 | 415,000 | 478,598 | ||||||
Bank of Montreal (Canada) | ||||||||
(3.803% to 12/15/27 then USD Swap 5 year + 1.432%), 3.803%, 12/15/323,4 | 335,000 | 370,987 | ||||||
Bank of New Zealand (New Zealand) | ||||||||
3.500%, 02/20/241 | 510,000 | 555,031 | ||||||
The Bank of Nova Scotia (Canada) | ||||||||
1.625%, 05/01/23 | 35,000 | 35,955 | ||||||
3.400%, 02/11/24 | 300,000 | 325,847 | ||||||
Bantrab Senior Trust (Cayman Islands) | ||||||||
9.000%, 11/14/20 | 150,000 | 149,251 | ||||||
Barclays PLC (United Kingdom) | ||||||||
(3 month LIBOR + 1.380%), 1.660%, 05/16/244 | 440,000 | 442,656 | ||||||
BDO Unibank, Inc., EMTN (Philippines) | ||||||||
2.950%, 03/06/23 | 1,000,000 | 1,039,875 | ||||||
Berkshire Hathaway Finance Corp. | ||||||||
2.850%, 10/15/50 | 160,000 | 162,628 | ||||||
BNP Paribas SA (France) | ||||||||
(3.052% to 01/13/30 then SOFRRATE + 1.507%), 3.052%, 01/13/311,3,4 | 445,000 | 471,636 | ||||||
BOC Aviation, Ltd. (Singapore) | ||||||||
(3 month LIBOR + 1.125%), 1.358%, 09/26/231,4 | 500,000 | 491,292 | ||||||
Boston Properties, LP | ||||||||
3.400%, 06/21/29 | 445,000 | 482,629 | ||||||
Capital One Financial Corp. | ||||||||
(3 month LIBOR + 0.720%), 0.934%, 01/30/234 | 134,000 | 134,104 | ||||||
The Charles Schwab Corp. | ||||||||
3.550%, 02/01/24 | 485,000 | 529,306 | ||||||
Citigroup, Inc. | ||||||||
(3 month LIBOR + 1.100%), 1.380%, 05/17/244 | 745,000 | 753,612 | ||||||
Commonwealth Bank of Australia (Australia) | ||||||||
4.316%, 01/10/481 | 535,000 | 638,246 | ||||||
Credit Acceptance Corp. | ||||||||
6.625%, 03/15/26 | 95,000 | 98,919 | ||||||
Credit Agricole SA/London (France) | ||||||||
3.750%, 04/24/231 | 545,000 | 586,038 | ||||||
Credit Suisse Group AG (Switzerland) | ||||||||
(3 month LIBOR + 1.240%), 1.489%, 06/12/241,4 | 430,000 | 434,230 | ||||||
Credito Real SAB de CV (Mexico) | ||||||||
9.500%, 02/07/261,2 | 300,000 | 294,300 | ||||||
The accompanying notes are an integral part of these financial statements.
56
Table of Contents
AMG Managers DoubleLine Core Plus Bond Fund Schedule of Portfolio Investments (continued) |
| Principal | ||||||||
| Amount | Value | |||||||
Financials - 7.7% (continued) | ||||||||
Credito Real SAB de CV SOFOM ER (Mexico) | ||||||||
(9.125% to 11/29/22 then U.S. Treasury Yield Curve CMT 5 year + 7.026%), 9.125%, 11/29/223,4,5 | $800,000 | $598,008 | ||||||
Crown Castle International Corp. | ||||||||
3.650%, 09/01/27 | 460,000 | 511,944 | ||||||
4.000%, 03/01/27 | 775,000 | 875,694 | ||||||
DBS Group Holdings, Ltd. (Singapore) | ||||||||
(4.520% to 12/11/23 then USD ICE Swap Rate 11:00 am NY 1 + 1.590%), 4.520%, 12/11/283,4 | 200,000 | 218,196 | ||||||
DBS Group Holdings, Ltd., GMTN (Singapore) | ||||||||
(3.600% to 09/07/21 then USD Swap 5 year + 2.390%), 3.600%, 09/07/213,4,5 | 679,000 | 686,785 | ||||||
Discover Financial Services | ||||||||
4.100%, 02/09/27 | 550,000 | 615,725 | ||||||
Equinix, Inc. | ||||||||
1.800%, 07/15/27 | 165,000 | 167,671 | ||||||
Equitable Holdings, Inc. | ||||||||
3.900%, 04/20/23 | 450,000 | 484,029 | ||||||
ESH Hospitality, Inc. | ||||||||
5.250%, 05/01/251 | 80,000 | 80,118 | ||||||
Gilex Holding Sarl (Luxembourg) | ||||||||
8.500%, 05/02/231 | 200,000 | 200,875 | ||||||
8.500%, 05/02/23 | 450,000 | 451,969 | ||||||
Global Aircraft Leasing Co., Ltd. (Cayman Islands) | ||||||||
6.500%, 09/15/241,6 | 82,900 | 55,750 | ||||||
Global Bank Corp. (Panama) | ||||||||
4.500%, 10/20/21 | 400,000 | 409,892 | ||||||
The Goldman Sachs Group, Inc. | ||||||||
(3 month LIBOR + 1.170%), 1.450%, 05/15/264 | 610,000 | 616,503 | ||||||
Grupo Aval, Ltd. (Cayman Islands) | ||||||||
4.750%, 09/26/22 | 200,000 | 208,250 | ||||||
HSBC Holdings PLC (United Kingdom) | ||||||||
(3 month LIBOR + 1.380%), 1.629%, 09/12/264 | 750,000 | 750,777 | ||||||
Icahn Enterprises LP/Icahn Enterprises Finance Corp. | ||||||||
5.250%, 05/15/27 | 70,000 | 72,655 | ||||||
Industrial Senior Trust (Cayman Islands) | ||||||||
5.500%, 11/01/22 | 300,000 | 313,567 | ||||||
Interoceanica IV Finance, Ltd. (Cayman Islands) | ||||||||
0.000%, 11/30/257 | 1,073,364 | 1,006,984 | ||||||
Iron Mountain, Inc. | ||||||||
4.500%, 02/15/311 | 40,000 | 39,873 | ||||||
4.875%, 09/15/291 | 85,000 | 85,510 | ||||||
iStar, Inc. | ||||||||
4.750%, 10/01/24 | 60,000 | 57,407 | ||||||
JPMorgan Chase & Co. | ||||||||
(2.522% to 04/22/30 then SOFRRATE + 2.040%), 2.522%, 04/22/313,4 | 300,000 | 316,544 | ||||||
| Principal | ||||||||
| Amount | Value | |||||||
LD Holdings Group LLC | ||||||||
6.500%, 11/01/251 | $35,000 | $35,613 | ||||||
Lions Gate Capital Holdings LLC | ||||||||
6.375%, 02/01/241 | 80,000 | 77,049 | ||||||
Lloyds Banking Group PLC (United Kingdom) | ||||||||
(3.574% to 11/07/27 then 3 month LIBOR + 1.205%), 3.574%, 11/07/283,4 | 430,000 | 472,188 | ||||||
Macquarie Group, Ltd. (Australia) | ||||||||
(4.150% to 03/27/23 then 3 month LIBOR + 1.330%), 4.150%, 03/27/241,3,4 | 430,000 | 461,084 | ||||||
Malayan Banking Bhd (Malaysia) | ||||||||
(3.905% to 10/29/21 then USD Swap 5 year + 2.542%), 3.905%, 10/29/263,4 | 1,000,000 | 1,020,305 | ||||||
Mexarrend SAPI de CV (Mexico) | ||||||||
10.250%, 07/24/241 | 500,000 | 385,625 | ||||||
MGM Growth Properties Operating Partnership LP/MGP Finance Co-Issuer, Inc. | ||||||||
5.750%, 02/01/27 | 95,000 | 102,666 | ||||||
Mitsubishi UFJ Financial Group, Inc. (Japan) | ||||||||
1.412%, 07/17/25 | 485,000 | 493,312 | ||||||
Morgan Stanley | ||||||||
(3.591% to 07/22/27 then 3 month LIBOR + 1.340%), 3.591%, 07/22/283,4 | 410,000 | 461,379 | ||||||
MPT Operating Partnership LP/MPT Finance Corp. | ||||||||
5.000%, 10/15/27 | 55,000 | 57,652 | ||||||
Multibank, Inc. (Panama) | ||||||||
4.375%, 11/09/22 | 200,000 | 204,455 | ||||||
National Retail Properties, Inc. | ||||||||
2.500%, 04/15/30 | 155,000 | 153,797 | ||||||
Nationstar Mortgage Holdings, Inc. | ||||||||
5.500%, 08/15/281 | 60,000 | 59,962 | ||||||
6.000%, 01/15/271 | 15,000 | 15,026 | ||||||
Navient Corp. | ||||||||
5.000%, 03/15/27 | 55,000 | 51,437 | ||||||
6.500%, 06/15/22 | 175,000 | 178,937 | ||||||
NFP Corp. | ||||||||
6.875%, 08/15/281 | 55,000 | 53,419 | ||||||
7.000%, 05/15/251 | 10,000 | 10,619 | ||||||
NongHyup Bank (South Korea) | ||||||||
1.250%, 07/20/251 | 200,000 | 201,905 | ||||||
OneMain Finance Corp. | ||||||||
6.625%, 01/15/28 | 25,000 | 27,383 | ||||||
6.875%, 03/15/25 | 59,000 | 65,011 | ||||||
7.125%, 03/15/26 | 5,000 | 5,551 | ||||||
Operadora de Servicios Mega, S.A. de CV Sofom ER (Mexico) | ||||||||
8.250%, 02/11/251 | 450,000 | 417,184 | ||||||
Oversea-Chinese Banking Corp., Ltd. (Singapore) | ||||||||
(1.832% to 09/10/25 then U.S. Treasury Yield Curve CMT 5 year + 1.580%), 1.832%, 09/10/301,3,4 | 400,000 | 398,804 | ||||||
The accompanying notes are an integral part of these financial statements.
57
Table of Contents
AMG Managers DoubleLine Core Plus Bond Fund Schedule of Portfolio Investments (continued) |
|
| Principal | ||||||||
| Amount | Value | |||||||
Financials - 7.7% (continued) | ||||||||
Oversea-Chinese Banking Corp., Ltd. (Singapore) | ||||||||
1.832%, 09/10/30 | $200,000 | $199,402 | ||||||
PennyMac Financial Services, Inc. | ||||||||
5.375%, 10/15/251 | 80,000 | 81,676 | ||||||
Prudential Financial, Inc. | ||||||||
3.905%, 12/07/47 | 225,000 | 253,114 | ||||||
Radiant Access, Ltd. (Virgin Islands, British) | ||||||||
4.600%, 11/18/205 | 1,100,000 | 1,102,442 | ||||||
Realogy Group LLC / Realogy Co-Issuer Corp. | ||||||||
7.625%, 06/15/251 | 30,000 | 31,733 | ||||||
Simon Property Group LP | ||||||||
2.450%, 09/13/29 | 230,000 | 227,656 | ||||||
SPARC EM SPC Panama Metro Line 2 SP (Cayman Islands) | ||||||||
0.000%, 12/05/221,7 | 885,233 | 862,004 | ||||||
0.000%, 12/05/227 | 887,770 | 864,474 | ||||||
Sumitomo Mitsui Financial Group, Inc. (Japan) | ||||||||
(3 month LIBOR + 0.740%), 0.958%, 01/17/234 | 730,000 | 734,201 | ||||||
Synchrony Financial | ||||||||
3.950%, 12/01/27 | 395,000 | 430,733 | ||||||
Temasek Financial I, Ltd. (Singapore) | ||||||||
1.000%, 10/06/301 | 250,000 | 243,614 | ||||||
Tempo Acquisition LLC/Tempo Acquisition Finance Corp. | ||||||||
6.750%, 06/01/251 | 130,000 | 132,080 | ||||||
Unifin Financiera SAB de CV (Mexico) | ||||||||
(8.875% to 01/29/25 then U.S. Treasury Yield Curve CMT 5 year + 6.308%), 8.875%, 01/29/253,4,5 | 1,600,000 | 1,084,016 | ||||||
United Overseas Bank, Ltd., EMTN (Singapore) | ||||||||
(3.500% to 09/16/21 then USD Swap 5 year + 2.236%), 3.500%, 09/16/263,4 | 1,000,000 | 1,018,775 | ||||||
(3.875% to 10/19/23 then USD Swap 5 year + 1.794%), 3.875%, 10/19/233,4,5 | 400,000 | 412,000 | ||||||
Wells Fargo & Co., MTN | ||||||||
(2.879% to 10/30/29 then 3 month LIBOR + 1.170%), 2.879%, 10/30/303,4 | 225,000 | 239,227 | ||||||
(3.196% to 06/17/26 then 3 month LIBOR + 1.170%), 3.196%, 06/17/273,4 | 245,000 | 266,967 | ||||||
WeWork Cos., Inc. | ||||||||
7.875%, 05/01/251 | 40,000 | 25,475 | ||||||
Willis North America, Inc. | ||||||||
4.500%, 09/15/28 | 415,000 | 496,294 | ||||||
XHR LP | ||||||||
6.375%, 08/15/251 | 40,000 | 39,725 | ||||||
Total Financials | 38,581,208 | |||||||
Industrials - 15.2% | ||||||||
AbbVie, Inc. | ||||||||
4.700%, 05/14/45 | 433,000 | 528,562 | ||||||
| Principal | ||||||||
| Amount | Value | |||||||
Academy, Ltd. | ||||||||
6.000%, 11/15/271,8 | $65,000 | $65,125 | ||||||
Activision Blizzard, Inc. | ||||||||
1.350%, 09/15/30 | 115,000 | 111,180 | ||||||
Adani Ports & Special Economic Zone, Ltd. (India) | ||||||||
3.950%, 01/19/22 | 400,000 | 407,646 | ||||||
Advanced Drainage Systems, Inc. | ||||||||
5.000%, 09/30/271 | 75,000 | 78,745 | ||||||
Albertsons Cos., Inc. / Safeway, Inc. / New | ||||||||
Albertsons LP / Albertsons LLC | ||||||||
3.500%, 03/15/291 | 60,000 | 58,296 | ||||||
Allison Transmission, Inc. | ||||||||
5.000%, 10/01/241 | 209,000 | 211,132 | ||||||
Altria Group, Inc. | ||||||||
4.800%, 02/14/29 | 410,000 | 481,389 | ||||||
American Axle & Manufacturing, Inc. | ||||||||
6.250%, 03/15/26 | 65,000 | 65,224 | ||||||
Anglo American Capital PLC (United Kingdom) | ||||||||
4.500%, 03/15/281 | 415,000 | 469,747 | ||||||
Anheuser-Busch Cos. LLC/Anheuser-Busch InBev Worldwide Inc. | ||||||||
4.900%, 02/01/46 | 100,000 | 122,749 | ||||||
Anheuser-Busch InBev Worldwide, Inc. | ||||||||
4.600%, 04/15/48 | 385,000 | 456,834 | ||||||
Antero Midstream Partners, LP/Antero Midstream Finance Corp. | ||||||||
5.750%, 03/01/271 | 59,000 | 53,211 | ||||||
Anthem, Inc. | ||||||||
2.375%, 01/15/25 | 255,000 | 270,617 | ||||||
Apache Corp. | ||||||||
4.375%, 10/15/28 | 60,000 | 55,236 | ||||||
4.625%, 11/15/25 | 30,000 | 28,538 | ||||||
Apple, Inc. | ||||||||
4.650%, 02/23/46 | 375,000 | 510,827 | ||||||
APT Pipelines, Ltd. (Australia) | ||||||||
4.250%, 07/15/271 | 1,000,000 | 1,122,034 | ||||||
Aramark Services, Inc. | ||||||||
6.375%, 05/01/251 | 80,000 | 84,010 | ||||||
Arconic Corp. | ||||||||
6.000%, 05/15/251 | 30,000 | 31,819 | ||||||
6.125%, 02/15/281 | 115,000 | 121,384 | ||||||
Arrow Electronics, Inc. | ||||||||
3.875%, 01/12/28 | 215,000 | 239,039 | ||||||
Asbury Automotive Group, Inc. | ||||||||
4.500%, 03/01/281 | 22,000 | 22,426 | ||||||
4.750%, 03/01/301 | 20,000 | 20,675 | ||||||
Ascend Learning LLC | ||||||||
6.875%, 08/01/251 | 30,000 | 31,050 | ||||||
6.875%, 08/01/251 | 170,000 | 173,382 | ||||||
ASGN, Inc. | ||||||||
4.625%, 05/15/281 | 60,000 | 61,799 | ||||||
The accompanying notes are an integral part of these financial statements.
58
Table of Contents
AMG Managers DoubleLine Core Plus Bond Fund Schedule of Portfolio Investments (continued) |
|
| Principal | ||||||||
| Amount | Value | |||||||
Industrials - 15.2% (continued) | ||||||||
AT&T, Inc. | ||||||||
3.500%, 09/15/531 | $723,000 | $687,828 | ||||||
Avantor Funding, Inc. | ||||||||
4.625%, 07/15/281 | 40,000 | 41,498 | ||||||
Avaya, Inc. | ||||||||
6.125%, 09/15/281 | 60,000 | 61,762 | ||||||
B&G Foods, Inc. | ||||||||
5.250%, 04/01/25 | 60,000 | 61,860 | ||||||
5.250%, 09/15/27 | 45,000 | 46,617 | ||||||
Baidu, Inc. (Cayman Islands) | ||||||||
3.425%, 04/07/30 | 200,000 | 220,425 | ||||||
Banff Merger Sub, Inc. | ||||||||
9.750%, 09/01/261 | 30,000 | 31,575 | ||||||
BAT Capital Corp. | ||||||||
3.462%, 09/06/29 | 715,000 | 766,849 | ||||||
Bausch Health Cos., Inc. (Canada) | ||||||||
5.250%, 01/30/301 | 80,000 | 78,690 | ||||||
6.250%, 02/15/291 | 60,000 | 61,920 | ||||||
7.000%, 01/15/281 | 140,000 | 148,637 | ||||||
Beacon Roofing Supply, Inc. | ||||||||
4.500%, 11/15/261 | 50,000 | 51,453 | ||||||
4.875%, 11/01/251 | 120,000 | 117,938 | ||||||
Becton Dickinson and Co. | ||||||||
2.894%, 06/06/22 | 700,000 | 724,304 | ||||||
Black Knight InfoServ LLC | ||||||||
3.625%, 09/01/281 | 45,000 | 45,619 | ||||||
Bombardier, Inc. (Canada) | ||||||||
6.000%, 10/15/221 | 65,000 | 59,191 | ||||||
7.875%, 04/15/271 | 45,000 | 32,850 | ||||||
Boxer Parent Co., Inc. | ||||||||
7.125%, 10/02/251 | 5,000 | 5,368 | ||||||
Boyd Gaming Corp. | ||||||||
4.750%, 12/01/27 | 115,000 | 112,076 | ||||||
Boyne USA, Inc. | ||||||||
7.250%, 05/01/251 | 215,000 | 225,347 | ||||||
Braskem Idesa SAPI (Mexico) | ||||||||
7.450%, 11/15/291 | 400,000 | 378,808 | ||||||
Braskem Netherlands Finance, B.V. (Netherlands) | ||||||||
(8.500% to 01/23/26 then U.S. Treasury Yield Curve CMT 5 year + 8.220%), 8.500%, 01/23/811,3,4 | 500,000 | 508,630 | ||||||
Bristol-Myers Squibb Co. | ||||||||
4.350%, 11/15/47 | 395,000 | 504,412 | ||||||
Broadcom, Inc. | ||||||||
3.150%, 11/15/25 | 380,000 | 410,115 | ||||||
Builders FirstSource, Inc. | ||||||||
5.000%, 03/01/301 | 80,000 | 84,500 | ||||||
6.750%, 06/01/271 | 36,000 | 38,655 | ||||||
Burlington Northern Santa Fe LLC | ||||||||
3.050%, 02/15/51 | 100,000 | 107,474 | ||||||
| Principal | ||||||||
| Amount | Value | |||||||
BWX Technologies, Inc. | ||||||||
4.125%, 06/30/281 | $45,000 | $45,591 | ||||||
BY Crown Parent LLC/BY Bond Finance, Inc. | ||||||||
4.250%, 01/31/261 | 35,000 | 35,481 | ||||||
Caesars Entertainment, Inc. | ||||||||
6.250%, 07/01/251 | 70,000 | 71,960 | ||||||
Caesars Resort Collection LLC/CRC Finco Inc. | ||||||||
5.250%, 10/15/251 | 95,000 | 90,481 | ||||||
Camelot Finance, S.A. (Luxembourg) | ||||||||
4.500%, 11/01/261 | 25,000 | 26,047 | ||||||
Campbell Soup Co. | ||||||||
2.375%, 04/24/30 | 155,000 | 160,065 | ||||||
Carnival Corp. (Panama) | ||||||||
11.500%, 04/01/231 | 30,000 | 33,194 | ||||||
Carrier Global Corp. | ||||||||
3.377%, 04/05/401 | 280,000 | 297,003 | ||||||
Carvana Co. | ||||||||
5.625%, 10/01/251 | 25,000 | 24,656 | ||||||
Castle US Holding Corp. | ||||||||
9.500%, 02/15/281 | 35,000 | 33,332 | ||||||
Catalent Pharma Solutions, Inc. | ||||||||
5.000%, 07/15/271 | 130,000 | 135,745 | ||||||
CCL Industries, Inc. (Canada) | ||||||||
3.050%, 06/01/301 | 220,000 | 233,889 | ||||||
CCO Holdings LLC/CCO Holdings Capital Corp. | ||||||||
4.500%, 08/15/301 | 70,000 | 72,800 | ||||||
4.750%, 03/01/301 | 150,000 | 157,965 | ||||||
5.750%, 02/15/261 | 155,000 | 160,876 | ||||||
CDK Global, Inc. | ||||||||
5.875%, 06/15/26 | 45,000 | 46,941 | ||||||
Cedar Fair LP | ||||||||
5.250%, 07/15/292 | 110,000 | 100,011 | ||||||
Cengage Learning, Inc. | ||||||||
9.500%, 06/15/241 | 70,000 | 56,445 | ||||||
Cenovus Energy, Inc. (Canada) | ||||||||
5.375%, 07/15/25 | 55,000 | 58,014 | ||||||
Centene Corp. | ||||||||
3.000%, 10/15/30 | 35,000 | 36,390 | ||||||
Century Communities, Inc. | ||||||||
6.750%, 06/01/27 | 70,000 | 74,753 | ||||||
CenturyLink, Inc. | ||||||||
4.000%, 02/15/271 | 70,000 | 71,662 | ||||||
5.125%, 12/15/261 | 80,000 | 81,916 | ||||||
Charles River Laboratories International, Inc. | ||||||||
4.250%, 05/01/281 | 70,000 | 73,268 | ||||||
Charter Communications Operating LLC/Charter | ||||||||
Communications Operating Capital | ||||||||
4.908%, 07/23/25 | 415,000 | 478,347 | ||||||
Cheniere Energy Partners LP | ||||||||
5.250%, 10/01/25 | 145,000 | 147,755 | ||||||
5.625%, 10/01/26 | 80,000 | 82,136 | ||||||
The accompanying notes are an integral part of these financial statements.
59
Table of Contents
AMG Managers DoubleLine Core Plus Bond Fund Schedule of Portfolio Investments (continued) |
|
| Principal | ||||||||
| Amount | Value | |||||||
Industrials - 15.2% (continued) | ||||||||
Cigna Corp. | ||||||||
(3 month LIBOR + 0.890%), 1.127%, 07/15/234 | $275,000 | $277,990 | ||||||
4.900%, 12/15/48 | 295,000 | 380,135 | ||||||
CK Hutchison International 20, Ltd. (Cayman Islands) | ||||||||
2.500%, 05/08/301 | 400,000 | 415,092 | ||||||
Clarios Global LP/Clarios US Finance Co. | ||||||||
6.250%, 05/15/261 | 85,000 | 88,931 | ||||||
8.500%, 05/15/271 | 45,000 | 47,016 | ||||||
Clean Harbors, Inc. | ||||||||
4.875%, 07/15/271 | 125,000 | 130,836 | ||||||
5.125%, 07/15/291 | 30,000 | 32,696 | ||||||
Clear Channel Worldwide Holdings, Inc. | ||||||||
9.250%, 02/15/24 | 29,000 | 25,171 | ||||||
CNAC HK Finbridge Co., Ltd. (Hong Kong) | ||||||||
3.375%, 06/19/24 | 400,000 | 415,358 | ||||||
3.500%, 07/19/22 | 400,000 | 410,125 | ||||||
CNOOC Finance 2012, Ltd. (Virgin Islands, British) | ||||||||
3.875%, 05/02/22 | 400,000 | 417,020 | ||||||
CNOOC Finance 2013, Ltd. (Virgin Islands, British) | ||||||||
3.000%, 05/09/23 | 400,000 | 418,795 | ||||||
CNOOC Finance 2015 USA LLC | ||||||||
3.750%, 05/02/23 | 590,000 | 628,772 | ||||||
CNPC Global Capital, Ltd. (Virgin Islands, British) | ||||||||
1.125%, 06/23/23 | 500,000 | 500,738 | ||||||
1.350%, 06/23/25 | 600,000 | 601,179 | ||||||
CNX Midstream Partners LP/CNX Midstream Finance Corp. | ||||||||
6.500%, 03/15/261 | 100,000 | 101,860 | ||||||
Comcast Corp. | ||||||||
1.500%, 02/15/31 | 360,000 | 351,385 | ||||||
3.400%, 04/01/30 | 200,000 | 227,968 | ||||||
3.950%, 10/15/25 | 175,000 | 200,637 | ||||||
Constellation Brands, Inc. | ||||||||
2.875%, 05/01/30 | 30,000 | 32,331 | ||||||
3.150%, 08/01/29 | 210,000 | 230,178 | ||||||
Constellation Merger Sub, Inc. | ||||||||
8.500%, 09/15/251,2 | 85,000 | 70,435 | ||||||
Cornerstone Building Brands, Inc. | ||||||||
6.125%, 01/15/291 | 45,000 | 46,054 | ||||||
Corning, Inc. | ||||||||
4.375%, 11/15/57 | 210,000 | 253,207 | ||||||
Cosan Overseas, Ltd. (Cayman Islands) | ||||||||
8.250%, 02/05/215 | 1,000,000 | 1,018,760 | ||||||
Costco Wholesale Corp. | ||||||||
1.750%, 04/20/32 | 100,000 | 101,879 | ||||||
CSI Compressco, LP/CSI Compressco Finance, Inc. | ||||||||
7.500%, 04/01/251 | 130,000 | 114,549 | ||||||
CSN Islands XII Corp. (Cayman Islands) | ||||||||
7.000%, 12/23/205 | 750,000 | 671,250 | ||||||
| Principal | ||||||||
| Amount | Value | |||||||
CSX Corp. | ||||||||
3.800%, 11/01/46 | $505,000 | $575,948 | ||||||
CVS Health Corp. | ||||||||
5.050%, 03/25/48 | 195,000 | 246,797 | ||||||
Dana Financing Luxembourg Sarl (Luxembourg) | ||||||||
5.750%, 04/15/251 | 70,000 | 72,669 | ||||||
Dana, Inc. | ||||||||
5.375%, 11/15/27 | 25,000 | 25,859 | ||||||
DaVita, Inc. | ||||||||
4.625%, 06/01/301 | 40,000 | 40,711 | ||||||
Dealer Tire LLC/DT Issuer LLC | ||||||||
8.000%, 02/01/281 | 25,000 | 25,625 | ||||||
Delek & Avner Tamar Bond, Ltd. (Israel) | ||||||||
5.082%, 12/30/231 | 100,000 | 102,831 | ||||||
Delek & Avner Tamar Bond, Ltd. (Israel) | ||||||||
5.412%, 12/30/251 | 300,000 | 308,046 | ||||||
Delta Air Lines, Inc. | ||||||||
7.000%, 05/01/251 | 25,000 | 27,308 | ||||||
Delta Air Lines, Inc. / SkyMiles IP, Ltd. | ||||||||
4.750%, 10/20/281 | 35,000 | 35,797 | ||||||
Diamond Sports Group LLC/Diamond Sports Finance Co. | ||||||||
5.375%, 08/15/261 | 60,000 | 35,063 | ||||||
Diamondback Energy, Inc. | ||||||||
2.875%, 12/01/24 | 135,000 | 136,794 | ||||||
Digicel Group 0.5, Ltd. (Bermuda) | ||||||||
7.000%, 11/16/201,5,6 | 249,729 | 34,962 | ||||||
8.000%, 04/01/251,6 | 167,482 | 56,944 | ||||||
DISH DBS Corp. | ||||||||
5.875%, 11/15/24 | 75,000 | 75,562 | ||||||
Dollar Tree, Inc. | ||||||||
4.000%, 05/15/25 | 150,000 | 169,064 | ||||||
The Dun & Bradstreet Corp. | ||||||||
6.875%, 08/15/261 | 33,000 | 35,372 | ||||||
10.250%, 02/15/271 | 39,000 | 43,759 | ||||||
DuPont de Nemours, Inc. | ||||||||
5.419%, 11/15/48 | 175,000 | 235,866 | ||||||
Eli Lilly and Co. | ||||||||
2.250%, 05/15/50 | 550,000 | 511,753 | ||||||
Embarq Corp. | ||||||||
7.995%, 06/01/36 | 75,000 | 88,078 | ||||||
Emergent BioSolutions, Inc. | ||||||||
3.875%, 08/15/281 | 50,000 | 50,344 | ||||||
Empresa de Transporte de Pasajeros Metro SA (Chile) | ||||||||
5.000%, 01/25/471 | 1,150,000 | 1,425,189 | ||||||
ENA Norte Trust (Panama) | ||||||||
4.950%, 04/25/23 | 893,468 | 899,061 | ||||||
Enable Midstream Partners LP | ||||||||
4.400%, 03/15/27 | 180,000 | 171,000 | ||||||
The accompanying notes are an integral part of these financial statements.
60
Table of Contents
AMG Managers DoubleLine Core Plus Bond Fund Schedule of Portfolio Investments (continued) |
|
| Principal | ||||||||
| Amount | Value | |||||||
Industrials - 15.2% (continued) | ||||||||
Encompass Health Corp. | ||||||||
4.500%, 02/01/28 | $35,000 | $35,903 | ||||||
4.625%, 04/01/31 | 75,000 | 77,344 | ||||||
4.750%, 02/01/30 | 10,000 | 10,433 | ||||||
Endeavor Energy Resources LP / EER Finance, Inc. | ||||||||
6.625%, 07/15/251 | 40,000 | 41,562 | ||||||
Energizer Holdings, Inc. | ||||||||
7.750%, 01/15/271 | 75,000 | 81,516 | ||||||
Energy Transfer Operating LP | ||||||||
4.200%, 04/15/27 | 30,000 | 31,217 | ||||||
4.750%, 01/15/26 | 490,000 | 525,276 | ||||||
Envision Healthcare Corp. | ||||||||
8.750%, 10/15/261 | 50,000 | 23,678 | ||||||
EOG Resources, Inc. | ||||||||
4.375%, 04/15/30 | 95,000 | 111,832 | ||||||
EQM Midstream Partners LP | ||||||||
6.500%, 07/01/271 | 20,000 | 21,004 | ||||||
EQT Corp. | ||||||||
7.875%, 02/01/259 | 60,000 | 66,834 | ||||||
Exelon Corp. | ||||||||
3.400%, 04/15/26 | 1,000,000 | 1,117,151 | ||||||
Expedia Group, Inc. | ||||||||
3.800%, 02/15/28 | 280,000 | 281,348 | ||||||
Exterran Energy Solutions, LP/EES Finance Corp | ||||||||
8.125%, 05/01/25 | 95,000 | 80,146 | ||||||
Extraction Oil & Gas, Inc. | ||||||||
5.625%, 02/01/261,10 | 45,000 | 11,090 | ||||||
Exxon Mobil Corp. | ||||||||
2.610%, 10/15/30 | 225,000 | 238,936 | ||||||
4.227%, 03/19/40 | 210,000 | 249,863 | ||||||
Falabella (Chile) | ||||||||
3.750%, 04/30/23 | 300,000 | 313,093 | ||||||
FedEx Corp. | ||||||||
4.750%, 11/15/45 | 195,000 | 241,296 | ||||||
Fermaca Enterprises S de RL de CV (Mexico) | ||||||||
6.375%, 03/30/381 | 211,834 | 233,018 | ||||||
Fideicomiso PA Pacifico Tres (Colombia) | ||||||||
8.250%, 01/15/35 | 200,000 | 234,502 | ||||||
Flex Acquisition Co, Inc. | ||||||||
6.875%, 01/15/251 | 125,000 | 123,281 | ||||||
Ford Motor Co. | ||||||||
7.450%, 07/16/31 | 80,000 | 95,450 | ||||||
9.000%, 04/22/25 | 35,000 | 41,214 | ||||||
Ford Motor Credit Co. LLC, GMTN | ||||||||
4.389%, 01/08/26 | 200,000 | 201,782 | ||||||
5.750%, 02/01/21 | 200,000 | 201,935 | ||||||
frontdoor, Inc. | ||||||||
6.750%, 08/15/261 | 150,000 | 160,500 | ||||||
| Principal | ||||||||
| Amount | Value | |||||||
Frontier Communications Corp. | ||||||||
5.875%, 10/15/271 | $20,000 | $20,425 | ||||||
7.125%, 01/15/2310 | 55,000 | 21,278 | ||||||
8.500%, 04/15/2010 | 30,000 | 12,000 | ||||||
8.500%, 04/01/261,10 | 45,000 | 45,326 | ||||||
FTS International, Inc. | ||||||||
6.250%, 05/01/2210 | 62,000 | 17,670 | ||||||
Garda World Security Corp. (Canada) | ||||||||
4.625%, 02/15/271 | 125,000 | 122,187 | ||||||
Gates Global LLC/Gates Corp. | ||||||||
6.250%, 01/15/261 | 80,000 | 82,334 | ||||||
GCI LLC | ||||||||
4.750%, 10/15/281 | 60,000 | 62,044 | ||||||
General Electric Co., MTN | ||||||||
5.875%, 01/14/38 | 245,000 | 294,741 | ||||||
General Motors Financial Co, Inc. | ||||||||
(3 month LIBOR + 0.990%), 1.224%, 01/05/234 | 690,000 | 683,385 | ||||||
Genesys Telecommunications Laboratories Inc/Greeneden Lux 3 Sarl/Greeneden US Ho | ||||||||
10.000%, 11/30/241 | 220,000 | 232,419 | ||||||
Geopark, Ltd. (Bermuda) | ||||||||
6.500%, 09/21/24 | 600,000 | 565,500 | ||||||
GFL Environmental, Inc. (Canada) | ||||||||
3.750%, 08/01/251 | 40,000 | 40,075 | ||||||
5.125%, 12/15/261 | 95,000 | 99,897 | ||||||
8.500%, 05/01/271 | 33,000 | 36,032 | ||||||
Globo Comunicacao e Participacoes, S.A. (Brazil) | ||||||||
4.875%, 01/22/301 | 200,000 | 198,352 | ||||||
GNL Quintero SA (Chile) | ||||||||
4.634%, 07/31/29 | 250,000 | 271,625 | ||||||
Gogo Intermediate Holdings LLC/Gogo Finance Co., Inc. | ||||||||
9.875%, 05/01/241 | 90,000 | 94,894 | ||||||
Golden Entertainment, Inc. | ||||||||
7.625%, 04/15/261 | 65,000 | 65,193 | ||||||
Golden Nugget, Inc. | ||||||||
6.750%, 10/15/241 | 120,000 | 101,762 | ||||||
8.750%, 10/01/251,2 | 30,000 | 24,656 | ||||||
Gran Tierra Energy International Holdings, Ltd. (Cayman Islands) | ||||||||
6.250%, 02/15/25 | 1,126,000 | 396,915 | ||||||
Gran Tierra Energy, Inc. | ||||||||
7.750%, 05/23/271 | 200,000 | 65,502 | ||||||
Gray Television, Inc. | ||||||||
7.000%, 05/15/271 | 90,000 | 97,200 | ||||||
Griffon Corp. | ||||||||
5.750%, 03/01/28 | 75,000 | 77,906 | ||||||
Group 1 Automotive, Inc. | ||||||||
4.000%, 08/15/281 | 20,000 | 20,050 | ||||||
GrubHub Holdings, Inc. | ||||||||
5.500%, 07/01/271 | 45,000 | 46,856 | ||||||
The accompanying notes are an integral part of these financial statements.
61
Table of Contents
AMG Managers DoubleLine Core Plus Bond Fund Schedule of Portfolio Investments (continued) |
|
| Principal | ||||||||
| Amount | Value | |||||||
Industrials - 15.2% (continued) | ||||||||
Grupo Idesa, S.A. de CV PIK (Mexico) | ||||||||
10.125%, 05/22/261,6 | $404,000 | $226,240 | ||||||
GTT Communications, Inc. | ||||||||
7.875%, 12/31/241 | 60,000 | 30,225 | ||||||
Gulfport Energy Corp. | ||||||||
6.375%, 05/15/25 | 100,000 | 55,750 | ||||||
GW Honos Security Corp. (Canada) | ||||||||
8.750%, 05/15/251 | 95,000 | 94,821 | ||||||
Halliburton Co. | ||||||||
2.920%, 03/01/302 | 140,000 | 136,184 | ||||||
HCA, Inc. | ||||||||
4.125%, 06/15/29 | 230,000 | 261,004 | ||||||
Health Care Service Corp A Mutual | ||||||||
Legal Reserve Co. | ||||||||
3.200%, 06/01/501 | 70,000 | 71,699 | ||||||
Hess Midstream Operations LP | ||||||||
5.125%, 06/15/281 | 40,000 | 39,838 | ||||||
5.625%, 02/15/261 | 85,000 | 85,159 | ||||||
Hexion, Inc. | ||||||||
7.875%, 07/15/271 | 55,000 | 57,166 | ||||||
H-Food Holdings LLC/Hearthside | ||||||||
Finance Co., Inc. | ||||||||
8.500%, 06/01/261 | 90,000 | 90,137 | ||||||
Hilcorp Energy I, LP/Hilcorp Finance Co. | ||||||||
6.250%, 11/01/281 | 105,000 | 96,550 | ||||||
Hill-Rom Holdings, Inc. | ||||||||
4.375%, 09/15/271 | 60,000 | 62,175 | ||||||
Hilton Domestic Operating Co., Inc. | ||||||||
5.375%, 05/01/251 | 5,000 | 5,172 | ||||||
5.750%, 05/01/281 | 5,000 | 5,250 | ||||||
The Home Depot, Inc. | ||||||||
3.900%, 06/15/47 | 190,000 | 229,735 | ||||||
Horizon Therapeutics USA, Inc. | ||||||||
5.500%, 08/01/271 | 200,000 | 213,162 | ||||||
Hyundai Capital America | ||||||||
1.800%, 10/15/251 | 35,000 | 34,952 | ||||||
2.650%, 02/10/251 | 465,000 | 480,686 | ||||||
IAA, Inc. | ||||||||
5.500%, 06/15/271 | 115,000 | 121,109 | ||||||
iHeartCommunications, Inc. | ||||||||
5.250%, 08/15/271 | 50,000 | 49,438 | ||||||
8.375%, 05/01/27 | 15,000 | 14,656 | ||||||
Illuminate Buyer LLC/Illuminate Holdings IV, Inc. | ||||||||
9.000%, 07/01/281 | 55,000 | 58,919 | ||||||
Imperial Brands Finance PLC (United Kingdom) | ||||||||
3.500%, 07/26/261 | 290,000 | 314,276 | ||||||
Indian Oil Corp., Ltd. (India) | ||||||||
5.750%, 08/01/23 | 300,000 | 327,437 | ||||||
Indigo Natural Resources LLC | ||||||||
6.875%, 02/15/261 | 55,000 | 54,175 | ||||||
| Principal | ||||||||
| Amount | Value | |||||||
Ingevity Corp. | ||||||||
3.875%, 11/01/281 | $75,000 | $76,281 | ||||||
Installed Building Products, Inc. | ||||||||
5.750%, 02/01/281 | 85,000 | 89,871 | ||||||
Intelligent Packaging, Ltd. Finco, Inc. / Intelligent Packaging, Ltd. Co-Issuer LLC (Canada) | ||||||||
6.000%, 09/15/281,8 | 35,000 | 35,678 | ||||||
Intelsat Jackson Holdings SA (Luxembourg) | ||||||||
5.500%, 08/01/2310 | 85,000 | 50,044 | ||||||
8.500%, 10/15/241,10 | 80,000 | 49,600 | ||||||
The Interpublic Group of Cos, Inc. | ||||||||
5.400%, 10/01/48 | 350,000 | 423,638 | ||||||
IRB Holding Corp. | ||||||||
6.750%, 02/15/261 | 110,000 | 110,412 | ||||||
7.000%, 06/15/251 | 45,000 | 48,038 | ||||||
Jaguar Holding Co. II / PPD Development LP | ||||||||
5.000%, 06/15/281 | 35,000 | 36,525 | ||||||
JBS USA LUX, S.A./JBS USA Finance, Inc. | ||||||||
5.750%, 06/15/251 | 15,000 | 15,458 | ||||||
JBS USA LUX, S.A./JBS USA Food Co./JBS USA Finance, Inc. | ||||||||
5.500%, 01/15/301 | 35,000 | 38,106 | ||||||
6.500%, 04/15/291 | 65,000 | 73,133 | ||||||
JD.com, Inc. (Cayman Islands) | ||||||||
3.375%, 01/14/30 | 700,000 | 755,108 | ||||||
JELD-WEN, Inc. | ||||||||
4.625%, 12/15/251 | 115,000 | 116,857 | ||||||
KAR Auction Services, Inc. | ||||||||
5.125%, 06/01/251 | 160,000 | 161,400 | ||||||
The Kenan Advantage Group Inc. | ||||||||
7.875%, 07/31/231,2 | 15,000 | 15,055 | ||||||
Keurig Dr Pepper, Inc. | ||||||||
3.800%, 05/01/50 | 165,000 | 187,857 | ||||||
Kinder Morgan Energy Partners L.P., MTN | ||||||||
6.950%, 01/15/38 | 355,000 | 457,072 | ||||||
Kraft Heinz Foods Co. | ||||||||
5.000%, 07/15/35 | 80,000 | 92,153 | ||||||
5.200%, 07/15/45 | 225,000 | 248,738 | ||||||
Kraton Polymers LLC/Kraton Polymers Capital Corp. | ||||||||
7.000%, 04/15/251 | 85,000 | 87,816 | ||||||
Kratos Defense & Security Solutions, Inc. | ||||||||
6.500%, 11/30/251 | 90,000 | 94,153 | ||||||
The Kroger Co. | ||||||||
3.400%, 04/15/22 | 220,000 | 228,215 | ||||||
Kronos Acquisition Holdings, Inc. | ||||||||
9.000%, 08/15/231 | 80,000 | 81,150 | ||||||
Lam Research Corp | ||||||||
2.875%, 06/15/50 | 250,000 | 256,439 | ||||||
Latam Finance, Ltd. (Cayman Islands) | ||||||||
6.875%, 04/11/2410 | 500,000 | 168,250 | ||||||
7.000%, 03/01/261,10 | 500,000 | 170,000 | ||||||
The accompanying notes are an integral part of these financial statements.
62
Table of Contents
AMG Managers DoubleLine Core Plus Bond Fund Schedule of Portfolio Investments (continued) |
|
| Principal | ||||||||
| Amount | Value | |||||||
Industrials - 15.2% (continued) | ||||||||
LifePoint Health, Inc. | ||||||||
4.375%, 02/15/271 | $80,000 | $79,377 | ||||||
6.750%, 04/15/251 | 40,000 | 42,400 | ||||||
Live Nation Entertainment, Inc. | ||||||||
5.625%, 03/15/261 | 180,000 | 172,170 | ||||||
6.500%, 05/15/271 | 35,000 | 37,495 | ||||||
Lockheed Martin Corp. | ||||||||
4.700%, 05/15/46 | 344,000 | 465,940 | ||||||
Logan Merger Sub, Inc. | ||||||||
5.500%, 09/01/271 | 30,000 | 30,450 | ||||||
LTF Merger Sub, Inc. | ||||||||
8.500%, 06/15/231 | 120,000 | 108,900 | ||||||
M/I Homes, Inc. | ||||||||
4.950%, 02/01/28 | 70,000 | 72,669 | ||||||
Marathon Petroleum Corp. | ||||||||
5.125%, 12/15/26 | 410,000 | 469,301 | ||||||
Marriott Ownership Resorts, Inc./ILG LLC | ||||||||
6.500%, 09/15/26 | 125,000 | 128,965 | ||||||
Marvell Technology Group, Ltd. (Bermuda) | ||||||||
4.200%, 06/22/23 | 440,000 | 476,239 | ||||||
Masonite International Corp. (Canada) | ||||||||
5.750%, 09/15/261 | 145,000 | 152,041 | ||||||
Match Group Holdings II LLC | ||||||||
4.625%, 06/01/281 | 30,000 | 31,117 | ||||||
Mattamy Group Corp. (Canada) | ||||||||
4.625%, 03/01/301 | 75,000 | 76,254 | ||||||
McDonald’s Corp. | ||||||||
3.600%, 07/01/30 | 230,000 | 265,612 | ||||||
4.450%, 03/01/47 | 245,000 | 300,292 | ||||||
Medco Bell Pte, Ltd. (Singapore) | ||||||||
6.375%, 01/30/271 | 200,000 | 177,100 | ||||||
MEG Energy Corp. (Canada) | ||||||||
7.125%, 02/01/271 | 120,000 | 108,268 | ||||||
MEGlobal Canada ULC (Canada) | ||||||||
5.000%, 05/18/251 | 500,000 | 545,603 | ||||||
Merck & Co., Inc. | ||||||||
3.400%, 03/07/29 | 445,000 | 514,694 | ||||||
MGM Resorts International | ||||||||
5.750%, 06/15/252 | 46,000 | 47,869 | ||||||
6.750%, 05/01/25 | 80,000 | 84,278 | ||||||
Micron Technology, Inc. | ||||||||
2.497%, 04/24/23 | 180,000 | 187,428 | ||||||
Mileage Plus Holdings LLC / Mileage Plus Intellectual Property Assets, Ltd. | ||||||||
6.500%, 06/20/271 | 65,000 | 67,803 | ||||||
Mondelez International, Inc. | ||||||||
1.500%, 05/04/25 | 175,000 | 179,896 | ||||||
1.875%, 10/15/32 | 265,000 | 261,782 | ||||||
Moss Creek Resources Holdings, Inc. | ||||||||
7.500%, 01/15/261 | 80,000 | 40,000 | ||||||
| Principal | ||||||||
| Amount | Value | |||||||
MPH Acquisition Holdings LLC | ||||||||
5.750%, 11/01/281 | $120,000 | $117,750 | ||||||
Murphy Oil USA, Inc. | ||||||||
4.750%, 09/15/29 | 55,000 | 57,740 | ||||||
Nabors Industries, Ltd. (Bermuda) | ||||||||
7.250%, 01/15/261 | 60,000 | 23,513 | ||||||
NCL Corp., Ltd. (Bermuda) | ||||||||
3.625%, 12/15/241 | 90,000 | 63,187 | ||||||
NetApp, Inc. | ||||||||
1.875%, 06/22/25 | 255,000 | 263,606 | ||||||
Newell Brands, Inc. | ||||||||
4.875%, 06/01/25 | 30,000 | 32,522 | ||||||
Newfield Exploration Co. | ||||||||
5.625%, 07/01/24 | 50,000 | 48,412 | ||||||
Nexstar Broadcasting, Inc. | ||||||||
5.625%, 07/15/271 | 60,000 | 62,644 | ||||||
NGL Energy Partners LP / NGL Energy Finance Corp. | ||||||||
7.500%, 04/15/262 | 50,000 | 25,793 | ||||||
Northrop Grumman Corp. | ||||||||
5.150%, 05/01/40 | 335,000 | 448,948 | ||||||
Novelis Corp. | ||||||||
4.750%, 01/30/301 | 40,000 | 40,640 | ||||||
NuStar Logistics LP | ||||||||
6.000%, 06/01/26 | 100,000 | 98,921 | ||||||
Nutrien, Ltd. (Canada) | ||||||||
4.200%, 04/01/29 | 425,000 | 501,566 | ||||||
NXP BV/NXP Funding LLC/NXP USA, Inc. (Netherlands) | ||||||||
3.875%, 06/18/261 | 190,000 | 213,663 | ||||||
OAS Finance, Ltd. (Virgin Islands, British) | ||||||||
(U.S. Treasury Yield Curve CMT 5 year + 8.186%), 8.875%, 11/30/201,5,10,11 | 400,000 | 3,000 | ||||||
(U.S. Treasury Yield Curve CMT 5 year + 8.186%), 8.875%, 11/30/205,10,11 | 600,000 | 4,500 | ||||||
Oasis Petroleum, Inc. | ||||||||
6.250%, 05/01/261,10 | 65,000 | 14,300 | ||||||
6.875%, 03/15/2210 | 50,000 | 9,925 | ||||||
Occidental Petroleum Corp. | ||||||||
2.700%, 08/15/22 | 69,000 | 63,911 | ||||||
3.500%, 08/15/29 | 135,000 | 97,613 | ||||||
6.625%, 09/01/30 | 95,000 | 83,391 | ||||||
8.000%, 07/15/25 | 40,000 | 39,075 | ||||||
ONEOK, Inc. | ||||||||
3.400%, 09/01/29 | 150,000 | 145,984 | ||||||
ONGC Videsh Vankorneft Pte, Ltd. (Singapore) | ||||||||
2.875%, 01/27/22 | 200,000 | 202,241 | ||||||
ONGC Videsh, Ltd. (India) | ||||||||
3.750%, 05/07/23 | 200,000 | 208,217 | ||||||
Ooredoo International Finance, Ltd. (Bermuda) | ||||||||
3.250%, 02/21/23 | 600,000 | 627,268 | ||||||
The accompanying notes are an integral part of these financial statements.
63
Table of Contents
AMG Managers DoubleLine Core Plus Bond Fund Schedule of Portfolio Investments (continued) |
|
| Principal | ||||||||
| Amount | Value | |||||||
Industrials - 15.2% (continued) | ||||||||
Oracle Corp. | ||||||||
3.850%, 04/01/60 | $315,000 | $357,593 | ||||||
Ortho-Clinical Diagnostics, Inc. / Ortho-Clinical Diagnostics, S.A. | ||||||||
7.250%, 02/01/281 | 95,000 | 99,453 | ||||||
7.375%, 06/01/251 | 10,000 | 10,569 | ||||||
Owens Corning | ||||||||
4.400%, 01/30/48 | 210,000 | 232,984 | ||||||
Packaging Corp of America | ||||||||
3.400%, 12/15/27 | 225,000 | 249,045 | ||||||
Par Petroleum LLC/Par Petroleum Finance Corp. | ||||||||
7.750%, 12/15/251 | 110,000 | 89,501 | ||||||
Parkland Corp. (Canada) | ||||||||
5.875%, 07/15/271 | 95,000 | 98,226 | ||||||
Parsley Energy LLC/Parsley Finance Corp. | ||||||||
5.625%, 10/15/271 | 110,000 | 117,177 | ||||||
PBF Holding Co. LLC/PBF Finance Corp. | ||||||||
6.000%, 02/15/281 | 45,000 | 17,466 | ||||||
Peabody Energy Corp. | ||||||||
6.000%, 03/31/221 | 80,000 | 36,750 | ||||||
Penn National Gaming, Inc. | ||||||||
5.625%, 01/15/271,2 | 120,000 | 122,886 | ||||||
Penske Truck Leasing Co. LP/PTL Finance Corp. | ||||||||
4.200%, 04/01/271 | 245,000 | 275,214 | ||||||
Performance Food Group, Inc. | ||||||||
5.500%, 10/15/271 | 115,000 | 118,085 | ||||||
Peru LNG Srl (Peru) | ||||||||
5.375%, 03/22/30 | 600,000 | 461,136 | ||||||
PetSmart, Inc. | ||||||||
5.875%, 06/01/251 | 61,000 | 62,029 | ||||||
7.125%, 03/15/231 | 60,000 | 59,325 | ||||||
Pilgrim’s Pride Corp. | ||||||||
5.875%, 09/30/271 | 70,000 | 74,034 | ||||||
Pioneer Natural Resources Co. | ||||||||
1.900%, 08/15/30 | 275,000 | 257,628 | ||||||
POSCO (South Korea) | ||||||||
2.375%, 11/12/22 | 200,000 | 205,064 | ||||||
2.375%, 01/17/23 | 500,000 | 512,727 | ||||||
Post Holdings, Inc. | ||||||||
4.625%, 04/15/301 | 100,000 | 102,750 | ||||||
5.500%, 12/15/291 | 25,000 | 27,001 | ||||||
Prime Security Services Borrower LLC / Prime Finance, Inc. | ||||||||
3.375%, 08/31/271 | 35,000 | 33,819 | ||||||
Prime Security Services Borrower LLC/Prime Finance, Inc. | ||||||||
6.250%, 01/15/281 | 60,000 | 60,713 | ||||||
The Providence Service Corp. | ||||||||
5.875%, 11/15/251,8 | 40,000 | 40,775 | ||||||
| Principal | ||||||||
| Amount | Value | |||||||
PSA Treasury Pte Ltd. (Singapore) | ||||||||
2.125%, 09/05/29 | $400,000 | $414,853 | ||||||
PTTEP Treasury Center Co., Ltd. (Thailand) | ||||||||
2.587%, 06/10/271 | 200,000 | 206,805 | ||||||
QEP Resources, Inc. | ||||||||
5.250%, 05/01/23 | 75,000 | 59,737 | ||||||
5.625%, 03/01/26 | 75,000 | 47,775 | ||||||
Radiate Holdco LLC / Radiate Finance, Inc. | ||||||||
4.500%, 09/15/261 | 50,000 | 50,375 | ||||||
6.500%, 09/15/281 | 15,000 | 15,488 | ||||||
Radiology Partners, Inc. | ||||||||
9.250%, 02/01/281,2 | 85,000 | 90,821 | ||||||
Rattler Midstream LP | ||||||||
5.625%, 07/15/251 | 45,000 | 46,322 | ||||||
Reliance Industries, Ltd. (India) | ||||||||
5.400%, 02/14/22 | 250,000 | 263,074 | ||||||
Resideo Funding, Inc. | ||||||||
6.125%, 11/01/261 | 95,000 | 91,912 | ||||||
Reynolds Group Issuer Inc/Reynolds Group Issuer LLC/Reynolds Group Issuer Lu | ||||||||
4.000%, 10/15/271,2 | 35,000 | 35,569 | ||||||
Riverbed Technology, Inc. | ||||||||
8.875%, 03/01/231 | 55,000 | 37,675 | ||||||
Roper Technologies, Inc. | ||||||||
1.750%, 02/15/31 | 560,000 | 552,139 | ||||||
Royalty Pharma PLC (United Kingdom) | ||||||||
3.300%, 09/02/401 | 265,000 | 260,105 | ||||||
Sabine Pass Liquefaction LLC | ||||||||
5.000%, 03/15/27 | 210,000 | 235,755 | ||||||
Sabre GLBL, Inc. | ||||||||
9.250%, 04/15/251 | 35,000 | 38,631 | ||||||
SBA Tower Trust | ||||||||
3.168%, 04/11/221 | 400,000 | 404,934 | ||||||
Schlumberger Investment, S.A. (Luxembourg) | ||||||||
2.650%, 06/26/30 | 115,000 | 115,725 | ||||||
Schweitzer-Mauduit International, Inc. | ||||||||
6.875%, 10/01/261 | 90,000 | 95,270 | ||||||
Science Applications International Corp. | ||||||||
4.875%, 04/01/281 | 35,000 | 36,725 | ||||||
Scientific Games International, Inc. | ||||||||
5.000%, 10/15/251 | 115,000 | 115,575 | ||||||
8.250%, 03/15/261 | 45,000 | 45,639 | ||||||
The Scotts Miracle-Gro Co. | ||||||||
4.500%, 10/15/29 | 85,000 | 90,581 | ||||||
Scripps Escrow, Inc. | ||||||||
5.875%, 07/15/271 | 60,000 | 58,425 | ||||||
SEG Holding LLC / SEG Finance Corp. | ||||||||
5.625%, 10/15/281 | 95,000 | 97,023 | ||||||
Select Medical Corp. | ||||||||
6.250%, 08/15/261 | 175,000 | 184,894 | ||||||
The accompanying notes are an integral part of these financial statements.
64
Table of Contents
AMG Managers DoubleLine Core Plus Bond Fund Schedule of Portfolio Investments (continued) |
|
| Principal | ||||||||
| Amount | Value | |||||||
Industrials - 15.2% (continued) | ||||||||
Shire Acquisitions Investments (Ireland) | ||||||||
2.875%, 09/23/23 | $435,000 | $461,685 | ||||||
Silgan Holdings, Inc. | ||||||||
4.125%, 02/01/28 | 110,000 | 114,532 | ||||||
Sinopec Group Overseas Development 2018, Ltd. (Virgin Islands, British) | ||||||||
2.700%, 05/13/301 | 1,100,000 | 1,146,585 | ||||||
Six Flags Entertainment Corp. | ||||||||
4.875%, 07/31/241 | 125,000 | 116,359 | ||||||
Six Flags Theme Parks, Inc. | ||||||||
7.000%, 07/01/251,2 | 45,000 | 47,728 | ||||||
Smithfield Foods, Inc. | ||||||||
4.250%, 02/01/271 | 455,000 | 495,650 | ||||||
Sociedad Quimica y Minera de Chile SA (Chile) | ||||||||
4.375%, 01/28/25 | 200,000 | 218,271 | ||||||
Southwest Airlines Co. | ||||||||
4.750%, 05/04/23 | 260,000 | 278,665 | ||||||
Spectrum Brands, Inc. | ||||||||
5.000%, 10/01/291 | 75,000 | 79,687 | ||||||
Staples, Inc. | ||||||||
7.500%, 04/15/261 | 65,000 | 60,884 | ||||||
10.750%, 04/15/271 | 25,000 | 19,906 | ||||||
Stars Group Holdings BV/Stars Group US Co-Borrower LLC (Netherlands) | ||||||||
7.000%, 07/15/261 | 135,000 | 142,965 | ||||||
Stevens Holding Co, Inc. | ||||||||
6.125%, 10/01/261 | 110,000 | 117,954 | ||||||
SunCoke Energy Partners LP/SunCoke Energy Partners Finance Corp. | ||||||||
7.500%, 06/15/251 | 125,000 | 112,109 | ||||||
Sunoco Logistics Partners Operations LP | ||||||||
3.900%, 07/15/26 | 1,000,000 | 1,030,917 | ||||||
Sunoco LP/Sunoco Finance Corp. | ||||||||
5.500%, 02/15/26 | 120,000 | 120,652 | ||||||
6.000%, 04/15/27 | 60,000 | 62,098 | ||||||
Switch, Ltd. | ||||||||
3.750%, 09/15/281 | 35,000 | 35,109 | ||||||
Sydney Airport Finance Co. Pty, Ltd. (Australia) | ||||||||
3.375%, 04/30/251 | 990,000 | 1,053,172 | ||||||
Syngenta Finance, N.V. (Netherlands) | ||||||||
5.676%, 04/24/48 | 400,000 | 438,904 | ||||||
Sysco Corp. | ||||||||
3.300%, 02/15/50 | 420,000 | 397,519 | ||||||
Targa Resources Partners LP / Targa Resources Partners Finance Corp. | ||||||||
4.875%, 02/01/311 | 100,000 | 97,741 | ||||||
Targa Resources Partners LP/Targa Resources Partners Finance Corp. | ||||||||
6.500%, 07/15/27 | 60,000 | 63,000 | ||||||
| Principal | ||||||||
| Amount | Value | |||||||
Target Corp. | ||||||||
3.375%, 04/15/29 | $470,000 | $546,461 | ||||||
Tecnoglass, Inc. (Cayman Islands) | ||||||||
8.200%, 01/31/22 | 200,000 | 206,705 | ||||||
Telesat Canada/Telesat LLC (Canada) | ||||||||
4.875%, 06/01/271 | 75,000 | 76,547 | ||||||
6.500%, 10/15/271,2 | 60,000 | 59,784 | ||||||
Tempur Sealy International Inc. | ||||||||
5.500%, 06/15/26 | 194,000 | 201,999 | ||||||
Tencent Holdings, Ltd. (Cayman Islands) | ||||||||
2.390%, 06/03/301 | 700,000 | 708,626 | ||||||
Tenet Healthcare Corp. | ||||||||
4.875%, 01/01/261 | 110,000 | 111,724 | ||||||
5.125%, 11/01/271 | 45,000 | 46,449 | ||||||
6.125%, 10/01/281 | 105,000 | 102,178 | ||||||
6.250%, 02/01/271 | 120,000 | 124,764 | ||||||
Terrier Media Buyer, Inc. | ||||||||
8.875%, 12/15/271 | 30,000 | 30,724 | ||||||
Tervita Corp. (Canada) | ||||||||
7.625%, 12/01/211 | 105,000 | 101,062 | ||||||
Texas Instruments, Inc. | ||||||||
1.750%, 05/04/30 | 140,000 | 143,031 | ||||||
The Hillman Group, Inc. | ||||||||
6.375%, 07/15/221 | 45,000 | 44,596 | ||||||
Titan Acquisition, Ltd. / Titan Co-Borrower LLC (Canada) | ||||||||
7.750%, 04/15/261 | 30,000 | 30,000 | ||||||
T-Mobile USA, Inc. | ||||||||
1.500%, 02/15/261 | 55,000 | 55,473 | ||||||
3.500%, 04/15/251 | 245,000 | 268,669 | ||||||
TransDigm, Inc. | ||||||||
5.500%, 11/15/27 | 70,000 | 68,379 | ||||||
6.250%, 03/15/261 | 120,000 | 125,251 | ||||||
6.375%, 06/15/26 | 90,000 | 89,917 | ||||||
8.000%, 12/15/251 | 20,000 | 21,645 | ||||||
Transocean Poseidon, Ltd. (Cayman Islands) | ||||||||
6.875%, 02/01/271 | 105,000 | 79,012 | ||||||
Transocean Proteus, Ltd. (Cayman Islands) | ||||||||
6.250%, 12/01/241 | 91,000 | 80,535 | ||||||
Transocean, Inc. (Cayman Islands) | ||||||||
11.500%, 01/30/271 | 27,000 | 8,977 | ||||||
Trident TPI Holdings, Inc. | ||||||||
6.625%, 11/01/251 | 80,000 | 79,692 | ||||||
Triumph Group, Inc. | ||||||||
6.250%, 09/15/241 | 35,000 | 30,293 | ||||||
7.750%, 08/15/252 | 53,000 | 34,384 | ||||||
Twin River Worldwide Holdings, Inc. | ||||||||
6.750%, 06/01/271 | 135,000 | 136,951 | ||||||
Uber Technologies, Inc. | ||||||||
7.500%, 09/15/271 | 40,000 | 41,860 | ||||||
The accompanying notes are an integral part of these financial statements.
65
Table of Contents
AMG Managers DoubleLine Core Plus Bond Fund Schedule of Portfolio Investments (continued) |
|
| Principal | ||||||||
| Amount | Value | |||||||
Industrials - 15.2% (continued) | ||||||||
Uber Technologies, Inc. | ||||||||
8.000%, 11/01/261 | $75,000 | $79,172 | ||||||
United Natural Foods, Inc. | ||||||||
6.750%, 10/15/281 | 55,000 | 55,756 | ||||||
United Rentals North America Inc. | ||||||||
3.875%, 02/15/31 | 10,000 | 10,119 | ||||||
United Rentals North America, Inc. | ||||||||
5.250%, 01/15/30 | 20,000 | 21,713 | ||||||
Univision Communications, Inc. | ||||||||
6.625%, 06/01/271 | 55,000 | 55,722 | ||||||
Upjohn, Inc. | ||||||||
1.650%, 06/22/251 | 150,000 | 153,316 | ||||||
UPL Corp, Ltd. (Mauritius) | ||||||||
3.250%, 10/13/21 | 1,100,000 | 1,112,295 | ||||||
US Foods, Inc. | ||||||||
6.250%, 04/15/251 | 5,000 | 5,232 | ||||||
USA Compression Partners LP/USA Compression Finance Corp. | ||||||||
6.875%, 09/01/27 | 120,000 | 120,828 | ||||||
Vedanta Resources Finance II PLC (United Kingdom) | ||||||||
9.250%, 04/23/261 | 200,000 | 125,600 | ||||||
Vedanta Resources, Ltd. (United Kingdom) | ||||||||
6.125%, 08/09/24 | 1,800,000 | 1,058,051 | ||||||
Verizon Communications, Inc. | ||||||||
4.400%, 11/01/34 | 425,000 | 524,683 | ||||||
Verscend Escrow Corp. | ||||||||
9.750%, 08/15/261 | 148,000 | 159,377 | ||||||
Vertical US Newco, Inc. | ||||||||
5.250%, 07/15/271 | 200,000 | 206,215 | ||||||
ViaSat, Inc. | ||||||||
6.500%, 07/15/281,2 | 70,000 | 72,383 | ||||||
Viking Cruises, Ltd. (Bermuda) | ||||||||
5.875%, 09/15/271 | 150,000 | 117,281 | ||||||
13.000%, 05/15/251 | 25,000 | 28,359 | ||||||
Vine Oil & Gas LP/Vine Oil & Gas Finance Corp. | ||||||||
8.750%, 04/15/231,2 | 30,000 | 22,500 | ||||||
Viper Energy Partners LP | ||||||||
5.375%, 11/01/271 | 75,000 | 76,679 | ||||||
Vizient, Inc. | ||||||||
6.250%, 05/15/271 | 70,000 | 74,274 | ||||||
Volkswagen Group of America Finance LLC | ||||||||
4.250%, 11/13/231 | 245,000 | 269,331 | ||||||
Waste Pro USA, Inc. | ||||||||
5.500%, 02/15/261 | 75,000 | 75,968 | ||||||
Weatherford International, Ltd. (Bermuda) | ||||||||
11.000%, 12/01/241 | 4,000 | 2,377 | ||||||
West Street Merger Sub, Inc. | ||||||||
6.375%, 09/01/251 | 105,000 | 106,772 | ||||||
| Principal | ||||||||
| Amount | Value | |||||||
Western Midstream Operating LP | ||||||||
4.100%, 02/01/259 | $70,000 | $66,060 | ||||||
5.050%, 02/01/309 | 75,000 | 71,250 | ||||||
The William Carter Co. | ||||||||
5.625%, 03/15/271 | 100,000 | 105,125 | ||||||
Wolverine Escrow LLC | ||||||||
9.000%, 11/15/261 | 50,000 | 38,235 | ||||||
WPX Energy, Inc. | ||||||||
4.500%, 01/15/30 | 40,000 | 38,460 | ||||||
5.250%, 10/15/27 | 85,000 | 85,391 | ||||||
5.875%, 06/15/28 | 50,000 | 51,189 | ||||||
WRKCo, Inc. | ||||||||
3.750%, 03/15/25 | 430,000 | 478,469 | ||||||
Wyndham Hotels & Resorts, Inc. | ||||||||
4.375%, 08/15/281 | 60,000 | 59,748 | ||||||
Yum! Brands, Inc. | ||||||||
3.625%, 03/15/31 | 55,000 | 54,106 | ||||||
4.750%, 01/15/301 | 75,000 | 80,566 | ||||||
7.750%, 04/01/251 | 35,000 | 38,490 | ||||||
Zayo Group Holdings, Inc. | ||||||||
4.000%, 03/01/271 | 85,000 | 83,538 | ||||||
6.125%, 03/01/281 | 35,000 | 35,366 | ||||||
Total Industrials | 76,278,765 | |||||||
Utilities - 3.7% | ||||||||
AES Andres BV/Dominican Power Partners/Empresa Generadora de Electricidad It (Netherlands) | ||||||||
7.950%, 05/11/26 | 200,000 | 203,252 | ||||||
AES Andres/Dominican Power Partners/Empresa Generadora De Electricidad IT (Netherlands) | ||||||||
7.950%, 05/11/261 | 1,000,000 | 1,016,260 | ||||||
AES Gener SA (Chile) | ||||||||
(6.350% to 04/07/25 then U.S. Treasury Yield Curve CMT 5 year + 4.917%), 6.350%, 10/07/791,3,4 | 200,000 | 201,825 | ||||||
(7.125% to 07/06/24 then USD Swap 5 year + 4.644%), 7.125%, 03/26/791,3,4 | 900,000 | 932,032 | ||||||
AES Panama Generation Holdings SRL (Panama) | ||||||||
4.375%, 05/31/301 | 350,000 | 371,329 | ||||||
American Electric Power Co, Inc. Series F | ||||||||
2.950%, 12/15/22 | 1,300,000 | 1,359,404 | ||||||
American Water Capital Corp. | ||||||||
3.400%, 03/01/25 | 775,000 | 855,499 | ||||||
Arizona Public Service Co. | ||||||||
3.350%, 05/15/50 | 175,000 | 193,187 | ||||||
The Brooklyn Union Gas Co. | ||||||||
4.487%, 03/04/491 | 390,000 | 486,480 | ||||||
Calpine Corp. | ||||||||
4.500%, 02/15/281 | 55,000 | 56,045 | ||||||
4.625%, 02/01/291 | 20,000 | 20,224 | ||||||
The accompanying notes are an integral part of these financial statements.
66
Table of Contents
AMG Managers DoubleLine Core Plus Bond Fund Schedule of Portfolio Investments (continued) |
|
| Principal | ||||||||
| Amount | Value | |||||||
Utilities - 3.7% (continued) | ||||||||
Calpine Corp. | ||||||||
5.125%, 03/15/281 | $35,000 | $36,138 | ||||||
Clearway Energy Operating LLC | ||||||||
4.750%, 03/15/281 | 75,000 | 78,914 | ||||||
DTE Energy Co. | ||||||||
2.950%, 03/01/30 | 1,000,000 | 1,082,094 | ||||||
Duke Energy Corp. | ||||||||
3.950%, 08/15/47 | 350,000 | 407,680 | ||||||
Duke Energy Progress LLC | ||||||||
4.150%, 12/01/44 | 290,000 | 354,478 | ||||||
Duquesne Light Holdings, Inc. | ||||||||
3.616%, 08/01/271 | 1,000,000 | 1,076,294 | ||||||
The East Ohio Gas Co. | ||||||||
3.000%, 06/15/501 | 275,000 | 278,592 | ||||||
Empresa Electrica Angamos SA (Chile) | ||||||||
4.875%, 05/25/29 | 305,175 | 303,594 | ||||||
Empresa Electrica Guacolda SA (Chile) | ||||||||
4.560%, 04/30/25 | 800,000 | 642,204 | ||||||
Engie Energia Chile SA (Chile) | ||||||||
4.500%, 01/29/25 | 550,000 | 606,230 | ||||||
Entergy Corp. | ||||||||
2.800%, 06/15/30 | 145,000 | 156,351 | ||||||
Essential Utilities, Inc. | ||||||||
2.704%, 04/15/30 | 205,000 | 217,111 | ||||||
Eversource Energy | ||||||||
Series R | ||||||||
1.650%, 08/15/30 | 275,000 | 268,691 | ||||||
FirstEnergy Corp. | ||||||||
Series B | ||||||||
2.250%, 09/01/30 | 75,000 | 70,820 | ||||||
Georgia Power Co. | ||||||||
Series A | ||||||||
2.200%, 09/15/24 | 440,000 | 462,321 | ||||||
ITC Holdings Corp. | ||||||||
3.250%, 06/30/26 | 1,000,000 | 1,112,205 | ||||||
Korea East-West Power Co., Ltd. (South Korea) | ||||||||
1.750%, 05/06/251 | 200,000 | 206,781 | ||||||
LLPL Capital Pte, Ltd. (Singapore) | ||||||||
6.875%, 02/04/391 | 187,800 | 215,903 | ||||||
Minejesa Capital BV (Netherlands) | ||||||||
5.625%, 08/10/37 | 200,000 | 207,859 | ||||||
Monongahela Power Co. | ||||||||
5.400%, 12/15/431 | 165,000 | 217,457 | ||||||
NextEra Energy Capital Holdings, Inc. | ||||||||
2.250%, 06/01/30 | 1,000,000 | 1,035,372 | ||||||
3.550%, 05/01/27 | 200,000 | 224,740 | ||||||
NiSource, Inc. | ||||||||
3.600%, 05/01/30 | 150,000 | 170,635 | ||||||
| Principal | ||||||||
| Amount | Value | |||||||
Oncor Electric Delivery Co. LLC | ||||||||
3.100%, 09/15/49 | $425,000 | $464,796 | ||||||
Pampa Energia SA (Argentina) | ||||||||
7.500%, 01/24/27 | 550,000 | 383,281 | ||||||
9.125%, 04/15/29 | 150,000 | 109,500 | ||||||
PG&E Corp. | ||||||||
5.000%, 07/01/28 | 30,000 | 30,116 | ||||||
Pike Corp. | ||||||||
5.500%, 09/01/281 | 65,000 | 66,639 | ||||||
Pinnacle West Capital Corp. | ||||||||
1.300%, 06/15/25 | 255,000 | 259,252 | ||||||
PSEG Power LLC | ||||||||
3.850%, 06/01/23 | 340,000 | 366,703 | ||||||
State Grid Overseas Investment 2013, Ltd. (Virgin Islands, British) | ||||||||
3.125%, 05/22/23 | 400,000 | 421,398 | ||||||
State Grid Overseas Investment 2016, Ltd., EMTN | ||||||||
(Virgin Islands, British) | ||||||||
1.000%, 08/05/25 | 200,000 | 198,243 | ||||||
Stoneway Capital Corp. (Canada) | ||||||||
10.000%, 03/01/2710 | 797,025 | 280,951 | ||||||
Superior Plus LP/Superior General Partner, Inc. (Canada) | ||||||||
7.000%, 07/15/261 | 170,000 | 182,385 | ||||||
Transelec SA (Chile) | ||||||||
4.625%, 07/26/231 | 300,000 | 323,816 | ||||||
Total Utilities | 18,215,081 | |||||||
Total Corporate Bonds and Notes | ||||||||
(Cost $132,616,091) | 133,075,054 | |||||||
Asset-Backed Securities - 9.9% | ||||||||
AASET US, Ltd. | ||||||||
Series 2018-1A, Class A | ||||||||
3.844%, 01/16/381 | 513,749 | 470,239 | ||||||
Adams Mill CLO, Ltd. | ||||||||
Series 2014-1A, Class D1 | ||||||||
(3 month LIBOR + 3.500%), 3.737%, 07/15/261,4 | 250,000 | 237,235 | ||||||
AIMCO CLO Series | ||||||||
Series 2018-AA, Class D | ||||||||
(3 month LIBOR + 2.550%), 2.768%, 04/17/311,4 | 500,000 | 464,224 | ||||||
ALM VII R, Ltd. | ||||||||
Series 2013-7RA, Class CR | ||||||||
(3 month LIBOR + 4.040%), 4.277%, 10/15/281,4 | 1,000,000 | 995,022 | ||||||
Apidos CLO XII | ||||||||
Series 2013-12A, Class DR | ||||||||
(3 month LIBOR + 2.600%), 2.837%, 04/15/311,4 | 500,000 | 442,607 | ||||||
Atrium IX | ||||||||
Series 9A, Class DR | ||||||||
(3 month LIBOR + 3.600%), 3.856%, 05/28/301,4 | 1,000,000 | 968,204 | ||||||
The accompanying notes are an integral part of these financial statements.
67
Table of Contents
AMG Managers DoubleLine Core Plus Bond Fund Schedule of Portfolio Investments (continued) |
|
| Principal | ||||||||
| Amount | Value | |||||||
Asset-Backed Securities - 9.9% | ||||||||
(continued) | ||||||||
Babson CLO, Ltd. | ||||||||
Series 2015-2A, Class DR (3 month LIBOR + 2.950%), 3.168%, 10/20/301,4 | $500,000 | $462,376 | ||||||
Series 2015-IA, Class DR (3 month LIBOR + 2.600%), 2.818%, 01/20/311,4 | 500,000 | 460,256 | ||||||
Barings CLO, Ltd. | ||||||||
Series 2017-1A, Class D (3 month LIBOR + 3.600%), 3.818%, 07/18/291,4 | 1,000,000 | 977,088 | ||||||
Series 2018-1A, Class C (3 month LIBOR + 2.600%), 2.837%, 04/15/311,4 | 350,000 | 310,126 | ||||||
Series 2018-3A, Class D (3 month LIBOR + 2.900%), 3.118%, 07/20/291,4 | 500,000 | 452,728 | ||||||
Series 2019-1A, Class D (3 month LIBOR + 3.850%), 4.087%, 04/15/311,4 | 500,000 | 493,567 | ||||||
Series 2019-2A, Class C (3 month LIBOR + 3.850%), 4.087%, 04/15/311,4 | 500,000 | 496,278 | ||||||
Beechwood Park CLO, Ltd. | ||||||||
Series 2019-1A, Class D1 (3 month LIBOR + 4.100%), 4.318%, 01/17/331,4 | 1,000,000 | 1,000,112 | ||||||
Blackbird Capital Aircraft Lease Securitization, Ltd. | ||||||||
Series 2016-1A, Class B 5.682%, 12/16/411,9 | 770,833 | 561,114 | ||||||
BlueMountain CLO, Ltd. | ||||||||
Series 2013-1A, Class CR (3 month LIBOR + 4.150%), 4.368%, 01/20/291,4 | 1,000,000 | 909,468 | ||||||
CAL Funding IV, Ltd. | ||||||||
Series 2020-1A, Class A 2.220%, 09/25/451 | 992,917 | 996,205 | ||||||
Canyon Capital CLO, Ltd. | ||||||||
Series 2014-1A, Class CR (3 month LIBOR + 2.750%), 2.964%, 01/30/311,4 | 500,000 | 439,024 | ||||||
Series 2017-1A, Class D (3 month LIBOR + 3.600%), 3.837%, 07/15/301,4 | 500,000 | 491,129 | ||||||
Castlelake Aircraft Structured Trust | ||||||||
Series 2019-1A, Class A 3.967%, 04/15/391 | 413,595 | 383,740 | ||||||
CBAM, Ltd. | ||||||||
Series 2019-10A, Class B (3 month LIBOR + 2.050%), 2.268%, 04/20/321,4 | 500,000 | 500,007 | ||||||
CIFC Funding, Ltd. | ||||||||
Series 2015-4A, Class CR (3 month LIBOR + 4.000%), 4.218%, 10/20/271,4 | 1,000,000 | 995,957 | ||||||
| Principal | ||||||||
| Amount | Value | |||||||
CLI Funding VI LLC | ||||||||
Series 2019-1A, Class A | ||||||||
3.710%, 05/18/441 | $429,537 | $436,647 | ||||||
Cook Park CLO Ltd. | ||||||||
Series 2018-1A, Class D | ||||||||
(3 month LIBOR + 2.600%), 2.818%, 04/17/301,4 | 750,000 | 677,502 | ||||||
Dorchester Park CLO DAC | ||||||||
Series 2015-1A, Class ER | ||||||||
(3 month LIBOR + 5.000%), 5.218%, | ||||||||
04/20/281,4 | 500,000 | 444,752 | ||||||
Dryden 40 Senior Loan Fund | ||||||||
Series 2015-40A, Class DR | ||||||||
(3 month LIBOR + 3.100%), 3.380%, 08/15/311,4 | 500,000 | 480,129 | ||||||
Dryden 43 Senior Loan Fund | ||||||||
Series 2016-43A, Class DRR | ||||||||
(3 month LIBOR + 3.550%), 3.768%, 07/20/291,4 | 500,000 | 491,104 | ||||||
Dryden 57 CLO, Ltd. | ||||||||
Series 2018-57A, Class D | ||||||||
(3 month LIBOR + 2.550%), 2.830%, 05/15/311,4 | 500,000 | 448,834 | ||||||
Elmwood CLO II, Ltd. | ||||||||
Series 2019-2A, Class B | ||||||||
(3 month LIBOR + 2.100%), 2.318%, 04/20/311,4 | 500,000 | 500,276 | ||||||
GAIA Aviation, Ltd. | ||||||||
Series 2019-1, Class A | ||||||||
3.967%, 12/15/441,9 | 367,394 | 331,477 | ||||||
Gilbert Park CLO, Ltd. | ||||||||
Series 2017-1A, Class D | ||||||||
(3 month LIBOR + 2.950%), 3.187%, 10/15/301,4 | 500,000 | 483,369 | ||||||
Series 2017-1A, Class E | ||||||||
(3 month LIBOR + 6.400%), 6.637%, 10/15/301,4 | 1,000,000 | 931,499 | ||||||
Global SC Finance II SRL | ||||||||
Series 2014-1A, Class A1 3.190%, 07/17/291 | 515,625 | 515,645 | ||||||
Halcyon Loan Advisors Funding, Ltd. | ||||||||
Series 2013-2A, Class C | ||||||||
(3 month LIBOR + 2.700%), 2.914%, 08/01/251,4 | 250,000 | 247,173 | ||||||
Highbridge Loan Management, Ltd. | ||||||||
Series 4A-2014, Class A2R | ||||||||
(3 month LIBOR + 1.500%), 1.722%, 01/28/301,4 | 1,000,000 | 971,187 | ||||||
Horizon Aircraft Finance III, Ltd. | ||||||||
Series 2019-2, Class A | ||||||||
3.425%, 11/15/391 | 965,772 | 905,091 | ||||||
Invitation Homes Trust | ||||||||
Series 2018-SFR1, Class C | ||||||||
(1 month LIBOR + 1.250%), 1.397%, | ||||||||
03/17/371,4 | 1,745,000 | 1,750,445 | ||||||
Series 2018-SFR1, Class D | ||||||||
(1 month LIBOR + 1.450%), 1.597%, 03/17/371,4 | 1,150,000 | 1,151,306 | ||||||
JOL Air, Ltd. | ||||||||
Series 2019-1, Class A | ||||||||
3.967%, 04/15/441 | 891,010 | 849,476 | ||||||
The accompanying notes are an integral part of these financial statements.
68
Table of Contents
AMG Managers DoubleLine Core Plus Bond Fund Schedule of Portfolio Investments (continued) |
|
| Principal | ||||||||
| Amount | Value | |||||||
Asset-Backed Securities - 9.9% | ||||||||
(continued) | ||||||||
LCM XIV, L.P. | ||||||||
Series 14A, Class DR | ||||||||
(3 month LIBOR + 2.750%), 2.968%, 07/20/311,4 | $500,000 | $435,370 | ||||||
LCM XVIII L.P. | ||||||||
Series 19A, Class D | ||||||||
(3 month LIBOR + 3.450%), 3.687%, 07/15/271,4 | 1,000,000 | 947,510 | ||||||
MACH 1 Cayman, Ltd. | ||||||||
Series 2019-1, Class A | ||||||||
3.474%, 10/15/391 | 1,843,750 | 1,761,468 | ||||||
Madison Park Funding XIV, Ltd. | ||||||||
Series 2014-14A, Class DRR | ||||||||
(3 month LIBOR + 2.950%), 3.166%, 10/22/301,4 | 500,000 | 475,091 | ||||||
Madison Park Funding XV, Ltd. | ||||||||
Series 2014-15A, Class CR | ||||||||
(3 month LIBOR + 3.450%), 3.667%, 01/27/261,4 | 500,000 | 495,106 | ||||||
Magnetite XXII, Ltd. | ||||||||
Series 2019-22A, Class D | ||||||||
(3 month LIBOR + 3.650%), 3.887%, 04/15/311,4 | 750,000 | 750,391 | ||||||
Mosaic Solar Loan Trust | ||||||||
Series 2018-1A, Class A | ||||||||
4.010%, 06/22/431 | 887,550 | 946,019 | ||||||
Mosaic Solar Loans LLC | ||||||||
Series 2017-1A, Class A | ||||||||
4.450%, 06/20/421 | 388,131 | 417,147 | ||||||
Myers Park CLO, Ltd. | ||||||||
Series 2018-1A, Class D | ||||||||
(3 month LIBOR + 3.050%), 3.268%, 10/20/301,4 | 1,000,000 | 958,278 | ||||||
Neuberger Berman Loan Advisers CLO, 27 Ltd. | ||||||||
Series 2018-27A, Class D | ||||||||
(3 month LIBOR + 2.600%), 2.837%, 01/15/301,4 | 500,000 | 469,550 | ||||||
Octagon Investment Partners 27, Ltd. | ||||||||
Series 2016-1A, Class DR | ||||||||
(3 month LIBOR + 2.950%), 3.187%, 07/15/301,4 | 500,000 | 449,442 | ||||||
Octagon Investment Partners 30, Ltd. | ||||||||
Series 2017-1A, Class D | ||||||||
(3 month LIBOR + 6.200%), 6.418%, 03/17/301,4 | 250,000 | 217,815 | ||||||
Octagon Investment Partners XV, Ltd. | ||||||||
Series 2013-1A, Class DR | ||||||||
(3 month LIBOR + 3.700%), 3.918%, 07/19/301,4 | 1,000,000 | 959,632 | ||||||
Octagon Investment Partners XVI, Ltd. | ||||||||
Series 2013-1A, Class DR | ||||||||
(3 month LIBOR + 3.000%), 3.218%, 07/17/301,4 | 500,000 | 451,373 | ||||||
Octagon Investment Partners XXI, Ltd. | ||||||||
Series 2014-1A, Class CRR | ||||||||
(3 month LIBOR + 3.950%), 4.215%, 02/14/311,4 | 500,000 | 496,773 | ||||||
Octagon Investment Partners XXII, Ltd. | ||||||||
Series 2014-1A, Class ERR | ||||||||
(3 month LIBOR + 5.450%), 5.666%, 01/22/301,4 | 500,000 | 420,935 | ||||||
| Principal | ||||||||
| Amount | Value | |||||||
Octagon Investment Partners30, Ltd. | ||||||||
Series 2017-1A, Class C | ||||||||
(3 month LIBOR + 3.500%), 3.718%, 03/17/301,4 | $500,000 | $476,385 | ||||||
OHA Credit Funding 1, Ltd. | ||||||||
Series 2018-1A, Class D | ||||||||
(3 month LIBOR + 3.050%), 3.268%, 10/20/301,4 | 500,000 | 479,335 | ||||||
OHA Credit Funding 5, Ltd. | ||||||||
Series 2020-5A, Class E | ||||||||
(3 month LIBOR + 6.250%), 6.468%, 04/18/331,4 | 500,000 | 466,151 | ||||||
Pretium Mortgage Credit Partners I LLC | ||||||||
Series 2020-NPL1, Class A2 | ||||||||
3.967%, 05/27/591,9 | 2,600,000 | 2,522,694 | ||||||
Primose Funding LLC | ||||||||
Series 2019-1A, | ||||||||
4.475%, 07/30/491 | 990,000 | 1,024,779 | ||||||
Sprite 2017-1, Ltd. | ||||||||
Series 2017-1, Class A | ||||||||
4.250%, 12/15/371 | 322,192 | 284,736 | ||||||
Stack Infrastructure Issuer LLC | ||||||||
Series 2019-1A, Class A2 | ||||||||
4.540%, 02/25/441 | 737,500 | 785,627 | ||||||
START Ireland | ||||||||
Series 2019-1, Class A | ||||||||
4.089%, 03/15/441 | 329,827 | 314,617 | ||||||
Textainer Marine Containers VII, Ltd. | ||||||||
Series 2019-1A, Class A | ||||||||
3.960%, 04/20/441 | 660,000 | 671,098 | ||||||
Trinity Rail Leasing 2010 LLC | ||||||||
Series 2010-1A, Class A | ||||||||
5.194%, 10/16/401 | 863,941 | 907,553 | ||||||
VB-S1 Issuer LLC | ||||||||
Series 2018-1A, Class D | ||||||||
4.122%, 02/15/481 | 1,500,000 | 1,532,874 | ||||||
Series 2020-1A, Class C2 | ||||||||
3.031%, 06/15/501 | 500,000 | 520,481 | ||||||
VERDE CLO, Ltd. | ||||||||
Series 2019-1A, Class D | ||||||||
(3 month LIBOR + 3.800%), 4.037%, 04/15/321,4 | 500,000 | 487,494 | ||||||
VOLT LXXXVII LLC | ||||||||
Series 2020-NPL3, Class A1A | ||||||||
2.981%, 02/25/501,9 | 532,902 | 533,786 | ||||||
Voya CLO, Ltd. | ||||||||
Series 2015-2A, Class DR | ||||||||
(3 month LIBOR + 2.950%), 3.159%, 07/23/271,4 | 500,000 | 457,968 | ||||||
WAVE LLC | ||||||||
Series 2019-1, Class A | ||||||||
3.597%, 09/15/441 | 1,415,942 | 1,328,118 | ||||||
Westcott Park CLO, Ltd. | ||||||||
Series 2016-1A, Class DR | ||||||||
(3 month LIBOR + 3.250%), 3.468%, 07/20/281,4 | 1,000,000 | 969,150 | ||||||
Total Asset-Backed Securities | ||||||||
(Cost $51,317,216) | 49,537,364 | |||||||
The accompanying notes are an integral part of these financial statements.
69
Table of Contents
AMG Managers DoubleLine Core Plus Bond Fund Schedule of Portfolio Investments (continued) |
|
| Principal | ||||||||
| Amount | Value | |||||||
Mortgage-Backed Securities - 17.4% |
| |||||||
Ajax Mortgage Loan Trust | ||||||||
Series 2019-C, Class A | ||||||||
3.950%, 10/25/581,4 | $2,598,256 | $2,612,539 | ||||||
Alternative Loan Trust | ||||||||
Series 2007-18CB, Class 2A17 | ||||||||
6.000%, 08/25/37 | 35,280 | 30,598 | ||||||
Series 2007-23CB, Class A3 | 159,829 | 61,679 | ||||||
Series 2007-23CB, Class A4 | ||||||||
Floor 0.000%), 6.351%, 09/25/374,12 | 152,610 | 49,700 | ||||||
Series 2007-J2, Class 2A1 | 99,212 | 100,707 | ||||||
Banc of America Funding Trust | ||||||||
Series 2006-B, Class 7A1 | ||||||||
3.564%, 03/20/364 | 176,761 | 160,487 | ||||||
BANK | ||||||||
Series 2020-BN28, Class AS | ||||||||
2.140%, 03/15/63 | 524,000 | 532,568 | ||||||
Series 2020-BN28, Class B | ||||||||
2.344%, 03/15/63 | 524,000 | 532,836 | ||||||
Bayview Financial Acquisition Trust | ||||||||
Series 2007-A, Class 1A5 | ||||||||
6.101%, 05/28/379 | 69,078 | 71,940 | ||||||
BBCMS Mortgage Trust | ||||||||
Series 2017-DELC, Class C | 132,000 | 123,421 | ||||||
Series 2017-DELC, Class D | 150,000 | 137,976 | ||||||
Series 2017-DELC, Class E | 302,000 | 273,407 | ||||||
Series 2017-DELC, Class F | 301,000 | 272,759 | ||||||
Bear Stearns Asset Backed Securities I Trust | ||||||||
Series 2004-AC2, Class 2A | ||||||||
5.000%, 05/25/34 | 53,155 | 52,769 | ||||||
Benchmark Mortgage Trust | ||||||||
Series 2020-B17, Class B 2.916%, 03/15/53 | 340,000 | 350,824 | ||||||
Series 2020-B19, Class AS 2.148%, 09/15/53 | 524,000 | 528,352 | ||||||
Series 2020-B19, Class B 2.351%, 09/15/53 | 524,000 | 530,869 | ||||||
BFLD | ||||||||
Series 2019-DPLO, Class E | ||||||||
(1 month LIBOR + 2.240%), 2.388%, 10/15/341,4 | 866,000 | 785,397 | ||||||
BHMS | ||||||||
Series 2018-ATLS, Class C | ||||||||
(1 month LIBOR + 1.900%), 2.048%, 07/15/351,4 | 115,000 | 105,471 | ||||||
| Principal | ||||||||
| Amount | Value | |||||||
BX Trust | ||||||||
Series 2019-OC11, Class E | ||||||||
4.075%, 12/09/411,4 | $709,000 | $653,275 | ||||||
CFCRE Commercial Mortgage Trust | ||||||||
Series 2016-C3, Class XA | ||||||||
1.005%, 01/10/484,12 | 8,702,864 | 386,422 | ||||||
Citigroup Commercial Mortgage Trust | ||||||||
Series 2012-GC8, Class XA 1.756%, 09/10/451,4,12 | 585,681 | 14,568 | ||||||
Series 2014-GC25, Class XA 0.990%, 10/10/474,12 | 4,547,310 | 146,156 | ||||||
Series 2015-GC27, Class D 4.421%, 02/10/481,4 | 197,700 | 163,192 | ||||||
Series 2015-GC31, Class C | ||||||||
4.055%, 06/10/484 | 780,000 | 760,242 | ||||||
Series 2016-GC36, Class B | ||||||||
4.755%, 02/10/494 | 763,000 | 820,159 | ||||||
Series 2016-GC36, Class XA | ||||||||
1.253%, 02/10/494,12 | 7,365,336 | 378,793 | ||||||
Series 2016-P3, Class XA | ||||||||
1.700%, 04/15/494,12 | 4,958,441 | 332,693 | ||||||
Series 2016-P4, Class XA | ||||||||
1.962%, 07/10/494,12 | 5,021,263 | 396,964 | ||||||
Citigroup Mortgage Loan Trust | ||||||||
Series 2006-AR2, Class 1A2 | ||||||||
3.703%, 03/25/364 | 517,626 | 493,494 | ||||||
Series 2010-7, Class 11A1 | ||||||||
4.899%, 07/25/361,4 | 44,618 | 44,612 | ||||||
COMM Mortgage Trust | ||||||||
Series 2016-DC2, Class XA | ||||||||
0.985%, 02/10/494,12 | 6,451,167 | 262,868 | ||||||
Series 2016-GCT, Class E | ||||||||
3.461%, 08/10/291,4 | 780,000 | 780,096 | ||||||
Series 2016-GCT, Class F | ||||||||
3.461%, 08/10/291,4 | 795,000 | 784,310 | ||||||
Commercial Mortgage Pass Through Certificates | ||||||||
Series 2012-CR3, Class XA 1.848%, 10/15/454,12 | 1,429,647 | 37,710 | ||||||
Series 2013-CR10, Class XA 0.658%, 08/10/464,12 | 16,028,112 | 255,216 | ||||||
Series 2015-CR26, Class B 4.480%, 10/10/484 | 600,000 | 647,384 | ||||||
Series 2015-CR26, Class XA 0.931%, 10/10/484,12 | 7,539,257 | 282,906 | ||||||
Series 2015-LC23, Class C 4.619%, 10/10/484 | 585,000 | 586,056 | ||||||
Series 2016-CR28, Class C 4.639%, 02/10/494 | 726,000 | 738,909 | ||||||
Commercial Mortgage Trust | ||||||||
Series 2018-HCLV, Class C | ||||||||
(1 month LIBOR + 1.700%), 1.848%, 09/15/331,4 | 600,000 | 566,811 | ||||||
CORE Mortgage Trust | ||||||||
Series 2019-CORE, Class E | 775,000 | 759,701 | ||||||
The accompanying notes are an integral part of these financial statements.
70
Table of Contents
AMG Managers DoubleLine Core Plus Bond Fund Schedule of Portfolio Investments (continued) |
|
| Principal | ||||||||
| Amount | Value | |||||||
| Mortgage-Backed Securities - 17.4% (continued) |
| |||||||
CORE Mortgage Trust | ||||||||
Series 2019-CORE, Class F | ||||||||
(1 month LIBOR + 2.350%), 2.498%, 12/15/311,4 | $775,000 | $747,896 | ||||||
Countrywide Alternative Loan Trust | ||||||||
Series 2005-86CB, Class A5 | ||||||||
5.500%, 02/25/36 | 596,896 | 496,351 | ||||||
Series 2006-J1, Class 2A1 | ||||||||
7.000%, 02/25/36 | 435,746 | 98,782 | ||||||
Countrywide Home Loan Mortgage Pass Through Trust | ||||||||
Series 2005-HYB8, Class 4A1 | ||||||||
3.646%, 12/20/354 | 253,763 | 241,892 | ||||||
Series 2007-14, Class A15 | ||||||||
6.500%, 09/25/37 | 729,631 | 602,679 | ||||||
Series 2007-2, Class A13 | ||||||||
6.000%, 03/25/37 | 270,605 | 206,978 | ||||||
Series 2007-7, Class A4 | ||||||||
5.750%, 06/25/37 | 46,446 | 36,865 | ||||||
Credit Suisse First Boston Mortgage Securities Corp. | ||||||||
Series 2005-9, Class 5A9 | ||||||||
5.500%, 10/25/35 | 775,271 | 635,085 | ||||||
Credit Suisse Mortgage Capital Certificates | ||||||||
Series 2007-1, Class 5A4 | ||||||||
6.000%, 02/25/37 | 450,933 | 402,496 | ||||||
Credit-Based Asset Servicing and Securitization LLC | ||||||||
Series 2007-MX1, Class A4 | ||||||||
6.231%, 12/25/361,9 | 100,000 | 104,153 | ||||||
CSAIL Commercial Mortgage Trust | ||||||||
Series 2016-C6, Class XA | ||||||||
1.896%, 01/15/494,12 | 5,240,184 | 380,186 | ||||||
Series 2017-CX10, Class B | ||||||||
3.892%, 11/15/504 | 506,000 | 536,875 | ||||||
Series 2018-C14, Class C | ||||||||
4.891%, 11/15/514 | 880,000 | 942,441 | ||||||
CSMC Trust | ||||||||
Series 2017-CHOP, Class D | ||||||||
(1 month LIBOR + 1.900%), 2.048%, 07/15/321,4 | 261,000 | 225,568 | ||||||
Series 2017-CHOP, Class E | ||||||||
(1 month LIBOR + 3.300%), 3.448%, 07/15/321,4 | 230,000 | 184,559 | ||||||
DBJPM | ||||||||
Series 2016-C1, Class C | ||||||||
3.347%, 05/10/494 | 534,000 | 483,179 | ||||||
Series 2016-C1, Class XA | ||||||||
1.440%, 05/10/494,12 | 7,380,697 | 427,048 | ||||||
Deutsche Alt-A Securities Mortgage Loan Trust | ||||||||
Series 2007-OA3, Class A2 | ||||||||
(1 month LIBOR + 0.250%), 0.399%, 07/25/474 | 2,862,071 | 2,522,684 | ||||||
| Principal | ||||||||
| Amount | Value | |||||||
First Horizon Alternative Mortgage | ||||||||
Securities Trust | ||||||||
Series 2006-AA7, Class A1 | ||||||||
3.166%, 01/25/374 | $1,314,150 | $1,178,559 | ||||||
Fontainebleau Miami Beach Trust | ||||||||
Series 2019-FBLU, Class E | ||||||||
3.963%, 12/10/361,4 | 472,000 | 442,063 | ||||||
Series 2019-FBLU, Class F | ||||||||
3.963%, 12/10/361,4 | 367,000 | 330,114 | ||||||
Series 2019-FBLU, Class G | ||||||||
3.963%, 12/10/361,4 | 424,000 | 374,804 | ||||||
FREMF Mortgage Trust | ||||||||
Series 2016-KF22, Class B | ||||||||
(1 month LIBOR + 5.050%), 5.198%, 07/25/231,4 | 94,301 | 95,519 | ||||||
Great Wolf Trust | ||||||||
Series 2019-WOLF, Class F | ||||||||
(1 month LIBOR + 3.131%), 3.279%, 12/15/361,4 | 717,000 | 624,492 | ||||||
GS Mortgage Securities Trust | ||||||||
Series 2014-GC26, Class D | ||||||||
4.511%, 11/10/471,4 | 1,301,000 | 915,196 | ||||||
Series 2015-GC34, Class XA | ||||||||
1.244%, 10/10/484,12 | 5,965,895 | 286,593 | ||||||
Series 2015-GS1, Class XA | ||||||||
0.766%, 11/10/484,12 | 10,308,160 | 343,132 | ||||||
Series 2016-GS2, Class XA | ||||||||
1.643%, 05/10/494,12 | 7,207,985 | 434,895 | ||||||
GSAA Home Equity Trust | ||||||||
Series 2006-15, Class AF3B | ||||||||
5.933%, 09/25/364 | 757,000 | 68,079 | ||||||
GSCG Trust | ||||||||
Series 2019-600C, Class D | ||||||||
3.764%, 09/06/341 | 862,000 | 848,670 | ||||||
Series 2019-600C, Class E | ||||||||
3.985%, 09/06/341,4 | 862,000 | 842,696 | ||||||
GSR Mortgage Loan Trust | ||||||||
Series 2006-2F, Class 2A17 | ||||||||
5.750%, 02/25/36 | 1,662,531 | 1,651,505 | ||||||
Series 2006-AR1, Class 3A1 | ||||||||
3.741%, 01/25/364 | 125,287 | 123,931 | ||||||
Headlands Residential LLC | ||||||||
Series 2019-RPL1, Class NOTE | ||||||||
3.967%, 06/25/241,9 | 5,900,000 | 5,935,038 | ||||||
HPLY Trust | ||||||||
Series 2019-HIT, Class F | ||||||||
(1 month LIBOR + 3.150%), 3.298%, 11/15/361,4 | 657,336 | 574,960 | ||||||
JP Morgan Chase Commercial Mortgage | ||||||||
Securities Trust | ||||||||
Series 2006-A2, Class 2A1 | ||||||||
3.550%, 04/25/364 | 945,490 | 930,673 | ||||||
Series 2006-LDP8, Class X | ||||||||
0.288%, 05/15/454,12 | 16,915 | 0 | ||||||
Series 2011-C4, Class XA | ||||||||
1.127%, 07/15/461,4,12 | 74,984 | 172 | ||||||
Series 2012-C8, Class XA | ||||||||
1.761%, 10/15/454,12 | 1,258,568 | 33,177 | ||||||
The accompanying notes are an integral part of these financial statements.
71
Table of Contents
AMG Managers DoubleLine Core Plus Bond Fund Schedule of Portfolio Investments (continued) |
|
| Principal | ||||||||
| Amount | Value | |||||||
Mortgage-Backed Securities - 17.4% |
| |||||||
(continued) | ||||||||
JP Morgan Chase Commercial Mortgage | ||||||||
Securities Trust | ||||||||
Series 2012-CBX, Class XA | ||||||||
1.472%, 06/15/454,12 | $513,050 | $4,974 | ||||||
Series 2015-JP1, Class XA | ||||||||
1.033%, 01/15/494,12 | 7,107,885 | 238,044 | ||||||
Series 2016-JP2, Class B | ||||||||
3.459%, 08/15/49 | 320,000 | 329,220 | ||||||
JPMBB Commercial Mortgage Securities Trust | ||||||||
Series 2014-C18, Class XA | ||||||||
0.825%, 02/15/474,12 | 4,364,866 | 94,178 | ||||||
Series 2014-C23, Class C | ||||||||
4.472%, 09/15/474 | 330,824 | 329,440 | ||||||
Series 2014-C25, Class C | ||||||||
4.450%, 11/15/474 | 450,000 | 430,895 | ||||||
Series 2014-C25, Class XA | ||||||||
0.849%, 11/15/474,12 | 5,162,612 | 146,716 | ||||||
Series 2015-C27, Class D | ||||||||
3.807%, 02/15/481,4 | 263,000 | 210,670 | ||||||
Series 2015-C28, Class XA | ||||||||
0.972%, 10/15/484,12 | 5,977,019 | 200,469 | ||||||
Series 2015-C33, Class C | ||||||||
4.612%, 12/15/484 | 670,000 | 700,317 | ||||||
JPMDB Commercial Mortgage Securities Trust | ||||||||
Series 2016-C2, Class XA | ||||||||
1.658%, 06/15/494,12 | 6,818,708 | 398,603 | ||||||
Series 2020-COR7, Class C | ||||||||
3.726%, 05/13/534 | 496,000 | 511,978 | ||||||
Legacy Mortgage Asset Trust | ||||||||
Series 2019-GS5, Class A1 | ||||||||
3.200%, 05/25/591,9 | 432,590 | 437,129 | ||||||
Lehman XS Trust | ||||||||
Series 2007-12N, Class 1A3A | ||||||||
(1 month LIBOR + 0.200%), 0.349%, 07/25/474 | 4,501,255 | 4,292,487 | ||||||
LSTAR Commercial Mortgage Trust | ||||||||
Series 2016-4, Class C | ||||||||
4.586%, 03/10/491,4 | 588,000 | 540,652 | ||||||
Merrill Lynch Mortgage Investors Trust | ||||||||
Series 2006-AF2, Class AF1 | ||||||||
6.250%, 10/25/36 | 2,726,853 | 1,851,288 | ||||||
Morgan Stanley Bank of America | ||||||||
Merrill Lynch Trust | ||||||||
Series 2012-C5, Class XA | ||||||||
1.417%, 08/15/451,4,12 | 618,558 | 11,009 | ||||||
Series 2014-C14, Class XA | ||||||||
0.976%, 02/15/474,12 | 2,542,251 | 66,151 | ||||||
Series 2014-C18, Class C | ||||||||
4.524%, 10/15/474 | 300,000 | 293,554 | ||||||
Series 2015-C27, Class C | ||||||||
4.524%, 12/15/474 | 80,000 | 78,956 | ||||||
| Principal | ||||||||
| Amount | Value | |||||||
Morgan Stanley Bank of America | ||||||||
Merrill Lynch Trust | ||||||||
Series 2016-C28, Class XA | ||||||||
1.199%, 01/15/494,12 | $7,309,517 | $335,293 | ||||||
Morgan Stanley Capital I Trust | ||||||||
Series 2016-UB11, Class XA | ||||||||
1.576%, 08/15/494,12 | 2,630,844 | 159,541 | ||||||
Morgan Stanley Mortgage Loan Trust | ||||||||
Series 2005-3AR, Class 2A2 | ||||||||
2.959%, 07/25/354 | 288,368 | 276,060 | ||||||
Series 2005-9AR, Class 2A | ||||||||
2.891%, 12/25/354 | 2,574,374 | 2,441,746 | ||||||
Series 2007-14AR, Class 1A3 | ||||||||
4.007%, 10/25/374 | 681,771 | 589,003 | ||||||
Nomura Asset Acceptance Corp. Alternative | ||||||||
Loan Trust | ||||||||
Series 2005-AP3, Class A3 | ||||||||
5.318%, 08/25/354 | 167,796 | 103,660 | ||||||
PR Mortgage Loan Trust | ||||||||
Series 2014-1, Class APT | ||||||||
5.911%, 10/25/491,4 | 1,628,172 | 1,609,132 | ||||||
Prime Mortgage Trust | ||||||||
Series 2006-1, Class 2A9 | ||||||||
6.250%, 06/25/36 | 3,280,675 | 3,279,092 | ||||||
PRPM LLC | ||||||||
Series 2019-3A, Class A1 | ||||||||
3.351%, 07/25/241,9 | 2,092,884 | 2,098,578 | ||||||
RALI Trust | ||||||||
Series 2005-QA10, Class A31 | ||||||||
4.031%, 09/25/354 | 620,382 | 523,679 | ||||||
Series 2006-QO10, Class A1 | ||||||||
(1 month LIBOR + 0.160%), 0.309%, | ||||||||
01/25/374 | 4,081,120 | 3,892,569 | ||||||
Series 2006-QS7, Class A2 | ||||||||
6.000%, 06/25/36 | 1,921,568 | 1,819,494 | ||||||
Residential Asset Securitization Trust | ||||||||
Series 2006-A6, Class 1A1 | ||||||||
6.500%, 07/25/36 | 179,262 | 80,641 | ||||||
Series 2007-A1, Class A8 | ||||||||
6.000%, 03/25/37 | 330,418 | 190,352 | ||||||
STRU JPM-3156 COLL | ||||||||
2.225%, 12/01/508,11 | 4,800,000 | 4,870,800 | ||||||
Structured Adjustable Rate Mortgage Loan Trust | ||||||||
Series 2006-1, Class 2A2 | ||||||||
3.113%, 02/25/364 | 91,727 | 88,030 | ||||||
UBS Commercial Mortgage Trust | ||||||||
Series 2018-C8, Class C | ||||||||
4.702%, 02/15/514 | 917,000 | 892,337 | ||||||
Series 2019-C16, Class B | ||||||||
4.320%, 04/15/524 | 769,000 | 839,186 | ||||||
Series 2019-C18, Class B | ||||||||
3.681%, 12/15/524 | 717,000 | 759,747 | ||||||
UBS-Barclays Commercial Mortgage Trust | ||||||||
Series 2012-C3, Class XA | ||||||||
1.815%, 08/10/491,4,12 | 1,307,147 | 34,264 | ||||||
The accompanying notes are an integral part of these financial statements.
72
Table of Contents
AMG Managers DoubleLine Core Plus Bond Fund Schedule of Portfolio Investments (continued) |
|
| Principal | ||||||||
| Amount | Value | |||||||
Mortgage-Backed Securities - 17.4% |
| |||||||
(continued) | ||||||||
Verus Securitization Trust | ||||||||
Series 2020-NPL1, Class A1 | ||||||||
3.598%, 08/25/501,9 | $1,557,084 | $1,560,049 | ||||||
Washington Mutual Mortgage Pass Through | ||||||||
Certificates WMALT Trust | ||||||||
Series 2005-8, Class 2CB1 | ||||||||
5.500%, 10/25/35 | 802,062 | 811,713 | ||||||
Washington Mutual Mortgage Pass-Through | ||||||||
Certificates WMALT Trust | ||||||||
Series 2005-6, Class 3CB | ||||||||
5.500%, 08/25/35 | 2,200,317 | 2,219,034 | ||||||
Wells Fargo Commercial Mortgage Trust | ||||||||
Series 2014-LC16, Class D | ||||||||
3.938%, 08/15/501 | 218,000 | 106,131 | ||||||
Series 2015-C28, Class C | ||||||||
4.101%, 05/15/484 | 400,000 | 388,673 | ||||||
Series 2015-NXS1, Class XA | ||||||||
1.096%, 05/15/484,12 | 3,362,275 | 129,058 | ||||||
Series 2016-C33, Class C | ||||||||
3.896%, 03/15/59 | 517,000 | 515,555 | ||||||
Series 2016-C33, Class XA | ||||||||
1.702%, 03/15/594,12 | 4,156,910 | 287,518 | ||||||
Series 2016-NXS6, Class XA | ||||||||
1.617%, 11/15/494,12 | 6,071,107 | 364,080 | ||||||
Series 2019-C50, Class B | ||||||||
4.192%, 05/15/52 | 637,000 | 696,861 | ||||||
Series 2019-C50, Class C | ||||||||
4.345%, 05/15/52 | 637,000 | 627,979 | ||||||
Series 2020-C57, Class XA | ||||||||
2.103%, 08/15/534,12 | 3,406,697 | 532,568 | ||||||
WFRBS Commercial Mortgage Trust | ||||||||
Series 2012-C8, Class XA | ||||||||
1.792%, 08/15/451,4,12 | 626,525 | 13,339 | ||||||
Series 2012-C9, Class XA | ||||||||
1.881%, 11/15/451,4,12 | 940,161 | 26,420 | ||||||
Series 2014-C21, Class XA | ||||||||
1.032%, 08/15/474,12 | 4,930,780 | 149,508 | ||||||
Total Mortgage-Backed Securities | ||||||||
(Cost $89,221,099) | 87,395,241 | |||||||
Municipal Bonds - 0.2% | ||||||||
California State General Obligation, | ||||||||
School Improvements | ||||||||
7.550%, 04/01/39 | 305,000 | 524,594 | ||||||
Missouri Highway & Transportation Commission, | ||||||||
Build America Bonds | ||||||||
5.063%, 05/01/24 | 220,000 | 250,707 | ||||||
Total Municipal Bonds | ||||||||
(Cost $672,941) | 775,301 | |||||||
U.S. Government and Agency Obligations - 33.8% |
| |||||||
Fannie Mae - 8.5% | ||||||||
FNMA, | ||||||||
2.140%, 10/01/29 | 7,000,000 | 7,448,441 | ||||||
| Principal | ||||||||
| Amount | Value | |||||||
FNMA, | ||||||||
2.260%, 01/01/30 | $3,200,000 | $3,439,057 | ||||||
2.500%, 12/01/39 | 8,679,961 | 9,052,218 | ||||||
3.000%, 03/01/45 | 1,713,790 | 1,800,742 | ||||||
3.500%, 12/01/31 to 01/01/32 | 460,567 | 490,473 | ||||||
4.000%, 09/01/31 to 06/01/42 | 173,811 | 186,154 | ||||||
4.500%, 03/01/42 | 76,682 | 81,670 | ||||||
FNMA Pool, | ||||||||
2.000%, 10/01/40 | 4,881,710 | 5,048,904 | ||||||
FNMA REMICS, | ||||||||
Series 2007-57, Class SX | ||||||||
(6.620% minus 1 month LIBOR, Cap 6.620%, | ||||||||
Floor 0.000%), 6.471%, 10/25/364,12 | 81,972 | 16,201 | ||||||
Series 2009-86, Class CI | ||||||||
(5.800% minus 1 month LIBOR, Cap 5.800%, | ||||||||
Floor 0.000%), 5.651%, 09/25/364,12 | 114,310 | 15,729 | ||||||
Series 2010-156, Class ZC | ||||||||
4.000%, 01/25/41 | 390,849 | 444,495 | ||||||
Series 2011-121, Class JP | ||||||||
4.500%, 12/25/41 | 85,534 | 92,268 | ||||||
Series 2012-105, Class Z | ||||||||
3.500%, 10/25/42 | 1,326,448 | 1,473,522 | ||||||
Series 2012-127, Class PA | ||||||||
2.750%, 11/25/42 | 1,111,800 | 1,183,850 | ||||||
Series 2012-20, Class ZT | ||||||||
3.500%, 03/25/42 | 4,873,626 | 5,325,090 | ||||||
Series 2012-31, Class Z | ||||||||
4.000%, 04/25/42 | 1,895,265 | 2,097,610 | ||||||
Series 2015-9, Class HA | ||||||||
3.000%, 01/25/45 | 2,970,813 | 3,184,802 | ||||||
Series 2015-95, Class AP | ||||||||
3.000%, 08/25/42 | 1,222,702 | 1,255,409 | ||||||
Total Fannie Mae | 42,636,635 | |||||||
Freddie Mac - 9.0% | ||||||||
FHLMC, | ||||||||
2.000%, 08/01/50 | 4,915,616 | 5,070,947 | ||||||
3.000%, 04/01/47 | 2,083,305 | 2,194,947 | ||||||
FHLMC Gold, | ||||||||
3.000%, 07/01/45 to 08/01/45 | 4,243,092 | 4,466,131 | ||||||
3.500%, 10/01/42 | 351,710 | 367,648 | ||||||
4.000%, 10/01/41 | 58,809 | 62,559 | ||||||
5.000%, 07/01/35 | 13,203 | 15,230 | ||||||
FHLMC Pool, | ||||||||
1.500%, 09/01/35 | 4,824,386 | 4,927,523 | ||||||
3.000%, 11/01/39 | 2,776,104 | 2,914,601 | ||||||
FHLMC REMICS, | ||||||||
Series 2909, Class Z | ||||||||
5.000%, 12/15/34 | 163,872 | 187,332 | ||||||
Series 3301, Class MS | ||||||||
(6.100% minus 1 month LIBOR, Cap 6.100%, | ||||||||
Floor 0.000%), 5.952%, 04/15/374,12 | 55,786 | 10,951 | ||||||
Series 3382, Class SB | ||||||||
(6.000% minus 1 month LIBOR, Cap | ||||||||
6.000%, Floor 0.000%), 5.852%, 11/15/374,12 | 9,739 | 1,351 | ||||||
Series 3384, Class S | ||||||||
(6.390% minus 1 month LIBOR, Cap 6.390%, | ||||||||
Floor 0.000%), 6.242%, 11/15/374,12 | 13,839 | 1,673 | ||||||
The accompanying notes are an integral part of these financial statements.
73
Table of Contents
AMG Managers DoubleLine Core Plus Bond Fund Schedule of Portfolio Investments (continued) |
|
| Principal | ||||||||
| Amount | Value | |||||||
Freddie Mac - 9.0% (continued) | ||||||||
FHLMC REMICS, | ||||||||
Series 3500, Class SA | ||||||||
(5.520% minus 1 month LIBOR, | $47,365 | $6,440 | ||||||
Series 3626, Class AZ | ||||||||
5.500%, 08/15/36 | 87,876 | 101,842 | ||||||
Series 3792, Class SE | ||||||||
(9.860% minus 2 times 1 month LIBOR, | 903,021 | 1,000,192 | ||||||
Series 3795, Class VZ | ||||||||
4.000%, 01/15/41 | 91,889 | 99,357 | ||||||
Series 3872, Class BA | ||||||||
4.000%, 06/15/41 | 22,821 | 24,602 | ||||||
Series 3894, Class ZA | ||||||||
4.500%, 07/15/41 | 178,933 | 202,599 | ||||||
Series 3957, Class HZ | ||||||||
4.000%, 11/15/41 | 642,471 | 698,953 | ||||||
Series 4016, Class KZ | ||||||||
4.000%, 03/15/42 | 2,535,901 | 2,885,467 | ||||||
Series 4075, Class S | ||||||||
(5.500% minus 1 month LIBOR, | 1,772,410 | 316,289 | ||||||
Series 4215, Class KC | ||||||||
2.250%, 03/15/38 | 135,066 | 135,105 | ||||||
Series 4316, Class BZ | ||||||||
3.000%, 03/15/44 | 3,654,159 | 4,004,062 | ||||||
Series 4323, Class GA | ||||||||
3.000%, 06/15/40 | 579,665 | 586,415 | ||||||
Series 4511, Class QA | ||||||||
3.000%, 01/15/41 | 533,878 | 536,327 | ||||||
Series 4750, Class PA | ||||||||
3.000%, 07/15/46 | 2,456,243 | 2,551,029 | ||||||
Series 4934, Class P | ||||||||
2.500%, 11/15/40 | 6,173,334 | 6,535,327 | ||||||
Seasoned Credit Risk Transfer Trust | ||||||||
Series 2018-2, Class HV | ||||||||
3.000%, 11/25/574 | 4,624,522 | 5,082,243 | ||||||
Total Freddie Mac | 44,987,142 | |||||||
Ginnie Mae - 0.3% | ||||||||
GNMA, | ||||||||
Series 2004-35, Class SA | ||||||||
(32.500% minus 6.5 times 1 month LIBOR, | ||||||||
03/20/344 | 14,212 | 24,121 | ||||||
Series 2008-69, Class SB | ||||||||
(7.630% minus 1 month LIBOR, | 167,103 | 37,199 | ||||||
Series 2009-32, Class ZE | ||||||||
4.500%, 05/16/39 | 171,767 | 190,411 | ||||||
Series 2009-35, Class DZ | ||||||||
4.500%, 05/20/39 | 197,281 | 221,349 | ||||||
Series 2009-75, Class GZ | ||||||||
4.500%, 09/20/39 | 194,530 | 215,727 | ||||||
Series 2010-98, Class IA | ||||||||
5.652%, 03/20/394,12 | 32,916 | 3,613 | ||||||
| Principal | ||||||||
| Amount | Value | |||||||
GNMA, | ||||||||
Series 2011-89, Class SA | ||||||||
(5.450% minus 1 month LIBOR, | $344,972 | $64,769 | ||||||
Series 2014-156, Class PS | ||||||||
(6.250% minus 1 month LIBOR, | 1,336,470 | 256,507 | ||||||
Series 2014-5, Class PS | ||||||||
(6.150% minus 1 month LIBOR, Cap 6.150%, | ||||||||
Floor 0.000%), 5.999%, 07/20/434,12 | 1,178,439 | 162,277 | ||||||
Total Ginnie Mae | 1,175,973 | |||||||
U.S. Treasury Obligations - 16.0% | ||||||||
U.S. Treasury Bonds, | ||||||||
1.125%, 08/15/40 | 4,440,000 | 4,206,900 | ||||||
1.375%, 08/15/50 | 3,960,000 | 3,692,081 | ||||||
4.750%, 02/15/37 | 2,400,000 | 3,681,750 | ||||||
2.750%, 11/15/42 to 11/15/47 | 3,225,000 | 4,030,223 | ||||||
U.S. Treasury Notes, | ||||||||
0.125%, 10/15/23 | 760,000 | 758,426 | ||||||
0.250%, 10/31/25 | 7,620,000 | 7,569,693 | ||||||
0.500%, 06/30/27 to 10/31/27 | 15,910,000 | 15,766,054 | ||||||
0.625%, 08/15/30 | 4,190,000 | 4,092,779 | ||||||
2.250%, 10/31/24 to 11/15/27 | 12,915,000 | 14,149,710 | ||||||
1.625%, 10/31/26 | 3,810,000 | 4,056,906 | ||||||
1.750%, 11/30/21 | 5,650,000 | 5,748,765 | ||||||
2.125%, 09/30/24 | 3,890,000 | 4,168,834 | ||||||
2.625%, 01/31/26 | 1,260,000 | 1,404,408 | ||||||
2.750%, 02/28/25 | 2,360,000 | 2,606,602 | ||||||
3.000%, 09/30/25 | 3,810,000 | 4,295,924 | ||||||
Total U.S. Treasury Obligations | 80,229,055 | |||||||
Total U.S. Government and Agency Obligations | ||||||||
(Cost $163,353,824) | 169,028,805 | |||||||
Foreign Government Obligations - 1.3% | ||||||||
Abu Dhabi Government International Bond | ||||||||
(United Arab Emirates) | ||||||||
0.750%, 09/02/231 | 200,000 | 200,203 | ||||||
2.500%, 04/16/251 | 200,000 | 212,560 | ||||||
3.125%, 04/16/301 | 300,000 | 334,600 | ||||||
Indonesia Government International Bond (Indonesia) | ||||||||
3.375%, 04/15/23 | 200,000 | 211,787 | ||||||
Korea Electric Power Corp. (South Korea) | ||||||||
1.125%, 06/15/251 | 300,000 | 301,429 | ||||||
Mexico Government International Bond (Mexico) | ||||||||
3.750%, 01/11/28 | 560,000 | 607,132 | ||||||
4.150%, 03/28/27 | 206,000 | 229,819 | ||||||
Perusahaan Penerbit SBSN Indonesia III (Indonesia) | ||||||||
4.150%, 03/29/27 | 500,000 | 561,325 | ||||||
Peruvian Government International Bond (Peru) | ||||||||
2.392%, 01/23/26 | 300,000 | 315,750 | ||||||
2.783%, 01/23/31 | 500,000 | 541,625 | ||||||
Philippine Government International Bond (Philippines) | ||||||||
2.457%, 05/05/30 | 300,000 | 321,286 | ||||||
The accompanying notes are an integral part of these financial statements.
74
Table of Contents
AMG Managers DoubleLine Core Plus Bond Fund Schedule of Portfolio Investments (continued) |
| Principal Amount | Value | |||||||
Foreign Government Obligations - 1.3% (continued) |
| |||||||
Qatar Government International Bond (Qatar) | ||||||||
3.375%, 03/14/24 | $700,000 | $755,853 | ||||||
3.875%, 04/23/23 | 300,000 | 322,384 | ||||||
Saudi Government International Bond (Saudi Arabia) | ||||||||
2.375%, 10/26/21 | 600,000 | 609,714 | ||||||
2.875%, 03/04/23 | 400,000 | 418,346 | ||||||
2.900%, 10/22/251 | 650,000 | 695,787 | ||||||
Total Foreign Government Obligations | 6,639,600 | |||||||
Floating Rate Senior Loan Interests - 3.0% | ||||||||
Financials - 0.3% | ||||||||
Acrisure LLC, Term Loan B 2020, | ||||||||
(1 month LIBOR + 0.000%), 0.036%, 02/15/274 | 170,523 | 164,875 | ||||||
AssuredPartners, Inc., 2020 February Refinancing Term Loan, | ||||||||
(1 month LIBOR + 3.500%), 3.648%, 02/13/274 | 243,798 | 235,691 | ||||||
Asurion LLC Replacement B-6 Term Loan, | ||||||||
(1 month LIBOR + 3.000%), 3.148%, 11/03/234 | 287,843 | 282,858 | ||||||
Asurion LLC, Second Lien Replacement B-2 Term Loan, | ||||||||
(1 month LIBOR + 6.500%), 6.648%, 08/04/254 | 75,152 | 75,355 | ||||||
Avantor Inc., Term Loan B, | ||||||||
(3 month LIBOR + 2.500%), 3.500%, 10/30/274,13 | 160,000 | 158,800 | ||||||
Blackhawk Network Holdings, Inc., First Lien Term Loan, | ||||||||
(1 month LIBOR + 3.000%), 3.148%, 06/15/254 | 146,121 | 137,427 | ||||||
Deerfield Dakota Holding LLC, First Lien Initial Dollar Term Loan, | ||||||||
(1 month LIBOR + 3.750%), 4.750%, 04/09/274 | 159,600 | 157,545 | ||||||
The Edelman Financial Center LLC, | ||||||||
(1 month LIBOR + 3.000%), 3.152%, 07/19/254 | 93,448 | 90,469 | ||||||
Sedgwick Claims Management Services, Inc., 2019 New Term Loans, | ||||||||
(1 month LIBOR + 4.000%), 4.148%, 09/03/264 | 143,188 | 139,531 | ||||||
TKC Holdings, Inc., Initial Term Loan (First Lien), | ||||||||
(1 month LIBOR + 3.750%), 4.250%, 02/01/234 | 178,917 | 168,481 | ||||||
Total Financials | 1,611,032 | |||||||
Industrials - 2.7% | ||||||||
Access CIG LLC, First Lien Term B Loan, | ||||||||
(3 month LIBOR + 3.750%), 3.975%, 02/27/254 | 59,391 | 57,981 | ||||||
Achilles Holdco LLC, Delayed Draw Term Loan, | ||||||||
(1 month LIBOR + 4.500%), 5.250%, 10/30/274,13 | 32,812 | 31,992 | ||||||
Achilles Holdco LLC, Term Loan, | ||||||||
(1 month LIBOR + 4.500%), 5.250%, 10/30/274,13 | 177,187 | 172,758 | ||||||
| Principal Amount | Value | |||||||
Air Methods Corp., First Lien Loan, | ||||||||
(3 month LIBOR + 3.500%), 4.500%, 04/22/244 | $84,346 | $72,622 | ||||||
Aldevron LLC, First Lien Initial Term Loan, | ||||||||
(1 month LIBOR + 4.250%), 5.250%, 10/11/264 | 149,262 | 149,542 | ||||||
AlixPartners LLP, 2017 Refinancing Term Loan, | ||||||||
(1 month LIBOR + 2.500%), 2.648%, 04/04/244 | 341,073 | 331,054 | ||||||
Alterra Mountain Co., Initial Term Loan, | ||||||||
(1 month LIBOR + 2.750%), 2.898%, 07/31/244 | 171,486 | 166,127 | ||||||
American Tire Distributors, Inc., Initial Term Loan, | ||||||||
(3 month LIBOR + 7.500%), 8.500%, 09/01/244 | 39,599 | 33,936 | ||||||
Ascend Learning LLC, Initial Term Loan, | ||||||||
(1 month LIBOR + 3.000%), 4.000%, 07/12/244 | 184,524 | 180,450 | ||||||
ASHCO LLC, Initial Term Loan, | ||||||||
(3 month LIBOR + 5.000%), 5.750%, 09/25/244 | 79,590 | 79,413 | ||||||
Asplundh Tree Expert LLC, Initial Term Loan, | ||||||||
(1 month LIBOR + 2.500%), 2.640%, 09/04/274 | 90,000 | 89,925 | ||||||
Avaya Inc., Tranche B-1 Term Loan, | ||||||||
(1 month LIBOR + 4.250%), 4.398%, 12/15/274 | 58,172 | 56,245 | ||||||
Avaya, Inc., Tranche B Term Loan, | ||||||||
(3 month LIBOR + 4.250%), 4.398%, 12/15/244 | 46,828 | 46,122 | ||||||
Bausch Health Companies, Inc., First Incremental Term Loan, | ||||||||
(1 month LIBOR + 2.750%), 2.899%, 11/27/254 | 128,000 | 125,067 | ||||||
Bioscrip, Inc., First Lien Term B Loan, | ||||||||
(1 month LIBOR + 4.500%), 4.648%, 08/06/264 | 178,800 | 175,112 | ||||||
Blackstone CQP Holdco LP, Initial Term Loan, | ||||||||
(3 month LIBOR + 3.500%), 3.730%, 09/30/244 | 113,389 | 111,121 | ||||||
Brand Industrial Services, Inc., Initial Term Loan, | ||||||||
(3 month LIBOR + 4.250%), 5.250%, 06/21/244 | 79,487 | 74,233 | ||||||
Buckeye Partners LP, Term Loan, | ||||||||
(1 month LIBOR + 2.750%), 2.900%, 11/01/264 | 99,500 | 97,603 | ||||||
Caesars Resort Collection LLC, Term B Loan, | ||||||||
(1 month LIBOR + 2.750%), 2.898%, 12/22/244 | 232,608 | 218,749 | ||||||
Caesars Resort Collection LLC, Term B-1 Loan, | ||||||||
(1 month LIBOR + 4.500%), 4.650%, 07/20/254 | 75,000 | 72,734 | ||||||
Camelot US Acquisition I Co., Amendment No. 2, Incremental Term Loans, | ||||||||
(1 month LIBOR + 3.000%), 4.000%, 10/31/264 | 145,000 | 143,097 | ||||||
Castle US Holding Corp., Term Loan, | ||||||||
(3 month LIBOR + 3.750%), 3.970%, 01/31/274 | 243,979 | 230,154 | ||||||
Cengage Learning, Inc., Term B Loan, | ||||||||
(3 month LIBOR + 4.250%), 5.250%, 06/07/234 | 113,940 | 102,136 | ||||||
CenturyLink, Inc., Term B Loan, | ||||||||
(1 month LIBOR + 2.250%), 2.398%, 03/15/274 | 343,271 | 331,100 | ||||||
Charter NEX US, Inc., Incremental Term Loan, | ||||||||
(1 month LIBOR + 3.250%), 3.400%, 05/16/244 | 68,654 | 67,169 | ||||||
CHG Healthcare Services, Inc., New Term Loan, | ||||||||
(3 month LIBOR + 3.000%), 4.000%, 06/07/234 | 73,825 | 72,145 | ||||||
The accompanying notes are an integral part of these financial statements.
75
Table of Contents
AMG Managers DoubleLine Core Plus Bond Fund Schedule of Portfolio Investments (continued) |
|
| Principal | ||||||||
| Amount | Value | |||||||
Industrials - 2.7% (continued) | ||||||||
Clear Channel Outdoor Holdings, Inc., | ||||||||
Term B Loan, | ||||||||
(3 month LIBOR + 3.500%), 3.500%, 08/21/264 | $14,850 | $13,600 | ||||||
ClubCorp Holdings Inc., Term B Loan (First Lien), | ||||||||
(3 month LIBOR + 2.750%), 2.970%, 09/18/244 | 54,578 | 46,152 | ||||||
Compass Power Generation LLC, Tranche B-1 | ||||||||
Term Loan, | ||||||||
(1 month LIBOR + 3.500%), 4.500%, 12/20/244 | 83,761 | 82,295 | ||||||
Cornerstone OnDemand, Inc., Term Loan, | ||||||||
(1 month LIBOR + 4.250%), 4.400%, 04/22/274 | 131,641 | 130,621 | ||||||
CSC Holdings LLC, September 2019 Term Loan, | ||||||||
(1 month LIBOR + 2.500%), 2.648%, 04/15/274 | 193,054 | 187,302 | ||||||
Cvent, Inc., First Lien Term Loan, | ||||||||
(1 month LIBOR + 3.750%), 3.898%, 11/30/244 | 144,551 | 133,565 | ||||||
Diamond (BC) B.V., Initial USD Term Loan, | ||||||||
(3 month LIBOR + 3.000%), 3.210%, 09/06/244 | 113,981 | 109,303 | ||||||
Envision Healthcare Corp., Initial Term Loan, | ||||||||
(1 month LIBOR + 3.750%), 3.898%, 10/10/254 | 69,470 | 50,001 | ||||||
Filtration Group Corporation, Initial Dollar | ||||||||
Term Loan, | ||||||||
(1 month LIBOR + 3.000%), 3.148%, 03/29/254 | 281,317 | 274,184 | ||||||
Finastra USA Inc., Dollar Term Loan | ||||||||
(Second Lien), | ||||||||
(3 month LIBOR + 7.250%), 8.250%, 06/13/254 | 30,000 | 29,317 | ||||||
Finastra USA, Inc., First Lien Dollar Term Loan, | ||||||||
(3 month LIBOR + 3.500%), 4.500%, 06/13/244 | 76,563 | 72,469 | ||||||
Flex Acquisition Co., Inc., Incremental B-2018 | ||||||||
Term Loan, | ||||||||
(3 month LIBOR + 3.250%), 3.480%, 06/29/254 | 9,989 | 9,628 | ||||||
Flex Acquisition Co., Inc., Initial Term Loan, | ||||||||
(3 month LIBOR + 3.000%), 4.000%, 12/29/234 | 105,965 | 103,581 | ||||||
Froneri U.S., Inc., First Lien Term B Loan, | ||||||||
(1 month LIBOR + 2.250%), 2.400%, 01/31/274 | 359,100 | 347,109 | ||||||
Gentiva Health Services Inc., New Term Loan B, | ||||||||
(1 month LIBOR + 3.250%), 3.438%, 07/02/254 | 273,407 | 268,281 | ||||||
Getty Images Inc., Initial Dollar Term Loan, | ||||||||
(3 month LIBOR + 4.500%), 4.688%, 02/19/264 | 49,087 | 45,958 | ||||||
Go Daddy Operating Company LLC, Tranche B-3 | ||||||||
Term Loan, | ||||||||
(1 month LIBOR + 2.500%), 2.648%, 08/10/274 | 104,737 | 103,199 | ||||||
GOBP Holdings Inc., First Lien Term Loan, | ||||||||
(1 month LIBOR + 2.750%), 2.899%, 10/22/254 | 117,427 | 115,128 | ||||||
Golden Nugget, Inc., B Term Loan, | ||||||||
(2 month LIBOR + 2.500%), 3.250%, 10/04/234 | 324,305 | 287,334 | ||||||
GrafTech Finance Inc., Initial Term Loan, | ||||||||
(1 month LIBOR + 3.500%), 4.500%, 02/12/254 | 58,066 | 57,413 | ||||||
Graham Packaging Co., Inc., | ||||||||
(1 month LIBOR + 3.750%), 4.500%, 08/04/274 | 100,000 | 99,214 | ||||||
| Principal | ||||||||
| Amount | Value | |||||||
Greeneden US Holdings II LLC, Term Loan B, | ||||||||
(1 month LIBOR + 4.250%), 4.750%, | ||||||||
10/08/274,13 | $70,000 | $69,300 | ||||||
Greeneden US Holdings II LLC, Tranche B-3 Dollar | ||||||||
Term Loan, | ||||||||
(1 month LIBOR + 3.250%), 3.398%, 12/01/234 | 234,362 | 233,751 | ||||||
Harbor Freight Tools USA Inc, 2020 Initial Term | ||||||||
Loan, | ||||||||
(1 month LIBOR + 3.250%), 4.000%, 10/19/274 | 125,000 | 123,389 | ||||||
H-Food Holdings LLC, Initial Term Loan, | ||||||||
(1 month LIBOR + 4.000%), 3.835%, 05/31/254 | 74,341 | 71,693 | ||||||
Hyland Software, Inc., 2018 Refinancing | ||||||||
Term Loan, | ||||||||
(1 month LIBOR + 3.500%), 4.000%, | ||||||||
07/01/244,13 | 304,256 | 300,548 | ||||||
Illuminate Buyer LLC, Term B Loan, | ||||||||
(1 month LIBOR + 4.000%), 4.148%, 06/30/274 | 110,000 | 108,391 | ||||||
Infoblox Inc., First Lien Term Loan, | ||||||||
(1 month LIBOR + 3.750), 4.500%, 10/07/274,13 | 85,000 | 83,789 | ||||||
Intelsat Jackson Holdings, S.A., Tranche B-3 Term | ||||||||
Loan, | ||||||||
(3 month LIBOR + 5.750%), 8.000%, 11/27/234 | 235,000 | 237,007 | ||||||
Ion Trading Finance Ltd., Initial Dollar Term Loan, | ||||||||
(3 month LIBOR + 4.000%), 5.000%, 11/21/244 | 29,691 | 29,235 | ||||||
IRB Holding Corp., Term B Loan, | ||||||||
(3 month LIBOR + 2.750%), 3.750%, 02/05/254 | 198,246 | 189,148 | ||||||
Kestrel Bidco Inc., Initial Term Loan, | ||||||||
(3 month LIBOR + 3.000%), 4.000%, 12/11/264 | 89,225 | 79,299 | ||||||
Kloeckner Pentaplast of America, Inc., Dollar | ||||||||
Term Loan, | ||||||||
(3 month LIBOR + 4.250%), 5.250%, 06/30/224 | 14,770 | 14,390 | ||||||
Kronos Acquisition Holdings, Inc., Term B-3 Loan, | ||||||||
(3 month LIBOR + 4.000%), 5.000%, 05/15/234 | 74,872 | 74,342 | ||||||
Life Time, Inc., New 2017 Refinancing Term Loan, | ||||||||
(3 month LIBOR + 2.750%), 3.750%, 06/10/224 | 71,416 | 66,111 | ||||||
LifePoint Health, Inc., First Lien Term B Loan, | ||||||||
(1 month LIBOR + 3.750%), 3.898%, 11/16/254 | 175,000 | 170,224 | ||||||
Lower Cadence Holdings LLC, Intial Term Loan, | ||||||||
(1 month LIBOR + 4.000%), 4.148%, 05/22/264 | 137,682 | 125,635 | ||||||
Mavis Tire Express Services Corp., Closing Date | ||||||||
Term Loan (First Lien), | ||||||||
(3 month LIBOR + 3.250%), 3.470%, 03/20/254 | 99,112 | 95,023 | ||||||
Messer Industries USA, Inc., Initial Term B-1 Loan, | ||||||||
(3 month LIBOR + 2.500%), 2.720%, 03/01/264 | 28,981 | 28,292 | ||||||
Milano Acquisition Corp, Term B Loan, | ||||||||
(3 month LIBOR + 4.000%), 4.750%, 10/01/274 | 150,000 | 147,656 | ||||||
Mister Car Wash Holdings, Inc., First Lien Initial | ||||||||
Term Loan, | ||||||||
(1 month LIBOR + 3.250%), 3.401%, 05/14/264 | 79,322 | 75,257 | ||||||
The accompanying notes are an integral part of these financial statements.
76
Table of Contents
AMG Managers DoubleLine Core Plus Bond Fund Schedule of Portfolio Investments (continued) |
|
| Principal | ||||||||
| Amount | Value | |||||||
Industrials - 2.7% (continued) | ||||||||
Mitchell International, Inc. Initial Term | ||||||||
Loan (First Lien), | ||||||||
(1 month LIBOR + 3.250%), 3.398%, 12/01/244 | $218,132 | $208,384 | ||||||
MLN US HoldCo LLC, Term B Loan (First Lien), | ||||||||
(1 month LIBOR + 4.500%), 4.648%, 11/30/254 | 35,522 | 29,323 | ||||||
Nexstar Broadcasting, Inc., Term B-4 Loan, | ||||||||
(1 month LIBOR + 2.750%), 2.899%, 09/19/264 | 273,778 | 267,333 | ||||||
Numericable U.S. LLC, USD TLB-13 Incremental | ||||||||
Term Loan, | ||||||||
(3 month LIBOR + 4.000%), 4.237%, 08/14/264 | 183,772 | 178,856 | ||||||
Panther BF Aggregator 2 LP, First Lien Initial | ||||||||
Dollar Term Loan , | ||||||||
(1 month LIBOR + 3.500%), 3.648%, 04/30/264 | 55,963 | 54,354 | ||||||
Parexel International Corp., Initial Term Loan, | ||||||||
(1 month LIBOR + 2.750%), 2.898%, 09/27/244 | 185,000 | 177,908 | ||||||
Peak 10 Holding Corp., Initial Term Loan | ||||||||
(First Lien), | ||||||||
(3 month LIBOR + 3.500%), 3.720%, 08/01/244 | 44,655 | 39,184 | ||||||
PetSmart, Inc., Tranche B-2 Loan, | ||||||||
(3 month LIBOR + 3.500%), 4.500%, 03/11/224 | 282,396 | 280,454 | ||||||
Playtika Holding Corp., Term B Loan, | ||||||||
(1 month LIBOR + 6.000%), 7.000%, | ||||||||
12/10/244,13 | 48,726 | 48,859 | ||||||
Ply Gem Midco, Inc., Initial Term Loan, | ||||||||
(1 month LIBOR + 3.750%), 3.895%, 04/12/254 | 70,442 | 69,319 | ||||||
Prime Security Services Borrower LLC (aka | ||||||||
Protection 1 Security Solutions), 2019 | ||||||||
Refinancing Term B-1 Loan, | ||||||||
(3 month LIBOR + 3.250%), 4.250%, 09/23/264 | 99,248 | 98,063 | ||||||
Project Alpha Intermediate Holding, Inc., | ||||||||
Term Loan, | ||||||||
(3 month LIBOR + 3.500%), 4.500%, 04/26/244 | 228,259 | 224,265 | ||||||
Radiate Holdco LLC, Term B Loan, | ||||||||
(1 month LIBOR + 3.500%), 4.250%, 09/25/264 | 160,000 | 157,650 | ||||||
Radiology Partners, Inc., Replacement Term B | ||||||||
Loan, | ||||||||
(1 month LIBOR + 4.250%), 4.810%, 07/09/254 | 127,547 | 120,771 | ||||||
Securus Technologies Holdings, Inc., Initial Term | ||||||||
Loan (First Lien), | ||||||||
(3 month LIBOR + 4.500%), 5.500%, 11/01/244 | 62,718 | 52,526 | ||||||
Select Medical Corp., Tranche B Term Loan, | ||||||||
(3 month LIBOR + 2.500%), 2.780%, 03/06/254 | 175,000 | 171,172 | ||||||
SolarWinds Holdings, Inc., 2018 Refinancing | ||||||||
Term Loan, | ||||||||
(1 month LIBOR + 2.750%), 2.898%, 02/05/244 | 238,163 | 234,274 | ||||||
Solenis International LP, First Lien Initial Dollar | ||||||||
Term Loan, | ||||||||
(3 month LIBOR + 4.250%), 4.256%, 06/26/254 | 109,162 | 106,638 | ||||||
| Principal | ||||||||
| Amount | Value | |||||||
Sophia LP, Closing Date Term Loan, | ||||||||
(3 month LIBOR + 3.750%), 4.500%, | ||||||||
10/07/274,13 | $185,000 | $182,254 | ||||||
Starfruit Finco BV, Initial Dollar Term Loan, | ||||||||
(1 month LIBOR + 3.000%), 3.145%, 10/01/254 | 99,353 | 96,559 | ||||||
Surf Holdings LLC, Senior Secured First Lien | ||||||||
Dollar Tranche Term Loan, | ||||||||
(3 month LIBOR + 3.500%), 3.750%, 03/05/274 | 199,500 | 193,365 | ||||||
Tapstone Energy Holdings III Subordinated | ||||||||
Term Loan, | ||||||||
(1 month LIBOR + 0.000%), 0.035%, | ||||||||
04/17/244,11 | 1,215 | 1,215 | ||||||
Team Health Holdings Inc., Initial Term Loan, | ||||||||
(1 month LIBOR + 2.750%), 3.750%, 02/06/244 | 34,730 | 28,392 | ||||||
Tempo Acquisition LLC, Extending Term Loan, | ||||||||
(1 month LIBOR + 3.250%), 3.750%, 11/02/264 | 208,127 | 201,623 | ||||||
Terrier Media Buyer, Inc., Term Loan, | ||||||||
(1 month LIBOR + 4.250%), 4.398%, 12/17/264 | 89,325 | 87,301 | ||||||
TIBCO Software, Inc., Term Loan B-3, | ||||||||
(1 month LIBOR + 3.750%), 3.900%, 07/03/264 | 199,437 | 194,036 | ||||||
Tiger Merger Sub Co., | ||||||||
(1 month LIBOR + 3.500%), 3.652%, 07/01/254 | 135,000 | 135,084 | ||||||
Titan Acquisition, Ltd., Initial Term Loan, | ||||||||
(3 month LIBOR + 3.000%), 3.361%, 03/28/254 | 59,474 | 56,542 | ||||||
TransDigm, Inc., Term F Loan, | ||||||||
(1 month LIBOR + 2.250%), 2.398%, 12/09/254 | 214,651 | 202,398 | ||||||
Uber Technologies Inc., First Lien Term Loan, | ||||||||
(1 month LIBOR + 4.000%), 5.000%, 04/04/254 | 173,605 | 171,696 | ||||||
Ultimate Software Group, Inc., First Lien Initial | ||||||||
Term Loan, | ||||||||
(1 month LIBOR + 3.750%), 3.898%, 05/03/264 | 158,745 | 156,165 | ||||||
The Ultimate Software Group, Inc., | ||||||||
(3 month LIBOR + 4.000%), 4.750%, 05/03/264 | 140,000 | 139,368 | ||||||
United Natural Foods Inc., Initial Term Loan, | ||||||||
(1 month LIBOR + 4.250%), 4.398%, 10/22/254 | 26,084 | 25,726 | ||||||
Vertical US Newco, Inc., | ||||||||
(1 month LIBOR + 4.250%), 4.567%, 07/31/274 | 260,000 | 256,858 | ||||||
VS Buyer LLC, Initial Term Loan, | ||||||||
(1 month LIBOR + 3.250%), 3.398%, 03/02/274 | 199,000 | 195,642 | ||||||
Web.com Group, Inc., First Lien Initial Term Loan, | ||||||||
(1 month LIBOR + 3.750%), 3.899%, 10/11/254 | 58,105 | 55,950 | ||||||
Zayo Group Holdings, Inc., Initial Dollar | ||||||||
Term Loan, | ||||||||
(1 month LIBOR + 3.000%), 3.148%, 03/09/274 | 348,250 | 336,533 | ||||||
Total Industrials | 13,412,761 | |||||||
Utilities - 0.0%# | ||||||||
PG&E Corp., | ||||||||
(3 month LIBOR + 4.500%), 5.500%, 06/23/254 | 94,763 | 94,230 | ||||||
Total Floating Rate Senior Loan Interests | ||||||||
(Cost $15,422,753) | 15,118,023 | |||||||
The accompanying notes are an integral part of these financial statements.
77
Table of Contents
AMG Managers DoubleLine Core Plus Bond Fund Schedule of Portfolio Investments (continued) |
|
Shares | Value | |||||||
Common Stocks - 0.0%# |
| |||||||
Energy - 0.0%# | ||||||||
Foresight*,11 | 202 | $3,077 | ||||||
Frontera Energy Corp. (Colombia) | 17,242 | 27,587 | ||||||
Tapstone Energy*,11 | 1,579 | 251 | ||||||
Weatherford International PLC (Switzerland)* | 612 | 1,279 | ||||||
Whiting Petroleum Corp.* | 2,257 | 32,952 | ||||||
Total Energy (Cost $572,811) | 65,146 | |||||||
Investment Companies - 4.8% | ||||||||
DoubleLine Global Bond Fund, Class I14 (Cost $23,657,172) | 2,284,287 | 24,304,814 | ||||||
| Principal Amount | ||||||||
Short-Term Investments - 4.2% |
| |||||||
Joint Repurchase Agreements - 0.3%15 |
| |||||||
Citigroup Global Markets, Inc., dated 10/30/20,due 11/02/20, 0.090% total to be received $335,976 (collateralized by various U.S. Government Agency Obligations and U.S. Treasuries, 0.000% - 6.500%, 10/31/20 - | ||||||||
08/20/70, totaling $342,692) | $335,973 | 335,973 | ||||||
RBC Dominion Securities, Inc., dated 10/30/20,due 11/02/20, 0.090% total to be received $1,000,008 (collateralized by various U.S. Government Agency Obligations and U.S. Treasuries, 0.000% - 5.000%, 02/04/21 - 11/01/50, totaling $1,020,000) | 1,000,000 | 1,000,000 | ||||||
Total Joint Repurchase Agreements |
|
| 1,335,973
|
| ||||
| Principal Amount | Value | |||||||
U.S. Government and Agency Obligations - 1.6% |
| |||||||
United States Treasury Bills, 1.256%, 11/05/2016 | $170,000 | $169,971 | ||||||
United States Treasury Bills, 0.096%, 11/27/2016 | 7,670,000 | 7,669,460 | ||||||
Total U.S. Government and Agency Obligations |
| 7,839,431 | ||||||
| Shares | ||||||||
Other Investment Companies - 2.3% |
| |||||||
Dreyfus Government Cash Management Fund, Institutional Shares, 0.02%17 | 3,900,851 | 3,900,851 | ||||||
Dreyfus Institutional Preferred Government Money Market Fund, Institutional Shares, 0.04%17 | 3,900,852 | 3,900,852 | ||||||
JPMorgan U.S. Government Money Market Fund, IM Shares, 0.04%17 | 4,019,059 | 4,019,059 | ||||||
Total Other Investment Companies |
| 11,820,762 | ||||||
Total Short-Term Investments |
| |||||||
(Cost $20,996,166) | 20,996,166 | |||||||
Total Investments - 101.2% |
| |||||||
(Cost $504,148,106) | 506,935,514 | |||||||
Other Assets, less Liabilities - (1.2)% | (6,195,642 | ) | ||||||
Net Assets - 100.0% |
| $500,739,872
|
| |||||
| * | Non-income producing security. |
| # | Less than 0.05%. |
| 1 | Security exempt from registration under Rule 144A of the Securities Act of 1933. This security may be resold in transactions exempt from registration, normally to qualified institutional buyers. At October 31, 2020, the value of these securities amounted to $123,210,912 or 24.6% of net assets. |
| 2 | Some of these securities, amounting to $1,422,660 or 0.3% of net assets, were out on loan to various borrowers and are collateralized by cash and various U.S. Treasury Obligations. See Note 4 of Notes to Financial Statements. |
| 3 | Fixed to variable rate investment. The rate shown reflects the fixed rate in effect at October 31, 2020. Rate will reset at a future date. |
| 4 | Variable rate security. The rate shown is based on the latest available information as of October 31, 2020. Certain variable rate securities are not based on a published reference rate and spread but are determined by the issuer or agent and are based on current market conditions. These securities do not indicate a reference rate and spread in their description above. |
| 5 | Perpetuity Bond. The date shown represents the next call date. |
| 6 | Payment-in-Kind Security: The security may pay interest/dividends in additional par/shares and/or in cash. Rates shown are the current rate and possible payment rates. |
| 7 | Zero Coupon Bond. |
| 8 | All or part of a security is delayed delivery transaction. The market value for delayed delivery securities at October 31, 2020, amounted to $5,002,184, or 1.0% of net assets. |
| 9 | Step Bond: A debt instrument with either deferred interest payments or an interest rate that resets at specific times during its term. |
| 10 | Security is in default. Issuer has failed to make a timely payment of either principal or interest or has failed to comply with some provision of the bond indenture. |
| 11 | Security’s value was determined by using significant unobservable inputs. |
| 12 | Interest only security. This type of security represents the right to receive the monthly interest payments on an underlying pool of mortgages. Payments of principal on the pool reduce the value of the “interest only” holding. |
| 13 | Estimated interest rate based on period end due to security settling after October 31, 2020. |
| 14 | Affiliated issuer. See summary of affiliated investment transaction for details. |
| 15 | Cash collateral received for securities lending activity was invested in these joint repurchase agreements. |
| 16 | Represents yield to maturity at October 31, 2020. |
| 17 | Yield shown represents the October 31, 2020, seven day average yield, which refers to the sum of the previous seven days’ dividends paid, expressed as an annual percentage. |
| CLO | Collateralized Loan Obligation |
| CMT | Constant Maturity Treasury |
The accompanying notes are an integral part of these financial statements.
78
Table of Contents
AMG Managers DoubleLine Core Plus Bond Fund Schedule of Portfolio Investments (continued) |
|
EMTN | European Medium Term Note | |
FHLMC | Freddie Mac | |
FNMA | Fannie Mae | |
GMTN | Global Medium-Term Notes | |
GNMA | Ginnie Mae | |
GSR | Goldman Sachs REMIC | |
LIBOR | London Interbank Offered Rate | |
MTN | Medium-Term Note | |
PIK | Payment-in-Kind | |
REMICS | Real Estate Mortgage Investment Conduit | |
SOFRRATE | Secured Overnight Financing Rate | |
USD | United States Dollar | |
The Fund had the following unfunded floating rate senior loan commitment outstanding as of October 31, 2020, which could be extended at the option of the borrower:
| Borrower | Unfunded Loan Commitment | Value | Unrealized Appreciation | |||||||||
Intelsat Jackson Holdings, S.A., SuperPriority Secured DIP Term Loan | $35,139 | $36,016 | $877 | |||||||||
The following schedule shows the value of affiliated investments at October 31, 2020.
Affiliated Issuers | Number of shares | Purchases | Sales | Net realized gain (loss) for the period | Net change in appreciation | Amount of Dividends or Interest | Value | |||||||
DoubleLine Global Bond Fund, Class I | 2,284,287 | — | $6,500,000 | $(244,485) | $478,547 | $105,334 | $24,304,814 |
The following table summarizes the inputs used to value the Fund’s investments by the fair value hierarchy levels as of October 31, 2020:
| Level 1 | Level 2 | Level 3 | Total | |||||||||||||
Investments in Securities | ||||||||||||||||
Common Stocks | ||||||||||||||||
Energy | $61,818 | — | $3,328 | $65,146 | ||||||||||||
Corporate Bonds and Notes† | — | $133,075,054 | — | 133,075,054 | ||||||||||||
Asset-Backed Securities | — | 49,537,364 | — | 49,537,364 | ||||||||||||
Mortgage-Backed Securities | — | 82,524,441 | 4,870,800 | 87,395,241 | ||||||||||||
Municipal Bonds | — | 775,301 | — | 775,301 | ||||||||||||
U.S. Government and Agency Obligations† | — | 169,028,805 | — | 169,028,805 | ||||||||||||
Foreign Government Obligations | — | 6,639,600 | — | 6,639,600 | ||||||||||||
Investment Companies | 24,304,814 | — | — | 24,304,814 | ||||||||||||
Floating Rate Senior Loan Interests | ||||||||||||||||
Financials | — | 1,611,032 | — | 1,611,032 | ||||||||||||
Industrials | — | 13,411,546 | 1,215 | 13,412,761 | ||||||||||||
Utilities | — | 94,230 | — | 94,230 | ||||||||||||
Unfunded Loan Commitment | — | 36,016 | — | 36,016 | ||||||||||||
Short-Term Investments | ||||||||||||||||
Joint Repurchase Agreements | — | 1,335,973 | — | 1,335,973 | ||||||||||||
Other Investment Companies | 11,820,762 | — | — | 11,820,762 | ||||||||||||
U.S. Government and Agency Obligations | — | 7,839,431 | — | 7,839,431 | ||||||||||||
|
|
|
|
|
|
|
| |||||||||
Total Investment in Securities | $36,187,394 | $465,908,793 | $4,875,343 | $506,971,530 | ||||||||||||
|
|
|
|
|
|
|
| |||||||||
| † | All corporate bonds and notes and U.S. government and agency obligations held in the Fund are Level 2 securities. For a detailed breakout of corporate bonds and notes and U.S. government and agency obligations by major industry or agency classification, please refer to the Fund’s Schedule of Portfolio Investments. |
The accompanying notes are an integral part of these financial statements.
79
Table of Contents
AMG Managers DoubleLine Core Plus Bond Fund Schedule of Portfolio Investments (continued) |
The following table below is a reconciliation of investments in which significant unobservable inputs (Level 3) were used in determining fair value at October 31, 2020:
| Common Stock | Corporate Bond | Mortgage-Backed Securities | Floating Rate Senior Loan Interests | |||||||||||||
Balance as of October 31, 2019 | — | $ | 7,500 | — | — | |||||||||||
Accrued discounts (premiums) | — | — | — | $ | 49 | |||||||||||
Realized gain (loss) | — | — | — | — | ||||||||||||
Change in unrealized appreciation/depreciation | $(162,361 | ) | — | $(28,200 | ) | 431 | ||||||||||
Purchases | 165,689 | — | 4,899,000 | 735 | ||||||||||||
Sales | — | — | — | — | ||||||||||||
Transfers in to Level 3 | — | — | — | — | ||||||||||||
Transfers out of Level 3 | — | $(7,500 | ) | — | — | |||||||||||
Balance as of October 31, 2020 | $3,328 | — | $4,870,800 | $1,215 | ||||||||||||
Net change in unrealized appreciation/depreciation on investments still held at October 31, 2020 | $(162,361 | ) | — | $(28,200 | ) | $431 | ||||||||||
The following table summarizes the quantitative inputs and assumptions used for investments categorized in Level 3 of the fair value hierarchy as of October 31, 2020. The table below is not intended to be all-inclusive, but rather provides information on the significant Level 3 inputs as they relate to the Fund’s fair value measurements:
Quantitative Information about Level 3 Fair Value Measurements
| Fair Value as of October 31, 2020 | Valuation Technique(s) | Unobservable Inputs(s) | Range | Median | Impact to Valuation from an Increase in Input(a) | |||||||||
Common Stock | $3,328 | Market Approach | EV/Sale Multiple | N/A | N/A | Increase | ||||||||
Mortgage-Backed Securities | $4,870,800 | Market Approach | EV/Sale Multiple | N/A | N/A | Increase | ||||||||
Floating Rate Senior Rate Interests | $1,215 | Market Approach | EV/Sale Multiple | N/A | N/A | Increase | ||||||||
| (a) | Represents the directional change in the fair value of the Level 3 investments that could have resulted from an increase in the corresponding input as of period end. A decrease to the unobservable input would have had the opposite effect. Significant changes in these inputs may have resulted in a significantly higher or lower fair value measurement at period end. |
The accompanying notes are an integral part of these financial statements.
80
Table of Contents
OVERVIEW
For the fiscal year ended October 31, 2020, the AMG River Road Long-Short Fund (the “Fund”) Class N shares returned (5.17%), trailing the 10.15% return for the Russell 3000® Index. The secondary benchmark, which is a blend of 50% Russell 3000® Index/50% ICE BofA Merrill Lynch U.S. T-Bill (0-3 mo) Index, returned 6.98%. During the period, the Fund had a 51% average net market exposure, yet captured 104% of the market’s return.
Both poor long stock performance versus the core index and the Drawdown Plan weighed on results. Our value approach was out of favor as the Russell 3000® Value (8.00%) dramatically underperformed the core Russell 3000® 10.15%; the Fund’s long portfolio returned (0.63%). The extreme volatility during the early portions of the pandemic whipsawed the Drawdown Plan, which resulted in a significant drag on portfolio performance.
PERFORMANCE REVIEW AND POSITIONING
The holdings with the largest positive contribution to total return during the period were Progressive Corp. (“Progressive”, long), Nintendo Unsponsored ADR | (“Nintendo”, long), and NextEra Energy Inc. (“NextEra”, long). Progressive is the third-largest auto insurer in the United States. With fewer drivers on the road as a result of the pandemic, accident frequency declined and profits rose for the company. Nintendo is one of the largest video game companies in the world. The stock responded well to increased demand for video games as people spent more time at home. NextEra is the largest utility in the U.S. and its leading global position in solar and wind renewable energy insulated the company from broader market volatility associated with the pandemic and the presidential election.
The holdings with the largest negative contribution to the Fund’s total return were Marathon Petroleum Corp. (“Marathon”, long), Delta Air Lines Inc. (“Delta”, long), and Raytheon Technologies Corp. (“Raytheon”, long). All three positions were victims of the pandemic. Marathon is the largest independent refiner in the United States. The company’s agreement to sell its downstream gas station | Speedway for more than we expected was not enough to overcome the dramatic decline in demand for transportation fuel. Delta is the third-largest air carrier in the world. The stock declined as air travel grounded to a halt as the pandemic spread. Raytheon is a diversified aerospace and defense industrial company. The aerospace segment weighed on results, particularly the commercial aftermarket, as demand for global air travel declined throughout the pandemic. None of the securities discussed as contributors or detractors were still held in the Fund as of October 31, 2020.
The Fund ended October within its normal net market exposure range (50%–70%) at 65%. We believe the Fund is well positioned to participate in future market upside.
This commentary reflects the viewpoints of River Road Asset Management as of November 24, 2020, and is not intended as a forecast or guarantee of future results. |
81
Table of Contents
AMG River Road Long-Short Fund Portfolio Manager’s Comments (continued) |
CUMULATIVE TOTAL RETURN PERFORMANCE
AMG River Road Long-Short Fund’s cumulative total return is based on the daily change in net asset value (NAV), and assumes that all dividends and distributions were reinvested. The graph compares a hypothetical $10,000 investment made in the AMG River Road Long-Short Fund’s Class N shares on May 4, 2011, to a $10,000 investment made in the Russell 3000® Index and the 50% Russell 3000®/50% ICE BofA Merrill Lynch U.S. T-Bill (0-3 mo) Index for the same time period. The graph and table do not reflect the deduction of taxes that a shareholder would pay on a Fund distribution or redemption of shares. The listed returns for the Fund are net of expenses and the returns for the index exclude expenses. Total returns would have been lower had certain expenses not been reduced.

The table below shows the average annual total returns for the AMG River Road Long-Short Fund and the Russell 3000® Index and the 50% Russell 3000®/50% ICE BofA Merrill Lynch U.S. T-Bill (0-3 mo) Index for the same time periods ended October 31, 2020.
| Average Annual Total Returns1 | One Year | Five Years | Since Inception | Inception Date | ||||||||||||
AMG River Road Long-Short Fund2, 3, 4, 5, 6, 7, 8, 9, 10, 11 |
| |||||||||||||||
Class N | (5.17%) | 3.49% | 4.44% | 05/04/11 | ||||||||||||
Class I | (4.98%) | 3.74% | 3.81% | 03/04/13 | ||||||||||||
Class Z | (4.82%) | — | 2.38% | 09/29/17 | ||||||||||||
Russell 3000® Index12 | 10.15% | 11.48% | 11.69% | 05/04/11† | ||||||||||||
50% Russell 3000® Index/50% ICE BofA Merrill Lynch U.S. T-Bill (0-3 mo) Index13 | 6.98% | 6.69% | 6.44% | 05/04/11† | ||||||||||||
The performance data shown represents past performance. Past performance is not a guarantee of future results. Current performance may be lower or higher than the performance data quoted. The investment return and principal value of an investment will fluctuate so that an investor’s shares, when redeemed, may be worth more or less than their original cost.
Investors should carefully consider the Fund’s investment objectives, risks, charges and expenses before investing. For performance information through the most recent month end, current net asset values per share for the Fund and other information, please call 800.548.4539 or visit our website at amgfunds.com for a free prospectus. Read it carefully before investing or sending money.
Distributed by AMG Distributors, Inc., member FINRA/SIPC.
| † | Date reflects the inception date of the Fund, not the index. |
1 Total return equals income yield plus share price change and assumes reinvestment of all dividends and capital gain distributions. Returns are net of fees and may reflect offsets of Fund expenses as described in the prospectus. No adjustment has been made for taxes payable by shareholders on their reinvested dividends and capital gain distributions. Returns for periods greater than one year are annualized. The listed returns on the Fund are net of expenses and based on the published NAV as of October 31, 2020. All returns are in U.S. dollars ($). |
2 The Fund may suffer significant losses on assets that it sells short. Unlike the possible loss on a security that is purchased, there is no limit on the amount of loss on an appreciating security that is sold short. |
3 Active and frequent trading of a fund may result in higher transaction costs and increased tax liability.
4 The Fund may invest in derivatives such as options and futures; the complexity and rapidly changing structure of derivatives markets may increase the possibility of market losses.
5 A greater percentage of the Fund’s holdings may be focused in a smaller number of securities which may place the Fund at greater risk than a more diversified fund. |
6 The Fund is subject to special risk considerations similar to those associated with the direct ownership of real estate. Real estate valuations may be subject to factors such as changing general and local economic, financial, competitive, and environmental conditions. |
7 Investments in international securities are subject to certain risks of overseas investing including currency fluctuations and changes in political and economic conditions, which could result in significant market fluctuations. These risks are magnified in emerging markets. |
8 Investing in Publicly Traded Partnerships (PTPs) (including master limited partnerships) involves risks in addition to those typically associated with publicly traded companies. PTPs are exposed to the risks of their underlying assets, which in many cases includes the same types of risks as energy and natural resources companies. PTPs are also subject to capital markets risk. PTPs may lose their partnership status for tax purposes. The Fund’s status as a regulated investment company may be jeopardized if it does not appropriately limit such investments in PTPs or if such investments are recharacterized for tax purposes. |
82
Table of Contents
AMG River Road Long-Short Fund Portfolio Manager’s Comments (continued) |
9 Market prices of investments held by the Fund may fall rapidly or unpredictably due to a variety of economic or political factors, market conditions, disasters or public health issues, or in response to events that affect particular industries or companies.
10 Companies that are in similar businesses may be similarly affected by particular economic or market events; to the extent the Fund has substantial holdings within a particular sector, the risks associated with that sector increase.
11 The Fund invests in value stocks, which may perform differently from the market as a whole and |
| may be undervalued by the market for a long period of time.
12 The Russell 3000® Index is composed of the 3,000 largest U.S. companies as measured by market capitalization, and represents about 98% of the U.S. stock market. Unlike the Fund, the Russell 3000® Index is unmanaged, is not available for investment and does not incur expenses.
13 The secondary benchmark is composed of 50% Russell 3000® Index and 50% ICE BofAML U.S. Treasury Bill Index (0-3 months). The Russell 3000® Index is composed of the 3,000 largest U.S. companies as measured by market capitalization, |
| and represents about 98% of the U.S. stock market. The ICE BofAML 0-3 Month U.S. Treasury Bill Index: Is a subset of The Bank of America Merrill Lynch 0-1 Year U.S. Treasury Index including all securities with a remaining term to final maturity less than 3 months. Unlike the Fund, the indices are unmanaged, are not available for investment and do not incur expenses.
The Russell Indices are a trademark of London Stock Exchange Group companies.
Not FDIC insured, nor bank guaranteed. May lose value. |
83
Table of Contents
AMG River Road Long-Short Fund Fund Snapshots (unaudited) October 31, 2020 |
|
PORTFOLIO BREAKDOWN
| Sector | Long Exposure1 | Short Exposure1 | Net Exposure1 | |||||||||
Financials | 24.5 | (3.7 | ) | 20.8 | ||||||||
Communication Services | 23.9 | (2.5 | ) | 21.4 | ||||||||
Industrials | 15.3 | (8.3 | ) | 7.0 | ||||||||
Health Care | 11.2 | (0.5 | ) | 10.7 | ||||||||
Consumer Discretionary | 8.0 | (7.0 | ) | 1.0 | ||||||||
Utilities | 6.6 | 0.0 | 6.6 | |||||||||
Consumer Staples | 4.2 | (0.7 | ) | 3.5 | ||||||||
Energy | 2.1 | (0.8 | ) | 1.3 | ||||||||
Materials | 1.7 | (2.6 | ) | (0.9 | ) | |||||||
Information Technology | 0.0 | (3.6 | ) | (3.6 | ) | |||||||
Real Estate | 0.0 | (2.9 | ) | (2.9 | ) | |||||||
Short Term Investments | 2.0 | – | 2.0 | |||||||||
Other Assets2 | 33.1 | – | 33.1 | |||||||||
| 1 | As a percentage of net assets. |
| 2 | Includes collateral for short sales. |
TOP TEN HOLDINGS
| Security Name | % of Net Assets | |||||
GCI Liberty, Inc., Class A | 4.0 | |||||
Liberty Media Corp.-Liberty SiriusXM, Class C | 3.3 | |||||
KKR & Co., Inc. | 3.2 | |||||
Berkshire Hathaway, Inc., Class B | 3.0 | |||||
Chubb, Ltd. (Switzerland) | 3.0 | |||||
Carlisle Cos., Inc. | 2.9 | |||||
Liberty Media Corp-Liberty Braves, Class C | 2.9 | |||||
General Dynamics Corp. | 2.9 | |||||
Huntington Ingalls Industries, Inc. | 2.8 | |||||
Hostess Brands, Inc. | 2.7 | |||||
| ||||||
Top Ten as a Group | 30.7 | |||||
| ||||||
Because a fund’s strategy may result in multiple investments in particular sectors of the economy, its performance may depend on the performance of those sectors and may fluctuate more widely than investments diversified across more sectors. For additional information on these and other risk considerations, please see the Fund’s prospectus.
Any sectors, industries, or securities discussed should not be perceived as investment recommendations. Mention of a specific security should not be considered a recommendation to buy or solicitation to sell that security. Specific securities mentioned in this report may have been sold from the Fund’s portfolio of investments by the time you receive this report.
84
Table of Contents
AMG River Road Long-Short Fund Schedule of Portfolio Investments October 31, 2020 |
|
| Shares | Value | |||||||
| Long Positions - 99.4% | ||||||||
| Common Stocks - 97.5% | ||||||||
Communication Services - 23.9% |
| |||||||
Comcast Corp., Class A1 | 7,498 | $316,716 | ||||||
GCI Liberty, Inc., Class A* | 8,063 | 654,957 | ||||||
IAC/InteractiveCorp.* | 3,611 | 435,920 | ||||||
Liberty Media Corp.-Liberty SiriusXM, Class C*,1 | 15,592 | 539,483 | ||||||
Liberty Media Corp-Liberty Braves, Class C*,1 | 23,113 | 473,123 | ||||||
Madison Square Garden Entertainment Corp.* | 5,933 | 385,645 | ||||||
Madison Square Garden Sports Corp.*,1 | 2,175 | 308,067 | ||||||
News Corp., Class A | 30,072 | 394,845 | ||||||
Quebecor, Inc., Class B (Canada) | 16,799 | 389,745 | ||||||
Total Communication Services | 3,898,501 | |||||||
Consumer Discretionary - 8.0% | ||||||||
Cie Financiere Richemont, S.A., ADR (Switzerland) | 68,439 | 421,584 | ||||||
Dollar Tree, Inc.*,1 | 4,868 | 439,678 | ||||||
LKQ Corp.* | 13,526 | 432,697 | ||||||
Total Consumer Discretionary | 1,293,959 | |||||||
Consumer Staples - 4.2% | ||||||||
Hostess Brands, Inc.*,1 | 35,435 | 447,898 | ||||||
Molson Coors Beverage Co., Class B1 | 6,525 | 230,072 | ||||||
Total Consumer Staples | 677,970 | |||||||
Energy - 2.1% | ||||||||
Texas Pacific Land Trust | 757 | 340,960 | ||||||
Financials - 24.5% | ||||||||
American Financial Group, Inc. | 4,811 | 360,536 | ||||||
Ares Management Corp., Class A | 8,077 | 341,657 | ||||||
Axis Capital Holdings, Ltd. (Bermuda) | 8,146 | 347,753 | ||||||
Berkshire Hathaway, Inc., Class B*,1 | 2,441 | 492,838 | ||||||
Cannae Holdings, Inc.* | 9,615 | 355,563 | ||||||
Chubb, Ltd. (Switzerland)1 | 3,703 | 481,057 | ||||||
Fidelity National Financial, Inc.1 | 11,323 | 354,297 | ||||||
Intercontinental Exchange, Inc. | 4,263 | 402,427 | ||||||
KKR&Co., Inc.1 | 15,090 | 515,323 | ||||||
U.S. Bancorp1 | 8,652 | 336,995 | ||||||
Total Financials | 3,988,446 | |||||||
Health Care - 11.2% | ||||||||
Bristol-Myers Squibb Co.1 | 6,150 | 359,468 | ||||||
Centene Corp.* | 5,329 | 314,944 | ||||||
CVS Health Corp. | 7,375 | 413,664 | ||||||
McKesson Corp.1 | 2,188 | 322,708 | ||||||
Premier, Inc., Class A | 12,814 | 419,402 | ||||||
Total Health Care | 1,830,186 | |||||||
| Shares | Value | |||||||
Industrials - 15.3% | ||||||||
API Group Corp.*,2 | 21,244 | $305,701 | ||||||
Armstrong World Industries, Inc. | 7,422 | 444,578 | ||||||
Carlisle Cos., Inc. | 3,820 | 473,184 | ||||||
General Dynamics Corp. | 3,552 | 466,484 | ||||||
Grupo Aeroportuario del Centro Norte SAB de CV, | ||||||||
ADR (Mexico)* | 9,665 | 349,680 | ||||||
Huntington Ingalls Industries, Inc.1 | 3,061 | 451,436 | ||||||
Total Industrials | 2,491,063 | |||||||
Materials - 1.7% | ||||||||
Sandstorm Gold, Ltd. (Canada)* | 37,551 | 277,877 | ||||||
Utilities - 6.6% | ||||||||
Atlantica Sustainable Infrastructure PLC (United Kingdom) | 10,815 | 318,935 | ||||||
Hawaiian Electric Industries, Inc.1 | 12,583 | 415,742 | ||||||
IDACORP, Inc. | 3,922 | 344,077 | ||||||
Total Utilities | 1,078,754 | |||||||
Total Common Stocks | 15,877,716 | |||||||
Short-Term Investments - 2.0% |
| |||||||
Other Investment Companies - 2.0% |
| |||||||
Dreyfus Government Cash Management Fund, Institutional Shares, 0.02%3 | 104,348 | 104,348 | ||||||
Dreyfus Institutional Preferred Government Money Market Fund, Institutional Shares, 0.04%3 | 104,348 | 104,348 | ||||||
JPMorgan U.S. Government Money Market Fund, IM Shares, 0.04%3 | 107,511 | 107,511 | ||||||
Total Short-Term Investments | 316,207 | |||||||
Total Investments - 99.4% | 16,193,923 | |||||||
Short Sales - (32.6%)4 | ||||||||
Common Stocks - (32.6%) | ||||||||
Communication Services - (2.5%) |
| |||||||
AT&T, Inc. | (5,960 | ) | (161,039 | ) | ||||
CenturyLink, Inc. | (8,879 | ) | (76,537 | ) | ||||
ViacomCBS, Inc., Class B | (5,760 | ) | (164,563 | ) | ||||
Total Communication Services | (402,139 | ) | ||||||
Consumer Discretionary - (7.0%) |
| |||||||
Abercrombie & Fitch Co., Class A | (11,259 | ) | (160,103 | ) | ||||
The Children’s Place, Inc. | (5,168 | ) | (130,595 | ) | ||||
Choice Hotels International, Inc. | (894 | ) | (78,091 | ) | ||||
La-Z-Boy, Inc. | (5,506 | ) | (188,471 | ) | ||||
Leggett & Platt, Inc. | (4,073 | ) | (169,966 | ) | ||||
The accompanying notes are an integral part of these financial statements.
85
Table of Contents
AMG River Road Long-Short Fund Schedule of Portfolio Investments (continued) |
|
| Shares | Value | |||||||
Consumer Discretionary - (7.0%) |
| |||||||
OneSpaWorld Holdings, Ltd. (Bahamas) | (17,896 | ) | $(111,134) | |||||
Planet Fitness, Inc., Class A * | (2,972 | ) | (176,151) | |||||
Regis Corp. * | (23,950 | ) | (132,683) | |||||
Total Consumer Discretionary | (1,147,194 | ) | ||||||
Consumer Staples - (0.7%) | ||||||||
Energizer Holdings, Inc. | (2,954 | ) | (116,240 | ) | ||||
Energy - (0.8%) | ||||||||
Schlumberger, Ltd. | (8,298 | ) | (123,972 | ) | ||||
Financials - (3.7%) | ||||||||
BOK Financial Corp. | (3,113 | ) | (182,857 | ) | ||||
Federated Hermes, Inc. | (3,771 | ) | (90,127 | ) | ||||
Janus Henderson Group PLC (United Kingdom) | (6,846 | ) | (166,358 | ) | ||||
Mercury General Corp. | (4,127 | ) | (168,010 | ) | ||||
Total Financials | (607,352 | ) | ||||||
Health Care - (0.5%) | ||||||||
Prestige Consumer Healthcare, | (2,460 | ) | (81,254 | ) | ||||
Industrials - (8.3%) | ||||||||
ACCO Brands Corp. | (20,672 | ) | (108,941 | ) | ||||
Deluxe Corp. | (6,576 | ) | (140,989 | ) | ||||
Encore Wire Corp. | (1,943 | ) | (89,786 | ) | ||||
GATX Corp. | (2,456 | ) | (167,696 | ) | ||||
H&E Equipment Services, Inc. | (6,138 | ) | (129,144 | ) | ||||
Heartland Express, Inc. | (6,788 | ) | (124,288 | ) | ||||
| * | Non-income producing security. |
| 1 | Security position is either entirely or partially held in a segregated account as collateral for securities sold short. As of October 31, 2020, value of securities held in the segregated account was $1,605,648. |
| 2 | Security exempt from registration under Rule 144A of the Securities Act of 1933. This security may be resold in transactions exempt from registration, normally to qualified institutional buyers. At October 31, 2020, the value of these securities amounted to $305,701 or 1.9% of net assets. |
| 3 | Yield shown represents the October 31, 2020, seven day average yield, which refers to the sum of the previous seven days’ dividends paid, expressed as an annual percentage. |
| Shares | Value | |||||||
Matthews International Corp., Class A | (10,767 | ) | $(235,044 | ) | ||||
The Middleby Corp. * | (1,479 | ) | (147,220 | ) | ||||
Snap-on, Inc. | (891 | ) | (140,359 | ) | ||||
Textron, Inc. | (1,975 | ) | (70,705 | ) | ||||
Total Industrials | (1,354,172 | ) | ||||||
Information Technology - (3.6%) |
| |||||||
Belden, Inc. | (5,102 | ) | (157,550 | ) | ||||
HP, Inc. | (13,875 | ) | (249,195 | ) | ||||
International Business Machines Corp. | (1,558 | ) | (173,966 | ) | ||||
Total Information Technology | (580,711 | ) | ||||||
Materials - (2.6%) | ||||||||
Domtar Corp. | (4,643 | ) | (110,875 | ) | ||||
Louisiana-Pacific Corp. | (5,372 | ) | (153,532 | ) | ||||
Rio Tinto PLC, Sponsored ADR (United Kingdom) | (2,897 | ) | (164,462 | ) | ||||
Total Materials | (428,869 | ) | ||||||
Real Estate - (2.9%) | ||||||||
Omega Healthcare Investors, Inc., REIT | (3,883 | ) | (111,869 | ) | ||||
PotlatchDeltic Corp., REIT | (4,606 | ) | (191,379 | ) | ||||
Rayonier, Inc., REIT | (6,362 | ) | (161,468 | ) | ||||
Total Real Estate | (464,716 | ) | ||||||
Total Common Stocks | (5,306,619 | ) | ||||||
Other Assets, less Liabilities - 33.1% |
| 5,397,438 | ||||||
Net Assets - 100.0% | $16,284,742 | |||||||
| 4 | The Fund is contractually responsible to the lender for any dividends payable on securities while those securities are outstanding in short position. These dividends and interest amounts are recorded as interest and dividend expense on the Statement of Operations. |
ADR American Depositary Receipt
REIT Real Estate Investment Trust
The accompanying notes are an integral part of these financial statements.
86
Table of Contents
AMG River Road Long-Short Fund Schedule of Portfolio Investments (continued) |
|
The following table summarizes the inputs used to value the Fund’s investments by the fair value hierarchy levels as of October 31, 2020:
| Level 1 | Level 2 | Level 3 | Value | |||||||||
Investments in Securities | ||||||||||||
Assets | ||||||||||||
Common Stocks† | $15,877,716 | – | – | $15,877,716 | ||||||||
Short-Term Investments | ||||||||||||
Other Investment Companies | 316,207 | – | – | 316,207 | ||||||||
|
|
|
|
|
| |||||||
Total Assets | 16,193,923 | – | – | 16,193,923 | ||||||||
|
|
|
|
|
| |||||||
Liabilities | ||||||||||||
Common Stocks† | (5,306,619) | – | – | (5,306,619) | ||||||||
|
|
|
|
|
| |||||||
Net Investments in Securities | $10,887,304 | – | – | $10,887,304 | ||||||||
|
|
|
|
|
| |||||||
| † | All common stocks held in the Fund are Level 1 securities. For a detailed breakout of common stocks by major industry classification, please refer to the Fund’s Schedule of Portfolio Investments. |
For the fiscal year ended October 31, 2020, there were no transfers in or out of Level 3.
The accompanying notes are an integral part of these financial statements.
87
Table of Contents
OVERVIEW
For the fiscal year ended October 31, 2020, the AMG Managers Pictet International Fund (the “Fund”) Class N shares returned (11.83 %), trailing the (6.86%) return for the MSCI EAFE Index.
MARKET COMMENTARY
While the decline in international equity markets over the review period as a whole was modest, the “round trip” to get to that outcome was historic in its scale and savagery. However, the first three months saw a continuation of the steady upward progress that characterized most of 2019. Then in mid-February 2020 it became apparent that a localized outbreak of a new and potentially deadly coronavirus (COVID-19) in China’s Hubei province was set to become a global pandemic. It was also quickly evident that the short- to medium-term impact on economies of global efforts to manage the spread of the virus could be devastating. The resulting equity, commodity, and energy price freefall wiped one third off the value of MSCI EAFE Index companies in the space of less than four weeks. In March governments and central banks coordinated to announce packages of monetary and fiscal stimulus what were unprecedented in their scale, and the decline was reversed. Even as many economies remained paralyzed by draconian lockdown measures to counter the pandemic, additional stimulus packages in April/May added fuel to the nascent market recovery as investors looked well beyond an uncertain short term to the likelihood of an extended period of ultra-cheap money. The second half of the period was characterized by a steady and powerful equity market recovery despite looming uncertainties like the outcome of the November U.S. election, the final terms for the U.K.’s exit from the European Union, and when a COVID-19 vaccine would become available.
| At a regional level, the underperformance came in Europe; Japan and the Pacific ex Japan achieved modest outperformance. At a sector level the largest negatives were both the underweight to and stock selection within the health care group, as well as stock selection within the industrials and materials sectors.
While all the factors listed above contributed to the weak outcome, at a stock level most of the largest individual negative contributors fell into the “mass gatherings/travel” category that was set to see unprecedented disruption from COVID-19 lockdown measures. These included: (1) Informa (conferences/exhibitions, U.K.) which fell victim to both travel and mass-gathering restrictions, and only joined the broader recovery late in the period, (2) Cineworld (European and U.S. (Regal) cinema operator, U.K.) which saw its entire operation closed in national lockdowns and was forced to abandon an intended acquisition, (3) Asahi (global brewer, Japan) which suffered a significant decline in hospitality revenue sales of beer, (4) Saga (insurance and cruise ship operator, U.K.) which was forced to cease cruise operations and mothball its fleet of cruise vessels, and (5) Elis (contract linen supply, France) which suffered a decline in hospitality and industrial linen demand. Another significant negative was OCI (fertilizer producer, Netherlands) for which ultra-low energy prices erode both margins and its competitive advantage. In several cases, the higher-than-normal levels of debt carried by the companies (whether because of acquisitions or heavy recent investment spending) exacerbated the underperformance.
While failing to offset these negatives, notable positive contributions were made by: (1) Nexon (digital games producer, Japan) which benefited from both a | has gathered pace since the review period end thanks largely to positive news on COVID-19 vaccine development. However, with mass vaccine availability unlikely before the end of the Northern Hemisphere winter, there remains significant scope for the second (and possibly a third) wave of infections to drive market volatility.
However, and as is consistent with a bottom-up and long-term investment approach, we don’t try to predict these shorter-term events. Instead we focus on trying to hold and acquire companies that are able to thrive under most scenarios. If the future is uncertain, we “invert” by asking ourselves “what is priced in” to the valuations, and then assess whether such a future is realistic. The COVID-19 pandemic has caused the earnings of many companies to collapse to levels that imply a significant and long-term impairment of their ability to recover, while our assessment of their normalized earnings power remains broadly unchanged. Indeed, in some cases, whether because of competitive position or strength of business model, we believe they should actually be able to capitalize on the demise of weaker players and emerge from the pandemic period stronger. We can’t say when this will be with any certainty, but companies like Wizz (ultra-low-cost airline, U.K.), Compass (the world’s largest contract catering company, U.K.), Asahi (global brewer, Japan), Trip.com (online travel agent, China), Elis (contract linen supply, France), and Informa (global conferences and exhibitions, U.K.) are just a few examples of portfolio companies that fall into this category—leaders and consolidators in industries that will likely see demand return. That said, the impact of the pandemic has been and remains | ||
PERFORMANCE REVIEW
The Fund’s underperformance of the MSCI EAFE Index over the period was largely a product of relative weakness as global markets collapsed in February/March 2020. Several factors combined to drive this outcome. The Fund was more cyclically tilted than the market, it continued to carry its characteristic overweight to mid and small companies, it entered the period very underweight large-cap pharmaceutical companies (which strongly outperformed), and it also had exposure to several companies which (although in very different sectors) are heavily dependent on non-essential mass gatherings/travel. | boost to revenues in lockdown and expectations surrounding the launch on mobile version of its most successful franchise in China, (2) JD.com (ecommerce platform, China) which experienced a similar lockdown related demand increase, but also saw margins expand as it passed a peak in investment, and (3) Pandora (jewelry, Denmark) which saw the pandemic speed a shift of sales to online and management action to restructure the business starting to yield results.
MARKET OUTLOOK AND STRATEGY
The massive government fiscal and monetary commitments made in the eye of the pandemic storm continue to underpin a market recovery that | significant. It has clearly accelerated a variety of structural trends that were already developing—online provision of services, working trends, the digitization of money—but we believe that the basic human need/desire to socialize, travel, consume, and aspire to better remains unchanged.
A business (rather than a stock) ownership mindset and a long-term horizon have always been and remain central to our investment approach. Although the immediate future remains uncertain, as we look ahead through this lens we are excited by the prospects for the Fund and the valuation opportunity created by the unique environment of 2020. |
88
Table of Contents
AMG Managers Pictet International Fund Portfolio Manager’s Comments (continued) |
|
| Through its history the Fund has suffered periods of relative performance similar to that experienced since COVID-19 became a pandemic in Q1 2020. In each case it has bounced back strongly. As before, the key to recovery was to stick to what we believe | in—to focus on maintaining both our investment process and a sense of what we are willing to pay for selected business models based on their long-term prospects. We are doing that now and will continue to as we navigate this extraordinary period. | This commentary reflects the viewpoints of Pictet Asset Management as of November 27, 2020, and is not intended as a forecast or guarantee of future results. |
89
Table of Contents
AMG Managers Pictet International Fund Portfolio Manager’s Comments (continued) |
CUMULATIVE TOTAL RETURN PERFORMANCE
AMG Managers Pictet International Fund’s cumulative total return is based on the daily change in net asset value (NAV), and assumes that all dividends and distributions were reinvested. The graph compares a hypothetical $10,000 investment made in the AMG Managers Pictet International Fund’s Class N shares on April 14, 2014, to a $10,000 investment made in the MSCI EAFE Index for the same time period. The graph and table do not reflect the deduction of taxes that a shareholder would pay on a Fund distribution or redemption of shares. The listed returns for the Fund are net of expenses and the returns for the index exclude expenses. Total returns would have been lower had certain expenses not been reduced.
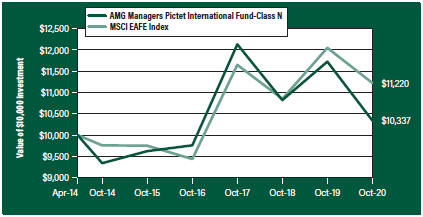
The table below shows the average annual total returns for the AMG Managers Pictet International Fund and the MSCI EAFE Index for the same time periods ended October 31, 2020.
| Average Annual Total Returns1 | One Year | Five Years | Since Inception | Inception Date | ||||||||||||
AMG Managers Pictet International Fund2, 3, 4, 5, 6, 7, 8 |
| |||||||||||||||
Class N | (11.83%) | 1.44% | 0.51% | 04/14/14 | ||||||||||||
Class I | (11.63%) | 1.69% | 0.79% | 04/14/14 | ||||||||||||
Class Z | (11.56%) | — | (4.21%) | 09/29/17 | ||||||||||||
MSCI EAFE Index9, 10 | (6.86%) | 2.85% | 1.78% | 04/14/14 | † | |||||||||||
The performance data shown represents past performance. Past performance is not a guarantee of future results. Current performance may be lower or higher than the performance data quoted. The investment return and principal value of an investment will fluctuate so that an investor’s shares, when redeemed, may be worth more or less than their original cost.
Investors should carefully consider the Fund’s investment objectives, risks, charges and expenses before investing. For performance information through the most recent month end, current net asset values per share for the Fund and other information, please call 800.548.4539 or visit our website at amgfunds.com for a free prospectus. Read it carefully before investing or sending money.
Distributed by AMG Distributors, Inc., member FINRA/SIPC.
| † | Date reflects the inception date of the Fund, not the index. |
| 1 | Total return equals income yield plus share price change and assumes reinvestment of all dividends and capital gain distributions. Returns are net of fees and may reflect offsets of Fund expenses as described in the prospectus. No adjustment has been made for taxes payable by shareholders on their reinvested dividends and |
capital gain distributions. Returns for periods greater than one year are annualized. The listed returns on the Fund are net of expenses and based on the published NAV as of October 31, 2020. All returns are in U.S. dollars ($). |
2 Investments in international securities are subject to certain risks of overseas investing including currency fluctuations and changes in political and economic conditions, which could result in significant market fluctuations. These risks are magnified in emerging markets. |
3 The Fund is subject to the risks associated with investments in emerging markets, such as erratic earnings patterns, economic and political instability, changing exchange controls, limitations on repatriation of foreign capital and changes in local governmental attitudes toward private investment, possibly leading to nationalization or confiscation of investor assets. |
4 Investing in initial public offerings (IPOs) is risky and the prices of stocks purchased in IPOs tend to fluctuate more widely than stocks of companies that have been publicly traded for a longer period of time. Stocks purchased in IPOs generally do not have a trading history, and information about the companies may be available for very limited periods. |
5 The Fund is subject to risks associated with investments in mid-capitalization companies such as greater price volatility, lower trading volume, and less liquidity than the stocks of larger, more established companies. |
6 The Fund is subject to risks associated with investments in small-capitalization companies, such as erratic earnings patterns, competitive conditions, limited earnings history and a reliance on one or a limited number of products. |
7 Market prices of investments held by the Fund may fall rapidly or unpredictably due to a variety of economic or political factors, market conditions, disasters or public health issues, or in response to events that affect particular industries or companies. |
8 A greater percentage of the Fund’s holdings may be focused in a smaller number of securities which may place the Fund at greater risk than a more diversified fund. |
9 The MSCI EAFE Index (Europe, Australasia, Far East) is a free float-adjusted market capitalization index that is designed to measure the equity market performance of developed markets, excluding the U.S. & Canada. Please go to msci.com for most current list of countries represented by the index. Unlike the Fund, the MSCI EAFE Index is unmanaged, is not available for investment and does not incur expenses. |
90
Table of Contents
AMG Managers Pictet International Fund Portfolio Manager’s Comments (continued) |
|
10 All MSCI data is provided “as is.” The products described herein are not sponsored or endorsed and have not been reviewed or passed on by MSCI. In no event shall MSCI, its affiliates, or any MSCI | data provider have any liability of any kind in connection with the MSCI data or the products described herein. Copying or redistributing the MSCI data is strictly prohibited. | Not FDIC insured, nor bank guaranteed. May lose value. |
91
Table of Contents
AMG Managers Pictet International Fund Fund Snapshots (unaudited) October 31, 2020 |
|
PORTFOLIO BREAKDOWN
| Sector | % of Net Assets | |||||
Industrials | 22.4 | |||||
Consumer Discretionary | 18.2 | |||||
Financials | 16.8 | |||||
Consumer Staples | 15.5 | |||||
Communication Services | 10.6 | |||||
Health Care | 5.8 | |||||
Information Technology | 5.8 | |||||
Energy | 1.6 | |||||
Materials | 1.5 | |||||
Real Estate | 0.6 | |||||
Short-Term Investments | 1.2 | |||||
Other Assets Less Liabilities | 0.0 | |||||
TOP TEN HOLDINGS
| Security Name | % of Net Assets | |||||
Nestle SA (Switzerland) | 3.4 | |||||
Informa PLC (United Kingdom) | 2.9 | |||||
Asahi Group Holdings, Ltd. (Japan) | 2.9 | |||||
Jardine Strategic Holdings, Ltd. (Hong Kong) | 2.7 | |||||
Trip.com Group, Ltd., ADR (China) | 2.4 | |||||
GlaxoSmithKline PLC (United Kingdom) | 2.3 | |||||
FANUC Corp. (Japan) | 2.2 | |||||
ASML Holding NV (Netherlands) | 2.2 | |||||
Tencent Holdings, Ltd. (China) | 2.1 | |||||
Matsumotokiyoshi Holdings Co., Ltd. (Japan) | 2.1 | |||||
|
|
| ||||
Top Ten as a Group | 25.2 | |||||
|
|
| ||||
Because a fund’s strategy may result in multiple investments in particular sectors of the economy, its performance may depend on the performance of those sectors and may fluctuate more widely than investments diversified across more sectors. For additional information on these and other risk considerations, please see the Fund’s prospectus.
Any sectors, industries, or securities discussed should not be perceived as investment recommendations. Mention of a specific security should not be considered a recommendation to buy or solicitation to sell that security. Specific securities mentioned in this report may have been sold from the Fund’s portfolio of investments by the time you receive this report.
92
Table of Contents
AMG Managers Pictet International Fund Schedule of Portfolio Investments October 31, 2020 |
|
| Shares | Value | |||||||
Common Stocks - 98.8% | ||||||||
Communication Services - 10.6% |
| |||||||
Bollore SA (France) | 786,564 | $2,819,426 | ||||||
Informa PLC (United Kingdom)* | 1,007,305 | 5,465,292 | ||||||
Nexon Co., Ltd. (Japan) | 122,200 | 3,405,825 | ||||||
Square Enix Holdings Co., Ltd. (Japan) | 28,000 | 1,626,878 | ||||||
Tencent Holdings, Ltd. (China) | 51,000 | 3,896,688 | ||||||
Vivendi SA (France) | 84,178 | 2,429,664 | ||||||
Total Communication Services | 19,643,773 | |||||||
Consumer Discretionary - 18.2% |
| |||||||
Cie Financiere Richemont SA (Switzerland) | 43,317 | 2,707,477 | ||||||
Compass Group PLC (United Kingdom) | 222,102 | 3,040,087 | ||||||
EssilorLuxottica, S.A. (France)* | 18,500 | 2,283,983 | ||||||
Freni Brembo SpA (Italy)*,1 | 216,062 | 2,244,898 | ||||||
Gestamp Automocion SA (Spain)2 | 423,524 | 1,295,128 | ||||||
InterContinental Hotels Group PLC (United Kingdom)* | 62,935 | 3,197,753 | ||||||
JD.com, Inc., ADR (China)* | 21,950 | 1,789,364 | ||||||
KOMEDA Holdings Co., Ltd. (Japan) | 127,100 | 2,246,433 | ||||||
Pandora A/S (Denmark) | 26,923 | 2,135,787 | ||||||
Rakuten, Inc. (Japan) | 282,100 | 2,744,603 | ||||||
Rinnai Corp. (Japan) | 23,600 | 2,325,461 | ||||||
Sony Corp. (Japan) | 38,100 | 3,176,263 | ||||||
Trip.com Group, Ltd., ADR (China)* | 157,677 | 4,534,790 | ||||||
Total Consumer Discretionary | 33,722,027 | |||||||
Consumer Staples - 15.5% |
| |||||||
Ain Holdings, Inc. (Japan) | 44,700 | 3,126,652 | ||||||
Anheuser-Busch InBev SA/NV (Belgium) | 71,084 | 3,676,893 | ||||||
Asahi Group Holdings, Ltd. (Japan) | 175,900 | 5,443,602 | ||||||
cocokara fine, Inc. (Japan) | 30,000 | 1,970,890 | ||||||
Danone SA (France) | 46,558 | 2,582,342 | ||||||
Matsumotokiyoshi Holdings Co., Ltd. (Japan) | 103,000 | 3,802,385 | ||||||
Nestle SA (Switzerland) | 55,884 | 6,285,717 | ||||||
Treasury Wine Estates, Ltd. (Australia) | 299,343 | 1,929,814 | ||||||
Total Consumer Staples | 28,818,295 | |||||||
Energy - 1.6% |
| |||||||
Royal Dutch Shell PLC, Class B (Netherlands) | 244,677 | 2,950,654 | ||||||
Financials - 16.8% |
| |||||||
ASR Nederland NV (Netherlands) | 68,361 | 2,074,440 | ||||||
Banco Bilbao Vizcaya Argentaria SA (Spain) | 838,885 | 2,420,304 | ||||||
DBS Group Holdings, Ltd. (Singapore)1 | 214,534 | 3,195,668 | ||||||
EXOR NV (Netherlands) | 67,715 | 3,522,985 | ||||||
Intesa Sanpaolo SpA (Italy)* | 1,131,978 | 1,879,196 | ||||||
| Shares | Value | |||||||
Julius Baer Group, Ltd. (Switzerland) | 83,934 | $3,735,503 | ||||||
Moscow Exchange MICEX-RTS PJSC (Russia) | 1,558,083 | 2,631,498 | ||||||
Nordea Bank Abp (Finland)* | 363,295 | 2,726,627 | ||||||
Prudential PLC (United Kingdom) | 276,135 | 3,377,282 | ||||||
Saga PLC (United Kingdom)* | 352,489 | 630,964 | ||||||
Shinsei Bank, Ltd. (Japan) | 215,400 | 2,591,595 | ||||||
Sompo Holdings, Inc. (Japan) | 62,100 | 2,318,558 | ||||||
Total Financials | 31,104,620 | |||||||
Health Care - 5.8% |
| |||||||
GlaxoSmithKline PLC (United Kingdom) | 251,489 | 4,199,503 | ||||||
Grifols SA, ADR (Spain) | 144,302 | 2,450,248 | ||||||
H.U. Group Holdings, Inc. (Japan) | 79,100 | 2,012,485 | ||||||
LivaNova PLC (United Kingdom)* | 43,211 | 2,175,242 | ||||||
Total Health Care | 10,837,478 | |||||||
Industrials - 22.4% |
| |||||||
Bunzl PLC (United Kingdom) | 41,775 | 1,298,635 | ||||||
CK Hutchison Holdings, Ltd. (Hong Kong) | 314,748 | 1,901,072 | ||||||
Elis SA (France)* | 270,444 | 2,966,172 | ||||||
FANUC Corp. (Japan) | 19,300 | 4,076,640 | ||||||
Fujitec Co., Ltd. (Japan) | 85,000 | 1,852,194 | ||||||
Hoshizaki Corp. (Japan) | 38,800 | 3,098,539 | ||||||
Jardine Strategic Holdings, Ltd. (Hong Kong) | 230,428 | 4,989,264 | ||||||
Knorr-Bremse AG (Germany) | 24,146 | 2,796,125 | ||||||
Park24 Co., Ltd. (Japan)* | 156,400 | 2,112,629 | ||||||
Reliance Worldwide Corp., Ltd. (United States) | 1,110,346 | 3,205,271 | ||||||
S-1 Corp. (South Korea) | 27,866 | 2,002,720 | ||||||
Safran SA (France)* | 35,536 | 3,748,322 | ||||||
Vinci SA (France) | 43,665 | 3,448,874 | ||||||
The Weir Group PLC (United Kingdom)* | 115,504 | 2,145,813 | ||||||
Wizz Air Holdings PLC (Switzerland)*,2 | 46,339 | 1,918,381 | ||||||
Total Industrials | 41,560,651 | |||||||
Information Technology - 5.8% |
| |||||||
ASML Holding NV (Netherlands) | 11,079 | 4,008,403 | ||||||
Samsung Electronics Co., Ltd. (South Korea) | 68,341 | 3,435,203 | ||||||
Siltronic AG (Germany) | 20,587 | 1,948,252 | ||||||
Worldline, S.A. (France)*,2 | 19,500 | 1,444,292 | ||||||
Total Information Technology | 10,836,150 | |||||||
Materials - 1.5% |
| |||||||
OCI NV (Netherlands)*,1 | 227,087 | 2,718,623 | ||||||
Real Estate - 0.6% |
| |||||||
Merlin Properties Socimi SA, REIT (Spain) | 160,817 | 1,082,463 | ||||||
Total Common Stocks | 183,274,734 | |||||||
The accompanying notes are an integral part of these financial statements.
93
Table of Contents
AMG Managers Pictet International Fund Schedule of Portfolio Investments (continued) |
|
Principal Amount | Value | |||||||
Short-Term Investments - 1.2% |
| |||||||
Joint Repurchase Agreements - 0.2%3 |
| |||||||
Daiwa Capital Markets America, dated 10/30/20,due 11/02/20, 0.100% total to be received $251,783 (collateralized by various U.S. Government Agency Obligations and U.S. Treasuries, 0.000% - 6.500%, 12/31/20 - 11/01/50, totaling $256,817) | $ | 251,781 | $ | 251,781 | ||||
| Shares | ||||||||
Other Investment Companies - 1.0% |
| |||||||
Dreyfus Government Cash Management Fund, Institutional Shares, 0.02%4 | 616,389 | 616,389 | ||||||
| * | Non-income producing security. |
| # | Less than 0.05%. |
| 1 | Some of these securities, amounting to $244,537 or 0.1% of net assets, were out on loan to various borrowers and are collateralized by cash. See Note 4 of Notes to Financial Statements. |
| 2 | Security exempt from registration under Rule 144A of the Securities Act of 1933. This security may be resold in transactions exempt from registration, normally to qualified institutional buyers. At October 31, 2020, the value of these securities amounted to $4,657,801 or 2.5% of net assets. |
Shares | Value | |||||||
Dreyfus Institutional Preferred Government Money Market Fund, Institutional Shares, 0.04%4 | 616,388 | $616,388 | ||||||
JPMorgan U.S. Government Money Market Fund, IM Shares, 0.04%4 | 635,067 | 635,067 | ||||||
Total Other Investment Companies |
| 1,867,844 | ||||||
Total Short-Term Investments |
| 2,119,625 | ||||||
Total Investments - 100.0% |
| 185,394,359 | ||||||
Other Assets, less Liabilities - 0.0%# |
| 83,510 | ||||||
Net Assets - 100.0% |
| $185,477,869 | ||||||
| 3 | Cash collateral received for securities lending activity was invested in these joint repurchase agreements. |
| 4 | Yield shown represents the October 31, 2020, seven day average yield, which refers to the sum of the previous seven days’ dividends paid, expressed as an annual percentage. |
ADR American Depositary Receipt
REIT Real Estate Investment Trust
The accompanying notes are an integral part of these financial statements.
94
Table of Contents
AMG Managers Pictet International Fund Schedule of Portfolio Investments (continued) |
|
The following table summarizes the inputs used to value the Fund’s investments by the fair value hierarchy levels as of October 31, 2020:
| Level 1 | Level 21 | Level 3 | Total | |||||||||||||
Investments in Securities | ||||||||||||||||
Common Stocks | ||||||||||||||||
Industrials | $2,796,125 | $38,764,526 | – | $41,560,651 | ||||||||||||
Consumer Discretionary | 6,324,154 | 27,397,873 | – | 33,722,027 | ||||||||||||
Financials | – | 31,104,620 | – | 31,104,620 | ||||||||||||
Consumer Staples | – | 28,818,295 | – | 28,818,295 | ||||||||||||
Communication Services | – | 19,643,773 | – | 19,643,773 | ||||||||||||
Health Care | 4,625,490 | 6,211,988 | – | 10,837,478 | ||||||||||||
Information Technology | – | 10,836,150 | – | 10,836,150 | ||||||||||||
Energy | – | 2,950,654 | – | 2,950,654 | ||||||||||||
Materials | – | 2,718,623 | – | 2,718,623 | ||||||||||||
Real Estate | – | 1,082,463 | – | 1,082,463 | ||||||||||||
Short-Term Investments | ||||||||||||||||
Joint Repurchase Agreements | – | 251,781 | – | 251,781 | ||||||||||||
Other Investment Companies | 1,867,844 | – | – | 1,867,844 | ||||||||||||
|
|
|
|
|
|
|
| |||||||||
Total Investments in Securities | $15,613,613 | $169,780,746 | – | $185,394,359 | ||||||||||||
|
|
|
|
|
|
|
| |||||||||
| 1 | An external pricing service is used to reflect any impact on security value due to market movements between the time the Fund valued such foreign securities and the earlier closing of foreign markets. |
For the fiscal year ended October 31, 2020, there were no transfers in or out of Level 3.
The country allocation in the Schedule of Portfolio Investments at October 31, 2020, was as follows:
| Country | % of Long-Term Investments | |||
Australia | 1.1 | |||
Belgium | 2.0 | |||
China | 5.6 | |||
Denmark | 1.2 | |||
Finland | 1.5 | |||
France | 11.8 | |||
Germany | 2.6 | |||
Hong Kong | 3.8 | |||
Italy | 2.2 | |||
Japan | 26.2 | |||
| Country | % of Long-Term Investments | |||
Netherlands | 8.3 | |||
Russia | 1.4 | |||
Singapore | 1.7 | |||
South Korea | 3.0 | |||
Spain | 4.0 | |||
Switzerland | 8.0 | |||
United Kingdom | 13.9 | |||
United States | 1.7 | |||
|
|
| ||
| 100.0 | ||||
|
|
| ||
The accompanying notes are an integral part of these financial statements.
95
Table of Contents
| AMG River Road Focused Absolute Value Fund | AMG Managers Montag & Caldwell Growth Fund | AMG River Road Dividend All Cap Value Fund | AMG Managers Fairpointe Mid Cap Fund | |||||||||||||
Assets: | ||||||||||||||||
Investments at value1 (including securities on loan valued at $0, $0, $23,567,198, and $0, respectively) | $145,595,944 | $476,127,267 | $463,691,953 | $432,868,570 | ||||||||||||
Receivable for investments sold | — | — | — | 22,334,300 | ||||||||||||
Dividend and interest receivables | 93,513 | 279,242 | 1,356,401 | 272,875 | ||||||||||||
Securities lending income receivable | — | — | 4,132 | — | ||||||||||||
Receivable for Fund shares sold | 155,699 | 100,413 | 121,671 | 41,320 | ||||||||||||
Receivable from affiliate | 2,316 | — | — | — | ||||||||||||
Prepaid expenses and other assets | 23,936 | 20,235 | 23,125 | 30,197 | ||||||||||||
Total assets | 145,871,408 | 476,527,157 | 465,197,282 | �� | 455,547,262 | |||||||||||
Liabilities: | ||||||||||||||||
Payable upon return of securities loaned | — | — | 11,813,488 | — | ||||||||||||
Payable for investments purchased | — | — | 396,935 | 7,975,648 | ||||||||||||
Payable for Fund shares repurchased | 45,669 | 324,654 | 486,616 | 550,264 | ||||||||||||
Accrued expenses: | ||||||||||||||||
Investment advisory and management fees | 76,116 | 325,616 | 240,675 | 616,830 | ||||||||||||
Administrative fees | 19,029 | 64,029 | 60,169 | 59,756 | ||||||||||||
Distribution fees | 2,736 | 19,382 | 9,171 | 48,631 | ||||||||||||
Shareholder service fees | 4,989 | 29,880 | 20,344 | 31,174 | ||||||||||||
Other | 37,044 | 75,193 | 66,997 | 110,436 | ||||||||||||
Total liabilities | 185,583 | 838,754 | 13,094,395 | 9,392,739 | ||||||||||||
| ||||||||||||||||
Net Assets | $145,685,825 | $475,688,403 | $452,102,887 | $446,154,523 | ||||||||||||
1 Investments at cost | $134,584,433 | $283,979,107 | $398,647,993 | $331,121,932 | ||||||||||||
The accompanying notes are an integral part of these financial statements.
96
Table of Contents
Statement of Assets and Liabilities (continued) |
| AMG River Road Focused Absolute Value Fund | AMG Managers Montag & Caldwell Growth Fund | AMG River Road Dividend All Cap Value Fund | AMG Managers Fairpointe Mid Cap Fund | |||||||||||||
Net Assets Represent: | ||||||||||||||||
Paid-in capital | $155,799,578 | $208,410,588 | $398,557,245 | $317,484,764 | ||||||||||||
Total distributable earnings (loss) | (10,113,753 | ) | 267,277,815 | 53,545,642 | 128,669,759 | |||||||||||
Net Assets | $145,685,825 | $475,688,403 | $452,102,887 | $446,154,523 | ||||||||||||
Class N: | ||||||||||||||||
Net Assets | $12,466,322 | $166,050,582 | $41,358,194 | $259,561,420 | ||||||||||||
Shares outstanding | 1,128,020 | 7,724,070 | 4,128,831 | 8,723,350 | ||||||||||||
Net asset value, offering and redemption price per share | $11.05 | $21.50 | $10.02 | $29.75 | ||||||||||||
Class I: | ||||||||||||||||
Net Assets | $130,757,905 | $309,637,821 | $408,843,508 | $176,807,446 | ||||||||||||
Shares outstanding | 11,761,174 | 14,276,372 | 40,850,814 | 5,762,504 | ||||||||||||
Net asset value, offering and redemption price per share | $11.12 | $21.69 | $10.01 | $30.68 | ||||||||||||
Class Z: | ||||||||||||||||
Net Assets | $2,461,598 | — | $1,901,185 | $9,785,657 | ||||||||||||
Shares outstanding | 221,298 | — | 189,936 | 319,436 | ||||||||||||
Net asset value, offering and redemption price per share | $11.12 | — | $10.01 | $30.63 | ||||||||||||
The accompanying notes are an integral part of these financial statements.
97
Table of Contents
Statement of Assets and Liabilities (continued) |
| AMG Managers LMCG Small Cap Growth Fund | AMG River Road Small-Mid Cap Value Fund | AMG River Road Small Cap Value Fund | AMG Managers Silvercrest Small Cap Fund | |||||||||||||
Assets: | ||||||||||||||||
Investments at value1 (including securities on loan valued at $5,732,071, $5,929,845, $13,281,878, and $12,791,387, respectively) | $ | 37,547,001 | $ | 178,966,420 | $ | 515,223,385 | $ | 176,143,683 | ||||||||
Receivable for investments sold | 2,310,826 | 825,994 | 1,551,270 | 2,271,698 | ||||||||||||
Dividend and interest receivables | 1,150 | 13,043 | 79,632 | 84,993 | ||||||||||||
Securities lending income receivable | 795 | 744 | 1,784 | 1,962 | ||||||||||||
Receivable for Fund shares sold | 1,313 | 21,130 | 494,735 | 331,033 | ||||||||||||
Receivable from affiliate | 2,165 | — | — | 619 | ||||||||||||
Prepaid expenses and other assets | 8,360 | 16,302 | 21,207 | 10,473 | ||||||||||||
Total assets | 39,871,610 | 179,843,633 | 517,372,013 | 178,844,461 | ||||||||||||
Liabilities: | ||||||||||||||||
Payable upon return of securities loaned | 1,290,673 | — | — | — | ||||||||||||
Payable for investments purchased | 2,958,612 | 694,306 | 1,345,674 | — | ||||||||||||
Payable for Fund shares repurchased | 162,788 | 437,963 | 904,151 | 167,725 | ||||||||||||
Due to custodian | — | — | — | 666,503 | ||||||||||||
Accrued expenses: | ||||||||||||||||
Investment advisory and management fees | 28,526 | 118,061 | 360,178 | 142,715 | ||||||||||||
Administrative fees | 4,754 | 23,612 | 67,533 | 23,786 | ||||||||||||
Distribution fees | 2,642 | 4,140 | 5,776 | 2,974 | ||||||||||||
Shareholder service fees | 2,219 | 8,590 | 55,166 | 9,006 | ||||||||||||
Other | 29,930 | 35,527 | 51,372 | 38,268 | ||||||||||||
Total liabilities | 4,480,144 | 1,322,199 | 2,789,850 | 1,050,977 | ||||||||||||
Net Assets | $ | 35,391,466 | $ | 178,521,434 | $ | 514,582,163 | $ | 177,793,484 | ||||||||
1 Investments at cost | $ | 30,247,385 | $ | 183,046,472 | $ | 495,650,827 | $ | 178,501,303 | ||||||||
The accompanying notes are an integral part of these financial statements.
98
Table of Contents
Statement of Assets and Liabilities (continued) |
| AMG Managers LMCG Small Cap Growth Fund | AMG River Road Small-Mid Cap Value Fund | AMG River Road Small Cap Value Fund | AMG Managers Silvercrest Small Cap Fund | |||||||||||||
Net Assets Represent: | ||||||||||||||||
Paid-in capital | $26,642,428 | $192,962,910 | $507,268,941 | $190,100,640 | ||||||||||||
Total distributable earnings (loss) | 8,749,038 | (14,441,476 | ) | 7,313,222 | (12,307,156 | ) | ||||||||||
Net Assets | $35,391,466 | $178,521,434 | $514,582,163 | $177,793,484 | ||||||||||||
Class N: | ||||||||||||||||
Net Assets | $28,908,353 | $21,617,812 | $25,919,771 | $21,726,993 | ||||||||||||
Shares outstanding | 1,367,231 | 3,179,581 | 2,409,693 | 1,604,775 | ||||||||||||
Net asset value, offering and redemption price per share | $21.14 | $6.80 | $10.76 | $13.54 | ||||||||||||
Class I: | ||||||||||||||||
Net Assets | $6,483,113 | $156,350,348 | $487,637,082 | $121,400,067 | ||||||||||||
Shares outstanding | 300,097 | 22,391,045 | 44,136,894 | 8,843,205 | ||||||||||||
Net asset value, offering and redemption price per share | $21.60 | $6.98 | $11.05 | $13.73 | ||||||||||||
Class Z: | ||||||||||||||||
Net Assets | — | $553,274 | $1,025,310 | $34,666,424 | ||||||||||||
Shares outstanding | — | 79,229 | 92,782 | 2,526,060 | ||||||||||||
Net asset value, offering and redemption price per share | — | $6.98 | $11.05 | $13.72 | ||||||||||||
The accompanying notes are an integral part of these financial statements.
99
Table of Contents
Statement of Assets and Liabilities (continued) |
| AMG Managers DoubleLine Core Plus Bond Fund | AMG River Road Long-Short Fund | AMG Managers Pictet International Fund | ||||||||||
Assets: | ||||||||||||
Investments at value1 (including securities on loan valued at $1,422,660, $0, and $244,537, respectively) | $482,630,700 | $16,193,923 | $185,394,359 | |||||||||
Affiliated Investments at value2 | 24,304,814 | — | — | |||||||||
Foreign currency3 | — | 158,348 | 103,004 | |||||||||
Receivable for investments sold | 19,041,973 | — | 53,026 | |||||||||
Segregated cash | — | 5,339,621 | — | |||||||||
Dividend and interest receivables | 2,483,523 | 12,310 | 1,082,988 | |||||||||
Securities lending income receivable | 714 | — | 86 | |||||||||
Receivable for Fund shares sold | 418,762 | 8,438 | 97,963 | |||||||||
Receivable from affiliate | 10,896 | 5,728 | — | |||||||||
Prepaid expenses and other assets | 23,257 | 9,282 | 17,093 | |||||||||
Unrealized appreciation on unfunded loan commitments | 877 | — | — | |||||||||
Total assets | 528,915,516 | 21,727,650 | 186,748,519 | |||||||||
Liabilities: | ||||||||||||
Payable upon return of securities loaned | 1,335,973 | — | 251,781 | |||||||||
Payable for investments purchased | 19,709,358 | 25,568 | — | |||||||||
Payable for delayed delivery investments purchased | 5,030,754 | — | — | |||||||||
Payable for Fund shares repurchased | 242,666 | 52,655 | 756,272 | |||||||||
Interest and dividends payable | — | 9,224 | — | |||||||||
Due to custodian | 1,471,429 | — | — | |||||||||
Accrued expenses: | ||||||||||||
Investment advisory and management fees | 192,474 | 12,246 | 153,862 | |||||||||
Administrative fees | 64,158 | 2,161 | 25,042 | |||||||||
Distribution fees | 12,027 | 345 | 1,522 | |||||||||
Shareholder service fees | 33,721 | 1,107 | 18,844 | |||||||||
Other | 83,084 | 32,983 | 63,327 | |||||||||
Securities sold short, at value4 | — | 5,306,619 | — | |||||||||
Total liabilities | 28,175,644 | 5,442,908 | 1,270,650 | |||||||||
| ||||||||||||
Net Assets | $500,739,872 | $16,284,742 | $185,477,869 | |||||||||
1 Investments at cost | $480,490,934 | $16,239,459 | $197,670,489 | |||||||||
2 Affiliated Investments at cost | $23,657,172 | — | — | |||||||||
3 Foreign currency at cost | — | $156,350 | $102,428 | |||||||||
4 Proceeds | — | $5,688,195 | — | |||||||||
The accompanying notes are an integral part of these financial statements.
100
Table of Contents
Statement of Assets and Liabilities (continued) |
| AMG Managers DoubleLine Core Plus Bond Fund | AMG River Road Long-Short Fund | AMG Managers Pictet International Fund | ||||||||||
Net Assets Represent: | ||||||||||||
Paid-in capital | $505,336,360 | $17,174,692 | $312,092,997 | |||||||||
Total distributable loss | (4,596,488 | ) | (889,950 | ) | (126,615,128 | ) | ||||||
Net Assets | $500,739,872 | $16,284,742 | $185,477,869 | |||||||||
Class N: | ||||||||||||
Net Assets | $56,175,393 | $1,583,923 | $6,791,642 | |||||||||
Shares outstanding | 5,221,962 | 138,971 | 825,310 | |||||||||
Net asset value, offering and redemption price per share | $10.76 | $11.40 | $8.23 | |||||||||
Class I: | ||||||||||||
Net Assets | $433,880,867 | $14,040,708 | $166,994,362 | |||||||||
Shares outstanding | 40,359,625 | 1,204,789 | 20,172,580 | |||||||||
Net asset value, offering and redemption price per share | $10.75 | $11.65 | $8.28 | |||||||||
Class Z: | ||||||||||||
Net Assets | $10,683,612 | $660,111 | $11,691,865 | |||||||||
Shares outstanding | 992,822 | 56,463 | 1,415,698 | |||||||||
Net asset value, offering and redemption price per share | $10.76 | $11.69 | $8.26 | |||||||||
The accompanying notes are an integral part of these financial statements.
101
Table of Contents
| AMG River Road Focused Absolute Value Fund | AMG Managers Montag & Caldwell Growth Fund | AMG River Road Dividend All Cap Value Fund | AMG Managers Fairpointe Mid Cap Fund | |||||||||||||||||
Investment Income: | ||||||||||||||||||||
Dividend income | $2,071,321 | 1 | $4,088,557 | $17,850,455 | $12,228,199 | |||||||||||||||
Interest income | 142 | — | — | — | ||||||||||||||||
Securities lending income | 25,441 | 3,226 | 103,294 | — | ||||||||||||||||
Foreign withholding tax | (11,135 | ) | — | (5,834 | ) | (114,644 | ) | |||||||||||||
Total investment income | 2,085,769 | 4,091,783 | 17,947,915 | 12,113,555 | ||||||||||||||||
Expenses: | ||||||||||||||||||||
Investment advisory and management fees | 923,146 | 3,359,593 | 3,076,734 | 4,632,984 | ||||||||||||||||
Administrative fees | 230,787 | 719,913 | 769,183 | 1,095,746 | ||||||||||||||||
Distribution fees - Class N | 40,198 | 271,418 | 133,933 | 824,970 | ||||||||||||||||
Shareholder servicing fees - Class N | 6,432 | 115,094 | 37,501 | 274,079 | ||||||||||||||||
Shareholder servicing fees - Class I | 54,743 | 220,865 | 224,669 | 295,390 | ||||||||||||||||
Registration fees | 60,613 | 44,585 | 73,025 | 87,579 | ||||||||||||||||
Professional fees | 33,999 | 61,681 | 52,605 | 61,202 | ||||||||||||||||
Custodian fees | 27,871 | 44,762 | 46,487 | 63,884 | ||||||||||||||||
Reports to shareholders | 13,681 | 56,353 | 28,988 | 40,239 | ||||||||||||||||
Trustee fees and expenses | 13,477 | 42,934 | 45,912 | 72,341 | ||||||||||||||||
Transfer agent fees | 5,413 | 44,658 | 18,051 | 40,530 | ||||||||||||||||
Interest expense | 838 | — | 2,775 | 2,315 | ||||||||||||||||
Miscellaneous | 11,386 | 32,056 | 37,230 | 71,594 | ||||||||||||||||
Total expenses before offsets | 1,422,584 | 5,013,912 | 4,547,093 | 7,562,853 | ||||||||||||||||
Expense reimbursements | (176,679 | ) | — | — | (176,021 | ) | ||||||||||||||
Expense reductions | (21,695 | ) | (7,182 | ) | (23,766 | ) | — | |||||||||||||
Net expenses | 1,224,210 | 5,006,730 | 4,523,327 | 7,386,832 | ||||||||||||||||
| ||||||||||||||||||||
Net investment income (loss) | 861,559 | (914,947 | ) | 13,424,588 | 4,726,723 | |||||||||||||||
Net Realized and Unrealized Gain (Loss): | ||||||||||||||||||||
Net realized gain (loss) on investments | (20,924,160 | ) | 85,184,256 | 2,020,791 | 124,204,848 | |||||||||||||||
Net change in unrealized appreciation/depreciation on investments | (655,316 | ) | 9,372,542 | (77,612,710 | ) | (179,176,911 | ) | |||||||||||||
Net realized and unrealized gain (loss) | (21,579,476 | ) | 94,556,798 | (75,591,919 | ) | (54,972,063 | ) | |||||||||||||
| ||||||||||||||||||||
Net increase (decrease) in net assets resulting from operations | $(20,717,917 | ) | $93,641,851 | $(62,167,331 | ) | $(50,245,340 | ) | |||||||||||||
1 Includes non-recurring dividends of 233,258. | ||||||||||||||||||||
The accompanying notes are an integral part of these financial statements.
102
Table of Contents
Statement of Operations (continued) |
|
| AMG Managers LMCG Small Cap Growth Fund | AMG River Road Small-Mid Cap Value Fund | AMG River Road Small Cap Value Fund | AMG Managers Silvercrest Small Cap Fund | |||||||||||||||||
Investment Income: | ||||||||||||||||||||
Dividend income | $120,956 | $2,027,194 | 1 | $5,233,202 | $2,681,018 | |||||||||||||||
Securities lending income | 11,813 | 22,251 | 47,218 | 24,155 | ||||||||||||||||
Foreign withholding tax | — | (4,398 | ) | (28,827 | ) | — | ||||||||||||||
Total investment income | 132,769 | 2,045,047 | 5,251,593 | 2,705,173 | ||||||||||||||||
Expenses: | ||||||||||||||||||||
Investment advisory and management fees | 322,632 | 1,345,765 | 3,658,731 | 1,759,128 | ||||||||||||||||
Administrative fees | 53,772 | 269,153 | 686,012 | 293,188 | ||||||||||||||||
Distribution fees - Class N | 52,401 | 59,694 | 81,737 | 57,801 | ||||||||||||||||
Shareholder servicing fees - Class N | 19,666 | 14,490 | 32,695 | 16,692 | ||||||||||||||||
Shareholder servicing fees - Class I | 5,427 | 83,700 | 358,340 | 96,872 | ||||||||||||||||
Registration fees | 33,402 | 61,474 | 72,653 | 57,472 | ||||||||||||||||
Professional fees | 24,871 | 32,193 | 47,363 | 32,932 | ||||||||||||||||
Custodian fees | 20,908 | 30,669 | 50,661 | 30,443 | ||||||||||||||||
Reports to shareholders | 9,852 | 19,135 | 43,452 | 17,223 | ||||||||||||||||
Transfer agent fees | 7,697 | 7,068 | 15,532 | 6,709 | ||||||||||||||||
Trustee fees and expenses | 3,222 | 15,766 | 39,621 | 17,389 | ||||||||||||||||
Interest expense | 2,611 | — | — | 39 | ||||||||||||||||
Miscellaneous | 4,069 | 12,917 | 29,145 | 14,787 | ||||||||||||||||
Repayment of prior reimbursements | — | 28,445 | — | — | ||||||||||||||||
Total expenses before offsets | 560,530 | 1,980,469 | 5,115,942 | 2,400,675 | ||||||||||||||||
Expense reimbursements | (111,190 | ) | — | — | (118,317 | ) | ||||||||||||||
Expense reductions | (1,836 | ) | (39,200 | ) | (109,023 | ) | (66,758 | ) | ||||||||||||
Net expenses | 447,504 | 1,941,269 | 5,006,919 | 2,215,600 | ||||||||||||||||
| ||||||||||||||||||||
Net investment income (loss) | (314,735 | ) | 103,778 | 244,674 | 489,573 | |||||||||||||||
Net Realized and Unrealized Gain (Loss): | ||||||||||||||||||||
Net realized gain (loss) on investments | 4,712,131 | (9,195,938 | ) | (10,803,606 | ) | (9,161,963 | ) | |||||||||||||
Net change in unrealized appreciation/depreciation on investments | 2,853,559 | (14,720,991 | ) | (29,318,189 | ) | (19,170,573 | ) | |||||||||||||
Net realized and unrealized gain (loss) | 7,565,690 | (23,916,929 | ) | (40,121,795 | ) | (28,332,536 | ) | |||||||||||||
| ||||||||||||||||||||
Net increase (decrease) in net assets resulting from operations | $7,250,955 | $(23,813,151 | ) | $(39,877,121 | ) | $(27,842,963 | ) | |||||||||||||
1 Includes non-recurring dividends of $205,874. | ||||||||||||||||||||
The accompanying notes are an integral part of these financial statements.
103
Table of Contents
Statement of Operations (continued) |
|
| AMG Managers DoubleLine Core Plus Bond Fund | AMG River Road Long-Short Fund | AMG Managers Pictet International Fund | |||||||||||||
Investment Income: | |||||||||||||||
Dividend income | $113,883 | $285,329 | $5,215,577 | 1 | |||||||||||
Interest income | 19,550,636 | 76 | 672 | ||||||||||||
Dividends from affiliated securities | 105,334 | — | — | ||||||||||||
Securities lending income | 17,808 | — | 19,853 | ||||||||||||
Foreign withholding tax | (798 | ) | (4,284 | ) | (410,562 | ) | |||||||||
Total investment income | 19,786,863 | 281,121 | 4,825,540 | ||||||||||||
Expenses: | |||||||||||||||
Investment advisory and management fees | 2,559,075 | 175,965 | 1,576,447 | ||||||||||||
Administrative fees | 853,025 | 31,053 | 349,771 | ||||||||||||
Distribution fees - Class N | 171,870 | 5,709 | 102,790 | ||||||||||||
Shareholder servicing fees - Class N | 54,998 | 1,827 | 58,766 | ||||||||||||
Shareholder servicing fees - Class I | 397,610 | 14,513 | 168,713 | ||||||||||||
Professional fees | 102,444 | 32,008 | 38,792 | ||||||||||||
Custodian fees | 100,648 | 19,101 | 106,970 | ||||||||||||
Registration fees | 70,116 | 47,239 | 61,119 | ||||||||||||
Trustee fees and expenses | 52,284 | 1,909 | 21,112 | ||||||||||||
Reports to shareholders | 42,720 | 4,350 | 37,264 | ||||||||||||
Transfer agent fees | 19,451 | 1,001 | 6,641 | ||||||||||||
Dividend expense | — | 258,301 | — | ||||||||||||
Interest expense | — | 24,619 | 7,298 | ||||||||||||
Miscellaneous | 40,013 | 3,653 | 21,919 | ||||||||||||
Total expenses before offsets | 4,464,254 | 621,248 | 2,557,602 | ||||||||||||
Expense reimbursements | (236,714 | ) | (84,419 | ) | (102,321 | ) | |||||||||
Expense reductions | — | (22,363 | ) | — | |||||||||||
Fee waivers | (134,092 | ) | — | — | |||||||||||
Net expenses | 4,093,448 | 514,466 | 2,455,281 | ||||||||||||
| |||||||||||||||
Net investment income (loss) | 15,693,415 | (233,345 | ) | 2,370,259 | |||||||||||
Net Realized and Unrealized Loss: | |||||||||||||||
Net realized gain (loss) on investments | 9,963,721 | (494,476 | ) | (16,840,414 | ) | ||||||||||
Net realized loss on affiliated investments | (244,485 | ) | — | — | |||||||||||
Net realized loss on short sales | — | (139,093 | ) | — | |||||||||||
Net realized gain (loss) on foreign currency transactions | — | (4,012 | ) | 50,957 | |||||||||||
Net change in unrealized appreciation/depreciation on investments | (14,921,837 | ) | (812,293 | ) | (20,707,863 | ) | |||||||||
Net change in unrealized appreciation/depreciation on affiliated investments | 478,547 | — | — | ||||||||||||
Net change in unrealized appreciation/depreciation on short sales | — | 538,164 | — | ||||||||||||
Net change in unrealized appreciation/depreciation on foreign currency translations | — | 1,732 | 53,670 | ||||||||||||
Net change in unrealized appreciation/depreciation on unfunded loan commitments | 946 | — | — | ||||||||||||
Net realized and unrealized loss | (4,723,108 | ) | (909,978 | ) | (37,443,650 | ) | |||||||||
| |||||||||||||||
Net increase (decrease) in net assets resulting from operations | $10,970,307 | $(1,143,323 | ) | $(35,073,391 | ) | ||||||||||
1 Includes non-recurring dividends of $778,569. | |||||||||||||||
The accompanying notes are an integral part of these financial statements.
104
Table of Contents
| AMG River Road Focused Absolute Value Fund | AMG Managers Montag & Caldwell Growth Fund | AMG River Road Dividend All Cap Value Fund | ||||||||||||||||||||||
| 2020 | 2019 | 2020 | 2019 | 2020 | 2019 | |||||||||||||||||||
Increase (Decrease) in Net Assets Resulting From Operations: | ||||||||||||||||||||||||
Net investment income (loss) | $861,559 | $431,888 | $(914,947 | ) | $99,327 | $13,424,588 | $18,292,187 | |||||||||||||||||
Net realized gain (loss) on investments | (20,924,160 | ) | 2,411,489 | 85,184,256 | 48,983,504 | 2,020,791 | 38,253,975 | |||||||||||||||||
Net change in unrealized appreciation/depreciation on investments | (655,316 | ) | 10,556,910 | 9,372,542 | 33,325,277 | (77,612,710 | ) | 8,086,074 | ||||||||||||||||
Net increase (decrease) in net assets resulting from operations | (20,717,917 | ) | 13,400,287 | 93,641,851 | 82,408,108 | (62,167,331 | ) | 64,632,236 | ||||||||||||||||
Distributions to Shareholders: | ||||||||||||||||||||||||
Class N | (376,933 | ) | (586,698 | ) | (14,140,899 | ) | (32,648,158 | ) | (5,975,070 | ) | (8,009,145 | ) | ||||||||||||
Class I | (3,160,161 | ) | (1,474,234 | ) | (28,027,374 | ) | (73,505,569 | ) | (47,458,557 | ) | (58,453,011 | ) | ||||||||||||
Class R1 | — | — | — | (119,576 | ) | — | — | |||||||||||||||||
Class Z | (3,318 | ) | (4,375 | ) | — | — | (20,856 | ) | (5,769 | ) | ||||||||||||||
Total distributions to shareholders | (3,540,412 | ) | (2,065,307 | ) | (42,168,273 | ) | (106,273,303 | ) | (53,454,483 | ) | (66,467,925 | ) | ||||||||||||
Capital Share Transactions:2 | ||||||||||||||||||||||||
Net increase (decrease) from capital share transactions | 23,576,015 | 104,854,748 | (71,363,061 | ) | (76,806,232 | ) | (45,255,562 | ) | (230,206,314 | ) | ||||||||||||||
| ||||||||||||||||||||||||
Total increase (decrease) in net assets | (682,314 | ) | 116,189,728 | (19,889,483 | ) | (100,671,427 | ) | (160,877,376 | ) | (232,042,003 | ) | |||||||||||||
Net Assets: | ||||||||||||||||||||||||
Beginning of year | 146,368,139 | 30,178,411 | 495,577,886 | 596,249,313 | 612,980,263 | 845,022,266 | ||||||||||||||||||
End of year | $145,685,825 | $146,368,139 | $475,688,403 | $495,577,886 | $452,102,887 | $612,980,263 | ||||||||||||||||||
1 Effective May 31, 2019, Class R shares were converted into Class N shares.
2 See Note 1(g) of the Notes to Financial Statements.
The accompanying notes are an integral part of these financial statements.
105
Table of Contents
Statements of Changes in Net Assets (continued) For the fiscal years ended October 31, |
| AMG Managers Fairpointe Mid Cap Fund | AMG Managers LMCG Small Cap Growth Fund | AMG River Road Small-Mid Cap Value Fund | ||||||||||||||||||||||
| 2020 | 2019 | 2020 | 2019 | 2020 | 2019 | |||||||||||||||||||
Increase (Decrease) in Net Assets Resulting From Operations: | ||||||||||||||||||||||||
Net investment income (loss) | $4,726,723 | $25,730,643 | $(314,735 | ) | $(294,184 | ) | $103,778 | $(61,527 | ) | |||||||||||||||
Net realized gain (loss) on investments | 124,204,848 | 150,936,113 | 4,712,131 | (780,765 | ) | (9,195,938 | ) | 2,556,562 | ||||||||||||||||
Net change in unrealized appreciation/depreciation on investments | (179,176,911 | ) | (163,566,555 | ) | 2,853,559 | 17,124 | (14,720,991 | ) | 7,741,087 | |||||||||||||||
Net increase (decrease) in net assets resulting from operations | (50,245,340 | ) | 13,100,201 | 7,250,955 | (1,057,825 | ) | (23,813,151 | ) | 10,236,122 | |||||||||||||||
Distributions to Shareholders: | ||||||||||||||||||||||||
Class N | (33,504,723 | ) | (60,784,071 | ) | — | — | (512,884 | ) | (990,330 | ) | ||||||||||||||
Class I | (37,562,764 | ) | (118,067,003 | ) | — | — | (3,093,005 | ) | (3,445,808 | ) | ||||||||||||||
Class Z | (3,451,809 | ) | (15,472,072 | ) | — | — | (3,815 | ) | (9,497 | ) | ||||||||||||||
Total distributions to shareholders | (74,519,296 | ) | (194,323,146 | ) | — | — | (3,609,704 | ) | (4,445,635 | ) | ||||||||||||||
Capital Share Transactions:1 | ||||||||||||||||||||||||
Net increase (decrease) from capital share transactions | (1,097,820,771 | ) | (1,003,127,045 | ) | (17,184,417 | ) | (56,651,158 | ) | 35,471,352 | 95,306,265 | ||||||||||||||
| ||||||||||||||||||||||||
Total increase (decrease) in net assets | (1,222,585,407 | ) | (1,184,349,990 | ) | (9,933,462 | ) | (57,708,983 | ) | 8,048,497 | 101,096,752 | ||||||||||||||
Net Assets: | ||||||||||||||||||||||||
Beginning of year | 1,668,739,930 | 2,853,089,920 | 45,324,928 | 103,033,911 | 170,472,937 | 69,376,185 | ||||||||||||||||||
End of year | $446,154,523 | $1,668,739,930 | $35,391,466 | $45,324,928 | $178,521,434 | $170,472,937 | ||||||||||||||||||
1 See Note 1(g) of the Notes to Financial Statements.
The accompanying notes are an integral part of these financial statements.
106
Table of Contents
Statements of Changes in Net Assets (continued) For the fiscal years ended October 31, |
| AMG River Road Small Cap Value Fund | AMG Managers Silvercrest Small Cap Fund | AMG Managers DoubleLine Core Plus Bond Fund | ||||||||||||||||||||||
| 2020 | 2019 | 2020 | 2019 | 2020 | 2019 | |||||||||||||||||||
Increase (Decrease) in Net Assets Resulting From Operations: | ||||||||||||||||||||||||
Net investment income (loss) | $244,674 | $(253,950 | ) | $489,573 | $794,327 | $15,693,415 | $21,540,707 | |||||||||||||||||
Net realized gain (loss) on investments | (10,803,606 | ) | 34,643,370 | (9,161,963 | ) | 4,890,467 | 9,719,236 | (987,474 | ) | |||||||||||||||
Net change in unrealized appreciation/depreciation on investments | (29,318,189 | ) | 2,456,593 | (19,170,573 | ) | 8,668,319 | (14,442,344 | ) | 32,237,519 | |||||||||||||||
Net increase (decrease) in net assets resulting from operations | (39,877,121 | ) | 36,846,013 | (27,842,963 | ) | 14,353,113 | 10,970,307 | 52,790,752 | ||||||||||||||||
Distributions to Shareholders: | ||||||||||||||||||||||||
Class N | (2,120,249 | ) | (2,950,509 | ) | (661,535 | ) | (2,775,383 | ) | (1,927,975 | ) | (3,097,945 | ) | ||||||||||||
Class I | (23,298,854 | ) | (28,932,862 | ) | (4,033,106 | ) | (14,843,605 | ) | (15,037,786 | ) | (19,657,097 | ) | ||||||||||||
Class Z | (11,458 | ) | (17,058 | ) | (958,145 | ) | (3,127,881 | ) | (96,813 | ) | (89,469 | ) | ||||||||||||
Total distributions to shareholders | (25,430,561 | ) | (31,900,429 | ) | (5,652,786 | ) | (20,746,869 | ) | (17,062,574 | ) | (22,844,511 | ) | ||||||||||||
Capital Share Transactions:1 | ||||||||||||||||||||||||
Net increase (decrease) from capital share transactions | 175,396,275 | 40,696,083 | (13,237,379 | ) | (6,575,314 | ) | (163,855,105 | ) | 69,623,432 | |||||||||||||||
| ||||||||||||||||||||||||
Total increase (decrease) in net assets | 110,088,593 | 45,641,667 | (46,733,128 | ) | (12,969,070 | ) | (169,947,372 | ) | 99,569,673 | |||||||||||||||
Net Assets: | ||||||||||||||||||||||||
Beginning of year | 404,493,570 | 358,851,903 | 224,526,612 | 237,495,682 | 670,687,244 | 571,117,571 | ||||||||||||||||||
End of year | $ | 514,582,163 | $ | 404,493,570 | $ | 177,793,484 | $ | 224,526,612 | $ | 500,739,872 | $ | 670,687,244 | ||||||||||||
1 See Note 1(g) of the Notes to Financial Statements.
The accompanying notes are an integral part of these financial statements.
107
Table of Contents
Statements of Changes in Net Assets (continued) For the fiscal years ended October 31, |
| AMG River Road Long-Short Fund | AMG Managers Pictet International Fund | |||||||||||||||
| 2020 | 2019 | 2020 | 2019 | |||||||||||||
Increase (Decrease) in Net Assets Resulting From Operations: | ||||||||||||||||
Net investment income (loss) | $(233,345 | ) | $(53,086 | ) | $2,370,259 | $7,250,795 | ||||||||||
Net realized gain (loss) on investments | (637,581 | ) | 2,434,819 | (16,789,457 | ) | (77,619,076 | ) | |||||||||
Net change in unrealized appreciation/depreciation on investments | (272,397 | ) | 808,308 | (20,654,193 | ) | 91,195,450 | ||||||||||
Net increase (decrease) in net assets resulting from operations | (1,143,323 | ) | 3,190,041 | (35,073,391 | ) | 20,827,169 | ||||||||||
Distributions to Shareholders: | ||||||||||||||||
Class N | (244,069 | ) | (208,970 | ) | (1,609,403 | ) | (10,017,518 | ) | ||||||||
Class I | (1,797,271 | ) | (1,381,832 | ) | (4,602,504 | ) | (15,985,185 | ) | ||||||||
Class Z | (6,804 | ) | (4,220 | ) | (1,338,806 | ) | (108,594,791 | ) | ||||||||
Total distributions to shareholders | (2,048,144 | ) | (1,595,022 | ) | (7,550,713 | ) | (134,597,494 | ) | ||||||||
Capital Share Transactions:1 | ||||||||||||||||
Net decrease from capital share transactions | (6,117,855 | ) | (4,748,295 | ) | (67,267,345 | ) | (1,171,252,631 | ) | ||||||||
| ||||||||||||||||
Total decrease in net assets | (9,309,322 | ) | (3,153,276 | ) | (109,891,449 | ) | (1,285,022,956 | ) | ||||||||
Net Assets: | ||||||||||||||||
Beginning of year | 25,594,064 | 28,747,340 | 295,369,318 | 1,580,392,274 | ||||||||||||
End of year | $ | 16,284,742 | $ | 25,594,064 | $ | 185,477,869 | $ | 295,369,318 | ||||||||
1 See Note 1(g) of the Notes to Financial Statements.
The accompanying notes are an integral part of these financial statements.
108
Table of Contents
AMG River Road Focused Absolute Value Fund For a share outstanding throughout each fiscal period |
| For the fiscal years ended October 31, | For the fiscal period ended October 31, | ||||||||||||||||||||||||
Class N | 2020 | 2019 | 2018 | 2017 | 20161 | ||||||||||||||||||||
Net Asset Value, Beginning of Period | $12.65 | $11.91 | $11.87 | $10.85 | $10.00 | ||||||||||||||||||||
Income (loss) from Investment Operations: | |||||||||||||||||||||||||
Net investment income (loss)2,3 | 0.04 | 4 | 0.04 | 0.05 | (0.01 | ) | 0.04 | ||||||||||||||||||
Net realized and unrealized gain (loss) on investments | (1.39 | ) | 1.45 | 0.93 | 1.85 | 0.81 | |||||||||||||||||||
Total income (loss) from investment operations | (1.35 | ) | 1.49 | 0.98 | 1.84 | 0.85 | |||||||||||||||||||
Less Distributions to Shareholders from: | |||||||||||||||||||||||||
Net investment income | (0.02 | ) | (0.05 | ) | (0.07 | ) | (0.09 | ) | — | ||||||||||||||||
Net realized gain on investments | (0.23 | ) | (0.70 | ) | (0.87 | ) | (0.73 | ) | — | ||||||||||||||||
Total distributions to shareholders | (0.25 | ) | (0.75 | ) | (0.94 | ) | (0.82 | ) | — | ||||||||||||||||
Net Asset Value, End of Period | $11.05 | $12.65 | $11.91 | $11.87 | $10.85 | ||||||||||||||||||||
Total Return3,5 | (11.03 | )% | 14.29 | % | 8.69 | % | 17.42 | % | 8.50 | %6 | |||||||||||||||
Ratio of net expenses to average net assets | 1.03 | %7 | 0.98 | %7 | 0.99 | %7 | 0.97 | %7 | 1.12 | %8 | |||||||||||||||
Ratio of gross expenses to average net assets9 | 1.15 | % | 1.21 | % | 1.32 | % | 1.50 | % | 3.15 | %8 | |||||||||||||||
Ratio of net investment income (loss) to average net assets3 | 0.34 | % | 0.34 | % | 0.43 | % | (0.09 | )% | 0.39 | %8 | |||||||||||||||
Portfolio turnover | 103 | % | 59 | % | 88 | % | 112 | % | 146 | %6,10 | |||||||||||||||
Net assets end of period (000’s) omitted | $12,466 | $15,284 | $9,184 | $7,448 | $489 | ||||||||||||||||||||
109
Table of Contents
AMG River Road Focused Absolute Value Fund Financial Highlights For a share outstanding throughout each fiscal period |
| For the fiscal years ended October 31, | For the fiscal period ended October 31, | ||||||||||||||||||||||||
Class I | 2020 | 2019 | 2018 | 2017 | 20161 | ||||||||||||||||||||
Net Asset Value, Beginning of Period | $12.72 | $11.98 | $11.92 | $10.88 | $10.00 | ||||||||||||||||||||
Income (loss) from Investment Operations: | |||||||||||||||||||||||||
Net investment income2,3 | 0.07 | 4 | 0.07 | 0.08 | 0.06 | 0.08 | |||||||||||||||||||
Net realized and unrealized gain (loss) on investments | (1.40 | ) | 1.46 | 0.93 | 1.81 | 0.80 | |||||||||||||||||||
Total income (loss) from investment operations | (1.33 | ) | 1.53 | 1.01 | 1.87 | 0.88 | |||||||||||||||||||
Less Distributions to Shareholders from: | |||||||||||||||||||||||||
Net investment income | (0.04 | ) | (0.09 | ) | (0.08 | ) | (0.10 | ) | — | ||||||||||||||||
Net realized gain on investments | (0.23 | ) | (0.70 | ) | (0.87 | ) | (0.73 | ) | — | ||||||||||||||||
Total distributions to shareholders | (0.27 | ) | (0.79 | ) | (0.95 | ) | (0.83 | ) | — | ||||||||||||||||
Net Asset Value, End of Period | $11.12 | $12.72 | $11.98 | $11.92 | $10.88 | ||||||||||||||||||||
Total Return3,5 | (10.81 | )% | 14.55 | % | 8.91 | % | 17.72 | % | 8.80 | %6 | |||||||||||||||
Ratio of net expenses to average net assets | 0.78 | %7 | 0.73 | %7 | 0.74 | %7 | 0.73 | %7 | 0.75 | %8 | |||||||||||||||
Ratio of gross expenses to average net assets9 | 0.90 | % | 0.96 | % | 1.07 | % | 1.20 | % | 2.90 | %8 | |||||||||||||||
Ratio of net investment income to average net assets3 | 0.59 | % | 0.59 | % | 0.68 | % | 0.50 | % | 0.81 | %8 | |||||||||||||||
Portfolio turnover | 103 | % | 59 | % | 88 | % | 112 | % | 146 | %6,10 | |||||||||||||||
Net assets end of period (000’s) omitted | $130,758 | $130,928 | $20,928 | $17,106 | $11,312 | ||||||||||||||||||||
110
Table of Contents
AMG River Road Focused Absolute Value Fund Financial Highlights For a share outstanding throughout each fiscal period |
| For the fiscal year ended October 31, | For the fiscal period ended October 31, | |||||||||||||||||||
Class Z | 2020 | 2019 | 2018 | 201711 | ||||||||||||||||
Net Asset Value, Beginning of Period | $12.73 | $11.98 | $11.92 | $12.18 | ||||||||||||||||
Income (loss) from Investment Operations: | ||||||||||||||||||||
Net investment income (loss)2,3 | 0.07 | 4 | 0.07 | 0.08 | (0.01 | ) | ||||||||||||||
Net realized and unrealized gain (loss) on investments | (1.41 | ) | 1.47 | 0.93 | (0.25 | ) | ||||||||||||||
Total income (loss) from investment operations | (1.34 | ) | 1.54 | 1.01 | (0.26) | |||||||||||||||
Less Distributions to Shareholders from: | ||||||||||||||||||||
Net investment income | (0.04 | ) | (0.09 | ) | (0.08 | ) | — | |||||||||||||
Net realized gain on investments | (0.23 | ) | (0.70 | ) | (0.87 | ) | — | |||||||||||||
Total distributions to shareholders | (0.27 | ) | (0.79 | ) | (0.95 | ) | — | |||||||||||||
Net Asset Value, End of Period | $11.12 | $12.73 | $11.98 | $11.92 | ||||||||||||||||
Total Return3,5 | (10.86 | )% | 14.69 | % | 8.96 | % | (2.13 | )%6 | ||||||||||||
Ratio of net expenses to average net assets | 0.74 | %7 | 0.69 | %7 | 0.70 | %7 | 0.70 | %7,8 | ||||||||||||
Ratio of gross expenses to average net assets9 | 0.86 | % | 0.92 | % | 1.03 | % | 1.32 | %8 | ||||||||||||
Ratio of net investment income (loss) to average net assets3 | 0.63 | % | 0.63 | % | 0.72 | % | (0.59 | )%8 | ||||||||||||
Portfolio turnover | 103 | % | 59 | % | 88 | % | 112 | %6 | ||||||||||||
Net assets end of period (000’s) omitted | $2,462 | $157 | $66 | $61 | ||||||||||||||||
| 1 | The commencement of operations for Class N and Class I shares was November 3, 2015. |
| 2 | Per share numbers have been calculated using average shares. |
| 3 | Total returns and net investment income (loss) would have been lower had certain expenses not been offset. |
| 4 | Includes non-recurring dividends. Without these dividends, net investment income per share would have been $0.02, $0.05, and $0.05 for Class N, Class I, and Class Z shares, respectively. |
| 5 | The total return is calculated using the published Net Asset Value as of fiscal year end. |
| 6 | Not annualized. |
| 7 | Includes reduction from broker recapture amounting to 0.01% for the fiscal year ended October 31, 2020, 0.02% for the fiscal year ended October 31, 2019, 0.01% for the fiscal year ended October 31, 2018, and 0.03%, 0.02%, and less than 0.01% for Class N, Class I and Class Z, respectively, for the fiscal period ended October 31, 2017. |
| 8 | Annualized. |
| 9 | Excludes the impact of expense reimbursement or fee waivers and expense reductions such as brokerage credits, but includes expense repayments and non-reimbursable expenses, if any, such as interest, taxes, and extraordinary expenses. (See Note 1(c) and 2 in the Notes to Financial Statements.) |
| 10 | Portfolio turnover rate excludes securities received from processing a subscription in-kind. |
| 11 | The commencement of operations for Class Z shares was October 2, 2017. |
111
Table of Contents
AMG Managers Montag & Caldwell Growth Fund Financial Highlights For a share outstanding throughout each fiscal year |
| For the fiscal years ended October 31, | |||||||||||||||||||||||||
Class N | 2020 | 2019 | 2018 | 2017 | 2016 | ||||||||||||||||||||
Net Asset Value, Beginning of Year | $19.34 | $20.52 | $20.76 | $19.56 | $26.67 | ||||||||||||||||||||
Income (loss) from Investment Operations: | |||||||||||||||||||||||||
Net investment income (loss)1,2 | (0.06 | ) | (0.02 | ) | (0.01 | ) | (0.02 | ) | 0.05 | ||||||||||||||||
Net realized and unrealized gain (loss) on investments | 3.92 | 2.74 | 1.71 | 3.20 | (0.33 | ) | |||||||||||||||||||
Total income (loss) from investment operations | 3.86 | 2.72 | 1.70 | 3.18 | (0.28) | ||||||||||||||||||||
Less Distributions to Shareholders from: | |||||||||||||||||||||||||
Net investment income | — | — | — | (0.04 | ) | (0.08 | ) | ||||||||||||||||||
Net realized gain on investments | (1.70 | ) | (3.90 | ) | (1.94 | ) | (1.94 | ) | (6.75 | ) | |||||||||||||||
Total distributions to shareholders | (1.70 | ) | (3.90 | ) | (1.94 | ) | (1.98 | ) | (6.83 | ) | |||||||||||||||
Net Asset Value, End of Year | $21.50 | $19.34 | $20.52 | $20.76 | $19.56 | ||||||||||||||||||||
Total Return2,3 | 21.36 | % | 18.29 | % | 8.58 | % | 17.99 | % | (1.77 | )% | |||||||||||||||
Ratio of net expenses to average net assets | 1.16 | %4 | 1.16 | %4 | 1.15 | %4 | 1.15 | %4 | 1.12 | % | |||||||||||||||
Ratio of gross expenses to average net assets5 | 1.16 | % | 1.17 | % | 1.16 | % | 1.17 | % | 1.12 | % | |||||||||||||||
Ratio of net investment income (loss) to average net assets2 | (0.30 | )% | (0.10 | )% | (0.03 | )% | (0.11 | )% | 0.25 | % | |||||||||||||||
Portfolio turnover | 30 | % | 20 | % | 33 | % | 42 | % | 64 | % | |||||||||||||||
Net assets end of year (000’s) omitted | $166,051 | $166,353 | $179,434 | $259,324 | $519,008 | ||||||||||||||||||||
112
Table of Contents
AMG Managers Montag & Caldwell Growth Fund Financial Highlights For a share outstanding throughout each fiscal year |
| For the fiscal years ended October 31, | |||||||||||||||||||||||||
Class I | 2020 | 2019 | 2018 | 2017 | 2016 | ||||||||||||||||||||
Net Asset Value, Beginning of Year | $19.46 | $20.62 | $20.84 | $19.70 | $26.82 | ||||||||||||||||||||
Income (loss) from Investment Operations: | |||||||||||||||||||||||||
Net investment income (loss)1,2 | (0.03 | ) | 0.01 | 0.03 | 0.02 | 0.10 | |||||||||||||||||||
Net realized and unrealized gain (loss) on investments | 3.96 | 2.76 | 1.71 | 3.20 | (0.31 | ) | |||||||||||||||||||
Total income (loss) from investment operations | 3.93 | 2.77 | 1.74 | 3.22 | (0.21) | ||||||||||||||||||||
Less Distributions to Shareholders from: | |||||||||||||||||||||||||
Net investment income | — | (0.03 | ) | (0.02 | ) | (0.13 | ) | (0.16 | ) | ||||||||||||||||
Net realized gain on investments | (1.70 | ) | (3.90 | ) | (1.94 | ) | (1.95 | ) | (6.75 | ) | |||||||||||||||
Total distributions to shareholders | (1.70 | ) | (3.93 | ) | (1.96 | ) | (2.08 | ) | (6.91 | ) | |||||||||||||||
Net Asset Value, End of Year | $21.69 | $19.46 | $20.62 | $20.84 | $19.70 | ||||||||||||||||||||
Total Return2,3 | 21.60 | % | 18.49 | % | 8.75 | % | 18.21 | % | (1.51 | )% | |||||||||||||||
Ratio of net expenses to average net assets | 0.99 | %4 | 0.98 | %4 | 0.96 | %4 | 0.92 | %4 | 0.87 | % | |||||||||||||||
Ratio of gross expenses to average net assets5 | 0.99 | % | 0.99 | % | 0.97 | % | 0.94 | % | 0.87 | % | |||||||||||||||
Ratio of net investment income (loss) to average net assets2 | (0.13 | )% | 0.08 | % | 0.16 | % | 0.12 | % | 0.50 | % | |||||||||||||||
Portfolio turnover | 30 | % | 20 | % | 33 | % | 42 | % | 64 | % | |||||||||||||||
Net assets end of year (000’s) omitted | $309,638 | $329,225 | $416,208 | $642,461 | $820,318 | ||||||||||||||||||||
| 1 | Per share numbers have been calculated using average shares. |
| 2 | Total returns and net investment income (loss) would have been lower had certain expenses not been offset. |
| 3 | The total return is calculated using the published Net Asset Value as of fiscal year end. |
| 4 | Includes reduction from broker recapture amounting to less than 0.01%, 0.01%, less than 0.01% and 0.01% for the fiscal years ended 2020, 2019, 2018 and 2017, respectively. |
| 5 | Excludes the impact of expense reimbursement or fee waivers and expense reductions such as brokerage credits, but includes expense repayments and non-reimbursable expenses, if any, such as interest, taxes, and extraordinary expenses. (See Note 1(c) and 2 in the Notes to Financial Statements.) |
113
Table of Contents
AMG River Road Dividend All Cap Value Fund Financial Highlights For a share outstanding throughout each fiscal year |
| For the fiscal years ended October 31, | |||||||||||||||||||||||||
Class N | 2020 | 2019 | 2018 | 2017 | 2016 | ||||||||||||||||||||
Net Asset Value, Beginning of Year | $12.34 | $12.29 | $12.87 | $12.18 | $12.67 | ||||||||||||||||||||
Income (loss) from Investment Operations: | |||||||||||||||||||||||||
Net investment income1,2 | 0.25 | 0.27 | 0.22 | 0.22 | 0.24 | ||||||||||||||||||||
Net realized and unrealized gain (loss) on investments | (1.49 | ) | 0.80 | 0.06 | 1.54 | 0.65 | |||||||||||||||||||
Total income (loss) from investment operations | (1.24 | ) | 1.07 | 0.28 | 1.76 | 0.89 | |||||||||||||||||||
Less Distributions to Shareholders from: | |||||||||||||||||||||||||
Net investment income | (0.34 | ) | (0.30 | ) | (0.28 | ) | (0.21 | ) | (0.22 | ) | |||||||||||||||
Net realized gain on investments | (0.74 | ) | (0.72 | ) | (0.58 | ) | (0.86 | ) | (1.16 | ) | |||||||||||||||
Total distributions to shareholders | (1.08 | ) | (1.02 | ) | (0.86 | ) | (1.07 | ) | (1.38 | ) | |||||||||||||||
Net Asset Value, End of Year | $10.02 | $12.34 | $12.29 | $12.87 | $12.18 | ||||||||||||||||||||
Total Return2,3 | (10.96 | )% | 10.11 | % | 2.06 | % | 14.79 | % | 7.88 | % | |||||||||||||||
Ratio of net expenses to average net assets | 1.13 | %4 | 1.11 | %4 | 1.10 | %4 | 1.11 | %4 | 1.10 | % | |||||||||||||||
Ratio of gross expenses to average net assets5 | 1.13 | % | 1.12 | % | 1.11 | % | 1.12 | % | 1.10 | % | |||||||||||||||
Ratio of net investment income to average net assets2 | 2.38 | % | 2.32 | % | 1.78 | % | 1.75 | % | 2.00 | % | |||||||||||||||
Portfolio turnover | 35 | % | 29 | % | 27 | % | 28 | % | 47 | % | |||||||||||||||
Net assets end of year (000’s) omitted | $41,358 | $79,811 | $100,420 | $136,534 | $295,797 | ||||||||||||||||||||
114
Table of Contents
AMG River Road Dividend All Cap Value Fund Financial Highlights For a share outstanding throughout each fiscal year |
| For the fiscal years ended October 31, | |||||||||||||||||||||||||
Class I | 2020 | 2019 | 2018 | 2017 | 2016 | ||||||||||||||||||||
Net Asset Value, Beginning of Year | $12.33 | $12.29 | $12.86 | $12.17 | $12.66 | ||||||||||||||||||||
Income (loss) from Investment Operations: | |||||||||||||||||||||||||
Net investment income1,2 | 0.28 | 0.31 | 0.26 | 0.24 | 0.28 | ||||||||||||||||||||
Net realized and unrealized gain (loss) on investments | (1.49 | ) | 0.78 | 0.06 | 1.55 | 0.64 | |||||||||||||||||||
Total income (loss) from investment operations | (1.21 | ) | 1.09 | 0.32 | 1.79 | 0.92 | |||||||||||||||||||
Less Distributions to Shareholders from: | |||||||||||||||||||||||||
Net investment income | (0.37 | ) | (0.33 | ) | (0.31 | ) | (0.24 | ) | (0.25 | ) | |||||||||||||||
Net realized gain on investments | (0.74 | ) | (0.72 | ) | (0.58 | ) | (0.86 | ) | (1.16 | ) | |||||||||||||||
Total distributions to shareholders | (1.11 | ) | (1.05 | ) | (0.89 | ) | (1.10 | ) | (1.41 | ) | |||||||||||||||
Net Asset Value, End of Year | $10.01 | $12.33 | $12.29 | $12.86 | $12.17 | ||||||||||||||||||||
Total Return2,3 | (10.69 | )% | 10.32 | % | 2.38 | % | 15.07 | % | 8.15 | % | |||||||||||||||
Ratio of net expenses to average net assets | 0.86 | %4 | 0.84 | %4 | 0.84 | %4 | 0.86 | %4 | 0.85 | % | |||||||||||||||
Ratio of gross expenses to average net assets5 | 0.86 | % | 0.85 | % | 0.85 | % | 0.87 | % | 0.85 | % | |||||||||||||||
Ratio of net investment income to average net assets2 | 2.65 | % | 2.59 | % | 2.04 | % | 1.93 | % | 2.30 | % | |||||||||||||||
Portfolio turnover | 35 | % | 29 | % | 27 | % | 28 | % | 47 | % | |||||||||||||||
Net assets end of year (000’s) omitted | $408,844 | $533,106 | $743,984 | $788,023 | $555,064 | ||||||||||||||||||||
115
Table of Contents
AMG River Road Dividend All Cap Value Fund Financial Highlights For a share outstanding throughout each fiscal period |
| For the fiscal years ended October 31, | For the fiscal period ended October 31, | |||||||||||||||||||
Class Z | 2020 | 2019 | 2018 | 20176 | ||||||||||||||||
Net Asset Value, Beginning of Period | $12.33 | $12.29 | $12.86 | $12.80 | ||||||||||||||||
Income (loss) from Investment Operations: | ||||||||||||||||||||
Net investment income1,2 | 0.27 | 0.32 | 0.26 | 0.01 | ||||||||||||||||
Net realized and unrealized gain (loss) on investments | (1.47 | ) | 0.77 | 0.06 | 0.07 | |||||||||||||||
Total income (loss) from investment operations | (1.20 | ) | 1.09 | 0.32 | 0.08 | |||||||||||||||
Less Distributions to Shareholders from: | ||||||||||||||||||||
Net investment income | (0.38 | ) | (0.33 | ) | (0.31 | ) | (0.02 | ) | ||||||||||||
Net realized gain on investments | (0.74 | ) | (0.72 | ) | (0.58 | ) | — | |||||||||||||
Total distributions to shareholders | (1.12 | ) | (1.05 | ) | (0.89 | ) | (0.02 | ) | ||||||||||||
Net Asset Value, End of Period | $10.01 | $12.33 | $12.29 | $12.86 | ||||||||||||||||
Total Return2,3 | (10.65 | )% | 10.37 | % | 2.42 | % | 0.59 | %7 | ||||||||||||
Ratio of net expenses to average net assets | 0.81 | %4 | 0.79 | %4 | 0.78 | %4 | 0.78 | %4,8 | ||||||||||||
Ratio of gross expenses to average net assets5 | 0.81 | % | 0.80 | % | 0.79 | % | 0.79 | %8 | ||||||||||||
Ratio of net investment income to average net assets2 | 2.69 | % | 2.64 | % | 2.10 | % | 0.79 | %8 | ||||||||||||
Portfolio turnover | 35 | % | 29 | % | 27 | % | 28 | %7 | ||||||||||||
Net assets end of period (000’s) omitted | $1,901 | $63 | $619 | $257 | ||||||||||||||||
| 1 | Per share numbers have been calculated using average shares. |
| 2 | Total returns and net investment income (loss) would have been lower had certain expenses not been offset. |
| 3 | The total return is calculated using the published Net Asset Value as of fiscal year end. |
| 4 | Includes reduction from broker recapture amounting to less than 0.01%, 0.01% and less than 0.01% for the fiscal years ended 2020, 2019 and 2018, respectively. |
| 5 | Excludes the impact of expense reimbursement or fee waivers and expense reductions such as brokerage credits, but includes expense repayments and non-reimbursable expenses, if any, such as interest, taxes, and extraordinary expenses. (See Note 1(c) and 2 in the Notes to Financial Statements.) |
| 6 | The commencement of operations was on October 2, 2017. |
| 7 | Not annualized. |
| 8 | Annualized. |
116
Table of Contents
AMG Managers Fairpointe Mid Cap Fund Financial Highlights For a share outstanding throughout each fiscal year |
| For the fiscal years ended October 31, | |||||||||||||||||||||||||
Class N | 2020 | 2019 | 2018 | 2017 | 2016 | ||||||||||||||||||||
Net Asset Value, Beginning of Year | $34.95 | $38.27 | $41.95 | $37.48 | $37.56 | ||||||||||||||||||||
Income (loss) from Investment Operations: | |||||||||||||||||||||||||
Net investment income (loss)1,2 | 0.16 | 0.34 | 3 | 0.08 | (0.02 | ) | 0.16 | ||||||||||||||||||
Net realized and unrealized gain (loss) on investments | (2.85 | ) | (0.85 | ) | (0.95 | ) | 6.33 | 1.92 | |||||||||||||||||
Total income (loss) from investment operations | (2.69 | ) | (0.51 | ) | (0.87 | ) | 6.31 | 2.08 | |||||||||||||||||
Less Distributions to Shareholders from: | |||||||||||||||||||||||||
Net investment income | (0.33 | ) | (0.15 | ) | — | (0.13 | ) | (0.11 | ) | ||||||||||||||||
Net realized gain on investments | (2.18 | ) | (2.66 | ) | (2.81 | ) | (1.71 | ) | (2.05 | ) | |||||||||||||||
Total distributions to shareholders | (2.51 | ) | (2.81 | ) | (2.81 | ) | (1.84 | ) | (2.16 | ) | |||||||||||||||
Net Asset Value, End of Year | $29.75 | $34.95 | $38.27 | $41.95 | $37.48 | ||||||||||||||||||||
Total Return2,4 | (8.62 | )% | (0.55 | )% | (2.82 | )% | 16.87 | % | 6.01 | % | |||||||||||||||
Ratio of net expenses to average net assets | 1.14 | % | 1.15 | % | 1.12 | % | 1.12 | % | 1.12 | % | |||||||||||||||
Ratio of gross expenses to average net assets5 | 1.16 | % | 1.15 | % | 1.13 | % | 1.13 | % | 1.12 | % | |||||||||||||||
Ratio of net investment income (loss) to average net assets2 | 0.52 | % | 0.95 | % | 0.19 | % | (0.05 | )% | 0.44 | % | |||||||||||||||
Portfolio turnover | 50 | % | 21 | % | 18 | % | 28 | % | 24 | % | |||||||||||||||
Net assets end of year (000’s) omitted | $259,561 | $518,354 | $893,685 | $1,292,107 | $1,374,982 | ||||||||||||||||||||
117
Table of Contents
AMG Managers Fairpointe Mid Cap Fund Financial Highlights For a share outstanding throughout each fiscal year |
| For the fiscal years ended October 31, | |||||||||||||||||||||||||
Class I | 2020 | 2019 | 2018 | 2017 | 2016 | ||||||||||||||||||||
Net Asset Value, Beginning of Year | $35.96 | $39.33 | $42.97 | $38.39 | $38.44 | ||||||||||||||||||||
Income (loss) from Investment Operations: | |||||||||||||||||||||||||
Net investment income1,2 | 0.25 | 0.45 | 3 | 0.19 | 0.08 | 0.25 | |||||||||||||||||||
Net realized and unrealized gain (loss) on investments | (2.94 | ) | (0.89 | ) | (0.99 | ) | 6.49 | 1.98 | |||||||||||||||||
Total income (loss) from investment operations | (2.69 | ) | (0.44 | ) | (0.80 | ) | 6.57 | 2.23 | |||||||||||||||||
Less Distributions to Shareholders from: | |||||||||||||||||||||||||
Net investment income | (0.41 | ) | (0.27 | ) | (0.03 | ) | (0.24 | ) | (0.23 | ) | |||||||||||||||
Net realized gain on investments | (2.18 | ) | (2.66 | ) | (2.81 | ) | (1.75 | ) | (2.05 | ) | |||||||||||||||
Total distributions to shareholders | (2.59 | ) | (2.93 | ) | (2.84 | ) | (1.99 | ) | (2.28 | ) | |||||||||||||||
Net Asset Value, End of Year | $30.68 | $35.96 | $39.33 | $42.97 | $38.39 | ||||||||||||||||||||
Total Return2,4 | (8.38 | )% | (0.33 | )% | (2.56 | )% | 17.16 | % | 6.26 | % | |||||||||||||||
Ratio of net expenses to average net assets | 0.90 | % | 0.90 | % | 0.87 | % | 0.87 | % | 0.87 | % | |||||||||||||||
Ratio of gross expenses to average net assets5 | 0.92 | % | 0.90 | % | 0.88 | % | 0.88 | % | 0.87 | % | |||||||||||||||
Ratio of net investment income to average net assets2 | 0.76 | % | 1.20 | % | 0.44 | % | 0.20 | % | 0.68 | % | |||||||||||||||
Portfolio turnover | 50 | % | 21 | % | 18 | % | 28 | % | 24 | % | |||||||||||||||
Net assets end of year (000’s) omitted | $176,807 | $1,102,479 | $1,754,203 | $2,668,464 | $2,135,998 | ||||||||||||||||||||
118
Table of Contents
AMG Managers Fairpointe Mid Cap Fund Financial Highlights For a share outstanding throughout each fiscal period |
| For the fiscal year ended October 31, | For the fiscal period ended October 31, | |||||||||||||||||||
Class Z | 2020 | 2019 | 2018 | 20176 | ||||||||||||||||
Net Asset Value, Beginning of Period | $35.95 | $39.34 | $42.98 | $44.24 | ||||||||||||||||
Income (loss) from Investment Operations: | ||||||||||||||||||||
Net investment income1,2 | 0.28 | 0.48 | 3 | 0.22 | 0.00 | 7 | ||||||||||||||
Net realized and unrealized loss on investments | (2.94 | ) | (0.89 | ) | (0.98 | ) | (1.26 | ) | ||||||||||||
Total loss from investment operations | (2.66 | ) | (0.41 | ) | (0.76 | ) | (1.26 | ) | ||||||||||||
Less Distributions to Shareholders from: | ||||||||||||||||||||
Net investment income | (0.48 | ) | (0.32 | ) | (0.07 | ) | — | |||||||||||||
Net realized gain on investments | (2.18 | ) | (2.66 | ) | (2.81 | ) | — | |||||||||||||
Total distributions to shareholders | (2.66 | ) | (2.98 | ) | (2.88 | ) | — | |||||||||||||
Net Asset Value, End of Period | $30.63 | $35.95 | $39.34 | $42.98 | ||||||||||||||||
Total Return2,4 | (8.32 | )% | (0.25 | )% | (2.48 | )% | (2.85 | )%8 | ||||||||||||
Ratio of net expenses to average net assets | 0.82 | % | 0.82 | % | 0.79 | % | 0.79 | %9 | ||||||||||||
Ratio of gross expenses to average net assets5 | 0.84 | % | 0.82 | % | 0.80 | % | 0.80 | %9 | ||||||||||||
Ratio of net investment income to average net assets2 | 0.84 | % | 1.28 | % | 0.52 | % | 0.01 | %9 | ||||||||||||
Portfolio turnover | 50 | % | 21 | % | 18 | % | 28 | %8 | ||||||||||||
Net assets end of period (000’s) omitted | $9,786 | $47,907 | $205,203 | $9,625 | ||||||||||||||||
| 1 | Per share numbers have been calculated using average shares. |
| 2 | Total returns and net investment income (loss) would have been lower had certain expenses not been offset. |
| 3 | Includes non-recurring dividends. Without these dividends, net investment income per share would have been $0.23, $0.33 and $0.36 for Class N, Class I and Class z, respectively. |
| 4 | The total return is calculated using the published Net Asset Value as of fiscal year end. |
| 5 | Excludes the impact of expense reimbursement or fee waivers and expense reductions such as brokerage credits, but includes expense repayments and non-reimbursable expenses, if any, such as interest, taxes, and extraordinary expenses. (See Note 1(c) and 2 in the Notes to Financial Statements.) |
| 6 | Commencement of operations was on October 2, 2017. |
| 7 | Less than $0.005 per share. |
| 8 | Not annualized. |
| 9 | Annualized. |
119
Table of Contents
AMG Managers LMCG Small Cap Growth Fund Financial Highlights For a share outstanding throughout each fiscal year |
| For the fiscal years ended October 31, | |||||||||||||||||||||||||
Class N | 2020 | 2019 | 2018 | 2017 | 2016 | ||||||||||||||||||||
Net Asset Value, Beginning of Year | $17.02 | $16.90 | $15.30 | $12.19 | $14.47 | ||||||||||||||||||||
Income (loss) from Investment Operations: | |||||||||||||||||||||||||
Net investment loss1,2 | (0.17 | ) | (0.08 | ) | (0.12 | ) | (0.09 | )3 | (0.11 | ) | |||||||||||||||
Net realized and unrealized gain (loss) on investments | 4.29 | 0.20 | 1.72 | 3.20 | (2.17 | ) | |||||||||||||||||||
Total income (loss) from investment operations | 4.12 | 0.12 | 1.60 | 3.11 | (2.28 | ) | |||||||||||||||||||
Less Distributions to Shareholders from: | |||||||||||||||||||||||||
Net realized gain on investments | — | — | — | — | (0.00 | )4 | |||||||||||||||||||
Net Asset Value, End of Year | $21.14 | $17.02 | $16.90 | $15.30 | $12.19 | ||||||||||||||||||||
Total Return2,5 | 24.27 | % | 0.71 | % | 10.46 | % | 25.51 | % | (15.74 | )% | |||||||||||||||
Ratio of net expenses to average net assets | 1.29 | %6,7 | 1.30 | %6 | 1.31 | %6 | 1.23 | %6 | 1.35 | % | |||||||||||||||
Ratio of gross expenses to average net assets8 | 1.60 | % | 1.47 | % | 1.43 | % | 1.36 | % | 1.51 | % | |||||||||||||||
Ratio of net investment loss to average net assets2 | (0.92 | )% | (0.48 | )% | (0.73 | )% | (0.65 | )% | (1.00 | )% | |||||||||||||||
Portfolio turnover | 126 | % | 138 | % | 161 | % | 151 | % | 138 | % | |||||||||||||||
Net assets end of year (000’s) omitted | $28,908 | $30,717 | $37,232 | $45,902 | $53,816 | ||||||||||||||||||||
120
Table of Contents
AMG Managers LMCG Small Cap Growth Fund Financial Highlights For a share outstanding throughout each fiscal year |
| For the fiscal years ended October 31, | ||||||||||||||||||||
Class I | 2020 | 2019 | 2018 | 2017 | 2016 | |||||||||||||||
Net Asset Value, Beginning of Year | $17.35 | $17.20 | $15.54 | $12.36 | $14.64 | |||||||||||||||
Income (loss) from Investment Operations: | ||||||||||||||||||||
Net investment loss1,2 | (0.14 | ) | (0.05 | ) | (0.09 | ) | (0.07 | )3 | (0.08 | ) | ||||||||||
Net realized and unrealized gain (loss) on investments | 4.39 | 0.20 | 1.75 | 3.25 | (2.20 | ) | ||||||||||||||
Total income (loss) from investment operations | 4.25 | 0.15 | 1.66 | 3.18 | (2.28 | ) | ||||||||||||||
Less Distributions to Shareholders from: | ||||||||||||||||||||
Net realized gain on investments | — | — | — | — | (0.00 | )4 | ||||||||||||||
Net Asset Value, End of Year | $21.60 | $17.35 | $17.20 | $15.54 | $12.36 | |||||||||||||||
Total Return2,5 | 24.48 | % | 0.93 | % | 10.68 | % | 25.73 | % | (15.56 | )% | ||||||||||
Ratio of net expenses to average net assets | 1.10 | %6,7 | 1.10 | %6 | 1.10 | %6 | 1.05 | %6 | 1.10 | % | ||||||||||
Ratio of gross expenses to average net assets8 | 1.41 | % | 1.27 | % | 1.22 | % | 1.18 | % | 1.25 | % | ||||||||||
Ratio of net investment loss to average net assets2 | (0.73 | )% | (0.28 | )% | (0.52 | )% | (0.47 | )% | (0.59 | )% | ||||||||||
Portfolio turnover | 126 | % | 138 | % | 161 | % | 151 | % | 138 | % | ||||||||||
Net assets end of year (000’s) omitted | $6,483 | $14,608 | $65,802 | $79,652 | $58,020 | |||||||||||||||
| 1 | Per share numbers have been calculated using average shares. |
| 2 | Total returns and net investment loss would have been lower had certain expenses not been offset. |
| 3 | Includes non-recurring dividends. Without these dividends, net investment loss per share would have been $(0.11) and $(0.09) for Class N and Class I shares, respectively. |
| 4 | Less than $(0.005) per share. |
| 5 | The total return is calculated using the published Net Asset Value as of fiscal year end. |
| 6 | Includes reduction from broker recapture amounting to 0.01%, less than 0.01%, 0.01% and 0.01% for the fiscal years ended 2020, 2019, 2018 and 2017, respectively. |
| 7 | Includes interest expense of 0.01%. |
| 8 | Excludes the impact of expense reimbursement or fee waivers and expense reductions such as brokerage credits, but includes expense repayments and non-reimbursable expenses, if any, such as interest, taxes, and extraordinary expenses. (See Note 1(c) and 2 in the Notes to Financial Statements.) |
121
Table of Contents
AMG River Road Small-Mid Cap Value Fund Financial Highlights For a share outstanding throughout each fiscal year |
| For the fiscal years ended October 31, | |||||||||||||||||||||||||
Class N | 2020 | 2019 | 2018 | 2017 | 2016 | ||||||||||||||||||||
Net Asset Value, Beginning of Year | $7.84 | $7.62 | $8.23 | $7.04 | $7.63 | ||||||||||||||||||||
Income (loss) from Investment Operations: | |||||||||||||||||||||||||
Net investment loss1,2 | (0.01 | )3 | (0.02 | ) | (0.03 | ) | (0.03 | ) | (0.04 | ) | |||||||||||||||
Net realized and unrealized gain (loss) on investments | (0.88 | ) | 0.78 | 0.57 | 1.81 | 0.56 | |||||||||||||||||||
Total income (loss) from investment operations | (0.89 | ) | 0.76 | 0.54 | 1.78 | 0.52 | |||||||||||||||||||
Less Distributions to Shareholders from: | |||||||||||||||||||||||||
Net investment income | (0.01 | ) | – | (0.02 | ) | (0.01 | ) | – | |||||||||||||||||
Net realized gain on investments | (0.14 | ) | (0.54 | ) | (1.13 | ) | (0.58 | ) | (1.11 | ) | |||||||||||||||
Total distributions to shareholders | (0.15 | ) | (0.54 | ) | (1.15 | ) | (0.59 | ) | (1.11 | ) | |||||||||||||||
Net Asset Value, End of Year | $6.80 | $7.84 | $7.62 | $8.23 | $7.04 | ||||||||||||||||||||
Total Return2,4 | (11.65 | )% | 11.82 | % | 7.09 | % | 26.18 | % | 8.55 | % | |||||||||||||||
Ratio of net expenses to average net assets | 1.31 | %5 | 1.31 | %5 | 1.32 | %5 | 1.35 | %5 | 1.50 | % | |||||||||||||||
Ratio of gross expenses to average net assets6 | 1.33 | % | 1.37 | % | 1.36 | % | 1.46 | % | 1.62 | % | |||||||||||||||
Ratio of net investment loss to average net assets2 | (0.16 | )% | (0.27 | )% | (0.35 | )% | (0.33 | )% | (0.52 | )% | |||||||||||||||
Portfolio turnover | 47 | % | 38 | % | 46 | % | 57 | % | 65 | % | |||||||||||||||
Net assets end of year (000’s) omitted | $21,618 | $24,669 | $17,840 | $7,810 | $4,942 | ||||||||||||||||||||
122
Table of Contents
AMG River Road Small-Mid Cap Value Fund Financial Highlights For a share outstanding throughout each fiscal year |
| For the fiscal years ended October 31, | |||||||||||||||||||||||||
Class I | 2020 | 2019 | 2018 | 2017 | 2016 | ||||||||||||||||||||
Net Asset Value, Beginning of Year | $8.04 | $7.78 | $8.38 | $7.16 | $7.76 | ||||||||||||||||||||
Income (loss) from Investment Operations: | |||||||||||||||||||||||||
Net investment income (loss)1,2 | 0.01 | 3 | (0.00 | )7 | (0.01 | ) | 0.00 | 7 | (0.02 | ) | |||||||||||||||
Net realized and unrealized gain (loss) on investments | (0.91 | ) | 0.80 | 0.57 | 1.84 | 0.55 | |||||||||||||||||||
Total income (loss) from investment operations | (0.90 | ) | 0.80 | 0.56 | 1.84 | 0.53 | |||||||||||||||||||
Less Distributions to Shareholders from: | |||||||||||||||||||||||||
Net investment income | (0.02 | ) | — | (0.03 | ) | (0.03 | ) | (0.02 | ) | ||||||||||||||||
Net realized gain on investments | (0.14 | ) | (0.54 | ) | (1.13 | ) | (0.59 | ) | (1.11 | ) | |||||||||||||||
Total distributions to shareholders | (0.16 | ) | (0.54 | ) | (1.16 | ) | (0.62 | ) | (1.13 | ) | |||||||||||||||
Net Asset Value, End of Year | $6.98 | $8.04 | $7.78 | $8.38 | $7.16 | ||||||||||||||||||||
Total Return2,4 | (11.47 | )% | 12.12 | % | 7.32 | % | 26.63 | % | 8.64 | % | |||||||||||||||
Ratio of net expenses to average net assets | 1.05 | %5 | 1.06 | %5 | 1.08 | %5 | 1.10 | %5 | 1.25 | % | |||||||||||||||
Ratio of gross expenses to average net assets6 | 1.07 | % | 1.12 | % | 1.12 | % | 1.21 | % | 1.38 | % | |||||||||||||||
Ratio of net investment income (loss) to average net assets2 | 0.09 | % | (0.02 | )% | (0.11 | )% | (0.06 | )% | (0.24 | )% | |||||||||||||||
Portfolio turnover | 47 | % | 38 | % | 46 | % | 57 | % | 65 | % | |||||||||||||||
Net assets end of year (000’s) omitted | $156,350 | $145,620 | $51,400 | $36,547 | $34,913 | ||||||||||||||||||||
123
Table of Contents
AMG River Road Small-Mid Cap Value Fund Financial Highlights For a share outstanding throughout each fiscal period |
| For the fiscal year ended October 31, | For the fiscal period ended October 31, | |||||||||||||||||||||||
| Class Z | 2020 | 2019 | 2018 | 20178 | ||||||||||||||||||||
Net Asset Value, Beginning of Period | $8.04 | $7.77 | $8.37 | $8.48 | ||||||||||||||||||||
Income (loss) from Investment Operations: | ||||||||||||||||||||||||
Net investment income (loss)1,2 | 0.01 | 3 | 0.00 | 7 | (0.01 | ) | (0.01 | ) | ||||||||||||||||
Net realized and unrealized gain (loss) on investments | (0.91 | ) | 0.81 | 0.58 | (0.10 | ) | ||||||||||||||||||
Total income (loss) from investment operations | (0.90 | ) | 0.81 | 0.57 | (0.11 | ) | ||||||||||||||||||
Less Distributions to Shareholders from: | ||||||||||||||||||||||||
Net investment income | (0.02 | ) | — | (0.04 | ) | — | ||||||||||||||||||
Net realized gain on investments | (0.14 | ) | (0.54 | ) | (1.13 | ) | — | |||||||||||||||||
Total distributions to shareholders | (0.16 | ) | (0.54 | ) | (1.17 | ) | — | |||||||||||||||||
Net Asset Value, End of Period | $6.98 | $8.04 | $7.77 | $8.37 | ||||||||||||||||||||
Total Return2,4 | (11.43 | )% | 12.26 | % | 7.37 | % | (1.30 | )%9 | ||||||||||||||||
Ratio of net expenses to average net assets | 1.00 | %5 | 1.01 | %5 | 1.03 | %5 | 1.04 | %5,10 | ||||||||||||||||
Ratio of gross expenses to average net assets6 | 1.02 | % | 1.07 | % | 1.07 | % | 1.48 | %10 | ||||||||||||||||
Ratio of net investment income (loss) to average net assets2 | 0.14 | % | 0.03 | % | (0.06 | )% | (0.71 | )%10 | ||||||||||||||||
Portfolio turnover | 47 | % | 38 | % | 46 | % | 57 | %9 | ||||||||||||||||
Net assets end of period (000’s) omitted | $553 | $183 | $136 | $49 | ||||||||||||||||||||
| 1 | Per share numbers have been calculated using average shares. |
| 2 | Total returns and net investment income (loss) would have been lower had certain expenses not been offset. |
| 3 | Includes non-recurring dividends. Without these dividends, net investment income per share would have been $(0.02), $(0.00), and $0.00 for Class N, Class I, and Class Z shares, respectively. |
| 4 | The total return is calculated using the published Net Asset Value as of fiscal year end. |
| 5 | Includes reduction from broker recapture amounting to 0.02%, 0.03%, 0.01% and 0.01% for the fiscal years ended 2020, 2019, 2018 and the fiscal period ended 2017, respectively. |
| 6 | Excludes the impact of expense reimbursement or fee waivers and expense reductions such as brokerage credits, but includes expense repayments and non-reimbursable expenses, if any, such as interest, taxes, and extraordinary expenses. (See Note 1(c) and 2 in the Notes to Financial Statements.) |
| 7 | Less than $0.005 or $(0.005) per share. |
| 8 | The commencement of operations was October 2, 2017. |
| 9 | Not annualized. |
| 10 | Annualized. |
124
Table of Contents
AMG River Road Small Cap Value Fund Financial Highlights For a share outstanding throughout each fiscal year |
| For the fiscal years ended October 31, | |||||||||||||||||||||||||
Class N | 2020 | 2019 | 2018 | 2017 | 2016 | ||||||||||||||||||||
Net Asset Value, Beginning of Year | $13.00 | $13.26 | $14.46 | $12.29 | $12.20 | ||||||||||||||||||||
Income (loss) from Investment Operations: | |||||||||||||||||||||||||
Net investment loss1,2 | (0.02 | ) | (0.04 | ) | (0.05 | ) | (0.05 | ) | (0.04 | ) | |||||||||||||||
Net realized and unrealized gain (loss) on investments | (1.43 | ) | 1.17 | 0.79 | 2.88 | 0.85 | |||||||||||||||||||
Total income (loss) from investment operations | (1.45 | ) | 1.13 | 0.74 | 2.83 | 0.81 | |||||||||||||||||||
Less Distributions to Shareholders from: | |||||||||||||||||||||||||
Net realized gain on investments | (0.79 | ) | (1.39 | ) | (1.94 | ) | (0.66 | ) | (0.72 | ) | |||||||||||||||
Net Asset Value, End of Year | $10.76 | $13.00 | $13.26 | $14.46 | $12.29 | ||||||||||||||||||||
Total Return2,3 | (12.09 | )% | 10.86 | % | 5.41 | % | 23.43 | % | 7.22 | % | |||||||||||||||
Ratio of net expenses to average net assets | 1.34 | %4 | 1.36 | %4 | 1.35 | %4 | 1.35 | %4 | 1.34 | % | |||||||||||||||
Ratio of gross expenses to average net assets5 | 1.36 | % | 1.37 | % | 1.36 | % | 1.36 | % | 1.34 | % | |||||||||||||||
Ratio of net investment loss to average net assets2 | (0.19 | )% | (0.33 | )% | (0.34 | )% | (0.36 | )% | (0.31 | )% | |||||||||||||||
Portfolio turnover | 42 | % | 47 | %6 | 41 | % | 42 | % | 57 | % | |||||||||||||||
Net assets end of year (000’s) omitted | $25,920 | $29,963 | $28,444 | $31,657 | $21,765 | ||||||||||||||||||||
125
Table of Contents
AMG River Road Small Cap Value Fund Financial Highlights For a share outstanding throughout each fiscal year |
| For the fiscal years ended October 31, | |||||||||||||||||||||||||
Class I | 2020 | 2019 | 2018 | 2017 | 2016 | ||||||||||||||||||||
Net Asset Value, Beginning of Year | $13.30 | $13.51 | $14.68 | $12.44 | $12.31 | ||||||||||||||||||||
Income (loss) from Investment Operations: | |||||||||||||||||||||||||
Net investment income (loss)1,2 | 0.01 | (0.01 | ) | (0.01 | ) | (0.01 | ) | (0.01 | ) | ||||||||||||||||
Net realized and unrealized gain (loss) on investments | (1.46 | ) | 1.20 | 0.79 | 2.92 | 0.86 | |||||||||||||||||||
Total income (loss) from investment operations | (1.45 | ) | 1.19 | 0.78 | 2.91 | 0.85 | |||||||||||||||||||
Less Distributions to Shareholders from: | |||||||||||||||||||||||||
Net investment income | (0.01 | ) | (0.01 | ) | (0.01 | ) | — | — | |||||||||||||||||
Net realized gain on investments | (0.79 | ) | (1.39 | ) | (1.94 | ) | (0.67 | ) | (0.72 | ) | |||||||||||||||
Total distributions to shareholders | (0.80 | ) | (1.40 | ) | (1.95 | ) | (0.67 | ) | (0.72 | ) | |||||||||||||||
Net Asset Value, End of Year | $11.05 | $13.30 | $13.51 | $14.68 | $12.44 | ||||||||||||||||||||
Total Return2,3 | (11.91 | )% | 11.23 | % | 5.60 | % | 23.80 | % | 7.50 | % | |||||||||||||||
Ratio of net expenses to average net assets | 1.07 | %4 | 1.09 | %4 | 1.10 | %4 | 1.10 | %4 | 1.09 | % | |||||||||||||||
Ratio of gross expenses to average net assets5 | 1.09 | % | 1.10 | % | 1.11 | % | 1.11 | % | 1.09 | % | |||||||||||||||
Ratio of net investment income (loss) to average net assets2 | 0.07 | % | (0.06 | )% | (0.09 | )% | (0.11 | )% | (0.06 | )% | |||||||||||||||
Portfolio turnover | 42 | % | 47 | %6 | 41 | % | 42 | % | 57 | % | |||||||||||||||
Net assets end of year (000’s) omitted | $487,637 | $374,344 | $330,245 | $279,574 | $246,753 | ||||||||||||||||||||
126
Table of Contents
AMG River Road Small Cap Value Fund Financial Highlights For a share outstanding throughout each fiscal period |
| For the fiscal years ended October 31, | For the fiscal period ended October 31, | |||||||||||||||||||||||
| Class Z | 2020 | 2019 | 2018 | 20177 | ||||||||||||||||||||
Net Asset Value, Beginning of Period | $13.30 | $13.51 | $14.68 | $14.68 | ||||||||||||||||||||
Income (loss) from Investment Operations: | ||||||||||||||||||||||||
Net investment income (loss)1,2 | 0.02 | 0.00 | 8 | 0.00 | 8 | (0.01 | ) | |||||||||||||||||
Net realized and unrealized gain (loss) on investments | (1.46 | ) | 1.20 | 0.79 | 0.01 | |||||||||||||||||||
Total income (loss) from investment operations | (1.44 | ) | 1.20 | 0.79 | — | |||||||||||||||||||
Less Distributions to Shareholders from: | ||||||||||||||||||||||||
Net investment income | (0.02 | ) | (0.02 | ) | (0.02 | ) | — | |||||||||||||||||
Net realized gain on investments | (0.79 | ) | (1.39 | ) | (1.94 | ) | — | |||||||||||||||||
Total distributions to shareholders | (0.81 | ) | (1.41 | ) | (1.96 | ) | — | |||||||||||||||||
Net Asset Value, End of Period | $11.05 | $13.30 | $13.51 | $14.68 | ||||||||||||||||||||
Total Return2,3 | (11.78 | )% | 11.29 | % | 5.71 | % | 0.00 | %9 | ||||||||||||||||
Ratio of net expenses to average net assets | 0.99 | %4 | 1.01 | %4 | 1.00 | %4 | 1.03 | %4,10 | ||||||||||||||||
Ratio of gross expenses to average net assets5 | 1.01 | % | 1.02 | % | 1.01 | % | 1.03 | %10 | ||||||||||||||||
Ratio of net investment income (loss) to average net assets2 | 0.16 | % | 0.02 | % | 0.01 | % | (0.58 | )%10 | ||||||||||||||||
Portfolio turnover | 42 | % | 47 | %6 | 41 | % | 42 | %9 | ||||||||||||||||
Net assets end of period (000’s) omitted | $1,025 | $186 | $163 | $154 | ||||||||||||||||||||
| 1 | Per share numbers have been calculated using average shares. |
| 2 | Total returns and net investment income (loss) would have been lower had certain expenses not been offset. |
| 3 | The total return is calculated using the published Net Asset Value as of fiscal year end. |
| 4 | Includes reduction from broker recapture amounting to 0.02%, 0.01%, 0.01% and 0.01% for the fiscal years ended 2020, 2019, 2018, and 2017, respectively. |
| 5 | Excludes the impact of expense reimbursement or fee waivers and expense reductions such as brokerage credits, but includes expense repayments and non-reimbursable expenses, if any, such as interest, taxes, and extraordinary expenses. (See Note 1(c) and 2 in the Notes to Financial Statements.) |
| 6 | Portfolio turnover rate excludes securities delivered from processing a redemption in-kind. |
| 7 | The commencement of operations was October 2, 2017. |
| 8 | Less than $0.005 or $(0.005) per share. |
| 9 | Not annualized. |
| 10 | Annualized. |
127
Table of Contents
AMG Managers Silvercrest Small Cap Fund Financial Highlights For a share outstanding throughout each fiscal year |
| For the fiscal years ended October 31, | |||||||||||||||||||||||||
Class N | 2020 | 2019 | 2018 | 2017 | 2016 | ||||||||||||||||||||
Net Asset Value, Beginning of Year | $15.97 | $16.69 | $19.28 | $15.43 | $15.20 | ||||||||||||||||||||
Income (loss) from Investment Operations: | |||||||||||||||||||||||||
Net investment income (loss)1,2 | 0.00 | 3 | 0.02 | (0.04 | ) | (0.02 | ) | 0.02 | |||||||||||||||||
Net realized and unrealized gain (loss) on investments | (2.06 | ) | 0.82 | (1.07 | ) | 4.00 | 0.80 | ||||||||||||||||||
Total income (loss) from investment operations | (2.06 | ) | 0.84 | (1.11 | ) | 3.98 | 0.82 | ||||||||||||||||||
Less Distributions to Shareholders from: | |||||||||||||||||||||||||
Net investment income | (0.02 | ) | (0.00 | )3 | — | — | (0.04 | ) | |||||||||||||||||
Net realized gain on investments | (0.35 | ) | (1.56 | ) | (1.48 | ) | (0.13 | ) | (0.55 | ) | |||||||||||||||
Total distributions to shareholders | (0.37 | ) | (1.56 | ) | (1.48 | ) | (0.13 | ) | (0.59 | ) | |||||||||||||||
Net Asset Value, End of Year | $13.54 | $15.97 | $16.69 | $19.28 | $15.43 | ||||||||||||||||||||
Total Return2,4 | (13.25 | )% | 6.85 | % | (6.43 | )% | 25.83 | % | 5.73 | % | |||||||||||||||
Ratio of net expenses to average net assets | 1.36 | %5 | 1.37 | %5 | 1.37 | %5 | 1.37 | %5 | 1.40 | % | |||||||||||||||
Ratio of gross expenses to average net assets6 | 1.45 | % | 1.46 | % | 1.43 | % | 1.43 | % | 1.45 | % | |||||||||||||||
Ratio of net investment income (loss) to average net assets2 | 0.03 | % | 0.13 | % | (0.19 | )% | (0.12 | )% | 0.16 | % | |||||||||||||||
Portfolio turnover | 30 | % | 20 | % | 34 | % | 40 | % | 32 | % | |||||||||||||||
Net assets end of year (000’s) omitted | $21,727 | $28,847 | $12,745 | $25,451 | $20,228 | ||||||||||||||||||||
128
Table of Contents
AMG Managers Silvercrest Small Cap Fund Financial Highlights For a share outstanding throughout each fiscal year |
| For the fiscal years ended October 31, | |||||||||||||||||||||||||
Class I | 2020 | 2019 | 2018 | 2017 | 2016 | ||||||||||||||||||||
Net Asset Value, Beginning of Year | $16.19 | $16.87 | $19.44 | $15.56 | $15.30 | ||||||||||||||||||||
Income (loss) from Investment Operations: | |||||||||||||||||||||||||
Net investment income1,2 | 0.04 | 0.06 | 0.01 | 0.02 | 0.06 | ||||||||||||||||||||
Net realized and unrealized gain (loss) on investments | (2.09 | ) | 0.84 | (1.08 | ) | 4.03 | 0.81 | ||||||||||||||||||
Total income (loss) from investment operations | (2.05 | ) | 0.90 | (1.07 | ) | 4.05 | 0.87 | ||||||||||||||||||
Less Distributions to Shareholders from: | |||||||||||||||||||||||||
Net investment income | (0.06 | ) | (0.02 | ) | (0.02 | ) | (0.04 | ) | (0.06 | ) | |||||||||||||||
Net realized gain on investments | (0.35 | ) | (1.56 | ) | (1.48 | ) | (0.13 | ) | (0.55 | ) | |||||||||||||||
Total distributions to shareholders | (0.41 | ) | (1.58 | ) | (1.50 | ) | (0.17 | ) | (0.61 | ) | |||||||||||||||
Net Asset Value, End of Year | $13.73 | $16.19 | $16.87 | $19.44 | $15.56 | ||||||||||||||||||||
Total Return2,4 | (13.04 | )% | 7.14 | % | (6.16 | )% | 26.07 | % | 6.04 | % | |||||||||||||||
Ratio of net expenses to average net assets | 1.12 | %5 | 1.12 | %5 | 1.13 | %5 | 1.12 | %5 | 1.15 | % | |||||||||||||||
Ratio of gross expenses to average net assets6 | 1.21 | % | 1.21 | % | 1.19 | % | 1.18 | % | 1.21 | % | |||||||||||||||
Ratio of net investment income to average net assets2 | 0.27 | % | 0.38 | % | 0.05 | % | 0.12 | % | 0.40 | % | |||||||||||||||
Portfolio turnover | 30 | % | 20 | % | 34 | % | 40 | % | 32 | % | |||||||||||||||
Net assets end of year (000’s) omitted | $121,400 | $159,069 | $191,477 | $241,626 | $181,964 | ||||||||||||||||||||
129
Table of Contents
AMG Managers Silvercrest Small Cap Fund Financial Highlights For a share outstanding throughout each fiscal period |
| For the fiscal year ended October 31, | For the fiscal period ended October 31, | |||||||||||||||||||||||
| Class Z | 2020 | 2019 | 2018 | 20177 | ||||||||||||||||||||
Net Asset Value, Beginning of Period | $16.18 | $16.87 | $19.45 | $19.24 | ||||||||||||||||||||
Income (loss) from Investment Operations: | ||||||||||||||||||||||||
Net investment income (loss)1,2 | 0.05 | 0.07 | 0.02 | (0.01 | ) | |||||||||||||||||||
Net realized and unrealized gain (loss) on investments | (2.09 | ) | 0.83 | (1.09 | ) | 0.22 | ||||||||||||||||||
Total income (loss) from investment operations | (2.04 | ) | 0.90 | (1.07 | ) | 0.21 | ||||||||||||||||||
Less Distributions to Shareholders from: | ||||||||||||||||||||||||
Net investment income | (0.07 | ) | (0.03 | ) | (0.03 | ) | — | |||||||||||||||||
Net realized gain on investments | (0.35 | ) | (1.56 | ) | (1.48 | ) | — | |||||||||||||||||
Total distributions to shareholders | (0.42 | ) | (1.59 | ) | (1.51 | ) | — | |||||||||||||||||
Net Asset Value, End of Period | $13.72 | $16.18 | $16.87 | $19.45 | ||||||||||||||||||||
Total Return2,4 | (12.99 | )% | 7.20 | % | (6.14 | )% | 1.09 | %8 | ||||||||||||||||
Ratio of net expenses to average net assets | 1.05 | %5 | 1.05 | %5 | 1.06 | %5 | 1.08 | %5,9 | ||||||||||||||||
Ratio of gross expenses to average net assets6 | 1.14 | % | 1.14 | % | 1.12 | % | 1.08 | %9 | ||||||||||||||||
Ratio of net investment income (loss) to average net assets2 | 0.34 | % | 0.45 | % | 0.12 | % | (0.44 | )%9 | ||||||||||||||||
Portfolio turnover | 30 | % | 20 | % | 34 | % | 40 | %8 | ||||||||||||||||
Net assets end of period (000’s) omitted | $34,666 | $36,610 | $33,273 | $206 | ||||||||||||||||||||
| 1 | Per share numbers have been calculated using average shares. |
| 2 | Total returns and net investment income (loss) would have been lower had certain expenses not been offset. |
| 3 | Less than $0.005 or $(0.005) per share. |
| 4 | The total return is calculated using the published Net Asset Value as of fiscal year end. |
| 5 | Includes reduction from broker recapture amounting to 0.03%, 0.03% and 0.02% for the fiscal years ended 2020, 2019, 2018, respectively, and 0.03%, 0.03% and 0.01% for Class N, Class I and Class Z, respectively, for the fiscal period ended 2017. |
| 6 | Excludes the impact of expense reimbursement or fee waivers and expense reductions such as brokerage credits, but includes expense repayments and non-reimbursable expenses, if any, such as interest, taxes, and extraordinary expenses. (See Note 1(c) and 2 in the Notes to Financial Statements.) |
| 7 | The commencement of operations was October 2, 2017. |
| 8 | Not annualized. |
| 9 | Annualized. |
130
Table of Contents
AMG Managers DoubleLine Core Plus Bond Fund Financial Highlights For a share outstanding throughout each fiscal year |
| For the fiscal years ended October 31, | |||||||||||||||||||||||||
Class N | 2020 | 2019 | 2018 | 2017 | 2016 | ||||||||||||||||||||
Net Asset Value, Beginning of Year | $10.74 | $10.23 | $10.68 | $10.77 | $10.60 | ||||||||||||||||||||
Income (loss) from Investment Operations: | |||||||||||||||||||||||||
Net investment income1,2 | 0.27 | 0.34 | 0.29 | 0.27 | 0.31 | ||||||||||||||||||||
Net realized and unrealized gain (loss) on investments | 0.05 | 0.53 | (0.43 | ) | 0.01 | 0.17 | |||||||||||||||||||
Total income (loss) from investment operations | 0.32 | 0.87 | (0.14 | ) | 0.28 | 0.48 | |||||||||||||||||||
Less Distributions to Shareholders from: | |||||||||||||||||||||||||
Net investment income | (0.30 | ) | (0.36 | ) | (0.31 | ) | (0.30 | ) | (0.31 | ) | |||||||||||||||
Net realized gain on investments | — | — | — | (0.02 | ) | — | |||||||||||||||||||
Paid in capital | — | — | — | (0.05 | ) | — | |||||||||||||||||||
Total distributions to shareholders | (0.30 | ) | (0.36 | ) | (0.31 | ) | (0.37 | ) | (0.31 | ) | |||||||||||||||
Net Asset Value, End of Year | $10.76 | $10.74 | $10.23 | $10.68 | $10.77 | ||||||||||||||||||||
Total Return2,3 | 3.01 | % | 8.67 | % | (1.33 | )% | 2.68 | % | 4.62 | % | |||||||||||||||
Ratio of net expenses to average net assets | 0.94 | % | 0.94 | % | 0.94 | % | 0.94 | % | 0.94 | % | |||||||||||||||
Ratio of gross expenses to average net assets4 | 1.01 | % | 1.02 | % | 1.01 | % | 1.02 | % | 1.02 | % | |||||||||||||||
Ratio of net investment income to average net assets2 | 2.54 | % | 3.24 | % | 2.80 | % | 2.58 | % | 2.84 | % | |||||||||||||||
Portfolio turnover | 96 | % | 47 | % | 69 | % | 106 | % | 78 | % | |||||||||||||||
Net assets end of year (000’s) omitted | $56,175 | $82,856 | $102,138 | $169,646 | $308,703 | ||||||||||||||||||||
131
Table of Contents
AMG Managers DoubleLine Core Plus Bond Fund Financial Highlights For a share outstanding throughout each fiscal year |
| For the fiscal years ended October 31, | |||||||||||||||||||||||||
Class I | 2020 | 2019 | 2018 | 2017 | 2016 | ||||||||||||||||||||
Net Asset Value, Beginning of Year | $10.74 | $10.23 | $10.67 | $10.76 | $10.60 | ||||||||||||||||||||
Income (loss) from Investment Operations: | |||||||||||||||||||||||||
Net investment income1,2 | 0.30 | 0.37 | 0.32 | 0.30 | 0.33 | ||||||||||||||||||||
Net realized and unrealized gain (loss) on investments | 0.03 | 0.53 | (0.42 | ) | 0.01 | 0.17 | |||||||||||||||||||
Total income (loss) from investment operations | 0.33 | 0.90 | (0.10 | ) | 0.31 | 0.50 | |||||||||||||||||||
Less Distributions to Shareholders from: | |||||||||||||||||||||||||
Net investment income | (0.32 | ) | (0.39 | ) | (0.34 | ) | (0.33 | ) | (0.34 | ) | |||||||||||||||
Net realized gain on investments | — | — | — | (0.02 | ) | — | |||||||||||||||||||
Paid in capital | — | — | — | (0.05 | ) | — | |||||||||||||||||||
Total distributions to shareholders | (0.32 | ) | (0.39 | ) | (0.34 | ) | (0.40 | ) | (0.34 | ) | |||||||||||||||
Net Asset Value, End of Year | $10.75 | $10.74 | $10.23 | $10.67 | $10.76 | ||||||||||||||||||||
Total Return2,3 | 3.17 | % | 8.94 | % | (0.98 | )% | 2.95 | % | 4.79 | % | |||||||||||||||
Ratio of net expenses to average net assets | 0.69 | % | 0.69 | % | 0.69 | % | 0.68 | % | 0.69 | % | |||||||||||||||
Ratio of gross expenses to average net assets4 | 0.76 | % | 0.77 | % | 0.76 | % | 0.76 | % | 0.77 | % | |||||||||||||||
Ratio of net investment income to average net assets2 | 2.79 | % | 3.49 | % | 3.05 | % | 2.83 | % | 3.11 | % | |||||||||||||||
Portfolio turnover | 96 | % | 47 | % | 69 | % | 106 | % | 78 | % | |||||||||||||||
Net assets end of year (000’s) omitted | $433,881 | $585,358 | $467,024 | $507,600 | $398,514 | ||||||||||||||||||||
132
Table of Contents
AMG Managers DoubleLine Core Plus Bond Fund Financial Highlights For a share outstanding throughout each fiscal period |
| For the fiscal years ended October 31, | For the fiscal period ended October 31, | |||||||||||||||||||||||
| Class Z | 2020 | 2019 | 2018 | 20175 | ||||||||||||||||||||
Net Asset Value, Beginning of Period | $10.74 | $10.24 | $10.68 | $10.69 | ||||||||||||||||||||
Income (loss) from Investment Operations: | ||||||||||||||||||||||||
Net investment income1,2 | 0.31 | 0.38 | 0.33 | 0.03 | ||||||||||||||||||||
Net realized and unrealized gain (loss) on investments | 0.04 | 0.52 | (0.43 | ) | (0.01 | ) | ||||||||||||||||||
Total income (loss) from investment operations | 0.35 | 0.90 | (0.10 | ) | 0.02 | |||||||||||||||||||
Less Distributions to Shareholders from: | ||||||||||||||||||||||||
Net investment income | (0.33 | ) | (0.40 | ) | (0.34 | ) | (0.03 | ) | ||||||||||||||||
Paid in capital | — | — | — | (0.00 | )6 | |||||||||||||||||||
Total distributions to shareholders | (0.33 | ) | (0.40 | ) | (0.34 | ) | (0.03 | ) | ||||||||||||||||
Net Asset Value, End of Period | $10.76 | $10.74 | $10.24 | $10.68 | ||||||||||||||||||||
Total Return2,3 | 3.35 | % | 8.91 | % | (0.91 | )% | 0.17 | %7 | ||||||||||||||||
Ratio of net expenses to average net assets | 0.61 | % | 0.61 | % | 0.61 | % | 0.60 | %8 | ||||||||||||||||
Ratio of gross expenses to average net assets4 | 0.68 | % | 0.69 | % | 0.68 | % | 0.63 | %8 | ||||||||||||||||
Ratio of net investment income to average net assets2 | 2.87 | % | 3.57 | % | 3.13 | % | 2.74 | %8 | ||||||||||||||||
Portfolio turnover | 96 | % | 47 | % | 69 | % | 106 | %7 | ||||||||||||||||
Net assets end of period (000’s) omitted | $10,684 | $2,473 | $1,955 | $1,597 | ||||||||||||||||||||
| 1 | Per share numbers have been calculated using average shares. |
| 2 | Total returns and net investment income would have been lower had certain expenses not been offset. |
| 3 | The total return is calculated using the published Net Asset Value as of fiscal year end. |
| 4 | Excludes the impact of expense reimbursement or fee waivers and expense reductions such as brokerage credits, but includes expense repayments and non-reimbursable expenses, if any, such as interest, taxes, and extraordinary expenses. (See Note 1(c) and 2 in the Notes to Financial Statements.) |
| 5 | The commencement of operations was October 2, 2017. |
| 6 | Less than $(0.005) per share. |
| 7 | Not annualized. |
| 8 | Annualized. |
133
Table of Contents
AMG River Road Long-Short Fund Financial Highlights For a share outstanding throughout each fiscal year |
| For the fiscal years ended October 31, | |||||||||||||||||||||||||
Class N | 2020 | 2019 | 2018 | 2017 | 2016 | ||||||||||||||||||||
Net Asset Value, Beginning of Year | $13.06 | $12.19 | $12.33 | $11.04 | $11.48 | ||||||||||||||||||||
Income (loss) from Investment Operations: | |||||||||||||||||||||||||
Net investment loss1,2 | (0.16 | ) | (0.05 | ) | (0.03 | )3 | (0.25 | ) | (0.19 | ) | |||||||||||||||
Net realized and unrealized gain (loss) on investments | (0.42 | ) | 1.63 | (0.11 | ) | 1.54 | 0.13 | ||||||||||||||||||
Total income (loss) from investment operations | (0.58 | ) | 1.58 | (0.14 | ) | 1.29 | (0.06 | ) | |||||||||||||||||
Less Distributions to Shareholders from: | |||||||||||||||||||||||||
Net realized gain on investments | (1.08 | ) | (0.71 | ) | — | — | (0.38 | ) | |||||||||||||||||
Net Asset Value, End of Year | $11.40 | $13.06 | $12.19 | $12.33 | $11.04 | ||||||||||||||||||||
Total Return2,4 | (5.17 | )% | 13.98 | % | (1.14 | )% | 11.69 | % | (0.52 | )% | |||||||||||||||
Ratio of net expenses to average net assets5 | 2.71 | %6 | 2.41 | %6 | 3.12 | %6 | 3.60 | %6 | 3.46 | % | |||||||||||||||
Ratio of gross expenses to average net assets7 | 3.23 | % | 2.83 | % | 3.41 | % | 3.75 | % | 3.62 | % | |||||||||||||||
Ratio of net investment loss to average net assets2 | (1.35 | )% | (0.43 | )% | (0.25 | )% | (2.23 | )% | (1.75 | )% | |||||||||||||||
Portfolio turnover | 257 | % | 264 | % | 189 | % | 186 | % | 298 | % | |||||||||||||||
Net assets end of year (000’s) omitted | $1,584 | $2,654 | $3,749 | $5,508 | $8,713 | ||||||||||||||||||||
134
Table of Contents
AMG River Road Long-Short Fund Financial Highlights For a share outstanding throughout each fiscal year |
| For the fiscal years ended October 31, | |||||||||||||||||||||||||
Class I | 2020 | 2019 | 2018 | 2017 | 2016 | ||||||||||||||||||||
Net Asset Value, Beginning of Year | $13.30 | $12.37 | $12.48 | $11.15 | $11.56 | ||||||||||||||||||||
Income (loss) from Investment Operations: | |||||||||||||||||||||||||
Net investment loss1,2 | (0.14 | ) | (0.02 | ) | 0.00 | 3,8 | (0.24 | ) | (0.18 | ) | |||||||||||||||
Net realized and unrealized gain (loss) on investments | (0.43 | ) | 1.66 | (0.11 | ) | 1.57 | 0.15 | ||||||||||||||||||
Total income (loss) from investment operations | (0.57 | ) | 1.64 | (0.11 | ) | 1.33 | (0.03 | ) | |||||||||||||||||
Less Distributions to Shareholders from: | |||||||||||||||||||||||||
Net realized gain on investments | (1.08 | ) | (0.71 | ) | — | — | (0.38 | ) | |||||||||||||||||
Net Asset Value, End of Year | $11.65 | $13.30 | $12.37 | $12.48 | $11.15 | ||||||||||||||||||||
Total Return2,4 | (4.98 | )% | 14.28 | % | (0.88 | )% | 11.93 | % | (0.24 | )% | |||||||||||||||
Ratio of net expenses to average net assets5 | 2.46 | %6 | 2.16 | %6 | 2.87 | %6 | 3.35 | %6 | 3.24 | % | |||||||||||||||
Ratio of gross expenses to average net assets7 | 2.98 | % | 2.58 | % | 3.16 | % | 3.50 | % | 3.39 | % | |||||||||||||||
Ratio of net investment loss to average net assets2 | (1.10 | )% | (0.18 | )% | 0.00 | %9 | (1.98 | )% | (1.67 | )% | |||||||||||||||
Portfolio turnover | 257 | % | 264 | % | 189 | % | 186 | % | 298 | % | |||||||||||||||
Net assets end of year (000’s) omitted | $14,041 | $22,856 | $24,925 | $29,030 | $37,549 | ||||||||||||||||||||
135
Table of Contents
AMG River Road Long-Short Fund Financial Highlights For a share outstanding throughout each fiscal period |
| For the fiscal year ended October 31, | For the fiscal period ended October 31, | |||||||||||||||||||||||
| Class Z | 2020 | 2019 | 2018 | 201710 | ||||||||||||||||||||
Net Asset Value, Beginning of Period | $13.32 | $12.38 | $12.49 | $12.53 | ||||||||||||||||||||
Income (loss) from Investment Operations: | ||||||||||||||||||||||||
Net investment income (loss)1,2 | (0.12 | ) | (0.01 | ) | 0.01 | 3 | (0.02 | ) | ||||||||||||||||
Net realized and unrealized gain (loss) on investments | (0.43 | ) | 1.66 | (0.12 | ) | (0.02 | ) | |||||||||||||||||
Total income (loss) from investment operations | (0.55 | ) | 1.65 | (0.11 | ) | (0.04 | ) | |||||||||||||||||
Less Distributions to Shareholders from: | ||||||||||||||||||||||||
Net realized gain on investments | (1.08 | ) | (0.71 | ) | — | — | ||||||||||||||||||
Net Asset Value, End of Period | $11.69 | $13.32 | $12.38 | $12.49 | ||||||||||||||||||||
Total Return2,4 | (4.82 | )% | 14.35 | % | (0.88 | )% | (0.32 | )%11 | ||||||||||||||||
Ratio of net expenses to average net assets5 | 2.38 | %6 | 2.08 | %6 | 2.79 | %6 | 3.38 | %6,12 | ||||||||||||||||
Ratio of gross expenses to average net assets7 | 2.90 | % | 2.50 | % | 3.08 | % | 3.38 | %12 | ||||||||||||||||
Ratio of net investment income (loss) to average net assets2 | (1.02 | )% | (0.10 | )% | 0.09 | % | (2.74 | )%12 | ||||||||||||||||
Portfolio turnover | 257 | % | 264 | % | 189 | % | 186 | %11 | ||||||||||||||||
Net assets end of period (000’s) omitted | $660 | $84 | $73 | $25 | ||||||||||||||||||||
| 1 | Per share numbers have been calculated using average shares. |
| 2 | Total returns and net investment income (loss) would have been lower had certain expenses not been offset. |
| 3 | Includes non-recurring dividends. Without these dividends, net investment loss per share would have been $(0.17), $(0.14), and $(0.13) for Class N, Class I and Class Z shares, respectively. |
| 4 | The total return is calculated using the published Net Asset Value as of fiscal year end. |
| 5 | Expense ratio includes dividend and interest expense related to securities sold short. Excluding such dividend and interest expense, the ratio of expenses to average net assets would be 1.34%, 1.09% and 1.01% for Class N, Class I and Class Z, respectively, for the fiscal year ended October 31, 2020, 1.44%, 1.19% and 1.11% for Class N, Class I and Class Z, respectively, for the fiscal year ended October 31, 2019, 1.45%, 1.20% and 1.12% for Class N, Class I and Class Z, respectively, for the fiscal year ended October 31, 2018, 1.48%, 1.23% and 1.12% for Class N, Class I and Class Z, respectively, for the fiscal year ended October 31, 2017, and 1.70% and 1.45% for Class N and Class I, respectively, for each of the fiscal periods ended 2016 and 2015. |
| 6 | Includes reduction from brokerage recapture amounting to 0.11%, 0.01% and 0.02% for the fiscal years ended 2020, 2019, 2018, respectively, and 0.02%, 0.02%, and less than 0.01% for Class N, Class I, and Class Z, respectively, for the fiscal period ended 2017. |
| 7 | Excludes the impact of expense reimbursement or fee waivers and expense reductions such as brokerage credits, but includes expense repayments and non-reimbursable expenses, if any, such as interest, taxes, and extraordinary expenses. (See Note 1(c) and 2 in the Notes to Financial Statements.) |
| 8 | Less than $0.005 per share. |
| 9 | Less than 0.005%. |
| 10 | Commencement of operations was on October 2, 2017. |
| 11 | Not annualized. |
| 12 | Annualized. |
136
Table of Contents
AMG Managers Pictet International Fund Financial Highlights For a share outstanding throughout each fiscal year |
| For the fiscal years ended October 31, | |||||||||||||||||||||||||
Class N | 2020 | 2019 | 2018 | 2017 | 2016 | ||||||||||||||||||||
Net Asset Value, Beginning of Year | $9.56 | $9.90 | $11.60 | $9.61 | $9.56 | ||||||||||||||||||||
Income (loss) from Investment Operations: | |||||||||||||||||||||||||
Net investment income1,2 | 0.07 | 3 | 0.07 | 0.12 | 0.04 | 0.13 | |||||||||||||||||||
Net realized and unrealized gain (loss) on investments | (1.17 | ) | 0.56 | (1.31 | ) | 2.22 | 0.00 | 4 | |||||||||||||||||
Total income (loss) from investment operations | (1.10 | ) | 0.63 | (1.19 | ) | 2.26 | 0.13 | ||||||||||||||||||
Less Distributions to Shareholders from: | |||||||||||||||||||||||||
Net investment income | (0.23 | ) | (0.20 | ) | (0.18 | ) | (0.07 | ) | (0.02 | ) | |||||||||||||||
Net realized gain on investments | — | (0.77 | ) | (0.33 | ) | (0.20 | ) | (0.06 | ) | ||||||||||||||||
Total distributions to shareholders | (0.23 | ) | (0.97 | ) | (0.51 | ) | (0.27 | ) | (0.08 | ) | |||||||||||||||
Net Asset Value, End of Year | $8.23 | $9.56 | $9.90 | $11.60 | $9.61 | ||||||||||||||||||||
Total Return2,5 | (11.83 | )% | 8.34 | % | (10.80 | )% | 24.30 | % | 1.42 | %6 | |||||||||||||||
Ratio of net expenses to average net assets | 1.31 | % | 1.32 | % | 1.27 | % | 1.30 | % | 1.40 | % | |||||||||||||||
Ratio of gross expenses to average net assets7 | 1.35 | % | 1.32 | % | 1.28 | % | 1.31 | % | 1.41 | % | |||||||||||||||
Ratio of net investment income to average net assets2 | 0.77 | % | 0.78 | % | 1.10 | % | 0.38 | % | 1.88 | % | |||||||||||||||
Portfolio turnover | 43 | % | 28 | % | 51 | % | 34 | % | 38 | % | |||||||||||||||
Net assets end of year (000’s) omitted | $6,792 | $87,998 | $82,839 | $4,006 | $131 | ||||||||||||||||||||
137
Table of Contents
AMG Managers Pictet International Fund Financial Highlights For a share outstanding throughout each fiscal year |
| For the fiscal years ended October 31, | |||||||||||||||||||||||||
Class I | 2020 | 2019 | 2018 | 2017 | 2016 | ||||||||||||||||||||
Net Asset Value, Beginning of Year | $9.62 | $9.93 | $11.59 | $9.65 | $9.60 | ||||||||||||||||||||
Income (loss) from Investment Operations: | |||||||||||||||||||||||||
Net investment income1,2 | 0.09 | 3 | 0.09 | 0.16 | 0.13 | 0.15 | |||||||||||||||||||
Net realized and unrealized gain (loss) on investments | (1.16 | ) | 0.57 | (1.32 | ) | 2.16 | 0.00 | 4 | |||||||||||||||||
Total income (loss) from investment operations | (1.07 | ) | 0.66 | (1.16 | ) | 2.29 | 0.15 | ||||||||||||||||||
Less Distributions to Shareholders from: | |||||||||||||||||||||||||
Net investment income | (0.27 | ) | (0.20 | ) | (0.17 | ) | (0.14 | ) | (0.04 | ) | |||||||||||||||
Net realized gain on investments | — | (0.77 | ) | (0.33 | ) | (0.21 | ) | (0.06 | ) | ||||||||||||||||
Total distributions to shareholders | (0.27 | ) | (0.97 | ) | (0.50 | ) | (0.35 | ) | (0.10 | ) | |||||||||||||||
Net Asset Value, End of Year | $8.28 | $9.62 | $9.93 | $11.59 | $9.65 | ||||||||||||||||||||
Total Return2,5 | (11.63 | )% | 8.65 | % | (10.57 | )% | 24.55 | % | 1.67 | %8 | |||||||||||||||
Ratio of net expenses to average net assets | 1.02 | % | 1.07 | % | 1.00 | % | 1.06 | % | 1.15 | % | |||||||||||||||
Ratio of gross expenses to average net assets7 | 1.06 | % | 1.07 | % | 1.01 | % | 1.07 | % | 1.15 | % | |||||||||||||||
Ratio of net investment income to average net assets2 | 1.06 | % | 1.03 | % | 1.38 | % | 1.28 | % | 2.13 | % | |||||||||||||||
Portfolio turnover | 43 | % | 28 | % | 51 | % | 34 | % | 38 | % | |||||||||||||||
Net assets end of year (000’s) omitted | $166,994 | $158,317 | $208,184 | $2,019,217 | $1,336,050 | ||||||||||||||||||||
138
Table of Contents
AMG Managers Pictet International Fund Financial Highlights For a share outstanding throughout each fiscal period |
| For the fiscal year ended October 31, | For the fiscal period ended October 31, | |||||||||||||||||||||||
| Class Z | 2020 | 2019 | 2018 | 20179 | ||||||||||||||||||||
Net Asset Value, Beginning of Period | $9.60 | $9.91 | $11.59 | $11.40 | ||||||||||||||||||||
Income (loss) from Investment Operations: | ||||||||||||||||||||||||
Net investment income1,2 | 0.10 | 3 | 0.10 | 0.16 | 0.00 | 4 | ||||||||||||||||||
Net realized and unrealized gain (loss) on investments | (1.16 | ) | 0.57 | (1.31 | ) | 0.19 | ||||||||||||||||||
Total income (loss) from investment operations | (1.06 | ) | 0.67 | (1.15 | ) | 0.19 | ||||||||||||||||||
Less Distributions to Shareholders from: | ||||||||||||||||||||||||
Net investment income | (0.28 | ) | (0.21 | ) | (0.20 | ) | — | |||||||||||||||||
Net realized gain on investments | — | (0.77 | ) | (0.33 | ) | — | ||||||||||||||||||
Total distributions to shareholders | (0.28 | ) | (0.98 | ) | (0.53 | ) | — | |||||||||||||||||
Net Asset Value, End of Period | $8.26 | $9.60 | $9.91 | $11.59 | ||||||||||||||||||||
Total Return2,5 | (11.56 | )% | 8.84 | % | (10.52 | )% | 1.67 | %10 | ||||||||||||||||
Ratio of net expenses to average net assets | 0.92 | % | 0.96 | % | 0.91 | % | 0.94 | %11 | ||||||||||||||||
Ratio of gross expenses to average net assets7 | 0.96 | % | 0.96 | % | 0.92 | % | 0.95 | %11 | ||||||||||||||||
Ratio of net investment income (loss) to average net assets2 | 1.16 | % | 1.14 | % | 1.46 | % | (0.36 | )%11 | ||||||||||||||||
Portfolio turnover | 43 | % | 28 | % | 51 | % | 34 | % | ||||||||||||||||
Net assets end of period (000’s) omitted | $11,692 | $49,054 | $1,289,369 | $254 | ||||||||||||||||||||
| 1 | Per share numbers have been calculated using average shares. |
| 2 | Total returns and net investment income would have been lower had certain expenses not been offset. |
| 3 | Includes non-recurring dividends. Without these dividends, net investment income per share would have been $0.04, $0.06, and $0.07 for Class N, Class I, and Class Z shares, respectively. |
| 4 | Less than $0.005 per share. |
| 5 | The total return is calculated using the published Net Asset Value as of fiscal year end. |
| 6 | The total return would have been 1.32% had the capital contribution not been included. |
| 7 | Excludes the impact of expense reimbursement or fee waivers and expense reductions such as brokerage credits, but includes expense repayments and non-reimbursable expenses, if any, such as interest, taxes, and extraordinary expenses. (See Note 1(c) and 2 in the Notes to Financial Statements.) |
| 8 | The total return would have been 1.57% had the capital contribution not been included. |
| 9 | The commencement of operations for Class Z Shares was October 2, 2017. |
| 10 | Not annualized. |
| 11 | Annualized. |
139
Table of Contents
1. ORGANIZATION AND SUMMARY OF SIGNIFICANT ACCOUNTING POLICIES
AMG Funds IV (the “Trust”) is an open-end management investment company, organized as a Delaware Statutory Trust, and registered under the Investment Company Act of 1940, as amended (the “1940 Act”). Currently, the Trust consists of a number of different funds, (each a “Fund” and collectively, the “Funds”), each having distinct investment management objectives, strategies, risks, and policies. Included in this report are:
Funds
|
AMG River Road Focused Absolute Value Fund (“River Road Focused Absolute Value”)
|
AMG Managers Montag & Caldwell Growth Fund (“Montag & Caldwell Growth”)
|
AMG River Road Dividend All Cap Value Fund (“River Road Dividend All Cap Value”)
|
AMG Managers Fairpointe Mid Cap Fund (“Fairpointe Mid Cap”)
|
AMG Managers LMCG Small Cap Growth Fund (“LMCG Small Cap Growth”)
|
AMG River Road Small-Mid Cap Value Fund (“River Road Small-Mid Cap Value”)
|
AMG River Road Small Cap Value Fund (“River Road Small Cap Value”)
|
AMG Managers Silvercrest Small Cap Fund (“Silvercrest Small Cap”)
|
AMG Managers DoubleLine Core Plus Bond Fund (“DoubleLine Core Plus Bond”)
|
AMG River Road Long-Short Fund (“River Road Long-Short”)
|
AMG Managers Pictet International Fund (“Pictet International”)
|
Each Fund is authorized to issue two classes of shares (Class N shares and Class I shares). River Road Focused Absolute Value, River Road Dividend All Cap Value, Fairpointe Mid Cap, River Road Small-Mid Cap Value, River Road Small Cap Value, Silvercrest Small Cap, DoubleLine Core Plus Bond, River Road Long-Short and Pictet International are authorized to issue Class Z shares. Effective May 31, 2019, Montag & Caldwell Growth Class R shares were converted to Class N shares. Each class represents an interest in the same assets of the respective Fund. Although all share classes generally have identical voting rights, each share class votes separately when required by law. Different share classes may have different net asset values per share to the extent the share classes pay different distribution amounts and/or the expenses of such share classes differ. Each share class has its own expense structure. Please refer to a current prospectus for additional information on each share class.
Market disruptions associated with the COVID-19 pandemic have had a global impact, and uncertainty exists as to the long-term implications. Such disruptions can adversely affect assets of the Funds and thus Fund performance.
Certain instruments held by a Fund may pay an interest rate based on the London Interbank Offered Rate (“LIBOR”), which is the offered rate for short-term loans between certain major international banks. LIBOR is expected to be phased out by the end of 2021. While the effect of the phase out cannot yet be determined, it may result in, among other things, increased volatility or illiquidity in markets for instruments based on LIBOR and changes in the value of some LIBOR-based investments or the effectiveness of new hedges placed against existing LIBOR-based investments. These effects could occur prior to the end of 2021. There also remains uncertainty and risk regarding the willingness and ability of issuers to include enhanced provisions in new and existing contracts or instruments. All of the aforementioned may adversely affect a Fund’s performance or net asset value.
The Funds’ financial statements are prepared in accordance with accounting principles generally accepted in the United States of America (“U.S. GAAP”), including accounting and reporting guidance pursuant to Accounting Standards Codification Topic 946 applicable to investment companies. U.S. GAAP requires management to make estimates and assumptions that affect the reported amounts of assets and liabilities and disclosure of contingent assets and liabilities at the date of the financial statements and the reported amounts of income and expenses during the reporting period. Actual results could differ from those estimates and such differences could be material. The following is a summary of significant accounting policies followed by the Funds in the preparation of their financial statements:
a. VALUATION OF INVESTMENTS
Equity securities, including securities sold short, traded on a national securities exchange or reported on the NASDAQ national market system (“NMS”) are valued at the last quoted sales price on the primary exchange or, if applicable, the NASDAQ official closing price or the official closing price of the relevant exchange or, lacking any sales, at the last quoted bid price or the mean between the last quoted bid and ask prices (the “mean price”). Equity securities and securities sold short traded in the over-the-counter market (other than NMS securities) are valued at the mean price. Foreign equity securities (securities principally traded in markets other than U.S. markets) are valued at the official closing price on the primary exchange or, for markets that either do not offer an official closing price or where the official closing price may not be representative of the overall market, the last quoted sale price.
Fixed income securities purchased with a remaining maturity exceeding 60 days are valued at the evaluated mean price provided by an authorized pricing service or, if an evaluated price is not available, by reference to other securities which are considered comparable in credit rating, interest rate, due date and other features (generally referred to as “matrix pricing”) or other similar pricing methodologies. Investments in certain mortgage-backed and stripped mortgage-backed securities, preferred stocks, convertible securities, derivatives and other debt securities not traded on an organized securities market are valued on the basis of valuations provided by dealers or by a pricing service which uses information with respect to transactions in such securities and various relationships between such securities and yield to maturity in determining value.
Fixed income securities purchased with a remaining maturity of 60 days or less are valued at amortized cost, provided that the amortized cost value is approximately the same as the fair value of the security valued without the use of amortized cost. Investments in other open-end registered investment companies are valued at their end of day net asset value per share.
The Funds’ portfolio investments are generally valued based on independent market quotations or prices or, if none, “evaluative” or other market based valuations provided by third party pricing services approved by the Board of Trustees of the Trust (the “Board”). Under certain circumstances, the value of certain Fund portfolio investments may be based on an evaluation of fair value, pursuant to procedures established by and under the general supervision of the Board. The Valuation Committee, which is comprised of the Independent Trustees of the Board, and the Pricing Committee, which is comprised of representatives from AMG Funds LLC (the “Investment Manager”) are the committees appointed by the Board to make fair value determinations. Each Fund may use the fair value of a portfolio investment to calculate its net asset value (“NAV”) in the event that the market quotation, price or market based valuation for the portfolio investment is not readily available or otherwise not determinable pursuant to the Board’s
140
Table of Contents
Notes to Financial Statements (continued) |
valuation procedures, if the Investment Manager or the Pricing Committee believes the quotation, price or market based valuation to be unreliable, or in certain other circumstances. When determining the fair value of an investment, the Pricing Committee and, if required under the Trust’s securities valuation procedures, the Valuation Committee, seeks to determine the price that the Fund might reasonably expect to receive from current sale of that portfolio investment in an arms-length transaction. Fair value determinations shall be based upon consideration of all available facts and information, including, but not limited to (i) attributes specific to the investment; (ii) fundamental and analytical data relating to the investment; and (iii) the value of other comparable securities or relevant financial instruments, including derivative securities, traded on other markets or among dealers.
The values assigned to fair value portfolio investments are based on available information and do not necessarily represent amounts that might ultimately be realized in the future, since such amounts depend on future developments inherent in long-term investments. Because of the inherent uncertainty of valuation, those estimated values may differ significantly from the values that would have been used had a ready market for the investments existed, and the differences could be material. The Board will be presented with a quarterly report showing as of the most recent quarter end, all outstanding securities fair valued by the Funds, including a comparison with the prior quarter end and the percentage of the Funds that the security represents at each quarter end.
With respect to foreign equity securities and certain foreign fixed income securities, the Board has adopted a policy that securities held in the Funds that can be fair valued by the applicable fair value pricing service are fair valued on each business day provided that each individual price exceeds a pre-established confidence level.
U.S. GAAP defines fair value as the price that a fund would receive to sell an asset or pay to transfer a liability in an orderly transaction between market participants at the measurement date. U.S. GAAP also establishes a framework for measuring fair value, and a three level hierarchy for fair value measurements based upon the transparency of inputs to the valuation of an asset or liability. Inputs may be observable or unobservable and refer broadly to the assumptions that market participants would use in pricing the asset or liability. Observable inputs reflect the assumptions market participants would use in pricing the asset or liability based on market data obtained from sources independent of the Funds. Unobservable inputs reflect the Funds’ own assumptions about the assumptions that market participants would use in pricing the asset or liability developed based on the best information available in the circumstances. Each investment is assigned a level based upon the observability of the inputs which are significant to the overall valuation.
The three-tier hierarchy of inputs is summarized below:
Level 1 – inputs are quoted prices in active markets for identical investments (e.g., equity securities, open-end investment companies)
Level 2 – other observable inputs (including, but not limited to: quoted prices for similar assets or liabilities in markets that are active, quoted prices for identical or similar assets or liabilities in markets that are not active, inputs other than quoted prices that are observable for the assets or liabilities (such as interest rates, yield curves, volatilities, prepayment speeds, loss severities, credit risks and default rates) or other market corroborated inputs) (e.g., debt securities, government securities, foreign currency exchange contracts, swaps, foreign securities utilizing international fair value pricing, fair valued securities with observable inputs)
Level 3 – inputs are significant unobservable inputs (including the Fund’s own assumptions used to determine the fair value of investments) (e.g., fair valued securities with unobservable inputs)
Changes in inputs or methodologies used for valuing investments may result in a transfer in or out of levels within the fair value hierarchy. The inputs or methodologies used for valuing investments may not necessarily be an indication of the risk associated with investing in those investments.
b. SECURITY TRANSACTIONS
Security transactions are accounted for as of trade date. Realized gains and losses on securities sold are determined on the basis of identified cost.
c. INVESTMENT INCOME AND EXPENSES
Dividend income is recorded on the ex-dividend date. Dividends from foreign securities are recorded on the ex-dividend date, and if after the fact, as soon as the Funds become aware of the ex-dividend date, except for Korean securities where dividends are recorded on confirmation date. Dividends declared on short positions are recorded on ex-date as dividend expense. Interest income, which includes amortization of premium and accretion of discount on debt securities, is accrued as earned. Dividend and interest income on foreign securities is recorded gross of any withholding tax. Non-cash dividends included in dividend income, if any, are reported at the fair market value of the securities received. Upon notification from issuers, distributions received from a real estate investment trust (“REIT”) may be redesignated as a reduction of cost of investments and/or realized gain. Other income and expenses are recorded on an accrual basis. Expenses that cannot be directly attributed to a Fund are apportioned among the funds in the Trust and other trusts or funds within the AMG Funds Family of Funds (collectively the “AMG Funds Family”) based upon their relative average net assets or number of shareholders. Investment income, realized and unrealized capital gains and losses, the common expenses of each Fund, and certain fund level expense reductions, if any, are allocated on a pro-rata basis to each class based on the relative net assets of each class to the total net assets of each Fund.
The following Funds had certain portfolio trades directed to various brokers under a brokerage recapture program. Credits received from the brokerage recapture program are earned and paid on a monthly basis, and are recorded as expense offsets, which serve to reduce the Funds’ overall expense ratio. For the fiscal year ended October 31, 2020, the impact on the expenses and expense ratios were as follows:
Amount
| Percentage
| |||||||
River Road Focused Absolute Value | $21,695 | 0.01% | ||||||
Montag & Caldwell Growth | 7,182 | 0.00%1 | ||||||
River Road Dividend All Cap Value | 23,766 | 0.01% | ||||||
LMCG Small Cap Growth | 1,836 | 0.01% | ||||||
River Road Small-Mid Cap Value | 39,200 | 0.02% | ||||||
River Road Small Cap Value | 109,023 | 0.02% | ||||||
Silvercrest Small Cap | 66,758 | 0.03% | ||||||
River Road Long-Short | 22,363 | 0.11% | ||||||
| 1 | Less than 0.005%. |
141
Table of Contents
Notes to Financial Statements (continued) |
d. DIVIDENDS AND DISTRIBUTIONS
Fund distributions resulting from either net investment income or realized net capital gains, if any, will normally be declared and paid at least annually in December. Distributions to shareholders are recorded on the ex-dividend date. Distributions are determined in accordance with federal income tax regulations, which may differ from net investment income and net realized capital gains for financial statement purposes (U.S. GAAP). Differences may be permanent or temporary. Permanent differences are reclassified among capital accounts in the financial statements to reflect their tax character. Permanent book and tax basis differences, if any, relating to shareholder distributions will result in reclassification to paid-in capital. Temporary differences arise when certain items
of income, expense and gain or loss are recognized in different periods for financial statement and tax purposes; these differences will reverse at some time in the future. Permanent differences are due to net operating losses, tax equalization utilized, distributions received from investments in certain partnerships, distributions in excess of earnings, and adjustments related to the merger. Temporary differences are due to the deferral of qualified late year losses, wash sale loss deferrals, mark-to-market of passive foreign investment companies, non-deductible organizational expense, amortization of premium outstanding, distributions received from investments in certain partnerships, defaulted bonds, non-deductible interest expense, and capital loss carryforwards.
The tax character of distributions paid during the fiscal years ended October 31, 2020 and October 31, 2019 were as follows:
River Road Focused Absolute Value
| Montag & Caldwell Growth
| River Road Dividend All Cap Value
| ||||||||||||||||||||||
| Distributions paid from: | 2020 | 2019 | 2020 | 2019 | 2020 | 2019 | ||||||||||||||||||
Ordinary income * | $1,516,569 | $1,602,886 | — | $12,569,951 | $19,814,208 | $19,767,269 | ||||||||||||||||||
Long-term capital gains | 2,023,843 | 462,421 | $42,168,273 | 93,703,352 | 33,640,275 | 46,700,656 | ||||||||||||||||||
|
|
|
|
|
|
|
|
|
|
|
| |||||||||||||
| $3,540,412 | $2,065,307 | $42,168,273 | $106,273,303 | $53,454,483 | $66,467,925 | |||||||||||||||||||
|
|
|
|
|
|
|
|
|
|
|
| |||||||||||||
| Fairpointe Mid Cap | LMCG Small Cap Growth | River Road Small-Mid Cap Value | ||||||||||||||||||||||
| Distributions paid from: | 2020 | 2019 | 2020 | 2019 | 2020 | 2019 | ||||||||||||||||||
Ordinary income * | $10,935,063 | $15,877,782 | — | — | $1,878,170 | $1,453,743 | ||||||||||||||||||
Long-term capital gains | 63,584,233 | 178,445,364 | — | — | 1,731,534 | 2,991,892 | ||||||||||||||||||
|
|
|
|
|
|
|
|
|
|
|
| |||||||||||||
| $74,519,296 | $194,323,146 | — | — | $3,609,704 | $4,445,635 | |||||||||||||||||||
|
|
|
|
|
|
|
|
|
|
|
| |||||||||||||
| River Road Small Cap Value | Silvercrest Small Cap | DoubleLine Core Plus Bond | ||||||||||||||||||||||
| Distributions paid from: | 2020 | 2019 | 2020 | 2019 | 2020 | 2019 | ||||||||||||||||||
Ordinary income * | $11,238,122 | $6,540,371 | $715,429 | $4,896,613 | $17,062,574 | $22,844,511 | ||||||||||||||||||
Long-term capital gains | 14,192,439 | 25,360,058 | 4,937,357 | 15,850,256 | — | — | ||||||||||||||||||
|
|
|
|
|
|
|
|
|
|
|
| |||||||||||||
| $25,430,561 | $31,900,429 | $5,652,786 | $20,746,869 | $17,062,574 | $22,844,511 | |||||||||||||||||||
|
|
|
|
|
|
|
|
|
|
|
| |||||||||||||
| River Road Long-Short | Pictet International | |||||||||||||||||||||||
| Distributions paid from: | 2020 | 2019 | 2020 | 2019 | ||||||||||||||||||||
Ordinary income * | $1,618,532 | $316,403 | $7,550,713 | $28,999,102 | ||||||||||||||||||||
Long-term capital gains | 429,612 | 1,278,619 | — | 105,598,392 | ||||||||||||||||||||
|
|
|
|
|
|
|
| |||||||||||||||||
| $2,048,144 | $1,595,022 | $7,550,713 | $134,597,494 | |||||||||||||||||||||
|
|
|
|
|
|
|
| |||||||||||||||||
| * | For tax purposes, short-term capital gain distributions, if any, are considered ordinary income distributions. |
As of October 31, 2020, the components of distributable earnings (excluding unrealized appreciation/depreciation) on a tax basis consisted of:
| River Road | River Road | River Road | ||||||||||||||||||||||
| Focused Absolute | Montag & Caldwell | Dividend All Cap | Fairpointe | LMCG Small | Small-Mid Cap | |||||||||||||||||||
| Value | Growth | Value | Mid Cap | Cap Growth | Value | |||||||||||||||||||
Capital loss carryforward | $18,870,842 | — | $4,628,045 | — | — | $9,468,137 | ||||||||||||||||||
Undistributed ordinary income | 812,152 | — | 949,352 | $541,862 | — | — | ||||||||||||||||||
Undistributed long-term capital gains | — | $76,313,438 | — | 26,397,544 | $1,699,965 | — | ||||||||||||||||||
Late-year loss deferral | — | 454,251 | — | — | 226,278 | 149,947 | ||||||||||||||||||
142
Table of Contents
Notes to Financial Statements (continued) |
| DoubleLine | ||||||||||||||||||||
| River Road | Silvercrest | Core Plus | River Road | Pictet | ||||||||||||||||
| Small Cap Value | Small Cap | Bond | Long-Short | International | ||||||||||||||||
Capital loss carryforward | $9,527,265 | $7,535,625 | $7,423,895 | $805,842 | $105,462,981 | |||||||||||||||
Undistributed ordinary income | 29,406 | 344,024 | 1,145,384 | — | 946,272 | |||||||||||||||
Undistributed long-term capital gains | — | — | — | — | — | |||||||||||||||
Late-year loss deferral | — | — | — | 153,583 | — | |||||||||||||||
At October 31, 2020, the cost of investments and the aggregate gross unrealized appreciation and depreciation for federal income tax purposes were as follows:
| Net Appreciation | ||||||||||||||||
| Fund | Cost | Appreciation | Depreciation | (Depreciation) | ||||||||||||
River Road Focused Absolute Value | $137,649,113 | $16,873,468 | $ | (8,926,637 | ) | $7,946,831 | ||||||||||
Montag & Caldwell Growth | 284,708,639 | 194,360,872 | (2,942,244 | ) | 191,418,628 | |||||||||||
River Road Dividend All Cap Value | 406,462,456 | 97,404,603 | (40,175,106 | ) | 57,229,497 | |||||||||||
Fairpointe Mid Cap | 331,138,217 | 117,231,612 | (15,501,259 | ) | 101,730,353 | |||||||||||
LMCG Small Cap Growth | 30,269,659 | 7,798,698 | (521,356 | ) | 7,277,342 | |||||||||||
River Road Small-Mid Cap Value | 183,789,812 | 22,277,272 | (27,100,664 | ) | (4,823,392 | ) | ||||||||||
River Road Small Cap Value | 498,412,304 | 77,787,511 | (60,976,430 | ) | 16,811,081 | |||||||||||
Silvercrest Small Cap | 181,253,886 | 23,269,978 | (28,380,181 | ) | (5,110,203 | ) | ||||||||||
DoubleLine Core Plus Bond | 505,189,294 | 15,750,836 | (14,003,739 | ) | 1,747,097 | |||||||||||
River Road Long-Short | 10,790,893 | 1,243,021 | (1,144,613 | ) | 98,408 | |||||||||||
Pictet International | 207,504,631 | 22,892,299 | (44,977,051 | ) | (22,084,752 | ) | ||||||||||
e. FEDERAL TAXES
Each Fund currently qualifies as an investment company and intends to comply with the requirements under Subchapter M of the Internal Revenue Code of 1986, as amended, and to distribute substantially all of its taxable income and gains to its shareholders and to meet certain diversification and income requirements with respect to investment companies. Therefore, no provision for federal income or excise tax is included in the accompanying financial statements.
Additionally, based on each Fund’s understanding of the tax rules and rates related to income, gains and transactions for the foreign jurisdictions in which it invests, each Fund will provide for foreign taxes, and where appropriate, deferred foreign taxes.
Management has analyzed the Funds’ tax positions taken on federal income tax returns as of October 31, 2020, and for all open tax years (generally, the three prior taxable years), and has concluded that no provision for federal income tax is required in the Funds’ financial statements. Additionally, Management is not aware of any tax position for which it is reasonably possible that the total amounts of unrecognized tax benefits will change materially in the next twelve months.
f. CAPITAL LOSS CARRYOVERS AND DEFERRALS
As of October 31, 2020, the following Funds had capital loss carryovers for federal income tax purposes as shown in the following chart. These amounts may be used to offset future realized capital gains indefinitely, and retain their character as short-term and/or long-term.
| Capital Loss Carryover Amounts | ||||||||||||
| Fund | Short-Term | Long-Term | ||||||||||
River Road Focused Absolute Value | $ | 14,911,337 | $ | 3,959,505 | ||||||||
River Road Dividend All Cap Value | 4,628,045 | — | ||||||||||
River Road Small-Mid Cap Value | 9,229,185 | 238,952 | ||||||||||
River Road Small Cap Value | 9,222,296 | 304,969 | ||||||||||
Silvercrest Small Cap | 3,713,729 | 3,821,896 | ||||||||||
DoubleLine Core Plus Bond | 1,640,976 | 5,782,919 | ||||||||||
River Road Long-Short | 805,842 | — | ||||||||||
Pictet International | 30,325,107 | 75,137,874 | ||||||||||
As of October 31, 2020, the Funds not listed above had no capital loss carryovers for federal income tax purposes. Should the Funds incur net capital losses for the fiscal year ended October 31, 2021, such amounts may be used to offset future realized capital gains indefinitely, and retain their character as either short-term and/or long-term.
For the fiscal year ended October 31, 2020, the following Funds utilized capital loss carryovers in the amount of:
| Capital Loss Carryover Utilized | ||||||||||||
| Fund | Short-Term | Long-Term | ||||||||||
LCMG Small Cap Growth | $2,528,120 | — | ||||||||||
DoubleLine Core Plus Bond | 2,626,173 | $5,123,035 | ||||||||||
143
Table of Contents
Notes to Financial Statements (continued) |
g. CAPITAL STOCK
The Trust’s Declaration of Trust authorizes for each Fund the issuance of an unlimited number of shares of beneficial interest, without par value. Each Fund records sales and repurchases of its capital stock on the trade date. On November 13, 2018, River Road Small Cap Value transferred securities and cash to certain shareholders in connection with redemptions in-kind transactions in the amount of $41,220,112. Prior to March 1, 2019, Pictet International deducted a 2.00% redemption fee from the proceeds of any redemption of shares (including a redemption by exchange) if the redemption occurred within 60 days of the purchase of those shares. For the fiscal year ended October 31, 2019, Pictet International had redemption fees amounting to $359,895. These amounts are netted against the cost of shares repurchased in the Statements of Changes in Net Assets.
For the fiscal years ended October 31, 2020 and October 31, 2019, the capital stock transactions by class for the Funds were as follows:
| River Road Focused Absolute Value | Montag & Caldwell Growth | |||||||||||||||||||||||||||||||
| October 31, 2020 | October 31, 2019 | October 31, 2020 | October 31, 2019 | |||||||||||||||||||||||||||||
| Shares | Amount | Shares | Amount | Shares | Amount | Shares | Amount | |||||||||||||||||||||||||
| Class N: | ||||||||||||||||||||||||||||||||
| Proceeds from sale of shares | 605,991 | $7,457,266 | 549,665 | $6,419,128 | 318,691 | $5,988,818 | 489,067 | $9,234,902 | ||||||||||||||||||||||||
| Reinvestment of distributions | 28,703 | 376,872 | 58,788 | 586,698 | 720,864 | 13,336,003 | 2,038,637 | 31,129,988 | ||||||||||||||||||||||||
| Cost of shares repurchased | (714,432 | ) | (7,662,321 | ) | (171,588 | ) | (2,011,511 | ) | (1,919,020 | ) | (37,035,160 | ) | (2,703,397 | ) | (48,344,095 | ) | ||||||||||||||||
| Share Conversion | — | — | — | — | — | — | 33,601 | 585,466 | ||||||||||||||||||||||||
|
|
|
|
|
|
|
|
|
|
|
|
|
|
|
| |||||||||||||||||
| Net increase (decrease) | (79,738 | ) | $171,817 | 436,865 | $4,994,315 | (879,465 | ) | $(17,710,339 | ) | (142,092 | ) | $(7,393,739 | ) | |||||||||||||||||||
|
|
|
|
|
|
|
|
|
|
|
|
|
|
|
| |||||||||||||||||
| Class I: | ||||||||||||||||||||||||||||||||
| Proceeds from sale of shares | 6,335,337 | $71,527,063 | 9,567,363 | $112,119,561 | 1,174,246 | $22,074,182 | 2,224,407 | $37,510,016 | ||||||||||||||||||||||||
| Reinvestment of distributions | 223,054 | 2,939,854 | 116,443 | 1,165,589 | 1,481,220 | 27,609,936 | 4,568,635 | 70,128,543 | ||||||||||||||||||||||||
| Cost of shares repurchased | (5,088,985 | ) | (53,279,690 | ) | (1,138,795 | ) | (13,504,092 | ) | (5,294,655 | ) | (103,336,840 | ) | (10,059,793 | ) | (175,935,523 | ) | ||||||||||||||||
|
|
|
|
|
|
|
|
|
|
|
|
|
|
|
| |||||||||||||||||
| Net increase (decrease) | 1,469,406 | $21,187,227 | 8,545,011 | $99,781,058 | (2,639,189 | ) | $(53,652,722 | ) | (3,266,751 | ) | $(68,296,964 | ) | ||||||||||||||||||||
|
|
|
|
|
|
|
|
|
|
|
|
|
|
|
| |||||||||||||||||
| Class R:1 | ||||||||||||||||||||||||||||||||
| Proceeds from sale of shares | — | — | — | — | — | — | 6,778 | $105,687 | ||||||||||||||||||||||||
| Reinvestment of distributions | — | — | — | — | — | — | 3,480 | 51,232 | ||||||||||||||||||||||||
| Cost of shares repurchased | — | — | — | — | — | — | (5,785 | ) | (686,982 | ) | ||||||||||||||||||||||
| Share Conversion | — | — | — | — | — | — | (34,906 | ) | (585,466 | ) | ||||||||||||||||||||||
|
|
|
|
|
|
|
|
|
|
|
|
|
|
|
| |||||||||||||||||
| Net decrease | — | — | — | — | — | — | (30,433 | ) | $(1,115,529 | ) | ||||||||||||||||||||||
|
|
|
|
|
|
|
|
|
|
|
|
|
|
|
| |||||||||||||||||
| Class Z: | ||||||||||||||||||||||||||||||||
| Proceeds from sale of shares | 222,551 | $2,353,952 | 6,356 | $75,000 | — | — | — | — | ||||||||||||||||||||||||
| Reinvestment of distributions | 252 | 3,319 | 437 | 4,375 | — | — | — | — | ||||||||||||||||||||||||
| Cost of shares repurchased | (13,810 | ) | (140,300 | ) | — | — | — | — | — | — | ||||||||||||||||||||||
|
|
|
|
|
|
|
|
|
|
|
|
|
|
|
| |||||||||||||||||
| Net increase | 208,993 | $2,216,971 | 6,793 | $79,375 | — | — | — | — | ||||||||||||||||||||||||
|
|
|
|
|
|
|
|
|
|
|
|
|
|
|
| |||||||||||||||||
144
Table of Contents
Notes to Financial Statements (continued) |
| River Road Dividend All Cap Value | Fairpointe Mid Cap | |||||||||||||||||||||||||||||||
| October 31, 2020 | October 31, 2019 | October 31, 2020 | October 31, 2019 | |||||||||||||||||||||||||||||
| Shares | Amount | Shares | Amount | Shares | Amount | Shares | Amount | |||||||||||||||||||||||||
| Class N: | ||||||||||||||||||||||||||||||||
| Proceeds from sale of shares | 167,234 | $1,454,138 | 545,101 | $6,434,066 | 1,043,587 | $30,389,017 | 2,004,707 | $71,071,732 | ||||||||||||||||||||||||
| Reinvestment of distributions | 515,286 | 5,884,839 | 744,290 | 7,942,959 | 957,529 | 32,737,912 | 1,845,204 | 58,437,613 | ||||||||||||||||||||||||
| Proceeds from sale of shares issued in connection with merger2 | 170,747 | 1,522,394 | — | — | — | — | — | — | ||||||||||||||||||||||||
| Cost of shares repurchased | (3,193,510 | ) | (34,235,056 | ) | (2,987,912 | ) | (34,927,219 | ) | (8,108,221 | ) | (259,648,250 | ) | (12,374,483 | ) | (443,743,803 | ) | ||||||||||||||||
|
|
|
|
|
|
|
|
|
|
|
|
|
|
|
| |||||||||||||||||
| Net decrease | (2,340,243 | ) | $(25,373,685 | ) | (1,698,521 | ) | $(20,550,194 | ) | (6,107,105 | ) | $(196,521,321 | ) | (8,524,572 | ) | $(314,234,458 | ) | ||||||||||||||||
|
|
|
|
|
|
|
|
|
|
|
|
|
|
|
| |||||||||||||||||
| Class I: | ||||||||||||||||||||||||||||||||
| Proceeds from sale of shares | 9,321,078 | $97,770,769 | 7,163,258 | $84,820,750 | 2,707,562 | $88,140,400 | 10,308,577 | $380,893,807 | ||||||||||||||||||||||||
| Reinvestment of distributions | 4,140,352 | 46,751,171 | 5,343,632 | 57,080,715 | 1,012,059 | 35,604,248 | 3,336,941 | 108,484,016 | ||||||||||||||||||||||||
| Proceeds from sale of shares issued in connection with merger2 | 3,839,907 | 34,205,889 | — | — | — | — | — | — | ||||||||||||||||||||||||
| Cost of shares repurchased | (19,682,512 | ) | (200,460,605 | ) | (29,815,893 | ) | (350,994,576 | ) | (28,612,112 | ) | (989,605,334 | ) | (27,594,317 | ) | (1,030,984,523 | ) | ||||||||||||||||
|
|
|
|
|
|
|
|
|
|
|
|
|
|
|
| |||||||||||||||||
| Net decrease | (2,381,175 | ) | $(21,732,776 | ) | (17,309,003 | ) | $(209,093,111 | ) | (24,892,491 | ) | $(865,860,686 | ) | (13,948,799 | ) | $(541,606,700 | ) | ||||||||||||||||
|
|
|
|
|
|
|
|
|
|
|
|
|
|
|
| |||||||||||||||||
| Class Z: | ||||||||||||||||||||||||||||||||
| Proceeds from sale of shares | 164,880 | $1,673,944 | — | — | 91,111 | $3,232,335 | 1,171,029 | $41,213,653 | ||||||||||||||||||||||||
| Reinvestment of distributions | 2,015 | 20,857 | 539 | $5,769 | 98,338 | 3,451,659 | 476,357 | 15,472,072 | ||||||||||||||||||||||||
| Proceeds from sale of shares issued in connection with merger2 | 20,040 | 178,535 | — | — | — | — | — | — | ||||||||||||||||||||||||
| Cost of shares repurchased | (2,133 | ) | (22,437 | ) | (45,743 | ) | (568,778 | ) | (1,202,505 | ) | (42,122,758 | ) | (5,531,480 | ) | (203,971,612 | ) | ||||||||||||||||
|
|
|
|
|
|
|
|
|
|
|
|
|
|
|
| |||||||||||||||||
| Net increase (decrease) | 184,802 | $1,850,899 | (45,204 | ) | $(563,009 | ) | (1,013,056 | ) | $(35,438,764 | ) | (3,884,094 | ) | $(147,285,887 | ) | ||||||||||||||||||
|
|
|
|
|
|
|
|
|
|
|
|
|
|
|
| |||||||||||||||||
| LMCG Small Cap Growth | River Road Small-Mid Cap Value | |||||||||||||||||||||||||||||||
| October 31, 2020 | October 31, 2019 | October 31, 2020 | October 31, 2019 | |||||||||||||||||||||||||||||
| Shares | Amount | Shares | Amount | Shares | Amount | Shares | Amount | |||||||||||||||||||||||||
| Class N: | ||||||||||||||||||||||||||||||||
| Proceeds from sale of shares | 36,920 | $687,740 | 77,043 | $1,335,673 | 2,175,588 | $15,236,384 | 3,383,305 | $25,245,640 | ||||||||||||||||||||||||
| Reinvestment of distributions | — | — | — | — | 62,404 | 505,470 | 154,345 | 964,654 | ||||||||||||||||||||||||
| Cost of shares repurchased | (473,941 | ) | (8,270,391 | ) | (475,807 | ) | (8,275,709 | ) | (2,205,618 | ) | (14,105,367 | ) | (2,731,529 | ) | (19,004,844 | ) | ||||||||||||||||
|
|
|
|
|
|
|
|
|
|
|
|
|
|
|
| |||||||||||||||||
| Net increase (decrease) | (437,021 | ) | $(7,582,651 | ) | (398,764 | ) | $(6,940,036 | ) | 32,374 | $1,636,487 | 806,121 | $7,205,450 | ||||||||||||||||||||
|
|
|
|
|
|
|
|
|
|
|
|
|
|
|
| |||||||||||||||||
| Class I: | ||||||||||||||||||||||||||||||||
| Proceeds from sale of shares | 34,550 | $621,155 | 962,910 | $17,061,091 | 12,348,904 | $87,077,448 | 13,135,436 | $100,556,973 | ||||||||||||||||||||||||
| Reinvestment of distributions | — | — | — | — | 335,635 | 2,785,767 | 500,729 | 3,199,661 | ||||||||||||||||||||||||
| Cost of shares repurchased | (576,238 | ) | (10,222,921 | ) | (3,946,908 | ) | (66,772,213 | ) | (8,407,421 | ) | (56,413,434 | ) | (2,128,365 | ) | (15,695,229 | ) | ||||||||||||||||
|
|
|
|
|
|
|
|
|
|
|
|
|
|
|
| |||||||||||||||||
| Net increase (decrease) | (541,688 | ) | $(9,601,766 | ) | (2,983,998 | ) | $(49,711,122 | ) | 4,277,118 | $33,449,781 | 11,507,800 | $88,061,405 | ||||||||||||||||||||
|
|
|
|
|
|
|
|
|
|
|
|
|
|
|
| |||||||||||||||||
145
Table of Contents
Notes to Financial Statements (continued) |
| LMCG Small Cap Growth | River Road Small-Mid Cap Value | |||||||||||||||||||||||||||||||
| October 31, 2020 | October 31, 2019 | October 31, 2020 | October 31, 2019 | |||||||||||||||||||||||||||||
| Shares | Amount | Shares | Amount | Shares | Amount | Shares | Amount | |||||||||||||||||||||||||
| Class Z: | ||||||||||||||||||||||||||||||||
| Proceeds from sale of shares | — | — | — | — | 62,039 | $414,123 | 7,503 | $58,059 | ||||||||||||||||||||||||
| Reinvestment of distributions | — | — | — | — | 460 | 3,815 | 1,486 | 9,497 | ||||||||||||||||||||||||
| Cost of shares repurchased | — | — | — | — | (6,100 | ) | (32,854 | ) | (3,665 | ) | (28,146 | ) | ||||||||||||||||||||
|
|
|
|
|
|
|
|
|
|
|
|
|
|
|
| |||||||||||||||||
| Net increase | — | — | — | — | 56,399 | $385,084 | 5,324 | $39,410 | ||||||||||||||||||||||||
|
|
|
|
|
|
|
|
|
|
|
|
|
|
|
| |||||||||||||||||
| River Road Small Cap Value | Silvercrest Small Cap | |||||||||||||||||||||||||||||||
| October 31, 2020 | October 31, 2019 | October 31, 2020 | October 31, 2019 | |||||||||||||||||||||||||||||
| Shares | Amount | Shares | Amount | Shares | Amount | Shares | Amount | |||||||||||||||||||||||||
| Class N: | ||||||||||||||||||||||||||||||||
| Proceeds from sale of shares | 2,345,923 | $27,389,252 | 789,028 | $9,842,913 | 265,768 | $3,703,030 | 1,282,981 | $20,241,344 | ||||||||||||||||||||||||
| Reinvestment of distributions | 163,198 | 2,103,624 | 278,695 | 2,940,228 | 40,987 | 661,535 | 207,428 | 2,775,383 | ||||||||||||||||||||||||
| Cost of shares repurchased | (2,405,007 | ) | (24,167,828 | ) | (907,582 | ) | (10,941,540 | ) | (508,355 | ) | (7,106,086 | ) | (447,723 | ) | (6,790,199 | ) | ||||||||||||||||
|
|
|
|
|
|
|
|
|
|
|
|
|
|
|
| |||||||||||||||||
| Net increase (decrease) | 104,114 | $5,325,048 | 160,141 | $1,841,601 | (201,600 | ) | $(2,741,521 | ) | 1,042,686 | $16,226,528 | ||||||||||||||||||||||
|
|
|
|
|
|
|
|
|
|
|
|
|
|
|
| |||||||||||||||||
| Class I: | ||||||||||||||||||||||||||||||||
| Proceeds from sale of shares | 27,142,324 | $284,598,207 | 10,281,841 | $128,672,870 | 3,344,085 | $43,840,355 | 2,338,382 | $35,839,074 | ||||||||||||||||||||||||
| Reinvestment of distributions | 1,701,697 | 22,479,421 | 2,630,242 | 28,327,708 | 244,758 | 3,996,897 | 1,088,541 | 14,727,958 | ||||||||||||||||||||||||
| Cost of shares repurchased | (12,851,781 | ) | (137,875,911 | ) | (9,212,731 | ) | (118,167,655 | )3 | (4,572,252 | ) | (61,700,564 | ) | (4,951,566 | ) | (77,317,287 | ) | ||||||||||||||||
|
|
|
|
|
|
|
|
|
|
|
|
|
|
|
| |||||||||||||||||
| Net increase (decrease) | 15,992,240 | $169,201,717 | 3,699,352 | $38,832,923 | (983,409 | ) | $(13,863,312 | ) | (1,524,643 | ) | $(26,750,255 | ) | ||||||||||||||||||||
|
|
|
|
|
|
|
|
|
|
|
|
|
|
|
| |||||||||||||||||
| Class Z: | ||||||||||||||||||||||||||||||||
| Proceeds from sale of shares | 92,949 | $1,010,670 | 344 | $4,501 | 605,490 | $8,029,577 | 339,198 | $5,192,669 | ||||||||||||||||||||||||
| Reinvestment of distributions | 868 | 11,458 | 1,585 | 17,058 | 58,746 | 958,146 | 231,352 | 3,127,881 | ||||||||||||||||||||||||
| Cost of shares repurchased | (15,034 | ) | (152,618 | ) | — | — | (400,565 | ) | (5,620,269 | ) | (280,410 | ) | (4,372,137 | ) | ||||||||||||||||||
|
|
|
|
|
|
|
|
|
|
|
|
|
|
|
| |||||||||||||||||
| Net increase | 78,783 | $869,510 | 1,929 | $21,559 | 263,671 | $3,367,454 | 290,140 | $3,948,413 | ||||||||||||||||||||||||
|
|
|
|
|
|
|
|
|
|
|
|
|
|
|
| |||||||||||||||||
| DoubleLine Core Plus Bond | River Road Long-Short | |||||||||||||||||||||||||||||||
| October 31, 2020 | October 31, 2019 | October 31, 2020 | October 31, 2019 | |||||||||||||||||||||||||||||
| Shares | Amount | Shares | Amount | Shares | Amount | Shares | Amount | |||||||||||||||||||||||||
| Class N: | ||||||||||||||||||||||||||||||||
| Proceeds from sale of shares | 874,920 | $9,390,552 | 2,290,302 | $24,157,256 | 46,000 | $591,651 | 44,736 | $567,292 | ||||||||||||||||||||||||
| Reinvestment of distributions | 179,196 | 1,900,548 | 292,173 | 3,065,506 | 19,409 | 242,803 | 18,650 | 208,129 | ||||||||||||||||||||||||
| Cost of shares repurchased | (3,545,101 | ) | (36,981,677 | ) | (4,850,423 | ) | (50,889,160 | ) | (129,701 | ) | (1,542,866 | ) | (167,772 | ) | (2,067,882 | ) | ||||||||||||||||
|
|
|
|
|
|
|
|
|
|
|
|
|
|
|
| |||||||||||||||||
| Net decrease | (2,490,985 | ) | $(25,690,577 | ) | (2,267,948 | ) | $(23,666,398 | ) | (64,292 | ) | $(708,412 | ) | (104,386 | ) | $(1,292,461 | ) | ||||||||||||||||
|
|
|
|
|
|
|
|
|
|
|
|
|
|
|
| |||||||||||||||||
146
Table of Contents
Notes to Financial Statements (continued) |
| DoubleLine Core Plus Bond | River Road Long-Short | |||||||||||||||||||||||||||||||
| October 31, 2020 | October 31, 2019 | October 31, 2020 | October 31, 2019 | |||||||||||||||||||||||||||||
| Shares | Amount | Shares | Amount | Shares | Amount | Shares | Amount | |||||||||||||||||||||||||
| Class I: | ||||||||||||||||||||||||||||||||
| Proceeds from sale of shares | 11,133,618 | $119,167,655 | 20,919,284 | $218,829,136 | 288,767 | $3,451,566 | 397,986 | $5,100,746 | ||||||||||||||||||||||||
| Reinvestment of distributions | 1,169,221 | 12,410,100 | 1,572,580 | 16,529,209 | 140,762 | 1,796,123 | 121,788 | 1,381,075 | ||||||||||||||||||||||||
| Cost of shares repurchased | (26,467,545 | ) | (278,022,756 | ) | (13,633,717 | ) | (142,471,689 | ) | (943,700 | ) | (11,249,964 | ) | (816,214 | ) | (9,941,875 | ) | ||||||||||||||||
|
|
|
|
|
|
|
|
|
|
|
|
|
|
|
| |||||||||||||||||
| Net increase (decrease) | (14,164,706 | ) | $(146,445,001 | ) | 8,858,147 | $92,886,656 | (514,171 | ) | $(6,002,275 | ) | (296,440 | ) | $(3,460,054 | ) | ||||||||||||||||||
|
|
|
|
|
|
|
|
|
|
|
|
|
|
|
| |||||||||||||||||
| Class Z: | ||||||||||||||||||||||||||||||||
| Proceeds from sale of shares | 805,370 | $8,736,685 | 76,150 | $790,032 | 50,123 | $591,769 | — | — | ||||||||||||||||||||||||
| Reinvestment of distributions | 9,088 | 96,814 | 8,502 | 89,469 | 532 | 6,804 | 372 | $4,220 | ||||||||||||||||||||||||
| Cost of shares repurchased | (51,777 | ) | (553,026 | ) | (45,503 | ) | (476,327 | ) | (484 | ) | (5,741 | ) | — | — | ||||||||||||||||||
|
|
|
|
|
|
|
|
|
|
|
|
|
|
|
| |||||||||||||||||
| Net increase | 762,681 | $8,280,473 | 39,149 | $403,174 | 50,171 | $592,832 | 372 | $4,220 | ||||||||||||||||||||||||
|
|
|
|
|
|
|
|
|
|
|
|
|
|
|
| |||||||||||||||||
| Pictet International | ||||||||||||||||||||||||||||||||
| October 31, 2020 | October 31, 2019 | |||||||||||||||||||||||||||||||
| Shares | Amount | Shares | Amount | |||||||||||||||||||||||||||||
| Class N: | ||||||||||||||||||||||||||||||||
| Proceeds from sale of shares | 1,474,294 | $10,168,943 | 3,166,486 | $30,468,916 | ||||||||||||||||||||||||||||
| Reinvestment of distributions | 166,414 | 1,609,222 | 1,264,376 | 10,013,861 | ||||||||||||||||||||||||||||
| Cost of shares repurchased | (10,019,105 | ) | (83,896,101 | ) | (3,593,474 | ) | (32,170,155 | ) | ||||||||||||||||||||||||
|
|
|
|
|
|
|
| |||||||||||||||||||||||||
| Net increase (decrease) | (8,378,397 | ) | $(72,117,936 | ) | 837,388 | $8,312,622 | ||||||||||||||||||||||||||
|
|
|
|
|
|
|
| |||||||||||||||||||||||||
| Class I: | ||||||||||||||||||||||||||||||||
| Proceeds from sale of shares | 13,990,321 | $117,385,742 | 6,948,169 | $60,766,536 | ||||||||||||||||||||||||||||
| Reinvestment of distributions | 473,923 | 4,592,306 | 1,993,197 | 15,845,913 | ||||||||||||||||||||||||||||
| Cost of shares repurchased | (10,750,975 | ) | (87,139,404 | ) | (13,441,948 | ) | (121,280,664 | ) | ||||||||||||||||||||||||
|
|
|
|
|
|
|
| |||||||||||||||||||||||||
| Net increase (decrease) | 3,713,269 | $34,838,644 | (4,500,582 | ) | $(44,668,215 | ) | ||||||||||||||||||||||||||
|
|
|
|
|
|
|
| |||||||||||||||||||||||||
| Class Z: | ||||||||||||||||||||||||||||||||
| Proceeds from sale of shares | 22,769 | $178,439 | 5,116,982 | $45,623,630 | ||||||||||||||||||||||||||||
| Reinvestment of distributions | 136,197 | 1,315,665 | 13,658,436 | 108,174,812 | ||||||||||||||||||||||||||||
| Cost of shares repurchased | (3,855,515 | ) | (31,482,157 | ) | (143,712,741 | ) | (1,288,695,480 | ) | ||||||||||||||||||||||||
|
|
|
|
|
|
|
| |||||||||||||||||||||||||
| Net decrease | (3,696,549 | ) | $(29,988,053 | ) | (124,937,323 | ) | $(1,134,897,038 | ) | ||||||||||||||||||||||||
|
|
|
|
|
|
|
| |||||||||||||||||||||||||
| 1 | Effective May 31, 2019, Class R shares were converted into Class N shares. |
| 2 | See note 13 of the Notes to Financial Statements. |
| 3 | Includes redemption in-kind in the amount of $41,220,112. |
147
Table of Contents
Notes to Financial Statements (continued) |
At October 31, 2020, certain affiliated and unaffiliated shareholders of record, including individually or collectively, held greater than 10% of the net assets of the Funds as follows: River Road Long-Short - one owns 25%. Transactions by this shareholder may have a material impact on the Fund.
h. REPURCHASE AGREEMENTS AND JOINT REPURCHASE AGREEMENTS
The Funds may enter into third-party repurchase agreements for temporary cash management purposes and third-party or bilateral joint repurchase agreements for reinvestment of cash collateral on securities lending transactions under the securities lending program offered by The Bank of New York Mellon (“BNYM”) (the “Program”) (collectively, “Repurchase Agreements”). The value of the underlying collateral, including accrued interest, must equal or exceed the value of the Repurchase Agreements during the term of the agreement. For joint repurchase agreements, the Funds participate on a pro rata basis with other clients of BNYM in its share of the underlying collateral under such joint repurchase agreements and in its share of proceeds from any repurchase or other disposition of the underlying collateral. The underlying collateral for all Repurchase Agreements is held in safekeeping by the Funds’ custodian or at the Federal Reserve Bank. If the seller defaults and the value of the collateral declines, or if bankruptcy proceedings commence with respect to the seller of the security, realization of the collateral by the Funds may be delayed or limited. Pursuant to the Program, the Funds are indemnified for such losses by BNYM on joint repurchase agreements.
At October 31, 2020, the market value of Repurchase Agreements outstanding is as follows:
| Market Value | ||||
River Road Dividend All Cap Value | $11,813,488 | |||
LMCG Small Cap Growth | 1,290,673 | |||
DoubleLine Core Plus Bond | 1,335,973 | |||
Pictet International | 251,781 | |||
i. FOREIGN CURRENCY TRANSLATION
The books and records of the Funds are maintained in U.S. dollars. The value of investments, assets and liabilities denominated in currencies other than U.S. dollars are translated into U.S. dollars based upon current foreign exchange rates. Purchases and sales of foreign investments, income and expenses are converted into U.S. dollars based on currency exchange rates prevailing on the respective dates of such transactions. Net realized and unrealized gain (loss) on foreign currency transactions represent: (1) foreign exchange gains and losses from the sale and holdings of foreign currencies; (2) gains and losses between trade date and settlement date on investment securities transactions and foreign currency exchange contracts; and (3) gains and losses from the difference between amounts of interest and dividends recorded and the amounts actually received.
The Funds do not isolate the net realized and unrealized gain or loss resulting from changes in exchange rates from the fluctuations in market prices of securities held. Such fluctuations are included with the net realized and unrealized gain or loss on investments.
j. SECURITIES TRANSACTED ON A WHEN ISSUED BASIS
DoubleLine Core Plus Bond may enter into To-Be-Announced (“TBA”) sale commitments to hedge their portfolio positions or to sell mortgage-backed securities they own under delayed delivery arrangements. Proceeds of TBA sale
commitments are not received until the contractual settlement date. During the time a TBA sale commitment is outstanding, equivalent deliverable securities, with the same counterparty, or an offsetting TBA purchase commitment deliverable on or before the sale commitment date, are held as “cover” for the transaction. Unsettled TBA sale commitments are valued at the current market value of the underlying securities according to the procedures described under “Valuation of Investments,” in Footnote 1a above.
Each TBA contract is marked-to-market daily and the change in market value is recorded by the Fund as an unrealized gain or loss. If the TBA sale commitment is closed through the acquisition of an offsetting purchase commitment with the same broker, the Fund realizes a gain or loss. If the Fund delivers securities under the commitment, the Fund realizes a gain or a loss from the sale of the securities based upon the unit price established at the date the commitment was entered into.
k. DELAYED DELIVERY TRANSACTIONS AND WHEN-ISSUED SECURITIES
DoubleLine Core Plus Bond may enter into securities transactions on a delayed delivery or when issued basis. Payment and delivery may take place after the customary settlement period for that security. The price of the underlying securities and the date when the securities will be delivered and paid for are fixed at the time the transaction is negotiated. During the time a delayed delivery sell is outstanding, the contract is marked to market daily and equivalent deliverable securities are held for the transaction. The value of the securities purchased on a delayed delivery or when-issued basis are identified as such in each Fund’s Schedule of Portfolio Investments. With respect to purchase commitments, the Fund identifies securities as segregated in its records with a value at least equal to the amount of the commitment. Delayed delivery or when-issued securities that have been purchased from and sold to different brokers are reflected as an investment in securities and a forward sale commitment in the Fund’s Statement of Assets and Liabilities. For financial reporting purposes, the Fund does offset the receivable and payable for delayed delivery investments purchased and sold on TBA commitments. Losses may arise due to changes in the value of the underlying securities or if the counterparty does not perform under the contract, or if the issuer does not issue the securities due to political, economic, or other factors.
2. AGREEMENTS AND TRANSACTIONS WITH AFFILIATES
For each of the Funds, the Trust has entered into an investment advisory agreement under which the Investment Manager, a subsidiary and the U.S. retail distribution arm of Affiliated Managers Group, Inc. (“AMG”), serves as investment manager to the Funds and is responsible for the Funds’ overall administration and operations. The Investment Manager selects one or more subadvisors for the Funds (subject to Board approval) and monitors each subadvisor’s investment performance, security holdings and investment strategies. The investment portfolios of River Road Focused Absolute Value, River Road Dividend All Cap Value, River Road Small-Mid Cap Value, River Road Small Cap Value and River Road Long-Short are managed by River Road Asset Management, LLC. AMG indirectly owns a majority interest in River Road Asset Management, LLC.
Investment management fees are paid directly by the Funds to the Investment Manager based on average daily net assets. For the fiscal year ended October 31, 2020, the Funds’ investment management fees were paid at the following annual rate of each Fund’s respective average daily net assets:
148
Table of Contents
Notes to Financial Statements (continued) |
River Road Focused Absolute Value | 0.60% | |
Montag & Caldwell Growth | ||
on first $800 million | 0.70% | |
over $800 million up to $6 billion | 0.50% | |
over $6 billion up to $12 billion | 0.45% | |
over $12 billion | 0.40% | |
River Road Dividend All Cap Value | 0.60% | |
Fairpointe Mid Cap | ||
on first $100 million | 0.70% | |
next $300 million | 0.65% | |
over $400 million | 0.60% | |
LMCG Small Cap Growth | 0.90% | |
River Road Small-Mid Cap Value | 0.75% | |
River Road Small Cap Value | 0.80% | |
Silvercrest Small Cap | 0.90% | |
DoubleLine Core Plus Bond | 0.45% | |
River Road Long-Short | 0.85% | |
Pictet International | 0.67%1 | |
| 1 | Effective January 1, 2020, the annual rate was reduced from 0.70% to 0.67%. |
The Investment Manager has contractually agreed, through at least March 1, 2022 for River Road Focused Absolute Value, and through at least March 1, 2021 for Montag & Caldwell Growth, River Road Dividend All Cap Value, Fairpointe Mid Cap, LMCG Small Cap Growth, River Road Small-Mid Cap Value, Silvercrest Small Cap, DoubleLine Core Plus Bond, River Road Long-Short, and Pictet International to waive management fees and/or reimburse fund expenses in order to limit total annual Fund operating expenses after fee waiver and expense reimbursements (exclusive of taxes, interest (including interest incurred in connection with bank and custody overdrafts and in connection with securities sold short), shareholder servicing fees, distribution and service 12b-1 fees, brokerage commissions and other transaction costs, dividends payable with respect to securities sold short, acquired fund fees and expenses and extraordinary expenses). The percentages of the Funds’ average daily net assets subject to later reimbursement by the Funds in certain circumstances are as follows:
River Road Focused Absolute Value | 0.78%1 | |
Montag & Caldwell Growth | 0.92% | |
River Road Dividend All Cap Value | 0.99% | |
Fairpointe Mid Cap | 0.82% | |
LMCG Small Cap Growth | 1.03% | |
River Road Small-Mid Cap Value | 1.04% | |
River Road Small Cap Value | N/A | |
Silvercrest Small Cap | 1.08% | |
DoubleLine Core Plus Bond | 0.61% | |
River Road Long-Short | 1.12% | |
Pictet International | 0.89%2 | |
| 1 | Prior to May 1, 2020, the expense limitation was 0.71%. |
| 2 | Prior to January 1, 2020, the expense limitation was 0.98%. |
In general, for a period of up to 36 months after the date any amounts are paid, waived or reimbursed by the Investment Manager, the Investment Manager may recover such amounts from a Fund, provided that such repayment would not cause the Fund’s total annual operating expenses after fee waiver and expense reimbursements (exclusive of the items noted in the parenthetical above) to exceed either (i) the Expense Cap in effect at the time such amounts were paid, waived or reimbursed, or (ii) the Expense Cap in effect at the time of such repayment by the Fund.
The contractual expense limitation may only be terminated in the event the Investment Manager or a successor ceases to be the investment manager of the Fund or a successor fund, by mutual agreement between the Investment Manager and the Board, or in the event of the Fund’s liquidation unless the Fund is reorganized or is a party to a merger in which the surviving entity is successor to the accounting and performance information of the Fund.
At October 31, 2020, each Fund’s expiration of recoupment are as follows:
Expiration Period | River Road Focused Absolute Value | Fairpointe Mid Cap | LMCG Small Cap Growth | ||||||||||||
Less than 1 year | $86,585 | — | $138,373 | ||||||||||||
1-2 years | 166,409 | — | 140,019 | ||||||||||||
2-3 years | 176,679 | $176,021 | 111,190 | ||||||||||||
|
|
|
|
|
| ||||||||||
Total | $429,673 | $176,021 | $389,582 | ||||||||||||
|
|
|
|
|
| ||||||||||
Expiration Period | Silvercrest Small Cap | DoubleLine Core Plus Bond | River Road Long-Short | ||||||||||||
Less than 1 year | $97,719 | $340,790 | $90,974 | ||||||||||||
1-2 years | 126,590 | 345,605 | 105,218 | ||||||||||||
2-3 years | 118,317 | 236,714 | 84,419 | ||||||||||||
|
|
|
|
|
| ||||||||||
Total | $342,626 | $923,109 | $280,611 | ||||||||||||
|
|
|
|
|
| ||||||||||
Expiration Period | Pictet International | ||||||||||||||
2-3 years | $102,321 | ||||||||||||||
|
| ||||||||||||||
Total | $102,321 | ||||||||||||||
|
| ||||||||||||||
The Trust, on behalf of the Funds, has entered into an amended and restated Administration Agreement under which the Investment Manager serves as the Funds’ administrator (the “Administrator”) and is responsible for all non-portfolio management aspects of managing the Funds’ operations, including administration and shareholder services to each Fund. Each Fund pays a fee to the Administrator at the rate of 0.15% per annum of the Fund’s average daily net assets for this service.
The Funds are distributed by AMG Distributors, Inc. (the “Distributor”), a wholly-owned subsidiary of the Investment Manager. The Distributor serves as the
149
Table of Contents
Notes to Financial Statements (continued) |
distributor and underwriter for each Fund and is a registered broker-dealer and member of the Financial Industry Regulatory Authority, Inc. (“FINRA”). Shares of each Fund will be continuously offered and will be sold directly to prospective purchasers and through brokers, dealers or other financial intermediaries who have executed selling agreements with the Distributor. Generally the Distributor bears all or a portion of the expenses of providing services pursuant to the distribution agreement, including the payment of the expenses relating to the distribution of prospectuses for sales purposes and any advertising or sales literature.
The Trust has adopted a distribution and service plan (the “Plan”) with respect to the Class N shares, in accordance with the requirements of Rule 12b-1 under the 1940 Act and the requirements of the applicable rules of FINRA regarding asset based sales charges. Pursuant to the Plan, each Fund may make payments to the Distributor for its expenditures in financing any activity primarily intended to result in the sale of each Fund’s Class N shares and for maintenance and personal service provided to existing shareholders of that class. The Plan authorizes payments to the Distributor of up to 0.25% annually of each Fund’s average daily net assets attributable to the Class N shares.
The impact on the annualized expense ratios for the fiscal year ended October 31, 2020, were as follows:
| Fund | Actual Amount Incurred | |||
River Road Focused Absolute Value |
| |||
Class N | 0.25% | |||
Montag & Caldwell Growth |
| |||
Class N | 0.17% | |||
River Road Dividend All Cap Value |
| |||
Class N | 0.25% | |||
Fairpointe Mid Cap |
| |||
Class N | 0.24% | |||
LMCG Small Cap Growth |
| |||
Class N | 0.19% | |||
River Road Small-Mid Cap Value |
| |||
Class N | 0.25% | |||
River Road Small Cap Value |
| |||
Class N | 0.25% | |||
Silvercrest Small Cap |
| |||
Class N | 0.24% | |||
DoubleLine Core Plus Bond |
| |||
Class N | 0.25% | |||
River Road Long-Short |
| |||
Class N | 0.25% | |||
Pictet International |
| |||
Class N | 0.25% | |||
For each of the Class N and Class I shares, the Board has approved reimbursement payments to the Investment Manager for shareholder servicing expenses (“shareholder servicing fees”) incurred. Shareholder servicing fees include
payments to financial intermediaries such as broker-dealers (including fund supermarket platforms), banks, and trust companies who provide shareholder recordkeeping, account servicing and other services. The Class N and Class I shares may reimburse the Investment Manager for the actual amount incurred up to a maximum annual rate of 0.15% of each respective Class’s average daily net assets as shown in the table below. Effective January 1, 2020, the maximum amount of shareholder servicing fees for Class I shares of Pictet International decreased from 0.15% to 0.10%.
The Investment Manager has agreed, through at least October 1, 2021, to waive a portion of shareholder servicing fees paid by the various share classes of each Fund, as necessary, to ensure the total net expense ratio for each share class of each Fund does not increase due to the changes in the methodology of shareholder servicing reimbursements described above. Effective January 1, 2020, the shareholder servicing fees waiver of Pictet International was eliminated.
The impact on the annualized expense ratios for the fiscal year ended October 31, 2020, were as follows:
| Fund | Actual Amount Incurred | |||
River Road Focused Absolute Value | ||||
Class N | 0.04% | |||
Class I | 0.04% | |||
Montag & Caldwell Growth | ||||
Class N | 0.07% | |||
Class I | 0.07% | |||
River Road Dividend All Cap Value | ||||
Class N | 0.07% | |||
Class I | 0.05% | |||
Fairpointe Mid Cap | ||||
Class N | 0.08% | |||
Class I | 0.08% | |||
LMCG Small Cap Growth | ||||
Class N | 0.07% | |||
Class I | 0.07% | |||
River Road Small-Mid Cap Value | ||||
Class N | 0.06% | |||
Class I | 0.05% | |||
River Road Small Cap Value | ||||
Class N | 0.10% | |||
Class I | 0.08% | |||
Silvercrest Small Cap | ||||
Class N | 0.07% | |||
Class I | 0.07% | |||
150
Table of Contents
Notes to Financial Statements (continued) |
| Fund | Actual Amount Incurred | |||
DoubleLine Core Plus Bond | ||||
Class N | 0.08% | |||
Class I | 0.08% | |||
River Road Long-Short | ||||
Class N | 0.08% | |||
Class I | 0.08% | |||
Pictet International | ||||
Class N | 0.14% | |||
Class I | 0.10% | |||
The Board provides supervision of the affairs of the Trust and other trusts within the AMG Funds Family. The Trustees of the Trust who are not affiliated with the Investment Manager receive an annual retainer and per meeting fees for regular, special and telephonic meetings, and they are reimbursed for out-of-pocket expenses incurred while carrying out their duties as Board members. The Chairman of the Board and the Audit Committee Chair receive additional annual retainers. Certain Trustees and Officers of the Funds are Officers and/or Directors of the Investment Manager, AMG and/or the Distributor.
The Securities and Exchange Commission (the “SEC”) granted an exemptive order that permits River Road Focused Absolute Value, Silvercrest Small Cap, River Road Long-Short and Pictet International to lend money for certain temporary purposes directly to other eligible funds in the AMG Funds Family. Participation in this interfund lending program is voluntary for the lending funds, and an interfund loan is only made if it benefits each participating fund. The Administrator manages the program according to procedures approved by the Board, and the Board monitors the operation of the program. An interfund loan must comply with certain conditions set out in the exemptive order, which are designed to assure fairness and protect all participating funds. The interest earned is included on the Statement of Operations as interest income. Silvercrest Small Cap did not loan to other funds in the AMG Funds Family. At October 31, 2020, the Funds had no interfund loans outstanding.
The following Funds utilized the interfund loan program during the fiscal year ended October 31, 2020:
| Fund | Average Lent | Number of Days | Interest Earned | Average Interest Rate | ||||||||||||
River Road Focused Absolute Value | $1,061,828 | 2 | $142 | 2.433% | ||||||||||||
River Road Long-Short | 1,128,565 | 1 | 76 | 2.465% | ||||||||||||
Pictet International | 2,094,556 | 2 | 175 | 1.525% | ||||||||||||
3. PURCHASES AND SALES OF SECURITIES
Purchases and sales of securities (excluding short-term securities and U.S. Government Obligations) for the fiscal year ended October 31, 2020, were as follows:
| Long Term Securities | ||||||||
| Fund | Purchases | Sales | ||||||
River Road Focused Absolute Value | $177,785,168 | $155,546,047 | ||||||
Montag & Caldwell Growth | 140,479,601 | 249,975,345 | ||||||
River Road Dividend All Cap Value | 176,609,940 | 289,965,409 | ||||||
Fairpointe Mid Cap | 358,146,615 | 1,468,034,492 | ||||||
LMCG Small Cap Growth | 45,355,246 | 65,046,909 | ||||||
River Road Small-Mid Cap Value | 118,552,280 | 81,037,055 | ||||||
River Road Small Cap Value | 328,373,829 | 177,186,820 | ||||||
Silvercrest Small Cap | 58,194,634 | 73,284,360 | ||||||
DoubleLine Core Plus Bond | 118,594,402 | 194,732,911 | ||||||
River Road Long-Short | 89,313,424 | 94,186,412 | ||||||
Pictet International | 97,433,712 | 167,044,080 | ||||||
Purchases and sales of U.S. Government Obligations for the fiscal year ended October 31, 2020 were as follows:
| U.S. Government Obligations | ||||||||
| Fund | Purchases | Sales | ||||||
DoubleLine Core Plus Bond | $413,812,774 | $486,675,891 | ||||||
4. PORTFOLIO SECURITIES LOANED
The Funds participate in the Program providing for the lending of securities to qualified borrowers. Securities lending income includes earnings of such temporary cash investments, plus or minus any rebate to a borrower. These earnings (after any rebate) are then divided between BNYM, as a fee for its services under the Program, and the Funds, according to agreed-upon rates. Collateral on all securities loaned is accepted in cash, U.S. Treasury Obligations or U.S. Government Agency Obligations. Collateral is maintained at a minimum level of 102% (105% in the case of certain foreign securities) of the market value, plus interest, if applicable, of investments on loan. It is the Funds’ policy to obtain additional collateral from or return excess collateral to the borrower by the end of the next business day, following the valuation date of the securities loaned. Therefore, the value of the collateral held may be temporarily less than the value of the securities on loan. Lending securities entails a risk of loss to the Funds if and to the extent that the market value of the securities loaned were to increase and the borrower did not increase the collateral accordingly, and the borrower fails to return the securities. Under the terms of the Program, the Funds are indemnified for such losses by BNYM. Cash collateral is held in separate omnibus accounts managed by BNYM, who is authorized to exclusively enter into joint repurchase agreements for that cash collateral. Securities collateral is held in separate omnibus accounts managed by BNYM that cannot be sold or pledged. BNYM bears the risk of any deficiency in the amount of the cash collateral available for return to the borrower due to any loss on the collateral invested. Loans of securities are terminable at any time and the borrower, after notice, is required to return borrowed securities as soon as practical, which is normally within three business days.
151
Table of Contents
Notes to Financial Statements (continued) |
The value of securities loaned on positions held, cash collateral and securities collateral received at October 31, 2020, were as follows:
| Fund | Securities Loaned | Cash Collateral Received | Securities Collateral Received | Total Collateral Received | ||||||||||||
River Road Dividend All Cap Value | $23,567,198 | $11,813,488 | $12,574,031 | $24,387,519 | ||||||||||||
LMCG Small Cap Growth | 5,732,071 | 1,290,673 | 5,110,069 | 6,400,742 | ||||||||||||
River Road Small-Mid Cap Value | 5,929,845 | — | 6,173,219 | 6,173,219 | ||||||||||||
River Road Small Cap Value | 13,281,878 | — | 13,709,741 | 13,709,741 | ||||||||||||
Silvercrest Small Cap | 12,791,387 | — | 13,374,032 | 13,374,032 | ||||||||||||
DoubleLine Core Plus Bond | 1,422,660 | 1,335,973 | 138,408 | 1,474,381 | ||||||||||||
Pictet International | 244,537 | 251,781 | — | 251,781 | ||||||||||||
The following table summarizes the securities received as collateral for securities lending at October 31, 2020:
| Fund | Collateral Type | Coupon Range | Maturity Date Range | |||
River Road Dividend All Cap Value | U.S. Treasury Obligations | 0.000%-8.125% | 11/05/20-02/15/50 | |||
LMCG Small Cap Growth | U.S. Treasury Obligations | 0.000%-8.125% | 11/05/20-02/15/50 | |||
River Road Small-Mid Cap Value | U.S. Treasury Obligations | 0.000%-8.125% | 11/05/20-02/15/50 | |||
River Road Small Cap Value | U.S. Treasury Obligations | 0.000%-8.125% | 11/05/20-02/15/50 | |||
Silvercrest Small Cap | U.S. Treasury Obligations | 0.000%-8.125% | 11/05/20-02/15/50 | |||
DoubleLine Core Plus Bond | U.S. Treasury Obligations | 0.000%-3.875% | 11/05/20-08/15/48 | |||
5. COMMITMENTS AND CONTINGENCIES
Under the Trust’s organizational documents, its trustees and officers are indemnified against certain liabilities arising out of the performance of their duties to the Trust. In addition, in the normal course of business, the Funds may enter into contracts and agreements that contain a variety of representations and warranties, which provide general indemnifications. The maximum exposure to the Funds under these arrangements is unknown, as this would involve future claims that may be made against a Fund that have not yet occurred. However, based on experience, the Funds had no prior claims or losses and expect the risks of loss to be remote.
6. RISKS ASSOCIATED WITH HIGH YIELD SECURITIES
Investing in high yield securities involves greater risks and considerations not typically associated with U.S. Government and other high quality/investment grade securities. High yield securities are generally below investment grade securities and do not have an established retail secondary market. Economic downturns may disrupt the high yield market and impair the issuer’s ability to repay principal
and interest. Also, an increase in interest rates would likely have an adverse impact on the value of such obligations and could cause the securities to become less liquid.
7. MORTGAGE-BACKED SECURITIES
DoubleLine Core Plus Bond may invest in mortgage-backed securities (“MBS”). These securities represent interests in pools of mortgage loans and they provide holders with payments consisting of both principal and interest as the mortgages in the underlying mortgage pools are paid. The timely payment of principal and interest on MBS issued or guaranteed by Ginnie Mae is backed by Ginnie Mae and the full faith and credit of the U.S. government. MBS issued by U.S. government agencies or instrumentalities other than Ginnie Mae are not full faith and credit obligations of the U.S. government. Certain obligations, such as those issued by the Federal Home Loan Banks, Fannie Mae and Freddie Mac are supported only by the credit of the issuer. MBS issued by private issuers are not government securities and are not guaranteed by any government agency. They are secured by the underlying collateral of the private issuer. Yields on privately issued MBS tend to be higher than those of government-backed issues. However, risk of loss due to default and sensitivity to interest rate fluctuations are also higher. DoubleLine Core Plus Bond may also invest in collateralized mortgage obligations (“CMOs”), collateralized loan obligations (“CLOs”) and real estate mortgage investment conduits (“REMICs”). A CMO and/or REMIC is a bond that is collateralized by a pool of MBS. A CLO is a bond that is collateralized by a financial institution’s receivables from loans. These MBS pools are divided into classes with each class having its own characteristics. The different classes are retired in sequence as the underlying mortgages or loans are repaid.
8. FLOATING RATE SENIOR LOAN INTERESTS
Doubleline Core Plus Bond may invest in Floating Rate Senior Loan Interests. These are senior, secured loans made to companies whose debt is below investment grade as well as investments with similar economic characteristics. Senior Loans typically hold a first lien priority and, unless otherwise indicated, are required to pay interest at floating rates that are periodically reset by reference to a base lending rate plus a spread. Senior Loans are generally not registered under the Securities Act of 1933 and often incorporate certain restrictions on resale and cannot be sold publicly. Senior Loans often require prepayments from excess cash flow or permit the borrower to repay at its election. The degree to which borrowers repay, whether as a contractual requirement or at their election, cannot be predicted. As a result, the actual maturity may be substantially less than the stated maturity. The interest rate on this Senior Loan is subject to a base lending rate plus a spread. These base lending rates are primarily the London Interbank Offered Rate (“LIBOR”) and secondarily the prime rate offered by one or more major U.S. banks (“Prime”). The interest rate is subject to a minimum floor, which may be less than or greater than the prevailing period end LIBOR/Prime rate.
9. STRIPPED SECURITIES
DoubleLine Core Plus Bond may invest in stripped securities (“STRIPS”) for hedging purposes to protect the Fund’s portfolio against interest rate fluctuations. STRIPS will most likely move differently than typical fixed-income securities in relation to changes in interest rates. STRIPS are usually structured with two classes that receive different proportions of the interest and principal distributions from a pool of underlying assets. A common type of STRIP will have one class receiving all of the interest from the underlying assets (“interest-only” or “IO” class), while the other class will receive the entire principal (“principal only” or
152
Table of Contents
Notes to Financial Statements (continued) |
“PO” class). However, in some instances, one class will receive some of the interest and most of the principal while the other class will receive most of the interest and the remainder of the principal. STRIPS are unusually volatile in response to changes in interest rates. The yield to maturity on an IO class of STRIPS is extremely sensitive not only to changes in prevailing interest rates but also to the rate of principal payments (including prepayments) on the underlying assets. A rapid rate of principal prepayments may have a measurably adverse effect on a Funds’ yield to maturity to the extent it invests in IOs. Conversely, POs tend to increase in value if prepayments are greater than anticipated and decline if prepayments are slower than anticipated. Thus, if the underlying assets experience greater than anticipated repayments of principal, a Fund may fail to fully recover its initial investment in these securities, even if the STRIPS were rated of the highest credit quality by Standard & Poor’s or Moody’s Investors Service, Inc. These risks are managed by investing in a variety of such securities and by using certain hedging techniques. In addition the secondary market for STRIPS may be less liquid than that of other mortgage-backed or asset-backed securities, potentially limiting the Fund’s ability to buy or sell those securities at any particular time.
10. SECURITIES SOLD SHORT
River Road Long-Short utilizes short sales as part of its overall portfolio management strategy. A short sale involves the sale of a security that is borrowed from a broker or other financial institution. A gain, limited to the price at which the Fund sold the security short, or a loss, unlimited in size, will be recognized upon closing a short sale. Short sales expose the Fund to the risk that it will be required to acquire, convert or exchange securities to replace the borrowed securities at a time when the securities sold short have appreciated in value, thus resulting in a loss to the Fund. The Fund must segregate liquid assets, or otherwise cover its position in a permissible manner. The Investment Manager determines the liquidity of assets, in accordance with procedures established by the Board. The Fund has entered into a Master Securities Loan Agreement (“MSLA”) with BNYM pursuant to which the Fund borrows securities from BNYM to facilitate short sale transactions. The Fund is required to pledge collateral, in cash and/or securities, to collateralize the Fund’s obligations to BNYM in respect of borrowed securities. The MSLA provides the right, in the event of default (including bankruptcy or insolvency) for the non-defaulting party to liquidate the collateral and calculate net exposure to the defaulting party. The Fund is subject to credit risk should BNYM be unable to meet its obligations to the Fund, including the obligation to return cash collateral to the Fund. For financial reporting purposes, the Fund does not offset financial assets and financial liabilities that are subject to the MSLA in the Statement of Assets and Liabilities, and security positions segregated as collateral for short sales are included in investments at value in the Statement of Assets and Liabilities. As of October 31, 2020, the value of securities sold short was
$5,306,619, and the Fund had $5,339,621 of cash deposited with BNYM and securities segregated as collateral worth $1,605,648. In accordance with the terms of its MSLA, the Fund may receive rebate income or be charged a fee on the market value on the collateral of loaned securities. The income received or fee paid is calculated based upon a variable rate minus a spread. The Fund will recognize interest income if the variable rate is greater than the spread or interest expense if the variable rate is less than the spread. For the fiscal year ended October 31, 2020, the Fund had interest expense and dividend expense in the amount of $24,619 and $258,301, respectively.
11. CREDIT AGREEMENT
Effective July 6, 2010, and amended and restated July 22, 2020, the Trust entered into a Credit Agreement with BNYM which provides the Trust with a revolving line of credit facility of up to $50 million. The facility is shared by each Fund of the Trust and is available for temporary, emergency purposes including liquidity needs in meeting redemptions. The interest rate on outstanding Alternate Base Rate Loans is equal to the greater of the Prime Rate plus 1.25%, or 0.50% plus the Federal Funds Effective Rate plus 1.25%. The interest rate on outstanding Overnight Loans is equal to the greater of the Federal Funds Effective Rate plus 1.25%, or the One-Month LIBOR Rate plus 1.25%. The Trust pays a commitment fee on the unutilized commitment amount of 0.175% per annum, which is allocated to the Funds based on average daily net assets and included in miscellaneous expense on the Statement of Operations. Interest incurred on the line of credit utilized is included in the Statement of Operations as interest expense. At October 31, 2020, the Funds had no loans outstanding.
The following Funds utilized the line of credit during the fiscal year ended October 31, 2020:
| Fund | Weighted Average Borrowed | Number of Days | Interest Paid | Average Interest Rate | ||||||||||||
River Road Focused Absolute Value | $1,872,496 | 9 | $838 | 1.816% | ||||||||||||
River Road Dividend All Cap Value | 3,726,509 | 13 | 2,775 | 2.091% | ||||||||||||
Fairpointe Mid Cap | 3,163,217 | 17 | 2,315 | 1.571% | ||||||||||||
LMCG Small Cap Growth | 1,353,792 | 25 | 2,611 | 2.816% | ||||||||||||
Silvercrest Small Cap | 1,015,127 | 1 | 39 | 1.399% | ||||||||||||
Pictet International | 2,802,712 | 45 | 7,298 | 2.112% | ||||||||||||
153
Table of Contents
Notes to Financial Statements (continued) |
12. MASTER NETTING AGREEMENTS
The Funds may enter into master netting agreements with their counterparties for the securities lending, short-sale programs and Repurchase Agreements, which provide the right, in the event of default (including bankruptcy or insolvency) for the non-defaulting party to liquidate the collateral and calculate net exposure to the defaulting party or request additional collateral. For financial reporting purposes, the Funds do not offset financial assets and financial liabilities that are subject to master netting agreements in the Statement of Assets and Liabilities. For securities lending and short sale transactions, see Note 4 and Note 10, respectively.
The following table is a summary of the Funds’ open Repurchase Agreements that are subject to a master netting agreement as of October 31, 2020:
| Gross Amount Not Offset in the Statement of Assets and Liabilities | ||||||||||||||||||||
| Fund | Gross Amounts of Assets Presented in the Statement of Assets and Liabilities | Offset Amount | Net Asset Balance | Collateral Received | Net Amount | |||||||||||||||
River Road Dividend All Cap Value |
| |||||||||||||||||||
Cantor Fitzgerald Securities, Inc. | $2,805,700 | — | $2,805,700 | $2,805,700 | — | |||||||||||||||
Citadel Securities LLC | 2,439,335 | — | 2,439,335 | 2,439,335 | — | |||||||||||||||
JVB Financial Group LLC | 1,595,819 | — | 1,595,819 | 1,595,819 | — | |||||||||||||||
Mirae Asset Securities, Inc. | 1,960,606 | — | 1,960,606 | 1,960,606 | — | |||||||||||||||
Morgan, Stanley & Co. LLC | 237,488 | — | 237,488 | 237,488 | — | |||||||||||||||
South Street Securities LLC | 2,774,540 | — | 2,774,540 | 2,774,540 | — | |||||||||||||||
|
|
|
|
|
|
|
|
|
| |||||||||||
Total | $11,813,488 | — | $11,813,488 | $11,813,488 | — | |||||||||||||||
|
|
|
|
|
|
|
|
|
| |||||||||||
LMCG Small Cap Growth |
| |||||||||||||||||||
Citigroup Global Markets, Inc. | $290,673 | — | $290,673 | $290,673 | — | |||||||||||||||
RBC Dominion Securities, Inc. | 1,000,000 | — | 1,000,000 | 1,000,000 | — | |||||||||||||||
|
|
|
|
|
|
|
|
|
| |||||||||||
Total | $1,290,673 | — | $1,290,673 | $1,290,673 | — | |||||||||||||||
|
|
|
|
|
|
|
|
|
| |||||||||||
DoubleLine Core Plus Bond | ||||||||||||||||||||
Citigroup Global Markets, Inc. | $335,973 | — | $335,973 | $335,973 | — | |||||||||||||||
RBC Dominion Securities, Inc. | 1,000,000 | — | 1,000,000 | 1,000,000 | — | |||||||||||||||
|
|
|
|
|
|
|
|
|
| |||||||||||
Total | $1,335,973 | — | $1,335,973 | $1,335,973 | — | |||||||||||||||
|
|
|
|
|
|
|
|
|
| |||||||||||
Pictet International |
| |||||||||||||||||||
Daiwa Capital Markets America | $251,781 | — | $251,781 | $251,781 | — | |||||||||||||||
154
Table of Contents
Notes to Financial Statements (continued) |
13. FUND MERGER
On April 27, 2020, River Road Dividend All Cap Value acquired all the net assets of AMG River Road Dividend All Cap Value Fund II (“River Road Dividend All Cap Value II”) based on the respective valuations as of the close of business on April 24, 2020, pursuant to a Plan of Reorganization approved by the Board of River Road Dividend All Cap Value II on March 19, 2020.
The acquisition was accomplished by a tax-free exchange of 156,555 Class N shares of River Road Dividend All Cap Value II at a net asset value of $8.92 per share for 170,747 Class N shares of River Road Dividend All Cap Value; 3,508,101 Class I shares of River Road Dividend All Cap Value II at a net asset value of $8.91 per share for 3,839,907 Class I shares of River Road Dividend All Cap Value; and 18,306 Class Z shares of River Road Dividend All Cap Value II at a net asset value of $8.91 per share for 20,040 Class Z shares of River Road Dividend All Cap Value.
The net assets of River Road Dividend All Cap Value and River Road Dividend All Cap Value II immediately before the acquisition were $425,135,278 and $35,906,818 respectively, including unrealized appreciation of $675,273 for River Road Dividend All Cap Value II. Immediately after the acquisition, the combined net assets of River Road Dividend All Cap Value amounted to $461,042,096. For financial reporting purposes, assets received and shares issued by River Road Dividend All Cap Value were recorded at fair value; however, the cost basis of the investments received from River Road Dividend All Cap Value II was carried forward to align ongoing reporting of River Road Dividend All Cap Value’s realized and unrealized gains and losses with amounts distributable to shareholders for tax purposes.
Assuming this reorganization had been completed on November 1, 2019, the Fund’s results of operations for the fiscal year ended October 31, 2020 would have been as follows:
Net Investment Income | $14,033,969 | |
Realized and Unrealized Loss on Investments | (89,245,365) | |
Net Decrease to Net Assets from Operations | $(75,211,396) | |
Because the combined investment portfolios have been managed as a single portfolio since the reorganization was completed, it is not practical to separate the amounts of revenue and earnings to the Fund that have been included in its statements of operations for the fiscal Year ended October 31, 2020.
14. SUBSEQUENT EVENTS
The Funds have determined that no material events or transactions occurred through the issuance date of the Funds’ financial statements, which require an additional disclosure in or adjustment of the Funds’ financial statements, except for effective January 1, 2021 (the “Implementation Date”), the expense cap for the River Road Dividend All Cap Value will be reduced from 0.99% to 0.78%. The expense cap will be in existence through at least March 1, 2022. Also effective on the Implementation Date, the maximum amount of shareholder servicing fees incurred for Class N and I shares of the River Road Dividend All Cap Value will decrease from 0.15% to 0.04%.
155
Table of Contents
To the Board of Trustees of AMG Funds IV and Shareholders of AMG River Road Focused Absolute Value Fund, AMG Managers Montag & Caldwell Growth Fund, AMG River Road Dividend All Cap Value Fund, AMG Managers Fairpointe Mid Cap Fund, AMG Managers LMCG Small Cap Growth Fund, AMG River Road Small-Mid Cap Value Fund, AMG River Road Small Cap Value Fund, AMG Managers Silvercrest Small Cap Fund, AMG Managers DoubleLine Core Plus Bond Fund, AMG River Road Long-Short Fund, and AMG Managers Pictet International Fund:
OPINION ON THE FINANCIAL STATEMENTS
We have audited the accompanying statements of assets and liabilities, including the schedules of portfolio investments, of AMG River Road Focused Absolute Value Fund, AMG Managers Montag & Caldwell Growth Fund, AMG River Road Dividend All Cap Value Fund, AMG Managers Fairpointe Mid Cap Fund, AMG Managers LMCG Small Cap Growth Fund, AMG River Road Small-Mid Cap Value Fund, AMG River Road Small Cap Value Fund, AMG Managers Silvercrest Small Cap Fund, AMG Managers DoubleLine Core Plus Bond Fund, AMG River Road Long-Short Fund, and AMG Managers Pictet International Fund (constituting AMG Funds IV, hereafter collectively referred to as the “Funds”) as of October 31, 2020, the related statements of operations for the year ended October 31, 2020, the statements of changes in net assets for each of the two years in the period ended October 31, 2020, including the related notes, and the financial highlights for each of the periods indicated therein (collectively referred to as the “financial statements”). In our opinion, the financial statements present fairly, in all material respects, the financial position of each of the Funds as of October 31, 2020, the results of each of their operations for the year then ended, the changes in each of their net assets for each of the two years in the period ended October 31 2020, and each of the financial highlights for each of the periods indicated therein, in conformity with accounting principles generally accepted in the United States of America.
BASIS FOR OPINIONS
These financial statements are the responsibility of the Funds’ management. Our responsibility is to express an opinion on the Funds’ financial statements based on our audits. We are a public accounting firm registered with the Public Company Accounting Oversight Board (United States) (PCAOB) and are required to be independent with respect to the Funds in accordance with the U.S. federal securities laws and the applicable rules and regulations of the Securities and Exchange Commission and the PCAOB.
We conducted our audits of these financial statements in accordance with the standards of the PCAOB. Those standards require that we plan and perform the audits to obtain reasonable assurance about whether the financial statements are free of material misstatement, whether due to error or fraud.
Our audits included performing procedures to assess the risks of material misstatement of the financial statements, whether due to error or fraud, and performing procedures that respond to those risks. Such procedures included examining, on a test basis, evidence regarding the amounts and disclosures in the financial statements. Our audits also included evaluating the accounting principles used and significant estimates made by management, as well as evaluating the overall presentation of the financial statements. Our procedures included confirmation of securities owned as of October 31, 2020 by correspondence with the custodian, transfer agent, and brokers; when replies were not received from brokers, we performed other auditing procedures. We believe that our audits provide a reasonable basis for our opinion.
PricewaterhouseCoopers LLP
Boston, Massachusetts
December 23, 2020
We have served as the auditor of one or more investment companies in the AMG Funds Family since 1993.
156
Table of Contents
TAX INFORMATION (unaudited)
The Funds each hereby designate the maximum amount allowable of its net taxable income as qualified dividends as provided in the Jobs and Growth Tax Relief Reconciliation Act of 2003. The 2019/2020 Form 1099-DIV you receive for each Fund will show the tax status of all distributions paid to you during the year.
In accordance with federal tax law, the following Fund elects to provide foreign taxes paid and the income sourced from foreign countries. Accordingly, the Fund hereby makes the following designations regarding its taxable period ended October 31, 2020:
AMG Managers Pictet International Fund
u The total amount of taxes paid and income sourced from foreign countries was $362,131 and $5,189,666, respectively.
Pursuant to section 852 of the Internal Revenue Code, the Funds each hereby designates as a capital gain distribution with respect to the taxable period ended October 31, 2020, or if subsequently determined to be different, the net capital gains of such period as follows:
| Fund | Amount | |||
River Road Focused Absolute Value | $2,023,843 | |||
Montag & Caldwell Growth | 50,438,861 | |||
River Road Dividend All Cap Value | 33,640,275 | |||
Fairpointe Mid Cap | 161,406,199 | |||
River Road Small-Mid Cap Value | 1,731,534 | |||
| Fund | Amount | |||
River Road Small Cap Value | $14,192,439 | |||
Silvercrest Small Cap | 4,937,357 | |||
River Road Long-Short | 429,612 | |||
157
Table of Contents
The Trustees and Officers of the Trust, their business addresses, principal occupations for the past five years and ages are listed below. The Trustees provide broad supervision over the affairs of the Trust and the Funds. The Trustees are experienced executives who meet periodically throughout the year to oversee the Funds’ activities, review contractual arrangements with companies that provide services to the Funds, and
| review the Funds’ performance. Unless otherwise noted, the address of each Trustee or Officer is the address of the Trust: 600 Steamboat Road, Suite 300, Greenwich, Connecticut 06830.
There is no stated term of office for Trustees. Trustees serve until their resignation, retirement or removal in | accordance with the Trust’s organizational documents and policies adopted by the Board from time to time. The Chairman of the Trustees, President, Treasurer and Secretary of the Trust are elected by the Trustees annually. Other officers hold office at the pleasure of the Trustees. |
Independent Trustees
The following Trustees are not “interested persons” of the Trust within the meaning of the 1940 Act:
Number of Funds Overseen in Fund Complex | Name, Age, Principal Occupation(s) During Past 5 Years and Other Directorships Held by Trustee | |
• Trustee since 2016 • Oversees 46 Funds in Fund Complex | Bruce B. Bingham, 72 Partner, Hamilton Partners (real estate development firm) (1987-2020); Director of The Yacktman Funds (2 portfolios) (2000-2012). | |
• Trustee since 2013 • Oversees 49 Funds in Fund Complex | Kurt A. Keilhacker, 57 Managing Partner, TechFund Capital (1997-Present); Managing Partner, TechFund Europe (2000-Present); Managing Partner, Elementum Ventures (2013-Present); Director, MetricStory, Inc. (2017-Present); Trustee, Wheaton College (2018-Present); Trustee, Gordon College (2001-2016). Trustee, Board Member, 6wind SA, (2002-2019). | |
• Trustee since 2000 • Oversees 46 Funds in Fund Complex | Steven J. Paggioli, 70 Independent Consultant (2002-Present); Trustee, Professionally Managed Portfolios (28 portfolios); Advisory Board Member, Sustainable Growth Advisors, LP; Independent Director, Muzinich BDC, Inc. (business development company) (2019-Present); Director, The Wadsworth Group; Independent Director, Chase Investment Counsel (2008–2019); Executive Vice President, Secretary and Director, Investment Company Administration, LLC and First Fund Distributors, INC. (1990-2001). | |
• Trustee since 2013 • Oversees 46 Funds in Fund Complex | Richard F. Powers III, 74 Adjunct Professor, U.S. Naval War College (2016-Present); Adjunct Professor, Boston College (2011-2015); Director, Ameriprise Financial Inc. (2005-2009); President and CEO of Van Kampen Investments Inc. (1998-2003); President, Morgan Stanley Client Group (2000-2002); Executive Vice President and Chief Marketing Officer of the Morgan Stanley Individual Investor Group (1984-1998). | |
• Independent Chairman • Trustee since 2000 • Oversees 49 Funds in Fund Complex | Eric Rakowski, 62 Professor of Law, University of California at Berkeley School of Law (1990-Present); Tax Attorney at Davis Polk & Wardwell and clerked for Judge Harry T. Edwards of the U.S. Court of Appeals for the District of Columbia Circuit and for Justice William J. Brennan Jr. of the U.S. Supreme Court; Director of Harding, Loevner Funds, Inc. (9 portfolios); Trustee of Third Avenue Trust (3 portfolios) (2002-2019); Trustee of Third Avenue Variable Trust (1 portfolio) (2002-2019). | |
• Trustee since 2013 • Oversees 49 Funds in Fund Complex | Victoria L. Sassine, 55 Adjunct Professor, Babson College (2007–Present); Director, Board of Directors, PRG Group (2017-Present); CEO, Founder, Scale Smarter Partners, LLC (2018-Present); Adviser, EVOFEM Biosciences (2019-Present); Teaching Fellow, Goldman Sachs 10,000 Small Business Initiative (2010-Present); Chairperson of the Board of Directors of Business Management Associates (2018 to 2019). | |
• Trustee since 2016 • Oversees 46 Funds in Fund Complex | Thomas R. Schneeweis, 73 Professor Emeritus, University of Massachusetts (2013-Present); President, TRS Associates (1982-Present); Board Member, Chartered Alternative Investment Association (“CAIA”) (2002-Present); Director, CAIA Foundation (2010-2019); Director, Institute for Global Asset and Risk Management (Education) (2010-Present); Co-Owner, Quantitative Investment Technologies (2014-Present); Co-Owner, Yes Wealth Management (2018-Present); Director of Research, Yes Wealth Management (2018-Present); Partner, S Capital Wealth Advisors (2015-2018); Partner, S Capital Management, LLC (2007-2015); President, Alternative Investment Analytics, LLC, (formerly Schneeweis Partners, LLC) (2001-2013); Finance Professor, University of Massachusetts (1977-2013). | |
158
Table of Contents
AMG Funds Trustees and Officers (continued) |
Interested Trustees
Each Trustee in the following table is an “interested person” of the Trust within the meaning of the 1940 Act. Ms. Carsman is an interested person of the Trust within the meaning of the 1940 Act by virtue of her position with, and interest in securities of, AMG.
Number of Funds Overseen in Fund Complex | Name, Age, Principal Occupation(s) During Past 5 Years and Other Directorships Held by Trustee | |
• Trustee since 2011 • Oversees 46 Funds in Fund Complex | Christine C. Carsman, 68 Senior Policy Advisor, Affiliated Managers Group, Inc. (2019-Present); Chair of the Board of Directors, AMG Funds plc (2015-2018); Director, AMG Funds plc (2010-2018); Executive Vice President, Deputy General Counsel and Chief Regulatory Counsel, Affiliated Managers Group, Inc. (2017-2018); Senior Vice President and Deputy General Counsel, Affiliated Managers Group, Inc. (2011-2016); Senior Vice President and Chief Regulatory Counsel, Affiliated Managers Group, Inc. (2007-2011); Vice President and Chief Regulatory Counsel, Affiliated Managers Group, Inc. (2004-2007); Senior Counsel, Vice President and Director of Operational Risk Management and Compliance, Wellington Management Company, LLP (1995-2004); Director of Harding, Loevner Funds, Inc. (9 portfolios) (2017-Present); Secretary and Chief Legal Officer, AMG Funds, AMG Funds I, AMG Funds II and AMG Funds III (2004-2011). | |
| Officers | ||
| Position(s) Held with Fund and Length of Time Served | Name, Age, Principal Occupation(s) During Past 5 Years | |
• President since 2018 • Principal Executive Officer since 2018 • Chief Executive Officer since 2018 • Chief Operating Officer since 2007 | Keitha L. Kinne, 62 Chief Operating Officer, AMG Funds LLC (2007-Present); Chief Investment Officer, AMG Funds LLC (2008-Present); President and Principal, AMG Distributors, Inc. (2018-Present); Chief Operating Officer, AMG Distributors, Inc. (2007-Present); President, Chief Executive Officer and Principal Executive Officer, AMG Funds, AMG Funds I, AMG Funds II, AMG Funds III and AMG Funds IV (2018-Present); Chief Operating Officer, AMG Funds, AMG Funds I, AMG Funds II, and AMG Funds III (2007-Present); Chief Operating Officer, AMG Funds IV (2016-Present); Chief Operating Officer and Chief Investment Officer, Aston Asset Management, LLC (2016); President and Principal Executive Officer, AMG Funds, AMG Funds I, AMG Funds II and AMG Funds III (2012-2014); Managing Partner, AMG Funds LLC (2007-2014); President and Principal, AMG Distributors, Inc. (2012-2014); Managing Director, Legg Mason & Co., LLC (2006-2007); Managing Director, Citigroup Asset Management (2004-2006). | |
• Secretary since 2015 • Chief Legal Officer since 2015 | Mark J. Duggan, 55 Senior Vice President and Senior Counsel, AMG Funds LLC (2015-Present); Secretary and Chief Legal Officer, AMG Funds, AMG Funds I, AMG Funds II, AMG Funds III and AMG Funds IV (2015-Present); Attorney, K&L Gates, LLP (2009-2015). | |
• Chief Financial Officer since 2017 • Treasurer since 2017 • Principal Financial Officer since 2017 • Principal Accounting Officer since 2017 | Thomas G. Disbrow, 54 Vice President, Mutual Fund Treasurer & CFO, AMG Funds, AMG Funds LLC (2017-Present); Chief Financial Officer, Principal Financial Officer, Treasurer and Principal Accounting Officer, AMG Funds, AMG Funds I, AMG Funds II, AMG Funds III and AMG Funds IV (2017-Present); Managing Director - Global Head of Traditional Funds Product Control, UBS Asset Management (Americas), Inc. (2015-2017); Managing Director - Head of North American Funds Treasury, UBS Asset Management (Americas), Inc. (2011-2015). | |
• Deputy Treasurer since 2017 | John A. Starace, 50 Director, Mutual Fund Accounting, AMG Funds LLC (2017-Present); Vice President, Deputy Treasurer of Mutual Funds Services, AMG Funds LLC (2014-2017); Deputy Treasurer, AMG Funds, AMG Funds I, AMG Funds II, AMG Funds III and AMG Funds IV (2017-Present); Vice President, Citi Hedge Fund Services (2010-2014); Audit Senior Manager (2005-2010) and Audit Manager (2001-2005), Deloitte & Touche LLP. | |
• Chief Compliance Officer since 2019 | Patrick J. Spellman, 46 Vice President, Chief Compliance Officer, AMG Funds LLC (2017-Present); Chief Compliance Officer and Sarbanes-Oxley Code of Ethics Compliance Officer, AMG Funds, AMG Funds I, AMG Funds II, AMG Funds III and AMG Funds IV (2019-Present); Chief Compliance Officer, AMG Distributors, Inc., (2010-Present); Senior Vice President, Chief Compliance Officer, AMG Funds LLC (2011-2017); Anti-Money Laundering Compliance Officer, AMG Funds, AMG Funds I, AMG Funds II, and AMG Funds III (2014-2019); Anti-Money Laundering Officer, AMG Funds IV, (2016-2019); Compliance Manager, Legal and Compliance, Affiliated Managers Group, Inc. (2005-2011). | |
• Assistant Secretary since 2016 | Maureen A. Meredith, 35 Vice President, Counsel, AMG Funds LLC (2019-Present); Director, Counsel, AMG Funds LLC (2017-2018); Vice President, Counsel, AMG Funds LLC (2015-2017); Assistant Secretary, AMG Funds, AMG Funds I, AMG Funds II, AMG Funds III and AMG Funds IV (2016-Present); Associate, Ropes & Gray LLP (2011-2015); Law Fellow, Massachusetts Appleseed Center for Law and Justice (2010-2011). | |
• Anti-Money Laundering Compliance Officer since 2019 | Hector D. Roman, 43 Director, Legal and Compliance, AMG Funds LLC (2020-Present); Manager, Legal and Compliance, AMG Funds LLC (2017-2019); Director of Compliance, Morgan Stanley Investment Management (2015-2017); Senior Advisory, PricewaterhouseCoopers LLP (2014-2015); Risk Manager, Barclays Investment Bank (2008-2014); Anti-Money Laundering Compliance Officer, AMG Funds, AMG Funds I, AMG Funds II, AMG Funds III and AMG Funds IV (2019-Present). | |
159
Table of Contents
AMG Managers DoubleLine Core Plus Bond Fund, AMG Managers Fairpointe Mid Cap Fund, AMG Managers LMCG Small Cap Growth Fund, AMG Managers Montag & Caldwell Growth Fund, AMG Managers Pictet International Fund, AMG River Road Dividend All Cap Value Fund, AMG River Road Focused Absolute Value Fund, AMG River Road Long-Short Fund, AMG River Road Small-Mid Cap Value Fund, AMG River Road Small Cap Value Fund and AMG Managers Silvercrest Small Cap Fund: Approval of Investment Advisory and Subadvisory Agreements on June 25, 2020
At a meeting held via telephone and video conference on June 25, 2020,1 the Board of Trustees (the “Board” or the “Trustees”), and separately a majority of the Trustees who are not “interested persons” of AMG Funds IV (the “Trust”) (the “Independent Trustees”), approved (i) the Investment Advisory Agreement, as amended pursuant to letter agreements at any time prior to the date of the meeting, with AMG Funds LLC (the “Investment Manager”) for each of AMG Managers DoubleLine Core Plus Bond Fund, AMG Managers Fairpointe Mid Cap Fund, AMG Managers LMCG Small Cap Growth Fund, AMG Managers Montag & Caldwell Growth Fund, AMG Managers Pictet International Fund, AMG River Road Dividend All Cap Value Fund, AMG River Road Focused Absolute Value Fund, AMG River Road Long-Short Fund, AMG River Road Small-Mid Cap Value Fund, AMG River Road Small Cap Value Fund and AMG Managers Silvercrest Small Cap Fund (each, a “Fund,” and collectively, the “Funds”) and separately Amendment No. 1 thereto dated October 1, 2016 (collectively, the “Investment Advisory Agreement”) and (ii) each Sub-Investment Advisory Agreement, as amended at any time prior to the date of the meeting, with the applicable Subadviser for each Fund (collectively, the “Subadvisory Agreements”). The Independent Trustees were separately represented by independent legal counsel in connection with their consideration of the approval of these agreements. In considering the Investment Advisory Agreement and the Subadvisory Agreements, the Trustees reviewed a variety of materials relating to each Fund, the Investment Manager and each Subadviser, including the nature, extent and quality of services, comparative performance, fee and expense information for an appropriate peer group of similar mutual funds for each Fund (each, a “Peer Group”), performance information for the relevant benchmark index for each Fund (each, a “Fund Benchmark”), other relevant matters, and other information provided to them on a periodic basis throughout the year. Prior
to voting, the Independent Trustees: (a) reviewed the foregoing information with their independent legal counsel; (b) received materials from their independent legal counsel discussing the legal standards applicable to their consideration of the Investment Advisory Agreement and the Subadvisory Agreements; and (c) met with their independent legal counsel in private sessions at which no representatives of management were present.
NATURE, EXTENT AND QUALITY OF SERVICES
In considering the nature, extent and quality of the services provided by the Investment Manager, the Trustees reviewed information relating to the Investment Manager’s operations and personnel. Among other things, the Investment Manager provided financial information, information about its supervisory and professional staff and descriptions of its organizational and management structure. The Trustees also took into account information provided periodically throughout the previous year by the Investment Manager in Board meetings relating to the performance of its duties with respect to the Funds and the Trustees’ knowledge of the Investment Manager’s management and the quality of the performance of the Investment Manager’s duties under the Investment Advisory Agreement and Administration Agreement. In the course of their deliberations regarding the Investment Manager, the Trustees evaluated, among other things: (a) the extent and quality of the Investment Manager’s oversight of the operation and management of the Funds; (b) the quality of the search, selection and monitoring services performed by the Investment Manager in overseeing the portfolio management responsibilities of the Subadvisers; (c) the Investment Manager’s ability to supervise the Funds’ other service providers; and (d) the Investment Manager’s compliance program. The Trustees also took into account that, in performing its functions under the Investment Advisory Agreement and supervising each Subadviser, the Investment Manager: performs periodic detailed analyses and reviews of the performance by each Subadviser of its obligations to a Fund, including, without limitation, analysis and review of portfolio and other compliance matters and review of each Subadviser’s investment performance with respect to a Fund; prepares and presents periodic reports to the Board regarding the investment performance of each Subadviser and other information regarding each Subadviser, at such times and in such forms as the Board may reasonably request; reviews and considers any changes in the personnel of each Subadviser responsible for performing the
Subadviser’s obligations and makes appropriate reports to the Board; reviews and considers any changes in the ownership or senior management of each Subadviser and makes appropriate reports to the Board; performs periodic in-person or telephonic diligence meetings, including with respect to compliance matters, with representatives of each Subadviser; assists the Board and management of the Trust in developing and reviewing information with respect to the initial approval of each Subadvisory Agreement and annual consideration of each Subadvisory Agreement thereafter; prepares recommendations with respect to the continued retention of any Subadviser or the replacement of any Subadviser, including at the request of the Board; identifies potential successors to, or replacements of, any Subadviser or potential additional subadvisers, including performing appropriate due diligence, and developing and presenting to the Board a recommendation as to any such successor, replacement or additional subadviser, including at the request of the Board; designates and compensates from its own resources such personnel as the Investment Manager may consider necessary or appropriate to the performance of its services; and performs such other review and reporting functions as the Board shall reasonably request consistent with the Investment Advisory Agreement and applicable law. With respect to AMG River Road Dividend All Cap Value Fund, AMG River Road Focused Absolute Value Fund, AMG River Road Long-Short Fund, AMG River Road Small-Mid Cap Value Fund and AMG River Road Small Cap Value Fund, the Trustees noted the affiliation of the Subadviser with the Investment Manager, noting any potential conflicts of interest. The Trustees also took into account the financial condition of the Investment Manager with respect to its ability to provide the services required under the Investment Advisory Agreement and the Investment Manager’s undertaking to maintain contractual expense limitations for certain Funds, as described below. The Trustees also considered the Investment Manager’s risk management processes.
For each Fund, the Trustees also reviewed information relating to each Subadviser’s operations and personnel and the investment philosophy, strategies and techniques (for each Subadviser, its “Investment Strategy”) used in managing the Fund. Among other things, the Trustees reviewed information on portfolio management and other professional staff, information regarding each Subadviser’s organizational and management structure and each Subadviser’s brokerage policies and practices. The Trustees considered specific
160
Table of Contents
| Annual Renewal of Investment Management and Subadvisory Agreements (continued) |
information provided regarding the experience of the individuals at each Subadviser with portfolio management responsibility for a Fund, including the information set forth in the Fund’s prospectus and statement of additional information. In the course of their deliberations, the Trustees evaluated, among other things: (a) the services rendered by each Subadviser in the past; (b) the qualifications and experience of the Subadviser’s personnel; and (c) the Subadviser’s compliance program. The Trustees also took into account the financial condition of each Subadviser with respect to its ability to provide the services required under its Subadvisory Agreement(s). The Trustees also considered each Subadviser’s risk management processes.
PERFORMANCE
The Board considered each Fund’s net performance during relevant time periods as compared to the Fund’s Peer Group and Fund Benchmark and considered the gross performance of the Fund as compared to the Subadviser’s relevant performance composite that utilizes the same investment strategy and approach and noted that the Board reviews on a quarterly basis detailed information about both the Fund’s performance results and portfolio composition, as well as each Subadviser’s Investment Strategy. The Board was mindful of the Investment Manager’s expertise, resources and attention to monitoring each Subadviser’s performance, investment style and risk-adjusted performance with respect to the Funds and its discussions with the Subadviser’s management regarding the factors that contributed to the performance of the Funds.
ADVISORY FEES; PROFITABILITY; AND ECONOMIES OF SCALE
In considering the reasonableness of the advisory fee charged by the Investment Manager for managing each Fund, the Trustees noted that the Investment Manager, and not the Fund, is responsible for paying the fees charged by the Fund’s Subadviser and, therefore, that the fees paid to the Investment Manager cover the cost of providing portfolio management services as well as the cost of providing search, selection and monitoring services in operating a “manager-of-managers” complex of mutual funds. The Trustees also considered the amount of the advisory fee retained by the Investment Manager after payment of the subadvisory fee with respect to each Fund. The Trustees also noted payments made or to be made from each Subadviser other than Fairpointe Capital LLC (“Fairpointe”) to the Investment Manager, and other payments made or to
be made from the Investment Manager to each Subadviser other than Fairpointe. The Trustees concluded that, in light of the high quality supervisory services provided by the Investment Manager and the fact that the subadvisory fees are paid out of the advisory fee, the advisory fee payable by each Fund to the Investment Manager can reasonably be expected to exceed the median advisory fee for the Peer Group, which consists of many funds that do not operate with a manager-of-managers structure. In this regard, the Trustees also noted that the Investment Manager has undertaken to maintain contractual expense limitations for AMG Managers DoubleLine Core Plus Bond Fund, AMG Managers Fairpointe Mid Cap Fund, AMG Managers LMCG Small Cap Growth Fund, AMG Managers Montag & Caldwell Growth Fund, AMG Managers Pictet International Fund, AMG River Road Dividend All Cap Value Fund, AMG River Road Focused Absolute Value Fund, AMG River Road Long-Short Fund, AMG River Road Small-Mid Cap Value Fund and AMG Managers Silvercrest Small Cap Fund.
In addition, in considering the reasonableness of the advisory fee payable to the Investment Manager, the Trustees also reviewed information provided by the Investment Manager setting forth all revenues and other benefits, both direct and indirect (including any so-called “fallout benefits” such as reputational value derived from the Investment Manager serving as Investment Manager to a Fund), received by the Investment Manager and its affiliates attributable to managing each Fund and all the mutual funds in the AMG Funds Family of Funds; the cost of providing such services; the significant risks undertaken as Investment Manager and sponsor of the Funds, including investment, operational, enterprise, entrepreneurial, litigation, regulatory and compliance risks; and the resulting profitability to the Investment Manager and its affiliates from these relationships. The Trustees also considered the changes in management, subadvisory, and shareholder servicing fee rates that were implemented during the past year for AMG Managers Pictet International Fund, as well as the changes to the expense caps that were implemented during the past year for AMG Managers Pictet International Fund and AMG River Road Focused Absolute Value Fund. The Trustees also noted the current asset levels of each Fund and the willingness of the Investment Manager to maintain contractual expense limitations for certain Funds, as described above, from time to time as a means of limiting total expenses. The Trustees also considered management’s discussion of the current
asset levels of the Funds, and the impact on profitability of both the current asset levels and any future growth of assets of the Funds. The Board took into account management’s discussion of the advisory fee structure, and the services the Investment Manager provides in performing its functions under the Investment Advisory Agreement and supervising each Subadviser. In this regard, the Trustees noted that, unlike a mutual fund that is managed by a single investment adviser, the Funds operate in a manager-of-managers structure. Based on the foregoing, the Trustees concluded that the profitability to the Investment Manager is reasonable and that the Investment Manager is not realizing material benefits from economies of scale that would warrant adjustments to the advisory fees for any Fund at this time. With respect to economies of scale, the Trustees also noted that, as a Fund’s assets increase over time, the Fund may realize other economies of scale to the extent that the increase in assets is proportionally greater than the increase in certain other expenses.
SUBADVISORY FEES; PROFITABILITY; AND ECONOMIES OF SCALE
In considering the reasonableness of the subadvisory fee payable by the Investment Manager to each of DoubleLine Capital LP, Fairpointe Capital LLC, LMCG Investments, LLC, Montag & Caldwell, LLC, Pictet Asset Management Limited and Silvercrest Asset Management Group LLC (each, an “Unaffiliated Subadviser” and collectively, the “Unaffiliated Subadvisers”), the Trustees relied on the ability of the Investment Manager to negotiate the terms of the Subadvisory Agreement at arm’s length as part of the manager-of-managers structure, noting that the Investment Manager is not affiliated with the Unaffiliated Subadvisers. In addition, the Trustees considered other potential benefits of the subadvisory relationship to the Unaffiliated Subadvisers, including, among others, the indirect benefits that each Unaffiliated Subadviser may receive from its relationship with a Fund, including any so-called “fallout benefits” to the Unaffiliated Subadvisers, such as reputational value derived from the Unaffiliated Subadvisers serving as Subadviser to a Fund. In addition, the Trustees noted that the subadvisory fees are paid by the Investment Manager out of its advisory fee. As a consequence of all of the foregoing, the cost of services to be provided by each Unaffiliated Subadviser and the profitability to each Unaffiliated Subadviser of its relationship with a Fund were not material factors in the Trustees’ deliberations. For similar reasons, the Trustees did not consider potential economies of
161
Table of Contents
| Annual Renewal of Investment Management and Subadvisory Agreements (continued) |
scale in the management of a Fund by each of the Unaffiliated Subadvisers to be a material factor in their deliberations at this time.
In considering the reasonableness of the fees payable by the Investment Manager to River Road, the Trustees noted that River Road is an affiliate of the Investment Manager, and the Trustees reviewed information regarding the cost to River Road of providing subadvisory services to a Fund and the resulting profitability from such relationship. The Trustees noted that, because River Road is an affiliate of the Investment Manager, a portion of River Road’s revenues or profits might be shared directly or indirectly with the Investment Manager. The Trustees also noted that the subadvisory fees are paid by the Investment Manager out of its advisory fee. With respect to each applicable Fund, the Board also took into account management’s discussion of the subadvisory fee structure, and the services River Road provides in performing its functions under the applicable Subadvisory Agreement. Based on the foregoing, the Trustees concluded that the profitability to River Road is reasonable and that River Road is not realizing material benefits from economies of scale that would warrant adjustments to the subadvisory fees at this time. Also with respect to economies of scale, the Trustees noted that as a Fund’s assets increase over time, the Fund may realize other economies of scale to the extent the increase in assets is proportionally greater than the increase in certain other expenses.
In addition to the foregoing, the Trustees considered the specific factors and related conclusions set forth below with respect to each applicable Fund, the Investment Manager and each Subadviser.
AMG Managers DoubleLine Core Plus Bond Fund
FUND PERFORMANCE
Among other information relating to the Fund’s performance, the Trustees noted that the Fund’s performance for Class I shares (which share class has one of the earliest inception dates and the largest amount of assets of all the share classes of the Fund) for the 1-year, 3-year and 5-year periods ended March 31, 2020 and for the period from the Class I shares’ inception on July 18, 2011 through March 31, 2020 was below, below, below, and above, respectively, the median performance of the Peer Group and below, below, below, and above, respectively, the performance of the Fund Benchmark, the Bloomberg Barclays U.S. Aggregate Bond Index. The Trustees also took into account management’s discussion of the Fund’s performance, including the reasons for the Fund’s
recent underperformance. The Trustees also noted that Class I shares of the Fund ranked in the top quintile relative to its Peer Group for the period since inception through March 31, 2020. The Trustees also noted the impact of the Fund’s recent underperformance on its 3-year and 5-year rankings. The Trustees concluded that the Fund’s overall performance has been satisfactory in light of the Fund’s investment objective, strategies and policies.
ADVISORY AND SUBADVISORY FEES AND FUND EXPENSES
The Trustees noted that the management fees (which include both the advisory and administration fees) and total expenses (net of applicable expense waivers/reimbursements) of Class I shares of the Fund as of March 31, 2020 were both higher than the average for the Fund’s Peer Group. The Trustees took into account the fact that the Investment Manager has contractually agreed, through March 1, 2021, to limit the Fund’s net annual operating expenses (subject to certain excluded expenses) to 0.61%. The Trustees also took into account management’s discussion of the Fund’s expenses, including fees and expenses relative to comparably sized funds and select peers. The Trustees concluded that, in light of the nature, extent and quality of the services provided by the Investment Manager and the Subadviser, the foregoing expense reimbursement arrangement and the considerations noted above with respect to the Investment Manager and the Subadviser, the Fund’s advisory and subadvisory fees are reasonable.
AMG Managers Fairpointe Mid Cap Fund
FUND PERFORMANCE
Among other information relating to the Fund’s performance, the Trustees noted that the Fund’s performance for Class N shares (which share class has the earliest inception date of all the share classes of the Fund) for the 1-year, 3-year, 5-year and 10-year periods ended March 31, 2020 was below the median performance of the Peer Group and below the performance of the Fund Benchmark, the S&P MidCap 400 Index. The Trustees took into account management’s discussion of the Fund’s performance, including the reasons for the Fund’s underperformance. The Trustees concluded that the Fund’s overall performance has been satisfactory in light of the Fund’s investment objective, strategies and policies.
ADVISORY AND SUBADVISORY FEES AND FUND EXPENSES
The Trustees noted that the management fees (which include both the advisory and administration fees) and total expenses (net of applicable expense waivers/reimbursements) of Class I shares (the class of shares which is the primary focus of the Fund’s distribution) of the Fund as of March 31, 2020 were both higher than the average for the Fund’s Peer Group. The Trustees took into account the fact that, effective August 1, 2019, the Investment Manager has contractually agreed, through March 1, 2021, to limit the Fund’s net annual operating expenses (subject to certain excluded expenses) to 0.82%. The Trustees also took into account management’s discussion of the Fund’s expenses, including fees and expenses relative to comparably sized funds and select competitors. The Trustees concluded that, in light of the nature, extent and quality of the services provided by the Investment Manager and the Subadviser, the foregoing expense reimbursement arrangement and the considerations noted above with respect to the Investment Manager and the Subadviser, the Fund’s advisory and subadvisory fees are reasonable.
AMG Managers LMCG Small Cap Growth Fund
FUND PERFORMANCE
Among other information relating to the Fund’s performance, the Trustees noted that the Fund’s performance for Class N shares (which share class has the earliest inception date of all the share classes of the Fund) for the 1-year, 3-year and 5-year periods ended March 31, 2020 and for the period from the Class N shares’ inception on November 3, 2010 through March 31, 2020 was below the median performance of the Peer Group and below, above, below, and below, respectively, the performance of the Fund Benchmark, the Russell 2000 Growth Index. The Trustees took into account management’s discussion of the Fund’s performance, including the reasons for the Fund’s underperformance. The Trustees concluded that the Fund’s overall performance has been satisfactory in light of the Fund’s investment objective, strategies and policies.
ADVISORY AND SUBADVISORY FEES AND FUND EXPENSES
The Trustees noted that the management fees (which include both the advisory and administration fees) and total expenses (net of applicable expense waivers/reimbursements) of Class I shares (the class of shares which is the primary focus of the Fund’s distribution) of the Fund as of March 31, 2020 were
162
Table of Contents
Annual Renewal of Investment Management and Subadvisory Agreements (continued) |
both higher than the average for the Fund’s Peer Group. The Trustees took into account the fact that the Investment Manager has contractually agreed, through March 1, 2021, to limit the Fund’s net annual operating expenses (subject to certain excluded expenses) to 1.03%. The Trustees also took into account management’s discussion of the Fund’s expenses, including fees and expenses relative to comparably sized funds and select competitors. The Trustees concluded that, in light of the nature, extent and quality of the services provided by the Investment Manager and the Subadviser, the foregoing expense reimbursement arrangement and the considerations noted above with respect to the Investment Manager and the Subadviser, the Fund’s advisory and subadvisory fees are reasonable.
AMG Managers Montag & Caldwell Growth Fund
FUND PERFORMANCE
Among other information relating to the Fund’s performance, the Trustees noted that the Fund’s performance for Class N shares (which share class has the earliest inception date of all the share classes of the Fund) for the 1-year, 3-year, 5-year and 10-year periods ended March 31, 2020 was above, below, below, and below, respectively, the median performance of the Peer Group and below the performance of the Fund Benchmark, the Russell 1000 Growth Index. The Trustees took into account management’s discussion of the Fund’s performance, including the Fund’s more recent improved performance relative to its Peer Group. The Trustees also noted the reasons for the Fund’s underperformance. The Trustees concluded that the Fund’s overall performance has been satisfactory in light of the Fund’s investment objective, strategies and policies.
ADVISORY AND SUBADVISORY FEES AND FUND EXPENSES
The Trustees noted that the management fees (which include both the advisory and administration fees) and total expenses (net of applicable expense waivers/reimbursements) of Class I shares (the class of shares which is the primary focus of the Fund’s distribution) of the Fund as of March 31, 2020 were both higher than the average for the Fund’s Peer Group. The Trustees took into account the fact that, effective August 1, 2019, the Investment Manager has contractually agreed, through March 1, 2021, to limit the Fund’s net annual operating expenses (subject to certain excluded expenses) to 0.92%. The Trustees also took into account management’s discussion of the Fund’s expenses and competitiveness with comparably sized funds and select competitors. The
Trustees concluded that, in light of the nature, extent and quality of the services provided by the Investment Manager and the Subadviser, the foregoing expense reimbursement arrangement and the considerations noted above with respect to the Investment Manager and the Subadviser, the Fund’s advisory and subadvisory fees are reasonable.
AMG Managers Pictet International Fund
FUND PERFORMANCE
Among other information relating to the Fund’s performance, the Trustees noted that the Fund’s performance for Class I shares (which share class has one of the earliest inception dates and the largest amount of assets of all the share classes of the Fund) for the 1-year, 3-year, and 5-year periods ended March 31, 2020 and for the period from the Class I shares’ inception on April 14, 2014 through March 31, 2020 was below the median performance of the Peer Group and below the performance of the Fund Benchmark, the MSCI EAFE Index. The Trustees took into account management’s discussion of the Fund’s performance, including the reasons for the Fund’s underperformance. The Trustees also noted the impact of the Fund’s recent underperformance on its 3-year and 5-year rankings. The Trustees concluded that the Fund’s overall performance has been satisfactory in light of the Fund’s investment objective, strategies and policies.
ADVISORY AND SUBADVISORY FEES AND FUND EXPENSES
The Trustees noted that the management fees (which include both the advisory and administration fees) and total expenses (net of applicable expense waivers/reimbursements) of Class I shares of the Fund as of March 31, 2020 were both higher than the average for the Fund’s Peer Group. The Trustees took into account the fact that, effective January 1, 2020, the Investment Manager has contractually agreed, through March 1, 2021, to lower the Fund’s contractual expense limitation from 0.98% to 0.89% of the Fund’s net annual operating expenses (subject to certain excluded expenses). The Trustees also noted that, effective January 1, 2020, the Fund’s management fee rate was reduced. The Trustees also took into account management’s discussion of the Fund’s expenses, including fees and expenses relative to comparably sized funds and select competitors. The Trustees concluded that, in light of the nature, extent and quality of the services provided by the Investment Manager and the Subadviser, the foregoing expense reimbursement arrangement and the considerations noted above with respect to the Investment Manager and the Subadviser, the Fund’s advisory and subadvisory fees are reasonable.
AMG River Road Dividend All Cap Value Fund
FUND PERFORMANCE
Among other information relating to the Fund’s performance, the Trustees noted that the Fund’s performance for Class N shares (which share class has the earliest inception date of all the share classes of the Fund) for the 1-year, 3-year, 5-year and 10-year periods ended March 31, 2020 was below the median performance of the Peer Group and below the performance of the Fund Benchmark, the Russell 3000 Value Index. The Trustees took into account management’s discussion of the Fund’s performance, including the reasons for the Fund’s underperformance. The Trustees concluded that the Fund’s overall performance has been satisfactory in light of the Fund’s investment objective, strategies and policies.
ADVISORY AND SUBADVISORY FEES AND FUND EXPENSES
The Trustees noted that the management fees (which include both the advisory and administration fees) and total expenses (net of applicable expense waivers/reimbursements) of Class I shares (the class of shares which is the primary focus of the Fund’s distribution) of the Fund as of March 31, 2020 were both higher than the average for the Fund’s Peer Group. The Trustees took into account the fact that the Investment Manager has contractually agreed, through March 1, 2021, to limit the Fund’s net annual operating expenses (subject to certain excluded expenses) to 0.99%. The Trustees also took into account management’s discussion of the Fund’s expenses, including fees and expenses relative to comparably sized funds and key competitors. The Trustees concluded that, in light of the nature, extent and quality of the services provided by the Investment Manager and the Subadviser (which is an affiliate of the Investment Manager), the foregoing expense limitation arrangement and the considerations noted above with respect to the Investment Manager and the Subadviser, the Fund’s advisory and subadvisory fees are reasonable.
AMG River Road Focused Absolute Value Fund
FUND PERFORMANCE
Among other information relating to the Fund’s performance, the Trustees noted that the Fund’s performance for Class I shares (which share class has one of the earliest inception dates and the largest amount of assets of all the share classes of
163
Table of Contents
Annual Renewal of Investment Management and Subadvisory Agreements (continued) |
the Fund) for the 1-year and 3-year periods ended March 31, 2020 and for the period from the Fund’s inception on November 3, 2015 through March 31, 2020 was above the median performance of the Peer Group and below, above and above, respectively, the performance of the Fund Benchmark, the Russell 3000 Value Index. The Trustees also took into account management’s discussion of the Fund’s performance, including the fact that Class I shares of the Fund ranked in the top quintile relative to its Peer Group for the 1-year period and in the top decile relative to its Peer Group for the 3-year period and the period from the Fund’s inception through March 31, 2020. The Trustees concluded that the Fund’s overall performance has been satisfactory.
ADVISORY AND SUBADVISORY FEES AND FUND EXPENSES
The Trustees noted that the management fees (which include both the advisory and administration fees) and total expenses (net of applicable expense waivers/reimbursements) of Class I shares of the Fund as of March 31, 2020 were both lower than the average for the Fund’s Peer Group. The Trustees took into account the fact that, effective May 1, 2020, the Investment Manager replaced the Fund’s contractual expense limitation with a new contractual expense limitation pursuant to which the Investment Manager has contractually agreed, through March 1, 2022, to limit the Fund’s net annual operating expenses (subject to certain excluded expenses) to 0.78% instead of the current contractual expense limitation rate of 0.71%. The Trustees concluded that, in light of the nature, extent and quality of the services provided by the Investment Manager and the Subadviser (which is an affiliate of the Investment Manager), the foregoing expense reimbursement arrangement and the considerations noted above with respect to the Investment Manager and the Subadviser, the Fund’s advisory and subadvisory fees are reasonable.
AMG River Road Long-Short Fund
FUND PERFORMANCE
Among other information relating to the Fund’s performance, the Trustees noted that the Fund’s performance for Class N shares (which share class has the earliest inception date of all the share classes of the Fund) for the 1-year, 3-year and 5-year periods ended March 31, 2020 and for the period from the Class N shares’ inception on May 4, 2011 through March 31, 2020 was above the median performance of the Peer Group and above, below, below, and below, respectively, the performance of the Fund Benchmark, the Russell 3000 Index. The
Trustees also took into account management’s discussion of the Fund’s performance, including the reasons for the Fund’s recent outperformance. The Trustees noted that Class N shares of the Fund ranked in the top quintile relative to its Peer Group for the 5-year period and in the top quartile relative to its Peer Group for the 1-year and 3-year periods and for the period from the Fund’s inception through March 31, 2020. The Trustees concluded that the Fund’s overall performance has been satisfactory.
ADVISORY AND SUBADVISORY FEES AND FUND EXPENSES
The Trustees noted that the management fees (which include both the advisory and administration fees) and total expenses (net of applicable expense waivers/reimbursements) of Class I shares (the class of shares which is the primary focus of the Fund’s distribution) of the Fund as of March 31, 2020 were lower and higher, respectively, than the average for the Fund’s Peer Group. The Trustees took into account the fact that the Investment Manager has contractually agreed, through March 1, 2021, to limit the Fund’s net annual operating expenses (subject to certain excluded expenses) to 1.12%. The Trustees also took into account management’s discussion of the Fund’s expenses, including fees and expenses relative to comparably sized funds and select competitors. The Trustees concluded that, in light of the nature, extent and quality of the services provided by the Investment Manager and the Subadviser (which is an affiliate of the Investment Manager), the foregoing expense reimbursement arrangement and the considerations noted above with respect to the Investment Manager and the Subadviser, the Fund’s advisory and subadvisory fees are reasonable.
AMG River Road Small-Mid Cap Value Fund
FUND PERFORMANCE
Among other information relating to the Fund’s performance, the Trustees noted that the Fund’s performance for Class N shares (which share class has the earliest inception date of all the share classes of the Fund) for the 1-year, 3-year, 5-year and 10-year periods ended March 31, 2020 was above the median performance of the Peer Group and above the performance of the Fund Benchmark, the Russell 2500 Value Index. The Trustees also took into account management’s discussion of the Fund’s performance, noting that Class N shares of the Fund ranked in the top quintile relative to its Peer Group for the 1-year period and in the top decile relative to its Peer Group for the 3-year, 5-year and 10-year periods. The Trustees concluded that the Fund’s overall performance has been satisfactory.
ADVISORY AND SUBADVISORY FEES AND FUND EXPENSES
The Trustees noted that the management fees (which include both the advisory and administration fees) and total expenses (net of applicable expense waivers/reimbursements) of Class I shares (the class of shares which is the primary focus of the Fund’s distribution) of the Fund as of March 31, 2020 were both higher than the average for the Fund’s Peer Group. The Trustees took into account the fact that the Investment Manager has contractually agreed, through March 1, 2021, to limit the Fund’s net annual operating expenses (subject to certain excluded expenses) to 1.04%. The Trustees also took into account management’s discussion of the Fund’s expenses, including fees and expenses relative to comparably sized funds and select competitors. The Trustees concluded that, in light of the nature, extent and quality of the services provided by the Investment Manager and the Subadviser (which is an affiliate of the Investment Manager), the foregoing expense reimbursement arrangement and the considerations noted above with respect to the Investment Manager and the Subadviser, the Fund’s advisory and subadvisory fees are reasonable.
AMG River Road Small Cap Value Fund
FUND PERFORMANCE
Among other information relating to the Fund’s performance, the Trustees noted that the Fund’s performance for Class N shares (which share class has the earliest inception date of all the share classes of the Fund) for the 1-year, 3-year, 5-year and 10-year periods ended March 31, 2020 was above the median performance of the Peer Group and above the performance of the Fund Benchmark, the Russell 2000 Value Index. The Trustees also took into account management’s discussion of the Fund’s performance, noting that Class N shares of the Fund ranked in the top quintile relative to its Peer Group for the 1-year period and in the top decile relative to its Peer Group for the 3-year, 5-year and 10-year periods. The Trustees concluded that the Fund’s overall performance has been satisfactory.
ADVISORY AND SUBADVISORY FEES AND FUND EXPENSES
The Trustees noted that the management fees (which include both the advisory and administration fees) and total expenses of Class I shares (the class of shares which is the primary focus of the Fund’s
164
Table of Contents
Annual Renewal of Investment Management and Subadvisory Agreements (continued) |
distribution) of the Fund as of March 31, 2020 were both higher than the average for the Fund’s Peer Group. The Trustees took into account management’s discussion of the Fund’s expenses, including fees and expenses relative to comparably sized funds and select competitors. The Trustees concluded that, in light of the nature, extent and quality of the services provided by the Investment Manager and the Subadviser (which is an affiliate of the Investment Manager) and the considerations noted above with respect to the Investment Manager and the Subadviser, the Fund’s advisory and subadvisory fees are reasonable.
AMG Managers Silvercrest Small Cap Fund
FUND PERFORMANCE
Among other information relating to the Fund’s performance, the Trustees noted that the Fund’s performance for Class I shares (which share class has one of the earliest inception dates and the largest amount of assets of all the share classes of the Fund) for the 1-year, 3-year and 5-year periods ended March 31, 2020 and for the period from the Class I shares’ inception on December 27, 2011 through March 31, 2020 was above, below, below, and below, respectively, the median performance of the Peer Group and above the performance of the Fund Benchmark, the Russell 2000 Value Index. The Trustees took into account management’s discussion of the Fund’s performance, including the reasons for the Fund’s recent outperformance. The Trustees concluded that the Fund’s overall performance has been satisfactory | ADVISORY AND SUBADVISORY FEES AND FUND EXPENSES
The Trustees noted that the management fees (which include both the advisory and administration fees) and total expenses (net of applicable expense waivers/reimbursements) of Class I shares of the Fund as of March 31, 2020 were both higher than the average for the Fund’s Peer Group. The Trustees took into account the fact that the Investment Manager has contractually agreed, through March 1, 2021, to limit the Fund’s net annual operating expenses (subject to certain excluded expenses) to 1.08%. The Trustees also took into account management’s discussion of the Fund’s expenses, including fees and expenses relative to comparably sized funds and select competitors. The Trustees concluded that, in light of the nature, extent and quality of the services provided by the Investment Manager and the Subadviser, the foregoing expense reimbursement arrangement and the considerations noted above with respect to the Investment Manager and the Subadviser, the Fund’s advisory and subadvisory fees are reasonable.
* * * * *
After consideration of the foregoing, the Trustees also reached the following conclusions (in addition to the conclusions discussed above) regarding the Investment Advisory Agreement and each Subadvisory Agreement: (a) the Investment Manager and each Subadviser have demonstrated that they possess the capability and resources to perform the duties required of them under the Investment Advisory Agreement and the applicable Subadvisory Agreement and (b) the Investment Manager and each Subadviser maintain appropriate compliance programs. | Based on all of the above-mentioned factors and their related conclusions, with no single factor or conclusion being determinative and with each Trustee not necessarily attributing the same weight to each factor, the Trustees concluded that approval of the Investment Advisory Agreement and each Subadvisory Agreement would be in the best interests of the applicable Fund and its shareholders. Accordingly, on June 25, 2020, the Trustees, and separately a majority of the Independent Trustees, voted to approve the Investment Advisory and the Subadvisory Agreements for each Fund.
1 The Trustees determined that the conditions surrounding COVID-19 constituted unforeseen or emergency circumstances and that reliance on the Securities and Exchange Commission’s (“SEC”) exemptive order, which provides relief from the in-person voting requirements of the Investment Company Act of 1940, as amended (the “1940 Act”), in certain circumstances (the “In-Person Relief”), was necessary or appropriate due to the circumstances related to current or potential effects of COVID-19. The Trustees unanimously wished to rely on the In-Person Relief with respect to the approval of those matters on the agenda for the June 25, 2020 meeting that would otherwise require in-person votes under the 1940 Act. The Trustees, including a majority of the Trustees who are not “interested persons” of AMG Funds IV, undertook to ratify the actions taken pursuant to the In-Person Relief at the Board’s next in-person meeting, consistent with the requirements of the In-Person Relief. See Investment Company Release No. 33897 (June 19, 2020). This exemptive order supersedes, in part, a similar, earlier exemptive order issued by the SEC (Investment Company Release No. 33824 (March 25, 2020)). | ||||||
165
Table of Contents
THIS PAGE INTENTIONALLY LEFT BLANK
Table of Contents
THIS PAGE INTENTIONALLY LEFT BLANK
Table of Contents
THIS PAGE INTENTIONALLY LEFT BLANK
Table of Contents
INVESTMENT MANAGER AND ADMINISTRATOR
AMG Funds LLC
600 Steamboat Road, Suite 300
Greenwich, CT 06830
800.548.4539
DISTRIBUTOR
AMG Distributors, Inc.
600 Steamboat Road, Suite 300
Greenwich, CT 06830
800.548.4539 | CUSTODIAN
The Bank of New York Mellon
111 Sanders Creek Parkway
East Syracuse, NY 13057
LEGAL COUNSEL
Ropes & Gray LLP
Prudential Tower, 800 Boylston Street
Boston, MA 02199-3600
TRANSFER AGENT
BNY Mellon Investment Servicing (US) Inc.
Attn: AMG Funds
4400 Computer Drive
Westborough, MA 01581
800.548.4539
| This report is prepared for the Funds’ shareholders. It is authorized for distribution to prospective investors only when preceded or accompanied by an effective prospectus. To receive a free copy of the prospectus or Statement of Additional Information, which includes additional information about Fund Trustees, please contact us by calling 800.548.4539. Distributed by AMG Distributors, Inc., member FINRA/SIPC.
Current net asset values per share for each Fund are available on the Funds’ website at amgfunds.com.
A description of the policies and procedures each Fund uses to vote its proxies is available: (i) without charge, upon request, by calling 800.548.4539, or (ii) on the Securities and Exchange Commission’s (SEC) website at sec.gov. For information regarding each Fund’s proxy voting record for the 12-month period ended June 30, call 800.548.4539 or visit the SEC website at sec.gov.
The Funds file their complete schedule of portfolio holdings with the SEC for the first and third quarters of each fiscal year as an exhibit to their reports on Form N-PORT, The Funds’ portfolio holdings on Form N-PORT are available on the SEC’s website at sec.gov. To review a complete list of the Funds’ portfolio holdings, or to view the most recent semiannual report or annual report, please visit amgfunds.com.
|
| amgfunds.com | |
Table of Contents
AFFILIATE SUBADVISED FUNDS
BALANCED FUNDS AMG GW&K Global Allocation
GW&K Investment Management, LLC
AMG FQ Global Risk-Balanced First Quadrant, L.P.
EQUITY FUNDS
AMG FQ Tax-Managed U.S. Equity AMG FQ Long-Short Equity First Quadrant, L.P.
AMG Frontier Small Cap Growth Frontier Capital Management Co., LLC
AMG GW&K Small Cap Core AMG GW&K Small Cap Value AMG GW&K Small/Mid Cap AMG GW&K Mid Cap AMG GW&K Emerging Markets Equity AMG GW&K Emerging Wealth Equity AMG GW&K International Small Cap GW&K Investment Management, LLC
AMG Renaissance Large Cap Growth
The Renaissance Group LLC
AMG River Road Dividend All Cap Value AMG River Road Focused Absolute Value AMG River Road Long-Short AMG River Road Small-Mid Cap Value AMG River Road Small Cap Value River Road Asset Management, LLC | AMG TimesSquare Emerging Markets Small Cap AMG TimesSquare Global Small Cap AMG TimesSquare International Small Cap AMG TimesSquare Mid Cap Growth AMG TimesSquare Small Cap Growth TimesSquare Capital Management, LLC
AMG Yacktman AMG Yacktman Focused AMG Yacktman Focused Fund - Security Selection Only AMG Yacktman Special Opportunities Yacktman Asset Management LP
FIXED INCOME FUNDS
AMG GW&K Core Bond ESG AMG GW&K Enhanced Core Bond ESG AMG GW&K High Income AMG GW&K Municipal Bond AMG GW&K Municipal Enhanced Yield GW&K Investment Management, LLC
OPEN-ARCHITECTURE FUNDS
EQUITY FUNDS
AMG Managers Brandywine AMG Managers Brandywine BIue Friess Associates, LLC
AMG Managers CenterSquare Real Estate CenterSquare Investment Management LLC | AMG Managers Emerging Opportunities WEDGE Capital Management L.L.P. Next Century Growth Investors LLC RBC Global Asset Management (U.S.) Inc.
AMG Managers Fairpointe Mid Cap Fairpointe Capital LLC
AMG Managers LMCG Small Cap Growth LMCG Investments, LLC
AMG Managers Montag & Caldwell Growth Montag & Caldwell, LLC
AMG Managers Pictet International Pictet Asset Management Limited
AMG Managers Silvercrest Small Cap Silvercrest Asset Management Group LLC
AMG Managers Special Equity Ranger Investment Management, L.P. Lord, Abbett & Co. LLC Smith Asset Management Group, L.P. Federated MDTA LLC
AMG SouthernSun Small Cap AMG SouthernSun U.S. Equity SouthernSun Asset Management, LLC
FIXED INCOME FUNDS
AMG Managers Doubleline Core Plus Bond DoubleLine Capital LP
AMG Managers Loomis Sayles Bond
Loomis, Sayles & Company, L.P. |
| amgfunds.com | | 103120 | AR082 |
Table of Contents
| Item 2. | Code of Ethics. |
Registrant has adopted a Code of Ethics. See attached exhibit (a) (1).
| Item 3. | Audit Committee Financial Expert. |
Registrant’s Board of Trustees has determined that independent Trustee Mr. Steven J. Paggioli qualifies as the Audit Committee Financial Expert. Mr. Paggioli is “independent” as such term is defined in Form N-CSR.
| Item 4. | Principal Accountant Fees and Services. |
| (a) | Audit Fees |
The aggregate fees billed for each of the last two fiscal years for professional services rendered by the principal accountant for the audit of the registrant’s annual financial statements or services that are normally provided by the accountant in connection with statutory and regulatory filings or engagements for those fiscal years are $307,976 for 2020 and $313,951 for 2019.
| (b) | Audit-Related Fees |
There were no fees billed by PwC to the Funds in its two recent fiscal years for services rendered for assurance and related services that are reasonably related to the performance of the audit or review of the Fund’s financial statements, but are not reported as Audit Fees (“Audit-Related Fees”).
For the Funds’ two most recent fiscal years, there were no Audit-Related Fees billed by PwC for engagements related directly to the operations and financial reporting of one or more Funds by a Fund Service Provider. A Fund Service Provider is (a) any investment adviser to the Fund (not including any Subadvisor whose role is primarily portfolio management and is subcontracted with or overseen by another investment adviser) or (b) any entity that provides ongoing services to the Fund and is controlling, controlled by or under common control with a Fund investment adviser described in (a).
| (c) | Tax Fees |
The aggregate fees billed in each of the last two fiscal years for professional services rendered by the principal accountant for tax compliance, tax advice, and tax planning are $79,433 for 2020 and $72,150 for 2019.
For the Funds’ two most recent fiscal years, Tax Fees billed by PwC for engagements by Fund Service Providers that related directly to the operations and financial reporting of the Funds were $0 for fiscal 2020 and $0 for fiscal 2019, respectively.
The services for which Tax Fees were charged comprise all services performed by professional staff in PwC’s tax division except those services related to the audit. Typically, this category would include fees for tax compliance, tax planning, and tax
Table of Contents
advice. Tax compliance, tax advice, and tax planning services include preparation of original and amended tax returns, claims for refund and tax payment-planning services, assistance with tax audits and appeals, tax advice related to mergers and acquisitions and requests for rulings or technical advice from taxing authorities.
| (d) | All Other Fees |
There were no other fees billed by PwC to the Funds for all other non-audit services (“Other Fees”) during the Funds’ two most recent fiscal years. During the same period, there were no Other Fees billed by PwC for engagements by Fund Service Providers that related directly to the operations and financial reporting of the Funds.
| (e) | (1) According to policies adopted by the Audit Committee, services provided by PwC to the Funds must be pre-approved by the Audit Committee. On an annual basis, the Audit Committee reviews and pre-approves various types of services that PwC may perform for the Funds without specific approval of each engagement, subject to specified budget limitations. As contemplated by the Sarbanes-Oxley Act of 2002 and related SEC rules, the Audit Committee also pre-approves non-audit services provided by PwC to any Fund Service Provider for any engagement that relates directly to the operations and financial reporting of the Funds. Any engagement that is not already pre-approved or that will exceed a pre-approved budget must be submitted to the Audit Committee for pre-approval. The Chairman of the Audit Committee is authorized on behalf of the Board of Trustees and the Audit Committee to approve the engagement of PwC to perform non-audit services subject to certain conditions, including notification to the Audit Committee of such pre-approval not later than the next meeting of the Audit Committee following the date of such pre-approval. |
| (e) | (2) None. |
| (f) | Not applicable. |
| (g) | The aggregate fees billed by PwC in 2020 and 2019 for non-audit services rendered to the Funds and Fund Service Providers were $128,933 for 2020 and $121,650 for 2019. For the fiscal year ended October 31, 2020, this amount reflects the amounts disclosed above in Item 4(b),(c),(d), plus $49,500 in fees billed to the Fund Service Providers for non-audit services that did not relate directly to the operations and financial reporting of the Funds. For the fiscal year ended October 31, 2019, this amount reflects the amounts disclosed above in Item 4(b),(c),(d), plus $49,500 in fees billed to the Fund Service Providers for non-audit services that did not relate directly to the operations and financial reporting of the Funds. |
| (h) | The Trust’s Audit Committee has considered whether the provision of non-audit services by registrant’s independent registered public accounting firm to the registrant’s investment adviser, and any entity controlling, controlled by, or under common control with the investment adviser that provided ongoing services to the registrant that were not pre-approved by the Committee (because such services did not relate directly to the |
Table of Contents
| operations and financial reporting of the registrant) was compatible with maintaining the independence of the independent registered public accounting firm. |
| Item 5. | Audit Committee of Listed Registrants. |
Not applicable.
| Item 6. | Schedule of Investments. |
| (a) | Schedule of Investments in securities of unaffiliated issuers as of the close of the reporting period is included as part of the report to shareholders filed under Item 1 of this form. |
| Item 7. | Disclosure of Proxy Voting Policies and Procedures for Closed-End Management Investment Companies. |
Not applicable.
| Item 8. | Portfolio Managers of Closed-End Management Investment Companies. |
Not applicable.
| Item 9. | Purchases of Equity Securities by Closed-End Management Investment Company and Affiliated Purchasers. |
Not applicable.
| Item 10. | Submission of Matters to a Vote of Security Holders. |
Not applicable.
| Item 11. | Controls and Procedures. |
| (a) | The Registrant’s principal executive and principal financial officers have concluded, based on their evaluation of the registrant’s disclosure controls and procedures as of a date within 90 days of the filing of this report, that the Registrant’s disclosure controls and procedures are reasonably designed to ensure that information required to be disclosed by the Registrant on Form N-CSR is recorded, processed, summarized and reported within the required time periods and that information required to be disclosed by the registrant in the reports that it files or submits on Form N-CSR is accumulated and communicated to the Registrant’s management, including its principal executive and principal financial officers, as appropriate to allow timely decisions regarding required disclosure. |
Table of Contents
| (b) | There were no changes in the Registrant’s internal control over financial reporting during the period covered by this report that have materially affected, or are reasonably likely to materially affect, the internal control over financial reporting. |
| Item 12. | DISCLOSURE OF SECURITIES LENDING ACTIVITIES FOR CLOSED-END MANAGEMENT INVESTMENT COMPANIES |
Not applicable.
| Item 13. | Exhibits. |
Table of Contents
SIGNATURES
Pursuant to the requirements of the Securities Exchange Act of 1934 and the Investment Company Act of 1940, the registrant has duly caused this report to be signed on its behalf by the undersigned, thereunto duly authorized.
AMG FUNDS IV
| By: | /s/ Keitha L. Kinne | |
| Keitha L. Kinne, Principal Executive Officer | ||
| Date: | January 6, 2021 | |
Pursuant to the requirements of the Securities Exchange Act of 1934 and the Investment Company Act of 1940, this report has been signed below by the following persons on behalf of the registrant and in the capacities and on the dates indicated.
| By: | /s/ Keitha L. Kinne | |
| Keitha L. Kinne, Principal Executive Officer | ||
| Date: | January 6, 2021 | |
| By: | /s/ Thomas Disbrow | |
| Thomas Disbrow, Principal Financial Officer | ||
| Date: | January 6, 2021 | |