UNITED STATES
SECURITIES AND EXCHANGE COMMISSION
Washington, D.C. 20549
FORMN-CSR
CERTIFIED SHAREHOLDER REPORT OF REGISTERED MANAGEMENT
INVESTMENT COMPANIES
Investment Company Act file number 811-08004
AMG Funds IV
(Exact name of registrant as specified in charter)
600 Steamboat Road, Suite 300, Greenwich, Connecticut 06830
(Address of principal executive offices) (Zip code)
AMG Funds LLC
600 Steamboat Road, Suite 300, Greenwich, Connecticut 06830
(Name and address of agent for service)
Registrant’s telephone number, including area code: (203)299-3500
Date of fiscal year end: October 31
Date of reporting period: November 1, 2018 - October 31, 2019
(Annual Shareholder Report)
Item 1. Reports to Stockholders.
| | |
 | | ANNUALREPORT |
| | | | | | | | |
| | | | | AMG Funds October 31, 2019 AMG Funds |
| | | | | |
| | | | | Class N, I, & Z Shares | | | | |
| | | | | |
| | | | | Equity Fixed Income International | | | | |
| | | | | |
| | | | | | | | | |
Beginning on January 1, 2021, as permitted by regulations adopted by the Securities and Exchange Commission, paper copies of the Funds’ shareholder reports like this one will no longer be sent by mail, unless you specifically request paper copies of the reports from the Funds or from your financial intermediary, such as a broker-dealer or bank. Instead, the reports will be made available on the Funds’ website (https://www.amgfunds.com/resources/order_literature.html), and you will be notified by mail each time a report is posted and provided with a website link to access the report.
If you already elected to receive shareholder reports electronically, you will not be affected by this change and you need not take any action. You may elect to receive shareholder reports and other communications from the Funds electronically at any time by contacting your financial intermediary or, if you invest directly with the Funds, by logging into your account at www.amgfunds.com.
You may elect to receive all future reports in paper free of charge. If you invest through a financial intermediary, you can contact your financial intermediary to request that you continue to receive paper copies of your shareholder reports. If you invest directly with the Funds, you can call 1.800.548.4539 to inform the Funds that you wish to continue receiving paper copies of your shareholder reports. Your election to receive reports in paper will apply to all funds in the AMG Funds Family of Funds held in your account if you invest through your financial intermediary or all funds in the AMG Funds Family of Funds held with the fund complex if you invest directly with the Funds.
| | |
| amgfunds.com | | 103119 AR082 |
| | |
| | | AMG Funds Annual Report — October 31, 2019 |
| | | | | | | | | | | | | | | | |
| | | | | | | |
| | | | | | | | | | | | | | | | | |
| | | TABLE OF CONTENTS | | | | | | | | | | | PAGE | |
| | | | |
| | | | | | | |
| | | LETTER TO SHAREHOLDERS | | | | | | | | | | | | | 2 | |
| | | | | | | |
| | | ABOUT YOUR FUND’S EXPENSES | | | | | | | | | | | | | 3 | |
| | |
| | PORTFOLIO MANAGER’S COMMENTS, FUND SNAPSHOTS AND SCHEDULES OF PORTFOLIO INVESTMENTS | |
| | | | | | | |
| | | AMG Managers Fairpointe ESG Equity Fund | | | 6 | | | | | | | AMG River RoadSmall-Mid Cap Value Fund | | | 46 | |
| | | | | | | |
| | | AMG River Road Focused Absolute Value Fund | | | 11 | | | | | | | AMG River Road Small Cap Value Fund | | | 51 | |
| | | | | | | |
| | | AMG Managers Montag & Caldwell Growth Fund | | | 17 | | | | | | | AMG Managers Silvercrest Small Cap Fund | | | 57 | |
| | | | | | | |
| | | AMG River Road Dividend All Cap Value Fund | | | 22 | | | | | | | AMG Managers DoubleLine Core Plus Bond Fund | | | 62 | |
| | | | | | | |
| | | AMG River Road Dividend All Cap Value Fund II | | | 29 | | | | | | | AMG River Road Long-Short Fund | | | 91 | |
| | | | | | | |
| | | AMG Managers Fairpointe Mid Cap Fund | | | 35 | | | | | | | AMG Managers Pictet International Fund | | | 98 | |
| | | | | | | |
| | | AMG Managers LMCG Small Cap Growth Fund | | | 41 | | | | | | | | | | | |
| | | |
| | | FINANCIAL STATEMENTS | | | | |
| | | | |
| | | Statement of Assets and Liabilities | | | | | 107 | |
| | | | |
| | | Balance sheets, net asset value (NAV) per share computations and cumulative distributable earnings (loss) | | | | | | |
| | | | |
| | | Statement of Operations | | | | | 113 | |
| | | | |
| | | Detail of sources of income, expenses, and realized and unrealized gains (losses) during the fiscal year | | | | | | |
| | | | |
| | | Statements of Changes in Net Assets | | | | | 116 | |
| | | | |
| | | Detail of changes in assets for the past two fiscal years | | | | | | |
| | | | |
| | | Financial Highlights | | | | | 121 | |
| | | | |
| | | Historical net asset values per share, distributions, total returns, income and expense ratios, turnover ratios and net assets | | | | | | |
| | | | |
| | | Notes to Financial Statements | | | | | 157 | |
| | | | |
| | | Accounting and distribution policies, details of agreements and transactions with Fund management and affiliates, and descriptions of certain investment risks | | | | | | |
| | | |
| | | REPORT OF INDEPENDENT REGISTERED PUBLIC ACCOUNTING FIRM | | | 174 | |
| | | |
| | | OTHER INFORMATION | | | 175 | |
| | | |
| | | TRUSTEES AND OFFICERS | | | 176 | |
| | | |
| | | ANNUAL RENEWAL OF INVESTMENT MANAGEMENT AND SUBADVISORY AGREEMENTS | | | 178 | |
| | | |
| | | | | | | |
| | |
| | Nothing contained herein is to be considered an offer, sale or solicitation of an offer to buy shares of any series of the AMG Funds family of mutual funds. Such offering is made only by prospectus, which includes details as to offering price and other material information. | | | | |
| | |
| | Letter to Shareholders |
Dear Shareholder:
The U.S. bull market celebrated its10-year anniversary during the fiscal year ended October 31, 2019, as stocks proved resilient in the face of global economic weakness, rising geopolitical tensions, and the ongoing trade war. Global stock markets swooned late in 2018 as hawkish U.S. Federal Reserve (Fed) policy and an escalation of the U.S./China trade war triggered a painful selloff. However, a dovish pivot from global central banks rescued investors and fueled a strong rebound early in 2019. Investors clung to hopes of a positive outcome from U.S./China trade negotiations, even as doubts about the durability of the economic cycle lingered, and the S&P 500® Index returned 14.33% for the fiscal year. International equities were also resistant to pressures facing the global economy and generated an 11.27% return as measured by the MSCI All Country World ex USA Index.
In total, ten out of eleven sectors of the S&P 500® Index were strongly positive during the prior twelve months. Investors sought the relative safety of defensive sectors, with utilities and real estate leading the index with returns of 26.73% and 23.71%, respectively. However, the higher growth information technology sector also generated a robust 22.60% return. Energy was the lone negative sector with a return of (11.40)% during the fiscal year. Growth stocks outperformed Value stocks for the full fiscal year with returns of 17.10% and 11.21% for the Russell 1000® Growth and Russell 1000® Value Indexes, respectively. The cycle of U.S. outperformance over international equities continued, but international developed and emerging markets still produced solidly positive returns, with the MSCI EAFE and MSCI Emerging Markets Index returning 11.04% and 11.86%, respectively, in the twelve months ending October 31, 2019.
Interest rates fell dramatically over the fiscal year and led to strong returns for bond investors as the Fed shifted to a more dovish policy stance early in 2019 and eventually cut short-term rates later in the year. The10-year Treasury yield fell from a high of 3.24% last November to a yield of 1.69% as of October 31, 2019. The plunge in long-term interest rates caused the yield curve to briefly invert with2-year yields rising higher than the10-year yields. The Bloomberg Barclays U.S. Aggregate Bond Index, a broad measure of U.S. bond market performance, ended the fiscal year with an 11.51% return. High yield bonds lagged the broader bond market and returned 8.38% as measured by the return of the Bloomberg Barclays U.S. Corporate High Yield Bond Index. Municipal bonds also performed strongly with a 9.42% return for the Bloomberg Barclays Municipal Bond Index.
AMG Funds appreciates the privilege of providing investment tools to you and your clients. Our foremost goal is to provide investment solutions that help our shareholders successfully reach their long-term investment goals. AMG Funds
provides access to a distinctive array of actively managed return-oriented investment strategies. We thank you for your continued confidence and investment in AMG Funds. You can rest assured that under all market conditions our team is focused on delivering excellent investment management services for your benefit.
Respectfully,

Keitha Kinne
President
AMG Funds
| | | | | | | | | | | | | | |
| Average Annual Total Returns | | Periods ended
October 31, 2019* | |
| | | | |
| Stocks: | | | | 1 Year | | | 3 Years | | | 5 Years | |
| | | | |
Large Caps | | (S&P 500® Index) | | | 14.33 | % | | | 14.91% | | | | 10.78% | |
| | | | |
Small Caps | | (Russell 2000® Index) | | | 4.90 | % | | | 10.96% | | | | 7.37% | |
| | | | |
International | | (MSCI All Country World Index ex USA) | | | 11.27 | % | | | 8.07% | | | | 3.82% | |
| Bonds: | | | | | | | | | | | |
| | | | |
Investment Grade | | (Bloomberg Barclays U.S. Aggregate Bond Index) | | | 11.51 | % | | | 3.29% | | | | 3.24% | |
| | | | |
High Yield | | (Bloomberg Barclays U.S. Corporate High Yield Bond Index) | | | 8.38 | % | | | 6.03% | | | | 5.18% | |
| | | | |
Tax-exempt | | (Bloomberg Barclays Municipal Bond Index) | | | 9.42 | % | | | 3.62% | | | | 3.55% | |
| | | | |
Treasury Bills | | (ICE BofAML U.S.6-Month Treasury Bill Index) | | | 2.71 | % | | | 1.74% | | | | 1.21% | |
*Source: FactSet. Past performance is no guarantee of future results.
2
|
About Your Fund’s Expenses |
| | | | | | | | |
As a shareholder of a Fund, you may incur two types of costs: (1) transaction costs, which may include sales charges (loads) on purchase payments; redemption fees; and exchange fees; and (2) ongoing costs, including management fees; distribution(12b-1) fees; and other Fund expenses. This example is intended to help you understand your ongoing costs (in dollars) of investing in the Fund and to compare these costs with the ongoing costs of investing in other mutual funds. The example is based on $1,000 invested at the beginning of the period and held for the entire period as indicated below. ACTUAL EXPENSES The first line of the following table provides information about the actual account values and | | | | actual expenses. You may use the information in this line, together with the amount you invested, to estimate the expenses that you paid over the period. Simply divide your account value by $1,000 (for example, an $8,600 account value divided by $1,000 = 8.6), then multiply the result by the number in the first line under the heading entitled “Expenses Paid During Period” to estimate the expenses you paid on your account during this period. HYPOTHETICAL EXAMPLE FOR COMPARISON PURPOSES The second line of the following table provides information about hypothetical account values and hypothetical expenses based on the Fund’s actual expense ratio and an assumed annual rate of return of 5% before expenses, which is not the Fund’s | | | | actual return. The hypothetical account values and expenses may not be used to estimate the actual ending account balance or expenses you paid for the period. You may use this information to compare the ongoing costs of investing in the Fund and other funds by comparing this 5% hypothetical example with the 5% hypothetical examples that appear in the shareholder reports of other funds. Please note that the expenses shown in the table are meant to highlight your ongoing costs only and do not reflect any transactional costs, such as sales charges (loads), redemption fees, or exchange fees. Therefore, the second line of the table is useful in comparing ongoing costs only, and will not help you determine the relative total costs of owning different funds. |
| | | | | | | | |
| | | | | | | | | | | | | | | | |
| | | | |
Six Months Ended October 31, 2019 | | Expense
Ratio for
the Period | | | Beginning
Account
Value
05/01/19 | | | Ending
Account
Value
10/31/19 | | | Expenses
Paid
During
the Period* |
AMG Managers Fairpointe ESG Equity Fund | |
|
Based on Actual Fund Return | |
| | | | |
Class N | | | 1.12 | % | | | $1,000 | | | | $946 | | | | $5.49 | |
| | | | |
Class I | | | 0.90 | % | | | $1,000 | | | | $947 | | | | $4.42 | |
|
Based on Hypothetical 5% Annual Return | |
| | | | |
Class N | | | 1.12 | % | | | $1,000 | | | | $1,020 | | | | $5.70 | |
| | | | |
Class I | | | 0.90 | % | | | $1,000 | | | | $1,021 | | | | $4.58 | |
| | | | | | | | | | | | | | | | |
AMG River Road Focused Absolute Value Fund | |
|
Based on Actual Fund Return | |
| | | | |
Class N | | | 1.00 | % | | | $1,000 | | | | $1,048 | | | | $5.16 | |
| | | | |
Class I | | | 0.75 | % | | | $1,000 | | | | $1,050 | | | | $3.87 | |
| | | | |
Class Z | | | 0.71 | % | | | $1,000 | | | | $1,050 | | | | $3.67 | |
|
Based on Hypothetical 5% Annual Return | |
| | | | |
Class N | | | 1.00 | % | | | $1,000 | | | | $1,020 | | | | $5.09 | |
| | | | |
Class I | | | 0.75 | % | | | $1,000 | | | | $1,021 | | | | $3.82 | |
| | | | |
Class Z | | | 0.71 | % | | | $1,000 | | | | $1,022 | | | | $3.62 | |
| | | | | | | | | | | | | | | | |
| | | | |
Six Months Ended October 31, 2019 | | Expense
Ratio for
the Period | | | Beginning
Account
Value
05/01/19 | | | Ending
Account
Value
10/31/19 | | | Expenses
Paid
During
the Period* |
AMG Managers Montag & Caldwell Growth Fund | |
|
Based on Actual Fund Return | |
| | | | |
Class N | | | 1.14 | % | | | $1,000 | | | | $1,063 | | | | $5.93 | |
| | | | |
Class I | | | 0.98 | % | | | $1,000 | | | | $1,063 | | | | $5.10 | |
|
Based on Hypothetical 5% Annual Return | |
| | | | |
Class N | | | 1.14 | % | | | $1,000 | | | | $1,019 | | | | $5.80 | |
| | | | |
Class I | | | 0.98 | % | | | $1,000 | | | | $1,020 | | | | $4.99 | |
| | | | | | | | | | | | | | | | |
AMG River Road Dividend All Cap Value Fund | |
|
Based on Actual Fund Return | |
| | | | |
Class N | | | 1.13 | % | | | $1,000 | | | | $1,033 | | | | $5.79 | |
| | | | |
Class I | | | 0.86 | % | | | $1,000 | | | | $1,035 | | | | $4.41 | |
| | | | |
Class Z | | | 0.81 | % | | | $1,000 | | | | $1,035 | | | | $4.15 | |
|
Based on Hypothetical 5% Annual Return | |
| | | | |
Class N | | | 1.13 | % | | | $1,000 | | | | $1,020 | | | | $5.75 | |
| | | | |
Class I | | | 0.86 | % | | | $1,000 | | | | $1,021 | | | | $4.38 | |
| | | | |
Class Z | | | 0.81 | % | | | $1,000 | | | | $1,021 | | | | $4.13 | |
3
|
About Your Fund’s Expenses(continued) |
| | | | | | | | | | | | | | | | |
| | | | |
Six Months Ended October 31, 2019 | | Expense
Ratio for
the Period | | | Beginning
Account
Value
05/01/19 | | | Ending
Account
Value
10/31/19 | | | Expenses
Paid
During
the Period* |
AMG River Road Dividend All Cap Value Fund II | |
|
Based on Actual Fund Return | |
| | | | |
Class N | | | 1.29 | % | | | $1,000 | | | | $1,034 | | | | $6.61 | |
| | | | |
Class I | | | 1.00 | % | | | $1,000 | | | | $1,036 | | | | $5.13 | |
| | | | |
Class Z | | | 0.94 | % | | | $1,000 | | | | $1,036 | | | | $4.82 | |
|
Based on Hypothetical 5% Annual Return | |
| | | | |
Class N | | | 1.29 | % | | | $1,000 | | | | $1,019 | | | | $6.56 | |
| | | | |
Class I | | | 1.00 | % | | | $1,000 | | | | $1,020 | | | | $5.09 | |
| | | | |
Class Z | | | 0.94 | % | | | $1,000 | | | | $1,020 | | | | $4.79 | |
| | | | | | | | | | | | | | | | |
AMG Managers Fairpointe Mid Cap Fund | |
|
Based on Actual Fund Return | |
| | | | |
Class N | | | 1.14 | % | | | $1,000 | | | | $924 | | | | $5.53 | |
| | | | |
Class I | | | 0.89 | % | | | $1,000 | | | | $925 | | | | $4.32 | |
| | | | |
Class Z | | | 0.82 | % | | | $1,000 | | | | $925 | | | | $3.98 | |
|
Based on Hypothetical 5% Annual Return | |
| | | | |
Class N | | | 1.14 | % | | | $1,000 | | | | $1,019 | | | | $5.80 | |
| | | | |
Class I | | | 0.89 | % | | | $1,000 | | | | $1,021 | | | | $4.53 | |
| | | | |
Class Z | | | 0.82 | % | | | $1,000 | | | | $1,021 | | | | $4.18 | |
| | | | | | | | | | | | | | | | |
AMG Managers LMCG Small Cap Growth Fund** | |
|
Based on Actual Fund Return | |
| | | | |
Class N | | | 1.31 | % | | | $1,000 | | | | $901 | | | | $6.28 | |
| | | | |
Class I | | | 1.10 | % | | | $1,000 | | | | $901 | | | | $5.27 | |
|
Based on Hypothetical 5% Annual Return | |
| | | | |
Class N | | | 1.31 | % | | | $1,000 | | | | $1,019 | | | | $6.67 | |
| | | | |
Class I | | | 1.10 | % | | | $1,000 | | | | $1,020 | | | | $5.60 | |
| | | | | | | | | | | | | | | | |
AMG River RoadSmall-Mid Cap Value Fund | |
|
Based on Actual Fund Return | |
| | | | |
Class N | | | 1.33 | % | | | $1,000 | | | | $1,026 | | | | $6.79 | |
| | | | |
Class I | | | 1.10 | % | | | $1,000 | | | | $1,027 | | | | $5.62 | |
| | | | |
Class Z | | | 1.04 | % | | | $1,000 | | | | $1,028 | | | | $5.32 | |
|
Based on Hypothetical 5% Annual Return | |
| | | | |
Class N | | | 1.33 | % | | | $1,000 | | | | $1,019 | | | | $6.77 | |
| | | | |
Class I | | | 1.10 | % | | | $1,000 | | | | $1,020 | | | | $5.60 | |
| | | | |
Class Z | | | 1.04 | % | | | $1,000 | | | | $1,020 | | | | $5.30 | |
| | | | | | | | | | | | | | | | |
| | | | |
Six Months Ended October 31, 2019 | | Expense
Ratio for
the Period | | | Beginning
Account
Value
05/01/19 | | | Ending
Account
Value
10/31/19 | | | Expenses
Paid
During
the Period* |
AMG River Road Small Cap Value Fund | |
|
Based on Actual Fund Return | |
| | | | |
Class N | | | 1.38 | % | | | $1,000 | | | | $1,020 | | | | $7.02 | |
| | | | |
Class I | | | 1.11 | % | | | $1,000 | | | | $1,022 | | | | $5.66 | |
| | | | |
Class Z | | | 1.03 | % | | | $1,000 | | | | $1,022 | | | | $5.25 | |
|
Based on Hypothetical 5% Annual Return | |
| | | | |
Class N | | | 1.38 | % | | | $1,000 | | | | $1,018 | | | | $7.02 | |
| | | | |
Class I | | | 1.11 | % | | | $1,000 | | | | $1,020 | | | | $5.65 | |
| | | | |
Class Z | | | 1.03 | % | | | $1,000 | | | | $1,020 | | | | $5.24 | |
| | | | | | | | | | | | | | | | |
AMG Managers Silvercrest Small Cap Fund | |
|
Based on Actual Fund Return | |
| | | | |
Class N | | | 1.42 | % | | | $1,000 | | | | $1,003 | | | | $7.17 | |
| | | | |
Class I | | | 1.15 | % | | | $1,000 | | | | $1,004 | | | | $5.81 | |
| | | | |
Class Z | | | 1.08 | % | | | $1,000 | | | | $1,004 | | | | $5.45 | |
|
Based on Hypothetical 5% Annual Return | |
| | | | |
Class N | | | 1.42 | % | | | $1,000 | | | | $1,018 | | | | $7.22 | |
| | | | |
Class I | | | 1.15 | % | | | $1,000 | | | | $1,019 | | | | $5.85 | |
| | | | |
Class Z | | | 1.08 | % | | | $1,000 | | | | $1,020 | | | | $5.50 | |
| | | | | | | | | | | | | | | | |
AMG Managers DoubleLine Core Plus Bond Fund | |
|
Based on Actual Fund Return | |
| | | | |
Class N | | | 0.94 | % | | | $1,000 | | | | $1,041 | | | | $4.84 | |
| | | | |
Class I | | | 0.69 | % | | | $1,000 | | | | $1,043 | | | | $3.55 | |
| | | | |
Class Z | | | 0.61 | % | | | $1,000 | | | | $1,043 | | | | $3.14 | |
|
Based on Hypothetical 5% Annual Return | |
| | | | |
Class N | | | 0.94 | % | | | $1,000 | | | | $1,020 | | | | $4.79 | |
| | | | |
Class I | | | 0.69 | % | | | $1,000 | | | | $1,022 | | | | $3.52 | |
| | | | |
Class Z | | | 0.61 | % | | | $1,000 | | | | $1,022 | | | | $3.11 | |
4
|
About Your Fund’s Expenses(continued) |
| | | | | | | | | | | | | | | | |
| | | | |
Six Months Ended October 31, 2019 | | Expense
Ratio for
the Period | | | Beginning
Account
Value
05/01/19 | | | Ending
Account
Value
10/31/19 | | | Expenses
Paid
During
the Period* |
AMG River Road Long-Short Fund*** | |
|
Based on Actual Fund Return | |
| | | | |
Class N | | | 1.45 | % | | | $1,000 | | | | $1,034 | | | | $7.43 | |
| | | | |
Class I | | | 1.20 | % | | | $1,000 | | | | $1,035 | | | | $6.16 | |
| | | | |
Class Z | | | 1.12 | % | | | $1,000 | | | | $1,035 | | | | $5.74 | |
|
Based on Hypothetical 5% Annual Return | |
| | | | |
Class N | | | 1.45 | % | | | $1,000 | | | | $1,018 | | | | $7.37 | |
| | | | |
Class I | | | 1.20 | % | | | $1,000 | | | | $1,019 | | | | $6.11 | |
| | | | |
Class Z | | | 1.12 | % | | | $1,000 | | | | $1,020 | | | | $5.70 | |
| | | | | | | | | | | | | | | | |
AMG Managers Pictet International Fund | |
|
Based on Actual Fund Return | |
| | | | |
Class N | | | 1.22 | % | | | $1,000 | | | | $1,013 | | | | $6.19 | |
| | | | |
Class I | | | 0.97 | % | | | $1,000 | | | | $1,014 | | | | $4.92 | |
| | | | |
Class Z | | | 0.90 | % | | | $1,000 | | | | $1,015 | | | | $4.57 | |
|
Based on Hypothetical 5% Annual Return | |
| | | | |
Class N | | | 1.22 | % | | | $1,000 | | | | $1,019 | | | | $6.21 | |
| | | | |
Class I | | | 0.97 | % | | | $1,000 | | | | $1,020 | | | | $4.94 | |
| | | | |
Class Z | | | 0.90 | % | | | $1,000 | | | | $1,021 | | | | $4.58 | |
| * | Expenses are equal to the Fund’s annualized expense ratio multiplied by the average account value over the period, multiplied by the number of days in the most recent fiscal half-year (184), then divided by 365. |
| ** | Excludes interest expense of 0.01% for Class N and Class I, respectively. If included, your actual and hypothetical expenses paid during the period would be $6.32 and $5.32 and $6.72 and $5.65 for Class N and Class I, respectively. |
| *** | Excludes interest expense and dividends on short positions. If included, your annualized expense ratios would be 1.92%, 1.67% and 1.59% for Class N, Class I and Class Z, respectively, and your actual and hypothetical expenses paid during the period would be $9.84, $8.57 and $8.16, and $9.75, $8.49 and $8.08 for Class N, Class I and Class Z, respectively. |
5
|
AMG Managers Fairpointe ESG Equity Fund Portfolio Manager’s Comments(unaudited) |
| | |
OVERVIEW The AMG Managers Fairpointe ESG Equity Fund (the “Fund”) Class N shares returned 2.54% for the fiscal year ended October 31, 2019, underperforming the Russell 1000® Index, which returned 14.15%. The Fund’s strategy is characterized by a long-term view, a portfolio of high-conviction investments, a focus on purchasing securities at a significant discount to fair value, and a willingness to hold (and add to) positions through volatile markets. FISCAL YEAR REVIEW Performance for the period was disappointing, marked by several positions that moved dramatically against us. We’ve reviewed our thesis and assumptions on all our holdings and eliminated one position due to deterioration of fundamentals, three others due to ESG (environmental, social, and governance) assessments, and the remaining five based on valuation. We are encouraged and believe that ultimately our holdings will be valued at higher levels than they are today. Our largest contributors were Qualcomm, Inc. (QCOM), TEGNA, Inc. (TGNA), International Business Machines Corp. (IBM), ResMed, Inc. (RMD), and Owens Corning (OC). Qualcomm engages in the development, design, and provision of digital telecommunications products and services, particularly relating to 5G technology. With headlines and aggressive ramps for 5G infrastructure around the world, the opportunity set for Qualcomm is particularly exciting and the stock has been strong. Additionally, the outstanding legal issues are trending slightly more positive and some of the outstanding litigation has been quantified, removing some of the uncertainty. | | |
| | |
TEGNA operates 47 television stations and 2 radio stations in 39 markets and offers marketing services through TEGNA Marketing Solutions. The company reported better-than-expected results due to subscriber gains and continued revenue from political advertising. We believe the stock has even further potential due to TEGNA’s strong broadcasting business and expected growth from local programming initiatives. Political advertising is expected to pick up significantly with the upcoming 2020 election, which should further boost the company’s revenue and earnings. | | |
| | |
While the stock has been strong, TEGNA remains undervalued due to investors’ negative perception around “cord cutting,” a concern that clouds the outlook for many cable and broadcasting companies. However, TEGNA has not been affected by this trend, and we believe that much of this trepidation is unfounded. | | |
| | |
IBM is an information technology company which provides integrated solutions that leverage information technology and knowledge of business processes. It has been acquisitive through the years, transforming the company to a higher growth and more software-focused company. Their acquisition of Red Hat has been positive and has contributed revenue growth. With IBM’s generous dividend yield and good free cash flow generation, the stock has been moving higher. Detractors for the fiscal year were Lions Gate Entertainment Corp. (LGF), Dean Foods Company (DF), Cars.com, Inc. (CARS), Adtalem Global Education, Inc. (ATGE), and Meredith Corp. (MDP). Lions Gate, a developer and distributer of motion pictures and television programming, remains misunderstood due to the market’s short-term focus, which tends to overlook their long-term potential. Currently, the company’s Starz network has 25 million domestic subscribers through cable providers and streaming services. The company is building on its domestic success and expanding its international subscriber base, which should increase the company’s value long-term. In addition, the company’s unique content makes it an attractive strategic takeover target. | | |
| | |
One ESG issue at Lions Gate is their corporate governance with two classes of stock (onenon-voting), and less than ideal independence of directors. We own the voting stock and have actively engaged with management on their corporate governance and compensation. | | |
| | |
Dean Foods engages in the manufacture, sale anddirect-to-store distribution of milk and other dairy products. Our original thesis had been that dairy volumes and prices were stabilizing and that management was actively attempting to align their operating cost structure. Once we realized that they could not keep pace, we began to reduce the position and ultimately exited. The combination of a commodity product with a leveraged balance sheet was certainly a concern to us when we initiated the position, but we learned a valuable lesson from this combination of factors. | | |
| | |
Cars.com provides an online digital platform that connects consumers with local automobile dealers across the country. Its revenues are derived from dealer subscriptions and automobile advertising. The company’s board of directors conducted a strategic review, including the potential sale of the company, for almost a year. In August this strategic review abruptly stopped, and although 29 interested parties came to the table, there was no sale of the company. | | |
| | |
We still think the company has substantial value. Digital automotive advertising is a large and growing market, and Cars.com is a leading player. The | | |
| | |
company generates high profit margins, has an attractive valuation, and is poised for improved cash flow generation. With the major distraction of putting the company up for sale out of the way, management is now focused on gaining market share. Senior management and members of the board purchased stock in the third quarter. Cars.com is an example of the problems with the ESG database providers rating systems. The company scores poorly due to concerns about data privacy, its peer group (which we think is inappropriate), and a lack of disclosure. In reality, the data the company collects is not credit sensitive information, and Facebook and certain other players are not appropriate peers. The company also has been rated poorly on carbon emissions, and while their customer is exposed to car sales (which include hybrids and electric vehicles), they have no direct material risks to carbon emissions in their business model. POSITIONING AND OUTLOOK-ATTRACTIVE FUNDAMENTALS Even though the U.S. economy continues to grow, we remain concerned about geopolitical risks, the trade war, slowing economic growth in Europe and China, and the overall impact of these conditions on the U.S. economy. The U.S. Federal Reserve (the Fed) has lowered the federal funds rate byone-quarter point twice in the past three months. Many U.S. companies are reluctant to invest in their businesses given the uncertainty. The volatility has allowed us to take advantage by adding several high-quality companies to the portfolio. We are mindful of the news flow regarding tariffs, elections, and recessions, but our focus continues to be on long-term investing in sustainable companies. The news flow on ESG topics has become prolific, as has awareness of climate change risks. We are mindful of these issues and focus on companies that are attentive and prepared for these risks and should ultimately offer investors excess returns. | | |
Thank you for your continued interest and support. Thyra E. Zerhusen, Chief Investment Officer Frances E. Tuite, CFA, Portfolio Manager Brian M. Washkowiak, CFA, Portfolio Manager | | |
The views expressed represent the opinions of Fairpointe Capital LLC, as ofOctober 31, 2019,and are not intended as a forecast or guarantee of future results and are subject to change without notice. | | |
6
|
AMG Managers Fairpointe ESG Equity Fund Portfolio Manager’s Comments(continued) |
CUMULATIVE TOTAL RETURN PERFORMANCE
AMG Managers Fairpointe ESG Equity Fund’s cumulative total return is based on the daily change in net asset value (NAV), and assumes that all dividends and distributions were reinvested. The graph compares a hypothetical $10,000 investment made in the AMG Managers Fairpointe ESG Equity Fund’s Class N shares on December 24, 2014, to a $10,000 investment made in the Russell 1000® Index for the same time period. The graph and table do not reflect the deduction of taxes that a shareholder would pay on a Fund distribution or redemption of shares. The listed returns for the Fund are net of expenses and the returns for the index exclude expenses. Total returns would have been lower had certain expenses not been reduced.
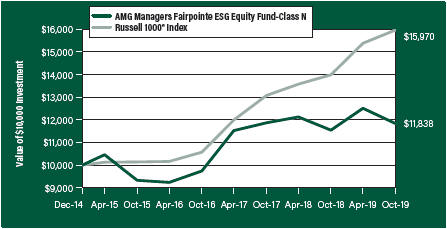
The table below shows the average annual total returns for the AMG Managers Fairpointe ESG Equity Fund and the Russell 1000® Index for the same time periods ended October 31, 2019.
| | | | | | | | | | | | |
| Average Annual Total Returns1 | | One
Year | | | Since
Inception | | | Inception
Date | |
| | | | | | | | | | | | |
AMG Managers Fairpointe ESG Equity Fund2, 3, 4, 5, 6, 7, 8, 9 | |
| | | |
Class N | | | 2.54 | % | | | 3.54 | % | | | 12/24/14 | |
| | | |
Class I | | | 2.75 | % | | | 3.75 | % | | | 12/24/14 | |
| | | |
Russell 1000® Index10 | | | 14.15 | % | | | 10.12 | % | | | 12/24/14 | † |
The performance data shown represents past performance. Past performance is not a guarantee of future results. Current performance may be lower or higher than the performance data quoted. The investment return and principal value of an investment will fluctuate so that an investor’s shares, when redeemed, may be worth more or less than their original cost.
Investors should carefully consider the Fund’s investment objectives, risks, charges and expenses before investing. For performance information through the most recent month end, current net asset values per share for the Fund and other information, please call 800.548.4539 or visit our website at amgfunds.com for a free prospectus. Read it carefully before investing or sending money.
Distributed by AMG Distributors, Inc., member FINRA/SIPC.
| † | Date reflects the inception date of the Fund, not the index. |
| 1 | Total return equals income yield plus share price change and assumes reinvestment of all dividends and capital gain distributions. Returns are net of fees and may reflect offsets of Fund expenses as described in the prospectus. No adjustment has been made for taxes payable by shareholders on their reinvested dividends and capital gain distributions. Returns for periods greater than one year are annualized. The listed returns on the Fund are net of expenses and based on the published NAV as of October 31, 2019. All returns are in U.S. dollars ($). |
| 2 | Applying the Fund’s ESG investment criteria may result in the selection or exclusion of securities of certain issuers for reasons other than performance, and the Fund may underperform funds that do not utilize an ESG |
| | |
| | |
| | | investment strategy. The application of this strategy may affect the Fund’s exposure to certain companies, sectors, regions, countries or types of investments, which could negatively impact the Fund’s performance depending on whether such investments are in or out of favor. Applying ESG criteria to investment decisions is qualitative and subjective by nature, and there is no guarantee that the criteria utilized by the Subadviser or any judgment exercised by the Subadviser will reflect the beliefs or values of any particular investor. 3 A greater percentage of the Fund’s holdings may be focused in a smaller number of securities which may place the Fund at greater risk than a more diversified fund. 4 Investments in international securities are subject to certain risks of overseas investing including currency fluctuations and changes in political and economic conditions, which could result in significant market fluctuations. These risks are magnified in emerging markets. 5 The Fund is subject to risks associated with investments inmid-capitalization companies such as greater price volatility, lower trading volume, and less liquidity than the stocks of larger, more established companies. |
| | |
| | | 6 The Fund is subject to risks associated with investments in small-capitalization companies, such as erratic earnings patterns, competitive conditions, limited earnings history and a reliance on one or a limited number of products. 7 The Fund invests in growth stocks, which may be more sensitive to market movements because their prices tend to reflect future investor expectations rather than just current profits. Growth stocks may underperform value stocks during given periods. |
| | |
| | | 8 The Fund invests in value stocks, which may perform differently from the market as a whole and may be undervalued by the market for a long period of time. 9 Companies that are in similar businesses may be similarly affected by particular economic or market events; to the extent the Fund has substantial holdings within a particular sector, the risks associated with that sector increase. |
| | |
| | | 10 The Russell 1000®Index measures the performance of approximately 1,000 of the largest securities based on a combination of their market cap and current index membership. The Russell 1000®represents approximately 92% of the U.S. market. Unlike the Fund, the Russell 1000®Index is unmanaged, is not available for investment and does not incur expenses. The Russell Indices are a trademark of the London Stock Exchange Group companies. Not FDIC insured, nor bank guaranteed. May lose value. |
7
|
AMG Managers Fairpointe ESG Equity Fund Fund Snapshots(unaudited) October 31, 2019 |
PORTFOLIO BREAKDOWN
| | |
| Sector | | % of
Net Assets |
Health Care | | 23.5 |
| | |
Information Technology | | 18.7 |
| | |
Industrials | | 15.9 |
| | |
Communication Services | | 13.8 |
| | |
Consumer Discretionary | | 8.6 |
| | |
Consumer Staples | | 6.6 |
| | |
Financials | | 2.5 |
| | |
Materials | | 2.4 |
| | |
Short-Term Investments | | 5.1 |
| | |
Other Assets Less Liabilities | | 2.9 |
TOP TEN HOLDINGS
| | |
| Security Name | | % of
Net Assets |
Bristol-Myers Squibb Co. | | 4.0 |
| | |
QUALCOMM, Inc. | | 3.7 |
| | |
Quest Diagnostics, Inc. | | 3.4 |
| | |
TEGNA, Inc. | | 3.4 |
| | |
Magna International, Inc. (Canada) | | 3.4 |
| | |
Wabtec Corp. | | 3.3 |
| | |
Juniper Networks, Inc. | | 3.2 |
| | |
Agilent Technologies, Inc. | | 3.1 |
| | |
Bunge, Ltd. | | 3.1 |
| | |
Pentair PLC (United Kingdom) | | 3.1 |
| | | |
| | |
Top Ten as a Group | | 33.7 |
| | |
Because a fund’s strategy may result in multiple investments in particular sectors of the economy, its performance may depend on the performance of those sectors and may fluctuate more widely than investments diversified across more sectors. For additional information on these and other risk considerations, please see the Fund’s prospectus.
Any sectors, industries, or securities discussed should not be perceived as investment recommendations. Mention of a specific security should not be considered a recommendation to buy or solicitation to sell that security. Specific securities mentioned in this report may have been sold from the Fund’s portfolio of investments by the time you receive this report.
8
|
AMG Managers Fairpointe ESG Equity Fund Schedule of Portfolio Investments October 31, 2019 |
| | | | | | | | |
| | | Shares | | | Value | |
| | |
Common Stocks - 92.0% | | | | | | | | |
| |
Communication Services - 13.8% | | | | | |
| | |
Cars.com, Inc.* | | | 21,600 | | | | $244,296 | |
| | |
Lions Gate Entertainment Corp., Class A* | | | 17,500 | | | | 139,825 | |
| | |
Meredith Corp. | | | 8,150 | | | | 307,255 | |
| | |
The New York Times Co., Class A | | | 8,600 | | | | 265,740 | |
| | |
Scholastic Corp. | | | 8,450 | | | | 325,325 | |
| | |
TEGNA, Inc. | | | 28,000 | | | | 420,840 | |
| | |
Total Communication Services | | | | | | | 1,703,281 | |
Consumer Discretionary - 8.6% | | | | | | | | |
| | |
Adtalem Global Education, Inc.* | | | 9,800 | | | | 291,844 | |
| | |
Magna International, Inc. (Canada) | | | 7,800 | | | | 419,406 | |
| | |
Mattel, Inc.* | | | 29,900 | | | | 357,006 | |
| | |
Total Consumer Discretionary | | | | | | | 1,068,256 | |
| | |
Consumer Staples - 6.6% | | | | | | | | |
| | |
Bunge, Ltd. | | | 7,100 | | | | 383,400 | |
| | |
Molson Coors Brewing Co., Class B | | | 6,400 | | | | 337,408 | |
| | |
Unilever PLC, Sponsored ADR (United Kingdom) | | | 1,500 | | | | 90,165 | |
| | |
Total Consumer Staples | | | | | | | 810,973 | |
| | |
Financials - 2.5% | | | | | | | | |
| | |
Northern Trust Corp. | | | 3,100 | | | | 309,008 | |
| | |
Health Care - 23.5% | | | | | | | | |
| | |
Agilent Technologies, Inc. | | | 5,100 | | | | 386,325 | |
| | |
Bristol-Myers Squibb Co. | | | 8,590 | | | | 492,809 | |
| | |
Patterson Cos., Inc. | | | 13,000 | | | | 222,690 | |
| | |
Quest Diagnostics, Inc. | | | 4,200 | | | | 425,250 | |
| | |
ResMed, Inc. | | | 1,910 | | | | 282,527 | |
| | |
Smith & Nephew PLC, ADR (United Kingdom) | | | 7,400 | | | | 319,828 | |
| | |
Varex Imaging Corp.* | | | 9,800 | | | | 294,098 | |
| | |
Varian Medical Systems, Inc.* | | | 1,200 | | | | 144,972 | |
| | |
Waters Corp.* | | | 1,600 | | | | 338,592 | |
| | |
Total Health Care | | | | | | | 2,907,091 | |
| | |
Industrials - 15.9% | | | | | | | | |
Donaldson Co., Inc. | | | 5,900 | | | | 311,166 | |
| | |
General Electric Co. | | | 5,400 | | | | 53,892 | |
| | | | | | | | |
| | | Shares | | | Value | |
| | |
ManpowerGroup, Inc. | | | 3,300 | | | | $300,036 | |
| | |
Owens Corning | | | 5,200 | | | | 318,656 | |
| | |
Pentair PLC (United Kingdom) | | | 9,200 | | | | 381,524 | |
| | |
Quanta Services, Inc. | | | 4,600 | | | | 193,430 | |
| | |
Wabtec Corp. | | | 5,800 | | | | 402,346 | |
| | |
Total Industrials | | | | | | | 1,961,050 | |
Information Technology - 18.7% | | | | | | | | |
| | |
Akamai Technologies, Inc.* | | | 2,600 | | | | 224,900 | |
| | |
Cisco Systems, Inc. | | | 2,250 | | | | 106,897 | |
| | |
Corning, Inc. | | | 8,700 | | | | 257,781 | |
| | |
Cree, Inc.* | | | 4,600 | | | | 219,558 | |
| | |
Hewlett Packard Enterprise Co. | | | 7,400 | | | | 121,434 | |
| | |
International Business Machines Corp. | | | 2,200 | | | | 294,206 | |
| | |
Juniper Networks, Inc. | | | 16,000 | | | | 397,120 | |
| | |
QUALCOMM, Inc. | | | 5,690 | | | | 457,704 | |
| | |
Teradata Corp.* | | | 7,600 | | | | 227,468 | |
| | |
Total Information Technology | | | | | | | 2,307,068 | |
| | |
Materials - 2.4% | | | | | | | | |
| | |
Commercial Metals Co. | | | 15,500 | | | | 299,615 | |
| | |
Total Common Stocks
(Cost $10,307,809) | | | | | | | 11,366,342 | |
| | |
Short-Term Investments - 5.1% | | | | | | | | |
| |
Other Investment Companies - 5.1% | | | | | |
| | |
Dreyfus Government Cash Management Fund, Institutional Shares, 1.73%1 | | | 208,812 | | | | 208,812 | |
| | |
Dreyfus Institutional Preferred Government Money Market Fund, Institutional Shares, 1.77%1 | | | 208,812 | | | | 208,812 | |
| | |
JPMorgan U.S. Government Money Market Fund, IM Shares, 1.75%1 | | | 215,139 | | | | 215,139 | |
| | |
Total Short-Term Investments
(Cost $632,763) | | | | | | | 632,763 | |
| | |
Total Investments - 97.1%
(Cost $10,940,572) | | | | | | | 11,999,105 | |
| |
Other Assets, less Liabilities - 2.9% | | | | 360,640 | |
| | |
Net Assets - 100.0% | | | | | | $ | 12,359,745 | |
| * | Non-income producing security. |
| 1 | Yield shown represents the October 31, 2019, seven day average yield, which refers to the sum of the previous seven days’ dividends paid, expressed as an annual percentage. |
ADR American Depositary Receipt
The accompanying notes are an integral part of these financial statements.
9
|
AMG Managers Fairpointe ESG Equity Fund Schedule of Portfolio Investments(continued) |
The following table summarizes the inputs used to value the Fund’s investments by the fair value hierarchy levels as of October 31, 2019:
| | | | | | | | | | | | | | | | |
| | | Level 1 | | | Level 2 | | | Level 3 | | | Total | |
Investments in Securities | | | | | | | | | | | | | | | | |
| | | | |
Common Stocks† | | $ | 11,366,342 | | | | — | | | | — | | | $ | 11,366,342 | |
| | | | | | | | | | | | | | | | |
| | | | |
Short-Term Investments | | | | | | | | | | | | | | | | |
| | | | |
Other Investment Companies | | | 632,763 | | | | — | | | | — | | | | 632,763 | |
| | | | | | | | | | | | | | | | |
| | | | |
Total Investments in Securities | | $ | 11,999,105 | | | | — | | | | — | | | $ | 11,999,105 | |
| | | | | | | | | | | | | | | | |
| † | All common stocks held in the Fund are Level 1 securities. For a detailed breakout of common stocks by major industry classification, please refer to the Fund’s Schedule of Portfolio Investments. |
For the fiscal year ended October 31, 2019, there were no transfers in or out of Level 3.
The accompanying notes are an integral part of these financial statements.
10
|
AMG River Road Focused Absolute Value Fund Portfolio Manager’s Comments(unaudited) |
| | | | | | | | |
OVERVIEW For the fiscal year ended October 31, 2019, the AMG River Road Focused Absolute Value Fund (the “Fund”) Class N shares returned 14.29%, outperforming the 10.65% return for the Russell 3000® Value Index. PERFORMANCE REVIEW The sector with the largest positive contribution to relative return was energy, driven by strong stock selection and an underweight allocation. Relative return also benefited from an overweight allocation and stock selection within communication services, as well as stock selection within financials. This was partially offset by negative stock selection in information technology and consumer staples, the sectors with the largest negative contribution to relative return. From a market cap perspective, the Fund’s small cap holdings significantly outperformed, returning 13.7% versus 3.2% for the Russell 2000® Value Index. Stock selection was positive across market capitalizations. The top contributing holdings in the Fund were GCI Liberty, Inc. (GLIBA) and Brookfield Asset Management, Inc. (BAM). GCI Liberty owns a 7% economic interest in Charter Communications (CHTR) and is the largest cable provider and second-largest wireless provider in Alaska through assets acquired in the 2018 merger with GCI. In January, Charter reported strong results in support of our investment thesis with accelerating internet subscriber growth and improved video subscriber trends. Of the 51 million potential subscribers passed by Charter’s network, 51.2% subscribed to Charter’s internet services, up from 42.0% in 2015, demonstrating that Charter’s superior network is driving market share gains. Throughout the year, Charter’s internet subscriber growth continued to dwarf modest video subscriber losses. More | | | | importantly, internet subscribers carry much higher margins than video subscribers, which led to consistent quarterly EBITDA (earnings before interest, tax, depreciation, and amortization) growth year over year, excluding mobile expenses. Lastly, both Charter and GCI Liberty repurchased shares over the last year, reducing shares outstanding by-6.2% and-2.1%, respectively. Given the inherent advantages of the connected pipe into the home, we continue to believe Charter is well positioned to grow its internet services, despite potential threats from 5G services. Brookfield Asset Management is a global alternative asset manager with more than $385B in AUM (assets under management). In August Brookfield reported quarterly results ahead of expectations with double-digit growth infee-related earnings driven by inflows across Brookfield’s strategies. Brookfield continues to build a significant war chest, with record liquidity of $49B, which we believe management will opportunistically invest in real assets. In September Brookfield held an investor day and highlighted the potential to generate $65B in cash flow over the next decade, of which $45B would be available for share repurchases, an amount nearly equivalent to Brookfield’s market cap as of October 31, 2019. The bottom contributing holdings in the Fund were Conduent, Inc. (CNDT) and Kraft Heinz Co. (KHC). Conduent is a global business process outsourcer with expertise in transaction processing, customer care, human resource services, analytics, and automation. The company reported disappointing Q1 2019 results with weak new business signings, which caused a-7% reduction to FY 2019 EBITDA guidance. The company also announced CEO Ashok Vemuri would step down. The quarterly report suggested deeper issues within the sales force and weakened our assessment of the competitive positioning of the transportation business. This | | | | information led to a reduction in the assessed value and lowered the Fund’s overall conviction. Despite the poor results, Carl Icahn (who controls three of the company’s board seats) meaningfully increased his ownership in the company from 11.6% to 18% after the significant drop in the stock price. The stock responded positively to the Icahn news, and the team used it as an opportunity to exit the position. Kraft is the fifth-largest food and beverage company globally. For much of 2018, the company dealt with weak consumer demand for packaged goods, resulting in shrinking revenues. By the end of the year the company produced strong organic revenue growth, but EBITDA margins fell significantly as Kraft reduced prices in the face of rising costs and higher SG&A. As a large unrealized loser with weaker fundamentals than expected, we exited the position. POSITIONING AND OUTLOOK The Fund invests in companies we believe represent the most attractive combination of risk (conviction) and reward (discount) available across the River Road universe of U.S. equity portfolio holdings. As of October 31, 2019, more than 63% of the Fund’s holdings were concentrated in the highest conviction stocks in the River Road universe and were trading at compelling discounts to assessed values. The Fund’s largest allocations by sector are in the financial and communication services sectors. We believe the Fund’s opportunistic, benchmark independent style is positioned to take advantage of even fleeting price dislocations created by rising volatility, a likely factor in the year ahead. The views expressed represent the opinions of River Road Asset Management LLC, as of October 31, 2019, and are not intended as a forecast or guarantee of future results and are subject to change without notice. |
11
|
AMG River Road Focused Absolute Value Fund Portfolio Manager’s Comments(continued) |
CUMULATIVE TOTAL RETURN PERFORMANCE
AMG River Road Focused Absolute Value Fund’s cumulative total return is based on the daily change in net asset value (NAV), and assumes that all dividends and distributions were reinvested. The graph compares a hypothetical $10,000 investment made in the AMG River Road Focused Absolute Value Fund’s Class N shares on November 3, 2015, to a $10,000 investment made in the Russell 3000® Value Index for the same time period. The graph and table do not reflect the deduction of taxes that a shareholder would pay on a Fund distribution or redemption of shares. The listed returns for the Fund are net of expenses and the returns for the index exclude expenses. Total returns would have been lower had certain expenses not been reduced.
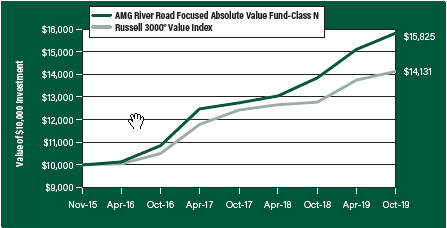
The table below shows the average annual total returns for the AMG River Road Focused Absolute Value Fund and the Russell 3000® Value Index for the same time periods ended October 31, 2019.
| | | | | | | | | | | | |
| Average Annual Total Returns1 | | One
Year | | | Since
Inception | | | Inception
Date | |
| | | | | | | | | | | | |
AMG River Road Focused Absolute Value Fund2, 3, 4, 5, 6, 7, 8, 9, 10, 11 | |
| | | |
Class N | | | 14.29 | % | | | 12.17 | % | | | 11/03/15 | |
| | | |
Class I | | | 14.55 | % | | | 12.44 | % | | | 11/03/15 | |
| | | |
Class Z | | | 14.69 | % | | | 10.12 | % | | | 09/29/17 | |
| | | |
Russell 3000® Value Index12 | | | 10.65 | % | | | 9.04 | % | | | 11/03/15 | † |
The performance data shown represents past performance. Past performance is not a guarantee of future results. Current performance may be lower or higher than the performance data quoted. The investment return and principal value of an investment will fluctuate so that an investor’s shares, when redeemed, may be worth more or less than their original cost.
Investors should carefully consider the Fund’s investment objectives, risks, charges and expenses before investing. For performance information through the most recent month end, current net asset values per share for the Fund and other information, please call 800.548.4539 or visit our website at amgfunds.com for a free prospectus. Read it carefully before investing or sending money.
Distributed by AMG Distributors, Inc., member FINRA/SIPC.
| † | Date reflects the inception date of the Fund, not the index. |
| 1 | Total return equals income yield plus share price change and assumes reinvestment of all dividends and capital gain distributions. Returns are net of fees and may reflect offsets of Fund expenses as described in the prospectus. No adjustment has been made for taxes payable by shareholders on their reinvested dividends and |
| | |
| | | capital gain distributions. Returns for periods greater than one year are annualized. The listed returns on the Fund are net of expenses and based on the published NAV as of October 31, 2019. All returns are in U.S. dollars ($). 2 The Fund is subject to risks associated with investments in small-capitalization companies, such as erratic earnings patterns, competitive conditions, limited earnings history and a reliance on one or a limited number of products. 3 The Fund is subject to risks associated with investments inmid-capitalization companies such as greater price volatility, lower trading volume, and less liquidity than the stocks of larger, more established companies. 4 Active and frequent trading of a fund may result in higher transaction costs and increased tax liability. |
| | | 5 A greater percentage of the Fund’s holdings may be focused in a smaller number of securities which may place the Fund at greater risk than a more diversified fund. 6 Investments in international securities are subject to certain risks of overseas investing including currency fluctuations and changes in political and economic conditions, which could result in significant market fluctuations. These risks are magnified in emerging markets. 7 The Fund is subject to the risks associated with investments in emerging markets, such as erratic earnings patterns, economic and political instability, changing exchange controls, limitations on repatriation of foreign capital and changes in local governmental attitudes toward private investment, possibly leading to nationalization or confiscation of investor assets. |
| | | 8 The Fund is subject to special risk considerations similar to those associated with the direct ownership of real estate. Real estate valuations may be subject to factors such as changing general and local economic, financial, competitive, and environmental conditions. 9 The Fund invests in value stocks, which may perform differently from the market as a whole and may be undervalued by the market for a long period of time. 10 Investing in Publicly Traded Partnerships (PTPs) (including master limited partnerships) involves risks in addition to those typically associated with publicly traded companies. PTPs are exposed to the risks of their underlying assets, which in many cases includes the same types of risks as energy and natural resources companies. PTPs are also subject to capital market risks. PTPs may lose their partnership status for tax purposes. The Fund’s status as a regulated investment company may be jeopardized if it does not appropriately limit such investments in PTPs or if such investments are recharacterized for tax purposes. |
12
|
AMG River Road Focused Absolute Value Fund Portfolio Manager’s Comments(continued) |
| | | | | | | | |
11 Companies that are in similar businesses may be similarly affected by particular economic or market events; to the extent the Fund has substantial holding within a particular sector, the risks associated with that sector increase. | | | | 12 The Russell 3000®Value Index measures the performance of the broad value segment of the U.S. equity universe. It includes those Russell 3000®companies with lowerprice-to-book ratios and lower forecasted growth values. Unlike the Fund, the Russell 3000®Value Index is unmanaged, is not available for investment and does not incur expenses. | | | | The Russell Indices are a trademark of the London Stock Exchange Group companies. Not FDIC insured, nor bank guaranteed. May lose value. |
13
|
AMG River Road Focused Absolute Value Fund Fund Snapshots(unaudited) October 31, 2019 |
PORTFOLIO BREAKDOWN
| | | | |
| Sector | | % of
Net Assets | |
Financials | | | 26.3 | |
| | |
Communication Services | | | 21.4 | |
| | |
Health Care | | | 10.4 | |
| | |
Information Technology | | | 9.6 | |
| | |
Energy | | | 7.6 | |
| | |
Consumer Discretionary | | | 7.5 | |
| | |
Consumer Staples | | | 6.6 | |
| | |
Industrials | | | 6.1 | |
| | |
Utilities | | | 2.6 | |
| | |
Short-Term Investments | | | 1.7 | |
| | |
Other Assets Less Liabilities | | | 0.2 | |
TOP TEN HOLDINGS
| | |
| Security Name | | % of
Net Assets |
Berkshire Hathaway, Inc., Class B | | 7.0 |
| | |
Comcast Corp., Class A | | 5.1 |
| | |
Brookfield Asset Management, Inc., Class A (Canada) | | 4.5 |
| | |
GCI Liberty, Inc., Class A | | 4.4 |
| | |
LKQ Corp. | | 4.3 |
| | |
Hostess Brands, Inc. | | 4.1 |
| | |
UnitedHealth Group, Inc. | | 4.0 |
| | |
Kinder Morgan, Inc. | | 4.0 |
| | |
Sabre Corp. | | 3.8 |
| | |
Liberty Broadband Corp., Class C | | 3.7 |
| | | |
| | |
Top Ten as a Group | | 44.9 |
| | |
Because a fund’s strategy may result in multiple investments in particular sectors of the economy, its performance may depend on the performance of those sectors and may fluctuate more widely than investments diversified across more sectors. For additional information on these and other risk considerations, please see the Fund’s prospectus.
Any sectors, industries, or securities discussed should not be perceived as investment recommendations. Mention of a specific security should not be considered a recommendation to buy or solicitation to sell that security. Specific securities mentioned in this report may have been sold from the Fund’s portfolio of investments by the time you receive this report.
14
|
AMG River Road Focused Absolute Value Fund Schedule of Portfolio Investments October 31, 2019 |
| | | | | | | | |
| | | Shares | | | Value | |
| | |
Common Stocks - 98.1% | | | | | | | | |
| |
Communication Services - 21.4% | | | | | |
| | |
Comcast Corp., Class A | | | 166,155 | | | | $7,447,067 | |
| | |
Discovery, Inc., Class C* | | | 172,561 | | | | 4,355,440 | |
| | |
GCI Liberty, Inc., Class A* | | | 91,585 | | | | 6,409,118 | |
| | |
Liberty Broadband Corp., Class C* | | | 46,020 | | | | 5,433,581 | |
| | |
Liberty Latin America, Ltd., Class C*,1 | | | 208,119 | | | | 3,831,471 | |
| | |
Liberty Media Corp.-Liberty SiriusXM, Class C* | | | 83,518 | | | | 3,774,179 | |
| | |
Total Communication Services | | | | | | | 31,250,856 | |
| |
Consumer Discretionary - 7.5% | | | | | |
| | |
Expedia Group, Inc. | | | 34,324 | | | | 4,690,718 | |
| | |
LKQ Corp.* | | | 185,139 | | | | 6,292,874 | |
| | |
Total Consumer Discretionary | | | | | | | 10,983,592 | |
| | |
Consumer Staples - 6.6% | | | | | | | | |
| | |
Hostess Brands, Inc.* | | | 472,309 | | | | 6,036,109 | |
| | |
Walgreens Boots Alliance, Inc. | | | 66,944 | | | | 3,667,192 | |
| | |
Total Consumer Staples | | | | | | | 9,703,301 | |
| | |
Energy - 7.6% | | | | | | | | |
| | |
Kinder Morgan, Inc. | | | 293,107 | | | | 5,856,278 | |
| | |
Marathon Petroleum Corp. | | | 83,157 | | | | 5,317,890 | |
| | |
Total Energy | | | | | | | 11,174,168 | |
| | |
Financials - 26.3% | | | | | | | | |
| | |
BB&T Corp.1 | | | 98,506 | | | | 5,225,743 | |
| | |
Berkshire Hathaway, Inc., Class B* | | | 47,783 | | | | 10,157,710 | |
| | |
Brookfield Asset Management, Inc., Class A (Canada) | | | 119,268 | | | | 6,589,557 | |
| | |
FGL Holdings (Bermuda)1 | | | 335,772 | | | | 3,032,021 | |
| | |
JPMorgan Chase & Co. | | | 36,205 | | | | 4,522,729 | |
| | |
The Progressive Corp. | | | 58,170 | | | | 4,054,449 | |
| | |
U.S. Bancorp | | | 85,575 | | | | 4,879,487 | |
| | |
Total Financials | | | | | | | 38,461,696 | |
| | |
Health Care - 10.4% | | | | | | | | |
| | |
McKesson Corp. | | | 31,439 | | | | 4,181,387 | |
| | | | | | | | |
| | | Shares | | | Value | |
| | |
Premier, Inc., Class A*,1 | | | 159,454 | | | | $5,195,012 | |
| | |
UnitedHealth Group, Inc. | | | 23,306 | | | | 5,889,426 | |
| | |
Total Health Care | | | | | | | 15,265,825 | |
| | |
Industrials - 6.1% | | | | | | | | |
| | |
Air Transport Services Group, Inc.* | | | 140,412 | | | | 2,936,015 | |
| | |
GrafTech International Ltd. | | | 262,427 | | | | 3,170,118 | |
| | |
Harsco Corp.* | | | 138,745 | | | | 2,812,361 | |
| | |
Total Industrials | | | | | | | 8,918,494 | |
| |
Information Technology - 9.6% | | | | | |
| | |
CDK Global, Inc. | | | 78,464 | | | | 3,965,571 | |
| | |
NCR Corp.*,1 | | | 153,892 | | | | 4,495,185 | |
| | |
Sabre Corp. | | | 236,331 | | | | 5,549,052 | |
| | |
Total Information Technology | | | | | | | 14,009,808 | |
| | |
Utilities - 2.6% | | | | | | | | |
| | |
AES Corp. | | | 219,722 | | | | 3,746,260 | |
| | |
Total Common Stocks
(Cost $131,847,173) | | | | | | | 143,514,000 | |
| | |
Short-Term Investments - 1.7% | | | | | | | | |
| |
Other Investment Companies - 1.7% | | | | | |
| | |
Dreyfus Government Cash Management Fund, Institutional Shares, 1.73%2 | | | 831,511 | | | | 831,511 | |
| | |
Dreyfus Institutional Preferred Government Money Market Fund, Institutional Shares, 1.77%2 | | | 831,511 | | | | 831,511 | |
| | |
JPMorgan U.S. Government Money Market Fund, IM Shares, 1.75%2 | | | 856,709 | | | | 856,709 | |
| | |
Total Short-Term Investments
(Cost $2,519,731) | | | | | | | 2,519,731 | |
| | |
Total Investments - 99.8%
(Cost $134,366,904) | | | | | | | 146,033,731 | |
| |
Other Assets, less Liabilities - 0.2% | | | | 334,408 | |
| | |
Net Assets - 100.0% | | | | | | $ | 146,368,139 | |
| * | Non-income producing security. |
| 1 | Some of these securities, amounting to $14,351,760 or 9.8% of net assets, were out on loan to various borrowers and are collateralized by various U.S. Treasury Obligations. See Note 4 of Notes to Financial Statements. |
| 2 | Yield shown represents the October 31, 2019, seven day average yield, which refers to the sum of the previous seven days’ dividends paid, expressed as an annual percentage. |
The accompanying notes are an integral part of these financial statements.
15
|
AMG River Road Focused Absolute Value Fund Schedule of Portfolio Investments(continued) |
The following table summarizes the inputs used to value the Fund’s investments by the fair value hierarchy levels as of October 31, 2019:
| | | | | | | | | | | | | | | | |
| | | Level 1 | | | Level 2 | | | Level 3 | | | Total | |
Investments in Securities | | | | | | | | | | | | | | | | |
| | | | |
Common Stocks† | | | $143,514,000 | | | | — | | | | — | | | | $143,514,000 | |
| | | | |
Short-Term Investments | | | | | | | | | | | | | | | | |
| | | | |
Other Investment Companies | | | 2,519,731 | | | | — | | | | — | | | | 2,519,731 | |
| | | | | | | | | | | | | | | | |
Total Investments in Securities | | | $146,033,731 | | | | — | | | | — | | | | $146,033,731 | |
| | | | | | | | | | | | | | | | |
| † | All common stocks held in the Fund are Level 1 securities. For a detailed breakout of common stocks by major industry classification, please refer to the Fund’s Schedule of Portfolio Investments. |
For the fiscal year ended October 31, 2019, there were no transfers in or out of Level 3.
The accompanying notes are an integral part of these financial statements.
16
|
AMG Managers Montag & Caldwell Growth Fund Portfolio Manager’s Comments(unaudited) |
| | | | | | | | |
For the fiscal year ended October 31, 2019, the AMG Managers Montag & Caldwell Growth Fund (the “Fund”) Class N shares returned 18.29%, compared to the 17.10% return for its benchmark, the Russell 1000® Growth Index. The Fund is managed using fundamental valuation techniques that focus on a company’s future earnings and dividend growth rates. The process is primarilybottom-up and utilizes a present valuation model in which the current price of the stock is related to the risk-adjusted present value of the company’s estimated future earnings stream. The Fund seeks to invest in growth stocks selling at a discount to estimates of fair value and at a time when relativeearnings-per-share growth is visible for the intermediate term. MARKET ENVIRONMENT U.S. stock indices experienced positive returns for the twelve months ended October 31, 2019, with a bias toward large cap stocks. The Russell 1000® Index (large cap) was up 14.15%, the Russell Midcap® Index (mid cap) was up 13.72%, and the Russell 2000® Index (small cap) was up 4.90% for the 12 months ended October 31, 2019. Among all capitalization categories, growth was the dominant theme. Technology and discretionary stocks led the way, resulting in unprecedented concentrations of position size and sector allocation for technology stocks in particular. For the full 12 months, growth outperformed value in each size segment, with the widest spread in returns between mid cap growth and mid cap value (18.93% vs. 10.08%, respectively). The performance advantage of growth over value in the large and small cap areas was also meaningful, though less pronounced than in mid cap. PERFORMANCE REVIEW The reporting period began with increased volatility in the equity markets as investors became increasingly concerned that both the Trump administration and the U.S. Federal Reserve (the | | | | Fed) might make policy mistakes that could push an otherwise healthy economy into recession. The Fund’s discipline, which emphasizes quality and earnings consistency, in addition to avoiding overpaying for growth stocks, held up relatively well. The Fund’s bias toward high quality issues and more consistent, secular growth stocks tends to outperform in periods like these, as investors seek safety in the strongest balance sheets and the most assured earnings and cash flow streams. In the first and second quarters of 2019 we had a major reversal in policy by the Fed. The “triple pivot” of halting rate hikes (and ultimately lowering short-term rates), winding down quantitative tightening sooner than anticipated, and potentially allowing the economy and inflation to “run hot,” combined with growing optimism about a U.S.-China trade deal, helped propel the market higher. During the first calendar quarter of 2019, the Fund produced a very strong absolute return, but trailed the growth index primarily due to an underweight, or absence of, technology and communication services stocks. During the June quarter, the Fund outperformed the growth index with strong stock selection in most sectors, but in particular technology, seeming to indicate the market’s preference for the combination of quality, earnings growth, and attractive valuation. During this period, investors were blindsided in early May when trade negotiations between the United States and China unraveled and President Trump raised the level of tariffs from 10% to 25% on $200 billion worth of Chinese goods, as well as ordering preparations for tariffs on the remaining $300 billion of Chinese imports not being taxed. The Fund’s third quarter performance essentially matched the growth index. The Fund benefited from strong stock selection in financials, health care, and communication services while stock selection in staples and industrials was a modest drag. While the gains were modest during the third quarter of 2019, they masked some significant bouts of choppiness and volatility, particularly in August as the market | | | | grappled with an inverted yield curve (historically a reliable recession indicator) and theback-and-forth trade spat between the Trump administration and China. The final month of the performance period saw better absolute returns as investors felt more optimistic with regard to lower interest rates and progress on the U.S.-China trade negotiations. Stock selection was strong in the industrial and communication services sectors. Staples and technology holdings detracted from the Fund’s returns. OUTLOOK We expect S&P 500® Index profits to grow modestly, likely low single digits, in 2019 and 2020. Similar to what was experienced in both the first and second quarters, third quarter 2019 earnings are projected to be down3%-4% versus theyear-ago period, reflecting slower global growth. Should we see a repeat of recent history with actual results coming in better than initial projections, it is possible that third quarter profits end up flat to slightly positive by the time reporting season winds down. Earnings growth is expected to resume in the fourth quarter and in 2020. That said, current estimates implying approximately 10% growth next year seem too high to us given the current macroeconomic backdrop. We forecast something closer to 5% growth in earnings next year. This could limit near-term gains in the market as investors continue to adjust their expectations. On a positive note, accommodative central banks, as well as are-opening of trade talks with China, should keep a floor under stocks. Netting it all out, we continue to see a narrow and volatile trading range for the time being, albeit with an upward bias as the business cycle continues to expand at a moderate pace. The views expressed represent the opinions of Montag & Caldwell LLC, as of October 31, 2019, and are not intended as a forecast or guarantee of future results and are subject to change without notice. |
17
|
AMG Managers Montag & Caldwell Growth Fund Portfolio Manager’s Comments(continued) |
CUMULATIVE TOTAL RETURN PERFORMANCE
AMG Managers Montag & Caldwell Growth Fund’s cumulative total return is based on the daily change in net asset value (NAV), and assumes that all dividends and distributions were reinvested. The graph compares a hypothetical $10,000 investment made in the AMG Managers Montag & Caldwell Growth Fund’s Class N shares on October 31, 2009, to a $10,000 investment made in the Russell 1000® Growth Index for the same time period. The graph and table do not reflect the deduction of taxes that a shareholder would pay on a Fund distribution or redemption of shares. The listed returns for the Fund are net of expenses and the returns for the index exclude expenses. Total returns would have been lower had certain expenses not been reduced.
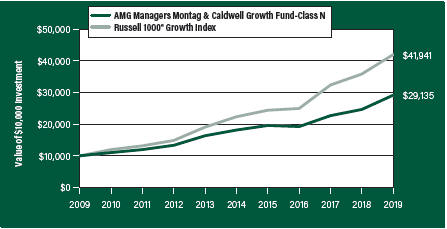
The table below shows the average annual total returns for the AMG Managers Montag & Caldwell Growth Fund and the Russell 1000® Growth Index for the same time periods ended October 31, 2019.
| | | | | | | | | | | | |
Average Annual Total Returns1 | | One Year | | | Five
Years | | | Ten Years | |
AMG Managers Montag & Caldwell Growth Fund2, 3, 4 | |
| | | |
Class N | | | 18.29 | % | | | 9.95 | % | | | 11.29 | % |
| | | |
Class I | | | 18.49 | % | | | 10.17 | % | | | 11.54 | % |
| | | |
Russell 1000® Growth Index5 | | | 17.10 | % | | | 13.43 | % | | | 15.41 | % |
The performance data shown represents past performance. Past performance is not a guarantee of future results. Current performance may be lower or higher than the performance data quoted. The investment return and principal value of an investment will fluctuate so that an investor’s shares, when redeemed, may be worth more or less than their original cost.
Investors should carefully consider the Fund’s investment objectives, risks, charges and expenses before investing. For performance information through the most recent month end, current net asset values per share for the Fund and other information, please call 800.548.4539 or visit our website at amgfunds.com for a free prospectus. Read it carefully before investing or sending money.
Distributed by AMG Distributors, Inc., member FINRA/SIPC.
| 1 | Total return equals income yield plus share price change and assumes reinvestment of all dividends and capital gain distributions. Returns are net of fees and may reflect offsets of Fund expenses as described in the prospectus. No adjustment has been made for taxes payable by shareholders on their reinvested dividends and capital gain distributions. Returns for periods greater than one year are annualized. The listed returns on the Fund are net of expenses and based on the published NAV as of October 31, 2019. All returns are in U.S. dollars ($). |
| | |
| | | 2 The Fund invests in growth stocks, which may be more sensitive to market movements because their prices tend to reflect future investor expectations rather than just current profits. Growth stocks may underperform value stocks during given periods. 3 Investments in international securities are subject to certain risks of overseas investing including currency fluctuations and changes in political and economic conditions, which could result in significant market fluctuations. These risks are magnified in emerging markets. 4 Companies that are in similar businesses may be similarly affected by particular economic or market events; to the extent the Fund has substantial holdings within a particular sector, the risks associated with that sector increase. 5 The Russell 1000® Growth Index is a market capitalization weighted index that measures the performance of those Russell 1000® companies with higherprice-to-book ratios and higher forecasted growth values. Unlike the Fund, the Russell 1000® Growth Index is unmanaged, is not available for investment and does not incur expenses. The Russell Indices are a trademark of the London Stock Exchange Group companies. Not FDIC insured, nor bank guaranteed. May lose value. |
| | | |
18
|
AMG Managers Montag & Caldwell Growth Fund Fund Snapshots(unaudited) October 31, 2019 |
PORTFOLIO BREAKDOWN
| | |
| Sector | | % of Net Assets |
Information Technology | | 34.2 |
| | |
Health Care | | 18.2 |
| | |
Communication Services | | 11.8 |
| | |
Consumer Discretionary | | 10.9 |
| | |
Financials | | 6.8 |
| | |
Materials | | 5.1 |
| | |
Consumer Staples | | 4.6 |
| | |
Industrials | | 4.6 |
| | |
Real Estate | | 1.4 |
| | |
Short-Term Investments | | 2.5 |
| | |
Other Assets Less Liabilities | | (0.1) |
TOP TEN HOLDINGS
| | |
| Security Name | | % of Net Assets |
Microsoft Corp. | | 5.5 |
| | |
Alphabet, Inc., Class A | | 4.9 |
| | |
Visa, Inc., Class A | | 4.6 |
| | |
Facebook, Inc., Class A | | 4.6 |
| | |
UnitedHealth Group, Inc. | | 4.3 |
| | |
Thermo Fisher Scientific, Inc. | | 4.3 |
| | |
Apple, Inc. | | 4.2 |
| | |
Abbott Laboratories | | 3.8 |
| | |
Lowe’s Cos., Inc. | | 3.7 |
| | |
S&P Global, Inc. | | 3.5 |
| | | |
| | |
Top Ten as a Group | | 43.4 |
| | |
Because a fund’s strategy may result in multiple investments in particular sectors of the economy, its performance may depend on the performance of those sectors and may fluctuate more widely than investments diversified across more sectors. For additional information on these and other risk considerations, please see the Fund’s prospectus.
Any sectors, industries, or securities discussed should not be perceived as investment recommendations. Mention of a specific security should not be considered a recommendation to buy or solicitation to sell that security. Specific securities mentioned in this report may have been sold from the Fund’s portfolio of investments by the time you receive this report.
19
|
AMG Managers Montag & Caldwell Growth Fund Schedule of Portfolio Investments October 31, 2019 |
| | | | | | | | |
| | | Shares | | | Value | |
| | |
Common Stocks - 97.6% | | | | | | | | |
| |
Communication Services - 11.8% | | | | | |
| | |
Activision Blizzard, Inc. | | | 204,000 | | | $ | 11,430,120 | |
| | |
Alphabet, Inc., Class A* | | | 19,331 | | | | 24,333,863 | |
| | |
Facebook, Inc., Class A* | | | 118,596 | | | | 22,728,923 | |
| | |
Total Communication Services | | | | | | | 58,492,906 | |
| |
Consumer Discretionary - 10.9% | | | | | |
| | |
Booking Holdings, Inc.* | | | 4,875 | | | | 9,987,754 | |
| | |
Dollar Tree, Inc.* | | | 73,680 | | | | 8,134,272 | |
| | |
Lowe’s Cos., Inc. | | | 163,300 | | | | 18,225,913 | |
| | |
Ross Stores, Inc. | | | 104,200 | | | | 11,427,614 | |
| | |
Ulta Beauty, Inc.* | | | 26,567 | | | | 6,194,096 | |
| | |
Total Consumer Discretionary | | | | | | | 53,969,649 | |
| | |
Consumer Staples - 4.6% | | | | | | | | |
| | |
Mondelez International, Inc., Class A | | | 279,500 | | | | 14,659,775 | |
| | |
Monster Beverage Corp.* | | | 149,181 | | | | 8,373,530 | |
| | |
Total Consumer Staples | | | | | | | 23,033,305 | |
| | |
Financials - 6.8% | | | | | | | | |
| | |
Intercontinental Exchange, Inc. | | | 176,735 | | | | 16,669,645 | |
| | |
S&P Global, Inc. | | | 66,263 | | | | 17,095,192 | |
| | |
Total Financials | | | | | | | 33,764,837 | |
| | |
Health Care - 18.2% | | | | | | | | |
| | |
Abbott Laboratories | | | 224,800 | | | | 18,795,528 | |
| | |
Becton Dickinson & Co. | | | 62,426 | | | | 15,981,056 | |
| | |
Edwards Lifesciences Corp.* | | | 52,131 | | | | 12,426,988 | |
| | |
Thermo Fisher Scientific, Inc. | | | 70,543 | | | | 21,302,575 | |
| | |
UnitedHealth Group, Inc. | | | 84,905 | | | | 21,455,493 | |
| | |
Total Health Care | | | | | | | 89,961,640 | |
| | |
Industrials - 4.6% | | | | | | | | |
| | |
Honeywell International, Inc. | | | 82,584 | | | | 14,264,734 | |
| | |
IHS Markit, Ltd. (United
Kingdom)*,1 | | | 122,600 | | | | 8,584,452 | |
| | |
Total Industrials | | | | | | | 22,849,186 | |
| |
Information Technology - 34.2% | | | | | |
| | |
Accenture PLC, Class A (Ireland) | | | 52,563 | | | | 9,746,231 | |
| | | | | | | | |
| | | Shares | | | Value | |
| | |
Amphenol Corp., Class A | | | 136,100 | | | | $13,654,913 | |
| | |
Apple, Inc. | | | 84,271 | | | | 20,963,254 | |
| | |
Arista Networks, Inc.* | | | 47,493 | | | | 11,615,363 | |
| | |
Fidelity National Information Services, Inc. | | | 125,100 | | | | 16,483,176 | |
| | |
FleetCor Technologies, Inc.* | | | 50,275 | | | | 14,791,910 | |
| | |
Mastercard, Inc., Class A | | | 55,892 | | | | 15,471,465 | |
| | |
Microsoft Corp. | | | 190,800 | | | | 27,354,996 | |
| | |
salesforce.com, Inc.* | | | 105,790 | | | | 16,555,077 | |
| | |
Visa, Inc., Class A | | | 127,202 | | | | 22,751,350 | |
| | |
Total Information Technology | | | | | | | 169,387,735 | |
| | |
Materials - 5.1% | | | | | | | | |
| | |
Air Products & Chemicals, Inc. | | | 57,366 | | | | 12,233,873 | |
| | |
The Sherwin-Williams Co. | | | 23,232 | | | | 13,296,138 | |
| | |
Total Materials | | | | | | | 25,530,011 | |
| | |
Real Estate - 1.4% | | | | | | | | |
| | |
American Tower Corp., REIT | | | 31,032 | | | | 6,767,459 | |
| | |
Total Common Stocks
(Cost $300,981,110) | | | | | | | 483,756,728 | |
| |
Short-Term Investments - 2.5% | | | | | |
| |
Other Investment Companies - 2.5% | | | | | |
| | |
Dreyfus Government Cash Management Fund, Institutional Shares, 1.73%2 | | | 4,140,347 | | | | 4,140,347 | |
| | |
Dreyfus Institutional Preferred Government Money Market Fund, Institutional Shares, 1.77%2 | | | 4,140,347 | | | | 4,140,347 | |
| | |
JPMorgan U.S. Government Money Market Fund, IM Shares, 1.75%2 | | | 4,265,812 | | | | 4,265,812 | |
| | |
Total Short-Term Investments
(Cost $12,546,506) | | | | | | | 12,546,506 | |
| | |
Total Investments - 100.1%
(Cost $313,527,616) | | | | | | | 496,303,234 | |
| |
Other Assets, less Liabilities - (0.1)% | | | | (725,348 | ) |
| | |
Net Assets - 100.0% | | | | | | | $495,577,886 | |
| * | Non-income producing security. |
| 1 | Some of these securities, amounting to $3,674,230 or 0.7% of net assets, were out on loan to various borrowers and are collateralized by various U.S. Treasury Obligations. See Note 4 of Notes to Financial Statements. |
| 2 | Yield shown represents the October 31, 2019, seven day average yield, which refers to the sum of the previous seven days’ dividends paid, expressed as an annual percentage. |
REIT Real Estate Investment Trust
The accompanying notes are an integral part of these financial statements.
20
|
AMG Managers Montag & Caldwell Growth Fund Schedule of Portfolio Investments(continued) |
The following table summarizes the inputs used to value the Fund’s investments by the fair value hierarchy levels as of October 31, 2019:
| | | | | | | | | | | | | | | | |
| | | Level 1 | | | Level 2 | | | Level 3 | | | Total | |
Investments in Securities | | | | | | | | | | | | | | | | |
| | | | |
Common Stocks† | | $ | 483,756,728 | | | | — | | | | — | | | $ | 483,756,728 | |
| | | | |
Short-Term Investments | | | | | | | | | | | | | | | | |
| | | | |
Other Investment Companies | | | 12,546,506 | | | | — | | | | — | | | | 12,546,506 | |
| | | | | | | | | | | | | | | | |
Total Investments in Securities | | $ | 496,303,234 | | | | — | | | | — | | | $ | 496,303,234 | |
| | | | | | | | | | | | | | | | |
| † | All common stocks held in the Fund are Level 1 securities. For a detailed breakout of common stocks by major industry classification, please refer to the Fund’s Schedule of Portfolio Investments. |
For the fiscal year ended October 31, 2019, there were no transfers in or out of Level 3.
The accompanying notes are an integral part of these financial statements.
21
|
AMG River Road Dividend All Cap Value Fund Portfolio Manager’s Comments(unaudited) |
| | | | | | | | |
OVERVIEW For the fiscal year ended October 31, 2019, the AMG River Road Dividend All Cap Value Fund (the “Fund”) Class N shares returned 10.11%, while the Russell 3000® Value Index returned 10.65%. MARKET AND PERFORMANCE REVIEW U.S. corporate earnings growth has been in a downtrend throughout 2019 as the impact of corporate tax reform fades, economic growth slows, and trade tensions with China ratchet up. High yielding stocks outperformed amid the decline in long-term interest rates. The industrial sector had the most significant positive impact on relative results in the period due to strong stock selection and an overweight allocation, while the information technology (IT) sector had the most significant negative impact on relative results due to weak stock selection and an underweight allocation. The two holdings with the largest positive contribution to the Fund’s total return were industrial distributor Fastenal Co. (FAST) and discount retailer Target Corp. (TGT). In Q1 2019, Fastenal reported strong daily sales growth of 13.1% for the quarter, marking seven consecutive quarters of double-digit growth. This strongtop-line growth drove strong operating leverage on SG&A costs, which offset significant gross margin compression caused by mix shift. The company grew its lower marginnon-fastener and national accounts businesses at much faster rates than the rest of the business, driving gross margin compression. We continue to believe that the company’s strategy of moving closer to its clients with onsite stores and vending machines makes it well positioned to continue taking market share. Target was among the top 10 holdings at the beginning of 2019 and returned 66% as of Q3 2019, making it the top contributor for the year by a wide margin. The company reported great results with comparable sales growth of 3.4% versus a very difficult comparison and strong margin expansion. The quarter marked the ninth consecutive quarter of positive comparable sales driven by 2.4% traffic growth, a 34% increase in digital sales, and market share gains across core merchandising categories.Same-day fulfillment services likein-store pickup,drive-up, and Shipt (Target’ssame-day delivery service) represented more thanone-third of digital sales, up from 20% last year, and are becoming the preferred fulfillment choice by customers as they offer speed, convenience, and reliability. This mix | | | | shift contributed to a 17% increase in operating profit assame-day fulfillment options leverage store infrastructure, technology, and labor costs. Additionally, return on invested capital improved 80 bps to 15% and the company reiterated its commitment to growing the dividend annually and returning excess cash to shareholders through repurchases. Following the company’s stellar results, we increased our assessed value by 25% and increased our overall conviction in the stock. We modestly reduced the position as the stock traded near our new assessed value in September. The two holdings with the lowest contribution to the Fund’s total return during the period were Marathon Petroleum Corp. (MPC), the largest independent petroleum product refining, marketing, retail, and transportation business in the United States, and Walgreens Boots Alliance, Inc. (WBA), the largest retail pharmacy chain in the U.S. and Europe. In October 2018, Marathon closed on its merger with Andeavor, making its new16-refinery network the largest in the United States, responsible for 15% of total domestic refining capacity. It announced strong results for Q3 2018 in November, reporting EBITDA (earnings before interest, tax, depreciation, and amortization) of $2B for the second consecutive quarter, and increased synergy estimates by $400M to $1.4B during its analyst day in early December. However, the company’s stock price declined alongside its refining peers during the quarter (despite only ~50% of its EBITDA coming from its refining segment) as concerns about the global economy grew. Even using conservative estimates, we continue to view the company as an attractive investment and maintained the position during the quarter. In January 2019, WBA reported weak results with a (3.2%) decline in retail sales comps in the United States. A portion of the weak retail sales was self-inflicted, as managementde-emphasized certain products like tobacco and lower margin items. The company continued to aggressively repurchase shares in the quarter, resulting in a (1.2%) reduction of diluted shares outstanding. Management reaffirmed its 2019 outlook for 7% to 12% EPS (earnings per share) growth, including $3B in share repurchases. However, in February CVS reported weak results and warned about headwinds facing its pharmacy business for 2019, including lower branded drug inflation, fewer generics, and heightened reimbursement pricing pressure. Later that month, Walgreen’s CFO commented that the company was seeing similar headwinds but it was | | | | not until the first week of April that the company management abandoned its earlier 7% to 12% 2019 EPS growth guidance, updating expectations to flat year over year. Despite the headwinds to the business, we believe that management will wisely use the substantial free cash flow the business generates to continue growing its dividend, repurchasing shares, and growing the business. POSITIONING AND OUTLOOK Based on average weight, the Fund is significantly overweight in industrials and energy and significantly underweight in health care and financials. The overweight to the industrial sector versus the Russell 3000® Value benchmark was notably reduced following the elimination of four holdings in that sector. Despite the elimination of three holdings, the energy sector ended the period as the Fund’s largest overweight versus the benchmark due to the addition of two new positions to the Fund and the reduction in the benchmark weight in that sector. The underweight in health care was decreased, primarily due to the addition of two new holdings. Financials decreased their underweight following two additions, in that sector. Slower global economic growth and declining interest rates remain our base expectation for the remainder of the year. However unlikely it may be, concerns that the economy is rolling over and a recession is possible before the 2020 election are legitimate. In addition to trade, Brexit, and the impeachment inquiry, we will be paying very close attention to consumer sentiment and our valuation inputs. In our view, there is no reason to expect a surge in earnings and economic growth in Q4 2019, and U.S. equity markets will be increasingly captive to trade discussions and political outcomes for the remainder of 2019. While politics will likely dictate the absolute direction of the market in the coming months, we believe that the near-term relative outlook for the Fund is largely shaped by any shift in the yield curve. We believe that the combination of an inverted yield curve and slowing economic growth is supportive of a defensive, income-oriented equity strategy like ours. The views expressed represent the opinions of River Road Asset Management LLC, as of October 31, 2019, and are not intended as a forecast or guarantee of future results and are subject to change without notice. |
22
|
AMG River Road Dividend All Cap Value Fund Portfolio Manager’s Comments(continued) |
CUMULATIVE TOTAL RETURN PERFORMANCE
AMG River Road Dividend All Cap Value Fund’s cumulative total return is based on the daily change in net asset value (NAV), and assumes that all dividends and distributions were reinvested. The graph compares a hypothetical $10,000 investment made in the AMG River Road Dividend All Cap Value Fund’s Class N shares on October 31, 2009, to a $10,000 investment made in the Russell 3000® Value Index for the same time period. The graph and table do not reflect the deduction of taxes that a shareholder would pay on a Fund distribution or redemption of shares. The listed returns for the Fund are net of expenses and the returns for the index exclude expenses. Total returns would have been lower had certain expenses not been reduced.
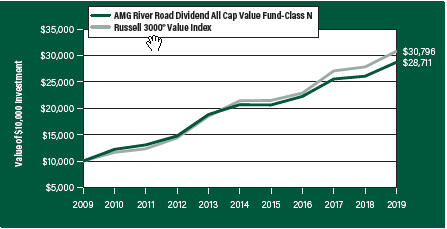
The table below shows the average annual total returns for the AMG River Road Dividend All Cap Value Fund and the Russell 3000® Value Index for the same time periods ended October 31, 2019.
| | | | | | | | | | | | | | | | | | | | |
| Average Annual Total Returns1 | | One
Year | | | Five
Years | | | Ten
Years | | | Since
Inception | | | Inception
Date | |
AMG River Road Dividend All Cap Value Fund2, 3, 4, 5, 6, 7, 8, 9 | |
| | | | | |
Class N | | | 10.11 | % | | | 6.79 | % | | | 11.12 | % | | | 8.00 | % | | | 06/28/05 | |
| | | | | |
Class I | | | 10.32 | % | | | 7.05 | % | | | 11.41 | % | | | 6.69 | % | | | 06/28/07 | |
| | | | | |
Class Z | | | 10.37 | % | | | — | | | | — | | | | 6.35 | % | | | 09/29/17 | |
| | | | | |
Russell 3000® Value Index10 | | | 10.65 | % | | | 7.52 | % | | | 11.91 | % | | | 7.33 | % | | | 06/28/05 | † |
The performance data shown represents past performance. Past performance is not a guarantee of future results. Current performance may be lower or higher than the performance data quoted. The investment return and principal value of an investment will fluctuate so that an investor’s shares, when redeemed, may be worth more or less than their original cost.
Investors should carefully consider the Fund’s investment objectives, risks, charges and expenses before investing. For performance information through the most recent month end, current net asset values per share for the Fund and other information, please call 800.548.4539 or visit our website at amgfunds.com for a free prospectus. Read it carefully before investing or sending money.
Distributed by AMG Distributors, Inc., member FINRA/SIPC.
| † | Date reflects the inception date of the Fund, not the index. |
| 1 | Total return equals income yield plus share price change and assumes reinvestment of all dividends and |
| | |
| | | capital gain distributions. Returns are net of fees and may reflect offsets of Fund expenses as described in the prospectus. No adjustment has been made for taxes payable by shareholders on their reinvested dividends and capital gain distributions. Returns for periods greater than one year are annualized. The listed returns on the Fund are net of expenses and based on the published NAV as of October 31, 2019. All returns are in U.S. dollars ($). 2 Investing in Publicly Traded Partnerships (PTPs) (including master limited partnerships) involves risks in addition to those typically associated with publicly traded companies. PTPs are exposed to the risks of their underlying assets, which in many cases includes the same types of risks as energy and natural resources companies. PTPs are also subject to capital market risks. PTPs may lose their partnership status for tax purposes. The Fund’s status as a regulated investment company may be jeopardized if it does not appropriately limit such investments in PTPs or if such investments are recharacterized for tax purposes. 3 An issuer of a security may be unwilling or unable to pay income on a security. Common stocks do not assure dividend payments and are paid only when declared by an issuer’s board of directors. 4 Investments in international securities are subject to certain risks of overseas investing including currency fluctuations and changes in political and economic conditions, which could result in significant market fluctuations. These risks are magnified in emerging markets. 5 The Fund is subject to risks associated with investments inmid-capitalization companies such as greater price volatility, lower trading volume, and less liquidity than the stocks of larger, more established companies. |
| | | 6 The Fund is subject to special risk considerations similar to those associated with the direct ownership of real estate. Real estate valuations may be subject to factors such as changing general and local economic, financial, competitive, and environmental conditions. 7 The Fund is subject to risks associated with investments in small-capitalization companies, such as erratic earnings patterns, competitive conditions, limited earnings history and a reliance on one or a limited number of products. 8 The Fund invests in value stocks, which may perform differently from the market as a whole and may be undervalued by the market for a long period of time. 9 Companies that are in similar businesses may be similarly affected by particular economic or market events; to the extent the Fund has substantial holdings within a particular sector, the risks associated with that sector increase. 10 The Russell 3000®Value Index measures the performance of the broad value segment of the U.S. equity universe. It includes those Russell 3000® |
23
|
AMG River Road Dividend All Cap Value Fund Portfolio Manager’s Comments(continued) |
| | | | | | | | |
companies with lowerprice-to-book ratios and lower forecasted growth values. Unlike the Fund, the Russell 3000® Value Index is unmanaged, is not | | | | available for investment and does not incur expenses. The Russell Indices are a trademark of the London Stock Exchange Group companies. | | | | Not FDIC insured, nor bank guaranteed. May lose value. |
24
|
AMG River Road Dividend All Cap Value Fund Fund Snapshots(unaudited) October 31, 2019 |
PORTFOLIO BREAKDOWN
| | |
| Sector | | % of Net Assets |
Financials | | 18.1 |
| | |
Energy | | 14.1 |
| | |
Industrials | | 11.3 |
| | |
Communication Services | | 11.0 |
| | |
Consumer Staples | | 7.8 |
| | |
Information Technology | | 7.8 |
| | |
Consumer Discretionary | | 7.6 |
| | |
Real Estate | | 6.5 |
| | |
Health Care | | 6.4 |
| | |
Utilities | | 4.2 |
| | |
Materials | | 3.6 |
| | |
Short-Term Investments | | 3.5 |
| | |
Other Assets Less Liabilities | | (1.9) |
TOP TEN HOLDINGS
| | |
| Security Name | | % of Net Assets |
Target Corp. | | 3.4 |
| | |
BB&T Corp. | | 3.2 |
| | |
U.S. Bancorp | | 3.1 |
| | |
Kinder Morgan, Inc. | | 2.9 |
| | |
Corning, Inc. | | 2.8 |
| | |
Verizon Communications, Inc. | | 2.8 |
| | |
Comcast Corp., Class A | | 2.5 |
| | |
Aircastle, Ltd. | | 2.5 |
| | |
Cisco Systems, Inc. | | 2.5 |
| | |
Bristol-Myers Squibb Co. | | 2.5 |
| | | |
| | |
Top Ten as a Group | | 28.2 |
| | |
Because a fund’s strategy may result in multiple investments in particular sectors of the economy, its performance may depend on the performance of those sectors and may fluctuate more widely than investments diversified across more sectors. For additional information on these and other risk considerations, please see the Fund’s prospectus.
Any sectors, industries, or securities discussed should not be perceived as investment recommendations. Mention of a specific security should not be considered a recommendation to buy or solicitation to sell that security. Specific securities mentioned in this report may have been sold from the Fund’s portfolio of investments by the time you receive this report.
25
|
AMG River Road Dividend All Cap Value Fund Schedule of Portfolio Investments October 31, 2019 |
| | | | | | | | |
| | | Shares | | | Value | |
| | |
Common Stocks - 98.4% | | | | | | | | |
| |
Communication Services - 11.0% | | | | | |
| | |
Cinemark Holdings, Inc.1 | | | 285,457 | | | $ | 10,447,726 | |
| | |
Comcast Corp., Class A | | | 346,025 | | | | 15,508,840 | |
| | |
The Interpublic Group of Cos., Inc. | | | 363,244 | | | | 7,900,557 | |
| | |
Meredith Corp. | | | 106,761 | | | | 4,024,890 | |
| | |
Omnicom Group, Inc.1 | | | 161,468 | | | | 12,463,715 | |
| | |
Verizon Communications, Inc. | | | 281,391 | | | | 17,015,714 | |
| | |
Total Communication Services | | | | | | | 67,361,442 | |
| |
Consumer Discretionary - 7.6% | | | | | |
| | |
Cedar Fair LP, MLP | | | 186,773 | | | | 10,416,330 | |
| | |
Extended Stay America, Inc. | | | 607,779 | | | | 8,636,540 | |
| | |
Six Flags Entertainment Corp. | | | 147,887 | | | | 6,239,353 | |
| | |
Target Corp. | | | 196,686 | | | | 21,027,700 | |
| | |
Total Consumer Discretionary | | | | | | | 46,319,923 | |
| | |
Consumer Staples - 7.8% | | | | | | | | |
| | |
Kimberly-Clark Corp. | | | 109,950 | | | | 14,610,156 | |
| | |
PepsiCo, Inc. | | | 86,186 | | | | 11,822,134 | |
| | |
Unilever PLC, Sponsored ADR (United Kingdom) | | | 201,148 | | | | 12,091,006 | |
| | |
Walgreens Boots Alliance, Inc. | | | 113,953 | | | | 6,242,345 | |
| | |
Walmart, Inc. | | | 24,790 | | | | 2,906,876 | |
| | |
Total Consumer Staples | | | | | | | 47,672,517 | |
| | |
Energy - 14.1% | | | | | | | | |
| | |
Chevron Corp. | | | 57,709 | | | | 6,702,323 | |
| | |
Enterprise Products Partners LP, MLP | | | 542,931 | | | | 14,132,494 | |
| | |
Exxon Mobil Corp. | | | 124,700 | | | | 8,425,979 | |
| | |
Kinder Morgan, Inc. | | | 887,549 | | | | 17,733,229 | |
| | |
Magellan Midstream Partners LP, MLP1 | | | 183,618 | | | | 11,443,074 | |
| | |
Marathon Petroleum Corp. | | | 165,288 | | | | 10,570,167 | |
| | |
Valero Energy Corp. | | | 76,867 | | | | 7,454,562 | |
| | |
The Williams Cos., Inc. | | | 460,877 | | | | 10,282,166 | |
| | |
Total Energy | | | | | | | 86,743,994 | |
| | |
Financials - 18.1% | | | | | | | | |
| | |
Axis Capital Holdings, Ltd. (Bermuda) | | | 163,173 | | | | 9,697,371 | |
| | |
BB&T Corp.1 | | | 369,116 | | | | 19,581,604 | |
| | |
CNA Financial Corp. | | | 197,935 | | | | 8,875,405 | |
| | |
Fidelity National Financial, Inc. | | | 298,340 | | | | 13,675,906 | |
| | |
Lazard, Ltd., Class A1 | | | 223,115 | | | | 8,328,883 | |
| | |
The PNC Financial Services Group, Inc. | | | 87,547 | | | | 12,843,145 | |
| | |
Stock Yards Bancorp, Inc. | | | 110,122 | | | | 4,398,273 | |
| | |
U.S. Bancorp | | | 329,979 | | | | 18,815,402 | |
| | |
Wells Fargo & Co. | | | 125,595 | | | | 6,484,470 | |
| | | | | | | | |
| | | Shares | | | Value | |
| | |
WesBanco, Inc.1 | | | 223,048 | | | $ | 8,384,374 | |
| | |
Total Financials | | | | | | | 111,084,833 | |
| | |
Health Care - 6.4% | | | | | | | | |
| | |
AbbVie, Inc. | | | 120,288 | | | | 9,568,910 | |
| | |
Amgen, Inc. | | | 67,199 | | | | 14,330,187 | |
| | |
Bristol-Myers Squibb Co. | | | 265,487 | | | | 15,230,989 | |
| | |
Total Health Care | | | | | | | 39,130,086 | |
| | |
Industrials - 11.3% | | | | | | | | |
| | |
Aircastle, Ltd.1 | | | 566,291 | | | | 15,414,441 | |
| | |
Fastenal Co.1 | | | 413,907 | | | | 14,875,818 | |
| | |
Illinois Tool Works, Inc. | | | 66,731 | | | | 11,249,512 | |
| | |
KAR Auction Services, Inc.1 | | | 189,888 | | | | 4,720,616 | |
| | |
MSC Industrial Direct Co., Inc., Class A1 | | | 42,462 | | | | 3,108,643 | |
| | |
Thomson Reuters Corp. (Canada) | | | 108,045 | | | | 7,267,107 | |
| | |
United Parcel Service, Inc., Class B | | | 112,315 | | | | 12,935,318 | |
| | |
Total Industrials | | | | | | | 69,571,455 | |
| |
Information Technology - 7.8% | | | | | |
| | |
Cisco Systems, Inc. | | | 323,473 | | | | 15,368,202 | |
| | |
Corning, Inc.1 | | | 578,939 | | | | 17,153,963 | |
| | |
Intel Corp. | | | 112,486 | | | | 6,358,834 | |
| | |
QUALCOMM, Inc. | | | 110,789 | | | | 8,911,867 | |
| | |
Total Information Technology | | | | | | | 47,792,866 | |
| | |
Materials - 3.6% | | | | | | | | |
| | |
Linde PLC (United Kingdom) | | | 22,024 | | | | 4,368,460 | |
| | |
LyondellBasell Industries NV, Class A | | | 117,884 | | | | 10,574,195 | |
| | |
RPM International, Inc. | | | 94,417 | | | | 6,838,623 | |
| | |
Total Materials | | | | | | | 21,781,278 | |
| | |
Real Estate - 6.5% | | | | | | | | |
| | |
Iron Mountain, Inc., REIT1 | | | 436,878 | | | | 14,329,598 | |
| | |
Ryman Hospitality Properties, Inc., REIT | | | 91,217 | | | | 7,677,735 | |
| | |
Sabra Health Care REIT, Inc.1 | | | 294,480 | | | | 7,244,208 | |
| | |
Ventas, Inc., REIT | | | 164,091 | | | | 10,682,324 | |
| | |
Total Real Estate | | | | | | | 39,933,865 | |
| | |
Utilities - 4.2% | | | | | | | | |
| | |
AES Corp. | | | 631,079 | | | | 10,759,897 | |
| | |
Dominion Resources, Inc. | | | 181,116 | | | | 14,951,126 | |
| | |
Total Utilities | | | | | | | 25,711,023 | |
| | |
Total Common Stocks
(Cost $460,446,612) | | | | | | | 603,103,282 | |
The accompanying notes are an integral part of these financial statements.
26
|
AMG River Road Dividend All Cap Value Fund Schedule of Portfolio Investments(continued) |
| | | | | | | | |
| | | Principal
Amount | | | Value | |
| | |
Short-Term Investments - 3.5% | | | | | | | | |
| |
Joint Repurchase Agreements - 1.9%2 | | | | | |
| | |
Cantor Fitzgerald Securities, Inc., dated 10/31/19, due 11/01/19, 1.750% total to be received $2,775,398 (collateralized by various U.S. Government Agency Obligations and U.S. Treasuries, 0.000% - 9.000%, 11/25/19 - 10/20/68, totaling $2,830,882) | | $ | 2,775,263 | | | | $2,775,263 | |
| | |
Citigroup Global Markets, Inc., dated 10/31/19, due 11/01/19, 1.740% total to be received $2,775,397 (collateralized by various U.S. Government Agency Obligations and U.S. Treasuries, 2.500% - 8.000%, 12/01/20 - 01/01/59, totaling $2,830,768) | | | 2,775,263 | | | | 2,775,263 | |
| | |
Credit Suisse AG, dated 10/31/19, due 11/01/19, 1.730% total to be received $583,670 (collateralized by various U.S. Treasuries, 0.125% - 3.125%, 11/15/22 - 05/15/47, totaling $595,315) | | | 583,642 | | | | 583,642 | |
| | |
Daiwa Capital Markets America, dated 10/31/19, due 11/01/19, 1.750% total to be received $2,775,398 (collateralized by various U.S. Government Agency Obligations and U.S. Treasuries, 0.000% - 6.500%, 11/21/19 - 10/20/49, totaling $2,830,768) | | | 2,775,263 | | | | 2,775,263 | |
| | |
Guggenheim Securities LLC, dated 10/31/19, due 11/01/19, 1.760% total to be received $2,775,399 (collateralized by various U.S. Government Agency Obligations and U.S. Treasuries, 1.625% - 5.000%, 01/01/27 - 06/20/69, totaling $2,830,769) | | | 2,775,263 | | | | 2,775,263 | |
| | |
Total Joint Repurchase Agreements | | | | | | | 11,684,694 | |
| | | | | | | | |
| | Shares | | | Value | |
| |
Other Investment Companies - 1.6% | | | | | |
| | |
Dreyfus Government Cash Management Fund, Institutional Shares, 1.73%3 | | | 3,160,382 | | | | $3,160,382 | |
| | |
Dreyfus Institutional Preferred Government Money Market Fund, Institutional Shares, 1.77%3 | | | 3,160,382 | | | | 3,160,382 | |
| | |
JPMorgan U.S. Government Money Market Fund, IM Shares, 1.75%3 | | | 3,256,151 | | | | 3,256,151 | |
| |
Total Other Investment Companies | | | | 9,576,915 | |
| |
Total Short-Term Investments
(Cost $21,261,609) | | | | 21,261,609 | |
| |
Total Investments - 101.9%
(Cost $481,708,221) | | | | 624,364,891 | |
| |
Other Assets, less Liabilities - (1.9)% | | | | (11,384,628 | ) |
| | |
Net Assets - 100.0% | | | | | | $ | 612,980,263 | |
| 1 | Some of these securities, amounting to $95,829,561 or 15.6% of net assets, were out on loan to various borrowers and are collateralized by cash and various U.S. Treasury Obligations. See Note 4 of Notes to Financial Statements. |
| 2 | Cash collateral received for securities lending activity was invested in these joint repurchase agreements. |
| 3 | Yield shown represents the October 31, 2019, seven day average yield, which refers to the sum of the previous seven days’ dividends paid, expressed as an annual percentage. |
ADR American Depositary Receipt
MLP Master Limited Partnership
REIT Real Estate Investment Trust
The accompanying notes are an integral part of these financial statements.
27
|
AMG River Road Dividend All Cap Value Fund Schedule of Portfolio Investments(continued) |
The following table summarizes the inputs used to value the Fund’s investments by the fair value hierarchy levels as of October 31, 2019:
| | | | | | | | | | | | | | | | |
| | | Level 1 | | | Level 2 | | | Level 3 | | | Total | |
Investments in Securities | | | | | | | | | | | | | | | | |
| | | | |
Common Stocks† | | $ | 603,103,282 | | | | — | | | | — | | | $ | 603,103,282 | |
| | | | |
Short-Term Investments | | | | | | | | | | | | | | | | |
| | | | |
Joint Repurchase Agreements | | | — | | | $ | 11,684,694 | | | | — | | | | 11,684,694 | |
| | | | |
Other Investment Companies | | | 9,576,915 | | | | — | | | | — | | | | 9,576,915 | |
| | | | | | | | | | | | | | | | |
Total Investments in Securities | | $ | 612,680,197 | | | $ | 11,684,694 | | | | — | | | $ | 624,364,891 | |
| | | | | | | | | | | | | | | | |
| † | All common stocks held in the Fund are Level 1 securities. For a detailed breakout of common stocks by major industry classification, please refer to the Fund’s Schedule of Portfolio Investments. |
For the fiscal year ended October 31, 2019, there were no transfers in or out of Level 3.
The accompanying notes are an integral part of these financial statements.
28
|
AMG River Road Dividend All Cap Value Fund II Portfolio Manager’s Comments(unaudited) |
| | | | | | | | |
OVERVIEW For the fiscal year ended October 31, 2019, the AMG River Road Dividend All Cap Value Fund II (the “Fund”) Class N shares returned 10.15%, while the Russell 3000® Value Index returned 10.65%. PERFORMANCE REVIEW U.S. corporate earnings growth has been in a downtrend throughout 2019 as the impact of corporate tax reform fades, economic growth slows, and trade tensions with China ratchet up. High yielding stocks outperformed amid the decline in long-term interest rates. The Fund outperformed due to strong stock selection. The industrial sector had the most significant positive impact on relative results in the period due to strong stock selection and an overweight allocation, while the information technology (IT) sector had the most significant negative impact on relative results due to weak stock selection and an overweight allocation. The two holdings with the largest positive contribution to the Fund’s total return were industrial distributor Fastenal Co. (FAST) and discount retailer Target Corp. (TGT). In Q1 2019 Fastenal reported strong daily sales growth of 13.1% for the quarter, marking seven consecutive quarters of double-digit growth. This strongtop-line growth drove strong operating leverage on SG&A costs, which offset significant gross margin compression caused by mix shift. The company grew its lower marginnon-fastener and national accounts businesses at much faster rates than the rest of the business, driving gross margin compression. We continue to believe that the company’s strategy of moving closer to its clients with onsite stores and vending machines makes it well positioned to continue taking market share. Target was among the top 10 holdings at the beginning of 2019 and returned 66% as of Q3 2019, making it the top contributor for the year by a wide margin. The company reported great results with comparable sales growth of 3.4% versus a very difficult comparison and strong margin expansion. The quarter marked the ninth consecutive quarter of positive comparable sales driven by 2.4% traffic growth, a 34% increase in digital sales, and market share gains across core merchandising categories.Same-day fulfillment services likein-store pickup,drive-up, and Shipt (Target’ssame-day delivery service) represented more thanone-third of digital sales, up from 20% last year, and are becoming the preferred fulfillment choice by customers as they | | | | offer speed, convenience, and reliability. This mix shift contributed to a +17% increase in operating profit assame-day fulfillment options leverage store infrastructure, technology, and labor costs. Additionally, return on invested capital improved 80 bps to 15% and the company reiterated its commitment to growing the dividend annually and returning excess cash to shareholders through repurchases. Following the company’s stellar results, we increased our assessed value by 25% and increased our overall conviction in the stock. We modestly reduced the position as the stock traded near our new assessed value in September. The two holdings with the lowest contribution to the Fund’s total return during the period were Marathon Petroleum Corp. (MPC), the largest independent petroleum product refining, marketing, retail, and transportation business in the United States, and Walgreens Boots Alliance, Inc. (WBA), the largest retail pharmacy chain in the U.S. and Europe. In October 2018, Marathon closed on its merger with Andeavor, making its new16-refinery network the largest in the United States, responsible for 15% of total domestic refining capacity. It announced strong results for Q3 2018 in November, reporting EBITDA (earnings before interest, tax, depreciation, and amortization) of $2B for the second consecutive quarter, and increased synergy estimates by $400M to $1.4B during its analyst day in early December. However, the company’s stock price declined alongside its refining peers during the quarter (despite only ~50% of its EBITDA coming from its refining segment) as concerns about the global economy grew. Even using conservative estimates, we continue to view the company as an attractive investment and maintained the position during the quarter. In January 2019, WBA reported weak results with a (3.2%) decline in retail sales comps in the United States. A portion of the weak retail sales was self-inflicted as managementde-emphasized certain products like tobacco and lower margin items. The company continued to aggressively repurchase shares in the quarter, resulting in a (1.2%) reduction of diluted shares outstanding. Management reaffirmed its 2019 outlook for 7% to 12% EPS (earnings per share) growth, including $3B in share repurchases. However, in February CVS reported weak results and warned about headwinds facing its pharmacy business for 2019, including lower branded drug inflation, fewer generics, and heightened reimbursement pricing pressure. Later that month, Walgeen’s CFO commented that the | | | | company was seeing similar headwinds, but it was not until the first week of April that the company management abandoned its earlier 7% to 12% 2019 EPS growth guidance, updating expectations to flat year over year. Despite the headwinds to the business, we believe that management will wisely use the substantial free cash flow the business generates to continue growing its dividend, repurchasing shares, and growing the business. POSITIONING AND OUTLOOK Based on average weight, the Fund is significantly overweight in energy and industrials and significantly underweight in health care and financials. Despite the elimination of two holdings, the energy sector ended the period as the largest overweight versus the benchmark due to the addition of two new positions to the Fund and the reduction in the benchmark weight in that sector. The overweight to the industrial sector decreased versus the Russell 3000® Value benchmark following the elimination of four holdings in that sector. The underweight in health care decreased, primarily due to the addition of two new holdings. Financials decreased their underweight following one addition in that sector. Slower global economic growth and declining interest rates remain our base expectation for the remainder of the year. However unlikely it may be, concerns that the economy is rolling over and a recession is possible before the 2020 election are legitimate. In addition to trade, Brexit, and the impeachment inquiry, we will be paying very close attention to consumer sentiment and our valuation inputs. In our view, there is no reason to expect a surge in earnings and economic growth in Q4 2019 and U.S. equity markets will be increasingly captive to trade discussions and political outcomes for the remainder of 2019. While politics will likely dictate the absolute direction of the market in the coming months, we believe that the near-term relative outlook for the Fund is largely shaped by any shift in the yield curve. We believe that the combination of an inverted yield curve and slowing economic growth is supportive of a defensive, income-oriented equity strategy like ours. The views expressed represent the opinions of River Road Asset Management LLC, as of October 31, 2019, and are not intended as a forecast or guarantee of future results and are subject to change without notice. |
29
|
AMG River Road Dividend All Cap Value Fund II Portfolio Manager’s Comments(continued) |
CUMULATIVE TOTAL RETURN PERFORMANCE
AMG River Road Dividend All Cap Value Fund II’s cumulative total return is based on the daily change in net asset value (NAV), and assumes that all dividends and distributions were reinvested. The graph compares a hypothetical $10,000 investment made in the AMG River Road Dividend All Cap Value Fund II’s Class N shares on June 27, 2012, to a $10,000 investment made in the Russell 3000® Value Index for the same time period. The graph and table do not reflect the deduction of taxes that a shareholder would pay on a Fund distribution or redemption of shares. The listed returns for the Fund are net of expenses and the returns for the index exclude expenses. Total returns would have been lower had certain expenses not been reduced.
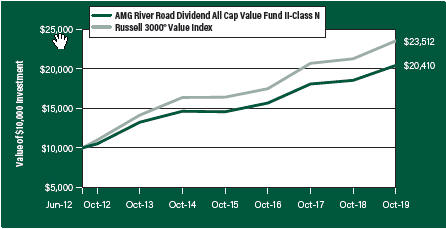
The table below shows the average annual total returns for the AMG River Road Dividend All Cap Value Fund II and the Russell 3000® Value Index for the same time periods ended October 31, 2019.
| | | | | | | | | | | | | | | | |
Average Annual Total Returns1 | | One
Year | | | Five
Years | | | Since
Inception | | | Inception
Date | |
AMG River Road Dividend All Cap Value Fund II2, 3, 4, 5, 6, 7, 8, 9 | | | | | | | | | | | | | | | | |
| | | | |
Class N | | | 10.15% | | | | 6.89% | | | | 10.20% | | | | 06/27/12 | |
| | | | |
Class I | | | 10.54% | | | | 7.21% | | | | 10.50% | | | | 06/27/12 | |
| | | | |
Class Z | | | 10.60% | | | | — | | | | 6.73% | | | | 09/29/17 | |
| | | | |
Russell 3000® Value Index10 | | | 10.65% | | | | 7.52% | | | | 12.34% | | | | 06/27/12 | † |
The performance data shown represents past performance. Past performance is not a guarantee of future results. Current performance may be lower or higher than the performance data quoted. The investment return and principal value of an investment will fluctuate so that an investor’s shares, when redeemed, may be worth more or less than their original cost.
Investors should carefully consider the Fund’s investment objectives, risks, charges and expenses before investing. For performance information through the most recent month end, current net asset values per share for the Fund and other information, please call 800.548.4539 or visit our website at amgfunds.com for a free prospectus. Read it carefully before investing or sending money.
Distributed by AMG Distributors, Inc., member FINRA/SIPC.
| † | Date reflects the inception date of the Fund, not the index. |
| 1 | Total return equals income yield plus share price change and assumes reinvestment of all dividends and capital gain distributions. Returns are net of fees and may reflect offsets of Fund expenses as described in the prospectus. No adjustment has been made for taxes payable by shareholders on their reinvested dividends and |
| | |
| | | capital gain distributions. Returns for periods greater than one year are annualized. The listed returns on the Fund are net of expenses and based on the published NAV as of October 31, 2019. All returns are in U.S. dollars ($). |
| | |
| | | 2 Investing in Publicly Traded Partnerships (PTPs) (including master limited partnerships) involves risks in addition to those typically associated with publicly traded companies. PTPs are exposed to the risks of their underlying assets, which in many cases includes the same types of risks as energy and natural resources companies. PTPs are also subject to capital market risks. PTPs may lose their partnership status for tax purposes. The Fund’s status as a regulated investment company may be jeopardized if it does not appropriately limit such investments in PTPs or if such investments are recharacterized for tax purposes. 3 An issuer of a security may be unwilling or unable to pay income on a security. Common stocks do not assure dividend payments and are paid only when declared by an issuer’s board of directors. |
| | |
| | | 4 Investments in international securities are subject to certain risks of overseas investing including currency fluctuations and changes in political and economic conditions, which could result in significant market fluctuations. These risks are magnified in emerging markets. |
| | |
| | | 5 The Fund is subject to risks associated with investments inmid-capitalization companies such as greater price volatility, lower trading volume, and less liquidity than the stocks of larger, more established companies. |
| | |
| | | 6 The Fund is subject to special risk considerations similar to those associated with the direct ownership of real estate. Real estate valuations may be subject to factors such as changing general and local economic, financial, competitive, and environmental conditions. |
| | |
| | | 7 The Fund is subject to risks associated with investments in small-capitalization companies, such as erratic earnings patterns, competitive conditions, limited earnings history and a reliance on one or a limited number of products. |
| | |
| | | 8 The Fund invests in value stocks, which may perform differently from the market as a whole and may be undervalued by the market for a long period of time. |
| | |
| | | 9 Companies that are in similar businesses may be similarly affected by particular economic or market events; to the extent the Fund has substantial holdings within a particular sector, the risks associated with that sector increase. |
| | |
| | | 10 The Russell 3000®Value Index measures the performance of the broad value segment of the U.S. equity universe. It includes those Russell 3000® |
30
|
AMG River Road Dividend All Cap Value Fund II Portfolio Manager’s Comments(continued) |
| | | | | | | | |
companies with lowerprice-to-book ratios and lower forecasted growth values. Unlike the Fund, the Russell 3000® Value Index is unmanaged, is not | | | | available for investment and does not incur expenses. The Russell Indices are a trademark of the London Stock Exchange Group companies. | | | | Not FDIC insured, not bank guaranteed. May lose value. |
31
|
AMG River Road Dividend All Cap Value Fund II Fund Snapshots(unaudited) October 31, 2019 |
PORTFOLIO BREAKDOWN
| | |
| Sector | | % of
Net Assets |
Financials | | 16.5 |
| | |
Energy | | 15.1 |
| | |
Communication Services | | 11.4 |
| | |
Industrials | | 10.4 |
| | |
Consumer Staples | | 8.3 |
| | |
Information Technology | | 8.3 |
| | |
Consumer Discretionary | | 7.1 |
| | |
Real Estate | | 6.9 |
| | |
Health Care | | 6.8 |
| | |
Utilities | | 4.4 |
| | |
Materials | | 3.9 |
| | |
Short-Term Investments | | 2.9 |
| | |
Other Assets Less Liabilities | | (2.0) |
TOP TEN HOLDINGS
| | |
| Security Name | | % of
Net Assets |
Target Corp. | | 3.6 |
| | |
BB&T Corp. | | 3.4 |
| | |
U.S. Bancorp | | 3.2 |
| | |
Kinder Morgan, Inc. | | 3.1 |
| | |
Corning, Inc. | | 3.0 |
| | |
Verizon Communications, Inc. | | 2.7 |
| | |
Comcast Corp., Class A | | 2.7 |
| | |
Cisco Systems, Inc. | | 2.7 |
| | |
Bristol-Myers Squibb Co. | | 2.6 |
| | |
Kimberly-Clark Corp. | | 2.6 |
| | | |
| | |
Top Ten as a Group | | 29.6 |
| | |
Because a fund’s strategy may result in multiple investments in particular sectors of the economy, its performance may depend on the performance of those sectors and may fluctuate more widely than investments diversified across more sectors. For additional information on these and other risk considerations, please see the Fund’s prospectus.
Any sectors, industries, or securities discussed should not be perceived as investment recommendations. Mention of a specific security should not be considered a recommendation to buy or solicitation to sell that security. Specific securities mentioned in this report may have been sold from the Fund’s portfolio of investments by the time you receive this report.
32
|
AMG River Road Dividend All Cap Value Fund II Schedule of Portfolio Investments October 31, 2019 |
| | | | | | | | |
| | | Shares | | | Value | |
| | |
Common Stocks - 99.1% | | | | | | | | |
| |
Communication Services - 11.4% | | | | | |
| | |
Cinemark Holdings, Inc.1 | | | 31,035 | | | | $1,135,881 | |
| | |
Comcast Corp., Class A | | | 37,078 | | | | 1,661,836 | |
| | |
The Interpublic Group of Cos., Inc.1 | | | 39,357 | | | | 856,015 | |
| | |
Meredith Corp.1 | | | 11,533 | | | | 434,794 | |
| | |
Omnicom Group, Inc. | | | 17,407 | | | | 1,343,646 | |
| | |
Verizon Communications, Inc. | | | 27,859 | | | | 1,684,634 | |
| | |
Total Communication Services | | | | | | | 7,116,806 | |
| |
Consumer Discretionary - 7.1% | | | | | |
| | |
Cedar Fair LP, MLP | | | 9,672 | | | | 539,407 | |
| | |
Extended Stay America, Inc. | | | 65,226 | | | | 926,862 | |
| | |
Six Flags Entertainment Corp. | | | 15,839 | | | | 668,247 | |
| | |
Target Corp. | | | 21,189 | | | | 2,265,316 | |
| | |
Total Consumer Discretionary | | | | | | | 4,399,832 | |
| | |
Consumer Staples - 8.3% | | | | | | | | |
| | |
Kimberly-Clark Corp. | | | 12,162 | | | | 1,616,086 | |
| | |
PepsiCo, Inc. | | | 9,347 | | | | 1,282,128 | |
| | |
Unilever PLC, Sponsored ADR (United Kingdom) | | | 21,342 | | | | 1,282,868 | |
| | |
Walgreens Boots Alliance, Inc. | | | 12,037 | | | | 659,387 | |
| | |
Walmart, Inc. | | | 2,649 | | | | 310,622 | |
| | |
Total Consumer Staples | | | | | | | 5,151,091 | |
| | |
Energy - 15.1% | | | | | | | | |
| | |
Chevron Corp. | | | 6,296 | | | | 731,217 | |
| | |
Enterprise Products Partners LP, MLP | | | 58,573 | | | | 1,524,655 | |
| | |
Exxon Mobil Corp. | | | 13,330 | | | | 900,708 | |
| | |
Kinder Morgan, Inc. | | | 95,926 | | | | 1,916,602 | |
| | |
Magellan Midstream Partners LP, MLP1 | | | 20,273 | | | | 1,263,413 | |
| | |
Marathon Petroleum Corp. | | | 17,862 | | | | 1,142,275 | |
| | |
Valero Energy Corp. | | | 8,384 | | | | 813,080 | |
| | |
The Williams Cos., Inc. | | | 49,747 | | | | 1,109,856 | |
| | |
Total Energy | | | | | | | 9,401,806 | |
| | |
Financials - 16.5% | | | | | | | | |
| | |
Axis Capital Holdings, Ltd. (Bermuda) | | | 17,624 | | | | 1,047,394 | |
| | |
BB&T Corp.1 | | | 39,961 | | | | 2,119,931 | |
| | |
CNA Financial Corp. | | | 13,888 | | | | 622,738 | |
| | |
Fidelity National Financial, Inc. | | | 32,794 | | | | 1,503,277 | |
| | |
Lazard, Ltd., Class A1 | | | 24,056 | | | | 898,011 | |
| | |
The PNC Financial Services Group, Inc. | | | 9,466 | | | | 1,388,662 | |
| | |
U.S. Bancorp | | | 34,824 | | | | 1,985,665 | |
| | |
Wells Fargo & Co. | | | 13,619 | | | | 703,149 | |
| | |
Total Financials | | | | | | | 10,268,827 | |
| | | | | | | | |
| | | Shares | | | Value | |
| | |
Health Care - 6.8% | | | | | | | | |
| | |
AbbVie, Inc. | | | 12,967 | | | | $1,031,525 | |
| | |
Amgen, Inc. | | | 7,211 | | | | 1,537,746 | |
| | |
Bristol-Myers Squibb Co. | | | 28,637 | | | | 1,642,904 | |
| | |
Total Health Care | | | | | | | 4,212,175 | |
| | |
Industrials - 10.4% | | | | | | | | |
| | |
Aircastle, Ltd. | | | 22,806 | | | | 620,779 | |
| | |
Fastenal Co.1 | | | 44,543 | | | | 1,600,875 | |
| | |
Illinois Tool Works, Inc. | | | 7,173 | | | | 1,209,224 | |
| | |
KAR Auction Services, Inc.1 | | | 20,375 | | | | 506,523 | |
| | |
MSC Industrial Direct Co., Inc., Class A1 | | | 4,562 | | | | 333,984 | |
| | |
Thomson Reuters Corp. (Canada) | | | 11,792 | | | | 793,130 | |
| | |
United Parcel Service, Inc., Class B | | | 12,044 | | | | 1,387,108 | |
| | |
Total Industrials | | | | | | | 6,451,623 | |
| |
Information Technology - 8.3% | | | | | |
| | |
Cisco Systems, Inc. | | | 34,819 | | | | 1,654,251 | |
| | |
Corning, Inc.1 | | | 62,431 | | | | 1,849,830 | |
| | |
Intel Corp. | | | 12,100 | | | | 684,013 | |
| | |
QUALCOMM, Inc. | | | 12,134 | | | | 976,059 | |
| | |
Total Information Technology | | | | | | | 5,164,153 | |
| | |
Materials - 3.9% | | | | | | | | |
| | |
Linde PLC (United Kingdom) | | | 2,376 | | | | 471,280 | |
| | |
LyondellBasell Industries NV, Class A | | | 13,239 | | | | 1,187,538 | |
| | |
RPM International, Inc. | | | 10,139 | | | | 734,368 | |
| | |
Total Materials | | | | | | | 2,393,186 | |
| | |
Real Estate - 6.9% | | | | | | | | |
| | |
Iron Mountain, Inc., REIT1 | | | 46,260 | | | | 1,517,328 | |
| | |
Ryman Hospitality Properties, Inc., REIT | | | 9,844 | | | | 828,569 | |
| | |
Sabra Health Care REIT, Inc.1 | | | 32,270 | | | | 793,842 | |
| | |
Ventas, Inc., REIT | | | 17,847 | | | | 1,161,840 | |
| | |
Total Real Estate | | | | | | | 4,301,579 | |
| | |
Utilities - 4.4% | | | | | | | | |
| | |
AES Corp. | | | 67,932 | | | | 1,158,241 | |
| | |
Dominion Resources, Inc. | | | 19,470 | | | | 1,607,248 | |
| | |
Total Utilities | | | | | | | 2,765,489 | |
| | |
Total Common Stocks
(Cost $48,720,498) | | | | | | | 61,626,567 | |
The accompanying notes are an integral part of these financial statements.
33
|
AMG River Road Dividend All Cap Value Fund II Schedule of Portfolio Investments(continued) |
| | | | | | | | |
| | | Principal
Amount | | | Value | |
| | |
Short-Term Investments - 2.9% | | | | | | | | |
| |
Joint Repurchase Agreements - 2.1%2 | | | | | |
| | |
Credit Suisse AG, dated 10/31/19, due 11/01/19, 1.730% total to be received $316,702 (collateralized by various U.S. Treasuries, 0.125% - 3.125%, 11/15/22 - 05/15/47, totaling $323,021) | | | $316,687 | | | | $316,687 | |
| | |
Guggenheim Securities LLC, dated 10/31/19, due 11/01/19, 1.760% total to be received $1,000,049 (collateralized by various U.S. Government Agency Obligations and U.S. Treasuries, 1.625% - 5.000%, 01/01/27 - 06/20/69, totaling $1,020,000) | | | 1,000,000 | | | | 1,000,000 | |
| | |
Total Joint Repurchase Agreements | | | | | | | 1,316,687 | |
| | |
| | | Shares | | | | |
| |
Other Investment Companies - 0.8% | | | | | |
| | |
Dreyfus Government Cash Management Fund, Institutional Shares, 1.73%3 | | | 154,506 | | | | 154,506 | |
| | |
Dreyfus Institutional Preferred Government Money Market Fund, Institutional Shares, 1.77%3 | | | 154,505 | | | | 154,505 | |
| | |
JPMorgan U.S. Government Money Market Fund, IM Shares, 1.75%3 | | | 159,187 | | | | 159,187 | |
| | |
Total Other Investment Companies | | | | | | | 468,198 | |
| | |
Total Short-Term Investments
(Cost $1,784,885) | | | | | | | 1,784,885 | |
| | | | | | | | |
| | | | | |
Value | |
| | |
Total Investments - 102.0%
(Cost $50,505,383) | | | | | | $ | 63,411,452 | |
| |
Other Assets, less Liabilities - (2.0)% | | | | (1,235,862 | ) |
| | |
Net Assets - 100.0% | | | | | | $ | 62,175,590 | |
| 1 | Some of these securities, amounting to $11,218,792 or 18.0% of net assets, were out on loan to various borrowers and are collateralized by cash and various U.S. Treasury Obligations. See Note 4 of Notes to Financial Statements. |
| 2 | Cash collateral received for securities lending activity was invested in these joint repurchase agreements. |
| 3 | Yield shown represents the October 31, 2019, seven day average yield, which refers to the sum of the previous seven days’ dividends paid, expressed as an annual percentage. |
ADR American Depositary Receipt
MLP Master Limited Partnership
REIT Real Estate Investment Trust
The following table summarizes the inputs used to value the Fund’s investments by the fair value hierarchy levels as of October 31, 2019:
| | | | | | | | | | | | | | | | |
| | | Level 1 | | | Level 2 | | | Level 3 | | | Total | |
Investments in Securities | | | | | | | | | | | | | | | | |
| | | | |
Common Stocks† | | $ | 61,626,567 | | | | — | | | | — | | | $ | 61,626,567 | |
| | | | |
Short-Term Investments | | | | | | | | | | | | | | | | |
Joint Repurchase Agreements | | | — | | | $ | 1,316,687 | | | | — | | | | 1,316,687 | |
Other Investment Companies | | | 468,198 | | | | — | | | | — | | | | 468,198 | |
| | | | | | | | | | | | | | | | |
Total Investments in Securities | | $ | 62,094,765 | | | $ | 1,316,687 | | | | — | | | $ | 63,411,452 | |
| | | | | | | | | | | | | | | | |
| † | All common stocks held in the Fund are Level 1 securities. For a detailed breakout of common stocks by major industry classification, please refer to the Fund’s Schedule of Portfolio Investments. |
For the fiscal year ended October 31, 2019, there were no transfers in or out of Level 3.
The accompanying notes are an integral part of these financial statements.
34
|
AMG Managers Fairpointe Mid Cap Fund Portfolio Manager’s Comments(unaudited) |
| | | | | | | | |
OVERVIEW For the fiscal year ended October 31, 2019, the AMG Managers Fairpointe Mid Cap Fund (the “Fund”) Class N shares returned (0.55)%, while the S&P MidCap 400® Index returned 9.02% and the Russell Midcap® Index returned 13.72%. OVERVIEW For the past 20 years, the Fund has generated an 11.5% average annual return, outperforming major benchmarks and the S&P 500® Index. The S&P MidCap 400® Index return was 9.8%, the Russell MidCap® Index was 9.3%, and the S&P 500® Index was 6.1%. During this 20-year period we have endured several periods of underperformance. The most recent period, however, has lasted longer than we expected. This has been partly due to the broad shift toward passive investing, which started several years ago. In this environment, stocks that performed well ended up performing exceptionally well, as more and more money moved into passive funds, which buy regardless of fundamentals. As a result, highly valued stocks enjoyed even higher prices—a trend that greatly favored growth and momentum stocks. We made significant changes to the portfolio in the past year which, we believe, position it well for the future, as discussed below. PERFORMANCE REVIEW The top five contributors to performance were TEGNA, Inc. (TGNA), Copa Holdings, S.A. (CPA), Jabil, Inc. (JBL), Whirlpool Corp. (WHR), and Werner Enterprises, Inc. (WERN). TEGNA operates 47 television stations and 2 radio stations in 39 markets and offers marketing services through TEGNA Marketing Solutions. The company reported better-than-expected results due to subscriber gains and continued revenue from political advertising. We believe the stock has even more potential due to the company’s strong broadcasting business and expected growth from local programming initiatives. Political advertising is expected to pick up significantly with the upcoming 2020 election, which should further boost the company’s revenue and earnings. TEGNA’s stock remains undervalued due to investors’ negative perceptions around “cord cutting,” a concern that clouds the outlook for many cable and broadcasting companies. However, the company has not been affected by this trend, and we believe that much of this trepidation is unfounded. | | | | Copa is a leading Latin American provider of airline passenger and cargo services that operates a fleet of over 100 aircraft providing service to 80 destinations across 32 countries in North, Central, and South America. The company posted better-than-expected results due to strong execution. We expect the company will improve operating margins even further by generating more high-margin ancillary revenue from seat assignments, baggage fees, and credit card miles. Jabil is a leading global provider of outsourced manufacturing services. The company continues to diversify into new end markets, like packaging and health care, which has driven higher earnings through revenue growth and operating leverage. The largest five detractors to performance were Lions Gate Entertainment Corp. (LGF.A/B), Cars.com, Inc. (CARS), Meredith Corp. (MDP), McDermott International, Inc. (MDR), and Adtalem Global Education, Inc. (ATGE). Lions Gate, a developer and distributer of motion pictures and television programming, remains misunderstood due to the market’s short-term focus, which tends to overlook the company’s long-term potential. Currently, Lions Gate’s Starz network has 25 million domestic subscribers through cable providers and streaming services. The company is building on its domestic success and expanding its international subscriber base, which should increase the company’s value in the long term. In addition, the company’s unique content makes it an attractive strategic takeover target. Cars.com provides an online digital platform that connects consumers with local automobile dealers across the country. Its revenues are derived from dealer subscriptions and automobile advertising. The company’s board of directors conducted a strategic review, including the potential sale of the company, for almost a year. In August, this strategic review abruptly stopped, and although 29 interested parties came to the table, there was no sale of the company. We still think the company has substantial value. Digital automotive advertising is a large and growing market, and the company is a leading player. The company generates high profit margins, has an attractive valuation, and is poised for improved cash flow generation. With the major distraction of putting the company up for sale out of the way, | | | | management is now focused on gaining market share. Senior management and members of the board purchased stock in the third quarter. Meredith produces print magazines and digital media and operates 17 television stations located throughout the U.S. The company completed the acquisition of Time, Inc. in January 2018. We like the assets, particularly the local television stations, which we think are attractive due to the burgeoning interest in political news, and advertising, much of which is accessed through local TV stations. The long-term outlook for Meredith is positive due to its improving profitability, its balance sheet, and the unrecognized value of the television stations. The company has a 6.8% dividend yield. POSITIONING AND OUTLOOK Even though the U.S. economy continues to grow, we remain concerned about geopolitical risks, the trade war, slowing economic growth in Europe and China, and the overall impact of these conditions on the U.S. economy. The U.S. Federal Reserve has lowered the federal funds interest rate by one-quarter point twice in the past three months. Many U.S. companies are reluctant to invest in their businesses given the uncertainty. The volatility has allowed us to take advantage by adding several high-quality companies to the Fund. Throughout the year, we added five new ideas and eliminated seven positions. The Fund is now more focused with 45 holdings compared to 47 a year ago. We have improved our balance sheet profile regarding the average debt-to-capitalization ratio while our weighted average market cap increased. The increase in the market cap is the result of expanding our investable universe two years ago to reflect the Russell Midcap® market cap range. The average net profit margin has increased and the ROE has improved in the past year. We believe we are well positioned for the future. All of us at Fairpointe are invested in the strategy and aligned with you, our clients. Thank you for your continued interest and support. The views expressed represent the opinions of Fairpointe Capital LLC, as ofOctober 31, 2019,and are not intended as a forecast or guarantee of future results and are subject to change without notice. |
35
|
AMG Managers Fairpointe Mid Cap Fund Portfolio Manager’s Comments(continued) |
CUMULATIVE TOTAL RETURN PERFORMANCE
AMG Managers Fairpointe Mid Cap Fund’s cumulative total return is based on the daily change in net asset value (NAV), and assumes that all dividends and distributions were reinvested. The graph compares a hypothetical $10,000 investment made in the AMG Managers Fairpointe Mid Cap Fund’s Class N shares on October 31, 2009, to a $10,000 investment made in the S&P MidCap 400® Index and Russell Midcap® Index for the same time period. The graph and table do not reflect the deduction of taxes that a shareholder would pay on a Fund distribution or redemption of shares. The listed returns for the Fund are net of expenses and the returns for the index exclude expenses. Total returns would have been lower had certain expenses not been reduced.
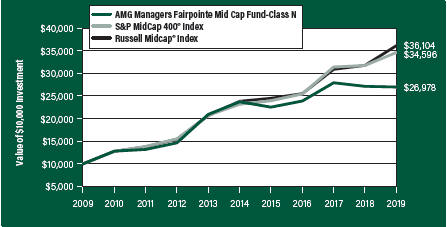
The table below shows the average annual total returns for the AMG Managers Fairpointe Mid Cap Fund and the S&P MidCap 400® Index and Russell Midcap® Index for the same time periods ended October 31, 2019.
| | | | | | | | | | | | | | | | | | | | |
Average Annual Total Returns1 | | One
Year | | | Five
Years | | | Ten
Years | | | Since
Inception | | | Inception
Date | |
AMG Managers Fairpointe | | | | | | | | | | | | | | | | | | | | |
Mid Cap Fund2, 3, 4, 5, 6, 7, 8 | | | | | | | | | | | | | | | | | | | | |
| | | | | |
Class N | | | (0.55% | ) | | | 2.61% | | | | 10.43% | | | | 10.97% | | | | 09/19/94 | |
| | | | | |
Class I | | | (0.33% | ) | | | 2.86% | | | | 10.71% | | | | 8.36% | | | | 07/06/04 | |
| | | | | |
Class Z | | | (0.25% | ) | | | — | | | | — | | | | (2.67% | ) | | | 09/29/17 | |
| | | | | |
S&P MidCap 400® Index9 | | | 9.02% | | | | 8.37% | | | | 13.21% | | | | 11.59% | | | | 09/19/94 | † |
| | | | | |
Russell Midcap® Index10 | | | 13.72% | | | | 8.67% | | | | 13.70% | | | | 10.91% | | | | 09/19/94 | † |
The performance data shown represents past performance. Past performance is not a guarantee of future results. Current performance may be lower or higher than the performance data quoted. The investment return and principal value of an investment will fluctuate so that an investor’s shares, when redeemed, may be worth more or less than their original cost.
Investors should carefully consider the Fund’s investment objectives, risks, charges and expenses before investing. For performance information through the most recent month end, current net asset values per share for the Fund and other information, please call 800.548.4539 or visit our website at amgfunds.com for a free prospectus. Read it carefully before investing or sending money.
Distributed by AMG Distributors, Inc., member FINRA/SIPC.
| † | Date reflects the inception date of the Fund, not the index. |
| 1 | Total return equals income yield plus share price change and assumes reinvestment of all dividends and capital gain distributions. Returns are net of fees and may reflect offsets of Fund expenses as described in the prospectus. No adjustment has been made for taxes payable by shareholders on their reinvested dividends and |
| | |
| | | capital gain distributions. Returns for periods greater than one year are annualized. The listed returns on the Fund are net of expenses and based on the published NAV as of October 31, 2019. All returns are in U.S. dollars ($). |
| | |
| | | 2 The Fund is subject to risks associated with investments inmid-capitalization companies such as greater price volatility, lower trading volume, and less liquidity than the stocks of larger, more established companies. 3 The Fund is subject to risks associated with investments in small-capitalization companies, such as erratic earnings patterns, competitive conditions, limited earnings history and a reliance on one or a limited number of products. 4 The Fund may invest in derivatives such as options and futures; the complexity and rapidly changing structure of derivatives markets may increase the possibility of market losses. 5 Investments in international securities are subject to certain risks of overseas investing including currency fluctuations and changes in political and economic conditions, which could result in significant market fluctuations. These risks are magnified in emerging markets. 6 Companies that are in similar businesses may be similarly affected by particular economic or market events; to the extent the Fund has substantial holdings within a particular sector, the risks associated with that sector increase. 7 The fund invests in growth stocks, which may me more sensitive to market movements because their prices tend to reflect future investor expectations rather than just current profits. Growth stocks may underperform value stocks during given periods. 8 The fund invests in value stocks, which may perform differently from the market as a whole and may be undervalued by the market for a long period of time. 9 The S&P MidCap 400® Index provides investors with a benchmark formid-sized companies. The Index, which is distinct from thelarge-cap S&P 500®, measures the performance ofmid-sized companies, reflecting the distinctive risk and return characteristics of this market segment. Unlike the Fund, the S&P MidCap 400® Index is unmanaged, is not available for investment and does not incur expenses. 10 The Russell Midcap® Index measures the performance of the 800 smallest companies in the Russell 1000® Index, which represent approximately 25% of the total market capitalization of the Russell 1000® Index. Unlike the Fund, the Russell Midcap® Index is unmanaged, is not available for investment and does not incur expenses. |
36
|
AMG Managers Fairpointe Mid Cap Fund Portfolio Manager’s Comments(continued) |
| | | | | | | | |
The S&P Index is proprietary data of Standard & Poor’s, a division of McGraw-Hill Companies, Inc. The Russell Indices are a trademark of the London Stock Exchange Group companies. | | | | Not FDIC insured, nor bank guaranteed. May lose value. | | | | |
37
|
AMG Managers Fairpointe Mid Cap Fund Fund Snapshots(unaudited) October 31, 2019 |
PORTFOLIO BREAKDOWN
| | |
| Sector | | % of
Net Assets |
Consumer Discretionary | | 17.5 |
| | |
Information Technology | | 16.8 |
| | |
Industrials | | 16.4 |
| | |
Communication Services | | 13.4 |
| | |
Health Care | | 10.6 |
| | |
Consumer Staples | | 8.7 |
| | |
Financials | | 6.6 |
| | |
Materials | | 2.9 |
| | |
Energy | | 1.0 |
| | |
Short-Term Investments | | 7.2 |
| | |
Other Assets Less Liabilities | | (1.1) |
TOP TEN HOLDINGS
| | |
| Security Name | | % of
Net Assets |
Juniper Networks, Inc. | | 3.8 |
| | |
Werner Enterprises, Inc. | | 3.7 |
| | |
Molson Coors Brewing Co., Class B | | 3.7 |
| | |
TEGNA, Inc. | | 3.6 |
Quest Diagnostics, Inc. | | 3.3 |
| | |
Northern Trust Corp. | | 3.3 |
| | |
Mattel, Inc. | | 3.2 |
| | |
LKQ Corp. | | 3.1 |
| | |
Agilent Technologies, Inc. | | 2.9 |
| | |
Domtar Corp. | | 2.9 |
| | | |
| | |
Top Ten as a Group | | 33.5 |
| | |
Because a fund’s strategy may result in multiple investments in particular sectors of the economy, its performance may depend on the performance of those sectors and may fluctuate more widely than investments diversified across more sectors. For additional information on these and other risk considerations, please see the Fund’s prospectus.
Any sectors, industries, or securities discussed should not be perceived as investment recommendations. Mention of a specific security should not be considered a recommendation to buy or solicitation to sell that security. Specific securities mentioned in this report may have been sold from the Fund’s portfolio of investments by the time you receive this report.
38
|
AMG Managers Fairpointe Mid Cap Fund Schedule of Portfolio Investments October 31, 2019 |
| | | | | | | | |
| | | Shares | | | Value | |
| | |
Common Stocks - 93.9% | | | | | | | | |
| |
Communication Services - 13.4% | | | | | |
| | |
Cars.com, Inc.* | | | 2,514,900 | | | | $28,443,519 | |
| | |
Lions Gate Entertainment Corp., Class A* | | | 2,036,900 | | | | 16,274,831 | |
| | |
Lions Gate Entertainment Corp., Class B* | | | 1,331,950 | | | | 9,976,306 | |
| | |
Meredith Corp. | | | 1,177,810 | | | | 44,403,437 | |
| | |
The New York Times Co., Class A | | | 935,495 | | | | 28,906,795 | |
| | |
Scholastic Corp. | | | 944,000 | | | | 36,344,000 | |
| | |
TEGNA, Inc. | | | 3,982,400 | | | | 59,855,472 | |
| | |
Total Communication Services | | | | | | | 224,204,360 | |
| |
Consumer Discretionary - 17.5% | | | | | |
| | |
Adtalem Global Education, Inc.* | | | 1,215,531 | | | | 36,198,513 | |
| | |
Cooper Tire & Rubber Co. | | | 1,272,600 | | | | 35,938,224 | |
| | |
Gentex Corp. | | | 391,500 | | | | 10,981,575 | |
| | |
Lear Corp. | | | 182,100 | | | | 21,445,917 | |
| | |
LKQ Corp.* | | | 1,503,400 | | | | 51,100,566 | |
| | |
Magna International, Inc. (Canada) | | | 806,400 | | | | 43,360,128 | |
| | |
Mattel, Inc.* | | | 4,522,800 | | | | 54,002,232 | |
| | |
Whirlpool Corp. | | | 260,300 | | | | 39,596,836 | |
Total Consumer Discretionary | | | | | | | 292,623,991 | |
| | |
Consumer Staples - 8.7% | | | | | | | | |
| | |
Bunge, Ltd. | | | 799,600 | | | | 43,178,400 | |
| | |
Hormel Foods Corp. | | | 977,800 | | | | 39,982,242 | |
| | |
Molson Coors Brewing Co., Class B | | | 1,167,200 | | | | 61,534,784 | |
| | |
Total Consumer Staples | | | | | | | 144,695,426 | |
| | |
Energy - 1.0% | | | | | | | | |
| | |
TechnipFMC PLC (United Kingdom) | | | 856,100 | | | | 16,890,853 | |
| | |
Financials - 6.6% | | | | | | | | |
| | |
Cincinnati Financial Corp. | | | 101,000 | | | | 11,434,210 | |
| | |
Northern Trust Corp. | | | 547,000 | | | | 54,524,960 | |
| | |
Raymond James Financial, Inc. | | | 533,800 | | | | 44,566,962 | |
| | |
Total Financials | | | | | | | 110,526,132 | |
| | |
Health Care - 10.6% | | | | | | | | |
| | |
Agilent Technologies, Inc. | | | 639,200 | | | | 48,419,400 | |
| | |
Patterson Cos., Inc. | | | 1,513,550 | | | | 25,927,111 | |
| | |
Quest Diagnostics, Inc. | | | 549,100 | | | | 55,596,375 | |
| | |
Varex Imaging Corp.* | | | 561,405 | | | | 16,847,764 | |
| | |
Varian Medical Systems, Inc.* | | | 250,601 | | | | 30,275,107 | |
| | |
Total Health Care | | | | | | | 177,065,757 | |
| | |
Industrials - 16.4% | | | | | | | | |
| | |
Copa Holdings, S.A., Class A (Panama) | | | 354,835 | | | | 36,100,913 | |
| | | | | | | | |
| | | Shares | | | Value | |
| | |
Donaldson Co., Inc. | | | 751,408 | | | | $39,629,258 | |
| | |
ManpowerGroup, Inc. | | | 319,100 | | | | 29,012,572 | |
| | |
Owens Corning | | | 547,900 | | | | 33,575,312 | |
| | |
Pentair PLC (United Kingdom) | | | 405,300 | | | | 16,807,791 | |
| | |
Stericycle, Inc.* | | | 123,500 | | | | 7,113,600 | |
| | |
Wabtec Corp. | | | 693,300 | | | | 48,094,221 | |
| | |
Werner Enterprises, Inc. | | | 1,706,000 | | | | 62,269,000 | |
| | |
Total Industrials | | | | | | | 272,602,667 | |
| |
Information Technology - 16.8% | | | | | |
| | |
Akamai Technologies, Inc.* | | | 254,200 | | | | 21,988,300 | |
| | |
Cerence, Inc.* | | | 180,251 | | | | 2,793,891 | |
| | |
Corning, Inc. | | | 1,190,100 | | | | 35,262,663 | |
| | |
Cree, Inc.* | | | 720,305 | | | | 34,380,158 | |
| | |
Itron, Inc.* | | | 129,400 | | | | 9,868,044 | |
| | |
Jabil, Inc. | | | 1,052,600 | | | | 38,756,732 | |
| | |
Juniper Networks, Inc. | | | 2,525,300 | | | | 62,677,946 | |
| | |
Nuance Communications, Inc.* | | | 1,442,012 | | | | 23,533,636 | |
| | |
Teradata Corp.* | | | 1,483,700 | | | | 44,407,141 | |
| | |
Unisys Corp.* | | | 587,038 | | | | 6,023,010 | |
| |
Total Information Technology | | | | 279,691,521 | |
| | |
Materials - 2.9% | | | | | | | | |
| | |
Domtar Corp. | | | 1,325,100 | | | | 48,220,389 | |
| | |
Total Common Stocks
(Cost $1,285,597,547) | | | | | | | 1,566,521,096 | |
| |
Short-Term Investments -7.2% | | | | | |
| | |
Other Investment Companies - 7.2% | | | | | | | | |
| | |
Dreyfus Government Cash Management Fund, | | | | | | | | |
| | |
Institutional Shares, 1.73%1 | | | 39,600,956 | | | | 39,600,956 | |
| | |
Dreyfus Institutional Preferred Government | | | | | | | | |
| | |
Money Market Fund, Institutional Shares, 1.77%1 | | | 39,600,955 | | | | 39,600,955 | |
| | |
JPMorgan U.S. Government Money Market Fund, | | | | | | | | |
| | |
IM Shares, 1.75%1 | | | 40,800,984 | | | | 40,800,984 | |
| | |
Total Short-Term Investments
(Cost $120,002,895) | | | | | | | 120,002,895 | |
| | |
Total Investments - 101.1%
(Cost $1,405,600,442) | | | | | | | 1,686,523,991 | |
| | |
Other Assets, lessLiabilities - (1.1)% | | | | | | | (17,784,061 | ) |
| | |
Net Assets - 100.0% | | | | | | $ | 1,668,739,930 | |
The accompanying notes are an integral part of these financial statements.
39
|
AMG Managers Fairpointe Mid Cap Fund Schedule of Portfolio Investments(continued) |
| * | Non-income producing security. |
| 1 | Yield shown represents the October 31, 2019, seven day average yield, which refers to the sum of the previous seven days’ dividends paid, expressed as an annual percentage. |
The following table summarizes the inputs used to value the Fund’s investments by the fair value hierarchy levels as of October 31, 2019:
| | | | | | | | | | | | | | | | |
| | | Level 1 | | | Level 2 | | | Level 3 | | | Total | |
Investments in Securities | | | | | | | | | | | | | | | | |
| | | | |
Common Stocks† | | $ | 1,566,521,096 | | | | — | | | | — | | | $ | 1,566,521,096 | |
| | | | |
Short-Term Investments | | | | | | | | | | | | | | | | |
| | | | |
Other Investment Companies | | | 120,002,895 | | | | — | | | | — | | | | 120,002,895 | |
| | | | | | | | | | | | | | | | |
Total Investments in Securities | | $ | 1,686,523,991 | | | | — | | | | — | | | $ | 1,686,523,991 | |
| | | | | | | | | | | | | | | | |
| † | All common stocks held in the Fund are Level 1 securities. For a detailed breakout of common stocks by major industry classification, please refer to the Fund’s Schedule of Portfolio Investments. |
For the fiscal year ended October 31, 2019, there were no transfers in or out of Level 3.
The accompanying notes are an integral part of these financial statements.
40
|
AMG Managers LMCG Small Cap Growth Fund Portfolio Manager’s Comments(unaudited) |
| | | | | | | | |
The AMG Managers LMCG Small Cap Growth Fund (the “Fund”) Class N shares returned 0.71% for the fiscal year ended October 31, 2019, compared with a 6.40% return for its benchmark, the Russell 2000® Growth Index. U.S. stocks closed out 2018 with extreme volatility and sharp declines across many market segments; in fact, in the previous 20 years, there were only seven months that saw worse price performance for the Russell 2000® Growth Index than December 2018. Markets rebounded in early 2019, with small cap growth stocks (measured by the Russell 2000® Growth Index) posting high double-digit returns in Q1 and muted but still positive returns in Q2. Volatility returned in Q3 as small caps lost ground amid an uncertain outlook on economic growth—although we view this most recent period, as we did in Q4 2018, as a buying opportunity. September 2019 also saw one of the sharpest momentum-value rotations in over 30 years, which created a difficult environment for many active managers, including our strategy. From a style perspective among U.S. small caps, growth stocks outperformed their value counterparts in the 12 months ending October 31, 2019: the Russell 2000® Growth Index returned 6.4% for the period, vs. 3.2% for the Russell 2000® Value Index. From a size perspective, large caps were the clear winner: the Russell 2000® Index returned 4.9%, while the Russell Midcap® Index finished at 13.7% and the Russell 1000® Index returned 14.2%. Stock selection was primarily responsible for the Fund’s underperformance, although portfolio positioning was negative as well. Health care was | | | | the worst sector overall as both stock selection and the portfolio’s overweight detracted from relative returns. The largest overall detractor in health care was Merit Medical Systems (MMSI), a cardiology and radiology device manufacturer. Merit traded off after reporting Q2 2019 earnings and revenues that missed estimates. The company had recently signed up several very large group purchasing organizations , which are groups of hospitals that organize to bundle their purchasing power. While that can drive revenue in the future, pricing concessions are normal to gain this business. More revenue from the company’s smaller, more unique and high margin products would then be required to offset these new sales. The company had more of this low margin business than anticipated in Q2, and without a clear indicator that this trend will reverse, we exited the position entirely in early October. The Fund’s overweight to IT (information technology) was positive, although not enough to offset the negative impact from stock selection in that sector. Underperformance in communication services was concentrated mainly in one company, Boingo Wireless, Inc. (WIFI). Similarly, in consumer discretionary, underperformance was concentrated in a handful of restaurants and hotels. The portfolio had few real estate holdings and no utilities holdings in the period, which hurt returns as those sectors in the benchmark were up over 8% and 33%, respectively. On the positive side, the Fund outperformed in energy, consumer staples, and financials. The lack of holdings in energy helped returns as that sector was down nearly (38%). Energy has traded off on global macro demand concerns while supply growth | | | | continues. Sentiment in the sector is severely depressed, especially in service names. Longer term, new technologies have suppressed growth in electricity demand; the U.S. is now essentially flat in terms of demand for the last 11 years, which is a secular headwind for the energy sector. Good stock selection in consumer staples was concentrated mostly in Central Garden & Pet (CENT). In financials, insurers Kinsale Capital Group and Palomar Holdings were significant contributors to performance. Palomar also focuses on earthquake and excess and surplus insurance (E&S), markets that continue to be strong as larger, more broad insurers pull back and increase prices for the remaining players. Also, after some earthquake activity in California, inbound interest in earthquake insurance has climbed sharply. As we enter the last two months of 2019, the Fund is most overweight the health care and communications services sectors. The Fund is underweight the consumer discretionary and industrial sectors. As always, these weights are fallout of our fundamentalbottom-up investment process. We continue to evaluate new opportunities, and have found several new investments that should add to results in the future and are in line with the disciplined process that has resulted in long-term results for our clients. These new stocks have come across multiple industry sectors, and we are confident in our companies going forward. The views expressed represent the opinions of LMCG Investments LLC, as of October 31, 2019, and are not intended as a forecast or guarantee of future results and are subject to change without notice. |
41
|
AMG Managers LMCG Small Cap Growth Fund Portfolio Manager’s Comments(continued) |
CUMULATIVE TOTAL RETURN PERFORMANCE
AMG Managers LMCG Small Cap Growth Fund’s cumulative total return is based on the daily change in net asset value (NAV), and assumes that all dividends and distributions were reinvested. The graph compares a hypothetical $10,000 investment made in the AMG Managers LMCG Small Cap Growth Fund’s Class N shares on November 3, 2010, to a $10,000 investment made in the Russell 2000® Growth Index for the same time period. The graph and table do not reflect the deduction of taxes that a shareholder would pay on a Fund distribution or redemption of shares. The listed returns for the Fund are net of expenses and the returns for the index exclude expenses. Total returns would have been lower had certain expenses not been reduced.
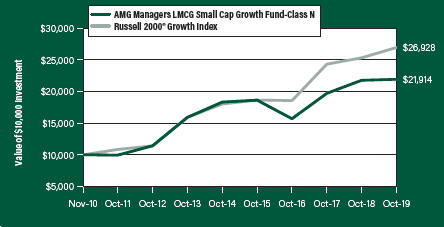
The table below shows the average annual total returns for the AMG Managers LMCG Small Cap Growth Fund and the Russell 2000® Growth Index for the same time periods ended October 31, 2019.
| | | | | | | | | | | | | | | | |
Average Annual Total Returns1 | | One
Year | | | Five
Years | | | Since
Inception | | | Inception
Date | |
AMG Managers LMCG Small Cap Growth Fund2, 3, 4, 5, 6, 7, 8, 9 | | | | | | | | | | | | | | | | |
| | | | |
Class N | | | 0.71 | % | | | 3.64 | % | | | 9.11 | % | | | 11/03/10 | |
| | | | |
Class I | | | 0.93 | % | | | 3.86 | % | | | 7.25 | % | | | 06/01/11 | |
| | | | |
Russell 2000® Growth Index10 | | | 6.40 | % | | | 8.38 | % | | | 11.64 | % | | | 11/03/10 | † |
The performance data shown represents past performance. Past performance is not a guarantee of future results. Current performance may be lower or higher than the performance data quoted. The investment return and principal value of an investment will fluctuate so that an investor’s shares, when redeemed, may be worth more or less than their original cost.
Investors should carefully consider the Fund’s investment objectives, risks, charges and expenses before investing. For performance information through the most recent month end, current net asset values per share for the Fund and other information, please call 800.548.4539 or visit our website at amgfunds.com for a free prospectus. Read it carefully before investing or sending money.
Distributed by AMG Distributors, Inc., member FINRA/SIPC.
| † | Date reflects the inception date of the Fund, not the index. |
| 1 | Total return equals income yield plus share price change and assumes reinvestment of all dividends and capital gain distributions. Returns are net of fees and may reflect offsets of Fund expenses as described in the prospectus. No adjustment has been made for taxes payable by shareholders on their reinvested dividends and capital gain distributions. Returns for periods greater than one year are annualized. The listed returns on the Fund are net of expenses and based on the published NAV as of October 31, 2019. All returns are in U.S. dollars ($). |
| | |
| | | 2 The Fund is subject to risks associated with investments in small-capitalization companies, such as erratic earnings patterns, competitive conditions, limited earnings history and a reliance on one or a limited number of products. |
| | |
| | | 3 Active and frequent trading of a fund may result in higher transaction costs and increased tax liability. 4 The Fund invests in growth stocks, which may be more sensitive to market movements because their prices tend to reflect future investor expectations rather than just current profits. Growth stocks may underperform value stocks during given periods. 5 Investments in international securities are subject to certain risks of overseas investing including currency fluctuations and changes in political and economic conditions, which could result in significant market fluctuations. These risks are magnified in emerging markets. 6 Investing in initial public offerings (IPOs) is risky and the prices of stocks purchased in IPOs tend to fluctuate more widely than stocks of companies that have been publicly traded for a longer period of time. Stocks purchased in IPOs generally do not have a trading history, and information about the companies may be available for very limited periods. 7 The Fund is subject to risks associated with investments inmid-capitalization companies such as greater price volatility, lower trading volume, and less liquidity than the stocks of larger, more established companies. |
| | |
| | | 8 Companies that are in similar businesses may be similarly affected by particular economic or market events; to the extent the Fund has substantial holdings within a particular sector, the risks associated with that sector increase. 9 The Fund is subject to special risk considerations similar to those associated with the direct ownership of real estate. Real estate valuations may be subject to factors such as changing general and local economic, financial, competitive, and environmental conditions. 10 The Russell 2000® Growth Index measures the performance of the Russell 2000® companies with higherprice-to-book ratios and higher forecasted growth values. Unlike the Fund, the Russell 2000® Growth Index is unmanaged, is not available for investment and does not incur expenses. The Russell Indices are a trademark of the London Stock Exchange Group companies. Not FDIC insured, nor bank guaranteed. May lose value. |
42
|
AMG Managers LMCG Small Cap Growth Fund Fund Snapshots(unaudited) October 31, 2019 |
PORTFOLIO BREAKDOWN
| | |
| Sector | | % of
Net Assets |
Health Care | | 40.5 |
| | |
Information Technology | | 22.5 |
| | |
Industrials | | 17.1 |
| | |
Communication Services | | 13.6 |
| | |
Financials | | 5.3 |
| | |
Consumer Discretionary | | 3.5 |
| | |
Short-Term Investments | | 1.9 |
| | |
Other Assets Less Liabilities | | (4.4) |
TOP TEN HOLDINGS
| | |
| Security Name | | % of
Net Assets |
Sinclair Broadcast Group, Inc., Class A | | 5.2 |
| | |
LHC Group, Inc. | | 4.8 |
| | |
Addus HomeCare Corp. | | 4.5 |
| | |
Tandem Diabetes Care, Inc. | | 4.1 |
| | |
R1 RCM, Inc. | | 3.9 |
| | |
The EW Scripps Co., Class A | | 3.8 |
| | |
AtriCure, Inc. | | 3.7 |
| | |
Insperity, Inc. | | 3.5 |
| | |
Albany International Corp., Class A | | 3.2 |
| | |
RealPage, Inc. | | 3.0 |
| | | |
| | |
Top Ten as a Group | | 39.7 |
| | |
Because a fund’s strategy may result in multiple investments in particular sectors of the economy, its performance may depend on the performance of those sectors and may fluctuate more widely than investments diversified across more sectors. For additional information on these and other risk considerations, please see the Fund’s prospectus.
Any sectors, industries, or securities discussed should not be perceived as investment recommendations. Mention of a specific security should not be considered a recommendation to buy or solicitation to sell that security. Specific securities mentioned in this report may have been sold from the Fund’s portfolio of investments by the time you receive this report.
43
|
AMG Managers LMCG Small Cap Growth Fund Schedule of Portfolio Investments October 31, 2019 |
| | | | | | | | |
| | | Shares | | | Value | |
| | |
Common Stocks - 102.5% | | | | | | | | |
| | |
Communication Services - 13.6% | | | | | | | | |
Boingo Wireless, Inc.* | | | 126,212 | | | | $1,195,228 | |
The EW Scripps Co., Class A1 | | | 127,383 | | | | 1,711,390 | |
Sinclair Broadcast Group, Inc., Class A | | | 58,610 | | | | 2,335,022 | |
Zayo Group Holdings, Inc.* | | | 26,420 | | | | 901,979 | |
Total Communication Services | | | | | | | 6,143,619 | |
| | |
Consumer Discretionary - 3.5% | | | | | | | | |
Churchill Downs, Inc. | | | 2,645 | | | | 343,824 | |
Marriott Vacations Worldwide Corp. | | | 8,197 | | | | 901,096 | |
Red Rock Resorts, Inc., Class A1 | | | 16,221 | | | | 353,293 | |
Total Consumer Discretionary | | | | | | | 1,598,213 | |
| | |
Financials - 5.3% | | | | | | | | |
Kinsale Capital Group, Inc. | | | 7,111 | | | | 751,775 | |
Palomar Holdings, Inc.* | | | 15,536 | | | | 701,450 | |
Trupanion, Inc.*,1 | | | 39,481 | | | | 935,700 | |
Total Financials | | | | | | | 2,388,925 | |
| | |
Health Care - 40.5% | | | | | | | | |
ACADIA Pharmaceuticals, Inc.*,1 | | | 12,919 | | | | 547,895 | |
Addus HomeCare Corp.* | | | 24,297 | | | | 2,046,050 | |
Amicus Therapeutics, Inc.*,1 | | | 38,728 | | | | 326,477 | |
AtriCure, Inc.* | | | 63,761 | | | | 1,695,405 | |
Bio-Techne Corp. | | | 2,506 | | | | 521,674 | |
CryoLife, Inc.* | | | 28,916 | | | | 649,164 | |
Encompass Health Corp. | | | 20,620 | | | | 1,320,092 | |
Global Blood Therapeutics, Inc.*,1 | | | 6,724 | | | | 322,416 | |
Haemonetics Corp.* | | | 2,277 | | | | 274,902 | |
HMS Holdings Corp.* | | | 34,800 | | | | 1,137,612 | |
iRhythm Technologies, Inc.*,1 | | | 13,187 | | | | 881,155 | |
LHC Group, Inc.* | | | 19,716 | | | | 2,187,885 | |
Molina Healthcare, Inc.* | | | 6,015 | | | | 707,605 | |
R1 RCM, Inc.* | | | 165,592 | | | | 1,760,243 | |
Radius Health, Inc.*,1 | | | 26,738 | | | | 760,429 | |
Repligen Corp.* | | | 6,738 | | | | 535,604 | |
Sage Therapeutics, Inc.* | | | 1,810 | | | | 245,526 | |
Sarepta Therapeutics, Inc.*,1 | | | 7,235 | | | | 600,939 | |
Tandem Diabetes Care, Inc.* | | | 30,053 | | | | 1,850,664 | |
Total Health Care | | | | | | | 18,371,737 | |
| | |
Industrials - 17.1% | | | | | | | | |
Albany International Corp., Class A | | | 17,058 | | | | 1,432,531 | |
Axon Enterprise, Inc.* | | | 5,608 | | | | 286,737 | |
Cubic Corp. | | | 7,111 | | | | 524,365 | |
| | | | | | | | |
| | | Shares | | | Value | |
Generac Holdings, Inc.* | | | 7,380 | | | | $712,761 | |
Insperity, Inc. | | | 15,083 | | | | 1,593,217 | |
John Bean Technologies Corp.1 | | | 6,663 | | | | 684,757 | |
Mercury Systems, Inc.* | | | 6,735 | | | | 496,100 | |
RBC Bearings, Inc.* | | | 1,279 | | | | 205,203 | |
Sunrun, Inc.*,1 | | | 37,391 | | | | 581,056 | |
Tetra Tech, Inc. | | | 2,922 | | | | 255,587 | |
TriNet Group, Inc.* | | | 18,205 | | | | 964,683 | |
Total Industrials | | | | | | | 7,736,997 | |
| |
Information Technology - 22.5% | | | | | |
Avalara, Inc.* | | | 11,232 | | | | 797,472 | |
Entegris, Inc. | | | 10,101 | | | | 484,848 | |
Envestnet, Inc.* | | | 12,865 | | | | 803,934 | |
Everbridge, Inc.* | | | 15,475 | | | | 1,075,667 | |
Lattice Semiconductor Corp.* | | | 36,026 | | | | 705,749 | |
LivePerson, Inc.*,1 | | | 21,023 | | | | 862,994 | |
Mimecast, Ltd.* | | | 5,169 | | | | 205,261 | |
Monolithic Power Systems, Inc. | | | 2,139 | | | | 320,679 | |
Paylocity Holding Corp.* | | | 5,926 | | | | 608,008 | |
Q2 Holdings, Inc.*,1 | | | 12,100 | | | | 865,029 | |
Rapid7, Inc.* | | | 25,204 | | | | 1,262,468 | |
RealPage, Inc.* | | | 22,811 | | | | 1,381,206 | |
Semtech Corp.* | | | 16,780 | | | | 846,719 | |
Total Information Technology | | | | | | | 10,220,034 | |
| | |
Total Common Stocks
(Cost $42,013,468) | | | | | | | 46,459,525 | |
| | | Principal
Amount | | | | |
| | |
Short-Term Investments - 1.9% | | | | | | | | |
| |
Joint Repurchase Agreements - 1.9%2 | | | | | |
Industrial and Commercial Bank of China Financial Services LLC, dated 10/31/19, due 11/01/19, 1.750% total to be received $849,625 (collateralized by various U.S. Government Agency Obligations and U.S. Treasuries, 0.000% - 9.500%, 12/24/19 - 10/01/49, totaling $866,576) | | | $849,584 | | | | 849,584 | |
| | |
Total Short-Term Investments
(Cost $849,584) | | | | | | | 849,584 | |
| | |
Total Investments - 104.4%
(Cost $42,863,052) | | | | | | | 47,309,109 | |
| |
Other Assets, less Liabilities - (4.4)% | | | | (1,984,181 | ) |
| | |
Net Assets - 100.0% | | | | | | $ | 45,324,928 | |
The accompanying notes are an integral part of these financial statements.
44
|
AMG Managers LMCG Small Cap Growth Fund Schedule of Portfolio Investments(continued) |
| * | Non-income producing security. |
| 1 | Some of these securities, amounting to $6,133,357 or 13.5% of net assets, were out on loan to various borrowers and are collateralized by cash and various U.S. Treasury Obligations. See Note 4 of Notes to Financial Statements. |
| 2 | Cash collateral received for securities lending activity was invested in these joint repurchase agreements. |
The following table summarizes the inputs used to value the Fund’s investments by the fair value hierarchy levels as of October 31, 2019:
| | | | | | | | | | | | | | | | |
| | | Level 1 | | | Level 2 | | | Level 3 | | | Total | |
Investments in Securities | | | | | | | | | | | | | | | | |
| | | | |
Common Stocks† | | $ | 46,459,525 | | | | — | | | | — | | | $ | 46,459,525 | |
| | | | |
Short-Term Investments | | | | | | | | | | | | | | | | |
Joint Repurchase Agreements | | | — | | | $ | 849,584 | | | | — | | | | 849,584 | |
| | | | | | | | | | | | | | | | |
Total Investments in Securities | | $ | 46,459,525 | | | $ | 849,584 | | | | — | | | $ | 47,309,109 | |
| | | | | | | | | | | | | | | | |
| † | All common stocks held in the Fund are Level 1 securities. For a detailed breakout of common stocks by major industry classification, please refer to the Fund’s Schedule of Portfolio Investments. |
For the fiscal year ended October 31, 2019, there were no transfers in or out of Level 3.
The accompanying notes are an integral part of these financial statements.
45
|
AMG River RoadSmall-Mid Cap Value Fund Portfolio Manager’s Comments(unaudited) |
| | | | | | | | | | |
OVERVIEW For the fiscal year ended October 31, 2019, the AMG River Road Small-Mid Cap Value Fund (the “Fund) Class N shares returned 11.82%, outperforming the Russell 2500® Value Index return of 6.10%. PERFORMANCE REVIEW The sector with the largest positive contribution to relative return was energy, which benefited from an underweight allocation and strong stock selection. The sector with the largest negative contribution to relative return was information technology, which suffered from poor stock selection. The Fund’s cash position, which averaged approximately 5% during the period, was slightly additive to relative performance. The top contributing holdings in the Fund were Cannae Holdings, Inc. (CNNE) and GCI Liberty, Inc. (GLIBA). Cannae Holdings is essentially a publicly traded private equity fund. Its two primary investments are a 20% equity stake in HR software and services firm Ceridian (CDAY) and a 25% equity stake in privately held commercial data and analytics provider Dun & Bradstreet (which Cannae and its partners purchased in February 2019). Under new ownership, the company has already achieved $153M of net annualized expense reductions and expects a run rate of more than $200M by the end of 2019, plus another $40M–$50M in 2020. Considering the company generated ~$550M of EBITDA in 2018, we believe this represents significant improvement given the company’s stable revenue base. Furthermore, Cannae sold two million Ceridian shares for gross proceeds of $100.5M. We slightly trimmed the position. GCI Liberty owns 7% of Charter | | | | Communications (CHTR) and is the largest cable provider in Alaska. The company reported several strong quarters with market share gains driving growth in internet subscribers, which carry much higher margins than video subscribers. The company’s mobile offering, launched in mid-2018, has also shown impressive gains. This positive mix shift has led to margin expansion and significant growth in free cash flow. We continue to believe the company is well positioned to grow its internet services and mobile business despite the threat from 5G services. We trimmed the position late in the year. The bottom contributing holdings in the Fund were Conduent, Inc. (CNDT) and Resideo Technologies, Inc. (REZI). Global business process outsourcer Conduent reported two consecutive quarters with results below expectations stemming from operational challenges and declining revenues. As a result, the company significantly lowered forward guidance. Interim CEO Cliff Skelton recently initiated a full strategic and operational review. Skelton plans to reinvest in the business to drive future growth. Further, the company stated “all opportunities are under review,” including selling individual businesses as well as the whole company. Conduent’s largest investor, activist Carl Icahn, purchased an additional 6.5 million shares ($6.51 average) after its Q2 results, bringing his total ownership to 18% of the company. We trimmed the position during the year. Resideo is a global provider and distributor of smart-home products (thermostats, security systems, etc.). In October, the company announced weak preliminary Q3 results and lowered 2019 EBITDA guidance by (19%) at the midpoint. Given that revenue guidance was reduced only modestly, the problems appear to be cost issues | | | | | | specific to the company and not reflective of weak end markets. In response, the company named a new interim-CFO, Bob Ryder, who had an excellent track record as CFO at Constellation Brands (STZ). We trimmed the position. OUTLOOK AND POSITIONING Little has changed in our outlook over the past 12 months as small caps continue to experience weak earnings growth and languish below their August 2018 high-water mark. As we look into 2020, year-over-year earnings comparisons should become more attractive and equity markets should begin to reflect the benefits of monetary easing. Additionally, relative valuations for small caps are attractive. However, it is difficult to say how much of these tailwinds have been pulled forward into the remarkable gains experienced in 2019. Further, it is difficult to predict how trade negotiations, which continue to weigh on CEO sentiment and capex, will unfold, or the results of upcoming elections and other political uncertainties. Despite these macro crosscurrents, what matters most to us is individual stock picking and effective portfolio management. While it has been difficult to keep the Fund fully invested, we are finding new opportunities, especially on market pullbacks. Additionally, we believe portfolio positioning remains a highly attractive balance of value and quality. The views expressed represent the opinions of River Road Asset Management LLC, as of October 31, 2019, and are not intended as a forecast or guarantee of future results and are subject to change without notice. |
46
|
AMG River RoadSmall-Mid Cap Value Fund Portfolio Manager’s Comments(continued) |
CUMULATIVE TOTAL RETURN PERFORMANCE
AMG River RoadSmall-Mid Cap Value Fund’s cumulative total return is based on the daily change in net asset value (NAV), and assumes that all dividends and distributions were reinvested. The graph compares a hypothetical $10,000 investment made in the AMG River RoadSmall-Mid Cap Value Fund’s Class N shares on October 31, 2009, to a $10,000 investment made in the Russell 2500® Value Index and Russell 2000® Value Index for the same time period. The graph and table do not reflect the deduction of taxes that a shareholder would pay on a Fund distribution or redemption of shares. The listed returns for the Fund are net of expenses and the returns for the index exclude expenses. Total returns would have been lower had certain expenses not been reduced.
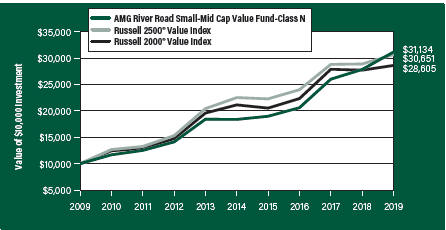
The table below shows the average annual total returns for the AMG River RoadSmall-Mid Cap Value Fund and the Russell 2500® Value Index and Russell 2000® Value Index for the same time periods ended October 31, 2019.
| | | | | | | | | | | | | | | | | | | | |
Average Annual Total Returns1 | | One
Year | | | Five
Years | | | Ten
Years | | | Since
Inception | | | Inception
Date | |
AMG River Road Small-Mid Cap Value Fund2,3, 4, 5, 6, 7 | | | | | |
| | | | | |
Class N | | | 11.82% | | | | 11.11% | | | | 12.03% | | | | 7.22% | | | | 03/29/07 | |
| | | | | |
Class I | | | 12.12% | | | | 11.39% | | | | 12.33% | | | | 7.21% | | | | 06/28/07 | |
| | | | | |
Class Z | | | 12.26% | | | | — | | | | — | | | | 8.68% | | | | 09/29/17 | |
| | | | | |
Russell 2500® Value Index8 | | | 6.10% | | | | 6.36% | | | | 11.85% | | | | 6.28% | | | | 03/29/07 | † |
| | | | | |
Russell 2000® Value Index9 | | | 3.22% | | | | 6.24% | | | | 11.08% | | | | 5.52% | | | | 03/29/07 | † |
The performance data shown represents past performance. Past performance is not a guarantee of future results. Current performance may be lower or higher than the performance data quoted. The investment return and principal value of an investment will fluctuate so that an investor’s shares, when redeemed, may be worth more or less than their original cost.
Investors should carefully consider the Fund’s investment objectives, risks, charges and expenses before investing. For performance information through the most recent month end, current net asset values per share for the Fund and other information, please call 800.548.4539 or visit our website at amgfunds.com for a free prospectus. Read it carefully before investing or sending money.
Distributed by AMG Distributors, Inc., member FINRA/SIPC.
| † | Date reflects the inception date of the Fund, not the index. |
| 1 | Total return equals income yield plus share price change and assumes reinvestment of all dividends and capital gain distributions. Returns are net of fees and may reflect offsets of Fund expenses as described in the |
| | |
| | | prospectus. No adjustment has been made for taxes payable by shareholders on their reinvested dividends and capital gain distributions. Returns for periods greater than one year are annualized. The listed returns on the Fund are net of expenses and based on the published NAV as of October 31, 2019. All returns are in U.S. dollars ($). |
| | |
| | | 2 Investments in international securities are subject to certain risks of overseas investing including currency fluctuations and changes in political and economic conditions, which could result in significant market fluctuations. These risks are magnified in emerging markets. |
| | |
| | | 3 The Fund is subject to risks associated with investments inmid-capitalization companies such as greater price volatility, lower trading volume, and less liquidity than the stocks of larger, more established companies. |
| | |
| | | 4 The Fund is subject to special risk considerations similar to those associated with the direct ownership of real estate. Real estate valuations may be subject to factors such as changing general and local economic, financial, competitive, and environmental conditions. |
| | |
| | | 5 The Fund is subject to risks associated with investments in small-capitalization companies, such as erratic earnings patterns, competitive conditions, limited earnings history and a reliance on one or a limited number of products. |
| | |
| | | 6 The Fund invests in value stocks, which may perform differently from the market as a whole and may be undervalued by the market for a long period of time. |
| | |
| | | 7 Companies that are in similar businesses may be similarly affected by particular economic or market events; to the extent the Fund has substantial holdings within a particular sector, the risks associated with that sector increase. |
| | |
| | | 8 The Russell 2500® Value Index measures the performance of the Russell 2500® companies with lowerprice-to-book ratios and lower forecasted growth values. Unlike the Fund, the Russell 2500® Value Index is unmanaged, is not available for investment and does not incur expenses. |
| | |
| | | 9 The Russell 2000® Value Index is an unmanaged, market-value weighted, value-oriented index comprised of small stocks that have relatively lowprice-to-book ratios and lower forecasted growth values. Unlike the Fund, the Russell 2000® Value Index is unmanaged, is not available for investment and does not incur expenses. |
| | |
| | | The Russell Indices are a trademark of the London Stock Exchange Group companies. Not FDIC insured, nor bank guaranteed. May lose value. |
47
|
AMG River RoadSmall-Mid Cap Value Fund Fund Snapshots(unaudited) October 31, 2019 |
PORTFOLIO BREAKDOWN
| | |
| Sector | | % of Net Assets |
Industrials | | 26.8 |
| | |
Communication Services | | 16.6 |
| | |
Information Technology | | 13.0 |
| | |
Consumer Discretionary | | 12.7 |
| | |
Financials | | 10.9 |
| | |
Consumer Staples | | 6.7 |
| | |
Health Care | | 4.6 |
| | |
Energy | | 2.7 |
| | |
Materials | | 0.8 |
| | |
Real Estate | | 0.5 |
| | |
Short-Term Investments | | 4.8 |
| | |
Other Assets Less Liabilities | | (0.1) |
TOP TEN HOLDINGS
| | |
| Security Name | | % of Net Assets |
Cannae Holdings, Inc. | | 4.0 |
| | |
GCI Liberty, Inc., Class A | | 4.0 |
| | |
Hostess Brands, Inc. | | 3.5 |
| | |
Premier, Inc., Class A | | 3.3 |
| | |
LKQ Corp. | | 3.2 |
| | |
Liberty Broadband Corp., Class C | | 3.2 |
| | |
Sabre Corp. | | 2.8 |
| | |
Air Transport Services Group, Inc. | | 2.7 |
| | |
Discovery, Inc., Class C | | 2.7 |
| | |
Extended Stay America, Inc. | | 2.4 |
| | |
| | |
Top Ten as a Group | | 31.8 |
| | |
Because a fund’s strategy may result in multiple investments in particular sectors of the economy, its performance may depend on the performance of those sectors and may fluctuate more widely than investments diversified across more sectors. For additional information on these and other risk considerations, please see the Fund’s prospectus.
Any sectors, industries, or securities discussed should not be perceived as investment recommendations. Mention of a specific security should not be considered a recommendation to buy or solicitation to sell that security. Specific securities mentioned in this report may have been sold from the Fund’s portfolio of investments by the time you receive this report.
48
|
AMG River RoadSmall-Mid Cap Value Fund Schedule of Portfolio Investments October 31, 2019 |
| | | | | | | | |
| | | Shares | | | Value | |
| | |
Common Stocks - 95.3% | | | | | | | | |
| |
Communication Services - 16.6% | | | | | |
| | |
Discovery, Inc., Class C* | | | 180,288 | | | | $4,550,469 | |
| | |
GCI Liberty, Inc., Class A* | | | 97,787 | | | | 6,843,134 | |
| | |
The Interpublic Group of Cos., Inc. | | | 50,408 | | | | 1,096,374 | |
| | |
Liberty Broadband Corp., Class C* | | | 46,121 | | | | 5,445,507 | |
| | |
Liberty Latin America, Ltd., Class A* | | | 96,852 | | | | 1,810,164 | |
| | |
Liberty Latin America, Ltd., Class C*,1 | | | 151,695 | | | | 2,792,705 | |
| | |
MSG Networks, Inc., Class A* | | | 137,023 | | | | 2,221,143 | |
| | |
TripAdvisor, Inc.* | | | 52,391 | | | | 2,116,596 | |
| | |
Vonage Holdings Corp.* | | | 99,299 | | | | 970,151 | |
| | |
Yelp, Inc.* | | | 12,139 | | | | 418,917 | |
| | |
Total Communication Services | | | | | | | 28,265,160 | |
| |
Consumer Discretionary - 12.7% | | | | | |
| | |
Advance Auto Parts, Inc. | | | 5,224 | | | | 848,796 | |
| | |
Aramark | | | 16,712 | | | | 731,317 | |
| | |
Biglari Holdings, Inc., Class A* | | | 286 | | | | 118,129 | |
| | |
Expedia Group, Inc. | | | 29,215 | | | | 3,992,522 | |
| | |
Extended Stay America, Inc. | | | 290,579 | | | | 4,129,128 | |
| | |
LKQ Corp.* | | | 161,661 | | | | 5,494,857 | |
| | |
Motorcar Parts of America, Inc.*,1 | | | 43,188 | | | | 823,163 | |
| | |
Murphy USA, Inc.* | | | 28,957 | | | | 3,414,899 | |
| | |
Six Flags Entertainment Corp. | | | 49,624 | | | | 2,093,637 | |
| | |
Total Consumer Discretionary | | | | | | | 21,646,448 | |
| | |
Consumer Staples - 6.7% | | | | | | | | |
| | |
BJ’s Wholesale Club Holdings, Inc.*,1 | | | 136,204 | | | | 3,636,647 | |
| | |
Hostess Brands, Inc.* | | | 464,345 | | | | 5,934,329 | |
| | |
Ingles Markets, Inc., Class A | | | 47,306 | | | | 1,865,275 | |
| | |
Total Consumer Staples | | | | | | | 11,436,251 | |
| | |
Energy - 2.7% | | | | | | | | |
| | |
PBF Energy, Inc., Class A | | | 80,807 | | | | 2,608,450 | |
| | |
QEP Resources, Inc. | | | 139,658 | | | | 465,061 | |
| | |
World Fuel Services Corp. | | | 35,870 | | | | 1,498,290 | |
| | |
Total Energy | | | | | | | 4,571,801 | |
| | |
Financials - 10.9% | | | | | | | | |
| | |
Axis Capital Holdings, Ltd. (Bermuda) | | | 40,154 | | | | 2,386,352 | |
| | |
Cannae Holdings, Inc.* | | | 235,723 | | | | 6,883,112 | |
| | |
FGL Holdings (Bermuda)1 | | | 273,142 | | | | 2,466,472 | |
| | |
Genworth Financial, Inc., Class A* | | | 135,403 | | | | 579,525 | |
| | |
Health Insurance Innovations, Inc., Class A* | | | 52,039 | | | | 1,377,993 | |
| | |
Webster Financial Corp. | | | 32,305 | | | | 1,424,650 | |
| | |
White Mountains Insurance Group, Ltd. | | | 3,332 | | | | 3,568,572 | |
| | |
Total Financials | | | | | | | 18,686,676 | |
| | | | | | | | |
| | | Shares | | | Value | |
| | |
Health Care - 4.6% | | | | | | | | |
| | |
Computer Programs & Systems, Inc. | | | 67,599 | | | | $1,559,509 | |
| | |
Patterson Cos., Inc.1 | | | 34,954 | | | | 598,762 | |
| | |
Premier, Inc., Class A*,1 | | | 174,452 | | | | 5,683,646 | |
| | |
Total Health Care | | | | | | | 7,841,917 | |
| |
Industrials - 26.8% | | | | | |
| | |
Air Transport Services Group, Inc.* | | | 219,305 | | | | 4,585,668 | |
| | |
Arcosa, Inc. | | | 40,502 | | | | 1,555,682 | |
| | |
Argan, Inc. | | | 82,391 | | | | 3,118,499 | |
| | |
Armstrong World Industries, Inc. | | | 19,435 | | | | 1,817,756 | |
| | |
Atkore International Group, Inc.* | | | 64,251 | | | | 2,229,510 | |
| | |
Colfax Corp.*,1 | | | 92,294 | | | | 3,101,078 | |
| | |
Comfort Systems USA, Inc. | | | 58,959 | | | | 2,972,123 | |
| | |
Cubic Corp.1 | | | 20,842 | | | | 1,536,889 | |
| | |
Forward Air Corp. | | | 17,847 | | | | 1,234,477 | |
| | |
GrafTech International Ltd. | | | 187,526 | | | | 2,265,314 | |
| | |
Harsco Corp.* | | | 124,737 | | | | 2,528,419 | |
| | |
Kansas City Southern | | | 21,027 | | | | 2,960,181 | |
| | |
MSC Industrial Direct Co., Inc., Class A1 | | | 33,975 | | | | 2,487,310 | |
| | |
Nielsen Holdings PLC | | | 125,010 | | | | 2,520,202 | |
| | |
nVent Electric PLC (United Kingdom) | | | 100,992 | | | | 2,328,876 | |
| | |
PICO Holdings, Inc.* | | | 46,753 | | | | 503,997 | |
| | |
Resideo Technologies, Inc.*,1 | | | 110,149 | | | | 1,049,720 | |
| | |
Resources Connection, Inc. | | | 36,930 | | | | 541,024 | |
| | |
UniFirst Corp. | | | 15,455 | | | | 3,103,982 | |
| | |
Viad Corp. | | | 54,493 | | | | 3,325,163 | |
| | |
Total Industrials | | | | | | | 45,765,870 | |
| | |
Information Technology - 13.0% | | | | | | | | |
| | |
Alliance Data Systems Corp. | | | 12,304 | | | | 1,230,400 | |
| | |
Anixter International, Inc.* | | | 19,261 | | | | 1,593,848 | |
| | |
Avaya Holdings Corp.*,1 | | | 235,191 | | | | 2,843,459 | |
| | |
CDK Global, Inc. | | | 60,627 | | | | 3,064,088 | |
| | |
Conduent, Inc.* | | | 183,398 | | | | 1,133,400 | |
| | |
NCR Corp.* | | | 94,489 | | | | 2,760,024 | |
| | |
Sabre Corp. | | | 201,775 | | | | 4,737,677 | |
| | |
Tech Data Corp.* | | | 30,022 | | | | 3,647,673 | |
| | |
Verra Mobility Corp.*,1 | | | 77,574 | | | | 1,113,187 | |
| | |
Total Information Technology | | | | | | | 22,123,756 | |
| | |
Materials - 0.8% | | | | | | | | |
| | |
Allegheny Technologies, Inc.*,1 | | | 63,445 | | | | 1,332,979 | |
The accompanying notes are an integral part of these financial statements.
49
|
AMG River RoadSmall-Mid Cap Value Fund Schedule of Portfolio Investments(continued) |
| | | | | | | | |
| | | Shares | | | Value | |
| | |
Real Estate - 0.5% | | | | | | | | |
| | |
Newmark Group, Inc., Class A | | | 84,979 | | | | $902,477 | |
| | |
Total Common Stocks
(Cost $151,932,396) | | | | | | | 162,573,335 | |
| |
Short-Term Investments - 4.8% | | | | | |
| |
Other Investment Companies - 4.8% | | | | | |
| | |
Dreyfus Government Cash Management Fund, Institutional Shares, 1.73%2 | | | 2,682,277 | | | | 2,682,277 | |
| | |
Dreyfus Institutional Preferred Government Money Market Fund, Institutional Shares, 1.77%2 | | | 2,682,277 | | | | 2,682,277 | |
| | |
JPMorgan U.S. Government Money Market Fund, IM Shares, 1.75%2 | | | 2,763,558 | | | | 2,763,558 | |
| | |
Total Short-Term Investments
(Cost $8,128,112) | | | | | | | 8,128,112 | |
| | | | | | | | |
| | | | | | Value | |
| | |
Total Investments - 100.1%
(Cost $160,060,508) | | | | | | $ | 170,701,447 | |
| |
Other Assets, less Liabilities - (0.1)% | | | | (228,510 | ) |
| | |
Net Assets - 100.0% | | | | | | $ | 170,472,937 | |
| * | Non-income producing security. |
| 1 | Some of these securities, amounting to $21,932,208 or 12.9% of net assets, were out on loan to various borrowers and are collateralized by cash and various U.S. Treasury Obligations. See Note 4 of Notes to Financial Statements. |
| 2 | Yield shown represents the October 31, 2019, seven day average yield, which refers to the sum of the previous seven days’ dividends paid, expressed as an annual percentage. |
The following table summarizes the inputs used to value the Fund’s investments by the fair value hierarchy levels as of October 31, 2019:
| | | | | | | | | | | | | | | | |
| | | Level 1 | | | Level 2 | | | Level 3 | | | Total | |
Investments in Securities | | | | | | | | | | | | | | | | |
| | | | |
Common Stocks† | | $ | 162,573,335 | | | | — | | | | — | | | $ | 162,573,335 | |
| | | | |
Short-Term Investments | | | | | | | | | | | | | | | | |
Other Investment Companies | | | 8,128,112 | | | | — | | | | — | | | | 8,128,112 | |
| | | | | | | | | | | | | | | | |
Total Investments in Securities | | $ | 170,701,447 | | | | — | | | | — | | | $ | 170,701,447 | |
| | | | | | | | | | | | | | | | |
| † | All common stocks held in the Fund are Level 1 securities. For a detailed breakout of common stocks by major industry classification, please refer to the Fund’s Schedule of Portfolio Investments. |
For the fiscal year ended October 31, 2019, there were no transfers in or out of Level 3.
The accompanying notes are an integral part of these financial statements.
50
|
AMG River Road Small Cap Value Fund Portfolio Manager’s Comments(unaudited) |
| | | | | | | | |
OVERVIEW For the fiscal year ended October 31, 2019, the AMG River Road Small Cap Value Fund (the “Fund”) Class N shares returned 10.86%, outperforming the 3.22% return for the Russell 2000® Value Index. PERFORMANCE REVIEW The sector with the largest positive contribution to relative return was industrials, which benefited from strong stock selection and an overweight allocation. The sector with the largest negative contribution to relative return was real estate, which suffered primarily from an underweight allocation. The Fund’s cash position, which averaged approximately 9% during the period, was slightly additive to relative performance. The top contributing holdings in the Fund were Cannae Holdings, Inc. (CNNE) and Computer Services, Inc. (CSVI). Cannae Holdings is essentially a publicly traded private equity fund. Its two primary investments are a 20% equity stake in HR software and services firm Ceridian (CDAY) and a 25% equity stake in privately held commercial data and analytics provider Dun & Bradstreet (which Cannae and its partners purchased in February 2019). Under new ownership, DNB has already achieved $153M of net annualized expense reductions and expects a run rate of more than $200M by the end of 2019, plus another $40M–$50M in 2020. Considering the company generated ~$550M of EBITDA in 2018, we believe this represents significant improvement given the company’s stable revenue base. Furthermore, Cannae sold two million Ceridian shares for gross proceeds of $100.5M. We slightly trimmed the position. Computer Services is a provider of core processing services and a variety of | | | | technology solutions (such as fraud prevention and regulatory compliance) for small community banks. Computer Services has reported several consecutive quarters of organic revenue growth, margin expansion, and strong free cash flow generation. These financial results also led to the company’s largest dividend hike (16.7%) since 2014, marking the 48th consecutive annual raise. We trimmed the position. The bottom contributing holdings in the Fund were Conduent (CNDT) and Premier, Inc. (Class A) (PINC). Global business process outsourcer Conduent reported two consecutive quarters with results below expectations stemming from operational challenges and declining revenues. As a result, the company significantly lowered forward guidance. Interim CEO Cliff Skelton recently initiated a full strategic and operational review. Skelton plans to reinvest in the business to drive future growth. Further, the company stated “all opportunities are under review,” including selling individual businesses as well as the whole company. The company’s largest investor, activist Carl Icahn, purchased an additional 6.5 million shares ($6.51 average) after its Q2 results, bringing his total ownership to 18% of the company. We trimmed the position during the year. Premier is a healthcare group purchasing organization (GPO) and data analytics provider for a large majority of U.S. community hospitals. The company reported fiscal fourth quarter EBITDA ahead of consensus and issued fiscal 2020 guidance in line with expectations. However, the stock later sold off when a short seller published a negative report on the company. It argued the two largest members of the GPO (contracts expire on September 30, 2020) will demand a much higher share of gross administrative | | | | fees and other members will follow suit, although 87% of the GPO business is under contract until September 30, 2023. Our research suggests Premier should be able to renew these contracts while maintaining similar economics due to high switching costs and the tremendous savings the company delivers to its members. We maintained the position. OUTLOOK AND POSITIONING Little has changed in our outlook over the past 12 months as small caps continue to experience weak earnings growth and languish below their August 2018 high-water mark. As we look into 2020, year-over-year earnings comparisons should become more attractive and equity markets should begin to reflect the benefits of monetary easing. Additionally, relative valuations for small caps are attractive. However, it is difficult to say how much of these tailwinds have been pulled forward into the remarkable gains experienced in 2019. Further, it is difficult to predict how trade negotiations, which continue to weigh on CEO sentiment and capex, will unfold, or the results of upcoming elections and other political uncertainties. Despite these macro crosscurrents, what matters most to us is individual stock picking and effective portfolio management. While it has been difficult to keep the Fund fully invested, we are finding new opportunities, especially on market pullbacks. Additionally, we believe portfolio positioning remains a highly attractive balance of value and quality. The views expressed represent the opinions of River Road Asset Management LLC, as of October 31, 2019, and are not intended as a forecast or guarantee of future results and are subject to change without notice. |
51
|
AMG River Road Small Cap Value Fund Portfolio Manager’s Comments(continued) |
CUMULATIVE TOTAL RETURN PERFORMANCE
AMG River Road Small Cap Value Fund’s cumulative total return is based on the daily change in net asset value (NAV), and assumes that all dividends and distributions were reinvested. The graph compares a hypothetical $10,000 investment made in the AMG River Road Small Cap Value Fund’s Class N shares on October 31, 2009, to a $10,000 investment made in the Russell 2000® Value Index for the same time period. The graph and table do not reflect the deduction of taxes that a shareholder would pay on a Fund distribution or redemption of shares. The listed returns for the Fund are net of expenses and the returns for the index exclude expenses. Total returns would have been lower had certain expenses not been reduced.
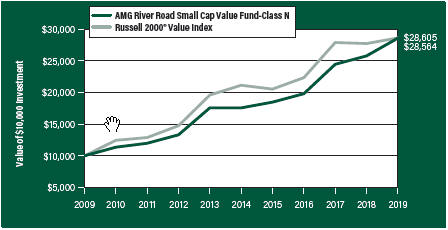
The table below shows the average annual total returns for the AMG River Road Small Cap Value Fund and the Russell 2000® Value Index for the same time periods ended October 31, 2019.
| | | | | | | | | | | | | | | | | | | | |
Average Annual Total Returns1 | | One
Year | | | Five
Years | | | Ten
Years | | | Since
Inception | | | Inception
Date | |
AMG River Road | | | | | | | | | | | | | | | | | | | | |
Small Cap Value
Fund2, 3, 4, 5, 6, 7 | | | | | | | | | | | | | | | | | | | | |
| | | | | |
Class N | | | 10.86% | | | | 10.21% | | | | 11.07% | | | | 8.17% | | | | 06/28/05 | |
| | | | | |
Class I | | | 11.23% | | | | 10.51% | | | | 11.35% | | | | 6.58% | | | | 12/13/06 | |
| | | | | |
Class Z | | | 11.29% | | | | — | | | | — | | | | 8.09% | | | | 09/29/17 | |
| | | | | |
Russell 2000® Value Index8 | | | 3.22% | | | | 6.24% | | | | 11.08% | | | | 6.73% | | | | 06/28/05 | † |
The performance data shown represents past performance. Past performance is not a guarantee of future results. Current performance may be lower or higher than the performance data quoted. The investment return and principal value of an investment will fluctuate so that an investor’s shares, when redeemed, may be worth more or less than their original cost.
Investors should carefully consider the Fund’s investment objectives, risks, charges and expenses before investing. For performance information through the most recent month end, current net asset values per share for the Fund and other information, please call 800.548.4539 or visit our website at amgfunds.com for a free prospectus. Read it carefully before investing or sending money.
Distributed by AMG Distributors, Inc., member FINRA/SIPC.
| † | Date reflects the inception date of the Fund, not the index. |
| 1 | Total return equals income yield plus share price change and assumes reinvestment of all dividends and capital gain distributions. Returns are net of fees and may reflect offsets of Fund expenses as described in the prospectus. No adjustment has been made for taxes payable by shareholders on their reinvested dividends and |
| | |
| | | capital gain distributions. Returns for periods greater than one year are annualized. The listed returns on the Fund are net of expenses and based on the published NAV as of October 31, 2019. All returns are in U.S. dollars ($). |
| | |
| | | 2 Investments in international securities are subject to certain risks of overseas investing including currency fluctuations and changes in political and economic conditions, which could result in significant market fluctuations. These risks are magnified in emerging markets. |
| | |
| | | 3 The Fund is subject to risks associated with investments in small-capitalization companies, such as erratic earnings patterns, competitive conditions, limited earnings history and a reliance on one or a limited number of products. |
| | |
| | | 4 The Fund is subject to risks associated with investments inmid-capitalization companies such as greater price volatility, lower trading volume, and less liquidity than the stocks of larger, more established companies. |
| | |
| | | 5 The Fund is subject to special risk considerations similar to those associated with the direct ownership of real estate. Real estate valuations may be subject to factors such as changing general and local economic, financial, competitive, and environmental conditions. |
| | |
| | | 6 The Fund invests in value stocks, which may perform differently from the market as a whole and may be undervalued by the market for a long period of time. |
| | |
| | | 7 Companies that are in similar businesses may be similarly affected by particular economic or market events; to the extent the Fund has substantial holdings within a particular sector, the risks associated with that sector increase. |
| | |
| | | 8 The Russell 2000® Value Index is an unmanaged, market-value weighted, value-oriented index comprised of small stocks that have relatively lowprice-to-book ratios and lower forecasted growth values. Unlike the Fund, the Russell 2000® Value Index is unmanaged, is not available for investment and does not incur expenses. |
| | |
| | | The Russell Indices are a trademark of the London Stock Exchange Group companies. |
| | |
| | | Not FDIC insured, nor bank guaranteed. May lose value. |
52
|
AMG River Road Small Cap Value Fund Fund Snapshots(unaudited) October 31, 2019 |
PORTFOLIO BREAKDOWN
| | |
| Sector | | % of Net Assets |
Industrials | | 30.0 |
| | |
Financials | | 13.9 |
| | |
Information Technology | | 12.4 |
| | |
Consumer Discretionary | | 9.9 |
| | |
Consumer Staples | | 7.4 |
| | |
Communication Services | | 6.1 |
| | |
Health Care | | 5.4 |
| | |
Energy | | 4.2 |
| | |
Materials | | 0.8 |
| | |
Real Estate | | 0.6 |
| | |
Short-Term Investments | | 9.9 |
| | |
Other Assets Less Liabilities | | (0.6) |
TOP TEN HOLDINGS
| | |
| Security Name | | % of Net Assets |
Cannae Holdings, Inc. | | 4.6 |
| | |
White Mountains Insurance Group, Ltd. | | 3.7 |
| | |
Premier, Inc., Class A | | 3.5 |
| | |
Hostess Brands, Inc. | | 3.3 |
| | |
Air Transport Services Group, Inc. | | 3.0 |
| | |
Tech Data Corp. | | 2.9 |
| �� | |
Murphy USA, Inc. | | 2.8 |
| | |
Liberty Latin America, Ltd., Class C | | 2.6 |
| | |
Extended Stay America, Inc. | | 2.5 |
| | |
UniFirst Corp. | | 2.4 |
| | |
| | |
Top Ten as a Group | | 31.3 |
| | |
Because a fund’s strategy may result in multiple investments in particular sectors of the economy, its performance may depend on the performance of those sectors and may fluctuate more widely than investments diversified across more sectors. For additional information on these and other risk considerations, please see the Fund’s prospectus.
Any sectors, industries, or securities discussed should not be perceived as investment recommendations. Mention of a specific security should not be considered a recommendation to buy or solicitation to sell that security. Specific securities mentioned in this report may have been sold from the Fund’s portfolio of investments by the time you receive this report.
53
|
AMG River Road Small Cap Value Fund Schedule of Portfolio Investments October 31, 2019 |
| | | | | | | | |
| | | Shares | | | Value | |
| | |
Common Stocks - 90.7% | | | | | | | | |
| |
Communication Services - 6.1% | | | | | |
| | |
Liberty Latin America, Ltd., Class C*,1 | | | 577,052 | | | $ | 10,623,527 | |
| | |
Liberty TripAdvisor Holdings, Inc., Class A* | | | 444,339 | | | | 4,287,871 | |
| | |
MSG Networks, Inc., Class A* | | | 321,001 | | | | 5,203,426 | |
| | |
Vonage Holdings Corp.*,1 | | | 366,537 | | | | 3,581,067 | |
| | |
Yelp, Inc.* | | | 30,752 | | | | 1,061,252 | |
| | |
Total Communication Services | | | | | | | 24,757,143 | |
| | |
Consumer Discretionary - 9.9% | | | | | | | | |
| | |
Biglari Holdings, Inc., Class A* | | | 1,388 | | | | 573,300 | |
| | |
Biglari Holdings, Inc., Class B* | | | 9,412 | | | | 785,714 | |
| | |
Camping World Holdings, Inc., Class A1 | | | 170,090 | | | | 1,607,350 | |
| | |
Extended Stay America, Inc. | | | 700,871 | | | | 9,959,377 | |
| | |
J Alexander’s Holdings, Inc.* | | | 330,397 | | | | 3,188,331 | |
| | |
Modine Manufacturing Co.* | | | 289,090 | | | | 3,304,299 | |
| | |
Motorcar Parts of America, Inc.*,1 | | | 224,807 | | | | 4,284,821 | |
| | |
Murphy USA, Inc.* | | | 95,888 | | | | 11,308,072 | |
| | |
Six Flags Entertainment Corp. | | | 119,397 | | | | 5,037,359 | |
| | |
Total Consumer Discretionary | | | | | | | 40,048,623 | |
| | |
Consumer Staples - 7.4% | | | | | | | | |
| | |
BJ’s Wholesale Club Holdings, Inc.*,1 | | | 321,552 | | | | 8,585,438 | |
| | |
Hostess Brands, Inc.*,1 | | | 1,042,004 | | | | 13,316,811 | |
| | |
Ingles Markets, Inc., Class A | | | 205,579 | | | | 8,105,980 | |
| | |
Total Consumer Staples | | | | | | | 30,008,229 | |
| | |
Energy - 4.2% | | | | | | | | |
| | |
Evolution Petroleum Corp. | | | 542,068 | | | | 3,046,422 | |
| | |
Gran Tierra Energy, Inc. (Canada)* | | | 1,090,650 | | | | 1,177,902 | |
| | |
PBF Energy, Inc., Class A | | | 200,911 | | | | 6,485,407 | |
| | |
QEP Resources, Inc. | | | 333,499 | | | | 1,110,552 | |
| | |
World Fuel Services Corp. | | | 127,340 | | | | 5,318,992 | |
| | |
Total Energy | | | | | | | 17,139,275 | |
| | |
Financials - 13.9% | | | | | | | | |
| | |
American National Insurance Co. | | | 31,475 | | | | 3,776,371 | |
| | |
Cannae Holdings, Inc.* | | | 640,280 | | | | 18,696,176 | |
| | |
FGL Holdings (Bermuda)1 | | | 664,029 | | | | 5,996,182 | |
| | |
First Citizens BancShares, Inc., Class A | | | 7,818 | | | | 3,845,831 | |
| | |
Genworth Financial, Inc., Class A* | | | 366,351 | | | | 1,567,982 | |
| | |
Health Insurance Innovations, Inc., Class A* | | | 126,767 | | | | 3,356,790 | |
| | |
Webster Financial Corp. | | | 92,874 | | | | 4,095,743 | |
| | |
White Mountains Insurance Group, Ltd. | | | 13,740 | | | | 14,715,540 | |
| | |
Total Financials | | | | | | | 56,050,615 | |
| | |
Health Care - 5.4% | | | | | | | | |
| | |
Computer Programs & Systems, Inc. | | | 233,089 | | | | 5,377,363 | |
| | | | | | | | |
| | | Shares | | | Value | |
| | |
Patterson Cos., Inc.1 | | | 123,830 | | | | $2,121,208 | |
| | |
Premier, Inc., Class A*,1 | | | 435,083 | | | | 14,175,004 | |
| | |
Total Health Care | | | | | | | 21,673,575 | |
| | |
Industrials - 30.0% | | | | | | | | |
| | |
Air Transport Services Group, Inc.* | | | 582,029 | | | | 12,170,226 | |
| | |
Arcosa, Inc. | | | 102,744 | | | | 3,946,397 | |
| | |
Argan, Inc.1 | | | 191,160 | | | | 7,235,406 | |
| | |
Armstrong World Industries, Inc. | | | 70,816 | | | | 6,623,420 | |
| | |
Atkore International Group, Inc.* | | | 155,035 | | | | 5,379,714 | |
| | |
Barrett Business Services, Inc. | | | 48,049 | | | | 4,215,339 | |
| | |
Colfax Corp.*,1 | | | 223,966 | | | | 7,525,258 | |
| | |
Comfort Systems USA, Inc. | | | 140,184 | | | | 7,066,675 | |
| | |
Cubic Corp.1 | | | 77,355 | | | | 5,704,158 | |
| | |
Forward Air Corp. | | | 68,129 | | | | 4,712,483 | |
| | |
GrafTech International Ltd.1 | | | 470,638 | | | | 5,685,307 | |
| | |
Harsco Corp.* | | | 280,322 | | | | 5,682,127 | |
| | |
MSC Industrial Direct Co., Inc., Class A1 | | | 110,188 | | | | 8,066,863 | |
| | |
nVent Electric PLC (United Kingdom) | | | 251,761 | | | | 5,805,609 | |
| | |
PICO Holdings, Inc.* | | | 286,514 | | | | 3,088,621 | |
| | |
Resideo Technologies, Inc.*,1 | | | 263,209 | | | | 2,508,382 | |
| | |
Resources Connection, Inc. | | | 250,109 | | | | 3,664,097 | |
| | |
SP Plus Corp.* | | | 108,534 | | | | 4,793,947 | |
| | |
UniFirst Corp. | | | 47,946 | | | | 9,629,475 | |
| | |
Viad Corp. | | | 131,729 | | | | 8,038,104 | |
| | |
Total Industrials | | | | | | | 121,541,608 | |
| |
Information Technology - 12.4% | | | | | |
| | |
Anixter International, Inc.* | | | 57,736 | | | | 4,777,654 | |
| | |
Avaya Holdings Corp.*,1 | | | 549,468 | | | | 6,643,068 | |
| | |
Computer Services, Inc. | | | 204,426 | | | | 9,199,170 | |
| | |
Conduent, Inc.* | | | 429,007 | | | | 2,651,263 | |
| | |
Ituran Location and Control, Ltd. (Israel) | | | 218,221 | | | | 5,352,961 | |
| | |
NCR Corp.*,1 | | | 234,550 | | | | 6,851,206 | |
| | |
Tech Data Corp.* | | | 97,669 | | | | 11,866,783 | |
| | |
Verra Mobility Corp.*,1 | | | 206,676 | | | | 2,965,801 | |
| | |
Total Information Technology | | | | | | | 50,307,906 | |
| | |
Materials - 0.8% | | | | | | | | |
| | |
Allegheny Technologies, Inc.*,1 | | | 152,841 | | | | 3,211,189 | |
| | |
Real Estate - 0.6% | | | | | | | | |
| | |
Newmark Group, Inc., Class A | | | 213,853 | | | | 2,271,119 | |
| | |
Total Common Stocks
(Cost $318,118,535) | | | | | | | 367,009,282 | |
The accompanying notes are an integral part of these financial statements.
54
|
AMG River Road Small Cap Value Fund Schedule of Portfolio Investments(continued) |
| | | | | | | | |
| | | Principal
Amount | | | Value | |
| |
Short-Term Investments - 9.9% | | | | | |
| |
Joint Repurchase Agreements - 0.3%2 | | | | | |
| | |
Bank of America Securities, Inc., dated 10/31/19, due 11/01/19, 1.730% total to be received $39,718 (collateralized by various U.S. Treasuries, 1.625% - 2.625%, 11/30/20 - 08/15/27, totaling $40,510) | | | $39,716 | | | | $39,716 | |
| | |
Guggenheim Securities LLC, dated 10/31/19, due 11/01/19, 1.760% total to be received $1,000,049 (collateralized by various U.S. Government Agency Obligations and U.S. Treasuries, 1.625% - 5.000%, 01/01/27 - 06/20/69, totaling $1,020,000) | | | 1,000,000 | | | | 1,000,000 | |
| | |
Total Joint Repurchase Agreements | | | | | | | 1,039,716 | |
| | | | | | | |
| | | Shares | | | | |
| |
Other Investment Companies - 9.6% | | | | | |
| | |
Dreyfus Government Cash Management Fund, Institutional Shares, 1.73%3 | | | 12,839,438 | | | | 12,839,438 | |
| | |
Dreyfus Institutional Preferred Government Money Market Fund, Institutional Shares, 1.77%3 | | | 12,839,438 | | | | 12,839,438 | |
| | |
JPMorgan U.S. Government Money Market Fund, IM Shares, 1.75%3 | | | 13,228,512 | | | | 13,228,512 | |
| | |
Total Other Investment Companies | | | | | | | 38,907,388 | |
| | |
Total Short-Term Investments
(Cost $39,947,104) | | | | | | | 39,947,104 | |
| | | | | | | | |
| | | | | | Value | |
| | |
Total Investments - 100.6%
(Cost $358,065,639) | | | | | | $ | 406,956,386 | |
| |
Other Assets, less Liabilities - (0.6)% | | | | (2,462,816 | ) |
| | |
Net Assets - 100.0% | | | | | | $ | 404,493,570 | |
| * | Non-income producing security. |
| 1 | Some of these securities, amounting to $46,261,890 or 11.4% of net assets, were out on loan to various borrowers and are collateralized by cash and various U.S. Treasury Obligations. See Note 4 of Notes to Financial Statements. |
| 2 | Cash collateral received for securities lending activity was invested in these joint repurchase agreements. |
| 3 | Yield shown represents the October 31, 2019, seven day average yield, which refers to the sum of the previous seven days’ dividends paid, expressed as an annual percentage. |
The accompanying notes are an integral part of these financial statements.
55
|
AMG River Road Small Cap Value Fund Schedule of Portfolio Investments(continued) |
The following table summarizes the inputs used to value the Fund’s investments by the fair value hierarchy levels as of October 31, 2019:
| | | | | | | | | | | | | | | | |
| | | Level 1 | | | Level 2 | | | Level 3 | | | Total | |
Investments in Securities | | | | | | | | | | | | | | | | |
| | | | |
Common Stocks† | | $ | 367,009,282 | | | | — | | | | — | | | $ | 367,009,282 | |
| | | | |
Short-Term Investments | | | | | | | | | | | | | | | | |
Joint Repurchase Agreements | | | — | | | $ | 1,039,716 | | | | — | | | | 1,039,716 | |
Other Investment Companies | | | 38,907,388 | | | | — | | | | — | | | | 38,907,388 | |
| | | | | | | | | | | | | | | | |
Total Investments in Securities | | $ | 405,916,670 | | | $ | 1,039,716 | | | | — | | | $ | 406,956,386 | |
| | | | | | | | | | | | | | | | |
| † | All common stocks held in the Fund are Level 1 securities. For a detailed breakout of common stocks by major industry classification, please refer to the Fund’s Schedule of Portfolio Investments. |
For the fiscal year ended October 31, 2019, there were no transfers in or out of Level 3.
The accompanying notes are an integral part of these financial statements.
56
|
AMG Managers Silvercrest Small Cap Fund Portfolio Manager’s Comments(unaudited) |
| | | | | | | | |
REVIEW AND OUTLOOK The AMG Managers Silvercrest Small Cap Fund (the “Fund”) Class N shares returned 6.85% for the fiscal year ended October 31, 2019, compared with a 3.22% return for its benchmark, the Russell 2000® Value Index. Our various sector overweights/underweights had an overall modestly positive impact for the fiscal year. Our overweight in the best performing index sector, technology, had a better than 100 basis point contribution to return, followed by our modest underweight in the index’s worst performing sector, energy. On the downside, our underweight in financials, particularly REITs, had the greatest negative impact and our overweight in the poorly performing healthcare sector was also a headwind. As is typical for us, the bulk of our performance relative to the index was from stock selection. We performed extremely well in materials (21% vs.-1%), paced by BMC Stock Holdings, Inc. (BMCH) (61%), our highest percentage gainer for the fiscal year, driven by improving sentiment for housing-related names in the low mortgage rate environment. We also did | | | | well in technology (33% vs. 27%), where SYNNEX Corp. (SNX) (54%) was our best contributor to return on strong earnings growth. While our overweight posture hurt us, our relative performance in health care was strong(-1% vs.-16%), led by AMN Healthcare Services, Inc. (AMN) (16%), a staffing company for the industry. On the downside, we lagged in the large financials sector (8% vs. 10%), largely a function of our underweight in REITs, which generally did well in the low interest rate environment. In the woeful energy sector(-46% vs. -43%) we had Callon Petroleum Co. (CPE)(-62%), our worst absolute performer, and Matador Resources Co. (MTDR)(-52%), our worst contributor to return. These Permian exploration & production companies struggled in a weak commodity environment, although we think both have performed reasonably well operationally. Our largest individual contributors to return, aside from the aforementioned SYNNEX, included data center REIT QTS Realty Trust, Inc. (QTS) (46%), on continuing big data demand, and Brooks Automation, | | | | Inc. (BRKS) (39%), where investors have embraced the strategic diversification toward health care while lessening more cyclical semiconductor exposure. Our largest detractors from return aside from our energy names included Pebblebrook Hotel Trust (PEB)(-20%), on relatively weak revenue per available room trends, and ICU Medical, Inc. (ICUI)(-37%), which has suffered through disruptions in their IV Solutions business. At present, we find both stocks undervalued. We are pleased that our results for the fiscal year rebounded following a difficult fiscal 2018. Sentiment appears to be improving for the value style of investing, which, if it persists, would be a nice tailwind for us. We continue to focus on building what we believe is a portfolio of above average companies selling at below average prices. The views expressed represent the opinions of Silvercrest Asset Management Group LLC, as of October 31, 2019, and are not intended as a forecast or guarantee of future results and are subject to change without notice. |
57
|
AMG Managers Silvercrest Small Cap Fund Portfolio Manager’s Comments(continued) |
CUMULATIVE TOTAL RETURN PERFORMANCE
AMG Managers Silvercrest Small Cap Fund’s cumulative total return is based on the daily change in net asset value (NAV), and assumes that all dividends and distributions were reinvested. The graph compares a hypothetical $10,000 investment made in the AMG Managers Silvercrest Small Cap Fund’s Class N shares on December 27, 2011, to a $10,000 investment made in the Russell 2000® Value Index and Russell 2000® Index for the same time period. The graph and table do not reflect the deduction of taxes that a shareholder would pay on a Fund distribution or redemption of shares. The listed returns for the Fund are net of expenses and the returns for the index exclude expenses. Total returns would have been lower had certain expenses not been reduced.
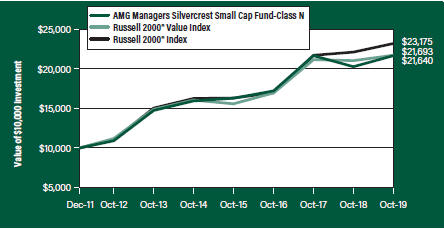
The table below shows the average annual total returns for the AMG Managers Silvercrest Small Cap Fund and the Russell 2000® Value Index and Russell 2000® Index for the same time periods ended October 31, 2019.
| | | | | | | | | | | | | | | | |
Average Annual Total Returns1 | | One
Year | | | Five
Years | | | Since
Inception | | | Inception
Date | |
AMG Managers Silvercrest Small Cap Fund2, 3, 4, 5, 6 | | | | | | | | | | | | | | | | |
| | | | |
Class N | | | 6.85% | | | | 6.32% | | | | 10.34% | | | | 12/27/11 | |
| | | | |
Class I | | | 7.14% | | | | 6.59% | | | | 10.62% | | | | 12/27/11 | |
| | | | |
Class Z | | | 7.20% | | | | — | | | | 0.82% | | | | 09/29/17 | |
| | | | |
Russell 2000® Value Index7 | | | 3.22% | | | | 6.24% | | | | 10.37% | | | | 12/27/11 | † |
| | | | |
Russell 2000® Index8 | | | 4.90% | | | | 7.37% | | | | 11.37% | | | | 12/27/11 | † |
The performance data shown represents past performance. Past performance is not a guarantee of future results. Current performance may be lower or higher than the performance data quoted. The investment return and principal value of an investment will fluctuate so that an investor’s shares, when redeemed, may be worth more or less than their original cost.
Investors should carefully consider the Fund’s investment objectives, risks, charges and expenses before investing. For performance information through the most recent month end, current net asset values per share for the Fund and other information, please call 800.548.4539 or visit our website at amgfunds.com for a free prospectus. Read it carefully before investing or sending money.
Distributed by AMG Distributors, Inc., member FINRA/SIPC.
| † | Date reflects the inception date of the Fund, not the index. |
| 1 | Total return equals income yield plus share price change and assumes reinvestment of all dividends and capital gain distributions. Returns are net of fees and may reflect offsets of Fund expenses as described in the prospectus. No adjustment has been made for taxes payable by shareholders on their reinvested dividends and |
| | |
| | | capital gain distributions. Returns for periods greater than one year are annualized. The listed returns on the Fund are net of expenses and based on the published NAV as of October 31, 2019. All returns are in U.S. dollars ($). |
| | |
| | | 2 The Fund is subject to risks associated with investments in small-capitalization companies, such as erratic earnings patterns, competitive conditions, limited earnings history and a reliance on one or a limited number of products. 3 The Fund is subject to risks associated with investments inmid-capitalization companies such as greater price volatility, lower trading volume, and less liquidity than the stocks of larger, more established companies. 4 The Fund is subject to special risk considerations similar to those associated with the direct ownership of real estate. Real estate valuations may be subject to factors such as changing general and local economic, financial, competitive, and environmental conditions. 5 The Fund invests in value stocks, which may perform differently from the market as a whole and may be undervalued by the market for a long period of time. 6 Companies that are in similar businesses may be similarly affected by particular economic or market events; to the extent the Fund has substantial holdings within a particular sector, the risks associated with that sector increase. 7 The Russell 2000® Value Index is an unmanaged, market-value weighted, value-oriented index comprised of small stocks that have relatively lowprice-to-book ratios and lower forecasted growth values. Unlike the Fund, the Russell 2000® Value Index is unmanaged, is not available for investment and does not incur expenses. |
| | |
| | | 8 The Russell 2000® Index is composed of the 2,000 smallest stocks in the Russell 3000® Index and is widely regarded in the industry as the premier measure ofsmall-cap stock performance. Unlike the Fund, the Russell 2000® Index is unmanaged, is not available for investment and does not incur expenses. The Russell Indices are a trademark of the London Stock Exchange Group companies. Not FDIC insured, nor bank guaranteed. May lose value. |
58
|
AMG Managers Silvercrest Small Cap Fund Fund Snapshots(unaudited) October 31, 2019 |
PORTFOLIO BREAKDOWN
| | |
| Sector | | % of
Net Assets |
Financials | | 20.5 |
| | |
Industrials | | 19.3 |
| | |
Information Technology | | 15.7 |
| | |
Consumer Discretionary | | 10.2 |
| | |
Real Estate | | 7.7 |
| | |
Health Care | | 7.7 |
| | |
Consumer Staples | | 4.0 |
| | |
Materials | | 4.0 |
| | |
Energy | | 3.9 |
| | |
Utilities | | 3.5 |
| | |
Communication Services | | 1.4 |
| | |
Short-Term Investments | | 2.0 |
| | |
Other Assets Less Liabilities | | 0.1 |
TOP TEN HOLDINGS
| | |
| Security Name | | % of
Net Assets |
BancorpSouth Bank | | 3.1 |
| | |
Independent Bank Corp. | | 3.0 |
| | |
Brooks Automation, Inc. | | 2.9 |
| | |
IBERIABANK Corp. | | 2.9 |
| | |
QTS Realty Trust, Inc., Class A | | 2.8 |
| | |
SYNNEX Corp. | | 2.6 |
| | |
Selective Insurance Group, Inc. | | 2.6 |
| | |
Glacier Bancorp, Inc. | | 2.5 |
| | |
ESCO Technologies, Inc. | | 2.4 |
| | |
ONE Gas, Inc. | | 2.4 |
| | | |
| | |
Top Ten as a Group | | 27.2 |
| | |
Because a fund’s strategy may result in multiple investments in particular sectors of the economy, its performance may depend on the performance of those sectors and may fluctuate more widely than investments diversified across more sectors. For additional information on these and other risk considerations, please see the Fund’s prospectus.
Any sectors, industries, or securities discussed should not be perceived as investment recommendations. Mention of a specific security should not be considered a recommendation to buy or solicitation to sell that security. Specific securities mentioned in this report may have been sold from the Fund’s portfolio of investments by the time you receive this report.
59
|
AMG Managers Silvercrest Small Cap Fund Schedule of Portfolio Investments October 31, 2019 |
| | | | | | | | |
| | | Shares | | | Value | |
| | |
Common Stocks - 97.9% | | | | | | | | |
| |
Communication Services - 1.4% | | | | | |
| | |
Meredith Corp. | | | 85,900 | | | | $3,238,430 | |
| |
Consumer Discretionary - 10.2% | | | | | |
| | |
Carter’s, Inc.1 | | | 26,550 | | | | 2,661,372 | |
| | |
Dana, Inc. | | | 190,600 | | | | 3,093,438 | |
| | |
Dine Brands Global, Inc.1 | | | 30,300 | | | | 2,216,445 | |
| | |
La-Z-Boy, Inc. | | | 140,285 | | | | 4,981,520 | |
| | |
Oxford Industries, Inc. | | | 39,660 | | | | 2,730,988 | |
| | |
Stoneridge, Inc.* | | | 85,260 | | | | 2,632,829 | |
| | |
Visteon Corp.*,1 | | | 11,720 | | | | 1,090,194 | |
| | |
Wolverine World Wide, Inc.1 | | | 115,720 | | | | 3,434,569 | |
| | |
Total Consumer Discretionary | | | | | | | 22,841,355 | |
| | |
Consumer Staples - 4.0% | | | | | | | | |
| | |
Central Garden & Pet Co., Class A* | | | 98,080 | | | | 2,773,702 | |
| | |
J&J Snack Foods Corp.1 | | | 22,458 | | | | 4,284,088 | |
| | |
Lancaster Colony Corp. | | | 14,836 | | | | 2,064,875 | |
| | |
Total Consumer Staples | | | | | | | 9,122,665 | |
| | |
Energy - 3.9% | | | | | | | | |
| | |
Callon Petroleum Co.* | | | 431,690 | | | | 1,640,422 | |
| | |
Magnolia Oil & Gas Corp., Class A*,1 | | | 266,170 | | | | 2,613,789 | |
| | |
Matador Resources Co.*,1 | | | 228,155 | | | | 3,173,636 | |
| | |
Select Energy Services, Inc., Class A*,1 | | | 164,215 | | | | 1,248,034 | |
| | |
Total Energy | | | | | | | 8,675,881 | |
| | |
Financials - 20.5% | | | | | | | | |
| | |
BancorpSouth Bank | | | 227,230 | | | | 6,969,144 | |
| | |
CVB Financial Corp.1 | | | 244,910 | | | | 5,089,230 | |
| | |
Glacier Bancorp, Inc. | | | 133,020 | | | | 5,629,406 | |
| | |
Horace Mann Educators Corp. | | | 82,619 | | | | 3,598,884 | |
| | |
IBERIABANK Corp. | | | 88,379 | | | | 6,486,135 | |
| | |
Independent Bank Corp. | | | 82,983 | | | | 6,811,245 | |
| | |
Selective Insurance Group, Inc. | | | 83,520 | | | | 5,772,902 | |
| | |
South State Corp. | | | 46,410 | | | | 3,659,893 | |
| | |
Synovus Financial Corp. | | | 58,491 | | | | 1,981,090 | |
| | |
Total Financials | | | | | | | 45,997,929 | |
| | |
Health Care - 7.7% | | | | | | | | |
| | |
Allscripts Healthcare Solutions, Inc.*,1 | | | 273,440 | | | | 2,991,434 | |
| | |
AMN Healthcare Services, Inc.* | | | 63,270 | | | | 3,717,745 | |
| | |
ICU Medical, Inc.* | | | 17,076 | | | | 2,759,652 | |
| | |
Integer Holdings Corp.* | | | 54,130 | | | | 4,191,827 | |
| | |
Natus Medical, Inc.* | | | 105,485 | | | | 3,552,735 | |
| | |
Total Health Care | | | | | | | 17,213,393 | |
| | | | | | | | |
| | | Shares | | | Value | |
| | |
Industrials - 19.3% | | | | | | | | |
| | |
ABM Industries, Inc. | | | 59,490 | | | | $2,169,005 | |
| | |
Altra Industrial Motion Corp. | | | 118,975 | | | | 3,664,430 | |
| | |
BMC Stock Holdings, Inc.* | | | 141,885 | | | | 3,829,476 | |
| | |
Casella Waste Systems, Inc., Class A* | | | 91,210 | | | | 3,975,844 | |
| | |
EMCOR Group, Inc. | | | 11,966 | | | | 1,049,538 | |
| | |
ESCO Technologies, Inc. | | | 63,470 | | | | 5,362,580 | |
| | |
Forward Air Corp. | | | 58,070 | | | | 4,016,702 | |
| | |
Gibraltar Industries, Inc.* | | | 75,770 | | | | 4,033,237 | |
| | |
ICF International, Inc. | | | 44,940 | | | | 3,850,909 | |
| | |
Knoll, Inc. | | | 132,445 | | | | 3,541,579 | |
| | |
Mueller Water Products, Inc., Class A | | | 123,635 | | | | 1,446,530 | |
| | |
Standex International Corp. | | | 29,235 | | | | 2,215,428 | |
| | |
US Ecology, Inc. | | | 66,664 | | | | 4,148,501 | |
| | |
Total Industrials | | | | | | | 43,303,759 | |
| |
Information Technology - 15.7% | | | | | |
| | |
ACI Worldwide, Inc.* | | | 135,187 | | | | 4,243,520 | |
| | |
Brooks Automation, Inc.1 | | | 156,185 | | | | 6,633,177 | |
| | |
Methode Electronics, Inc. | | | 113,545 | | | | 3,905,948 | |
| | |
MKS Instruments, Inc. | | | 24,805 | | | | 2,684,397 | |
| | |
Plexus Corp.* | | | 54,395 | | | | 4,021,966 | |
| | |
Rogers Corp.* | | | 18,952 | | | | 2,567,617 | |
| | |
Semtech Corp.* | | | 50,850 | | | | 2,565,891 | |
| | |
SYNNEX Corp. | | | 50,430 | | | | 5,937,628 | |
| | |
Verra Mobility Corp.* | | | 183,890 | | | | 2,638,822 | |
| | |
Total Information Technology | | | | | | | 35,198,966 | |
| | |
Materials - 4.0% | | | | | | | | |
| | |
HB Fuller Co. | | | 89,375 | | | | 4,361,500 | |
| | |
Minerals Technologies, Inc. | | | 42,320 | | | | 2,092,724 | |
| | |
PH Glatfelter Co. | | | 139,828 | | | | 2,516,904 | |
| | |
Total Materials | | | | | | | 8,971,128 | |
| | |
Real Estate - 7.7% | | | | | | | | |
| | |
EastGroup Properties, Inc., REIT | | | 22,813 | | | | 3,055,801 | |
| | |
Pebblebrook Hotel Trust, REIT1 | | | 160,695 | | | | 4,131,469 | |
| | |
Physicians Realty Trust, REIT | | | 207,255 | | | | 3,869,451 | |
| | |
QTS Realty Trust, Inc., Class A, REIT1 | | | 116,400 | | | | 6,237,876 | |
| | |
Total Real Estate | | | | | | | 17,294,597 | |
| | |
Utilities - 3.5% | | | | | | | | |
| | |
MGE Energy, Inc. | | | 34,478 | | | | 2,656,185 | |
| | |
ONE Gas, Inc. | | | 57,105 | | | | 5,301,628 | |
| | |
Total Utilities | | | | | | | 7,957,813 | |
| | |
Total Common Stocks
(Cost $203,002,963) | | | | | | | 219,815,916 | |
The accompanying notes are an integral part of these financial statements.
60
|
AMG Managers Silvercrest Small Cap Fund Schedule of Portfolio Investments(continued) |
| | | | | | | | |
| | | Shares | | | Value | |
| | |
Short-Term Investments - 2.0% | | | | | | | | |
| |
Other Investment Companies - 2.0% | | | | | |
| | |
Dreyfus Government Cash Management Fund, Institutional Shares, 1.73%2 | | | 1,464,664 | | | | $1,464,664 | |
| | |
Dreyfus Institutional Preferred Government Money Market Fund, Institutional Shares, 1.77%2 | | | 1,464,665 | | | | 1,464,665 | |
| | |
JPMorgan U.S. Government Money Market Fund, IM Shares, 1.75%2 | | | 1,509,048 | | | | 1,509,048 | |
| | |
Total Short-Term Investments
(Cost $4,438,377) | | | | | | | 4,438,377 | |
| * | Non-income producing security. |
| 1 | Some of these securities, amounting to $36,337,666 or 16.2% of net assets, were out on loan to various borrowers and are collateralized by various U.S. Treasury Obligations. See Note 4 of Notes to Financial Statements. |
| | | | | | | | |
| | | | | | Value | |
| | |
Total Investments - 99.9%
(Cost $207,441,340) | | | | | | | $224,254,293 | |
| |
Other Assets, less Liabilities - 0.1% | | | | 272,319 | |
| | |
Net Assets - 100.0% | | | | | | | $224,526,612 | |
| 2 | Yield shown represents the October 31, 2019, seven day average yield, which refers to the sum of the previous seven days’ dividends paid, expressed as an annual percentage. |
| | REIT Real Estate Investment Trust |
The following table summarizes the inputs used to value the Fund’s investments by the fair value hierarchy levels as of October 31, 2019:
| | | | | | | | | | | | | | | | |
| | | Level 1 | | | Level 2 | | | Level 3 | | | Total | |
Investments in Securities | | | | | | | | | | | | | | | | |
| | | | |
Common Stocks† | | $ | 219,815,916 | | | | — | | | | — | | | $ | 219,815,916 | |
| | | | |
Short-Term Investments | | | | | | | | | | | | | | | | |
Other Investment Companies | | | 4,438,377 | | | | — | | | | — | | | | 4,438,377 | |
| | | | | | | | | | | | | | | | |
Total Investments in Securities | | $ | 224,254,293 | | | | — | | | | — | | | $ | 224,254,293 | |
| | | | | | | | | | | | | | | | |
| † | All common stocks held in the Fund are Level 1 securities. For a detailed breakout of common stocks by major industry classification, please refer to the Fund’s Schedule of Portfolio Investments. |
For the fiscal year ended October 31, 2019, there were no transfers in or out of Level 3.
The accompanying notes are an integral part of these financial statements.
61
|
AMG Managers DoubleLine Core Plus Bond Fund Portfolio Manager’s Comments(unaudited) |
| | | | | | | | |
OVERVIEW For the fiscal year ended October 31, 2019, the AMG Managers DoubleLine Core Plus Bond Fund (the “Fund”) Class N shares returned 8.67%, while the Bloomberg Barclays U.S. Aggregate Bond Index returned 11.51%. MARKET REVIEW AND OUTLOOK The major story over the past 12 months has been the decline in rates across the U.S. Treasury curve. Over the12-month period, rates tumbled with the10-year yield falling 145 basis points. Shortly after the U.S. Federal Reserve (the “Fed”) raised the federal funds target rate in December, Chairman Jerome Powell’s rhetoric shifted dovish as he expressed concern over the slowdown in global growth. This dovish rhetoric turned into action as the Fed cut rates three times in 2019, citing weakening economic data, trade war uncertainty, and an inflation number below the 2% long-term objective. While the primary beneficiaries of the decrease in rates have been longer duration sectors, shorter duration sectors exposed to real estate, the consumer, and U.S. corporates have also benefited from this stimulus. Overall fundamentals for the U.S. consumer have remained solid due to low unemployment and relatively low debt burdens on household balance | | | | sheets. These factors, combined with historically stringent lending standards, have resulted in strong credit performance across consumer asset-backed securities (ABS) and residential mortgages. While leverage on the corporate side remains an area of concern, defaults continue to be low. We believe we are approaching the end of a credit cycle, but in our view it is still at least a few quarters away. While the current inflation environment appears relatively benign over the near term, we think inflation could surprise to the upside over the intermediate to long term supported by historically low unemployment and the Fed adopting easier monetary policy. We believe intermediate andlong-end rates are headed higher in the long term, and as a result we are likely to continue to manage the portfolio with a shorter duration relative to the benchmark. PERFORMANCE AND POSITIONING The Fund underperformed the Bloomberg Barclays U.S. Aggregate Bond Index’s return of 11.51% over the trailing12-month period ending October 31, 2019. The Fund’s short duration positioning relative to the benchmark was the primary detractor from performance as rates rallied across all tenors of the U.S. Treasury Curve with2- and10-year yields falling | | | | by 134 and 145 basis points, respectively. Sectors that outperformed the benchmark over the period such as investment-grade corporates and agency residential mortgage-backed securities (RMBS) benefited from having a longer duration profile than other assets as rates decreased significantly. Floating rate products such as collateralized loan obligations (CLOs) and bank loans tended to have the worst performance over the period driven by lower perceived future income due to the decline in short-term rates. Despite posting positive returns over the year, the remainder of the structured products complex underperformed because each of these sectors maintained a duration shorter than the benchmark over the period. Overall, DoubleLine continues to believe yields across the intermediate to long tenors of the U.S. Treasury curve are biased upward and we are in the later stages of the economic cycle. The result is a Fund that remains defensively positioned with a shorter duration than the benchmark. The views expressed represent the opinions of DoubleLine Capital LLC, as of October 31, 2019, and are not intended as a forecast or guarantee of future results and are subject to change without notice. |
| | | | | | | | |
62
|
AMG Managers DoubleLine Core Plus Bond Fund Portfolio Manager’s Comments(continued) |
CUMULATIVE TOTAL RETURN PERFORMANCE
AMG Managers Doubleline Core Plus Bond Fund’s cumulative total return is based on the daily change in net asset value (NAV), and assumes that all dividends and distributions were reinvested. The graph compares a hypothetical $10,000 investment made in the AMG Managers Doubleline Core Plus Bond Fund’s Class N shares on July 18, 2011, to a $10,000 investment made in the Bloomberg Barclays U.S. Aggregate Bond Index for the same time period. The graph and table do not reflect the deduction of taxes that a shareholder would pay on a Fund distribution or redemption of shares. The listed returns for the Fund are net of expenses and the returns for the index exclude expenses. Total returns would have been lower had certain expenses not been reduced.
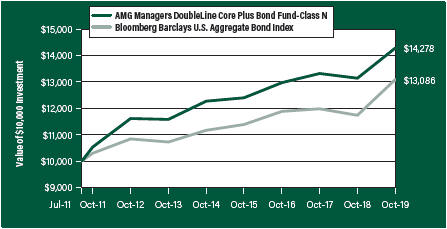
The table below shows the average annual total returns for the AMG Managers Doubleline Core Plus Bond Fund and the Bloomberg Barclays U.S. Aggregate Bond Index for the same time periods ended October 31, 2019.
| | | | | | | | | | | | | | | | |
Average Annual Total Returns1 | | One
Year | | | Five
Years | | | Since
Inception | | | Inception
Date | |
AMG Managers DoubleLine Core Plus Bond Fund2, 3, 4, 5, 6, 7, 8, 9, 10, 11 | | | | | |
| | | | |
Class N | | | 8.67 | % | | | 3.08 | % | | | 4.39 | % | | | 07/18/11 | |
| | | | |
Class I | | | 8.94 | % | | | 3.34 | % | | | 4.65 | % | | | 07/18/11 | |
| | | | |
Class Z | | | 8.91 | % | | | — | | | | 3.80 | % | | | 09/29/17 | |
| | | | |
Bloomberg Barclays U.S. Aggregate Bond Index12 | | | 11.51 | % | | | 3.24 | % | | | 3.30 | % | | | 07/18/11 | † |
The performance data shown represents past performance. Past performance is not a guarantee of future results. Current performance may be lower or higher than the performance data quoted. The investment return and principal value of an investment will fluctuate so that an investor’s shares, when redeemed, may be worth more or less than their original cost.
Investors should carefully consider the Fund’s investment objectives, risks, charges and expenses before investing. For performance information through the most recent month end, current net asset values per share for the Fund and other information, please call 800.548.4539 or visit our website at amgfunds.com for a free prospectus. Read it carefully before investing or sending money.
Distributed by AMG Distributors, Inc., member FINRA/SIPC.
| † | Date reflects the inception date of the Fund, not the index. |
| 1 | Total return equals income yield plus share price change and assumes reinvestment of all dividends and capital gain distributions. Returns are net of fees and may reflect offsets of Fund expenses as described in the prospectus. No adjustment has been made for taxes payable by shareholders on their reinvested dividends and |
| | |
| | | capital gain distributions. Returns for periods greater than one year are annualized. The listed returns on the Fund are net of expenses and based on the published NAV as of October 31, 2019. All returns are in U.S. dollars ($). |
| | |
| | | 2 The Fund is subject to the risks associated with investments in debt securities, such as default risk and fluctuations in the perception of the debtor’s ability to pay its creditors. Changing interest rates may adversely affect the value of an investment. An increase in interest rates typically causes the value of bonds and other fixed income securities to fall. 3 Investments in international securities are subject to certain risks of overseas investing including currency fluctuations and changes in political and economic conditions, which could result in significant market fluctuations. These risks are magnified in emerging markets. 4 The Fund is subject to the risks associated with investments in emerging markets, such as erratic earnings patterns, economic and political instability, changing exchange controls, limitations on repatriation of foreign capital and changes in local governmental attitudes toward private investment, possibly leading to nationalization or confiscation of investor assets. 5 To the extent that the Fund invests in asset-backed or mortgage-backed securities, its exposure to prepayment and extension risks may be greater than investments in other fixed income securities. 6 The Fund may invest in derivatives, such as options and futures; the complexity and rapidly changing structure of derivatives markets may increase the possibility of market losses. 7 Bank loans are subject to the credit risk of nonpayment of principal or interest. |
| | |
| | | 8 High-yield bonds (also known as “junk bonds”) may be subject to greater levels of interest rate, credit, and liquidity risk than investments in higher rated securities. These securities are considered predominantly speculative with respect to the issuer’s continuing ability to make principal and interest payments. The issuers of the Fund’s holdings may be involved in bankruptcy proceedings, reorganizations, or financial restructurings, and are not as strong financially as higher rated issuers. |
| | |
| | | 9 Factors unique to the municipal bond market may negatively affect the value in municipal bonds. |
63
|
AMG Managers DoubleLine Core Plus Bond Fund Portfolio Manager’s Comments(continued) |
| | | | | | | | |
10 Obligations of certain government agencies are not backed by the full faith and credit of the U.S. government. If one of these agencies defaulted on a loan, there is no guarantee that the U.S. government would provide financial support. Additionally, debt securities of the U.S. government may be affected by changing interest rates and subject to prepayment risk. 11 Active and frequent trading of a fund may result in higher transaction costs and increase tax liability. 12 The Bloomberg Barclays U.S. Aggregate Bond Index is an index of the U.S. investment-grade fixed-rate | | | | bond market, including both government and corporate bonds. Unlike the Fund, the Bloomberg Barclays U.S. Aggregate Bond Index is unmanaged, is not available for investment and does not incur expenses. Source: Bloomberg Index Services Limited. BLOOMBERG® is a trademark and service mark of Bloomberg Finance L.P. and its affiliates (collectively “Bloomberg”). BARCLAYS® is a trademark and service mark of Barclays Bank Plc (collectively with its affiliates, “Barclays”), used under license. Bloomberg or Bloomberg’s licensors, including Barclays, own all | | | | proprietary rights in the Bloomberg Barclays Indices. Neither Bloomberg nor Barclays approves or endorses this material, or guarantees the accuracy or completeness of any information herein, or makes any warranty, express or implied, as to the results to be obtained therefrom and, to the maximum extent allowed by law, neither shall have any liability or responsibility for injury or damages arising in connection therewith. Not FDIC insured, nor bank guaranteed. May lose value. |
| | | | | | | | |
64
|
AMG Managers DoubleLine Core Plus Bond Fund Fund Snapshots(unaudited) October 31, 2019 |
PORTFOLIO BREAKDOWN
| | |
| Category | | % of
Net Assets |
U.S. Government and Agency Obligations | | 33.0 |
| | |
Corporate Bonds and Notes | | 30.1 |
| | |
Mortgage-Backed Securities | | 17.2 |
| | |
Asset-Backed Securities | | 8.0 |
| | |
Investment Companies | | 4.6 |
| | |
Floating Rate Senior Loan Interests | | 2.0 |
| | |
Foreign Government Obligations | | 0.7 |
| | |
Municipal Bonds | | 0.1 |
| | |
Common Stocks1 | | 0.0 |
| | |
Short-Term Investments | | 6.6 |
| | |
Other Assets Less Liabilities2 | | (2.3) |
| 2 | Includes payable for delayed delivery securities. |
| | |
| Rating | | % of
Market Value3 |
U.S. Government and Agency Obligations | | 40.1 |
| | |
Aaa | | 2.9 |
| | |
Aa | | 2.1 |
| | |
A | | 12.1 |
| | |
Baa | | 20.3 |
| | |
Ba | | 10.9 |
| | |
B | | 5.5 |
| | |
Caa & lower | | 6.1 |
| 3 | Includes market value of long-term fixed-income securities only. |
TOP TEN HOLDINGS
| | |
| Security Name | | % of
Net Assets |
DoubleLine Global Bond Fund, Class I | | 4.6 |
| | |
Fannie Mae, 2.500%, 11/01/39 | | 1.7 |
| | |
U.S. Treasury Notes, 1.750%, 11/30/21 | | 1.3 |
| | |
STRUBNP-4950, Class P, 2.500%, 11/01/49 | | 1.2 |
| | |
Fannie Mae, 3.500%, 03/01/46 | | 1.2 |
| | |
U.S. Treasury Notes, 2.875%, 10/15/21 | | 1.1 |
| | |
Fannie Mae REMICS, Series2013-5, Class EZ, 2.000%, 08/25/42 | | 1.0 |
| | |
U.S. Treasury Notes, 2.250%, 08/15/27 | | 1.0 |
| | |
U.S. Treasury Notes, 2.375%, 05/15/27 | | 1.0 |
| | |
U.S. Treasury Notes, 2.250%, 10/31/24 | | 1.0 |
| | | |
| | |
Top Ten as a Group | | 15.1 |
| | |
Credit quality ratings shown above reflect the highest rating assigned by either Standard & Poor’s (“S&P”) or Moody’s Investors Service, Inc. (“Moody’s”). These rating agencies are independent, nationally recognized statistical rating organizations and are widely used. Investment grade ratings are credit ratings of BBB/Baa or higher. Below investment grade ratings are credit ratings of BB/Ba or lower. Investments designated N/R are not rated by either rating agency. Unrated investments do not necessarily indicate low credit quality. Credit quality ratings are subject to change.
Because a fund’s strategy may result in multiple investments in particular sectors of the economy, its performance may depend on the performance of those sectors and may fluctuate more widely than investments diversified across more sectors. For additional information on these and other risk considerations, please see the Fund’s prospectus.
Any sectors, industries, or securities discussed should not be perceived as investment recommendations. Mention of a specific security should not be considered a recommendation to buy or solicitation to sell that security. Specific securities mentioned in this report may have been sold from the Fund’s portfolio of investments by the time you receive this report.
65
|
AMG Managers DoubleLine Core Plus Bond Fund Schedule of Portfolio Investments October 31, 2019 |
| | | | | | | | |
| | | Principal | | | | |
| | | Amount | | | Value | |
| | |
Corporate Bonds and Notes - 30.1% | | | | | | | | |
| | |
Financials - 9.0% | | | | | | | | |
| | |
A.S.P AMC Merger Sub, Inc. | | | | | | | | |
8.000%, 05/15/251,2 | | | $98,000 | | | | $61,250 | |
| | |
Acrisure LLC/Acrisure Finance, Inc. | | | | | | | | |
8.125%, 02/15/241 | | | 105,000 | | | | 112,088 | |
| | |
AerCap Ireland Capital DAC/AerCap Global Aviation Trust (Ireland) | | | | | | | | |
3.500%, 01/15/25 | | | 485,000 | | | | 501,350 | |
| | |
Air Lease Corp. | | | | | | | | |
2.750%, 01/15/23 | | | 70,000 | | | | 70,886 | |
3.750%, 02/01/22 | | | 430,000 | | | | 444,267 | |
| | |
Alexandria Real Estate Equities, Inc. | | | | | | | | |
4.000%, 01/15/24 | | | 460,000 | | | | 492,911 | |
| | |
Alliant Holdings Intermediate LLC / Alliant Holdings Co-Issuer | | | | | | | | |
6.750%, 10/15/271 | | | 75,000 | | | | 78,196 | |
| | |
Allied Universal Holdco LLC/Allied Universal Finance Corp. | | | | | | | | |
6.625%, 07/15/261 | | | 80,000 | | | | 85,600 | |
9.750%, 07/15/271 | | | 55,000 | | | | 57,613 | |
| | |
American Express Co. | | | | | | | | |
2.500%, 08/01/22 | | | 520,000 | | | | 527,412 | |
| | |
American Tower Corp. | | | | | | | | |
3.600%, 01/15/28 | | | 525,000 | | | | 552,170 | |
4.400%, 02/15/26 | | | 1,300,000 | | | | 1,426,710 | |
| | |
AssuredPartners, Inc. | | | | | | | | |
7.000%, 08/15/251 | | | 180,000 | | | | 180,225 | |
| | |
Athene Global Funding | | | | | | | | |
3.000%, 07/01/221 | | | 565,000 | | | | 575,245 | |
| | |
AXA Equitable Holdings, Inc. | | | | | | | | |
3.900%, 04/20/23 | | | 560,000 | | | | 587,387 | |
| | |
Banco BTG Pactual SA
(Cayman Islands)
(U.S. Treasury Yield Curve CMT 5 year + 5.257%) | | | | | | | | |
7.750%, 02/15/291,3 | | | 1,250,000 | | | | 1,323,750 | |
| | |
Banco de Reservas de la Republica Dominicana (Dominican Republic) | | | | | | | | |
7.000%, 02/01/231 | | | 300,000 | | | | 315,753 | |
7.000%, 02/01/23 | | | 200,000 | | | | 210,502 | |
| | |
Banco do Brasil SA/Cayman
(Cayman Islands)
(U.S. Treasury Yield Curve CMT 10 year + 4.398%) | | | | | | | | |
6.250%, 10/15/683,4 | | | 1,500,000 | | | | 1,494,825 | |
| | |
Banco General SA (Panama) | | | | | | | | |
4.125%, 08/07/27 | | | 300,000 | | | | 314,985 | |
| | |
Banco Internacional del Peru SAA Interbank (Peru)
(3 month LIBOR + 6.740%) | | | | | | | | |
8.500%, 04/23/703 | | | 500,000 | | | | 511,880 | |
| | | | | | | | |
| | | | | | | | |
| | | Principal | | | | |
| | | Amount | | | Value | |
| | |
Banco Macro SA (Argentina) | | | | | | | | |
(USD Swap 5 year + 5.463%), | | | | | | | | |
6.750%, 11/04/262,3 | | | $950,000 | | | | $698,250 | |
(USD Swap 5 year + 5.463%), | | | | | | | | |
6.750%, 11/04/261,3 | | | 200,000 | | | | 147,000 | |
| | |
Banco Mercantil del Norte SA/Grand Cayman (Cayman Islands) | | | | | | | | |
(U.S. Treasury Yield Curve CMT 5 year + 4.447%), 5.750%, 10/04/313 | | | 400,000 | | | | 405,504 | |
(U.S. Treasury Yield Curve CMT 5 year + 5.035%), 6.875%, 10/06/682,3,4 | | | 500,000 | | | | 518,130 | |
(U.S. Treasury Yield Curve CMT 10 year + 5.470%), 7.500%, 09/27/681,3,4 | | | 200,000 | | | | 208,800 | |
(U.S. Treasury Yield Curve CMT 10 year + 5.353%), 7.625%, 10/06/683,4 | | | 1,200,000 | | | | 1,258,512 | |
| | |
Banco Nacional de Comercio Exterior | | | | | | | | |
SNC/Cayman Islands (Cayman Islands) | | | | | | | | |
(U.S. Treasury Yield Curve CMT 5 year + 3.000%)
3.800%, 08/11/263 | | | 200,000 | | | | 203,252 | |
| | |
Banco Santander Mexico SA Institucion de Banca Multiple Grupo Financiero Santand (Mexico) | | | | | | | | |
(U.S. Treasury Yield Curve CMT 5 year + 2.995%)
5.950%, 10/01/281,3 | | | 200,000 | | | | 215,400 | |
| | |
Banco Santander SA (Spain) | | | | | | | | |
(3 month LIBOR + 1.090%) | | | | | | | | |
3.238%, 02/23/233 | | | 600,000 | | | | 603,585 | |
| | |
Bancolombia SA (Colombia) | | | | | | | | |
(U.S. Treasury Yield Curve CMT 5 year + 2.929%),
4.875%, 10/18/273 | | | 400,000 | | | | 412,504 | |
5.125%, 09/11/22 | | | 500,000 | | | | 527,450 | |
| | |
Bank of America Corp., MTN | | | | | | | | |
(3 month LIBOR + 1.210%) | | | | | | | | |
3.974%, 02/07/303 | | | 590,000 | | | | 644,409 | |
| | |
Bank of Montreal (Canada) | | | | | | | | |
(USD Swap 5 year + 1.432%) | | | | | | | | |
3.803%, 12/15/323 | | | 450,000 | | | | 467,280 | |
| | |
Bank of New Zealand (New Zealand) | | | | | | | | |
3.500%, 02/20/241 | | | 510,000 | | | | 534,631 | |
| | |
The Bank of Nova Scotia (Canada) | | | | | | | | |
3.400%, 02/11/24 | | | 375,000 | | | | 393,360 | |
| | |
Bantrab Senior Trust (Cayman Islands) | | | | | | | | |
9.000%, 11/14/20 | | | 150,000 | | | | 155,252 | |
| | |
Barclays PLC (United Kingdom) | | | | | | | | |
(3 month LIBOR + 1.380%) | | | | | | | | |
3.548%, 05/16/243 | | | 640,000 | | | | 644,791 | |
| | |
BBVA Bancomer SA/Texas | | | | | | | | |
(U.S. Treasury Yield Curve CMT 5 year + 2.650%), 5.125%, 01/18/333 | | | 1,500,000 | | | | 1,466,265 | |
(U.S. Treasury Yield Curve CMT 5 year + 3.000%), 5.350%, 11/12/293 | | | 400,000 | | | | 405,004 | |
| | |
BDO Unibank, Inc., EMTN (Philippines) | | | | | | | | |
2.950%, 03/06/23 | | | 1,000,000 | | | | 1,015,782 | |
| | | | | | | | |
The accompanying notes are an integral part of these financial statements.
66
|
AMG Managers DoubleLine Core Plus Bond Fund Schedule of Portfolio Investments(continued) |
| | | | | | | | |
| | | Principal | | | | |
| | | Amount | | | Value | |
| | |
Financials - 9.0%(continued) | | | | | | | | |
| | |
BNP Paribas SA (France) | | | | | | | | |
3.375%, 01/09/251 | | | $620,000 | | | | $643,917 | |
| | |
BOC Aviation, Ltd. (Singapore) | | | | | | | | |
(3 month LIBOR + 1.125%) | | | | | | | | |
3.238%, 09/26/231,3 | | | 500,000 | | | | 503,548 | |
| | |
Boston Properties, LP | | | | | | | | |
3.400%, 06/21/29 | | | 545,000 | | | | 575,316 | |
| | |
Capital One Financial Corp. | | | | | | | | |
(3 month LIBOR + 0.720%) | | | | | | | | |
2.656%, 01/30/233 | | | 120,000 | | | | 120,000 | |
| | |
CFX Escrow Corp. | | | | | | | | |
6.000%, 02/15/241 | | | 75,000 | | | | 79,969 | |
6.375%, 02/15/261 | | | 135,000 | | | | 146,475 | |
| | |
The Charles Schwab Corp. | | | | | | | | |
3.550%, 02/01/24 | | | 485,000 | | | | 513,909 | |
| | |
Citigroup, Inc. | | | | | | | | |
(3 month LIBOR + 1.100%) | | | | | | | | |
3.224%, 05/17/243 | | | 825,000 | | | | 835,618 | |
| | |
CNO Financial Group, Inc. | | | | | | | | |
5.250%, 05/30/29 | | | 60,000 | | | | 66,322 | |
| | |
Commonwealth Bank of Australia (Australia) | | | | | | | | |
4.316%, 01/10/481 | | | 535,000 | | | | 591,195 | |
| | |
Credit Acceptance Corp. | | | | | | | | |
6.625%, 03/15/261 | | | 155,000 | | | | 165,075 | |
| | |
Credit Agricole SA/London (United Kingdom) | | | | | | | | |
3.750%, 04/24/231 | | | 545,000 | | | | 570,085 | |
| | |
Credit Suisse Group AG (Switzerland) | | | | | | | | |
(3 month LIBOR + 1.240%) | | | | | | | | |
3.372%, 06/12/241,3 | | | 430,000 | | | | 434,712 | |
| | |
Credito Real SAB de CV (Mexico) | | | | | | | | |
9.500%, 02/07/261 | | | 700,000 | | | | 806,750 | |
| | |
Credito Real SAB de CV SOFOM ER (Mexico) | | | | | | | | |
(U.S. Treasury Yield Curve CMT 5 year + 7.026%) | | | | | | | | |
9.125%, 05/29/683,4 | | | 800,000 | | | | 831,008 | |
| | |
Crown Castle International Corp. | | | | | | | | |
3.650%, 09/01/27 | | | 590,000 | | | | 627,340 | |
3.700%, 06/15/26 | | | 600,000 | | | | 636,763 | |
4.000%, 03/01/27 | | | 775,000 | | | | 839,361 | |
| | |
DBS Group Holdings, Ltd. (Singapore) | | | | | | | | |
(3 month LIBOR + 0.620%),
2.560%, 07/25/223 | | | 200,000 | | | | 201,046 | |
(USD Swap 5 year + 1.590%), 4.520%, 12/11/283 | | | 200,000 | | | | 212,590 | |
| | |
DBS Group Holdings, Ltd., GMTN (Singapore) | | | | | | | | |
(USD Swap 5 year + 2.390%) | | | | | | | | |
3.600%, 03/07/683,4 | | | 1,379,000 | | | | 1,389,342 | |
| | |
Digital Realty Trust LP | | | | | | | | |
3.700%, 08/15/27 | | | 1,135,000 | | | | 1,197,353 | |
| | |
Discover Financial Services | | | | | | | | |
4.100%, 02/09/27 | | | 730,000 | | | | 785,323 | |
| | |
Docuformas SAPI de CV (Mexico) | | | | | | | | |
10.250%, 07/24/241 | | | 500,000 | | | | 508,250 | |
| | | | | | | | |
| | | | | | | | |
| | | Principal | | | | |
| | | Amount | | | Value | |
| | |
ERP Operating LP | | | | | | | | |
2.500%, 02/15/30 | | | $290,000 | | | | $289,457 | |
| | |
ESH Hospitality, Inc. | | | | | | | | |
5.250%, 05/01/251 | | | 245,000 | | | | 253,269 | |
| | |
Gilex Holding Sarl (Colombia) | | | | | | | | |
8.500%, 05/02/231 | | | 200,000 | | | | 217,750 | |
8.500%, 05/02/23 | | | 450,000 | | | | 489,937 | |
| | |
Global Aircraft Leasing Co., Ltd. (Cayman Islands) | | | | | | | | |
6.500%, 09/15/241,5 | | | 135,000 | | | | 138,503 | |
| | |
Global Bank Corp. (Panama) | | | | | | | | |
4.500%, 10/20/21 | | | 900,000 | | | | 929,259 | |
(3 month LIBOR + 3.300%),
5.250%, 04/16/291,3 | | | 400,000 | | | | 428,700 | |
| | |
The Goldman Sachs Group, Inc. | | | | | | | | |
(3 month LIBOR + 1.170%) | | | | | | | | |
3.328%, 05/15/263 | | | 790,000 | | | | 800,072 | |
| | |
HSBC Holdings PLC (United Kingdom) | | | | | | | | |
(3 month LIBOR + 1.380%) | | | | | | | | |
3.512%, 09/12/263 | | | 750,000 | | | | 759,296 | |
| | |
Icahn Enterprises LP/Icahn Enterprises | | | | | | | | |
Finance Corp. | | | | | | | | |
6.250%, 02/01/22 | | | 110,000 | | | | 112,888 | |
6.250%, 05/15/26 | | | 175,000 | | | | 185,938 | |
6.375%, 12/15/25 | | | 40,000 | | | | 42,100 | |
| | |
Industrial Senior Trust
(Cayman Islands) | | | | | | | | |
5.500%, 11/01/22 | | | 500,000 | | | | 523,125 | |
| | |
Interoceanica IV Finance, Ltd. (Cayman Islands) | | | | | | | | |
0.000%, 11/30/256 | | | 1,337,475 | | | | 1,227,749 | |
| | |
Iron Mountain, Inc. | | | | | | | | |
4.875%, 09/15/291 | | | 105,000 | | | | 107,756 | |
| | |
iStar, Inc. | | | | | | | | |
4.750%, 10/01/24 | | | 60,000 | | | | 62,025 | |
| | |
Itau Unibanco Holding SA/Cayman Island (Cayman Islands) | | | | | | | | |
(U.S. Treasury Yield Curve CMT 5 year + 3.863%) | | | | | | | | |
6.500%, 09/19/682,3,4 | | | 200,000 | | | | 208,750 | |
| | |
Liberty Mutual Group, Inc. | | | | | | | | |
3.951%, 10/15/501 | | | 854,000 | | | | 884,628 | |
| | |
Lions Gate Capital Holdings LLC | | | | | | | | |
6.375%, 02/01/241 | | | 115,000 | | | | 110,785 | |
| | |
Lloyds Banking Group PLC (United Kingdom) | | | | | | | | |
(3 month LIBOR + 1.205%) | | | | | | | | |
3.574%, 11/07/283 | | | 630,000 | | | | 654,224 | |
| | |
Macquarie Group, Ltd. (Australia) | | | | | | | | |
(3 month LIBOR + 1.023%),
3.189%, 11/28/231,3 | | | 185,000 | | | | 189,187 | |
(3 month LIBOR + 1.330%),
4.150%, 03/27/241,3 | | | 355,000 | | | | 374,860 | |
| | |
Malayan Banking Bhd (Malaysia) | | | | | | | | |
(USD Swap 5 year + 2.542%) | | | | | | | | |
3.905%, 10/29/263 | | | 1,800,000 | | | | 1,838,880 | |
| | |
MGM Growth Properties Operating | | | | | | | | |
Partnership LP/MGP Finance
Co-Issuer, Inc. | | | | | | | | |
5.750%, 02/01/271 | | | 95,000 | | | | 107,469 | |
| | | | | | | | |
The accompanying notes are an integral part of these financial statements.
67
|
AMG Managers DoubleLine Core Plus Bond Fund Schedule of Portfolio Investments(continued) |
| | | | | | | | |
| | | Principal | | | | |
| | | Amount | | | Value | |
| | |
Financials - 9.0% (continued) | | | | | | | | |
| | |
Mitsubishi UFJ Financial Group, Inc. (Japan) | | | | | | | | |
(3 month LIBOR + 0.740%) | | | | | | | | |
2.878%, 03/02/233 | | | $570,000 | | | | $570,995 | |
| | |
Morgan Stanley | | | | | | | | |
(3 month LIBOR + 1.340%) | | | | | | | | |
3.591%, 07/22/283 | | | 585,000 | | | | 618,822 | |
| | |
MPT Operating Partnership LP/MPT | | | | | | | | |
Finance Corp. | | | | | | | | |
4.625%, 08/01/29 | | | 80,000 | | | | 83,601 | |
5.000%, 10/15/27 | | | 205,000 | | | | 216,787 | |
| | |
Nationstar Mortgage Holdings Inc. | | | | | | | | |
8.125%, 07/15/231 | | | 120,000 | | | | 127,500 | |
| | |
Navient Corp. | | | | | | | | |
6.500%, 06/15/22 | | | 175,000 | | | | 187,687 | |
| | |
NFP Corp. | | | | | | | | |
6.875%, 07/15/251 | | | 190,000 | | | | 187,862 | |
| | |
Oversea-Chinese Banking Corp., Ltd. (Singapore) | | | | | | | | |
4.250%, 06/19/24 | | | 600,000 | | | | 637,194 | |
| | |
Prudential Financial, Inc. | | | | | | | | |
3.905%, 12/07/47 | | | 275,000 | | | | 296,964 | |
| | |
Public Storage | | | | | | | | |
3.385%, 05/01/29 | | | 520,000 | | | | 562,320 | |
| | |
Radiant Access, Ltd. (Virgin Islands, British) | | | | | | | | |
4.600%, 11/18/674 | | | 1,100,000 | | | | 1,094,760 | |
| | |
Royal Bank of Scotland Group PLC | | | | | | | | |
(United Kingdom) | | | | | | | | |
(3 month LIBOR + 1.480%) | | | | | | | | |
3.498%, 05/15/233 | | | 285,000 | | | | 291,297 | |
| | |
S.P.A.RC EM SPC Panama Metro Line 2 SP (Cayman Islands) | | | | | | | | |
0.000%, 12/05/221,6 | | | 1,192,412 | | | | 1,146,218 | |
0.000%, 12/05/226 | | | 1,195,828 | | | | 1,149,502 | |
| | |
Scotiabank Peru SAA (Peru) | | | | | | | | |
(3 month LIBOR + 3.856%) | | | | | | | | |
4.500%, 12/13/273 | | | 200,000 | | | | 207,002 | |
| | |
Simon Property Group LP | | | | | | | | |
2.450%, 09/13/29 | | | 290,000 | | | | 287,080 | |
| | |
Springleaf Finance Corp. | | | | | | | | |
6.625%, 01/15/28 | | | 25,000 | | | | 27,750 | |
6.875%, 03/15/25 | | | 104,000 | | | | 118,040 | |
7.125%, 03/15/26 | | | 5,000 | | | | 5,722 | |
| | |
Sprint Capital Corp. | | | | | | | | |
6.875%, 11/15/28 | | | 245,000 | | | | 266,437 | |
| | |
Sumitomo Mitsui Financial Group, Inc. (Japan) | | | | | | | | |
(3 month LIBOR + 0.740%) | | | | | | | | |
2.742%, 01/17/233 | | | 880,000 | | | | 881,803 | |
| | |
SURA Asset Management SA (Colombia) | | | | | | | | |
4.875%, 04/17/24 | | | 200,000 | | | | 216,252 | |
| | |
Synchrony Financial | | | | | | | | |
3.950%, 12/01/27 | | | 565,000 | | | | 589,121 | |
| | | | | | | | |
| | | | | | | | |
| | | Principal | | | | |
| | | Amount | | | Value | |
| | |
Tempo Acquisition LLC/Tempo Acquisition | | | | | | | | |
Finance Corp. | | | | | | | | |
6.750%, 06/01/251 | | | $210,000 | | | | $217,087 | |
| | |
TerraForm Power Operating LLC | | | | | | | | |
4.250%, 01/31/231 | | | 155,000 | | | | 160,425 | |
| | |
Unifin Financiera SAB de CV (Mexico) | | | | | | | | |
(U.S. Treasury Yield Curve CMT 5 year + 6.308%) | | | | | | | | |
8.875%, 07/29/682,3,4 | | | 1,600,000 | | | | 1,456,016 | |
| | |
United Overseas Bank, Ltd., EMTN (Singapore) | | | | | | | | |
(USD Swap 5 year + 2.236%), | | | | | | | | |
3.500%, 09/16/263 | | | 1,000,000 | | | | 1,012,690 | |
(USD Swap 5 year + 1.794%), | | | | | | | | |
3.875%, 04/19/673,4 | | | 600,000 | | | | 607,116 | |
| | |
Wells Fargo & Co., MTN | | | | | | | | |
(3 month LIBOR + 1.170%),
2.879%, 10/30/303 | | | 290,000 | | | | 291,604 | |
(3 month LIBOR + 1.170%),
3.196%, 06/17/273 | | | 245,000 | | | | 253,515 | |
| | |
Welltower, Inc. | | | | | | | | |
3.950%, 09/01/23 | | | 525,000 | | | | 558,130 | |
| | |
Westpac Banking Corp. (Australia) | | | | | | | | |
(3 month LIBOR + 0.720%) | | | | | | | | |
2.878%, 05/15/232,3 | | | 580,000 | | | | 585,056 | |
| | |
WeWork Cos., Inc. | | | | | | | | |
7.875%, 05/01/251,2 | | | 40,000 | | | | 34,100 | |
| | |
Willis North America, Inc. | | | | | | | | |
4.500%, 09/15/28 | | | 495,000 | | | | 551,359 | |
| | |
Total Financials | | | | | | | 60,565,854 | |
| | |
Industrials - 16.9% | | | | | | | | |
| | |
AbbVie, Inc. | | | | | | | | |
4.700%, 05/14/45 | | | 518,000 | | | | 554,640 | |
| | |
Adani Ports & Special Economic Zone, Ltd. (India) | | | | | | | | |
3.950%, 01/19/22 | | | 600,000 | | | | 615,238 | |
| | |
Advanced Drainage Systems, Inc. | | | | | | | | |
5.000%, 09/30/271 | | | 75,000 | | | | 76,875 | |
| | |
AECOM | | | | | | | | |
5.125%, 03/15/27 | | | 145,000 | | | | 153,656 | |
| | |
Aeropuerto Internacional de Tocumen SA (Panama) | | | | | | | | |
5.625%, 05/18/36 | | | 200,000 | | | | 232,502 | |
| | |
AI Candelaria Spain SLU (Spain) | | | | | | | | |
7.500%, 12/15/28 | | | 750,000 | | | | 848,437 | |
7.500%, 12/15/281 | | | 250,000 | | | | 282,812 | |
| | |
Air Medical Group Holdings, Inc. | | | | | | | | |
6.375%, 05/15/231,2 | | | 90,000 | | | | 77,063 | |
| | |
Ajecorp BV (Netherlands) | | | | | | | | |
6.500%, 05/14/22 | | | 200,000 | | | | 196,500 | |
| | |
AK Steel Corp. | | | | | | | | |
6.375%, 10/15/252 | | | 20,000 | | | | 16,600 | |
7.625%, 10/01/212 | | | 15,000 | | | | 14,750 | |
| | |
Aker BP A.S.A. (Norway) | | | | | | | | |
4.750%, 06/15/241 | | | 150,000 | | | | 156,375 | |
| | | | | | | | |
The accompanying notes are an integral part of these financial statements.
68
|
AMG Managers DoubleLine Core Plus Bond Fund Schedule of Portfolio Investments(continued) |
| | | | | | | | |
| | | Principal | | | | |
| | | Amount | | | Value | |
| | |
Industrials - 16.9%(continued) | | | | | | | | |
| | |
Albertsons Cos., Inc. / Safeway, Inc. / New Albertsons LP / Albertsons LLC | | | | | | | | |
5.875%, 02/15/281 | | | $165,000 | | | | $177,581 | |
| | |
Alcoa Nederland Holding BV (Netherlands) | | | | | | | | |
6.125%, 05/15/281 | | | 200,000 | | | | 215,000 | |
| | |
Allison Transmission, Inc. | | | | | | | | |
5.000%, 10/01/241 | | | 149,000 | | | | 153,097 | |
| | |
Altice France, S.A. (France) | | | | | | | | |
7.375%, 05/01/261 | | | 200,000 | | | | 214,669 | |
| | |
Altria Group, Inc. | | | | | | | | |
4.800%, 02/14/29 | | | 510,000 | | | | 560,938 | |
| | |
American Axle & Manufacturing, Inc. | | | | | | | | |
6.250%, 03/15/262 | | | 65,000 | | | | 62,075 | |
| | |
Amsted Industries, Inc. | | | | | | | | |
5.625%, 07/01/271 | | | 105,000 | | | | 111,037 | |
| | |
Anglo American Capital PLC (United Kingdom) | | | | | | | | |
4.500%, 03/15/281 | | | 615,000 | | | | 655,354 | |
| | |
Anheuser-Busch Cos. LLC/Anheuser-Busch InBev Worldwide Inc. | | | | | | | | |
4.900%, 02/01/46 | | | 140,000 | | | | 167,403 | |
| | |
Anheuser-Busch InBev Worldwide, Inc. | | | | | | | | |
4.600%, 04/15/48 | | | 385,000 | | | | 442,509 | |
| | |
Antero Midstream Partners, LP/Antero Midstream Finance Corp. | | | | | | | | |
5.750%, 03/01/271 | | | 59,000 | | | | 44,250 | |
| | |
Anthem, Inc. | | | | | | | | |
2.375%, 01/15/25 | | | 295,000 | | | | 295,760 | |
| | |
APT Pipelines, Ltd. (Australia) | | | | | | | | |
4.250%, 07/15/271 | | | 1,000,000 | | | | 1,077,168 | |
| | |
Aramark Services, Inc. | | | | | | | | |
5.000%, 04/01/251 | | | 185,000 | | | | 193,094 | |
| | |
Ardagh Packaging Finance PLC/Ardagh Holdings USA, Inc. (Ireland) | | | | | | | | |
6.000%, 02/15/251 | | | 200,000 | | | | 210,500 | |
| | |
Arrow Electronics, Inc. | | | | | | | | |
3.875%, 01/12/28 | | | 245,000 | | | | 253,518 | |
| | |
Ascend Learning LLC | | | | | | | | |
6.875%, 08/01/251 | | | 30,000 | | | | 31,425 | |
6.875%, 08/01/251 | | | 170,000 | | | | 178,500 | |
| | |
AstraZeneca PLC (United Kingdom) | | | | | | | | |
6.450%, 09/15/37 | | | 410,000 | | | | 579,031 | |
| | |
AT&T, Inc. | | | | | | | | |
5.250%, 03/01/37 | | | 735,000 | | | | 866,332 | |
| | |
Avantor, Inc. | | | | | | | | |
9.000%, 10/01/251 | | | 190,000 | | | | 212,743 | |
| | |
Avolon Holdings Funding, Ltd. (Ireland) | | | | | | | | |
3.950%, 07/01/241 | | | 395,000 | | | | 410,583 | |
5.250%, 05/15/241 | | | 140,000 | | | | 153,020 | |
| | |
B&G Foods, Inc. | | | | | | | | |
5.250%, 04/01/252 | | | 115,000 | | | | 117,875 | |
| | | | | | | | |
| | | | | | | | |
| | | Principal | | | | |
| | | Amount | | | Value | |
| | |
B&G Foods, Inc. | | | | | | | | |
5.250%, 09/15/27 | | | $75,000 | | | | $74,906 | |
| | |
Banff Merger Sub, Inc. | | | | | | | | |
9.750%, 09/01/261 | | | 55,000 | | | | 51,494 | |
| | |
BAT Capital Corp. | | | | | | | | |
3.462%, 09/06/29 | | | 915,000 | | | | 899,867 | |
| | |
Bausch Health Cos., Inc. | | | | | | | | |
5.750%, 08/15/271 | | | 30,000 | | | | 32,653 | |
7.000%, 03/15/241 | | | 90,000 | | | | 94,381 | |
7.000%, 01/15/281 | | | 140,000 | | | | 151,375 | |
7.250%, 05/30/291 | | | 140,000 | | | | 154,525 | |
| | |
BBA US Holdings, Inc. | | | | | | | | |
4.000%, 03/01/281 | | | 20,000 | | | | 19,900 | |
| | |
Beacon Escrow Corp. | | | | | | | | |
4.875%, 11/01/251 | | | 150,000 | | | | 147,945 | |
| | |
Beacon Roofing Supply, Inc. | | | | | | | | |
4.500%, 11/15/261,2 | | | 50,000 | | | | 51,063 | |
| | |
Becton Dickinson and Co. | | | | | | | | |
2.894%, 06/06/22 | | | 835,000 | | | | 851,415 | |
| | |
Berry Global, Inc. | | | | | | | | |
5.625%, 07/15/271,2 | | | 130,000 | | | | 138,287 | |
| | |
Bharat Petroleum Corp., Ltd., EMTN (India) | | | | | | | | |
4.000%, 05/08/25 | | | 400,000 | | | | 413,862 | |
| | |
Bharti Airtel International Netherlands BV (Netherlands) | | | | | | | | |
5.125%, 03/11/23 | | | 800,000 | | | | 831,028 | |
| | |
Bharti Airtel, Ltd. (India) | | | | | | | | |
4.375%, 06/10/252 | | | 1,000,000 | | | | 1,006,084 | |
| | |
Bombardier, Inc. (Canada) | | | | | | | | |
6.000%, 10/15/221 | | | 65,000 | | | | 63,700 | |
7.875%, 04/15/271 | | | 45,000 | | | | 42,638 | |
| | |
Boyne USA, Inc. | | | | | | | | |
7.250%, 05/01/251 | | | 215,000 | | | | 235,962 | |
| | |
BPRL International Singapore Pte, Ltd., EMTN (Singapore) | | | | | | | | |
4.375%, 01/18/27 | | | 1,000,000 | | | | 1,063,710 | |
| | |
Builders FirstSource, Inc. | | | | | | | | |
5.625%, 09/01/241 | | | 165,000 | | | | 172,012 | |
6.750%, 06/01/271 | | | 40,000 | | | | 43,600 | |
| | |
C&W Senior Financing DAC (Ireland) | | | | | | | | |
6.875%, 09/15/27 | | | 1,700,000 | | | | 1,795,625 | |
7.500%, 10/15/261 | | | 500,000 | | | | 538,125 | |
| | |
Cable Onda, S.A. (Panama) | | | | | | | | |
4.500%, 01/30/301 | | | 200,000 | | | | 203,054 | |
| | |
Camelot Finance, S.A. (Luxembourg) | | | | | | | | |
4.500%, 11/01/261 | | | 25,000 | | | | 25,323 | |
| | |
Canacol Energy, Ltd. (Canada) | | | | | | | | |
7.250%, 05/03/251 | | | 200,000 | | | | 210,252 | |
7.250%, 05/03/25 | | | 1,300,000 | | | | 1,366,638 | |
| | |
Carvana Co. | | | | | | | | |
8.875%, 10/01/231 | | | 70,000 | | | | 72,800 | |
| | | | | | | | |
The accompanying notes are an integral part of these financial statements.
69
|
AMG Managers DoubleLine Core Plus Bond Fund Schedule of Portfolio Investments(continued) |
| | | | | | | | |
| | | Principal | | | | |
| | | Amount | | | Value | |
| | |
Industrials - 16.9%(continued) | | | | | | | | |
| | |
Catalent Pharma Solutions, Inc. | | | | | | | | |
5.000%, 07/15/271 | | | $130,000 | | | | $136,175 | |
| | |
CCO Holdings LLC/CCO Holdings Capital Corp. | | | | | | | | |
5.000%, 02/01/281 | | | 170,000 | | | | 178,287 | |
5.750%, 02/15/261 | | | 155,000 | | | | 164,067 | |
| | |
CDK Global, Inc. | | | | | | | | |
5.250%, 05/15/291 | | | 50,000 | | | | 53,156 | |
5.875%, 06/15/26 | | | 65,000 | | | | 69,794 | |
| | |
Cedar Fair LP | | | | | | | | |
5.250%, 07/15/291 | | | 110,000 | | | | 118,525 | |
| | |
Celgene Corp. | | | | | | | | |
4.350%, 11/15/47 | | | 555,000 | | | | 648,576 | |
| | |
Celulosa Arauco y Constitucion SA (Chile) | | | | | | | | |
5.500%, 04/30/491 | | | 750,000 | | | | 794,062 | |
| | |
Cemex SAB de CV (Mexico) | | | | | | | | |
7.750%, 04/16/262 | | | 200,000 | | | | 216,252 | |
| | |
Cengage Learning, Inc. | | | | | | | | |
9.500%, 06/15/241,2 | | | 95,000 | | | | 85,500 | |
| | |
Cenovus Energy Inc. (Canada) | | | | | | | | |
5.400%, 06/15/47 | | | 250,000 | | | | 280,124 | |
| | |
Centene Corp. | | | | | | | | |
4.750%, 01/15/25 | | | 175,000 | | | | 181,477 | |
5.375%, 06/01/261 | | | 90,000 | | | | 95,490 | |
| | |
Century Communities, Inc. | | | | | | | | |
6.750%, 06/01/271 | | | 70,000 | | | | 75,075 | |
| | |
Charles River Laboratories International, Inc. | | | | | | | | |
4.250%, 05/01/281 | | | 70,000 | | | | 71,495 | |
| | |
Charter Communications Operating LLC/Charter Communications Operating Capital | | | | | | | | |
4.908%, 07/23/25 | | | 535,000 | | | | 590,641 | |
| | |
Cheniere Energy Partners LP | | | | | | | | |
4.500%, 10/01/291 | | | 50,000 | | | | 51,188 | |
5.250%, 10/01/25 | | | 205,000 | | | | 212,944 | |
5.625%, 10/01/26 | | | 80,000 | | | | 84,900 | |
| | |
Cigna Corp. | | | | | | | | |
(3 month LIBOR + 0.890%),
2.891%, 07/15/233 | | | 275,000 | | | | 276,153 | |
4.900%, 12/15/48 | | | 265,000 | | | | 308,149 | |
| | |
Cincinnati Bell, Inc. | | | | | | | | |
7.000%, 07/15/241,2 | | | 115,000 | | | | 104,362 | |
| | |
Clean Harbors, Inc. | | | | | | | | |
4.875%, 07/15/271 | | | 125,000 | | | | 130,617 | |
5.125%, 07/15/291 | | | 30,000 | | | | 32,025 | |
| | |
Clear Channel Worldwide Holdings, Inc. | | | | | | | | |
5.125%, 08/15/271 | | | 90,000 | | | | 93,909 | |
9.250%, 02/15/241 | | | 29,000 | | | | 31,954 | |
| | |
CNOOC Finance 2013, Ltd. (Hong Kong) | | | | | | | | |
3.000%, 05/09/23 | | | 400,000 | | | | 406,149 | |
| | |
CNOOC Finance 2015 USA LLC | | | | | | | | |
3.500%, 05/05/25 | | | 700,000 | | | | 730,131 | |
| | | | | | | | |
| | | | | | | | |
| | | Principal | | | | |
| | | Amount | | | Value | |
| | |
CNOOC Finance 2015 USA LLC | | | | | | | | |
3.750%, 05/02/232 | | | $590,000 | | | | $613,629 | |
| | |
CNX Midstream Partners LP/CNX Midstream Finance Corp. | | | | | | | | |
6.500%, 03/15/261 | | | 195,000 | | | | 182,812 | |
| | |
Colombia Telecomunicaciones SA ESP | | | | | | | | |
(Colombia) | | | | | | | | |
(USD Swap 5 year + 6.958%) | | | | | | | | |
8.500%, 09/30/683,4 | | | 200,000 | | | | 204,400 | |
| | |
Comcast Corp. | | | | | | | | |
3.950%, 10/15/25 | | | 545,000 | | | | 599,048 | |
| | |
CommScope, Inc. | | | | | | | | |
5.500%, 03/01/241 | | | 75,000 | | | | 76,388 | |
6.000%, 03/01/261 | | | 40,000 | | | | 41,300 | |
| | |
Comunicaciones Celulares SA Via Comcel Trust (Cayman Islands) | | | | | | | | |
6.875%, 02/06/24 | | | 500,000 | | | | 516,250 | |
| | |
Constellation Brands, Inc. | | | | | | | | |
3.150%, 08/01/29 | | | 140,000 | | | | 143,028 | |
| | |
Constellation Merger Sub, Inc. | | | | | | | | |
8.500%, 09/15/251,2 | | | 85,000 | | | | 60,775 | |
| | |
Controladora Mabe SA de CV (Mexico) | | | | | | | | |
5.600%, 10/23/282 | | | 500,000 | | | | 551,375 | |
| | |
Corning, Inc. | | | | | | | | |
4.375%, 11/15/57 | | | 285,000 | | | | 301,914 | |
| | |
Cosan Overseas, Ltd. (Cayman Islands) | | | | | | | | |
8.250%, 02/05/674 | | | 2,000,000 | | | | 2,087,520 | |
| | |
Cott Holdings, Inc. | | | | | | | | |
5.500%, 04/01/251 | | | 180,000 | | | | 188,325 | |
| | |
CRC Escrow Issuer LLC/CRC Finco, Inc. | | | | | | | | |
5.250%, 10/15/251 | | | 130,000 | | | | 133,412 | |
| | |
Crown Americas LLC/Crown | | | | | | | | |
Americas Capital Corp. IV | | | | | | | | |
4.500%, 01/15/23 | | | 115,000 | | | | 120,462 | |
| | |
Crown Americas LLC/Crown | | | | | | | | |
Americas Capital Corp. VI | | | | | | | | |
4.750%, 02/01/26 | | | 230,000 | | | | 242,075 | |
| | |
CSC Holdings LLC | | | | | | | | |
5.250%, 06/01/242 | | | 135,000 | | | | 145,800 | |
| | |
CSI Compressco, LP/CSI Compressco | | | | | | | | |
Finance, Inc. | | | | | | | | |
7.500%, 04/01/251 | | | 170,000 | | | | 165,750 | |
| | |
CSN Islands XII Corp. (Brazil) | | | | | | | | |
7.000%, 12/23/674 | | | 750,000 | | | | 662,992 | |
| | |
CSN Resources SA (Brazil) | | | | | | | | |
7.625%, 04/17/261 | | | 300,000 | | | | 305,250 | |
| | |
CSX Corp. | | | | | | | | |
3.800%, 11/01/46 | | | 555,000 | | | | 585,884 | |
| | |
CVS Health Corp. | | | | | | | | |
5.050%, 03/25/48 | | | 260,000 | | | | 298,303 | |
| | | | | | | | |
The accompanying notes are an integral part of these financial statements.
70
|
AMG Managers DoubleLine Core Plus Bond Fund Schedule of Portfolio Investments(continued) |
| | | | | | | | |
| | | Principal | | | | |
| | | Amount | | | Value | |
| | |
Industrials - 16.9%(continued) | | | | | | | | |
| | |
Dana Financing Luxembourg Sarl (Luxembourg) | | | | | | | | |
5.750%, 04/15/251 | | | $155,000 | | | | $161,200 | |
| | |
Delek & Avner Tamar Bond, Ltd. (Israel) | | | | | | | | |
5.082%, 12/30/231 | | | 100,000 | | | | 103,847 | |
| | |
Delek & Avner Tamar Bond, Ltd. (Israel) | | | | | | | | |
5.412%, 12/30/251 | | | 300,000 | | | | 314,964 | |
| | |
Delta Air Lines, Inc. | | | | | | | | |
3.800%, 04/19/23 | | | 585,000 | | | | 606,743 | |
| | |
Diamond Sports Group LLC/Diamond Sports Finance Co. | | | | | | | | |
5.375%, 08/15/261 | | | 100,000 | | | | 104,625 | |
| | |
Digicel Group Two, Ltd. PIK (Jamaica) | | | | | | | | |
9.125%, 04/01/241,5 | | | 1,622,912 | | | | 300,239 | |
| | |
DISH DBS Corp. | | | | | | | | |
5.875%, 11/15/24 | | | 65,000 | | | | 65,406 | |
| | |
Dollar Tree, Inc. | | | | | | | | |
4.000%, 05/15/25 | | | 510,000 | | | | 548,906 | |
| | |
The Dun & Bradstreet Corp. | | | | | | | | |
6.875%, 08/15/261 | | | 55,000 | | | | 60,242 | |
10.250%, 02/15/271 | | | 40,000 | | | | 44,001 | |
| | |
DuPont de Nemours, Inc. | | | | | | | | |
5.419%, 11/15/48 | | | 460,000 | | | | 571,923 | |
| | |
Eagle Holding Co. II LLC | | | | | | | | |
7.750%, 05/15/221,5 | | | 80,000 | | | | 81,400 | |
| | |
Eldorado Resorts, Inc. | | | | | | | | |
6.000%, 04/01/25 | | | 105,000 | | | | 110,906 | |
| | |
Embarq Corp. | | | | | | | | |
7.995%, 06/01/36 | | | 125,000 | | | | 124,375 | |
| | |
Empresa de Transporte de Pasajeros Metro SA (Chile) | | | | | | | | |
5.000%, 01/25/471 | | | 1,150,000 | | | | 1,353,895 | |
| | |
Empresa Nacional de Telecomunicaciones SA (Chile) | | | | | | | | |
4.875%, 10/30/24 | | | 300,000 | | | | 314,321 | |
| | |
ENA Norte Trust (Panama) | | | | | | | | |
4.950%, 04/25/23 | | | 945,706 | | | | 978,815 | |
| | |
Enable Midstream Partners LP | | | | | | | | |
4.400%, 03/15/27 | | | 280,000 | | | | 277,678 | |
| | |
Encompass Health Corp. | | | | | | | | |
4.500%, 02/01/28 | | | 35,000 | | | | 35,875 | |
4.750%, 02/01/30 | | | 10,000 | | | | 10,338 | |
| | |
Energizer Holdings, Inc. | | | | | | | | |
7.750%, 01/15/271 | | | 75,000 | | | | 83,250 | |
| | |
Energy Transfer LP | | | | | | | | |
4.200%, 04/15/27 | | | 30,000 | | | | 31,311 | |
4.750%, 01/15/26 | | | 490,000 | | | | 531,214 | |
| | |
Envision Healthcare Corp. | | | | | | | | |
8.750%, 10/15/261 | | | 25,000 | | | | 14,188 | |
| | |
EP Energy LLC/Everest Acquisition Finance, Inc. | | | | | | | | |
7.750%, 05/15/261,7 | | | 70,000 | | | | 49,000 | |
| | | | | | | | |
| | | | | | | | |
| | | Principal | | | | |
| | | Amount | | | Value | |
| | |
Exelon Corp. | | | | | | | | |
3.400%, 04/15/26 | | | $1,000,000 | | | | $1,052,776 | |
| | |
Expedia, Inc. | | | | | | | | |
3.800%, 02/15/28 | | | 280,000 | | | | 293,584 | |
| | |
Exterran Energy Solutions, LP/EES Finance Corp | | | | | | | | |
8.125%, 05/01/25 | | | 95,000 | | | | 94,525 | |
| | |
Extraction Oil & Gas, Inc. | | | | | | | | |
5.625%, 02/01/261 | | | 45,000 | | | | 19,350 | |
| | |
FedEx Corp. | | | | | | | | |
4.750%, 11/15/45 | | | 270,000 | | | | 290,586 | |
| | |
Fermaca Enterprises S de RL de CV (Mexico) | | | | | | | | |
6.375%, 03/30/381 | | | 218,669 | | | | 237,258 | |
| | |
Fideicomiso PA Pacifico Tres (Colombia) | | | | | | | | |
8.250%, 01/15/35 | | | 200,000 | | | | 225,502 | |
| | |
Flex Acquisition Co, Inc. | | | | | | | | |
7.875%, 07/15/261 | | | 50,000 | | | | 47,125 | |
| | |
Ford Motor Co. | | | | | | | | |
7.450%, 07/16/31 | | | 125,000 | | | | 145,343 | |
| | |
Foresight Energy LLC/Foresight Energy | | | | | | | | |
Finance Corp. | | | | | | | | |
11.500%, 04/01/231 | | | 180,000 | | | | 16,650 | |
| | |
Freeport-McMoRan, Inc. | | | | | | | | |
5.400%, 11/14/34 | | | 1,150,000 | | | | 1,128,437 | |
5.450%, 03/15/43 | | | 1,000,000 | | | | 935,000 | |
| | |
Fresnillo PLC (Mexico) | | | | | | | | |
5.500%, 11/13/23 | | | 200,000 | | | | 218,752 | |
| | |
Frontdoor, Inc. | | | | | | | | |
6.750%, 08/15/261 | | | 150,000 | | | | 164,625 | |
| | |
Frontier Communications Corp. | | | | | | | | |
7.125%, 01/15/23 | | | 55,000 | | | | 24,956 | |
8.000%, 04/01/271 | | | 55,000 | | | | 57,888 | |
8.500%, 04/15/202 | | | 40,000 | | | | 23,200 | |
8.500%, 04/01/261 | | | 45,000 | | | | 45,225 | |
| | |
FTS International, Inc. | | | | | | | | |
6.250%, 05/01/22 | | | 62,000 | | | | 44,563 | |
| | |
General Electric Co., MTN | | | | | | | | |
5.875%, 01/14/38 | | | 505,000 | | | | 604,932 | |
| | |
General Motors Co. | | | | | | | | |
(3 month LIBOR + 0.800%) | | | | | | | | |
3.009%, 08/07/203 | | | 210,000 | | | | 210,339 | |
| | |
General Motors Financial Co, Inc. | | | | | | | | |
(3 month LIBOR + 0.990%) | | | | | | | | |
3.033%, 01/05/233 | | | 690,000 | | | | 684,135 | |
| | |
Genesys Telecommunications Laboratories Inc. | | | | | | | | |
10.000%, 11/30/241 | | | 220,000 | | | | 238,150 | |
| | |
Geopark, Ltd. (Chile) | | | | | | | | |
6.500%, 09/21/24 | | | 1,400,000 | | | | 1,450,764 | |
| | |
GFL Environmental, Inc. (Canada) | | | | | | | | |
8.500%, 05/01/271 | | | 55,000 | | | | 60,638 | |
| | |
GNL Quintero SA (Chile) | | | | | | | | |
4.634%, 07/31/29 | | | 450,000 | | | | 477,112 | |
| | | | | | | | |
The accompanying notes are an integral part of these financial statements.
71
|
AMG Managers DoubleLine Core Plus Bond Fund Schedule of Portfolio Investments(continued) |
| | | | | | | | |
| | | Principal | | | | |
| | | Amount | | | Value | |
| | |
Industrials - 16.9%(continued) | | | | | | | | |
| | |
Gogo Intermediate Holdings LLC/Gogo Finance Co., Inc. | | | | | | | | |
9.875%, 05/01/241 | | | $110,000 | | | | $116,050 | |
| | |
Gohl Capital, Ltd. (Isle of Man) | | | | | | | | |
4.250%, 01/24/27 | | | 1,500,000 | | | | 1,572,915 | |
| | |
Golden Entertainment, Inc. | | | | | | | | |
7.625%, 04/15/261 | | | 65,000 | | | | 68,494 | |
| | |
Golden Nugget, Inc. | | | | | | | | |
6.750%, 10/15/241 | | | 220,000 | | | | 227,172 | |
8.750%, 10/01/251 | | | 30,000 | | | | 31,650 | |
| | |
Gran Tierra Energy International Holdings, Ltd. (Cayman Islands) | | | | | | | | |
6.250%, 02/15/25 | | | 1,126,000 | | | | 1,059,847 | |
| | |
Gran Tierra Energy, Inc. (Canada) | | | | | | | | |
7.750%, 05/23/271 | | | 200,000 | | | | 192,000 | |
| | |
Gray Television, Inc. | | | | | | | | |
5.125%, 10/15/241 | | | 55,000 | | | | 57,131 | |
7.000%, 05/15/271 | | | 90,000 | | | | 98,822 | |
| | |
GrubHub Holdings, Inc. | | | | | | | | |
5.500%, 07/01/271 | | | 45,000 | | | | 42,300 | |
| | |
Grupo Bimbo SAB de CV (Mexico) | | | | | | | | |
(U.S. Treasury Yield Curve CMT 5 year + 3.280%) | | | | | | | | |
5.950%, 07/17/682,3,4 | | | 600,000 | | | | 637,200 | |
| | |
Grupo Idesa SA de CV (Mexico) | | | | | | | | |
7.875%, 12/18/201 | | | 100,000 | | | | 75,375 | |
7.875%, 12/18/20 | | | 600,000 | | | | 452,250 | |
| | |
GTT Communications, Inc. | | | | | | | | |
7.875%, 12/31/241 | | | 80,000 | | | | 47,000 | |
| | |
Guanay Finance, Ltd. (Cayman Islands) | | | | | | | | |
6.000%, 12/15/20 | | | 575,621 | | | | 581,809 | |
| | |
Gulfport Energy Corp. | | | | | | | | |
6.375%, 05/15/25 | | | 110,000 | | | | 67,100 | |
| | |
GW Honos Security Corp. (Canada) | | | | | | | | |
8.750%, 05/15/251 | | | 130,000 | | | | 130,650 | |
| | |
Hasbro, Inc. | | | | | | | | |
3.500%, 09/15/27 | | | 565,000 | | | | 578,389 | |
| | |
HCA, Inc. | | | | | | | | |
4.125%, 06/15/29 | | | 270,000 | | | | 286,742 | |
5.250%, 04/15/25 | | | 55,000 | | | | 61,422 | |
5.375%, 09/01/26 | | | 305,000 | | | | 333,212 | |
5.875%, 02/01/29 | | | 15,000 | | | | 17,025 | |
| | |
Hess Infrastructure Partners, LP/Hess | | | | | | | | |
Infrastructure Partners Finance Corp. | | | | | | | | |
5.625%, 02/15/261 | | | 300,000 | | | | 315,375 | |
| | |
Hexion, Inc. | | | | | | | | |
7.875%, 07/15/271 | | | 55,000 | | | | 53,213 | |
| | |
H-Food Holdings LLC/Hearthside | | | | | | | | |
Finance Co., Inc. | | | | | | | | |
8.500%, 06/01/261 | | | 75,000 | | | | 55,875 | |
| | | | | | | | |
| | | | | | | | |
| | | Principal | | | | |
| | | Amount | | | Value | |
| | |
Hilcorp Energy I, LP/Hilcorp Finance Co. | | | | | | | | |
6.250%, 11/01/281 | | | $80,000 | | | | $68,000 | |
| | |
Hill-Rom Holdings, Inc. | | | | | | | | |
4.375%, 09/15/271 | | | 60,000 | | | | 61,950 | |
| | |
Hilton Domestic Operating Co, Inc. | | | | | | | | |
4.250%, 09/01/24 | | | 305,000 | | | | 311,100 | |
| | |
The Home Depot, Inc. | | | | | | | | |
3.900%, 06/15/47 | | | 260,000 | | | | 300,080 | |
| | |
Horizon Pharma USA, Inc. | | | | | | | | |
5.500%, 08/01/271 | | | 200,000 | | | | 209,000 | |
| | |
IAA, Inc. | | | | | | | | |
5.500%, 06/15/271 | | | 115,000 | | | | 123,498 | |
| | |
iHeartCommunications, Inc. | | | | | | | | |
5.250%, 08/15/271 | | | 60,000 | | | | 62,052 | |
6.375%, 05/01/262 | | | 30,000 | | | | 32,438 | |
8.375%, 05/01/272 | | | 15,000 | | | | 16,163 | |
| | |
Imperial Brands Finance PLC (United Kingdom) | | | | | | | | |
3.500%, 07/26/261 | | | 290,000 | | | | 289,503 | |
| | |
Indian Oil Corp., Ltd. (India) | | | | | | | | |
5.625%, 08/02/21 | | | 450,000 | | | | 473,680 | |
5.750%, 08/01/23 | | | 1,700,000 | | | | 1,869,294 | |
| | |
Indigo Natural Resources LLC | | | | | | | | |
6.875%, 02/15/261 | | | 55,000 | | | | 50,325 | |
| | |
Informatica LLC | | | | | | | | |
7.125%, 07/15/231 | | | 185,000 | | | | 188,469 | |
| | |
Installed Building Products, Inc. | | | | | | | | |
5.750%, 02/01/281 | | | 85,000 | | | | 89,504 | |
| | |
Intelsat Jackson Holdings SA (Luxembourg) | | | | | | | | |
5.500%, 08/01/23 | | | 85,000 | | | | 79,900 | |
8.500%, 10/15/241 | | | 95,000 | | | | 95,921 | |
| | |
InterCement Financial Operations BV | | | | | | | | |
(Netherlands) | | | | | | | | |
5.750%, 07/17/24 | | | 400,000 | | | | 296,004 | |
| | |
The Interpublic Group of Cos, Inc. | | | | | | | | |
5.400%, 10/01/48 | | | 485,000 | | | | 586,559 | |
| | |
Inversiones CMPC SA (Chile) | | | | | | | | |
4.750%, 09/15/24 | | | 200,000 | | | | 211,582 | |
| | |
IQVIA, Inc. | | | | | | | | |
5.000%, 05/15/271 | | | 200,000 | | | | 212,500 | |
| | |
IRB Holding Corp. | | | | | | | | |
6.750%, 02/15/261 | | | 140,000 | | | | 142,800 | |
| | |
Iridium Communications, Inc. | | | | | | | | |
10.250%, 04/15/231 | | | 165,000 | | | | 178,612 | |
| | |
JBS Investments II GmbH (Austria) | | | | | | | | |
5.750%, 01/15/281 | | | 1,200,000 | | | | 1,253,100 | |
| | |
JBS USA LUX, S.A./JBS USA Finance, Inc. | | | | | | | | |
5.750%, 06/15/251 | | | 15,000 | | | | 15,638 | |
5.875%, 07/15/241 | | | 25,000 | | | | 25,813 | |
6.750%, 02/15/281 | | | 105,000 | | | | 115,895 | |
| | |
JBS USA LUX, S.A./JBS USA Food Co./JBS USA Finance, Inc. | | | | | | | | |
5.500%, 01/15/301 | | | 35,000 | | | | 37,800 | |
| | | | | | | | |
The accompanying notes are an integral part of these financial statements.
72
|
AMG Managers DoubleLine Core Plus Bond Fund Schedule of Portfolio Investments(continued) |
| | | | | | | | |
| | | Principal | | | | |
| | | Amount | | | Value | |
| | |
Industrials - 16.9%(continued) | | | | | | | | |
| | |
JBS USA LUX, S.A./JBS USA Food Co./JBS USA Finance, Inc. | | | | | | | | |
6.500%, 04/15/291 | | | $100,000 | | | | $111,503 | |
| | |
Jeld-Wen, Inc. | | | | | | | | |
4.625%, 12/15/251 | | | 175,000 | | | | 173,687 | |
| | |
John Deere Capital Corp., MTN | | | | | | | | |
3.450%, 01/10/24 | | | 250,000 | | | | 264,643 | |
| | |
JSL Europe, S.A. (Luxembourg) | | | | | | | | |
7.750%, 07/26/24 | | | 850,000 | | | | 907,375 | |
| | |
KAR Auction Services, Inc. | | | | | | | | |
5.125%, 06/01/251 | | | 160,000 | | | | 167,800 | |
| | |
Kinder Morgan Energy Partners L.P., MTN | | | | | | | | |
6.950%, 01/15/38 | | | 430,000 | | | | 556,262 | |
| | |
Kraton Polymers LLC/Kraton Polymers Capital Corp. | | | | | | | | |
7.000%, 04/15/251 | | | 45,000 | | | | 45,900 | |
| | |
Kratos Defense & Security Solutions, Inc. | | | | | | | | |
6.500%, 11/30/251 | | | 90,000 | | | | 95,625 | |
| | |
The Kroger Co. | | | | | | | | |
3.400%, 04/15/22 | | | 510,000 | | | | 528,267 | |
| | |
Kronos Acquisition Holdings, Inc. (Canada) | | | | | | | | |
9.000%, 08/15/231 | | | 85,000 | | | | 74,375 | |
| | |
Latam Finance, Ltd.
(Cayman Islands) | | | | | | | | |
6.875%, 04/11/24 | | | 500,000 | | | | 530,375 | |
7.000%, 03/01/261 | | | 500,000 | | | | 539,750 | |
| | |
Level 3 Financing, Inc. | | | | | | | | |
4.625%, 09/15/271 | | | 90,000 | | | | 91,687 | |
5.375%, 01/15/24 | | | 190,000 | | | | 194,037 | |
| | |
Live Nation Entertainment, Inc. | | | | | | | | |
5.625%, 03/15/261 | | | 180,000 | | | | 192,150 | |
| | |
Lockheed Martin Corp. | | | | | | | | |
4.700%, 05/15/46 | | | 435,000 | | | | 550,207 | |
| | |
LTF Merger Sub, Inc. | | | | | | | | |
8.500%, 06/15/231 | | | 175,000 | | | | 179,812 | |
| | |
Marathon Petroleum Corp. | | | | | | | | |
5.125%, 12/15/26 | | | 540,000 | | | | 617,617 | |
| | |
MARB BondCo PLC
(United Kingdom) | | | | | | | | |
6.875%, 01/19/25 | | | 1,700,000 | | | | 1,775,140 | |
| | |
Marriott Ownership Resorts, Inc./ILG LLC | | | | | | | | |
6.500%, 09/15/26 | | | 125,000 | | | | 135,779 | |
| | |
Marvell Technology Group, Ltd. | | | | | | | | |
4.200%, 06/22/23 | | | 590,000 | | | | 621,369 | |
| | |
Masonite International Corp. | | | | | | | | |
5.750%, 09/15/261 | | | 145,000 | | | | 154,425 | |
| | |
Match Group, Inc. | | | | | | | | |
5.000%, 12/15/271 | | | 150,000 | | | | 157,312 | |
| | |
McDonald’s Corp., MTN | | | | | | | | |
4.450%, 03/01/47 | | | 245,000 | | | | 283,113 | |
| | | | | | | | |
| | | | | | | | |
| | | Principal | | | | |
| | | Amount | | | Value | |
| | |
MEG Energy Corp. (Canada) | | | | | | | | |
7.000%, 03/31/241 | | | $60,000 | | | | $56,658 | |
| | |
MGM Resorts International | | | | | | | | |
5.750%, 06/15/25 | | | 70,000 | | | | 78,050 | |
| | |
Millicom International Cellular SA (Luxembourg) | | | | | | | | |
5.125%, 01/15/28 | | | 400,000 | | | | 413,500 | |
6.000%, 03/15/25 | | | 200,000 | | | | 207,750 | |
6.250%, 03/25/291 | | | 200,000 | | | | 218,746 | |
6.625%, 10/15/26 | | | 500,000 | | | | 543,750 | |
| | |
Minerva Luxembourg SA (Luxembourg) | | | | | | | | |
5.875%, 01/19/28 | | | 1,000,000 | | | | 1,022,000 | |
6.500%, 09/20/26 | | | 200,000 | | | | 209,500 | |
| | |
The Mosaic Co. | | | | | | | | |
4.050%, 11/15/27 | | | 595,000 | | | | 629,558 | |
| | |
Moss Creek Resources Holdings, Inc. | | | | | | | | |
7.500%, 01/15/261 | | | 75,000 | | | | 51,000 | |
| | |
MPH Acquisition Holdings LLC | | | | | | | | |
7.125%, 06/01/241 | | | 90,000 | | | | 84,375 | |
| | |
Murphy Oil USA, Inc. | | | | | | | | |
4.750%, 09/15/29 | | | 55,000 | | | | 57,544 | |
| | |
Nabors Industries, Inc. | | | | | | | | |
5.750%, 02/01/25 | | | 85,000 | | | | 63,776 | |
| | |
NBM US Holdings, Inc. | | | | | | | | |
7.000%, 05/14/261 | | | 200,000 | | | | 212,725 | |
| | |
Netflix, Inc. | | | | | | | | |
4.875%, 06/15/301 | | | 30,000 | | | | 30,405 | |
5.375%, 11/15/291 | | | 45,000 | | | | 47,531 | |
5.875%, 02/15/25 | | | 55,000 | | | | 60,638 | |
| | |
Network i2i, Ltd. (India) | | | | | | | | |
(U.S. Treasury Yield Curve CMT 5 year + 4.277%) | | | | | | | | |
5.650%, 04/15/681,3,4 | | | 400,000 | | | | 377,400 | |
| | |
New Red Finance, Inc. (Canada) | | | | | | | | |
5.000%, 10/15/251 | | | 230,000 | | | | 237,475 | |
| | |
NuStar Logistics LP | | | | | | | | |
6.000%, 06/01/26 | | | 100,000 | | | | 107,370 | |
| | |
Nutrien, Ltd. (Canada) | | | | | | | | |
4.200%, 04/01/29 | | | 575,000 | | | | 636,340 | |
| | |
NVA Holdings, Inc. | | | | | | | | |
6.875%, 04/01/261 | | | 55,000 | | | | 59,263 | |
| | |
NXP BV/NXP Funding LLC/NXP USA, Inc. (Netherlands) | | | | | | | | |
3.875%, 06/18/261 | | | 265,000 | | | | 278,111 | |
| | |
OAS Finance, Ltd. (Virgin Islands, British) | | | | | | | | |
(U.S. Treasury Yield Curve CMT 5 year + 8.186%), 8.875%, 07/25/68*,1,4,7,8 | | | 400,000 | | | | 3,000 | |
(U.S. Treasury Yield Curve CMT 5 year + 8.186%), 8.875%, 07/25/68*,4,7,8 | | | 600,000 | | | | 4,500 | |
| | |
Oasis Petroleum, Inc. | | | | | | | | |
6.250%, 05/01/261,2 | | | 65,000 | | | | 44,558 | |
| | | | | | | | |
The accompanying notes are an integral part of these financial statements.
73
|
AMG Managers DoubleLine Core Plus Bond Fund Schedule of Portfolio Investments(continued) |
| | | | | | | | |
| | | Principal | | | | |
| | | Amount | | | Value | |
| | |
Industrials - 16.9%(continued) | | | | | | | | |
| | |
Oasis Petroleum, Inc. | | | | | | | | |
6.875%, 03/15/22 | | | $95,000 | | | | $84,788 | |
| | |
Oleoducto Central, S.A. (Colombia) | | | | | | | | |
4.000%, 05/07/21 | | | 200,000 | | | | 205,002 | |
| | |
ONEOK, Inc. | | | | | | | | |
3.400%, 09/01/29 | | | 150,000 | | | | 149,769 | |
| | |
ONGC Videsh Vankorneft Pte, Ltd. (Singapore) | | | | | | | | |
3.750%, 07/27/26 | | | 1,000,000 | | | | 1,038,417 | |
| | |
Owens Corning | | | | | | | | |
4.400%, 01/30/48 | | | 295,000 | | | | 276,074 | |
| | |
Packaging Corp of America | | | | | | | | |
3.400%, 12/15/27 | | | 255,000 | | | | 266,247 | |
| | |
Panther BF Aggregator 2 LP/Panther Finance Co., Inc. | | | | | | | | |
6.250%, 05/15/261,2 | | | 85,000 | | | | 90,074 | |
8.500%, 05/15/271 | | | 45,000 | | | | 45,338 | |
| | |
Par Petroleum LLC/Petroleum Finance Corp. | | | | | | | | |
7.750%, 12/15/251 | | | 160,000 | | | | 160,400 | |
| | |
Parkland Fuel Corp. (Canada) | | | | | | | | |
5.875%, 07/15/271 | | | 70,000 | | | | 74,257 | |
| | |
Parsley Energy LLC/Parsley Finance Corp. | | | | | | | | |
5.625%, 10/15/271 | | | 140,000 | | | | 145,250 | |
| | |
Peabody Energy Corp. | | | | | | | | |
6.000%, 03/31/221 | | | 125,000 | | | | 116,250 | |
| | |
Penn National Gaming, Inc. | | | | | | | | |
5.625%, 01/15/271,2 | | | 130,000 | | | | 134,550 | |
| | |
Penske Truck Leasing Co. LP/PTL Finance Corp. | | | | | | | | |
4.200%, 04/01/271 | | | 245,000 | | | | 260,490 | |
| | |
Performance Food Group, Inc. | | | | | | | | |
5.500%, 10/15/271 | | | 115,000 | | | | 122,187 | |
| | |
Pertamina Persero PT (Indonesia) | | | | | | | | |
4.300%, 05/20/23 | | | 1,100,000 | | | | 1,161,539 | |
| | |
Petrobras Global Finance BV (Netherlands) | | | | | | | | |
5.750%, 02/01/29 | | | 1,000,000 | | | | 1,114,600 | |
6.900%, 03/19/49 | | | 150,000 | | | | 174,645 | |
| | |
PetSmart, Inc. | | | | | | | | |
5.875%, 06/01/251 | | | 26,000 | | | | 25,740 | |
7.125%, 03/15/231 | | | 80,000 | | | | 74,400 | |
| | |
Pilgrim’s Pride Corp. | | | | | | | | |
5.875%, 09/30/271 | | | 185,000 | | | | 198,925 | |
| | |
Polaris Intermediate Corp., PIK | | | | | | | | |
8.500%, 12/01/221,2,5 | | | 115,000 | | | | 97,175 | |
| | |
Post Holdings, Inc. | | | | | | | | |
5.500%, 03/01/251 | | | 140,000 | | | | 147,189 | |
5.500%, 12/15/291 | | | 25,000 | | | | 26,418 | |
| | |
Prime Security Services Borrower LLC | | | | | | | | |
9.250%, 05/15/231 | | | 79,000 | | | | 83,256 | |
| | | | | | | | |
| | | | | | | | |
| | | Principal | | | | |
| | | Amount | | | Value | |
| | |
PTTEP Treasury Center Co., Ltd. (Thailand) | | | | | | | | |
(U.S. Treasury Yield Curve CMT 5 year + 2.724%) | | | | | | | | |
4.600%, 01/17/683,4 | | | $700,000 | | | | $719,919 | |
| | |
QEP Resources, Inc. | | | | | | | | |
5.250%, 05/01/23 | | | 75,000 | | | | 71,625 | |
5.625%, 03/01/262 | | | 75,000 | | | | 67,875 | |
| | |
Radiate Holdco LLC/Radiate Finance, Inc. | | | | | | | | |
6.625%, 02/15/251 | | | 155,000 | | | | 157,325 | |
6.875%, 02/15/231 | | | 10,000 | | | | 10,275 | |
| | |
Refinitiv US Holdings, Inc. | | | | | | | | |
6.250%, 05/15/261 | | | 95,000 | | | | 103,431 | |
8.250%, 11/15/261 | | | 100,000 | | | | 112,500 | |
| | |
Reliance Holding USA, Inc. | | | | | | | | |
5.400%, 02/14/22 | | | 1,500,000 | | | | 1,596,057 | |
| | |
Resideo Funding, Inc. | | | | | | | | |
6.125%, 11/01/261 | | | 135,000 | | | | 136,350 | |
| | |
Riverbed Technology, Inc. | | | | | | | | |
8.875%, 03/01/231,2 | | | 70,000 | | | | 32,550 | |
| | |
Royal Caribbean Cruises, Ltd. | | | | | | | | |
3.700%, 03/15/28 | | | 265,000 | | | | 274,694 | |
| | |
Sabine Pass Liquefaction LLC | | | | | | | | |
5.000%, 03/15/27 | | | 495,000 | | | | 543,533 | |
| | |
SACI Falabella (Chile) | | | | | | | | |
3.750%, 04/30/23 | | | 900,000 | | | | 922,583 | |
| | |
SBA Tower Trust | | | | | | | | |
3.168%, 04/11/221 | | | 400,000 | | | | 405,728 | |
| | |
Schweitzer-Mauduit International, Inc. | | | | | | | | |
6.875%, 10/01/261 | | | 90,000 | | | | 96,300 | |
| | |
Scientific Games International, Inc. | | | | | | | | |
5.000%, 10/15/251 | | | 115,000 | | | | 118,737 | |
8.250%, 03/15/261 | | | 70,000 | | | | 74,200 | |
| | |
The Scotts Miracle-Gro Co. | | | | | | | | |
4.500%, 10/15/291 | | | 85,000 | | | | 85,638 | |
| | |
Scripps Escrow, Inc. | | | | | | | | |
5.875%, 07/15/271,2 | | | 75,000 | | | | 77,040 | |
| | |
Select Medical Corp. | | | | | | | | |
6.250%, 08/15/261 | | | 115,000 | | | | 122,762 | |
| | |
The ServiceMaster Co. LLC | | | | | | | | |
5.125%, 11/15/241 | | | 120,000 | | | | 124,650 | |
| | |
Shire Acquisitions Investments (Ireland) | | | | | | | | |
2.875%, 09/23/23 | | | 535,000 | | | | 546,453 | |
| | |
Sinopec Group Overseas Development 2016, Ltd. (China) | | | | | | | | |
2.750%, 09/29/26 | | | 300,000 | | | | 299,001 | |
| | |
Sirius XM Radio, Inc. | | | | | | | | |
5.375%, 07/15/261 | | | 135,000 | | | | 142,931 | |
5.500%, 07/01/291 | | | 65,000 | | | | 70,403 | |
| | |
Six Flags Entertainment Corp. | | | | | | | | |
4.875%, 07/31/241 | | | 125,000 | | | | 129,375 | |
| | |
Smithfield Foods, Inc. | | | | | | | | |
4.250%, 02/01/271 | | | 530,000 | | | | 552,480 | |
| | | | | | | | |
The accompanying notes are an integral part of these financial statements.
74
|
AMG Managers DoubleLine Core Plus Bond Fund Schedule of Portfolio Investments(continued) |
| | | | | | | | |
| | | Principal | | | | |
| | | Amount | | | Value | |
| | |
Industrials - 16.9%(continued) | | | | | | | | |
| | |
Sociedad Quimica y Minera de Chile SA (Chile) | | | | | | | | |
4.375%, 01/28/25 | | | $200,000 | | | | $210,750 | |
| | |
Sophia LP/Sophia Finance, Inc. | | | | | | | | |
9.000%, 09/30/231 | | | 164,000 | | | | 169,227 | |
| | |
Spectrum Brands, Inc. | | | | | | | | |
5.000%, 10/01/291,2 | | | 75,000 | | | | 76,875 | |
| | |
Sprint Corp. | | | | | | | | |
7.125%, 06/15/24 | | | 235,000 | | | | 255,562 | |
| | |
Sprint Spectrum Co. LLC/Sprint Spectrum Co. II LLC/Sprint Spectrum Co. III LLC | | | | | | | | |
4.738%, 03/20/251 | | | 270,000 | | | | 288,565 | |
| | |
SS&C Technologies, Inc. | | | | | | | | |
5.500%, 09/30/271 | | | 115,000 | | | | 122,906 | |
| | |
Staples, Inc. | | | | | | | | |
7.500%, 04/15/261 | | | 90,000 | | | | 94,050 | |
10.750%, 04/15/271 | | | 25,000 | | | | 26,063 | |
| | |
Stars Group Holdings BV/Stars Group US Co-Borrower LLC (Netherlands) | | | | | | | | |
7.000%, 07/15/261 | | | 135,000 | | | | 145,969 | |
| | |
Stevens Holding Co, Inc. | | | | | | | | |
6.125%, 10/01/261 | | | 110,000 | | | | 118,800 | |
| | |
SunCoke Energy Partners LP/SunCoke Energy Partners Finance Corp. | | | | | | | | |
7.500%, 06/15/251 | | | 175,000 | | | | 149,625 | |
| | |
Sunoco Logistics Partners Operations LP | | | | | | | | |
3.900%, 07/15/26 | | | 1,000,000 | | | | 1,037,075 | |
| | |
Sunoco LP/Sunoco Finance Corp. | | | | | | | | |
5.500%, 02/15/26 | | | 120,000 | | | | 124,362 | |
6.000%, 04/15/27 | | | 60,000 | | | | 63,150 | |
| | |
Sydney Airport Finance Co. Pty, Ltd. (Australia) | | | | | | | | |
3.375%, 04/30/251 | | | 990,000 | | | | 1,025,720 | |
| | |
Syngenta Finance, N.V. (Netherlands) | | | | | | | | |
5.676%, 04/24/48 | | | 1,600,000 | | | | 1,672,290 | |
| | |
Tapstone Energy LLC/Tapstone Energy Finance Corp. | | | | | | | | |
9.750%, 06/01/221 | | | 60,000 | | | | 15,600 | |
| | |
Targa Resources Partners, LP/Targa Resources Partners Finance Corp. | | | | | | | | |
5.875%, 04/15/26 | | | 175,000 | | | | 183,330 | |
6.500%, 07/15/271 | | | 60,000 | | | | 64,351 | |
| | |
Tecnoglass, Inc. (Colombia) | | | | | | | | |
8.200%, 01/31/22 | | | 200,000 | | | | 217,500 | |
| | |
Telefonica Celular del Paraguay SA (Paraguay) | | | | | | | | |
5.875%, 04/15/271 | | | 250,000 | | | | 270,046 | |
| | |
Telesat Canada/Telesat LLC (Canada) | | | | | | | | |
6.500%, 10/15/271 | | | 75,000 | | | | 78,469 | |
| | |
Tempur Sealy International Inc. | | | | | | | | |
5.500%, 06/15/26 | | | 194,000 | | | | 203,700 | |
| | |
Tenet Healthcare Corp. | | | | | | | | |
4.875%, 01/01/261 | | | 110,000 | | | | 113,919 | |
| | | | | | | | |
| | | Principal | | | | |
| | | Amount | | | Value | |
| | |
Tenet Healthcare Corp. | | | | | | | | |
5.125%, 11/01/271 | | | $45,000 | | | | $46,968 | |
6.250%, 02/01/271 | | | 120,000 | | | | 126,900 | |
7.000%, 08/01/252 | | | 110,000 | | | | 113,987 | |
| | |
Tervita Corp. (Canada) | | | | | | | | |
7.625%, 12/01/211 | | | 190,000 | | | | 188,100 | |
| | |
The Hillman Group, Inc. | | | | | | | | |
6.375%, 07/15/221 | | | 25,000 | | | | 23,125 | |
| | |
T-Mobile USA, Inc. | | | | | | | | |
4.500%, 02/01/26 | | | 285,000 | | | | 294,975 | |
| | |
T-Mobile USA, Inc., Contingent Value Bond | | | | | | | | |
0.000%,*,8,9 | | | 100,000 | | | | 0 | |
| | |
TransDigm, Inc. | | | | | | | | |
5.500%, 11/15/271,10 | | | 70,000 | | | | 69,943 | |
6.250%, 03/15/261 | | | 120,000 | | | | 128,850 | |
6.375%, 06/15/26 | | | 90,000 | | | | 94,500 | |
| | |
Transocean Guardian, Ltd.
(Cayman Islands) | | | | | | | | |
5.875%, 01/15/241 | | | 71,200 | | | | 71,556 | |
| | |
Transocean Poseidon, Ltd.
(Cayman Islands) | | | | | | | | |
6.875%, 02/01/271 | | | 105,000 | | | | 106,393 | |
| | |
Transocean Proteus, Ltd.
(Cayman Islands) | | | | | | | | |
6.250%, 12/01/241 | | | 105,000 | | | | 105,787 | |
| | |
Transocean, Inc. | | | | | | | | |
7.250%, 11/01/251 | | | 65,000 | | | | 57,688 | |
| | |
Trident TPI Holdings, Inc. | | | | | | | | |
6.625%, 11/01/251 | | | 80,000 | | | | 71,800 | |
| | |
Triumph Group, Inc. | | | | | | | | |
6.250%, 09/15/241 | | | 35,000 | | | | 36,838 | |
7.750%, 08/15/252 | | | 118,000 | | | | 118,295 | |
| | |
Twin River Worldwide Holdings, Inc. | | | | | | | | |
6.750%, 06/01/271 | | | 85,000 | | | | 89,701 | |
| | |
Uber Technologies, Inc. | | | | | | | | |
7.500%, 09/15/271 | | | 40,000 | | | | 39,500 | |
8.000%, 11/01/261 | | | 75,000 | | | | 75,398 | |
| | |
United Rentals North America, Inc. | | | | | | | | |
3.875%, 11/15/2710 | | | 45,000 | | | | 45,574 | |
5.250%, 01/15/30 | | | 20,000 | | | | 21,100 | |
6.500%, 12/15/26 | | | 145,000 | | | | 157,506 | |
| | |
Univision Communications, Inc. | | | | | | | | |
5.125%, 05/15/231 | | | 30,000 | | | | 30,113 | |
| | |
UPL Corp, Ltd. (Mauritius) | | | | | | | | |
3.250%, 10/13/21 | | | 1,100,000 | | | | 1,107,214 | |
| | |
USA Compression Partners, LP/USA Compression Finance Corp. | | | | | | | | |
6.875%, 09/01/271 | | | 205,000 | | | | 206,025 | |
| | |
Vedanta Resources Finance II PLC (United Kingdom) | | | | | | | | |
9.250%, 04/23/261 | | | 200,000 | | | | 201,300 | |
| | | | | | | | |
The accompanying notes are an integral part of these financial statements.
75
|
AMG Managers DoubleLine Core Plus Bond Fund Schedule of Portfolio Investments(continued) |
| | | | | | | | |
| | | Principal
Amount | | | Value | |
| |
Industrials - 16.9%(continued) | | | | | |
| | |
Vedanta Resources PLC (India) | | | | | | | | |
6.125%, 08/09/24 | | $ | 1,800,000 | | | | $1,673,841 | |
| | |
Verizon Communications, Inc. | | | | | | | | |
4.272%, 01/15/36 | | | 255,000 | | | | 288,358 | |
4.400%, 11/01/34 | | | 500,000 | | | | 578,059 | |
| | |
Verscend Escrow Corp. | | | | | | | | |
9.750%, 08/15/261 | | | 148,000 | | | | 157,990 | |
| | |
Viking Cruises, Ltd. | | | | | | | | |
5.875%, 09/15/271 | | | 205,000 | | | | 218,325 | |
| | |
Vine Oil & Gas LP/Vine Oil & Gas Finance Corp. | | | | | | | | |
8.750%, 04/15/231 | | | 75,000 | | | | 29,250 | |
| | |
Viper Energy Partners LP | | | | | | | | |
5.375%, 11/01/271 | | | 75,000 | | | | 76,500 | |
| | |
Vizient, Inc. | | | | | | | | |
6.250%, 05/15/271 | | | 90,000 | | | | 97,284 | |
| | |
Volkswagen Group of America Finance LLC | | | | | | | | |
4.250%, 11/13/231 | | | 615,000 | | | | 659,452 | |
| | |
VTR Finance BV (Chile) | | | | | | | | |
6.875%, 01/15/24 | | | 1,500,000 | | | | 1,541,251 | |
| | |
Waste Management, Inc. | | | | | | | | |
4.000%, 07/15/39 | | | 525,000 | | | | 598,420 | |
| | |
Waste Pro USA, Inc. | | | | | | | | |
5.500%, 02/15/261 | | | 145,000 | | | | 150,437 | |
| | |
Weatherford International, Ltd. | | | | | | | | |
9.875%, 02/15/24*,7 | | | 65,000 | | | | 20,150 | |
| | |
WellCare Health Plans, Inc. | | | | | | | | |
5.250%, 04/01/25 | | | 160,000 | | | | 168,050 | |
5.375%, 08/15/261 | | | 120,000 | | | | 127,950 | |
| | |
West Street Merger Sub, Inc. | | | | | | | | |
6.375%, 09/01/251 | | | 65,000 | | | | 62,075 | |
| | |
Whiting Petroleum Corp. | | | | | | | | |
6.625%, 01/15/262 | | | 145,000 | | | | 90,625 | |
| | |
The William Carter Co. | | | | | | | | |
5.625%, 03/15/271 | | | 100,000 | | | | 107,000 | |
| | |
WPX Energy, Inc. | | | | | | | | |
5.250%, 10/15/27 | | | 85,000 | | | | 82,875 | |
| | |
WRKCo, Inc. | | | | | | | | |
3.750%, 03/15/25 | | | 600,000 | | | | 632,093 | |
| | |
YPF SA (Argentina) | | | | | | | | |
6.950%, 07/21/27 | | | 600,000 | | | | 450,906 | |
8.500%, 07/28/25 | | | 650,000 | | | | 518,050 | |
| | |
Yum! Brands, Inc. | | | | | | | | |
4.750%, 01/15/301 | | | 75,000 | | | | 78,844 | |
| | |
Total Industrials | | | | | | | 113,351,231 | |
| | |
Utilities - 4.2% | | | | | | | | |
| | |
AES Andres BV/Dominican Power Partners/Empresa Generadora de Electricidad It (Netherlands) | | | | | | | | |
7.950%, 05/11/26 | |
| 200,000
|
| |
| 214,002
|
|
| | | | | | | | |
| | | Principal
Amount | | | Value | |
| | |
AES Andres/Dominican Power Partners/Empresa Generadora De Electricidad IT (Netherlands) | | | | | | | | |
7.950%, 05/11/261 | | $ | 1,000,000 | | | | $1,070,010 | |
| | |
AES Gener SA (Chile) | | | | | | | | |
(U.S. Treasury Yield Curve CMT 5 year + 4.917%), 6.350%, 10/07/791,3 | | | 200,000 | | | | 201,160 | |
(USD Swap 5 year + 4.644%), 7.125%, 03/26/791,3 | | | 900,000 | | | | 936,726 | |
(USD Swap 5 year + 4.644%), 7.125%, 03/26/792,3 | | | 600,000 | | | | 624,608 | |
| | |
American Electric Power Co, Inc. | | | | | | | | |
Series F | | | | | | | | |
2.950%, 12/15/22 | | | 1,300,000 | | | | 1,329,282 | |
| | |
American Water Capital Corp. | | | | | | | | |
3.400%, 03/01/25 | | | 775,000 | | | | 820,682 | |
| | |
The Brooklyn Union Gas Co. | | | | | | | | |
4.487%, 03/04/491 | | | 510,000 | | | | 616,144 | |
| | |
Calpine Corp. | | | | | | | | |
5.250%, 06/01/261 | | | 70,000 | | | | 73,062 | |
5.750%, 01/15/25 | | | 75,000 | | | | 77,156 | |
| | |
Colbun SA (Chile) | | | | | | | | |
3.950%, 10/11/27 | | | 200,000 | | | | 207,377 | |
| | |
Cometa Energia SA de CV (Mexico) | | | | | | | | |
6.375%, 04/24/35 | | | 1,744,200 | | | | 1,894,637 | |
| | |
DTE Energy Co. | | | | | | | | |
2.950%, 03/01/30 | | | 1,000,000 | | | | 1,007,275 | |
| | |
Duke Energy Corp. | | | | | | | | |
3.950%, 08/15/47 | | | 350,000 | | | | 378,028 | |
| | |
Duke Energy Progress LLC | | | | | | | | |
4.150%, 12/01/44 | | | 365,000 | | | | 418,286 | |
| | |
Duquesne Light Holdings, Inc. | | | | | | | | |
3.616%, 08/01/271 | | | 1,000,000 | | | | 1,016,430 | |
| | |
Empresa de Transmision Electrica SA (Panama) | | | | | | | | |
5.125%, 05/02/491 | | | 700,000 | | | | 804,125 | |
| | |
Empresa Electrica Angamos SA (Chile) | | | | | | | | |
4.875%, 05/25/29 | | | 339,105 | | | | 353,888 | |
| | |
Empresa Electrica Guacolda SA (Chile) | | | | | | | | |
4.560%, 04/30/25 | | | 800,000 | | | | 691,219 | |
| | |
Empresas Publicas de Medellin ESP (Colombia) | | | | | | | | |
4.250%, 07/18/291 | | | 400,000 | | | | 419,720 | |
| | |
Energuate Trust (Guatemala) | | | | | | | | |
5.875%, 05/03/27 | | | 400,000 | | | | 403,004 | |
| | |
Engie Energia Chile SA (Chile) | | | | | | | | |
4.500%, 01/29/252 | | | 550,000 | | | | 587,374 | |
| | |
Eversource Energy | | | | | | | | |
Series K | | | | | | | | |
2.750%, 03/15/22 | | | 1,000,000 | | | | 1,017,723 | |
| | |
Fortis, Inc. (Canada) | | | | | | | | |
2.100%, 10/04/21 | |
| 455,000
|
| |
| 454,836
|
|
The accompanying notes are an integral part of these financial statements.
76
|
AMG Managers DoubleLine Core Plus Bond Fund Schedule of Portfolio Investments(continued) |
| | | | | | | | |
| | | Principal
Amount | | | Value | |
| | |
Utilities - 4.2%(continued) | | | | | | | | |
| | |
Georgia Power Co. | | | | | | | | |
Series A | | | | | | | | |
2.200%, 09/15/24 | | | $585,000 | | | | $584,915 | |
| | |
Inkia Energy, Ltd. (Peru) | | | | | | | | |
5.875%, 11/09/27 | | | 1,000,000 | | | | 1,040,010 | |
| | |
ITC Holdings Corp. | | | | | | | | |
3.250%, 06/30/26 | | | 1,000,000 | | | | 1,043,120 | |
| | |
LLPL Capital Pte, Ltd. (Singapore) | | | | | | | | |
6.875%, 02/04/391 | | | 790,560 | | | | 926,971 | |
| | |
Mexico Generadora de Energia S de rl (Mexico) | | | | | | | | |
5.500%, 12/06/32 | | | 504,306 | | | | 545,281 | |
| | |
Minejesa Capital BV (Netherlands) | | | | | | | | |
4.625%, 08/10/30 | | | 600,000 | | | | 622,512 | |
5.625%, 08/10/37 | | | 200,000 | | | | 220,417 | |
| | |
Monongahela Power Co. | | | | | | | | |
5.400%, 12/15/431 | | | 225,000 | | | | 299,492 | |
| | |
NextEra Energy Capital Holdings, Inc. | | | | | | | | |
3.550%, 05/01/27 | | | 240,000 | | | | 255,891 | |
| | |
NGL Energy Partners, LP/NGL Energy | | | | | | | | |
Finance Corp. | | | | | | | | |
7.500%, 04/15/261,2 | | | 70,000 | | | | 67,180 | |
| | |
NRG Energy, Inc. | | | | | | | | |
5.250%, 06/15/291 | | | 110,000 | | | | 118,387 | |
| | |
Oncor Electric Delivery Co. LLC | | | | | | | | |
3.100%, 09/15/491 | | | 575,000 | | | | 580,839 | |
| | |
Orazul Energy Egenor SCA (Peru) | | | | | | | | |
5.625%, 04/28/27 | | | 400,000 | | | | 411,250 | |
| | |
Pampa Energia SA (Argentina) | | | | | | | | |
7.500%, 01/24/272 | | | 1,200,000 | | | | 967,212 | |
| | |
PSEG Power LLC | | | | | | | | |
3.850%, 06/01/23 | | | 415,000 | | | | 438,537 | |
| | |
Southern California Edison Co. | | | | | | | | |
4.000%, 04/01/47 | | | 325,000 | | | | 341,927 | |
| | |
Star Energy Geothermal Wayang Windu, Ltd. (Indonesia) | | | | | | | | |
6.750%, 04/24/33 | | | 1,104,000 | | | | 1,174,725 | |
| | |
Stoneway Capital Corp. (Argentina) | | | | | | | | |
10.000%, 03/01/27 | | | 929,862 | | | | 481,213 | |
| | |
Superior Plus LP/Superior General Partner, Inc. (Canada) | | | | | | | | |
7.000%, 07/15/261 | | | 225,000 | | | | 243,000 | |
| | |
Talen Energy Supply LLC | | | | | | | | |
6.625%, 01/15/281 | | | 65,000 | | | | 63,050 | |
| | |
Transelec SA (Chile) | | | | | | | | |
4.625%, 07/26/231 | | | 300,000 | | | | 319,503 | |
4.625%, 07/26/23 | | | 200,000 | | | | 213,002 | |
| | |
Vistra Operations Co. LLC | | | | | | | | |
5.625%, 02/15/271 | | | 145,000 | | | | 154,244 | |
| | | | | | | | |
| | | Principal
Amount | | | Value | |
| | |
Xcel Energy, Inc. | | | | | | | | |
3.300%, 06/01/25 | | $ | 1,300,000 | | | $ | 1,364,401 | |
| | |
Total Utilities | | | | | | | 28,093,833 | |
| | |
Total Corporate Bonds and Notes | | | | | | | | |
(Cost $195,788,561) | | | | | | | 202,010,918 | |
| | |
Asset-Backed Securities - 8.0% | | | | | | | | |
| | |
AASET US, Ltd. | | | | | | | | |
Series 2018-1A, Class A | | | | | | | | |
3.844%, 01/16/381 | | | 765,305 | | | | 771,112 | |
| | |
Adams Mill CLO, Ltd. | | | | | | | | |
Series 2014-1A, Class D1 | | | | | | | | |
(3 month LIBOR + 3.500%), 5.501%, 07/15/261,3 | | | 250,000 | | | | 249,789 | |
| | |
AIMCO CLO Series | | | | | | | | |
Series 2018-AA, Class D | | | | | | | | |
(3 month LIBOR + 2.550%), 4.552%, 04/17/311,3 | | | 500,000 | | | | 446,841 | |
| | |
ALM VII R, Ltd. | | | | | | | | |
Series 2013-7RA, Class CR | | | | | | | | |
(3 month LIBOR + 4.040%), 6.041%, 10/15/281,3 | | | 1,000,000 | | | | 998,088 | |
| | |
Apidos CLO XII | | | | | | | | |
Series 2013-12A, Class DR | | | | | | | | |
(3 month LIBOR + 2.600%), 4.601%, 04/15/311,3 | | | 500,000 | | | | 446,421 | |
| | |
Apidos CLO XVI | | | | | | | | |
Series 2013-16A, Class BR | | | | | | | | |
(3 month LIBOR + 1.950%), 3.916%, 01/19/251,3 | | | 500,000 | | | | 500,900 | |
| | |
Atrium IX | | | | | | | | |
Series 9A, Class DR | | | | | | | | |
(3 month LIBOR + 3.600%), 5.744%, 05/28/301,3 | | | 1,000,000 | | | | 1,000,734 | |
| | |
Babson CLO, Ltd. | | | | | | | | |
Series 2015-2A, Class DR | | | | | | | | |
(3 month LIBOR + 2.950%), 4.916%, 10/20/301,3 | | | 500,000 | | | | 477,801 | |
Series 2015-IA, Class DR | | | | | | | | |
(3 month LIBOR + 2.600%), 4.566%, 01/20/311,3 | | | 500,000 | | | | 454,811 | |
| | |
Barings CLO, Ltd. | | | | | | | | |
Series 2017-1A, Class D | | | | | | | | |
(3 month LIBOR + 3.600%), 5.603%, 07/18/291,3 | | | 1,000,000 | | | | 976,250 | |
Series 2018-1A, Class C | | | | | | | | |
(3 month LIBOR + 2.600%), 4.601%, 04/15/311,3 | | | 350,000 | | | | 319,424 | |
Series 2018-3A, Class D | | | | | | | | |
(3 month LIBOR + 2.900%), 4.866%, 07/20/291,3 | | | 500,000 | | | | 464,048 | |
Series 2019-1A, Class D | | | | | | | | |
(3 month LIBOR + 3.850%), 5.851%, 04/15/311,3 | | | 500,000 | | | | 494,841 | |
The accompanying notes are an integral part of these financial statements.
77
|
AMG Managers DoubleLine Core Plus Bond Fund Schedule of Portfolio Investments(continued) |
| | | | | | | | |
| | | Principal
Amount | | | Value | |
| | |
Asset-Backed Securities - 8.0% | | | | | | | | |
(continued) | | | | | | | | |
| | |
Barings CLO, Ltd. | | | | | | | | |
Series 2019-2A, Class C | | | | | | | | |
(3 month LIBOR + 3.850%), 5.851%, 04/15/311,3 | | $ | 500,000 | | | $ | 496,521 | |
| | |
Blackbird Capital Aircraft Lease | | | | | | | | |
Securitization, Ltd. | | | | | | | | |
Series 2016-1A, Class B | | | | | | | | |
5.682%, 12/16/411,11 | | | 828,125 | | | | 871,429 | |
| | |
BlueMountain CLO, Ltd. | | | | | | | | |
Series 2013-1A, Class CR | | | | | | | | |
(3 month LIBOR + 4.150%), 6.116%, 01/20/291,3 | | | 1,000,000 | | | | 969,817 | |
| | |
CAL Funding | | | | | | | | |
Series 2018-1A, Class A | | | | | | | | |
3.960%, 02/25/431 | | | 625,000 | | | | 628,096 | |
| | |
Canyon Capital CLO 2014-1 Ltd. | | | | | | | | |
Series 2014-1A, Class CR | | | | | | | | |
(3 month LIBOR + 2.750%), 4.686%, 01/30/311,3 | | | 500,000 | | | | 450,670 | |
| | |
Canyon Capital CLO, Ltd. | | | | | | | | |
Series 2017-1A, Class D | | | | | | | | |
(3 month LIBOR + 3.600%), 5.601%, 07/15/301,3 | | | 500,000 | | | | 482,872 | |
| | |
Castlelake Aircraft Structured Trust | | | | | | | | |
Series 2019-1A, Class A | | | | | | | | |
3.967%, 04/15/391 | | | 477,613 | | | | 485,997 | |
| | |
CBAM, Ltd. | | | | | | | | |
Series 2019-10A, Class B | | | | | | | | |
(3 month LIBOR + 2.050%), 4.016%, 04/20/321,3 | | | 500,000 | | | | 500,602 | |
| | |
CLI Funding V LLC | | | | | | | | |
Series 2013-2A, | | | | | | | | |
3.220%, 06/18/281 | | | 549,750 | | | | 550,983 | |
| | |
CLI Funding VI LLC | | | | | | | | |
Series 2019-1A, Class A | | | | | | | | |
3.710%, 05/18/441 | | | 478,053 | | | | 485,880 | |
| | |
Cook Park CLO | | | | | | | | |
Series 2018-1A, Class D | | | | | | | | |
(3 month LIBOR + 2.600%), 4.602%, 04/17/301,3 | | | 750,000 | | | | 685,307 | |
| | |
Dorchester Park CLO DAC | | | | | | | | |
Series 2015-1A, Class ER | | | | | | | | |
(3 month LIBOR + 5.000%), 6.966%, 04/20/281,3 | | | 500,000 | | | | 449,839 | |
| | |
Dryden 40 Senior Loan Fund | | | | | | | | |
Series 2015-40A, Class DR | | | | | | | | |
(3 month LIBOR + 3.100%), 5.258%, 08/15/311,3 | | | 500,000 | | | | 477,637 | |
| | |
Dryden 43 Senior Loan Fund | | | | | | | | |
Series 2016-43A, Class DRR | | | | | | | | |
(3 month LIBOR + 3.550%), 5.516%, 07/20/291,3 | | | 500,000 | | | | 499,313 | |
| | |
Dryden 57 CLO, Ltd. | | | | | | | | |
Series 2018-57A, Class D | | | | | | | | |
(3 month LIBOR + 2.550%), 4.708%, 05/15/311,3 | | | 500,000 | | | | 455,034 | |
| | |
ECAF I, Ltd. | | | | | | | | |
Series 2015-1A, Class A1 | | | | | | | | |
3.473%, 06/15/401 | | | 354,487 | | | | 354,788 | |
| | | | | | | | |
| | | Principal
Amount | | | Value | |
| | |
Elmwood CLO II, Ltd. | | | | | | | | |
Series 2019-2A, Class B | | | | | | | | |
(3 month LIBOR + 2.100%), 4.066%, 04/20/311,3 | | $ | 500,000 | | | $ | 500,582 | |
| | |
Gilbert Park CLO, Ltd. | | | | | | | | |
Series 2017-1A, Class D | | | | | | | | |
(3 month LIBOR + 2.950%), 4.951%, 10/15/301,3 | | | 500,000 | | | | 476,512 | |
Series 2017-1A, Class E | | | | | | | | |
(3 month LIBOR + 6.400%), 8.401%, 10/15/301,3 | | | 1,000,000 | | | | 929,272 | |
| | |
Global SC Finance II SRL | | | | | | | | |
Series 2014-1A, Class A1 | | | | | | | | |
3.190%, 07/17/291 | | | 653,125 | | | | 654,689 | |
| | |
Global SC Finance IV, Ltd. | | | | | | | | |
Series 2018-1A, Class A | | | | | | | | |
4.290%, 05/17/381 | | | 423,800 | | | | 440,175 | |
| | |
Halcyon Loan Advisors Funding, Ltd. | | | | | | | | |
Series 2013-2A, Class C | | | | | | | | |
(3 month LIBOR + 2.700%), 4.609%, 08/01/251,3 | | | 250,000 | | | | 249,497 | |
| | |
Highbridge Loan Management, Ltd. | | | | | | | | |
Series 4A-2014, Class A2R | | | | | | | | |
(3 month LIBOR + 1.500%), 3.436%, 01/28/301,3 | | | 1,000,000 | | | | 981,163 | |
| | |
Horizon Aircraft Finance III, Ltd. | | | | | | | | |
Series 2019-2, Class A | | | | | | | | |
3.425%, 11/15/391 | | | 1,000,000 | | | | 1,007,150 | |
| | |
HPS Loan Management, Ltd. | | | | | | | | |
Series 11A-17, Class D | | | | | | | | |
(3 month LIBOR + 3.600%), 5.839%, 05/06/301,3 | | | 500,000 | | | | 476,677 | |
| | |
Invitation Homes Trust | | | | | | | | |
Series 2018-SFR1, Class C | | | | | | | | |
(1 month LIBOR + 1.250%), 3.139%, 03/17/371,3 | | | 1,745,000 | | | | 1,743,190 | |
Series 2018-SFR1, Class D | | | | | | | | |
(1 month LIBOR + 1.450%), 3.339%, 03/17/371,3 | | | 1,150,000 | | | | 1,151,369 | |
| | |
JOL Air, Ltd. | | | | | | | | |
Series 2019-1, Class A | | | | | | | | |
3.967%, 04/15/441 | | | 952,883 | | | | 963,081 | |
| | |
LCM XIV, L.P. | | | | | | | | |
Series 14A, Class DR | | | | | | | | |
(3 month LIBOR + 2.750%), 4.716%, 07/20/311,3 | | | 500,000 | | | | 448,308 | |
| | |
LCM XVIII L.P. | | | | | | | | |
Series 19A, Class D | | | | | | | | |
(3 month LIBOR + 3.450%), 5.451%, 07/15/271,3 | | | 1,000,000 | | | | 958,643 | |
| | |
Legacy Mortgage Asset Trust | | | | | | | | |
Series 2019-GS5, Class A1 | | | | | | | | |
3.200%, 05/25/591,11 | | | 487,005 | | | | 490,329 | |
| | |
MACH 1 Cayman, Ltd. | | | | | | | | |
Series 2019-1, Class A | | | | | | | | |
3.474%, 10/15/391 | | | 2,000,000 | | | | 1,992,183 | |
| | |
Madison Park Funding XIV, Ltd. | | | | | | | | |
Series 2014-14A, Class DRR | | | | | | | | |
(3 month LIBOR + 2.950%), 4.903%, 10/22/301,3 | |
| 500,000
|
| |
| 477,080
|
|
The accompanying notes are an integral part of these financial statements.
78
|
AMG Managers DoubleLine Core Plus Bond Fund Schedule of Portfolio Investments(continued) |
| | | | | | | | |
| | | Principal
Amount | | | Value | |
Asset-Backed Securities - 8.0% (continued) | | | | | |
| |
Madison Park Funding XV, Ltd. | | | | | |
Series2014-15A, Class CR | | | | | |
(3 month LIBOR + 3.450%), 5.386%, 01/27/261,3 | | $ | 500,000 | | | $ | 497,866 | |
| |
Magnetite XXII, Ltd. | | | | | |
Series2019-22A, Class D | | | | | |
(3 month LIBOR + 3.650%), 5.651%, 04/15/311,3 | | | 750,000 | | | | 742,329 | |
| |
Mosaic Solar Loan Trust | | | | | |
Series2018-1A, Class A 4.010%, 06/22/431 | | | 1,068,483 | | | | 1,093,179 | |
| |
Mosaic Solar Loans LLC | | | | | |
Series2017-1A, Class A 4.450%, 06/20/421 | | | 479,855 | | | | 500,285 | |
| |
Myers Park CLO, Ltd. | | | | | |
Series2018-1A, Class D | | | | | |
(3 month LIBOR + 3.050%), 5.016%, 10/20/301,3 | | | 1,000,000 | | | | 950,882 | |
| |
Neuberger Berman Loan Advisers CLO, 27 Ltd. | | | | | |
Series2018-27A, Class D | | | | | |
(3 month LIBOR + 2.600%), 4.601%, 01/15/301,3 | | | 500,000 | | | | 449,676 | |
| |
Newark BSL, Ltd. | | | | | |
Series2016-1A, Class C | | | | | |
(3 month LIBOR + 4.000%), 5.936%, 12/21/291,3 | | | 1,000,000 | | | | 1,000,431 | |
| |
Octagon Investment Partners 27, Ltd. | | | | | |
Series2016-1A, Class DR | | | | | |
(3 month LIBOR + 2.950%), 4.951%, 07/15/301,3 | | | 500,000 | | | | 460,355 | |
| |
Octagon Investment Partners XV, Ltd. | | | | | |
Series2013-1A, Class DR | | | | | |
(3 month LIBOR + 3.700%), 5.666%, 07/19/301,3 | | | 1,000,000 | | | | 960,000 | |
| |
Octagon Investment Partners XVI, Ltd. | | | | | |
Series2013-1A, Class DR | | | | | |
(3 month LIBOR + 3.000%), 5.002%, 07/17/301,3 | | | 500,000 | | | | 468,062 | |
| |
Octagon Investment Partners XXI, Ltd. | | | | | |
Series2014-1A, Class CRR | | | | | |
(3 month LIBOR + 3.950%), 6.125%, 02/14/311,3 | | | 500,000 | | | | 497,627 | |
| |
Octagon Investment Partners XXII, Ltd. | | | | | |
Series2014-1A, Class ERR | | | | | |
(3 month LIBOR + 5.450%), 7.403%, 01/22/301,3 | | | 500,000 | | | | 437,451 | |
| |
Octagon Investment Partners XXX, Ltd. | | | | | |
Series2017-1A, Class C | | | | | |
(3 month LIBOR + 3.500%), 5.466%, 03/17/301,3 | | | 500,000 | | | | 489,674 | |
Series2017-1A, Class D | | | | | |
(3 month LIBOR + 6.200%), 8.166%, 03/17/301,3 | | | 250,000 | | | | 232,414 | |
| |
OHA Credit Funding 1, Ltd. | | | | | |
Series2018-1A, Class D | | | | | |
(3 month LIBOR + 3.050%), 5.016%, 10/20/301,3 | | | 500,000 | | | | 469,120 | |
| |
Primose Funding LLC | | | | | |
Series2019-1A, 4.475%, 07/30/491 | | | 1,000,000 | | | | 1,030,502 | |
| | | | | | | | |
| | | Principal
Amount | | | Value | |
| |
PRPM LLC | | | | | |
Series2019-3A, Class A1 3.351%, 07/25/241,11 | | $ | 2,509,433 | | | $ | 2,520,369 | |
| |
Sprite2017-1, Ltd. | | | | | |
Series2017-1, Class A 4.250%, 12/15/371 | | | 347,715 | | | | 354,599 | |
| |
Stack Infrastructure Issuer LLC | | | | | |
Series2019-1A, Class A2 4.540%, 02/25/441 | | | 745,000 | | | | 781,200 | |
| |
START Ireland | | | | | |
Series2019-1, Class A 4.089%, 03/15/441 | | | 479,167 | | | | 490,933 | |
| |
TAL Advantage VI LLC | | | | | |
Series2017-1A, Class A 4.500%, 04/20/421 | | | 745,182 | | | | 769,468 | |
| |
Textainer Marine Containers VII, Ltd. | | | | | |
Series2019-1A, Class A 3.960%, 04/20/441 | | | 720,000 | | | | 733,420 | |
| |
Thunderbolt Aircraft Lease, Ltd. | | | | | |
Series2017-A, Class A 4.212%, 05/17/321,11 | | | 354,833 | | | | 364,279 | |
| |
Trinity Rail Leasing 2010 LLC | | | | | |
Series2010-1A, Class A 5.194%, 10/16/401 | | | 899,386 | | | | 999,359 | |
| |
Triton Container Finance V LLC | | | | | |
Series2018-1A, Class A 3.950%, 03/20/431 | | | 420,833 | | | | 423,423 | |
| |
Vantage Data Centers Issuer LLC | | | | | |
Series2018-1A, Class A2 4.072%, 02/16/431 | | | 688,333 | | | | 715,740 | |
| |
VB-S1 Issuer LLC | | | | | |
Series2018-1A, Class D 4.122%, 02/15/481 | | | 1,500,000 | | | | 1,541,050 | |
| |
VERDE CLO, Ltd. | | | | | |
Series2019-1A, Class D | | | | | | | | |
(3 month LIBOR + 3.800%), 5.801%, 04/15/321,3 | | | 500,000 | | | | 493,210 | |
| |
WAVE LLC | | | | | |
Series2019-1, Class A 3.597%, 09/15/441 | | | 1,491,000 | | | | 1,492,069 | |
| |
Westcott Park CLO, Ltd. | | | | | |
Series2016-1A, Class DR | | | | | | | | |
(3 month LIBOR + 3.250%), 5.216%, 07/20/281,3 | | | 1,000,000 | | | | 992,747 | |
| | |
Total Asset-Backed Securities
(Cost $53,945,989) | | | | | | | 53,337,464 | |
| |
Mortgage-Backed Securities - 17.2% | | | | | |
| |
Ajax Mortgage Loan Trust | | | | | |
Series2019-C, Class A 3.950%, 10/25/581,3 | | | 2,956,843 | | | | 2,966,479 | |
| |
Alternative Loan Trust | | | | | |
Series 2007-18CB, Class 2A17
6.000%, 08/25/37 | | | 41,808 | | | | 39,327 | |
The accompanying notes are an integral part of these financial statements.
79
|
AMG Managers DoubleLine Core Plus Bond Fund Schedule of Portfolio Investments(continued) |
| | | | | | | | |
| | | Principal
Amount | | | Value | |
Mortgage-Backed Securities - 17.2% | | | | | |
(continued) | | | | | | | | |
| | |
Alternative Loan Trust | | | | | | | | |
Series 2007-23CB, Class A3 | | | | | | | | |
(1 month LIBOR + 0.500%), 2.323%, 09/25/373 | | | $183,471 | | | | $103,731 | |
Series 2007-23CB, Class A4 | | | | | | | | |
(6.500% minus 1 month LIBOR, Cap 6.500%, Floor 0.000%), 4.677%, 09/25/373,12 | | | 175,185 | | | | 57,567 | |
Series 2007-J2, Class 2A1 | | | | | | | | |
6.000%, 07/25/37 | | | 215,070 | | | | 214,883 | |
| | |
Banc of America Funding Trust | | | | | | | | |
Series 2006-B, Class 7A1 | | | | | | | | |
4.444%, 03/20/363 | | | 254,256 | | | | 244,731 | |
Series 2010-R9, Class 3A3 | | | | | | | | |
5.500%, 12/26/351 | | | 357,456 | | | | 299,353 | |
| | |
Barclays Commercial Mortgage Trust | | | | | | | | |
Series 2019-C3, Class AS | | | | | | | | |
3.895%, 05/15/52 | | | 808,000 | | | | 883,424 | |
Series 2019-C3, Class B | | | | | | | | |
4.096%, 05/15/52 | | | 808,000 | | | | 879,533 | |
| | |
Bayview Financial Acquisition Trust | | | | | | | | |
Series 2007-A, Class 1A5 | | | | | | | | |
6.101%, 05/28/3711 | | | 119,672 | | | | 124,289 | |
| | |
BBCMS Mortgage Trust | | | | | | | | |
Series 2017-DELC, Class C | | | | | | | | |
(1 month LIBOR + 1.200%), 3.114%, 08/15/361,3 | | | 132,000 | | | | 131,804 | |
Series 2017-DELC, Class D | | | | | | | | |
(1 month LIBOR + 1.700%), 3.614%, 08/15/361,3 | | | 150,000 | | | | 150,443 | |
Series 2017-DELC, Class E | | | | | | | | |
(1 month LIBOR + 2.500%), 4.414%, 08/15/361,3 | | | 302,000 | | | | 303,934 | |
Series 2017-DELC, Class F | | | | | | | | |
(1 month LIBOR + 3.500%), 5.414%, 08/15/361,3 | | | 301,000 | | | | 305,402 | |
| | |
Bear Stearns Asset Backed Securities I Trust | | | | | | | | |
Series 2004-AC2, Class 2A | | | | | | | | |
5.000%, 05/25/34 | | | 53,160 | | | | 55,479 | |
| | |
Bear Stearns Commercial Mortgage | | | | | | | | |
Securities Trust | | | | | | | | |
Series 2007-T26, Class AJ | | | | | | | | |
5.450%, 01/12/453 | | | 450,000 | | | | 400,741 | |
| | |
BFLD | | | | | | | | |
Series 2019-DPLO, Class E | | | | | | | | |
(1 month LIBOR + 2.240%), 4.154%, 10/15/341,3 | | | 866,000 | | | | 866,741 | |
| | |
BHMS | | | | | | | | |
Series 2018-ATLS, Class C | | | | | | | | |
(1 month LIBOR + 1.900%), 3.814%, 07/15/351,3 | | | 125,000 | | | | 125,524 | |
| | |
CFCRE Commercial Mortgage Trust | | | | | | | | |
Series 2016-C3, Class XA | | | | | | | | |
1.031%, 01/10/483,12 | | | 8,833,057 | | | | 475,594 | |
| | | | | | | | |
| | | Principal
Amount | | | Value | |
| | |
Citicorp Mortgage Securities Trust Series | | | | | | | | |
Series 2007-2, Class 3A1 | | | | | | | | |
5.500%, 02/25/37 | | $ | 837 | | | $ | 821 | |
| | |
Citigroup Commercial Mortgage Trust | | | | | | | | |
Series 2012-GC8, Class XA | | | | | | | | |
1.771%, 09/10/451,3,12 | | | 611,671 | | | | 25,118 | |
Series 2014-GC25, Class XA | | | | | | | | |
0.995%, 10/10/473,12 | | | 4,645,134 | | | | 195,380 | |
Series 2015-GC27, Class D | | | | | | | | |
4.428%, 02/10/481,3 | | | 197,700 | | | | 189,354 | |
Series 2015-GC31, Class C | | | | | | | | |
4.057%, 06/10/483 | | | 780,000 | | | | 791,955 | |
Series 2015-GC35, Class C | | | | | | | | |
4.497%, 11/10/483 | | | 235,000 | | | | 248,665 | |
Series 2015-GC35, Class XA | | | | | | | | |
0.857%, 11/10/483,12 | | | 7,316,788 | | | | 255,301 | |
Series 2016-GC36, Class B | | | | | | | | |
4.756%, 02/10/493 | | | 763,000 | | | | 841,667 | |
Series 2016-GC36, Class XA | | | | | | | | |
1.279%, 02/10/493,12 | | | 7,478,686 | | | | 470,995 | |
Series 2016-P3, Class XA | | | | | | | | |
1.688%, 04/15/493,12 | | | 5,402,271 | | | | 417,509 | |
Series 2016-P4, Class XA | | | | | | | | |
1.982%, 07/10/493,12 | | | 5,093,150 | | | | 494,616 | |
| | |
Citigroup Mortgage Loan Trust | | | | | | | | |
Series 2006-AR2, Class 1A2 | | | | | | | | |
4.728%, 03/25/363 | | | 732,234 | | | | 715,835 | |
Series 2010-7, Class 11A1 | | | | | | | | |
4.990%, 07/25/361,3 | | | 611,481 | | | | 614,016 | |
| | |
COMM Mortgage Trust | | | | | | | | |
Series 2016-DC2, Class C | | | | | | | | |
4.640%, 02/10/493 | | | 453,000 | | | | 477,581 | |
Series 2016-DC2, Class XA | | | | | | | | |
1.015%, 02/10/493,12 | | | 6,555,493 | | | | 330,385 | |
Series 2016-GCT, Class D | | | | | | | | |
3.461%, 08/10/291,3 | | | 644,881 | | | | 650,491 | |
Series 2016-GCT, Class E | | | | | | | | |
3.461%, 08/10/291,3 | | | 780,000 | | | | 780,025 | |
Series 2016-GCT, Class F | | | | | | | | |
3.461%, 08/10/291,3 | | | 795,000 | | | | 787,852 | |
| | |
Commercial Mortgage Pass Through Certificates | | | | | | | | |
Series 2012-CR3, Class XA | | | | | | | | |
1.861%, 10/15/453,12 | | | 1,462,208 | | | | 65,112 | |
Series 2013-CR10, Class XA | | | | | | | | |
0.666%, 08/10/463,12 | | | 16,457,302 | | | | 375,105 | |
Series 2014-CR20, Class C | | | | | | | | |
4.512%, 11/10/473 | | | 300,000 | | | | 320,043 | |
Series 2015-CR26, Class B | | | | | | | | |
4.485%, 10/10/483 | | | 600,000 | | | | 653,201 | |
Series 2015-CR26, Class XA | | | | | | | | |
0.952%, 10/10/483,12 | | | 7,746,076 | | | | 358,917 | |
Series 2015-LC23, Class C | | | | | | | | |
4.645%, 10/10/483 | | | 585,000 | | | | 628,635 | |
Series 2016-CR28, Class C | | | | | | | | |
4.646%, 02/10/493 | | | 726,000 | | | | 784,393 | |
| | |
Commercial Mortgage Trust | | | | | | | | |
Series 2018-HCLV, Class C | | | | | | | | |
(1 month LIBOR + 1.700%), 3.621%, 09/15/331,3 | | | 600,000 | | | | 600,187 | |
The accompanying notes are an integral part of these financial statements.
80
|
AMG Managers DoubleLine Core Plus Bond Fund Schedule of Portfolio Investments(continued) |
| | | | | | | | |
| | | Principal
Amount | | | Value | |
| | |
Mortgage-Backed Securities - 17.2% | | | | | | | | |
(continued) | | | | | | | | |
| | |
CORE Mortgage Trust | | | | | | | | |
Series 2019-CORE, Class E | | | | | | | | |
(1 month LIBOR + 1.900%), 3.814%, 12/15/311,3 | | | $775,000 | | | | $777,423 | |
Series 2019-CORE, Class F | | | | | | | | |
(1 month LIBOR + 2.350%), 4.264%, 12/15/311,3 | | | 775,000 | | | | 778,394 | |
| | |
Countrywide Alternative Loan Trust | | | | | | | | |
Series 2005-86CB, Class A5 | | | | | | | | |
5.500%, 02/25/36 | | | 704,944 | | | | 613,934 | |
Series 2006-J1, Class 2A1 | | | | | | | | |
7.000%, 02/25/36 | | | 452,132 | | | | 123,538 | |
| | |
Countrywide Home Loan Mortgage Pass Through Trust | | | | | | | | |
Series 2005-HYB8, Class 4A1 | | | | | | | | |
3.961%, 12/20/353 | | | 319,783 | | | | 321,105 | |
Series 2007-14, Class A15 | | | | | | | | |
6.500%, 09/25/37 | | | 832,164 | | | | 738,356 | |
Series 2007-2, Class A13 | | | | | | | | |
6.000%, 03/25/37 | | | 319,939 | | | | 266,401 | |
Series 2007-7, Class A4 | | | | | | | | |
5.750%, 06/25/37 | | | 56,717 | | | | 47,853 | |
| | |
Credit Suisse First Boston Mortgage | | | | | | | | |
Securities Corp. | | | | | | | | |
Series 2005-9, Class 5A9 | | | | | | | | |
5.500%, 10/25/35 | | | 888,323 | | | | 790,842 | |
| | |
Credit Suisse Mortgage Capital Certificates | | | | | | | | |
Series 2007-1, Class 5A4 | | | | | | | | |
6.000%, 02/25/37 | | | 512,055 | | | | 450,341 | |
| | |
Credit-Based Asset Servicing & | | | | | | | | |
Securitization LLC | | | | | | | | |
Series 2007-MX1, Class A4 | | | | | | | | |
6.231%, 12/25/361,11 | | | 100,000 | | | | 106,578 | |
| | |
CSAIL Commercial Mortgage Trust | | | | | | | | |
Series 2016-C6, Class XA | | | | | | | | |
1.781%, 01/15/493,12 | | | 5,312,706 | | | | 470,177 | |
Series 2018-C14, Class C | | | | | | | | |
4.893%, 11/15/513 | | | 880,000 | | | | 981,008 | |
| | |
CSMC Trust | | | | | | | | |
Series 2013-IVR4, Class A2 | | | | | | | | |
3.000%, 07/25/431,3 | | | 2,481,555 | | | | 2,505,973 | |
Series 2017-CHOP, Class D | | | | | | | | |
(1 month LIBOR + 1.900%), 3.814%, 07/15/321,3 | | | 261,000 | | | | 261,512 | |
Series 2017-CHOP, Class E | | | | | | | | |
(1 month LIBOR + 3.300%), 5.214%, 07/15/321,3 | | | 261,000 | | | | 262,677 | |
| | |
DBJPM | | | | | | | | |
Series 2016-C1, Class C | | | | | | | | |
3.348%, 05/10/493 | | | 534,000 | | | | 537,353 | |
| | | | | | | | |
| | | Principal
Amount | | | Value | |
| | |
DBJPM | | | | | | | | |
Series 2016-C1, Class XA | | | | | | | | |
1.463%, 05/10/493,12 | | | $7,491,249 | | | | $537,030 | |
| | |
DBUBS Mortgage Trust | | | | | | | | |
Series 2017-BRBK, Class F | | | | | | | | |
3.530%, 10/10/341,3 | | | 541,000 | | | | 538,739 | |
| | |
First Horizon Alternative Mortgage | | | | | | | | |
Securities Trust | | | | | | | | |
Series 2006-AA7, Class A1 | | | | | | | | |
4.080%, 01/25/373 | | | 1,543,502 | | | | 1,420,469 | |
| | |
FREMF Mortgage Trust | | | | | | | | |
Series 2016-KF22, Class B | | | | | | | | |
(1 month LIBOR + 5.050%), 7.066%, 07/25/231,3 | | | 132,546 | | | | 136,254 | |
| | |
GS Mortgage Securities Trust | | | | | | | | |
Series 2014-GC26, Class C | | | | | | | | |
4.517%, 11/10/473 | | | 391,000 | | | | 402,366 | |
Series 2014-GC26, Class D | | | | | | | | |
4.517%, 11/10/471,3 | | | 1,301,000 | | | | 1,164,091 | |
Series 2015-GC34, Class XA | | | | | | | | |
1.318%, 10/10/483,12 | | | 6,270,817 | | | | 377,605 | |
Series 2015-GS1, Class XA | | | | | | | | |
0.789%, 11/10/483,12 | | | 10,439,051 | | | | 431,019 | |
Series 2016-GS2, Class XA | | | | | | | | |
1.653%, 05/10/493,12 | | | 7,250,927 | | | | 559,025 | |
| | |
GSAA Home Equity Trust | | | | | | | | |
Series 2006-15, Class AF3B | | | | | | | | |
5.933%, 09/25/363 | | | 757,000 | | | | 92,679 | |
| | |
GSCG Trust | | | | | | | | |
Series 2019-600C, Class D | | | | | | | | |
3.764%, 09/06/341 | | | 862,000 | | | | 872,758 | |
Series 2019-600C, Class E | | | | | | | | |
4.118%, 09/06/341,3 | | | 862,000 | | | | 865,081 | |
| | |
GSR Mortgage Loan Trust | | | | | | | | |
Series 2006-2F, Class 2A17 | | | | | | | | |
5.750%, 02/25/36 | | | 2,120,848 | | | | 2,087,522 | |
Series 2006-AR1, Class 3A1 | | | | | | | | |
4.471%, 01/25/363 | | | 200,681 | | | | 201,461 | |
| | |
Headlands Residential LLC | | | | | | | | |
Series 2019-RPL1, Class NOTE | | | | | | | | |
3.967%, 06/25/241,11 | | | 5,900,000 | | | | 5,957,698 | |
| | |
HPLY Trust | | | | | | | | |
Series 2019-HIT, Class F | | | | | | | | |
(1 month LIBOR + 3.150%), 5.064%, 11/15/361,3 | | | 794,884 | | | | 803,123 | |
| | |
HSI Asset Loan Obligation Trust | | | | | | | | |
Series 2007-2, Class 1A1 | | | | | | | | |
5.500%, 09/25/37 | | | 3,759 | | | | 3,486 | |
| | |
JP Morgan Chase Commercial Mortgage Securities Trust | | | | | | | | |
Series 2006-A2, Class 2A1 | | | | | | | | |
4.210%, 04/25/363 | | | 1,200,092 | | | | 1,189,455 | |
Series 2006-LDP8, Class X | | | | | | | | |
0.305%, 05/15/453,12 | | | 21,168 | | | | 9 | |
Series 2007-LDPX, Class AM | | | | | | | | |
5.464%, 01/15/493 | | | 27,525 | | | | 27,463 | |
The accompanying notes are an integral part of these financial statements.
81
|
AMG Managers DoubleLine Core Plus Bond Fund Schedule of Portfolio Investments(continued) |
| | | | | | | | |
| | | Principal
Amount | | | Value | |
| |
Mortgage-Backed Securities - 17.2% | | | | | |
(continued) | | | | | | | | |
| | |
JP Morgan Chase Commercial Mortgage Securities Trust | | | | | | | | |
Series 2011-C4, Class XA | | | | | | | | |
1.179%, 07/15/461,3,12 | | | $237,175 | | | | $3,198 | |
Series 2012-C8, Class XA | | | | | | | | |
1.764%, 10/15/453,12 | | | 1,387,117 | | | | 57,071 | |
Series 2012-CBX, Class XA | | | | | | | | |
1.479%, 06/15/453,12 | | | 531,739 | | | | 13,122 | |
Series 2015-JP1, Class XA | | | | | | | | |
1.087%, 01/15/493,12 | | | 8,073,538 | | | | 318,146 | |
Series 2016-JP2, Class B | | | | | | | | |
3.460%, 08/15/49 | | | 320,000 | | | | 333,030 | |
Series 2016-JP2, Class C | | | | | | | | |
3.791%, 08/15/493 | | | 246,000 | | | | 255,340 | |
| | |
JPMBB Commercial Mortgage Securities Trust | | | | | | | | |
Series 2014-C18, Class XA | | | | | | | | |
0.849%, 02/15/473,12 | | | 4,672,493 | | | | 140,647 | |
Series 2014-C23, Class C | | | | | | | | |
4.463%, 09/15/473 | | | 330,824 | | | | 353,513 | |
Series 2014-C25, Class C | | | | | | | | |
4.455%, 11/15/473 | | | 450,000 | | | | 465,719 | |
Series 2014-C25, Class XA | | | | | | | | |
0.864%, 11/15/473,12 | | | 5,457,234 | | | | 195,964 | |
Series 2014-C26, Class XA | | | | | | | | |
1.007%, 01/15/483,12 | | | 4,113,727 | | | | 162,396 | |
Series 2015-C27, Class D | | | | | | | | |
3.842%, 02/15/481,3 | | | 263,000 | | | | 260,880 | |
Series 2015-C28, Class XA | | | | | | | | |
1.099%, 10/15/483,12 | | | 6,780,418 | | | | 263,843 | |
Series 2015-C33, Class C | | | | | | | | |
4.617%, 12/15/483 | | | 670,000 | | | | 718,900 | |
Series 2016-C1, Class C | | | | | | | | |
4.737%, 03/15/493 | | | 755,000 | | | | 818,134 | |
| | |
JPMDB Commercial Mortgage Securities Trust | | | | | | | | |
Series 2016-C2, Class XA | | | | | | | | |
1.676%, 06/15/493,12 | | | 7,555,580 | | | | 525,757 | |
| | |
Lehman XS Trust | | | | | | | | |
Series 2007-12N, Class 1A3A | | | | | | | | |
(1 month LIBOR + 0.200%), 2.023%, 07/25/473 | | | 5,261,772 | | | | 5,167,010 | |
| | |
LSTAR Commercial Mortgage Trust | | | | | | | | |
Series 2016-4, Class C | | | | | | | | |
4.555%, 03/10/491,3 | | | 588,000 | | | | 594,171 | |
| | |
Merrill Lynch Mortgage Investors Trust | | | | | | | | |
Series 2006-AF2, Class AF1 | | | | | | | | |
6.250%, 10/25/36 | | | 3,345,374 | | | | 2,831,846 | |
| | |
Morgan Stanley Bank of America | | | | | | | | |
Merrill Lynch Trust | | | | | | | | |
Series 2012-C5, Class XA | | | | | | | | |
1.443%, 08/15/451,3,12 | | | 653,109 | | | | 20,558 | |
Series 2014-C14, Class XA | | | | | | | | |
0.999%, 02/15/473,12 | | | 3,818,581 | | | | 109,912 | |
Series 2014-C18, Class C | | | | | | | | |
4.520%, 10/15/473 | | | 300,000 | | | | 318,301 | |
Series 2014-C19, Class C | | | | | | | | |
4.000%, 12/15/47 | | | 413,500 | | | | 431,585 | |
| | | | | | | | |
| | | Principal
Amount | | | Value | |
| | |
Morgan Stanley Bank of America | | | | | | | | |
Merrill Lynch Trust | | | | | | | | |
Series 2015-C25, Class C | | | | | | | | |
4.527%, 10/15/483 | | | $785,000 | | | | $850,631 | |
Series 2015-C27, Class C | | | | | | | | |
4.527%, 12/15/473 | | | 80,000 | | | | 83,356 | |
Series 2016-C28, Class XA | | | | | | | | |
1.244%, 01/15/493,12 | | | 7,404,884 | | | | 423,705 | |
| | |
Morgan Stanley Capital I Trust | | | | | | | | |
Series 2011-C1, Class XA | | | | | | | | |
0.342%, 09/15/471,3,12 | | | 446,927 | | | | 1,324 | |
Series 2014-150E, Class B | | | | | | | | |
4.264%, 09/09/321 | | | 761,000 | | | | 819,426 | |
Series 2014-CPT, Class E | | | | | | | | |
3.446%, 07/13/291,3 | | | 250,000 | | | | 253,402 | |
Series 2016-UB11, Class XA | | | | | | | | |
1.623%, 08/15/493,12 | | | 2,735,711 | | | | 209,873 | |
Series 2019-H6, Class AS | | | | | | | | |
3.700%, 06/15/52 | | | 818,000 | | | | 871,374 | |
| | |
Morgan Stanley Mortgage Loan Trust | | | | | | | | |
Series 2005-3AR, Class 2A2 | | | | | | | | |
3.529%, 07/25/353 | | | 323,041 | | | | 306,898 | |
Series 2005-9AR, Class 2A | | | | | | | | |
4.162%, 12/25/353 | | | 3,137,762 | | | | 3,034,120 | |
Series 2007-14AR, Class 1A3 | | | | | | | | |
4.218%, 10/25/373 | | | 901,907 | | | | 864,273 | |
| | |
MSCG Trust | | | | | | | | |
Series 2016-SNR, Class C | | | | | | | | |
5.205%, 11/15/341 | | | 804,100 | | | | 824,613 | |
| | |
Natixis Commercial Mortgage Securities Trust | | | | | | | | |
Series 2018-FL1, Class A | | | | | | | | |
(1 month LIBOR + 0.950%), 2.978%, 06/15/351,3 | | | 545,801 | | | | 544,267 | |
| | |
Nomura Asset Acceptance Corp. Alternative Loan Trust | | | | | | | | |
Series 2005-AP3, Class A3 | | | | | | | | |
5.318%, 08/25/353 | | | 189,753 | | | | 124,973 | |
| | |
PR Mortgage Loan Trust | | | | | | | | |
Series 2014-1, Class APT | | | | | | | | |
5.910%, 10/25/491,3 | | | 1,797,576 | | | | 1,764,211 | |
| | |
PRPM LLC | | | | | | | | |
Series 2017-2A, Class A1 | | | | | | | | |
3.470%, 09/25/221,11 | | | 2,051,669 | | | | 2,060,812 | |
| | |
RALI Trust | | | | | | | | |
Series 2005-QA10, Class A31 | | | | | | | | |
4.626%, 09/25/353 | | | 778,091 | | | | 702,249 | |
Series 2006-QO10, Class A1 | | | | | | | | |
(1 month LIBOR + 0.160%), 1.983%, 01/25/373 | | | 4,789,292 | | | | 4,617,894 | |
Series 2006-QS7, Class A2 | | | | | | | | |
6.000%, 06/25/36 | | | 2,297,520 | | | | 2,156,051 | |
| | |
Residential Asset Securitization Trust | | | | | | | | |
Series 2006-A6, Class 1A1 | | | | | | | | |
6.500%, 07/25/36 | | | 181,141 | | | | 81,316 | |
The accompanying notes are an integral part of these financial statements.
82
|
AMG Managers DoubleLine Core Plus Bond Fund Schedule of Portfolio Investments(continued) |
| | | | | | | | |
| | | Principal
Amount | | | Value | |
| |
Mortgage-Backed Securities - 17.2% | | | | | |
(continued) | | | | | | | | |
| | |
Residential Asset Securitization Trust | | | | | | | | |
Series 2007-A1, Class A8 | | | | | | | | |
6.000%, 03/25/37 | | | $347,799 | | | | $198,289 | |
| | |
Sequoia Mortgage Trust | | | | | | | | |
Series 2013-1, Class 2A1 | | | | | | | | |
1.855%, 02/25/433 | | | 1,037,306 | | | | 1,006,895 | |
| | |
STRU BNP-4950 | | | | | | | | |
Class P | | | | | | | | |
2.500%, 11/01/4910 | | | 8,000,000 | | | | 8,088,750 | |
| | |
STRU JPM-2411 | | | | | | | | |
Class COLL | | | | | | | | |
2.260%, 01/25/3010 | | | 3,200,000 | | | | 3,235,500 | |
| | |
Structured Adjustable Rate Mortgage Loan Trust | | | | | | | | |
Series 2006-1, Class 2A2 | | | | | | | | |
4.033%, 02/25/363 | | | 109,957 | | | | 108,584 | |
| | |
UBS Commercial Mortgage Trust | | | | | | | | |
Series 2018-C8, Class C | | | | | | | | |
4.703%, 02/15/513 | | | 917,000 | | | | 1,004,158 | |
Series 2019-C16, Class B | | | | | | | | |
4.320%, 04/15/523 | | | 769,000 | | | | 845,086 | |
| | |
UBS-Barclays Commercial Mortgage Trust | | | | | | | | |
Series 2012-C3, Class XA | | | | | | | | |
1.823%, 08/10/491,3,12 | | | 1,350,082 | | | | 58,931 | |
| | |
Vericrest Opportunity Loan Trust | | | | | | | | |
Series 2019-NPL3, Class A1 | | | | | | | | |
3.967%, 03/25/491,11 | | | 3,893,672 | | | | 3,963,034 | |
| | |
VOLT LXII LLC | | | | | | | | |
Series 2017-NPL9, Class A1 | | | | | | | | |
3.125%, 09/25/471,11 | | | 2,487,865 | | | | 2,496,536 | |
| | |
Washington Mutual Mortgage Pass Through | | | | | | | | |
Certificates WMALT Trust | | | | | | | | |
Series 2005-8, Class 2CB1 | | | | | | | | |
5.500%, 10/25/35 | | | 1,040,024 | | | | 1,059,733 | |
| | |
Washington Mutual Mortgage Pass-Through | | | | | | | | |
Certificates WMALT Trust | | | | | | | | |
Series 2005-6, Class 3CB | | | | | | | | |
5.500%, 08/25/35 | | | 2,734,452 | | | | 2,654,680 | |
| | |
Wells Fargo Commercial Mortgage Trust | | | | | | | | |
Series 2014-LC16, Class D | | | | | | | | |
3.938%, 08/15/501 | | | 218,000 | | | | 170,891 | |
Series 2015-C28, Class C | | | | | | | | |
4.111%, 05/15/483 | | | 400,000 | | | | 411,921 | |
Series 2015-C31, Class C | | | | | | | | |
4.608%, 11/15/483 | | | 585,000 | | | | 626,440 | |
Series 2015-C31, Class XA | | | | | | | | |
1.021%, 11/15/483,12 | | | 8,033,222 | | | | 404,375 | |
Series 2015-NXS1, Class XA | | | | | | | | |
1.135%, 05/15/483,12 | | | 3,708,402 | | | | 171,611 | |
Series 2015-NXS3, Class C | | | | | | | | |
4.487%, 09/15/573 | | | 610,000 | | | | 650,864 | |
Series 2016-C32, Class C | | | | | | | | |
4.722%, 01/15/593 | | | 558,000 | | | | 592,337 | |
| | | | | | | | |
| | | Principal
Amount | | | Value | |
| | |
Wells Fargo Commercial Mortgage Trust | | | | | | | | |
Series 2016-C33, Class C | | | | | | | | |
3.896%, 03/15/59 | | | $517,000 | | | | $532,782 | |
Series 2016-C33, Class XA | | | | | | | | |
1.757%, 03/15/593,12 | | | 5,133,403 | | | | 400,490 | |
Series 2016-NXS6, Class XA | | | | | | | | |
1.632%, 11/15/493,12 | | | 6,149,099 | | | | 461,617 | |
Series 2019-C50, Class B | | | | | | | | |
4.192%, 05/15/52 | | | 637,000 | | | | 700,274 | |
Series 2019-C50, Class C | | | | | | | | |
4.345%, 05/15/52 | | | 637,000 | | | | 687,686 | |
Series 2019-C51, Class AS | | | | | | | | |
3.584%, 06/15/52 | | | 412,000 | | | | 440,703 | |
Series 2019-C51, Class B | | | | | | | | |
3.836%, 06/15/523 | | | 412,000 | | | | 440,488 | |
| | |
WFRBS Commercial Mortgage Trust | | | | | | | | |
Series 2012-C8, Class XA | | | | | | | | |
1.814%, 08/15/451,3,12 | | | 654,784 | | | | 25,774 | |
Series 2012-C9, Class XA | | | | | | | | |
1.899%, 11/15/451,3,12 | | | 975,840 | | | | 45,344 | |
Series 2014-C21, Class XA | | | | | | | | |
1.038%, 08/15/473,12 | | | 5,084,021 | | | | 203,970 | |
| | |
Total Mortgage-Backed Securities
| | | | | | | | |
(Cost $112,280,304) | | | | | | | 115,044,490 | |
| | |
Municipal Bonds - 0.1% | | | | | | | | |
| | |
California State General Obligation, | | | | | | | | |
School Improvements | | | | | | | | |
7.550%, 04/01/39 | | | 305,000 | | | | 500,862 | |
| | |
Missouri Highway & Transportation Commission, Build America Bonds | | | | | | | | |
5.063%, 05/01/24 | | | 220,000 | | | | 247,927 | |
| | |
Total Municipal Bonds
| | | | | | | | |
(Cost $680,668) | | | | | | | 748,789 | |
| |
U.S. Government and Agency
Obligations - 33.0% | | | | | |
| | |
Fannie Mae - 11.2% | | | | | | | | |
| | |
Fannie Mae, | | | | | | | | |
2.140%, 10/01/29 | | | 7,000,000 | | | | 6,951,977 | |
2.500%, 11/01/3910 | | | 11,400,000 | | | | 11,414,398 | |
3.000%, 03/01/45 to 04/01/45 | | | 5,643,274 | | | | 5,744,349 | |
3.500%, 12/01/31 to 03/01/46 | | | 8,233,325 | | | | 8,666,826 | |
4.000%, 09/01/31 to 06/01/42 | | | 261,859 | | | | 273,510 | |
4.500%, 03/01/42 | | | 78,770 | | | | 81,835 | |
| | |
Fannie Mae REMICS, | | | | | | | | |
Series 2007-57, Class SX | | | | | | | | |
(6.620% minus 1 month LIBOR, Cap 6.620%, Floor 0.000%), 4.797%, 10/25/363,12 | | | 98,154 | | | | 16,660 | |
Series 2009-86, Class CI | | | | | | | | |
(5.800% minus 1 month LIBOR, Cap 5.800%, Floor 0.000%), 3.977%, 09/25/363,12 | | | 118,378 | | | | 11,882 | |
Series 2010-156, Class ZC | | | | | | | | |
4.000%, 01/25/41 | | | 375,548 | | | | 433,784 | |
Series 2011-121, Class JP | | | | | | | | |
4.500%, 12/25/41 | | | 121,301 | | | | 130,234 | |
Series 2011-18, Class UZ | | | | | | | | |
4.000%, 03/25/41 | | | 412,506 | | | | 435,671 | |
The accompanying notes are an integral part of these financial statements.
83
|
AMG Managers DoubleLine Core Plus Bond Fund Schedule of Portfolio Investments(continued) |
| | | | | | | | |
| | | Principal
Amount | | | Value | |
| |
Fannie Mae - 11.2%(continued) | | | | | |
| | |
Fannie Mae REMICS, | | | | | | | | |
Series 2012-105, Class Z | | | | | | | | |
3.500%, 10/25/42 | | $ | 1,280,891 | | | | $1,386,916 | |
Series 2012-127, Class PA | | | | | | | | |
2.750%, 11/25/42 | | | 1,355,123 | | | | 1,387,915 | |
Series 2012-20, Class ZT | | | | | | | | |
3.500%, 03/25/42 | | | 4,706,239 | | | | 4,972,955 | |
Series 2012-31, Class Z | | | | | | | | |
4.000%, 04/25/42 | | | 2,030,524 | | | | 2,260,737 | |
Series 2013-5, Class EZ | | | | | | | | |
2.000%, 08/25/42 | | | 7,200,986 | | | | 6,824,016 | |
Series 2013-8, Class Z | | | | | | | | |
3.000%, 02/25/43 | | | 5,830,470 | | | | 5,880,321 | |
Series 2014-73, Class CZ | | | | | | | | |
3.000%, 11/25/44 | | | 5,808,084 | | | | 5,919,188 | |
Series 2015-9, Class HA | | | | | | | | |
3.000%, 01/25/45 | | | 3,706,729 | | | | 3,812,451 | |
Series 2015-95, Class AP | | | | | | | | |
3.000%, 08/25/42 | | | 2,546,743 | | | | 2,582,259 | |
Series 2016-24, Class NZ | | | | | | | | |
3.000%, 05/25/46 | | | 6,042,307 | | | | 6,158,039 | |
| | |
Total Fannie Mae | | | | | | | 75,345,923 | |
| |
Freddie Mac - 5.2% | | | | | |
| | |
Freddie Mac, | | | | | | | | |
3.000%, 04/01/47 | | | 2,973,230 | | | | 3,054,563 | |
| | |
Freddie Mac Gold, | | | | | | | | |
3.000%, 07/01/45 to 08/01/45 | | | 5,858,226 | | | | 6,029,940 | |
3.500%, 10/01/42 | | | 549,599 | | | | 560,439 | |
4.000%, 10/01/41 | | | 100,181 | | | | 105,092 | |
5.000%, 07/01/35 | | | 16,398 | | | | 18,129 | |
| | |
Freddie Mac Multifamily Structured Pass | | | | | | | | |
Through Certificates, | | | | | | | | |
Series K050, Class A2 | | | | | | | | |
3.334%, 08/25/253 | | | 569,000 | | | | 609,155 | |
Series K053, Class A2 | | | | | | | | |
2.995%, 12/25/25 | | | 766,000 | | | | 807,857 | |
| | |
Freddie Mac REMICS, | | | | | | | | |
Series 2909, Class Z | | | | | | | | |
5.000%, 12/15/34 | | | 227,103 | | | | 251,734 | |
Series 3301, Class MS | | | | | | | | |
(6.100% minus 1 month LIBOR, Cap 6.100%, Floor 0.000%), 4.179%, 04/15/373,12 | | | 62,866 | | | | 11,964 | |
Series 3382, Class SB | | | | | | | | |
(6.000% minus 1 month LIBOR, Cap 6.000%, Floor 0.000%), 4.079%, 11/15/373,12 | | | 13,157 | | | | 1,716 | |
Series 3384, Class S | | | | | | | | |
(6.390% minus 1 month LIBOR, Cap 6.390%, Floor 0.000%), 4.469%, 11/15/373,12 | | | 19,027 | | | | 2,385 | |
Series 3500, Class SA | | | | | | | | |
(5.520% minus 1 month LIBOR, Cap 5.520%, Floor 0.000%), 3.599%, 01/15/393,12 | | | 57,630 | | | | 5,652 | |
Series 3626, Class AZ | | | | | | | | |
5.500%, 08/15/36 | | | 105,085 | | | | 116,147 | |
Series 3792, Class SE | | | | | | | | |
(9.860% minus 2 times 1 month LIBOR, Cap 9.860%, Floor 0.000%), 6.018%, 01/15/413 | |
| 903,021
|
| |
| 1,110,375
|
|
| | | | | | | | |
| | | Principal
Amount | | | Value | |
| | |
Freddie Mac REMICS, | | | | | | | | |
Series 3795, Class VZ | | | | | | | | |
4.000%, 01/15/41 | | | $127,583 | | | | $135,828 | |
Series 3872, Class BA | | | | | | | | |
4.000%, 06/15/41 | | | 27,641 | | | | 28,783 | |
Series 3894, Class ZA | | | | | | | | |
4.500%, 07/15/41 | | | 290,983 | | | | 316,826 | |
Series 3957, Class DZ | | | | | | | | |
3.500%, 11/15/41 | | | 430,465 | | | | 449,231 | |
Series 3957, Class HZ | | | | | | | | |
4.000%, 11/15/41 | | | 617,320 | | | | 685,881 | |
Series 4016, Class KZ | | | | | | | | |
4.000%, 03/15/42 | | | 2,436,629 | | | | 2,698,057 | |
Series 4075, Class S | | | | | | | | |
(5.500% minus 1 month LIBOR, Cap 5.500%, Floor 0.000%), 3.579%, 07/15/423,12 | | | 2,547,093 | | | | 341,409 | |
Series 4215, Class KC | | | | | | | | |
2.250%, 03/15/38 | | | 1,160,294 | | | | 1,164,282 | |
Series 4316, Class BZ | | | | | | | | |
3.000%, 03/15/44 | | | 3,546,295 | | | | 3,640,765 | |
Series 4323, Class GA | | | | | | | | |
3.000%, 06/15/40 | | | 1,465,609 | | | | 1,486,283 | |
Series 4511, Class QA | | | | | | | | |
3.000%, 01/15/41 | | | 2,255,736 | | | | 2,293,030 | |
Series 4750, Class PA | | | | | | | | |
3.000%, 07/15/46 | | | 4,156,051 | | | | 4,188,775 | |
| | |
Seasoned Credit Risk Transfer Trust | | | | | | | | |
Series 2018-2, Class HV | | | | | | | | |
3.000%, 11/25/573 | | | 4,783,196 | | | | 4,711,429 | |
| | |
Total Freddie Mac | | | | | | | 34,825,727 | |
| | |
Ginnie Mae - 0.2% | | | | | | | | |
| | |
Ginnie Mae, | | | | | | | | |
Series 2004-35, Class SA | | | | | | | | |
(32.500% minus 6.5 times 1 month LIBOR, Cap 32.500%, Floor 0.000%), 20.499%, | | | | | | | | |
03/20/343 | | | 17,580 | | | | 28,318 | |
Series 2008-69, Class SB | | | | | | | | |
(7.630% minus 1 month LIBOR, Cap 7.630%, Floor 0.000%), 5.784%, 08/20/383,12 | | | 208,777 | | | | 46,867 | |
Series 2009-32, Class ZE | | | | | | | | |
4.500%, 05/16/39 | | | 225,938 | | | | 246,280 | |
Series 2009-35, Class DZ | | | | | | | | |
4.500%, 05/20/39 | | | 257,247 | | | | 281,858 | |
Series 2009-75, Class GZ | | | | | | | | |
4.500%, 09/20/39 | | | 266,251 | | | | 288,523 | |
Series 2010-98, Class IA | | | | | | | | |
5.703%, 03/20/393,12 | | | 46,824 | | | | 5,431 | |
Series 2011-89, Class SA | | | | | | | | |
(5.450% minus 1 month LIBOR, Cap 5.450%, Floor 0.000%), 3.604%, 06/20/413,12 | | | 462,549 | | | | 64,734 | |
Series 2014-156, Class PS | | | | | | | | |
(6.250% minus 1 month LIBOR, Cap 6.250%, Floor 0.000%), 4.404%, 10/20/443,12 | | | 1,829,642 | | | | 303,272 | |
Series 2014-5, Class PS | | | | | | | | |
(6.150% minus 1 month LIBOR, Cap 6.150%, Floor 0.000%), 4.304%, 07/20/433,12 | | | 1,706,415 | | | | 231,993 | |
| | |
Total Ginnie Mae | | | | | | | 1,497,276 | |
The accompanying notes are an integral part of these financial statements.
84
|
AMG Managers DoubleLine Core Plus Bond Fund Schedule of Portfolio Investments(continued) |
| | | | | | | | |
| | | Principal
Amount | | | Value | |
| |
U.S. Treasury Obligations - 16.4% | | | | | |
| | |
U.S. Treasury Bonds, | | | | | | | | |
2.750%, 11/15/42 | | | $690,000 | | | | $764,862 | |
3.125%, 02/15/43 | | | 3,400,000 | | | | 4,005,625 | |
3.625%, 08/15/43 | | | 2,720,000 | | | | 3,464,813 | |
3.750%, 11/15/43 | | | 2,670,000 | | | | 3,469,018 | |
| | |
U.S. Treasury Inflation Indexed Bonds, | | | | | | | | |
0.875%, 01/15/29 | | | 2,611,274 | | | | 2,775,304 | |
1.000%, 02/15/46 | | | 5,121,550 | | | | 5,668,508 | |
| | |
U.S. Treasury Notes, | | | | | | | | |
1.625%, 05/31/23 | | | 4,180,000 | | | | 4,196,165 | |
1.750%, 11/30/21 | | | 8,935,000 | | | | 8,974,091 | |
1.875%, 08/31/24 | | | 2,160,000 | | | | 2,194,636 | |
2.125%, 09/30/24 | | | 5,340,000 | | | | 5,488,415 | |
2.250%, 10/31/24 to 11/15/27 | | | 18,110,000 | | | | 18,872,095 | |
2.375%, 05/15/27 | | | 6,200,000 | | | | 6,538,215 | |
2.500%, 01/15/22 to 03/31/23 | | | 8,040,000 | | | | 8,268,705 | |
2.625%, 02/28/23 to 01/31/26 | | | 7,540,000 | | | | 7,842,554 | |
2.750%, 08/15/21 to 11/15/47 | | | 14,690,000 | | | | 15,569,855 | |
2.875%, 10/15/21 | | | 7,420,000 | | | | 7,608,398 | |
3.000%, 09/30/25 | | | 3,760,000 | | | | 4,060,286 | |
| | |
Total U.S. Treasury Obligations | | | | | | | 109,761,545 | |
| | |
Total U.S. Government and Agency Obligations | | | | | | | | |
(Cost $212,683,410) | | | | | | | 221,430,471 | |
| | |
| Foreign Government Obligations - 0.7% | | | | | | | | |
| | |
Costa Rica Government International Bond (Costa Rica) | | | | | | | | |
9.995%, 08/01/20 | | | 300,000 | | | | 313,503 | |
| | |
Export Import Bank of Thailand (Thailand) | | | | | | | | |
(3 month LIBOR + 0.850%), 2.998%, 05/23/243 | | | 400,000 | | | | 401,576 | |
| | |
Mexico Government International Bond (Mexico) | | | | | | | | |
3.750%, 01/11/28 | | | 560,000 | | | | 585,066 | |
4.150%, 03/28/27 | | | 206,000 | | | | 221,040 | |
| | |
Perusahaan Penerbit SBSN Indonesia III (Indonesia) | | | | | | | | |
3.400%, 03/29/22 | | | 200,000 | | | | 204,500 | |
3.750%, 03/01/23 | | | 1,200,000 | | | | 1,247,250 | |
4.150%, 03/29/27 | | | 800,000 | | | | 857,600 | |
| | |
Philippine Government International Bond (Philippines) | | | | | | | | |
4.200%, 01/21/24 | | | 1,000,000 | | | | 1,081,936 | |
| | |
Total Foreign Government Obligations | | | | | | | | |
(Cost $4,791,670) | | | | | | | 4,912,471 | |
| | |
Floating Rate Senior Loan Interests - 2.0% | | | | | | | | |
| | |
Financials - 0.3% | | | | | | | | |
| | |
Acrisure LLC, First Lien Term LoanB-2, | | | | | | | | |
(3 month LIBOR + 4.250%), 6.354%, 11/22/233 | | | 171,819 | | | | 169,313 | |
| | |
AlixPartners LLP, 2017 Refinancing Term Loan, | | | | | | | | |
(1 month LIBOR + 2.750%), 4.536%, 04/04/243 | | | 319,401 | | | | 319,658 | |
| | |
AssuredPartners, Inc., 2017 September Refinancing Term Loan, | | | | | | | | |
(1 month LIBOR + 3.500%), 5.286%, 10/22/243 | | | 211,220 | | | | 208,052 | |
| | | | | | | | |
| | | Principal
Amount | | | Value | |
| | |
Blackhawk Network Holdings, Inc., First Lien Term Loan, | | | | | | | | |
(1 month LIBOR + 3.000%), 4.786%, 06/15/253 | | | $72,616 | | | | $72,136 | |
| | |
Canyon Valor Companies, Inc., Initial Dollar Term Loan (First Lien), | | | | | | | | |
(3 month LIBOR + 2.750%), 4.854%, 06/16/233 | | | 434,011 | | | | 434,327 | |
| | |
The Edelman Financial Center LLC, | | | | | | | | |
(1 month LIBOR + 3.250%), 5.096%, 07/19/253 | | | 94,399 | | | | 93,727 | |
| | |
Forest City Enterprises LP, Initial Term Loan, | | | | | | | | |
(1 month LIBOR + 4.000%), 5.786%, 12/07/253 | | | 133,988 | | | | 134,992 | |
| | |
Iron Mountain Information Management LLC, Term B Loan, | | | | | | | | |
(1 month LIBOR + 1.750%), 3.536%, 01/02/263 | | | 89,772 | | | | 88,762 | |
| | |
Sedgwick Claims Management Services, Inc., 2019 New Term Loans, | | | | | | | | |
(1 month LIBOR + 4.000%), 5.786%, 09/04/263 | | | 144,637 | | | | 143,806 | |
| | |
TKC Holdings, Inc., Initial Term Loan (First Lien), | | | | | | | | |
(1 month LIBOR + 3.750%), 5.800%, 02/01/233 | | | 195,872 | | | | 190,608 | |
| | |
UFC Holdings LLC, Term B Loan, | | | | | | | | |
(1 month LIBOR + 3.250%), 5.040%, 04/29/263 | | | 193,012 | | | | 193,181 | |
| | |
Total Financials | | | | | | | 2,048,562 | |
| | |
Industrials - 1.7% | | | | | | | | |
| | |
Albertsons LLC,2019-1 TermB-7 Loan, | | | | | | | | |
(1 month LIBOR + 2.750%), 4.536%, 11/17/253 | | | 71,429 | | | | 71,870 | |
| | |
Aldevron LLC, First Lien Initial Term Loan, | | | | | | | | |
(3 month LIBOR + 4.250%), 6.232%, 09/20/263 | | | 180,000 | | | | 180,900 | |
| | |
Allied Universal Holdco LLC, Initial Term Loan, | | | | | | | | |
(3 month LIBOR + 4.250%), 6.507%, 07/12/263 | | | 127,387 | | | | 126,691 | |
| | |
Alterra Mountain Company, Initial Term Loan, | | | | | | | | |
(1 month LIBOR + 3.000%), 4.786%, 07/31/243 | | | 193,313 | | | | 194,127 | |
| | |
American Airlines, Inc., 2017 Replacement Class B Term Loan, | | | | | | | | |
(1 month LIBOR + 2.000%), 3.921%, 12/14/233 | | | 284,990 | | | | 285,030 | |
| | |
Applied Systems, Inc., Initial Term Loan (First Lien), | | | | | | | | |
(3 month LIBOR + 3.000%), 5.104%, 09/19/243 | | | 62,055 | | | | 61,845 | |
| | |
Ascend Learning LLC, Initial Term Loan, | | | | | | | | |
(1 month LIBOR + 3.000%), 5.043%, 07/12/243,13 | | | 144,631 | | | | 143,848 | |
| | |
AthenaHealth, Inc., Term B Loan (First Lien), | | | | | | | | |
(3 month LIBOR + 4.500%), 6.681%, 02/11/263 | | | 137,637 | | | | 136,776 | |
| | |
Auris Luxembourg III SARL, Facility B2 Loan, | | | | | | | | |
(1 month LIBOR + 3.750%), 5.536%, 02/21/263 | | | 189,050 | | | | 186,155 | |
| | |
Bausch Health Companies, Inc., First Incremental Term Loan, | | | | | | | | |
(1 month LIBOR + 2.750%), 4.671%, 11/27/253 | | | 140,000 | | | | 140,288 | |
| | |
Berry Global, Inc., Term U Loan, | | | | | | | | |
(1 month LIBOR + 2.500%), 4.439%, 07/01/263 | | | 194,512 | | | | 195,461 | |
| | |
Bioscrip, Inc., First Lien Term B Loan, | | | | | | | | |
(1 month LIBOR + 4.500%), 6.286%, 08/06/263 | | | 150,000 | | | | 147,750 | |
The accompanying notes are an integral part of these financial statements.
85
|
AMG Managers DoubleLine Core Plus Bond Fund Schedule of Portfolio Investments(continued) |
| | | | | | | | |
| | | Principal
Amount | | | Value | |
| | |
Industrials - 1.7%(continued) | | | | | | | | |
| | |
BJ’s Wholesale Club, Inc., 2018 Other Term Loan, | | | | | | | | |
(1 month LIBOR + 2.750%), 4.671%, 02/03/243 | | | $192,149 | | | | $192,498 | |
| | |
Blackstone CQP Holdco LP, Initial Term Loan, | | | | | | | | |
(3 month LIBOR + 3.500%), 5.656%, 09/30/243 | | | 149,625 | | | | 149,313 | |
| | |
Brookfield WEC Holdings, Inc., First Lien Term Loan, | | | | | | | | |
(1 month LIBOR + 3.500%), 5.544%, 08/01/253 | | | 262,165 | | | | 260,854 | |
| | |
Buckeye Partners LP, Term Loan, | | | | | | | | |
(1 month LIBOR + 2.750%), 2.750%, 10/16/263,13 | | | 100,000 | | | | 100,578 | |
| | |
Catalent Pharma Solutions, Inc., Dollar TermB-2 Loan, | | | | | | | | |
(1 month LIBOR + 2.250%), 4.036%, 05/17/263 | | | 184,075 | | | | 184,572 | |
| | |
Change Healthcare Holdings LLC, Closing Date Term Loan, | | | | | | | | |
(1 month LIBOR + 2.500%), 4.544%, 03/01/243 | | | 162,764 | | | | 162,039 | |
| | |
CHG Healthcare Services, Inc., New Term Loan, | | | | | | | | |
(1 month LIBOR + 3.000%), 4.786%, 06/07/233 | | | 74,439 | | | | 74,416 | |
| | |
Clear Channel Outdoor Holdings, Inc., Term B Loan, | | | | | | | | |
(1 month LIBOR + 3.500%), 5.286%, 08/21/263 | | | 15,000 | | | | 15,050 | |
| | |
Concentra, Inc., First Lien TermB-1 Loan, | | | | | | | | |
(1 month LIBOR + 2.500%), 4.540%, 06/01/223 | | | 287,676 | | | | 288,273 | |
| | |
CSC Holdings LLC, September 2019 Term Loan, | | | | | | | | |
(3 month LIBOR + 2.500%), 4.327%, 04/15/273 | | | 194,513 | | | | 194,511 | |
| | |
Cvent, Inc., First Lien Term Loan, | | | | | | | | |
(1 month LIBOR + 3.750%), 5.536%, 11/30/243 | | | 146,034 | | | | 143,022 | |
| | |
DCert Buyer, Inc., First Lien Initial Term Loan, | | | | | | | | |
(1 month LIBOR + 4.000%), 5.913%, 08/08/263,13 | | | 110,000 | | | | 108,121 | |
| | |
Dell International LLC, Refinancing TermB-1 Loan, | | | | | | | | |
(1 month LIBOR + 2.000%), 3.790%, 09/19/253 | | | 115,000 | | | | 115,539 | |
| | |
EG America LLC, Additional Facility Loan, | | | | | | | | |
(3 month LIBOR + 4.000%), 6.104%, 02/05/253 | | | 44,267 | | | | 42,884 | |
| | |
Equinox Holdings, Inc., Incremental TermB-1 Loan (First Lien), | | | | | | | | |
(1 month LIBOR + 3.000%), 4.786%, 03/08/243 | | | 422,116 | | | | 421,061 | |
| | |
EW Scripps Co., TrancheB-1 Term Loan, | | | | | | | | |
(1 month LIBOR + 2.750%), 4.536%, 05/01/263 | | | 109,450 | | | | 109,642 | |
| | |
Filtration Group Corporation, Initial Dollar Term Loan, | | | | | | | | |
(1 month LIBOR + 3.000%), 4.786%, 03/29/253 | | | 284,317 | | | | 284,566 | |
| | |
Financial & Risk US Holdings, Inc., Initial Dollar Term Loan, | | | | | | | | |
(1 month LIBOR + 3.750%), 5.536%, 10/01/253 | | | 141,529 | | | | 142,428 | |
| | |
Finastra USA, Inc., First Lien Dollar Term Loan, | | | | | | | | |
(3 month LIBOR + 3.500%), 5.696%, 06/13/243 | | | 68,127 | | | | 65,274 | |
| | |
Gentiva Health Services, Inc., First Lien Closing Date Initial Term Loan, | | | | | | | | |
(1 month LIBOR + 3.750%), 5.563%, 07/02/253 | | | 275,477 | | | | 276,252 | |
| | | | | | | | |
| | | Principal
Amount | | | Value | |
| | |
Gobp Holdings, Inc., First Lien Term Loan B, | | | | | | | | |
(1 month LIBOR + 3.500%), 5.323%, 10/22/253 | | | $117,427 | | | | $118,033 | |
| | |
Golden Nugget, Inc., B Term Loan, | | | | | | | | |
(1 month LIBOR + 2.750%), 4.793%, 10/04/233,13 | | | 280,000 | | | | 279,877 | |
| | |
Greeneden US Holdings II LLC, TrancheB-3 Dollar Term Loan, | | | | | | | | |
(1 month LIBOR + 3.250%), 5.036%, 12/01/233 | | | 167,232 | | | | 163,679 | |
| | |
Hyland Software, Inc., 2018 Refinancing Term Loan, | | | | | | | | |
(1 month LIBOR + 3.250%), 5.036%, 07/01/243 | | | 371,988 | | | | 370,128 | |
| | |
IAA, Inc., Term Loan, | | | | | | | | |
(1 month LIBOR + 2.250%), 4.312%, 06/28/263 | | | 118,200 | | | | 118,863 | |
| | |
Informatica LLC, Dollar TermB-1 Loan, | | | | | | | | |
(1 month LIBOR + 3.250%), 5.036%, 08/06/223 | | | 142,247 | | | | 142,656 | |
| | |
IQVIA, Inc., Incremental TermB-2 Dollar Loan, | | | | | | | | |
(1 month LIBOR + 2.000%), 4.104%, 01/18/253 | | | 119,695 | | | | 120,168 | |
| | |
IRB Holding Corp., Term B Loan, | | | | | | | | |
(3 month LIBOR + 3.250%), 5.216%, 02/05/253 | | | 200,279 | | | | 199,099 | |
| | |
Jaguar Holding Company II, 2018 Term Loan, | | | | | | | | |
(1 month LIBOR + 2.500%), 4.286%, 08/18/223 | | | 286,538 | | | | 286,299 | |
| | |
JBS USA LUX, S.A., New Term Loan, | | | | | | | | |
(1 month LIBOR + 2.500%), 4.286%, 05/01/263 | | | 184,075 | | | | 184,952 | |
| | |
Kronos Incorporated, 2018 New Incremental Term Loan, | | | | | | | | |
(3 month LIBOR + 3.000%), 5.253%, 11/01/233 | | | 72,579 | | | | 72,496 | |
| | |
Life Time, Inc., New 2017 Refinancing Term Loan, | | | | | | | | |
(3 month LIBOR + 2.750%), 4.874%, 06/15/223 | | | 72,153 | | | | 71,983 | |
| | |
Lower Cadence Holdings LLC, Intial Term Loan, | | | | | | | | |
(1 month LIBOR + 4.000%), 5.804%, 05/22/263 | | | 139,076 | | | | 129,602 | |
| | |
Messer Industries USA, Inc., Initial TermB-1 Loan, | | | | | | | | |
(3 month LIBOR + 2.500%), 4.604%, 03/01/263 | | | 29,275 | | | | 29,068 | |
| | |
Milacron LLC, Term B Loan, | | | | | | | | |
(1 month LIBOR + 2.500%), 4.286%, 09/28/233 | | | 130,980 | | | | 130,976 | |
| | |
MLN US HoldCo LLC, Term B Loan (First Lien), | | | | | | | | |
(1 month LIBOR + 4.500%), 6.532%, 11/30/253 | | | 35,883 | | | | 32,056 | |
| | |
MPH Acquisition Holdings LLC, Initial Term Loan, | | | | | | | | |
(3 month LIBOR + 2.750%), 4.854%, 06/07/233 | | | 70,469 | | | | 66,296 | |
| | |
Nexstar Broadcasting, Inc., TermB-4 Loan, | | | | | | | | |
(1 month LIBOR + 2.750%), 4.554%, 09/19/263 | | | 285,000 | | | | 286,567 | |
| | |
Panther BF Aggregator 2 LP, First Lien Initial Dollar Term Loan, | | | | | | | | |
(1 month LIBOR + 3.500%), 5.300%, 04/30/263 | | | 37,566 | | | | 37,096 | |
| | |
Ply Gem Midco, Inc., Initial Term Loan, | | | | | | | | |
(1 month LIBOR + 3.750%), 5.667%, 04/12/253 | | | 71,163 | | | | 68,997 | |
| | |
PODS LLC, TrancheB-4 Term Loan, | | | | | | | | |
(1 month LIBOR + 2.750%), 4.671%, 11/21/243 | | | 72,543 | | | | 71,682 | |
| | |
Radiology Partners, Inc., First Lien Term B Loan, | | | | | | | | |
(1 month LIBOR + 4.750%), 6.661%, 07/09/253 | | | 132,643 | | | | 129,161 | |
The accompanying notes are an integral part of these financial statements.
86
|
AMG Managers DoubleLine Core Plus Bond Fund Schedule of Portfolio Investments(continued) |
|
| | | | | | | | |
| | | Principal
Amount | | | Value | |
| | |
Industrials - 1.7%(continued) | | | | | | | | |
| | |
Reynolds Group Holdings, Inc., Incremental U.S. Term Loan,
(1 month LIBOR + 2.750%), 4.793%, 02/05/233,13 | | | $285,000 | | | | $285,392 | |
| | |
Scientific Games International, Inc., Initial TermB-5 Loan,
(1 month LIBOR + 2.750%), 4.536%, 08/14/243 | | | 72,386 | | | | 71,625 | |
| | |
Securus Technologies Holdings, Inc., Initial Term Loan (First Lien),
(1 month LIBOR + 4.500%), 6.286%, 11/01/243 | | | 168,430 | | | | 132,638 | |
| | |
Select Medical Corp., Tranche B Term Loan,
(3 month LIBOR + 2.500%), 4.580%, 03/06/253 | | | 277,036 | | | | 276,430 | |
| | |
Solera LLC, Dollar Term Loan,
(1 month LIBOR + 2.750%), 4.536%, 03/03/233 | | | 426,236 | | | | 423,268 | |
| | |
Sophia LP, Term B Loan,
(3 month LIBOR + 3.250%), 5.354%, 09/30/223 | | | 284,948 | | | | 284,814 | |
| | |
Sprint Communications, Inc., Initial Term Loan,
(1 month LIBOR + 2.500%), 4.313%, 02/03/243 | | | 218,144 | | | | 216,052 | |
| | |
Starfruit Finco BV, Initial Dollar Term Loan,
(1 month LIBOR + 3.250%), 5.190%, 10/01/253 | | | 100,388 | | | | 98,224 | |
| | |
Tempo Acquisition LLC, Initial Term Loan,
(1 month LIBOR + 3.000%), 4.786%, 05/01/243 | | | 193,046 | | | | 193,432 | |
| | |
U.S. Foods, Inc., IncrementalB-2019 Term Loan,
(1 month LIBOR + 2.000%), 3.786%, 09/13/263 | | | 105,000 | | | | 105,459 | |
| | |
Ultimate Software Group, Inc., First Lien Initial Term Loan,
(1 month LIBOR + 3.750%), 5.536%, 05/03/263 | | | 295,000 | | | | 295,983 | |
| | |
Verscend Holding Corp., Term B Loan,
(1 month LIBOR + 4.500%), 6.286%, 08/27/253 | | | 221,407 | | | | 222,015 | |
| | |
Vertafore, Inc., Initial Term Loan (First Lien),
(1 month LIBOR + 3.250%), 5.036%, 07/02/253 | | | 143,731 | | | | 139,554 | |
| | |
Web.com Group, Inc., First Lien Initial Term Loan,
(1 month LIBOR + 3.750%), 5.663%, 10/11/253 | | | 43,105 | | | | 42,045 | |
| | |
WestJet Airlines Ltd., Term Loan B,
(1 month LIBOR + 3.000%), 4.000%, 10/08/263,13 | | | 130,000 | | | | 130,789 | |
| | |
Zelis Cost Management Buyer, Inc., Initial Term Loan,
(1 month LIBOR + 4.750%), 6.536%, 09/30/263 | | | 145,000 | | | | 143,912 | |
| | |
Total Industrials | | | | | | | 11,373,000 | |
| | |
Utilities - 0.0%# | | | | | | | | |
| | |
Calpine Corp., Term Loan,
(3 month LIBOR + 2.750%), 4.860%, 04/01/263 | | | 184,537 | | | | 184,903 | |
| | |
Edgewater Generation LLC, Term Loan,
(1 month LIBOR + 3.750%), 5.536%, 12/13/253 | | | 69,210 | | | | 66,528 | |
| | |
Total Utilities | | | | | | | 251,431 | |
| |
Total Floating Rate Senior Loan Interests
(Cost $13,752,348) | | | | 13,672,993 | |
| | | | | | | | |
| | | Shares | | | Value | |
| |
Common Stock - 0.0%# | | | | | |
| | |
Energy - 0.0%# | | | | | | | | |
| | |
Frontera Energy Corp. (Colombia)
(Cost $322,698) | | | 17,242 | | | | $137,419 | |
| | |
Investment Companies - 4.6% | | | | | | | | |
| | |
DoubleLine Global Bond Fund, Class I14
(Cost $30,401,657) | | | 2,928,233 | | | | 30,570,752 | |
| | |
| | | Principal
Amount | | | | |
| |
Short-Term Investments - 6.6% | | | | | |
| |
Joint Repurchase Agreements - 1.0%15 | | | | | |
| | |
Cantor Fitzgerald Securities, Inc., dated 10/31/19, due 11/01/19, 1.750% total to be received $1,616,695 (collateralized by various U.S. Government Agency Obligations and U.S. Treasuries, 0.000% - 9.000%, 11/25/19 - 10/20/68, totaling $1,649,015) | | | $1,616,616 | | | | 1,616,616 | |
| | |
Citigroup Global Markets, Inc., dated 10/31/19, due 11/01/19, 1.740% total to be received $1,616,694 (collateralized by various U.S. Government Agency Obligations and U.S. Treasuries, 2.500% - 8.000%, 12/01/20 - 01/01/59, totaling $1,648,948) | | | 1,616,616 | | | | 1,616,616 | |
| | |
Credit Suisse AG, dated 10/31/19, due 11/01/19, 1.730% total to be received $340,000 (collateralized by various U.S. Treasuries, 0.125% - 3.125%, 11/15/22 - 05/15/47, totaling $346,784) | | | 339,984 | | | | 339,984 | |
| | |
Daiwa Capital Markets America, dated 10/31/19, due 11/01/19, 1.750% total to be received $1,616,695 (collateralized by various U.S. Government Agency Obligations and U.S. Treasuries, 0.000% - 6.500%, 11/21/19 - 10/20/49, totaling $1,648,948) | | | 1,616,616 | | | | 1,616,616 | |
| | |
Guggenheim Securities LLC, dated 10/31/19, due 11/01/19, 1.760% total to be received $1,616,695 (collateralized by various U.S. Government Agency Obligations and U.S. Treasuries, 1.625% - 5.000%, 01/01/27 - 06/20/69, totaling $1,648,949) | | | 1,616,616 | | | | 1,616,616 | |
| |
Total Joint Repurchase Agreements | | | | 6,806,448 | |
| |
U.S. Government Obligations - 0.8% | | | | | |
| | |
United States Treasury Bill,
2.018%, 11/07/1916 | | | 310,000 | | | | 309,881 | |
| | |
United States Treasury Bill,
1.802%, 09/10/2016 | | | 5,230,000 | | | | 5,162,247 | |
| |
Total U.S. Government Obligations | | | | 5,472,128 | |
| | |
| | | Shares | | | | |
| |
Other Investment Companies - 4.8% | | | | | |
| | |
Dreyfus Government Cash Management Fund, Institutional Shares, 1.73%17 | | | 10,504,099 | | | | 10,504,099 | |
The accompanying notes are an integral part of these financial statements.
87
|
AMG Managers DoubleLine Core Plus Bond Fund Schedule of Portfolio Investments(continued) |
|
| | | | | | | | |
| | | Shares | | | Value | |
| | |
Dreyfus Institutional Preferred Government Money Market Fund, Institutional Shares, 1.77%17 | | | 10,504,099 | | | | $10,504,099 | |
| | |
JPMorgan U.S. Government Money Market Fund, IM Shares, 1.75%17 | | | 10,822,405 | | | | 10,822,405 | |
| |
Total Other Investment Companies | | | | 31,830,603 | |
| |
Total Short-Term Investments
(Cost $44,096,943) | | | | 44,109,179 | |
| | | | |
| | | Value | |
| |
Total Investments - 102.3% | | | | |
(Cost $668,744,248) | | | $685,974,946 | |
| |
Other Assets, less Liabilities - (2.3)% | | | (15,287,702 | ) |
| |
Net Assets - 100.0% | | | $670,687,244 | |
| * | Non-income producing security. |
| 1 | Security exempt from registration under Rule 144A of the Securities Act of 1933. This security may be resold in transactions exempt from registration, normally to qualified buyers. At October 31, 2019, the value of these securities amounted to $144,994,034 or 21.6% of net assets. |
| 2 | Some of these securities, amounting to $6,202,046 or 0.9% of net assets, were out on loan to various borrowers and are collateralized by cash and various U.S. Treasury Obligations. See Note 4 of Notes to Financial Statements. |
| 3 | Variable rate security. The rate shown is based on the latest available information as of October 31, 2019. Certain variable rate securities are not based on a published reference rate and spread but are determined by the issuer or agent and are based on current market conditions. These securities do not indicate a reference rate and spread in their description above. |
| 4 | Perpetuity Bond. The date shown is the final call date. |
| 5 | Payment-in-Kind Security: The security may pay interest/dividends in additional par/shares and/or in cash. Rates shown are the current rate and possible payment rates. |
| 7 | Security is in default. Issuer has failed to make a timely payment of either principal or either interest or has failed to comply with some provision of the bond indenture. |
| 8 | Security’s value was determined by using significant unobservable inputs. |
| 9 | Escrow shares received as part of a corporate action on June 12, 2019, are restricted and not available forre-sale. |
| 10 | All or part of the security is delayed delivery transaction. The market value for delayed delivery securities at October 31, 2019, amounted to $22,854,165, or 3.4% of net assets. |
| 11 | Step Bond: A debt instrument with either deferred interest payments or an interest rate that resets at specific times during its term. |
| 12 | Interest only security. This type of security represents the right to receive the monthly interest payments on an underlying pool of mortgages. Payments of principal on the pool reduce the value of the “interest only” holding. |
| 13 | Estimated interest rate based on period end due to security settling after October 31, 2019. |
| 14 | Affiliated issuer. See summary of affiliated investment transaction for details. |
| 15 | Cash collateral received for securities lending activity was invested in these joint repurchase agreements. |
| 16 | Represents yield to maturity at October 31, 2019. |
| 17 | Yield shown represents the October 31, 2019, seven day average yield, which refers to the sum of the previous seven days’ dividends paid, expressed as an annual percentage. |
| | |
CLO | | Collateralized Loan Obligation |
| |
CMT | | Constant Maturity Treasury |
| |
CSI | | China Securities Index |
| |
EMTN | | European Medium Term Note |
| |
GMTN | | Global Medium-Term Notes |
| |
GSR | | Goldman Sachs REMIC |
| |
LIBOR | | London Interbank Offered Rate |
| |
MTN | | Medium-Term Note |
| |
PIK | | Payment-in-Kind |
| |
REMICS | | Real Estate Mortgage Investment Conduit |
| |
USD | | United States Dollar |
The accompanying notes are an integral part of these financial statements.
88
|
AMG Managers DoubleLine Core Plus Bond Fund Schedule of Portfolio Investments(continued) |
|
The Fund had the following unfunded floating rate senior loan commitment outstanding as of October 31, 2019, which could be extended at the option of the borrower:
| | | | | | | | | | | | |
| Borrower | | Unfunded Loan Commitment | | | Value | | | Unrealized Appreciation (Depreciation) | |
Allied Universal Holdco LLC, Delayed Draw Term Loan | | | $12,613 | | | | $12,544 | | | | $(69 | ) |
The following schedule shows the value of affiliated investments at October 31, 2019.
| | | | | | | | | | | | | | |
Affiliated Issuers | | Number of shares | | Purchases | | Sales | | Net realized gain (loss) for the period | | Net increase (decrease) in unrealized appreciation (depreciation)
for the period | | Amount of Dividends or Interest | | Value |
DoubleLine Global Bond Fund Class I | | 2,928,233 | | $9,200,000 | | – | | – | | $1,230,972 | | $254,142 | | $30,570,752 |
The following table summarizes the inputs used to value the Fund’s investments by the fair value hierarchy levels as of October 31, 2019:
| | | | | | | | | | | | | | | | |
| | | Level 1 | | | Level 2 | | | Level 3 | | | Total | |
Investments in Securities | | | | | | | | | | | | | | | | |
| | | | |
Corporate Bonds and Notes | | | | | | | | | | | | | | | | |
| | | | |
Industrials | | | – | | | | $113,343,731 | | | | $7,500 | | | | $113,351,231 | |
| | | | |
Financials | | | – | | | | 60,565,854 | | | | – | | | | 60,565,854 | |
| | | | |
Utilities | | | – | | | | 28,093,833 | | | | – | | | | 28,093,833 | |
| | | | |
Asset-Backed Securities | | | – | | | | 53,337,464 | | | | – | | | | 53,337,464 | |
| | | | |
Mortgage-Backed Securities | | | – | | | | 115,044,490 | | | | – | | | | 115,044,490 | |
| | | | |
Municipal Bonds | | | – | | | | 748,789 | | | | – | | | | 748,789 | |
| | | | |
U.S. Government and Agency Obligations† | | | – | | | | 221,430,471 | | | | – | | | | 221,430,471 | |
| | | | |
Foreign Government Obligations | | | – | | | | 4,912,471 | | | | – | | | | 4,912,471 | |
| | | | |
Floating Rate Senior Loan Interests† | | | – | | | | 13,672,993 | | | | – | | | | 13,672,993 | |
| | | | |
Common Stock†† | | | $137,419 | | | | – | | | | – | | | | 137,419 | |
| | | | |
Investment Companies | | | 30,570,752 | | | | – | | | | – | | | | 30,570,752 | |
| | | | |
Short-Term Investments | | | | | | | | | | | | | | | | |
| | | | |
Joint Repurchase Agreements | | | – | | | | 6,806,448 | | | | – | | | | 6,806,448 | |
| | | | |
U.S. Government Obligations | | | – | | | | 5,472,128 | | | | – | | | | 5,472,128 | |
| | | | |
Other Investment Companies | | | 31,830,603 | | | | – | | | | – | | | | 31,830,603 | |
| | | | |
Unfunded Loan Commitment | | | – | | | | 12,544 | | | | – | | | | 12,544 | |
| | | | | | | | | | | | | | | | |
| | | | |
Total Investments in Securities | | | $62,538,774 | | | | $623,441,216 | | | | $7,500 | | | | $685,987,490 | |
| | | | | | | | | | | | | | | | |
| † | All U.S. government and agency obligations and floating rate senior loan interest held in the Fund are Level 2 securities. For a detailed breakout of U.S. government and agency obligations by agency classification and floating rate senior loan interest by major industries classification, please refer to the Fund’s Schedule of Portfolio Investments. |
| †† | All common stocks held in the Fund are Level 1 securities. For a detailed breakout of common stocks by major industry classification, please refer to the Fund’s Schedule of Portfolio Investments. |
The accompanying notes are an integral part of these financial statements.
89
|
AMG Managers DoubleLine Core Plus Bond Fund Schedule of Portfolio Investments(continued) |
|
The following table below is a reconciliation of investments in which significant unobservable inputs (Level 3) were used in determining fair value at October 31, 2019:
| | | | |
| | | Corporate Bonds
and Notes | |
Balance as of October 31, 2018 | | | – | |
Accrued discounts (premiums) | | | – | |
Realized gain (loss) | | | – | |
Change in unrealized appreciation/depreciation | | | $(23,750 | ) |
Purchases | | | – | |
Sales | | | – | |
Transfers in to Level 3 | | | 31,250 | |
Transfers out of Level 3 | | | – | |
Balance as of October 31, 2019 | | | $7,500 | |
| | | | |
Net change in unrealized appreciation/depreciation on investments still held at October 31, 2019 | | | $(23,750 | ) |
The following table summarizes the quantitative inputs and assumptions used for investments categorized in Level 3 of the fair value hierarchy as of October 31, 2019. The table below is not intended to beall-inclusive, but rather provides information on the significant Level 3 inputs as they relate to the Fund’s fair value measurements:
Quantitative Information about Level 3 Fair Value Measurements
| | | | | | | | | | | | |
| | | Fair Value as of
October 31, 2019 | | | Valuation
Technique(s) | | Unobservable
Inputs(s) | | Range | | Average |
| | | | | |
Corporate Bonds and Notes | | | $7,500 | | | Market Approach | | Indicative Broker Bid | | N/A | | N/A |
The accompanying notes are an integral part of these financial statements.
90
|
AMG River Road Long-Short Fund Portfolio Manager’s Comments(unaudited) |
|
| | | | |
OVERVIEW For the fiscal year ended October 31, 2019, the AMG River Road Long-Short Fund (the “Fund”) Class N shares returned 13.98%, outperforming the 13.49% return for the Russell 3000® Index. The secondary benchmark, which is a blend of 50% Russell 3000®/50% ICE BofA Merrill Lynch3-Month U.S. Treasury-Bill Index, returned 8.10%. During the period, the Fund had a 51% average net market exposure, yet captured 104% of the market’s return. PERFORMANCE REVIEW AND POSITIONING The holdings with the largest positive contribution to total return during the period were Liberty Broadband Corp. Class C (LBRDK, long), Dollar Tree, Inc. (DLTR, long), and Blackstone Group, Inc. (BX, long). Liberty Broadband is a holding company with a 21% stake in Charter Communications, the second-largest cable company in the United States. The company rose along with Charter as the cable company announced that free cash flow will double in 2019. Dollar Tree is a leading discount retailer in | | the U.S. and Canada. The stock responded well to continued strength at the company banner and better operating results at Family Dollar. The position was sold during the period. Blackstone is the largest alternative asset manager in the world. The company announced its conversion to a C corporation from a partnership, which dramatically increased the number of potential investors in the stock. Blackstone was sold during the period. The holdings with the largest negative contribution to the Fund’s total return were Conduent, Inc. (CNDT, long), Nielsen Holdings PLC (NLSN, long), and L Brands, Inc. (LB, long). Conduent is a global business process outsourcer with expertise in transaction processing, customer care, human resource services, analytics, and automation. The stock declined after disappointing operating results with weak new business signings, lowered FY 2019 guidance, and news that the CEO would step down, leading us to exit the position. Nielsen provides global marketing data collection and analytics services. The stock declined as it became clear the company’s efforts to sell itself would not result in a transaction, along | | with weakening analytics results as consumer-packaged firms tightened up their spending. We remain holders of Nielsen. L Brands is a specialty retailer with two dominant concepts, Victoria’s Secret and Bath and Body Works. Strength at Bath and Body Works was not enough to offset the continued weakness at Victoria’s Secret and the stock declined. The Fund ended October within its normal net market exposure range(50%-70%) at 64%. The Fund’s largest relative exposures on the long side are overweights to the communication services and industrial sectors and an underweight to the information technology sector. The largest sector exposures on the short side are in the industrial and consumer discretionary sectors. The views expressed represent the opinions of River Road Asset Management LLC, as of October 31, 2019, and are not intended as a forecast or guarantee of future results and are subject to change without notice. |
91
|
AMG River Road Long-Short Fund Portfolio Manager’s Comments(continued) |
CUMULATIVE TOTAL RETURN PERFORMANCE
AMG River Road Long-Short Fund’s cumulative total return is based on the daily change in net asset value (NAV), and assumes that all dividends and distributions were reinvested. The graph compares a hypothetical $10,000 investment made in the AMG River Road Long-Short Fund’s Class N shares on May 4, 2011, to a $10,000 investment made in the Russell 3000® Index and the 50% Russell 3000®/50% ICE BofA Merrill Lynch U.S.T-Bill(0-3 mo) Index for the same time period. The graph and table do not reflect the deduction of taxes that a shareholder would pay on a Fund distribution or redemption of shares. The listed returns for the Fund are net of expenses and the returns for the index exclude expenses. Total returns would have been lower had certain expenses not been reduced.
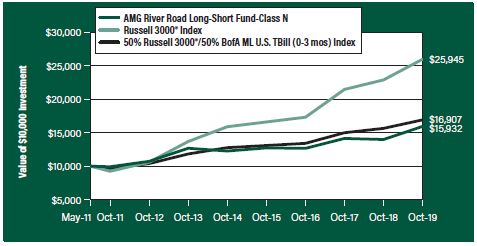
The table below shows the average annual total returns for the AMG River Road Long-Short Fund and the Russell 3000® Index and the 50% Russell 3000®/50% ICE BofA Merrill Lynch U.S.T-Bill(0-3 mo) Index for the same time periods ended October 31, 2019.
| | | | | | | | | | | | | | | | |
| Average Annual Total Returns1 | | One Year | | | Five Years | | | Since Inception | | | Inception Date | |
AMG River Road Long-Short
Fund2, 3, 4, 5, 6, 7, 8, 9, 10 | | | | | | | | | | | | | | | | |
| | | | |
Class N | | | 13.98% | | | | 5.38% | | | | 5.64% | | | | 05/04/11 | |
| | | | |
Class I | | | 14.28% | | | | 5.64% | | | | 5.20% | | | | 03/04/13 | |
| | | | |
Class Z | | | 14.35% | | | | – | | | | 6.02% | | | | 09/29/17 | |
| | | | |
Russell 3000® Index11 | | | 13.49% | | | | 10.31% | | | | 11.87% | | | | 05/04/11† | |
| | | | |
50% Russell 3000® Index/50% ICE BofA Merrill Lynch U.S.T-Bill(0-3 mo) Index12 | | | 8.10% | | | | 5.78% | | | | 6.38% | | | | 05/04/11† | |
The performance data shown represents past performance. Past performance is not a guarantee of future results. Current performance may be lower or higher than the performance data quoted. The investment return and principal value of an investment will fluctuate so that an investor’s shares, when redeemed, may be worth more or less than their original cost.
Investors should carefully consider the Fund’s investment objectives, risks, charges and expenses before investing. For performance information through the most recent month end, current net asset values per share for the Fund and other information, please call 800.548.4539 or visit our website at amgfunds.com for a free prospectus. Read it carefully before investing or sending money.
Distributed by AMG Distributors, Inc., member FINRA/SIPC.
| † | Date reflects the inception date of the Fund, not the index. |
| | |
| | | 1 Total return equals income yield plus share price change and assumes reinvestment of all dividends and capital gain distributions. Returns are net of fees and may reflect offsets of Fund expenses as described in the prospectus. No adjustment has been made for taxes payable by shareholders on their reinvested dividends and capital gain distributions. Returns for periods greater than one year are annualized. The listed returns on the Fund are net of expenses and based on the published NAV as of October 31, 2019. All returns are in U.S. dollars ($). |
| | |
| | | 2 The Fund may suffer significant losses on assets that it sells short. Unlike the possible loss on a security that is purchased, there is no limit on the amount of loss on an appreciating security that is sold short. |
| | |
| | | 3 Active and frequent trading of a fund may result in higher transaction costs and increased tax liability. |
| | |
| | | 4 The Fund may invest in derivatives such as options and futures; the complexity and rapidly changing structure of derivatives markets may increase the possibility of market losses. |
| | |
| | | 5 A greater percentage of the Fund’s holdings may be focused in a smaller number of securities which may place the Fund at greater risk than a more diversified fund. |
| | |
| | | 6 Investments in international securities are subject to certain risks of overseas investing including currency fluctuations and changes in political and economic conditions, which could result in significant market fluctuations. These risks are magnified in emerging markets. |
| | |
| | | 7 The Fund is subject to special risk considerations similar to those associated with the direct ownership of real estate. Real estate valuations may be subject to factors such as changing general and local economic, financial, competitive, and environmental conditions. |
| | |
| | | 8 The Fund invests in value stocks, which may perform differently from the market as a whole and may be undervalued by the market for a long period of time. |
| | |
| | | 9 Investing in Publicly Traded Partnerships (PTPs) (including master limited partnerships) involves risks in addition to those typically associated with publicly traded companies. PTPs are exposed to the risks of their underlying assets, which in many cases includes the same types of risks as energy and natural resources companies. PTPs are also subject to capital markets risk. PTPs may lose their partnership status for tax purposes. The Fund’s status as a regulated investment company may be jeopardized if it does not appropriately limit such investments in PTPs or if such investments are recharacterized for tax purposes. |
92
|
AMG River Road Long-Short Fund Portfolio Manager’s Comments(continued) |
|
| | | | | | | | |
10 Companies that are in similar businesses may be similarly affected by particular economic or market events; to the extent the Fund has substantial holdings within a particular sector, the risks associated with that sector increase. 11 The Russell 3000® Index is composed of the 3,000 largest U.S. companies as measured by market capitalization, and represents about 98% of the U.S. stock market. Unlike the Fund, the Russell 3000® Index is unmanaged, is not available for investment and does not incur expenses. | | | | 12 The secondary benchmark is composed of 50% Russell 3000®Index and 50% ICE BofAML U.S. Treasury Bill Index(0-3 months). The Russell 3000®Index is composed of the 3,000 largest U.S. companies as measured by market capitalization, and represents about 98% of the U.S. stock market. The ICE BofAML0-3 Month U.S. Treasury Bill Index: Is a subset of The Bank of America Merrill Lynch0-1 Year U.S. Treasury Index including all securities with a remaining term to final maturity less than 3 months. Unlike the Fund, the indices are | | | | unmanaged, are not available for investment and do not incur expenses. The Russell Indices are a trademark of London Stock Exchange Group companies. Not FDIC insured, nor bank guaranteed. May lose value. |
93
|
AMG River Road Long-Short Fund Fund Snapshots(unaudited) October 31, 2019 |
|
PORTFOLIO BREAKDOWN
| | | | | | | | | | | | |
| Sector | | Long Exposure1 | | Short Exposure1 | | Net Exposure1 |
| | | | |
Communication Services | | | 24.3 | | | | (0.5 | ) | | | 23.8 | |
| | | | |
Financials | | | 16.3 | | | | (2.6 | ) | | | 13.7 | |
| | | | |
Industrials | | | 15.7 | | | | (8.1 | ) | | | 7.6 | |
| | | | |
Health Care | | | 8.7 | | | | (1.3 | ) | | | 7.4 | |
| | | | |
Consumer Staples | | | 8.5 | | | | (3.2 | ) | | | 5.3 | |
| | | | |
Consumer Discretionary | | | 7.1 | | | | (9.6 | ) | | | (2.5 | ) |
| | | | |
Energy | | | 7.0 | | | | 0.0 | | | | 7.0 | |
| | | | |
Information Technology | | | 5.0 | | | | (3.4 | ) | | | 1.6 | |
| | | | |
Real Estate | | | 2.3 | | | | (0.5 | ) | | | 1.8 | |
| | | | |
Materials | | | 0.0 | | | | (0.7 | ) | | | (0.7 | ) |
| | | | |
Exchange Traded Funds | | | 0.0 | | | | (0.5 | ) | | | (0.5 | ) |
| | | | |
Short Term Investments | | | 8.1 | | | | – | | | | 8.1 | |
| | | | |
Other Assets2 | | | 27.4 | | | | – | | | | 27.4 | |
| 1 | As a percentage of net assets. |
| 2 | Includes collateral for short sales. |
TOP TEN HOLDINGS
| | | | | | | | |
| | | Security Name | | | | % of Net Assets | |
| | | | |
| | | UnitedHealth Group, Inc. | | | | | 4.2 | |
| | | | |
| | | Alphabet, Inc., Class C | | | | | 4.0 | |
| | | | |
| | | Berkshire Hathaway, Inc., Class B | | | | | 3.9 | |
| | | | |
| | | LKQ Corp. | | | | | 3.3 | |
| | | | |
| | | Expedia Group, Inc. | | | | | 3.1 | |
| | | | |
| | | Liberty Media Corp.-Liberty SiriusXM, Class C | | | | | 3.1 | |
| | | | |
| | | GCI Liberty, Inc., Class A | | | | | 3.0 | |
| | | | |
| | | Nintendo Co., Ltd., ADR (Japan) | | | | | 3.0 | |
| | | | |
| | | Liberty Broadband Corp., Class C | | | | | 3.0 | |
| | | | |
| | | CDK Global, Inc. | | | | | 2.9 | |
| | | | | | | | | |
| | | | |
| | | Top Ten as a Group | | | | | 33.5 | |
| | | | | | | | | |
Because a fund’s strategy may result in multiple investments in particular sectors of the economy, its performance may depend on the performance of those sectors and may fluctuate more widely than investments diversified across more sectors. For additional information on these and other risk considerations, please see the Fund’s prospectus.
Any sectors, industries, or securities discussed should not be perceived as investment recommendations. Mention of a specific security should not be considered a recommendation to buy or solicitation to sell that security. Specific securities mentioned in this report may have been sold from the Fund’s portfolio of investments by the time you receive this report.
94
|
AMG River Road Long-Short Fund Schedule of Portfolio Investments October 31, 2019 |
|
| | | | | | | | |
| | | Shares | | | Value | |
Long Positions - 103.0% | | | | | | | | |
Common Stocks - 94.9% | | | | | | | | |
| |
Communication Services - 24.3% | | | | | |
| | |
Alphabet, Inc., Class C*,1 | | | 811 | | | | $1,021,949 | |
| | |
Comcast Corp., Class A | | | 8,541 | | | | 382,808 | |
| | |
GCI Liberty, Inc., Class A* | | | 11,097 | | | | 776,568 | |
| | |
Liberty Broadband Corp., Class C*,1 | | | 6,541 | | | | 772,296 | |
| | |
Liberty Global PLC, Class C
(United Kingdom)* | | | 28,903 | | | | 689,914 | |
| | |
Liberty Latin America, Ltd., Class C* | | | 20,724 | | | | 381,529 | |
| | |
Liberty Media Corp.-Liberty SiriusXM, Class C*,1 | | | 17,222 | | | | 778,262 | |
| | |
Nintendo Co., Ltd., ADR (Japan) | | | 16,644 | | | | 774,279 | |
| | |
The Walt Disney Co.1 | | | 4,964 | | | | 644,923 | |
| | |
Total Communication Services | | | | | | | 6,222,528 | |
| | |
Consumer Discretionary - 7.1% | | | | | | | | |
| | |
Expedia Group, Inc. | | | 5,815 | | | | 794,678 | |
| | |
L Brands, Inc. | | | 10,585 | | | | 180,368 | |
| | |
LKQ Corp.*,1 | | | 24,892 | | | | 846,079 | |
| | |
Total Consumer Discretionary | | | | | | | 1,821,125 | |
| | |
Consumer Staples - 8.5% | | | | | | | | |
| | |
Hostess Brands, Inc.*,1 | | | 45,755 | | | | 584,749 | |
| | |
Molson Coors Brewing Co., Class B | | | 9,013 | | | | 475,166 | |
| | |
Seaboard Corp. | | | 159 | | | | 670,835 | |
| | |
Walgreens Boots Alliance, Inc.1 | | | 7,927 | | | | 434,241 | |
| | |
Total Consumer Staples | | | | | | | 2,164,991 | |
| | |
Energy - 7.0% | | | | | | | | |
| | |
Marathon Petroleum Corp. | | | 11,300 | | | | 722,635 | |
| | |
Texas Pacific Land Trust | | | 854 | | | | 485,951 | |
| | |
The Williams Cos., Inc. | | | 26,083 | | | | 581,912 | |
| | |
Total Energy | | | | | | | 1,790,498 | |
| | |
Financials - 16.3% | | | | | | | | |
| | |
Berkshire Hathaway, Inc., Class B*,1 | | | 4,646 | | | | 987,647 | |
| | |
Brookfield Asset Management, Inc., Class A (Canada) | | | 5,010 | | | | 276,803 | |
| | |
JPMorgan Chase & Co. | | | 4,757 | | | | 594,244 | |
| | |
KKR & Co.,Inc.1 | | | 22,411 | | | | 646,109 | |
| | |
Lazard, Ltd., Class A | | | 18,270 | | | | 682,019 | |
| | |
The Progressive Corp. | | | 6,383 | | | | 444,895 | |
| | |
Wells Fargo & Co.1 | | | 10,442 | | | | 539,121 | |
| | |
Total Financials | | | | | | | 4,170,838 | |
| | |
Health Care - 8.7% | | | | | | | | |
| | |
Anthem, Inc. | | | 1,961 | | | | 527,666 | |
| | |
McKesson Corp.1 | | | 4,737 | | | | 630,021 | |
| | | | | | | | |
| | | Shares | | | Value | |
UnitedHealth Group, Inc.1 | | | 4,237 | | | | $1,070,690 | |
| | |
Total Health Care | | | | | | | 2,228,377 | |
| | |
Industrials - 15.7% | | | | | | | | |
| | |
3M Co. | | | 2,294 | | | | 378,487 | |
| | |
Air Transport Services Group, Inc.* | | | 23,255 | | | | 486,262 | |
| | |
FedEx Corp.1 | | | 3,626 | | | | 553,545 | |
| | |
GEA Group AG, Sponsored ADR (Germany) | | | 22,296 | | | | 681,812 | |
| | |
General Electric Co. | | | 33,854 | | | | 337,863 | |
| | |
GrafTech International Ltd. | | | 23,088 | | | | 278,903 | |
| | |
Kuehne + Nagel International AG, ADR (Switzerland)1 | | | 11,650 | | | | 375,945 | |
| | |
Nielsen Holdings PLC1 | | | 19,469 | | | | 392,495 | |
| | |
United Technologies Corp. | | | 3,815 | | | | 547,758 | |
| | |
Total Industrials | | | | | | | 4,033,070 | |
| | |
Information Technology - 5.0% | | | | | | | | |
| | |
CDK Global, Inc. | | | 14,873 | | | | 751,681 | |
| | |
Sabre Corp. | | | 22,493 | | | | 528,136 | |
| | |
Total Information Technology | | | | | | | 1,279,817 | |
| | |
Real Estate - 2.3% | | | | | | | | |
| | |
Brookfield Property Partners LP | | | 31,084 | | | | 585,933 | |
| | |
Total Common Stocks
(Cost $23,530,420) | | | | | | | 24,297,177 | |
| | |
Short-Term Investments - 8.1% | | | | | | | | |
| |
Other Investment Companies - 8.1% | | | | | |
| | |
Dreyfus Government Cash Management Fund, Institutional Shares, 1.73%2 | | | 681,891 | | | | 681,891 | |
| | |
Dreyfus Institutional Preferred Government Money Market Fund, Institutional Shares, 1.77%2 | | | 681,892 | | | | 681,892 | |
| | |
JPMorgan U.S. Government Money Market Fund, IM Shares, 1.75%2 | | | 702,555 | | | | 702,555 | |
| | |
Total Short-Term Investments
(Cost $2,066,338) | | | | | | | 2,066,338 | |
| | |
Total Investments - 103.0%
(Cost $25,596,758) | | | | | | | 26,363,515 | |
| | |
Short Sales - (30.4%)3 | | | | | | | | |
| | |
Common Stocks - (29.9%) | | | | | | | | |
| |
Communication Services - (0.5%) | | | | | |
| | |
SoftBank Group Corp., ADR (Japan) | | | (6,438 | ) | | | (122,064 | ) |
| |
Consumer Discretionary - (9.6%) | | | | | |
| | |
Best Buy Co., Inc. | | | (3,856 | ) | | | (276,977 | ) |
| | |
Brinker International, Inc. | | | (4,534 | ) | | | (201,536 | ) |
| | |
Brunswick Corp. | | | (3,560 | ) | | | (207,334 | ) |
| | |
Domino’s Pizza, Inc. | | | (1,081 | ) | | | (293,621 | ) |
| | |
Dorman Products, Inc.* | | | (1,779 | ) | | | (127,999 | ) |
The accompanying notes are an integral part of these financial statements.
95
|
AMG River Road Long-Short Fund Schedule of Portfolio Investments (continued) |
|
| | | | | | | | |
| | | Shares | | | Value | |
Consumer Discretionary - (9.6%)
(continued) | | | | | |
| | |
Foot Locker, Inc. | | | (3,599 | ) | | | $(156,593 | ) |
| | |
Fossil Group, Inc.* | | | (18,265 | ) | | | (198,723 | ) |
| | |
Leggett & Platt, Inc. | | | (5,105 | ) | | | (261,887 | ) |
| | |
Movado Group, Inc. | | | (7,937 | ) | | | (206,759 | ) |
| | |
Regis Corp.* | | | (12,780 | ) | | | (263,268 | ) |
| | |
Whirlpool Corp. | | | (1,736 | ) | | | (264,080 | ) |
| | |
Total Consumer Discretionary | | | | | | | (2,458,777 | ) |
| | |
Consumer Staples - (3.2%) | | | | | | | | |
| | |
Church & Dwight Co., Inc. | | | (3,657 | ) | | | (255,770 | ) |
| | |
The Clorox Co. | | | (1,265 | ) | | | (186,828 | ) |
| | |
Conagra Brands, Inc. | | | (6,755 | ) | | | (182,723 | ) |
| | |
Energizer Holdings, Inc. | | | (4,788 | ) | | | (203,442 | ) |
| | |
Total Consumer Staples | | | | | | | (828,763 | ) |
| | |
Financials - (2.6%) | | | | | | | | |
| | |
Axos Financial, Inc.* | | | (4,666 | ) | | | (135,547 | ) |
| | |
Canadian Imperial Bank of Commerce (Canada) | | | (1,663 | ) | | | (141,788 | ) |
| | |
Federated Investors, Inc., Class B | | | (6,328 | ) | | | (202,116 | ) |
| | |
Mercury General Corp. | | | (3,859 | ) | | | (185,464 | ) |
| | |
Total Financials | | | | | | | (664,915 | ) |
| | |
Health Care - (1.3%) | | | | | | | | |
| | |
Prestige Consumer Healthcare, Inc.* | | | (9,002 | ) | | | (319,211 | ) |
| | |
Industrials - (8.1%) | | | | | | | | |
| | |
Caterpillar, Inc. | | | (1,970 | ) | | | (271,466 | ) |
| | |
Deere & Co. | | | (1,765 | ) | | | (307,357 | ) |
| | |
Deluxe Corp. | | | (8,348 | ) | | | (432,677 | ) |
| * | Non-income producing security. |
| 1 | Security position is either entirely or partially held in a segregated account as collateral for securities sold short. As of October 31, 2019, value of securities held in the segregated account was $2,420,276. |
| 2 | Yield shown represents the October 31, 2019, seven day average yield, which refers to the sum of the previous seven days’ dividends paid, expressed as an annual percentage. |
| | | | | | | | |
| | | Shares | | | Value | |
Ennis, Inc. | | | (6,781 | ) | | | $(132,840 | ) |
| | |
Matthews International Corp., Class A | | | (7,200 | ) | | | (266,256 | ) |
| | |
The Middleby Corp.* | | | (1,685 | ) | | | (203,801 | ) |
| | |
Quad/Graphics, Inc. | | | (11,059 | ) | | | (50,097 | ) |
| | |
Snap-On, Inc. | | | (1,695 | ) | | | (275,726 | ) |
| | |
Textron, Inc. | | | (2,773 | ) | | | (127,807 | ) |
| | |
Total Industrials | | | | | | | (2,068,027 | ) |
| |
Information Technology - (3.4%) | | | | | |
| | |
Belden, Inc. | | | (2,514 | ) | | | (128,918 | ) |
| | |
Canon, Inc., Sponsored ADR (Japan) | | | (7,223 | ) | | | (195,743 | ) |
| | |
HP, Inc. | | | (10,571 | ) | | | (183,618 | ) |
| | |
International Business Machines Corp. | | | (1,438 | ) | | | (192,304 | ) |
| | |
Stratasys, Ltd.* | | | (8,772 | ) | | | (181,405 | ) |
| | |
Total Information Technology | | | | | | | (881,988 | ) |
| | |
Materials - (0.7%) | | | | | | | | |
| | |
Rio Tinto PLC, Sponsored ADR (United Kingdom) | | | (3,656 | ) | | | (190,149 | ) |
| | |
Real Estate - (0.5%) | | | | | | | | |
| | |
Tanger Factory Outlet Centers, Inc., REIT | | | (8,000 | ) | | | (128,960 | ) |
| | |
Total Common Stocks
(Proceeds $(7,502,037)) | | | | | | | (7,662,854 | ) |
| |
Exchange Traded Funds - (0.5%) | | | | | |
| | |
United States Natural Gas Fund, LP*
(Proceeds $(120,993)) | | | (5,611 | ) | | | (116,765 | ) |
| | |
Total Short Sales - (30.4%)
(Proceeds $(7,623,030)) | | | | | | | (7,779,619 | ) |
| |
Other Assets, less Liabilities - 27.4% | | | | 7,010,168 | |
| | |
Net Assets - 100.0% | | | | | | | $25,594,064 | |
| 3 | The Fund is contractually responsible to the lender for any dividends payable on securities while those securities are outstanding in short position. These dividends and interest amounts are recorded as interest and dividend expense on the Statement of Operations. |
| | |
ADR | | American Depositary Receipt |
REIT | | Real Estate Investment Trust |
The accompanying notes are an integral part of these financial statements.
96
|
AMG River Road Long-Short Fund Schedule of Portfolio Investments (continued) |
|
The following table summarizes the inputs used to value the Fund’s investments by the fair value hierarchy levels as of October 31, 2019:
| | | | | | | | | | | | |
| | | Level 1 | | Level 2 | | | Level 3 | | | Value |
| | | | |
Investments in Securities | | | | | | | | | | | | |
| | | | |
Assets | | | | | | | | | | | | |
| | | | |
Common Stocks† | | $24,297,177 | | | – | | | | – | | | $24,297,177 |
| | | | |
Short-Term Investments | | | | | | | | | | | | |
| | | | |
Other Investment Companies | | 2,066,338 | | | – | | | | – | | | 2,066,338 |
| | | | | | | | | | | | |
| | | | |
Total Assets | | 26,363,515 | | | – | | | | – | | | 26,363,515 |
| | | | | | | | | | | | |
| | | | |
Liabilities | | | | | | | | | | | | |
| | | | |
Common Stocks† | | (7,662,854) | | | – | | | | – | | | (7,662,854) |
| | | | |
Exchange Traded Funds† | | (116,765) | | | – | | | | – | | | (116,765) |
| | | | | | | | | | | | |
| | | | |
Total Liabilities | | (7,779,619) | | | – | | | | – | | | (7,779,619) |
| | | | | | | | | | | | |
| | | | |
Net Investments in Securities | | $18,583,896 | | | – | | | | – | | | $18,583,896 |
| | | | | | | | | | | | |
| † | All common stocks and exchange traded funds held or shorted in the Fund are Level 1 securities. For a detailed breakout of common stocks and exchange traded funds by major industry classification, please refer to the Fund’s Schedule of Portfolio Investments. |
For the fiscal year ended October 31, 2019, there were no transfers in or out of Level 3.
The accompanying notes are an integral part of these financial statements.
97
|
AMG Managers Pictet International Fund Portfolio Manager’s Comments(unaudited) |
|
| | | | |
OVERVIEW For the fiscal year ended October 31, 2019, the AMG Managers Pictet International Fund (the “Fund”) Class N shares returned 8.34%, trailing the 11.04% return for the MSCI EAFE Index. MARKET COMMENTARY As the review period began, global equity markets were in a downward spiral driven principally by concerns that had overshadowed much of 2018–the escalating U.S.-China trade war and its impact on economic growth along with the expectation of continued monetary policy tightening by the U.S. Federal Reserve (the “Fed”) and other central banks. The start of 2019 marked a turning point as equities were buoyed by speculation that the on/off trade talks between the U.S. and China were close to producing an agreement to end the tariff war, and central banks’ rhetoric shifted to suggest a softer stance on the outlook for interest rates. There was little support from the corporate sector, with Q4 2018 results on average disappointing, and 2019 guidance erring on the conservative side. Indeed, the economic backdrop for the period as whole remained lackluster at best, with U.S. data pointing to economic growth having peaked, European data showing flat to only modest growth, and Asian economies clearly feeling the impact of U.S. trade tariffs. Geopolitical developments did little to lift investor spirits either. The U.K.’s Parliament repeatedly failed to agree on the nature of the relationship the country should have with Europe after leaving the EU (Brexit) and the initialend-March deadline was delayed three times. By the end of the review period, Brexit was still unresolved, leading to continued uncertainty. Elsewhere in Europe, France suffered civil unrest after an unpopular President Macron tried to force through pension changes, Italy’s populist government narrowly avoided a showdown with the European Union over budget levels (and then saw a reshuffle in its ruling coalition), and German political stability took a knock as elections shifted the balance of parties in its longstanding coalition. Despite all this, international markets tracked broadly upward from a low point at the end of 2019 through to the period’s end in October, led mainly by defensive/“growth” companies. More cyclically sensitive “value” companies lagged. This broad market progression was punctuated only by | | downswings associated with renewed trade fears (in May and August) and by fears that a reversal of Fed interest rate policy (with a 25 bp reduction in its target rate, also in August) might prove to be aone-offmid-cycle adjustment. A second 25 basis point cut in September assuaged these fears and allowed markets to finish the period close to a12-month high. Of the international regions, the Pacific ex Japan posted the best returns thanks mainly to Australian market strength and a Hong Kong market that was largely unaffected by the broader weakness at the end of 2018. Japan was the weakest in the region that, after strength in its currency, was seen as undermining the competitiveness of its major exporters, and underperformed. At a sector level, IT, utility, and health care companies were the best performers, while energy, financials, and materials companies were the weakest. PERFORMANCE REVIEW The Fund underperformed the benchmark over the period, but this was largely a result of faring poorly in the very weak markets between the start of the period and December 2018. While this weakness would appear to have been broadly distributed across sectors and regions, and there were also stock-specific drivers, two themes tie together the performance of a number of the stocks that contributed most to the outcome. The first was exposure (direct or indirect) to China during the period of peak concern over escalating U.S.-China trade tensions through to the end of December. The second was a simultaneous decline in sentiment toward companies deemed to have excessive debt in a climate (since reversed) of rising interest rate expectations. The portfolio spent much of the remainder of the period recovering this underperformance as these negative influences waned, but that progression was punctuated by short spells of further weakness (e.g. in May and August) as trade and cyclical/monetary concerns resurfaced. At a regional level the main area of weakness over the period as whole was stock selection within Europe and the Pacific ex Japan. At a sector level, the main detractors were stock selection with the health care, materials, and consumer discretionary groups. While failing to offset these negatives, stock selection in Japan was positive, as was the contribution from the few names held in Emerging Asia (which recovered strongly after the weak start to the period described above). At an individual stock level the main negatives were: | | 1. LivaNova PLC (surgical devices, U.K.), a specialist producer of devices and implants for cardiac surgery and neuro-modulation. Its stock declined sharply in early April on thepre-release of Q1 results. The driver was a sharp downward adjustment to 2019 earnings guidance that had been issued only a few weeks earlier. The source of the problem was a sudden deterioration in sales of the company’s Vagus Nerve Stimulation (VNS) implant to control treatment-resistant epilepsy (TRE) following the launch of a rival treatment, Epidiolex, by GW Pharma in September 2018. Epidiolex is a cannabis-based drug that had been cleverly marketed, received significant press coverage, and had been hailed as a miracle “natural” treatment. With early production/distribution bottlenecks fixed, Epidiolex became more freely available for clinicians to trial through Q1, and this led to a suddendrop-off in surgeries to implant the company’s VNS device toward the end of the period. The key question at the time was the extent to which the development would impact a long-term investment thesis for which growth in Livanova’s neuromodulation franchise is an important pillar. A focus on the facts rather than the hype suggests that Epidiolex can currently address only 5% to 10% of the epilepsy market, and only produces a material response in aboutone-third of patients. It also costs significantly more than the VNS implant on a multi-year view. Other drugs with a similar efficacy/cost profile have challenged VNS in the past and ultimately failed to halt its upward sales progression in a market that is itself growing. After lengthy discussions with the company’s management, GW Pharma management, neurology clinicians, and a previous VNS sales director, our conclusion was that with Livanova’s Cardiopulmonary business on track, and with multiple other options in the mix that could drive intrinsic value significantly higher on the1- to4-year view, the investment case remained robust. While we continue to monitor data from the epilepsy market closely, we took the view that the April stock price fall was disproportionate to any likely underlying value hit, and we added to the company’s position on the weakness. Through the remainder of the period the stock began to recover but had yet to regain itspre-decline levels by the end of October. 2. OCI NV (fertilizer producer, Netherlands) had a volatile 12 months but ultimately underperformed. The company is the fourth-largest nitrogen fertilizer producer globally and has methanol production |
98
|
AMG Managers Pictet International Fund Portfolio Manager’s Comments(continued) |
|
| | | | |
operations. Due to significant recent investments in new, highly efficient production facilities in the U.S. corn belt (fertilizer) and Texas (methanol), group debt was high at the start of the period, and the company’s stock suffered in late 2018 along with other geared companies. Through 2019, the stock initially recovered strongly, but fell back in May and again in August, as the U.S.-China trade war rekindled. A significant contributor to raised tensions was China’s refusal to resume buying agricultural products (primarily soybeans and corn) from the U.S. The news had a rapid and negative impact on U.S. corn prices. Aknock-on effect was that all nitrogen fertilizer producers were marked down as the profitability of corn sales for farmers in the current growing season is seen as a leading indicator of fertilizer demand/sales for the next growing season. A further source of volatility was speculation through the middle of the period that the company would sell its methanol operations to Saudi chemicals giant SABIC. That deal went away when the Saudi Public Investment Fund (owner of 70% of SABIC) began to encounter problems with its planned IPO of Aramco. Subsequently the company announced the appointment of bankers to help find another buyer. While the geopolitical climate has generated short-term challenges for the company, our investment thesis remains as it was when the stock was added to the portfolio in early 2018: in its core nitrogen fertilizer operations its recent investments take it to the bottom of the industry cost curve, with the most strategically placed and most efficient production facilities. In a market that is set to be more stable than in the past, the company’s cash generation will be prodigious, and facilitate both the rapidpay-down of debt, and further investment in growth. 3. Saga PLC (insurance, U.K.), like Livanova above, also fell sharply in April on weak Q1 results that were accompanied by a profit warning and a dividend cut. The release in turn raised concerns about the sustainability of the group’s debt levels. The company specializes in providing insurance and travel services to theover-50s and has a strong brand name in the U.K. The long-term investment thesis is predicated on Saga’s brand strength and a target population segment that is typically wealthier (with higher disposable income) than average and is set to grow by >2% p.a. over the next few years. The profit warning was the product of anill-advised move to start selling insurance policies through price comparison websites, overly conservative underwriting practices, and a change to European privacy regulations that came into force in early 2018 | | and rendered data on roughly half of the roughly 10 million individuals in Saga’s customer database unusable. The group is rebuilding the database rapidly (with better quality data), but the short-term impact was an impairment to targeted marketing activities. The financial gearing concerns related to the travel division, the core of which is a cruise ship operation that has two new vessels coming into service shortly. The debt associated with the lumpy order cycle for new ships is familiar to cruise company analysts, but it alarmed insurance analysts. However, we remained comfortable that the switch to prodigious cash flows once the vessels are commissioned will pay down this debt rapidly, and its level was not an issue. Regarding the insurance and database problems, they were clearly a disappointment; being in part driven by regulation (for which the impact should have been predictable) and in part by poor management decisions. That said, the key tenets of our initial investment case remain. After extensive talks with both the executive andnon-executive managers of the company, we believe they have a credible plan that will improve execution and deliver (albeit with a delay) what we feel the business is capable of. As with Livanova, our conclusion was that the stock price markdown had been far larger than the deterioration in prospects justified. Threestand-out positive contributions over the period were: 1. Square Enix Holdings Co., Ltd. (digital games, Japan) was only added to the fund in Q1 2019, but toward the end of the period it rose sharply following the release of (fiscal) Q1 results. The group develops games principally for the console and mobile markets. The results were strong across the board, but particularly in the key MMO (massively multiplayer online) business that saw a pickup in Final Fantasy franchise sales ahead of releasing an expansion pack. The pickup underpins several characteristics of the business that we find highly attractive: enduring brands (leading to pricing power), the loyalty of a user base that comprises a relatively small number of core players (paying a monthly subscription fee), and a significantly longer tail of “dormant” users whore-engage with successive updates. Mobile games were also a key area of strength in the quarter following a recent restructuring in which separate development studios were consolidated under one umbrella to focus on quality rather than quantity of new title launches. While it’s too early to link the operating improvement to the new structure, we believe the performance may hint at the better earnings to be expected from | | this division in the future. Also looking to the future, part of our thesis for the company was that the potential for a strategic increase in development spend (which the company capitalizes) to improve the game development pipeline has been under-appreciated by investors. This investment is now starting to bear fruit with March 2020 slated as the launch date for new Final Fantasy and Marvel Avengers games. These were both presented at the E3 show recently and have caused significant excitement. With the stock move narrowing the gap to our assessment of the company’s fair value we took some profit from the position at the end of the period but remain holders. 2. ASML Holding NV (semiconductor manufacturing equipment, Netherlands) was a steady and strong performer throughout the period as its own underlying developments have outweighed the volatility of markets as drivers of the stock. In short, 2019 has been the year in which ASML, the dominant supplier of silicon lithography equipment to the semiconductor industry, has begun to commercialize the next generation of equipment that will give it a global monopoly. The technology in question is extreme ultra-violet (EUV) lithography, and it will allow the next steps in miniaturization of digital components on silicon wafers. The progression of Moore’s Law has slowed over the last decade as existing lithography methods have approached their physical limits. Through 2017 and 2018 several major chip producers were testing EUV equipment atsub-commercial scales to establish proof of concept, and in 2019 this has translated into a full-scale commitment to the technology by the likes of Samsung Electronics, Intel TSMC, and HiSilicon (part of Huawei). A parallel decade-long process has seen a chip manufacturing market that was notorious for over-investment and price indiscipline undergo a massive consolidation. Aside from a belief in the potential success of EUV and the company’s unique positioning, our investment case was predicated on this consolidation creating a far more orderedhigh-end market comprising a few major players with very deep pockets focused on returns and profitability than on market share. There will still be cycles, and a period of oversupply has delayed our thesis for the investment playing out, but in the review period it has begun. 3. JD.com, Inc. (ecommerce, China) was one of the fund’s weaker performers in 2018, partly due to tradewar-related negativity toward Chinese companies, but also to disappointment in the margin progression of its core ecommerce platform. A third negative was the potential for the company’s founder |
99
|
AMG Managers Pictet International Fund Portfolio Manager’s Comments(continued) |
|
| | | | |
and CEO Richard Liu to end up in a U.S. jail after alleged sexual misconduct at a conference in Minnesota; the case was subsequently dropped at the end of 2018. The company is the second largest ecommerce player in China after Alibaba but operates with a very different business model. Unlike Alibaba (which is essentially a marketplace platform linking buyers and sellers) JD.com is more like an Amazon, owning inventory, giant ware-houses, and even its own distribution network. Its low margins (compared to Alibaba’s) are a result of massive investments it has made in expanding these warehouse and logistics operations to keep pace with its meteoric growth. It has now reached a point where this investment can be reined back in. From its stock low point at the end of December 2018 the company’s strong recovery was driven by successive quarterly announcements that have finally seen margins rising to levels comparable with those of Alibaba. While we took some profit from the the company’s position toward the end of the period, we believe there is further upside to be realized as investors start to focus on the value inherent in not only the retail operations, but also the potential for JD. com’s logistics and finance operations as standalone businesses. FUND ACTIVITY Despite several changes at a stock level through the period the net effect on overall portfolio shape was relatively modest. The most notable shift was a reduction in the overweight position in consumer sectors (particularly consumer discretionary), a reduction from neutral to underweight in health care, and a corresponding increase from neutral to overweight in industrials. At a regional level, a modest overweight to Europe has moved back to modest underweight, and a more significant underweight to Japan has moved up to neutral. The modest overweight to the Pacific ex Japan persisted through the whole period. It should be noted that none of these aggregate positions are targeted; rather they are pure byproducts of underlying stock level decisions. The stock level changes in the portfolio were, as ever, driven either by new stock-specific investment cases, or by the valuation shifts within markets (whereby more cyclically sensitive companies generally lost out to tech and more defensive growth companies). While not identified as such at the time, one theme that runs through the list of new positions added to the portfolio might be described as “quality cyclicals”–companies classed as cyclicals, but with identifiable long-duration cash flow. Examples would | | include BBA Aviation PLC (private airport services, U.K.),UPM-Kymmene Oyj (paper and forest products, Finland), Hoshizaki Corp. (commercial kitchen equipment, Japan), Freni Brembo SpA (auto brakes, Italy), EXOR NV (holding company, Italy) and Samsung Electronics Co., Ltd. (semiconductors and consumer electronics, Republic of Korea). In each case we believed that stock weakness, driven either by investor focus on short-term metrics or a company-specific bump in the road, was unjustified in the context of visible and in some cases prodigious long-term future cash flow prospects; high quality business models that have been labelled as “cyclical” and suffered in a blanket selloff. The final addition was Square Enix (digital games, Japan. See Performance Review, above). In order to fund these additions, profit was taken mainly in companies whose strong performance had brought them close to or through our assessment of their intrinsic value. These included SEEK (employment agency, Australia), Bandai Namco (toys and digital games, Japan),ABC-Mart (shoe retailer, Japan), Mizrahi Tefahot Bank (banking, Israel), and Rubis (fuel/chemical bulk storage utility, France). Inmarsat (satellite services, U.K.) was acquired and taken private during the period (at well below our assessment of intrinsic value), and Dignity (funeral services, U.K.) was sold following the collapse of our investment case (and its stock price). MARKET OUTLOOK AND STRATEGY Concerns are mounting across global markets driven by fears of recession and political uncertainty. While all these concerns are ultimately either transient or cyclical in nature, they have resulted in a renewed downward progression in interest rates. This, in turn, has driven negative-yielding bonds to new highs. Within equity markets the second-order impact of this unprecedented situation has been a flight to quality and “long duration” businesses that has materially inflated their valuations. Our approach to valuation, however, is absolute rather than relative–and certainly not relative tonear-zero-percent interest rates. We typically seek to invest in companies offering normalized free cash flow yields of between 5% and 10%, cash flows which we believe will grow over time and offer attractive real rates of return for our clients. However, the current paradigm is making it increasingly difficult to find attractive opportunities. Given historically high margins, low rates of unemployment, and persistently low inflation, we don’t feel that now would be the appropriate time to | | compromise our core business quality principles in search of incremental returns. This puts us in quite an unusual situation. On one hand, traditionally fertile hunting grounds for the business models we would like to own often do not offer acceptable future real rates of return. On the other hand, lower quality businesses which optically offer attractive returns need to be looked at with an even more critical eye given where we are in the economic cycle. This points to the challenge for investors to be more esoteric and company-specific than ever. One significant advantage we do have as international equity investors is the range of choice at our disposal: the scope to invest across the market cap spectrum in a universe of over 4,000 companies. Another, in turbulent times, is a very clear idea of the types of business characteristics we seek: situations where the way in which a management’s strategy plays out is more dependent on factors that they can control than on external forces they can’t. A further and perhaps most significant advantage is that we assess companies based on their prospects over a long-term time horizon. This generates a view of their value that constitutes a relatively stable reference point and gives us the ability to exploit the increased levels of volatility we are seeing today. In many cases, this has meant buying into high quality businesses which are dealing with short-term problems. This has been the case with commercial kitchen equipment maker Hoshizaki Corp. in Japan. Hoshizaki has been on our watch list for several years and has several qualities we admire: a strong competitive advantage anchored in its service network and industry leading R&D, an owner-operator management team with a great track record, and an extremely high return on capital. However, accounting irregularities at a small subsidiary in Osaka which represented less than 3% of sales led to the stock declining (46%) from its peak during Q4 2018. After interviewing management and assessing the situation we took the view that the problem was specific to this small branch and had been resolved. We were therefore able to start a position in the company at a price that we believe offers attractive returns. At other times, we have bought businesses where cyclicality or upfront investments mask the fundamental qualities of the business. One example here would be OCI NV, a Dutch-listed fertilizer business with core assets in North Africa and the U.S. Operating in a cyclical industry with high levels of debt, OCI has been victim of low fertilizer prices |
100
|
AMG Managers Pictet International Fund Portfolio Manager’s Comments(continued) |
|
| | | | |
| over the past few years and has had an optically highly leveraged balance sheet. However, the underlying demand conditions for fertilizers are favorable over the long term and OCI operates at the low end of the cost curve. Through cycles, this should lead to high returns on capital. Leverage will also decline significantly over the coming years as a new plant in Iowa completes its production ramp up, to generate predictable cash flow growth. A common thread to both Hoshizaki and OCI is that management are also the largest shareholders and are therefore intensely focused on value creation. | | However, we also remain mindful of the wider risks after nearly a decade of economic and equity market growth, and levels of interest rates that are still some way from reflecting a normal risk premium. During recent months we have therefore spent a lot of time reconfirming the investment cases and valuation assessments of the companies we hold, to be as certain as possible of both their upside potential and their downside protection, especially at this time of the cycle. | | As always, we continue to run a very active portfolio (active share close to 90%) and remain enthusiastic about the prospects of the companies we have invested in. We believe that their cash generation ability and bright prospects for growth will, over the long term, deliver attractive returns. The views expressed represent the opinions of Pictet Asset Management Limited, as of October 31, 2019, and are not intended as a forecast or guarantee of future results and are subject to change without notice. |
101
|
AMG Managers Pictet International Fund Portfolio Manager’s Comments(continued) |
CUMULATIVE TOTAL RETURN PERFORMANCE
AMG Managers Pictet International Fund’s cumulative total return is based on the daily change in net asset value (NAV), and assumes that all dividends and distributions were reinvested. The graph compares a hypothetical $10,000 investment made in the AMG Managers Pictet International Fund’s Class N shares on April 14, 2014, to a $10,000 investment made in the MSCI EAFE Index for the same time period. The graph and table do not reflect the deduction of taxes that a shareholder would pay on a Fund distribution or redemption of shares. The listed returns for the Fund are net of expenses and the returns for the index exclude expenses. Total returns would have been lower had certain expenses not been reduced.
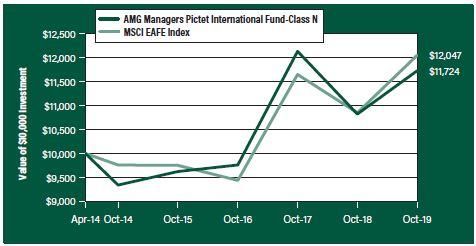
The table below shows the average annual total returns for the AMG Managers Pictet International Fund and the MSCI EAFE Index for the same time periods ended October 31, 2019.
| | | | | | | | | | | | | | | | |
| Average Annual Total Returns1 | | One
Year | | | Five
Years | | | Since
Inception | | | Inception
Date | |
AMG Managers Pictet International
Fund2, 3, 4, 5, 6, 7 | |
| | | | |
Class N | | | 8.34% | | | | 4.65% | | | | 2.91% | | | | 04/14/14 | |
| | | | |
Class I | | | 8.65% | | | | 4.94% | | | | 3.20% | | | | 04/14/14 | |
| | | | |
Class Z | | | 8.84% | | | | – | | | | (0.48%) | | | | 09/29/17 | |
| |
MSCI EAFE Index8,9 | | | 11.04% | | | | 4.31% | | | | 3.42% | | | | 04/14/14 | † |
| |
The performance data shown represents past performance. Past performance is not a guarantee of future results. Current performance may be lower or higher than the performance data quoted. The investment return and principal value of an investment will fluctuate so that an investor’s shares, when redeemed, may be worth more or less than their original cost.
Investors should carefully consider the Fund’s investment objectives, risks, charges and expenses before investing. For performance information through the most recent month end, current net asset values per share for the Fund and other information, please call 800.548.4539 or visit our website at amgfunds.com for a free prospectus. Read it carefully before investing or sending money.
Distributed by AMG Distributors, Inc., member FINRA/SIPC.
| † | Date reflects the inception date of the Fund, not the index. |
| 1 | Total return equals income yield plus share price change and assumes reinvestment of all dividends and capital gain distributions. Returns are net of fees and may reflect offsets of Fund expenses as described in the prospectus. No adjustment has been made for taxes payable by shareholders on their reinvested dividends and capital gain distributions. Returns for periods greater than one year are annualized. The listed returns on the Fund are net of expenses and based on the published NAV as of October 31, 2019. All returns are in U.S. dollars ($). |
| | |
| | | 2 Investments in international securities are subject to certain risks of overseas investing including currency fluctuations and changes in political and economic conditions, which could result in significant market fluctuations. These risks are magnified in emerging markets. |
| | |
| | | 3 The Fund is subject to the risks associated with investments in emerging markets, such as erratic earnings patterns, economic and political instability, changing exchange controls, limitations on repatriation of foreign capital and changes in local governmental attitudes toward private investment, possibly leading to nationalization or confiscation of investor assets. |
| | |
| | | 4 Investing in initial public offerings (IPOs) is risky and the prices of stocks purchased in IPOs tend to fluctuate more widely than stocks of companies that have been publicly traded for a longer period of time. Stocks purchased in IPOs generally do not have a trading history, and information about the companies may be available for very limited periods. |
| | |
| | | 5 The Fund is subject to risks associated with investments inmid-capitalization companies such as greater price volatility, lower trading volume, and less liquidity than the stocks of larger, more established companies. |
| | |
| | | 6 The Fund is subject to risks associated with investments in small-capitalization companies, such as erratic earnings patterns, competitive conditions, limited earnings history and a reliance on one or a limited number of products. |
| | |
| | | 7 A greater percentage of the Fund’s holdings may be focused in a smaller number of securities which may place the Fund at greater risk than a more diversified fund. |
| | |
| | | 8 The MSCI EAFE Index (Europe, Australasia, Far East) is a free float-adjusted market capitalization index that is designed to measure the equity market performance of developed markets, excluding the U.S. & Canada. Please go to msci.com for most current list of countries represented by the index. Unlike the Fund, the MSCI EAFE Index is unmanaged, is not available for investment and does not incur expenses. |
| | |
| | | 9 All MSCI data is provided “as is.” The products described herein are not sponsored or endorsed and have not been reviewed or passed on by MSCI. In no event shall MSCI, its affiliates, or any MSCI data provider have any liability of any kind in connection with the MSCI data or the products described herein. Copying or redistributing the MSCI data is strictly prohibited. |
| | |
| | | Not FDIC insured, nor bank guaranteed. May lose value. |
102
|
AMG Managers Pictet International Fund Fund Snapshots(unaudited) October 31, 2019 |
|
PORTFOLIO BREAKDOWN
| | | | | | |
| | | Sector | | % of
Net Assets |
| | |
| | Industrials | | | 20.1 | |
| | |
| | Financials | | | 16.9 | |
| | |
| | Consumer Staples | | | 14.8 | |
| | |
| | Consumer Discretionary | | | 13.7 | |
| | |
| | Communication Services | | | 10.3 | |
| | |
| | Health Care | | | 8.2 | |
| | |
| | Information Technology | | | 6.6 | |
| | |
| | Materials | | | 3.4 | |
| | |
| | Energy | | | 3.4 | |
| | |
| | Real Estate | | | 0.9 | |
| | |
| | Short-Term Investments | | | 2.3 | |
| | |
| | Other Assets Less Liabilities | | | (0.6 | ) |
TOP TEN HOLDINGS
| | | | | | | | |
| | | Security Name | | | | % of
Net Assets |
| | | | | | | | |
| | | |
| | Nestle SA (Switzerland) | | | | | 3.2 | |
| | | |
| | Asahi Group Holdings, Ltd. (Japan) | | | | | 3.0 | |
| | | |
| | Informa PLC (United Kingdom) | | | | | 2.9 | |
| | | |
| | Safran SA (France) | | | | | 2.8 | |
| | | |
| | Trip.com Group, Ltd., ADR (China) | | | | | 2.8 | |
| | | |
| | Royal Dutch Shell PLC, Class B (Netherlands) | | | | | 2.7 | |
| | | |
| | GlaxoSmithKline PLC (United Kingdom) | | | | | 2.5 | |
| | | |
| | Elis SA (France) | | | | | 2.4 | |
| | | |
| | OCI NV (Netherlands) | | | | | 2.3 | |
| | | |
| | Hoshizaki Corp. (Japan) | | | | | 2.3 | |
| | Top Ten as a Group | | | | | 26.9 | |
| | | | | | | | |
Because a fund’s strategy may result in multiple investments in particular sectors of the economy, its performance may depend on the performance of those sectors and may fluctuate more widely than investments diversified across more sectors. For additional information on these and other risk considerations, please see the Fund’s prospectus.
Any sectors, industries, or securities discussed should not be perceived as investment recommendations. Mention of a specific security should not be considered a recommendation to buy or solicitation to sell that security. Specific securities mentioned in this report may have been sold from the Fund’s portfolio of investments by the time you receive this report.
103
|
AMG Managers Pictet International Fund Schedule of Portfolio Investments October 31, 2019 |
|
| | | | | | | | |
| | | Shares | | | Value | |
| | |
Common Stocks - 98.3% | | | | | | | | |
| |
Communication Services - 10.3% | | | | | |
| | |
Cineworld Group PLC (United Kingdom) | | | 1,556,697 | | | | $4,485,743 | |
| | |
Informa PLC (United Kingdom) | | | 861,532 | | | | 8,659,498 | |
| | |
PCCW, Ltd. (Hong Kong) | | | 6,879,309 | | | | 4,085,724 | |
| | |
SoftBank Group Corp. (Japan) | | | 139,000 | | | | 5,346,832 | |
| | |
Square Enix Holdings Co., Ltd. (Japan) | | | 100,200 | | | | 4,768,342 | |
| | |
Vivendi SA (France) | | | 116,098 | | | | 3,233,051 | |
| | |
Total Communication Services | | | | | | | 30,579,190 | |
| |
Consumer Discretionary - 13.7% | | | | | |
| | |
Cie Financiere Richemont SA (Switzerland) | | | 56,039 | | | | 4,403,611 | |
| | |
Freni Brembo SpA (Italy)1 | | | 357,543 | | | | 3,804,044 | |
| | |
Gestamp Automocion SA (Spain)1,2 | | | 613,524 | | | | 2,628,945 | |
| | |
JD.com, Inc., ADR (China)* | | | 178,280 | | | | 5,553,422 | |
| | |
KOMEDA Holdings Co., Ltd. (Japan) | | | 194,600 | | | | 3,782,325 | |
| | |
Matas A/S (Denmark) | | | 144,875 | | | | 1,110,487 | |
| | |
MGM China Holdings, Ltd. (Macau) | | | 1,662,400 | | | | 2,632,383 | |
| | |
Pandora A/S (Denmark) | | | 65,885 | | | | 3,241,939 | |
| | |
Sony Corp. (Japan) | | | 80,100 | | | | 4,875,619 | |
| | |
Trip.com Group, Ltd., ADR (China)* | | | 251,497 | | | | 8,296,886 | |
| | |
Total Consumer Discretionary | | | | | | | 40,329,661 | |
| |
Consumer Staples - 14.8% | | | | | |
| | |
Ain Holdings, Inc. (Japan) | | | 85,500 | | | | 4,892,238 | |
| | |
Anheuser-Busch InBev SA/NV (Belgium) | | | 70,614 | | | | 5,699,781 | |
| | |
Asahi Group Holdings, Ltd. (Japan) | | | 173,800 | | | | 8,703,463 | |
| | |
cocokara fine, Inc. (Japan) | | | 99,400 | | | | 5,480,782 | |
| | |
Danone SA (France) | | | 48,460 | | | | 4,014,488 | |
| | |
Japan Tobacco, Inc. (Japan) | | | 191,900 | | | | 4,337,460 | |
| | |
Nestle SA (Switzerland) | | | 88,091 | | | | 9,424,094 | |
| | |
Ontex Group NV (Belgium) | | | 57,368 | | | | 1,040,690 | |
| | |
Total Consumer Staples | | | | | | | 43,592,996 | |
| | |
Energy - 3.4% | | | | | | | | |
| | |
Royal Dutch Shell PLC, Class B (Netherlands) | | | 274,419 | | | | 7,903,229 | |
| | |
Z Energy, Ltd. (New Zealand) | | | 643,206 | | | | 2,208,745 | |
| | |
Total Energy | | | | | | | 10,111,974 | |
| | |
Financials - 16.9% | | | | | | | | |
| | |
Banco Bilbao Vizcaya Argentaria SA (Spain) | | | 1,136,440 | | | | 5,985,437 | |
| | |
EXOR NV (Netherlands) | | | 65,619 | | | | 5,030,616 | |
| | |
Intesa Sanpaolo SpA (Italy) | | | 1,555,356 | | | | 3,897,450 | |
| | |
Julius Baer Group, Ltd. (Switzerland) | | | 143,291 | | | | 6,345,446 | |
| | |
M&G PLC (United Kingdom)* | | | 383,085 | | | | 1,060,941 | |
| | |
Moscow ExchangeMICEX-RTS PJSC (Russia) | | | 3,384,075 | | | | 5,016,346 | |
| | |
Nordea Bank Abp (Finland) | | | 507,824 | | | | 3,716,935 | |
| | | | | | | | |
| | | Shares | | | Value | |
| | |
Prudential PLC (United Kingdom) | | | 383,085 | | | | $6,691,302 | |
| | |
Saga PLC (United Kingdom) | | | 4,581,752 | | | | 2,784,697 | |
| | |
Shinsei Bank, Ltd. (Japan) | | | 324,900 | | | | 5,065,110 | |
| | |
Sompo Holdings, Inc. (Japan) | | | 113,700 | | | | 4,469,101 | |
| | |
Total Financials | | | | | | | 50,063,381 | |
| | |
Health Care - 8.2% | | | | | | | | |
| | |
GlaxoSmithKline PLC
(United Kingdom) | | | 322,457 | | | | 7,385,880 | |
| | |
Grifols SA, ADR (Spain) | | | 217,580 | | | | 4,767,178 | |
| | |
Healius, Ltd. (Australia) | | | 1,491,994 | | | | 3,171,605 | |
| | |
LivaNova PLC (United Kingdom)* | | | 76,081 | | | | 5,381,209 | |
| | |
Miraca Holdings, Inc. (Japan) | | | 144,200 | | | | 3,403,441 | |
| | |
Total Health Care | | | | | | | 24,109,313 | |
| | |
Industrials - 20.1% | | | | | | | | |
| | |
BBA Aviation PLC (United Kingdom) | | | 1,019,158 | | | | 4,009,517 | |
| | |
Bollore SA (France) | | | 772,197 | | | | 3,345,443 | |
| | |
Bollore SA - New (France)* | | | 3,816 | | | | 16,258 | |
| | |
CK Hutchison Holdings, Ltd.
(Hong Kong) | | | 683,748 | | | | 6,313,103 | |
| | |
Elis SA (France) | | | 368,781 | | | | 7,050,545 | |
| | |
FANUC Corp. (Japan) | | | 26,100 | | | | 5,148,207 | |
| | |
Fujitec Co., Ltd. (Japan) | | | 256,200 | | | | 3,727,031 | |
| | |
Hoshizaki Corp. (Japan) | | | 80,000 | | | | 6,800,187 | |
| | |
Jardine Strategic Holdings, Ltd.
(Hong Kong) | | | 93,200 | | | | 3,009,598 | |
| | |
Knorr-Bremse AG (Germany) | | | 29,629 | | | | 2,990,261 | |
| | |
Reliance Worldwide Corp., Ltd. (United States) | | | 1,610,894 | | | | 4,687,497 | |
| | |
Safran SA (France) | | | 52,522 | | | | 8,318,958 | |
| | |
Vinci SA (France)1 | | | 35,903 | | | | 4,028,184 | |
| | |
Total Industrials | | | | | | | 59,444,789 | |
| |
Information Technology - 6.6% | | | | | |
| | |
ams AG (Austria)*,1 | | | 61,640 | | | | 2,769,650 | |
| | |
ASML Holding NV (Netherlands) | | | 21,157 | | | | 5,545,557 | |
| | |
Nokia OYJ (Finland) | | | 513,329 | | | | 1,884,437 | |
| | |
Samsung Electronics Co., Ltd.
(South Korea) | | | 107,253 | | | | 4,635,459 | |
| | |
Siltronic AG (Germany) | | | 47,817 | | | | 4,554,063 | |
| | |
Total Information Technology | | | | | | | 19,389,166 | |
| | |
Materials - 3.4% | | | | | | | | |
| | |
KAZ Minerals PLC (United Kingdom) | | | 243,531 | | | | 1,488,298 | |
| | |
OCI NV (Netherlands)* | | | 302,884 | | | | 6,810,157 | |
| | |
UPM-Kymmene Oyj (Finland) | | | 56,616 | | | | 1,843,954 | |
| | |
Total Materials | | | | | | | 10,142,409 | |
| | |
Real Estate - 0.9% | | | | | | | | |
| | |
Merlin Properties Socimi SA, REIT (Spain)1 | | | 182,466 | | | | 2,686,050 | |
| | |
Total Common Stocks
(Cost $282,017,196) | | | | | | | 290,448,929 | |
The accompanying notes are an integral part of these financial statements.
104
|
AMG Managers Pictet International Fund Schedule of Portfolio Investments (continued) |
|
| | | | | | | | |
| | | Principal Amount | | | Value | |
| |
Short-Term Investments - 2.3% | | | | | |
| |
Joint Repurchase Agreements - 2.0%3 | | | | | |
| | |
Cantor Fitzgerald Securities, Inc., dated 10/31/19, due 11/01/19, 1.750% total to be received $1,403,362 (collateralized by various U.S. Government Agency Obligations and U.S. Treasuries, 0.000% - 9.000%, 11/25/19 - 10/20/68, totaling $1,431,417) | | $ | 1,403,294 | | | $ | 1,403,294 | |
| | |
Citigroup Global Markets, Inc., dated 10/31/19, due 11/01/19, 1.740% total to be received $1,403,362 (collateralized by various U.S. Government Agency Obligations and U.S. Treasuries, 2.500% - 8.000%, 12/01/20 - 01/01/59, totaling $1,431,360) | | | 1,403,294 | | | | 1,403,294 | |
| | |
Credit Suisse AG, dated 10/31/19, due 11/01/19, 1.730% total to be received $295,175 (collateralized by various U.S. Treasuries, 0.125% - 3.125%, 11/15/22 - 05/15/47, totaling $301,064) | | | 295,161 | | | | 295,161 | |
| | |
Daiwa Capital Markets America, dated 10/31/19, due 11/01/19, 1.750% total to be received $1,403,362 (collateralized by various U.S. Government Agency Obligations and U.S. Treasuries, 0.000% - 6.500%, 11/21/19 - 10/20/49, totaling $1,431,360) | | | 1,403,294 | | | | 1,403,294 | |
| | |
Guggenheim Securities LLC, dated 10/31/19, due 11/01/19, 1.760% total to be received $1,403,363 (collateralized by various U.S. Government Agency Obligations and U.S. Treasuries, 1.625% - 5.000%, 01/01/27 - 06/20/69, totaling $1,431,360) | | | 1,403,294 | | | | 1,403,294 | |
| |
Total Joint Repurchase Agreements | | | | 5,908,337 | |
| | | | | | | | |
| | | Shares | | | Value | |
| |
Other Investment Companies - 0.3% | | | | | |
| | |
Dreyfus Government Cash Management Fund, Institutional Shares, 1.73%4 | | | 269,825 | | | | $269,825 | |
| | |
Dreyfus Institutional Preferred Government Money Market Fund, Institutional Shares, 1.77%4 | | | 269,825 | | | | 269,825 | |
| | |
JPMorgan U.S. Government Money Market Fund, IM Shares, 1.75%4 | | | 278,002 | | | | 278,002 | |
| |
Total Other Investment Companies | | | | 817,652 | |
| |
Total Short-Term Investments
(Cost $6,725,989) | | | | 6,725,989 | |
| |
Total Investments - 100.6%
(Cost $288,743,185) | | | | 297,174,918 | |
| |
Other Assets, less Liabilities - (0.6)% | | | | (1,805,600 | ) |
| |
Net Assets - 100.0% | | | | $295,369,318 | |
| * | Non-income producing security. |
| 1 | Some of these securities, amounting to $5,603,327 or 1.9% of net assets, were out on loan to various borrowers and are collateralized by cash. See Note 4 of Notes to Financial Statements. |
| 2 | Security exempt from registration under Rule 144A of the Securities Act of 1933. This security may be resold in transactions exempt from registration, normally to qualified buyers. At October 31, 2019, the value of these securities amounted to $2,628,945 or 0.9% of net assets. |
| 3 | Cash collateral received for securities lending activity was invested in these joint repurchase agreements. |
| 4 | Yield shown represents the October 31, 2019, seven day average yield, which refers to the sum of the previous seven days’ dividends paid, expressed as an annual percentage. |
| | |
ADR | | American Depositary Receipt |
REIT | | Real Estate Investment Trust |
The accompanying notes are an integral part of these financial statements.
105
|
AMG Managers Pictet International Fund Schedule of Portfolio Investments (continued) |
|
The following table summarizes the inputs used to value the Fund’s investments by the fair value hierarchy levels as of October 31, 2019:
| | | | | | | | | | | | | | | | |
| | | Level 1 | | | Level 21 | | | Level 3 | | | Total | |
Investments in Securities | | | | | | | | | | | | | | | | |
| | | | |
Common Stocks | | | | | | | | | | | | | | | | |
| | | | |
Industrials | | | $3,006,519 | | | | $56,438,270 | | | | – | | | | $59,444,789 | |
| | | | |
Financials | | | 3,845,638 | | | | 46,217,743 | | | | – | | | | 50,063,381 | |
| | | | |
Consumer Staples | | | – | | | | 43,592,996 | | | | – | | | | 43,592,996 | |
| | | | |
Consumer Discretionary | | | 13,850,308 | | | | 26,479,353 | | | | – | | | | 40,329,661 | |
| | | | |
Communication Services | | | – | | | | 30,579,190 | | | | – | | | | 30,579,190 | |
| | | | |
Health Care | | | 10,148,387 | | | | 13,960,926 | | | | – | | | | 24,109,313 | |
| | | | |
Information Technology | | | – | | | | 19,389,166 | | | | – | | | | 19,389,166 | |
| | | | |
Materials | | | – | | | | 10,142,409 | | | | – | | | | 10,142,409 | |
| | | | |
Energy | | | – | | | | 10,111,974 | | | | – | | | | 10,111,974 | |
| | | | |
Real Estate | | | – | | | | 2,686,050 | | | | – | | | | 2,686,050 | |
| | | | |
Short-Term Investments | | | | | | | | | | | | | | | | |
| | | | |
Joint Repurchase Agreements | | | – | | | | 5,908,337 | | | | – | | | | 5,908,337 | |
| | | | |
Other Investment Companies | | | 817,652 | | | | – | | | | – | | | | 817,652 | |
| | | | |
| | | | | | | | | | | | | | | | |
| | | | |
Total Investments in Securities | | | $31,668,504 | | | | $265,506,414 | | | | – | | | | $297,174,918 | |
| | | | | | | | | | | | | | | | |
| 1 | An external pricing service is used to reflect any impact on security value due to market movements between the time the Fund valued such foreign securities and the earlier closing of foreign markets. |
For the fiscal year ended October 31, 2019, there were no transfers in or out of Level 3.
The country allocation in the Schedule of Portfolio Investments at October 31, 2019 is as follows:
| | | | |
| Country | | % of Long-Term Investments |
| |
Australia | | | 1.1 | |
| |
Austria | | | 1.0 | |
| |
Belgium | | | 2.3 | |
| |
China | | | 4.8 | |
| |
Denmark | | | 1.5 | |
| |
Finland | | | 2.6 | |
| |
France | | | 10.3 | |
| |
Germany | | | 2.6 | |
| |
Hong Kong | | | 4.6 | |
| |
Italy | | | 2.7 | |
| |
Japan | | | 24.4 | |
| | | | |
| Country | | % of Long-Term Investments |
| |
Macau | | | 0.9 | |
| |
Netherlands | | | 8.7 | |
| |
New Zealand | | | 0.8 | |
| |
Russia | | | 1.7 | |
| |
South Korea | | | 1.6 | |
| |
Spain | | | 5.5 | |
| |
Switzerland | | | 6.9 | |
| |
United Kingdom | | | 14.4 | |
| |
United States | | | 1.6 | |
| |
| | | | |
| | | 100.0 | |
| | | | |
The accompanying notes are an integral part of these financial statements.
106
| | |
| | | Statement of Assets and Liabilities October 31, 2019 |
| | | | | | | | | | | | | | | | | | | | |
| | | AMG
Managers
Fairpointe ESG
Equity Fund | | | AMG
River Road
Focused Absolute
Value Fund | | | AMG
Managers
Montag & Caldwell
Growth Fund | | | AMG
River Road
Dividend All Cap
Value Fund | | | AMG
River Road
Dividend All
Cap
Value Fund II | |
| | | | | |
Assets: | | | | | | | | | | | | | | | | | | | | |
| | | | | |
Investments at value1(including securities on loan valued at $0, $14,351,760, $3,674,230, $95,829,561, and $11,218,792, respectively) | | | $11,999,105 | | | | $146,033,731 | | | | $496,303,234 | | | | $624,364,891 | | | | $63,411,452 | |
| | | | | | | | | | | | | | | | | | | | |
Receivable for investments sold | | | 481,187 | | | | 2,161,837 | | | | — | | | | — | | | | — | |
| | | | | | | | | | | | | | | | | | | | |
Dividend, interest and other receivables | | | 8,793 | | | | 106,936 | | | | 319,554 | | | | 1,251,074 | | | | 136,017 | |
| | | | | | | | | | | | | | | | | | | | |
Receivable for Fund shares sold | | | 195 | | | | 322,938 | | | | 59,202 | | | | 128,822 | | | | 2,852 | |
| | | | | | | | | | | | | | | | | | | | |
Receivable from affiliate | | | 9,286 | | | | 36,686 | | | | — | | | | — | | | | — | |
| | | | | | | | | | | | | | | | | | | | |
Prepaid expenses and other assets | | | 17,069 | | | | 36,981 | | | | 21,474 | | | | 26,526 | | | | 20,867 | |
| | | | | | | | | | | | | | | | | | | | |
| | | | | |
Total assets | | | 12,515,635 | | | | 148,699,109 | | | | 496,703,464 | | | | 625,771,313 | | | | 63,571,188 | |
| | | | | | | | | | | | | | | | | | | | |
| | | | | | | | | | | | | | | | | | | | |
Liabilities: | | | | | | | | | | | | | | | | | | | | |
| | | | | | | | | | | | | | | | | | | | |
Payable upon return of securities loaned | | | — | | | | — | | | | — | | | | 11,684,694 | | | | 1,316,687 | |
| | | | | | | | | | | | | | | | | | | | |
Payable for investments purchased | | | 117,849 | | | | 2,132,714 | | | | — | | | | — | | | | — | |
| | | | | | | | | | | | | | | | | | | | |
Payable for Fund shares repurchased | | | — | | | | 60,023 | | | | 621,852 | | | | 599,302 | | | | — | |
| | | | | | | | | | | | | | | | | | | | |
Accrued expenses: | | | | | | | | | | | | | | | | | | | | |
| | | | | | | | | | | | | | | | | | | | |
Investment advisory and management fees | | | 7,205 | | | | 71,644 | | | | 290,961 | | | | 305,743 | | | | 31,397 | |
| | | | | | | | | | | | | | | | | | | | |
Administrative fees | | | 1,544 | | | | 17,911 | | | | 62,349 | | | | 76,436 | | | | 7,849 | |
| | | | | | | | | | | | | | | | | | | | |
Distribution fees | | | 117 | | | | 3,167 | | | | 15,580 | | | | 16,826 | | | | 455 | |
| | | | | | | | | | | | | | | | | | | | |
Shareholder service fees | | | 823 | | | | 4,771 | | | | 29,096 | | | | 23,311 | | | | 3,467 | |
| | | | | | | | | | | | | | | | | | | | |
Other | | | 28,352 | | | | 40,740 | | | | 105,740 | | | | 84,738 | | | | 35,743 | |
| | | | | | | | | | | | | | | | | | | | |
| | | | | |
Total liabilities | | | 155,890 | | | | 2,330,970 | | | | 1,125,578 | | | | 12,791,050 | | | | 1,395,598 | |
| | | | | | | | | | | | | | | | | | | | |
| | | | | | | | | | | | | | | | | | | | |
| | | | | |
Net Assets | | | $12,359,745 | | | | $146,368,139 | | | | $495,577,886 | | | | $612,980,263 | | | | $62,175,590 | |
| | | | | | | | | | | | | | | | | | | | |
| | | | | | | | | | | | | | | | | | | | |
1Investments at cost | | | $10,940,572 | | | | $134,366,904 | | | | $313,527,616 | | | | $481,708,221 | | | | $50,505,383 | |
The accompanying notes are an integral part of these financial statements.
107
| | |
| | | Statement of Assets and Liabilities(continued) |
| | | | | | | | | | | | | | | | | | | | |
| | | AMG
Managers
Fairpointe ESG
Equity Fund | | | AMG
River Road
Focused Absolute
Value Fund | | | AMG
Managers
Montag & Caldwell
Growth Fund | | | AMG
River Road
Dividend All Cap
Value Fund | | | AMG
River Road
Dividend All
Cap
Value Fund II | |
| | | | | |
Net Assets Represent: | | | | | | | | | | | | | | | | | | | | |
| | | | | |
Paid-in capital | | | $11,508,660 | | | | $132,223,563 | | | | $271,503,061 | | | | $441,753,719 | | | | $46,815,138 | |
| | | | | | | | | | | | | | | | | | | | |
| | | | | |
Total distributable earnings | | | 851,085 | | | | 14,144,576 | | | | 224,074,825 | | | | 171,226,544 | | | | 15,360,452 | |
| | | | | | | | | | | | | | | | | | | | |
| | | | | |
Net Assets | | | $12,359,745 | | | | $146,368,139 | | | | $495,577,886 | | | | $612,980,263 | | | | $62,175,590 | |
| | | | | | | | | | | | | | | | | | | | |
| | | | | |
Class N: | | | | | | | | | | | | | | | | | | | | |
| | | | | | | | | | | | | | | | | | | | |
| | | | | |
Net Assets | | | $632,179 | | | | $15,283,593 | | | | $166,353,314 | | | | $79,811,103 | | | | $2,224,177 | |
| | | | | | | | | | | | | | | | | | | | |
Shares outstanding | | | 55,261 | | | | 1,207,758 | | | | 8,603,535 | | | | 6,469,074 | | | | 166,812 | |
| | | | | | | | | | | | | | | | | | | | |
| | | | | |
Net asset value, offering and redemption price per share | | | $11.44 | | | | $12.65 | | | | $19.34 | | | | $12.34 | | | | $13.33 | |
| | | | | | | | | | | | | | | | | | | | |
| | | | | | | | | | | | | | | | | | | | |
Class I: | | | | | | | | | | | | | | | | | | | | |
| | | | | | | | | | | | | | | | | | | | |
| | | | | |
Net Assets | | | $11,727,566 | | | | $130,927,964 | | | | $329,224,572 | | | | $533,105,837 | | | | $59,606,357 | |
| | | | | | | | | | | | | | | | | | | | |
| | | | | | | | | | | | | | | | | | | | |
Shares outstanding | | | 1,030,815 | | | | 10,291,768 | | | | 16,915,561 | | | | 43,231,989 | | | | 4,459,394 | |
| | | | | | | | | | | | | | | | | | | | |
| | | | | |
Net asset value, offering and redemption price per share | | | $11.38 | | | | $12.72 | | | | $19.46 | | | | $12.33 | | | | $13.37 | |
| | | | | | | | | | | | | | | | | | | | |
| | | | | | | | | | | | | | | | | | | | |
Class Z: | | | | | | | | | | | | | | | | | | | | |
| | | | | | | | | | | | | | | | | | | | |
| | | | | |
Net Assets | | | — | | | | $156,582 | | | | — | | | | $63,323 | | | | $345,056 | |
| | | | | | | | | | | | | | | | | | | | |
| | | | | | | | | | | | | | | | | | | | |
Shares outstanding | | | — | | | | 12,305 | | | | — | | | | 5,134 | | | | 25,808 | |
| | | | | | | | | | | | | | | | | | | | |
| | | | | |
Net asset value, offering and redemption price per share | | | — | | | | $12.73 | | | | — | | | | $12.33 | | | | $13.37 | |
| | | | | | | | | | | | | | | | | | | | |
The accompanying notes are an integral part of these financial statements.
108
| | |
| | | Statement of Assets and Liabilities(continued) |
| | | | | | | | | | | | | | | | | | | | |
| | | AMG
Managers
Fairpointe
Mid
Cap Fund | | | AMG
Managers
LMCG Small
Cap
Growth Fund | | | AMG
River Road
Small-Mid Cap
Value Fund | | | AMG
River Road
Small Cap
Value Fund | | | AMG Managers
Silvercrest
Small
Cap Fund | |
| | | | | |
Assets: | | | | | | | | | | | | | | | | | | | | |
| | | | | | | | | | | | | | | | | | | | |
Investments at value1(including securities on loan valued at $0, $6,133,357, $21,932,208, $46,261,890, and $36,337,666, respectively) | | | $1,686,523,991 | | | | $47,309,109 | | | | $170,701,447 | | | | $406,956,386 | | | | $224,254,293 | |
| | | | | | | | | | | | | | | | | | | | |
Receivable for investments sold | | | 10,085,255 | | | | 3,278,981 | | | | 759,232 | | | | 3,871,585 | | | | 441,617 | |
| | | | | | | | | | | | | | | | | | | | |
Dividend, interest and other receivables | | | 701,521 | | | | 8,644 | | | | 30,976 | | | | 111,941 | | | | 64,448 | |
| | | | | | | | | | | | | | | | | | | | |
Receivable for Fund shares sold | | | 1,201,660 | | | | 1,191 | | | | 2,529,200 | | | | 1,041,895 | | | | 82,819 | |
| | | | | | | | | | | | | | | | | | | | |
Receivable from affiliate | | | — | | | | 3,960 | | | | 7,680 | | | | — | | | | 9,295 | |
| | | | | | | | | | | | | | | | | | | | |
Prepaid expenses and other assets | | | 43,948 | | | | 19,176 | | | | 24,600 | | | | 21,415 | | | | 12,907 | |
| | | | | | | | | | | | | | | | | | | | |
| | | | | |
Total assets | | | 1,698,556,375 | | | | 50,621,061 | | | | 174,053,135 | | | | 412,003,222 | | | | 224,865,379 | |
| | | | | | | | | | | | | | | | | | | | |
Liabilities: | | | | | | | | | | | | | | | | | | | | |
| | | | | | | | | | | | | | | | | | | | |
Payable upon return of securities loaned | | | — | | | | 849,584 | | | | — | | | | 1,039,716 | | | | — | |
| | | | | | | | | | | | | | | | | | | | |
Payable for investments purchased | | | 14,192,661 | | | | 139,336 | | | | 3,386,387 | | | | 5,913,986 | | | | — | |
| | | | | | | | | | | | | | | | | | | | |
Payable for Fund shares repurchased | | | 14,031,774 | | | | 1,483,343 | | | | 19,256 | | | | 135,425 | | | | 72,467 | |
| | | | | | | | | | | | | | | | | | | | |
Line of credit payable | | | — | | | | 2,719,390 | | | | — | | | | — | | | | — | |
| | | | | | | | | | | | | | | | | | | | |
Accrued expenses: | | | | | | | | | | | | | | | | | | | | |
| | | | | | | | | | | | | | | | | | | | |
Investment advisory and management fees | | | 874,934 | | | | 48,609 | | | | 101,234 | | | | 262,611 | | | | 167,787 | |
| | | | | | | | | | | | | | | | | | | | |
Administrative fees | | | 212,945 | | | | 8,101 | | | | 20,247 | | | | 49,239 | | | | 27,965 | |
| | | | | | | | | | | | | | | | | | | | |
Distribution fees | | | 112,577 | | | | 6,529 | | | | 3,898 | | | | 5,790 | | | | 9,943 | |
| | | | | | | | | | | | | | | | | | | | |
Shareholder service fees | | | 110,356 | | | | 3,781 | | | | 9,087 | | | | 41,411 | | | | 10,912 | |
| | | | | | | | | | | | | | | | | | | | |
Other | | | 281,198 | | | | 37,460 | | | | 40,089 | | | | 61,474 | | | | 49,693 | |
| | | | | | | | | | | | | | | | | | | | |
| | | | | |
Total liabilities | | | 29,816,445 | | | | 5,296,133 | | | | 3,580,198 | | | | 7,509,652 | | | | 338,767 | |
| | | | | | | | | | | | | | | | | | | | |
| | | | | |
Net Assets | | | $1,668,739,930 | | | | $45,324,928 | | | | $170,472,937 | | | | $404,493,570 | | | | $224,526,612 | |
1Investments at cost | | | $1,405,600,442 | | | | $42,863,052 | | | | $160,060,508 | | | | $358,065,639 | | | | $207,441,340 | |
The accompanying notes are an integral part of these financial statements.
109
| | |
| | | Statement of Assets and Liabilities(continued) |
| | | | | | | | | | | | | | | | | | | | |
| | | AMG
Managers
Fairpointe
Mid
Cap Fund | | | AMG
Managers
LMCG Small
Cap
Growth Fund | | | AMG
River Road
Small-Mid Cap
Value Fund | | | AMG
River Road
Small Cap
Value Fund | | | AMG Managers
Silvercrest
Small
Cap Fund | |
| | | | | |
Net Assets Represent: | | | | | | | | | | | | | | | | | | | | |
| | | | | |
Paid-in capital | | | $1,315,475,578 | | | | $44,207,214 | | | | $157,640,690 | | | | $331,872,666 | | | | $203,338,019 | |
| | | | | |
Total distributable earnings | | | 353,264,352 | | | | 1,117,714 | | | | 12,832,247 | | | | 72,620,904 | | | | 21,188,593 | |
| | | | | |
Net Assets | | | $1,668,739,930 | | | | $45,324,928 | | | | $170,472,937 | | | | $404,493,570 | | | | $224,526,612 | |
| | | | | |
Class N: | | | | | | | | | | | | | | | | | | | | |
| | | | | |
Net Assets | | | $518,353,584 | | | | $30,716,684 | | | | $24,669,298 | | | | $29,963,101 | | | | $28,846,675 | |
| | | | | |
Shares outstanding | | | 14,830,455 | | | | 1,804,252 | | | | 3,147,207 | | | | 2,305,579 | | | | 1,806,375 | |
| | | | | |
Net asset value, offering and redemption price per share | | | $34.95 | | | | $17.02 | | | | $7.84 | | | | $13.00 | | | | $15.97 | |
| | | | | |
Class I: | | | | | | | | | | | | | | | | | | | | |
| | | | | |
Net Assets | | | $1,102,479,401 | | | | $14,608,244 | | | | $145,620,163 | | | | $374,344,334 | | | | $159,069,478 | |
| | | | | |
Shares outstanding | | | 30,654,995 | | | | 841,785 | | | | 18,113,927 | | | | 28,144,654 | | | | 9,826,614 | |
| | | | | |
Net asset value, offering and redemption price per share | | | $35.96 | | | | $17.35 | | | | $8.04 | | | | $13.30 | | | | $16.19 | |
| | | | | |
Class Z: | | | | | | | | | | | | | | | | | | | | |
| | | | | |
Net Assets | | | $47,906,945 | | | | — | | | | $183,476 | | | | $186,135 | | | | $36,610,459 | |
| | | | | |
Shares outstanding | | | 1,332,492 | | | | — | | | | 22,830 | | | | 13,999 | | | | 2,262,389 | |
| | | | | |
Net asset value, offering and redemption price per share | | | $35.95 | | | | — | | | | $8.04 | | | | $13.30 | | | | $16.18 | |
The accompanying notes are an integral part of these financial statements.
110
| | |
| | | Statement of Assets and Liabilities(continued) |
| | | | | | | | | | | | |
| | | AMG Managers
DoubleLine
Core Plus
Bond Fund | | | AMG
River Road
Long-Short Fund | | | AMG
Managers
Pictet
International Fund | |
| | | |
Assets: | | | | | | | | | | | | |
| | | | | | | | | | | | |
Investments at value1(including securities on loan valued at $6,202,046, $0, and $5,603,327, respectively) | | | $655,404,194 | | | | $26,363,515 | | | | $297,174,918 | |
| | | | | | | | | | | | |
Affiliated Investments at value2 | | | 30,570,752 | | | | — | | | | — | |
| | | | | | | | | | | | |
Cash | | | 4,170 | | | | — | | | | — | |
| | | | | | | | | | | | |
Foreign currency3 | | | — | | | | 27,266 | | | | 18,697 | |
| | | | | | | | | | | | |
Receivable for investments sold | | | 12,136,401 | | | | 606,977 | | | | 2,153,079 | |
| | | | | | | | | | | | |
Segregated cash | | | — | | | | 8,041,931 | | | | — | |
| | | | | | | | | | | | |
Dividend, interest and other receivables | | | 4,038,819 | | | | 10,537 | | | | 2,619,375 | |
| | | | | | | | | | | | |
Receivable for Fund shares sold | | | 1,101,746 | | | | 12,461 | | | | 71,114 | |
| | | | | | | | | | | | |
Receivable from affiliate | | | 50,127 | | | | 9,157 | | | | — | |
| | | | | | | | | | | | |
Prepaid expenses and other assets | | | 33,807 | | | | 11,463 | | | | 23,259 | |
| | | | | | | | | | | | |
| | | |
Total assets | | | 703,340,016 | | | | 35,083,307 | | | | 302,060,442 | |
| | | | | | | | | | | | |
Liabilities: | | | | | | | | | | | | |
| | | | | | | | | | | | |
Payable upon return of securities loaned | | | 6,806,448 | | | | — | | | | 5,908,337 | |
| | | | | | | | | | | | |
Payable for investments purchased | | | 2,258,179 | | | | 1,565,471 | | | | 29,379 | |
| | | | | | | | | | | | |
Payable for delayed delivery investments purchased | | | 22,737,542 | | | | — | | | | — | |
| | | | | | | | | | | | |
Payable for Fund shares repurchased | | | 276,925 | | | | 72,525 | | | | 292,409 | |
| | | | | | | | | | | | |
Interest and dividends payable | | | — | | | | 11,880 | | | | — | |
| | | | | | | | | | | | |
Unrealized depreciation on unfunded loan commitments | | | 69 | | | | — | | | | — | |
| | | | | | | | | | | | |
Accrued expenses: | | | | | | | | | | | | |
| | | | | | | | | | | | |
Investment advisory and management fees | | | 255,893 | | | | 18,303 | | | | 297,590 | |
| | | | | | | | | | | | |
Administrative fees | | | 85,298 | | | | 3,230 | | | | 36,964 | |
| | | | | | | | | | | | |
Distribution fees | | | 18,264 | | | | 549 | | | | 17,331 | |
| | | | | | | | | | | | |
Shareholder service fees | | | 45,324 | | | | 1,717 | | | | 20,344 | |
| | | | | | | | | | | | |
Other | | | 168,830 | | | | 35,949 | | | | 88,770 | |
| | | | | | | | | | | | |
Securities sold short, at value4 | | | — | | | | 7,779,619 | | | | — | |
| | | | | | | | | | | | |
| | | |
Total liabilities | | | 32,652,772 | | | | 9,489,243 | | | | 6,691,124 | |
| | | | | | | | | | | | |
| | | |
Net Assets | | | $670,687,244 | | | | $25,594,064 | | | | $295,369,318 | |
| | | | | | | | | | | | |
1Investments at cost | | | $638,342,591 | | | | $25,596,758 | | | | $288,743,185 | |
| | | | | | | | | | | | |
2Affiliated Investments at cost | | | $30,401,657 | | | | — | | | | — | |
| | | | | | | | | | | | |
3Foreign currency at cost | | | — | | | | $27,001 | | | | $18,647 | |
| | | | | | | | | | | | |
4Proceeds | | | — | | | | $7,623,030 | | | | — | |
The accompanying notes are an integral part of these financial statements.
111
| | |
| | | Statement of Assets and Liabilities(continued) |
| | | | | | | | | | | | |
| | | AMG Managers
DoubleLine
Core Plus
Bond Fund | | | AMG
River Road
Long-Short Fund | | | AMG
Managers
Pictet
International Fund | |
| | | |
Net Assets Represent: | | | | | | | | | | | | |
| | | | | | | | | | | | |
Paid-in capital | | | $669,191,465 | | | | $23,323,880 | | | | $379,360,342 | |
| | | | | | | | | | | | |
Total distributable earnings (loss) | | | 1,495,779 | | | | 2,270,184 | | | | (83,991,024 | ) |
| | | | | | | | | | | | |
| | | |
Net Assets | | | $670,687,244 | | | | $25,594,064 | | | | $295,369,318 | |
| | | | | | | | | | | | |
| | | |
Class N: | | | | | | | | | | | | |
| | | | | | | | | | | | |
| | | |
Net Assets | | | $82,856,338 | | | | $2,653,913 | | | | $87,997,508 | |
| | | | | | | | | | | | |
| | | | | | | | | | | | |
Shares outstanding | | | 7,712,947 | | | | 203,263 | | | | 9,203,707 | |
| | | | | | | | | | | | |
| | | |
Net asset value, offering and redemption price per share | | | $10.74 | | | | $13.06 | | | | $9.56 | |
| | | | | | | | | | | | |
| | | | | | | | | | | | |
Class I: | | | | | | | | | | | | |
| | | | | | | | | | | | |
| | | |
Net Assets | | | $585,358,091 | | | | $22,856,322 | | | | $158,317,382 | |
| | | | | | | | | | | | |
| | | | | | | | | | | | |
Shares outstanding | | | 54,524,331 | | | | 1,718,960 | | | | 16,459,311 | |
| | | | | | | | | | | | |
| | | |
Net asset value, offering and redemption price per share | | | $10.74 | | | | $13.30 | | | | $9.62 | |
| | | | | | | | | | | | |
| | | | | | | | | | | | |
Class Z: | | | | | | | | | | | | |
| | | | | | | | | | | | |
| | | |
Net Assets | | | $2,472,815 | | | | $83,829 | | | | $49,054,428 | |
| | | | | | | | | | | | |
| | | | | | | | | | | | |
Shares outstanding | | | 230,141 | | | | 6,292 | | | | 5,112,247 | |
| | | | | | | | | | | | |
| | | |
Net asset value, offering and redemption price per share | |
| $10.74
|
| |
| $13.32
|
| |
| $9.60
|
|
| | | | | | | | | | | | |
The accompanying notes are an integral part of these financial statements.
112
| | |
| | | Statement of Operations For the fiscal year ended October 31, 2019 |
| | | | | | | | | | | | | | | | | | | | |
| | | AMG
Managers
Fairpointe ESG
Equity Fund | | | AMG
River Road
Focused Absolute
Value Fund | | | AMG
Managers
Montag & Caldwell
Growth Fund | | | AMG
River Road
Dividend All Cap
Value Fund | | | AMG
River Road
Dividend All
Cap
Value Fund II | |
| | | | | |
Investment Income: | | | | | | | | | | | | | | | | | | | | |
| | | | | | | | | | | | | | | | | | | | |
Dividend income | | | $247,660 | | | | $1,033,879 | | | | $5,447,517 | | | | $24,512,320 | | | | $2,543,218 | |
| | | | | | | | | | | | | | | | | | | | |
Securities lending income | | | — | | | | 10,663 | | | | 8,555 | | | | 132,580 | | | | 8,649 | |
| | | | | | | | | | | | | | | | | | | | |
Foreign withholding tax | | | (1,585 | ) | | | (8,224 | ) | | | — | | | | (34,567 | ) | | | (3,827 | ) |
| | | | | | | | | | | | | | | | | | | | |
| | | | | |
Total investment income | | | 246,075 | | | | 1,036,318 | | | | 5,456,072 | | | | 24,610,333 | | | | 2,548,040 | |
. | | | | | | | | | | | | | | | | | | | | |
| | | | | | | | | | | | | | | | | | | | |
Expenses: | | | | | | | | | | | | | | | | | | | | |
| | | | | | | | | | | | | | | | | | | | |
Investment advisory and management fees | | | 81,768 | | | | 471,299 | | | | 3,610,447 | | | | 4,289,882 | | | | 444,438 | |
| | | | | | | | | | | | | | | | | | | | |
Administrative fees | | | 17,522 | | | | 117,825 | | | | 773,667 | | | | 1,072,471 | | | | 111,109 | |
| | | | | | | | | | | | | | | | | | | | |
Distribution fees - Class N | | | 1,487 | | | | 30,770 | | | | 294,319 | | | | 222,638 | | | | 5,305 | |
| | | | | | | | | | | | | | | | | | | | |
Distribution fees - Class R | | | — | | | | — | | | | 1,814 | | | | — | | | | — | |
| | | | | | | | | | | | | | | | | | | | |
Shareholder servicing fees - Class N | | | 549 | | | | 4,923 | | | | 117,021 | | | | 62,339 | | | | 2,389 | |
| | | | | | | | | | | | | | | | | | | | |
Shareholder servicing fees - Class I | | | 8,796 | | | | 26,451 | | | | 243,770 | | | | 306,613 | | | | 46,550 | |
| | | | | | | | | | | | | | | | | | | | |
Shareholder servicing fees - Class R | | | — | | | | — | | | | 254 | | | | — | | | | — | |
| | | | | | | | | | | | | | | | | | | | |
Registration fees | | | 38,225 | | | | 51,925 | | | | 55,592 | | | | 65,147 | | | | 52,610 | |
| | | | | | | | | | | | | | | | | | | | |
Professional fees | | | 23,108 | | | | 34,316 | | | | 71,924 | | | | 76,678 | | | | 30,468 | |
| | | | | | | | | | | | | | | | | | | | |
Custodian fees | | | 17,597 | | | | 23,783 | | | | 46,492 | | | | 62,796 | | | | 22,404 | |
| | | | | | | | | | | | | | | | | | | | |
Reports to shareholders | | | 1,453 | | | | 10,186 | | | | 45,020 | | | | 48,921 | | | | 5,461 | |
| | | | | | | | | | | | | | | | | | | | |
Trustee fees and expenses | | | 1,043 | | | | 5,870 | | | | 50,346 | | | | 67,795 | | | | 7,114 | |
| | | | | | | | | | | | | | | | | | | | |
Transfer agent fees | | | 518 | | | | 2,437 | | | | 54,326 | | | | 24,031 | | | | 2,538 | |
| | | | | | | | | | | | | | | | | | | | |
Interest expense | | | — | | | | 513 | | | | 1,609 | | | | 31,457 | | | | 2,446 | |
| | | | | | | | | | | | | | | | | | | | |
Miscellaneous | | | 2,044 | | | | 6,471 | | | | 27,772 | | | | 35,949 | | | | 5,598 | |
| | | | | | | | | | | | | | | | | | | | |
| | | | | |
Total expenses before offsets | | | 194,110 | | | | 786,769 | | | | 5,394,373 | | | | 6,366,717 | | | | 738,430 | |
. | | | | | | | | | | | | | | | | | | | | |
| | | | | | | | | | | | | | | | | | | | |
Expense reimbursements | | | (87,493 | ) | | | (166,409 | ) | | | — | | | | — | | | | — | |
| | | | | | | | | | | | | | | | | | | | |
Expense reductions | | | — | | | | (15,930 | ) | | | (37,628 | ) | | | (48,571 | ) | | | (4,605 | ) |
| | | | | | | | | | | | | | | | | | | | |
| | | | | |
Net expenses | | | 106,617 | | | | 604,430 | | | | 5,356,745 | | | | 6,318,146 | | | | 733,825 | |
. | | | | | | | | | | | | | | | | | | | | |
| | | | | | | | | | | | | | | | | | | | |
| | | | | |
Net investment income | | | 139,458 | | | | 431,888 | | | | 99,327 | | | | 18,292,187 | | | | 1,814,215 | |
. | | | | | | | | | | | | | | | | | | | | |
| | | | | | | | | | | | | | | | | | | | |
Net Realized and Unrealized Gain: | | | | | | | | | | | | | | | | | | | | |
| | | | | | | | | | | | | | | | | | | | |
Net realized gain (loss) on investments | | | (96,691 | ) | | | 2,411,489 | | | | 48,983,504 | | | | 38,253,975 | | | | 2,934,510 | |
| | | | | | | | | | | | | | | | | | | | |
Net change in unrealized appreciation/depreciation on investments | | | 297,758 | | | | 10,556,910 | | | | 33,325,277 | | | | 8,086,074 | | | | 1,193,672 | |
| | | | | | | | | | | | | | | | | | | | |
| | | | | |
Net realized and unrealized gain | | | 201,067 | | | | 12,968,399 | | | | 82,308,781 | | | | 46,340,049 | | | | 4,128,182 | |
. | | | | | | | | | | | | | | | | | | | | |
| | | | | | | | | | | | | | | | | | | | |
| | | | | |
Net increase in net assets resulting from operations | |
| $340,525
|
| |
| $13,400,287
|
| |
| $82,408,108
|
| |
| $64,632,236
|
| |
| $5,942,397
|
|
. | | | | | | | | | | | | | | | | | | | | |
The accompanying notes are an integral part of these financial statements.
113
| | |
| | | Statement of Operations(continued) |
| | | | | | | | | | | | | | | | | | | | |
| | | AMG
Managers
Fairpointe
Mid
Cap Fund | | | AMG
Managers
LMCG Small
Cap
Growth Fund | | | AMG
River Road
Small-Mid Cap
Value Fund | | | AMG
River Road
Small Cap
Value Fund | | | AMG Managers
Silvercrest
Small
Cap Fund | |
| | | | | |
Investment Income: | | | | | | | | | | | | | | | | | | | | |
| | | | | | | | | | | | | | | | | | | | |
Dividend income | | | $47,898,919 | 1 | | | $312,906 | | | | $951,885 | | | | $3,341,503 | | | | $3,290,121 | |
| | | | | | | | | | | | | | | | | | | | |
Interest income | | | — | | | | — | | | | — | | | | — | | | | 71 | |
| | | | | | | | | | | | | | | | | | | | |
Securities lending income | | | — | | | | 346,892 | | | | 54,850 | | | | 278,925 | | | | 35,895 | |
| | | | | | | | | | | | | | | | | | | | |
Foreign withholding tax | | | (162,920 | ) | | | — | | | | — | | | | (42,727 | ) | | | — | |
| | | | | | | | | | | | | | | | | | | | |
| | | | | |
Total investment income | | | 47,735,999 | | | | 659,798 | | | | 1,006,735 | | | | 3,577,701 | | | | 3,326,087 | |
| | | | | |
| | | | | | | | | | | | | | | | | | | | |
| | | | | | | | | | | | | | | | | | | | |
Expenses: | | | | | | | | | | | | | | | | | | | | |
| | | | | | | | | | | | | | | | | | | | |
Investment advisory and management fees | | | 13,933,276 | | | | 722,557 | | | | 722,754 | | | | 2,763,200 | | | | 1,998,083 | |
| | | | | | | | | | | | | | | | | | | | |
Administrative fees | | | 3,420,819 | | | | 120,426 | | | | 144,551 | | | | 518,100 | | | | 333,014 | |
| | | | | | | | | | | | | | | | | | | | |
Distribution fees - Class N | | | 1,709,973 | | | | 72,308 | | | | 39,798 | | | | 66,079 | | | | 65,356 | |
| | | | | | | | | | | | | | | | | | | | |
Shareholder servicing fees - Class N | | | 550,619 | | | | 24,832 | | | | 9,818 | | | | 26,432 | | | | 18,474 | |
| | | | | | | | | | | | | | | | | | | | |
Shareholder servicing fees - Class I | | | 1,131,080 | | | | 31,367 | | | | 43,134 | | | | 244,241 | | | | 112,817 | |
| | | | | | | | | | | | | | | | | | | | |
Reports to shareholders | | | 379,828 | | | | 4,925 | | | | 11,158 | | | | 38,640 | | | | 24,186 | |
| | | | | | | | | | | | | | | | | | | | |
Trustee fees and expenses | | | 230,293 | | | | 7,867 | | | | 7,687 | | | | 31,429 | | | | 20,755 | |
| | | | | | | | | | | | | | | | | | | | |
Professional fees | | | 179,302 | | | | 30,163 | | | | 30,069 | | | | 48,191 | | | | 39,609 | |
| | | | | | | | | | | | | | | | | | | | |
Custodian fees | | | 157,345 | | | | 23,216 | | | | 28,588 | | | | 39,920 | | | | 31,528 | |
| | | | | | | | | | | | | | | | | | | | |
Registration fees | | | 99,300 | | | | 41,541 | | | | 60,568 | | | | 64,435 | | | | 57,484 | |
| | | | | | | | | | | | | | | | | | | | |
Transfer agent fees | | | 90,531 | | | | 11,089 | | | | 4,133 | | | | 11,380 | | | | 7,000 | |
| | | | | | | | | | | | | | | | | | | | |
Interest expense | | | 12,309 | | | | 5,357 | | | | 1,096 | | | | — | | | | 912 | |
| | | | | | | | | | | | | | | | | | | | |
Miscellaneous | | | 110,681 | | | | 5,161 | | | | 7,413 | | | | 18,247 | | | | 12,631 | |
| | | | | | | | | | | | | | | | | | | | |
Repayment of prior reimbursements | | | — | | | | — | | | | 5,905 | | | | — | | | | — | |
| | | | | | | | | | | | | | | | | | | | |
| | | | | |
Total expenses before offsets | | | 22,005,356 | | | | 1,100,809 | | | | 1,116,672 | | | | 3,870,294 | | | | 2,721,849 | |
| | | | | |
| | | | | | | | | | | | | | | | | | | | |
| | | | | | | | | | | | | | | | | | | | |
Expense reimbursements | | | — | | | | (140,019 | ) | | | (20,606 | ) | | | — | | | | (126,590 | ) |
| | | | | | | | | | | | | | | | | | | | |
Expense reductions | | | — | | | | (6,808 | ) | | | (27,804 | ) | | | (38,643 | ) | | | (63,499 | ) |
| | | | | | | | | | | | | | | | | | | | |
| | | | | |
Net expenses | | | 22,005,356 | | | | 953,982 | | | | 1,068,262 | | | | 3,831,651 | | | | 2,531,760 | |
| | | | | |
| | | | | | | | | | | | | | | | | | | | |
| | | | | | | | | | | | | | | | | | | | |
| | | | | |
Net investment income (loss) | | | 25,730,643 | | | | (294,184 | ) | | | (61,527 | ) | | | (253,950 | ) | | | 794,327 | |
| | | | | |
| | | | | | | | | | | | | | | | | | | | |
| | | | | | | | | | | | | | | | | | | | |
Net Realized and Unrealized Gain (Loss): | | | | | | | | | | | | | | | | | | | | |
| | | | | | | | | | | | | | | | | | | | |
Net realized gain (loss) on investments | | | 150,936,113 | | | | (780,765 | ) | | | 2,556,562 | | | | 34,643,370 | 2 | | | 4,890,467 | |
| | | | | | | | | | | | | | | | | | | | |
Net change in unrealized appreciation/depreciation on investments | | | (163,566,555 | ) | | | 17,124 | | | | 7,741,087 | | | | 2,456,593 | | | | 8,668,319 | |
| | | | | | | | | | | | | | | | | | | | |
| | | | | |
Net realized and unrealized gain (loss) | | | (12,630,442 | ) | | | (763,641 | ) | | | 10,297,649 | | | | 37,099,963 | | | | 13,558,786 | |
| | | | | |
| | | | | | | | | | | | | | | | | | | | |
| | | | | | | | | | | | | | | | | | | | |
| | | | | |
Net increase (decrease) in net assets resulting from operations | | | $13,100,201 | | | | $(1,057,825 | ) | | | $10,236,122 | | | | $36,846,013 | | | | $14,353,113 | |
| | | | | |
| | | | | | | | | | | | | | | | | | | | |
| | | | | | | | | | | | | | | | | | | | |
1 Includesnon-recurring dividends of $7,157,625.
2 Includes realized gains of $10,333,328 relating to a redemptionin-kind. See note 1(g) of the Notes to Financial Statement.
The accompanying notes are an integral part of these financial statements.
114
| | |
| | | Statement of Operations(continued) |
| | | | | | | | | | | | |
| | | AMG Managers
DoubleLine
Core Plus
Bond Fund | | | AMG
River Road
Long-Short Fund | | | AMG
Managers
Pictet
International Fund | |
| | | |
Investment Income: | | | | | | | | | | | | |
| | | |
Dividend income | | | $408,599 | | | | $353,971 | | | | $15,569,425 | |
| | | |
Interest income | | | 25,348,317 | | | | 142,934 | | | | — | |
| | | |
Dividends from affiliated securities | | | 254,142 | | | | — | | | | — | |
| | | |
Securities lending income | | | 53,116 | | | | — | | | | 95,099 | |
| | | |
Foreign withholding tax | | | (2,745 | ) | | | (2,028 | ) | | | (1,327,365 | ) |
| | | |
Total investment income | | | 26,061,429 | | | | 494,877 | | | | 14,337,159 | |
| | | | | | | | | | | | |
Expenses: | | | | | | | | | | | | |
| | | |
Investment advisory and management fees | | | 2,804,696 | | | | 212,680 | | | | 4,775,098 | |
| | | |
Administrative fees | | | 934,899 | | | | 37,532 | | | | 1,023,235 | |
| | | |
Distribution fees - Class N | | | 225,781 | | | | 7,946 | | | | 229,960 | |
| | | |
Shareholder servicing fees - Class N | | | 72,250 | | | | 2,543 | | | | 101,183 | |
| | | |
Shareholder servicing fees - Class I | | | 420,770 | | | | 17,411 | | | | 178,234 | |
| | | |
Custodian fees | | | 207,663 | | | | 18,997 | | | | 217,075 | |
| | | |
Professional fees | | | 130,382 | | | | 55,950 | | | | 65,509 | |
| | | |
Registration fees | | | 77,355 | | | | 50,578 | | | | 125,211 | |
| | | |
Trustee fees and expenses | | | 57,610 | | | | 2,437 | | | | 89,984 | |
| | | |
Transfer agent fees | | | 18,295 | | | | 1,080 | | | | 54,581 | |
| | | |
Reports to shareholders | | | 18,196 | | | | 2,948 | | | | 95,030 | |
| | | |
Dividend expense | | | — | | | | 236,202 | | | | — | |
| | | |
Interest expense | | | — | | | | 7,030 | | | | 99,493 | |
| | | |
Miscellaneous | | | 33,733 | | | | 3,253 | | | | 31,771 | |
| | | |
Total expenses before offsets | | | 5,001,630 | | | | 656,587 | | | | 7,086,364 | |
| | | | | | | | | | | | |
| | | |
Expense reimbursements | | | (345,605 | ) | | | (105,218 | ) | | | — | |
| | | |
Expense reductions | | | — | | | | (3,406 | ) | | | — | |
| | | |
Fee waivers | | | (135,303 | ) | | | — | | | | — | |
| | | |
Net expenses | | | 4,520,722 | | | | 547,963 | | | | 7,086,364 | |
| | | | | | | | | | | | |
| | | | | | | | | | | | |
| | | |
Net investment income (loss) | | | 21,540,707 | | | | (53,086 | ) | | | 7,250,795 | |
| | | | | | | | | | | | |
| | | |
Net Realized and Unrealized Gain: | | | | | | | | | | | | |
| | | |
Net realized gain (loss) on investments | | | (987,474 | ) | | | 2,390,980 | | | | (77,264,790 | ) |
| | | |
Net realized gain on short sales | | | — | | | | 45,361 | | | | — | |
| | | |
Net realized loss on foreign currency transactions | | | — | | | | (1,522 | ) | | | (354,286 | ) |
| | | |
Net change in unrealized appreciation/depreciation on investments | | | 31,006,616 | | | | 944,365 | | | | 91,157,097 | |
| | | |
Net change in unrealized appreciation/depreciation on affiliated investments | | | 1,230,972 | | | | — | | | | — | |
| | | |
Net change in unrealized appreciation/depreciation on short sales | | | — | | | | (138,692 | ) | | | — | |
| | | |
Net change in unrealized appreciation/depreciation on foreign currency translations | | | — | | | | 2,635 | | | | 38,353 | |
| | | |
Net change in unrealized appreciation/depreciation on unfunded loan commitments | | | (69 | ) | | | — | | | | — | |
| | | |
Net realized and unrealized gain | | | 31,250,045 | | | | 3,243,127 | | | | 13,576,374 | |
| | | | | | | | | | | | |
| | | | | | | | | | | | |
| | | |
Net increase in net assets resulting from operations | | | $52,790,752 | | | | $3,190,041 | | | | $20,827,169 | |
| | | | | | | | | | | | |
The accompanying notes are an integral part of these financial statements.
115
| | |
| | | Statements of Changes in Net Assets For the fiscal years ended October 31, |
| | | | | | | | | | | | | | | | | | | | | | | | |
| | | AMG
Managers
Fairpointe ESG
Equity Fund | | | AMG
River Road
Focused Absolute
Value Fund | | | AMG
Managers
Montag & Caldwell
Growth Fund | |
| | | | | | |
| | | 2019 | | | 2018 | | | 2019 | | | 2018 | | | 2019 | | | 2018 | |
| | | | | | |
Increase (Decrease) in Net Assets Resulting From Operations: | | | | | | | | | | | | | | | | | | | | | | | | |
| | | | | | |
Net investment income | | | $139,458 | | | | $99,987 | | | | $431,888 | | | | $162,960 | | | | $99,327 | | | | $754,095 | |
| | | | | | |
Net realized gain (loss) on investments | | | (96,691 | ) | | | (65,003 | ) | | | 2,411,489 | | | | 1,739,736 | | | | 48,983,504 | | | | 131,657,896 | |
| | | | | | |
Net change in unrealized appreciation/depreciation on investments | | | 297,758 | | | | (606,423 | ) | | | 10,556,910 | | | | 146,591 | | | | 33,325,277 | | | | (60,460,282 | ) |
| | | | | | |
Net increase (decrease) in net assets resulting from operations | | | 340,525 | | | | (571,439 | ) | | | 13,400,287 | | | | 2,049,287 | | | | 82,408,108 | | | | 71,951,709 | |
| | | | | | | | | | | | | | | | | | | | | | | | |
Distributions to Shareholders: | | | | | | | | | | | | | | | | | | | | | | | | |
| | | | | | | | | | | | | | | | | | | | | | | | |
Class N | | | (6,356 | ) | | | (9,243 | ) | | | (586,698 | ) | | | (584,246 | ) | | | (32,648,158 | ) | | | (21,977,990 | ) |
| | | | | | | | | | | | | | | | | | | | | | | | |
Class I | | | (127,192 | ) | | | (111,123 | ) | | | (1,474,234 | ) | | | (1,352,550 | ) | | | (73,505,569 | ) | | | (53,210,522 | ) |
| | | | | | | | | | | | | | | | | | | | | | | | |
Class R1 | | | — | | | | — | | | | — | | | | — | | | | (119,576 | ) | | | (65,328 | ) |
| | | | | | | | | | | | | | | | | | | | | | | | |
Class Z | | | — | | | | — | | | | (4,375 | ) | | | (4,840 | ) | | | — | | | | — | |
| | | | | | | | | | | | | | | | | | | | | | | | |
| | | | | | |
Total distributions to shareholders | | | (133,548 | ) | | | (120,366 | ) | | | (2,065,307 | ) | | | (1,941,636 | ) | | | (106,273,303 | ) | | | (75,253,840 | ) |
| | | | | | |
Capital Share Transactions:2 | | | | | | | | | | | | | | | | | | | | | | | | |
| | | | | | |
Net increase (decrease) from capital share transactions | | | 1,330,924 | | | | 4,959,826 | | | | 104,854,748 | | | | 5,456,211 | | | | (76,806,232 | ) | | | (302,907,352 | ) |
| | | | | | | | | | | | | | | | | | | | | | | | |
| | | | | | |
Total increase (decrease) in net assets | | | 1,537,901 | | | | 4,268,021 | | | | 116,189,728 | | | | 5,563,862 | | | | (100,671,427 | ) | | | (306,209,483 | ) |
| | | | | | |
Net Assets: | | | | | | | | | | | | | | | | | | | | | | | | |
| | | | | | |
Beginning of year | | | 10,821,844 | | | | 6,553,823 | | | | 30,178,411 | | | | 24,614,549 | | | | 596,249,313 | | | | 902,458,796 | |
| | | | | | |
End of year | | | $12,359,745 | | | | $10,821,844 | | | | $146,368,139 | | | | $30,178,411 | | | | $495,577,886 | | | | $596,249,313 | |
1 Effective May 31, 2019 Class R shares converted to Class N shares.
2 See Note 1(g) of the Notes to Financial Statements.
The accompanying notes are an integral part of these financial statements.
116
| | |
| | | Statements of Changes in Net Assets(continued) For the fiscal years ended October 31, |
| | | | | | | | | | | | | | | | | | | | | | | | |
| | | AMG
River Road
Dividend All Cap
Value Fund | | | AMG
River Road
Dividend All
Cap Value Fund II | | | AMG
Managers
Fairpointe
Mid Cap Fund | |
| | | | | | |
| | | 2019 | | | 2018 | | | 2019 | | | 2018 | | | 2019 | | | 2018 | |
| | | | | | |
Increase (Decrease) in Net Assets Resulting From Operations: | | | | | | | | | | | | | | | | | | | | | | | | |
| | | | | | |
Net investment income | | | $18,292,187 | | | | $18,332,299 | | | | $1,814,215 | | | | $2,277,127 | | | | $25,730,643 | | | | $13,808,060 | |
| | | | | | |
Net realized gain on investments | | | 38,253,975 | | | | 47,243,403 | | | | 2,934,510 | | | | 8,793,061 | | | | 150,936,113 | | | | 178,668,438 | |
| | | | | | |
Net change in unrealized appreciation/depreciation on investments | | | 8,086,074 | | | | (42,248,243 | ) | | | 1,193,672 | | | | (7,291,620 | ) | | | (163,566,555 | ) | | | (208,004,516 | ) |
| | | | | | | | | | | | | | | | | | | | | | | | |
| | | | | | |
Net increase (decrease) in net assets resulting from operations | | | 64,632,236 | | | | 23,327,459 | | | | 5,942,397 | | | | 3,778,568 | | | | 13,100,201 | | | | (15,528,018 | ) |
| | | | | | | | | | | | | | | | | | | | | | | | |
| | | | | | |
Distributions to Shareholders: | | | | | | | | | | | | | | | | | | | | | | | | |
| | | | | | |
Class N | | | (8,009,145 | ) | | | (8,404,188 | ) | | | (292,875 | ) | | | (200,402 | ) | | | (60,784,071 | ) | | | (84,025,015 | ) |
| | | | | | |
Class I | | | (58,453,011 | ) | | | (54,573,572 | ) | | | (10,386,384 | ) | | | (8,474,655 | ) | | | (118,067,003 | ) | | | (168,619,081 | ) |
| | | | | | |
Class Z | | | (5,769 | ) | | | (182,603 | ) | | | (26,316 | ) | | | (23,529 | ) | | | (15,472,072 | ) | | | (7,084,279 | ) |
| | | | | | | | | | | | | | | | | | | | | | | | |
| | | | | | |
Total distributions to shareholders | | | (66,467,925 | ) | | | (63,160,363 | ) | | | (10,705,575 | ) | | | (8,698,586 | ) | | | (194,323,146 | ) | | | (259,728,375 | ) |
| | | | | | | | | | | | | | | | | | | | | | | | |
| | | | | | |
Capital Share Transactions:1 | | | | | | | | | | | | | | | | | | | | | | | | |
| | | | | | | | | | | | | | | | | | | | | | | | |
| | | | | | |
Net decrease from capital share transactions | | | (230,206,314 | ) | | | (39,958,807 | ) | | | (19,852,184 | ) | | | (30,576,474 | ) | | | (1,003,127,045 | ) | | | (841,850,349 | ) |
| | | | | | | | | | | | | | | | | | | | | | | | |
| | | | | | | | | | | | | | | | | | | | | | | | |
| | | | | | |
Total decrease in net assets | | | (232,042,003 | ) | | | (79,791,711 | ) | | | (24,615,362 | ) | | | (35,496,492 | ) | | | (1,184,349,990 | ) | | | (1,117,106,742 | ) |
| | | | | | | | | | | | | | | | | | | | | | | | |
| | | | | | |
Net Assets: | | | | | | | | | | | | | | | | | | | | | | | | |
| | | | | | |
Beginning of year | | | 845,022,266 | | | | 924,813,977 | | | | 86,790,952 | | | | 122,287,444 | | | | 2,853,089,920 | | | | 3,970,196,662 | |
| | | | | | | | | | | | | | | | | | | | | | | | |
| | | | | | |
End of year | | | $612,980,263 | | | | $845,022,266 | | | | $62,175,590 | | | | $86,790,952 | | | | $1,668,739,930 | | | | $2,853,089,920 | |
| | | | | | | | | | | | | | | | | | | | | | | | |
1See Note 1(g) of the Notes to Financial Statements.
The accompanying notes are an integral part of these financial statements.
117
| | |
| | | Statements of Changes in Net Assets(continued) For the fiscal years ended October 31, |
| | | | | | | | | | | | | | | | | | | | | | | | |
| | | AMG
Managers
LMCG Small
Cap Growth Fund | | | AMG
River Road
Small-Mid Cap Value Fund | | | AMG
River Road
Small Cap Value Fund | |
| | | | | | |
| | | 2019 | | | 2018 | | | 2019 | | | 2018 | | | 2019 | | | 2018 | |
| | | | | | |
Increase (Decrease) in Net Assets Resulting From Operations: | | | | | | | | | | | | | | | | | | | | | | | | |
| | | | | | | | | | | | | | | | | | | | | | | | |
Net investment loss | | | $(294,184 | ) | | | $(667,467 | ) | | | $(61,527 | ) | | | $(76,321 | ) | | | $(253,950 | ) | | | $(370,357 | ) |
| | | | | | | | | | | | | | | | | | | | | | | | |
Net realized gain (loss) on investments | | | (780,765 | ) | | | 21,869,038 | | | | 2,556,562 | | | | 4,462,548 | | | | 34,643,370 | | | | 32,294,367 | |
| | | | | | | | | | | | | | | | | | | | | | | | |
Net change in unrealized appreciation/depreciation on investments | | | 17,124 | | | | (9,890,828 | ) | | | 7,741,087 | | | | (2,114,772 | ) | | | 2,456,593 | | | | (14,979,042 | ) |
| | | | | | | | | | | | | | | | | | | | | | | | |
| | | | | | |
Net increase (decrease) in net assets resulting from operations | | | (1,057,825 | ) | | | 11,310,743 | | | | 10,236,122 | | | | 2,271,455 | | | | 36,846,013 | | | | 16,944,968 | |
| | | | | | | | | | | | | | | | | | | | | | | | |
| | | | | | |
Distributions to Shareholders: | | | | | | | | | | | | | | | | | | | | | | | | |
| | | | | | | | | | | | | | | | | | | | | | | | |
Class N | | | — | | | | — | | | | (990,330 | ) | | | (1,015,313 | ) | | | (2,950,509 | ) | | | (4,305,561 | ) |
| | | | | | | | | | | | | | | | | | | | | | | | |
Class I | | | — | | | | — | | | | (3,445,808 | ) | | | (5,151,226 | ) | | | (28,932,862 | ) | | | (36,602,318 | ) |
| | | | | | | | | | | | | | | | | | | | | | | | |
Class Z | | | — | | | | — | | | | (9,497 | ) | | | (17,688 | ) | | | (17,058 | ) | | | (20,634 | ) |
| | | | | | | | | | | | | | | | | | | | | | | | |
| | | | | | |
Total distributions to shareholders | | | — | | | | — | | | | (4,445,635 | ) | | | (6,184,227 | ) | | | (31,900,429 | ) | | | (40,928,513 | ) |
| | | | | | | | | | | | | | | | | | | | | | | | |
| | | | | | | | | | | | | | | | | | | | | | | | |
Capital Share Transactions:1 | | | | | | | | | | | | | | | | | | | | | | | | |
| | | | | | | | | | | | | | | | | | | | | | | | |
| | | | | | |
Net increase (decrease) from capital share transactions | | | (56,651,158 | ) | | | (33,831,195 | ) | | | 95,306,265 | | | | 28,882,067 | | | | 40,696,083 | | | | 71,449,859 | |
| | | | | | | | | | | | | | | | | | | | | | | | |
| | | | | | | | | | | | | | | | | | | | | | | | |
| | | | | | |
Total increase (decrease) in net assets | | | (57,708,983 | ) | | | (22,520,452 | ) | | | 101,096,752 | | | | 24,969,295 | | | | 45,641,667 | | | | 47,466,314 | |
| | | | | | | | | | | | | | | | | | | | | | | | |
| | | | | | | | | | | | | | | | | | | | | | | | |
Net Assets: | | | | | | | | | | | | | | | | | | | | | | | | |
| | | | | | | | | | | | | | | | | | | | | | | | |
Beginning of year | | | 103,033,911 | | | | 125,554,363 | | | | 69,376,185 | | | | 44,406,890 | | | | 358,851,903 | | | | 311,385,589 | |
| | | | | | | | | | | | | | | | | | | | | | | | |
| | | | | | |
End of year | | | $45,324,928 | | | | $103,033,911 | | | | $170,472,937 | | | | $69,376,185 | | | | $404,493,570 | | | | $358,851,903 | |
| | | | | | | | | | | | | | | | | | | | | | | | |
1See Note 1(g) of the Notes to Financial Statements.
The accompanying notes are an integral part of these financial statements.
118
| | |
| | | Statements of Changes in Net Assets(continued) For the fiscal years ended October 31, |
| | | | | | | | | | | | | | | | | | | | | | | | |
| | | AMG Managers
Silvercrest
Small Cap Fund | | | AMG Managers
DoubleLine
Core Plus
Bond Fund | | | AMG
River Road
Long-Short Fund | |
| | | | | | |
| | | 2019 | | | 2018 | | | 2019 | | | 2018 | | | 2019 | | | 2018 | |
| | | | | | |
Increase (Decrease) in Net Assets Resulting From Operations: | | | | | | | | | | | | | | | | | | | | | | | | |
| | | | | | | | | | | | | | | | | | | | | | | | |
Net investment income (loss) | | | $794,327 | | | | $95,286 | | | | $21,540,707 | | | | $19,575,986 | | | | $(53,086 | ) | | | $(10,305 | ) |
| | | | | | | | | | | | | | | | | | | | | | | | |
Net realized gain (loss) on investments | | | 4,890,467 | | | | 23,131,258 | | | | (987,474 | ) | | | (7,256,523 | ) | | | 2,434,819 | | | | 1,994,219 | |
| | | | | | | | | | | | | | | | | | | | | | | | |
Net change in unrealized appreciation/depreciation on investments | | | 8,668,319 | | | | (38,560,552 | ) | | | 32,237,519 | | | | (19,634,553 | ) | | | 808,308 | | | | (2,389,808 | ) |
| | | | | | | | | | | | | | | | | | | | | | | | |
| | | | | | |
Net increase (decrease) in net assets resulting from operations | | | 14,353,113 | | | | (15,334,008 | ) | | | 52,790,752 | | | | (7,315,090 | ) | | | 3,190,041 | | | | (405,894 | ) |
| | | | | | | | | | | | | | | | | | | | | | | | |
| | | | | | | | | | | | | | | | | | | | | | | | |
Distributions to Shareholders: | | | | | | | | | | | | | | | | | | | | | | | | |
| | | | | | | | | | | | | | | | | | | | | | | | |
Class N | | | (2,775,383 | ) | | | (1,953,748 | ) | | | (3,097,945 | ) | | | (3,953,588 | ) | | | (208,970 | ) | | | — | |
| | | | | | | | | | | | | | | | | | | | | | | | |
Class I | | | (14,843,605 | ) | | | (19,107,515 | ) | | | (19,657,097 | ) | | | (16,432,493 | ) | | | (1,381,832 | ) | | | — | |
| | | | | | | | | | | | | | | | | | | | | | | | |
Class Z | | | (3,127,881 | ) | | | (16,089 | ) | | | (89,469 | ) | | | (57,102 | ) | | | (4,220 | ) | | | — | |
| | | | | | | | | | | | | | | | | | | | | | | | |
| | | | | | |
Total distributions to shareholders | | | (20,746,869 | ) | | | (21,077,352 | ) | | | (22,844,511 | ) | | | (20,443,183 | ) | | | (1,595,022 | ) | | | — | |
| | | | | | | | | | | | | | | | | | | | | | | | |
| | | | | | | | | | | | | | | | | | | | | | | | |
Capital Share Transactions:1 | | | | | | | | | | | | | | | | | | | | | | | | |
| | | | | | | | | | | | | | | | | | | | | | | | |
| | | | | | |
Net increase (decrease) from capital share transactions | | | (6,575,314 | ) | | | 6,623,865 | | | | 69,623,432 | | | | (79,966,857 | ) | | | (4,748,295 | ) | | | (5,409,284 | ) |
| | | | | | | | | | | | | | | | | | | | | | | | |
| | | | | | | | | | | | | | | | | | | | | | | | |
| | | | | | |
Total increase (decrease) in net assets | | | (12,969,070 | ) | | | (29,787,495 | ) | | | 99,569,673 | | | | (107,725,130 | ) | | | (3,153,276 | ) | | | (5,815,178 | ) |
| | | | | | | | | | | | | | | | | | | | | | | | |
| | | | | | | | | | | | | | | | | | | | | | | | |
Net Assets: | | | | | | | | | | | | | | | | | | | | | | | | |
| | | | | | | | | | | | | | | | | | | | | | | | |
Beginning of year | | | 237,495,682 | | | | 267,283,177 | | | | 571,117,571 | | | | 678,842,701 | | | | 28,747,340 | | | | 34,562,518 | |
| | | | | | | | | | | | | | | | | | | | | | | | |
| | | | | | |
End of year | | | $224,526,612 | | | | $237,495,682 | | | | $670,687,244 | | | | $571,117,571 | | | | $25,594,064 | | | | $28,747,340 | |
| | | | | | | | | | | | | | | | | | | | | | | | |
1See Note 1(g) of the Notes to Financial Statements.
The accompanying notes are an integral part of these financial statements.
119
| | |
| | | Statements of Changes in Net Assets(continued) For the fiscal years ended October 31, |
Statements of Changes in Net Assets(continued)
| | | | | | | | |
| | | AMG
Managers
Pictet International Fund | |
| | |
| | | 2019 | | | 2018 | |
| | |
Increase (Decrease) in Net Assets Resulting From Operations: | | | | | | | | |
| | |
Net investment income | | | $7,250,795 | | | | $30,224,511 | |
| | |
Net realized gain (loss) on investments | | | (77,619,076 | ) | | | 144,571,653 | |
| | |
Net change in unrealized appreciation/depreciation on investments | | | 91,195,450 | | | | (398,668,510 | ) |
| | |
Net increase (decrease) in net assets resulting from operations | | | 20,827,169 | | | | (223,872,346 | ) |
| | |
Distributions to Shareholders: | | | | | | | | |
| | |
Class N | | | (10,017,518 | ) | | | (222,099 | ) |
| | |
Class I | | | (15,985,185 | ) | | | (21,428,887 | ) |
| | |
Class Z | | | (108,594,791 | ) | | | (68,430,312 | ) |
| | |
Total distributions to shareholders | | | (134,597,494 | ) | | | (90,081,298 | ) |
| | |
Capital Share Transactions:1 | | | | | | | | |
| | |
Net decrease from capital share transactions | | | (1,171,252,631 | ) | | | (129,131,327 | ) |
| | | | | | | | |
| | |
Total decrease in net assets | | | (1,285,022,956 | ) | | | (443,084,971 | ) |
| | |
Net Assets: | | | | | | | | |
| | |
Beginning of year | | | 1,580,392,274 | | | | 2,023,477,245 | |
| | |
End of year | | | $295,369,318 | | | | $1,580,392,274 | |
1See Note 1(g) of the Notes to Financial Statements.
The accompanying notes are an integral part of these financial statements.
120
| | |
| | | AMG Managers Fairpointe ESG Equity Fund Financial Highlights For a share outstanding throughout each fiscal period |
| | | | | | | | | | | | | | | | | | |
| | | For the fiscal year ended October 31, | | | For the fiscal period ended October 31, |
| | | | | |
Class N | | 2019 | | | 2018 | | | 2017 | | | 2016 | | | 20151 |
Net Asset Value, Beginning of Period | | | $11.27 | | | | $11.74 | | | | $9.65 | | | | $9.33 | | | $10.00 |
Income (loss) from Investment Operations: | | | | | | | | | | | | | | | | | | |
Net investment income2,3 | | | 0.11 | | | | 0.10 | | | | 0.17 | 4 | | | 0.08 | | | 0.06 |
Net realized and unrealized gain (loss) on investments | | | 0.17 | | | | (0.42 | ) | | | 1.94 | | | | 0.33 | | | (0.73) |
Total income (loss) from investment operations | | | 0.28 | | | | (0.32 | ) | | | 2.11 | | | | 0.41 | | | (0.67) |
Less Distributions to Shareholders from: | | | | | | | | | | | | | | | | | | |
Net investment income | | | (0.11 | ) | | | (0.15 | ) | | | (0.02 | ) | | | (0.09 | ) | | – |
Net Asset Value, End of Period | | | $11.44 | | | | $11.27 | | | | $11.74 | | | | $9.65 | | | $9.33 |
Total Return3,5 | | | 2.54 | % | | | (2.73 | )% | | | 21.83 | % | | | 4.43 | % | | (6.70)%6 |
Ratio of net expenses to average net assets | | | 1.12 | % | | | 1.11 | % | | | 1.12 | % | | | 1.15 | % | | 1.15%7 |
Ratio of gross expenses to average net assets8 | | | 1.87 | % | | | 1.96 | % | | | 1.76 | % | | | 2.63 | % | | 3.78%7 |
Ratio of net investment income to average net assets3 | | | 0.99 | % | | | 0.80 | % | | | 1.53 | % | | | 0.87 | % | | 0.70%7 |
Portfolio turnover | | | 43 | % | | | 41 | % | | | 51 | % | | | 31 | % | | 1%6,9 |
Net assets end of period (000’s) omitted | | | $632 | | | | $664 | | | | $807 | | | | $546 | | | $2,295 |
|
121
| | |
| | | AMG Managers Fairpointe ESG Equity Fund Financial Highlights For a share outstanding throughout each fiscal period |
| | | | | | | | | | | | | | | | | | |
| | | For the fiscal year ended October 31, | | | For the fiscal period ended October 31, |
Class I | | | 2019 | | | | 2018 | | | | 2017 | | | | 2016 | | | 20151 |
Net Asset Value, Beginning of Period | | | $11.21 | | | | $11.70 | | | | $9.67 | | | | $9.35 | | | $10.00 |
Income (loss) from Investment Operations: | | | | | | | | | | | | | | | | | | |
Net investment income2,3 | | | 0.14 | | | | 0.12 | | | | 0.19 | 4 | | | 0.10 | | | 0.08 |
Net realized and unrealized gain (loss) on investments | | | 0.17 | | | | (0.42 | ) | | | 1.94 | | | | 0.32 | | | (0.73) |
Total income (loss) from investment operations | | | 0.31 | | | | (0.30 | ) | | | 2.13 | | | | 0.42 | | | (0.65) |
Less Distributions to Shareholders from: | | | | | | | | | | | | | | | | | | |
Net investment income | | | (0.14 | ) | | | (0.19 | ) | | | (0.10 | ) | | | (0.10 | ) | | – |
Net Asset Value, End of Period | | | $11.38 | | | | $11.21 | | | | $11.70 | | | | $9.67 | | | $9.35 |
Total Return3,5 | | | 2.75 | % | | | (2.54 | )% | | | 22.04 | % | | | 4.65 | % | | (6.50)%6 |
Ratio of net expenses to average net assets | | | 0.90 | % | | | 0.90 | % | | | 0.90 | % | | | 0.90 | % | | 0.90%7 |
Ratio of gross expenses to average net assets8 | | | 1.65 | % | | | 1.75 | % | | | 1.54 | % | | | 2.51 | % | | 3.53%7 |
Ratio of net investment income to average net assets3 | | | 1.21 | % | | | 1.01 | % | | | 1.75 | % | | | 1.10 | % | | 0.95%7 |
Portfolio turnover | | | 43 | % | | | 41 | % | | | 51 | % | | | 31 | % | | 1%6,9 |
Net assets end of period (000’s) omitted | | | $11,728 | | | | $10,158 | | | | $5,747 | | | | $6,489 | | | $4,162 |
|
| 1 | Commencement of operations was on December 23, 2014. |
| 2 | Per share numbers have been calculated using average shares. |
| 3 | Total returns and net investment income (loss) would have been lower had certain expenses not been offset. |
| 4 | Includesnon-recurring dividends. Without these dividends, net investment income per share would have been $0.06 and $0.08 for Class N and Class I shares, respectively. |
| 5 | The total return is calculated using the published Net Asset Value as of fiscal year end. |
| 8 | Excludes the impact of expense reimbursement or fee waivers and expense reductions such as brokerage credits, but includes expense repayments andnon-reimbursable expenses, if any, such as interest, taxes, and extraordinary expenses. (See Note 1(c) and 2 in the Notes to Financial Statements.) |
| 9 | Portfolio turnover rate excludes securities received from processing a subscriptionin-kind. |
122
| | |
| | | AMG River Road Focused Absolute Value Fund Financial Highlights For a share outstanding throughout each fiscal period |
| | | | | | | | | | | | | | |
| | | For the fiscal year ended October 31, | | | For the fiscal period ended October 31, |
| | | | |
Class N | | | 2019 | | | | 2018 | | | | 2017 | | | 20161 |
Net Asset Value, Beginning of Period | | | $11.91 | | | | $11.87 | | | | $10.85 | | | $10.00 |
Income (loss) from Investment Operations: | | | | | | | | | | | | | | |
Net investment income (loss)2,3 | | | 0.04 | | | | 0.05 | | | | (0.01 | ) | | 0.04 |
Net realized and unrealized gain on investments | | | 1.45 | | | | 0.93 | | | | 1.85 | | | 0.81 |
Total income from investment operations | | | 1.49 | | | | 0.98 | | | | 1.84 | | | 0.85 |
Less Distributions to Shareholders from: | | | | | | | | | | | | | | |
Net investment income | | | (0.05 | ) | | | (0.07 | ) | | | (0.09 | ) | | – |
Net realized gain on investments | | | (0.70 | ) | | | (0.87 | ) | | | (0.73 | ) | | – |
Total distributions to shareholders | | | (0.75 | ) | | | (0.94 | ) | | | (0.82 | ) | | – |
Net Asset Value, End of Period | | | $12.65 | | | | $11.91 | | | | $11.87 | | | $10.85 |
Total Return3,4 | | | 14.29 | % | | | 8.69 | % | | | 17.42 | % | | 8.50%5 |
Ratio of net expenses to average net assets | | | 0.98 | %6 | | | 0.99 | %6 | | | 0.97 | %6 | | 1.12%7 |
Ratio of gross expenses to average net assets8 | | | 1.21 | % | | | 1.32 | % | | | 1.50 | % | | 3.15%7 |
Ratio of net investment income (loss) to average net assets3 | | | 0.34 | % | | | 0.43 | % | | | (0.09 | )% | | 0.39%7 |
Portfolio turnover | | | 59 | % | | | 88 | % | | | 112 | % | | 146%5,9 |
Net assets end of period (000’s) omitted | | | $15,284 | | | | $9,184 | | | | $7,448 | | | $489 |
|
123
| | |
| | | AMG River Road Focused Absolute Value Fund Financial Highlights For a share outstanding throughout each fiscal period |
| | | | | | | | | | | | | | |
| | | For the fiscal year ended October 31, | | | For the fiscal period ended October 31, |
| | | | |
Class I | | | 2019 | | | | 2018 | | | | 2017 | | | 20161 |
Net Asset Value, Beginning of Period | | | $11.98 | | | | $11.92 | | | | $10.88 | | | $10.00 |
Income from Investment Operations: | | | | | | | | | | | | | | |
Net investment income2,3 | | | 0.07 | | | | 0.08 | | | | 0.06 | | | 0.08 |
Net realized and unrealized gain on investments | | | 1.46 | | | | 0.93 | | | | 1.81 | | | 0.80 |
Total income from investment operations | | | 1.53 | | | | 1.01 | | | | 1.87 | | | 0.88 |
Less Distributions to Shareholders from: | | | | | | | | | | | | | | |
Net investment income | | | (0.09 | ) | | | (0.08 | ) | | | (0.10 | ) | | – |
Net realized gain on investments | | | (0.70 | ) | | | (0.87 | ) | | | (0.73 | ) | | – |
Total distributions to shareholders | | | (0.79 | ) | | | (0.95 | ) | | | (0.83 | ) | | – |
Net Asset Value, End of Period | | | $12.72 | | | | $11.98 | | | | $11.92 | | | $10.88 |
Total Return3,4 | | | 14.55 | % | | | 8.91 | % | | | 17.72 | % | | 8.80%5 |
Ratio of net expenses to average net assets | | | 0.73 | %6 | | | 0.74 | %6 | | | 0.73 | %6 | | 0.75%7 |
Ratio of gross expenses to average net assets8 | | | 0.96 | % | | | 1.07 | % | | | 1.20 | % | | 2.90%7 |
Ratio of net investment income to average net assets3 | | | 0.59 | % | | | 0.68 | % | | | 0.50 | % | | 0.81%7 |
Portfolio turnover | | | 59 | % | | | 88 | % | | | 112 | % | | 146%5,9 |
Net assets end of period (000’s) omitted | | | $130,928 | | | | $20,928 | | | | $17,106 | | | $11,312 |
|
124
| | |
| | | AMG River Road Focused Absolute Value Fund Financial Highlights For a share outstanding throughout each fiscal period |
| | | | | | | | | | |
| | | For the fiscal year ended October 31, | | | For the fiscal period ended October 31, |
Class Z | | | 2019 | | | | 2018 | | | 201710 |
Net Asset Value, Beginning of Period | | | $11.98 | | | | $11.92 | | | $12.18 |
Income (loss) from Investment Operations: | | | | | | | | | | |
Net investment income (loss)2,3 | | | 0.07 | | | | 0.08 | | | (0.01) |
Net realized and unrealized gain (loss) on investments | | | 1.47 | | | | 0.93 | | | (0.25) |
Total income (loss) from investment operations | | | 1.54 | | | | 1.01 | | | (0.26) |
Less Distributions to Shareholders from: | | | | | | | | | | |
Net investment income | | | (0.09 | ) | | | (0.08 | ) | | – |
Net realized gain on investments | | | (0.70 | ) | | | (0.87 | ) | | – |
Total distributions to shareholders | | | (0.79 | ) | | | (0.95 | ) | | – |
Net Asset Value, End of Period | | | $12.73 | | | | $11.98 | | | $11.92 |
Total Return3,4 | | | 14.69 | % | | | 8.96 | % | | (2.13)%5 |
Ratio of net expenses to average net assets | | | 0.69 | %6 | | | 0.70 | %6 | | 0.70%6,7 |
Ratio of gross expenses to average net assets8 | | | 0.92 | % | | | 1.03 | % | | 1.32%7 |
Ratio of net investment income (loss) to average net assets3 | | | 0.63 | % | | | 0.72 | % | | (0.59)%7 |
Portfolio turnover | | | 59 | % | | | 88 | % | | 112%5 |
Net assets end of period (000’s) omitted | | | $157 | | | | $66 | | | $61 |
|
| 1 | The commencement of operations for Class N and Class I shares was November 3, 2015. |
| 2 | Per share numbers have been calculated using average shares. |
| 3 | Total returns and net investment income (loss) would have been lower had certain expenses not been offset. |
| 4 | The total return is calculated using the published Net Asset Value as of fiscal year end. |
| 6 | Includes reduction from broker recapture amounting to 0.02% for the fiscal year ended October 31, 2019, 0.01% for the fiscal year ended October 31, 2018, and 0.03%, 0.02%, and less than 0.01% for Class N, Class I and Class Z, respectively, for the period ended October 31, 2017. |
| 8 | Excludes the impact of expense reimbursement or fee waivers and expense reductions such as brokerage credits, but includes expense repayments and non-reimbursable expenses, if any, such as interest, taxes, and extraordinary expenses. (See Note 1(c) and 2 in the Notes to Financial Statements.) |
| 9 | Portfolio turnover rate excludes securities received from processing a subscription in-kind. |
| 10 | The commencement of operations for Class Z shares was October 2, 2017. |
125
| | |
| | | AMG Managers Montag & Caldwell Growth Fund Financial Highlights For a share outstanding throughout each fiscal year |
| | | | | | | | | | | | | | | | | | | | |
| | | For the fiscal year ended October 31, | |
| | | | | |
Class N | | | 2019 | | | | 2018 | | | | 2017 | | | | 2016 | | | | 2015 | |
Net Asset Value, Beginning of Year | | | $20.52 | | | | $20.76 | | | | $19.56 | | | | $26.67 | | | | $29.59 | |
Income (loss) from Investment Operations: | | | | | | | | | | | | | | | | | | | | |
Net investment income (loss)1,2 | | | (0.02 | ) | | | (0.01 | ) | | | (0.02 | ) | | | 0.05 | | | | 0.07 | |
Net realized and unrealized gain (loss) on investments | | | 2.74 | | | | 1.71 | | | | 3.20 | | | | (0.33 | ) | | | 2.06 | |
Total income (loss) from investment operations | | | 2.72 | | | | 1.70 | | | | 3.18 | | | | (0.28 | ) | | | 2.13 | |
Less Distributions to Shareholders from: | | | | | | | | | | | | | | | | | | | | |
Net investment income | | | – | | | | – | | | | (0.04 | ) | | | (0.08 | ) | | | (0.05) | |
Net realized gain on investments | | | (3.90 | ) | | | (1.94 | ) | | | (1.94 | ) | | | (6.75 | ) | | | (5.00) | |
Total distributions to shareholders | | | (3.90 | ) | | | (1.94 | ) | | | (1.98 | ) | | | (6.83 | ) | | | (5.05) | |
Net Asset Value, End of Year | | | $19.34 | | | | $20.52 | | | | $20.76 | | | | $19.56 | | | | $26.67 | |
Total Return2,3 | | | 18.29 | % | | | 8.58 | % | | | 17.99 | % | | | (1.77 | )% | | | 7.93% | |
Ratio of net expenses to average net assets | | | 1.16 | %4 | | | 1.15 | %4 | | | 1.15 | %4 | | | 1.12 | % | | | 1.05% | |
Ratio of gross expenses to average net assets5 | | | 1.17 | % | | | 1.16 | % | | | 1.17 | % | | | 1.12 | % | | | 1.05% | |
Ratio of net investment income (loss) to average net assets2 | | | (0.10 | )% | | | (0.03 | )% | | | (0.11 | )% | | | 0.25 | % | | | 0.28% | |
Portfolio turnover | | | 20 | % | | | 33 | % | | | 42 | % | | | 64 | % | | | 12% | |
Net assets end of year (000’s) omitted | | | $166,353 | | | | $179,434 | | | | $259,324 | | | | $519,008 | | | | $835,725 | |
| |
126
| | |
| | | AMG Managers Montag & Caldwell Growth Fund Financial Highlights For a share outstanding throughout each fiscal year |
| | | | | | | | | | | | | | | | | | | | | | |
| | | For the fiscal year ended October 31, | | | |
| | | | | | |
Class I | | | 2019 | | | | 2018 | | | | 2017 | | | | 2016 | | | 2015 | | | | |
| | | | | | |
Net Asset Value, Beginning of Year | | | $20.62 | | | | $20.84 | | | | $19.70 | | | | $26.82 | | | $29.80 | | | | |
| | | | | | |
Income (loss) from Investment Operations: | | | | | | | | | | | | | | | | | | | | | | |
| | | | | | |
Net investment income1,2 | | | 0.01 | | | | 0.03 | | | | 0.02 | | | | 0.10 | | | 0.14 | | | | |
| | | | | | |
Net realized and unrealized gain (loss) on investments | | | 2.76 | | | | 1.71 | | | | 3.20 | | | | (0.31 | ) | | 2.06 | | | | |
| | | | | | |
Total income (loss) from investment operations | | | 2.77 | | | | 1.74 | | | | 3.22 | | | | (0.21 | ) | | 2.20 | | | | |
| | | | | | |
Less Distributions to Shareholders from: | | | | | | | | | | | | | | | | | | | | | | |
| | | | | | |
Net investment income | | | (0.03 | ) | | | (0.02 | ) | | | (0.13 | ) | | | (0.16 | ) | | (0.18) | | | | |
| | | | | | |
Net realized gain on investments | | | (3.90 | ) | | | (1.94 | ) | | | (1.95 | ) | | | (6.75 | ) | | (5.00) | | | | |
| | | | | | |
Total distributions to shareholders | | | (3.93 | ) | | | (1.96 | ) | | | (2.08 | ) | | | (6.91 | ) | | (5.18) | | | | |
| | | | | | |
Net Asset Value, End of Year | | | $19.46 | | | | $20.62 | | | | $20.84 | | | | $19.70 | | | $26.82 | | | | |
| | | | | | |
Total Return2,3 | | | 18.49 | % | | | 8.75 | % | | | 18.21 | % | | | (1.51 | )% | | 8.21% | | | | |
| | | | | | |
Ratio of net expenses to average net assets | | | 0.98 | %4 | | | 0.96 | %4 | | | 0.92 | %4 | | | 0.87 | % | | 0.80% | | | | |
| | | | | | |
Ratio of gross expenses to average net assets5 | | | 0.99 | % | | | 0.97 | % | | | 0.94 | % | | | 0.87 | % | | 0.80% | | | | |
| | | | | | |
Ratio of net investment income to average net assets2 | | | 0.08 | % | | | 0.16 | % | | | 0.12 | % | | | 0.50 | % | | 0.53% | | | | |
| | | | | | |
Portfolio turnover | | | 20 | % | | | 33 | % | | | 42 | % | | | 64 | % | | 12% | | | | |
| | | | | | |
Net assets end of year (000’s) omitted | | | $329,225 | | | | $416,208 | | | | $642,461 | | | | $820,318 | | | $1,344,231 | | | | |
| | | | |
| 1 | Per share numbers have been calculated using average shares. |
| 2 | Total returns and net investment income (loss) would have been lower had certain expenses not been offset. |
| 3 | The total return is calculated using the published Net Asset Value as of fiscal year end. |
| 4 | Includes reduction from broker recapture amounting to 0.01% for the fiscal year ended 2019 and less than 0.01% and 0.01% for the fiscal years ended 2018 and 2017, respectively. |
| 5 | Excludes the impact of expense reimbursement or fee waivers and expense reductions such as brokerage credits, but includes expense repayments andnon-reimbursable expenses, if any, such as interest, taxes, and extraordinary expenses. (See Note 1(c) and 2 in the Notes to Financial Statements.) |
127
| | |
| | | AMG River Road Dividend All Cap Value Fund Financial Highlights For a share outstanding throughout each fiscal year |
| | | | | | | | | | | | | | | | | | | | | | |
| | | For the fiscal year ended October 31, | | | |
| | | | | | |
Class N | | | 2019 | | | | 2018 | | | | 2017 | | | | 2016 | | | 2015 | | | | |
| | | | | | |
Net Asset Value, Beginning of Year | | | $12.29 | | | | $12.87 | | | | $12.18 | | | | $12.67 | | | $14.05 | | | | |
| | | | | | |
Income (loss) from Investment Operations: | | | | | | | | | | | | | | | | | | | | | | |
| | | | | | |
Net investment income1 | | | 0.27 | 2 | | | 0.22 | 2 | | | 0.22 | 2 | | | 0.24 | 2 | | 0.21 | | | | |
| | | | | | |
Net realized and unrealized gain (loss) on investments | | | 0.80 | | | | 0.06 | | | | 1.54 | | | | 0.65 | | | (0.20) | | | | |
| | | | | | |
Total income from investment operations | | | 1.07 | | | | 0.28 | | | | 1.76 | | | | 0.89 | | | 0.01 | | | | |
| | | | | | |
Less Distributions to Shareholders from: | | | | | | | | | | | | | | | | | | | | | | |
| | | | | | |
Net investment income | | | (0.30 | ) | | | (0.28 | ) | | | (0.21 | ) | | | (0.22 | ) | | (0.22) | | | | |
| | | | | | |
Net realized gain on investments | | | (0.72 | ) | | | (0.58 | ) | | | (0.86 | ) | | | (1.16 | ) | | (1.17) | | | | |
| | | | | | |
Total distributions to shareholders | | | (1.02 | ) | | | (0.86 | ) | | | (1.07 | ) | | | (1.38 | ) | | (1.39) | | | | |
| | | | | | |
Net Asset Value, End of Year | | | $12.34 | | | | $12.29 | | | | $12.87 | | | | $12.18 | | | $12.67 | | | | |
| | | | | | |
Total Return1,3 | | | 10.11 | % | | | 2.06 | % | | | 14.79 | % | | | 7.88 | % | | (0.23)% | | | | |
| | | | | | |
Ratio of net expenses to average net assets | | | 1.11 | %4 | | | 1.10 | %4 | | | 1.11 | %4 | | | 1.10 | % | | 1.10% | | | | |
| | | | | | |
Ratio of gross expenses to average net assets5 | | | 1.12 | % | | | 1.11 | % | | | 1.12 | % | | | 1.10 | % | | 1.10% | | | | |
| | | | | | |
Ratio of net investment income to average net assets1 | | | 2.32 | % | | | 1.78 | % | | | 1.75 | % | | | 2.00 | % | | 1.62% | | | | |
| | | | | | |
Portfolio turnover | | | 29 | % | | | 27 | % | | | 28 | % | | | 47 | % | | 27% | | | | |
| | | | | | |
Net assets end of year (000’s) omitted | | | $79,811 | | | | $100,420 | | | | $136,534 | | | | $295,797 | | | $214,789 | | | | |
| | | | |
128
| | |
| | | AMG River Road Dividend All Cap Value Fund Financial Highlights For a share outstanding throughout each fiscal year |
| | | | | | | | | | | | | | | | | | | | | | | | | | | | |
| | | | | | For the fiscal year ended October 31, | | | | | | | | | | |
| | | | | | | |
Class I | | | 2019 | | | | 2018 | | | | 2017 | | | | 2016 | | | | 2015 | | | | | | | | | |
Net Asset Value, Beginning of Year | | | $12.29 | | | | $12.86 | | | | $12.17 | | | | $12.66 | | | | $14.04 | | | | | | | | | |
| | | | | | | |
Income (loss) from Investment Operations: | | | | | | | | | | | | | | | | | | | | | | | | | | | | |
| | | | | | | |
Net investment income1 | | | 0.31 | 2 | | | 0.26 | 2 | | | 0.24 | 2 | | | 0.28 | 2 | | | 0.25 | | | | | | | | | |
| | | | | | | |
Net realized and unrealized gain (loss) on investments | | | 0.78 | | | | 0.06 | | | | 1.55 | | | | 0.64 | | | | (0.20 | ) | | | | | | | | |
| | | | | | | |
Total income from investment operations | | | 1.09 | | | | 0.32 | | | | 1.79 | | | | 0.92 | | | | 0.05 | | | | | | | | | |
Less Distributions to Shareholders from: | | | | | | | | | | | | | | | | | | | | | | | | | | | | |
| | | | | | | |
Net investment income | | | (0.33 | ) | | | (0.31 | ) | | | (0.24 | ) | | | (0.25 | ) | | | (0.26 | ) | | | | | | | | |
| | | | | | | |
Net realized gain on investments | | | (0.72 | ) | | | (0.58 | ) | | | (0.86 | ) | | | (1.16 | ) | | | (1.17 | ) | | | | | | | | |
| | | | | | | |
Total distributions to shareholders | | | (1.05 | ) | | | (0.89 | ) | | | (1.10 | ) | | | (1.41 | ) | | | (1.43 | ) | | | | | | | | |
| | | | | | | |
Net Asset Value, End of Year | | | $12.33 | | | | $12.29 | | | | $12.86 | | | | $12.17 | | | | $12.66 | | | | | | | | | |
Total Return1,3 | | | 10.32 | % | | | 2.38 | % | | | 15.07 | % | | | 8.15 | % | | | 0.02 | % | | | | | | | | |
Ratio of net expenses to average net assets | | | 0.84 | %4 | | | 0.84 | %4 | | | 0.86 | %4 | | | 0.85 | % | | | 0.85 | % | | | | | | | | |
| | | | | | | |
Ratio of gross expenses to average net assets5 | | | 0.85 | % | | | 0.85 | % | | | 0.87 | % | | | 0.85 | % | | | 0.85 | % | | | | | | | | |
| | | | | | | |
Ratio of net investment income to average net assets1 | | | 2.59 | % | | | 2.04 | % | | | 1.93 | % | | | 2.30 | % | | | 1.87 | % | | | | | | | | |
| | | | | | | |
Portfolio turnover | | | 29 | % | | | 27 | % | | | 28 | % | | | 47 | % | | | 27 | % | | | | | | | | |
| | | | | | | |
Net assets end of year (000’s) omitted | | | $533,106 | | | | $743,984 | | | | $788,023 | | | | $555,064 | | | | $635,189 | | | | | | | | | |
| | | | | |
| | | | | |
129
| | |
| | | AMG River Road Dividend All Cap Value Fund Financial Highlights For a share outstanding throughout each fiscal period |
| | | | | | | | | | |
| | | For the fiscal year ended October 31, | | | For the fiscal period ended October 31, |
| | | |
Class Z | | | 2019 | | | | 2018 | | | 20176 |
| | | |
Net Asset Value, Beginning of Period | | | $12.29 | | | | $12.86 | | | $12.80 |
| | | |
Income from Investment Operations: | | | | | | | | | | |
| | | |
Net investment income1 | | | 0.32 | 2 | | | 0.26 | 2 | | 0.012 |
| | | |
Net realized and unrealized gain on investments | | | 0.77 | | | | 0.06 | | | 0.07 |
| | | |
Total income from investment operations | | | 1.09 | | | | 0.32 | | | 0.08 |
| | | |
Less Distributions to Shareholders from: | | | | | | | | | | |
| | | |
Net investment income | | | (0.33 | ) | | | (0.31 | ) | | (0.02) |
| | | |
Net realized gain on investments | | | (0.72 | ) | | | (0.58 | ) | | – |
| | | |
Total distributions to shareholders | | | (1.05 | ) | | | (0.89 | ) | | (0.02) |
| | | |
Net Asset Value, End of Period | | | $12.33 | | | | $12.29 | | | $12.86 |
| | | |
Total Return1,3 | | | 10.37 | % | | | 2.42 | % | | 0.59%7 |
| | | |
Ratio of net expenses to average net assets | | | 0.79 | %4 | | | 0.78 | %4 | | 0.78%4,8 |
| | | |
Ratio of gross expenses to average net assets5 | | | 0.80 | % | | | 0.79 | % | | 0.79%8 |
| | | |
Ratio of net investment income to average net assets1 | | | 2.64 | % | | | 2.10 | % | | 0.79%8 |
| | | |
Portfolio turnover | | | 29 | % | | | 27 | % | | 28%7 |
| | | |
Net assets end of period (000’s) omitted | | | $63 | | | | $619 | | | $257 |
|
|
| 1 | Total returns and net investment income (loss) would have been lower had certain expenses not been offset. |
| 2 | Per share numbers have been calculated using average shares. |
| 3 | The total return is calculated using the published Net Asset Value as of fiscal year end. |
| 4 | Includes reduction from broker recapture amounting to 0.01% for the fiscal year ended October 31, 2019 and less than 0.01% for the fiscal year ended October 31, 2018 and the period ended October 31, 2017. |
| 5 | Excludes the impact of expense reimbursement or fee waivers and expense reductions such as brokerage credits, but includes expense repayments andnon-reimbursable expenses, if any, such as interest, taxes, and extraordinary expenses. (See Note 1(c) and 2 in the Notes to Financial Statements.) |
| 6 | The commencement of operations for Class Z shares was October 2, 2017. |
130
|
AMG River Road Dividend All Cap Value Fund II Financial Highlights For a share outstanding throughout each fiscal year |
| | | | | | | | | | | | | | | | | | | | | | | | |
| | | For the fiscal year ended October 31, | | | | |
| | | | | | |
Class N | | 2019 | | | 2018 | | | 2017 | | | 2016 | | | 2015 | | | | |
| | | | | | |
Net Asset Value, Beginning of Year | | $ | 14.12 | | | $ | 14.80 | | | $ | 13.52 | | | $ | 12.99 | | | $ | 13.69 | | | | | |
| | | | | | |
Income (loss) from Investment Operations: | | | | | | | | | | | | | | | | | | | | | | | | |
| | | | | | |
Net investment income1,2 | | | 0.28 | | | | 0.27 | | | | 0.24 | | | | 0.26 | | | | 0.22 | | | | | |
| | | | | | |
Net realized and unrealized gain (loss) on investments | | | 0.81 | | | | 0.12 | | | | 1.80 | | | | 0.71 | | | | (0.26 | ) | | | | |
| | | | | | |
Total income (loss) from investment operations | | | 1.09 | | | | 0.39 | | | | 2.04 | | | | 0.97 | | | | (0.04 | ) | | | | |
| | | | | | |
Less Distributions to Shareholders from: | | | | | | | | | | | | | | | | | | | | | | | | |
| | | | | | |
Net investment income | | | (0.33 | ) | | | (0.33 | ) | | | (0.20 | ) | | | (0.25 | ) | | | (0.23 | ) | | | | |
| | | | | | |
Net realized gain on investments | | | (1.55 | ) | | | (0.74 | ) | | | (0.56 | ) | | | (0.19 | ) | | | (0.43 | ) | | | | |
| | | | | | |
Total distributions to shareholders | | | (1.88 | ) | | | (1.07 | ) | | | (0.76 | ) | | | (0.44 | ) | | | (0.66 | ) | | | | |
| | | | | | |
Net Asset Value, End of Year | | $ | 13.33 | | | $ | 14.12 | | | $ | 14.80 | | | $ | 13.52 | | | $ | 12.99 | | | | | |
| | | | | | |
Total Return2,3 | | | 10.15 | % | | | 2.56 | % | | | 15.33 | % | | | 7.61 | % | | | (0.47 | )% | | | | |
| | | | | | |
Ratio of net expenses to average net assets | | | 1.26 | %4 | | | 1.19 | %4 | | | 1.20 | %4 | | | 1.18 | % | | | 1.15 | % | | | | |
| | | | | | |
Ratio of gross expenses to average net assets5 | | | 1.27 | % | | | 1.19 | % | | | 1.20 | % | | | 1.18 | % | | | 1.15 | % | | | | |
| | | | | | |
Ratio of net investment income to average net assets2 | | | 2.17 | % | | | 1.85 | % | | | 1.69 | % | | | 1.99 | % | | | 1.62 | % | | | | |
| | | | | | |
Portfolio turnover | | | 32 | % | | | 28 | % | | | 27 | % | | | 34 | % | | | 35 | % | | | | |
| | | | | | |
Net assets end of year (000’s) omitted | | $ | 2,224 | | | $ | 2,176 | | | $ | 3,090 | | | $ | 3,394 | | | $ | 2,930 | | | | | |
| | | | | | |
| | | | | | |
131
|
AMG River Road Dividend All Cap Value Fund II Financial Highlights For a share outstanding throughout each fiscal year |
| | | | | | | | | | | | | | | | | | | | | | | | |
| | | For the fiscal year ended October 31, | | | | |
| | | | | | |
Class I | | 2019 | | | 2018 | | | 2017 | | | 2016 | | | 2015 | | | | |
| | | | | | |
Net Asset Value, Beginning of Year | | | $14.15 | | | | $14.82 | | | | $13.53 | | | | $13.00 | | | | $13.69 | | | | | |
| | | | | | |
Income (loss) from Investment Operations: | | | | | | | | | | | | | | | | | | | | | | | | |
| | | | | | |
Net investment income1,2 | | | 0.32 | | | | 0.31 | | | | 0.28 | | | | 0.29 | | | | 0.25 | | | | | |
| | | | | | |
Net realized and unrealized gain (loss) on investments | | | 0.82 | | | | 0.12 | | | | 1.80 | | | | 0.71 | | | | (0.25 | ) | | | | |
| | | | | | |
Total income from investment operations | | | 1.14 | | | | 0.43 | | | | 2.08 | | | | 1.00 | | | | – | | | | | |
| | | | | | |
Less Distributions to Shareholders from: | | | | | | | | | | | | | | | | | | | | | | | | |
| | | | | | |
Net investment income | | | (0.37 | ) | | | (0.36 | ) | | | (0.23 | ) | | | (0.28 | ) | | | (0.26 | ) | | | | |
| | | | | | |
Net realized gain on investments | | | (1.55 | ) | | | (0.74 | ) | | | (0.56 | ) | | | (0.19 | ) | | | (0.43 | ) | | | | |
| | | | | | |
Total distributions to shareholders | | | (1.92 | ) | | | (1.10 | ) | | | (0.79 | ) | | | (0.47 | ) | | | (0.69 | ) | | | | |
| | | | | | |
Net Asset Value, End of Year | | | $13.37 | | | | $14.15 | | | | $14.82 | | | | $13.53 | | | | $13.00 | | | | | |
| | | | | | |
Total Return2,3 | | | 10.54 | % | | | 2.86 | % | | | 15.65 | % | | | 7.87 | % | | | (0.13 | )% | | | | |
| | | | | | |
Ratio of net expenses to average net assets | | | 0.98 | %4 | | | 0.91 | %4 | | | 0.91 | %4 | | | 0.93 | % | | | 0.90 | % | | | | |
| | | | | | |
Ratio of gross expenses to average net assets5 | | | 0.99 | % | | | 0.91 | % | | | 0.91 | % | | | 0.93 | % | | | 0.90 | % | | | | |
| | | | | | |
Ratio of net investment income to average net assets2 | | | 2.45 | % | | | 2.13 | % | | | 1.96 | % | | | 2.24 | % | | | 1.87 | % | | | | |
| | | | | | |
Portfolio turnover | | | 32 | % | | | 28 | % | | | 27 | % | | | 34 | % | | | 35 | % | | | | |
| | | | | | |
Net assets end of year (000’s) omitted | | | $59,606 | | | | $84,438 | | | | $118,876 | | | | $114,532 | | | | $121,414 | | | | | |
| | | | | | |
| | | | | | |
132
|
AMG River Road Dividend All Cap Value Fund II Financial Highlights For a share outstanding throughout each fiscal period |
| | | | | | | | | | | | | | | | | | | | |
| | | For the fiscal year ended October 31, | | | For the fiscal period ended October 31, | | | | |
| | | | | |
Class Z | | 2019 | | | 2018 | | | 20176 | | | | | | | |
| | | | | |
Net Asset Value, Beginning of Period | | | $14.15 | | | | $14.82 | | | | $14.74 | | | | | | | | | |
| | | | | |
Income (loss) from Investment Operations: | | | | | | | | | | | | | | | | | | | | |
| | | | | |
Net investment income (loss)1,2 | | | 0.33 | | | | 0.32 | | | | (0.01 | ) | | | | | | | | |
| | | | | |
Net realized and unrealized gain on investments | | | 0.82 | | | | 0.12 | | | | 0.11 | | | | | | | | | |
| | | | | |
Total income from investment operations | | | 1.15 | | | | 0.44 | | | | 0.10 | | | | | | | | | |
| | | | | |
Less Distributions to Shareholders from: | | | | | | | | | | | | | | | | | | | | |
| | | | | |
Net investment income | | | (0.38 | ) | | | (0.37 | ) | | | (0.02 | ) | | | | | | | | |
| | | | | |
Net realized gain on investments | | | (1.55 | ) | | | (0.74 | ) | | | – | | | | | | | | | |
| | | | | |
Total distributions to shareholders | | | (1.93 | ) | | | (1.11 | ) | | | (0.02 | ) | | | | | | | | |
| | | | | |
Net Asset Value, End of Period | | | $13.37 | | | | $14.15 | | | | $14.82 | | | | | | | | | |
| | | | | |
Total Return2,3 | | | 10.60 | % | | | 2.93 | % | | | 0.65 | %7 | | | | | | | | |
| | | | | |
Ratio of net expenses to average net assets | | | 0.91 | %4 | | | 0.84 | %4 | | | 0.90 | %4,8 | | | | | | | | |
| | | | | |
Ratio of gross expenses to average net assets5 | | | 0.92 | % | | | 0.84 | % | | | 0.90 | %8 | | | | | | | | |
| | | | | |
Ratio of net investment income (loss) to average net assets2 | | | 2.52 | % | | | 2.19 | % | | | (0.47 | )%8 | | | | | | | | |
| | | | | |
Portfolio turnover | | | 32 | % | | | 28 | % | | | 27 | %7 | | | | | | | | |
| | | | | |
Net assets end of period (000’s) omitted | | | $345 | | | | $176 | | | | $321 | | | | | | | | | |
| | | | | | |
| | | | | | |
| 1 | Per share numbers have been calculated using average shares. |
| 2 | Total returns and net investment income (loss) would have been lower had certain expenses not been offset. |
| 3 | The total return is calculated using the published Net Asset Value as of fiscal year end. |
| 4 | Includes reduction from broker recapture amounting to 0.01% for the year ended October 31, 2019; less than 0.01%, less than 0.01% and 0.01% for Class N, Class I and Class Z, respectively, for the year ended October 31, 2018; and less than 0.01% for the period ended October 31, 2017. |
| 5 | Excludes the impact of expense reimbursement or fee waivers and expense reductions such as brokerage credits, but includes expense repayments and non-reimbursable expenses, if any, such as interest, taxes, and extraordinary expenses. (See Note 1(c) and 2 in the Notes to Financial Statements.) |
| 6 | The commencement of operations was on October 2, 2017. |
133
|
AMG Managers Fairpointe Mid Cap Fund Financial Highlights For a share outstanding throughout each fiscal year |
| | | | | | | | | | | | | | | | | | | | | | | | |
| | | For the fiscal year ended October 31, | | | | |
| | | | | | |
Class N | | 2019 | | | 2018 | | | 2017 | | | 2016 | | | 2015 | | | | |
| | | | | | |
Net Asset Value, Beginning of Year | | | $38.27 | | | | $41.95 | | | | $37.48 | | | | $37.56 | | | | $46.89 | | | | | |
| | | | | | |
Income (loss) from Investment Operations: | | | | | | | | | | | | | | | | | | | | | | | | |
| | | | | | |
Net investment income (loss)1,2 | | | 0.34 | 3 | | | 0.08 | | | | (0.02 | ) | | | 0.16 | | | | 0.12 | | | | | |
| | | | | | |
Net realized and unrealized gain (loss) on investments | | | (0.85 | ) | | | (0.95 | ) | | | 6.33 | | | | 1.92 | | | | (1.83 | ) | | | | |
| | | | | | |
Total income (loss) from investment operations | | | (0.51 | ) | | | (0.87 | ) | | | 6.31 | | | | 2.08 | | | | (1.71 | ) | | | | |
| | | | | | |
Less Distributions to Shareholders from: | | | | | | | | | | | | | | | | | | | | | | | | |
| | | | | | |
Net investment income | | | (0.15 | ) | | | – | | | | (0.13 | ) | | | (0.11 | ) | | | (0.04 | ) | | | | |
| | | | | | |
Net realized gain on investments | | | (2.66 | ) | | | (2.81 | ) | | | (1.71 | ) | | | (2.05 | ) | | | (7.58 | ) | | | | |
| | | | | | |
Total distributions to shareholders | | | (2.81 | ) | | | (2.81 | ) | | | (1.84 | ) | | | (2.16 | ) | | | (7.62 | ) | | | | |
| | | | | | |
Net Asset Value, End of Year | | | $34.95 | | | | $38.27 | | | | $41.95 | | | | $37.48 | | | | $37.56 | | | | | |
| | | | | | |
Total Return2,4 | | | (0.55 | )% | | | (2.82 | )% | | | 16.87 | % | | | 6.01 | % | | | (5.02 | )% | | | | |
| | | | | | |
Ratio of net expenses to average net assets | | | 1.15 | % | | | 1.12 | % | | | 1.12 | % | | | 1.12 | % | | | 1.11 | % | | | | |
| | | | | | |
Ratio of gross expenses to average net assets5 | | | 1.15 | % | | | 1.13 | % | | | 1.13 | % | | | 1.12 | % | | | 1.11 | % | | | | |
| | | | | | |
Ratio of net investment income (loss) to average net assets2 | | | 0.95 | % | | | 0.19 | % | | | (0.05 | )% | | | 0.44 | % | | | 0.27 | % | | | | |
| | | | | | |
Portfolio turnover | | | 21 | % | | | 18 | % | | | 28 | % | | | 24 | % | | | 32 | % | | | | |
| | | | | | |
Net assets end of year (000’s) omitted | | | $518,354 | | | | $893,685 | | | | $1,292,107 | | | | $1,374,982 | | | | $1,861,753 | | | | | |
| | | | | | |
| | | | | | |
134
|
AMG Managers Fairpointe Mid Cap Fund Financial Highlights For a share outstanding throughout each fiscal year |
| | | | | | | | | | | | | | | | | | | | | | | | |
| | | For the fiscal year ended October 31, | | | | |
| | | | | | |
| Class I | | 2019 | | | 2018 | | | 2017 | | | 2016 | | | 2015 | | | | |
| | | | | | |
Net Asset Value, Beginning of Year | | | $39.33 | | | | $42.97 | | | | $38.39 | | | | $38.44 | | | | $47.74 | | | | | |
| | | | | | |
Income (loss) from Investment Operations: | | | | | | | | | | | | | | | | | | | | | | | | |
| | | | | | |
Net investment income1,2 | | | 0.45 | 3 | | | 0.19 | | | | 0.08 | | | | 0.25 | | | | 0.23 | | | | | |
| | | | | | |
Net realized and unrealized gain (loss) on investments | | | (0.89 | ) | | | (0.99 | ) | | | 6.49 | | | | 1.98 | | | | (1.89 | ) | | | | |
| | | | | | |
Total income (loss) from investment operations | | | (0.44 | ) | | | (0.80 | ) | | | 6.57 | | | | 2.23 | | | | (1.66 | ) | | | | |
| | | | | | |
Less Distributions to Shareholders from: | | | | | | | | | | | | | | | | | | | | | | | | |
| | | | | | |
Net investment income | | | (0.27 | ) | | | (0.03 | ) | | | (0.24 | ) | | | (0.23 | ) | | | (0.06 | ) | | | | |
| | | | | | |
Net realized gain on investments | | | (2.66 | ) | | | (2.81 | ) | | | (1.75 | ) | | | (2.05 | ) | | | (7.58 | ) | | | | |
| | | | | | |
Total distributions to shareholders | | | (2.93 | ) | | | (2.84 | ) | | | (1.99 | ) | | | (2.28 | ) | | | (7.64 | ) | | | | |
| | | | | | |
Net Asset Value, End of Year | | | $35.96 | | | | $39.33 | | | | $42.97 | | | | $38.39 | | | | $38.44 | | | | | |
| | | | | | |
Total Return2,4 | | | (0.33 | )% | | | (2.56 | )% | | | 17.16 | % | | | 6.26 | % | | | (4.78 | )% | | | | |
| | | | | | |
Ratio of net expenses to average net assets | | | 0.90 | % | | | 0.87 | % | | | 0.87 | % | | | 0.87 | % | | | 0.86 | % | | | | |
| | | | | | |
Ratio of gross expenses to average net assets5 | | | 0.90 | % | | | 0.88 | % | | | 0.88 | % | | | 0.87 | % | | | 0.86 | % | | | | |
| | | | | | |
Ratio of net investment income to average net assets2 | | | 1.20 | % | | | 0.44 | % | | | 0.20 | % | | | 0.68 | % | | | 0.52 | % | | | | |
| | | | | | |
Portfolio turnover | | | 21 | % | | | 18 | % | | | 28 | % | | | 24 | % | | | 32 | % | | | | |
| | | | | | |
Net assets end of year (000’s) omitted | | | $1,102,479 | | | | $1,754,203 | | | | $2,668,464 | | | | $2,135,998 | | | | $2,838,642 | | | | | |
| | | | | | |
| | | | | | |
135
|
AMG Managers Fairpointe Mid Cap Fund Financial Highlights For a share outstanding throughout each fiscal period |
| | | | | | | | | | | | | | | | | | | | |
| | | For the fiscal year ended October 31, | | | For the fiscal period ended October 31, | | | | |
| | | | | |
Class Z | | 2019 | | | 2018 | | | 20176 | | | | | | | |
| | | | | |
Net Asset Value, Beginning of Period | | | $39.34 | | | | $42.98 | | | | $44.24 | | | | | | | | | |
| | | | | |
Income (loss) from Investment Operations: | | | | | | | | | | | | | | | | | | | | |
| | | | | |
Net investment income1,2 | | | 0.48 | 3 | | | 0.22 | | | | 0.00 | 7 | | | | | | | | |
| | | | | |
Net realized and unrealized loss on investments | | | (0.89 | ) | | | (0.98 | ) | | | (1.26 | ) | | | | | | | | |
| | | | | |
Total loss from investment operations | | | (0.41 | ) | | | (0.76 | ) | | | (1.26 | ) | | | | | | | | |
| | | | | |
Less Distributions to Shareholders from: | | | | | | | | | | | | | | | | | | | | |
| | | | | |
Net investment income | | | (0.32 | ) | | | (0.07 | ) | | | – | | | | | | | | | |
| | | | | |
Net realized gain on investments | | | (2.66 | ) | | | (2.81 | ) | | | – | | | | | | | | | |
| | | | | |
Total distributions to shareholders | | | (2.98 | ) | | | (2.88 | ) | | | – | | | | | | | | | |
| | | | | |
Net Asset Value, End of Period | | | $35.95 | | | | $39.34 | | | | $42.98 | | | | | | | | | |
| | | | | |
Total Return2,4 | | | (0.25 | )% | | | (2.48 | )% | | | (2.85 | )%8 | | | | | | | | |
| | | | | |
Ratio of net expenses to average net assets | | | 0.82 | % | | | 0.79 | % | | | 0.79 | %9 | | | | | | | | |
| | | | | |
Ratio of gross expenses to average net assets5 | | | 0.82 | % | | | 0.80 | % | | | 0.80 | %9 | | | | | | | | |
| | | | | |
Ratio of net investment income to average net assets2 | | | 1.28 | % | | | 0.52 | % | | | 0.01 | %9 | | | | | | | | |
| | | | | |
Portfolio turnover | | | 21 | % | | | 18 | % | | | 28 | %8 | | | | | | | | |
| | | | | |
Net assets end of period (000’s) omitted | | | $47,907 | | | | $205,203 | | | | $9,625 | | | | | | | | | |
| | | | | | |
| | | | | | |
| 1 | Per share numbers have been calculated using average shares. |
| 2 | Total returns and net investment income (loss) would have been lower had certain expenses not been offset. |
| 3 | Includes non-recurring dividends. Without these dividends, net investment income per share would have been $0.23, $0.33 and $0.36 for Class N, Class I and Class z, respectively. |
| 4 | The total return is calculated using the published Net Asset Value as of fiscal year end. |
| 5 | Excludes the impact of expense reimbursement or fee waivers and expense reductions such as brokerage credits, but includes expense repayments and non-reimbursable expenses, if any, such as interest, taxes, and extraordinary expenses. (See Note 1(c) and 2 in the Notes to Financial Statements.) |
| 6 | Commencement of operations was on October 2, 2017. |
| 7 | Less than $0.005 per share. |
136
|
AMG Managers LMCG Small Cap Growth Fund Financial Highlights For a share outstanding throughout each fiscal year |
| | | | | | | | | | | | | | | | | | | | |
| | | For the fiscal year ended October 31, | |
| | | | |
| | | | | |
Class N | | 2019 | | | 2018 | | | 2017 | | | 2016 | | | 2015 | |
| | | | | |
Net Asset Value, Beginning of Year | | | $16.90 | | | | $15.30 | | | | $12.19 | | | | $14.47 | | | | $14.76 | |
| | | | | |
Income (loss) from Investment Operations: | | | | | | | | | | | | | | | | | | | | |
| | | | | |
Net investment loss1,2 | | | (0.08 | ) | | | (0.12 | ) | | | (0.09 | )3 | | | (0.11 | ) | | | (0.15 | ) |
| | | | | |
Net realized and unrealized gain (loss) on investments | | | 0.20 | | | | 1.72 | | | | 3.20 | | | | (2.17 | ) | | | 0.40 | |
| | | | | |
Total income (loss) from investment operations | | | 0.12 | | | | 1.60 | | | | 3.11 | | | | (2.28 | ) | | | 0.25 | |
| | | | | |
Less Distributions to Shareholders from: | | | | | | | | | | | | | | | | | | | | |
| | | | | |
Net realized gain on investments | | | — | | | | — | | | | — | | | | (0.00 | )4 | | | (0.54 | ) |
| | | | | |
Net Asset Value, End of Year | | | $17.02 | | | | $16.90 | | | | $15.30 | | | | $12.19 | | | | $14.47 | |
| | | | | |
Total Return2,5 | | | 0.71 | % | | | 10.46 | % | | | 25.51 | % | | | (15.74 | )% | | | 1.65 | % |
| | | | | |
Ratio of net expenses to average net assets | | | 1.30 | %6 | | | 1.31 | %6 | | | 1.23 | %6 | | | 1.35 | % | | | 1.35 | % |
| | | | | |
Ratio of gross expenses to average net assets7 | | | 1.47 | % | | | 1.43 | % | | | 1.36 | % | | | 1.51 | % | | | 1.53 | % |
| | | | | |
Ratio of net investment loss to average net assets2 | | | (0.48 | )% | | | (0.73 | )% | | | (0.65 | )% | | | (1.00 | )% | | | (1.00 | )% |
| | | | | |
Portfolio turnover | | | 138 | % | | | 161 | % | | | 151 | % | | | 138 | % | | | 79 | % |
| | | | | |
Net assets end of year (000’s) omitted | | | $30,717 | | | | $37,232 | | | | $45,902 | | | | $53,816 | | | | $154,394 | |
| | |
| | |
137
|
AMG Managers LMCG Small Cap Growth Fund Financial Highlights For a share outstanding throughout each fiscal year |
| | | | | | | | | | | | | | | | | | | | |
| | | For the fiscal year ended October 31, | |
| | | | |
| | | | | |
| Class I | | 2019 | | | 2018 | | | 2017 | | | 2016 | | | 2015 | |
| | | | | |
Net Asset Value, Beginning of Year | | | $17.20 | | | | $15.54 | | | | $12.36 | | | | $14.64 | | | | $14.89 | |
| | | | | |
Income (loss) from Investment Operations: | | | | | | | | | | | | | | | | | | | | |
| | | | | |
Net investment loss1,2 | | | (0.05 | ) | | | (0.09 | ) | | | (0.07 | )3 | | | (0.08 | ) | | | (0.12 | ) |
| | | | | |
Net realized and unrealized gain (loss) on investments | | | 0.20 | | | | 1.75 | | | | 3.25 | | | | (2.20 | ) | | | 0.41 | |
| | | | | |
Total income (loss) from investment operations | | | 0.15 | | | | 1.66 | | | | 3.18 | | | | (2.28 | ) | | | 0.29 | |
| | | | | |
Less Distributions to Shareholders from: | | | | | | | | | | | | | | | | | | | | |
| | | | | |
Net realized gain on investments | | | — | | | | — | | | | — | | | | (0.00 | )4 | | | (0.54 | ) |
| | | | | |
Net Asset Value, End of Year | | | $17.35 | | | | $17.20 | | | | $15.54 | | | | $12.36 | | | | $14.64 | |
| | | | | |
Total Return2,5 | | | 0.93 | % | | | 10.68 | % | | | 25.73 | % | | | (15.56 | )% | | | 1.91 | % |
| | | | | |
Ratio of net expenses to average net assets | | | 1.10 | %6 | | | 1.10 | %6 | | | 1.05 | %6 | | | 1.10 | % | | | 1.10 | % |
| | | | | |
Ratio of gross expenses to average net assets7 | | | 1.27 | % | | | 1.22 | % | | | 1.18 | % | | | 1.25 | % | | | 1.28 | % |
| | | | | |
Ratio of net investment loss to average net assets2 | | | (0.28 | )% | | | (0.52 | )% | | | (0.47 | )% | | | (0.59 | )% | | | (0.75 | )% |
| | | | | |
Portfolio turnover | | | 138 | % | | | 161 | % | | | 151 | % | | | 138 | % | | | 79 | % |
| | | | | |
Net assets end of year (000’s) omitted | | | $14,608 | | | | $65,802 | | | | $79,652 | | | | $58,020 | | | | $76,989 | |
| | |
| | |
| 1 | Per share numbers have been calculated using average shares. |
| 2 | Total returns and net investment loss would have been lower had certain expenses not been offset. |
| 3 | Includesnon-recurring dividends. Without these dividends, net investment loss per share would have been $(0.11) and $(0.09) for Class N and Class I shares, respectively. |
| 4 | Less than $(0.005) per share. |
| 5 | The total return is calculated using the published Net Asset Value as of fiscal year end. |
| 6 | Includes reduction from broker recapture amounting to 0.01%, less than 0.01% and 0.01% for the fiscal years ended 2019, 2018 and 2017, respectively. |
| 7 | Excludes the impact of expense reimbursement or fee waivers and expense reductions such as brokerage credits, but includes expense repayments andnon-reimbursable expenses, if any, such as interest, taxes, and extraordinary expenses. (See Note 1(c) and 2 in the Notes to Financial Statements.) |
138
|
AMG River RoadSmall-Mid Cap Value Fund Financial Highlights For a share outstanding throughout each fiscal year |
| | | | | | | | | | | | | | | | | | | | |
| | | For the fiscal year ended October 31, | |
| | | | |
| | | | | |
| Class N | | 2019 | �� | | 2018 | | | 2017 | | | 2016 | | | 2015 | |
| | | | | |
Net Asset Value, Beginning of Year | | | $7.62 | | | | $8.23 | | | | $7.04 | | | | $7.63 | | | | $8.77 | |
| | | | | |
Income (loss) from Investment Operations: | | | | | | | | | | | | | | | | | | | | |
| | | | | |
Net investment loss1,2 | | | (0.02 | ) | | | (0.03 | ) | | | (0.03 | ) | | | (0.04 | ) | | | (0.04 | ) |
| | | | | |
Net realized and unrealized gain on investments | | | 0.78 | | | | 0.57 | | | | 1.81 | | | | 0.56 | | | | 0.33 | |
| | | | | |
Total income from investment operations | | | 0.76 | | | | 0.54 | | | | 1.78 | | | | 0.52 | | | | 0.29 | |
| | | | | |
Less Distributions to Shareholders from: | | | | | | | | | | | | | | | | | | | | |
| | | | | |
Net investment income | | | — | | | | (0.02 | ) | | | (0.01 | ) | | | — | | | | — | |
| | | | | |
Net realized gain on investments | | | (0.54 | ) | | | (1.13 | ) | | | (0.58 | ) | | | (1.11 | ) | | | (1.43 | ) |
| | | | | |
Total distributions to shareholders | | | (0.54 | ) | | | (1.15 | ) | | | (0.59 | ) | | | (1.11 | ) | | | (1.43 | ) |
| | | | | |
Net Asset Value, End of Year | | | $7.84 | | | | $7.62 | | | | $8.23 | | | | $7.04 | | | | $7.63 | |
| | | | | |
Total Return2,3 | | | 11.82 | % | | | 7.09 | % | | | 26.18 | % | | | 8.55 | % | | | 3.26 | % |
| | | | | |
Ratio of net expenses to average net assets | | | 1.31 | %4 | | | 1.32 | %4 | | | 1.35 | %4 | | | 1.50 | % | | | 1.49 | % |
| | | | | |
Ratio of gross expenses to average net assets5 | | | 1.37 | % | | | 1.36 | % | | | 1.46 | % | | | 1.62 | % | | | 1.49 | % |
| | | | | |
Ratio of net investment loss to average net assets2 | | | (0.27 | )% | | | (0.35 | )% | | | (0.33 | )% | | | (0.52 | )% | | | (0.52 | )% |
| | | | | |
Portfolio turnover | | | 38 | % | | | 46 | % | | | 57 | % | | | 65 | % | | | 59 | % |
| | | | | |
Net assets end of year (000’s) omitted | | | $24,669 | | | | $17,840 | | | | $7,810 | | | | $4,942 | | | | $5,038 | |
| | |
| | |
139
|
AMG River RoadSmall-Mid Cap Value Fund Financial Highlights For a share outstanding throughout each fiscal year |
| | | | | | | | | | | | | | | | | | | | |
| | | For the fiscal year ended October 31, | |
| | | | |
| | | | | |
Class I | | 2019 | | | 2018 | | | 2017 | | | 2016 | | | 2015 | |
| | | | | |
Net Asset Value, Beginning of Year | | | $7.78 | | | | $8.38 | | | | $7.16 | | | | $7.76 | | | | $8.88 | |
| | | | | |
Income (loss) from Investment Operations: | | | | | | | | | | | | | | | | | | | | |
| | | | | |
Net investment income (loss)1,2 | | | (0.00 | )6 | | | (0.01 | ) | | | 0.00 | 6 | | | (0.02 | ) | | | (0.02 | ) |
| | | | | |
Net realized and unrealized gain on investments | | | 0.80 | | | | 0.57 | | | | 1.84 | | | | 0.55 | | | | 0.33 | |
| | | | | |
Total income from investment operations | | | 0.80 | | | | 0.56 | | | | 1.84 | | | | 0.53 | | | | 0.31 | |
| | | | | |
Less Distributions to Shareholders from: | | | | | | | | | | | | | | | | | | | | |
| | | | | |
Net investment income | | | — | | | | (0.03 | ) | | | (0.03 | ) | | | (0.02 | ) | | | — | |
| | | | | |
Net realized gain on investments | | | (0.54 | ) | | | (1.13 | ) | | | (0.59 | ) | | | (1.11 | ) | | | (1.43 | ) |
| | | | | |
Total distributions to shareholders | | | (0.54 | ) | | | (1.16 | ) | | | (0.62 | ) | | | (1.13 | ) | | | (1.43 | ) |
| | | | | |
Net Asset Value, End of Year | | | $8.04 | | | | $7.78 | | | | $8.38 | | | | $7.16 | | | | $7.76 | |
| | | | | |
Total Return2,3 | | | 12.12 | % | | | 7.32 | % | | | 26.63 | % | | | 8.64 | % | | | 3.60 | % |
| | | | | |
Ratio of net expenses to average net assets | | | 1.06 | %4 | | | 1.08 | %4 | | | 1.10 | %4 | | | 1.25 | % | | | 1.24 | % |
| | | | | |
Ratio of gross expenses to average net assets5 | | | 1.12 | % | | | 1.12 | % | | | 1.21 | % | | | 1.38 | % | | | 1.24 | % |
| | | | | |
Ratio of net investment loss to average net assets2 | | | (0.02 | )% | | | (0.11 | )% | | | (0.06 | )% | | | (0.24 | )% | | | (0.27 | )% |
| | | | | |
Portfolio turnover | | | 38 | % | | | 46 | % | | | 57 | % | | | 65 | % | | | 59 | % |
| | | | | |
Net assets end of year (000’s) omitted | | | $145,620 | | | | $51,400 | | | | $36,547 | | | | $34,913 | | | | $92,073 | |
| | |
| | |
140
|
AMG River RoadSmall-Mid Cap Value Fund Financial Highlights For a share outstanding throughout each fiscal period |
| | | | | | | | | | | | | | | |
| | | For the fiscal year ended October 31, | | For the fiscal period ended October 31, |
| | | | | |
| | | |
| Class Z | | 2019 | | 2018 | | 20177 |
| | | |
Net Asset Value, Beginning of Period | | | | $7.77 | | | | | $8.37 | | | | | $8.48 | |
| | | |
Income (loss) from Investment Operations: | | | | | | | | | | | | | | | |
| | | |
Net investment income (loss)1,2 | | | | 0.00 | 6 | | | | (0.01 | ) | | | | (0.01 | ) |
| | | |
Net realized and unrealized gain (loss) on investments | | | | 0.81 | | | | | 0.58 | | | | | (0.10 | ) |
| | | |
Total income (loss) from investment operations | | | | 0.81 | | | | | 0.57 | | | | | (0.11 | ) |
| | | |
Less Distributions to Shareholders from: | | | | | | | | | | | | | | | |
| | | |
Net investment income | | | | — | | | | | (0.04 | ) | | | | — | |
| | | |
Net realized gain on investments | | | | (0.54 | ) | | | | (1.13 | ) | | | | — | |
| | | |
Total distributions to shareholders | | | | (0.54 | ) | | | | (1.17 | ) | | | | — | |
| | | |
Net Asset Value, End of Period | | | | $8.04 | | | | | $7.77 | | | | | $8.37 | |
| | | |
Total Return2,3 | | | | 12.26 | % | | | | 7.37 | % | | | | (1.30 | )%8 |
| | | |
Ratio of net expenses to average net assets | | | | 1.01 | %4 | | | | 1.03 | %4 | | | | 1.04 | %4,9 |
| | | |
Ratio of gross expenses to average net assets5 | | | | 1.07 | % | | | | 1.07 | % | | | | 1.48 | %9 |
| | | |
Ratio of net investment income (loss) to average net assets2 | | | | 0.03 | % | | | | (0.06 | )% | | | | (0.71 | )%9 |
| | | |
Portfolio turnover | | | | 38 | % | | | | 46 | % | | | | 57 | %8 |
| | | |
Net assets end of period (000’s) omitted | | | | $183 | | | | | $136 | | | | | $49 | |
| | |
| | |
| 1 | Per share numbers have been calculated using average shares. |
| 2 | Total returns and net investment income (loss) would have been lower had certain expenses not been offset. |
| 3 | The total return is calculated using the published Net Asset Value as of fiscal year end. |
| 4 | Includes reduction from broker recapture amounting to 0.03% for the fiscal year ended October 31, 2019 and 0.01% for the fiscal year ended October 31, 2018 and the period ended October 31, 2017. |
| 5 | Excludes the impact of expense reimbursement or fee waivers and expense reductions such as brokerage credits, but includes expense repayments andnon-reimbursable expenses, if any, such as interest, taxes, and extraordinary expenses. (See Note 1(c) and 2 in the Notes to Financial Statements.) |
| 6 | Less than $0.005 or $(0.005) per share. |
| 7 | The commencement of operations was October 2, 2017. |
141
|
AMG River Road Small Cap Value Fund Financial Highlights For a share outstanding throughout each fiscal year |
| | | | | | | | | | | | | | | | | | | | |
| | | For the fiscal year ended October 31, | |
| | | | |
| | | | | |
| Class N | | 2019 | | | 2018 | | | 2017 | | | 2016 | | | 2015 | |
| | | | | |
Net Asset Value, Beginning of Year | | | $13.26 | | | | $14.46 | | | | $12.29 | | | | $12.20 | | | | $13.53 | |
| | | | | |
Income (loss) from Investment Operations: | | | | | | | | | | | | | | | | | | | | |
| | | | | |
Net investment loss1,2 | | | (0.04 | ) | | | (0.05 | ) | | | (0.05 | ) | | | (0.04 | ) | | | (0.06 | ) |
| | | | | |
Net realized and unrealized gain on investments | | | 1.17 | | | | 0.79 | | | | 2.88 | | | | 0.85 | | | | 0.72 | |
| | | | | |
Total income from investment operations | | | 1.13 | | | | 0.74 | | | | 2.83 | | | | 0.81 | | | | 0.66 | |
| | | | | |
Less Distributions to Shareholders from: | | | | | | | | | | | | | | | | | | | | |
| | | | | |
Net realized gain on investments | | | (1.39 | ) | | | (1.94 | ) | | | (0.66 | ) | | | (0.72 | ) | | | (1.99 | ) |
| | | | | |
Net Asset Value, End of Year | | | $13.00 | | | | $13.26 | | | | $14.46 | | | | $12.29 | | | | $12.20 | |
| | | | | |
Total Return2,3 | | | 10.86 | % | | | 5.41 | % | | | 23.43 | % | | | 7.22 | % | | | 5.15 | % |
| | | | | |
Ratio of net expenses to average net assets | | | 1.36 | %4 | | | 1.35 | %4 | | | 1.35 | %4 | | | 1.34 | % | | | 1.34 | % |
| | | | | |
Ratio of gross expenses to average net assets5 | | | 1.37 | % | | | 1.36 | % | | | 1.36 | % | | | 1.34 | % | | | 1.34 | % |
| | | | | |
Ratio of net investment loss to average net assets2 | | | (0.33 | )% | | | (0.34 | )% | | | (0.36 | )% | | | (0.31 | )% | | | (0.45 | )% |
| | | | | |
Portfolio turnover | | | 47 | %6 | | | 41 | % | | | 42 | % | | | 57 | % | | | 61 | % |
| | | | | |
Net assets end of year (000’s) omitted | | | $29,963 | | | | $28,444 | | | | $31,657 | | | | $21,765 | | | | $25,246 | |
| | |
| | |
142
|
AMG River Road Small Cap Value Fund Financial Highlights For a share outstanding throughout each fiscal year |
| | | | | | | | | | | | | | | | | | | | |
| | | For the fiscal year ended October 31, | |
| | | | |
| | | | | |
| Class I | | 2019 | | | 2018 | | | 2017 | | | 2016 | | | 2015 | |
| | | | | |
Net Asset Value, Beginning of Year | | | $13.51 | | | | $14.68 | | | | $12.44 | | | | $12.31 | | | | $13.60 | |
| | | | | |
Income (loss) from Investment Operations: | | | | | | | | | | | | | | | | | | | | |
| | | | | |
Net investment loss1,2 | | | (0.01 | ) | | | (0.01 | ) | | | (0.01 | ) | | | (0.01 | ) | | | (0.03 | ) |
| | | | | |
Net realized and unrealized gain on investments | | | 1.20 | | | | 0.79 | | | | 2.92 | | | | 0.86 | | | | 0.73 | |
| | | | | |
Total income from investment operations | | | 1.19 | | | | 0.78 | | | | 2.91 | | | | 0.85 | | | | 0.70 | |
| | | | | |
Less Distributions to Shareholders from: | | | | | | | | | | | | | | | | | | | | |
| | | | | |
Net investment income | | | (0.01 | ) | | | (0.01 | ) | | | — | | | | — | | | | — | |
| | | | | |
Net realized gain on investments | | | (1.39 | ) | | | (1.94 | ) | | | (0.67 | ) | | | (0.72 | ) | | | (1.99 | ) |
| | | | | |
Total distributions to shareholders | | | (1.40 | ) | | | (1.95 | ) | | | (0.67 | ) | | | (0.72 | ) | | | (1.99 | ) |
| | | | | |
Net Asset Value, End of Year | | | $13.30 | | | | $13.51 | | | | $14.68 | | | | $12.44 | | | | $12.31 | |
| | | | | |
Total Return2,3 | | | 11.23 | % | | | 5.60 | % | | | 23.80 | % | | | 7.50 | % | | | 5.45 | % |
| | | | | |
Ratio of net expenses to average net assets | | | 1.09 | %4 | | | 1.10 | %4 | | | 1.10 | %4 | | | 1.09 | % | | | 1.09 | % |
| | | | | |
Ratio of gross expenses to average net assets5 | | | 1.10 | % | | | 1.11 | % | | | 1.11 | % | | | 1.09 | % | | | 1.09 | % |
| | | | | |
Ratio of net investment loss to average net assets2 | | | (0.06 | )% | | | (0.09 | )% | | | (0.11 | )% | | | (0.06 | )% | | | (0.20 | )% |
| | | | | |
Portfolio turnover | | | 47 | %6 | | | 41 | % | | | 42 | % | | | 57 | % | | | 61 | % |
| | | | | |
Net assets end of year (000’s) omitted | | | $374,344 | | | | $330,245 | | | | $279,574 | | | | $246,753 | | | | $245,192 | |
| | |
| | |
143
|
AMG River Road Small Cap Value Fund Financial Highlights For a share outstanding throughout each fiscal period |
| | | | | | | | | | | | | | | |
| | | For the fiscal year ended October 31, | | For the fiscal period ended October 31, |
| | | | | |
| | | |
| Class Z | | 2019 | | 2018 | | 20177 |
| | | |
Net Asset Value, Beginning of Period | | | | $13.51 | | | | | $14.68 | | | | | $14.68 | |
| | | |
Income (loss) from Investment Operations: | | | | | | | | | | | | | | | |
| | | |
Net investment income (loss)1,2 | | | | 0.00 | 8 | | | | 0.00 | 8 | | | | (0.01 | ) |
| | | |
Net realized and unrealized gain on investments | | | | 1.20 | | | | | 0.79 | | | | | 0.01 | |
| | | |
Total income from investment operations | | | | 1.20 | | | | | 0.79 | | | | | — | |
| | | |
Less Distributions to Shareholders from: | | | | | | | | | | | | | | | |
| | | |
Net investment income | | | | (0.02 | ) | | | | (0.02 | ) | | | | — | |
| | | |
Net realized gain on investments | | | | (1.39 | ) | | | | (1.94 | ) | | | | — | |
| | | |
Total distributions to shareholders | | | | (1.41 | ) | | | | (1.96 | ) | | | | — | |
| | | |
Net Asset Value, End of Period | | | | $13.30 | | | | | $13.51 | | | | | $14.68 | |
| | | |
Total Return2,3 | | | | 11.29 | % | | | | 5.71 | % | | | | 0.00 | %9 |
| | | |
Ratio of net expenses to average net assets | | | | 1.01 | %4 | | | | 1.00 | %4 | | | | 1.03 | %10 |
| | | |
Ratio of gross expenses to average net assets5 | | | | 1.02 | % | | | | 1.01 | % | | | | 1.03 | %10 |
| | | |
Ratio of net investment income (loss) to average net assets2 | | | | 0.02 | % | | | | 0.01 | % | | | | (0.58 | )%10 |
| | | |
Portfolio turnover | | | | 47 | %6 | | | | 41 | % | | | | 42 | %9 |
| | | |
Net assets end of period (000’s) omitted | | | | $186 | | | | | $163 | | | | | $154 | |
| | |
| | |
| 1 | Per share numbers have been calculated using average shares. |
| 2 | Total returns and net investment income (loss) would have been lower had certain expenses not been offset. |
| 3 | The total return is calculated using the published Net Asset Value as of fiscal year end. |
| 4 | Includes reduction from broker recapture amounting to 0.01%. |
| 5 | Excludes the impact of expense reimbursement or fee waivers and expense reductions such as brokerage credits, but includes expense repayments andnon-reimbursable expenses, if any, such as interest, taxes, and extraordinary expenses. (See Note 1(c) and 2 in the Notes to Financial Statements.) |
| 6 | Portfolio turnover rate excludes securities delivered from processing a redemptionin-kind. |
| 7 | The commencement of operations was October 2, 2017. |
| 8 | Less than $0.005 or $(0.005) per share. |
144
|
AMG Managers Silvercrest Small Cap Fund Financial Highlights For a share outstanding throughout each fiscal year |
| | | | | | | | | | | | | | | | | | | | |
| | | For the fiscal year ended October 31, | |
| | | | |
| | | | | |
| Class N | | 2019 | | | 2018 | | | 2017 | | | 2016 | | | 2015 | |
| | | | | |
Net Asset Value, Beginning of Year | | | $16.69 | | | | $19.28 | | | | $15.43 | | | | $15.20 | | | | $15.20 | |
| | | | | |
Income (loss) from Investment Operations: | | | | | | | | | | | | | | | | | | | | |
| | | | | |
Net investment income (loss)1,2 | | | 0.02 | | | | (0.04 | ) | | | (0.02 | ) | | | 0.02 | | | | 0.01 | |
| | | | | |
Net realized and unrealized gain (loss) on investments | | | 0.82 | | | | (1.07 | ) | | | 4.00 | | | | 0.80 | | | | 0.31 | |
| | | | | |
Total income (loss) from investment operations | | | 0.84 | | | | (1.11 | ) | | | 3.98 | | | | 0.82 | | | | 0.32 | |
| | | | | |
Less Distributions to Shareholders from: | | | | | | | | | | | | | | | | | | | | |
| | | | | |
Net investment income | | | (0.00 | )3 | | | — | | | | — | | | | (0.04 | ) | | | (0.02 | ) |
| | | | | |
Net realized gain on investments | | | (1.56 | ) | | | (1.48 | ) | | | (0.13 | ) | | | (0.55 | ) | | | (0.30 | ) |
| | | | | |
Total distributions to shareholders | | | (1.56 | ) | | | (1.48 | ) | | | (0.13 | ) | | | (0.59 | ) | | | (0.32 | ) |
| | | | | |
Net Asset Value, End of Year | | | $15.97 | | | | $16.69 | | | | $19.28 | | | | $15.43 | | | | $15.20 | |
| | | | | |
Total Return2,4 | | | 6.85 | % | | | (6.43 | )% | | | 25.83 | % | | | 5.73 | % | | | 2.14 | % |
| | | | | |
Ratio of net expenses to average net assets | | | 1.37 | %5 | | | 1.37 | %5 | | | 1.37 | %5 | | | 1.40 | % | | | 1.40 | % |
| | | | | |
Ratio of gross expenses to average net assets6 | | | 1.46 | % | | | 1.43 | % | | | 1.43 | % | | | 1.45 | % | | | 1.47 | % |
| | | | | |
Ratio of net investment income (loss) to average net assets2 | | | 0.13 | % | | | (0.19 | )% | | | (0.12 | )% | | | 0.16 | % | | | 0.04 | % |
| | | | | |
Portfolio turnover | | | 20 | % | | | 34 | % | | | 40 | % | | | 32 | % | | | 36 | % |
| | | | | |
Net assets end of year (000’s) omitted | | | $28,847 | | | | $12,745 | | | | $25,451 | | | | $20,228 | | | | $19,061 | |
| | |
| | |
145
|
AMG Managers Silvercrest Small Cap Fund Financial Highlights For a share outstanding throughout each fiscal year |
| | | | | | | | | | | | | | | | | | | | |
| | | For the fiscal year ended October 31, | |
| | | | |
| | | | | |
| Class I | | 2019 | | | 2018 | | | 2017 | | | 2016 | | | 2015 | |
| | | | | |
Net Asset Value, Beginning of Year | | | $16.87 | | | | $19.44 | | | | $15.56 | | | | $15.30 | | | | $15.27 | |
| | | | | |
Income (loss) from Investment Operations: | | | | | | | | | | | | | | | | | | | | |
| | | | | |
Net investment income1,2 | | | 0.06 | | | | 0.01 | | | | 0.02 | | | | 0.06 | | | | 0.04 | |
| | | | | |
Net realized and unrealized gain (loss) on investments | | | 0.84 | | | | (1.08 | ) | | | 4.03 | | | | 0.81 | | | | 0.32 | |
| | | | | |
Total income (loss) from investment operations | | | 0.90 | | | | (1.07 | ) | | | 4.05 | | | | 0.87 | | | | 0.36 | |
| | | | | |
Less Distributions to Shareholders from: | | | | | | | | | | | | | | | | | | | | |
| | | | | |
Net investment income | | | (0.02 | ) | | | (0.02 | ) | | | (0.04 | ) | | | (0.06 | ) | | | (0.03 | ) |
| | | | | |
Net realized gain on investments | | | (1.56 | ) | | | (1.48 | ) | | | (0.13 | ) | | | (0.55 | ) | | | (0.30 | ) |
| | | | | |
Total distributions to shareholders | | | (1.58 | ) | | | (1.50 | ) | | | (0.17 | ) | | | (0.61 | ) | | | (0.33 | ) |
| | | | | |
Net Asset Value, End of Year | | | $16.19 | | | | $16.87 | | | | $19.44 | | | | $15.56 | | | | $15.30 | |
| | | | | |
Total Return2,4 | | | 7.14 | % | | | (6.16 | )% | | | 26.07 | % | | | 6.04 | % | | | 2.37 | % |
| | | | | |
Ratio of net expenses to average net assets | | | 1.12 | %5 | | | 1.13 | %5 | | | 1.12 | %5 | | | 1.15 | % | | | 1.15 | % |
| | | | | |
Ratio of gross expenses to average net assets6 | | | 1.21 | % | | | 1.19 | % | | | 1.18 | % | | | 1.21 | % | | | 1.22 | % |
| | | | | |
Ratio of net investment income to average net assets2 | | | 0.38 | % | | | 0.05 | % | | | 0.12 | % | | | 0.40 | % | | | 0.29 | % |
| | | | | |
Portfolio turnover | | | 20 | % | | | 34 | % | | | 40 | % | | | 32 | % | | | 36 | % |
| | | | | |
Net assets end of year (000’s) omitted | | | $159,069 | | | | $191,477 | | | | $241,626 | | | | $181,964 | | | | $145,402 | |
| | |
| | |
146
|
AMG Managers Silvercrest Small Cap Fund Financial Highlights For a share outstanding throughout each fiscal period |
| | | | | | | | | | | | | | | |
| | | For the fiscal year ended October 31, | | For the fiscal period ended October 31, |
| | | | | |
| | | |
Class Z | | 2019 | | 2018 | | 20177 |
| | | |
Net Asset Value, Beginning of Period | | | | $16.87 | | | | | $19.45 | | | | | $19.24 | |
| | | |
Income (loss) from Investment Operations: | | | | | | | | | | | | | | | |
| | | |
Net investment income (loss)1,2 | | | | 0.07 | | | | | 0.02 | | | | | (0.01 | ) |
| | | |
Net realized and unrealized gain (loss) on investments | | | | 0.83 | | | | | (1.09 | ) | | | | 0.22 | |
| | | |
Total income (loss) from investment operations | | | | 0.90 | | | | | (1.07 | ) | | | | 0.21 | |
| | | |
Less Distributions to Shareholders from: | | | | | | | | | | | | | | | |
| | | |
Net investment income | | | | (0.03 | ) | | | | (0.03 | ) | | | | — | |
| | | |
Net realized gain on investments | | | | (1.56 | ) | | | | (1.48 | ) | | | | — | |
| | | |
Total distributions to shareholders | | | | (1.59 | ) | | | | (1.51 | ) | | | | — | |
| | | |
Net Asset Value, End of Period | | | | $16.18 | | | | | $16.87 | | | | | $19.45 | |
| | | |
Total Return2,4 | | | | 7.20 | % | | | | (6.14 | )% | | | | 1.09 | %8 |
| | | |
Ratio of net expenses to average net assets | | | | 1.05 | %5 | | | | 1.06 | %5 | | | | 1.08 | %5,9 |
| | | |
Ratio of gross expenses to average net assets6 | | | | 1.14 | % | | | | 1.12 | % | | | | 1.08 | %9 |
| | | |
Ratio of net investment income (loss) to average net assets2 | | | | 0.45 | % | | | | 0.12 | % | | | | (0.44 | )%9 |
| | | |
Portfolio turnover | | | | 20 | % | | | | 34 | % | | | | 40 | %8 |
| | | |
Net assets end of period (000’s) omitted | | | | $36,610 | | | | | $33,273 | | | | | $206 | |
| | |
| | |
| 1 | Per share numbers have been calculated using average shares. |
| 2 | Total returns and net investment income (loss) would have been lower had certain expenses not been offset. |
| 3 | Less than $(0.005) per share. |
| 4 | The total return is calculated using the published Net Asset Value as of fiscal year end. |
| 5 | Includes reduction from broker recapture amounting to 0.03% for the fiscal year ended October 31, 2019, 0.02% for the fiscal year ended October 31, 2018, and 0.03%, 0.03% and 0.01% for Class N, Class I and Class Z, respectively, for the fiscal period ended 2017. |
| 6 | Excludes the impact of expense reimbursement or fee waivers and expense reductions such as brokerage credits, but includes expense repayments andnon-reimbursable expenses, if any, such as interest, taxes, and extraordinary expenses. (See Note 1(c) and 2 in the Notes to Financial Statements.) |
| 7 | The commencement of operations was October 2, 2017. |
147
|
AMG Managers DoubleLine Core Plus Bond Fund Financial Highlights For a share outstanding throughout each fiscal year |
| | | | | | | | | | | | | | | | | | | | |
| | | For the fiscal year ended October 31, | |
| | | | |
| | | | | |
| Class N | | 2019 | | | 2018 | | | 2017 | | | 2016 | | | 2015 | |
| | | | | |
Net Asset Value, Beginning of Year | | | $10.23 | | | | $10.68 | | | | $10.77 | | | | $10.60 | | | | $10.86 | |
| | | | | |
Income (loss) from Investment Operations: | | | | | | | | | | | | | | | | | | | | |
| | | | | |
Net investment income1,2 | | | 0.34 | | | | 0.29 | | | | 0.27 | | | | 0.31 | | | | 0.38 | |
| | | | | |
Net realized and unrealized gain (loss) on investments | | | 0.53 | | | | (0.43 | ) | | | 0.01 | | | | 0.17 | | | | (0.27 | ) |
| | | | | |
Total income (loss) from investment operations | | | 0.87 | | | | (0.14 | ) | | | 0.28 | | | | 0.48 | | | | 0.11 | |
| | | | | |
Less Distributions to Shareholders from: | | | | | | | | | | | | | | | | | | | | |
| | | | | |
Net investment income | | | (0.36 | ) | | | (0.31 | ) | | | (0.30 | ) | | | (0.31 | ) | | | (0.37 | ) |
| | | | | |
Net realized gain on investments | | | — | | | | — | | | | (0.02 | ) | | | — | | | | — | |
| | | | | |
Paid in capital | | | — | | | | — | | | | (0.05 | ) | | | — | | | | — | |
| | | | | |
Total distributions to shareholders | | | (0.36 | ) | | | (0.31 | ) | | | (0.37 | ) | | | (0.31 | ) | | | (0.37 | ) |
| | | | | |
Net Asset Value, End of Year | | | $10.74 | | | | $10.23 | | | | $10.68 | | | | $10.77 | | | | $10.60 | |
| | | | | |
Total Return2,3 | | | 8.67 | % | | | (1.33 | )% | | | 2.68 | % | | | 4.62 | % | | | 1.04 | % |
| | | | | |
Ratio of net expenses to average net assets | | | 0.94 | % | | | 0.94 | % | | | 0.94 | % | | | 0.94 | % | | | 0.94 | % |
| | | | | |
Ratio of gross expenses to average net assets4 | | | 1.02 | % | | | 1.01 | % | | | 1.02 | % | | | 1.02 | % | | | 1.05 | % |
| | | | | |
Ratio of net investment income to average net assets2 | | | 3.24 | % | | | 2.80 | % | | | 2.58 | % | | | 2.84 | % | | | 3.32 | % |
| | | | | |
Portfolio turnover | | | 47 | % | | | 69 | % | | | 106 | % | | | 78 | % | | | 59 | % |
| | | | | |
Net assets end of year (000’s) omitted | | | $82,856 | | | | $102,138 | | | | $169,646 | | | | $308,703 | | | | $188,286 | |
| | |
| | |
148
|
AMG Managers DoubleLine Core Plus Bond Fund Financial Highlights For a share outstanding throughout each fiscal year |
| | | | | | | | | | | | | | | | | | | | |
| | | For the fiscal year ended October 31, | |
| | | | |
| | | | | |
| Class I | | 2019 | | | 2018 | | | 2017 | | | 2016 | | | 2015 | |
| | | | | |
Net Asset Value, Beginning of Year | | | $10.23 | | | | $10.67 | | | | $10.76 | | | | $10.60 | | | | $10.86 | |
| | | | | |
Income (loss) from Investment Operations: | | | | | | | | | | | | | | | | | | | | |
| | | | | |
Net investment income1,2 | | | 0.37 | | | | 0.32 | | | | 0.30 | | | | 0.33 | | | | 0.41 | |
| | | | | |
Net realized and unrealized gain (loss) on investments | | | 0.53 | | | | (0.42 | ) | | | 0.01 | | | | 0.17 | | | | (0.27 | ) |
| | | | | |
Total income (loss) from investment operations | | | 0.90 | | | | (0.10 | ) | | | 0.31 | | | | 0.50 | | | | 0.14 | |
| | | | | |
Less Distributions to Shareholders from: | | | | | | | | | | | | | | | | | | | | |
| | | | | |
Net investment income | | | (0.39 | ) | | | (0.34 | ) | | | (0.33 | ) | | | (0.34 | ) | | | (0.40 | ) |
| | | | | |
Net realized gain on investments | | | — | | | | — | | | | (0.02 | ) | | | — | | | | — | |
| | | | | |
Paid in capital | | | — | | | | — | | | | (0.05 | ) | | | — | | | | — | |
| | | | | |
Total distributions to shareholders | | | (0.39 | ) | | | (0.34 | ) | | | (0.40 | ) | | | (0.34 | ) | | | (0.40 | ) |
| | | | | |
Net Asset Value, End of Year | | | $10.74 | | | | $10.23 | | | | $10.67 | | | | $10.76 | | | | $10.60 | |
| | | | | |
Total Return2,3 | | | 8.94 | % | | | (0.98 | )% | | | 2.95 | % | | | 4.79 | % | | | 1.28 | % |
| | | | | |
Ratio of net expenses to average net assets | | | 0.69 | % | | | 0.69 | % | | | 0.68 | % | | | 0.69 | % | | | 0.69 | % |
| | | | | |
Ratio of gross expenses to average net assets4 | | | 0.77 | % | | | 0.76 | % | | | 0.76 | % | | | 0.77 | % | | | 0.80 | % |
| | | | | |
Ratio of net investment income to average net assets2 | | | 3.49 | % | | | 3.05 | % | | | 2.83 | % | | | 3.11 | % | | | 3.57 | % |
| | | | | |
Portfolio turnover | | | 47 | % | | | 69 | % | | | 106 | % | | | 78 | % | | | 59 | % |
| | | | | |
Net assets end of year (000’s) omitted | | | $585,358 | | | | $467,024 | | | | $507,600 | | | | $398,514 | | | | $304,051 | |
| | |
| | |
149
|
AMG Managers DoubleLine Core Plus Bond Fund Financial Highlights For a share outstanding throughout each fiscal period |
| | | | | | | | | | | | | | | |
| | | For the fiscal year ended October 31, | | For the fiscal period ended October 31, |
| | | | | |
| | | |
| Class Z | | 2019 | | 2018 | | 20175 |
| | | |
Net Asset Value, Beginning of Period | | | | $10.24 | | | | | $10.68 | | | | | $10.69 | |
| | | |
Income (loss) from Investment Operations: | | | | | | | | | | | | | | | |
| | | |
Net investment income1,2 | | | | 0.38 | | | | | 0.33 | | | | | 0.03 | |
| | | |
Net realized and unrealized gain (loss) on investments | | | | 0.52 | | | | | (0.43 | ) | | | | (0.01 | ) |
| | | |
Total income (loss) from investment operations | | | | 0.90 | | | | | (0.10 | ) | | | | 0.02 | |
| | | |
Less Distributions to Shareholders from: | | | | | | | | | | | | | | | |
| | | |
Net investment income | | | | (0.40 | ) | | | | (0.34 | ) | | | | (0.03 | ) |
| | | |
Paid in capital | | | | — | | | | | — | | | | | (0.00 | )6 |
| | | |
Total distributions to shareholders | | | | (0.40 | ) | | | | (0.34 | ) | | | | (0.03 | ) |
| | | |
Net Asset Value, End of Period | | | | $10.74 | | | | | $10.24 | | | | | $10.68 | |
| | | |
Total Return2,3 | | | | 8.91 | % | | | | (0.91 | )% | | | | 0.17 | %7 |
| | | |
Ratio of net expenses to average net assets | | | | 0.61 | % | | | | 0.61 | % | | | | 0.60 | %8 |
| | | |
Ratio of gross expenses to average net assets4 | | | | 0.69 | % | | | | 0.68 | % | | | | 0.63 | %8 |
| | | |
Ratio of net investment income to average net assets2 | | | | 3.57 | % | | | | 3.13 | % | | | | 2.74 | %8 |
| | | |
Portfolio turnover | | | | 47 | % | | | | 69 | % | | | | 106 | %7 |
| | | |
Net assets end of period (000’s) omitted | | | | $2,473 | | | | | $1,955 | | | | | $1,597 | |
| | |
| | |
| 1 | Per share numbers have been calculated using average shares. |
| 2 | Total returns and net investment income (loss) would have been lower had certain expenses not been offset. |
| 3 | The total return is calculated using the published Net Asset Value as of fiscal year end. |
| 4 | Excludes the impact of expense reimbursement or fee waivers and expense reductions such as brokerage credits, but includes expense repayments andnon-reimbursable expenses, if any, such as interest, taxes, and extraordinary expenses. (See Note 1(c) and 2 in the Notes to Financial Statements.) |
| 5 | The commencement of operations was October 2, 2017. |
| 6 | Less than $(0.005) per share. |
150
|
AMG River Road Long-Short Fund Financial Highlights For a share outstanding throughout each fiscal year |
| | | | | | | | | | | | | | | | | | | | |
| | | For the fiscal year ended October 31, | |
| | | | |
| | | | | |
| Class N | | 2019 | | | 2018 | | | 2017 | | | 2016 | | | 2015 | |
| | | | | |
Net Asset Value, Beginning of Year | | $ | 12.19 | | | $ | 12.33 | | | $ | 11.04 | | | $ | 11.48 | | | | $11.35 | |
| | | | | |
Income (loss) from Investment Operations: | | | | | | | | | | | | | | | | | | | | |
| | | | | |
Net investment loss1,2 | | | (0.05 | ) | | | (0.03 | )3 | | | (0.25 | ) | | | (0.19 | ) | | | (0.14 | ) |
| | | | | |
Net realized and unrealized gain (loss) on investments | | | 1.63 | | | | (0.11 | ) | | | 1.54 | | | | 0.13 | | | | 0.57 | |
| | | | | |
Total income (loss) from investment operations | | | 1.58 | | | | (0.14 | ) | | | 1.29 | | | | (0.06 | ) | | | 0.43 | |
| | | | | |
Less Distributions to Shareholders from: | | | | | | | | | | | | | | | | | | | | |
| | | | | |
Net realized gain on investments | | | (0.71 | ) | | | — | | | | — | | | | (0.38 | ) | | | (0.30 | ) |
| | | | | |
Net Asset Value, End of Year | | $ | 13.06 | | | $ | 12.19 | | | $ | 12.33 | | | $ | 11.04 | | | | $11.48 | |
| | | | | |
Total Return2,4 | | | 13.98 | % | | | (1.14 | )% | | | 11.69 | % | | | (0.52 | )% | | | 3.79 | % |
| | | | | |
Ratio of net expenses to average net assets5 | | | 2.41 | %6 | | | 3.12 | %6 | | | 3.60 | %6 | | | 3.46 | % | | | 2.89 | % |
| | | | | |
Ratio of gross expenses to average net assets7 | | | 2.83 | % | | | 3.41 | % | | | 3.75 | % | | | 3.62 | % | | | 2.87 | % |
| | | | | |
Ratio of net investment loss to average net assets2 | | | (0.43 | )% | | | (0.25 | )% | | | (2.23 | )% | | | (1.75 | )% | | | (1.19 | )% |
| | | | | |
Portfolio turnover | | | 264 | % | | | 189 | % | | | 186 | % | | | 298 | % | | | 279 | % |
| | | | | |
Net assets end of year (000’s) omitted | | $ | 2,654 | | | $ | 3,749 | | | $ | 5,508 | | | $ | 8,713 | | | $ | 27,983 | |
| | |
| | |
151
|
AMG River Road Long-Short Fund Financial Highlights For a share outstanding throughout each fiscal year |
| | | | | | | | | | | | | | | | | | | | |
| | | For the fiscal year ended October 31, | |
| | | | |
| | | | | |
Class I | | 2019 | | | 2018 | | | 2017 | | | 2016 | | | 2015 | |
| | | | | |
Net Asset Value, Beginning of Year | | | $12.37 | | | | $12.48 | | | | $11.15 | | | | $11.56 | | | | $11.40 | |
| | | | | |
Income (loss) from Investment Operations: | | | | | | | | | | | | | | | | | | | | |
| | | | | |
Net investment income (loss)1,2 | | | (0.02 | ) | | | 0.00 | 3,8 | | | (0.24 | ) | | | (0.18 | ) | | | (0.11 | ) |
| | | | | |
Net realized and unrealized gain (loss) on investments | | | 1.66 | | | | (0.11 | ) | | | 1.57 | | | | 0.15 | | | | 0.57 | |
| | | | | |
Total income (loss) from investment operations | | | 1.64 | | | | (0.11 | ) | | | 1.33 | | | | (0.03 | ) | | | 0.46 | |
| | | | | |
Less Distributions to Shareholders from: | | | | | | | | | | | | | | | | | | | | |
| | | | | |
Net realized gain on investments | | | (0.71 | ) | | | — | | | | — | | | | (0.38 | ) | | | (0.30 | ) |
| | | | | |
Net Asset Value, End of Year | | | $13.30 | | | | $12.37 | | | | $12.48 | | | | $11.15 | | | | $11.56 | |
| | | | | |
Total Return2,4 | | | 14.28 | % | | | (0.88 | )% | | | 11.93 | % | | | (0.24 | )% | | | 4.04 | % |
| | | | | |
Ratio of net expenses to average net assets5 | | | 2.16 | %6 | | | 2.87 | %6 | | | 3.35 | %6 | | | 3.24 | % | | | 2.64 | % |
| | | | | |
Ratio of gross expenses to average net assets7 | | | 2.58 | % | | | 3.16 | % | | | 3.50 | % | | | 3.39 | % | | | 2.62 | % |
| | | | | |
Ratio of net investment loss to average net assets2 | | | (0.18 | )% | | | 0.00 | %9 | | | (1.98 | )% | | | (1.67 | )% | | | (0.94 | )% |
| | | | | |
Portfolio turnover | | | 264 | % | | | 189 | % | | | 186 | % | | | 298 | % | | | 279 | % |
| | | | | |
Net assets end of year (000’s) omitted | | $ | 22,856 | | | $ | 24,925 | | | $ | 29,030 | | | $ | 37,549 | | | $ | 49,088 | |
| | |
| | |
152
|
AMG River Road Long-Short Fund Financial Highlights For a share outstanding throughout each fiscal period |
| | | | | | | | | | | | | | | |
| | | For the fiscal year ended October 31, | | For the fiscal period ended October 31, |
| | | | | |
| | | |
| Class Z | | 2019 | | 2018 | | 201710 |
| | | |
Net Asset Value, Beginning of Period | | | | $12.38 | | | | | $12.49 | | | | | $12.53 | |
| | | |
Income (loss) from Investment Operations: | | | | | | | | | | | | | | | |
| | | |
Net investment income (loss)1,2 | | | | (0.01 | ) | | | | 0.01 | 3 | | | | (0.02 | ) |
| | | |
Net realized and unrealized gain (loss) on investments | | | | 1.66 | | | | | (0.12 | ) | | | | (0.02 | ) |
| | | |
Total income (loss) from investment operations | | | | 1.65 | | | | | (0.11 | ) | | | | (0.04 | ) |
| | | |
Less Distributions to Shareholders from: | | | | | | | | | | | | | | | |
| | | |
Net realized gain on investments | | | | (0.71 | ) | | | | — | | | | | — | |
| | | |
Net Asset Value, End of Period | | | | $13.32 | | | | | $12.38 | | | | | $12.49 | |
| | | |
Total Return2,4 | | | | 14.35 | % | | | | (0.88 | )% | | | | (0.32 | )%11 |
| | | |
Ratio of net expenses to average net assets5 | | | | 2.08 | %6 | | | | 2.79 | %6 | | | | 3.38 | %6,12 |
| | | |
Ratio of gross expenses to average net assets7 | | | | 2.50 | % | | | | 3.08 | % | | | | 3.38 | %12 |
| | | |
Ratio of net investment income (loss) to average net assets2 | | | | (0.10 | )% | | | | 0.09 | % | | | | (2.74 | )%12 |
| | | |
Portfolio turnover | | | | 264 | % | | | | 189 | % | | | | 186 | %11 |
| | | |
Net assets end of period (000’s) omitted | | | | $84 | | | | | $73 | | | | | $25 | |
| | |
| | |
| 1 | Per share numbers have been calculated using average shares. |
| 2 | Total returns and net investment income (loss) would have been lower had certain expenses not been offset. |
| 3 | Includesnon-recurring dividends. Without these dividends, net investment loss per share would have been $(0.17), $(0.14), and $(0.13) for Class N, Class I and Class Z shares, respectively. |
| 4 | The total return is calculated using the published Net Asset Value as of fiscal year end. |
| 5 | Expense ratio includes dividend and interest expense related to securities sold short. Excluding such dividend and interest expense, the ratio of expenses to average net assets would be 1.44%, 1.19% and 1.11% for Class N, Class I and Class Z, respectively, for the fiscal year ended October 31, 2019, 1.45%, 1.20% and 1.12% for Class N, Class I and Class Z, respectively, for the fiscal year ended October 31, 2018, 1.48%, 1.23% and 1.12% for Class N, Class I and Class Z, respectively, for the fiscal year ended October 31, 2017, and 1.70% and 1.45% for Class N and Class I, respectively, for each of the fiscal periods ended 2016 and 2015. |
| 6 | Includes reduction from brokerage recapture amounting to 0.01% for the fiscal year ended October 31, 2019, 0.02% for the fiscal year ended October 31, 2018, and 0.02%, 0.02%, and less than 0.01% for Class N, Class I, and Class Z, respectively, for the fiscal period ended 2017. |
| 7 | Excludes the impact of expense reimbursement or fee waivers and expense reductions such as brokerage credits, but includes expense repayments andnon-reimbursable expenses, if any, such as interest, taxes, and extraordinary expenses. (See Note 1(c) and 2 in the Notes to Financial Statements.) |
| 8 | Less than $0.005 per share. |
| 10 | Commencement of operations was on October 2, 2017. |
153
|
AMG Managers Pictet International Fund Financial Highlights For a share outstanding throughout each fiscal year |
| | | | | | | | | | | | | | | | | | | | |
| | | For the fiscal year ended October 31, | |
| | | | |
| | | | | |
Class N | | 2019 | | | 2018 | | | 2017 | | | 2016 | | | 2015 | |
| | | | | |
Net Asset Value, Beginning of Year | | | $9.90 | | | | $11.60 | | | | $9.61 | | | | $9.56 | | | | $9.34 | |
| | | | | |
Income (loss) from Investment Operations: | | | | | | | | | | | | | | | | | | | | |
| | | | | |
Net investment income1,2 | | | 0.07 | | | | 0.12 | | | | 0.04 | | | | 0.13 | | | | 0.10 | |
| | | | | |
Net realized and unrealized gain (loss) on investments | | | 0.56 | | | | (1.31 | ) | | | 2.22 | | | | 0.00 | 3 | | | 0.17 | 4 |
| | | | | |
Total income (loss) from investment operations | | | 0.63 | | | | (1.19 | ) | | | 2.26 | | | | 0.13 | | | | 0.27 | |
| | | | | |
Less Distributions to Shareholders from: | | | | | | | | | | | | | | | | | | | | |
| | | | | |
Net investment income | | | (0.20 | ) | | | (0.18 | ) | | | (0.07 | ) | | | (0.02 | ) | | | (0.03 | ) |
| | | | | |
Net realized gain on investments | | | (0.77 | ) | | | (0.33 | ) | | | (0.20 | ) | | | (0.06 | ) | | | (0.02 | ) |
| | | | | |
Total distributions to shareholders | | | (0.97 | ) | | | (0.51 | ) | | | (0.27 | ) | | | (0.08 | ) | | | (0.05 | ) |
| | | | | |
Net Asset Value, End of Year | | | $9.56 | | | | $9.90 | | | | $11.60 | | | | $9.61 | | | | $9.56 | |
| | | | | |
Total Return2,5 | | | 8.34 | % | | | (10.80 | )% | | | 24.30 | % | | | 1.42 | %6 | | | 3.02 | % |
| | | | | |
Ratio of net expenses to average net assets | | | 1.32 | % | | | 1.27 | % | | | 1.30 | % | | | 1.40 | % | | | 1.40 | % |
| | | | | |
Ratio of gross expenses to average net assets7 | | | 1.32 | % | | | 1.28 | % | | | 1.31 | % | | | 1.41 | % | | | 1.92 | % |
| | | | | |
Ratio of net investment income to average net assets2 | | | 0.78 | % | | | 1.10 | % | | | 0.38 | % | | | 1.88 | % | | | 1.06 | % |
| | | | | |
Portfolio turnover | | | 28 | % | | | 51 | % | | | 34 | % | | | 38 | % | | | 53 | % |
| | | | | |
Net assets end of year (000’s) omitted | | | $87,998 | | | | $82,839 | | | | $4,006 | | | | $131 | | | | $1,056 | |
| | |
| | |
154
|
AMG Managers Pictet International Fund Financial Highlights For a share outstanding throughout each fiscal year |
| | | | | | | | | | | | | | | | | | | | |
| | | For the fiscal year ended October 31, | |
| | | | |
| | | | | |
Class I | | 2019 | | | 2018 | | | 2017 | | | 2016 | | | 2015 | |
| | | | | |
Net Asset Value, Beginning of Year | | | $9.93 | | | | $11.59 | | | | $9.65 | | | | $9.60 | | | | $9.36 | |
| | | | | |
Income (loss) from Investment Operations: | | | | | | | | | | | | | | | | | | | | |
| | | | | |
Net investment income1,2 | | | 0.09 | | | | 0.16 | | | | 0.13 | | | | 0.15 | | | | 0.12 | |
| | | | | |
Net realized and unrealized gain (loss) on investments | | | 0.57 | | | | (1.32 | ) | | | 2.16 | | | | 0.00 | 3 | | | 0.19 | 4 |
| | | | | |
Total income (loss) from investment operations | | | 0.66 | | | | (1.16 | ) | | | 2.29 | | | | 0.15 | | | | 0.31 | |
| | | | | |
Less Distributions to Shareholders from: | | | | | | | | | | | | | | | | | | | | |
| | | | | |
Net investment income | | | (0.20 | ) | | | (0.17 | ) | | | (0.14 | ) | | | (0.04 | ) | | | (0.05 | ) |
| | | | | |
Net realized gain on investments | | | (0.77 | ) | | | (0.33 | ) | | | (0.21 | ) | | | (0.06 | ) | | | (0.02 | ) |
| | | | | |
Total distributions to shareholders | | | (0.97 | ) | | | (0.50 | ) | | | (0.35 | ) | | | (0.10 | ) | | | (0.07 | ) |
| | | | | |
Net Asset Value, End of Year | | | $9.62 | | | | $9.93 | | | | $11.59 | | | | $9.65 | | | | $9.60 | |
| | | | | |
Total Return2,5 | | | 8.65 | % | | | (10.57 | )% | | | 24.55 | % | | | 1.67 | %8 | | | 3.43 | % |
| | | | | |
Ratio of net expenses to average net assets | | | 1.07 | % | | | 1.00 | % | | | 1.06 | % | | | 1.15 | % | | | 1.15 | % |
| | | | | |
Ratio of gross expenses to average net assets7 | | | 1.07 | % | | | 1.01 | % | | | 1.07 | % | | | 1.15 | % | | | 1.67 | % |
| | | | | |
Ratio of net investment income to average net assets2 | | | 1.03 | % | | | 1.38 | % | | | 1.28 | % | | | 2.13 | % | | | 1.31 | % |
| | | | | |
Portfolio turnover | | | 28 | % | | | 51 | % | | | 34 | % | | | 38 | % | | | 53 | % |
| | | | | |
Net assets end of year (000’s) omitted | | $ | 158,317 | | | $ | 208,184 | | | $ | 2,019,217 | | | $ | 1,336,050 | | | $ | 49,803 | |
| | |
| | |
155
|
AMG Managers Pictet International Fund Financial Highlights For a share outstanding throughout each fiscal period |
| | | | | | | | | | | | | | | |
| | | For the fiscal year ended October 31, | | For the fiscal period ended October 31, |
| | | | | |
| | | |
Class Z | | 2019 | | 2018 | | 20179 |
| | | |
Net Asset Value, Beginning of Period | | | | $9.91 | | | | | $11.59 | | | | | $11.40 | |
| | | |
Income (loss) from Investment Operations: | | | | | | | | | | | | | | | |
| | | |
Net investment income1,2 | | | | 0.10 | | | | | 0.16 | | | | | 0.00 | 3 |
| | | | |
Net realized and unrealized gain (loss) on investments | | | | 0.57 | | | | | (1.31 | ) | | | | 0.19 | |
| | | |
Total income (loss) from investment operations | | | | 0.67 | | | | | (1.15 | ) | | | | 0.19 | |
| | | |
Less Distributions to Shareholders from: | | | | | | | | | | | | | | | |
| | | |
Net investment income | | | | (0.21 | ) | | | | (0.20 | ) | | | | — | |
| | | |
Net realized gain on investments | | | | (0.77 | ) | | | | (0.33 | ) | | | | — | |
| | | |
Total distributions to shareholders | | | | (0.98 | ) | | | | (0.53 | ) | | | | — | |
| | | |
Net Asset Value, End of Period | | | | $9.60 | | | | | $9.91 | | | | | $11.59 | |
| | | |
Total Return2,5 | | | | 8.84 | % | | | | (10.52 | )% | | | | 1.67 | %10 |
| | | |
Ratio of net expenses to average net assets | | | | 0.96 | % | | | | 0.91 | % | | |
| 0.94
| %11
|
| | | |
Ratio of gross expenses to average net assets7 | | | | 0.96 | % | | | | 0.92 | % | | |
| 0.95
| %11
|
| | | |
Ratio of net investment income (loss) to average net assets2 | | | | 1.14 | % | | | | 1.46 | % | | | | (0.36 | )%11 |
| | | |
Portfolio turnover | | | | 28 | % | | | | 51 | % | | | | 34 | % |
| | | |
Net assets end of period (000’s) omitted | | | | $49,054 | | | | | $1,289,369 | | | | | $254 | |
| | |
| | |
| 1 | Per share numbers have been calculated using average shares. |
| 2 | Total returns and net investment income would have been lower had certain expenses not been offset. |
| 3 | Less than $0.005 per share. |
| 4 | Includes capital contribution of $0.01 per share. |
| 5 | The total return is calculated using the published Net Asset Value as of fiscal year end. |
| 6 | The total return would have been 1.32% had the capital contribution not been included. |
| 7 | Excludes the impact of expense reimbursement or fee waivers and expense reductions such as brokerage credits, but includes expense repayments andnon-reimbursable expenses, if any, such as interest, taxes, and extraordinary expenses. (See Note 1(c) and 2 in the Notes to Financial Statements.) |
| 8 | The total return would have been 1.57% had the capital contribution not been included. |
| 9 | The commencement of operations for Class Z Shares was October 2, 2017. |
156
| | |
| | | Notes to Financial Statements October 31, 2019 |
1. SUMMARY OF SIGNIFICANT ACCOUNTING POLICIES
AMG Funds IV (the “Trust”) is an open-end management investment company, organized as a Delaware Statutory Trust, and registered under the Investment Company Act of 1940, as amended (the “1940 Act”). Currently, the Trust consists of a number of different funds, (each a “Fund” and collectively, the “Funds”), each having distinct investment management objectives, strategies, risks, and policies. Included in this report are:
|
Funds |
|
AMG Managers Fairpointe ESG Equity Fund (“Fairpointe ESG Equity”) |
|
AMG River Road Focused Absolute Value Fund (“River Road Focused Absolute Value”) |
|
AMG Managers Montag & Caldwell Growth Fund (“Montag & Caldwell Growth”) |
|
AMG River Road Dividend All Cap Value Fund (“River Road Dividend All Cap Value”) |
|
AMG River Road Dividend All Cap Value Fund II (“River Road Dividend All Cap Value II”) |
|
AMG Managers Fairpointe Mid Cap Fund (“Fairpointe Mid Cap”) |
|
AMG Managers LMCG Small Cap Growth Fund (“LMCG Small Cap Growth”) |
|
AMG River Road Small-Mid Cap Value Fund (“River Road Small-Mid Cap Value”) |
|
AMG River Road Small Cap Value Fund (“River Road Small Cap Value”) |
|
AMG Managers Silvercrest Small Cap Fund (“Silvercrest Small Cap”) |
|
AMG Managers DoubleLine Core Plus Bond Fund (“DoubleLine Core Plus Bond”) |
|
AMG River Road Long-Short Fund (“River Road Long-Short”) |
|
AMG Managers Pictet International Fund (“Pictet International”) |
Each Fund is authorized to issue two classes of shares (Class N shares and Class I shares). River Road Focused Absolute Value, River Road Dividend All Cap Value, River Road Dividend All Cap Value II, Fairpointe Mid Cap, River Road Small-Mid Cap Value, River Road Small Cap Value, Silvercrest Small Cap, DoubleLine Core Plus Bond, River Road Long-Short and Pictet International are authorized to issue Class Z shares. Effective May 31, 2019, Montag & Caldwell Growth Class R shares were converted to Class N shares. Each class represents an interest in the same assets of the respective Fund. Although all share classes generally have identical voting rights, each share class votes separately when required by law. Different share classes may have different net asset values per share to the extent the share classes pay different distribution amounts and/or the expenses of such share classes differ. Each share class has its own expense structure. Please refer to a current prospectus for additional information on each share class.
The Funds’ financial statements are prepared in accordance with accounting principles generally accepted in the United States of America (“U.S. GAAP”), including accounting and reporting guidance pursuant to Accounting Standards Codification Topic 946 applicable to investment companies. U.S. GAAP requires management to make estimates and assumptions that affect the reported amounts of assets and liabilities and disclosure of contingent assets and liabilities at the date of the financial statements and the reported amounts of income and expenses during the reporting period. Actual results could differ from those estimates and such differences could be material. The following is a summary of significant accounting policies followed by the Funds in the preparation of their financial statements:
a. VALUATION OF INVESTMENTS
Equity securities, including securities sold short, traded on a national securities exchange or reported on the NASDAQ national market system (“NMS”) are valued at the last quoted sales price on the primary exchange or, if applicable, the NASDAQ official closing price or the official closing price of the relevant exchange or, lacking any sales, at the last quoted bid price or the mean between the last quoted bid and ask prices (the “exchange mean price”). Equity securities and securities sold short traded in the over-the-counter market (other than NMS securities) are valued at the exchange mean price. Foreign equity securities (securities principally traded in markets other than U.S. markets) are valued at the official closing price on the primary exchange or, for markets that either do not offer an official closing price or where the official closing price may not be representative of the overall market, the last quoted sale price.
Fixed income securities purchased with a remaining maturity exceeding 60 days are valued at the evaluated mean price provided by an authorized pricing service or, if an evaluated price is not available, by reference to other securities which are considered comparable in credit rating, interest rate, due date and other features (generally referred to as “matrix pricing”) or other similar pricing methodologies. Investments in certain mortgage-backed and stripped mortgage-backed securities, preferred stocks, convertible securities, derivatives and other debt securities not traded on an organized securities market are valued on the basis of valuations provided by dealers or by a pricing service which uses information with respect to transactions in such securities and various relationships between such securities and yield to maturity in determining value.
Fixed income securities purchased with a remaining maturity of 60 days or less are valued at amortized cost, provided that the amortized cost value is approximately the same as the fair value of the security valued without the use of amortized cost. Investments in other open-end registered investment companies are valued at their end of day net asset value per share.
The Funds’ portfolio investments are generally valued based on independent market quotations or prices or, if none, “evaluative” or other market based valuations provided by third party pricing services approved by the Board of Trustees of the Trust (the “Board”). Under certain circumstances, the value of certain Fund portfolio investments may be based on an evaluation of fair value, pursuant to procedures established by and under the general supervision of the Board. The Valuation Committee, which is comprised of the Independent Trustees of the Board, and the Pricing Committee, which is comprised of representatives from AMG Funds LLC (the “Investment Manager”) are the committees appointed by the Board to make fair value determinations. Each Fund may use the fair value of a portfolio investment to calculate its net asset value (“NAV”) in the event that the market quotation, price or market based valuation for the portfolio investment is not readily available or otherwise not determinable pursuant to the Board’s valuation procedures, if the Investment Manager or the Pricing Committee believes the quotation, price or market based valuation to be unreliable, or in certain other circumstances. When determining the fair value of an investment, the Pricing Committee and, if required under the Trust’s securities valuation procedures, the Valuation Committee, seeks to determine the price that the Fund might reasonably expect to receive from current sale of that portfolio investment in an arms-length transaction. Fair value determinations shall be based upon consideration of all available facts and information, including, but not limited to (i) attributes specific to the investment; (ii) fundamental and analytical data relating to the investment; and (iii) the value of other comparable securities or relevant financial instruments, including derivative securities, traded on other markets or among dealers.
157
| | |
| | | Notes to Financial Statements(continued) |
The values assigned to fair value portfolio investments are based on available information and do not necessarily represent amounts that might ultimately be realized in the future, since such amounts depend on future developments inherent in long-term investments. Because of the inherent uncertainty of valuation, those estimated values may differ significantly from the values that would have been used had a ready market for the investments existed, and the differences could be material. The Board will be presented with a quarterly report showing as of the most recent quarter end, all outstanding securities fair valued by the Funds, including a comparison with the prior quarter end and the percentage of the Funds that the security represents at each quarter end.
With respect to foreign equity securities and certain foreign fixed income securities, the Board has adopted a policy that securities held in the Funds that can be fair valued by the applicable fair value pricing service are fair valued on each business day provided that each individual price exceeds a pre-established confidence level.
U.S. GAAP defines fair value as the price that a fund would receive to sell an asset or pay to transfer a liability in an orderly transaction between market participants at the measurement date. U.S. GAAP also establishes a framework for measuring fair value, and a three level hierarchy for fair value measurements based upon the transparency of inputs to the valuation of an asset or liability. Inputs may be observable or unobservable and refer broadly to the assumptions that market participants would use in pricing the asset or liability. Observable inputs reflect the assumptions market participants would use in pricing the asset or liability based on market data obtained from sources independent of the Funds. Unobservable inputs reflect the Funds’ own assumptions about the assumptions that market participants would use in pricing the asset or liability developed based on the best information available in the circumstances. Each investment is assigned a level based upon the observability of the inputs which are significant to the overall valuation.
The three-tier hierarchy of inputs is summarized below:
Level 1 – inputs are quoted prices in active markets for identical investments (e.g., equity securities, open-end investment companies)
Level 2 – other observable inputs (including, but not limited to: quoted prices for similar assets or liabilities in markets that are active, quoted prices for identical or similar assets or liabilities in markets that are not active, inputs other than quoted prices that are observable for the assets or liabilities (such as interest rates, yield curves, volatilities, prepayment speeds, loss severities, credit risks and default rates) or other market corroborated inputs) (e.g., debt securities, government securities, foreign currency exchange contracts, swaps, foreign securities utilizing international fair value pricing, fair valued securities with observable inputs)
Level 3 – inputs are significant unobservable inputs (including the Fund’s own assumptions used to determine the fair value of investments) (e.g., fair valued securities with unobservable inputs)
Changes in inputs or methodologies used for valuing investments may result in a transfer in or out of levels within the fair value hierarchy. The inputs or methodologies used for valuing investments may not necessarily be an indication of the risk associated with investing in those investments.
b. SECURITY TRANSACTIONS
Security transactions are accounted for as of trade date. Realized gains and losses on securities sold are determined on the basis of identified cost.
c. INVESTMENT INCOME AND EXPENSES
Dividend income is recorded on the ex-dividend date. Dividends from foreign securities are recorded on the ex-dividend date, and if after the fact, as soon as the Funds become aware of the ex-dividend date, except for Korean securities where dividends are recorded on confirmation date. Dividends declared on short positions are recorded on ex-date as dividend expense. Interest income, which includes amortization of premium and accretion of discount on debt securities, is accrued as earned. Dividend and interest income on foreign securities is recorded gross of any withholding tax. Non-cash dividends included in dividend income, if any, are reported at the fair market value of the securities received. Upon notification from issuers, distributions received from a real estate investment trust (“REIT”) may be redesignated as a reduction of cost of investments and/or realized gain. Other income and expenses are recorded on an accrual basis. Expenses that cannot be directly attributed to a Fund are apportioned among the funds in the Trust and other trusts or funds within the AMG Funds family of mutual funds (collectively the “AMG Funds Family”) based upon their relative average net assets or number of shareholders. Investment income, realized and unrealized capital gains and losses, the common expenses of each Fund, and certain fund level expense reductions, if any, are allocated on a pro-rata basis to each class based on the relative net assets of each class to the total net assets of each Fund.
The following Funds had certain portfolio trades directed to various brokers under a brokerage recapture program. Credits received from the brokerage recapture program are earned and paid on a monthly basis, and are recorded as expense offsets, which serve to reduce the Funds’ overall expense ratio. For the fiscal year ended October 31, 2019, the impact on the expenses and expense ratios were as follows:
| | | | | | | | |
| | | Amount | | | Percentage
Reduction | |
River Road Focused Absolute Value | | | $15,930 | | | | 0.02% | |
| | |
Montag & Caldwell Growth | | | 37,628 | | | | 0.01% | |
| | |
River Road Dividend All Cap Value | | | 48,571 | | | | 0.01% | |
| | |
River Road Dividend All Cap Value II | | | 4,605 | | | | 0.01% | |
| | |
LMCG Small Cap Growth | | | 6,808 | | | | 0.01% | |
| | |
River Road Small-Mid Cap Value | | | 27,804 | | | | 0.03% | |
| | |
River Road Small Cap Value | | | 38,643 | | | | 0.01% | |
| | |
Silvercrest Small Cap | | | 63,499 | | | | 0.03% | |
| | |
River Road Long-Short | | | 3,406 | | | | 0.01% | |
d. DIVIDENDS AND DISTRIBUTIONS
Fund distributions resulting from either net investment income or realized net capital gains, if any, will normally be declared and paid at least annually in December. Distributions to shareholders are recorded on the ex-dividend date. Distributions are determined in accordance with federal income tax regulations, which may differ from net investment income and net realized capital gains for financial statement purposes (U.S. GAAP). Differences may be permanent or temporary. Permanent differences are reclassified among capital accounts in the financial statements to reflect their tax character. Permanent book and tax basis differences, if any, relating to shareholder distributions will result in reclassification to paid-in capital. Temporary differences arise when certain items of income, expense and gain or loss are recognized in different periods for financial statement and tax purposes; these differences will reverse at some time
158
| | |
| | | Notes to Financial Statements(continued) |
in the future. Permanent differences are due to net operating losses, tax equalization utilized, distributions received from investments in certain partnerships, and gains from shareholder redemptions in kind. Temporary differences are due to the deferral of qualified late year losses, wash sale loss
deferrals, mark-to-market of passive foreign investment companies, non-deductible organizational expense, amortization of premium outstanding, distributions received from investments in certain partnerships, and capital loss carryforwards.
The tax character of distributions paid during the fiscal years ended October 31, 2019 and October 31, 2018 were as follows:
| | | | | | | | | | | | | | | | | | | | | | | | |
| | | Fairpointe ESG Equity | | | River Road Focused Absolute Value | | | Montag & Caldwell Growth | |
| Distributions paid from: | | 2019 | | | 2018 | | | 2019 | | | 2018 | | | 2019 | | | 2018 | |
| | | | | | |
Ordinary income | | | $133,548 | | | | $120,366 | | | | $202,395 | | | | $151,316 | | | | $341,791 | | | | $188,976 | |
| | | | | | |
Short-term capital gains | | | — | | | | — | | | | 1,400,491 | | | | 910,064 | | | | 12,228,160 | | | | 346,008 | |
| | | | | | |
Long-term capital gains | | | — | | | | — | | | | 462,421 | | | | 880,256 | | | | 93,703,352 | | | | 74,718,856 | |
| | | | | | | | | | | | | | | | | | | | | | | | |
| | | | | | |
| | | $133,548 | | | | $120,366 | | | | $2,065,307 | | | | $1,941,636 | | | | $106,273,303 | | | | $75,253,840 | |
| | | | | | | | | | | | | | | | | | | | | | | | |
| | | |
| | | River Road Dividend All Cap Value | | | River Road Dividend All Cap Value II | | | Fairpointe Mid Cap | |
| Distributions paid from: | | 2019 | | | 2018 | | | 2019 | | | 2018 | | | 2019 | | | 2018 | |
| | | | | | |
Ordinary income | | | $19,767,269 | | | | $21,817,357 | | | | $2,056,928 | | | | $2,717,745 | | | | $15,877,782 | | | | $2,121,795 | |
| | | | | | |
Short-term capital gains | | | — | | | | 3,102,255 | | | | — | | | | 318,039 | | | | — | | | | — | |
| | | | | | |
Long-term capital gains | | | 46,700,656 | | | | 38,240,751 | | | | 8,648,647 | | | | 5,662,802 | | | | 178,445,364 | | | | 257,606,580 | |
| | | | | | | | | | | | | | | | | | | | | | | | |
| | | | | | |
| | | $66,467,925 | | | | $63,160,363 | | | | $10,705,575 | | | | $8,698,586 | | | | $194,323,146 | | | | $259,728,375 | |
| | | | | | | | | | | | | | | | | | | | | | | | |
| | | |
| | | LMCG Small Cap Growth | | | River Road Small-Mid Cap Value | | | River Road Small Cap Value | |
| Distributions paid from: | | 2019 | | | 2018 | | | 2019 | | | 2018 | | | 2019 | | | 2018 | |
| | | | | | |
Ordinary income | | | — | | | | — | | | | — | | | | — | | | | — | | | | — | |
| | | | | | |
Short-term capital gains | | | — | | | | — | | | | $1,453,743 | | | | $1,297,400 | | | | $6,540,371 | | | | $8,295,795 | |
| | | | | | |
Long-term capital gains | | | — | | | | — | | | | 2,991,892 | | | | 4,886,827 | | | | 25,360,058 | | | | 32,632,718 | |
| | | | | | | | | | | | | | | | | | | | | | | | |
| | | | | | |
| | | — | | | | — | | | | $4,445,635 | | | | $6,184,227 | | | | $31,900,429 | | | | $40,928,513 | |
| | | | | | | | | | | | | | | | | | | | | | | | |
| | | |
| | | Silvercrest Small Cap | | | DoubleLine Core Plus Bond | | | River Road Long-Short | |
| Distributions paid from: | | 2019 | | | 2018 | | | 2019 | | | 2018 | | | 2019 | | | 2018 | |
| | | | | | |
Ordinary income | | | $245,754 | | | | $153,570 | | | | $22,844,511 | | | | $20,443,183 | | | | — | | | | — | |
| | | | | | |
Short-term capital gains | | | 4,650,859 | | | | 620,025 | | | | — | | | | — | | | | $316,403 | | | | — | |
| | | | | | |
Long-term capital gains | | | 15,850,256 | | | | 20,303,757 | | | | — | | | | — | | | | 1,278,619 | | | | — | |
| | | | | | | | | | | | | | | | | | | | | | | | |
| | | | | | |
| | | $20,746,869 | | | | $21,077,352 | | | | $22,844,511 | | | | $20,443,183 | | | | $1,595,022 | | | | — | |
| | | | | | | | | | | | | | | | | | | | | | | | |
| | | |
| | | | | | | | | Pictet International | |
| Distributions paid from: | | | | | | | | | | | | | | 2019 | | | 2018 | |
| | | | | | |
Ordinary income | | | | | | | | | | | | | | | | | | | $28,999,102 | | | | $32,906,014 | |
| | | | | | |
Short-term capital gains | | | | | | | | | | | | | | | | | | | — | | | | 25,626,511 | |
| | | | | | |
Long-term capital gains | | | | | | | | | | | | | | | | | | | 105,598,392 | | | | 31,548,773 | |
| | | | | | | | | | | | | | | | | | | | | | | | |
| | | | | | |
| | | | | | | | | | | | | | | | | | | $134,597,494 | | | | $90,081,298 | |
| | | | | | | | | | | | | | | | | | | | | | | | |
159
| | |
| | | Notes to Financial Statements(continued) |
As of October 31, 2019, the components of distributable earnings (excluding unrealized appreciation/depreciation) on a tax basis consisted of:
| | | | | | | | | | | | | | | | | | | | |
| | | Fairpointe ESG
Equity | | | River Road
Focused Absolute
Value | | | Montag & Caldwell
Growth | | | River Road
Dividend All Cap
Value | | | River Road
Dividend All
Cap Value II | |
| | | | | |
Capital loss carryforward | | | $302,232 | | | | — | | | | — | | | | — | | | | — | |
| | | | | | | | | | | | | | | | | | | | |
| | | | | | | | | | | | | | | | | | | | |
Undistributed ordinary income | | | 97,741 | | | | $392,540 | | | | — | | | | $4,776,937 | | | | $270,643 | |
| | | | | | | | | | | | | | | | | | | | |
| | | | | |
Undistributed short-term capital gains | | | — | | | | 1,033,665 | | | | — | | | | — | | | | — | |
| | | | | | | | | | | | | | | | | | | | |
| | | | | | | | | | | | | | | | | | | | |
Undistributed long-term capital gains | | | — | | | | 2,023,593 | | | | $42,167,371 | | | | 35,668,194 | | | | 3,201,715 | |
| | | | | | | | | | | | | | | | | | | | |
| | | | | |
Late-year loss deferral | | | — | | | | — | | | | 242,464 | | | | — | | | | — | |
| | | | | | | | | | | | | | | | | | | | |
| | | | | |
| | | Fairpointe Mid Cap | | | LMCG Small Cap Growth | | | River Road Small-Mid Cap
Value | | | River Road
Small Cap Value | | | Silvercrest
Small Cap | |
| | | | | |
Capital loss carryforward | | | — | | | | $2,561,414 | | | | — | | | | — | | | | — | |
| | | | | | | | | | | | | | | | | | | | |
| | | | | | | | | | | | | | | | | | | | |
Undistributed ordinary income | | | $8,758,194 | | | | — | | | | — | | | | — | | | | $570,742 | |
| | | | | | | | | | | | | | | | | | | | |
| | | | | |
Undistributed short-term capital gains | | | — | | | | — | | | | $1,475,313 | | | | $11,022,854 | | | | — | |
| | | | | | | | | | | | | | | | | | | | |
| | | | | | | | | | | | | | | | | | | | |
Undistributed long-term capital gains | | | 63,582,610 | | | | — | | | | 1,731,534 | | | | 14,192,439 | | | | 4,849,841 | |
| | | | | | | | | | | | | | | | | | | | |
Late-year loss deferral | | | — | | | | 291,217 | | | | — | | | | — | | | | — | |
| | | | | |
| | | | | | | | | | | | | | | | | | | | |
| | | | | |
| | | | | | | | | DoubleLine Core Plus Bond | | | River Road
Long-Short | | | Pictet
International | |
| | | | | |
Capital loss carryforward | | | | | | | | | | | $15,173,103 | | | | — | | | | $84,849,136 | |
| | | | | | | | | | | | | | | | | | | | |
| | | | | | | | | | | | | | | | | | | | |
Undistributed ordinary income | | | | | | | | | | | 744,081 | | | | $21 | | | | 6,584,315 | |
| | | | | | | | | | | | | | | | | | | | |
| | | | | |
Undistributed short-term capital gains | | | | | | | | | | | — | | | | 1,620,588 | | | | — | |
| | | | | | | | | | | | | | | | | | | | |
| | | | | | | | | | | | | | | | | | | | |
Undistributed long-term capital gains | | | | | | | | | | | — | | | | 427,448 | | | | — | |
| | | | | | | | | | | | | | | | | | | | |
At October 31, 2019, the cost of investments and the aggregate gross unrealized appreciation and depreciation for federal income tax purposes were as follows:
| | | | | | | | | | | | | | | | |
| Fund | | Cost | | | Appreciation | | | Depreciation | | | Net | |
| | | | |
Fairpointe ESG Equity | | | $10,943,144 | | | | $1,571,955 | | | | $(515,994) | | | | $1,055,961 | |
| | | | | | | | | | | | | | | | |
| | | | | | | | | | | | | | | | |
River Road Focused Absolute Value | | | 135,336,869 | | | | 12,617,288 | | | | (1,920,426 | ) | | | 10,696,862 | |
| | | | | | | | | | | | | | | | |
| | | | |
Montag & Caldwell Growth | | | 314,153,316 | | | | 183,778,087 | | | | (1,628,169 | ) | | | 182,149,918 | |
| | | | | | | | | | | | | | | | |
| | | | | | | | | | | | | | | | |
River Road Dividend All Cap Value | | | 493,583,478 | | | | 156,492,269 | | | | (25,710,856 | ) | | | 130,781,413 | |
| | | | | | | | | | | | | | | | |
| | | | |
River Road Dividend All Cap Value II | | | 51,516,823 | | | | 14,158,079 | | | | (2,263,450 | ) | | | 11,894,629 | |
| | | | | | | | | | | | | | | | |
| | | | | | | | | | | | | | | | |
Fairpointe Mid Cap | | | 1,405,600,442 | | | | 402,572,939 | | | | (121,649,390 | ) | | | 280,923,549 | |
| | | | | | | | | | | | | | | | |
| | | | |
LMCG Small Cap Growth | | | 43,336,375 | | | | 7,192,623 | | | | (3,219,889 | ) | | | 3,972,734 | |
| | | | | | | | | | | | | | | | |
| | | | | | | | | | | | | | | | |
River Road Small-Mid Cap Value | | | 161,076,047 | | | | 18,058,061 | | | | (8,432,661 | ) | | | 9,625,400 | |
| | | | | | | | | | | | | | | | |
| | | | |
River Road Small Cap Value | | | 359,550,775 | | | | 76,842,075 | | | | (29,436,464 | ) | | | 47,405,611 | |
| | | | | | | | | | | | | | | | |
| | | | | | | | | | | | | | | | |
Silvercrest Small Cap | | | 208,480,069 | | | | 31,472,267 | | | | (15,698,043 | ) | | | 15,774,224 | |
| | | | | | | | | | | | | | | | |
| | | | |
DoubleLine Core Plus Bond | | | 669,974,074 | | | | 24,049,366 | | | | (8,048,563 | ) | | | 16,000,803 | |
| | | | | | | | | | | | | | | | |
| | | | | | | | | | | | | | | | |
River Road Long-Short | | | 18,347,374 | | | | 1,810,433 | | | | (1,573,645 | ) | | | 236,788 | |
| | | | | | | | | | | | | | | | |
| | | | |
Pictet International | | | 302,857,777 | | | | 27,918,575 | | | | (33,629,563 | ) | | | (5,710,988 | ) |
| | | | | | | | | | | | | | | | |
e. FEDERAL TAXES
Each Fund currently qualifies as an investment company and intends to comply with the requirements under Subchapter M of the Internal Revenue Code of 1986, as amended, and to distribute substantially all of its taxable income and gains to
its shareholders and to meet certain diversification and income requirements with respect to investment companies. Therefore, no provision for federal income or excise tax is included in the accompanying financial statements.
160
| | |
| | | Notes to Financial Statements(continued) |
Additionally, based on each Fund’s understanding of the tax rules and rates related to income, gains and transactions for the foreign jurisdictions in which it invests, each Fund will provide for foreign taxes, and where appropriate, deferred foreign taxes.
Management has analyzed the Funds’ tax positions taken on federal income tax returns as of October 31, 2019, and for all open tax years (generally, the three prior taxable years), and has concluded that no provision for federal income tax is required in the Funds’ financial statements. Additionally, Management is not aware of any tax position for which it is reasonably possible that the total amounts of unrecognized tax benefits will change materially in the next twelve months.
f. CAPITAL LOSS CARRYOVERS AND DEFERRALS
As of October 31, 2019, the following Funds had capital loss carryovers for federal income tax purposes as shown in the following chart. These amounts may be used to offset future realized capital gains indefinitely, and retain their character as short-term and/or long-term.
| | | | | | | | | | | | |
| Capital Loss Carryover Amounts | |
| | | |
Fund | | Short-Term | | | Long-Term | | | | |
| | | |
FairPointe ESG Equity | | | $302,232 | | | | — | | | | | |
| | | |
LMCG Small Cap Growth | | | $2,561,414 | | | | — | | | | | |
| | | |
DoubleLine Core Plus Bond | | | $4,267,149 | | | | $10,905,954 | | | | | |
| | | |
Pictet International | | | $27,996,636 | | | | $56,852,500 | | | | | |
As of October 31, 2019, the Funds not listed above had no capital loss carryovers for federal income tax purposes. Should the Funds incur net capital losses for the fiscal year ended October 31, 2020, such amounts may be used to offset future realized capital gains indefinitely, and retain their character as either short-term and/or long-term.
For the fiscal year ended October 31, 2019, the following Funds utilized capital loss carryovers in the amount of:
| | | | | | | | |
| | | Capital Loss Carryover Utilized | |
| | | |
Fund | | Short-Term | | Long-Term | | | |
| | | |
DoubleLine Core Plus Bond | | $1,651,453 | | — | | | | |
g. CAPITAL STOCK
The Trust’s Declaration of Trust authorizes for each Fund the issuance of an unlimited number of shares of beneficial interest, without par value. Each Fund records sales and repurchases of its capital stock on the trade date. As of November 13, 2018, River Road Small Cap Value transferred securities and cash to certain shareholders in connection with redemptions in-kind transactions in the amount of $41,220,112. For the purposes of U.S. GAAP, the transaction was treated as a sale of securities and the resulting gain or loss was recognized based on the market value of the securities on the date of the transfer. For tax purposes, no gains or losses were recognized. Prior to March 1, 2019, Pictet International deducted a 2.00% redemption fee from the proceeds of any redemption of shares (including a redemption by exchange) if the redemption occurred within 60 days of the purchase of those shares. For the fiscal year ended October 31, 2019, Pictet International had redemption fees amounting to $359,895. For the fiscal year ended October 31, 2018, Pictet International had redemption fees amounting to $125,630. These amounts are netted against the cost of shares repurchased in the Statements of Changes in Net Assets.
For the fiscal years ended October 31, 2019 and October 31, 2018, the capital stock transactions by class for the Funds were as follows:
| | | | | | | | | | | | | | | | | | | | | | | | | | | | | | | | |
| | | Fairpointe ESG Equity | | | River Road Focused Absolute Value | |
| | | | |
| | | October 31, 2019 | | | October 31, 2018 | | | October 31, 2019 | | | October 31, 2018 | |
| | | | | | | | |
| | | Shares | | | Amount | | | Shares | | | Amount | | | Shares | | | Amount | | | Shares | | | Amount | |
| Class N: | | | | | | | | | | | | | | | | | | | | | | | | | | | | | | | | |
| | | | | | | | |
| Proceeds from sale of shares | | | 13,776 | | | | $151,372 | | | | 8,773 | | | | $107,345 | | | | 549,665 | | | | $6,419,128 | | | | 345,357 | | | | $4,132,526 | |
| | | | | | | | |
| Reinvestment of distributions | | | 627 | | | | 6,356 | | | | 748 | | | | 9,243 | | | | 58,788 | | | | 586,698 | | | | 51,795 | | | | 584,247 | |
| | | | | | | | |
| Cost of shares repurchased | | | (18,079 | ) | | | (207,060 | ) | | | (19,289 | ) | | | (236,085 | ) | | | (171,588 | ) | | | (2,011,511 | ) | | | (253,622 | ) | | | (2,931,767 | ) |
| | | | | | | | |
| | | | | | | | | | | | | | | | | | | | | | | | | | | | | | | | |
| | | | | | | | |
| Net increase (decrease) | | | (3,676 | ) | | | $(49,332 | ) | | | (9,768 | ) | | | $(119,497 | ) | | | 436,865 | | | | $4,994,315 | | | | 143,530 | | | | $1,785,006 | |
| | | | | | | | | | | | | | | | | | | | | | | | | | | | | | | | |
| Class I: | | | | | | | | | | | | | | | | | | | | | | | | | | | | | | | | |
| | | | | | | | |
| Proceeds from sale of shares | | | 136,922 | | | | $1,538,895 | | | | 412,889 | | | | $5,059,710 | | | | 9,567,363 | | | | $112,119,561 | | | | 506,084 | | | | $5,975,162 | |
| | | | | | | | |
| Reinvestment of distributions | | | 12,631 | | | | 127,192 | | | | 9,049 | | | | 111,123 | | | | 116,443 | | | | 1,165,589 | | | | 119,483 | | | | 1,352,549 | |
| | | | | | | | |
| Cost of shares repurchased | | | (24,662 | ) | | | (285,831 | ) | | | (7,327 | ) | | | (91,510 | ) | | | (1,138,795 | ) | | | (13,504,092 | ) | | | (314,384 | ) | | | (3,661,346 | ) |
| | | | | | | | |
| | | | | | | | | | | | | | | | | | | | | | | | | | | | | | | | |
| | | | | | | | |
| Net increase | | | 124,891 | | | | $1,380,256 | | | | 414,611 | | | | $5,079,323 | | | | 8,545,011 | | | | $99,781,058 | | | | 311,183 | | | | $3,666,365 | |
| | | | | | | | | | | | | | | | | | | | | | | | | | | | | | | | |
161
| | |
| | | Notes to Financial Statements(continued) |
| | | | | | | | | | | | | | | | | | | | | | | | | | | | | | | | |
| | | Fairpointe ESG Equity | | | River Road Focused Absolute Value | |
| | | | |
| | | October 31, 2019 | | | October 31, 2018 | | | October 31, 2019 | | | October 31, 2018 | |
| | | Shares | | | Amount | | | Shares | | | Amount | | | Shares | | | Amount | | | Shares | | | Amount | |
| | | | | | | | |
Class Z: | | | | | | | | | | | | | | | | | | | | | | | | | | | | | | | | |
| | | | | | | | | | | | | | | | | | | | | | | | | | | | | | | | |
| | | | | | | | |
Proceeds from sale of shares | | | — | | | | — | | | | — | | | | — | | | | 6,356 | | | | $75,000 | | | | — | | | | — | |
| | | | | | | | |
Reinvestment of distributions | | | — | | | | — | | | | — | | | | — | | | | 437 | | | | 4,375 | | | | 427 | | | | $4,840 | |
| | | | | | | | | | | | | | | | | | | | | | | | | | | | | | | | |
| | | | | | | | |
Net increase | | | — | | | | — | | | | — | | | | — | | | | 6,793 | | | | $79,375 | | | | 427 | | | | $4,840 | |
| | | | | | | | | | | | | | | | | | | | | | | | | | | | | | | | |
| | |
| | | Montag & Caldwell Growth | | | River Road Dividend All Cap Value | |
| | | | |
| | | October 31, 2019 | | | October 31, 2018 | | | October 31, 2019 | | | October 31, 2018 | |
| | | Shares | | | Amount | | | Shares | | | Amount | | | Shares | | | Amount | | | Shares | | | Amount | |
| | | | | | | | |
Class N: | | | | | | | | | | | | | | | | | | | | | | | | | | | | | | | | |
| | | | | | | | | | | | | | | | | | | | | | | | | | | | | | | | |
| | | | | | | | |
Proceeds from sale of��shares | | | 489,067 | | | | $9,234,902 | | | | 534,645 | | | | $11,026,782 | | | | 545,101 | | | | $6,434,066 | | | | 954,322 | | | | $12,023,431 | |
| | | | | | | | |
Reinvestment of distributions | | | 2,038,637 | | | | 31,129,988 | | | | 1,063,852 | | | | 20,957,885 | | | | 744,290 | | | | 7,942,959 | | | | 660,797 | | | | 8,289,573 | |
| | | | | | | | |
Cost of shares repurchased | | | (2,703,397 | ) | | | (48,344,095 | ) | | | (5,342,480 | ) | | | (111,440,545 | ) | | | (2,987,912 | ) | | | (34,927,219 | ) | | | (4,057,839 | ) | | | (51,163,298 | ) |
| | | | | | | | |
Share Conversion | | | 33,601 | | | | 585,466 | | | | — | | | | — | | | | — | | | | — | | | | — | | | | — | |
| | | | | | | | | | | | | | | | | | | | | | | | | | | | | | | | |
Net decrease | | | (142,092 | ) | | | $(7,393,739 | ) | | | (3,743,983 | ) | | | $(79,455,878 | ) | | | (1,698,521 | ) | | | $(20,550,194 | ) | | | (2,442,720 | ) | | | $(30,850,294 | ) |
| | | | | | | | | | | | | | | | | | | | | | | | | | | | | | | | |
| | | | | | | | |
Class I: | | | | | | | | | | | | | | | | | | | | | | | | | | | | | | | | |
| | | | | | | | | | | | | | | | | | | | | | | | | | | | | | | | |
| | | | | | | | |
Proceeds from sale of shares | | | 2,224,407 | | | | $37,510,016 | | | | 3,812,515 | | | | $79,045,937 | | | | 7,163,258 | | | | $84,820,750 | | | | 11,123,981 | | | | $139,902,240 | |
| | | | | | | | |
Reinvestment of distributions | | | 4,568,635 | | | | 70,128,543 | | | | 2,312,557 | | | | 45,742,378 | | | | 5,343,632 | | | | 57,080,715 | | | | 4,272,488 | | | | 53,560,954 | |
| | | | | | | | |
Cost of shares repurchased | | | (10,059,793 | ) | | | (175,935,523 | ) | | | (16,764,310 | ) | | | (348,176,399 | ) | | | (29,815,893 | ) | | | (350,994,576 | ) | | | (16,140,415 | ) | | | (203,004,384 | ) |
| | | | | | | | | | | | | | | | | | | | | | | | | | | | | | | | |
| | | | | | | | |
Net decrease | | | (3,266,751 | ) | | | $(68,296,964 | ) | | | (10,639,238 | ) | | | $(223,388,084 | ) | | | (17,309,003 | ) | | | $(209,093,111 | ) | | | (743,946 | ) | | | $(9,541,190 | ) |
| | | | | | | | | | | | | | | | | | | | | | | | | | | | | | | | |
| | | | | | | | |
Class R:1 | | | | | | | | | | | | | | | | | | | | | | | | | | | | | | | | |
| | | | | | | | | | | | | | | | | | | | | | | | | | | | | | | | |
| | | | | | | | |
Proceeds from sale of shares | | | 6,778 | | | | $105,687 | | | | 5,292 | | | | $105,496 | | | | — | | | | — | | | | — | | | | — | |
| | | | | | | | |
Reinvestment of distributions | | | 3,480 | | | | 51,232 | | | | 1,879 | | | | 36,074 | | | | — | | | | — | | | | — | | | | — | |
| | | | | | | | |
Cost of shares repurchased | | | (5,785 | ) | | | (686,982 | ) | | | (9,961 | ) | | | (204,960 | ) | | | — | | | | — | | | | — | | | | — | |
| | | | | | | | |
Share Conversion | | | (34,906 | ) | | | (585,466 | ) | | | — | | | | — | | | | — | | | | — | | | | — | | | | — | |
| | | | | | | | | | | | | | | | | | | | | | | | | | | | | | | | |
| | | | | | | | |
Net decrease | | | (30,433 | ) | | | $(1,115,529 | ) | | | (2,790 | ) | | | $(63,390 | ) | | | — | | | | — | | | | — | | | | — | |
| | | | | | | | | | | | | | | | | | | | | | | | | | | | | | | | |
| | | | | | | | |
Class Z: | | | | | | | | | | | | | | | | | | | | | | | | | | | | | | | | |
| | | | | | | | | | | | | | | | | | | | | | | | | | | | | | | | |
| | | | | | | | |
Proceeds from sale of shares | | | — | | | | — | | | | — | | | | — | | | | — | | | | — | | | | 251,380 | | | | $3,195,307 | |
| | | | | | | | |
Reinvestment of distributions | | | — | | | | — | | | | — | | | | — | | | | 539 | | | | $5,769 | | | | 1,709 | | | | 21,471 | |
| | | | | | | | |
Cost of shares repurchased | | | — | | | | — | | | | — | | | | — | | | | (45,743 | ) | | | (568,778 | ) | | | (222,749 | ) | | | (2,784,101 | ) |
| | | | | | | | | | | | | | | | | | | | | | | | | | | | | | | | |
| | | | | | | | |
Net increase (decrease) | | | — | | | | — | | | | — | | | | — | | | | (45,204 | ) | | | $(563,009 | ) | | | 30,340 | | | | $432,677 | |
| | | | | | | | | | | | | | | | | | | | | | | | | | | | | | | | |
162
| | |
| | | Notes to Financial Statements(continued) |
| | | | | | | | | | | | | | | | | | | | | | | | | | | | | | | | |
| | | River Road Dividend All Cap Value II | | | | | | Fairpointe Mid Cap | | | | |
| | | | |
| | | October 31, 2019 | | | October 31, 2018 | | | October 31, 2019 | | | October 31, 2018 | |
| | | | | | | | |
| | | Shares | | | Amount | | | Shares | | | Amount | | | Shares | | | Amount | | | Shares | | | Amount | |
| | | | | | | | |
Class N: | | | | | | | | | | | | | | | | | | | | | | | | | | | | | | | | |
| | | | | | | | | | | | | | | | | | | | | | | | | | | | | | | | |
| | | | | | | | |
Proceeds from sale of shares | | | 10,248 | | | | $133,078 | | | | 4,348 | | | | $64,163 | | | | 2,004,707 | | | | $71,071,732 | | | | 3,794,347 | | | | $162,654,871 | |
| | | | | | | | |
Reinvestment of distributions | | | 25,613 | | | | 292,874 | | | | 13,908 | | | | 200,402 | | | | 1,845,204 | | | | 58,437,613 | | | | 1,896,462 | | | | 81,377,192 | |
| | | | | | | | |
Cost of shares repurchased | | | (23,177) | | | | (294,793) | | | | (72,926) | | | | (1,057,300) | | | | (12,374,483) | | | | (443,743,803) | | | | (13,139,539) | | | | (553,934,059) | |
| | | | | | | | | | | | | | | | | | | | | | | | | | | | | | | | |
| | | | | | | | |
Net increase (decrease) | | | 12,684 | | | | $131,159 | | | | (54,670) | | | | $(792,735) | | | | (8,524,572) | | | | $(314,234,458) | | | | (7,448,730) | | | | $(309,901,996) | |
| | | | | | | | | | | | | | | | | | | | | | | | | | | | | | | | |
| | | | | | | | |
Class I: | | | | | | | | | | | | | | | | | | | | | | | | | | | | | | | | |
| | | | | | | | | | | | | | | | | | | | | | | | | | | | | | | | |
| | | | | | | | |
Proceeds from sale of shares | | | 977,377 | | | | $12,171,977 | | | | 714,224 | | | | $10,217,669 | | | | 10,308,577 | | | | $380,893,807 | | | | 13,948,944 | | | | $602,613,915 | |
| | | | | | | | |
Reinvestment of distributions | | | 881,877 | | | | 10,105,338 | | | | 575,938 | | | | 8,307,708 | | | | 3,336,941 | | | | 108,484,016 | | | | 3,724,484 | | | | 163,915,906 | |
| | | | | | | | |
Cost of shares repurchased | | | (3,366,588) | | | | (42,423,588) | | | | (3,344,871) | | | | (48,175,390) | | | | (27,594,317) | | | | (1,030,984,523) | | | | (35,171,978) | | | | (1,514,381,967) | |
| | | | | | | | | | | | | | | | | | | | | | | | | | | | | | | | |
| | | | | | | | |
Net decrease | | | (1,507,334) | | | | $(20,146,273) | | | | (2,054,709) | | | | $(29,650,013) | | | | (13,948,799) | | | | $(541,606,700) | | | | (17,498,550) | | | | $(747,852,146) | |
| | | | | | | | | | | | | | | | | | | | | | | | | | | | | | | | |
| | | | | | | | |
Class Z: | | | | | | | | | | | | | | | | | | | | | | | | | | | | | | | | |
| | | | | | | | | | | | | | | | | | | | | | | | | | | | | | | | |
| | | | | | | | |
Proceeds from sale of shares | | | 11,080 | | | | $136,614 | | | | 2,278 | | | | $33,368 | | | | 1,171,029 | | | | $41,213,653 | | | | 7,991,905 | | | | $346,133,605 | |
| | | | | | | | |
Reinvestment of distributions | | | 2,274 | | | | 26,316 | | | | 1,632 | | | | 23,529 | | | | 476,357 | | | | 15,472,072 | | | | 36,921 | | | | 1,624,158 | |
| | | | | | | | |
Cost of shares repurchased | | | — | | | | — | | | | (13,143) | | | | (190,623) | | | | (5,531,480) | | | | (203,971,612) | | | | (3,036,213) | | | | (131,853,970) | |
| | | | | | | | | | | | | | | | | | | | | | | | | | | | | | | | |
| | | | | | | | |
Net increase (decrease) | | | 13,354 | | | | $162,930 | | | | (9,233) | | | | $(133,726) | | | | (3,884,094) | | | | $(147,285,887) | | | | 4,992,613 | | | | $215,903,793 | |
| | | | | | | | | | | | | | | | | | | | | | | | | | | | | | | | |
| | |
| | | LMCG Small Cap Growth | | | River Road Small-Mid Cap Value | |
| | | | |
| | | October 31, 2019 | | | October 31, 2018 | | | October 31, 2019 | | | October 31, 2018 | |
| | | | | | | | |
| | | Shares | | | Amount | | | Shares | | | Amount | | | Shares | | | Amount | | | Shares | | | Amount | |
| | | | | | | | |
Class N: | | | | | | | | | | | | | | | | | | | | | | | | | | | | | | | | |
| | | | | | | | | | | | | | | | | | | | | | | | | | | | | | | | |
| | | | | | | | |
Proceeds from sale of shares | | | 77,043 | | | | $1,335,673 | | | | 530,613 | | | | $9,552,619 | | | | 3,383,305 | | | | $25,245,640 | | | | 1,868,113 | | | | $14,965,056 | |
| | | | | | | | |
Reinvestment of distributions | | | — | | | | — | | | | — | | | | — | | | | 154,345 | | | | 964,654 | | | | 125,130 | | | | 917,204 | |
| | | | | | | | |
Cost of shares repurchased | | | (475,807) | | | | (8,275,709) | | | | (1,327,776) | | | | (22,567,317) | | | | (2,731,529) | | | | (19,004,844) | | | | (601,269) | | | | (4,706,768) | |
| | | | | | | | | | | | | | | | | | | | | | | | | | | | | | | | |
| | | | | | | | |
Net increase (decrease) | | | (398,764) | | | | $(6,940,036) | | | | (797,163) | | | | $(13,014,698) | | | | 806,121 | | | | $7,205,450 | | | | 1,391,974 | | | | $11,175,492 | |
| | | | | | | | | | | | | | | | | | | | | | | | | | | | | | | | |
| | | | | | | | |
Class I: | | | | | | | | | | | | | | | | | | | | | | | | | | | | | | | | |
| | | | | | | | | | | | | | | | | | | | | | | | | | | | | | | | |
| | | | | | | | |
Proceeds from sale of shares | | | 962,910 | | | | $17,061,091 | | | | 1,318,884 | | | | $23,153,350 | | | | 13,135,436 | | | | $100,556,973 | | | | 2,610,047 | | | | $20,648,002 | |
| | | | | | | | |
Reinvestment of distributions | | | — | | | | — | | | | — | | | | — | | | | 500,729 | | | | 3,199,661 | | | | 675,443 | | | | 5,045,558 | |
| | | | | | | | |
Cost of shares repurchased | | | (3,946,908) | | | | (66,772,213) | | | | (2,619,482) | | | | (43,969,847) | | | | (2,128,365) | | | | (15,695,229) | | | | (1,042,654) | | | | (8,084,673) | |
| | | | | | | | | | | | | | | | | | | | | | | | | | | | | | | | |
| | | | | | | | |
Net increase (decrease) | | | (2,983,998) | | | | $(49,711,122) | | | | (1,300,598) | | | | $(20,816,497) | | | | 11,507,800 | | | | $88,061,405 | | | | 2,242,836 | | | | $17,608,887 | |
| | | | | | | | | | | | | | | | | | | | | | | | | | | | | | | | |
| | | | | | | | |
Class Z: | | | | | | | | | | | | | | | | | | | | | | | | | | | | | | | | |
| | | | | | | | | | | | | | | | | | | | | | | | | | | | | | | | |
| | | | | | | | |
Proceeds from sale of shares | | | — | | | | — | | | | — | | | | — | | | | 7,503 | | | | $58,059 | | | | 9,228 | | | | $80,000 | |
| | | | | | | | |
Reinvestment of distributions | | | — | | | | — | | | | — | | | | — | | | | 1,486 | | | | 9,497 | | | | 2,371 | | | | 17,688 | |
| | | | | | | | |
Cost of shares repurchased | | | — | | | | — | | | | — | | | | — | | | | (3,665) | | | | (28,146) | | | | — | | | | — | |
| | | | | | | | | | | | | | | | | | | | | | | | | | | | | | | | |
| | | | | | | | |
Net increase | | | — | | | | — | | | | — | | | | — | | | | 5,324 | | | | $39,410 | | | | 11,599 | | | | $97,688 | |
| | | | | | | | | | | | | | | | | | | | | | | | | | | | | | | | |
163
| | |
| | | Notes to Financial Statements(continued) |
| | | | | | | | | | | | | | | | | | | | | | | | | | | | | | | | |
| | | River Road Small Cap Value | | | Silvercrest Small Cap | |
| | | | |
| | | October 31, 2019 | | | October 31, 2018 | | | October 31, 2019 | | | October 31, 2018 | |
| | | Shares | | | Amount | | | Shares | | | Amount | | | Shares | | | Amount | | | Shares | | | Amount | |
| | | | | | | | |
Class N: | | | | | | | | | | | | | | | | | | | | | | | | | | | | | | | | |
| | | | | | | | |
Proceeds from sale of shares | | | 789,028 | | | | $9,842,913 | | | | 514,388 | | | | $6,981,510 | | | | 1,282,981 | | | | $20,241,344 | | | | 119,787 | | | | $2,187,349 | |
| | | | | | | | |
Reinvestment of distributions | | | 278,695 | | | | 2,940,228 | | | | 329,745 | | | | 4,286,683 | | | | 207,428 | | | | 2,775,383 | | | | 106,704 | | | | 1,953,748 | |
| | | | | | | | |
Cost of shares repurchased | | | (907,582) | | | | (10,941,540) | | | | (887,258) | | | | (12,019,368) | | | | (447,723) | | | | (6,790,199) | | | | (783,060) | | | | (14,267,961) | |
| | | | | | | | | | | | | | | | | | | | | | | | | | | | | | | | |
| | | | | | | | |
Net increase (decrease) | | | 160,141 | | | | $1,841,601 | | | | (43,125) | | | | $(751,175) | | | | 1,042,686 | | | | $16,226,528 | | | | (556,569) | | | | $(10,126,864) | |
| | | | | | | | | | | | | | | | | | | | | | | | | | | | | | | | |
Class I: | | | | | | | | | | | | | | | | | | | | | | | | | | | | | | | | |
| | | | | | | | |
Proceeds from sale of shares | | | 10,281,841 | | | | $128,672,870 | | | | 6,805,339 | | | | $93,808,922 | | | | 2,338,382 | | | | $35,839,074 | | | | 3,725,270 | | | | $68,983,519 | |
| | | | | | | | |
Reinvestment of distributions | | | 2,630,242 | | | | 28,327,708 | | | | 2,767,209 | | | | 36,582,499 | | | | 1,088,541 | | | | 14,727,958 | | | | 1,034,516 | | | | 19,107,515 | |
| | | | | | | | |
Cost of shares repurchased | | | (9,212,731) | | | | (118,167,655) | 2 | | | (4,176,601) | | | | (58,213,101) | | | | (4,951,566) | | | | (77,317,287) | | | | (5,835,136) | | | | (107,793,516) | |
| | | | | | | | | | | | | | | | | | | | | | | | | | | | | | | | |
| | | | | | | | |
Net increase (decrease) | | | 3,699,352 | | | | $38,832,923 | | | | 5,395,947 | | | | $72,178,320 | | | | (1,524,643) | | | | $(26,750,255) | | | | (1,075,350) | | | | $(19,702,482) | |
| | | | | | | | | | | | | | | | | | | | | | | | | | | | | | | | |
| | | | | | | | |
Class Z: | | | | | | | | | | | | | | | | | | | | | | | | | | | | | | | | |
| | | | | | | | |
Proceeds from sale of shares | | | 344 | | | | $4,501 | | | | 2,080 | | | | $29,536 | | | | 339,198 | | | | $5,192,669 | | | | 2,144,119 | | | | $39,852,797 | |
| | | | | | | | |
Reinvestment of distributions | | | 1,585 | | | | 17,058 | | | | 1,562 | | | | 20,634 | | | | 231,352 | | | | 3,127,881 | | | | 872 | | | | 16,089 | |
| | | | | | | | |
Cost of shares repurchased | | | — | | | | — | | | | (2,080) | | | | (27,456) | | | | (280,410) | | | | (4,372,137) | | | | (183,354) | | | | (3,415,675) | |
| | | | | | | | | | | | | | | | | | | | | | | | | | | | | | | | |
| | | | | | | | |
Net increase | | | 1,929 | | | | $21,559 | | | | 1,562 | | | | $22,714 | | | | 290,140 | | | | $3,948,413 | | | | 1,961,637 | | | | $36,453,211 | |
| | | | | | | | | | | | | | | | | | | | | | | | | | | | | | | | |
| | |
| | | DoubleLine Core Plus Bond | | | River Road Long-Short | |
| | | | |
| | | October 31, 2019 | | | October 31, 2018 | | | October 31, 2019 | | | October 31, 2018 | |
| | | Shares | | | Amount | | | Shares | | | Amount | | | Shares | | | Amount | | | Shares | | | Amount | |
| | | | | | | | |
Class N: | | | | | | | | | | | | | | | | | | | | | | | | | | | | | | | | |
| | | | | | | | |
Proceeds from sale of shares | | | 2,290,302 | | | | $24,157,256 | | | | 3,208,660 | | | | $33,620,666 | | | | 44,736 | | | | $567,292 | | | | 21,068 | | | | $263,257 | |
| | | | | | | | |
Reinvestment of distributions | | | 292,173 | | | | 3,065,506 | | | | 375,842 | | | | 3,927,700 | | | | 18,650 | | | | 208,129 | | | | — | | | | — | |
| | | | | | | | |
Cost of shares repurchased | | | (4,850,423) | | | | (50,889,160) | | | | (9,494,394) | | | | (99,246,564) | | | | (167,772) | | | | (2,067,882) | | | | (160,145) | | | | (1,980,544) | |
| | | | | | | | | | | | | | | | | | | | | | | | | | | | | | | | |
| | | | | | | | |
Net decrease | | | (2,267,948) | | | | $(23,666,398) | | | | (5,909,892) | | | | $(61,698,198) | | | | (104,386) | | | | $(1,292,461) | | | | (139,077) | | | | $(1,717,287) | |
| | | | | | | | | | | | | | | | | | | | | | | | | | | | | | | | |
| | | | | | | | |
Class I: | | | | | | | | | | | | | | | | | | | | | | | | | | | | | | | | |
| | | | | | | | |
Proceeds from sale of shares | | | 20,919,284 | | | | $218,829,136 | | | | 15,144,066 | | | | $159,105,577 | | | | 397,986 | | | | $5,100,746 | | | | 676,485 | | | | $8,599,175 | |
| | | | | | | | |
Reinvestment of distributions | | | 1,572,580 | | | | 16,529,209 | | | | 1,435,849 | | | | 14,975,472 | | | | 121,788 | | | | 1,381,075 | | | | — | | | | — | |
| | | | | | | | |
Cost of shares repurchased | | | (13,633,717) | | | | (142,471,689) | | | | (18,483,535) | | | | (192,781,692) | | | | (816,214) | | | | (9,941,875) | | | | (986,687) | | | | (12,341,172) | |
| | | | | | | | | | | | | | | | | | | | | | | | | | | | | | | | |
| | | | | | | | |
Net increase (decrease) | | | 8,858,147 | | | | $92,886,656 | | | | (1,903,620) | | | | $(18,700,643) | | | | (296,440) | | | | $(3,460,054) | | | | (310,202) | | | | $(3,741,997) | |
| | | | | | | | | | | | | | | | | | | | | | | | | | | | | | | | |
| | | | | | | | |
Class Z: | | | | | | | | | | | | | | | | | | | | | | | | | | | | | | | | |
| | | | | | | | |
Proceeds from sale of shares | | | 76,150 | | | | $790,032 | | | | 72,697 | | | | $756,674 | | | | — | | | | — | | | | 3,925 | | | | $50,000 | |
| | | | | | | | |
Reinvestment of distributions | | | 8,502 | | | | 89,469 | | | | 5,475 | | | | 57,102 | | | | 372 | | | | $4,220 | | | | — | | | | — | |
| | | | | | | | |
Cost of shares repurchased | | | (45,503) | | | | (476,327) | | | | (36,721) | | | | (381,792) | | | | — | | | | — | | | | — | | | | — | |
| | | | | | | | | | | | | | | | | | | | | | | | | | | | | | | | |
| | | | | | | | |
Net increase | | | 39,149 | | | | $403,174 | | | | 41,451 | | | | $431,984 | | | | 372 | | | | $4,220 | | | | 3,925 | | | | $50,000 | |
| | | | | | | | | | | | | | | | | | | | | | | | | | | | | | | | |
164
|
Notes to Financial Statements(continued) |
| | | | | | | | | | | | | | | | |
| | | Pictet International | |
| | |
| | | October 31, 2019 | | | October 31, 2018 | |
| | | | |
| | | Shares | | | Amount | | | Shares | | | Amount | |
| | | | |
Class N: | | | | | | | | | | | | | | | | |
| | | | |
Proceeds from sale of shares | | | 3,166,486 | | | | $30,468,916 | | | | 8,747,423 | | | | $95,768,145 | |
| | | | |
Reinvestment of distributions | | | 1,264,376 | | | | 10,013,861 | | | | 19,707 | | | | 222,100 | |
| | | | |
Cost of shares repurchased | | | (3,593,474) | | | | (32,170,155) | | | | (746,267) | | | | (8,057,404) | |
| | | | | | | | | | | | | | | | |
| | | | |
Net increase | | | 837,388 | | | | $8,312,622 | | | | 8,020,863 | | | | $87,932,841 | |
| | | | | | | | | | | | | | | | |
| | | | |
Class I: | | | | | | | | | | | | | | | | |
| | | | |
Proceeds from sale of shares | | | 6,948,169 | | | | $60,766,536 | | | | 16,627,610 | | | | $184,401,813 | |
| | | | |
Reinvestment of distributions | | | 1,993,197 | | | | 15,845,913 | | | | 1,873,692 | | | | 21,135,242 | |
| | | | |
Cost of shares repurchased | | | (13,441,948) | | | | (121,280,664) | | | | (171,793,280) | | | | (1,979,453,800) | |
| | | | | | | | | | | | | | | | |
| | | | |
Net decrease | | | (4,500,582) | | | | $(44,668,215) | | | | (153,291,978) | | | | $(1,773,916,745) | |
| | | | | | | | | | | | | | | | |
| | | | |
Class Z: | | | | | | | | | | | | | | | | |
| | | | |
Proceeds from sale of shares | | | 5,116,982 | | | | $45,623,630 | | | | 191,849,252 | | | | $2,203,485,726 | |
| | | | |
Reinvestment of distributions | | | 13,658,436 | | | | 108,174,812 | | | | 238,202 | | | | 2,679,750 | |
| | | | |
Cost of shares repurchased | | | (143,712,741) | | | | (1,288,695,480) | | | | (62,059,814) | | | | (649,312,899) | |
| | | | | | | | | | | | | | | | |
| | | | |
Net increase (decrease) | | | (124,937,323) | | | | $(1,134,897,038) | | | | 130,027,640 | | | | $1,556,852,577 | |
| | | | | | | | | | | | | | | | |
| 1 | Effective May 31, 2019, Class R shares were converted into Class N shares. |
| 2 | Includes redemptionin-kind in the amount of $41,220,112. |
At October 31, 2019, certain affiliated and unaffiliated shareholders of record, including individually or collectively, held greater than 10% of the net assets of the Funds as follows: Silvercrest Small Cap - one owns 12%, and River Road Long-Short - one owns 19%. Transactions by this shareholder may have a material impact on the Fund.
h. REPURCHASE AGREEMENTS AND JOINT REPURCHASE AGREEMENTS
The Funds may enter into third-party repurchase agreements for temporary cash management purposes and third-party or bilateral joint repurchase agreements for reinvestment of cash collateral on securities lending transactions under the securities lending program offered by The Bank of New York Mellon (“BNYM”) (the “Program”) (collectively, “Repurchase Agreements”). The value of the underlying collateral, including accrued interest, must equal or exceed the value of the Repurchase Agreements during the term of the agreement. For joint repurchase agreements, the Funds participate on a pro rata basis with other clients of BNYM in its share of the underlying collateral under such joint repurchase agreements and in its share of proceeds from any repurchase or other disposition of the underlying collateral. The underlying collateral for all Repurchase Agreements is held in safekeeping by the Funds’ custodian or at the Federal Reserve Bank. If the seller defaults and the value of the collateral declines, or if bankruptcy proceedings commence with respect to the seller of the security, realization of the collateral by the Funds may be delayed or limited. Pursuant to the Program, the Funds are indemnified for such losses by BNYM on joint repurchase agreements.
At October 31, 2019, the market value of Repurchase Agreements outstanding is as follows:
| | | | |
| | | Market Value | |
| |
River Road Dividend All Cap Value | | | $11,684,694 | |
| |
River Road Dividend All Cap Value II | | | 1,316,687 | |
| |
LMCG Small Cap Growth | | | 849,584 | |
| |
River Road Small Cap Value | | | 1,039,716 | |
| |
DoubleLine Core Plus Bond | | | 6,806,448 | |
| |
Pictet International | | | 5,908,337 | |
i. FOREIGN CURRENCY TRANSLATION
The books and records of the Funds are maintained in U.S. dollars. The value of investments, assets and liabilities denominated in currencies other than U.S. dollars are translated into U.S. dollars based upon current foreign exchange rates. Purchases and sales of foreign investments, income and expenses are converted into U.S. dollars based on currency exchange rates prevailing on the respective dates of such transactions. Net realized and unrealized gain (loss) on foreign currency transactions represent: (1) foreign exchange gains and losses from the sale and holdings of foreign currencies; (2) gains and losses between trade date and settlement date on investment securities transactions and foreign currency
165
|
Notes to Financial Statements(continued) |
exchange contracts; and (3) gains and losses from the difference between amounts of interest and dividends recorded and the amounts actually received.
The Funds do not isolate the net realized and unrealized gain or loss resulting from changes in exchange rates from the fluctuations in market prices of securities held. Such fluctuations are included with the net realized and unrealized gain or loss on investments.
j. SECURITIES TRANSACTED ON A WHEN ISSUED BASIS
DoubleLine Core Plus Bond may enter intoTo-Be-Announced (“TBA”) sale commitments to hedge their portfolio positions or to sell mortgage-backed securities they own under delayed delivery arrangements. Proceeds of TBA sale commitments are not received until the contractual settlement date. During the time a TBA sale commitment is outstanding, equivalent deliverable securities, with the same counterparty, or an offsetting TBA purchase commitment deliverable on or before the sale commitment date, are held as “cover” for the transaction. Unsettled TBA sale commitments are valued at the current market value of the underlying securities according to the procedures described under “Valuation of Investments,” in Footnote 1a above.
Each TBA contract ismarked-to-market daily and the change in market value is recorded by the Fund as an unrealized gain or loss. If the TBA sale commitment is closed through the acquisition of an offsetting purchase commitment with the same broker, the Fund realizes a gain or loss. If the Fund delivers securities under the commitment, the Fund realizes a gain or a loss from the sale of the securities based upon the unit price established at the date the commitment was entered into.
k. DELAYED DELIVERY TRANSACTIONS AND WHEN-ISSUED SECURITIES
DoubleLine Core Plus Bond may enter into securities transactions on a delayed delivery or when issued basis. Payment and delivery may take place after the customary settlement period for that security. The price of the underlying securities and the date when the securities will be delivered and paid for are fixed at the time the transaction is negotiated. During the time a delayed delivery sell is outstanding, the contract is marked to market daily and equivalent deliverable securities are held for the transaction. The value of the securities purchased on a delayed delivery or when-issued basis are identified as such in the Fund’s Schedules of Portfolio Investments. With respect to purchase commitments, the Fund identifies securities as segregated in its records with a value at least equal to the amount of the commitment. Delayed delivery or when-issued securities that have been purchased from and sold to different brokers are reflected as an investment in securities and a forward sale commitment in the Fund’s Statement of Assets and Liabilities. For financial reporting purposes, the Fund does offset the receivable and payable for delayed delivery investments purchased and sold on TBA commitments. Losses may arise due to changes in the value of the underlying securities or if the counterparty does not perform under the contract, or if the issuer does not issue the securities due to political, economic, or other factors.
2. AGREEMENTS AND TRANSACTIONS WITH AFFILIATES
For each of the Funds, the Trust has entered into an investment advisory agreement under which the Investment Manager, a subsidiary and the U.S. retail distribution arm of Affiliated Managers Group, Inc. (“AMG”), serves as investment manager to the Funds and is responsible for the Funds’ overall administration and operations. The Investment Manager selects one or more subadvisors for the Funds (subject to Board approval) and monitors each subadvisor’s investment
performance, security holdings and investment strategies. The investment portfolios of River Road Focused Absolute Value, River Road Dividend All Cap Value, River Road Dividend All Cap Value II, River RoadSmall-Mid Cap, River Road Small Cap Value and River Road Long-Short are managed by River Road Asset Management, LLC. AMG indirectly owns a majority interest in River Road Asset Management, LLC.
Investment management fees are paid directly by the Funds to the Investment Manager based on average daily net assets. For the fiscal year ended October 31, 2019, the Funds’ investment management fees were paid at the following annual rate of each Fund’s respective average daily net assets:
| | |
| |
Fairpointe ESG Equity | | 0.70% |
| |
River Road Focused Absolute Value | | 0.60% |
| |
Montag & Caldwell Growth | | |
| |
on first $800 million | | 0.70% |
| |
over $800 million up to $6 billion | | 0.50% |
| |
over $6 billion up to $12 billion | | 0.45% |
| |
over $12 billion | | 0.40% |
| |
River Road Dividend All Cap Value | | 0.60% |
| |
River Road Dividend All Cap Value II | | 0.60% |
| |
Fairpointe Mid Cap | | |
| |
on first $100 million | | 0.70% |
| |
next $300 million | | 0.65% |
| |
over $400 million | | 0.60% |
| |
LMCG Small Cap Growth | | 0.90% |
| |
River RoadSmall-Mid Cap Value | | 0.75% |
| |
River Road Small Cap Value | | 0.80% |
| |
Silvercrest Small Cap | | 0.90% |
| |
DoubleLine Core Plus Bond | | 0.45% |
| |
River Road Long-Short | | 0.85% |
| |
Pictet International | | 0.70% |
The Investment Manager has contractually agreed, through at least March 1, 2020 for Fairpointe ESG Equity, River Road Focused Absolute Value, River Road Dividend All Cap Value, River Road Dividend All Cap Value II, LMCG Small Cap Growth, River RoadSmall-Mid Cap Value, Silvercrest Small Cap, DoubleLine Core Plus Bond, River Road Long-Short, and Pictet International, and through at least March 1, 2021 for Montag & Caldwell Growth and Fairpointe Mid Cap, to waive management fees and/or reimburse fund expenses in order to limit total annual Fund operating expenses after fee waiver and expense reimbursements (exclusive of taxes, interest (including interest incurred in connection with bank and custody overdrafts in connection with securities sold short), shareholder servicing fees, distribution and service12b-1 fees, brokerage commissions and other transaction costs, dividends payable with respect to securities sold short, acquired fund fees and expenses and extraordinary expenses). The percentages of the Funds’ average daily net assets subject to later reimbursement by the Funds in certain circumstances are as follows:
166
|
Notes to Financial Statements(continued) |
| | | | |
| |
Fairpointe ESG Equity | | | 0.82% | |
| |
River Road Focused Absolute Value | | | 0.71% | |
| |
Montag & Caldwell Growth1 | | | 0.92% | |
| |
River Road Dividend All Cap Value | | | 0.99% | |
| |
River Road Dividend All Cap Value II | | | 0.99% | |
| |
Fairpointe Mid Cap1 | | | 0.82% | |
| |
LMCG Small Cap Growth | | | 1.03% | |
| |
River RoadSmall-Mid Cap Value | | | 1.04% | |
| |
River Road Small Cap Value | | | N/A | |
| |
Silvercrest Small Cap | | | 1.08% | |
| |
DoubleLine Core Plus Bond | | | 0.61% | |
| |
River Road Long-Short | | | 1.12% | |
| |
Pictet International | | | 0.98% | |
| 1 | Prior to August 1, 2019, Montag & Caldwell Growth and Fairpointe Mid Cap did not have an expense cap. |
The contractual expense limitation may only be terminated in the event the Investment Manager or a successor ceases to be the investment manager of the Fund or a successor fund, by mutual agreement between the Investment Manager and the Board, or in the event of the Fund’s liquidation unless the Fund is reorganized or is a party to a merger in which the surviving entity is successor to the accounting and performance information of the Fund.
In general, for a period of up to 36 months, the Investment Manager may recover from each Fund fees waived and expenses paid pursuant to this contractual agreement, provided that such repayment would not cause the Fund’s total annual operating expenses after fee waiver and expense reimbursements (exclusive of the items noted in the parenthetical above) to exceed the contractual expense limitation amount.
At October 31, 2019, each Fund’s expiration of recoupment are as follows:
| | | | | | | | | | | | |
Expiration
Period | | Fairpointe ESG
Equity | | | River Road
Focused Absolute
Value | | | LMCG Small
Cap Growth | |
| | | |
Less than 1 year | | | $46,791 | | | | $81,771 | | | | — | |
| | | |
1-2 years | | | 85,192 | | | | 86,585 | | | | $138,373 | |
| | | |
2-3 years | | | 87,493 | | | | 166,409 | | | | 140,019 | |
| | | | | | | | | | | | |
| | | |
Total | | | $219,476 | | | | $334,765 | | | | $278,392 | |
| | | | | | | | | | | | |
| | | | | | | | | | | | |
| | | |
Expiration
Period | | River Road
Small-Mid Cap
Value | | | Silvercrest
Small Cap | | | DoubleLine
Core Plus
Bond | |
| | | |
1-2 years | | | $7,839 | | | | $97,719 | | | | $340,790 | |
| | | |
2-3 years | | | 20,606 | | | | 126,590 | | | | 345,605 | |
| | | | | | | | | | | | |
| | | |
Total | | | $28,445 | | | | $224,309 | | | | $686,395 | |
| | | | | | | | | | | | |
| | | | |
Expiration
Period | | River Road
Long-Short | |
| |
1-2 years | | | $90,974 | |
| |
2-3 years | | | 105,218 | |
| | | | |
| |
Total | | | $196,192 | |
| | | | |
The Trust, on behalf of the Funds, has entered into an amended and restated Administration Agreement under which the Investment Manager serves as the Funds’ administrator (the “Administrator”) and is responsible for allnon-portfolio management aspects of managing the Funds’ operations, including administration and shareholder services to each Fund. Each Fund pays a fee to the Administrator at the rate of 0.15% per annum of the Fund’s average daily net assets for this service.
The Funds are distributed by AMG Distributors, Inc. (the “Distributor”), a wholly-owned subsidiary of the Investment Manager. The Distributor serves as the distributor and underwriter for each Fund and is a registered broker-dealer and member of the Financial Industry Regulatory Authority, Inc. (“FINRA”). Shares of each Fund will be continuously offered and will be sold directly to prospective purchasers and through brokers, dealers or other financial intermediaries who have executed selling agreements with the Distributor. Generally the Distributor bears all or a portion of the expenses of providing services pursuant to the distribution agreement, including the payment of the expenses relating to the distribution of prospectuses for sales purposes and any advertising or sales literature.
The Trust has adopted a distribution and service plan (the “Plan”) with respect to the Class N and Class R shares, in accordance with the requirements of Rule12b-1 under the 1940 Act and the requirements of the applicable rules of FINRA regarding asset based sales charges. Pursuant to the Plan, each Fund may make payments to the Distributor for its expenditures in financing any activity primarily intended to result in the sale of each such class of the Fund’s shares and for maintenance and personal service provided to existing shareholders of that class. The Plan authorizes payments to the Distributor of up to 0.25% and 0.50% annually of each Fund’s average daily net assets attributable to the Class N and Class R shares, respectively.
The impact on the annualized expense ratios for the fiscal year ended October 31, 2019, were as follows:
| | | | |
| Fund | | Actual Amount Incurred | |
| |
Fairpointe ESG Equity | | | | |
| |
Class N | | | 0.22 | % |
| |
River Road Focused Absolute Value | | | | |
| |
Class N | | | 0.25 | % |
| |
Montag & Caldwell Growth | | | | |
| |
Class N | | | 0.18 | % |
| |
Class R1 | | | 0.50 | % |
| |
River Road Dividend All Cap Value | | | | |
| |
Class N | | | 0.25 | % |
| |
River Road Dividend All Cap Value II | | | | |
| |
Class N | | | 0.24 | % |
167
|
Notes to Financial Statements(continued) |
| | | | |
| Fund | | Actual Amount Incurred �� | |
|
Fairpointe Mid Cap | |
| |
Class N | | | 0.25% | |
|
LMCG Small Cap Growth | |
| |
Class N | | | 0.20% | |
|
River Road Small-Mid Cap Value | |
| |
Class N | | | 0.24% | |
|
River Road Small Cap Value | |
| |
Class N | | | 0.25% | |
|
Silvercrest Small Cap | |
| |
Class N | | | 0.25% | |
|
DoubleLine Core Plus Bond | |
| |
Class N | | | 0.25% | |
|
River Road Long-Short | |
| |
Class N | | | 0.25% | |
|
Pictet International | |
| |
Class N | | | 0.25% | |
|
1 Effective May 31, 2019 Class R shares converted to Class N shares. | |
The Plan further provides for periodic payments by the Trust or the Distributor to brokers, dealers and other financial intermediaries for providing shareholder services and for promotional and other sales related costs. The portion of payments made under the plan by Class N and R shares of Montag & Caldwell Growth for shareholder servicing may not exceed an annual rate of 0.25% of the average daily net asset value of Class R shares of that class owned by clients of such broker, dealer or financial intermediary.
For each of the Class N, Class I and Class R shares, the Board has approved reimbursement payments to the Investment Manager for shareholder servicing expenses (“shareholder servicing fees”) incurred. Shareholder servicing fees include payments to financial intermediaries such as broker-dealers (including fund supermarket platforms), banks, and trust companies who provide shareholder recordkeeping, account servicing and other services. The Class N, Class I and Class R shares may reimburse the Investment Manager for the actual amount incurred up to a maximum annual rate of 0.15% of each respective Class’s average daily net assets as shown in the table below.
The Investment Manager has agreed, through at least October 1, 2020, to waive a portion of shareholder servicing fees paid by the various share classes of each Fund, as necessary, to ensure the total net expense ratio for each share class of each Fund does not increase due to the changes in the methodology of shareholder servicing reimbursements described above.
The impact on the annualized expense ratios for the fiscal year ended October 31, 2019, were as follows:
| | | | |
| Fund | | Actual
Amount
Incurred | |
| |
Fairpointe ESG Equity | | | | |
| |
Class N | | | 0.08% | |
| |
Class I | | | 0.08% | |
| |
River Road Focused Absolute Value | | | | |
| |
Class N | | | 0.04% | |
| |
Class I | | | 0.04% | |
| |
Montag & Caldwell Growth | | | | |
| |
Class N | | | 0.07% | |
| |
Class I | | | 0.07% | |
| |
Class R | | | 0.07% | |
| |
River Road Dividend All Cap Value | | | | |
| |
Class N | | | 0.07% | |
| |
Class I | | | 0.05% | |
| |
River Road Dividend All Cap Value II | | | | |
| |
Class N | | | 0.11% | |
| |
Class I | | | 0.07% | |
| |
Fairpointe Mid Cap | | | | |
| |
Class N | | | 0.08% | |
| |
Class I | | | 0.08% | |
| |
LMCG Small Cap Growth | | | | |
| |
Class N | | | 0.07% | |
| |
Class I | | | 0.07% | |
| |
River RoadSmall-Mid Cap Value | | | | |
| |
Class N | | | 0.06% | |
| |
Class I | | | 0.05% | |
| |
River Road Small Cap Value | | | | |
| |
Class N | | | 0.10% | |
| |
Class I | | | 0.08% | |
| |
Silvercrest Small Cap | | | | |
| |
Class N | | | 0.07% | |
| |
Class I | | | 0.07% | |
| |
DoubleLine Core Plus Bond | | | | |
| |
Class N | | | 0.08% | |
| |
Class I | | | 0.08% | |
| |
River Road Long-Short | | | | |
| |
Class N | | | 0.08% | |
| |
Class I | | | 0.08% | |
168
|
Notes to Financial Statements(continued) |
| | | | |
| Fund | | Actual
Amount Incurred | |
| |
Pictet International | | | | |
| |
Class N | | | 0.11% | |
| |
Class I | | | 0.11% | |
The Board provides supervision of the affairs of the Trust and other trusts within the AMG Funds family. The Trustees of the Trust who are not affiliated with the Investment Manager receive an annual retainer and per meeting fees for regular, special and telephonic meetings, and they are reimbursed forout-of-pocket expenses incurred while carrying out their duties as Board members. The Chairman of the Board and the Audit Committee Chair receive additional annual retainers. Certain Trustees and Officers of the Funds are Officers and/or Directors of the Investment Manager, AMG and/or the Distributor.
The Securities and Exchange Commission (the “SEC”) granted an exemptive order that permits Fairpointe ESG Equity, River Road Focused Absolute Value, River Road Dividend All Cap Value II, Silvercrest Small Cap, River Road Long-Short and Pictet International to lend money for certain temporary purposes directly to other eligible funds in the AMG Funds family. Participation in this interfund lending program is voluntary for the lending funds, and an interfund loan is only made if it benefits each participating fund. The Administrator manages the program according to procedures approved by the Board, and the Board monitors the operation of the program. An interfund loan must comply with certain conditions set out in the exemptive order, which are designed to assure fairness and protect all participating funds. For the fiscal year ended October 31, 2019, Silvercrest Small Cap lent a maximum of $237,737 for five days earning interest of $71. The interest earned is included on the Statement of Operations as interest income. Fairpointe ESG Equity, River Road Focused Absolute Value, River Road Dividend All Cap Value II, River Road Long-Short and Pictet International did not loan to other funds in the AMG Funds family. At October 31, 2019, the Funds had no interfund loans outstanding.
3. PURCHASES AND SALES OF SECURITIES
Purchases and sales of securities (excluding short-term securities and U.S. Government Obligations) for the fiscal year ended October 31, 2019, were as follows:
| | | | | | | | |
| | | Long Term Securities | |
| | |
| Fund | | Purchases | | | Sales | |
| | |
Fairpointe ESG Equity | | | $5,804,802 | | | | $4,790,549 | |
| | |
River Road Focused Absolute Value | | | 146,470,954 | | | | 45,660,999 | |
| | |
Montag & Caldwell Growth | | | 100,443,181 | | | | 267,680,219 | |
| | |
River Road Dividend All Cap Value | | | 208,365,075 | | | | 484,387,201 | |
| | |
River Road Dividend All Cap Value II | | | 23,411,169 | | | | 50,402,234 | |
| | |
Fairpointe Mid Cap | | | 460,667,835 | | | | 1,690,774,990 | |
| | |
LMCG Small Cap Growth | | | 108,329,005 | | | | 162,208,426 | |
| | |
River RoadSmall-Mid Cap Value | | | 122,972,889 | | | | 35,621,463 | |
| | |
River Road Small Cap Value | | | 184,085,866 | | | | 148,855,604 | |
| | |
Silvercrest Small Cap | | | 44,734,622 | | | | 71,423,867 | |
| | | | | | | | |
| | | Long Term Securities | |
| | |
| Fund | | Purchases | | | Sales | |
| | |
DoubleLine Core Plus Bond | | $ | 170,105,654 | | | | $133,822,464 | |
| | |
River Road Long-Short | | | 98,933,094 | | | | 92,323,454 | |
| | |
Pictet International | | | 194,838,031 | | | | 1,477,987,191 | |
Purchases and sales of U.S. Government Obligations for the fiscal year ended October 31, 2019 were as follows:
| | | | | | | | |
| | | U.S. Government Obligations | |
| | |
| Fund | | Purchases | | | Sales | |
| | |
DoubleLine Core Plus Bond | | | $168,221,636 | | | | $145,487,394 | |
4. PORTFOLIO SECURITIES LOANED
The Funds participate in the Program providing for the lending of securities to qualified borrowers. Securities lending income includes earnings of such temporary cash investments, plus or minus any rebate to a borrower. These earnings (after any rebate) are then divided between BNYM, as a fee for its services under the Program, and the Funds, according to agreed-upon rates. Collateral on all securities loaned is accepted in cash or U.S. Government and Agency Obligations. Collateral is maintained at a minimum level of 102% (105% in the case of certain foreign securities) of the market value, plus interest, if applicable, of investments on loan. It is the Funds’ policy to obtain additional collateral from or return excess collateral to the borrower by the end of the next business day, following the valuation date of the securities loaned. Therefore, the value of the collateral held may be temporarily less than the value of the securities on loan. Lending securities entails a risk of loss to the Funds if and to the extent that the market value of the securities loaned were to increase and the borrower did not increase the collateral accordingly, and the borrower fails to return the securities. Under the terms of the Program, the Funds are indemnified for such losses by BNYM. Cash collateral is held in separate omnibus accounts managed by BNYM, who is authorized to exclusively enter into joint repurchase agreements for that cash collateral. Securities collateral is held in separate omnibus accounts managed by BNYM that cannot be sold or pledged. BNYM bears the risk of any deficiency in the amount of the cash collateral available for return to the borrower due to any loss on the collateral invested.
The value of securities loaned on positions held, and cash and securities collateral received at October 31, 2019, were as follows:
| | | | | | | | | | | | | | | | |
| Fund | | Securities
Loaned | | | Cash
Collateral
Received | | | Securities
Collateral
Received | | | Total
Collateral
Received | |
| | | | |
River Road Focused Absolute Value | | | $14,351,760 | | | | — | | | | $15,055,980 | | | | $15,055,980 | |
| | | | |
Montag & Caldwell Growth | | | 3,674,230 | | | | — | | | | 3,753,903 | | | | 3,753,903 | |
| | | | |
River Road Dividend All Cap Value | | | 95,829,561 | | | | $11,684,694 | | | | 87,468,529 | | | | 99,153,223 | |
| | | | |
River Road Dividend All Cap Value II | | | 11,218,792 | | | | 1,316,687 | | | | 10,299,743 | | | | 11,616,430 | |
| | | | |
LMCG Small Cap Growth | | | 6,133,357 | | | | 849,584 | | | | 5,473,503 | | | | 6,323,087 | |
169
|
Notes to Financial Statements(continued) |
| | | | | | | | | | | | | | | | |
| Fund | | Securities
Loaned | | | Cash
Collateral
Received | | | Securities
Collateral
Received | | | Total
Collateral
Received | |
| | | | |
River RoadSmall-Mid Cap Value | | | 21,932,208 | | | | — | | | | $22,467,564 | | | | $22,467,564 | |
| | | | |
River Road Small Cap Value | | | 46,261,890 | | | | $1,039,716 | | | | 45,763,238 | | | | 46,802,954 | |
| | | | |
Silvercrest Small Cap | | | 36,337,666 | | | | — | | | | 37,589,196 | | | | 37,589,196 | |
| | | | |
DoubleLine Core Plus Bond | | | 6,202,046 | | | | 6,806,448 | | | | 237,233 | | | | 7,043,681 | |
| | | | |
Pictet International | | | 5,603,327 | | | | 5,908,337 | | | | — | | | | 5,908,337 | |
The following table summarizes the securities received as collateral for securities lending at October 31, 2019:
| | | | | | |
| Fund | | Collateral
Type | | Coupon
Range | | Maturity
Date Range |
| | | |
River Road Focused Absolute Value | | U.S. Treasury
Obligations | | 0.000%-8.750% | | 11/15/19-02/15/49 |
| | | |
Montag & Caldwell Growth | | U.S. Treasury
Obligations | | 0.010%-3.625% | | 04/15/20-05/15/47 |
| | | |
River Road Dividend All Cap Value | | U.S. Treasury
Obligations | | 0.000%-8.750% | | 11/15/19-02/15/49 |
| | | |
River Road Dividend All Cap Value II | | U.S. Treasury
Obligations | | 0.000%-8.750% | | 11/15/19-02/15/49 |
| | | |
LMCG Small Cap Growth | | U.S. Treasury
Obligations | | 0.000%-8.750% | | 11/15/19-02/15/49 |
| | | |
River RoadSmall-Mid Cap Value | | U.S. Treasury
Obligations | | 0.000%-8.750% | | 11/15/19-02/15/49 |
| | | |
River Road Small Cap Value | | U.S. Treasury
Obligations | | 0.000%-8.750% | | 11/15/19-02/15/49 |
| | | |
Silvercrest Small Cap | | U.S. Treasury
Obligations | | 0.000%-8.750% | | 11/14/19-02/15/49 |
| | | |
DoubleLine Core Plus Bond | | U.S. Treasury
Obligations | | 0.000%-8.750% | | 11/15/19-05/15/48 |
5. FOREIGN SECURITIES
Certain Funds invest in securities of foreign entities and in instruments denominated in foreign currencies which involve risks not typically associated with investments in domestic securities.Non-domestic securities carry special risks, such as exposure to currency fluctuations, less developed or less efficient trading markets, political instability, a lack of company information, differing auditing and legal standards, and, potentially, less liquidity. A Fund’s investments in emerging market countries are exposed to additional risks. A Fund’s performance will be influenced by political, social and economic factors affecting companies in emerging market countries. Emerging market countries generally have economic structures that are less diverse and mature, and political systems that are less stable, than those of developed countries. Realized gains in certain countries may be subject to foreign taxes at the Fund level and would pay such foreign taxes at the appropriate rate for each jurisdiction.
6. COMMITMENTS AND CONTINGENCIES
Under the Trust’s organizational documents, its trustees and officers are indemnified against certain liabilities arising out of the performance of their duties to the Trust. In addition, in the normal course of business, the Funds may enter into contracts and agreements that contain a variety of representations and warranties, which provide general indemnifications. The maximum exposure to the Funds under these arrangements is unknown, as this would involve future claims that may be made against a Fund that have not yet occurred. However, based on experience, the Funds had no prior claims or losses and expect the risks of loss to be remote.
7. RISKS ASSOCIATED WITH HIGH YIELD SECURITIES
Investing in high yield securities involves greater risks and considerations not typically associated with U.S. Government and other high quality/investment grade securities. High yield securities are generally below investment grade securities and do not have an established retail secondary market. Economic downturns may disrupt the high yield market and impair the issuer’s ability to repay principal and interest. Also, an increase in interest rates would likely have an adverse impact on the value of such obligations and could cause the securities to become less liquid.
8. MORTGAGE-BACKED SECURITIES
DoubleLine Core Plus Bond may invest in mortgage-backed securities (“MBS”). These securities represent interests in pools of mortgage loans and they provide holders with payments consisting of both principal and interest as the mortgages in the underlying mortgage pools are paid. The timely payment of principal and interest on MBS issued or guaranteed by Ginnie Mae is backed by Ginnie Mae and the full faith and credit of the U.S. government. MBS issued by U.S. government agencies or instrumentalities other than Ginnie Mae are not full faith and credit obligations of the U.S. government. Certain obligations, such as those issued by the Federal Home Loan Banks, Fannie Mae and Freddie Mac are supported only by the credit of the issuer. MBS issued by private issuers are not government securities and are not guaranteed by any government agency. They are secured by the underlying collateral of the private issuer. Yields on privately issued MBS tend to be higher than those of government-backed issues. However, risk of loss due to default and sensitivity to interest rate fluctuations are also higher. DoubleLine Core Plus Bond may also invest in collateralized mortgage obligations (“CMOs”), collateralized loan obligations (“CLOs”) and real estate mortgage investment conduits (“REMICs”). A CMO and/or REMIC is a bond that is collateralized by a pool of MBS. A CLO is a bond that is collateralized by a financial institution’s receivables from loans. These MBS pools are divided into classes with each class having its own characteristics. The different classes are retired in sequence as the underlying mortgages or loans are repaid.
9. FLOATING RATE SENIOR LOAN INTERESTS
Doubleline Core Plus Bond may invest in Floating Rate Senior Loan Interests. These are senior, secured loans made to companies whose debt is below investment grade as well as investments with similar economic characteristics. Senior Loans typically hold a first lien priority and, unless otherwise indicated, are required to pay interest at floating rates that are periodically reset by reference to a base lending rate plus a spread. In some instances, the rates shown represent the weighted average rate as of October 31, 2019. Senior Loans are generally not registered under the Securities Act of 1933 and often incorporate certain
170
|
Notes to Financial Statements(continued) |
restrictions on resale and cannot be sold publicly. Senior Loans often require prepayments from excess cash flow or permit the borrower to repay at its election. The degree to which borrowers repay, whether as a contractual requirement or at their election, cannot be predicted. As a result, the actual maturity may be substantially less than the stated maturity. The interest rate on this Senior Loan is subject to a base lending rate plus a spread. These base lending rates are primarily the London Interbank Offered Rate (“LIBOR”) and secondarily the prime rate offered by one or more major U.S. banks (“Prime”). The interest rate is subject to a minimum floor, which may be less than or greater than the prevailing period end LIBOR/Prime rate.
10. STRIPPED SECURITIES
DoubleLine Core Plus Bond may invest in stripped securities (“STRIPS”) for hedging purposes to protect the Fund’s portfolio against interest rate fluctuations. Interest-only STRIPS will most likely move differently than typical fixed-income securities in relation to changes in interest rates. STRIPS are usually structured with two classes that receive different proportions of the interest and principal distributions from a pool of underlying assets. A common type of STRIP will have one class receiving all of the interest from the underlying assets (“interest-only” or “IO” class), while the other class will receive the entire principal (“principal only” or “PO” class). However, in some instances, one class will receive some of the interest and most of the principal while the other class will receive most of the interest and the remainder of the principal. STRIPS are unusually volatile in response to changes in interest rates. The yield to maturity on an IO class of STRIPS is extremely sensitive not only to changes in prevailing interest rates but also to the rate of principal payments (including prepayments) on the underlying assets. A rapid rate of principal prepayments may have a measurably adverse effect on a Funds’ yield to maturity to the extent it invests in IOs. Conversely, POs tend to increase in value if prepayments are greater than anticipated and decline if prepayments are slower than anticipated. Thus, if the underlying assets experience greater than anticipated repayments of principal, a Fund may fail to fully recover its initial investment in these securities, even if the STRIPS were rated of the highest credit quality by Standard & Poor’s Corporation or Moody’s Investors Service, Inc. These risks are managed by investing in a variety of such securities and by using certain hedging techniques. In addition the secondary market for STRIPS may be less liquid than that of other mortgage-backed or asset-backed securities, potentially limiting the Fund’s ability to buy or sell those securities at any particular time.
11. SECURITIES SOLD SHORT
River Road Long-Short utilizes short sales as part of its overall portfolio management strategy. A short sale involves the sale of a security that is borrowed from a broker or other financial institution. A gain, limited to the price at which the Fund sold the security short, or a loss, unlimited in size, will be recognized upon closing a short sale. Short sales expose the Fund to the risk that it will be required to acquire, convert or exchange securities to replace the borrowed securities at a time when the securities sold short have appreciated in value, thus resulting in a loss to the Fund. The Fund must segregate liquid assets, or otherwise cover its position in a permissible manner. The Investment Manager determines the liquidity of assets, in accordance with procedures established by the Board. The Fund has entered into a Master Securities Loan Agreement (“MSLA”) with BNYM pursuant to which the Fund borrows securities from BNYM to facilitate short sale transactions. The Fund is required to pledge collateral, in cash and/or securities, to collateralize the Fund’s obligations to BNYM in respect of borrowed securities. The MSLA provides the right, in the event of default (including bankruptcy or
insolvency) for thenon-defaulting party to liquidate the collateral and calculate net exposure to the defaulting party. The Fund is subject to credit risk should BNYM be unable to meet its obligations to the Fund, including the obligation to return cash collateral to the Fund. For financial reporting purposes, the Fund does not offset financial assets and financial liabilities that are subject to the MSLA in the Statement of Assets and Liabilities, and security positions segregated as collateral for short sales are included in investments at value in the Statement of Assets and Liabilities. As of October 31, 2019, the value of securities sold short was $7,779,619, and the Fund had $8,041,931 of cash deposited with BNYM and securities segregated as collateral worth $2,420,276. In accordance with the terms of its MSLA, the Fund may receive rebate income or be charged a fee on the market value on the collateral of loaned securities. The income received or fee paid is calculated based upon a variable rate minus a spread. The Fund will recognize interest income if the variable rate is greater than the spread or interest expense if the variable rate is less than the spread. For the fiscal year ended October 31, 2019, the Fund had interest income and dividend expense in the amount of $136,225 and $236,202, respectively.
12. CREDIT AGREEMENT
Effective July 6, 2010, and as amended July 24, 2019, the Trust entered into a Credit Agreement with BNYM which provides the Trust with a revolving line of credit facility of up to $50 million. The facility is shared by each Fund of the Trust and is available for temporary, emergency purposes including liquidity needs in meeting redemptions. The interest rate on outstanding Alternate Base Rate Loans is equal to the greater of the Prime Rate plus 1.25%, or 0.50% plus the Federal Funds Effective Rate plus 1.25%. The interest rate on outstanding Overnight Loans is equal to the greater of the Federal Funds Effective Rate plus 1.25%, or theOne-Month LIBOR Rate plus 1.25%. The Trust pays a commitment fee on the unutilized commitment amount of 0.175% per annum, which is allocated to the Funds based on average daily net assets and included in miscellaneous expense on the Statement of Operations. The Funds listed below utilized the line of credit during the fiscal year ended October 31, 2019. The interest expense amount is included in the Statement of Operations as interest expense. At October 31, 2019, the Funds had no loans outstanding, except for LMCG Small Cap Growth which had a loan outstanding in the amount of $2,719,390.
The following Funds utilized the line of credit during the fiscal year ended October 31, 2019:
| | | | | | | | | | | | |
| Fund | | Maximum
Amount
Borrowed | | | Number
of Days | | | Interest
Paid | |
| | | |
River Road Focused Absolute Value | | | $2,812,429 | | | | 2 | | | | $513 | |
| | | |
Montag & Caldwell Growth | | | 5,079,710 | | | | 5 | | | | 1,609 | |
| | | |
River Road Dividend All Cap Value | | | 50,000,000 | | | | 18 | | | | 31,457 | |
| | | |
River Road Dividend All Cap Value II | | | 2,855,275 | | | | 16 | | | | 2,446 | |
| | | |
Fairpointe Mid Cap | | | 21,818,628 | | | | 16 | | | | 12,309 | |
| | | |
LMCG Small Cap Growth | | | 11,505,739 | | | | 14 | | | | 5,357 | |
| | | |
River RoadSmall-Mid Cap Value | | | 3,799,855 | | | | 3 | | | | 1,096 | |
| | | |
Silvercrest Small Cap | | | 2,429,131 | | | | 7 | | | | 912 | |
| | | |
River Road Long-Short | | | 1,072,272 | | | | 5 | | | | 321 | |
| | | |
Pictet International | | | 46,880,140 | | | | 82 | | | | 99,493 | |
171
|
Notes to Financial Statements(continued) |
13. MASTER NETTING AGREEMENTS
The Funds may enter into master netting agreements with their counterparties for the securities lending, short-sale programs and Repurchase Agreements, which provide the right, in the event of default (including bankruptcy or insolvency) for thenon-defaulting party to liquidate the collateral and calculate net exposure to the defaulting party or request additional collateral. For financial reporting purposes, the Funds do not offset financial assets and financial liabilities that are subject to master netting agreements in the Statement of Assets and Liabilities. For securities lending and short sale transactions, see Note 4 and Note 11, respectively.
The following table is a summary of the Funds’ open Repurchase Agreements that are subject to a master netting agreement as of October 31, 2019:
| | | | | | | | | | | | | | | | | | | | |
| | | | | | Gross Amount Not Offset in the
Statement of Assets and Liabilities | | | | | | | |
| | | | | |
| Fund | | Gross Amounts of
Assets Presented in
the Statement of
Assets and Liabilities | | | Offset Amount | | | Net Asset Balance | | | Collateral Received | | | Net Amount | |
| | | | |
River Road Dividend All Cap Value | | | | | | | | | | | | | | | | | |
| | | | | |
Cantor Fitzgerald Securities, Inc. | | | $2,775,263 | | | | — | | | | $2,775,263 | | | | $2,775,263 | | | | — | |
| | | | | |
Citigroup Global Markets, Inc. | | | 2,775,263 | | | | — | | | | 2,775,263 | | | | 2,775,263 | | | | — | |
| | | | | |
Credit Suisse AG | | | 583,642 | | | | — | | | | 583,642 | | | | 583,642 | | | | — | |
| | | | | |
Daiwa Capital Markets America | | | 2,775,263 | | | | — | | | | 2,775,263 | | | | 2,775,263 | | | | — | |
| | | | | |
Guggenheim Securities LLC | | | 2,775,263 | | | | — | | | | 2,775,263 | | | | 2,775,263 | | | | — | |
| | | | | | | | | | | | | | | | | | | | |
| | | | | |
Total | | | $11,684,694 | | | | — | | | | $11,684,694 | | | | $11,684,694 | | | | — | |
| | | | | | | | | | | | | | | | | | | | |
| | | | |
River Road Dividend All Cap Value II | | | | | | | | | | | | | | | | | |
| | | | | |
Credit Suisse AG | | | $316,687 | | | | — | | | | $316,687 | | | | $316,687 | | | | — | |
| | | | | |
Guggenheim Securities LLC | | | 1,000,000 | | | | — | | | | 1,000,000 | | | | 1,000,000 | | | | — | |
| | | | | | | | | | | | | | | | | | | | |
| | | | | |
Total | | | $1,316,687 | | | | — | | | | $1,316,687 | | | | $1,316,687 | | | | — | |
| | | | | | | | | | | | | | | | | | | | |
| | | | | |
LMCG Small Cap Growth | | | | | | | | | | | | | | | | | | | | |
| | | | | |
Industrial and Commercial Bank of China Financial Services LLC | | | $849,584 | | | | — | | | | $849,584 | | | | $849,584 | | | | — | |
| | | | |
River Road Small Cap Value | | | | | | | | | | | | | | | | | |
| | | | | |
Bank of America Securities, Inc. | | | $39,716 | | | | — | | | | $39,716 | | | | $39,716 | | | | — | |
| | | | | |
Guggenheim Securities LLC, | | | 1,000,000 | | | | — | | | | 1,000,000 | | | | 1,000,000 | | | | — | |
| | | | | | | | | | | | | | | | | | | | |
| | | | | |
Total | | | $1,039,716 | | | | — | | | | $1,039,716 | | | | $1,039,716 | | | | — | |
| | | | | | | | | | | | | | | | | | | | |
| | | | |
DoubleLine Core Plus Bond | | | | | | | | | | | | | | | | | |
| | | | | |
Cantor Fitzgerald Securities, Inc. | | | $1,616,616 | | | | — | | | | $1,616,616 | | | | $1,616,616 | | | | — | |
| | | | | |
Citigroup Global Markets, Inc. | | | 1,616,616 | | | | — | | | | 1,616,616 | | | | 1,616,616 | | | | — | |
| | | | | |
Credit Suisse AG | | | 339,984 | | | | — | | | | 339,984 | | | | 339,984 | | | | — | |
| | | | | |
Daiwa Capital Markets America | | | 1,616,616 | | | | — | | | | 1,616,616 | | | | 1,616,616 | | | | — | |
| | | | | |
Guggenheim Securities LLC | | | 1,616,616 | | | | — | | | | 1,616,616 | | | | 1,616,616 | | | | — | |
| | | | | | | | | | | | | | | | | | | | |
| | | | | |
Total | | | $6,806,448 | | | | — | | | | $6,806,448 | | | | $6,806,448 | | | | — | |
| | | | | | | | | | | | | | | | | | | | |
172
|
Notes to Financial Statements(continued) |
| | | | | | | | | | | | | | | | | | | | |
| | | | | | Gross Amount Not Offset in the
Statement of Assets and Liabilities | | | | | | | |
| | | | | |
| Fund | | Gross Amounts of
Assets Presented in
the Statement of
Assets and Liabilities | | | Offset Amount | | | Net Asset Balance | | | Collateral Received | | | Net Amount | |
| | | | | |
Pictet International | | | | | | | | | | | | | | | | | | | | |
| | | | | |
Cantor Fitzgerald Securities, Inc. | | | $1,403,294 | | | | — | | | | $1,403,294 | | | | $1,403,294 | | | | — | |
| | | | | |
Citigroup Global Markets, Inc. | | | 1,403,294 | | | | — | | | | 1,403,294 | | | | 1,403,294 | | | | — | |
| | | | | |
Credit Suisse AG | | | 295,161 | | | | — | | | | 295,161 | | | | 295,161 | | | | — | |
| | | | | |
Daiwa Capital Markets America | | | 1,403,294 | | | | — | | | | 1,403,294 | | | | 1,403,294 | | | | — | |
| | | | | |
Guggenheim Securities LLC | | | 1,403,294 | | | | — | | | | 1,403,294 | | | | 1,403,294 | | | | — | |
| | | | | | | | | | | | | | | | | | | | |
| | | | | |
Total | | | $5,908,337 | | | | — | | | | $5,908,337 | | | | $5,908,337 | | | | — | |
| | | | | | | | | | | | | | | | | | | | |
14. SUBSEQUENT EVENTS
The Funds have determined that no other material events or transactions occurred through the issuance date of the Funds’ financial statements, which require an additional disclosure in or adjustment of the Funds’ financial statements, except for effective January 1, 2020 (the “Implementation Date”), the management fee and
the expense cap for the Pictet International will be reduced from 0.70% to 0.67% and 0.98% to 0.89%, respectively. The expense cap will be in existence through at least March 1, 2021. Also effective on the Implementation Date, the maximum amount of shareholder servicing fees incurred for Class I shares of the Pictet International will decrease from 0.15% to 0.10%.
173
|
Report of Independent Registered Public Accounting Firm |
To the Board of Trustees of AMG Funds IV and Shareholders of AMG Managers Fairpointe ESG Equity Fund, AMG River Road Focused Absolute Value Fund, AMG Managers Montag & Caldwell Growth Fund, AMG River Road Dividend All Cap Value Fund, AMG River Road Dividend All Cap Value Fund II, AMG Managers Fairpointe Mid Cap Fund, AMG Managers LMCG Small Cap Growth Fund, AMG River RoadSmall-Mid Cap Value Fund, AMG River Road Small Cap Value Fund, AMG Managers Silvercrest Small Cap Fund, AMG Managers DoubleLine Core Plus Bond Fund, AMG River Road Long-Short Fund, and AMG Managers Pictet International Fund:
OPINIONS ON THE FINANCIAL STATEMENTS
We have audited the accompanying statements of assets and liabilities, including the schedules of portfolio investments, of AMG Funds IV and Shareholders of AMG Managers Fairpointe ESG Equity Fund, AMG River Road Focused Absolute Value Fund, AMG Managers Montag & Caldwell Growth Fund, AMG River Road Dividend All Cap Value Fund, AMG River Road Dividend All Cap Value Fund II, AMG Managers Fairpointe Mid Cap Fund, AMG Managers LMCG Small Cap Growth Fund, AMG River RoadSmall-Mid Cap Value Fund, AMG River Road Small Cap Value Fund, AMG Managers Silvercrest Small Cap Fund, AMG Managers DoubleLine Core Plus Bond Fund, AMG River Road Long-Short Fund, and AMG Managers Pictet International Fund (constituting AMG Funds IV, hereafter collectively referred to as the “Funds”) as of October 31, 2019, the related statements of operations for the year ended October 31, 2019, the statements of changes in net assets for each of the two years in the period ended October 31, 2019, including the related notes, and the financial highlights for each of the periods indicated therein (collectively referred to as the “financial statements”). In our opinion, the financial statements present fairly, in all material respects, the financial position of each of the Funds as of October 31, 2019, the results of each of their operations for the year then ended, the changes in each of their net assets for each of the two years in the period ended October 31, 2019 and each of the financial highlights for each of the periods indicated therein in conformity with accounting principles generally accepted in the United States of America.
BASIS FOR OPINIONS
These financial statements are the responsibility of the Funds’ management. Our responsibility is to express an opinion on the Funds’ financial statements based on our audits. We are a public accounting firm registered with the Public Company Accounting Oversight Board (United States) (“PCAOB”) and are required to be independent with respect to the Funds in accordance with the U.S. federal securities laws and the applicable rules and regulations of the Securities and Exchange Commission and the PCAOB.
We conducted our audits of these financial statements in accordance with the standards of the PCAOB. Those standards require that we plan and perform the audit to obtain reasonable assurance about whether the financial statements are free of material misstatement, whether due to error or fraud.
Our audits included performing procedures to assess the risks of material misstatement of the financial statements, whether due to error or fraud, and performing procedures that respond to those risks. Such procedures included examining, on a test basis, evidence regarding the amounts and disclosures in the financial statements. Our audits also included evaluating the accounting principles used and significant estimates made by management, as well as evaluating the overall presentation of the financial statements. Our procedures included confirmation of securities owned as of October 31, 2019 by correspondence with the custodian, transfer agent, agent banks, and brokers; when replies were not received from brokers, we performed other auditing procedures. We believe that our audits provide a reasonable basis for our opinions. The financial highlights for the period ended October 31, 2015 for the Funds were audited by another independent registered public accounting firm whose report dated December 22, 2015 expressed an unqualified opinion on those financial highlights.
PricewaterhouseCoopers LLP
Boston, Massachusetts
December 27, 2019
We have served as the auditor of one or more investment companies in the AMG Funds Family since 1993.
174
|
Other Information(unaudited) |
TAX INFORMATION (unaudited)
The Funds each hereby designate the maximum amount allowable of its net taxable income as qualified dividends as provided in the Jobs and Growth Tax Relief Reconciliation Act of 2003. The 2016/2017 Form1099-DIV you receive for each Fund will show the tax status of all distributions paid to you during the year.
In accordance with federal tax law, the following Fund elect to provide foreign taxes paid and the income sourced from foreign countries. Accordingly, the Fund hereby makes the following designations regarding its taxable period ended October 31, 2019:
AMG Managers Pictet International Fund
uThe total amount of taxes paid and income sourced from foreign countries was $1,209,274 and $15,480,196, respectively.
Pursuant to section 852 of the Internal Revenue Code, the Funds each hereby designates as a capital gain distribution with respect to the taxable period ended October 31, 2019, or if subsequently determined to be different, the net capital gains of such period as follows:
| | | | |
| Fund | | Amount | |
| |
River Road Focused Absolute Value | | | $462,421 | |
| |
Montag & Caldwell Growth | | | 100,207,255 | |
| |
River Road Dividend All Cap Value | | | 51,225,258 | |
| |
River Road Dividend All Cap Value II | | | 8,864,692 | |
| |
Fairpointe Mid Cap | | | 265,761,574 | |
| |
River RoadSmall-Mid Cap Value | | | 2,991,892 | |
| | | | |
| Fund | | Amount | |
| |
River Road Small Cap Value | | | $25,360,058 | |
| |
Silvercrest Small Cap | | | 15,850,256 | |
| |
River Road Long-Short | | | 1,278,619 | |
| |
Pictet International | | | 105,598,392 | |
175
|
AMG Funds Trustees and Officers |
| | | | | | | | |
The Trustees and Officers of the Trust, their business addresses, principal occupations for the past five years and ages are listed below. The Trustees provide broad supervision over the affairs of the Trust and the Funds. The Trustees are experienced executives who meet periodically throughout the year to oversee the Funds’ activities, review contractual arrangements with companies that provide services to the Funds, and | | | | review the Funds’ performance. Unless otherwise noted, the address of each Trustee or Officer is the address of the Trust: 600 Steamboat Road, Suite 300, Greenwich, Connecticut 06830. There is no stated term of office for Trustees. Trustees serve until their resignation, retirement or removal in | | | | accordance with the Trust’s organizational documents and policies adopted by the Board from time to time. The Chairman of the Trustees, President, Treasurer and Secretary of the Trust are elected by the Trustees annually. Other officers hold office at the pleasure of the Trustees. |
Independent Trustees
The following Trustees are not “interested persons” of the Trust within the meaning of the 1940 Act:
| | |
| | |
Number of Funds Overseen in Fund Complex | | Name, Age, Principal Occupation(s) During Past 5 Years and Other Directorships Held by Trustee |
| | |
• Trustee since 2016 • Oversees 49 Funds in Fund Complex | | Bruce B. Bingham, 71 Partner, Hamilton Partners (real estate development firm) (1987-Present); Director of The Yacktman Funds (2000-2012). |
| | |
• Trustee since 2016 • Oversees 49 Funds in Fund Complex | | Edward J. Kaier, 74 Attorney at Law and Partner, Teeters Harvey Marrone & Kaier LLP (2007-Present); Attorney at Law and Partner, Hepburn Willcox Hamilton & Putnam, LLP (1977-2007); Trustee of Third Avenue Trust (2002-2019); Trustee of Third Avenue Variable Trust (2002-2019). |
| | |
• Trustee since 2013 • Oversees 52 Funds in Fund Complex | | Kurt A. Keilhacker, 56 Managing Partner, TechFund Capital (1997-Present); Managing Partner, TechFund Europe (2000-Present); Board Member, 6wind SA, (2002-Present); Managing Partner, Elementum Ventures (2013-Present); Director, MetricStory, Inc. (2017-Present); Trustee, Wheaton College (2018-Present); Trustee, Gordon College (2001-2016). |
| | |
• Trustee since 2000 • Oversees 49 Funds in Fund Complex | | Steven J. Paggioli, 69 Independent Consultant (2002-Present); Trustee, Professionally Managed Portfolios (28 portfolios); Advisory Board Member, Sustainable Growth Advisors, LP; Independent Director, Muzinich BDC, Inc. (business development company) (2019-Present); Independent Director, Chase Investment Counsel (2008-2019); Executive Vice President, Secretary and Director, Investment Company Administration, LLC (1990-2001). |
| | |
• Trustee since 2013 • Oversees 49 Funds in Fund Complex | | Richard F. Powers III, 73 Adjunct Professor, U.S. Naval War College (2016-Present); Adjunct Professor, Boston College (2010-2013); President and CEO of Van Kampen Investments Inc. (1998-2003). |
| | |
• Independent Chairman • Trustee since 2000 • Oversees 52 Funds in Fund Complex | | Eric Rakowski, 61 Professor of Law, University of California at Berkeley School of Law - Boalt Hall (1990-Present); Director of Harding, Loevner Funds, Inc. (9 portfolios); Trustee of Third Avenue Trust(2002-2019); Trustee of Third Avenue Variable Trust (2002-2019). |
| | |
• Trustee since 2013 • Oversees 52 Funds in Fund Complex | | Victoria L. Sassine, 54 Adjunct Professor, Babson College (2007-Present); Director, Board of Directors, PRG Group (2017-Present); CEO, Founder, Scale Smarter Partners, LLC (2018-Present); Chairperson, Board of Directors, Business Management Associates (2018-Present). |
| | |
• Trustee since 2016 • Oversees 49 Funds in Fund Complex | | Thomas R. Schneeweis, 72 Professor Emeritus, University of Massachusetts (2013-Present); President, TRS Associates (1982-Present); Board Member, Chartered Alternative Investment Association (“CAIA”)(2002-Present); Director, Institute for Global Asset and Risk Management (Education)(2010-Present);Co-Owner, Quantitative Investment Technologies (2014-Present); Director of Research, Yes Wealth Management (2018-Present); Partner, S Capital Wealth Advisors(2015-2018); Partner, S Capital Management, LLC (2007-2015); President, Alternative Investment Analytics, LLC, (formerly Schneeweis Partners, LLC) (2001-2013). |
176
|
AMG Funds Trustees and Officers(continued) |
Interested Trustees
Each Trustee in the following table is an “interested person” of the Trust within the meaning of the 1940 Act. Ms. Carsman is an interested person of the Trust within the meaning of the 1940 Act by virtue of her position with, and interest in securities of, AMG.
| | |
| Number of Funds Overseen in Fund Complex | | Name, Age, Principal Occupation(s) During Past 5 Years and Other Directorships Held by Trustee |
• Trustee since 2011 • Oversees 52 Funds in Fund Complex | | Christine C. Carsman, 67 Senior Policy Advisor, Affiliated Managers Group, Inc. (2019-Present); Director of Harding, Loevner Funds, Inc. (9 portfolios); Executive Vice President, Deputy General Counsel and Chief Regulatory Counsel, Affiliated Managers Group, Inc. (2017-2018); Director (2010-2018) and Chair of the Board of Directors (2015-2018), AMG Funds plc; Senior Vice President and Deputy General Counsel, Affiliated Managers Group, Inc. (2011-2016); Senior Vice President and Chief Regulatory Counsel, Affiliated Managers Group, Inc. (2007-2011); Vice President and Chief Regulatory Counsel, Affiliated Managers Group, Inc. (2004-2007); Secretary and Chief Legal Officer, AMG Funds, AMG Funds I, AMG Funds II and AMG Funds III (2004-2011); Senior Counsel, Vice President and Director of Operational Risk Management and Compliance, Wellington Management Company, LLP (1995-2004). |
| |
| Officers | | |
| |
| Position(s) Held with Fund and Length of Time Served | | Name, Age, Principal Occupation(s) During Past 5 Years |
| |
• President since 2018 • Principal Executive Officer since 2018 • Chief Executive Officer since 2018 • Chief Operating Officer since 2007 | | Keitha L. Kinne, 61 Chief Operating Officer, AMG Funds LLC (2007-Present); Chief Investment Officer, AMG Funds LLC (2008-Present); President and Principal, AMG Distributors, Inc. (2018-Present); Chief Operating Officer, AMG Distributors, Inc. (2007-Present); President, Chief Executive Officer and Principal Executive Officer, AMG Funds, AMG Funds I, AMG Funds II, AMG Funds III and AMG Funds IV (2018-Present); Chief Operating Officer, AMG Funds, AMG Funds I, AMG Funds II, and AMG Funds III (2007-Present); Chief Operating Officer, AMG Funds IV (2016-Present); Chief Operating Officer and Chief Investment Officer, Aston Asset Management, LLC (2016); President and Principal Executive Officer, AMG Funds, AMG Funds I, AMG Funds II and AMG Funds III (2012-2014); Managing Partner, AMG Funds LLC (2007-2014); President and Principal, AMG Distributors, Inc. (2012-2014); Managing Director, Legg Mason & Co., LLC (2006-2007); Managing Director, Citigroup Asset Management (2004-2006). |
| |
• Secretary since 2015 • Chief Legal Officer since 2015 | | Mark J. Duggan, 54 Senior Vice President and Senior Counsel, AMG Funds LLC (2015-Present); Secretary and Chief Legal Officer, AMG Funds, AMG Funds I, AMG Funds II, AMG Funds III and AMG Funds IV (2015-Present); Attorney, K&L Gates, LLP (2009-2015). |
| |
• Chief Financial Officer since 2017 • Treasurer since 2017 • Principal Financial Officer since 2017 • Principal Accounting Officer since 2017 | | Thomas G. Disbrow, 53 Vice President, Mutual Fund Treasurer & CFO, AMG Funds, AMG Funds LLC (2017-Present); Chief Financial Officer, Principal Financial Officer, Treasurer and Principal Accounting Officer, AMG Funds, AMG Funds I, AMG Funds II, AMG Funds III and AMG Funds IV (2017-Present); Managing Director - Global Head of Traditional Funds Product Control, UBS Asset Management (Americas), Inc. (2015-2017); Managing Director - Head of North American Funds Treasury, UBS Asset Management (Americas), Inc. (2011-2015). |
| |
• Deputy Treasurer since 2017 | | John A. Starace, 49 Director, Mutual Fund Accounting, AMG Funds LLC (2017-Present); Vice President, Deputy Treasurer of Mutual Funds Services, AMG Funds LLC (2014-2017); Deputy Treasurer, AMG Funds, AMG Funds I, AMG Funds II, AMG Funds III and AMG Funds IV (2017-Present); Vice President, Citi Hedge Fund Services (2010-2014); Audit Senior Manager (2005-2010) and Audit Manager (2001-2005), Deloitte & Touche LLP. |
| |
• Chief Compliance Officer since 2019 | | Patrick J. Spellman, 45 Vice President, Chief Compliance Officer, AMG Funds LLC (2017-Present); Chief Compliance Officer and Sarbanes-Oxley Code of Ethics Compliance Officer, AMG Funds, AMG Funds I, AMG Funds II, AMG Funds III and AMG Funds IV (2019-Present); Chief Compliance Officer, AMG Distributors, Inc., (2010-Present) Senior Vice President, Chief Compliance Officer, AMG Funds LLC (2011-2017); Anti-Money Laundering Compliance Officer, AMG Funds, AMG Funds I, AMG Funds II, and AMG Funds III (2014-2019); Anti-Money Laundering Officer, AMG Funds IV, (2016-2019); Compliance Manager, Legal and Compliance, Affiliated Managers Group, Inc. (2005-2011). |
| |
• Assistant Secretary since 2016 | | Maureen A. Meredith, 34 Vice President, Counsel, AMG Funds LLC (2019-Present); Director, Counsel, AMG Funds LLC (2017-2018); Vice President, Counsel, AMG Funds LLC (2015-2017); Assistant Secretary, AMG Funds, AMG Funds I, AMG Funds II, AMG Funds III and AMG Funds IV (2016-Present); Associate, Ropes & Gray LLP (2011-2015); Law Fellow, Massachusetts Appleseed Center for Law and Justice (2010-2011). |
| |
• Anti-Money Laundering Compliance Officer since 2019 | | Hector D. Roman, 41 Manager, Legal and Compliance, AMG Funds LLC (2017-Present); Director of Compliance, Morgan Stanley Investment Management (2015-2017); Senior Advisory, PricewaterhouseCoopers LLP (2014-2015); Risk Manager, Barclays Investment Bank (2008-2014); Anti-Money Laundering Compliance Officer, AMG Funds, AMG Funds I, AMG Funds II, AMG Funds III and AMG Funds IV (2019-Present). |
177
|
Annual Renewal of Investment Management and Subadvisory Agreements |
AMG Managers DoubleLine Core Plus Bond Fund, AMG Managers Fairpointe ESG Equity Fund, AMG Managers Fairpointe Mid Cap Fund, AMG Managers LMCG Small Cap Growth Fund, AMG Managers Montag & Caldwell Growth Fund, AMG Managers Pictet International Fund, AMG River Road Dividend All Cap Value Fund, AMG River Road Dividend All Cap Value Fund II, AMG River Road Focused Absolute Value Fund, AMG River Road Long-Short Fund, AMG River RoadSmall-Mid Cap Value Fund, AMG River Road Small Cap Value Fund and AMG Managers Silvercrest Small Cap Fund: Approval of Investment Advisory and Subadvisory Agreements on June 27, 2019
At anin-person meeting held on June 27, 2019, the Board of Trustees (the “Board” or the “Trustees”), and separately a majority of the Trustees who are not “interested persons” of AMG Funds IV (the “Trust”) (the “Independent Trustees”), approved (i) the Investment Advisory Agreement, as amended pursuant to letter agreements at any time prior to the date of the meeting, with AMG Funds LLC (the “Investment Manager”) for each of AMG Managers DoubleLine Core Plus Bond Fund, AMG Managers Fairpointe ESG Equity Fund, AMG Managers Fairpointe Mid Cap Fund, AMG Managers LMCG Small Cap Growth Fund, AMG Managers Montag & Caldwell Growth Fund, AMG Managers Pictet International Fund, AMG River Road Dividend All Cap Value Fund, AMG River Road Dividend All Cap Value Fund II, AMG River Road Focused Absolute Value Fund, AMG River Road Long-Short Fund, AMG River RoadSmall-Mid Cap Value Fund, AMG River Road Small Cap Value Fund and AMG Managers Silvercrest Small Cap Fund (each, a “Fund,” and collectively, the “Funds”) and separately Amendment No. 1 thereto dated October 1, 2016 (collectively, the “Investment Advisory Agreement”) and (ii) eachSub-Investment Advisory Agreement, as amended at any time prior to the date of the meeting, with the applicable Subadviser for each Fund (collectively, the “Subadvisory Agreements”). The Independent Trustees were separately represented by independent legal counsel in connection with their consideration of the approval of these agreements. In considering the Investment Advisory Agreement and the Subadvisory Agreements, the Trustees reviewed a variety of materials relating to each Fund, the Investment Manager and each Subadviser, including comparative performance, fee and expense information for an appropriate peer group of similar mutual funds for each Fund (each, a “Peer Group”), performance information for the relevant benchmark index for each Fund (each, a “Fund Benchmark”) and
other information provided to them on a periodic basis throughout the year, as well as information provided in connection with their meeting held on June 27, 2019, regarding the nature, extent and quality of services provided by the Investment Manager and the Subadvisers under their respective agreements and other relevant matters. Prior to voting, the Independent Trustees: (a) reviewed the foregoing information with their independent legal counsel; (b) received materials from their independent legal counsel discussing the legal standards applicable to their consideration of the Investment Advisory Agreement and the Subadvisory Agreements; and (c) met with their independent legal counsel in private sessions at which no representatives of management were present.
NATURE, EXTENT AND QUALITY OF SERVICES
In considering the nature, extent and quality of the services provided by the Investment Manager, the Trustees reviewed information relating to the Investment Manager’s operations and personnel. Among other things, the Investment Manager provided financial information, information about its supervisory and professional staff and descriptions of its organizational and management structure. The Trustees also took into account information provided periodically throughout the previous year by the Investment Manager in Board meetings relating to the performance of its duties with respect to the Funds and the Trustees’ knowledge of the Investment Manager’s management and the quality of the performance of the Investment Manager’s duties under the Investment Advisory Agreement and Administration Agreement. In the course of their deliberations regarding the Investment Manager, the Trustees evaluated, among other things: (a) the extent and quality of the Investment Manager’s oversight of the operation and management of the Funds; (b) the quality of the search, selection and monitoring services performed by the Investment Manager in overseeing the portfolio management responsibilities of the Subadvisers; (c) the Investment Manager’s ability to supervise the Funds’ other service providers; and (d) the Investment Manager’s compliance program. The Trustees also took into account that, in performing its functions under the Investment Advisory Agreement and supervising each Subadviser, the Investment Manager: performs periodic detailed analyses and reviews of the performance by each Subadviser of its obligations to a Fund, including, without limitation, analysis and review of portfolio and other compliance matters and review of each Subadviser’s investment performance with respect to a Fund;
prepares and presents periodic reports to the Board regarding the investment performance of each Subadviser and other information regarding each Subadviser, at such times and in such forms as the Board may reasonably request; reviews and considers any changes in the personnel of each Subadviser responsible for performing the Subadviser’s obligations and makes appropriate reports to the Board; reviews and considers any changes in the ownership or senior management of each Subadviser and makes appropriate reports to the Board; performs periodicin-person or telephonic diligence meetings, including with respect to compliance matters, with representatives of each Subadviser; assists the Board and management of the Trust in developing and reviewing information with respect to the initial approval of each Subadvisory Agreement and annual consideration of each Subadvisory Agreement thereafter; prepares recommendations with respect to the continued retention of any Subadviser or the replacement of any Subadviser, including at the request of the Board; identifies potential successors to, or replacements of, any Subadviser or potential additional subadvisers, including performing appropriate due diligence, and developing and presenting to the Board a recommendation as to any such successor, replacement or additional subadviser, including at the request of the Board; designates and compensates from its own resources such personnel as the Investment Manager may consider necessary or appropriate to the performance of its services; and performs such other review and reporting functions as the Board shall reasonably request consistent with the Investment Advisory Agreement and applicable law. With respect to AMG River Road Dividend All Cap Value Fund, AMG River Road Dividend All Cap Value Fund II, AMG River Road Focused Absolute Value Fund, AMG River Road Long-Short Fund, AMG River RoadSmall-Mid Cap Value Fund and AMG River Road Small Cap Value Fund, the Trustees noted the affiliation of the Subadviser with the Investment Manager, noting any potential conflicts of interest. The Trustees also took into account the financial condition of the Investment Manager with respect to its ability to provide the services required under the Investment Advisory Agreement and the Investment Manager’s undertaking to maintain contractual expense limitations for certain Funds, as described below. The Trustees also considered the Investment Manager’s risk management processes.
For each Fund, the Trustees also reviewed information relating to each Subadviser’s operations and personnel and the investment philosophy,
178
|
Annual Renewal of Investment Management and Subadvisory Agreements(continued) |
strategies and techniques (for each Subadviser, its “Investment Strategy”) used in managing the Fund. Among other things, the Trustees reviewed information on portfolio management and other professional staff, information regarding each Subadviser’s organizational and management structure and each Subadviser’s brokerage policies and practices. The Trustees considered specific information provided regarding the experience of the individuals at each Subadviser with portfolio management responsibility for a Fund, including the information set forth in the Fund’s prospectus and statement of additional information. In the course of their deliberations, the Trustees evaluated, among other things: (a) the services rendered by each Subadviser in the past; (b) the qualifications and experience of the Subadviser’s personnel; and (c) the Subadviser’s compliance program. The Trustees also took into account the financial condition of each Subadviser with respect to its ability to provide the services required under its Subadvisory Agreement(s). The Trustees also considered each Subadviser’s risk management processes.
PERFORMANCE
The Board considered each Fund’s net performance during relevant time periods as compared to the Fund’s Peer Group and Fund Benchmark and considered the gross performance of the Fund as compared to the Subadviser’s relevant performance composite that utilizes the same investment strategy and approach and noted that the Board reviews on a quarterly basis detailed information about both the Fund’s performance results and portfolio composition, as well as each Subadviser’s Investment Strategy. The Board noted the Investment Manager’s expertise and resources in monitoring the performance, investment style and risk-adjusted performance of each Subadviser. The Board was mindful of the Investment Manager’s attention to monitoring each Subadviser’s performance with respect to the Funds and its discussions with management regarding the factors that contributed to the performance of the Funds.
ADVISORY FEES AND PROFITABILITY
In considering the reasonableness of the advisory fee charged by the Investment Manager for managing each Fund, the Trustees noted that the Investment Manager, and not the Fund, is responsible for paying the fees charged by the Fund’s Subadviser and, therefore, that the fees paid to the Investment Manager cover the cost of providing portfolio management services as well as the cost of providing search, selection and monitoring services in operating a
“manager-of-managers” complex of mutual funds. The Trustees also considered the amount of the advisory fee retained by the Investment Manager after payment of the subadvisory fee with respect to each Fund. The Trustees also noted payments made or to be made from River Road Asset Management, LLC (“River Road”) to the Investment Manager, and other payments made or to be made from the Investment Manager to River Road. The Trustees concluded that, in light of the high quality supervisory services provided by the Investment Manager and the fact that the subadvisory fees are paid out of the advisory fee, the advisory fee payable by each Fund to the Investment Manager can reasonably be expected to exceed the median advisory fee for the Peer Group, which consists of many funds that do not operate with amanager-of-managers structure. In this regard, the Trustees also noted that the Investment Manager has undertaken to maintain contractual expense limitations for AMG Managers DoubleLine Core Plus Bond Fund, AMG Managers Fairpointe ESG Equity Fund, AMG Managers LMCG Small Cap Growth Fund, AMG Managers Pictet International Fund, AMG River Road Dividend All Cap Value Fund, AMG River Road Dividend All Cap Value Fund II, AMG River Road Focused Absolute Value Fund, AMG River Road Long-Short Fund, AMG River RoadSmall-Mid Cap Value Fund and AMG Managers Silvercrest Small Cap Fund, and, effective August 1, 2019, for AMG Managers Fairpointe Mid Cap Fund and AMG Managers Montag & Caldwell Growth Fund.
In addition, in considering the reasonableness of the advisory fee payable to the Investment Manager, the Trustees also reviewed information provided by the Investment Manager setting forth all revenues and other benefits, both direct and indirect (including anyso-called “fallout benefits” such as reputational value derived from the Investment Manager serving as Investment Manager to a Fund), received by the Investment Manager and its affiliates attributable to managing each Fund and all the mutual funds in the AMG Funds Family of Funds; the cost of providing such services; the significant risks undertaken as Investment Manager and sponsor of the Funds, including investment, operational, enterprise, entrepreneurial, litigation, regulatory and compliance risks; and the resulting profitability to the Investment Manager and its affiliates from these relationships. The Trustees also noted the current asset levels of each Fund and the willingness of the Investment Manager to maintain contractual expense limitations for certain Funds, as described above, from time to time as a means of limiting total expenses. The Trustees also considered management’s discussion of the current asset levels of the Funds, and the
impact on profitability of both the current asset levels and any future growth of assets of the Funds. The Board took into account management’s discussion of the advisory fee structure, and the services the Investment Manager provides in performing its functions under the Investment Advisory Agreement and supervising each Subadviser. In this regard, the Trustees noted that, unlike a mutual fund that is managed by a single investment adviser, the Funds operate in amanager-of-managers structure. Based on the foregoing, the Trustees concluded that the profitability to the Investment Manager is reasonable and that the Investment Manager is not realizing material benefits from economies of scale that would warrant adjustments to the advisory fees for any Fund at this time. With respect to economies of scale, the Trustees also noted that, as a Fund’s assets increase over time, the Fund may realize other economies of scale to the extent that the increase in assets is proportionally greater than the increase in certain other expenses.
SUBADVISORY FEES AND PROFITABILITY
In considering the reasonableness of the subadvisory fee payable by the Investment Manager to each of DoubleLine Capital LP, Fairpointe Capital LLC, LMCG Investments, LLC, Montag & Caldwell, LLC, Pictet Asset Management Limited and Silvercrest Asset Management Group LLC (each, an “Unaffiliated Subadviser” and collectively, the “Unaffiliated Subadvisers”), the Trustees relied on the ability of the Investment Manager to negotiate the terms of the Subadvisory Agreement at arm’s length as part of themanager-of-managers structure, noting that the Investment Manager is not affiliated with the Unaffiliated Subadvisers. In addition, the Trustees considered other potential benefits of the subadvisory relationship to the Unaffiliated Subadvisers, including, among others, the indirect benefits that each Unaffiliated Subadviser may receive from its relationship with a Fund, including anyso-called “fallout benefits” to the Unaffiliated Subadvisers, such as reputational value derived from the Unaffiliated Subadvisers serving as Subadviser to a Fund. In addition, the Trustees noted that the subadvisory fees are paid by the Investment Manager out of its advisory fee. As a consequence of all of the foregoing, the cost of services to be provided by each Unaffiliated Subadviser and the profitability to each Unaffiliated Subadviser of its relationship with a Fund were not material factors in the Trustees’ deliberations. For similar reasons, the Trustees did not consider potential economies of
179
|
Annual Renewal of Investment Management and Subadvisory Agreements(continued) |
scale in the management of a Fund by each of the Unaffiliated Subadvisers to be a material factor in their deliberations at this time.
In considering the reasonableness of the fees payable by the Investment Manager to River Road, the Trustees noted that River Road is an affiliate of the Investment Manager, and the Trustees reviewed information regarding the cost to River Road of providing subadvisory services to a Fund and the resulting profitability from such relationship. The Trustees noted that, because River Road is an affiliate of the Investment Manager, a portion of River Road’s revenues or profits might be shared directly or indirectly with the Investment Manager. The Trustees also noted that the subadvisory fees are paid by the Investment Manager out of its advisory fee. With respect to each applicable Fund, the Board also took into account management’s discussion of the subadvisory fee structure, and the services River Road provides in performing its functions under the applicable Subadvisory Agreement. Based on the foregoing, the Trustees concluded that the profitability to River Road is reasonable and that River Road is not realizing material benefits from economies of scale that would warrant adjustments to the subadvisory fees at this time. Also with respect to economies of scale, the Trustees noted that as a Fund’s assets increase over time, the Fund may realize other economies of scale to the extent the increase in assets is proportionally greater than the increase in certain other expenses.
In addition to the foregoing, the Trustees considered the specific factors and related conclusions set forth below with respect to each applicable Fund, the Investment Manager and each Subadviser.
AMG Managers DoubleLine Core Plus Bond Fund
FUND PERFORMANCE
Among other information relating to the Fund’s performance, the Trustees noted that the Fund’s performance for Class I shares (which share class has one of the earliest inception dates and the largest amount of assets of all the share classes of the Fund) for the1-year,3-year and5-year periods ended March 31, 2019 and for the period from the Class I shares’ inception on July 18, 2011 through March 31, 2019 was below, above, above and above, respectively, the median performance of the Peer Group and below, above, above, and above, respectively, the performance of the Fund Benchmark, the Bloomberg Barclays U.S. Aggregate Bond Index. The Trustees also took into account
management’s discussion of the Fund’s performance, noting that Class I shares of the Fund ranked in the top decile relative to its Peer Group for the5-year period and the period from inception through March 31, 2019 and in the top quintile relative to its Peer Group for the3-year period. The Trustees concluded that the Fund’s overall performance has been satisfactory.
ADVISORY AND SUBADVISORY FEES
The Trustees noted that the Fund’s management fees (which include both the advisory and administration fees) and total expenses (weighted average, all classes combined) (net of applicable expense waivers/reimbursements) as of March 31, 2019 were both higher than the average for the Fund’s Peer Group. The Trustees took into account the fact that the Investment Manager has contractually agreed, through March 1, 2020, to limit the Fund’s net annual operating expenses (subject to certain excluded expenses) to 0.61%. The Trustees also took into account management’s discussion of the Fund’s expenses, including fees and expenses relative to comparably sized funds. The Trustees concluded that, in light of the nature, extent and quality of the services provided by the Investment Manager and the Subadviser, the foregoing expense reimbursement arrangement and the considerations noted above with respect to the Investment Manager and the Subadviser, the Fund’s advisory and subadvisory fees are reasonable.
AMG Managers Fairpointe ESG Equity Fund
FUND PERFORMANCE
Among other information relating to the Fund’s performance, the Trustees noted that the Fund’s performance for Class I shares (which share class has the largest amount of assets of all the share classes of the Fund) for the1-year and3-year periods ended March 31, 2019 and for the period from the Class I shares’ inception on December 24, 2014 through March 31, 2019 was below the median performance of the Peer Group and below the performance of the Fund Benchmark, the Russell 1000® Index. The Trustees noted that the Fund changed its investment strategy to follow an ESG mandate in 2017 and took into account the Fund’s relatively short performance history with its current investment strategy. The Trustees took into account management’s discussion of the Fund’s performance, including the reasons for the Fund’s underperformance, and any actions being taken to address such underperformance. The Trustees concluded that the Fund’s performance is being addressed.
ADVISORY AND SUBADVISORY FEES
The Trustees noted that the Fund’s management fees (which include both the advisory and administration fees) and total expenses (weighted average, all classes combined) (net of applicable expense waivers/reimbursements) as of March 31, 2019 were higher and lower, respectively, than the average for the Fund’s Peer Group. The Trustees took into account the fact that the Investment Manager has contractually agreed, through March 1, 2020, to limit the Fund’s net annual operating expenses (subject to certain excluded expenses) to 0.82%. The Trustees also took into account management’s discussion of the Fund’s expenses, including fees and expenses relative to comparably sized funds, and the current size of the Fund. The Trustees concluded that, in light of the nature, extent and quality of the services provided by the Investment Manager and the Subadviser, the foregoing expense reimbursement arrangement and the considerations noted above with respect to the Investment Manager and the Subadviser, the Fund’s advisory and subadvisory fees are reasonable.
AMG Managers Fairpointe Mid Cap Fund
FUND PERFORMANCE
Among other information relating to the Fund’s performance, the Trustees noted that the Fund’s performance for Class N shares (which share class has the earliest inception date of all the share classes of the Fund) for the1-year,3-year,5-year and10-year periods ended March 31, 2019 was below, below, below and above, respectively, the median performance of the Peer Group and below the performance of the Fund Benchmark, the S&P MidCap 400® Index. The Trustees also noted that Class N shares of the Fund ranked in the top quintile relative to its Peer Group for the10-year period. The Trustees took into account management’s discussion of the Fund’s performance, including the reasons for the Fund’s underperformance and any actions being taken to address such underperformance. The Trustees concluded that the Fund’s performance is being addressed.
ADVISORY AND SUBADVISORY FEES
The Trustees noted that the Fund’s management fees (which include both the advisory and administration fees) and total expenses (weighted average, all
180
|
Annual Renewal of Investment Management and Subadvisory Agreements(continued) |
classes combined) as of March 31, 2019 were both lower than the average for the Fund’s Peer Group. The Trustees took into account the fact that, effective August 1, 2019, the Investment Manager has contractually agreed, through March 1, 2021, to limit the Fund’s net annual operating expenses (subject to certain excluded expenses) to 0.82%. The Trustees concluded that, in light of the nature, extent and quality of the services provided by the Investment Manager and the Subadviser, the foregoing expense reimbursement arrangement and the considerations noted above with respect to the Investment Manager and the Subadviser, the Fund’s advisory and subadvisory fees are reasonable.
AMG Managers LMCG Small Cap Growth Fund
FUND PERFORMANCE
Among other information relating to the Fund’s performance, the Trustees noted that the Fund’s performance for Class N shares (which share class has the earliest inception date of all the share classes of the Fund) for the1-year,3-year and5-year periods ended March 31, 2019 and for the period from the Class N shares’ inception on November 3, 2010 through March 31, 2019 was above, below, below and below, respectively, the median performance of the Peer Group and above, below, below and below, respectively, the performance of the Fund Benchmark, the Russell 2000® Growth Index. The Trustees took into account management’s discussion of the Fund’s performance, including the Fund’s more recent improved performance relative to its Peer Group and the Fund Benchmark. The Trustees also noted the reasons for the Fund’s underperformance and any actions being taken to address such underperformance. The Trustees concluded that the Fund’s performance is being addressed.
ADVISORY AND SUBADVISORY FEES
The Trustees noted that the Fund’s management fees (which include both the advisory and administration fees) and total expenses (weighted average, all classes combined) (net of applicable expense waivers/reimbursements) as of March 31, 2019 were both higher than the average for the Fund’s Peer Group. The Trustees took into account the fact that the Investment Manager has contractually agreed, through March 1, 2020, to limit the Fund’s net annual operating expenses (subject to certain excluded expenses) to 1.03%. The Trustees also took into account management’s discussion of the Fund’s expenses, including fees and expenses relative to comparably sized funds. The Trustees concluded that, in light of the nature, extent and quality of the
services provided by the Investment Manager and the Subadviser, the foregoing expense reimbursement arrangement and the considerations noted above with respect to the Investment Manager and the Subadviser, the Fund’s advisory and subadvisory fees are reasonable.
AMG Managers Montag & Caldwell Growth Fund
FUND PERFORMANCE
Among other information relating to the Fund’s performance, the Trustees noted that the Fund’s performance for Class N shares (which share class has the earliest inception date of all the share classes of the Fund) for the1-year,3-year,5-year and10-year periods ended March 31, 2019 was above, below, below and below, respectively, the median performance of the Peer Group and below the performance of the Fund Benchmark, the Russell 1000® Growth Index. The Trustees took into account management’s discussion of the Fund’s performance, including the Fund’s more recent improved performance relative to its Peer Group. The Trustees also noted the reasons for the Fund’s underperformance. The Trustees concluded that the Fund’s overall performance has been satisfactory in light of the Fund’s investment objective, strategies and policies.
ADVISORY AND SUBADVISORY FEES
The Trustees noted that the Fund’s management fees (which include both the advisory and administration fees) and total expenses (weighted average, all classes combined) as of March 31, 2019 were both higher than the average for the Fund’s Peer Group. The Trustees took into account the fact that, effective August 1, 2019, the Investment Manager has contractually agreed, through March 1, 2021, to limit the Fund’s net annual operating expenses (subject to certain excluded expenses) to 0.92%. The Trustees also took into account management’s discussion of the Fund’s expenses and competitiveness with comparably sized funds. The Trustees concluded that, in light of the nature, extent and quality of the services provided by the Investment Manager and the Subadviser, the foregoing expense reimbursement arrangement and the considerations noted above with respect to the Investment Manager and the Subadviser, the Fund’s advisory and subadvisory fees are reasonable.
AMG Managers Pictet International Fund
FUND PERFORMANCE
Among other information relating to the Fund’s performance, the Trustees noted that the Fund’s performance for Class I shares (which share class
has one of the earliest inception dates and the largest amount of assets of all the share classes of the Fund with that inception date) for the1-year and3-year periods ended March 31, 2019 and for the period from the Class I shares’ inception on April 14, 2014 through March 31, 2019 was below, below and above, respectively, the median performance of the Peer Group and below, below, and at, respectively, the performance of the Fund Benchmark, the MSCI EAFE Index. The Trustees took into account management’s discussion of the Fund’s performance, including the reasons for the Fund’s underperformance. The Trustees concluded that the Fund’s overall performance has been satisfactory in light of the Fund’s investment objective, strategies and policies.
ADVISORY AND SUBADVISORY FEES
The Trustees noted that the Fund’s management fees (which include both the advisory and administration fees) and total expenses (weighted average, all classes combined) (net of applicable expense waivers/reimbursements) as of March 31, 2019 were both higher than the average for the Fund’s Peer Group. The Trustees took into account the fact that the Investment Manager has contractually agreed, through March 1, 2020 to limit the Fund’s net annual operating expenses (subject to certain excluded expenses) to 0.98%. The Trustees also took into account management’s discussion of the Fund’s expenses, including fees and expenses relative to comparably sized funds. The Trustees concluded that, in light of the nature, extent and quality of the services provided by the Investment Manager and the Subadviser, the foregoing expense reimbursement arrangement and the considerations noted above with respect to the Investment Manager and the Subadviser, the Fund’s advisory and subadvisory fees are reasonable.
AMG River Road Dividend All Cap Value Fund
FUND PERFORMANCE
Among other information relating to the Fund’s performance, the Trustees noted that the Fund’s performance for Class N shares (which share class has the earliest inception date of all the share classes of the Fund) for the1-year,3-year,5-year and10-year periods ended March 31, 2019 was above, below, below and below, respectively, the median performance of the Peer Group and above, below, below and below, respectively, the performance of
181
|
Annual Renewal of Investment Management and Subadvisory Agreements(continued) |
the Fund Benchmark, the Russell 3000® Value Index. The Trustees noted the Fund’s more recent improved performance relative to its Peer Group and the Fund Benchmark. The Trustees also noted that Class N shares of the Fund ranked in the top quartile relative to its Peer Group for the1-year period. The Trustees took into account management’s discussion of the Fund’s performance, including the reasons for the Fund’s previous underperformance. The Trustees concluded that the Fund’s overall performance has been satisfactory in light of the Fund’s investment objective, strategies and policies.
ADVISORY AND SUBADVISORY FEES
The Trustees noted that the Fund’s management fees (which include both the advisory and administration fees) and total expenses (weighted average, all classes combined) (net of applicable expense waivers/reimbursements) as of March 31, 2019 were both higher than the average for the Fund’s Peer Group. The Trustees took into account the fact that the Investment Manager has contractually agreed, through March 1, 2020, to limit the Fund’s net annual operating expenses (subject to certain excluded expenses) to 0.99%. The Trustees also took into account management’s discussion of the Fund’s expenses, including fees and expenses relative to comparably sized funds. The Trustees concluded that, in light of the nature, extent and quality of the services provided by the Investment Manager and the Subadviser (which is an affiliate of the Investment Manager), the foregoing expense limitation arrangement and the considerations noted above with respect to the Investment Manager and the Subadviser, the Fund’s advisory and subadvisory fees are reasonable.
AMG River Road Dividend All Cap Value Fund II
FUND PERFORMANCE
Among other information relating to the Fund’s performance, the Trustees noted that the Fund’s performance for Class I shares (which share class has one of the earliest inception dates and the largest amount of assets of all the share classes of the Fund) for the1-year,3-year and5-year periods ended March 31, 2019 and for the period from the Class I shares’ inception on June 27, 2012 through March 31, 2019 was above, below, above and below, respectively, the median performance of the Peer Group and above, below, below and below, respectively, the performance of the Fund Benchmark, the Russell 3000® Value Index. The Trustees noted the Fund’s more recent improved performance relative to its Peer Group and the Fund Benchmark. The Trustees also noted that Class I
shares of the Fund ranked in the top quartile relative to its Peer Group for the1-year period. The Trustees took into account management’s discussion of the Fund’s performance, including the reasons for the Fund’s previous underperformance. The Trustees concluded that the Fund’s overall performance has been satisfactory in light of the Fund’s investment objective, strategies and policies.
ADVISORY AND SUBADVISORY FEES
The Trustees noted that the Fund’s management fees (which include both the advisory and administration fees) and total expenses (weighted average, all classes combined) (net of applicable expense waivers/reimbursements) as of March 31, 2019 were both higher than the average for the Fund’s Peer Group. The Trustees took into account the fact that the Investment Manager has contractually agreed, through March 1, 2020, to limit the Fund’s net annual operating expenses (subject to certain excluded expenses) to 0.99%. The Trustees also took into account management’s discussion of the Fund’s expenses, including fees and expenses relative to comparably sized funds. The Trustees concluded that, in light of the nature, extent and quality of the services provided by the Investment Manager and the Subadviser (which is an affiliate of the Investment Manager), the foregoing expense reimbursement arrangement and the considerations noted above with respect to the Investment Manager and the Subadviser, the Fund’s advisory and subadvisory fees are reasonable.
AMG River Road Focused Absolute Value Fund
FUND PERFORMANCE
Among other information relating to the Fund’s performance, the Trustees noted that the Fund’s performance for Class I shares (which share class has one of the earliest inception dates and the largest amount of assets of all the share classes of the Fund) for the1-year and3-year periods ended March 31, 2019 and for the period from the Fund’s inception on November 3, 2015 through March 31, 2019 was above the median performance of the Peer Group and above the performance of the Fund Benchmark, the Russell 3000® Value Index. The Trustees also took into account management’s discussion of the Fund’s performance, including the fact that Class I shares of the Fund ranked in the top decile relative to its Peer Group for all relevant time periods. The Trustees concluded that the Fund’s overall performance has been satisfactory.
ADVISORY AND SUBADVISORY FEES
The Trustees noted that the Fund’s management fees (which include both the advisory and administration fees) and total expenses (weighted average, all classes combined) (net of applicable expense waivers/reimbursements) as of March 31, 2019 were higher and lower, respectively, than the average for the Fund’s Peer Group. The Trustees took into account the fact that the Investment Manager has contractually agreed, through March 1, 2020, to limit the Fund’s net annual operating expenses (subject to certain excluded expenses) to 0.71%. The Trustees also took into account management’s discussion of the Fund’s expenses, including fees and expenses relative to comparably sized funds, and the current size of the Fund. The Trustees concluded that, in light of the nature, extent and quality of the services provided by the Investment Manager and the Subadviser, the foregoing expense reimbursement arrangement and the considerations noted above with respect to the Investment Manager and the Subadviser, the Fund’s advisory and subadvisory fees are reasonable.
AMG River Road Long-Short Fund
FUND PERFORMANCE
Among other information relating to the Fund’s performance, the Trustees noted that the Fund’s performance for Class N shares (which share class has the earliest inception date of all the share classes of the Fund) for the1-year,3-year and5-year periods ended March 31, 2019 and for the period from the Class N shares’ inception on May 4, 2011 through March 31, 2019 was above the median performance of the Peer Group and below the performance of the Fund Benchmark, the Russell 3000® Index. The Trustees also noted that Class N shares of the Fund ranked in the top decile relative to its Peer Group for the1-year period. The Trustees concluded that the Fund’s overall performance has been satisfactory in light of the Fund’s investment objective, strategies and policies.
ADVISORY AND SUBADVISORY FEES
The Trustees noted that the Fund’s management fees (which include both the advisory and administration fees) and total expenses (weighted average, all classes combined) (net of applicable expense waivers/reimbursements) as of March 31, 2019 were lower and higher, respectively, than the average for the Fund’s Peer Group. The Trustees took into account the fact that the Investment Manager has contractually agreed, through March 1, 2020, to limit the Fund’s net annual operating expenses (subject
182
|
Annual Renewal of Investment Management and Subadvisory Agreements(continued) |
to certain excluded expenses) to 1.12%. The Trustees also took into account management’s discussion of the Fund’s expenses, including fees and expenses relative to comparably sized funds. The Trustees concluded that, in light of the nature, extent and quality of the services provided by the Investment Manager and the Subadviser (which is an affiliate of the Investment Manager), the foregoing expense reimbursement arrangement and the considerations noted above with respect to the Investment Manager and the Subadviser, the Fund’s advisory and subadvisory fees are reasonable.
AMG River RoadSmall-Mid Cap Value Fund
FUND PERFORMANCE
Among other information relating to the Fund’s performance, the Trustees noted that the Fund’s performance for Class N shares (which share class has the earliest inception date of all the share classes of the Fund) for the1-year,3-year,5-year and10-year periods ended March 31, 2019 was above, above, above and below, respectively, the median performance of the Peer Group and above, above, above and below, respectively, the performance of the Fund Benchmark, the Russell 2500® Value Index. The Trustees also took into account management’s discussion of the Fund’s performance, noting that Class N shares of the Fund ranked in the top decile relative to its Peer Group for the1-year,3-year and5-year periods. The Trustees concluded that the Fund’s overall performance has been satisfactory.
ADVISORY AND SUBADVISORY FEES
The Trustees noted that the Fund’s management fees (which include both the advisory and administration fees) and total expenses (weighted average, all classes combined) (net of applicable expense waivers/reimbursements) as of March 31, 2019 were both higher than the average for the Fund’s Peer Group. The Trustees took into account the fact that the Investment Manager has contractually agreed, through March 1, 2020, to limit the Fund’s net annual operating expenses (subject to certain excluded expenses) to 1.04%. The Trustees also took into account management’s discussion of the Fund’s expenses, including fees and expenses relative to comparably sized funds, and the current size of the Fund. The Trustees concluded that, in light of the nature, extent and quality of the services provided by the Investment Manager and the Subadviser (which is an affiliate of the Investment Manager), the foregoing expense reimbursement arrangement and the considerations noted above with respect to the Investment Manager and the Subadviser, the Fund’s
advisory and subadvisory fees are reasonable.
AMG River Road Small Cap Value Fund
FUND PERFORMANCE
Among other information relating to the Fund’s performance, the Trustees noted that the Fund’s performance for Class N shares (which share class has the earliest inception date of all the share classes of the Fund) for the1-year,3-year,5-year and10-year periods ended March 31, 2019 was above, above, above and below, respectively, the median performance of the Peer Group and above, above, above and below, respectively, the performance of the Fund Benchmark, the Russell 2000® Value Index. The Trustees also took into account management’s discussion of the Fund’s performance, noting that Class N shares of the Fund ranked in the top decile relative to its Peer Group for the1-year,3-year and5-year periods. The Trustees concluded that the Fund’s overall performance has been satisfactory.
ADVISORY AND SUBADVISORY FEES
The Trustees noted that the Fund’s management fees (which include both the advisory and administration fees) and total expenses (weighted average, all classes combined) as of March 31, 2019 were both higher than the average for the Fund’s Peer Group. The Trustees took into account management’s discussion of the Fund’s expenses, including fees and expenses relative to comparably sized funds. The Trustees concluded that, in light of the nature, extent and quality of the services provided by the Investment Manager and the Subadviser (which is an affiliate of the Investment Manager) and the considerations noted above with respect to the Investment Manager and the Subadviser, the Fund’s advisory and subadvisory fees are reasonable.
AMG Managers Silvercrest Small Cap Fund
FUND PERFORMANCE
Among other information relating to the Fund’s performance, the Trustees noted that the Fund’s performance for Class I shares (which share class has one of the earliest inception dates and the largest amount of assets of all the share classes of the Fund) for the1-year,3-year and5-year periods ended March 31, 2019 and for the period from the Class I shares’ inception on December 27, 2011 through March 31, 2019 was below, below, at and below, respectively, the median performance of the Peer Group and below the performance of the Fund Benchmark, the Russell 2000® Value Index. The Trustees took into account management’s discussion of the Fund’s performance, including the reasons for
the Fund’s underperformance. The Trustees concluded that the Fund’s overall performance has been satisfactory in light of the Fund’s investment objective, strategies and policies.
ADVISORY AND SUBADVISORY FEES
The Trustees noted that the Fund’s management fees (which include both the advisory and administration fees) and total expenses (weighted average, all classes combined) (net of applicable expense waivers/reimbursements) as of March 31, 2019 were both higher than the average for the Fund’s Peer Group. The Trustees took into account the fact that the Investment Manager has contractually agreed, through March 1, 2020, to limit the Fund’s net annual operating expenses (subject to certain excluded expenses) to 1.08%. The Trustees also took into account management’s discussion of the Fund’s expenses, including fees and expenses relative to comparably sized funds. The Trustees concluded that, in light of the nature, extent and quality of the services provided by the Investment Manager and the Subadviser, the foregoing expense reimbursement arrangement and the considerations noted above with respect to the Investment Manager and the Subadviser, the Fund’s advisory and subadvisory fees are reasonable.
* * * *
After consideration of the foregoing, the Trustees also reached the following conclusions (in addition to the conclusions discussed above) regarding the Investment Advisory Agreement and each Subadvisory Agreement: (a) the Investment Manager and each Subadviser have demonstrated that they possess the capability and resources to perform the duties required of them under the Investment Advisory Agreement and the applicable Subadvisory Agreement and (b) the Investment Manager and each Subadviser maintain appropriate compliance programs.
Based on all of the above-mentioned factors and their related conclusions, with no single factor or conclusion being determinative and with each Trustee not necessarily attributing the same weight to each factor, the Trustees concluded that approval of the Investment Advisory Agreement and each Subadvisory Agreement would be in the best interests of the applicable Fund and its shareholders. Accordingly, on June 27, 2019, the Trustees, and separately a majority of the Independent Trustees, voted to approve the Investment Advisory and the Subadvisory Agreements for each Fund.
183
THIS PAGE INTENTIONALLY LEFT BLANK
|
|
| | | | | | | | | | | | |
INVESTMENT MANAGER AND ADMINISTRATOR AMG Funds LLC 600 Steamboat Road, Suite 300 Greenwich, CT 06830 800.548.4539 DISTRIBUTOR AMG Distributors, Inc. 600 Steamboat Road, Suite 300 Greenwich, CT 06830 800.548.4539 | | | | | | CUSTODIAN The Bank of New York Mellon 111 Sanders Creek Parkway East Syracuse, NY 13057 LEGAL COUNSEL Ropes & Gray LLP Prudential Tower, 800 Boylston Street Boston, MA 02199-3600 TRANSFER AGENT BNY Mellon Investment Servicing (US) Inc. Attn: AMG Funds P.O. Box 9769 Providence, RI 02940 800.548.4539 | | | | | | This report is prepared for the Funds’ shareholders. It is authorized for distribution to prospective investors only when preceded or accompanied by an effective prospectus. To receive a free copy of the prospectus or Statement of Additional Information, which includes additional information about Fund Trustees, please contact us by calling 800.548.4539. Distributed by AMG Distributors, Inc., member FINRA/SIPC. Current net asset values per share for each Fund are available on the Funds’ website at amgfunds.com. A description of the policies and procedures each Fund uses to vote its proxies is available: (i) without charge, upon request, by calling 800.548.4539, or (ii) on the Securities and Exchange Commission’s (SEC) website at sec.gov. For information regarding each Fund’s proxy voting record for the12-month period ended June 30, call 800.548.4539 or visit the SEC website at sec.gov. The Funds file their complete schedule of portfolio holdings with the SEC for the first and third quarters of each fiscal year as an exhibit to their reports on FormN-PORT, which has replaced FormN-Q. The Funds’ portfolio holdings on FormN-PORT are available on the SEC’s website at sec.gov. To review a complete list of the Funds’ portfolio holdings, or to view the most recent semiannual report or annual report, please visit amgfunds.com. |
|
|
| | | | | | | | | | | | |
AFFILIATE SUBADVISED FUNDS BALANCED FUNDS AMG Chicago Equity Partners Balanced Chicago Equity Partners, LLC AMG FQ Global Risk-Balanced First Quadrant, L.P. EQUITY FUNDS AMG FQTax-Managed U.S. Equity AMG FQ Long-Short Equity First Quadrant, L.P. AMG Frontier Small Cap Growth Frontier Capital Management Co., LLC AMG GW&K Small Cap Core AMG GW&K Small/Mid Cap AMG GW&K Trilogy Emerging Markets Equity AMG GW&K Trilogy Emerging Wealth Equity GW&K Investment Management, LLC AMG Renaissance Large Cap Growth The Renaissance Group LLC AMG River Road Dividend All Cap Value AMG River Road Dividend All Cap Value II AMG River Road Focused Absolute Value AMG River Road Long-Short AMG River RoadSmall-Mid Cap Value AMG River Road Small Cap Value River Road Asset Management, LLC AMG SouthernSun Small Cap AMG SouthernSun U.S. Equity SouthernSun Asset Management, LLC | | | | | | AMG TimesSquare Emerging Markets Small Cap AMG TimesSquare Global Small Cap AMG TimesSquare International Small Cap AMG TimesSquare Mid Cap Growth AMG TimesSquare Small Cap Growth TimesSquare Capital Management, LLC AMG Yacktman AMG Yacktman Focused AMG Yacktman Focused Fund - Security Selection Only AMG Yacktman Special Opportunities Yacktman Asset Management LP FIXED INCOME FUNDS AMG GW&K Core Bond ESG AMG GW&K Enhanced Core Bond ESG AMG GW&K Municipal Bond AMG GW&K Municipal Enhanced Yield GW&K Investment Management, LLC OPEN-ARCHITECTURE FUNDS EQUITY FUNDS AMG Managers Brandywine AMG Managers Brandywine Advisors Mid Cap Growth AMG Managers Brandywine Blue Friess Associates, LLC AMG Managers Cadence Emerging Companies AMG Managers Cadence Mid Cap Cadence Capital Management LLC AMG Managers CenterSquare Real Estate CenterSquare Investment Management LLC | | | | | | AMG Managers Emerging Opportunities WEDGE Capital Management L.L.P. Next Century Growth Investors LLC RBC Global Asset Management (U.S.) Inc. AMG Managers Fairpointe ESG Equity AMG Managers Fairpointe Mid Cap Fairpointe Capital LLC AMG Managers LMCG Small Cap Growth LMCG Investments, LLC AMG Managers Montag & Caldwell Growth Montag & Caldwell, LLC AMG Managers Pictet International Pictet Asset Management Limited AMG Managers Silvercrest Small Cap Silvercrest Asset Management Group LLC AMG Managers Skyline Special Equities Skyline Asset Management, L.P. AMG Managers Special Equity Ranger Investment Management, L.P. Lord, Abbett & Co. LLC Smith Asset Management Group, L.P. Federated MDTA LLC FIXED INCOME FUNDS AMG Managers Doubleline Core Plus Bond DoubleLine Capital LP AMG Managers Global Income Opportunity AMG Managers Loomis Sayles Bond Loomis, Sayles & Company, L.P. |
| | | | | | |
| amgfunds.com | | | | | 103119 | | AR082 |
Item 2. Code of Ethics.
Registrant has adopted a Code of Ethics. See attached exhibit (a) (1).
Item 3. Audit Committee Financial Expert.
Registrant’s Board of Trustees has determined that independent Trustee Mr. Steven J. Paggioli qualifies as the Audit Committee Financial Expert. Mr. Paggioli is “independent” as such term is defined in FormN-CSR.
Item 4. Principal Accountant Fees and Services.
The aggregate fees billed for each of the last two fiscal years for professional services rendered by the principal accountant for the audit of the registrant’s annual financial statements or services that are normally provided by the accountant in connection with statutory and regulatory filings or engagements for those fiscal years are $313,951 for 2019 and $496,037 for 2018.
There were no fees billed by PwC to the Funds in its two recent fiscal years for services rendered for assurance and related services that are reasonably related to the performance of the audit or review of the Fund’s financial statements, but are not reported as Audit Fees (“Audit-Related Fees”).
For the Funds’ two most recent fiscal years, there were no Audit-Related Fees billed by PwC for engagements related directly to the operations and financial reporting of one or more Funds by a Fund Service Provider. A Fund Service Provider is (a) any investment adviser to the Fund (not including any Subadvisor whose role is primarily portfolio management and is subcontracted with or overseen by another investment adviser) or (b) any entity that provides ongoing services to the Fund and is controlling, controlled by or under common control with a Fund investment adviser described in (a).
The aggregate fees billed in each of the last two fiscal years for professional services rendered by the principal accountant for tax compliance, tax advice, and tax planning are $72,150 for 2019 and $98,939 for 2018.
For the Funds’ two most recent fiscal years, Tax Fees billed by PwC for engagements by Fund Service Providers that related directly to the operations and financial reporting of the Funds were $0 for fiscal 2019 and $0 for fiscal 2018, respectively.
The services for which Tax Fees were charged comprise all services performed by professional staff in PwC’s tax division except those services related to the audit. Typically, this category would include fees for tax compliance, tax planning, and tax
advice. Tax compliance, tax advice, and tax planning services include preparation of original and amended tax returns, claims for refund and tax payment-planning services, assistance with tax audits and appeals, tax advice related to mergers and acquisitions and requests for rulings or technical advice from taxing authorities.
There were no other fees billed by PwC to the Funds for all othernon-audit services (“Other Fees”) during the Funds’ two most recent fiscal years. During the same period, there were no Other Fees billed by PwC for engagements by Fund Service Providers that related directly to the operations and financial reporting of the Funds.
| | (e) | (1) According to policies adopted by the Audit Committee, services provided by PwC to the Funds must bepre-approved by the Audit Committee. On an annual basis, the Audit Committee reviews andpre-approves various types of services that PwC may perform for the Funds without specific approval of each engagement, subject to specified budget limitations. As contemplated by the Sarbanes-Oxley Act of 2002 and related SEC rules, the Audit Committee alsopre-approvesnon-audit services provided by PwC to any Fund Service Provider for any engagement that relates directly to the operations and financial reporting of the Funds. Any engagement that is not alreadypre-approved or that will exceed apre-approved budget must be submitted to the Audit Committee forpre-approval. The Chairman of the Audit Committee is authorized on behalf of the Board of Trustees and the Audit Committee to approve the engagement of PwC to performnon-audit services subject to certain conditions, including notification to the Audit Committee of suchpre-approval not later than the next meeting of the Audit Committee following the date of suchpre-approval. |
(e)(2) None.
| | (g) | The aggregate fees billed by PwC in 2019 and 2018 fornon-audit services rendered to the Funds and Fund Service Providers were $121,650 for 2019 and $148,439 for 2018. For the fiscal year ended October 31, 2019, this amount reflects the amounts disclosed above in Item 4(b),(c),(d), plus $49,500 in fees billed to the Fund Service Providers fornon-audit services that did not relate directly to the operations and financial reporting of the Funds. For the fiscal year ended October 31, 2018, this amount reflects the amounts disclosed above in Item 4(b),(c),(d), plus $49,500 in fees billed to the Fund Service Providers fornon-audit services that did not relate directly to the operations and financial reporting of the Funds. |
| | (h) | The Trust’s Audit Committee has considered whether the provision ofnon-audit services by registrant’s independent registered public accounting firm to the registrant’s investment adviser, and any entity controlling, controlled by, or under common control with the investment adviser that provided ongoing services to the registrant that were notpre-approved by the Committee (because such services did not relate directly to the |
| | operations and financial reporting of the registrant) was compatible with maintaining the independence of the independent registered public accounting firm. |
Item 5. Audit Committee of Listed Registrants.
Not applicable.
Item 6. Schedule of Investments.
| (a) | Schedule of Investments in securities of unaffiliated issuers as of the close of the reporting period is included as part of the report to shareholders filed under Item 1 of this form. |
| Item 7. | Disclosure of Proxy Voting Policies and Procedures forClosed-End Management Investment Companies. |
Not applicable.
Item 8. Portfolio Managers ofClosed-End Management Investment Companies.
Not applicable.
| Item 9. | Purchases of Equity Securities byClosed-End Management Investment Company and Affiliated Purchasers. |
Not applicable.
Item 10. Submission of Matters to a Vote of Security Holders.
Not applicable.
Item 11. Controls and Procedures.
| | (a) | The Registrant’s principal executive and principal financial officers have concluded, based on their evaluation of the registrant’s disclosure controls and procedures as of a date within 90 days of the filing of this report, that the Registrant’s disclosure controls and procedures are reasonably designed to ensure that information required to be disclosed by the Registrant on FormN-CSR is recorded, processed, summarized and reported within the required time periods and that information required to be disclosed by the registrant in the reports that it files or submits on FormN-CSR is accumulated and communicated to the Registrant’s management, including its principal executive and principal financial officers, as appropriate to allow timely decisions regarding required disclosure. |
| | (b) | There were no changes in the Registrant’s internal control over financial reporting during the period covered by this report that have materially affected, or are reasonably likely to materially affect, the internal control over financial reporting. |
| Item 12. | DISCLOSURE OF SECURITIES LENDING ACTIVITIES FORCLOSED-END MANAGEMENT INVESTMENT COMPANIES |
Not applicable.
Item 13. Exhibits.
| | (a)(1) | Any Code of Ethics or amendments hereto. Filed herewith. |
| | (a)(2) | Certifications pursuant to Rule30a-2(a) under the Investment Company Act of 1940 - Filed herewith. |
(b) Certifications pursuant to Rule30a-2(b) under the Investment Company Act of 1940 - Filed herewith.
SIGNATURES
Pursuant to the requirements of the Securities Exchange Act of 1934 and the Investment Company Act of 1940, the registrant has duly caused this report to be signed on its behalf by the undersigned, thereunto duly authorized.
| | |
| AMG FUNDS IV |
| |
| By: | | /s/ Keitha L. Kinne |
| | Keitha L. Kinne, Principal Executive Officer |
| |
| Date: | | January 23, 2020 |
Pursuant to the requirements of the Securities Exchange Act of 1934 and the Investment Company Act of 1940, this report has been signed below by the following persons on behalf of the registrant and in the capacities and on the dates indicated.
| | |
| By: | | /s/ Keitha L. Kinne |
| | Keitha L. Kinne, Principal Executive Officer |
| |
| Date: | | January 23, 2020 |
| |
| By: | | /s/ Thomas Disbrow |
| | Thomas Disbrow, Principal Financial Officer |
| |
| Date: | | January 23, 2020 |