UNITED STATES
SECURITIES AND EXCHANGE COMMISSION
Washington, D.C. 20549
FORM N-CSR
CERTIFIED SHAREHOLDER REPORT OF REGISTERED
MANAGEMENT INVESTMENT COMPANIES
Investment Company Act file number 811-08004
AMG Funds IV
(Exact name of registrant as specified in charter)
600 Steamboat Road, Suite 300,
Greenwich, Connecticut 06830
(Address of principal executive offices) (Zip code)
AMG Funds LLC
600 Steamboat Road, Suite 300,
Greenwich, Connecticut 06830
(Name and address of agent for service)
Registrant’s telephone number, including area code: (203) 299-3500
Date of fiscal year end: October 31
Date of reporting period: November 1, 2016 - October 31, 2017
(Annual Shareholder Report)
Item 1. Reports to Stockholders.
| | |
| | AMG Funds October 31, 2017 AMG Funds IV Class N, I, R & Z Shares Equity Fixed Income Alternative International Balanced |
| | | | |
| | | |
| amgfunds.com | | 103117 | | AR082 |
AMG Funds
Annual Report — October 31, 2017
Nothing contained herein is to be considered an offer, sale or solicitation of an offer to buy shares of any series of the AMG Funds family of mutual funds.Such offering is made only by prospectus, which includes details as to offering price and other material information.
| | |

| | Letter to Shareholders |
Dear Shareholder:
The last 12 months was a strong period for equity markets as the health of the global economy improved amid an environment of low volatility and higher returns. The S&P 500® Index, a widely followed barometer of the U.S. equity market, returned 23.63% during the fiscal year ended October 31, 2017. Small cap stocks performed even better with a 27.85% return for the small cap Russell 2000® Index.
Following the surprising U.S. presidential election results last November, interest rates spiked and pro-cyclical sectors rallied, especially financials, as the new administration’s plans for tax reform and increased fiscal spending drove a reflationary theme of stronger future economic growth. Equity market volatility fell to historic lows during the year while major indexes notched record highs. The rally in pro-cyclicals ebbed and flowed at times as investors assessed the Trump administration’s ability to enact pro-growth tax reform and infrastructure spending. Later in the year, elevated geopolitical tensions from saber-rattling in North Korea and devastation from three major hurricanes did not disrupt the equity bull market. In September, the S&P 500 Index marked eight straight quarters of positive returns and has not seen a pullback greater than 5% since the summer of 2016.
In total, all but one sector of the S&P 500 Index was positive during the last 12 months; however, there was significant dispersion in performance across sectors. Information technology and financials stocks led the Index with returns of 38.99% and 37.06%, respectively, while companies within the energy and telecommunication services sectors were the laggards with returns of 2.60% and -1.37%, respectively. International stock performance significantly improved from the prior year with a return of 23.64%, as measured by the MSCI All Country World ex-USA Index. The U.S. Dollar weakened during the year, providing a boost for international investments in Dollar terms. Additionally, emerging markets equities outperformed developed markets, as the MSCI Emerging Markets Index returned 26.45% for the year, compared with a 23.44% return for the developed market MSCI EAFE Index.
The U.S. bond market produced slightly positive returns for the year, as measured by the 0.90% return for the Bloomberg Barclays U.S. Aggregate Bond Index, a broad measure of U.S. bond market performance. Interest rates spiked following the presidential election leading to price declines for most bonds. Returns improved as interest rates generally fell through the spring and summer. Overall, 10-year U.S. Treasury Notes rose 54 basis points during the year to end at a yield of 2.38%. The U.S. Federal Reserve (the Fed) continued to normalize interest rates by hiking the federal funds rate three times and signaled further tightening in the future through benchmark interest rate increases and the gradual reduction of its massive balance sheet. Bond investors willing to accept more credit risk were rewarded with higher returns as high yield bonds performed strongly and credit spreads tightened. The Bloomberg Barclays U.S. Corporate High Yield Index ended the period with an 8.92% return.
AMG Funds appreciates the privilege of providing investment tools to you and your clients. Our foremost goal is to provide investment solutions that help our shareholders successfully reach their long-term investment goals. By partnering with AMG’s affiliated investment boutiques, AMG Funds provides access to a distinctive array of actively managed return-oriented investment strategies. Additionally, we oversee and distribute a number of complementary open-architecture mutual funds sub advised by unaffiliated investment managers.
We thank you for your continued confidence and investment in AMG Funds. You can rest assured that under all market conditions our team is focused on delivering excellent investment management services for your benefit.
Respectfully,

Jeffrey Cerutti
President
AMG Funds
| | | | | | | | | | | | | | |
Average Annual Total Returns | | Periods ended October 31, 2017* | |
| | | | | 1 Year | | | 3 Years | | | 5 Years | |
Stocks: | | | | | | | | | | | | | | |
Large Caps | | (S&P 500 Index) | | | 23.63 | % | | | 10.77 | % | | | 15.18 | % |
Small Caps | | (Russell 2000® Index) | | | 27.85 | % | | | 10.12 | % | | | 14.49 | % |
International | | (MSCI All Country World ex-USA Index) | | | 23.64 | % | | | 5.71 | % | | | 7.29 | % |
Bonds: | | | | | | | | | | | | | | |
Investment Grade | | (Bloomberg Barclays U.S. Aggregate Bond Index) | | | 0.90 | % | | | 2.40 | % | | | 2.04 | % |
High Yield | | (Bloomberg Barclays U.S. Corporate High Yield Index) | | | 8.92 | % | | | 5.56 | % | | | 6.27 | % |
Tax-exempt | | (Bloomberg Barclays U.S. Municipal Bond Index) | | | 2.19 | % | | | 3.04 | % | | | 3.00 | % |
Treasury Bills | | (ICE BofA Merrill Lynch 6-Month U.S. Treasury Bill Index) | | | 0.84 | % | | | 0.56 | % | | | 0.40 | % |
| * | Source: Factset. Past performance is no guarantee of future results. |
2
About Your Fund’s Expenses
As a shareholder of a Fund, you may incur two types of costs: (1) transaction costs, which may include sales charges (loads) on purchase payments; redemption fees; and exchange fees; and (2) ongoing costs, including management fees; distribution (12b-1) fees; and other Fund expenses. This example is intended to help you understand your ongoing costs (in dollars) of investing in the Fund and to compare these costs with the ongoing costs of investing in other mutual funds. The example is based on $1,000 invested at the beginning of the period and held for the entire period as indicated below.
ACTUAL EXPENSES
The first line of the following table provides information about the actual account values and
actual expenses. You may use the information in this line, together with the amount you invested, to estimate the expenses that you paid over the period. Simply divide your account value by $1,000 (for example, an $8,600 account value divided by $1,000 = 8.6), then multiply the result by the number in the first line under the heading entitled “Expenses Paid During Period” to estimate the expenses you paid on your account during this period.
HYPOTHETICAL EXAMPLE FOR COMPARISON PURPOSES
The second line of the following table provides information about hypothetical account values and hypothetical expenses based on the Fund’s actual expense ratio and an assumed annual rate of return of 5% before expenses, which is not the Fund’s
actual return. The hypothetical account values and expenses may not be used to estimate the actual ending account balance or expenses you paid for the period. You may use this information to compare the ongoing costs of investing in the Fund and other funds by comparing this 5% hypothetical example with the 5% hypothetical examples that appear in the shareholder reports of other funds.
Please note that the expenses shown in the table are meant to highlight your ongoing costs only and do not reflect any transactional costs, such as sales charges (loads), redemption fees, or exchange fees. Therefore, the second line of the table is useful in comparing ongoing costs only, and will not help you determine the relative total costs of owning different funds.
| | | | | | | | | | | | | | | | |
Six Months Ended
October 31, 2017 | | Expense
Ratio for
the Period | | | Beginning
Account
Value
05/01/17 | | | Ending
Account
Value
10/31/17 | | | Expenses
Paid
During
the Period* | |
AMG Managers Fairpointe ESG Equity Fund | |
Based on Actual Fund Return | | | | | | | | | |
Class N | | | 1.09 | % | | $ | 1,000 | | | $ | 1,030 | | | $ | 5.58 | |
Class I | | | .90 | % | | $ | 1,000 | | | $ | 1,030 | | | $ | 4.61 | |
Based on Hypothetical 5% Annual Return | |
Class N | | | 1.09 | % | | $ | 1,000 | | | $ | 1,020 | | | $ | 5.55 | |
Class I | | | .90 | % | | $ | 1,000 | | | $ | 1,021 | | | $ | 4.58 | |
| | | | | | | | | | | | | | | | |
Six Months Ended
October 31, 2017 | | Expense
Ratio for
the Period | | | Beginning
Account
Value
05/01/17 | | | Ending
Account
Value
10/31/17 | | | Expenses
Paid
During
the Period* | |
AMG River Road Focused Absolute Value Fund | |
Based on Actual Fund Return | |
Class N | | | 1.00 | % | | $ | 1,000 | | | $ | 1,022 | | | $ | 5.10 | |
Class I | | | .75 | % | | $ | 1,000 | | | $ | 1,023 | | | $ | 3.82 | |
Class Z** | | | .71 | % | | $ | 1,000 | | | $ | 979 | | | $ | 0.60 | |
Based on Hypothetical 5% Annual Return | |
Class N | | | 1.00 | % | | $ | 1,000 | | | $ | 1,020 | | | $ | 5.09 | |
Class I | | | .75 | % | | $ | 1,000 | | | $ | 1,021 | | | $ | 3.82 | |
Class Z** | | | .71 | % | | $ | 1,000 | | | $ | 1,022 | | | $ | 3.62 | |
3
About Your Fund’s Expenses (continued)
| | | | | | | | | | | | | | | | |
Six Months Ended
October 31, 2017 | | Expense Ratio for
the Period | | | Beginning
Account
Value
05/01/17 | | | Ending
Account
Value
10/31/17 | | | Expenses
Paid
During
the Period* | |
AMG Managers Montag & Caldwell Growth Fund | |
Based on Actual Fund Return | |
Class N | | | 1.15 | % | | $ | 1,000 | | | $ | 1,084 | | | $ | 6.04 | |
Class I | | | .94 | % | | $ | 1,000 | | | $ | 1,085 | | | $ | 4.94 | |
Class R | | | 1.41 | % | | $ | 1,000 | | | $ | 1,083 | | | $ | 7.40 | |
Based on Hypothetical 5% Annual Return | |
Class N | | | 1.15 | % | | $ | 1,000 | | | $ | 1,019 | | | $ | 5.85 | |
Class I | | | .94 | % | | $ | 1,000 | | | $ | 1,020 | | | $ | 4.79 | |
Class R | | | 1.41 | % | | $ | 1,000 | | | $ | 1,018 | | | $ | 7.17 | |
AMG River Road Dividend All Cap Value Fund | |
Based on Actual Fund Return | |
Class N | | | 1.13 | % | | $ | 1,000 | | | $ | 1,035 | | | $ | 5.79 | |
Class I | | | .87 | % | | $ | 1,000 | | | $ | 1,036 | | | $ | 4.46 | |
Class Z** | | | .78 | % | | $ | 1,000 | | | $ | 1,006 | | | $ | 0.66 | |
Based on Hypothetical 5% Annual Return | |
Class N | | | 1.13 | % | | $ | 1,000 | | | $ | 1,020 | | | $ | 5.75 | |
Class I | | | .87 | % | | $ | 1,000 | | | $ | 1,021 | | | $ | 4.43 | |
Class Z** | | | .78 | % | | $ | 1,000 | | | $ | 1,021 | | | $ | 3.97 | |
AMG River Road Dividend All Cap Value Fund II | |
Based on Actual Fund Return | |
Class N | | | 1.26 | % | | $ | 1,000 | | | $ | 1,039 | | | $ | 6.48 | |
Class I | | | .92 | % | | $ | 1,000 | | | $ | 1,041 | | | $ | 4.73 | |
Class Z** | | | .90 | % | | $ | 1,000 | | | $ | 1,007 | | | $ | 0.77 | |
Based on Hypothetical 5% Annual Return | |
Class N | | | 1.26 | % | | $ | 1,000 | | | $ | 1,019 | | | $ | 6.41 | |
Class I | | | .92 | % | | $ | 1,000 | | | $ | 1,021 | | | $ | 4.69 | |
Class Z** | | | .90 | % | | $ | 1,000 | | | $ | 1,021 | | | $ | 4.58 | |
| | | | | | | | | | | | | | | | |
Six Months Ended
October 31, 2017 | | Expense Ratio for
the Period | | | Beginning
Account
Value
05/01/17 | | | Ending
Account
Value
10/31/17 | | | Expenses
Paid
During
the Period* | |
AMG Managers Fairpointe Mid Cap Fund | |
Based on Actual Fund Return | |
Class N | | | 1.13 | % | | $ | 1,000 | | | $ | 979 | | | $ | 5.64 | |
Class I | | | .88 | % | | $ | 1,000 | | | $ | 981 | | | $ | 4.39 | |
Class Z** | | | .79 | % | | $ | 1,000 | | | $ | 972 | | | $ | 0.66 | |
Based on Hypothetical 5% Annual Return | |
Class N | | | 1.13 | % | | $ | 1,000 | | | $ | 1,020 | | | $ | 5.75 | |
Class I | | | .88 | % | | $ | 1,000 | | | $ | 1,021 | | | $ | 4.48 | |
Class Z** | | | .79 | % | | $ | 1,000 | | | $ | 1,021 | | | $ | 4.02 | |
AMG Managers Montag & Caldwell Mid Cap Growth Fund | |
Based on Actual Fund Return | |
Class N | | | 1.23 | % | | $ | 1,000 | | | $ | 1,070 | | | $ | 6.42 | |
Class I | | | 1.00 | % | | $ | 1,000 | | | $ | 1,071 | | | $ | 5.22 | |
Based on Hypothetical 5% Annual Return | |
Class N | | | 1.23 | % | | $ | 1,000 | | | $ | 1,019 | | | $ | 6.26 | |
Class I | | | 1.00 | % | | $ | 1,000 | | | $ | 1,020 | | | $ | 5.09 | |
AMG Managers LMCG Small Cap Growth Fund | |
Based on Actual Fund Return | |
Class N | | | 1.28 | % | | $ | 1,000 | | | $ | 1,057 | | | $ | 6.64 | |
Class I | | | 1.03 | % | | $ | 1,000 | | | $ | 1,059 | | | $ | 5.34 | |
Based on Hypothetical 5% Annual Return | |
Class N | | | 1.28 | % | | $ | 1,000 | | | $ | 1,019 | | | $ | 6.51 | |
Class I | | | 1.03 | % | | $ | 1,000 | | | $ | 1,020 | | | $ | 5.24 | |
AMG River Road Small-Mid Cap Value Fund | |
Based on Actual Fund Return | |
Class N | | | 1.33 | % | | $ | 1,000 | | | $ | 1,041 | | | $ | 6.84 | |
Class I | | | 1.08 | % | | $ | 1,000 | | | $ | 1,042 | | | $ | 5.56 | |
Class Z** | | | 1.04 | % | | $ | 1,000 | | | $ | 987 | | | $ | 0.88 | |
Based on Hypothetical 5% Annual Return | |
Class N | | | 1.33 | % | | $ | 1,000 | | | $ | 1,019 | | | $ | 6.77 | |
Class I | | | 1.08 | % | | $ | 1,000 | | | $ | 1,020 | | | $ | 5.50 | |
Class Z** | | | 1.04 | % | | $ | 1,000 | | | $ | 1,020 | | | $ | 5.30 | |
4
About Your Fund’s Expenses (continued)
| | | | | | | | | | | | | | | | |
Six Months Ended
October 31, 2017 | | Expense
Ratio for
the Period | | | Beginning
Account
Value
05/01/17 | | | Ending
Account
Value
10/31/17 | | | Expenses
Paid
During
the Period* | |
AMG River Road Small Cap Value Fund | |
Based on Actual Fund Return | | | | | | | | | |
Class N | | | 1.37 | % | | $ | 1,000 | | | $ | 1,035 | | | $ | 7.03 | |
Class I | | | 1.12 | % | | $ | 1,000 | | | $ | 1,037 | | | $ | 5.75 | |
Class Z** | | | 1.03 | % | | $ | 1,000 | | | $ | 1,000 | | | $ | 0.87 | |
Based on Hypothetical 5% Annual Return | |
Class N | | | 1.37 | % | | $ | 1,000 | | | $ | 1,018 | | | $ | 6.97 | |
Class I | | | 1.12 | % | | $ | 1,000 | | | $ | 1,020 | | | $ | 5.70 | |
Class Z** | | | 1.03 | % | | $ | 1,000 | | | $ | 1,020 | | | $ | 5.24 | |
AMG Managers Silvercrest Small Cap Fund | |
Based on Actual Fund Return | | | | | | | | | |
Class N | | | 1.39 | % | | $ | 1,000 | | | $ | 1,073 | | | $ | 7.26 | |
Class I | | | 1.15 | % | | $ | 1,000 | | | $ | 1,074 | | | $ | 6.01 | |
Class Z** | | | 1.08 | % | | $ | 1,000 | | | $ | 1,011 | | | $ | 0.92 | |
Based on Hypothetical 5% Annual Return | |
Class N | | | 1.39 | % | | $ | 1,000 | | | $ | 1,018 | | | $ | 7.07 | |
Class I | | | 1.15 | % | | $ | 1,000 | | | $ | 1,019 | | | $ | 5.85 | |
Class Z** | | | 1.08 | % | | $ | 1,000 | | | $ | 1,020 | | | $ | 5.50 | |
AMG GW&K U.S. Small Cap Growth Fund | |
Based on Actual Fund Return | | | | | | | | | |
Class N | | | 1.24 | % | | $ | 1,000 | | | $ | 1,112 | | | $ | 6.60 | |
Class I | | | 1.03 | % | | $ | 1,000 | | | $ | 1,113 | | | $ | 5.49 | |
Class Z | | | .90 | % | | $ | 1,000 | | | $ | 1,115 | | | $ | 4.80 | |
Based on Hypothetical 5% Annual Return | |
Class N | | | 1.24 | % | | $ | 1,000 | | | $ | 1,019 | | | $ | 6.31 | |
Class I | | | 1.03 | % | | $ | 1,000 | | | $ | 1,020 | | | $ | 5.24 | |
Class Z | | | .90 | % | | $ | 1,000 | | | $ | 1,021 | | | $ | 4.58 | |
| | | | | | | | | | | | | | | | |
Six Months Ended
October 31, 2017 | | Expense
Ratio for
the Period | | | Beginning
Account
Value
05/01/17 | | | Ending
Account
Value
10/31/17 | | | Expenses
Paid
During
the Period* | |
AMG Managers DoubleLine Core Plus Bond Fund | |
Based on Actual Fund Return | |
Class N | | | .94 | % | | $ | 1,000 | | | $ | 1,020 | | | $ | 4.79 | |
Class I | | | .68 | % | | $ | 1,000 | | | $ | 1,021 | | | $ | 3.46 | |
Class Z** | | | .60 | % | | $ | 1,000 | | | $ | 1,002 | | | $ | 0.51 | |
Based on Hypothetical 5% Annual Return | |
Class N | | | .94 | % | | $ | 1,000 | | | $ | 1,020 | | | $ | 4.79 | |
Class I | | | .68 | % | | $ | 1,000 | | | $ | 1,022 | | | $ | 3.47 | |
Class Z** | | | .60 | % | | $ | 1,000 | | | $ | 1,022 | | | $ | 3.06 | |
AMG Managers Lake Partners LASSO Alternatives Fund | |
Based on Actual Fund Return | |
Class N | | | 1.40 | % | | $ | 1,000 | | | $ | 1,029 | | | $ | 7.16 | |
Class I | | | 1.15 | % | | $ | 1,000 | | | $ | 1,031 | | | $ | 5.89 | |
Based on Hypothetical 5% Annual Return | |
Class N | | | 1.40 | % | | $ | 1,000 | | | $ | 1,018 | | | $ | 7.12 | |
Class I | | | 1.15 | % | | $ | 1,000 | | | $ | 1,019 | | | $ | 5.85 | |
AMG River Road Long-Short Fund*** | |
Based on Actual Fund Return | |
Class N | | | 1.45 | % | | $ | 1,000 | | | $ | 1,035 | | | $ | 7.44 | |
Class I | | | 1.20 | % | | $ | 1,000 | | | $ | 1,037 | | | $ | 6.16 | |
Class Z** | | | 1.12 | % | | $ | 1,000 | | | $ | 997 | | | $ | 0.95 | |
Based on Hypothetical 5% Annual Return | |
Class N | | | 1.45 | % | | $ | 1,000 | | | $ | 1,018 | | | $ | 7.37 | |
Class I | | | 1.20 | % | | $ | 1,000 | | | $ | 1,019 | | | $ | 6.11 | |
Class Z** | | | 1.12 | % | | $ | 1,000 | | | $ | 1,020 | | | $ | 5.70 | |
AMG Managers Guardian Capital Global Dividend Fund | |
Based on Actual Fund Return | |
Class N | | | .91 | % | | $ | 1,000 | | | $ | 1,086 | | | $ | 4.78 | |
Class I | | | 1.05 | % | | $ | 1,000 | | | $ | 1,085 | | | $ | 5.52 | |
Based on Hypothetical 5% Annual Return | |
Class N | | | .91 | % | | $ | 1,000 | | | $ | 1,021 | | | $ | 4.63 | |
Class I | | | 1.05 | % | | $ | 1,000 | | | $ | 1,020 | | | $ | 5.35 | |
5
About Your Fund’s Expenses (continued)
| | | | | | | | | | | | | | | | |
Six Months Ended
October 31, 2017 | | Expense
Ratio for
the Period | | | Beginning
Account
Value
05/01/17 | | | Ending
Account
Value
10/31/17 | | | Expenses
Paid
During
the Period* | |
AMG Managers Pictet International Fund | |
Based on Actual Fund Return | | | | | | | | | |
Class N | | | 1.30 | % | | $ | 1,000 | | | $ | 1,104 | | | $ | 6.89 | |
Class I | | | 1.03 | % | | $ | 1,000 | | | $ | 1,105 | | | $ | 5.46 | |
Class Z** | | | .94 | % | | $ | 1,000 | | | $ | 1,017 | | | $ | 0.81 | |
Based on Hypothetical 5% Annual Return | |
Class N | | | 1.30 | % | | $ | 1,000 | | | $ | 1,019 | | | $ | 6.61 | |
Class I | | | 1.03 | % | | $ | 1,000 | | | $ | 1,020 | | | $ | 5.24 | |
Class Z** | | | .94 | % | | $ | 1,000 | | | $ | 1,020 | | | $ | 4.79 | |
AMG Managers Value Partners Asia Dividend Fund | |
Based on Actual Fund Return | | | | | | | | | |
Class N | | | 1.19 | % | | $ | 1,000 | | | $ | 1,163 | | | $ | 6.49 | |
Class I | | | 1.15 | % | | $ | 1,000 | | | $ | 1,163 | | | $ | 6.27 | |
Based on Hypothetical 5% Annual Return | |
Class N | | | 1.19 | % | | $ | 1,000 | | | $ | 1,019 | | | $ | 6.06 | |
Class I | | | 1.15 | % | | $ | 1,000 | | | $ | 1,019 | | | $ | 5.85 | |
AMG Managers Montag & Caldwell Balanced Fund | |
Based on Actual Fund Return | | | | | | | | | |
Class N | | | 1.19 | % | | $ | 1,000 | | | $ | 1,050 | | | $ | 6.15 | |
Class I | | | 1.10 | % | | $ | 1,000 | | | $ | 1,051 | | | $ | 5.69 | |
Based on Hypothetical 5% Annual Return | | | | | |
Class N | | | 1.19 | % | | $ | 1,000 | | | $ | 1,019 | | | $ | 6.06 | |
Class I | | | 1.10 | % | | $ | 1,000 | | | $ | 1,020 | | | $ | 5.60 | |
| * | Expenses are equal to the Fund’s annualized expense ratio multiplied by the average account value over the period, multiplied by the number of days in the most recent fiscal half-year (184), then divided by 365. |
| ** | Commenced operations on October 2, 2017 and as such, the expenses are equal to the Fund’s annualized expense ratio multiplied by the average account value over the period, multiplied by the number of days in the most recent fiscal half-year (31), then divided by 365. |
| *** | Excludes interest expense and dividends on short positions. If included, your annualized expense ratios would be 3.90%, 3.65% and 3.38% for Class N, Class I and Class Z, respectively, and your actual and hypothetical expenses paid during the period would be $20.01 and $19.71, $18.74 and $18.46 and $2.87 and $17.11 for Class N, Class I and Class Z, respectively. |
6
AMG Managers Fairpointe ESG Equity Fund
Portfolio Manager’s Comments (unaudited)
OVERVIEW
The AMG Managers Fairpointe ESG Equity Fund (the “Fund”), (formerly AMG Managers Fairpointe Focused Equity Fund) Class N shares returned 21.83% for the fiscal year ended October 31, 2017, slightly underperforming the Russell 1000® Index, which returned 23.67%. The Fund’s strategy is characterized by a long-term view, a portfolio of high-conviction investments, a focus on purchasing securities at a significant discount to fair value, and a willingness to hold (and add to) positions through volatile markets.
With the Fund’s transition from Focused Equity to the ESG Strategy, the Fund sold several positions that did not fit our mandate of owning companies with strong environmental, social and governance records. We have developed internal guidelines and processes to evaluate each company based on these factors. Fairpointe has a history of active engagement on governance issues and has always been environmentally and socially aware. We have now formalized these practices into written guidelines.
FISCAL YEAR REVIEW
The Fund’s largest contributors to performance during the period were FMC Corporation (FMC), Cree, Inc. (CREE), Kennametal Inc. (KMT), Unilever PLC (UL), and VMware, Inc. (VMW).
FMC Corporation recently completed the acquisition of DuPont’s agricultural crop protection business in an accretive transaction. The company also plans to spin off its small but fast growing and highly profitable lithium business, which is benefiting from the growth in electric vehicles. These corporate restructurings created significant value this year.
Cree’s stock price increased based on the newly hired CEO’s semiconductor background and his strategic review of the company. Investors also expect more focus on Cree’s faster growing chip business.
Kennametal’s stock price was driven by cost reductions and recovering end markets, which resulted in improved pricing and demand.
Detractors from performance for the fiscal year were Mattel, Inc. (MAT), General Electric Company (GE), Discovery Communications, Inc. (DISCA), Ralph Lauren Corporation (RL), and Hormel Foods Corporation (HRL).
Mattel has a new management team led by Margo Georgiadis. They are refreshing core brands, simplifying the portfolio while significantly reducing costs, and focusing on the emerging markets in China and India. This has been a difficult year for Mattel with the bankruptcy of Toys R Us, yet we remain optimistic about the strategic plan and find the valuation very compelling.
General Electric also has a new CEO, John Flannery, with a dramatic transformation plan; his review has yielded a reduced outlook and a significant cut in the dividend. Mr. Flannery is focused on cash flow and capital allocation, which is refreshing and appropriate, but disappointing in the timing of the turnaround.
Hormel Foods is a new position purchased on the thesis that the market has not given them credit for their expanded portfolio of value-added products. Higher input costs, resulted in a tough quarter, which we believe is a temporary issue. The company has a history of strong returns and a conservative balance sheet and is cited as one of the top employers in the country.
ADDITIONS AND ELIMINATIONS
Fifteen new stocks were added to the Fund during the fiscal year—Akamai Technologies, Bank of New York Mellon, DXC Technology, Dean Foods, General Electric, Hormel Foods, IBM, Lions Gate Entertainment, Mattel, Micro Focus Intl, Patterson Companies, Qualcomm, Ralph Lauren, Varex Imaging Corp, and WPP PLC. Three of these were spin-offs from existing holdings (DXC, Micro Focus and Varex Imaging).
Qualcomm was purchased with the thesis that the significant intellectual property in its patent portfolio was being dramatically discounted by the market. We do not believe the IP battle with Apple will have the negative consequences the market is expecting.
The experienced management team has created a unique technology franchise that, in our opinion, is underappreciated and not properly valued.
Since the close of the fiscal year, both Qualcomm and Mattel have had takeover offers that have resulted in a significant move in their stock prices. While they both have rebuffed the offers, we believe the development demonstrates the significant undervaluation of these companies.
Ten holdings were eliminated during the fiscal year—Apache Corp, Baker Hughes, Fluor Corp, Greif, News Corp, Ralph Lauren, Staples, Transocean, Twenty-First Century FOX, and Varex Imaging Corp.
The Fund remains overweight relative to its benchmarks in the consumer discretionary, technology, and industrials sectors. This outcome is driven by our fundamental, bottom up valuation-based approach to stock selection. As our holding period is generally three to five years, we advocate patience to allow the discount between current security prices and our estimates of fair value to narrow.
OUTLOOK
The U.S. economy continues its recovery. We would not be surprised to see increased volatility in equity markets due to high equity valuations; we will seek to capitalize on opportunities emerging due to near-term disruptions.
The Fund’s holdings remain attractively positioned relative to its equity benchmark and other asset classes (e.g. fixed income). As of October 31, 2017, the Fund’s holdings trade at 16.3x 2018 consensus earnings estimates, while the Russell 1000® trades at 17.3x. Moreover, the Fund’s holdings trade at 1.1x enterprise value/trailing 12 months’ revenue, which is a substantial discount to the Russell 1000® benchmark of 2.1x.1
The views expressed represent the opinions Fairpointe Capital LLC as of October 31, 2017, and are not intended as a forecast or guarantee of future results and are subject to change without notice.
7
AMG Managers Fairpointe ESG Equity Fund
Portfolio Manager’s Comments (continued)
CUMULATIVE TOTAL RETURN PERFORMANCE
The AMG Managers Fairpointe ESG Equity Fund’s (formerly known as AMG Managers Fairpointe Focused Equity Fund) cumulative total return is based on the daily change in net asset value (NAV), and assumes that all dividends and distributions were reinvested. The graph compares a hypothetical $10,000 investment made in AMG Managers Fairpointe ESG Equity Fund’s Class N shares on December 24, 2014, to a $10,000 investment made in the Russell 1000® Index for the same time period. The graph and table do not reflect the deduction of taxes that a shareholder would pay on a Fund distribution or redemption of shares. The listed returns for the Fund are net of expenses and the returns for the index exclude expenses. Total returns would have been lower had certain expenses not been reduced.
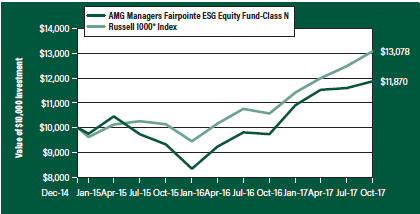
The table below shows the average annual total returns for AMG Managers Fairpointe ESG Equity Fund and the Russell 1000® Index for the same time periods ended October 31, 2017.
| | | | | | | | | | | | |
| Average Annual Total Returns 1 | | One Year | | | Since Inception | | | Inception Date | |
AMG Managers Fairpointe ESG Equity Fund2, 3, 4, 5, 6, 7, 8 | | | | | | | | | | | | |
Class N | | | 21.83 | % | | | 6.19 | % | | | 12/24/14 | |
Class I | | | 22.04 | % | | | 6.41 | % | | | 12/24/14 | |
Russell 1000® Index9 | | | 23.67 | % | | | 9.85 | % | | | 12/24/14 | † |
The performance data shown represents past performance. Past performance is not a guarantee of future results. Current performance may be lower or higher than the performance data quoted. The investment return and principal value of an investment will fluctuate so that an investor’s shares, when redeemed, may be worth more or less than their original cost.
Investors should carefully consider the Fund’s investment objectives, risks, charges and expenses before investing. For performance information through the most recent month end, current net asset values per share for the Fund and other information, please call 800.835.3879 or visit our website at amgfunds.com for a free prospectus. Read it carefully before investing or sending money.
Distributed by AMG Distributors, Inc., member FINRA/SIPC.
| † | Date reflects the inception date of the Fund, not the index. |
| 1 | Total return equals income yield plus share price change and assumes reinvestment of all dividends and capital gain distributions. Returns are net of fees and may reflect offsets of Fund expenses as described in the prospectus. No adjustment has been made for taxes payable by shareholders on their reinvested dividends and capital gain distributions. Returns for periods greater than one year are annualized. The listed returns on the Fund are net of expenses and based on the published NAV as of October 31, 2017. All returns are in U.S. dollars ($). |
| 2 | Applying the Fund’s ESG investment criteria may result in the selection or exclusion of securities of certain issuers for reasons other than performance, and the Fund may underperform funds that do not utilize an ESG investment strategy. The application of this strategy may affect the Fund’s exposure to certain companies, sectors, regions, countries or types of investments, which could negatively impact the Fund’s performance depending on whether such investments are in or out of favor. Applying ESG criteria to investment decisions is qualitative and subjective by nature, and there is no guarantee that the criteria utilized by the Subadviser or any judgment exercised by the Subadviser will reflect the beliefs or values of any particular investor. |
| 3 | A greater percentage of the Fund’s holdings may be focused in a smaller number of securities which may place the Fund at greater risk than a more diversified fund. |
| 4 | Investments in international securities are subject to certain risks of overseas investing including currency fluctuations and changes in political and economic conditions, which could result in significant market fluctuations. |
| 5 | The Fund is subject to risks associated with investments in mid-capitalization companies such as greater price volatility, lower trading volume, and less liquidity than the stocks of larger, more established companies. |
| 6 | The Fund is subject to risks associated with investments in small-capitalization companies, such as erratic earnings patterns, competitive conditions, limited earnings history and a reliance on one or a limited number of products. |
| 7 | The Fund invests in growth stocks, which may be more sensitive to market movements because their prices tend to reflect future investor expectations rather than just current profits. Growth stocks may underperform value stocks during given periods. |
| 8 | The Fund invests in value stocks, which may perform differently from the market as a whole and may be undervalued by the market for a long period of time. |
| 9 | The Russell 1000® Index measures the performance of approximately 1,000 of the largest securities based on a combination of their market cap and current index membership. The Russell 1000® represents approximately 92% of the U.S. market. Unlike the Fund, the Russell 1000® Index is unmanaged, is not available for investment and does not incur expenses. |
The Russell Indices are a trademark of the London Stock Exchange Group companies.
Not FDIC insured, nor bank guaranteed. May lose value.
8
| | |
| AMG Managers Fairpointe ESG Equity Fund | | October 31, 2017 |
| Fund Snapshots (unaudited) | | |
PORTFOLIO BREAKDOWN
| | | | |
| | | % of | |
Sector | | Net Assets | |
Information Technology | | | 31.8 | |
Consumer Discretionary | | | 18.7 | |
Industrials | | | 12.5 | |
Consumer Staples | | | 12.2 | |
Financials | | | 9.0 | |
Health Care | | | 8.3 | |
Materials | | | 3.8 | |
Energy | | | 1.3 | |
Other Assets Less Liabilities | | | 2.4 | |
TOP TEN HOLDINGS
| | | | |
| | | % of | |
Security Name | | Net Assets | |
Cree, Inc. | | | 4.9 | |
Quanta Services, Inc. | | | 4.2 | |
Unilever PLC, Sponsored ADR | | | 4.2 | |
Varian Medical Systems, Inc. | | | 4.1 | |
WPP PLC, Sponsored ADR | | | 4.0 | |
International Business Machines Corp. | | | 4.0 | |
Northern Trust Corp. | | | 4.0 | |
VMware, Inc., Class A | | | 3.9 | |
FMC Corp. | | | 3.8 | |
Liberty Interactive Corp. QVC Group, Class A | | | 3.8 | |
| | | | |
Top Ten as a Group | | | 40.9 | |
| | | | |
Because a fund’s strategy may result in multiple investments in particular sectors of the economy, its performance may depend on the performance of those sectors and may fluctuate more widely than investments diversified across more sectors. For additional information on these and other risk considerations, please see the Fund’s prospectus.
Any sectors, industries, or securities discussed should not be perceived as investment recommendations. Mention of a specific security should not be considered a recommendation to buy or solicitation to sell that security. Specific securities mentioned in this report may have been sold from the Fund’s portfolio of investments by the time you receive this report.
9
| | |
| AMG Managers Fairpointe ESG Equity Fund | | October 31, 2017 |
| |
| Schedule of Portfolio Investments | | |
| | | | | | | | |
| | | Shares | | | Value | |
Common Stocks – 97.6% | | | | | | | | |
Consumer Discretionary – 18.7% | | | | | | | | |
Carnival Corp. | | | 1,400 | | | $ | 92,946 | |
Discovery Communications, Inc., Class C * | | | 2,800 | | | | 49,868 | |
Liberty Interactive Corp. QVC Group, Class A * | | | 11,000 | | | | 249,920 | |
Lions Gate Entertainment Corp., Class B * | | | 7,100 | | | | 196,386 | |
Mattel, Inc. | | | 14,326 | | | | 202,283 | |
Scholastic Corp. | | | 4,600 | | | | 169,924 | |
WPP PLC, Sponsored ADR (United Kingdom) | | | 3,000 | | | | 264,870 | |
Total Consumer Discretionary | | | | | | | 1,226,197 | |
Consumer Staples – 12.2% | | | | | | | | |
Dean Foods Co. | | | 11,300 | | | | 110,175 | |
Hormel Foods Corp. | | | 6,600 | | | | 205,656 | |
PepsiCo, Inc. | | | 500 | | | | 55,115 | |
Unilever PLC, Sponsored ADR (United Kingdom) | | | 4,800 | | | | 271,920 | |
Wal-Mart Stores, Inc. | | | 1,800 | | | | 157,158 | |
Total Consumer Staples | | | | | | | 800,024 | |
Energy – 1.3% | | | | | | | | |
BP PLC, Sponsored ADR (United Kingdom) | | | 2,100 | | | | 85,407 | |
Financials – 9.0% | | | | | | | | |
Legg Mason, Inc. | | | 5,400 | | | | 206,172 | |
Northern Trust Corp. | | | 2,800 | | | | 261,856 | |
The Bank of New York Mellon Corp. | | | 2,400 | | | | 123,480 | |
Total Financials | | | | | | | 591,508 | |
Health Care – 8.3% | | | | | | | | |
Hologic, Inc. * | | | 4,100 | | | | 155,185 | |
Patterson Cos, Inc. | | | 3,100 | | | | 114,700 | |
Varian Medical Systems, Inc. * | | | 2,600 | | | | 270,894 | |
Total Health Care | | | | | | | 540,779 | |
Industrials – 12.5% | | | | | | | | |
AGCO Corp. | | | 2,900 | | | | 198,853 | |
General Electric Co. | | | 7,700 | | | | 155,232 | |
| | | | | | | | |
| | | Shares | | | Value | |
Kennametal, Inc. | | | 4,400 | | | $ | 192,060 | |
Quanta Services, Inc. * | | | 7,300 | | | | 275,429 | |
Total Industrials | | | | | | | 821,574 | |
Information Technology – 31.8% | | | | | | | | |
Akamai Technologies, Inc. * | | | 3,800 | | | | 198,550 | |
Cisco Systems, Inc. | | | 5,000 | | | | 170,750 | |
Cree, Inc. * | | | 9,000 | | | | 321,300 | |
DXC Technology Co. | | | 1,426 | | | | 130,508 | |
Hewlett Packard Enterprise Co. | | | 12,400 | | | | 172,608 | |
HP, Inc. | | | 9,300 | | | | 200,415 | |
International Business Machines Corp. | | | 1,700 | | | | 261,902 | |
Micro Focus International PLC, Sponsored ADR (United Kingdom)* | | | 1,730 | | | | 60,429 | |
QUALCOMM, Inc. | | | 2,200 | | | | 112,222 | |
Teradata Corp. * | | | 6,000 | | | | 200,700 | |
VMware, Inc., Class A * | | | 2,100 | | | | 251,349 | |
Total Information Technology | | | | | | | 2,080,733 | |
Materials – 3.8% | | | | | | | | |
FMC Corp. | | | 2,700 | | | | 250,722 | |
Total Common Stocks
(Cost $5,029,746) | | | | | | | 6,396,944 | |
Short-Term Investments – 2.4% | | | | | | | | |
Other Investment Companies – 2.4% | | | | | | | | |
Dreyfus Institutional Preferred Government Money Market Fund, Institutional Class Shares, 1.00%1 | | | 155,911 | | | | 155,911 | |
Total Short-Term Investments
(Cost $155,911) | | | | | | | 155,911 | |
Total Investments – 100.0%
(Cost $5,185,657) | | | | | | | 6,552,855 | |
Other Assets, less Liabilities – 0.0%# | | | | | | | 968 | |
Net Assets – 100.0% | | | | | | $ | 6,553,823 | |
| * | Non-income producing security. |
| 1 | Yield shown represents the October 31, 2017, seven day average yield, which refers to the sum of the previous seven days’ dividends paid, expressed as an annual percentage. |
ADR American Depositary Receipt
The accompanying notes are an integral part of these financial statements.
10
| | |
| AMG Managers Fairpointe ESG Equity Fund | | |
| |
| Schedule of Portfolio Investments (continued) | | |
The following table summarizes the inputs used to value the Fund’s investments by the fair value hierarchy levels as of October 31, 2017:
| | | | | | | | | | | | | | | | |
| | | Level 1 | | | Level 2 | | | Level 3 | | | Total | |
Investments in Securities | | | | | | | | | | | | | | | | |
Common Stocks† | | $ | 6,396,944 | | | | — | | | | — | | | $ | 6,396,944 | |
Short-Term Investments | | | 155,911 | | | | — | | | | — | | | | 155,911 | |
| | | | | | | | | | | | | | | | |
Total Investments in Securities | | $ | 6,552,855 | | | | — | | | | — | | | $ | 6,552,855 | |
| | | | | | | | | | | | | | | | |
| † | All common stocks held in the Fund are Level 1 securities. For a detailed breakout of common stocks by major industry classification, please refer to the Fund’s Schedule of Portfolio Investments. |
As of October 31, 2017, the Fund had no transfers between levels from the beginning of the reporting period.
The accompanying notes are an integral part of these financial statements.
11
AMG River Road Focused Absolute Value Fund
Portfolio Manager’s Comments (unaudited)
OVERVIEW
For the fiscal year ended October 31, 2017, the AMG River Road Focused Absolute Value Fund (the “Fund”) Class N shares returned 17.42%, compared to the 18.30% return for the Russell 3000® Value Index.
PERFORMANCE REVIEW
The sector with the largest positive contribution to relative return was real estate, which benefited from strong stock selection. The Fund’s relative return also benefited from a lack of exposure to the energy sector. This was partially offset by negative stock selection in financials and consumer staples. From a market cap perspective, the Fund’s mid cap holdings significantly outperformed while small caps were a headwind.
The two holdings with the largest positive contribution to portfolio return were Liberty Interactive Corporation Ventures Series A (LVNTA) and Spirit Aerosystems Holdings Inc. (SPR). LVNTA is a tracking stock representing the economic performance of digital and media investments, the most valuable of which are its stakes in Liberty Broadband Corp. (LBRDK) and Charter Communications Inc. (Cl A) (CHTR). LVNTA’s business model is dependent on the exceptional capital allocation skills of its Chairman, Dr. John Malone, and CEO Greg Maffei, who share a long track record of building shareholder value. In Q4 2015, we established a position in LVNTA as the market failed to fully appreciate the value of LVNTA’s assets. Displeased with the embedded discount in the stock, LVNTA management announced plans to spin off assets into separate publicly traded companies in order to reduce the company’s “complexity discount.” Executing this plan included spinning off its Expedia stake into a separate legal entity and announcing a merger with General Communication Inc. (GNCMA), the largest cable provider and second-largest wireless provider in Alaska. After the merger and reattribution of some assets and liabilities between LVNTA and QVC, LVNTA will no longer be a tracking stock, which should set up a potential tax efficient combination with CHTR or another entity in the future. Throughout the year, Charter has appreciated in value as the company’s integration of Time Warner Cable continues to progress smoothly. Furthermore, according to media reports, a variety of industry participants have expressed an interest in pursuing an acquisition of Charter.
SPR is the largest independent non-OEM designer and manufacturer of aero-structures such as fuselages, engine casings, and wing components. SPR was purchased in Q2 2016, when the company was trading at a significant discount to its peers and free cash flow generation was accelerating. Key to the investment thesis was Spirit’s entrenchment in its customers’ supply chains (Boeing and Airbus) that contributed to a seven-year revenue backlog, more than 80% of revenue under long-term exclusive contracts, and a management team willing to return capital to shareholders. In early August, SPR announced quarterly revenue and earnings above consensus expectations, raised annual guidance, and revealed that the longstanding negotiation with Boeing (dating back to 2015) had finally come to a close. The agreement with Boeing removed a major source of uncertainty and provided pricing and volume visibility through 2022. Based on the pricing agreement, management also increased free cash flow conversion guidance. Through our holding period, Spirit grew free cash flow, initiated a dividend, and retired ~15% of shares outstanding at a discount to assessed valuation.
The two holdings with the largest negative contribution to the Fund’s return were Vista Outdoor Inc. (VSTO) and L Brands Inc. (LB). Vista Outdoor Inc. (VSTO), a maker and marketer of outdoor sporting and recreation goods. VSTO was purchased in the Fund in late November 2016, well into a period of stock price weakness due to poor fiscal Q1 earnings. Our investment thesis in Vista was predicated on the company’s ability to continue consolidating the branded outdoor products market, where growth prospects are higher than the legacy hunting and shooting business. In January, VSTO unexpectedly announced a material non-cash impairment precipitated by a sharp decline in consumer spending on firearms and related accessories during the holiday season. Management further disappointed with weak guidance driven by bloated channel inventories as retailers had built large inventories of firearms, firearm accessories, and ammunition expecting a different presidential election result. We lowered our fiscal 2017 and 2018 financial forecasts since it is likely to take several quarters for channel inventories to correct. With a pressing need to focus on debt reduction, our thesis
became impaired as management signaled a slower pace of M&A activity. The Fund exited the position in accordance with our sell discipline.
In February, Victoria’s Secret and Bath and Body Works which LB owns reported Q4 earnings ahead of estimates but issued disappointing guidance for Q1 and 2017 that fell short of both our and Wall Street’s expectations. Comparable sales for Q1 were expected to decline high-single digits to low-double digits, with a mid- to high-teens decline in February versus previous guidance for a mid-single digit decline. The magnitude of the deceleration in comparable sales sent shares down precipitously as investors extrapolated monthly sales results. Management acknowledged a substantial decrease in mall traffic during the month, as well as the impact of delayed tax refunds compared to last year, which was partially offset by strong online sales across both businesses. Investors remained concerned about the impact of mall traffic on comparable sales, a key risk to the investment thesis. The Fund exited the position in accordance with our sell discipline.
POSITIONING AND OUTLOOK
The Fund invests in companies that we believe represent the most attractive combination of risk (conviction) and reward (discount) available across the River Road universe of holdings. The largest changes to positioning in the Fund over the last year were a decrease in the industrials exposure and an increase to financials. Exposure to industrials decreased as several holdings approached their assessed valuations and exposure to financials increased as a larger number of opportunities emerged in the Fund’s investment universe.
We believe the Fund is attractively positioned relative to the benchmark from the perspective of valuation, quality, and long-term earnings growth. Further, if returns do moderate in the coming year, we expect the Fund’s holdings and low volatility approach to be well positioned.
The views expressed represent the opinions of River Road Asset Management LLC, as of October 31, 2017, and are not intended as a forecast or guarantee of future results and are subject to change without notice.
12
AMG River Road Focused Absolute Value Fund
Portfolio Manager’s Comments (continued)
CUMULATIVE TOTAL RETURN PERFORMANCE
The AMG River Road Focused Absolute Value Fund’s cumulative total return is based on the daily change in net asset value (NAV), and assumes that all dividends and distributions were reinvested. The graph compares a hypothetical $10,000 investment made in AMG River Road Focused Absolute Value Fund’s Class N shares on November 3, 2015, to a $10,000 investment made in the Russell 3000® Value Index for the same time period. The graph and table do not reflect the deduction of taxes that a shareholder would pay on a Fund distribution or redemption of shares. The listed returns for the Fund are net of expenses and the returns for the index exclude expenses. Total returns would have been lower had certain expenses not been reduced.
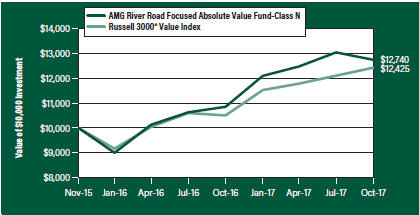
The table below shows the average annual total returns for AMG River Road Focused Absolute Value Fund and the Russell 3000® Value Index for the same time periods ended October 31, 2017.
| | | | | | | | | | | | |
| Average Annual Total Returns 1 | | One
Year | | | Since
Inception | | | Inception
Date | |
AMG River Road Focused Absolute Value Fund2, 3, 4, 5, 6, 7, 8, 9 | | | | | | | | | | | | |
Class N | | | 17.42 | % | | | 12.89 | % | | | 11/03/15 | |
Class I | | | 17.72 | % | | | 13.19 | % | | | 11/03/15 | |
Class Z | | | — | | | | (2.13 | %) | | | 09/29/17 | |
Russell 3000® Value Index10 | | | 18.30 | % | | | 11.50 | % | | | 11/03/15 | † |
The performance data shown represents past performance. Past performance is not a guarantee of future results. Current performance may be lower or higher than the performance data quoted. The investment return and principal value of an investment will fluctuate so that an investor’s shares, when redeemed, may be worth more or less than their original cost.
Investors should carefully consider the Fund’s investment objectives, risks, charges and expenses before investing. For performance information through the most recent month end, current net asset values per share for the Fund and other information, please call 800.835.3879 or visit our website at amgfunds.com for a free prospectus. Read it carefully before investing or sending money.
Distributed by AMG Distributors, Inc., member FINRA/SIPC.
| † | Date reflects the inception date of the Fund, not the index. |
| 1 | Total return equals income yield plus share price change and assumes reinvestment of all dividends and capital gain distributions. Returns are net of fees and may reflect offsets of Fund expenses as described in the prospectus. No adjustment has been made for taxes payable by shareholders on their reinvested dividends and capital gain distributions. Returns for periods greater than one year are annualized. The listed returns on the Fund are net of expenses and based on the published NAV as of October 31, 2017. All returns are in U.S. dollars ($). |
| 2 | The Fund is subject to risks associated with investments in small-capitalization companies, such as erratic earnings patterns, competitive conditions, limited earnings history and a reliance on one or a limited number of products. |
| 3 | The Fund is subject to risks associated with investments in mid-capitalization companies such as greater price volatility, lower trading volume, and less liquidity than the stocks of larger, more established companies. |
| 4 | Active and frequent trading of a fund may result in higher transaction costs and increased tax liability. |
| 5 | A greater percentage of the Fund’s holdings may be focused in a smaller number of securities which may place the Fund at greater risk than a more diversified fund. |
| 6 | Investments in international securities are subject to certain risks of overseas investing including currency fluctuations and changes in political and economic conditions, which could result in significant market fluctuations. These risks are magnified in emerging markets. |
| 7 | The Fund is subject to the risks associated with investments in emerging markets, such as erratic earnings patterns, economic and political instability, changing exchange controls, limitations on repatriation of foreign capital and changes in local governmental attitudes toward private investment, possibly leading to nationalization or confiscation of investor assets. |
| 8 | The Fund is subject to special risk considerations similar to those associated with the direct ownership of real estate. Real estate valuations may be subject to factors such as changing general and local economic, financial, competitive, and environmental conditions. |
| 9 | The Fund invests in value stocks, which may perform differently from the market as a whole and may be undervalued by the market for a long period of time. |
| 10 | The Russell 3000® Value Index measures the performance of the broad value segment of the U.S. equity universe. It includes those Russell 3000® companies with lower price-to-book ratios and lower forecasted growth values. Unlike the Fund, the Russell 3000® Value Index is unmanaged, is not available for investment and does not incur expenses. |
The Russell Indices are a trademark of the London Stock Exchange Group companies.
Not FDIC insured, nor bank guaranteed. May lose value.
13
| | |
| AMG River Road Focused Absolute Value Fund | | October 31, 2017 |
| Fund Snapshots (unaudited) | | |
PORTFOLIO BREAKDOWN
| | | | |
| | | % of | |
Sector | | Net Assets | |
Consumer Discretionary | | | 33.7 | |
Financials | | | 26.2 | |
Information Technology | | | 12.4 | |
Health Care | | | 9.4 | |
Consumer Staples | | | 6.4 | |
Utilities | | | 4.0 | |
Industrials | | | 3.9 | |
Real Estate | | | 3.0 | |
Other Assets Less Liabilities | | | 1.0 | |
TOP TEN HOLDINGS
| | | | |
| | | % of | |
Security Name | | Net Assets | |
Berkshire Hathaway, Inc., Class B | | | 7.4 | |
Premier, Inc., Class A | | | 6.1 | |
Liberty Ventures, Class A | | | 6.1 | |
White Mountains Insurance Group, Ltd. | | | 5.0 | |
Oaktree Capital Group LLC, MLP | | | 4.5 | |
Comcast Corp., Class A | | | 4.1 | |
National Fuel Gas Co. | | | 4.0 | |
Armstrong World Industries, Inc. | | | 3.9 | |
CVS Health Corp. | | | 3.8 | |
The Interpublic Group of Cos, Inc. | | | 3.8 | |
| | | | |
Top Ten as a Group | | | 48.7 | |
| | | | |
Because a fund’s strategy may result in multiple investments in particular sectors of the economy, its performance may depend on the performance of those sectors and may fluctuate more widely than investments diversified across more sectors. For additional information on these and other risk considerations, please see the Fund’s prospectus.
Any sectors, industries, or securities discussed should not be perceived as investment recommendations. Mention of a specific security should not be considered a recommendation to buy or solicitation to sell that security. Specific securities mentioned in this report may have been sold from the Fund’s portfolio of investments by the time you receive this report.
14
| | |
| AMG River Road Focused Absolute Value Fund | | October 31, 2017 |
| |
| Schedule of Portfolio Investments | | |
| | | | | | | | |
| | | Shares | | | Value | |
Common Stocks – 99.0% | | | | | | | | |
Consumer Discretionary – 33.7% | | | | | | | | |
Advance Auto Parts, Inc. | | | 8,472 | | | $ | 692,501 | |
Asbury Automotive Group, Inc. * | | | 14,898 | | | | 914,737 | |
Cinemark Holdings, Inc. 1 | | | 21,591 | | | | 784,617 | |
Comcast Corp., Class A | | | 28,121 | | | | 1,013,200 | |
General Motors Co. | | | 20,865 | | | | 896,778 | |
The Interpublic Group of Cos, Inc. | | | 48,533 | | | | 934,260 | |
Liberty Global PLC Lilac Group, Class C (United Kingdom)* | | | 42,065 | | | | 925,430 | |
Liberty Media Corp-Liberty SiriusXM,
Class C * | | | 15,432 | | | | 642,743 | |
Liberty Ventures, Class A *,1 | | | 26,104 | | | | 1,486,884 | |
Total Consumer Discretionary | | | | | | | 8,291,150 | |
Consumer Staples – 6.4% | | | | | | | | |
Coty, Inc., Class A | | | 41,625 | | | | 641,025 | |
CVS Health Corp. | | | 13,772 | | | | 943,795 | |
Total Consumer Staples | | | | | | | 1,584,820 | |
Financials – 26.2% | | | | | | | | |
Berkshire Hathaway, Inc., Class B * | | | 9,786 | | | | 1,829,395 | |
Oaktree Capital Group LLC, MLP | | | 24,377 | | | | 1,116,466 | |
Oaktree Specialty Lending Corp. | | | 137,628 | | | | 799,619 | |
U.S. Bancorp | | | 12,178 | | | | 662,240 | |
Wells Fargo & Co. | | | 14,458 | | | | 811,672 | |
White Mountains Insurance Group, Ltd. | | | 1,380 | | | | 1,227,027 | |
Total Financials | | | | | | | 6,446,419 | |
Health Care – 9.4% | | | | | | | | |
DaVita, Inc. * | | | 13,528 | | | | 821,691 | |
Premier, Inc., Class A * | | | 45,965 | | | | 1,501,676 | |
Total Health Care | | | | | | | 2,323,367 | |
Industrials – 3.9% | | | | | | | | |
Armstrong World Industries, Inc. * | | | 18,661 | | | | 953,577 | |
Information Technology – 12.4% | | | | | | | | |
Blackhawk Network Holdings, Inc. * | | | 17,558 | | | | 596,094 | |
Cars.com, Inc. *,1 | | | 34,230 | | | | 815,358 | |
Mitel Networks Corp. (Canada)* | | | 99,193 | | | | 852,068 | |
| | | | | | | | |
| | | Shares | | | Value | |
Sabre Corp. | | | 40,496 | | | $ | 792,102 | |
Total Information Technology | | | | | | | 3,055,622 | |
Real Estate – 3.0% | | | | | | | | |
Iron Mountain, Inc., REIT | | | 18,333 | | | | 733,320 | |
Utilities – 4.0% | | | | | | | | |
National Fuel Gas Co. 1 | | | 16,849 | | | | 978,085 | |
Total Common Stocks
(Cost $23,403,034) | | | | | | | 24,366,360 | |
| | |
| | | Principal | | | | |
| | | Amount | | | | |
Short-Term Investments – 9.7% | | | | | | | | |
Repurchase Agreements – 8.5%2 | | | | | | | | |
Citigroup Global Markets, Inc., dated 10/31/17, due 11/01/17, 1.070% total to be received $1,000,030 (collateralized by various U.S. Government Agency Obligations, 0.000% - 11.500%, 11/01/17 - 09/09/49, totaling $1,020,000) | | $ | 1,000,000 | | | | 1,000,000 | |
Credit Suisse Securities (USA) LLC, dated 10/31/17, due 11/01/17, 1.010% total to be received $1,000,028 (collateralized by various U.S. Government Agency Obligations, 0.375% -2.125%, 01/15/19 - 02/15/44, totaling $1,020,011) | | | 1,000,000 | | | | 1,000,000 | |
Merrill Lynch, Pierce, Fenner & Smith, Inc., dated 10/31/17, due 11/01/17, 1.050% total to be received $100,676 (collateralized by various U.S. Government Agency Obligations, 2.000% -2.125%, 03/31/24 - 06/30/24, totaling $102,686) | | | 100,673 | | | | 100,673 | |
Total Repurchase Agreements | | | | | | | 2,100,673 | |
| | |
| | | Shares | | | | |
Other Investment Companies – 1.2% | | | | | | | | |
Dreyfus Institutional Preferred Government Money Market Fund, Institutional Class Shares, 1.00%3 | | | 293,526 | | | | 293,526 | |
Total Short-Term Investments
(Cost $2,394,199) | | | | | | | 2,394,199 | |
Total Investments – 108.7%
(Cost $25,797,233) | | | | | | | 26,760,559 | |
Other Assets, less Liabilities – (8.7)% | | | | | | | (2,146,010 | ) |
Net Assets – 100.0% | | | | | | $ | 24,614,549 | |
| * | Non-income producing security. |
| 1 | Some or all of these securities, amounting to $2,076,480 or 8.4% of net assets, were out on loan to various brokers. |
| 2 | Collateral received from brokers for securities lending was invested in these joint repurchase agreements. |
| 3 | Yield shown represents the October 31, 2017, seven day average yield, which refers to the sum of the previous seven days’ dividends paid, expressed as an annual percentage. |
| MLP | Master Limited Partnership |
| REIT | Real Estate Investment Trust |
The accompanying notes are an integral part of these financial statements.
15
| | |
| AMG River Road Focused Absolute Value Fund | | |
| |
| Schedule of Portfolio Investments (continued) | | |
The following table summarizes the inputs used to value the Fund’s investments by the fair value hierarchy levels as of October 31, 2017:
| | | | | | | | | | | | | | | | |
| | | Level 1 | | | Level 2 | | | Level 3 | | | Total | |
Investments in Securities | | | | | | | | | | | | | | | | |
Common Stocks† | | $ | 24,366,360 | | | | — | | | | — | | | $ | 24,366,360 | |
Short-Term Investments | | | | | | | | | | | | | | | | |
Repurchase Agreements | | | — | | | $ | 2,100,673 | | | | — | | | | 2,100,673 | |
Other Investment Companies | | | 293,526 | | | | — | | | | — | | | | 293,526 | |
| | | | | | | | | | | | | | | | |
Total Investments in Securities | | $ | 24,659,886 | | | $ | 2,100,673 | | | | — | | | $ | 26,760,559 | |
| | | | | | | | | | | | | | | | |
| † | All common stocks held in the Fund are Level 1 securities. For a detailed breakout of common stocks by major industry classification, please refer to the Fund’s Schedule of Portfolio Investments. |
As of October 31, 2017, the Fund had no transfers between levels from the beginning of the reporting period.
The accompanying notes are an integral part of these financial statements.
16
AMG Managers Montag & Caldwell Growth Fund
Portfolio Manager’s Comments (unaudited)
THE YEAR IN REVIEW
For the fiscal year ended October 31, 2017, the AMG Managers Montag & Caldwell Growth Fund (the “Fund”) Class N shares returned 17.99%, compared to the 29.71% return for its benchmark, the Russell 1000® Growth Index. The Fund is managed using fundamental valuation techniques that focus on a company’s future earnings and dividend growth rates. The process is primarily bottom up and utilizes a present valuation model in which the current price of the stock is related to the risk adjusted present value of the company’s estimated future earnings stream. The Fund seeks to invest in growth stocks selling at a discount to estimates of fair value and at a time when relative earnings per share growth is visible for the intermediate term.
MARKET ENVIRONMENT
U.S. stock indices experienced strong gains for the twelve months ended October 31, 2017, with a bias toward small cap stocks. The Russell 1000® (large cap) Index was up 23.67%, the Russell Midcap® Index (mid cap) was up 21.09%, and the Russell 2000® Index (small cap) was up 27.85% for the 12 months ended October 31, 2017. There was, however, a significant bias toward growth, particularly in the second half of the 12-month period. For the full 12 months, growth outperformed value in each size segment, with the widest spread in returns between large cap growth and large cap value. As mentioned, the Russell 1000® Growth Index (large cap growth) was up 29.71% vs. a 17.78% return for the Russell 1000® Value Index (large cap value). The performance advantage of growth over value in both the mid cap and small cap areas was also meaningful, though less pronounced than in large cap.
PERFORMANCE REVIEW
While the major indices all posted solid gains during the 12-month period, there were several notable, some would say violent, underlying rotations that occurred throughout the period. Following the U.S. presidential election and the surprise victory of Donald Trump as our 45th president, U.S. stocks embarked upon a vigorous rally to close out 2016. The rally was lopsided, however, with most of the upside coming in small cap, cyclical and value-oriented issues (like financials, energy, materials and industrials) as the biggest perceived beneficiaries of President Trump’s economic agenda, which included lower corporate taxes, lighter business regulation and potential domestic infrastructure spending. In fact, all of the return from
the Russell 1000® Growth Index following the election could be attributed to cyclical sectors/issues. This return pattern contrasted with that of 2015 when the less cyclical sectors led the markets and the Fund outperformed both the Russell 1000® Growth Index and the broad market S&P 500® Index. During these initial weeks of the post-election rally, the Fund’s performance lagged the Russell 1000® Growth benchmark, which was mostly attributable to adverse stock selection, particularly within technology, discretionary and industrials, as well as an impact from an underweight allocation to industrials and an overweight allocation to consumer staples.
The post-election market rally continued in the first quarter of 2017 with the S&P 500® Index tacking on over 6% in total return, on top of its 5% fourth quarter post-election advance. However, there was a notable shift in leadership, particularly after the administration’s initial failure to repeal Obamacare in February. The so-called “Trump stocks” that led the initial advance took a breather and gave way to some of the secular growers within health care, technology and consumer discretionary. The lagging performance of the “Trump stocks,” which persisted well into the third quarter of 2017, seemed to coincide with a pullback in the dollar and bond yields, a sign that investors’ enthusiasm for the timing, if not the substance, of the Trump administration’s pro-growth agenda, and in particular tax reform, started to wane a bit. During this time period, the Fund benefited from solid stock selection in technology, health care, and financial services versus both the broad market S&P 500® Index and the Russell 1000® Growth Index. The Fund’s overweight allocation to health care also added to relative results versus both indices. In addition, results relative to the Russell 1000® Growth Index were better due to an underweight allocation to the discretionary sector and an overweight allocation to the financial services sector. Results relative to both the S&P 500® Index and the Russell 1000® Growth Index were diminished by stock selection in the industrials and discretionary sectors.
The final few weeks of the period favored small cap and more cyclical areas of the market as investors once again began to anticipate the administration’s pivot away from health care reform to tax reform.
Finally, while there were several observable style/size shifts over the course of the 12-month period, overall market volatility, as measured by the CBOE Volatility Index (VIX), remained extraordinarily
subdued. While the VIX rose briefly in response to the heightened geopolitical tensions in August, it did so from all-time low levels. Beyond that brief blip up, the VIX remained near all-time low levels. Downside market action also remained extremely limited. In fact, the market hasn’t suffered a 3% decline since right before the presidential election, and has not seen a 5% correction since June 2016, the longest such stretch in over 20 years.1 It seems highly unlikely that this relative tranquility can persist for much longer.
OUTLOOK
While valuation and investor sentiment data continue to be red flags for the stock market, volatility remains contained and any significant market weakness is quickly met by buyers of stock. With both the stock and bond markets highly valued and a significant drawdown in share prices long overdue in our opinion, we are sensitive to any developments that could cause the market to correct. The S&P 500 median price-to-earnings ratio is currently 23.1x and is higher than 96% of historical periods.2 The 10-year U.S. Treasury is also highly valued and offers only a 2.3% yield to maturity. For now, a low risk of recession, improving corporate profits, a better global economy, very accommodative policies by Central Banks throughout the developed world, a gradual and predictable increase in interest rates by our Federal Reserve and the likelihood of fiscal stimulus coming out of Congress are all supportive of the market and continue to keep it elevated.
The Fund’s holdings are benefiting from improving global economic growth due to their strong brands and entrenched global presence. In addition, they operate from financial strength and we believe will be better able to cope with what is likely to be higher interest expense as the Federal Reserve gradually raises interest rates. Importantly, the Fund’s holdings are reasonably valued based on our work and, with their favorable attributes of global diversification and financial strength, we believe are well positioned to provide attractive investment returns relative to the market in the period ahead and over the long term.
The views expressed represent the opinions of Montag & Caldwell LLC, as of October 31, 2017, and are not intended as a forecast or guarantee of future results and are subject to change without notice.
17
AMG Managers Montag & Caldwell Growth Fund
Portfolio Manager’s Comments (continued)
CUMULATIVE TOTAL RETURN PERFORMANCE
The AMG Managers Montag & Caldwell Growth Fund’s cumulative total return is based on the daily change in net asset value (NAV), and assumes that all dividends and distributions were reinvested. The graph compares a hypothetical $10,000 investment made in AMG Managers Montag & Caldwell Growth Fund’s Class N shares on October 31, 2007, to a $10,000 investment made in the Russell 1000® Growth Index for the same time period. The graph and table do not reflect the deduction of taxes that a shareholder would pay on a Fund distribution or redemption of shares. The listed returns for the Fund are net of expenses and the returns for the index exclude expenses. Total returns would have been lower had certain expenses not been reduced.
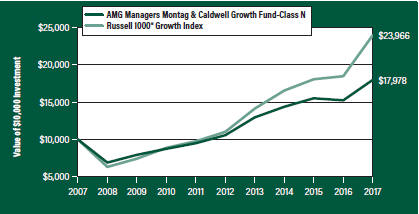
The table below shows the average annual total returns for AMG Managers Montag & Caldwell Growth Fund and the Russell 1000® Growth Index for the same time periods ended October 31, 2017.
| | | | | | | | | | | | |
| Average Annual Total Returns1 | | One Year | | | Five Year | | | Ten Year | |
AMG Managers Montag & Caldwell Growth Fund2,3 | | | | | | | | | | | | |
Class N | | | 17.99 | % | | | 11.23 | % | | | 6.04 | % |
Class I | | | 18.21 | % | | | 11.50 | % | | | 6.30 | % |
Class R | | | 17.77 | % | | | 10.97 | % | | | 5.79 | % |
Russell 1000® Growth Index4 | | | 29.71 | % | | | 16.83 | % | | | 9.13 | % |
The performance data shown represents past performance. Past performance is not a guarantee of future results. Current performance may be lower or higher than the performance data quoted. The investment return and principal value of an investment will fluctuate so that an investor’s shares, when redeemed, may be worth more or less than their original cost.
Investors should carefully consider the Fund’s investment objectives, risks, charges and expenses before investing. For performance information through the most recent month end, current net asset values per share for the Fund and other information, please call 800.835.3879 or visit our website at amgfunds.com for a free prospectus. Read it carefully before investing or sending money.
Distributed by AMG Distributors, Inc., member FINRA/SIPC.
| 1 | Total return equals income yield plus share price change and assumes reinvestment of all dividends and capital gain distributions. Returns are net of fees and may reflect offsets of Fund expenses as described in the prospectus. No adjustment has been made for taxes payable by shareholders on their reinvested dividends and capital gain distributions. Returns for periods greater than one year are the average annual returns. The listed returns on the Fund are net of expenses and based on the published NAV as of October 31, 2017. All returns are in U.S. dollars ($). |
| 2 | The Fund invests in growth stocks, which may be more sensitive to market movements because their prices tend to reflect future investor expectations rather than just current profits. |
| 3 | Investments in international securities are subject to certain risks of overseas investing including currency fluctuations and changes in political and economic conditions, which could result in significant market fluctuations. These risks are magnified in emerging markets. |
| 4 | The Russell 1000® Growth Index is a market capitalization weighted index that measures the performance of those Russell 1000® companies with higher price-to-book ratios and higher forecasted growth values. Unlike the Fund, the Russell 1000® Growth Index is unmanaged, is not available for investment and does not incur expenses. |
The Russell Indices are a trademark of the London Stock Exchange Group companies.
Not FDIC insured, nor bank guaranteed. May lose value.
18
| | |
| AMG Managers Montag & Caldwell Growth Fund | | October 31, 2017 |
| Fund Snapshots (unaudited) | | |
| | | | |
| PORTFOLIO BREAKDOWN | | | |
| |
| | | % of | |
Sector | | Net Assets | |
Information Technology | | | 38.8 | |
Health Care | | | 14.5 | |
Consumer Staples | | | 14.3 | |
Consumer Discretionary | | | 11.9 | |
Financials | | | 8.7 | |
Industrials | | | 3.3 | |
Materials | | | 3.3 | |
Other Assets Less Liabilities | | | 5.2 | |
| | | | |
| TOP TEN HOLDINGS | | | |
| |
| | | % of | |
Security Name | | Net Assets | |
UnitedHealth Group, Inc. | | | 5.1 | |
Alphabet, Inc., Class A | | | 4.8 | |
Microsoft Corp. | | | 4.7 | |
Facebook, Inc., Class A | | | 4.5 | |
Visa, Inc., Class A | | | 4.5 | |
Apple, Inc. | | | 3.8 | |
Dollar Tree, Inc. | | | 3.8 | |
Analog Devices, Inc. | | | 3.7 | |
Oracle Corp. | | | 3.6 | |
The Estee Lauder Cos, Inc., Class A | | | 3.4 | |
| | | | |
Top Ten as a Group | | | 41.9 | |
| | | | |
Because a fund’s strategy may result in multiple investments in particular sectors of the economy, its performance may depend on the performance of those sectors and may fluctuate more widely than investments diversified across more sectors. For additional information on these and other risk considerations, please see the Fund’s prospectus.
Any sectors, industries, or securities discussed should not be perceived as investment recommendations. Mention of a specific security should not be considered a recommendation to buy or solicitation to sell that security. Specific securities mentioned in this report may have been sold from the Fund’s portfolio of investments by the time you receive this report.
19
| | |
| AMG Managers Montag & Caldwell Growth Fund | | October 31, 2017 |
| |
| Schedule of Portfolio Investments | | |
| | | | | | | | |
| | | Shares | | | Value | |
Common Stocks – 94.8% | | | | | | | | |
Consumer Discretionary – 11.9% | | | | | | | | |
Dollar Tree, Inc. * | | | 371,680 | | | $ | 33,915,800 | |
The Priceline Group, Inc. * | | | 14,298 | | | | 27,337,204 | |
Starbucks Corp. | | | 494,705 | | | | 27,129,622 | |
The TJX Cos., Inc. | | | 200,300 | | | | 13,980,940 | |
Ulta Beauty, Inc. * | | | 24,739 | | | | 4,992,083 | |
Total Consumer Discretionary | | | | | | | 107,355,649 | |
Consumer Staples – 14.3% | | | | | | | | |
The Estee Lauder Cos, Inc., Class A | | | 276,900 | | | | 30,960,189 | |
The Kraft Heinz Co. | | | 293,000 | | | | 22,657,690 | |
Mondelez International, Inc., Class A | | | 647,600 | | | | 26,830,068 | |
Monster Beverage Corp. * | | | 406,400 | | | | 23,542,752 | |
PepsiCo, Inc. | | | 226,600 | | | | 24,978,118 | |
Total Consumer Staples | | | | | | | 128,968,817 | |
Financials – 8.7% | | | | | | | | |
The Charles Schwab Corp. | | | 600,100 | | | | 26,908,484 | |
Intercontinental Exchange, Inc. | | | 420,585 | | | | 27,800,668 | |
S&P Global, Inc. | | | 154,083 | | | | 24,109,367 | |
Total Financials | | | | | | | 78,818,519 | |
Health Care – 14.5% | | | | | | | | |
Becton Dickinson & Co. | | | 134,448 | | | | 28,055,264 | |
Edwards Lifesciences Corp. * | | | 258,509 | | | | 26,427,375 | |
Thermo Fisher Scientific, Inc. | | | 155,219 | | | | 30,086,099 | |
UnitedHealth Group, Inc. | | | 219,580 | | | | 46,160,107 | |
Total Health Care | | | | | | | 130,728,845 | |
Industrials – 3.3% | | | | | | | | |
Honeywell International, Inc. | | | 204,100 | | | | 29,423,056 | |
| | | | | | | | |
| | | Shares | | | Value | |
Information Technology – 38.8% | | | | | | | | |
Alphabet, Inc., Class A * | | | 41,863 | | | $ | 43,246,154 | |
Analog Devices, Inc. | | | 359,800 | | | | 32,849,740 | |
Apple, Inc. | | | 202,771 | | | | 34,276,410 | |
eBay, Inc. * | | | 565,300 | | | | 21,277,892 | |
Facebook, Inc., Class A * | | | 228,302 | | | | 41,108,058 | |
Fidelity National Information Services, Inc. | | | 234,391 | | | | 21,742,109 | |
FleetCor Technologies, Inc. * | | | 92,837 | | | | 15,343,171 | |
Mastercard, Inc., Class A | | | 166,100 | | | | 24,710,697 | |
Microsoft Corp. | | | 508,800 | | | | 42,321,984 | |
Oracle Corp. | | | 643,900 | | | | 32,774,510 | |
Visa, Inc., Class A | | | 370,100 | | | | 40,703,598 | |
Total Information Technology | | | | | | | 350,354,323 | |
Materials – 3.3% | | | | | | | | |
Air Products & Chemicals, Inc. | | | 78,761 | | | | 12,556,866 | |
The Sherwin-Williams Co. | | | 44,570 | | | | 17,611,836 | |
Total Materials | | | | | | | 30,168,702 | |
Total Common Stocks
(Cost $645,907,288) | | | | | | | 855,817,911 | |
Short-Term Investments – 5.3% | | | | | | | | |
Other Investment Companies – 5.3% | | | | | |
Dreyfus Government Cash Management Fund, Institutional Class Shares, 0.93%1 | | | 47,222,379 | | | | 47,222,379 | |
Total Short-Term Investments
(Cost $47,222,379) | | | | | | | 47,222,379 | |
Total Investments – 100.1%
(Cost $693,129,667) | | | | | | | 903,040,290 | |
Other Assets, less Liabilities – (0.1)% | | | | | | | (581,494 | ) |
Net Assets – 100.0% | | | | | | $ | 902,458,796 | |
| * | Non-income producing security. |
| 1 | Yield shown represents the October 31, 2017, seven day average yield, which refers to the sum of the previous seven days’ dividends paid, expressed as an annual percentage. |
The accompanying notes are an integral part of these financial statements.
20
| | |
| AMG Managers Montag & Caldwell Growth Fund | | |
| |
| Schedule of Portfolio Investments (Continued) | | |
The following table summarizes the inputs used to value the Fund’s investments by the fair value hierarchy levels as of October 31, 2017:
| | | | | | | | | | | | | | | | |
| | | Level 1 | | | Level 2 | | | Level 3 | | | Total | |
Investments in Securities | | | | | | | | | | | | | | | | |
Common Stocks† | | $ | 855,817,911 | | | | — | | | | — | | | $ | 855,817,911 | |
Short-Term Investments | | | | | | | | | | | | | | | | |
Other Investment Companies | | | 47,222,379 | | | | — | | | | — | | | | 47,222,379 | |
| | | | | | | | | | | | | | | | |
Total Investments in Securities | | $ | 903,040,290 | | | | — | | | | — | | | $ | 903,040,290 | |
| | | | | | | | | | | | | | | | |
| † | All common stocks held in the Fund are Level 1 securities. For a detailed breakout of common stocks by major industry classification, please refer to the Fund’s Schedule of Portfolio Investments. |
As of October 31, 2017, the Fund had no transfers between levels from the beginning of the reporting period.
The accompanying notes are an integral part of these financial statements.
21
AMG River Road Dividend All Cap Value Fund
Portfolio Manager’s Comments (unaudited)
OVERVIEW
For the fiscal year ended October 31, 2017, the AMG River Road Dividend All Cap Value Fund (the “Fund”) Class N shares returned 14.79%, while the Russell 3000® Value Index returned 18.30%.
PERFORMANCE REVIEW
Over the last 12 months, the most significant market factors affecting absolute returns were the steady improvement in corporate earnings growth, the possibility of tax reform, and uncertainty about the timing of monetary tightening by the Federal Reserve (the “Fed”). Additionally, those stocks in the Russell 3000® Value Index with lower yields outperformed those with higher yields, creating a significant relative headwind for a dividend-oriented strategy. Given these challenges, the Fund underperformed due to both sector allocation and stock selection. The energy sector had the most significant positive impact on relative results in the period, primarily due to strong stock selection, while the financials sector had the most significant negative impact on relative results due to the underweight allocation and weak stock selection.
The two holdings with the largest positive contribution to the Fund’s total return were PNC Financial Services Group Inc. (PNC), a super-regional commercial bank, and GEO Group Inc. (GEO), a REIT offering correctional and detention facilities and services to federal, state, local, and foreign governments. PNC, along with other banks, saw earnings improve significantly during Q4 2016, and stock prices followed suit. In the wake of the U.S. elections, interest rates moved higher and the yield curve steepened, leading to an improved outlook for net interest margins. Additionally, the Republican sweep of the White House and Congress raised the possibility of meaningful tax and regulatory reform, which could significantly reduce taxes and operating expenses for banks. In recognition of the positive
impact of the elections, we increased the multiples employed in our assessed values across the banking industry, including PNC. The position in PNC was trimmed as it was trading at a modest premium to the updated assessed value, the yield had declined below 2%, and it was the second-largest position early in the period, prior to reducing the position size.
GEO marched higher following the November presidential election and continued to do so in Q1, supported by a respectable Q4 earnings report and solid 2017 guidance. GEO investors received another piece of good news in late February when newly confirmed U.S. Attorney General Jeff Sessions issued a memo rescinding an August 18, 2016, directive from then-Deputy Attorney General Sally Yates instructing the BOP (Federal Bureau of Prisons) to reduce—and ultimately end—its use of privately operated prisons.
The two holdings with the lowest contribution to the Fund’s total return during the period were QUALCOMM Inc. (QCOM), a designer and manufacturer of integrated circuits, and W.W. Grainger Inc. (GWW), an industrial distribution industry leader. In January, QCOM shares declined sharply on news that Apple Inc. (AAPL) filed a lawsuit claiming they should be able to pay QCOM a percentage of the chip price rather than a percentage of a device’s average sale price. Apple believes QCOM is unduly benefiting from its brand, which commands a higher price, while QCOM believes AAPL would not be able to charge a higher price if devices did not have the technology provided by QCOM. QCOM intends to vigorously fight the suits. In fact, QCOM countersued AAPL claiming the company failed to engage in good faith negotiations and inappropriately interfered with the contract manufacturers who produce iPhones and iPads. We believe there is support for QCOM’s stance. We trimmed the position in accordance with our sell discipline.
In April, GWW announced an unexpected acceleration of its price rationalization effort in a bid to grow market share. As the pricing cuts are expected to outweigh increased volumes in the near term, the firm was forced to cut full year guidance for 2017. Over time, GWW expects that it will expand market share and margins should rebound as increased volumes fuel operating leverage. However, it is unclear how competitors will respond to these lowered prices and whether GWW can sustain market share expansion. In the wake of GWW’s actions we reviewed and lowered our assessed valuation and conviction and reduced the position. We ultimately eliminated the position in August due to unrealized losses.
POSITIONING AND OUTLOOK
The Fund is significantly overweight in industrials and real estate and significantly underweight in financials and health care. Industrials went from +1.3% to +6.6% overweight versus the Russell 3000® Value benchmark, driven by the addition of four new positions to the Fund in this sector. Real estate ended the period at +5.5% overweight versus the benchmark. Driven by the elimination of three holdings, the underweight in financials increased from -8.0% to -12.2% versus the benchmark, and health care ended the period at -10.0% underweight. Our outlook for the market is cautious, but reasons to be optimistic about the underlying economy are increasing. From either a valuation or a foreign policy perspective, risks remain elevated and we continue to expect the relative return of the Fund to improve as downside volatility increases.
The views expressed represent the opinions of River Road Asset Management LLC, as of October 31, 2017, and are not intended as a forecast or guarantee of future results and are subject to change without notice.
22
AMG River Road Dividend All Cap Value Fund
Portfolio Manager’s Comments (continued)
CUMULATIVE TOTAL RETURN PERFORMANCE
The AMG River Road Dividend All Cap Value Fund’s cumulative total return is based on the daily change in net asset value (NAV), and assumes that all dividends and distributions were reinvested. The graph compares a hypothetical $10,000 investment made in AMG River Road Dividend All Cap Value Fund’s Class N shares on October 31, 2007, to a $10,000 investment made in the Russell 3000® Value Index for the same time period. The graph and table do not reflect the deduction of taxes that a shareholder would pay on a Fund distribution or redemption of shares. The listed returns for the Fund are net of expenses and the returns for the index exclude expenses. Total returns would have been lower had certain expenses not been reduced.
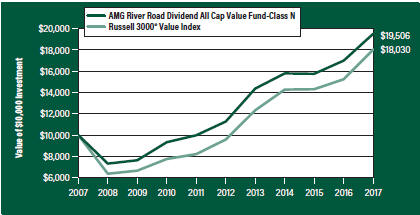
The table below shows the average annual total returns for AMG River Road Dividend All Cap Value Fund and the Russell 3000® Value Index for the same time periods ended October 31, 2017.
| | | | | | | | | | | | | | | | | | | | |
| | | One | | | Five | | | Ten | | | Since | | | Inception | |
| Average Annual Total Returns 1 | | Year | | | Years | | | Years | | | Inception | | | Date | |
AMG River Road Dividend All Cap Value Fund2, 3, 4, 5, 6, 7 | | | | | | | | | | | | | | | | | | | | |
Class N | | | 14.79 | % | | | 11.59 | % | | | 6.91 | % | | | 8.33 | % | | | 06/28/05 | |
Class I | | | 15.07 | % | | | 11.88 | % | | | 7.18 | % | | | 6.77 | % | | | 06/28/07 | |
Class Z | | | — | | | | — | | | | — | | | | 0.59 | % | | | 09/29/17 | |
Russell 3000® Value Index8 | | | 18.30 | % | | | 13.48 | % | | | 6.07 | % | | | 7.44 | % | | | 06/28/05 | † |
The performance data shown represents past performance. Past performance is not a guarantee of future results. Current performance may be lower or higher than the performance data quoted. The investment return and principal value of an investment will fluctuate so that an investor’s shares, when redeemed, may be worth more or less than their original cost.
Investors should carefully consider the Fund’s investment objectives, risks, charges and expenses before investing. For performance information through the most recent month end, current net asset values per share for the Fund and other information, please call 800.835.3879 or visit our website at amgfunds.com for a free prospectus. Read it carefully before investing or sending money.
Distributed by AMG Distributors, Inc., member FINRA/SIPC.
| † | Date reflects the inception date of the Fund, not the index. |
| 1 | Total return equals income yield plus share price change and assumes reinvestment of all dividends and capital gain distributions. Returns are net of fees and may reflect offsets of Fund expenses as described in the prospectus. No adjustment has been made for taxes payable by shareholders on their reinvested dividends and capital gain distributions. Returns for periods greater than one year are annualized. The listed returns on the Fund are net of expenses and based on the published NAV as of October 31, 2017. All returns are in U.S. dollars ($). |
| 2 | An issuer of a security may be unwilling or unable to pay income on a security. Common stocks do not assure dividend payments and are paid only when declared by an issuer’s board of directors. |
| 3 | Investments in international securities are subject to certain risks of overseas investing including currency fluctuations and changes in political and economic conditions, which could result in significant market fluctuations. These risks are magnified in emerging markets. |
| 4 | The Fund is subject to risks associated with investments in mid-capitalization companies such as greater price volatility, lower trading volume, and less liquidity than the stocks of larger, more established companies. |
| 5 | The Fund is subject to special risk considerations similar to those associated with the direct ownership of real estate. Real estate valuations may be subject to factors such as changing general and local economic, financial, competitive, and environmental conditions. |
| 6 | The Fund is subject to risks associated with investments in small-capitalization companies, such as erratic earnings patterns, competitive conditions, limited earnings history and a reliance on one or a limited number of products. |
| 7 | The Fund invests in value stocks, which may perform differently from the market as a whole and may be undervalued by the market for a long period of time. |
| 8 | The Russell 3000® Value Index measures the performance of the broad value segment of the U.S. equity universe. It includes those Russell 3000® companies with lower price-to-book ratios and lower forecasted growth values. Unlike the Fund, the Russell 3000® Value Index is unmanaged, is not available for investment and does not incur expenses. |
The Russell Indices are a trademark of the London Stock Exchange Group companies.
Not FDIC insured, nor bank guaranteed. May lose value.
23
| | |
| AMG River Road Dividend All Cap Value Fund | | October 31, 2017 |
| Fund Snapshots (unaudited) | | |
| | | | |
| PORTFOLIO BREAKDOWN | | | |
| |
| | | % of | |
Sector | | Net Assets | |
Industrials | | | 15.3 | |
Financials | | | 14.7 | |
Energy | | | 12.4 | |
Consumer Discretionary | | | 10.7 | |
Real Estate | | | 10.7 | |
Information Technology | | | 10.5 | |
Consumer Staples | | | 8.5 | |
Materials | | | 5.3 | |
Utilities | | | 3.7 | |
Health Care | | | 3.1 | |
Telecommunication Services | | | 2.2 | |
Other Assets Less Liabilities | | | 2.9 | |
| | | | |
| TOP TEN HOLDINGS | | | |
| |
| | | % of | |
Security Name | | Net Assets | |
Iron Mountain, Inc. | | | 3.3 | |
Praxair, Inc. | | | 2.9 | |
Marathon Petroleum Corp. | | | 2.9 | |
BB&T Corp. | | | 2.8 | |
U.S. Bancorp | | | 2.8 | |
Corning, Inc. | | | 2.6 | |
Fastenal Co. | | | 2.2 | |
National Fuel Gas Co. | | | 2.1 | |
Wal-Mart Stores, Inc. | | | 2.1 | |
Ryman Hospitality Properties, Inc. | | | 2.0 | |
| | | | |
Top Ten as a Group | | | 25.7 | |
| | | | |
Because a fund’s strategy may result in multiple investments in particular sectors of the economy, its performance may depend on the performance of those sectors and may fluctuate more widely than investments diversified across more sectors. For additional information on these and other risk considerations, please see the Fund’s prospectus.
Any sectors, industries, or securities discussed should not be perceived as investment recommendations. Mention of a specific security should not be considered a recommendation to buy or solicitation to sell that security. Specific securities mentioned in this report may have been sold from the Fund’s portfolio of investments by the time you receive this report.
24
| | |
| AMG River Road Dividend All Cap Value Fund | | October 31, 2017 |
| |
| Schedule of Portfolio Investments | | |
| | | | | | | | |
| | | Shares | | | Value | |
Common Stocks – 97.1% | | | | | | | | |
Consumer Discretionary – 10.7% | | | | | | | | |
Cedar Fair LP, MLP | | | 254,911 | | | $ | 15,957,429 | |
Cinemark Holdings, Inc. | | | 456,543 | | | | 16,590,773 | |
Extended Stay America, Inc. (Units) | | | 848,726 | | | | 16,821,749 | |
The Interpublic Group of Cos, Inc. | | | 578,414 | | | | 11,134,469 | |
Omnicom Group, Inc. | | | 199,474 | | | | 13,402,658 | |
Polaris Industries, Inc. 1 | | | 87,521 | | | | 10,365,112 | |
Target Corp. | | | 249,122 | | | | 14,708,163 | |
Total Consumer Discretionary | | | | | | | 98,980,353 | |
Consumer Staples – 8.5% | | | | | | | | |
Coty, Inc., Class A | | | 631,954 | | | | 9,732,092 | |
CVS Health Corp. | | | 115,191 | | | | 7,894,039 | |
Kimberly-Clark Corp. | | | 133,853 | | | | 15,059,801 | |
PepsiCo, Inc. | | | 91,445 | | | | 10,079,982 | |
Unilever PLC, Sponsored ADR (United Kingdom)1 | | | 282,873 | | | | 16,024,756 | |
Wal-Mart Stores, Inc. | | | 221,452 | | | | 19,334,974 | |
Total Consumer Staples | | | | | | | 78,125,644 | |
Energy – 12.4% | | | | | | | | |
Chevron Corp. | | | 91,740 | | | | 10,631,749 | |
Exxon Mobil Corp. | | | 198,353 | | | | 16,532,722 | |
Magellan Midstream Partners LP, MLP | | | 190,321 | | | | 13,076,956 | |
Marathon Petroleum Corp. | | | 440,286 | | | | 26,302,686 | |
Occidental Petroleum Corp. | | | 176,350 | | | | 11,386,919 | |
Spectra Energy Partners LP, MLP | | | 342,432 | | | | 14,765,668 | |
TransMontaigne Partners LP, MLP 1 | | | 262,647 | | | | 10,915,609 | |
Valero Energy Corp. | | | 143,094 | | | | 11,288,686 | |
Total Energy | | | | | | | 114,900,995 | |
Financials – 14.7% | | | | | | | | |
Axis Capital Holdings, Ltd. (Bermuda) | | | 177,201 | | | | 9,637,962 | |
BB&T Corp. | | | 532,682 | | | | 26,229,262 | |
CNA Financial Corp. | | | 156,989 | | | | 8,497,815 | |
MetLife, Inc. | | | 250,299 | | | | 13,411,020 | |
The PNC Financial Services Group, Inc. | | | 108,224 | | | | 14,803,961 | |
Thomson Reuters Corp. (Canada) | | | 290,596 | | | | 13,611,517 | |
U.S. Bancorp | | | 479,993 | | | | 26,102,019 | |
Wells Fargo & Co. | | | 254,519 | | | | 14,288,697 | |
WesBanco, Inc. | | | 239,265 | | | | 9,666,306 | |
Total Financials | | | | | | | 136,248,559 | |
Health Care – 3.1% | | | | | | | | |
Amgen, Inc. | | | 88,698 | | | | 15,541,664 | |
Cardinal Health, Inc. | | | 130,331 | | | | 8,067,489 | |
| | | | | | | | |
| | | Shares | | | Value | |
Novo Nordisk, Sponsored ADR (Denmark)1 | | | 91,065 | | | $ | 4,534,126 | |
Total Health Care | | | | | | | 28,143,279 | |
Industrials – 15.3% | | | | | | | | |
Aircastle, Ltd. | | | 619,320 | | | | 14,405,383 | |
Emerson Electric Co. | | | 238,230 | | | | 15,356,306 | |
Fastenal Co. | | | 426,126 | | | | 20,015,138 | |
General Electric Co. | | | 658,453 | | | | 13,274,412 | |
Johnson Controls International PLC | | | 393,697 | | | | 16,295,119 | |
KAR Auction Services, Inc. | | | 301,738 | | | | 14,281,260 | |
Nielsen Holdings PLC | | | 415,965 | | | | 15,419,823 | |
Union Pacific Corp. | | | 151,690 | | | | 17,564,185 | |
United Parcel Service, Inc., Class B | | | 125,101 | | | | 14,703,120 | |
Total Industrials | | | | | | | 141,314,746 | |
Information Technology – 10.5% | | | | | | | | |
Corning, Inc. | | | 766,497 | | | | 23,999,021 | |
CSG Systems International, Inc. | | | 106,346 | | | | 4,502,690 | |
Intel Corp. | | | 366,470 | | | | 16,670,720 | |
Microsoft Corp. | | | 145,852 | | | | 12,131,969 | |
Motorola Solutions, Inc. | | | 171,509 | | | | 15,528,425 | |
QUALCOMM, Inc. | | | 175,058 | | | | 8,929,709 | |
TE Connectivity, Ltd. (Switzerland) | | | 171,402 | | | | 15,592,440 | |
Total Information Technology | | | | | | | 97,354,974 | |
Materials – 5.3% | | | | | | | | |
Compass Minerals International, Inc. 1 | | | 170,234 | | | | 11,167,350 | |
LyondellBasell Industries NV, Class A | | | 101,552 | | | | 10,513,679 | |
Praxair, Inc. | | | 186,817 | | | | 27,297,700 | |
Total Materials | | | | | | | 48,978,729 | |
Real Estate – 10.7% | | | | | | | | |
The GEO Group Inc., REIT | | | 423,248 | | | | 10,983,286 | |
Iron Mountain, Inc., REIT | | | 754,429 | | | | 30,177,160 | |
Ryman Hospitality Properties, Inc., REIT | | | 276,103 | | | | 18,258,691 | |
Sabra Health Care REIT, Inc., REIT | | | 620,201 | | | | 12,354,404 | |
Ventas, Inc., REIT | | | 229,474 | | | | 14,399,493 | |
Weyerhaeuser Co., REIT | | | 362,546 | | | | 13,019,027 | |
Total Real Estate | | | | | | | 99,192,061 | |
Telecommunication Services – 2.2% | | | | | | | | |
Cogent Communications Holdings, Inc. | | | 89,600 | | | | 4,829,440 | |
Verizon Communications, Inc. | | | 328,436 | | | | 15,722,231 | |
Total Telecommunication Services | | | | | | | 20,551,671 | |
Utilities – 3.7% | | | | | | | | |
AmeriGas Partners LP, MLP 1 | | | 326,733 | | | | 14,784,668 | |
The accompanying notes are an integral part of these financial statements.
25
| | |
| AMG River Road Dividend All Cap Value Fund | | |
| |
| Schedule of Portfolio Investments (continued) | | |
| | | | | | | | |
| | | Shares | | | Value | |
Utilities – 3.7% (continued) | | | | | | | | |
National Fuel Gas Co. | | | 339,390 | | | $ | 19,701,590 | |
Total Utilities | | | | | | | 34,486,258 | |
Total Common Stocks
(Cost $721,458,430) | | | | | | | 898,277,269 | |
| | |
| | | Principal | | | | |
| | | Amount | | | | |
Short-Term Investments – 5.4% | | | | | | | | |
Repurchase Agreements – 2.8%2 | | | | | | | | |
Citigroup Global Markets, Inc., dated 10/31/17, due 11/01/17, 1.070% total to be received $6,197,648 (collateralized by various U.S. Government Agency Obligations, 0.000% - 11.500%, 11/01/17 - 09/09/49, totaling $6,321,413) | | $ | 6,197,464 | | | | 6,197,464 | |
HSBC Securities USA, Inc. dated 10/31/17, due 11/01/17, 1.040% total to be received $6,197,643 (collateralized by various U.S. Government Agency Obligations, 2.500% - 8.000%, 04/01/22 - 10/01/47, totaling $6,321,443) | | | 6,197,464 | | | | 6,197,464 | |
Jefferies LLC, dated 10/31/17, due 11/01/17, 1.180% total to be received $6,197,667 (collateralized by various U.S. Government Agency Obligations, 2.750% - 4.000%, 04/01/27 -10/15/52, totaling $6,321,413) | | | 6,197,464 | | | | 6,197,464 | |
| | | | | | | | |
| | | Principal | | | | |
| | | Amount | | | Value | |
Merrill Lynch, Pierce, Fenner & Smith, Inc., dated 10/31/17, due 11/01/17, 1.050% total to be received $1,303,986 (collateralized by various U.S. Government Agency Obligations, 2.000% -2.125%, 03/31/24 - 06/30/24, totaling $1,330,027) | | $ | 1,303,948 | | | $ | 1,303,948 | |
Nomura Securities International, Inc., dated 10/31/17, due 11/01/17, 1.060% total to be received $6,197,646 (collateralized by various U.S. Government Agency Obligations, 0.000% -6.250%, 11/30/17 - 09/09/49, totaling $6,321,413) | | | 6,197,464 | | | | 6,197,464 | |
Total Repurchase Agreements | | | | | | | 26,093,804 | |
| | |
| | | Shares | | | | |
Other Investment Companies – 2.6% | | | | | | | | |
Dreyfus Government Cash Management Fund, Institutional Class Shares, 0.93%3 | | | 23,992,820 | | | | 23,992,820 | |
Total Short-Term Investments
(Cost $50,086,624) | | | | | | | 50,086,624 | |
Total Investments – 102.5%
(Cost $771,545,054) | | | | | | | 948,363,893 | |
Other Assets, less Liabilities – (2.5)% | | | | | | | (23,549,916 | ) |
Net Assets – 100.0% | | | | | | $ | 924,813,977 | |
| 1 | Some or all of these securities, amounting to $25,556,279 or 2.8% of net assets, were out on loan to various brokers. |
| 2 | Collateral received from brokers for securities lending was invested in these joint repurchase agreements. |
| 3 | Yield shown represents the October 31, 2017, seven day average yield, which refers to the sum of the previous seven days’ dividends paid, expressed as an annual percentage. |
| | |
| ADR | | American Depositary Receipt |
| LP | | Limited Partnership |
| MLP | | Master Limited Partnership |
| REIT | | Real Estate Investment Trust |
The following table summarizes the inputs used to value the Fund’s investments by the fair value hierarchy levels as of October 31, 2017:
| | | | | | | | | | | | | | | | |
| | | Level 1 | | | Level 2 | | | Level 3 | | | Total | |
Investments in Securities | | | | | | | | | | | | | | | | |
Common Stocks† | | $ | 898,277,269 | | | | — | | | | — | | | $ | 898,277,269 | |
Short-Term Investments | | | | | | | | | | | | | | | | |
Repurchase Agreements | | | — | | | $ | 26,093,804 | | | | — | | | | 26,093,804 | |
Other Investment Companies | | | 23,992,820 | | | | — | | | | — | | | | 23,992,820 | |
| | | | | | | | | | | | | | | | |
Total Investments in Securities | | $ | 922,270,089 | | | $ | 26,093,804 | | | | — | | | $ | 948,363,893 | |
| | | | | | | | | | | | | | | | |
| † | All common stocks held in the Fund are Level 1 securities. For a detailed breakout of common stocks by major industry classification, please refer to the Fund’s Schedule of Portfolio Investments. |
As of October 31, 2017, the Fund had no transfers between levels from the beginning of the reporting period.
The accompanying notes are an integral part of these financial statements.
26
| | |
| AMG River Road Dividend All Cap Value Fund II | | |
| Portfolio Manager’s Comments (unaudited) | | |
OVERVIEW
For the fiscal year ended October 31, 2017, the AMG River Road Dividend All Cap Value Fund II (the “Fund”) Class N shares returned 15.33%, while the Russell 3000® Value Index returned 18.30%.
PERFORMANCE REVIEW
Over the last 12 months, the most significant market factors affecting absolute returns were the steady improvement in corporate earnings growth, the possibility of tax reform, and uncertainty about the timing of monetary tightening by the Federal Reserve (the “Fed”). Additionally, those stocks in the Russell 3000® Value Index with lower yields outperformed those with higher yields, creating a significant relative headwind for a dividend-oriented strategy. Given these challenges, the Fund underperformed due to both sector allocation and stock selection. The energy sector had the most significant positive impact on relative results in the period, primarily due to strong stock selection, while the financials sector had the most significant negative impact on relative results due to the underweight allocation and weak stock selection.
The two holdings with the largest positive contribution to the Fund’s total return were PNC Financial Services Group Inc. (PNC), a super-regional commercial bank, and GEO Group Inc. (GEO), a REIT offering correctional and detention facilities and services to federal, state, local and foreign governments. PNC, along with other banks, saw earnings improve significantly during Q4 2016, and stock prices followed suit. In the wake of the U.S. elections, interest rates moved higher and the yield curve steepened, leading to an improved outlook for net interest margins. Additionally, the Republican sweep of the White House and Congress raised the possibility of meaningful tax and regulatory reform, which could significantly reduce taxes and operating expenses for banks. In recognition of the positive
impact of the elections, we increased the multiples employed in our assessed values across the banking industry, including PNC. The position in PNC was trimmed as it was trading at a modest premium to the updated assessed value, the yield had declined below 2%, and it was the second-largest position early in the period, prior to reducing the position size.
GEO marched higher following the November presidential election and continued to do so in Q1, supported by a respectable Q4 earnings report and solid 2017 guidance. GEO investors received another piece of good news in late February when newly confirmed U.S. Attorney General Jeff Sessions issued a memo rescinding an August 18, 2016, directive from then-Deputy Attorney General Sally Yates instructing the BOP (Federal Bureau of Prisons) to reduce—and ultimately end—its use of privately operated prisons.
The two holdings with the lowest contribution to the Fund’s total return during the period were QUALCOMM Inc. (QCOM), a designer and manufacturer of integrated circuits, and W.W. Grainger Inc. (GWW), an industrial distribution industry leader. In January, QCOM shares declined sharply on news that Apple Inc. (AAPL) filed a lawsuit claiming they should be able to pay QCOM a percentage of the chip price rather than a percentage of a device’s average sale price. Apple believes QCOM is unduly benefiting from its brand, which commands a higher price, while QCOM believes AAPL would not be able to charge a higher price if devices did not have the technology provided by QCOM. QCOM intends to vigorously fight the suits. In fact, QCOM countersued AAPL claiming the company failed to engage in good faith negotiations, and inappropriately interfered with the contract manufacturers who produce iPhones and iPads. We believe there is support for QCOM’s stance. We trimmed the position in accordance with our sell discipline.
In April, GWW announced an unexpected acceleration of its price rationalization effort in a bid to grow market share. As the pricing cuts are expected to outweigh increased volumes in the near term, the firm was forced to cut full year guidance for 2017. Over time, GWW expects that it will expand market share and margins should rebound as increased volumes fuel operating leverage. However, it is unclear how competitors will respond to these lowered prices and whether GWW can sustain market share expansion. In the wake of GWW’s actions we reviewed and lowered our assessed valuation and conviction and reduced the position. We ultimately eliminated the position in August due to unrealized losses.
POSITIONING AND OUTLOOK
The Fund is significantly overweight in industrials and real estate and significantly underweight in financials and health care. Industrials went from +1.3% to +7.3% overweight versus the Russell 3000® Value benchmark, driven by the addition of four new positions to the Fund in this sector. Real estate ended the period at +6.0% overweight versus the benchmark. Driven by the elimination of three holdings, the underweight in financials increased from -8.0% to -12.5% versus the benchmark, and health care ended the period at -9.7% underweight. Our outlook for the market is cautious, but reasons to be optimistic about the underlying economy are increasing. From either a valuation or foreign policy perspective, risks remain elevated and we continue to expect the relative return of the Fund to improve as downside volatility increases.
The views expressed represent the opinions of River Road Asset Management LLC, as of October 31, 2017, and are not intended as a forecast or guarantee of future results and are subject to change without notice.
27
AMG River Road Dividend All Cap Value Fund II
Portfolio Manager’s Comments (continued)
CUMULATIVE TOTAL RETURN PERFORMANCE
The AMG River Road Dividend All Cap Value Fund II’s cumulative total return is based on the daily change in net asset value (NAV), and assumes that all dividends and distributions were reinvested. The graph compares a hypothetical $10,000 investment made in AMG River Road Dividend All Cap Value Fund II’s Class N shares on June 27, 2012, to a $10,000 investment made in the Russell 3000® Value Index for the same time period. The graph and table do not reflect the deduction of taxes that a shareholder would pay on a Fund distribution or redemption of shares. The listed returns for the Fund are net of expenses and the returns for the index exclude expenses. Total returns would have been lower had certain expenses not been reduced.
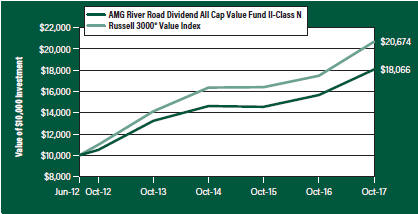
The table below shows the average annual total returns for AMG River Road Dividend All Cap Value Fund II and the Russell 3000® Value Index for the same time periods ended October 31, 2017.
| | | | | | | | | | | | | | | | |
| | | One | | | Five | | | Since | | | Inception | |
| Average Annual Total Returns 1 | | Year | | | Years | | | Inception | | | Date | |
AMG River Road Dividend All Cap Value Fund II2, 3, 4, 5, 6, 7 | | | | | | | | | | | | | | | | |
Class N | | | 15.33 | % | | | 11.45 | % | | | 11.69 | % | | | 06/27/12 | |
Class I | | | 15.65 | % | | | 11.74 | % | | | 11.99 | % | | | 06/27/12 | |
Class Z | | | — | | | | — | | | | 0.65 | % | | | 09/29/17 | |
Russell 3000® Value Index8 | | | 18.30 | % | | | 13.48 | % | | | 14.55 | % | | | 06/27/12 | † |
The performance data shown represents past performance. Past performance is not a guarantee of future results. Current performance may be lower or higher than the performance data quoted. The investment return and principal value of an investment will fluctuate so that an investor’s shares, when redeemed, may be worth more or less than their original cost.
Investors should carefully consider the Fund’s investment objectives, risks, charges and expenses before investing. For performance information through the most recent month end, current net asset values per share for the Fund and other information, please call 800.835.3879 or visit our website at amgfunds.com for a free prospectus. Read it carefully before investing or sending money.
Distributed by AMG Distributors, Inc., member FINRA/SIPC.
| † | Date reflects the inception date of the Fund, not the index. |
| 1 | Total return equals income yield plus share price change and assumes reinvestment of all dividends and capital gain distributions. Returns are net of fees and may reflect offsets of Fund expenses as described in the prospectus. No adjustment has been made for taxes payable by shareholders on their reinvested dividends and capital gain distributions. Returns for periods greater than one year are annualized. The listed returns on the Fund are net of expenses and based on the published NAV as of October 31, 2017. All returns are in U.S. dollars ($). |
| 2 | An issuer of a security may be unwilling or unable to pay income on a security. Common stocks do not assure dividend payments and are paid only when declared by an issuer’s board of directors. |
| 3 | Investments in international securities are subject to certain risks of overseas investing including currency fluctuations and changes in political and economic conditions, which could result in significant market fluctuations. These risks are magnified in emerging markets. |
| 4 | The Fund is subject to risks associated with investments in mid-capitalization companies such as greater price volatility, lower trading volume, and less liquidity than the stocks of larger, more established companies. |
| 5 | The Fund is subject to special risk considerations similar to those associated with the direct ownership of real estate. Real estate valuations may be subject to factors such as changing general and local economic, financial, competitive, and environmental conditions. |
| 6 | The Fund is subject to risks associated with investments in small-capitalization companies, such as erratic earnings patterns, competitive conditions, limited earnings history and a reliance on one or a limited number of products. |
| 7 | The Fund invests in value stocks, which may perform differently from the market as a whole and may be undervalued by the market for a long period of time. |
| 8 | The Russell 3000® Value Index measures the performance of the broad value segment of the U.S. equity universe. It includes those Russell 3000® companies with lower price-to-book ratios and lower forecasted growth values. Unlike the Fund, the Russell 3000® Value Index is unmanaged, is not available for investment and does not incur expenses. |
The Russell Indices are a trademark of the London Stock Exchange Group companies.
Not FDIC insured, nor bank guaranteed. May lose value.
28
| | |
| AMG River Road Dividend All Cap Value Fund II | | October 31, 2017 |
| |
| Fund Snapshots (unaudited) | | |
PORTFOLIO BREAKDOWN
| | | | |
Sector | | % of
Net Assets | |
Industrials | | | 15.9 | |
Financials | | | 14.4 | |
Energy | | | 12.2 | |
Real Estate | | | 11.2 | |
Information Technology | | | 10.9 | |
Consumer Discretionary | | | 10.4 | |
Consumer Staples | | | 9.2 | |
Materials | | | 5.7 | |
Utilities | | | 3.5 | |
Health Care | | | 3.4 | |
Telecommunication Services | | | 2.4 | |
Other Assets Less Liabilities | | | 0.8 | |
TOP TEN HOLDINGS
| | | | |
Security Name | | % of
Net Assets | |
Iron Mountain, Inc. | | | 3.5 | |
Praxair, Inc. | | | 3.1 | |
BB&T Corp. | | | 3.1 | |
U.S. Bancorp | | | 3.1 | |
Marathon Petroleum Corp. | | | 3.0 | |
Corning, Inc. | | | 2.9 | |
Wal-Mart Stores, Inc. | | | 2.4 | |
Fastenal Co. | | | 2.3 | |
National Fuel Gas Co. | | | 2.3 | |
Union Pacific Corp. | | | 2.1 | |
| | | | |
Top Ten as a Group | | | 27.8 | |
| | | | |
Because a fund’s strategy may result in multiple investments in particular sectors of the economy, its performance may depend on the performance of those sectors and may fluctuate more widely than investments diversified across more sectors. For additional information on these and other risk considerations, please see the Fund’s prospectus.
Any sectors, industries, or securities discussed should not be perceived as investment recommendations. Mention of a specific security should not be considered a recommendation to buy or solicitation to sell that security. Specific securities mentioned in this report may have been sold from the Fund’s portfolio of investments by the time you receive this report.
29
| | |
| AMG River Road Dividend All Cap Value Fund II | | October 31, 2017 |
| |
| Schedule of Portfolio Investments | | |
| | | | | | | | |
| | | Shares | | | Value | |
Common Stocks – 99.2% | | | | | | | | |
Consumer Discretionary – 10.4% | | | | | | | | |
Cedar Fair LP, MLP | | | 14,933 | | | $ | 934,805 | |
Cinemark Holdings, Inc. 1 | | | 65,895 | | | | 2,394,624 | |
Extended Stay America, Inc. (Units) | | | 119,615 | | | | 2,370,769 | |
The Interpublic Group of Cos, Inc. | | | 83,512 | | | | 1,607,606 | |
Omnicom Group, Inc. | | | 28,203 | | | | 1,894,960 | |
Polaris Industries, Inc. 1 | | | 12,637 | | | | 1,496,600 | |
Target Corp. | | | 35,155 | | | | 2,075,551 | |
Total Consumer Discretionary | | | | | | | 12,774,915 | |
Consumer Staples – 9.2% | | | | | | | | |
Coty, Inc., Class A | | | 90,475 | | | | 1,393,315 | |
CVS Health Corp. | | | 16,100 | | | | 1,103,333 | |
Kimberly-Clark Corp. | | | 19,248 | | | | 2,165,592 | |
PepsiCo, Inc. | | | 12,870 | | | | 1,418,660 | |
Unilever PLC, Sponsored ADR (United Kingdom) | | | 40,029 | | | | 2,267,643 | |
Wal-Mart Stores, Inc. | | | 32,587 | | | | 2,845,171 | |
Total Consumer Staples | | | | | | | 11,193,714 | |
Energy – 12.2% | | | | | | | | |
Chevron Corp. | | | 13,336 | | | | 1,545,509 | |
Exxon Mobil Corp. | | | 28,383 | | | | 2,365,723 | |
Magellan Midstream Partners LP, MLP | | | 27,461 | | | | 1,886,845 | |
Marathon Petroleum Corp. | | | 62,629 | | | | 3,741,457 | |
Occidental Petroleum Corp. | | | 25,374 | | | | 1,638,399 | |
Spectra Energy Partners LP, MLP 1 | | | 47,979 | | | | 2,068,855 | |
Valero Energy Corp. | | | 20,506 | | | | 1,617,718 | |
Total Energy | | | | | | | 14,864,506 | |
Financials – 14.4% | | | | | | | | |
Axis Capital Holdings, Ltd. (Bermuda) | | | 25,073 | | | | 1,363,721 | |
BB&T Corp. | | | 76,672 | | | | 3,775,329 | |
CNA Financial Corp. | | | 13,262 | | | | 717,872 | |
MetLife, Inc. | | | 35,369 | | | | 1,895,071 | |
The PNC Financial Services Group, Inc. | | | 15,222 | | | | 2,082,218 | |
Thomson Reuters Corp. (Canada) | | | 41,915 | | | | 1,963,299 | |
U.S. Bancorp | | | 69,314 | | | | 3,769,295 | |
Wells Fargo & Co. | | | 35,945 | | | | 2,017,952 | |
Total Financials | | | | | | | 17,584,757 | |
Health Care – 3.4% | | | | | | | | |
Amgen, Inc. | | | 12,909 | | | | 2,261,915 | |
Cardinal Health, Inc. | | | 18,840 | | | | 1,166,196 | |
| | | | | | | | |
| | | Shares | | | Value | |
Novo Nordisk, Sponsored ADR (Denmark) | | | 13,455 | | | $ | 669,925 | |
Total Health Care | | | | | | | 4,098,036 | |
Industrials – 15.9% | | | | | | | | |
Aircastle, Ltd. | | | 48,308 | | | | 1,123,644 | |
Emerson Electric Co. | | | 35,056 | | | | 2,259,710 | |
Fastenal Co. | | | 60,464 | | | | 2,839,994 | |
General Electric Co. | | | 94,487 | | | | 1,904,858 | |
Johnson Controls International PLC | | | 57,147 | | | | 2,365,314 | |
KAR Auction Services, Inc. | | | 43,496 | | | | 2,058,666 | |
Nielsen Holdings PLC | | | 60,276 | | | | 2,234,431 | |
Union Pacific Corp. | | | 22,386 | | | | 2,592,075 | |
United Parcel Service, Inc., Class B | | | 17,562 | | | | 2,064,062 | |
Total Industrials | | | | | | | 19,442,754 | |
Information Technology – 10.9% | | | | | | | | |
Corning, Inc. | | | 113,303 | | | | 3,547,517 | |
Intel Corp. | | | 53,465 | | | | 2,432,123 | |
Microsoft Corp. | | | 21,164 | | | | 1,760,421 | |
Motorola Solutions, Inc. | | | 23,955 | | | | 2,168,886 | |
QUALCOMM, Inc. | | | 25,176 | | | | 1,284,228 | |
TE Connectivity, Ltd. (Switzerland) | | | 24,067 | | | | 2,189,375 | |
Total Information Technology | | | | | | | 13,382,550 | |
Materials – 5.7% | | | | | | | | |
Compass Minerals International, Inc. 1 | | | 24,892 | | | | 1,632,915 | |
LyondellBasell Industries NV, Class A | | | 14,492 | | | | 1,500,357 | |
Praxair, Inc. | | | 26,453 | | | | 3,865,312 | |
Total Materials | | | | | | | 6,998,584 | |
Real Estate – 11.2% | | | | | | | | |
The GEO Group Inc., REIT | | | 60,664 | | | | 1,574,231 | |
Iron Mountain, Inc., REIT | | | 105,890 | | | | 4,235,600 | |
Ryman Hospitality Properties, Inc., REIT | | | 39,090 | | | | 2,585,022 | |
Sabra Health Care REIT, Inc., REIT | | | 69,942 | | | | 1,393,244 | |
Ventas, Inc., REIT | | | 32,894 | | | | 2,064,098 | |
Weyerhaeuser Co., REIT | | | 52,826 | | | | 1,896,982 | |
Total Real Estate | | | | | | | 13,749,177 | |
Telecommunication Services – 2.4% | | | | | | | | |
Cogent Communications Holdings, Inc. | | | 12,916 | | | | 696,172 | |
Verizon Communications, Inc. | | | 47,418 | | | | 2,269,900 | |
Total Telecommunication Services | | | | | | | 2,966,072 | |
Utilities – 3.5% | | | | | | | | |
AmeriGas Partners LP, MLP 1 | | | 30,702 | | | | 1,389,265 | |
The accompanying notes are an integral part of these financial statements.
30
| | |
| AMG River Road Dividend All Cap Value Fund II | | |
| |
| Schedule of Portfolio Investments (continued) | | |
| | | | | | | | |
| | | Shares | | | Value | |
Utilities – 3.5% (continued) | | | | | | | | |
National Fuel Gas Co. | | | 48,914 | | | $ | 2,839,458 | |
Total Utilities | | | | | | | 4,228,723 | |
Total Common Stocks
(Cost $102,279,771) | | | | | | | 121,283,788 | |
| | |
| | | Principal
Amount | | | | |
Short-Term Investments – 5.4% | | | | | | | | |
Repurchase Agreements – 4.9%2 | | | | | | | | |
Citigroup Global Markets, Inc., dated 10/31/17, due 11/01/17, 1.070% total to be received $1,414,351 (collateralized by various U.S. Government Agency Obligations, 0.000% - 11.500%, 11/01/17 - 09/09/49, totaling $1,442,595) | | $ | 1,414,309 | | | | 1,414,309 | |
Daiwa Capital Markets America, dated 10/31/17, due 11/01/17, 1.080% total to be received $1,414,351 (collateralized by various U.S. Government Agency Obligations, 0.000% -6.500%, 11/02/17 - 12/01/51, totaling $1,442,272) | | | 1,414,309 | | | | 1,414,309 | |
HSBC Securities USA, Inc., dated 10/31/17, due 11/01/17, 1.040% total to be received $1,414,350 (collateralized by various U.S. Government Agency Obligations, 2.500% - 8.000%, 04/01/22 - 10/01/47, totaling $1,442,602) | | | 1,414,309 | | | | 1,414,309 | |
| 1 | Some or all of these securities, amounting to $5,837,316 or 4.8% of net assets, were out on loan to various brokers. |
| 2 | Collateral received from brokers for securities lending was invested in these joint repurchase agreements. |
| 3 | Yield shown represents the October 31, 2017, seven day average yield, which refers to the sum of the previous seven days’ dividends paid, expressed as an annual percentage. |
| | | | | | | | |
| | | Principal
Amount | | | Value | |
Merrill Lynch, Pierce, Fenner & Smith, Inc., dated 10/31/17, due 11/01/17, 1.050% total to be received $297,573 (collateralized by various U.S. Government Agency Obligations, 2.000% -2.125%, 03/31/24 - 06/30/24, totaling $303,515) | | $ | 297,564 | | | $ | 297,564 | |
Nomura Securities International, Inc., dated 10/31/17, due 11/01/17, 1.060% total to be received $1,414,351 (collateralized by various U.S. Government Agency Obligations, 0.000% -6.250%, 11/30/17 - 09/09/49, totaling $1,442,595) | | | 1,414,309 | | | | 1,414,309 | |
Total Repurchase Agreements | | | | | | | 5,954,800 | |
| | |
| | | Shares | | | | |
Other Investment Companies – 0.5% | | | | | | | | |
Dreyfus Institutional Preferred Government Money Market Fund, Institutional Class Shares, 1.00%3 | | | 683,049 | | | | 683,049 | |
Total Short-Term Investments
(Cost $6,637,849) | | | | | | | 6,637,849 | |
Total Investments – 104.6%
(Cost $108,917,620) | | | | | | | 127,921,637 | |
Other Assets, less Liabilities – (4.6)% | | | | | | | (5,634,193 | ) |
Net Assets – 100.0% | | | | | | $ | 122,287,444 | |
ADR American Depositary Receipt
LP Limited Partnership
MLP Master Limited Partnership
REIT Real Estate Investment Trust
The following table summarizes the inputs used to value the Fund’s investments by the fair value hierarchy levels as of October 31, 2017:
| | | | | | | | | | | | | | | | |
| | | Level 1 | | | Level 2 | | | Level 3 | | | Total | |
Investments in Securities | | | | | | | | | | | | | | | | |
Common Stocks† | | $ | 121,283,788 | | | | — | | | | — | | | $ | 121,283,788 | |
Short-Term Investments | | | | | | | | | | | | | | | | |
Repurchase Agreements | | | — | | | $ | 5,954,800 | | | | — | | | | 5,954,800 | |
Other Investment Companies | | | 683,049 | | | | — | | | | — | | | | 683,049 | |
| | | | | | | | | | | | | | | | |
Total Investments in Securities | | $ | 121,966,837 | | | $ | 5,954,800 | | | | — | | | $ | 127,921,637 | |
| | | | | | | | | | | | | | | | |
| † | All common stocks held in the Fund are Level 1 securities. For a detailed breakout of common stocks by major industry classification, please refer to the Fund’s Schedule of Portfolio Investments. |
As of October 31, 2017, the Fund had no transfers between levels from the beginning of the reporting period.
The accompanying notes are an integral part of these financial statements.
31
| | |
| AMG Managers Fairpointe Mid Cap Fund | | |
| Portfolio Manager’s Comments (unaudited) | | |
OVERVIEW
For the fiscal year ended October 31, 2017, the AMG Managers Fairpointe Mid Cap Fund (the “Fund”) Class N shares returned 16.87%, while the S&P MidCap 400® Index returned 23.48%.
PERFORMANCE REVIEW
Equity markets began fiscal 2017 with a post-election rally, and the momentum continued. Drivers of relative performance for the Fund included strong stock selection in the materials sector and a positive contribution from an underweight position in real estate, offset by underperformance in the industrial and technology sectors. Markets were unusually calm with a lack of volatility; the largest selloff of approximately 5% in the S&P 400 Index came in August.
The top five contributors to performance were: The New York Times Company (NYT), FMC Corporation (FMC), Adtalem Global Education Inc. (ATGE, formerly DeVry Education Group), Cree, Inc. (CREE) and United States Steel Corporation (X). We highlight three contributors below.
The New York Times Company continues to benefit from a mesmerizing news cycle and reputation as a trusted brand. Digital subscriptions grew over 60% this year, exceeding estimates.
FMC Corporation acquired DuPont’s agricultural crop protection business in an accretive transaction. The company also plans to spin off its small but highly profitable lithium business, which provides lithium for electric vehicle batteries.
Adtalem Global Education removed a large overhang when it settled investigations into past marketing practices. A new management team has reduced costs and invested in growth areas.
Detractors from performance included Mattel, Inc. (MAT), Chicago Bridge & Iron Company (CBI), Akamai Technologies Inc. (AKAM), TechnipFMC plc (FTI) and Stericycle, Inc. (SRCL). We highlight three of these detractors below.
Mattel management is invigorating core brands with more emphasis on digital toys in partnership with technology companies like Google. This has been a difficult year for Mattel, beginning with an inventory overhang from a disappointing 2016 holiday season and the recent bankruptcy announcement by Toys “R” Us. However, we believe the tide is turning in Mattel’s favor, as core brands are showing improvement, new movies for Barbie and Toy Story are being planned, and strategic initiatives take hold. With this outlook, the current valuation is compelling.
Chicago Bridge & Iron Company declined due to cost overruns on several large projects. A new CEO is focused on improving project execution and profitability. The company is in the process of selling its technology unit, and we expect proceeds to be used to pay off debt. We believe shares are undervalued given earnings potential.
Akamai Technologies announced lower- than-expected revenue in its content delivery segment and increased spending on product development. While the stock declined on this revised near-term outlook, we expect these expenditures to be beneficial for long-term growth.
PERSPECTIVE AND OUTLOOK
The OECD forecast for global GDP growth is 3.5% for 2017, an acceleration from 3% in 20161. In the U.S., with the unemployment rate down to 4.3%2, the economy was strong enough for the Fed to raise interest rates three times in fiscal 2017.
At the end of October, the S&P 400 and Russell MidCap benchmarks were trading at 17.4x and 17.0x projected 2018 earnings, respectively. In comparison, the Fund traded at 14.9x expected 2018 earnings3.We believe the Fund is well positioned to generate earnings growth and multiple expansion over the next several years, relative to its benchmarks.
| 1 | OECD (The Organization for Economic Co-operation and Development). |
| 2 | U.S. Bureau of Labor Statistics. |
The views expressed represent the opinions of Fairpointe Capital LLC, as of October 31, 2017, and are not intended as a forecast or guarantee of future results and are subject to change without notice.
32
AMG Managers Fairpointe Mid Cap Fund
Portfolio Manager’s Comments (continued)
CUMULATIVE TOTAL RETURN PERFORMANCE
The AMG Managers Fairpointe Mid Cap Fund’s cumulative total return is based on the daily change in net asset value (NAV), and assumes that all dividends and distributions were reinvested. The graph compares a hypothetical $10,000 investment made in AMG Managers Fairpointe Mid Cap Fund’s Class N shares on October 31, 2007, to a $10,000 investment made in the S&P MidCap 400® Index and Russell Midcap Index for the same time period. The graph and table do not reflect the deduction of taxes that a shareholder would pay on a Fund distribution or redemption of shares. The listed returns for the Fund are net of expenses and the returns for the index exclude expenses. Total returns would have been lower had certain expenses not been reduced.
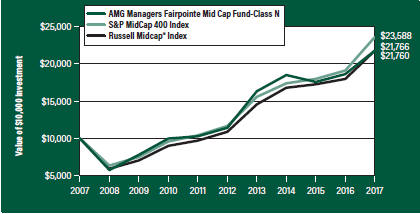
The table below shows the average annual total returns for AMG Managers Fairpointe Mid Cap Fund and the S&P MidCap 400® Index and Russell Midcap Index for the same time periods ended October 31, 2017.
| | | | | | | | | | | | | | | | | | | | |
| | | One | | | Five | | | Ten | | | Since | | | Inception | |
| Average Annual Total Returns 1 | | Year | | | Years | | | Years | | | Inception | | | Date | |
AMG Managers Fairpointe Mid Cap Fund2, 3, 4, 5 | | | | | | | | | | | | | | | | | | | | |
Class N | | | 16.87 | % | | | 13.76 | % | | | 8.09 | % | | | 12.14 | % | | | 09/19/94 | |
Class I | | | 17.16 | % | | | 14.05 | % | | | 8.36 | % | | | 9.91 | % | | | 07/06/04 | |
Class Z | | | — | | | | — | | | | — | | | | (2.85 | %) | | | 09/29/17 | |
S&P MidCap 400® Index6 | | | 23.48 | % | | | 15.13 | % | | | 8.96 | % | | | 12.18 | % | | | 09/19/94 | † |
Russell Midcap® Index7 | | | 21.09 | % | | | 14.87 | % | | | 8.09 | % | | | 10.07 | % | | | 07/06/04 | † |
The performance data shown represents past performance. Past performance is not a guarantee of future results. Current performance may be lower or higher than the performance data quoted. The investment return and principal value of an investment will fluctuate so that an investor’s shares, when redeemed, may be worth more or less than their original cost.
Investors should carefully consider the Fund’s investment objectives, risks, charges and expenses before investing. For performance information through the most recent month end, current net asset values per share for the Fund and other information, please call 800.835.3879 or visit our website at amgfunds.com for a free prospectus. Read it carefully before investing or sending money.
Distributed by AMG Distributors, Inc., member FINRA/SIPC.
| † | Date reflects the inception date of the Fund, not the index. |
| 1 | Total return equals income yield plus share price change and assumes reinvestment of all dividends and capital gain distributions. Returns are net of fees and may reflect offsets of Fund expenses as described in the prospectus. No adjustment has been made for taxes payable by shareholders on their reinvested dividends and capital gain distributions. Returns for periods greater than one year are annualized. The listed returns on the Fund are net of expenses and based on the published NAV as of October 31, 2017. All returns are in U.S. dollars ($). |
| 2 | The Fund is subject to risks associated with investments in mid-capitalization companies such as greater price volatility, lower trading volume, and less liquidity than the stocks of larger, more established companies. |
| 3 | The Fund is subject to risks associated with investments in small-capitalization companies, such as erratic earnings patterns, competitive conditions, limited earnings history and a reliance on one or a limited number of products. |
| 4 | The Fund may invest in derivatives such as options and futures; the complexity and rapidly changing structure of derivatives markets may increase the possibility of market losses. |
| 5 | Investments in international securities are subject to certain risks of overseas investing including currency fluctuations and changes in political and economic conditions, which could result in significant market fluctuations. These risks are magnified in emerging markets. |
| 6 | The S&P MidCap 400® Index provides investors with a benchmark for mid-sized companies. The Index, which is distinct from the large-cap S&P 500, measures the performance of mid-sized companies, reflecting the distinctive risk and return characteristics of this market segment. Unlike the Fund, the S&P MidCap 400® Index is unmanaged, is not available for investment and does not incur expenses. |
| 7 | The Russell Midcap® Index measures the performance of the 800 smallest companies in the Russell 1000® Index, which represent approximately 25% of the total market capitalization of the Russell 1000 Index. Unlike the Fund, the S&P MidCap 400® Index is unmanaged, is not available for investment and does not incur expenses. |
The S&P Index is proprietary data of Standard & Poor’s, a division of McGraw-Hill Companies, Inc.
The Russell Indices are a trademark of the London Stock Exchange Group companies.
Not FDIC insured, nor bank guaranteed. May lose value.
33
| | |
| AMG Managers Fairpointe Mid Cap Fund | | October 31, 2017 |
| Fund Snapshots (unaudited) | | |
PORTFOLIO BREAKDOWN
| | | | |
| | | % of | |
| Sector | | Net Assets | |
Consumer Discretionary | | | 32.1 | |
Information Technology | | | 21.3 | |
Industrials | | | 14.4 | |
Health Care | | | 7.6 | |
Materials | | | 7.2 | |
Financials | | | 5.6 | |
Consumer Staples | | | 4.3 | |
Energy | | | 3.9 | |
Other Assets Less Liabilities | | | 3.6 | |
TOP TEN HOLDINGS
| | | | |
| | | % of | |
| Security Name | | Net Assets | |
Cree, Inc. | | | 3.7 | |
Domtar Corp. | | | 3.4 | |
Akamai Technologies, Inc. | | | 3.4 | |
Teradata Corp. | | | 3.3 | |
The New York Times Co., Class A | | | 3.3 | |
Stericycle, Inc. | | | 3.1 | |
Juniper Networks, Inc. | | | 3.1 | |
Hormel Foods Corp. | | | 2.9 | |
Patterson Cos, Inc. | | | 2.7 | |
Mattel, Inc. | | | 2.7 | |
| | | | |
Top Ten as a Group | | | 31.6 | |
| | | | |
Because a fund’s strategy may result in multiple investments in particular sectors of the economy, its performance may depend on the performance of those sectors and may fluctuate more widely than investments diversified across more sectors. For additional information on these and other risk considerations, please see the Fund’s prospectus.
Any sectors, industries, or securities discussed should not be perceived as investment recommendations. Mention of a specific security should not be considered a recommendation to buy or solicitation to sell that security. Specific securities mentioned in this report may have been sold from the Fund’s portfolio of investments by the time you receive this report.
34
| | |
| AMG Managers Fairpointe Mid Cap Fund | | October 31, 2017 |
| |
| Schedule of Portfolio Investments | | |
| | | | | | | | |
| | | Shares | | | Value | |
Common Stocks – 96.4% | | | | | | | | |
Consumer Discretionary – 32.1% | | | | | | | | |
Adtalem Global Education, Inc. | | | 1,794,673 | | | $ | 66,313,167 | |
BorgWarner, Inc. | | | 841,700 | | | | 44,374,424 | |
Cooper Tire & Rubber Co. | | | 2,889,220 | | | | 94,766,416 | |
Gentex Corp. | | | 4,846,700 | | | | 94,074,447 | |
The Interpublic Group of Cos, Inc. | | | 2,065,600 | | | | 39,762,800 | |
Lear Corp. | | | 393,300 | | | | 69,059,547 | |
Lions Gate Entertainment Corp., Class A * | | | 2,363,444 | | | | 68,587,145 | |
Lions Gate Entertainment Corp., Class B * | | | 2,313,467 | | | | 63,990,497 | |
LKQ Corp. * | | | 2,503,900 | | | | 94,371,991 | |
Mattel, Inc. | | | 7,547,300 | | | | 106,567,876 | |
The New York Times Co., Class A | | | 6,908,654 | | | | 131,955,292 | |
Office Depot, Inc. | | | 23,881,700 | | | | 74,033,270 | |
Scholastic Corp. | | | 1,308,423 | | | | 48,333,146 | |
TEGNA, Inc. | | | 8,655,700 | | | | 105,859,211 | |
Time, Inc. | | | 8,430,109 | | | | 97,789,264 | |
Whirlpool Corp. | | | 462,500 | | | | 75,817,625 | |
Total Consumer Discretionary | | | | | | | 1,275,656,118 | |
Consumer Staples – 4.3% | | | | | | | | |
Bunge, Ltd. | | | 805,500 | | | | 55,402,290 | |
Hormel Foods Corp. | | | 3,711,200 | | | | 115,640,992 | |
Total Consumer Staples | | | | | | | 171,043,282 | |
Energy – 3.9% | | | | | | | | |
McDermott International, Inc. * | | | 12,189,200 | | | | 80,692,504 | |
TechnipFMC PLC (United Kingdom)* | | | 2,576,892 | | | | 70,581,072 | |
Transocean, Ltd. (Switzerland)* | | | 218,700 | | | | 2,296,350 | |
Total Energy | | | | | | | 153,569,926 | |
Financials – 5.6% | | | | | | | | |
Cincinnati Financial Corp. | | | 673,200 | | | | 47,238,444 | |
Northern Trust Corp. | | | 980,900 | | | | 91,733,768 | |
Raymond James Financial, Inc. | | | 975,100 | | | | 82,668,978 | |
Total Financials | | | | | | | 221,641,190 | |
Health Care – 7.6% | | | | | | | | |
Patterson Cos, Inc. | | | 2,881,238 | | | | 106,605,806 | |
Quest Diagnostics, Inc. | | | 718,900 | | | | 67,418,442 | |
Varex Imaging Corp. * | | | 662,520 | | | | 22,770,812 | |
Varian Medical Systems, Inc. * | | | 1,016,500 | | | | 105,909,135 | |
Total Health Care | | | | | | | 302,704,195 | |
Industrials – 14.4% | | | | | | | | |
AGCO Corp. | | | 1,143,800 | | | | 78,430,366 | |
| | | | | | | | |
| | | Shares | | | Value | |
Arconic Inc. | | | 3,570,834 | | | $ | 89,699,350 | |
Chicago Bridge & Iron Co. NV (Netherlands) | | | 3,297,800 | | | | 45,971,332 | |
Copa Holdings, S.A., Class A (Panama) | | | 805,435 | | | | 99,221,538 | |
Donaldson Co., Inc. | | | 939,600 | | | | 44,358,516 | |
Stericycle, Inc. * | | | 1,745,100 | | | | 123,640,335 | |
Werner Enterprises, Inc. | | | 2,495,400 | | | | 88,961,010 | |
Total Industrials | | | | | | | 570,282,447 | |
Information Technology – 21.3% | | | | | | | | |
Akamai Technologies, Inc. * | | | 2,585,800 | | | | 135,108,050 | |
Cars.com, Inc. * | | | 2,990,133 | | | | 71,224,968 | |
Cree, Inc. * | | | 4,071,473 | | | | 145,351,586 | |
Itron, Inc. * | | | 753,898 | | | | 58,917,129 | |
Jabil, Inc. | | | 2,957,700 | | | | 83,643,756 | |
Juniper Networks, Inc. | | | 4,939,500 | | | | 122,647,785 | |
Nuance Communications, Inc. * | | | 4,061,400 | | | | 59,865,036 | |
Teradata Corp. * | | | 3,946,700 | | | | 132,017,115 | |
Unisys Corp. * | | | 4,313,288 | | | | 37,741,270 | |
Total Information Technology | | | | | | | 846,516,695 | |
Materials – 7.2% | | | | | | | | |
Domtar Corp. | | | 2,883,804 | | | | 136,461,605 | |
FMC Corp. | | | 1,035,700 | | | | 96,175,102 | |
Gerdau SA, Sponsored ADR (Brazil) | | | 16,482,200 | | | | 54,556,082 | |
Total Materials | | | | | | | 287,192,789 | |
Total Common Stocks
(Cost $3,176,112,022) | | | | | | | 3,828,606,642 | |
Short-Term Investments – 2.8% | | | | | | | | |
Other Investment Companies – 2.8% | | | | | | | | |
Dreyfus Government Cash Management Fund, Institutional Class Shares, 0.93%1 | | | 109,436,594 | | | | 109,436,594 | |
Total Short-Term Investments
(Cost $109,436,594) | | | | | | | 109,436,594 | |
Total Investments – 99.2%
(Cost $3,285,548,616) | | | | | | | 3,938,043,236 | |
Other Assets, less Liabilities – 0.8% | | | | | | | 32,153,426 | |
Net Assets – 100.0% | | | | | | $ | 3,970,196,662 | |
The accompanying notes are an integral part of these financial statements.
35
| | |
| AMG Managers Fairpointe Mid Cap Fund | | |
| |
| Schedule of Portfolio Investments (continued) | | |
| * | Non-income producing security. |
| 1 | Yield shown represents the October 31, 2017, seven day average yield, which refers to the sum of the previous seven days’ dividends paid, expressed as an annual percentage. |
| ADR | American Depositary Receipt |
The following table summarizes the inputs used to value the Fund’s investments by the fair value hierarchy levels as of October 31, 2017:
| | | | | | | | | | | | | | | | |
| | | Level 1 | | | Level 2 | | | Level 3 | | | Total | |
Investments in Securities | | | | | | | | | | | | | | | | |
Common Stocks† | | $ | 3,828,606,642 | | | | — | | | | — | | | $ | 3,828,606,642 | |
Short-Term Investments | | | | | | | | | | | | | | | | |
Other Investment Companies | | | 109,436,594 | | | | — | | | | — | | | | 109,436,594 | |
| | | | | | | | | | | | | | | | |
Total Investments in Securities | | $ | 3,938,043,236 | | | | — | | | | — | | | $ | 3,938,043,236 | |
| | | | | | | | | | | | | | | | |
| † | All common stocks held in the Fund are Level 1 securities. For a detailed breakout of common stocks by major industry classification, please refer to the Fund’s Schedule of Portfolio Investments. |
As of October 31, 2017, the Fund had no transfers between levels from the beginning of the reporting period.
The accompanying notes are an integral part of these financial statements.
36
| | |
| AMG Managers Montag & Caldwell Mid Cap Growth Fund | | |
| Portfolio Manager’s Comments (unaudited) | | |
OVERVIEW
For the fiscal year ended October 31, 2017, the AMG Managers Montag & Caldwell Mid Cap Growth Fund (the “Fund”) Class N shares returned 19.09%, compared with the 26.25% return for its benchmark, the Russell Midcap® Growth Index. The Fund is managed using fundamental analysis that focuses on a company’s future earnings and dividend growth potential. The process is primarily bottom up and utilizes an intrinsic valuation model in which the current price of the stock is related to the present value of the company’s estimated future earnings and dividend streams. The Fund seeks to invest in mid cap growth stocks selling at a discount to our estimate of fair value and whose earnings per share are growing faster than the market.
MARKET ENVIRONMENT
Stocks posted a strong rally over the past year led by small caps followed by large caps and then mid caps. The Russell 2000® Index (small cap) was up 27.8%, the Russell 1000® Index (large cap) was up 23.7%, and the Russell Midcap® Index (mid cap) was up 21.1%. Contrary to the prior year, growth strongly outperformed value across the market cap spectrum. The Russell 2000® Growth Index (small cap growth) was up 31.0%, compared to a 24.8% return for the Russell 2000® Value Index (small cap value). The Russell 1000® Growth Index (large cap growth) was up 29.7%, versus a return of 17.8% for the Russell 1000® Value Index (large cap value). And the Russell Midcap® Growth Index (mid cap growth) was up 26.3%, compared to a 17.1% return for the Russell Midcap® Value Index (mid cap value).
PERFORMANCE REVIEW
The market staged a powerful rally in the immediate aftermath of Donald Trump’s election a year ago and has continued to march steadily higher ever since with very little volatility. The initial election reaction caused the dollar to soar, bond yields to spike, and
shares of cyclicals such as financials, energy, materials and industrials to rally on the hopes that a Republican-controlled Congress would push through Trump’s pro-growth agenda of tax reform, increased infrastructure spending and reduced regulatory burdens.
The “Trump rally” eventually gave way to reality when congressional Republicans failed to pass healthcare “repeal and replace” legislation, signaling potential difficulties getting more ambitious tax reform legislation through Congress. Stocks, however, continued to grind higher fueled by improving global economic growth, rising corporate profits and sustained central bank accommodation. Market leadership shifted from the cyclicals back to the secular growers, especially technology, over the spring and summer months thanks to falling bond yields and a weaker dollar. More recently, the “Trump stocks” have seemingly regained favor on renewed hopes for tax cuts.
Underpinning the steady rise in stocks this past year has been record low volatility. The CBOE Volatility Index (VIX) (aka the “Fear Gauge”) has recently tested multi-decade lows at or below 9.0.1 Meanwhile, the last time the S&P 500® experienced as much as a 3% pullback from its highs was before last year’s election, a record streak, and the percentage of bulls in the weekly Investors’ Intelligence survey is within 3% of its high. All are troubling signs of investor complacency.
Furthermore, this lack of stock market volatility continues to rob active managers like ourselves of the ability to add alpha by selling stocks when they get pricey and reinvesting once they have experienced a pullback and are selling at more reasonable valuations. For the year ended October 31, 2017, the Fund returned 19.09%, compared to the 26.25% return for the Russell Midcap® Growth Index. The Fund’s lagging performance versus the benchmark can be
explained partly by sector allocation and partly by individual stock selection. An overweight position in industrials, an underweight in health care, and an allocation to cash amidst a strong market advance all weighed against relative performance. Individual stocks that weighed most heavily on relative performance this past year include Newell Brands, Hanesbrands, Molson Coors, O’Reilly Automotive, and Acuity Brands. Also, not owning shares of NVIDIA was a major drag. Partially offsetting this have been strong performances from Arista Networks, VCA Inc., Panera Bread, Raymond James Financial and ANSYS.
OUTLOOK
Looking ahead, we remain concerned with elevated valuations, investor complacency and suppressed market volatility, although these remain pre-conditions to a market decline, not catalysts themselves. We expect the market could continue to be supported in the near term by low risk of recession, an improving global economy and rising corporate profits, accommodative central bank policies, a gradual and predictable increase in interest rates by our Federal Reserve (the Fed) and the possibility of fiscal stimulus. Changes to any of these factors, however, could be a cause for the market to sell off.
We continue to have high conviction in the Fund’s holdings, believing this portfolio of high-quality midcap growth stocks offers a compelling combination of above-average profit growth at reasonable valuations. We believe the odds favor renewed market volatility in the period ahead and feel confident that the Fund’s holdings should hold up better during more challenging markets.
The views expressed represent the opinions of Montag & Caldwell LLC, as of October 31, 2017, and are not intended as a forecast or guarantee of future results and are subject to change without notice.
37
| | |
| AMG Managers Montag & Caldwell Mid Cap Growth Fund | | |
| Portfolio Manager’s Comments (continued) | | |
CUMULATIVE TOTAL RETURN PERFORMANCE
The AMG Managers Montag & Caldwell Mid Cap Growth Fund’s cumulative total return is based on the daily change in net asset value (NAV), and assumes that all dividends and distributions were reinvested. The graph compares a hypothetical $10,000 investment made in AMG Managers Montag & Caldwell Mid Cap Growth Fund’s Class N shares on November 2, 2007, to a $10,000 investment made in the Russell MidCap® Growth Index for the same time period. The graph and table do not reflect the deduction of taxes that a shareholder would pay on a Fund distribution or redemption of shares. The listed returns for the Fund are net of expenses and the returns for the index exclude expenses. Total returns would have been lower had certain expenses not been reduced.
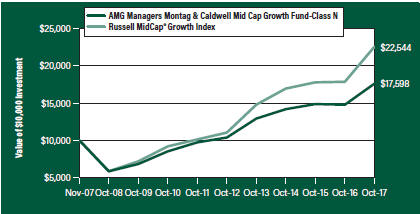
The table below shows the average annual total returns for AMG Managers Montag & Caldwell Mid Cap Growth Fund and the Russell MidCap® Growth Index for the same time periods ended October 31, 2017.
| | | | | | | | | | | | | | | | |
| | | One | | | Five | | | Since | | | Inception | |
| Average Annual Total Returns 1 | | Year | | | Years | | | Inception | | | Date | |
AMG Managers Montag & Caldwell Mid Cap Growth Fund2, 3, 4 | | | | | | | | | | | | | | | | |
Class N | | | 19.09 | % | | | 11.14 | % | | | 5.82 | % | | | 11/02/07 | |
Class I | | | 19.35 | % | | | — | | | | 8.32 | % | | | 05/14/14 | |
Russell Midcap® Growth Index5 | | | 26.25 | % | | | 15.34 | % | | | 8.47 | % | | | 11/02/07 | † |
The performance data shown represents past performance. Past performance is not a guarantee of future results. Current performance may be lower or higher than the performance data quoted. The investment return and principal value of an investment will fluctuate so that an investor’s shares, when redeemed, may be worth more or less than their original cost.
Investors should carefully consider the Fund’s investment objectives, risks, charges and expenses before investing. For performance information through the most recent month end, current net asset values per share for the Fund and other information, please call 800.835.3879 or visit our website at amgfunds.com for a free prospectus. Read it carefully before investing or sending money.
Distributed by AMG Distributors, Inc., member FINRA/SIPC.
| † | Date reflects the inception date of the Fund, not the index. |
| 1 | Total return equals income yield plus share price change and assumes reinvestment of all dividends and capital gain distributions. Returns are net of fees and may reflect offsets of Fund expenses as described in the prospectus. No adjustment has been made for taxes payable by shareholders on their reinvested dividends and capital gain distributions. Returns for periods greater than one year are annualized. The listed returns on the Fund are net of expenses and based on the published NAV as of October 31, 2017. All returns are in U.S. dollars ($). |
| 2 | The Fund is subject to risks associated with investments in mid-capitalization companies such as greater price volatility, lower trading volume, and less liquidity than the stocks of larger, more established companies. |
| 3 | The Fund invests in growth stocks, which may be more sensitive to market movements because their prices tend to reflect future investor expectations rather than just current profits. |
| 4 | Investments in international securities are subject to certain risks of overseas investing including currency fluctuations and changes in political and economic conditions, which could result in significant market fluctuations. These risks are magnified in emerging markets. |
| 5 | The Russell Midcap® Growth Index measures the performance of those Russell Midcap companies with higher price/ book ratios and higher forecasted growth values. The stocks are also members of the Russell 1000® Growth Index. Unlike the Fund, the Russell Midcap® Growth Index is unmanaged, is not available for investment and does not incur expenses. |
The Russell Indices are a trademark of the London Stock Exchange Group companies.
Not FDIC insured, nor bank guaranteed. May lose value.
38
| | |
| AMG Managers Montag & Caldwell Mid Cap Growth Fund | | October 31, 2017 |
| Fund Snapshots (unaudited) | | |
PORTFOLIO BREAKDOWN
| | | | |
Sector | | % of
Net Assets | |
Information Technology | | | 28.6 | |
Consumer Discretionary | | | 20.8 | |
Industrials | | | 17.6 | |
Health Care | | | 9.6 | |
Financials | | | 9.0 | |
Consumer Staples | | | 6.6 | |
Energy | | | 1.4 | |
Other Assets Less Liabilities | | | 6.4 | |
TOP TEN HOLDINGS
| | | | |
Security Name | | % of
Net Assets | |
Copart, Inc. | | | 3.3 | |
WEX, Inc. | | | 3.3 | |
Dollar Tree, Inc. | | | 3.2 | |
Laboratory Corp. of America Holdings | | | 3.1 | |
Genpact, Ltd. | | | 3.0 | |
Edwards Lifesciences Corp. | | | 3.0 | |
Ross Stores, Inc. | | | 3.0 | |
Blue Buffalo Pet Products, Inc. | | | 3.0 | |
J.B. Hunt Transport Services, Inc. | | | 2.9 | |
FleetCor Technologies, Inc. | | | 2.8 | |
| | | | |
Top Ten as a Group | | | 30.6 | |
| | | | |
Because a fund’s strategy may result in multiple investments in particular sectors of the economy, its performance may depend on the performance of those sectors and may fluctuate more widely than investments diversified across more sectors. For additional information on these and other risk considerations, please see the Fund’s prospectus.
Any sectors, industries, or securities discussed should not be perceived as investment recommendations. Mention of a specific security should not be considered a recommendation to buy or solicitation to sell that security. Specific securities mentioned in this report may have been sold from the Fund’s portfolio of investments by the time you receive this report.
39
| | |
| AMG Managers Montag & Caldwell Mid Cap Growth Fund | | October 31, 2017 |
| |
| Schedule of Portfolio Investments | | |
| | | | | | | | |
| | | Shares | | | Value | |
Common Stocks – 93.6% | | | | | | | | |
Consumer Discretionary – 20.8% | | | | | | | | |
Dollar Tree, Inc. * | | | 3,220 | | | $ | 293,825 | |
Dunkin’ Brands Group, Inc. 1 | | | 1,470 | | | | 86,833 | |
Expedia, Inc. | | | 1,393 | | | | 173,651 | |
Five Below, Inc. * | | | 2,020 | | | | 111,605 | |
LKQ Corp. * | | | 6,010 | | | | 226,517 | |
Newell Brands, Inc. | | | 6,290 | | | | 256,506 | |
O’Reilly Automotive, Inc. * | | | 547 | | | | 115,390 | |
Planet Fitness, Inc., Class A | | | 5,080 | | | | 135,331 | |
Ross Stores, Inc. | | | 4,380 | | | | 278,086 | |
ServiceMaster Global Holdings, Inc. * | | | 5,390 | | | | 253,923 | |
Total Consumer Discretionary | | | | | | | 1,931,667 | |
Consumer Staples – 6.6% | | | | | | | | |
Blue Buffalo Pet Products, Inc. *,1 | | | 9,540 | | | | 275,992 | |
Molson Coors Brewing Co., Class B | | | 1,200 | | | | 97,044 | |
Monster Beverage Corp. * | | | 4,190 | | | | 242,727 | |
Total Consumer Staples | | | | | | | 615,763 | |
Energy – 1.4% | | | | | | | | |
Core Laboratories NV (Netherlands)1 | | | 1,280 | | | | 127,872 | |
Financials – 9.0% | | | | | | | | |
FactSet Research Systems, Inc. | | | 725 | | | | 137,656 | |
Intercontinental Exchange, Inc. | | | 3,780 | | | | 249,858 | |
Raymond James Financial, Inc. | | | 2,330 | | | | 197,537 | |
Signature Bank/New York NY * | | | 1,919 | | | | 249,489 | |
Total Financials | | | | | | | 834,540 | |
Health Care – 9.6% | | | | | | | | |
Edwards Lifesciences Corp. * | | | 2,750 | | | | 281,133 | |
Henry Schein, Inc. * | | | 1,120 | | | | 88,032 | |
Laboratory Corp. of America Holdings * | | | 1,900 | | | | 292,049 | |
Quintiles IMS Holdings, Inc. * | | | 2,130 | | | | 230,253 | |
Total Health Care | | | | | | | 891,467 | |
Industrials – 17.6% | | | | | | | | |
Acuity Brands, Inc. | | | 593 | | | | 99,150 | |
AMETEK, Inc. | | | 3,610 | | | | 243,639 | |
Copart, Inc. * | | | 8,490 | | | | 308,102 | |
IHS Markit, Ltd. (United Kingdom)* | | | 4,705 | | | | 200,480 | |
J.B. Hunt Transport Services, Inc. | | | 2,520 | | | | 268,103 | |
| | | | | | | | |
| | | Shares | | | Value | |
Snap-on, Inc. | | | 1,640 | | | $ | 258,759 | |
Verisk Analytics, Inc. * | | | 2,990 | | | | 254,299 | |
Total Industrials | | | | | | | 1,632,532 | |
Information Technology – 28.6% | | | | | | | | |
Akamai Technologies, Inc. * | | | 1,470 | | | | 76,807 | |
Amphenol Corp., Class A | | | 2,640 | | | | 229,680 | |
ANSYS, Inc. * | | | 690 | | | | 94,330 | |
Arista Networks, Inc. * | | | 1,202 | | | | 240,268 | |
Cavium, Inc. * | | | 2,530 | | | | 174,545 | |
EPAM Systems, Inc. * | | | 2,480 | | | | 226,052 | |
Euronet Worldwide, Inc. * | | | 1,710 | | | | 165,254 | |
Fidelity National Information Services, Inc. | | | 2,640 | | | | 244,886 | |
FleetCor Technologies, Inc. * | | | 1,566 | | | | 258,813 | |
Genpact, Ltd. | | | 9,270 | | | | 282,271 | |
MACOM Technology Solutions Holdings, Inc. *,1 | | | 3,960 | | | | 161,885 | |
Skyworks Solutions, Inc. | | | 1,780 | | | | 202,671 | |
WEX, Inc. * | | | 2,440 | | | | 301,560 | |
Total Information Technology | | | | | | | 2,659,022 | |
Total Common Stocks
(Cost $7,078,594) | | | | | | | 8,692,863 | |
| | | | | | | | |
| | | Principal
Amount | | | | |
Short-Term Investments – 12.1% | | | | | | | | |
Repurchase Agreements – 5.3%2 | | | | | | | | |
HSBC Securities, Inc. dated 10/31/17, due 11/01/17, 1.030% total to be received $499,395 (collateralized by various U.S. Government Agency Obligations, 1.500% - 2.250%, 06/30/24 - 02/15/27, totaling $509,370) | | $ | 499,381 | | | | 499,381 | |
| | | | | | | | |
| | | Shares | | | | |
Other Investment Companies – 6.8% | | | | | | | | |
Dreyfus Institutional Preferred Government Money Market Fund, Institutional Class Shares, 1.00%3 | | | 629,614 | | | | 629,614 | |
Total Short-Term Investments
(Cost $1,128,995) | | | | | | | 1,128,995 | |
Total Investments – 105.7%
(Cost $8,207,589) | | | | | | | 9,821,858 | |
Other Assets, less Liabilities – (5.7)% | | | | | | | (531,352 | ) |
Net Assets – 100.0% | | | | | | $ | 9,290,506 | |
| * | Non-income producing security. |
| 1 | Some or all of these securities, amounting to $489,407 or 5.3% of net assets, were out on loan to various brokers. |
| 2 | Collateral received from brokers for securities lending was invested in these joint repurchase agreements. |
| 3 | Yield shown represents the October 31, 2017, seven day average yield, which refers to the sum of the previous seven days’ dividends paid, expressed as an annual percentage. |
The accompanying notes are an integral part of these financial statements.
40
| | |
| AMG Managers Montag & Caldwell Mid Cap Growth Fund | | |
| |
| Schedule of Portfolio Investments (continued) | | |
The following table summarizes the inputs used to value the Fund’s investments by the fair value hierarchy levels as of October 31, 2017:
| | | | | | | | | | | | | | | | |
| | | Level 1 | | | Level 2 | | | Level 3 | | | Total | |
Investments in Securities | | | | | | | | | | | | | | | | |
Common Stocks† | | $ | 8,692,863 | | | | — | | | | — | | | $ | 8,692,863 | |
Short-Term Investments | | | | | | | | | | | | | | | | |
Repurchase Agreements | | | — | | | $ | 499,381 | | | | — | | | | 499,381 | |
Other Investment Companies | | | 629,614 | | | | — | | | | — | | | | 629,614 | |
| | | | | | | | | | | | | | | | |
Total Investments in Securities | | $ | 9,322,477 | | | $ | 499,381 | | | | — | | | $ | 9,821,858 | |
| | | | | | | | | | | | | | | | |
| † | All common stocks held in the Fund are Level 1 securities. For a detailed breakout of common stocks by major industry classification, please refer to the Fund’s Schedule of Portfolio Investments. |
As of October 31, 2017, the Fund had no transfers between levels from the beginning of the reporting period.
The accompanying notes are an integral part of these financial statements.
41
| | |
| AMG Managers LMCG Small Cap Growth Fund | | |
| Portfolio Manager’s Comments (unaudited) | | |
The AMG Managers LMCG Small Cap Growth Fund (the “Fund”) Class N shares returned 25.5% for the fiscal year ended October 31, 2017, compared with a 31.0% return for its benchmark, the Russell 2000® Growth Index.
Stocks closed out a volatile 2016 with full-year returns for many market segments ranging from low-single-digit gains to very strong gains. Markets opened 2017 buoyed by improving economic data and anticipated policy changes in interest rates and corporate tax rates. Among U.S. small caps, growth stocks are ahead of their value counterparts in the twelve months ending 10/31/2017; the Russell 2000® Growth Index returned 31.0% for the period, vs. 24.8% for the Russell 2000® Value Index. From a size perspective, the strongest returns were found in small caps. The Russell 2000® Index returned 27.9%, while the Russell Midcap® Index finished at 21.1% and the Russell 1000® Index returned 23.7%.
The Fund underperformed in the period as a result of several factors. Our growth strategy seeks to identify unrecognized growth potential wherever it exists, across all sectors and industries. The run-up to the U.S. presidential election, the days following the election, and the subsequent regulatory overhang weighed on our health care holdings and muted the positive attribution we saw in other areas of the portfolio. Health care positioning and stock selection is responsible for much of the relative shortfall. Companies in the healthcare services segment
struggled on concerns about the impact of a proposed repeal of the Affordable Care Act. Tenet Healthcare and Envision underperformed for the period. Our holdings in biotech, where we are historically often underweight, lagged the benchmark as well. In industrials, supply chain management company Echo Global Logistics and electrical equipment manufacturer Acuity Brands weighed on performance; the portfolio’s underweight to the sector also hurt relative returns, although that underweight has decreased as we have found more opportunity in the space in recent months.
The portfolio benefited from our underweight to staples, along with good stock selection in beverages (namely National Beverage). Relative comparisons were also helped by avoiding some segments of the benchmark that underperformed, like food products. In discretionary, our overweight hurt performance but relative performance benefitted from positive stock selection. In industrials, top 10 holdings SiteOne Landscape Supply and Beacon Roofing Supply were particularly strong.
With the exception of the biotech rally in the most recent quarter, the market’s focus over the last several months on company fundamentals rather than macro events and/or stylistic factors is supportive to our investment returns going forward. These opportunities, combined with our ability to
identify companies offering underappreciated, unrecognized growth potential, leave us optimistic going forward. As we enter the last three months of the year, our portfolio is fairly neutral in terms of sector weights. We do not currently have overlarge bets in any sectors. Our portfolio is most overweight the financials, consumer discretionary and materials sectors, and our largest underweights are in information technology and real estate. As always, these weights are a fallout of our fundamental bottom-up investment process.
Additionally, we continue to evaluate new opportunities and have found several new investments that should add to results in the future and are in line with the disciplined process that has resulted in strong long-term results for our clients. These new stocks have come across multiple industry sectors, including large sectors like healthcare and technology and smaller sectors such as energy and financials. Importantly, many of the largest positions in our portfolio as of October 31 are poised for potential appreciation based on Street expectations (measured by, for example, the average price target across sell-side analysts on Bloomberg). We feel very confident in our companies going forward.
The views expressed represent the opinions of LMCG Investments LLC, as of October 31, 2017, and are not intended as a forecast or guarantee of future results and are subject to change without notice.
42
| | |
| AMG Managers LMCG Small Cap Growth Fund | | |
| Portfolio Manager’s Comments (continued) | | |
CUMULATIVE TOTAL RETURN PERFORMANCE
The AMG Managers LMCG Small Cap Growth Fund’s cumulative total return is based on the daily change in net asset value (NAV), and assumes that all dividends and distributions were reinvested. The graph compares a hypothetical $10,000 investment made in AMG Managers LMCG Small Cap Growth Fund’s Class N shares on November 3, 2010, to a $10,000 investment made in the Russell 2000® Growth Index for the same time period. The graph and table do not reflect the deduction of taxes that a shareholder would pay on a Fund distribution or redemption of shares. The listed returns for the Fund are net of expenses and the returns for the index exclude expenses. Total returns would have been lower had certain expenses not been reduced.
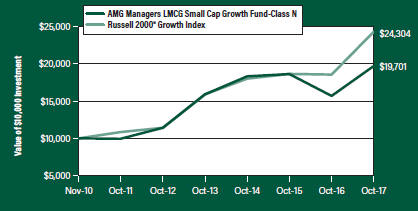
The table below shows the average annual total returns for AMG Managers LMCG Small Cap Growth Fund and the Russell 2000® Growth Index for the same time periods ended October 31, 2017.
| | | | | | | | | | | | | | | | |
| | | One | | | Five | | | Since | | | Inception | |
| Average Annual Total Returns 1 | | Year | | | Years | | | Inception | | | Date | |
AMG Managers LMCG Small Cap Growth Fund2, 3, 4, 5, 6, 7, 8 | | | | | | | | | | | | | | | | |
Class N | | | 25.51 | % | | | 11.52 | % | | �� | 10.18 | % | | | 11/03/10 | |
Class I | | | 25.73 | % | | | 11.80 | % | | | 7.74 | % | | | 06/01/11 | |
Russell 2000® Growth Index9 | | | 31.00 | % | | | 15.36 | % | | | 13.53 | % | | | 11/03/10 | † |
The performance data shown represents past performance. Past performance is not a guarantee of future results. Current performance may be lower or higher than the performance data quoted. The investment return and principal value of an investment will fluctuate so that an investor’s shares, when redeemed, may be worth more or less than their original cost.
Investors should carefully consider the Fund’s investment objectives, risks, charges and expenses before investing. For performance information through the most recent month end, current net asset values per share for the Fund and other information, please call 800.835.3879 or visit our website at amgfunds.com for a free prospectus. Read it carefully before investing or sending money.
Distributed by AMG Distributors, Inc., member FINRA/SIPC.
| † | Date reflects the inception date of the Fund, not the index. |
| 1 | Total return equals income yield plus share price change and assumes reinvestment of all dividends and capital gain distributions. Returns are net of fees and may reflect offsets of Fund expenses as described in the prospectus. No adjustment has been made for taxes payable by shareholders on their reinvested dividends and capital gain distributions. Returns for periods greater than one year are annualized. The listed returns on the Fund are net of expenses and based on the published NAV as of October 31, 2017. All returns are in U.S. dollars ($). |
| 2 | The Fund is subject to risks associated with investments in small-capitalization companies, such as erratic earnings patterns, competitive conditions, limited earnings history and a reliance on one or a limited number of products. |
| 3 | Active and frequent trading of a fund may result in higher transaction costs and increased tax liability. |
| 4 | The Fund invests in growth stocks, which may be more sensitive to market movements because their prices tend to reflect future investor expectations rather than just current profits. |
| 5 | Investments in international securities are subject to certain risks of overseas investing including currency fluctuations and changes in political and economic conditions, which could result in significant market fluctuations. These risks are magnified in emerging markets. |
| 6 | Investing in initial public offerings (IPOs) is risky and the prices of stocks purchased in IPOs tend to fluctuate more widely than stocks of companies that have been publicly traded for a longer period of time. Stocks purchased in IPOs generally do not have a trading history, and information about the companies may be available for very limited periods. |
| 7 | The Fund is subject to risks associated with investments in mid-capitalization companies such as greater price volatility, lower trading volume, and less liquidity than the stocks of larger, more established companies. |
| 8 | The Fund is subject to special risk considerations similar to those associated with the direct ownership of real estate. Real estate valuations may be subject to factors such as changing general and local economic, financial, competitive, and environmental conditions. |
| 9 | The Russell 2000® Growth Index measures the performance of the Russell 2000® companies with higher price-to-book ratios and higher forecasted growth values. Unlike the Fund, the Russell 2000® Growth Index is unmanaged, is not available for investment and does not incur expenses. |
The Russell Indices are a trademark of the London Stock Exchange Group companies.
Not FDIC insured, nor bank guaranteed. May lose value.
43
| | |
| AMG Managers LMCG Small Cap Growth Fund | | October 31, 2017 |
| |
| Fund Snapshots (unaudited) | | |
PORTFOLIO BREAKDOWN
| | | | |
Sector | | % of
Net Assets | |
Information Technology | | | 24.5 | |
Industrials | | | 20.7 | |
Health Care | | | 20.2 | |
Consumer Discretionary | | | 13.5 | |
Financials | | | 7.6 | |
Materials | | | 6.2 | |
Energy | | | 2.2 | |
Consumer Staples | | | 1.5 | |
Real Estate | | | 1.4 | |
Other Assets Less Liabilities | | | 2.2 | |
TOP TEN HOLDINGS
| | | | |
Security Name | | % of
Net Assets | |
Nexstar Media Group, Inc., Class A | | | 4.9 | |
WageWorks, Inc. | | | 4.1 | |
GTT Communications, Inc. | | | 3.9 | |
Beacon Roofing Supply, Inc. | | | 3.8 | |
Ingevity Corp. | | | 3.5 | |
Pinnacle Financial Partners, Inc. | | | 2.9 | |
John Bean Technologies Corp. | | | 2.8 | |
Sinclair Broadcast Group, Inc., Class A | | | 2.7 | |
J2 Global, Inc. | | | 2.6 | |
SiteOne Landscape Supply, Inc. | | | 2.4 | |
| | | | |
Top Ten as a Group | | | 33.6 | |
| | | | |
Because a fund’s strategy may result in multiple investments in particular sectors of the economy, its performance may depend on the performance of those sectors and may fluctuate more widely than investments diversified across more sectors. For additional information on these and other risk considerations, please see the Fund’s prospectus.
Any sectors, industries, or securities discussed should not be perceived as investment recommendations. Mention of a specific security should not be considered a recommendation to buy or solicitation to sell that security. Specific securities mentioned in this report may have been sold from the Fund’s portfolio of investments by the time you receive this report.
44
| | |
| AMG Managers LMCG Small Cap Growth Fund | | October 31, 2017 |
| |
| Schedule of Portfolio Investments | | |
| | | | | | | | |
| | | Shares | | | Value | |
Common Stocks – 97.8% | | | | | | | | |
Consumer Discretionary – 13.5% | | | | | | | | |
Camping World Holdings, Inc., Class A | | | 30,711 | | | $ | 1,290,476 | |
Canada Goose Holdings, Inc. (Canada)* | | | 86,958 | | | | 1,867,858 | |
ILG, Inc. | | | 42,120 | | | | 1,249,700 | |
Nexstar Media Group, Inc., Class A 1 | | | 97,403 | | | | 6,214,312 | |
Papa John’s International, Inc. 1 | | | 9,244 | | | | 629,054 | |
Planet Fitness, Inc., Class A | | | 48,151 | | | | 1,282,743 | |
Red Robin Gourmet Burgers, Inc. * | | | 14,901 | | | | 1,019,228 | |
Sinclair Broadcast Group, Inc., Class A 1 | | | 106,197 | | | | 3,366,445 | |
Total Consumer Discretionary | | | | | | | 16,919,816 | |
Consumer Staples – 1.5% | | | | | | | | |
Central Garden & Pet Co., Class A * | | | 52,460 | | | | 1,936,299 | |
Energy – 2.2% | | | | | | | | |
Carrizo Oil & Gas, Inc. *,1 | | | 102,592 | | | | 1,814,853 | |
Jagged Peak Energy, Inc. *,1 | | | 71,390 | | | | 991,607 | |
Total Energy | | | | | | | 2,806,460 | |
Financials – 7.6% | | | | | | | | |
Ameris Bancorp. | | | 22,616 | | | | 1,083,306 | |
Chemical Financial Corp. | | | 31,442 | | | | 1,656,679 | |
Home BancShares, Inc. | | | 56,506 | | | | 1,270,255 | |
Pinnacle Financial Partners, Inc. | | | 55,666 | | | | 3,685,089 | |
Western Alliance Bancorp. * | | | 33,680 | | | | 1,879,344 | |
Total Financials | | | | | | | 9,574,673 | |
Health Care – 20.2% | | | | | | | | |
Agios Pharmaceuticals, Inc. *,1 | | | 18,552 | | | | 1,192,337 | |
Almost Family, Inc. * | | | 10,578 | | | | 468,077 | |
Clovis Oncology, Inc. * | | | 14,023 | | | | 1,056,914 | |
Cross Country Healthcare, Inc. * | | | 117,622 | | | | 1,605,540 | |
Exact Sciences Corp. * | | | 12,690 | | | | 697,823 | |
Haemonetics Corp. * | | | 21,337 | | | | 1,014,788 | |
HealthEquity, Inc. * | | | 35,884 | | | | 1,802,095 | |
Inogen, Inc. * | | | 9,079 | | | | 898,185 | |
Integra LifeSciences Holdings Corp. * | | | 35,727 | | | | 1,671,309 | |
iRhythm Technologies, Inc. * | | | 9,192 | | | | 468,332 | |
LHC Group, Inc. * | | | 31,742 | | | | 2,120,683 | |
Ligand Pharmaceuticals, Inc. *,1 | | | 9,170 | | | | 1,332,860 | |
Loxo Oncology, Inc. *,1 | | | 5,570 | | | | 479,911 | |
Medidata Solutions, Inc. * | | | 5,848 | | | | 439,945 | |
Neurocrine Biosciences, Inc. * | | | 17,336 | | | | 1,076,739 | |
Nevro Corp. * | | | 8,511 | | | | 745,393 | |
| | | | | | | | |
| | | Shares | | | Value | |
Pacira Pharmaceuticals, Inc. * | | | 31,117 | | | $ | 997,300 | |
PRA Health Sciences, Inc. * | | | 31,156 | | | | 2,537,033 | |
Prestige Brands Holdings, Inc. * | | | 28,749 | | | | 1,348,328 | |
Ultragenyx Pharmaceutical, Inc. * | | | 28,157 | | | | 1,297,756 | |
Wright Medical Group NV (Netherlands)*,1 | | | 78,809 | | | | 2,065,584 | |
Total Health Care | | | | | | | 25,316,932 | |
Industrials – 20.7% | | | | | | | | |
Beacon Roofing Supply, Inc. * | | | 86,990 | | | | 4,820,116 | |
Healthcare Services Group, Inc. | | | 9,874 | | | | 522,236 | |
JELD-WEN Holding, Inc. * | | | 77,769 | | | | 2,868,121 | |
John Bean Technologies Corp. | | | 32,586 | | | | 3,483,443 | |
Kennametal, Inc. | | | 47,157 | | | | 2,058,403 | |
Rexnord Corp. * | | | 45,654 | | | | 1,165,090 | |
SiteOne Landscape Supply, Inc. * | | | 47,261 | | | | 3,001,546 | |
The Brink’s Co. | | | 37,470 | | | | 2,851,467 | |
WageWorks, Inc. * | | | 81,414 | | | | 5,190,143 | |
Total Industrials | | | | | | | 25,960,565 | |
Information Technology – 24.5% | | | | | | | | |
Blackbaud, Inc. | | | 22,469 | | | | 2,276,110 | |
Box, Inc., Class A * | | | 61,718 | | | | 1,354,710 | |
Brooks Automation, Inc. | | | 30,003 | | | | 1,031,803 | |
Carbonite, Inc. * | | | 41,431 | | | | 940,484 | |
Cavium, Inc. * | | | 25,262 | | | | 1,742,825 | |
Coherent, Inc. * | | | 2,106 | | | | 553,267 | |
Fair Isaac Corp. | | | 10,635 | | | | 1,543,777 | |
GrubHub, Inc. *,1 | | | 29,425 | | | | 1,795,513 | |
GTT Communications, Inc. * | | | 133,106 | | | | 4,851,714 | |
HubSpot, Inc. * | | | 4,561 | | | | 394,754 | |
J2 Global, Inc. | | | 43,184 | | | | 3,201,662 | |
Littelfuse, Inc. | | | 5,003 | | | | 1,045,627 | |
LogMeIn, Inc. | | | 12,816 | | | | 1,551,377 | |
Lumentum Holdings, Inc. *,1 | | | 17,771 | | | | 1,122,239 | |
Microsemi Corp. * | | | 34,809 | | | | 1,857,756 | |
MKS Instruments, Inc. | | | 13,979 | | | | 1,518,818 | |
MongoDB, Inc. *,1 | | | 20,600 | | | | 627,888 | |
Proofpoint, Inc. *,1 | | | 5,853 | | | | 540,876 | |
RealPage, Inc. * | | | 65,117 | | | | 2,819,566 | |
Total Information Technology | | | | | | | 30,770,766 | |
Materials – 6.2% | | | | | | | | |
Eagle Materials, Inc. | | | 9,644 | | | | 1,018,117 | |
Ingevity Corp. * | | | 60,982 | | | | 4,343,748 | |
The accompanying notes are an integral part of these financial statements.
45
| | |
| AMG Managers LMCG Small Cap Growth Fund | | |
| |
| Schedule of Portfolio Investments (continued) | | |
| | | | | | | | |
| | | Shares | | | Value | |
Materials – 6.2% (continued) | | | | | | | | |
Sensient Technologies Corp. | | | 31,720 | | | $ | 2,412,306 | |
Total Materials | | | | | | | 7,774,171 | |
Real Estate – 1.4% | | | | | | | | |
QTS Realty Trust, Inc., Class A, REIT | | | 17,811 | | | | 1,030,366 | |
Ryman Hospitality Properties, Inc., REIT | | | 10,353 | | | | 684,644 | |
Total Real Estate | | | | | | | 1,715,010 | |
Total Common Stocks
(Cost $108,454,931) | | | | | | | 122,774,692 | |
Rights – 0.0% | | | | | | | | |
Health Care – 0.0% | | | | | | | | |
Dyax Corp., CVR Expiration 12/31/19*,2,3
(Cost $0) | | | 99,639 | | | | 0 | |
| | |
| | | Principal
Amount | | | | |
Short-Term Investments – 8.0% | | | | | | | | |
Repurchase Agreements – 6.0%4 | | | | | | | | |
Cantor Fitzgerald Securities, Inc., dated 10/31/17, due 11/01/17, 1.080% total to be received $1,782,980 (collateralized by various U.S. Government Agency Obligations, 0.000% -10.000%, 12/01/17 - 09/20/67, totaling $1,818,585) | | $ | 1,782,927 | | | | 1,782,927 | |
Citigroup Global Markets, Inc., dated 10/31/17, due 11/01/17, 1.070% total to be received $1,782,980 (collateralized by various U.S. Government Agency Obligations, 0.000% - 11.500%, 11/01/17 - 09/09/49, totaling $1,818,586) | | | 1,782,927 | | | | 1,782,927 | |
| * | Non-income producing security. |
| 1 | Some or all of these securities, amounting to $7,396,018 or 5.9% of net assets, were out on loan to various brokers. |
| 2 | Security’s value was determined by using significant unobservable inputs. |
| 3 | This security is restricted and not available for re-sale. The security was received as part of a corporate action on January 22, 2016. |
| 4 | Collateral received from brokers for securities lending was invested in these joint repurchase agreements. |
| | | | | | | | |
| | | Principal
Amount | | | Value | |
Daiwa Capital Markets America, dated 10/31/17, due 11/01/17, 1.080% total to be received $1,782,980 (collateralized by various U.S. Government Agency Obligations, 0.000% - 6.500%, 11/02/17 – 12/01/51, totaling $1,818,178) | | $ | 1,782,927 | | | $ | 1,782,927 | |
HSBC Securities USA, Inc., dated 10/31/17, due 11/01/17, 1.040% total to be received $1,782,979 (collateralized by various U.S. Government Agency Obligations, 2.500% – 8.000%, 04/01/22 – 10/01/47, totaling $1,818,594) | | | 1,782,927 | | | | 1,782,927 | |
Jefferies LLC, dated 10/31/17, due 11/01/17, 1.140% total to be received $375,179 (collateralized by various U.S. Government Agency Obligations, 0.000% – 2.375%, 12/15/17 – 05/15/27, totaling $382,670) | | | 375,167 | | | | 375,167 | |
Total Repurchase Agreements | | | | | | | 7,506,875 | |
| | |
| | | Shares | | | | |
Other Investment Companies – 2.0% | | | | | | | | |
Dreyfus Government Cash Management Fund, Institutional Class Shares, 0.93%5 | | | 2,543,210 | | | | 2,543,210 | |
Total Short-Term Investments
(Cost $10,050,085) | | | | | | | 10,050,085 | |
Total Investments – 105.8%
(Cost $118,505,016) | | | | | | | 132,824,777 | |
Other Assets, less Liabilities – (5.8)% | | | | | | | (7,270,414 | ) |
Net Assets – 100.0% | | | | | | $ | 125,554,363 | |
| 5 | Yield shown represents the October 31, 2017, seven day average yield, which refers to the sum of the previous seven days’ dividends paid, expressed as an annual percentage. |
CVR Contingent Value Rights
REIT Real Estate Investment Trust
The accompanying notes are an integral part of these financial statements.
46
| | |
| AMG Managers LMCG Small Cap Growth Fund | | |
| |
| Schedule of Portfolio Investments (continued) | | |
The following table summarizes the inputs used to value the Fund’s investments by the fair value hierarchy levels as of October 31, 2017:
| | | | | | | | | | | | | | | | |
| | | Level 1 | | | Level 2 | | | Level 3 | | | Total | |
Investments in Securities | | | | | | | | | | | | | | | | |
Common Stocks† | | $ | 122,774,692 | | | | — | | | | — | | | $ | 122,774,692 | |
Rights | | | — | | | | — | | | | — | | | | — | |
Short-Term Investments | | | | | | | | | | | | | | | | |
Repurchase Agreements | | | — | | | $ | 7,506,875 | | | | — | | | | 7,506,875 | |
Other Investment Companies | | | 2,543,210 | | | | — | | | | — | | | | 2,543,210 | |
| | | | | | | | | | | | | | | | |
Total Investments in Securities | | $ | 125,317,902 | | | $ | 7,506,875 | | | | — | | | $ | 132,824,777 | |
| | | | | | | | | | | | | | | | |
| † | All common stocks held in the Fund are Level 1 securities. For a detailed breakout of common stocks by major industry classification, please refer to the Fund’s Schedule of Portfolio Investments. |
At October 31, 2017, the Level 3 securities are Rights received as a result of a corporate action. The security’s value was determined by using significant unobservable inputs which generated a change in unrealized appreciation/depreciation of $(996).
As of October 31, 2017, the Fund had no transfers between levels from the beginning of the reporting period.
The accompanying notes are an integral part of these financial statements.
47
| | |
| AMG River Road Small-Mid Cap Value Fund | | |
| Portfolio Manager’s Comments (unaudited) | | |
OVERVIEW
For the fiscal year ended October 31, 2017, the AMG River Road Small-Mid Cap Value Fund (the “Fund”), (formerly AMG River Road Select Value Fund) Class N shares returned 26.18%, outperforming the Russell 2500® Value Index return of 19.97%.
PERFORMANCE REVIEW
The sector with the largest positive contribution to relative return was real estate, which benefited from strong stock selection and an underweight allocation. The sector with the largest negative contribution to relative return was information technology, which lagged due to poor stock selection.
The two holdings with the largest positive contribution to the Fund’s return were Liberty Interactive Corp. Ventures Series A (LVNTA) and Fidelity National Financial Inc. – FNFV Group (FNFV). FNFV is a collection of investments in operating companies in various industries that are opportunistically managed by the company’s chairman, Bill Foley. FNFV currently has ownership stakes in an HR software company (Ceridian), various restaurant brands (O’Charley’s, Village Inn, Bakers Square, 99), and a healthcare IT platform company called T-System Holdings. FNFV’s Ceridian posted strong revenue growth and margin expansion during 2017 in its Dayforce cloud segment. We believe Ceridian is now positioned for an IPO or outright sale in the near future. To help monetize a portion of its restaurant holdings, FNFV agreed to merge its 55%-owned 99 Restaurant Group with J. Alexander’s Holdings Inc. (JAX). FNFV also sold its insurance broker One Digital for $560 million in cash. Lastly, FNFV is near conversion to a common stock
from a tracking stock, which will likely increase management’s flexibility for M&A and make the stock more widely eligible for institutional ownership. The position was trimmed as the stock approached our assessed value. LVNTA is also a tracking stock and is invested in cable companies both publicly and privately. LVNTA owns 42.7 million shares of Liberty Broadband (LBRDK), 5.4 million shares of Charter Communications (CHTR), and has agreed to acquire Alaska’s largest cable provider General Communication Inc. (GNCMA). Our investment thesis that cord-cutting fears of pay TV are overblown and that broadband will gain market share and maintain pricing power has begun to play out. Once the GNCMA deal closes, LVNTA will also be converted to a common stock. This should set up a potential tax efficient combination with CHTR or another entity down the road. We maintained our position as the stock still trades at a sizable discount to our assessed valuation.
The two holdings with the largest negative contribution to the Fund’s return were Ingles Markets Inc. (Cl A) (IMKTA) and Vista Outdoor Inc. (VSTO). Shares of Ingles began to decline following Amazon’s announcement to acquire Whole Foods Market, which ignited fears regarding increased competition in the grocery space. Ingles is based in Asheville, NC, and was founded in 1965. It has 201 stores mostly located in small towns in Georgia, North Carolina, South Carolina and Tennessee. We believe IMKTA is unique in that the company owns the real estate at 77% of its stores, owns the entire shopping center at 37% of its stores, and often has the best locations. The mountainous terrain in many of the company’s markets makes it far more expensive to build a new store because new locations require extensive site preparation. This acts
as a barrier to new competition in many towns served by Ingles. Also, Whole Foods has very little presence in Ingles’s markets. We took no action on the position. Vista is a maker and marketer of outdoor sporting and recreation goods and is the largest manufacturer of gun ammunition in the United States. The company has reported disappointing results in 2017 due to a sharp decline in consumer spending on firearms and related accessories after the U.S. presidential election. Making matters worse, retailers built large inventories of firearms, firearm accessories, and ammunition expecting a different election result. It is likely to take several quarters for bloated channel inventories to correct. We sold the position in the Fund in accordance with our sell discipline.
OUTLOOK AND POSITIONING
We continue to position the Fund in shares of high quality companies that we believe will perform well in a sustained period of weak-to-moderate economic growth. Rapidly rising equity prices paired with modest earnings growth over the past several years has resulted in unattractive valuations in the broader small cap market. As a result, identifying companies to replace those that are being sold at their assessed valuations is challenging. If returns do moderate over the coming months, we expect the Fund’s holdings and low volatility approach to be well positioned.
The views expressed represent the opinions of River Road Asset Management LLC, as of October 31, 2017, and are not intended as a forecast or guarantee of future results and are subject to change without notice.
48
AMG River Road Small-Mid Cap Value Fund
Portfolio Manager’s Comments (continued)
CUMULATIVE TOTAL RETURN PERFORMANCE
The AMG River Road Small-Mid Cap Value Fund’s (formerly known as AMG River Road Select Value Fund) cumulative total return is based on the daily change in net asset value (NAV), and assumes that all dividends and distributions were reinvested. The graph compares a hypothetical $10,000 investment made in AMG River Road Small-Mid Cap Value Fund’s Class N shares on March 29, 2007, to a $10,000 investment made in the Russell 2500® Value Index and Russell 2000® Value Index for the same time period. The graph and table do not reflect the deduction of taxes that a shareholder would pay on a Fund distribution or redemption of shares. The listed returns for the Fund are net of expenses and the returns for the index exclude expenses. Total returns would have been lower had certain expenses not been reduced.
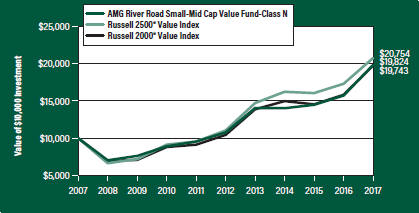
The table below shows the average annual total returns for AMG River Road Small-Mid Cap Value Fund and the Russell 2500® Value Index and Russell 2000® Value Index for the same time periods ended October 31, 2017.
| | | | | | | | | | | | | | | | | | | | |
| Average Annual Total Returns1 | | One
Year | | | Five
Years | | | Ten
Years | | | Since
Inception | | | Inception
Date | |
AMG River Road Small-Mid Cap Value Fund2, 3, 4, 5, 6 | | | | | | | | | | | | | | | | | |
Class N | | | 26.18 | % | | | 12.98 | % | | | 7.08 | % | | | 6.81 | % | | | 03/29/07 | |
Class I | | | 26.63 | % | | | 13.25 | % | | | 7.36 | % | | | 6.74 | % | | | 06/28/07 | |
Class Z | | | — | | | | — | | | | — | | | | (1.30 | %) | | | 09/29/17 | |
Russell 2500® Value Index7 | | | 19.97 | % | | | 13.46 | % | | | 7.57 | % | | | 6.88 | % | | | 03/29/07 | † |
Russell 2000® Value Index8 | | | 24.81 | % | | | 13.58 | % | | | 7.04 | % | | | 6.34 | % | | | 03/29/07 | † |
The performance data shown represents past performance. Past performance is not a guarantee of future results. Current performance may be lower or higher than the performance data quoted. The investment return and principal value of an investment will fluctuate so that an investor’s shares, when redeemed, may be worth more or less than their original cost.
Investors should carefully consider the Fund’s investment objectives, risks, charges and expenses before investing. For performance information through the most recent month end, current net asset values per share for the Fund and other information, please call 800.835.3879 or visit our website at amgfunds.com for a free prospectus. Read it carefully before investing or sending money.
Distributed by AMG Distributors, Inc., member FINRA/SIPC.
| † | Date reflects the inception date of the Fund, not the index. |
| 1 | Total return equals income yield plus share price change and assumes reinvestment of all dividends and capital gain distributions. Returns are net of fees and may reflect offsets of Fund expenses as described in the prospectus. No |
| | adjustment has been made for taxes payable by shareholders on their reinvested dividends and capital gain distributions. Returns for periods greater than one year are annualized. The listed returns on the Fund are net of expenses and based on the published NAV as of October 31, 2017. All returns are in U.S. dollars ($). |
| 2 | Investments in international securities are subject to certain risks of overseas investing including currency fluctuations and changes in political and economic conditions, which could result in significant market fluctuations. These risks are magnified in emerging markets. |
| 3 | The Fund is subject to risks associated with investments in mid-capitalization companies such as greater price volatility, lower trading volume, and less liquidity than the stocks of larger, more established companies. |
| 4 | The Fund is subject to special risk considerations similar to those associated with the direct ownership of real estate. Real estate valuations may be subject to factors such as changing general and local economic, financial, competitive, and environmental conditions. |
| 5 | The Fund is subject to risks associated with investments in small-capitalization companies, such as erratic earnings patterns, competitive conditions, limited earnings history and a reliance on one or a limited number of products. |
| 6 | The Fund invests in value stocks, which may perform differently from the market as a whole and may be undervalued by the market for a long period of time. |
| 7 | The Russell 2500® Value Index measures the performance of the Russell 2500® companies with lower price-to-book ratios and lower forecasted growth values. Unlike the Fund, the Russell 2500® Value Index is unmanaged, is not available for investment and does not incur expenses. |
| 8 | The Russell 2000® Value Index is an unmanaged, market-value weighted, value-oriented index comprised of small stocks that have relatively low price-to-book ratios and lower forecasted growth values. Unlike the Fund, the Russell 2000® Value Index is unmanaged, is not available for investment and does not incur expenses. |
The Russell Indices are a trademark of the London Stock Exchange Group companies.
Not FDIC insured, nor bank guaranteed. May lose value.
49
| | |
| AMG River Road Small-Mid Cap Value Fund | | October 31, 2017 |
| Fund Snapshots (unaudited) | | |
PORTFOLIO BREAKDOWN
| | | | |
Sector | | % of
Net Assets | |
Consumer Discretionary | | | 34.7 | |
Information Technology | | | 18.8 | |
Industrials | | | 14.5 | |
Financials | | | 11.6 | |
Health Care | | | 5.6 | |
Energy | | | 3.6 | |
Consumer Staples | | | 2.6 | |
Telecommunication Services | | | 2.2 | |
Real Estate | | | 1.3 | |
Utilities | | | 1.1 | |
Materials | | | 0.8 | |
Other Assets Less Liabilities | | | 3.2 | |
TOP TEN HOLDINGS
| | | | |
Security Name | | % of
Net Assets | |
Liberty Ventures, Class A | | | 5.1 | |
White Mountains Insurance Group, Ltd. | | | 4.5 | |
Premier, Inc., Class A | | | 4.3 | |
UniFirst Corp. | | | 4.1 | |
Murphy USA, Inc. | | | 3.8 | |
FNFV Group | | | 3.5 | |
Liberty Expedia Holdings, Inc., Class A | | | 2.8 | |
Blackhawk Network Holdings, Inc. | | | 2.7 | |
Conduent, Inc. | | | 2.5 | |
Mitel Networks Corp. | | | 2.5 | |
| | | | |
Top Ten as a Group | | | 35.8 | |
| | | | |
Because a fund’s strategy may result in multiple investments in particular sectors of the economy, its performance may depend on the performance of those sectors and may fluctuate more widely than investments diversified across more sectors. For additional information on these and other risk considerations, please see the Fund’s prospectus.
Any sectors, industries, or securities discussed should not be perceived as investment recommendations. Mention of a specific security should not be considered a recommendation to buy or solicitation to sell that security. Specific securities mentioned in this report may have been sold from the Fund’s portfolio of investments by the time you receive this report.
50
| | |
| AMG River Road Small-Mid Cap Value Fund | | October 31, 2017 |
| |
| Schedule of Portfolio Investments | | |
| | | | | | | | |
| | | Shares | | | Value | |
Common Stocks – 96.8% | | | | | | | | |
Consumer Discretionary – 34.7% | | | | | | | | |
Advance Auto Parts, Inc. | | | 11,220 | | | $ | 917,123 | |
Asbury Automotive Group, Inc. * | | | 12,310 | | | | 755,834 | |
Biglari Holdings, Inc. * | | | 1,828 | | | | 653,400 | |
Cinemark Holdings, Inc. 1 | | | 10,430 | | | | 379,026 | |
Extended Stay America, Inc. (Units) | | | 33,960 | | | | 673,087 | |
International Speedway Corp., Class A | | | 17,177 | | | | 667,326 | |
The Interpublic Group of Cos, Inc. | | | 28,300 | | | | 544,775 | |
J Alexander’s Holdings, Inc. * | | | 23,631 | | | | 248,126 | |
La Quinta Holdings, Inc. * | | | 12,200 | | | | 214,964 | |
Liberty Broadband Corp., Class C * | | | 7,834 | | | | 683,830 | |
Liberty Expedia Holdings, Inc., Class A * | | | 26,678 | | | | 1,229,856 | |
Liberty Global PLC Lilac Group, Class A
(United Kingdom) *,1 | | | 15,940 | | | | 346,217 | |
Liberty Global PLC Lilac Group, Class C
(United Kingdom) * | | | 35,720 | | | | 785,840 | |
Liberty Ventures, Class A * | | | 39,372 | | | | 2,242,629 | |
The Madison Square Garden Co., Class A * | | | 1,939 | | | | 431,796 | |
Motorcar Parts of America, Inc. * | | | 28,880 | | | | 834,921 | |
Murphy USA, Inc. * | | | 22,933 | | | | 1,705,298 | |
National CineMedia, Inc. | | | 53,010 | | | | 356,757 | |
PICO Holdings, Inc. * | | | 40,912 | | | | 773,237 | |
Sleep Number Corp. * | | | 29,452 | | | | 957,190 | |
Total Consumer Discretionary | | | | | | | 15,401,232 | |
Consumer Staples – 2.6% | | | | | | | | |
Hostess Brands, Inc. * | | | 48,310 | | | | 557,014 | |
Ingles Markets, Inc., Class A | | | 25,693 | | | | 598,647 | |
Total Consumer Staples | | | | | | | 1,155,661 | |
Energy – 3.6% | | | | | | | | |
HollyFrontier Corp. | | | 15,850 | | | | 585,657 | |
PBF Energy, Inc., Class A 1 | | | 13,415 | | | | 388,633 | |
QEP Resources, Inc. * | | | 19,520 | | | | 174,704 | |
World Fuel Services Corp. | | | 15,870 | | | | 441,186 | |
Total Energy | | | | | | | 1,590,180 | |
Financials – 11.6% | | | | | | | | |
Axis Capital Holdings, Ltd. (Bermuda) | | | 12,890 | | | | 701,087 | |
Capital Southwest Corp., BDC | | | 20,567 | | | | 356,220 | |
FNFV Group * | | | 90,455 | | | | 1,560,349 | |
Leucadia National Corp. | | | 20,129 | | | | 509,264 | |
| | | | | | | | |
| | | Shares | | | Value | |
White Mountains Insurance Group, Ltd. | | | 2,252 | | | $ | 2,002,366 | |
Total Financials | | | | | | | 5,129,286 | |
Health Care – 5.6% | | | | | | | | |
Computer Programs & Systems, Inc. | | | 18,633 | | | | 561,785 | |
Premier, Inc., Class A * | | | 58,650 | | | | 1,916,095 | |
Total Health Care | | | | | | | 2,477,880 | |
Industrials – 14.5% | | | | | | | | |
Air Transport Services Group, Inc. * | | | 17,586 | | | | 425,581 | |
Armstrong Flooring, Inc. * | | | 34,770 | | | | 514,596 | |
Armstrong World Industries, Inc. * | | | 17,611 | | | | 899,922 | |
Cubic Corp. | | | 11,613 | | | | 633,489 | |
Forward Air Corp. | | | 10,129 | | | | 581,810 | |
Kansas City Southern | | | 6,132 | | | | 639,077 | |
Resources Connection, Inc. | | | 33,958 | | | | 534,838 | |
SP Plus Corp. * | | | 5,965 | | | | 231,144 | |
Spirit AeroSystems Holdings, Inc., Class A | | | 2,166 | | | | 173,497 | |
UniFirst Corp. | | | 11,436 | | | | 1,801,170 | |
Total Industrials | | | | | | | 6,435,124 | |
Information Technology – 18.8% | | | | | | | | |
Blackhawk Network Holdings, Inc. * | | | 35,820 | | | | 1,216,089 | |
Cars.com, Inc. *,1 | | | 39,590 | | | | 943,034 | |
Conduent, Inc. * | | | 72,460 | | | | 1,121,681 | |
CSG Systems International, Inc. | | | 17,964 | | | | 760,596 | |
Dolby Laboratories, Inc., Class A | | | 11,230 | | | | 650,666 | |
ePlus, Inc. * | | | 2,382 | | | | 227,719 | |
EVERTEC, Inc. (Puerto Rico) | | | 34,620 | | | | 519,300 | |
Mitel Networks Corp. (Canada)* | | | 128,830 | | | | 1,106,650 | |
Sabre Corp. | | | 30,810 | | | | 602,643 | |
Sykes Enterprises, Inc. * | | | 18,818 | | | | 544,593 | |
VeriFone Systems, Inc. * | | | 33,650 | | | | 642,042 | |
Total Information Technology | | | | | | | 8,335,013 | |
Materials – 0.8% | | | | | | | | |
Compass Minerals International, Inc. 1 | | | 5,700 | | | | 373,920 | |
Real Estate – 1.3% | | | | | | | | |
Marcus & Millichap, Inc., REIT * | | | 7,790 | | | | 221,392 | |
Realogy Holdings Corp., REIT | | | 11,610 | | | | 375,351 | |
Total Real Estate | | | | | | | 596,743 | |
Telecommunication Services – 2.2% | | | | | | | | |
ATN International, Inc. | | | 10,369 | | | | 562,933 | |
The accompanying notes are an integral part of these financial statements.
51
| | |
| AMG River Road Small-Mid Cap Value Fund | | October 31, 2017 |
| |
| Schedule of Portfolio Investment (continued) | | |
| | | | | | | | |
| | | Shares | | | Value | |
Telecommunication Services – 2.2%
(continued) | | | | | | | | |
Telephone & Data Systems, Inc. | | | 14,393 | | | $ | 419,556 | |
Total Telecommunication Services | | | | | | | 982,489 | |
Utilities – 1.1% | | | | | | | | |
National Fuel Gas Co. 1 | | | 8,478 | | | | 492,148 | |
Total Common Stocks
(Cost $37,955,052) | | | | | | | 42,969,676 | |
| | |
| | | Principal
Amount | | | | |
Short-Term Investments – 7.8% | | | | | | | | |
Repurchase Agreements – 4.6%2 | | | | | | | | |
Citigroup Global Markets, Inc., dated 10/31/17, due 11/01/17, 1.070% total to be received $1,000,030 (collateralized by various U.S. Government Agency Obligations, 0.000% - 11.500%, 11/01/17 - 09/09/49, totaling $1,020,000) | | $ | 1,000,000 | | | | 1,000,000 | |
Credit Suisse Securities (USA) LLC, dated 10/31/17, due 11/01/17, 1.010% total to be received $1,000,028 (collateralized by various U.S. Government Agency Obligations, 0.375% - 2.125%, 01/15/19 - 02/15/44, totaling $1,020,011) | | | 1,000,000 | | | | 1,000,000 | |
| | | | | | | | |
| | | Principal
Amount | | | Value | |
Merrill Lynch, Pierce, Fenner & Smith, Inc., dated 10/31/2017, due 11/1/2017, 1.050% total to be received $65,479 (collateralized by various U.S. Government Agency Obligations, 2.000% -2.125%, 03/31/24 - 06/30/24, totaling $66,787) | | $ | 65,477 | | | $ | 65,477 | |
Total Repurchase Agreements | | | | | | | 2,065,477 | |
| | |
| | | Shares | | | | |
Other Investment Companies – 3.2% | | | | | | | | |
Dreyfus Institutional Preferred Government Money Market Fund, Institutional Class Shares, 1.00%3 | | | 1,418,696 | | | | 1,418,696 | |
Total Short-Term Investments
(Cost $3,484,173) | | | | | | | 3,484,173 | |
Total Investments – 104.6%
(Cost $41,439,225) | | | | | | | 46,453,849 | |
Other Assets, less Liabilities – (4.6)% | | | | | | | (2,046,959 | ) |
Net Assets – 100.0% | | | | | | $ | 44,406,890 | |
| * | Non-income producing security. |
| 1 | Some or all of these securities, amounting to $2,024,592 or 4.6% of net assets, were out on loan to various brokers. |
| 2 | Collateral received from brokers for securities lending was invested in these joint repurchase agreements. |
| 3 | Yield shown represents the October 31, 2017, seven day average yield, which refers to the sum of the previous seven days’ dividends paid, expressed as an annual percentage. |
BDC Business Development Company
REIT Real Estate Investment Trust
The following table summarizes the inputs used to value the Fund’s investments by the fair value hierarchy levels as of October 31, 2017:
| | | | | | | | | | | | | | | | |
| | | Level 1 | | | Level 2 | | | Level 3 | | | Total | |
Investments in Securities | | | | | | | | | | | | | | | | |
Common Stocks† | | $ | 42,969,676 | | | | — | | | | — | | | $ | 42,969,676 | |
Short-Term Investments | | | | | | | | | | | | | | | | |
Repurchase Agreements | | | — | | | $ | 2,065,477 | | | | — | | | | 2,065,477 | |
Other Investment Companies | | | 1,418,696 | | | | — | | | | — | | | | 1,418,696 | |
| | | | | | | | | | | | | | | | |
Total Investments in Securities | | $ | 44,388,372 | | | $ | 2,065,477 | | | | — | | | $ | 46,453,849 | |
| | | | | | | | | | | | | | | | |
| † | All common stocks held in the Fund are Level 1 securities. For a detailed breakout of common stocks by major industry classification, please refer to the Fund’s Schedule of Portfolio Investments. |
As of October 31, 2017, the Fund had no transfers between levels from the beginning of the reporting period.
The accompanying notes are an integral part of these financial statements.
52
AMG River Road Small Cap Value Fund
Portfolio Manager’s Comments (unaudited)
OVERVIEW
For the fiscal year ended October 31. 2017, the AMG River Road Small Cap Value Fund (the “Fund”) Class N shares returned 23.43%, trailing the 24.81% return for the Russell 2000® Value Index.
PERFORMANCE REVIEW
The sector with the largest positive contribution to relative return was real estate, which benefited from strong stock selection and an underweight allocation. The sector with the largest negative contribution to relative return was consumer staples, which lagged due to poor stock selection. The Fund’s cash position, which averaged approximately 8% during the period, was also a detractor to relative performance, given the strong returns of the overall market.
The two holdings with the largest positive contribution to the Fund’s return were Fidelity National Financial Inc. – FNFV Group (FNFV) and Air Transport Services Group (ATSG). FNFV Group is a collection of investments in operating companies in various industries that are opportunistically managed by the company’s chairman, Bill Foley. FNFV currently has ownership stakes in an HR software company (Ceridian), various restaurant brands (O’Charley’s, Village Inn, Bakers Square, 99), and a health care IT platform company called T-System Holdings. FNFV’s Ceridian posted strong revenue growth and margin expansion during 2017 in its Dayforce cloud segment. We believe Ceridian is now positioned for an IPO or outright sale in the near future. To help monetize a portion of its restaurant holdings, FNFV agreed to merge its 55%-owned 99
Restaurant Group with J. Alexander’s Holdings Inc. (JAX). FNFV also sold its insurance broker One Digital for $560 million in cash. Lastly, FNFV is near conversion to a common stock from a tracking stock, which will likely increase management’s flexibility for M&A and make the stock more widely eligible for institutional ownership. The position was trimmed as the stock approached our assessed value. ATSG is the largest independent lessor of the Boeing 767, which are the most cost-effective aircraft for just-in-time freight delivery. In early 2017, ATSG finished delivering 20 aircraft to Amazon under long-term contracts, which created significant revenue growth and improved efficiencies in operations. We significantly trimmed the position at our assessed value.
The two holdings with the largest negative contribution to the Fund’s return were grocery store chains: Ingles Markets Inc. (Cl A) (IMKTA) and Natural Grocers by Vitamin Cottage Inc. (NGVC). The shares of both companies began to decline when Amazon announced a deal to acquire Whole Foods Market, sparking fear regarding increased competition in the grocery industry. Ingles is based in Asheville, NC, and was founded in 1965. It has 201 stores mostly located in small towns in Georgia, North Carolina, South Carolina and Tennessee. We believe IMKTA is unique in that the company owns the real estate at 77% of its stores, owns the entire shopping center at 37% of its stores, and often has the best locations. The mountainous terrain in many of the company’s markets makes it far more expensive to build a new store because new locations require extensive site preparation. This acts as a barrier to new competition in many towns
served by Ingles. Also, Whole Foods has very little presence in Ingles’s markets. We took no action on the position. NGVC is a small chain on the west coast with 135 stores that focus on natural/organic foods plus dietary supplements. Increased competition slowed sales growth, and higher wage pressures and occupancy costs negatively impacted profitability in 2017. We believe recent margin compression will be a permanent change for the company, which does not own its real estate and operates in more urban markets. We eliminated the position from the Fund as part of our sell discipline.
OUTLOOK AND POSITIONING
We continue to position the Fund in shares of high quality companies that we believe will perform well in a sustained period of weak-to-moderate economic growth. Rapidly rising equity prices paired with modest earnings growth over the past several years has resulted in unattractive valuations in the broader small cap market. As a result, identifying companies to replace those that are being sold at their assessed valuations is challenging. Thus, cash in the Fund is at the higher end of its historical range. If returns do moderate over the coming months, we expect the Fund’s holdings and low volatility approach to be well positioned.
The views expressed represent the opinions of River Road Asset Management LLC, as of October 31, 2017, and are not intended as a forecast or guarantee of future results and are subject to change without notice.
53
AMG River Road Small Cap Value Fund
Portfolio Manager’s Comments (continued)
CUMULATIVE TOTAL RETURN PERFORMANCE
The AMG River Road Small Cap Value Fund’s cumulative total return is based on the daily change in net asset value (NAV), and assumes that all dividends and distributions were reinvested. The graph compares a hypothetical $10,000 investment made in AMG River Road Small Cap Value Fund’s Class N shares on October 31, 2007, to a $10,000 investment made in the Russell 2000® Value Index for the same time period. The graph and table do not reflect the deduction of taxes that a shareholder would pay on a Fund distribution or redemption of shares. The listed returns for the Fund are net of expenses and the returns for the index exclude expenses. Total returns would have been lower had certain expenses not been reduced.
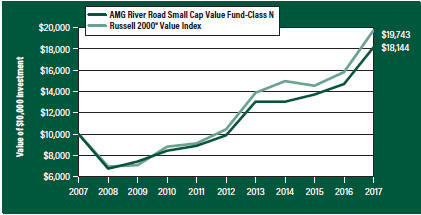
The table below shows the average annual total returns for AMG River Road Small Cap Value Fund and the Russell 2000® Value Index for the same time periods ended October 31, 2017.
| | | | | | | | | | | | | | | | | | | | |
| | | One | | | Five | | | Ten | | | Since | | | Inception | |
| Average Annual Total Returns1 | | Year | | | Years | | | Years | | | Inception | | | Date | |
AMG River Road Small Cap Value Fund2,3,4,5,6 | | | | | | | | | | | | | | | | | | | | |
Class N | | | 23.43 | % | | | 12.92 | % | | | 6.14 | % | | | 8.19 | % | | | 06/28/05 | |
Class I | | | 23.80 | % | | | 13.22 | % | | | 6.41 | % | | | 6.25 | % | | | 12/13/06 | |
Class Z | | | — | | | | — | | | | — | | | | 0.00 | % | | | 09/29/17 | |
Russell 2000® Value Index7 | | | 24.81 | % | | | 13.58 | % | | | 7.04 | % | | | 7.64 | % | | | 06/28/05 | † |
The performance data shown represents past performance. Past performance is not a guarantee of future results. Current performance may be lower or higher than the performance data quoted. The investment return and principal value of an investment will fluctuate so that an investor’s shares, when redeemed, may be worth more or less than their original cost.
Investors should carefully consider the Fund’s investment objectives, risks, charges and expenses before investing. For performance information through the most recent month end, current net asset values per share for the Fund and other information, please call 800.835.3879 or visit our website at amgfunds.com for a free prospectus. Read it carefully before investing or sending money.
Distributed by AMG Distributors, Inc., member FINRA/SIPC.
| † | Date reflects the inception date of the Fund, not the index. |
| 1 | Total return equals income yield plus share price change and assumes reinvestment of all dividends and capital gain distributions. Returns are net of fees and may reflect offsets of Fund expenses as described in the prospectus. No adjustment has been made for taxes payable by shareholders on their reinvested dividends and capital gain distributions. Returns for periods greater than one year are annualized. The listed returns on the Fund are net of expenses and based on the published NAV as of October 31, 2017. All returns are in U.S. dollars ($). |
| 2 | The Fund is subject to risks associated with investments in small-capitalization companies, such as erratic earnings patterns, competitive conditions, limited earnings history and a reliance on one or a limited number of products. |
| 3 | The Fund is subject to risks associated with investments in mid-capitalization companies such as greater price volatility, lower trading volume, and less liquidity than the stocks of larger, more established companies. |
| 4 | The Fund invests in value stocks, which may perform differently from the market as a whole and may be undervalued by the market for a long period of time. |
| 5 | The Fund is subject to special risk considerations similar to those associated with the direct ownership of real estate. Real estate valuations may be subject to factors such as changing general and local economic, financial, competitive, and environmental conditions. |
| 6 | Investments in international securities are subject to certain risks of overseas investing including currency fluctuations and changes in political and economic conditions, which could result in significant market fluctuations. |
| 7 | The Russell 2000® Value Index is an unmanaged, market-value weighted, value-oriented index comprised of small stocks that have relatively low price-to-book ratios and lower forecasted growth values. Unlike the Fund, the Russell 2000® Value Index is unmanaged, is not available for investment and does not incur expenses. |
The Russell Indices are a trademark of the London Stock Exchange Group companies.
Not FDIC insured, nor bank guaranteed. May lose value.
54
| | |
| AMG River Road Small Cap Value Fund | | October 31, 2017 |
| Fund Snapshots (unaudited) | | |
PORTFOLIO BREAKDOWN
| | | | |
| | | % of | |
Sector | | Net Assets | |
Consumer Discretionary | | | 23.1 | |
Information Technology | | | 21.6 | |
Industrials | | | 20.1 | |
Financials | | | 12.5 | |
Energy | | | 4.1 | |
Consumer Staples | | | 3.4 | |
Telecommunication Services | | | 2.8 | |
Health Care | | | 2.6 | |
Materials | | | 1.0 | |
Real Estate | | | 0.8 | |
Other Assets Less Liabilities | | | 8.0 | |
TOP TEN HOLDINGS
| | | | |
| | | % of | |
Security Name | | Net Assets | |
White Mountains Insurance Group, Ltd. | | | 4.7 | |
UniFirst Corp. | | | 4.4 | |
FNFV Group | | | 4.3 | |
Murphy USA, Inc. | | | 3.9 | |
Blackhawk Network Holdings, Inc. | | | 3.0 | |
Liberty Expedia Holdings, Inc., Class A | | | 2.7 | |
Cars.com, Inc. | | | 2.6 | |
Mitel Networks Corp. | | | 2.6 | |
Armstrong World Industries, Inc. | | | 2.4 | |
CSG Systems International, Inc. | | | 2.4 | |
| | | | |
Top Ten as a Group | | | 33.0 | |
| | | | |
Because a fund’s strategy may result in multiple investments in particular sectors of the economy, its performance may depend on the performance of those sectors and may fluctuate more widely than investments diversified across more sectors. For additional information on these and other risk considerations, please see the Fund’s prospectus.
Any sectors, industries, or securities discussed should not be perceived as investment recommendations. Mention of a specific security should not be considered a recommendation to buy or solicitation to sell that security. Specific securities mentioned in this report may have been sold from the Fund’s portfolio of investments by the time you receive this report.
55
| | |
| AMG River Road Small Cap Value Fund | | October 31, 2017 |
| |
| Schedule of Portfolio Investments | | |
| | | | | | | | |
| | | Shares | | | Value | |
Common Stocks – 92.0% | | | | | | | | |
Consumer Discretionary – 23.1% | | | | | | | | |
Asbury Automotive Group, Inc. * | | | 92,750 | | | $ | 5,694,850 | |
Biglari Holdings, Inc. * | | | 15,845 | | | | 5,663,637 | |
International Speedway Corp., Class A | | | 180,126 | | | | 6,997,895 | |
J Alexander’s Holdings, Inc. * | | | 326,645 | | | | 3,429,772 | |
La Quinta Holdings, Inc. * | | | 206,330 | | | | 3,635,535 | |
Liberty Expedia Holdings, Inc., Class A * | | | 183,830 | | | | 8,474,563 | |
The Marcus Corp. | | | 33,101 | | | | 898,692 | |
Motorcar Parts of America, Inc. * | | | 220,176 | | | | 6,365,288 | |
Murphy USA, Inc. * | | | 162,512 | | | | 12,084,392 | |
National CineMedia, Inc. | | | 364,220 | | | | 2,451,201 | |
PICO Holdings, Inc. * | | | 345,294 | | | | 6,526,057 | |
Sleep Number Corp. * | | | 198,293 | | | | 6,444,522 | |
SodaStream International, Ltd. (Israel)* | | | 31,522 | | | | 2,007,006 | |
Vista Outdoor, Inc. * | | | 65,520 | | | | 1,370,023 | |
Total Consumer Discretionary | | | | | | | 72,043,433 | |
Consumer Staples – 3.4% | | | | | | | | |
Hostess Brands, Inc. * | | | 340,130 | | | | 3,921,699 | |
Ingles Markets, Inc., Class A | | | 216,895 | | | | 5,053,653 | |
Natural Grocers by Vitamin Cottage, Inc. *,1 | | | 294,103 | | | | 1,444,046 | |
Total Consumer Staples | | | | | | | 10,419,398 | |
Energy – 4.1% | | | | | | | | |
Evolution Petroleum Corp. | | | 211,470 | | | | 1,564,878 | |
Gran Tierra Energy, Inc. (Canada)* | | | 657,120 | | | | 1,425,950 | |
PBF Energy, Inc., Class A 1 | | | 174,060 | | | | 5,042,518 | |
QEP Resources, Inc. * | | | 122,690 | | | | 1,098,076 | |
World Fuel Services Corp. | | | 125,900 | | | | 3,500,020 | |
Total Energy | | | | | | | 12,631,442 | |
Financials – 12.5% | | | | | | | | |
American National Insurance Co. | | | 30,690 | | | | 3,735,894 | |
Capital Southwest Corp., BDC | | | 239,229 | | | | 4,143,446 | |
First Citizens BancShares, Inc., Class A | | | 7,185 | | | | 2,909,925 | |
FNFV Group * | | | 775,255 | | | | 13,373,149 | |
White Mountains Insurance Group, Ltd. | | | 16,438 | | | | 14,615,847 | |
Total Financials | | | | | | | 38,778,261 | |
Health Care – 2.6% | | | | | | | | |
Computer Programs & Systems, Inc. | | | 208,872 | | | | 6,297,491 | |
| | | | | | | | |
| | | Shares | | | Value | |
Orthofix International, N.V. * | | | 33,808 | | | $ | 1,816,504 | |
Total Health Care | | | | | | | 8,113,995 | |
Industrials – 20.1% | | | | | | | | |
Aegion Corp. * | | | 142,780 | | | | 3,325,346 | |
Air Transport Services Group, Inc. * | | | 174,133 | | | | 4,214,019 | |
Armstrong Flooring, Inc. * | | | 289,660 | | | | 4,286,968 | |
Armstrong World Industries, Inc. * | | | 149,663 | | | | 7,647,779 | |
Barrett Business Services, Inc. | | | 46,142 | | | | 2,804,972 | |
Cubic Corp. | | | 92,757 | | | | 5,059,894 | |
Forward Air Corp. | | | 106,950 | | | | 6,143,208 | |
Kelly Services, Inc., Class A | | | 133,480 | | | | 3,511,859 | |
KLX, Inc. * | | | 29,207 | | | | 1,602,296 | |
Resources Connection, Inc. | | | 285,383 | | | | 4,494,782 | |
SP Plus Corp. * | | | 91,383 | | | | 3,541,091 | |
UniFirst Corp. | | | 87,377 | | | | 13,761,878 | |
Viad Corp. | | | 37,569 | | | | 2,180,881 | |
Total Industrials | | | | | | | 62,574,973 | |
Information Technology – 21.6% | | | | | | | | |
Blackhawk Network Holdings, Inc. * | | | 273,917 | | | | 9,299,482 | |
Cars.com, Inc. *,1 | | | 341,410 | | | | 8,132,386 | |
Computer Services, Inc. | | | 136,105 | | | | 6,601,093 | |
CSG Systems International, Inc. | | | 174,445 | | | | 7,386,001 | |
ePlus, Inc. * | | | 46,028 | | | | 4,400,277 | |
EVERTEC, Inc. (Puerto Rico) | | | 163,930 | | | | 2,458,950 | |
Ituran Location and Control, Ltd. (Israel) | | | 155,578 | | | | 5,523,019 | |
Match Group, Inc. *,1 | | | 60,536 | | | | 1,618,733 | |
Mitel Networks Corp. (Canada)* | | | 935,880 | | | | 8,039,209 | |
OSI Systems, Inc. * | | | 23,300 | | | | 2,059,254 | |
Sykes Enterprises, Inc. * | | | 129,968 | | | | 3,761,274 | |
TechTarget, Inc. * | | | 140,344 | | | | 1,748,686 | |
VeriFone Systems, Inc. * | | | 333,870 | | | | 6,370,240 | |
Total Information Technology | | | | | | | 67,398,604 | |
Materials – 1.0% | | | | | | | | |
Compass Minerals International, Inc. 1 | | | 48,910 | | | | 3,208,496 | |
Real Estate – 0.8% | | | | | | | | |
Marcus & Millichap, Inc., REIT * | | | 85,801 | | | | 2,438,464 | |
Telecommunication Services – 2.8% | | | | | | | | |
ATN International, Inc. | | | 86,143 | | | | 4,676,704 | |
The accompanying notes are an integral part of these financial statements.
56
| | |
| AMG River Road Small Cap Value Fund | | |
| |
| Schedule of Portfolio Investments (continued) | | |
| | | | | | | | |
| | | Shares | | | Value | |
Telecommunication Services – 2.8% (continued) | | | | | | | | |
Telephone & Data Systems, Inc. | | | 139,240 | | | $ | 4,058,846 | |
Total Telecommunication Services | | | | | | | 8,735,550 | |
Total Common Stocks
(Cost $224,929,420) | | | | | | | 286,342,616 | |
| | |
| | | Principal | | | | |
| | | Amount | | | | |
Short-Term Investments – 12.5% | | | | | | | | |
Repurchase Agreements – 4.2%2 | | | | | | | | |
Citigroup Global Markets, Inc., dated 10/31/17, due 11/01/17, 1.070% total to be received $3,139,077 (collateralized by various U.S. Government Agency Obligations, 0.000% - 11.500%, 11/01/17 - 09/09/49, totaling $3,201,764) | | $ | 3,138,984 | | | | 3,138,984 | |
Daiwa Capital Markets America, dated 10/31/17, due 11/01/17, 1.080% total to be received $3,139,078 (collateralized by various U.S. Government Agency Obligations, 0.000% - 6.500%, 11/02/17 - 12/01/51, totaling $3,201,046) | | | 3,138,984 | | | | 3,138,984 | |
HSBC Securities USA, Inc., dated 10/31/17, due 11/01/17, 1.040% total to be received $3,139,075 (collateralized by various U.S. Government Agency Obligations, 2.500% - 8.000%, 04/01/22 - 10/01/47, totaling $3,201,779) | | | 3,138,984 | | | | 3,138,984 | |
| | | | | | | | |
| | | Principal | | | | |
| | | Amount | | | Value | |
Jefferies LLC, dated 10/31/17, due 11/01/17, 1.140% total to be received $660,518 (collateralized by various U.S. Government Agency Obligations, 0.000% - 2.375%, 12/15/17 - 05/15/27, totaling $673,707) | | $ | 660,497 | | | $ | 660,497 | |
Nomura Securities International, Inc., dated 10/31/17, due 11/01/17, 1.060% total to be received $3,139,076 (collateralized by various U.S. Government Agency Obligations, 0.000% - 6.250%, 11/30/17 - 09/09/49, totaling $3,201,764) | | | 3,138,984 | | | | 3,138,984 | |
Total��Repurchase Agreements | | | | | | | 13,216,433 | |
| | |
| | | Shares | | | | |
Other Investment Companies – 8.3% | | | | | |
Dreyfus Institutional Preferred Government Money Market Fund, Institutional Class Shares, 1.00%3 | | | 25,740,343 | | | | 25,740,343 | |
Total Short-Term Investments
(Cost $38,956,776) | | | | | | | 38,956,776 | |
Total Investments – 104.5%
(Cost $263,886,196) | | | | | | | 325,299,392 | |
Other Assets, less Liabilities – (4.5)% | | | | | | | (13,913,803 | ) |
Net Assets – 100.0% | | | | | | $ | 311,385,589 | |
| * | Non-income producing security. |
| 1 | Some or all of these securities, amounting to $12,933,398 or 4.2% of net assets, were out on loan to various brokers. |
| 2 | Collateral received from brokers for securities lending was invested in these joint repurchase agreements. |
| 3 | Yield shown represents the October 31, 2017, seven day average yield, which refers to the sum of the previous seven days’ dividends paid, expressed as an annual percentage. |
| BDC | Business Development Company |
| REIT | Real Estate Investment Trust |
The following table summarizes the inputs used to value the Fund’s investments by the fair value hierarchy levels as of October 31, 2017:
| | | | | | | | | | | | | | | | |
| | | Level 1 | | | Level 2 | | | Level 3 | | | Total | |
Investments in Securities | | | | | | | | | | | | | | | | |
Common Stocks† | | $ | 286,342,616 | | | | — | | | | — | | | $ | 286,342,616 | |
Short-Term Investments | | | | | | | | | | | | | | | | |
Repurchase Agreements | | | — | | | $ | 13,216,433 | | | | — | | | | 13,216,433 | |
Other Investment Companies | | | 25,740,343 | | | | — | | | | — | | | | 25,740,343 | |
| | | | | | | | | | | | | | | | |
Total Investments in Securities | | $ | 312,082,959 | | | $ | 13,216,433 | | | | — | | | $ | 325,299,392 | |
| | | | | | | | | | | | | | | | |
| † | All common stocks held in the Fund are Level 1 securities. For a detailed breakout of common stocks by major industry classification, please refer to the Fund’s Schedule of Portfolio Investments. |
As of October 31, 2017, the Fund had no transfers between levels from the beginning of the reporting period.
The accompanying notes are an integral part of these financial statements.
57
| | |
| AMG Managers Silvercrest Small Cap Fund | | |
| Portfolio Manager’s Comments (unaudited) | | |
REVIEW AND OUTLOOK
The AMG Managers Silvercrest Small Cap Fund (the “Fund”) Class N shares returned 25.83% for the fiscal year ended October 31, 2017, compared with a 24.81% return for its benchmark, the Russell 2000® Value Index.
We saw a modest positive impact on relative performance from our various sector over/under weightings versus the Russell 2000® Value Index, with our overweights in producer durables and healthcare and our underweight in utilities having the greatest impact. Our cash position, while relatively modest at an average weight of less than 3%, hurt us given the strong equity return over the period. As is typical for us, the bulk of our positive performance relative to the index was from stock selection. We enjoyed excellent relative performance in technology, with our holdings gaining 61% versus 31% for the benchmark. Together with our overweighted positioning, technology represented our largest contribution to return at the sector level. We also performed relatively well in our largest sector exposure, financial services (+31% vs. +25%), and in consumer discretionary (+32% vs. +19%). On the negative side, our weakest sector contribution to return was in producer durables (+20% vs. +38%),
where we were hurt by our single worst performer Babcock & Wilcox Enterprises (-83%). Babcock, obviously, was quite a disappointment and we eliminated our position. We also lagged in healthcare (+34% vs. +43%), where despite a strong absolute return we couldn’t quite keep up with the powerful return from the index’s biotechnology holdings, which we generally find ill-suited to our investment philosophy.
Our largest individual contributors to return included MKS Instruments and Entegris, which both gained over 100% for the year, benefiting from strong demand in the semiconductor industry. Fox Factory Holdings, a provider of suspension products for bikes and powered vehicles, gained substantially on strong earnings results and excitement over growing content in the sport truck market.
Our largest detractors from return included the aforementioned Babcock & Wilcox, an engineering and construction company where cost overruns on various projects dramatically reduced the earnings outlook. Finish Line, an athletic footwear and apparel retailer also performed poorly in a weak environment for many mall-based sports-oriented retailers.
Looking forward, we are struck by the generally optimistic tone we are hearing from most of our company management teams. Current economic conditions around the world appear favorable, which has led to generally solid earnings results over the past year. Corporate balance sheets remain in good shape, cash flow is solid, and potential tax reform would be a plus. While we are disappointed in not seeing any M+A activity in the portfolio this year after three of our holdings were targeted last year, we continue to believe there is substantial franchise value in our names and expect to see more activity in the years ahead. Within the portfolio, we have been relatively active, trimming/eliminating some tenured holdings to keep the portfolio’s valuation and market cap reasonable. We would expect a modest increase in our name count as we redeploy those assets. Overall, while political wrangling and global intrigue may influence the market on a day-to-day basis, we are comforted by what we see as a still constructive earnings outlook that leaves our portfolio appearing modestly undervalued.
The views expressed represent the opinions of Silvercrest Asset Management Group LLC, as of October 31, 2017, and are not intended as a forecast or guarantee of future results and are subject to change without notice.
58
AMG Managers Silvercrest Small Cap Fund
Portfolio Manager’s Comments (continued)
CUMULATIVE TOTAL RETURN PERFORMANCE
The AMG Managers Silvercrest Small Cap Fund’s cumulative total return is based on the daily change in net asset value (NAV), and assumes that all dividends and distributions were reinvested. The graph compares a hypothetical $10,000 investment made in AMG Managers Silvercrest Small Cap Fund’s Class N shares on December 27, 2011, to a $10,000 investment made in the Russell 2000® Value Index and Russell 2000® Index for the same time period. The graph and table do not reflect the deduction of taxes that a shareholder would pay on a Fund distribution or redemption of shares. The listed returns for the Fund are net of expenses and the returns for the index exclude expenses. Total returns would have been lower had certain expenses not been reduced.
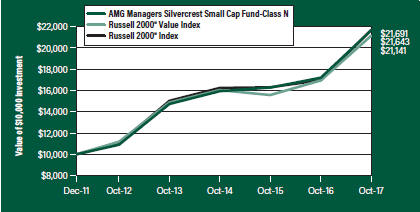
The table below shows the average annual total returns for AMG Managers Silvercrest Small Cap Fund and the Russell 2000® Value Index and Russell 2000® Index for the same time periods ended October 31, 2017.
| | | | | | | | | | | | | | | | |
| | | One | | | Five | | | Since | | | Inception | |
| Average Annual Total Returns1 | | Year | | | Years | | | Inception | | | Date | |
AMG Managers Silvercrest Small Cap Fund2,3,4,5 | | | | | | | | | | | | | | | | |
Class N | | | 25.83 | % | | | 14.71 | % | | | 14.11 | % | | | 12/27/11 | |
Class I | | | 26.07 | % | | | 14.98 | % | | | 14.40 | % | | | 12/27/11 | |
Class Z | | | — | | | | — | | | | 1.09 | % | | | 09/29/17 | |
Russell 2000® Value Index6 | | | 24.81 | % | | | 13.58 | % | | | 13.65 | % | | | 12/27/11 | † |
Russell 2000® Index7 | | | 27.85 | % | | | 14.49 | % | | | 14.24 | % | | | 12/27/11 | † |
The performance data shown represents past performance. Past performance is not a guarantee of future results. Current performance may be lower or higher than the performance data quoted. The investment return and principal value of an investment will fluctuate so that an investor’s shares, when redeemed, may be worth more or less than their original cost.
Investors should carefully consider the Fund’s investment objectives, risks, charges and expenses before investing. For performance information through the most recent month end, current net asset values per share for the Fund and other information, please call 800.835.3879 or visit our website at amgfunds.com for a free prospectus. Read it carefully before investing or sending money.
Distributed by AMG Distributors, Inc., member FINRA/SIPC.
| † | Date reflects the inception date of the Fund, not the index. |
| 1 | Total return equals income yield plus share price change and assumes reinvestment of all dividends and capital gain distributions. Returns are net of fees and may reflect offsets of Fund expenses as described in the prospectus. No adjustment has been made for taxes payable by shareholders on their reinvested dividends and capital gain |
| | distributions. Returns for periods greater than one year are annualized. The listed returns on the Fund are net of expenses and based on the published NAV as of October 31, 2017. All returns are in U.S. dollars ($). |
| 2 | The Fund is subject to risks associated with investments in small-capitalization companies, such as erratic earnings patterns, competitive conditions, limited earnings history and a reliance on one or a limited number of products. |
| 3 | The Fund is subject to risks associated with investments in mid-capitalization companies such as greater price volatility, lower trading volume, and less liquidity than the stocks of larger, more established companies. |
| 4 | The Fund is subject to special risk considerations similar to those associated with the direct ownership of real estate. Real estate valuations may be subject to factors such as changing general and local economic, financial, competitive, and environmental conditions. |
| 5 | The Fund invests in value stocks, which may perform differently from the market as a whole and may be undervalued by the market for a long period of time. |
| 6 | The Russell 2000® Value Index is an unmanaged, market-value weighted, value-oriented index comprised of small stocks that have relatively low price-to-book ratios and lower forecasted growth values. Unlike the Fund, the Russell 2000® Value Index is unmanaged, is not available for investment and does not incur expenses. |
| 7 | The Russell 2000® Index is composed of the 2,000 smallest stocks in the Russell 3000® Index and is widely regarded in the industry as the premier measure of small-cap stock performance. Unlike the Fund, the Russell 2000® Index is unmanaged, is not available for investment and does not incur expenses. |
The Russell Indices are a trademark of the London Stock Exchange Group companies.
Not FDIC insured, nor bank guaranteed. May lose value.
59
| | |
| AMG Managers Silvercrest Small Cap Fund | | October 31, 2017 |
| Fund Snapshots (unaudited) | | |
PORTFOLIO BREAKDOWN
| | | | |
Sector | | % of
Net Assets | |
Financials | | | 19.8 | |
Industrials | | | 17.2 | |
Information Technology | | | 17.1 | |
Consumer Discretionary | | | 11.3 | |
Real Estate | | | 7.7 | |
Materials | | | 7.1 | |
Energy | | | 5.9 | |
Health Care | | | 5.7 | |
Utilities | | | 3.1 | |
Consumer Staples | | | 2.1 | |
Other Assets Less Liabilities | | | 3.0 | |
TOP TEN HOLDINGS
| | | | |
Security Name | | % of
Net Assets | |
BancorpSouth, Inc. | | | 3.3 | |
MKS Instruments, Inc. | | | 3.1 | |
FCB Financial Holdings, Inc., Class A | | | 2.9 | |
IBERIABANK Corp. | | | 2.8 | |
Independent Bank Corp./Rockland MA | | | 2.7 | |
CVB Financial Corp. | | | 2.7 | |
Pebblebrook Hotel Trust, 0.380% | | | 2.6 | |
Ingevity Corp. | | | 2.3 | |
Selective Insurance Group, Inc. | | | 2.3 | |
Matador Resources Co. | | | 2.3 | |
| | | | |
Top Ten as a Group | | | 27.0 | |
| | | | |
Because a fund’s strategy may result in multiple investments in particular sectors of the economy, its performance may depend on the performance of those sectors and may fluctuate more widely than investments diversified across more sectors. For additional information on these and other risk considerations, please see the Fund’s prospectus.
Any sectors, industries, or securities discussed should not be perceived as investment recommendations. Mention of a specific security should not be considered a recommendation to buy or solicitation to sell that security. Specific securities mentioned in this report may have been sold from the Fund’s portfolio of investments by the time you receive this report.
60
| | |
| AMG Managers Silvercrest Small Cap Fund | | October 31, 2017 |
| |
| Schedule of Portfolio Investments | | |
| | | | | | | | |
| | | Shares | | | Value | |
Common Stocks – 97.0% | | | | | | | | |
Consumer Discretionary – 11.3% | | | | | | | | |
Dana, Inc. | | | 160,780 | | | $ | 4,902,182 | |
The EW Scripps Co., Class A * | | | 124,040 | | | | 2,150,854 | |
Fox Factory Holding Corp. * | | | 34,950 | | | | 1,487,122 | |
La-Z-Boy, Inc. | | | 171,480 | | | | 4,621,386 | |
Lithia Motors, Inc., Class A | | | 36,350 | | | | 4,114,093 | |
Meredith Corp. | | | 65,770 | | | | 3,485,810 | |
Murphy USA, Inc. * | | | 53,280 | | | | 3,961,901 | |
Wolverine World Wide, Inc. | | | 205,750 | | | | 5,616,975 | |
Total Consumer Discretionary | | | | | | | 30,340,323 | |
Consumer Staples – 2.1% | | | | | | | | |
J&J Snack Foods Corp. | | | 26,244 | | | | 3,494,914 | |
Lancaster Colony Corp. | | | 16,404 | | | | 2,054,109 | |
Total Consumer Staples | | | | | | | 5,549,023 | |
Energy – 5.9% | | | | | | | | |
Callon Petroleum Co. * | | | 342,720 | | | | 3,800,765 | |
Forum Energy Technologies, Inc. * | | | 170,320 | | | | 2,452,608 | |
Matador Resources Co. *,1 | | | 230,500 | | | | 6,119,775 | |
Select Energy Services, Inc., Class A * | | | 200,750 | | | | 3,268,210 | |
Total Energy | | | | | | | 15,641,358 | |
Financials – 19.8% | | | | | | | | |
BancorpSouth, Inc. | | | 277,780 | | | | 8,777,848 | |
CVB Financial Corp. | | | 299,390 | | | | 7,143,445 | |
FCB Financial Holdings, Inc., Class A * | | | 164,040 | | | | 7,660,668 | |
Glacier Bancorp, Inc. | | | 93,360 | | | | 3,543,946 | |
Horace Mann Educators Corp. | | | 113,834 | | | | 4,985,929 | |
IBERIABANK Corp. | | | 100,029 | | | | 7,377,139 | |
Independent Bank Corp./Rockland MA | | | 101,423 | | | | 7,312,598 | |
Selective Insurance Group, Inc. | | | 103,310 | | | | 6,157,276 | |
Total Financials | | | | | | | 52,958,849 | |
Health Care – 5.7% | | | | | | | | |
AMN Healthcare Services, Inc. * | | | 113,090 | | | | 4,964,651 | |
ICU Medical, Inc. * | | | 27,334 | | | | 5,223,528 | |
Natus Medical, Inc. * | | | 117,210 | | | | 4,969,704 | |
Total Health Care | | | | | | | 15,157,883 | |
Industrials – 17.2% | | | | | | | | |
Advanced Disposal Services, Inc. * | | | 156,560 | | | | 3,901,475 | |
Altra Industrial Motion Corp. | | | 111,205 | | | | 5,326,719 | |
| | | | | | | | |
| | | Shares | | | Value | |
BMC Stock Holdings, Inc. * | | | 173,420 | | | $ | 3,719,859 | |
CIRCOR International, Inc. | | | 43,850 | | | | 1,927,208 | |
EMCOR Group, Inc. | | | 42,506 | | | | 3,422,158 | |
ESCO Technologies, Inc. | | | 64,360 | | | | 3,729,662 | |
Insperity, Inc. | | | 38,150 | | | | 3,620,435 | |
Knoll, Inc. | | | 161,850 | | | | 3,434,457 | |
MSA Safety, Inc. | | | 22,979 | | | | 1,826,831 | |
Mueller Water Products, Inc., Class A | | | 310,710 | | | | 3,709,877 | |
Quanex Building Products Corp. | | | 115,010 | | | | 2,524,470 | |
Standex International Corp. | | | 39,850 | | | | 4,126,467 | |
US Ecology, Inc. | | | 97,389 | | | | 4,630,847 | |
Total Industrials | | | | | | | 45,900,465 | |
Information Technology – 17.1% | | | | | | | | |
ACI Worldwide, Inc. * | | | 165,247 | | | | 3,979,148 | |
Entegris, Inc. | | | 182,840 | | | | 5,988,010 | |
Littelfuse, Inc. | | | 22,188 | | | | 4,637,292 | |
MACOM Technology Solutions
Holdings, Inc. *,1 | | | 130,990 | | | | 5,354,871 | |
Methode Electronics, Inc. | | | 63,640 | | | | 2,984,716 | |
MKS Instruments, Inc. | | | 75,490 | | | | 8,201,988 | |
NETGEAR, Inc. * | | | 58,100 | | | | 2,710,365 | |
NetScout Systems, Inc. * | | | 84,870 | | | | 2,410,308 | |
Plexus Corp. * | | | 60,360 | | | | 3,707,915 | |
Rogers Corp. * | | | 37,620 | | | | 5,721,250 | |
Total Information Technology | | | | | | | 45,695,863 | |
Materials – 7.1% | | | | | | | | |
HB Fuller Co. | | | 85,510 | | | | 4,862,954 | |
Ingevity Corp. * | | | 88,750 | | | | 6,321,662 | |
Minerals Technologies, Inc. | | | 68,340 | | | | 4,913,646 | |
PH Glatfelter Co. | | | 139,653 | | | | 2,927,127 | |
Total Materials | | | | | | | 19,025,389 | |
Real Estate – 7.7% | | | | | | | | |
EastGroup Properties, Inc., REIT | | | 38,628 | | | | 3,499,311 | |
Pebblebrook Hotel Trust, REIT 1 | | | 196,450 | | | | 7,005,407 | |
Physicians Realty Trust, REIT | | | 253,400 | | | | 4,404,092 | |
QTS Realty Trust, Inc., Class A, REIT | | | 100,210 | | | | 5,797,148 | |
Total Real Estate | | | | | | | 20,705,958 | |
Utilities – 3.1% | | | | | | | | |
MGE Energy, Inc. | | | 42,133 | | | | 2,782,884 | |
ONE Gas, Inc. | | | 35,250 | | | | 2,713,545 | |
The accompanying notes are an integral part of these financial statements.
61
| | |
| AMG Managers Silvercrest Small Cap Fund | | |
| |
| Schedule of Portfolio Investments (continued) | | |
| | | | | | | | |
| | | Shares | | | Value | |
Utilities – 3.1% (continued) | | | | | | | | |
Portland General Electric Co. | | | 60,009 | | | $ | 2,864,830 | |
Total Utilities | | | | | | | 8,361,259 | |
Total Common Stocks | | | | | | | | |
(Cost $212,631,184) | | | | | | | 259,336,370 | |
| | |
| | | Principal
Amount | | | | |
Short-Term Investments – 6.6% | | | | | | | | |
Repurchase Agreements – 4.9%2 | | | | | | | | |
Citigroup Global Markets, Inc., dated 10/31/17, due 11/01/17, 1.070% total to be received $3,088,031 (collateralized by various U.S. Government Agency Obligations, 0.000% - 11.500%, 11/01/17 - 09/09/49, totaling $3,149,698) | | $ | 3,087,939 | | | | 3,087,939 | |
HSBC Securities USA, Inc., dated 10/31/17, due 11/01/17, 1.040% total to be received $3,088,028 (collateralized by various U.S. Government Agency Obligations, 2.500% - 8.000%, 04/01/22 - 10/01/47, totaling $3,149,713) | | | 3,087,939 | | | | 3,087,939 | |
Jefferies LLC, dated 10/31/17, due 11/01/17, 1.180%total to be received $3,088,040 (collateralized by various U.S. Government Agency Obligations, 2.750% - 4.000%, 04/01/27 - 10/15/52, totaling $3,149,698) | | | 3,087,939 | | | | 3,087,939 | |
Merrill Lynch, Pierce, Fenner & Smith, Inc., dated 10/31/17, due 11/01/17, 1.050% total to be received $649,734 (collateralized by various U.S. Government Agency Obligations, 2.000% - 2.125%, 03/31/24 - 06/30/24, totaling $662,709) | | $ | 649,715 | | | $ | 649,715 | |
| * | Non-income producing security. |
| 1 | Some or all of these securities, amounting to $12,903,710 or 4.8% of net assets, were out on loan to various brokers. |
| 2 | Collateral received from brokers for securities lending was invested in these joint repurchase agreements. |
| | | | | | | | |
| | | Principal
Amount | | | Value | |
Nomura Securities International, Inc., dated 10/31/17, due 11/01/17, 1.060% total to be received $3,088,030 (collateralized by various U.S. Government Agency Obligations, 0.000% - 6.250%, 11/30/17 - 09/09/49, totaling $3,149,698) | | | 3,087,939 | | | | 3,087,939 | |
Total Repurchase Agreements | | | | | | | 13,001,471 | |
| | |
| | | Shares | | | | |
Other Investment Companies – 1.7% | | | | | | | | |
Dreyfus Government Cash Management Fund, Institutional Class Shares, 0.93%3 | | | 4,480,642 | | | | 4,480,642 | |
Total Short-Term Investments
(Cost $17,482,113) | | | | | | | 17,482,113 | |
Total Investments – 103.6%
(Cost $230,113,297) | | | | | | | 276,818,483 | |
Other Assets, less Liabilities – (3.6)% | | | | | | | (9,535,306 | ) |
Net Assets – 100.0% | | | | | | $ | 267,283,177 | |
| 3 | Yield shown represents the October 31, 2017, seven day average yield, which refers to the sum of the previous seven days’ dividends paid, expressed as an annual percentage. |
REIT Real Estate Investment Trust
The following table summarizes the inputs used to value the Fund’s investments by the fair value hierarchy levels as of October 31, 2017:
| | | | | | | | | | | | | | | | |
| | | Level 1 | | | Level 2 | | | Level 3 | | | Total | |
Investments in Securities | | | | | | | | | | | | | | | | |
Common Stocks† | | $ | 259,336,370 | | | | — | | | | — | | | $ | 259,336,370 | |
Short-Term Investments | | | | | | | | | | | | | | | | |
Repurchase Agreements | | | — | | | $ | 13,001,471 | | | | — | | | | 13,001,471 | |
Other Investment Companies | | | 4,480,642 | | | | — | | | | — | | | | 4,480,642 | |
| | | | | | | | | | | | | | | | |
Total Investments in Securities | | $ | 263,817,012 | | | $ | 13,001,471 | | | | — | | | $ | 276,818,483 | |
| | | | | | | | | | | | | | | | |
| † | All common stocks held in the Fund are Level 1 securities. For a detailed breakout of common stocks by major industry classification, please refer to the Fund’s Schedule of Portfolio Investments. |
As of October 31, 2017, the Fund had no transfers between levels from the beginning of the reporting period.
62
| | |
| AMG GW&K U.S. Small Cap Growth Fund | | |
| Portfolio Manager’s Comments (unaudited) | | |
THE YEAR IN REVIEW
For the fiscal year ending October 31, 2017, the AMG GW&K U.S. Small Cap Growth Fund (the “Fund”) Class N shares returned 30.91% compared to the return of 31.00% for the Russell 2000® Growth Index.
This measurement period began with a bang—the surprising (to many professional observers, at least) election of a businessman and political novice to the highest office in the land. This outcome, along with the Republican sweep of Congress, catalyzed a dramatic swing in market sentiment. Investors moved from positioning for a Washington and macroeconomic status quo (or perhaps even a tilt in the Senate toward Democrats) to a political landscape dominated by the Republican ticket. Making the situation even more interesting was the lack of a clearly articulated ideology for the incoming administration. This blank slate permitted investors to imagine the most positive outcomes this newly elected leader might be able to accomplish. And dream they did, driving equity prices up on hope of lower taxes, lower regulation, and beneficial infrastructure spending which would drive overall higher growth rates for both the economy and corporate profits.
The narrative for a market rally was set up by the preceding two and a half years, when corporate profits stalled and small cap growth stocks had mostly vacillated. This was compounded by a macro overlay where investors were obsessed with safety and embraced the idea that low rates and low growth were here to stay. The result was too much emphasis on safety and low growth trades, while avoiding cyclical growth at all costs. Furthermore, stocks had pulled back considerably heading into the election as the Russell 2000® Growth Index sat 7.3% off its recent high. Thus, while the election was the spark that started the fire, the dry kindling and crumpled newspaper were already in the fireplace. This fire produced a return of 9.0% in the month of November alone for U.S. small cap growth stocks. The subsequent market gains were generally more orderly than this initial burst of excitement, but they were gains nonetheless as the Russell 2000® Growth Index returned a total of 31.0% for the 12 months ended October 31, 2017. While the legislative agenda of the administration did not materialize over this span, the potential for progress remained a tantalizing prospect for investors. Perhaps more importantly for stocks, over this time frame the market digested respectable earnings growth, generally improving economic data, and disciplined monetary policy which translated into meaningful gains for stocks.
This rally demonstrated some modest preferences for lower quality stocks and increasing risk profiles. These characteristics can be seen in looking at the style factors where non-earners and high beta (sensitivity to market movements) stocks were outperformers during the period. Further evidence of the risk-on dynamics at play can be found in looking at the sector returns as two of the three worst performers were the prosaic consumer staples 6.6% and real estate 21.7% sectors. Rounding out the bottom three was energy 17.8%, as the sector continued its slide from the preceding 12-month period. While the decline in energy was striking, its impact on the benchmark was not given that it constitutes little more than 1% of the Index. Another marginal sector formed the opposite bookend on performance with the diminutive telecommunication services (less than 1% of the benchmark) posting an eye-popping gain of 63.6%. The move in this sector was fairly idiosyncratic as the M&A activity of two constituents (Straight Path Communications and General Communication) played a significant role in the gains for this group. In looking at the remaining meaningful sectors, the strength in the market was broad based as all but consumer discretionary 22.4% posted a return of better than 30%. The leaders of this pack were materials 38.6% and health care 37.2%. Within health care, the biotechnology industry was a notable contributor given its gain of 54.8%, lending further credence to the idea of a risk-on rally.
The Fund produced an attractive absolute return of 30.91% during the measurement period. The Fund’s relative performance finished in line with the Index. The Fund had strong stock selection distributed across the Fund’s portfolio as a total of six sectors (information technology, industrials, consumer discretionary, energy, financials and real estate) demonstrated positive stock selection. The biggest contributor was the information technology sector where nearly all of our positions produced double-digit percentage returns during the period. The strength in the overall sector 33.4% certainly created an attractive environment, but having 21 out of 22 holdings post gains of better than 10% seems noteworthy nonetheless. There were a number of significant contributors to our performance including six stocks (Cabot Microelectronics, Zebra Technologies, Cognex, Mimecast, Blackbaud and HubSpot) that rallied by more than 50%. Good earnings results were a frequent driver of our information technology stocks, with M&A activity providing a modest incremental boost. Specifically, IntraLinks and Xactly were beneficiaries of acquisition offers during the period.
At the other end of the performance spectrum, the health care, materials and consumer staples sectors were the only ones to report negative stock selection. Of the three, health care was by far the most impactful. The weakness in health care can be attributed to our underweight position in the biotechnology industry combined with our position in one stock. As previously mentioned, the biotechnology industry was very strong during the period, boasting a gain of 54.8%. The difficulty of finding biotechnology companies that meet our investment requirements means that we usually carry an underweight position in the industry and the preceding twelve months were no different. We have generally made progress over the past few years in narrowing our underweight. However, anything less than an equal weight position is likely to create a headwind for results when a sector or industry beats the rest of the Index by more than 2,000 basis points, as was the case with biotechnology during the period. The remainder of the underperformance in health care can be attributed to our ownership of shares in Inotek. This stock was more than cut in half in January on the heels of weak data for its lead drug candidate. We subsequently exited our position as we no longer had confidence in the company’s ability to bring a drug to market in a timely fashion. Other top detractors in health care included DBV Technologies, Endologix, Inc, and Impax Laboratories. We had a few strong performers elsewhere in biotechnology, most notably Amicus Therapeutics which more than doubled during the period. However, it was not enough to offset the deleterious impact of Inotek.
Our recent trading activity has been fairly normal as our long-term approach leads to relatively low turnover. At a high level, the most notable uses of cash during the period were the industrials and health care sectors, as we narrowed our underweight in the case of the former and swung from an underweight to an overweight in the case of the latter. As is typical of our approach the overweights and underweights in any given sector tend to be fairly modest and are driven by our bottom-up stock selection process. The most notable source of capital for this trading activity was a reduction in our overweight position in the financials sector. The main driver of this change was the sale of one our largest positions, MarketAxess, once that
63
| | |
| AMG GW&K U.S. Small Cap Growth Fund | | |
| Portfolio Manager’s Comments (continued) | | |
stock exceeded our market cap threshold. MarketAxess was but one example of a forced sale during the period. We sold one other position due to its market cap, along with a host of others that were acquired, including Team Health, CEB, and PrivateBancorp, as well as the previously discussed
Xactly and IntraLinks. These forced sales present welcome, high class problems of needing to redeploy capital to other ideas. We successful solved these specific problems to such an extent that we actually reduced our cash position during the period.
The views expressed represent the opinions of GW&K Investment Management LLC, as of October 31, 2017, and are not intended as a forecast or guarantee of future results and are subject to change without notice.
64
AMG GW&K U.S. Small Cap Growth Fund
Portfolio Manager’s Comments (continued)
CUMULATIVE TOTAL RETURN PERFORMANCE
The AMG GW&K U.S. Small Cap Growth Fund’s cumulative total return is based on the daily change in net asset value (NAV), and assumes that all dividends and distributions were reinvested. The graph compares a hypothetical $10,000 investment made in AMG GW&K U.S. Small Cap Growth Fund’s Class N shares on October 31, 2007, to a $10,000 investment made in the Russell 2000® Index and the Russell 2000® Growth Index for the same time period. The graph and table do not reflect the deduction of taxes that a shareholder would pay on a Fund distribution or redemption of shares. The listed returns for the Fund are net of expenses and the returns for the index exclude expenses. Total returns would have been lower had certain expenses not been reduced.
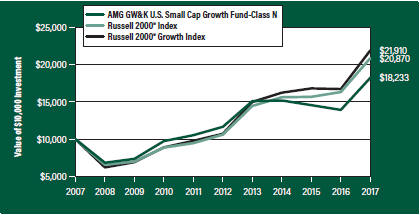
The table below shows the average annual total returns for AMG GW&K U.S. Small Cap Growth Fund and the Russell 2000® Index and the Russell 2000® Growth Index for the same time periods ended October 31, 2017.
| | | | | | | | | | | | | | | | | | | | |
| | | One | | | Five | | | Ten | | | Since | | | Inception | |
| Average Annual Total Returns 1 | | Year | | | Years | | | Years | | | Inception | | | Date | |
AMG GW&K U.S. Small Cap Growth Fund2,3,4 | | | | | | | | | | | | | | | | | | | | |
Class N | | | 30.91 | % | | | 9.35 | % | | | 6.19 | % | | | 9.93 | % | | | 11/30/00 | |
Class I | | | 31.57 | % | | | 9.64 | % | | | 6.47 | % | | | 8.16 | % | | | 01/04/05 | |
Class Z | | | — | | | | — | | | | — | | | | 15.67 | % | | | 02/24/17 | |
Russell 2000® Index5 | | | 27.85 | % | | | 14.49 | % | | | 7.63 | % | | | 8.89 | % | | | 11/30/00 | † |
Russell 2000® Growth Index6 | | | 31.00 | % | | | 15.36 | % | | | 8.16 | % | | | 7.44 | % | | | 11/30/00 | † |
The performance data shown represents past performance. Past performance is not a guarantee of future results. Current performance may be lower or higher than the performance data quoted. The investment return and principal value of an investment will fluctuate so that an investor’s shares, when redeemed, may be worth more or less than their original cost.
Investors should carefully consider the Fund’s investment objectives, risks, charges and expenses before investing. For performance information through the most recent month end, current net asset values per share for the Fund and other information, please call 800.835.3879 or visit our website at amgfunds.com for a free prospectus. Read it carefully before investing or sending money.
Distributed by AMG Distributors, Inc., member FINRA/SIPC.
| † | Date reflects the inception date of the Fund, not the index. |
| 1 | Total return equals income yield plus share price change and assumes reinvestment of all dividends and capital gain distributions. Returns are net of fees and may reflect offsets of Fund expenses as described in the prospectus. No |
| | adjustment has been made for taxes payable by shareholders on their reinvested dividends and capital gain distributions. Returns for periods greater than one year are annualized. The listed returns on the Fund are net of expenses and based on the published NAV as of October 31, 2017. All returns are in U.S. dollars ($). |
| 2 | The Fund is subject to risks associated with investments in small-capitalization companies, such as erratic earnings patterns, competitive conditions, limited earnings history and a reliance on one or a limited number of products. |
| 3 | The Fund invests in growth stocks, which may be more sensitive to market movements because their prices tend to reflect future investor expectations rather than just current profits. Growth stocks may underperform value stocks during given periods. |
| 4 | Companies that are in similar businesses may be similarly affected by particular economic or market events; to the extent the Fund has substantial holdings within a particular sector, the risks associated with that sector increase. |
| 5 | The Russell 2000® Index is composed of the 2,000 smallest stocks in the Russell 3000® Index and is widely regarded in the industry as the premier measure of small-cap stock performance. Unlike the Fund, the Russell 2000® Index is unmanaged, is not available for investment and does not incur expenses. |
| 6 | The Russell 2000® Growth Index measures the performance of the Russell 2000® companies with higher price-to-book ratios and higher forecasted growth values. Unlike the Fund, the Russell 2000® Growth Index is unmanaged, is not available for investment and does not incur expenses. |
The Russell Indices are a trademark of London Stock Exchange Group companies.
Not FDIC insured, nor bank guaranteed. May lose value.
65
| | |
| AMG GW&K U.S. Small Cap Growth Fund | | October 31, 2017 |
| Fund Snapshots (unaudited) | | |
PORTFOLIO BREAKDOWN
| | | | |
Sector | | % of
Net Assets | |
Information Technology | | | 23.2 | |
Health Care | | | 22.7 | |
Industrials | | | 17.9 | |
Consumer Discretionary | | | 14.5 | |
Financials | | | 7.0 | |
Materials | | | 4.2 | |
Real Estate | | | 3.4 | |
Consumer Staples | | | 1.3 | |
Energy | | | 1.1 | |
Other Assets Less Liabilities | | | 4.7 | |
TOP TEN HOLDINGS
| | | | |
Security Name | | % of
Net Assets | |
Grand Canyon Education, Inc. | | | 2.7 | |
HEICO Corp. | | | 2.3 | |
Burlington Stores, Inc. | | | 2.2 | |
SiteOne Landscape Supply, Inc. | | | 2.1 | |
Medidata Solutions, Inc. | | | 2.1 | |
Silicon Laboratories, Inc. | | | 1.9 | |
LogMeIn, Inc. | | | 1.9 | |
EPAM Systems, Inc. | | | 1.9 | |
Tyler Technologies, Inc. | | | 1.9 | |
Balchem Corp. | | | 1.8 | |
| | | | |
Top Ten as a Group | | | 20.8 | |
| | | | |
Because a fund’s strategy may result in multiple investments in particular sectors of the economy, its performance may depend on the performance of those sectors and may fluctuate more widely than investments diversified across more sectors. For additional information on these and other risk considerations, please see the Fund’s prospectus.
Any sectors, industries, or securities discussed should not be perceived as investment recommendations. Mention of a specific security should not be considered a recommendation to buy or solicitation to sell that security. Specific securities mentioned in this report may have been sold from the Fund’s portfolio of investments by the time you receive this report.
66
| | |
| AMG GW&K U.S. Small Cap Growth Fund | | October 31, 2017 |
| |
| Schedule of Portfolio Investments | | |
| | | | | | | | |
| | | Shares | | | Value | |
Common Stocks – 95.3% | | | | | | | | |
Consumer Discretionary – 14.5% | | | | | | | | |
Burlington Stores, Inc. * | | | 8,720 | | | $ | 818,721 | |
Chuy’s Holdings, Inc. * | | | 15,292 | | | | 344,070 | |
Dave & Buster’s Entertainment, Inc. * | | | 10,927 | | | | 526,681 | |
Five Below, Inc. * | | | 11,159 | | | | 616,535 | |
Fox Factory Holding Corp. * | | | 12,690 | | | | 539,960 | |
Grand Canyon Education, Inc. * | | | 10,989 | | | | 983,625 | |
Horizon Global Corp. * | | | 11,662 | | | | 189,274 | |
Lithia Motors, Inc., Class A | | | 3,230 | | | | 365,571 | |
Oxford Industries, Inc. | | | 5,710 | | | | 368,866 | |
Pool Corp. | | | 4,600 | | | | 555,588 | |
Total Consumer Discretionary | | | | | | | 5,308,891 | |
Consumer Staples – 1.3% | | | | | | | | |
Amplify Snack Brands, Inc. * | | | 17,863 | | | | 114,145 | |
PriceSmart, Inc. | | | 4,450 | | | | 372,910 | |
Total Consumer Staples | | | | | | | 487,055 | |
Energy – 1.1% | | | | | | | | |
Matador Resources Co. *,1 | | | 15,335 | | | | 407,144 | |
Financials – 7.0% | | | | | | | | |
Ameris Bancorp. | | | 13,057 | | | | 625,430 | |
Encore Capital Group, Inc. *,1 | | | 10,557 | | | | 490,373 | |
Greenhill & Co., Inc. 1 | | | 5,263 | | | | 96,313 | |
Heritage Insurance Holdings, Inc. 1 | | | 12,841 | | | | 205,970 | |
Pinnacle Financial Partners, Inc. | | | 5,372 | | | | 355,626 | |
Stifel Financial Corp. | | | 5,912 | | | | 313,513 | |
Texas Capital Bancshares, Inc. * | | | 5,363 | | | | 461,486 | |
Total Financials | | | | | | | 2,548,711 | |
Health Care – 22.7% | | | | | | | | |
ABIOMED, Inc. * | | | 2,792 | | | | 538,632 | |
Acadia Healthcare Co., Inc. *,1 | | | 7,409 | | | | 232,346 | |
Amicus Therapeutics, Inc. *,1 | | | 24,415 | | | | 347,670 | |
Bruker Corp. | | | 9,692 | | | | 304,329 | |
Cardiovascular Systems, Inc. * | | | 11,276 | | | | 271,413 | |
Catalent, Inc. * | | | 15,260 | | | | 649,923 | |
Cotiviti Holdings, Inc. * | | | 11,557 | | | | 406,344 | |
DBV Technologies, S.A., Sponsored ADR (France)* | | | 11,563 | | | | 270,806 | |
Endologix, Inc. *,1 | | | 18,222 | | | | 96,577 | |
Global Blood Therapeutics, Inc. * | | | 12,128 | | | | 482,694 | |
Globus Medical, Inc., Class A * | | | 16,229 | | | | 517,218 | |
ICU Medical, Inc. * | | | 3,110 | | | | 594,321 | |
Impax Laboratories, Inc. * | | | 18,720 | | | | 339,768 | |
| | | | | | | | |
| | | Shares | | | Value | |
INC Research Holdings, Inc., Class A * | | | 10,131 | | | $ | 578,987 | |
Medidata Solutions, Inc. * | | | 9,979 | | | | 750,720 | |
Neurocrine Biosciences, Inc. * | | | 9,499 | | | | 589,983 | |
Retrophin, Inc. * | | | 15,036 | | | | 373,945 | |
West Pharmaceutical Services, Inc. | | | 4,930 | | | | 499,902 | |
Wright Medical Group NV (Netherlands)*,1 | | | 18,245 | | | | 478,202 | |
Total Health Care | | | | | | | 8,323,780 | |
Industrials – 17.9% | | | | | | | | |
Cubic Corp. | | | 5,998 | | | | 327,191 | |
Dycom Industries, Inc. *,1 | | | 3,804 | | | | 334,105 | |
Exponent, Inc. | | | 7,627 | | | | 563,254 | |
Graco, Inc. | | | 3,049 | | | | 401,828 | |
HEICO Corp. | | | 9,172 | | | | 831,717 | |
John Bean Technologies Corp. | | | 5,313 | | | | 567,960 | |
Knight-Swift Transportation Holdings, Inc. * | | | 8,986 | | | | 372,470 | |
Ritchie Bros. Auctioneers, Inc. (Canada) | | | 18,979 | | | | 531,981 | |
SiteOne Landscape Supply, Inc. * | | | 12,374 | | | | 785,873 | |
Sun Hydraulics Corp. | | | 8,098 | | | | 465,878 | |
Thermon Group Holdings, Inc. * | | | 8,413 | | | | 180,963 | |
WageWorks, Inc. * | | | 10,105 | | | | 644,194 | |
Woodward, Inc. | | | 6,870 | | | | 531,257 | |
Total Industrials | | | | | | | 6,538,671 | |
Information Technology – 23.2% | | | | | | | | |
Blackbaud, Inc. | | | 6,431 | | | | 651,460 | |
Bottomline Technologies de, Inc. * | | | 9,707 | | | | 316,060 | |
Cabot Microelectronics Corp. | | | 4,985 | | | | 481,900 | |
Callidus Software, Inc. * | | | 18,171 | | | | 460,635 | |
EPAM Systems, Inc. * | | | 7,536 | | | | 686,906 | |
ExlService Holdings, Inc. * | | | 5,782 | | | | 360,912 | |
Forrester Research, Inc. | | | 11,493 | | | | 502,244 | |
HubSpot, Inc. *,1 | | | 7,240 | | | | 626,622 | |
LogMeIn, Inc. | | | 5,865 | | | | 709,958 | |
MACOM Technology Solutions Holdings, Inc. *,1 | | | 12,377 | | | | 505,972 | |
MAXIMUS, Inc. | | | 5,016 | | | | 333,213 | |
Mimecast, Ltd. * | | | 10,279 | | | | 326,769 | |
Power Integrations, Inc. | | | 8,322 | | | | 668,673 | |
Silicon Laboratories, Inc. * | | | 7,505 | | | | 712,225 | |
Tyler Technologies, Inc. * | | | 3,851 | | | | 682,744 | |
Zebra Technologies Corp., Class A * | | | 4,043 | | | | 468,948 | |
Total Information Technology | | | | | | | 8,495,241 | |
Materials – 4.2% | | | | | | | | |
Balchem Corp. | | | 7,957 | | | | 670,695 | |
The accompanying notes are an integral part of these financial statements.
67
| | |
| AMG GW&K U.S. Small Cap Growth Fund | | |
| |
| Schedule of Portfolio Investments (continued) | | |
| | | | | | | | |
| | | Shares | | | Value | |
Materials – 4.2% (continued) | | | | | | | | |
KapStone Paper and Packaging Corp. | | | 14,035 | | | $ | 315,226 | |
PolyOne Corp. | | | 11,611 | | | | 534,919 | |
Total Materials | | | | | | | 1,520,840 | |
Real Estate – 3.4% | | | | | | | | |
QTS Realty Trust, Inc., Class A, REIT | | | 2,575 | | | | 148,964 | |
STAG Industrial, Inc., REIT | | | 20,683 | | | | 564,646 | |
Sun Communities, Inc., REIT | | | 6,081 | | | | 548,871 | |
Total Real Estate | | | | | | | 1,262,481 | |
Total Common Stocks
(Cost $24,897,301) | | | | | | | 34,892,814 | |
| | | Principal
Amount | | | | |
Short-Term Investments – 10.4% | | | | | | | | |
Repurchase Agreements – 5.9%2 | | | | | | | | |
Daiwa Capital Markets America, dated 10/31/17,due 11/01/17, 1.080% total to be received $1,000,030 (collateralized by various U.S. Government Agency Obligations, 0.000% - 6.500%, 11/02/17 - 12/01/51, totaling $1,019,771) | | $ | 1,000,000 | | | | 1,000,000 | |
Merrill Lynch, Pierce, Fenner & Smith, Inc., dated 10/31/17, due 11/01/17, 1.050% total to be received $144,000 (collateralized by various U.S. Government Agency Obligations, 2.000% - 2.125%, 03/31/24 - 06/30/24, totaling $146,876) | | | 143,996 | | | | 143,996 | |
| * | Non-income producing security. |
| 1 | Some or all of these securities, amounting to $2,107,510 or 5.8% of net assets, were out on loan to various brokers. |
| 2 | Collateral received from brokers for securities lending was invested in these joint repurchase agreements. |
| | | | | | | | |
| | | Principal
Amount | | | Value | |
HSBC Securities USA, Inc., dated 10/31/17, due 11/01/17, 1.040% total to be received $1,000,029 (collateralized by various U.S. Government Agency Obligations, 2.500% - 8.000%, 04/01/22 - 10/01/47, totaling $1,020,005) | | $ | 1,000,000 | | | $ | 1,000,000 | |
Total Repurchase Agreements | | | | | | | 2,143,996 | |
| | |
| | | Shares | | | | |
Other Investment Companies – 4.5% | | | | | | | | |
Dreyfus Institutional Preferred Government Money Market Fund, Institutional Class Shares, 1.00%3 | | | 1,652,910 | | | | 1,652,910 | |
Total Short-Term Investments | | | | | | | | |
(Cost $3,796,906) | | | | | | | 3,796,906 | |
Total Investments – 105.7% | | | | | | | | |
(Cost $28,694,207) | | | | | | | 38,689,720 | |
Other Assets, less Liabilities – (5.7)% | | | | | | | (2,077,787 | ) |
Net Assets – 100.0% | | | | | | $ | 36,611,933 | |
| 3 | Yield shown represents the October 31, 2017, seven day average yield, which refers to the sum of the previous seven days’ dividends paid, expressed as an annual percentage. |
ADR American Depositary Receipt
REIT Real Estate Investment Trust
The following table summarizes the inputs used to value the Fund’s investments by the fair value hierarchy levels as of October 31, 2017:
| | | | | | | | | | | | | | | | |
| | | Level 1 | | | Level 2 | | | Level 3 | | | Total | |
Investments in Securities | | | | | | | | | | | | | | | | |
Common Stocks† | | $ | 34,892,814 | | | | — | | | | — | | | $ | 34,892,814 | |
Short-Term Investments | | | | | | | | | | | | | | | | |
Repurchase Agreements | | | — | | | $ | 2,143,996 | | | | — | | | | 2,143,996 | |
Other Investment Companies | | | 1,652,910 | | | | — | | | | — | | | | 1,652,910 | |
| | | | | | | | | | | | | | | | |
Total Investments in Securities | | $ | 36,545,724 | | | $ | 2,143,996 | | | | — | | | $ | 38,689,720 | |
| | | | | | | | | | | | | | | | |
| † | All common stocks held in the Fund are Level 1 securities. For a detailed breakout of common stocks by major industry classification, please refer to the Fund’s Schedule of Portfolio Investments. |
As of October 31, 2017, the Fund had no transfers between levels from the beginning of the reporting period.
The accompanying notes are an integral part of these financial statements.
68
AMG Managers DoubleLine Core Plus Bond Fund
Portfolio Manager’s Comments (unaudited)
Overview
For the fiscal year ended October 31, 2017, the AMG Managers DoubleLine Core Plus Bond Fund (the “Fund”) Class N shares returned 2.68%, while the Bloomberg Barclays U.S. Aggregate Bond Index returned 0.90%.
Market Review and Outlook
At the beginning of 2017, DoubleLine predicted lower 10-year Treasury (UST10) yields, 2-3 interest rate hikes during 2017 and the potential for UST10 yields to rise during the second half of 2017, finishing above the year-end 2016 2.45% level. While many economists called for increased UST yields, we believed the data supported the possibility of a move lower before increasing. Time will tell for UST10 yields but, after two successful rate hikes this year, it appears the U.S. Federal Reserve (the Fed) will finally meet their own expectations. We believe the true probability is accurately reflected in the futures market, and the Fed will hike rates once more by year-end.
One of the biggest market events recently was the Fed announcing plans to begin unwinding their $4.5 trillion balance sheet in October. At DoubleLine, we believe quantitative easing (QE) has been highly correlated with higher pricing of risk assets. The S&P 500® Index has moved up almost in tandem with the Fed’s balance sheet increases. One might conclude that if QE supports risk assets, then QT (quantitative tightening) will hurt. DoubleLine believes the beginning of a reduction of the Fed’s balance sheet raises some long-term concern for risk assets, particularly U.S. equities and corporate bonds.
However, investors seem to not yet share our long-term concern about the impact on risk assets, and instead seem more concerned with the effect on treasuries and agency mortgage-backed securities (MBS). For both treasuries and agency MBS, the plan is to implement a redemption cap which would allow securities to roll off in the form of a “step function.” For the smaller holding of agency MBS, the Fed will
allow reinvestment through 2018, with future pay downs not reinvested. While certain to add supply, the implementation will be very gradual, and demand for treasury and agency MBS remains strong domestically and internationally. We further believe the gradual reductions will be transparent and the potential spread widening for agency MBS will be minimal. If spread widening does occur, we expect it to have a bigger impact on credit sectors as investors decide whether to own credit risk for potentially the same amount of yield and duration of a treasury or agency MBS.
Growth expectations remain strong in the United States. Unemployment has fallen below the estimated full-employment level to 4.2%1. Consumer confidence remains strong, evidenced by the Conference Board’s Consumer Confidence Index rising to 125.9 in October, the highest since December 2000.2 Meanwhile, business activity continues to expand as measured by the ISM Manufacturing Index and the ISM Non-Manufacturing Index increasing. None of our internal indicators are signaling a recession.
We continue to see little value in short-term treasuries, and remain tactically bearish on the longer maturities. We believe UST10 yields will continue range bound, but likely move higher over the next few months. We remain bearish on European government bonds due to their long duration and low yields. Generally, we maintain a higher credit quality bias. In a positive economic environment, the UST10 yield has historically significantly exceeded the 2-year. Weakening economic conditions tend to be evidenced by the spread narrowing and curve flattening.
In conclusion, we continue to monitor both the lack of volatility and higher valuations among risk assets. While we are not forecasting a recession soon, future delays and disappointments in economic policy, rising bond yields and subpar growth all could lead to investor uncertainty. Given that backdrop, we remain defensive in terms of the risk we are taking in the Fund.
Performance and Positioning
The AMG DoubleLine Core Plus Bond Fund outperformed the Bloomberg Barclays U.S. Aggregate Bond Index’s return of 0.90% over the trailing 12-month period ending October 31, 2017. The outperformance can largely be attributed to strong performance from emerging markets fixed income (EMFI) and high yield corporate debt. Additionally, the Fund began investing in infrastructure related debt in October of last year and has been ramping up exposure steadily over the past 12-month period. Although still only a small percentage of the Fund, infrastructure debt has proven to be a promising new sector by outperforming its respective benchmark nearly every month, with the exception of November 2016. The Fund also slightly increased its exposure to non-agency MBS while simultaneously decreasing its exposure to agency MBS. Non-agency MBS contributed positively with the largest contributions coming from allocations to alt-A collateralized mortgage obligations (CMOs) and prime mortgages. Other sectors such as investment grade corporate bonds, CMBS and asset-backed securities (ABS) all posted positive returns as spreads continued to tighten. Over the past 12-month period, the U.S. yield curve steepened, with higher rates both in the short and long ends of the yield curve. As a result of the steeper curve, U.S. Treasuries, agency MBS, and municipal bonds detracted from the overall performance of the Fund (although still outperforming their respective benchmarks). Over the past year, the Fund has decreased exposure to these sectors collectively by more than 7%.
| 1 | US Bureau of Economic Analysis |
The views expressed represent the opinions of DoubleLine Capital LP, as of October 31, 2017, and are not intended as a forecast or guarantee of future results and are subject to change without notice.
69
AMG Managers DoubleLine Core Plus Bond Fund
Portfolio Manager’s Comments (continued)
CUMULATIVE TOTAL RETURN PERFORMANCE
The AMG Managers Doubleline Core Plus Bond Fund’s cumulative total return is based on the daily change in net asset value (NAV), and assumes that all dividends and distributions were reinvested. The graph compares a hypothetical $10,000 investment made in AMG Managers Doubleline Core Plus Bond Fund’s Class N shares on July 18, 2011, to a $10,000 investment made in the Bloomberg Barclays U.S. Aggregate Bond Index for the same time period. The graph and table do not reflect the deduction of taxes that a shareholder would pay on a Fund distribution or redemption of shares. The listed returns for the Fund are net of expenses and the returns for the index exclude expenses. Total returns would have been lower had certain expenses not been reduced.
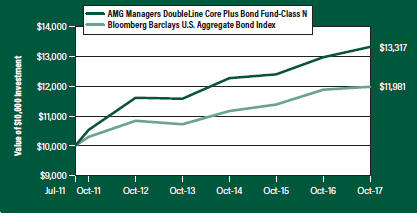
The table below shows the average annual total returns for AMG Managers Doubleline Core Plus Bond Fund and the Bloomberg Barclays U.S. Aggregate Bond Index for the same time periods ended October 31, 2017.
| | | | | | | | | | | | | | | | |
| | | One | | | Five | | | Since | | | Inception | |
| Average Annual Total Returns1 | | Year | | | Years | | | Inception | | | Date | |
AMG Managers DoubleLine Core Plus Bond Fund2,3,4,5,6,7,8,9,10 | | | | | | | | | | | | | | | | |
Class N | | | 2.68 | % | | | 2.78 | % | | | 4.66 | % | | | 07/18/11 | |
Class I | | | 2.95 | % | | | 3.02 | % | | | 4.90 | % | | | 07/18/11 | |
Class Z | | | — | | | | — | | | | 0.17 | % | | | 09/29/17 | |
Bloomberg Barclays U.S. Aggregate Bond Index11 | | | 0.90 | % | | | 2.04 | % | | | 2.91 | % | | | 07/18/11 | † |
The performance data shown represents past performance. Past performance is not a guarantee of future results. Current performance may be lower or higher than the performance data quoted. The investment return and principal value of an investment will fluctuate so that an investor’s shares, when redeemed, may be worth more or less than their original cost.
Investors should carefully consider the Fund’s investment objectives, risks, charges and expenses before investing. For performance information through the most recent month end, current net asset values per share for the Fund and other information, please call 800.835.3879 or visit our website at amgfunds.com for a free prospectus. Read it carefully before investing or sending money.
Distributed by AMG Distributors, Inc., member FINRA/SIPC.
| † | Date reflects the inception date of the Fund, not the index. |
| 1 | Total return equals income yield plus share price change and assumes reinvestment of all dividends and capital gain distributions. Returns are net of fees and may reflect offsets of Fund expenses as described in the prospectus. No adjustment has been made for taxes payable by shareholders on their reinvested dividends and capital gain distributions. Returns for periods greater than one year are annualized. The listed returns on the Fund are net of expenses and based on the published NAV as of October 31, 2017. All returns are in U.S. dollars ($). |
| 2 | The Fund is subject to the risks associated with investments in debt securities, such as default risk and fluctuations in the perception of the debtor’s ability to pay its creditors. Changing interest rates may adversely affect the value of an investment. An increase in interest rates typically causes the value of bonds and other fixed income securities to fall. |
| 3 | Investments in international securities are subject to certain risks of overseas investing including currency fluctuations and changes in political and economic conditions, which could result in significant market fluctuations. These risks are magnified in emerging markets. |
| 4 | The Fund is subject to the risks associated with investments in emerging markets, such as erratic earnings patterns, economic and political instability, changing exchange controls, limitations on repatriation of foreign capital and changes in local governmental attitudes toward private investment, possibly leading to nationalization or confiscation of investor assets. |
| 5 | To the extent that the Fund invests in asset-backed or mortgage-backed securities, its exposure to prepayment and extension risks may be greater than investments in other fixed income securities. |
| 6 | The Fund may invest in derivatives, such as options and futures; the complexity and rapidly changing structure of derivatives markets may increase the possibility of market losses. |
| 7 | Bank loans are subject to the credit risk of nonpayment of principal or interest. |
| 8 | High-yield bonds (also known as “junk bonds”) may be subject to greater levels of interest rate, credit, and liquidity risk than investments in higher rated securities. These securities are considered predominantly speculative with respect to the issuer’s continuing ability to make principal and interest payments. The issuers of the Fund’s holdings may be involved in bankruptcy proceedings, reorganizations, or financial restructurings, and are not as strong financially as higher rated issuers. |
| 9 | Factors unique to the municipal bond market may negatively affect the value in municipal bonds. |
| 10 | Obligations of certain government agencies are not backed by the full faith and credit of the U.S. government. If one of these agencies defaulted on a loan, there is no guarantee that the U.S. government would provide financial support. Additionally, debt securities of the U.S. government may be affected by changing interest rates and subject to prepayment risk. |
| 11 | The Bloomberg Barclays U.S. Aggregate Bond Index is an index of the U.S. investment-grade fixed-rate bond market, including both government and corporate bonds. Unlike the Fund, the index is unmanaged, is not available for investment and does not incur expenses. |
Not FDIC insured, nor bank guaranteed. May lose value.
70
| | |
| AMG Managers DoubleLine Core Plus Bond Fund | | October 31, 2017 |
| Fund Snapshots (unaudited) | | |
PORTFOLIO BREAKDOWN
| | | | |
| | | % of | |
Category | | Net Assets | |
U.S. Government and Agency Obligations | | | 32.0 | |
Corporate Bonds and Notes | | | 27.4 | |
Mortgage-Backed Securities | | | 17.4 | |
Asset-Backed Securities | | | 9.3 | |
Foreign Government Obligations | | | 4.6 | |
Investment Companies | | | 4.3 | |
Municipal Bonds | | | 0.1 | |
Common Stocks# | | | 0.0 | |
Warrants# | | | 0.0 | |
Other Assets Less Liabilities | | | 4.9 | |
| | | | |
Rating | | % of
Market Value* | |
U.S. Government and Agency Obligations | | | 33.9 | |
Aaa | | | 3.6 | |
Aa | | | 3.4 | |
A | | | 12.1 | |
Baa | | | 20.1 | |
Ba | | | 4.1 | |
B | | | 2.7 | |
Caa & lower | | | 8.4 | |
N/R | | | 11.7 | |
| * | Includes market value of fixed-income securities only. |
TOP TEN HOLDINGS
| | | | |
| | | % of | |
Security Name | | Net Assets | |
DoubleLine Global Bond Fund, Class I | | | 2.6 | |
U.S. Treasury Notes, 1.875%, 08/31/24 | | | 2.3 | |
U.S. Treasury Notes, 0.750%, 10/31/18 | | | 2.0 | |
DoubleLine Floating Rate Fund, Class I | | | 1.7 | |
U.S. Treasury Notes, 2.375%, 05/15/27 | | | 1.4 | |
Fannie Mae, 3.500%, 03/01/46 | | | 1.4 | |
U.S. Treasury Notes, 1.250%, 11/30/18 | | | 1.2 | |
U.S. Treasury Note, 1.750%, 03/31/22 | | | 1.2 | |
U.S. Treasury Notes, 2.875%, 08/15/45 | | | 1.1 | |
U.S. Treasury Bonds, 2.750%, 11/15/42 | | | 1.0 | |
| | | | |
Top Ten as a Group | | | 15.9 | |
| | | | |
Credit quality ratings shown above reflect the highest rating assigned by either Standard & Poor’s (“S&P”) or Moody’s Investors Service, Inc. (“Moody’s”). These rating agencies are independent, nationally recognized statistical rating organizations and are widely used. Investment grade ratings are credit ratings of BBB/Baa or higher. Below investment grade ratings are credit ratings of BB/Ba or lower. Investments designated N/R are not rated by either rating agency. Unrated investments do not necessarily indicate low credit quality. Credit quality ratings are subject to change.
Because a fund’s strategy may result in multiple investments in particular sectors of the economy, its performance may depend on the performance of those sectors and may fluctuate more widely than investments diversified across more sectors. For additional information on these and other risk considerations, please see the Fund’s prospectus.
Any sectors, industries, or securities discussed should not be perceived as investment recommendations. Mention of a specific security should not be considered a recommendation to buy or solicitation to sell that security. Specific securities mentioned in this report may have been sold from the Fund’s portfolio of investments by the time you receive this report.
71
| | |
| AMG Managers DoubleLine Core Plus Bond Fund | | October 31, 2017 |
| |
| Schedule of Portfolio Investments | | |
| | | | | | | | |
| | | Shares | | | Value | |
Common Stocks – 0.0%# | | | | | | | | |
Energy – 0.0%# | | | | | | | | |
Energy XXI Gulf Coast, Inc. * | | | 3,600 | | | $ | 30,780 | |
Frontera Energy Corp. (Colombia)* | | | 8,621 | | | | 257,753 | |
SandRidge Energy, Inc. * | | | 864 | | | | 16,217 | |
Total Energy | | | | | | | 304,750 | |
Total Common Stocks
(Cost $448,428)# | | | | | | | 304,750 | |
| | |
| | | Principal | | | | |
| | | Amount | | | | |
Corporate Bonds and Notes – 27.4% | | | | | | | | |
Basic Materials – 0.0%# | | | | | | | | |
Celulosa Arauco y Constitucion S.A. (Chile)
5.000%, 01/21/21 | | $ | 200,000 | | | | 213,870 | |
Consumer Discretionary – 0.0%# | | | | | | | | |
LTF Merger Sub, Inc.
8.500%, 06/15/231 | | | 280,000 | | | | 300,300 | |
Energy – 0.2% | | | | | | | | |
Petronas Global Sukuk , Ltd. (Malaysia)
2.707%, 03/18/20 | | | 1,100,000 | | | | 1,109,843 | |
Financials – 8.3% | | | | | | | | |
A.S.P AMC Merger Sub, Inc.
8.000%, 05/15/251 | | | 305,000 | | | | 296,613 | |
Air Lease Corp.
3.750%, 02/01/22 | | | 430,000 | | | | 449,510 | |
Alliant Holdings Intermediate LLC
8.250%, 08/01/231 | | | 285,000 | | | | 304,237 | |
Ally Financial, Inc.
4.125%, 03/30/20 | | | 545,000 | | | | 564,075 | |
American Express Co.
2.500%, 08/01/22 | | | 465,000 | | | | 462,130 | |
American Express Credit Corp., MTN
| | | | | | | | |
2.250%, 05/05/21 | | | 220,000 | | | | 220,261 | |
2.700%, 03/03/22 | | | 585,000 | | | | 591,368 | |
American Tower Corp. | | | | | | | | |
3.550%, 07/15/27 | | | 610,000 | | | | 608,398 | |
4.400%, 02/15/26 | | | 1,300,000 | | | | 1,379,972 | |
AssuredPartners, Inc.
7.000%, 08/15/251 | | | 440,000 | | | | 459,800 | |
Athene Global Funding
3.000%, 07/01/221 | | | 605,000 | | | | 603,764 | |
Australia & New Zealand Banking Group, Ltd. (Australia)
4.875%, 01/12/211 | | | 660,000 | | | | 710,241 | |
Banco de Credito del Peru/Panama (Panama)
2.250%, 10/25/19 | | | 2,100,000 | | | | 2,105,250 | |
| | | | | | | | |
| | | Principal | | | | |
| | | Amount | | | Value | |
Banco de Credito del Peru/Panama (Panama)
5.375%, 09/16/20 | | $ | 200,000 | | | $ | 217,250 | |
Banco de Credito e Inversiones (Chile)
4.000%, 02/11/23 | | | 700,000 | | | | 736,606 | |
Banco de Reservas de la Republica Dominicana (Dominican Republic) | | | | | | | | |
7.000%, 02/01/231 | | | 300,000 | | | | 316,125 | |
7.000%, 02/01/23 | | | 200,000 | | | | 210,750 | |
Banco del Estado de Chile (Chile) | | | | | | | | |
3.875%, 02/08/22 | | | 500,000 | | | | 523,665 | |
4.125%, 10/07/20 | | | 500,000 | | | | 525,797 | |
Banco Internacional del Peru SAA Interbank (Peru) | | | | | | | | |
(3-Month LIBOR plus 6.740%) | | | | | | | | |
8.500%, 04/23/702 | | | 500,000 | | | | 552,500 | |
Banco Internacional del Peru, S.A.A/Panama (Panama)
5.750%, 10/07/20 | | | 1,500,000 | | | | 1,642,500 | |
Banco Santander Chile (Chile)
3.875%, 09/20/22 | | | 150,000 | | | | 157,563 | |
Banco Santander Mexico, S.A. Institucion de Banca Multiple Grupo Financiero Santand (Mexico) | | | | | | | | |
(US Treasury 5 Year plus 4.580%) | | | | | | | | |
5.950%, 01/30/242,3 | | | 1,204,000 | | | | 1,259,685 | |
Banco Santander, S.A. (Spain) | | | | | | | | |
(3-Month LIBOR plus 1.090%) | | | | | | | | |
2.453%, 02/23/232 | | | 600,000 | | | | 604,375 | |
Banistmo, S.A. (Panama)
3.650%, 09/19/221 | | | 200,000 | | | | 200,380 | |
Bank of America Corp., MTN | | | | | | | | |
2.503%, 10/21/22 | | | 455,000 | | | | 450,523 | |
(3-Month LIBOR plus 1.021%), 2.881%, 04/24/232 | | | 375,000 | | | | 376,561 | |
Bantrab Senior Trust (Cayman Islands)
9.000%, 11/14/20 | | | 150,000 | | | | 152,625 | |
BBVA Banco Continental, S.A. (Peru)
5.000%, 08/26/22 | | | 300,000 | | | | 327,375 | |
BDO Unibank, Inc., EMTN (Philippines)
| | | | | | | | |
2.625%, 10/24/21 | | | 600,000 | | | | 598,694 | |
2.950%, 03/06/23 | | | 1,650,000 | | | | 1,649,946 | |
Boston Properties LP
4.125%, 05/15/21 | | | 546,000 | | | | 575,934 | |
Brighthouse Financial, Inc.
3.700%, 06/22/271 | | | 615,000 | | | | 606,568 | |
Citigroup, Inc. | | | | | | | | |
(3-Month LIBOR plus 1.100%) | | | | | | | | |
2.414%, 05/17/242 | | | 1,005,000 | | | | 1,015,334 | |
Commonwealth Bank of Australia (Australia)
2.750%, 03/10/221 | | | 910,000 | | | | 920,506 | |
The accompanying notes are an integral part of these financial statements.
72
| | |
| AMG Managers DoubleLine Core Plus Bond Fund | | |
| |
| Schedule of Portfolio Investments (continued) | | |
| | | | | | | | |
| | | Principal | | | | |
| | | Amount | | | Value | |
Financials – 8.3% (continued) | | | | | | | | |
Credit Suisse Group AG (Switzerland) | | | | | | | | |
(3-Month LIBOR plus 1.200%) | | | | | | | | |
2.519%, 12/14/231,2 | | $ | 615,000 | | | $ | 621,475 | |
Crown Castle International Corp. | | | | | | | | |
3.650%, 09/01/27 | | | 610,000 | | | | 609,928 | |
3.700%, 06/15/26 | | | 600,000 | | | | 602,794 | |
4.000%, 03/01/27 | | | 775,000 | | | | 795,044 | |
DBS Group Holdings, Ltd. (Singapore) | | | | | | | | |
(3-Month LIBOR plus 0.620%), 1.987%, 07/25/221,2 | | | 2,100,000 | | | | 2,108,142 | |
(3-Month LIBOR plus 0.620%), 1.987%, 07/25/222 | | | 500,000 | | | | 501,939 | |
Digital Realty Trust LP
3.700%, 08/15/27 | | | 350,000 | | | | 355,557 | |
Discover Financial Services
4.100%, 02/09/27 | | | 740,000 | | | | 758,057 | |
ESH Hospitality, Inc.
5.250%, 05/01/251 | | | 290,000 | | | | 300,513 | |
Global Bank Corp. (Panama)
5.125%, 10/30/19 | | | 1,300,000 | | | | 1,363,050 | |
The Goldman Sachs Group, Inc.
(3-Month LIBOR plus 0.780%)
2.160%, 10/31/222 | | | 780,000 | | | | 780,102 | |
Icahn Enterprises LP / Icahn Enterprises Finance Corp.
6.250%, 02/01/22 | | | 215,000 | | | | 225,213 | |
Industrial Senior Trust (Cayman Islands)
5.500%, 11/01/22 | | | 1,500,000 | | | | 1,533,375 | |
Interoceanica IV Finance, Ltd. (Cayman Islands)
0.000%, 11/30/254 | | | 1,577,360 | | | | 1,358,502 | |
Itau Corp. (Chile)
3.875%, 09/22/19 | | | 2,300,000 | | | | 2,362,078 | |
JPMorgan Chase & Co.
2.972%, 01/15/23 | | | 590,000 | | | | 597,502 | |
Liberty Mutual Group, Inc.
6.500%, 05/01/421 | | | 714,000 | | | | 941,440 | |
Lloyds Banking Group PLC (United Kingdom)
(3-Month LIBOR plus 1.205%)
3.574%, 11/07/282,5 | | | 630,000 | | | | 630,000 | |
Magnesita Finance SA (Luxembourg)
8.625%, 04/29/496 | | | 700,000 | | | | 701,050 | |
Malayan Banking Bhd (Malaysia)
3.905%, 10/29/267 | | | 700,000 | | | | 723,577 | |
MGM Growth Properties Operating Partnership LP / MGP Finance Co.-Issuer, Inc.
4.500%, 01/15/281 | | | 300,000 | | | | 300,000 | |
| | | | | | | | |
| | | Principal | | | | |
| | | Amount | | | Value | |
Mizuho Financial Group, Inc. (Japan)
(3-Month LIBOR plus 0.880%)
2.197%, 09/11/227 | | $ | 410,000 | | | $ | 411,657 | |
Morgan Stanley | | | | | | | | |
2.750%, 05/19/22 | | | 605,000 | | | | 606,508 | |
(3-Month LIBOR plus 1.340%), 3.591%, 07/22/282 | | | 585,000 | | | | 590,206 | |
MPT Operating Partnership LP / MPT Finance Corp.
5.000%, 10/15/27 | | | 320,000 | | | | 329,600 | |
MUFG Americas Holdings Corp.
1.625%, 02/09/18 | | | 285,000 | | | | 285,022 | |
National Rural Utilities Cooperative Finance Corp.
2.000%, 01/27/20 | | | 335,000 | | | | 335,244 | |
Nationstar Mortgage LLC/Nationstar Capital Corp.
6.500%, 07/01/21 | | | 135,000 | | | | 137,447 | |
Navient Corp.
6.500%, 06/15/22 | | | 210,000 | | | | 223,125 | |
New York Life Global Funding | | | | | | | | |
2.300%, 06/10/221 | | | 210,000 | | | | 209,180 | |
2.900%, 01/17/241 | | | 380,000 | | | | 383,705 | |
NFP Corp.
6.875%, 07/15/251 | | | 290,000 | | | | 302,325 | |
Nuveen Finance LLC
2.950%, 11/01/191 | | | 595,000 | | | | 604,432 | |
Oversea-Chinese Banking Corp., Ltd. (Singapore)
(USD Swap 5 Year plus 2.203%)
4.000%, 10/15/242 | | | 1,305,000 | | | | 1,337,943 | |
Royal Bank of Scotland Group PLC (United Kingdom)
(3-Month LIBOR plus 1.480%)
3.498%, 05/15/232 | | | 860,000 | | | | 867,000 | |
S.P.A.RC EM SPC Panama Metro Line 2 SP (Cayman Islands)
0.000%, 12/05/224 | | | 1,400,000 | | | | 1,281,000 | |
Sumitomo Mitsui Financial Group, Inc. (Japan) | | | | | | | | |
2.058%, 07/14/21 | | | 480,000 | | | | 472,594 | |
2.934%, 03/09/21 | | | 430,000 | | | | 437,596 | |
SURA Asset Management SA (Colombia)
4.375%, 04/11/271 | | | 300,000 | | | | 304,860 | |
Synchrony Financial
3.000%, 08/15/19 | | | 560,000 | | | | 568,196 | |
Temasek Financial I, Ltd. (Singapore)
2.375%, 01/23/23 | | | 1,800,000 | | | | 1,795,883 | |
Tempo Acquisition LLC / Tempo Acquisition Finance Corp.
6.750%, 06/01/251 | | | 295,000 | | | | 299,425 | |
The accompanying notes are an integral part of these financial statements.
73
| | |
| AMG Managers DoubleLine Core Plus Bond Fund | | |
| |
| Schedule of Portfolio Investments (continued) | | |
| | | | | | | | |
| | | Principal | | | | |
| | | Amount | | | Value | |
Financials – 8.3% (continued) | | | | | | | | |
United Overseas Bank, Ltd., EMTN (Singapore)
(USD Swap 5 Year plus 2.236%), 3.500%, 09/16/262 | | $ | 1,500,000 | | | $ | 1,529,320 | |
(USD Swap 5 Year plus 1.995%), 3.750%, 09/19/242 | | | 1,000,000 | | | | 1,022,934 | |
Wells Fargo & Co.
3.069%, 01/24/23 | | | 605,000 | | | | 613,357 | |
Westpac Banking Corp. (Australia) | | | | | | | | |
2.000%, 08/19/21 | | | 255,000 | | | | 252,269 | |
2.500%, 06/28/22 | | | 50,000 | | | | 50,163 | |
2.600%, 11/23/20 | | | 375,000 | | | | 379,659 | |
Total Financials | | | | | | | 56,176,869 | |
Industrials – 16.3% | | | | | | | | |
AbbVie, Inc.
4.700%, 05/14/45 | | | 583,000 | | | | 634,541 | |
Adani Ports & Special Economic Zone, Ltd. (India)
3.950%, 01/19/22 | | | 500,000 | | | | 515,467 | |
Aeropuerto Internacional de Tocumen SA (Panama)
5.750%, 10/09/23 | | | 995,385 | | | | 1,096,167 | |
Aeropuertos Argentina 2000 SA (Argentina)
6.875%, 02/01/271 | | | 300,000 | | | | 324,000 | |
Air Medical Group Holdings, Inc.
6.375%, 05/15/231 | | | 280,000 | | | | 271,600 | |
Ajecorp BV (Netherlands)
6.500%, 05/14/22 | | | 200,000 | | | | 185,000 | |
AK Steel Corp.
6.375%, 10/15/25 | | | 310,000 | | | | 318,564 | |
Albertsons Cos LLC / Safeway, Inc. / New Albertson’s, Inc. / Albertson’s LLC
5.750%, 03/15/25 | | | 215,000 | | | | 190,275 | |
Allergan Funding SCS (Luxembourg)
2.350%, 03/12/18 | | | 583,000 | | | | 584,378 | |
Altice US Finance I Corp.
5.375%, 07/15/231 | | | 200,000 | | | | 209,000 | |
Amazon.com, Inc.
4.050%, 08/22/471 | | | 590,000 | | | | 611,348 | |
America Movil, S.A.B de CV (Mexico)
5.000%, 03/30/20 | | | 300,000 | | | | 319,407 | |
American Axle & Manufacturing, Inc.
6.625%, 10/15/223 | | | 265,000 | | | | 274,772 | |
Anheuser-Busch InBev Finance, Inc.
4.900%, 02/01/46 | | | 275,000 | | | | 309,887 | |
Anthem, Inc.
2.300%, 07/15/18 | | | 590,000 | | | | 592,250 | |
Applied Materials, Inc.
4.350%, 04/01/47 | | | 310,000 | | | | 339,310 | |
APT Pipelines, Ltd. (Australia)
4.250%, 07/15/271 | | | 1,000,000 | | | | 1,031,229 | |
| | | | | | | | |
| | | Principal | | | | |
| | | Amount | | | Value | |
Ardagh Packaging Finance PLC / Ardagh Holdings USA, Inc. (Ireland)
6.000%, 02/15/251 | | $ | 200,000 | | | $ | 212,750 | |
Arrow Electronics, Inc.
3.875%, 01/12/28 | | | 295,000 | | | | 298,714 | |
Ascend Learning LLC
6.875%, 08/01/251 | | | 190,000 | | | | 199,500 | |
Ashland LLC
4.750%, 08/15/22 | | | 285,000 | | | | 301,445 | |
Ashton Woods USA LLC / Ashton Woods Finance Co.
6.750%, 08/01/251 | | | 200,000 | | | | 199,000 | |
AstraZeneca PLC (United Kingdom) | | | | | | | | |
2.375%, 11/16/20 | | | 295,000 | | | | 296,423 | |
2.375%, 06/12/22 | | | 315,000 | | | | 312,927 | |
AT&T, Inc.
5.250%, 03/01/37 | | | 515,000 | | | | 540,377 | |
Avantor, Inc.
| | | | | | | | |
6.000%, 10/01/241 | | | 170,000 | | | | 173,613 | |
9.000%, 10/01/251 | | | 150,000 | | | | 151,688 | |
Axiata SPV2 Bhd (Malaysia)
3.466%, 11/19/20 | | | 2,000,000 | | | | 2,045,800 | |
B&G Foods, Inc.
5.250%, 04/01/25 | | | 300,000 | | | | 307,125 | |
BAT Capital Corp.
(3-Month LIBOR plus 0.880%)
2.195%, 08/15/221,2 | | | 110,000 | | | | 111,099 | |
BC ULC / New Red Finance, Inc. (Canada)
4.250%, 05/15/241,3 | | | 305,000 | | | | 307,958 | |
Beacon Escrow Corp.
4.875%, 11/01/251 | | | 150,000 | | | | 152,813 | |
Becton Dickinson and Co.
2.894%, 06/06/22 | | | 915,000 | | | | 917,763 | |
Bharti Airtel International Netherlands BV (Netherlands)
5.125%, 03/11/23 | | | 1,300,000 | | | | 1,394,874 | |
Bharti Airtel, Ltd. (India)
4.375%, 06/10/25 | | | 1,200,000 | | | | 1,230,012 | |
BlueLine Rental Finance Corp.
9.250%, 03/15/241 | | | 145,000 | | | | 158,050 | |
The Boeing Co.
6.875%, 03/15/39 | | | 392,000 | | | | 577,150 | |
BPRL International Singapore Pte, Ltd., EMTN (Singapore)
4.375%, 01/18/27 | | | 1,500,000 | | | | 1,569,682 | |
Brand Industrial Services, Inc.
8.500%, 07/15/251,5 | | | 200,000 | | | | 212,000 | |
British Telecommunications PLC (United Kingdom)
5.950%, 01/15/18 | | | 981,000 | | | | 989,885 | |
The accompanying notes are an integral part of these financial statements.
74
| | |
| AMG Managers DoubleLine Core Plus Bond Fund | | |
| |
| Schedule of Portfolio Investments (continued) | | |
| | | | | | | | |
| | | Principal | | | | |
| | | Amount | | | Value | |
Industrials – 16.3% (continued) | | | | | | | | |
Broadcom Corp. / Broadcom Cayman Finance, Ltd.
3.625%, 01/15/241 | | $ | 305,000 | | | $ | 315,017 | |
Builders FirstSource, Inc.
5.625%, 09/01/241 | | | 91,000 | | | | 96,460 | |
Burlington Northern Santa Fe LLC
4.550%, 09/01/44 | | | 540,000 | | | | 608,912 | |
BWAY Holding Co.
5.500%, 04/15/241 | | | 215,000 | | | | 224,406 | |
Camposol SA (Peru)
10.500%, 07/15/211 | | | 200,000 | | | | 217,000 | |
Canadian Natural Resources, Ltd. (Canada)
2.950%, 01/15/23 | | | 1,005,000 | | | | 1,011,560 | |
Cardinal Health, Inc.
4.368%, 06/15/47 | | | 565,000 | | | | 564,711 | |
CB Escrow Corp.
8.000%, 10/15/251 | | | 170,000 | | | | 176,375 | |
CCO Holdings LLC / CCO Holdings Capital Corp.
5.000%, 02/01/281 | | | 245,000 | | | | 244,388 | |
Celgene Corp.
4.350%, 11/15/475 | | | 625,000 | | | | 624,478 | |
Celulosa Arauco y Constitucion, S.A. (Chile) | | | | | | | | |
4.750%, 01/11/22 | | | 200,000 | | | | 212,458 | |
7.250%, 07/29/19 | | | 200,000 | | | | 217,934 | |
Cengage Learning, Inc.
9.500%, 06/15/241,3 | | | 255,000 | | | | 231,094 | |
Centene Corp. | | | | | | | | |
4.750%, 01/15/25 | | | 290,000 | | | | 300,150 | |
5.625%, 02/15/21 | | | 85,000 | | | | 88,400 | |
CEVA Group PLC (United Kingdom)
| | | | | | | | |
7.000%, 03/01/211,3 | | | 100,000 | | | | 96,250 | |
Charter Communications Operating LLC / Charter Communications Operating Capital
4.908%, 07/23/25 | | | 575,000 | | | | 612,620 | |
Cheniere Corpus Christi Holdings LLC
5.125%, 06/30/271 | | | 120,000 | | | | 124,050 | |
Cheniere Energy Partners LP
5.250%, 10/01/251 | | | 160,000 | | | | 165,200 | |
CHS/Community Health Systems, Inc.
6.250%, 03/31/23 | | | 155,000 | | | | 149,381 | |
CIMPOR Financial Operations BV (Netherlands)
5.750%, 07/17/24 | | | 200,000 | | | | 191,150 | |
Cincinnati Bell, Inc.
7.000%, 07/15/241 | | | 185,000 | | | | 185,000 | |
CK Hutchison International 17 II, Ltd. (Cayman Islands)
2.250%, 09/29/201 | | | 200,000 | | | | 199,382 | |
CK Hutchison International 17, Ltd. (Cayman Islands)
2.875%, 04/05/22 | | | 400,000 | | | | 402,137 | |
| | | | | | | | |
| | | Principal | | | | |
| | | Amount | | | Value | |
CK Hutchison International 17, Ltd. (Cayman Islands)
3.500%, 04/05/271 | | $ | 1,000,000 | | | $ | 1,008,582 | |
CNOOC Finance 2012, Ltd. (Hong Kong)
3.875%, 05/02/22 | | | 600,000 | | | | 627,300 | |
CNOOC Finance 2015 USA LLC
3.500%, 05/05/25 | | | 1,800,000 | | | | 1,838,941 | |
CNPC General Capital, Ltd. (Virgin Islands, British)
3.950%, 04/19/22 | | | 300,000 | | | | 314,891 | |
CNPC HK Overseas Capital, Ltd. (China)
4.500%, 04/28/21 | | | 1,800,000 | | | | 1,912,419 | |
Comcast Corp.
4.400%, 08/15/35 | | | 575,000 | | | | 624,659 | |
CommScope, Inc.
5.000%, 06/15/211 | | | 175,000 | | | | 179,156 | |
Constellation Merger Sub, Inc.
8.500%, 09/15/251 | | | 155,000 | | | | 154,613 | |
Cosan Overseas, Ltd. (Cayman Islands)
8.250%, 11/29/496 | | | 2,000,000 | | | | 2,050,500 | |
CRC Escrow Issuer LLC / CRC Finco, Inc.
5.250%, 10/15/251 | | | 305,000 | | | | 307,745 | |
CrownRock LP / CrownRock Finance, Inc.
5.625%, 10/15/251 | | | 155,000 | | | | 157,771 | |
CSX Corp.
3.800%, 11/01/46 | | | 645,000 | | | | 627,765 | |
DAE Funding LLC (United Arab Emirates)
5.000%, 08/01/241 | | | 150,000 | | | | 153,563 | |
Dana Financing Luxembourg Sarl (Luxembourg)
5.750%, 04/15/251 | | | 155,000 | | | | 164,688 | |
Dell International LLC / EMC Corp.
7.125%, 06/15/241 | | | 195,000 | | | | 215,311 | |
Delphi Jersey Holdings PLC (United Kingdom)
5.000%, 10/01/251 | | | 300,000 | | | | 303,000 | |
Delta Air Lines, Inc.
3.625%, 03/15/22 | | | 300,000 | | | | 308,539 | |
Digicel Group, Ltd. (Jamaica) | | | | | | | | |
7.125%, 04/01/221,3 | | | 300,000 | | | | 283,875 | |
7.125%, 04/01/223 | | | 1,300,000 | | | | 1,230,125 | |
DJO Finco Inc. / DJO Finance LLC / DJO Finance Corp.
8.125%, 06/15/211 | | | 85,000 | | | | 81,600 | |
eBay, Inc.
2.750%, 01/30/23 | | | 605,000 | | | | 605,791 | |
Eldorado Resorts, Inc.
6.000%, 04/01/25 | | | 300,000 | | | | 318,000 | |
Embarq Corp.
7.995%, 06/01/36 | | | 295,000 | | | | 299,056 | |
Embotelladora Andina SA (Chile)
5.000%, 10/01/23 | | | 1,400,000 | | | | 1,544,922 | |
The accompanying notes are an integral part of these financial statements.
75
| | |
| AMG Managers DoubleLine Core Plus Bond Fund | | |
| |
| Schedule of Portfolio Investments (continued) | | |
| | | | | | | | |
| | | Principal | | | | |
| | | Amount | | | Value | |
Industrials – 16.3% (continued) | | | | | | | | |
Empresa de Transporte de Pasajeros Metro SA (Chile)
5.000%, 01/25/471 | | $ | 1,150,000 | | | $ | 1,271,037 | |
ENA Norte Trust (Panama)
4.950%, 04/25/23 | | | 951,036 | | | | 995,022 | |
Enable Midstream Partners LP
4.400%, 03/15/27 | | | 620,000 | | | | 636,403 | |
Energy Transfer LP | | | | | | | | |
4.200%, 04/15/27 | | | 225,000 | | | | 228,050 | |
4.750%, 01/15/26 | | | 400,000 | | | | 421,644 | |
Envision Healthcare Corp.
6.250%, 12/01/241 | | | 230,000 | | | | 239,488 | |
EP Energy LLC / Everest Acquisition Finance, Inc.
9.375%, 05/01/20 | | | 25,000 | | | | 21,117 | |
EQT Corp.
3.900%, 10/01/27 | | | 620,000 | | | | 618,850 | |
Expedia, Inc.
3.800%, 02/15/281 | | | 615,000 | | | | 599,539 | |
Express Scripts Holding Co.
3.400%, 03/01/27 | | | 435,000 | | | | 428,090 | |
Exterran Energy Solutions LP / EES Finance Corp.
8.125%, 05/01/251 | | | 90,000 | | | | 94,950 | |
FedEx Corp.
4.750%, 11/15/45 | | | 560,000 | | | | 612,611 | |
Fermaca Enterprises S de RL de CV (Mexico)
6.375%, 03/30/381 | | | 232,000 | | | | 254,620 | |
Fidelity National Information Services, Inc.
3.625%, 10/15/20 | | | 423,000 | | | | 439,130 | |
First Data Corp. | | | | | | | | |
5.750%, 01/15/241 | | | 135,000 | | | | 141,750 | |
7.000%, 12/01/231 | | | 130,000 | | | | 139,428 | |
Flex Acquisition Co, Inc.
6.875%, 01/15/251 | | | 215,000 | | | | 222,659 | |
FMG Resources August 2006 Pty, Ltd. (Australia)
4.750%, 05/15/221 | | | 190,000 | | | | 194,750 | |
Ford Motor Co.
7.450%, 07/16/31 | | | 480,000 | | | | 624,866 | |
Foresight Energy LLC / Foresight Energy Finance Corp.
11.500%, 04/01/231,3 | | | 50,000 | | | | 44,750 | |
Frontier Communications Corp.
8.500%, 04/15/203 | | | 145,000 | | | | 143,731 | |
FTS International, Inc. | | | | | | | | |
6.250%, 05/01/22 | | | 162,000 | | | | 157,950 | |
(3-Month LIBOR plus 7.500%), 8.820%, 06/15/201,2 | | | 200,000 | | | | 204,250 | |
Gates Global LLC
6.000%, 07/15/221 | | | 185,000 | | | | 191,244 | |
| | | | | | | | |
| | | Principal | | | | |
| | | Amount | | | Value | |
General Motors Co.
(3-Month LIBOR plus 0.800%)
2.192%, 08/07/202 | | $ | 210,000 | | | $ | 210,977 | |
General Motors Financial Co, Inc.
3.950%, 04/13/24 | | | 835,000 | | | | 861,750 | |
Genesys Telecommunications Laboratories Inc.
10.000%, 11/30/241 | | | 285,000 | | | | 322,406 | |
Georgia-Pacific LLC
3.600%, 03/01/251 | | | 995,000 | | | | 1,027,046 | |
Globo Comunicacao e Participacoes SA (Brazil)
5.125%, 03/31/271 | | | 500,000 | | | | 511,250 | |
GLP Capital LP
5.375%, 04/15/26 | | | 135,000 | | | | 146,475 | |
Gohl Capital, Ltd. (Isle of Man)
4.250%, 01/24/27 | | | 1,500,000 | | | | 1,560,100 | |
Golden Nugget, Inc.
6.750%, 10/15/241 | | | 280,000 | | | | 285,600 | |
Gray Television, Inc.
| | | | | | | | |
5.125%, 10/15/241 | | | 170,000 | | | | 169,949 | |
5.875%, 07/15/261 | | | 135,000 | | | | 138,713 | |
Grupo Idesa SA de CV (Mexico) | | | | | | | | |
7.875%, 12/18/201 | | | 600,000 | | | | 594,000 | |
7.875%, 12/18/20 | | | 600,000 | | | | 594,000 | |
GTT Communications, Inc.
7.875%, 12/31/241 | | | 195,000 | | | | 208,406 | |
Guanay Finance, Ltd. (Cayman Islands)
6.000%, 12/15/20 | | | 1,405,342 | | | | 1,454,656 | |
GW Honos Security Corp. (Canada)
8.750%, 05/15/251 | | | 250,000 | | | | 266,875 | |
Harland Clarke Holdings Corp.
8.375%, 08/15/221 | | | 95,000 | | | | 100,106 | |
Hasbro, Inc.
3.500%, 09/15/27 | | | 180,000 | | | | 178,435 | |
Hexion, Inc.
10.375%, 02/01/221 | | | 310,000 | | | | 293,725 | |
Hilton Domestic Operating Co., Inc.
4.250%, 09/01/24 | | | 310,000 | | | | 317,362 | |
The Home Depot Inc.
3.000%, 04/01/26 | | | 565,000 | | | | 570,732 | |
Hutchison Whampoa International 12 II, Ltd. (Cayman Islands)
3.250%, 11/08/22 | | | 900,000 | | | | 918,838 | |
Indian Oil Corp, Ltd. (India)
5.750%, 08/01/23 | | | 1,500,000 | | | | 1,692,811 | |
Indian Oil Corp., Ltd. (India)
5.625%, 08/02/21 | | | 450,000 | | | | 494,477 | |
Informatica LLC
7.125%, 07/15/231 | | | 310,000 | | | | 316,975 | |
The accompanying notes are an integral part of these financial statements.
76
| | |
| AMG Managers DoubleLine Core Plus Bond Fund | | |
| |
| Schedule of Portfolio Investments (continued) | | |
| | | | | | | | |
| | | Principal | | | | |
| | | Amount | | | Value | |
Industrials – 16.3% (continued) | | | | | | | | |
Intelsat Jackson Holdings SA (Luxembourg) | | | | | | | | |
5.500%, 08/01/23 | | $ | 210,000 | | | $ | 179,813 | |
9.750%, 07/15/251 | | | 95,000 | | | | 95,950 | |
International Paper Co.
3.000%, 02/15/27 | | | 330,000 | | | | 320,760 | |
inVentiv Group Holdings, Inc.
7.500%, 10/01/241 | | | 110,000 | | | | 121,825 | |
Inversiones CMPC, S.A. (Chile)
6.125%, 11/05/19 | | | 100,000 | | | | 107,487 | |
JBS USA LUX SA / JBS USA Finance, Inc.
7.250%, 06/01/211 | | | 235,000 | | | | 240,753 | |
JBS USA LUX, S.A. / JBS USA Finance, Inc.
7.250%, 06/01/211 | | | 100,000 | | | | 102,448 | |
KAR Auction Services, Inc.
5.125%, 06/01/251 | | | 135,000 | | | | 140,063 | |
The Kenan Advantage Group Inc.
7.875%, 07/31/231 | | | 85,000 | | | | 88,613 | |
Kinder Morgan Energy Partners LP, MTN
6.950%, 01/15/38 | | | 500,000 | | | | 615,612 | |
Kraft Heinz Foods Co. | | | | | | | | |
2.000%, 07/02/18 | | | 265,000 | | | | 265,380 | |
2.800%, 07/02/20 | | | 345,000 | | | | 349,601 | |
The Kroger Co.
3.400%, 04/15/22 | | | 720,000 | | | | 740,692 | |
Kronos Acquisition Holdings, Inc. (Canada)
9.000%, 08/15/231 | | | 305,000 | | | | 294,630 | |
Level 3 Communications, Inc.
5.750%, 12/01/22 | | | 150,000 | | | | 154,500 | |
Levi Strauss & Co.
5.000%, 05/01/25 | | | 90,000 | | | | 95,058 | |
LifePoint Health, Inc.
5.375%, 05/01/24 | | | 90,000 | | | | 90,675 | |
Lima Metro Line 2 Finance, Ltd. (Cayman Islands)
5.875%, 07/05/34 | | | 1,000,000 | | | | 1,105,000 | |
Live Nation Entertainment, Inc.
4.875%, 11/01/241 | | | 195,000 | | | | 202,248 | |
Lockheed Martin Corp.
4.700%, 05/15/46 | | | 530,000 | | | | 603,604 | |
Lowe’s Cos, Inc.
3.100%, 05/03/27 | | | 305,000 | | | | 305,327 | |
MARB BondCo PLC (United Kingdom)
7.000%, 03/15/241 | | | 500,000 | | | | 505,000 | |
Maxim Integrated Products, Inc.
3.450%, 06/15/27 | | | 285,000 | | | | 290,224 | |
MEG Energy Corp. (Canada)
7.000%, 03/31/241 | | | 230,000 | | | | 209,875 | |
Mexico City Airport Trust (Mexico)
4.250%, 10/31/261 | | | 1,000,000 | | | | 1,026,250 | |
| | | | | | | | |
| | | Principal | | | | |
| | | Amount | | | Value | |
Micron Technology, Inc.
5.250%, 08/01/231 | | $ | 140,000 | | | $ | 147,238 | |
Microsoft Corp.
4.450%, 11/03/45 | | | 550,000 | | | | 625,007 | |
MPH Acquisition Holdings LLC
7.125%, 06/01/241 | | | 415,000 | | | | 447,681 | |
NCL Corp, Ltd.
4.750%, 12/15/211 | | | 200,000 | | | | 208,000 | |
Netflix, Inc.
4.875%, 04/15/281 | | | 130,000 | | | | 129,376 | |
Nexstar Broadcasting, Inc.
5.625%, 08/01/241,3 | | | 135,000 | | | | 138,881 | |
Noble Holding International, Ltd. (Cayman Islands)
7.750%, 01/15/243 | | | 50,000 | | | | 45,000 | |
OAS Finance, Ltd. (Virgin Islands, British) | | | | | | | | |
(US Treasury 5 Year plus 8.186%), 8.875%, 04/29/491,2,6,8 | | | 400,000 | | | | 31,500 | |
(US Treasury 5 Year plus 8.186%), 8.875%, 04/29/492,6,8 | | | 600,000 | | | | 47,250 | |
Odebrecht Finance, Ltd. (Cayman Islands)
7.125%, 06/26/42 | | | 400,000 | | | | 153,000 | |
Omnicom Group, Inc.
3.600%, 04/15/26 | | | 725,000 | | | | 736,292 | |
ONGC Videsh Vankorneft Pte, Ltd. (Singapore)
3.750%, 07/27/26 | | | 2,500,000 | | | | 2,512,977 | |
Ooredoo International Finance, Ltd. (Bermuda)
3.875%, 01/31/28 | | | 1,600,000 | | | | 1,605,360 | |
Oracle Corp.
4.125%, 05/15/45 | | | 565,000 | | | | 596,202 | |
Orange SA (France)
2.750%, 02/06/19 | | | 454,000 | | | | 459,070 | |
Peabody Energy Corp.
6.000%, 03/31/221 | | | 300,000 | | | | 309,375 | |
Penske Truck Leasing Co. Lp / PTL Finance Corp.
4.200%, 04/01/271 | | | 300,000 | | | | 314,822 | |
Pesquera Exalmar S.A.A. (Peru)
7.375%, 01/31/20 | | | 400,000 | | | | 392,000 | |
Petrobras Global Finance BV (Netherlands)
7.250%, 03/17/44 | | | 400,000 | | | | 420,500 | |
Petroleos Mexicanos (Mexico)
6.750%, 09/21/47 | | | 340,000 | | | | 351,288 | |
Petronas Capital, Ltd. (Malaysia)
3.500%, 03/18/25 | | | 1,300,000 | | | | 1,346,411 | |
PetSmart, Inc.
| | | | | | | | |
5.875%, 06/01/251 | | | 40,000 | | | | 35,000 | |
7.125%, 03/15/231,3 | | | 285,000 | | | | 218,025 | |
Phillips 66
5.875%, 05/01/42 | | | 256,000 | | | | 320,875 | |
The accompanying notes are an integral part of these financial statements.
77
| | |
| AMG Managers DoubleLine Core Plus Bond Fund | | |
| |
| Schedule of Portfolio Investments (continued) | | |
| | | | | | | | |
| | | Principal | | | | |
| | | Amount | | | Value | |
Industrials – 16.3% (continued) | | | | | | | | |
Pilgrim’s Pride Corp.
5.750%, 03/15/251 | | $ | 290,000 | | | $ | 307,763 | |
Pinnacle Entertainment, Inc.
5.625%, 05/01/24 | | | 440,000 | | | | 456,500 | |
Plastipak Holdings, Inc.
6.250%, 10/15/251 | | | 155,000 | | | | 158,681 | |
Post Holdings, Inc.
5.500%, 03/01/251 | | | 290,000 | | | | 302,325 | |
Prime Security Services Borrower LLC
9.250%, 05/15/231 | | | 265,000 | | | | 294,336 | |
Radiate Holdco LLC / Radiate Finance, Inc.
6.625%, 02/15/251 | | | 155,000 | | | | 152,675 | |
RegionalCare Hospital Partners Holdings, Inc.
8.250%, 05/01/231 | | | 140,000 | | | | 147,700 | |
Reliance Holding USA, Inc.
5.400%, 02/14/22 | | | 2,400,000 | | | | 2,639,395 | |
Reynolds American, Inc.
4.000%, 06/12/22 | | | 545,000 | | | | 574,833 | |
Reynolds Group Issuer, Inc.
7.000%, 07/15/241 | | | 210,000 | | | | 224,569 | |
Riverbed Technology, Inc.
8.875%, 03/01/231 | | | 235,000 | | | | 211,206 | |
S&P Global, Inc.
4.400%, 02/15/26 | | | 345,000 | | | | 373,378 | |
Sabre GLBL, Inc.
5.250%, 11/15/231 | | | 180,000 | | | | 189,450 | |
Sanchez Energy Corp.
6.125%, 01/15/233 | | | 165,000 | | | | 138,600 | |
SBA Tower Trust
3.168%, 04/11/221 | | | 400,000 | | | | 401,963 | |
Schlumberger Holdings Corp.
2.350%, 12/21/181 | | | 240,000 | | | | 241,218 | |
Scientific Games International, Inc.
7.000%, 01/01/221 | | | 125,000 | | | | 132,500 | |
Select Medical Corp.
6.375%, 06/01/21 | | | 190,000 | | | | 196,175 | |
The ServiceMaster Co. LLC
5.125%, 11/15/241 | | | 90,000 | | | | 92,925 | |
Shire Acquisitions Investments (Ireland)
2.875%, 09/23/23 | | | 615,000 | | | | 609,492 | |
Signode Industrial Group Lux SA
6.375%, 05/01/221 | | | 295,000 | | | | 307,906 | |
Sinclair Television Group, Inc.
5.625%, 08/01/241 | | | 45,000 | | | | 45,788 | |
SingTel Group Treasury Pte, Ltd., EMTN (Singapore)
4.500%, 09/08/21 | | | 500,000 | | | | 536,238 | |
| | | | | | | | |
| | | Principal | | | | |
| | | Amount | | | Value | |
Sinopec Group Overseas Development 2016, Ltd. (China) | | | | | | | | |
2.750%, 05/03/21 | | $ | 500,000 | | | $ | 502,950 | |
2.750%, 09/29/26 | | | 2,300,000 | | | | 2,212,552 | |
Sirius XM Radio, Inc.
5.375%, 07/15/261 | | | 215,000 | | | | 227,094 | |
Six Flags Entertainment Corp.
4.875%, 07/31/241 | | | 300,000 | | | | 309,375 | |
Sixsigma Networks Mexico SA de CV (Mexico)
8.250%, 11/07/211 | | | 200,000 | | | | 211,500 | |
SM Energy Co.
5.000%, 01/15/24 | | | 160,000 | | | | 153,600 | |
Smithfield Foods, Inc.
4.250%, 02/01/271 | | | 630,000 | | | | 654,685 | |
Solera LLC
10.500%, 03/01/241 | | | 150,000 | | | | 171,750 | |
Sophia LP / Sophia Finance, Inc.
9.000%, 09/30/231 | | | 280,000 | | | | 291,900 | |
Staples, Inc.
8.500%, 09/15/251 | | | 30,000 | | | | 26,550 | |
SunCoke Energy Partners LP / SunCoke Energy Partners Finance Corp.
7.500%, 06/15/251 | | | 85,000 | | | | 89,675 | |
Sunoco Logistics Partners Operations LP
3.900%, 07/15/26 | | | 1,000,000 | | | | 996,379 | |
Surgery Center Holdings, Inc.
6.750%, 07/01/251,3 | | | 240,000 | | | | 219,600 | |
Sydney Airport Finance Co. Pty, Ltd. (Australia)
3.375%, 04/30/251 | | | 990,000 | | | | 995,749 | |
Sysco Corp.
3.250%, 07/15/27 | | | 610,000 | | | | 610,595 | |
Tapstone Energy LLC / Tapstone Energy Finance Corp.
9.750%, 06/01/221 | | | 140,000 | | | | 126,350 | |
Team Health Holdings, Inc.
6.375%, 02/01/251,3 | | | 315,000 | | | | 291,375 | |
TEGNA, Inc.
4.875%, 09/15/211 | | | 285,000 | | | | 292,125 | |
Telesat Canada / Telesat LLC (Canada)
8.875%, 11/15/241 | | | 135,000 | | | | 151,538 | |
Tempur Sealy International, Inc.
5.625%, 10/15/23 | | | 85,000 | | | | 90,100 | |
Tenet Healthcare Corp. | | | | | | | | |
7.000%, 08/01/251,3 | | | 80,000 | | | | 73,600 | |
8.125%, 04/01/22
| | | 45,000 | | | | 45,225 | |
Tesla, Inc.
5.300%, 08/15/251,3 | | | 150,000 | | | | 144,938 | |
The accompanying notes are an integral part of these financial statements.
78
| | |
| AMG Managers DoubleLine Core Plus Bond Fund | | |
| |
| Schedule of Portfolio Investments (continued) | | |
| | | | | | | | |
| | | Principal | | | | |
| | | Amount | | | Value | |
Industrials – 16.3% (continued) | | | | | | | | |
Teva Pharmaceutical Finance Netherlands III (Netherlands)
2.800%, 07/21/23 | | $ | 820,000 | | | $ | 755,269 | |
Transocean Proteus, Ltd. (Cayman Islands)
6.250%, 12/01/241 | | | 142,500 | | | | 150,159 | |
Transocean, Inc.
7.500%, 01/15/261 | | | 70,000 | | | | 72,363 | |
TreeHouse Foods, Inc.
6.000%, 02/15/241 | | | 160,000 | | | | 172,000 | |
Trident Merger Sub, Inc.
6.625%, 11/01/251 | | | 155,000 | | | | 154,566 | |
Triumph Group, Inc.
7.750%, 08/15/251 | | | 215,000 | | | | 230,319 | |
Unilever Capital Corp.
2.900%, 05/05/27 | | | 485,000 | | | | 482,104 | |
Union Pacific Corp.
3.000%, 04/15/27 | | | 400,000 | | | | 403,134 | |
United Continental Holdings, Inc.
4.250%, 10/01/22 | | | 80,000 | | | | 80,500 | |
Universal Hospital Services, Inc.
7.625%, 08/15/20 | | | 225,000 | | | | 228,938 | |
Vale Overseas, Ltd. (Brazil)
5.875%, 06/10/21 | | | 410,000 | | | | 449,975 | |
Valeant Pharmaceuticals International, Inc.
| | | | | | | | |
5.500%, 11/01/251 | | | 75,000 | | | | 76,781 | |
7.000%, 03/15/241 | | | 90,000 | | | | 97,650 | |
Valero Energy Corp.
6.625%, 06/15/37 | | | 235,000 | | | | 302,392 | |
Valvoline, Inc.
4.375%, 08/15/251 | | | 95,000 | | | | 96,069 | |
Verizon Communications, Inc.
4.400%, 11/01/34 | | | 550,000 | | | | 554,944 | |
Viking Cruises, Ltd.
5.875%, 09/15/271 | | | 295,000 | | | | 297,950 | |
Vine Oil & Gas LP / Vine Oil & Gas Finance Corp.
8.750%, 04/15/231,3 | | | 135,000 | | | | 132,057 | |
Vizient, Inc.
10.375%, 03/01/241 | | | 180,000 | | | | 205,650 | |
VMware, Inc.
2.950%, 08/21/22 | | | 765,000 | | | | 767,623 | |
Waste Management, Inc.
4.100%, 03/01/45 | | | 450,000 | | | | 475,944 | |
WellCare Health Plans, Inc.
5.250%, 04/01/25 | | | 225,000 | | | | 237,375 | |
West Street Merger Sub, Inc.
6.375%, 09/01/251 | | | 150,000 | | | | 152,813 | |
| | | | | | | | |
| | | Principal | | | | |
| | | Amount | | | Value | |
Western Digital Corp.
7.375%, 04/01/231 | | $ | 70,000 | | | $ | 76,825 | |
Whiting Petroleum Corp.
5.000%, 03/15/193 | | | 305,000 | | | | 309,194 | |
Williams Partners LP
3.750%, 06/15/27 | | | 290,000 | | | | 291,504 | |
WMG Acquisition Corp.
6.750%, 04/15/221 | | | 190,000 | | | | 200,640 | |
Zimmer Biomet Holdings, Inc.
2.700%, 04/01/20 | | | 695,000 | | | | 701,218 | |
Total Industrials | | | | | | | 110,824,056 | |
Utilities – 2.6% | | | | | | | | |
AES Andres / Dominican Power Partners / Empresa Generadora De Electricidad IT (Netherlands)
7.950%, 05/11/261 | | | 1,000,000 | | | | 1,087,500 | |
American Electric Power Co, Inc.
2.950%, 12/15/22 | | | 1,300,000 | | | | 1,324,998 | |
American Water Capital Corp.
3.400%, 03/01/25 | | | 775,000 | | | | 800,426 | |
Berkshire Hathaway Energy Co.
6.500%, 09/15/37 | | | 648,000 | | | | 881,228 | |
Calpine Corp.
5.750%, 01/15/253 | | | 95,000 | | | | 90,666 | |
Duke Energy Corp.
| | | | | | | | |
3.750%, 09/01/46 | | | 110,000 | | | | 107,296 | |
3.950%, 08/15/47 | | | 350,000 | | | | 352,407 | |
Duke Energy Progress LLC
4.150%, 12/01/44 | | | 465,000 | | | | 499,652 | |
Duquesne Light Holdings, Inc.
3.616%, 08/01/271 | | | 500,000 | | | | 498,490 | |
Energuate Trust (Guatemala)
5.875%, 05/03/271 | | | 200,000 | | | | 208,400 | |
Engie Energia Chile, S.A. (Chile)
5.625%, 01/15/21 | | | 700,000 | | | | 765,781 | |
Eversource Energy
2.750%, 03/15/22 | | | 1,000,000 | | | | 1,009,633 | |
Exelon Corp.
3.400%, 04/15/26 | | | 1,420,000 | | | | 1,432,272 | |
Fortis, Inc. (Canada)
2.100%, 10/04/21 | | | 470,000 | | | | 461,574 | |
ITC Holdings Corp.
3.250%, 06/30/26 | | | 1,000,000 | | | | 998,285 | |
NextEra Energy Capital Holdings, Inc.
3.550%, 05/01/27 | | | 290,000 | | | | 299,842 | |
NextEra Energy Operating Partners LP
4.500%, 09/15/271 | | | 295,000 | | | | 297,581 | |
The accompanying notes are an integral part of these financial statements.
79
| | |
| AMG Managers DoubleLine Core Plus Bond Fund | | |
| |
| Schedule of Portfolio Investments (continued) | | |
| | | | | | | | |
| | | Principal | | | | |
| | | Amount | | | Value | |
Utilities – 2.6% (continued) | | | | | | | | |
NGL Energy Partners LP / NGL Energy Finance Corp. | | | | | | | | |
6.125%, 03/01/25 | | $ | 245,000 | | | $ | 233,363 | |
7.500%, 11/01/23 | | | 160,000 | | | | 160,400 | |
Sierra Pacific Power Co.
2.600%, 05/01/26 | | | 1,300,000 | | | | 1,262,967 | |
The Southern Co.
| | | | | | | | |
1.850%, 07/01/19 | | | 20,000 | | | | 19,968 | |
2.450%, 09/01/18 | | | 830,000 | | | | 834,544 | |
Transelec, S.A. (Chile) | | | | | | | | |
4.625%, 07/26/231 | | | 300,000 | | | | 320,549 | |
4.625%, 07/26/23 | | | 200,000 | | | | 213,744 | |
Transportadora de Gas del Peru SA (Peru)
4.250%, 04/30/28 | | | 1,800,000 | | | | 1,865,250 | |
Xcel Energy, Inc.
3.300%, 06/01/25 | | | 1,300,000 | | | | 1,322,816 | |
Total Utilities | | | | | | | 17,349,632 | |
Total Corporate Bonds and Notes
(Cost $183,925,383) | | | | | | | 185,974,570 | |
Asset-Backed Securities – 9.3% | | | | | | | | |
Adams Mill CLO, Ltd. | | | | | | | | |
Series 2014-1A, Class D1
(3-Month LIBOR plus 3.500%), 4.859%, 07/15/26 (01/16/18)1,2 | | | 250,000 | | | | 252,551 | |
Series 2014-1A, Class E1
(3-Month LIBOR plus 5.000%), 6.359%, 07/15/26 (01/16/18)1,2 | | | 250,000 | | | | 244,796 | |
ALM VII R, Ltd.
Series 2013-7RA, Class CR
(3-Month LIBOR plus 4.040%), 5.399%, 10/15/28 (01/16/18)1,2 | | | 1,000,000 | | | | 1,016,827 | |
ALM XIV, Ltd.
Series 2014-14A, Class C
(3-Month LIBOR plus 3.450%), 4.828%, 07/28/26 (01/29/18)1,2 | | | 1,000,000 | | | | 1,017,423 | |
ALM XIX, Ltd. | | | | | | | | |
Series 2016-19A, Class B
(3-Month LIBOR plus 3.000%), 4.359%, 07/15/28 (01/16/18)1,2 | | | 500,000 | | | | 503,555 | |
Series 2016-19A, Class C
(3-Month LIBOR plus 4.350%), 5.709%, 07/15/28 (01/16/18)1,2 | | | 500,000 | | | | 510,195 | |
Apidos CLO XVI
Series 2013-16A, Class BR
(3-Month LIBOR plus 1.950%), 3.256%, 01/19/25 (01/19/18)1,2 | | | 500,000 | | | | 501,247 | |
Apidos CLO XVIII
Series 2014-18A, Class D
(3-Month LIBOR plus 5.200%), 6.563%, 07/22/26 (01/22/18)1,2 | | | 250,000 | | | | 251,768 | |
| | | | | | | | |
| | | Principal | | | | |
| | | Amount | | | Value | |
Apidos CLO XX
Series 2015-20A, Class C
(3-Month LIBOR plus 3.700%), 5.059%, 01/16/27 (01/16/18)1,2 | | $ | 500,000 | | | $ | 503,939 | |
Apidos CLO XXI
Series 2015-21A, Class C
(3-Month LIBOR plus 3.550%), 4.904%, 07/18/27 (01/18/18)1,2 | | | 500,000 | | | | 504,611 | |
ARES XXVI CLO, Ltd.
Series 2013-1A, Class D
(3-Month LIBOR plus 3.750%), 5.109%, 04/15/25 (01/16/18)1,2 | | | 500,000 | | | | 504,329 | |
Atrium IX
Series 9A, Class DR
(3-Month LIBOR plus 3.600%), 4.917%, 05/28/30 (11/28/17)1,2 | | | 1,000,000 | | | | 1,019,681 | |
Babson CLO, Ltd.
| | | | | | | | |
Series 2014-3A, Class E2
(3-Month LIBOR plus 6.500%), 7.859%, 01/15/26 (01/16/18)1,2 | | | 250,000 | | | | 251,757 | |
Series 2015-2A, Class DR
(3-Month LIBOR plus 2.950%), 4.313%, 10/20/30 (01/22/18)1,2 | | | 500,000 | | | | 499,993 | |
Series 2015-IA, Class D1
(3-Month LIBOR plus 3.450%), 4.813%, 04/20/27 (01/22/18)1,2 | | | 250,000 | | | | 251,037 | |
Barings CLO, Ltd.
Series 2017-1A, Class D
(3-Month LIBOR plus 3.600%), 4.881%, 07/18/29 (01/18/18)1,2 | | | 1,000,000 | | | | 1,012,629 | |
Bayview Financial Acquisition Trust
Series 2007-A, Class 1A5
6.101%, 05/28/379 | | | 291,604 | | | | 299,740 | |
Blackbird Capital Aircraft Lease Securitization, Ltd.
Series 2016-1A, Class B
5.682%, 12/16/411,9 | | | 953,125 | | | | 961,954 | |
BlueMountain CLO, Ltd. | | | | | | | | |
Series 2013-1A, Class CR
(3-Month LIBOR plus 4.150%), 5.513%, 01/20/29 (10/20/17)1,2 | | | 1,000,000 | | | | 1,012,548 | |
Series 2015-2A, Class C
(3-Month LIBOR plus 2.700%), 4.054%, 07/18/27 (01/18/18)1,2 | | | 500,000 | | | | 504,624 | |
Series 2015-2A, Class D
(3-Month LIBOR plus 3.550%), 4.904%, 07/18/27 (01/18/18)1,2 | | | 1,000,000 | | | | 1,009,126 | |
Series 2016-2A, Class C
(3-Month LIBOR plus 4.100%), 5.416%, 08/20/28 (11/20/17)1,2 | | | 1,000,000 | | | | 1,010,165 | |
The accompanying notes are an integral part of these financial statements.
80
| | |
| AMG Managers DoubleLine Core Plus Bond Fund | | |
| |
| Schedule of Portfolio Investments (continued) | | |
| | | | | | | | |
| | | Principal | | | | |
| | | Amount | | | Value | |
Asset-Backed Securities – 9.3% (continued) | | | | | | | | |
Brookside Mill CLO, Ltd. | | | | | | | | |
Series 2013-1A, Class D
(3-Month LIBOR plus 3.050%), 4.403%, 04/17/25 (01/17/18)1,2 | | $ | 250,000 | | | $ | 246,774 | |
Series 2013-1A, Class E
(3-Month LIBOR plus 4.400%), 5.753%, 04/17/25 (01/17/18)1,2 | | | 250,000 | | | | 240,692 | |
Canyon Capital CLO, Ltd. | | | | | | | | |
Series 2014-1A, Class B
(3-Month LIBOR plus 2.650%), 4.028%, 04/30/25 (01/30/18)1,2 | | | 500,000 | | | | 500,509 | |
Series 2017-1A, Class D
(3-Month LIBOR plus 3.600%), 4.855%, 07/15/30 (01/16/18)1,2 | | | 500,000 | | | | 503,505 | |
Castle Aircraft Securitiz
Series 2015-1A, Class A
4.703%, 12/15/401 | | | 1,983,238 | | | | 2,007,898 | |
Catamaran CLO
Series 2015-1A, Class C1
(3-Month LIBOR plus 3.100%), 4.463%, 04/22/27 (01/22/18)1,2 | | | 250,000 | | | | 250,349 | |
CLI Funding V LLC
Series 2013-2A, Class NOTE
3.220%, 06/18/281 | | | 796,400 | | | | 793,500 | |
Credit Suisse Commercial Mortgage Trust
Series 2015-PR2, Class A1
4.250%, 07/26/551,9 | | | 2,223,915 | | | | 2,201,644 | |
Credit-Based Asset Servicing & Securitization LLC
Series 2007-MX1, Class A4
6.231%, 12/25/361,9 | | | 100,000 | | | | 104,644 | |
Dryden XXIV Senior Loan Fund
Series 2012-24RA, Class DR
(3-Month LIBOR plus 3.700%), 5.015%, 11/15/23 (11/15/17)1,2 | | | 750,000 | | | | 750,508 | |
ECAF I, Ltd.
Series 2015-1A, Class A1
3.473%, 06/15/401 | | | 629,051 | | | | 624,308 | |
Element Rail Leasing II LLC Series
Series 2016-1A, Class A2
5.047%, 03/19/461 | | | 842,763 | | | | 901,297 | |
Flatiron CLO, Ltd.
Series 2014-1A, Class C
(3-Month LIBOR plus 3.300%), 4.653%, 07/17/26 (01/17/18)1,2 | | | 250,000 | | | | 249,907 | |
Galaxy XVIII CLO, Ltd.
Series 2014-18A, Class D1
(3-Month LIBOR plus 3.700%),
5.059%, 10/15/26 (01/16/18)1,2 | | | 500,000 | | | | 506,502 | |
| | | | | | | | |
| | | Principal | | | | |
| | | Amount | | | Value | |
Galaxy XXII CLO, Ltd.
Series 2016-22A, Class D
(3-Month LIBOR plus 4.450%),
5.809%, 07/16/28 (01/16/18)1,2 | | $ | 1,000,000 | | | $ | 1,009,369 | |
Gilbert Park CLO, Ltd.
| | | | | | | | |
Series 2017-1A, Class D
(3-Month LIBOR plus 2.950%),
4.315%, 10/15/30 (04/16/18)1,2 | | | 500,000 | | | | 498,875 | |
Series 2017-1A, Class E
(3-Month LIBOR plus 6.400%),
7.765%, 10/15/30 (04/16/18)1,7 | | | 1,000,000 | | | | 996,250 | |
Global SC Finance II SRL
Series 2014-1A, Class A1
3.190%, 07/17/291 | | | 928,125 | | | | 919,983 | |
Goldentree Loan Opportunities X, Ltd.
Series 2015-10A, Class D
(3-Month LIBOR plus 3.350%),
4.713%, 07/20/27 (01/22/18)1,2 | | | 500,000 | | | | 504,391 | |
GSAA Home Equity Trust
Series 2006-15, Class AF3B
5.933%, 09/25/367 | | | 757,000 | | | | 117,579 | |
Halcyon Loan Advisors Funding, Ltd.
Series 2013-2A, Class C
(3-Month LIBOR plus 2.700%),
4.077%, 08/01/25 (02/01/18)1,2 | | | 250,000 | | | | 252,180 | |
LCM XIV LP
Series 14A, Class D
(3-Month LIBOR plus 3.500%),
4.859%, 07/15/25 (01/16/18)1,2 | | | 250,000 | | | | 251,259 | |
LCM XVIII LP
Series 19A, Class D
(3-Month LIBOR plus 3.450%),
4.809%, 07/15/27 (01/16/18)1,2 | | | 1,000,000 | | | | 1,004,934 | |
Madison Park Funding XV, Ltd.
Series 2014-15A, Class CR
(3-Month LIBOR plus 3.450%),
4.824%, 01/27/26 (01/29/18)1,2 | | | 500,000 | | | | 502,195 | |
Magnetite IX, Ltd.
Series 2014-9A, Class BR
(3-Month LIBOR plus 2.000%),
3.367%,
07/25/26 (01/25/18)1,2 | | | 500,000 | | | | 505,000 | |
Mosaic Solar Loans LLC
Series 2017-1A, Class A
4.450%, 06/20/421 | | | 770,352 | | | | 786,211 | |
MP CLO, VI Ltd.
Series 2014-2A, Class DR
(3-Month LIBOR plus 3.500%),
4.859%, 01/15/27 (01/16/18)1,2 | | | 500,000 | | | | 504,958 | |
The accompanying notes are an integral part of these financial statements.
81
| | |
| AMG Managers DoubleLine Core Plus Bond Fund | | |
| |
| Schedule of Portfolio Investments (continued) | | |
| | | | | | | | |
| | | Principal | | | | |
| | | Amount | | | Value | |
Asset-Backed Securities – 9.3% (continued) | | | | | | | | |
Octagon Investment Partners XVI, Ltd. | | | | | | | | |
Series 2013-1A, Class D
(3-Month LIBOR plus 3.350%), 4.703%, 07/17/25 (01/17/18)1,2 | | $ | 250,000 | | | $ | 251,593 | |
Series 2013-1A, Class E
(3-Month LIBOR plus 4.500%), 5.853%, 07/17/25 (01/17/18)1,2 | | | 250,000 | | | | 248,057 | |
Octagon Investment Partners XXI, Ltd.
Series 2014-1A, Class C
(3-Month LIBOR plus 3.650%), 4.959%, 11/14/26 (11/14/17)1,2 | | | 250,000 | | | | 250,845 | |
Octagon Investment Partners XXII, Ltd.
Series 2014-1A, Class E1
(3-Month LIBOR plus 5.250%), 6.613%, 11/25/25 (10/23/17)1,7 | | | 500,000 | | | | 505,134 | |
Octagon Investment Partners XXVII, Ltd.
| | | | | | | | |
Series 2016-1A, Class C
(3-Month LIBOR plus 3.000%), 4.359%, 07/15/27 (01/16/18)1,2 | | | 250,000 | | | | 250,346 | |
Series 2016-1A, Class D
(3-Month LIBOR plus 4.750%), 6.109%, 07/15/27 (01/16/18)1,2 | | | 500,000 | | | | 501,547 | |
Octagon Investment Partners XXX, Ltd. | | | | | | | | |
Series 2017-1A, Class C
(3-Month LIBOR plus 3.500%), 4.863%, 03/17/30 (01/22/18)1,2 | | | 500,000 | | | | 510,672 | |
Series 2017-1A, Class D
(3-Month LIBOR plus 6.200%), 7.563%, 03/17/30 (01/22/18)1,2 | | | 250,000 | | | | 253,126 | |
OneMain Financial Issuance Trust | | | | | | | | |
Series 2015-1A, Class A
3.190%, 03/18/261 | | | 2,000,000 | | | | 2,017,376 | |
Series 2015-2A, Class A
2.570%, 07/18/251 | | | 418,553 | | | | 419,652 | |
PRPM LLC
Series 2017-2A, Class A1
3.500%, 09/25/221,9 | | | 4,940,209 | | | | 4,943,170 | |
SpringCastle America Funding LLC
Series 2016-AA, Class A
3.050%, 04/25/291 | | | 1,284,914 | | | | 1,297,195 | |
Springleaf Funding Trust
Series 2015-AA, Class A
3.160%, 11/15/241 | | | 2,000,000 | | | | 2,011,722 | |
Symphony CLO XIV, Ltd.
Series 2014-14A, Class D2
(3-Month LIBOR plus 3.600%), 4.959%, 07/14/26 (01/16/18)1,2 | | | 750,000 | | | | 754,993 | |
| | | | | | | | |
| | | Principal | | | | |
| | | Amount | | | Value | |
TAL Advantage VI LLC
Series 2017-1A, Class A
4.500%, 04/20/421 | | $ | 953,751 | | | $ | 988,968 | |
TCI-Cent CLO, Ltd.
Series 2016-1A, Class C
(3-Month LIBOR plus 4.000%), 5.317%, 12/21/29 (01/29/18)1,2 | | | 1,000,000 | | | | 1,007,183 | |
TCI-Flatiron CLO, Ltd.
Series 2016-1A, Class C
(3-Month LIBOR plus 3.050%), 4.403%, 07/17/28 (01/17/18)1,2 | | | 750,000 | | | | 758,937 | |
TCI-Symphony CLO, Ltd.
Series 2016-1A, Class D
(3-Month LIBOR plus 3.800%), 5.159%, 10/13/29 (01/16/18)1,2 | | | 1,000,000 | | | | 1,009,338 | |
THL Credit Wind River CLO, Ltd.
| | | | | | | | |
Series 2013-1A, Class CR
(3-Month LIBOR plus 3.650%), 5.013%, 07/20/30 (01/22/18)1,2 | | | 250,000 | | | | 250,018 | |
Series 2014-1A, Class DR
(3-Month LIBOR plus 3.500%), 4.854%, 04/18/26 (01/18/18)1,2 | | | 1,000,000 | | | | 1,006,216 | |
Series 2014-2A, Class D
(3-Month LIBOR plus 3.900%), 5.259%, 07/15/26 (01/16/18)1,2 | | | 1,200,000 | | | | 1,205,379 | |
Series 2016-1A, Class C
(3-Month LIBOR plus 3.200%), 4.559%, 07/15/28 (01/16/18)1,2 | | | 500,000 | | | | 506,986 | |
Series 2016-1A, Class D
(3-Month LIBOR plus 4.650%), 6.009%, 07/15/28 (01/16/18)1,2 | | | 250,000 | | | | 254,697 | |
Thunderbolt Aircraft Lease, Ltd.
Series 2017-A, Class A
4.212%, 05/17/321,9 | | | 485,119 | | | | 501,388 | |
Towd Point Mortgage Trust
Series 2015-6, Class A1B
2.750%, 04/25/551,7 | | | 3,346,993 | | | | 3,366,907 | |
Trinity Rail Leasing 2010 LLC
Series 2010-1A, Class A
5.194%, 10/16/401 | | | 964,042 | | | | 1,007,147 | |
Venture VIII CDO, Ltd.
Series 2007-8A, Class A1A
(3-Month LIBOR plus 0.280%), 1.643%, 07/22/21 (01/22/18)1,2 | | | 84,866 | | | | 84,609 | |
VOLT LXII LLC
Series 2017-NPL9, Class A1
3.125%, 09/25/471,9 | | | 4,964,630 | | | | 4,966,134 | |
The accompanying notes are an integral part of these financial statements.
82
| | |
| AMG Managers DoubleLine Core Plus Bond Fund | | |
| |
| Schedule of Portfolio Investments (continued) | | |
| | | | | | | | |
| | | Principal | | | | |
| | | Amount | | | Value | |
Asset-Backed Securities – 9.3% (continued) | | | | | | | | |
Westcott Park CLO, Ltd.
Series 2016-1A, Class D
(3-Month LIBOR plus 4.350%), 5.713%, 07/20/28 (01/22/18)1,2 | | $ | 1,000,000 | | | $ | 1,014,737 | |
Total Asset-Backed Securities
(Cost $62,709,044) | | | | | | | 63,523,788 | |
Mortgage-Backed Securities – 17.4% | | | | | | | | |
Alternative Loan Trust | | | | | | | | |
Series 2007-18CB, Class 2A17
6.000%, 08/25/37 | | | 55,363 | | | | 49,523 | |
Series 2007-23CB, Class A3
(1-Month LIBOR plus 0.500%), 1.738%, 09/25/37 (11/25/17)2 | | | 239,678 | | | | 160,633 | |
Series 2007-23CB, Class A4
(6.500% minus 1-Month LIBOR,
Cap 6.500%, Floor 0.000%),
5.262%, 09/25/37 (11/25/17)2,10 | | | 228,852 | | | | 51,766 | |
Series 2007-J2, Class 2A1
6.000%, 07/25/37 | | | 1,424,818 | | | | 1,385,793 | |
Banc of America Funding Trust | | | | | | | | |
Series 2006-B, Class 7A1
3.559%, 03/20/36 7 | | | 313,355 | | | | 295,479 | |
Series 2010-R9, Class 3A3
5.500%, 12/26/35 1 | | | 477,754 | | | | 417,799 | |
BBCMS Mortgage Trust | | | | | | | | |
Series 2017-DELC, Class C
(1-Month LIBOR plus 1.200%), 2.439%, 08/15/36 (11/15/17)1,2 | | | 132,000 | | | | 132,187 | |
Series 2017-DELC, Class D
(1-Month LIBOR plus 1.700%), 2.939%, 08/15/36 (11/15/17)1,2 | | | 150,000 | | | | 150,215 | |
Series 2017-DELC, Class E
(1-Month LIBOR plus 2.500%), 3.739%, 08/15/36 (11/15/17)1,2 | | | 314,000 | | | | 314,819 | |
Series 2017-DELC, Class F
(1-Month LIBOR plus 3.500%), 4.739%, 08/15/36 (11/15/17)1,2 | | | 301,000 | | | | 302,361 | |
BBCMS Trust | | | | | | | | |
Series 2015-STP, Class D
4.284%, 09/10/28 1,7 | | | 630,000 | | | | 634,308 | |
Series 2017-C1, Class XA
1.525%, 02/15/50 7,10 | | | 7,924,626 | | | | 873,983 | |
Bear Stearns Asset Backed Securities I Trust
Series 2004-AC2, Class 2A
5.000%, 05/25/34 | | | 151,098 | | | | 150,917 | |
Bear Stearns Commercial Mortgage Securities Trust
Series 2007-T26, Class AJ
5.531%, 01/12/457 | | | 450,000 | | | | 412,304 | |
BX Trust
Series 2017-SLCT, Class D
(1-Month LIBOR plus 2.050%), 3.289%, 07/15/34 (11/15/17)1,2 | | | 336,000 | | | | 337,363 | |
| | | | | | | | |
| | | Principal | | | | |
| | | Amount | | | Value | |
BX Trust
Series 2017-SLCT, Class E
(1-Month LIBOR plus 3.150%), 4.389%, 07/15/34 (11/15/17)1,2 | | $ | 552,000 | | | $ | 555,943 | |
CFCRE Commercial Mortgage Trust | | | | | | | | |
Series 2016-C3, Class XA
1.076%, 01/10/48 7,10 | | | 9,039,279 | | | | 628,498 | |
Series 2016-C4, Class C
4.877%, 05/10/58 7 | | | 858,000 | | | | 890,662 | |
Series 2016-C7, Class A3
3.839%, 12/10/54 | | | 940,000 | | | | 993,001 | |
Chicago Skyscraper Trust | | | | | | | | |
Series 2017-SKY, Class B
(1-Month LIBOR plus 1.100%), 2.439%, 02/15/30 (11/15/17)1,2 | | | 174,000 | | | | 174,406 | |
Series 2017-SKY, Class C
(1-Month LIBOR plus 1.250%), 2.489%, 02/15/30 (11/15/17)1,2 | | | 96,000 | | | | 96,222 | |
Citicorp Mortgage Securities Trust Series
Series 2007-2, Class 3A1
5.500%, 02/25/37 | | | 2,675 | | | | 2,673 | |
Citigroup Commercial Mortgage Trust | | | | | | | | |
Series 2012-GC8, Class XA
1.816%, 09/10/45 1,7,10 | | | 700,009 | | | | 47,869 | |
Series 2013-SMP, Class C
2.738%, 01/12/30 1 | | | 350,000 | | | | 350,047 | |
Series 2013-SMP, Class D
2.911%, 01/12/30 1,7 | | | 350,000 | | | | 349,962 | |
Series 2014-GC25, Class XA
1.044%, 10/10/47 7,10 | | | 4,811,387 | | | | 276,385 | |
Series 2015-GC27, Class D
4.576%, 02/10/48 1,7 | | | 440,700 | | | | 373,008 | |
Series 2015-GC31, Class C
4.063%, 06/10/48 7 | | | 780,000 | | | | 760,295 | |
Series 2015-GC35, Class C
4.500%, 11/10/48 7 | | | 235,000 | | | | 236,713 | |
Series 2015-GC35, Class XA
0.891%, 11/10/48 7,10 | | | 7,448,682 | | | | 361,435 | |
Series 2016-GC36, Class XA
1.338%, 02/10/49 7,10 | | | 7,720,483 | | | | 631,529 | |
Series 2016-P3, Class XA
1.711%, 04/15/49 7,10 | | | 5,487,011 | | | | 566,292 | |
Series 2016-P4, Class XA
2.009%, 07/10/49 7,10 | | | 6,705,259 | | | | 826,980 | |
Series 2016-P6, Class A5
3.720%, 12/10/49 7 | | | 756,000 | | | | 798,792 | |
Series 2016-SMPL, Class D
3.520%, 09/10/31 1 | | | 952,000 | | | | 945,466 | |
Citigroup Mortgage Loan Trust | | | | | | | | |
Series 2006-AR2, Class 1A2
3.583%, 03/25/36 7 | | | 1,421,603 | | | | 1,406,118 | |
Series 2010-7, Class 11A1
5.326%, 07/25/36 1,7 | | | 1,750,000 | | | | 1,783,462 | |
COBALT Commercial Mortgage Trust
Series 2007-C2, Class AJFX
5.568%, 04/15/477 | | | 272,979 | | | | 278,568 | |
The accompanying notes are an integral part of these financial statements.
83
| | |
| AMG Managers DoubleLine Core Plus Bond Fund | | |
| |
| Schedule of Portfolio Investments (continued) | | |
| | | | | | | | |
| | | Principal | | | | |
| | | Amount | | | Value | |
Mortgage-Backed Securities – 17.4% (continued) | | | | | | | | |
COMM Mortgage Trust | | | | | | | | |
Series 2010-C1, Class XPA
1.664%, 07/10/46 1,7,10 | | $ | 48,187 | | | $ | 0 | |
Series 2016-DC2, Class C
4.642%, 02/10/49 7 | | | 453,000 | | | | 445,599 | |
Series 2016-DC2, Class XA
1.064%, 02/10/49 7,10 | | | 6,733,322 | | | | 432,335 | |
Series 2016-GCT, Class E
3.461%, 08/10/29 1,7 | | | 780,000 | | | | 756,942 | |
Commercial Mortgage Pass Through Certificates | | | | | | | | |
Series 2012-CR3, Class XA
2.000%, 10/15/45 7,10 | | | 1,549,928 | | | | 119,001 | |
Series 2013-CR10, Class XA
0.894%, 08/10/46 7,10 | | | 20,037,923 | | | | 618,182 | |
Series 2014-CR20, Class C
4.505%, 11/10/47 7 | | | 300,000 | | | | 306,666 | |
Series 2015-CR23, Class D
4.254%, 05/10/48 7 | | | 350,000 | | | | 303,264 | |
Series 2015-CR25, Class C
4.546%, 08/10/48 7 | | | 470,000 | | | | 487,356 | |
Series 2015-CR26, Class B
4.494%, 10/10/48 7 | | | 600,000 | | | | 610,843 | |
Series 2015-CR26, Class XA
1.045%, 10/10/48 7,10 | | | 8,287,270 | | | | 490,737 | |
Series 2015-LC23, Class C
4.646%, 10/10/48 7 | | | 585,000 | | | | 601,271 | |
Series 2016-CR28, Class C
4.647%, 02/10/49 7 | | | 807,000 | | | | 799,899 | |
Core Industrial Trust
Series 2015-CALW, Class D
3.850%, 02/10/341,7 | | | 500,000 | | | | 507,983 | |
Cosmopolitan Hotel Trust
Series 2016-CSMO, Class C
(1-Month LIBOR plus 2.650%), 3.889%, 11/15/33 (11/15/17)1,2 | | | 680,000 | | | | 682,944 | |
Countrywide Alternative Loan Trust | | | | | | | | |
Series 2005-86CB, Class A5
5.500%, 02/25/36 | | | 916,960 | | | | 820,040 | |
Series 2006-J1, Class 2A1
7.000%, 02/25/36 | | | 450,643 | | | | 190,685 | |
Countrywide Home Loan Mortgage Pass Through Trust | | | | | | | | |
Series 2005-HYB8, Class 4A1
3.213%, 12/20/35 7 | | | 427,133 | | | | 410,318 | |
Series 2007-14, Class A15
6.500%, 09/25/37 | | | 1,110,081 | | | | 1,046,897 | |
Series 2007-2, Class A13
6.000%, 03/25/37 | | | 402,712 | | | | 357,406 | |
Series 2007-7, Class A4
5.750%, 06/25/37 | | | 79,206 | | | | 73,345 | |
Credit Suisse First Boston Mortgage Securities Corp.
Series 2005-9, Class 5A9
5.500%, 10/25/35 | | | 1,262,413 | | | | 1,142,614 | |
| | | | | | | | |
| | | Principal | | | | |
| | | Amount | | | Value | |
Credit Suisse Mortgage Capital Certificates
Series 2007-1, Class 5A4
6.000%, 02/25/37 | | $ | 650,089 | | | $ | 594,248 | |
CSAIL Commercial Mortgage Trust
Series 2016-C6, Class XA
1.810%, 01/15/497,10 | | | 6,962,477 | | | | 744,526 | |
CSMC Trust | | | | | | | | |
Series 2013-IVR4, Class A11
3.483%, 07/27/43 1,7 | | | 3,037,297 | | | | 3,027,898 | |
Series 2013-IVR4, Class A2
3.000%, 07/25/43 1,7 | | | 3,037,297 | | | | 2,982,440 | |
Series 2017-CHOP, Class D
(1-Month LIBOR plus 1.900%), 3.139%, 07/15/32 (11/15/17)1,2 | | | 261,000 | | | | 261,774 | |
Series 2017-CHOP, Class E
(1-Month LIBOR plus 3.300%), 4.539%, 07/15/32 (11/15/17)1,2 | | | 261,000 | | | | 262,242 | |
DBJPM | | | | | | | | |
Series 2016-C1, Class C
3.351%, 05/10/49 7 | | | 534,000 | | | | 517,362 | |
Series 2016-C1, Class XA
1.498%, 05/10/49 7,10 | | | 7,666,054 | | | | 724,933 | |
Fannie Mae-Aces
Series 2016-M3, Class A2
2.702%, 02/25/26 | | | 757,000 | | | | 753,972 | |
First Horizon Alternative Mortgage Securities Trust | | | | | | | | |
Series 2005-FA4, Class 1A6
5.500%, 06/25/35 | | | 2,254,208 | | | | 2,145,494 | |
Series 2006-AA7, Class A1
3.197%, 01/25/37 7 | | | 2,471,205 | | | | 2,213,697 | |
First Horizon Mortgage Pass-Through Trust
Series 2006-2, Class 1A3
6.000%, 08/25/36 | | | 1,177,839 | | | | 1,060,404 | |
FirstKey Mortgage Trust
Series 2014-1, Class A8
3.500%, 11/25/441,7 | | | 4,211,557 | | | | 4,297,907 | |
FREMF Mortgage Trust
Series 2016-KF22, Class B
(1-Month LIBOR plus 5.050%), 6.282%, 07/25/23 (11/25/17)1,2 | | | 371,772 | | | | 375,671 | |
Great Wolf Trust | | | | | | | | |
Series 2017-WOLF, Class D
(1-Month LIBOR plus 2.100%), 3.335%, 09/15/34 (11/15/17)1,7 | | | 274,000 | | | | 275,109 | |
Series 2017-WOLF, Class E
(1-Month LIBOR plus 3.100%), 4.339%, 09/15/34 (11/15/17)1,7 | | | 425,000 | | | | 427,678 | |
Series 2017-WOLF, Class F
(1-Month LIBOR plus 4.070%), 5.309%, 09/15/34 (11/15/17)1,7 | | | 226,000 | | | | 227,834 | |
GS Mortgage Securities Trust
Series 2014-GC26, Class C
4.510%, 11/10/47 7 | | | 391,000 | | | | 395,172 | |
The accompanying notes are an integral part of these financial statements.
84
| | |
| AMG Managers DoubleLine Core Plus Bond Fund | | |
| |
| Schedule of Portfolio Investments (continued) | | |
| | | | | | | | |
| | | Principal | | | | |
| | | Amount | | | Value | |
Mortgage-Backed Securities – 17.4% (continued) | | | | | | | | |
GS Mortgage Securities Trust | | | | | | | | |
Series 2014-GC26, Class D
4.510%, 11/10/47 1,7 | | $ | 1,500,000 | | | $ | 1,316,119 | |
Series 2015-GC34, Class XA
1.360%, 10/10/48 7,10 | | | 6,416,764 | | | | 512,960 | |
Series 2015-GS1, Class XA
0.826%, 11/10/48 7,10 | | | 10,668,469 | | | | 552,048 | |
Series 2016-GS2, Class XA
1.667%, 05/10/49 7,10 | | | 7,316,623 | | | | 740,032 | |
Series 2017-GS7, Class XA
1.143%, 08/10/50 7,10 | | | 10,370,443 | | | | 870,656 | |
GSR Mortgage Loan Trust | | | | | | | | |
Series 2006-2F, Class 2A17
5.750%, 02/25/36 | | | 3,064,902 | | | | 2,965,002 | |
Series 2006-AR1, Class 3A1
3.674%, 01/25/36 7 | | | 320,971 | | | | 313,850 | |
HSI Asset Loan Obligation Trust
Series 2007-2, Class 1A1
5.500%, 09/25/37 | | | 17,970 | | | | 17,466 | |
JP Morgan Chase Commercial Mortgage Securities Corp. | | | | | | | | |
Series 2017-MAUI, Class C
(1-Month LIBOR plus 1.250%), 2.489%, 07/15/34 (11/15/17)1,2 | | | 223,000 | | | | 223,656 | |
Series 2017-MAUI, Class D
(1-Month LIBOR plus 1.950%), 3.189%, 07/15/34 (11/15/17)1,2 | | | 209,000 | | | | 209,752 | |
Series 2017-MAUI, Class E
(1-Month LIBOR plus 2.950%), 4.189%, 07/15/34 (11/15/17)1,2 | | | 185,000 | | | | 186,370 | |
Series 2017-MAUI, Class F
(1-Month LIBOR plus 3.750%), 4.989%, 07/15/34 (11/15/17)1,2 | | | 260,000 | | | | 262,463 | |
JP Morgan Chase Commercial Mortgage Securities Trust | | | | | | | | |
Series 2006-A2, Class 2A1
3.344%, 04/25/36 7 | | | 1,936,929 | | | | 1,913,403 | |
Series 2006-LDP8, Class X
0.308%, 05/15/45 7,10 | | | 54,274 | | | | 1 | |
Series 2006-LDP9, Class AM
5.372%, 05/15/47 | | | 179,908 | | | | 181,144 | |
Series 2007-CB19, Class AM
5.795%, 02/12/49 7 | | | 16,293 | | | | 16,387 | |
Series 2007-LDPX, Class AM
5.464%, 01/15/49 7 | | | 278,191 | | | | 279,235 | |
Series 2011-C4, Class XA
1.356%, 07/15/46 1,7,10 | | | 780,342 | | | | 12,020 | |
Series 2012-C8, Class XA
1.810%, 10/15/45 7,10 | | | 1,703,204 | | | | 119,385 | |
Series 2012-CBX, Class XA
1.647%, 06/15/45 7,10 | | | 649,817 | | | | 30,936 | |
Series 2014-DSTY, Class A
3.429%, 06/10/27 1 | | | 300,000 | | | | 303,578 | |
Series 2015-JP1, Class XA
1.140%, 01/15/49 7,10 | | | 8,302,900 | | | | 440,183 | |
| | | | | | | | |
| | | Principal | | | | |
| | | Amount | | | Value | |
JP Morgan Chase Commercial Mortgage Securities Trust | | | | | | | | |
Series 2016-JP2, Class B
3.460%, 08/15/49 | | $ | 320,000 | | | $ | 316,939 | |
Series 2016-JP2, Class C
3.794%, 08/15/49 7 | | | 246,000 | | | | 245,828 | |
JPMBB Commercial Mortgage Securities Trust | | | | | | | | |
Series 2014-C18, Class XA
1.045%, 02/15/47 7,10 | | | 5,658,604 | | | | 227,478 | |
Series 2014-C21, Class C
4.660%, 08/15/47 7 | | | 300,000 | | | | 307,511 | |
Series 2014-C21, Class XA
1.077%, 08/15/47 7,10 | | | 3,656,079 | | | | 196,782 | |
Series 2014-C23, Class C
4.458%, 09/15/47 7 | | | 330,824 | | | | 340,440 | |
Series 2014-C25, Class C
4.446%, 11/15/47 7 | | | 450,000 | | | | 452,832 | |
Series 2014-C25, Class XA
0.971%, 11/15/47 7,10 | | | 6,395,648 | | | | 299,406 | |
Series 2014-C26, Class XA
1.136%, 01/15/48 7,10 | | | 5,152,393 | | | | 255,743 | |
Series 2015-C27, Class D
3.844%, 02/15/48 1,7 | | | 263,000 | | | | 212,490 | |
Series 2015-C27, Class XA
1.358%, 02/15/48 7,10 | | | 4,353,243 | | | | 271,653 | |
Series 2015-C28, Class XA
1.183%, 10/15/48 7,10 | | | 7,872,781 | | | | 423,132 | |
Series 2015-C32, Class C
4.668%, 11/15/48 7 | | | 650,000 | | | | 658,168 | |
Series 2015-C33, Class C
4.618%, 12/15/48 7 | | | 670,000 | | | | 705,049 | |
Series 2016-C1, Class C
4.747%, 03/15/49 7 | | | 755,000 | | | | 800,903 | |
JPMDB Commercial Mortgage Securities Trust
Series 2016-C2, Class XA
1.704%, 06/15/497,10 | | | 7,681,650 | | | | 712,972 | |
LB-UBS Commercial Mortgage Trust
Series 2007-C7, Class AJ
6.420%, 09/15/457 | | | 747,000 | | | | 759,027 | |
Lehman XS Trust
Series 2007-12N, Class 1A3A
(1-Month LIBOR plus 0.200%), 1.438%, 07/25/47 (11/27/17)7 | | | 7,184,503 | | | | 6,720,692 | |
LSTAR Commercial Mortgage Trust
Series 2016-4, Class C
4.549%, 03/10/491,7 | | | 588,000 | | | | 547,033 | |
Morgan Stanley Bank of America Merrill Lynch Trust | | | | | | | | |
Series 2012-C5, Class XA
1.482%, 08/15/45 1,7,10 | | | 703,459 | | | | 39,035 | |
Series 2014-C14, Class XA
1.176%, 02/15/47 7,10 | | | 5,566,460 | | | | 219,981 | |
Series 2014-C18, Class C
4.482%, 10/15/47 7 | | | 300,000 | | | | 293,157 | |
Series 2014-C19, Class C
4.000%, 12/15/47 | | | 413,500 | | | | 393,225 | |
The accompanying notes are an integral part of these financial statements.
85
| | |
| AMG Managers DoubleLine Core Plus Bond Fund | | |
| |
| Schedule of Portfolio Investments (continued) | | |
| | | | | | | | |
| | | Principal | | | | |
| | | Amount | | | Value | |
Mortgage-Backed Securities – 17.4% (continued) | | | | | | | | |
Morgan Stanley Bank of America Merrill Lynch Trust | | | | | | | | |
Series 2015-C25, Class C
4.528%, 10/15/48 7 | | $ | 785,000 | | | $ | 813,544 | |
Series 2015-C26, Class D
3.060%, 10/15/48 1 | | | 800,000 | | | | 653,136 | |
Series 2015-C27, Class C
4.535%, 12/15/47 7 | | | 80,000 | | | | 77,712 | |
Series 2016-C28, Class XA
1.283%, 01/15/49 7,10 | | | 8,441,728 | | | | 648,249 | |
Series 2016-C29, Class C
4.752%, 05/15/49 7 | | | 844,000 | | | | 891,205 | |
Series 2016-C32, Class A4
3.720%, 12/15/49 | | | 787,000 | | | | 828,041 | |
Morgan Stanley Capital I Trust | | | | | | | | |
Series 2007-HQ11, Class AJ
5.508%, 02/12/44 7 | | | 125,565 | | | | 122,938 | |
Series 2007-IQ16, Class AMA
6.091%, 12/12/49 7 | | | 156,540 | | | | 157,638 | |
Series 2011-C1, Class XA
0.422%, 09/15/47 1,7,10 | | | 515,949 | | | | 4,999 | |
Series 2014-CPT, Class E
3.446%, 07/13/29 1,7 | | | 250,000 | | | | 251,462 | |
Series 2014-MP, Class D
3.693%, 08/11/33 1,7 | | | 350,000 | | | | 355,442 | |
Series 2015-XLF2, Class AFSC
(1-Month LIBOR plus 3.000%), 4.239%, 08/15/26 (11/15/17)1,2 | | | 588,000 | | | | 585,425 | |
Series 2016-UB11, Class XA
1.667%, 08/15/49 7,10 | | | 2,838,662 | | | | 281,482 | |
Series 2017-PRME, Class D
(1-Month LIBOR plus 3.400%), 4.639%, 02/15/34 (11/15/17)1,2 | | | 697,000 | | | | 703,341 | |
Morgan Stanley Mortgage Loan Trust | | | | | | | | |
Series 2005-3AR, Class 2A2
3.245%, 07/25/35 7 | | | 568,403 | | | | 506,023 | |
Series 2005-9AR, Class 2A
3.547%, 12/25/35 7 | | | 5,179,923 | | | | 4,931,905 | |
Series 2007-14AR, Class 1A3
3.531%, 10/25/37 7 | | | 1,126,203 | | | | 1,024,781 | |
MSCG Trust
Series 2016-SNR, Class C
5.205%, 11/15/341 | | | 946,000 | | | | 967,288 | |
Nomura Asset Acceptance Corp. Alternative Loan Trust
Series 2005-AP3, Class A3
5.318%, 08/25/357 | | | 233,760 | | | | 142,846 | |
PR Mortgage Loan Trust
Series 2014-1, Class APT
5.914%, 10/25/491,7 | | | 2,205,107 | | | | 2,082,031 | |
RALI Trust
Series 2005-QA10, Class A31
4.280%, 09/25/35 7 | | | 1,111,763 | | | | 944,467 | |
| | | | | | | | |
| | | Principal | | | | |
| | | Amount | | | Value | |
RALI Trust | | | | | | | | |
Series 2006-QO10, Class A1
(1-Month LIBOR plus 0.160%), 1.398%, 01/25/37 (11/27/17)7 | | $ | 7,009,031 | | | $ | 6,620,473 | |
Series 2006-QS7, Class A2
6.000%, 06/25/36 | | | 3,310,655 | | | | 3,015,652 | |
Residential Asset Securitization Trust | | | | | | | | |
Series 2006-A6, Class 1A1
6.500%, 07/25/36 | | | 208,033 | | | | 120,301 | |
Series 2007-A1, Class A8
6.000%, 03/25/37 | | | 412,223 | | | | 296,722 | |
Sequoia Mortgage Trust
Series 2013-1, Class 2A1
1.855%, 02/25/437 | | | 1,422,735 | | | | 1,363,311 | |
Structured Adjustable Rate Mortgage Loan Trust
Series 2006-1, Class 2A2
3.449%, 02/25/367 | | | 176,722 | | | | 161,780 | |
UBS-Barclays Commercial Mortgage Trust
Series 2012-C3, Class XA
1.893%, 08/10/491,7,10 | | | 1,538,254 | | | | 116,199 | |
Wachovia Bank Commercial Mortgage Trust | | | | | | | | |
Series 2006-C26, Class AM
5.997%, 06/15/45 7 | | | 138,274 | | | | 139,160 | |
Series 2006-C28, Class AJ
5.632%, 10/15/48 7 | | | 254,913 | | | | 254,681 | |
Series 2007-C33, Class AJ
6.002%, 02/15/51 7 | | | 300,000 | | | | 308,034 | |
Series 2007-C33, Class AM
6.002%, 02/15/51 7 | | | 307,887 | | | | 307,538 | |
Washington Mutual Mortgage Pass-Through Certificates WMALT Trust
Series 2005-8, Class 2CB1
5.500%, 10/25/35 | | | 1,556,023 | | | | 1,525,619 | |
Wells Fargo Commercial Mortgage Trust
| | | | | | | | |
Series 2014-LC16, Class D
3.938%, 08/15/50 1 | | | 725,000 | | | | 610,076 | |
Series 2014-LC18, Class B
3.959%, 12/15/47 | | | 512,000 | | | | 523,203 | |
Series 2015-C26, Class D
3.586%, 02/15/48 1 | | | 471,800 | | | | 368,864 | |
Series 2015-C28, Class C
4.133%, 05/15/48 7 | | | 400,000 | | | | 391,636 | |
Series 2015-C31, Class C
4.611%, 11/15/48 7 | | | 585,000 | | | | 607,610 | |
Series 2015-C31, Class XA
1.098%, 11/15/48 7,10 | | | 8,366,560 | | | | 542,210 | |
Series 2015-LC22, Class C
4.541%, 09/15/58 7 | | | 480,000 | | | | 482,522 | |
Series 2015-NXS1, Class XA
1.179%, 05/15/48 7,10 | | | 4,403,387 | | | | 258,603 | |
Series 2015-NXS3, Class C
4.488%, 09/15/57 7 | | | 610,000 | | | | 606,934 | |
Series 2016-C32, Class C
4.721%, 01/15/59 7 | | | 558,000 | | | | 537,238 | |
The accompanying notes are an integral part of these financial statements.
86
| | |
| AMG Managers DoubleLine Core Plus Bond Fund | | |
| |
| Schedule of Portfolio Investments (continued) | | |
| | | | | | | | |
| | | Principal | | | | |
| | | Amount | | | Value | |
Mortgage-Backed Securities – 17.4% (continued) | | | | | | | | |
Wells Fargo Commercial Mortgage Trust | | | | | | | | |
Series 2016-C33, Class C
3.896%, 03/15/59 | | $ | 517,000 | | | $ | 512,463 | |
Series 2016-C33, Class XA
1.801%, 03/15/59 7,10 | | | 5,290,168 | | | | 547,500 | |
Series 2016-NXS6, Class XA
1.656%, 11/15/49 7,10 | | | 6,283,858 | | | | 619,929 | |
Series 2017-C39, Class XA
1.148%, 09/15/50 7,10 | | | 13,787,274 | | | | 1,153,394 | |
Wells Fargo Mortgage Backed Securities Trust | | | | | | | | |
Series 2007-13, Class A6
6.000%, 09/25/37 | | | 202,589 | | | | 204,547 | |
Series 2007-8, Class 1A16
6.000%, 07/25/37 | | | 197,553 | | | | 199,106 | |
WFRBS Commercial Mortgage Trust | | | | | | | | |
Series 2012-C8, Class XA
1.854%, 08/15/45 1,7,10 | | | 717,561 | | | | 50,748 | |
Series 2012-C9, Class XA
1.995%, 11/15/45 1,7,10 | | | 1,206,114 | | | | 88,374 | |
Series 2014-C21, Class XA
1.134%, 08/15/47 7,10 | | | 6,169,353 | | | | 328,316 | |
Total Mortgage-Backed Securities
(Cost $116,134,047) | | | | | | | 118,199,284 | |
Municipal Bond – 0.1% | | | | | | | | |
North Texas Municipal Water District Water
System Revenue GO
5.000%, 09/01/35 | | | 380,000 | | | | 446,291 | |
Total Municipal Bond
(Cost $431,592) | | | | | | | 446,291 | |
U.S. Government and Agency Obligations – 32.0% | | | | | |
Fannie Mae – 8.9% | | | | | | | | |
Fannie Mae, | | | | | | | | |
3.000%, 03/01/45 to 04/01/45 | | | 6,983,470 | | | | 6,976,575 | |
3.500%, 12/01/31 to 03/01/46 | | | 9,896,898 | | | | 10,236,100 | |
4.000%, 09/01/31 to 06/01/42 | | | 422,440 | | | | 442,532 | |
4.500%, 03/01/42 | | | 82,654 | | | | 86,653 | |
Fannie Mae REMICS, | | | | | | | | |
Series 2007-57, Class SX
(6.620% minus 1-Month LIBOR, Cap 6.620%, Floor 0.000%), 5.382%, 10/25/362,10 | | | 146,539 | | | | 24,341 | |
Series 2009-86, Class CI
(5.800% minus 1-Month LIBOR, Cap 5.800%, Floor 0.000%), 4.562%, 09/25/362,10 | | | 182,980 | | | | 22,781 | |
4.000%, 01/25/41 to 04/25/42 | | | 2,743,392 | | | | 2,914,232 | |
Series 2011-121, Class JP
4.500%, 12/25/41 | | | 160,865 | | | | 169,987 | |
3.500%, 03/25/42 to 10/25/42 | | | 5,582,931 | | | | 5,665,952 | |
| | | | | | | | |
| | | Principal | | | | |
| | | Amount | | | Value | |
Fannie Mae REMICS, | | | | | | | | |
Series 2012-127, Class PA
2.750%, 11/25/42 | | $ | 1,847,164 | | | $ | 1,831,057 | |
Series 2013-5, Class EZ
2.000%, 08/25/42 | | | 6,918,861 | | | | 6,319,353 | |
3.000%, 08/25/42 to 05/25/46 | | | 26,029,425 | | | | 25,342,107 | |
Total Fannie Mae | | | | | | | 60,031,670 | |
Freddie Mac – 5.1% | | | | | | | | |
Freddie Mac Gold, | | | | | | | | |
3.000%, 07/01/45 to 08/01/45 | | | 7,322,686 | | | | 7,340,111 | |
3.500%, 10/01/42 to 02/01/45 | | | 5,455,598 | | | | 5,606,391 | |
4.000%, 10/01/41 | | | 137,697 | | | | 142,481 | |
5.000%, 07/01/35 | | | 23,851 | | | | 26,055 | |
5.500%, 12/01/38 | | | 6,651 | | | | 7,395 | |
Freddie Mac Multifamily Structured Pass Through Certificates, | | | | | | | | |
Series K050, Class A2
3.334%, 08/25/257 | | | 569,000 | | | | 596,952 | |
Series K053, Class A2
2.995%, 12/25/25 | | | 766,000 | | | | 784,531 | |
Series K054, Class A2
2.745%, 01/25/26 | | | 831,000 | | | | 834,847 | |
Series K722, Class X1
1.311%, 03/25/237,10 | | | 5,443,589 | | | | 310,458 | |
Freddie Mac REMICS, | | | | | | | | |
Series 2909, Class Z
5.000%, 12/15/34 | | | 329,775 | | | | 359,841 | |
Series 3301, Class MS
(6.100% minus 1-Month LIBOR, Cap 6.100%, Floor 0.000%),
4.861%, 04/15/372,10 | | | 93,360 | | | | 13,541 | |
Series 3382, Class SB
(6.000% minus 1-Month LIBOR, Cap 6.000%, Floor 0.000%),
4.761%, 11/15/372,10 | | | 35,289 | | | | 3,920 | |
Series 3384, Class S
(6.390% minus 1-Month LIBOR, Cap 6.390%, Floor 0.000%),
5.151%, 11/15/372,10 | | | 46,572 | | | | 5,683 | |
Series 3500, Class SA
(5.520% minus 1-Month LIBOR, Cap 5.520%, Floor 0.000%),
4.281%, 01/15/392,10 | | | 113,051 | | | | 11,500 | |
Series 3626, Class AZ
5.500%, 08/15/36 | | | 154,171 | | | | 166,800 | |
4.000%, 12/15/38 to 03/15/42 | | | 4,144,651 | | | | 4,378,366 | |
Series 3792, Class SE
(9.860% minus 2 times 1-Month LIBOR, Cap 9.860%, Floor 0.000%), 7.382%, 01/15/412 | | | 903,021 | | | | 962,205 | |
Series 3894, Class ZA
4.500%, 07/15/41 | | | 398,067 | | | | 418,612 | |
Series 3957, Class DZ
3.500%, 11/15/41 | | | 514,812 | | | | 523,486 | |
Series 4075, Class S
(5.500% minus 1-Month LIBOR, Cap 5.500%, Floor 0.000%),
4.261%, 07/15/422,10 | | | 3,979,546 | | | | 545,601 | |
The accompanying notes are an integral part of these financial statements.
87
| | |
| AMG Managers DoubleLine Core Plus Bond Fund | | |
| |
| Schedule of Portfolio Investments (continued) | | |
| | | | | | | | |
| | | Principal | | | | |
| | | Amount | | | Value | |
Freddie Mac – 5.1% (continued) | | | | | | | | |
Freddie Mac REMICS, | | | | | | | | |
Series 4215, Class KC
2.250%, 03/15/38 | | $ | 2,554,709 | | | $ | 2,567,400 | |
3.000%, 06/15/40 to 03/15/44 | | | 9,136,571 | | | | 9,072,166 | |
Total Freddie Mac | | | | | | | 34,678,342 | |
Ginnie Mae – 0.3% | | | | | | | | |
Ginnie Mae, | | | | | | | | |
Series 2004-35, Class SA
(32.500% minus 6.5 times 1-Month LIBOR, Cap 32.500%, Floor 0.000%), 24.447%, 03/20/342 | | | 24,793 | | | | 41,950 | |
Series 2008-69, Class SB
(7.630% minus 1-Month LIBOR, Cap 7.630%, Floor 0.000%), 6.391%, 08/20/382,10 4.500%, 05/16/39 to 09/20/39 | |
| 295,265
1,099,336 |
| |
| 58,256
1,171,799 |
|
Series 2010-98, Class IA
5.781%, 03/20/397,10 | | | 89,403 | | | | 10,810 | |
Series 2011-89, Class SA
(5.450% minus 1-Month LIBOR, Cap 5.450%, Floor 0.000%), 4.211%, 06/20/412,10 | | | 676,319 | | | | 84,055 | |
Series 2014-156, Class PS
(6.250% minus 1-Month LIBOR, Cap 6.250%, Floor 0.000%), 5.011%, 10/20/442,10 | | | 2,724,062 | | | | 428,510 | |
Series 2014-5, Class PS
(6.150% minus 1-Month LIBOR, Cap 6.150%, Floor 0.000%), 4.911%, 07/20/432,10 | | | 2,618,153 | | | | 346,933 | |
Total Ginnie Mae | | | | | | | 2,142,313 | |
U.S. Treasury Obligations – 17.7% | | | | | | | | |
U.S. Treasury Bonds,
2.750%, 11/15/42 | | | 7,020,000 | | | | 6,909,901 | |
U.S. Treasury Note,
1.750%, 03/31/22 | | | 7,950,000 | | | | 7,879,506 | |
U.S. Treasury Notes, | | | | | | | | |
0.750%, 10/31/18 | | | 14,040,000 | | | | 13,938,813 | |
1.000%, 05/15/18 | | | 1,960,000 | | | | 1,956,740 | |
1.125%, 01/15/19 to 09/30/21 | | | 7,300,000 | | | | 7,135,097 | |
1.250%, 11/30/18 to 10/31/21 | | | 14,580,000 | | | | 14,393,875 | |
1.500%, 02/28/23 | | | 1,190,000 | | | | 1,156,113 | |
1.625%, 05/15/26 | | | 930,000 | | | | 879,122 | |
1.750%, 12/31/20 to 11/30/21 | | | 8,010,000 | | | | 7,966,940 | |
1.875%, 01/31/22 to 08/31/24 | | | 22,960,000 | | | | 22,589,705 | |
2.000%, 08/31/21 to 12/31/21 | | | 10,460,000 | | | | 10,500,812 | |
2.375%, 05/15/27 | | | 9,490,000 | | | | 9,494,634 | |
2.875%, 08/15/45 | | | 7,520,000 | | | | 7,526,463 | |
3.625%, 08/15/43 | | | 4,540,000 | | | | 5,191,916 | |
United States Treasury Inflation Indexed Bonds,
0.125%, 04/15/22 | | | 2,624,830 | | | | 2,620,777 | |
Total U.S. Treasury Obligations | | | | | | | 120,140,414 | |
Total U.S. Government and Agency Obligations
(Cost $217,574,058) | | | | | | | 216,992,739 | |
Foreign Government Obligations – 4.6% | | | | | | | | |
Argentine Republic Government International Bond
6.875%, 01/26/27 | | | 250,000 | | | | 273,000 | |
| | | | | | | | |
| | | Principal | | | | |
| | | Amount | | | Value | |
Banco de Costa Rica
5.250%, 08/12/18 | | $ | 300,000 | | | $ | 304,500 | |
Banco Latinoamericano de Comercio Exterior S.A.
3.250%, 05/07/20 | | | 350,000 | | | | 358,313 | |
Brazilian Government International Bond
5.625%, 01/07/41 | | | 200,000 | | | | 203,200 | |
Chile Government International Bond | | | | | | | | |
2.250%, 10/30/22 | | | 150,000 | | | | 149,053 | |
3.125%, 03/27/25 | | | 1,200,000 | | | | 1,236,000 | |
3.125%, 01/21/26 | | | 2,300,000 | | | | 2,357,500 | |
3.860%, 06/21/47 | | | 300,000 | | | | 304,613 | |
Costa Rica Government
9.995%, 08/01/20 | | | 500,000 | | | | 581,250 | |
Dominican Republic International Bond
5.950%, 01/25/271,3 | | | 400,000 | | | | 431,600 | |
Export-Import Bank of India | | | | | | | | |
3.125%, 07/20/21 | | | 700,000 | | | | 708,715 | |
4.000%, 01/14/23 | | | 800,000 | | | | 838,451 | |
Fondo MIVIVIENDA SA
3.500%, 01/31/23 | | | 950,000 | | | | 970,567 | |
Indonesia Government International Bond
4.875%, 05/05/21 | | | 1,100,000 | | | | 1,184,617 | |
Israel Government International Bond | | | | | | | | |
2.875%, 03/16/26 | | | 1,100,000 | | | | 1,104,077 | |
3.150%, 06/30/23 | | | 500,000 | | | | 513,950 | |
4.000%, 06/30/22 | | | 700,000 | | | | 746,081 | |
Malaysia Sovereign Sukuk Bhd
3.043%, 04/22/25 | | | 900,000 | | | | 914,580 | |
Malaysia Sukuk Global Bhd
3.179%, 04/27/26 | | | 750,000 | | | | 767,203 | |
Mexico Government International Bond | | | | | | | | |
4.000%, 10/02/23 | | | 750,000 | | | | 787,500 | |
4.125%, 01/21/26 | | | 2,000,000 | | | | 2,086,500 | |
4.150%, 03/28/27 | | | 2,316,000 | | | | 2,410,377 | |
Panama Government International Bond | | | | | | | | |
3.875%, 03/17/28 | | | 2,700,000 | | | | 2,828,250 | |
4.000%, 09/22/24 | | | 1,200,000 | | | | 1,282,200 | |
Perusahaan Penerbit SBSN Indonesia III | | | | | | | | |
4.150%, 03/29/271 | | | 1,500,000 | | | | 1,548,375 | |
4.150%, 03/29/27 | | | 800,000 | | | | 825,800 | |
Philippine Government International Bond | | | | | | | | |
3.700%, 02/02/42 | | | 1,500,000 | | | | 1,497,394 | |
4.200%, 01/21/243 | | | 2,300,000 | | | | 2,523,624 | |
S.P.A.RC EM SPC Panama Metro Line 2 SP
0.000%, 12/05/221,4 | | | 1,396,000 | | | | 1,277,340 | |
Total Foreign Government Obligations
(Cost $30,499,783) | | | | | | | 31,014,630 | |
| | |
| | | Shares | | | | |
Investment Companies – 4.3% | | | | | | | | |
DoubleLine Floating Rate Fund,
Class I11 | | | 1,166,449 | | | | 11,594,504 | |
The accompanying notes are an integral part of these financial statements.
88
| | |
| AMG Managers DoubleLine Core Plus Bond Fund | | |
| |
| Schedule of Portfolio Investments (continued) | | |
| | | | | | | | |
| | | Shares | | | Value | |
DoubleLine Global Bond Fund, Class I11 | | | 1,687,433 | | | $ | 17,616,798 | |
Total Investment Companies
(Cost $29,310,570) | | | | | | | 29,211,302 | |
Warrants – 0.0%# | | | | | | | | |
Energy – 0.0%# | | | | | | | | |
Energy XXI Gulf Coast, Inc., 12/30/21
(United States)*
(Cost $5,530) | | | 1,106 | | | | 221 | |
| | |
| | | Principal | | | | |
| | | Amount | | | | |
Short-Term Investments – 5.5% | | | | | | | | |
Repurchase Agreements – 0.6%12 | | | | | | | | |
Citigroup Global Markets, Inc., dated 10/31/17, due 11/01/17, 1.070% total to be received $1,000,030 (collateralized by various U.S. Government Agency Obligations, 0.000% - 11.500%, 11/01/17 - 09/09/49, totaling $1,020,000) | | $ | 1,000,000 | | | | 1,000,000 | |
Credit Suisse Securities (USA) LLC, dated 10/31/17, due 11/01/17, 1.010% total to be received $1,000,028 (collateralized by various U.S. Government Agency Obligations, 0.375% - 2.125%, 01/15/19 - 02/15/44, totaling $1,020,011) | | | 1,000,000 | | | | 1,000,000 | |
Daiwa Capital Markets America, dated 10/31/17,due 11/01/17, 1.080% total to be received $1,000,030 (collateralized by various U.S. Government Agency Obligations, 0.000% - 6.500%, 11/02/17 - 12/01/51, totaling $1,019,771) | | | 1,000,000 | | | | 1,000,000 | |
| | | | | | | | |
| | | Principal | | | | |
| | | Amount | | | Value | |
Merrill Lynch, Pierce, Fenner & Smith, Inc., dated 10/31/17, due 11/01/17, 1.050% total to be received $124,388 (collateralized by various U.S. Government Agency Obligations, 2.000% - 2.125%, 03/31/24 - 06/30/24, totaling $126,872) | | $ | 124,384 | | | $ | 124,384 | |
Nomura Securities International, Inc., dated 10/31/17, due 11/01/17, 1.060% total to be received $1,000,029 (collateralized by various U.S. Government Agency Obligations, 0.000% - 6.250%, 11/30/17 - 09/09/49, totaling $1,020,000) | | | 1,000,000 | | | | 1,000,000 | |
Total Repurchase Agreements | | | | | | | 4,124,384 | |
U.S. Government Obligations – 2.4% | | | | | |
United States Treasury Bill, 0.954%, 12/07/1713 | | | 8,130,000 | | | | 8,122,148 | |
United States Treasury Bill, 1.133%, 03/08/1813 | | | 7,900,000 | | | | 7,867,254 | |
Total U.S. Government Obligations | | | | 15,989,402 | |
| | |
| | | Shares | | | | | |
Other Investment Companies – 2.5% | | | | | |
Dreyfus Government Cash Management Fund, Institutional Class Shares, 0.93%14,15 | | | 17,140,939 | | | | 17,140,939 | |
Total Short-Term Investments
(Cost $37,256,202) | | | | | | | 37,254,725 | |
Total Investments – 100.6%
(Cost $678,294,637) | | | | | | | 682,922,300 | |
Other Assets, less Liabilities – (0.6)% | | | | (4,079,599 | ) |
Net Assets – 100.0% | | | | | | $ | 678,842,701 | |
| * | Non-income producing security. |
| 1 | Security exempt from registration under Rule 144A of the Securities Act of 1933. This security may be resold in transactions exempt from registration, normally to qualified buyers. At October 31, 2017, the value of these securities amounted to $143,127,989 or 21.1% of net assets. |
| 2 | Variable rate security. The rate shown is based on the latest available information as of October 31, 2017. |
| 3 | Some or all of these securities, amounting to $3,962,814 or 0.6% of net assets, were out on loan to various brokers. |
| 5 | All or part of the security is delayed delivery transaction. The market value for delayed delivery security at October 31, 2017, amounted to $1,466,478, or 0.2% of net assets. |
| 6 | Perpetuity Bond. The date shown is the final call date. |
| 7 | Certain variable rate securities are not based on a published reference rate and spread but are determined by the issuer or agent and are based on current market conditions. These securities do not indicate a reference rate and spread in their description above. |
| 8 | Security is in default. Issuer has failed to make a timely payment of either principal or either interest or has failed to comply with some provision of the bond indenture. |
| 9 | Step Coupon. Security becomes interest bearing at a future date. |
| 10 | Interest only security. This type of security represents the right to receive the monthly interest payments on an underlying pool of mortgages. Payments of principal on the pool reduce the value of the “interest only” holding. |
| 11 | Affiliated issuer. See summary of affiliated investment transaction for details. |
| 12 | Collateral received from brokers for securities lending was invested in these joint repurchase agreements. |
| 13 | Represents yield to maturity at October 31, 2017. |
| 14 | Yield shown represents the October 31, 2017, seven day average yield, which refers to the sum of the previous seven days’ dividends paid, expressed as an annual percentage. |
| 15 | Some of this security has been pledged as collateral for delayed delivery securities. |
| CDO | Collateralized Debt Obligation |
| CLO | Collateralized Loan Obligation |
| EMTN | European Medium Term Note |
| LIBOR | London Interbank Offered Rate |
The accompanying notes are an integral part of these financial statements.
89
| | |
| AMG Managers DoubleLine Core Plus Bond Fund | | |
| |
| Schedule of Portfolio Investments (continued) | | |
| | | | | | | | | | | | | | | | | | | | | | | | | | | | |
| | | | | | | | | | | | | | | Net increase | | | | | | | |
| | | | | | | | | | | | | | | (decrease) in | | | | | | | |
| | | | | | | | | | | | | | | unrealized | | | | | | | |
| | | | | | | | | | | | Net realized | | | appreciation | | | Amount of | | | | |
| Affiliated | | Number | | | | | | | | | gain (loss) for | | | (depreciation) | | | Dividends or | | | | |
| Issuers | | of shares | | | Purchases | | | Sales | | | the period | | | for the period | | | Interest | | | Value | |
DoubleLine Floating Rate Fund | | | 1,166,449 | | | $ | 5,400,000 | | | $ | (1,700,000 | ) | | $ | (29,383 | ) | | $ | 86,479 | | | $ | 347,652 | | | $ | 11,594,504 | |
DoubleLine Global Bond Fund | | | 1,687,433 | | | | 32,500,000 | | | | (15,000,000 | ) | | | 128,205 | | | | (11,407 | ) | | | 74,755 | | | | 17,616,798 | |
The following table summarizes the inputs used to value the Fund’s investments by the fair value hierarchy levels as of October 31, 2017:
| | | | | | | | | | | | | | | | |
| | | Level 1 | | | Level 2 | | | Level 3 | | | Total | |
Investments in Securities | | | | | | | | | | | | | | | | |
Common Stocks† | | $ | 304,750 | | | | — | | | | — | | | $ | 304,750 | |
Corporate Bonds and Notes†† | | | — | | | $ | 185,974,570 | | | | — | | | | 185,974,570 | |
Asset-Backed Securities | | | — | | | | 63,523,788 | | | | — | | | | 63,523,788 | |
Mortgage-Backed Securities | | | — | | | | 118,199,284 | | | | — | | | | 118,199,284 | |
Municipal Bond | | | — | | | | 446,291 | | | | — | | | | 446,291 | |
U.S. Government and Agency Obligations†† | | | — | | | | 216,992,739 | | | | — | | | | 216,992,739 | |
Foreign Government Obligations | | | — | | | | 31,014,630 | | | | — | | | | 31,014,630 | |
Investment Companies | | | 29,211,302 | | | | — | | | | — | | | | 29,211,302 | |
Warrants | | | — | | | | 221 | | | | — | | | | 221 | |
Short-Term Investments | | | | | | | | | | | | | | | | |
U.S. Government Obligations | | | — | | | | 15,989,402 | | | | — | | | | 15,989,402 | |
Repurchase Agreements | | | — | | | | 4,124,384 | | | | — | | | | 4,124,384 | |
Other Investment Companies | | | 17,140,939 | | | | — | | | | — | | | | 17,140,939 | |
| | | | | | | | | | | | | | | | |
Total Investments in Securities | | $ | 46,656,991 | | | $ | 636,265,309 | | | | — | | | $ | 682,922,300 | |
| | | | | | | | | | | | | | | | |
| † | All common stocks held in the Fund are Level 1 securities. For a detailed breakout of common stocks by major industry classification, please refer to the Fund’s Schedule of Portfolio Investments. |
| †† | All corporate bonds and notes and U.S. government and agency obligations held in the Fund are Level 2 securities. For a detailed breakout of corporate bonds and notes and U.S. government and agency obligations by major industry or agency classification, please refer to the Fund’s Schedule of Portfolio Investments. |
As of October 31, 2017, the Fund had no transfers between levels from the beginning of the reporting period.
The accompanying notes are an integral part of these financial statements.
90
AMG Managers Lake Partners LASSO Alternatives Fund
Portfolio Manager’s Comments (unaudited)
For the fiscal year ended October 31, 2017, the AMG Managers Lake Partners LASSO Alternatives Fund (the “Fund”) Class I shares returned 5.74%. In comparison, the Fund’s benchmark, the HFRX Equity Hedge Index, was up 9.69%. However, the Fund outperformed the median of its peer group, the Morningstar Multialternative Category, which rose 5.3%. Since its inception1, the Fund has generated a cumulative gain of 49.6%, outperforming both its benchmark and its peer group median, which were up only 22.5% and 36.3%, respectively.
MARKET REVIEW
Regarding the investment backdrop, the broad U.S. equity market mounted a substantial rally throughout the fiscal year. Any interruptions to the market’s climb that did occur were relatively brief and limited in magnitude. Indeed, volatility as measured by VIX, the Chicago Board Options Exchange (“CBOE”) Volatility Index, remained at historically low levels during the fiscal year. International equity markets also did very well, driven by stronger economic news, although they tended to be more volatile than the U.S.
U.S. equities were driven primarily by a combination of excess liquidity and improved corporate earnings, while optimistic expectations for tax reform, deregulation and fiscal stimulus in the wake of the election of Donald Trump as president added to the
market’s momentum. In contrast, investors largely discounted the risks associated with the Federal Reserve’s (the Fed) policy shift toward normalizing interest rates and reducing its balance sheet, the potential for trade wars stemming from Trump’s “America First” promises, and the increasingly heated rhetoric between Trump and Kim Jong-un of North Korea about threats of nuclear conflict.
Under the surface, though, there were significant divergences between market segments and industry sectors. Most notably, growth stocks outperformed value significantly, and small caps had the edge over large caps. Among sectors, tech was the leader, led by companies such as Alphabet (Google), Facebook and Amazon. Financials also outperformed, as bank stocks rose on expectations for improving profitability from deregulation and higher lending margins from a steepening yield curve. In fact, 3-month Treasury rates climbed from 0.3% to 1.1% during the fiscal year, while 10-year yields increased from 1.8% to nearly 2.4%. In contrast to tech and financials, telecoms were down, and energy struggled to eke out a single-digit gain.
PERFORMANCE AND POSITIONING REVIEW
Regarding the Fund’s performance attribution by strategy, long-biased equity funds contributed the most to performance. Global/international equities, discretionary macro, U.S. multi-asset hedged,
strategic fixed income, arbitrage, and option funds also were positive. In contrast, hedged equity funds were slightly negative due to headwinds from short selling. Managed futures funds were also slightly negative, as traders faced several trend reversals in currencies, rates and commodities.
Equity-related funds have continued to be the core of the Fund, with an allocation of 45% at the end of the fiscal year, a modest increase from 41% a year earlier. This broad category encompasses a diverse mix of long-biased, hedged and multi-asset funds, as well as global/international equities, which we doubled during the year. Global macro, which includes discretionary and systematic approaches, was the next largest fund allocation at 21%. Alternative fixed income funds accounted for 15%, while convertible arbitrage/merger arbitrage funds were 15%.
The views expressed represent the opinions of Lake Partners Inc., as of October 31, 2017, and are not intended as a forecast or guarantee of future results and are subject to change without notice.
91
AMG Managers Lake Partners LASSO Alternatives Fund
Portfolio Manager’s Comments (continued)
CUMULATIVE TOTAL RETURN PERFORMANCE
The AMG Managers Lake Partners LASSO Alternatives Fund’s cumulative total return is based on the daily change in net asset value (NAV), and assumes that all dividends and distributions were reinvested. The graph compares a hypothetical $10,000 investment made in AMG Managers Lake Partners LASSO Alternatives Fund’s Class I shares on March 3, 2010, to a $10,000 investment made in the HFRX Equity Hedge Index for the same time period. The graph and table do not reflect the deduction of taxes that a shareholder would pay on a Fund distribution or redemption of shares. The listed returns for the Fund are net of expenses and the returns for the index exclude expenses. Total returns would have been lower had certain expenses not been reduced.
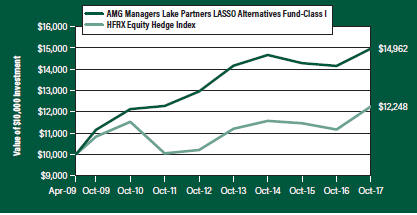
The table below shows the average annual total returns for AMG Managers Lake Partners LASSO Alternatives Fund and the HFRX Equity Hedge Index for the same time periods ended October 31, 2017.
| | | | | | | | | | | | | | | | |
| | | One | | | Five | | | Since | | | Inception | |
| Average Annual Total Returns1 | | Year | | | Years | | | Inception | | | Date | |
AMG Managers Lake Partners LASSO Alternatives Fund2,3,4,5,6,7,8,9 | | | | | | | | | | | | | | | | |
Class N | | | 5.51 | % | | | 2.66 | % | | | 3.11 | % | | | 03/03/10 | |
Class I | | | 5.74 | % | | | 2.93 | % | | | 4.81 | % | | | 04/01/09 | |
HFRX Equity Hedge Index10 | | | 9.69 | % | | | 3.72 | % | | | 2.39 | % | | | 04/01/09 | † |
The performance data shown represents past performance. Past performance is not a guarantee of future results. Current performance may be lower or higher than the performance data quoted. The investment return and principal value of an investment will fluctuate so that an investor’s shares, when redeemed, may be worth more or less than their original cost.
Investors should carefully consider the Fund’s investment objectives, risks, charges and expenses before investing. For performance information through the most recent month end, current net asset values per share for the Fund and other information, please call 800.835.3879 or visit our website at amgfunds.com for a free prospectus. Read it carefully before investing or sending money.
Distributed by AMG Distributors, Inc., member FINRA/SIPC.
| † | Date reflects the inception date of the Fund, not the index. |
| 1 | Total return equals income yield plus share price change and assumes reinvestment of all dividends and capital gain distributions. Returns are net of fees and may reflect offsets of Fund expenses as described in the prospectus. No adjustment has been made for taxes payable by shareholders on their reinvested dividends and capital gain distributions. Returns for periods greater than one year are annualized. The listed returns on the Fund are net of expenses and based on the published NAV as of October 31, 2017. All returns are in U.S. dollars ($). |
| 2 | The Fund may suffer significant losses on assets that it sells short. Unlike the possible loss on a security that is purchased, there is no limit on the amount of loss on an appreciating security that is sold short. |
| 3 | Alternative investments are speculative, subject to high return volatility and involve aggressive investment techniques and a high degree of risk including, but not limited to, the risks associated with leverage, derivative instruments such as options and futures, commodities, and distressed securities may be illiquid on a long term basis and short sales. There can be no assurance that these types of strategies will achieve their objectives or avoid substantial losses. |
| 4 | The Fund is subject to currency risk resulting from fluctuations in exchange rates that may affect the total loss or gain on a non-U.S. Dollar investment when converted back to U.S. Dollars. |
| 5 | The Fund is subject to the risks associated with investments in debt securities, such as default risk and fluctuations in the perception of the debtor’s ability to pay its creditors. Changing interest rates may adversely affect the value of an investment. An increase in interest rates typically causes the value of bonds and other fixed income securities to fall. |
| 6 | The Fund may invest in derivatives such as options and futures; the complexity and rapidly changing structure of derivatives markets may increase the possibility of market losses. |
| 7 | A greater percentage of the Fund’s holdings may be focused in a smaller number of securities which may place the Fund at greater risk than a more diversified fund. |
| 8 | The Fund is subject to the risks of any underlying fund in which the Fund invests. There are expenses associated with the underlying funds in addition to the Fund’s expenses. |
| 9 | Investments in international securities are subject to certain risks of overseas investing including currency fluctuations and changes in political and economic conditions, which could result in significant market fluctuations. |
| 10 | The HFRX Equity Hedge Index is an unmanaged index designed to measure daily performance representative of long-short equity hedge funds. Source: Hedge Fund Research, Inc. (HFR). Indices are adjusted for the reinvestment of capital gains, income, and dividends. Unlike the Fund, the HFRX Equity Hedge Index is unmanaged, is not available for investment and does not incur expenses. |
Not FDIC insured, nor bank guaranteed. May lose value.
92
| | |
| AMG Managers Lake Partners LASSO Alternatives Fund | | October 31, 2017 |
| Fund Snapshots (unaudited) | | |
PORTFOLIO BREAKDOWN
| | | | |
Category | | % of
Net Assets | |
Investment Companies | | | 82.6 | |
Exchange Traded Funds | | | 13.3 | |
Other Assets Less Liabilities | | | 4.1 | |
TOP TEN HOLDINGS
| | | | |
Security Name | | % of
Net Assets | |
Western Asset Macro Opportunities Fund, Class IS | | | 7.5 | |
PIMCO Mortgage Opportunities Fund, Institutional Class | | | 7.4 | |
Metropolitan West Unconstrained Bond Fund, Class I | | | 7.4 | |
Boston Partners Long/Short Equity Fund, Institutional Class | | | 7.4 | |
Otter Creek Long/Short Opportunity Fund, Institutional Class | | | 7.3 | |
ProShares Large Cap Core Plus | | | 5.9 | |
Abbey Capital Futures Strategy Fund, Class I | | | 5.0 | |
Neuberger Berman US Equity Index PutWrite Strategy Fund, Institutional Class | | | 4.9 | |
Calamos Market Neutral Income Fund, Class I | | | 4.9 | |
Kellner Merger Fund, Institutional Class | | | 4.9 | |
| | | | |
Top Ten as a Group | | | 62.6 | |
| | | | |
Because a fund’s strategy may result in multiple investments in particular sectors of the economy, its performance may depend on the performance of those sectors and may fluctuate more widely than investments diversified across more sectors. For additional information on these and other risk considerations, please see the Fund’s prospectus.
Any sectors, industries, or securities discussed should not be perceived as investment recommendations. Mention of a specific security should not be considered a recommendation to buy or solicitation to sell that security. Specific securities mentioned in this report may have been sold from the Fund’s portfolio of investments by the time you receive this report.
93
| | |
| AMG Managers Lake Partners LASSO Alternatives Fund | | October 31, 2017 |
| |
| Schedule of Portfolio Investments | | |
| | | | | | | | |
| | | Shares | | | Value | |
Investment Companies – 82.6% | | | | | | | | |
Long/Short Strategies – 32.1% | | | | | | | | |
361 Global Long/Short Equity Fund, Class Y | | | 197,380 | | | $ | 2,413,960 | |
Balter European L/S Small Cap Fund, Institutional Class* | | | 121,923 | | | | 1,422,835 | |
Boston Partners Long/Short Equity Fund, Institutional Class* | | | 170,616 | | | | 3,690,425 | |
Diamond Hill Long-Short Fund, Class I* | | | 105 | | | | 2,752 | |
FPA Crescent Fund | | | 69,560 | | | | 2,451,299 | |
Neuberger Berman US Equity Index PutWrite Strategy Fund, Institutional Class | | | 216,947 | | | | 2,458,010 | |
Otter Creek Long/Short Opportunity Fund, Institutional Class* | | | 313,002 | | | | 3,646,469 | |
Total Long/Short Strategies | | | | | | | 16,085,750 | |
Strategic Fixed Income – 14.8% | | | | | | | | |
Metropolitan West Unconstrained Bond Fund, Class I | | | 309,789 | | | | 3,711,276 | |
PIMCO Mortgage Opportunities Fund, Institutional Class | | | 332,739 | | | | 3,716,698 | |
Total Strategic Fixed Income | | | | | | | 7,427,974 | |
Arbitrage – 14.7% | | | | | | | | |
Calamos Market Neutral Income Fund, Class I | | | 185,321 | | | | 2,457,350 | |
Kellner Merger Fund, Institutional Class | | | 225,793 | | | | 2,454,375 | |
Touchstone Arbitrage Fund, Institutional Class | | | 235,837 | | | | 2,450,349 | |
Total Arbitrage | | | | | | | 7,362,074 | |
Managed Futures – 13.5% | | | | | | | | |
361 Global Managed Futures Strategy Fund, Institutional Class | | | 154,847 | | | | 1,788,487 | |
Abbey Capital Futures Strategy Fund, Class I* | | | 217,310 | | | | 2,496,895 | |
| * | Non-income producing security. |
| 1 | Yield shown represents the October 31, 2017, seven day average yield, which refers to the sum of the previous seven days’ dividends paid, expressed as an annual percentage. |
| | | | | | | | |
| | | Shares | | | Value | |
Credit Suisse Managed Futures Strategy Fund, Class I | | | 233,294 | | | $ | 2,447,250 | |
Total Managed Futures | | | | | | | 6,732,632 | |
Global Macro – 7.5% | | | | | | | | |
Western Asset Macro Opportunities Fund, Class IS | | | 318,495 | | | | 3,767,797 | |
Total Investment Companies
(cost $ 39,242,308) | | | | | | | 41,376,227 | |
Exchange Traded Funds – 13.3% | | | | | | | | |
Long/Short Strategies – 8.5% | | | | | | | | |
ProShares Large Cap Core Plus | | | 46,635 | | | | 2,973,914 | |
WisdomTree Dynamic Long/Short U.S. Equity Fund | | | 41,825 | | | | 1,301,372 | |
Total Long/Short Strategies | | | | | | | 4,275,286 | |
Hedged International Equity – 4.8% | | | | | | | | |
Wisdomtree Dynamic Currency Hedged International Equity Fund, Institutional Class | | | 79,260 | | | | 2,397,615 | |
Total Exchange Traded Funds
(cost $ 5,893,886) | | | | | | | 6,672,901 | |
Other Investment Companies – 4.8% | | | | | | | | |
Money Market Fund – 4.8% | | | | | | | | |
Dreyfus Institutional Preferred Government Money Market Fund, Institutional Class Shares, 1.00%1 | | | 2,404,538 | | | | 2,404,538 | |
Total Investments – 100.7%
(cost $47,540,732) | | | | | | $ | 50,453,666 | |
Other Assets, less Liabilities – (0.7%) | | | | | | | (329,034 | ) |
Net Assets – 100.0% | | | | | | $ | 50,124,632 | |
The accompanying notes are an integral part of these financial statements.
94
| | |
| AMG Managers Lake Partners LASSO Alternatives Fund | | |
| |
| Schedule of Portfolio Investments (continued) | | |
The following table summarizes the inputs used to value the Fund’s investments by the fair value hierarchy levels as of October 31, 2017:
| | | | | | | | | | | | | | | | |
| | | Level 1 | | | Level 2 | | | Level 3 | | | Total | |
Investments in Securities | | | | | | | | | | | | | | | | |
Investment Companies† | | $ | 41,376,227 | | | | — | | | | — | | | $ | 41,376,227 | |
Exchange Traded Funds | | | 6,672,901 | | | | — | | | | — | | | | 6,672,901 | |
Short-Term Investments | | | 2,404,538 | | | | — | | | | — | | | | 2,404,538 | |
| | | | | | | | | | | | | | | | |
Total Investments in Securities | | $ | 50,453,666 | | | | — | | | | — | | | $ | 50,453,666 | |
| | | | | | | | | | | | | | | | |
| † | All investment companies and exchange traded funds held in the Fund are level 1 securities. For a detailed listing of these securities, please refer to the Fund’s Schedule of Portfolio Investments. |
As of October 31, 2017, the Fund had no transfers between levels from the beginning of the reporting period.
The accompanying notes are an integral part of these financial statements.
95
| | |
| AMG River Road Long-Short Fund | | |
| Portfolio Manager’s Comments (unaudited) | | |
OVERVIEW
For the fiscal year ended October 31, 2017, the AMG River Road Long-Short Fund (the “Fund”) Class N shares returned 11.69%, underperforming the 23.98% return for the Russell 3000® Index. The secondary benchmark, which is a blend of 50% Russell 3000®/ICE 50% BofA Merrill Lynch U.S. T-Bill (0-3 month), returned 11.81%. During the period, the Fund captured 56% of the market’s return with 58% average net market exposure.
PERFORMANCE REVIEW AND POSITIONING
The holdings with the largest positive contribution to total return during the period were HollyFrontier Corp (HFC, long), Spirit AeroSystems Holdings Inc. (SPR, long), and Alphabet Inc. (GOOG, long). HollyFrontier is an independent petroleum refiner
that benefited from widening crack spreads as a result of Hurricane Harvey impacting 15% of the country’s refining capacity. Spirit Aerosystems is a leading aerospace supplier. SPR rose after it announced an end to the longstanding negotiation with Boeing. Alphabet manages the largest search engine in the world. GOOG increased as the company continued to report significant top- and bottom-line growth.
The holdings with the largest negative contribution to the Fund’s total return were Vista Outdoor Inc. (VSTO, long), Diamond Offshore Drilling Inc. (DO, long), and Hudson’s Bay Co. (*HBC, long). VSTO is an outdoor sports manufacturer that declined as retail trends for its shooting products accelerated to the downside. Diamond Offshore Drilling is an offshore drilling service provider. DO declined as low commodity prices weighed on E&P plans to drill
offshore. Hudson’s Bay is a luxury and upper middle-market department store. *HBC declined as falling traffic resulted in lower profitability.
The Fund ended October within its normal net market exposure range (50-70%) at 62%. The Fund’s largest sector exposures on the long side were in consumer discretionary 34.1%, financials 19.4% and information technology 12.6%. The Fund’s largest sector exposures on the short side were in consumer discretionary (-9.9%), industrials (-6.4%) and materials (-3.8%).
The views expressed represent the opinions of River Road Asset Management LLC, as of October 31, 2017, and are not intended as a forecast or guarantee of future results and are subject to change without notice.
96
AMG River Road Long-Short Fund
Portfolio Manager’s Comments (continued)
CUMULATIVE TOTAL RETURN PERFORMANCE
The AMG River Road Long-Short Fund’s cumulative total return is based on the daily change in net asset value (NAV), and assumes that all dividends and distributions were reinvested. The graph compares a hypothetical $10,000 investment made in AMG River Road Long-Short Fund’s Class N shares on May 4, 2011, to a $10,000 investment made in the Russell 3000® Index and the 50% Russell 3000®/50% ICE BofA Merrill Lynch U.S. T-Bill (0-3 mo) for the same time period. The graph and table do not reflect the deduction of taxes that a shareholder would pay on a Fund distribution or redemption of shares. The listed returns for the Fund are net of expenses and the returns for the index exclude expenses. Total returns would have been lower had certain expenses not been reduced.
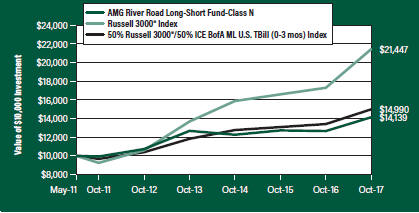
The table below shows the average annual total returns for the AMG River Road Long-Short Fund, Russell 3000® Index and the 50% Russell 3000®/50% ICE BofA Merrill Lynch U.S. T-Bill (0-3) mo) Index for the same time periods ended October 31, 2017.
| | | | | | | | | | | | | | | | |
| | | One | | | Five | | | Since | | | Inception | |
| Average Annual Total Returns1 | | Year | | | Years | | | Inception | | | Date | |
AMG River Road Long-Short Fund2,3,4,5,6,7, 8 | | | | | | | | | | | | | | | | |
Class N | | | 11.69 | % | | | 5.67 | % | | | 5.48 | % | | | 05/04/11 | |
Class I | | | 11.93 | % | | | — | | | | 4.68 | % | | | 03/04/13 | |
Class Z | | | — | | | | — | | | | (0.32 | %) | | | 09/29/17 | |
Russell 3000® Index9,11 | | | 23.98 | % | | | 15.12 | % | | | 12.46 | % | | | 05/04/11 | † |
50% Russell 3000®/50% ICE BofA Merrill Lynch U.S. T-Bill (0-3 mo)10,11 | | | 11.81 | % | | | 7.61 | % | | | 6.43 | % | | | 05/04/11 | † |
The performance data shown represents past performance. Past performance is not a guarantee of future results. Current performance may be lower or higher than the performance data quoted. The investment return and principal value of an investment will fluctuate so that an investor’s shares, when redeemed, may be worth more or less than their original cost.
Investors should carefully consider the Fund’s investment objectives, risks, charges and expenses before investing. For performance information through the most recent month end, current net asset values per share for the Fund and other information, please call 800.835.3879 or visit our website at amgfunds.com for a free prospectus. Read it carefully before investing or sending money.
Distributed by AMG Distributors, Inc., member FINRA/SIPC.
| † | Date reflects the inception date of the Fund, not the index. |
| 1 | Total return equals income yield plus share price change and assumes reinvestment of all dividends and capital gain distributions. Returns are net of fees and may reflect offsets of Fund expenses as described in the prospectus. No adjustment has been made for taxes payable by shareholders on their reinvested dividends and capital gain distributions. Returns for periods greater than one year are annualized. The listed returns on the Fund are net of expenses and based on the published NAV as of October 31, 2017. All returns are in U.S. dollars ($). |
| 2 | The Fund may suffer significant losses on assets that it sells short. Unlike the possible loss on a security that is purchased, there is no limit on the amount of loss on an appreciating security that is sold short. |
| 3 | Active and frequent trading of a fund may result in higher transaction costs and increased tax liability. |
| 4 | The Fund may invest in derivatives such as options and futures; the complexity and rapidly changing structure of derivatives markets may increase the possibility of market losses. |
| 5 | A greater percentage of the Fund’s holdings may be focused in a smaller number of securities which may place the Fund at greater risk than a more diversified fund. |
| 6 | Investments in international securities are subject to certain risks of overseas investing including currency fluctuations and changes in political and economic conditions, which could result in significant market fluctuations. These risks are magnified in emerging markets. |
| 7 | The Fund is subject to special risk considerations similar to those associated with the direct ownership of real estate. Real estate valuations may be subject to factors such as changing general and local economic, financial, competitive, and environmental conditions. |
| 8 | The Fund invests in value stocks, which may perform differently from the market as a whole and may be undervalued by the market for a long period of time. |
| 9 | The Russell 3000® Index is composed of the 3,000 largest U.S. companies as measured by market capitalization, and represents about 98% of the U.S. stock market. |
| 10 | The secondary benchmark is composed of 50% Russell 3000® Index and 50% ICE BofA Merrill Lynch U.S. T-Bill (0-3 mo). The 50% ICE BofA Merrill Lynch 0-3 Month US Treasury Index is a subset of The Bank of America Merrill Lynch 0-1 Year US Treasury Index including all securities with a remaining term to final maturity less than 3 months. |
| 11 | Unlike the Fund, the indices are unmanaged, are not available for investment and do not incur expenses. |
The Russell Indices are a trademark of London Stock Exchange Group companies.
Not FDIC insured, nor bank guaranteed. May lose value.
97
| | |
| AMG River Road Long-Short Fund | | October 31, 2017 |
| Fund Snapshots (unaudited) | | |
PORTFOLIO BREAKDOWN
| | | | |
Sector | | % of
Net Assets | |
Long Investments: | | | | |
Consumer Discretionary | | | 34.1 | |
Financials | | | 19.4 | |
Information Technology | | | 12.6 | |
Health Care | | | 11.4 | |
Consumer Staples | | | 6.0 | |
Industrials | | | 5.6 | |
Energy | | | 4.3 | |
Real Estate | | | 3.8 | |
Short Investments: | | | | |
Consumer Discretionary | | | (9.9 | ) |
Industrials | | | (6.4 | ) |
Materials | | | (3.8 | ) |
Financials | | | (3.7 | ) |
Real Estate | | | (2.6 | ) |
Consumer Staples | | | (1.7 | ) |
Exchange Traded Funds | | | (1.6 | ) |
Information Technology | | | (1.5 | ) |
Telecommunication Services | | | (1.4 | ) |
Utilities | | | (1.3 | ) |
Energy | | | (0.8 | ) |
Health Care | | | (0.8 | ) |
Other Assets Less Liabilities* | | | 38.3 | |
| * | Includes investments in short-term investments and cash proceeds on securities sold transactions held at the Prime Broker. |
TOP TEN HOLDINGS
| | | | |
Security Name | | % of
Net Assets | |
Liberty Ventures, Class A | | | 6.1 | |
McKesson Corp. | | | 5.0 | |
Alphabet, Inc., Class C | | | 5.0 | |
Berkshire Hathaway, Inc., Class B | | | 4.9 | |
Comcast Corp., Class A | | | 4.9 | |
Nestle SA, Sponsored ADR, 2.284% | | | 4.0 | |
Premier, Inc., Class A | | | 4.0 | |
Liberty Media Corp-Liberty SiriusXM, Class C | | | 3.8 | |
Nielsen Holdings PLC | | | 3.7 | |
Brookfield Asset Management, Inc., Class A | | | 3.4 | |
| | | | |
Top Ten as a Group | | | 44.8 | |
| | | | |
Because a fund’s strategy may result in multiple investments in particular sectors of the economy, its performance may depend on the performance of those sectors and may fluctuate more widely than investments diversified across more sectors. For additional information on these and other risk considerations, please see the Fund’s prospectus.
Any sectors, industries, or securities discussed should not be perceived as investment recommendations. Mention of a specific security should not be considered a recommendation to buy or solicitation to sell that security. Specific securities mentioned in this report may have been sold from the Fund’s portfolio of investments by the time you receive this report.
98
| | |
| AMG River Road Long-Short Fund | | October 31, 2017 |
| |
| Schedule of Portfolio Investments | | |
| | | | | | | | |
| | | Shares | | | Value | |
Common Stocks – 97.2% | | | | | | | | |
Consumer Discretionary – 34.1% | | | | | | | | |
Advance Auto Parts, Inc. 1 | | | 9,674 | | | $ | 790,753 | |
Asbury Automotive Group, Inc. *,1 | | | 18,264 | | | | 1,121,409 | |
Biglari Holdings, Inc. *,1 | | | 2,946 | | | | 1,053,018 | |
Comcast Corp., Class A 1 | | | 46,998 | | | | 1,693,338 | |
Liberty Global PLC Lilac Group, Class C (United Kingdom)*,1 | | | 37,761 | | | | 830,742 | |
Liberty Media Corp-Liberty SiriusXM, Class C *,1 | | | 31,478 | | | | 1,311,059 | |
Liberty Ventures, Class A *,1 | | | 37,100 | | | | 2,113,216 | |
Papa John’s International, Inc. | | | 10,223 | | | | 695,675 | |
Quebecor, Inc., Class B (Canada) | | | 13,723 | | | | 517,817 | |
Target Corp. 1 | | | 8,627 | | | | 509,338 | |
The TJX Cos., Inc. | | | 9,957 | | | | 694,999 | |
TRI Pointe Group, Inc. *,1 | | | 24,733 | | | | 437,527 | |
Total Consumer Discretionary | | | | | | | 11,768,891 | |
Consumer Staples – 6.0% | | | | | | | | |
CVS Health Corp. 1 | | | 9,929 | | | | 680,434 | |
Nestle SA, Sponsored ADR (Switzerland)1 | | | 16,561 | | | | 1,394,933 | |
Total Consumer Staples | | | | | | | 2,075,367 | |
Energy – 4.3% | | | | | | | | |
HollyFrontier Corp. 1 | | | 16,440 | | | | 607,458 | |
Marathon Petroleum Corp. 1 | | | 14,700 | | | | 878,178 | |
Total Energy | | | | | | | 1,485,636 | |
Financials – 19.4% | | | | | | | | |
Berkshire Hathaway, Inc., Class B *,1 | | | 9,151 | | | | 1,710,688 | |
The Blackstone Group LP, MLP 1 | | | 34,283 | | | | 1,141,281 | |
Brookfield Asset Management, Inc., Class A (Canada)1 | | | 27,687 | | | | 1,161,193 | |
Oaktree Capital Group LLC, MLP 1 | | | 24,202 | | | | 1,108,452 | |
Oaktree Specialty Lending Corp. 1 | | | 109,171 | | | | 634,283 | |
Wells Fargo & Co. 1 | | | 17,124 | | | | 961,341 | |
Total Financials | | | | | | | 6,717,238 | |
Health Care – 11.4% | | | | | | | | |
DaVita, Inc. *,1 | | | 13,982 | | | | 849,267 | |
McKesson Corp. 1 | | | 12,581 | | | | 1,734,668 | |
Premier, Inc., Class A *,1 | | | 41,898 | | | | 1,368,808 | |
Total Health Care | | | | | | | 3,952,743 | |
Industrials – 5.6% | | | | | | | | |
General Electric Co. | | | 33,415 | | | | 673,646 | |
Nielsen Holdings PLC 1 | | | 34,307 | | | | 1,271,761 | |
Total Industrials | | | | | | | 1,945,407 | |
Information Technology – 12.6% | | | | | | | | |
Alphabet, Inc., Class C *,1 | | | 1,690 | | | | 1,718,122 | |
| | | | | | | | |
| | | Shares | | | Value | |
Blackhawk Network Holdings, Inc. *,1 | | | 29,790 | | | $ | 1,011,370 | |
Cars.com, Inc. *,1 | | | 31,674 | | | | 754,475 | |
Conduent, Inc. *,1 | | | 55,197 | | | | 854,449 | |
Total Information Technology | | | | | | | 4,338,416 | |
Real Estate – 3.8% | | | | | | | | |
Alexander & Baldwin, Inc. 1 | | | 19,396 | | | | 877,475 | |
Realogy Holdings Corp., REIT 1 | | | 13,167 | | | | 425,689 | |
Total Real Estate | | | | | | | 1,303,164 | |
Total Common Stocks
(Cost $31,493,129) | | | | | | | 33,586,862 | |
Short-Term Investments – 53.4% | | | | | | | | |
Other Investment Companies – 53.4% | | | | | | | | |
Dreyfus Government Cash Management Fund, Institutional Class Shares, 0.93%2 | | | 10,104,107 | | | | 10,104,107 | |
JP Morgan U.S Government Money Market Fund, 0.95%2 | | | 396,995 | | | | 396,995 | |
Dreyfus Institutional Preferred Government Money Market Fund, Institutional Class Shares, 1.00%2 | | | 7,981,511 | | | | 7,981,511 | |
Total Short-Term Investments
(Cost $18,482,613) | | | | | | | 18,482,613 | |
Total Investments – 150.6%
(Cost $49,975,742) | | | | | | | 52,069,475 | |
Short Sales – (35.5%)3 | | | | | | | | |
Common Stocks – (33.9%) | | | | | | | | |
Consumer Discretionary – (9.9%) | | | | | | | | |
Aaron’s, Inc. | | | (6,612 | ) | | | (243,322 | ) |
Burlington Stores, Inc. * | | | (1,894 | ) | | | (177,828 | ) |
The Cato Corp., Class A | | | (26,252 | ) | | | (337,601 | ) |
Dave & Buster’s Entertainment, Inc. * | | | (4,984 | ) | | | (240,229 | ) |
Foot Locker, Inc. | | | (10,393 | ) | | | (312,621 | ) |
Gannett Co., Inc. | | | (42,428 | ) | | | (369,123 | ) |
La-Z-Boy, Inc. | | | (12,877 | ) | | | (347,035 | ) |
The Michaels Co., Inc. * | | | (15,350 | ) | | | (298,097 | ) |
Party City Holdco, Inc. * | | | (23,031 | ) | | | (256,796 | ) |
Regis Corp. * | | | (13,395 | ) | | | (199,987 | ) |
Whirlpool Corp. | | | (2,032 | ) | | | (333,106 | ) |
WideOpenWest, Inc. * | | | (23,320 | ) | | | (298,263 | ) |
Total Consumer Discretionary | | | | | | | (3,414,008 | ) |
Consumer Staples – (1.7%) | | | | | | | | |
Conagra Brands, Inc. | | | (10,103 | ) | | | (345,119 | ) |
Energizer Holdings, Inc. | | | (5,967 | ) | | | (256,521 | ) |
Total Consumer Staples | | | | | | | (601,640 | ) |
Energy – (0.8%) | | | | | | | | |
Core Laboratories, N.V. (Netherlands) | | | (2,967 | ) | | | (296,403 | ) |
The accompanying notes are an integral part of these financial statements.
99
| | |
| AMG River Road Long-Short Fund | | |
| |
| Schedule of Portfolio Investments (continued) | | |
| | | | | | | | |
| | | Shares | | | Value | |
Financials – (3.7%) | | | | | | | | |
Amtrust Financial Services, Inc. | | | (23,687 | ) | | $ | (297,509 | ) |
Mercury General Corp. | | | (6,075 | ) | | | (340,018 | ) |
Popular, Inc. (Puerto Rico) | | | (9,624 | ) | | | (353,008 | ) |
SLM Corp. * | | | (27,660 | ) | | | (292,919 | ) |
Total Financials | | | | | | | (1,283,454 | ) |
Health Care – (0.8%) | | | | | | | | |
Horizon Pharma PLC * | | | (13,553 | ) | | | (183,778 | ) |
Mallinckrodt PLC (United Kingdom)* | | | (2,710 | ) | | | (85,826 | ) |
Total Health Care | | | | | | | (269,604 | ) |
Industrials – (6.4%) | | | | | | | | |
ACCO Brands Corp. * | | | (26,445 | ) | | | (345,107 | ) |
American Airlines Group, Inc. | | | (7,531 | ) | | | (352,601 | ) |
Knight-Swift Transportation Holdings, Inc. * | | | (4,148 | ) | | | (171,935 | ) |
Pitney Bowes, Inc. | | | (41,534 | ) | | | (570,677 | ) |
Quad/Graphics, Inc. | | | (18,198 | ) | | | (414,733 | ) |
Snap-on, Inc. | | | (2,339 | ) | | | (369,047 | ) |
Total Industrials | | | | | | | (2,224,100 | ) |
Information Technology – (1.5%) | | | | | | | | |
International Business Machines Corp. | | | (3,278 | ) | | | (505,009 | ) |
Materials – (3.8%) | | | | | | | | |
Ball Corp. | | | (8,775 | ) | | | (376,711 | ) |
Domtar Corp. | | | (7,361 | ) | | | (348,322 | ) |
Freeport-McMoRan, Inc. * | | | (18,044 | ) | | | (252,255 | ) |
Teck Resources, Ltd., Class B (Canada) | | | (15,884 | ) | | | (324,669 | ) |
Total Materials | | | | | | | (1,301,957 | ) |
Real Estate – (2.6%) | | | | | | | | |
Boardwalk Real Estate Investment Trust, REIT (Canada) | | | (10,743 | ) | | | (331,508 | ) |
| | | | | | | | |
| | | Shares | | | Value | |
Canadian Apartment Properties REIT, REIT (Canada) | | | (11,835 | ) | | $ | (312,548 | ) |
Pennsylvania Real Estate Investment Trust, REIT | | | (25,506 | ) | | | (247,919 | ) |
Total Real Estate | | | | | | | (891,975 | ) |
Telecommunication Services – (1.4%) | | | | | | | | |
Consolidated Communications Holdings, Inc. | | | (25,862 | ) | | | (495,775 | ) |
Utilities – (1.3%) | | | | | | | | |
American Water Works Co., Inc. | | | (1,985 | ) | | | (174,204 | ) |
Consolidated Edison, Inc. | | | (3,122 | ) | | | (268,648 | ) |
Total Utilities | | | | | | | (442,852 | ) |
Total Common Stocks
(Proceeds $11,824,193) | | | | | | | (11,726,777 | ) |
Exchange Traded Funds – (1.6%) | | | | | | | | |
United States Natural Gas Fund LP* | | | (25,605 | ) | | | (153,118 | ) |
United States Oil Fund LP* | | | (36,099 | ) | | | (394,562 | ) |
Total Exchange Traded Funds (Proceeds $555,803) | | | | | | | (547,680 | ) |
Total Short Sales – (35.5%)
(Proceeds $12,379,996) | | | | | | | (12,274,457 | ) |
Other Assets, less Liabilities – (15.1)% | | | | | | | (5,232,500 | ) |
Net Assets – 100.0% | | | | | | $ | 34,562,518 | |
| * | Non-income producing security. |
| 1 | Security position is either entirely or partially held in a segregated account as collateral for securities sold short. As of October 31, 2017, $29,998,231 in securities was segregated to cover short sales. |
| 2 | Yield shown represents the October 31, 2017, seven day average yield, which refers to the sum of the previous seven days’ dividends paid, expressed as an annual percentage. |
| 3 | The Fund is contractually responsible to the lender for any dividends payable and interest accrued on securities while those securities are outstanding in short position. These dividends and interest amounts are recorded as dividend expense on the Statement of Operations. |
| | |
| ADR | | American Depositary Receipt |
| LP | | Limited Partnership |
| MLP | | Master Limited Partnership |
| REIT | | Real Estate Investment Trust |
The accompanying notes are an integral part of these financial statements.
100
| | |
| AMG River Road Long-Short Fund | | |
| |
| Schedule of Portfolio Investments (continued) | | |
The following table summarizes the inputs used to value the Fund’s investments by the fair value hierarchy levels as of October 31, 2017:
| | | | | | | | | | | | | | | | |
| | | Level 1 | | | Level 2 | | | Level 3 | | | Value | |
Investments in Securities | | | | | | | | | | | | | | | | |
Assets | | | | | | | | | | | | | | | | |
Common Stocks† | | $ | 33,586,862 | | | | — | | | | — | | | $ | 33,586,862 | |
Short-Term Investments | | | | | | | | | | | | | | | | |
Other Investment Companies | | | 18,482,613 | | | | — | | | | — | | | | 18,482,613 | |
| | | | | | | | | | | | | | | | |
Total Assets | | | 52,069,475 | | | | — | | | | — | | | | 52,069,475 | |
| | | | | | | | | | | | | | | | |
Liabilities | | | | | | | | | | | | | | | | |
Common Stocks† | | | (11,726,777 | ) | | | — | | | | — | | | | (11,726,777 | ) |
Exchange Traded Funds†† | | | (547,680 | ) | | | — | | | | — | | | | (547,680 | ) |
| | | | | | | | | | | | | | | | |
Total Liabilities | | | (12,274,457 | ) | | | — | | | | — | | | | (12,274,457 | ) |
| | | | | | | | | | | | | | | | |
Net Investments in Securities | | $ | 39,795,018 | | | | — | | | | — | | | $ | 39,795,018 | |
| | | | | | | | | | | | | | | | |
| † | All common stocks held in the Fund are Level 1 securities. For a detailed breakout of common stocks by major industry classification, please refer to the Fund’s Schedule of Portfolio Investments. |
| †† | All exchange traded funds and exchange traded notes held in the Fund are level 1 securities. For a detailed listing of these securities, please refer to the Fund’s Schedule of Portfolio Investments. |
As of October 31, 2017, the Fund had no transfers between levels from the beginning of the reporting period.
The accompanying notes are an integral part of these financial statements.
101
AMG Managers Guardian Capital Global Dividend Fund
Portfolio Manager’s Comments (unaudited)
The AMG Managers Guardian Capital Global Dividend Fund (the “Fund”) Class N shares returned 20.51% for the fiscal year ended October 31, 2017, compared with a 22.77% return for its benchmark, the MSCI World Index.
GLOBAL MARKETS REVIEW
The first half of the year saw historically muted moves in global stock markets (to either the up or downside), and actual market volatility continued to plumb record lows; we have seen just eight days with +/-1% moves so far in 2017, which is the fewest to this point in any year since 1972. During the third quarter the S&P 500® Index set 15 new record highs.
The risk of a destabilizing shock to the system of a ballistic nature loomed large over the summer, but recent months have seen other risks continue to ebb and the backdrop is looking increasingly sanguine across most of the globe. The powers that be in Washington managed to reach a short-term agreement to avoid a government shutdown and potential debt default, although these issues were simply delayed rather than outright resolved.
And while the multitude of hurricanes wreaked havoc on Texas and Florida, “broken windows economics” points to that ultimately proving to be positive from an economic growth standpoint. The net result is that the outlook calls for more of the same: effectively steady underlying growth that will continue to underpin a tightening job market that is already operating at full employment by many metrics, though still not generating much in terms of cost-push inflation.
Europe, which a year ago was viewed as being on the verge of economic collapse against the rising wave of Euroscepticism, continues to see its political backdrop mellow. Indeed, it appears that the events of the first half of this year (most notably the strong mandate won by France’s Emmanuel Macron, but also the defeat of nationalist parties in other elections, including wins in the Netherlands and Italy) have sowed the seeds for greater cohesion among the members of the European Union. Germany’s Angela Merkel, the de facto leader of the bloc, won her fourth term as Chancellor in her country’s federal election on September 24, adding to the increasing political stability in the region.
Elsewhere in Europe, the weakening of Prime Minister Theresa May’s political capital in the aftermath of her electoral humiliation in June has seen her soften her stance and upped the odds of an amicable breakup between the U.K. and the
European Union (EU), although the process is expected to be a long slog, with the early stages of negotiations yielding little so far.
The ongoing uncertainty surrounding the end result of any Brexit deal, however, has left companies unwilling to deploy capital into the British economy, resulting in the lack of business investment providing a drag on growth. The significantly weaker currency has not yet generated a sufficient pickup in U.K. exports to offset this loss.
Farther to the east, despite having to deal with the angst that comes from having the occasional missile fired overhead, the Japanese economy is on a run of sustained growth unlike anything the country has seen in two decades—a run that consensus forecasts show is expected to continue. The concurrent boost in approval ratings for the ruling Liberal Democratic Party underpinned a decision by Prime Minister Shinzō Abe to call a snap election for October 22 designed to strengthen his mandate for reforms (he also announced $18 billion in added macroeconomic stimulus as part of his platform).
Despite the ongoing uncertainty about the relationship with its largest trade partner, the Canadian economy has continued to quietly remain atop of the Developed Market growth league tables thanks to it posting its best two-quarter performance in five years over the first half of the year (and early data for Q3 show the momentum being largely maintained). The outlook, however, is somewhat less robust as Canada’s significant export sector (which accounts for 30% of GDP) will have to grapple with the impact of a stronger currency and the ongoing uncertainty surrounding the outcome of the negotiations related to the North American Free Trade Agreement (the U.S. accounts for 75% of Canada’s exports while Mexico represents another 2%) while the impact of the recent interest rate hikes filters through the domestic economy. A renewed uptick in the commodity space (the energy sector in particular) should help provide some offset.
In the Emerging Market space, China has worked to show itself as a bastion of stability and strength ahead of the upcoming National Congress of the Communist Party of China starting October 18 (where President Xi Jinping is expected to strengthen his hold on power within the Party’s ranks in this five-yearly changing of the guard within the Politburo). The Brazilian central bank is doing its part to support the economy by continuing its campaign of aggressive easing policy; Banco Central do Brazil has slashed its policy rates by 200 basis points over
the last three months. In India, the Modi government continues to make progress on important economic reforms and has seen some renewed verve in its economy following a moderation in growth over the past year.
PERFORMANCE REVIEW
The Fund slightly underperformed the index during the year. The portfolio outperformed in 6 of the 11 sectors led by information technology, health care, real estate, energy and consumer discretionary. Financials, utilities, consumer staples and telecommunication services were the largest detractors from relative performance.
The information technology sector was the largest contributor to relative performance due to positive stock selection. Outperformance in the information technology sector was driven by Tokyo Electron, Broadcom and Analog Devices.
Health care was the second largest contributor to relative performance during the year, primarily as a result of positive stock selection. The portfolio’s holdings in Abbvie, Novo-Nordisk, Amgen and Stryker drove the majority of the outperformance in the health care sector.
Stock selection as well as an underweight position within the real estate sector also contributed to relative performance. Positive contributions came from Icade and Tag Immobilien while Unibail Rodamco slightly detracted.
The financials sector was the largest detractor from relative performance driven by an underweight to the sector as well as stock selection. Swiss Re, Wells Fargo and Westpac Banking were the largest detractors from relative performance. On the positive side JP Morgan, Bank of America and AXA contributed to performance during the year.
The utilities sector also detracted from relative performance due to stock selection and a slight overweight position in the sector. National Grid, SSE, RWE and E.ON were the largest detractors during the year.
The consumer staples sector detracted from relative performance due to an overweight position in the sector. The tobacco cluster was a large driver of the underperformance in the sector with Imperial Brands, Philip Morris and Altria all detracting from relative performance after the FDA announced a comprehensive plan in July 2017 that featured an outline for tobacco related policy and enforcement in the coming decade. We continue to have exposure to
102
AMG Managers Guardian Capital Global Dividend Fund
Portfolio Manager’s Comments (continued)
tobacco stocks because they have strong cash flows, strong market positions and high barriers to entry. Dr Pepper Snapple Group and Kimberley-Clark also detracted during the year.
POSITIONING
Based on the economic backdrop and outlook on economies and valuations, our core view on uses of cash investment recommendations is to own stocks that deploy cash in a shareholder friendly way that reflects the current late stage of the economic cycle of rising interest rates, de-regulation, increased capex and marginal expansion. We look to position in stocks with low price to book values, high cash/assets, strategic M&A/assets ratio, sustainable net buyback yields and growing dividend yields. We continue to emphasize higher yielding names that have the lowest probability of a dividend cut.
The portfolio has an overweight in the yield friendly, defensive sectors, consumer staples (+5.1%), telecommunication services (+4.3%) and utilities (3.4%). Underweight sectors are the consumer discretionary (-5.9%), financials (-5.5%) and health care (-2.0%).
Geographically, the portfolio is overweight Europe (+14.4%) and is underweight Asia & Pacific Basin (-6.4%) and North America (-7.8%). The portfolio does not have a weight in Emerging Markets at this time. The dividend yield at the end of October was 3.25% and the portfolio has a large cap, high-quality bias.
The current market environment requires continued immunization to rising interest rates on a relative basis to our peer group. We continue to increase diversification, finding yield outside of the traditionally defensive sectors favored by our peer group. We have slightly increased exposure to European growth over the year.
OUTLOOK
The macro backdrop is generally improving across the board. Accordingly, the International Monetary Fund (IMF) got out its eraser over the summer and
again revised its estimates of world economic growth—and in contrast to what we have seen over much of the last decade, the revisions were to the high side. As it currently stands, global real GDP growth is expected to accelerate in 2017 (the first uptick in the rate of expansion of the world economy this cycle since the initial snapback in 2010) and the momentum is projected to be sustained into 2018.
A big reason for this upward trajectory is the fact that just as this economic expansion finishes celebrating its eight birthday, more countries are joining the party. All 45 major economies tracked by the Organisation for Economic Co-operation and Development (OECD) are projected to grow in 2017, the first time there has been such a degree of synchronized growth in a decade. Moreover, of the 191 economies tracked by the IMF, 179 are projected to expand this year, also the highest share in a decade—and that tally is expected to continue to increase next year.
Expansions are stronger when they are broadly based because such an environment can help create a “virtuous cycle” of growth—rising demand in one economy creates rising demand for another country’s exports, which in turn supports domestic demand there and further supports more exports. And it is no coincidence that this breadth of synchronized economic improvement comes at a time when growth in global trade flows is accelerating.
But of course, while this broad-based improvement is a positive development—and should be supportive of continued corporate earnings growth and continue to help underpin positive performance in most financial assets—the fact of the matter is that the rate of acceleration in global growth is likely only going to be fairly tepid by historical standards. Absent some sort of catalyst to drive a productivity surge, it is highly unlikely that we will return to growth rates that will rival the tech boom of the
1990s in the foreseeable future. This is because while the breadth of growth is improving, not all growth is created equal.
The major advanced economies are at a stage of industrialization where productivity gains are less dramatic than those earlier in their development and overall economic growth converges with that of the labor force—and on that last point, the underlying demographics of aging populations in these economies enforces a low speed limit. So what we are seeing is a general convergence among growth rates across the world, and the underlying trends are generally shifting lower, albeit with expectations of a further modest uptick among Emerging Market economies thanks simply to more countries expanding.
Our internal analysis does show greater visibility in overall cash flow generation amid greater confidence in extending the length of the duration (duration defined as the summation of both the next-10-years’ visible cash flow plus the long-term assumptions of future cash flow) of stocks. At the industry level, the strongest revenue growth going forward continues to be from global semiconductor stocks predicated on solid non-PC computing/data center demand, ongoing stabilization in PC market driven by corporates). Diversified financials including U.S. based global banks are expected to show strong earnings momentum supported by higher net interest margins and stronger investment banking activity. The weakest growth is expected from telecom due to intense price competition. We feel that maintaining a longer equity duration (supported by earnings growth and greater cash flow visibility) with a strong dividend growth outlook (quality with a fair payout) would outperform a yield chasing strategy.
The views expressed represent the opinions of Guardian Capital LP, as of October 31, 2017, and are not intended as a forecast or guarantee of future results and are subject to change without notice.
103
AMG Managers Guardian Capital Global Dividend Fund
Portfolio Manager’s Comments (continued)
CUMULATIVE TOTAL RETURN PERFORMANCE
The AMG Managers Guardian Capital Global Dividend Fund’s cumulative total return is based on the daily change in net asset value (NAV), and assumes that all dividends and distributions were reinvested. The graph compares a hypothetical $10,000 investment made in AMG Managers Guardian Capital Global Dividend Fund’s Class N shares on April 14, 2014, to a $10,000 investment made in the MSCI World Index for the same time period. The graph and table do not reflect the deduction of taxes that a shareholder would pay on a Fund distribution or redemption of shares. The listed returns for the Fund are net of expenses and the returns for the index exclude expenses. Total returns would have been lower had certain expenses not been reduced.
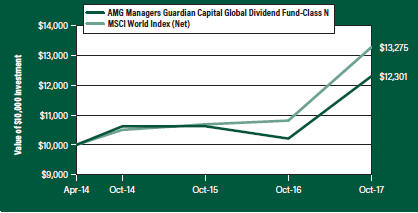
The table below shows the average annual total returns for AMG Managers Guardian Capital Global Dividend Fund and the MSCI World Index for the same time periods ended October 31, 2017.
| | | | | | | | | | | | |
| | | One | | | Since | | | Inception | |
| Average Annual Total Returns1 | | Year | | | Inception | | | Date | |
AMG Managers Guardian Capital Global Dividend Fund2, 3, 4, 5, 6, 7, 8 | | | | | | | | | | | | |
Class N | | | 20.51 | % | | | 6.01 | % | | | 04/14/14 | |
Class I | | | 20.66 | % | | | 6.21 | % | | | 04/14/14 | |
MSCI World Index9, 10 | | | 22.77 | % | | | 8.32 | % | | | 04/14/14 | † |
The performance data shown represents past performance. Past performance is not a guarantee of future results. Current performance may be lower or higher than the performance data quoted. The investment return and principal value of an investment will fluctuate so that an investor’s shares, when redeemed, may be worth more or less than their original cost.
Investors should carefully consider the Fund’s investment objectives, risks, charges and expenses before investing. For performance information through the most recent month end, current net asset values per share for the Fund and other information, please call 800.835.3879 or visit our website at amgfunds.com for a free prospectus. Read it carefully before investing or sending money.
Distributed by AMG Distributors, Inc., member FINRA/SIPC.
| † | Date reflects the inception date of the Fund, not the index. |
| 1 | Total return equals income yield plus share price change and assumes reinvestment of all dividends and capital gain distributions. Returns are net of fees and may reflect offsets of Fund expenses as described in the prospectus. No adjustment has been made for taxes payable by shareholders on their reinvested dividends and capital gain distributions. Returns for periods greater than one year are annualized. The listed returns on the Fund are net of expenses and based on the published NAV as of October 31, 2017. All returns are in U.S. dollars ($). |
| 2 | Investments in international securities are subject to certain risks of overseas investing including currency fluctuations and changes in political and economic conditions, which could result in significant market fluctuations. |
| 3 | The Fund is subject to the risks associated with investments in emerging markets, such as erratic earnings patterns, economic and political instability, changing exchange controls, limitations on repatriation of foreign capital and changes in local governmental attitudes toward private investment, possibly leading to nationalization or confiscation of investor assets. |
| 4 | A short-term redemption fee of 2% will be charged on shares held for less than 90 days. |
| 5 | An issuer of a security may be unwilling or unable to pay income on a security. Common stocks do not assure dividend payments and are paid only when declared by an issuer’s board of directors. |
| 6 | The Fund is subject to risks associated with investments in mid-capitalization companies such as greater price volatility, lower trading volume, and less liquidity than the stocks of larger, more established companies. |
| 7 | The Fund is subject to special risk considerations similar to those associated with the direct ownership of real estate. Real estate valuations may be subject to factors such as changing general and local economic, financial, competitive, and environmental conditions. |
| 8 | The Fund is subject to risks associated with investments in small-capitalization companies, such as erratic earnings patterns, competitive conditions, limited earnings history and a reliance on one or a limited number of products. |
| 9 | The MSCI World Index is a free float-adjusted market capitalization weighted index that is designed to measure the equity market performance of developed markets. The MSCI World Index consists of the following 23 developed market country indices: Australia, Austria, Belgium, Canada, Denmark, Finland, France, Germany, Hong Kong, Ireland, Israel, Italy, Japan, Netherlands, New Zealand, Norway, Portugal, Singapore, Spain, Sweden, Switzerland, the United Kingdom and the United States. Unlike the Fund, the MSCI World Index is unmanaged, is not available for investment and does not incur expenses. |
| 10 | All MSCI data is provided ‘as is.’ The products described herein are not sponsored or endorsed and have not been reviewed or passed on by MSCI. In no event shall MSCI, its affiliates, or any MSCI data provider have any liability of any kind in connection with the MSCI data or the products described herein. Copying or redistributing the MSCI data is strictly prohibited. |
Not FDIC insured, nor bank guaranteed. May lose value.
104
| | |
| AMG Managers Guardian Capital Global Dividend Fund | | October 31, 2017 |
Fund Snapshots (unaudited)
PORTFOLIO BREAKDOWN
| | | | |
Sector | | % of
Net Assets | |
Information Technology | | | 15.8 | |
Consumer Staples | | | 14.0 | |
Industrials | | | 12.6 | |
Financials | | | 12.5 | |
Health Care | | | 10.0 | |
Energy | | | 7.6 | |
Telecommunication Services | | | 7.1 | |
Utilities | | | 6.5 | |
Consumer Discretionary | | | 6.2 | |
Materials | | | 4.7 | |
Real Estate | | | 2.4 | |
Other Assets Less Liabilities | | | 0.6 | |
TOP TEN HOLDINGS
| | | | |
Security Name | | %of
Net Assets | |
British American Tobacco PLC, Sponsored ADR | | | 2.6 | |
Apple, Inc. | | | 2.4 | |
BASF SE | | | 2.3 | |
Illinois Tool Works, Inc. | | | 2.2 | |
Anheuser-Busch InBev SA/NV, Sponsored ADR | | | 2.2 | |
Royal Dutch Shell PLC, Class A | | | 2.2 | |
Bank of America Corp. | | | 2.2 | |
Ferrovial SA | | | 2.1 | |
Johnson & Johnson | | | 2.1 | |
Microsoft Corp. | | | 2.0 | |
| | | | |
Top Ten as a Group | | | 22.3 | |
| | | | |
Because a fund’s strategy may result in multiple investments in particular sectors of the economy, its performance may depend on the performance of those sectors and may fluctuate more widely than investments diversified across more sectors. For additional information on these and other risk considerations, please see the Fund’s prospectus.
Any sectors, industries, or securities discussed should not be perceived as investment recommendations. Mention of a specific security should not be considered a recommendation to buy or solicitation to sell that security. Specific securities mentioned in this report may have been sold from the Fund’s portfolio of investments by the time you receive this report.
105
| | |
| AMG Managers Guardian Capital Global Dividend Fund | | October 31, 2017 |
| |
| Schedule of Portfolio Investments | | |
| | | | | | | | |
| | | Shares | | | Value | |
Common Stocks – 99.3% | | | | | | | | |
Consumer Discretionary – 6.2% | | | | | | | | |
Daimler AG (Germany) | | | 2,510 | | | $ | 209,550 | |
Hanesbrands, Inc. 1 | | | 14,748 | | | | 331,830 | |
The Home Depot, Inc. | | | 1,839 | | | | 304,870 | |
McDonald’s Corp. | | | 3,265 | | | | 544,961 | |
PulteGroup, Inc. | | | 15,000 | | | | 453,450 | |
Six Flags Entertainment Corp. 1 | | | 7,775 | | | | 488,192 | |
Total Consumer Discretionary | | | | | | | 2,332,853 | |
Consumer Staples – 14.0% | | | | | | | | |
Altria Group, Inc. | | | 6,810 | | | | 437,338 | |
Anheuser-Busch InBev SA/NV, Sponsored ADR (Belgium) | | | 6,803 | | | | 835,272 | |
British American Tobacco PLC, Sponsored ADR (United Kingdom) | | | 15,246 | | | | 981,842 | |
Dr Pepper Snapple Group, Inc. | | | 3,134 | | | | 268,458 | |
Imperial Brands PLC (United Kingdom) | | | 14,092 | | | | 574,551 | |
Kimberly-Clark Corp. | | | 1,553 | | | | 174,728 | |
Nestle SA (Switzerland) | | | 8,906 | | | | 749,338 | |
The Procter & Gamble Co. | | | 1,937 | | | | 167,241 | |
Swedish Match AB (Sweden) | | | 10,000 | | | | 376,710 | |
Unilever NV (United Kingdom) | | | 11,683 | | | | 677,147 | |
Total Consumer Staples | | | | | | | 5,242,625 | |
Energy – 7.6% | | | | | | | | |
Enbridge Income Fund Holdings, Inc. (Canada) | | | 15,707 | | | | 366,103 | |
Energy Transfer Equity LP, MLP | | | 20,234 | | | | 359,153 | |
Enterprise Products Partners LP, MLP 1 | | | 8,906 | | | | 218,197 | |
Royal Dutch Shell PLC, Class A (Netherlands) | | | 25,670 | | | | 808,083 | |
Snam SpA (Italy) | | | 54,000 | | | | 275,716 | |
Statoil ASA, Sponsored ADR (Norway)1 | | | 14,333 | | | | 291,103 | |
Targa Resources Corp. | | | 5,799 | | | | 240,659 | |
TOTAL SA (France) | | | 4,885 | | | | 272,281 | |
Total Energy | | | | | | | 2,831,295 | |
Financials – 12.5% | | | | | | | | |
AXA SA (France) | | | 10,893 | | | | 328,842 | |
Bank of America Corp. | | | 29,459 | | | | 806,882 | |
Chubb, Ltd. (Switzerland) | | | 2,461 | | | | 371,168 | |
ING Groep NV, Sponsored ADR (Netherlands) | | | 29,974 | | | | 555,119 | |
JPMorgan Chase & Co. | | | 6,901 | | | | 694,310 | |
Muenchener Rueckversicherungs-Gesellschaft AG in Muenchen (Germany) | | | 1,659 | | | | 372,449 | |
Royal Bank of Canada (Canada) | | | 5,086 | | | | 397,663 | |
SCOR SE (France) | | | 6,126 | | | | 254,311 | |
| | | | | | | | |
| | | Shares | | | Value | |
Wells Fargo & Co. | | | 6,930 | | | $ | 389,050 | |
Westpac Banking Corp. (Australia) | | | 20,776 | | | | 526,245 | |
Total Financials | | | | | | | 4,696,039 | |
Health Care – 10.0% | | | | | | | | |
AbbVie, Inc. | | | 5,770 | | | | 520,743 | |
Amgen, Inc. | | | 1,472 | | | | 257,924 | |
AstraZeneca PLC (United Kingdom) | | | 5,437 | | | | 367,871 | |
Fresenius Medical Care AG & Co. KGaA, ADR (Germany) | | | 6,088 | | | | 294,537 | |
Johnson & Johnson | | | 5,579 | | | | 777,768 | |
Medtronic PLC (Ireland) | | | 4,454 | | | | 358,636 | |
Merck & Co., Inc. | | | 2,677 | | | | 147,476 | |
Novo Nordisk, Sponsored ADR (Denmark) | | | 9,197 | | | | 457,919 | |
Pfizer, Inc. | | | 6,231 | | | | 218,459 | |
Stryker Corp. | | | 2,100 | | | | 325,227 | |
Total Health Care | | | | | | | 3,726,560 | |
Industrials – 12.5% | | | | | | | | |
Bouygues SA (France) | | | 12,125 | | | | 581,923 | |
Ferrovial SA (Spain) | | | 36,770 | | | | 798,520 | |
Illinois Tool Works, Inc. | | | 5,359 | | | | 838,791 | |
Lockheed Martin Corp. | | | 2,013 | | | | 620,326 | |
Raytheon Co. | | | 3,199 | | | | 576,460 | |
Republic Services, Inc. | | | 5,949 | | | | 387,101 | |
Sojitz Corp. (Japan) | | | 97,064 | | | | 292,941 | |
Sydney Airport (Australia) | | | 37,051 | | | | 201,865 | |
Waste Management, Inc. | | | 4,777 | | | | 392,526 | |
Total Industrials | | | | | | | 4,690,453 | |
Information Technology – 15.8% | | | | | | | | |
Accenture PLC, Class A (Ireland) | | | 3,429 | | | | 488,152 | |
Amadeus IT Group SA (Spain) | | | 7,285 | | | | 494,279 | |
Analog Devices, Inc. | | | 4,415 | | | | 403,089 | |
Apple, Inc. | | | 5,297 | | | | 895,405 | |
Automatic Data Processing, Inc. | | | 3,253 | | | | 378,194 | |
Broadcom, Ltd. | | | 2,623 | | | | 692,236 | |
Microsoft Corp. | | | 9,192 | | | | 764,591 | |
Paychex, Inc. | | | 6,666 | | | | 425,224 | |
Texas Instruments, Inc. | | | 5,552 | | | | 536,823 | |
Tokyo Electron, Ltd. (Japan) | | | 2,591 | | | | 456,223 | |
Xilinx, Inc. | | | 5,137 | | | | 378,545 | |
Total Information Technology | | | | | | | 5,912,761 | |
Materials – 4.7% | | | | | | | | |
Air Products & Chemicals, Inc. | | | 2,433 | | | | 387,893 | |
The accompanying notes are an integral part of these financial statements.
106
| | |
| AMG Managers Guardian Capital Global Dividend Fund | | |
Schedule of Portfolio Investments (continued) | | |
| | | | | | | | |
| | | Shares | | | Value | |
Materials – 4.7% (continued) | | | | | | | | |
BASF SE (Germany) | | | 7,842 | | | $ | 857,549 | |
DowDuPont, Inc. | | | 7,188 | | | | 519,765 | |
Total Materials | | | | | | | 1,765,207 | |
Real Estate – 2.4% | | | | | | | | |
ICADE, REIT (France) | | | 4,480 | | | | 391,389 | |
TAG Immobilien AG (Germany) | | | 13,000 | | | | 224,118 | |
Unibail-Rodamco SE, REIT (France) | | | 1,128 | | | | 282,347 | |
Total Real Estate | | | | | | | 897,854 | |
Telecommunication Services – 7.1% | | | | | | | | |
AT&T, Inc. | | | 12,538 | | | | 421,904 | |
BCE, Inc. (Canada) | | | 5,645 | | | | 260,656 | |
Rogers Communications, Inc., Class B (Canada) | | | 8,299 | | | | 430,614 | |
Spark New Zealand, Ltd. (New Zealand) | | | 212,055 | | | | 534,275 | |
TELUS Corp. (Canada) | | | 7,340 | | | | 265,813 | |
Verizon Communications, Inc. | | | 7,624 | | | | 364,961 | |
Vodafone Group PLC, Sponsored ADR (United Kingdom) | | | 12,650 | | | | 366,597 | |
Total Telecommunication Services | | | | | | | 2,644,820 | |
Utilities – 6.5% | | | | | | | | |
Duke Energy Corp. | | | 3,266 | | | | 288,420 | |
E.ON SE (Germany) | | | 23,800 | | | | 281,898 | |
Great Plains Energy, Inc. | | | 12,111 | | | | 397,604 | |
National Grid PLC (United Kingdom) | | | 42,640 | | | | 513,275 | |
PPL Corp. | | | 6,875 | | | | 258,225 | |
RWE AG (Germany)* | | | 10,900 | | | | 274,068 | |
SSE PLC (United Kingdom) | | | 23,838 | | | | 437,805 | |
Total Utilities | | | | | | | 2,451,295 | |
Total Common Stocks
(Cost $32,236,610) | | | | | | | 37,191,762 | |
| | | | | | | | |
| | | Shares | | | Value | |
Rights – 0.1% | | | | | | | | |
Industrials – 0.1% | | | | | | | | |
Ferrovial SA Expiration 02/27/18*
(Cost $17,230) | | | 36,770 | | | $ | 17,689 | |
| | |
| | | Principal
Amount | | | | |
Short-Term Investments – 3.3% | | | | | | | | |
Repurchase Agreements – 2.7%2 | | | | | | | | |
Credit Suisse Securities (USA) LLC, dated 10/31/17, due 11/01/17, 1.010% total to be received $1,000,028 (collateralized by various U.S. Government Agency Obligations, 0.375% - 2.125%, 01/15/19 - 02/15/44, totaling $1,020,011) | | $ | 1,000,000 | | | | 1,000,000 | |
Merrill Lynch, Pierce, Fenner & Smith, Inc., dated 10/31/17, due 11/01/17, 1.050% total to be received $22,932 (collateralized by various U.S. Government Agency Obligations, 2.000% - 2.125%, 03/31/24 - 06/30/24, totaling $23,390) | | | 22,931 | | | | 22,931 | |
Total Repurchase Agreements | | | | | | | 1,022,931 | |
| | |
| | | Shares | | | | |
Other Investment Companies – 0.6% | | | | | | | | |
Dreyfus Institutional Preferred Government Money Market Fund, Institutional Class Shares, 1.00%3 | | | 222,256 | | | | 222,256 | |
Total Short-Term Investments
(Cost $1,245,187) | | | | | | | 1,245,187 | |
Total Investments – 102.7%
(Cost $33,499,027) | | | | | | | 38,454,638 | |
Other Assets, less Liabilities – (2.7)% | | | | | | | (1,008,122 | ) |
Net Assets – 100.0% | | | | | | $ | 37,446,516 | |
| * | Non-income producing security. |
| 1 | Some or all of these securities, amounting to $996,949 or 2.7% of net assets, were out on loan to various brokers. |
| 2 | Collateral received from brokers for securities lending was invested in these joint repurchase agreements. |
| 3 | Yield shown represents the October 31, 2017, seven day average yield, which refers to the sum of the previous seven days’ dividends paid, expressed as an annual percentage. |
| | |
| ADR | | American Depositary Receipt |
| LP | | Limited Partnership |
| MLP | | Master Limited Partnership |
| REIT | | Real Estate Investment Trust |
The accompanying notes are an integral part of these financial statements.
107
| | |
| AMG Managers Guardian Capital Global Dividend Fund | | |
| |
| Schedule of Portfolio Investments (continued) | | |
The following table summarizes the inputs used to value the Fund’s investments by the fair value hierarchy levels as of October 31, 2017:
| | | | | | | | | | | | | | | | |
| | | Level 1 | | | Level 2 | | | Level 3 | | | Total | |
Investments in Securities | | | | | | | | | | | | | | | | |
Common Stocks | | | | | | | | | | | | | | | | |
Information Technology | | $ | 4,962,259 | | | $ | 950,502 | | | | — | | | $ | 5,912,761 | |
Consumer Staples | | | 3,542,026 | | | | 1,700,599 | | | | — | | | | 5,242,625 | |
Financials | | | 3,214,192 | | | | 1,481,847 | | | | — | | | | 4,696,039 | |
Industrials | | | 2,815,204 | | | | 1,875,249 | | | | — | | | | 4,690,453 | |
Health Care | | | 3,358,689 | | | | 367,871 | | | | — | | | | 3,726,560 | |
Energy | | | 1,475,215 | | | | 1,356,080 | | | | — | | | | 2,831,295 | |
Telecommunication Services | | | 2,110,545 | | | | 534,275 | | | | — | | | | 2,644,820 | |
Utilities | | | 944,249 | | | | 1,507,046 | | | | — | | | | 2,451,295 | |
Consumer Discretionary | | | 2,123,303 | | | | 209,550 | | | | — | | | | 2,332,853 | |
Materials | | | 907,658 | | | | 857,549 | | | | — | | | | 1,765,207 | |
Real Estate | | | 391,389 | | | | 506,465 | | | | — | | | | 897,854 | |
Rights | | | 17,689 | | | | — | | | | — | | | | 17,689 | |
Short-Term Investments | | | | | | | | | | | | | | | | |
Repurchase Agreements | | | — | | | | 1,022,931 | | | | — | | | | 1,022,931 | |
Other Investment Companies | | | 222,256 | | | | — | | | | — | | | | 222,256 | |
| | | | | | | | | | | | | | | | |
Total Investments in Securities | | $ | 26,084,674 | | | $ | 12,369,964 | | | | — | | | $ | 38,454,638 | |
| | | | | | | | | | | | | | | | |
As of October 31, 2017, the Fund had no transfers between levels from the beginning of the reporting period.
| | | | |
Country | | % of Long-Term
Investments | |
Australia | | | 2.0 | % |
Belgium | | | 2.3 | % |
Canada | | | 4.6 | % |
Denmark | | | 1.2 | % |
France | | | 5.7 | % |
Germany | | | 6.8 | % |
Ireland | | | 2.3 | % |
Italy | | | 0.7 | % |
Japan | | | 2.0 | % |
Netherlands | | | 3.7 | % |
| | | | |
| | | % of Long-Term | |
Country | | Investments | |
New Zealand | | | 1.4 | % |
Norway | | | 0.8 | % |
Spain | | | 3.5 | % |
Sweden | | | 1.0 | % |
Switzerland | | | 3.0 | % |
United Kingdom | | | 10.5 | % |
United States | | | 48.5 | % |
| | | | |
| | | 100.0 | % |
| | | | |
The accompanying notes are an integral part of these financial statements.
108
AMG Managers Pictet International Fund
Portfolio Manager’s Comments (unaudited)
OVERVIEW
For the fiscal year ended October 31, 2017, the AMG Managers Pictet International Fund (the “Fund”) Class N shares returned 24.30%, modestly outperforming the 23.44% return for the MSCI EAFE Index.
MARKET COMMENTARY
In contrast to the modest return but high volatility of markets in the prior period, the twelve months ended October 2017 saw developed international equities rise significantly in U.S. Dollar (USD) terms, and they did so in an uncannily straight line. While partly due to a near 6% weakening of the USD against the key European currencies, the MSCI EAFE Index climbed 23.4% (in USD terms) and posted gains in nine of the twelve months. In the other months, the declines were only modest.
The first of these declines was in November 2016, which saw the surprise election of Donald Trump as U.S. president. Through most of the month uncertainty ahead of the election had caused markets to slide, but investors shrugged off the potentially damaging protectionist agenda that Trump had campaigned on, and instead focused on the promised economic boost. Markets turned, led by the deeper cyclical stocks (materials, industrials) and by financials. The first group was buoyed in particular by the prospect of a higher investment in infrastructure spending, and the latter on better growth driving a faster normalization of interest rates that would in turn relieve the pressure on bank profitability. However, the outstanding feature of the period as a whole was the seemingly relentless upward surge in technology stocks. In the “networks” (social, retail, search, etc.) segment of the market some of these performances have a whiff of speculation about them, but for the larger more established companies in the U.S., Europe and China, they represent the genuine creation of very tangible value by business models that were given little credence only a very few years ago. In the hardware and materials subsectors the rise is equally supported, but in this case by the shift to more ordered and potentially less cyclical markets that are a product of a significant consolidation since the 2008 financial crisis. While they were also lifted by the tide, more defensive sectors (telecoms, utilities, consumer staples) lagged the Index.
Give or take a few blips around the other notable political events during 2017, this post U.S. election bounce set the trajectory for broadly the same pattern of market performance through the rest of
the review period. On the positive side was the April/May French presidential election in which reformist Emmanuel Macron beat far right candidate Marine Le Pen to restore confidence in the political stability of the European Union (EU). On the negative were rising tensions between the U.S. and North Korea, the painfully slow progress of the UK’s negotiations to leave the EU and an inconclusive German general election toward the end of the period.
Underpinning the gains in all markets was a steady flow of positive macro and micro data, particularly in Europe, which was the strongest of the major index regions. In all areas, growth has been well established and inflationary pressures have been benign. At a corporate level, each earnings season saw, on balance, positive surprises, with companies guiding to better full year outcomes, and confidence indicators reaching post financial crisis highs.
PERFORMANCE REVIEW
The Fund outperformed the benchmark over the period. At an aggregate level the main positive drivers were strong stock selection in Europe and Japan, and particularly within the industrials, telecom services and utilities sectors. The main negative was weak stock selection within the consumer discretionary, energy and health care sectors. The underweight positions in financials and materials were also a drag on performance, but the effect was largely offset by positive stock selection within the sectors. At an individual stock level the top positive contributions were made by:
1. ASML (semiconductor manufacturing equipment, Netherlands) is the dominant supplier of lithography equipment to the global semiconductor manufacturing industry. Its stock rose strongly through the year, but particularly following its Q2 2017 earnings announcement, as the market became more comfortable with developments that are key to our investment thesis. First is evidence of a broad uptick in the global semiconductor cycle driven by new applications such as cloud and AI, which both have a significantly higher requirement for memory. Second is evidence from both ASML and its customers of an inflection point for the company’s new generation EUV (extreme ultraviolet) technology. It is clear that ASML’s tools now meet all the performance metrics for insertion of EUV into high volume manufacturing. In addition to this there is growing evidence that an emerging Chinese market opportunity exists—a source of new demand which could mean less EUV cannibalization of the non-EUV tools that ASML continues to produce. While
consistent with our thesis, these developments give greater visibility to the case, and mean that the more bullish scenario outlined by the company in October 2016 is more likely to play out. As a result we still see considerable further upside to intrinsic value.
2. Elis (contract linen and hygiene services, France) is Europe’s leading supplier of linen rental and cleaning services to hotels, restaurants, hospitals, etc., and additional hygiene and sanitary services. The Elis holding was acquired in the company’s early 2015 initial public offering (IPO). Since then the group has steadily expanded through targeted and controlled acquisitions that have both consolidated positions in existing European and Latin American markets, and opened up new ones. Its success is predicated on finding the right targets, on integrating them into its infrastructure quickly, and on seizing opportunities to increase efficiencies. Elis typically achieves this by cross-selling multiple group services to locations where it already has a toehold with one. In June $5 billion market cap Elis had a $2.9 billion bid accepted by Berendsen, a UK textile cleaning group. As its largest acquisition to date, the move propels Elis well up the ranking of players in the UK market and opens up significant further cross-selling and margin expansion opportunities. While the stock appreciated strongly on the back of the Berendsen news, we see significant further upside, and remain holders of Elis.
While failing to fully offset these and other positives, two holdings made notable negative contributions to performance:
1. Teva (generic and branded pharmaceuticals, Israel) was acquired for the Fund in Q3 2016. The stock had already been weak in the aftermath of Teva’s acquisition of generic drug rival Actavis earlier in the year. Teva was broadly perceived to have paid too much for Actavis, and had taken on debt to do so. Added to this was a looming patent expiry for branded drug Copaxone (MS treatment) that accounted for 30% of Teva’s group cash generation, and an apparent lack of credible pipeline drugs to offset the blow. We had a more bullish view on both the drop off in Copaxone revenues, and the quality of the drugs under development. Furthermore, and the key driver of our case, was the prodigious cash generation engine that was Teva’s global (and particularly U.S.) generic drug business. While expensive, the logic of the Actavis acquisition was to help that U.S. business offset the impact of annual price erosion and maintain cash flow at levels that could both pay down debt and fund future research and development (R&D). Post buying Teva these
109
AMG Managers Pictet International Fund
Portfolio Manager’s Comments (continued)
concerns (and new ones like the loss of its CEO with no apparent successor) weighed further on the stock and it underperformed. Based on our long-term thesis we retained the position. However, in Q3 the company announced results that showed a significant cash generation shortfall relative to expectations. The reason was an apparent change of policy by the SEC with respect to the approval of new generic drugs versus rivals to existing generic drugs. We believe the mix change is detrimental to Teva’s capacity to generate cash from its generic business at levels that supported our investment case. Although the position has lost the Fund money, we concluded that our investment case was broken and sold out of the holding.
2. Japan Tobacco (“JT”) (cigarette manufacturer, Japan) fell over the period on news relating to a domestic cigarette market in which it has the largest share. JT saw both delays and then production problems around the launch of “Ploom TECH,” its response to Philip Morris’s (PMI) iQos heat-not-burn alternative cigarette technology. While Ploom TECH was launched across the Tokyo area in June (to positive reviews), each delay has given PMI more time as the only player to establish users and chew into JT’s market share. Based on two aspects of our longer-term thesis, we used the weakest periods of price performance to add to the Fund’s holding in JT. The first is that while there is a lot of current noise about alternative tobacco delivery technologies, we believe they will quickly “commoditize” to leave brand as the key driver of sales and market share; this plays to JT’s strength in its domestic market. Second, thanks to its use of liquid tobacco rather than leaf, Ploom TECH is set to attract a much lower level of tax on sales in Japan than iQos, and is potentially much more profitable than cigarettes if sold at a similar price point. We remain holders.
FUND ACTIVITY
Given the seemingly rich valuation of markets and the prevailing environment of relatively high volatility, the Fund started the period under review with relatively defensive positioning. This was the by-product of a stock level focus (established as early as 2014/15) on buying business models with longer-duration, more visible future cash flow generation profiles. Industrial companies constituted the biggest overweight, but few of the holdings were traditional deep cyclical manufacturers. The exposure was instead tilted toward long contract industrial service names like Elis (contract supplier
of linen to hospitality trade, France) and Fujitec (elevator manufacturing and contract maintenance, Japan), and “utility-like” companies such as Vinci (contractor and toll road operator, France). This exposure has remained broadly unchanged over the period and these stocks are still in the Fund.
The main changes to positioning occurred in the wake of the Trump victory in the U.S. elections. Cyclical sectors led and defensive sectors lagged a broad market rise. Unlike many competitors we used the sharp recovery in banks not to raise exposure, but to take profit. The effect was to further reduce the Fund’s underweight position in financials. Our belief is that regulatory headwinds and sub-normal interest rates will continue to challenge bank profitability for some time to come. We also took profit from or sold a number of industrial sector holdings on their strong performance. This activity was biased toward Japanese names that even before the bounce had made strong positive contributions through 2016. The sales reduced the Fund’s neutral weighting in Japan to underweight.
Consistent with the improving macro environment, but driven wholly by stock level considerations, the proceeds of these sales were largely used to add (or add to) holdings in Europe, and particularly a few larger cap companies.
The historically significant tilt of the Fund away from mega/large cap in favor of mid and smaller cap names is not because we believe large companies are inherently bad. The reason is that further down the size spectrum we tend to find less complex companies that we can value with more confidence, and where our view will be one of a few, rather than one of hundreds. Pricing anomalies that we can exploit are therefore more likely. Following the U.S. election several larger cap, more defensive growth companies that were either in the Fund or had been on our watch lists didn’t just underperform, but declined. These moves brought them back in to compelling territory and we used opportunity to buy Danone (dairy food and beverages, France) and add significantly to Anheuser-Busch Inbev (brewing, Belgium). As a result, the position in consumer staples moved from underweight at the start of the review year to overweight by early 2017. This, and the appreciation of several smaller cap names that moved them into mid cap space, meant the Fund held a lower than usual weighting to small cap through most of the period.
At a sector and region level the position described above remained relatively consistent through to the end of the period.
MARKET OUTLOOK AND STRATEGY
Globally economic growth has good momentum and, aside from the recent events in Spain and the vagaries of the ongoing Brexit process, Europe’s political landscape is looking more stable than at any point since the 2008 financial crisis. This environment should prove at least supportive, and potentially even positive for markets. However, we are several years into an international equity bull market, and with the implied risk premia of many asset classes at very low levels, we believe asset valuations offer considerably less support than in the past. While this latter position suggests that a prudent investor might proceed with some caution, we are actually seeing some evidence of corporate and investor euphoria—a higher level of IPOs, an increase in mergers and acquisitions (M&A), and the relentless upward progression of markets with minimal volatility.
Moreover, if the current economic momentum is maintained and inflation rises further, we believe central banks will be forced into a monetary policy reaction. U.S. Federal Reserve interest rate hikes will likely continue in earnest and the European Central Bank (presiding over the developed region with the strongest current momentum) will have no choice but to follow. Although rates beginning to rise from very low levels will underpin the case that struggling economies are back on a solid footing (and will be welcomed by many), the policy shift also raises risks. We believe central banks getting it “perfectly right” is unlikely, and market setbacks are possible.
Despite the challenges presented by market conditions so far in 2017—from a bottom up perspective attractively valued stocks have been getting harder to find—we remain enthusiastic about the companies we hold in the Fund.
More recently we have noticed a change—an increased level of volatility and a fall in the correlation between stocks in the market. For our investment approach based on a multi-year investment horizon this type of environment, if sustained, is likely to start yielding rather more opportunities (both on the sell and buy side), and is to be welcomed. As is typical, the common thread running through the list of holdings is an ability to deliver long-term growth in cash flows at a price
110
AMG Managers Pictet International Fund
Portfolio Manager’s Comments (continued)
substantially below our assessment of intrinsic value. In a world driven by ETFs and short termism we continue to believe that the Fund will generate superior long-term returns.
The Fund remains highly active (active share – the percentage of holdings in the Fund that differ from the benchmark index – remains close to 90%) with a more defensive bias than in the past as the weight (in particular) in consumer staples has moved from a
significant underweight in 2016 to an overweight position. In periods of more limited upside our focus on intrinsic value remains central to the process but the downside protection and stability of the business model becomes even more important. The impact of stock level shifts toward the end of 2016 and so far in 2017 has been to increase further an already significant underweight in financials, to reduce sizeable overweight positions in industrials and technology, to move from a significant underweight
in consumer staples to overweight, and to increase the existing overweight in consumer discretionary stocks. These positions have been maintained so far in 2017.
The views expressed represent the opinions of Pictet Asset Management Limited, as of October 31, 2017, and are not intended as a forecast or guarantee of future results and are subject to change without notice.
111
AMG Managers Pictet International Fund
Portfolio Manager’s Comments (continued)
CUMULATIVE TOTAL RETURN PERFORMANCE
The AMG Managers Pictet International Fund’s cumulative total return is based on the daily change in net asset value (NAV), and assumes that all dividends and distributions were reinvested. The graph compares a hypothetical $10,000 investment made in AMG Managers Pictet International Fund’s Class N shares on April 14, 2014, to a $10,000 investment made in the MSCI EAFE Index for the same time period. The graph and table do not reflect the deduction of taxes that a shareholder would pay on a Fund distribution or redemption of shares. The listed returns for the Fund are net of expenses and the returns for the index exclude expenses. Total returns would have been lower had certain expenses not been reduced.
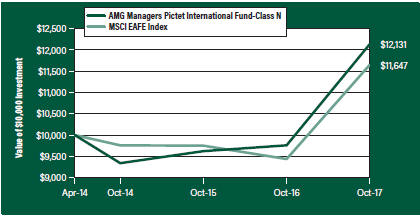
The table below shows the average annual total returns for AMG Managers Pictet International Fund and the MSCI EAFE Index for the same time periods ended October 31, 2017.
| | | | | | | | | | | | |
| | | One | | | Since | | | Inception | |
| Average Annual Total Returns 1 | | Year | | | Inception | | | Date | |
AMG Managers Pictet International
Fund2, 3, 4, 5, 6, 7 | | | | | | | | | | | | |
Class N | | | 24.30 | % | | | 5.59 | % | | | 04/14/14 | |
Class I | | | 24.55 | % | | | 5.91 | % | | | 04/14/14 | |
Class Z | | | — | | | | 1.67 | % | | | 09/29/17 | |
MSCI EAFE Index8, 9 | | | 23.44 | % | | | 4.40 | % | | | 04/14/14 | † |
The performance data shown represents past performance. Past performance is not a guarantee of future results. Current performance may be lower or higher than the performance data quoted. The investment return and principal value of an investment will fluctuate so that an investor’s shares, when redeemed, may be worth more or less than their original cost.
Investors should carefully consider the Fund’s investment objectives, risks, charges and expenses before investing. For performance information through the most recent month end, current net asset values per share for the Fund and other information, please call 800.835.3879 or visit our website at amgfunds.com for a free prospectus. Read it carefully before investing or sending money.
Distributed by AMG Distributors, Inc., member FINRA/SIPC.
| † | Date reflects the inception date of the Fund, not the index. |
| 1 | Total return equals income yield plus share price change and assumes reinvestment of all dividends and capital gain distributions. Returns are net of fees and may reflect offsets of Fund expenses as described in the prospectus. No adjustment has been made for taxes payable by shareholders on their reinvested dividends and capital gain distributions. Returns for periods greater than one year are annualized. The listed returns on the Fund are net of expenses and based on the published NAV as of October 31, 2017. All returns are in U.S. dollars ($). |
| 2 | A short-term redemption fee of 2% will be charged on shares held for less than 90 days. |
| 3 | Investments in international securities are subject to certain risks of overseas investing including currency fluctuations and changes in political and economic conditions, which could result in significant market fluctuations. |
| 4 | The Fund is subject to the risks associated with investments in emerging markets, such as erratic earnings patterns, economic and political instability, changing exchange controls, limitations on repatriation of foreign capital and changes in local governmental attitudes toward private investment, possibly leading to nationalization or confiscation of investor assets. |
| 5 | Investing in initial public offerings (IPOs) is risky and the prices of stocks purchased in IPOs tend to fluctuate more widely than stocks of companies that have been publicly traded for a longer period of time. Stocks purchased in IPOs generally do not have a trading history, and information about the companies may be available for very limited periods. |
| 6 | The Fund is subject to risks associated with investments in mid-capitalization companies such as greater price volatility, lower trading volume, and less liquidity than the stocks of larger, more established companies. |
| 7 | The Fund is subject to risks associated with investments in small-capitalization companies, such as erratic earnings patterns, competitive conditions, limited earnings history and a reliance on one or a limited number of products. |
| 8 | The MSCI EAFE Index (Europe, Australasia, Far East) is a free float-adjusted market capitalization index that is designed to measure the equity market performance of developed markets, excluding the U.S. & Canada. The MSCI EAFE Index consists of the following 21 developed market country indices: Australia, Austria, Belgium, Denmark, Finland, France, Germany, Hong Kong, Ireland, Israel, Italy, Japan, Netherlands, New Zealand, Norway, Portugal, Singapore, Spain, Sweden, Switzerland and the United Kingdom. Please go to msci.com for most current list of countries represented by the index. Unlike the Fund, the MSCI EAFE Index is unmanaged, is not available for investment and does not incur expenses. |
| 9 | All MSCI data is provided ‘as is.’ The products described herein are not sponsored or endorsed and have not been reviewed or passed on by MSCI. In no event shall MSCI, its affiliates, or any MSCI data provider have any liability of any kind in connection with the MSCI data or the products described herein. Copying or redistributing the MSCI data is strictly prohibited. |
Not FDIC insured, nor bank guaranteed. May lose value.
112
| | |
| AMG Managers Pictet International Fund | | October 31, 2017 |
| Fund Snapshots (unaudited) | | |
PORTFOLIO BREAKDOWN
| | | | |
| | | % of | |
Sector | | Net Assets | |
Consumer Discretionary | | | 20.1 | |
Industrials | | | 16.5 | |
Financials | | | 14.2 | |
Consumer Staples | | | 13.9 | |
Health Care | | | 10.1 | |
Telecommunication Services | | | 7.4 | |
Information Technology | | | 6.1 | |
Energy | | | 5.2 | |
Materials | | | 3.0 | |
Utilities | | | 1.1 | |
Real Estate | | | 1.0 | |
Other Assets Less Liabilities | | | 1.4 | |
TOP TEN HOLDINGS
| | | | |
| | | % of | |
Security Name | | Net Assets | |
Anheuser-Busch InBev SA/NV | | | 3.7 | |
SoftBank Group Corp. | | | 3.0 | |
Royal Dutch Shell PLC, Class B | | | 2.5 | |
Japan Tobacco, Inc. | | | 2.5 | |
ASML Holding NV | | | 2.4 | |
Nestle SA | | | 2.4 | |
GlaxoSmithKline PLC | | | 2.4 | |
LivaNova PLC | | | 2.4 | |
Hyundai Mobis | | | 2.4 | |
Orpea | | | 2.3 | |
| | | | |
Top Ten as a Group | | | 26.0 | |
| | | | |
Because a fund’s strategy may result in multiple investments in particular sectors of the economy, its performance may depend on the performance of those sectors and may fluctuate more widely than investments diversified across more sectors. For additional information on these and other risk considerations, please see the Fund’s prospectus.
Any sectors, industries, or securities discussed should not be perceived as investment recommendations. Mention of a specific security should not be considered a recommendation to buy or solicitation to sell that security. Specific securities mentioned in this report may have been sold from the Fund’s portfolio of investments by the time you receive this report.
113
| | |
| AMG Managers Pictet International Fund | | October 31, 2017 |
| |
| Schedule of Portfolio Investments | | |
| | | | | | | | |
| | | Shares | | | Value | |
Common Stocks – 98.6% | | | | | | | | |
Consumer Discretionary – 20.1% | | | | | | | | |
ABC-Mart, Inc. (Japan) | | | 530,100 | | | $ | 26,739,824 | |
Bandai Namco Holdings, Inc. (Japan) | | | 875,700 | | | | 30,008,527 | |
Cie Financiere Richemont SA (Switzerland) | | | 293,390 | | | | 27,046,532 | |
CyberAgent, Inc. (Japan) | | | 638,200 | | | | 19,764,889 | |
Dignity PLC (United Kingdom) | | | 736,302 | | | | 23,694,895 | |
EI Group PLC (United Kingdom)* | | | 1,691,496 | | | | 3,021,612 | |
Gestamp Automocion SA (Spain)*,1 | | | 5,192,253 | | | | 34,474,702 | |
Hyundai Mobis (South Korea) | | | 199,344 | | | | 47,418,375 | |
Informa PLC (United Kingdom) | | | 4,262,033 | | | | 39,449,994 | |
JD.com, Inc., ADR (China)* | | | 1,072,330 | | | | 40,233,821 | |
Loen Entertainment, Inc. (South Korea) | | | 129,880 | | | | 12,346,338 | |
Matas A/S (Denmark) | | | 704,928 | | | | 7,893,675 | |
MGM China Holdings, Ltd. (Macau)2 | | | 15,753,600 | | | | 35,538,630 | |
NGK Spark Plug Co., Ltd. (Japan) | | | 1,093,200 | | | | 24,948,058 | |
REA Group, Ltd. (Australia) | | | 300,834 | | | | 16,679,671 | |
Vivendi SA (France) | | | 747,704 | | | | 18,566,831 | |
Total Consumer Discretionary | | | | | | | 407,826,374 | |
Consumer Staples – 13.9% | | | | | | | | |
Anheuser-Busch InBev SA/NV (Belgium) | | | 613,963 | | | | 75,284,875 | |
Asahi Group Holdings, Ltd. (Japan) | | | 815,500 | | | | 37,234,428 | |
cocokara fine, Inc. (Japan) | | | 314,400 | | | | 17,529,053 | |
Danone SA (France) | | | 359,481 | | | | 29,380,792 | |
Japan Tobacco, Inc. (Japan) | | | 1,492,200 | | | | 49,392,121 | |
Nestle SA (Switzerland) | | | 582,166 | | | | 48,982,594 | |
Ontex Group NV (Belgium)2 | | | 645,443 | | | | 22,701,928 | |
Total Consumer Staples | | | | | | | 280,505,791 | |
Energy – 5.2% | | | | | | | | |
Inpex Corp. (Japan) | | | 2,879,400 | | | | 30,830,286 | |
Oil Search, Ltd. (Australia) | | | 1,794,815 | | | | 10,173,710 | |
Royal Dutch Shell PLC, Class A (Netherlands) | | | 75,261 | | | | 2,369,191 | |
Royal Dutch Shell PLC, Class B (Netherlands) | | | 1,582,920 | | | | 50,965,533 | |
Z Energy, Ltd. (New Zealand) | | | 2,327,572 | | | | 11,739,612 | |
Total Energy | | | | | | | 106,078,332 | |
Financials – 14.2% | | | | | | | | |
Ageas (Belgium) | | | 587,001 | | | | 28,466,681 | |
Banco Bilbao Vizcaya Argentaria SA (Spain) | | | 5,364,173 | | | | 46,906,877 | |
BPER Banca (Italy)2 | | | 3,994,966 | | | | 19,446,621 | |
Cerved Information Solutions SpA (Italy) | | | 892,366 | | | | 11,476,507 | |
Mizrahi Tefahot Bank, Ltd. (Israel)2 | | | 947,196 | | | | 17,100,070 | |
Moscow Exchange MICEX-RTS PJSC (Russia) | | | 10,273,857 | | | | 20,718,174 | |
| | | | | | | | |
| | | Shares | | | Value | |
Prudential PLC (United Kingdom) | | | 1,632,893 | | | $ | 40,079,814 | |
Saga PLC (United Kingdom) | | | 2,902,023 | | | | 7,365,580 | |
Sompo Holdings, Inc. (Japan) | | | 938,700 | | | | 37,731,269 | |
Standard Chartered PLC (United Kingdom)* | | | 3,500,717 | | | | 34,866,580 | |
UBS Group AG (Switzerland) | | | 1,336,335 | | | | 22,735,210 | |
Total Financials | | | | | | | 286,893,383 | |
Health Care – 10.1% | | | | | | | | |
GlaxoSmithKline PLC (United Kingdom) | | | 2,711,820 | | | | 48,669,780 | |
Grifols SA, ADR (Spain) | | | 1,146,632 | | | | 27,117,847 | |
LivaNova PLC (United Kingdom)*,2 | | | 650,962 | | | | 48,106,092 | |
Miraca Holdings, Inc. (Japan) | | | 402,200 | | | | 18,713,160 | |
Orpea (France) | | | 393,456 | | | | 47,139,523 | |
Primary Health Care, Ltd. (Australia) | | | 5,327,337 | | | | 13,963,095 | |
Total Health Care | | | | | | | 203,709,497 | |
Industrials – 16.5% | | | | | | | | |
BBA Aviation PLC (United Kingdom) | | | 8,674,745 | | | | 36,647,557 | |
Bollore SA (France) | | | 6,113,245 | | | | 29,530,595 | |
Bollore SA-New (France)*,2 | | | 29,777 | | | | 141,171 | |
CK Hutchison Holdings, Ltd. (Hong Kong) | | | 3,705,248 | | | | 47,063,011 | |
DSV A/S (Denmark) | | | 295,079 | | | | 22,817,254 | |
Elis SA (France)2 | | | 1,426,554 | | | | 37,193,366 | |
Fujitec Co., Ltd. (Japan) | | | 920,700 | | | | 13,705,577 | |
Jardine Strategic Holdings, Ltd. (Hong Kong) | | | 663,976 | | | | 27,850,554 | |
Obrascon Huarte Lain SA (Spain)* | | | 2,530,820 | | | | 14,192,184 | |
Safran SA (France) | | | 366,946 | | | | 38,647,612 | |
SEEK, Ltd. (Australia) | | | 1,579,015 | | | | 22,234,745 | |
Vinci SA (France) | | | 453,231 | | | | 44,406,503 | |
Total Industrials | | | | | | | 334,430,129 | |
Information Technology – 6.1% | | | | | | | | |
ASML Holding NV (Netherlands) | | | 273,105 | | | | 49,276,171 | |
Computershare, Ltd. (Australia) | | | 2,207,257 | | | | 26,386,779 | |
Nokia OYJ (Finland) | | | 4,703,165 | | | | 23,129,795 | |
Siltronic AG (Germany)* | | | 170,000 | | | | 25,372,110 | |
Total Information Technology | | | | | | | 124,164,855 | |
Materials – 3.0% | | | | | | | | |
KAZ Minerals PLC (United Kingdom)* | | | 1,321,812 | | | | 14,272,155 | |
Koninklijke DSM NV (Netherlands) | | | 242,248 | | | | 20,668,036 | |
Linde AG (Germany)* | | | 118,820 | | | | 25,598,452 | |
Total Materials | | | | | | | 60,538,643 | |
Real Estate – 1.0% | | | | | | | | |
Merlin Properties Socimi SA, REIT (Spain) | | | 1,532,163 | | | | 20,230,859 | |
The accompanying notes are an integral part of these financial statements.
114
| | |
| AMG Managers Pictet International Fund | | |
| |
| Schedule of Portfolio Investments (continued) | | |
| | | | | | | | |
| | | Shares | | | Value | |
Telecommunication Services – 7.4% | | | | | | | | |
Inmarsat PLC (United Kingdom) | | | 4,935,117 | | | $ | 40,707,220 | |
Millicom International Cellular SA, SDR (Luxembourg) | | | 303,928 | | | | 19,436,169 | |
PCCW, Ltd. (Hong Kong) | | | 50,783,309 | | | | 28,000,062 | |
SoftBank Group Corp. (Japan) | | | 686,700 | | | | 60,856,860 | |
Total Telecommunication Services | | | | | | | 149,000,311 | |
Utilities – 1.1% | | | | | | | | |
Rubis SCA (France) | | | 352,471 | | | | 22,118,477 | |
Total Common Stocks
(Cost $1,679,606,807) | | | | | | | 1,995,496,651 | |
| | |
| | | Principal | | | | |
| | | Amount | | | | |
Short-Term Investments – 2.3% | | | | | | | | |
Repurchase Agreements – 1.4%3 | | | | | | | | |
Citigroup Global Markets, Inc., dated 10/31/17, due 11/01/17, 1.070% total to be received $6,740,633 (collateralized by various U.S. Government Agency Obligations, 0.000% – 11.500%, 11/01/17 - 09/09/49, totaling $6,875,241) | | $ | 6,740,433 | | | | 6,740,433 | |
HSBC Securities USA, Inc. dated 10/31/17, due 11/01/17, 1.040% total to be received $6,740,628 (collateralized by various U.S. Government Agency Obligations, 2.500% – 8.000%, 04/01/22 – 10/01/47, totaling $6,875,274) | | | 6,740,433 | | | | 6,740,433 | |
Jefferies LLC, dated 10/31/17, due 11/01/17, 1.180% total to be received $6,740,654 (collateralized by various U.S. Government Agency Obligations, 2.750% – 4.000%, 04/01/27 - 10/15/52, totaling $6,875,242) | | | 6,740,433 | | | | 6,740,433 | |
| | | | | | | | |
| | | Principal | | | | |
| | | Amount | | | Value | |
Merrill Lynch, Pierce, Fenner & Smith, Inc., dated 10/31/17, due 11/01/17, 1.050% total to be received $1,418,270 (collateralized by various U.S. Government Agency Obligations, 2.000% - 2.125%, 03/31/24 – 06/30/24, totaling $1,446,594) | | $ | 1,418,229 | | | $ | 1,418,229 | |
Nomura Securities International, Inc., dated 10/31/17, due 11/01/17, 1.060% total to be received $6,740,631 (collateralized by various U.S. Government Agency Obligations, 0.000% - 6.250%, 11/30/17 – 09/09/49, totaling $6,875,242) | | | 6,740,433 | | | | 6,740,433 | |
Total Repurchase Agreements | | | | | | | 28,379,961 | |
| | |
| | | Shares | | | | |
Other Investment Companies – 0.9% | | | | | | | | |
Dreyfus Government Cash Management Fund, Institutional Class Shares, 0.93%4 | | | 17,580,122 | | | | 17,580,122 | |
Total Short-Term Investments
(Cost $45,960,083) | | | | | | | 45,960,083 | |
Total Investments – 100.9%
(Cost $1,725,566,890) | | | | | | | 2,041,456,734 | |
Other Assets, less Liabilities – (0.9)% | | | | | | | (17,979,489 | ) |
Net Assets – 100.0% | | | | | | $ | 2,023,477,245 | |
| * | Non-income producing security. |
| 1 | Security exempt from registration under Rule 144A of the Securities Act of 1933. This security may be resold in transactions exempt from registration, normally to qualified buyers. At October 31, 2017, the value of these securities amounted to $34,474,702 or 1.7% of net assets. |
| 2 | Some or all of these securities, amounting to $26,905,926 or 1.3% of net assets, were out on loan to various brokers. |
| 3 | Collateral received from brokers for securities lending was invested in these joint repurchase agreements. |
| 4 | Yield shown represents the October 31, 2017, seven day average yield, which refers to the sum of the previous seven days’ dividends paid, expressed as an annual percentage. |
| | |
| ADR | | American Depositary Receipt |
| REIT | | Real Estate Investment Trust |
| SDR | | Sponsored Depositary Receipt |
The accompanying notes are an integral part of these financial statements.
115
AMG Managers Pictet International Fund
Schedule of Portfolio Investments (continued)
The following table summarizes the inputs used to value the Fund’s investments by the fair value hierarchy levels as of October 31, 2017:
| | | | | | | | | | | | | | | | |
| | | Level 1 | | | Level 2 | | | Level 3 | | | Total | |
Investments in Securities | | | | | | | | | | | | | | | | |
Common Stocks | | | | | | | | | | | | | | | | |
Consumer Discretionary | | $ | 161,189,743 | | | $ | 246,636,631 | | | | — | | | $ | 407,826,374 | |
Industrials | | | 141,171 | | | | 334,288,958 | | | | — | | | | 334,430,129 | |
Financials | | | 7,365,580 | | | | 279,527,803 | | | | — | | | | 286,893,383 | |
Consumer Staples | | | 22,701,928 | | | | 257,803,863 | | | | — | | | | 280,505,791 | |
Health Care | | | 75,223,939 | | | | 128,485,558 | | | | — | | | | 203,709,497 | |
Telecommunication Services | | | — | | | | 149,000,311 | | | | — | | | | 149,000,311 | |
Information Technology | | | — | | | | 124,164,855 | | | | — | | | | 124,164,855 | |
Energy | | | — | | | | 106,078,332 | | | | — | | | | 106,078,332 | |
Materials | | | 25,598,452 | | | | 34,940,191 | | | | — | | | | 60,538,643 | |
Utilities | | | — | | | | 22,118,477 | | | | — | | | | 22,118,477 | |
Real Estate | | | — | | | | 20,230,859 | | | | — | | | | 20,230,859 | |
Short-Term Investments | | | | | | | | | | | | | | | | |
Repurchase Agreements | | | — | | | | 28,379,961 | | | | — | | | | 28,379,961 | |
Other Investment Companies | | | 17,580,122 | | | | — | | | | — | | | | 17,580,122 | |
| | | | | | | | | | | | | | | | |
Total Investments in Securities | | $ | 309,800,935 | | | $ | 1,731,655,799 | | | | — | | | $ | 2,041,456,734 | |
| | | | | | | | | | | | | | | | |
As of October 31, 2017, the Fund had transfers between Level 1 and Level 2 as follows:
| | | | | | | | | | | | | | | | |
| | | Transfer into Level 11 | | | Transfer out of Level 11 | | | Transfer into Level 21 | | | Transfer out of Level 21 | |
Assets: | | | | | | | | | | | | | | | | |
Common Stocks | | $ | 22,018,451 | | | $ | (32,610,832 | ) | | $ | 32,610,832 | | | $ | (22,018,451 | ) |
| 1 | An external pricing service is used to reflect any significant market movements between the time the Fund valued such foreign securities and the earlier closing of foreign markets. (See Note 1(a) in the Notes to Financial Statements.) |
| | | | |
| | | % of Long-Term | |
Country | | Investments | |
Australia | | | 4.5 | % |
Belgium | | | 6.3 | % |
China | | | 2.0 | % |
Denmark | | | 1.5 | % |
Finland | | | 1.2 | % |
France | | | 13.4 | % |
Germany | | | 2.5 | % |
Hong Kong | | | 5.2 | % |
Israel | | | 0.9 | % |
Italy | | | 1.5 | % |
Japan | | | 18.4 | % |
| | | | |
| | | % of Long-Term | |
Country | | Investments | |
Luxembourg | | | 1.0 | % |
Macau | | | 1.8 | % |
Netherlands | | | 6.2 | % |
New Zealand | | | 0.6 | % |
Russia | | | 1.0 | % |
South Korea | | | 3.0 | % |
Spain | | | 7.2 | % |
Switzerland | | | 4.9 | % |
United Kingdom | | | 16.9 | % |
| | | | |
| | | 100.0 | % |
| | | | |
The accompanying notes are an integral part of these financial statements.
116
AMG Managers Value Partners Asia Dividend Fund
Portfolio Manager’s Comments (unaudited)
OVERVIEW
For the fiscal year ending October 31, 2017, the AMG Managers Value Partners Asia Dividend Fund (the “Fund”) Class N shares gained 29.71%, while the MSCI AC Asia ex-Japan Index (the “Index”) gained 30.45%.
MARKET REVIEW
The Asia ex-Japan market rallied strongly on the recovery of external demand and solid corporate earnings in the year under review, with the MSCI AC Asia ex-Japan Index gaining 30.4%.
The Hong Kong and China stock markets rallied during the year on favorable capital flows and upbeat first-half corporate earnings—the earnings per share (EPS) of the MSCI China Index increased 14% year-on-year in the third quarter,1 one of the highest increases in global emerging markets. Southbound capital flows remained sanguine, partly due to robust offshore investment demand and the A-H premium, which stood at 39% as of October 27, 2017.2 As a result, in the first half of 2017, an average RMB1.3 billion of southbound capital flowed into Hong Kong daily, accounting for about 13% of the turnover on the Hong Kong stock market.
Previously, foreign exchange controls made it difficult for mainland Chinese investors to diversify their investments overseas. That said, the southbound flow through the Stock Connect program has become a key channel for mainland investors such as insurance companies to invest in offshore assets. We believe the southbound flow will continue and will support offshore China equities, since mainland investors are more familiar with the companies there and offshore China markets are trading at a discount to the onshore A-share market.
In terms of capital inflows from overseas, foreign investment allocations to China remain subdued as foreign investors are still wary of the China stock market and tend to overplay the risks of a hard landing by the Chinese economy. However, as China’s economy maintains a healthy growth momentum and policy continues to focus on deleveraging the Chinese financial system, we expect foreign investors to attach greater importance to the China market, which would be favorable for China stocks in the long run.
The 19th Party Congress – which took place in October – was the most watched event in China this year. The Congress not only saw a reshuffling of China’s senior leadership but also marked the start of China’s new political and economic cycle.
President Xi was made the paramount leader of China, while “Xi Jinping’s Thought on Socialism with Chinese Characteristics for a New Era” was formally enshrined in the Party’s Constitution, cementing Xi’s status as one of China’s most powerful leaders since Mao Zedong. Although there was no mention of quantitative targets, Xi’s new ideology made it clear that China is transitioning from rapid growth to high- quality development.
In South Korea, the benchmark KOSPI continued its positive momentum in 2017 and advanced to a record high later in the year, driven by foreign fund inflows fueled by the strongest upward earnings revisions in the region. Year to date as of the third quarter, Korea is the second best-performing market in Asia ex-Japan with a 47% gain (in USD). Despite the strong performance, we believe Korea is still the most undervalued market in the region with a substantial discount.
On the macro front, South Korea’s economic recovery remains intact, with the government still forecasting gross domestic product (GDP) growth of a healthy 3% this year.3 The guidance is supported by the Nikkei South Korea Manufacturing Purchasing Managers’ Index (PMI), which entered expansionary territory for the first time in 11 months in June 2017.4 Export growth also remained strong, with the September reading surging 35% year-on-year, marking the longest expansionary streak since 2011.5 Meanwhile, the ouster of South Korean President Park Geun-hye removed a major source of uncertainty for Asia’s fourth-largest economy.
Taiwan’s stocks had a solid start in 2017 underpinned by net buying from both foreign and domestic investors. Together with Taiwan’s ongoing economic recovery and market expectations on significant specification upgrades in upcoming new smart devices, Taiwanese stocks were sent higher and reached a five-year high.
On the macro front, economic data suggested continued recovery driven by robust external demand, especially in electronics products this year. The technology hardware sector was the bright spot of the stock market as it has broad exposure to the complete hardware value chain, from basic components such as printed circuit board (PCB) to core components such as integrated circuit (IC) chips. Many companies in this sector are competitive in the global market with their own intellectual properties and growing, dominating market shares. These companies are key beneficiaries in an IT-intensive economy brought about by Internet of Things, cloud computing, wearable technologies and autonomous driving.
FUND PERFORMANCE REVIEW
The top performing sector was technology. Among technology names, the Fund’s holding in the largest South Korean technology hardware company was the top contributor thanks to its strong earnings. The company’s third quarter operating profit surged to a new quarterly record high. Its leading position in memory chips and organic light-emitting diode (OLED) panels also continued to add strength to its earnings, while its outlook remains positive given robust demand for smart devices. The share prices of our holdings in a Chinese optical fiber company appreciated during the third quarter on strong first-half 2017 results that were underscored by a stronger-than-expected improvement in margins. The company gave positive guidance on its earnings outlook given the tight supply of optical fiber in China and the leading industry position that it has attained with its integrated business model.
In real estate, the Fund’s key holding in a Chinese developer was another top performance contributor. The company announced strong contract sales in the first half of 2017 and has revised its sales target upward for 2017 by 50% (from RMB100 billion to RMB150 billion). Gross margin and profit both jumped, while recurring income—a key driver for boosting earnings and achieving stable cash flows—was up 29% year-on-year in the first half of 2017. The company also declared its first-ever interim dividend of RMB0.2 per share, reaffirming it as a high-conviction stock for our dividend strategy.
Thus far, 2017 has been a constructive year for Asia ex Japan equities driven by the strongest earnings upward revision in 6 years. In particular, companies with strong earnings growth in the information technology sector surged remarkably in the first half and were the key performance contributors for the Index. However, these companies were deemed challenging for dividend investors as they are generally trading at high multiples and pay almost zero dividend. We view these as unfit dividend plays, and the Fund’s underweight to the technology sector was the largest detractor from relative performance and among the key reasons for the Fund’s modest performance gap year-to-date. However, with the market’s keen interest in internet stocks, many sectors are left under appreciated, which created compelling investment opportunities. In the first half of the year three of our holdings in the consumer
117
AMG Managers Value Partners Asia Dividend Fund
Portfolio Manager’s Comments (continued)
sector were privatized, which showed that private equities funds were also capturing these undervalued opportunities. Stock selection within the consumer discretionary sector was a detractor from relative performance, thanks to a position in a Chinese designer and manufacturer of consumer electronics. Stock selection within the energy sector also detracted from performance, particularly due to positioning in a Chinese oil and gas company.
OUTLOOK
Although the growth momentum may moderate in Asia ex-Japan markets, the outlook for the region remains positive as supported by stable external
demand recovery and solid corporate earnings. In particular, we remain positive on North Asia, such as South Korea and Greater China equities despite the 40%-plus rally so far this year. We expect the region’s earnings growth (21.9% forecasted in October versus 13.2% in January6) will continue to be the fundamental driver. This, together with continued strength in cash flow generation should be supportive for dividend growth within the region. Although the 12-month forward price-to-earnings (P/E) ratio of the MSCI Asia ex Japan index has normalized to 13.1 times,6 it is still trading at an attractive level relative to developed markets and most emerging countries.
| 6 | FactSet, I/B/E/S, MSCI. |
The views expressed represent the opinions of Value Partners Hong Kong Limited, as of October 31, 2017, and are not intended as a forecast or guarantee of future results and are subject to change without notice.
118
AMG Managers Value Partners Asia Dividend Fund
Portfolio Manager’s Comments (continued)
CUMULATIVE TOTAL RETURN PERFORMANCE
The AMG Managers Value Partners Asia Dividend Fund’s cumulative total return is based on the daily change in net asset value (NAV), and assumes that all dividends and distributions were reinvested. The graph compares a hypothetical $10,000 investment made in AMG Managers Value Partners Asia Dividend Fund’s Class N shares on December 16, 2015, to a $10,000 investment made in the MSCI All Country Asia Ex-Japan Index for the same time period. The graph and table do not reflect the deduction of taxes that a shareholder would pay on a Fund distribution or redemption of shares. The listed returns for the Fund are net of expenses and the returns for the index exclude expenses. Total returns would have been lower had certain expenses not been reduced.
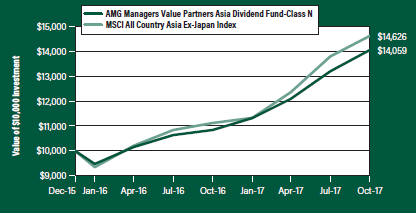
The table below shows the average annual total returns for AMG Managers Value Partners Asia Dividend Fund and the MSCI All Country Asia Ex-Japan Index for the same time periods ended October 31, 2017.
| | | | | | | | | | | | |
| | | One | | | Since | | | Inception | |
| Average Annual Total Returns 1 | | Year | | | Inception | | | Date | |
AMG Managers Value Partners Asia Dividend Fund2, 3, 4, 5, 6, 7, 8, 9, 10, 11, 12 | | | | | | | | | | | | |
Class N | | | 29.71 | % | | | 19.91 | % | | | 12/16/15 | |
Class I | | | 29.79 | % | | | 20.07 | % | | | 12/16/15 | |
MSCI All Country Asia Ex-Japan Index13, 14 | | | 30.45 | % | | | 22.49 | % | | | 12/16/15 | † |
The performance data shown represents past performance. Past performance is not a guarantee of future results. Current performance may be lower or higher than the performance data quoted. The investment return and principal value of an investment will fluctuate so that an investor’s shares, when redeemed, may be worth more or less than their original cost.
Investors should carefully consider the Fund’s investment objectives, risks, charges and expenses before investing. For performance information through the most recent month end, current net asset values per share for the Fund and other information, please call 800.835.3879 or visit our website at amgfunds.com for a free prospectus. Read it carefully before investing or sending money.
Distributed by AMG Distributors, Inc., member FINRA/SIPC.
| † | Date reflects the inception date of the Fund, not the index. |
| 1 | Total return equals income yield plus share price change and assumes reinvestment of all dividends and capital gain distributions. Returns are net of fees and may reflect offsets of Fund expenses as described in the prospectus. No adjustment has been made for taxes payable by shareholders on their reinvested dividends and capital gain distributions. Returns for periods greater than one year are annualized. The listed returns on the Fund are net of expenses and based on the published NAV as of October 31, 2017. All returns are in U.S. dollars ($). |
| 2 | The Fund is subject to the risks associated with investments in debt securities, such as default risk and fluctuations in |
| | the perception of the debtor’s ability to pay its creditors. Changing interest rates may adversely affect the value of an investment. An increase in interest rates typically causes the value of bonds and other fixed income securities to fall. |
| 3 | The Fund may invest in derivatives such as options and futures; the complexity and rapidly changing structure of derivatives markets may increase the possibility of market losses. |
| 4 | A short-term redemption fee of 2% will be charged on shares held for less than 90 days. |
| 5 | The Fund is subject to the risks associated with investments in emerging markets, such as erratic earnings patterns, economic and political instability, changing exchange controls, limitations on repatriation of foreign capital and changes in local governmental attitudes toward private investment, possibly leading to nationalization or confiscation of investor assets. |
| 6 | High-yield bonds (also known as “junk bonds”) may be subject to greater levels of interest rate, credit, and liquidity risk than investments in higher rated securities. These securities are considered predominantly speculative with respect to the issuer’s continuing ability to make principal and interest payments. The issuers of the Fund’s holdings may be involved in bankruptcy proceedings, reorganizations, or financial restructurings, and are not as strong financially as higher-rated issuers. |
| 7 | Investments in international securities are subject to certain risks of overseas investing including currency fluctuations and changes in political and economic conditions, which could result in significant market fluctuations. These risks are magnified in emerging markets. |
| 8 | The Fund is subject to risks associated with investments in mid-capitalization companies such as greater price volatility, lower trading volume, and less liquidity than the stocks of larger, more established companies. |
| 9 | The Fund is subject to special risk considerations similar to those associated with the direct ownership of real estate. Real estate valuations may be subject to factors such as changing general and local economic, financial, competitive, and environmental conditions. |
| 10 | The Fund may suffer significant losses on assets that it sells short. Unlike the possible loss on a security that is purchased, there is no limit on the amount of loss on an appreciating security that is sold short. |
| 11 | The Fund is subject to risks associated with investments in small-capitalization companies, such as erratic earnings patterns, competitive conditions, limited earnings history and a reliance on one or a limited number of products. |
| 12 | The Fund invests in value stocks, which may perform |
119
AMG Managers Value Partners Asia Dividend Fund
Portfolio Manager’s Comments (continued)
| | differently from the market as a whole and may be undervalued by the market for a long period of time. |
| 13 | The MSCI All Country Asia ex-Japan Index captures large-and mid-cap representation across 2 of 3 Developed Markets countries (excluding Japan) and 9 Emerging Markets countries in Asia. The developed market country indices included are: Hong Kong and Singapore. The emerging market country indices included are: China, India, Indonesia, Korea, Malaysia, |
| | Pakistan, the Philippines, Taiwan and Thailand. Please go to msci.com for most current list of countries represented by the index. Unlike the Fund, the MSCI All Country Asia ex-Japan Index is unmanaged, is not available for investment and does not incur expenses. |
| 14 | All MSCI data is provided ‘as is.’ The products described herein are not sponsored or endorsed and have not been reviewed or passed on by MSCI. In no event shall MSCI, its affiliates, or any MSCI data |
| | provider have any liability of any kind in connection with the MSCI data or the products described herein. Copying or redistributing the MSCI data is strictly prohibited. |
Not FDIC insured, nor bank guaranteed. May lose value.
120
| | |
| AMG Managers Value Partners Asia Dividend Fund | | October 31, 2017 |
Fund Snapshots (unaudited)
PORTFOLIO BREAKDOWN
| | | | |
| | | % of | |
Sector | | Net Assets | |
Information Technology | | | 19.3 | |
Financials | | | 17.8 | |
Real Estate | | | 16.6 | |
Industrials | | | 15.7 | |
Consumer Discretionary | | | 11.8 | |
Utilities | | | 4.1 | |
Energy | | | 2.9 | |
Telecommunication Services | | | 2.8 | |
Consumer Staples | | | 2.3 | |
Materials | | | 0.9 | |
Health Care | | | 0.2 | |
Other Assets Less Liabilities | | | 5.6 | |
TOP TEN HOLDINGS
| | | | |
| | | % of | |
Security Name | | Net Assets | |
Samsung Electronics Co., Ltd. | | | 8.6 | |
China Construction Bank Corp., Class H | | | 5.7 | |
Longfor Properties Co., Ltd. | | | 3.9 | |
KB Financial Group, Inc. | | | 2.8 | |
PetroChina Co., Ltd., Class H | | | 2.6 | |
Ping An Insurance Group Co. of China, Ltd., Class H | | | 2.5 | |
China Resources Power Holdings Co., Ltd. | | | 2.4 | |
Far East Horizon, Ltd. | | | 2.2 | |
SITC International Holdings Co., Ltd. | | | 2.2 | |
Far East Consortium International, Ltd. | | | 2.1 | |
| | | | |
Top Ten as a Group | | | 35.0 | |
| | | | |
Because a fund’s strategy may result in multiple investments in particular sectors of the economy, its performance may depend on the performance of those sectors and may fluctuate more widely than investments diversified across more sectors. For additional information on these and other risk considerations, please see the Fund’s prospectus.
Any sectors, industries, or securities discussed should not be perceived as investment recommendations. Mention of a specific security should not be considered a recommendation to buy or solicitation to sell that security. Specific securities mentioned in this report may have been sold from the Fund’s portfolio of investments by the time you receive this report.
121
| | |
| AMG Managers Value Partners Asia Dividend Fund | | October 31, 2017 |
| |
| Schedule of Portfolio Investments | | |
| | | | | | | | |
| | | Shares | | | Value | |
Common Stocks – 82.1% | | | | | | | | |
Consumer Discretionary – 9.8% | | | | | | | | |
Asian Pay Television Trust (Singapore) | | | 98,900 | | | $ | 42,093 | |
Basso Industry Corp. (Taiwan) | | | 25,000 | | | | 69,108 | |
China Lilang, Ltd. (China) | | | 185,000 | | | | 144,033 | |
Chongqing Changan Automobile Co., Ltd., Class B (China) | | | 87,963 | | | | 115,121 | |
Chow Sang Sang Holdings International, Ltd. (Hong Kong) | | | 28,000 | | | | 61,066 | |
EGL Holdings Co., Ltd. (Hong Kong) | | | 74,000 | | | | 12,722 | |
Fila Korea, Ltd. (South Korea) | | | 974 | | | | 58,861 | |
Hotel Shilla Co., Ltd. (South Korea) | | | 589 | | | | 41,211 | |
Jinmao Hotel and Jinmao China Hotel | | | | | | | | |
Investments and Management, Ltd. (Hong Kong) | | | 78,500 | | | | 49,104 | |
Kang Yong Electric PCL (Thailand) | | | 1,500 | | | | 21,403 | |
Mitra Pinasthika Mustika (Indonesia) | | | 748,200 | | | | 59,856 | |
Nameson Holdings, Ltd. (Hong Kong) | | | 184,000 | | | | 54,045 | |
Nasmedia Co., Ltd. (South Korea) | | | 1,063 | | | | 59,073 | |
Skyworth Digital Holdings, Ltd. (Hong Kong) | | | 223,225 | | | | 102,799 | |
Taiwan Sakura Corp. (Taiwan) | | | 54,000 | | | | 69,893 | |
Wonderful Sky Financial Group Holdings, Ltd. (Hong Kong) | | | 214,000 | | | | 52,416 | |
Xtep International Holdings, Ltd. (China) | | | 47,500 | | | | 15,719 | |
Total Consumer Discretionary | | | | | | | 1,028,523 | |
Consumer Staples – 2.3% | | | | | | | | |
Convenience Retail Asia, Ltd. (Hong Kong) | | | 92,000 | | | | 42,561 | |
E-MART, Inc. (South Korea) | | | 416 | | | | 83,274 | |
Hengan International Group Co., Ltd. (China) | | | 8,500 | | | | 83,822 | |
Springland International Holdings, Ltd. (China) | | | 47,000 | | | | 8,615 | |
Ultrajaya Milk Industry & Trading Co. (Indonesia) | | | 220,400 | | | | 21,207 | |
Total Consumer Staples | | | | | | | 239,479 | |
Energy – 2.9% | | | | | | | | |
PetroChina Co., Ltd., Class H (China) | | | 418,000 | | | | 273,246 | |
Pryce Corp. (Philippines)* | | | 222,500 | | | | 28,109 | |
Total Energy | | | | | | | 301,355 | |
Financials – 17.8% | | | | | | | | |
Bangkok Bank PCL (Thailand) | | | 5,400 | | | | 31,372 | |
Bank Pan Indonesia (Indonesia)* | | | 263,800 | | | | 21,208 | |
BOC Hong Kong Holdings, Ltd. (Hong Kong) | | | 19,500 | | | | 92,921 | |
China Construction Bank Corp., Class H (China) | | | 672,000 | | | | 600,577 | |
Chongqing Rural Commercial Bank Co., Ltd., Class H (China) | | | 119,000 | | | | 80,896 | |
CIMB Group Holdings (Malaysia) | | | 17,716 | | | | 25,694 | |
Dongbu Insurance Co., Ltd. (South Korea) | | | 1,181 | | | | 74,352 | |
| | | | | | | | |
| | | Shares | | | Value | |
Far East Horizon, Ltd. (Hong Kong) | | | 236,000 | | | $ | 234,517 | |
KB Financial Group, Inc. (South Korea) | | | 5,698 | | | | 297,916 | |
Metropolitan Bank & Trust Co. (Philippines) | | | 28,950 | | | | 48,580 | |
Oi Wah Pawnshop Credit Holdings, Ltd. (Hong Kong) | | | 227,049 | | | | 12,089 | |
Panin Financial (Indonesia)* | | | 5,172,600 | | | | 90,008 | |
Ping An Insurance Group Co. of China, Ltd., Class H (China) | | | 29,000 | | | | 254,851 | |
Total Financials | | | | | | | 1,864,981 | |
Health Care – 0.2% | | | | | | | | |
SSY Group, Ltd. (Hong Kong) | | | 54,000 | | | | 25,686 | |
Industrials – 14.1% | | | | | | | | |
Acset Indonusa (Indonesia) | | | 129,900 | | | | 28,255 | |
BOC Aviation, Ltd. (Singapore)1 | | | 25,100 | | | | 134,984 | |
CB Industrial Product Holding (Malaysia) | | | 36,500 | | | | 16,649 | |
China Communications Construction Co., Ltd., Class H (China) | | | 44,000 | | | | 53,442 | |
China Machinery Engineering Corp., Class H (China) | | | 83,000 | | | | 50,888 | |
China State Construction International Holdings, Ltd. (Hong Kong) | | | 82,000 | | | | 115,215 | |
CRRC Corp., Ltd., Class H (China) | | | 61,000 | | | | 60,189 | |
FSE Engineering Holdings, Ltd. (Hong Kong) | | | 159,000 | | | | 52,210 | |
Haitian International Holdings, Ltd. (China) | | | 28,000 | | | | 83,848 | |
Kerry TJ Logistics Co., Ltd. (Taiwan) | | | 22,000 | | | | 26,662 | |
Pembangunan Perumahan Persero (Indonesia) | | | 216,400 | | | | 45,492 | |
Qingdao Port International Co., Ltd., Class H (China)1 | | | 286,000 | | | | 202,185 | |
SITC International Holdings Co., Ltd. (Hong Kong) | | | 236,000 | | | | 227,637 | |
TK Group Holdings, Ltd. (Hong Kong) | | | 212,000 | | | | 104,644 | |
Total Bangun Persada (Indonesia) | | | 369,700 | | | | 19,627 | |
TURVO International Co., Ltd. (Taiwan) | | | 15,000 | | | | 60,001 | |
Waskita Karya Persero (Indonesia) | | | 320,300 | | | | 50,070 | |
Xinjiang Goldwind Science & Technology Co., Ltd., Class H (China) | | | 109,160 | | | | 138,359 | |
Total Industrials | | | | | | | 1,470,357 | |
Information Technology – 10.7% | | | | | | | | |
Accton Technology Corp. (Taiwan) | | | 10,000 | | | | 32,244 | |
Advanced Semiconductor Engineering, Inc. (Taiwan) | | | 14,343 | | | | 17,340 | |
Amotech Co., Ltd. (South Korea)* | | | 1,205 | | | | 40,831 | |
BH Co., Ltd. (South Korea)* | | | 3,676 | | | | 71,817 | |
Chilisin Electronics Corp. (Taiwan) | | | 10,108 | | | | 34,549 | |
ChipMOS TECHNOLOGIES, INC. (Taiwan) | | | 27,000 | | | | 26,930 | |
FLEXium Interconnect, Inc. (Taiwan) | | | 23,148 | | | | 88,756 | |
The accompanying notes are an integral part of these financial statements.
122
| | |
| AMG Managers Value Partners Asia Dividend Fund | | |
| |
| Schedule of Portfolio Investments (continued) | | |
| | | | | | | | |
| | | Shares | | | Value | |
Information Technology – 10.7% (continued) | | | | | | | | |
Goldpac Group, Ltd. (China) | | | 169,000 | | | $ | 51,387 | |
Hyundai Robotics Co., Ltd. (South Korea)* | | | 40 | | | | 16,142 | |
Inventec Corp. (Taiwan) | | | 59,000 | | | | 45,850 | |
King Yuan Electronics Co., Ltd. (Taiwan) | | | 113,000 | | | | 119,840 | |
Primax Electronics, Ltd. (Taiwan) | | | 16,000 | | | | 41,546 | |
Quanta Computer, Inc. (Taiwan) | | | 17,000 | | | | 40,049 | |
Silicon Motion Technology Corp., ADR (Taiwan)2 | | | 1,183 | | | | 57,281 | |
Taiwan Semiconductor Manufacturing Co., Ltd. (Taiwan) | | | 23,000 | | | | 185,939 | |
Transtech Optelecom Science Holdings, Ltd. (Hong Kong)* | | | 196,000 | | | | 89,943 | |
Yangtze Optical Fibre and Cable Joint Stock Co., Ltd., Class H (China)1 | | | 42,500 | | | | 158,336 | |
Total Information Technology | | | | | | | 1,118,780 | |
Materials – 0.9% | | | | | | | | |
EcoGreen International Group, Ltd. (Hong Kong) | | | 124,000 | | | | 25,114 | |
Hyundai Steel Co. (South Korea) | | | 253 | | | | 13,003 | |
Lee & Man Chemical Co., Ltd. (Hong Kong) | | | 106,000 | | | | 59,181 | |
Total Materials | | | | | | | 97,298 | |
Real Estate – 16.5% | | | | | | | | |
AIMS AMP Capital Industrial, REIT (Singapore) | | | 40,200 | | | | 42,615 | |
AP Thailand PCL (Thailand) | | | 304,700 | | | | 81,659 | |
Bekasi Fajar Industrial Estate (Indonesia) | | | 1,365,000 | | | | 28,583 | |
CapitaLand Retail China Trust, REIT (Singapore) | | | 39,940 | | | | 48,639 | |
China Overseas Land & Investment, Ltd. (Hong Kong) | | | 14,000 | | | | 45,458 | |
CIFI Holdings Group Co., Ltd. (China) | | | 258,000 | | | | 143,838 | |
CK Asset Holdings, Ltd. (Hong Kong) | | | 24,500 | | | | 201,631 | |
CSI Properties, Ltd. (Hong Kong) | | | 1,710,000 | | | | 87,755 | |
Far East Consortium International, Ltd. (Hong Kong) | | | 400,179 | | | | 218,585 | |
Hopefluent Group Holdings, Ltd. (China) | | | 72,000 | | | | 32,284 | |
Jaya Real Property (Indonesia) | | | 409,300 | | | | 27,312 | |
Longfor Properties Co., Ltd. (China) | | | 176,000 | | | | 411,123 | |
Mah Sing Group (Malaysia) | | | 134,500 | | | | 48,984 | |
Megaworld Corp. (Philippines) | | | 324,000 | | | | 33,451 | |
Metropolitan Land (Indonesia) | | | 851,300 | | | | 22,346 | |
Puradelta Lestari (Indonesia) | | | 1,889,900 | | | | 26,197 | |
SP Setia Group (Malaysia) | | | 31,900 | | | | 24,640 | |
Supalai PCL (Thailand) | | | 63,600 | | | | 47,097 | |
Times Property Holdings, Ltd. (China) | | | 84,000 | | | | 86,771 | |
| | | | | | | | |
| | | Shares | | | Value | |
UOA Development (Malaysia) | | | 53,900 | | | $ | 32,466 | |
Viva Industrial Trust (Singapore) | | | 56,100 | | | | 40,375 | |
Total Real Estate | | | | | | | 1,731,809 | |
Telecommunication Services – 2.8% | | | | | | | | |
HKBN, Ltd. (Hong Kong) | | | 84,000 | | | | 85,291 | |
Indosat (Indonesia) | | | 212,500 | | | | 94,009 | |
Link Net (Indonesia) | | | 213,400 | | | | 78,516 | |
SmarTone Telecommunications Holdings, Ltd. (Hong Kong) | | | 28,000 | | | | 34,862 | |
Total Telecommunication Services | | | | | | | 292,678 | |
Utilities – 4.1% | | | | | | | | |
China Jinjiang Environment Holding Co., Ltd. (China) | | | 44,000 | | | | 26,469 | |
China Power International Development, Ltd. (Hong Kong) | | | 82,000 | | | | 26,071 | |
China Resources Power Holdings Co., Ltd. (Hong Kong) | | | 132,000 | | | | 253,846 | |
China Tian Lun Gas Holdings, Ltd. (China) | | | 72,000 | | | | 52,052 | |
Cikarang Listrindo (Indonesia)1 | | | 364,000 | | | | 29,388 | |
Datang International Power Generation Co., Ltd., Class H (China)* | | | 110,000 | | | | 37,095 | |
Total Utilities | | | | | | | 424,921 | |
Total Common Stocks
(Cost $7,428,085) | | | | | | | 8,595,867 | |
Preferred Stock – 8.6% | | | | | | | | |
Information Technology - 8.6% | | | | | | | | |
Samsung Electronics Co., Ltd. (South Korea) | | | 447 | | | | 895,272 | |
Total Preferred Stock
(Cost $572,362) | | | | | | | 895,272 | |
Participation Notes – 3.6% | | | | | | | | |
Consumer Discretionary – 2.0% | | | | | | | | |
Midea Group Co., Ltd. (HSBC Bank) (China) | | | 26,700 | | | | 205,583 | |
Industrials – 1.6% | | | | | | | | |
Huayu Automotive Systems Co., Ltd. (China) | | | 44,700 | | | | 171,518 | |
Total Participation Notes
(Cost $218,515) | | | | | | | 377,101 | |
Warrants – 0.1% | | | | | | | | |
Energy – 0.0% | | | | | | | | |
Ezion Holdings, Ltd., 04/24/20 (Singapore)*
(Cost $0) | | | 18,520 | | | | 0 | |
The accompanying notes are an integral part of these financial statements.
123
| | |
| AMG Managers Value Partners Asia Dividend Fund | | |
| |
| Schedule of Portfolio Investments (continued) | | |
| | | | | | | | |
| | | Shares | | | Value | |
Real Estate – 0.1% | | | | | | | | |
Supalai PCL, 10/20/18 (Thailand)*
(Cost $5,535) | | | 15,900 | | | $ | 9,860 | |
Total Warrants
(Cost $5,535) | | | | | | | 9,860 | |
| | |
| | | Principal | | | | |
| | | Amount | | | | |
Short-Term Investments – 2.1% | | | | | | | | |
Repurchase Agreements – 0.3%3 | | | | | | | | |
Cantor Fitzgerald Securities, Inc., dated 10/31/17, due 11/01/17, 1.080% total to be received $32,122 (collateralized by various U.S. Government Agency Obligations, 0.000% -10.000%, 12/01/17 - 09/20/67, totaling $32,763) | | $ | 32,121 | | | | 32,121 | |
| | | | | | | | |
| | | Shares | | | Value | |
Other Investment Companies – 1.8% | | | | | | | | |
Dreyfus Institutional Preferred Government Money Market Fund, Institutional Class Shares, 1.00%4 | | | 191,360 | | | $ | 191,360 | |
Total Short-Term Investments
(Cost $223,481) | | | | | | | 223,481 | |
Total Investments – 96.5%
(Cost $8,447,978) | | | | | | | 10,101,581 | |
Other Assets, less Liabilities – 3.5% | | | | | | | 366,085 | |
Net Assets – 100.0% | | | | | | $ | 10,467,666 | |
| * | Non-income producing security. |
| 1 | Security exempt from registration under Rule 144A of the Securities Act of 1933. This security may be resold in transactions exempt from registration, normally to qualified buyers. At October 31, 2017, the value of these securities amounted to $524,893 or 5.0% of net assets. |
| 2 | Some or all of these securities, amounting to $32,199 or 0.3% of net assets, were out on loan to various brokers. |
| 3 | Collateral received from brokers for securities lending was invested in these joint repurchase agreements. |
| 4 | Yield shown represents the October 31, 2017, seven day average yield, which refers to the sum of the previous seven days’ dividends paid, expressed as an annual percentage. |
ADR American Depositary Receipt
REIT Real Estate Investment Trust
The accompanying notes are an integral part of these financial statements.
124
AMG Managers Value Partners Asia Dividend Fund
Schedule of Portfolio Investments (continued)
The following table summarizes the inputs used to value the Fund’s investments by the fair value hierarchy levels as of October 31, 2017:
| | | | | | | | | | | | | | | | |
| | | Level 1 | | | Level 2 | | | Level 3 | | | Total | |
Investments in Securities | | | | | | | | | | | | | | | | |
Common Stocks | | | | | | | | | | | | | | | | |
Financials | | $ | 90,008 | | | $ | 1,774,973 | | | | — | | | $ | 1,864,981 | |
Real Estate | | | 286,249 | | | | 1,445,560 | | | | — | | | | 1,731,809 | |
Industrials | | | 74,544 | | | | 1,395,813 | | | | — | | | | 1,470,357 | |
Information Technology | | | 147,224 | | | | 971,556 | | | | — | | | | 1,118,780 | |
Consumer Discretionary | | | 224,081 | | | | 804,442 | | | | — | | | | 1,028,523 | |
Utilities | | | 107,909 | | | | 317,012 | | | | — | | | | 424,921 | |
Energy | | | — | | | | 301,355 | | | | — | | | | 301,355 | |
Telecommunication Services | | | 172,525 | | | | 120,153 | | | | — | | | | 292,678 | |
Consumer Staples | | | 29,822 | | | | 209,657 | | | | — | | | | 239,479 | |
Materials | | | 25,114 | | | | 72,184 | | | | — | | | | 97,298 | |
Health Care | | | — | | | | 25,686 | | | | — | | | | 25,686 | |
Preferred Stock | | | | | | | | | | | | | | | | |
Information Technology | | | — | | | | 895,272 | | | | — | | | | 895,272 | |
Participation Notes | | | | | | | | | | | | | | | | |
Consumer Discretionary | | | — | | | | 205,583 | | | | — | | | | 205,583 | |
Industrials | | | — | | | | 171,518 | | | | — | | | | 171,518 | |
Warrants | | | — | | | | 9,860 | | | | — | | | | 9,860 | |
Short-Term Investments | | | | | | | | | | | | | | | | |
Repurchase Agreements | | | — | | | | 32,121 | | | | — | | | | 32,121 | |
Other Investment Companies | | | 191,360 | | | | — | | | | — | | | | 191,360 | |
| | | | | | | | | | | | | | | | |
Total Investments in Securities | | $ | 1,348,836 | | | $ | 8,752,745 | | | | — | | | $ | 10,101,581 | |
| | | | | | | | | | | | | | | | |
As of October 31, 2017, the Fund had transfers between Level 1 and Level 2 as follows:
| | | | | | | | | | | | | | | | |
| | | Transfer | | | Transfer | | | Transfer | | | Transfer | |
| | | into | | | out of | | | into | | | out of | |
| | | Level 11 | | | Level 11 | | | Level 21 | | | Level 21 | |
Assets: | | | | | | | | | | | | | | | | |
Common Stocks | | $ | 249,910 | | | $ | (165,778 | ) | | $ | 165,778 | | | $ | (249,910 | ) |
| 1 | An external pricing service is used to reflect any significant market movements between the time the Fund valued such foreign securities and the earlier closing of foreign markets. (See Note 1(a) in the Notes to Financial Statements.) |
| | | | |
| | | % of Long-Term | |
Country | | Investments | |
China | | | 35.9 | % |
Hong Kong | | | 24.0 | % |
Indonesia | | | 6.5 | % |
Malaysia | | | 1.5 | % |
Philippines | | | 1.1 | % |
| | | | |
| | | % of Long-Term | |
Country | | Investments | |
Singapore | | | 3.1 | % |
South Korea | | | 16.7 | % |
Taiwan | | | 9.3 | % |
Thailand | | | 1.9 | % |
| | | | |
| | | 100.0 | % |
| | | | |
The accompanying notes are an integral part of these financial statements.
125
AMG Managers Montag & Caldwell Balanced Fund
Portfolio Manager’s Comments (unaudited)
OVERVIEW
For the fiscal year ended October 31, 2017, the AMG Managers Montag & Caldwell Balanced Fund (the “Fund”) Class N shares returned 10.61%, compared to the 14.16% return for its benchmark, 60% S&P 500® Index/40% Bloomberg Barclays U.S. Government/Credit Bond Index. The Fund is managed using fundamental valuation techniques that focus on a company’s future earnings and dividend growth rates. The equity process is primarily bottom up and utilizes a present valuation model in which the current price of the stock is related to the risk adjusted present value of the company’s estimated future earnings stream. The Fund seeks to invest in growth stocks selling at a discount to estimates of fair value, and at a time when relative earnings per share growth is visible for the intermediate term. The stock portfolio is coupled with a core bond portfolio that aims to maximize total return and minimize volatility.
MARKET ENVIRONMENT
U.S. stock indices experienced strong gains for the twelve months ended October 31, 2017, with a bias toward small cap stocks. The Russell 1000® (large cap) Index was up 23.67%, the Russell Midcap® Index (mid cap) was up 21.09%, and the Russell 2000® Index (small cap) was up 27.85% for the 12 months ended October 31, 2017. There was, however, a significant bias toward growth, particularly in the second half of the 12-month period. For the full 12 months, growth outperformed value in each size segment, with the widest spread in returns between large cap growth and large cap value. The Russell 1000® Growth Index (large cap growth) was up 29.71% vs. a 17.78% return for the Russell 1000® Value Index (large cap value). The performance advantage of growth over value in both the mid cap and small cap areas was also meaningful, though less pronounced than in large cap.
In the bond market, there was a flattening of the Treasury yield curve as yields on short-term bonds rose more than long-term bonds after the Federal Reserve (Fed) raised the target on the Federal Funds rate three times during the period. Yields on longer-term maturities did not rise as much because economic growth is moderate and inflation remains below central bank targets. Risk assets outperformed in the bond market during the period as investors continue to seek out incremental yield and corporate fundamentals improved with a recovery in profits.
PERFORMANCE REVIEW
While the major equity indices all posted solid gains during the 12-month period, there were several notable, some would say violent, underlying
rotations that occurred throughout the period. Following the U.S. presidential election, and the surprise victory of Donald Trump as our 45th president, U.S. stocks embarked upon a vigorous rally to close out 2016 while the bond market sold off as yields rose. The equity rally was lopsided, however, with most of the upside coming in small cap, cyclical and value-oriented issues (like financials, energy, materials and industrials) as the biggest perceived beneficiaries of President Trump’s economic agenda which included lower corporate taxes, lighter business regulation and potential domestic infrastructure spending. This return pattern contrasted with that of 2015 when the less cyclical sectors led the markets and the equity portion of the Fund out-performed both the Russell 1000® Growth and the broad market S&P 500 indices. During these initial weeks of the post-election rally, the equity portion of the Fund’s performance lagged the S&P 500 benchmark, which was mostly attributable to adverse stock selection, particularly within financial services, technology, discretionary and industrials, as well as an impact from overweight allocations to staples, health care and technology. The bond portion of the Fund declined less than the Bloomberg Barclays U.S. Government/Credit Index during this period because the duration of the Fund was shorter than the index and a higher weighting was held in corporate bonds, which outperformed.
The post-election market rally continued in the first quarter of 2017 with the S&P 500 tacking on over 6% in total return, on top of its 5% fourth quarter post-election advance. However, there was a notable shift in leadership, particularly after the administration’s initial failure to repeal Obamacare in February. The so-called “Trump stocks” that led the initial advance took a breather and gave way to some of the secular growers within health care, technology and consumer discretionary. The lagging performance of the “Trump stocks,” which persisted well into the third quarter of 2017, seemed to coincide with a pullback in the dollar and bond yields, a sign that investors’ enthusiasm for the timing, if not the substance, of the Trump administration’s pro-growth agenda, and in particular tax reform, started to wane a bit. During this period, the Fund benefited from solid stock selection in technology, health care and financial services versus the S&P 500® Index. The Fund’s overweight allocation to technology and health care and absence from the energy sector also added to relative results versus the S&P 500. Results relative
to the S&P 500 were diminished by stock selection in the industrials and discretionary sectors and an overweight allocation to the staples sector. The final few weeks of the period favored small cap and more cyclical areas of the market as investors once again began to anticipate the administration’s pivot away from health care reform to tax reform. In the bond market, the Treasury yield curve flattened during this period as the Fed raised the Fed Funds target, which pressured short-term yields higher, while longer maturity bonds declined slightly in yield since inflation remained muted and U.S. yields were attractive relative to other developed market bond yields, attracting foreign buyers. Lower quality corporate bonds significantly outperformed as investors embraced risk with corporate profitability recovering. The Fund’s fixed income results lagged during this period because the Fund had a shorter duration, with less exposure to longer maturity bonds, and held higher quality corporate bonds than the index.
Finally, while there were several observable style/size shifts over the course of the 12-month period, overall market volatility, as measured by the CBOE Volatility Index (VIX), remained extraordinarily subdued. While the VIX rose briefly in response to the heightened geopolitical tensions in August, it did so from all-time low levels. Beyond that brief blip up, the VIX remained near all-time low levels. Downside market action also remained extremely limited. In fact, the market hasn’t suffered a 3% decline since right before the presidential election, and has not seen a 5% correction since June 2016, the longest such stretch in over 20 years.1 It seems highly unlikely that this relative tranquility can persist for much longer.
OUTLOOK
While valuation and investor sentiment data continue to be red flags for the stock market, volatility remains contained and any significant market weakness is quickly met by buyers of stock. With both the stock and bond markets highly valued and a significant drawdown in share prices long overdue, we are sensitive to any developments that could cause the market to correct. The S&P 500® Index median price-to-earnings ratio is currently 23.1x and is higher than 96% of historical periods.2 The 10-year U.S. Treasury is also highly valued and offers only a 2.3% yield to maturity. For now, a low risk of recession, improving corporate profits, a better global economy, very accommodative policies
126
AMG Managers Montag & Caldwell Balanced Fund
Portfolio Manager’s Comments (continued)
by central banks throughout the developed world, a gradual and predictable increase in interest rates by our Fed and the likelihood of fiscal stimulus coming out of Congress are all supportive of the equity market and will likely continue to keep it elevated. Looking ahead in the bond market, continued moderate economic growth and the normalization of the Federal Reserve’s balance sheet are likely to exert upward pressure on Treasury yields. Tax reform proposals are supportive of a modest boost to economic growth if passage is successful. The proposals include a reduction of interest expense deductibility for companies, which could reduce corporate bond issuance. This dynamic, in addition
to solid corporate profits, should lead to continued outperformance of corporate bonds versus similar duration Treasury bonds. Given this outlook for higher absolute interest rates and a narrowing of corporate bond spreads, we continue to maintain a shorter duration position in the Fund’s bond portfolio versus the bond index and to favor high quality corporate bonds.
The Fund’s equity holdings are benefiting from improving global economic growth due to their strong brands and entrenched global presence. In addition, they operate from financial strength and, we believe, will be better able to cope with what is likely to be higher interest expense as the Federal
Reserve (the Fed) gradually raises interest rates. Importantly, the Fund’s holdings are reasonably valued based on our work and, with their favorable attributes of global diversification and financial strength, we believe they are well positioned to provide attractive investment returns relative to the market in the period ahead and over the long term.
The views expressed represent the opinions of Montag & Caldwell LLC, as of October 31, 2017, and are not intended as a forecast or guarantee of future results and are subject to change without notice.
127
AMG Managers Montag & Caldwell Balanced Fund
Portfolio Manager’s Comments (continued)
CUMULATIVE TOTAL RETURN PERFORMANCE
The AMG Managers Montag & Caldwell Balanced Fund’s cumulative total return is based on the daily change in net asset value (NAV), and assumes that all dividends and distributions were reinvested. The graph compares a hypothetical $10,000 investment made in AMG Managers Montag & Caldwell Balanced Fund’s Class N shares on October 31, 2007, to a $10,000 investment made in the 60% S&P 500 Index/40% Bloomberg Barclays U.S. Government Credit Bond Index, S&P 500 Index and Bloomberg Barclays U.S. Government Credit Bond Index for the same time period. The graph and table do not reflect the deduction of taxes that a shareholder would pay on a Fund distribution or redemption of shares. The listed returns for the Fund are net of expenses and the returns for the index exclude expenses. Total returns would have been lower had certain expenses not been reduced.
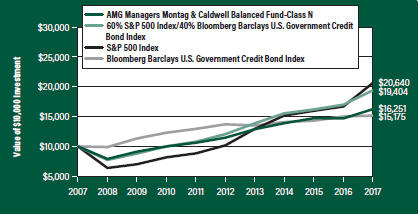
The table below shows the average annual total returns for AMG Managers Montag & Caldwell Balanced Fund and the 60% S&P 500 Index/40% Bloomberg Barclays U.S. Government Credit Bond Index, S&P 500 Index and Bloomberg Barclays U.S. Government Credit Bond Index for the same time periods ended October 31, 2017.
| | | | | | | | | | | | |
| Average Annual Total Returns1 | | One Year | | | Five Year | | | Ten Year | |
AMG Managers Montag & Caldwell Balanced
Fund2, 3, 4, 5, 6 | | | | | | | | | | | | |
Class N | | | 10.61 | % | | | 7.22 | % | | | 4.98 | % |
Class I | | | 10.70 | % | | | 7.33 | % | | | 5.11 | % |
60% S&P 500 Index/40% Bloomberg Barclays U.S. Government Credit Bond Index7 | | | 14.16 | % | | | 9.98 | % | | | 6.85 | % |
S&P 500 Index7 | | | 23.63 | % | | | 15.18 | % | | | 7.51 | % |
Bloomberg Barclays U.S. Government Credit Bond Index7 | | | 1.05 | % | | | 2.05 | % | | | 4.26 | % |
The performance data shown represents past performance. Past performance is not a guarantee of future results. Current performance may be lower or higher than the performance data quoted. The investment return and principal value of an investment will fluctuate so that an investor’s shares, when redeemed, may be worth more or less than their original cost.
Investors should carefully consider the Fund’s investment objectives, risks, charges and expenses before investing. For performance information through the most recent month end, current net asset values per share for the Fund and other information, please call 800.835.3879 or visit our website at amgfunds.com for a free prospectus. Read it carefully before investing or sending money.
Distributed by AMG Distributors, Inc., member FINRA/SIPC.
| 1 | Total return equals income yield plus share price change and assumes reinvestment of all dividends and capital gain distributions. Returns are net of fees and may reflect offsets of Fund expenses as described in the prospectus. No |
| | adjustment has been made for taxes payable by shareholders on their reinvested dividends and capital gain distributions. Returns for periods greater than one year are annualized. The listed returns on the Fund are net of expenses and based on the published NAV as of October 31, 2017. All returns are in U.S. dollars ($). |
| 2 | To the extent that the Fund invests in asset-backed or mortgage-backed securities, its exposure to prepayment and extension risks may be greater than investments in other fixed income securities. |
| 3 | The Fund is subject to the risks associated with investments in debt securities, such as default risk and fluctuations in the perception of the debtor’s ability to pay its creditors. Changing interest rates may adversely affect the value of an investment. An increase in interest rates typically causes the value of bonds and other fixed income securities to fall. |
| 4 | The Fund invests in growth stocks, which may be more sensitive to market movements because their prices tend to reflect future investor expectations rather than just current profits. |
| 5 | Investments in international securities are subject to certain risks of overseas investing including currency fluctuations and changes in political and economic conditions, which could result in significant market fluctuations. These risks are magnified in emerging markets. |
| 6 | Obligations of certain government agencies are not backed by the full faith and credit of the U.S. government. If one of these agencies defaulted on a loan, there is no guarantee that the U.S. government would provide financial support. Additionally, debt securities of the U.S. government may be affected by changing interest rates and subject to prepayment risk. |
| 7 | The benchmark is composed of 60% S&P 500 Index and 40% Bloomberg Barclays U.S. Government Credit Bond Index. The S&P 500 Index is a capitalization-weighted index of 500 stocks. The S&P 500 Index is designed to measure performance of the broad domestic economy through changes in the aggregate market value of 500 stocks representing all major industries. The Bloomberg Barclays U.S. Government Credit Bond Index is an Index of investment grade government and corporate bonds with a maturity date of more than one year. Unlike the Fund, the indices are unmanaged, are not available for investment and do not incur expenses. |
The S&P Index is proprietary data of Standard & Poor’s, a division of McGraw-Hill Companies, Inc. All rights reserved.
Not FDIC insured, nor bank guaranteed. May lose value.
128
| | |
| AMG Managers Montag & Caldwell Balanced Fund | | October 31, 2017 |
| Fund Snapshots (unaudited) | | |
PORTFOLIO BREAKDOWN
| | | | |
| | | % of | |
Sector | | Net Assets | |
Information Technology | | | 24.4 | |
Corporate Bonds and Notes | | | 19.8 | |
Consumer Staples | | | 18.3 | |
Health Care | | | 9.5 | |
U.S. Government and Agency Obligations | | | 8.7 | |
Consumer Discretionary | | | 7.3 | |
Financials | | | 5.3 | |
Materials | | | 2.0 | |
Industrials | | | 1.9 | |
Other Assets Less Liabilities | | | 2.8 | |
| | | | |
Rating | | % of
Market Value* | |
U.S. Government and Agency Obligations | | | 30.4 | |
Aaa | | | 3.4 | |
Aa | | | 33.8 | |
A | | | 32.4 | |
| * | Includes market value of fixed-income securities only. |
TOP TEN HOLDINGS
| | | | |
| | | % of | |
Security Name | | Net Assets | |
Alphabet, Inc., Class A | | | 3.1 | |
Becton Dickinson & Co. | | | 3.0 | |
Visa, Inc., Class A | | | 2.9 | |
UnitedHealth Group, Inc. | | | 2.8 | |
Mondelez International, Inc., Class A | | | 2.7 | |
Apple, Inc. | | | 2.6 | |
Philip Morris International, Inc. | | | 2.6 | |
Microsoft Corp. | | | 2.6 | |
Dollar Tree, Inc. | | | 2.5 | |
Facebook, Inc., Class A | | | 2.4 | |
| | | | |
Top Ten as a Group | | | 27.2 | |
| | | | |
Credit quality ratings shown above reflect the highest rating assigned by either Standard & Poor’s (“S&P”) or Moody’s Investors Service, Inc. (“Moody’s”). These rating agencies are independent, nationally recognized statistical rating organizations and are widely used. Investment grade ratings are credit ratings of BBB/Baa or higher. Below investment grade ratings are credit ratings of BB/Ba or lower. Investments designated N/R are not rated by either rating agency. Unrated investments do not necessarily indicate low credit quality. Credit quality ratings are subject to change.
Because a fund’s strategy may result in multiple investments in particular sectors of the economy, its performance may depend on the performance of those sectors and may fluctuate more widely than investments diversified across more sectors. For additional information on these and other risk considerations, please see the Fund’s prospectus.
Any sectors, industries, or securities discussed should not be perceived as investment recommendations. Mention of a specific security should not be considered a recommendation to buy or solicitation to sell that security. Specific securities mentioned in this report may have been sold from the Fund’s portfolio of investments by the time you receive this report.
129
| | |
| AMG Managers Montag & Caldwell Balanced Fund | | October 31, 2017 |
| |
| Schedule of Portfolio Investments | | |
| | | | | | | | |
| | | Shares | | | Value | |
Common Stocks – 68.7% | | | | | | | | |
Consumer Discretionary – 7.3% | | | | | | | | |
Dollar Tree, Inc. * | | | 5,800 | | | $ | 529,250 | |
The Priceline Group, Inc. * | | | 214 | | | | 409,159 | |
Starbucks Corp. | | | 9,000 | | | | 493,560 | |
The TJX Cos., Inc. | | | 2,000 | | | | 139,600 | |
Total Consumer Discretionary | | | | | | | 1,571,569 | |
Consumer Staples – 18.3% | | | | | | | | |
The Coca-Cola Co. | | | 9,200 | | | | 423,016 | |
The Estee Lauder Cos, Inc., Class A | | | 4,600 | | | | 514,326 | |
The Kraft Heinz Co. | | | 6,600 | | | | 510,378 | |
Mondelez International, Inc., Class A | | | 14,000 | | | | 580,020 | |
Monster Beverage Corp. * | | | 6,800 | | | | 393,924 | |
PepsiCo, Inc. | | | 4,700 | | | | 518,081 | |
Philip Morris International, Inc. | | | 5,300 | | | | 554,592 | |
The Procter & Gamble Co. | | | 4,800 | | | | 414,432 | |
Total Consumer Staples | | | | | | | 3,908,769 | |
Financials – 5.3% | | | | | | | | |
The Charles Schwab Corp. | | | 7,300 | | | | 327,332 | |
Intercontinental Exchange, Inc. | | | 6,530 | | | | 431,633 | |
S&P Global, Inc. | | | 2,409 | | | | 376,936 | |
Total Financials | | | | | | | 1,135,901 | |
Health Care – 9.5% | | | | | | | | |
Becton Dickinson & Co. | | | 3,011 | | | | 628,305 | |
Edwards Lifesciences Corp. * | | | 3,700 | | | | 378,251 | |
Thermo Fisher Scientific, Inc. | | | 2,165 | | | | 419,642 | |
UnitedHealth Group, Inc. | | | 2,873 | | | | 603,962 | |
Total Health Care | | | | | | | 2,030,160 | |
Industrials – 1.9% | | | | | | | | |
Honeywell International, Inc. | | | 2,800 | | | | 403,648 | |
Information Technology – 24.4% | | | | | | | | |
Alphabet, Inc., Class A * | | | 652 | | | | 673,542 | |
Analog Devices, Inc. | | | 5,700 | | | | 520,410 | |
Apple, Inc. | | | 3,300 | | | | 557,832 | |
eBay, Inc. * | | | 9,400 | | | | 353,816 | |
Facebook, Inc., Class A * | | | 2,918 | | | | 525,415 | |
Fidelity National Information Services, Inc. | | | 3,900 | | | | 361,764 | |
FleetCor Technologies, Inc. * | | | 942 | | | | 155,685 | |
Mastercard, Inc., Class A | | | 2,500 | | | | 371,925 | |
| | | | | | | | |
| | | Shares | | | Value | |
Microsoft Corp. | | | 6,600 | | | $ | 548,988 | |
Oracle Corp. | | | 10,200 | | | | 519,180 | |
Visa, Inc., Class A | | | 5,700 | | | | 626,886 | |
Total Information Technology | | | | | | | 5,215,443 | |
Materials – 2.0% | | | | | | | | |
Air Products & Chemicals, Inc. | | | 942 | | | | 150,183 | |
The Sherwin-Williams Co. | | | 717 | | | | 283,323 | |
Total Materials | | | | | | | 433,506 | |
Total Common Stocks
(Cost $12,586,562) | | | | | | | 14,698,996 | |
| | |
| | | Principal | | | | |
| | | Amount | | | | |
Corporate Bonds and Notes – 19.8% | | | | | | | | |
Financials – 7.7% | | | | | | | | |
Berkshire Hathaway, Inc.
3.125%, 03/15/26 | | $ | 225,000 | | | | 227,997 | |
General Electric Co.
4.375%, 09/16/20 | | | 200,000 | | | | 213,078 | |
JPMorgan Chase & Co.
4.350%, 08/15/21 | | | 225,000 | | | | 240,564 | |
State Street Corp.
2.550%, 08/18/20 | | | 250,000 | | | | 254,596 | |
US Bancorp, MTN
2.950%, 07/15/22 | | | 250,000 | | | | 256,007 | |
Visa, Inc.
3.150%, 12/14/25 | | | 200,000 | | | | 204,461 | |
Wells Fargo & Co.
Series N
2.150%, 01/30/20 | | | 250,000 | | | | 250,600 | |
Total Financials | | | | | | | 1,647,303 | |
Industrials – 12.1% | | | | | | | | |
Alphabet, Inc.
3.625%, 05/19/21 | | | 200,000 | | | | 210,351 | |
Apple, Inc.
1.000%, 05/03/18 | | | 250,000 | | | | 249,468 | |
Chevron Corp.
1.718%, 06/24/18 | | | 250,000 | | | | 250,161 | |
Cisco Systems, Inc.
1.850%, 09/20/21 | | | 200,000 | | | | 197,651 | |
Johnson & Johnson
5.950%, 08/15/37 | | | 150,000 | | | | 206,267 | |
Merck & Co.,Inc.
2.350%, 02/10/22 | | | 250,000 | | | | 251,650 | |
The accompanying notes are an integral part of these financial statements.
130
AMG Managers Montag & Caldwell Balanced Fund
| | |
| Schedule of Portfolio Investments (continued) | | |
| | | | | | | | |
| | | Principal | | | | |
| | | Amount | | | Value | |
Industrials – 12.1% (continued) | | | | | | | | |
Oracle Corp.
2.500%, 10/15/22 | | $ | 250,000 | | | $ | 251,392 | |
PepsiCo, Inc.
5.000%, 06/01/18 | | | 250,000 | | | | 255,113 | |
QUALCOMM, Inc.
2.250%, 05/20/20 | | | 250,000 | | | | 251,350 | |
United Parcel Service, Inc.
3.125%, 01/15/21 | | | 250,000 | | | | 258,489 | |
Wal-Mart Stores, Inc.
3.250%, 10/25/20 | | | 200,000 | | | | 207,936 | |
Total Industrials | | | | | | | 2,589,828 | |
Total Corporate Bonds and Notes
(Cost $4,229,719) | | | | | | | 4,237,131 | |
U.S. Government and Agency Obligations – 8.7% | | | | | | | | |
Fannie Mae – 0.1% | | | | | | | | |
Fannie Mae,
6.000%, 11/01/35 | | | 7,583 | | | | 8,508 | |
7.500%, 02/01/35 to 04/01/35 | | | 10,237 | | | | 10,953 | |
Total Fannie Mae | | | | | | | 19,461 | |
Freddie Mac – 0.0%# | | | | | | | | |
Freddie Mae Gold,
5.500%, 12/01/20 | | | 2,747 | | | | 2,845 | |
Ginnie Mae – 0.0%# | | | | | | | | |
Ginnie Mae,
5.500%, 02/15/39 | | | 3,203 | | | | 3,561 | |
| | | | | | | | |
| | | Principal | | | | |
| | | Amount | | | Value | |
U.S. Treasury Obligations – 8.6% | | | | | | | | |
U.S. Treasury Bonds,
2.750%, 11/15/42 | | $ | 250,000 | | | $ | 246,079 | |
3.125%, 11/15/41 | | | 125,000 | | | | 131,863 | |
3.500%, 02/15/39 | | | 300,000 | | | | 337,752 | |
5.375%, 02/15/31 | | | 125,000 | | | | 166,592 | |
U.S. Treasury Notes,
1.375%, 09/30/18 | | | 225,000 | | | | 224,806 | |
1.500%, 01/31/19 | | | 225,000 | | | | 224,965 | |
2.125%, 05/15/25 | | | 240,000 | | | | 237,567 | |
2.500%, 05/15/24 | | | 250,000 | | | | 254,624 | |
Total U.S. Treasury Obligations | | | | | | | 1,824,248 | |
Total U.S. Government and Agency Obligations
(Cost $1,871,012) | | | | | | | 1,850,115 | |
| | |
| | | Shares | | | | |
Short-Term Investments – 0.7% | | | | | | | | |
Other Investment Companies – 0.7% | | | | | | | | |
Dreyfus Institutional Preferred Government
Money Market Fund, Institutional
Class Shares, 1.00%1 | | | 153,673 | | | | 153,673 | |
Total Short-Term Investments
(Cost $153,673) | | | | | | | 153,673 | |
Total Investments – 97.9%
(Cost $18,840,966) | | | | | | | 20,939,915 | |
Other Assets, less Liabilities – 2.1% | | | | | | | 458,322 | |
Net Assets – 100.0% | | | | | | $ | 21,398,237 | |
| * | Non-income producing security. |
| 1 | Yield shown represents the October 31, 2017, seven day average yield, which refers to the sum of the previous seven days’ dividends paid, expressed as an annual percentage. |
The accompanying notes are an integral part of these financial statements.
131
AMG Managers Montag & Caldwell Balanced Fund
| | |
| Schedule of Portfolio Investments (continued) | | |
The following table summarizes the inputs used to value the Fund’s investments by the fair value hierarchy levels as of October 31, 2017:
| | | | | | | | | | | | | | | | |
| | | Level 1 | | | Level 2 | | | Level 3 | | | Total | |
Investments in Securities | | | | | | | | | | | | | | | | |
Common Stocks† | | $ | 14,698,996 | | | | — | | | | — | | | $ | 14,698,996 | |
Corporate Bonds and Notes†† | | | — | | | $ | 4,237,131 | | | | — | | | | 4,237,131 | |
U.S. Government and Agency Obligations†† | | | — | | | | 1,850,115 | | | | — | | | | 1,850,115 | |
Short-Term Investments | | | | | | | | | | | | | | | | |
Other Investment Companies | | | 153,673 | | | | — | | | | — | | | | 153,673 | |
| | | | | | | | | | | | | | | | |
Total Investments in Securities | | $ | 14,852,669 | | | $ | 6,087,246 | | | | — | | | $ | 20,939,915 | |
| | | | | | | | | | | | | | | | |
| † | All common stocks held in the Fund are Level 1 securities. For a detailed breakout of common stocks by major industry classification, please refer to the Fund’s Schedule of Portfolio Investments. |
| †† | All corporate bonds and notes and U.S. government and agency obligations held in the Fund are Level 2 securities. For a detailed breakout of corporate bonds and notes and U.S. government and agency obligations by major industry or agency classification, please refer to the Fund’s Schedule of Portfolio Investments. |
As of October 31, 2017, the Fund had no transfers between levels from the beginning of the reporting period.
The accompanying notes are an integral part of these financial statements.
132
October 31, 2017
Statement of Assets and Liabilities
| | | | | | | | | | | | | | | | | | | | |
| | | AMG
Managers
Fairpointe ESG
Equity Fund | | | AMG
River Road
Focused Absolute
Value Fund | | | AMG
Managers
Montag & Caldwell
Growth Fund | | | AMG
River Road
Dividend All Cap
Value Fund | | | AMG
River Road
Dividend All
Cap
Value Fund II | |
Assets: | | | | | | | | | | | | | | | | | | | | |
Investments at Value* (including securities on loan valued at $0, $2,076,480, $0, $25,556,279, and $5,837,316, respectively) | | $ | 6,552,855 | | | $ | 26,760,559 | | | $ | 903,040,290 | | | $ | 948,363,893 | | | $ | 127,921,637 | |
Receivable for investments sold | | | 77,396 | | | | 191,287 | | | | 9,069,645 | | | | 7,750,509 | | | | 1,031,726 | |
Dividend, interest and other receivables | | | 5,945 | | | | 7,581 | | | | 142,343 | | | | 523,310 | | | | 73,526 | |
Receivable for Fund shares sold | | | — | | | | 12,726 | | | | 299,533 | | | | 1,657,851 | | | | 152,345 | |
Receivable from affiliate | | | — | | | | 12,942 | | | | 4,701 | | | | 4,157 | | | | — | |
Prepaid expenses | | | 32 | | | | — | | | | 5,289 | | | | 2,059 | | | | 331 | |
Total assets | | | 6,636,228 | | | | 26,985,095 | | | | 912,561,801 | | | | 958,301,779 | | | | 129,179,565 | |
Liabilities: | | | | | | | | | | | | | | | | | | | | |
Payable upon return of securities loaned | | | — | | | | 2,100,673 | | | | — | | | | 26,093,804 | | | | 5,954,800 | |
Payable for investments purchased | | | 34,553 | | | | 236,072 | | | | 7,352,537 | | | | 4,958,065 | | | | 717,286 | |
Payable for Fund shares repurchased | | | — | | | | 1,059 | | | | 1,771,393 | | | | 1,557,505 | | | | 97,318 | |
Accrued expenses: | | | | | | | | | | | | | | | | | | | | |
Investment advisory and management fees | | | 17,653 | | | | 12,785 | | | | 521,215 | | | | 470,588 | | | | 62,596 | |
Administrative fees | | | 840 | | | | 3,196 | | | | 115,597 | | | | 117,647 | | | | 15,649 | |
Distribution fees | | | 19 | | | | 1,750 | | | | 31,783 | | | | 34,385 | | | | 822 | |
Shareholder service fees | | | 584 | | | | 851 | | | | 102,822 | | | | 138,789 | | | | 5,813 | |
Professional fees | | | 22,659 | | | | 6,307 | | | | 57,970 | | | | 41,955 | | | | 23,082 | |
Custody fees | | | 3,512 | | | | 4,657 | | | | 32,886 | | | | 29,393 | | | | 6,511 | |
Trustee fees and expenses | | | 58 | | | | 208 | | | | 8,654 | | | | 8,518 | | | | 1,143 | |
Other | | | 2,527 | | | | 2,988 | | | | 108,148 | | | | 37,153 | | | | 7,101 | |
Total liabilities | | | 82,405 | | | | 2,370,546 | | | | 10,103,005 | | | | 33,487,802 | | | | 6,892,121 | |
Net Assets | | $ | 6,553,823 | | | $ | 24,614,549 | | | $ | 902,458,796 | | | $ | 924,813,977 | | | $ | 122,287,444 | |
* Investments at cost | | $ | 5,185,657 | | | $ | 25,797,233 | | | $ | 693,129,667 | | | $ | 771,545,054 | | | $ | 108,917,620 | |
The accompanying notes are an integral part of these financial statements.
133
Statement of Assets and Liabilities (continued)
| | | | | | | | | | | | | | | | | | | | |
| | | AMG
Managers
Fairpointe ESG
Equity Fund | | | AMG
River Road
Focused Absolute
Value Fund | | | AMG
Managers
Montag & Caldwell
Growth Fund | | | AMG
River Road
Dividend All Cap
Value Fund | | | AMG
River Road
Dividend All
Cap
Value Fund II | |
Net Assets Represent: | | | | | | | | | | | | | | | | | | | | |
Paid-in capital | | $ | 5,217,910 | | | $ | 21,912,604 | | | $ | 619,356,780 | | | $ | 707,013,995 | | | $ | 96,942,033 | |
Undistributed (distribution in excess of) net investment income | | | 111,828 | | | | 56,005 | | | | (565,119 | ) | | | 2,235,531 | | | | 409,437 | |
Accumulated net realized gain (loss) from investments | | | (143,113 | ) | | | 1,682,614 | | | | 73,756,512 | | | | 38,745,612 | | | | 5,931,957 | |
Net unrealized appreciation of investments | | | 1,367,198 | | | | 963,326 | | | | 209,910,623 | | | | 176,818,839 | | | | 19,004,017 | |
Net Assets | | $ | 6,553,823 | | | $ | 24,614,549 | | | $ | 902,458,796 | | | $ | 924,813,977 | | | $ | 122,287,444 | |
Class N: | | | | | | | | | | | | | | | | | | | | |
Net Assets | | $ | 806,732 | | | $ | 7,448,174 | | | $ | 259,323,716 | | | $ | 136,533,706 | | | $ | 3,089,821 | |
Shares outstanding | | | 68,705 | | | | 627,363 | | | | 12,489,610 | | | | 10,610,315 | | | | 208,798 | |
Net asset value, offering and redemption price per share | | $ | 11.74 | | | $ | 11.87 | | | $ | 20.76 | | | $ | 12.87 | | | $ | 14.80 | |
Class I: | | | | | | | | | | | | | | | | | | | | |
Net Assets | | $ | 5,747,091 | | | $ | 17,105,784 | | | $ | 642,461,052 | | | $ | 788,023,068 | | | $ | 118,876,171 | |
Shares outstanding | | | 491,313 | | | | 1,435,574 | | | | 30,821,550 | | | | 61,284,938 | | | | 8,021,437 | |
Net asset value, offering and redemption price per share | | $ | 11.70 | | | $ | 11.92 | | | $ | 20.84 | | | $ | 12.86 | | | $ | 14.82 | |
Class R: | | | | | | | | | | | | | | | | | | | | |
Net Assets | | | — | | | | — | | | $ | 674,028 | | | | — | | | | — | |
Shares outstanding | | | — | | | | — | | | | 33,223 | | | | — | | | | — | |
Net asset value, offering and redemption price per share | | | — | | | | — | | | $ | 20.29 | | | | — | | | | — | |
Class Z: | | | | | | | | | | | | | | | | | | | | |
Net Assets | | | — | | | $ | 60,591 | | | | — | | | $ | 257,203 | | | $ | 321,452 | |
Shares outstanding | | | — | | | | 5,085 | | | | — | | | | 19,998 | | | | 21,687 | |
Net asset value, offering and redemption price per share | | | — | | | $ | 11.92 | | | | — | | | $ | 12.86 | | | $ | 14.82 | |
The accompanying notes are an integral part of these financial statements.
134
Statement of Assets and Liabilities (continued)
| | | | | | | | | | | | | | | | | | | | |
| | | AMG
Managers
Fairpointe
Mid
Cap Fund | | | AMG
Managers
Montag & Caldwell
Mid Cap
Growth Fund | | | AMG
Managers
LMCG Small
Cap
Growth Fund | | | AMG
River Road
Small-Mid Cap
Value Fund | | | AMG
River Road
Small Cap
Value Fund | |
Assets: | | | | | | | | | | | | | | | | | | | | |
Investments at Value* (including securities on loan valued at $0, $489,407, $7,396,018, $2,024,592, and $12,933,398, respectively) | | $ | 3,938,043,236 | | | $ | 9,821,858 | | | $ | 132,824,777 | | | $ | 46,453,849 | | | $ | 325,299,392 | |
Cash | | | 321,490 | | | | — | | | | — | | | | — | | | | — | |
Receivable for investments sold | | | 47,317,634 | | | | — | | | | 1,568,462 | | | | 421,447 | | | | 667,418 | |
Dividend, interest and other receivables | | | 944,080 | | | | 1,297 | | | | 5,055 | | | | 3,025 | | | | 34,950 | |
Receivable for Fund shares sold | | | 5,546,371 | | | | 294 | | | | 83,746 | | | | 30,446 | | | | 403,314 | |
Receivable from affiliate | | | 22,521 | | | | 2,261 | | | | 8,762 | | | | 17,659 | | | | 590 | |
Prepaid expenses | | | 9,338 | | | | 14 | | | | 317 | | | | 81 | | | | 651 | |
Total assets | | | 3,992,204,670 | | | | 9,825,724 | | | | 134,491,119 | | | | 46,926,507 | | | | 326,406,315 | |
Liabilities: | | | | | | | | | | | | | | | | | | | | |
Payable upon return of securities loaned | | | — | | | | 499,381 | | | | 7,506,875 | | | | 2,065,477 | | | | 13,216,433 | |
Payable for investments purchased | | | 12,752,876 | | | | — | | | | 946,411 | | | | 290,293 | | | | 1,240,656 | |
Payable for Fund shares repurchased | | | 5,451,015 | | | | — | | | | 309,682 | | | | 99,804 | | | | 201,765 | |
Accrued expenses: | | | | | | | | | | | | | | | | | | | | |
Investment advisory and management fees | | | 2,100,058 | | | | 5,885 | | | | 107,302 | | | | 28,995 | | | | 214,471 | |
Administrative fees | | | 519,706 | | | | 1,177 | | | | 15,916 | | | | 5,799 | | | | 40,214 | |
Distribution fees | | | 322,050 | | | | 986 | | | | — | | | | 1,411 | | | | 6,773 | |
Shareholder service fees | | | 342,479 | | | | — | | | | — | | | | — | | | | 54,289 | |
Professional fees | | | 114,321 | | | | 22,151 | | | | 24,894 | | | | 17,693 | | | | 17,467 | |
Custody fees | | | 121,600 | | | | 2,542 | | | | 9,745 | | | | 4,779 | | | | 12,200 | |
Trustee fees and expenses | | | 36,637 | | | | 85 | | | | 1,145 | | | | 418 | | | | 2,839 | |
Other | | | 247,266 | | | | 3,011 | | | | 14,786 | | | | 4,948 | | | | 13,619 | |
Total liabilities | | | 22,008,008 | | | | 535,218 | | | | 8,936,756 | | | | 2,519,617 | | | | 15,020,726 | |
Net Assets | | $ | 3,970,196,662 | | | $ | 9,290,506 | | | $ | 125,554,363 | | | $ | 44,406,890 | | | $ | 311,385,589 | |
* Investments at cost | | $ | 3,285,548,616 | | | $ | 8,207,589 | | | $ | 118,505,016 | | | $ | 41,439,225 | | | $ | 263,886,196 | |
The accompanying notes are an integral part of these financial statements.
135
Statements of Assets and Liabilities (continued)
| | | | | | | | | | | | | | | | | | | | |
| | | AMG
Managers
Fairpointe
Mid
Cap Fund | | | AMG
Managers
Montag & Caldwell
Mid Cap
Growth Fund | | | AMG
Managers
LMCG Small
Cap
Growth Fund | | | AMG
River Road
Small-Mid Cap
Value Fund | | | AMG
River Road
Small Cap
Value Fund | |
Net Assets Represent: | | | | | | | | | | | | | | | | | | | | |
Paid-in capital | | $ | 3,060,352,762 | | | $ | 7,071,833 | | | $ | 135,905,029 | | | $ | 33,452,358 | | | $ | 209,532,308 | |
Distribution in excess of income | | | — | | | | — | | | | (826,039 | ) | | | — | | | | — | |
Accumulated net realized gain (loss) from investments | | | 257,349,280 | | | | 604,404 | | | | (23,844,388 | ) | | | 5,939,908 | | | | 40,440,085 | |
Net unrealized appreciation of investments | | | 652,494,620 | | | | 1,614,269 | | | | 14,319,761 | | | | 5,014,624 | | | | 61,413,196 | |
Net Assets | | $ | 3,970,196,662 | | | $ | 9,290,506 | | | $ | 125,554,363 | | | $ | 44,406,890 | | | $ | 311,385,589 | |
Class N: | | | | | | | | | | | | | | | | | | | | |
Net Assets | | $ | 1,292,107,445 | | | $ | 4,574,200 | | | $ | 45,902,078 | | | $ | 7,809,945 | | | $ | 31,656,908 | |
Shares outstanding | | | 30,803,757 | | | | 406,358 | | | | 3,000,179 | | | | 949,112 | | | | 2,188,563 | |
Net asset value, offering and redemption price per share | | $ | 41.95 | | | $ | 11.26 | | | $ | 15.30 | | | $ | 8.23 | | | $ | 14.46 | |
Class I: | | | | | | | | | | | | | | | | | | | | |
Net Assets | | $ | 2,668,463,947 | | | $ | 4,716,306 | | | $ | 79,652,285 | | | $ | 36,547,489 | | | $ | 279,574,409 | |
Shares outstanding | | | 62,102,344 | | | | 416,458 | | | | 5,126,381 | | | | 4,363,291 | | | | 19,049,355 | |
Net asset value, offering and redemption price per share | | $ | 42.97 | | | $ | 11.32 | | | $ | 15.54 | | | $ | 8.38 | | | $ | 14.68 | |
Class Z: | | | | | | | | | | | | | | | | | | | | |
Net Assets | | $ | 9,625,270 | | | | — | | | | — | | | $ | 49,456 | | | $ | 154,272 | |
Shares outstanding | | | 223,973 | | | | — | | | | — | | | | 5,907 | | | | 10,508 | |
Net asset value, offering and redemption price per share | | $ | 42.98 | | | | — | | | | — | | | $ | 8.37 | | | $ | 14.68 | |
The accompanying notes are an integral part of these financial statements.
136
Statements of Assets and Liabilities (continued)
| | | | | | | | | | | | | | | | | | | | |
| | | AMG Managers
Silvercrest
Small
Cap Fund | | | AMG
GW&K
U.S. Small Cap
Growth Fund | | | AMG Managers
DoubleLine
Core Plus
Bond Fund | | | AMG Managers
Lake Partners
LASSO
Alternatives Fund | | | AMG
River Road
Long-Short Fund | |
Assets: | | | | | | | | | | | | | | | | | | | | |
Investments at Value* (including securities on loan valued at $12,903,710, $2,107,510, $3,962,814, $0, and $0, respectively) | | $ | 276,818,483 | | | $ | 38,689,720 | | | $ | 653,710,998 | | | $ | 50,453,666 | | | $ | 52,069,475 | |
Affiliated Investments at value** | | | — | | | | — | | | | 29,211,302 | | | | — | | | | — | |
Cash | | | — | | | | — | | | | 142,882 | | | | — | | | | — | |
Due from broker 1 | | | — | | | | — | | | | — | | | | — | | | | 736,034 | |
Foreign currency*** | | | — | | | | — | | | | — | | | | — | | | | 28,538 | |
Receivable for investments sold | | | 501,136 | | | | 830,664 | | | | 1,320,184 | | | | — | | | | 3,404,623 | |
Segregated cash | | | — | | | | — | | | | — | | | | — | | | | 7,403,393 | |
Receivable for delayed delivery investments sold | | | — | | | | — | | | | 152,250 | | | | — | | | | — | |
Dividend, interest and other receivables | | | 61,670 | | | | 11,210 | | | | 3,727,589 | | | | 19,346 | | | | 50,120 | |
Receivable for Fund shares sold | | | 4,825,799 | | | | 2,378 | | | | 916,798 | | | | 15,351 | | | | 60,994 | |
Receivable from affiliate | | | — | | | | 1,893 | | | | 15,147 | | | | — | | | | — | |
Prepaid expenses | | | 588 | | | | 170 | | | | 1,647 | | | | 673 | | | | 259 | |
Total assets | | | 282,207,676 | | | | 39,536,035 | | | | 689,198,797 | | | | 50,489,036 | | | | 63,753,436 | |
Liabilities: | | | | | | | | | | | | | | | | | | | | |
Payable upon return of securities loaned | | | 13,001,471 | | | | 2,143,996 | | | | 4,124,384 | | | | — | | | | — | |
Payable for investments purchased | | | 1,541,589 | | | | 627,178 | | | | 1,997,290 | | | | 17,982 | | | | 2,914,066 | |
Payable for Fund shares repurchased | | | 76,810 | | | | 51,970 | | | | 1,969,984 | | | | 247,037 | | | | 75,856 | |
Due to broker | | | — | | | | — | | | | — | | | | — | | | | 13,827,747 | |
Interest and dividends payable | | | — | | | | — | | | | — | | | | — | | | | 22,961 | |
Payable for delayed delivery investments purchased | | | — | | | | — | | | | 1,621,617 | | | | — | | | | — | |
Accrued expenses: | | | | | | | | | | | | | | | | | | | | |
Investment advisory and management fees | | | 201,685 | | | | 44,712 | | | | 258,610 | | | | 44,439 | | | | 30,171 | |
Administrative fees | | | 33,225 | | | | 4,614 | | | | 86,203 | | | | 6,569 | | | | 4,450 | |
Distribution fees | | | 4,576 | | | | — | | | | 44,550 | | | | 1,928 | | | | 1,379 | |
Shareholder service fees | | | 15,499 | | | | 8,751 | | | | 48,048 | | | | 2,628 | | | | 2,372 | |
Professional fees | | | 23,877 | | | | 22,772 | | | | 55,584 | | | | 25,240 | | | | 25,835 | |
Custody fees | | | 9,999 | | | | 8,204 | | | | 100,641 | | | | 6,015 | | | | 5,081 | |
Trustee fees and expenses | | | 2,307 | | | | 341 | | | | 6,349 | | | | 482 | | | | 320 | |
Other | | | 13,461 | | | | 11,564 | | | | 42,836 | | | | 12,084 | | | | 6,223 | |
Securities sold short, at value (proceeds $0, $0, $0, $0 and $12,379,996, respectively) | | | — | | | | — | | | | — | | | | — | | | | 12,274,457 | |
Total liabilities | | | 14,924,499 | | | | 2,924,102 | | | | 10,356,096 | | | | 364,404 | | | | 29,190,918 | |
Net Assets | | $ | 267,283,177 | | | $ | 36,611,933 | | | $ | 678,842,701 | | | $ | 50,124,632 | | | $ | 34,562,518 | |
* Investments at cost | | $ | 230,113,297 | | | $ | 28,694,207 | | | $ | 648,984,067 | | | $ | 47,540,732 | | | $ | 49,975,742 | |
** Affiliated Investments at cost | | | — | | | | — | | | $ | 29,310,570 | | | | — | | | | — | |
*** Foreign currency at cost | | | — | | | | — | | | | — | | | | — | | | $ | 28,807 | |
| 1 | Represents foreign cash held at the Prime Broker. Cost amount equals $743,112. |
The accompanying notes are an integral part of these financial statements.
137
Statements of Assets and Liabilities (continued)
| | | | | | | | | | | | | | | | | | | | |
| | | AMG Managers
Silvercrest
Small
Cap Fund | | | AMG
GW&K
U.S. Small Cap
Growth Fund | | | AMG Managers
DoubleLine
Core Plus
Bond Fund | | | AMG Managers
Lake Partners
LASSO
Alternatives Fund | | | AMG
River Road
Long-Short Fund | |
Net Assets Represent: | | | | | | | | | | | | | | | | | | | | |
Paid-in capital | | $ | 200,650,525 | | | $ | 21,695,657 | | | $ | 679,534,890 | | | $ | 45,863,634 | | | $ | 33,481,191 | |
Undistributed (distribution in excess of) net investment income | | | 43,263 | | | | — | | | | (858,405 | ) | | | (461,196 | ) | | | (757,484 | ) |
Accumulated net realized gain (loss) from investments | | | 19,884,203 | | | | 4,920,763 | | | | (4,461,447 | ) | | | 1,809,260 | | | | (353,123 | ) |
Net unrealized appreciation of investments | | | 46,705,186 | | | | 9,995,513 | | | | 4,627,663 | | | | 2,912,934 | | | | 2,191,934 | |
Net Assets | | $ | 267,283,177 | | | $ | 36,611,933 | | | $ | 678,842,701 | | | $ | 50,124,632 | | | $ | 34,562,518 | |
Class N: | | | | | | | | | | | | | | | | | | | | |
Net Assets | | $ | 25,450,545 | | | $ | 26,670,697 | | | $ | 169,646,152 | | | $ | 8,879,991 | | | $ | 5,508,070 | |
Shares outstanding | | | 1,320,258 | | | | 5,697,024 | | | | 15,890,787 | | | | 715,460 | | | | 446,726 | |
Net asset value, offering and redemption price per share | | $ | 19.28 | | | $ | 4.68 | | | $ | 10.68 | | | $ | 12.41 | | | $ | 12.33 | |
Class I: | | | | | | | | | | | | | | | | | | | | |
Net Assets | | $ | 241,626,239 | | | $ | 9,798,355 | | | $ | 507,599,694 | | | $ | 41,244,641 | | | $ | 29,029,540 | |
Shares outstanding | | | 12,426,607 | | | | 1,747,163 | | | | 47,569,804 | | | | 3,302,198 | | | | 2,325,602 | |
Net asset value, offering and redemption price per share | | $ | 19.44 | | | $ | 5.61 | | | $ | 10.67 | | | $ | 12.49 | | | $ | 12.48 | |
Class Z: | | | | | | | | | | | | | | | | | | | | |
Net Assets | | $ | 206,393 | | | $ | 142,881 | | | $ | 1,596,855 | | | | — | | | $ | 24,908 | |
Shares outstanding | | | 10,612 | | | | 25,469 | | | | 149,541 | | | | — | | | | 1,995 | |
Net asset value, offering and redemption price per share | | $ | 19.45 | | | $ | 5.61 | | | $ | 10.68 | | | | — | | | $ | 12.49 | |
The accompanying notes are an integral part of these financial statements.
138
Statements of Assets and Liabilities (continued)
| | | | | | | | | | | | | | | | |
| | | AMG
Managers
Guardian Capital
Global
Dividend Fund | | | AMG
Managers
Pictet
International Fund | | | AMG
Managers
Value Partners
Asia
Dividend Fund | | | AMG
Managers
Montag & Caldwell
Balanced Fund | |
Assets: | | | | | | | | | | | | | | | | |
Investments at Value* (including securities on loan valued at $996,949, $26,905,926, $32,199, and $0, respectively) | | $ | 38,454,638 | | | $ | 2,041,456,734 | | | $ | 10,101,581 | | | $ | 20,939,915 | |
Foreign currency*** | | | — | | | | 2,314,075 | | | | 319,518 | | | | — | |
Receivable for investments sold | | | — | | | | 9,329,304 | | | | 158,798 | | | | 609,317 | |
Dividend, interest and other receivables | | | 80,666 | | | | 3,984,260 | | | | 4,174 | | | | 51,912 | |
Receivable for Fund shares sold | | | 4,673 | | | | 929,297 | | | | 9,950 | | | | 45,669 | |
Receivable from affiliate | | | — | | | | 9,351 | | | | 9,020 | | | | 59 | |
Prepaid expenses | | | 735 | | | | — | | | | — | | | | 96 | |
Total assets | | | 38,540,712 | | | | 2,058,023,021 | | | | 10,603,041 | | | | 21,646,968 | |
Liabilities: | | | | | | | | | | | | | | | | |
Payable upon return of securities loaned | | | 1,022,931 | | | | 28,379,961 | | | | 32,121 | | | | — | |
Payable for investments purchased | | | — | | | | 3,123,697 | | | | 36,032 | | | | 155,642 | |
Payable for Fund shares repurchased | | | 4,659 | | | | 1,010,177 | | | | — | | | | 30,005 | |
Accrued expenses: | | | | | | | | | | | | | | | | |
Investment advisory and management fees | | | 23,418 | | | | 1,190,086 | | | | 7,003 | | | | 22,057 | |
Administrative fees | | | 4,718 | | | | 255,018 | | | | 1,313 | | | | 2,781 | |
Distribution fees | | | — | | | | 767 | | | | 185 | | | | — | |
Shareholder service fees | | | — | | | | 238,051 | | | | — | | | | 1,112 | |
Professional fees | | | 26,295 | | | | 65,641 | | | | 21,970 | | | | 26,298 | |
Custody fees | | | 8,713 | | | | 156,749 | | | | 33,748 | | | | 4,997 | |
Trustee fees and expenses | | | 346 | | | | 18,927 | | | | 96 | | | | 210 | |
Other | | | 3,116 | | | | 106,702 | | | | 2,907 | | | | 5,629 | |
Total liabilities | | | 1,094,196 | | | | 34,545,776 | | | | 135,375 | | | | 248,731 | |
Net Assets | | $ | 37,446,516 | | | $ | 2,023,477,245 | | | $ | 10,467,666 | | | $ | 21,398,237 | |
* Investments at cost | | $ | 33,499,027 | | | $ | 1,725,566,890 | | | $ | 8,447,978 | | | $ | 18,840,966 | |
*** Foreign currency at cost | | | — | | | $ | 2,315,785 | | | $ | 318,401 | | | | — | |
The accompanying notes are an integral part of these financial statements.
139
Statements of Assets and Liabilities (continued)
| | | | | | | | | | | | | | | | |
| | | AMG
Managers
Guardian Capital
Global
Dividend Fund | | | AMG
Managers
Pictet
International Fund | | | AMG
Managers
Value Partners
Asia
Dividend Fund | | | AMG
Managers
Montag & Caldwell
Balanced Fund | |
Net Assets Represent: | | | | | | | | | | | | | | | | |
Paid-in capital | | $ | 32,254,062 | | | $ | 1,637,190,295 | | | $ | 8,127,115 | | | $ | 18,594,121 | |
Undistributed (distribution in excess of) net investment income | | | 110,120 | | | | 18,585,148 | | | | 78,243 | | | | (331,385 | ) |
Accumulated net realized gain from investments | | | 126,471 | | | | 51,825,138 | | | | 607,513 | | | | 1,036,552 | |
Net unrealized appreciation of investments | | | 4,955,863 | | | | 315,876,664 | | | | 1,654,795 | | | | 2,098,949 | |
Net Assets | | $ | 37,446,516 | | | $ | 2,023,477,245 | | | $ | 10,467,666 | | | $ | 21,398,237 | |
Class N: | | | | | | | | | | | | | | | | |
Net Assets | | $ | 1,166,514 | | | $ | 4,006,432 | | | $ | 1,195,124 | | | $ | 18,185,653 | |
Shares outstanding | | | 101,664 | | | | 345,456 | | | | 92,609 | | | | 799,012 | |
Net asset value, offering and redemption price per share | | $ | 11.47 | | | $ | 11.60 | | | $ | 12.91 | | | $ | 22.76 | |
Class I: | | | | | | | | | | | | | | | | |
Net Assets | | $ | 36,280,002 | | | $ | 2,019,216,753 | | | $ | 9,272,542 | | | $ | 3,212,584 | |
Shares outstanding | | | 3,178,877 | | | | 174,251,871 | | | | 717,975 | | | | 141,676 | |
Net asset value, offering and redemption price per share | | $ | 11.41 | | | $ | 11.59 | | | $ | 12.91 | | | $ | 22.68 | |
Class Z: | | | | | | | | | | | | | | | | |
Net Assets | | | — | | | $ | 254,060 | | | | — | | | | — | |
Shares outstanding | | | — | | | | 21,930 | | | | — | | | | — | |
Net asset value, offering and redemption price per share | | | — | | | $ | 11.59 | | | | — | | | | — | |
The accompanying notes are an integral part of these financial statements.
140
Statement of Operations
For the fiscal year ended October 31, 2017
| | | | | | | | | | | | | | | | | | | | |
| | | AMG
Managers
Fairpointe ESG
Equity Fund | | | AMG
River Road
Focused Absolute
Value Fund | | | AMG
Managers
Montag & Caldwell
Growth Fund | | | AMG
River Road
Dividend All Cap
Value Fund | | | AMG
River Road
Dividend All
Cap
Value Fund II | |
Investment Income: | | | | | | | | | | | | | | | | | | | | |
Dividend income | | $ | 194,416 | 1 | | $ | 211,723 | | | $ | 10,683,003 | | | $ | 25,658,906 | | | $ | 3,563,355 | |
Securities lending income | | | — | | | | 4,300 | | | | — | | | | 205,790 | | | | 26,751 | |
Foreign withholding tax | | | (89 | ) | | | — | | | | — | | | | (96,473 | ) | | | (14,256 | ) |
Total investment income | | | 194,327 | | | | 216,023 | | | | 10,683,003 | | | | 25,768,223 | | | | 3,575,850 | |
Expenses: | | | | | | | | | | | | | | | | | | | | |
Investment advisory and management fees | | | 51,322 | | | | 108,859 | | | | 6,750,891 | | | | 5,514,348 | | | | 747,644 | |
Administrative fees | | | 10,998 | | | | 27,215 | | | | 1,545,267 | | | | 1,378,587 | | | | 186,911 | |
Distribution fees - Class N | | | 2,003 | | | | 4,373 | | | | 863,457 | | | | 605,059 | | | | 8,802 | |
Distribution fees - Class R | | | — | | | | — | | | | 22,459 | | | | — | | | | — | |
Shareholder servicing fees - Class N | | | 718 | | | | 696 | | | | 260,818 | | | | 169,544 | | | | 3,950 | |
Shareholder servicing fees - Class I | | | 5,146 | | | | 6,560 | | | | 457,487 | | | | 473,622 | | | | 76,566 | |
Shareholder servicing fees - Class R | | | — | | | | — | | | | 1,879 | | | | — | | | | — | |
Professional fees | | | 22,806 | | | | 21,582 | | | | 151,599 | | | | 122,682 | | | | 37,990 | |
Registration fees | | | 10,512 | | | | 41,272 | | | | 72,264 | | | | 74,019 | | | | 51,165 | |
Transfer agent fees | | | 426 | | | | 811 | | | | 85,864 | | | | 30,339 | | | | 936 | |
Custodian fees | | | 6,722 | | | | 7,985 | | | | 62,568 | | | | 60,239 | | | | 12,224 | |
Reports to shareholders | | | 2,036 | | | | — | | | | 126,976 | | | | 36,326 | | | | 3,947 | |
Trustee fees and expenses | | | 538 | | | | 1,034 | | | | 86,608 | | | | 62,586 | | | | 8,872 | |
Miscellaneous | | | 1,551 | | | | 1,829 | | | | 27,348 | | | | 20,316 | | | | 3,763 | |
Total expenses before offsets | | | 114,778 | | | | 222,216 | | | | 10,515,485 | | | | 8,547,667 | | | | 1,142,770 | |
Expense reimbursements | | | (46,791 | ) | | | (81,771 | ) | | | — | | | | — | | | | — | |
Expense reductions | | | — | | | | (4,310 | ) | | | (136,850 | ) | | | (17,608 | ) | | | (2,276 | ) |
Fee waivers | | | — | | | | — | | | | (62,841 | ) | | | (48,710 | ) | | | — | |
Net expenses | | | 67,987 | | | | 136,135 | | | | 10,315,794 | | | | 8,481,349 | | | | 1,140,494 | |
Net investment income | | | 126,340 | | | | 79,888 | | | | 367,209 | | | | 17,286,874 | | | | 2,435,356 | |
Net Realized and Unrealized Gain: | | | | | | | | | | | | | | | | | | | | |
Net realized gain on investments | | | 9,113 | | | | 1,785,151 | | | | 93,131,174 | | | | 42,526,733 | | | | 6,085,039 | |
Net change in unrealized appreciation/depreciation on investments | | | 1,389,919 | | | | 455,132 | | | | 73,415,699 | | | | 64,504,761 | | | | 9,399,851 | |
Net realized and unrealized gain | | | 1,399,032 | | | | 2,240,283 | | | | 166,546,873 | | | | 107,031,494 | | | | 15,484,890 | |
Net increase in net assets resulting from operations | | $ | 1,525,372 | | | $ | 2,320,171 | | | $ | 166,914,082 | | | $ | 124,318,368 | | | $ | 17,920,246 | |
| 1 | Includes non-recurring dividends of $73,500. |
The accompanying notes are an integral part of these financial statements.
141
Statements of Operations (continued)
| | | | | | | | | | | | | | | | | | | | |
| | | AMG
Managers
Fairpointe
Mid
Cap Fund | | | AMG
Managers
Montag & Caldwell
Mid Cap
Growth Fund | | | AMG
Managers
LMCG Small
Cap
Growth Fund | | | AMG
River Road
Small-Mid Cap
Value Fund | | | AMG
River Road
Small Cap
Value Fund | |
Investment Income: | | | | | | | | | | | | | | | | | | | | |
Dividend income | | $ | 42,978,626 | | | $ | 43,958 | | | $ | 711,429 | 2 | | $ | 416,813 | | | $ | 2,942,992 | |
Securities lending income | | | — | | | | 772 | | | | 18,986 | | | | 17,284 | | | | 63,057 | |
Foreign withholding tax | | | (67,884 | ) | | | (404 | ) | | | — | | | | — | | | | (42,756 | ) |
Total investment income | | | 42,910,742 | | | | 44,326 | | | | 730,415 | | | | 434,097 | | | | 2,963,293 | |
Expenses: | | | | | | | | | | | | | | | | | | | | |
Investment advisory and management fees | | | 24,246,742 | | | | 66,381 | | | | 1,146,793 | | | | 323,566 | | | | 2,394,607 | |
Administrative fees | | | 5,999,185 | | | | 13,276 | | | | 191,132 | | | | 62,607 | | | | 448,989 | |
Distribution fees - Class N | | | 3,734,542 | | | | 10,621 | | | | 64,586 | | | | 13,798 | | | | 69,952 | |
Shareholder servicing fees - Class N | | | 1,195,054 | | | | 2,209 | | | | 33,218 | | | | 3,479 | | | | 28,005 | |
Shareholder servicing fees - Class I | | | 2,006,424 | | | | 2,162 | | | | 22,765 | | | | 17,707 | | | | 271,550 | |
Professional fees | | | 457,137 | | | | 22,417 | | | | 35,959 | | | | 25,696 | | | | 54,755 | |
Registration fees | | | 142,567 | | | | 27,029 | | | | 33,821 | | | | 45,482 | | | | 50,988 | |
Transfer agent fees | | | 155,049 | | | | 821 | | | | 18,710 | | | | 4,804 | | | | 9,497 | |
Custodian fees | | | 239,352 | | | | 4,912 | | | | 20,204 | | | | 9,036 | | | | 23,991 | |
Reports to shareholders | | | 372,311 | | | | 2,259 | | | | 8,246 | | | | 6,706 | | | | 9,938 | |
Trustee fees and expenses | | | 284,622 | | | | 671 | | | | 10,233 | | | | 3,094 | | | | 20,660 | |
Miscellaneous | | | 148,887 | | | | 1,473 | | | | 5,399 | | | | 2,678 | | | | 7,309 | |
Total expenses before offsets | | | 38,981,872 | | | | 154,231 | | | | 1,591,066 | | | | 518,653 | | | | 3,390,241 | |
Expense reimbursements | | | — | | | | (55,155 | ) | | | (157,295 | ) | | | (39,064 | ) | | | — | |
Expense reductions | | | — | | | | (1,186 | ) | | | (14,586 | ) | | | (5,343 | ) | | | (18,818 | ) |
Fee waivers | | | (259,965 | ) | | | — | | | | — | | | | — | | | | (6,585 | ) |
Net expenses | | | 38,721,907 | | | | 97,890 | | | | 1,419,185 | | | | 474,246 | | | | 3,364,838 | |
Net investment income (loss) | | | 4,188,835 | | | | (53,564 | ) | | | (688,770 | ) | | | (40,149 | ) | | | (401,545 | ) |
Net Realized and Unrealized Gain: | | | | | | | | | | | | | | | | | | | | |
Net realized gain on investments | | | 312,147,791 | | | | 743,000 | | | | 11,137,262 | | | | 6,362,384 | | | | 41,224,676 | |
Net change in unrealized appreciation/depreciation on investments | | | 275,789,998 | | | | 852,784 | | | | 17,761,836 | | | | 3,424,682 | | | | 20,988,302 | |
Net realized and unrealized gain | | | 587,937,789 | | | | 1,595,784 | | | | 28,899,098 | | | | 9,787,066 | | | | 62,212,978 | |
Net increase in net assets resulting from operations | | $ | 592,126,624 | | | $ | 1,542,220 | | | $ | 28,210,328 | | | $ | 9,746,917 | | | $ | 61,811,433 | |
| 2 | Includes non-recurring dividends of $215,696. |
The accompanying notes are an integral part of these financial statements.
142
Statements of Operations (continued)
| | | | | | | | | | | | | | | | | | | | |
| | | AMG Managers
Silvercrest
Small
Cap Fund | | | AMG
GW&K
U.S. Small Cap
Growth Fund | | | AMG Managers
DoubleLine
Core Plus
Bond Fund | | | AMG Managers
Lake Partners
LASSO
Alternatives Fund | | | AMG
River Road
Long-Short Fund | |
Investment Income: | | | | | | | | | | | | | | | | | | | | |
Interest income | | $ | 315 | | | | — | | | $ | 22,625,672 | | | | — | | | $ | 13,500 | |
Dividend income | | | 3,063,936 | | | $ | 182,194 | | | | 124,786 | | | $ | 750,248 | | | | 551,124 | |
Dividends from affiliated securities | | | — | | | | — | | | | 422,407 | | | | — | | | | — | |
Securities lending income | | | 6,104 | | | | 15,224 | | | | 37,711 | | | | — | | | | — | |
Foreign withholding tax | | | — | | | | (2,436 | ) | | | (5,050 | ) | | | — | | | | (6,623 | ) |
Total investment income | | | 3,070,355 | | | | 194,982 | | | | 23,205,526 | | | | 750,248 | | | | 558,001 | |
Expenses: | | | | | | | | | | | | | | | | | | | | |
Investment advisory and management fees | | | 2,230,080 | | | | 283,421 | | | | 2,976,933 | | | | 686,174 | | | | 364,959 | |
Administrative fees | | | 371,680 | | | | 57,849 | | | | 992,311 | | | | 114,362 | | | | 60,902 | |
Distribution fees - Class N | | | 60,959 | | | | 61,958 | | | | 567,192 | | | | 53,934 | | | | 17,594 | |
Shareholder servicing fees - Class N | | | 17,275 | | | | 34,086 | | | | 180,805 | | | | 12,944 | | | | 5,617 | |
Shareholder servicing fees - Class I | | | 156,169 | | | | 9,244 | | | | 328,048 | | | | 32,801 | | | | 26,862 | |
Professional fees | | | 47,558 | | | | 35,971 | | | | 120,061 | | | | 33,022 | | | | 33,698 | |
Registration fees | | | 35,144 | | | | 40,511 | | | | 100,203 | | | | 29,869 | | | | 35,896 | |
Transfer agent fees | | | 7,430 | | | | 7,325 | | | | 16,546 | | | | 2,529 | | | | 2,203 | |
Custodian fees | | | 20,141 | | | | 16,647 | | | | 194,017 | | | | 12,578 | | | | 12,927 | |
Reports to shareholders | | | 15,241 | | | | 1,024 | | | | 62,270 | | | | 10,122 | | | | 5,797 | |
Trustee fees and expenses | | | 16,199 | | | | 5,030 | | | | 48,843 | | | | 7,364 | | | | 3,306 | |
Miscellaneous | | | 5,915 | | | | 6,888 | | | | 23,007 | | | | 5,177 | | | | 2,360 | |
Interest and dividend expense | | | — | | | | — | | | | — | | | | — | | | | 863,055 | |
Total expenses before offsets | | | 2,983,791 | | | | 559,954 | | | | 5,610,236 | | | | 1,000,876 | | | | 1,435,176 | |
Expense reimbursements | | | (73,291 | ) | | | (89,792 | ) | | | (427,559 | ) | | | (70,164 | ) | | | (47,466 | ) |
Expense reductions | | | (78,489 | ) | | | (18,483 | ) | | | — | | | | — | | | | (8,490 | ) |
Fee waivers | | | — | | | | — | | | | (105,635 | ) | | | — | | | | — | |
Net expenses | | | 2,832,011 | | | | 451,679 | | | | 5,077,042 | | | | 930,712 | | | | 1,379,220 | |
Net investment income (loss) | | | 238,344 | | | | (256,697 | ) | | | 18,128,484 | | | | (180,464 | ) | | | (821,219 | ) |
Net Realized and Unrealized Gain (Loss): | | | | | | | | | | | | | | | | | | | | |
Net realized gain (loss) on investments | | | 20,362,183 | | | | 5,923,460 | | | | (1,524,544 | ) | | | 1,673,547 | | | | 4,328,779 | |
Net realized gain on affiliated investments | | | — | | | | — | | | | 98,822 | | | | — | | | | — | |
Net realized loss on short sales | | | — | | | | — | | | | — | | | | — | | | | (1,102,222 | ) |
Net realized loss on foreign currency transactions | | | — | | | | — | | | | (2,121 | ) | | | — | | | | (28,856 | ) |
Capital gain distribution received | | | — | | | | — | | | | — | | | | 498,342 | | | | — | |
Net change in unrealized appreciation/depreciation on investments | | | 34,036,455 | | | | 5,001,575 | | | | 537,660 | | | | 2,210,908 | | | | 2,422,890 | |
Net change in unrealized appreciation/depreciation on affiliated investments | | | — | | | | — | | | | 75,072 | | | | — | | | | — | |
Net change in unrealized appreciation/depreciation on short sales | | | — | | | | — | | | | — | | | | — | | | | (198,465 | ) |
Net change in unrealized appreciation/depreciation on foreign currency translations | | | — | | | | — | | | | — | | | | — | | | | 67,003 | |
Net realized and unrealized gain (loss) | | | 54,398,638 | | | | 10,925,035 | | | | (815,111 | ) | | | 4,382,797 | | | | 5,489,129 | |
Net increase in net assets resulting from operations | | $ | 54,636,982 | | | $ | 10,668,338 | | | $ | 17,313,373 | | | $ | 4,202,333 | | | $ | 4,667,910 | |
The accompanying notes are an integral part of these financial statements.
143
Statements of Operations (continued)
| | | | | | | | | | | | | | | | |
| | | AMG
Managers
Guardian Capital
Global
Dividend Fund | | | AMG
Managers
Pictet
International Fund | | | AMG
Managers
Value Partners
Asia
Dividend Fund | | | AMG
Managers
Montag & Caldwell
Balanced Fund | |
Investment Income: | | | | | | | | | | | | | | | | |
Interest income | | $ | 455 | | | | — | | | $ | 11,671 | | | $ | 148,704 | |
Dividend income | | | 1,171,195 | 3 | | $ | 41,784,833 | | | | 364,211 | | | | 207,122 | |
Securities lending income | | | 12,328 | | | | 338,301 | | | | 197 | | | | 82 | |
Foreign withholding tax | | | (71,547 | ) | | | (3,239,295 | ) | | | (26,691 | ) | | | — | |
Total investment income | | | 1,112,431 | | | | 38,883,839 | | | | 349,388 | | | | 355,908 | |
Expenses: | | | | | | | | | | | | | | | | |
Investment advisory and management fees | | | 233,557 | | | | 12,633,058 | | | | 72,458 | | | | 153,928 | |
Administrative fees | | | 50,048 | | | | 2,491,518 | | | | 13,586 | | | | 35,522 | |
Distribution fees - Class N | | | 122 | | | | 2,142 | | | | 212 | | | | 13,417 | |
Shareholder servicing fees - Class N | | | — | | | | 925 | | | | — | | | | 12,442 | |
Shareholder servicing fees - Class I | | | — | | | | 1,280,826 | | | | — | | | | 1,767 | |
Professional fees | | | 28,032 | | | | 186,427 | | | | 22,372 | | | | 28,266 | |
Registration fees | | | 29,110 | | | | 96,809 | | | | 28,594 | | | | 22,203 | |
Transfer agent fees | | | 1,088 | | | | 239,682 | | | | 293 | | | | 9,568 | |
Custodian fees | | | 19,302 | | | | 316,866 | | | | 53,909 | | | | 12,018 | |
Reports to shareholders | | | 2,244 | | | | 136,499 | | | | 673 | | | | 3,667 | |
Trustee fees and expenses | | | 1,683 | | | | 91,054 | | | | 598 | | | | 2,052 | |
Miscellaneous | | | 2,212 | | | | 47,517 | | | | 9,410 | | | | 2,164 | |
Repayment of prior reimbursements | | | — | | | | 120,411 | | | | — | | | | — | |
Total expenses before offsets | | | 367,398 | | | | 17,643,734 | | | | 202,105 | | | | 297,014 | |
Expense reimbursements | | | (16,939 | ) | | | — | | | | (97,734 | ) | | | (23,103 | ) |
Expense reductions | | | — | | | | — | | | | — | | | | (1,989 | ) |
Fee waivers | | | — | | | | (91,356 | ) | | | — | | | | — | |
Net expenses | | | 350,459 | | | | 17,552,378 | | | | 104,371 | | | | 271,922 | |
Net investment income | | | 761,972 | | | | 21,331,461 | | | | 245,017 | | | | 83,986 | |
Net Realized and Unrealized Gain: | | | | | | | | | | | | | | | | |
Net realized gain on investments | | | 449,263 | | | | 55,352,778 | | | | 660,621 | | | | 1,114,103 | |
Net realized gain (loss) on foreign currency transactions | | | 490 | | | | (1,061,603 | ) | | | 2,812 | | | | — | |
Net change in unrealized appreciation/depreciation on investments | | | 4,966,615 | | | | 288,975,281 | | | | 1,482,229 | | | | 1,101,333 | |
Net change in unrealized appreciation/depreciation on foreign currency translations | | | 821 | | | | 99,853 | | | | 1,328 | | | | — | |
Net realized and unrealized gain | | | 5,417,189 | | | | 343,366,309 | | | | 2,146,990 | | | | 2,215,436 | |
Net increase in net assets resulting from operations | | $ | 6,179,161 | | | $ | 364,697,770 | | | $ | 2,392,007 | | | $ | 2,299,422 | |
| 3 | Includes non-recurring dividends of $43,888. |
The accompanying notes are an integral part of these financial statements.
144
Statements fo Changes in Net Assets
For the fiscal years ended October 31
| | | | | | | | | | | | | | | | | | | | | | | | |
| | | AMG
Managers
Fairpointe ESG
Equity Fund | | | AMG
River Road
Focused Absolute
Value Fund | | | AMG
Managers
Montag & Caldwell
Growth Fund | |
| | | 2017 | | | 2016 | | | 2017# | | | 2016## | | | 2017 | | | 2016 | |
Increase (Decrease) in Net Assets Resulting From Operations: | | | | | | | | | | | | | | | | | | | | | | | | |
Net investment income | | $ | 126,340 | | | $ | 66,906 | | | $ | 79,888 | | | $ | 62,755 | | | $ | 367,209 | | | $ | 6,345,072 | |
Net realized gain (loss) on investments and foreign currency transactions | | | 9,113 | | | | (14,597 | ) | | | 1,785,151 | | | | 711,183 | | | | 93,131,174 | | | | 114,108,879 | |
Net change in unrealized appreciation/depreciation of investments | | | 1,389,919 | | | | 297,720 | | | | 455,132 | | | | 508,194 | | | | 73,415,699 | | | | (147,303,621 | ) |
Net increase (decrease) in net assets resulting from operations | | | 1,525,372 | | | | 350,029 | | | | 2,320,171 | | | | 1,282,132 | | | | 166,914,082 | | | | (26,849,670 | ) |
Distributions to Shareholders: | | | | | | | | | | | | | | | | | | | | | | | | |
From net investment income: | | | | | | | | | | | | | | | | | | | | | | | | |
Class N | | | (874 | ) | | | (21,065 | ) | | | (7,854 | ) | | | — | | | | (828,374 | ) | | | (2,341,331 | ) |
Class I | | | (68,181 | ) | | | (46,607 | ) | | | (112,913 | ) | | | — | | | | (4,910,866 | ) | | | (5,950,061 | ) |
Class R | | | — | | | | — | | | | — | | | | — | | | | (8,072 | ) | | | (3,417 | ) |
From net realized gain on investments: | | | | | | | | | | | | | | | | | | | | | | | | |
Class N | | | — | | | | — | | | | (66,646 | ) | | | — | | | | (39,690,379 | ) | | | (195,686,596 | ) |
Class I | | | — | | | | — | | | | (842,368 | ) | | | — | | | | (72,425,486 | ) | | | (256,099,119 | ) |
Class R | | | — | | | | — | | | | — | | | | — | | | | (535,608 | ) | | | (1,528,281 | ) |
Total distributions to shareholders | | | (69,055 | ) | | | (67,672 | ) | | | (1,029,781 | ) | | | — | | | | (118,398,785 | ) | | | (461,608,805 | ) |
Capital Share Transactions:1 | | | | | | | | | | | | | | | | | | | | | | | | |
Net increase (decrease) from capital share transactions | | | (1,937,234 | ) | | | 295,591 | | | | 11,523,190 | | | | 10,518,837 | | | | (490,841,087 | ) | | | (352,589,552 | ) |
Total increase (decrease) in net assets | | | (480,917 | ) | | | 577,948 | | | | 12,813,580 | | | | 11,800,969 | | | | (442,325,790 | ) | | | (841,048,027 | ) |
Net Assets: | | | | | | | | | | | | | | | | | | | | | | | | |
Beginning of year | | | 7,034,740 | | | | 6,456,792 | | | | 11,800,969 | | | | — | | | | 1,344,784,586 | | | | 2,185,832,613 | |
End of year | | $ | 6,553,823 | | | $ | 7,034,740 | | | $ | 24,614,549 | | | $ | 11,800,969 | | | $ | 902,458,796 | | | $ | 1,344,784,586 | |
End of year undistributed (distribution in excess of) net investment income (loss) | | $ | 111,828 | | | $ | 54,543 | | | $ | 56,005 | | | $ | 77,538 | | | $ | (565,119 | ) | | $ | 4,018,189 | |
| | | | | | | | | | | | | | | | | | | | | | | | |
| # | The commencement of operations for Class Z shares was October 2, 2017. |
| ## | The commencement of operations for the AMG River Road Focused Absolute Value Fund was November 3, 2015. |
| 1 | See Note 1(g) of the Notes to Financial Statements. |
The accompanying notes are an integral part of these financial statements.
145
Statements of Changes in Net Assets (continued)
For the fiscal years ended October 31
| | | | | | | | | | | | | | | | | | | | | | | | |
| | | AMG
River Road
Dividend All Cap
Value Fund | | | AMG
River Road
Dividend All
Cap Value Fund II | | | AMG
Managers
Fairpointe
Mid Cap Fund | |
| | | 2017# | | | 2016 | | | 2017# | | | 2016 | | | 2017# | | | 2016 | |
Increase in Net Assets Resulting From Operations: | | | | | | | | | | | | | | | | | | | | | | | | |
Net investment income | | $ | 17,286,874 | | | $ | 17,015,871 | | | $ | 2,435,356 | | | $ | 2,615,674 | | | $ | 4,188,835 | | | $ | 22,055,241 | |
Net realized gain on investments | | | 42,526,733 | | | | 59,263,397 | | | | 6,085,039 | | | | 4,771,695 | | | | 312,147,791 | | | | 157,821,250 | |
Net change in unrealized appreciation/depreciation of investments | | | 64,504,761 | | | | (25,544,317 | ) | | | 9,399,851 | | | | 1,173,678 | | | | 275,789,998 | | | | (27,081,901 | ) |
Net increase in net assets resulting from operations | | | 124,318,368 | | | | 50,734,951 | | | | 17,920,246 | | | | 8,561,047 | | | | 592,126,624 | | | | 152,794,590 | |
Distributions to Shareholders: | | | | | | | | | | | | | | | | | | | | | |
From net investment income: | | | | | | | | | | | | | | | | | | | | | | | | |
Class N | | | (4,378,159 | ) | | | (4,651,630 | ) | | | (50,019 | ) | | | (57,390 | ) | | | (4,738,012 | ) | | | (5,351,086 | ) |
Class I | | | (12,190,543 | ) | | | (10,931,278 | ) | | | (1,944,514 | ) | | | (2,436,119 | ) | | | (13,393,786 | ) | | | (15,653,440 | ) |
Class Z | | | (234 | ) | | | — | | | | (102 | ) | | | — | | | | — | | | | — | |
From net realized gain on investments: | | | | | | | | | | | | | | | | | | | | | |
Class N | | | (20,724,974 | ) | | | (19,557,150 | ) | | | (139,259 | ) | | | (41,705 | ) | | | (61,100,310 | ) | | | (95,369,480 | ) |
Class I | | | (38,518,497 | ) | | | (49,288,884 | ) | | | (4,633,931 | ) | | | (1,625,842 | ) | | | (96,561,949 | ) | | | (139,128,106 | ) |
Total distributions to shareholders | | | (75,812,407 | ) | | | (84,428,942 | ) | | | (6,767,825 | ) | | | (4,161,056 | ) | | | (175,794,057 | ) | | | (255,502,112 | ) |
Capital Share Transactions:1 | | | | | | | | | | | | | | | | | | | | | | | | |
Net increase (decrease) from capital share transactions | | | 25,446,779 | | | | 34,577,649 | | | | (6,790,967 | ) | | | (10,817,938 | ) | | | 42,884,347 | | | | (1,086,708,672 | ) |
Total increase (decrease) in net assets | | | 73,952,740 | | | | 883,658 | | | | 4,361,454 | | | | (6,417,947 | ) | | | 459,216,914 | | | | (1,189,416,194 | ) |
Net Assets: | | | | | | | | | | | | | | | | | | | | | | | | |
Beginning of year | | | 850,861,237 | | | | 849,977,579 | | | | 117,925,990 | | | | 124,343,937 | | | | 3,510,979,748 | | | | 4,700,395,942 | |
End of year | | $ | 924,813,977 | | | $ | 850,861,237 | | | $ | 122,287,444 | | | $ | 117,925,990 | | | $ | 3,970,196,662 | | | $ | 3,510,979,748 | |
End of year undistributed (distribution in excess of) net investment income (loss) | | $ | 2,235,531 | | | $ | (374,380 | ) | | $ | 409,437 | | | $ | (158,107 | ) | | | — | | | $ | 13,117,515 | |
| | | | | | | | | | | | | | | | | | | | | | | | |
| # | The commencement of operations for Class Z shares was October 2, 2017. |
| 1 | See Note 1(g) of the Notes to Financial Statements. |
The accompanying notes are an integral part of these financial statements.
146
Statements of Changes in Net Assets (continued)
For the fiscal years ended October 31
| | | | | | | | | | | | | | | | | | | | | | | | |
| | | AMG | | | AMG | | | | | | | |
| | | Managers | | | Managers | | | AMG | |
| | | Montag & Caldwell | | | LMCG Small | | | River Road | |
| | | Mid Cap Growth Fund | | | Cap Growth Fund | | | Small-Mid Cap Value Fund | |
| | | 2017 | | | 2016 | | | 2017 | | | 2016 | | | 2017# | | | 2016 | |
Increase (Decrease) in Net Assets Resulting From Operations: | | | | | | | | | | | | | | | | | | | | | | | | |
Net investment loss | | $ | (53,564 | ) | | $ | (50,872 | ) | | $ | (688,770 | ) | | $ | (1,188,638 | ) | | $ | (40,149 | ) | | $ | (124,066 | ) |
Net realized gain (loss) on investments and foreign currency transactions | | | 743,000 | | | | 629,604 | | | | 11,137,262 | | | | (34,954,281 | ) | | | 6,362,384 | | | | 3,630,244 | |
Net change in unrealized appreciation/depreciation of investments | | | 852,784 | | | | (611,887 | ) | | | 17,761,836 | | | | 2,727,088 | | | | 3,424,682 | | | | (1,228,248 | ) |
Net increase (decrease) in net assets resulting from operations | | | 1,542,220 | | | | (33,155 | ) | | | 28,210,328 | | | | (33,415,831 | ) | | | 9,746,917 | | | | 2,277,930 | |
Distributions to Shareholders: | | | | | | | | | | | | | | | | | | | | | | | | |
From net investment income: | | | | | | | | | | | | | | | | | | | | | | | | |
Class N | | | (12,389 | ) | | | — | | | | — | | | | — | | | | (6,217 | ) | | | — | |
Class I | | | (22,879 | ) | | | — | | | | — | | | | — | | | | (124,646 | ) | | | (153,030 | ) |
From net realized gain on investments: | | | | | | | | | | | | | | | | | | | | | | | | |
Class N | | | (297,569 | ) | | | (556,661 | ) | | | — | | | | (26,929 | ) | | | (388,245 | ) | | | (697,557 | ) |
Class I | | | (291,792 | ) | | | (693,830 | ) | | | — | | | | (13,737 | ) | | | (2,623,776 | ) | | | (7,272,173 | ) |
Total distributions to shareholders | | | (624,629 | ) | | | (1,250,491 | ) | | | — | | | | (40,666 | ) | | | (3,142,884 | ) | | | (8,122,760 | ) |
Capital Share Transactions:1 | | | | | | | | | | | | | | | | | | | | | | | | |
Net increase (decrease) from capital share transactions | | | 174,952 | | | | (1,571,391 | ) | | | (14,492,344 | ) | | | (86,089,728 | ) | | | (2,051,545 | ) | | | (51,412,101 | ) |
Total increase (decrease) in net assets | | | 1,092,543 | | | | (2,855,037 | ) | | | 13,717,984 | | | | (119,546,225 | ) | | | 4,552,488 | | | | (57,256,931 | ) |
Net Assets: | | | | | | | | | | | | | | | | | | | | | | | | |
Beginning of year | | | 8,197,963 | | | | 11,053,000 | | | | 111,836,379 | | | | 231,382,604 | | | | 39,854,402 | | | | 97,111,333 | |
End of year | | $ | 9,290,506 | | | $ | 8,197,963 | | | $ | 125,554,363 | | | $ | 111,836,379 | | | $ | 44,406,890 | | | $ | 39,854,402 | |
End of year distribution in excess of income | | | — | | | $ | (45,628 | ) | | $ | (826,039 | ) | | $ | (983,642 | ) | | | — | | | | — | |
| | | | | | | | | | | | | | | | | | | | | | | | |
| # | The commencement of operations for Class Z shares was October 2, 2017. |
| 1 | See Note 1(g) of the Notes to Financial Statements. |
The accompanying notes are an integral part of these financial statements.
147
Statements of Changes in Net Assets (continued)
For the fiscal years ended October 31
| | | | | | | | | | | | | | | | | | | | | | | | |
| | | | | | | | | | | | | | | AMG | |
| | | AMG | | | AMG Managers | | | GW&K | |
| | | River Road | | | Silvercrest | | | U.S. Small Cap | |
| | | Small Cap Value Fund | | | Small Cap Fund | | | Growth Fund | |
| | | 2017# | | | 2016 | | | 2017# | | | 2016 | | | 2017## | | | 2016 | |
Increase (Decrease) in Net Assets Resulting From Operations: | | | | | | | | | | | | | | | | | | | | | | | | |
Net investment income (loss) | | $ | (401,545 | ) | | $ | (219,950 | ) | | $ | 238,344 | | | $ | 671,845 | | | $ | (256,697 | ) | | $ | (892,635 | ) |
Net realized gain on investments | | | 41,224,676 | | | | 14,928,166 | | | | 20,362,183 | | | | 1,621,595 | | | | 5,923,460 | | | | 57,625,496 | |
Net change in unrealized appreciation/depreciation of investments | | | 20,988,302 | | | | 3,659,498 | | | | 34,036,455 | | | | 9,200,867 | | | | 5,001,575 | | | | (74,735,996 | ) |
Net increase (decrease) in net assets resulting from operations | | | 61,811,433 | | | | 18,367,714 | | | | 54,636,982 | | | | 11,494,307 | | | | 10,668,338 | | | | (18,003,135 | ) |
Distributions to Shareholders: | | | | | | | | | | | | | | | | | | | | | |
From net investment income: | | | | | | | | | | | | | | | | | | | | | | | | |
Class N | | | — | | | | — | | | | — | | | | (50,273 | ) | | | — | | | | — | |
Class I | | | — | | | | — | | | | (462,292 | ) | | | (577,200 | ) | | | — | | | | — | |
From net realized gain on investments: | | | | | | | | | | | | | | | | | | | | | |
Class N | | | (1,206,779 | ) | | | (1,286,224 | ) | | | (172,910 | ) | | | (734,281 | ) | | | (44,632 | ) | | | (58,589,159 | ) |
Class I | | | (13,057,219 | ) | | | (13,941,244 | ) | | | (1,603,029 | ) | | | (5,513,361 | ) | | | (14,009 | ) | | | (97,356,917 | ) |
Total distributions to shareholders | | | (14,263,998 | ) | | | (15,227,468 | ) | | | (2,238,231 | ) | | | (6,875,115 | ) | | | (58,641 | ) | | | (155,946,076 | ) |
Capital Share Transactions:1 | | | | | | | | | | | | | | | | | | | | | | | | |
Net increase (decrease) from capital share transactions | | | (4,679,906 | ) | | | (5,060,384 | ) | | | 12,692,188 | | | | 33,109,349 | | | | (16,006,845 | ) | | | (332,727,603 | ) |
Total increase (decrease) in net assets | | | 42,867,529 | | | | (1,920,138 | ) | | | 65,090,939 | | | | 37,728,541 | | | | (5,397,148 | ) | | | (506,676,814 | ) |
Net Assets: | | | | | | | | | | | | | | | | | | | | | | | | |
Beginning of year | | | 268,518,060 | | | | 270,438,198 | | | | 202,192,238 | | | | 164,463,697 | | | | 42,009,081 | | | | 548,685,895 | |
End of year | | $ | 311,385,589 | | | $ | 268,518,060 | | | $ | 267,283,177 | | | $ | 202,192,238 | | | $ | 36,611,933 | | | $ | 42,009,081 | |
End of year undistributed (distribution in excess of) net investment income (loss) | | | — | | | | — | | | $ | 43,263 | | | $ | 256,102 | | | | — | | | $ | (603,111 | ) |
| | | | | | | | | | | | | | | | | | | | | | | | |
| # | The commencement of operations for Class Z shares was October 2, 2017. |
| ## | The commencement of operations for Class Z shares was February 24, 2017. |
| 1 | See Note 1(g) of the Notes to Financial Statements. |
The accompanying notes are an integral part of these financial statements.
148
Statements of Changes in Net Assets (continued)
For the fiscal years ended October 31
| | | | | | | | | | | | | | | | | | | | | | | | |
| | | AMG Managers | | | | | | | | | | | | | |
| | | DoubleLine | | | AMG Managers | | | AMG | |
| | | Core Plus | | | Lake Partners | | | River Road | |
| | | Bond Fund | | | LASSO Alternatives Fund | | | Long-Short Fund | |
| | | 2017# | | | 2016 | | | 2017 | | | 2016 | | | 2017# | | | 2016 | |
Increase (Decrease) in Net Assets Resulting From Operations: | | | | | | | | | | | | | | | | | | | | | | | | |
Net investment income (loss) | | $ | 18,128,484 | | | $ | 19,598,374 | | | $ | (180,464 | ) | | $ | 637,553 | | | $ | (821,219 | ) | | $ | (824,629 | ) |
Net realized gain (loss) on investments and foreign currency transactions | | | (1,427,843 | ) | | | 7,058,091 | | | | 2,171,889 | | | | 679,033 | | | | 3,197,701 | | | | (765,605 | ) |
Net change in unrealized appreciation/depreciation of investments | | | 612,732 | | | | 7,311,823 | | | | 2,210,908 | | | | (3,892,607 | ) | | | 2,291,428 | | | | 498,635 | |
Net increase (decrease) in net assets resulting from operations | | | 17,313,373 | | | | 33,968,288 | | | | 4,202,333 | | | | (2,576,021 | ) | | | 4,667,910 | | | | (1,091,599 | ) |
Distributions to Shareholders: | | | | | | | | | | | | | | | | | | | | | | | | |
From net investment income: | | | | | | | | | | | | | | | | | | | | | | | | |
Class N | | | (6,469,092 | ) | | | (8,449,442 | ) | | | — | | | | — | | | | — | | | | — | |
Class I | | | (13,470,209 | ) | | | (11,766,309 | ) | | | — | | | | (335,854 | ) | | | — | | | | — | |
Class Z | | | (659 | ) | | | — | | | | — | | | | — | | | | — | | | | — | |
From net realized gain on investments: | | | | | | | | | | | | | | | | | | | | | | | | |
Class N | | | (566,979 | ) | | | — | | | | (123,358 | ) | | | (2,460,419 | ) | | | — | | | | (688,352 | ) |
Class I | | | (780,506 | ) | | | — | | | | (263,958 | ) | | | (8,718,084 | ) | | | — | | | | (1,158,800 | ) |
From return of capital: | | | | | | | | | | | | | | | | | | | | | | | | |
Class N | | | (992,351 | ) | | | — | | | | — | | | | — | | | | — | | | | — | |
Class I | | | (1,912,231 | ) | | | — | | | | — | | | | — | | | | — | | | | — | |
Class Z | | | (115 | ) | | | — | | | | — | | | | — | | | | — | | | | — | |
Total distributions to shareholders | | | (24,192,142 | ) | | | (20,215,751 | ) | | | (387,316 | ) | | | (11,514,357 | ) | | | — | | | | (1,847,152 | ) |
Capital Share Transactions:1 | | | | | | | | | | | | | | | | | | | | | | | | |
Net increase (decrease) from capital share transactions | | | (21,494,709 | ) | | | 201,126,053 | | | | (56,374,436 | ) | | | (92,964,601 | ) | | | (16,366,899 | ) | | | (27,870,287 | ) |
Total increase (decrease) in net assets | | | (28,373,478 | ) | | | 214,878,590 | | | | (52,559,419 | ) | | | (107,054,979 | ) | | | (11,698,989 | ) | | | (30,809,038 | ) |
Net Assets: | | | | | | | | | | | | | | | | | | | | | | | | |
Beginning of year | | | 707,216,179 | | | | 492,337,589 | | | | 102,684,051 | | | | 209,739,030 | | | | 46,261,507 | | | | 77,070,545 | |
End of year | | $ | 678,842,701 | | | $ | 707,216,179 | | | $ | 50,124,632 | | | $ | 102,684,051 | | | $ | 34,562,518 | | | $ | 46,261,507 | |
End of year undistributed (distribution in excess of) net investment income (loss) | | $ | (858,405 | ) | | $ | 417,962 | | | $ | (461,196 | ) | | $ | (472,938 | ) | | $ | (757,484 | ) | | $ | (717,392 | ) |
| | | | | | | | | | | | | | | | | | | | | | | | |
| # | The commencement of operations for Class Z shares was October 2, 2017. |
| 1 | See Note 1(g) of the Notes to Financial Statements. |
The accompanying notes are an integral part of these financial statements.
149
Statements of Changes in Net Assets (continued)
For the fiscal years ended October 31
| | | | | | | | | | | | | | | | | | | | | | | | |
| | | AMG | | | | | | | | | AMG | |
| | | Managers | | | AMG | | | Managers | |
| | | Guardian Capital | | | Managers | | | Value Partners | |
| | | Global Dividend Fund | | | Pictet International Fund | | | Asia Dividend Fund | |
| | | 2017 | | | 2016 | | | 2017# | | | 2016 | | | 2017 | | | 2016## | |
Increase (Decrease) in Net Assets Resulting From Operations: | | | | | | | | | | | | | | | | | | | | | | | | |
Net investment income | | $ | 761,972 | | | $ | 122,429 | | | $ | 21,331,461 | | | $ | 15,997,232 | | | $ | 245,017 | | | $ | 198,128 | |
Net realized gain (loss) on investments and foreign currency transactions | | | 449,753 | | | | (201,443 | ) | | | 54,291,175 | | | | 26,038,832 | | | | 663,433 | | | | 271,025 | |
Net change in unrealized appreciation/depreciation of investments | | | 4,967,436 | | | | (226,865 | ) | | | 289,075,134 | | | | 26,658,010 | | | | 1,483,557 | | | | 171,238 | |
Net increase (decrease) in net assets resulting from operations | | | 6,179,161 | | | | (305,879 | ) | | | 364,697,770 | | | | 68,694,074 | | | | 2,392,007 | | | | 640,391 | |
| | | | | | | | | | | | | | | | | | | | | | | | |
Distributions to Shareholders: | | | | | | | | | | | | | | | | | | | | | | | | |
From net investment income: | | | | | | | | | | | | | | | | | | | | | | | | |
Class N | | | (16,721 | ) | | | (23,942 | ) | | | (946 | ) | | | (2,108 | ) | | | (33,987 | ) | | | (15,227 | ) |
Class I | | | (665,170 | ) | | | (95,299 | ) | | | (19,015,823 | ) | | | (384,729 | ) | | | (282,917 | ) | | | (150,172 | ) |
From net realized gain on investments: | | | | | | | | | | | | | | | | | | | | | | | | |
Class N | | | — | | | | — | | | | (2,721 | ) | | | (7,188 | ) | | | (22,865 | ) | | | — | |
Class I | | | — | | | | — | | | | (28,593,441 | ) | | | (581,130 | ) | | | (203,640 | ) | | | — | |
Total distributions to shareholders | | | (681,891 | ) | | | (119,241 | ) | | | (47,612,931 | ) | | | (975,155 | ) | | | (543,409 | ) | | | (165,399 | ) |
Capital Share Transactions:1 | | | | | | | | | | | | | | | | | | | | | | | | |
Net increase from capital share transactions | | | 2,965,562 | | | | 25,063,021 | | | | 370,211,280 | | | | 1,217,603,116 | | | | 528,187 | | | | 7,615,889 | |
Total increase in net assets | | | 8,462,832 | | | | 24,637,901 | | | | 687,296,119 | | | | 1,285,322,035 | | | | 2,376,785 | | | | 8,090,881 | |
Net Assets: | | | | | | | | | | | | | | | | | | | | | | | | |
Beginning of year | | | 28,983,684 | | | | 4,345,783 | | | | 1,336,181,126 | | | | 50,859,091 | | | | 8,090,881 | | | | — | |
End of year | | $ | 37,446,516 | | | $ | 28,983,684 | | | $ | 2,023,477,245 | | | $ | 1,336,181,126 | | | $ | 10,467,666 | | | $ | 8,090,881 | |
End of year undistributed net investment income | | $ | 110,120 | | | $ | 26,396 | | | $ | 18,585,148 | | | $ | 17,081,975 | | | $ | 78,243 | | | $ | 90,750 | |
| | | | | | | | | | | | | | | | | | | | | | | | |
| # | The commencement of operations for Class Z shares was October 2, 2017. |
| ## | The commencement of operations for the Value Partners Asia Dividend Fund is December 16, 2015. |
| 1 | See Note 1(g) of the Notes to Financial Statements. |
The accompanying notes are an integral part of these financial statements.
150
Statements of Changes in Net Assets (continued)
For the fiscal years ended October 31
| | | | | | | | |
| | | AMG Managers | |
| | | Montag & Caldwell | |
| | | Balanced Fund | |
| | | 2017 | | | 2016 | |
Increase in Net Assets Resulting From Operations: | | | | | | | | |
Net investment income | | $ | 83,986 | | | $ | 168,860 | |
Net realized gain on investments | | | 1,114,103 | | | | 2,160,564 | |
Net change in unrealized appreciation/depreciation of investments | | | 1,101,333 | | | | (1,925,238 | ) |
Net increase in net assets resulting from operations | | | 2,299,422 | | | | 404,186 | |
Distributions to Shareholders: | | | | | | | | |
From net investment income: | | | | | | | | |
Class N | | | (104,641 | ) | | | (207,163 | ) |
Class I | | | (16,404 | ) | | | (27,438 | ) |
From net realized gain on investments: | | | | | | | | |
Class N | | | (1,915,882 | ) | | | (1,154,068 | ) |
Class I | | | (232,384 | ) | | | (170,597 | ) |
Total distributions to shareholders | | | (2,269,311 | ) | | | (1,559,266 | ) |
Capital Share Transactions:1 | | | | | | | | |
Net decrease from capital share transactions | | | (7,095,911 | ) | | | (505,817 | ) |
Total decrease in net assets | | | (7,065,800 | ) | | | (1,660,897 | ) |
Net Assets: | | | | | | | | |
Beginning of year | | | 28,464,037 | | | | 30,124,934 | |
End of year | | $ | 21,398,237 | | | $ | 28,464,037 | |
End of year distribution in excess of income | | $ | (331,385 | ) | | $ | (325,337 | ) |
| | | | | | | | |
| 1 | See Note 1(g) of the Notes to Financial Statements. |
The accompanying notes are an integral part of these financial statements.
151
Statement of Cash Flows
For the fiscal year ended October 31, 2017
| | | | |
| | | AMG River
Road Long-Short Fund | |
CASH FLOWS PROVIDED BY OPERATING ACTIVITIES: | | | | |
Net increase in net assets resulting from operations | | $ | 4,667,910 | |
ADJUSTMENTS TO RECONCILE NET INCREASE IN NET ASSETS RESULTING FROM OPERATIONS TO NET CASH PROVIDED BY OPERATING ACTIVITIES: | | | | |
Purchases of long-term investment securities | | | (63,702,222 | ) |
Proceeds from disposition of long-term investment securities | | | 81,974,216 | |
Proceeds from securities sold short | | | 32,457,338 | |
Purchases to cover securities sold short | | | (35,786,807 | ) |
Proceeds from investment distributions | | | 10,011 | |
Net sales of short-term securities | | | 1,791,687 | |
Net realized gain on investment | | | (4,328,779 | ) |
Net realized loss on short sales | | | 1,102,222 | |
Net realized loss from foreign currency transactions | | | 28,856 | |
Net change in unrealized appreciation/depreciation on investments | | | (2,422,890 | ) |
Net change in unrealized appreciation/depreciation on short sales | | | 198,465 | |
Net change in unrealized appreciation/depreciation on foreign currency translations | | | (67,003 | ) |
Increase in due from broker | | | (736,034 | ) |
Increase in segregated cash | | | (3,564,370 | ) |
Decrease in dividends, interest and other receivables | | | 41,929 | |
Increase in prepaid expenses | | | (90 | ) |
Increase in due to broker payable | | | 2,405,191 | |
Increase in interest and dividends payable | | | 6,529 | |
Decrease in investment advisory and management fees payable | | | (18,424 | ) |
Decrease in administration fees payable | | | (1,345 | ) |
Decrease in distribution fees payable | | | (549 | ) |
Decrease in shareholder servicing fees payable | | | (7,190 | ) |
Decrease in professional fees payable | | | (4,272 | ) |
Decrease in custodian fees payable | | | (1,306 | ) |
Decrease in trustees fees payable | | | (584 | ) |
Decrease in accrued expenses and other payables | | | (24,621 | ) |
Net cash provided by operating activities | | | 14,017,868 | |
Effect of exchange rate changes on foreign currency | | | 38,197 | |
CASH FLOWS FROM FINANCING ACTIVITIES: | | | | |
Proceeds from sale of shares | | | 11,566,943 | |
Cost of shares repurchased | | | (28,064,509 | ) |
Net cash used in financing activities | | | (16,497,566 | ) |
Net decrease in cash | | | (2,441,501 | ) |
CASH: | | | | |
Beginning of year | | | 2,470,039 | |
End of year | | $ | 28,538 | |
The accompanying notes are an integral part of these financial statements.
152
AMG Managers Fairpointe ESG Equity Fund
Financial Highlights
For a share outstanding throughout each fiscal period
| | | | | | | | | | | | |
| | | For the fiscal years
ended
October 31, | | | For the fiscal period
ended
October 31, | |
| Class N | | 2017 | | | 2016 | | | 20151 | |
Net Asset Value, Beginning of Period | | $ | 9.65 | | | $ | 9.33 | | | $ | 10.00 | |
Income (loss) from Investment Operations: | | | | | | | | | | | | |
Net investment income2,3 | | | 0.17 | 4 | | | 0.08 | | | | 0.06 | |
Net realized and unrealized gain (loss) on investments | | | 1.94 | | | | 0.33 | | | | (0.73 | ) |
Total income (loss) from investment operations | | | 2.11 | | | | 0.41 | | | | (0.67 | ) |
Less Distributions to Shareholders from: | | | | | | | | | | | | |
Net investment income | | | (0.02 | ) | | | (0.09 | ) | | | — | |
Total distributions to shareholders | | | (0.02 | ) | | | (0.09 | ) | | | — | |
Net Asset Value, End of Period | | $ | 11.74 | | | $ | 9.65 | | | $ | 9.33 | |
Total Return3,5 | | | 21.83 | % | | | 4.43 | % | | | (6.70 | )%6 |
Ratio of net expenses to average net assets | | | 1.12 | % | | | 1.15 | % | | | 1.15 | %7 |
Ratio of gross expenses to average net assets8 | | | 1.76 | % | | | 2.63 | % | | | 3.78 | %7 |
Ratio of net investment income to average net assets3 | | | 1.53 | % | | | 0.87 | % | | | 0.70 | %7 |
Portfolio turnover | | | 51 | % | | | 31 | % | | | 1 | %6,9 |
Net assets end of period (000’s) omitted | | $ | 807 | | | $ | 546 | | | $ | 2,295 | |
| | | | | | | | | | | | |
153
AMG Managers Fairpointe ESG Equity Fund
Financial Highlights
For a share outstanding throughout each fiscal period
| | | | | | | | | | | | |
| | | For the fiscal years
ended
October 31, | | | For the fiscal period
ended
October 31, | |
| Class I | | 2017 | | | 2016 | | | 20151 | |
Net Asset Value, Beginning of Period | | $ | 9.67 | | | $ | 9.35 | | | $ | 10.00 | |
Income (loss) from Investment Operations: | | | | | | | | | | | | |
Net investment income2,3 | | | 0.19 | 4 | | | 0.10 | | | | 0.08 | |
Net realized and unrealized gain (loss) on investments | | | 1.94 | | | | 0.32 | | | | (0.73 | ) |
Total income (loss) from investment operations | | | 2.13 | | | | 0.42 | | | | (0.65 | ) |
Less Distributions to Shareholders from: | | | | | | | | | | | | |
Net investment income | | | (0.10 | ) | | | (0.10 | ) | | | — | |
Total distributions to shareholders | | | (0.10 | ) | | | (0.10 | ) | | | — | |
Net Asset Value, End of Period | | $ | 11.70 | | | $ | 9.67 | | | $ | 9.35 | |
Total Return3,5 | | | 22.04 | % | | | 4.65 | % | | | (6.50 | )%6 |
Ratio of net expenses to average net assets | | | 0.90 | % | | | 0.90 | % | | | 0.90 | %7 |
Ratio of gross expenses to average net assets8 | | | 1.54 | % | | | 2.51 | % | | | 3.53 | %7 |
Ratio of net investment income to average net assets3 | | | 1.75 | % | | | 1.10 | % | | | 0.95 | %7 |
Portfolio turnover | | | 51 | % | | | 31 | % | | | 1 | %6,9 |
Net assets end of period (000’s) omitted | | $ | 5,747 | | | $ | 6,489 | | | $ | 4,162 | |
| | | | | | | | | | | | |
| 1 | Commencement of operations was on December 23, 2014. |
| 2 | Per share numbers have been calculated using average shares. |
| 3 | Total returns and net investment income would have been lower had certain expenses not been offset. |
| 4 | Includes non-recurring dividends. Without these dividends, net investment income per share would have been $0.06, and $0.08 for Class N and Class I, respectively. |
| 5 | The total return is calculated using the published Net Asset Value as of fiscal year end. |
| 8 | Excludes the impact of expense reimbursement or fee waivers and expense reductions such as brokerage credits, but includes expense repayments and non-reimbursable expenses, if any, such as interest, taxes, and extraordinary expenses. (See Note 1(c) and 2 in the Notes to Financial Statements.) |
| 9 | Portfolio turnover rate excludes securities received from processing a subscription in-kind. |
AMG River Road Focused Absolute Value Fund
Financial Highlights
For a share outstanding throughout each fiscal period
| | | | | | | | |
| | | For the fiscal years
ended
October 31, | | | For the fiscal period
ended
October 31, | |
| Class N | | 2017 | | | 20161 | |
Net Asset Value, Beginning of Period | | $ | 10.85 | | | $ | 10.00 | |
Income (loss) from Investment Operations: | | | | | | | | |
Net investment income (loss)2,3 | | | (0.01 | ) | | | 0.04 | |
Net realized and unrealized gains on investments | | | 1.85 | | | | 0.81 | |
Total income from investment operations | | | 1.84 | | | | 0.85 | |
Less Distributions to Shareholders from: | | | | | | | | |
Net investment income | | | (0.09 | ) | | | — | |
Net realized gain on investments | | | (0.73 | ) | | | — | |
Total distributions to shareholders | | | (0.82 | ) | | | — | |
Net Asset Value, End of Period | | $ | 11.87 | | | $ | 10.85 | |
Total Return3,4 | | | 17.42 | % | | | 8.50 | %5 |
Ratio of net expenses to average net assets | | | 0.97 | %6 | | | 1.12 | %7 |
Ratio of gross expenses to average net assets8 | | | 1.50 | % | | | 3.15 | %7 |
Ratio of net investment income (loss) to average net assets3 | | | (0.09 | )% | | | 0.39 | %7 |
Portfolio turnover | | | 112 | % | | | 146 | %5,9 |
Net assets end of period (000’s) omitted | | $ | 7,448 | | | $ | 489 | |
| | | | | | | | |
AMG River Road Focused Absolute Value Fund
Financial Highlights
For a share outstanding throughout each fiscal period
| | | | | | | | |
| | | For the fiscal years
ended
October 31, | | | For the fiscal period
ended
October 31, | |
| Class I | | 2017 | | | 20161 | |
Net Asset Value, Beginning of Period | | $ | 10.88 | | | $ | 10.00 | |
Income (loss) from Investment Operations: | | | | | | | | |
Net investment income2,3 | | | 0.06 | | | | 0.08 | |
Net realized and unrealized gains on investments | | | 1.81 | | | | 0.80 | |
Total income from investment operations | | | 1.87 | | | | 0.88 | |
Less Distributions to Shareholders from: | | | | | | | | |
Net investment income | | | (0.10 | ) | | | — | |
Net realized gain on investments | | | (0.73 | ) | | | — | |
Total distributions to shareholders | | | (0.83 | ) | | | — | |
Net Asset Value, End of Period | | $ | 11.92 | | | $ | 10.88 | |
Total Return3,4 | | | 17.72 | % | | | 8.80 | %5 |
Ratio of net expenses to average net assets | | | 0.73 | %6 | | | 0.75 | %7 |
Ratio of gross expenses to average net assets8 | | | 1.20 | % | | | 2.90 | %7 |
Ratio of net investment income to average net assets3 | | | 0.50 | % | | | 0.81 | %7 |
Portfolio turnover | | | 112 | % | | | 146 | %5,9 |
Net assets end of period (000’s) omitted | | $ | 17,106 | | | $ | 11,312 | |
| | | | | | | | |
AMG River Road Focused Absolute Value Fund
Financial Highlights
For a share outstanding throughout each fiscal period
| | | | |
| | | For the fiscal period
ended
October 31, | |
| Class Z | | 201710 | |
Net Asset Value, Beginning of Period | | $ | 12.18 | |
Income (loss) from Investment Operations: | | | | |
Net investment loss2,3 | | | (0.01 | ) |
Net realized and unrealized loss on investments | | | (0.25 | ) |
Total loss from investment operations | | | (0.26 | ) |
Net Asset Value, End of Period | | $ | 11.92 | |
Total Return3,4 | | | (2.13 | )%5 |
Ratio of net expenses to average net assets | | | 0.70 | %6,7 |
Ratio of gross expenses to average net assets8 | | | 1.32 | %7 |
Ratio of net investment loss to average net assets3 | | | (0.59 | )%7 |
Portfolio turnover | | | 112 | %5 |
Net assets end of period (000’s) omitted | | $ | 61 | |
| | | | |
| 1 | The commencement of operations for Class N and Class I shares was November 3, 2015. |
| 2 | Per share numbers have been calculated using average shares. |
| 3 | Total returns and net investment income would have been lower had certain expenses not been offset. |
| 4 | The total return is calculated using the published Net Asset Value as of fiscal year end. |
| 6 | Includes reduction from broker recapture amounting to 0.03%, 0.02% and less than 0.01% for Class N, Class I and Class Z, respectively. |
| 8 | Excludes the impact of expense reimbursement or fee waivers and expense reductions such as brokerage credits, but includes expense repayments and non-reimbursable expenses, if any, such as interest, taxes, and extraordinary expenses. (See Note 1(c) and 2 in the Notes to Financial Statements.) |
| 9 | Portfolio turnover rate excludes securities received from processing a subscription in-kind. |
| 10 | The commencement of operations for Class Z shares was October 2, 2017. |
AMG Managers Montag & Caldwell Growth Fund
Financial Highlights
For a share outstanding throughout each fiscal year
| | | | | | | | | | | | | | | | | | | | |
| | | For the fiscal years ended October 31, | |
| Class N | | 2017 | | | 2016 | | | 2015 | | | 2014 | | | 2013 | |
Net Asset Value, Beginning of Year | | $ | 19.56 | | | $ | 26.67 | | | $ | 29.59 | | | $ | 28.68 | | | $ | 25.31 | |
Income (loss) from Investment Operations: | | | | | | | | | | | | | | | | | | | | |
Net investment income (loss)1,2 | | | (0.02 | ) | | | 0.05 | | | | 0.07 | | | | 0.10 | | | | 0.23 | |
Net realized and unrealized gain (loss) on investments | | | 3.20 | | | | (0.33 | ) | | | 2.06 | | | | 2.93 | | | | 5.07 | |
Total income (loss) from investment operations | | | 3.18 | | | | (0.28 | ) | | | 2.13 | | | | 3.03 | | | | 5.30 | |
Less Distributions to Shareholders from: | | | | | | | | | | | | | | | | | | | | |
Net investment income | | | (0.04 | ) | | | (0.08 | ) | | | (0.05 | ) | | | (0.16 | ) | | | (0.22 | ) |
Net realized gain on investments | | | (1.94 | ) | | | (6.75 | ) | | | (5.00 | ) | | | (1.96 | ) | | | (1.71 | ) |
Total distributions to shareholders | | | (1.98 | ) | | | (6.83 | ) | | | (5.05 | ) | | | (2.12 | ) | | | (1.93 | ) |
Net Asset Value, End of Year | | $ | 20.76 | | | $ | 19.56 | | | $ | 26.67 | | | $ | 29.59 | | | $ | 28.68 | |
Total Return2,3 | | | 17.99 | % | | | (1.77 | )% | | | 7.93 | % | | | 10.98 | % | | | 22.61 | % |
Ratio of net expenses to average net assets | | | 1.15 | %4 | | | 1.12 | % | | | 1.05 | % | | | 1.03 | % | | | 1.04 | % |
Ratio of gross expenses to average net assets5 | | | 1.17 | % | | | 1.12 | % | | | 1.05 | % | | | 1.03 | % | | | 1.04 | % |
Ratio of net investment income (loss) to average net assets2 | | | (0.11 | )% | | | 0.25 | % | | | 0.28 | % | | | 0.34 | % | | | 0.88 | % |
Portfolio turnover | | | 42 | % | | | 64 | % | | | 12 | % | | | 47 | % | | | 51 | % |
Net assets end of year (000’s) omitted | | $ | 259,324 | | | $ | 519,008 | | | $ | 835,725 | | | $ | 1,344,317 | | | $ | 2,190,074 | |
| | | | | | | | | | | | | | | | | | | | |
AMG Managers Montag & Caldwell Growth Fund
Financial Highlights
For a share outstanding throughout each fiscal year
| | | | | | | | | | | | | | | | | | | | |
| | | For the fiscal years ended October 31, | |
| Class I | | 2017 | | | 2016 | | | 2015 | | | 2014 | | | 2013 | |
Net Asset Value, Beginning of Year | | $ | 19.70 | | | $ | 26.82 | | | $ | 29.80 | | | $ | 28.87 | | | $ | 25.46 | |
Income (loss) from Investment Operations: | | | | | | | | | | | | | | | | | | | | |
Net investment income1,2 | | | 0.02 | | | | 0.10 | | | | 0.14 | | | | 0.17 | | | | 0.30 | |
Net realized and unrealized gain (loss) on investments | | | 3.20 | | | | (0.31 | ) | | | 2.06 | | | | 2.96 | | | | 5.10 | |
Total income (loss) from investment operations | | | 3.22 | | | | (0.21 | ) | | | 2.20 | | | | 3.13 | | | | 5.40 | |
Less Distributions to Shareholders from: | | | | | | | | | | | | | | | | | | | | |
Net investment income | | | (0.13 | ) | | | (0.16 | ) | | | (0.18 | ) | | | (0.24 | ) | | | (0.28 | ) |
Net realized gain on investments | | | (1.95 | ) | | | (6.75 | ) | | | (5.00 | ) | | | (1.96 | ) | | | (1.71 | ) |
Total distributions to shareholders | | | (2.08 | ) | | | (6.91 | ) | | | (5.18 | ) | | | (2.20 | ) | | | (1.99 | ) |
Net Asset Value, End of Year | | $ | 20.84 | | | $ | 19.70 | | | $ | 26.82 | | | $ | 29.80 | | | $ | 28.87 | |
Total Return2,3 | | | 18.21 | % | | | (1.51 | )% | | | 8.21 | % | | | 11.26 | % | | | 22.95 | % |
Ratio of net expenses to average net assets | | | 0.92 | %4 | | | 0.87 | % | | | 0.80 | % | | | 0.78 | % | | | 0.79 | % |
Ratio of gross expenses to average net assets5 | | | 0.94 | % | | | 0.87 | % | | | 0.80 | % | | | 0.78 | % | | | 0.79 | % |
Ratio of net investment income to average net assets2 | | | 0.12 | % | | | 0.50 | % | | | 0.53 | % | | | 0.59 | % | | | 1.13 | % |
Portfolio turnover | | | 42 | % | | | 64 | % | | | 12 | % | | | 47 | % | | | 51 | % |
Net assets end of year (000’s) omitted | | $ | 642,461 | | | $ | 820,318 | | | $ | 1,344,231 | | | $ | 2,784,650 | | | $ | 3,035,623 | |
| | | | | | | | | | | | | | | | | | | | |
AMG Managers Montag & Caldwell Growth Fund
Financial Highlights
For a share outstanding throughout each fiscal year
| | | | | | | | | | | | | | | | | | | | |
| | | For the fiscal years ended October 31, | |
| Class R | | 2017 | | | 2016 | | | 2015 | | | 2014 | | | 2013 | |
Net Asset Value, Beginning of Year | | $ | 19.14 | | | $ | 26.22 | | | $ | 29.21 | | | $ | 28.33 | | | $ | 25.02 | |
Income (loss) from Investment Operations: | | | | | | | | | | | | | | | | | | | | |
Net investment income (loss)1,2 | | | (0.07 | ) | | | 0.00 | 6 | | | 0.01 | | | | 0.03 | | | | 0.16 | |
Net realized and unrealized gain (loss) on investments | | | 3.15 | | | | (0.31 | ) | | | 2.01 | | | | 2.91 | | | | 5.01 | |
Total income (loss) from investment operations | | | 3.08 | | | | (0.31 | ) | | | 2.02 | | | | 2.94 | | | | 5.17 | |
Less Distributions to Shareholders from: | | | | | | | | | | | | | | | | | | | | |
Net investment income | | | (0.03 | ) | | | (0.02 | ) | | | (0.01 | ) | | | (0.10 | ) | | | (0.15 | ) |
Net realized gain on investments | | | (1.90 | ) | | | (6.75 | ) | | | (5.00 | ) | | | (1.96 | ) | | | (1.71 | ) |
Total distributions to shareholders | | | (1.93 | ) | | | (6.77 | ) | | | (5.01 | ) | | | (2.06 | ) | | | (1.86 | ) |
Net Asset Value, End of Year | | $ | 20.29 | | | $ | 19.14 | | | $ | 26.22 | | | $ | 29.21 | | | $ | 28.33 | |
Total Return2,3 | | | 17.77 | % | | | (2.02 | )% | | | 7.66 | % | | | 10.74 | % | | | 22.30 | % |
Ratio of net expenses to average net assets | | | 1.39 | %4 | | | 1.37 | % | | | 1.30 | % | | | 1.28 | % | | | 1.29 | % |
Ratio of gross expenses to average net assets5 | | | 1.41 | % | | | 1.37 | % | | | 1.30 | % | | | 1.28 | % | | | 1.29 | % |
Ratio of net investment income (loss) to average net assets2 | | | (0.35 | )% | | | (0.02 | )% | | | 0.03 | % | | | 0.09 | % | | | 0.63 | % |
Portfolio turnover | | | 42 | % | | | 64 | % | | | 12 | % | | | 47 | % | | | 51 | % |
Net assets end of year (000’s) omitted | | $ | 674 | | | $ | 5,458 | | | $ | 5,877 | | | $ | 7,701 | | | $ | 10,099 | |
| | | | | | | | | | | | | | | | | | | | |
| 1 | Per share numbers have been calculated using average shares. |
| 2 | Total returns and net investment income would have been lower had certain expenses not been offset. |
| 3 | The total return is calculated using the published Net Asset Value as of fiscal year end. |
| 4 | Includes reduction from brokerage recapture amounting to 0.01%. |
| 5 | Excludes the impact of expense reimbursement or fee waivers and expense reductions such as brokerage credits, but includes expense repayments and non-reimbursable expenses, if any, such as interest, taxes, and extraordinary expenses. (See Note 1(c) and 2 in the Notes to Financial Statements.) |
| 6 | Less than $0.005 or $(0.005) per share. |
AMG River Road Dividend All Cap Value Fund
Financial Highlights
For a share outstanding throughout each fiscal year
| | | | | | | | | | | | | | | | | | | | |
| | | For the fiscal years ended October 31, | |
| Class N | | 2017 | | | 2016 | | | 2015 | | | 2014 | | | 2013 | |
Net Asset Value, Beginning of Year | | $ | 12.18 | | | $ | 12.67 | | | $ | 14.05 | | | $ | 13.99 | | | $ | 11.67 | |
Income from Investment Operations: | | | | | | | | | | | | | | | | | | | | |
Net investment income1 | | | 0.22 | 2 | | | 0.24 | 2 | | | 0.21 | | | | 0.42 | | | | 0.30 | |
Net realized and unrealized gain (loss) on investments | | | 1.54 | | | | 0.65 | | | | (0.20 | ) | | | 0.89 | | | | 2.73 | |
Total income from investment operations | | | 1.76 | | | | 0.89 | | | | 0.01 | | | | 1.31 | | | | 3.03 | |
Less Distributions to Shareholders from: | | | | | | | | | | | | | | | | | | | | |
Net investment income | | | (0.21 | ) | | | (0.22 | ) | | | (0.22 | ) | | | (0.44 | ) | | | (0.27 | ) |
Net realized gain on investments | | | (0.86 | ) | | | (1.16 | ) | | | (1.17 | ) | | | (0.81 | ) | | | (0.44 | ) |
Total distributions to shareholders | | | (1.07 | ) | | | (1.38 | ) | | | (1.39 | ) | | | (1.25 | ) | | | (0.71 | ) |
Net Asset Value, End of Year | | $ | 12.87 | | | $ | 12.18 | | | $ | 12.67 | | | $ | 14.05 | | | $ | 13.99 | |
Total Return1,3 | | | 14.79 | % | | | 7.88 | % | | | (0.23 | )% | | | 9.89 | % | | | 27.47 | % |
Ratio of net expenses to average net assets | | | 1.11 | %4 | | | 1.10 | % | | | 1.10 | % | | | 1.09 | % | | | 1.09 | % |
Ratio of gross expenses to average net assets5 | | | 1.12 | % | | | 1.10 | % | | | 1.10 | % | | | 1.09 | % | | | 1.09 | % |
Ratio of net investment income to average net assets1 | | | 1.75 | % | | | 2.00 | % | | | 1.62 | % | | | 2.96 | % | | | 2.38 | % |
Portfolio turnover | | | 28 | % | | | 47 | % | | | 27 | % | | | 32 | % | | | 35 | % |
Net assets end of year (000’s) omitted | | $ | 136,534 | | | $ | 295,797 | | | $ | 214,789 | | | $ | 349,937 | | | $ | 449,130 | |
| | | | | | | | | | | | | | | | | | | | |
AMG River Road Dividend All Cap Value Fund
Financial Highlights
For a share outstanding throughout each fiscal year
| | | | | | | | | | | | | | | | | | | | |
| | | For the fiscal years ended October 31, | |
| Class I | | 2017 | | | 2016 | | | 2015 | | | 2014 | | | 2013 | |
Net Asset Value, Beginning of Year | | $ | 12.17 | | | $ | 12.66 | | | $ | 14.04 | | | $ | 13.98 | | | $ | 11.66 | |
Income from Investment Operations: | | | | | | | | | | | | | | | | | | | | |
Net investment income1 | | | 0.24 | 2 | | | 0.28 | 2 | | | 0.25 | | | | 0.44 | | | | 0.34 | |
Net realized and unrealized gain (loss) on investments | | | 1.55 | | | | 0.64 | | | | (0.20 | ) | | | 0.90 | | | | 2.72 | |
Total income from investment operations | | | 1.79 | | | | 0.92 | | | | 0.05 | | | | 1.34 | | | | 3.06 | |
Less Distributions to Shareholders from: | | | | | | | | | | | | | | | | | | | | |
Net investment income | | | (0.24 | ) | | | (0.25 | ) | | | (0.26 | ) | | | (0.47 | ) | | | (0.30 | ) |
Net realized gain on investments | | | (0.86 | ) | | | (1.16 | ) | | | (1.17 | ) | | | (0.81 | ) | | | (0.44 | ) |
Total distributions to shareholders | | | (1.10 | ) | | | (1.41 | ) | | | (1.43 | ) | | | (1.28 | ) | | | (0.74 | ) |
Net Asset Value, End of Year | | $ | 12.86 | | | $ | 12.17 | | | $ | 12.66 | | | $ | 14.04 | | | $ | 13.98 | |
Total Return1,3 | | | 15.07 | % | | | 8.15 | % | | | 0.02 | % | | | 10.18 | % | | | 27.81 | % |
Ratio of net expenses to average net assets | | | 0.86 | %4 | | | 0.85 | % | | | 0.85 | % | | | 0.84 | % | | | 0.84 | % |
Ratio of gross expenses to average net assets5 | | | 0.87 | % | | | 0.85 | % | | | 0.85 | % | | | 0.84 | % | | | 0.84 | % |
Ratio of net investment income to average net assets1 | | | 1.93 | % | | | 2.30 | % | | | 1.87 | % | | | 3.21 | % | | | 2.63 | % |
Portfolio turnover | | | 28 | % | | | 47 | % | | | 27 | % | | | 32 | % | | | 35 | % |
Net assets end of year (000’s) omitted | | $ | 788,023 | | | $ | 555,064 | | | $ | 635,189 | | | $ | 788,322 | | | $ | 779,859 | |
| | | | | | | | | | | | | | | | | | | | |
AMG River Road Dividend All Cap Value Fund
Financial Highlights
For a share outstanding throughout each fiscal period
| | | | |
| | | For the fiscal period
ended
October 31, | |
| Class Z | | 20176 | |
Net Asset Value, Beginning of Period | | $ | 12.80 | |
Income from Investment Operations: | | | | |
Net investment income1 | | | 0.01 | 2 |
Net realized and unrealized gains on investments | | | 0.07 | |
Total income from investment operations | | | 0.08 | |
Less Distributions to Shareholders from: | | | | |
Net investment income | | | (0.02 | ) |
Total distributions to shareholders | | | (0.02 | ) |
Net Asset Value, End of Period | | $ | 12.86 | |
Total Return1,3 | | | 0.59 | %7 |
Ratio of net expenses to average net assets | | | 0.78 | %4,8 |
Ratio of gross expenses to average net assets5 | | | 0.79 | %8 |
Ratio of net investment income to average net assets1 | | | 0.79 | %8 |
Portfolio turnover | | | 28 | %7 |
Net assets end of period (000’s) omitted | | $ | 257 | |
| | | | |
| 1 | Total returns and net investment income would have been lower had certain expenses not been offset. |
| 2 | Per share numbers have been calculated using average shares. |
| 3 | The total return is calculated using the published Net Asset Value as of fiscal year end. |
| 4 | Includes reduction from broker recapture amounting to less than 0.01%. |
| 5 | Excludes the impact of expense reimbursement or fee waivers and expense reductions such as brokerage credits, but includes expense repayments and non-reimbursable expenses, if any, such as interest, taxes, and extraordinary expenses. (See Note 1(c) and 2 in the Notes to Financial Statements.) |
| 6 | The commencement of operations for Class Z shares was October 2, 2017. |
AMG River Road Dividend All Cap Value Fund II
Financial Highlights
For a share outstanding throughout each fiscal year
| | | | | | | | | | | | | | | | | | | | |
| | | For the fiscal years ended October 31, | |
| Class N | | 2017 | | | 2016 | | | 2015 | | | 2014 | | | 2013 | |
Net Asset Value, Beginning of Year | | $ | 13.52 | | | $ | 12.99 | | | $ | 13.69 | | | $ | 12.89 | | | $ | 10.44 | |
Income (loss) from Investment Operations: | | | | | | | | | | | | | | | | | | | | |
Net investment income1 | | | 0.24 | 2 | | | 0.26 | 2 | | | 0.22 | 2 | | | 0.36 | | | | 0.22 | |
Net realized and unrealized gain (loss) on investments | | | 1.80 | | | | 0.71 | | | | (0.26 | ) | | | 0.96 | | | | 2.46 | |
Total income (loss) from investment operations | | | 2.04 | | | | 0.97 | | | | (0.04 | ) | | | 1.32 | | | | 2.68 | |
Less Distributions to Shareholders from: | | | | | | | | | | | | | | | | | | | | |
Net investment income | | | (0.20 | ) | | | (0.25 | ) | | | (0.23 | ) | | | (0.38 | ) | | | (0.23 | ) |
Net realized gain on investments | | | (0.56 | ) | | | (0.19 | ) | | | (0.43 | ) | | | (0.14 | ) | | | (0.00 | )3 |
Total distributions to shareholders | | | (0.76 | ) | | | (0.44 | ) | | | (0.66 | ) | | | (0.52 | ) | | | (0.23 | ) |
Net Asset Value, End of Year | | $ | 14.80 | | | $ | 13.52 | | | $ | 12.99 | | | $ | 13.69 | | | $ | 12.89 | |
Total Return1,4 | | | 15.33 | % | | | 7.61 | % | | | (0.47 | )% | | | 10.46 | % | | | 25.99 | % |
Ratio of net expenses to average net assets | | | 1.20 | %5 | | | 1.18 | % | | | 1.15 | % | | | 1.25 | % | | | 1.30 | % |
Ratio of gross expenses to average net assets6 | | | 1.20 | % | | | 1.18 | % | | | 1.15 | % | | | 1.17 | % | | | 1.37 | % |
Ratio of net investment income to average net assets1 | | | 1.69 | % | | | 1.99 | % | | | 1.62 | % | | | 2.72 | % | | | 1.76 | % |
Portfolio turnover | | | 27 | % | | | 34 | % | | | 35 | % | | | 29 | % | | | 28 | % |
Net assets end of year (000’s) omitted | | $ | 3,090 | | | $ | 3,394 | | | $ | 2,930 | | | $ | 7,037 | | | $ | 3,634 | |
| | | | | | | | | | | | | | | | | | | | |
AMG River Road Dividend All Cap Value Fund II
Financial Highlights
For a share outstanding throughout each fiscal year
| | | | | | | | | | | | | | | | | | | | |
| | | For the fiscal years ended October 31, | |
| Class I | | 2017 | | | 2016 | | | 2015 | | | 2014 | | | 2013 | |
Net Asset Value, Beginning of Year | | $ | 13.53 | | | $ | 13.00 | | | $ | 13.69 | | | $ | 12.89 | | | $ | 10.45 | |
Income (loss) from Investment Operations: | | | | | | | | | | | | | | | | | | | | |
Net investment income1 | | | 0.28 | 2 | | | 0.29 | 2 | | | 0.25 | 2 | | | 0.39 | | | | 0.25 | |
Net realized and unrealized gain (loss) on investments | | | 1.80 | | | | 0.71 | | | | (0.25 | ) | | | 0.96 | | | | 2.45 | |
Total income from investment operations | | | 2.08 | | | | 1.00 | | | | — | | | | 1.35 | | | | 2.70 | |
Less Distributions to Shareholders from: | | | | | | | | | | | | | | | | | | | | |
Net investment income | | | (0.23 | ) | | | (0.28 | ) | | | (0.26 | ) | | | (0.41 | ) | | | (0.26 | ) |
Net realized gain on investments | | | (0.56 | ) | | | (0.19 | ) | | | (0.43 | ) | | | (0.14 | ) | | | (0.00 | )3 |
Total distributions to shareholders | | | (0.79 | ) | | | (0.47 | ) | | | (0.69 | ) | | | (0.55 | ) | | | (0.26 | ) |
Net Asset Value, End of Year | | $ | 14.82 | | | $ | 13.53 | | | $ | 13.00 | | | $ | 13.69 | | | $ | 12.89 | |
Total Return1,4 | | | 15.65 | % | | | 7.87 | % | | | (0.13 | )% | | | 10.73 | % | | | 26.30 | % |
Ratio of net expenses to average net assets | | | 0.91 | %5 | | | 0.93 | % | | | 0.90 | % | | | 1.00 | % | | | 1.05 | % |
Ratio of gross expenses to average net assets6 | | | 0.91 | % | | | 0.93 | % | | | 0.90 | % | | | 0.92 | % | | | 1.12 | % |
Ratio of net investment income to average net assets1 | | | 1.96 | % | | | 2.24 | % | | | 1.87 | % | | | 2.97 | % | | | 2.01 | % |
Portfolio turnover | | | 27 | % | | | 34 | % | | | 35 | % | | | 29 | % | | | 28 | % |
Net assets end of year (000’s) omitted | | $ | 118,876 | | | $ | 114,532 | | | $ | 121,414 | | | $ | 125,660 | | | $ | 86,240 | |
| | | | | | | | | | | | | | | | | | | | |
AMG River Road Dividend All Cap Value Fund II
Financial Highlights
For a share outstanding throughout each fiscal period
| | | | |
| | | For the fiscal period
ended
October 31, | |
| Class Z | | 20177 | |
Net Asset Value, Beginning of Period | | $ | 14.74 | |
Income (loss) from Investment Operations: | | | | |
Net investment loss1 | | | (0.01 | )2 |
Net realized and unrealized gains on investments | | | 0.11 | |
Total income from investment operations | | | 0.10 | |
Less Distributions to Shareholders from: | | | | |
Net investment income | | | (0.02 | ) |
Total distributions to shareholders | | | (0.02 | ) |
Net Asset Value, End of Period | | $ | 14.82 | |
Total Return1,4 | | | 0.65 | %8 |
Ratio of net expenses to average net assets | | | 0.90 | %5,9 |
Ratio of gross expenses to average net assets6 | | | 0.90 | %9 |
Ratio of net investment loss to average net assets1 | | | (0.47 | )%9 |
Portfolio turnover | | | 27 | %8 |
Net assets end of period (000’s) omitted | | $ | 321 | |
| | | | |
| 1 | Total returns and net investment income would have been lower had certain expenses not been offset. |
| 2 | Per share numbers have been calculated using average shares. |
| 3 | Less than $0.005 or $(0.005) per share. |
| 4 | The total return is calculated using the published Net Asset Value as of fiscal year end. |
| 5 | Includes reduction from broker recapture amounting to less than 0.01%. |
| 6 | Excludes the impact of expense reimbursement or fee waivers and expense reductions such as brokerage credits, but includes expense repayments and non-reimbursable expenses, if any, such as interest, taxes, and extraordinary expenses. (See Note 1(c) and 2 in the Notes to Financial Statements.) |
| 7 | The commencement of operations for Class Z shares was October 2, 2017. |
AMG Managers Fairpointe Mid Cap Fund
Financial Highlights
For a share outstanding throughout each fiscal year
| | | | | | | | | | | | | | | | | | | | |
| | | For the fiscal years ended October 31, | |
| Class N | | 2017 | | | 2016 | | | 2015 | | | 2014 | | | 2013 | |
Net Asset Value, Beginning of Year | | $ | 37.48 | | | $ | 37.56 | | | $ | 46.89 | | | $ | 45.40 | | | $ | 32.79 | |
Income (loss) from Investment Operations: | | | | | | | | | | | | | | | | | | | | |
Net investment income (loss)1,2 | | | (0.02 | ) | | | 0.16 | | | | 0.12 | | | | (0.06 | ) | | | 0.17 | |
Net realized and unrealized gain (loss) on investments | | | 6.33 | | | | 1.92 | | | | (1.83 | ) | | | 5.82 | | | | 13.48 | |
Total income (loss) from investment operations | | | 6.31 | | | | 2.08 | | | | (1.71 | ) | | | 5.76 | | | | 13.65 | |
Less Distributions to Shareholders from: | | | | | | | | | | | | | | | | | | | | |
Net investment income | | | (0.13 | ) | | | (0.11 | ) | | | (0.04 | ) | | | — | | | | (0.30 | ) |
Net realized gain on investments | | | (1.71 | ) | | | (2.05 | ) | | | (7.58 | ) | | | (4.27 | ) | | | (0.74 | ) |
Total distributions to shareholders | | | (1.84 | ) | | | (2.16 | ) | | | (7.62 | ) | | | (4.27 | ) | | | (1.04 | ) |
Net Asset Value, End of Year | | $ | 41.95 | | | $ | 37.48 | | | $ | 37.56 | | | $ | 46.89 | | | $ | 45.40 | |
Total Return2,3 | | | 16.87 | % | | | 6.01 | % | | | (5.02 | )% | | | 13.32 | % | | | 42.88 | % |
Ratio of net expenses to average net assets | | | 1.12 | % | | | 1.12 | % | | | 1.11 | % | | | 1.10 | % | | | 1.11 | % |
Ratio of gross expenses to average net assets4 | | | 1.13 | % | | | 1.12 | % | | | 1.11 | % | | | 1.10 | % | | | 1.11 | % |
Ratio of net investment income (loss) to average net assets2 | | | (0.05 | )% | | | 0.44 | % | | | 0.27 | % | | | (0.12 | )% | | | 0.42 | % |
Portfolio turnover | | | 28 | % | | | 24 | % | | | 32 | % | | | 50 | % | | | 37 | % |
Net assets end of year (000’s) omitted | | $ | 1,292,107 | | | $ | 1,374,982 | | | $ | 1,861,753 | | | $ | 2,432,815 | | | $ | 2,370,432 | |
| | | | | | | | | | | | | | | | | | | | |
AMG Managers Fairpointe Mid Cap Fund
Financial Highlights
For a share outstanding throughout each fiscal year
| | | | | | | | | | | | | | | | | | | | |
| | | For the fiscal years ended October 31, | |
| Class I | | 2017 | | | 2016 | | | 2015 | | | 2014 | | | 2013 | |
Net Asset Value, Beginning of Year | | $ | 38.39 | | | $ | 38.44 | | | $ | 47.74 | | | $ | 46.10 | | | $ | 33.28 | |
Income (loss) from Investment Operations: | | | | | | | | | | | | | | | | | | | | |
Net investment income1,2 | | | 0.08 | | | | 0.25 | | | | 0.23 | | | | 0.05 | | | | 0.28 | |
Net realized and unrealized gain (loss) on investments | | | 6.49 | | | | 1.98 | | | | (1.89 | ) | | | 5.92 | | | | 13.67 | |
Total income (loss) from investment operations | | | 6.57 | | | | 2.23 | | | | (1.66 | ) | | | 5.97 | | | | 13.95 | |
Less Distributions to Shareholders from: | | | | | | | | | | | | | | | | | | | | |
Net investment income | | | (0.24 | ) | | | (0.23 | ) | | | (0.06 | ) | | | (0.06 | ) | | | (0.39 | ) |
Net realized gain on investments | | | (1.75 | ) | | | (2.05 | ) | | | (7.58 | ) | | | (4.27 | ) | | | (0.74 | ) |
Total distributions to shareholders | | | (1.99 | ) | | | (2.28 | ) | | | (7.64 | ) | | | (4.33 | ) | | | (1.13 | ) |
Net Asset Value, End of Year | | $ | 42.97 | | | $ | 38.39 | | | $ | 38.44 | | | $ | 47.74 | | | $ | 46.10 | |
Total Return2,3 | | | 17.16 | % | | | 6.26 | % | | | (4.78 | )% | | | 13.61 | % | | | 43.23 | % |
Ratio of net expenses to average net assets | | | 0.87 | % | | | 0.87 | % | | | 0.86 | % | | | 0.85 | % | | | 0.86 | % |
Ratio of gross expenses to average net assets4 | | | 0.88 | % | | | 0.87 | % | | | 0.86 | % | | | 0.85 | % | | | 0.86 | % |
Ratio of net investment income to average net assets2 | | | 0.20 | % | | | 0.68 | % | | | 0.52 | % | | | 0.13 | % | | | 0.67 | % |
Portfolio turnover | | | 28 | % | | | 24 | % | | | 32 | % | | | 50 | % | | | 37 | % |
Net assets end of year (000’s) omitted | | $ | 2,668,464 | | | $ | 2,135,998 | | | $ | 2,838,642 | | | $ | 3,531,114 | | | $ | 2,521,876 | |
| | | | | | | | | | | | | | | | | | | | |
AMG Managers Fairpointe Mid Cap Fund
Financial Highlights
For a share outstanding throughout each fiscal period
| | | | |
| | | For the fiscal period
ended
October 31, | |
| Class Z | | 20175 | |
Net Asset Value, Beginning of Period | | $ | 44.24 | |
Income (loss) from Investment Operations: | | | | |
Net investment income1,2 | | | 0.00 | 6 |
Net realized and unrealized loss on investments | | | (1.26 | ) |
Total loss from investment operations | | | (1.26 | ) |
Net Asset Value, End of Period | | $ | 42.98 | |
Total Return2,3 | | | (2.85 | )%7 |
Ratio of net expenses to average net assets | | | 0.79 | %8 |
Ratio of gross expenses to average net assets4 | | | 0.80 | %8 |
Ratio of net investment income to average net assets2 | | | 0.01 | %8 |
Portfolio turnover | | | 28 | %7 |
Net assets end of period (000’s) omitted | | $ | 9,625 | |
| | | | |
| 1 | Per share numbers have been calculated using average shares. |
| 2 | Total returns and net investment income would have been lower had certain expenses not been offset. |
| 3 | The total return is calculated using the published Net Asset Value as of fiscal year end. |
| 4 | Excludes the impact of expense reimbursement or fee waivers and expense reductions such as brokerage credits, but includes expense repayments and non-reimbursable expenses, if any, such as interest, taxes, and extraordinary expenses. (See Note 1(c) and 2 in the Notes to Financial Statements.) |
| 5 | Commencement of operations was on October 2, 2017. |
| 6 | Less than $0.005 or $(0.005) per share. |
AMG Managers Montag & Caldwell Mid Cap Growth Fund
Financial Highlights
For a share outstanding throughout each fiscal year
| | | | | | | | | | | | | | | | | | | | |
| | | For the fiscal years ended October 31, | |
| Class N | | 2017 | | | 2016 | | | 2015 | | | 2014 | | | 2013 | |
Net Asset Value, Beginning of Year | | $ | 10.19 | | | $ | 11.57 | | | $ | 11.99 | | | $ | 12.77 | | | $ | 10.36 | |
| | | | | | | | | | | | | | | | | | | | |
Income (loss) from Investment Operations: | | | | | | | | | | | | | | | | | | | | |
Net investment loss2 | | | (0.08 | )3 | | | (0.07 | )3 | | | (0.08 | ) | | | (0.06 | )3 | | | (0.07 | ) |
Net realized and unrealized gains on investments | | | 1.92 | | | | 0.02 | | | | 0.65 | | | | 1.20 | | | | 2.58 | |
Total income (loss) from investment operations | | | 1.84 | | | | (0.05 | ) | | | 0.57 | | | | 1.14 | | | | 2.51 | |
Less Distributions to Shareholders from: | | | | | | | | | | | | | | | | | | | | |
Net investment income | | | (0.03 | ) | | | — | | | | — | | | | — | | | | — | |
Net realized gain on investments | | | (0.74 | ) | | | (1.33 | ) | | | (0.99 | ) | | | (1.92 | ) | | | (0.10 | ) |
Total distributions to shareholders | | | (0.77 | ) | | | (1.33 | ) | | | (0.99 | ) | | | (1.92 | ) | | | (0.10 | ) |
Net Asset Value, End of Year | | $ | 11.26 | | | $ | 10.19 | | | $ | 11.57 | | | $ | 11.99 | | | $ | 12.77 | |
Total Return2,4 | | | 19.09 | % | | | (0.60 | )% | | | 4.81 | % | | | 9.75 | % | | | 24.51 | % |
Ratio of net expenses to average net assets | | | 1.23 | %6 | | | 1.25 | % | | | 1.25 | % | | | 1.25 | % | | | 1.25 | % |
Ratio of gross expenses to average net assets8 | | | 1.86 | % | | | 2.12 | % | | | 2.10 | % | | | 2.16 | % | | | 1.85 | % |
Ratio of net investment loss to average net assets2 | | | (0.73 | )% | | | (0.64 | )% | | | (0.60 | )% | | | (0.55 | )% | | | (0.58 | )% |
Portfolio turnover | | | 49 | % | | | 39 | % | | | 58 | % | | | 33 | % | | | 74 | % |
Net assets end of year (000’s) omitted | | $ | 4,574 | | | $ | 4,216 | | | $ | 4,890 | | | $ | 7,633 | | | $ | 11,402 | |
| | | | | | | | | | | | | | | | | | | | |
AMG Managers Montag & Caldwell Mid Cap Growth Fund
Financial Highlights
For a share outstanding throughout each fiscal period
| | | | | | | | | | | | | | | | |
| | | For the fiscal years
ended
October 31, | | | For the fiscal period
ended
October 31, | |
| Class I | | 2017 | | | 2016 | | | 2015 | | | 20141 | |
Net Asset Value, Beginning of Period | | $ | 10.25 | | | $ | 11.61 | | | $ | 12.00 | | | $ | 11.36 | |
Income (loss) from Investment Operations: | | | | | | | | | | | | | | | | |
Net investment loss2 | | | (0.05 | )3 | | | (0.04 | )3 | | | (0.04 | ) | | | (0.04 | )3 |
Net realized and unrealized gains on investments | | | 1.92 | | | | 0.01 | | | | 0.64 | | | | 0.68 | |
Total income (loss) from investment operations | | | 1.87 | | | | (0.03 | ) | | | 0.60 | | | | 0.64 | |
Less Distributions to Shareholders from: | | | | | | | | | | | | | | | | |
Net investment income | | | (0.06 | ) | | | — | | | | — | | | | — | |
Net realized gain on investments | | | (0.74 | ) | | | (1.33 | ) | | | (0.99 | ) | | | — | |
Total distributions to shareholders | | | (0.80 | ) | | | (1.33 | ) | | | (0.99 | ) | | | — | |
Net Asset Value, End of Period | | $ | 11.32 | | | $ | 10.25 | | | $ | 11.61 | | | $ | 12.00 | |
Total Return2,4 | | | 19.35 | % | | | (0.41 | )% | | | 5.08 | % | | | 5.63 | %5 |
Ratio of net expenses to average net assets | | | 0.99 | %6 | | | 1.00 | % | | | 1.00 | % | | | 1.00 | %7 |
Ratio of gross expenses to average net assets8 | | | 1.62 | % | | | 1.86 | % | | | 1.85 | % | | | 2.27 | %7 |
Ratio of net investment loss to average net assets2 | | | (0.48 | )% | | | (0.38 | )% | | | (0.35 | )% | | | (0.68 | )%7 |
Portfolio turnover | | | 49 | % | | | 39 | % | | | 58 | % | | | 33 | %5 |
Net assets end of period (000’s) omitted | | $ | 4,716 | | | $ | 3,982 | | | $ | 6,163 | | | $ | 3,867 | |
| | | | | | | | | | | | | | | | |
| 1 | The commencement of operations for Class I shares was May 13, 2014. |
| 2 | Total returns and net investment income would have been lower had certain expenses not been offset. |
| 3 | Per share numbers have been calculated using average shares. |
| 4 | The total return is calculated using the published Net Asset Value as of fiscal year end. |
| 6 | Includes reduction from brokerage recapture amounting to 0.01%. |
| 8 | Excludes the impact of expense reimbursement or fee waivers and expense reductions such as brokerage credits, but includes expense repayments and non-reimbursable expenses, if any, such as interest, taxes, and extraordinary expenses. (See Note 1(c) and 2 in the Notes to Financial Statements.) |
AMG Managers LMCG Small Cap Growth Fund
Financial Highlights
For a share outstanding throughout each fiscal year
| | | | | | | | | | | | | | | | | | | | |
| | | For the fiscal years ended October 31, | |
| Class N | | 2017 | | | 2016 | | | 2015 | | | 2014 | | | 2013 | |
Net Asset Value, Beginning of Year | | $ | 12.19 | | | $ | 14.47 | | | $ | 14.76 | | | $ | 14.71 | | | $ | 11.42 | |
Income (loss) from Investment Operations: | | | | | | | | | | | | | | | | | | | | |
Net investment loss1,2 | | | (0.09 | )3 | | | (0.11 | ) | | | (0.15 | ) | | | (0.13 | ) | | | 0.00 | 4 |
Net realized and unrealized gain (loss) on investments | | | 3.20 | | | | (2.17 | ) | | | 0.40 | | | | 2.21 | | | | 4.18 | |
Total income (loss) from investment operations | | | 3.11 | | | | (2.28 | ) | | | 0.25 | | | | 2.08 | | | | 4.18 | |
Less Distributions to Shareholders from: | | | | | | | | | | | | | | | | | | | | |
Net investment income | | | — | | | | — | | | | — | | | | — | | | | — | |
Net realized gain on investments | | | — | | | | (0.00 | )4 | | | (0.54 | ) | | | (2.03 | ) | | | (0.89 | ) |
Total distributions to shareholders | | | — | | | | (0.00 | )4 | | | (0.54 | ) | | | (2.03 | ) | | | (0.89 | ) |
Net Asset Value, End of Year | | $ | 15.30 | | | $ | 12.19 | | | $ | 14.47 | | | $ | 14.76 | | | $ | 14.71 | |
Total Return2,5 | | | 25.51 | % | | | (15.74 | )% | | | 1.65 | % | | | 15.18 | % | | | 39.31 | % |
Ratio of net expenses to average net assets | | | 1.23 | %6 | | | 1.35 | % | | | 1.35 | % | | | 1.35 | % | | | 1.35 | % |
Ratio of gross expenses to average net assets7 | | | 1.36 | % | | | 1.51 | % | | | 1.53 | % | | | 1.67 | % | | | 2.03 | % |
Ratio of net investment income (loss) to average net assets2 | | | (0.65 | )% | | | (1.00 | )% | | | (1.00 | )% | | | (0.90 | )% | | | 0.02 | % |
Portfolio turnover | | | 151 | % | | | 138 | % | | | 79 | % | | | 144 | % | | | 186 | %8 |
Net assets end of year (000’s) omitted | | $ | 45,902 | | | $ | 53,816 | | | $ | 154,394 | | | $ | 37,099 | | | $ | 32,045 | |
| | | | | | | | | | | | | | | | | | | | |
AMG Managers LMCG Small Cap Growth Fund
Financial Highlights
For a share outstanding throughout each fiscal year
| | | | | | | | | | | | | | | | | | | | |
| | | For the fiscal years ended October 31, | |
| Class I | | 2017 | | | 2016 | | | 2015 | | | 2014 | | | 2013 | |
Net Asset Value, Beginning of Year | | $ | 12.36 | | | $ | 14.64 | | | $ | 14.89 | | | $ | 14.81 | | | $ | 11.46 | |
Income (loss) from Investment Operations: | | | | | | | | | | | | | | | | | | | | |
Net investment income (loss)1,2 | | | (0.07 | )3 | | | (0.08 | ) | | | (0.12 | ) | | | (0.09 | ) | | | 0.04 | |
Net realized and unrealized gain (loss) on investments | | | 3.25 | | | | (2.20 | ) | | | 0.41 | | | | 2.23 | | | | 4.20 | |
Total income (loss) from investment operations | | | 3.18 | | | | (2.28 | ) | | | 0.29 | | | | 2.14 | | | | 4.24 | |
Less Distributions to Shareholders from: | | | | | | | | | | | | | | | | | | | | |
Net investment income | | | — | | | | — | | | | — | | | | (0.03 | ) | | | — | |
Net realized gain on investments | | | — | | | | (0.00 | )4 | | | (0.54 | ) | | | (2.03 | ) | | | (0.89 | ) |
Total distributions to shareholders | | | — | | | | (0.00 | )4 | | | (0.54 | ) | | | (2.06 | ) | | | (0.89 | ) |
Net Asset Value, End of Year | | $ | 15.54 | | | $ | 12.36 | | | $ | 14.64 | | | $ | 14.89 | | | $ | 14.81 | |
Total Return2,5 | | | 25.73 | % | | | (15.56 | )% | | | 1.91 | % | | | 15.51 | % | | | 39.72 | % |
Ratio of net expenses to average net assets | | | 1.05 | %6 | | | 1.10 | % | | | 1.10 | % | | | 1.10 | % | | | 1.10 | % |
Ratio of gross expenses to average net assets7 | | | 1.18 | % | | | 1.25 | % | | | 1.28 | % | | | 1.42 | % | | | 1.78 | % |
Ratio of net investment income (loss) to average net assets2 | | | (0.47 | )% | | | (0.59 | )% | | | (0.75 | )% | | | (0.65 | )% | | | 0.27 | % |
Portfolio turnover | | | 151 | % | | | 138 | % | | | 79 | % | | | 144 | % | | | 186 | %8 |
Net assets end of year (000’s) omitted | | $ | 79,652 | | | $ | 58,020 | | | $ | 76,989 | | | $ | 15,083 | | | $ | 8,496 | |
| | | | | | | | | | | | | | | | | | | | |
| 1 | Per share numbers have been calculated using average shares. |
| 2 | Total returns and net investment income would have been lower had certain expenses not been offset. |
| 3 | Includes non-recurring dividends. Without these dividends, net investment income per share would have been $(0.11), and $(0.09) for Class N and Class I, respectively. |
| 4 | Less than $0.005 or $(0.005) per share. |
| 5 | The total return is calculated using the published Net Asset Value as of fiscal year end. |
| 6 | Includes reduction from brokerage recapture amounting to 0.01%. |
| 7 | Excludes the impact of expense reimbursement or fee waivers and expense reductions such as brokerage credits, but includes expense repayments and non-reimbursable expenses, if any, such as interest, taxes, and extraordinary expenses. (See Note 1(c) and 2 in the Notes to Financial Statements.) |
| 8 | Portfolio turnover rate excludes securities received from the reorganization. |
AMG River Road Small-Mid Cap Value Fund
Financial Highlights
For a share outstanding throughout each fiscal year
| | | | | | | | | | | | | | | | | | | | |
| | | For the fiscal years ended October 31, | |
| Class N | | 2017 | | | 2016 | | | 2015 | | | 2014 | | | 2013 | |
Net Asset Value, Beginning of Year | | $ | 7.04 | | | $ | 7.63 | | | $ | 8.77 | | | $ | 10.28 | | | $ | 8.50 | |
Income (loss) from Investment Operations: | | | | | | | | | | | | | | | | | | | | |
Net investment income (loss)1,2 | | | (0.03 | ) | | | (0.04 | ) | | | (0.04 | ) | | | (0.03 | ) | | | 0.07 | |
Net realized and unrealized gains on investments | | | 1.81 | | | | 0.56 | | | | 0.33 | | | | 0.03 | | | | 2.34 | |
Total income from investment operations | | | 1.78 | | | | 0.52 | | | | 0.29 | | | | — | | | | 2.41 | |
Less Distributions to Shareholders from: | | | | | | | | | | | | | | | | | | | | |
Net investment income | | | (0.01 | ) | | | — | | | | — | | | | (0.02 | ) | | | (0.12 | ) |
Net realized gain on investments | | | (0.58 | ) | | | (1.11 | ) | | | 1.43 | | | | (1.49 | ) | | | (0.51 | ) |
Total distributions to shareholders | | | (0.59 | ) | | | (1.11 | ) | | | (1.43 | ) | | | (1.51 | ) | | | (0.63 | ) |
Net Asset Value, End of Year | | $ | 8.23 | | | $ | 7.04 | | | $ | 7.63 | | | $ | 8.77 | | | $ | 10.28 | |
Total Return2,3 | | | 26.18 | % | | | 8.55 | % | | | 3.26 | % | | | (0.23 | )% | | | 30.44 | % |
Ratio of net expenses to average net assets | | | 1.35 | %4 | | | 1.50 | % | | | 1.49 | % | | | 1.45 | % | | | 1.46 | % |
Ratio of gross expenses to average net assets5 | | | 1.46 | % | | | 1.62 | % | | | 1.49 | % | | | 1.45 | % | | | 1.46 | % |
Ratio of net investment income (loss) to average net assets2 | | | (0.33 | )% | | | (0.52 | )% | | | (0.52 | )% | | | (0.36 | )% | | | 0.78 | % |
Portfolio turnover | | | 57 | % | | | 65 | % | | | 59 | % | | | 64 | % | | | 71 | % |
Net assets end of year (000’s) omitted | | $ | 7,810 | | | $ | 4,942 | | | $ | 5,038 | | | $ | 8,388 | | | $ | 19,099 | |
| | | | | | | | | | | | | | | | | | | | |
AMG River Road Small-Mid Cap Value Fund
Financial Highlights
For a share outstanding throughout each fiscal year
| | | | | | | | | | | | | | | | | | | | |
| | | For the fiscal years ended October 31, | |
| Class I | | 2017 | | | 2016 | | | 2015 | | | 2014 | | | 2013 | |
Net Asset Value, Beginning of Year | | $ | 7.16 | | | $ | 7.76 | | | $ | 8.88 | | | $ | 10.38 | | | $ | 8.58 | |
Income (loss) from Investment Operations: | | | | | | | | | | | | | | | | | | | | |
Net investment income (loss)1,2 | | | 0.00 | | | | (0.02 | ) | | | (0.02 | ) | | | (0.01 | ) | | | 0.10 | |
Net realized and unrealized gains on investments | | | 1.84 | | | | 0.55 | | | | 0.33 | | | | 0.04 | | | | 2.36 | |
Total income from investment operations | | | 1.84 | | | | 0.53 | | | | 0.31 | | | | 0.03 | | | | 2.46 | |
Less Distributions to Shareholders from: | | | | | | | | | | | | | | | | | | | | |
Net investment income | | | (0.03 | ) | | | (0.02 | ) | | | — | | | | (0.04 | ) | | | (0.15 | ) |
Net realized gain on investments | | | (0.59 | ) | | | (1.11 | ) | | | (1.43 | ) | | | (1.49 | ) | | | (0.51 | ) |
Total distributions to shareholders | | | (0.62 | ) | | | (1.13 | ) | | | (1.43 | ) | | | (1.53 | ) | | | (0.66 | ) |
Net Asset Value, End of Year | | $ | 8.38 | | | $ | 7.16 | | | $ | 7.76 | | | $ | 8.88 | | | $ | 10.38 | |
Total Return2,3 | | | 26.63 | % | | | 8.64 | % | | | 3.60 | % | | | 0.00 | % | | | 30.74 | % |
Ratio of net expenses to average net assets | | | 1.10 | %4 | | | 1.25 | % | | | 1.24 | % | | | 1.20 | % | | | 1.21 | % |
Ratio of gross expenses to average net assets5 | | | 1.21 | % | | | 1.38 | % | | | 1.24 | % | | | 1.20 | % | | | 1.21 | % |
Ratio of net investment income (loss) to average net assets2 | | | (0.06 | )% | | | (0.24 | )% | | | (0.27 | )% | | | (0.11 | )% | | | 1.03 | % |
Portfolio turnover | | | 57 | % | | | 65 | % | | | 59 | % | | | 64 | % | | | 71 | % |
Net assets end of year (000’s) omitted | | $ | 36,547 | | | $ | 34,913 | | | $ | 92,073 | | | $ | 176,166 | | | $ | 198,220 | |
| | | | | | | | | | | | | | | | | | | | |
AMG River Road Small-Mid Cap Value Fund
Financial Highlights
For a share outstanding throughout each fiscal period
| | | | |
| | | For the fiscal period
ended
October 31, | |
| Class Z | | 20176 | |
Net Asset Value, Beginning of Period | | $ | 8.48 | |
Income (loss) from Investment Operations: | | | | |
Net investment loss1,2 | | | (0.01 | ) |
Net realized and unrealized loss on investments | | | (0.10 | ) |
Total loss from investment operations | | | (0.11 | ) |
Net Asset Value, End of Period | | $ | 8.37 | |
Total Return2,3 | | | (1.30 | )%7 |
Ratio of net expenses to average net assets | | | 1.04 | %4,8 |
Ratio of gross expenses to average net assets5 | | | 1.48 | %8 |
Ratio of net investment loss to average net assets2 | | | (0.71 | )%8 |
Portfolio turnover | | | 57 | %7 |
Net assets end of period (000’s) omitted | | $ | 49 | |
| | | | |
| 1 | Per share numbers have been calculated using average shares. |
| 2 | Total returns and net investment income would have been lower had certain expenses not been offset. |
| 3 | The total return is calculated using the published Net Asset Value as of fiscal year end. |
| 4 | Includes reduction of brokerage recapture amounting to 0.01%. |
| 5 | Excludes the impact of expense reimbursement or fee waivers and expense reductions such as brokerage credits, but includes expense repayments and non-reimbursable expenses, if any, such as interest, taxes, and extraordinary expenses. (See Note 1(c) and 2 in the Notes to Financial Statements.) |
| 6 | The commencement of operations was October 2, 2017. |
AMG River Road Small Cap Value Fund
Financial Highlights
For a share outstanding throughout each fiscal year
| | | | | | | | | | | | | | | | | | | | |
| | | For the fiscal years
ended
October 31, | |
| Class N | | 2017 | | | 2016 | | | 2015 | | | 2014 | | | 2013 | |
Net Asset Value, Beginning of Year | | $ | 12.29 | | | $ | 12.20 | | | $ | 13.53 | | | $ | 17.05 | | | $ | 13.56 | |
Income from Investment Operations: | | | | | | | | | | | | | | | | | | | | |
Net investment income (loss)1 | | | (0.05 | )2 | | | (0.04 | )2 | | | (0.06 | )2 | | | (0.04 | )2 | | | 0.16 | |
Net realized and unrealized gains on investments | | | 2.88 | | | | 0.85 | | | | 0.72 | | | | 0.14 | | | | 3.98 | |
Total income from investment operations | | | 2.83 | | | | 0.81 | | | | 0.66 | | | | 0.10 | | | | 4.14 | |
Less Distributions to Shareholders from: | | | | | | | | | | | | | | | | | | | | |
Net investment income | | | — | | | | — | | | | — | | | | (0.04 | ) | | | (0.22 | ) |
Net realized gain on investments | | | (0.66 | ) | | | (0.72 | ) | | | (1.99 | ) | | | (3.58 | ) | | | (0.43 | ) |
Total distributions to shareholders | | | (0.66 | ) | | | (0.72 | ) | | | (1.99 | ) | | | (3.62 | ) | | | (0.65 | ) |
Net Asset Value, End of Year | | $ | 14.46 | | | $ | 12.29 | | | $ | 12.20 | | | $ | 13.53 | | | $ | 17.05 | |
Total Return1,3 | | | 23.43 | % | | | 7.22 | % | | | 5.15 | % | | | (0.05 | )% | | | 31.98 | % |
Ratio of net expenses to average net assets | | | 1.35 | %4 | | | 1.34 | % | | | 1.34 | % | | | 1.33 | % | | | 1.34 | % |
Ratio of gross expenses to average net assets5 | | | 1.36 | % | | | 1.34 | % | | | 1.34 | % | | | 1.33 | % | | | 1.34 | % |
Ratio of net investment income (loss) to average net assets1 | | | (0.36 | )% | | | (0.31 | )% | | | (0.45 | )% | | | (0.26 | )% | | | 1.03 | % |
Portfolio turnover | | | 42 | % | | | 57 | % | | | 61 | % | | | 66 | % | | | 56 | % |
Net assets end of year (000’s) omitted | | $ | 31,657 | | | $ | 21,765 | | | $ | 25,246 | | | $ | 49,049 | | | $ | 56,793 | |
| | | | | | | | | | | | | | | | | | | | |
AMG River Road Small Cap Value Fund
Financial Highlights
For a share outstanding throughout each fiscal year
| | | | | | | | | | | | | | | | | | | | |
| | | For the fiscal years
ended
October 31, | |
| Class I | | 2017 | | | 2016 | | | 2015 | | | 2014 | | | 2013 | |
Net Asset Value, Beginning of Year | | $ | 12.44 | | | $ | 12.31 | | | $ | 13.60 | | | $ | 17.13 | | | $ | 13.62 | |
Income from Investment Operations: | | | | | | | | | | | | | | | | | | | | |
Net investment income (loss)1 | | | (0.01 | )2 | | | (0.01 | )2 | | | (0.03 | )2 | | | (0.00 | )2,6 | | | 0.19 | |
Net realized and unrealized gains on investments | | | 2.92 | | | | 0.86 | | | | 0.73 | | | | 0.13 | | | | 4.01 | |
Total income from investment operations | | | 2.91 | | | | 0.85 | | | | 0.70 | | | | 0.13 | | | | 4.20 | |
Less Distributions to Shareholders from: | | | | | | | | | | | | | | | | | | | | |
Net investment income | | | — | | | | — | | | | — | | | | (0.08 | ) | | | (0.26 | ) |
Net realized gain on investments | | | (0.67 | ) | | | (0.72 | ) | | | (1.99 | ) | | | (3.58 | ) | | | (0.43 | ) |
Total distributions to shareholders | | | (0.67 | ) | | | (0.72 | ) | | | (1.99 | ) | | | (3.66 | ) | | | (0.69 | ) |
Net Asset Value, End of Year | | $ | 14.68 | | | $ | 12.44 | | | $ | 12.31 | | | $ | 13.60 | | | $ | 17.13 | |
Total Return1,3 | | | 23.80 | % | | | 7.50 | % | | | 5.45 | % | | | 0.16 | % | | | 32.36 | % |
Ratio of net expenses to average net assets | | | 1.10 | %4 | | | 1.09 | % | | | 1.09 | % | | | 1.08 | % | | | 1.09 | % |
Ratio of gross expenses to average net assets5 | | | 1.11 | % | | | 1.09 | % | | | 1.09 | % | | | 1.08 | % | | | 1.09 | % |
Ratio of net investment income (loss) to average net assets1 | | | (0.11 | )% | | | (0.06 | )% | | | (0.20 | )% | | | (0.01 | )% | | | 1.28 | % |
Portfolio turnover | | | 42 | % | | | 57 | % | | | 61 | % | | | 66 | % | | | 56 | % |
Net assets end of year (000’s) omitted | | $ | 279,574 | | | $ | 246,753 | | | $ | 245,192 | | | $ | 250,173 | | | $ | 252,804 | |
| | | | | | | | | | | | | | | | | | | | |
AMG River Road Small Cap Value Fund
Financial Highlights
For a share outstanding throughout each fiscal period
| | | | |
| | | For the fiscal period
ended
October 31, | |
| Class Z | | 20177 | |
Net Asset Value, Beginning of Period | | $ | 14.68 | |
Income from Investment Operations: | | | | |
Net investment loss1 | | | (0.01 | )2 |
Net realized and unrealized gains on investments | | | 0.01 | |
Total income from investment operations | | | — | |
Net Asset Value, End of Period | | $ | 14.68 | |
Total Return1,3 | | | 0.00 | %8 |
Ratio of net expenses to average net assets | | | 1.03 | %9 |
Ratio of gross expenses to average net assets5 | | | 1.03 | %9 |
Ratio of net investment loss to average net assets1 | | | (0.58 | )%9 |
Portfolio turnover | | | 42 | %8 |
Net assets end of period (000’s) omitted | | $ | 154 | |
| | | | |
| 1 | Total returns and net investment income would have been lower had certain expenses not been offset. |
| 2 | Per share numbers have been calculated using average shares. |
| 3 | The total return is calculated using the published Net Asset Value as of fiscal year end. |
| 4 | Includes reduction of brokerage recapture amounting to less than 0.01%. |
| 5 | Excludes the impact of expense reimbursement or fee waivers and expense reductions such as brokerage credits, but includes expense repayments and non-reimbursable expenses, if any, such as interest, taxes, and extraordinary expenses. (See Note 1(c) and 2 in the Notes to Financial Statements.) |
| 6 | Less than $0.005 or $(0.005) per share. |
| 7 | The commencement of operations was October 2, 2017. |
AMG Managers Silvercrest Small Cap Fund
Financial Highlights
For a share outstanding throughout each fiscal year
| | | | | | | | | | | | | | | | | | | | |
| | | For the fiscal years
ended
October 31, | |
| Class N | | 2017 | | | 2016 | | | 2015 | | | 2014 | | | 2013 | |
Net Asset Value, Beginning of Year | | $ | 15.43 | | | $ | 15.20 | | | $ | 15.20 | | | $ | 14.54 | | | $ | 10.90 | |
Income from Investment Operations: | | | | | | | | | | | | | | | | | | | | |
Net investment income (loss)1 | | | (0.02 | )2 | | | 0.02 | 2 | | | 0.01 | 2 | | | 0.01 | | | | 0.01 | 2 |
Net realized and unrealized gains on investments | | | 4.00 | | | | 0.80 | | | | 0.31 | | | | 1.16 | | | | 3.77 | |
Total income from investment operations | | | 3.98 | | | | 0.82 | | | | 0.32 | | | | 1.17 | | | | 3.78 | |
Less Distributions to Shareholders from: | | | | | | | | | | | | | | | | | | | | |
Net investment income | | | — | | | | (0.04 | ) | | | (0.02 | ) | | | (0.00 | )3 | | | (0.11 | ) |
Net realized gain on investments | | | (0.13 | ) | | | (0.55 | ) | | | (0.30 | ) | | | (0.51 | ) | | | (0.03 | ) |
Total distributions to shareholders | | | (0.13 | ) | | | (0.59 | ) | | | (0.32 | ) | | | (0.51 | ) | | | (0.14 | ) |
Net Asset Value, End of Year | | $ | 19.28 | | | $ | 15.43 | | | $ | 15.20 | | | $ | 15.20 | | | $ | 14.54 | |
Total Return1,4 | | | 25.83 | % | | | 5.73 | % | | | 2.14 | % | | | 8.18 | % | | | 35.09 | % |
Ratio of net expenses to average net assets | | | 1.37 | %5 | | | 1.40 | % | | | 1.40 | % | | | 1.40 | % | | | 1.40 | % |
Ratio of gross expenses to average net assets6 | | | 1.43 | % | | | 1.45 | % | | | 1.47 | % | | | 1.61 | % | | | 2.05 | % |
Ratio of net investment income (loss) to average net assets1 | | | (0.12 | )% | | | 0.16 | % | | | 0.04 | % | | | 0.04 | % | | | 0.04 | % |
Portfolio turnover | | | 40 | % | | | 32 | % | | | 36 | % | | | 32 | % | | | 37 | % |
Net assets end of year (000’s) omitted | | $ | 25,451 | | | $ | 20,228 | | | $ | 19,061 | | | $ | 6,673 | | | $ | 4,049 | |
| | | | | | | | | | | | | | | | | | | | |
AMG Managers Silvercrest Small Cap Fund
Financial Highlights
For a share outstanding throughout each fiscal year
| | | | | | | | | | | | | | | | | | | | |
| | | For the fiscal years
ended
October 31, | |
| Class I | | 2017 | | | 2016 | | | 2015 | | | 2014 | | | 2013 | |
Net Asset Value, Beginning of Year | | $ | 15.56 | | | $ | 15.30 | | | $ | 15.27 | | | $ | 14.59 | | | $ | 10.93 | |
Income from Investment Operations: | | | | | | | | | | | | | | | | | | | | |
Net investment income1 | | | 0.02 | 2 | | | 0.06 | 2 | | | 0.04 | 2 | | | 0.05 | | | | 0.04 | 2 |
Net realized and unrealized gains on investments | | | 4.03 | | | | 0.81 | | | | 0.32 | | | | 1.17 | | | | 3.78 | |
Total income from investment operations | | | 4.05 | | | | 0.87 | | | | 0.36 | | | | 1.22 | | | | 3.82 | |
Less Distributions to Shareholders from: | | | | | | | | | | | | | | | | | | | | |
Net investment income | | | (0.04 | ) | | | (0.06 | ) | | | (0.03 | ) | | | (0.03 | ) | | | (0.13 | ) |
Net realized gain on investments | | | (0.13 | ) | | | (0.55 | ) | | | (0.30 | ) | | | (0.51 | ) | | | (0.03 | ) |
Total distributions to shareholders | | | (0.17 | ) | | | (0.61 | ) | | | (0.33 | ) | | | (0.54 | ) | | | (0.16 | ) |
Net Asset Value, End of Year | | $ | 19.44 | | | $ | 15.56 | | | $ | 15.30 | | | $ | 15.27 | | | $ | 14.59 | |
Total Return1,4 | | | 26.07 | % | | | 6.04 | % | | | 2.37 | % | | | 8.47 | % | | | 35.39 | % |
Ratio of net expenses to average net assets | | | 1.12 | %5 | | | 1.15 | % | | | 1.15 | % | | | 1.15 | % | | | 1.15 | % |
Ratio of gross expenses to average net assets6 | | | 1.18 | % | | | 1.21 | % | | | 1.22 | % | | | 1.36 | % | | | 1.80 | % |
Ratio of net investment income to average net assets1 | | | 0.12 | % | | | 0.40 | % | | | 0.29 | % | | | 0.29 | % | | | 0.29 | % |
Portfolio turnover | | | 40 | % | | | 32 | % | | | 36 | % | | | 32 | % | | | 37 | % |
Net assets end of year (000’s) omitted | | $ | 241,626 | | | $ | 181,964 | | | $ | 145,402 | | | $ | 62,215 | | | $ | 29,219 | |
| | | | | | | | | | | | | | | | | | | | |
AMG Managers Silvercrest Small Cap Fund
Financial Highlights
For a share outstanding throughout each fiscal period
| | | | |
| | | For the fiscal period
ended
October 31, | |
| Class Z | | 20177 | |
Net Asset Value, Beginning of Period | | $ | 19.24 | |
Income from Investment Operations: | | | | |
Net investment loss1 | | | (0.01 | )2 |
Net realized and unrealized gains on investments | | | 0.22 | |
Total income from investment operations | | | 0.21 | |
Net Asset Value, End of Period | | $ | 19.45 | |
Total Return1,4 | | | 1.09 | %8 |
Ratio of net expenses to average net assets | | | 1.08 | %5,9 |
Ratio of gross expenses to average net assets6 | | | 1.08 | %9 |
Ratio of net investment loss to average net assets1 | | | (0.44 | )%9 |
Portfolio turnover | | | 40 | %8 |
Net assets end of period (000’s) omitted | | $ | 206 | |
| | | | |
| 1 | Total returns and net investment income would have been lower had certain expenses not been offset. |
| 2 | Per share numbers have been calculated using average shares. |
| 3 | Less than $0.005 or $(0.005) per share. |
| 4 | The total return is calculated using the published Net Asset Value as of fiscal year end. |
| 5 | Includes reduction of brokerage recapture amounting to 0.03%, 0.03%, and 0.01% for Class N, Class I and Class Z, respectively. |
| 6 | Excludes the impact of expense reimbursement or fee waivers and expense reductions such as brokerage credits, but includes expense repayments and non-reimbursable expenses, if any, such as interest, taxes, and extraordinary expenses. (See Note 1(c) and 2 in the Notes to Financial Statements.) |
| 7 | The commencement of operations for Class Z shares was October 2, 2017. |
AMG GW&K U.S. Small Cap Growth Fund
Financial Highlights
For a share outstanding throughout each fiscal year
| | | | | | | | | | | | | | | | | | | | |
| | | For the fiscal years
ended
October 31, | |
| Class N | | 2017 | | | 2016 | | | 2015 | | | 2014 | | | 2013 | |
Net Asset Value, Beginning of Year | | $ | 3.58 | | | $ | 18.59 | | | $ | 22.07 | | | $ | 24.06 | | | $ | 20.52 | |
Income (loss) from Investment Operations: | | | | | | | | | | | | | | | | | | | | |
Net investment loss1,2 | | | (0.03 | ) | | | (0.06 | ) | | | (0.12 | ) | | | (0.13 | ) | | | (0.03 | ) |
Net realized and unrealized gain (loss) on investments | | | 1.14 | | | | (0.62 | ) | | | (0.62 | ) | | | 0.30 | | | | 5.55 | |
Total income (loss) from investment operations | | | 1.11 | | | | (0.68 | ) | | | (0.74 | ) | | | 0.17 | | | | 5.52 | |
Less Distributions to Shareholders from: | | | | | | | | | | | | | | | | | | | | |
Net realized gain on investments | | | (0.01 | ) | | | (14.33 | ) | | | (2.74 | ) | | | (2.16 | ) | | | (1.98 | ) |
Total distributions to shareholders | | | (0.01 | ) | | | (14.33 | ) | | | (2.74 | ) | | | (2.16 | ) | | | (1.98 | ) |
Net Asset Value, End of Year | | $ | 4.68 | | | $ | 3.58 | | | $ | 18.59 | | | $ | 22.07 | | | $ | 24.06 | |
Total Return2,3 | | | 30.91 | % | | | (4.39 | )% | | | (4.12 | )% | | | 0.57 | % | | | 29.52 | % |
Ratio of net expenses to average net assets | | | 1.23 | %4 | | | 1.36 | % | | | 1.31 | % | | | 1.31 | % | | | 1.31 | % |
Ratio of gross expenses to average net assets2,5 | | | 1.51 | % | | | 1.39 | % | | | 1.31 | % | | | 1.31 | % | | | 1.31 | % |
Ratio of net investment loss to average net assets2 | | | (0.72 | )% | | | (0.76 | )% | | | (0.58 | )% | | | (0.57 | )% | | | (0.16 | )% |
Portfolio turnover | | | 24 | % | | | 106 | %6 | | | 65 | % | | | 70 | % | | | 71 | %6,7 |
Net assets end of year (000’s) omitted | | $ | 26,671 | | | $ | 30,977 | | | $ | 241,283 | | | $ | 336,350 | | | $ | 533,627 | |
| | | | | | | | | | | | | | | | | | | | |
AMG GW&K U.S. Small Cap Growth Fund
Financial Highlights
For a share outstanding throughout each fiscal year
| | | | | | | | | | | | | | | | | | | | |
| | | For the fiscal years
ended
October 31, | |
| Class I | | 2017 | | | 2016 | | | 2015 | | | 2014 | | | 2013 | |
Net Asset Value, Beginning of Year | | $ | 4.27 | | | $ | 19.30 | | | $ | 22.76 | | | $ | 24.69 | | | $ | 20.96 | |
Income (loss) from Investment Operations: | | | | | | | | | | | | | | | | | | | | |
Net investment income (loss)1,2 | | | (0.02 | ) | | | (0.05 | ) | | | (0.07 | ) | | | (0.07 | ) | | | 0.02 | |
Net realized and unrealized gain (loss) on investments | | | 1.37 | | | | (0.65 | ) | | | (0.65 | ) | | | 0.30 | | | | 5.69 | |
Total income (loss) from investment operations | | | 1.35 | | | | (0.70 | ) | | | (0.72 | ) | | | 0.23 | | | | 5.71 | |
Less Distributions to Shareholders from: | | | | | | | | | | | | | | | | | | | | |
Net realized gain on investments | | | (0.01 | ) | | | (14.33 | ) | | | (2.74 | ) | | | (2.16 | ) | | | (1.98 | ) |
Total distributions to shareholders | | | (0.01 | ) | | | (14.33 | ) | | | (2.74 | ) | | | (2.16 | ) | | | (1.98 | ) |
Net Asset Value, End of Year | | $ | 5.61 | | | $ | 4.27 | | | $ | 19.30 | | | $ | 22.76 | | | $ | 24.69 | |
Total Return2,3 | | | 31.57 | % | | | (4.27 | )% | | | (3.93 | )% | | | 0.86 | % | | | 29.84 | % |
Ratio of net expenses to average net assets | | | 1.00 | %4 | | | 1.11 | % | | | 1.06 | % | | | 1.06 | % | | | 1.06 | % |
Ratio of gross expenses to average net assets2,5 | | | 1.28 | % | | | 1.16 | % | | | 1.06 | % | | | 1.06 | % | | | 1.06 | % |
Ratio of net investment income (loss) to average net assets2 | | | (0.49 | )% | | | (0.53 | )% | | | (0.33 | )% | | | (0.32 | )% | | | 0.09 | % |
Portfolio turnover | | | 24 | % | | | 106 | %6 | | | 65 | % | | | 70 | % | | | 71 | %6,7 |
Net assets end of year (000’s) omitted | | $ | 9,798 | | | $ | 11,032 | | | $ | 307,403 | | | $ | 469,518 | | | $ | 792,172 | |
| | | | | | | | | | | | | | | | | | | | |
AMG GW&K U.S. Small Cap Growth Fund
Financial Highlights
For a share outstanding throughout each fiscal period
| | | | |
| | | For the fiscal period
ended
October 31, | |
| Class Z | | 20178 | |
Net Asset Value, Beginning of Period | | $ | 4.85 | |
Income (loss) from Investment Operations: | | | | |
Net investment loss1,2 | | | (0.02 | ) |
Net realized and unrealized gains on investments | | | 0.78 | |
Total income from investment operations | | | 0.76 | |
Net Asset Value, End of Period | | $ | 5.61 | |
Total Return2,3 | | | 15.67 | %9 |
Ratio of net expenses to average net assets | | | 0.89 | %4,10 |
Ratio of gross expenses to average net assets2,5 | | | 1.13 | %10 |
Ratio of net investment loss to average net assets2 | | | (0.47 | )%10 |
Portfolio turnover | | | 24 | %9 |
Net assets end of period (000’s) omitted | | $ | 143 | |
| | | | |
| 1 | Per share numbers have been calculated using average shares. |
| 2 | Total returns and net investment income would have been lower had certain expenses not been offset. |
| 3 | The total return is calculated using the published Net Asset Value as of fiscal year end. |
| 4 | Includes reduction of brokerage recapture amounting to 0.05%, 0.05%, and 0.01% for Class N, Class I and Class Z, respectively. |
| 5 | Excludes the impact of expense reimbursement or fee waivers and expense reductions such as brokerage credits, but includes expense repayments and non-reimbursable expenses, if any, such as interest, taxes, and extraordinary expenses. (See Note 1(c) and 2 in the Notes to Financial Statements.) |
| 6 | Portfolio turnover rate excludes securities delivered from processing a redemption in-kind. |
| 7 | Portfolio turnover rate excludes securities received from processing a subscription in-kind. |
| 8 | The commencement of operations for Class Z shares was February 24, 2017. |
AMG Managers DoubleLine Core Plus Bond Fund
Financial Highlights
For a share outstanding throughout each fiscal year
| | | | | | | | | | | | | | | | | | | | |
| | | For the fiscal years
ended
October 31, | |
| Class N | | 2017 | | | 2016 | | | 2015 | | | 2014 | | | 2013 | |
Net Asset Value, Beginning of Year | | $ | 10.77 | | | $ | 10.60 | | | $ | 10.86 | | | $ | 10.65 | | | $ | 11.10 | |
Income (loss) from Investment Operations: | | | | | | | | | | | | | | | | | | | | |
Net investment income1,2 | | | 0.27 | | | | 0.31 | | | | 0.38 | | | | 0.40 | | | | 0.30 | |
Net realized and unrealized gain (loss) on investments | | | 0.01 | | | | 0.17 | | | | (0.27 | ) | | | 0.22 | | | | (0.33 | ) |
Total income (loss) from investment operations | | | 0.28 | | | | 0.48 | | | | 0.11 | | | | 0.62 | | | | (0.03 | ) |
Less Distributions to Shareholders from: | | | | | | | | | | | | | | | | | | | | |
Net investment income | | | (0.30 | ) | | | (0.31 | ) | | | (0.37 | ) | | | (0.41 | ) | | | (0.36 | ) |
Net realized gain on investments | | | (0.02 | ) | | | — | | | | — | | | | — | | | | (0.06 | ) |
Distributions from return of capital | | | (0.05 | ) | | | — | | | | — | | | | — | | | | — | |
Total distributions to shareholders | | | (0.37 | ) | | | (0.31 | ) | | | (0.37 | ) | | | (0.41 | ) | | | (0.42 | ) |
Net Asset Value, End of Year | | $ | 10.68 | | | $ | 10.77 | | | $ | 10.60 | | | $ | 10.86 | | | $ | 10.65 | |
Total Return2,3 | | | 2.68 | % | | | 4.62 | % | | | 1.04 | % | | | 5.96 | % | | | (0.28 | )% |
Ratio of net expenses to average net assets | | | 0.94 | % | | | 0.94 | % | | | 0.94 | % | | | 0.94 | % | | | 0.94 | % |
Ratio of gross expenses to average net assets4 | | | 1.02 | % | | | 1.02 | % | | | 1.05 | % | | | 1.08 | % | | | 1.04 | % |
Ratio of net investment income to average net assets2 | | | 2.58 | % | | | 2.84 | % | | | 3.32 | % | | | 3.72 | % | | | 2.77 | % |
Portfolio turnover | | | 106 | % | | | 78 | % | | | 59 | % | | | 117 | % | | | 125 | % |
Net assets end of year (000’s) omitted | | $ | 169,646 | | | $ | 308,703 | | | $ | 188,286 | | | $ | 49,147 | | | $ | 66,368 | |
| | | | | | | | | | | | | | | | | | | | |
AMG Managers DoubleLine Core Plus Bond Fund
Financial Highlights
For a share outstanding throughout each fiscal year
| | | | | | | | | | | | | | | | | | | | |
| | | For the fiscal years
ended
October 31, | |
| Class I | | 2017 | | | 2016 | | | 2015 | | | 2014 | | | 2013 | |
Net Asset Value, Beginning of Year | | $ | 10.76 | | | $ | 10.60 | | | $ | 10.86 | | | $ | 10.65 | | | $ | 11.10 | |
Income (loss) from Investment Operations: | | | | | | | | | | | | | | | | | | | | |
Net investment income1,2 | | | 0.30 | | | | 0.33 | | | | 0.41 | | | | 0.44 | | | | 0.33 | |
Net realized and unrealized gain (loss) on investments | | | 0.01 | | | | 0.17 | | | | (0.27 | ) | | | 0.21 | | | | (0.33 | ) |
Total income from investment operations | | | 0.31 | | | | 0.50 | | | | 0.14 | | | | 0.65 | | | | — | |
Less Distributions to Shareholders from: | | | | | | | | | | | | | | | | | | | | |
Net investment income | | | (0.33 | ) | | | (0.34 | ) | | | (0.40 | ) | | | (0.44 | ) | | | (0.39 | ) |
Net realized gain on investments | | | (0.02 | ) | | | — | | | | — | | | | — | | | | (0.06 | ) |
Distributions from return of capital | | | (0.05 | ) | | | — | | | | — | | | | — | | | | — | |
Total distributions to shareholders | | | (0.40 | ) | | | (0.34 | ) | | | (0.40 | ) | | | (0.44 | ) | | | (0.45 | ) |
Net Asset Value, End of Year | | $ | 10.67 | | | $ | 10.76 | | | $ | 10.60 | | | $ | 10.86 | | | $ | 10.65 | |
Total Return2,3 | | | 2.95 | % | | | 4.79 | % | | | 1.28 | % | | | 6.22 | % | | | (0.03 | )% |
Ratio of net expenses to average net assets | | | 0.68 | % | | | 0.69 | % | | | 0.69 | % | | | 0.69 | % | | | 0.69 | % |
Ratio of gross expenses to average net assets4 | | | 0.76 | % | | | 0.77 | % | | | 0.80 | % | | | 0.83 | % | | | 0.79 | % |
Ratio of net investment income to average net assets2 | | | 2.83 | % | | | 3.11 | % | | | 3.57 | % | | | 3.97 | % | | | 3.02 | % |
Portfolio turnover | | | 106 | % | | | 78 | % | | | 59 | % | | | 117 | % | | | 125 | % |
Net assets end of year (000’s) omitted | | $ | 507,600 | | | $ | 398,514 | | | $ | 304,051 | | | $ | 158,198 | | | $ | 110,018 | |
| | | | | | | | | | | | | | | | | | | | |
AMG Managers DoubleLine Core Plus Bond Fund
Financial Highlights
For a share outstanding throughout each fiscal period
| | | | |
| | | For the fiscal period
ended
October 31, | |
| Class Z | | 20175 | |
Net Asset Value, Beginning of Period | | $ | 10.69 | |
Income (loss) from Investment Operations: | | | | |
Net investment income1,2 | | | 0.03 | |
Net realized and unrealized loss on investments | | | (0.01 | ) |
Total income from investment operations | | | 0.02 | |
Less Distributions to Shareholders from: | | | | |
Net investment income | | | (0.03 | ) |
Distributions from return of capital | | | (0.00 | )6 |
Total distributions to shareholders | | | (0.03 | ) |
Net Asset Value, End of Period | | $ | 10.68 | |
Total Return2,3 | | | 0.17 | %7 |
Ratio of net expenses to average net assets | | | 0.60 | %8 |
Ratio of gross expenses to average net assets4 | | | 0.63 | %8 |
Ratio of net investment income to average net assets2 | | | 2.74 | %8 |
Portfolio turnover | | | 106 | %7 |
Net assets end of period (000’s) omitted | | $ | 1,597 | |
| | | | |
| 1 | Per share numbers have been calculated using average shares. |
| 2 | Total returns and net investment income would have been lower had certain expenses not been offset. |
| 3 | The total return is calculated using the published Net Asset Value as of fiscal year end. |
| 4 | Excludes the impact of expense reimbursement or fee waivers and expense reductions such as brokerage credits, but includes expense repayments and non-reimbursable expenses, if any, such as interest, taxes, and extraordinary expenses. (See Note 1(c) and 2 in the Notes to Financial Statements.) |
| 5 | The commencement of operations was October 2, 2017. |
| 6 | Less than $(0.005) per share. |
AMG Managers Lake Partners LASSO Alternatives Fund
Financial Highlights
For a share outstanding throughout each fiscal year
| | | | | | | | | | | | | | | | | | | | |
| | | For the fiscal years
ended
October 31, | |
| Class N | | 2017 | | | 2016 | | | 2015 | | | 2014 | | | 2013 | |
Net Asset Value, Beginning of Year | | $ | 11.81 | | | $ | 12.76 | | | $ | 13.64 | | | $ | 13.34 | | | $ | 12.39 | |
Income (loss) from Investment Operations: | | | | | | | | | | | | | | | | | | | | |
Net investment income (loss)1,2 | | | (0.05 | ) | | | 0.02 | | | | (0.04 | ) | | | (0.07 | ) | | | 0.00 | 3 |
Net realized and unrealized gain (loss) on investments | | | 0.70 | | | | (0.17 | ) | | | (0.34 | ) | | | 0.50 | 4 | | | 1.11 | |
Total income (loss) from investment operations | | | 0.65 | | | | (0.15 | ) | | | (0.38 | ) | | | 0.43 | | | | 1.11 | |
Less Distributions to Shareholders from: | | | | | | | | | | | | | | | | | | | | |
Net investment income | | | — | | | | — | | | | — | | | | (0.09 | ) | | | (0.16 | ) |
Net realized gain on investments | | | (0.05 | ) | | | (0.80 | ) | | | (0.50 | ) | | | (0.04 | ) | | | — | |
Total distributions to shareholders | | | (0.05 | ) | | | (0.80 | ) | | | (0.50 | ) | | | (0.13 | ) | | | (0.16 | ) |
Net Asset Value, End of Year | | $ | 12.41 | | | $ | 11.81 | | | $ | 12.76 | | | $ | 13.64 | | | $ | 13.34 | |
Total Return2,5 | | | 5.51 | % | | | (1.18 | )% | | | (2.87 | )% | | | 3.27 | % | | | 9.05 | % |
Ratio of net expenses to average net assets6 | | | 1.40 | % | | | 1.40 | % | | | 1.41 | % | | | 1.43 | % | | | 1.45 | % |
Ratio of gross expenses to average net assets6,7 | | | 1.49 | % | | | 1.47 | % | | | 1.43 | % | | | 1.41 | % | | | 1.43 | %8 |
Ratio of net investment income (loss) to average net assets2 | | | (0.42 | )% | | | 0.13 | % | | | (0.31 | )% | | | (0.53 | )% | | | (0.03 | )% |
Portfolio turnover | | | 29 | % | | | 30 | % | | | 73 | % | | | 46 | % | | | 44 | % |
Net assets end of year (000’s) omitted | | $ | 8,880 | | | $ | 32,630 | | | $ | 40,667 | | | $ | 44,386 | | | $ | 54,388 | |
| | | | | | | | | | | | | | | | | | | | |
AMG Managers Lake Partners LASSO Alternatives Fund
Financial Highlights
For a share outstanding throughout each fiscal year
| | | | | | | | | | | | | | | | | | | | |
| | | For the fiscal years
ended
October 31, | |
| Class I | | 2017 | | | 2016 | | | 2015 | | | 2014 | | | 2013 | |
Net Asset Value, Beginning of Year | | $ | 11.86 | | | $ | 12.81 | | | $ | 13.69 | | | $ | 13.38 | | | $ | 12.42 | |
Income (loss) from Investment Operations: | | | | | | | | | | | | | | | | | | | | |
Net investment income (loss)1,2 | | | (0.02 | ) | | | 0.07 | | | | (0.01 | ) | | | (0.04 | ) | | | 0.03 | |
Net realized and unrealized gain (loss) on investments | | | 0.70 | | | | (0.19 | ) | | | (0.33 | )4 | | | 0.51 | 4 | | | 1.11 | |
Total income (loss) from investment operations | | | 0.68 | | | | (0.12 | ) | | | (0.34 | ) | | | 0.47 | | | | 1.14 | |
Less Distributions to Shareholders from: | | | | | | | | | | | | | | | | | | | | |
Net investment income | | | — | | | | (0.03 | ) | | | (0.04 | ) | | | (0.12 | ) | | | (0.18 | ) |
Net realized gain on investments | | | (0.05 | ) | | | (0.80 | ) | | | (0.50 | ) | | | (0.04 | ) | | | — | |
Total distributions to shareholders | | | (0.05 | ) | | | (0.83 | ) | | | (0.54 | ) | | | (0.16 | ) | | | (0.18 | ) |
Net Asset Value, End of Year | | $ | 12.49 | | | $ | 11.86 | | | $ | 12.81 | | | $ | 13.69 | | | $ | 13.38 | |
Total Return2,5 | | | 5.74 | % | | | (0.91 | )% | | | (2.62 | )% | | | 3.56 | % | | | 9.31 | % |
Ratio of net expenses to average net assets6 | | | 1.15 | % | | | 1.15 | % | | | 1.16 | % | | | 1.18 | % | | | 1.20 | % |
Ratio of gross expenses to average net assets6,7 | | | 1.24 | % | | | 1.22 | % | | | 1.18 | % | | | 1.16 | % | | | 1.18 | %8 |
Ratio of net investment income (loss) to average net assets2 | | | (0.17 | )% | | | 0.57 | % | | | (0.06 | )% | | | (0.28 | )% | | | 0.22 | % |
Portfolio turnover | | | 29 | % | | | 30 | % | | | 73 | % | | | 46 | % | | | 44 | % |
Net assets end of year (000’s) omitted | | $ | 41,245 | | | $ | 70,054 | | | $ | 169,072 | | | $ | 477,157 | | | $ | 416,475 | |
| | | | | | | | | | | | | | | | | | | | |
| 1 | Per share numbers have been calculated using average shares. |
| 2 | Total returns and net investment income would have been lower had certain expenses not been offset. |
| 3 | Less than $0.005 or $(0.005) per share. |
| 4 | Includes capital contribution of less than $0.005 per share. |
| 5 | The total return is calculated using the published Net Asset Value as of fiscal year end. |
| 6 | Does not include expenses of the underlying funds in which the Fund invests. |
| 7 | Excludes the impact of expense reimbursement or fee waivers and expense reductions such as brokerage credits, but includes expense repayments and non-reimbursable expenses, if any, such as interest, taxes, and extraordinary expenses. (See Note 1(c) and 2 in the Notes to Financial Statements.) |
| 8 | Ratios of expenses to average net assets includes Earnings credits of less than 0.005% for each of the fiscal years ended October 31, 2013 and October 31, 2012, which is not included in the contractual expense limitation. |
AMG River Road Long-Short Fund
Financial Highlights
For a share outstanding throughout each fiscal year
| | | | | | | | | | | | | | | | | | | | |
| | | For the fiscal years
ended
October 31, | |
| Class N | | 2017 | | | 2016 | | | 2015 | | | 2014 | | | 2013 | |
Net Asset Value, Beginning of Year | | $ | 11.04 | | | $ | 11.48 | | | $ | 11.35 | | | $ | 12.02 | | | $ | 10.73 | |
Income (loss) from Investment Operations: | | | | | | | | | | | | | | | | | | | | |
Net investment loss1 | | | (0.25 | )2 | | | (0.19 | )2 | | | (0.14 | )2 | | | (0.19 | ) | | | (0.17 | )2 |
Net realized and unrealized gain (loss) on investments | | | 1.54 | | | | 0.13 | | | | 0.57 | | | | (0.19 | ) | | | 2.02 | |
Total income (loss) from investment operations | | | 1.29 | | | | (0.06 | ) | | | 0.43 | | | | (0.38 | ) | | | 1.85 | |
Less Distributions to Shareholders from: | | | | | | | | | | | | | | | | | | | | |
Net realized gain on investments | | | — | | | | (0.38 | ) | | | (0.30 | ) | | | (0.29 | ) | | | (0.56 | ) |
Total distributions to shareholders | | | — | | | | (0.38 | ) | | | (0.30 | ) | | | (0.29 | ) | | | (0.56 | ) |
Net Asset Value, End of Year | | $ | 12.33 | | | $ | 11.04 | | | $ | 11.48 | | | $ | 11.35 | | | $ | 12.02 | |
Total Return1,3 | | | 11.69 | % | | | (0.52 | )% | | | 3.79 | % | | | (3.27 | )% | | | 18.14 | % |
Ratio of net expenses to average net assets4 | | | 3.60 | %5 | | | 3.46 | % | | | 2.89 | % | | | 2.58 | % | | | 2.38 | % |
Ratio of gross expenses to average net assets6 | | | 3.75 | % | | | 3.62 | % | | | 2.87 | % | | | 2.53 | % | | | 2.54 | % |
Ratio of net investment loss to average net assets1 | | | (2.23 | )% | | | (1.75 | )% | | | (1.19 | )% | | | (1.590 | )% | | | (1.46 | )% |
Portfolio turnover | | | 186 | % | | | 298 | % | | | 279 | % | | | 303 | % | | | 291 | % |
Net assets end of year (000’s) omitted | | $ | 5,508 | | | $ | 8,713 | | | $ | 27,983 | | | $ | 109,140 | | | $ | 108,966 | |
| | | | | | | | | | | | | | | | | | | | |
AMG River Road Long-Short Fund
Financial Highlights
For a share outstanding throughout each fiscal period
| | | | | | | | | | | | | | | | | | | | |
| | | For the fiscal years
ended
October 31, | | | For the fiscal period
ended
October 31, | |
| Class I | | 2017 | | | 2016 | | | 2015 | | | 2014 | | | 20137 | |
Net Asset Value, Beginning of Period | | $ | 11.15 | | | $ | 11.56 | | | $ | 11.40 | | | $ | 12.05 | | | $ | 10.96 | |
Income (loss) from Investment Operations: | | | | | | | | | | | | | | | | | | | | |
Net investment loss1 | | | (0.24 | )2 | | | (0.18 | )2 | | | (0.11 | )2 | | | (0.16 | ) | | | (0.10 | )2 |
Net realized and unrealized gain (loss) on investments | | | 1.57 | | | | (0.15 | ) | | | 0.57 | | | | (0.20 | ) | | | 1.19 | |
Total income (loss) from investment operations | | | 1.33 | | | | (0.03 | ) | | | 0.46 | | | | (0.36 | ) | | | 1.09 | |
Less Distributions to Shareholders from: | | | | | | | | | | | | | | | | | | | | |
Net realized gain on investments | | | — | | | | (0.38 | ) | | | (0.30 | ) | | | (0.29 | ) | | | — | |
Total distributions to shareholders | | | — | | | | (0.38 | ) | | | (0.30 | ) | | | (0.29 | ) | | | — | |
Net Asset Value, End of Period | | $ | 12.48 | | | $ | 11.15 | | | $ | 11.56 | | | $ | 11.40 | | | $ | 12.05 | |
Total Return1,3 | | | 11.93 | % | | | (0.24 | )% | | | 4.04 | % | | | (3.01 | )% | | | 9.85 | %8 |
Ratio of net expenses to average net assets4 | | | 3.35 | %5 | | | 3.24 | % | | | 2.64 | % | | | 2.33 | % | | | 2.10 | %9 |
Ratio of gross expenses to average net assets6 | | | 3.50 | % | | | 3.39 | % | | | 2.62 | % | | | 2.28 | % | | | 2.20 | %9 |
Ratio of net investment loss to average net assets1 | | | (1.98 | )% | | | (1.67 | )% | | | (0.94 | )% | | | (1.34 | )% | | | (1.33 | )%9 |
Portfolio turnover | | | 186 | % | | | 298 | % | | | 279 | % | | | 303.0 | % | | | 291 | %8 |
Net assets end of period (000’s) omitted | | $ | 29,030 | | | $ | 37,549 | | | $ | 49,088 | | | $ | 110,271 | | | $ | 71,175 | |
| | | | | | | | | | | | | | | | | | | | |
AMG River Road Long-Short Fund
Financial Highlights
For a share outstanding throughout each fiscal period
| | | | |
| | | For the fiscal period
ended
October 31, | |
| Class Z | | 201710 | |
Net Asset Value, Beginning of Period | | $ | 12.53 | |
Income (loss) from Investment Operations: | | | | |
Net investment loss1 | | | (0.02 | )2 |
Net realized and unrealized loss on investments | | | (0.02 | ) |
Total loss from investment operations | | | (0.04 | ) |
Net Asset Value, End of Period | | $ | 12.49 | |
Total Return1,3 | | | (0.32 | )%8 |
Ratio of net expenses to average net assets4 | | | 3.38 | %5,9 |
Ratio of gross expenses to average net assets6 | | | 3.38 | %9 |
Ratio of net investment loss to average net assets1 | | | (2.74 | )%9 |
Portfolio turnover | | | 186 | %8 |
Net assets end of period (000’s) omitted | | $ | 25 | |
| | | | |
| 1 | Total returns and net investment income would have been lower had certain expenses not been offset. |
| 2 | Per share numbers have been calculated using average shares. |
| 3 | The total return is calculated using the published Net Asset Value as of fiscal year end. |
| 4 | Expense ratio includes dividend and interest expense related to securities sold short. Excluding such dividend and interest expense, the ratio of expenses to average net assets would be 1.48%, 1.23% and 1.12% for Class N, Class I and Class Z, respectively, for the fiscal year ended October 31, 2017, and 1.70% and 1.45% for Class N and Class I, respectively, for each of the fiscal periods ended 2016, 2015, 2014 and 2014. |
| 5 | Includes reduction of brokerage recapture amounting to 0.02%, 0.02%, and less than 0.01% for Class N, Class I and Class Z, respectively. |
| 6 | Excludes the impact of expense reimbursement or fee waivers and expense reductions such as brokerage credits, but includes expense repayments and non-reimbursable expenses, if any, such as interest, taxes, and extraordinary expenses. (See Note 1(c) and 2 in the Notes to Financial Statements.) |
| 7 | The commencement of operations was March 1, 2013. |
| 10 | Commencement of operations was on October 2, 2017. |
AMG Managers Guardian Capital Global Dividend Fund
Financial Highlights
For a share outstanding throughout each fiscal period
| | | | | | | | | | | | | | | | |
| | | For the fiscal years
ended
October 31, | | | For the fiscal period
ended
October 31, | |
| Class N | | 2017 | | | 2016 | | | 2015 | | | 20141 | |
Net Asset Value, Beginning of Period | | $ | 9.67 | | | $ | 10.30 | | | $ | 10.51 | | | $ | 10.00 | |
Income (loss) from Investment Operations: | | | | | | | | | | | | | | | | |
Net investment income2 | | | 0.24 | 3,4 | | | 0.22 | 3 | | | 0.24 | | | | 0.13 | |
Net realized and unrealized gain (loss) on investments | | | 1.73 | | | | (0.62 | ) | | | (0.23 | ) | | | 0.49 | |
Total income (loss) from investment operations | | | 1.97 | | | | (0.40 | ) | | | 0.01 | | | | 0.62 | |
Less Distributions to Shareholders from: | | | | | | | | | | | | | | | | |
Net investment income | | | (0.17 | ) | | | (0.23 | ) | | | (0.22 | ) | | | (0.11 | ) |
Total distributions to shareholders | | | (0.17 | ) | | | (0.23 | ) | | | (0.22 | ) | | | (0.11 | ) |
Net Asset Value, End of Period | | $ | 11.47 | | | $ | 9.67 | | | $ | 10.30 | | | $ | 10.51 | |
Total Return2,5 | | | 20.51 | % | | | (3.91 | )% | | | 0.07 | % | | | 6.17 | %6 |
Ratio of net expenses to average net assets | | | 1.07 | % | | | 1.30 | % | | | 1.30 | % | | | 1.30 | %7 |
Ratio of gross expenses to average net assets8 | | | 1.12 | % | | | 3.34 | % | | | 4.10 | % | | | 5.21 | %7 |
Ratio of net investment income to average net assets2 | | | 2.27 | % | | | 2.24 | % | | | 2.28 | % | | | 2.17 | %7 |
Portfolio turnover | | | 34 | % | | | 36 | % | | | 28 | % | | | 16 | %6 |
Net assets end of period (000’s) omitted | | $ | 1,167 | | | $ | 997 | | | $ | 1,054 | | | $ | 1,052 | |
| | | | | | | | | | | | | | | | |
AMG Managers Guardian Capital Global Dividend Fund
Financial Highlights
For a share outstanding throughout each fiscal period
| | | | | | | | | | | | | | | | |
| | | For the fiscal years
ended
October 31, | | | For the fiscal period
ended
October 31, | |
| Class I | | 2017 | | | 2016 | | | 2015 | | | 20141 | |
Net Asset Value, Beginning of Period | | $ | 9.65 | | | $ | 10.28 | | | $ | 10.52 | | | $ | 10.00 | |
Income (loss) from Investment Operations: | | | | | | | | | | | | | | | | |
Net investment income2 | | | 0.24 | 3,4 | | | 0.23 | 3 | | | 0.27 | | | | 0.14 | |
Net realized and unrealized gain (loss) on investments | | | 1.74 | | | | (0.60 | ) | | | (0.25 | ) | | | 0.50 | |
Total income (loss) from investment operations | | | 1.98 | | | | (0.37 | ) | | | 0.02 | | | | 0.64 | |
Less Distributions to Shareholders from: | | | | | | | | | | | | | | | | |
Net investment income | | | (0.22 | ) | | | (0.26 | ) | | | (0.26 | ) | | | (0.12 | ) |
Total distributions to shareholders | | | (0.22 | ) | | | (0.26 | ) | | | (0.26 | ) | | | (0.12 | ) |
Net Asset Value, End of Period | | $ | 11.41 | | | $ | 9.65 | | | $ | 10.28 | | | $ | 10.52 | |
Total Return2,5 | | | 20.66 | % | | | (3.68 | )% | | | 0.14 | % | | | 6.39 | %6 |
Ratio of net expenses to average net assets | | | 1.05 | % | | | 1.05 | % | | | 1.05 | % | | | 1.05 | %7 |
Ratio of gross expenses to average net assets8 | | | 1.10 | % | | | 2.82 | % | | | 3.85 | % | | | 4.96 | %7 |
Ratio of net investment income to average net assets2 | | | 2.28 | % | | | 2.32 | % | | | 2.52 | % | | | 2.42 | %7 |
Portfolio turnover | | | 34 | % | | | 36 | % | | | 28 | % | | | 16 | %6 |
Net assets end of period (000’s) omitted | | $ | 36,280 | | | $ | 27,986 | | | $ | 3,292 | | | $ | 3,211 | |
| | | | | | | | | | | | | | | | |
| 1 | Commencement of operations for Class N and Class I was on April 11, 2014. |
| 2 | Total returns and net investment income would have been lower had certain expenses not been offset. |
| 3 | Per share numbers have been calculated using average shares. |
| 4 | Includes non-recurring dividends. Without these dividends, net investment income per share would have been $0.23 for Class N and Class I. |
| 5 | The total return is calculated using the published Net Asset Value as of fiscal year end. |
| 8 | Excludes the impact of expense reimbursement or fee waivers and expense reductions such as brokerage credits, but includes expense repayments and non-reimbursable expenses, if any, such as interest, taxes, and extraordinary expenses. (See Note 1(c) and 2 in the Notes to Financial Statements.) |
AMG Managers Pictet International Fund
Financial Highlights
For a share outstanding throughout each fiscal period
| | | | | | | | | | | | | | | | |
| | | For the fiscal years
ended
October 31, | | | For the fiscal period
ended
October 31, | |
| Class N | | 2017 | | | 2016 | | | 2015 | | | 20141 | |
Net Asset Value, Beginning of Period | | $ | 9.61 | | | $ | 9.56 | | | $ | 9.34 | | | $ | 10.00 | |
Income (loss) from Investment Operations: | | | | | | | | | | | | | | | | |
Net investment income2 | | | 0.04 | 3 | | | 0.13 | 3 | | | 0.10 | 3 | | | 0.09 | |
Net realized and unrealized gain (loss) on investments | | | 2.22 | | | | 0.00 | 4 | | | 0.17 | 5 | | | (0.75 | ) |
Total income (loss) from investment operations | | | 2.26 | | | | 0.13 | | | | 0.27 | | | | (0.66 | ) |
Less Distributions to Shareholders from: | | | | | | | | | | | | | | | | |
Net investment income | | | (0.07 | ) | | | (0.02 | ) | | | (0.03 | ) | | | — | |
Net realized gain on investments | | | (0.20 | ) | | | (0.06 | ) | | | (0.02 | ) | | | — | |
Total distributions to shareholders | | | (0.27 | ) | | | (0.08 | ) | | | (0.05 | ) | | | — | |
Net Asset Value, End of Period | | $ | 11.60 | | | $ | 9.61 | | | $ | 9.56 | | | $ | 9.34 | |
Total Return2,6 | | | 24.30 | % | | | 1.42 | %7 | | | 3.02 | % | | | (6.60 | )%8 |
Ratio of net expenses to average net assets | | | 1.30 | % | | | 1.40 | % | | | 1.40 | % | | | 1.40 | %9 |
Ratio of gross expenses to average net assets10 | | | 1.31 | % | | | 1.41 | % | | | 1.92 | % | | | 3.26 | %9 |
Ratio of net investment income to average net assets2 | | | 0.38 | % | | | 1.88 | % | | | 1.06 | % | | | 1.61 | %9 |
Portfolio turnover | | | 34 | % | | | 38 | % | | | 53 | % | | | 26 | %8 |
Net assets end of period (000’s) omitted | | $ | 4,006 | | | $ | 131 | | | $ | 1,056 | | | $ | 984 | |
| | | | | | | | | | | | | | | | |
AMG Managers Pictet International Fund
Financial Highlights
For a share outstanding throughout each fiscal period
| | | | | | | | | | | | | | | | |
| | | For the fiscal years
ended
October 31, | | | For the fiscal period
ended
October 31, | |
| Class I | | 2017 | | | 2016 | | | 2015 | | | 20141 | |
Net Asset Value, Beginning of Period | | $ | 9.65 | | | $ | 9.60 | | | $ | 9.36 | | | $ | 10.00 | |
Income (loss) from Investment Operations: | | | | | | | | | | | | | | | | |
Net investment income2 | | | 0.13 | 3 | | | 0.15 | 3 | | | 0.12 | 3 | | | 0.10 | |
Net realized and unrealized gain (loss) on investments | | | 2.16 | | | | 0.00 | 4 | | | 0.19 | 5 | | | (0.74 | ) |
Total income (loss) from investment operations | | | 2.29 | | | | 0.15 | | | | 0.31 | | | | (0.64 | ) |
Less Distributions to Shareholders from: | | | | | | | | | | | | | | | | |
Net investment income | | | (0.14 | ) | | | (0.04 | ) | | | (0.05 | ) | | | — | |
Net realized gain on investments | | | (0.21 | ) | | | (0.06 | ) | | | (0.02 | ) | | | — | |
Total distributions to shareholders | | | (0.35 | ) | | | (0.10 | ) | | | (0.07 | ) | | | — | |
Net Asset Value, End of Period | | $ | 11.59 | | | $ | 9.65 | | | $ | 9.60 | | | $ | 9.36 | |
Total Return2,6 | | | 24.55 | % | | | 1.67 | %11 | | | 3.43 | % | | | (6.40 | )%8 |
Ratio of net expenses to average net assets | | | 1.06 | % | | | 1.15 | % | | | 1.15 | % | | | 1.15 | %9 |
Ratio of gross expenses to average net assets10 | | | 1.07 | % | | | 1.15 | % | | | 1.67 | % | | | 3.01 | %9 |
Ratio of net investment income to average net assets2 | | | 1.28 | % | | | 2.13 | % | | | 1.31 | % | | | 1.86 | %9 |
Portfolio turnover | | | 34 | % | | | 38 | % | | | 53 | % | | | 26 | %8 |
Net assets end of period (000’s) omitted | | $ | 2,019,217 | | | $ | 1,336,050 | | | $ | 49,803 | | | $ | 8,467 | |
| | | | | | | | | | | | | | | | |
AMG Managers Pictet International Fund
Financial Highlights
For a share outstanding throughout each fiscal period
| | | | |
| | | For the fiscal period
ended
October 31, | |
| Class Z | | 201712 | |
Net Asset Value, Beginning of Period | | $ | 11.40 | |
Income (loss) from Investment Operations: | | | | |
Net investment income2 | | | 0.00 | 3,4 |
Net realized and unrealized gains on investments | | | 0.19 | |
Total income from investment operations | | | 0.19 | |
Net Asset Value, End of Period | | $ | 11.59 | |
Total Return2,6 | | | 1.67 | %8 |
Ratio of net expenses to average net assets | | | 0.94 | %9 |
Ratio of gross expenses to average net assets10 | | | 0.95 | %9 |
Ratio of net investment loss to average net assets2 | | | (0.36 | )%9 |
Portfolio turnover | | | 34 | %8 |
Net assets end of period (000’s) omitted | | $ | 254 | |
| | | | |
| 1 | The commencement of operations for Class N and Class I Shares was April 11, 2014. |
| 2 | Total returns and net investment income would have been lower had certain expenses not been offset. |
| 3 | Per share numbers have been calculated using average shares. |
| 4 | Less than $0.005 or $(0.005) per share. |
| 5 | Includes capital contribution of $0.01 per share. |
| 6 | The total return is calculated using the published Net Asset Value as of fiscal year end. |
| 7 | The total return would have been 1.32% had the capital contribution not been included. |
| 10 | Excludes the impact of expense reimbursement or fee waivers and expense reductions such as brokerage credits, but includes expense repayments and non-reimbursable expenses, if any, such as interest, taxes, and extraordinary expenses. (See Note 1(c) and 2 in the Notes to Financial Statements.) |
| 11 | The total return would have been 1.57% had the capital contribution not been included. |
| 12 | The commencement of operations for Class Z shares was October 2, 2017. |
AMG Managers Value Partners Asia Dividend Fund
Financial Highlights
For a share outstanding throughout each fiscal period
| | | | | | | | |
| | | For the fiscal years
ended
October 31, | | | For the fiscal period
ended
October 31, | |
| Class N | | 2017 | | | 20161 | |
Net Asset Value, Beginning of Period | | $ | 10.63 | | | $ | 10.00 | |
Income from Investment Operations: | | | | | | | | |
Net investment income2,3 | | | 0.31 | | | | 0.24 | |
Net realized and unrealized gains on investments | | | 2.68 | | | | 0.59 | |
Total income from investment operations | | | 2.99 | | | | 0.83 | |
Less Distributions to Shareholders from: | | | | | | | | |
Net investment income | | | (0.41 | ) | | | (0.20 | ) |
Net realized gain on investments | | | (0.30 | ) | | | — | |
Total distributions to shareholders | | | (0.71 | ) | | | (0.20 | ) |
Net Asset Value, End of Period | | $ | 12.91 | | | $ | 10.63 | |
Total Return3,4 | | | 29.71 | % | | | 8.39 | %5 |
Ratio of net expenses to average net assets | | | 1.17 | % | | | 1.40 | %6 |
Ratio of gross expenses to average net assets7 | | | 2.25 | % | | | 4.18 | %6 |
Ratio of net investment income to average net assets3 | | | 2.69 | % | | | 2.74 | %6 |
Portfolio turnover | | | 86 | % | | | 51 | %5 |
Net assets end of period (000’s) omitted | | $ | 1,195 | | | $ | 808 | |
| | | | | | | | |
199
AMG Managers Value Partners Asia Dividend Fund
Financial Highlights
For a share outstanding throughout each fiscal period
| | | | | | | | |
| | | For the fiscal years
ended
October 31, | | | For the fiscal period
ended
October 31, | |
| Class I | | 2017 | | | 20161 | |
Net Asset Value, Beginning of Period | | $ | 10.63 | | | $ | 10.00 | |
Income from Investment Operations: | | | | | | | | |
Net investment income2,3 | | | 0.31 | | | | 0.27 | |
Net realized and unrealized gains on investments | | | 2.67 | | | | 0.58 | |
Total income from investment operations | | | 2.98 | | | | 0.85 | |
Less Distributions to Shareholders from: | | | | | | | | |
Net investment income | | | (0.40 | ) | | | (0.22 | ) |
Net realized gain on investments | | | (0.30 | ) | | | — | |
Total distributions to shareholders | | | (0.70 | ) | | | (0.22 | ) |
Net Asset Value, End of Period | | $ | 12.91 | | | $ | 10.63 | |
Total Return3,4 | | | 29.79 | % | | | 8.60 | %5 |
Ratio of net expenses to average net assets | | | 1.15 | % | | | 1.15 | %6 |
Ratio of gross expenses to average net assets7 | | | 2.23 | % | | | 3.94 | %6 |
Ratio of net investment income to average net assets3 | | | 2.71 | % | | | 2.99 | %6 |
Portfolio turnover | | | 86 | % | | | 51 | %5 |
Net assets end of period (000’s) omitted | | $ | 9,273 | | | $ | 7,283 | |
| | | | | | | | |
| 1 | The commencement of operations was December 16, 2015. |
| 2 | Per share numbers have been calculated using average shares. |
| 3 | Total returns and net investment income would have been lower had certain expenses not been offset. |
| 4 | The total return is calculated using the published Net Asset Value as of fiscal year end. |
| 7 | Excludes the impact of expense reimbursement or fee waivers and expense reductions such as brokerage credits, but includes expense repayments and non-reimbursable expenses, if any, such as interest, taxes, and extraordinary expenses. (See Note 1(c) and 2 in the Notes to Financial Statements.) |
200
AMG Managers Montag & Caldwell Balanced Fund
Financial Highlights
For a share outstanding throughout each fiscal year
| | | | | | | | | | | | | | | | | | | | |
| | | For the fiscal years
ended
October 31, | |
| Class N | | 2017 | | | 2016 | | | 2015 | | | 2014 | | | 2013 | |
Net Asset Value, Beginning of Year | | $ | 22.58 | | | $ | 23.83 | | | $ | 24.68 | | | $ | 23.81 | | | $ | 21.46 | |
Income (loss) from Investment Operations: | | | | | | | | | | | | | | | | | | | | |
Net investment income1,2 | | | 0.08 | | | | 0.11 | | | | 0.10 | | | | 0.12 | | | | 0.21 | |
Net realized and unrealized gain (loss) on investments | | | 2.09 | | | | (0.17 | ) | | | 1.31 | | | | 1.70 | | | | 2.43 | |
Total income (loss) from investment operations | | | 2.17 | | | | (0.06 | ) | | | 1.41 | | | | 1.82 | | | | 2.64 | |
Less Distributions to Shareholders from: | | | | | | | | | | | | | | | | | | | | |
Net investment income | | | (0.11 | ) | | | (0.15 | ) | | | (0.18 | ) | | | (0.21 | ) | | | (0.29 | ) |
Net realized gain on investments | | | (1.88 | ) | | | (1.04 | ) | | | (2.08 | ) | | | (0.74 | ) | | | — | |
Total distributions to shareholders | | | (1.99 | ) | | | (1.19 | ) | | | (2.26 | ) | | | (0.95 | ) | | | (0.29 | ) |
Net Asset Value, End of Year | | $ | 22.76 | | | $ | 22.58 | | | $ | 23.83 | | | $ | 24.68 | | | $ | 23.81 | |
Total Return2,3 | | | 10.61 | % | | | (0.28 | )% | | | 6.01 | % | | | 7.83 | % | | | 12.40 | % |
Ratio of net expenses to average net assets | | | 1.15 | %4 | | | 1.20 | % | | | 1.20 | % | | | 1.20 | % | | | 1.20 | % |
Ratio of gross expenses to average net assets5 | | | 1.26 | % | | | 1.31 | % | | | 1.44 | % | | | 1.43 | % | | | 1.37 | % |
Ratio of net investment income to average net assets2 | | | 0.35 | % | | | 0.46 | % | | | 0.43 | % | | | 0.50 | % | | | 0.94 | % |
Portfolio turnover | | | 41 | % | | | 85 | % | | | 36 | % | | | 27 | % | | | 35 | % |
Net assets end of year (000’s) omitted | | $ | 18,186 | | | $ | 25,373 | | | $ | 26,607 | | | $ | 20,446 | | | $ | 22,425 | |
| | | | | | | | | | | | | | | | | | | | |
201
AMG Managers Montag & Caldwell Balanced Fund
Financial Highlights
For a share outstanding throughout each fiscal year
| | | | | | | | | | | | | | | | | | | | |
| | | For the fiscal years
ended
October 31, | |
| Class I | | 2017 | | | 2016 | | | 2015 | | | 2014 | | | 2013 | |
Net Asset Value, Beginning of Year | | $ | 22.50 | | | $ | 23.75 | | | $ | 24.60 | | | $ | 23.76 | | | $ | 21.41 | |
Income (loss) from Investment Operations: | | | | | | | | | | | | | | | | | | | | |
Net investment income1,2 | | | 0.09 | | | | 0.13 | | | | 0.12 | | | | 0.14 | | | | 0.23 | |
Net realized and unrealized gain (loss) on investments | | | 2.10 | | | | (0.17 | ) | | | 1.31 | | | | 1.70 | | | | 2.43 | |
Total income (loss) from investment operations | | | 2.19 | | | | (0.04 | ) | | | 1.43 | | | | 1.84 | | | | 2.66 | |
Less Distributions to Shareholders from: | | | | | | | | | | | | | | | | | | | | |
Net investment income | | | (0.13 | ) | | | (0.17 | ) | | | (0.20 | ) | | | (0.26 | ) | | | (0.31 | ) |
Net realized gain on investments | | | (1.88 | ) | | | (1.04 | ) | | | (2.08 | ) | | | (0.74 | ) | | | — | |
Total distributions to shareholders | | | (2.01 | ) | | | (1.21 | ) | | | (2.28 | ) | | | (1.00 | ) | | | (0.31 | ) |
Net Asset Value, End of Year | | $ | 22.68 | | | $ | 22.50 | | | $ | 23.75 | | | $ | 24.60 | | | $ | 23.76 | |
Total Return2,3 | | | 10.70 | % | | | (0.19 | )% | | | 6.13 | % | | | 7.92 | % | | | 12.53 | % |
Ratio of net expenses to average net assets | | | 1.09 | %4 | | | 1.10 | % | | | 1.10 | % | | | 1.10 | % | | | 1.10 | % |
Ratio of gross expenses to average net assets5 | | | 1.20 | % | | | 1.22 | % | | | 1.34 | % | | | 1.33 | % | | | 1.27 | % |
Ratio of net investment income to average net assets2 | | | 0.41 | % | | | 0.55 | % | | | 0.53 | % | | | 0.60 | % | | | 1.04 | % |
Portfolio turnover | | | 41 | % | | | 85 | % | | | 36 | % | | | 27 | % | | | 35 | % |
Net assets end of year (000’s) omitted | | $ | 3,213 | | | $ | 3,091 | | | $ | 3,518 | | | $ | 1,934 | | | $ | 1,839 | |
| | | | | | | | | | | | | | | | | | | | |
| 1 | Per share numbers have been calculated using average shares. |
| 2 | Total returns and net investment income would have been lower had certain expenses not been offset. |
| 3 | The total return is calculated using the published Net Asset Value as of fiscal year end. |
| 4 | Includes reduction from brokerage recapture amounting to less than 0.01%. |
| 5 | Excludes the impact of expense reimbursement or fee waivers and expense reductions such as brokerage credits, but includes expense repayments and non-reimbursable expenses, if any, such as interest, taxes, and extraordinary expenses. (See Note 1(c) and 2 in the Notes to Financial Statements.) |
202
| | |
| |
| Notes to Financial Statements | | October 31, 2017 |
1. SUMMARY OF SIGNIFICANT ACCOUNTING POLICIES
AMG Funds IV (the “Trust”) is an open-end management investment company, organized as a Delaware Statutory Trust, and registered under the Investment Company Act of 1940, as amended (the “1940 Act”). Currently, the Trust consists of a number of different funds, (each a “Fund” and collectively, the “Funds”), each having distinct investment management objectives, strategies, risks, and policies. Included in this report are:
|
Funds |
AMG Managers Fairpointe ESG Equity Fund (the “Fairpointe ESG Equity”)1 |
AMG River Road Focused Absolute Value Fund (the “River Road Focused Absolute Value”) |
AMG Managers Montag & Caldwell Growth Fund (the “Montag & Caldwell Growth”) |
AMG River Road Dividend All Cap Value Fund (the “River Road Dividend All Cap Value”) |
AMG River Road Dividend All Cap Value Fund II (the “River Road Dividend All Cap Value II”) |
AMG Managers Fairpointe Mid Cap Fund (the “Fairpointe Mid Cap”) |
AMG Managers Montag & Caldwell Mid Cap Growth Fund (the “Montag & Caldwell Mid Cap Growth”) |
AMG Managers LMCG Small Cap Growth Fund (the “LMCG Small Cap Growth”) |
AMG River Road Small-Mid Cap Value Fund (the “River Road Small-Mid Cap Value”)2 |
AMG River Road Small Cap Value Fund (the “River Road Small Cap Value”) |
AMG Managers Silvercrest Small Cap Fund (the “Silvercrest Small Cap”) |
AMG GW&K U.S. Small Cap Growth Fund (the “GW&K U.S. Small Cap Growth”) |
AMG Managers DoubleLine Core Plus Bond Fund (the “DoubleLine Core Plus Bond”) |
AMG Managers Lake Partners LASSO Alternatives Fund (the “Lake Partners LASSO Alternatives”) |
AMG River Road Long-Short Fund (the “River Road Long-Short”) |
AMG Managers Guardian Capital Global Dividend Fund (the “Guardian Capital Global Dividend”) |
AMG Managers Pictet International Fund (the “Pictet International”) |
AMG Managers Value Partners Asia Dividend Fund (the “Value Partners Asia Dividend”) |
| AMG Managers Montag & Caldwell Balanced Fund (the “Montag & Caldwell Balanced”) |
| 1 | Formerly known as AMG Managers Fairpointe Focused Equity Fund. |
| 2 | Formerly known as AMG River Road Select Value Fund. |
Effective October 1, 2017, Fairpointe ESG Equity changed its principle investment strategy to prefer investment in companies it deems to have strong environmental, social and governance (ESG) records and seek to avoid those with inferior ESG records relative to the market and peers.
Each Fund is authorized to issue two classes of shares (Class N shares and Class I shares). Montag & Caldwell Growth is also authorized to issue Class R shares. Effective February 24, 2017, GW&K U.S. Small Cap Growth began issuing Class Z shares, and effective October 2, 2017, River Road Focused Absolute Value, River
Road Dividend All Cap Value, River Road Dividend All Cap Value II, Fairpointe Mid Cap, River Road Small-Mid Cap, River Road Small Cap Value, Silvercrest Small Cap, DoubleLine Core Plus Bond, River Road Long-Short and Pictet International began issuing Class Z shares. Each class represents an interest in the same assets of the respective Fund. Although all share classes generally have identical voting rights, each share class votes separately when required by law. Different share classes may pay different distribution amounts to the extent the net asset value per share and/or the expenses of such share classes differ. Each share class has its own expense structure. Please refer to a current prospectus for additional information on each share class.
The Funds’ financial statements are prepared in accordance with accounting principles generally accepted in the United States of America (“U.S. GAAP”), including accounting and reporting guidance pursuant to Accounting Standards Codification Topic 946 applicable to investment companies. U.S. GAAP requires management to make estimates and assumptions that affect the reported amounts of assets and liabilities and disclosure of contingent assets and liabilities at the date of the financial statements and the reported amounts of income and expenses during the reporting period. Actual results could differ from those estimates and such differences could be material. The following is a summary of significant accounting policies followed by the Funds in the preparation of their financial statements:
a. VALUATION OF INVESTMENTS
Equity securities, including securities sold short, traded on a national securities exchange or reported on the NASDAQ national market system (“NMS”) are valued at the last quoted sales price on the primary exchange or, if applicable, the NASDAQ official closing price or the official closing price of the relevant exchange or, lacking any sales, at the last quoted bid price or the mean between the last quoted bid and ask prices (the “exchange mean price”). Equity securities and securities sold short traded in the over-the-counter market (other than NMS securities) are valued at the exchange mean price. Foreign equity securities (securities principally traded in markets other than U.S. markets) are valued at the official closing price on the primary exchange or, for markets that either do not offer an official closing price or where the official closing price may not be representative of the overall market, the last quoted sale price.
Fixed income securities purchased with a remaining maturity exceeding 60 days are valued at the evaluated bid price or the mean price provided by an authorized pricing service or, if an evaluated price is not available, by reference to other securities which are considered comparable in credit rating, interest rate, due date and other features (generally referred to as “matrix pricing”) or other similar pricing methodologies. Investments in certain mortgage-backed and stripped mortgage-backed securities, preferred stocks, convertible securities, derivatives and other debt securities not traded on an organized securities market are valued on the basis of valuations provided by dealers or by a pricing service which uses information with respect to transactions in such securities and various relationships between such securities and yield to maturity in determining value.
Fixed income securities purchased with a remaining maturity of 60 days or less are valued at amortized cost, provided that the amortized cost value is approximately the same as the fair value of the security valued without the use of amortized cost. Investments in other open-end regulated investment companies are valued at their end of day net asset value per share.
The Funds’ portfolio investments are generally valued based on independent market quotations or prices or, if none, “evaluative” or other market based
Notes to Financial Statements (continued)
valuations provided by third party pricing services approved by the Board of Trustees of the Trust (the “Board”). Under certain circumstances, the value of certain Fund portfolio investments (including derivatives) may be based on an evaluation of fair value, pursuant to procedures established by and under the general supervision of the Board. The Valuation Committee, which is comprised of the Independent Trustees of the Board, and the Pricing Committee, which is comprised of representatives from AMG Funds LLC (the “Investment Manager”) are the committees appointed by the Board to make fair value determinations. Each Fund may use the fair value of a portfolio investment to calculate its net asset value (“NAV”) in the event that the market quotation, price or market based valuation for the portfolio investment is not readily available or otherwise not determinable pursuant to the Board’s valuation procedures, if the Investment Manager or the Pricing Committee believes the quotation, price or market based valuation to be unreliable, or in certain other circumstances. When determining the fair value of an investment, the Pricing Committee and, if required under the Trust’s securities valuation procedures, the Valuation Committee, seeks to determine the price that the Fund might reasonably expect to receive from current sale of that portfolio investment in an arms-length transaction. Fair value determinations shall be based upon consideration of all available facts and information, including, but not limited to (i) attributes specific to the investment; (ii) fundamental and analytical data relating to the investment; and (iii) the value of other comparable securities or relevant financial instruments, including derivative securities, traded on other markets or among dealers.
The values assigned to fair value portfolio investments are based on available information and do not necessarily represent amounts that might ultimately be realized in the future, since such amounts depend on future developments inherent in long-term investments. Because of the inherent uncertainty of valuation, those estimated values may differ significantly from the values that would have been used had a ready market for the investments existed, and the differences could be material. The Board will be presented with a quarterly report showing as of the most recent quarter end, all outstanding securities fair valued by the Fund, including a comparison with the prior quarter end and the percentage of the Fund that the security represents at each quarter end.
With respect to foreign equity securities and certain foreign fixed income securities, the Board has adopted a policy that securities held in a Fund that can be fair valued by the applicable fair value pricing service are fair valued on each business day provided that each individual price exceeds a pre-established confidence level. U.S. GAAP defines fair value as the price that a fund would receive to sell an asset or pay to transfer a liability in an orderly transaction between market participants at the measurement date. U.S. GAAP also establishes a framework for measuring fair value, and a three level hierarchy for fair value measurements based upon the transparency of inputs to the valuation of an asset or liability. Inputs may be observable or unobservable and refer broadly to the assumptions that market participants would use in pricing the asset or liability. Observable inputs reflect the assumptions market participants would use in pricing the asset or liability based on market data obtained from sources independent of the Funds. Unobservable inputs reflect the Funds’ own assumptions about the assumptions that market participants would use in pricing the asset or liability developed based on the best information available in the circumstances. Each investment is assigned a level based upon the observability of the inputs which are significant to the overall valuation.
The three-tier hierarchy of inputs is summarized below:
| | |
| Level 1 – | | inputs are quoted prices in active markets for identical investments (e.g., equity securities, open-end investment companies) |
| Level 2 – | | other observable inputs (including, but not limited to: quoted prices for similar assets or liabilities in markets that are active, quoted prices for identical or similar assets or liabilities in markets that are not active, inputs other than quoted prices that are observable for the assets or liabilities (such as interest rates, yield curves, volatilities, prepayment speeds, loss severities, credit risks and default rates) or other market corroborated inputs) (e.g., debt securities, government securities, foreign currency exchange contracts, foreign securities utilizing international fair value pricing, fair valued securities with observable inputs) |
| Level 3 – | | inputs are significant unobservable inputs (including the Fund’s own assumptions used to determine the fair value of investments) (e.g., fair valued securities with unobservable inputs) |
Changes in inputs or methodologies used for valuing investments may result in a transfer in or out of levels within the fair value hierarchy. The inputs or methodologies used for valuing investments may not necessarily be an indication of the risk associated with investing in those investments. Transfers between different levels of the fair value disclosure hierarchy are deemed to have occurred as of the beginning of the reporting period.
b. SECURITY TRANSACTIONS
Security transactions are accounted for as of trade date. Realized gains and losses on securities sold are determined on the basis of identified cost.
c. INVESTMENT INCOME AND EXPENSES
Dividend income is recorded on the ex-dividend date. Dividends from foreign securities are recorded on the ex-dividend date, and if after the fact, as soon as the Funds become aware of the ex-dividend date, except for Korean securities where dividends are recorded on confirmation date. Dividends declared on short positions are recorded on the ex-date as dividend expense. Interest income, which includes amortization of premium and accretion of discount on debt securities, is accrued as earned. Dividend and interest income on foreign securities is recorded gross of any withholding tax. Non-cash dividends included in dividend income, if any, are reported at the fair market value of the securities received. Upon notification from issuers, distributions received from a real estate investment trust (“REIT”) may be redesignated as a reduction of cost of investments and/or realized gain. Other income and expenses are recorded on an accrual basis. Expenses that cannot be directly attributed to a Fund are apportioned among the funds in the Trust and other trusts within the AMG Funds family of mutual funds (collectively the “AMG Funds Family”) based upon their relative average net assets or number of shareholders. Investment income, realized and unrealized capital gains and losses, the common expenses of each Fund, and certain fund level expense reductions, if any, are allocated on a pro-rata basis to each class based on the relative net assets of each class to the total net assets of each Fund.
DoubleLine Core Plus Bond recorded an out-of-period adjustment to correct errors relating to income recognition on interest only securities. DoubleLine Core Plus Bond recorded a cumulative adjustment to decrease beginning undistributed net investment income and investments at cost as of November 1, 2016 by $3,432,795. The adjustment did not impact DoubleLine Core Plus’s net assets, NAV per Share or total return. Management determined that the adjustment was not material to the Fund’s prior year or current year annual financial statements.
Notes to Financial Statements (continued)
The following Funds had certain portfolio trades directed to various brokers under a brokerage recapture program. Credits received from the brokerage recapture program are earned and paid on a monthly basis, and are recorded as expense offsets, which serve to reduce the Funds’ overall expense ratio. For the fiscal year ended October 31, 2017, the impact on the expense ratios, if any, were as follows:
| | | | |
| | | Reduction | |
River Road Focused Absolute Value | | $ | 4,310 | |
Montag & Caldwell Growth | | | 136,850 | |
River Road Dividend All Cap Value | | | 17,608 | |
River Road Dividend All Cap Value II | | | 2,276 | |
Montag & Caldwell Mid Cap Growth | | | 1,186 | |
LMCG Small Cap Growth | | | 14,586 | |
River Road Small-Mid Cap Value | | | 5,343 | |
River Road Small Cap Value | | | 18,818 | |
Silvercrest Small Cap | | | 78,489 | |
GW&K U.S. Small Cap Growth | | | 18,483 | |
River Road Long-Short | | | 8,490 | |
Montag & Caldwell Balanced | | | 1,989 | |
d. DIVIDENDS AND DISTRIBUTIONS
Fund distributions resulting from either net investment income or realized net capital gains, if any, will normally be declared and paid at least annually in
December, as described in the Fund’s prospectus. Dividends and distributions to shareholders are recorded on the ex-dividend date.
Distributions are determined in accordance with federal income tax regulations, which may differ from net investment income and net realized capital gains for financial statement purposes (U.S. GAAP). Differences may be permanent or temporary. Permanent differences are reclassified among capital accounts in the financial statements to reflect their tax character. Permanent book and tax basis differences, if any, relating to shareholder distributions will result in reclassifications to paid-in capital. Temporary differences arise when certain items of income, expense and gain or loss are recognized in different periods for financial statement and tax purposes; these differences will reverse at some time in the future. Permanent differences are primarily due to net operating losses, tax equalization utilized, amortization on securities sold, partnerships, net operating losses offset by short term capital gains, gains/losses on foreign currency, paydowns, tax adjustments on passive foreign investment companies sold, redesignation of dividends paid by a fund, distributions received from regulated investment companies, distributions in excess of net investment income paid by a fund, and expenses disallowed for tax purposes. Temporary differences are primarily due to differences between book and tax treatment of losses for excise tax purposes, wash sale loss deferrals, amortization, mark-to-market of passive foreign investment companies, gains/losses on foreign currency, non-deductible organizational expense, premiums outstanding, and partnerships.
The tax character of distributions paid during the fiscal years ended October 31, 2017 and October 31, 2016 were as follows:
| | | | | | | | | | | | | | | | | | | | | | | | |
| | | Fairpointe ESG Equity | | | River Road Focused Absolute Value | | | Montag & Caldwell Growth | |
| Distributions paid from: | | 2017 | | | 2016 | | | 2017 | | | 2016 | | | 2017 | | | 2016 | |
Ordinary income | | $ | 69,055 | | | $ | 67,672 | | | $ | 114,198 | | | | — | | | $ | 4,950,517 | | | $ | 8,294,809 | |
Short-term capital gains | | | — | | | | — | | | | 867,539 | | | | — | | | | 796,795 | | | | — | |
Long-term capital gains | | | — | | | | — | | | | 48,044 | | | | — | | | | 112,651,473 | | | | 453,313,996 | |
| | | | | | | | | | | | | | | | | | | | | | | | |
| | $ | 69,055 | | | $ | 67,672 | | | $ | 1,029,781 | | | | — | | | $ | 118,398,785 | | | $ | 461,608,805 | |
| | | | | | | | | | | | | | | | | | | | | | | | |
| | | River Road Dividend All Cap Value | | | River Road Dividend All Cap Value II | | | Fairpointe Mid Cap | |
| Distributions paid from: | | 2017 | | | 2016 | | | 2017 | | | 2016 | | | 2017 | | | 2016 | |
Ordinary income | | $ | 16,568,936 | | | $ | 15,720,202 | | | $ | 1,994,635 | | | $ | 2,501,192 | | | $ | 17,306,350 | | | $ | 21,004,526 | |
Short-term capital gains | | | — | | | | — | | | | — | | | | — | | | | — | | | | — | |
Long-term capital gains | | | 59,243,471 | | | | 68,846,034 | | | | 4,773,190 | | | | 1,667,547 | | | | 158,487,707 | | | | 234,497,586 | |
| | | | | | | | | | | | | | | | | | | | | | | | |
| | $ | 75,812,407 | | | $ | 84,566,236 | | | $ | 6,767,825 | | | $ | 4,168,739 | | | $ | 175,794,057 | | | $ | 255,502,112 | |
| | | | | | | | | | | | | | | | | | | | | | | | |
Notes to Financial Statements (continued)
| | | | | | | | | | | | | | | | | | | | | | | | |
| | | Montag & Caldwell Mid Cap Growth | | | LMCG Small Cap Growth | | | River Road Small-Mid Cap Value | |
| Distributions paid from: | | 2017 | | | 2016 | | | 2017 | | | 2016 | | | 2017 | | | 2016 | |
Ordinary income | | | — | | | | — | | | | — | | | | — | | | | — | | | | — | |
Short-term capital gains | | $ | 35,268 | | | | — | | | | — | | | $ | 15,280 | | | $ | 180,261 | | | $ | 153,030 | |
Long-term capital gains | | | 589,361 | | | $ | 1,250,491 | | | | — | | | | 25,386 | | | | 2,962,623 | | | | 7,969,730 | |
| | | | | | | | | | | | | | | | | | | | | | | | |
| | $ | 624,629 | | | $ | 1,250,491 | | | | — | | | $ | 40,666 | | | $ | 3,142,884 | | | $ | 8,122,760 | |
| | | | | | | | | | | | | | | | | | | | | | | | |
| | | River Road Small Cap Value | | | Silvercrest Small Cap | | | GW&K U.S. Small Cap Growth | |
| Distributions paid from: | | 2017 | | | 2016 | | | 2017 | | | 2016 | | | 2017 | | | 2016 | |
Ordinary income | | | — | | | | — | | | $ | 451,183 | | | $ | 628,202 | | | | — | | | | — | |
Short-term capital gains | | $ | 8,589,024 | | | $ | 1,533,976 | | | | — | | | | 37,746 | | | | — | | | | — | |
Long-term capital gains | | | 5,674,974 | | | | 13,693,492 | | | | 1,787,048 | | | | 6,209,167 | | | $ | 58,641 | | | $ | 155,946,076 | |
| | | | | | | | | | | | | | | | | | | | | | | | |
| | $ | 14,263,998 | | | $ | 15,227,468 | | | $ | 2,238,231 | | | $ | 6,875,115 | | | $ | 58,641 | | | $ | 155,946,076 | |
| | | | | | | | | | | | | | | | | | | | | | | | |
| | | DoubleLine Core Plus Bond | | | Lake Partners LASSO Alternatives | | | River Road Long-Short | |
| Distributions paid from: | | 2017 | | | 2016 | | | 2017 | | | 2016 | | | 2017 | | | 2016 | |
Ordinary income | | $ | 20,629,001 | | | $ | 20,343,204 | | | | — | | | $ | 335,854 | | | | — | | | | — | |
Short-term capital gains | | | 658,444 | | | | — | | | | — | | | | — | | | | — | | | $ | 1,302,075 | |
Long-term capital gains | | | — | | | | — | | | $ | 387,316 | | | | 11,178,503 | | | | — | | | | 545,077 | |
Return of capital | | | 2,904,697 | | | | — | | | | — | | | | — | | | | — | | | | — | |
| | | | | | | | | | | | | | | | | | | | | | | | |
| | $ | 24,192,142 | | | $ | 20,343,204 | | | $ | 387,316 | | | $ | 11,514,357 | | | | — | | | $ | 1,847,152 | |
| | | | | | | | | | | | | | | | | | | | | | | | |
| | | Guardian Capital Global Dividend | | | Pictet International | | | Value Partners Asia Dividend | |
| Distributions paid from: | | 2017 | | | 2016 | | | 2017 | | | 2016 | | | 2017 | | | 2016 | |
Ordinary income | | $ | 681,891 | | | $ | 119,241 | | | $ | 19,016,769 | | | $ | 386,837 | | | $ | 316,904 | | | $ | 165,399 | |
Short-term capital gains | | | — | | | | — | | | | 27,968,749 | | | | 588,318 | | | | 226,505 | | | | — | |
Long-term capital gains | | | — | | | | — | | | | 627,413 | | | | — | | | | — | | | | — | |
| | | | | | | | | | | | | | | | | | | | | | | | |
| | $ | 681,891 | | | $ | 119,241 | | | $ | 47,612,931 | | | $ | 975,155 | | | $ | 543,409 | | | $ | 165,399 | |
| | | | | | | | | | | | | | | | | | | | | | | | |
| | | | | | | | | | | | | | | Montag & Caldwell Balanced | |
| Distributions paid from: | | | | | | | | | | | | | | 2017 | | | 2016 | |
Ordinary income | | | | | | | | | | | | | | | | | | $ | 121,045 | | | $ | 234,601 | |
Short-term capital gains | | | | | | | | | | | | | | | | | | | — | | | | — | |
Long-term capital gains | | | | | | | | | | | | | | | | | | | 2,148,266 | | | | 1,324,665 | |
| | | | | | | | | | | | | | | | | | | | | | | | |
| | | | | | | | | | | | | | | | | | $ | 2,269,311 | | | $ | 1,559,266 | |
| | | | | | | | | | | | | | | | | | | | | | | | |
As of October 31, 2017, the components of distributable earnings (excluding unrealized appreciation/depreciation) on tax basis consisted of:
| | | | | | | | | | | | |
| | | Fairpointe ESG Equity | | | River Road Focused Absolute Value | | | Montag & Caldwell Growth | |
Capital loss carryforward | | $ | 136,123 | | | | — | | | | — | |
Undistributed ordinary income | | | 112,283 | | | $ | 99,243 | | | | — | |
Undistributed short-term capital gains | | | — | | | | 910,011 | | | | — | |
Undistributed long-term capital gains | | | — | | | | 880,230 | | | $ | 74,717,703 | |
Late-year loss deferral | | | — | | | | — | | | | 565,119 | |
Notes to Financial Statements (continued)
| | | | | | | | | | | | |
| | | River Road Dividend All Cap Value | | | River Road Dividend All Cap Value II | | | Fairpointe Mid Cap | |
Capital loss carryforward | | | — | | | | — | | | | — | |
Undistributed ordinary income | | $ | 9,158,276 | | | $ | 1,018,034 | | | | ��� | |
Undistributed short-term capital gains | | | 3,083,372 | | | | 318,072 | | | | — | |
Undistributed long-term capital gains | | | 38,242,609 | | | | 5,663,011 | | | $ | 257,609,647 | |
Late-year loss deferral | | | — | | | | — | | | | — | |
| | | Montag & Caldwell Mid Cap Growth | | | LMCG Small Cap Growth | | | River Road Small-Mid Cap Value | |
Capital loss carryforward | | | — | | | $ | 23,053,861 | | | | — | |
Undistributed ordinary income | | | — | | | | — | | | | — | |
Undistributed short-term capital gains | | $ | 53,132 | | | | — | | | $ | 1,132,226 | |
Undistributed long-term capital gains | | | 566,999 | | | | — | | | | 4,886,099 | |
Late-year loss deferral | | | — | | | | 822,854 | | | | — | |
| | | River Road Small Cap Value | | | Silvercrest Small Cap | | | GW&K U.S. Small Cap Growth | |
Capital loss carryforward | | | — | | | | — | | | | — | |
Undistributed ordinary income | | | — | | | $ | 51,201 | | | | — | |
Undistributed short-term capital gains | | $ | 8,200,654 | | | | 502,076 | | | $ | 374,460 | |
Undistributed long-term capital gains | | | 32,614,718 | | | | 20,303,467 | | | | 4,703,596 | |
Late-year loss deferral | | | — | | | | — | | | | — | |
| | | DoubleLine Core Plus Bond | | | Lake Partners
LASSO Alternatives | | | River Road Long-
Short | |
Capital loss carryforward | | $ | 4,188,381 | | | | — | | | $ | 11,649 | |
Undistributed ordinary income | | | — | | | | — | | | | — | |
Undistributed short-term capital gains | | | — | | | | — | | | | — | |
Undistributed long-term capital gains | | | — | | | $ | 1,989,538 | | | | — | |
Late-year loss deferral | | | — | | | | 461,196 | | | | 591,680 | |
| | | Guardian Capital Global Dividend | | | Pictet International | | | Value Partners Asia Dividend | |
Capital loss carryforward | | | — | | | | — | | | | — | |
Undistributed ordinary income | | $ | 152,715 | | | $ | 31,141,106 | | | $ | 122,417 | |
Undistributed short-term capital gains | | | 38,051 | | | | 25,626,511 | | | | 408,804 | |
Undistributed long-term capital gains | | | 127,378 | | | | 31,547,895 | | | | 200,506 | |
Late-year loss deferral | | | — | | | | — | | | | — | |
| | | | | | | | | Montag & Caldwell Balanced | |
Capital loss carryforward | | | | | | | | | | | — | |
Undistributed ordinary income | | | | | | | | | | $ | 31,170 | |
Undistributed short-term capital gains | | | | | | | | | | | 59,416 | |
Undistributed long-term capital gains | | | | | | | | | | | 1,000,434 | |
Late-year loss deferral | | | | | | | | | | | — | |
Notes to Financial Statements (continued)
At October 31, 2017, the approximate cost of investments and the aggregate gross unrealized appreciation and depreciation for federal income tax were as follows:
| | | | | | | | | | | | | | | | |
| Fund | | Cost | | | Appreciation | | | Depreciation | | | Net | |
Fairpointe ESG Equity | | $ | 5,192,647 | | | $ | 1,503,738 | | | $ | (143,530 | ) | | $ | 1,360,208 | |
River Road Focused Absolute Value | | | 25,945,634 | | | | 1,614,119 | | | | (799,194 | ) | | | 814,925 | |
Montag & Caldwell Growth | | | 694,090,858 | | | | 212,663,458 | | | | (3,714,026 | ) | | | 208,949,432 | |
River Road Dividend All Cap Value | | | 781,048,168 | | | | 197,120,315 | | | | (29,804,590 | ) | | | 167,315,725 | |
River Road Dividend All Cap Value II | | | 109,567,160 | | | | 22,725,161 | | | | (4,370,684 | ) | | | 18,354,477 | |
Fairpointe Mid Cap | | | 3,285,808,983 | | | | 982,841,003 | | | | (330,606,750 | ) | | | 652,234,253 | |
Montag & Caldwell Mid Cap Growth | | | 8,223,316 | | | | 1,761,838 | | | | (163,296 | ) | | | 1,598,542 | |
LMCG Small Cap Growth | | | 119,295,543 | | | | 16,497,707 | | | | (2,968,473 | ) | | | 13,529,234 | |
River Road Small-Mid Cap Value | | | 41,517,642 | | | | 6,487,475 | | | | (1,551,268 | ) | | | 4,936,207 | |
River Road Small Cap Value | | | 264,261,483 | | | | 71,137,004 | | | | (10,099,096 | ) | | | 61,037,908 | |
Silvercrest Small Cap | | | 231,034,637 | | | | 48,337,747 | | | | (2,553,901 | ) | | | 45,783,846 | |
GW&K U.S. Small Cap Growth | | | 28,851,500 | | | | 11,005,557 | | | | (1,167,337 | ) | | | 9,838,220 | |
DoubleLine Core Plus Bond | | | 679,328,250 | | | | 15,206,851 | | | | (11,612,801 | ) | | | 3,594,050 | |
Lake Partners LASSO Alternatives | | | 47,721,010 | | | | 3,172,175 | | | | (439,519 | ) | | | 2,732,656 | |
River Road Long-Short | | | 38,084,079 | | | | 3,473,232 | | | | (1,769,631 | ) | | | 1,703,601 | |
Guardian Capital Global Dividend | | | 33,577,789 | | | | 5,449,670 | | | | (572,821 | ) | | | 4,876,849 | |
Pictet International | | | 1,743,453,805 | | | | 349,549,209 | | | | (51,546,280 | ) | | | 298,002,929 | |
Value Partners Asia Dividend | | | 8,487,013 | | | | 1,908,089 | | | | (293,521 | ) | | | 1,614,568 | |
Montag & Caldwell Balanced | | | 19,226,819 | | | | 2,181,172 | | | | (468,076 | ) | | | 1,713,096 | |
e. FEDERAL TAXES
Each Fund currently qualifies as an investment company and intends to comply with the requirements under Subchapter M of the Internal Revenue Code of 1986, as amended, and to distribute substantially all of its taxable income and gains to its shareholders and to meet certain diversification and income requirements with respect to investment companies. Therefore, no provision for federal income or excise tax is included in the accompanying financial statements.
Additionally, based on each Fund’s understanding of the tax rules and rates related to income, gains and transactions for the foreign jurisdictions in which it invests, each Fund will provide for foreign taxes, and where appropriate, deferred foreign taxes.
Management has analyzed the Funds’ tax positions taken on federal income tax returns as of October 31, 2017, and for all open tax years (generally, the three prior taxable years), and has concluded that no provision for federal income tax is required in the Funds’ financial statements. Additionally, Management is not aware of any tax position for which it is reasonably possible that the total amounts of unrecognized tax benefits will change materially in the next twelve months.
Net capital losses incurred may be carried forward for an unlimited time period, and retain their tax character as either short-term or long-term capital losses.
f. CAPITAL LOSS CARRYOVERS AND DEFERRALS
As of October 31, 2017, the following Funds had accumulated net realized capital loss carryovers from securities transactions for federal income tax purposes. These amounts may be used to offset future realized capital gains, if any, for an unlimited time period.
| | | | | | | | |
| | | Capital Loss Carryover Amounts | |
| Fund | | Short-Term | | | Long-Term | |
Fairpointe ESG Equity | | $ | 136,123 | | | | — | |
LMCG Small Cap Growth | | $ | 22,011,181 | | | $ | 1,042,680 | |
DoubleLine Core Plus Bond | | $ | 1,405,809 | | | $ | 2,782,572 | |
River Road Long-Short | | $ | 11,649 | | | | — | |
| |
| | | Capital Loss Carryover Utilized | |
| Fund | | Short-Term | | | Long-Term | |
Fairpointe ESG Equity | | $ | 2,499 | | | $ | 8,883 | |
LMCG Small Cap Growth | | $ | 8,247,138 | | | $ | 3,130,798 | |
River Road Long-Short | | $ | 2,647,640 | | | $ | 450,310 | |
Guardian Capital Global Dividend | | $ | 248,044 | | | $ | 57,327 | |
As of October 31, 2017, the Funds not listed above had no accumulated net realized capital loss carryovers from securities transactions for federal income tax purposes. Should the Funds incur capital losses for the fiscal year ended October 31, 2017, such amounts may be used to offset future realized capital gains, if any, for an unlimited time period.
g. CAPITAL STOCK
The Trust’s Declaration of Trust authorizes for each Fund the issuance of an unlimited number of shares of beneficial interest, without par value. Each Fund records sales and repurchases of its capital stock on the trade date. Pictet International and Value Partners Asia Dividend will deduct a 2.00% redemption fee from the proceeds of any redemption (including a redemption by exchange) of shares if the redemption occurs within 90 days of the purchase of those shares.
208
Notes to Financial Statements (continued)
For the fiscal year ended October 31, 2017, Pictet International and Value Partners Asia Dividend had redemption fees amounting to $16,629 and $282, respectively. These amounts are netted against the cost of shares repurchased in the
Statements of Changes in Net Assets.
For the fiscal years ended October 31, 2017 and October 31, 2016, the capital stock transactions by class for the Funds were as follows:
| | | | | | | | | | | | | | | | | | | | | | | | | | | | | | | | |
| | | Fairpointe ESG Equity | | | River Road Focused Absolute Value | |
| | | October 31, 2017 | | | October 31, 2016 | | | October 31, 2017 | | | October 31, 20161 | |
| | | Shares | | | Amount | | | Shares | | | Amount | | | Shares | | | Amount | | | Shares | | | Amount | |
Class N: | | | | | | | | | | | | | | | | | | | | | | | | | | | | | | | | |
Proceeds from sale of shares | | | 88,201 | | | $ | 961,090 | | | | 17,363 | | | $ | 149,301 | | | | 647,479 | | | $ | 7,753,495 | | | | 79,891 | | | $ | 823,215 | 2 |
Reinvestment of distributions | | | 82 | | | | 874 | | | | 2,394 | | | | 21,065 | | | | 6,633 | | | | 74,093 | | | | — | | | | — | |
Cost of shares repurchased | | | (76,166 | ) | | | (853,127 | ) | | | (209,166 | ) | | | (2,022,877 | ) | | | (71,797 | ) | | | (828,931 | ) | | | (34,843 | ) | | | (376,833 | ) |
| | | | | | | | | | | | | | | | | | | | | | | | | | | | | | | | |
Net increase (decrease) | | | 12,117 | | | $ | 108,837 | | | | (189,409 | ) | | $ | (1,852,511 | ) | | | 582,315 | | | $ | 6,998,657 | | | | 45,048 | | | $ | 446,382 | |
| | | | | | | | | | | | | | | | | | | | | | | | | | | | | | | | |
Class I: | | | | | | | | | | | | | | | | | | | | | | | | | | | | | | | | |
Proceeds from sale of shares | | | 272,498 | | | $ | 3,060,629 | | | | 220,622 | | | $ | 2,101,495 | | | | 719,816 | | | $ | 8,242,714 | | | | 1,211,166 | | | $ | 11,864,367 | 2 |
Reinvestment of distributions | | | 6,396 | | | | 68,181 | | | | 5,296 | | | | 46,607 | | | | 81,254 | | | | 908,302 | | | | — | | | | — | |
Cost of shares repurchased | | | (458,651 | ) | | | (5,174,881 | ) | | | — | | | | — | | | | (405,387 | ) | | | (4,688,032 | ) | | | (171,275 | ) | | | (1,791,912 | ) |
| | | | | | | | | | | | | | | | | | | | | | | | | | | | | | | | |
Net increase (decrease) | | | (179,757 | ) | | $ | (2,046,071 | ) | | | 225,918 | | | $ | 2,148,102 | | | | 395,683 | | | $ | 4,462,984 | | | | 1,039,891 | | | $ | 10,072,455 | |
| | | | | | | | | | | | | | | | | | | | | | | | | | | | | | | | |
Class Z:3 | | | | | | | | | | | | | | | | | | | | | | | | | | | | | | | | |
Proceeds from sale of shares | | | — | | | | — | | | | — | | | | — | | | | 5,906 | | | $ | 71,500 | | | | — | | | | — | |
Cost of shares repurchased | | | — | | | | — | | | | — | | | | — | | | | (821 | ) | | | (9,951 | ) | | | — | | | | — | |
| | | | | | | | | | | | | | | | | | | | | | | | | | | | | | | | |
Net increase | | | — | | | | — | | | | — | | | | — | | | | 5,085 | | | $ | 61,549 | | | | — | | | | — | |
| | | | | | | | | | | | | | | | | | | | | | | | | | | | | | | | |
209
Notes to Financial Statements (continued)
| | | | | | | | | | | | | | | | | | | | | | | | | | | | | | | | |
| | | Montag & Caldwell Growth | | | River Road Dividend All Cap Value | |
| | | October 31, 2017 | | | October 31, 2016 | | | October 31, 2017 | | | October 31, 2016 | |
| | | Shares | | | Amount | | | Shares | | | Amount | | | Shares | | | Amount | | | Shares | | | Amount | |
Class N: | | | | | | | | | | | | | | | | | | | | | | | | | | | | | | | | |
Proceeds from sale of shares | | | 1,593,399 | | | $ | 30,026,822 | | | | 6,885,996 | | | $ | 138,793,971 | | | | 5,980,618 | | | $ | 75,919,541 | | | | 13,306,940 | | | $ | 160,818,056 | |
Reinvestment of distributions | | | 2,190,601 | | | | 38,861,264 | | | | 9,531,891 | | | | 192,258,234 | | | | 1,997,056 | | | | 24,865,471 | | | | 2,090,827 | | | | 23,932,444 | |
Cost of shares repurchased | | | (17,821,873 | ) | | | (347,708,108 | ) | | | (21,230,999 | ) | | | (438,292,746 | ) | | | (21,657,253 | ) | | | (270,192,230 | ) | | | (8,055,733 | ) | | | (95,895,185 | ) |
| | | | | | | | | | | | | | | | | | | | | | | | | | | | | | | | |
Net increase (decrease) | | | (14,037,873 | ) | | $ | (278,820,022 | ) | | | (4,813,112 | ) | | $ | (107,240,541 | ) | | | (13,679,579 | ) | | $ | (169,407,218 | ) | | | 7,342,034 | | | $ | 88,855,315 | |
| | | | | | | | | | | | | | | | | | | | | | | | | | | | | | | | |
Class I: | | | | | | | | | | | | | | | | | | | | | | | | | | | | | | | | |
Proceeds from sale of shares | | | 9,700,745 | | | $ | 190,872,936 | | | | 16,816,934 | | | $ | 343,661,135 | | | | 24,499,792 | | | $ | 306,814,880 | | | | 11,327,948 | | | $ | 136,478,192 | |
Reinvestment of distributions | | | 3,487,749 | | | | 61,975,608 | | | | 9,866,673 | | | | 199,997,475 | | | | 3,741,774 | | | | 46,603,083 | | | | 4,402,905 | | | | 50,321,034 | |
Cost of shares repurchased | | | (24,013,174 | ) | | | (459,956,099 | ) | | | (35,152,702 | ) | | | (790,240,872 | ) | | | (12,575,939 | ) | | | (158,820,333 | ) | | | (20,268,357 | ) | | | (241,076,892 | ) |
| | | | | | | | | | | | | | | | | | | | | | | | | | | | | | | | |
Net increase (decrease) | | | (10,824,680 | ) | | $ | (207,107,555 | ) | | | (8,469,095 | ) | | $ | (246,582,262 | ) | | | 15,665,627 | | | $ | 194,597,630 | | | | (4,537,504 | ) | | $ | (54,277,666 | ) |
| | | | | | | | | | | | | | | | | | | | | | | | | | | | | | | | |
Class R: | | | | | | | | | | | | | | | | | | | | | | | | | | | | | | | | |
Proceeds from sale of shares | | | 41,235 | | | $ | 780,021 | | | | 61,438 | | | $ | 1,369,978 | | | | — | | | | — | | | | — | | | | — | |
Reinvestment of distributions | | | 27,055 | | | | 469,668 | | | | 66,520 | | | | 1,315,758 | | | | — | | | | — | | | | — | | | | — | |
Cost of shares repurchased | | | (320,225 | ) | | | (6,163,199 | ) | | | (66,927 | ) | | | (1,452,485 | ) | | | — | | | | — | | | | — | | | | — | |
| | | | | | | | | | | | | | | | | | | | | | | | | | | | | | | | |
Net increase (decrease) | | | (251,935 | ) | | $ | (4,913,510 | ) | | | 61,031 | | | $ | 1,233,251 | | | | — | | | | — | | | | — | | | | — | |
| | | | | | | | | | | | | | | | | | | | | | | | | | | | | | | | |
Class Z:3 | | | | | | | | | | | | | | | | | | | | | | | | | | | | | | | | |
Proceeds from sale of shares | | | — | | | | — | | | | — | | | | — | | | | 19,980 | | | $ | 256,133 | | | | — | | | | — | |
Reinvestment of distributions | | | — | | | | — | | | | — | | | | — | | | | 18 | | | | 234 | | | | — | | | | — | |
| | | | | | | | | | | | | | | | | | | | | | | | | | | | | | | | |
Net increase | | | — | | | | — | | | | — | | | | — | | | | 19,998 | | | $ | 256,367 | | | | — | | | | — | |
| | | | | | | | | | | | | | | | | | | | | | | | | | | | | | | | |
210
Notes to Financial Statements (continued)
| | | | | | | | | | | | | | | | | | | | | | | | | | | | | | | | |
| | | River Road Dividend All Cap Value II | | | Fairpointe Mid Cap | |
| | | October 31, 2017 | | | October 31, 2016 | | | October 31, 2017 | | | October 31, 2016 | |
| | | Shares | | | Amount | | | Shares | | | Amount | | | Shares | | | Amount | | | Shares | | | Amount | |
Class N: | | | | | | | | | | | | | | | | | | | | | | | | | | | | | | | | |
Proceeds from sale of shares | | | 27,314 | | | $ | 393,482 | | | | 54,504 | | | $ | 731,061 | | | | 7,305,104 | | | $ | 309,293,225 | | | | 6,721,809 | | | $ | 235,715,950 | |
Reinvestment of distributions | | | 13,295 | | | | 189,278 | | | | 7,583 | | | | 98,773 | | | | 1,525,543 | | | | 63,599,870 | | | | 2,786,316 | | | | 96,573,724 | |
Cost of shares repurchased | | | (82,903 | ) | | | (1,202,400 | ) | | | (36,513 | ) | | | (472,861 | ) | | | (14,716,260 | ) | | | (623,654,945 | ) | | | (22,391,843 | ) | | | (793,563,705 | ) |
| | | | | | | | | | | | | | | | | | | | | | | | | | | | | | | | |
Net increase (decrease) | | | (42,294 | ) | | $ | (619,640 | ) | | | 25,574 | | | $ | 356,973 | | | | (5,885,613 | ) | | $ | (250,761,850 | ) | | | (12,883,718 | ) | | $ | (461,274,031 | ) |
| | | | | | | | | | | | | | | | | | | | | | | | | | | | | | | | |
Class I: | | | | | | | | | | | | | | | | | | | | | | | | | | | | | | | | |
Proceeds from sale of shares | | | 1,000,176 | | | $ | 14,381,093 | | | | 1,028,192 | | | $ | 13,465,509 | | | | 23,047,039 | | | $ | 1,002,859,544 | | | | 18,281,929 | | | $ | 622,488,962 | |
Reinvestment of distributions | | | 453,032 | | | | 6,458,281 | | | | 288,126 | | | | 3,759,968 | | | | 2,326,071 | | | | 99,113,891 | | | | 3,759,518 | | | | 133,199,701 | |
Cost of shares repurchased | | | (1,899,080 | ) | | | (27,331,967 | ) | | | (2,187,747 | ) | | | (28,400,388 | ) | | | (18,908,575 | ) | | | (818,033,752 | ) | | | (40,242,836 | ) | | | (1,421,123,304 | ) |
| | | | | | | | | | | | | | | | | | | | | | | | | | | | | | | | |
Net increase (decrease) | | | (445,872 | ) | | $ | (6,492,593 | ) | | | (871,429 | ) | | $ | (11,174,911 | ) | | | 6,464,535 | | | $ | 283,939,683 | | | | (18,201,389 | ) | | $ | (625,434,641 | ) |
| | | | | | | | | | | | | | | | | | | | | | | | | | | | | | | | |
Class Z:3 | | | | | | | | | | | | | | | | | | | | | | | | | | | | | | | | |
Proceeds from sale of shares | | | 28,471 | | | $ | 422,148 | | | | — | | | | — | | | | 235,275 | | | $ | 10,195,777 | | | | — | | | | — | |
Reinvestment of distributions | | | 7 | | | | 102 | | | | — | | | | — | | | | — | | | | — | | | | — | | | | — | |
Cost of shares repurchased | | | (6,791 | ) | | | (100,984 | ) | | | — | | | | — | | | | (11,302 | ) | | | (489,263 | ) | | | — | | | | — | |
| | | | | | | | | | | | | | | | | | | | | | | | | | | | | | | | |
Net increase | | | 21,687 | | | $ | 321,266 | | | | — | | | | — | | | | 223,973 | | | $ | 9,706,514 | | | | — | | | | — | |
| | | | | | | | | | | | | | | | | | | | | | | | | | | | | | | | |
211
Notes to Financial Statements (continued)
| | | | | | | | | | | | | | | | | | | | | | | | | | | | | | | | |
| | | Montag & Caldwell Mid Cap Growth | | | LMCG Small Cap Growth | |
| | | October 31, 2017 | | | October 31, 2016 | | | October 31, 2017 | | | October 31, 2016 | |
| | | Shares | | | Amount | | | Shares | | | Amount | | | Shares | | | Amount | | | Shares | | | Amount | |
Class N: | | | | | | | | | | | | | | | | | | | | | | | | | | | | | | | | |
Proceeds from sale of shares | | | 9,006 | | | $ | 91,555 | | | | 12,426 | | | $ | 122,976 | | | | 592,230 | | | $ | 8,766,397 | | | | 1,114,051 | | | $ | 14,417,787 | |
Reinvestment of distributions | | | 31,174 | | | | 308,929 | | | | 53,656 | | | | 553,193 | | | | — | | | | — | | | | 1,863 | | | | 26,618 | |
Cost of shares repurchased | | | (47,693 | ) | | | (501,916 | ) | | | (74,744 | ) | | | (736,302 | ) | | | (2,005,892 | ) | | | (28,161,175 | ) | | | (7,368,417 | ) | | | (92,674,265 | ) |
| | | | | | | | | | | | | | | | | | | | | | | | | | | | | | | | |
Net decrease | | | (7,513 | ) | | $ | (101,432 | ) | | | (8,662 | ) | | $ | (60,133 | ) | | | (1,413,662 | ) | | $ | (19,394,778 | ) | | | (6,252,503 | ) | | $ | (78,229,860 | ) |
| | | | | | | | | | | | | | | | | | | | | | | | | | | | | | | | |
Class I: | | | | | | | | | | | | | | | | | | | | | | | | | | | | | | | | |
Proceeds from sale of shares | | | 19,554 | | | $ | 203,649 | | | | 11,713 | | | $ | 120,040 | | | | 3,523,420 | | | $ | 49,198,752 | | | | 3,981,494 | | | $ | 51,076,318 | |
Reinvestment of distributions | | | 31,625 | | | | 314,672 | | | | 67,037 | | | | 693,830 | | | | — | | | | — | | | | 738 | | | | 10,674 | |
Cost of shares repurchased | | | (23,213 | ) | | | (241,937 | ) | | | (221,127 | ) | | | (2,325,128 | ) | | | (3,091,429 | ) | | | (44,296,318 | ) | | | (4,547,748 | ) | | | (58,946,860 | ) |
| | | | | | | | | | | | | | | | | | | | | | | | | | | | | | | | |
Net increase (decrease) | | | 27,966 | | | $ | 276,384 | | | | (142,377 | ) | | $ | (1,511,258 | ) | | | 431,991 | | | $ | 4,902,434 | | | | (565,516 | ) | | $ | (7,859,868 | ) |
| | | | | | | | | | | | | | | | | | | | | | | | | | | | | | | | |
212
Notes to Financial Statements (continued)
| | | | | | | | | | | | | | | | | | | | | | | | | | | | | | | | |
| | | River Road Small-Mid Cap Value | | | River Road Small Cap Value | |
| | | October 31, 2017 | | | October 31, 2016 | | | October 31, 2017 | | | October 31, 2016 | |
| | | Shares | | | Amount | | | Shares | | | Amount | | | Shares | | | Amount | | | Shares | | | Amount | |
Class N: | | | | | | | | | | | | | | | | | | | | | | | | | | | | | | | | |
Proceeds from sale of shares | | | 385,856 | | | $ | 3,108,607 | | | | 141,827 | | | $ | 960,698 | | | | 944,431 | | | $ | 12,965,444 | | | | 471,028 | | | $ | 5,575,217 | |
Reinvestment of distributions | | | 47,035 | | | | 349,943 | | | | 100,813 | | | | 635,124 | | | | 89,002 | | | | 1,200,640 | | | | 114,605 | | | | 1,280,134 | |
Cost of shares repurchased | | | (186,000 | ) | | | (1,432,561 | ) | | | (200,434 | ) | | | (1,392,341 | ) | | | (615,238 | ) | | | (8,425,533 | ) | | | (884,374 | ) | | | (10,279,537 | ) |
| | | | | | | | | | | | | | | | | | | | | | | | | | | | | | | | |
Net increase (decrease) | | | 246,891 | | | $ | 2,025,989 | | | | 42,206 | | | $ | 203,481 | | | | 418,195 | | | $ | 5,740,551 | | | | (298,741 | ) | | $ | (3,424,186 | ) |
| | | | | | | | | | | | | | | | | | | | | | | | | | | | | | | | |
Class I: | | | | | | | | | | | | | | | | | | | | | | | | | | | | | | | | |
Proceeds from sale of shares | | | 535,556 | | | $ | 4,333,931 | | | | 412,100 | | | $ | 2,938,365 | | | | 3,656,695 | | | $ | 50,889,911 | | | | 3,313,689 | | | $ | 38,510,584 | |
Reinvestment of distributions | | | 356,000 | | | | 2,691,359 | | | | 1,133,203 | | | | 7,252,502 | | | | 928,655 | | | | 12,685,426 | | | | 1,196,902 | | | | 13,501,050 | |
Cost of shares repurchased | | | (1,402,176 | ) | | | (11,152,559 | ) | | | (8,536,883 | ) | | | (61,806,449 | ) | | | (5,367,339 | ) | | | (74,149,737 | ) | | | (4,595,113 | ) | | | (53,647,832 | ) |
| | | | | | | | | | | | | | | | | | | | | | | | | | | | | | | | |
Net decrease | | | (510,620 | ) | | $ | (4,127,269 | ) | | | (6,991,580 | ) | | $ | (51,615,582 | ) | | | (781,989 | ) | | $ | (10,574,400 | ) | | | (84,522 | ) | | $ | (1,636,198 | ) |
| | | | | | | | | | | | | | | | | | | | | | | | | | | | | | | | |
Class Z:3 | | | | | | | | | | | | | | | | | | | | | | | | | | | | | | | | |
Proceeds from sale of shares | | | 8,855 | | | $ | 75,000 | | | | — | | | | — | | | | 17,320 | | | $ | 254,624 | | | | — | | | | — | |
Cost of shares repurchased | | | (2,948 | ) | | | (25,265 | ) | | | — | | | | — | | | | (6,812 | ) | | | (100,681 | ) | | | — | | | | — | |
| | | | | | | | | | | | | | | | | | | | | | | | | | | | | | | | |
Net increase | | | 5,907 | | | $ | 49,735 | | | | — | | | | — | | | | 10,508 | | | $ | 153,943 | | | | — | | | | — | |
| | | | | | | | | | | | | | | | | | | | | | | | | | | | | | | | |
213
Notes to Financial Statements (continued)
| | | | | | | | | | | | | | | | | | | | | | | | | | | | | | | | |
| | | Silvercrest Small Cap | | | GW&K U.S. Small Cap Growth | |
| | | October 31, 2017 | | | October 31, 2016 | | | October 31, 2017 | | | October 31, 2016 | |
| | | Shares | | | Amount | | | Shares | | | Amount | | | Shares | | | Amount | | | Shares | | | Amount | |
Class N: | | | | | | | | | | | | | | | | | | | | | | | | | | | | | | | | |
Proceeds from sale of shares | | | 644,208 | | | $ | 11,387,511 | | | | 361,591 | | | $ | 5,273,540 | | | | 1,523,840 | | | $ | 6,465,730 | | | | 1,153,211 | | | $ | 7,338,783 | |
Reinvestment of distributions | | | 9,537 | | | | 172,910 | | | | 55,211 | | | | 784,554 | | | | 11,295 | | | | 43,938 | | | | 10,933,982 | | | | 56,843,888 | |
Cost of shares repurchased | | | (644,356 | ) | | | (11,580,225 | ) | | | (359,930 | ) | | | (5,188,836 | ) | | | (4,499,264 | ) | | | (18,748,206 | ) | | | (16,404,588 | ) | | | (207,677,409 | ) |
| | | | | | | | | | | | | | | | | | | | | | | | | | | | | | | | |
Net increase (decrease) | | | 9,389 | | | $ | (19,804 | ) | | | 56,872 | | | $ | 869,258 | | | | (2,964,129 | ) | | $ | (12,238,538 | ) | | | (4,317,395 | ) | | $ | (143,494,738 | ) |
| | | | | | | | | | | | | | | | | | | | | | | | | | | | | | | | |
Class I: | | | | | | | | | | | | | | | | | | | | | | | | | | | | | | | | |
Proceeds from sale of shares | | | 4,944,964 | | | $ | 88,696,627 | | | | 3,803,977 | | | $ | 55,865,834 | | | | 425,289 | | | $ | 2,183,766 | | | | 2,555,143 | | | $ | 28,714,382 | |
Reinvestment of distributions | | | 113,141 | | | | 2,064,810 | | | | 425,913 | | | | 6,090,561 | | | | 2,888 | | | | 13,402 | | | | 14,542,368 | | | | 88,178,272 | |
Cost of shares repurchased | | | (4,327,524 | ) | | | (78,254,984 | ) | | | (2,034,956 | ) | | | (29,716,304 | ) | | | (1,262,888 | ) | | | (6,088,383 | ) | | | (30,445,627 | ) | | | (306,125,519 | )4 |
| | | | | | | | | | | | | | | | | | | | | | | | | | | | | | | | |
Net increase (decrease) | | | 730,581 | | | $ | 12,506,453 | | | | 2,194,934 | | | $ | 32,240,091 | | | | (834,711 | ) | | $ | (3,891,215 | ) | | | (13,348,116 | ) | | $ | (189,232,865 | ) |
| | | | | | | | | | | | | | | | | | | | | | | | | | | | | | | | |
Class Z:5 | | | | | | | | | | | | | | | | | | | | | | | | | | | | | | | | |
Proceeds from sale of shares | | | 15,810 | | | $ | 306,839 | | | | — | | | | — | | | | 35,770 | | | $ | 172,252 | | | | — | | | | — | |
Cost of shares repurchased | | | (5,198 | ) | | | (101,300 | ) | | | — | | | | — | | | | (10,301 | ) | | | (49,344 | ) | | | — | | | | — | |
| | | | | | | | | | | | | | | | | | | | | | | | | | | | | | | | |
Net increase | | | 10,612 | | | $ | 205,539 | | | | — | | | | — | | | | 25,469 | | | $ | 122,908 | | | | — | | | | — | |
| | | | | | | | | | | | | | | | | | | | | | | | | | | | | | | | |
214
Notes to Financial Statements (continued)
| | | | | | | | | | | | | | | | | | | | | | | | | | | | | | | | |
| | | DoubleLine Core Plus Bond | | | Lake Partners LASSO Alternatives | |
| | | October 31, 2017 | | | October 31, 2016 | | | October 31, 2017 | | | October 31, 2016 | |
| | | Shares | | | Amount | | | Shares | | | Amount | | | Shares | | | Amount | | | Shares | | | Amount | |
Class N: | | | | | | | | | | | | | | | | | | | | | | | | | | | | | | | | |
Proceeds from sale of shares | | | 5,970,051 | | | $ | 63,317,627 | | | | 22,657,884 | | | $ | 238,831,911 | | | | 345,295 | | | $ | 4,172,790 | | | | 489,315 | | | $ | 5,828,383 | |
Reinvestment of distributions | | | 755,186 | | | | 7,984,132 | | | | 783,701 | | | | 8,367,108 | | | | 10,180 | | | | 122,769 | | | | 206,436 | | | | 2,444,199 | |
Cost of shares repurchased | | | (19,500,094 | ) | | | (206,673,345 | ) | | | (12,532,368 | ) | | | (133,778,257 | ) | | | (2,402,154 | ) | | | (29,008,523 | ) | | | (1,121,075 | ) | | | (13,344,999 | ) |
| | | | | | | | | | | | | | | | | | | | | | | | | | | | | | | | |
Net increase (decrease) | | | (12,774,857 | ) | | $ | (135,371,586 | ) | | | 10,909,217 | | | $ | 113,420,762 | | | | (2,046,679 | ) | | $ | (24,712,964 | ) | | | (425,324 | ) | | $ | (5,072,417 | ) |
| | | | | | | | | | | | | | | | | | | | | | | | | | | | | | | | |
Class I: | | | | | | | | | | | | | | | | | | | | | | | | | | | | | | | | |
Proceeds from sale of shares | | | 22,185,109 | | | $ | 235,853,686 | | | | 20,257,212 | | | $ | 215,384,722 | | | | 1,126,021 | | | $ | 13,576,530 | | | | 1,608,291 | | | $ | 19,329,625 | |
Reinvestment of distributions | | | 1,358,488 | | | | 14,390,670 | | | | 977,499 | | | | 10,425,030 | | | | 10,176 | | | | 123,226 | | | | 384,769 | | | | 4,563,357 | |
Cost of shares repurchased | | | (12,994,909 | ) | | | (137,962,662 | ) | | | (12,902,219 | ) | | | (138,104,461 | ) | | | (3,741,362 | ) | | | (45,361,228 | ) | | | (9,289,112 | ) | | | (111,785,166 | ) |
| | | | | | | | | | | | | | | | | | | | | | | | | | | | | | | | |
Net increase (decrease) | | | 10,548,688 | | | $ | 112,281,694 | | | | 8,332,492 | | | $ | 87,705,291 | | | | (2,605,165 | ) | | $ | (31,661,472 | ) | | | (7,296,052 | ) | | $ | (87,892,184 | ) |
| | | | | | | | | | | | | | | | | | | | | | | | | | | | | | | | |
Class Z:3 | | | | | | | | | | | | | | | | | | | | | | | | | | | | | | | | |
Proceeds from sale of shares | | | 163,536 | | | $ | 1,744,375 | | | | — | | | | — | | | | — | | | | — | | | | — | | | | — | |
Reinvestment of distributions | | | 73 | | | | 774 | | | | — | | | | — | | | | — | | | | — | | | | — | | | | — | |
Cost of shares repurchased | | | (14,068 | ) | | | (149,966 | ) | | | — | | | | — | | | | — | | | | — | | | | — | | | | — | |
| | | | | | | | | | | | | | | | | | | | | | | | | | | | | | | | |
Net increase | | | 149,541 | | | $ | 1,595,183 | | | | — | | | | — | | | | — | | | | — | | | | — | | | | — | |
| | | | | | | | | | | | | | | | | | | | | | | | | | | | | | | | |
215
Notes to Financial Statements (continued)
| | | | | | | | | | | | | | | | | | | | | | | | | | | | | | | | |
| | | River Road Long-Short | | | Guardian Capital Global Dividend | |
| | | October 31, 2017 | | | October 31, 2016 | | | October 31, 2017 | | | October 31, 2016 | |
| | | Shares | | | Amount | | | Shares | | | Amount | | | Shares | | | Amount | | | Shares | | | Amount | |
Class N: | | | | | | | | | | | | | | | | | | | | | | | | | | | | | | | | |
Proceeds from sale of shares | | | 124,722 | | | $ | 1,462,085 | | | | 104,231 | | | $ | 1,143,023 | | | | 99,578 | | | $ | 1,071,014 | | | | 1,166 | | | $ | 11,595 | |
Reinvestment of distributions | | | — | | | | — | | | | 61,918 | | | | 683,579 | | | | 768 | | | | 8,393 | | | | 69 | | | | 692 | |
Cost of shares repurchased | | | (467,341 | ) | | | (5,484,160 | ) | | | (1,814,546 | ) | | | (19,872,053 | ) | | | (101,832 | ) | | | (1,065,121 | ) | | | (409 | ) | | | (3,920 | ) |
| | | | | | | | | | | | | | | | | | | | | | | | | | | | | | | | |
Net increase (decrease) | | | (342,619 | ) | | $ | (4,022,075 | ) | | | (1,648,397 | ) | | $ | (18,045,451 | ) | | | (1,486 | ) | | $ | 14,286 | | | | 826 | | | $ | 8,367 | |
| | | | | | | | | | | | | | | | | | | | | | | | | | | | | | | | |
Class I: | | | | | | | | | | | | | | | | | | | | | | | | | | | | | | | | |
Proceeds from sale of shares | | | 847,233 | | | $ | 10,107,303 | | | | 2,591,251 | | | $ | 28,866,703 | | | | 344,631 | | | $ | 3,660,623 | | | | 2,574,130 | | | $ | 24,999,875 | |
Reinvestment of distributions | | | — | | | | — | | | | 102,909 | | | | 1,144,342 | | | | 45,392 | | | | 481,171 | | | | 6,791 | | | | 67,637 | |
Cost of shares repurchased | | | (1,890,230 | ) | | | (22,477,127 | ) | | | (3,571,926 | ) | | | (39,835,881 | ) | | | (110,943 | ) | | | (1,190,518 | ) | | | (1,319 | ) | | | (12,858 | ) |
| | | | | | | | | | | | | | | | | | | | | | | | | | | | | | | | |
Net increase (decrease) | | | (1,042,997 | ) | | $ | (12,369,824 | ) | | | (877,766 | ) | | $ | (9,824,836 | ) | | | 279,080 | | | $ | 2,951,276 | | | | 2,579,602 | | | $ | 25,054,654 | |
| | | | | | | | | | | | | | | | | | | | | | | | | | | | | | | | |
Class Z:3 | | | | | | | | | | | | | | | | | | | | | | | | | | | | | | | | |
Proceeds from sale of shares | | | 1,995 | | | $ | 25,000 | | | | — | | | | — | | | | — | | | | — | | | | — | | | | — | |
| | | | | | | | | | | | | | | | | | | | | | | | | | | | | | | | |
Net increase | | | 1,995 | | | $ | 25,000 | | | | — | | | | — | | | | — | | | | — | | | | — | | | | — | |
| | | | | | | | | | | | | | | | | | | | | | | | | | | | | | | | |
216
Notes to Financial Statements (continued)
| | | | | | | | | | | | | | | | | | | | | | | | | | | | | | | | |
| | | Pictet International | | | Value Partners Asia Dividend | |
| | | October 31, 2017 | | | October 31, 2016 | | | October 31, 2017 | | | October 31, 20166 | |
| | | Shares | | | Amount | | | Shares | | | Amount | | | Shares | | | Amount | | | Shares | | | Amount | |
Class N: | | | | | | | | | | | | | | | | | | | | | | | | | | | | | | | | |
Proceeds from sale of shares | | | 348,926 | | | $ | 3,906,238 | | | | 7,362 | | | $ | 68,989 | | | | 14,410 | | | $ | 166,466 | | | | 75,011 | | | $ | 750,122 | |
Reinvestment of distributions | | | 396 | | | | 3,668 | | | | 97 | | | | 915 | | | | 3,872 | | | | 40,610 | | | | 1,033 | | | | 10,659 | |
Cost of shares repurchased | | | (17,490 | ) | | | (191,463 | ) | | | (104,219 | ) | | | (979,005 | ) | | | (1,716 | ) | | | (19,730 | ) | | | (1 | ) | | | (11 | ) |
Share Conversion | | | — | | | | — | | | | — | | | | 96 | | | | — | | | | — | | | | — | | | | — | |
| | | | | | | | | | | | | | | | | | | | | | | | | | | | | | | | |
Net increase (decrease) | | | 331,832 | | | $ | 3,718,443 | | | | (96,760 | ) | | $ | (909,005 | ) | | | 16,566 | | | $ | 187,346 | | | | 76,043 | | | $ | 760,770 | |
| | | | | | | | | | | | | | | | | | | | | | | | | | | | | | | | |
Class I: | | | | | | | | | | | | | | | | | | | | | | | | | | | | | | | | |
Proceeds from sale of shares | | | 55,029,309 | | | $ | 564,088,083 | | | | 146,143,544 | | | $ | 1,339,299,965 | | | | — | | | | — | | | | 675,001 | | | $ | 6,750,010 | |
Reinvestment of distributions | | | 1,273,736 | | | | 11,756,503 | | | | 7,456 | | | | 70,238 | | | | 32,781 | | | | 340,841 | | | | 10,194 | | | | 105,120 | |
Cost of shares repurchased | | | (20,551,993 | ) | | | (209,601,749 | ) | | | (12,838,794 | ) | | | (121,477,160 | ) | | | — | | | | — | | | | (1 | ) | | | (11 | ) |
Share Conversion | | | — | | | | — | | | | — | | | | 619,078 | | | | — | | | | — | | | | — | | | | — | |
| | | | | | | | | | | | | | | | | | | | | | | | | | | | | | | | |
Net increase | | | 35,751,052 | | | $ | 366,242,837 | | | | 133,312,206 | | | $ | 1,218,512,121 | | | | 32,781 | | | $ | 340,841 | | | | 685,194 | | | $ | 6,855,119 | |
| | | | | | | | | | | | | | | | | | | | | | | | | | | | | | | | |
Class Z:3 | | | | | | | | | | | | | | | | | | | | | | | | | | | | | | | | |
Proceeds from sale of shares | | | 21,930 | | | $ | 250,000 | | | | — | | | | — | | | | — | | | | — | | | | — | | | | — | |
| | | | | | | | | | | | | | | | | | | | | | | | | | | | | | | | |
Net increase | | | 21,930 | | | $ | 250,000 | | | | — | | | | — | | | | — | | | | — | | | | — | | | | — | |
| | | | | | | | | | | | | | | | | | | | | | | | | | | | | | | | |
217
Notes to Financial Statements (continued)
| | | | | | | | | | | | | | | | |
| | | Montag & Caldwell Balanced | |
| | | October 31, 2017 | | | October 31, 2016 | |
| | | Shares | | | Amount | | | Shares | | | Amount | |
Class N: | | | | | | | | | | | | | | | | |
Proceeds from sale of shares | | | 54,946 | | | $ | 1,201,059 | | | | 813,318 | | | $ | 18,188,595 | |
Reinvestment of distributions | | | 95,759 | | | | 1,962,272 | | | | 58,085 | | | | 1,325,502 | |
Cost of shares repurchased | | | (475,469 | ) | | | (10,336,837 | ) | | | (864,228 | ) | | | (19,777,162 | ) |
| | | | | | | | | | | | | | | | |
Net increase (decrease) | | | (324,764 | ) | | $ | (7,173,506 | ) | | | 7,175 | | | $ | (263,065 | ) |
| | | | | | | | | | | | | | | | |
Class I: | | | | | | | | | | | | | | | | |
Proceeds from sale of shares | | | 48,632 | | | $ | 1,050,692 | | | | 54,898 | | | $ | 1,259,171 | |
Reinvestment of distributions | | | 8,056 | | | | 164,681 | | | | 4,977 | | | | 113,182 | |
Cost of shares repurchased | | | (52,380 | ) | | | (1,137,778 | ) | | | (70,649 | ) | | | (1,615,105 | ) |
| | | | | | | | | | | | | | | | |
Net increase (decrease) | | | 4,308 | | | $ | 77,595 | | | | (10,774 | ) | | $ | (242,752 | ) |
| | | | | | | | | | | | | | | | |
| 1 | The commencement of investment operations for River Road Focused Absolute Value was November 3, 2015. |
| 2 | River Road Focused Absolute Value had a subscription in-kind in the amount of $3,663,463 on November 3, 2015. The subscription was comprised of securities, cash and dividends accrued in the amounts of $3,632,219, $26,056 and $5,188, respectively. |
| 3 | Commencement of operations for Class Z shares was October 2, 2017. |
| 4 | GW&K U.S. Small Cap Growth had a redemption in-kind in the amount of $142,509,610 on December 1, 2015. The redemption was comprised of securities and cash in the amount of $134,464,305 and $8,045,305, respectively. |
| 5 | Commencement of operations was October 2, 2017 for Class Z of Silvercrest Small Cap and February 27, 2017 for Class Z of GW&K U.S. Small Cap Growth. |
| 6 | The commencement of operations was December 16, 2015. |
At October 31, 2017, certain affiliated and unaffiliated shareholders of record individually or collectively held greater than 10% of the net assets of the Funds as follows:
| | | | | | | | |
| | | Number of | | | Collectively | |
| | | Shareholders | | | Own | |
River Road Focused Absolute Value | | | 1 | | | | 16 | % |
Montag & Caldwell Mid Cap Growth | | | 1 | | | | 13 | % |
River Road Small Mid-Cap Value | | | 1 | | | | 16 | % |
River Road Small Cap Value | | | 1 | | | | 14 | % |
Silvercrest Small Cap | | | 1 | | | | 13 | % |
River Road Long-Short | | | 1 | | | | 12 | % |
Guardian Capital Global Dividend | | | 2 | | | | 89 | % |
Value Partners Asia Dividend | | | 1 | | | | 98 | % |
Transactions by these shareholders may have a material impact on their respective Fund.
h. REPURCHASE AGREEMENTS AND JOINT REPURCHASE AGREEMENTS
The Funds may enter into third-party repurchase agreements for temporary cash management purposes and third-party joint repurchase agreements for reinvestment of cash collateral on securities lending transactions under the securities lending program offered by The Bank of New York Mellon (“BNYM”) (the “Program”) (collectively, “Repurchase Agreements”). The value of the underlying collateral, including accrued interest, must equal or exceed the value of the
Repurchase Agreements during the term of the agreement. For joint repurchase agreements, the Funds participate on a pro rata basis with other clients of BNYM in its share of the underlying collateral under such joint repurchase agreements and in its share of proceeds from any repurchase or other disposition of the underlying collateral. The underlying collateral for all Repurchase Agreements is held in safekeeping by the Funds’ custodian or at the Federal Reserve Bank. If the seller defaults and the value of the collateral declines, or if bankruptcy proceedings commence with respect to the seller of the security, realization of the collateral by the Funds may be delayed or limited. Pursuant to the Program, the Funds are indemnified for such losses by BNYM on joint repurchase agreements.
At October 31, 2017, the market value of Repurchase Agreements outstanding is as follows:
| | | | |
| | | Market Value | |
River Road Focused Absolute Value | | $ | 2,100,673 | |
River Road Dividend All Cap Value | | | 26,093,804 | |
River Road Dividend All Cap Value II | | | 5,954,800 | |
Montag & Caldwell Mid Cap Growth | | | 499,381 | |
LMCG Small Cap Growth | | | 7,506,875 | |
River Road Small-Mid Cap Value | | | 2,065,477 | |
River Road Small Cap Value | | | 13,216,433 | |
Silvercrest Small Cap | | | 13,001,471 | |
GW&K U.S. Small Cap Growth | | | 2,143,996 | |
DoubleLine Core Plus Bond | | | 4,124,384 | |
218
Notes to Financial Statements (continued)
| | | | |
| | | Market Value | |
Guardian Capital Global Dividend | | $ | 1,022,931 | |
Pictet International | | | 28,379,961 | |
Value Partners Asia Dividend | | | 32,121 | |
i. FOREIGN CURRENCY TRANSLATION
The books and records of the Funds are maintained in U.S. dollars. The value of investments, assets and liabilities denominated in currencies other than U.S. dollars are translated into U.S. dollars based upon current foreign exchange rates. Purchases and sales of foreign investments, income and expenses are converted into U.S. dollars based on currency exchange rates prevailing on the respective dates of such transactions. Net realized and unrealized gain (loss) on foreign currency transactions represent: (1) foreign exchange gains and losses from the sale and holdings of foreign currencies; (2) gains and losses between trade date and settlement date on investment securities transactions and forward foreign currency exchange contracts; and (3) gains and losses from the difference between amounts of interest and dividends recorded and the amounts actually received.
The Funds do not isolate the net realized and unrealized gain or loss resulting from changes in exchange rates from the fluctuations in market prices of securities held. Such fluctuations are included with the net realized and unrealized gain or loss on investments.
j. SECURITIES TRANSACTED ON A WHEN ISSUED BASIS
DoubleLine Core Plus Bond may enter into To-Be-Announced (“TBA”) sale commitments to hedge their portfolio positions or to sell mortgage-backed securities they own under delayed delivery arrangements. Proceeds of TBA sale commitments are not received until the contractual settlement date. During the time a TBA sale commitment is outstanding, equivalent deliverable securities, with the same counterparty, or an offsetting TBA purchase commitment deliverable on or before the sale commitment date, are held as “cover” for the transaction. Unsettled TBA sale commitments are valued at the current market value of the underlying securities according to the procedures described under “Valuation of Investments,” in Footnote 1a above.
Each TBA contract is marked-to-market daily and the change in market value is recorded by the Fund as an unrealized gain or loss. If the TBA sale commitment is closed through the acquisition of an offsetting purchase commitment with the same broker, the Fund realize a gain or loss. If the Fund deliver securities under the commitment, the Fund realize a gain or a loss from the sale of the securities based upon the unit price established at the date the commitment was entered into.
k. DELAYED DELIVERY TRANSACTIONS AND WHEN-ISSUED SECURITIES
DoubleLine Core Plus Bond may enter into securities transactions on a delayed delivery or when issued basis. Payment and delivery may take place after the customary settlement period for that security. The price of the underlying securities and the date when the securities will be delivered and paid for are fixed at the time the transaction is negotiated. During the time a delayed delivery sell is outstanding, the contract is marked to market daily and equivalent deliverable securities are held for the transaction. The value of the securities purchased on a delayed delivery or when-issued basis are identified as such in the Fund’s
Schedule of Portfolio Investments. With respect to purchase commitments, the securities as segregated in their records with a value at least equal to the amount of the commitment. Delayed delivery or when-issued securities that have been purchased from and sold to different brokers are reflected as an investment in securities and a forward sale commitment in the Fund’s Statement of Assets and Liabilities. For financial reporting purposes, the Funds does offset the receivable and payable for delayed delivery investments purchased or sold on TBA commitments. Losses may arise due to changes in the value of the underlying securities or if the counterparty does not perform under the contract, or if the issuer does not issue the securities due to political, economic, or other factors.
l. FOREIGN SECURITIES
Certain Funds invest in securities of foreign entities and in instruments denominated in foreign currencies which involve risks not typically associated with investments in domestic securities. Non-domestic securities carry special risks, such as exposure to currency fluctuations, less developed or less efficient trading markets, political instability, a lack of company information, differing auditing and legal standards, and, potentially, less liquidity. A Fund’s investments in emerging market countries are exposed to additional risks. A Fund’s performance will be influenced by political, social and economic factors affecting companies in emerging market countries. Emerging market countries generally have economic structures that are less diverse and mature, and political systems that are less stable, than those of developed countries. Realized gains in certain countries may be subject to foreign taxes at the Fund level and would pay such foreign taxes at the appropriate rate for each jurisdiction.
2. AGREEMENTS AND TRANSACTIONS WITH AFFILIATES
For each of the Funds, the Trust has entered into an investment advisory agreement under which the Investment Manager, a subsidiary and the U.S. retail distribution arm of Affiliated Managers Group, Inc. (“AMG”), serves as investment manager to the Funds and is responsible for the Funds’ overall administration and operations. The Investment Manager selects one or more subadvisors for the Funds (subject to Board approval) and monitors each subadvisor’s investment performance, security holdings and investment strategies. The investment portfolios of River Road Focused Absolute Value, River Road Dividend All Cap Value, River Road Dividend All Cap Value II, River Road Small-Mid Cap, River Road Small Cap Value and River Road Long-Short are managed by River Road Asset Management, LLC. The investment portfolio of GW&K U.S. Small Cap Growth is managed by GW&K Investment Management, LLC. AMG indirectly owns a majority interest in River Road Asset Management, LLC and GW&K Investment Management, LLC. The investment portfolio of Value Partners Asia Dividend is managed by Value Partners Hong Kong Limited. AMG indirectly owns a minority interest in Value Partners Hong Kong Limited. Prior to October 1, 2016, Aston Asset Management, LLC (“Aston”), a wholly-owned subsidiary of the Investment Manager, served as investment manager to each of the Funds under a similar investment management agreement. On October 1, 2016, Aston merged with and into the Investment Manager.
219
Notes to Financial Statements (continued)
Investment management fees are paid directly by the Funds to the Investment Manager based on average daily net assets. The investment management fees are paid at the following annual rate of each Fund’s respective average daily net assets:
| | | | |
Fairpointe ESG Equity | | | 0.70 | % |
River Road Focused Absolute Value | | | 0.60 | % |
Montag & Caldwell Growth | | | | |
on first $800 million | | | 0.70 | % |
over $800 million up to $6 billion | | | 0.50 | % |
over $6 billion up to $12 billion | | | 0.45 | % |
over $12 billion | | | 0.40 | % |
River Road Dividend All Cap Value | | | 0.60 | % |
River Road Dividend All Cap Value II | | | 0.60 | % |
Fairpointe Mid Cap | | | | |
on first $100 million | | | 0.70 | % |
next $300 million | | | 0.65 | % |
over $400 million | | | 0.60 | % |
Montag & Caldwell Mid Cap Growth | | | 0.75 | % |
LMCG Small Cap Growth | | | 0.90 | % |
River Road Small-Mid Cap Value1 | | | 0.75 | % |
River Road Small Cap Value | | | 0.80 | % |
Silvercrest Small Cap | | | 0.90 | % |
GW&K U.S. Small Cap Growth2 | | | 0.70 | % |
DoubleLine Core Plus Bond | | | 0.45 | % |
Lake Partners LASSO Alternatives | | | 0.90 | % |
River Road Long-Short1 | | | 0.85 | % |
Guardian Capital Global Dividend | | | 0.70 | % |
Pictet International3 | | | 0.70 | % |
Value Partners Asia Dividend | | | 0.80 | % |
Montag & Caldwell Balanced | | | 0.65 | % |
| 1 | Prior to January 1, 2017, the annual rate for the investment management fees were 0.90% and 1.10% of the average daily net assets for River Road Small-Mid Cap Value and River Road Long-Short, respectively. |
| 2 | Prior to February 27, 2017, the annual rate for GW&K U.S. Small Cap Growth’s investment management fee was 0.80% of the Fund’s average daily net assets. |
| 3 | Prior to July 1, 2017, the annual rate for Pictet International’s investment management fee was 0.80% of the Fund’s average daily net assets. |
The Investment Manager has contractually agreed, through at least February 28, 2018 for Fairpointe ESG Equity, River Road Dividend All Cap Value, River Road Dividend All Cap Value II, Montag & Caldwell Mid Cap Growth, LMCG Small Cap Growth, GW&K U.S. Small Cap Growth, Lake Partners LASSO Alternatives, Guardian Capital Global Dividend, Value Partners Asia Dividend and Montag & Caldwell Balanced, to waive management fees and/or reimburse fund expenses in order to limit total annual Fund operating expenses after fee waiver and expense reimbursements (exclusive of taxes, interest (including interest incurred in connection with bank and custody overdrafts), shareholder servicing fees, distribution and service 12b-1 fees, brokerage commissions and other transaction costs, acquired fund fees and expenses and extraordinary expenses). The Investment Manager has contractually agreed, through at least March 1, 2019 for River Road Focused Absolute Value, River Road Small-Mid Cap Value, Silvercrest
Small Cap, DoubleLine Core Plus Bond, River Road Long-Short and Pictet International, to waive management fees and/or reimburse fund expenses in order to limit total annual Fund operating expenses after fee waiver and expense reimbursements (exclusive of taxes, interest (including interest incurred in connection with bank and custody overdrafts), shareholder servicing fees, distribution and service 12b-1 fees, brokerage commissions and other transaction costs, acquired fund fees and expenses and extraordinary expenses). The percentages of the Funds’ average daily net assets subject to later reimbursement by the Funds in certain circumstances are as follows:
| | | | |
Fairpointe ESG Equity | | | 0.82 | % |
River Road Focused Absolute Value | | | 0.71 | % |
Montag & Caldwell Growth | | | N/A | |
River Road Dividend All Cap Value | | | 0.99 | % |
River Road Dividend All Cap Value II | | | 0.99 | % |
Fairpointe Mid Cap | | | N/A | |
Montag & Caldwell Mid Cap Growth | | | 0.95 | % |
LMCG Small Cap Growth | | | 1.03 | % |
River Road Small-Mid Cap Value1 | | | 1.04 | % |
River Road Small Cap Value | | | N/A | |
Silvercrest Small Cap | | | 1.08 | % |
GW&K U.S. Small Cap Growth2 | | | 0.90 | % |
DoubleLine Core Plus Bond | | | 0.61 | % |
Lake Partners LASSO Alternatives | | | 1.09 | % |
River Road Long-Short1 | | | 1.12 | % |
Guardian Capital Global Dividend | | | 1.05 | % |
Pictet International3 | | | 0.98 | % |
Value Partners Asia Dividend | | | 1.15 | % |
Montag & Caldwell Balanced | | | 1.04 | % |
| 1 | Prior to January 1, 2017, the expense cap was 1.19% and 1.37% of the average daily net assets for River Road Small-Mid Cap Value and River Road Long-Short, respectively. |
| 2 | Prior to February 27, 2017, the expense cap was 1.03% of the average daily net assets for GW&K U.S. Small Cap Growth. |
| 3 | Prior to July 1, 2017, the expense cap was 1.08% of the average daily net assets for Pictet International. |
The contractual expense limitation may only be terminated in the event the Investment Manager or a successor ceases to be the investment manager of the Fund or a successor fund, by mutual agreement between the Investment Manager and the Board, or in the event of the Fund’s liquidation unless the Fund is reorganized or is a party to a merger in which the surviving entity is successor to the accounting and performance information of the Fund.
For a period of up to three years from the end of the fiscal year during which fees were waived or expenses were reimbursed (the “Recovery Period”), the Investment Manager is entitled to be reimbursed by the Fund for such fees waived and expenses reimbursed from the commencement of operations through the completion of the first three full fiscal years to the extent that the Fund’s total annual operating expenses, not including interest, taxes, brokerage commissions, other investment-related costs, shareholder servicing fees, distribution and service (12b-1) fees, extraordinary expenses, such as litigation and other expenses not incurred in the ordinary course of the Fund’s business, and acquired fund fees and expenses, are at or below the Operating Expense Limit during the Recovery Period.
220
Notes to Financial Statements (continued)
Effective July 1, 2017, Pictet International is obligated to repay the Investment Manager through at least March 1, 2019, such amounts waived, paid or reimbursed in future years provided that the repayment occurs within thirty-six (36) months after the waiver or reimbursement and that such repayment would not cause the Fund’s total annual operating expenses after fee waiver and expense reimbursements in any such future year to exceed that Fund’s contractual expense limitation amount.
At October 31, 2017, Fund’s expiration of reimbursement are as follows:
| | | | | | | | | | | | |
| | | Expiration | |
| | | 2018 | | | 2019 | | | 2020 | |
Fairpointe ESG Equity | | $ | 128,683 | | | $ | 103,052 | | | $ | 46,791 | |
River Road Focused Absolute Value | | | N/A | | | | 170,129 | | | | 81,771 | |
River Road Dividend All Cap Value II | | | — | | | | N/A | | | | N/A | |
Silvercrest Small Cap | | | 77,805 | | | | N/A | | | | N/A | |
Guardian Capital Global Dividend | | | 122,164 | | | | 96,649 | | | | 16,939 | |
Pictet International | | | — | | | | — | | | | — | |
Value Partners Asia Dividend | | | N/A | | | | 186,218 | | | | 97,734 | |
Through the fiscal year ended October 31, 2017, the Investment Manager recaptured prior year fee waivers and expense reimbursements of $120,411 from Pictet International.
The Trust, on behalf of the Funds, has entered into an amended and restated Administration Agreement under which the Investment Manager serves as the Funds’ administrator (the “Administrator”) and is responsible for all non-portfolio management aspects of managing the Funds’ operations, including administration and shareholder services to each Fund, as further described in each Fund’s prospectus. Effective October 1, 2016, each Fund pays a fee to the Administrator at the rate of 0.15% per annum of the Fund’s average daily net assets for this service. Prior to October 1, 2016, under the terms of the prior administration agreement between the Trust and Aston, the Funds’ administration fees were accrued daily and paid monthly, based on a specified percentage of average daily net assets of the Trust, and a base fee was charged at a fixed annual rate of $12,000 per Fund. The asset-based fee was allocated to each Fund based on the relative net assets of each Fund. The asset-based administration fee arrangement prior to October 1, 2016 was 0.0437% on the first $7.4 billion and 0.0412% over $7.4 billion.
The Investment Manager has agreed, through at least October 1, 2018, to waive a portion of the administrative fee in an amount equal to 0.0061% of the average daily net assets of Montag & Caldwell Growth, 0.0053% of the average daily net assets of River Road Dividend All Cap Value, 0.0065% of the average daily net assets of Fairpointe Mid Cap, 0.0022% of the average daily net assets of River Road Small Cap Value, 0.0052% of the average daily net assets of DoubleLine Core Plus Bond and 0.0055% of the average daily net assets of Pictet International.
The Funds are distributed by AMG Distributors, Inc. (the “Distributor”), a wholly owned subsidiary of the Investment Manager. Prior to October 1, 2016, the Funds’ distributor was Foreside Funds Distributors LLC. The Distributor serves as the distributor and underwriter for each Fund and is a registered broker-dealer and member of the Financial Industry Regulatory Authority, Inc. (“FINRA”). Shares of
each Fund will be continuously offered and will be sold directly to prospective purchasers and through brokers, dealers or other financial intermediaries who have executed selling agreements with the Distributor. Generally the Distributor bears all or a portion of the expenses of providing services pursuant to the distribution agreement, including the payment of the expenses relating to the distribution of prospectuses for sales purposes and any advertising or sales literature.
The Trust has adopted a distribution and service plan (the “Plan”) with respect to the Class N shares and Class R shares, in accordance with the requirements of Rule 12b-1 under the 1940 Act and the requirements of the applicable rules of FINRA regarding asset based sales charges. Pursuant to the Plan, each Fund may make reimbursements to the Distributor for its expenditures in financing any activity primarily intended to result in the sale of each such class of the Fund’s shares and for maintenance and personal service provided to existing shareholders of that class. The Plan authorizes payments to the Distributor of up to 0.25% and 0.50% annually of each Fund’s average daily net assets attributable to the Class N shares and Class R shares, respectively. The actual amount incurred for Class N shares was 0.25% for all funds except the following: Montag & Caldwell Mid Cap Growth and River Road Small-Mid Cap Value incurred 0.24%, Montag & Caldwell Growth incurred 0.23%, Fairpointe ESG Equity incurred 0.22%, GW&K U.S. Small Cap Growth incurred 0.21%, LMCG Small Cap Growth incurred 0.14%, Montag & Caldwell Balance incurred 0.07%, Guardian Capital Global Dividend and Value Partners Asia Dividend incurred 0.02%. The Plan further provides for periodic payments by the Trust or the Distributor to brokers, dealers and other financial intermediaries for providing shareholder services and for promotional and other sales related costs. The portion of payments made under the plan by Class R shares of Montag & Caldwell Growth for shareholder servicing may not exceed an annual rate of 0.25% of the average daily net asset value of Class R shares of that class owned by clients of such broker, dealer or financial intermediary. The Funds made payments to the previous distributor at the same rates.
For each of the Class N, Class I and Class R shares, the Board has approved reimbursement payments to the Investment Manager for shareholder servicing expenses (“shareholder servicing fees”) incurred. Shareholder servicing fees include payments to each financial intermediary such as broker-dealers (including fund supermarket platforms), bank, and trust companies that provide shareholder recordkeeping, account servicing and other services. The Class N, Class I and Class R shares may reimburse the Investment Manager for the actual amount incurred up to a maximum annual rate of 0.15% of each respective Class’s average daily net asset value.
The Investment Manager has agreed, through at least October 1, 2018, to waive a portion of shareholder servicing fees paid by the various share classes of each Fund, as necessary, to ensure the total net expense ratio for each share class of each Fund does not increase due to the changes in the methodology of shareholder servicing reimbursements described above.
221
Notes to Financial Statements (continued)
The impact on the annualized expense ratios for the fiscal year ended October 31, 2017, were as follows:
| | | | |
| Fund | | Actual
Amount
Incurred | |
Fairpointe ESG Equity | | | | |
Class N | | | 0.08 | % |
Class I | | | 0.08 | % |
River Road Focused Absolute Value | | | | |
Class N | | | 0.04 | % |
Class I | | | 0.04 | % |
Montag & Caldwell Growth | | | | |
Class N | | | 0.07 | % |
Class I | | | 0.07 | % |
Class R | | | 0.04 | % |
River Road Dividend All Cap Value | | | | |
Class N | | | 0.07 | % |
Class I | | | 0.07 | % |
River Road Dividend All Cap Value II | | | | |
Class N | | | 0.11 | % |
Class I | | | 0.06 | % |
Fairpointe Mid Cap | | | | |
Class N | | | 0.08 | % |
Class I | | | 0.08 | % |
Montag & Caldwell Mid Cap Growth | | | | |
Class N | | | 0.05 | % |
Class I | | | 0.05 | % |
LMCG Small Cap Growth | | | | |
Class N | | | 0.07 | % |
Class I | | | 0.03 | % |
River Road Small-Mid Cap Value | | | | |
Class N | | | 0.06 | % |
Class I | | | 0.05 | % |
River Road Small Cap Value | | | | |
Class N | | | 0.10 | % |
Class I | | | 0.10 | % |
Silvercrest Small Cap | | | | |
Class N | | | 0.07 | % |
Class I | | | 0.07 | % |
GW&K U.S. Small Cap Growth | | | | |
Class N | | | 0.12 | % |
Class I | | | 0.10 | % |
DoubleLine Core Plus Bond | | | | |
Class N | | | 0.08 | % |
Class I | | | 0.08 | % |
| | | | |
| | | | |
| Fund | | Actual
Amount
Incurred | |
Lake Partners LASSO Alternatives | | | | |
Class N | | | 0.06 | % |
Class I | | | 0.06 | % |
River Road Long-Short | | | | |
Class N | | | 0.08 | % |
Class I | | | 0.08 | % |
Pictet International | | | | |
Class N | | | 0.11 | % |
Class I | | | 0.08 | % |
Montag & Caldwell Balanced | | | | |
Class N | | | 0.06 | % |
Class I | | | 0.06 | % |
| | | | |
Guardian Capital Global Dividend and Value Partners Asia Dividend did not incur any shareholder servicing fees for the fiscal year ended October 31, 2017.
The Board provides supervision of the affairs of the Trust and other trusts within the AMG Funds family. The Trustees of the Trust who are not affiliated with an Investment Manager receive an annual retainer and per meeting fees for regular, special and telephonic meetings, and they are reimbursed for out-of-pocket expenses incurred while carrying out their duties as Board members. The Chairman of the Board and the Audit Committee Chair receive additional annual retainers. Certain Trustees and Officers of the Funds are Officers and/or Directors of the Investment Manager, AMG and/or the Distributor.
The Securities and Exchange Commission (the “SEC”) granted an exemptive order that permits certain Funds to lend and borrow money for certain temporary purposes directly to and from other eligible funds in the AMG Funds family. GW&K U.S. Small Cap Growth is eligible to lend and borrow, while Fairpointe ESG Equity, River Road Focused Absolute Value, River Road Dividend All Cap Value II, Silvercrest Small Cap, River Road Long-Short, Guardian Capital Global Dividend, Pictet International and Value Partners Asia Dividend are eligible to lend. Participation in this interfund lending program is voluntary for both the borrowing and lending funds, and an interfund loan is only made if it benefits each participating fund. The Administrator manages the program according to procedures approved by the Board, and the Board monitors the operation of the program. An interfund loan must comply with certain conditions set out in the exemptive order, which are designed to assure fairness and protect all participating funds. For the fiscal year ended October 31, 2017, Silvercrest Small Cap lent a maximum of $1,644,053 for seven days earning interest of $315 and Long-Short Equity lent a maximum of $1,309,659 for four days earning interest of $283. The interest income amount is included in the Statement of Operations as interest income. GW&K U.S. Small Cap Growth borrowed a maximum of $1,309,659 for four days paying interest of $283. The interest expense amount is included in the Statement of Operations as miscellaneous expense. At October 31, 2017, the Funds had no interfund loans outstanding.
During the fiscal year ended October 31, 2016, Pictet International was reimbursed by the Investment Manager and its subadviser for losses incurred on executed transactions not meeting the Fund’s investment guidelines and the cost of correcting the Fund’s net asset value was $619,174.
222
Notes to Financial Statements (continued)
3. PURCHASES AND SALES OF SECURITIES
Purchases and sales of securities (excluding short-term securities and U.S. Government Obligations) for the fiscal year ended October 31, 2017, were as follows:
| | | | | | | | |
| | | Long Term Securities | |
| Fund | | Purchases | | | Sales | |
Fairpointe ESG Equity | | $ | 3,679,338 | | | $ | 5,684,252 | |
River Road Focused Absolute Value | | | 30,685,459 | | | | 20,201,679 | |
Montag & Caldwell Growth | | | 413,652,123 | | | | 974,555,481 | |
River Road Dividend All Cap Value | | | 250,413,849 | | | | 273,174,011 | |
River Road Dividend All Cap Value II | | | 33,237,246 | | | | 43,152,799 | |
Fairpointe Mid Cap | | | 1,077,196,625 | | | | 1,180,091,613 | |
Montag & Caldwell Mid Cap Growth | | | 4,113,896 | | | | 4,640,812 | |
LMCG Small Cap Growth | | | 187,298,532 | | | | 204,407,708 | |
River Road Small-Mid Cap Value | | | 23,087,323 | | | | 28,161,388 | |
River Road Small Cap Value | | | 117,003,693 | | | | 135,137,407 | |
Silvercrest Small Cap | | | 108,150,774 | | | | 97,476,069 | |
GW&K U.S. Small Cap Growth | | | 9,086,338 | | | | 26,536,284 | |
DoubleLine Core Plus Bond | | | 327,315,184 | | | | 282,053,512 | |
Lake Partners LASSO Alternatives | | | 21,552,820 | | | | 74,119,928 | |
River Road Long-Short | | | 97,365,116 | | | | 110,489,489 | |
Guardian Capital Global Dividend | | | 14,155,421 | | | | 11,303,627 | |
Pictet International | | | 890,755,120 | | | | 545,827,535 | |
Value Partners Asia Dividend | | | 7,425,527 | | | | 7,379,111 | |
Montag & Caldwell Balanced | | | 9,249,664 | | | | 17,068,418 | |
| |
| | | U.S. Government Obligations | |
| Fund | | Purchases | | | Sales | |
DoubleLine Core Plus Bond | | $ | 336,383,182 | | | $ | 399,377,198 | |
Montag & Caldwell Balanced | | | 240,791 | | | | 1,487,706 | |
4. PORTFOLIO SECURITIES LOANED
The Funds participate in the Program providing for the lending of securities to qualified brokers. Securities lending income includes earnings of such temporary cash investments, plus or minus any rebate to a borrower. These earnings (after any rebate) are then divided between BNYM, as a fee for its services under the Program, and the Funds, according to agreed-upon rates. Collateral on all securities loaned is accepted in cash and is maintained at a minimum level of 102% (105% in the case of certain foreign securities) of the market value, plus interest, if applicable, of investments on loan. It is the Funds’ policy to obtain additional collateral from or return excess collateral to the borrower by the end of the next business day, following the valuation date of the securities loaned. Therefore, the value of the collateral held may be temporarily less than the value of
the securities on loan. Lending securities entails a risk of loss to the Funds if and to the extent that the market value of the securities loaned were to increase and the borrower did not increase the collateral accordingly, and the borrower fails to return the securities. Under the terms of the Program, the Funds are indemnified for such losses by BNYM. Cash collateral is held in a separate omnibus account managed by BNYM, who is authorized to exclusively enter into joint repurchase agreements. BNYM bears the risk of any deficiency in the amount of the cash collateral available for return to the borrower due to any loss on the collateral invested. At October 31, 2017, the following Funds did not participate in the Program: Fairpointe ESG Equity, Montag & Caldwell Growth, Fairpointe Mid Cap, Lake Partners LASSO Alternatives, River Road Long-Short and Montag & Caldwell Balanced.
At October 31, 2017, the value of the securities loaned and cash collateral received were as follows:
| | | | | | | | |
| | | | | | Cash | |
| | | Securities | | | Collateral | |
| Fund | | Loaned | | | Received | |
River Road Focused Absolute Value | | $ | 2,076,480 | | | $ | 2,100,673 | |
River Road Dividend All Cap Value | | | 25,556,279 | | | | 26,093,804 | |
River Road Dividend All Cap Value II | | | 5,837,316 | | | | 5,954,800 | |
Montag & Caldwell Mid Cap Growth | | | 489,407 | | | | 499,381 | |
LMCG Small Cap Growth | | | 7,396,018 | | | | 7,506,875 | |
River Road Small-Mid Cap Value | | | 2,024,592 | | | | 2,065,477 | |
River Road Small Cap Value | | | 12,933,398 | | | | 13,216,433 | |
Silvercrest Small Cap | | | 12,903,710 | | | | 13,001,471 | |
GW&K U.S. Small Cap Growth | | | 2,107,510 | | | | 2,143,996 | |
DoubleLine Core Plus Bond | | | 3,962,814 | | | | 4,124,384 | |
Guardian Capital Global Dividend | | | 996,949 | | | | 1,022,931 | |
Pictet International | | | 26,905,926 | | | | 28,379,961 | |
Value Partners Asia Dividend | | | 32,199 | | | | 32,121 | |
5. COMMITMENTS AND CONTINGENCIES
Under the Trust’s organizational documents, its trustees and officers are indemnified against certain liabilities arising out of the performance of their duties to the Trust. In addition, in the normal course of business, the Funds may enter into contracts and agreements that contain a variety of representations and warranties, which provide general indemnifications. The maximum exposure to the Funds under these arrangements is unknown, as this would involve future claims that may be made against a Fund that have not yet occurred. However, based on experience, the Funds had no prior claims or losses and expect the risks of loss to be remote.
6. RISKS ASSOCIATED WITH HIGH YIELD SECURITIES
Investing in high yield securities involves greater risks and considerations not typically associated with U.S. Government and other high quality/investment grade securities. High yield securities are generally below investment grade securities and do not have an established retail secondary market. Economic downturns may disrupt the high yield market and impair the issuer’s ability to repay principal and interest. Also, an increase in interest rates would likely have an adverse impact on the value of such obligations and could cause the securities to become less liquid.
223
Notes to Financial Statements (continued)
7. MORTGAGE-BACKED SECURITIES
DoubleLine Core Plus Bond and Montag & Caldwell Balanced may invest in mortgage-backed securities (“MBS”). These securities represent interests in pools of mortgage loans and they provide holders with payments consisting of both principal and interest as the mortgages in the underlying mortgage pools are paid. The timely payment of principal and interest on MBS issued or guaranteed by Ginnie Mae (formerly known as the Government National Mortgage Association) is backed by Ginnie Mae and the full faith and credit of the U.S. government. MBS issued by U.S. government agencies or instrumentalities other than Ginnie Mae are not “full faith and credit” obligations. Certain obligations, such as those issued by the Federal Home Loan Banks, Fannie Mae (formerly known as the Federal National Mortgage Association) and Freddie Mac (formerly known as the Federal Home Loan Mortgage Corporation) are supported only by the credit of the issuer. MBS issued by private issuers are not government securities and are not guaranteed by any government agency. They are secured by the underlying collateral of the private issuer. Yields on privately issued MBS tend to be higher than those of government-backed issues. However, risk of loss due to default and sensitivity to interest rate fluctuations are also higher. DoubleLine Core Plus Bond and Montag & Caldwell Balanced may also invest in collateralized mortgage obligations (“CMOs”), collateralized loan obligations (“CLOs”) and real estate mortgage investment conduits (“REMICs”). A CMO and/or REMIC is a bond that is collateralized by a pool of MBS. A CLO is a bond that is collateralized by a financial institution’s receivables from loans. These MBS pools are divided into classes with each class having its own characteristics. The different classes are retired in sequence as the underlying mortgages are repaid.
8. STRIPPED SECURITIES
DoubleLine Core Plus Bond may invest in stripped securities (“STRIPS”) for hedging purposes to protect the Fund’s portfolio against interest rate fluctuations. Interest-only STRIPS will most likely move differently than typical fixed-income securities in relation to changes in interest rates. STRIPS are usually structured with two classes that receive different proportions of the interest and principal distributions from a pool of underlying assets. A common type of STRIP will have one class receiving all of the interest from the underlying assets (“interest-only” or “IO” class), while the other class will receive the entire principal (“principal only” or “PO” class). However, in some instances, one class will receive some of the interest and most of the principal while the other class will receive most of the interest and the remainder of the principal. STRIPS are unusually volatile in response to changes in interest rates. The yield to maturity on an IO class of STRIPS is extremely sensitive not only to changes in prevailing interest rates but also to the rate of principal payments (including prepayments) on the underlying assets. A rapid rate of principal prepayments may have a measurably adverse effect on a Funds’ yield to maturity to the extent it invests in IOs. Conversely, POs tend to increase in value if prepayments are greater than anticipated and decline if prepayments are slower than anticipated. Thus, if the underlying assets experience greater than anticipated repayments of principal, a Fund may fail to fully recover its initial investment in these securities, even if the STRIPS were rated of the highest credit quality by Standard & Poor’s Corporation or Moody’s Investors Service, Inc. These risks are managed by investing in a variety of such securities and by using certain hedging techniques. In addition the secondary market for STRIPS may be less liquid than that of other mortgage-backed or asset-backed
securities, potentially limiting a Fund’s ability to buy or sell those securities at any particular time.
9. INVESTMENT COMPANIES
Lake Partners LASSO Alternatives primarily invests, and certain other Funds in this Trust, may invest in securities of other investment companies, including open-end funds, closed end funds and exchange-traded funds (“ETFs”). Open-end funds are investment companies that issue new shares continuously and redeem shares daily. Closed-end funds are investment companies that typically issue a fixed number of shares that trade on a securities exchange or over-the-counter. An ETF is an investment company. Typically, an ETF seeks to track the performance of an index by holding in its portfolio shares of all the companies, or a representative sample of the companies, that are components of a particular index; however, some ETFs are actively managed. ETFs are traded on securities exchanges based on their market values. The risks of investment in other investment companies typically reflect the risks of the types of securities in which investment companies invest. Investments in ETFs and closed-end funds are subject to the additional risk that shares of the fund may trade at a premium or discount to their NAV per share. When a Fund invests in another investment company, shareholders of the Fund bear their proportionate shares of the other investment company’s fees and expenses, as well as their share of the Fund’s fees and expenses. The Trust has obtained an exemptive order from the SEC that allows the Funds to invest in both affiliated and unaffiliated investment companies in excess of the limits of the 1940 Act, subject to the terms and conditions of such order. Prior to its investment in shares of an unaffiliated investment company in excess of the limits of the 1940 Act, the Trust, on behalf of a Fund, and the underlying fund must execute an agreement that is designed to ensure that each party understands the terms and conditions of the order and agrees to fulfill its responsibilities under the order. For the fiscal year ended October 31, 2017, Lake Partners LASSO Alternatives relied on such exemptive order.
10. SECURITIES SOLD SHORT AND DUE TO/FROM BROKERS
River Road Long-Short utilizes short sales as part of its overall portfolio management strategy. A short sale involves the sale of a security that is borrowed from a broker or other financial institution. A gain, limited to the price at which the Fund sold the security short, or a loss, unlimited in size, will be recognized upon closing a short sale. Short sales expose the Fund to the risk that it will be required to acquire, convert or exchange securities to replace the borrowed securities at a time when the securities sold short have appreciated in value, thus resulting in a loss to the Fund. The Fund must segregate liquid assets, or otherwise cover its position in a permissible manner. The Investment Manager determines the liquidity of assets, in accordance with procedures established by the Board. Cash segregated as collateral for short sales is shown in the Statement of Assets and Liabilities as segregated cash. Security positions segregated as collateral for short sales are included in unaffiliated investments at value in the Statement of Assets and Liabilities. Due to/from brokers represents cash balances on deposit with, or cash balances owed to the Prime Broker. When the Fund has cash balances on deposit with the Prime Broker, the Fund is subject to credit risk should the Prime Broker be unable to meet their obligations to the Fund; and when the Fund has cash balances owed to the Prime Broker, the amount is payable upon demand and the Fund must segregate liquid assets. The Fund has entered into a Special Custody and Pledge Agreement with the Prime Broker for securities sold short, which provides the right, in the event of default (including bankruptcy or insolvency) for the non-defaulting party to liquidate the collateral and calculate net exposure to the defaulting party or request additional collateral. For financial
224
Notes to Financial Statements (continued)
reporting purposes, the Fund does not offset financial assets and financial liabilities that are subject to a Special Custody and Pledge Agreement in the Statement of Assets and Liabilities. As of October 31, 2017, the value of securities sold short was $12,274,457 and the Fund owes the Prime Broker $13,827,747 relating to cash on margin; which both were collateralized with securities worth $29,998,231.
11. CREDIT AGREEMENT
Effective July 6, 2010, and as amended July 26, 2017, the Trust entered into a Credit Agreement with The Bank of New York Mellon (the “Bank”) which provides the Trust with a revolving line of credit facility of up to $50 million. The facility is shared by each Fund of the Trust and is available for temporary, emergency purposes including liquidity needs in meeting redemptions. The interest rate on outstanding Alternate Base Rate Loans is equal to the greater of the Prime Rate plus 1.25%, or 0.50% plus the Federal Funds Effective Rate plus 1.25%. The interest rate on outstanding Overnight Loans is equal to the greater of the Federal Funds Effective Rate plus 1.25%, or the One-Month LIBOR Rate plus 1.25%. Effective July 27, 2016, the Trust pays a commitment fee on the unutilized commitment amount of 0.175% per annum, which is allocated to the Funds based on average daily net
assets and included in Miscellaneous Expense on the Statement of Operations. Prior to July 27, 2016, the Trust paid a commitment fee of 0.15% per annum. LMCG Small Cap Growth utilized the line of credit during the fiscal year ended October 31, 2017. LMCG Small Cap Growth borrowed a maximum of $5,505,079 for two days paying interest of $761. The interest expense amount is included in the Statement of Operations as miscellaneous expense. At October 31, 2017, the Funds had no loans outstanding.
12. MASTER NETTING AGREEMENTS
The Funds may enter into master netting agreements with their counterparties for the securities lending and short-sale programs, and Repurchase Agreements, which provide the right, in the event of default (including bankruptcy or insolvency) for the non-defaulting party to liquidate the collateral and calculate net exposure to the defaulting party or request additional collateral. For financial reporting purposes, the Funds do not offset financial assets and financial liabilities that are subject to master netting agreements in the Statement of Assets and Liabilities. For securities lending and short sale transactions, see Note 4 and Note 11.
The following table is a summary of the Funds’ open Repurchase Agreements that are subject to a master netting agreement as of October 31, 2017:
| | | | | | | | | | | | | | | | |
| | | | | | Gross Amount Not Offset in the
Statement of Assets and Liabilities | | | | |
| | | | |
| Fund | | Net Amounts of Assets
Presented in the Statement
of Assets and Liabilities | | | Financial
Instruments
Collateral | | | Cash
Collateral
Received | | | Net Amount | |
River Road Focused Absolute Value | | | | | | | | | | | | | | | | |
Citigroup Global Markets, Inc. | | $ | 1,000,000 | | | $ | 1,000,000 | | | | — | | | | — | |
Credit Suisse Securities (USA) LLC | | | 1,000,000 | | | | 1,000,000 | | | | — | | | | — | |
Merrill Lynch, Pierce, Fenner & Smith, Inc. | | | 100,673 | | | | 100,673 | | | | — | | | | — | |
River Road Dividend All Cap Value | | | | | | | | | | | | | | | | |
Citigroup Global Markets, Inc., | | $ | 6,197,464 | | | $ | 6,197,464 | | | | — | | | | — | |
HSBC Securities USA, Inc. | | | 6,197,464 | | | | 6,197,464 | | | | — | | | | — | |
Jefferies LLC | | | 6,197,464 | | | | 6,197,464 | | | | — | | | | — | |
Merrill Lynch, Pierce, Fenner & Smith, Inc. | | | 1,303,948 | | | | 1,303,948 | | | | — | | | | — | |
Nomura Securities International, Inc. | | | 6,197,464 | | | | 6,197,464 | | | | — | | | | — | |
River Road Dividend All Cap Value II | | | | | | | | | | | | | | | | |
Citigroup Global Markets, Inc. | | $ | 1,414,309 | | | $ | 1,414,309 | | | | — | | | | — | |
Daiwa Capital Markets America | | | 1,414,309 | | | | 1,414,309 | | | | — | | | | — | |
HSBC Securities USA, Inc. | | | 1,414,309 | | | | 1,414,309 | | | | — | | | | — | |
Merrill Lynch, Pierce, Fenner & Smith, Inc. | | | 297,564 | | | | 297,564 | | | | — | | | | — | |
Nomura Securities International, Inc. | | | 1,414,309 | | | | 1,414,309 | | | | — | | | | — | |
Montag & Caldwell Mid Cap Growth | | | | | | | | | | | | | | | | |
HSBC Securities, Inc. | | $ | 499,381 | | | $ | 499,381 | | | | — | | | | — | |
225
Notes to Financial Statements (continued)
| | | | | | | | | | | | | | | | |
| | | | | | Gross Amount Not Offset in the
Statement of Assets and Liabilities | | | | |
| | | | |
| Fund | | Net Amounts of Assets
Presented in the Statement
of Assets and Liabilities | | | Financial
Instruments
Collateral | | | Cash Collateral
Received | | | Net Amount | |
LMCG Small Cap Growth | | | | | | | | | | | | | | | | |
Cantor Fitzgerald Securities, Inc. | | $ | 1,782,927 | | | $ | 1,782,927 | | | | — | | | | — | |
Citigroup Global Markets, Inc. | | | 1,782,927 | | | | 1,782,927 | | | | — | | | | — | |
Daiwa Capital Markets America | | | 1,782,927 | | | | 1,782,927 | | | | — | | | | — | |
HSBC Securities USA, Inc. | | | 1,782,927 | | | | 1,782,927 | | | | — | | | | — | |
Jefferies LLC | | | 375,167 | | | | 375,167 | | | | — | | | | — | |
River Road Small-Mid Cap Value | | | | | | | | | | | | | | | | |
Citigroup Global Markets, Inc. | | $ | 1,000,000 | | | $ | 1,000,000 | | | | — | | | | — | |
Credit Suisse Securities (USA) LLC | | | 1,000,000 | | | | 1,000,000 | | | | — | | | | — | |
Merrill Lynch, Pierce, Fenner & Smith, Inc. | | | 65,477 | | | | 65,477 | | | | — | | | | — | |
River Road Small Cap Value | | | | | | | | | | | | | | | | |
Citigroup Global Markets, Inc. | | $ | 3,138,984 | | | $ | 3,138,984 | | | | — | | | | — | |
Daiwa Capital Markets America | | | 3,138,984 | | | | 3,138,984 | | | | — | | | | — | |
HSBC Securities USA, Inc. | | | 3,138,984 | | | | 3,138,984 | | | | — | | | | — | |
Jefferies LLC | | | 660,497 | | | | 660,497 | | | | — | | | | — | |
Nomura Securities International, Inc. | | | 3,138,984 | | | | 3,138,984 | | | | — | | | | — | |
Silvercrest Small Cap | | | | | | | | | | | | | | | | |
Citigroup Global Markets, Inc. | | $ | 3,087,939 | | | $ | 3,087,939 | | | | — | | | | — | |
HSBC Securities USA, Inc. | | | 3,087,939 | | | | 3,087,939 | | | | — | | | | — | |
Jefferies LLC | | | 3,087,939 | | | | 3,087,939 | | | | — | | | | — | |
Merrill Lynch, Pierce, Fenner & Smith, Inc. | | | 649,715 | | | | 649,715 | | | | — | | | | — | |
Nomura Securities International, Inc. | | | 3,087,939 | | | | 3,087,939 | | | | — | | | | — | |
GW&K U.S. Small Cap Growth | | | | | | | | | | | | | | | | |
Daiwa Capital Markets America | | $ | 1,000,000 | | | $ | 1,000,000 | | | | — | | | | — | |
Merrill Lynch, Pierce, Fenner & Smith, Inc. | | | 143,996 | | | | 143,996 | | | | — | | | | — | |
HSBC Securities USA, Inc. | | | 1,000,000 | | | | 1,000,000 | | | | — | | | | — | |
DoubleLine Core Plus Bond | | | | | | | | | | | | | | | | |
Citigroup Global Markets, Inc. | | $ | 1,000,000 | | | $ | 1,000,000 | | | | — | | | | — | |
Credit Suisse Securities (USA) LLC | | | 1,000,000 | | | | 1,000,000 | | | | — | | | | — | |
Daiwa Capital Markets America | | | 1,000,000 | | | | 1,000,000 | | | | — | | | | — | |
Merrill Lynch, Pierce, Fenner & Smith, Inc. | | | 124,384 | | | | 124,384 | | | | — | | | | — | |
Nomura Securities International, Inc. | | | 1,000,000 | | | | 1,000,000 | | | | — | | | | — | |
Guardian Capital Global Dividend | | | | | | | | | | | | | | | | |
Credit Suisse Securities (USA) LLC | | $ | 1,000,000 | | | $ | 1,000,000 | | | | — | | | | — | |
Merrill Lynch, Pierce, Fenner & Smith, Inc. | | | 22,931 | | | | 22,931 | | | | — | | | | — | |
Pictet International | | | | | | | | | | | | | | | | |
Citigroup Global Markets, Inc. | | $ | 6,740,433 | | | $ | 6,740,433 | | | | — | | | | — | |
HSBC Securities USA, Inc. | | | 6,740,433 | | | | 6,740,433 | | | | — | | | | — | |
226
Notes to Financial Statements (continued)
| | | | | | | | | | | | | | | | |
| | | | | | Gross Amount Not Offset in the
Statement of Assets and Liabilities | | | | |
| | | | |
| Fund | | Net Amounts of Assets
Presented in the Statement
of Assets and Liabilities | | | Financial
Instruments
Collateral | | | Cash Collateral
Received | | | Net Amount | |
Jefferies LLC | | | 6,740,433 | | | | 6,740,433 | | | | — | | | | — | |
Merrill Lynch, Pierce, Fenner & Smith, Inc. | | | 1,418,229 | | | | 1,418,229 | | | | — | | | | — | |
Nomura Securities International, Inc. | | | 6,740,433 | | | | 6,740,433 | | | | — | | | | — | |
Value Partners Asia Dividend | | | | | | | | | | | | | | | | |
Cantor Fitzgerald Securities, Inc. | | $ | 32,121 | | | $ | 32,121 | | | | — | | | | — | |
13. REGULATORY UPDATES
On October 13, 2016, the SEC amended existing rules intended to modernize reporting and disclosure of information. These amendments relate to Regulation S-X, which sets forth the form and content of financial statements. Effective August 1, 2017, the Funds have adopted these amendments and noted no significant impact on the financial statements and accompanying notes.
14. SUBSEQUENT EVENTS
The Funds have determined that no material events or transactions occurred through the issuance date of the Funds’ financial statements, which require an
additional disclosure in or adjustment of the Funds’ financial statements except for the following: Effective November 1, 2017, except Montag & Caldwell Growth, Fairpointe Mid Cap, River Road Small Cap Value, and Pictet International, the Investment Manager, for a period of up to 36 months, may recover from each Fund fees waived and expenses paid pursuant to the contractual agreement, provided that such repayment would not cause the Fund’s total annual operating expenses after fee waiver and expense reimbursements to exceed the contractual expense limitation amount.
TAX INFORMATION (unaudited)
The Funds each hereby designates the maximum amount allowable of its net taxable income as qualified dividends as provided in the Jobs and Growth Tax Relief Reconciliation Act of 2003. The 2016/2017 Form 1099-DIV you receive for each Fund will show the tax status of all distributions paid to you during the year.
In accordance with federal tax law, the following Funds elect to provide foreign taxes paid and the income sourced from foreign countries. Accordingly, each Fund hereby makes the following designations regarding its taxable period ended October 31, 2017:
AMG Managers Pictet International Fund
u The total amount of taxes paid and income sourced from foreign countries was $2,574,353 and $41,551,988, respectively.
AMG Managers Guardian Capital Global Dividend Fund
u The total amount of taxes paid and income sourced from foreign countries was $47,319 and $688,290, respectively.
AMG Managers Value Partners Asia Dividend Fund
u The total amount of taxes paid and income sourced from foreign countries was $25,048 and $359,641, respectively.
Pursuant to section 852 of the Internal Revenue Code, the Funds each hereby designates as a capital gain distribution with respect to the taxable period ended October 31, 2017, or if subsequently determined to be different, the net capital gains of such period as follows:
| | | | |
| Fund | | Amount | |
River Road Focused Absolute Value | | $ | 48,044 | |
Montag & Caldwell Growth | | | 128,952,853 | |
River Road Dividend All Cap Value | | | 59,243,471 | |
River Road Dividend All Cap Value II | | | 4,773,190 | |
Fairpointe Mid Cap | | | 211,962,047 | |
Montag & Caldwell Mid Cap Growth | | | 589,361 | |
River Road Small-Mid Cap Value | | | 2,962,623 | |
| | | | |
| Fund | | Amount | |
River Road Small Cap Value | | $ | 5,674,974 | |
Silvercrest Small Cap | | | 1,787,048 | |
GW&K U.S. Small Cap Growth | | | 58,641 | |
Lake Partners LASSO Alternatives | | | 387,316 | |
Pictet International | | | 627,413 | |
Montag & Caldwell Balanced | | | 2,148,266 | |
227
Report of Independent Registered Public Accounting Firm
TO THE BOARD OF TRUSTEES AND SHAREHOLDERS OF AMG FUNDS IV:
In our opinion, the accompanying statements of assets and liabilities, including the schedules of portfolio investments, and the related statements of operations, of changes in net assets, and of cash flows (statement of cash flows only for AMG River Road Long-Short Fund) and the financial highlights present fairly, in all material respects, the financial position of the nineteen funds listed in Note 1 (the “Funds”) comprising AMG Funds IV as of October 31, 2017, the results of each of their operations and cash flows for AMG River Road Long-Short Fund for the year then ended, and the changes in each of their net assets and the financial highlights for each of the periods indicated, in conformity with accounting principles generally accepted in the United States of America. These financial statements and financial highlights (hereafter referred to as “financial statements”) are the responsibility of the Funds’ management. Our responsibility is to express an opinion on these financial statements based on our audits. We conducted our audits of these financial statements in accordance with the standards of the Public Company Accounting Oversight Board (United States). Those standards require that we plan and perform the audit to obtain reasonable assurance about whether the financial statements are free of material misstatement. An audit includes examining, on a test basis, evidence supporting the amounts and disclosures in the financial statements, assessing the accounting principles used and significant estimates made by management, and evaluating the overall financial statement presentation. We believe that our audits, which included confirmation of securities as of October 31, 2017 by correspondence with the custodian and brokers, and the application of alternative auditing procedures where securities purchased had not been received, provide a reasonable basis for our opinion. The financial highlights for the periods ended from October 31, 2013 through October 31, 2015 for the Funds were audited by another independent registered public accounting firm whose report dated December 22, 2015 expressed an unqualified opinion on those financial highlights.
PricewaterhouseCoopers LLP
Boston, Massachusetts
December 29, 2017
228
AMG Funds
Trustees and Officers
The Trustees and Officers of the Trust, their business addresses, principal occupations for the past five years and ages are listed below. The Trustees provide broad supervision over the affairs of the Trust and the Funds. The Trustees are experienced executives who meet periodically throughout the year to oversee the Funds’ activities, review contractual arrangements with companies that provide services to the Funds, and review the Funds’ performance. Unless otherwise noted, the address of each Trustee or Officer is the address of the Trust: 600 Steamboat Road, Suite 300, Greenwich, Connecticut 06830.
There is no stated term of office for Trustees. Trustees serve until their resignation, retirement or removal in accordance with the Trust’s organizational documents and policies adopted by the Board from time to time. The Chairman of the Trustees, President, Treasurer and Secretary of the Trust are elected by the Trustees annually. Other officers hold office at the pleasure of the Trustees.
Independent Trustees
The following Trustees are not “interested persons” of the Trust within the meaning of the 1940 Act:
| | |
Number of Funds Overseen in Fund Complex | | Name, Age, Principal Occupation(s) During Past 5 Years and Other Directorships Held by Trustee |
• Trustee since 2016 | | Bruce B. Bingham, 69 |
• Oversees 61 Funds in Fund Complex | | Partner, Hamilton Partners (real estate development firm) (1987-Present); Director of The Yacktman Funds (2000-2012). |
| |
• Trustee since 2016 | | Edward J. Kaier, 72 |
• Oversees 61 Funds in Fund Complex | | Attorney at Law and Partner, Teeters Harvey Marrone & Kaier LLP (2007-Present); Attorney at Law and Partner, Hepburn Willcox Hamilton & Putnam, LLP (1977-2007); Trustee of Third Avenue Trust (5 portfolios); Trustee of Third Avenue Variable Trust (1 portfolio). |
| |
• Trustee since 2016 | | Kurt A. Keilhacker, 54 |
• Oversees 63 Funds in Fund Complex | | Managing Member, TechFund Capital (1997-Present); Managing Member, TechFund Europe (2000-Present); Board Member, 6wind SA, (2002-Present); Managing Member, Elementum Ventures (2013-Present); Trustee, Gordon College (2001-2016). |
| |
• Trustee since 2016 | | Steven J. Paggioli, 67 |
• Oversees 61 Funds in Fund Complex | | Independent Consultant (2002-Present); Formerly Executive Vice President and Director, The Wadsworth Group (1986-2001); Executive Vice President, Secretary and Director, Investment Company Administration, LLC (1990-2001); Vice President, Secretary and Director, First Fund Distributors, Inc. (1991-2001); Trustee, Professionally Managed Portfolios (32 portfolios); Advisory Board Member, Sustainable Growth Advisors, LP; Independent Director, Chase Investment Counsel (2008–Present). |
| |
• Trustee since 2016 | | Richard F. Powers III, 71 |
• Oversees 61 Funds in Fund Complex | | Adjunct Professor, U.S. Naval War College (2016); Adjunct Professor, Boston College (2010-2013); President and CEO of Van Kampen Investments Inc. (1998-2003). |
| |
• Independent Chairman | | Eric Rakowski, 59 |
• Trustee since 2016 • Oversees 63 Funds in Fund Complex | | Professor, University of California at Berkeley School of Law (1990-Present); Director of Harding, Loevner Funds, Inc. (9 portfolios); Trustee of Third Avenue Trust (5 portfolios); Trustee of Third Avenue Variable Trust (1 portfolio). |
| |
• Trustee since 2016 | | Victoria L. Sassine, 52 |
• Oversees 63 Funds in Fund Complex | | Lecturer, Babson College (2007-Present). |
| |
• Trustee since 2016 | | Thomas R. Schneeweis, 70 |
• Oversees 61 Funds in Fund Complex | | Professor Emeritus, University of Massachusetts (2013-Present); Partner, S Capital Wealth Advisors (2015-Present); President, TRS Associates (1982-Present); Board Member, Chartered Alternative Investment Association (“CAIA”) (2002-Present); Director, CAIA Foundation (Education) (2010-Present); Director, Institute for Global Asset and Risk Management (Education) (2010-Present); Partner, S Capital Management, LLC (2007-2015); Director, CISDM at the University of Massachusetts, (1996-2013); President, Alternative Investment Analytics, LLC, (formerly Schneeweis Partners, LLC) (2001-2013); Professor of Finance, University of Massachusetts (1977-2013). |
229
AMG Funds
Trustees and Officers (continued)
Interested Trustees
Each Trustee in the following table is an “interested person” of the Trust within the meaning of the 1940 Act. Ms. Carsman is an interested person of the Trust within the meaning of the 1940 Act by virtue of her position with, and interest in securities of, AMG.
| | |
Number of Funds Overseen in Fund Complex | | Name, Age, Principal Occupation(s) During Past 5 Years and Other Directorships Held by Trustee |
• Trustee since 2016 | | Christine C. Carsman, 65 |
• Oversees 63 Funds in Fund Complex | | Executive Vice President, Deputy General Counsel and Chief Regulatory Counsel, Affiliated Managers Group, Inc. (2017-Present); Director (2010-Present) and Chair of the Board of Directors (2015-Present), AMG Funds plc; Director of Harding, Loevner Funds, Inc. (9 portfolios); Senior Vice President and Deputy General Counsel, Affiliated Managers Group, Inc. (2011-2016); Senior Vice President and Chief Regulatory Counsel, Affiliated Managers Group, Inc. (2007-2011); Vice President and Chief Regulatory Counsel, Affiliated Managers Group, Inc. (2004-2007); Secretary and Chief Legal Officer, AMG Funds, AMG Funds I, AMG Funds II and AMG Funds III (2004-2011); Senior Counsel, Vice President and Director of Operational Risk Management and Compliance, Wellington Management Company, LLP (1995-2004). |
Officers | | |
Position(s) Held with Fund and Length of Time Served | | Name, Age, Principal Occupation(s) During Past 5 Years |
• President since 2016 | | Jeffrey T. Cerutti, 49 |
• Principal Executive Officer since 2016 • Chief Executive Officer since 2016 | | Chief Executive Officer, AMG Funds LLC (2014-Present); Director, President and Principal, AMG Distributors, Inc. (2014-Present); President and Principal Executive Officer, AMG Funds, AMG Funds I, AMG Funds II and AMG Funds III (2014-Present); Chief Executive Officer, President and Principal Executive Officer, AMG Funds IV, (2015-Present); Chief Executive Officer, AMG Funds, AMG Funds I, AMG Funds II and AMG Funds III (2016-Present); Chief Executive Officer, Aston Asset Management, LLC (2016); President, VP Distributors, (2011-2014); Executive Vice President, Head of Distribution, Virtus Investment Partners, Inc. (2010-2014); Managing Director, Head of Sales, UBS Global Asset Management (2001-2010). |
| |
• Chief Operating Officer | | Keitha L. Kinne, 59 |
since 2016 | | Chief Operating Officer, AMG Funds LLC (2007-Present); Chief Investment Officer, AMG Funds LLC (2008-Present); Chief Operating Officer, AMG Distributors, Inc. (2007-Present); Chief Operating Officer, AMG Funds, AMG Funds I, AMG Funds II, and AMG Funds III (2007-Present); Chief Operating Officer, AMG Funds IV, (2016-Present); Chief Operating Officer and Chief Investment Officer, Aston Asset Management, LLC (2016); President and Principal Executive Officer, AMG Funds, AMG Funds I, AMG Funds II and AMG Funds III (2012-2014); Managing Partner, AMG Funds LLC (2007-2014); President, AMG Funds (2012-2014); President, AMG Distributors, Inc. (2012-2014); Managing Director, Legg Mason & Co., LLC (2006-2007); Managing Director, Citigroup Asset Management (2004-2006). |
| |
• Secretary since 2015 | | Mark J. Duggan, 52 |
• Chief Legal Officer
since 2016 | | Senior Vice President and Senior Counsel, AMG Funds LLC (2015-Present); Secretary and Chief Legal Officer, AMG Funds, AMG Funds I, AMG Funds II and AMG Funds III (2015-Present); Secretary and Chief Legal Officer, AMG Funds IV, (2015-Present); Attorney, K&L Gates, LLP (2009-2015). |
| |
• Chief Financial Officer
since 2017 • Treasurer since 2017 • Principal Financial Officer since 2017 • Principal Accounting Officer since 2017 | | Thomas G. Disbrow, 51 Vice President, Mutual Fund Treasurer & CFO, AMG Funds, AMG Funds LLC (2017-Present); Chief Financial Officer, Principal Financial Officer, Treasurer and Principal Accounting Officer, AMG Funds, AMG Funds I, AMG Funds II, AMG Funds III and AMG Funds IV (2017-Present); Managing Director - Global Head of Traditional Funds Product Control, UBS Asset Management (Americas), Inc. (2015-2017); Managing Director - Head of North American Funds Treasury, UBS Asset Management (Americas), Inc. (2011-2015). |
| |
• Deputy Treasurer since 2017 | | John A. Starace, 47 Director, Mutual Fund Accounting, AMG Funds LLC (2017-Present); Vice President, Deputy Treasurer of Mutual Funds Services, AMG Funds LLC (2014-2017); Deputy Treasurer, AMG Funds, AMG Funds I, AMG Funds II, AMG Funds III and AMG Funds IV (2017-Present); Vice President, Citi Hedge Fund Services (2010-2014); Audit Senior Manager (2005-2010) and Audit Manager (2001-2005), Deloitte & Touche LLP. |
| |
• Controller since 2017 | | Christopher R. Townsend, 50 Vice President, Business Finance, AMG Funds LLC (2017-Present); Head of Business Finance, AMG Funds LLC (2015-2017); Chief Financial Officer and Financial and Operations Principal, AMG Distributors, Inc. (2016-Present); Controller, AMG Funds, AMG Funds I, AMG Funds II, AMG Funds III and AMG Funds IV (2017-Present); Treasurer, Chief Financial Officer, Principal Financial Officer, Principal Accounting Officer, AMG Funds, AMG Funds I, AMG Funds II, AMG Funds III and AMG Funds IV (2017); Chief Financial Officer, Aston Asset Management LLC (2016); Head of Finance and Accounting, Allianz Asset Management (2006-2015). |
230
AMG Funds
Trustees and Officers (continued)
| | |
Position(s) Held with Fund
and Length of Time Served | | Name, Age, Principal Occupation(s) During Past 5 Years |
• Chief Compliance Officer since 2016 | | Gerald F. Dillenburg, 50 Vice President, Chief Compliance Officer AMG Funds, AMG Funds LLC (2017-Present); Chief Compliance Officer AMG Funds, AMG Funds LLC (2016-2017); Chief Compliance Officer and Sarbanes Oxley Code of Ethics Compliance Officer, AMG Funds, AMG Funds I, AMG Funds II and AMG Funds III (2016-Present); Chief Compliance Officer, AMG Funds IV (1996-Present); Sarbanes-Oxley Code of Ethics Compliance Officer, AMG Funds IV (2016-Present); Chief Compliance Officer, Aston Asset Management, LLC (2006-2016); Chief Operating Officer, Aston Funds (2003-2016); Secretary, Aston Funds (1996-2015); Chief Financial Officer, Aston Funds (1997-2010); Chief Financial Officer, Aston Asset Management, LLC (2006-2010); Treasurer, Aston Funds (1996-2010). |
| |
• Anti-Money Laundering Compliance Officer since 2016 | | Patrick J. Spellman, 43 Vice President, Chief Compliance Officer, AMG Funds LLC (2017-Present);Senior Vice President, Chief Compliance Officer, AMG Funds LLC (2011-2017); Chief Compliance Officer, AMG Distributors, Inc., (2010-Present); Anti-Money Laundering Compliance Officer, AMG Funds, AMG Funds I, AMG Funds II, and AMG Funds III (2014-Present); Anti-Money Laundering Officer, AMG Funds IV, (2016-Present); Compliance Manager, Legal and Compliance, Affiliated Managers Group, Inc. (2005-2011). |
| |
• Assistant Secretary since 2016 | | Maureen A. Meredith, 32 Director, Counsel, AMG Funds LLC (2017-Present); Vice President, Counsel, AMG Funds LLC (2015-2017); Assistant Secretary, AMG Funds, AMG Funds I, AMG Funds II, AMG Funds III and AMG Funds IV (2016-Present); Associate, Ropes & Gray LLP (2011-2015); Law Fellow, Massachusetts Appleseed Center for Law and Justice (2010-2011). |
| |
• Assistant Secretary since 2016 | | Marc J. Peirce, 55 Director, Legal and Compliance, AMG Funds LLC (2017-Present); Vice President, Compliance Officer, AMG Funds LLC (2016-2017); Assistant Secretary, AMG Funds IV (2001-Present); Assistant Secretary, AMG Funds, AMG Funds I, AMG Funds II and AMG Funds III (2016-Present); Vice President, Aston Asset Management, LLC (1998-2016); Assistant Chief Compliance Officer, Aston Asset Management, LLC (2006-2016). |
231
Annual Renewal of Investment Management and Subadvisory Agreements
AMG Managers DoubleLine Core Plus Bond Fund (formerly ASTON/DoubleLine Core Plus Fixed Income Fund), AMG Managers Fairpointe Focused Equity Fund (formerly ASTON/Fairpointe Focused Equity Fund), AMG Managers Fairpointe Mid Cap Fund (formerly ASTON/Fairpointe Mid Cap Fund), AMG Managers Guardian Capital Global Dividend Fund (formerly ASTON/Guardian Capital Global Dividend Fund), AMG Managers Lake Partners LASSO Alternatives Fund (formerly ASTON/Lake Partners LASSO Alternatives Fund), AMG Managers LMCG Small Cap Growth Fund (formerly ASTON/LMCG Small Cap Growth Fund), AMG Managers Montag & Caldwell Balanced Fund (formerly ASTON/Montag & Caldwell Balanced Fund), AMG Managers Montag & Caldwell Growth Fund (formerly ASTON/Montag & Caldwell Growth Fund), AMG Managers Montag & Caldwell Mid Cap Growth Fund (formerly ASTON/Montag & Caldwell Mid Cap Growth Fund), AMG Managers Pictet International Fund (formerly ASTON/Pictet International Fund), AMG River Road Dividend All Cap Value Fund (formerly ASTON/River Road Dividend All Cap Value Fund), AMG River Road Dividend All Cap Value Fund II (formerly ASTON/River Road Dividend All Cap Value Fund II), AMG River Road Focused Absolute Value Fund (formerly ASTON/River Road Focused Absolute Value Fund), AMG River Road Long-Short Fund (formerly ASTON/River Road Long-Short Fund), AMG River Road Small-Mid Cap Value Fund (formerly AMG River Road Select Value Fund), AMG River Road Small Cap Value Fund (formerly ASTON/River Road Small Cap Value Fund), AMG Managers Silvercrest Small Cap Fund (formerly ASTON/Silvercrest Small Cap Fund), AMG GW&K U.S. Small Cap Growth Fund (formerly ASTON Small Cap Fund) and AMG Managers Value Partners Asia Dividend Fund (formerly ASTON/Value Partners Asia Dividend Fund): Approval of Investment Advisory and Sub-Investment Advisory Agreements on June 28-29, 2017
At an in-person meeting held on June 28-29, 2017, the Board of Trustees (the “Board” or the “Trustees”), and separately a majority of the Trustees who are not “interested persons” of the Trust (the “Independent Trustees”), approved (i) the Investment Advisory Agreement, as amended pursuant to letter agreements at any time prior to the date of the meeting, with AMG Funds LLC (the “Investment
Manager”) for each of AMG Managers DoubleLine Core Plus Bond Fund (formerly ASTON/DoubleLine Core Plus Fixed Income Fund), AMG Managers Fairpointe Focused Equity Fund (formerly ASTON/Fairpointe Focused Equity Fund), AMG Managers Fairpointe Mid Cap Fund (formerly ASTON/Fairpointe Mid Cap Fund), AMG Managers Guardian Capital Global Dividend Fund (formerly ASTON/Guardian Capital Global Dividend Fund), AMG Managers Lake Partners LASSO Alternatives Fund (formerly ASTON/Lake Partners LASSO Alternatives Fund), AMG Managers LMCG Small Cap Growth Fund (formerly ASTON/LMCG Small Cap Growth Fund), AMG Managers Montag & Caldwell Balanced Fund (formerly ASTON/Montag & Caldwell Balanced Fund), AMG Managers Montag & Caldwell Growth Fund (formerly ASTON/Montag & Caldwell Growth Fund), AMG Managers Montag & Caldwell Mid Cap Growth Fund (formerly ASTON/Montag & Caldwell Mid Cap Growth Fund), AMG Managers Pictet International Fund (formerly ASTON/Pictet International Fund), AMG River Road Dividend All Cap Value Fund (formerly ASTON/River Road Dividend All Cap Value Fund), AMG River Road Dividend All Cap Value Fund II (formerly ASTON/River Road Dividend All Cap Value Fund II), AMG River Road Focused Absolute Value Fund (formerly ASTON/River Road Focused Absolute Value Fund), AMG River Road Long-Short Fund (formerly ASTON/River Road Long-Short Fund), AMG River Road Small-Mid Cap Value Fund (formerly AMG River Road Select Value Fund), AMG River Road Small Cap Value Fund (formerly ASTON/River Road Small Cap Value Fund), AMG Managers Silvercrest Small Cap Fund (formerly ASTON/Silvercrest Small Cap Fund), AMG GW&K U.S. Small Cap Growth Fund (formerly ASTON Small Cap Fund) and AMG Managers Value Partners Asia Dividend Fund (formerly ASTON/Value Partners Asia Dividend Fund) (each, a “Fund,” and collectively, the “Funds”) and separately Amendment No. 1 thereto dated October 1, 2016 and separately an amendment, to be effective July 1, 2017, to the Investment Advisory Agreement with respect to AMG Managers Pictet International Fund (collectively, the “Investment Advisory Agreement”) and (ii) each Sub-Investment Advisory Agreement, as amended at any time prior to the date of the meeting, with the applicable Subadviser for each of AMG Managers DoubleLine Core Plus Bond Fund, AMG Managers Fairpointe Focused Equity Fund, AMG Managers Fairpointe Mid Cap Fund, AMG Managers Guardian Capital Global Dividend Fund, AMG Managers Lake Partners LASSO Alternatives Fund, AMG Managers LMCG Small Cap Growth Fund, AMG Managers Montag & Caldwell Balanced Fund,
AMG Managers Montag & Caldwell Growth Fund, AMG Managers Montag & Caldwell Mid Cap Growth Fund, AMG Managers Pictet International Fund, AMG River Road Dividend All Cap Value Fund, AMG River Road Dividend All Cap Value Fund II, AMG River Road Focused Absolute Value Fund, AMG River Road Long-Short Fund, AMG River Road Small-Mid Cap Value Fund, AMG River Road Small Cap Value Fund, AMG Managers Silvercrest Small Cap Fund and AMG Managers Value Partners Asia Dividend Fund, and separately an amendment, to be effective July 1, 2017, to the Sub-Investment Advisory Agreement for AMG Managers Pictet International Fund (collectively, the “Subadvisory Agreements”)1. The Independent Trustees were separately represented by independent legal counsel in connection with their consideration of the approval of these agreements. In considering the Investment Advisory Agreement and the Subadvisory Agreements, the Trustees reviewed a variety of materials relating to each Fund, the Investment Manager and each Subadviser, including comparative performance, fee and expense information for an appropriate peer group of similar mutual funds (each, a “Peer Group”), performance information for relevant benchmark indices (each, a “Fund Benchmark”) and, as to all other matters, other information provided to them on a periodic basis throughout the year, as well as information provided in connection with the meetings of June 28-29, 2017, regarding the nature, extent and quality of services provided by the Investment Manager and the Subadvisers under their respective agreements. Prior to voting, the Independent Trustees: (a) reviewed the foregoing information with their independent legal counsel and with management; (b) received materials from their independent legal counsel discussing the legal standards applicable to their consideration of the Investment Advisory Agreement and the Subadvisory Agreements; and (c) met with their independent legal counsel in private sessions at which no representatives of management were present.
| 1 | At an in-person meeting held on January 11, 2016, the Board of Trustees, and separately a majority of the Independent Trustees, approved the Sub-Investment Advisory Agreement with respect to AMG GW&K U.S. Small Cap Growth Fund, which was subsequently approved by Fund shareholders at a special meeting held on June 30, 2016, for an initial two-year period. |
NATURE, EXTENT AND QUALITY OF SERVICES
In considering the nature, extent and quality of the services provided by the Investment Manager, the Trustees reviewed information relating to the
Annual Renewal of Investment Management and Subadvisory Agreements (continued)
Investment Manager’s operations and personnel. Among other things, the Investment Manager provided financial information, biographical information on its supervisory and professional staff and descriptions of its organizational and management structure. The Trustees also took into account information provided periodically throughout the previous year by the Investment Manager in Board meetings relating to the performance of its duties with respect to the Funds and the Trustees’ knowledge of the Investment Manager’s management and the quality of the performance of the Investment Manager’s duties under the Investment Management Agreement and Administration Agreement. In the course of their deliberations regarding the Investment Manager, the Trustees evaluated, among other things: (a) the extent and quality of the Investment Manager’s oversight of the operation and management of the Funds; (b) the quality of the search, selection and monitoring services performed by the Investment Manager in overseeing the portfolio management responsibilities of the Subadvisers; (c) the Investment Manager’s ability to supervise the Funds’ other service providers; and (d) the Investment Manager’s compliance program. The Trustees also took into account that, in performing its functions under the Investment Advisory Agreement and supervising each Subadviser, the Investment Manager: performs periodic detailed analyses and reviews of the performance by each Subadviser of its obligations to a Fund, including, without limitation, analysis and review of portfolio and other compliance matters and review of each Subadviser’s investment performance with respect to a Fund; prepares and presents periodic reports to the Board regarding the investment performance of each Subadviser and other information regarding each Subadviser, at such times and in such forms as the Board may reasonably request; reviews and considers any changes in the personnel of each Subadviser responsible for performing the Subadviser’s obligations and makes appropriate reports to the Board; reviews and considers any changes in the ownership or senior management of each Subadviser and makes appropriate reports to the Board; performs periodic in-person or telephonic diligence meetings, including with respect to compliance matters, with representatives of each Subadviser; assists the Board and management of the Trust in developing and reviewing information with respect to the initial approval of each Subadvisory Agreement and annual consideration of each Subadvisory Agreement thereafter; prepares
recommendations with respect to the continued retention of any Subadviser or the replacement of any Subadviser, including at the request of the Board; identifies potential successors to or replacements of any Subadviser or potential additional subadvisers, performs appropriate due diligence, and develops and presents to the Board a recommendation as to any such successor, replacement or additional subadviser, including at the request of the Board; designates and compensates from its own resources such personnel as the Investment Manager may consider necessary or appropriate to the performance of its services; and performs such other review and reporting functions as the Board shall reasonably request consistent with the Investment Advisory Agreement and applicable law. With respect to AMG GW&K U.S. Small Cap Growth Fund, AMG River Road Dividend All Cap Value Fund, AMG River Road Dividend All Cap Value Fund II, AMG River Road Focused Absolute Value Fund, AMG River Road Long-Short Fund, AMG River Road Small-Mid Cap Value Fund and AMG River Road Small Cap Value Fund, the Trustees noted the affiliation of the Subadviser with the Investment Manager, noting any potential conflicts of interest. The Trustees also took into account the financial condition of the Investment Manager with respect to its ability to provide the services required under the Investment Advisory Agreement and the Investment Manager’s undertaking to maintain contractual expense limitations for certain Funds, as described below. The Trustees also considered the Investment Manager’s risk management processes.
For each applicable Fund, the Trustees also reviewed information relating to each Subadviser’s operations and personnel and the investment philosophy, strategies and techniques (for each Subadviser, its “Investment Strategy”) used in managing the Fund. Among other things, the Trustees reviewed biographical information on portfolio management and other professional staff, information regarding each Subadviser’s organizational and management structure and each Subadviser’s brokerage policies and practices. The Trustees considered specific information provided regarding the experience of the individuals at each Subadviser with portfolio management responsibility for a Fund, including the information set forth in the Fund’s prospectus and statement of additional information. In the course of their deliberations, the Trustees evaluated, among other things: (a) the services rendered by each Subadviser in the past; (b) the qualifications and experience of the Subadviser’s personnel; and (c) the
Subadviser’s compliance program. The Trustees also took into account the financial condition of each Subadviser with respect to its ability to provide the services required under its Subadvisory Agreement(s). The Trustees also considered each Subadviser’s risk management processes.
PERFORMANCE
As noted above, the Board considered each Fund’s net performance during relevant time periods as compared to the Fund’s Peer Group and Fund Benchmark and considered the gross performance of the Fund as compared to the Subadviser’s relevant performance composite that utilizes the same investment strategy and approach and noted that the Board reviews on a quarterly basis detailed information about both the Fund’s performance results and portfolio composition, as well as each Subadviser’s Investment Strategy. The Board noted the Investment Manager’s expertise and resources in monitoring the performance, investment style and risk-adjusted performance of each Subadviser. The Board was mindful of the Investment Manager’s attention to monitoring each Subadviser’s performance with respect to the Funds and its discussions with management regarding the factors that contributed to the performance of the Funds.
ADVISORY AND PROFITABILITY
In considering the reasonableness of the advisory fee charged by the Investment Manager for managing each Fund, the Trustees noted that the Investment Manager, and not the Fund, is responsible for paying the fees charged by the Fund’s Subadviser and, therefore, that the fees paid to the Investment Manager cover the cost of providing portfolio management services as well as the cost of providing search, selection and monitoring services in operating a “manager-of-managers” complex of mutual funds. The Trustees also considered the various changes in management, administrative and shareholder servicing fee rates that were implemented during the past year for the applicable Funds, noting that the Investment Manager provides administrative and shareholder services to the Funds pursuant to an Administrative Agreement with the Funds. The Trustees noted that, effective July 1, 2017, the management fee rate for AMG Managers Pictet International Fund will be reduced. The Trustees also considered the amount of the advisory fee retained by the Investment Manager after payment of the subadvisory fee with respect to each Fund. The Trustees also noted any payments that were made
Annual Renewal of Investment Management and Subadvisory Agreements (continued)
from River Road Asset Management, LLC (“River Road”) and GW&K Investment Management, LLC (“GW&K”) to the Investment Manager, and any other payments made or to be made from the Investment Manager to River Road and GW&K. The Trustees concluded that, in light of the high quality supervisory services provided by the Investment Manager and the fact that the subadvisory fees are paid out of the advisory fee, the advisory fee payable by each Fund to the Investment Manager can reasonably be expected to exceed the median advisory fee for the Peer Group, which consists of many funds that do not operate with a manager-of-managers structure. In this regard, the Trustees also noted that the Investment Manager has undertaken to maintain contractual expense limitations for AMG GW&K U.S. Small Cap Growth Fund, AMG Managers DoubleLine Core Plus Bond Fund, AMG Managers Fairpointe Focused Equity Fund, AMG Managers Guardian Capital Global Dividend Fund, AMG Managers Lake Partners LASSO Alternatives Fund, AMG Managers LMCG Small Cap Growth Fund, AMG Managers Montag & Caldwell Balanced Fund, AMG Managers Montag & Caldwell Mid Cap Growth Fund, AMG Managers Pictet International Fund, AMG River Road Dividend All Cap Value Fund, AMG River Road Dividend All Cap Value Fund II, AMG River Road Focused Absolute Value Fund, AMG River Road Long-Short Fund, AMG River Road Small-Mid Cap Value Fund, AMG Managers Silvercrest Small Cap Fund and AMG Managers Value Partners Asia Dividend Fund.
In addition, in considering the reasonableness of the advisory fee payable to the Investment Manager, the Trustees also reviewed information provided by the Investment Manager setting forth all revenues and other benefits, both direct and indirect (including any so-called “fallout benefits” such as reputational value derived from the Investment Manager serving as Investment Manager to a Fund), received by the Investment Manager and its affiliates attributable to managing each Fund and all the mutual funds in the AMG Funds Family of Funds, the cost of providing such services, the enterprise and entrepreneurial risks undertaken as Investment Manager and sponsor of the Funds and the resulting profitability to the Investment Manager and its affiliates from these relationships. The Trustees also noted the current asset levels of each Fund and the willingness of the Investment Manager to maintain contractual expense limitations, as described above, from time to time as a means of limiting total expenses. The Trustees also considered management’s discussion
of the current asset levels of the Funds, and the impact on profitability of both the current asset levels and any future growth of assets of the Funds. The Board took into account management’s discussion of the current and proposed advisory fee structure, as applicable, and, as noted above, the services the Investment Manager provides in performing its functions under the Investment Advisory Agreement and supervising each Subadviser. In this regard, the Trustees noted that, unlike a mutual fund that is managed by a single investment adviser, the Funds operate in a manager-of-managers structure. Based on the foregoing, the Trustees concluded that the profitability to the Investment Manager is reasonable and that the Investment Manager is not realizing material benefits from economies of scale that would warrant adjustments to the advisory fees for any Fund at this time (after noting the fee rate changes made at the meeting). With respect to economies of scale, the Trustees also noted that, as a Fund’s assets increase over time, the Fund may realize other economies of scale to the extent that the increase in assets is proportionally greater than the increase in certain other expenses.
SUBADVISORY FEES AND PROFITABILITY
In considering the reasonableness of the fee payable by the Investment Manager to each of DoubleLine Capital LP, Fairpointe Capital LLC, Guardian Capital LP, Lake Partners, Inc., LMCG Investments, LLC, Montag & Caldwell, LLC, Pictet Asset Management Limited, Silvercrest Asset Management Group LLC and Value Partners Hong Kong, Limited (each, an “Unaffiliated Subadviser” and collectively, the “Unaffiliated Subadvisers”), the Trustees relied on the ability of the Investment Manager to negotiate the terms of the Subadvisory Agreement at arm’s length as part of the manager-of-managers structure, noting that the Investment Manager is not affiliated with the Unaffiliated Subadvisers. In addition, the Trustees considered other potential benefits of the subadvisory relationship to the Unaffiliated Subadvisers, including, among others, the indirect benefits that each Unaffiliated Subadviser may receive from its relationship with a Fund, including any so-called “fallout benefits” to the Unaffiliated Subadvisers, such as reputational value derived from the Unaffiliated Subadvisers serving as Subadviser to a Fund. In addition, the Trustees noted that the subadvisory fees are paid by the Investment Manager out of its advisory fee. As a consequence of all of the foregoing, the cost of services to be provided by each Unaffiliated Subadviser and the
profitability to each Unaffiliated Subadviser of its relationship with a Fund were not material factors in the Trustees’ deliberations. For similar reasons, the Trustees did not consider potential economies of scale in the management of a Fund by each of the Unaffiliated Subadvisers to be a material factor in their deliberations at this time.
In considering the reasonableness of the fees payable by the Investment Manager to River Road, the Trustees noted that River Road is an affiliate of the Investment Manager, and the Trustees reviewed information regarding the cost to River Road of providing subadvisory services to a Fund and the resulting profitability from such relationship. The Trustees noted that, because River Road is an affiliate of the Investment Manager, a portion of River Road’s revenues or profits might be shared directly or indirectly with the Investment Manager. The Trustees also noted that the subadvisory fees are paid by the Investment Manager out of its advisory fee. With respect to each applicable Fund, the Board also took into account management’s discussion of the subadvisory fee structure, and the services River Road provides in performing its functions under the applicable Subadvisory Agreement. Based on the foregoing, the Trustees concluded that the profitability to River Road is reasonable and that River Road is not realizing material benefits from economies of scale that would warrant adjustments to the investment advisory or subadvisory fees at this time. Also with respect to economies of scale, the Trustees noted that as a Fund’s assets increase over time, the Fund may realize other economies of scale to the extent the increase in assets is proportionally greater than the increase in certain other expenses.
In addition to the foregoing, the Trustees considered the specific factors and related conclusions set forth below with respect to each applicable Fund, the Investment Manager and each Subadviser.
AMG Managers DoubleLine Core Plus Bond Fund
FUND PERFORMANCE
Among other information relating to the Fund’s performance, the Trustees noted that the Fund’s performance for Class I shares (which share class has the largest amount of assets of all the share classes of the Fund) for the 1-year, 3-year and 5-year periods ended March 31, 2017 and for the period from the Class I shares’ inception on July 18, 2011 through March 31, 2017 was above the median performance of
Annual Renewal of Investment Management and Subadvisory Agreements (continued)
the Peer Group and above the performance of the Fund Benchmark, the Bloomberg Barclays U.S. Aggregate Bond Index. The Trustees also took into account management’s discussion of the Fund’s performance, including the fact that the Fund outperformed the Fund Benchmark and its Peer Group for all relevant time periods. The Trustees also noted that Class I shares of the Fund ranked in the top decile relative to its Peer Group for the 3-year period and since inception, and in the top quintile relative to its Peer Group for the 1-year and 5-year periods. The Trustees concluded that the Fund’s performance has been satisfactory.
ADVISORY AND SUBADVISORY FEES
The Trustees noted that the Fund’s management fees (which include both the advisory and administration fees) and total expenses (weighted average, all classes combined) (net of applicable expense waivers/reimbursements) as of March 31, 2017 were both higher than the average for the Fund’s Peer Group. The Trustees took into account the fact that the Investment Manager has contractually agreed, through February 28, 2018, to limit the Fund’s net annual operating expenses (subject to certain excluded expenses) to 0.61%. The Trustees also took into account management’s discussion of the Fund’s expenses, including fees and expenses relative to comparably sized funds. The Trustees concluded that, in light of the nature, extent and quality of the services provided by the Investment Manager and the Subadviser, the foregoing expense reimbursement arrangement and the considerations noted above with respect to the Investment Manager and the Subadviser, the Fund’s advisory and subadvisory fees are reasonable.
AMG Managers Fairpointe Focused Equity Fund
FUND PERFORMANCE
Among other information relating to the Fund’s performance, the Trustees noted that the Fund’s performance for Class I shares (which share class has the largest amount of assets of all the share classes of the Fund) for the 1-year period ended March 31, 2017 and for the period from the Class I shares’ inception on December 24, 2014 through March 31, 2017 was above and at, respectively, the median performance of the Peer Group and above and below, respectively, the performance of the Fund Benchmark, the Russell 1000® Index. The Trustees
also took into account management’s discussion of the Fund’s performance, including its more recent improved performance relative to its Peer Group and Fund Benchmark. The Trustees noted that Class I shares of the Fund ranked in the top decile relative to its Peer Group for the 1-year period. The Trustees concluded that the Fund’s overall performance has been satisfactory.
ADVISORY AND SUBADVISORY FEES
The Trustees noted that the Fund’s management fees (which include both the advisory and administration fees) and total expenses (weighted average, all classes combined) (net of applicable expense waivers/reimbursements) as of March 31, 2017 were higher and lower, respectively, than the average for the Fund’s Peer Group. The Trustees took into account the fact that the Investment Manager has contractually agreed, through February 28, 2018, to limit the Fund’s net annual operating expenses (subject to certain excluded expenses) to 0.82%. The Trustees also took into account management’s discussion of the Fund’s expenses, including fees and expenses relative to comparably sized funds, and the current size of the Fund. The Trustees concluded that, in light of the nature, extent and quality of the services provided by the Investment Manager and the Subadviser and the considerations noted above with respect to the Investment Manager and the Subadviser, the Fund’s advisory and subadvisory fees are reasonable.
AMG Managers Fairpointe Mid Cap Fund
FUND PERFORMANCE
Among other information relating to the Fund’s performance, the Trustees noted that the Fund’s performance for Class N shares (which share class has the earliest inception date of all the share classes of the Fund) for the 1-year, 3-year, 5-year and 10-year periods ended March 31, 2017 was above the median performance of the Peer Group and above, below, above and above, respectively, the performance of the Fund Benchmark, the S&P MidCap 400® Index. The Trustees also took into account management’s discussion of the Fund’s performance, including its more recent improved performance relative to its Peer Group and Fund Benchmark. The Trustees noted that Class N shares of the Fund ranked in the top decile relative to its Peer Group for the 1-year, 5-year and 10-year periods and in the second quartile relative to its Peer Group
for the 3-year period. The Trustees concluded that the Fund’s overall performance has been satisfactory.
ADVISORY AND SUBADVISORY FEES
The Trustees noted that the Fund’s management fees (which include both the advisory and administration fees) and total expenses (weighted average, all classes combined) as of March 31, 2017 were both lower than the average for the Fund’s Peer Group. The Trustees concluded that, in light of the nature, extent and quality of the services provided by the Investment Manager and the Subadviser and the considerations noted above with respect to the Investment Manager and the Subadviser, the Fund’s advisory and subadvisory fees are reasonable.
AMG Managers Guardian Capital Global Dividend Fund
FUND PERFORMANCE
Among other information relating to the Fund’s performance, the Trustees noted that the Fund’s performance for Class I shares (which share class has the largest amount of assets of all the share classes of the Fund) for the 1-year period ended March 31, 2017 and for the period from the Class I shares’ inception on April 14, 2014 through March 31, 2017 was below the median performance of the Peer Group and below the performance of the Fund Benchmark, the MSCI World Index. The Trustees took into account management’s discussion of the Fund’s performance, including the reasons for the Fund’s underperformance and any actions being taken to address such performance. The Trustees also noted that Class I shares of the Fund ranked in the third quartile relative to its Peer Group for the period from inception through March 31, 2017. The Trustees concluded that the Fund’s performance is being addressed.
ADVISORY AND SUBADVISORY FEES
The Trustees noted that the Fund’s management fees (which include both the advisory and administration fees) and total expenses (weighted average, all classes combined) (net of applicable expense waivers/reimbursements) as of March 31, 2017 were both lower than the average for the Fund’s Peer Group. The Trustees took into account the fact that the Investment Manager has contractually agreed, through February 28, 2018, to limit the Fund’s net annual operating expenses (subject to certain
Annual Renewal of Investment Management and Subadvisory Agreements (continued)
excluded expenses) to 1.05%. The Trustees concluded that, in light of the nature, extent and quality of the services provided by the Investment Manager and the Subadviser, the foregoing expense reimbursement arrangement and the considerations noted above with respect to the Investment Manager and the Subadviser, the Fund’s advisory and subadvisory fees are reasonable.
AMG Managers Lake Partners LASSO Alternative Fund
FUND PERFORMANCE
Among other information relating to the Fund’s performance, the Trustees noted that the Fund’s performance for Class I shares (which share class has the earliest inception date and the largest amount of assets of all the share classes of the Fund) for the 1-year, 3-year and 5-year periods ended March 31, 2017 and for the period from the Class I shares’ inception on April 1, 2009 through March 31, 2017 was below the median performance of the Peer Group and below, below, below and above, respectively, the performance of the Fund Benchmark, the HFRX Equity Hedge Index. The Trustees took into account management’s discussion of the Fund’s performance, including the reasons for the Fund’s underperformance and any actions being taken to address such performance. The Trustees noted that Class I shares of the Fund ranked in the third quintile relative to the Peer Group for the 1-year and 5-year periods and for the period from inception through March 31, 2017. The Trustees concluded that the Fund’s performance is being addressed.
ADVISORY AND SUBADVISORY FEES
The Trustees noted that the Fund’s management fees (which include both the advisory and administration fees) and total expenses (weighted average, all classes combined) (net of applicable expense waivers/reimbursements) as of March 31, 2017 were both lower than the average for the Fund’s Peer Group. The Trustees took into account the fact that the Investment Manager has contractually agreed, through February 28, 2018, to limit the Fund’s net annual operating expenses (subject to certain excluded expenses) to 1.09%. The Trustees concluded that, in light of the nature, extent and quality of the services provided by the Investment Manager and the Subadviser, the foregoing expense reimbursement arrangement and the considerations noted above with respect to the Investment Manager and the Subadviser, the Fund’s advisory and subadvisory fees are reasonable.
The Board considered that the Fund, as a fund of funds, invests primarily in other investment companies. The Board noted that the Fund historically has invested in underlying funds outside of the AMG Funds Family of Funds. In approving the continuance of the Investment Advisory Agreement for the Fund, the Board, including a majority of the Independent Trustees, found that the advisory fees charged with respect to the Fund under the Investment Advisory Agreement are based on services provided that will be in addition to, rather than duplicative of, the services provided under the advisory agreement with respect to any underlying fund in which the Fund may invest.
AMG Managers LMCG Small Cap Growth Fund
FUND PERFORMANCE
Among other information relating to the Fund’s performance, the Trustees noted that the Fund’s performance for Class N shares (which share class has the earliest inception date of all the share classes of the Fund) for the 1-year, 3-year and 5-year periods ended March 31, 2017 and for the period from the Class N shares’ inception on November 3, 2010 through March 31, 2017 was below the median performance of the Peer Group and below the performance of the Fund Benchmark, the Russell 2000® Growth Index. The Trustees also took into account management’s discussion of the Fund’s performance, including the reasons given for the Fund’s underperformance and any actions being taken to address such performance. The Trustees also noted that Class N shares of the Fund ranked in the third quartile relative to the Peer Group for the 5-year period. The Trustees concluded that the Fund’s performance is being addressed.
ADVISORY AND SUBADVISORY FEES
The Trustees noted that the Fund’s management fees (which include both the advisory and administration fees) and total expenses (weighted average, all classes combined) (net of applicable expense waivers/reimbursements) as of March 31, 2017 were both higher than the average for the Fund’s Peer Group. The Trustees took into account the fact that the Investment Manager has contractually agreed, through February 28, 2018, to limit the Fund’s net annual operating expenses (subject to certain excluded expenses) to 1.03%. The Trustees also took into account management’s discussion of the Fund’s expenses, including fees and expenses relative to comparably sized funds. The Trustees concluded that, in light of the nature, extent and quality of the
services provided by the Investment Manager and the Subadviser, the foregoing expense reimbursement arrangement and the considerations noted above with respect to the Investment Manager and the Subadviser, the Fund’s advisory and subadvisory fees are reasonable.
AMG Managers Montag & Caldwell Balanced Fund
FUND PERFORMANCE
Among other information relating to the Fund’s performance, the Trustees noted that the Fund’s performance for Class N shares (which share class has the earliest inception date and the largest amount of assets of all the share classes of the Fund) for the 1-year, 3-year, 5-year and 10-year periods ended March 31, 2017 was below, below, below and above, respectively, the median performance of the Peer Group below the performance of the Fund Benchmark, a Composite Index (60% S&P 500 Index and 40% Bloomberg Barclays U.S. Government Credit Bond Index). The Trustees also took into account management’s discussion of the Fund’s performance, including the reasons given for the Fund’s underperformance and any actions being taken to address such performance. The Trustees also noted that Class N shares of the Fund ranked in the second quintile relative to its Peer Group for the 10-year period and in the third quintile relative to its Peer Group for the 3-year period. The Trustees concluded that the Fund’s performance is being addressed.
ADVISORY AND SUBADVISORY FEES
The Trustees noted that the Fund’s management fees (which include both the advisory and administration fees) and total expenses (weighted average, all classes combined) (net of applicable expense waivers/reimbursements) as of March 31, 2017 were both higher than the average for the Fund’s Peer Group. The Trustees took into account the fact that the Investment Manager has contractually agreed, through February 28, 2018, to limit the Fund’s net annual operating expenses (subject to certain excluded expenses) to 1.04%. The Trustees also took into account management’s discussion of the Fund’s expenses, including fees and expenses relative to comparably sized funds, and the current size of the Fund. The Trustees concluded that, in light of the nature, extent and quality of the services provided by the Investment Manager and the Subadviser, the foregoing expense limitation arrangement and the
Annual Renewal of Investment Management and Subadvisory Agreements (continued)
considerations noted above with respect to the Investment Manager and the Subadviser, the Fund’s advisory and subadvisory fees are reasonable.
AMG Managers Montag & Caldwell Growth Fund
FUND PERFORMANCE
Among other information relating to the Fund’s performance, the Trustees noted that the Fund’s performance for Class N shares (which share class has the earliest inception date of all the share classes of the Fund) for the 1-year, 3-year, 5-year and 10-year periods ended March 31, 2017 was below the median performance of the Peer Group and below the performance of the Fund Benchmark, the Russell 1000® Growth Index. The Trustees also took into account management’s discussion of the Fund’s performance, including the reasons given for the Fund’s underperformance and any actions being taken to address such performance. The Trustees noted that Class N shares of the Fund ranked in the third quartile relative to its Peer Group for the 10-year period. The Trustees concluded that the Fund’s performance is being addressed.
ADVISORY AND SUBADVISORY FEES
The Trustees noted that the Fund’s management fees (which include both the advisory and administration fees) and total expenses (weighted average, all classes combined) as of March 31, 2017 were both lower than the average for the Fund’s Peer Group. The Trustees concluded that, in light of the nature, extent and quality of the services provided by the Investment Manager and the Subadviser and the considerations noted above with respect to the Investment Manager and the Subadviser, the Fund’s advisory and subadvisory fees are reasonable.
AMG Managers Montag & Caldwell Mid Cap Growth Fund
FUND PERFORMANCE
Among other information relating to the Fund’s performance, the Trustees noted that the Fund’s performance for Class N shares (which share class has the earliest inception date of all the share classes of the Fund) for the 1-year, 3-year and 5-year periods ended March 31, 2017 and for the period from the Class N shares’ inception on November 2, 2007 through March 31, 2017 was below the median performance of the Peer Group and below the performance of the Fund Benchmark, the Russell
Midcap® Growth Index. The Trustees also took into account management’s discussion of the Fund’s performance, including the reasons given for the Fund’s underperformance and any actions being taken to address such performance. The Trustees noted that Class N shares of the Fund ranked in the third quintile relative to its Peer Group for the 3-year period and in the third quartile relative to its Peer Group for the period from inception through March 31, 2017. The Trustees concluded that the Fund’s performance is being addressed.
ADVISORY AND SUBADVISORY FEES
The Trustees noted that the Fund’s management fees (which include both the advisory and administration fees) and total expenses (weighted average, all classes combined) (net of applicable expense waivers/reimbursements) as of March 31, 2017 were lower and higher, respectively, than the average for the Fund’s Peer Group. The Trustees took into account the fact that the Investment Manager has contractually agreed, through February 28, 2018, to limit the Fund’s net annual operating expenses (subject to certain excluded expenses) to 0.95%. The Trustees also took into account management’s discussion of the Fund’s expenses, including fees and expenses relative to comparably sized funds, and the current size of the Fund. The Trustees concluded that, in light of the nature, extent and quality of the services provided by the Investment Manager and the Subadviser, the foregoing expense reimbursement arrangement and the considerations noted above with respect to the Investment Manager and the Subadviser, the Fund’s advisory and subadvisory fees are reasonable.
AMG Managers Pictet International Fund
FUND PERFORMANCE
Among other information relating to the Fund’s performance, the Trustees noted that the Fund’s performance for Class I shares (which share class has the largest amount of assets of all the share classes of the Fund) for the 1-year period ended March 31, 2017 and for the period from the Class I shares’ inception on April 14, 2014 through March 31, 2017 was above the median performance of the Peer Group and above the performance of the Fund Benchmark, the MSCI EAFE Index. The Trustees also took into account management’s discussion of the Fund’s performance, including the fact that Class I shares of the Fund ranked in the top quintile relative to the Peer Group for the period from inception
through March 31, 2017 and in the top quartile relative to the Peer Group for the 1-year period. The Trustees concluded that the Fund’s performance has been satisfactory.
ADVISORY AND SUBADVISORY FEES
The Trustees noted that the Fund’s management fees (which include both the advisory and administration fees) and total expenses (weighted average, all classes combined) (net of applicable expense waivers/reimbursements) as of March 31, 2017 were both higher than the average for the Fund’s Peer Group. The Trustees took into account the fact that effective July 1, 2017, the Fund’s existing contractual expense limitation agreement will be replaced with a new contractual expense limitation agreement pursuant to which the Investment Manager has contractually agreed, through at least March 1, 2019, to lower the Fund’s contractual expense limitation from 1.08% to 0.98% of the Fund’s net annual operating expenses (subject to certain excluded expenses), subject to later reimbursement by the Fund in certain circumstances. The Trustees noted that, effective July 1, 2017, the Fund’s management fee rate was being reduced. The Trustees also took into account management’s discussion of the Fund’s expenses, including fees and expenses relative to comparably sized funds. The Trustees concluded that, in light of the nature, extent and quality of the services provided by the Investment Manager and the Subadviser, the foregoing expense reimbursement arrangement and the considerations noted above with respect to the Investment Manager and the Subadviser, the Fund’s advisory and subadvisory fees are reasonable.
AMG River Road Dividend All Cap Value Fund
FUND PERFORMANCE
Among other information relating to the Fund’s performance, the Trustees noted that the Fund’s performance for Class N shares (which share class has the earliest inception date of all the share classes of the Fund) for the 1-year, 3-year, 5-year and 10-year periods ended March 31, 2017 was below, above, above and above, respectively, the median performance of the Peer Group and below, below, below and above, respectively, the performance of the Fund Benchmark, the Russell 3000® Value Index. The Trustees took into account management’s discussion of the Fund’s performance, including the reasons for the Fund’s more recent underperformance relative to its Peer Group and the
Annual Renewal of Investment Management and Subadvisory Agreements (continued)
Fund Benchmark. The Trustees also noted that the 10-year performance results for Class N shares of the Fund ranked in the top quintile relative to its Peer Group and the 3-year performance results for Class N shares of the Fund ranked in the top quartile relative to its Peer Group. The Trustees concluded that the Fund’s overall performance has been satisfactory.
ADVISORY AND SUBADVISORY FEES
The Trustees noted that the Fund’s management fees (which include both the advisory and administration fees) and total expenses (weighted average, all classes combined) (net of applicable expense waivers/reimbursements) as of March 31, 2017 were both lower than the average for the Fund’s Peer Group. The Trustees took into account the fact that the Investment Manager has contractually agreed, through February 28, 2018, to limit the Fund’s net annual operating expenses (subject to certain excluded expenses) to 0.99%. The Trustees concluded that, in light of the nature, extent and quality of the services provided by the Investment Manager and the Subadviser (which is an affiliate of the Investment Manager), the foregoing expense limitation arrangement and the considerations noted above with respect to the Investment Manager and the Subadviser, the Fund’s advisory and subadvisory fees are reasonable.
AMG River Road Dividend All Cap Value Fund II
FUND PERFORMANCE
Among other information relating to the Fund’s performance, the Trustees noted that the Fund’s performance for Class I shares (which share class has the largest amount of assets of all the share classes of the Fund) for the 1-year and 3-year periods ended March 31, 2017 and for the period from the Class I shares’ inception on June 27, 2012 through March 31, 2017 was below, above and below, respectively, the median performance of the Peer Group and below, above and below, respectively, the performance of the Fund Benchmark, the Russell 3000® Value Index. The Trustees also took into account management’s discussion of the Fund’s performance, including the reasons for the Fund’s more recent underperformance relative to its Peer Group and the Fund Benchmark. The Trustees also noted that Class I shares of the Fund ranked in the top quintile relative to the Peer Group for the 3-year period. The Trustees concluded that the Fund’s overall performance has been satisfactory in light of all factors considered.
ADVISORY AND SUBADVISORY FEES
The Trustees noted that the Fund’s management fees (which include both the advisory and administration fees) and total expenses (weighted average, all classes combined) (net of applicable expense waivers/reimbursements) as of March 31, 2017 were both lower than the average for the Fund’s Peer Group. The Trustees took into account the fact that the Investment Manager has contractually agreed, through February 28, 2018, to limit the Fund’s net annual operating expenses (subject to certain excluded expenses) to 0.99%. The Trustees concluded that, in light of the nature, extent and quality of the services provided by the Investment Manager and the Subadviser (which is an affiliate of the Investment Manager), the foregoing expense reimbursement arrangement and the considerations noted above with respect to the Investment Manager and the Subadviser, the Fund’s advisory and subadvisory fees are reasonable.
AMG River Road Focused Absolute Value Fund
FUND PERFORMANCE
Among other information relating to the Fund’s performance, the Trustees noted that the Fund’s performance for Class I shares (which share class has the largest amount of assets of all the share classes of the Fund) for the 1-year period ended March 31, 2017 and for the period from the Fund’s inception on November 3, 2015 through March 31, 2017 was above the median performance of the Peer Group and above the performance of the Fund Benchmark, the Russell 3000® Value Index. The Trustees also took into account management’s discussion of the Fund’s performance, including the fact that the Fund outperformed its Peer Group and the Fund Benchmark for all relevant time periods. The Trustees noted that Class I shares of the Fund ranked in the top quintile relative to its Peer Group for the period from inception through March 31, 2017 and in the top quartile relative to its Peer Group for the 1-year period. The Trustees concluded that the Fund’s performance has been satisfactory.
ADVISORY AND SUBADVISORY FEES
The Trustees noted that the Fund’s management fees (which include both the advisory and administration fees) and total expenses (weighted average, all classes combined) (net of applicable expense waivers/reimbursements) as of March 31, 2017 were
both lower than the average for the Fund’s Peer Group. The Trustees took into account the fact that the Investment Manager has contractually agreed, through February 28, 2018, to limit the Fund’s net annual operating expenses (subject to certain excluded expenses) to 0.71%. The Trustees concluded that, in light of the nature, extent and quality of the services provided by the Investment Manager and the Subadviser, the foregoing expense reimbursement arrangement and the considerations noted above with respect to the Investment Manager and the Subadviser, the Fund’s advisory and subadvisory fees are reasonable.
AMG River Road Long-Short Fund
FUND PERFORMANCE
Among other information relating to the Fund’s performance, the Trustees noted that the Fund’s performance for Class N shares (which share class has the earliest inception date of all the share classes of the Fund) for the 1-year, 3-year and 5-year periods ended March 31, 2017 and for the period from the Class N shares’ inception on May 4, 2011 through March 31, 2017 was below, below, below and above, respectively, the median performance of the Peer Group and below the performance of the Fund Benchmark, the Russell 3000® Index. The Trustees also took into account management’s discussion of the Fund’s performance, including the reasons given for the Fund’s underperformance and any actions being taken to address such performance. The Trustees also noted that Class N shares of the Fund ranked in the top half relative to its Peer Group for the period from inception through March 31, 2017 and in the third quintile relative to its Peer Group for the 1-year, 3-year and 5-year periods. The Trustees concluded that the Fund’s performance is being addressed.
ADVISORY AND SUBADVISORY FEES
The Trustees noted that the Fund’s management fees (which include both the advisory and administration fees) and total expenses (weighted average, all classes combined) (net of applicable expense waivers/reimbursements) as of March 31, 2017 were both lower than the average for the Fund’s Peer Group. The Trustees took into account the fact that, effective January 1, 2017, the Investment Manager has contractually agreed, through February 28, 2018, to lower the Fund’s contractual expense limitation from
Annual Renewal of Investment Management and Subadvisory Agreements (continued)
1.37% to 1.12% of the Fund’s net annual operating expenses (subject to certain excluded expenses). The Trustees concluded that, in light of the nature, extent and quality of the services provided by the Investment Manager and the Subadviser (which is an affiliate of the Investment Manager), the foregoing expense reimbursement arrangement and the considerations noted above with respect to the Investment Manager and the Subadviser, the Fund’s advisory and subadvisory fees are reasonable.
AMG River Road Small-Mid Cap Value Fund
FUND PERFORMANCE
Among other information relating to the Fund’s performance, the Trustees noted that the Fund’s performance for Class N shares (which share class has the earliest inception date of all the share classes of the Fund) for the 1-year, 3-year, 5-year and 10-year periods ended March 31, 2017 was below, above, below and below, respectively, the median performance of the Peer Group and above, above, below and below, respectively, the performance of the Fund Benchmark, the Russell 2500® Value Index. The Trustees also took into account management’s discussion of the Fund’s performance, including its more recent improved performance relative to the Fund Benchmark. The Trustees also noted that Class N shares of the Fund ranked in the top quartile relative to its Peer Group for the 3-year period and in the third quintile relative to its Peer Group for the 1-year, 5-year and 10-year periods. The Trustees concluded that the Fund’s overall performance has been satisfactory.
ADVISORY AND SUBADVISORY FEES
The Trustees noted that the Fund’s management fees (which include both the advisory and administration fees) and total expenses (weighted average, all classes combined) (net of applicable expense waivers/reimbursements) as of March 31, 2017 were both higher than the average for the Fund’s Peer Group. The Trustees took into account the fact that, effective January 1, 2017, the Investment Manager has contractually agreed, through February 28, 2018, to lower the Fund’s contractual expense limitation from 1.19% to 1.04% of the Fund’s net annual operating expenses (subject to certain excluded expenses). The Trustees also took into account management’s discussion of the Fund’s expenses, including fees and expenses relative to comparably sized funds, and the current size of the Fund. The Trustees concluded that, in light of the nature, extent and quality of the services provided by the Investment
Manager and the Subadviser (which is an affiliate of the Investment Manager), the foregoing expense reimbursement arrangement and the considerations noted above with respect to the Investment Manager and the Subadviser, the Fund’s advisory and subadvisory fees are reasonable.
AMG River Road Small Cap Value Fund
FUND PERFORMANCE
Among other information relating to the Fund’s performance, the Trustees noted that the Fund’s performance for Class N shares (which share class has the earliest inception date of all the share classes of the Fund) for the 1-year, 3-year, 5-year and 10-year periods ended March 31, 2017 was below, above, below and below, respectively, the median performance of the Peer Group and below, above, below and below, respectively, the performance of the Fund Benchmark, the Russell 2000® Value Index. The Trustees also took into account management’s discussion of the Fund’s performance, including the reasons for the Fund’s more recent underperformance relative to its Peer Group and Fund Benchmark. The Trustees also noted that Class N shares of the Fund ranked in the second quintile relative to its Peer Group for the 3-year period and in the third quintile relative to its Peer Group for the 1-year and 5-year periods. The Trustees concluded that the Fund’s overall performance has been satisfactory in light of all factors considered.
ADVISORY AND SUBADVISORY FEES
The Trustees noted that the Fund’s management fees (which include both the advisory and administration fees) and total expenses (weighted average, all classes combined) as of March 31, 2017 were higher and lower, respectively, than the average for the Fund’s Peer Group. The Trustees took into account management’s discussion of the Fund’s expenses, including fees and expenses relative to comparably sized funds. The Trustees concluded that, in light of the nature, extent and quality of the services provided by the Investment Manager and the Subadviser (which is an affiliate of the Investment Manager) and the considerations noted above with respect to the Investment Manager and the Subadviser, the Fund’s advisory and subadvisory fees are reasonable.
AMG Managers Silvercrest Small Cap Fund
FUND PERFORMANCE
Among other information relating to the Fund’s performance, the Trustees noted that the Fund’s performance for Class I shares (which share class has the largest amount of assets of all the share classes of the Fund) for the 1-year, 3-year and 5-year periods ended March 31, 2017 and for the period from the Class I shares’ inception on December 27, 2011 through March 31, 2017 was above the median performance of the Peer Group and below, above, above and above, respectively, the performance of the Fund Benchmark, the Russell 2000® Value Index. The Trustees also took into account management’s discussion of the Fund’s performance, including the Fund’s outperformance of the Peer Group for all relevant periods and the reasons for the Fund’s more recent underperformance relative to the Fund Benchmark. The Trustees also noted that Class I shares of the Fund ranked in the top quintile relative to its Peer Group for the 1-year and 3-year periods and in the second quintile relative to its Peer Group for the 5-year period and since inception. The Trustees concluded that the Fund’s overall performance has been satisfactory.
ADVISORY AND SUBADVISORY FEES
The Trustees noted that the Fund’s management fees (which include both the advisory and administration fees) and total expenses (weighted average, all classes combined) (net of applicable expense waivers/reimbursements) as of March 31, 2017 were both higher than the average for the Fund’s Peer Group. The Trustees took into account the fact that the Investment Manager has contractually agreed, through February 28, 2018, to limit the Fund’s net annual operating expenses (subject to certain excluded expenses) to 1.08%. The Trustees also took into account management’s discussion of the Fund’s expenses, including fees and expenses relative to comparably sized funds. The Trustees concluded that, in light of the nature, extent and quality of the services provided by the Investment Manager and the Subadviser, the foregoing expense reimbursement arrangement and the considerations noted above with respect to the Investment Manager and the Subadviser, the Fund’s advisory and subadvisory fees are reasonable.
Annual Renewal of Investment Management and Subadvisory Agreements (continued)
AMG GW&K U.S. Small Cap Growth Fund
FUND PERFORMANCE
Among other information relating to the Fund’s performance, the Trustees noted that the Fund’s performance for Class N shares (which share class has the earliest inception date and the largest amount of assets of all the share classes of the Fund) for the 1-year, 3-year, 5-year and 10-year periods ended March 31, 2017 was below the median performance of the Peer Group and below the performance of the Fund Benchmark, the Russell 2000® Growth Index. The Trustees also took into account management’s discussion of the Fund’s performance, including the reasons given for the Fund’s underperformance and any actions being taken to address such performance. The Trustees specifically noted the change in the Fund’s Subadviser in February 2016 and that the performance record largely reflects that of the prior Subadviser. The Trustees also noted that Class N shares of the Fund ranked in the third quartile relative to its Peer Group for the 1-year period. The Trustees concluded that the Fund’s performance is being addressed.
ADVISORY FEES
The Trustees noted that the Fund’s management fees (which include both the advisory and administration fees) and total expenses (weighted average, all classes combined) (net of applicable expense waivers/reimbursements) as of March 31, 2017 were both lower than the average for the Fund’s Peer Group. The Trustees took into account the fact that the Investment Manager has contractually agreed, through February 28, 2018, to limit the Fund’s net annual operating expenses (subject to certain excluded expenses) to 0.90%. The Trustees noted that the Investment Manager reduced the Fund’s expense limitation in 2016. The Trustees concluded that, in light of the nature, extent and quality of the services provided by the Investment Manager, the foregoing expense reimbursement arrangement and the considerations noted above with respect to the
Investment Manager, the Fund’s advisory fees are reasonable.
AMG Managers Value Partners Asia Dividend Fund
FUND PERFORMANCE
Among other information relating to the Fund’s performance, the Trustees noted that the Fund’s performance for Class I shares (which share class has the largest amount of assets of all the share classes of the Fund) for the 1-year period ended March 31, 2017 and for the period from the Fund’s inception on December 16, 2015 through March 31, 2017 was above the median performance of the Peer Group and above and below, respectively, the performance of the Fund Benchmark, the MSCI AC Asia ex Japan Index. The Trustees also took into account management’s discussion of the Fund’s performance, including the fact that Class I shares of the Fund ranked in the second quintile relative to its Peer Group for all relevant periods. The Trustees concluded that the Fund’s overall performance has been satisfactory.
ADVISORY AND SUBADVISORY FEES
The Trustees noted that the Fund’s management fees (which include both the advisory and administration fees) and total expenses (weighted average, all classes combined) (net of applicable expense waivers/reimbursements) as of March 31, 2017 were both lower than the average for the Fund’s Peer Group. The Trustees took into account the fact that the Investment Manager has contractually agreed, through February 28, 2018, to limit the Fund’s net annual operating expenses (subject to certain excluded expenses) to 1.15%. The Trustees concluded that, in light of the nature, extent and quality of the services provided by the Investment Manager and the Subadviser, the foregoing expense reimbursement arrangement and the considerations noted above with respect to the Investment Manager and the Subadviser, the Fund’s advisory and subadvisory fees are reasonable.
* * * *
After consideration of the foregoing, the Trustees also reached the following conclusions (in addition to the conclusions discussed above) regarding the Investment Advisory Agreement and each Subadvisory Agreement: (a) the Investment Manager and each Subadviser have demonstrated that they possess the capability and resources to perform the duties required of them under the Investment Advisory Agreement and the applicable Subadvisory Agreement; (b) each Subadviser’s Investment Strategy is appropriate for pursuing the applicable Fund’s investment objective(s); and (c) the Investment Manager and each Subadviser maintain appropriate compliance programs.
Based on all of the above-mentioned factors and their related conclusions, with no single factor or conclusion being determinative and with each Trustee not necessarily attributing the same weight to each factor, the Trustees concluded that approval of the Investment Advisory Agreement and each Subadvisory Agreement would be in the best interests of the applicable Fund and its shareholders. Accordingly, on June 28-29, 2017, the Trustees, and separately a majority of the Independent Trustees, voted to approve the Investment Advisory Agreement for each Fund and the Subadvisory Agreement for each of AMG Managers DoubleLine Core Plus Bond Fund, AMG Managers Fairpointe Focused Equity Fund, AMG Managers Fairpointe Mid Cap Fund, AMG Managers Guardian Capital Global Dividend Fund, AMG Managers Lake Partners LASSO Alternatives Fund, AMG Managers LMCG Small Cap Growth Fund, AMG Managers Montag & Caldwell Balanced Fund, AMG Managers Montag & Caldwell Growth Fund, AMG Managers Montag & Caldwell Mid Cap Growth Fund, AMG Managers Pictet International Fund, AMG River Road Dividend All Cap Value Fund, AMG River Road Dividend All Cap Value Fund II, AMG River Road Focused Absolute Value Fund, AMG River Road Long-Short Fund, AMG River Road Small-Mid Cap Value Fund, AMG River Road Small Cap Value Fund, AMG Managers Silvercrest Small Cap Fund and AMG Managers Value Partners Asia Dividend Fund.
INVESTMENT MANAGER AND ADMINISTRATOR*
AMG Funds LLC
600 Steamboat Road, Suite 300
Greenwich, CT 06830
(800) 835-3879
DISTRIBUTOR
AMG Distributors, Inc.
600 Steamboat Road, Suite 300
Greenwich, CT 06830
(800) 835-3879
CUSTODIAN
The Bank of New York Mellon
111 Sanders Creek Parkway
East Syracuse, NY 13057
LEGAL COUNSEL
Ropes & Gray LLP
Prudential Tower, 800 Boylston Street
Boston, MA 02199-3600
TRANSFER AGENT
BNY Mellon Investment Servicing (US) Inc.
Attn: AMG Funds
P.O. Box 9769
Providence, RI 02940
(800) 548-4539
This report is prepared for the Fund’s shareholders. It is authorized for distribution to prospective investors only when preceded or accompanied by an effective prospectus. To receive a free copy of the prospectus or Statement of Additional Information, which includes additional information about Fund Trustees, please contact us by calling 800.835.3879. Distributed by AMG Distributors, Inc., member FINRA.
A description of the policies and procedures each Fund uses to vote its proxies is available: (i) without charge, upon request, by calling 800.835.3879, or (ii) on the Securities and Exchange Commission’s (SEC) Web site at sec.gov. For information regarding each Fund’s proxy voting record for the 12-month period ended June 30, call 800.835.3879 or visit the SEC Web site at sec.gov.
The Fund files its complete schedule of portfolio holdings with the SEC for the first and third quarters of each fiscal year on Form N-Q. The Fund’s Forms N-Q are available on the SEC’s website at sec.gov. A Fund’s Forms N-Q may be reviewed and copied at the SEC’s Public Reference Room in Washington, DC. Information on the operation of the Public Reference Room may be obtained by calling 1.800.SEC.0330. To review a complete list of the Fund’s portfolio holdings, or to view the most recent quarterly holdings report, semiannual report, or annual report, please visit amgfunds.com.
AFFILIATE SUBADVISED FUNDS
BALANCED FUNDS
AMG Chicago Equity Partners Balanced
Chicago Equity Partners, LLC
AMG FQ Global Risk-Balanced
First Quadrant, L.P.
EQUITY FUNDS
AMG Chicago Equity Partners Small Cap Value
Chicago Equity Partners, LLC
AMG FQ Tax-Managed U.S. Equity
AMG FQ Long-Short Equity
First Quadrant, L.P.
AMG Frontier Small Cap Growth
Frontier Capital Management Company, LLC
AMG GW&K Small Cap Core
AMG GW&K Small/Mid Cap
AMG GW&K U.S. Small Cap Growth
GW&K Investment Management, LLC
AMG Renaissance International Equity
AMG Renaissance Large Cap Growth
The Renaissance Group LLC
AMG River Road Dividend All Cap Value
AMG River Road Dividend All Cap Value II
AMG River Road Focused Absolute Value
AMG River Road Long-Short
AMG River Road Small-Mid Cap Value
AMG River Road Small Cap Value
River Road Asset Management, LLC
AMG SouthernSun Small Cap
AMG SouthernSun Global Opportunities
AMG SouthernSun U.S. Equity
SouthernSun Asset Management, LLC
AMG Systematic Mid Cap Value
Systematic Financial Management, L.P.
AMG TimesSquare Emerging Markets Small Cap
AMG TimesSquare International Small Cap
AMG TimesSquare Mid Cap Growth
AMG TimesSquare Small Cap Growth
TimesSquare Capital Management, LLC
AMG Trilogy Emerging Markets Equity
AMG Trilogy Emerging Wealth Equity
Trilogy Global Advisors, L.P.
AMG Yacktman
AMG Yacktman Focused
AMG Yacktman Focused Fund - Security Selection Only
AMG Yacktman Special Opportunities
Yacktman Asset Management LP
FIXED INCOME FUNDS
AMG GW&K Core Bond
AMG GW&K Enhanced Core Bond
AMG GW&K Municipal Bond
AMG GW&K Municipal Enhanced Yield
GW&K Investment Management, LLC
OPEN-ARCHITECTURE FUNDS
ALTERNATIVE FUNDS
AMG Managers Lake Partners LASSO Alternative
Lake Partners, Inc.
BALANCED FUNDS
AMG Managers Montag & Caldwell Balanced
Montag & Caldwell, LLC
EQUITY FUNDS
AMG Managers Brandywine
AMG Managers Brandywine Advisors Mid Cap Growth
AMG Managers Brandywine Blue
Friess Associates, LLC
AMG Managers Cadence Emerging Companies
AMG Managers Cadence Mid Cap
Cadence Capital Management, LLC
AMG Managers CenterSquare Real Estate
CenterSquare Investment Management, Inc.
AMG Managers Emerging Opportunities
Lord, Abbett & Co. LLC
WEDGE Capital Management L.L.P.
Next Century Growth Investors LLC
RBC Global Asset Management (U.S.) Inc.
AMG Managers Essex Small/Micro Cap Growth
Essex Investment Management Co., LLC
AMG Managers Fairpointe ESG Equity
AMG Managers Fairpointe Mid Cap
Fairpointe Capital LLC
AMG Managers Guardian Capital Global Dividend
Guardian Capital LP
AMG Managers LMCG Small Cap Growth
LMCG Investments, LLC
AMG Managers Montag & Caldwell Growth
AMG Managers Montag & Caldwell Mid Cap Growth
Montag & Caldwell, LLC
AMG Managers Pictet International
Pictet Asset Management Limited
AMG Managers Silvercrest Small Cap
Silvercrest Asset Management Group LLC
AMG Managers Skyline Special Equities
Skyline Asset Management, L.P.
AMG Managers Special Equity
Ranger Investment Management, L.P. Lord, Abbett & Co. LLC
Smith Asset Management Group, L.P. Federated MDTA LLC
AMG Managers Value Partners Asia Dividend
Value Partners Hong Kong Limited
FIXED INCOME FUNDS
AMG Managers Amundi Intermediate Government
AMG Managers Amundi Short Duration Government
Amundi Smith Breeden LLC
AMG Managers Doubleline Core Plus Bond
DoubleLine Capital LP
AMG Managers Global Income Opportunity
AMG Managers Loomis Sayles Bond
Loomis, Sayles & Co., L.P.
| | | | |
| 103117 | | AR082 | | amgfunds.com |
Item 2. Code of Ethics.
Registrant has adopted a Code of Ethics. See attached exhibit (a) (1).
Item 3. Audit Committee Financial Expert.
Registrant’s Board of Trustees has determined that independent Trustee Mr. Steven J. Paggioli qualifies as the Audit Committee Financial Expert. Mr. Paggioli is “independent” as such term is defined in Form N-CSR.
Item 4. Principal Accountant Fees and Services.
The aggregate fees billed for each of the last two fiscal years for professional services rendered by the principal accountant for the audit of the registrant’s annual financial statements or services that are normally provided by the accountant in connection with statutory and regulatory filings or engagements for those fiscal years are $488,480 for 2017 and $389,373 for 2016.
There were no fees billed by PwC to the Funds in its two recent fiscal years for services rendered for assurance and related services that are reasonably related to the performance of the audit or review of the Fund’s financial statements, but are not reported as Audit Fees (“Audit-Related Fees”).
For the Funds’ two most recent fiscal years, there were no Audit-Related Fees billed by PwC for engagements related directly to the operations and financial reporting of one or more Funds by a Fund Service Provider. A Fund Service Provider is (a) any investment adviser to the Fund (not including any Subadvisor whose role is primarily portfolio management and is subcontracted with or overseen by another investment adviser) or (b) any entity that provides ongoing services to the Fund and is controlling, controlled by or under common control with a Fund investment adviser described in (a). Tax Fees
The aggregate fees billed in each of the last two fiscal years for professional services rendered by the principal accountant for tax compliance, tax advice, and tax planning are $105,265 for 2017 and $109,701 for 2016.
For the Funds’ two most recent fiscal years, Tax Fees billed by PwC for engagements by Fund Service Providers that related directly to the operations and financial reporting of the Funds were $0 for fiscal 2017 and $0 for fiscal 2016, respectively.
The services for which Tax Fees were charged comprise all services performed by professional staff in PwC’s tax division except those services related to the audit. Typically, this category would include fees for tax compliance, tax planning, and tax
advice. Tax compliance, tax advice, and tax planning services include preparation of original and amended tax returns, claims for refund and tax payment-planning services, assistance with tax audits and appeals, tax advice related to mergers and acquisitions and requests for rulings or technical advice from taxing authorities.
There were no other fees billed by PwC to the Funds for all other non-audit services (“Other Fees”) during the Funds’ two most recent fiscal years. During the same period, there were no Other Fees billed by PwC for engagements by Fund Service Providers that related directly to the operations and financial reporting of the Funds.
| | (e) | (1) According to policies adopted by the Audit Committee, services provided by PwC to the Funds must be pre-approved by the Audit Committee. On an annual basis, the Audit Committee reviews and pre-approves various types of services that PwC may perform for the Funds without specific approval of each engagement, subject to specified budget limitations. As contemplated by the Sarbanes-Oxley Act of 2002 and related SEC rules, the Audit Committee also pre-approves non-audit services provided by PwC to any Fund Service Provider for any engagement that relates directly to the operations and financial reporting of the Funds. Any engagement that is not already pre-approved or that will exceed a pre-approved budget must be submitted to the Audit Committee for pre-approval. The Chairman of the Audit Committee is authorized on behalf of the Board of Trustees and the Audit Committee to approve the engagement of PwC to perform non-audit services subject to certain conditions, including notification to the Audit Committee of such pre-approval not later than the next meeting of the Audit Committee following the date of such pre-approval. |
| | (g) | The aggregate non-audit fees billed by the registrant’s accountant for services rendered to the Funds and Fund Service Providers for each of the last two fiscal years of the registrant was $186,115 for 2017 and $142,101 for 2016. For the fiscal year ended October 31, 2017, this amount reflects the amounts disclosed above in Item 4(b),(c),(d), plus $80,850 in fees billed to the Fund Service Providers for non-audit services that did not relate directly to the operations and financial reporting of the Funds. For the fiscal year ended October 31, 2016, this amount reflects the amounts disclosed above in Item 4(b),(c),(d), plus $32,400 in fees billed to the Fund Service Providers for non-audit services that did not relate directly to the operations and financial reporting of the Funds. |
| | (h) | The registrant’s audit committee of the board of trustees has considered whether the provision of non-audit services that were rendered to the registrant’s investment adviser (not including any sub-adviser whose role is primarily portfolio management and is subcontracted with or overseen by another investment adviser), and any entity controlling, controlled by, or under common control with the investment adviser that provides ongoing services to the registrant that were not pre-approved pursuant to paragraph (c)(7)(ii) of Rule 2-01 of Regulation S-X is compatible with maintaining the principal accountant’s independence. |
Item 5. Audit Committee of Listed Registrants.
Not applicable.
Item 6. Investments.
| (a) | Schedule of Investments in securities of unaffiliated issuers as of the close of the reporting period is included as part of the report to shareholders filed under Item 1 of this form. |
Item 7. Disclosure of Proxy Voting Policies and Procedures for Closed-End Management Investment Companies.
Not applicable.
Item 8. Portfolio Managers of Closed-End Management Investment Companies.
Not applicable.
Item 9. Purchases of Equity Securities by Closed-End Management Investment Company and Affiliated Purchasers.
Not applicable.
Item 10. Submission of Matters to a Vote of Security Holders.
There have been no material changes to the procedures by which the shareholders may recommend nominees to the registrant’s board of directors, where those changes were implemented after the registrant last provided disclosure in response to the requirements of Item 407(c)(2)(iv) of Regulation S-K (17 CFR 229.407) (as required by Item 22(b)(15) of Schedule 14A (17 CFR 240.14a-101)), or this Item.
Item 11. Controls and Procedures.
| | (a) | The Registrant’s principal executive and principal financial officers have concluded, based on their evaluation of the registrant’s disclosure controls and procedures as of a date within 90 days of the filing of this report, that the Registrant’s disclosure controls and procedures are reasonably designed to ensure that information required to be disclosed by the Registrant on Form N-CSR is recorded, processed, summarized and reported within the required time periods and that information required to be disclosed by the registrant in the reports that it files or submits on Form N-CSR is accumulated and communicated to the Registrant’s management, including its principal executive and principal financial officers, as appropriate to allow timely decisions regarding required disclosure. |
| | (b) | There were no changes in the Registrant’s internal control over financial reporting during the Registrant’s fourth fiscal quarter of the period covered by this report that have materially affected, or are reasonably likely to affect, the internal control over financial reporting. |
Item 12. DISCLOSURE OF SECURITIES LENDING ACTIVITIES FOR CLOSED-END MANAGEMENT INVESTMENT COMPANIES
Not applicable.
| (a)(1) | Any Code of Ethics or amendments hereto. Filed herewith. |
| (a)(2) | Certifications pursuant to Rule 30a-2(a) under the Investment Company Act of 1940 - Filed herewith. |
| (b) | Certifications pursuant to Rule 30a-2(b) under the Investment Company Act of 1940 - Filed herewith. |
SIGNATURES
Pursuant to the requirements of the Securities Exchange Act of 1934 and the Investment Company Act of 1940, the registrant has duly caused this report to be signed on its behalf by the undersigned, thereunto duly authorized.
AMG FUNDS IV
| | |
| By: | | /s/ Jeffrey T. Cerutti |
| | Jeffrey T. Cerutti, Principal Executive Officer |
|
| Date: January 8, 2018 |
Pursuant to the requirements of the Securities Exchange Act of 1934 and the Investment Company Act of 1940, this report has been signed below by the following persons on behalf of the registrant and in the capacities and on the dates indicated.
| | |
| By: | | /s/ Jeffrey T. Cerutti |
| | Jeffrey T. Cerutti, Principal Executive Officer |
|
| Date: January 8, 2018 |
| | |
| By: | | /s/ Thomas Disbrow |
| | Thomas Disbrow, Principal Financial Officer |
|
| Date: January 8, 2018 |