UNITED STATES
SECURITIES AND EXCHANGE COMMISSION
Washington, D.C. 20549
FORM N-CSR
CERTIFIED SHAREHOLDER REPORT OF REGISTERED MANAGEMENT
INVESTMENT COMPANIES
Investment Company Act file number 811-08004
Aston Funds
(Exact name of registrant as specified in charter)
120 North LaSalle Street, 25th Floor
Chicago, IL 60602
(Address of principal executive offices) (Zip code)
Jeffrey T. Cerutti, President
Aston Funds
120 North LaSalle Street, 25th Floor
Chicago, IL 60602
(Name and address of agent for service)
Registrant’s telephone number, including area code: (312) 268-1400
Date of fiscal year end: October 31
Date of reporting period: October 31, 2015
Form N-CSR is to be used by management investment companies to file reports with the Commission not later than 10 days after the transmission to stockholders of any report that is required to be transmitted to stockholders under Rule 30e-1 under the Investment Company Act of 1940 (17 CFR 270.30e-1). The Commission may use the information provided on Form N-CSR in its regulatory, disclosure review, inspection, and policymaking roles.
A registrant is required to disclose the information specified by Form N-CSR, and the Commission will make this information public. A registrant is not required to respond to the collection of information contained in Form N-CSR unless the Form displays a currently valid Office of Management and Budget (“OMB”) control number. Please direct comments concerning the accuracy of the information collection burden estimate and any suggestions for reducing the burden to Secretary, Securities and Exchange Commission, 100 F Street, NE, Washington, DC 20549. The OMB has reviewed this collection of information under the clearance requirements of 44 U.S.C. § 3507.
Item 1. Reports to Stockholders.
The Report to Shareholders is attached herewith.

Annual Report 2015
October 31, 2015
Class N, I & R Shares
Equity
Fixed Income
Alternative
International
Sector
Balanced
Aston Funds
Dear Fellow Shareholder:
Overall, U.S. equity investors were rewarded with positive, albeit modest, returns despite increasing market volatility for the fiscal year ended October 31, 2015. The S&P 500® Index, a widely followed barometer of the U.S. equity market, returned 5.2% during the past twelve months. However, the U.S. equity market did experience its first correction in four years in August as investors worried about slowing China growth and the potential impact of a U.S. Federal Reserve (the “Fed”) rate hike on the slow recovery in the U.S. During the year, there was significant dispersion in performance across sectors with Consumer Discretionary stocks returning more than 21% while companies within the Energy sector fell 19%, driven in large part by the precipitous fall in oil prices. Meanwhile, international stocks fell during the prior year, returning -4.7%, as measured by the MSCI ACWI ex USA (in U.S. Dollar terms). International investment returns in U.S. Dollar terms were negatively impacted by continued strengthening in the U.S. Dollar. Despite the more recent difficult performance for equities, it’s worth noting that the first quarter of 2015 marked the six-year anniversary of the equity bull market.
The Barclays U.S. Aggregate Bond Index, a broad U.S. bond market benchmark, returned 2.0% for the fiscal year ended October 31, 2015. Interest rates fell throughout much of 2014 and for periods throughout the past fiscal year, lending positive support to bond prices. Investors, however, enter the new fiscal year with a close watch on the strength of the underlying U.S. economy and its potential impact on the Fed’s zero-interest-rate policy (and its subsequent impact on bond prices).
Our foremost goal at Aston Funds is to provide investment solutions that help our shareholders successfully reach their long-term investment goals. By partnering with our well-established investment managers, Aston Funds provides access to a distinctive array of actively-managed, return-oriented investment strategies. We thank you for your continued confidence and investment in Aston Funds. You can rest assured that under all market conditions our team is focused on delivering excellent investment management services for your benefit.
Respectfully,

Jeffrey Cerutti
Chief Executive Officer and President
Aston Funds
|
| The views expressed in this report reflect those of the portfolio managers only, through the end of the period covered and do not necessarily represent the views of Aston Funds or Aston Asset Management, LLC. Any such views are subject to change at any time based upon market or other conditions and Aston Funds and Aston Asset Management, LLC disclaim any responsibility to update such views. These views may not be relied on as investment advice and, because investment decisions for an Aston Fund are based on numerous factors, may not be relied on as an indication of trading intent on behalf of any Aston Fund. |
Aston Funds
Large Cap Funds
ASTON/Cornerstone Large Cap Value Fund
ASTON/Fairpointe Focused Equity Fund
ASTON/Herndon Large Cap Value Fund
ASTON/Montag & Caldwell Growth Fund
Equity Income Funds
ASTON/River Road Dividend All Cap Value Fund
ASTON/River Road Dividend All Cap Value Fund II
Mid Cap Funds
ASTON/Fairpointe Mid Cap Fund
ASTON/Montag & Caldwell Mid Cap Growth Fund
Table of Contents
Small Cap Funds
ASTON/LMCG Small Cap Growth Fund
ASTON/River Road Independent Value Fund
ASTON/River Road Select Value Fund
ASTON/River Road Small Cap Value Fund
ASTON/Silvercrest Small Cap Fund
ASTON/TAMRO Small Cap Fund
Fixed Income Funds
ASTON/DoubleLine Core Plus Fixed Income Fund ASTON/TCH Fixed Income Fund
Alternative Funds
ASTON/Anchor Capital Enhanced Equity Fund
ASTON/Lake Partners LASSO Alternatives Fund
ASTON/River Road Long-Short Fund
International Funds
ASTON/Barings International Fund
ASTON/Guardian Capital Global Dividend Fund
ASTON/LMCG Emerging Markets Fund
ASTON/Pictet International Fund
ASTON/TAMRO International Small Cap Fund
Sector Fund
ASTON/Harrison Street Real Estate Fund
Balanced Fund
ASTON/Montag & Caldwell Balanced Fund
This report is submitted for general information to the shareholders of the funds. It is not authorized for distribution to prospective investors in the funds unless preceded or accompanied by an effective prospectus which includes details regarding the funds’ objectives, policies, expenses and other information.
Aston Funds are distributed by Foreside Funds Distributors LLC, 400 Berwyn Park, 899 Cassatt Road, Berwyn, PA 19312
Shareholder Services 800-992-8151 • www.astonfunds.com
NOT FDIC INSURED • NO BANK GUARANTEE • MAY LOSE VALUE
ASTON/Cornerstone Large Cap Value Fund
| | |
| |
| Portfolio Manager Commentary (unaudited) | | October 31, 2015 |
| John Campbell, CFA; Rick van Nostrand, CFA; Cameron Clement, CFA; & Dean Morris, CFA |
| Q. | What were the most significant market factors affecting Fund performance and returns relative to the benchmark during the past 12 months? |
| A. | The Russell 1000® Value Index posted a return of roughly 0.5% over the past year, but exhibited substantial volatility along the way. Our investment process focuses on valuation, as measured by Cornerstone Investment Partners’ proprietary valuation tool, paired with rigorous fundamental analysis. Occasionally, short-term, non-fundamental factors such as price momentum and earnings estimate revisions may drive market performance. We have experienced such a period not only for the last 12 months, but for most of the past two years. During these periods, it is not uncommon for expensive stocks to outperform their more attractively valued peers. However, it is our experience that these periods typically end without warning, and exhibit dramatic reversals in market leadership. As disciplined investors, our response to such periods is to stick to our investment philosophy, which is simple, sensible, and has proven its worth over the long term. |
| Q. | What were the best performing holdings for the Fund during the period? |
| A. | Cisco Systems (+21.5%) was the top performer over the trailing twelve-month period. The market has rewarded Cisco for consistently delivering quarterly results in excess of Wall Street consensus expectations. The company offers a deeply embedded position across a broad customer base, and its valuation is compelling. Microsoft (+15.1%) also performed well. The company has delivered strong results under CEO Satya Nadella, and appears to be embracing the opportunity presented by cloud computing. Boeing (+17.4%) has outperformed as it has become clear that the company’s 787 airplane program will likely become highly cash generative in the future. The company continues to operate in an effective duopoly and appears meaningfully undervalued. |
| Q. | What were the weakest performing holdings? |
| A. | Ensco (-57.1%) was the weakest performer. The stock has been pressured by the decline in the price of crude oil, which has raised concerns regarding demand for offshore rigs. Ensco operates with a sizable backlog, strong balance sheet, and a high caliber rig fleet. We believe the company is well positioned to survive the downturn in oil prices, and emerge stronger. Additionally, the company is trading well below our estimate of its fair value. Cummins (-27.5%) performed poorly, trading lower due to concerns regarding demand in emerging market economies such as China and Brazil. The company continues to operate with a reputation for technological leadership, as well as a very strong balance sheet. Gap (-26.4%) has traded downward after delivering results below expectations, particularly in its Gap and Banana Republic brands. The company has generated strong results in its Old Navy brand, margins well above many peers, and growth in the Athleta brand. The stock appears significantly undervalued, with low expectations from investors. |
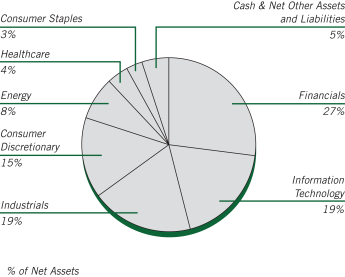
| Q. | How was the Fund positioned as of October 31, 2015? |
| A. | Our actively constructed 800 stock universe is trading at 89% of fair value based on our proprietary Fair Value Model. Within the universe, approximately 416 stocks remain undervalued, with the median stock price near our fair value estimate. While the six-and-a-half-year bull market has placed the overall market close to fair value, we believe that we are able to find attractive value in those companies that have demonstrated long-term profitability. Despite the market’s current valuation level, our work suggests attractive valuations in the Consumer Discretionary, Industrial, and Technology sectors, and we are overweight these sectors as a result. We continue to believe that divergences between price and value create compelling opportunities for long-term performance, and that we are positioned to capitalize on these opportunities in 2016 and beyond. |
Growth of a Hypothetical
$10,000 Investment—Class N
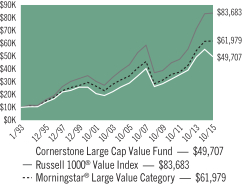
All dividends and capital gains are reinvested. Indexes are unmanaged and do not take into account fees, expenses or other costs.
Returns shown in the chart and table do not reflect taxes that a shareholder would pay on Fund distributions or on the sale of the Fund shares.
Value investing involves the risk that a Fund’s investments in companies believed to be undervalued will not appreciate as anticipated.
RETURNSFOR PERIOD ENDED 10/31/15
Average Annual Total Returns - Class N
| | | | |
One Year | | | -10.17 | % |
Five Year | | | 9.09 | % |
Ten Year | | | 5.52 | % |
Since Inception | | | 7.28 | % |
Inception Date 01/04/93
Average Annual Total Returns - Class I
| | | | |
One Year | | | -9.88 | % |
Five Year | | | 9.40 | % |
Ten Year | | | 5.79 | % |
Since Inception | | | 5.55 | % |
Inception Date 09/20/05
The performance data quoted represents past performance. Past performance does not guarantee future results. Investment return and principal value will fluctuate so that an investor’s shares, upon redemption, may be worth more or less than their original cost. Current performance may be lower or higher than the performance data quoted. For performance data current to the most recent month-end, please visit our website at www.astonfunds.com.
The total expense ratios for Class N and Class I shares are 1.31% and 1.06%, respectively, as disclosed in the prospectus dated February 28, 2015. Please refer to the Financial Highlights section in this report for more information.
| | |
| |
| ASTON/Cornerstone Large Cap Value Fund | | October 31, 2015 |
| |
| Schedule of Investments | | |
| | | | | | | | |
Shares | | | | | Market
Value | |
| |
| | COMMON STOCKS – 95.59% | | | | |
| | |
| | | | Consumer Discretionary – 15.17% | | | | |
| | 101,200 | | | BorgWarner | | $ | 4,333,384 | |
| | 43,350 | | | Dollar General | | | 2,937,829 | |
| | 137,575 | | | Gap | | | 3,744,791 | |
| | 88,300 | | | Magna International (Canada) | | | 4,656,059 | |
| | 60,050 | | | VF | | | 4,054,576 | |
| | | | | | | | |
| | | | | | | 19,726,639 | |
| | | | | | | | |
| | |
| | | | Consumer Staples – 3.26% | | | | |
| | 95,525 | | | Tyson Foods, Class A | | | 4,237,489 | |
| | | | | | | | |
| | |
| | | | Energy – 7.54% | | | | |
| | 50,500 | | | Chevron | | | 4,589,440 | |
| | 134,800 | | | Ensco, Class A (United Kingdom) | | | 2,241,724 | |
| | 56,775 | | | Royal Dutch Shell, Class A SP ADR | | | 2,978,417 | |
| | | | | | | | |
| | | | | | | 9,809,581 | |
| | | | | | | | |
| | |
| | | | Financials – 26.98% | | | | |
| | 34,950 | | | ACE (Switzerland) | | | 3,968,223 | |
| | 71,050 | | | Capital One Financial | | | 5,605,845 | |
| | 101,850 | | | Citigroup | | | 5,415,364 | |
| | 98,700 | | | JPMorgan Chase | | | 6,341,475 | |
| | 73,150 | | | Lincoln National | | | 3,914,256 | |
| | 42,175 | | | PNC Financial Services Group | | | 3,806,716 | |
| | 42,400 | | | State Street | | | 2,925,600 | |
| | 73,700 | | | US Bancorp | | | 3,108,666 | |
| | | | | | | | |
| | | | | | | 35,086,145 | |
| | | | | | | | |
| | |
| | | | Healthcare – 4.43% | | | | |
| | 57,075 | | | Johnson & Johnson | | | 5,766,287 | |
| | | | | | | | |
| | |
| | | | Industrials – 18.78% | | | | |
| | 26,925 | | | Boeing | | | 3,986,785 | |
| | 41,025 | | | Cummins | | | 4,246,498 | |
| | | | | | | | |
Shares | | | | | Market
Value | |
| | |
| | | | Industrials (continued) | | | | |
| | 46,725 | | | Honeywell International | | $ | 4,825,758 | |
| | 40,250 | | | Norfolk Southern | | | 3,221,208 | |
| | 49,400 | | | Parker-Hannifin | | | 5,172,180 | |
| | 14,130 | | | WW Grainger | | | 2,967,300 | |
| | | | | | | | |
| | | | | | | 24,419,729 | |
| | | | | | | | |
| | |
| | | | Information Technology – 19.43% | | | | |
| | 3,875 | | | Alphabet, Class A * | | | 2,857,386 | |
| | 203,100 | | | Cisco Systems | | | 5,859,435 | |
| | 99,750 | | | EMC | | | 2,615,445 | |
| | 118,800 | | | Microsoft | | | 6,253,632 | |
| | 142,825 | | | Oracle | | | 5,547,323 | |
| | 31,900 | | | Western Digital | | | 2,131,558 | |
| | | | | | | | |
| | | | | | | 25,264,779 | |
| | | | | | | | |
| | |
| | | | Total Common Stocks
(Cost $133,553,841) | | | 124,310,649 | |
| | | | | | | | |
| |
| | INVESTMENT COMPANY – 3.70% | | | | |
| | |
| | 4,808,638 | | | BlackRock Liquidity Funds TempFund Portfolio | | | 4,808,638 | |
| | | | | | | | |
| | |
| | | | Total Investment Company
(Cost $4,808,638) | | | 4,808,638 | |
| | | | | | | | |
| Total Investments – 99.29%
(Cost $138,362,479)** | | | 129,119,287 | |
| | | | | | | | |
| Net Other Assets and Liabilities – 0.71% | | | 925,315 | |
| | | | | | | | |
| Net Assets – 100.00% | | $ | 130,044,602 | |
| | | | | | | | |
| * | | Non-income producing security. |
| ** | | Aggregate cost for Federal income tax purposes is $140,374,896. |
| | | | |
Gross unrealized appreciation | | $ | 4,523,285 | |
Gross unrealized depreciation | | | (15,778,894 | ) |
| | | | |
Net unrealized depreciation | | $ | (11,255,609 | ) |
| | | | |
| SP ADR | | Sponsored American Depositary Receipt |
See accompanying Notes to Financial Statements.
ASTON/Fairpointe Focused Equity Fund
| | |
| |
| Portfolio Manager Commentary (unaudited) | | October 31, 2015 |
| Robert S. Burnstine & Thyra E. Zerhusen |
| Q. | What were the most significant market factors affecting Fund performance and returns relative to the benchmark during the past 10 months? |
| A. | Macroeconomic concerns increased during 2015, primarily attributable to China’s devaluation of the yuan in August highlighting the slowing pace of China’s economic growth, the strong dollar weakening corporate earnings due to foreign currency exchange issues, and investor worries regarding the timing of interest rate increases by the Federal Reserve. In this macro-driven investment environment, stock price movements over the short term have been driven by momentum (both positive and negative) without regard to valuation. Over the longer term, however, valuation matters. Year to date, the Russell 1000® Growth benchmark has outperformed the Russell 1000® Value benchmark by over 900 basis points. As value investors, we focus on identifying companies that trade at significant discounts to our estimates of intrinsic value. Many of our holdings remain cyclically depressed and trade at the low end of their respective historical trading ranges on several financial metrics. And while the timing for change in investor sentiment is difficult to call, sentiment can change rather quickly. We anticipate our patience to be rewarded over time. |
| Q. | What were the best performing holdings for the Fund during the period? |
| A. | Our best performer, Hospira, agreed to be acquired by Pfizer for $90 per share in cash. Hologic, our second best performer, posted strong organic revenue growth across its diagnostic, breast health, surgical and skeletal health business segments. Management has led a broad turnaround focusing on better resource and capital allocation as well as excellent execution. Boston Scientific has benefited from solid organic revenue growth from its product pipeline and increasing margins due to better mix and productivity improvements. |
| Q. | What were the weakest performing holdings? |
| A. | Avon Products, our worst performer, was sold during the third quarter at a significant loss. Avon appeared inexpensive on several financial metrics, its own historical trading range, and competitor comparisons. While Avon’s balance sheet seemed secure several months ago, the magnitude of foreign currency issues created uncertainty regarding the ability of Avon to service its debt over time. Hewlett-Packard, our second worst performer, provided lower cash flow guidance due to currency headwinds and costs related to the separation into Hewlett-Packard Enterprises and HP Inc. We view the separation positively allowing each company to become more focused and enhance capital allocation efficiency. We believe its stock remains attractively valued. Teradata reported disappointing revenue and margins. Teradata is investing in its big data analytics applications as it seeks to expand its customer base to generate higher revenue growth. Teradata currently trades at the lower end of its historical trading range, yet continues to generate solid free cash flow and to repurchase a significant amount of its shares outstanding. |
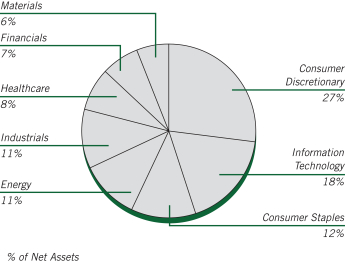
| Q. | How was the Fund positioned as of October 31, 2015? |
| A. | While global equity markets have seen increased volatility, we have capitalized on opportunities that have emerged due to near-term disruptions. We continue to find undervalued stocks that, in our view, will perform well over a several year period. As our holding period is generally three to five years, we seek to be patient to allow the discount between current prices and our estimates of fair value to narrow. The Fund is overweight Consumer and Energy sectors relative to their respective benchmarks in our continued pursuit to hold stocks that we view as significantly undervalued. Conversely, we have reduced our exposure to Healthcare as the gap between price and our estimate of fair value narrowed for many of our Healthcare holdings. |
Note: A basis point (bp) is a unit of measure. 1 bp = .01%.
Growth of a Hypothetical
$10,000 Investment—Class N
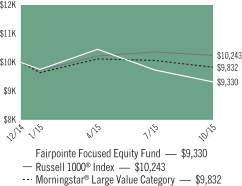
All dividends and capital gains are reinvested. Indexes are unmanaged and do not take into account fees, expenses or other costs.
Returns shown in the chart and table do not reflect taxes that a shareholder would pay on Fund distributions or on the sale of the Fund shares.
Value investing involves the risk that a Fund’s investments in companies believed to be undervalued will not appreciate as anticipated.
RETURNSFOR PERIOD ENDED 10/31/15
Total Return - Class N
| | | | |
Cumulative Since Inception | | | -6.70 | % |
Inception Date 12/24/14
Total Return - Class I
| | | | |
Cumulative Since Inception | | | -6.50 | % |
Inception Date 12/24/14
The performance data quoted represents past performance. Past performance does not guarantee future results. Investment return and principal value will fluctuate so that an investor’s shares, upon redemption, may be worth more or less than their original cost. Current performance may be lower or higher than the performance data quoted. For performance data current to the most recent month-end, please visit our website at www.astonfunds.com.
The performance quoted would have been lower if fee waivers and/or expense reimbursements had not been in effect.
| | |
| |
| ASTON/Fairpointe Focused Equity Fund | | October 31, 2015 |
| |
| Schedule of Investments | | |
| | | | | | | | |
Shares | | | | | Market
Value | |
| |
| | COMMON STOCKS – 99.64% | | | | |
| | |
| | | | Consumer Discretionary – 27.11% | | | | |
| | 11,100 | | | 21st Century Fox, Class A | | $ | 340,659 | |
| | 4,500 | | | Carnival | | | 243,360 | |
| | 11,600 | | | Discovery Communications, Class C * | | | 319,232 | |
| | 5,400 | | | Interpublic Group | | | 123,822 | |
| | 4,700 | | | Liberty Interactive, Class A * | | | 128,639 | |
| | 18,900 | | | News, Class A | | | 291,060 | |
| | 4,600 | | | Scholastic | | | 188,002 | |
| | 8,900 | | | Staples | | | 115,611 | |
| | | | | | | | |
| | | | | | | 1,750,385 | |
| | | | | | | | |
| | |
| | | | Consumer Staples – 12.04% | | | | |
| | 3,200 | | | PepsiCo | | | 327,008 | |
| | 5,500 | | | Unilever, SP ADR (Great Britain) | | | 244,475 | |
| | 3,600 | | | Wal-Mart Stores | | | 206,064 | |
| | | | | | | | |
| | | | | | | 777,547 | |
| | | | | | | | |
| | |
| | | | Energy – 10.78% | | | | |
| | 4,450 | | | Apache | | | 209,728 | |
| | 7,500 | | | BP, SP ADR | | | 267,750 | |
| | 13,800 | | | Transocean Ltd. (Switzerland) | | | 218,454 | |
| | | | | | | | |
| | | | | | | 695,932 | |
| | | | | | | | |
| | |
| | | | Financials – 6.90% | | | | |
| | 5,400 | | | Legg Mason | | | 241,650 | |
| | 2,900 | | | Northern Trust | | | 204,131 | |
| | | | | | | | |
| | | | | | | 445,781 | |
| | | | | | | | |
| | |
| | | | Healthcare – 8.43% | | | | |
| | 9,600 | | | Boston Scientific * | | | 175,488 | |
| | 3,000 | | | Hologic * | | | 116,580 | |
| | 700 | | | Quest Diagnostics | | | 47,565 | |
| | 2,400 | | | Varian Medical Systems * | | | 188,472 | |
| | 300 | | | VCA * | | | 16,431 | |
| | | | | | | | |
| | | | | | | 544,536 | |
| | | | | | | | |
| | | | | | | | |
Shares | | | | | Market
Value | |
| | |
| | | | Industrials – 11.19% | | | | |
| | 4,600 | | | AGCO | | $ | 222,594 | |
| | 5,100 | | | Fluor | | | 243,831 | |
| | 9,100 | | | Kennametal | | | 255,892 | |
| | | | | | | | |
| | | | | | | 722,317 | |
| | | | | | | | |
| | |
| | | | Information Technology – 17.69% | | | | |
| | 7,900 | | | Cisco Systems | | | 227,915 | |
| | 10,400 | | | Cree * | | | 261,976 | |
| | 12,300 | | | Hewlett-Packard * | | | 331,608 | |
| | 2,300 | | | Itron * | | | 84,479 | |
| | 8,400 | | | Teradata * | | | 236,124 | |
| | | | | | | | |
| | | | | | | 1,142,102 | |
| | | | | | | | |
| | |
| | | | Materials – 5.50% | | | | |
| | 4,300 | | | FMC | | | 175,053 | |
| | 5,500 | | | Greif, Class A | | | 180,290 | |
| | | | | | | | |
| | | | | | | 355,343 | |
| | | | | | | | |
| | |
| | | | Total Common Stocks
(Cost $6,754,384) | | | 6,433,943 | |
| | | | | | | | |
| |
| | INVESTMENT COMPANY – 0.71% | | | | |
| | |
| | 45,705 | | | BlackRock Liquidity Funds
TempFund Portfolio | | | 45,705 | |
| | | | | | | | |
| | |
| | | | Total Investment Company
(Cost $45,705) | | | 45,705 | |
| | | | | | | | |
| Total Investments – 100.35%
(Cost $6,800,089)** | | | 6,479,648 | |
| | | | | | | | |
| Net Other Assets and Liabilities – (0.35)% | | | (22,856 | ) |
| | | | | | | | |
| Net Assets – 100.00% | | $ | 6,456,792 | |
| | | | | | | | |
| * | | Non-income producing security. |
| ** | | Aggregate cost for Federal income tax purposes is $6,802,160. |
| | | | |
Gross unrealized appreciation | | $ | 261,688 | |
Gross unrealized depreciation | | | (584,200 | ) |
| | | | |
Net unrealized depreciation | | $ | (322,512 | ) |
| | | | |
| SP ADR | | Sponsored American Depositary Receipt |
See accompanying Notes to Financial Statements.
ASTON/Herndon Large Cap Value Fund
| | |
| |
| Portfolio Manager Commentary (unaudited) | | October 31, 2015 |
| | Randell A. Cain, Jr., CFA |
| Q. | What were the most significant market factors affecting Fund performance and returns relative to the benchmark during the past 12 months? |
| A. | Over the past 1-year period ended October 31, 2015, the Russell 1000® Value Index increased less than 1%. The Fund underperformed the Russell 1000® Value Index by more than 500 basis points during the period. Both stock selection and sector allocation were negative; however, sector allocation was the main driver of relative performance. In terms of allocation, the portfolio’s overweight position in the underperforming Energy sector, along with the underweight position in Healthcare were the largest detractors from relative performance. |
The three sectors with the highest relative contribution for the period were Consumer Staples, Consumer Discretionary and Materials. The Consumer Staples sector garnered positive double-digit returns led by Altria Group, a domestic manufacturer and seller of cigarettes and other tobacco products. Consumer Discretionary benefited from the increased spending in US off-brand retail establishments such as TJX Companies and Ross Stores that appealed to investors over the period. Stock selection of chemical companies, Newmarket and Lyondellbassell, drove the relative outperformance in the Materials sector.
The three sectors with the lowest level of relative contribution were Energy, Financials and Healthcare. Much of the maligned performance of Energy occurred in the fourth quarter of 2014 as the decline in oil prices wreaked havoc on this part of the portfolio. The two worst performing Energy stocks during the period were Oasis Petroleum and SM Energy, which were challenged by the severe volatility and price declines in crude oil. The majority of the underperformance in Financials can be attributed to Nationstar Mortgage and Waddell & Reed. Nationstar was negatively impacted by disappointing earnings and heightened regulatory scrutiny. Nationstar Mortgage was sold from the portfolio at the end of the second quarter of 2015 as a result of it being removed from our universe, the Russell 1000®
Index. Waddell & Reed is an asset manager that underperformed due to negative sentiment associated with turnover in the portfolio management ranks. Increased outflows and weaker fund performance have disproportionately punished the company. Our stock selection in the biotechnology industry led the relative underperformance in the Healthcare sector.
| Q. | What were the best performing holdings for the Fund during the period? |
| A. | The top three positive individual stock contributors were Altria (+30%) a tobacco company in the Consumer Staples sector, Mylan (+9%) a global pharmaceuticals company in the Healthcare sector and Valero Energy (+35%) an oil refining and marketing company in the Energy sector. |
| Q. | What were the weakest performing holdings? |
| A. | The bottom three individual stock contributors were Nationstar Mortgage (-52%) a mortgage company in the Financials sector, SM Energy (-41%) and Oasis Petroleum (-58%). Both SM Energy and Oasis Petroleum are exploration and production companies within the Energy sector. |
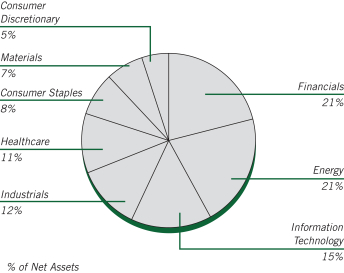
| Q. | How was the Fund positioned as of October 31, 2015? |
| A. | As of October 31, 2015, the Fund was overweight in the Energy, Materials and Technology sectors while underweight in Financials, Utilities, and Telecom. We believe the stimulus in the global economy will eventually begin to have a more positive impact. We believe the portfolio is advantageously exposed and highly correlated with the sectors that have the potential to perform well during such a period of market performance and significantly underweight those that should lag. |
Note: A basis point (bp) is a unit of measure. 1 bp = .01%.
Growth of a Hypothetical
$10,000 Investment—Class N
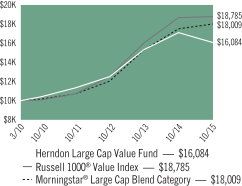
All dividends and capital gains are reinvested. Indexes are unmanaged and do not take into account fees, expenses or other costs.
Returns shown in the chart and table do not reflect taxes that a shareholder would pay on Fund distributions or on the sale of the Fund shares.
Value investing involves the risk that a Fund’s investments in companies believed to be undervalued will not appreciate as anticipated.
RETURNSFOR PERIOD ENDED 10/31/15
Average Annual Total Returns - Class N
| | | | |
1 Year | | | -6.10 | % |
Five Year | | | 9.13 | % |
Since Inception | | | 8.87 | % |
Inception Date 03/31/10
Average Annual Total Returns - Class I
| | | | |
1 Year | | | -5.88 | % |
Since Inception | | | 7.72 | % |
Inception Date 03/02/11
The performance data quoted represents past performance. Past performance does not guarantee future results. Investment return and principal value will fluctuate so that an investor’s shares, upon redemption, may be worth more or less than their original cost. Current performance may be lower or higher than the performance data quoted. For performance data current to the most recent month-end, please visit our website at www.astonfunds.com.
| | |
| |
| ASTON/Herndon Large Cap Value Fund | | October 31, 2015 |
| |
| Schedule of Investments | | |
| | | | | | | | |
Shares | | | | | Market
Value | |
|
| | COMMON STOCKS – 99.66% | |
| | | | Consumer Discretionary – 5.23% | | | | |
| | 15,849 | | | Ross Stores | | $ | 801,642 | |
| | 60,753 | | | TJX | | | 4,446,512 | |
| | 14,969 | | | Yum! Brands | | | 1,061,452 | |
| | | | | | | | |
| | | | | | | 6,309,606 | |
| | | | | | | | |
| | | | Consumer Staples – 8.50% | | | | |
| | 73,080 | | | Altria Group | | | 4,419,148 | |
| | 41,098 | | | Campbell Soup | | | 2,087,367 | |
| | 42,263 | | | Philip Morris International | | | 3,736,049 | |
| | | | | | | | |
| | | | | | | 10,242,564 | |
| | | | | | | | |
| | | | Energy – 21.12% | | | | |
| | 43,731 | | | Apache | | | 2,061,042 | |
| | 119,745 | | | Chesapeake Energy | | | 853,782 | |
| | 67,797 | | | Continental Resources * | | | 2,298,996 | |
| | 25,828 | | | Exxon Mobil | | | 2,137,009 | |
| | 85,700 | | | Halliburton | | | 3,289,166 | |
| | 79,243 | | | Marathon Petroleum | | | 4,104,787 | |
| | 174,627 | | | Noble (United Kingdom) | | | 2,352,226 | |
| | 62,514 | | | SM Energy | | | 2,084,842 | |
| | 26,121 | | | Tesoro | | | 2,793,119 | |
| | 52,829 | | | Valero Energy | | | 3,482,488 | |
| | | | | | | | |
| | | | | | | 25,457,457 | |
| | | | | | | | |
| | | | Financials – 20.72% | | | | |
| | 31,697 | | | American Express | | | 2,322,122 | |
| | 82,471 | | | Apartment Investment & Management, Class A, REIT | | | 3,232,038 | |
| | 65,742 | | | CBOE Holdings | | | 4,407,344 | |
| | 5,283 | | | Credit Acceptance * | | | 998,962 | |
| | 54,590 | | | Discover Financial Services | | | 3,069,050 | |
| | 75,427 | | | Eaton Vance | | | 2,723,669 | |
| | 32,871 | | | McGraw-Hill Financial | | | 3,045,169 | |
| | 29,056 | | | Moody’s | | | 2,794,025 | |
| | 64,568 | | | Waddell & Reed Financial, Class A | | | 2,385,142 | |
| | | | | | | | |
| | | | | | | 24,977,521 | |
| | | | | | | | |
| | | | | | | | |
Shares | | | | | Market
Value | |
| | | | Healthcare – 10.68% | | | | |
| | 58,699 | | | AbbVie | | $ | 3,495,525 | |
| | 24,360 | | | Gilead Sciences | | | 2,634,047 | |
| | 24,414 | | | Jazz Pharmaceuticals (Ireland) * | | | 3,351,556 | |
| | 76,901 | | | Mylan * | | | 3,390,565 | |
| | | | | | | | |
| | | | | | | 12,871,693 | |
| | | | | | | | |
| | | | Industrials – 11.69% | | | | |
| | 22,012 | | | Lockheed Martin | | | 4,838,898 | |
| | 29,643 | | | Rockwell Collins | | | 2,570,641 | |
| | 37,274 | | | United Parcel Service, Class B | | | 3,839,967 | |
| | 39,622 | | | Verisk Analytics * | | | 2,837,331 | |
| | | | | | | | |
| | | | | | | 14,086,837 | |
| | | | | | | | |
| | | | Information Technology – 15.12% | | | | |
| | 12,621 | | | Accenture, Class A (Ireland) | | | 1,352,971 | |
| | 4,109 | | | Alliance Data Systems * | | | 1,221,647 | |
| | 33,458 | | | Apple | | | 3,998,231 | |
| | 16,142 | | | Harris | | | 1,277,316 | |
| | 40,796 | | | Hewlett-Packard * | | | 1,099,860 | |
| | 25,828 | | | MasterCard, Class A | | | 2,556,714 | |
| | 22,046 | | | Microsoft | | | 1,160,501 | |
| | 37,861 | | | Western Digital | | | 2,529,872 | |
| | 157,605 | | | Western Union | | | 3,033,896 | |
| | | | | | | | |
| | | | | | | 18,231,008 | |
| | | | | | | | |
| | | | Materials – 6.60% | | | | |
| | 47,252 | | | CF Industries Holdings | | | 2,398,984 | |
| | 29,937 | | | LyondellBasell Industries, Class A (Netherlands) | | | 2,781,447 | |
| | 7,044 | | | NewMarket | | | 2,773,505 | |
| | | | | | | | |
| | | | | | | 7,953,936 | |
| | | | | | | | |
| | |
| | | | Total Common Stocks
(Cost $110,469,323) | | | 120,130,622 | |
| | | | | | | | |
|
| | INVESTMENT COMPANY – 0.44% | |
| | |
| | 524,577 | | | BlackRock Liquidity Funds TempFund Portfolio | | | 524,577 | |
| | | | | | | | |
| | |
| | | | Total Investment Company
(Cost $524,577) | | | 524,577 | |
| | | | | | | | |
| Total Investments – 100.10%
(Cost $110,993,900)** | | | 120,655,199 | |
| | | | | | | | |
| Net Other Assets and Liabilities – (0.10)% | | | (115,144 | ) |
| | | | | | | | |
| Net Assets – 100.00% | | $ | 120,540,055 | |
| | | | | | | | |
| * | | Non-income producing security. |
| ** | | Aggregate cost for Federal income tax purposes is $111,531,704. |
| | | | |
Gross unrealized appreciation | | $ | 17,822,154 | |
Gross unrealized depreciation | | | (8,698,659 | ) |
| | | | |
Net unrealized appreciation | | $ | 9,123,495 | |
| | | | |
| REIT | | Real Estate Investment Trust |
See accompanying Notes to Financial Statements.
ASTON/Montag & Caldwell Growth Fund
| | |
| |
| Portfolio Manager Commentary (unaudited) | | October 31, 2015 |
Ronald E. Canakaris, CFA, CIC & Andrew W. Jung, CFA |
| Q. | What were the most significant market factors affecting Fund performance and returns relative to the benchmark during the past 12 months? |
| A. | The Fund lagged its primary benchmark, the Russell 1000® Growth Index for the period. Performance benefited from an overweight allocation to Consumer Staples and underweight positions in Technology and Energy. We believe that the ending of Quantitative Easing (QE) in late 2014 allowed for normal market forces and company specific fundamentals to have a greater impact on share prices than was the case during the previous periods of significant liquidity being provided by the Fed. Against this backdrop we think active managers with strong, fundamentally-driven investment processes, like Montag & Caldwell, should benefit. |
| Q. | What were the best performing holdings for the Fund during the period? |
| A. | Our best performing stock was Starbucks (+67.9%) which benefited from strong same store sales and earnings growth as well as new initiatives such as mobile ordering which is anticipated to drive further sales/earnings strength. Nike rose 42.5%. Nike is a premier global athletic brand and sustained rapid growth across all key geographies during the period, propelling shares higher. Facebook rose 36% as the company demonstrated success monetizing its customers’ transition to mobile usage. IT consulting firm Accenture’s shares rose 35%. Fundamentals remained strong as Accenture assists its clients’ transition to mobile and digital applications. Walgreens Boots Alliance shares rose 34%. New management, resulting from the closing of the merger between Walgreens and European-based Alliance Boots, moved quickly to improve performance in US-based Walgreens stores and realize merger-related cost and revenue synergies. |
| Q. | What were the weakest performing holdings? |
| A. | Chipmaker Qualcomm shares fell 22% following losses to competitors and a patent dispute in China. We maintained only a modest position during the period, limiting its impact on relative performance. Union Pacific, one of our best performers the prior year, fell 22% as the slowdown in energy and industrial end markets resulted in slowing rail cargo volumes. Biogen shares fell 20% as sales for its key multiple sclerosis drug, Tecfidera, failed to meet expectations. Ralph Lauren lost 18% as ongoing heavy investments in stores, infrastructure and technology depressed earnings growth. Shares of online travel company Priceline fell 17%, as reported results suffered from the negative influence of the significant increase in the value of the dollar versus key currencies like the Euro. |
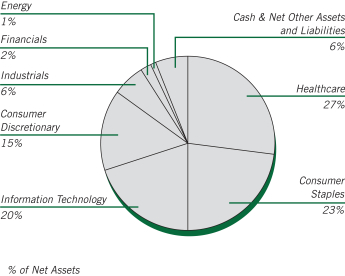
| Q. | How was the Fund positioned as of October 31, 2015? |
| A. | After several years of a zero interest rate policy and multiple rounds of QE, it appears that the Fed would like to begin raising interest rates off the zero-bound. Because economic growth is still very moderate, inflation is low and earnings growth continues to slow, the market is likely to be choppy as investors evaluate the Fed’s likely course of action. After the recent and overdue stock market correction in August, the market has recouped all of its losses even as the outlook for economic and earnings growth remains muted. With QE3 having ended a year ago, we think market forces will influence share prices more so than the Fed’s intervention in capital markets. As such, we expect stock market volatility to persist. We believe the high quality growth stocks in the Fund are well positioned for what could be a choppy and more volatile market environment. With the corporate earnings cycle maturing, these companies are particularly attractive as their earnings growth is more assured due to their strong business franchises both at home and abroad and their financial strength. |
Growth of a Hypothetical
$10,000 Investment—Class N
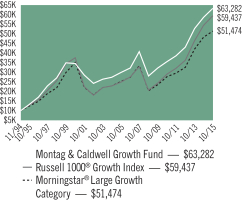
All dividends and capital gains are reinvested. Indexes are unmanaged and do not take into account fees, expenses or other costs.
Returns shown in the chart and table do not reflect taxes that a shareholder would pay on Fund distributions or on the sale of the Fund shares.
RETURNSFOR PERIOD ENDED 10/31/15
Average Annual Total Returns - Class N
| | | | |
One Year | | | 7.93 | % |
Five Year | | | 12.18 | % |
Ten Year | | | 7.79 | % |
Since Inception | | | 9.19 | % |
Inception Date 11/02/94
Average Annual Total Returns - Class I
| | | | |
One Year | | | 8.21 | % |
Five Year | | | 12.46 | % |
Ten Year | | | 8.07 | % |
Since Inception | | | 7.79 | % |
Inception Date 06/28/96
Average Annual Total Returns - Class R
| | | | |
One Year | | | 7.66 | % |
Five Year | | | 11.89 | % |
Ten Year | | | 7.54 | % |
Since Inception | | | 7.69 | % |
Inception Date 12/31/02
The performance data quoted represents past performance. Past performance does not guarantee future results. Investment return and principal value will fluctuate so that an investor’s shares, upon redemption, may be worth more or less than their original cost. Current performance may be lower or higher than the performance data quoted. For performance data current to the most recent month-end, please visit our website at www.astonfunds.com.
The total expense ratios for Class N, Class I and Class R shares are 1.04%, 0.79% and 1.29%, respectively, as disclosed in the prospectus dated February 28, 2015. Please refer to the Financial Highlights section in this report for more information.
| | |
| |
| ASTON/Montag & Caldwell Growth Fund | | October 31, 2015 |
| |
| Schedule of Investments | | |
| | | | | | | | |
Shares | | | | | Market Value | |
| |
| | COMMON STOCKS – 93.40% | | | | |
| | |
| | | | Consumer Discretionary – 14.84% | | | | |
| | 1,150,000 | | | Carnival | | $ | 62,192,000 | |
| | 570,000 | | | Dollar General | | | 38,628,900 | |
| | 987,080 | | | Dollar Tree * | | | 64,643,869 | |
| | 259,100 | | | NIKE, Class B | | | 33,949,873 | |
| | 955,000 | | | Starbucks | | | 59,754,350 | |
| | 890,000 | | | TJX | | | 65,139,100 | |
| | | | | | | | |
| | | | | | | 324,308,092 | |
| | | | | | | | |
| | |
| | | | Consumer Staples – 23.43% | | | | |
| | 880,000 | | | Colgate-Palmolive | | | 58,388,000 | |
| | 213,761 | | | Costco Wholesale | | | 33,799,889 | |
| | 665,000 | | | CVS Health | | | 65,688,700 | |
| | 737,400 | | | Estee Lauder, Class A | | | 59,331,204 | |
| | 2,200,000 | | | Mondelez International, Class A | | | 101,552,000 | |
| | 1,077,800 | | | PepsiCo | | | 110,140,382 | |
| | 984,256 | | | Walgreens Boots Alliance | | | 83,346,798 | |
| | | | | | | | |
| | | | | | | 512,246,973 | |
| | | | | | | | |
| | |
| | | | Energy – 0.41% | | | | |
| | 120,000 | | | Occidental Petroleum | | | 8,944,800 | |
| | | | | | | | |
| | |
| | | | Financials – 1.51% | | | | |
| | 610,100 | | | Wells Fargo | | | 33,030,814 | |
| | | | | | | | |
| | |
| | | | Healthcare – 26.71% | | | | |
| | 1,700,000 | | | Abbott Laboratories | | | 76,160,000 | |
| | 257,121 | | | Allergan PLC (Ireland) * | | | 79,314,115 | |
| | 425,000 | | | AmerisourceBergen | | | 41,016,750 | |
| | 405,923 | | | Amgen | | | 64,208,900 | |
| | 720,900 | | | Celgene * | | | 88,461,639 | |
| | 930,000 | | | Cerner * | | | 61,649,700 | |
| | 536,900 | | | Gilead Sciences | | | 58,054,997 | |
| | 245,000 | | | McKesson | | | 43,806,000 | |
| | 544,000 | | | Thermo Fisher Scientific | | | 71,144,320 | |
| | | | | | | | |
| | | | | | | 583,816,421 | |
| | | | | | | | |
| | | | | | | | |
Shares | | | | | Market Value | |
| | |
| | | | Industrials – 6.34% | | | | |
| | 650,000 | | | Honeywell International | | $ | 67,132,000 | |
| | 46,000 | | | Union Pacific | | | 4,110,100 | |
| | 655,000 | | | United Parcel Service, Class B | | | 67,478,100 | |
| | | | | | | | |
| | | | | | | 138,720,200 | |
| | | | | | | | |
| | |
| | | | Information Technology – 20.16% | | | | |
| | 570,000 | | | Accenture, Class A (Ireland) | | | 61,104,000 | |
| | 133,337 | | | Alphabet, Class A * | | | 98,321,371 | |
| | 791,591 | | | Cognizant Technology Solutions, Class A * | | | 53,915,263 | |
| | 537,000 | | | Facebook, Class A * | | | 54,757,890 | |
| | 415,000 | | | MasterCard, Class A | | | 41,080,850 | |
| | 485,300 | | | PayPal Holdings * | | | 17,475,653 | |
| | 125,000 | | | QUALCOMM | | | 7,427,500 | |
| | 1,373,000 | | | Visa, Class A | | | 106,517,340 | |
| | | | | | | | |
| | | | | | | 440,599,867 | |
| | | | | | | | |
| | |
| | | | Total Common Stocks
(Cost $1,757,868,622) | | | 2,041,667,167 | |
| | | | | | | | |
| |
| | INVESTMENT COMPANY – 5.45% | | | | |
| | |
| | 119,122,132 | | | BlackRock Liquidity Funds TempFund Portfolio | | | 119,122,132 | |
| | | | | | | | |
| | |
| | | | Total Investment Company
(Cost $119,122,132) | | | 119,122,132 | |
| | | | | | | | |
| Total Investments – 98.85%
(Cost $1,876,990,754)** | | | 2,160,789,299 | |
| | | | | | | | |
| Net Other Assets and Liabilities – 1.15% | | | 25,043,314 | |
| | | | | | | | |
| Net Assets – 100.00% | | $ | 2,185,832,613 | |
| | | | | | | | |
| * | | Non-income producing security. |
| ** | | Aggregate cost for Federal income tax purposes is $1,878,212,993. |
| | | | |
Gross unrealized appreciation | | $ | 310,150,622 | |
Gross unrealized depreciation | | | (27,574,316 | ) |
| | | | |
Net unrealized appreciation | | $ | 282,576,306 | |
| | | | |
See accompanying Notes to Financial Statements.
ASTON/River Road Dividend All Cap Value Fund
| | |
| |
| Portfolio Manager Commentary (unaudited) | | October 31, 2015 |
Henry W. Sanders, III, CFA; Thomas S. Forsha, CFA & James C. Shircliff, CFA
| Q. | What were the most significant market factors affecting Fund performance and returns relative to the benchmark during the past 12 months? |
| A. | Over the last 12 months, the most significant market factor affecting absolute return was increased volatility amidst the decline in commodity prices, weak corporate earnings, and uncertainty about the timing of monetary tightening by the Fed. Additionally, according to Ned Davis Research*, among S&P 500 companies, the companies with the lowest yields significantly outperformed those with the highest yields, creating a significant relative headwind for a dividend-oriented strategy. The Information Technology sector had the most significant positive impact on relative results in the period, primarily due to strong stock selection. The Financials sector had the most significant negative impact on relative results due to both weak stock selection and an underweight allocation. |
| Q. | What were the best performing holdings for the Fund during the period? |
| A. | The two holdings with the largest positive contribution to the Fund’s total return were Hasbro Inc., a worldwide leader in branded toys and games, and j2 Global Inc., a global provider of digital media and communications services. Hasbro shares surged following a dividend increase in the first quarter, followed by strong quarterly results in the second quarter, and excitement around the release of the new Jurassic Park film. The position was reduced multiple times and eventually eliminated at a substantial premium to our assessed valuation. j2 Global reported solid results from its Cloud Services and Digital Media divisions, driven by organic growth of the fax and voice customer base and improved monetization of media properties. We reduced the position twice during the year as it traded at a premium to its assessed valuation. |
| Q. | What were the weakest performing holdings? |
| A. | The two holdings with the lowest contribution to the Fund’s total return during the period were National Fuel Gas Co., an integrated natural gas utility, and Qualcomm Inc., which manufactures and sells integrated mobile communications technology. Shares of Natural Fuel Gas were down after the company introduced preliminary guidance for 2016 that included price-related production curtailments due to lower natural gas prices in the Marcellus Shale. We trimmed the position due to accumulated unrealized losses. Qualcomm faced two significant headwinds over the last year: (1) an anti-monopoly investigation by the Chinese government and (2) headwinds in its chip division due to increasing competition and Samsung’s decision to take its chip manufacturing in-house for its highest end smartphones. While Qualcomm settled favorably with the Chinese authorities, the Samsung decision resulted in a significant revenue headwind. We maintained the position during the period. |
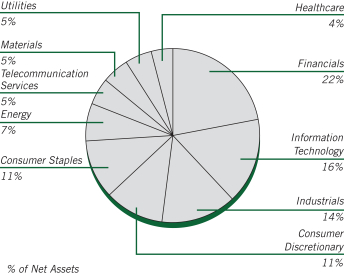
| Q. | How was the Fund positioned as of October 31, 2015? |
| A. | The Fund remains significantly overweight in Consumer stocks (both Staples and Discretionary) and Information Technology, and is significantly underweight in Financials, Healthcare, and Energy. The underweight in Financials decreased meaningfully during the period versus the Russell 3000® Value Index benchmark, driven by a number of new positions that were added to the Fund. In Energy, the underweight increased rather dramatically versus the benchmark due to a number of holdings that were eliminated from this sector. Turnover remained elevated as we dealt with numerous overvalued positions and the average yield of Fund holdings increased marginally. We were pleased to see that the Fund largely behaved as expected over the duration of the brief pullback in recent months and were equally pleased with the participation in the sharp recovery. |
| * | | Ned Davis Research, Inc. examined S&P 500 Stock Constituents ranked by quartiles (Dividend Yield) for the twelve months ended October 31, 2015. |
Growth of a Hypothetical
$10,000 Investment—Class N
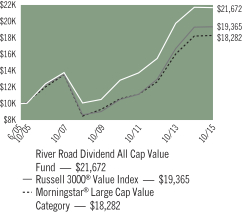
All dividends and capital gains are reinvested. Indexes are unmanaged and do not take into account fees, expenses or other costs.
Returns shown in the chart and table do not reflect taxes that a shareholder would pay on Fund distributions or on the sale of the Fund shares.
Value investing involves the risk that a Fund’s investments in companies believed to be undervalued will not appreciate as anticipated.
Small-cap and mid-cap stocks may be subject to a higher degree of market risk than the securities of more established companies because they tend to be more volatile and less liquid.
RETURNSFOR PERIOD ENDED 10/31/15
Average Annual Total Returns - Class N
| | | | |
One Year | | | -0.23 | % |
Five Year | | | 11.04 | % |
Ten Year | | | 8.01 | % |
Since Inception | | | 7.76 | % |
Inception Date 06/28/05
Average Annual Total Returns - Class I
| | | | |
One Year | | | 0.02 | % |
Five Year | | | 11.33 | % |
Since Inception | | | 5.65 | % |
Inception Date 06/28/07
The performance data quoted represents past performance. Past performance does not guarantee future results. Investment return and principal value will fluctuate so that an investor’s shares, upon redemption, may be worth more or less than their original cost. Current performance may be lower or higher than the performance data quoted. For performance data current to the most recent month-end, please visit our website at www.astonfunds.com.
The total expense ratios for Class N and Class I shares are 1.09% and 0.84%, respectively, as disclosed in the prospectus dated February 28, 2015. Please refer to the Financial Highlights section in this report for more information.
| | |
| |
| ASTON/River Road Dividend All Cap Value Fund | | October 31, 2015 |
| |
| Schedule of Investments | | |
| | | | | | | | |
Shares | | | | | Market
Value | |
|
| | COMMON STOCKS – 99.12% | |
| | |
| | | | Consumer Discretionary – 11.38% | | | | |
| | 243,952 | | �� | Cinemark Holdings | | $ | 8,645,659 | |
| | 573,097 | | | Ford Motor | | | 8,487,567 | |
| | 267,207 | | | Kohl’s | | | 12,323,587 | |
| | 135,813 | | | Macy’s | | | 6,923,747 | |
| | 464,584 | | | National CineMedia | | | 6,597,093 | |
| | 284,167 | | | Omnicom Group | | | 21,289,792 | |
| | 210,670 | | | Target | | | 16,259,511 | |
| | 394,152 | | | Thomson Reuters (Canada) | | | 16,168,115 | |
| | | | | | | | |
| | | | | | | 96,695,071 | |
| | | | | | | | |
| | |
| | | | Consumer Staples – 10.86% | | | | |
| | 150,574 | | | Kimberly-Clark | | | 18,025,214 | |
| | 190,014 | | | Molson Coors Brewing, Class B | | | 16,740,233 | |
| | 103,263 | | | PepsiCo | | | 10,552,446 | |
| | 454,868 | | | Sysco | | | 18,763,305 | |
| | 311,970 | | | Unilever, SP ADR (Great Britain) | | | 13,867,067 | |
| | 250,741 | | | Wal-Mart Stores | | | 14,352,415 | |
| | | | | | | | |
| | | | | | | 92,300,680 | |
| | | | | | | | |
| | |
| | | | Energy – 6.75% | | | | |
| | 104,056 | | | Chevron | | | 9,456,609 | |
| | 174,025 | | | Exxon Mobil | | | 14,398,829 | |
| | 256,218 | | | Martin Midstream Partners LP | | | 7,417,511 | |
| | 285,066 | | | Occidental Petroleum | | | 21,248,820 | |
| | 153,233 | | | TransMontaigne Partners LP | | | 4,857,486 | |
| | | | | | | | |
| | | | | | | 57,379,255 | |
| | | | | | | | |
| | |
| | | | Financials – 22.06% | | | | |
| | 138,865 | | | CME Group | | | 13,118,577 | |
| | 177,108 | | | CNA Financial | | | 6,475,068 | |
| | 179,114 | | | Communications Sales & Leasing, REIT | | | 3,598,400 | |
| | 281,794 | | | Compass Diversified Holdings | | | 4,635,511 | |
| | 326,398 | | | CyrusOne, REIT | | | 11,515,321 | |
| | | | | | | | |
Shares | | | | | Market
Value | |
| | |
| | | | Financials (continued) | | | | |
| | 470,711 | | | GEO Group, REIT | | $ | 15,189,844 | |
| | 776,653 | | | Iron Mountain, REIT | | | 23,796,636 | |
| | 290,443 | | | PNC Financial Services Group | | | 26,215,385 | |
| | 310,645 | | | Sabra Health Care, REIT | | | 7,045,429 | |
| | 140,147 | | | Stock Yards Bancorp | | | 5,280,739 | |
| | 487,563 | | | U.S. Bancorp | | | 20,565,407 | |
| | 255,629 | | | Ventas, REIT | | | 13,732,390 | |
| | 65,937 | | | Washington Trust Bancorp | | | 2,558,356 | |
| | 402,053 | | | Wells Fargo | | | 21,767,149 | |
| | 409,976 | | | Weyerhaeuser, REIT | | | 12,024,596 | |
| | | | | | | | |
| | | | | | | 187,518,808 | |
| | | | | | | | |
| | |
| | | | Healthcare – 3.69% | | | | |
| | 353,725 | | | Owens & Minor | | | 12,681,041 | |
| | 275,501 | | | Quest Diagnostics | | | 18,720,293 | |
| | | | | | | | |
| | | | | | | 31,401,334 | |
| | | | | | | | |
| | |
| | | | Industrials – 14.00% | | | | |
| | 657,948 | | | ADT | | | 21,738,602 | |
| | 586,070 | | | Aircastle (Bermuda) | | | 13,280,346 | |
| | 230,964 | | | Emerson Electric | | | 10,908,430 | |
| | 482,787 | | | Fastenal | | | 18,905,939 | |
| | 145,586 | | | MSC Industrial Direct, Class A | | | 9,138,433 | |
| | 136,824 | | | Parker-Hannifin | | | 14,325,473 | |
| | 285,842 | | | Republic Services | | | 12,502,729 | |
| | 176,201 | | | United Parcel Service, Class B | | | 18,152,227 | |
| | | | | | | | |
| | | | | | | 118,952,179 | |
| | | | | | | | |
| | |
| | | | Information Technology – 16.30% | | | | |
| | 489,065 | | | Corning | | | 9,096,609 | |
| | 185,862 | | | CSG Systems International | | | 6,230,094 | |
| | 687,481 | | | Intel | | | 23,278,107 | |
| | 136,011 | | | j2 Global | | | 10,547,653 | |
| | 646,420 | | | Microsoft | | | 34,027,549 | |
| | 309,953 | | | Motorola Solutions | | | 21,687,411 | |
| | 283,111 | | | QUALCOMM | | | 16,822,456 | |
| | 876,708 | | | Western Union | | | 16,876,629 | |
| | | | | | | | |
| | | | | | | 138,566,508 | |
| | | | | | | | |
| | |
| | | | Materials – 4.77% | | | | |
| | 172,986 | | | Bemis | | | 7,919,299 | |
| | 169,026 | | | Compass Minerals International | | | 13,731,672 | |
| | 113,025 | | | Innophos Holdings | | | 4,802,432 | |
| | 174,310 | | | Nucor | | | 7,373,313 | |
| | 60,226 | | | Praxair | | | 6,690,506 | |
| | | | | | | | |
| | | | | | | 40,517,222 | |
| | | | | | | | |
| | |
| | | | Telecommunication Services – 4.67% | | | | |
| | 92,158 | | | Atlantic Tele-Network | | | 7,042,714 | |
| | 245,463 | | | Rogers Communications, Class B (Canada) | | | 9,769,427 | |
| | 488,392 | | | Verizon Communications | | | 22,895,817 | |
| | | | | | | | |
| | | | | | | 39,707,958 | |
| | | | | | | | |
| | |
| | | | Utilities – 4.64% | | | | |
| | 244,788 | | | AmeriGas Partners LP | | | 10,437,760 | |
See accompanying Notes to Financial Statements.
| | |
| |
| ASTON/River Road Dividend All Cap Value Fund | | October 31, 2015 |
| |
| Schedule of Investments – continued | | |
| | | | | | | | |
Shares | | | | | Market
Value | |
| | |
| | | | Utilities (continued) | | | | |
| | 290,877 | | | National Fuel Gas | | $ | 15,279,769 | |
| | 302,532 | | | Vectren | | | 13,756,130 | |
| | | | | | | | |
| | | | | | | 39,473,659 | |
| | | | | | | | |
| | |
| | | | Total Common Stocks
(Cost $704,654,279) | | | 842,512,674 | |
| | | | | | | | |
|
| | INVESTMENT COMPANY – 0.33% | |
| | |
| | 2,820,183 | | | BlackRock Liquidity Funds TempFund Portfolio | | | 2,820,183 | |
| | | | | | | | |
| | |
| | | | Total Investment Company
(Cost $2,820,183) | | | 2,820,183 | |
| | | | | | | | |
| Total Investments – 99.45%
(Cost $707,474,462)* | | | 845,332,857 | |
| | | | | | | | |
| Net Other Assets and Liabilities – 0.55% | | | 4,644,722 | |
| | | | | | | | |
| Net Assets – 100.00% | | $ | 849,977,579 | |
| | | | | | | | |
| * | | Aggregate cost for Federal income tax purposes is $705,527,430. |
| | | | |
Gross unrealized appreciation | | $ | 165,675,256 | |
Gross unrealized depreciation | | | (25,869,829 | ) |
| | | | |
Net unrealized appreciation | | $ | 139,805,427 | |
| | | | |
| REIT | | Real Estate Investment Trust |
| SP ADR | | Sponsored American Depositary Receipt |
See accompanying Notes to Financial Statements.
ASTON/River Road Dividend All Cap Value Fund II
| | |
| |
| Portfolio Manager Commentary (unaudited) | | October 31, 2015 |
Henry W. Sanders, III, CFA; Thomas S. Forsha, CFA & James C. Shircliff, CFA
| Q. | What were the most significant market factors affecting Fund performance and returns relative to the benchmark during the past 12 months? |
| A. | Over the last 12 months, the most significant market factor affecting absolute return was increased volatility amidst the decline in commodity prices, weak corporate earnings, and uncertainty about the timing of monetary tightening by the Federal Reserve. Additionally, according to Ned Davis Research*, among S&P 500 companies, the companies with the lowest yields significantly outperformed those with the highest yields, creating a significant relative headwind for a dividend-oriented strategy. The Information Technology sector had the most significant positive impact on relative results in the period, primarily due to strong stock selection. The Financials sector had the most significant negative impact on relative results due to both weak stock selection and an underweight allocation. |
| Q. | What were the best performing holdings for the Fund during the period? |
| A. | The two holdings with the largest positive contribution to the Fund’s total return were Hasbro Inc., a worldwide leader in branded toys and games, and Microsoft Corp., the company behind Windows and Office. Hasbro shares surged following a dividend increase in the first quarter, followed by strong quarterly results in the second quarter, and excitement around the release of the new Jurassic Park film. The position was reduced multiple times and eventually eliminated at a substantial premium to our assessed valuation. Microsoft reported strong fiscal third quarter results highlighted by significant growth in cloud revenue and constant currency revenue growth in its enterprise business. We maintained the position during the period. |
| Q. | What were the weakest performing holdings? |
| A. | The two holdings with the lowest contribution to the Fund’s total return during the period were National Fuel Gas Co., an integrated natural gas utility, and Qualcomm Inc., which manufactures and sells integrated mobile communications technology. Shares of National Fuel Gas were |
| | down after the company introduced preliminary guidance for 2016 that included price-related production curtailments due to lower natural gas prices in the Marcellus Shale. We trimmed the position due to accumulated unrealized losses. Qualcomm faced two significant headwinds over the last year: (1) an anti-monopoly investigation by the Chinese government and (2) headwinds in its chip division due to increasing competition and Samsung’s decision to take its chip manufacturing in-house for its highest end smartphones. While Qualcomm settled favorably with the Chinese authorities, the Samsung decision resulted in a significant revenue headwind. We maintained the position during the period. |
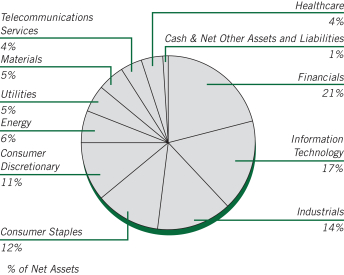
| Q. | How was the Fund positioned as of October 31, 2015? |
| A. | The Fund remains significantly overweight in Consumer stocks (Staples and Discretionary) and Information Technology, and is significantly underweight in Financials, Healthcare, and Energy. The underweight in Financials decreased meaningfully during the period versus the Russell 3000® Value Index benchmark, driven by a number of new positions that were added to the Fund. In Energy, the underweight increased rather dramatically versus the benchmark due to a number of holdings that were eliminated from this sector. Turnover remained elevated as we dealt with numerous overvalued positions and the average yield of Fund holdings increased marginally. We were pleased to see that the Fund largely behaved as expected over the duration of the brief pullback in recent months and were equally pleased with the participation in the sharp recovery. |
| * | | Ned Davis Research, Inc. examined S&P 500 Stock Constituents ranked by quartiles (Dividend Yield) for the twelve months ended October 31, 2015. |
Growth of a Hypothetical
$10,000 Investment—Class N
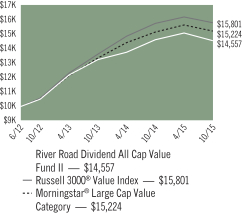
All dividends and capital gains are reinvested. Indexes are unmanaged and do not take into account fees, expenses or other costs.
Returns shown in the chart and table do not reflect taxes that a shareholder would pay on Fund distributions or on the sale of the Fund shares.
Value investing involves the risk that a Fund’s investments in companies believed to be undervalued will not appreciate as anticipated.
Small-cap and mid-cap stocks may be subject to a higher degree of market risk than the securities of more established companies because they tend to be more volatile and less liquid.
RETURNSFOR PERIOD ENDED 10/31/15
Average Annual Total Returns - Class N
| | | | |
One-Year | | | -0.47 | % |
Since Inception | | | 11.87 | % |
Inception Date 06/27/12
Average Annual Total Returns - Class I
| | | | |
One Year | | | -0.13 | % |
Since Inception | | | 12.17 | % |
Inception Date 06/27/12
The performance data quoted represents past performance. Past performance does not guarantee future results. Investment return and principal value will fluctuate so that an investor’s shares, upon redemption, may be worth more or less than their original cost. Current performance may be lower or higher than the performance data quoted. For performance data current to the most recent month-end, please visit our website at www.astonfunds.com.
The performance quoted would have been lower if fee waivers and/or expense reimbursements had not been in effect.
| | |
| |
| ASTON/River Road Dividend All Cap Value Fund II | | October 31, 2015 |
| |
| Schedule of Investments | | |
| | | | | | | | |
Shares | | | | | Market
Value | |
|
| | COMMON STOCKS – 98.52% | |
| | |
| | | | Consumer Discretionary – 11.25% | | | | |
| | 36,589 | | | Cinemark Holdings | | $ | 1,296,714 | |
| | 88,155 | | | Ford Motor | | | 1,305,576 | |
| | 42,143 | | | Kohl’s | | | 1,943,635 | |
| | 21,768 | | | Macy’s | | | 1,109,733 | |
| | 43,823 | | | Omnicom Group | | | 3,283,219 | |
| | 33,401 | | | Target | | | 2,577,889 | |
| | 60,228 | | | Thomson Reuters (Canada) | | | 2,470,553 | |
| | | | | | | | |
| | | | | | | 13,987,319 | |
| | | | | | | | |
| | |
| | | | Consumer Staples – 11.62% | | | | |
| | 22,751 | | | Kimberly-Clark | | | 2,723,522 | |
| | 30,020 | | | Molson Coors Brewing, Class B | | | 2,644,762 | |
| | 15,781 | | | PepsiCo | | | 1,612,660 | |
| | 72,160 | | | Sysco | | | 2,976,600 | |
| | 49,376 | | | Unilever, SP ADR (Great Britain) | | | 2,194,763 | |
| | 40,160 | | | Wal-Mart Stores | | | 2,298,758 | |
| | | | | | | | |
| | | | | | | 14,451,065 | |
| | | | | | | | |
| | |
| | | | Energy – 6.24% | | | | |
| | 16,345 | | | Chevron | | | 1,485,434 | |
| | 27,018 | | | Exxon Mobil | | | 2,235,469 | |
| | 23,709 | | | Martin Midstream Partners LP | | | 686,376 | |
| | 44,973 | | | Occidental Petroleum | | | 3,352,287 | |
| | | | | | | | |
| | | | | | | 7,759,566 | |
| | | | | | | | |
| | |
| | | | Financials – 20.64% | | | | |
| | 21,439 | | | CME Group | | | 2,025,342 | |
| | 16,274 | | | CNA Financial | | | 594,977 | |
| | 28,433 | | | Communications Sales & Leasing, REIT | | | 571,219 | |
| | 49,134 | | | CyrusOne, REIT | | | 1,733,448 | |
| | 68,237 | | | GEO Group, REIT | | | 2,202,008 | |
| | 122,758 | | | Iron Mountain, REIT | | | 3,761,307 | |
| | 45,780 | | | PNC Financial Services Group | | | 4,132,103 | |
| | | | | | | | |
Shares | | | | | Market
Value | |
| | |
| | | | Financials (continued) | | | | |
| | 75,776 | | | U.S. Bancorp | | $ | 3,196,232 | |
| | 40,475 | | | Ventas, REIT | | | 2,174,317 | |
| | 62,019 | | | Wells Fargo | | | 3,357,709 | |
| | 65,245 | | | Weyerhaeuser, REIT | | | 1,913,636 | |
| | | | | | | | |
| | | | | | | 25,662,298 | |
| | | | | | | | |
| | |
| | | | Healthcare – 3.86% | | | | |
| | 51,359 | | | Owens & Minor | | | 1,841,220 | |
| | 43,491 | | | Quest Diagnostics | | | 2,955,213 | |
| | | | | | | | |
| | | | | | | 4,796,433 | |
| | | | | | | | |
| | |
| | | | Industrials – 14.27% | | | | |
| | 101,728 | | | ADT | | | 3,361,093 | |
| | 59,306 | | | Aircastle (Bermuda) | | | 1,343,874 | |
| | 36,673 | | | Emerson Electric | | | 1,732,066 | |
| | 74,646 | | | Fastenal | | | 2,923,137 | |
| | 23,403 | | | MSC Industrial Direct, Class A | | | 1,469,006 | |
| | 21,107 | | | Parker-Hannifin | | | 2,209,903 | |
| | 45,205 | | | Republic Services | | | 1,977,267 | |
| | 26,492 | | | United Parcel Service, Class B | | | 2,729,206 | |
| | | | | | | | |
| | | | | | | 17,745,552 | |
| | | | | | | | |
| | |
| | | | Information Technology – 16.66% | | | | |
| | 77,480 | | | Corning | | | 1,441,128 | |
| | 108,522 | | | Intel | | | 3,674,555 | |
| | 21,603 | | | j2 Global | | | 1,675,313 | |
| | 102,277 | | | Microsoft | | | 5,383,861 | |
| | 47,713 | | | Motorola Solutions | | | 3,338,479 | |
| | 44,180 | | | QUALCOMM | | | 2,625,176 | |
| | 133,702 | | | Western Union | | | 2,573,764 | |
| | | | | | | | |
| | | | | | | 20,712,276 | |
| | | | | | | | |
| | |
| | | | Materials – 4.87% | | | | |
| | 27,006 | | | Bemis | | | 1,236,335 | |
| | 27,045 | | | Compass Minerals International | | | 2,197,136 | |
| | 10,825 | | | Innophos Holdings | | | 459,954 | |
| | 26,151 | | | Nucor | | | 1,106,187 | |
| | 9,549 | | | Praxair | | | 1,060,798 | |
| | | | | | | | |
| | | | | | | 6,060,410 | |
| | | | | | | | |
| | |
| | | | Telecommunication Services – 4.15% | | | | |
| | 38,921 | | | Rogers Communications, Class B (Canada) | | | 1,549,056 | |
| | 77,097 | | | Verizon Communications | | | 3,614,307 | |
| | | | | | | | |
| | | | | | | 5,163,363 | |
| | | | | | | | |
| | |
| | | | Utilities – 4.96% | | | | |
| | 37,631 | | | AmeriGas Partners LP | | | 1,604,586 | |
| | 45,683 | | | National Fuel Gas | | | 2,399,728 | |
| | 47,405 | | | Vectren | | | 2,155,505 | |
| | | | | | | | |
| | | | | | | 6,159,819 | |
| | | | | | | | |
| | |
| | | | Total Common Stocks
(Cost $114,067,613) | | | 122,498,101 | |
| | | | | | | | |
See accompanying Notes to Financial Statements.
| | |
| |
| ASTON/River Road Dividend All Cap Value Fund II | | October 31, 2015 |
| |
| Schedule of Investments – continued | | |
| | | | | | | | |
Shares | | | | | Market
Value | |
|
| | INVESTMENT COMPANY – 0.60% | |
| | |
| | 750,500 | | | BlackRock Liquidity Funds TempFund Portfolio | | $ | 750,500 | |
| | | | | | | | |
| | |
| | | | Total Investment Company
(Cost $750,500) | | | 750,500 | |
| | | | | | | | |
| Total Investments – 99.12%
(Cost $114,818,113)* | | | 123,248,601 | |
| | | | | | | | |
| Net Other Assets and Liabilities – 0.88% | | | 1,095,336 | |
| | | | | | | | |
| Net Assets – 100.00% | | $ | 124,343,937 | |
| | | | | | | | |
| * | | Aggregate cost for Federal income tax purposes is $114,625,396. |
| | | | |
Gross unrealized appreciation | | $ | 14,717,681 | |
Gross unrealized depreciation | | | (6,094,476 | ) |
| | | | |
Net unrealized appreciation | | $ | 8,623,205 | |
| | | | |
| REIT | | Real Estate Investment Trust |
| SP ADR | | Sponsored American Depositary Receipt |
See accompanying Notes to Financial Statements.
ASTON/Fairpointe Mid Cap Fund
| | |
| |
| Portfolio Manager Commentary (unaudited) | | October 31, 2015 |
Thyra E. Zerhusen; Marie L. Lorden & Mary L. Pierson
| Q. | What were the most significant market factors affecting Fund performance and returns relative to the benchmark during the past 12 months? |
| A. | In the past 12 months, the market has continued to value Healthcare, growth and momentum stocks at ever higher valuations while stocks related to Energy or with a value bias fell out of favor. Fears of slowing economic growth, principally in China, had a significant negative impact on both commodity prices and the currencies of countries exporting commodities. Our investment process led us to reduce the Fund’s exposure to relatively expensive Healthcare stocks and increase the exposure to more economically sensitive stocks, which we believe to be undervalued. |
| Q. | What were the best performing holdings for the Fund during the period? |
| A. | The Fund’s top three contributors to performance were Juniper Networks, Inc., Owens Corning, and Staples, Inc. Juniper is a leading provider of communication network equipment. The stock advanced as a turn-around plan, focusing on new product introductions and improved profitability, was implemented. Owens Corning, a global producer of building material products, benefited from a U.S. housing market recovery. Staples stock reacted to the announcement that Staples would acquire its rival Office Depot. We used the opportunity to exit most of the Fund’s position. |
| Q. | What were the weakest performing holdings? |
| A. | After being one of our best performing stocks in 2014, United States Steel Corp. was our worst performing stock in 2015. The stock declined due to a high level of subsidized steel imports from China as well as weak demand from the energy market. The company is in the midst of a restructuring plan that aims to increase manufacturing efficiency. U.S. Steel offers attractive upside potential as its restructuring plan may begin to improve profits in coming quarters. Copa Holdings, SA, provides passenger airline service to destinations in North, Central and |
| | South America from its strategically advantaged hub in Panama City, Panama. We expect Copa to be a long-term beneficiary of increasing airline traffic in Latin America by adding new destinations and flight frequencies to its network. The company’s stock decline was caused by the weak Brazilian economy and currency. Copa offers upside potential as the company is shifting capacity from weak to strong markets. Gerdau, SA, is the leading producer of long steel products used for construction markets in the Americas. The stock was hurt by the economic slowdown in Brazil. Gerdau operates efficient mini-mill assets and we believe the shares offer compelling upside when Brazil’s economy recovers. |
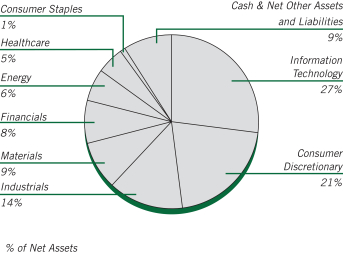
| Q. | How was the Fund positioned as of October 31, 2015? |
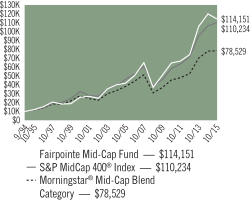
| A. | We maintain a long-term view and take advantage of both market and stock specific conditions to position the portfolio. Many of our holdings are trading near trough valuation multiples. The current price to revenue multiple is at a historical low for the Fund, at less than half of the S&P 500’s price to revenue multiple. In the coming year, we believe more companies may spur growth through mergers and acquisitions based on these valuations. Mid-cap companies experience more takeover activity than large caps, and historically, our portfolio has had a higher incidence of takeovers than the S&P MidCap 400® Index. Last year, three portfolio holdings received significant takeover offers including Polypore, Hospira and most recently, long-term portfolio holding Con-way, Inc. We continue to actively rebalance the portfolio on a stock by stock basis to keep the overall valuation attractive relative to the Fund’s S&P MidCap 400® benchmark and the broader market S&P 500® Index. |
Growth of a Hypothetical
$10,000 Investment—Class N
All dividends and capital gains are reinvested. Indexes are unmanaged and do not take into account fees, expenses or other costs.
Returns shown in the chart and table do not reflect taxes that a shareholder would pay on Fund distributions or on the sale of the Fund shares.
Small-cap and mid-cap stocks may be subject to a higher degree of market risk than the securities of more established companies because they tend to be more volatile and less liquid.
RETURNSFOR PERIOD ENDED 10/31/15
Average Annual Total Returns - Class N
| | | | |
One Year | | | -5.02 | % |
Five Year | | | 11.97 | % |
Ten Year | | | 10.48 | % |
Since Inception | | | 12.22 | % |
Inception Date 09/19/94
Average Annual Total Returns - Class I
| | | | |
One Year | | | -4.78 | % |
Five Year | | | 12.26 | % |
Ten Years | | | 10.77 | % |
Since Inception | | | 9.62 | % |
Inception Date 07/06/04
The performance data quoted represents past performance. Past performance does not guarantee future results. Investment return and principal value will fluctuate so that an investor’s shares, upon redemption, may be worth more or less than their original cost. Current performance may be lower or higher than the performance data quoted. For performance data current to the most recent month-end, please visit our website at www.astonfunds.com.
The total expense ratios for Class N and Class I shares are 1.11% and 0.86%, respectively, as disclosed in the prospectus dated February 28, 2015. Please refer to the Financial Highlights section in this report for more information.
| | |
| |
| ASTON/Fairpointe Mid Cap Fund | | October 31, 2015 |
| |
| Schedule of Investments | | |
| | | | | | | | |
Shares | | | | | Market
Value | |
|
| | COMMON STOCKS – 91.25% | |
| | |
| | | | Consumer Discretionary – 21.29% | | | | |
| | 1,238,600 | | | BorgWarner | | $ | 53,036,852 | |
| | 2,129,800 | | | Cooper Tire & Rubber | | | 89,004,342 | |
| | 3,886,100 | | | DeVry Education Group | | | 91,556,516 | |
| | 1,386,800 | | | Gannett | | | 21,939,176 | |
| | 5,529,300 | | | Interpublic Group | | | 126,786,849 | |
| | 814,200 | | | Lear | | | 101,823,852 | |
| | 7,033,100 | | | Mattel | | | 172,873,598 | |
| | 10,345,354 | | | New York Times, Class A | | | 137,386,301 | |
| | 1,829,894 | | | Scholastic | | | 74,787,768 | |
| | 874,900 | | | Staples | | | 11,364,951 | |
| | 6,474,152 | | | Time | | | 120,289,744 | |
| | | | | | | | |
| | | | | | | 1,000,849,949 | |
| | | | | | | | |
| | |
| | | | Consumer Staples – 0.94% | | | | |
| | 605,400 | | | Bunge | | | 44,169,984 | |
| | | | | | | | |
| | |
| | | | Energy – 6.39% | | | | |
| | 3,792,692 | | | FMC Technologies * | | | 128,306,771 | |
| | 15,694,800 | | | McDermott International * | | | 72,353,028 | |
| | 6,294,000 | | | Transocean Ltd. (Switzerland) | | | 99,634,020 | |
| | | | | | | | |
| | | | | | | 300,293,819 | |
| | | | | | | | |
| | |
| | | | Financials – 7.80% | | | | |
| | 1,078,800 | | | Cincinnati Financial | | | 64,976,124 | |
| | 1,530,085 | | | Eaton Vance | | | 55,251,369 | |
| | 1,601,700 | | | Northern Trust | | | 112,743,663 | |
| | 2,424,700 | | | Raymond James Financial | | | 133,625,217 | |
| | | | | | | | |
| | | | | | | 366,596,373 | |
| | | | | | | | |
| | |
| | | | Healthcare – 4.57% | | | | |
| | 1,449,400 | | | Quest Diagnostics | | | 98,486,730 | |
| | 1,483,300 | | | Varian Medical Systems * | | | 116,483,549 | |
| | | | | | | | |
| | | | | | | 214,970,279 | |
| | | | | | | | |
| | | | | | | | |
Shares | | | | | Market
Value | |
| | |
| | | | Industrials – 14.48% | | | | |
| | 2,264,700 | | | AGCO | | $ | 109,588,833 | |
| | 1,942,000 | | | Chicago Bridge & Iron (Netherlands) | | | 87,137,540 | |
| | 2,319,900 | | | Copa Holdings, Class A (Panama) | | | 117,201,348 | |
| | 1,236,500 | | | Donaldson | | | 37,342,300 | |
| | 3,123,500 | | | Owens Corning | | | 142,212,955 | |
| | 2,700,200 | | | Werner Enterprises | | | 71,447,292 | |
| | 3,174,100 | | | Xylem | | | 115,568,981 | |
| | | | | | | | |
| | | | | | | 680,499,249 | |
| | | | | | | | |
| | |
| | | | Information Technology – 26.97% | | | | |
| | 1,751,800 | | | Akamai Technologies * | | | 106,544,476 | |
| | 807,200 | | | Citrix Systems * | | | 66,271,120 | |
| | 5,062,692 | | | Cree * | | | 127,529,212 | |
| | 1,640,400 | | | Finisar * | | | 18,651,348 | |
| | 2,410,448 | | | Itron * | | | 88,535,755 | |
| | 5,657,800 | | | Jabil Circuit | | | 130,016,244 | |
| | 6,300,000 | | | Juniper Networks | | | 197,757,000 | |
| | 7,362,400 | | | Nuance Communications * | | | 124,939,928 | |
| | 4,029,000 | | | NVIDIA | | | 114,302,730 | |
| | 3,613,400 | | | Tegna | | | 97,706,336 | |
| | 4,779,100 | | | Teradata * | | | 134,340,501 | |
| | 4,550,038 | | | Unisys * | | | 60,970,509 | |
| | | | | | | | |
| | | | | | | 1,267,565,159 | |
| | | | | | | | |
| | |
| | | | Materials – 8.81% | | | | |
| | 12,632,000 | | | Alcoa | | | 112,803,760 | |
| | 2,162,004 | | | Domtar (Canada) | | | 89,161,045 | |
| | 2,335,762 | | | FMC | | | 95,088,871 | |
| | 28,933,700 | | | Gerdau SA, SP ADR | | | 40,217,843 | |
| | 6,570,600 | | | United States Steel | | | 76,744,608 | |
| | | | | | | | |
| | | | | | | 414,016,127 | |
| | | | | | | | |
| | | | Total Common Stocks
(Cost $3,885,174,416) | | | 4,288,960,939 | |
| | | | | | | | |
|
| | INVESTMENT COMPANY – 2.24% | |
| | |
| | 105,377,985 | | | BlackRock Liquidity Funds TempFund Portfolio | | | 105,377,985 | |
| | | | | | | | |
| | |
| | | | Total Investment Company
(Cost $105,377,985) | | | 105,377,985 | |
| | | | | | | | |
| Total Investments – 93.49%
(Cost $3,990,552,401)** | | | 4,394,338,924 | |
| | | | | | | | |
| Net Other Assets and Liabilities – 6.51% | | | 306,057,018 | |
| | | | | | | | |
| Net Assets – 100.00% | | $ | 4,700,395,942 | |
| | | | | | | | |
| * | | Non-income producing security. |
| ** | | Aggregate cost for Federal income tax purposes is $3,991,209,257. |
| | | | |
Gross unrealized appreciation | | $ | 930,264,786 | |
Gross unrealized depreciation | | | (527,135,119 | ) |
| | | | |
Net unrealized appreciation | | $ | 403,129,667 | |
| | | | |
| SP ADR | | Sponsored American Depositary Receipt |
See accompanying Notes to Financial Statements.
ASTON/Montag & Caldwell Mid Cap Growth Fund
| | |
| |
| Portfolio Manager Commentary (unaudited) | | October 31, 2015 |
| M. Scott Thompson, CFA & Jeffrey S. Wilson, CFA, CPA |
| Q. | What were the most significant market factors affecting Fund performance and returns relative to the benchmark during the past 12 months? |
| A. | The past twelve months have witnessed a pickup in market volatility which we believe is the result of the end of quantitative easing (QE). Without that liquidity markets are beginning to clear, fundamentals are starting to matter again, and investors are increasingly being forced to reassess risk and price it accordingly. Not surprisingly, our disciplined, fundamental approach to stock selection began to reassert itself this past year. Stock selection and sector allocation contributed roughly equally to this performance. Good stock selection within Financials, Consumer Staples, and Healthcare, and an underweight position in Energy stocks contributed the most to relative performance, more than offsetting weaker performances from a number of our Consumer Discretionary and Technology holdings. |
| Q. | What were the best performing holdings for the Fund during the period? |
| A. | The Fund’s top four performing stocks over the past 12 months were O’Reilly Automotive, (+57%); Pall Corp., (+37%); and Monster Beverage and FactSet Research Systems, which were both up 35%. O’Reilly shares were boosted by strong underlying fundamentals in the auto after-market parts industry, which drove better than expected sales and profits. Pall Corp. was acquired by Danaher at a healthy premium. Monster benefitted from an expanding price-to-earnings (P/E) multiple as more investors began to anticipate the benefits of its preferred global distribution arrangement with Coca-Cola. FactSet shares likewise rose as investors paid up for solid, visible earnings-per-share (EPS) growth. |
| Q. | What were the weakest performing holdings? |
| A. | We sold our small remaining position in Oceaneering International in June, but not before suffering a 33% decline. Exploration and production capital spending cuts in the face of collapsing oil prices severely pressured the company’s |
| | near-term profit outlook. Borg Warner suffered a 24% drop on investor worries about the impact of weakening Chinese auto sales and the emissions testing scandal at Volkswagen. Both Michael Kors and Wex Inc. fell 21%. We exited our Kors position believing that the share price weakness likely signaled a forthcoming profit disappointment. Indeed, the shares fell an additional 40% after a big earnings miss and downward estimate revision on softening Kors sales. We took advantage of the decline in Wex shares to add to our position believing that the near-term pressure on earnings from falling gas prices would prove transitory. |
| Q. | How was the Fund positioned as of October 31, 2015? |
| A. | The subdued nature of this economic recovery thus far has prevented significant imbalances from developing within the economy and may serve to extend the duration of the cycle beyond what has typically been considered normal in the past. In addition, the Fed is very clearly attuned to market volatility as exemplified by the decision not to raise interest rates in the immediate aftermath of the market decline, suggesting that the path to normalization will likely be slower than originally anticipated. The broader implication for the market is that stocks should ultimately be able to grind higher, albeit at a slower pace than experienced in recent years due to the still high valuations. |
Against a backdrop of generally tepid profit growth and reduced Fed liquidity, we believe that the reasonably valued, high quality growth stocks held in the Fund offer a compelling combination of attractive valuations along with the potential for superior earnings growth.
Growth of a Hypothetical $10,000 Investment—Class N
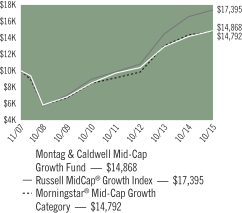
All dividends and capital gains are reinvested. Indexes are unmanaged and do not take into account fees, expenses or other costs.
Returns shown in the chart and table do not reflect taxes that a shareholder would pay on Fund distributions or on the sale of the Fund shares.
Mid-cap stocks may be subject to a higher degree of market risk than the securities of more established companies because they tend to be more volatile and less liquid.
RETURNSFOR PERIOD ENDED 10/31/15
Average Annual Total Returns - Class N
| | | | |
One Year | | | 4.81 | % |
Five Year | | | 11.76 | % |
Since Inception | | | 5.08 | % |
Inception Date 11/02/07
Average Annual Total Returns - Class I
| | | | |
1 Year | | | 5.08 | % |
Since Inception | | | 7.36 | % |
Inception Date 05/14/14
The performance data quoted represents past performance. Past performance does not guarantee future results. Investment return and principal value will fluctuate so that an investor’s shares, upon redemption, may be worth more or less than their original cost. Current performance may be lower or higher than the performance data quoted. For performance data current to the most recent month-end, please visit our website at www.astonfunds.com.
The performance quoted would have been lower if fee waivers and/or expense reimbursements had not been in effect.
| | |
| |
| ASTON/Montag & Caldwell Mid Cap Growth Fund | | October 31, 2015 |
| |
| Schedule of Investments | | |
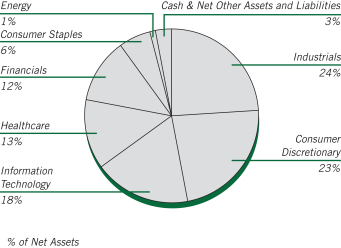
| | | | | | | | |
Shares | | | | | Market
Value | |
|
| | COMMON STOCKS – 96.28% | |
| | |
| | | | Consumer Discretionary – 23.23% | | | | |
| | 1,112 | | | Advance Auto Parts | | $ | 220,654 | |
| | 4,280 | | | BorgWarner | | | 183,270 | |
| | 2,380 | | | Dollar General | | | 161,293 | |
| | 5,360 | | | Dollar Tree * | | | 351,026 | |
| | 5,640 | | | Dunkin’ Brands Group | | | 233,552 | |
| | 3,930 | | | Hanesbrands | | | 125,524 | |
| | 2,290 | | | Harman International Industries | | | 251,808 | |
| | 10,500 | | | LKQ * | | | 310,905 | |
| | 430 | | | O’Reilly Automotive * | | | 118,792 | |
| | 455 | | | Panera Bread, Class A * | | | 80,703 | |
| | 1,040 | | | PVH | | | 94,588 | |
| | 4,970 | | | Ross Stores | | | 251,383 | |
| | 1,990 | | | Tractor Supply | | | 183,856 | |
| | | | | | | | |
| | | | | | | 2,567,354 | |
| | | | | | | | |
| | | | Consumer Staples – 5.79% | | | | |
| | 940 | | | Church & Dwight | | | 80,925 | |
| | 1,570 | | | Mead Johnson Nutrition | | | 128,740 | |
| | 1,650 | | | Molson Coors Brewing, Class B | | | 145,365 | |
| | 2,090 | | | Monster Beverage * | | | 284,909 | |
| | | | | | | | |
| | | | | | | 639,939 | |
| | | | | | | | |
| | | | Energy – 1.33% | | | | |
| | 1,260 | | | Core Laboratories (Netherlands) | | | 146,576 | |
| | | | | | | | |
| | | | Financials – 11.57% | | | | |
| | 4,290 | | | First Republic Bank | | | 280,180 | |
| | 1,299 | | | Intercontinental Exchange | | | 327,868 | |
| | 3,070 | | | Lazard, Class A (Bermuda) | | | 142,202 | |
| | 5,390 | | | Raymond James Financial | | | 297,043 | |
| | 1,554 | | | Signature Bank New York NY * | | | 231,422 | |
| | | | | | | | |
| | | | | | | 1,278,715 | |
| | | | | | | | |
| | | | Healthcare – 12.70% | | | | |
| | 2,200 | | | AmerisourceBergen | | | 212,322 | |
| | 5,460 | | | Cerner * | | | 361,943 | |
| | 920 | | | Edwards Lifesciences * | | | 144,578 | |
| | 1,095 | | | Henry Schein * | | | 166,122 | |
| | | | | | | | |
Shares | | | | | Market
Value | |
| | | | Healthcare (continued) | | | | |
| | 3,660 | | | MEDNAX * | | $ | 257,920 | |
| | 737 | | | Perrigo (Ireland) | | | 116,254 | |
| | 2,280 | | | Quintiles Transnational Holdings * | | | 145,122 | |
| | | | | | | | |
| | | | | | | 1,404,261 | |
| | | | | | | | |
| | | | Industrials – 23.77% | | | | |
| | 4,940 | | | AMETEK | | | 270,811 | |
| | 4,970 | | | Copart * | | | 179,964 | |
| | 4,320 | | | Expeditors International of Washington | | | 215,093 | |
| | 2,920 | | | Fastenal | | | 114,347 | |
| | 6,780 | | | HD Supply Holdings * | | | 201,976 | |
| | 2,230 | | | IHS, Class A * | | | 266,574 | |
| | 2,940 | | | J.B. Hunt Transport Services | | | 224,528 | |
| | 1,690 | | | Nordson | | | 120,396 | |
| | 503 | | | Roper Technologies | | | 93,734 | |
| | 2,830 | | | Sensata Technologies Holding * | | | 136,095 | |
| | 875 | | | Snap-On | | | 145,154 | |
| | 2,210 | | | Stericycle * | | | 268,228 | |
| | 3,070 | | | Verisk Analytics * | | | 219,843 | |
| | 2,060 | | | Wabtec | | | 170,712 | |
| | | | | | | | |
| | | | | | | 2,627,455 | |
| | | | | | | | |
| | | | Information Technology – 17.89% | | | | |
| | 3,750 | | | Amphenol, Class A | | | 203,325 | |
| | 2,230 | | | ANSYS * | | | 212,541 | |
| | 2,180 | | | Arista Networks * | | | 140,632 | |
| | 4,710 | | | EPAM Systems * | | | 364,318 | |
| | 1,140 | | | F5 Networks * | | | 125,628 | |
| | 2,280 | | | FactSet Research Systems | | | 399,274 | |
| | 2,760 | | | Skyworks Solutions | | | 213,182 | |
| | 3,540 | | | WEX * | | | 318,281 | |
| | | | | | | | |
| | | | | | | 1,977,181 | |
| | | | | | | | |
| | | | Total Common Stocks
(Cost $9,268,109) | | | 10,641,481 | |
| | | | | | | | |
|
| | INVESTMENT COMPANY – 1.81% | |
| | |
| | 200,343 | | | BlackRock Liquidity Funds
TempFund Portfolio | | | 200,343 | |
| | | | | | | | |
| | | | Total Investment Company
(Cost $200,343) | | | 200,343 | |
| | | | | | | | |
| Total Investments – 98.09%
(Cost $9,468,452)** | | | 10,841,824 | |
| | | | | | | | |
| Net Other Assets and Liabilities – 1.91% | | | 211,176 | |
| | | | | | | | |
| Net Assets – 100.00% | | $ | 11,053,000 | |
| | | | | | | | |
| * | | Non-income producing security. |
| ** | | Aggregate cost for Federal income tax purposes is $9,474,708. |
| | | | |
Gross unrealized appreciation | | $ | 1,596,883 | |
Gross unrealized depreciation | | | (229,767 | ) |
| | | | |
Net unrealized appreciation | | $ | 1,367,116 | |
| | | | |
See accompanying Notes to Financial Statements.
ASTON/LMCG Small Cap Growth Fund
| | |
| |
| Portfolio Manager Commentary (unaudited) | | October 31, 2015 |
| | Andrew Morey, CFA |
| Q. | What were the most significant market factors affecting Fund performance and returns relative to the benchmark during the past 12 months? |
| A. | At the close of 2014, the developing concern was that a weaker world economy would weigh on U.S. results and continue to impact energy prices. Strong corporate earnings releases and an improving employment picture, however, helped push U.S. equities to positive performance early in 2015. In more recent months, we have seen many key economic data points either stagnate or even reverse, resulting in increased day-to-day volatility for U.S. stocks—while investors tried to gauge and debate the strength of the economy and, therefore, the timing and pace at which the Fed would raise interest rates. |
Among U.S. small caps, growth stocks outperformed their value counterparts in the twelve months ending October 31, 2015; the Russell 2000® Growth Index returned 3.5% for the period, vs. a decline of 2.9% for the Russell 2000® Value Index. In terms of size, large caps led the pack, followed by mid-caps, while small caps trailed for the period; the Russell 1000® Index logged a return of 4.9%, while the Russell Mid Cap® Index finished at 2.8% and the Russell 2000® finished flat at 0.3%.
| Q. | What were the best performing holdings for the Fund during the period? |
| A. | Our best performing holdings for the period included Dealertrack Technologies, Heartland Payment Systems, and ExlService Holdings. Dealertrack’s stock spiked following the company’s agreement to be purchased by privately held Cox Automotive for $4 billion. Heartland Payment Systems is a provider of bankcard payment systems, and the company’s first quarter 2015 earnings release surpassed analysts’ estimates. Shares of ExlService Holdings, a business process solutions company, advanced on record results in early 2015. |
| Q. | What were the weakest performing holdings? |
| A. | Community Health Systems, United Natural Foods, and Puma Biotechnology were among the weakest holdings in the period. Community Health Systems, in the health care services segment, experienced some volatility in the period, including a steep decline after releasing disappointing third quarter 2015 results. United Natural Foods is a distributor and retailer of organic and specialty foods, and the stock was down on reduced earnings guidance and the termination of the company’s contract with Albertson’s. Puma Biotechnology’s shares dropped on concerns about side effects from the company’s experimental breast cancer drug. |
| Q. | How was the Fund positioned as of October 31, 2015? |
| A. | We remain positive about our small cap growth universe and our ability to identify companies offering underappreciated, unrecognized growth potential. Given the breadth of the 1,200 companies that comprise the opportunity set, we are generally optimistic that we will be able to capitalize on the inefficiency inherent in our universe. If anything, recent market turmoil has created more opportunities, whether measured in absolute terms or relative to large cap stocks. We also continue to see solid earnings power for small-cap growth stocks, based on forward estimates for the next couple years. |
On a sector basis, our most notable overweights are currently in Industrials and Information Technology—although, as always, both of these positions represent fall outs of our bottom up process. In IT, we hold meaningful positions in internet, IT service, and payment processing companies, given strong growth characteristics in the individual names. Our largest positions in the Industrials sector continue to be the professional services companies. We continue to have meaningful underweights in the Consumer Staples and Healthcare sectors. Again, these broad sector positions are by-products of our bottom up, stock by stock investment process.
Growth of a Hypothetical
$10,000 Investment—Class N
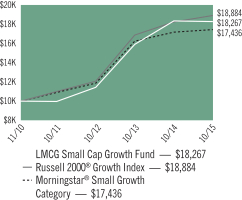
All dividends and capital gains are reinvested. Indexes are unmanaged and do not take into account fees, expenses or other costs.
Returns shown in the chart and table do not reflect taxes that a shareholder would pay on Fund distributions or on the sale of the Fund shares.
Small company stocks may be subject to a higher degree of market risk than the securities of more established companies because they tend to be more volatile and less liquid.
RETURNSFOR PERIOD ENDED 10/31/15
Average Annual Total Returns - Class N
| | | | |
One Year | | | 1.65 | % |
Since Inception | | | 13.26 | % |
Inception Date 11/03/10
Average Annual Total Returns - Class I
| | | | |
One Year | | | 1.91 | % |
Since Inception | | | 9.94 | % |
Inception Date 06/01/11
The performance data quoted represents past performance. Past performance does not guarantee future results. Investment return and principal value will fluctuate so that an investor’s shares, upon redemption, may be worth more or less than their original cost. Current performance may be lower or higher than the performance data quoted. For performance data current to the most recent month-end, please visit our website at www.astonfunds.com.
The performance quoted would have been lower if fee waivers and/or expense reimbursements had not been in effect.
| | |
| |
| ASTON/LMCG Small Cap Growth Fund | | October 31, 2015 |
| |
| Schedule of Investments | | |
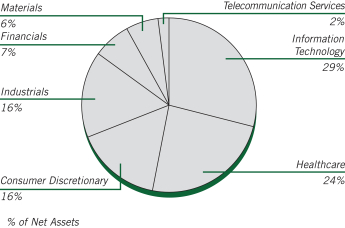
| | | | | | | | |
Shares | | | | | Market
Value | |
|
| | COMMON STOCKS – 99.98% | |
| | |
| | | | Consumer Discretionary – 15.93% | | | | |
| | 139,826 | | | Bloomin’ Brands | | $ | 2,372,847 | |
| | 71,636 | | | Group 1 Automotive | | | 6,228,750 | |
| | 43,545 | | | Lithia Motors, Class A | | | 5,111,748 | |
| | 98,786 | | | Nexstar Broadcasting Group, Class A | | | 5,258,379 | |
| | 154,989 | | | Party City Holdco * | | | 2,453,476 | |
| | 92,371 | | | Sinclair Broadcast Group, Class A | | | 2,772,054 | |
| | 114,672 | | | Sonic | | | 3,272,739 | |
| | 271,124 | | | Sotheby’s | | | 9,394,447 | |
| | | | | | | | |
| | | | | | | 36,864,440 | |
| | | | | | | | |
| | | | Financials – 6.62% | | | | |
| | 27,857 | | | Evercore Partners | | | 1,504,278 | |
| | 96,542 | | | Great Western Bancorp | | | 2,728,277 | |
| | 105,259 | | | Marcus & Millichap * | | | 4,586,135 | |
| | 50,651 | | | Moelis, Class A | | | 1,493,191 | |
| | 91,273 | | | PRA Group * | | | 5,001,760 | |
| | | | | | | | |
| | | | | | | 15,313,641 | |
| | | | | | | | |
| | | | Healthcare – 23.70% | | | | |
| | 50,552 | | | ACADIA Pharmaceuticals * | | | 1,760,221 | |
| | 78,520 | | | Akorn * | | | 2,099,625 | |
| | 44,939 | | | Align Technology * | | | 2,941,707 | |
| | 137,693 | | | AMN Healthcare Services * | | | 3,906,351 | |
| | 43,250 | | | Amsurg * | | | 3,031,393 | |
| | 19,736 | | | Anacor Pharmaceuticals * | | | 2,218,524 | |
| | 216,889 | | | Community Health Systems * | | | 6,081,568 | |
| | 229,802 | | | Cross Country Healthcare * | | | 3,102,327 | |
| | 114,255 | | | Dyax * | | | 3,145,440 | |
| | 54,057 | | | FibroGen * | | | 1,260,069 | |
| | 63,112 | | | HealthSouth | | | 2,198,191 | |
| | 99,976 | | | HeartWare International * | | | 4,317,964 | |
| | 12,026 | | | ICON (Ireland) * | | | 768,101 | |
| | 66,146 | | | Insulet * | | | 1,977,766 | |
| | 4,422 | | | Intercept Pharmaceuticals * | | | 695,138 | |
| | 17,660 | | | Neurocrine Biosciences * | | | 866,929 | |
| | | | | | | | |
Shares | | | | | Market
Value | |
| | | | Healthcare (continued) | | | | |
| | 58,933 | | | PAREXEL International * | | $ | 3,719,851 | |
| | 146,887 | | | Premier, Class A * | | | 4,966,249 | |
| | 96,816 | | | Team Health Holdings * | | | 5,777,011 | |
| | | | | | | | |
| | | | | | | 54,834,425 | |
| | | | | | | | |
| | | | Industrials – 16.57% | | | | |
| | 146,181 | | | Advisory Board * | | | 6,407,113 | |
| | 337,315 | | | Builders FirstSource * | | | 3,987,063 | |
| | 38,761 | | | CEB | | | 2,897,772 | |
| | 53,534 | | | HEICO | | | 2,700,255 | |
| | 59,419 | | | Hexcel | | | 2,752,288 | |
| | 171,668 | | | Kelly Services, Class A | | | 2,712,354 | |
| | 159,046 | | | Kforce | | | 4,470,783 | |
| | 150,538 | | | Korn/Ferry International | | | 5,475,067 | |
| | 192,575 | | | USG * | | | 4,538,993 | |
| | 49,873 | | | WageWorks * | | | 2,394,901 | |
| | | | | | | | |
| | | | | | | 38,336,589 | |
| | | | | | | | |
| | | | Information Technology – 29.00% | | | | |
| | 145,278 | | | Cardtronics * | | | 5,012,091 | |
| | 333,747 | | | Cypress Semiconductor * | | | 3,517,693 | |
| | 77,301 | | | ExlService Holdings * | | | 3,421,342 | |
| | 33,232 | | | Fleetmatics Group (Ireland) * | | | 1,849,693 | |
| | 246,601 | | | Global Eagle Entertainment * | | | 3,284,725 | |
| | 46,115 | | | Heartland Payment Systems | | | 3,412,510 | |
| | 1,171,140 | | | Internap * | | | 7,916,906 | |
| | 104,091 | | | M/A-COM Technology Solutions Holdings * | | | 3,512,030 | |
| | 79,723 | | | Microsemi * | | | 2,870,825 | |
| | 65,800 | | | NCR * | | | 1,750,280 | |
| | 121,744 | | | NetScout Systems * | | | 4,366,957 | |
| | 43,227 | | | SS&C Technologies Holdings | | | 3,205,282 | |
| | 336,699 | | | Synchronoss Technologies * | | | 11,845,071 | |
| | 89,107 | | | Syntel * | | | 4,191,593 | |
| | 10,673 | | | Tyler Technologies * | | | 1,818,252 | |
| | 150,531 | | | WNS Holdings, ADR * | | | 5,128,591 | |
| | | | | | | | |
| | | | | | | 67,103,841 | |
| | | | | | | | |
| | | | Materials – 5.73% | | | | |
| | 152,636 | | | Boise Cascade * | | | 4,568,396 | |
| | 47,854 | | | Eagle Materials | | | 3,159,800 | |
| | 262,811 | | | Summit Materials, Class A * | | | 5,534,800 | |
| | | | | | | | |
| | | | | | | 13,262,996 | |
| | | | | | | | |
| | | | Telecommunication Services – 2.43% | | | | |
| | 183,035 | | | Cogent Communications Holdings | | | 5,622,835 | |
| | | | | | | | |
| | |
| | | | Total Common Stocks
(Cost $237,507,930) | | | 231,338,767 | |
| | | | | | | | |
See accompanying Notes to Financial Statements.
| | |
| |
| ASTON/LMCG Small Cap Growth Fund | | October 31, 2015 |
| |
| Schedule of Investments – continued | | |
| | | | | | | | |
Shares | | | | | Market
Value | |
|
| | WARRANTS – 0% | |
| | |
| | | | Energy – 0.00% | | | | |
| | 11,820 | | | Magnum Hunter Resources, Strike Price $8.50, Expiration 04/15/16 | | $ | — | |
| | | | | | | | |
| | |
| | | | Total Warrants
(Cost $—) | | | — | |
| | | | | | | | |
| Total Investments – 99.98%
(Cost $237,507,930)** | | | 231,338,767 | |
| | | | | | | | |
| Net Other Assets and Liabilities – 0.02% | | | 43,837 | |
| | | | | | | | |
| Net Assets – 100.00% | | $ | 231,382,604 | |
| | | | | | | | |
| * | | Non-income producing security. |
| ** | | Aggregate cost for Federal income tax purposes is $237,535,299. |
| | | | |
Gross unrealized appreciation | | $ | 12,678,337 | |
Gross unrealized depreciation | | | (18,874,869 | ) |
| | | | |
Net unrealized appreciation | | $ | (6,196,532 | ) |
| | | | |
| ADR | | American Depositary Receipt |
See accompanying Notes to Financial Statements.
ASTON/River Road Independent Value Fund
| | |
| |
| Portfolio Manager Commentary (unaudited) | | October 31, 2015 |
| | Eric K. Cinnamond, CFA |
| Q. | What were the most significant market factors affecting Fund performance and returns relative to the benchmark during the past 12 months? |
| A. | The Class N Shares of the Fund returned -3.38% during the past 12 months versus -2.88% for the Russell 2000® Value benchmark index. Favorable relative performance over the past year was driven mainly by the Fund’s large cash position. On average, we did not believe we were being appropriately compensated relative to risk assumed during the year, as prices for the majority of stocks on our possible buy list traded over our calculated valuations. We have responded by selling positions that have appreciated over valuation, which has caused the Fund’s cash balance to increase. Cash remained at very high levels, averaging 81% over the past 12 months. |
| Q. | What were the best performing holdings for the Fund during the period? |
| A. | Sykes Enterprises Inc. and Silver Standard Resources Inc. were the largest positive contributors during the period. Sykes Enterprises is a market-leading outsourced call center operator with approximately $1.3 billion in revenue. The company benefited from higher demand as well as improved margins as capacity initiatives boosted profitability. Silver Standard Resources Inc. is a precious metals mining company. The company’s two operating mines, Marigold and Pirquitas, performed well during the year with improving production and lower operating costs. Positive operating results allowed Silver Standard to generate positive cash flow and improve its already strong balance sheet. |
| Q. | What were the weakest performing holdings? |
| A. | Alamos Gold Inc. and New Gold Inc., both precious metal miners, were the largest negative contributors during the period. Alamos Gold Inc. has three operating mines in Canada and Mexico with a combined 6.2 million ounces of gold reserves. New Gold Inc.’s business consists of four operating gold mines and three development projects with a combined 18 million ounces of proven and |
probable gold reserves. While both companies performed well operationally over the past year, their stocks suffered from declining sentiment caused by a falling gold price. We continue to hold an above average position in the precious metal mining industry, including New Gold and Alamos Gold, as we believe many trade at large discounts to the replacement cost of their assets and remain very out of favor by investors.
| Q. | How was the Fund positioned as of October 31, 2015? |
| A. | The Fund continues to be defensively positioned, with above average cash levels as most high-quality small cap stocks remain expensive, in our opinion. Many of the stocks we are avoiding and believe are overvalued are performing well on an absolute and relative basis. Conversely, equities that we believe are undervalued are often out of favor and in many cases are in bear markets. In effect, the Fund is positioned in a contrarian manner with very high cash levels and out of favor equities. We believe such positioning may cause the Fund’s performance to deviate considerably from the Fund’s peers and benchmark. We expect to maintain our contrarian and defensive positioning until we believe small cap prices accurately reflect their underlying risks. |
Growth of a Hypothetical
$10,000 Investment—Class N

All dividends and capital gains are reinvested. Indexes are unmanaged and do not take into account fees, expenses or other costs.
Returns shown in the chart and table do not reflect taxes that a shareholder would pay on Fund distributions or on the sale of the Fund shares.
Small-cap stocks may be subject to a higher degree of market risk than the securities of more established companies because they tend to be more volatile and less liquid.
Value investing involves the risk that a Fund’s investments in companies believed to be undervalued will not appreciate as anticipated.
RETURNSFOR PERIOD ENDED 10/31/15
Average Annual Total Returns - Class N
| | | | |
One Year | | | -3.38 | % |
Since Inception | | | 3.34 | % |
Inception Date 12/31/10
Average Annual Total Returns - Class I
| | | | |
One Year | | | -3.16 | % |
Since Inception | | | 1.84 | % |
The performance data quoted represents past performance. Past performance does not guarantee future results. Investment return and principal value will fluctuate so that an investor’s shares, upon redemption, may be worth more or less than their original cost. Current performance may be lower or higher than the performance data quoted. For performance data current to the most recent month-end, please visit our website at www.astonfunds.com.
The performance quoted would have been lower if fee waivers and/or expense reimbursements had not been in effect.
| | |
| |
| ASTON/River Road Independent Value Fund | | October 31, 2015 |
| |
| Schedule of Investments | | |
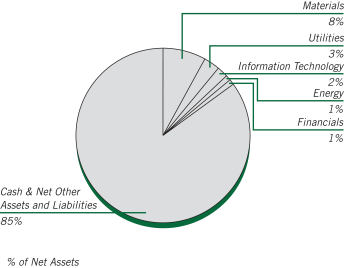
| | | | | | | | |
Shares | | | | | Market
Value | |
|
| | COMMON STOCKS – 14.61% | |
| | |
| | | | Consumer Staples – 0.22% | | | | |
| | 24,610 | | | Oil-Dri Corporation of America | | $ | 772,262 | |
| | | | | | | | |
| | |
| | | | Energy – 1.32% | | | | |
| | 193,073 | | | QEP Resources | | | 2,984,909 | |
| | 136,522 | | | Unit * | | | 1,721,542 | |
| | | | | | | | |
| | | | | | | 4,706,451 | |
| | | | | | | | |
| | |
| | | | Financials – 0.48% | | | | |
| | 74,160 | | | Baldwin & Lyons, Class B | | | 1,722,737 | |
| | | | | | | | |
| | |
| | | | Information Technology – 1.95% | | | | |
| | 103,367 | | | Benchmark Electronics * | | | 2,044,599 | |
| | 60,324 | | | Convergys | | | 1,548,517 | |
| | 50,740 | | | CSG Systems International | | | 1,700,805 | |
| | 57,398 | | | Sykes Enterprises * | | | 1,664,542 | |
| | | | | | | | |
| | | | | | | 6,958,463 | |
| | | | | | | | |
| | |
| | | | Materials – 8.01% | | | | |
| | 2,834,771 | | | Alamos Gold (Canada), Class A | | | 10,885,521 | |
| | 2,718,197 | | | New Gold (Canada) * | | | 6,659,583 | |
| | 1,449,778 | | | Pan American Silver (Canada) | | | 10,974,819 | |
| | | | | | | | |
| | | | | | | 28,519,923 | |
| | | | | | | | |
| | |
| | | | Utilities – 2.63% | | | | |
| | 414,348 | | | Empire District Electric | | | 9,343,547 | |
| | | | | | | | |
| | | | Total Common Stocks
(Cost $60,749,568) | | | 52,023,383 | |
| | | | | | | | |
| | | | | | | | |
Shares | | | | | Market
Value | |
|
| | INVESTMENT COMPANY – 86.18% | |
| | |
| | 306,797,200 | | | BlackRock Liquidity Funds Treasury Trust Fund Portfolio | | $ | 306,797,200 | |
| | | | | | | | |
| | | | Total Investment Company
(Cost $306,797,200) | | | 306,797,200 | |
| | | | | | | | |
| Total Investments – 100.79%
(Cost $367,546,768)** | | | 358,820,583 | |
| | | | | | | | |
| Net Other Assets and Liabilities – (0.79)% | | | (2,825,001 | ) |
| | | | | | | | |
| Net Assets – 100.00% | | $ | 355,995,582 | |
| | | | | | | | |
| * | | Non-income producing security. |
| ** | | Aggregate cost for Federal income tax purposes is $384,597,656. |
| | | | |
Gross unrealized appreciation | | $ | 2,624,352 | |
Gross unrealized depreciation | | | (28,401,425 | ) |
| | | | |
Net unrealized depreciation | | $ | (25,777,073 | ) |
| | | | |
See accompanying Notes to Financial Statements.
ASTON/River Road Select Value Fund
| | |
| |
| Portfolio Manager Commentary (unaudited) | | October 31, 2015 |
James C. Shircliff, CFA; R. Andrew Beck & J. Justin Akin
| Q. | What were the most significant market factors affecting Fund performance and returns relative to the benchmark during the past 12 months? |
| A. | The Class N Shares of the Fund outperformed the Russell 2500® Value benchmark during the period, with a return of 3.26% versus -1.06% for the index. The largest positive contribution was from the Industrials sector, which benefited from strong stock selection. The largest negative contributor was the Financials sector, which lagged due to an underweight allocation and poor stock selection. |
| Q. | What were the best performing holdings for the Fund during the period? |
| A. | The two holdings with the largest positive contribution to portfolio return were Remy International Inc. and White Mountains Insurance Group Ltd. Remy is a manufacturer of starters, alternators, and other components for cars and trucks. The company accepted a buyout offer from strategic acquirer BorgWarner that was at a premium to the unaffected stock price and slightly above our assessed value. The Fund exited the position near the deal price. White Mountains Insurance Group is a specialty commercial and property insurer. In July, White Mountains announced an agreement to sell its ownership in Sirius Group. In August, Symetra Financial Corp. announced an agreement to merge with Sumitomo Life. White Mountains holds a 17% stake in Symetra Financial, and the deal’s valuation added to White Mountains’ book value per share. Our assessed value increased as a result of the announced transactions. The position was trimmed as the discount narrowed. |
| Q. | What were the weakest performing holdings? |
| A. | The two holdings with the largest negative contribution to portfolio return were PICO Holdings Inc. and Ascent Capital Group Inc. PICO is a holding company that owns water rights in the southwestern United States and 58% of publicly-traded home builder UCP Inc. In July, PICO sold its canola oil producer Northstar, which |
eliminated a negative cash flow investment. However, the company has not taken meaningful action to monetize its water rights or its stake in UCP, which disappointed investors. We are actively encouraging the management team and Board to pursue various actions we believe would unlock shareholder value. Ascent owns and operates Monitronics, the second-largest home security monitoring company in the United States. The company has struggled with higher than average customer attrition and a slight compression of margins. Due to the Fund’s sell discipline, the position was eliminated.
| Q. | How was the Fund positioned as of October 31, 2015? |
| A. | We continue to position the Fund in shares of high quality companies that we believe will perform well in a sustained period of weak economic growth. Rapidly rising equity prices paired with modest earnings growth over the past several years has resulted in unattractive valuations in the broader small cap market. |
As a result, if returns do moderate over the coming months we expect the Fund’s holdings and low volatility approach to be well positioned. Further, whether markets rise or fall, we believe merger and acquisition activity within the Fund will continue to support relative performance.
Growth of a Hypothetical
$10,000 Investment—Class N
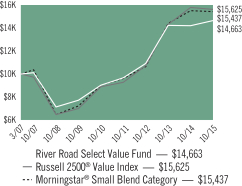
All dividends and capital gains are reinvested. Indexes are unmanaged and do not take into account fees, expenses or other costs.
Returns shown in the chart and table do not reflect taxes that a shareholder would pay on Fund distributions or on the sale of the Fund shares.
Small-cap and mid-cap stocks may be subject to a higher degree of market risk than the securities of more established companies because they tend to be more volatile and less liquid.
Value investing involves the risk that a Fund’s investments in companies believed to be undervalued will not appreciate as anticipated.
RETURNSFOR PERIOD ENDED 10/31/15
Average Annual Total Returns - Class N
| | | | |
One Year | | | 3.26 | % |
Five Year | | | 10.19 | % |
Since Inception | | | 4.56 | % |
Inception Date 03/29/07
Average Annual Total Returns - Class I
| | | | |
One Year | | | 3.60 | % |
Five Year | | | 10.52 | % |
Since Inception | | | 4.35 | % |
Inception Date 06/28/07
The performance data quoted represents past performance. Past performance does not guarantee future results. Investment return and principal value will fluctuate so that an investor’s shares, upon redemption, may be worth more or less than their original cost. Current performance may be lower or higher than the performance data quoted. For performance data current to the most recent month-end, please visit our website at www.astonfunds.com.
| | |
| |
| ASTON/River Road Select Value Fund | | October 31, 2015 |
| |
| Schedule of Investments | | |
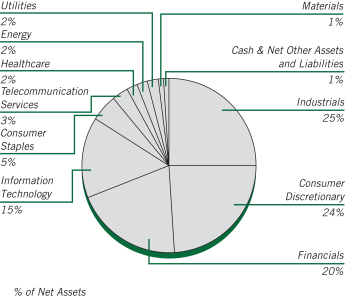
| | | | | | | | |
Shares | | | | | Market
Value | |
|
| | COMMON STOCKS – 99.25% | |
| | |
| | | | Consumer Discretionary – 23.82% | | | | |
| | 44,431 | | | Ascena Retail Group * | | $ | 591,821 | |
| | 5,730 | | | Biglari Holdings * | | | 2,201,065 | |
| | 34,141 | | | Carmike Cinemas * | | | 874,351 | |
| | 18,830 | | | Children’s Place | | | 1,010,606 | |
| | 76,683 | | | International Speedway, Class A | | | 2,660,133 | |
| | 27,063 | | | J. Alexander’s Holdings * | | | 260,887 | |
| | 33,771 | | | Liberty Broadband, Class C * | | | 1,815,867 | |
| | 38,204 | | | Liberty Ventures, Class A * | | | 1,664,548 | |
| | 5,025 | | | Madison Square Garden, Class A * | | | 896,963 | |
| | 30,631 | | | Michael Kors Holdings (British Virgin Islands) * | | | 1,183,582 | |
| | 15,076 | | | MSG Networks, Class A * | | | 309,360 | |
| | 33,125 | | | Murphy USA * | | | 2,032,881 | |
| | 70,072 | | | News, Class A | | | 1,079,109 | |
| | 23,798 | | | Outerwall | | | 1,427,880 | |
| | 27,350 | | | Rent-A-Center | | | 502,967 | |
| | 108,383 | | | SeaWorld Entertainment | | | 2,160,073 | |
| | 78,720 | | | SodaStream International (Israel) * | | | 1,179,226 | |
| | 29,637 | | | Sotheby’s | | | 1,026,922 | |
| | 6,366 | | | Tribune Media, Class A | | | 256,741 | |
| | | | | | | | |
| | | | | | | 23,134,982 | |
| | | | | | | | |
| | |
| | | | Consumer Staples – 4.50% | | | | |
| | 103,773 | | | Fresh Market * | | | 2,586,023 | |
| | 8,111 | | | Ingles Markets, Class A | | | 405,063 | |
| | 9,052 | | | Sanderson Farms | | | 629,205 | |
| | 29,813 | | | Village Super Market, Class A | | | 747,114 | |
| | | | | | | | |
| | | | | | | 4,367,405 | |
| | | | | | | | |
| | |
| | | | Energy – 1.89% | | | | |
| | 95,888 | | | Evolution Petroleum | | | 661,627 | |
| | 253,134 | | | Gran Tierra Energy * | | | 607,522 | |
| | | | | | | | |
Shares | | | | | Market
Value | |
| | |
| | | | Energy (continued) | | | | |
| | 36,972 | | | QEP Resources | | $ | 571,587 | |
| | | | | | | | |
| | | | | | | 1,840,736 | |
| | | | | | | | |
| | |
| | | | Financials – 19.63% | | | | |
| | 4,165 | | | Alleghany * | | | 2,066,965 | |
| | 27,090 | | | Allied World Assurance Co Holdings AG (Switzerland) | | | 984,992 | |
| | 7,345 | | | American National Insurance | | | 758,592 | |
| | 67,521 | | | Brown & Brown | | | 2,178,903 | |
| | 27,237 | | | Capital Southwest | | | 407,193 | |
| | 125,740 | | | FNFV Group * | | | 1,413,318 | |
| | 57,514 | | | Forest City Enterprises, Class A * | | | 1,271,059 | |
| | 53,020 | | | GEO Group, REIT | | | 1,710,955 | |
| | 36,076 | | | Hilltop Holdings * | | | 756,514 | |
| | 22,897 | | | International Bancshares | | | 617,074 | |
| | 87,492 | | | Leucadia National | | | 1,750,715 | |
| | 154,432 | | | PICO Holdings * | | | 1,491,813 | |
| | 4,630 | | | White Mountains Insurance Group (Bermuda) | | | 3,657,700 | |
| | | | | | | | |
| | | | | | | 19,065,793 | |
| | | | | | | | |
| | |
| | | | Healthcare – 2.51% | | | | |
| | 38,955 | | | Air Methods * | | | 1,594,428 | |
| | 20,983 | | | Myriad Genetics * | | | 847,084 | |
| | | | | | | | |
| | | | | | | 2,441,512 | |
| | | | | | | | |
| | |
| | | | Industrials – 25.25% | | | | |
| | 109,929 | | | ADT | | | 3,632,054 | |
| | 97,818 | | | Air Transport Services Group * | | | 957,638 | |
| | 58,147 | | | Brink’s | | | 1,801,394 | |
| | 31,593 | | | Clean Harbors * | | | 1,468,758 | |
| | 49,569 | | | Cubic | | | 2,223,170 | |
| | 26,223 | | | Forward Air | | | 1,189,475 | |
| | 16,140 | | | Insperity | | | 749,864 | |
| | 45,239 | | | Kelly Services, Class A | | | 714,776 | |
| | 67,310 | | | KLX * | | | 2,632,494 | |
| | 51,689 | | | Marten Transport | | | 847,183 | |
| | 12,248 | | | MSC Industrial Direct, Class A | | | 768,807 | |
| | 34,250 | | | Progressive Waste Solutions (Canada) | | | 823,713 | |
| | 92,459 | | | SP Plus * | | | 2,357,705 | |
| | 36,730 | | | UniFirst | | | 3,859,221 | |
| | 12,500 | | | US Ecology | | | 490,125 | |
| | | | | | | | |
| | | | | | | 24,516,377 | |
| | | | | | | | |
| | |
| | | | Information Technology – 14.56% | | | | |
| | 59,711 | | | Blackhawk Network Holdings * | | | 2,542,494 | |
| | 96,818 | | | CSG Systems International | | | 3,245,339 | |
| | 85,436 | | | Dolby Laboratories, Class A | | | 2,962,066 | |
| | 21,292 | | | IAC/InterActive | | | 1,426,777 | |
| | 78,943 | | | NeuStar, Class A * | | | 2,146,460 | |
| | 25,004 | | | Tech Data * | | | 1,820,041 | |
| | | | | | | | |
| | | | | | | 14,143,177 | |
| | | | | | | | |
| | |
| | | | Materials – 1.30% | | | | |
| | 13,090 | | | Airgas | | | 1,258,734 | |
| | | | | | | | |
See accompanying Notes to Financial Statements.
| | |
| |
| ASTON/River Road Select Value Fund | | October 31, 2015 |
| |
| Schedule of Investments – continued | | |
| | | | | | | | |
Shares | | | | | Market
Value | |
| | |
| | | | Telecommunication Services – 3.44% | | | | |
| | 15,034 | | | Atlantic Tele-Network | | $ | 1,148,898 | |
| | 76,405 | | | Telephone & Data Systems | | | 2,188,239 | |
| | | | | | | | |
| | | | | | | 3,337,137 | |
| | | | | | | | |
| | |
| | | | Utilities – 2.35% | | | | |
| | 41,793 | | | ITC Holdings | | | 1,367,467 | |
| | 17,388 | | | National Fuel Gas | | | 913,392 | |
| | | | | | | | |
| | | | | | | 2,280,859 | |
| | | | | | | | |
| | |
| | | | Total Common Stocks
(Cost $93,035,063) | | | 96,386,712 | |
| | | | | | | | |
| |
| | INVESTMENT COMPANY – 1.48% | | | | |
| | 1,436,865 | | | BlackRock Liquidity Funds TempFund Portfolio | | | 1,436,865 | |
| | | | | | | | |
| | |
| | | | Total Investment Company
(Cost $1,436,865) | | | 1,436,865 | |
| | | | | | | | |
| Total Investments – 100.73%
(Cost $94,471,928)** | | | 97,823,577 | |
| | | | | | | | |
| Net Other Assets and Liabilities – (0.73)% | | | (712,244 | ) |
| | | | | | | | |
| Net Assets – 100.00% | | $ | 97,111,333 | |
| | | | | | | | |
| * | | Non-income producing security. |
| ** | | Aggregate cost for Federal income tax purposes is $94,840,765. |
| | | | |
Gross unrealized appreciation | | $ | 9,497,777 | |
Gross unrealized depreciation | | | (6,514,965 | ) |
| | | | |
Net unrealized appreciation | | $ | 2,982,812 | |
| | | | |
| REIT | | Real Estate Investment Trust |
See accompanying Notes to Financial Statements.
ASTON/River Road Small Cap Value Fund
| | |
| |
| Portfolio Manager Commentary (unaudited) | | October 31, 2015 |
| James C. Shircliff, CFA; R. Andrew Beck & J. Justin Akin |
| Q. | What were the most significant market factors affecting Fund performance and returns relative to the benchmark during the past 12 months? |
| A. | The Class N Shares of the Fund outperformed the Russell 2000® Value benchmark during the period, with a return of 5.15% versus -2.88% for the index. The largest positive contribution was from the Industrials sector, which benefited from strong stock selection. The largest negative contributor was the Financials sector, which lagged due to an underweight allocation. The Fund’s cash position, which averaged approximately 9% during the period, was also a positive contributor to performance. |
| Q. | What were the best performing holdings for the Fund during the period? |
| A. | The two holdings with the largest positive contribution to the Fund’s return were Remy International Inc. and Ingles Markets Inc. Remy is a manufacturer of starters, alternators, and other components for cars and trucks. The company accepted a buyout offer from strategic acquirer BorgWarner that was at a premium to the unaffected stock price and slightly above our assessed value. The Fund exited the position near the deal price. Ingles Markets is a regional grocery chain in the Southeastern United States. At first glance, Ingles Markets would appear to most investors as heavily leveraged, but the company’s debt is supported by a sizeable portfolio of owned real estate. Since establishing our position in late 2012, management has consistently delivered strong operating results. The surge in the share price is likely attributable to market discovery, as Ingles was trading at a large discount to private market transactions. We have trimmed the position as the discount narrowed. |
| Q. | What were the weakest performing holdings? |
| A. | The two holdings with the largest negative contribution to the Fund’s return were PICO Holdings Inc. and Ascent Capital Group Inc. PICO is a holding company |
that owns water rights in the southwestern United States and 58% of publicly-traded home builder UCP Inc. In July, PICO sold its canola oil producer Northstar, which eliminated a negative cash flow investment. However, the company has not taken meaningful action to monetize its water rights or its stake in UCP, which disappointed investors. We are actively encouraging the management team and Board to pursue various actions we believe would unlock shareholder value. Ascent owns and operates Monitronics, the second-largest home security monitoring company in the United States. The company has struggled with higher than average customer attrition and a slight compression of margins. Due to the Fund’s sell discipline, the position was eliminated.
| Q. | How was the Fund positioned as of October 31, 2015? |
| A. | We continue to position the Fund in shares of high quality companies that we believe will perform well in a sustained period of weak-to-moderate economic growth. Rapidly rising equity prices paired with modest earnings growth over the past several years has resulted in unattractive valuations in the broader small cap market. As a result, identifying companies to replace those that are being sold at their assessed Absolute Value is more difficult. Thus, cash in the Fund is at the higher end of its historical range. |
As a result, if returns do moderate over the coming months we expect the Fund’s holdings and low volatility approach to be well positioned. Further, whether markets rise or fall, we believe merger and acquisition activity within the Fund will continue to support relative performance.
Growth of a Hypothetical
$10,000 Investment—Class N
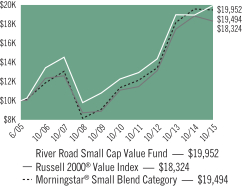
All dividends and capital gains are reinvested. Indexes are unmanaged and do not take into account fees, expenses or other costs.
Returns shown in the chart and table do not reflect taxes that a shareholder would pay on Fund distributions or on the sale of the Fund shares.
Small-cap and mid-cap stocks may be subject to a higher degree of market risk than the securities of more established companies because they tend to be more volatile and less liquid.
Value investing involves the risk that a Fund’s investments in companies believed to be undervalued will not appreciate as anticipated.
RETURNSFOR PERIOD ENDED 10/31/15
Average Annual Total Returns - Class N
| | | | |
One Year | | | 5.15 | % |
Five Year | | | 10.21 | % |
Ten Year | | | 6.86 | % |
Since Inception | | | 6.91 | % |
Inception Date 06/28/05
Average Annual Total Returns - Class I
| | | | |
One Year | | | 5.45 | % |
Five Year | | | 10.49 | % |
Since Inception | | | 4.30 | % |
Inception Date 12/13/06
The performance data quoted represents past performance. Past performance does not guarantee future results. Investment return and principal value will fluctuate so that an investor’s shares, upon redemption, may be worth more or less than their original cost. Current performance may be lower or higher than the performance data quoted. For performance data current to the most recent month-end, please visit our website at www.astonfunds.com.
The total expense ratios for Class N and Class I shares are 1.35% and 1.10%, respectively, as disclosed in the prospectus dated February 28, 2015. Please refer to the Financial Highlights section in this report for more information.
| | |
| |
| ASTON/River Road Small Cap Value Fund | | October 31, 2015 |
| |
| Schedule of Investments | | |
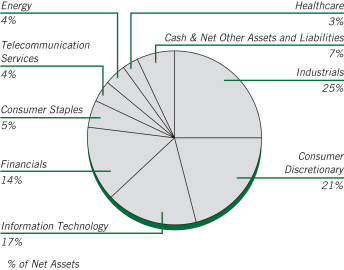
| | | | | | | | |
Shares | | | | | Market
Value | |
|
| | COMMON STOCKS – 92.55% | |
| | |
| | | | Consumer Discretionary – 21.27% | | | | |
| | 133,058 | | | Ascena Retail Group * | | $ | 1,772,333 | |
| | 15,449 | | | Biglari Holdings * | | | 5,934,424 | |
| | 156,220 | | | Carmike Cinemas * | | | 4,000,794 | |
| | 61,060 | | | Children’s Place | | | 3,277,090 | |
| | 217,370 | | | International Speedway, Class A | | | 7,540,565 | |
| | 77,225 | | | J. Alexander’s Holdings * | | | 744,449 | |
| | 106,000 | | | Liberty Tax | | | 2,447,540 | |
| | 70,230 | | | Marcus | | | 1,453,059 | |
| | 186,552 | | | Monarch Casino & Resort * | | | 4,092,951 | |
| | 89,550 | | | Murphy USA * | | | 5,495,683 | |
| | 67,900 | | | Outerwall | | | 4,074,000 | |
| | 76,850 | | | Rent-A-Center | | | 1,413,271 | |
| | 354,793 | | | SeaWorld Entertainment | | | 7,071,024 | |
| | 234,130 | | | SodaStream International (Israel) * | | | 3,507,267 | |
| | 89,310 | | | Sotheby’s | | | 3,094,592 | |
| | 240,360 | | | UCP Class A * (a) | | | 1,610,412 | |
| | | | | | | | |
| | | | | | | 57,529,454 | |
| | | | | | | | |
| | |
| | | | Consumer Staples – 5.18% | | | | |
| | 281,340 | | | Fresh Market * | | | 7,010,993 | |
| | 37,759 | | | Ingles Markets, Class A | | | 1,885,684 | |
| | 35,950 | | | Sanderson Farms | | | 2,498,884 | |
| | 103,934 | | | Village Super Market, Class A | | | 2,604,586 | |
| | | | | | | | |
| | | | | | | 14,000,147 | |
| | | | | | | | |
| | |
| | | | Energy – 3.52% | | | | |
| | 599,473 | | | Evolution Petroleum (a) | | | 4,136,364 | |
| | 862,180 | | | Gran Tierra Energy * | | | 2,069,232 | |
| | 62,904 | | | PHI * | | | 1,197,692 | |
| | 137,000 | | | QEP Resources | | | 2,118,020 | |
| | | | | | | | |
| | | | | | | 9,521,308 | |
| | | | | | | | |
| | | | | | | | |
Shares | | | | | Market
Value | |
| | |
| | | | Financials – 14.53% | | | | |
| | 71,020 | | | 1st Source | | $ | 2,255,595 | |
| | 43,160 | | | American National Insurance | | | 4,457,565 | |
| | 100,848 | | | Capital Southwest | | | 1,507,678 | |
| | 6,685 | | | First Citizens BancShares, Class A | | | 1,712,296 | |
| | 422,311 | | | FNFV Group * | | | 4,746,776 | |
| | 156,555 | | | GEO Group, REIT | | | 5,052,030 | |
| | 160,470 | | | Hilltop Holdings * | | | 3,365,056 | |
| | 72,729 | | | International Bancshares | | | 1,960,047 | |
| | 361,294 | | | PICO Holdings * | | | 3,490,100 | |
| | 13,618 | | | White Mountains Insurance Group (Bermuda) | | | 10,758,220 | |
| | | | | | | | |
| | | | | | | 39,305,363 | |
| | | | | | | | |
| | |
| | | | Healthcare – 2.94% | | | | |
| | 122,286 | | | Air Methods * | | | 5,005,166 | |
| | 73,015 | | | Myriad Genetics * | | | 2,947,616 | |
| | | | | | | | |
| | | | | | | 7,952,782 | |
| | | | | | | | |
| | |
| | | | Industrials – 24.88% | | | | |
| | 271,730 | | | Air Transport Services Group * | | | 2,660,237 | |
| | 161,194 | | | Brink’s | | | 4,993,790 | |
| | 93,760 | | | Clean Harbors * | | | 4,358,902 | |
| | 155,511 | | | Cubic | | | 6,974,668 | |
| | 93,030 | | | Forward Air | | | 4,219,841 | |
| | 80,775 | | | Insperity | | | 3,752,807 | |
| | 160,640 | | | Kelly Services, Class A | | | 2,538,112 | |
| | 193,977 | | | KLX * | | | 7,586,440 | |
| | 191,317 | | | Marten Transport | | | 3,135,686 | |
| | 122,850 | | | Progressive Waste Solutions (Canada) | | | 2,954,542 | |
| | 309,369 | | | SP Plus * | | | 7,888,910 | |
| | 93,877 | | | UniFirst | | | 9,863,656 | |
| | 52,200 | | | US Ecology | | | 2,046,762 | |
| | 94,074 | | | Viad | | | 2,832,568 | |
| | 55,420 | | | Werner Enterprises | | | 1,466,413 | |
| | | | | | | | |
| | | | | | | 67,273,334 | |
| | | | | | | | |
| | |
| | | | Information Technology – 16.65% | | | | |
| | 180,926 | | | Blackhawk Network Holdings * | | | 7,703,829 | |
| | 134,105 | | | Computer Services (a) | | | 5,191,205 | |
| | 25,123 | | | Convergys | | | 644,907 | |
| | 288,800 | | | CSG Systems International | | | 9,680,576 | |
| | 229,800 | | | Daktronics | | | 2,229,060 | |
| | 67,207 | | | ePlus * | | | 5,673,615 | |
| | 120,178 | | | Ituran Location and Control (Israel) (a) | | | 2,451,631 | |
| | 215,830 | | | NeuStar, Class A * | | | 5,868,418 | |
| | 76,690 | | | Tech Data * | | | 5,582,265 | |
| | | | | | | | |
| | | | | | | 45,025,506 | |
| | | | | | | | |
| | |
| | | | Telecommunication Services – 3.58% | | | | |
| | 43,290 | | | Atlantic Tele-Network | | | 3,308,222 | |
| | 222,180 | | | Telephone & Data Systems | | | 6,363,235 | |
| | | | | | | | |
| | | | | | | 9,671,457 | |
| | | | | | | | |
| | |
| | | | Total Common Stocks
(Cost $212,205,337) | | | 250,279,351 | |
| | | | | | | | |
See accompanying Notes to Financial Statements.
| | |
| |
| ASTON/River Road Small Cap Value Fund | | October 31, 2015 |
| |
| Schedule of Investments – continued | | |
| | | | | | | | |
Shares | | | | | Market
Value | |
|
| | INVESTMENT COMPANY – 8.16% | |
| | |
| | 22,075,021 | | | BlackRock Liquidity Funds TempFund Portfolio | | $ | 22,075,021 | |
| | | | | | | | |
| | |
| | | | Total Investment Company
(Cost $22,075,021) | | | 22,075,021 | |
| | | | | | | | |
| Total Investments – 100.71%
(Cost $234,280,358)** | | | 272,354,372 | |
| | | | | | | | |
| Net Other Assets and Liabilities – (0.71)% | | | (1,916,174 | ) |
| | | | | | | | |
| Net Assets – 100.00% | | $ | 270,438,198 | |
| | | | | | | | |
| * | | Non-income producing security. |
| ** | | Aggregate cost for Federal income tax purposes is $235,815,745. |
| | | | |
Gross unrealized appreciation | | $ | 48,007,777 | |
Gross unrealized depreciation | | | (11,469,150 | ) |
| | | | |
Net unrealized appreciation | | $ | 36,538,627 | |
| | | | |
| (a) | | These securities have been determined by the Subadviser to be illiquid securities. At October 31, 2015, these securities amounted to $13,389,612 or 4.95% of net assets. |
| REIT | | Real Estate Investment Trust |
See accompanying Notes to Financial Statements.
ASTON/Silvercrest Small Cap Fund
| | |
| |
| Portfolio Manager Commentary (unaudited) | | October 31, 2015 |
| | Roger W. Vogel, CFA |
| Q. | What were the most significant market factors affecting Fund performance and returns relative to the benchmark during the past 12 months? |
| A. | Our sharp underweighting in Financials and overweight in Producer Durables relative to the Russell 2000® Value Index had the largest negative impact on our relative performance. We more than offset this drag, however, as our stock selection within sectors was superior, as we outperformed the Russell 2000® Value Index in each of its nine sectors. |
| Q. | What were the best performing holdings for the Fund during the period? |
| A. | Our largest contributors to return included M/A-Com Technology Solutions (+53%), ICU Medical (+55%), Lithia Motors (+52%), Bank of the Ozarks (+44%), and Lancaster Colony (+27%). All tended to report solid earnings. |
| Q. | What were the weakest performing holdings? |
| A. | Our largest detractors to return included Bonanza Creek Energy (-79%), Forum Energy Technologies (-51%), CIRCOR International (-39%), US Ecology (-21%), and Wolverine Worldwide (-31%). All reported disappointing earnings, with Bonanza Creek, Forum Energy, and CIRCOR adversely impacted by very weak energy markets. |
| Q. | How was the Fund positioned as of October 31, 2015? |
| A. | As is typical for us, we do not anticipate making significant changes at the sector level. We expect to continue to focus on what we believe are higher quality companies available at attractive valuations. As we write this, we are at the tail-end of September earnings reporting season. In many cases, companies have tempered their earnings guidance for the fourth quarter of 2015 into 2016. This has led to some dislocations that may prove to be attractive buying opportunities should economic conditions remain stable or show some improvement, prompting us to spend more time looking at companies with perhaps greater cyclical exposure. In general, balance sheets remain in solid shape and we would expect companies to use their balance sheets through merger and acquisition (M&A) activity in a bid to bolster somewhat lackluster organic growth. We are hopeful that the Fund will benefit from some M&A activity. We would be encouraged should the Federal Reserve raise interest rates in the next quarter or so, as that would suggest an economic environment strong enough to support a hike, and may prove beneficial to the Financial sector, a large part of our portfolio. |
Growth of a Hypothetical
$10,000 Investment—Class N
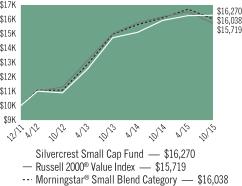
All dividends and capital gains are reinvested. Indexes are unmanaged and do not take into account fees, expenses or other costs.
Returns shown in the chart and table do not reflect taxes that a shareholder would pay on Fund distributions or on the sale of the Fund shares.
Small-cap stocks may be subject to a higher degree of market risk than the securities of more established companies because they tend to be more volatile and less liquid.
RETURNSFOR PERIOD ENDED 10/31/15
Average Annual Total Returns - Class N
| | | | |
One Year | | | 2.14 | % |
Since Inception | | | 13.48 | % |
Inception Date 12/27/11
Average Annual Total Returns - Class I
| | | | |
One Year | | | 2.37 | % |
Since Inception | | | 13.77 | % |
Inception Date 12/27/11
The performance data quoted represents past performance. Past performance does not guarantee future results. Investment return and principal value will fluctuate so that an investor’s shares, upon redemption, may be worth more or less than their original cost. Current performance may be lower or higher than the performance data quoted. For performance data current to the most recent month-end, please visit our website at www.astonfunds.com.
The performance quoted would have been lower if fee waivers and/or expense reimbursements had not been in effect.
| | |
| |
| ASTON/Silvercrest Small Cap Fund | | October 31, 2015 |
| |
| Schedule of Investments | | |
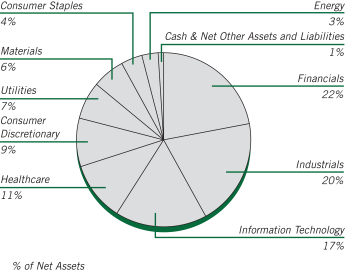
| | | | | | | | |
Shares | | | | | Market
Value | |
|
| | COMMON STOCKS – 98.91% | |
| | |
| | | | Consumer Discretionary – 8.77% | | | | |
| | 98,420 | | | EW Scripps, Class A | | $ | 2,171,145 | |
| | 73,480 | | | Hillenbrand | | | 2,180,152 | |
| | 119,220 | | | La-Z-Boy | | | 3,403,731 | |
| | 25,210 | | | Lithia Motors, Class A | | | 2,959,402 | |
| | 42,620 | | | Men’s Wearhouse | | | 1,703,948 | |
| | 108,250 | | | Wolverine World Wide | | | 2,010,202 | |
| | | | | | | | |
| | | | | | | 14,428,580 | |
| | | | | | | | |
| | |
| | | | Consumer Staples – 4.37% | | | | |
| | 22,124 | | | J & J Snack Foods | | | 2,716,606 | |
| | 39,344 | | | Lancaster Colony | | | 4,474,200 | |
| | | | | | | | |
| | | | | | | 7,190,806 | |
| | | | | | | | |
| | |
| | | | Energy – 2.60% | | | | |
| | 100,040 | | | Forum Energy Technologies * | | | 1,325,530 | |
| | 114,720 | | | Matador Resources * | | | 2,949,451 | |
| | | | | | | | |
| | | | | | | 4,274,981 | |
| | | | | | | | |
| | |
| | | | Financials – 22.39% | | | | |
| | 159,080 | | | BancorpSouth | | | 3,965,864 | |
| | 58,270 | | | Bank of the Ozarks | | | 2,914,665 | |
| | 216,140 | | | CVB Financial | | | 3,771,643 | |
| | 55,758 | | | EastGroup Properties, REIT | | | 3,131,369 | |
| | 139,234 | | | Horace Mann Educators | | | 4,767,372 | |
| | 48,829 | | | Iberiabank | | | 2,960,502 | |
| | 87,243 | | | Independent Bank/Rockland MA | | | 4,077,738 | |
| | 102,780 | | | Pebblebrook Hotel Trust, REIT | | | 3,513,020 | |
| | 178,030 | | | Physicians Realty Trust, REIT | | | 2,844,919 | |
| | 65,280 | | | QTS Realty Trust, Class A, REIT | | | 2,807,693 | |
| | 46,590 | | | Stifel Financial * | | | 2,069,994 | |
| | | | | | | | |
| | | | | | | 36,824,779 | |
| | | | | | | | |
| | | | | | | | |
Shares | | | | | Market
Value | |
| | |
| | | | Healthcare – 10.67% | | | | |
| | 39,187 | | | Analogic | | $ | 3,433,565 | |
| | 57,220 | | | Greatbatch * | | | 3,058,409 | |
| | 31,974 | | | ICU Medical * | | | 3,516,181 | |
| | 62,850 | | | INC Research Holdings, Class A * | | | 2,621,473 | |
| | 49,370 | | | Integra LifeSciences Holdings * | | | 2,940,971 | |
| | 26,390 | | | STERIS | | | 1,977,931 | |
| | | | | | | | |
| | | | | | | 17,548,530 | |
| | | | | | | | |
| | |
| | | | Industrials – 20.06% | | | | |
| | 108,865 | | | Altra Industrial Motion | | | 2,880,568 | |
| | 62,193 | | | Applied Industrial Technologies | | | 2,569,193 | |
| | 119,710 | | | CBIZ * | | | 1,286,883 | |
| | 48,290 | | | CIRCOR International | | | 2,217,477 | |
| | 76,686 | | | EMCOR Group | | | 3,702,400 | |
| | 71,670 | | | ESCO Technologies | | | 2,658,240 | |
| | 31,170 | | | G & K Services, Class A | | | 2,051,609 | |
| | 151,430 | | | Knoll | | | 3,519,233 | |
| | 60,039 | | | MSA Safety | | | 2,610,496 | |
| | 36,490 | | | Standex International | | | 3,273,883 | |
| | 91,129 | | | US Ecology | | | 3,573,168 | |
| | 48,600 | | | Watts Water Technologies, Class A | | | 2,645,784 | |
| | | | | | | | |
| | | | | | | 32,988,934 | |
| | | | | | | | |
| | |
| | | | Information Technology – 17.24% | | | | |
| | 142,887 | | | ACI Worldwide * | | | 3,422,144 | |
| | 236,450 | | | Entegris * | | | 3,033,653 | |
| | 24,747 | | | FEI | | | 1,786,486 | |
| | 68,170 | | | Itron * | | | 2,503,884 | |
| | 41,805 | | | Littelfuse | | | 4,177,574 | |
| | 93,805 | | | M/A-COM Technology Solutions Holdings * | | | 3,164,981 | |
| | 132,560 | | | Mentor Graphics | | | 3,605,632 | |
| | 39,080 | | | Methode Electronics | | | 1,302,536 | |
| | 91,325 | | | MKS Instruments | | | 3,218,293 | |
| | 59,580 | | | NetScout Systems * | | | 2,137,135 | |
| | | | | | | | |
| | | | | | | 28,352,318 | |
| | | | | | | | |
| | |
| | | | Materials – 6.16% | | | | |
| | 114,370 | | | Calgon Carbon | | | 1,967,164 | |
| | 52,280 | | | Minerals Technologies | | | 3,081,383 | |
| | 127,363 | | | PH Glatfelter | | | 2,470,842 | |
| | 39,919 | | | Sensient Technologies | | | 2,605,513 | |
| | | | | | | | |
| | | | | | | 10,124,902 | |
| | | | | | | | |
| | |
| | | | Utilities – 6.65% | | | | |
| | 70,863 | | | MGE Energy | | | 2,924,516 | |
| | 71,130 | | | ONE Gas | | | 3,473,989 | |
| | 52,319 | | | Portland General Electric | | | 1,939,989 | |
| | 51,013 | | | UIL Holdings | | | 2,601,153 | |
| | | | | | | | |
| | | | | | | 10,939,647 | |
| | | | | | | | |
| | |
| | | | Total Common Stocks
(Cost $159,205,613) | | | 162,673,477 | |
| | | | | | | | |
See accompanying Notes to Financial Statements.
| | |
| |
| ASTON/Silvercrest Small Cap Fund | | October 31, 2015 |
| |
| Schedule of Investments – continued | | |
| | | | | | | | |
Shares | | | | | Market
Value | |
|
| | INVESTMENT COMPANY – 0.55% | |
| | 894,752 | | | BlackRock Liquidity Funds TempFund Portfolio | | $ | 894,752 | |
| | | | | | | | |
| | |
| | | | Total Investment Company
(Cost $894,752) | | | 894,752 | |
| | | | | | | | |
| Total Investments – 99.46%
(Cost $160,100,365)** | | | 163,568,229 | |
| | | | | | | | |
| Net Other Assets and Liabilities – 0.54% | | | 895,468 | |
| | | | | | | | |
| Net Assets – 100.00% | | $ | 164,463,697 | |
| | | | | | | | |
| * | | Non-income producing security. |
| ** | | Aggregate cost for Federal income tax purposes is $160,411,792. |
| | | | |
Gross unrealized appreciation | | $ | 9,895,059 | |
Gross unrealized depreciation | | | (6,738,622 | ) |
| | | | |
Net unrealized appreciation | | $ | 3,156,437 | |
| | | | |
| REIT | | Real Estate Investment Trust |
See accompanying Notes to Financial Statements.
ASTON/TAMRO Small Cap Fund
| | |
| |
| Portfolio Manager Commentary (unaudited) | | October 31, 2015 |
Philip D. Tasho, CFA & Timothy A. Holland, CFA
| Q. | What were the most significant market factors affecting Fund performance and returns relative to the benchmark during the past 12 months? |
| A. | The Fund has been in recovery mode over the past year with relative performance against the Russell 2000® starting to improve in the second and third quarters of the calendar year. As we know, nothing is linear and October reminded us of this fact, as an encouraging two steps forward were followed by a few steps back. Four stocks in particular drove the recent shortfall, which led to the underperformance for the year. In our opinion, investors overreacted relative to the long-term fundamentals and we added to all four positions as they came down in price and offered an attractive valuation. For the year, Consumer Discretionary stocks detracted the most with specialty retailers impacted by the emerging dominance of ecommerce, and media stocks impacted by on demand services that are upending traditional viewing and listening habits. Stock selection in the Financials and Healthcare sectors also detracted. On the positive side, stock selection was strong in the Industrials, Technology and Materials sectors. A large underweight to Energy, the worst performing sector in the benchmark, benefitted the portfolio. |
| Q. | What were the best performing holdings for the Fund during the period? |
| A. | The three holdings that contributed the most to performance during the year were DexCom, Manhattan Associates and Bank of the Ozarks. DexCom benefitted from strong momentum for its continuous glucose monitoring products. A record deal level led to robust revenue growth for Manhattan Associates, a supply chain management software and services company. Bank of the Ozarks advanced on continued strong earnings, organic loan growth and growth through acquisition. |
| Q. | What were the weakest performing holdings? |
| A. | Iconix Brand Group, Eros International and HMS Holdings were the biggest detractors from portfolio performance during the year. Iconix, which owns a portfolio of consumer brands, corrected on the departure of its CEO and disappointing revenue and earnings. Eros, a media and entertainment company that has a 40% share of the Indian film market, received criticism for not providing a detailed subscriber breakdown. Shares of HMS Holdings sold off following the announcement that the company lost a significant, long-standing contract to a new industry competitor. |
| Q. | How was the Fund positioned as of October 31, 2015? |
| A. | TAMRO’s investment process focuses on individual, bottom-up stock selection to identify companies that we believe possess a sustainable competitive advantage and are attractively valued. Our approach to portfolio management is opportunistic and broadly diversified, with sector weights determined by where we see opportunities at the stock level. As of October 31, 2015, Consumer Discretionary was the largest sector in the portfolio on an absolute basis and a significant overweight versus the benchmark. We believe the renaissance of the U.S. consumer is unfolding gradually. Lower energy prices, new job growth, rising incomes and improved personal balance sheets are all factors in our thesis. We were attracted to many leading companies in the sector based on historic execution and attractive valuation. While many of the Consumer Discretionary names we hold have yet to resonate with investors, we are comfortable with our exposure to the sector relative to the potential opportunity. In Financials, we have a higher exposure to the banking sector, which should benefit from rising interest rates. Conversely, we have reduced exposure to Real Estate Investment Trusts (REITs), which normally underperform in a rising interest rate environment. We remain confident in our strategy and believe a portfolio of higher quality companies purchased at attractive valuations will resonate once again. |
Growth of a Hypothetical
$10,000 Investment—Class N
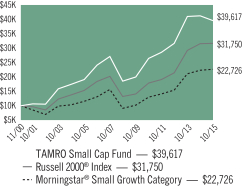
All dividends and capital gains are reinvested. Indexes are unmanaged and do not take into account fees, expenses or other costs.
Returns shown in the chart and table do not reflect taxes that a shareholder would pay on Fund distributions or on the sale of the Fund shares.
Small-cap and mid-cap stocks may be subject to a higher degree of market risk than the securities of more established companies because they tend to be more volatile and less liquid.
RETURNSFOR PERIOD ENDED 10/31/15
Average Annual Total Returns - Class N
| | | | |
One Year | | | -4.12 | % |
Five Year | | | 8.38 | % |
Ten Year | | | 7.54 | % |
Since Inception | | | 9.67 | % |
Inception Date 11/30/00
Average Annual Total Returns - Class I
| | | | |
One Year | | | -3.93 | % |
Five Year | | | 8.64 | % |
Ten Year | | | 7.81 | % |
Since Inception | | | 7.42 | % |
Inception Date 01/04/05
The performance data quoted represents past performance. Past performance does not guarantee future results. Investment return and principal value will fluctuate so that an investor’s shares, upon redemption, may be worth more or less than their original cost. Current performance may be lower or higher than the performance data quoted. For performance data current to the most recent month-end, please visit our website at www.astonfunds.com.
The total expense ratios for Class N and Class I shares are 1.31% and 1.06%, respectively, as disclosed in the prospectus dated February 28, 2015. Please refer to the Financial Highlights section in this report for more information.
| | |
| |
| ASTON/TAMRO Small Cap Fund | | October 31, 2015 |
| |
| Schedule of Investments | | |
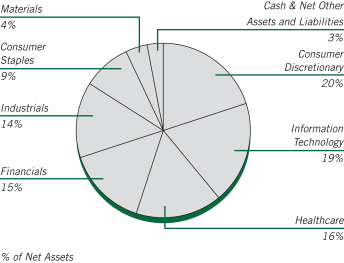
| | | | | | | | |
Shares | | | | | Market
Value | |
|
| | COMMON STOCKS – 97.49% | |
| | |
| | | | Consumer Discretionary – 20.39% | | | | |
| | 240,948 | | | Dorman Products * | | $ | 11,247,452 | |
| | 483,551 | | | Eros International * | | | 5,401,265 | |
| | 169,255 | | | Five Below * | | | 5,812,217 | |
| | 561,237 | | | Iconix Brand Group * | | | 8,598,151 | |
| | 158,351 | | | Monro Muffler Brake | | | 11,744,894 | |
| | 93,198 | | | Morningstar | | | 7,652,488 | |
| | 156,062 | | | Pool | | | 12,725,295 | |
| | 145,224 | | | Red Robin Gourmet Burgers * | | | 10,875,825 | |
| | 124,858 | | | Rentrak * | | | 6,889,664 | |
| | 293,539 | | | Steven Madden * | | | 10,229,834 | |
| | 307,720 | | | Texas Roadhouse | | | 10,570,182 | |
| | 294,250 | | | Zoe’s Kitchen * | | | 10,131,027 | |
| | | | | | | | |
| | | | | | | 111,878,294 | |
| | | | | | | | |
| | |
| | | | Consumer Staples – 8.51% | | | | |
| | 19,562 | | | Boston Beer, Class A * | | | 4,295,620 | |
| | 53,386 | | | Calavo Growers | | | 2,744,574 | |
| | 83,662 | | | Casey’s General Stores | | | 8,886,578 | |
| | 99,364 | | | Sanderson Farms | | | 6,906,792 | |
| | 142,533 | | | TreeHouse Foods * | | | 12,206,526 | |
| | 230,817 | | | United Natural Foods * | | | 11,644,718 | |
| | | | | | | | |
| | | | | | | 46,684,808 | |
| | | | | | | | |
| | |
| | | | Financials – 15.11% | | | | |
| | 343,701 | �� | | Bank of the Ozarks | | | 17,191,924 | |
| | 172,101 | | | BofI Holding * | | | 13,769,801 | |
| | 528,623 | | | Colony Capital Class A, REIT | | | 10,752,192 | |
| | 285,328 | | | Financial Engines | | | 9,176,148 | |
| | 274,544 | | | GEO Group, REIT | | | 8,859,535 | |
| | 269,902 | | | Home BancShares | | | 11,584,194 | |
| | 260,649 | | | Stifel Financial * | | | 11,580,635 | |
| | | | | | | | |
| | | | | | | 82,914,429 | |
| | | | | | | | |
| | | | | | | | |
Shares | | | | | Market
Value | |
| | |
| | | | Healthcare – 16.22% | | | | |
| | 27,651 | | | BioSpecifics Technologies * | | $ | 1,615,095 | |
| | 331,698 | | | Cepheid * | | | 11,078,713 | |
| | 43,266 | | | Clovis Oncology * | | | 4,322,706 | |
| | 131,139 | | | ICU Medical * | | | 14,421,356 | |
| | 302,197 | | | INC Research Holdings, Class A * | | | 12,604,637 | |
| | 275,598 | | | Medidata Solutions * | | | 11,850,714 | |
| | 181,856 | | | Neogen * | | | 9,829,317 | |
| | 388,978 | | | Repligen * | | | 12,929,629 | |
| | 538,917 | | | Retrophin * | | | 10,309,482 | |
| | | | | | | | |
| | | | | | | 88,961,649 | |
| | | | | | | | |
| | |
| | | | Industrials – 14.10% | | | | |
| | 264,987 | | | Advisory Board * | | | 11,614,380 | |
| | 129,615 | | | CEB | | | 9,690,017 | |
| | 372,281 | | | Healthcare Services Group | | | 13,871,190 | |
| | 152,972 | | | Landstar System | | | 9,643,355 | |
| | 152,178 | | | Proto Labs * | | | 9,867,222 | |
| | 361,569 | | | Simpson Manufacturing | | | 13,732,391 | |
| | 255,602 | | | Team * | | | 8,946,070 | |
| | | | | | | | |
| | | | | | | 77,364,625 | |
| | | | | | | | |
| | |
| | | | Information Technology – 18.83% | | | | |
| | 374,530 | | | Cardtronics * | | | 12,921,285 | |
| | 142,353 | | | Cavium * | | | 10,099,945 | |
| | 328,288 | | | Integrated Device Technology * | | | 8,371,344 | |
| | 204,545 | | | Interactive Intelligence Group * | | | 6,614,985 | |
| | 179,913 | | | Manhattan Associates * | | | 13,106,662 | |
| | 750,468 | | | Pandora Media * | | | 8,637,887 | |
| | 131,257 | | | Synaptics * | | | 11,168,658 | |
| | 272,751 | | | Synchronoss Technologies * | | | 9,595,380 | |
| | 64,853 | | | Tyler Technologies * | | | 11,048,357 | |
| | 390,255 | | | VeriFone Systems * | | | 11,762,286 | |
| | | | | | | | |
| | | | | | | 103,326,789 | |
| | | | | | | | |
| | |
| | | | Materials – 4.33% | | | | |
| | 192,033 | | | Balchem | | | 13,115,854 | |
| | 588,569 | | | Flotek Industries * | | | 10,653,099 | |
| | | | | | | | |
| | | | | | | 23,768,953 | |
| | | | | | | | |
| | |
| | | | Total Common Stocks
(Cost $455,169,613) | | | 534,899,547 | |
| | | | | | | | |
|
| | INVESTMENT COMPANY – 2.84% | |
| | 15,604,945 | | | BlackRock Liquidity Funds TempFund Portfolio | | | 15,604,945 | |
| | | | | | | | |
| | |
| | | | Total Investment Company
(Cost $15,604,945) | | | 15,604,945 | |
| | | | | | | | |
| Total Investments – 100.33%
(Cost $470,774,558)** | | | 550,504,492 | |
| | | | | | | | |
| Net Other Assets and Liabilities – (0.33)% | | | (1,818,597 | ) |
| | | | | | | | |
| Net Assets – 100.00% | | $ | 548,685,895 | |
| | | | | | | | |
See accompanying Notes to Financial Statements.
| | |
| |
| ASTON/TAMRO Small Cap Fund | | October 31, 2015 |
| |
| Schedule of Investments – continued | | |
| * | | Non-income producing security. |
| ** | | Aggregate cost for Federal income tax purposes is $478,903,412. |
| | | | |
Gross unrealized appreciation | | $ | 119,637,469 | |
Gross unrealized depreciation | | | (48,036,389 | ) |
| | | | |
Net unrealized appreciation | | $ | 71,601,080 | |
| | | | |
| REIT | | Real Estate Investment Trust |
See accompanying Notes to Financial Statements.
ASTON/DoubleLine Core Plus Fixed Income Fund
| | |
| |
| Portfolio Manager Commentary (unaudited) | | October 31, 2015 |
Jeffrey E. Gundlach; Philip A. Barach; Bonnie Baha, CFA & Luz M. Padilla
| Q. | What were the most significant market factors affecting Fund performance and returns relative to the benchmark during the past 12 months? |
| A. | Fund performance was driven by both sector allocation amongst the varying sectors of the fixed income market as well as security selection within each of the respective sectors. Both benchmark and non-benchmark sectors added positive returns to the portfolio, with the exception of Emerging Market Fixed Income (EMFI). EMFI experienced a challenging environment over the last year, plagued by political scandal, commodity weakness and deteriorating global growth. The High Yield market also had a tough year given the decline in oil and gas, but the positions held in the Fund actually performed relatively well. The Fund’s overweight in Structured Products continues to enhance returns with Mortgage-Backed Securities (MBS) as the best performing sector. |
| Q. | What were the best performing holdings for the Fund during the period? |
| A. | Agency Residential Mortgage-Backed Securities (RMBS) and Treasuries were the best performing sectors held within the Fund. With interest rates declining over the period, longer duration holdings generally outperformed shorter duration holdings. |
| Q. | What were the weakest performing holdings? |
| A. | EMFI performed the worst over the twelve month period. Latin America, which accounts for a majority of the EMFI exposure, struggled from both political involvements as well as decline in the commodity complex. |
| Q. | How was the Fund positioned as of October 31, 2015? |
| A. | Over the last twelve month period, the Fund decreased its exposure to Investment Grade Corporate debt and Non-Agency RMBS, while increased exposure to Agency MBS, Treasuries, Collateralized Loan Obligations (CLO), Commercial Mortgage-Backed Securities (CMBS) and High Yield. The Fund remains underweight U.S. Corporate debt, MBS and Treasuries versus the index. |
Over the last twelve month period, the Fund generally decreased its exposure to more credit sensitive sectors and increased exposures to higher quality sectors. The Fund added to Investment Grade Corporate credit and Municipal holdings, while decreased exposure to junk bonds and Emerging Markets.
Growth of a Hypothetical
$10,000 Investment—Class N
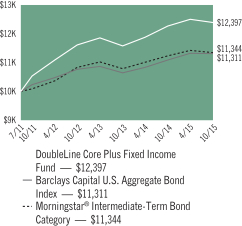
All dividends and capital gains are reinvested. Indexes are unmanaged and do not take into account fees, expenses or other costs.
Returns shown in the chart and table do not reflect taxes that a shareholder would pay on Fund distributions or on the sale of the Fund shares.
Bond funds have the same interest rate, high yield and credit risks associated with the underlying bonds in the portfolio, all of which could reduce the Fund’s value. As interest rates rise, the value of the Fund can decline and an investor can lose principal.
RETURNSFOR PERIOD ENDED 10/31/15
Average Annual Total Returns - Class N
| | | | |
One Year | | | 1.04 | % |
Since Inception | | | 5.14 | % |
Inception Date 07/18/11
Average Annual Total Returns - Class I
| | | | |
One Year | | | 1.28 | % |
Since Inception | | | 5.39 | % |
Inception Date 07/18/11
The performance data quoted represents past performance. Past performance does not guarantee future results. Investment return and principal value will fluctuate so that an investor’s shares, upon redemption, may be worth more or less than their original cost. Current performance may be lower or higher than the performance data quoted. For performance data current to the most recent month-end, please visit our website at www.astonfunds.com.
The performance quoted would have been lower if fee waivers and/or expense reimbursements had not been in effect.
| | |
| |
| ASTON/DoubleLine Core Plus Fixed Income Fund | | October 31, 2015 |
| |
| Schedule of Investments | | |
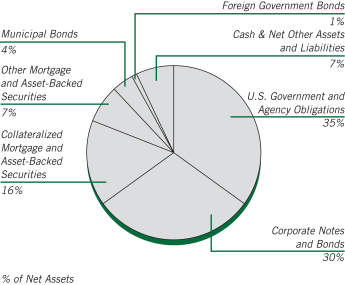
At October 31, 2015, 24.96% of the Total Net Assets of the Fund were comprised of securities of issuers located outside the United States.
| | | | | | | | |
Par Value | | | | | Market
Value | |
| | | | | | | |
|
| | CORPORATE NOTES AND BONDS – 29.64% | |
| | |
| | | | Basic Materials – 0.33% | | | | |
| | $ 300,000 | | | Freeport-McMoRan
4.000%, 11/14/21 | | $ | 253,350 | |
| | 500,000 | | | Inversiones CMPC SA (Chile)
4.500%, 04/25/22 | | | 506,034 | |
| | 400,000 | | | Minsur SA (Peru)
Senior Unsecured Notes
6.250%, 02/07/24 | | | 416,800 | |
| | 500,000 | | | Southern Copper
Senior Unsecured Notes
5.875%, 04/23/45 | | | 440,360 | |
| | | | | | | | |
| | | | | | | 1,616,544 | |
| | | | | | | | |
| | |
| | | | Consumer Discretionary – 1.02% | | | | |
| | 200,000 | | | American Axle & Manufacturing
6.625%, 10/15/22 | | | 213,500 | |
| | 50,000 | | | Anthem
Senior Unsecured Notes
1.875%, 01/15/18 | | | 50,224 | |
| | 100,000 | | | Asbury Automotive Group
6.000%, 12/15/24 | | | 106,250 | |
| | 300,000 | | | Celgene
Senior Unsecured Notes
3.875%, 08/15/25 | | | 301,514 | |
| | 235,000 | | | Coca-Cola
Senior Unsecured Notes
1.875%, 10/27/20 | | | 233,377 | |
| | 70,000 | | | Family Tree Escrow LLC
Senior Secured Notes
5.750%, 03/01/23 (a) | | | 74,112 | |
| | 415,000 | | | Ford Motor
Senior Unsecured Notes
7.450%, 07/16/31 | | | 534,420 | |
| | | | | | | | |
Par Value | | | | | Market
Value | |
| | | | | | | |
| | |
| | | | Consumer Discretionary (continued) | | | | |
| | $ 200,000 | | | Gol LuxCo SA (Luxembourg)
8.875%, 01/24/22 | | $ | 105,750 | |
| | 135,000 | | | Goodyear Tire & Rubber
7.000%, 05/15/22 | | | 147,319 | |
| | 140,000 | | | Gray Television
7.500%, 10/01/20 | | | 146,643 | |
| | 600,000 | | | Grupo Idesa SA de CV (Mexico)
7.875%, 12/18/20 (a) | | | 613,500 | |
| | 300,000 | | | Hutchison Whampoa International 12 (Cayman Islands)
6.000%, 05/29/49 (b) | | | 314,251 | |
| | 200,000 | | | Hutchison Whampoa International 12 II (Cayman Islands)
3.250%, 11/08/22 | | | 201,896 | |
| | 160,000 | | | Levi Strauss
Senior Unsecured Notes
5.000%, 05/01/25 | | | 163,600 | |
| | 200,000 | | | McGraw Hill Financial
4.400%, 02/15/26 (a) | | | 205,207 | |
| | 275,000 | | | NCL (Bermuda)
Senior Unsecured Notes
5.250%, 11/15/19 (a) | | | 284,109 | |
| | 70,000 | | | Pilgrim’s Pride
5.750%, 03/15/25 (a) | | | 71,750 | |
| | 115,000 | | | Regal Entertainment Group
Senior Unsecured Notes
5.750%, 03/15/22 | | | 119,169 | |
| | 195,000 | | | Sally Holdings
5.750%, 06/01/22 | | | 206,700 | |
| | 135,000 | | | Station Casinos
7.500%, 03/01/21 | | | 144,788 | |
| | 210,000 | | | Tenet Healthcare
Senior Unsecured Notes
6.750%, 06/15/23 | | | 210,788 | |
| | 420,000 | | | Teva Pharmaceutical Finance Co BV (Cook Islands)
2.950%, 12/18/22 | | | 395,531 | |
| | 170,000 | | | Viking Cruises (Bermuda)
Senior Unsecured Notes
8.500%, 10/15/22 (a) | | | 185,725 | |
| | | | | | | | |
| | | | | | | 5,030,123 | |
| | | | | | | | |
| | |
| | | | Consumer Staples – 2.95% | | | | |
| | 400,000 | | | Ajecorp BV (Netherlands)
6.500%, 05/14/22 | | | 207,000 | |
| | | | Camposol SA (Peru) | | | | |
| | 280,000 | | | 9.875%, 02/02/17 | | | 245,000 | |
| | 150,000 | | | 9.875%, 02/02/17 (a) | | | 131,250 | |
| | | | Cencosud SA (Chile) | | | | |
| | 500,000 | | | 5.500%, 01/20/21 | | | 525,648 | |
| | 900,000 | | | 4.875%, 01/20/23 | | | 892,515 | |
| | 600,000 | | | Central American Bottling (British Virgin Islands)
6.750%, 02/09/22 | | | 630,000 | |
| | 525,000 | | | Coca-Cola
Senior Unsecured Notes
1.650%, 11/01/18 | | | 530,392 | |
See accompanying Notes to Financial Statements.
| | |
| |
| ASTON/DoubleLine Core Plus Fixed Income Fund | | October 31, 2015 |
| |
| Schedule of Investments – continued | | |
| | | | | | | | |
Par Value | | | | | Market
Value | |
| | | | | | | |
| | |
| | | | Consumer Staples (continued) | | | | |
| | $ 800,000 | | | Corp Azucarera del Peru SA (Peru)
6.375%, 08/02/22 | | $ | 671,000 | |
| | 350,000 | | | Cosan Overseas (Cayman Islands)
8.250%, 11/29/49 | | | 295,750 | |
| | 110,000 | | | Dana Holding
Senior Unsecured Notes
5.500%, 12/15/24 | | | 110,275 | |
| | 1,433,797 | | | ENA Norte Trust (Panama)
4.950%, 04/25/23 | | | 1,473,943 | |
| | 400,000 | | | Grupo Bimbo SAB de CV (Mexico)
4.500%, 01/25/22 | | | 417,742 | |
| | 220,000 | | | HCA
5.375%, 02/01/25 | | | 226,600 | |
| | 450,000 | | | Home Depot
Senior Unsecured Notes
3.350%, 09/15/25 | | | 462,462 | |
| | 400,000 | | | JBS Investments GmbH (Austria)
7.250%, 04/03/24 | | | 413,000 | |
| | 155,000 | | | JBS USA
Senior Unsecured Notes
5.750%, 06/15/25 (a) | | | 150,737 | |
| | 173,000 | | | Kellogg
Senior Unsecured Notes
7.450%, 04/01/31 | | | 223,131 | |
| | 535,000 | | | Kraft Heinz Foods
1.600%, 06/30/17 (a) | | | 535,691 | |
| | 690,000 | | | Kroger
Senior Unsecured Notes
3.400%, 04/15/22 | | | 704,812 | |
| | 500,000 | | | Laboratory Corp of America Holdings
Senior Unsecured Notes
2.500%, 11/01/18 | | | 503,406 | |
| | 405,000 | | | 4.700%, 02/01/45 | | | 374,133 | |
| | 130,000 | | | Maestro Peru SA (Peru)
6.750%, 09/26/19 | | | 137,215 | |
| | | | Marfrig Holding Europe BV (Netherlands) | | | | |
| | 200,000 | | | 8.375%, 05/09/18 | | | 196,500 | |
| | 800,000 | | | 6.875%, 06/24/19 | | | 738,000 | |
| | 200,000 | | | 6.875%, 06/24/19 (a) | | | 184,500 | |
| | | | Minerva Luxembourg SA (Luxembourg) | | | | |
| | 400,000 | | | 7.750%, 01/31/23 | | | 397,000 | |
| | 600,000 | | | 8.750%, 12/29/49 (b) | | | 574,500 | |
| | 300,000 | | | 8.750%, 12/29/49 (a) (b) | | | 287,250 | |
| | 200,000 | | | Post Holdings
7.375%, 02/15/22 | | | 211,470 | |
| | 260,000 | | | Revlon Consumer Products
5.750%, 02/15/21 | | | 264,550 | |
| | 105,000 | | | Rite Aid
6.125%, 04/01/23 (a) | | | 113,531 | |
| | 220,000 | | | Scientific Games International
Senior Secured Notes
7.000%, 01/01/22 (a) | | | 223,300 | |
| | 205,000 | | | Service Corp International
Senior Unsecured Notes
5.375%, 01/15/22 | | | 217,300 | |
| | | | | | | | |
Par Value | | | | | Market
Value | |
| | | | | | | |
| | |
| | | | Consumer Staples (continued) | | | | |
| | $ 210,000 | | | Spectrum Brands
5.750%, 07/15/25 (a) | | $ | 224,963 | |
| | 990,000 | | | Tyson Foods
3.950%, 08/15/24 | | | 1,012,922 | |
| | | | | | | | |
| | | | | | | 14,507,488 | |
| | | | | | | | |
| | |
| | | | Energy – 3.44% | | | | |
| | 400,000 | | | AES General SA (Chile)
Senior Unsecured Notes
5.250%, 08/15/21 | | | 425,288 | |
| | 490,000 | | | Apache
Senior Unsecured Notes
4.750%, 04/15/43 | | | 455,309 | |
| | 375,000 | | | BP Capital Markets (United Kingdom)
3.062%, 03/17/22 | | | 377,152 | |
| | 465,000 | | | Chevron
Senior Unsecured Notes
1.365%, 03/02/18 | | | 466,469 | |
| | 1,100,000 | | | CNOOC Finance 2015 Australia Property (Australia)
2.625%, 05/05/20 | | | 1,085,592 | |
| | 200,000 | | | CNPC HK Overseas Capital (British Virgin Islands)
4.500%, 04/28/21 | | | 213,369 | |
| | 400,000 | | | Comision Federal De Electricidad (Mexico)
Senior Unsecured Notes
4.875%, 05/26/21 | | | 420,500 | |
| | | | Delek & Avner Tamar Bond (Israel)
Senior Unsecured Notes | | | | |
| | 1,300,000 | | | 4.435%, 12/30/20 (a) | | | 1,342,250 | |
| | 140,000 | | | 5.412%, 12/30/25 (a) | | | 142,625 | |
| | 390,000 | | | Devon Energy
Senior Unsecured Notes
6.300%, 01/15/19 | | | 434,730 | |
| | | | Ecopetrol SA (Colombia)
Senior Unsecured Notes | | | | |
| | 400,000 | | | 4.125%, 01/16/25 | | | 353,480 | |
| | 300,000 | | | 7.375%, 09/18/43 | | | 286,500 | |
| | 1,150,000 | | | 5.875%, 05/28/45 | | | 948,750 | |
| | 410,000 | | | Energy Transfer Partners LP
Senior Unsecured Notes
4.750%, 01/15/26 | | | 377,398 | |
| | | | Energy XXI Gulf Coast | | | | |
| | 330,000 | | | 9.250%, 12/15/17 | | | 109,065 | |
| | 45,000 | | | 7.500%, 12/15/21 | | | 9,000 | |
| | | | Senior Secured Notes | | | | |
| | 44,000 | | | 11.000%, 03/15/20 (a) | | | 23,815 | |
| | 180,000 | | | EP Energy
9.375%, 05/01/20 | | | 157,500 | |
| | 115,000 | | | EPL Oil & Gas
8.250%, 02/15/18 | | | 36,800 | |
| | 175,000 | | | Gibson Energy (Canada)
6.750%, 07/15/21 (a) | | | 170,187 | |
| | | | Inkia Energy (Bermuda)
Senior Unsecured Notes | | | | |
| | 200,000 | | | 8.375%, 04/04/21 (a) | | | 205,500 | |
| | 400,000 | | | 8.375%, 04/04/21 | | | 411,000 | |
See accompanying Notes to Financial Statements.
| | |
| |
| ASTON/DoubleLine Core Plus Fixed Income Fund | | October 31, 2015 |
| |
| Schedule of Investments – continued | | |
| | | | | | | | |
Par Value | | | | | Market
Value | |
| | | | | | | |
| | |
| | | | Energy (continued) | | | | |
| | $1,200,000 | | | Instituto Costarricense de Electricidad (Costa Rica)
Senior Unsecured Notes
6.950%, 11/10/21 | | $ | 1,230,000 | |
| | 370,000 | | | Kinder Morgan Energy Partners, MTN
Senior Unsecured Notes
6.950%, 01/15/38 | | | 368,137 | |
| | 515,000 | | | Memorial Production Partners
Senior Unsecured Notes
6.875%, 08/01/22 | | | 327,025 | |
| | | | Pacific Rubiales Energy (Canada) | | | | |
| | 750,000 | | | 5.125%, 03/28/23 | | | 277,500 | |
| | 300,000 | | | 5.625%, 01/19/25 | | | 114,000 | |
| | 500,000 | | | 5.625%, 01/19/25 (a) | | | 190,000 | |
| | | | Petroleos Mexicanos (Mexico) | | | | |
| | 200,000 | | | 5.500%, 01/21/21 | | | 214,000 | |
| | 400,000 | | | 4.500%, 01/23/26 (a) | | | 382,920 | |
| | 500,000 | | | 6.375%, 01/23/45 | | | 476,250 | |
| | 1,075,000 | | | 5.625%, 01/23/46 (a) | | | 931,004 | |
| | | | Phillips 66 | | | | |
| | 95,000 | | | 5.875%, 05/01/42 | | | 106,523 | |
| | 75,000 | | | 4.875%, 11/15/44 | | | 74,928 | |
| | 500,000 | | | Reliance Industries (India)
Senior Unsecured Notes
5.875%, 02/28/49 | | | 502,500 | |
| | 115,000 | | | Sanchez Energy
6.125%, 01/15/23 | | | 83,950 | |
| | 85,000 | | | Sandridge Energy
Senior Secured Notes
8.750%, 06/01/20 (a) | | | 52,063 | |
| | 215,000 | | | Southern Star Central
Senior Unsecured Notes
5.125%, 07/15/22 (a) | | | 209,625 | |
| | 285,000 | | | Tesoro Logistics
Senior Unsecured Notes
6.250%, 10/15/22 (a) | | | 297,825 | |
| | 2,200,000 | | | Transportadora de Gas Internacional SA ESP (Colombia)
Senior Unsecured Notes
5.700%, 03/20/22 | | | 2,271,500 | |
| | 330,000 | | | Triangle USA Petroleum
Senior Unsecured Notes
6.750%, 07/15/22 (a) | | | 156,750 | |
| | 355,000 | | | Ultra Petroleum (Canada)
Senior Unsecured Notes
5.750%, 12/15/18 (a) | | | 239,625 | |
| | | | | | | | |
| | | | | | | 16,958,404 | |
| | | | | | | | |
| | |
| | | | Financials – 9.33% | | | | |
| | | | Agromercantil Senior Trust (Cayman Islands) | | | | |
| | 400,000 | | | 6.250%, 04/10/19 (a) | | | 403,000 | |
| | 900,000 | | | 6.250%, 04/10/19 | | | 906,750 | |
| | 375,000 | | | Air Lease
Senior Unsecured Notes
3.750%, 02/01/22 | | | 371,750 | |
| | | | | | | | |
Par Value | | | | | Market
Value | |
| | | | | | | |
| | |
| | | | Financials (continued) | | | | |
| | $ 370,000 | | | Ally Financial
Senior Unsecured Notes
4.125%, 03/30/20 | | $ | 382,950 | |
| | 145,000 | | | American Express Credit
Senior Unsecured Notes
2.125%, 03/18/19 | | | 145,768 | |
| | 880,000 | | | American Express Credit, GMTN
Senior Unsecured Notes
2.250%, 08/15/19 | | | 884,179 | |
| | 70,000 | | | Argos Merger Sub
Senior Unsecured Notes
7.125%, 03/15/23 (a) | | | 73,850 | |
| | 665,000 | | | Australia & New Zealand Banking Group, EMTN (Australia)
Senior Unsecured Notes
4.875%, 01/12/21 (a) | | | 742,683 | |
| | 700,000 | | | Banco Continental SAECA (Paraguay)
Senior Unsecured Notes
8.875%, 10/15/17 | | | 712,695 | |
| | 600,000 | | | Banco Davivienda SA (Peru) Subordinated Notes
5.875%, 07/09/22 | | | 612,750 | |
| | 600,000 | | | Banco de Costa Rica (Costa Rica)
5.250%, 08/12/18 | | | 611,250 | |
| | 1,000,000 | | | Banco de Credito del Peru (Peru) Subordinated Notes
6.125%, 04/24/27 | | | 1,080,000 | |
| | 500,000 | | | Banco do Brasil SA (Brazil)
9.000%, 06/29/49 (a) (b) | | | 347,500 | |
| | 700,000 | | | Banco GNB Sudameris SA (Colombia) Subordinated Notes
7.500%, 07/30/22 | | | 726,950 | |
| | 1,700,000 | | | Banco Internacional del Peru SAA (Peru) Subordinated Notes
6.625%, 03/19/29 (b) | | | 1,751,000 | |
| | 200,000 | | | Banco Latinoamericano de Comercio Exterior SA (Panama)
Senior Unsecured Notes
3.250%, 05/07/20 (a) | | | 198,750 | |
| | 1,000,000 | | | Banco Nacional de Comercio Exterior SNC (Mexico)
Senior Unsecured Notes
4.375%, 10/14/25 | | | 1,007,500 | |
| | 600,000 | | | Banco Nacional de Costa Rica (Costa Rica)
Senior Unsecured Notes
4.875%, 11/01/18 | | | 604,500 | |
| | | | Banco Regional SAECA (Paraguay)
Senior Unsecured Notes | | | | |
| | 150,000 | | | 8.125%, 01/24/19 (a) | | | 154,500 | |
| | 950,000 | | | 8.125%, 01/24/19 | | | 978,500 | |
| | 1,000,000 | | | Banco Santander Mexico SA Institucion de Banca Multiple Grupo Financiero Santand (Mexico) Subordinated Notes
5.950%, 01/30/24 (b) | | | 1,047,500 | |
See accompanying Notes to Financial Statements.
| | |
| |
| ASTON/DoubleLine Core Plus Fixed Income Fund | | October 31, 2015 |
| |
| Schedule of Investments – continued | | |
| | | | | | | | |
Par Value | | | | | Market
Value | |
| | | | | | | |
| | |
| | | | Financials (continued) | | | | |
| | $1,500,000 | | | Bancolombia SA (Colombia) Subordinated Notes
6.125%, 07/26/20 | | $ | 1,597,500 | |
| | 735,000 | | | Bank of America
Senior Unsecured Notes
2.000%, 01/11/18 | | | 738,607 | |
| | 475,000 | | | Bank of Montreal, MTN (Canada)
Senior Unsecured Notes
2.375%, 01/25/19 | | | 481,702 | |
| | 150,000 | | | Bantrab Senior Trust (Cayman Islands)
Senior Secured Notes
9.000%, 11/14/20 | | | 151,530 | |
| | 545,000 | | | BB&T, MTN
Senior Unsecured Notes
2.450%, 01/15/20 | | | 549,294 | |
| | 600,000 | | | BBVA Banco Continental SA (Peru)
Subordinated Notes
5.250%, 09/22/29 (b) | | | 603,000 | |
| | 1,100,000 | | | BBVA Bancomer SA (Mexico) Subordinated Notes
5.350%, 11/12/29 (b) | | | 1,111,000 | |
| | | | BBVA Bancomer SA (Mexico) Subordinated Notes | | | | |
| | 350,000 | | | 6.008%, 05/17/22 (b) | | | 358,750 | |
| | 300,000 | | | 5.350%, 11/12/29 (a) (b) | | | 303,000 | |
| | 250,000 | | | BBVA Colombia SA (Colombia)
Subordinated Notes
4.875%, 04/21/25 (a) | | | 245,000 | |
| | 485,000 | | | Boston Properties, REIT
Senior Unsecured Notes
4.125%, 05/15/21 | | | 517,448 | |
| | 200,000 | | | Cementos Progreso Trust (Cayman Islands)
7.125%, 11/06/23 | | | 208,500 | |
| | | | CIMPOR Financial Operations BV (Netherlands) | | | | |
| | 200,000 | | | 5.750%, 07/17/24 | | | 133,750 | |
| | 200,000 | | | 5.750%, 07/17/24 (a) | | | 133,750 | |
| | 800,000 | | | Citigroup
Senior Unsecured Notes
2.650%, 10/26/20 | | | 799,169 | |
| | 300,000 | | | Comcel Trust (Cayman Islands)
6.875%, 02/06/24 (a) | | | 240,000 | |
| | 300,000 | | | Corp Financiera de Desarrollo SA (Peru) Subordinated Notes
5.250%, 07/15/29 | | | 301,125 | |
| | | | CorpGroup Banking SA (Chile)
Senior Unsecured Notes | | | | |
| | 250,000 | | | 6.750%, 03/15/23 (a) | | | 239,063 | |
| | 500,000 | | | 6.750%, 03/15/23 | | | 478,125 | |
| | | | Credito Real SAB de CV (Mexico)
Senior Unsecured Notes | | | | |
| | 200,000 | | | 7.500%, 03/13/19 | | | 207,200 | |
| | 200,000 | | | 7.500%, 03/13/19 (a) | | | 207,200 | |
| | 920,000 | | | GE Capital International Funding (Ireland)
0.964%, 04/15/16 | | | 919,880 | |
| | | | | | | | |
Par Value | | | | | Market
Value | |
| | | | | | | |
| | |
| | | | Financials (continued) | | | | |
| | $ 105,000 | | | General Motors Financial
2.400%, 04/10/18 | | $ | 104,043 | |
| | 425,000 | | | General Motors Financial
3.200%, 07/13/20 | | | 422,172 | |
| | | | Global Bank (Panama) | | | | |
| | 800,000 | | | 4.750%, 10/05/17 | | | 814,160 | |
| | 600,000 | | | 5.125%, 10/30/19 | | | 609,000 | |
| | | | Senior Unsecured Notes | | | | |
| | 700,000 | | | 5.125%, 10/30/19 (a) | | | 710,500 | |
| | 560,000 | | | Goldman Sachs Group
Senior Unsecured Notes
2.600%, 04/23/20 | | | 562,747 | |
| | 1,000,000 | | | Grupo Aval (Cayman Islands)
4.750%, 09/26/22 | | | 977,400 | |
| | 1,000,000 | | | GrupoSura Finance SA (Cayman Islands)
5.700%, 05/18/21 | | | 1,052,500 | |
| | 1,550,000 | | | Guanay Finance (Cayman Islands)
Senior Secured Notes
6.000%, 12/15/20 | | | 1,573,250 | |
| | 150,000 | | | Icahn Enterprises
4.875%, 03/15/19 | | | 153,795 | |
| | 1,500,000 | | | Industrial Senior Trust (Cayman Islands)
5.500%, 11/01/22 | | | 1,374,562 | |
| | 600,000 | | | Intercorp Peru (Peru)
Senior Unsecured Notes
5.875%, 02/12/25 | | | 576,000 | |
| | | | JPMorgan Chase
Senior Unsecured Notes | | | | |
| | 530,000 | | | 2.550%, 10/29/20 | | | 528,370 | |
| | | | Subordinated Notes | | | | |
| | 510,000 | | | 4.250%, 10/01/27 | | | 513,879 | |
| | 629,000 | | | Liberty Mutual Group
6.500%, 05/01/42 (a) | | | 757,654 | |
| | 700,000 | | | Magnesita Finance (British Virgin Islands)
8.625%, 04/29/49 | | | 437,500 | |
| | 1,025,000 | | | MetLife
Senior Unsecured Notes
4.125%, 08/13/42 | | | 982,873 | |
| | | | Morgan Stanley
Senior Unsecured Notes | | | | |
| | 475,000 | | | 2.650%, 01/27/20 | | | 478,982 | |
| | 520,000 | | | 3.750%, 02/25/23 | | | 536,792 | |
| | 455,000 | | | MUFG Americas Holdings
Senior Unsecured Notes
1.625%, 02/09/18 | | | 454,250 | |
| | | | National Rural Utilities Cooperative Finance | | | | |
| | 105,000 | | | 10.375%, 11/01/18 | | | 130,350 | |
| | 540,000 | | | 2.000%, 01/27/20 | | | 532,751 | |
| | 800,000 | | | Oversea-Chinese Banking, EMTN (Singapore)
Subordinated Notes
4.000%, 10/15/24 (b) | | | 819,914 | |
| | 480,000 | | | PNC Funding
3.300%, 03/08/22 | | | 495,083 | |
See accompanying Notes to Financial Statements.
| | |
| |
| ASTON/DoubleLine Core Plus Fixed Income Fund | | October 31, 2015 |
| |
| Schedule of Investments – continued | | |
| | | | | | | | |
Par Value | | | | | Market
Value | |
| | | | | | | |
| | |
| | | | Financials (continued) | | | | |
| | | | Simon Property Group, REIT
Senior Unsecured Notes | | | | |
| | $ 175,000 | | | 5.650%, 02/01/20 | | $ | 198,114 | |
| | 170,000 | | | 4.125%, 12/01/21 | | | 182,579 | |
| | 355,000 | | | State Street
Senior Unsecured Notes
3.550%, 08/18/25 | | | 365,089 | |
| | 525,000 | | | Synchrony Financial
Senior Unsecured Notes
3.000%, 08/15/19 | | | 530,876 | |
| | 1,000,000 | | | Tanner Servicios Financieros SA (Chile)
Senior Unsecured Notes
4.375%, 03/13/18 | | | 1,016,000 | |
| | 375,000 | | | TIAA Asset Management Finance
Senior Unsecured Notes
2.950%, 11/01/19 (a) | | | 380,149 | |
| | 480,000 | | | Toronto-Dominion Bank (Canada)
Senior Unsecured Notes
1.750%, 07/23/18 | | | 482,612 | |
| | | | Unifin Financiera SA de CV (Mexico) | | | | |
| | 700,000 | | | 6.250%, 07/22/19 | | | 679,000 | |
| | 200,000 | | | 6.250%, 07/22/19 (a) | | | 194,000 | |
| | 1,000,000 | | | United Overseas Bank, EMTN (Singapore)
Subordinated Notes
3.750%, 09/19/24 (b) | | | 1,022,040 | |
| | 1,030,000 | | | Wells Fargo, MTN
Senior Unsecured Notes
3.550%, 09/29/25 | | | 1,033,224 | |
| | | | | | | | |
| | | | | | | 45,951,128 | |
| | | | | | | | |
| | |
| | | | Healthcare – 0.93% | | | | |
| | 553,000 | | | AbbVie
Senior Unsecured Notes
4.700%, 05/14/45 | | | 531,434 | |
| | 940,000 | | | Actavis Funding SCS (Luxembourg)
2.350%, 03/12/18 | | | 945,053 | |
| | 265,000 | | | Alere
6.500%, 06/15/20 | | | 274,938 | |
| | 210,000 | | | Amgen
Senior Unsecured Notes
2.700%, 05/01/22 | | | 206,416 | |
| | 360,000 | | | Baxalta
Senior Unsecured Notes
5.250%, 06/23/45 (a) | | | 369,945 | |
| | 515,000 | | | Cardinal Health
Senior Unsecured Notes
1.950%, 06/15/18 | | | 517,761 | |
| | 235,000 | | | Covidien International Finance SA (Luxembourg)
2.950%, 06/15/23 | | | 232,921 | |
| | 260,000 | | | LifePoint Hospitals
5.500%, 12/01/21 | | | 264,550 | |
| | 140,000 | | | Quintiles Transnational
4.875%, 05/15/23 (a) | | | 144,637 | |
| | 245,000 | | | Select Medical
6.375%, 06/01/21 | | | 218,050 | |
| | | | | | | | |
Par Value | | | | | Market
Value | |
| | | | | | | |
| | |
| | | | Healthcare (continued) | | | | |
| | $ 435,000 | | | WellPoint
Senior Unsecured Notes
2.300%, 07/15/18 | | $ | 437,448 | |
| | 421,000 | | | Zimmer Holdings
Senior Unsecured Notes
1.450%, 04/01/17 | | | 420,250 | |
| | | | | | | | |
| | | | | | | 4,563,403 | |
| | | | | | | | |
| | |
| | | | Industrials – 2.94% | | | | |
| | 850,000 | | | Aeropuerto Internacional de Tocumen SA (Panama)
Senior Secured Notes
5.750%, 10/09/23 | | | 888,305 | |
| | | | Aeropuertos Dominicanos Siglo XXI SA (Domican Republic)
Senior Secured Notes | | | | |
| | 200,000 | | | 9.750%, 11/13/19 (d) | | | 201,250 | |
| | 200,000 | | | 9.750%, 11/13/19 (a) (d) | | | 201,250 | |
| | 245,000 | | | Air Medical Merger Sub
Senior Unsecured Notes
6.375%, 05/15/23 (a) | | | 224,175 | |
| | | | Avianca Holdings SA (Panama) | | | | |
| | 400,000 | | | 8.375%, 05/10/20 (a) | | | 329,000 | |
| | 800,000 | | | 8.375%, 05/10/20 | | | 658,000 | |
| | 230,000 | | | Avis Budget Car Rental
5.500%, 04/01/23 | | | 239,200 | |
| | 145,000 | | | Berry Plastics
Secured Notes
5.500%, 05/15/22 | | | 149,531 | |
| | 295,000 | | | Boeing
Senior Unsecured Notes
6.875%, 03/15/39 | | | 414,697 | |
| | 480,000 | | | Burlington Northern Santa Fe
Senior Unsecured Notes
4.550%, 09/01/44 | | | 477,661 | |
| | 390,000 | | | Delphi
4.150%, 03/15/24 | | | 392,112 | |
| | 414,000 | | | Enterprise Products Operating
3.700%, 02/15/26 | | | 394,512 | |
| | | | ESAL GmbH (Austria) | | | | |
| | 600,000 | | | 6.250%, 02/05/23 (a) | | | 586,500 | |
| | 200,000 | | | 6.250%, 02/05/23 | | | 195,500 | |
| | 515,000 | | | FedEx
4.750%, 11/15/45 | | | 507,847 | |
| | 355,000 | | | Gates Global
6.000%, 07/15/22 (a) | | | 286,662 | |
| | 400,000 | | | Gol LuxCo SA (Luxembourg)
8.875%, 01/24/22 (a) | | | 211,500 | |
| | 200,000 | | | Grupo Cementos de Chihuahua SAB de CV (Mexico)
Senior Secured Notes
8.125%, 02/08/20 | | | 210,000 | |
| | 750,000 | | | Grupo Elektra SAB de CV (Mexico)
7.250%, 08/06/18 | | | 721,875 | |
| | 200,000 | | | Grupo Posadas SAB de CV (Mexico)
7.875%, 06/30/22 (a) | | | 193,000 | |
See accompanying Notes to Financial Statements.
| | |
| |
| ASTON/DoubleLine Core Plus Fixed Income Fund | | October 31, 2015 |
| |
| Schedule of Investments – continued | | |
| | | | | | | | |
Par Value | | | | | Market
Value | |
| | | | | | | |
| | |
| | | | Industrials (continued) | | | | |
| | $ 205,000 | | | HD Supply
7.500%, 07/15/20 | | $ | 219,350 | |
| | 245,000 | | | Hexion US Finance
Senior Secured Notes
6.625%, 04/15/20 | | | 208,862 | |
| | 800,000 | | | Latam Airlines Group (Chile)
Senior Unsecured Notes
7.250%, 06/09/20 (a) | | | 744,000 | |
| | 300,000 | | | Lima Metro Line 2 Finance (Cayman Islands)
Senior Secured Notes
5.875%, 07/05/34 | | | 303,000 | |
| | 210,000 | | | Milacron
7.750%, 02/15/21 (a) | | | 216,300 | |
| | | | OAS Financial (British Virgin Islands) | | | | |
| | 400,000 | | | 8.875%, 04/29/49 (a) | | | 36,000 | |
| | 600,000 | | | 8.875%, 04/29/49 | | | 54,000 | |
| | 400,000 | | | Odebrecht Finance (Cayman Island)
7.125%, 06/26/42 | | | 242,000 | |
| | | | Pesquera Exalmar S.A.A. (Peru)
Senior Unsecured Notes | | | | |
| | 200,000 | | | 7.375%, 01/31/20 (a) | | | 148,000 | |
| | 400,000 | | | 7.375%, 01/31/20 | | | 296,000 | |
| | 310,000 | | | Plastipak Holdings
Senior Unsecured Notes
6.500%, 10/01/21 (a) | | | 308,450 | |
| | 370,000 | | | Reynolds American
4.000%, 06/12/22 | | | 388,531 | |
| | 285,000 | | | Reynolds Group Issuer
8.250%, 02/15/21 | | | 297,469 | |
| | 200,000 | | | Southern Copper
Senior Unsecured Notes
7.500%, 07/27/35 | | | 208,562 | |
| | 230,000 | | | Steel Dynamics
5.125%, 10/01/21 | | | 229,425 | |
| | 200,000 | | | Terex
6.000%, 05/15/21 | | | 199,000 | |
| | 770,000 | | | Thermo Fisher Scientific
Senior Unsecured Notes
3.300%, 02/15/22 | | | 772,481 | |
| | 300,000 | | | TransDigm
6.000%, 07/15/22 | | | 304,500 | |
| | | | Union Andina de Cementos SAA (Peru)
Senior Unsecured Notes | | | | |
| | 350,000 | | | 5.875%, 10/30/21 (a) | | | 351,313 | |
| | 900,000 | | | 5.875%, 10/30/21 | | | 903,375 | |
| | 145,000 | | | United Rentals North America
7.625%, 04/15/22 | | | 158,066 | |
| | 410,000 | | | Waste Management
4.100%, 03/01/45 | | | 386,734 | |
| | | | | | | | |
| | | | | | | 14,457,995 | |
| | | | | | | | |
| | |
| | | | Information Technology – 1.23% | | | | |
| | 195,000 | | | Activision Blizzard
5.625%, 09/15/21 (a) | | | 206,739 | |
| | 382,000 | | | Apple
Senior Unsecured Notes
0.900%, 05/12/17 | | | 383,007 | |
| | | | | | | | |
Par Value | | | | | Market
Value | |
| | | | | | | |
| | |
| | | | Information Technology (continued) | | | | |
| | $ 225,000 | | | Audatex North America
6.000%, 06/15/21 (a) | | $ | 227,421 | |
| | 150,000 | | | CDW
6.000%, 08/15/22 | | | 161,345 | |
| | 505,000 | | | Cisco Systems
Senior Unsecured Notes
1.650%, 06/15/18 | | | 509,237 | |
| | 295,000 | | | Ensemble S Merger
Senior Notes
9.000%, 09/30/23 (a) | | | 298,687 | |
| | 420,000 | | | Fidelity National Information Services
Senior Unsecured Notes
3.625%, 10/15/20 | | | 428,025 | |
| | 40,000 | | | First Data
7.000%, 12/01/23 | | | 40,900 | |
| | 370,000 | | | Hewlett Packard Enterprise
3.600%, 10/15/20 (a) | | | 373,131 | |
| | 275,000 | | | Infor US
Senior Unsecured Notes
6.500%, 05/15/22 (a) | | | 261,250 | |
| | 430,000 | | | International Business Machines
Senior Unsecured Notes
1.125%, 02/06/18 | | | 429,207 | |
| | 330,000 | | | 1.250%, 02/08/18 | | | 329,834 | |
| | 495,000 | | | Microsoft
Senior Unsecured Notes
4.450%, 11/03/45 | | | 504,846 | |
| | | | Oracle
Senior Unsecured Notes | | | | |
| | 420,000 | | | 2.375%, 01/15/19 | | | 428,670 | |
| | 525,000 | | | 2.250%, 10/08/19 | | | 531,688 | |
| | 200,000 | | | Tencent Holdings (Cayman Islands)
Senior Unsecured Notes
3.800%, 02/11/25 (a) | | | 199,226 | |
| | 290,000 | | | Tribune Media
5.875%, 07/15/22 (a) | | | 298,700 | |
| | 450,000 | | | Xerox
Senior Unsecured Notes
2.950%, 03/15/17 | | | 454,824 | |
| | | | | | | | |
| | | | | | | 6,066,737 | |
| | | | | | | | |
| | |
| | | | Materials – 1.99% | | | | |
| | 220,000 | | | Ashland
4.750%, 08/15/22 | | | 220,946 | |
| | 500,000 | | | Braskem America Finance
7.125%, 07/22/41 | | | 400,000 | |
| | 170,000 | | | Celulosa Arauco y Constitucion SA (Chile)
Senior Unsecured Notes
5.000%, 01/21/21 | | | 179,969 | |
| | 1,100,000 | | | Cia Minera Ares SAC (Peru)
7.750%, 01/23/21 | | | 1,072,500 | |
| | 100,000 | | | Colbun SA (Chile)
Senior Unsecured Notes
6.000%, 01/21/20 | | | 111,178 | |
| | 415,000 | | | Dow Chemical
Senior Unsecured Notes
3.000%, 11/15/22 | | | 408,379 | |
See accompanying Notes to Financial Statements.
| | |
| |
| ASTON/DoubleLine Core Plus Fixed Income Fund | | October 31, 2015 |
| |
| Schedule of Investments – continued | | |
| | | | | | | | |
Par Value | | | | | Market
Value | |
| | | | | | | |
| | |
| | | | Materials (continued) | | | | |
| | $ 300,000 | | | Freeport-McMoRan
3.875%, 03/15/23 | | $ | 236,100 | |
| | 850,000 | | | Freeport-McMoRan
5.450%, 03/15/43 | | | 609,875 | |
| | 1,040,000 | | | Georgia-Pacific
Senior Unsecured Notes
3.600%, 03/01/25 (a) | | | 1,040,548 | |
| | 600,000 | | | Grupo Idesa SA de CV (Mexico)
7.875%, 12/18/20 | | | 613,500 | |
| | 1,000,000 | | | Mexichem SAB De CV (Mexico)
5.875%, 09/17/44 | | | 898,750 | |
| | 85,000 | | | Platform Specialty Products
Senior Unsecured Notes
6.500%, 02/01/22 (a) | | | 72,675 | |
| | 325,000 | | | Signode Industrial Group Lux SA
Senior Unsecured Notes
6.375%, 05/01/22 (a) | | | 306,313 | |
| | 200,000 | | | SINOPEC Group Overseas Developement (British Virgin Islands)
2.500%, 04/28/20 (a) | | | 197,541 | |
| | | | Southern Copper
Senior Unsecured Notes | | | | |
| | 1,000,000 | | | 6.750%, 04/16/40 | | | 960,487 | |
| | 280,000 | | | 5.250%, 11/08/42 | | | 228,365 | |
| | | | Vedanta Resources (United Kingdom)
Senior Unsecured Notes | | | | |
| | 400,000 | | | 7.125%, 05/31/23 | | | 299,000 | |
| | 800,000 | | | 7.125%, 05/31/23 (a) | | | 598,000 | |
| | 1,300,000 | | | Volcan Cia Minera SAA (Peru)
5.375%, 02/02/22 | | | 1,173,250 | |
| | 162,000 | | | WCI Communities
6.875%, 08/15/21 | | | 170,910 | |
| | | | | | | | |
| | | | | | | 9,798,286 | |
| | | | | | | | |
| | |
| | | | Telecommunications – 2.62% | | | | |
| | 265,000 | | | 21st Century Fox America
4.750%, 09/15/44 | | | 267,443 | |
| | 780,000 | | | Alibaba Group Holding (Cayman Islands)
3.600%, 11/28/24 (a) | | | 758,472 | |
| | 200,000 | | | Amazon.com
Senior Unsecured Notes
3.800%, 12/05/24 | | | 209,175 | |
| | 555,000 | | | AT&T
Senior Unsecured Notes
3.400%, 05/15/25 | | | 539,880 | |
| | 801,000 | | | British Telecommunications (United Kingdom)
Senior Unsecured Notes
5.950%, 01/15/18 | | | 874,512 | |
| | | | CCO Holdings | | | | |
| | 320,000 | | | 5.250%, 09/30/22 | | | 324,930 | |
| | 55,000 | | | 5.125%, 05/01/23 (a) | | | 55,413 | |
| | 305,000 | | | Cequel Communications Holdings I
Senior Unsecured Notes
6.375%, 09/15/20 (a) | | | 306,525 | |
| | | | | | | | |
Par Value | | | | | Market
Value | |
| | | | | | | |
| | |
| | | | Telecommunications (continued) | | | | |
| | | | Comcast | | | | |
| | $ 120,000 | | | 4.200%, 08/15/34 | | $ | 118,741 | |
| | 355,000 | | | 4.400%, 08/15/35 | | | 360,958 | |
| | 400,000 | | | Comcel Trust Via Comunicaciones Celulares SA (Cayman Islands)
6.875%, 02/06/24 | | | 320,000 | |
| | 220,000 | | | CommScope
5.000%, 06/15/21 (a) | | | 222,200 | |
| | | | Digicel Group (Bermuda)
Senior Unsecured Notes | | | | |
| | 300,000 | | | 7.125%, 04/01/22 (a) | | | 249,000 | |
| | 1,200,000 | | | 7.125%, 04/01/22 | | | 996,000 | |
| | | | ENTEL Chile SA (Chile)
Senior Unsecured Notes | | | | |
| | 700,000 | | | 4.750%, 08/01/26 | | | 683,925 | |
| | 300,000 | | | 4.750%, 08/01/26 (a) | | | 293,111 | |
| | 165,000 | | | Frontier Communications
Senior Unsecured Notes
10.500%, 09/15/22 (a) | | | 171,600 | |
| | 295,000 | | | Gannett
4.875%, 09/15/21 (a) | | | 292,788 | |
| | 200,000 | | | Globo Comunicacao e Participacoes SA (Brazil)
Senior Unsecured Notes
5.307%, 05/11/22 (d) | | | 200,500 | |
| | 255,000 | | | Intelsat Jackson Holdings SA (Luxembourg)
5.500%, 08/01/23 | | | 212,925 | |
| | 295,000 | | | Level 3 Communications
Senior Unsecured Notes
5.750%, 12/01/22 | | | 303,112 | |
| | 210,000 | | | Level 3 Financing
5.375%, 01/15/24 | | | 213,150 | |
| | 375,000 | | | Orange SA (France)
Senior Unsecured Notes
2.750%, 09/14/16 | | | 380,801 | |
| | 300,000 | | | SBA Communications
Senior Unsecured Notes
5.625%, 10/01/19 | | | 314,625 | |
| | 200,000 | | | Sixsigma Networks Mexico SA de CV (Mexico)
8.250%, 11/07/21 (a) | | | 196,000 | |
| | 1,000,000 | | | Telefonica Celular del Paraguay SA (Paraguay)
Senior Unsecured Notes
6.750%, 12/13/22 | | | 915,000 | |
| | 300,000 | | | Telefonica Chile SA (Chile)
Senior Unsecured Notes
3.875%, 10/12/22 | | | 301,340 | |
| | 205,000 | | | Time Warner
3.600%, 07/15/25 | | | 203,683 | |
| | 200,000 | | | TV Azteca SAB de CV (Mexico)
7.500%, 05/25/18 | | | 179,831 | |
| | 500,000 | | | TV Azteca SAB de CV, EMTN (Mexico)
7.625%, 09/18/20 | | | 416,250 | |
| | 985,000 | | | Verizon Communications
Senior Unsecured Notes
4.400%, 11/01/34 | | | 929,648 | |
See accompanying Notes to Financial Statements.
| | |
| |
| ASTON/DoubleLine Core Plus Fixed Income Fund | | October 31, 2015 |
| |
| Schedule of Investments – continued | | |
| | | | | | | | |
Par Value | | | | | Market
Value | |
| | | | | | | |
| | |
| | | | Telecommunications (continued) | | | | |
| | $1,100,000 | | | VTR Finance BV (Netherlands)
Senior Secured Notes
6.875%, 01/15/24 | | $ | 1,069,750 | |
| | | | | | | | |
| | | | | | | 12,881,288 | |
| | | | | | | | |
| | |
| | | | Utilities – 2.86% | | | | |
| | 1,200,000 | | | Abengoa Transmision Sur SA (Peru)
Senior Secured Notes
6.875%, 04/30/43 (a) | | | 1,246,500 | |
| | 500,000 | | | 6.875%, 04/30/43 | | | 519,375 | |
| | 1,700,000 | | | AES Andres Dominicana (Cayman Island)
Senior Secured Notes
9.500%, 11/12/20 | | | 1,719,125 | |
| | 300,000 | | | AES El Salvador Trust II (Panama)
6.750%, 03/28/23 | | | 272,625 | |
| | 400,000 | | | Comision Federal de Electricidad (Mexico)
Senior Unsecured Notes
6.125%, 06/16/45 | | | 389,000 | |
| | 390,000 | | | Duke Energy Progress
4.150%, 12/01/44 | | | 393,114 | |
| | 400,000 | | | Empresa de Energia de Bogota SA ESP (Colombia)
Senior Unsecured Notes
6.125%, 11/10/21 | | | 419,000 | |
| | 2,000,000 | | | Empresa Electrica Angamos SA (Chile)
Senior Secured Notes
4.875%, 05/25/29 | | | 1,884,348 | |
| | 700,000 | | | Empresa Electrica Guacolda SA (Chile) Senior Unsecured Notes
4.560%, 04/30/25 (a) | | | 678,989 | |
| | 600,000 | | | Empresas Publicas de Medellin ESP (Colombia)
Senior Unsecured Notes
7.625%, 07/29/19 | | | 685,320 | |
| | | | Fermaca Enterprises S de RL de CV (Mexico)
Senior Secured Notes | | | | |
| | 293,761 | | | 6.375%, 03/30/38 (a) | | | 284,948 | |
| | 1,028,163 | | | 6.375%, 03/30/38 | | | 997,318 | |
| | 2,000,000 | | | GNL Quintero SA (Chile)
Senior Unsecured Notes
4.634%, 07/31/29 | | | 1,996,856 | |
| | 500,000 | | | Israel Electric (Israel)
Senior Secured Notes
5.000%, 11/12/24 (a) | | | 520,425 | |
| | 984,120 | | | Mexico Generadora de Energia S de rl (Mexico)
Senior Secured Notes
5.500%, 12/06/32 | | | 944,755 | |
| | 343,000 | | | Midamerican Energy Holdings
Senior Unsecured Notes
6.500%, 09/15/37 | | | 430,828 | |
| | | | | | | | |
Par Value | | | | | Market
Value | |
| | | | | | | |
| | |
| | | | Utilities (continued) | | | | |
| | $ 685,000 | | | Southern
Senior Unsecured Notes
2.450%, 09/01/18 | | $ | 693,319 | |
| | | | | | | | |
| | | | | | | 14,075,845 | |
| | | | | | | | |
| | |
| | | | Total Corporate Notes and Bonds
(Cost $152,178,091) | | | 145,907,241 | |
| | | | | | | | |
|
| COLLATERALIZED MORTGAGE AND ASSET-BACKED
SECURITIES – 16.56% |
|
| | 2,920,552 | | | Alternative Loan Trust
Series 2007-J2, Class 2A1
6.000%, 07/01/37 | | | 3,025,705 | |
| | 686,175 | | | American General Mortgage Loan Trust
Series 2010-1A, Class A3
5.650%, 03/01/58 (a) (b) | | | 693,257 | |
| | 600,000 | | | Banc of America Commercial Mortgage Trust
Series 2007-1, Class AMFX
5.482%, 01/01/49 (b) | | | 619,498 | |
| | 350,000 | | | Banc of America Commercial Mortgage Trust
Series 2007-4, Class AM
5.809%, 02/01/51 (b) | | | 372,030 | |
| | 560,866 | | | Banc of America Funding
Series 2006-B, Class 7A1
5.711%, 03/01/36 (b) | | | 505,944 | |
| | 729,874 | | | Banc of America Funding
Series 2010-R9, Class 3A3
5.500%, 12/01/35 (a) | | | 615,341 | |
| | 207,885 | | | Banc of America Funding
Series 2012-R4, Class A
0.452%, 03/03/39 (a) (b) | | | 206,204 | |
| | 630,000 | | | BBCMS Trust
Series 2015-STP, Class D
4.427%, 09/06/28 | | | 621,889 | |
| | 271,662 | | | Bear Stearns Asset Backed Securities I Trust
Series 2004-AC2, Class 2A
5.000%, 05/01/34 | | | 274,103 | |
| | 450,000 | | | Bear Stearns Commercial Mortgage Securities Trust
Series 2007-T26, Class AJ
5.566%, 01/01/45 (b) | | | 454,445 | |
| | 403,500 | | | CDGJ Commercial Mortgage Trust
Series 2014-BXCH, Class B
2.046%, 12/15/27 (a) (b) | | | 398,662 | |
| | 126,150 | | | Citicorp Mortgage Securities Trust
Series 2007-2, Class 3A1
5.500%, 02/01/37 | | | 126,516 | |
| | 450,000 | | | Citigroup Commercial Mortgage Trust
Series 2007-C6, Class AM
5.711%, 12/01/49 (b) | | | 468,461 | |
| | 955,393 | | | Citigroup Commercial Mortgage Trust
Series 2012-GC8, Class XA
2.181%, 09/01/45 (a) (b) | | | 81,052 | |
See accompanying Notes to Financial Statements.
| | |
| |
| ASTON/DoubleLine Core Plus Fixed Income Fund | | October 31, 2015 |
| |
| Schedule of Investments – continued | | |
| | | | | | | | |
Par Value | | | | | Market
Value | |
| | | | | | | |
| | $ 350,000 | | | Citigroup Commercial Mortgage Trust
Series 2013-SMP, Class C
2.738%, 01/01/30 (a) | | $ | 353,834 | |
| | 350,000 | | | Citigroup Commercial Mortgage Trust
Series 2013-SMP, Class D
2.911%, 01/01/30 (a) (b) | | | 352,897 | |
| | 4,931,261 | | | Citigroup Commercial Mortgage Trust
Series 2014-GC25, Class XA
1.094%, 10/01/47 (b) | | | 360,384 | |
| | 440,700 | | | Citigroup Commercial Mortgage Trust
Series 2015-GC27, Class D
4.429%, 02/01/48 (a) (b) | | | 363,299 | |
| | 780,000 | | | Citigroup Commercial Mortgage Trust
Series 2015-GC31, Class C
4.200%, 06/01/48 | | | 746,536 | |
| | 2,274,301 | | | Citigroup Mortgage Loan Trust
Series 2006-AR2, Class 1A2
2.644%, 03/01/36 (b) | | | 2,144,180 | |
| | 340,000 | | | Citigroup/Deutsche Bank Commercial Mortgage Trust
Series 2007-CD4, Class AMFX
5.366%, 12/01/49 (b) | | | 349,904 | |
| | 300,000 | | | COBALT CMBS Commercial Mortgage Trust
Series 2007-C2, Class AFJX
5.568%, 04/01/47 (b) | | | 300,165 | |
| | 64,089 | | | Commercial Mortgage Pass Through Certificates
Series 2010-C1, Class XPA
1.629%, 07/01/46 (a) (b) | | | 1,914 | |
| | 1,890,003 | | | Commercial Mortgage Pass Through Certificates
Series 2012-CR3, Class XA
2.118%, 10/01/45 (b) | | | 181,919 | |
| | 20,722,126 | | | Commercial Mortgage Pass Through Certificates
Series 2013-CR10, Class XA
0.983%, 08/01/46 (b) | | | 936,686 | |
| | 3,702,478 | | | Commercial Mortgage Pass Through Certificates
Series 2014-CCRE19, Class XA
1.306%, 08/01/47 (b) | | | 265,836 | |
| | 300,000 | | | Commercial Mortgage Pass Through Certificates
Series 2014-CR20, Class C
4.507%, 11/01/47 (b) | | | 298,041 | |
| | 350,000 | | | Commercial Mortgage Pass Through Certificates
Series 2014-KYO, Class E
2.546%, 06/11/27 (a) (b) | | | 344,370 | |
| | 300,000 | | | Commercial Mortgage Pass Through Certificates
Series 2014-KYO, Class F
3.696%, 06/11/27 (a) (b) | | | 295,922 | |
| | 350,000 | | | Commercial Mortgage Pass Through Certificates
Series 2015-CCRE23, Class D
4.257%, 05/01/48 (b) | | | 286,563 | |
| | | | | | | | |
Par Value | | | | | Market
Value | |
| | | | | | | |
| | $ 470,000 | | | Commercial Mortgage Pass Through Certificates
Series 2015-CR25, Class C
4.548%, 08/01/48 | | $ | 454,694 | |
| | 600,000 | | | Commercial Mortgage Pass Through Certificates
Series 2015-CR26, Class B
4.646%, 10/01/48 | | | 622,725 | |
| | 8,400,000 | | | Commercial Mortgage Pass Through Certificates
Series 2015-CR26, Class XA
1.220%, 10/01/48 | | | 619,723 | |
| | 350,000 | | | Commercial Mortgage Trust
Series 2006-GG7, Class AJ
5.819%, 07/01/38 (b) | | | 347,827 | |
| | 650,000 | | | Commercial Mortgage Trust
Series 2007-GG11, Class AJ
6.047%, 12/01/49 (b) | | | 666,785 | |
| | 500,000 | | | Core Industrial Trust
Series 2015-CALW, Class D
3.850%, 02/01/34 (a) (b) | | | 500,298 | |
| | 1,422,928 | | | Countrywide Alternative Loan Trust
Series 2005-86CB, Class A5
5.500%, 02/01/36 | | | 1,295,166 | |
| | 532,200 | | | Countrywide Alternative Loan Trust
Series 2006-J1, Class 2A1
7.000%, 02/01/36 | | | 275,721 | |
| | 86,538 | | | Countrywide Alternative Loan Trust
Series 2007-18CB, Class 2A17
6.000%, 08/01/37 | | | 77,864 | |
| | 331,552 | | | Countrywide Alternative Loan Trust
Series 2007-23CB, Class A3
0.697%, 09/25/37 (b) | | | 212,191 | |
| | 316,577 | | | Countrywide Alternative Loan Trust
Series 2007-23CB, Class A4
6.303%, 09/25/37 (b) (e) | | | 86,632 | |
| | 665,137 | | | Countrywide Home Loan Mortgage Pass Through Trust
Series 2005-HYB8, Class 4A1
4.106%, 12/01/35 (b) | | | 597,237 | |
| | 1,732,255 | | | Countrywide Home Loan Mortgage Pass Through Trust
Series 2007-14, Class A15
6.500%, 09/01/37 | | | 1,718,149 | |
| | 597,180 | | | Countrywide Home Loan Mortgage Pass Through Trust
Series 2007-2, Class A13
6.000%, 03/01/37 | | | 572,973 | |
| | 132,400 | | | Countrywide Home Loan Mortgage Pass Through Trust
Series 2007-7, Class A4
5.750%, 06/01/37 | | | 127,414 | |
| | 275,000 | | | Credit Suisse Commercial Mortgage Trust
Series 2006-C4, Class AM
5.509%, 09/01/39 | | | 282,783 | |
| | 625,000 | | | Credit Suisse Commercial Mortgage Trust
Series 2007-C4, Class A1AM
5.949%, 09/01/39 | | | 661,606 | |
See accompanying Notes to Financial Statements.
| | |
| |
| ASTON/DoubleLine Core Plus Fixed Income Fund | | October 31, 2015 |
| |
| Schedule of Investments – continued | | |
| | | | | | | | |
Par Value | | | | | Market
Value | |
| | | | | | | |
| | $ 40,183 | | | Credit Suisse First Boston Mortgage Securities
Series 1998-C2, Class F
6.750%, 11/11/30 (a) (b) | | $ | 40,816 | |
| | 1,953,606 | | | Credit Suisse First Boston Mortgage Securities
Series 2005-9, Class 5A9
5.500%, 10/01/35 | | | 1,731,020 | |
| | 944,708 | | | Credit Suisse Mortgage Capital Certificates
Series 2007-1, Class 5A4
6.000%, 02/01/37 | | | 836,241 | |
| | 250,000 | | | Credit Suisse Mortgage Capital Certificates
Series 2009-RR2, Class IQB
5.695%, 04/01/49 (a) (b) | | | 260,423 | |
| | 4,113,275 | | | CSMC Trust
Series 2013-IVR4, Class A11
3.492%, 07/01/43 (a) (b) | | | 4,153,892 | |
| | 4,113,275 | | | CSMC Trust
Series 2013-IVR4, Class A2
3.000%, 07/01/43 (a) (b) | | | 4,063,081 | |
| | 150,000 | | | Del Coronado Trust
Series 2013-HDC, Class D
2.146%, 03/15/26 (a) (b) | | | 149,979 | |
| | 150,000 | | | Del Coronado Trust
Series 2013-HDC, Class E
2.846%, 03/15/26 (a) (b) | | | 150,228 | |
| | 3,514,516 | | | First Horizon Alternative Mortgage Securities Trust
Series 2005-FA4, Class 1A6
5.500%, 06/01/35 | | | 3,269,807 | |
| | 1,901,720 | | | First Horizon Mortgage Pass-Through Trust
Series 2006-2, Class 1A3
6.000%, 08/01/36 | | | 1,832,705 | |
| | 601,400 | | | GE Commercial Mortgage Trust
Series 2007-C1, Class AM
5.606%, 12/01/49 | | | 623,819 | |
| | 350,000 | | | GS Mortgage Securities Trust
Series 2006-GG6, Class AJ
5.522%, 04/01/38 (b) | | | 351,032 | |
| | 396,600 | | | GS Mortgage Securities Trust
Series 2006-GG8, Class AJ
5.622%, 11/01/39 | | | 399,968 | |
| | 391,000 | | | GS Mortgage Securities Trust
Series 2014-GC26, Class C
4.511%, 11/01/47 (b) | | | 391,229 | |
| | 6,500,000 | | | GS Mortgage Securities Trust
Series 2015-GC34, Class XA
1.537%, 10/01/48 | | | 641,341 | |
| | 646,740 | | | GSR Mortgage Loan Trust
Series 2006-AR1, Class 3A1
2.839%, 01/01/36 (b) | | | 589,604 | |
| | 50,129 | | | HSI Asset Loan Obligation Trust
Series 2007-2, Class 1A1
5.500%, 09/01/37 | | | 48,320 | |
| | | | | | | | |
Par Value | | | | | Market
Value | |
| | | | | | | |
| | $1,615,145 | | | JP Morgan Chase Commercial Mortgage Securities Trust
Series 2006-LDP8, Class X
0.504%, 05/01/45 (b) | | $ | 5,278 | |
| | 350,000 | | | JP Morgan Chase Commercial Mortgage Securities Trust
Series 2006-LDP9, Class AM
5.372%, 05/01/47 | | | 358,309 | |
| | 350,000 | | | JP Morgan Chase Commercial Mortgage Securities Trust
Series 2007-CB19 Class AM
5.695%, 02/01/49 (b) | | | 367,621 | |
| | 537,200 | | | JP Morgan Chase Commercial Mortgage Securities Trust
Series 2007-CB20, Class AJ
6.076%, 02/01/51 (b) | | | 552,721 | |
| | 250,000 | | | JP Morgan Chase Commercial Mortgage Securities Trust
Series 2007-LD12, Class AM
6.009%, 02/01/51 (b) | | | 265,646 | |
| | 1,095,277 | | | JP Morgan Chase Commercial Mortgage Securities Trust
Series 2011-C4, Class XA
1.444%, 07/01/46 (a) (b) | | | 36,289 | |
| | 2,326,268 | | | JP Morgan Chase Commercial Mortgage Securities Trust
Series 2012-C8, Class XA
2.093%, 10/01/45 (b) | | | 203,054 | |
| | 789,324 | | | JP Morgan Chase Commercial Mortgage Securities Trust
Series 2012-CBX, Class XA
1.748%, 06/01/45 (b) | | | 52,073 | |
| | 5,887,484 | | | JP Morgan Chase Commercial Mortgage Securities Trust
Series 2014-C18, Class XA
1.138%, 02/01/47 (b) | | | 344,807 | |
| | 300,000 | | | JP Morgan Chase Commercial Mortgage Securities Trust
Series 2014-C21, Class C
4.661%, 08/01/47 (b) | | | 296,804 | |
| | 3,715,391 | | | JP Morgan Chase Commercial Mortgage Securities Trust
Series 2014-C21, Class XA
1.113%, 08/01/47 (b) | | | 262,410 | |
| | 330,824 | | | JP Morgan Chase Commercial Mortgage Securities Trust
Series 2014-C23, Class C
4.460%, 09/01/47 (b) | | | 329,138 | |
| | 450,000 | | | JP Morgan Chase Commercial Mortgage Securities Trust
Series 2014-C25, Class C
4.449%, 11/01/47 (b) | | | 444,527 | |
| | 6,524,820 | | | JP Morgan Chase Commercial Mortgage Securities Trust
Series 2014-C25, Class XA
1.012%, 11/01/47 (b) | | | 412,293 | |
| | 5,296,743 | | | JP Morgan Chase Commercial Mortgage Securities Trust
Series 2014-C26, Class XA
1.183%, 01/01/48 (b) | | | 355,773 | |
See accompanying Notes to Financial Statements.
| | |
| |
| ASTON/DoubleLine Core Plus Fixed Income Fund | | October 31, 2015 |
| |
| Schedule of Investments – continued | | |
| | | | | | | | |
Par Value | | | | | Market
Value | |
| | | | | | | |
| | $ 300,000 | | | JP Morgan Chase Commercial Mortgage Securities Trust
Series 2014-DSTY, Class A
3.429%, 06/06/27 (a) | | $ | 311,117 | |
| | 4,445,231 | | | JP Morgan Chase Commercial Mortgage Securities Trust
Series 2015-C27, Class XA
1.391%, 02/01/48 (b) | | | 365,557 | |
| | 7,979,088 | | | JP Morgan Chase Commercial Mortgage Securities Trust
Series 2015-C28, Class XA
1.207%, 10/01/48 (b) | | | 571,701 | |
| | 650,000 | | | JP Morgan Chase Commercial Mortgage Securities Trust
Series 2015-C32, Class C
4.819%, 11/01/48 | | | 606,834 | |
| | 250,000 | | | LB Commercial Mortgage Trust
Series 2007-C3, Class AMFL
5.899%, 07/11/44 (a) (b) | | | 265,971 | |
| | 350,000 | | | LB-UBS Commercial Mortgage Trust
Series 2007-C1, Class AJ
5.484%, 02/11/40 | | | 359,440 | |
| | 350,000 | | | Merrill Lynch Mortgage Trust
Series 2006-C2, Class AJ
5.802%, 08/01/43 (b) | | | 352,339 | |
| | 300,000 | | | ML-CFC Commercial Mortgage Trust
Series 2006-1, Class AJ
5.563%, 02/01/39 (b) | | | 302,116 | |
| | 250,000 | | | ML-CFC Commercial Mortgage Trust
Series 2007-5, Class AM
5.419%, 08/01/48 | | | 259,036 | |
| | 938,665 | | | Morgan Stanley Bank of America Merrill Lynch Trust
Series 2012-C5, Class XA
1.809%, 08/01/45 (a) (b) | | | 66,801 | |
| | 5,945,597 | | | Morgan Stanley Bank of America Merrill Lynch Trust
Series 2014-C14, Class XA
1.286%, 02/01/47 (b) | | | 360,247 | |
| | 300,000 | | | Morgan Stanley Bank of America Merrill Lynch Trust
Series 2014-C18, Class C
4.489%, 10/01/47 | | | 306,446 | |
| | 413,500 | | | Morgan Stanley Bank of America Merrill Lynch Trust
Series 2014-C19, Class C
4.000%, 12/01/47 | | | 402,368 | |
| | 785,000 | | | Morgan Stanley Bank of America Merrill Lynch Trust
Series 2015-C25, Class C
4.680%, 10/01/48 | | | 750,807 | |
| | 800,000 | | | Morgan Stanley Bank of America Merrill Lynch Trust
Series 2015-C26, Class D
3.060%, 11/01/48 (c) | | | 579,246 | |
| | 300,000 | | | Morgan Stanley Capital I Trust
Series 2006-HQ8, Class AJ
5.495%, 03/01/44 (b) | | | 300,867 | |
| | | | | | | | |
Par Value | | | | | Market
Value | |
| | | | | | | |
| | $ 375,100 | | | Morgan Stanley Capital I Trust
Series 2007-1Q16, Class AMA 6.070%, 12/01/49 (b) | | $ | 398,540 | |
| | 300,000 | | | Morgan Stanley Capital I Trust
Series 2007-HQ11, Class AJ
5.508%, 02/01/44 (b) | | | 305,130 | |
| | 250,000 | | | Morgan Stanley Capital I Trust
Series 2007-IQ13, Class AM
5.406%, 03/01/44 | | | 258,361 | |
| | 758,946 | | | Morgan Stanley Capital I Trust
Series 2011-C1, Class XA
0.752%, 09/01/47 (a) (b) | | | 13,207 | |
| | 250,000 | | | Morgan Stanley Capital I Trust
Series 2014-CPT, Class E
3.446%, 07/01/29 (a) (b) | | | 247,704 | |
| | 350,000 | | | Morgan Stanley Capital I Trust
Series 2014-MP, Class D
3.693%, 08/01/29 (a) (b) | | | 355,488 | |
| | 955,723 | | | Morgan Stanley Mortgage Loan Trust
Series 2005-3AR, Class 2A2
2.496%, 07/01/35 (b) | | | 879,914 | |
| | 7,483,762 | | | Morgan Stanley Mortgage Loan Trust
Series 2005-9AR, Class 2A
2.768%, 12/01/35 | | | 6,427,646 | |
| | 289,187 | | | Nomura Asset Acceptance Corp Alternative Loan Trust
Series 2005-AP3, Class A3
5.318%, 08/01/35 (b) | | | 195,230 | |
| | 4,862,323 | | | RALI Trust
Series 2006-QS7, Class A2
6.000%, 06/01/36 | | | 4,045,882 | |
| | 230,908 | | | Residential Asset Securitization Trust
Series 2006-A6, Class 1A1
6.500%, 07/01/36 | | | 136,555 | |
| | 518,634 | | | Residential Asset Securitization Trust
Series 2007-A1, Class A8
6.000%, 03/01/37 | | | 368,351 | |
| | 2,288,159 | | | Sequoia Mortgage Trust
Series 2013-1, Class 2A1
1.855%, 02/01/43 (b) | | | 2,084,265 | |
| | 360,216 | | | Structured Adjustable Rate Mortgage Loan Trust
Series 2006-1, Class 2A2
2.634%, 02/01/36 (b) | | | 319,710 | |
| | 1,891,068 | | | UBS-Barclays Commercial Mortgage Trust
Series 2012-C3, Class XA
2.097%, 08/01/49 (a) (b) | | | 180,252 | |
| | 500,000 | | | Wachovia Bank Commercial Mortgage Trust
Series 2007-C32, Class AMFX
5.703%, 06/01/49 (a) | | | 524,816 | |
| | 540,000 | | | Wachovia Bank Commercial Mortgage Trust
Series 2006-C28, Class AJ
5.632%, 10/01/48 (b) | | | 547,613 | |
| | 1,063,000 | | | Wachovia Bank Commercial Mortgage Trust
Series 2007-C30, Class AJ
5.413%, 12/01/43 (b) | | | 1,065,275 | |
See accompanying Notes to Financial Statements.
| | |
| |
| ASTON/DoubleLine Core Plus Fixed Income Fund | | October 31, 2015 |
| |
| Schedule of Investments – continued | | |
| | | | | | | | |
Par Value | | | | | Market
Value | |
| | | | | | | |
| | $ 250,000 | | | Wachovia Bank Commercial Mortgage Trust
Series 2007-C30, Class AM
5.383%, 12/01/43 | | $ | 259,312 | |
| | 350,000 | | | Wachovia Bank Commercial Mortgage Trust
Series 2007-C30, Class AMFL
0.407%, 12/15/43 (a) (b) | | | 340,342 | |
| | 300,000 | | | Wachovia Bank Commercial Mortgage Trust
Series 2007-C33, Class AJ
5.952%, 02/01/51 (b) | | | 307,843 | |
| | 2,306,196 | | | Washington Mutual Mortgage Pass-Through Certificates WMALT Trust
Series 2005-8, Class 2CB1
5.500%, 10/01/35 | | | 2,323,166 | |
| | 471,800 | | | Wells Fargo Commercial Mortgage Trust
Series 2015-C26, Class D
3.586%, 02/01/48 (a) | | | 366,301 | |
| | 725,000 | | | Wells Fargo Commercial Mortgage Trust
Series 2014-LC16, Class D
3.938%, 08/01/50 | | | 593,104 | |
| | 400,000 | | | Wells Fargo Commercial Mortgage Trust
Series 2015-C28, Class C
4.139%, 05/01/48 (b) | | | 379,745 | |
| | 585,000 | | | Wells Fargo Commercial Mortgage Trust
Series 2015-C31, Class C
4.612%, 11/01/48 (c) | | | 558,991 | |
| | 4,483,085 | | | Wells Fargo Commercial Mortgage Trust
Series 2015-NXS1, Class XA
1.210%, 05/01/48 (b) | | | 339,981 | |
| | 610,000 | | | Wells Fargo Commercial Mortgage Trust
Series 2015-NXS3, Class C
4.638%, 09/01/57 | | | 593,309 | |
| | 512,000 | | | Wells Fargo Commercial Mortgage Trust
Series 2014-LC18, Class B
3.959%, 12/01/47 | | | 509,459 | |
| | 380,596 | | | Wells Fargo Mortgage Backed Securities Trust
Series 2007-13, Class A6
6.000%, 09/01/37 | | | 392,099 | |
| | 401,987 | | | Wells Fargo Mortgage Backed Securities Trust
Series 2007-8, Class 1A16
6.000%, 07/01/37 | | | 399,989 | |
| | 952,804 | | | WF-RBS Commercial Mortgage Trust
Series 2012-C8, Class XA
2.171%, 08/01/45 (a) (b) | | | 83,137 | |
| | 1,409,961 | | | WF-RBS Commercial Mortgage Trust
Series 2012-C9, Class XA
2.176%, 11/01/45 (a) (b) | | | 135,866 | |
| | 6,324,729 | | | WFRBS Commercial Mortgage Trust
Series 2014-C21, Class XA
1.185%, 08/01/47 | | | 448,128 | |
| | | | | | | | |
| | |
| | | | Total Collateralized Mortgage and Asset-Backed Securities
(Cost $81,276,951) | | | 81,531,197 | |
| | | | | | | | |
| | | | | | | | |
Par Value | | | | | Market
Value | |
| | | | | | | |
|
| | U.S. GOVERNMENT AND AGENCY OBLIGATIONS – 35.93% | |
| | |
| | | | Fannie Mae – 10.60% | | | | |
| | $ 379,138 | | | 4.000%, 06/01/42
Pool # AB5459 | | $ | 396,063 | |
| | 4,431,845 | | | 3.000%, 10/01/34
Pool # AS3456 | | | 4,592,750 | |
| | 4,703,032 | | | 3.000%, 01/01/35
Pool # AS4281 | | | 4,865,322 | |
| | 3,888,043 | | | 3.000%, 03/01/45
Pool # AS4645 | | | 3,934,049 | |
| | 679,288 | | | 3.500%, 12/01/31
Pool # MA0919 | | | 716,289 | |
| | 598,461 | | | 3.500%, 01/01/32
Pool # MA0949 | | | 631,001 | |
| | 204,295 | | | 4.500%, 03/01/42
Pool # MA1050 | | | 215,749 | |
| | 1,595,444 | | | 3.000%, 06/01/33
Pool # MA1459 | | | 1,651,533 | |
| | 5,341,242 | | | 3.000%, 04/01/45
Pool # MA2248 | | | 5,347,249 | |
| | 266,830 | | | 4.000%, 09/01/31
Pool # MA3894 | | | 287,102 | |
| | 234,834 | | | 6.423%, 10/25/36 (b) (e)
Series 2007-57, Class SX, REMIC | | | 37,455 | |
| | 465,006 | | | 5.603%, 09/25/36 (b) (e)
Series 2009-86, Class CI, REMIC | | | 54,355 | |
| | 320,107 | | | 4.000%, 01/01/41
Series 2010-156, Class ZC, REMIC | | | 341,125 | |
| | 380,387 | | | 4.500%, 12/01/41
Series 2011-121, Class JP, REMIC | | | 404,764 | |
| | 481,941 | | | 4.000%, 03/01/41
Series 2011-18, Class UZ, REMIC | | | 498,443 | |
| | 1,113,780 | | | 3.500%, 10/01/42
Series 2012-105, Class Z, REMIC | | | 1,098,812 | |
| | 2,623,877 | | | 2.750%, 11/01/42
Series 2012-127, Class PA | | | 2,633,880 | |
| | 4,092,242 | | | 3.500%, 03/01/42
Series 2012-20, Class ZT, REMIC | | | 4,149,871 | |
| | 1,730,759 | | | 4.000%, 04/01/42
Series 2012-31, Class Z, REMIC | | | 1,805,325 | |
| | 5,175,021 | | | 3.000%, 02/01/43
Series 2013-8, Class Z, REMIC | | | 4,760,969 | |
| | 5,152,080 | | | 3.000%, 11/01/44
Series 2014-73, Class CZ, REMIC | | | 4,690,199 | |
| | 8,720,272 | | | 3.000%, 01/01/45
Series 2015-9, Class HA | | | 9,055,633 | |
| | | | | | | | |
| | | | | | | 52,167,938 | |
| | | | | | | | |
| | |
| | | | Freddie Mac – 8.82% | | | | |
| | 3,145,752 | | | 3.000%, 03/01/44
Series 4316, Class BZ, REMIC | | | 2,943,924 | |
| | 1,524,368 | | | 3.000%, 01/01/33
Gold Pool # C91594 | | | 1,577,211 | |
| | 39,597 | | | 5.000%, 07/01/35
Gold Pool # G01840 | | | 43,831 | |
| | 11,933 | | | 5.500%, 12/01/38
Gold Pool # G06172 | | | 13,284 | |
See accompanying Notes to Financial Statements.
| | |
| |
| ASTON/DoubleLine Core Plus Fixed Income Fund | | October 31, 2015 |
| |
| Schedule of Investments – continued | | |
| | | | | | | | |
Par Value | | | | | Market
Value | |
| | | | | | | |
| | |
| | | | Freddie Mac (continued) | | | | |
| | $6,730,410 | | | 3.500%, 02/01/45
Gold Pool # Q31596 | | $ | 7,000,396 | |
| | 252,056 | | | 4.000%, 10/01/41
Gold Pool # T60392 | | | 263,965 | |
| | 939,525 | | | 3.500%, 10/01/42
Gold Pool # T65110 | | | 965,467 | |
| | 3,961,673 | | | 3.000%, 07/01/45
Pool # G08653 | | | 3,996,793 | |
| | 4,968,222 | | | 3.000%, 08/01/45
Pool # G08658 | | | 5,012,265 | |
| | 519,603 | | | 5.000%, 12/01/34
Series 2909, Class Z, REMIC | | | 570,820 | |
| | 150,230 | | | 5.904%, 04/15/37 (b) (e)
Series 3301, Class MS, REMIC | | | 23,027 | |
| | 77,692 | | | 5.804%, 11/15/37 (b) (e)
Series 3382, Class SB, REMIC | | | 10,450 | |
| | 96,273 | | | 6.194%, 11/15/37 (b) (e)
Series 3384, Class S, REMIC | | | 13,789 | |
| | 234,052 | | | 5.324%, 01/15/39 (b) (e)
Series 3500, Class SA, REMIC | | | 25,307 | |
| | 267,000 | | | 5.500%, 08/01/36
Series 3626, Class AZ, REMIC | | | 294,104 | |
| | 1,500,000 | | | 4.000%, 12/01/38
Series 3738, Class BP, REMIC | | | 1,600,584 | |
| | 120,887 | | | 4.000%, 01/01/41
Series 3795, Class VZ, REMIC | | | 128,654 | |
| | 73,420 | | | 4.000%, 06/01/41
Series 3872, Class BA, REMIC | | | 76,776 | |
| | 236,994 | | | 4.000%, 07/01/41
Series 3888, Class ZG, REMIC | | | 253,287 | |
| | 423,558 | | | 4.500%, 07/01/41
Series 3894, Class ZA, REMIC | | | 457,204 | |
| | 573,347 | | | 3.500%, 11/01/41
Series 3957, Class DZ, REMIC | | | 570,644 | |
| | 526,185 | | | 4.000%, 11/01/41
Series 3957, Class HZ, REMIC | | | 559,876 | |
| | 4,656,204 | | | 2.250%, 03/01/38 | | | 4,715,208 | |
| | 4,964,292 | | | 3.000%, 01/01/41 | | | 5,094,819 | |
| | 6,571,038 | | | 5.304%, 07/15/42 | | | 1,032,403 | |
| | 2,155,006 | | | 9.469%, 01/15/41 (b)
Series 3792, Class SE, REMIC | | | 2,213,865 | |
| | 3,819,815 | | | 3.000%, 06/01/40
Series 4323, Class GA, REMIC | | | 3,951,890 | |
| | | | | | | | |
| | | | | | | 43,409,843 | |
| | | | | | | | |
| | |
| | | | Ginnie Mae – 0.81% | | | | |
| | 36,940 | | | 31.237%, 03/20/34 (b)
Series 2004-35, Class SA | | | 62,520 | |
| | 477,457 | | | 7.436%, 08/20/38 (b) (e)
Series 2008-69, Class SB | | | 104,934 | |
| | 555,737 | | | 4.500%, 05/01/39
Series 2009-32, Class ZE | | | 602,695 | |
| | 646,532 | | | 4.500%, 05/01/39
Series 2009-35, Class DZ | | | 698,101 | |
| | 657,107 | | | 4.500%, 09/01/39
Series 2009-75, Class GZ | | | 705,202 | |
| | | | | | | | |
Par Value | | | | | Market
Value | |
| | | | | | | |
| | |
| | | | Ginnie Mae (continued) | | | | |
| | $ 228,980 | | | 5.867%, 03/01/39 (b) (e)
Series 2010-98, Class IA | | $ | 25,863 | |
| | 1,182,352 | | | 5.256%, 06/20/41 (b) (e)
Series 2011-89, Class SA | | | 174,407 | |
| | 4,919,870 | | | 6.056%, 10/20/44 (b) (e)
Series 2014-156, Class PS | | | 881,917 | |
| | 4,688,420 | | | 5.956%, 07/20/43 (b) (e)
Series 2014-5, Class PS | | | 737,771 | |
| | | | | | | | |
| | | | | | | 3,993,410 | |
| | | | | | | | |
| | |
| | | | U.S. Treasury Bonds – 1.65% | | | | |
| | 4,920,000 | | | 2.750%, 11/15/42 | | | 4,763,943 | |
| | 2,940,000 | | | 3.625%, 02/15/44 | | | 3,362,013 | |
| | | | | | | | |
| | | | | | | 8,125,956 | |
| | | | | | | | |
| |
| | | | U.S. Treasury Inflation Index Bonds – 2.33% | |
| | 11,502,949 | | | 0.125%, 04/15/19 | | | 11,489,467 | |
| | | | | | | | |
| | |
| | | | U.S. Treasury Notes – 11.72% | | | | |
| | 2,390,000 | | | 0.250%, 12/31/15 | | | 2,390,576 | |
| | 3,510,000 | | | 0.375%, 03/31/16 | | | 3,512,376 | |
| | 4,260,000 | | | 2.125%, 01/31/21 | | | 4,371,493 | |
| | 8,300,000 | | | 2.250%, 03/31/21 | | | 8,564,621 | |
| | 7,960,000 | | | 2.000%, 08/31/21 | | | 8,080,284 | |
| | 7,930,000 | | | 1.750%, 02/28/22 | | | 7,896,702 | |
| | 7,950,000 | | | 1.750%, 03/31/22 | | | 7,909,010 | |
| | 6,820,000 | | | 1.750%, 05/15/23 | | | 6,714,283 | |
| | 8,180,000 | | | 2.250%, 11/15/24 | | | 8,271,600 | |
| | | | | | | | |
| | | | | | | 57,710,945 | |
| | | | | | | | |
| | |
| | | | Total U.S. Government and Agency Obligations
(Cost $176,854,731) | | | 176,897,559 | |
| | | | | | | | |
|
| | OTHER MORTGAGE AND ASSET-BACKED SECURITIES – 6.73% | |
| | 250,000 | | | Adams Mill CLO (Cayman Islands)
Series 2014-1A, Class D1
3.821%, 07/15/26 (a) (b) | | | 228,155 | |
| | 250,000 | | | Adams Mill CLO (Cayman Islands)
Series 2014-1A, Class E1
5.321%, 07/15/26 (a) (b) | | | 210,526 | |
| | 500,000 | | | Apidos CDO V (Cayman Islands)
Seires 2007-5A, Class B
1.021%, 04/15/21 (a) (b) | | | 488,289 | |
| | 500,000 | | | Apidos CDO XXI (Cayman Islands)
Series 2015-21A, Class C
3.827%, 07/18/27 (a) (b) | | | 465,539 | |
| | 500,000 | | | Apidos CLO XVI (Cayman Islands)
Series 2013-16A, Class B
3.115%, 01/19/25 (a) (b) | | | 485,500 | |
| | 250,000 | | | Apidos CLO XVIII (Cayman Islands)
Series 2014-18A, Class C
3.970%, 07/22/26 (a) (b) | | | 235,694 | |
| | 250,000 | | | Apidos CLO XVIII (Cayman Islands)
Series 2014-18A, Class D
5.520%, 07/22/26 (a) (b) | | | 216,248 | |
See accompanying Notes to Financial Statements.
| | |
| |
| ASTON/DoubleLine Core Plus Fixed Income Fund | | October 31, 2015 |
| |
| Schedule of Investments – continued | | |
| | | | | | | | |
Par Value | | | | | Market
Value | |
| | | | | | | |
| | $ 500,000 | | | Apidos CLO XX (Cayman Islands)
Series 2015-20A, Class B
3.517%, 01/16/27 (a) (b) | | $ | 498,241 | |
| | 500,000 | | | Apidos CLO XX (Cayman Islands)
Series 2015-20A, Class C
4.017%, 01/16/27 (a) (b) | | | 468,319 | |
| | 500,000 | | | ARES XXVI CLO (Cayman Islands)
Series 2013-1A, Class D
4.071%, 04/15/25 (a) (b) | | | 466,557 | |
| | 500,000 | | | Atrium V (Cayman Islands)
0.723%, 07/20/20 (a) | | | 483,828 | |
| | 500,000 | | | Babson CLO (Cayman Islands)
Series 2012-2A, Class CR
3.921%, 05/15/23 (a) (b) | | | 483,334 | |
| | 250,000 | | | Babson CLO (Cayman Islands)
Series 2014-3A, Class E2
6.821%, 01/15/26 (a) (b) | | | 231,428 | |
| | 500,000 | | | Babson CLO (Cayman Islands)
Series 2015-2A, Class D
3.894%, 07/20/27 (a) (b) | | | 473,750 | |
| | 250,000 | | | Babson CLO (Cayman Islands)
Series 2015-IA, Class D1
3.729%, 04/20/27 (a) (b) | | | 233,952 | |
| | 673,619 | | | Bayview Financial Acquisition Trust
Series 2007-A, Class 1A5
6.101%, 05/01/37 (d) | | | 677,713 | |
| | 250,000 | | | Birchwood Park CLO (Cayman Islands)
Series 2014-1A, Class C2
3.471%, 07/15/26 (a) (b) | | | 248,304 | |
| | 250,000 | | | Birchwood Park CLO (Cayman Islands)
Series 2014-1A, Class D2
4.521%, 07/15/26 (a) (b) | | | 247,547 | |
| | 250,000 | | | BlueMountain CLO (Cayman Islands)
Series 2012-1A, Class E
5.787%, 07/20/23 (a) (b) | | | 245,285 | |
| | 750,000 | | | BlueMountain CLO (Cayman Islands)
Series 2012-2A, Class C
3.083%, 11/20/24 (a) (b) | | | 749,203 | |
| | 500,000 | | | BlueMountain CLO (Cayman Islands)
Series 2015-2A, Class C
2.976%, 07/18/27 (a) (b) | | | 489,802 | |
| | 500,000 | | | BlueMountain CLO (Cayman Islands)
Series 2015-2A, Class D
3.826%, 07/18/27 (a) (b) | | | 470,295 | |
| | 250,000 | | | Brookside Mill CLO (Cayman Islands)
Series 2013-1A, Class D
3.365%, 04/17/25 (a) (b) | | | 223,166 | |
| | 250,000 | | | Brookside Mill CLO (Cayman Islands)
Series 2013-1A, Class E
4.715%, 04/17/25 (a) (b) | | | 206,643 | |
| | 500,000 | | | Canyon Capital CLO (Cayman Islands)
Series 2014-1A, Class B
2.947%, 04/30/25 (a) (b) | | | 479,404 | |
| | 500,000 | | | Carlyle Global Market Strategies (Cayman Islands)
Series 2014-7A, Class C
3.317%, 04/17/25 (a) (b) | | | 492,592 | |
| | | | | | | | |
Par Value | | | | | Market
Value | |
| | | | | | | |
| | $1,479,332 | | | Carlyle High Yield Partners X (Cayman Islands)
Series 2007-10A, Class A1
0.540%, 04/19/22 | | $ | 1,435,509 | |
| | 250,000 | | | Catamaran CLO (Cayman Islands)
Series 2015-1A, Class C1
3.420%, 04/22/27 (a) (b) | | | 243,350 | |
| | 500,000 | | | Cent CDO 10 (Cayman Islands)
Series 2005-10A, Class D
2.087%, 12/15/17 (a) (b) | | | 495,171 | |
| | 500,000 | | | ColumbusNova CLO (Cayman Islands) Series 2006-1A, Class D
1.865%, 07/18/18 | | | 495,677 | |
| | 500,000 | | | ColumbusNova CLO (Cayman Islands)
Series 2006-2A, Class D
1.811%, 04/04/18 (a) (b) | | | 500,570 | |
| | 2,580,493 | | | Credit Suisse Commercial Mortgage Trust
Series 2015-PR2, Class A1
4.250%, 07/26/55 (a) | | | 2,556,863 | |
| | 100,000 | | | Credit-Based Asset Servicing and Securitization
Series 2007-MX1, Class A4
6.231%, 12/01/36 (a) (d) | | | 95,698 | |
| | 1,000,000 | | | Dryden 33 Senior Loan Fund (Cayman Islands)
Series 2014-33A, Class B
2.321%, 07/15/26 (c) | | | 986,000 | |
| | 750,000 | | | Dryden XXIV Senior Loan Fund (Cayman Islands)
Series 2012-24RA, Class DR
4.021%, 11/15/23 (a) (b) | | | 730,254 | |
| | 250,000 | | | Eaton Vance CDO VIII (Cayman Islands)
Series 2006-8A, Class B
0.971%, 08/15/22 (a) (b) | | | 238,208 | |
| | 250,000 | | | Emerson Park CLO (Cayman Islands)
Series 2013-1A, Class C1
3.071%, 07/15/25 (a) (b) | | | 244,518 | |
| | 250,000 | | | Flatiron CLO (Cayman Islands)
Series 2014-1A, Class C
3.615%, 07/17/26 (a) (b) | | | 225,187 | |
| | 500,000 | | | Galaxy XVIII CLO (Cayman Islands)
Series 2014-18A, Class D1
4.021%, 10/15/26 (a) (b) | | | 461,350 | |
| | 250,000 | | | Goldentree Loan Opportunities VI (Cayman Islands)
Series 2012-6A, Class D
4.515%, 04/17/22 (a) (b) | | | 248,150 | |
| | 500,000 | | | Goldentree Loan Opportunities X (Cayman Islands)
Series 2015-10A, Class D
3.632%, 07/20/27 (a) (b) | | | 454,283 | |
| | 757,000 | | | GSAA Home Equity Trust
Series 2006-15, Class AF3B
5.933%, 09/01/36 (b) | | | 151,753 | |
See accompanying Notes to Financial Statements.
| | |
| |
| ASTON/DoubleLine Core Plus Fixed Income Fund | | October 31, 2015 |
| |
| Schedule of Investments – continued | | |
| | | | | | | | |
Par Value | | | | | Market
Value | |
| | | | | | | |
| | $ 250,000 | | | Halcyon Loan Advisors Funding (Cayman Islands)
Series 2013-2A, Class C
3.000%, 08/01/25 (a) (b) | | $ | 234,715 | |
| | 500,000 | | | ING Investment Management CLO II (Cayman Islands)
Series 2006-2X, Class D
1.929%, 08/01/20 (b) | | | 482,646 | |
| | 500,000 | | | LCM VI (Cayman Islands)
Series 6A, Class C
1.125%, 05/28/19 (a) (b) | | | 500,280 | |
| | 250,000 | | | LCM XI (Cayman Islands)
Series 11A, Class D
4.265%, 04/19/22 (a) (b) | | | 250,377 | |
| | 500,000 | | | LCM XII (Cayman Islands)
Series 12A, Class DR
3.992%, 10/19/22 (a) (b) | | | 487,729 | |
| | 250,000 | | | LCM XIV (Cayman Islands)
Series 14A, Class D
3.821%, 07/15/25 (a) (b) | | | 231,665 | |
| | 500,000 | | | LCM XV (Cayman Islands)
Series 15A, Class C
3.429%, 08/25/24 (a) (b) | | | 493,633 | |
| | 1,000,000 | | | LCM XVIII (Cayman Islands)
Series 19A, Class D
3.771%, 07/15/27 (a) (b) | | | 913,826 | |
| | 750,000 | | | Madison Park Funding (Cayman Islands)
Series 2007-6A, Class C
1.320%, 07/26/21 (a) (b) | | | 721,944 | |
| | 1,000,000 | | | Madison Park Funding IV (Cayman Islands)
Series 2007-4A, Class A1B
0.619%, 03/22/21 | | | 950,119 | |
| | 350,000 | | | Madison Park Funding IV (Cayman Islands)
Series 2007-4A, Class D
1.749%, 03/22/21 (a) (b) | | | 330,072 | |
| | 500,000 | | | Madison Park Funding XIV (Cayman Islands)
Series 2014-14A, Class D
3.887%, 07/20/26 (a) (b) | | | 474,700 | |
| | 500,000 | | | Madison Park Funding XV (Cayman Islands)
Series 2014-15A, Class C
3.995%, 01/27/26 (a) (b) | | | 482,047 | |
| | 500,000 | | | Madison Park Funding XVI (Cayman Islands)
Series 2015-16A, Class B
3.302%, 04/20/26 (a) (b) | | | 494,546 | |
| | 500,000 | | | Magnetite IX (Cayman Islands)
Series 2014-9A, Class B
3.320%, 07/25/26 (a) (b) | | | 489,300 | |
| | 500,000 | | | Magnetite XI (Cayman Islands)
Series 2014-11A, Class C
3.917%, 01/18/27 (a) (b) | | | 470,453 | |
| | 1,000,000 | | | Nautique Funding (Cayman Islands)
Series 2006-1A, Class A3
0.711%, 04/15/20 | | | 968,251 | |
| | | | | | | | |
Par Value | | | | | Market
Value | |
| | | | | | | |
| | $ 250,000 | | | Nomad CLO (Cayman Islands)
Series 2013-1A, Class B
3.271%, 01/15/25 (a) (b) | | $ | 245,646 | |
| | 250,000 | | | Nomad CLO (Cayman Islands)
Series 2013-1A, Class C
3.821%, 01/15/25 (a) (b) | | | 235,105 | |
| | 250,000 | | | Octagon Investment Partners XVI (Cayman Islands)
Series 2013-1A, Class D
3.665%, 07/17/25 (a) (b) | | | 227,588 | |
| | 250,000 | | | Octagon Investment Partners XVI (Cayman Islands)
Series 2013-1A, Class E
4.815%, 07/17/25 (a) (b) | | | 212,267 | |
| | 250,000 | | | Octagon Investment Partners XXI (Cayman Islands)
Series 2014-1A, Class C
3.925%, 11/14/26 (a) (b) | | | 231,519 | |
| | 250,000 | | | Octagon Investment Partners XXII (Cayman Islands)
Series 2014-1A, Class C2
3.820%, 11/22/25 (a) (b) | | | 248,254 | |
| | 250,000 | | | Octagon Investment Partners XXII (Cayman Islands)
Series 2014-1A, Class D2
4.900%, 11/22/25 (a) (b) | | | 246,212 | |
| | 500,000 | | | Race Point VII CLO (Cayman Islands)
Series 2012-7A, Class A
1.731%, 11/08/24 | | | 494,943 | |
| | 81,539 | | | Residential Asset Mortgage Products
Series 2006-RS5, Class A3
0.367%, 09/25/36 (b) | | | 80,398 | |
| | 500,000 | | | Symphony CLO XI (Cayman Islands)
Series 2013-11A, Class C
3.465%, 01/17/25 (a) (b) | | | 495,514 | |
| | 750,000 | | | Symphony CLO XIV (Cayman Islands)
Series 2014-14A, Class D2
3.921%, 07/14/26 (a) (b) | | | 703,657 | |
| | 750,000 | | | Venture XV CLO (Cayman Islands)
Series 2013-15A, Class C
3.421%, 07/15/25 (a) (b) | | | 739,865 | |
| | 250,000 | | | Wind River CLO (Cayman Islands)
Series 2013-1A, Class C
3.695%, 04/20/25 (a) (b) | | | 231,376 | |
| | | | | | | | |
| | |
| | | | Total Other Mortgage and Asset-Backed Securities
(Cost $33,778,136) | | | 33,130,502 | |
| | | | | | | | |
|
| | MUNICIPAL BONDS – 3.82% | |
| | |
| | | | Arizona – 0.21% | | | | |
| | 900,000 | | | Arizona Department of Transportation State Highway Fund Revenue RB
5.000%, 07/01/32 | | | 1,054,287 | |
| | | | | | | | |
| | |
| | | | California – 0.67% | | | | |
| | 1,000,000 | | | State of California, GO
5.000%, 09/01/32 | | | 1,172,780 | |
See accompanying Notes to Financial Statements.
| | |
| |
| ASTON/DoubleLine Core Plus Fixed Income Fund | | October 31, 2015 |
| |
| Schedule of Investments – continued | | |
| | | | | | | | |
Par Value | | | | | Market
Value | |
| | | | | | | |
| | |
| | | | California (continued) | | | | |
| | $ 580,000 | | | East Bay Municipal Utility District Water System RB,
Series A
5.000%, 06/01/31 | | $ | 695,675 | |
| | 1,220,000 | | | State of California, GO
5.000%, 08/01/33 | | | 1,414,541 | |
| | | | | | | | |
| | | | | | | 3,282,996 | |
| | | | | | | | |
| | |
| | | | Georgia – 0.21% | | | | |
| | 840,000 | | | Gwinnett County School District GO
5.000%, 02/01/31 | | | 1,011,671 | |
| | | | | | | | |
| | |
| | | | Louisiana – 0.16% | | | | |
| | 670,000 | | | State of Louisiana, GO
5.000%, 05/01/28 | | | 792,114 | |
| | | | | | | | |
| | |
| | | | Minnesota – 0.16% | | | | |
| | 650,000 | | | State of Minnesota, GO
5.000%, 08/01/33 | | | 774,826 | |
| | | | | | | | |
| | |
| | | | Nevada – 0.25% | | | | |
| | 1,030,000 | | | State of Nevada GO,
Series B
5.000%, 11/01/26 | | | 1,254,149 | |
| | | | | | | | |
| | |
| | | | New York – 0.65% | | | | |
| | 790,000 | | | Utility Debt Securitization Authority, RB
5.000%, 12/15/32 | | | 943,679 | |
| | 880,000 | | | Port Authority of New York & New Jersey, RB
5.000%, 10/15/32 | | | 1,033,692 | |
| | 1,060,000 | | | New York State Dormitory Authority RB,
Series A
5.000%, 03/15/33 | | | 1,225,360 | |
| | | | | | | | |
| | | | | | | 3,202,731 | |
| | | | | | | | |
| | |
| | | | Oregon – 0.26% | | | | |
| | 1,050,000 | | | State of Oregon Department of Transportation RB,
Series A
5.000%, 11/15/29 | | | 1,259,139 | |
| | | | | | | | |
| | |
| | | | Texas – 0.67% | | | | |
| | 630,000 | | | Texas Water Development Board RB, Class A
5.000%, 04/15/28 | | | 767,321 | |
| | 980,000 | | | State of Texas GO, Transportation Commission,
Series A
5.000%, 10/01/28 | | | 1,173,687 | |
| | 1,130,000 | | | University of Texas System RB,
Series B
5.000%, 08/15/27 | | | 1,367,289 | |
| | | | | | | | |
| | | | | | | 3,308,297 | |
| | | | | | | | |
| | | | | | | | |
Par Value | | | | | Market
Value | |
| | | | | | | |
| | |
| | | | Utah – 0.21% | | | | |
| | $ 890,000 | | | Utah Transit Authority RB,
Series A
5.000%, 06/15/31 | | $ | 1,059,794 | |
| | | | | | | | |
| | |
| | | | Washington – 0.37% | | | | |
| | 560,000 | | | Central Puget Sound Regional Transit Authority RB
5.000%, 11/01/32 | | | 662,978 | |
| | 1,000,000 | | | State of Washington GO,
Series R-2015E
5.000%, 07/01/33 | | | 1,163,430 | |
| | | | | | | | |
| | | | | | | 1,826,408 | |
| | | | | | | | |
| | |
| | | | Total Municipal Bonds
(Cost $18,763,571) | | | 18,826,412 | |
| | | | | | | | |
|
| | FOREIGN GOVERNMENT BONDS – 0.63% | |
| | 1,650,000 | | | Colombia Government International Bond
Senior Unsecured Notes
4.375%, 07/12/21 | | | 1,701,975 | |
| | 500,000 | | | Mexico Government International Bond
Senior Unsecured Notes
3.500%, 01/21/21 | | | 515,500 | |
| | 560,000 | | | Mexico Government International Bond
Senior Unsecured Notes
4.000%, 10/02/23 | | | 579,320 | |
| | 300,000 | | | Panama Government International Bond
Senior Unsecured Notes
5.200%, 01/30/20 | | | 329,250 | |
| | | | | | | | |
| | |
| | | | Total Foreign Government Bonds
(Cost $3,146,634) | | | 3,126,045 | |
| | | | | | | | |
Shares | | | | | | |
|
| | INVESTMENT COMPANY – 7.03% | |
| | 25,026,234 | | | BlackRock Liquidity Funds
TempFund Portfolio | | | 25,026,234 | |
| | 963,812 | | | DoubleLine Floating Rate Fund (f) | | | 9,589,931 | |
| | | | | | | | |
| | |
| | | | Total Investment Company
(Cost $34,766,694) | | | 34,616,165 | |
| | | | | | | | |
| Total Investments – 100.34%
(Cost $500,764,808)* | | | 494,035,121 | |
| | | | | | | | |
| Net Other Assets and Liabilities – (0.34)% | | | (1,697,532 | ) |
| | | | | | | | |
| Net Assets – 100.00% | | $ | 492,337,589 | |
| | | | | | | | |
| * | | Aggregate cost for Federal income tax purposes is $501,524,126. |
| | | | |
Gross unrealized appreciation | | $ | 4,078,734 | |
Gross unrealized depreciation | | | (11,567,739 | ) |
| | | | |
Net unrealized depreciation | | $ | (7,489,005 | ) |
| | | | |
See accompanying Notes to Financial Statements.
| | |
| |
| ASTON/DoubleLine Core Plus Fixed Income Fund | | October 31, 2015 |
| |
| Schedule of Investments – continued | | |
| (a) | | Securities exempt from registration under Rule 144A of the Securities Act of 1933, as amended. These securities are purchased in accordance with guidelines approved by the Funds’ Board of Trustees and may only be resold, in transactions exempt from registration, to qualified institutional buyers. At October 31, 2015, these securities amounted to $69,027,600 or 14.02% of net assets. These securities have not been determined by the Subadviser to be illiquid securities. |
| (b) | | Variable rate bond. The interest rate shown reflects the rate in effect at October 31, 2015. |
| (c) | | Securities with a total aggregate market value of $2,124,237 or 0.43% of the net assets, were valued under the fair value procedures established by the Funds’ Board of Trustees. |
| (d) | | Step Coupon. Security becomes interest bearing at a future date. |
| (e) | | Interest only security. This type of security represents the right to receive the monthly interest payments on an underlying pool of mortgages. Payments of principal on the pool reduce the value of the “interest only” holding. |
| (f) | | Affiliated issuer. (See Note G of the Financial Statement) |
| CDO | | Collateralized Debt Obligation |
| CLO | | Collateralized Loan Obligation |
| EMTN | | Euro Medium Term Note |
| GMTN | | Global Medium Term Note |
| REIT | | Real Estate Investment Trust |
| REMIC | | Real Estate Mortgage Investment Conduit |
| | | | |
Portfolio Composition | | | | |
U.S. Government Obligations | | | 15% | |
U.S. Government Agency Obligations | | | 20% | |
Corporate Notes and Bonds | | | | |
(S&P Ratings (unaudited)) | | | | |
AAA | | | 7% | |
AA | | | 5% | |
A | | | 9% | |
BBB | | | 17% | |
BB | | | 9% | |
B | | | 4% | |
Lower than B | | | 7% | |
Not Rated | | | 7% | |
| | | | |
| | | 100% | |
| | | | |
For financial reporting purposes, credit quality ratings shown are assigned by Standard & Poor’s. This rating agency is an independent, nationally recognized statistical rating organization and is widely used. Investment grade ratings are credit ratings of BBB or higher. Below investment grade ratings are credit ratings of BB or lower. Credit quality ratings are subject to change.
See accompanying Notes to Financial Statements.
ASTON/TCH Fixed Income Fund
| | |
| |
| Portfolio Manager Commentary (unaudited) | | October 31, 2015 |
| Tere Alvarez Canida, CFA; Alan M. Habacht, William J. Canida, CFA; Scott M. Kimball CFA & Daniela M. Mardarovici, CFA |
| Q. | What were the most significant market factors affecting Fund performance and returns relative to the benchmark during the past 12 months? |
| A. | The past twelve months represented a difficult period for U.S. credit. Global economic weakening, particularly in China, paired with record corporate issuance in the U.S. and a lower liquidity environment with weak demand contributed to widening spreads and the underperformance versus Treasuries on a duration adjusted basis. Credit markets have suffered in the recent environment with spreads widening across the board, often in excess of what is justified by the fundamentals of specific issuers. The decoupling of spreads from fundamentals made security selection based on fundamental analysis extremely difficult and detracted from performance during the period. |
| Q. | What were the best performing holdings for the Fund during the period? |
| A. | An overweight position in long-term securities paired with short-term, high quality floating rate notes and relative underweight to intermediate positions benefited the portfolio as long Treasuries meaningfully outperformed intermediate Treasuries and the yield curve flattened. An additional structural contributor during the period was the portfolio’s yield advantage; the portfolio aims to generate higher interest income than the benchmark, which added to performance. Allocations to financial issuers outperformed versus broader credit as a more defensive sector. |
| Q. | What were the weakest performing holdings? |
| A. | The portfolio had an above benchmark allocation to credit, which underperformed in the trailing twelve months. Within credit, the portfolio was overweight lower quality credit, which meaningfully underperformed higher quality credit. Further, tactical allocations to higher quality high yield hurt performance as that market segment had negative excess returns. By credit sector, the above benchmark allocation to industrials detracted from returns. Specific issuers within Industrials, such as metals & mining and technology companies detracted from performance. |
Our exposure to Treasury Inflation Protected Securities (TIPS) detracted from returns as TIPS underperformed nominal securities during the last year, as signs of a significant increase in inflation remain muted.
| Q. | How was the Fund positioned as of October 31, 2015? |
| A. | When market pricings temporarily deviate from fundamentals, it can result in short term dislocations at the issuer, term structure and sector level. While painful in the short term, these mispricings offer an accompanying opportunity to seek particularly dislocated securities or market segments and progressively position them for a return to rationality. We believe that avoiding reactive risk-averse behavior is as important to long-term results as correctly assessing risks. Such inefficient risk-pricing conditions are particularly well suited for combining top-down and bottom-up analysis to identify attractive risk-adjusted opportunities—the core of our investment approach. The widening of credit spreads overall and the steepening of credit curves and quality curves have created a more attractive yield environment for investors. Investment grade corporate bonds offering 5% are now readily available for the first time in several years. |
Accordingly, we have positioned to take advantage of the recent dislocations with overweight allocations to the market segments which have underperformed and in our view are mispriced. We are currently positioned with an overweight to credit, in particular lower quality investment grade credit. Similarly, we have positioned for a flattening of credit curves, which we believe to be too steep. On the margin, we have also added to credit sectors and securities, which have been most impacted by the recent disruption, which we believe should offer value looking forward.
Growth of a Hypothetical
$10,000 Investment—Class N
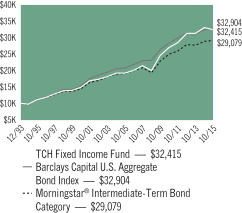
All dividends and capital gains are reinvested. Indexes are unmanaged and do not take into account fees, expenses or other costs.
Returns shown in the chart and table do not reflect taxes that a shareholder would pay on Fund distributions or on the sale of the Fund shares.
Bond funds have the same interest rate, high yield and credit risks associated with the underlying bonds in the portfolio, all of which could reduce the Fund’s value. As interest rates rise, the value of the Fund can decline and an investor can lose principal.
RETURNSFOR PERIOD ENDED 10/31/15
Average Annual Total Returns - Class N
| | | | |
One Year | | | -1.61 | % |
Five Year | | | 3.79 | % |
Ten Year | | | 5.37 | % |
Since Inception | | | 5.52 | % |
Inception Date 12/13/93
Average Annual Total Returns - Class I
| | | | |
One Year | | | -1.37 | % |
Five Year | | | 4.01 | % |
Ten Year | | | 5.59 | % |
Since Inception | | | 5.65 | % |
Inception Date 07/31/00
The performance data quoted represents past performance. Past performance does not guarantee future results. Investment return and principal value will fluctuate so that an investor’s shares, upon redemption, may be worth more or less than their original cost. Current performance may be lower or higher than the performance data quoted. For performance data current to the most recent month-end, please visit our website at www.astonfunds.com.
The performance quoted would have been lower if fee waivers and/or expense reimbursements had not been in effect.
The total expense ratios for Class N and Class I shares are 1.18% and 0.93%, respectively, as disclosed in the prospectus dated February 28, 2015. Please refer to the Financial Highlights section in this report for more information.
| | |
| |
| ASTON/TCH Fixed Income Fund | | October 31, 2015 |
| |
| Schedule of Investments | | |
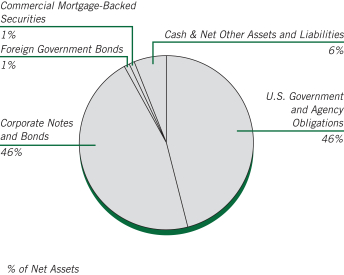
At October 31, 2015, 13.47% of the Total Net Assets of the Fund were comprised of securities of issuers located outside the United States.
| | | | | | | | |
Par Value | | | | | Market
Value | |
| | | | | | | | |
|
| | CORPORATE NOTES AND BONDS – 46.03% | |
| | |
| | | | Consumer Discretionary – 2.79% | | | | |
| | $ 225,000 | | | Coach
Senior Unsecured Notes
4.250%, 04/01/25 | | $ | 213,635 | |
| | 500,000 | | | Ford Motor
Senior Unsecured Notes
1.264%, 11/04/19 (a) | | | 485,716 | |
| | 390,000 | | | L Brands
Senior Unsecured Notes
7.600%, 07/15/37 | | | 427,050 | |
| | 250,000 | | | Netflix
Senior Unsecured Notes
5.750%, 03/01/24 | | | 265,998 | |
| | | | | | | | |
| | | | | | | 1,392,399 | |
| | | | | | | | |
| | |
| | | | Consumer Staples – 2.42% | | | | |
| | 65,000 | | | Altria Group
10.200%, 02/06/39 | | | 107,863 | |
| | 320,000 | | | Conagra Foods
6.625%, 08/15/39 | | | 351,565 | |
| | | | Reynolds American | | | | |
| | 100,000 | | | 7.750%,06/01/18 | | | 113,493 | |
| | 500,000 | | | 8.125%,05/01/40 (b) | | | 631,325 | |
| | | | | | | | |
| | | | | | | 1,204,246 | |
| | | | | | | | |
| | |
| | | | Energy – 4.29% | | | | |
| | | | Chesapeake Energy | | | | |
| | 250,000 | | | 6.625%,08/15/20 | | | 171,875 | |
| | 250,000 | | | 6.125%,02/15/21 | | | 164,975 | |
| | 250,000 | | | Ecopetrol SA (Colombia)
Senior Unsecured Notes
7.375%, 09/18/43 | | | 238,750 | |
| | | | | | | | |
Par Value | | | | | Market
Value | |
| | |
| | | | Energy (continued) | | | | |
| | $ 250,000 | | | Energy Transfer Partners
Senior Unsecured Notes
9.000%, 04/15/19 | | $ | 292,338 | |
| | 250,000 | | | KazMunayGas National (Kazakhstan)
Senior Unsecured Notes
5.750%, 04/30/43 (b) | | | 193,594 | |
| | 100,000 | | | Petroleos Mexicanos (Mexico)
4.500%, 01/23/26 (b) | | | 95,730 | |
| | 250,000 | | | Pride International
6.875%, 08/15/20 | | | 246,516 | |
| | 180,000 | | | Rowan Cos
4.875%, 06/01/22 | | | 144,957 | |
| | 250,000 | | | Transocean (Cayman Islands)
7.850%, 12/15/41 (c) | | | 173,125 | |
| | 400,000 | | | Weatherford International (Bermuda)
9.625%, 03/01/19 | | | 416,000 | |
| | | | | | | | |
| | | | | | | 2,137,860 | |
| | | | | | | | |
| | |
| | | | Financials – 13.23% | | | | |
| | 250,000 | | | AerCap Ireland Capital/AerCap Global Aviation Trust (Netherland)
4.500%, 05/15/21 | | | 257,500 | |
| | 450,000 | | | American Express Credit, MTN
Senior Unsecured Notes
0.602%, 06/05/17 (a) | | | 447,534 | |
| | 450,000 | | | American Financial Group
Senior Unsecured Notes
9.875%, 06/15/19 | | | 556,800 | |
| | 580,000 | | | Bank of America
Senior Unsecured Notes
1.361%, 01/15/19 (a) | | | 583,069 | |
| | | | MTN, Subordinated Notes | | | | |
| | 175,000 | | | 4.000%, 01/22/25 | | | 172,934 | |
| | 250,000 | | | Barrick North America Finance
5.700%, 05/30/41 | | | 208,985 | |
| | 250,000 | | | Berkshire Hathaway Finance
0.621%, 01/12/18 (a) | | | 249,880 | |
| | 250,000 | | | Bunge Ltd Finance
8.500%, 06/15/19 | | | 296,165 | |
| | 185,000 | | | Capital One Financial
3.150%, 07/15/16 | | | 187,678 | |
| | 140,000 | | | Citigroup
Senior Unsecured Notes
1.280%, 07/25/16 (a) | | | 140,368 | |
| | 500,000 | | | Credit Suisse New York (Switzerland) MTN, Senior Unsecured Notes
0.633%, 03/11/16 (a) | | | 499,747 | |
| | 150,000 | | | Daimler Finance
1.009%, 08/01/16 (a) (b) | | | 149,928 | |
| | 250,000 | | | Discover Bank
Subordinated Notes
7.000%, 04/15/20 | | | 288,199 | |
| | 500,000 | | | Ensco (United Kingdom)
Senior Unsecured Notes
5.200%, 03/15/25 | | | 418,485 | |
| | 500,000 | | | Goldman Sachs Group MTN,
Senior Unsecured Notes
1.421%, 11/15/18 (a) | | | 502,882 | |
See accompanying Notes to Financial Statements.
| | |
| |
| ASTON/TCH Fixed Income Fund | | October 31, 2015 |
| |
| Schedule of Investments – continued | | |
| | | | | | | | |
Par Value | | | | | Market
Value | |
| | | | | | | | |
| | |
| | | | Financials (continued) | | | | |
| | $ 375,000 | | | Goldman Sachs Group
Senior Unsecured Notes
1.336%, 10/23/19 (a) | | $ | 376,007 | |
| | 400,000 | | | Itau Unibanco Holding (Brazil)
Subordinated Notes
5.500%, 08/06/22 (b) | | | 376,500 | |
| | 250,000 | | | Jefferies Group
Senior Unsecured Notes
6.500%, 01/20/43 | | | 245,695 | |
| | 183,000 | | | JPMorgan Chase
Senior Unsecured Notes
3.150%, 07/05/16 | | | 185,369 | |
| | 200,000 | | | Leucadia National
Senior Unsecured Notes
5.500%, 10/18/23 | | | 200,198 | |
| | 250,000 | | | Nomura Holdings (Japan) MTN,
Senior Unsecured Notes
1.786%, 09/13/16 (a) | | | 251,298 | |
| | | | | | | | |
| | | | | | | 6,595,221 | |
| | | | | | | | |
| | |
| | | | Healthcare – 2.53% | | | | |
| | 275,000 | | | Actavis Funding
4.850%, 06/15/44 | | | 266,383 | |
| | 1,000,000 | | | Merck
Senior Unsecured Notes
0.719%, 02/10/20 (a) | | | 994,125 | |
| | | | | | | | |
| | | | | | | 1,260,508 | |
| | | | | | | | |
| | |
| | | | Industrials – 4.42% | | | | |
| | 650,000 | | | ADT
Senior Unsecured Notes
4.875%, 07/15/42 | | | 500,500 | |
| | 250,000 | | | FedEx
Senior Notes
8.000%, 01/15/19 | | | 296,343 | |
| | 500,000 | | | Mexichem SAB de CV (Mexico)
6.750%, 09/19/42 (b) | | | 504,375 | |
| | 200,000 | | | Nissan Motor Acceptance
1.026%, 09/26/16 (a) (b) | | | 200,176 | |
| | 500,000 | | | Southern Copper
Senior Unsecured Notes
7.500%, 07/27/35 | | | 521,405 | |
| | 250,000 | | | Vale (Brazil)
Senior Unsecured Notes
5.625%, 09/11/42 | | | 179,538 | |
| | | | | | | | |
| | | | | | | 2,202,337 | |
| | | | | | | | |
| | |
| | | | Information Technology – 3.81% | | | | |
| | 350,000 | | | eBay
Senior Unsecured Notes
4.000%, 07/15/42 | | | 272,627 | |
| | 250,000 | | | EMC
Senior Unsecured Notes
3.375%, 06/01/23 | | | 210,824 | |
| | 500,000 | | | Hewlett Packard Enterprise (b)
4.900%, 10/15/25 | | | 495,242 | |
| | | | | | | | |
Par Value | | | | | Market
Value | |
| | | | | | | | |
| | |
| | | | Information Technology (continued) | | | | |
| | $ 250,000 | | | Micron Technology
Senior Unsecured Notes
5.500%, 02/01/25 | | $ | 238,750 | |
| | 250,000 | | | Microsoft
Senior Unsecured Notes
4.200%, 11/03/35 | | | 252,090 | |
| | 250,000 | | | QUALCOMM
4.800%, 05/20/45 | | | 216,960 | |
| | 250,000 | | | Seagate HDD (Cayman Islands)
5.750%, 12/01/34 (b) | | | 212,298 | |
| | | | | | | | |
| | | | | | | 1,898,791 | |
| | | | | | | | |
| | |
| | | | Materials – 5.45% | | | | |
| | 100,000 | | | Allegheny Technologies
Senior Unsecured Notes
7.125%, 08/15/23 (c) | | | 85,500 | |
| | 400,000 | | | ArcelorMittal (Luxembourg)
Senior Unsecured Notes
7.750%, 10/15/39 (c) | | | 343,000 | |
| | 300,000 | | | Ball Corp
5.000%, 03/15/22 | | | 311,250 | |
| | 500,000 | | | Braskem America Finance
7.125%, 07/22/41 (b) | | | 400,000 | |
| | 250,000 | | | Dow Chemical (The)
Senior Unsecured Notes
8.550%, 05/15/19 | | | 300,942 | |
| | 500,000 | | | GTL Trade Finance (Virgin Islands)
7.250%, 04/16/44 (b) | | | 377,500 | |
| | 250,000 | | | International Paper
Senior Unsecured Notes
8.700%, 06/15/38 | | | 342,804 | |
| | 250,000 | | | Teck Resources (Canada)
6.250%, 07/15/41 | | | 143,125 | |
| | 500,000 | | | Vale Overseas (Cayman Islands)
6.875%, 11/21/36 | | | 409,550 | |
| | | | | | | | |
| | | | | | | 2,713,671 | |
| | | | | | | | |
| | |
| | | | Media – 0.26% | | | | |
| | 150,000 | | | Viacom
Senior Unsecured Notes
4.850%, 12/15/34 | | | 129,870 | |
| | | | | | | | |
| | |
| | | | Telecommunication Services – 5.80% | | | | |
| | | | CenturyLink
Senior Unsecured Notes | | | | |
| | 500,000 | | | 7.600%, 09/15/39 | | | 430,000 | |
| | 500,000 | | | 7.650%, 03/15/42 | | | 430,000 | |
| | 350,000 | | | Frontier Communications
Senior Unsecured Notes
9.000%, 08/15/31 | | | 318,325 | |
| | 300,000 | | | Juniper Networks
Senior Unsecured Notes
5.950%, 03/15/41 | | | 290,183 | |
| | 250,000 | | | Telecom Italia Capital (Luxembourg)
6.375%, 11/15/33 | | | 242,940 | |
| | 500,000 | | | Telefonica Europe (Netherlands)
8.250%, 09/15/30 | | | 659,513 | |
See accompanying Notes to Financial Statements.
| | |
| |
| ASTON/TCH Fixed Income Fund | | October 31, 2015 |
| |
| Schedule of Investments – continued | | |
| | | | | | | | |
Par Value | | | | | Market
Value | |
| | | | | | | | |
| | |
| | | | Telecommunication Services (continued) | | | | |
| | $ 100,000 | | | Verizon Communications
Senior Unsecured Notes
1.867%, 09/15/16 (a) | | $ | 100,956 | |
| | 500,000 | | | Windstream
7.500%, 06/01/22 | | | 417,500 | |
| | | | | | | | |
| | | | | | | 2,889,417 | |
| | | | | | | | |
| | |
| | | | Utilities – 1.03% | | | | |
| | 334,000 | | | FPL Group Capital
7.875%, 12/15/15 | | | 336,769 | |
| | 150,000 | | | Pacific Gas & Electric
Senior Unsecured Notes
8.250%, 10/15/18 | | | 176,698 | |
| | | | | | | | |
| | | | | | | 513,467 | |
| | | | | | | | |
| | |
| | | | Total Corporate Notes and Bonds
(Cost $23,604,507) | | | 22,937,787 | |
| | | | | | | | |
|
| U.S. GOVERNMENT AND AGENCY OBLIGATIONS – 46.24%
|
|
| | |
| | | | Fannie Mae – 14.61% | | | | |
| | 85,158 | | | 6.000%, 11/01/17
Pool # 662854 | | | 88,029 | |
| | 17,332 | | | 6.000%, 04/01/18
Pool # 725175 | | | 17,762 | |
| | 100,786 | | | 5.500%, 11/01/18
Pool # 748886 | | | 105,896 | |
| | 31,772 | | | 4.500%, 06/01/19
Pool # 747860 | | | 33,059 | |
| | 194,985 | | | 6.000%, 01/01/21
Pool # 850787 | | | 213,069 | |
| | 100,691 | | | 6.000%, 09/01/32
Pool # 847899 | | | 114,007 | |
| | 58,002 | | | 6.000%, 02/01/34
Pool # 771952 | | | 66,334 | |
| | 52,183 | | | 7.500%, 02/01/35
Pool # 787557 | | | 57,461 | |
| | 18,099 | | | 7.500%, 04/01/35
Pool # 819231 | | | 19,249 | |
| | 68,156 | | | 6.000%, 11/01/35
Pool # 844078 | | | 77,169 | |
| | 79,323 | | | 5.000%, 05/01/36
Pool # 745581 | | | 87,395 | |
| | 40,875 | | | 6.000%, 12/01/36
Pool # 888029 | | | 46,350 | |
| | 56,317 | | | 5.500%, 06/01/37
Pool # 918778 | | | 63,033 | |
| | 59,616 | | | 6.500%, 10/01/37
Pool # 888890 | | | 68,798 | |
| | 179,481 | | | 5.500%, 03/01/38
Pool # 962344 | | | 201,029 | |
| | 198,620 | | | 4.000%, 02/01/41
Pool # AE0949 | | | 212,018 | |
| | 172,235 | | | 4.000%, 02/01/41
Pool # AH5695 | | | 183,743 | |
| | 886,082 | | | 3.000%, 03/01/43
Pool # AB8615 | | | 898,516 | |
| | | | | | | | |
Par Value | | | | | Market
Value | |
| | | | | | | | |
| | |
| | | | Fannie Mae (continued) | | | | |
| | $ 479,620 | | | 3.500%, 05/01/43
Pool # AB9512 | | $ | 500,288 | |
| | 520,720 | | | 3.000%, 07/01/43
Pool # AU1629 | | | 527,925 | |
| | 884,021 | | | 3.000%, 08/01/43
Pool # AS0331 | | | 896,180 | |
| | 837,090 | | | 3.000%, 09/01/44
Pool # AX7336 | | | 847,332 | |
| | 1,438,258 | | | 3.000%, 02/01/45
Pool # AS4474 | | | 1,455,276 | |
| | 492,063 | | | 3.000%, 06/01/45
Pool # AY6104 | | | 497,885 | |
| | | | | | | | |
| | | | | | | 7,277,803 | |
| | | | | | | | |
| | |
| | | | Freddie Mac – 12.01% | | | | |
| | 186,485 | | | 5.500%, 11/01/20
Gold Pool # G18083 | | | 201,345 | |
| | 37,476 | | | 5.500%, 12/01/20
Gold Pool # G11820 | | | 40,427 | |
| | 53,832 | | | 5.500%, 05/01/37
Gold Pool # A60048 | | | 59,648 | |
| | 116,818 | | | 5.500%, 09/01/37
Gold Pool # G03202 | | | 130,343 | |
| | 92,446 | | | 5.000%, 02/01/38
Gold Pool # A73409 | | | 101,274 | |
| | 285,532 | | | 5.000%, 04/01/38
Gold Pool # G04334 | | | 316,864 | |
| | 177,951 | | | 4.000%, 12/01/39
Gold Pool # G06935 | | | 189,636 | |
| | 81,637 | | | 4.000%, 05/01/41
Gold Pool # Q00870 | | | 87,038 | |
| | 556,503 | | | 4.000%, 11/01/41
Gold Pool # Q04550 | | | 592,750 | |
| | 842,578 | | | 3.000%, 04/01/43
Gold Pool # V80006 | | | 852,384 | |
| | 843,911 | | | 3.000%, 05/01/43
Gold Pool # G08525 | | | 853,246 | |
| | 435,682 | | | 3.000%, 09/01/43
Gold Pool # G08544 | | | 440,168 | |
| | 704,276 | | | 3.500%, 10/01/43
Gold Pool # G08554 | | | 732,601 | |
| | 258,863 | | | 3.500%, 11/01/43
Gold Pool # G08557 | | | 269,117 | |
| | 608,883 | | | 3.500%, 01/01/44
Gold Pool # G08562 | | | 632,910 | |
| | 467,078 | | | 3.500%, 02/01/44
Gold Pool # G08572 | | | 485,515 | |
| | | | | | | | |
| | | | | | | 5,985,266 | |
| | | | | | | | |
| | |
| | | | Ginnie Mae – 1.20% | | | | |
| | 86,468 | | | 5.000%, 05/01/37
Pool # 782156 | | | 94,036 | |
| | 179,979 | | | 5.000%, 08/01/37
Pool # 4015 | | | 196,336 | |
| | 156,683 | | | 6.000%, 07/01/38
Pool # 4195 | | | 176,332 | |
See accompanying Notes to Financial Statements.
| | |
| |
| ASTON/TCH Fixed Income Fund | | October 31, 2015 |
| |
| Schedule of Investments – continued | | |
| | | | | | | | |
Par Value | | | | | Market
Value | |
| | | | | | | | |
| | |
| | | | Ginnie Mae (continued) | | | | |
| | $ 81,763 | | | 5.500%, 08/01/38
Pool # 4215 | | $ | 87,263 | |
| | 38,615 | | | 6.000%, 01/01/39
Pool # 698036 | | | 43,898 | |
| | | | | | | | |
| | | | | | | 597,865 | |
| | | | | | | | |
| |
| | | | U.S. Treasury Inflation Index Bonds – 6.00% | |
| | 1,657,740 | | | 1.375%, 07/15/18 | | | 1,725,485 | |
| | 1,137,570 | | | 1.750%, 01/15/28 | | | 1,265,910 | |
| | | | | | | | |
| | | | | | | 2,991,395 | |
| | | | | | | | |
| | |
| | | | U.S. Treasury Notes – 12.42% | | | | |
| | 1,500,000 | | | 2.000%, 01/31/16 | | | 1,506,875 | |
| | 1,250,000 | | | 2.000%, 04/30/16 | | | 1,260,636 | |
| | 1,000,000 | | | 2.500%, 06/30/17 | | | 1,030,247 | |
| | 500,000 | | | 2.250%, 11/30/17 | | | 515,130 | |
| | 350,000 | | | 2.000%, 11/30/20 | | | 357,333 | |
| | 1,500,000 | | | 2.000%, 11/15/21 | | | 1,520,498 | |
| | | | | | | | |
| | | | | | | 6,190,719 | |
| | | | | | | | |
| | |
| | | | Total U.S. Government and Agency Obligations
(Cost $22,439,005) | | | 23,043,048 | |
| | | | | | | | |
|
| | COMMERCIAL MORTGAGE-BACKED SECURITY – 0.58% | |
| | 274,137 | | | Bear Stearns Commercial Mortgage Securities
Series 2007-T28, Class A4
5.742%, 09/01/42 (a) | | | 290,761 | |
| | | | | | | | |
| | |
| | | | Total Commercial Mortgage-Backed Security
(Cost $193,912) | | | 290,761 | |
| | | | | | | | |
| |
| | FOREIGN GOVERNMENT BOND – 0.91% | | | | |
| | 500,000 | | | Costa Rica Government International Bond
Senior Unsecured Notes
7.158%, 03/12/45 (b) | | | 451,875 | |
| | | | | | | | |
| | |
| | | | Total Foreign Government Bond
(Cost $500,000) | | | 451,875 | |
| | | | | | | | |
Shares | | | | | | |
| |
| | INVESTMENT COMPANY – 6.33% | | | | |
| | 3,152,143 | | | BlackRock Liquidity Funds
TempFund Portfolio | | | 3,152,143 | |
| | | | | | | | |
| | |
| | | | Total Investment Company
(Cost $3,152,143) | | | 3,152,143 | |
| | | | | | | | |
| Total Investments – 100.09%
(Cost $49,889,567)* | | | 49,875,614 | |
| | | | | | | | |
| Net Other Assets and Liabilities – (0.09)% | | | (44,333 | ) |
| | | | | | | | |
| Net Assets – 100.00% | | $ | 49,831,281 | |
| | | | | | | | |
| * | | Aggregate cost for Federal income tax purposes is $49,895,088. |
| | | | |
Gross unrealized appreciation | | $ | 1,544,166 | |
Gross unrealized depreciation | | | (1,563,640 | ) |
| | | | |
Net unrealized depreciation | | $ | (19,474 | ) |
| | | | |
| (a) | | Variable rate bond. The interest rate shown reflects the rate in effect at October 31, 2015. |
| (b) | | Securities exempt from registration under Rule 144A of the Securities Act of 1933, as amended. These securities are purchased in accordance with guidelines approved by the Funds’ Board of Trustees and may only be resold, in transactions exempt from registration, to qualified institutional buyers. At October 31, 2015, these securities amounted to $4,088,543 or 8.21% of net assets. These securities have not been determined by the Subadviser to be illiquid securities. |
| (c) | | Step Coupon. A bond that pays an initial coupon rate for the first period and then a higher coupon rate for the following periods until maturity. The coupon rate shown will be accrual rate until maturity. |
| | | | |
Portfolio Composition | | | | |
U.S. Government and Agency Obligations | | | 45% | |
Commercial Mortgage-Backed Security | | | 1% | |
Foreign Government Bond | | | 1% | |
Investment Company | | | 4% | |
Corporate Notes and Bonds | | | | |
(Moody’s Ratings (unaudited)) | | | | |
Aa | | | 1% | |
A | | | 8% | |
Baa | | | 25% | |
Ba | | | 13% | |
B | | | 2% | |
| | | | |
| | | 100% | |
| | | | |
For financial reporting purposes, credit quality ratings shown are assigned by Moody’s Investors Service. If a Moody’s credit quality rating is not available the credit quality ratings shown are assigned by Standard & Poor’s. These rating agencies are independent, nationally recognized statistical rating organizations and are widely used. Investment grade ratings are credit ratings of Baa/ BBB or higher. Below investment grade ratings are credit ratings of Ba/BB or lower. Credit quality ratings are subject to change.
See accompanying Notes to Financial Statements.
ASTON/Anchor Capital Enhanced Equity Fund
| | |
| |
| Portfolio Manager Commentary (unaudited) | | October 31, 2015 |
| Ronald L. Altman; Adam D. Neves & David J. Watson |
| Q. | What were the most significant market factors affecting Fund performance and returns relative to the benchmark during the past 12 months? |
| A. | For the year ended October 31, 2015, the Fund was down 1.8% compared to a gain of 5.2% for the S&P 500® Index. Virtually the entire shortfall was a function of the cost of owning put options for the period as opposed to stock selection. Overall our equity holdings performed in line with the S&P 500® Index; however, there was a signification dispersion in terms of the individual stocks and sectors. The highest yielding stocks were the worst performers while those that had more modest yields and were thought of as growth companies did the best. |
Selling calls and buying puts were a net contributor for the year but that unfortunately overstates the benefit because when we sell a call the upside is capped by the strike price. We always try to move that strike price higher for the stocks that have performed relatively well. Also, when a position declines we will buy back the calls and lower the strike price to reduce the risk, but this brings down the up-capture if the stock recovers. Due to the changes in underlying positions, the net gain on the options were not realized. Another complication arises when a stock advances significantly over a short period of time and we liquidate both the stock and the call option. Closing a transaction in this manner will result in a loss on the call and a gain on the stock. Although the whole transaction just described generates a net gain, the gain is less than the benefit we would have derived if we did not sell the call option. When all of these factors are added together, they explain why we were not able to match the S&P 500® for the past 12 months. However, the result of holding higher yielding stocks, selling out of the money call options, plus buying protective put options did statistically lower the Fund’s volatility significantly vs. the S&P 500® Index.
| Q. | What were the best performing holdings for the Fund during the period? |
| A. | On the positive side were the Technology and Financial Services sectors. Additionally the Energy segment was a positive contributor. |
| Q. | What were the weakest performing holdings? |
| A. | Utilities and Consumer Discretionary were the two areas that performed the worst during this past year. In our opinion the ongoing focus of investors as to when the Federal Reserve might raise short term interest rates had a materially negative impact on the higher yielding equities. |
| Q. | How was the Fund positioned as of October 31, 2015? |
| A. | In spite of the issues associated with holding higher yielding stocks, we remain focused on dividends and low multiples of cash flow as the cornerstone of our equity strategy. Our cash flow price-to-earnings and our multiple of sales was significantly below the S&P 500® Index. Lastly the Fund’s beta was less than half the overall market. In terms of all the value metrics we evaluate, the portfolio’s equity holdings are clearly in the large cap value area and we remain hedged with both call options and index puts. |
Note: A strike price is the price at which a specific derivative contract can be exercised. Multiple is a term that measures some aspect of a company’s financial well-being. Beta is a measure of the volatility, or systematic risk, of a security in comparison to market as a whole.
Growth of a Hypothetical
$10,000 Investment—Class N
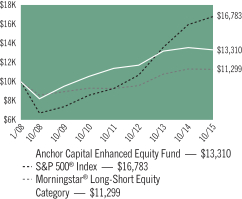
All dividends and capital gains are reinvested. Indexes are unmanaged and do not take into account fees, expenses or other costs.
Returns shown in the chart and table do not reflect taxes that a shareholder would pay on Fund distributions or on the sale of the Fund shares.
By selling covered call options, the Fund limits its opportunity to profit from an increase in the price of the underlying stock above the exercise price, but continues to bear the risk of a decline in the stock. A liquid market may not exist for options held by the Fund. If the Fund is not able to close out an options transaction, it will not be able to sell the underlying security until the option expires or is exercised. If the Fund receives premiums for writing the call options, the price it realizes from the exercise of an option could be substantially below a stock’s current market price. Premiums from the Fund’s sale of call options typically will result in short-term capital gains for federal income tax purposes.
RETURNSFOR PERIOD ENDED 10/31/15
Average Annual Total Returns - Class N
| | | | |
One Year | | | -1.86 | % |
Five Year | | | 4.73 | % |
Since Inception | | | 3.74 | % |
Inception Date 01/15/08
Average Annual Total Returns - Class I
| | | | |
One Year | | | -1.60 | % |
Five Year | | | 5.01 | % |
Since Inception | | | 5.34 | % |
Inception Date 03/03/10
The performance data quoted represents past performance. Past performance does not guarantee future results. Investment return and principal value will fluctuate so that an investor’s shares, upon redemption, may be worth more or less than their original cost. Current performance may be lower or higher than the performance data quoted. For performance data current to the most recent month-end, please visit our website at www.astonfunds.com.
| | |
| |
| ASTON/Anchor Capital Enhanced Equity Fund | | October 31, 2015 |
| |
| Schedule of Investments | | |
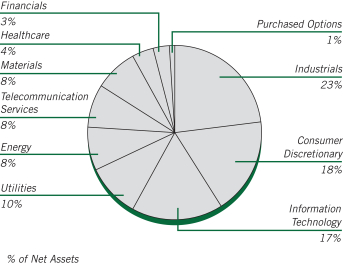
| | | | | | | | |
Shares | | | | | Market
Value | |
|
| | COMMON STOCKS – 100.21% | |
| | |
| | | | Consumer Discretionary – 18.09% | | | | |
| | 115,000 | | | Coach (a) | | $ | 3,588,000 | |
| | 500,000 | | | Ford Motor (a) | | | 7,405,000 | |
| | 225,000 | | | General Motors (a) | | | 7,854,750 | |
| | 50,000 | | | Kohl’s (a) | | | 2,306,000 | |
| | 30,000 | | | Macy’s | | | 1,529,400 | |
| | 600,000 | | | Staples (a) | | | 7,794,000 | |
| | | | | | | | |
| | | | | | | 30,477,150 | |
| | | | | | | | |
| | |
| | | | Energy – 8.41% | | | | |
| | 70,000 | | | Baker Hughes (a) | | | 3,687,600 | |
| | 100,000 | | | Halliburton (a) | | | 3,838,000 | |
| | 85,000 | | | Schlumberger (a) | | | 6,643,600 | |
| | | | | | | | |
| | | | | | | 14,169,200 | |
| | | | | | | | |
| | |
| | | | Financials – 3.48% | | | | |
| | 20,000 | | | Hartford Financial Services Group (a) | | | 925,200 | |
| | 450,000 | | | Huntington Bancshares (a) | | | 4,936,500 | |
| | | | | | | | |
| | | | | | | 5,861,700 | |
| | | | | | | | |
| | |
| | | | Healthcare – 4.04% | | | | |
| | 100,000 | | | Quest Diagnostics (a) | | | 6,795,000 | |
| | | | | | | | |
| | |
| | | | Industrials – 22.52% | | | | |
| | 172,600 | | | ADT (a) | | | 5,702,704 | |
| | 30,000 | | | Caterpillar (a) | | | 2,189,700 | |
| | 50,000 | | | Deere (a) | | | 3,900,000 | |
| | 110,000 | | | Emerson Electric (a) | | | 5,195,300 | |
| | 140,000 | | | Fastenal (a) | | | 5,482,400 | |
| | 270,000 | | | General Electric (a) | | | 7,808,400 | |
| | 175,000 | | | Republic Services (a) | | | 7,654,500 | |
| | | | | | | | |
| | | | | | | 37,933,004 | |
| | | | | | | | |
| | | | | | | | |
Shares | | | | | Market
Value | |
| | |
| | | | Information Technology – 17.43% | | | | |
| | 30,000 | | | Altera (a) | | $ | 1,576,500 | |
| | 267,700 | | | Cisco Systems (a) | | | 7,723,145 | |
| | 130,000 | | | EMC (a) | | | 3,408,600 | |
| | 260,000 | | | Intel (a) | | | 8,803,600 | |
| | 165,000 | | | Xilinx (a) | | | 7,857,300 | |
| | | | | | | | |
| | | | | | | 29,369,145 | |
| | | | | | | | |
| | |
| | | | Materials – 7.85% | | | | |
| | 220,000 | | | Alcoa (a) | | | 1,964,600 | |
| | 65,000 | | | Dow Chemical (a) | | | 3,358,550 | |
| | 85,000 | | | LyondellBasell Industries, Class A (a) | | | 7,897,350 | |
| | | | | | | | |
| | | | | | | 13,220,500 | |
| | | | | | | | |
| | |
| | | | Telecommunication Services – 8.31% | | | | |
| | 170,000 | | | AT&T (a) | | | 5,696,700 | |
| | 120,000 | | | CenturyLink (a) | | | 3,385,200 | |
| | 105,000 | | | Verizon Communications (a) | | | 4,922,400 | |
| | | | | | | | |
| | | | | | | 14,004,300 | |
| | | | | | | | |
| | |
| | | | Utilities – 10.08% | | | | |
| | 200,000 | | | Exelon (a) | | | 5,584,000 | |
| | 200,000 | | | FirstEnergy (a) | | | 6,240,000 | |
| | 150,000 | | | PPL (a) | | | 5,160,000 | |
| | | | | | | | |
| | | | | | | 16,984,000 | |
| | | | | | | | |
| | |
| | | | Total Common Stocks
(Cost $165,476,190) | | | 168,813,999 | |
| | | | | | | | |
Number of
Contracts | | | | | | |
|
| | PURCHASED OPTIONS – 0.73% | |
| | |
| | | | SPDR S&P 500 ETF TRUST | | | | |
| | 1,000 | | | Strike @ $177 Exp 12/15 | | | 49,000 | |
| | 1,000 | | | Strike @ $178 Exp 12/15 | | | 53,000 | |
| | 1,000 | | | Strike @ $179 Exp 12/15 | | | 58,000 | |
| | 4,000 | | | Strike @ $183 Exp 12/15 | | | 316,000 | |
| | 4,000 | | | Strike @ $184 Exp 12/15 | | | 338,000 | |
| | 4,500 | | | Strike @ $185 Exp 12/15 | | | 423,000 | |
| | | | | | | | |
| | |
| | | | Total Purchased Options
(Cost $1,572,836) | | | 1,237,000 | |
| | | | | | | | |
Shares | | | | | | |
|
| | INVESTMENT COMPANY – 1.10% | |
| | 1,851,341 | | | BlackRock Liquidity Funds TempFund Portfolio | | | 1,851,341 | |
| | | | | | | | |
| | |
| | | | Total Investment Company
(Cost $1,851,341) | | | 1,851,341 | |
| | | | | | | | |
| Total Investments – 102.04%
(Cost $168,900,367)* | | | 171,902,340 | |
| | | | | | | | |
| Net Other Assets and Liabilities – (2.04)% | | | (3,432,755 | ) |
| | | | | | | | |
| Net Assets – 100.00% | | $ | 168,469,585 | |
| | | | | | | | |
See accompanying Notes to Financial Statements.
| | |
| |
| ASTON/Anchor Capital Enhanced Equity Fund | | October 31, 2015 |
| |
| Schedule of Investments – continued | | |
| * | | Aggregate cost for Federal income tax purposes is $169,303,776. |
| | | | |
Gross unrealized appreciation | | $ | 14,953,997 | |
Gross unrealized depreciation | | | (12,355,433 | ) |
| | | | |
Net unrealized appreciation | | $ | 2,598,564 | |
| | | | |
| (a) | | These securities are pledged as collateral for call options written. |
| SPDR | | Standard & Poor’s Depositary Receipt |
Transactions in written call options for the year ended October 31, 2015 were as follows:
| | | | | | | | |
| Contracts | | Number of
Contracts | | | Premium | |
Outstanding, October 31, 2014 | | | 59,168 | | | $ | 5,230,766 | |
Call Options Written | | | 273,048 | | | | 26,785,217 | |
Call Options Closed or Expired | | | (280,863 | ) | | | (27,752,545 | ) |
| | | | | | | | |
Outstanding, October 31, 2015 | | | 51,353 | | | $ | 4,263,438 | |
| | | | | | | | |
Premiums received and value of written call equity options outstanding as of October 31, 2015.
| | | | | | | | | | | | |
Number of
Contracts | | | Description | | Premium
Received | | | Market
Value | |
| | | | ADT | | | | | | | | |
| | 300 | | | Strike @ $38 Exp 4/16 | | | $ 31,387 | | | | $ 27,000 | |
| | 1,426 | | | Strike @ $40 Exp 4/16 | | | 118,020 | | | | 81,995 | |
| | | |
| | | | Alcoa | | | | | | | | |
| | 500 | | | Strike @ $12 Exp 6/16 | | | 15,000 | | | | 16,000 | |
| | 1,700 | | | Strike @ $13 Exp 6/16 | | | 67,975 | | | | 37,400 | |
| | | |
| | | | Altera | | | | | | | | |
| | 300 | | | Strike @ $43 Exp 1/16 | | | 203,396 | | | | 298,500 | |
| | | |
| | | | AT&T | | | | | | | | |
| | 1,700 | | | Strike @ $37 Exp 7/16 | | | 62,999 | | | | 54,400 | |
| |
| | | | Baker Hughes | |
| | 650 | | | Strike @ $57.5 Exp 4/16 | | | 164,796 | | | | 212,550 | |
| | 50 | | | Strike @ $60 Exp 1/16 | | | 10,948 | | | | 6,650 | |
| |
| | | | Caterpillar | |
| | 90 | | | Strike @ $75 Exp 5/16 | | | 18,041 | | | | 37,710 | |
| | 40 | | | Strike @ $77.5 Exp 1/16 | | | 2,758 | | | | 5,200 | |
| | 170 | | | Strike @ $80 Exp 5/16 | | | 33,072 | | | | 42,160 | |
| | | |
| | | | CenturyLink | | | | | | | | |
| | 1,200 | | | Strike @ $33 Exp 4/16 | | | 52,748 | | | | 45,000 | |
| |
| | | | Cisco Systems | |
| | 1,000 | | | Strike @ $30 Exp 7/16 | | | 59,957 | | | | 155,000 | |
| | 1,677 | | | Strike @ $32 Exp 7/16 | | | 61,978 | | | | 134,160 | |
| |
| | | | Coach | |
| | 950 | | | Strike @ $37 Exp 5/16 | | | 60,759 | | | | 80,750 | |
| | 200 | | | Strike @ $38 Exp 5/16 | | | 10,791 | | | | 13,500 | |
| |
| | | | Deere | |
| | 79 | | | Strike @ $87.5 Exp 3/16 | | | 12,257 | | | | 12,482 | |
| | 421 | | | Strike @ $90 Exp 3/16 | | | 140,380 | | | | 46,731 | |
| | | | | | | | | | | | |
Number of
Contracts | | | Description | | Premium
Received | | | Market
Value | |
| |
| | | | Dow Chemical | |
| | 150 | | | Strike @ $49 Exp 3/16 | | | $ 22,001 | | | | $ 70,875 | |
| | 500 | | | Strike @ $50 Exp 3/16 | | | 96,551 | | | | 205,000 | |
| |
| | | | EMC | |
| | 75 | | | Strike @ $31 Exp 4/16 | | | 1,947 | | | | 1,875 | |
| | 225 | | | Strike @ $32 Exp 1/16 | | | 4,950 | | | | 3,263 | |
| | 500 | | | Strike @ $34 Exp 1/16 | | | 5,000 | | | | 7,000 | |
| | 500 | | | Strike @ $35 Exp 1/16 | | | 3,000 | | | | 500 | |
| | | |
| | | | Emerson Electric | | | | | | | | |
| | 750 | | | Strike @ $50 Exp 3/16 | | | 67,467 | | | | 113,250 | |
| | 300 | | | Strike @ $52.50 Exp 3/16 | | | 20,096 | | | | 24,000 | |
| | 50 | | | Strike @ $67.50 Exp 1/16 | | | 4,996 | | | | 250 | |
| | | |
| | | | Exelon | | | | | | | | |
| | 1,000 | | | Strike @ $38 Exp 4/16 | | | 97,998 | | | | 5,000 | |
| |
| | | | Fastenal | |
| | 1,050 | | | Strike @ $45 Exp 5/16 | | | 46,210 | | | | 70,875 | |
| | 200 | | | Strike @ $46 Exp 5/16 | | | 11,300 | | | | 9,500 | |
| | 150 | | | Strike @ $47 Exp 5/16 | | | 6,600 | | | | 4,500 | |
| |
| | | | FirstEnergy | |
| | 1,700 | | | Strike @ $38 Exp 4/16 | | | 52,692 | | | | 12,750 | |
| | 150 | | | Strike @ $40 Exp 1/16 | | | 9,969 | | | | 375 | |
| |
| | | | Ford Motor | |
| | 500 | | | Strike @ $16 Exp 6/16 | | | 17,044 | | | | 28,000 | |
| | 2,500 | | | Strike @ $17 Exp 6/16 | | | 70,394 | | | | 77,500 | |
| | | |
| | | | General Electric | | | | | | | | |
| | 2,700 | | | Strike @ $27 Exp 6/16 | | | 178,084 | | | | 715,500 | |
| |
| | | | General Motors | |
| | 332 | | | Strike @ $35 Exp 3/16 | | | 23,830 | | | | 66,068 | |
| | 650 | | | Strike @ $37 Exp 6/16 | | | 71,121 | | | | 99,450 | |
| | 668 | | | Strike @ $38 Exp 6/16 | | | 56,615 | | | | 79,826 | |
| | 600 | | | Strike @ $39 Exp 6/16 | | | 54,574 | | | | 56,100 | |
| |
| | | | Halliburton | |
| | 500 | | | Strike @ $42 Exp 4/16 | | | 85,977 | | | | 94,750 | |
| | 500 | | | Strike @ $45 Exp 4/16 | | | 65,978 | | | | 53,750 | |
| | | |
| | | | Hartford Financial Services Group | | | | | | | | |
| | 200 | | | Strike @ $45 Exp 1/16 | | | 32,199 | | | | 51,000 | |
| | | |
| | | | Huntington Bancshares | | | | | | | | |
| | 4,500 | | | Strike @ $12 Exp 4/16 | | | 156,808 | | | | 130,500 | |
| | | |
| | | | Intel | | | | | | | | |
| | 2,600 | | | Strike @ $32 Exp 7/16 | | | 469,183 | | | | 923,000 | |
| |
| | | | Kohl’s | |
| | 400 | | | Strike @ $52.5 Exp 4/16 | | | 38,314 | | | | 42,400 | |
| | 100 | | | Strike @ $55 Exp 4/16 | | | 9,400 | | | | 8,000 | |
| | |
| | | | LyondellBasell Industries NV | | | | | |
| | 850 | | | Strike @ $90 Exp 3/16 | | | 396,770 | | | | 663,000 | |
| |
| | | | Macy’s | |
| | 30 | | | Strike @ $62.5 Exp 5/16 | | | 5,040 | | | | 6,000 | |
| | 170 | | | Strike @ $65 Exp 5/16 | | | 20,160 | | | | 26,860 | |
| |
| | | | PPL | |
| | 500 | | | Strike @ $35 Exp 1/16 | | | 14,479 | | | | 27,500 | |
| | 1,000 | | | Strike @ $36 Exp 4/16 | | | 63,957 | | | | 62,500 | |
See accompanying Notes to Financial Statements.
| | |
| |
| ASTON/Anchor Capital Enhanced Equity Fund | | October 31, 2015 |
| |
| Schedule of Investments – continued | | |
| | | | | | | | | | | | |
Number of
Contracts | | | Description | | Premium
Received | | | Market
Value | |
| | | |
| | | | Quest Diagnostics | | | | | | | | |
| | 1,000 | | | Strike @ $70 Exp 5/16 | | | $ 186,667 | | | | $ 370,000 | |
| | | |
| | | | Republic Services | | | | | | | | |
| | 1,750 | | | Strike @ $44 Exp 4/16 | | | 143,673 | | | | 301,875 | |
| | | |
| | | | Schlumberger | | | | | | | | |
| | 850 | | | Strike @ $85 Exp 5/16 | | | 143,336 | | | | 239,700 | |
| |
| | | | Staples | |
| | 4,000 | | | Strike @ $20 Exp 3/16 | | | 77,833 | | | | 80,000 | |
| | 1,500 | | | Strike @ $21 Exp 1/16 | | | 26,729 | | | | 15,000 | |
| | 500 | | | Strike @ $23 Exp 1/16 | | | 13,480 | | | | 2,500 | |
| |
| | | | Verizon Communications | |
| | 124 | | | Strike @ $47 Exp 1/16 | | | 3,343 | | | | 13,020 | |
| | 26 | | | Strike @ $47 Exp 7/16 | | | 2,989 | | | | 5,174 | |
| | 50 | | | Strike @ $48 Exp 4/16 | | | 5,398 | | | | 5,800 | |
| | 850 | | | Strike @ $50 Exp 7/16 | | | 34,678 | | | | 68,000 | |
| |
| | | | Xilinx | |
| | 1,150 | | | Strike @ $46 Exp 3/16 | | | 160,847 | | | | 462,875 | |
| | 500 | | | Strike @ $47 Exp 3/16 | | | 56,499 | | | | 171,250 | |
| | | | | | | | | | | | |
| | | |
| | | | Total Written Call Options | | | $4,263,438 | | | | $6,783,099 | |
| | | | | | | | | | | | |
See accompanying Notes to Financial Statements.
ASTON/Lake Partners LASSO Alternatives Fund
| | |
| |
| Portfolio Manager Commentary (unaudited) | | October 31, 2015 |
| Frederick C. Lake & Ronald A. Lake |
| Q. | What were the most significant market factors affecting Fund performance and returns relative to the benchmark during the past 12 months? |
| A. | Throughout the year we positioned the portfolio to dampen the risk of conventional asset classes while aiming for relatively stable returns, by: |
| | • | | Diversifying among 1) a core of Long/Short and Long-biased Equity strategies and 2) a mix of less correlated strategies (Strategic Fixed Income, Hedged Credit, Arbitrage-related, and Global Macro); |
| | • | | Maintaining moderate composite net equity exposures; and |
| | • | | Being proactive in adjusting the mix of strategies incrementally to take advantage of opportunities or sidestep potential risks. |
Although the S&P 500® gained 5.2% for the year ending October 31, 2015, this masked much turmoil and dispersion under the surface. Most significantly, the market was driven by a relatively narrow number of large-cap growth and momentum stocks, while value stocks generally lagged. These conditions created a headwind for Long/Short Equity strategies. Furthermore, spread widening undermined Credit strategies, while sharp reversals in currencies, Fixed Income, and Commodities whipsawed Managed Futures strategies between the first and second quarters of 2015.
For the fiscal year, the Class I shares of the Fund declined -2.6%, while the Fund’s benchmark, the HFRX Equity Hedge Index, was off -1.0%. The Fund’s underperformance was attributable largely to its exposure to non-equity oriented strategies, as discussed below.
| Q. | What were the best performing holdings for the Fund during the period? |
| A. | As a group, Equity-oriented strategies made a positive contribution to returns, although there was a fair amount of dispersion within the group. The Global Macro, Arbitrage-related, and Strategic Fixed Income categories also were positive contributors, albeit to a lesser degree. |
| Q. | What were the weakest performing holdings? |
| A. | Hedged Credit strategies became a detractor as spreads widened, while Managed Futures allocations were whipsawed by volatility in a variety of asset classes. While Hedged Credit was reduced, and ultimately eliminated, during the fiscal year, managed futures was increased. |
| Q. | How was the Fund positioned as of October 31, 2015? |
| A. | The core of the portfolio is comprised of a diverse set of Equity-oriented strategies, which represented 41% of the program as of October 31. Note that this broad category encompasses a mix of Long-biased, Hedged, Multi-asset, and Global strategies. This group is intended to be a “return driver” for the portfolio. Global Macro was the next largest strategy allocation, representing 28% of the program. This category includes Discretionary and Systematic approaches, which are intended to serve as “diversifiers” as well as “return drivers.” Alternative Fixed Income strategies accounted for 15%, while arbitrage was 11%. These two sets of allocations are intended to be “stable return sources” or “volatility dampeners.” |
Over the past year, we have written that we expect heightened volatility and dispersion across markets, stemming from the divergence of economic prospects for the US, Europe, Japan, and China. Looking forward, we believe that the U.S. is on a path towards sustainable but modest growth, eventually leading to a normalization of interest rates. In contrast, Europe and Japan are still engaged in quantitative easing. Although excess liquidity is supportive for these markets, they face ongoing economic weakness and serious structural issues that impede long-term growth. In China, the economy is clearly slowing while policy makers are grappling not only with reining in financial excesses but also shifting the economy from an emphasis on investment to consumption.
Given this backdrop, we have allocated the Fund across a diversified mix of strategies, and composite net equity exposure remains near the middle of our target range of 20% to 50%. We believe that the LASSO strategy is well positioned to produce attractive risk-adjusted returns over time.
Growth of a Hypothetical
$10,000 Investment—Class I

All dividends and capital gains are reinvested. Indexes are unmanaged and do not take into account fees, expenses or other costs.
Returns shown in the chart and table do not reflect taxes that a shareholder would pay on Fund distributions or on the sale of the Fund shares.
A fund-of-funds that invests in funds using alternative or hedging strategies may be exposed to potentially dramatic changes in the value of certain of its portfolio holdings. Investments in a fund-of-funds are subject to higher costs than investing directly in the underlying funds.
RETURNSFOR PERIOD ENDED 10/31/15
Average Annual Total Returns - Class N
| | | | |
One Year | | | -2.87 | % |
Five Year | | | 3.06 | % |
Since Inception | | | 3.46 | % |
Inception Date 03/03/10
Average Annual Total Returns - Class I
| | | | |
One Year | | | -2.62 | % |
Five Year | | | 3.33 | % |
Since Inception | | | 5.56 | % |
Inception Date 04/01/09*
* Because the Fund invests primarily in open-end investment companies which are priced as of the close of the NYSE, performance is shown from April 2, 2009.
The performance data quoted represents past performance. Past performance does not guarantee future results. Investment return and principal value will fluctuate so that an investor’s shares, upon redemption, may be worth more or less than their original cost. Current performance may be lower or higher than the performance data quoted. For performance data current to the most recent month-end, please visit our website at www.astonfunds.com.
The performance quoted would have been lower if fee waivers and/or expense reimbursements had not been in effect.
The oldest share Class, Class I, is being shown in the above chart. Performance would have been lower for Class N shares, due to higher fees and expenses.
| | |
| |
| ASTON/Lake Partners LASSO Alternatives Fund | | October 31, 2015 |
| |
| Schedule of Investments | | |
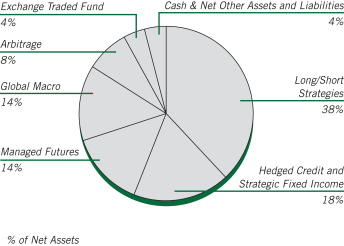
| | | | | | | | |
Shares | | | | | Market
Value | |
| |
| | INVESTMENT COMPANIES – 97.30% | | | | |
| | |
| | | | Long/Short Strategies – 37.85% | | | | |
| | 539,288 | | | Blackrock Global Long/Short Equity Fund-IS | | $ | 6,395,959 | |
| | 626,951 | | | Convergence Core Plus Fund | | | 11,579,785 | |
| | 101 | | | Diamond Hill Long/Short Fund-I * | | | 2,441 | |
| | 406,609 | | | FPA Crescent Fund-I | | | 13,572,605 | |
| | 855,622 | | | John Hancock Seaport Fund-I * | | | 9,317,724 | |
| | 1,603,326 | | | Mainstay U.S. Equity Opportunities Fund | | | 14,429,933 | |
| | 553,574 | | | Robeco Boston Partners Long/Short Equity Fund-IS | | | 11,215,404 | |
| | 880,186 | | | The Weitz Funds - Partners III Opportunity Fund | | | 12,859,521 | |
| | | | | | | | |
| | | | | | | 79,373,372 | |
| | | | | | | | |
| |
| | | | Hedged Credit and Strategic Fixed Income – 17.87% | |
| | 1,346,023 | | | Metropolitan West Unconstrained Bond Fund | | | 15,829,232 | |
| | 1,429,658 | | | PIMCO Mortgage Opportunities Fund | | | 15,854,910 | |
| | 111,511 | | | Schooner Hedged Alternative Income Fund | | | 5,803,047 | |
| | | | | | | | |
| | | | | | | 37,487,189 | |
| | | | | | | | |
| |
| | | | Managed Futures – 14.28% | |
| | 535,714 | | | 361 Managed Futures Fund | | | 6,042,857 | |
| | 1,506,408 | | | Abbey Capital Futures Strategy Fund-I | | | 18,016,635 | |
| | 548,784 | | | ASG Managed Futures Strategy Fund-Y | | | 5,888,453 | |
| | | | | | | | |
| | | | | | | 29,947,945 | |
| | | | | | | | |
| |
| | | | Global Macro – 13.98% | |
| | 1,158,683 | | | John Hancock Funds II - Global Absolute Return Strategies Fund | | | 12,977,250 | |
| | | | | | | | |
Shares | | | | | Market
Value | |
| | |
| | | | Global Macro (continued) | | | | |
| | 1,495,864 | | | Western Asset Macro Opportunities Fund | | $ | 16,349,788 | |
| | | | | | | | |
| | | | | | | 29,327,038 | |
| | | | | | | | |
| |
| | | | Arbitrage – 7.73% | |
| | 843,152 | | | Calamos Market Neutral Income Fund | | | 10,910,393 | |
| | 486,685 | | | Kellner Merger Fund | | | 5,300,000 | |
| | | | | | | | |
| | | | | | | 16,210,393 | |
| | | | | | | | |
| |
| | | | Money Market – 5.59% | |
| | 11,719,397 | | | BlackRock Liquidity Funds Treasury Trust Fund Portfolio | | | 11,719,397 | |
| | | | | | | | |
| | |
| | | | Total Investment Companies
(Cost $199,384,728) | | | 204,065,334 | |
| | | | | | | | |
| |
| | EXCHANGE TRADED FUNDS – 3.55% | | | | |
| | |
| | | | Fixed Income – 3.55% | | | | |
| | 148,640 | | | Proshares Large Cap Core Plus | | | 7,448,350 | |
| | | | | | | | |
| | |
| | | | Total Exchange Traded Funds
(Cost $7,534,323) | | | 7,448,350 | |
| | | | | | | | |
| Total Investments – 100.85%
(Cost $206,919,051)** | | | 211,513,684 | |
| | | | | | | | |
| Net Other Assets and Liabilities – (0.85)% | | | (1,774,654 | ) |
| | | | | | | | |
| Net Assets – 100.00% | | $ | 209,739,030 | |
| | | | | | | | |
| ** | | Aggregate cost for Federal income tax purposes is $207,157,656. |
| | | | |
Gross unrealized appreciation | | $ | 7,187,957 | |
Gross unrealized depreciation | | | (2,831,929 | ) |
| | | | |
Net unrealized appreciation | | $ | 4,356,028 | |
| | | | |
See accompanying Notes to Financial Statements.
ASTON/River Road Long-Short Fund
| | |
| |
| Portfolio Manager Commentary (unaudited) | | October 31, 2015 |
| Matthew W. Moran, CFA & Daniel R. Johnson, CFA, CPA |
| Q. | What were the most significant market factors affecting Fund performance and returns relative to the benchmark during the past 12 months? |
| A. | In the last 12 months, the Russell 3000® has returned +4.49%. The Class N Shares of the Fund returned +3.79%. Our strategy’s method for capital protection – the Drawdown Plan – detracted from the Fund. |
| Q. | What were the best performing holdings for the Fund during the period? |
| A. | The holdings with the largest positive contribution to total return during the period were United States Oil Fund LP (short), Alphabet Inc. (long) and ArcelorMittal SA ADR (short). The United States Oil Fund LP is a structurally flawed Exchange Traded Fund (ETF) that attempts to track oil prices. Alphabet manages the largest search engine in the world. Despite its immense size, Alphabet continued to grow at a rapid rate and hinted at a potential repurchase plan. ArcelorMittal is the world’s largest steel producer. ArcelorMittal declined as lackluster steel demand and overcapacity issues within the global steel industry kept a lid on steel prices. |
| Q. | What were the weakest performing holdings? * |
| A. | The holdings with the largest negative contribution to the Fund’s total return were Rolls-Royce Holdings PLC Sponsored ADR (long), Wal-Mart Stores Inc. (long) and Wesco Aircraft Holdings Inc. (long). Rolls-Royce manufactures and maintains engines typically under long-term contracts for aircraft, ships, and land machinery. After reporting its fourth profit warning in two years, the company announced a new CEO and the activist investor ValueAct took a more than 5% position in the company. We trimmed the position due to our unrealized loss sell discipline. Wal-Mart is the world’s largest retailer. The company issued disappointing guidance that called for margin compression due to higher wages and investment in e-commerce. We maintained our position. Wesco Aircraft is the largest distributor of fasteners, hardware, bearings, tools, electronic components, and chemicals to the aerospace industry. Wesco reported a poor quarter as expected synergies from its Haas acquisition failed to materialize. After the long-time CEO retired, we exited the position. |
| Q. | How was the Fund positioned as of October 31, 2015? |
| A. | The Fund was below the low end of its normal net market exposure range (50 - 70%) at 46% at the end of October. The Fund was in the Drawdown Plan and maintained a sizeable short position in the S&P 500 Exchange Traded Fund (ETF) as a hedge. |
Growth of a Hypothetical
$10,000 Investment—Class N
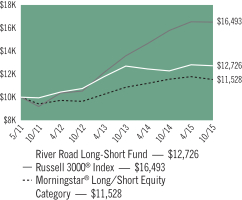
All dividends and capital gains are reinvested. Indexes are unmanaged and do not take into account fees, expenses or other costs.
Returns shown in the chart and table do not reflect taxes that a shareholder would pay on Fund distributions or on the sale of the Fund shares.
RETURNSFOR PERIOD ENDED 10/31/15
Average Annual Total Returns - Class N
| | | | |
One Year | | | 3.79 | % |
Since Inception | | | 5.51 | % |
Inception Date 05/04/11
Average Annual Total Returns - Class I
| | | | |
One Year | | | 4.04 | % |
Since Inception | | | 3.94 | % |
Inception Date 03/04/13
Short sales may involve the risk that the Fund will incur a loss by subsequently buying a security at a higher price than that at which it was previously sold short. Losses incurred on a short sale result from increases in the values of the securities, thus losses on a short sale are theoretically unlimited.
Value investing often involves buying the stocks of companies that are currently out-of-favor that may decline further. Investing in exchange-traded and closed-end funds subjects the Fund to the additional risk that shares of the underlying fund may trade at a premium or discount to their net asset value.
The performance data quoted represents past performance. Past performance does not guarantee future results. Investment return and principal value will fluctuate so that an investor’s shares, upon redemption, may be worth more or less than their original cost. Current performance may be lower or higher than the performance data quoted. For performance data current to the most recent month-end, please visit our website at www.astonfunds.com.
The performance quoted would have been lower if fee waivers and/or expense reimbursements had not been in effect.
| | |
| |
| ASTON/River Road Long-Short Fund | | October 31, 2015 |
| |
| Schedule of Investments | | |
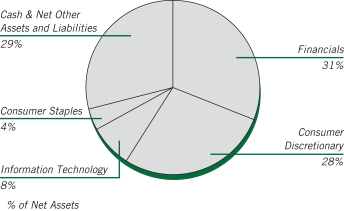
The chart represents total investments in the Fund. Materials, Healthcare, Utilities, Energy, Telecommunication Services, and Exchange Traded Funds are negative 0.21%, 0.60%, 1.64%, 1.59%, 2.65% and 18.33%, respectively, and cannot be represented in the pie chart format.
| | | | | | | | |
Shares | | | | | Market
Value | |
|
| | COMMON STOCKS – 96.86% | |
| | |
| | | | Consumer Discretionary – 33.27% | | | | |
| | 50,795 | | | 21st Century Fox, Class A (a) | | $ | 1,558,899 | |
| | 15,911 | | | Aaron’s | | | 392,524 | |
| | 40,883 | | | Comcast, Class A (a) | | | 2,560,093 | |
| | 49,072 | | | DSW, Class A | | | 1,223,856 | |
| | 46,589 | | | General Motors (a) | | | 1,626,422 | |
| | 65,667 | | | Liberty Media, Class C (a) * | | | 2,570,863 | |
| | 55,361 | | | Liberty Ventures, Class A (a) * | | | 2,412,079 | |
| | 82,742 | | | MSG Networks, Class A * | | | 1,697,866 | |
| | 16,095 | | | Murphy USA * | | | 987,750 | |
| | 130,926 | | | News, Class A (a) | | | 2,016,260 | |
| | 14,263 | | | Ralph Lauren | | | 1,579,913 | |
| | 64,404 | | | Rent-A-Center | | | 1,184,390 | |
| | 105,703 | | | SeaWorld Entertainment (a) | | | 2,106,661 | |
| | 44,998 | | | Sotheby’s | | | 1,559,181 | |
| | 28,732 | | | Time Warner (a) | | | 2,164,669 | |
| | | | | | | | |
| | | | | | | 25,641,426 | |
| | | | | | | | |
| |
| | | | Consumer Staples – 5.05% | |
| | 40,563 | | | Fresh Market * | | | 1,010,830 | |
| | 37,514 | | | Wal-Mart Stores (a) | | | 2,147,301 | |
| | 24,500 | | | Whole Foods Market (a) | | | 734,020 | |
| | | | | | | | |
| | | | | | | 3,892,151 | |
| | | | | | | | |
| |
| | | | Financials – 37.50% | |
| | 74,993 | | | Allied World Assurance Co Holdings AG (Swizterland) | | | 2,726,745 | |
| | 42,836 | | | American Express (a) | | | 3,138,165 | |
| | 11,427 | | | Berkshire Hathaway, Class B * | | | 1,554,301 | |
| | | | | | | | |
Shares | | | | | Market
Value | |
| | |
| | | | Financials (continued) | | | | |
| | 102,699 | | | Brown & Brown | | $ | 3,314,097 | |
| | 38,718 | | | Equity Commonwealth, REIT * | | | 1,111,594 | |
| | 87,621 | | | GEO Group, REIT (a) | | | 2,827,530 | |
| | 62,903 | | | Iron Mountain, REIT (a) | | | 1,927,348 | |
| | 37,151 | | | Oaktree Capital Group, MLP (a) | | | 1,852,349 | |
| | 96,111 | | | PayPal Holdings (a) * | | | 3,460,957 | |
| | 46,940 | | | Ventas, REIT (a) | | | 2,521,617 | |
| | 36,623 | | | Wells Fargo (a) | | | 1,982,769 | |
| | 84,774 | | | Weyerhaeuser, REIT (a) | | | 2,486,421 | |
| | | | | | | | |
| | | | | | | 28,903,893 | |
| | | | | | | | |
| |
| | | | Industrials – 8.98% | |
| | 52,397 | | | Cubic | | | 2,350,005 | |
| | 151,053 | | | Rolls-Royce Holdings, SP ADR | | | 1,601,162 | |
| | 28,235 | | | UniFirst (a) | | | 2,966,651 | |
| | | | | | | | |
| | | | | | | 6,917,818 | |
| | | | | | | | |
| |
| | | | Information Technology – 9.54% | |
| | 2,086 | | | Alphabet, Class C * | | | 1,482,750 | |
| | 49,392 | | | Blackhawk Network Holdings * | | | 2,103,111 | |
| | 66,524 | | | Corning | | | 1,237,346 | |
| | 12,459 | | | IAC/InterActive | | | 834,878 | |
| | 32,120 | | | Microsoft (a) | | | 1,690,797 | |
| | | | | | | | |
| | | | | | | 7,348,882 | |
| | | | | | | | |
| |
| | | | Materials – 2.52% | |
| | 17,492 | | | Praxair | | | 1,943,186 | |
| | | | | | | | |
| | |
| | | | Total Common Stocks
(Cost $73,551,747) | | | 74,647,356 | |
| | | | | | | | |
|
| | INVESTMENT COMPANY – 28.50% | |
| | |
| | 21,968,651 | | | BlackRock Liquidity Funds
TempFund Portfolio | | | 21,968,651 | |
| | | | | | | | |
| | |
| | | | Total Investment Company
(Cost $21,968,651) | | | 21,968,651 | |
| | | | | | | | |
| Total Investments – 125.36%
(Cost $95,520,398)** | | | 96,616,007 | |
| | | | | | | | |
| $17,014,211 in cash and $33,917,928 in securities was segregated or
on deposit with a prime broker to cover short sales as of October 31,
2015 and are included in “Net Other Assets and Liabilities”. |
|
|
| | SHORT SALES (b) – (50.91)% | |
|
| | Common Stocks – (32.58)% | |
| |
| | | | Consumer Discretionary – (5.41)% | |
| | (11,314) | | | Best Buy | | | (396,328 | ) |
| | (8,180) | | | Burlington Stores * | | | (393,294 | ) |
| | (24,719) | | | Gannett | | | (391,055 | ) |
| | (47,048) | | | Regis * | | | (777,233 | ) |
| | (4,532) | | | Royal Caribbean Cruises | | | (445,722 | ) |
| | (13,553) | | | Sonic | | | (386,803 | ) |
| | (2,857) | | | TESLA Motors * | | | (591,199 | ) |
| | (4,904) | | | Whirlpool | | | (785,327 | ) |
| | | | | | | | |
| | | | | | | (4,166,961 | ) |
| | | | | | | | |
See accompanying Notes to Financial Statements.
| | |
| |
| ASTON/River Road Long-Short Fund | | October 31, 2015 |
| |
| Schedule of Investments – continued | | |
| | | | | | | | |
Shares | | | | | Market
Value | |
| | |
| | | | Consumer Staples – (1.41)% | | | | |
| | (59,911) | | | Dean Foods | | $ | (1,084,988 | ) |
| | | | | | | | |
| |
| | | | Energy – (1.59)% | |
| | (45,827) | | | Noble (United Kingdom) | | | (617,289 | ) |
| | (4,446) | | | Pioneer Natural Resources | | | (609,724 | ) |
| | | | | | | | |
| | | | | | | (1,227,013 | ) |
| | | | | | | | |
| |
| | | | Financials – (6.44)% | |
| | (10,050) | | | Camden Property Trust, REIT | | | (741,590 | ) |
| | (7,394) | | | Equity Residential, REIT | | | (571,704 | ) |
| | (29,495) | | | Home Capital Group (Canada) | | | (718,427 | ) |
| | (55,513) | | | Janus Capital Group | | | (862,117 | ) |
| | (14,536) | | | Mercury General | | | (785,089 | ) |
| | (15,315) | | | Plum Creek Timber, REIT | | | (623,933 | ) |
| | (13,909) | | | Primerica | | | (662,486 | ) |
| | | | | | | | |
| | | | | | | (4,965,346 | ) |
| | | | | | | | |
| |
| | | | Healthcare – (0.60)% | |
| | (7,003) | | | Mallinckrodt * | | | (459,887 | ) |
| | | | | | | | |
| |
| | | | Industrials – (8.56)% | |
| | (94,857) | | | ACCO Brands * | | | (765,495 | ) |
| | (8,482) | | | Caterpillar | | | (619,101 | ) |
| | (22,660) | | | Mobile Mini | | | (775,878 | ) |
| | (34,224) | | | Pitney Bowes | | | (706,726 | ) |
| | (22,390) | | | Ritchie Bros. Auctioneers (Canada) | | | (581,468 | ) |
| | (45,949) | | | RR Donnelley & Sons | | | (775,160 | ) |
| | (22,140) | | | Tetra Tech | | | (595,566 | ) |
| | (16,480) | | | United Continental Holdings * | | | (993,909 | ) |
| | (10,539) | | | United Rentals * | | | (788,950 | ) |
| | | | | | | | |
| | | | | | | (6,602,253 | ) |
| | | | | | | | |
| |
| | | | Information Technology – (1.55)% | |
| | (33,411) | | | Ciena * | | | (806,542 | ) |
| | (16,111) | | | GrubHub * | | | (386,342 | ) |
| | | | | | | | |
| | | | | | | (1,192,884 | ) |
| | | | | | | | |
| |
| | | | Materials – (2.73)% | |
| | (99,414) | | | ArcelorMittal, SP ADR | | | (557,713 | ) |
| | (59,275) | | | Louisiana-Pacific * | | | (1,046,797 | ) |
| | (85,340) | | | Teck Resources, Class B (Canada) | | | (500,946 | ) |
| | | | | | | | |
| | | | | | | (2,105,456 | ) |
| | | | | | | | |
| |
| | | | Telecommunication Services – (2.65)% | |
| | (30,039) | | | CenturyLink | | | (847,400 | ) |
| | (35,682) | | | Consolidated Communications Holdings | | | (788,572 | ) |
| | (78,775) | | | Frontier Communications | | | (404,904 | ) |
| | | | | | | | |
| | | | | | | (2,040,876 | ) |
| | | | | | | | |
| |
| | | | Utilities – (1.64)% | |
| | (9,384) | | | DTE Energy | | | (765,641 | ) |
| | (18,735) | | | South Jersey Industries | | | (496,665 | ) |
| | | | | | | | |
| | | | | | | (1,262,306 | ) |
| | | | | | | | |
| | | | Total Common Stocks
(Proceeds $24,418,432) | | | (25,107,970 | ) |
| | | | | | | | |
| | | | | | | | |
Shares | | | | | Market
Value | |
|
| | EXCHANGE TRADED FUNDS – (18.33)% | |
| | (65,265) | | | SPDR S&P 500 ETF Trust | | $ | (13,570,551 | ) |
| | (37,771) | | | United States Oil Fund LP * | | | (559,389 | ) |
| | | | | | | | |
| | |
| | | | TOTAL EXCHANGE TRADED FUNDS
(Proceeds $13,127,711) | | | (14,129,940 | ) |
| | | | | | | | |
| Total Short Sales – (50.91)%
(Proceeds $37,546,143) | | | (39,237,910 | ) |
| | | | | | | | |
| Net Other Assets and Liabilities – 25.55% | | | 19,692,448 | |
| | | | | | | | |
| Net Assets – 100.00% | | $ | 77,070,545 | |
| | | | | | | | |
| * | | Non-income producing security. |
| ** | | Aggregate cost for Federal income tax purposes is $98,230,281. |
| | | | |
Gross unrealized appreciation | | $ | 3,312,801 | |
Gross unrealized depreciation | | | (4,927,075 | ) |
| | | | |
Net unrealized appreciation | | $ | (1,614,274 | ) |
| | | | |
| (a) | | Security position is either entirely or partially held in a segregated account as collateral for securities sold short. |
| (b) | | The Fund is contractually responsible to the lender for any dividends payable and interest accrued on securities while those securities are in a short position. These dividends and interest are recorded as an expense of the Fund. |
| MLP | | Master Limited Partnership |
| REIT | | Real Estate Investment Trust |
| SP ADR | | Sponsored American Depositary Receipt |
| SPDR | | Standard & Poor’s Depositary Receipt |
See accompanying Notes to Financial Statements.
ASTON/Barings International Fund
| | |
| |
| Portfolio Manager Commentary (unaudited) | | October 31, 2015 |
David Bertocchi, CFA
| Q. | What were the most significant market factors affecting Fund performance and returns relative to the benchmark during the past 12 months? |
| A. | The portfolio performed strongly over the year, outperforming its benchmark significantly. It is also pleasing that the portfolio generated a positive absolute return, while the benchmark produced a return only marginally above zero percent. The source of this outperformance came from a number of key areas: a number of our UK and European stocks performed very well during the year, while we also largely avoided areas of the market that came under significant pressure during the year (namely Energy and Materials stocks). Our stock selection was particularly strong in continental Europe, where a number of the Financials holdings performed well, as did our holdings in the Healthcare and Information Technology sectors. |
| Q. | What were the best performing holdings for the Fund during the period? |
| A. | Our holding in Deutsche Boerse, the German stock exchange group, performed very well over the year. The company benefitted significantly from the increase in volatility in a number of its key markets over the year. Increased equity market volatility in the third quarter of the year benefitted the group in particular. Our holding in Fresenius SE, the German-listed healthcare company, performed very well over the year. Its dialysis business, Fresenius Medical Care, performed well, as did a number of its other divisions. Another of our German holdings, Wirecard, AG produced strong performance over the year. The company is a market leader in online payments processing, an industry which is experiencing very strong growth at the moment (and we think that this growth will continue). |
| Q. | What were the weakest performing holdings? |
| A. | A number of our Japanese holdings struggled during the year, primarily because of their exposure to the slowing Chinese economy. Our holding in Hitachi Metals, a world leader in specialist materials used in turbo-charged engines, underperformed during the year. We continue to believe that the selloff in the name is unjustified, and continue to hold the company in the portfolio. Our holding in Oil Search, and Australian-listed Energy company, did not perform well during the year, because of the significant fall experienced in the price of oil. We sold the holding from the portfolio during the year. |
| Q. | How was the Fund positioned as of October 31, 2015? |
| A. | A sizeable proportion of the portfolio is invested in the Healthcare and Information Technology sectors, as we continue to find a number of high quality, attractively valued investments which we believe will generate substantial earnings growth over the medium- to long-term. Conversely, we do not hold any mining companies, while our holdings in the Energy sector are focused on high quality businesses that we believe can weather the current storm being faced by the sector at the moment. We hold only a few emerging market names, as we do hold concerns about slowing economic growth in a number of key emerging markets around the world (namely China, Brazil, and South Africa). As usual, we will maintain our focus on finding high quality, attractively valued investments which we believe will produce substantial growth in earnings over the medium- to long-term. |
Growth of a Hypothetical
$10,000 Investment—Class I
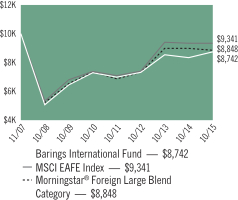
All dividends and capital gains are reinvested. Indexes are unmanaged and do not take into account fees, expenses or other costs.
Returns shown in the chart and table do not reflect taxes that a shareholder would pay on Fund distributions or on the sale of the Fund shares.
The securities of foreign companies may be less liquid and may fluctuate more widely than those traded in U.S. markets.
Emerging market securities may be subject to additional risks such as price volatility, currency fluctuation, financial reporting requirements, as well as political and economic instability.
RETURNSFOR PERIOD ENDED 10/31/15
Average Annual Total Returns - Class N
| | | | |
One Year | | | 4.47 | % |
Five Year | | | 3.46 | % |
Since Inception | | | 5.08 | % |
Inception Date 03/03/10
Average Annual Total Returns - Class I
| | | | |
One Year | | | 4.78 | % |
Five Year | | | 3.70 | % |
Since Inception | | | -1.67 | % |
Inception Date 11/02/07
The performance data quoted represents past performance. Past performance does not guarantee future results. Investment return and principal value will fluctuate so that an investor’s shares, upon redemption, may be worth more or less than their original cost. Current performance may be lower or higher than the performance data quoted. For performance data current to the most recent month-end, please visit our website at www.astonfunds.com.
The performance quoted would have been lower if fee waivers and/or expense reimbursements had not been in effect.
The oldest share Class, Class I, is being shown. Performance would have been lower for Class N shares, due to higher fees and expenses.
| | |
| |
| ASTON/Barings International Fund | | October 31, 2015 |
| |
| Schedule of Investments | | |
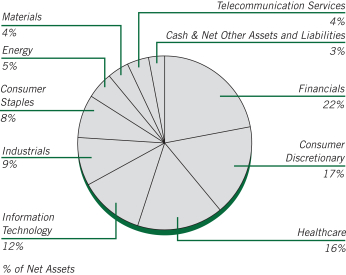
| | | | | | | | |
Shares | | | | | Market
Value | |
|
| | COMMON STOCKS – 97.22% | |
| | |
| | | | Australia – 3.41% | | | | |
| | 36,411 | | | Amcor (a) | | $ | 351,686 | |
| | 5,355 | | | CSL (a) | | | 355,948 | |
| | | | | | | | |
| | | | | | | 707,634 | |
| | | | | | | | |
| | |
| | | | China – 0.95% | | | | |
| | 151,000 | | | Pax Global Technology (a) | | | 197,457 | |
| | | | | | | | |
| | |
| | | | France – 9.34% | | | | |
| | 7,658 | | | Accor (a) | | | 380,292 | |
| | 2,409 | | | Air Liquide (a) | | | 311,645 | |
| | 12,214 | | | AXA (a) | | | 325,969 | |
| | 4,552 | | | BNP Paribas (a) | | | 275,838 | |
| | 8,152 | | | SES (a) | | | 240,528 | |
| | 8,304 | | | Total (a) | | | 401,572 | |
| | | | | | | | |
| | | | | | | 1,935,844 | |
| | | | | | | | |
| | |
| | | | Germany – 12.53% | | | | |
| | 2,743 | | | Bayer (a) | | | 365,739 | |
| | 3,400 | | | Daimler (a) | | | 294,827 | |
| | 4,587 | | | Deutsche Boerse (a) | | | 422,942 | |
| | 6,688 | | | Fresenius (a) | | | 491,450 | |
| | 4,280 | | | SAP (a) | | | 337,414 | |
| | 17,183 | | | TUI (a) | | | 319,529 | |
| | 7,113 | | | Wirecard (a) | | | 367,416 | |
| | | | | | | | |
| | | | | | | 2,599,317 | |
| | | | | | | | |
| | |
| | | | Hong Kong – 2.31% | | | | |
| | 47,400 | | | AIA Group (a) | | | 277,922 | |
| | 25,600 | | | HSBC Holdings (a) | | | 200,163 | |
| | | | | | | | |
| | | | | | | 478,085 | |
| | | | | | | | |
| | |
| | | | Japan – 28.36% | | | | |
| | 22,900 | | | Astellas Pharma (a) | | | 332,382 | |
| | | | | | | | |
Shares | | | | | Market
Value | |
| | |
| | | | Japan (continued) | | | | |
| | 9,900 | | | Bridgestone (a) | | $ | 363,042 | |
| | 5,800 | | | Daikin Industries (a) | | | 372,656 | |
| | 34,000 | | | Hitachi (a) | | | 196,139 | |
| | 24,900 | | | Hitachi Metals (a) | | | 282,014 | |
| | 3,700 | | | Hoshizaki Electric (a) | | | 267,541 | |
| | 20,500 | | | Isuzu Motors (a) | | | 239,430 | |
| | 8,900 | | | Japan Tobacco (a) | | | 308,045 | |
| | 14,900 | | | KDDI (a) | | | 360,555 | |
| | 28,000 | | | Mitsubishi Electric (a) | | | 291,613 | |
| | 63,500 | | | Mitsubishi UFJ Financial Group (a) | | | 410,688 | |
| | 11,000 | | | Mitsui Fudosan (a) | | | 299,350 | |
| | 26,600 | | | Rakuten (a) | | | 368,495 | |
| | 13,300 | | | Sony (a) | | | 378,058 | |
| | 1,533 | | | Sony, SP ADR | | | 43,537 | |
| | 77,000 | | | Sumitomo Mitsui Trust Holdings (a) | | | 295,568 | |
| | 7,600 | | | Takeda Pharmaceuticals (a) | | | 371,125 | |
| | 10,700 | | | Tokio Marine Holdings (a) | | | 412,289 | |
| | 4,700 | | | Toyota Motor (a) | | | 287,943 | |
| | | | | | | | |
| | | | | | | 5,880,470 | |
| | | | | | | | |
| | |
| | | | Netherlands – 7.99% | | | | |
| | 3,914 | | | Airbus Group (a) | | | 272,553 | |
| | 3,851 | | | ASML Holding (a) | | | 357,224 | |
| | 21,336 | | | Koninklijke Ahold (a) | | | 434,052 | |
| | 9,139 | | | Koninklijke Philips (a) | | | 246,378 | |
| | 13,228 | | | Royal Dutch Shell, Class A (a) | | | 346,513 | |
| | | | | | | | |
| | | | | | | 1,656,720 | |
| | | | | | | | |
| | |
| | | | Spain – 1.62% | | | | |
| | 7,918 | | | Amadeus IT Holding (a) | | | 336,805 | |
| | | | | | | | |
| | |
| | | | Sweden – 1.66% | | | | |
| | 17,319 | | | Assa Abloy (a) | | | 344,528 | |
| | | | | | | | |
| | |
| | | | Switzerland – 7.30% | | | | |
| | 2,825 | | | Actelion (a) | | | 392,150 | |
| | 4,685 | | | Julius Baer Group (a) | | | 232,294 | |
| | 3,373 | | | Novartis (a) | | | 305,556 | |
| | 19,320 | | | UBS Group (a) | | | 385,867 | |
| | 753 | | | Zurich Financial Services (a) | | | 198,717 | |
| | | | | | | | |
| | | | | | | 1,514,584 | |
| | | | | | | | |
| | |
| | | | United Kingdom – 21.75% | | | | |
| | 12,914 | | | Admiral Group (a) | | | 320,475 | |
| | 25,531 | | | ARM Holdings (a) | | | 402,077 | |
| | 5,042 | | | AstraZeneca (a) | | | 321,338 | |
| | 68,582 | | | Barclays (a) | | | 244,342 | |
| | 13,309 | | | BG Group (a) | | | 210,262 | |
| | 5,790 | | | British American Tobacco (a) | | | 343,980 | |
| | 54,574 | | | BT Group (a) | | | 389,739 | |
| | 49,659 | | | GKN (a) | | | 219,424 | |
| | 22,257 | | | Indivior (a) | | | 70,321 | |
| | 16,397 | | | Prudential (a) | | | 382,975 | |
| | 3,567 | | | Reckitt Benckiser Group (a) | | | 348,104 | |
| | 5,285 | | | SABMiller (a) | | | 324,621 | |
| | 4,781 | | | Shire (a) | | | 362,067 | |
| | 55,562 | | | Worldpay Group * | | | 238,975 | |
See accompanying Notes to Financial Statements.
| | |
| |
| ASTON/Barings International Fund | | October 31, 2015 |
| |
| Schedule of Investments – continued | | |
| | | | | | | | |
Shares | | | | | Market
Value | |
| | |
| | | | United Kingdom (continued) | | | | |
| | 14,752 | | | WPP (a) | | $ | 330,690 | |
| | | | | | | | |
| | | | | | | 4,509,390 | |
| | | | | | | | |
| | |
| | | | Total Common Stocks
(Cost $18,805,082) | | | 20,160,834 | |
| | | | | | | | |
|
| | INVESTMENT COMPANY – 1.52% | |
| | |
| | 313,701 | | | BlackRock Liquidity Funds
TempFund Portfolio | | | 313,701 | |
| | | | | | | | |
| | |
| | | | Total Investment Company
(Cost $313,701) | | | 313,701 | |
| | | | | | | | |
| Total Investments – 98.74%
(Cost $19,118,783)** | | | 20,474,535 | |
| | | | | | | | |
| Net Other Assets and Liabilities – 1.26% | | | 262,211 | |
| | | | | | | | |
| Net Assets – 100.00% | | $ | 20,736,746 | |
| | | | | | | | |
| * | | Non-income producing security. |
| ** | | Aggregate cost for Federal income tax purposes is $19,247,143. |
| | | | |
Gross unrealized appreciation | | $ | 2,009,198 | |
Gross unrealized depreciation | | | (781,806 | ) |
| | | | |
Net unrealized appreciation | | $ | 1,227,392 | |
| | | | |
| (a) | | Securities with a total aggregate market value of $19,878,322 or 95.86% of the net assets, were valued under the fair value procedures established by the Funds’ Board of Trustees. |
| SP ADR | | Sponsored American Depositary Receipt |
See accompanying Notes to Financial Statements.
ASTON/Guardian Capital Global Dividend Fund
| | |
| |
| Portfolio Manager Commentary (unaudited) | | October 31, 2015 |
| Srikanth Iyer & Fiona Wilson, CFA |
| Q. | What were the most significant market factors affecting Fund performance and returns relative to the benchmark during the past 12 months? |
| A. | The portfolio underperformed the benchmark for the year ended October 31, 2015. The second quarter of 2015 saw market volatility spike amidst growth concerns in China, geopolitical risk in Europe, and uncertainty surrounding a Federal Reserve (Fed) interest rate hike. Materials were the hardest hit during the selloff, declining 19.7% in the benchmark compared to a decline of 13.2% for the portfolio due to its positioning in large blue chip chemical companies. |
Market uncertainty spilled over into the third quarter 2015, with the turmoil in China coming to the fore after a sudden devaluation of the yuan in August brought into focus the country’s ailing economy. Initially conceived as a way to stem the outflow from equities following July’s margin tightening, the move had the opposite effect, undermining the government’s ability to reign in the markets and prompting investors to question whether the country’s woes portend a macro economic slowdown.
The portfolio benefitted from its overweighting of the U.S., which continued to show promise in its domestic economy after unemployment in the U.S. dropped to 5.1% in August and the Core Consumer Price Index mustered another gain of 1.8%. Gains were further buoyed by Europe, where the economy—having emerged relatively unscathed from the debacle in Greece—reported strong earnings, fuelled by the interplay of a weaker euro, higher exports, and margin expansion.
| Q. | What were the best performing holdings for the Fund during the period? |
| A. | Performance was driven by the tobacco cluster, with Reynolds American, Altria Group, and Imperial Tobacco Group posting solid returns backed by strong profit margin expansion. |
Industrials also had a strong year, led by Ferrovial. The company has reached an inflection point in its balance sheet with refinancing risk mitigated by a net cash position at the holding company level and its investment grade credit rating. With substantial return on equity and strong dividend yield, the stock is a standout amongst its competitors.
| Q. | What were the weakest performing holdings? |
| A. | Information Technology had the weakest selection effects, with performance being dragged down by Garmin, Amazon, and Seagate Technology. Seagate Technology’s decaying earnings weighed the most as the company struggles to transition to solid state memory. |
| Q. | How was the Fund positioned as of October 31, 2015? |
| A. | The portfolio maintains overweight in the yield bearing sectors which include Consumer Staples, Telecommunications, Industrials and Utilities. Underweight sectors include Consumer Discretionary, Financials, Information Technology and Energy. |
Geographically, the portfolio is underweight Japan/Asia Pacific with Japan being the lowest yielding country in the index, underweight the U.S. and overweight Europe. The portfolio did not have a weight in Emerging Markets. In terms of portfolio characteristics, the portfolio exhibited a strong three year dividend growth rate and yield. The portfolio has a large cap, high-quality bias.
We continue to stay well within our risk limits of sector and industry, allowing for performance based on stock selection, without the need for any large sector bets.
Growth of a Hypothetical
$10,000 Investment—Class N
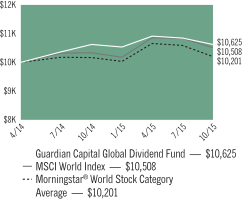
All dividends and capital gains are reinvested. Indexes are unmanaged and do not take into account fees, expenses or other costs.
Returns shown in the chart and table do not reflect taxes that a shareholder would pay on Fund distributions or on the sale of the Fund shares.
The securities of foreign companies may be less liquid and may fluctuate more widely than those traded in U.S. markets.
Emerging market securities may be subject to additional risks such as price volatility, currency fluctuation, financial reporting requirements as well as political and economic instability.
RETURNSFOR PERIOD ENDED 10/31/15
Average Annual Total Returns - Class N
| | | | |
One Year | | | 0.07 | % |
Since Inception | | | 3.99 | % |
Inception Date 04/14/14
Average Annual Total Returns - Class I
| | | | |
One Year | | | 0.14 | % |
Since Inception | | | 4.17 | % |
Inception Date 04/14/14
The performance data quoted represents past performance. Past performance does not guarantee future results. Investment return and principal value will fluctuate so that an investor’s shares, upon redemption, may be worth more or less than their original cost. Current performance may be lower or higher than the performance data quoted. For performance data current to the most recent month-end, please visit our website at www.astonfunds.com.
The performance quoted would have been lower if fee waivers and/or expense reimbursements had not been in effect.
| | |
| |
| ASTON/Guardian Capital Global Dividend Fund | | October 31, 2015 |
| |
| Schedule of Investments | | |
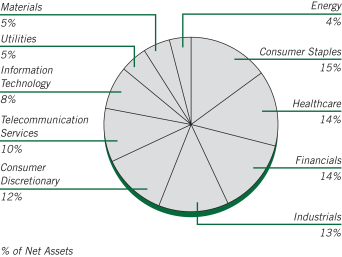
| | | | | | | | |
Shares | | | | | Market
Value | |
|
| | COMMON STOCKS – 99.87% | |
| | |
| | | | Australia – 3.15% | | | | |
| | 1,679 | | | Australia & New Zealand Banking Group (a) | | $ | 32,472 | |
| | 1,100 | | | Sonic Healthcare (a) | | | 15,044 | |
| | 5,200 | | | Sydney Airport (a) | | | 23,765 | |
| | 10,100 | | | Telstra (a) | | | 38,700 | |
| | 1,200 | | | Westpac Banking (a) | | | 26,729 | |
| | | | | | | | |
| | | | | | | 136,710 | |
| | | | | | | | |
| | |
| | | | Belgium – 3.48% | | | | |
| | 660 | | | Anheuser-Busch InBev, SP ADR | | | 78,758 | |
| | 2,100 | | | Proximus (a) | | | 72,670 | |
| | | | | | | | |
| | | | | | | 151,428 | |
| | | | | | | | |
| | |
| | | | Canada – 1.50% | | | | |
| | 417 | | | Keyera | | | 12,868 | |
| | 690 | | | Pembina Pipeline | | | 17,345 | |
| | 610 | | | Royal Bank of Canada | | | 34,880 | |
| | | | | | | | |
| | | | | | | 65,093 | |
| | | | | | | | |
| | |
| | | | Denmark – 0.69% | | | | |
| | 562 | | | Novo Nordisk, SP ADR | | | 29,887 | |
| | | | | | | | |
| | |
| | | | Finland – 0.54% | | | | |
| | 621 | | | Elisa (a) | | | 23,397 | |
| | | | | | | | |
| | |
| | | | France – 2.49% | | | | |
| | 2,600 | | | AXA (a) | | | 69,389 | |
| | 800 | | | Total (a) | | | 38,687 | |
| | | | | | | | |
| | | | | | | 108,076 | |
| | | | | | | | |
| | |
| | | | Germany – 6.41% | | | | |
| | 600 | | | BASF (a) | | | 49,154 | |
| | 393 | | | Bayer (a) | | | 52,401 | |
| | 222 | | | Daimler (a) | | | 19,250 | |
| | | | | | | | |
Shares | | | | | Market
Value | |
| | |
| | | | Germany (continued) | | | | |
| | 2,500 | | | Deutsche Telekom (a) | | $ | 46,829 | |
| | 176 | | | Muenchener Rueckversicherungs-Gesellschaft (a) | | | 35,093 | |
| | 1,400 | | | ProSiebenSat.1 Media (a) | | | 75,650 | |
| | | | | | | | |
| | | | | | | 278,377 | |
| | | | | | | | |
| | |
| | | | Ireland – 1.14% | | | | |
| | 673 | | | Medtronic | | | 49,748 | |
| | | | | | | | |
| | |
| | | | Israel – 1.17% | | | | |
| | 858 | | | Teva Pharmaceutical, SP ADR | | | 50,785 | |
| | | | | | | | |
| | |
| | | | Italy – 0.74% | | | | |
| | 1,960 | | | Eni (a) | | | 32,007 | |
| | | | | | | | |
| | |
| | | | Japan – 1.93% | | | | |
| | 581 | | | Fuji Heavy Industries (a) | | | 22,469 | |
| | 6,297 | | | Mitsubishi UFJ Financial Group (a) | | | 40,726 | |
| | 518 | | | Sumitomo Mitsui Financial Group (a) | | | 20,665 | |
| | | | | | | | |
| | | | | | | 83,860 | |
| | | | | | | | |
| | |
| | | | Netherlands – 1.50% | | | | |
| | 218 | | | LyondellBasell Industries, Class A | | | 20,254 | |
| | 1,003 | | | Unilever | | | 45,115 | |
| | | | | | | | |
| | | | | | | 65,369 | |
| | | | | | | | |
| | |
| | | | Spain – 3.11% | | | | |
| | 5,367 | | | Ferrovial (a) | | | 135,396 | |
| | | | | | | | |
| | |
| | | | Sweden – 1.38% | | | | |
| | 4,200 | | | Skandinaviska Enskilda Banken (a) | | | 44,104 | |
| | 700 | | | Swedbank, Class A (a) | | | 16,039 | |
| | | | | | | | |
| | | | | | | 60,143 | |
| | | | | | | | |
| | |
| | | | Switzerland – 6.02% | | | | |
| | 1,000 | | | Nestle (a) | | | 76,374 | |
| | 910 | | | Novartis, ADR | | | 82,291 | |
| | 200 | | | Swisscom (a) | | | 103,043 | |
| | | | | | | | |
| | | | | | | 261,708 | |
| | | | | | | | |
| | |
| | | | United Kingdom – 10.31% | | | | |
| | 600 | | | AstraZeneca (a) | | | 38,239 | |
| | 5,491 | | | BAE Systems (a) | | | 37,144 | |
| | 258 | | | BP, SP ADR | | | 9,211 | |
| | 540 | | | British American Tobacco, SP ADR | | | 63,774 | |
| | 418 | | | GlaxoSmithKline, SP ADR | | | 17,999 | |
| | 1,400 | | | Imperial Tobacco Group (a) | | | 75,387 | |
| | 5,500 | | | Legal & General Group (a) | | | 22,148 | |
| | 5,000 | | | National Grid (a) | | | 71,224 | |
| | 442 | | | Prudential, ADR | | | 20,681 | |
| | 500 | | | Royal Dutch Shell, Class A (a) | | | 13,054 | |
| | 3,400 | | | SSE (a) | | | 79,099 | |
| | | | | | | | |
| | | | | | | 447,960 | |
| | | | | | | | |
| | |
| | | | United States – 54.31% | | | | |
| | 1,090 | | | AbbVie | | | 64,910 | |
| | 440 | | | Air Products & Chemicals | | | 61,151 | |
See accompanying Notes to Financial Statements.
| | |
| |
| ASTON/Guardian Capital Global Dividend Fund | | October 31, 2015 |
| |
| Schedule of Investments – continued | | |
| | | | | | | | |
Shares | | | | | Market
Value | |
| | |
| | | | United States (continued) | | | | |
| | 1,500 | | | Altria Group | | $ | 90,705 | |
| | 564 | | | Ameren | | | 24,636 | |
| | 222 | | | Amgen | | | 35,116 | |
| | 1,054 | | | Apple | | | 125,953 | |
| | 2,194 | | | AT&T | | | 73,521 | |
| | 860 | | | Automatic Data Processing | | | 74,811 | |
| | 252 | | | Avago Technologies | | | 31,029 | |
| | 132 | | | Chevron | | | 11,996 | |
| | 294 | | | ConocoPhillips | | | 15,685 | |
| | 1,400 | | | CSX | | | 37,786 | |
| | 1,390 | | | Dow Chemical | | | 71,821 | |
| | 666 | | | Dr Pepper Snapple Group | | | 59,520 | |
| | 475 | | | Duke Energy | | | 33,948 | |
| | 560 | | | General Dynamics | | | 83,205 | |
| | 379 | | | Gilead Sciences | | | 40,981 | |
| | 372 | | | Goldman Sachs Group | | | 69,750 | |
| | 934 | | | Illinois Tool Works | | | 85,872 | |
| | 760 | | | Intel | | | 25,734 | |
| | 899 | | | Johnson & Johnson | | | 90,826 | |
| | 1,148 | | | JPMorgan Chase | | | 73,759 | |
| | 200 | | | Kimberly-Clark | | | 23,942 | |
| | 764 | | | Kinder Morgan | | | 20,895 | |
| | 360 | | | Lockheed Martin | | | 79,139 | |
| | 252 | | | Macquarie Infrastructure | | | 20,047 | |
| | 220 | | | McDonald’s | | | 24,695 | |
| | 562 | | | Merck | | | 30,719 | |
| | 487 | | | Microsoft | | | 25,636 | |
| | 988 | | | Newell Rubbermaid | | | 41,921 | |
| | 857 | | | Paychex | | | 44,204 | |
| | 876 | | | Pfizer | | | 29,626 | |
| | 747 | | | Philip Morris International | | | 66,035 | |
| | 370 | | | Procter & Gamble | | | 28,261 | |
| | 200 | | | Raytheon | | | 23,480 | |
| | 396 | | | Republic Services | | | 17,321 | |
| | 2,172 | | | Reynolds American | | | 104,951 | |
| | 1,380 | | | Six Flags Entertainment | | | 71,815 | |
| | 1,434 | | | Starbucks | | | 89,725 | |
| | 422 | | | Texas Instruments | | | 23,936 | |
| | 1,355 | | | Verizon Communications | | | 63,522 | |
| | 882 | | | VF | | | 59,553 | |
| | 423 | | | Walt Disney | | | 48,112 | |
| | 740 | | | Waste Management | | | 39,782 | |
| | 1,540 | | | Wells Fargo | | | 83,376 | |
| | 427 | | | Williams | | | 16,843 | |
| | | | | | | | |
| | | | | | | 2,360,251 | |
| | | | | | | | |
| | |
| | | | Total Common Stocks
(Cost $4,124,889) | | | 4,340,195 | |
| | | | | | | | |
|
| | RIGHTS – 0.01% | |
| | |
| | | | Australia – 0.01% | | | | |
| | 52 | | | Westpac Banking, Expiring 05/04/2016 * | | | 182 | |
| | | | | | | | |
| | |
| | | | Total Rights
(Cost $0) | | | 182 | |
| | | | | | | | |
| | | | | | | | |
Shares | | | | | Market
Value | |
|
| | INVESTMENT COMPANY – 0.04% | |
| | |
| | 1,827 | | | BlackRock Liquidity Funds
TempFund Portfolio | | $ | 1,827 | |
| | | | | | | | |
| | |
| | | | Total Investment Company
(Cost $1,827) | | | 1,827 | |
| | | | | | | | |
| Total Investments – 99.92%
(Cost $4,126,716)** | | | 4,342,204 | |
| | | | | | | | |
| Net Other Assets and Liabilities – 0.08% | | | 3,579 | |
| | | | | | | | |
| Net Assets – 100.00% | | $ | 4,345,783 | |
| | | | | | | | |
| * | | Non-income producing security. |
| ** | | Aggregate cost for Federal income tax purposes is $4,126,447. |
| | | | |
Gross unrealized appreciation | | $ | 429,979 | |
Gross unrealized depreciation | | | (214,222 | ) |
| | | | |
Net unrealized appreciation | | $ | 215,757 | |
| | | | |
| (a) | | Securities with a total aggregate market value of $1,446,348 or 33.28% of the net assets, were valued under the fair value procedures established by the Funds’ Board of a Trustees. |
| ADR | | American Depositary Receipt |
| SP ADR | | Sponsored American Depositary Receipt |
See accompanying Notes to Financial Statements.
ASTON/LMCG Emerging Markets Fund
| | |
| |
| Portfolio Manager Commentary (unaudited) | | October 31, 2015 |
| Gordon Johnson, PhD, CFA; Shannon Ericson, CFA & Vikram Srimurthy, PhD, CFA |
| Q. | What were the most significant market factors affecting Fund performance and returns relative to the benchmark during the past 12 months? |
| A. | Political and economic uncertainties in many countries led to a volatile year for emerging market equities. The timing of the U.S. Federal Reserve’s (Fed) decision to raise interest rates added to the turmoil as investors worried economic growth could slow in many emerging countries with higher financing costs. It was a challenging period for our quantitative stock selection process to add value; investors focused more on macro events and less on company fundamentals, creating a difficult environment for active stock pickers like we are. For most of the year, our stock selection model was effective, largely driven by Price Momentum. Valuation struggled as investors viewed cheapness as more risky. Earnings Quality was important but its contribution was substantially more muted than Price Momentum. October saw a sharp reversal to Price Momentum after the Fed delayed an interest rate increase following weaker economic data. Our strategy is to maintain a balanced approach between Valuation and Momentum, and it is difficult to outperform when the payoffs to these factors offset one another. |
| Q. | What were the best performing holdings for the Fund during the period? |
| A. | The best performing holdings were Evergrande Real Estate Group, China Railway Group and Grupo Aeroportuario del Pacifico. All three stocks were up strong on positive earnings related news. Evergrande, a Chinese property company, reported strong earnings results boosted by higher real estate demand in China. Shares of China Railway Group and Grupo Aeroportuario del Pacifico also gained as earnings exceeded Wall Street expectations and management provided positive guidance. |
| Q. | What were the weakest performing holdings? |
| A. | The biggest negative contributions came from overweight positions in Great Wall Motor Co., Banco do Brasil and Metalurgica Gerdau. After Great Wall Motors announced they would raise capital through a private placement, Wall Street analysts downgraded the stock on concerns the company would not use the capital effectively. Shares of Banco do Brasil declined as the company reported profit numbers in line with expectations, but disappointing asset quality trends. Metalurgica Gerdau also struggled as steel demand trends continued to be challenging. |
| Q. | How was the Fund positioned as of October 31, 2015? |
| A. | Emerging markets have dramatically underperformed developed markets over the last year on macroeconomic concerns related to China’s growth prospects and the timing of the Fed’s plan to raise rates. We believe markets could continue to be volatile as these events play out over the coming months. We anticipate that our quantitative process may experience some difficulty adding value. However, we’ve recently seen changes in the behavior of our quantitative factors that could indicate that investors are starting to focus more on corporate fundamentals, which would benefit our stock selection process. |
We remain cautious on Price Momentum given its strong payoff over the last several months. We believe Price Momentum has become a proxy for safety as investors bid up stocks with similar characteristics such as low beta (a measure of volatility) and low oil sensitivity. If markets stabilize, the payoff to Price Momentum could quickly reverse. In this environment, we continue to believe in the importance of balancing the portfolio against an up or down market by having more equal exposures across all of the major stock selection factor components. We have put additional emphasis on risk control to ensure that we do not have any unwanted biases. We believe this approach will allow us to hang on to gains despite a difficult environment for stock picking.
Growth of a Hypothetical
$10,000 Investment—Class N
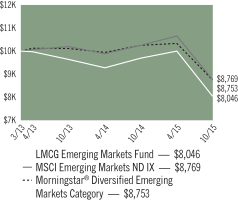
All dividends and capital gains are reinvested. Indexes are unmanaged and do not take into account fees, expenses or other costs.
Returns shown in the chart and table do not reflect taxes that a shareholder would pay on Fund distributions or on the sale of the Fund shares.
The securities of foreign companies may be less liquid and may fluctuate more widely than those traded in U.S. markets.
Emerging market securities may be subject to additional risks such as price volatility, currency fluctuation, financial reporting requirements as well as political and economic instability.
RETURNSFOR PERIOD ENDED 10/31/15
Average Annual Total Returns - Class N
| | | | |
One Year | | | -17.02 | % |
Since Inception | | | -8.03 | % |
Inception Date 03/28/13
Average Annual Total Returns - Class I
| | | | |
One Year | | | -16.77 | % |
Since Inception | | | -7.74 | % |
Inception Date 03/28/13
The performance data quoted represents past performance. Past performance does not guarantee future results. Investment return and principal value will fluctuate so that an investor’s shares, upon redemption, may be worth more or less than their original cost. Current performance may be lower or higher than the performance data quoted. For performance data current to the most recent month-end, please visit our website at www.astonfunds.com.
The performance quoted would have been lower if fee waivers and/or expense reimbursements had not been in effect.
| | |
| |
| ASTON/LMCG Emerging Markets Fund | | October 31, 2015 |
| |
| Schedule of Investments | | |
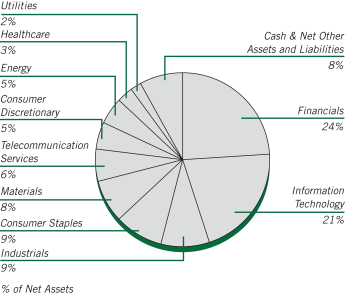
| | | | | | | | |
Shares | | | | | Market
Value | |
|
| | COMMON STOCKS – 92.32% | |
| | |
| | | | Brazil – 8.36% | | | | |
| | 3,600 | | | Ambev SA | | $ | 17,820 | |
| | 2,980 | | | Banco Bradesco | | | 16,227 | |
| | 2,100 | | | Banco do Brasil SA | | | 8,696 | |
| | 1,900 | | | BB Seguridade Participacoes SA | | | 13,105 | |
| | 2,500 | | | Braskem, Preference A | | | 14,119 | |
| | 2,100 | | | Embraer SA | | | 15,399 | |
| | 1,200 | | | Fibria Celulose SA | | | 16,379 | |
| | 3,080 | | | Itau Unibanco Holding | | | 21,140 | |
| | 6,000 | | | JBS | | | 22,170 | |
| | 2,000 | | | Lojas Renner SA | | | 9,594 | |
| | 4,000 | | | Suzano Papel e Celulose, Preference A | | | 17,166 | |
| | | | | | | | |
| | | | | | | 171,815 | |
| | | | | | | | |
| | |
| | | | Cayman Islands – 1.38% | | | | |
| | 2,000 | | | Shenzhou International Group Holdings (a) | | | 9,856 | |
| | 8,000 | | | Sino Biopharmaceutical (a) | | | 9,942 | |
| | 3,000 | | | Zhen Ding Technology Holding (a) | | | 8,526 | |
| | | | | | | | |
| | | | | | | 28,324 | |
| | | | | | | | |
| | |
| | | | China – 14.76% | | | | |
| | 18,000 | | | Air China, Class H (a) | | | 17,338 | |
| | 27,000 | | | Bank of Communications, Class H (a) | | | 19,915 | |
| | 31,000 | | | China CITIC Bank, Class H (a) * | | | 20,047 | |
| | 32,000 | | | China Construction Bank, Class H (a) | | | 23,192 | |
| | 21,000 | | | China Railway Group (a) | | | 19,782 | |
| | 4,000 | | | China Resources Power Holdings (a) | | | 9,049 | |
| | 4,000 | | | China Taiping Insurance Holdings (a) * | | | 12,559 | |
| | 26,000 | | | Chongqing Rural Commercial Bank, Class H (a) | | | 16,329 | |
| | 28,000 | | | Evergrande Real Estate, Class H (a) | | | 21,412 | |
| | 71,000 | | | Industrial and Commercial Bank of China, Class H (a) | | | 45,036 | |
| | 24,000 | | | People’s Insurance, Group of China, Class H (a) | | | 12,844 | |
| | | | | | | | |
Shares | | | | | Market
Value | |
| | |
| | | | China (continued) | | | | |
| | 6,000 | | | PICC Property & Casulty, Class H (a) | | $ | 13,614 | |
| | 5,300 | | | Shanghai Pharmaceuticals Holding, Class H (a) | | | 12,225 | |
| | 2,400 | | | Tencent Holdings (a) | | | 45,239 | |
| | 12,000 | | | Zhejiang Expressway, Class H (a) | | | 14,752 | |
| | | | | | | | |
| | | | | | | 303,333 | |
| | | | | | | | |
| | |
| | | | Czech Republic – 0.48% | | | | |
| | 490 | | | CEZ AS (a) | | | 9,790 | |
| | | | | | | | |
| | |
| | | | Egypt – 0.53% | | | | |
| | 1,879 | | | Commerical International Bank SAE, GDR (a) | | | 10,964 | |
| | | | | | | | |
| | |
| | | | Hong Kong – 3.88% | | | | |
| | 3,000 | | | China Mobile (a) | | | 35,970 | |
| | 12,000 | | | CITIC (a) | | | 22,374 | |
| | 40,000 | | | Geely Automobile Holdings (a) | | | 21,331 | |
| | | | | | | | |
| | | | | | | 79,675 | |
| | | | | | | | |
| | |
| | | | India – 5.43% | | | | |
| | 204 | | | Dr. Reddy’s Laboratories, ADR | | | 13,217 | |
| | 2,450 | | | ICICI Bank, SP ADR | | | 21,119 | |
| | 1,929 | | | Infosys, SP ADR | | | 35,031 | |
| | 793 | | | Reliance Industries, GDR | | | 22,759 | |
| | 1,576 | | | Wipro, ADR | | | 19,511 | |
| | | | | | | | |
| | | | | | | 111,637 | |
| | | | | | | | |
| | |
| | | | Indonesia – 0.84% | | | | |
| | 22,500 | | | Bank Rakyat Indonesia Persero Tbk PT (a) | | | 17,220 | |
| | | | | | | | |
| | |
| | | | Malaysia – 1.37% | | | | |
| | 9,400 | | | IHH Healthcare (a) | | | 13,813 | |
| | 3,400 | | | Public Bank (a) | | | 14,294 | |
| | | | | | | | |
| | | | | | | 28,107 | |
| | | | | | | | |
| | |
| | | | Mexico – 6.71% | | | | |
| | 40,200 | | | America Movil | | | 35,776 | |
| | 2,900 | | | Arca Continental | | | 18,524 | |
| | 8,600 | | | Compartamos * | | | 15,797 | |
| | 1,300 | | | Gruma, Class B * | | | 19,951 | |
| | 3,200 | | | Grupo Aeroportuario del Pacifico | | | 28,862 | |
| | 7,137 | | | Wal-Mart de Mexico SAB de CV | | | 18,903 | |
| | | | | | | | |
| | | | | | | 137,813 | |
| | | | | | | | |
| | |
| | | | Poland – 1.35% | | | | |
| | 921 | | | Polski Koncern Naftowy Orlen SA (a) | | | 14,942 | |
| | 131 | | | Powszechny Zaklad Ubezpieczen SA (a) | | | 12,720 | |
| | | | | | | | |
| | | | | | | 27,662 | |
| | | | | | | | |
| | |
| | | | Russia – 2.72% | | | | |
| | 1,015 | | | Gazprom, SP ADR | | | 4,243 | |
| | 3,073 | | | Gazprom, SP ADR (a) | | | 12,951 | |
| | 326 | | | Lukoil, SP ADR | | | 11,818 | |
| | 45 | | | Lukoil, SP ADR (a) | | | 1,635 | |
| | 557 | | | MMC Norilsk Nickel OJSC, ADR (a) | | | 8,249 | |
| | 552 | | | Tatneft, SP ADR (a) | | | 17,023 | |
| | | | | | | | |
| | | | | | | 55,919 | |
| | | | | | | | |
See accompanying Notes to Financial Statements.
| | |
| |
| ASTON/LMCG Emerging Markets Fund | | October 31, 2015 |
| |
| Schedule of Investments – continued | | |
| | | | | | | | |
Shares | | | | | Market
Value | |
| | |
| | | | South Africa – 5.62% | | | | |
| | 1,894 | | | Barloworld (a) | | $ | 10,686 | |
| | 1,191 | | | Discovery (a) | | | 12,717 | |
| | 1,107 | | | Foschini Group (a) | | | 11,294 | |
| | 1,341 | | | Liberty Holdings (a) | | | 13,112 | |
| | 7,492 | | | Netcare (a) | | | 21,305 | |
| | 4,981 | | | Sappi (a) * | | | 19,655 | |
| | 1,860 | | | Truworths International (a) | | | 12,584 | |
| | 1,301 | | | Vodacom Group (a) | | | 14,052 | |
| | | | | | | | |
| | | | | | | 115,405 | |
| | | | | | | | |
| | |
| | | | South Korea – 19.29% | | | | |
| | 51 | | | CJ CheilJedang (a) | | | 15,619 | |
| | 360 | | | Daesang (a) | | | 9,781 | |
| | 360 | | | Dongbu Insurance (a) | | | 21,589 | |
| | 83 | | | E-Mart (a) | | | 15,440 | |
| | 577 | | | Hana Financial Group (a) | | | 14,032 | |
| | 181 | | | Hyosung (a) | | | 18,481 | |
| | 248 | | | Hyundai Development Co-Engineering & Construction (a) | | | 9,960 | |
| | 1,563 | | | Industrial Bank of Korea (a) | | | 19,132 | |
| | 330 | | | Kangwon Land | | | 12,244 | |
| | 506 | | | KB Financial Group (a) | | | 16,031 | |
| | 379 | | | Korea Electric Power (a) | | | 17,064 | |
| | 212 | | | KT&G | | | 21,199 | |
| | 690 | | | LG Display (a) | | | 13,108 | |
| | 446 | | | LG International (a) | | | 13,621 | |
| | 68 | | | Lotte Chemical (a) | | | 14,277 | |
| | 473 | | | Nexen Tire (a) | | | 5,474 | |
| | 336 | | | Samsung Electro-Mechanics (a) | | | 19,122 | |
| | 76 | | | Samsung Electronics (a) | | | 91,156 | |
| | 308 | | | Samsung Securities (a) | | | 12,957 | |
| | 746 | | | SK Hynix (a) | | | 19,965 | |
| | 155 | | | SK Innovation (a) * | | | 16,072 | |
| | | | | | | | |
| | | | | | | 396,324 | |
| | | | | | | | |
| | |
| | | | Taiwan – 13.54% | | | | |
| | 15,000 | | | Advanced Semiconductor Engineering (a) | | | 17,317 | |
| | 3,000 | | | Catcher Technology (a) | | | 29,442 | |
| | 7,000 | | | Cheng Uei Precision Industry (a) | | | 10,226 | |
| | 5,000 | | | Chunghwa Telecom (a) | | | 15,319 | |
| | 18,000 | | | Compal Electronics (a) | | | 11,195 | |
| | 1,000 | | | Eclat Textile (a) | | | 14,708 | |
| | 3,124 | | | FLEXium Interconnect (a) | | | 8,716 | |
| | 15,000 | | | Fubon Financial Holding (a) | | | 24,245 | |
| | 7,000 | | | Highwealth Construction (a) | | | 10,314 | |
| | 15,120 | | | Hon Hai Precision Industry (a) | | | 40,190 | |
| | 18,000 | | | King Yuan Electronics (a) | | | 11,487 | |
| | 4,000 | | | Pegatron (a) | | | 9,775 | |
| | 9,000 | | | Pou Chen (a) | | | 12,694 | |
| | 9,000 | | | Taiwan Semiconductor Manufacturing (a) | | | 37,923 | |
| | 14,544 | | | Uni-President Enterprises (a) | | | 24,590 | |
| | | | | | | | |
| | | | | | | 278,141 | |
| | | | | | | | |
| | |
| | | | Thailand – 1.77% | | | | |
| | 81,000 | | | Jasmine International (a) | | | 12,861 | |
| | 7,700 | | | PTT Global Chemical (a) | | | 12,063 | |
| | | | | | | | |
Shares | | | | | Market
Value | |
| | |
| | | | Thailand (continued) | | | | |
| | 900 | | | Siam Cement Public (a) | | $ | 11,429 | |
| | | | | | | | |
| | | | | | | 36,353 | |
| | | | | | | | |
| | |
| | | | Turkey – 4.29% | | | | |
| | 12,262 | | | Eregli Demir ve Celik Fabrikalari TAS (a) | | | 17,378 | |
| | 3,008 | | | KOC Holding AS (a) | | | 13,585 | |
| | 2,008 | | | Koza Altin Isletmeleri AS (a) | | | 11,272 | |
| | 984 | | | Tav Havalimanlari Holding AS (a) | | | 7,719 | |
| | 5,116 | | | Turk Hava Yollari (a) * | | | 15,084 | |
| | 5,727 | | | Turk Telekomunikasyon AS (a) | | | 12,353 | |
| | 7,534 | | | Turkiye Vakiflar Bankasi Tao, Class D (a) | | | 10,724 | |
| | | | | | | | |
| | | | | | | 88,115 | |
| | | | | | | | |
| | |
| | | | Total Common Stocks
(Cost $2,049,870) | | | 1,896,597 | |
| | | | | | | | |
|
| | EXCHANGE TRADED FUNDS – 4.51% | |
| | |
| | | | United States – 4.51% | | | | |
| | 1,897 | | | iShares MSCI Emerging Markets Index Fund | | | 66,148 | |
| | 928 | | | iShares MSCI India | | | 26,429 | |
| | | | | | | | |
| | | | | | | 92,577 | |
| | | | | | | | |
| | |
| | | | Total Exchange Traded Funds
(Cost $91,584) | | | 92,577 | |
| | | | | | | | |
|
| | INVESTMENT COMPANY – 3.94% | |
| | |
| | 81,048 | | | BlackRock Liquidity Funds
TempFund Portfolio | | | 81,048 | |
| | | | | | | | |
| | |
| | | | Total Investment Company
(Cost $81,048) | | | 81,048 | |
| | | | | | | | |
| Total Investments – 100.77%
(Cost $2,222,502)** | | | 2,070,222 | |
| | | | | | | | |
| Net Other Assets and Liabilities – (0.77)% | | | (15,828 | ) |
| | | | | | | | |
| Net Assets – 100.00% | | $ | 2,054,394 | |
| | | | | | | | |
| * | | Non-income producing security. |
| ** | | Aggregate cost for Federal income tax purposes is $2,226,163. |
| | | | |
Gross unrealized appreciation | | $ | 108,938 | |
Gross unrealized depreciation | | | (264,879 | ) |
| | | | |
Net unrealized depreciation | | $ | (155,941 | ) |
| | | | |
| (a) | | Securities with a total aggregate market value of $1,425,828 or 69.40% of the net assets, were valued under the fair value procedures established by the Funds’ Board of Trustees. |
| ADR | | American Depositary Receipt |
| GDR | | Global Depositary Receipt |
| SP ADR | | Sponsored American Depositary Receipt |
See accompanying Notes to Financial Statements.
ASTON/Pictet International Fund
| | |
| |
| Portfolio Manager Commentary (unaudited) | | October 31, 2015 |
| Fabio Paolini, CFA; Swee-Kheng Lee, PhD. & Benjamin Beneche, CFA |
| Q. | What were the most significant market factors affecting Fund performance and returns relative to the benchmark during the past 12 months? |
| A. | For the year ended October 31, 2015, the Fund outperformed the benchmark, MSCI EAFE Index. Although international equities ultimately posted only a modest decline, both currencies and underlying markets were volatile over the period. Panic over declining energy prices and ebola gave way to steady recovery – underpinned by strengthening European fundamentals. Markets then fell again late in the period on concerns over growth in China and the potential for global contagion. Energy and Materials companies were the worst performers, while IT and Telecoms stocks were the main outperformers. Due to indirect exposure to Russia, Energy sector holdings, and holdings hurt by the ebola crisis, the portfolio performed poorly early in the period – particularly in Europe. Subsequently, strong relative performance was driven by recovery in a number of the stocks, successful stock selection within Industrial and Financial sectors (especially in Europe and Japan), and the decision to cut the portfolio’s exposure to commodity stocks early in 2015. |
| Q. | What were the best performing holdings for the Fund during the period? |
| A. | Swiss airline caterer Gategroup made the top positive contribution as it began to benefit from a major cost cutting effort, and new management regained investor confidence. UK satellite communications operator Inmarsat also rose strongly following a new satellite launch that will allow the group to offer high speed data services globally. Aena, the operator of Spain’s airports, was acquired for the portfolio and subsequently rose sharply. Japanese insurance holding Sompo Japan Nipponkoa also appreciated steadily as it began to return some of its cash flow to stockholders, and the Japanese insurance pricing cycle turned positive. Also in Japan, monitored alarm network operator Sohgo Security Services performed strongly as strong customer growth drove profit margin expansion. |
| Q. | What were the weakest performing holdings? |
| A. | The largest negative contribution was made by VW holding company Porsche Automobil on news of the VW emissions testing scandal. After careful consideration the stock was sold. Macau casino operator MGM China was a weak performer on concerns about the impact of China’s growth slowdown on revenues, and the Chinese government threatened to place greater restrictions on the flow of tourists into Macau. Spanish civil engineering group OHL also fell after it became embroiled in allegations of improper payments by its Mexican subsidiary to win toll road contracts. Japanese gas exploration and production (E&P) group Inpex declined in response to weaker energy prices, and delays to first production at its key gas project off the Australian coast. |
| Q. | How was the Fund positioned as of October 31, 2015? |
| A. | The Fund’s investment process focuses on bottom-up stock selection and seeks to hold companies that are both capable of sustaining profitable cash flow growth and trade at a discount to our assessment of their underlying (intrinsic) value. Region, sector and market capitalization positions are by-products of stock selection. |
Globally, equities continue to price in an improvement in underlying economic fundamentals. Developments over the period suggest that Europe is the region currently in the most attractive phase of recovery, and this is where our process has been identifying a disproportionate number of investment opportunities. From a previously underweight position, the portfolio is neutral in Europe, underweight in Japan and overweight the Pacific ex Japan region. At a sector level it is biased in favor of Industrials and IT, and against Materials and Financials. It retains a tilt towards less efficiently priced smaller companies at the expense of their larger, better covered counterparts.
Growth of a Hypothetical
$10,000 Investment—Class N
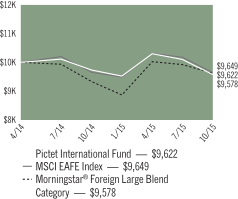
All dividends and capital gains are reinvested. Indexes are unmanaged and do not take into account fees, expenses or other costs.
Returns shown in the chart and table do not reflect taxes that a shareholder would pay on Fund distributions or on the sale of the Fund shares.
The securities of foreign companies may be less liquid and may fluctuate more widely than those traded in U.S. markets.
Emerging market securities may be subject to additional risks such as price volatility, currency fluctuation, financial reporting requirements as well as political and economic instability.
RETURNSFOR PERIOD ENDED 10/31/15
Average Annual Total Returns - Class N
| | | | |
One Year | | | 3.02 | % |
Since Inception | | | -2.46 | % |
Inception Date 04/14/14
Average Annual Total Returns - Class I
| | | | |
One Year | | | 3.43 | % |
Since Inception | | | -2.07 | % |
Inception Date 04/14/14
The performance data quoted represents past performance. Past performance does not guarantee future results. Investment return and principal value will fluctuate so that an investor’s shares, upon redemption, may be worth more or less than their original cost. Current performance may be lower or higher than the performance data quoted. For performance data current to the most recent month-end, please visit our website at www.astonfunds.com.
The performance quoted would have been lower if fee waivers and/or expense reimbursements had not been in effect.
| | |
| |
| ASTON/Pictet International Fund | | October 31, 2015 |
| |
| Schedule of Investments | | |
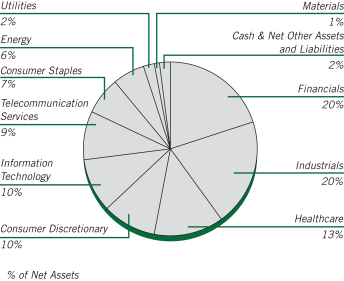
| | | | | | | | |
Shares | | | | | Market
Value | |
|
| | COMMON STOCKS – 97.65% | |
| | |
| | | | Australia – 5.04% | | | | |
| | 34,676 | | | Ansell (a) | | $ | 493,439 | |
| | 100,155 | | | Computershare (a) | | | 767,632 | |
| | 91,823 | | | Estia Health (a) | | | 485,271 | |
| | 43,643 | | | Link Administration Holdings (a) * | | | 198,246 | |
| | 234,748 | | | Primary Health Care (a) | | | 616,743 | |
| | | | | | | | |
| | | | 2,561,331 | |
| | | | | | | | |
| | |
| | | | Austria – 1.25% | | | | |
| | 21,590 | | | Erste Bank Group (a) * | | | 633,101 | |
| | | | | | | | |
| | |
| | | | Belgium – 2.02% | | | | |
| | 14,875 | | | Ageas (a) | | | 655,956 | |
| | 12,020 | | | Ontex Group (a) | | | 369,234 | |
| | | | | | | | |
| | | | 1,025,190 | |
| | | | | | | | |
| | |
| | | | Bermuda – 1.22% | | | | |
| | 11,398 | | | Jardine Matheson Holdings (a) | | | 619,782 | |
| | | | | | | | |
| | |
| | | | Cayman Islands – 3.64% | | | | |
| | 60,748 | | | Cheung Kong Property Holding (a) | | | 425,062 | |
| | 70,748 | | | CK Hutchison Holdings (a) | | | 968,788 | |
| | 312,400 | | | MGM China Holdings (a) | | | 455,661 | |
| | | | | | | | |
| | | | 1,849,511 | |
| | | | | | | | |
| | |
| | | | Denmark – 4.30% | | | | |
| | 8,192 | | | Carlsberg, Class B (a) | | | 671,164 | |
| | 31,632 | | | H Lundbeck (a) * | | | 929,247 | |
| | 32,439 | | | Matas (a) | | | 588,764 | |
| | | | | | | | |
| | | | 2,189,175 | |
| | | | | | | | |
| | |
| | | | Finland – 3.32% | | | | |
| | 227,160 | | | Nokia (a) | | | 1,689,813 | |
| | | | | | | | |
| | | | | | | | |
Shares | | | | | Market
Value | |
| | |
| | | | France – 8.59% | | | | |
| | 184,936 | | | Bollore (a) | | $ | 914,216 | |
| | 34,551 | | | Elis | | | 585,488 | |
| | 13,812 | | | Orpea (a) | | | 1,108,042 | |
| | 9,129 | | | Rubis (a) | | | 731,682 | |
| | 15,321 | | | Vinci (a) | | | 1,031,506 | |
| | | | | | | | |
| | | | 4,370,934 | |
| | | | | | | | |
| | |
| | | | Hong Kong – 1.47% | | | | |
| | 1,384,355 | | | PCCW (a) | | | 745,394 | |
| | | | | | | | |
| | |
| | | | Italy – 4.00% | | | | |
| | 24,017 | | | Astaldi (a) | | | 193,460 | |
| | 71,054 | | | Cerved Information Solutions (a) * | | | 538,295 | |
| | 48,507 | | | Finmeccanica (a) * | | | 634,118 | |
| | 277,184 | | | UnipolSai (a) | | | 668,273 | |
| | | | | | | | |
| | | | 2,034,146 | |
| | | | | | | | |
| | |
| | | | Japan – 16.15% | | | | |
| | 22,200 | | | Bandai Namco Holdings (a) | | | 545,681 | |
| | 5,700 | | | FANUC (a) | | | 1,005,716 | |
| | 29,500 | | | Fujitec (a) | | | 318,321 | |
| | 76,000 | | | Inpex (a) | | | 724,432 | |
| | 25,600 | | | Japan Tobacco (a) | | | 886,062 | |
| | 39,900 | | | LIXIL Group (a) | | | 854,261 | |
| | 9,200 | | | Miraca Holdings (a) | | | 409,449 | |
| | 59,500 | | | SKY Perfect JSAT Holdings (a) | | | 313,181 | |
| | 29,600 | | | SoftBank Group (a) | | | 1,658,426 | |
| | 25,300 | | | Sompo Japan Nipponkoa Holdings (a) | | | 794,376 | |
| | 17,700 | | | Sumitomo Mitsui Financial Group (a) | | | 706,118 | |
| | | | | | | | |
| | | | 8,216,023 | |
| | | | | | | | |
| | |
| | | | Luxembourg – 1.12% | | | | |
| | 10,213 | | | Millicom International Cellular, SDR (a) | | | 569,340 | |
| | | | | | | | |
| | |
| | | | Netherlands – 3.23% | | | | |
| | 10,537 | | | ASML Holding (a) | | | 977,426 | |
| | 12,517 | | | Konnikluke DSM (a) | | | 667,251 | |
| | | | | | | | |
| | | | 1,644,677 | |
| | | | | | | | |
| | |
| | | | New Zealand – 1.00% | | | | |
| | 205,841 | | | Trade Me Group (a) | | | 510,326 | |
| | | | | | | | |
| | |
| | | | Papua New Guinea – 0.65% | | | | |
| | 59,040 | | | Oil Search (a) | | | 329,044 | |
| | | | | | | | |
| | |
| | | | Philippines – 0.74% | | | | |
| | 3,364,700 | | | Metro Pacific Investments (a) | | | 373,972 | |
| | | | | | | | |
| | |
| | | | Portugal – 0.88% | | | | |
| | 53,933 | | | NOS SGPS (a) | | | 447,566 | |
| | | | | | | | |
| | |
| | | | Russia – 1.77% | | | | |
| | 147,504 | | | Sberbank, SP ADR | | | 901,249 | |
| | | | | | | | |
| | |
| | | | South Korea – 3.02% | | | | |
| | 1,623 | | | NAVER (a) | | | 852,197 | |
| | 568 | | | Samsung Electronics (a) | | | 681,274 | |
| | | | | | | | |
| | | | 1,533,471 | |
| | | | | | | | |
See accompanying Notes to Financial Statements.
| | |
| |
| ASTON/Pictet International Fund | | October 31, 2015 |
| |
| Schedule of Investments – continued | | |
| | | | | | | | |
Shares | | | | | Market
Value | |
| | |
| | | | Spain – 5.23% | | | | |
| | 926 | | | Banco Bilbao Vizcaya Argentaria (a) | | $ | 7,967 | |
| | 85,271 | | | Banco Bilbao Vizcaya Argentaria (a) | | | 733,639 | |
| | 101,347 | | | Distribuidora Internacional de Alimentacion (a) * | | | 643,918 | |
| | 46,891 | | | Merlin Properties Socimi, REIT (a) * | | | 600,895 | |
| | 51,330 | | | Obrascon Huarte Lain (a) * | | | 410,547 | |
| | 33,128 | | | Obrascon Huarte Lain (a) | | | 264,964 | |
| | | | | | | | |
| | | | 2,661,930 | |
| | | | | | | | |
| | |
| | | | Sweden – 2.36% | | | | |
| | 33,834 | | | Alfa Laval (a) | | | 593,578 | |
| | 71,097 | | | Com Hem Holding (a) | | | 607,347 | |
| | | | | | | | |
| | | | 1,200,925 | |
| | | | | | | | |
| | |
| | | | Switzerland – 6.75% | | | | |
| | 7,334 | | | Cie Financiere Richemont (a) | | | 628,873 | |
| | 16,166 | | | Gategroup Holding (a) * | | | 606,130 | |
| | 17,051 | | | Nestle (a) | | | 1,302,253 | |
| | 44,955 | | | UBS Group (a) | | | 897,860 | |
| | | | | | | | |
| | | | 3,435,116 | |
| | | | | | | | |
| | |
| | | | United Kingdom – 19.90% | | | | |
| | 10,737 | | | AstraZeneca (a) | | | 684,293 | |
| | 324,321 | | | BBA Aviation (a) | | | 952,758 | |
| | 75,452 | | | BG Group (a) | | | 1,192,025 | |
| | 370,567 | | | Enterprise Inns (a) * | | | 612,784 | |
| | 44,236 | | | GlaxoSmithKline (a) | | | 953,977 | |
| | 145,540 | | | HSBC Holdings (a) | | | 1,137,094 | |
| | 72,287 | | | Inmarsat (a) | | | 1,095,642 | |
| | 10,454 | | | LivaNova * | | | 685,260 | |
| | 68,784 | | | Petrofac (a) | | | 892,485 | |
| | 39,043 | | | Prudential (a) | | | 911,903 | |
| | 23,926 | | | Standard Chartered (a) | | | 265,593 | |
| | 37,918 | | | Tate & Lyle (a) | | | 348,051 | |
| | 79,801 | | | William Hill (a) | | | 389,369 | |
| | | | | | | | |
| | | | 10,121,234 | |
| | | | | | | | |
| | |
| | | | Total Common Stocks
(Cost $49,519,122) | | | 49,663,250 | |
| | | | | | | | |
|
| | INVESTMENT COMPANY – 2.05% | |
| | |
| | 1,040,842 | | | BlackRock Liquidity Funds TempFund Portfolio | | | 1,040,842 | |
| | | | | | | | |
| | |
| | | | Total Investment Company
(Cost $1,040,842) | | | 1,040,842 | |
| | | | | | | | |
| Total Investments – 99.70%
(Cost $50,559,964)** | | | 50,704,092 | |
| | | | | | | | |
| Net Other Assets and Liabilities – 0.30% | | | 154,999 | |
| | | | | | | | |
| Net Assets – 100.00% | | $ | 50,859,091 | |
| | | | | | | | |
| * | | Non-income producing security. |
| ** | | Aggregate cost for Federal income tax purposes is $50,791,597. |
| | | | |
Gross unrealized appreciation | | $ | 2,670,017 | |
Gross unrealized depreciation | | | (2,757,522 | ) |
| | | | |
Net unrealized appreciation | | $ | (87,505 | ) |
| | | | |
| (a) | | Securities with a total aggregate market value of $47,491,253 or 93.38% of the net assets, were valued under the fair value procedures established by the Funds’ Board of Trustees. |
| REIT | | Real Estate Investment Trust |
| SDR | | Special Drawing Rights |
| SP ADR | | Sponsored American Depositary Receipt |
See accompanying Notes to Financial Statements.
ASTON/TAMRO International Small Cap Fund
| | |
| |
| Portfolio Manager Commentary (unaudited) | | October 31, 2015 |
| Q. | What were the most significant market factors affecting Fund performance and returns relative to the benchmark during the past 10 months? |
| A. | First, slowing gross domestic product (GDP) growth in China combined with expectations of rising U.S. interest rates depressed stock market returns of commodity-exporting countries. Our exposure to stocks in Latin America, Canada, and Australia generated the bulk of negative returns since the Fund’s inception. Although we maintained an overall underweight position in commodity businesses, the severity of the decline in affected markets overwhelmed companies in Financial Services, Consumer Discretionary, Consumer Staples, and Healthcare sectors. Second, the Fund benefitted from an overweight position in European and Japanese equities, the two regions with the greatest contribution to international small cap returns. European stocks continue to rally in response to accommodative monetary policy and modest earnings growth. Japanese small caps are benefitting from capital investments and a modest revival in consumer spending. Third, market volatility in response to confusing signals from the U.S. Federal Reserve pressured Financial Services companies that rely on debt financing, which negatively impacted many of the Financial Services stocks in the Fund. |
| Q. | What were the best performing holdings for the Fund during the period? |
| A. | Ubisoft Entertainment, a videogame developer and publisher generated the most significant performance since the Fund’s inception. Ubisoft is benefitting from strong next generation console sales that enable maximum enjoyment of Ubisoft’s rich gaming environments. In addition, an integrated media and content group has taken an equity stake in Ubisoft and may pursue a takeover. Park24, a company that operates parking lots and car sharing services throughout major metropolitan areas in Japan, also contributed significantly to Fund performance. The company is experiencing a rebound in utilization trends which are translating into sales and earnings growth. |
| Q. | What were the weakest performing holdings? |
| A. | Our holding in Cosan, a Brazilian conglomerate with assets in logistics infrastructure weighed on performance since the Fund’s inception. The Brazilian economy is stagnating as demand for its commodity exports has waned while a corruption scandal has paralyzed demand for Cosan’s services. Although Cosan’s holdings are diversified, asset utilization and improved pricing requires a higher level of economic activity. Similarly, our holding in Arcos Dorados, the largest McDonald’s franchisee in Latin America (and the world), has been negatively impacted by poor economic conditions in all of Latin America. Although the company generates positive sales momentum, the foreign exchange translation impact from the company’s U.S. listing has negatively impacted earnings. |
| Q. | How was the Fund positioned as of October 31, 2015? |
| A. | The Fund’s positioning is heavily weighted towards high-quality companies that can generate earnings growth from local economic conditions. We view Japanese small cap stocks favorably due to their combination of attractive local growth prospects and reasonable valuations relative to most other geographies. Recent concerns about GDP growth in China have lowered equity valuations in Japan. But, Japanese small caps are mainly domestic-facing businesses and our overweight positioning reflects our confidence in local growth. We are also maintaining an overweight position in Europe due to stock-specific factors rather than overall confidence in economic conditions. |
At the sector level, Consumer Discretionary, Industrials, and Technology were the Fund’s most significant overweight positions. Despite tepid global GDP growth, online shopping continues to power consumer spending in many parts of the world. Our Consumer Discretionary and Technology holdings have benefitted from e-commerce growth and also generated high returns on invested capital and earnings growth. Similarly, our overweight position in Industrials also benefited from global e-commerce growth with holdings in logistics support, business services, or equipment for warehouse automation.
Growth of a Hypothetical
$10,000 Investment—Class N
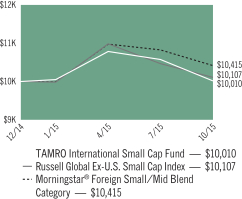
All dividends and capital gains are reinvested. Indexes are unmanaged and do not take into account fees, expenses or other costs.
Returns shown in the chart and table do not reflect taxes that a shareholder would pay on Fund distributions or on the sale of the Fund shares.
Small Company stocks may be subject to a higher degree of market risk than the securities of more established companies because they tend to be more volatile and less liquid.
The securities of foreign companies may be less liquid and may fluctuate more widely than those traded in U.S. markets.
Emerging market securities may be subject to additional risks such as price volatility, currency fluctuation, financial reporting requirements, as well as political and economic instability.
RETURNSFOR PERIOD ENDED 10/31/15
Total Return - Class N
| | | | |
Cumulative Since Inception | | | 0.10 | % |
Inception Date 12/23/14
Total Return - Class I
| | | | |
Cumulative Since Inception | | | 0.30 | % |
Inception Date 12/23/14
The performance data quoted represents past performance. Past performance does not guarantee future results. Investment return and principal value will fluctuate so that an investor’s shares, upon redemption, may be worth more or less than their original cost. Current performance may be lower or higher than the performance data quoted. For performance data current to the most recent month-end, please visit our website at www.astonfunds.com.
The performance quoted would have been lower if fee waivers and/or expense reimbursements had not been in effect.
| | |
| |
| ASTON/TAMRO International Small Cap Fund | | October 31, 2015 |
| |
| Schedule of Investments | | |
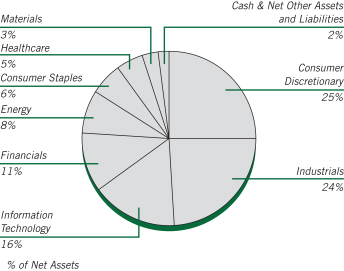
| | | | | | | | |
Shares | | Market
Value | |
| |
| | COMMON STOCKS – 97.00% | | | | |
| | |
| | | | Australia – 3.87% | | | | |
| | 4,300 | | | Super Retail Group (a) | | $ | 29,367 | |
| | 7,500 | | | Treasury Wine Estates (a) | | | 37,538 | |
| | | | | | | | |
| | | | 66,905 | |
| | | | | | | | |
| | |
| | | | Bermuda – 1.76% | | | | |
| | 1,050 | | | Golar LNG | | | 30,461 | |
| | | | | | | | |
| | |
| | | | Brazil – 1.82% | | | | |
| | 9,000 | | | Cosan, Class A | | | 31,500 | |
| | | | | | | | |
| | |
| | | | Canada – 2.74% | | | | |
| | 2,700 | | | Descartes Systems Group * | | | 47,244 | |
| | | | | | | | |
| | |
| | | | China – 5.54% | | | | |
| | 68,000 | | | Baoxin Auto Group (a) | | | 28,075 | |
| | 109,000 | | | China Modern Dairy Holdings (a) | | | 32,787 | |
| | 23,000 | | | Phoenix Healthcare Group (a) | | | 34,830 | |
| | | | | | | | |
| | | | 95,692 | |
| | | | | | | | |
| | |
| | | | France – 14.49% | | | | |
| | 400 | | | Criteo * | | | 15,224 | |
| | 700 | | | Gaztransport Et Technigaz (a) | | | 35,021 | |
| | 300 | | | ID Logistics Group * | | | 38,895 | |
| | 2,000 | | | Tarkett SA | | | 59,711 | |
| | 3,380 | | | UBISOFT Entertainment (a) * | | | 101,269 | |
| | | | | | | | |
| | | | 250,120 | |
| | | | | | | | |
| | |
| | | | Germany – 3.58% | | | | |
| | 600 | | | Carl Zeiss Meditec (a) | | | 17,575 | |
| | 280 | | | KUKA (a) | | | 23,662 | |
| | 400 | | | Norma Group (a) | | | 20,513 | |
| | | | | | | | |
| | | | 61,750 | |
| | | | | | | | |
| | | | | | | | |
Shares | | Market
Value | |
| | |
| | | | Hong Kong – 4.20% | | | | |
| | 36,500 | | | Hongkong & Shanghai Hotels | | $ | 41,536 | |
| | 20,000 | | | Melco International Development (a) | | | 30,959 | |
| | | | | | | | |
| | | | 72,495 | |
| | | | | | | | |
| | |
| | | | Italy – 6.04% | | | | |
| | 1,150 | | | Recordati (a) | | | 28,584 | |
| | 270 | | | Tod’s (a) | | | 22,613 | |
| | 1,565 | | | Yoox (a) * | | | 53,062 | |
| | | | | | | | |
| | | | 104,259 | |
| | | | | | | | |
| | |
| | | | Japan – 30.21% | | | | |
| | 3,000 | | | Aiming (a) * | | | 26,634 | |
| | 3,400 | | | AP (a) * | | | 42,923 | |
| | 1,000 | | | Askul (a) | | | 36,706 | |
| | 2,100 | | | Azbil (a) | | | 52,981 | |
| | 4,700 | | | DCM Holdings (a) | | | 31,136 | |
| | 55 | | | GLP J-REIT (a) | | | 54,728 | |
| | 2,000 | | | Ito En (a) | | | 41,777 | |
| | 1,600 | | | Kanamoto (a) | | | 32,331 | |
| | 3,300 | | | MISUMI Group (a) | | | 42,973 | |
| | 1,400 | | | Park24 (a) | | | 29,342 | |
| | 6,300 | | | Shinko Plantech (a) | | | 50,634 | |
| | 1,700 | | | Sumitomo Real Estate Sales (a) | | | 39,164 | |
| | 1,500 | | | TechnoPro Holdings (a) | | | 40,224 | |
| | | | | | | | |
| | | | 521,553 | |
| | | | | | | | |
| | |
| | | | Mexico – 2.97% | | | | |
| | 37,000 | | | Mexico Real Estate Management SA de CV, REIT | | | 51,207 | |
| | | | | | | | |
| | |
| | | | Norway – 1.48% | | | | |
| | 1,625 | | | Kongsberg Gruppen (a) | | | 25,512 | |
| | | | | | | | |
| | |
| | | | Poland – 1.01% | | | | |
| | 400 | | | CCC (a) | | | 17,464 | |
| | | | | | | | |
| | |
| | | | Switzerland – 2.52% | | | | |
| | 55 | | | dorma+kaba Holding, Class B (a) | | | 34,295 | |
| | 80 | | | Panalpina Welttransport Holding (a) | | | 9,134 | |
| | | | | | | | |
| | | | 43,429 | |
| | | | | | | | |
| | |
| | | | Thailand – 0.78% | | | | |
| | 100,000 | | | Beauty Community | | | 13,487 | |
| | | | | | | | |
| | |
| | | | United Kingdom – 12.42% | | | | |
| | 3,100 | | | BrainJuicer Group | | | 17,013 | |
| | 745 | | | Dialog Semiconductor (a) * | | | 27,561 | |
| | 4,457 | | | Intermediate Capital Group (a) | | | 38,791 | |
| | 7,340 | | | SThree (a) | | | 40,800 | |
| | 1,010 | | | Ted Baker | | | 47,131 | |
| | 1,520 | | | Victrex (a) | | | 43,191 | |
| | | | | | | | |
| | | | 214,487 | |
| | | | | | | | |
| | |
| | | | Virgin Islands (British) – 1.57% | | | | |
| | 8,800 | | | Arcos Dorados Holdings, Class A | | | 27,103 | |
| | | | | | | | |
| | |
| | | | Total Common Stocks
(Cost $1,696,266) | | | 1,674,668 | |
| | | | | | | | |
See accompanying Notes to Financial Statements.
| | |
| |
| ASTON/TAMRO International Small Cap Fund | | October 31, 2015 |
| |
| Schedule of Investments – continued | | |
| | | | | | | | |
Shares | | Market
Value | |
| |
| | PREFERRED STOCK – 1.28% | | | | |
| | |
| | | | Germany – 1.28% | | | | |
| | 300 | | | Jungheinrich (a) | | $ | 22,163 | |
| | | | | | | | |
| | |
| | | | Total Preferred Stock
(Cost $21,686) | | | 22,163 | |
| | | | | | | | |
| |
| | RIGHTS – 0% | | | | |
| | |
| | | | Australia – 0.00% | | | | |
| | 1,000 | | | Treasury Wine Estates, Expiring 02/29/2016 (a) * | | | — | |
| | | | | | | | |
| | |
| | | | Total Rights
(Cost $0) | | | — | |
| | | | | | | | |
| |
| | INVESTMENT COMPANY – 4.11% | | | | |
| | |
| | 71,004 | | | BlackRock Liquidity Funds TempFund Portfolio | | | 71,004 | |
| | | | | | | | |
| | |
| | | | Total Investment Company
(Cost $71,004) | | | 71,004 | |
| | | | | | | | |
| Total Investments – 102.39%
(Cost $1,788,956)** | | | 1,767,835 | |
| | | | | | | | |
| Net Other Assets and Liabilities – (2.39)% | | | (41,325 | ) |
| | | | | | | | |
| Net Assets – 100.00% | | $ | 1,726,510 | |
| | | | | | | | |
| * | | Non-income producing security. |
| ** | | Aggregate cost for Federal income tax purposes is $1,789,375. |
| | | | |
Gross unrealized appreciation | | $ | 146,247 | |
Gross unrealized depreciation | | | (167,787 | ) |
| | | | |
Net unrealized depreciation | | $ | (21,540 | ) |
| | | | |
| (a) | | Securities with a total aggregate market value of $1,276,319 or 73.92% of the net assets, were valued under the fair value procedures established by the Funds’ Board of Trustees. |
| REIT | | Real Estate Investment Trust |
See accompanying Notes to Financial Statements.
ASTON/Harrison Street Real Estate Fund
| | |
| |
| Portfolio Manager Commentary (unaudited) | | October 31, 2015 |
| Q. | What were the most significant market factors affecting Fund performance and returns relative to the benchmark during the past 12 months? |
| A. | Two macro forces impacted performance during the year: a) volatility surrounding anticipated changes in Federal Reserve monetary policy—namely impact of a ‘rate increase’—on capital laden Real Estate Investment Trusts (REITs); and b) the extended commercial real estate recovery cycle—wherein even the generally acknowledged lower quality REITs benefited from a ‘rising tide.’ These ‘top down’ forces, determined more by broader capital flows and less so by dedicated REIT investor actions are always difficult to anticipate or counter. The poor performing positions in the Fund during the year were typically not the outcome of poor fundamental earnings reports, but ‘sell the news’ phenomenon, after several years of rising valuations, and rotation into lower quality, but less expensive stocks. This happens each cycle and we remain convinced that much of the run in the lower quality spectrum will ebb, particularly in an environment of slow economic growth, flat to moderately rising interest rates and more restricted access to equity capital in particular. |
| Q. | What were the best performing holdings for the Fund during the period? |
| A. | Holdings in two Self-storage property owners aided performance notably. Extra Space Storage returned an impressive 41% total return while competitor Sovran Self Storage returned over 21% reflecting sound property level results bolstered by clear capitalization rate compression as well as price/cash flow multiples rose and net asset values increased. Apartment landlords also performed well supported by comparable trends—impressive property cash flow growth and rising net asset value estimates. Positions in sun-belt focused, ‘middle market’ Mid-America Apartments and national apartment portfolio owner UDR Inc. (ticker: UDR) performed well, as did the Apartment sector overall. |
| Q. | What were the weakest performing holdings? |
| A. | The sources of performance drag included a position in GEO Group a leading private operator of corrections facilities. Ironically, pre-opening costs of several new prisons to accommodate new contracts depressed current earnings unexpectedly and investors disregarded the long-term cash flow growth implications. Accelerated fears regarding any rise in interest rates and anticipated ensuing compression of the differential between the property investment yields and cost of capital impaired the performance of two ‘spread investment’ names—Stag Industrial an Industrial landlord and Healthcare property owner Ventas Inc. While, the actual cap rates have yet to compress, the market has pressured the share prices and effectively raised the equity cost of capital—a bit of a self-fulfilling, anticipatory effect. |
| Q. | How was the Fund positioned as of October 31, 2015? |
| A. | As always, the Fund remains well diversified by property sector and geography. However, after a six year run from the depths of the ‘08/’09 financial crisis, we are cognizant of the ‘rising tide’ effect. During the year, a handful of additional positions were added to broaden the portfolio across the value spectrum, take some money off the table from strong out performers and add more exposure among the larger capitalization stocks as, generally, the larger companies within each property sector have matured to stronger business models—higher proportions of retained capital, lower leverage, better access to and pricing of capital and comparable to superior dividend growth. REITs continue to mature as an industry and the ‘have’ vs ‘have not’ business models are becoming enduring and the portfolio will increasingly reflect that evolution barring compelling valuation barriers. |
Growth of a Hypothetical
$10,000 Investment—Class N
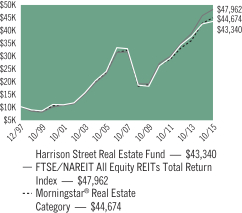
All dividends and capital gains are reinvested. Indexes are unmanaged and do not take into account fees, expenses or other costs.
Returns shown in the chart and table do not reflect taxes that a shareholder would pay on Fund distributions or on the sale of the Fund shares.
Real estate funds may be subject to a higher degree of market risk than diversified funds because of the concentration in a specific industry or geographical sector. Risks also include declines in the value of real estate, general and economic conditions, changes in the value of underlying properties and defaults by borrowers.
RETURNSFOR PERIOD ENDED 10/31/15
Average Annual Total Returns - Class N
| | | | |
One Year | | | 2.38 | % |
Five Year | | | 10.76 | % |
Ten Year | | | 6.19 | % |
Since Inception | | | 8.57 | % |
Inception Date 12/30/97
Average Annual Total Returns - Class I
| | | | |
One Year | | | 2.65 | % |
Five Year | | | 11.01 | % |
Ten Year | | | 6.44 | % |
Since Inception | | | 6.10 | % |
Inception Date 09/20/05
The performance data quoted represents past performance. Past performance does not guarantee future results. Investment return and principal value will fluctuate so that an investor’s shares, upon redemption, may be worth more or less than their original cost. Current performance may be lower or higher than the performance data quoted. For performance data current to the most recent month-end, please visit our website at www.astonfunds.com.
The performance quoted would have been lower if fee waivers and/or expense reimbursements had not been in effect.
The total expense ratios for Class N and Class I shares are 2.16% and 1.91%, respectively, as disclosed in the prospectus dated February 28, 2015. Please refer to the Financial Highlights section in this report for more information.
| | |
| |
| ASTON/Harrison Street Real Estate Fund | | October 31, 2015 |
| |
| Schedule of Investments | | |
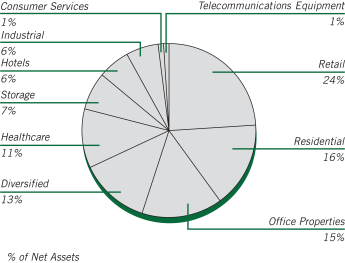
| | | | | | | | |
Shares | | | | | Market
Value | |
|
| | COMMON STOCKS – 99.76% | |
| | |
| | | | Diversified – 13.31% | | | | |
| | 5,809 | | | American Tower | | $ | 593,854 | |
| | 13,374 | | | Duke Realty | | | 276,842 | |
| | 1,040 | | | EQUINIX | | | 308,547 | |
| | 26,823 | | | Spirit Realty Capital | | | 273,058 | |
| | | | | | | | |
| | | | | | | 1,452,301 | |
| | | | | | | | |
| | |
| | | | Healthcare – 11.27% | | | | |
| | 5,612 | | | LTC Properties | | | 240,474 | |
| | 12,192 | | | Omega Healthcare Investors | | | 420,868 | |
| | 8,764 | | | Welltower | | | 568,521 | |
| | | | | | | | |
| | | | | | | 1,229,863 | |
| | | | | | | | |
| | |
| | | | Hotels – 6.88% | | | | |
| | 5,720 | | | Chesapeake Lodging Trust | | | 157,529 | |
| | 1,700 | | | Las Vegas Sands | | | 84,167 | |
| | 4,227 | | | Pebblebrook Hotel Trust, REIT | | | 144,479 | |
| | 2,571 | | | Starwood Hotels & Resorts Worldwide | | | 205,346 | |
| | 11,324 | | | Strategic Hotels & Resorts * | | | 159,668 | |
| | | | | | | | |
| | | | | | | 751,189 | |
| | | | | | | | |
| | |
| | | | Industrial – 5.82% | | | | |
| | 3,294 | | | EastGroup Properties, REIT | | | 184,991 | |
| | 10,530 | | | Prologis | | | 449,947 | |
| | | | | | | | |
| | | | | | | 634,938 | |
| | | | | | | | |
| | |
| | | | Office Properties – 15.38% | | | | |
| | 4,027 | | | Boston Properties | | | 506,798 | |
| | 7,802 | | | CyrusOne, REIT | | | 275,255 | |
| | 3,253 | | | Digital Realty Trust | | | 240,592 | |
| | 7,536 | | | Hudson Pacific Properties | | | 215,303 | |
| | 3,721 | | | SL Green Realty | | | 441,385 | |
| | | | | | | | |
| | | | | | | 1,679,333 | |
| | | | | | | | |
| | | | | | | | |
Shares | | | | | Market
Value | |
| | |
| | | | Residential – 15.56% | | | | |
| | 2,546 | | | AvalonBay Communities | | $ | 445,117 | |
| | 3,422 | | | Camden Property Trust, REIT | | | 252,509 | |
| | 2,018 | | | Essex Property Trust | | | 444,848 | |
| | 3,199 | | | Mid-America Apartment Communities | | | 272,523 | |
| | 8,212 | | | UDR | | | 282,986 | |
| | | | | | | | |
| | | | | | | 1,697,983 | |
| | | | | | | | |
| | |
| | | | Retail – 24.26% | | | | |
| | 7,941 | | | Acadia Realty Trust | | | 261,179 | |
| | 3,360 | | | Agree Realty | | | 108,797 | |
| | 12,422 | | | Kimco Realty | | | 332,537 | |
| | 4,504 | | | Macerich | | | 381,669 | |
| | 7,735 | | | National Retail Properties | | | 293,930 | |
| | 13,594 | | | Retail Opportunity Investments | | | 246,459 | |
| | 5,081 | | | Simon Property Group | | | 1,023,618 | |
| | | | | | | | |
| | | | | | | 2,648,189 | |
| | | | | | | | |
| | |
| | | | Storage – 6.51% | | | | |
| | 4,619 | | | Extra Space Storage | | | 366,010 | |
| | 3,452 | | | Sovran Self Storage | | | 344,751 | |
| | | | | | | | |
| | | | | | | 710,761 | |
| | | | | | | | |
| | |
| | | | Telecommunications Equipment – 0.77% | | | | |
| | 707 | | | SBA Communications * | | | 84,147 | |
| | | | | | | | |
| | |
| | | | Total Common Stocks
(Cost $10,570,326) | | | 10,888,704 | |
| | | | | | | | |
|
| | INVESTMENT COMPANY – 0.38% | |
| | |
| | 41,330 | | | BlackRock Liquidity Funds TempFund Portfolio | | | 41,330 | |
| | | | | | | | |
| | |
| | | | Total Investment Company
(Cost $41,330) | | | 41,330 | |
| | | | | | | | |
| Total Investments – 100.14%
(Cost $10,611,656)** | | | 10,930,034 | |
| | | | | | | | |
| Net Other Assets and Liabilities – (0.14)% | | | (15,380 | ) |
| | | | | | | | |
| Net Assets – 100.00% | | $ | 10,914,654 | |
| | | | | | | | |
| * | | Non-income producing security. |
| ** | | Aggregate cost for Federal income tax purposes is $10,691,715. |
| | | | |
Gross unrealized appreciation | | $ | 564,605 | |
Gross unrealized depreciation | | | (326,286 | ) |
| | | | |
Net unrealized appreciation | | $ | 238,319 | |
| | | | |
| REIT | | Real Estate Investment Trust |
See accompanying Notes to Financial Statements.
ASTON/Montag & Caldwell Balanced Fund
| | |
| |
| Portfolio Manager Commentary (unaudited) | | October 31, 2015 |
Ronald E. Canakaris, CFA, CIC & Helen M. Donahue, CFA
| Q. | What were the most significant market factors affecting Fund performance and returns relative to the benchmark during the past 12 months? |
| A. | The Fund outperformed the blended index for the period. Equity performance benefited from an overweight allocation to Consumer Staples and underweight positions in Technology and Energy. We believe that the ending of Quantitative Easing (QE) in late 2014 allowed for normal market forces and company specific fundamentals to have a greater impact on share prices than was the case during the previous periods of significant liquidity being provided by the U.S. Federal Reserve (Fed). Against this backdrop we think active managers with strong, fundamentally-driven investment processes, such as Montag & Caldwell’s, should benefit. The fixed income portion rose more than the Barclays Government/Credit Index as the Fund’s higher quality holdings performed better during the period. |
| Q. | What were the best performing holdings for the Fund during the period? |
| A. | Our best performing stock was Starbucks (+67.9%) which benefited from strong same store sales and earnings growth as well as new initiatives such as mobile ordering which is anticipated to drive further sales/earnings strength. Nike rose 42.5%, benefiting from sustained rapid growth across all key geographies during the period. Facebook rose 36% as the company demonstrated success monetizing its customers’ transition to mobile usage. IT consulting firm Accenture’s shares rose 35%. Fundamentals remained strong as they assist their clients’ transition to mobile and digital applications. Walgreens Boots Alliance shares rose 34%. New management, resulting from the closing of the merger between Walgreens and European-based Alliance Boots, moved quickly to improve performance in US-based Walgreens stores and realize merger-related synergies. |
| Q. | What were the weakest performing holdings? |
| A. | Chipmaker Qualcomm shares fell 22% following losses to competitors and a patent dispute in China. The small position size during the period limited its impact on relative performance. Following strong gains in the prior year, Union Pacific fell 22% as the slowdown in energy and industrial end markets resulted in slowing rail cargo volumes. Biogen shares fell 20% as sales for its key multiple sclerosis drug, Tecfidera, failed to meet expectations. Ralph Lauren lost 18% as ongoing heavy investments in stores and technology depressed earnings growth. Shares of online travel company Priceline fell 17%, as results suffered from the negative influence of dollar strength versus key currencies like the Euro. |
| Q. | How was the Fund positioned as of October 31, 2015? |
| A. | After several years of a zero interest rate policy and multiple rounds of QE, it appears that the Fed would like to begin raising interest rates off the zero-bound. Because economic growth is still very moderate, inflation is low and earnings growth continues to slow, the market is likely to be choppy as investors evaluate the Fed’s likely course of action. After the recent stock market correction in August, the market has recouped all of its losses even as the outlook for economic and earnings growth remains muted. With QE3 having ended a year ago, we expect stock market volatility to persist. We believe the high quality growth stocks in our Fund’s portfolio are well positioned for what could be a continuing choppy and more volatile market environment. The bond portion of the Fund is shorter in duration than the Barclays Government Credit Bond Index and is overweight high quality intermediate corporate bonds. |
Growth of a Hypothetical
$10,000 Investment—Class N
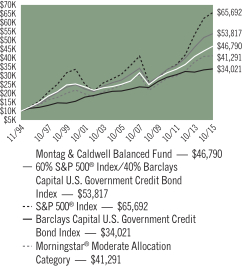
All dividends and capital gains are reinvested. Indexes are unmanaged and do not take into account fees, expenses or other costs.
Returns shown in the chart and table do not reflect taxes that a shareholder would pay on Fund distributions or on the sale of the Fund shares.
The Fund is subject to interest rate risk associated with the underlying bond holdings in the portfolio. The value of the Fund can decline as interest rates rise and an investor can lose principal.
RETURNSFOR PERIOD ENDED 10/31/15
Average Annual Total Returns - Class N
| | | | |
One Year | | | 6.01 | % |
Five Year | | | 8.07 | % |
Ten Year | | | 6.33 | % |
Since Inception | | | 7.63 | % |
Inception Date 11/02/94
Average Annual Total Returns - Class I
| | | | |
One Year | | | 6.13 | % |
Five Year | | | 8.22 | % |
Ten Year | | | 6.49 | % |
Since Inception | | | 4.41 | % |
Inception Date 12/31/98
The performance data quoted represents past performance. Past performance does not guarantee future results. Investment return and principal value will fluctuate so that an investor’s shares, upon redemption, may be worth more or less than their original cost. Current performance may be lower or higher than the performance data quoted. For performance data current to the most recent month-end, please visit our website at www.astonfunds.com.
The performance quoted would have been lower if fee waivers and/or expense reimbursements had not been in effect.
The total expense ratios for Class N shares and Class I shares are 1.59% and 1.34%, respectively, as disclosed in the prospectus dated February 28, 2015. Please refer to the Financial Highlights section in this report for more information.
| | |
| |
| ASTON/Montag & Caldwell Balanced Fund | | October 31, 2015 |
| |
| Schedule of Investments | | |
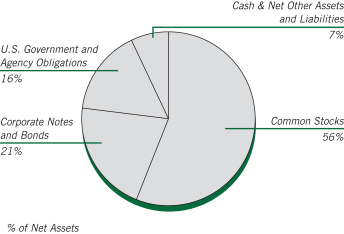
| | | | | | | | |
Shares | | | | | Market
Value | |
| |
| | COMMON STOCKS – 56.14% | | | | |
| | |
| | | | Consumer Discretionary – 8.90% | | | | |
| | 9,300 | | | Carnival | | $ | 502,944 | |
| | 5,200 | | | Dollar General | | | 352,404 | |
| | 8,100 | | | Dollar Tree * | | | 530,469 | |
| | 2,100 | | | NIKE, Class B | | | 275,163 | |
| | 7,600 | | | Starbucks | | | 475,532 | |
| | 7,450 | | | TJX | | | 545,266 | |
| | | | | | | | |
| | | | | | | 2,681,778 | |
| | | | | | | | |
| | |
| | | | Consumer Staples – 13.16% | | | | |
| | 7,000 | | | Colgate-Palmolive | | | 464,450 | |
| | 1,800 | | | Costco Wholesale | | | 284,616 | |
| | 5,400 | | | CVS Health | | | 533,412 | |
| | 5,950 | | | Estee Lauder, Class A | | | 478,737 | |
| | 16,550 | | | Mondelez International, Class A | | | 763,948 | |
| | 7,620 | | | PepsiCo | | | 778,688 | |
| | 7,800 | | | Walgreens Boots Alliance | | | 660,504 | |
| | | | | | | | |
| | | | | | | 3,964,355 | |
| | | | | | | | |
| | |
| | | | Energy – 0.67% | | | | |
| | 2,700 | | | Occidental Petroleum | | | 201,258 | |
| | | | | | | | |
| | |
| | | | Financials – 1.01% | | | | |
| | 5,600 | | | Wells Fargo | | | 303,184 | |
| | | | | | | | |
| | |
| | | | Healthcare – 15.43% | | | | |
| | 12,350 | | | Abbott Laboratories | | | 553,280 | |
| | 2,019 | | | Allergan PLC (Ireland) * | | | 622,801 | |
| | 3,050 | | | AmerisourceBergen | | | 294,356 | |
| | 3,282 | | | Amgen | | | 519,147 | |
| | 5,800 | | | Celgene * | | | 711,718 | |
| | 7,600 | | | Cerner * | | | 503,804 | |
| | 4,400 | | | Gilead Sciences | | | 475,772 | |
| | 2,049 | | | McKesson | | | 366,361 | |
| | 4,600 | | | Thermo Fisher Scientific | | | 601,588 | |
| | | | | | | | |
| | | | | | | 4,648,827 | |
| | | | | | | | |
| | | | | | | | |
Shares | | | | | Market
Value | |
| | |
| | | | Industrials – 4.56% | | | | |
| | 5,700 | | | Honeywell International | | $ | 588,696 | |
| | 1,996 | | | Union Pacific | | | 178,343 | |
| | 5,900 | | | United Parcel Service, Class B | | | 607,818 | |
| | | | | | | | |
| | | | | | | 1,374,857 | |
| | | | | | | | |
| | |
| | | | Information Technology – 12.41% | | | | |
| | 4,950 | | | Accenture, Class A (Ireland) | | | 530,640 | |
| | 1,011 | | | Alphabet, Class A * | | | 745,500 | |
| | 7,000 | | | Cognizant Technology Solutions, Class A * | | | 476,770 | |
| | 4,900 | | | Facebook, Class A * | | | 499,653 | |
| | 4,100 | | | MasterCard, Class A | | | 405,859 | |
| | 3,900 | | | PayPal Holdings * | | | 140,439 | |
| | 1,500 | | | QUALCOMM | | | 89,130 | |
| | 10,968 | | | Visa, Class A | | | 850,897 | |
| | | | | | | | |
| | | | | | | 3,738,888 | |
| | | | | | | | |
| | |
| | | | Total Common Stocks
(Cost $14,187,231) | | | 16,913,147 | |
| | | | | | | | |
Par Value | | | | | | |
|
| | CORPORATE NOTES AND BONDS – 21.34% | |
| | |
| | | | Consumer Staples – 2.41% | | | | |
| | $325,000 | | | PepsiCo
Senior Unsecured Notes
5.000%, 06/01/18 | | | 354,867 | |
| | 350,000 | | | Wal-Mart Stores
Senior Unsecured Notes
3.250%, 10/25/20 | | | 370,891 | |
| | | | | | | | |
| | | | | | | 725,758 | |
| | | | | | | | |
| | |
| | | | Energy – 1.34% | | | | |
| | 400,000 | | | Chevron
Senior Unsecured Notes
1.718%, 06/24/18 | | | 404,408 | |
| | | | | | | | |
| | |
| | | | Financials – 6.00% | | | | |
| | 300,000 | | | General Electric Capital
Senior Unsecured Notes, MTN
4.375%, 09/16/20 | | | 329,452 | |
| | 350,000 | | | Goldman Sachs Group
Senior Unsecured Notes
3.625%, 02/07/16 | | | 352,725 | |
| | 350,000 | | | JPMorgan Chase
Senior Unsecured Notes
4.350%, 08/15/21 | | | 375,212 | |
| | 350,000 | | | U.S. Bancorp
Subordinated Notes, MTN
2.950%, 07/15/22 | | | 350,164 | |
| | 400,000 | | | Wells Fargo & Co
Senior Unsecured Notes, MTN
2.150%, 01/30/20 | | | 399,286 | |
| | | | | | | | |
| | | | | | | 1,806,839 | |
| | | | | | | | |
See accompanying Notes to Financial Statements.
| | |
| |
| ASTON/Montag & Caldwell Balanced Fund | | October 31, 2015 |
| |
| Schedule of Investments – continued | | |
| | | | | | | | |
Par Value | | | | | Market
Value | |
| | |
| | | | Healthcare – 3.73% | | | | |
| | $ 250,000 | | | Johnson & Johnson
Senior Unsecured Notes
5.950%, 08/15/37 | | $ | 324,056 | |
| | 400,000 | | | Merck & Co., Inc.
Senior Unsecured Notes
2.350%, 02/10/22 | | | 398,238 | |
| | 400,000 | | | Pfizer
Senior Unsecured Notes
1.100%, 05/15/17 | | | 401,360 | |
| | | | | | | | |
| | | | | | | 1,123,654 | |
| | | | | | | | |
| | |
| | | | Industrials – 1.39% | | | | |
| | 400,000 | | | United Parcel Service
Senior Unsecured Notes
3.125%, 01/15/21 | | | 419,381 | |
| | | | | | | | |
| | |
| | | | Information Technology – 6.47% | | | | |
| | 400,000 | | | Apple
Senior Unsecured Notes
1.000%, 05/03/18 | | | 399,014 | |
| | 375,000 | | | EMC
Senior Unsecured Notes
1.875%, 06/01/18 | | | 358,631 | |
| | 350,000 | | | Google
Senior Unsecured Notes
3.625%, 05/19/21 | | | 376,715 | |
| | 400,000 | | | Oracle
Senior Unsecured Notes
2.500%, 10/15/22 | | | 392,252 | |
| | 425,000 | | | QUALCOMM
Senior Unsecured Notes
2.250%, 05/20/20 | | | 422,328 | |
| | | | | | | | |
| | | | | | | 1,948,940 | |
| | | | | | | | |
| | |
| | | | Total Corporate Notes and Bonds
(Cost $6,330,638) | | | 6,428,980 | |
| | | | | | | | |
|
| | U.S. GOVERNMENT AND AGENCY OBLIGATIONS – 15.64% | |
| | |
| | | | Fannie Mae – 0.09% | | | | |
| | 8,181 | | | 7.500%, 02/01/35
Pool # 787557 | | | 9,009 | |
| | 2,838 | | | 7.500%, 04/01/35
Pool # 819231 | | | 3,019 | |
| | 12,126 | | | 6.000%, 11/01/35
Pool # 844078 | | | 13,729 | |
| | | | | | | | |
| | | | | | | 25,757 | |
| | | | | | | | |
| | |
| | | | Freddie Mac – 1.27% | | | | |
| | 375,000 | | | 1.000%, 09/29/17 | | | 376,726 | |
| | 6,665 | | | 5.500%, 12/01/20
Gold Pool # G11820 | | | 7,189 | |
| | | | | | | | |
| | | | | | | 383,915 | |
| | | | | | | | |
| | |
| | | | Ginnie Mae – 0.02% | | | | |
| | 4,744 | | | 5.500%, 02/15/39
Pool # 698060 | | | 5,316 | |
| | | | | | | | |
| | | | | | | | |
Par Value | | | | | Market
Value | |
| | |
| | | | U.S. Treasury Bonds – 3.86% | | | | |
| | $ 325,000 | | | 5.375%, 02/15/31 | | $ | 446,883 | |
| | 450,000 | | | 3.500%, 02/15/39 | | | 505,831 | |
| | 200,000 | | | 3.125%, 11/15/41 | | | 209,922 | |
| | | | | | | | |
| | | | | | | 1,162,636 | |
| | | | | | | | |
| | |
| | | | U.S. Treasury Notes – 10.40% | | | | |
| | 225,000 | | | 4.500%, 02/15/16 | | | 227,804 | |
| | 350,000 | | | 2.625%, 04/30/16 | | | 354,097 | |
| | 375,000 | | | 4.625%, 02/15/17 | | | 394,563 | |
| | 425,000 | | | 1.375%, 09/30/18 | | | 429,394 | |
| | 450,000 | | | 1.500%, 01/31/19 | | | 455,215 | |
| | 425,000 | | | 2.125%, 08/15/21 | | | 434,438 | |
| | 425,000 | | | 2.500%, 05/15/24 | | | 439,485 | |
| | 400,000 | | | 2.125%, 05/15/25 | | | 399,380 | |
| | | | | | | | |
| | | | | | | 3,134,376 | |
| | | | | | | | |
| | |
| | | | Total U.S. Government and Agency Obligations
(Cost $4,613,404) | | | 4,712,000 | |
| | | | | | | | |
Shares | | | | | | |
|
| | INVESTMENT COMPANY – 5.66% | |
| | |
| | 1,703,074 | | | BlackRock Liquidity Funds
TempFund Portfolio | | | 1,703,074 | |
| | | | | | | | |
| | |
| | | | Total Investment Company
(Cost $1,703,074) | | | 1,703,074 | |
| | | | | | | | |
| Total Investments – 98.78%
(Cost $26,834,347)** | | | 29,757,201 | |
| | | | | | | | �� |
| Net Other Assets and Liabilities – 1.22% | | | 367,733 | |
| | | | | | | | |
| Net Assets – 100.00% | | $ | 30,124,934 | |
| | | | | | | | |
| * | | Non-income producing security. |
| ** | | Aggregate cost for Federal income tax purposes is $27,164,079. |
| | | | |
Gross unrealized appreciation | | $ | 3,130,162 | |
Gross unrealized depreciation | | | (537,040 | ) |
| | | | |
Net unrealized appreciation | | $ | 2,593,122 | |
| | | | |
See accompanying Notes to Financial Statements.
| | |
| |
| ASTON/Montag & Caldwell Balanced Fund | | October 31, 2015 |
| |
| Schedule of Investments – continued | | |
| | | | |
Portfolio Composition | | | | |
Common Stocks | | | 56% | |
U.S. Government and Agency Obligations | | | 16% | |
Investment Company | | | 7% | |
Corporate Notes and Bonds | | | | |
(Moody’s Ratings) (unaudited) | | | | |
Aaa | | | 1% | |
Aa | | | 6% | |
A | | | 14% | |
| | | | |
| | | 100% | |
| | | | |
For financial reporting purposes, credit quality ratings shown are assigned by Moody’s Investors Service. If a Moody’s credit quality rating is not available the credit quality ratings shown are assigned by Standard & Poor’s. These rating agencies are independent, nationally recognized statistical rating organizations and are widely used. Investment grade ratings are credit ratings of Baa/ BBB or higher. Below investment grade ratings are credit ratings of Ba/BB or lower. Credit quality ratings are subject to change.
See accompanying Notes to Financial Statements.
| | |
| |
| | October 31, 2015 |
| |
| Statements of Assets and Liabilities | | |
| | | | | | | | |
| | |
| |
| Cornerstone
Large Cap
Value Fund
|
| |
| Fairpointe
Focused
Equity Fund
|
|
| | |
ASSETS: | | | | | | | | |
Investments: | | | | | | | | |
Investments at cost | | $ | 138,362,479 | | | $ | 6,800,089 | |
Net unrealized appreciation (depreciation) | | | (9,243,192 | ) | | | (320,441 | ) |
| | | | | | | | |
Total investments at value | | | 129,119,287 | | | | 6,479,648 | |
Receivables: | | | | | | | | |
Dividends and interest | | | 83,182 | | | | 3,700 | |
Dividend reclaims | | | 7,653 | | | | 341 | |
Fund shares sold | | | 94,124 | | | | — | |
Investments sold | | | 1,305,168 | | | | 10,275 | |
Due from Adviser, net (Note G) | | | — | | | | — | |
Deferred offering cost (Note B-13) | | | — | | | | 6,131 | |
Other assets | | | 346 | | | | 6 | |
| | | | | | | | |
Total assets | | | 130,609,760 | | | | 6,500,101 | |
| | | | | | | | |
| | |
LIABILITIES: | | | | | | | | |
Payables: | | | | | | | | |
Due to custodian | | | — | | | | — | |
Dividend distribution | | | — | | | | — | |
Investments purchased | | | — | | | | 22,311 | |
Fund shares redeemed | | | 422,962 | | | | — | |
Due to Adviser, net (Note G) | | | 86,342 | | | | 2,865 | |
Administration fees (Note G) | | | 6,481 | | | | 1,652 | |
Distribution fees (Note G) | | | 2,416 | | | | 94 | |
Audit and tax fees | | | 12,245 | | | | 10,578 | |
Custodian fees | | | 5,508 | | | | 652 | |
Transfer agent fees | | | 22,282 | | | | 4,878 | |
Accrued expenses and other payables | | | 6,922 | | | | 279 | |
| | | | | | | | |
Total liabilities | | | 565,158 | | | | 43,309 | |
| | | | | | | | |
NET ASSETS | | $ | 130,044,602 | | | $ | 6,456,792 | |
| | | | | | | | |
| | |
NET ASSETS CONSIST OF: | | | | | | | | |
Paid-in capital | | $ | 154,665,618 | | | $ | 6,860,832 | |
Accumulated undistributed (distribution in excess of) net investment income (loss) | | | 999,888 | | | | 54,030 | |
Accumulated net realized gain (loss) on investments | | | (16,377,712 | ) | | | (137,629 | ) |
Net unrealized appreciation (depreciation) on investments | | | (9,243,192 | ) | | | (320,441 | ) |
| | | | | | | | |
TOTAL NET ASSETS | | $ | 130,044,602 | | | $ | 6,456,792 | |
| | | | | | | | |
Class N: | | | | | | | | |
Net Assets | | $ | 58,598,137 | | | $ | 2,294,928 | |
Shares of beneficial interest outstanding (unlimited authorization) | | | 4,279,555 | | | | 245,997 | |
NET ASSET VALUE Offering and redemption price per share
(Net Assets/Shares Outstanding) | | $ | 13.69 | | | $ | 9.33 | |
| | | | | | | | |
Class I: | | | | | | | | |
Net Assets | | $ | 71,446,465 | | | $ | 4,161,864 | |
Shares of beneficial interest outstanding (unlimited authorization) | | | 5,200,142 | | | | 445,152 | |
NET ASSET VALUE Offering and redemption price per share
(Net Assets/Shares Outstanding) | | $ | 13.74 | | | $ | 9.35 | |
| | | | | | | | |
Class R: | | | | | | | | |
Net Assets | | $ | — | | | $ | — | |
Shares of beneficial interest outstanding (unlimited authorization) | | | — | | | | — | |
NET ASSET VALUE Offering and redemption price per share
(Net Assets/Shares Outstanding) | | $ | — | | | $ | — | |
| | | | | | | | |
See accompanying Notes to Financial Statements.
| | | | | | | | | | | | | | | | | | | | | | | | | | |
| | | | | | |
Herndon
Large Cap
Value Fund | | | Montag & Caldwell
Growth Fund | | | River Road
Dividend All
Cap Value Fund | | | River Road
Dividend All
Cap Value Fund II | | | Fairpointe
Mid Cap Fund | | | Montag & Caldwell
Mid Cap
Growth Fund | | | LMCG
Small Cap
Growth Fund | |
| | | | | | | | | | | | | | | | | | | | | | | | | | |
| | | | | | |
| | | | | | | | | | | | | | | | | | | | | | | | | | |
| | | | | | | | | | | | | | | | | | | | | | | | | | |
| $ | 110,993,900 | | | $ | 1,876,990,754 | | | $ | 707,474,462 | | | $ | 114,818,113 | | | $ | 3,990,552,401 | | | $ | 9,468,452 | | | $ | 237,507,930 | |
| | 9,661,299 | | | | 283,798,545 | | | | 137,858,395 | | | | 8,430,488 | | | | 403,786,523 | | | | 1,373,372 | | | | (6,169,163 | ) |
| | | | | | | | | | | | | | | | | | | | | | | | | | |
| | 120,655,199 | | | | 2,160,789,299 | | | | 845,332,857 | | | | 123,248,601 | | | | 4,394,338,924 | | | | 10,841,824 | | | | 231,338,767 | |
| | | | | | | | | | | | | | | | | | | | | | | | | | |
| | 173,197 | | | | 1,740,534 | | | | 1,186,229 | | | | 169,598 | | | | 1,215,409 | | | | 3,159 | | | | 11,127 | |
| | — | | | | — | | | | 9,544 | | | | — | | | | — | | | | — | | | | — | |
| | 41,020 | | | | 1,595,395 | | | | 745,360 | | | | 398,060 | | | | 5,024,398 | | | | — | | | | 449,057 | |
| | — | | | | 28,234,734 | | | | 8,687,263 | | | | 1,115,490 | | | | 341,868,776 | | | | 227,068 | | | | 4,537,647 | |
| | — | | | | — | | | | — | | | | — | | | | — | | | | 643 | | | | — | |
| | — | | | | — | | | | — | | | | — | | | | — | | | | — | | | | — | |
| | 302 | | | | 8,347 | | | | 2,285 | | | | 279 | | | | 12,176 | | | | 22 | | | | 131 | |
| | | | | | | | | | | | | | | | | | | | | | | | | | |
| | 120,869,718 | | | | 2,192,368,309 | | | | 855,963,538 | | | | 124,932,028 | | | | 4,742,459,683 | | | | 11,072,716 | | | | 236,336,729 | |
| | | | | | | | | | | | | | | | | | | | | | | | | | |
| | | | | | |
| | | | | | | | | | | | | | | | | | | | | | | | | | |
| | | | | | | | | | | | | | | | | | | | | | | | | | |
| | — | | | | — | | | | — | | | | — | | | | — | | | | — | | | | 742,275 | |
| | — | | | | — | | | | 137,294 | | | | 7,683 | | | | — | | | | — | | | | — | |
| | — | | | | — | | | | 2,839,005 | | | | 447,693 | | | | 26,326,436 | | | | — | | | | 3,029,944 | |
| | 185,104 | | | | 4,592,034 | | | | 2,197,543 | | | | 15,499 | | | | 11,275,920 | | | | — | | | | 956,115 | |
| | 96,298 | | | | 1,234,792 | | | | 498,836 | | | | 72,292 | | | | 2,802,068 | | | | — | | | | 129,806 | |
| | 6,318 | | | | 88,058 | | | | 35,374 | | | | 6,522 | | | | 189,127 | | | | 2,055 | | | | 11,054 | |
| | 348 | | | | 35,064 | | | | 8,845 | | | | 120 | | | | 76,517 | | | | 204 | | | | 6,366 | |
| | 10,878 | | | | 17,148 | | | | 13,295 | | | | 13,295 | | | | 17,123 | | | | 10,578 | | | | 10,578 | |
| | 2,890 | | | | 16,845 | | | | 8,486 | | | | 2,079 | | | | 37,232 | | | | 604 | | | | 3,814 | |
| | 22,438 | | | | 425,928 | | | | 212,671 | | | | 17,559 | | | | 1,068,189 | | | | 5,776 | | | | 48,345 | |
| | 5,389 | | | | 125,827 | | | | 34,610 | | | | 5,349 | | | | 271,129 | | | | 499 | | | | 15,828 | |
| | | | | | | | | | | | | | | | | | | | | | | | | | |
| | 329,663 | | | | 6,535,696 | | | | 5,985,959 | | | | 588,091 | | | | 42,063,741 | | | | 19,716 | | | | 4,954,125 | |
| | | | | | | | | | | | | | | | | | | | | | | | | | |
| $ | 120,540,055 | | | $ | 2,185,832,613 | | | $ | 849,977,579 | | | $ | 124,343,937 | | | $ | 4,700,395,942 | | | $ | 11,053,000 | | | $ | 231,382,604 | |
| | | | | | | | | | | | | | | | | | | | | | | | | | |
| | | | | | |
| | | | | | | | | | | | | | | | | | | | | | | | | | |
| $ | 110,296,503 | | | $ | 1,446,486,039 | | | $ | 641,467,396 | | | $ | 114,071,549 | | | $ | 4,050,702,747 | | | $ | 8,515,078 | | | $ | 239,276,454 | |
| | 963,616 | | | | 5,987,336 | | | | (3,666,927 | ) | | | (328,499 | ) | | | 12,066,800 | | | | (44,348 | ) | | | (1,161,099 | ) |
| | (381,363 | ) | | | 449,560,693 | | | | 74,318,715 | | | | 2,170,399 | | | | 233,839,872 | | | | 1,208,898 | | | | (563,588 | ) |
| | 9,661,299 | | | | 283,798,545 | | | | 137,858,395 | | | | 8,430,488 | | | | 403,786,523 | | | | 1,373,372 | | | | (6,169,163 | ) |
| | | | | | | | | | | | | | | | | | | | | | | | | | |
| $ | 120,540,055 | | | $ | 2,185,832,613 | | | $ | 849,977,579 | | | $ | 124,343,937 | | | $ | 4,700,395,942 | | | $ | 11,053,000 | | | $ | 231,382,604 | |
| | | | | | | | | | | | | | | | | | | | | | | | | | |
| | | | | | | | | | | | | | | | | | | | | | | | | | |
| $ | 8,499,910 | | | $ | 835,725,159 | | | $ | 214,788,925 | | | $ | 2,930,398 | | | $ | 1,861,753,472 | | | $ | 4,889,514 | | | $ | 154,393,781 | |
| | 640,639 | | | | 31,340,595 | | | | 16,947,860 | | | | 225,518 | | | | 49,573,088 | | | | 422,533 | | | | 10,666,344 | |
| | | | | | | | | | | | | | | | | | | | | | | | | | |
| $ | 13.27 | | | $ | 26.67 | | | $ | 12.67 | | | $ | 12.99 | | | $ | 37.56 | | | $ | 11.57 | | | $ | 14.47 | |
| | | | | | | | | | | | | | | | | | | | | | | | | | |
| | | | | | | | | | | | | | | | | | | | | | | | | | |
| $ | 112,040,145 | | | $ | 1,344,230,744 | | | $ | 635,188,654 | | | $ | 121,413,539 | | | $ | 2,838,642,470 | | | $ | 6,163,486 | | | $ | 76,988,823 | |
| | 8,454,689 | | | | 50,115,325 | | | | 50,156,815 | | | | 9,338,738 | | | | 73,839,198 | | | | 530,869 | | | | 5,259,906 | |
| | | | | | | | | | | | | | | | | | | | | | | | | | |
| $ | 13.25 | | | $ | 26.82 | | | $ | 12.66 | | | $ | 13.00 | | | $ | 38.44 | | | $ | 11.61 | | | $ | 14.64 | |
| | | | | | | | | | | | | | | | | | | | | | | | | | |
| | | | | | | | | | | | | | | | | | | | | | | | | | |
| $ | — | | | $ | 5,876,710 | | | $ | — | | | $ | — | | | $ | — | | | $ | — | | | $ | — | |
| | — | | | | 224,127 | | | | — | | | | — | | | | — | | | | — | | | | — | |
| | | | | | | | | | | | | | | | | | | | | | | | | | |
| $ | — | | | $ | 26.22 | | | $ | — | | | $ | — | | | $ | — | | | $ | — | | | $ | — | |
| | | | | | | | | | | | | | | | | | | | | | | | | | |
See accompanying Notes to Financial Statements.
| | |
| |
| | October 31, 2015 |
| |
| Statements of Assets and Liabilities – continued | | |
| | | | | | | | |
| | |
| | | River Road
Independent
Value Fund | | | River Road
Select Value
Fund | |
| | | | | | | | |
| | |
ASSETS: | | | | | | | | |
Investments: | | | | | | | | |
Investments at cost | | $ | 367,546,768 | | | $ | 94,471,928 | |
Affiliated Investment at cost (Note G) | | | — | | | | — | |
Net unrealized appreciation (depreciation) | | | (8,726,185 | ) | | | 3,351,649 | |
| | | | | | | | |
Total investments at value | | | 358,820,583 | | | | 97,823,577 | |
Total affiliated investment at value (Note G) | | | — | | | | — | |
Cash | | | — | | | | — | |
Receivables: | | | | | | | | |
Dividends and interest | | | 27,452 | | | | 33,443 | |
Fund shares sold | | | 425,784 | | | | 50,338 | |
Investments sold | | | 645,804 | | | | 712,850 | |
Other assets | | | 1,245 | | | | 337 | |
| | | | | | | | |
Total assets | | | 359,920,868 | | | | 98,620,545 | |
| | | | | | | | |
| | |
LIABILITIES: | | | | | | | | |
Payables: | | | | | | | | |
Due to custodian | | | — | | | | — | |
Dividend distribution | | | — | | | | — | |
Investments purchased | | | — | | | | 1,369,654 | |
Fund shares redeemed | | | 3,497,664 | | | | 10,397 | |
Due to Adviser, net (Note G) | | | 252,715 | | | | 81,584 | |
Administration fees (Note G) | | | 15,876 | | | | 5,643 | |
Distribution fees (Note G) | | | 9,950 | | | | 206 | |
Audit and tax fees | | | 10,578 | | | | 12,245 | |
Custodian fees | | | 3,786 | | | | 2,969 | |
Transfer agent fees | | | 105,569 | | | | 20,114 | |
Accrued expenses and other payables | | | 29,148 | | | | 6,400 | |
Call options written, at value (premiums received $4,263,438) | | | — | | | | — | |
| | | | | | | | |
Total liabilities | | | 3,925,286 | | | | 1,509,212 | |
| | | | | | | | |
NET ASSETS | | $ | 355,995,582 | | | $ | 97,111,333 | |
| | | | | | | | |
| | |
NET ASSETS CONSIST OF: | | | | | | | | |
Paid-in capital | | $ | 390,243,056 | | | $ | 86,563,624 | |
Accumulated undistributed (distribution in excess of) net investment income (loss) | | | (3,636,008 | ) | | | (404,126 | ) |
Accumulated net realized gain (loss) on investments, purchased and written options and capital gain distributions received | | | (21,885,281 | ) | | | 7,600,186 | |
Net unrealized appreciation (depreciation) on investments and purchased and written options | | | (8,726,185 | ) | | | 3,351,649 | |
| | | | | | | | |
TOTAL NET ASSETS | | $ | 355,995,582 | | | $ | 97,111,333 | |
| | | | | | | | |
Class N: | | | | | | | | |
Net Assets | | $ | 239,543,135 | | | $ | 5,038,187 | |
Shares of beneficial interest outstanding (unlimited authorization) | | | 24,203,325 | | | | 660,015 | |
NET ASSET VALUE Offering and redemption price per share
(Net Assets/Shares Outstanding) | | $ | 9.90 | | | $ | 7.63 | |
| | | | | | | | |
Class I: | | | | | | | | |
Net Assets | | $ | 116,452,447 | | | $ | 92,073,146 | |
Shares of beneficial interest outstanding (unlimited authorization) | | | 11,628,366 | | | | 11,865,491 | |
NET ASSET VALUE Offering and redemption price per share
(Net Assets/Shares Outstanding) | | $ | 10.01 | | | $ | 7.76 | |
| | | | | | | | |
See accompanying Notes to Financial Statements.
| | | | | | | | | | | | | | | | | | | | | | | | | | |
| | | | | | |
River Road
Small Cap
Value Fund | | | Silvercrest
Small Cap
Fund | | | TAMRO
Small Cap
Fund | | | DoubleLine Core
Plus Fixed
Income Fund | | | TCH
Fixed Income
Fund | | | Anchor Capital
Enhanced Equity
Fund | | | Lake Partners
LASSO
Alternatives Fund | |
| | | | | | | | | | | | | | | | | | | | | | | | | | |
| | | | | | |
| | | | | | | | | | | | | | | | | | | | | | | | | | |
| | | | | | | | | | | | | | | | | | | | | | | | | | |
| $ | 234,280,358 | | | $ | 160,100,365 | | | $ | 470,774,558 | | | $ | 491,024,348 | | | $ | 49,889,567 | | | $ | 168,900,367 | | | $ | 206,919,051 | |
| | — | | | | — | | | | — | | | | 9,740,460 | | | | — | | | | — | | | | — | |
| | 38,074,014 | | | | 3,467,864 | | | | 79,729,934 | | | | (6,729,687 | ) | | | (13,953 | ) | | | 3,001,973 | | | | 4,594,633 | |
| | | | | | | | | | | | | | | | | | | | | | | | | | |
| | 272,354,372 | | | | 163,568,229 | | | | 550,504,492 | | | | 484,445,590 | | | | 49,875,614 | | | | 171,902,340 | | | | 211,513,684 | |
| | — | | | | — | | | | — | | | | 9,589,531 | | | | — | | | | — | | | | — | |
| | — | | | | — | | | | — | | | | 1,762,711 | | | | — | | | | 80,042 | | | | — | |
| | | | | | | | | | | | | | | | | | | | | | | | | | |
| | 21,919 | | | | 30,129 | | | | 19,509 | | | | 3,422,228 | | | | 422,927 | | | | 331,713 | | | | 91,356 | |
| | 159,670 | | | | 319,575 | | | | 202,085 | | | | 2,139,270 | | | | 8,550 | | | | 128,636 | | | | 109,120 | |
| | 5,431,037 | | | | 1,392,431 | | | | 4,793,901 | | | | 4,298,103 | | | | 250,878 | | | | 5,559,800 | | | | — | |
| | 592 | | | | 151 | | | | 1,633 | | | | 533 | | | | 106 | | | | 445 | | | | 853 | |
| | | | | | | | | | | | | | | | | | | | | | | | | | |
| | 277,967,590 | | | | 165,310,515 | | | | 555,521,620 | | | | 505,657,966 | | | | 50,558,075 | | | | 178,002,976 | | | | 211,715,013 | |
| | | | | | | | | | | | | | | | | | | | | | | | | | |
| | | | | | |
| | | | | | | | | | | | | | | | | | | | | | | | | | |
| | | | | | | | | | | | | | | | | | | | | | | | | | |
| | — | | | | — | | | | — | | | | — | | | | — | | | | — | | | | 66,911 | |
| | — | | | | — | | | | — | | | | 127,453 | | | | 4,117 | | | | — | | | | — | |
| | 5,963,265 | | | | — | | | | 5,659,340 | | | | 12,001,939 | | | | 659,347 | | | | 2,163,214 | | | | — | |
| | 1,224,470 | | | | 669,578 | | | | 516,797 | | | | 923,598 | | | | 14,877 | | | | 400,509 | | | | 1,683,872 | |
| | 204,566 | | | | 125,445 | | | | 424,887 | | | | 86,362 | | | | 9,164 | | | | 102,469 | | | | 154,579 | |
| | 12,482 | | | | 8,120 | | | | 24,099 | | | | 43,955 | | | | 7,302 | | | | 9,198 | | | | 9,842 | |
| | 1,032 | | | | 780 | | | | 10,017 | | | | 7,679 | | | | 1,443 | | | | 3,507 | | | | 1,679 | |
| | 12,245 | | | | 10,578 | | | | 12,545 | | | | 18,648 | | | | 14,064 | | | | 11,638 | | | | 11,638 | |
| | 4,235 | | | | 1,836 | | | | 6,915 | | | | 10,205 | | | | 1,690 | | | | 16,901 | | | | 1,946 | |
| | 95,451 | | | | 24,486 | | | | 151,802 | | | | 76,074 | | | | 12,855 | | | | 31,797 | | | | 34,733 | |
| | 11,646 | | | | 5,995 | | | | 29,323 | | | | 24,464 | | | | 1,935 | | | | 11,059 | | | | 10,783 | |
| | — | | | | — | | | | — | | | | — | | | | — | | | | 6,783,099 | | | | — | |
| | | | | | | | | | | | | | | | | | | | | | | | | | |
| | 7,529,392 | | | | 846,818 | | | | 6,835,725 | | | | 13,320,377 | | | | 726,794 | | | | 9,533,391 | | | | 1,975,983 | |
| | | | | | | | | | | | | | | | | | | | | | | | | | |
| $ | 270,438,198 | | | $ | 164,463,697 | | | $ | 548,685,895 | | | $ | 492,337,589 | | | $ | 49,831,281 | | | $ | 168,469,585 | | | $ | 209,739,030 | |
| | | | | | | | | | | | | | | | | | | | | | | | | | |
| | | | | | | | | | | | | | | | | | | | | | | | | | |
| $ | 218,674,982 | | | $ | 154,848,988 | | | $ | 351,900,961 | | | $ | 503,890,295 | | | $ | 53,074,531 | | | $ | 167,431,844 | | | $ | 195,236,202 | |
| | — | | | | 212,459 | | | | (2,699,597 | ) | | | (599,281 | ) | | | 2,758 | | | | 368,674 | | | | (1,030,882 | ) |
| 13,689,202 | | | | 5,934,386 | | | | 119,754,597 | | | | (4,223,738 | ) | | | (3,232,055 | ) | | | 186,755 | | | | 10,939,077 | |
| | 38,074,014 | | | | 3,467,864 | | | | 79,729,934 | | | | (6,729,687 | ) | | | (13,953 | ) | | | 482,312 | | | | 4,594,633 | |
| | | | | | | | | | | | | | | | | | | | | | | | | | |
| $ | 270,438,198 | | | $ | 164,463,697 | | | $ | 548,685,895 | | | $ | 492,337,589 | | | $ | 49,831,281 | | | $ | 168,469,585 | | | $ | 209,739,030 | |
| | | | | | | | | | | | | | | | | | | | | | | | | | |
| | | | | | | | | | | | | | | | | | | | | | | | | | |
| $ | 25,246,339 | | | $ | 19,061,274 | | | $ | 241,283,378 | | | $ | 188,286,450 | | | $ | 35,023,019 | | | $ | 84,994,419 | | | $ | 40,666,996 | |
| | 2,069,109 | | | | 1,253,997 | | | | 12,978,548 | | | | 17,756,427 | | | | 3,384,933 | | | | 9,296,152 | | | | 3,187,463 | |
| $ | 12.20 | | | $ | 15.20 | | | $ | 18.59 | | | $ | 10.60 | | | $ | 10.35 | | | $ | 9.14 | | | $ | 12.76 | |
| | | | | | | | | | | | | | | | | | | | | | | | | | |
| $ | 245,191,859 | | | $ | 145,402,423 | | | $ | 307,402,517 | | | $ | 304,051,139 | | | $ | 14,808,262 | | | $ | 83,475,166 | | | $ | 169,072,034 | |
| | 19,915,866 | | | | 9,501,092 | | | | 15,929,990 | | | | 28,688,624 | | | | 1,430,892 | | | | 9,120,297 | | | | 13,203,415 | |
$ | 12.31 | | | $ | 15.30 | | | $ | 19.30 | | | $ | 10.60 | | | $ | 10.35 | | | $ | 9.15 | | | $ | 12.81 | |
| | | | | | | | | | | | | | | | | | | | | | | | | | |
See accompanying Notes to Financial Statements.
| | |
| |
| | October 31, 2015 |
| |
| Statements of Assets and Liabilities – continued | | |
| | | | | | | | |
| | |
| | | River Road
Long-Short
Fund | | | Barings
International
Fund | |
| | | | | | | | |
| | |
ASSETS: | | | | | | | | |
Investments: | | | | | | | | |
Investments at cost | | $ | 95,520,398 | | | $ | 19,118,783 | |
Net unrealized appreciation (depreciation) | | | 1,095,609 | | | | 1,355,752 | |
| | | | | | | | |
Total investments at value | | | 96,616,007 | | | | 20,474,535 | |
Foreign currency (Cost $988,830, $5,900, $2,207, $10,124, $79,818, $283, respectively) | | | 986,859 | | | | 5,765 | |
Cash | | | 2,251,838 | | | | — | |
Segregated Cash (Note B-5) | | | 17,014,211 | | | | — | |
Receivables: | | | | | | | | |
Dividends and interest | | | 34,337 | | | | 44,210 | |
Dividend reclaims | | | 22,514 | | | | 127,739 | |
Fund shares sold | | | 39,963 | | | | — | |
Investments sold | | | 7,432,772 | | | | 134,242 | |
Due from Adviser, net (Note G) | | | — | | | | — | |
Deferred offering costs (Note B-13) | | | — | | | | — | |
Other assets | | | 425 | | | | 44 | |
| | | | | | | | |
Total assets | | | 124,398,926 | | | | 20,786,535 | |
| | | | | | | | |
| | |
LIABILITIES: | | | | | | | | |
Payables: | | | | | | | | |
Interest and dividends on securities sold short | | | 47,094 | | | | — | |
Investments purchased | | | 7,392,443 | | | | — | |
Fund shares redeemed | | | 507,349 | | | | — | |
Due to Adviser, net (Note G) | | | 97,182 | | | | 8,680 | |
Administration fees (Note G) | | | 5,112 | | | | 11,260 | |
Distribution fees (Note G) | | | 1,168 | | | | 16 | |
Audit and tax fees | | | 12,688 | | | | 12,245 | |
Custodian fees | | | 4,435 | | | | 8,945 | |
Transfer agent fees | | | 17,944 | | | | 7,993 | |
Accrued expenses and other payables | | | 5,056 | | | | 650 | |
Securities sold short, at value (proceeds $37,546,143) | | | 39,237,910 | | | | — | |
| | | | | | | | |
Total liabilities | | | 47,328,381 | | | | 49,789 | |
| | | | | | | | |
NET ASSETS | | $ | 77,070,545 | | | $ | 20,736,746 | |
| | | | | | | | |
| | |
NET ASSETS CONSIST OF: | | | | | | | | |
Paid-in capital | | $ | 78,554,924 | | | $ | 19,002,448 | |
Accumulated undistributed (distribution in excess of) net investment income (loss) | | | (23,229 | ) | | | 220,278 | |
Accumulated net realized gain (loss) on investments and foreign currency transactions | | | (863,021 | ) | | | 176,318 | |
Net unrealized appreciation (depreciation) on investments, securities sold short and translation of assets and liabilities in foreign currency | | | (598,129 | ) | | | 1,337,702 | |
| | | | | | | | |
TOTAL NET ASSETS | | $ | 77,070,545 | | | $ | 20,736,746 | |
| | | | | | | | |
Class N: | | | | | | | | |
Net Assets | | $ | 27,982,788 | | | $ | 399,059 | |
Shares of beneficial interest outstanding (unlimited authorization) | | | 2,437,742 | | | | 64,240 | |
NET ASSET VALUE Offering and redemption price per share
(Net Assets/Shares Outstanding) | | $ | 11.48 | | | $ | 6.21 | |
| | | | | | | | |
Class I: | | | | | | | | |
Net Assets | | $ | 49,087,757 | | | $ | 20,337,687 | |
Shares of beneficial interest outstanding (unlimited authorization) | | | 4,246,365 | | | | 3,267,484 | |
NET ASSET VALUE Offering and redemption price per share
(Net Assets/Shares Outstanding) | | $ | 11.56 | | | $ | 6.22 | |
| | | | | | | | |
See accompanying Notes to Financial Statements.
| | | | | | | | | | | | | | | | | | | | | | |
| | | | | |
Guardian
Capital Global
Dividend Fund | | | LMCG
Emerging
Markets Fund | | | Pictet
International
Fund | | | TAMRO
International
Small Cap Fund | | | Harrison Street
Real Estate
Fund | | | Montag & Caldwell
Balanced Fund | |
| | | | | | | | | | | | | | | | | | | | | | |
| | | | | |
| | | | | | | | | | | | | | | | | | | | | | |
| | | | | | | | | | | | | | | | | | | | | | |
| $ | 4,126,716 | | | $ | 2,222,502 | | | $ | 50,559,964 | | | $ | 1,788,956 | | | $ | 10,611,656 | | | $ | 26,834,347 | |
| | 215,488 | | | | (152,280 | ) | | | 144,128 | | | | (21,121 | ) | | | 318,378 | | | | 2,922,854 | |
| | | | | | | | | | | | | | | | | | | | | | |
| | 4,342,204 | | | | 2,070,222 | | | | 50,704,092 | | | | 1,767,835 | | | | 10,930,034 | | | | 29,757,201 | |
| | 2,236 | | | | 10,058 | | | | 79,081 | | | | 283 | | | | — | | | | — | |
| | — | | | | — | | | | — | | | | — | | | | — | | | �� | — | |
| | — | | | | — | | | | — | | | | — | | | | — | | | | — | |
| | | | | | | | | | | | | | | | | | | | | | |
| | 8,290 | | | | 333 | | | | 74,229 | | | | 3,327 | | | | 26,160 | | | | 97,007 | |
| | 5,471 | | | | 22 | | | | 39,436 | | | | 901 | | | | 1,916 | | | | — | |
| | 175 | | | | — | | | | 297,195 | | | | — | | | | 690 | | | | 324,975 | |
| | 9,312 | | | | — | | | | 184,687 | | | | 23,247 | | | | 522,600 | | | | 139,364 | |
| | 2,329 | | | | 14,357 | | | | — | | | | 8,932 | | | | — | | | | — | |
| | — | | | | — | | | | — | | | | 6,143 | | | | — | | | | — | |
| | 8 | | | | 7 | | | | 46 | | | | 2 | | | | 28 | | | | 47 | |
| | | | | | | | | | | | | | | | | | | | | | |
| | 4,370,025 | | | | 2,094,999 | | | | 51,378,766 | | | | 1,810,670 | | | | 11,481,428 | | | | 30,318,594 | |
| | | | | | | | | | | | | | | | | | | | | | |
| | | | | |
| | | | | | | | | | | | | | | | | | | | | | |
| | | | | | | | | | | | | | | | | | | | | | |
| | — | | | | — | | | | — | | | | — | | | | — | | | | — | |
| | — | | | | — | | | | 398,472 | | | | 8,959 | | | | 413,797 | | | | 103,776 | |
| | — | | | | — | | | | 52,812 | | | | 49,504 | | | | 127,196 | | | | 46,191 | |
| | — | | | | — | | | | 10,018 | | | | — | | | | 2,934 | | | | 14,103 | |
| | 6,827 | | | | 13,067 | | | | 13,476 | | | | 7,742 | | | | 1,813 | | | | 3,706 | |
| | 44 | | | | 25 | | | | 43 | | | | 45 | | | | 432 | | | | 433 | |
| | 12,245 | | | | 12,545 | | | | 12,245 | | | | 12,245 | | | | 11,628 | | | | 14,064 | |
| | 857 | | | | 10,703 | | | | 12,005 | | | | 1,425 | | | | 1,237 | | | | 1,441 | |
| | 4,088 | | | | 4,145 | | | | 19,243 | | | | 4,122 | | | | 6,843 | | | | 8,788 | |
| | 181 | | | | 120 | | | | 1,361 | | | | 118 | | | | 894 | | | | 1,158 | |
| | — | | | | — | | | | — | | | | — | | | | — | | | | — | |
| | | | | | | | | | | | | | | | | | | | | | |
| | 24,242 | | | | 40,605 | | | | 519,675 | | | | 84,160 | | | | 566,774 | | | | 193,660 | |
| | | | | | | | | | | | | | | | | | | | | | |
| $ | 4,345,783 | | | $ | 2,054,394 | | | $ | 50,859,091 | | | $ | 1,726,510 | | | $ | 10,914,654 | | | $ | 30,124,934 | |
| | | | | | | | | | | | | | | | | | | | | | |
| | | | | |
| | | | | | | | | | | | | | | | | | | | | | |
| $ | 4,225,479 | | | $ | 2,660,248 | | | $ | 49,995,073 | | | $ | 1,751,831 | | | $ | 21,447,852 | | | $ | 26,195,849 | |
| | 25,313 | | | | 16,180 | | | | 364,479 | | | | 27,483 | | | | 122,213 | | | | (310,864 | ) |
| | (120,301 | ) | | | (469,686 | ) | | | 356,019 | | | | (31,716 | ) | | | (10,973,789 | ) | | | 1,317,095 | |
| 215,292 | | | | (152,348 | ) | | | 143,520 | | | | (21,088 | ) | | | 318,378 | | | | 2,922,854 | |
| | | | | | | | | | | | | | | | | | | | | | |
| $ | 4,345,783 | | | $ | 2,054,394 | | | $ | 50,859,091 | | | $ | 1,726,510 | | | $ | 10,914,654 | | | $ | 30,124,934 | |
| | | | | | | | | | | | | | | | | | | | | | |
| | | | | | | | | | | | | | | | | | | | | | |
| $ | 1,053,816 | | | $ | 605,369 | | | $ | 1,055,768 | | | $ | 1,059,261 | | | $ | 10,407,778 | | | $ | 26,606,861 | |
| | 102,324 | | | | 76,863 | | | | 110,384 | | | | 105,852 | | | | 814,102 | | | | 1,116,601 | |
| | | | | | | | | | | | | | | | | | | | | | |
| $ | 10.30 | | | $ | 7.88 | | | $ | 9.56 | | | $ | 10.01 | | | $ | 12.78 | | | $ | 23.83 | |
| | | | | | | | | | | | | | | | | | | | | | |
| | | | | | | | | | | | | | | | | | | | | | |
| $ | 3,291,967 | | | $ | 1,449,025 | | | $ | 49,803,323 | | | $ | 667,249 | | | $ | 506,876 | | | $ | 3,518,073 | |
| | 320,195 | | | | 183,161 | | | | 5,188,613 | | | | 66,528 | | | | 39,838 | | | | 148,142 | |
| | | | | | | | | | | | | | | | | | | | | | |
| $ | 10.28 | | | $ | 7.91 | | | $ | 9.60 | | | $ | 10.03 | | | $ | 12.72 | | | $ | 23.75 | |
| | | | | | | | | | | | | | | | | | | | | | |
See accompanying Notes to Financial Statements.
| | |
| |
| For the Year Ended October 31, 2015 | | |
| |
| Statements of Operations | | |
| | | | | | | | |
| | |
| | | Cornerstone
Large Cap
Value Fund | | | Fairpointe
Focused
Equity Fund(a) | |
| | | | | | | | |
INVESTMENT INCOME: | | | | | | | | |
Dividends | | $ | 3,273,470 | | | $ | 91,215 | |
Less: foreign taxes withheld | | | (34,264 | ) | | | (679 | ) |
| | | | | | | | |
Total investment income | | | 3,239,206 | | | | 90,536 | |
| | | | | | | | |
EXPENSES: | | | | | | | | |
Investment advisory fees (Note G) | | | 1,196,666 | | | | 39,167 | |
Distribution expenses (Note G)(b) | | | 140,448 | | | | 3,922 | |
Transfer agent fees | | | 141,443 | | | | 25,637 | |
Administration fees (Note G) | | | 81,141 | | | | 13,900 | |
Custodian fees | | | 24,587 | | | | 5,473 | |
Audit and tax fees | | | 22,343 | | | | 18,759 | |
Legal fees | | | 4,081 | | | | 347 | |
Registration expenses | | | 37,873 | | | | 23,314 | |
Amortization of offering costs (Note B-13) | | | — | | | | 43,836 | |
Reports to shareholder expense | | | 14,852 | | | | 259 | |
Trustees fees and related expenses (Note G) | | | 10,115 | | | | 258 | |
Other expenses | | | 7,980 | | | | 1,795 | |
| | | | | | | | |
Total expenses before waivers/reimbursement/recoupment | | | 1,681,529 | | | | 176,667 | |
| | | | | | | | |
Less: Investment advisory fees waived (Note G) | | | — | | | | (39,167 | ) |
Less: Expenses reimbursed (Note G) | | | — | | | | (89,516 | ) |
Plus: Net expenses recouped (Note G) | | | — | | | | — | |
| | | | | | | | |
Net expenses | | | 1,681,529 | | | | 47,984 | |
| | | | | | | | |
NET INVESTMENT INCOME (LOSS) | | | 1,557,677 | | | | 42,552 | |
| | | | | | | | |
NET REALIZED AND UNREALIZED GAIN (LOSS) ON INVESTMENTS: | | | | | | | | |
Net realized gain (loss) on investments | | | 1,649,684 | | | | (137,629 | ) |
Net change in unrealized appreciation (depreciation) on investments | | | (18,638,883 | ) | | | (320,441 | ) |
| | | | | | | | |
NET REALIZED AND UNREALIZED GAIN (LOSS) ON INVESTMENTS | | | (16,989,199 | ) | | | (458,070 | ) |
| | | | | | | | |
| | |
NET INCREASE (DECREASE) IN NET ASSETS FROM OPERATIONS | | $ | (15,431,522 | ) | | $ | (415,518 | ) |
| | | | | | | | |
| (a) | The commencement of investment operations for the Fairpointe Focused Equity Fund is December 23, 2014. |
| (b) | Distribution expense is incurred at the Class N level for all funds except the Montag & Caldwell Growth Fund. The distribution expenses for Class N and Class R of the Montag the Montag & Caldwell Growth Fund are $2,440,877 and $33,661, respectively. |
See accompanying Notes to Financial Statements.
| | | | | | | | | | | | | | | | | | | | | | | | | | |
| | | | | | |
Herndon
Large Cap
Value Fund | | | Montag & Caldwell
Growth Fund | | | River Road
Dividend All
Cap Value Fund | | | River Road
Dividend All Cap
Value Fund II | | | Fairpointe
Mid Cap Fund | | | Montag & Caldwell
Mid Cap
Growth Fund | | | LMCG
Small Cap
Growth Fund | |
| | | | | | | | | | | | | | | | | | | | | | | | | | |
| | | | | | | | | | | | | | | | | | | | | | | | | | |
| $ | 2,668,614 | | | $ | 39,316,823 | | | $ | 26,762,949 | | | $ | 3,789,674 | | | $ | 75,932,502 | | | $ | 69,609 | | | $ | 468,299 | |
| | — | | | | — | | | | (263,210 | ) | | | (37,704 | ) | | | (305,095 | ) | | | (398 | ) | | | — | |
| | | | | | | | | | | | | | | | | | | | | | | | | | |
| | 2,668,614 | | | | 39,316,823 | | | | 26,499,739 | | | | 3,751,970 | | | | 75,627,407 | | | | 69,211 | | | | 468,299 | |
| | | | | | | | | | | | | | | | | | | | | | | | | | |
| | | | | | | | | | | | | | | | | | | | | | | | | | |
| | 1,089,260 | | | | 19,333,611 | | | | 6,826,423 | | | | 945,208 | | | | 38,541,887 | | | | 91,112 | | | | 1,336,681 | |
| | 26,521 | | | | 2,474,538 | | | | 630,530 | | | | 13,914 | | | | 5,659,357 | | | | 13,509 | | | | 222,743 | |
| | 122,327 | | | | 2,221,399 | | | | 682,797 | | | | 101,963 | | | | 4,393,673 | | | | 30,331 | | | | 152,944 | |
| | 75,682 | | | | 1,338,790 | | | | 452,825 | | | | 75,628 | | | | 2,468,683 | | | | 19,815 | | | | 75,908 | |
| | 8,942 | | | | 86,247 | | | | 33,140 | | | | 6,660 | | | | 157,989 | | | | 3,597 | | | | 12,848 | |
| | 19,058 | | | | 32,862 | | | | 23,393 | | | | 23,393 | | | | 32,877 | | | | 18,758 | | | | 18,758 | |
| | 3,639 | | | | 80,821 | | | | 25,966 | | | | 3,635 | | | | 147,739 | | | | 287 | | | | 3,576 | |
| | 34,390 | | | | 95,506 | | | | 44,954 | | | | 39,343 | | | | 110,712 | | | | 29,080 | | | | 69,213 | |
| | — | | | | — | | | | — | | | | — | | | | — | | | | — | | | | — | |
| | 8,448 | | | | 233,916 | | | | 43,693 | | | | 8,484 | | | | 547,059 | | | | 2,208 | | | | 29,631 | |
| | 9,199 | | | | 216,669 | | | | 66,598 | | | | 8,910 | | | | 368,643 | | | | 702 | | | | 6,711 | |
| | 7,658 | | | | 143,553 | | | | 44,319 | | | | 7,331 | | | | 168,958 | | | | 2,496 | | | | 6,820 | |
| | | | | | | | | | | | | | | | | | | | | | | | | | |
| | 1,405,124 | | | | 26,257,912 | | | | 8,874,638 | | | | 1,234,469 | | | | 52,597,577 | | | | 211,895 | | | | 1,935,833 | |
| | | | | | | | | | | | | | | | | | | | | | | | | | |
| | — | | | | — | | | | — | | | | — | | | | — | | | | (91,112 | ) | | | (242,740 | ) |
| | — | | | | — | | | | — | | | | — | | | | — | | | | (83 | ) | | | — | |
| | 42,793 | | | | — | | | | — | | | | — | | | | — | | | | — | | | | — | |
| | | | | | | | | | | | | | | | | | | | | | | | | | |
| | 1,447,917 | | | | 26,257,912 | | | | 8,874,638 | | | | 1,234,469 | | | | 52,597,577 | | | | 120,700 | | | | 1,693,093 | |
| | | | | | | | | | | | | | | | | | | | | | | | | | |
| | 1,220,697 | | | | 13,058,911 | | | | 17,625,101 | | | | 2,517,501 | | | | 23,029,830 | | | | (51,489 | ) | | | (1,224,794 | ) |
| | | | | | | | | | | | | | | | | | | | | | | | | | |
| | | | | | | | | | | | | | | | | | | | | | | | | | |
| | (5,778 | ) | | | 646,002,403 | | | | 78,461,890 | | | | 1,871,086 | | | | 314,132,084 | | | | 1,246,022 | | | | 605,946 | |
| | (9,545,604 | ) | | | (401,880,540 | ) | | | (92,867,978 | ) | | | (4,861,779 | ) | | | (558,847,097 | ) | | | (713,635 | ) | | | (11,741,432 | ) |
| | | | | | | | | | | | | | | | | | | | | | | | | | |
| | (9,551,382 | ) | | | 244,121,863 | | | | (14,406,088 | ) | | | (2,990,693 | ) | | | (244,715,013 | ) | | | 532,387 | | | | (11,135,486 | ) |
| | | | | | | | | | | | | | | | | | | | | | | | | | |
| | | | | | |
| $ | (8,330,685 | ) | | $ | 257,180,774 | | | $ | 3,219,013 | | | $ | (473,192 | ) | | $ | (221,685,183 | ) | | $ | 480,898 | | | $ | (12,360,280 | ) |
| | | | | | | | | | | | | | | | | | | | | | | | | | |
See accompanying Notes to Financial Statements.
| | |
| |
| For the Year Ended October 31, 2015 | | |
| |
| Statements of Operations – continued | | |
| | | | | | | | |
| | |
| | | River Road
Independent
Value Fund | | | River Road
Select Value
Fund | |
| | | | | | | | |
INVESTMENT INCOME: | | | | | | | | |
Dividends | | $ | 1,780,704 | | | $ | 1,307,236 | |
Dividends from affiliated security | | | — | | | | — | |
Less: foreign taxes withheld | | | (113,470 | ) | | | (1,220 | ) |
Interest | | | — | | | | — | |
| | | | | | | | |
Total investment income | | | 1,667,234 | | | | 1,306,016 | |
| | | | | | | | |
EXPENSES: | | | | | | | | |
Investment advisory fees (Note G) | | | 4,741,908 | | | | 1,348,429 | |
Distribution expenses (Note G)(a) | | | 644,986 | | | | 17,710 | |
Transfer agent fees | | | 452,818 | | | | 145,491 | |
Administration fees (Note G) | | | 225,954 | | | | 76,062 | |
Custodian fees | | | 17,310 | | | | 14,896 | |
Audit and tax fees | | | 18,758 | | | | 22,343 | |
Legal fees | | | 12,817 | | | | 3,607 | |
Registration expenses | | | 42,258 | | | | 32,245 | |
Reports to shareholder expense | | | 59,183 | | | | 11,688 | |
Trustees fees and related expenses (Note G) | | | 34,223 | | | | 9,624 | |
Other expenses | | | 23,809 | | | | 8,058 | |
| | | | | | | | |
Total expenses before waivers/reimbursement | | | 6,274,024 | | | | 1,690,153 | |
| | | | | | | | |
Less: Investment advisory fees waived (Note G) | | | (81,005 | ) | | | — | |
| | | | | | | | |
Net expenses | | | 6,193,019 | | | | 1,690,153 | |
| | | | | | | | |
NET INVESTMENT INCOME (LOSS) | | | (4,525,785 | ) | | | (384,137 | ) |
| | | | | | | | |
NET REALIZED AND UNREALIZED GAIN (LOSS) ON INVESTMENTS: | | | | | | | | |
Net realized gain (loss) on investments | | | (10,441,681 | ) | | | 9,998,759 | |
Net realized loss on purchased options | | | — | | | | — | |
Net realized loss on written options | | | — | | | | — | |
Net realized gain on foreign currency transactions | | | — | | | | — | |
Net realized gain on affiliated investments | | | — | | | | — | |
Capital gain distributions received | | | — | | | | — | |
Net change in unrealized appreciation (depreciation) on investments | | | 2,361,945 | | | | (4,782,442 | ) |
Net change in unrealized appreciation on purchased options | | | — | | | | — | |
Net change in unrealized appreciation on written options | | | — | | | | — | |
| | | | | | | | |
NET REALIZED AND UNREALIZED GAIN (LOSS) ON INVESTMENTS | | | (8,079,736 | ) | | | 5,216,317 | |
| | | | | | | | |
| | |
NET INCREASE (DECREASE) IN NET ASSETS FROM OPERATIONS | | $ | (12,605,521 | ) | | $ | 4,832,180 | |
| | | | | | | | |
| (a) | Distribution expense is incurred at the Class N level. |
See accompanying Notes to Financial Statements.
| | | | | | | | | | | | | | | | | | | | | | | | | | |
| | | | | | |
River Road
Small Cap
Value Fund | | | Silvercrest
Small Cap
Fund | | | TAMRO
Small Cap
Fund | | | DoubleLine Core
Plus Fixed
Income Fund | | | TCH
Fixed Income
Fund | | | Anchor Capital
Enhanced Equity
Fund | | | Lake Partners
LASSO
Alternatives Fund | |
| | | | | | | | | | | | | | | | | | | | | | | | | | |
| | | | | | | | | | | | | | | | | | | | | | | | | | |
| $ | 2,498,008 | | | $ | 1,537,300 | | | $ | 5,120,763 | | | $ | 21,194 | | | $ | 2,100 | | | $ | 6,045,912 | | | $ | 3,534,402 | |
| | — | | | | — | | | | — | | | | 301,078 | | | | — | | | | — | | | | — | |
| | (23,950 | ) | | | — | | | | — | | | | — | | | | — | | | | — | | | | — | |
| | — | | | | — | | | | — | | | | 14,445,706 | | | | 1,957,363 | | | | — | | | | — | |
| | | | | | | | | | | | | | | | | | | | | | | | | | |
| | 2,474,058 | | | | 1,537,300 | | | | 5,120,763 | | | | 14,767,978 | | | | 1,959,463 | | | | 6,045,912 | | | | 3,534,402 | |
| | | | | | | | | | | | | | | | | | | | | | | | | | |
| | | | | | | | | | | | | | | | | | | | | | | | | | |
| | 2,508,044 | | | | 1,066,552 | | | | 6,312,433 | | | | 1,908,289 | | | | 291,222 | | | | 1,423,193 | | | | 3,198,520 | |
| | 77,755 | | | | 21,181 | | | | 735,734 | | | | 253,037 | | | | 92,014 | | | | 242,200 | | | | 129,205 | |
| | 261,189 | | | | 85,801 | | | | 578,937 | | | | 312,462 | | | | 71,830 | | | | 194,678 | | | | 264,478 | |
| | 140,676 | | | | 63,112 | | | | 329,869 | | | | 255,173 | | | | 52,854 | | | | 109,649 | | | | 156,922 | |
| | 17,839 | | | | 11,308 | | | | 29,355 | | | | 42,205 | | | | 7,500 | | | | 70,802 | | | | 9,366 | |
| | 22,343 | | | | 18,758 | | | | 22,643 | | | | 34,314 | | | | 26,249 | | | | 21,041 | | | | 21,041 | |
| | 7,531 | | | | 2,751 | | | | 18,361 | | | | 11,866 | | | | 1,436 | | | | 5,765 | | | | 8,736 | |
| | 39,895 | | | | 34,910 | | | | 37,005 | | | | 136,355 | | | | 29,181 | | | | 37,624 | | | | 66,213 | |
| | 16,315 | | | | 9,156 | | | | 42,863 | | | | 44,755 | | | | 4,409 | | | | 25,862 | | | | 23,321 | |
| | 18,444 | | | | 6,192 | | | | 48,542 | | | | 20,192 | | | | 3,452 | | | | 13,653 | | | | 23,488 | |
| | 7,927 | | | | 5,799 | | | | 33,951 | | | | 8,645 | | | | 2,949 | | | | 6,373 | | | | 13,833 | |
| | | | | | | | | | | | | | | | | | | | | | | | | | |
| | 3,117,958 | | | | 1,325,520 | | | | 8,189,693 | | | | 3,027,293 | | | | 583,096 | | | | 2,150,840 | | | | 3,915,123 | |
| | | | | | | | | | | | | | | | | | | | | | | | | | |
| | — | | | | (77,805 | ) | | | — | | | | (380,220 | ) | | | (125,730 | ) | | | — | | | | (68,670 | ) |
| | | | | | | | | | | | | | | | | | | | | | | | | | |
| | 3,117,958 | | | | 1,247,715 | | | | 8,189,693 | | | | 2,647,073 | | | | 457,366 | | | | 2,150,840 | | | | 3,846,453 | |
| | | | | | | | | | | | | | | | | | | | | | | | | | |
| | (643,900 | ) | | | 289,585 | | | | (3,068,930 | ) | | | 12,120,905 | | | | 1,502,097 | | | | 3,895,072 | | | | (312,051 | ) |
| | | | | | | | | | | | | | | | | | | | | | | | | | |
| | | | | | | | | | | | | | | | | | | | | | | | | | |
| | 16,134,670 | | | | 5,949,673 | | | | 146,503,032 | | | | 702,108 | | | | 767,386 | | | | 14,951,868 | | | | 5,462,503 | |
| | — | | | | — | | | | — | | | | — | | | | — | | | | (9,048,106 | ) | | | — | |
| | — | | | | — | | | | — | | | | — | | | | — | | | | (4,175,940 | ) | | | — | |
| | 688 | | | | — | | | | — | | | | — | | | | — | | | | — | | | | — | |
| | — | | | | — | | | | — | | | | 23,712 | | | | — | | | | — | | | | — | |
| | — | | | | — | | | | — | | | | 159 | | | | — | | | | — | | | | 10,640,319 | |
| | (468,319 | ) | | | (3,498,719 | ) | | | (162,319,947 | ) | | | (9,455,664 | ) | | | (3,098,937 | ) | | | (11,142,124 | ) | | | (22,840,249 | ) |
| | — | | | | — | | | | — | | | | — | | | | — | | | | 1,112,672 | | | | — | |
| | — | | | | — | | | | — | | | | — | | | | — | | | | 1,475,160 | | | | — | |
| | | | | | | | | | | | | | | | | | | | | | | | | | |
| | 15,667,039 | | | | 2,450,954 | | | | (15,816,915 | ) | | | (8,729,685 | ) | | | (2,331,551 | ) | | | (6,826,470 | ) | | | (6,737,427 | ) |
| | | | | | | | | | | | | | | | | | | | | | | | | | |
| | | | | | |
| $ | 15,023,139 | | | $ | 2,740,539 | | | $ | (18,885,845 | ) | | $ | 3,391,220 | | | $ | (829,454 | ) | | $ | (2,931,398 | ) | | $ | (7,049,478 | ) |
| | | | | | | | | | | | | | | | | | | | | | | | | | |
See accompanying Notes to Financial Statements.
| | |
| |
| For the Year Ended October 31, 2015 | | |
| |
| Statements of Operations – continued | | |
| | | | | | | | |
| | |
| | | River Road
Long-Short
Fund | | | Barings
International
Fund | |
| | | | | | | | |
INVESTMENT INCOME: | | | | | | | | |
Dividends | | $ | 2,738,331 | | | $ | 511,219 | |
Less: foreign taxes withheld | | | (182,033 | ) | | | (42,948 | ) |
Interest | | | 4,723 | | | | — | |
| | | | | | | | |
Total investment income | | | 2,561,021 | | | | 468,271 | |
| | | | | | | | |
EXPENSES: | | | | | | | | |
Investment advisory fees (Note G) | | | 1,802,939 | | | | 210,414 | |
Distribution expenses (Note G)(b) | | | 179,493 | | | | 912 | |
Transfer agent fees | | | 146,336 | | | | 40,152 | |
Administration fees (Note G) | | | 83,523 | | | | 46,269 | |
Custodian fees | | | 14,824 | | | | 35,389 | |
Audit and tax fees | | | 22,091 | | | | 22,343 | |
Legal fees | | | 4,146 | | | | 560 | |
Registration expenses | | | 37,367 | | | | 29,080 | |
Interest and dividend expense on securities sold-short | | | 1,788,936 | | | | — | |
Amortization of offering costs (Note B-13) | | | — | | | | — | |
Reports to shareholder expense | | | 12,130 | | | | 2,232 | |
Trustees fees and related expenses (Note G) | | | 11,484 | | | | 1,376 | |
Other expenses | | | 8,763 | | | | 2,632 | |
| | | | | | | | |
Total expenses before recoupment | | | 4,112,032 | | | | 391,359 | |
| | | | | | | | |
Less: Investment advisory fees waived (Note G) | | | — | | | | (148,471 | ) |
Less: Expenses reimbursed (Note G) | | | — | | | | — | |
Plus: Net expenses recouped (Note G) | | | 34,948 | | | | — | |
| | | | | | | | |
Net expenses | | | 4,146,980 | | | | 242,888 | |
| | | | | | | | |
NET INVESTMENT INCOME (LOSS) | | | (1,585,959 | ) | | | 225,383 | |
| | | | | | | | |
NET REALIZED AND UNREALIZED GAIN (LOSS) ON INVESTMENTS: | | | | | | | | |
Net realized gain (loss) on investments | | | 10,610,114 | | | | 341,653 | |
Net realized loss on securities sold short | | | (3,386,269 | ) | | | — | |
Net realized gain (loss) on foreign currency transactions | | | (102,036 | ) | | | (4,019 | ) |
Net change in unrealized appreciation (depreciation) on investments | | | (1,616,367 | ) | | | 441,306 | |
Net change in unrealized appreciation on securities sold short | | | 3,671,826 | | | | — | |
Net change in unrealized appreciation (depreciation) on translation of assets and liabilities denominated in foreign currency | | | (1,205 | ) | | | (9,465 | ) |
| | | | | | | | |
NET REALIZED AND UNREALIZED GAIN (LOSS) ON INVESTMENTS | | | 9,176,063 | | | | 769,475 | |
| | | | | | | | |
| | |
NET INCREASE (DECREASE) IN NET ASSETS FROM OPERATIONS | | $ | 7,590,104 | | | $ | 994,858 | |
| | | | | | | | |
| (a) | The commencement of investment operations for TAMRO International Small Cap Fund is December 22, 2014. |
| (b) | Distribution expense is incurred at the Class N level. |
See accompanying Notes to Financial Statements.
| | | | | | | | | | | | | | | | | | | | | | |
| | | | | |
Guardian
Capital Global
Dividend Fund | | | LMCG
Emerging
Markets Fund | | | Pictet
International
Fund | | | TAMRO
International
Small Cap Fund(a) | | | Harrison Street
Real Estate
Fund | | | Montag & Caldwell
Balanced Fund | |
| | | | | | | | | | | | | | | | | | | | | | |
| | | | | | | | | | | | | | | | | | | | | | |
| $ | 164,249 | | | $ | 90,606 | | | $ | 901,707 | | | $ | 46,462 | | | $ | 343,057 | | | $ | 194,400 | |
| | (8,419 | ) | | | (10,615 | ) | | | (81,352 | ) | | | (3,039 | ) | | | — | | | | — | |
| | — | | | | — | | | | — | | | | — | | | | — | | | | 199,732 | |
| | | | | | | | | | | | | | | | | | | | | | |
| | 155,830 | | | | 79,991 | | | | 820,355 | | | | 43,423 | | | | 343,057 | | | | 394,132 | |
| | | | | | | | | | | | | | | | | | | | | | |
| | | | | | | | | | | | | | | | | | | | | | |
| | 34,871 | | | | 33,899 | | | | 300,511 | | | | 14,113 | | | | 126,748 | | | | 181,384 | |
| | 2,650 | | | | 1,703 | | | | 2,528 | | | | 2,163 | | | | 29,923 | | | | 21,634 | |
| | 24,312 | | | | 24,570 | | | | 69,450 | | | | 22,573 | | | | 40,447 | | | | 46,309 | |
| | 27,476 | | | | 41,021 | | | | 50,132 | | | | 23,138 | | | | 19,694 | | | | 29,290 | |
| | 2,341 | | | | 35,419 | | | | 47,369 | | | | 7,366 | | | | 4,954 | | | | 3,439 | |
| | 22,344 | | | | 25,645 | | | | 22,343 | | | | 22,341 | | | | 19,808 | | | | 26,249 | |
| | 398 | | | | 87 | | | | 900 | | | | 253 | | | | 344 | | | | 656 | |
| | 27,619 | | | | 29,643 | | | | 27,618 | | | | 23,584 | | | | 27,916 | | | | 28,331 | |
| | — | | | | — | | | | — | | | | — | | | | — | | | | — | |
| | 24,002 | | | | — | | | | 33,422 | | | | 44,377 | | | | — | | | | — | |
| | 1,899 | | | | 1,695 | | | | 2,831 | | | | 76 | | | | 3,836 | | | | 3,261 | |
| | 284 | | | | 227 | | | | 1,778 | | | | 75 | | | | 863 | | | | 1,495 | |
| | 2,387 | | | | 2,158 | | | | 2,709 | | | | 1,733 | | | | 2,405 | | | | 2,671 | |
| | | | | | | | | | | | | | | | | | | | | | |
| | 170,583 | | | | 196,067 | | | | 561,591 | | | | 161,792 | �� | | | 276,938 | | | | 344,719 | |
| | | | | | | | | | | | | | | | | | | | | | |
| | (34,871 | ) | | | (33,899 | ) | | | (175,077 | ) | | | (14,113 | ) | | | (105,057 | ) | | | (57,055 | ) |
| | (87,293 | ) | | | (122,369 | ) | | | — | | | | (127,876 | ) | | | — | | | | — | |
| | — | | | | — | | | | — | | | | — | | | | — | | | | — | |
| | | | | | | | | | | | | | | | | | | | | | |
| | 48,419 | | | | 39,799 | | | | 386,514 | | | | 19,803 | | | | 171,881 | | | | 287,664 | |
| | | | | | | | | | | | | | | | | | | | | | |
| | 107,411 | | | | 40,192 | | | | 433,841 | | | | 23,620 | | | | 171,176 | | | | 106,468 | |
| | | | | | | | | | | | | | | | | | | | | | |
| | | | | | | | | | | | | | | | | | | | | | |
| | (82,685 | ) | | | (200,041 | ) | | | 361,470 | | | | (31,716 | ) | | | 881,247 | | | | 1,390,086 | |
| | — | | | | — | | | | — | | | | — | | | | — | | | | — | |
| | (268 | ) | | | (13,849 | ) | | | (62,053 | ) | | | (774 | ) | | | (75 | ) | | | — | |
| | (18,774 | ) | | | (289,329 | ) | | | 943,586 | | | | (21,121 | ) | | | (835,595 | ) | | | (109,152 | ) |
| | — | | | | — | | | | — | | | | — | | | | — | | | | — | |
|
(80 |
) | | | 59 | | | | 547 | | | | 33 | | | | 45 | | | | — | |
| | | | | | | | | | | | | | | | | | | | | | |
| | (101,807 | ) | | | (503,160 | ) | | | 1,243,550 | | | | (53,578 | ) | | | 45,622 | | | | 1,280,934 | |
| | | | | | | | | | | | | | | | | | | | | | |
| | | | | |
| $ | 5,604 | | | $ | (462,968 | ) | | $ | 1,677,391 | | | $ | (29,958 | ) | | $ | 216,798 | | | $ | 1,387,402 | |
| | | | | | | | | | | | | | | | | | | | | | |
See accompanying Notes to Financial Statements.
| | |
| |
| | |
| |
| Statements of Changes in Net Assets | | |
| | | | | | | | | | | | |
| | |
| | | Cornerstone Large Cap
Value Fund | | | Fairpointe Focused
Equity Fund | |
| | | Year Ended October 31, | | | Period Ended | |
| | | 2015 | | | 2014 | | | October 31, 2015(a) | |
NET ASSETS at Beginning of Period | | $ | 163,910,660 | | | $ | 62,648,378 | | | $ | — | |
| | | | | | | | | | | | |
Increase (decrease) in net assets from operations: | | | | | | | | | | | | |
Net investment income | | | 1,557,677 | | | | 1,017,771 | | | | 42,552 | |
Net realized gain (loss) on investments | | | 1,649,684 | | | | 6,701,835 | | | | (137,629 | ) |
Net change in unrealized appreciation (depreciation) on investments | | | (18,638,883 | ) | | | 2,552,837 | | | | (320,441 | ) |
| | | | | | | | | | | | |
Net increase (decrease) in net assets from operations | | | (15,431,522 | ) | | | 10,272,443 | | | | (415,518 | ) |
| | | | | | | | | | | | |
Distributions to shareholders from: | | | | | | | | | | | | |
Net investment income: | | | | | | | | | | | | |
Class N | | | (453,376 | ) | | | (102,489 | ) | | | — | |
Class I | | | (916,253 | ) | | | (297,744 | ) | | | — | |
Class R | | | — | | | | — | | | | — | |
Net realized gain on investments: | | | | | | | | | | | | |
Class N | | | — | | | | — | | | | — | |
Class I | | | — | | | | — | | | | — | |
Class R | | | — | | | | — | | | | — | |
| | | | | | | | | | | | |
Total distributions | | | (1,369,629 | ) | | | (400,233 | ) | | | — | |
| | | | | | | | | | | | |
Capital share transactions: | | | | | | | | | | | | |
Proceeds from sales of shares: | | | | | | | | | | | | |
Class N | | | 25,360,315 | | | | 46,807,591 | | | | 2,662,257 | (b) |
Class I | | | 15,432,813 | | | | 71,518,302 | | | | 4,383,700 | (b) |
Class R | | | — | | | | — | | | | — | |
Proceeds from reinvestment of distributions: | | | | | | | | | | | | |
Class N | | | 443,961 | | | | 97,214 | | | | — | |
Class I | | | 892,106 | | | | 290,077 | | | | — | |
Class R | | | — | | | | — | | | | — | |
Cost of shares redeemed: | | | | | | | | | | | | |
Class N | | | (21,728,149 | ) | | | (12,358,613 | ) | | | (173,637 | ) |
Class I | | | (37,465,953 | ) | | | (14,964,499 | ) | | | (10 | ) |
Class R | | | — | | | | — | | | | — | |
| | | | | | | | | | | | |
Net increase (decrease) from capital share transactions | | | (17,064,907 | ) | | | 91,390,072 | | | | 6,872,310 | |
| | | | | | | | | | | | |
Total increase (decrease) in net assets | | | (33,866,058 | ) | | | 101,262,282 | | | | 6,456,792 | |
| | | | | | | | | | | | |
NET ASSETS at End of Period | | $ | 130,044,602 | | | $ | 163,910,660 | | | $ | 6,456,792 | |
| | | | | | | | | | | | |
Undistributed (distributions in excess of) net investment income (loss) | | $ | 999,888 | | | $ | 811,840 | | | $ | 54,030 | |
| | | | | | | | | | | | |
| (a) | The commencement of investment operations for the Fairpointe Focused Equity Fund is December 23, 2014. |
| (b) | Fairpointe Focused Equity Fund had a subscription-in-kind in the amount of $2,333,718 on December 23, 2014. The subscription was composed of securities, cash, and dividends accrued in the amounts of $2,305,531, $26,148 and $2,039, respectively. |
See accompanying Notes to Financial Statements.
| | | | | | | | | | | | | | | | | | | | | | |
| | |
Herndon Large Cap
Value Fund | | | Montag & Caldwell
Growth Fund | | | River Road Dividend
All Cap Value Fund | |
Year Ended October 31, | | | Year Ended October 31, | | | Year Ended October 31, | |
| 2015 | | | 2014 | | | 2015 | | | 2014 | | | 2015 | | | 2014 | |
| $ | 153,445,046 | | | $ | 122,395,081 | | | $ | 4,136,667,896 | | | $ | 5,235,796,676 | | | $ | 1,138,258,945 | | | $ | 1,228,988,525 | |
| | | | | | | | | | | | | | | | | | | | | | |
| | | | | | | | | | | | | | | | | | | | | | |
| | 1,220,697 | | | | 1,429,201 | | | | 13,058,911 | | | | 23,807,692 | | | | 17,625,101 | | | | 38,247,126 | |
| | (5,778 | ) | | | 9,189,481 | | | | 646,002,403 | | | | 830,078,413 | | | | 78,461,890 | | | | 100,414,252 | |
| | (9,545,604 | ) | | | 3,565,628 | | | | (401,880,540 | ) | | | (344,295,024 | ) | | | (92,867,978 | ) | | | (21,456,186 | ) |
| | | | | | | | | | | | | | | | | | | | | | |
| | (8,330,685 | ) | | | 14,184,310 | | | | 257,180,774 | | | | 509,591,081 | | | | 3,219,013 | | | | 117,205,192 | |
| | | | | | | | | | | | | | | | | | | | | | |
| | | | | | | | | | | | | | | | | | | | | | |
| | | | | | | | | | | | | | | | | | | | | | |
| | (45,033 | ) | | | (300,533 | ) | | | (2,061,261 | ) | | | (12,394,334 | ) | | | (4,291,181 | ) | | | (13,621,324 | ) |
| | (1,262,041 | ) | | | (733,243 | ) | | | (15,765,431 | ) | | | (24,280,948 | ) | | | (14,028,198 | ) | | | (26,859,558 | ) |
| | — | | | | — | | | | (2,777 | ) | | | (34,093 | ) | | | — | | | | — | |
| | | | | | | | | | | | | | | | | | | | | | |
| | (823,682 | ) | | | (829,848 | ) | | | (212,615,826 | ) | | | (147,918,291 | ) | | | (24,073,946 | ) | | | (26,590,807 | ) |
| | (7,930,253 | ) | | | (1,561,843 | ) | | | (439,875,741 | ) | | | (202,241,647 | ) | | | (65,111,598 | ) | | | (45,069,967 | ) |
| | — | | | | — | | | | (1,298,521 | ) | | | (700,844 | ) | | | — | | | | — | |
| | | | | | | | | | | | | | | | | | | | | | |
| | (10,061,009 | ) | | | (3,425,467 | ) | | | (671,619,557 | ) | | | (387,570,157 | ) | | | (107,504,923 | ) | | | (112,141,656 | ) |
| | | | | | | | | | | | | | | | | | | | | | |
| | | | | | | | | | | | | | | | | | | | | | |
| | | | | | | | | | | | | | | | | | | | | | |
| | 2,861,832 | | | | 11,262,099 | | | | 186,556,494 | | | | 215,113,264 | | | | 41,437,554 | | | | 62,653,200 | |
| | 20,901,274 | | | | 88,729,125 | | | | 241,907,926 | | | | 694,385,708 | | | | 90,897,533 | | | | 134,042,328 | |
| | — | | | | — | | | | 914,418 | | | | 1,218,147 | | | | — | | | | — | |
| | | | | | | | | | | | | | | | | | | | | | |
| | 868,259 | | | | 1,130,230 | | | | 209,112,111 | | | | 156,933,268 | | | | 27,956,925 | | | | 39,949,265 | |
| | 8,623,751 | | | | 2,099,431 | | | | 365,652,584 | | | | 167,592,670 | | | | 54,080,077 | | | | 46,719,016 | |
| | — | | | | — | | | | 1,092,345 | | | | 580,629 | | | | — | | | | — | |
| | | | | | | | | | | | | | | | | | | | | | |
| | (7,618,749 | ) | | | (44,133,670 | ) | | | (769,717,997 | ) | | | (1,264,451,943 | ) | | | (177,421,338 | ) | | | (202,510,406 | ) |
| | (40,149,664 | ) | | | (38,796,093 | ) | | | (1,768,877,865 | ) | | | (1,188,092,282 | ) | | | (220,946,207 | ) | | | (176,646,519 | ) |
| | — | | | | — | | | | (3,036,516 | ) | | | (4,429,165 | ) | | | — | | | | — | |
| | | | | | | | | | | | | | | | | | | | | | |
| | (14,513,297 | ) | | | 20,291,122 | | | | (1,536,396,500 | ) | | | (1,221,149,704 | ) | | | (183,995,456 | ) | | | (95,793,116 | ) |
| | | | | | | | | | | | | | | | | | | | | | |
| | (32,904,991 | ) | | | 31,049,965 | | | | (1,950,835,283 | ) | | | (1,099,128,780 | ) | | | (288,281,366 | ) | | | (90,729,580 | ) |
| | | | | | | | | | | | | | | | | | | | | | |
| $ | 120,540,055 | | | $ | 153,445,046 | | | $ | 2,185,832,613 | | | $ | 4,136,667,896 | | | $ | 849,977,579 | | | $ | 1,138,258,945 | |
| | | | | | | | | | | | | | | | | | | | | | |
| $ | 963,616 | | | $ | 1,050,704 | | | $ | 5,987,336 | | | $ | 13,249,668 | | | $ | (3,666,927 | ) | | $ | (883,544 | ) |
| | | | | | | | | | | | | | | | | | | | | | |
See accompanying Notes to Financial Statements.
| | |
| |
| | |
| |
| Statements of Changes in Net Assets – continued | | |
| | | | | | | | | | | | | | | | |
| | |
| | | River Road Dividend
All Cap Value Fund II | | | Fairpointe Mid Cap Fund | |
| | | Year Ended October 31, | | | Year Ended October 31, | |
| | | 2015 | | | 2014 | | | 2015 | | | 2014 | |
NET ASSETS at Beginning of Period | | $ | 132,696,953 | | | $ | 89,873,662 | | | $ | 5,963,929,210 | | | $ | 4,892,248,060 | |
| | | | | | | | | | | | | | | | |
Increase (decrease) in net assets from operations: | | | | | | | | | | | | | | | | |
Net investment income (loss) | | | 2,517,501 | | | | 3,295,012 | | | | 23,029,830 | | | | 890,017 | |
Net realized gain (loss) on investments | | | 1,871,086 | | | | 4,129,826 | | | | 314,132,084 | | | | 1,049,016,350 | |
Net change in unrealized appreciation (depreciation) on investments | | | (4,861,779 | ) | | | 4,067,038 | | | | (558,847,097 | ) | | | (389,789,424 | ) |
| | | | | | | | | | | | | | | | |
Net increase (decrease) in net assets from operations | | | (473,192 | ) | | | 11,491,876 | | | | (221,685,183 | ) | | | 660,116,943 | |
| | | | | | | | | | | | | | | | |
Distributions to shareholders from: | | | | | | | | | | | | | | | | |
Net investment income: | | | | | | | | | | | | | | | | |
Class N | | | (90,999 | ) | | | (173,767 | ) | | | (2,292,874 | ) | | | — | |
Class I | | | (2,543,708 | ) | | | (3,298,001 | ) | | | (4,564,241 | ) | | | (3,375,463 | ) |
Net realized gain on investments: | | | | | | | | | | | | | | | | |
Class N | | | (214,191 | ) | | | (43,196 | ) | | | (388,644,763 | ) | | | (223,568,950 | ) |
Class I | | | (3,926,742 | ) | | | (981,977 | ) | | | (533,671,049 | ) | | | (234,479,219 | ) |
| | | | | | | | | | | | | | | | |
Total distributions | | | (6,775,640 | ) | | | (4,496,941 | ) | | | (929,172,927 | ) | | | (461,423,632 | ) |
| | | | | | | | | | | | | | | | |
Capital share transactions: | | | | | | | | | | | | | | | | |
Proceeds from sales of shares: | | | | | | | | | | | | | | | | |
Class N | | | 974,246 | | | | 3,999,728 | | | | 416,140,464 | | | | 611,134,453 | |
Class I | | | 26,220,994 | | | | 41,902,478 | | | | 915,244,322 | | | | 1,427,015,336 | |
Proceeds from reinvestment of distributions: | | | | | | | | | | | | | | | | |
Class N | | | 304,395 | | | | 215,899 | | | | 374,916,825 | | | | 215,069,467 | |
Class I | | | 6,012,510 | | | | 3,879,481 | | | | 421,110,375 | | | | 170,521,263 | |
Cost of shares redeemed: | | | | | | | | | | | | | | | | |
Class N | | | (5,131,502 | ) | | | (1,213,066 | ) | | | (876,287,601 | ) | | | (850,386,062 | ) |
Class I | | | (29,484,827 | ) | | | (12,956,164 | ) | | | (1,363,799,543 | ) | | | (700,366,618 | ) |
| | | | | | | | | | | | | | | | |
Net increase (decrease) from capital share transactions | | | (1,104,184 | ) | | | 35,828,356 | | | | (112,675,158 | ) | | | 872,987,839 | |
| | | | | | | | | | | | | | | | |
Total increase (decrease) in net assets | | | (8,353,016 | ) | | | 42,823,291 | | | | (1,263,533,268 | ) | | | 1,071,681,150 | |
| | | | | | | | | | | | | | | | |
NET ASSETS at End of Period | | $ | 124,343,937 | | | $ | 132,696,953 | | | $ | 4,700,395,942 | | | $ | 5,963,929,210 | |
| | | | | | | | | | | | | | | | |
Undistributed (distributions in excess of) net investment income (loss) | | $ | (328,499 | ) | | $ | (73,053 | ) | | $ | 12,066,800 | | | $ | — | |
| | | | | | | | | | | | | | | | |
See accompanying Notes to Financial Statements.
| | | | | | | | | | | | | | | | | | | | | | |
| | |
Montag & Caldwell Mid Cap
Growth Fund | | | LMCG Small Cap
Growth Fund | | | River Road
Independent Value Fund | |
Year Ended October 31, | | | Year Ended October 31, | | | Year Ended October 31, | |
| 2015 | | | 2014 | | | 2015 | | | 2014 | | | 2015 | | | 2014 | |
| $ | 11,500,265 | | | $ | 11,402,187 | | | $ | 52,181,137 | | | $ | 40,540,640 | | | $ | 667,238,002 | | | $ | 725,355,861 | |
| | | | | | | | | | | | | | | | | | | | | | |
| | | | | | | | | | | | | | | | | | | | | | |
| | (51,489 | ) | | | (63,632 | ) | | | (1,224,794 | ) | | | (350,017 | ) | | | (4,525,785 | ) | | | (6,388,141 | ) |
| | 1,246,022 | | | | 797,891 | | | | 605,946 | | | | 3,358,983 | | | | (10,441,681 | ) | | | 37,973,231 | |
| | | | | |
| | (713,635 | ) | | | 320,711 | | | | (11,741,432 | ) | | | 3,429,213 | | | | 2,361,945 | | | | (38,109,822 | ) |
| | | | | | | | | | | | | | | | | | | | | | |
| | | | | |
| | 480,898 | | | | 1,054,970 | | | | (12,360,280 | ) | | | 6,438,179 | | | | (12,605,521 | ) | | | (6,524,732 | ) |
| | | | | | | | | | | | | | | | | | | | | | |
| | | | | | | | | | | | | | | | | | | | | | |
| | | | | | | | | | | | | | | | | | | | | | |
| | — | | | | — | | | | — | | | | — | | | | — | | | | — | |
| | — | | | | — | | | | — | | | | (14,282 | ) | | | — | | | | — | |
| | (403,184 | ) | | | (1,708,527 | ) | | | (1,601,490 | ) | | | (4,374,487 | ) | | | (16,133,453 | ) | | | (13,027,499 | ) |
| | | | | | | | | | | | | | | | | | | | | | |
| | (315,621 | ) | | | — | | | | (873,314 | ) | | | (1,139,027 | ) | | | (18,654,429 | ) | | | (15,234,387 | ) |
| | | | | | | | | | | | | | | | | | | | | | |
| | (718,805 | ) | | | (1,708,527 | ) | | | (2,474,804 | ) | | | (5,527,796 | ) | | | (34,787,882 | ) | | | (28,261,886 | ) |
| | | | | | | | | | | | | | | | | | | | | | |
| | | | | | | | | | | | | | | | | | | | | | |
| | | | | | | | | | | | | | | | | | | | | | |
| | 254,809 | | | | 411,838 | | | | 163,893,120 | | | | 8,647,070 | | | | 58,337,595 | | | | 74,910,227 | |
| | 2,248,304 | | | | 3,668,445 | | | | 78,735,146 | | | | 9,672,810 | | | | 24,984,792 | | | | 154,544,987 | |
| | | | | | | | | | | | | | | | | | | | | | |
| | 401,617 | | | | 1,673,347 | | | | 1,532,620 | | | | 4,189,554 | | | | 16,067,708 | | | | 12,978,719 | |
| | 315,621 | | | | — | | | | 772,122 | | | | 1,140,513 | | | | 16,055,433 | | | | 14,687,638 | |
| | | | | | | | | | | | | | | | | | | | | | |
| | (3,272,973 | ) | | | (5,001,822 | ) | | | (38,253,671 | ) | | | (8,150,286 | ) | | | (96,524,628 | ) | | | (125,071,162 | ) |
| | (156,736 | ) | | | (173 | ) | | | (12,642,786 | ) | | | (4,769,547 | ) | | | (282,769,917 | ) | | | (155,381,650 | ) |
| | | | | | | | | | | | | | | | | | | | | | |
| | | | | |
| | (209,358 | ) | | | 751,635 | | | | 194,036,551 | | | | 10,730,114 | | | | (263,849,017 | ) | | | (23,331,241 | ) |
| | | | | | | | | | | | | | | | | | | | | | |
| | (447,265 | ) | | | 98,078 | | | | 179,201,467 | | | | 11,640,497 | | | | (311,242,420 | ) | | | (58,117,859 | ) |
| | | | | | | | | | | | | | | | | | | | | | |
| $ | 11,053,000 | | | $ | 11,500,265 | | | $ | 231,382,604 | | | $ | 52,181,137 | | | $ | 355,995,582 | | | $ | 667,238,002 | |
| | | | | | | | | | | | | | | | | | | | | | |
| | | | | |
| $ | (44,348 | ) | | $ | — | | | $ | (1,161,099 | ) | | $ | (4,379 | ) | | $ | (3,636,008 | ) | | $ | (36,937 | ) |
| | | | | | | | | | | | | | | | | | | | | | |
See accompanying Notes to Financial Statements.
| | |
| |
| | |
| |
| Statements of Changes in Net Assets – continued | | |
| | | | | | | | | | | | | | | | |
| | |
| | | River Road
Select Value Fund | | | River Road
Small Cap Value Fund | |
| | | Year Ended October 31, | | | Year Ended October 31, | |
| | | 2015 | | | 2014 | | | 2015 | | | 2014 | |
NET ASSETS at Beginning of Period | | $ | 184,553,976 | | | $ | 217,318,502 | | | $ | 299,221,337 | | | $ | 309,597,171 | |
| | | | | | | | | | | | | | | | |
Increase in net assets from operations: | | | | | | | | | | | | | | | | |
Net investment income (loss) | | | (384,137 | ) | | | (270,098 | ) | | | (643,900 | ) | | | (163,580 | ) |
Net realized gain (loss) on investments, affiliated investments and capital gain distributions | | | 9,998,759 | | | | 30,115,873 | | | | 16,135,358 | | | | 48,359,630 | |
Net change in unrealized appreciation (depreciation) on investments and affiliated investments | | | (4,782,442 | ) | | | (29,790,084 | ) | | | (468,319 | ) | | | (46,163,511 | ) |
| | | | | | | | | | | | | | | | |
Net increase (decrease) in net assets from operations | | | 4,832,180 | | | | 55,691 | | | | 15,023,139 | | | | 2,032,539 | |
| | | | | | | | | | | | | | | | |
Distributions to shareholders from: | | | | | | | | | | | | | | | | |
Net investment income: | | | | | | | | | | | | | | | | |
Class N | | | — | | | | (30,707 | ) | | | — | | | | (125,993 | ) |
Class I | | | — | | | | (702,476 | ) | | | — | | | | (1,180,379 | ) |
Net realized gain on investments: | | | | | | | | | | | | | | | | |
Class N | | | (1,302,384 | ) | | | (2,748,770 | ) | | | (6,051,268 | ) | | | (12,061,338 | ) |
Class I | | | (23,636,785 | ) | | | (28,381,897 | ) | | | (35,176,931 | ) | | | (54,042,337 | ) |
| | | | | | | | | | | | | | | | |
Total distributions | | | (24,939,169 | ) | | | (31,863,850 | ) | | | (41,228,199 | ) | | | (67,410,047 | ) |
| | | | | | | | | | | | | | | | |
Capital share transactions: | | | | | | | | | | | | | | | | |
Proceeds from sales of shares: | | | | | | | | | | | | | | | | |
Class N | | | 563,077 | | | | 1,992,585 | | | | 4,898,671 | | | | 10,064,979 | |
Class I | | | 5,734,516 | | | | 29,881,645 | | | | 51,083,192 | | | | 87,864,652 | |
Proceeds from reinvestment of distributions: | | | | | | | | | | | | | | | | |
Class N | | | 1,186,303 | | | | 2,654,598 | | | | 6,025,655 | | | | 12,142,608 | |
Class I | | | 23,099,814 | | | | 28,799,580 | | | | 34,115,956 | | | | 55,057,909 | |
Cost of shares redeemed: | | | | | | | | | | | | | | | | |
Class N | | | (4,058,556 | ) | | | (12,614,171 | ) | | | (30,860,654 | ) | | | (17,845,889 | ) |
Class I | | | (93,860,808 | ) | | | (51,670,604 | ) | | | (67,840,899 | ) | | | (92,282,585 | ) |
| | | | | | | | | | | | | | | | |
Net increase (decrease) from capital share transactions | | | (67,335,654 | ) | | | (956,367 | ) | | | (2,578,079 | ) | | | 55,001,674 | |
| | | | | | | | | | | | | | | | |
Total increase (decrease) in net assets | | | (87,442,643 | ) | | | (32,764,526 | ) | | | (28,783,139 | ) | | | (10,375,834 | ) |
| | | | | | | | | | | | | | | | |
NET ASSETS at End of Period | | $ | 97,111,333 | | | $ | 184,553,976 | | | $ | 270,438,198 | | | $ | 299,221,337 | |
| | | | | | | | | | | | | | | | |
Undistributed (distributions in excess of) net investment income (loss) | | $ | (404,126 | ) | | $ | — | | | $ | — | | | $ | — | |
| | | | | | | | | | | | | | | | |
See accompanying Notes to Financial Statements.
| | | | | | | | | | | | | | | | | | | | | | |
| | |
Silvercrest
Small Cap Fund | | | TAMRO
Small Cap Fund | | | DoubleLine Core Plus
Fixed Income Fund | |
Year Ended October 31, | | | Year Ended October 31, | | | Year Ended October 31, | |
| 2015 | | | 2014 | | | 2015 | | | 2014 | | | 2015 | | | 2014 | |
| $ | 68,888,134 | | | $ | 33,267,442 | | | $ | 835,868,756 | | | $ | 1,325,799,376 | | | $ | 207,345,624 | | | $ | 176,385,864 | |
| | | | | | | | | | | | | | | | | | | | | | |
| | | | | | | | | | | | | | | | | | | | | | |
| | 289,585 | | | | 135,005 | | | | (3,068,930 | ) | | | (4,876,541 | ) | | | 12,120,905 | | | | 5,528,276 | |
|
5,949,673 |
| | | 1,540,966 | | | | 146,503,032 | | | | 116,264,947 | | | | 725,979 | | | | (860,472 | ) |
|
(3,498,719 |
) | | | 2,445,591 | | | | (162,319,947 | ) | | | (117,572,672 | ) | | | (9,455,664 | ) | | | 3,161,286 | |
| | | | | | | | | | | | | | | | | | | | | | |
| | 2,740,539 | | | | 4,121,562 | | | | (18,885,845 | ) | | | (6,184,266 | ) | | | 3,391,220 | | | | 7,829,090 | |
| | | | | | | | | | | | | | | | | | | | | | |
| | | | | | | | | | | | | | | | | | | | | | |
| | | | | | | | | | | | | | | | | | | | | | |
| | (10,817 | ) | | | (229 | ) | | | — | | | | — | | | | (3,720,662 | ) | | | (1,658,186 | ) |
| | (144,060 | ) | | | (56,178 | ) | | | — | | | | — | | | | (9,249,014 | ) | | | (4,001,526 | ) |
| | | | | | | | | | | | | | | | | | | | | | |
| | (132,428 | ) | | | (146,801 | ) | | | (42,602,557 | ) | | | (47,504,176 | ) | | | — | | | | — | |
| | (1,405,279 | ) | | | (1,082,382 | ) | | | (51,414,056 | ) | | | (68,914,775 | ) | | | — | | | | — | |
| | | | | | | | | | | | | | | | | | | | | | |
| | (1,692,584 | ) | | | (1,285,590 | ) | | | (94,016,613 | ) | | | (116,418,951 | ) | | | (12,969,676 | ) | | | (5,659,712 | ) |
| | | | | | | | | | | | | | | | | | | | | | |
| | | | | | | | | | | | | | | | | | | | | | |
| | | | | | | | | | | | | | | | | | | | | | |
| | 14,949,946 | | | | 4,648,830 | | | | 19,025,334 | | | | 48,233,449 | | | | 184,596,263 | | | | 23,358,553 | |
| | 120,581,732 | | | | 34,184,068 | | | | 60,349,910 | | | | 124,353,293 | | | | 194,716,457 | | | | 109,666,232 | |
| | | | | | | | | | | | | | | | | | | | | | |
| | 143,245 | | | | 147,030 | | | | 41,973,876 | | | | 44,495,639 | | | | 3,553,381 | | | | 1,513,332 | |
| | 1,549,338 | | | | 1,138,560 | | | | 49,177,354 | | | | 55,420,970 | | | | 7,995,114 | | | | 3,409,741 | |
| | | | | | | | | | | | | | | | | | | | | | |
| | (2,969,906 | ) | | | (2,442,586 | ) | | | (133,982,290 | ) | | | (211,736,661 | ) | | | (45,659,902 | ) | | | (42,728,442 | ) |
| | (39,726,747 | ) | | | (4,891,182 | ) | | | (210,824,587 | ) | | | (428,094,093 | ) | | | (50,630,892 | ) | | | (66,429,034 | ) |
| | | | | | | | | | | | | | | | | | | | | | |
|
94,527,608 |
| | | 32,784,720 | | | | (174,280,403 | ) | | | (367,327,403 | ) | | | 294,570,421 | | | | 28,790,382 | |
| | | | | | | | | | | | | | | | | | | | | | |
| | 95,575,563 | | | | 35,620,692 | | | | (287,182,861 | ) | | | (489,930,620 | ) | | | 284,991,965 | | | | 30,959,760 | |
| | | | | | | | | | | | | | | | | | | | | | |
| $ | 164,463,697 | | | $ | 68,888,134 | | | $ | 548,685,895 | | | $ | 835,868,756 | | | $ | 492,337,589 | | | $ | 207,345,624 | |
| | | | | | | | | | | | | | | | | | | | | | |
| | | | | |
| $ | 212,459 | | | $ | 77,751 | | | $ | (2,699,597 | ) | | $ | (4,567,670 | ) | | $ | (599,281 | ) | | $ | (376,971 | ) |
| | | | | | | | | | | | | | | | | | | | | | |
See accompanying Notes to Financial Statements.
| | |
| |
| | |
| |
| Statements of Changes in Net Assets – continued | | |
| | | | | | | | | | | | | | | | |
| | |
| | | TCH Fixed Income Fund | | | Anchor Capital
Enhanced Equity Fund | |
| | | Year Ended October 31, | | | Year Ended October 31, | |
| | | 2015 | | | 2014 | | | 2015 | | | 2014 | |
NET ASSETS at Beginning of Period | | $ | 52,148,980 | | | $ | 54,512,660 | | | $ | 210,964,549 | | | $ | 159,761,924 | |
| | | | | | | | | | | | | | | | |
Increase (decrease) in net assets from operations: | | | | | | | | | | | | | | | | |
Net investment income (loss) | | | 1,502,097 | | | | 1,750,503 | | | | 3,895,072 | | | | 3,494,860 | |
Net realized gain (loss) on investments, purchased and written options, securities sold short, capital gain distributions and foreign currency transactions | | | 767,386 | | | | 937,543 | | | | 1,727,822 | | | | (487,554 | ) |
Net change in unrealized appreciation (depreciation) on investments, purchased and written options, securities sold short, and translation of assets and liabilities denominated in foreign currency | | | (3,098,937 | ) | | | 153,019 | | | | (8,554,292 | ) | | | 2,733,967 | |
| | | | | | | | | | | | | | | | |
Net increase (decrease) in net assets from operations | | | (829,454 | ) | | | 2,841,065 | | | | (2,931,398 | ) | | | 5,741,273 | |
| | | | | | | | | | | | | | | | |
Distributions to shareholders from: | | | | | | | | | | | | | | | | |
Net investment income: | | | | | | | | | | | | | | | | |
Class N | | | (1,136,381 | ) | | | (1,513,765 | ) | | | (1,707,469 | ) | | | (1,760,434 | ) |
Class I | | | (538,130 | ) | | | (444,550 | ) | | | (2,146,798 | ) | | | (1,547,989 | ) |
Net realized gain on investments: | | | | | | | | | | | | | | | | |
Class N | | | — | | | | — | | | | — | | | | — | |
Class I | | | — | | | | — | | | | — | | | | — | |
| | | | | | | | | | | | | | | | |
Total distributions | | | (1,674,511 | ) | | | (1,958,315 | ) | | | (3,854,267 | ) | | | (3,308,423 | ) |
| | | | | | | | | | | | | | | | |
Capital share transactions: | | | | | | | | | | | | | | | | |
Proceeds from sales of shares: | | | | | | | | | | | | | | | | |
Class N | | | 5,212,865 | | | | 5,903,056 | | | | 19,879,836 | | | | 35,023,834 | |
Class I | | | 7,349,230 | | | | 9,601,364 | | | | 38,797,603 | | | | 71,169,669 | |
Proceeds from reinvestment of distributions: | | | | | | | | | | | | | | | | |
Class N | | | 1,082,315 | | | | 1,435,599 | | | | 1,660,101 | | | | 1,731,451 | |
Class I | | | 528,388 | | | | 433,047 | | | | 1,570,561 | | | | 1,151,589 | |
Cost of shares redeemed: | | | | | | | | | | | | | | | | |
Class N | | | (6,493,178 | ) | | | (16,909,433 | ) | | | (35,314,017 | ) | | | (37,674,832 | ) |
Class I | | | (7,493,354 | ) | | | (3,710,063 | ) | | | (62,303,383 | ) | | | (22,631,936 | ) |
Capital Contribution (Note G): | | | | | | | | | | | | | | | | |
Class N | | | — | | | | — | | | | — | | | | — | |
Class I | | | — | | | | — | | | | — | | | | — | |
| | | | | | | | | | | | | | | | |
Net increase (decrease) from capital share transactions | | | 186,266 | | | | (3,246,430 | ) | | | (35,709,299 | ) | | | 48,769,775 | |
| | | | | | | | | | | | | | | | |
Total increase (decrease) in net assets | | | (2,317,699 | ) | | | (2,363,680 | ) | | | (42,494,964 | ) | | | 51,202,625 | |
| | | | | | | | | | | | | | | | |
NET ASSETS at End of Period | | $ | 49,831,281 | | | $ | 52,148,980 | | | $ | 168,469,585 | | | $ | 210,964,549 | |
| | | | | | | | | | | | | | | | |
Undistributed (distributions in excess of) net investment income (loss) | | $ | 2,758 | | | $ | 101,428 | | | $ | 368,674 | | | $ | 327,869 | |
| | | | | | | | | | | | | | | | |
See accompanying Notes to Financial Statements.
| | | | | | | | | | | | | | | | | | | | | | |
| | |
Lake Partners
LASSO Alternatives Fund | | | River Road
Long-Short Fund | | | Barings
International Fund | |
Year Ended October 31, | | | Year Ended October 31, | | | Year Ended October 31, | |
| 2015 | | | 2014 | | | 2015 | | | 2014 | | | 2015 | | | 2014 | |
| $ | 521,542,660 | | | $ | 470,862,793 | | | $ | 219,410,621 | | | $ | 180,141,159 | | | $ | 21,590,303 | | | $ | 37,984,420 | |
| | | | | | | | | | | | | | | | | | | | | | |
| | | | | | | | | | | | | | | | | | | | | | |
| | (312,051 | ) | | | (1,496,938 | ) | | | (1,585,959 | ) | | | (3,311,713 | ) | | | 225,383 | | | | 619,600 | |
| | | | | |
| | 16,102,822 | | | | 18,553,737 | | | | 7,121,809 | | | | 2,468,897 | | | | 337,634 | | | | 3,377,022 | |
| | | | | |
| | (22,840,249 | ) | | | (448,365 | ) | | | 2,054,254 | | | | (8,658,331 | ) | | | 431,841 | | | | (4,350,016 | ) |
| | | | | | | | | | | | | | | | | | | | | | |
| | (7,049,478 | ) | | | 16,608,434 | | | | 7,590,104 | | | | (9,501,147 | ) | | | 994,858 | | | | (353,394 | ) |
| | | | | | | | | | | | | | | | | | | | | | |
| | | | | | | | | | | | | | | | | | | | | | |
| | | | | | | | | | | | | | | | | | | | | | |
| | (15,074 | ) | | | (378,809 | ) | | | — | | | | — | | | | (6,430 | ) | | | (10,891 | ) |
| | (1,016,136 | ) | | | (3,788,207 | ) | | | — | | | | — | | | | (466,160 | ) | | | (988,215 | ) |
| | | | | | | | | | | | | | | | | | | | | | |
| | (1,747,938 | ) | | | (186,666 | ) | | | (2,666,296 | ) | | | (2,911,026 | ) | | | (41,149 | ) | | | (28,909 | ) |
| | (13,332,770 | ) | | | (1,404,331 | ) | | | (2,591,487 | ) | | | (2,032,930 | ) | | | (2,620,405 | ) | | | (2,374,296 | ) |
| | | | | | | | | | | | | | | | | | | | | | |
| | (16,111,918 | ) | | | (5,758,013 | ) | | | (5,257,783 | ) | | | (4,943,956 | ) | | | (3,134,144 | ) | | | (3,402,311 | ) |
| | | | | | | | | | | | | | | | | | | | | | |
| | | | | | | | | | | | | | | | | | | | | | |
| | | | | | | | | | | | | | | | | | | | | | |
| | 34,958,681 | | | | 21,759,727 | | | | 24,668,308 | | | | 94,199,671 | | | | 79,319 | | | | 61,141 | |
| | 91,358,414 | | | | 136,099,370 | | | | 21,197,504 | | | | 106,897,007 | | | | 1,046,591 | | | | 5,876,501 | |
| | | | | | | | | | | | | | | | | | | | | | |
| | 1,751,278 | | | | 544,810 | | | | 2,640,850 | | | | 2,838,180 | | | | 47,579 | | | | 39,800 | |
| | 10,592,840 | | | | 4,429,761 | | | | 1,835,170 | | | | 1,960,122 | | | | 3,086,565 | | | | 3,362,511 | |
| | | | | | | | | | | | | | | | | | | | | | |
| | (36,889,708 | ) | | | (33,487,553 | ) | | | (109,558,808 | ) | | | (89,100,715 | ) | | | (22,075 | ) | | | (202,001 | ) |
| | (390,414,611 | ) | | | (89,517,183 | ) | | | (85,455,421 | ) | | | (63,079,700 | ) | | | (2,952,250 | ) | | | (21,776,364 | ) |
| | | | | | | | | | | | | | | | | | | | | | |
| | — | | | | 45 | | | | — | | | | — | | | | — | | | | — | |
| | 872 | | | | 469 | | | | — | | | | — | | | | — | | | | — | |
| | | | | | | | | | | | | | | | | | | | | | |
| | (288,642,234 | ) | | | 39,829,446 | | | | (144,672,397 | ) | | | 53,714,565 | | | | 1,285,729 | | | | (12,638,412 | ) |
| | | | | | | | | | | | | | | | | | | | | | |
| | (311,803,630 | ) | | | 50,679,867 | | | | (142,340,076 | ) | | | 39,269,462 | | | | (853,557 | ) | | | (16,394,117 | ) |
| | | | | | | | | | | | | | | | | | | | | | |
| $ | 209,739,030 | | | $ | 521,542,660 | | | $ | 77,070,545 | | | $ | 219,410,621 | | | $ | 20,736,746 | | | $ | 21,590,303 | |
| | | | | | | | | | | | | | | | | | | | | | |
| | | | | |
| $ | (1,030,882 | ) | | $ | (1,997,170 | ) | | $ | (23,229 | ) | | $ | (25,371 | ) | | $ | 220,278 | | | $ | 471,531 | |
| | | | | | | | | | | | | | | | | | | | | | |
See accompanying Notes to Financial Statements.
| | |
| |
| | |
| |
| Statements of Changes in Net Assets – continued | | |
| | | | | | | | | | | | | | | | |
| | |
| | | Guardian Capital
Global Dividend Fund | | | LMCG Emerging
Markets Fund | |
| | | Year Ended
October 31,
2015 | | | Period Ended
October 31,
2014(a) | | | Year Ended October 31, | |
| | | | | 2015 | | | 2014 | |
NET ASSETS at Beginning of Period | | $ | 4,263,024 | | | $ | — | | | $ | 3,913,026 | | | $ | 3,981,658 | |
| | | | | | | | | | | | | | | | |
Increase (decrease) in net assets from operations: | | | | | | | | | | | | | | | | |
Net investment income | | | 107,411 | | | | 54,125 | | | | 40,192 | | | | 53,625 | |
Net realized gain (loss) on investments and foreign currency transactions | | | (82,953 | ) | | | (34,774 | ) | | | (213,890 | ) | | | (44,370 | ) |
Net change in unrealized appreciation (depreciation) on investments and translation of assets and liabilities denominated in foreign currency | | | (18,854 | ) | | | 234,146 | | | | (289,270 | ) | | | 47,409 | |
| | | | | | | | | | | | | | | | |
Net increase (decrease) in net assets from operations | | | 5,604 | | | | 253,497 | | | | (462,968 | ) | | | 56,664 | |
| | | | | | | | | | | | | | | | |
Distributions to shareholders from: | | | | | | | | | | | | | | | | |
Net investment income: | | | | | | | | | | | | | | | | |
Class N | | | (22,159 | ) | | | (10,791 | ) | | | (3,910 | ) | | | (9,940 | ) |
Class I | | | (80,811 | ) | | | (35,829 | ) | | | (24,689 | ) | | | (54,634 | ) |
Net realized gain on investments: | | | | | | | | | | | | | | | | |
Class N | | | — | | | | — | | | | — | | | | — | |
Class I | | | — | | | | — | | | | — | | | | — | |
| | | | | | | | | | | | | | | | |
Total distributions | | | (102,970 | ) | | | (46,620 | ) | | | (28,599 | ) | | | (64,574 | ) |
| | | | | | | | | | | | | | | | |
Capital share transactions: | | | | | | | | | | | | | | | | |
Proceeds from sales of shares: | | | | | | | | | | | | | | | | |
Class N | | | 35,451 | | | | 1,001,103 | | | | 18,704 | | | | 58,981 | |
Class I | | | 106,476 | | | | 3,029,962 | | | | — | | | | 225,396 | |
Proceeds from reinvestment of distributions: | | | | | | | | | | | | | | | | |
Class N | | | 339 | | | | 1 | | | | 3,910 | | | | 9,940 | |
Class I | | | 57,526 | | | | 25,081 | | | | 24,689 | | | | 54,634 | |
Cost of shares redeemed: | | | | | | | | | | | | | | | | |
Class N | | | (12,441 | ) | | | — | | | | (14,368 | ) | | | (12,775 | ) |
Class I | | | (7,667 | ) | | | — | | | | (1,400,000 | ) | | | (396,898 | ) |
Capital Contribution (Note G): | | | | | | | | | | | | | | | | |
Class N | | | 107 | | | | — | | | | — | | | | — | |
Class I | | | 334 | | | | — | | | | — | | | | — | |
| | | | | | | | | | | | | | | | |
Net increase (decrease) from capital share transactions | | | 180,125 | | | | 4,056,147 | | | | (1,367,065 | ) | | | (60,722 | ) |
| | | | | | | | | | | | | | | | |
Total increase (decrease) in net assets | | | 82,759 | | | | 4,263,024 | | | | (1,858,632 | ) | | | (68,632 | ) |
| | | | | | | | | | | | | | | | |
NET ASSETS at End of Period | | $ | 4,345,783 | | | $ | 4,263,024 | | | $ | 2,054,394 | | | $ | 3,913,026 | |
| | | | | | | | | | | | | | | | |
Undistributed net investment income | | $ | 25,314 | | | $ | 16,335 | | | $ | 16,180 | | | $ | 18,436 | |
| | | | | | | | | | | | | | | | |
| (a) | The commencement of investment operations for the Guardian Capital Global Dividend Fund is April 11, 2014. |
| (b) | The commencement of investment operations for the Pictet International Fund is April 11, 2014. |
| (c) | The commencement of investment operations for the TAMRO International Small Cap Fund is December 22, 2014. |
See accompanying Notes to Financial Statements.
| | | | | | | | | | | | | | | | | | |
| | |
| Pictet International Fund | | | TAMRO International
Small Cap Fund | | | Harrison Street
Real Estate Fund | |
Year Ended
October 31,
2015 | | | Period Ended
October 31,
2014(b) | | | Period Ended
October 31,
2015(c) | | | Year Ended October 31, | |
| | | | 2015 | | | 2014 | |
| $ | 9,450,969 | | | $ | — | | | $ | — | | | $ | 13,583,237 | | | $ | 13,625,155 | |
| | | | | | | | | | | | | | | | | | |
| | | | | | | | | | | | | | | | | | |
| | 433,841 | | | | 100,895 | | | | 23,620 | | | | 171,176 | | | | 115,696 | |
|
299,417 |
| | | 47,967 | | | | (32,490 | ) | | | 881,172 | | | | 398,784 | |
|
944,133 |
| | | (800,613 | ) | | | (21,088 | ) | | | (835,550 | ) | | | 1,080,562 | |
| | | | | | | | | | | | | | | | | | |
| | 1,677,391 | | | | (651,751 | ) | | | (29,958 | ) | | | 216,798 | | | | 1,595,042 | |
| | | | | | | | | | | | | | | | | | |
| | | | | | | | | | | | | | | | | | |
| | | | | | | | | | | | | | | | | | |
| | (3,516 | ) | | | — | | | | — | | | | (153,737 | ) | | | (140,263 | ) |
| | (122,686 | ) | | | — | | | | — | | | | (10,621 | ) | | | (7,304 | ) |
| | | | | | | | | | | | | | | | | | |
| | (2,589 | ) | | | — | | | | — | | | | — | | | | — | |
| | (59,646 | ) | | | — | | | | — | | | | — | | | | — | |
| | | | | | | | | | | | | | | | | | |
| | (188,437 | ) | | | — | | | | — | | | | (164,358 | ) | | | (147,567 | ) |
| | | | | | | | | | | | | | | | | | |
| | | | | | | | | | | | | | | | | | |
| | | | | | | | | | | | | | | | | | |
| | 66,599 | | | | 1,052,710 | | | | 1,150,470 | | | | 1,977,600 | | | | 4,328,824 | |
| | 47,089,385 | | | | 9,050,010 | | | | 672,510 | | | | 125,440 | | | | 356,754 | |
| | | | | | | | | | | | | | | | | | |
| | 305 | | | | — | | | | — | | | | 148,501 | | | | 136,039 | |
| | 47,892 | | | | — | | | | — | | | | 7,332 | | | | 4,230 | |
| | | | | | | | | | | | | | | | | | |
| | (17,102 | ) | | | — | | | | (66,502 | ) | | | (4,621,226 | ) | | | (6,092,762 | ) |
| | (7,291,209 | ) | | | — | | | | (10 | ) | | | (358,670 | ) | | | (222,478 | ) |
| | | | | | | | | | | | | | | | | | |
| | 1,022 | | | | — | | | | — | | | | — | | | | — | |
| | 22,276 | | | | — | | | | — | | | | — | | | | — | |
| | | | | | | | | | | | | | | | | | |
| | 39,919,168 | | | | 10,102,720 | | | | 1,756,468 | | | | (2,721,023 | ) | | | (1,489,393 | ) |
| | | | | | | | | | | | | | | | | | |
| | 41,408,122 | | | | 9,450,969 | | | | 1,726,510 | | | | (2,668,583 | ) | | | (41,918 | ) |
| | | | | | | | | | | | | | | | | | |
| $ | 50,859,091 | | | $ | 9,450,969 | | | $ | 1,726,510 | | | $ | 10,914,654 | | | $ | 13,583,237 | |
| | | | | | | | | | | | | | | | | | |
| $ | 364,480 | | | $ | 102,611 | | | $ | 27,484 | | | $ | 122,214 | | | $ | 115,470 | |
| | | | | | | | | | | | | | | | | | |
See accompanying Notes to Financial Statements.
| | |
| |
| | |
| |
| Statements of Changes in Net Assets – continued | | |
| | | | | | | | |
| |
| | | Montag & Caldwell
Balanced Fund | |
| | | Year Ended October 31, | |
| | | 2015 | | | 2014 | |
NET ASSETS at Beginning of Period | | $ | 22,379,687 | | | $ | 24,264,373 | |
| | | | | | | | |
Increase in net assets from operations: | | | | | | | | |
Net investment income | | | 106,468 | | | | 118,156 | |
Net realized gain on investments | | | 1,390,086 | | | | 1,933,249 | |
Net change in unrealized depreciation on investments | | | (109,152 | ) | | | (274,140 | ) |
| | | | | | | | |
Net increase in net assets from operations | | | 1,387,402 | | | | 1,777,265 | |
| | | | | | | | |
Distributions to shareholders from: | | | | | | | | |
Net investment income: | | | | | | | | |
Class N | | | (156,641 | ) | | | (189,116 | ) |
Class I | | | (20,244 | ) | | | (19,216 | ) |
Net realized gain on investments: | | | | | | | | |
Class N | | | (1,709,309 | ) | | | (686,237 | ) |
Class I | | | (163,800 | ) | | | (54,424 | ) |
| | | | | | | | |
Total distributions | | | (2,049,994 | ) | | | (948,993 | ) |
| | | | | | | | |
Capital share transactions: | | | | | | | | |
Proceeds from sales of shares: | | | | | | | | |
Class N | | | 8,907,085 | | | | 1,181,819 | |
Class I | | | 2,184,522 | | | | 356,063 | |
Proceeds from reinvestment of distributions: | | | | | | | | |
Class N | | | 1,812,107 | | | | 851,885 | |
Class I | | | 88,941 | | | | 31,658 | |
Cost of shares redeemed: | | | | | | | | |
Class N | | | (3,919,684 | ) | | | (4,776,971 | ) |
Class I | | | (665,132 | ) | | | (357,412 | ) |
| | | | | | | | |
Net increase (decrease) from capital share transactions | | | 8,407,839 | | | | (2,712,958 | ) |
| | | | | | | | |
Total increase (decrease) in net assets | | | 7,745,247 | | | | (1,884,686 | ) |
| | | | | | | | |
NET ASSETS at End of Period | | $ | 30,124,934 | | | $ | 22,379,687 | |
| | | | | | | | |
Distributions in excess of net investment income | | $ | (310,864 | ) | | $ | (304,404 | ) |
| | | | | | | | |
See accompanying Notes to Financial Statements.
| | |
| |
| ASTON/Cornerstone Large Cap Value Fund – Class N | | October 31, 2015 |
| |
| Financial Highlights | | |
| | | | | | | | | | | | | | | | | | | | |
| | | Year
Ended
10/31/15
| | | Year
Ended
10/31/14 | | | Year
Ended
10/31/13 | | | Year
Ended
10/31/12 | | | Year
Ended
10/31/11 | |
Net Asset Value, Beginning of Period | | $ | 15.35 | | | $ | 13.74 | | | $ | 11.04 | | | $ | 10.04 | | | $ | 9.20 | |
| | | | | | | | | | | | | | | | | | | | |
Income from Investment Operations: | | | | | | | | | | | | | | | | | | | | |
Net investment income | | | 0.13 | (a) | | | 0.11 | (a) | | | 0.09 | (a) | | | 0.10 | (a) | | | 0.12 | (a) |
Net realized and unrealized gain (loss) on investments | | | (1.67 | ) | | | 1.56 | | | | 2.72 | | | | 0.94 | | | | 0.83 | |
| | | | | | | | | | | | | | | | | | | | |
Total from investment operations | | | (1.54 | ) | | | 1.67 | | | | 2.81 | | | | 1.04 | | | | 0.95 | |
| | | | | | | | | | | | | | | | | | | | |
Less Distributions: | | | | | | | | | | | | | | | | | | | | |
Distributions from and in excess of net investment income | | | (0.12 | ) | | | (0.06 | ) | | | (0.11 | ) | | | (0.04 | ) | | | (0.11 | ) |
| | | | | | | | | | | | | | | | | | | | |
Total distributions | | | (0.12 | ) | | | (0.06 | ) | | | (0.11 | ) | | | (0.04 | ) | | | (0.11 | ) |
| | | | | | | | | | | | | | | | | | | | |
Net increase (decrease) in net asset value . | | | (1.66 | ) | | | 1.61 | | | | 2.70 | | | | 1.00 | | | | 0.84 | |
| | | | | | | | | | | | | | | | | | | | |
Net Asset Value, End of Period | | $ | 13.69 | | | $ | 15.35 | | | $ | 13.74 | | | $ | 11.04 | | | $ | 10.04 | |
| | | | | | | | | | | | | | | | | | | | |
Total Return (b) | | | (10.17 | )% | | | 12.17 | % | | | 25.72 | % | | | 10.43 | % | | | 10.44 | % |
| | | | | |
Ratios/Supplemental Data: | | | | | | | | | | | | | | | | | | | | |
Net Assets, End of Period (in 000’s) | | $ | 58,598 | | | $ | 60,683 | | | $ | 23,913 | | | $ | 21,105 | | | $ | 24,631 | |
Ratios of expenses to average net assets: | | | | | | | | | | | | | | | | | | | | |
Before expense reimbursement and/or fee waiver by Adviser | | | 1.28 | % | | | 1.30 | % | | | 1.48 | % | | | 1.58 | % | | | 1.61 | % |
After expense reimbursement and/or fee waiver by Adviser | | | 1.28 | % | | | 1.30 | % | | | 1.30 | % | | | 1.26 | %(c) | | | 1.14 | %(c) |
Ratios of net investment income to average net assets: | | | | | | | | | | | | | | | | | | | | |
Before expense reimbursement and/or fee waiver by Adviser | | | 0.89 | % | | | 0.73 | % | | | 0.53 | % | | | 0.60 | % | | | 0.80 | % |
After expense reimbursement and/or fee waiver by Adviser | | | 0.89 | % | | | 0.73 | % | | | 0.71 | % | | | 0.92 | % | | | 1.27 | % |
Portfolio Turnover | | | 57.64 | % | | | 30.03 | % | | | 58.24 | % | | | 58.21 | % | | | 59.07 | %(d) |
| | (a) | The selected per share data was calculated using the weighted average shares outstanding method for the period. |
| | (b) | The total return is calculated using the Net Asset Value used for trading at the close of business at period end. |
| | (c) | Effective March 22, 2011, the Adviser changed the voluntary expense limitation from 1.07% to 1.19%. Subsequently, on February 29, 2012, the Adviser removed the voluntary expense limitation and replaced it with a contractual expense limitation of 1.30%. |
| | (d) | Portfolio turnover rate excludes securities delivered from processing a redemption-in-kind. |
See accompanying Notes to Financial Statements.
| | |
| |
| ASTON/Cornerstone Large Cap Value Fund – Class I | | October 31, 2015 |
| |
| Financial Highlights | | |
| | | | | | | | | | | | | | | | | | | | |
| | | Year
Ended
10/31/15 | | | Year
Ended
10/31/14 | | | Year
Ended
10/31/13 | | | Year
Ended
10/31/12 | | | Year
Ended
10/31/11 | |
Net Asset Value, Beginning of Period | | $ | 15.38 | | | $ | 13.78 | | | $ | 11.07 | | | $ | 10.05 | | | $ | 9.19 | |
| | | | | | | | | | | | | | | | | | | | |
Income from Investment Operations: | | | | | | | | | | | | | | | | | | | | |
Net investment income | | | 0.17 | (a) | | | 0.15 | (a) | | | 0.12 | (a) | | | 0.11 | (a) | | | 0.16 | (a) |
Net realized and unrealized gain (loss) on
investments | | | (1.67 | ) | | | 1.54 | | | | 2.73 | | | | 0.96 | | | | 0.84 | |
| | | | | | | | | | | | | | | | | | | | |
Total from investment operations | | | (1.50 | ) | | | 1.69 | | | | 2.85 | | | | 1.07 | | | | 1.00 | |
| | | | | | | | | | | | | | | | | | | | |
Less Distributions: | | | | | | | | | | | | | | | | | | | | |
Distributions from and in excess of net investment income | | | (0.14 | ) | | | (0.09 | ) | | | (0.14 | ) | | | (0.05 | ) | | | (0.14 | ) |
| | | | | | | | | | | | | | | | | | | | |
Total distributions | | | (0.14 | ) | | | (0.09 | ) | | | (0.14 | ) | | | (0.05 | ) | | | (0.14 | ) |
| | | | | | | | | | | | | | | | | | | | |
Net increase (decrease) in net asset value . | | | (1.64 | ) | | | 1.60 | | | | 2.71 | | | | 1.02 | | | | 0.86 | |
| | | | | | | | | | | | | | | | | | | | |
Net Asset Value, End of Period | | $ | 13.74 | | | $ | 15.38 | | | $ | 13.78 | | | $ | 11.07 | | | $ | 10.05 | |
| | | | | | | | | | | | | | | | | | | | |
Total Return (b) | | | (9.88 | )% | | | 12.33 | % | | | 26.08 | % | | | 10.66 | % | | | 10.95 | % |
| | | | | |
Ratios/Supplemental Data: | | | | | | | | | | | | | | | | | | | | |
Net Assets, End of Period (in 000’s) | | $ | 71,446 | | | $ | 103,228 | | | $ | 38,735 | | | $ | 5,397 | | | $ | 126 | |
Ratios of expenses to average net assets: | | | | | | | | | | | | | | | | | | | | |
Before expense reimbursement and/or fee waiver by Adviser | | | 1.03 | % | | | 1.05 | % | | | 1.23 | % | | | 1.33 | % | | | 1.36 | % |
After expense reimbursement and/or fee waiver by Adviser | | | 1.03 | % | | | 1.05 | % | | | 1.05 | % | | | 1.01 | %(c) | | | 0.89 | %(c) |
Ratios of net investment income to average net assets: | | | | | | | | | | | | | | | | | | | | |
Before expense reimbursement and/or fee waiver by Adviser | | | 1.14 | % | | | 0.98 | % | | | 0.78 | % | | | 0.85 | % | | | 1.05 | % |
After expense reimbursement and/or fee waiver by Adviser | | | 1.14 | % | | | 0.98 | % | | | 0.96 | % | | | 1.17 | % | | | 1.52 | % |
Portfolio Turnover | | | 57.64 | % | | | 30.03 | % | | | 58.24 | % | | | 58.21 | % | | | 59.07 | %(d) |
| | (a) | The selected per share data was calculated using the weighted average shares outstanding method for the period. |
| | (b) | The total return is calculated using the Net Asset Value used for trading at the close of business at period end. |
| | (c) | Effective March 22, 2011, the Adviser changed the voluntary expense limitation from 0.82% to 0.94%. Subsequently, on February 29, 2012, the Adviser removed the voluntary expense limitation and replaced it with a contractual expense limitation of 1.05%. |
| | (d) | Portfolio turnover rate excludes securities delivered from processing a redemption-in-kind. |
See accompanying Notes to Financial Statements.
| | |
| |
| ASTON/Fairpointe Focused Equity Fund – Class N | | October 31, 2015 |
| |
| Financial Highlights | | |
| | | | |
| | | Period
Ended
10/31/15(a) | |
Net Asset Value, Beginning of Period | | $ | 10.00 | |
| | | | |
Income from Investment Operations: | | | | |
Net investment income | | | 0.06 | (b) |
Net realized and unrealized loss on investments | | | (0.73 | ) |
| | | | |
Total from investment operations | | | (0.67 | ) |
| | | | |
Net decrease in net asset value | | | (0.67 | ) |
| | | | |
Net Asset Value, End of Period | | $ | 9.33 | |
| | | | |
Total Return (c) | | | (6.70 | )%(d) |
| |
Ratios/Supplemental Data: | | | | |
Net Assets, End of Period (in 000’s) | | $ | 2,295 | |
Ratios of expenses to average net assets: | | | | |
Before expense reimbursement and/or fee waiver by Adviser | | | 3.78 | %(e) |
After expense reimbursement and/or fee waiver by Adviser | | | 1.15 | %(e) |
Ratios of net investment income (loss) to average net assets: | | | | |
Before expense reimbursement and/or fee waiver by Adviser | | | (1.93 | )%(e) |
After expense reimbursement and/or fee waiver by Adviser | | | 0.70 | %(e) |
Portfolio Turnover | | | 0.91 | %(d)(f) |
| | (a) | The commencement of investment operations for Fairpointe Focused Equity Fund Class N shares is December 23, 2014. |
| | (b) | The selected per share data was calculated using the weighted average shares outstanding method for the period. |
| | (c) | The total return is calculated using the Net Asset Value used for trading at the close of business at period end. |
| | (f) | Portfolio turnover rate excludes securities received from processing a subscription-in-kind. |
See accompanying Notes to Financial Statements.
| | |
| |
| ASTON/Fairpointe Focused Equity Fund – Class I | | October 31, 2015 |
| |
| Financial Highlights | | |
| | | | |
| | | Period
Ended
10/31/15(a)
| |
Net Asset Value, Beginning of Period | | $ | 10.00 | |
| | | | |
Income from Investment Operations: | | | | |
Net investment income | | | 0.08 | (b) |
Net realized and unrealized loss on investments | | | (0.73 | ) |
| | | | |
Total from investment operations | | | (0.65 | ) |
| | | | |
Net decrease in net asset value | | | (0.65 | ) |
| | | | |
Net Asset Value, End of Period | | $ | 9.35 | |
| | | | |
Total Return (c) | | | (6.50 | )%(d) |
| |
Ratios/Supplemental Data: | | | | |
Net Assets, End of Period (in 000’s) | | $ | 4,162 | |
Ratios of expenses to average net assets: | | | | |
Before expense reimbursement and/or fee waiver by Adviser | | | 3.53 | %(e) |
After expense reimbursement and/or fee waiver by Adviser | | | 0.90 | %(e) |
Ratios of net investment income (loss) to average net assets: | | | | |
Before expense reimbursement and/or fee waiver by Adviser | | | (1.68 | )%(e) |
After expense reimbursement and/or fee waiver by Adviser | | | 0.95 | %(e) |
Portfolio Turnover | | | 0.91 | %(d)(f) |
| | (a) | The commencement of investment operations for Fairpointe Focused Equity Fund Class I shares is December 23, 2014. |
| | (b) | The selected per share data was calculated using the weighted average shares outstanding method for the period. |
| | (c) | The total return is calculated using the Net Asset Value used for trading at the close of business at period end. |
| | (f) | Portfolio turnover rate excludes securities received from processing a subscription-in-kind. |
See accompanying Notes to Financial Statements.
| | |
| |
| ASTON/Herndon Large Cap Value Fund – Class N | | October 31, 2015 |
| |
| Financial Highlights | | |
| | | | | | | | | | | | | | | | | | | | |
| | | Year
Ended
10/31/15 | | | Year
Ended
10/31/14 | | | Year
Ended
10/31/13 | | | Year
Ended
10/31/12 | | | Year
Ended
10/31/11 | |
Net Asset Value, Beginning of Period | | $ | 15.08 | | | $ | 13.84 | | | $ | 11.73 | | | $ | 11.31 | | | $ | 10.39 | |
| | | | | | | | | | | | | | | | | | | | |
Income from Investment Operations: | | | | | | | | | | | | | | | | | | | | |
Net investment income | | | 0.09 | (a) | | | 0.11 | (a) | | | 0.15 | (a) | | | 0.18 | (a) | | | 0.12 | (a) |
Net realized and unrealized gain (loss) on investments | | | (0.97 | ) | | | 1.49 | | | | 2.40 | | | | 0.91 | | | | 0.81 | |
| | | | | | | | | | | | | | | | | | | | |
Total from investment operations | | | (0.88 | ) | | | 1.60 | | | | 2.55 | | | | 1.09 | | | | 0.93 | |
| | | | | | | | | | | | | | | | | | | | |
Less Distributions: | | | | | | | | | | | | | | | | | | | | |
Distributions from and in excess of net investment income | | | (0.05 | ) | | | (0.10 | ) | | | (0.22 | ) | | | (0.11 | ) | | | (0.01 | ) |
Distributions from net realized gain on investments | | | (0.88 | ) | | | (0.26 | ) | | | (0.22 | ) | | | (0.56 | ) | | | — | |
| | | | | | | | | | | | | | | | | | | | |
Total distributions | | | (0.93 | ) | | | (0.36 | ) | | | (0.44 | ) | | | (0.67 | ) | | | (0.01 | ) |
| | | | | | | | | | | | | | | | | | | | |
Net increase (decrease) in net asset value | | | (1.81 | ) | | | 1.24 | | | | 2.11 | | | | 0.42 | | | | 0.92 | |
| | | | | | | | | | | | | | | | | | | | |
Net Asset Value, End of Period | | $ | 13.27 | | | $ | 15.08 | | | $ | 13.84 | | | $ | 11.73 | | | $ | 11.31 | |
| | | | | | | | | | | | | | | | | | | | |
Total Return (b) | | | (6.10 | )% | | | 11.67 | % | | | 22.58 | % | | | 10.39 | % | | | 9.09 | % |
| | | | | |
Ratios/Supplemental Data: | | | | | | | | | | | | | | | | | | | | |
Net Assets, End of Period (in 000’s) | | $ | 8,500 | | | $ | 13,997 | | | $ | 41,861 | | | $ | 20,832 | | | $ | 6,089 | |
Ratios of expenses to average net assets: | | | | | | | | | | | | | | | | | | | | |
Before expense reimbursement and/or fee waiver, or recoupment by Adviser | | | 1.26 | % | | | 1.23 | % | | | 1.27 | % | | | 1.41 | % | | | 2.38 | % |
After expense reimbursement and/or fee waiver, or recoupment by Adviser | | | 1.29 | % | | | 1.30 | % | | | 1.30 | % | | | 1.30 | % | | | 1.30 | % |
Ratios of net investment income (loss) to average net assets: | | | | | | | | | | | | | | | | | | | | |
Before expense reimbursement and/or fee waiver, or recoupment by Adviser | | | 0.70 | % | | | 0.84 | % | | | 1.24 | % | | | 1.44 | % | | | (0.05 | )% |
After expense reimbursement and/or fee waiver, or recoupment by Adviser | | | 0.67 | % | | | 0.77 | % | | | 1.21 | % | | | 1.55 | % | | | 1.03 | % |
Portfolio Turnover | | | 62.28 | % | | | 75.46 | % | | | 69.51 | % | | | 80.56 | % | | | 189.70 | % |
| | (a) | The selected per share data was calculated using the weighted average shares outstanding method for the period. |
| | (b) | The total return is calculated using the Net Asset Value used for trading at the close of business at period end. |
See accompanying Notes to Financial Statements.
| | |
| |
| ASTON/Herndon Large Cap Value Fund – Class I | | October 31, 2015 |
| |
| Financial Highlights | | |
| | | | | | | | | | | | | | | | | | | | |
| | | Year
Ended
10/31/15 | | | Year
Ended
10/31/14 | | | Year
Ended
10/31/13 | | | Year
Ended
10/31/12 | | | Period
Ended
10/31/11(a) | |
Net Asset Value, Beginning of Period | | $ | 15.12 | | | $ | 13.87 | | | $ | 11.75 | | | $ | 11.33 | | | $ | 11.48 | |
| | | | | | | | | | | | | | | | | | | | |
Income from Investment Operations: | | | | | | | | | | | | | | | | | | | | |
Net investment income | | | 0.13 | (b) | | | 0.15 | (b) | | | 0.19 | (b) | | | 0.21 | (b) | | | 0.10 | (b) |
Net realized and unrealized gain (loss) on investments | | | (0.98 | ) | | | 1.48 | | | | 2.39 | | | | 0.91 | | | | (0.25 | ) |
| | | | | | | | | | | | | | | | | | | | |
Total from investment operations | | | (0.85 | ) | | | 1.63 | | | | 2.58 | | | | 1.12 | | | | (0.15 | ) |
| | | | | | | | | | | | | | | | | | | | |
Less Distributions: | | | | | | | | | | | | | | | | | | | | |
Distributions from and in excess of net investment income | | | (0.14 | ) | | | (0.12 | ) | | | (0.24 | ) | | | (0.14 | ) | | | — | |
Distributions from net realized gain on investments | | | (0.88 | ) | | | (0.26 | ) | | | (0.22 | ) | | | (0.56 | ) | | | — | |
| | | | | | | | | | | | | | | | | | | | |
Total distributions | | | (1.02 | ) | | | (0.38 | ) | | | (0.46 | ) | | | (0.70 | ) | | | — | |
| | | | | | | | | | | | | | | | | | | | |
Net increase (decrease) in net asset value | | | (1.87 | ) | | | 1.25 | | | | 2.12 | | | | 0.42 | | | | (0.15 | ) |
| | | | | | | | | | | | | | | | | | | | |
Net Asset Value, End of Period | | $ | 13.25 | | | $ | 15.12 | | | $ | 13.87 | | | $ | 11.75 | | | $ | 11.33 | |
| | | | | | | | | | | | | | | | | | | | |
Total Return (c) | | | (5.88 | )% | | | 11.94 | % | | | 22.94 | % | | | 10.69 | % | | | (1.31 | )%(d) |
| | | | | |
Ratios/Supplemental Data: | | | | | | | | | | | | | | | | | | | | |
Net Assets, End of Period (in 000’s) | | $ | 112,040 | | | $ | 139,448 | | | $ | 80,534 | | | $ | 34,575 | | | $ | 11,881 | |
Ratios of expenses to average net assets: | | | | | | | | | | | | | | | | | | | | |
Before expense reimbursement and/or fee waiver, or recoupment by Adviser | | | 1.01 | % | | | 0.98 | % | | | 1.02 | % | | | 1.16 | % | | | 2.13 | %(e) |
After expense reimbursement and/or fee waiver, or recoupment by Adviser | | | 1.04 | % | | | 1.05 | % | | | 1.05 | % | | | 1.05 | % | | | 1.05 | %(e) |
Ratios of net investment income to average net assets: | | | | | | | | | | | | | | | | | | | | |
Before expense reimbursement and/or fee waiver, or recoupment by Adviser | | | 0.95 | % | | | 1.09 | % | | | 1.49 | % | | | 1.69 | % | | | 0.20 | %(e) |
After expense reimbursement and/or fee waiver, or recoupment by Adviser | | | 0.92 | % | | | 1.02 | % | | | 1.46 | % | | | 1.80 | % | | | 1.28 | %(e) |
Portfolio Turnover | | | 62.28 | % | | | 75.46 | % | | | 69.51 | % | | | 80.56 | % | | | 189.70 | %(d) |
| | (a) | The commencement of investment operations for Herndon Large Cap Value Fund Class I shares is March 1, 2011. |
| | (b) | The selected per share data was calculated using the weighted average shares outstanding method for the period. |
| | (c) | The total return is calculated using the Net Asset Value used for trading at the close of business at period end. |
See accompanying Notes to Financial Statements.
| | |
| |
| ASTON/Montag & Caldwell Growth Fund – Class N | | October 31, 2015 |
| |
| Financial Highlights | | |
| | | | | | | | | | | | | | | | | | | | |
| | | Year
Ended
10/13/15 | | | Year
Ended
10/31/14 | | | Year
Ended
10/31/13 | | | Year
Ended
10/31/12 | | | Year
Ended
10/31/11 | |
Net Asset Value, Beginning of Period | | $ | 29.59 | | | $ | 28.68 | | | $ | 25.31 | | | $ | 24.72 | | | $ | 22.92 | |
| | | | | | | | | | | | | | | | | | | | |
Income from Investment Operations: | | | | | | | | | | | | | | | | | | | | |
Net investment income | | | 0.07 | (a) | | | 0.10 | (a) | | | 0.23 | (a) | | | 0.15 | (a) | | | 0.14 | (a) |
Net realized and unrealized gain on investments | | | 2.06 | | | | 2.93 | | | | 5.07 | | | | 2.45 | | | | 1.83 | |
| | | | | | | | | | | | | | | | | | | | |
Total from investment operations | | | 2.13 | | | | 3.03 | | | | 5.30 | | | | 2.60 | | | | 1.97 | |
| | | | | | | | | | | | | | | | | | | | |
Less Distributions: | | | | | | | | | | | | | | | | | | | | |
Distributions from and in excess of net investment income | | | (0.05 | ) | | | (0.16 | ) | | | (0.22 | ) | | | (0.13 | ) | | | (0.13 | ) |
Distributions from net realized gain on investments | | | (5.00 | ) | | | (1.96 | ) | | | (1.71 | ) | | | (1.88 | ) | | | (0.04 | ) |
| | | | | | | | | | | | | | | | | | | | |
Total distributions | | | (5.05 | ) | | | (2.12 | ) | | | (1.93 | ) | | | (2.01 | ) | | | (0.17 | ) |
| | | | | | | | | | | | | | | | | | | | |
Net increase (decrease) in net asset value | | | (2.92 | ) | | | 0.91 | | | | 3.37 | | | | 0.59 | | | | 1.80 | |
| | | | | | | | | | | | | | | | | | | | |
Net Asset Value, End of Period | | $ | 26.67 | | | $ | 29.59 | | | $ | 28.68 | | | $ | 25.31 | | | $ | 24.72 | |
| | | | | | | | | | | | | | | | | | | | |
Total Return (b) | | | 7.93 | % | | | 10.98 | % | | | 22.61 | % | | | 11.40 | % | | | 8.56 | % |
| | | | | |
Ratios/Supplemental Data: | | | | | | | | | | | | | | | | | | | | |
Net Assets, End of Period (in 000’s) | | $ | 835,725 | | | $ | 1,344,317 | | | $ | 2,190,074 | | | $ | 1,908,663 | | | $ | 1,683,183 | |
Ratios of expenses to average net assets: | | | | | | | | | | | | | | | | | | | | |
Before expense reimbursement and/or fee waiver by Adviser | | | 1.05 | % | | | 1.03 | % | | | 1.04 | % | | | 1.05 | % | | | 1.06 | % |
After expense reimbursement and/or fee waiver by Adviser | | | 1.05 | % | | | 1.03 | % | | | 1.04 | % | | | 1.05 | % | | | 1.06 | % |
Ratios of net investment income to average net assets: | | | | | | | | | | | | | | | | | | | | |
Before expense reimbursement and/or fee waiver by Adviser | | | 0.28 | % | | | 0.34 | % | | | 0.88 | % | | | 0.60 | % | | | 0.59 | % |
After expense reimbursement and/or fee waiver by Adviser | | | 0.28 | % | | | 0.34 | % | | | 0.88 | % | | | 0.60 | % | | | 0.59 | % |
Portfolio Turnover | | | 12.11 | % | | | 47.31 | % | | | 50.57 | % | | | 46.42 | % | | | 63.48 | % |
| | (a) | The selected per share data was calculated using the weighted average shares outstanding method for the period. |
| | (b) | The total return is calculated using the Net Asset Value used for trading at the close of business at period end. |
See accompanying Notes to Financial Statements.
| | |
| |
| ASTON/Montag & Caldwell Growth Fund – Class I | | October 31, 2015 |
| |
| Financial Highlights | | |
| | | | | | | | | | | | | | | | | | | | |
| | | Year
Ended
10/31/15 | | | Year
Ended
10/31/14 | | | Year
Ended
10/31/13 | | | Year
Ended
10/31/12 | | | Year
Ended
10/31/11 | |
Net Asset Value, Beginning of Period | | $ | 29.80 | | | $ | 28.87 | | | $ | 25.46 | | | $ | 24.85 | | | $ | 23.05 | |
| | | | | | | | | | | | | | | | | | | | |
Income from Investment Operations: | | | | | | | | | | | | | | | | | | | | |
Net investment income | | | 0.14 | (a) | | | 0.17 | (a) | | | 0.30 | (a) | | | 0.21 | (a) | | | 0.21 | (a) |
Net realized and unrealized gain on investments | | | 2.06 | | | | 2.96 | | | | 5.10 | | | | 2.47 | | | | 1.82 | |
| | | | | | | | | | | | | | | | | | | | |
Total from investment operations | | | 2.20 | | | | 3.13 | | | | 5.40 | | | | 2.68 | | | | 2.03 | |
| | | | | | | | | | | | | | | | | | | | |
Less Distributions: | | | | | | | | | | | | | | | | | | | | |
Distributions from and in excess of net investment income | | | (0.18 | ) | | | (0.24 | ) | | | (0.28 | ) | | | (0.19 | ) | | | (0.19 | ) |
Distributions from net realized gain on investments | | | (5.00 | ) | | | (1.96 | ) | | | (1.71 | ) | | | (1.88 | ) | | | (0.04 | ) |
| | | | | | | | | | | | | | | | | | | | |
Total distributions | | | (5.18 | ) | | | (2.20 | ) | | | (1.99 | ) | | | (2.07 | ) | | | (0.23 | ) |
| | | | | | | | | | | | | | | | | | | | |
Net increase (decrease) in net asset value | | | (2.98 | ) | | | 0.93 | | | | 3.41 | | | | 0.61 | | | | 1.80 | |
| | | | | | | | | | | | | | | | | | | | |
Net Asset Value, End of Period | | $ | 26.82 | | | $ | 29.80 | | | $ | 28.87 | | | $ | 25.46 | | | $ | 24.85 | |
| | | | | | | | | | | | | | | | | | | | |
Total Return (b) | | | 8.21 | % | | | 11.26 | % | | | 22.95 | % | | | 11.67 | % | | | 8.82 | % |
| | | | | |
Ratios/Supplemental Data: | | | | | | | | | | | | | | | | | | | | |
Net Assets, End of Period (in 000’s) | | $ | 1,344,231 | | | $ | 2,784,650 | | | $ | 3,035,623 | | | $ | 2,406,145 | | | $ | 1,749,183 | |
Ratios of expenses to average net assets: | | | | | | | | | | | | | | | | | | | | |
Before expense reimbursement and/or fee waiver by Adviser | | | 0.80 | % | | | 0.78 | % | | | 0.79 | % | | | 0.80 | % | | | 0.81 | % |
After expense reimbursement and/or fee waiver by Adviser | | | 0.80 | % | | | 0.78 | % | | | 0.79 | % | | | 0.80 | % | | | 0.81 | % |
Ratios of net investment income to average net assets: | | | | | | | | | | | | | | | | | | | | |
Before expense reimbursement and/or fee waiver by Adviser | | | 0.53 | % | | | 0.59 | % | | | 1.13 | % | | | 0.85 | % | | | 0.84 | % |
After expense reimbursement and/or fee waiver by Adviser | | | 0.53 | % | | | 0.59 | % | | | 1.13 | % | | | 0.85 | % | | | 0.84 | % |
Portfolio Turnover | | | 12.11 | % | | | 47.31 | % | | | 50.57 | % | | | 46.42 | % | | | 63.48 | % |
| | (a) | The selected per share data was calculated using the weighted average shares outstanding method for the period. |
| | (b) | The total return is calculated using the Net Asset Value used for trading at the close of business at period end. |
See accompanying Notes to Financial Statements.
| | |
| |
| ASTON/Montag & Caldwell Growth Fund – Class R | | October 31, 2015 |
| |
| Financial Highlights | | |
| | | | | | | | | | | | | | | | | | | | |
| | | Year
Ended
10/31/15 | | | Year
Ended
10/31/14 | | | Year
Ended
10/31/13 | | | Year
Ended
10/31/12 | | | Year
Ended
10/31/11 | |
Net Asset Value, Beginning of Period | | $ | 29.21 | | | $ | 28.33 | | | $ | 25.02 | | | $ | 24.45 | | | $ | 22.70 | |
| | | | | | | | | | | | | | | | | | | | |
Income from Investment Operations: | | | | | | | | | | | | | | | | | | | | |
Net investment income | | | 0.01 | (a) | | | 0.03 | (a) | | | 0.16 | (a) | | | 0.09 | (a) | | | 0.08 | (a) |
Net realized and unrealized gain on investments | | | 2.01 | | | | 2.91 | | | | 5.01 | | | | 2.43 | | | | 1.80 | |
| | | | | | | | | | | | | | | | | | | | |
Total from investment operations | | | 2.02 | | | | 2.94 | | | | 5.17 | | | | 2.52 | | | | 1.88 | |
| | | | | | | | | | | | | | | | | | | | |
Less Distributions: | | | | | | | | | | | | | | | | | | | | |
Distributions from and in excess of net investment income | | | (0.01 | ) | | | (0.10 | ) | | | (0.15 | ) | | | (0.07 | ) | | | (0.09 | ) |
Distributions from net realized gain on investments | | | (5.00 | ) | | | (1.96 | ) | | | (1.71 | ) | | | (1.88 | ) | | | (0.04 | ) |
| | | | | | | | | | | | | | | | | | | | |
Total distributions | | | (5.01 | ) | | | (2.06 | ) | | | (1.86 | ) | | | (1.95 | ) | | | (0.13 | ) |
| | | | | | | | | | | | | | | | | | | | |
Net increase (decrease) in net asset value . | | | (2.99 | ) | | | 0.88 | | | | 3.31 | | | | 0.57 | | | | 1.75 | |
| | | | | | | | | | | | | | | | | | | | |
Net Asset Value, End of Period | | $ | 26.22 | | | $ | 29.21 | | | $ | 28.33 | | | $ | 25.02 | | | $ | 24.45 | |
| | | | | | | | | | | | | | | | | | | | |
Total Return (b) | | | 7.66 | % | | | 10.74 | % | | | 22.30 | % | | | 11.10 | % | | | 8.29 | % |
| | | | | |
Ratios/Supplemental Data: | | | | | | | | | | | | | | | | | | | | |
Net Assets, End of Period (in 000’s) | | $ | 5,877 | | | $ | 7,701 | | | $ | 10,099 | | | $ | 8,771 | | | $ | 8,654 | |
Ratios of expenses to average net assets: | | | | | | | | | | | | | | | | | | | | |
Before expense reimbursement and/or fee waiver by Adviser | | | 1.30 | % | | | 1.28 | % | | | 1.29 | % | | | 1.30 | % | | | 1.31 | % |
After expense reimbursement and/or fee waiver by Adviser | | | 1.30 | % | | | 1.28 | % | | | 1.29 | % | | | 1.30 | % | | | 1.31 | % |
Ratios of net investment income to average net assets: | | | | | | | | | | | | | | | | | | | | |
Before expense reimbursement and/or fee waiver by Adviser | | | 0.03 | % | | | 0.09 | % | | | 0.63 | % | | | 0.35 | % | | | 0.34 | % |
After expense reimbursement and/or fee waiver by Adviser | | | 0.03 | % | | | 0.09 | % | | | 0.63 | % | | | 0.35 | % | | | 0.34 | % |
Portfolio Turnover | | | 12.11 | % | | | 47.31 | % | | | 50.57 | % | | | 46.42 | % | | | 63.48 | % |
| | (a) | The selected per share data was calculated using the weighted average shares outstanding method for the period. |
| | (b) | The total return is calculated using the Net Asset Value used for trading at the close of business at period end. |
See accompanying Notes to Financial Statements.
| | |
| |
| ASTON/River Road Dividend All Cap Value Fund – Class N | | October 31, 2015 |
| |
| Financial Highlights | | |
| | | | | | | | | | | | | | | | | | | | |
| | | Year
Ended
10/31/15 | | | Year
Ended
10/31/14 | | | Year
Ended
10/31/13 | | | Year
Ended
10/31/12 | | | Year
Ended
10/31/11 | |
Net Asset Value, Beginning of Period | | $ | 14.05 | | | $ | 13.99 | | | $ | 11.67 | | | $ | 10.68 | | | $ | 10.23 | |
| | | | | | | | | | | | | | | | | | | | |
Income from Investment Operations: | | | | | | | | | | | | | | | | | | | | |
Net investment income | | | 0.21 | | | | 0.42 | | | | 0.30 | | | | 0.31 | (a) | | | 0.29 | (a) |
Net realized and unrealized gain (loss) on investments | | | (0.20 | ) | | | 0.89 | | | | 2.73 | | | | 1.05 | | | | 0.42 | |
| | | | | | | | | | | | | | | | | | | | |
Total from investment operations | | | 0.01 | | | | 1.31 | | | | 3.03 | | | | 1.36 | | | | 0.71 | |
| | | | | | | | | | | | | | | | | | | | |
Less Distributions: | | | | | | | | | | | | | | | | | | | | |
Distributions from and in excess of net investment income | | | (0.22 | ) | | | (0.44 | ) | | | (0.27 | ) | | | (0.30 | ) | | | (0.26 | ) |
Distributions from net realized gain on investments | | | (1.17 | ) | | | (0.81 | ) | | | (0.44 | ) | | | (0.07 | ) | | | — | |
| | | | | | | | | | | | | | | | | | | | |
Total distributions | | | (1.39 | ) | | | (1.25 | ) | | | (0.71 | ) | | | (0.37 | ) | | | (0.26 | ) |
| | | | | | | | | | | | | | | | | | | | |
Net increase (decrease) in net asset value | | | (1.38 | ) | | | 0.06 | | | | 2.32 | | | | 0.99 | | | | 0.45 | |
| | | | | | | | | | | | | | | | | | | | |
Net Asset Value, End of Period | | $ | 12.67 | | | $ | 14.05 | | | $ | 13.99 | | | $ | 11.67 | | | $ | 10.68 | |
| | | | | | | | | | | | | | | | | | | | |
Total Return (b) | | | (0.23 | )% | | | 9.89 | % | | | 27.47 | % | | | 12.96 | % | | | 6.94 | % |
| | | | | |
Ratios/Supplemental Data: | | | | | | | | | | | | | | | | | | | | |
Net Assets, End of Period (in 000’s) | | $ | 214,789 | | | $ | 349,937 | | | $ | 449,130 | | | $ | 338,166 | | | $ | 301,290 | |
Ratios of expenses to average net assets: | | | | | | | | | | | | | | | | | | | | |
Before expense reimbursement and/or fee waiver by Adviser | | | 1.10 | % | | | 1.09 | % | | | 1.09 | % | | | 1.12 | % | | | 1.12 | % |
After expense reimbursement and/or fee waiver by Adviser | | | 1.10 | % | | | 1.09 | % | | | 1.09 | % | | | 1.12 | % | | | 1.12 | % |
Ratios of net investment income to average net assets: | | | | | | | | | | | | | | | | | | | | |
Before expense reimbursement and/or fee waiver by Adviser | | | 1.62 | % | | | 2.96 | % | | | 2.38 | % | | | 2.74 | % | | | 2.70 | % |
After expense reimbursement and/or fee waiver by Adviser | | | 1.62 | % | | | 2.96 | % | | | 2.38 | % | | | 2.74 | % | | | 2.70 | % |
Portfolio Turnover | | | 26.68 | % | | | 31.78 | % | | | 35.18 | % | | | 28.17 | % | | | 24.65 | % |
| | (a) | The selected per share data was calculated using the weighted average shares outstanding method for the period. |
| | (b) | The total return is calculated using the Net Asset Value used for trading at the close of business at period end. |
See accompanying Notes to Financial Statements.
| | |
| |
| ASTON/River Road Dividend All Cap Value Fund – Class I | | October 31, 2015 |
| |
| Financial Highlights | | |
| | | | | | | | | | | | | | | | | | | | |
| | | Year
Ended
10/31/15 | | | Year
Ended
10/31/14 | | | Year
Ended
10/31/13 | | | Year
Ended
10/31/12 | | | Year
Ended
10/31/11 | |
Net Asset Value, Beginning of Period | | $ | 14.04 | | | $ | 13.98 | | | $ | 11.66 | | | $ | 10.67 | | | $ | 10.22 | |
| | | | | | | | | | | | | | | | | | | | |
Income from Investment Operations: | | | | | | | | | | | | | | | | | | | | |
Net investment income | | | 0.25 | | | | 0.44 | | | | 0.34 | | | | 0.34 | (a) | | | 0.32 | (a) |
Net realized and unrealized gain (loss) on investments | | | (0.20 | ) | | | 0.90 | | | | 2.72 | | | | 1.05 | | | | 0.42 | |
| | | | | | | | | | | | | | | | | | | | |
Total from investment operations | | | 0.05 | | | | 1.34 | | | | 3.06 | | | | 1.39 | | | | 0.74 | |
| | | | | | | | | | | | | | | | | | | | |
Less Distributions: | | | | | | | | | | | | | | | | | | | | |
Distributions from and in excess of net investment income | | | (0.26 | ) | | | (0.47 | ) | | | (0.30 | ) | | | (0.33 | ) | | | (0.29 | ) |
Distributions from net realized gain on investments | | | (1.17 | ) | | | (0.81 | ) | | | (0.44 | ) | | | (0.07 | ) | | | — | |
| | | | | | | | | | | | | | | | | | | | |
Total distributions | | | (1.43 | ) | | | (1.28 | ) | | | (0.74 | ) | | | (0.40 | ) | | | (0.29 | ) |
| | | | | | | | | | | | | | | | | | | | |
Net increase (decrease) in net asset value . | | | (1.38 | ) | | | 0.06 | | | | 2.32 | | | | 0.99 | | | | 0.45 | |
| | | | | | | | | | | | | | | | | | | | |
Net Asset Value, End of Period | | $ | 12.66 | | | $ | 14.04 | | | $ | 13.98 | | | $ | 11.66 | | | $ | 10.67 | |
| | | | | | | | | | | | | | | | | | | | |
Total Return (b) | | | 0.02 | % | | | 10.18 | % | | | 27.81 | % | | | 13.25 | % | | | 7.21 | % |
| | | | | |
Ratios/Supplemental Data: | | | | | | | | | | | | | | | | | | | | |
Net Assets, End of Period (in 000’s) | | $ | 635,189 | | | $ | 788,322 | | | $ | 779,859 | | | $ | 586,043 | | | $ | 318,863 | |
Ratios of expenses to average net assets: | | | | | | | | | | | | | | | | | | | | |
Before expense reimbursement and/or fee waiver by Adviser | | | 0.85 | % | | | 0.84 | % | | | 0.84 | % | | | 0.87 | % | | | 0.87 | % |
After expense reimbursement and/or fee waiver by Adviser | | | 0.85 | % | | | 0.84 | % | | | 0.84 | % | | | 0.87 | % | | | 0.87 | % |
Ratios of net investment income to average net assets: | | | | | | | | | | | | | | | | | | | | |
Before expense reimbursement and/or fee waiver by Adviser | | | 1.87 | % | | | 3.21 | % | | | 2.63 | % | | | 2.99 | % | | | 2.95 | % |
After expense reimbursement and/or fee waiver by Adviser | | | 1.87 | % | | | 3.21 | % | | | 2.63 | % | | | 2.99 | % | | | 2.95 | % |
Portfolio Turnover | | | 26.68 | % | | | 31.78 | % | | | 35.18 | % | | | 28.17 | % | | | 24.65 | % |
| | (a) | The selected per share data was calculated using the weighted average shares outstanding method for the period. |
| | (b) | The total return is calculated using the Net Asset Value used for trading at the close of business at period end. |
See accompanying Notes to Financial Statements.
| | |
| |
| ASTON/River Road Dividend All Cap Value Fund II – Class N | | October 31, 2015 |
| |
| Financial Highlights | | |
| | | | | | | | | | | | | | | | |
| | | Year
Ended
10/31/15 | | | Year
Ended
10/31/14 | | | Year
Ended
10/31/13 | | | Period
Ended
10/31/12(a) | |
Net Asset Value, Beginning of Period | | $ | 13.69 | | | $ | 12.89 | | | $ | 10.44 | | | $ | 10.00 | |
| | | | | | | | | | | | | | | | |
Income from Investment Operations: | | | | | | | | | | | | | | | | |
Net investment income | | | 0.22 | (b) | | | 0.36 | | | | 0.22 | | | | 0.09 | (b) |
Net realized and unrealized gain (loss) on investments | | | (0.26 | ) | | | 0.96 | | | | 2.46 | | | | 0.41 | |
| | | | | | | | | | | | | | | | |
Total from investment operations | | | (0.04 | ) | | | 1.32 | | | | 2.68 | | | | 0.50 | |
| | | | | | | | | | | | | | | | |
Less Distributions: | | | | | | | | | | | | | | | | |
Distributions from and in excess of net investment income | | | (0.23 | ) | | | (0.38 | ) | | | (0.23 | ) | | | (0.06 | ) |
Distributions from net realized gain on investments | | | (0.43 | ) | | | (0.14 | ) | | | — | (c) | | | — | |
| | | | | | | | | | | | | | | | |
Total distributions | | | (0.66 | ) | | | (0.52 | ) | | | (0.23 | ) | | | (0.06 | ) |
| | | | | | | | | | | | | | | | |
Net increase (decrease) in net asset value | | | (0.70 | ) | | | 0.80 | | | | 2.45 | | | | 0.44 | |
| | | | | | | | | | | | | | | | |
Net Asset Value, End of Period | | $ | 12.99 | | | $ | 13.69 | | | $ | 12.89 | | | $ | 10.44 | |
| | | | | | | | | | | | | | | | |
Total Return (d) | | | (0.47 | )% | | | 10.46 | % | | | 25.99 | % | | | 5.09 | %(e) |
| | | | |
Ratios/Supplemental Data: | | | | | | | | | | | | | | | | |
Net Assets, End of Period (in 000’s) | | $ | 2,930 | | | $ | 7,037 | | | $ | 3,634 | | | $ | 1,049 | |
Ratios of expenses to average net assets: | | | | | | | | | | | | | | | | |
Before expense reimbursement and/or fee waiver, or recoupment by Adviser | | | 1.15 | % | | | 1.17 | % | | | 1.37 | % | | | 4.99 | %(f) |
After expense reimbursement and/or fee waiver, or recoupment by Adviser | | | 1.15 | % | | | 1.25 | % | | | 1.30 | % | | | 1.30 | %(f) |
Ratios of net investment income (loss) to average net assets: | | | | | | | | | | | | | | | | |
Before expense reimbursement and/or fee waiver, or recoupment by Adviser | | | 1.62 | % | | | 2.81 | % | | | 1.68 | % | | | (1.24 | )%(f) |
After expense reimbursement and/or fee waiver, or recoupment by Adviser | | | 1.62 | % | | | 2.72 | % | | | 1.76 | % | | | 2.45 | %(f) |
Portfolio Turnover | | | 34.86 | % | | | 29.42 | % | | | 27.80 | % | | | 5.58 | %(e)(g) |
| | (a) | The commencement of investment operations for River Road Dividend All Cap Value Fund II Class N shares is June 26, 2012. |
| | (b) | The selected per share data was calculated using the weighted average shares outstanding method for the period. |
| | (c) | Represents less than $(0.005) per share. |
| | (d) | The total return is calculated using the Net Asset Value used for trading at the close of business at period end. |
| | (g) | Portfolio turnover excludes securities received from processing a subscription-in-kind. |
See accompanying Notes to Financial Statements.
| | |
| |
| ASTON/River Road Dividend All Cap Value Fund II – Class I | | October 31, 2015 |
| |
| Financial Highlights | | |
| | | | | | | | | | | | | | | | |
| | | Year
Ended
10/31/15 | | | Year
Ended
10/31/14 | | | Year
Ended
10/31/13 | | | Period
Ended
10/31/12(a) | |
Net Asset Value, Beginning of Period | | $ | 13.69 | | | $ | 12.89 | | | $ | 10.45 | | | $ | 10.00 | |
| | | | | | | | | | | | | | | | |
Income from Investment Operations: | | | | | | | | | | | | | | | | |
Net investment income | | | 0.25 | (b) | | | 0.39 | | | | 0.25 | | | | 0.10 | (b) |
Net realized and unrealized gain (loss) on investments | | | (0.25 | ) | | | 0.96 | | | | 2.45 | | | | 0.42 | |
| | | | | | | | | | | | | | | | |
Total from investment operations | | | — | | | | 1.35 | | | | 2.70 | | | | 0.52 | |
| | | | | | | | | | | | | | | | |
Less Distributions: | | | | | | | | | | | | | | | | |
Distributions from and in excess of net investment income | | | (0.26 | ) | | | (0.41 | ) | | | (0.26 | ) | | | (0.07 | ) |
Distributions from net realized gain on investments | | | (0.43 | ) | | | (0.14 | ) | | | — | (c) | | | — | |
| | | | | | | | | | | | | | | | |
Total distributions | | | (0.69 | ) | | | (0.55 | ) | | | (0.26 | ) | | | (0.07 | ) |
| | | | | | | | | | | | | | | | |
Net increase (decrease) in net asset value | | | (0.69 | ) | | | 0.80 | | | | 2.44 | | | | 0.45 | |
| | | | | | | | | | | | | | | | |
Net Asset Value, End of Period | | $ | 13.00 | | | $ | 13.69 | | | $ | 12.89 | | | $ | 10.45 | |
| | | | | | | | | | | | | | | | |
Total Return (d) | | | (0.13 | )% | | | 10.73 | % | | | 26.30 | % | | | 5.17 | %(e) |
| | | | |
Ratios/Supplemental Data: | | | | | | | | | | | | | | | | |
Net Assets, End of Period (in 000’s) | | $ | 121,414 | | | $ | 125,660 | | | $ | 86,240 | | | $ | 9,370 | |
Ratios of expenses to average net assets: | | | | | | | | | | | | | | | | |
Before expense reimbursement and/or fee waiver, or recoupment by Adviser | | | 0.90 | % | | | 0.92 | % | | | 1.12 | % | | | 4.74 | %(f) |
After expense reimbursement and/or fee waiver, or recoupment by Adviser | | | 0.90 | % | | | 1.00 | % | | | 1.05 | % | | | 1.05 | %(f) |
Ratios of net investment income (loss) to average net assets: | | | | | | | | | | | | | | | | |
Before expense reimbursement and/or fee waiver, or recoupment by Adviser | | | 1.87 | % | | | 3.06 | % | | | 1.93 | % | | | (0.99 | )%(f) |
After expense reimbursement and/or fee waiver, or recoupment by Adviser | | | 1.87 | % | | | 2.97 | % | | | 2.01 | % | | | 2.70 | %(f) |
Portfolio Turnover | | | 34.86 | % | | | 29.42 | % | | | 27.80 | % | | | 5.58 | %(e)(g) |
| | (a) | The commencement of investment operations for River Road Dividend All Cap Value Fund II Class I shares is June 26, 2012. |
| | (b) | The selected per share data was calculated using the weighted average shares outstanding method for the period. |
| | (c) | Represents less than $(0.005) per share. |
| | (d) | The total return is calculated using the Net Asset Value used for trading at the close of business at period end. |
| | (g) | Portfolio turnover excludes securities received from processing a subscription-in-kind. |
See accompanying Notes to Financial Statements.
| | |
| |
| ASTON/Fairpointe Mid Cap Fund – Class N | | October 31, 2015 |
| |
| Financial Highlights | | |
| | | | | | | | | | | | | | | | | | | | |
| | | Year
Ended
10/31/15 | | | Year
Ended
10/31/14 | | | Year
Ended
10/31/13 | | | Year
Ended
10/31/12 | | | Year
Ended
10/31/11 | |
Net Asset Value, Beginning of Period | | $ | 46.89 | | | $ | 45.40 | | | $ | 32.79 | | | $ | 29.76 | | | $ | 29.04 | |
| | | | | | | | | | | | | | | | | | | | |
Income from Investment Operations: | | | | | | | | | | | | | | | | | | | | |
Net investment income (loss) | | | 0.12 | | | | (0.06 | ) | | | 0.17 | | | | 0.16 | | | | 0.06 | (a) |
Net realized and unrealized gain (loss) on investments | | | (1.83 | ) | | | 5.82 | | | | 13.48 | | | | 3.13 | | | | 0.82 | |
| | | | | | | | | | | | | | | | | | | | |
Total from investment operations | | | (1.71 | ) | | | 5.76 | | | | 13.65 | | | | 3.29 | | | | 0.88 | |
| | | | | | | | | | | | | | | | | | | | |
Less Distributions: | | | | | | | | | | | | | | | | | | | | |
Distributions from and in excess of net investment income | | | (0.04 | ) | | | — | | | | (0.30 | ) | | | (0.05 | ) | | | (0.08 | ) |
Distributions from net realized gain on investments | | | (7.58 | ) | | | (4.27 | ) | | | (0.74 | ) | | | (0.21 | ) | | | (0.08 | ) |
| | | | | | | | | | | | | | | | | | | | |
Total distributions | | | (7.62 | ) | | | (4.27 | ) | | | (1.04 | ) | | | (0.26 | ) | | | (0.16 | ) |
| | | | | | | | | | | | | | | | | | | | |
Net increase (decrease) in net asset value . | | | (9.33 | ) | | | 1.49 | | | | 12.61 | | | | 3.03 | | | | 0.72 | |
| | | | | | | | | | | | | | | | | | | | |
Net Asset Value, End of Period | | $ | 37.56 | | | $ | 46.89 | | | $ | 45.40 | | | $ | 32.79 | | | $ | 29.76 | |
| | | | | | | | | | | | | | | | | | | | |
Total Return (b) | | | (5.02 | )% | | | 13.32 | % | | | 42.88 | % | | | 11.15 | % | | | 2.98 | % |
| | | | | |
Ratios/Supplemental Data: | | | | | | | | | | | | | | | | | | | | |
Net Assets, End of Period (in 000’s) | | $ | 1,861,753 | | | $ | 2,432,815 | | | $ | 2,370,432 | | | $ | 1,561,510 | | | $ | 1,502,266 | |
Ratios of expenses to average net assets: | | | | | | | | | | | | | | | | | | | | |
Before expense reimbursement and/or fee waiver by Adviser | | | 1.11 | % | | | 1.10 | % | | | 1.11 | % | | | 1.11 | %(c) | | | 1.14 | %(c) |
After expense reimbursement and/or fee waiver by Adviser | | | 1.11 | % | | | 1.10 | % | | | 1.11 | % | | | 1.11 | %(c) | | | 1.14 | %(c) |
Ratios of net investment income (loss) to average net assets: | | | | | | | | | | | | | | | | | | | | |
Before expense reimbursement and/or fee waiver by Adviser | | | 0.27 | % | | | (0.12 | )% | | | 0.42 | % | | | 0.50 | % | | | 0.21 | % |
After expense reimbursement and/or fee waiver by Adviser | | | 0.27 | % | | | (0.12 | )% | | | 0.42 | % | | | 0.50 | % | | | 0.21 | % |
Portfolio Turnover | | | 31.75 | % | | | 50.25 | % | | | 36.98 | % | | | 28.06 | %(d) | | | 11.20 | % |
| | (a) | The selected per share data was calculated using the weighted average shares outstanding method for the period. |
| | (b) | The total return is calculated using the Net Asset Value used for trading at the close of business at period end. |
| | (c) | Ratios of expenses to average net assets include interest expense of less than 0.005% for each of the years ended October 31, 2012, and October 31, 2011, which are not included in the contractual expense limitation. The interest expense is from utilizing the line of credit, as discussed in Note H to the Financial Statements. |
| | (d) | Portfolio turnover rate excludes securities delivered from processing a redemption-in-kind. |
See accompanying Notes to Financial Statements.
| | |
| |
| ASTON/Fairpointe Mid Cap Fund – Class I | | October 31, 2015 |
| |
| Financial Highlights | | |
| | | | | | | | | | | | | | | | | | | | |
| | | Year
Ended
10/31/15 | | | Year
Ended
10/31/14 | | | Year
Ended
10/31/13 | | | Year
Ended
10/31/12 | | | Year
Ended
10/31/11 | |
Net Asset Value, Beginning of Period | | $ | 47.74 | | | $ | 46.10 | | | $ | 33.28 | | | $ | 30.20 | | | $ | 29.41 | |
| | | | | | | | | | | | | | | | | | | | |
Income from Investment Operations: | | | | | | | | | | | | | | | | | | | | |
Net investment income | | | 0.23 | | | | 0.05 | | | | 0.28 | | | | 0.24 | | | | 0.14 | (a) |
Net realized and unrealized gain (loss) on investments | | | (1.89 | ) | | | 5.92 | | | | 13.67 | | | | 3.18 | | | | 0.82 | |
| | | | | | | | | | | | | | | | | | | | |
Total from investment operations | | | (1.66 | ) | | | 5.97 | | | | 13.95 | | | | 3.42 | | | | 0.96 | |
| | | | | | | | | | | | | | | | | | | | |
Less Distributions: | | | | | | | | | | | | | | | | | | | | |
Distributions from and in excess of net investment income | | | (0.06 | ) | | | (0.06 | ) | | | (0.39 | ) | | | (0.13 | ) | | | (0.09 | ) |
Distributions from net realized gain on investment | | | (7.58 | ) | | | (4.27 | ) | | | (0.74 | ) | | | (0.21 | ) | | | (0.08 | ) |
| | | | | | | | | | | | | | | | | | | | |
Total distributions | | | (7.64 | ) | | | (4.33 | ) | | | (1.13 | ) | | | (0.34 | ) | | | (0.17 | ) |
| | | | | | | | | | | | | | | | | | | | |
Net increase (decrease) in net asset value | | | (9.30 | ) | | | 1.64 | | | | 12.82 | | | | 3.08 | | | | 0.79 | |
| | | | | | | | | | | | | | | | | | | | |
Net Asset Value, End of Period | | $ | 38.44 | | | $ | 47.74 | | | $ | 46.10 | | | $ | 33.28 | | | $ | 30.20 | |
| | | | | | | | | | | | | | | | | | | | |
Total Return (b) | | | (4.78 | )% | | | 13.61 | % | | | 43.23 | % | | | 11.46 | % | | | 3.22 | % |
| | | | | |
Ratios/Supplemental Data: | | | | | | | | | | | | | | | | | | | | |
Net Assets, End of Period (in 000’s) | | $ | 2,838,642 | | | $ | 3,531,114 | | | $ | 2,521,876 | | | $ | 1,464,222 | | | $ | 1,339,223 | |
Ratios of expenses to average net assets: | | | | | | | | | | | | | | | | | | | | |
Before expense reimbursement and/or fee waiver by Adviser | | | 0.86 | % | | | 0.85 | % | | | 0.86 | % | | | 0.86 | %(c) | | | 0.89 | %(c) |
After expense reimbursement and/or fee waiver by Adviser | | | 0.86 | % | | | 0.85 | % | | | 0.86 | % | | | 0.86 | %(c) | | | 0.89 | %(c) |
Ratios of net investment income to average net assets: | | | | | | | | | | | | | | | | | | | | |
Before expense reimbursement and/or fee waiver by Adviser | | | 0.52 | % | | | 0.13 | % | | | 0.67 | % | | | 0.75 | % | | | 0.46 | % |
After expense reimbursement and/or fee waiver by Adviser | | | 0.52 | % | | | 0.13 | % | | | 0.67 | % | | | 0.75 | % | | | 0.46 | % |
Portfolio Turnover | | | 31.75 | % | | | 50.25 | % | | | 36.98 | % | | | 28.06 | %(d) | | | 11.20 | % |
| | (a) | The selected per share data was calculated using the weighted average shares outstanding method for the period. |
| | (b) | The total return is calculated using the Net Asset Value used for trading at the close of business at period end. |
| | (c) | Ratios of expenses to average net assets include interest expense of less than 0.005% for each of the years ended October 31, 2012, and October 31, 2011, which are not included in the contractual expense limitation. The interest expense is from utilizing the line of credit, as discussed in Note H to the Financial Statements. |
| | (d) | Portfolio turnover rate excludes securities delivered from processing a redemption-in-kind. |
See accompanying Notes to Financial Statements.
| | |
| |
| ASTON/Montag & Caldwell Mid Cap Growth Fund – Class N | | October 31, 2015 |
| |
| Financial Highlights | | |
| | | | | | | | | | | | | | | | | | | | |
| | | Year
Ended
10/31/15 | | | Year
Ended
10/31/14 | | | Year
Ended
10/31/13 | | | Year
Ended
10/31/12 | | | Year
Ended
10/31/11 | |
Net Asset Value, Beginning of Period | | $ | 11.99 | | | $ | 12.77 | | | $ | 10.36 | | | $ | 9.71 | | | $ | 8.51 | |
| | | | | | | | | | | | | | | | | | | | |
Income from Investment Operations: | | | | | | | | | | | | | | | | | | | | |
Net investment loss | | | (0.08 | ) | | | (0.06 | )(a) | | | (0.07 | ) | | | (0.07 | )(a) | | | (0.07 | ) |
Net realized and unrealized gain on investments | | | 0.65 | | | | 1.20 | | | | 2.58 | | | | 0.72 | | | | 1.27 | |
| | | | | | | | | | | | | | | | | | | | |
Total from investment operations | | | 0.57 | | | | 1.14 | | | | 2.51 | | | | 0.65 | | | | 1.20 | |
| | | | | | | | | | | | | | | | | | | | |
Less Distributions: | | | | | | | | | | | | | | | | | | | | |
Distributions from net realized gain on investments | | | (0.99 | ) | | | (1.92 | ) | | | (0.10 | ) | | | — | | | | — | |
| | | | | | | | | | | | | | | | | | | | |
Total distributions | | | (0.99 | ) | | | (1.92 | ) | | | (0.10 | ) | | | — | | | | — | |
| | | | | | | | | | | | | | | | | | | | |
Net increase (decrease) in net asset value | | | (0.42 | ) | | | (0.78 | ) | | | 2.41 | | | | 0.65 | | | | 1.20 | |
| | | | | | | | | | | | | | | | | | | | |
Net Asset Value, End of Period | | $ | 11.57 | | | $ | 11.99 | | | $ | 12.77 | | | $ | 10.36 | | | $ | 9.71 | |
| | | | | | | | | | | | | | | | | | | | |
Total Return (b) | | | 4.81 | % | | | 9.75 | % | | | 24.51 | % | | | 6.70 | % | | | 14.10 | % |
| | | | | |
Ratios/Supplemental Data: | | | | | | | | | | | | | | | | | | | | |
Net Assets, End of Period (in 000’s) | | $ | 4,890 | | | $ | 7,633 | | | $ | 11,402 | | | $ | 7,369 | | | $ | 4,507 | |
Ratios of expenses to average net assets: | | | | | | | | | | | | | | | | | | | | |
Before expense reimbursement and/or fee waiver by Adviser | | | 2.10 | % | | | 2.16 | % | | | 1.85 | % | | | 2.50 | % | | | 3.07 | % |
After expense reimbursement and/or fee waiver by Adviser | | | 1.25 | % | | | 1.25 | % | | | 1.25 | % | | | 1.25 | %(c) | | | 1.39 | %(c) |
Ratios of net investment loss to average net assets: | | | | | | | | | | | | | | | | | | | | |
Before expense reimbursement and/or fee waiver by Adviser | | | (1.46 | )% | | | (1.45 | )% | | | (1.18 | )% | | | (1.88 | )% | | | (2.39 | )% |
After expense reimbursement and/or fee waiver by Adviser | | | (0.60 | )% | | | (0.55 | )% | | | (0.58 | )% | | | (0.63 | )% | | | (0.71 | )% |
Portfolio Turnover | | | 58.12 | % | | | 32.96 | % | | | 74.24 | % | | | 36.60 | % | | | 29.31 | % |
| | (a) | The selected per share data was calculated using the weighted average shares outstanding method for the period. |
| | (b) | The total return is calculated using the Net Asset Value used for trading at the close of business at period end. |
| | (c) | For the period November 1, 2010 through September 29, 2011 the Adviser contractually waived management fees and/or reimbursed expenses so that the net expense ratio did not exceed 1.40%, excluding interest, taxes, investment-related costs (such as brokerage commissions), extraordinary expenses and acquired fund fees and expenses. Effective September 30, 2011, the Adviser implemented a voluntary expense limitation of 1.25%. Subsequently, on February 29, 2012, the Adviser removed the voluntary expense limitation and replaced it with a contractual expense limitation of 1.25%. |
See accompanying Notes to Financial Statements.
| | |
| |
| ASTON/Montag & Caldwell Mid Cap Growth Fund – Class I | | October 31, 2015 |
| |
| Financial Highlights | | |
| | | | | | | | |
| | | Year
Ended
10/31/15 | | | Period
Ended
10/31/14(a) | |
| | | | | | | | |
Net Asset Value, Beginning of Period | | $ | 12.00 | | | $ | 11.36 | |
| | | | | | | | |
Income from Investment Operations: | | | | | | | | |
Net investment loss | | | (0.04 | ) | | | (0.04 | )(b) |
Net realized and unrealized gain on investments | | | 0.64 | | | | 0.68 | |
| | | | | | | | |
Total from investment operations | | | 0.60 | | | | 0.64 | |
| | | | | | | | |
Less Distributions: | | | | | | | | |
Distributions from net realized gain on investments | | | (0.99 | ) | | | — | |
| | | | | | | | |
Total Distributions | | | (0.99 | ) | | | — | |
| | | | | | | | |
Net increase (decrease) in net asset value | | | (0.39 | ) | | | 0.64 | |
| | | | | | | | |
Net Asset Value, End of Period | | $ | 11.61 | | | $ | 12.00 | |
| | | | | | | | |
Total Return (c) | | | 5.08 | % | | | 5.63 | %(d) |
| | |
Ratios/Supplemental Data: | | | | | | | | |
Net Assets, End of Period (in 000’s) | | $ | 6,163 | | | $ | 3,867 | |
Ratios of expenses to average net assets: | | | | | | | | |
Before expense reimbursement and/or fee waiver by Adviser | | | 1.85 | % | | | 2.27 | %(e) |
After expense reimbursement and/or fee waiver by Adviser | | | 1.00 | % | | | 1.00 | %(e) |
Ratios of net investment loss to average net assets: | | | | | | | | |
Before expense reimbursement and/or fee waiver by Adviser | | | (1.21 | )% | | | (1.95 | )%(e) |
After expense reimbursement and/or fee waiver by Adviser | | | (0.35 | )% | | | (0.68 | )%(e) |
Portfolio Turnover | | | 58.12 | % | | | 32.96 | %(d) |
| | (a) | The commencement of investment operations for Montag & Caldwell Mid Cap Growth Fund Class I shares is May 13, 2014. |
| | (b) | The selected per share data was calculated using the weighted average shares outstanding method for the period. |
| | (c) | The total return is calculated using the Net Asset Value used for trading at the close of business at period end. |
See accompanying Notes to Financial Statements.
| | |
| |
| ASTON/LMCG Small Cap Growth Fund – Class N | | October 31, 2015 |
| |
| Financial Highlights | | |
| | | | | | | | | | | | | | | | | | | | |
| | | Year
Ended
10/31/15 | | | Year
Ended
10/31/14 | | | Year
Ended
10/31/13 | | | Year
Ended
10/31/12 | | | Period
Ended
10/31/11(a) | |
| | | | | |
| | | | | |
| | | | | |
Net Asset Value, Beginning of Period | | $ | 14.76 | | | $ | 14.71 | | | $ | 11.42 | | | $ | 9.95 | | | $ | 10.00 | |
| | | | | | | | | | | | | | | | | | | | |
Income from Investment Operations: | | | | | | | | | | | | | | | | | | | | |
Net investment income (loss) | | | (0.15 | )(b) | | | (0.13 | )(b) | | | — | (b)(c) | | | (0.12 | )(b) | | | (0.04 | ) |
Net realized and unrealized gain (loss) on investments | | | 0.40 | | | | 2.21 | | | | 4.18 | | | | 1.59 | | | | (0.01 | ) |
| | | | | | | | | | | | | | | | | | | | |
Total from investment operations | | | 0.25 | | | | 2.08 | | | | 4.18 | | | | 1.47 | | | | (0.05 | ) |
| | | | | | | | | | | | | | | | | | | | |
Less Distributions: | | | | | | | | | | | | | | | | | | | | |
Distributions from net realized gains on investments | | | (0.54 | ) | | | (2.03 | ) | | | (0.89 | ) | | | — | | | | — | |
| | | | | | | | | | | | | | | | | | | | |
Total distributions | | | (0.54 | ) | | | (2.03 | ) | | | (0.89 | ) | | | — | | | | — | |
| | | | | | | | | | | | | | | | | | | | |
Net increase (decrease) in net asset value | | | (0.29 | ) | | | 0.05 | | | | 3.29 | | | | 1.47 | | | | (0.05 | ) |
| | | | | | | | | | | | | | | | | | | | |
Net Asset Value, End of Period | | $ | 14.47 | | | $ | 14.76 | | | $ | 14.71 | | | $ | 11.42 | | | $ | 9.95 | |
| | | | | | | | | | | | | | | | | | | | |
Total Return (d) | | | 1.65 | % | | | 15.18 | % | | | 39.31 | % | | | 14.77 | % | | | (0.50 | )%(e) |
| | | | | |
Ratios/Supplemental Data: | | | | | | | | | | | | | | | | | | | | |
Net Assets, End of Period (in 000’s) | | $ | 154,394 | | | $ | 37,099 | | | $ | 32,045 | | | $ | 5,659 | | | $ | 5,411 | |
Ratios of expenses to average net assets: | | | | | | | | | | | | | | | | | | | | |
Before expense reimbursement and/or fee waiver by Adviser | | | 1.53 | % | | | 1.67 | % | | | 2.03 | % | | | 2.86 | % | | | 8.27 | %(f) |
After expense reimbursement and/or fee waiver by Adviser | | | 1.35 | % | | | 1.35 | % | | | 1.35 | % | | | 1.35 | % | | | 1.35 | %(f) |
Ratios of net investment income (loss) to average net assets: | | | | | | | | | | | | | | | | | | | | |
Before expense reimbursement and/or fee waiver by Adviser | | | (1.18 | )% | | | (1.22 | )% | | | (0.66 | )% | | | (2.68 | )% | | | (8.14 | )%(f) |
After expense reimbursement and/or fee waiver by Adviser | | | (1.00 | )% | | | (0.90 | )% | | | 0.02 | % | | | (1.17 | )% | | | (1.21 | )%(f) |
Portfolio Turnover | | | 79.46 | % | | | 143.99 | % | | | 186.40 | %(g) | | | 168.05 | %(h) | | | 205.85 | %(e) |
| | (a) | The commencement of investment operations for LMCG Small Cap Growth Fund Class N shares is November 2, 2010. |
| | (b) | The selected per share data was calculated using the weighted average shares outstanding method for the period. |
| | (c) | Represents less than $0.005 per share. |
| | (d) | The total return is calculated using the Net Asset Value used for trading at the close of business at period end. |
| | (g) | Portfolio turnover rate excludes securities received from the reorganization. |
| | (h) | Portfolio turnover rate excludes securities delivered from processing a redemption-in-kind. |
See accompanying Notes to Financial Statements.
| | |
| |
| ASTON/LMCG Small Cap Growth Fund – Class I | | October 31, 2015 |
| |
| Financial Highlights | | |
| | | | | | | | | | | | | | | | | | | | |
| | | Year
Ended
10/31/15 | | | Year
Ended
10/31/14 | | | Year
Ended
10/31/13 | | | Year
Ended
10/31/12 | | | Period
Ended
10/31/11(a) | |
| | | | | |
| | | | | |
| | | | | |
Net Asset Value, Beginning of Period | | $ | 14.89 | | | $ | 14.81 | | | $ | 11.46 | | | $ | 9.97 | | | $ | 12.40 | |
| | | | | | | | | | | | | | | | | | | | |
Income from Investment Operations: | | | | | | | | | | | | | | | | | | | | |
Net investment income (loss) | | | (0.12 | )(b) | | | (0.09 | )(b) | | | 0.04 | (b) | | | (0.10 | )(b) | | | (0.04 | ) |
Net realized and unrealized gain (loss) on investments | | | 0.41 | | | | 2.23 | | | | 4.20 | | | | 1.59 | | | | (2.39 | ) |
| | | | | | | | | | | | | | | | | | | | |
Total from investment operations | | | 0.29 | | | | 2.14 | | | | 4.24 | | | | 1.49 | | | | (2.43 | ) |
| | | | | | | | | | | | | | | | | | | | |
Less Distributions: | | | | | | | | | | | | | | | | | | | | |
Distributions from and in excess of net investment income | | | — | | | | (0.03 | ) | | | — | | | | — | | | | — | |
Distributions from net realized gains on investments | | | (0.54 | ) | | | (2.03 | ) | | | (0.89 | ) | | | — | | | | — | |
| | | | | | | | | | | | | | | | | | | | |
Total distributions | | | (0.54 | ) | | | (2.06 | ) | | | (0.89 | ) | | | — | | | | — | |
| | | | | | | | | | | | | | | | | | | | |
Net increase (decrease) in net asset value | | | (0.25 | ) | | | 0.08 | | | | 3.35 | | | | 1.49 | | | | (2.43 | ) |
| | | | | | | | | | | | | | | | | | | | |
Net Asset Value, End of Period | | $ | 14.64 | | | $ | 14.89 | | | $ | 14.81 | | | $ | 11.46 | | | $ | 9.97 | |
| | | | | | | | | | | | | | | | | | | | |
Total Return (c) | | | 1.91 | % | | | 15.51 | % | | | 39.72 | % | | | 14.95 | % | | | (19.60 | )%(d) |
| | | | | |
Ratios/Supplemental Data: | | | | | | | | | | | | | | | | | | | | |
Net Assets, End of Period (in 000’s) | | $ | 76,989 | | | $ | 15,083 | | | $ | 8,496 | | | $ | 755 | | | $ | 2,551 | |
Ratios of expenses to average net assets: | | | | | | | | | | | | | | | | | | | | |
Before expense reimbursement and/or fee waiver by Adviser | | | 1.28 | % | | | 1.42 | % | | | 1.78 | % | | | 2.61 | % | | | 6.25 | %(e) |
After expense reimbursement and/or fee waiver by Adviser | | | 1.10 | % | | | 1.10 | % | | | 1.10 | % | | | 1.10 | % | | | 1.10 | %(e) |
Ratios of net investment income (loss) to average net assets: | | | | | | | | | | | | | | | | | | | | |
Before expense reimbursement and/or fee waiver by Adviser | | | (0.93 | )% | | | (0.97 | )% | | | (0.41 | )% | | | (2.43 | )% | | | (6.11 | )%(e) |
After expense reimbursement and/or fee waiver by Adviser | | | (0.75 | )% | | | (0.65 | )% | | | 0.27 | % | | | (0.92 | )% | | | (0.96 | )%(e) |
Portfolio Turnover | | | 79.46 | % | | | 143.99 | % | | | 186.40 | %(f) | | | 168.05 | %(g) | | | 205.85 | %(d) |
| | (a) | The commencement of investment operations for LMCG Small Cap Growth Fund Class I shares is May 31, 2011. |
| | (b) | The selected per share data was calculated using the weighted average shares outstanding method for the period. |
| | (c) | The total return is calculated using the Net Asset Value used for trading at the close of business at period end. |
| | (f) | Portfolio turnover rate excludes securities received from the reorganization. |
| | (g) | Portfolio turnover rate excludes securities delivered from processing a redemption-in-kind. |
See accompanying Notes to Financial Statements.
| | |
| |
| ASTON/River Road Independent Value Fund – Class N | | October 31, 2015 |
| |
| Financial Highlights | | |
| | | | | | | | | | | | | | | | | | | | |
| | | Year
Ended
10/31/15 | | | Year
Ended
10/31/14 | | | Year
Ended
10/31/13 | | | Year
Ended
10/31/12 | | | Period
Ended
10/31/11(a) | |
Net Asset Value, Beginning of Period | | $ | 10.89 | | | $ | 11.47 | | | $ | 11.42 | | | $ | 10.75 | | | $ | 10.00 | |
| | | | | | | | | | | | | | | | | | | | |
Income from Investment Operations: | | | | | | | | | | | | | | | | | | | | |
Net investment loss | | | (0.11 | )(b) | | | (0.12 | )(b) | | | (0.07 | ) | | | (0.09 | )(b) | | | (0.07 | )(b) |
Net realized and unrealized gain (loss) on investments | | | (0.23 | ) | | | (0.01 | ) | | | 0.75 | | | | 0.88 | | | | 0.82 | |
| | | | | | | | | | | | | | | | | | | | |
Total from investment operations | | | (0.34 | ) | | | (0.13 | ) | | | 0.68 | | | | 0.79 | | | | 0.75 | |
| | | | | | | | | | | | | | | | | | | | |
Less Distributions: | | | | | | | | | | | | | | | | | | | | |
Distributions from net realized gain on investments | | | (0.65 | ) | | | (0.45 | ) | | | (0.63 | ) | | | (0.12 | ) | | | — | |
| | | | | | | | | | | | | | | | | | | | |
Total distributions | | | (0.65 | ) | | | (0.45 | ) | | | (0.63 | ) | | | (0.12 | ) | | | — | |
| | | | | | | | | | | | | | | | | | | | |
Net increase (decrease) in net asset value | | | (0.99 | ) | | | (0.58 | ) | | | 0.05 | | | | 0.67 | | | | 0.75 | |
| | | | | | | | | | | | | | | | | | | | |
Net Asset Value, End of Period | | $ | 9.90 | | | $ | 10.89 | | | $ | 11.47 | | | $ | 11.42 | | | $ | 10.75 | |
| | | | | | | | | | | | | | | | | | | | |
Total Return (c) | | | (3.38 | )% | | | (1.24 | )% | | | 6.37 | % | | | 7.41 | % | | | 7.50 | %(d) |
| | | | | |
Ratios/Supplemental Data: | | | | | | | | | | | | | | | | | | | | |
Net Assets, End of Period (in 000’s) | | $ | 239,543 | | | $ | 285,949 | | | $ | 339,088 | | | $ | 362,416 | | | $ | 306,223 | |
Ratios of expenses to average net assets: | | | | | | | | | | | | | | | | | | | | |
Before earnings credit, expense reimbursement and/or fee waiver, by the Adviser | | | 1.44 | % | | | 1.42 | %(e) | | | 1.43 | %(e) | | | 1.44 | %(e) | | | 1.59 | %(f) |
After earnings credit, expense reimbursement and/or fee waiver, by the Adviser | | | 1.42 | % | | | 1.42 | %(e) | | | 1.41 | %(e) | | | 1.42 | %(e) | | | 1.42 | %(f) |
Ratios of net investment loss to average net assets: | | | | | | | | | | | | | | | | | | | | |
Before earnings credit, expense reimbursement and/or fee waiver, by the Adviser | | | (1.09 | )% | | | (1.04 | )% | | | (0.61 | )% | | | (0.81 | )% | | | (0.98 | )%(f) |
After earnings credit, expense reimbursement and/or fee waiver, by the Adviser | | | (1.07 | )% | | | (1.03 | )% | | | (0.59 | )% | | | (0.79 | )% | | | (0.80 | )%(f) |
Portfolio Turnover | | | 59.40 | % | | | 91.10 | % | | | 82.24 | %(g) | | | 141.17 | % | | | 105.69 | %(d) |
| | (a) | The commencement of investment operations for River Road Independent Value Fund Class N shares is December 30, 2010. |
| | (b) | The selected per share data was calculated using the weighted average shares outstanding method for the period. |
| | (c) | The total return is calculated using the Net Asset Value used for trading at the close of business at period end. |
| | (e) | Ratios of expenses to average net assets include Earnings Credits of 0.01% for the year ended October 31, 2013 and less than 0.005% for the years ended October 31, 2014 and 2012, which are not included in the contractual expense limitation. See Note I to the Financial Statements. |
| | (g) | Portfolio turnover rate excludes securities received from processing a subscription-in-kind. |
See accompanying Notes to Financial Statements.
| | |
| |
| ASTON/River Road Independent Value Fund – Class I | | October 31, 2015 |
| |
| Financial Highlights | | |
| | | | | | | | | | | | | | | | | | | | |
| | | Year
Ended
10/31/15 | | | Year
Ended
10/31/14 | | | Year
Ended
10/31/13 | | | Year
Ended
10/31/12 | | | Period
Ended
10/31/11(a) | |
Net Asset Value, Beginning of Period | | $ | 10.98 | | | $ | 11.54 | | | $ | 11.46 | | | $ | 10.75 | | | $ | 10.92 | |
| | | | | | | | | | | | | | | | | | | | |
Income from Investment Operations: | | | | | | | | | | | | | | | | | | | | |
Net investment loss | | | (0.09 | )(b) | | | (0.09 | )(b) | | | (0.04 | ) | | | (0.06 | )(b) | | | (0.02 | )(b) |
Net realized and unrealized gain (loss) on investments | | | (0.23 | ) | | | (0.02 | ) | | | 0.75 | | | | 0.89 | | | | (0.15 | ) |
| | | | | | | | | | | | | | | | | | | | |
Total from investment operations | | | (0.32 | ) | | | (0.11 | ) | | | 0.71 | | | | 0.83 | | | | (0.17 | ) |
| | | | | | | | | | | | | | | | | | | | |
Less Distributions: | | | | | | | | | | | | | | | | | | | | |
Distributions from net realized gain on investments | | | (0.65 | ) | | | (0.45 | ) | | | (0.63 | ) | | | (0.12 | ) | | | — | |
| | | | | | | | | | | | | | | | | | | | |
Total distributions | | | (0.65 | ) | | | (0.45 | ) | | | (0.63 | ) | | | (0.12 | ) | | | — | |
| | | | | | | | | | | | | | | | | | | | |
Net increase (decrease) in net asset value | | | (0.97 | ) | | | (0.56 | ) | | | 0.08 | | | | 0.71 | | | | (0.17 | ) |
| | | | | | | | | | | | | | | | | | | | |
Net Asset Value, End of Period | | $ | 10.01 | | | $ | 10.98 | | | $ | 11.54 | | | $ | 11.46 | | | $ | 10.75 | |
| | | | | | | | | | | | | | | | | | | | |
Total Return (c) | | | (3.16 | )% | | | (1.05 | )% | | | 6.62 | % | | | 7.68 | % | | | (1.47 | )%(d) |
| | | | | |
Ratios/Supplemental Data: | | | | | | | | | | | | | | | | | | | | |
Net Assets, End of Period (in 000’s) | | $ | 116,452 | | | $ | 381,289 | | | $ | 386,268 | | | $ | 338,234 | | | $ | 85,478 | |
Ratios of expenses to average net assets: | | | | | | | | | | | | | | | | | | | | |
Before earnings credit, expense reimbursement and/or fee waiver, by the Adviser | | | 1.19 | % | | | 1.17 | %(e) | | | 1.18 | %(e) | | | 1.19 | %(e) | | | 1.34 | %(f) |
After earnings credit, expense reimbursement and/or fee waiver, by the Adviser | | | 1.17 | % | | | 1.17 | %(e) | | | 1.16 | %(e) | | | 1.17 | %(e) | | | 1.17 | %(f) |
Ratios of net investment loss to average net assets: | | | | | | | | | | | | | | | | | | | | |
Before earnings credit, expense reimbursement and/or fee waiver, by the Adviser | | | (0.84 | )% | | | (0.79 | )% | | | (0.36 | )% | | | (0.56 | )% | | | (0.73 | )%(f) |
After earnings credit, expense reimbursement and/or fee waiver, by the Adviser | | | (0.82 | )% | | | (0.78 | )% | | | (0.34 | )% | | | (0.54 | )% | | | (0.55 | )%(f) |
Portfolio Turnover | | | 59.40 | % | | | 91.10 | % | | | 82.24 | %(g) | | | 141.17 | % | | | 105.69 | %(d) |
| | (a) | The commencement of investment operations for River Road Independent Value Fund Class I shares is May 31, 2011. |
| | (b) | The selected per share data was calculated using the weighted average shares outstanding method for the period. |
| | (c) | The total return is calculated using the Net Asset Value used for trading at the close of business at period end. |
| | (e) | Ratios of expenses to average net assets include Earnings Credits of 0.01% for the year ended October 31, 2013 and less than 0.005% for the years ended October 31, 2014 and 2012, which are not included in the contractual expense limitation. See Note I to the Financial Statements. |
| | (g) | Portfolio turnover rate excludes securities received from processing a subscription-in-kind. |
See accompanying Notes to Financial Statements.
| | |
| |
| ASTON/River Road Select Value Fund – Class N | | October 31, 2015 |
| |
| Financial Highlights | | |
| | | | | | | | | | | | | | | | | | | | |
| | | Year
Ended
10/31/15 | | | Year
Ended
10/31/14 | | | Year
Ended
10/31/13 | | | Year
Ended
10/31/12 | | | Year
Ended
10/31/11 | |
Net Asset Value, Beginning of Period | | $ | 8.77 | | | $ | 10.28 | | | $ | 8.50 | | | $ | 9.54 | | | $ | 9.01 | |
| | | | | | | | | | | | | | | | | | | | |
Income from Investment Operations: | | | | | | | | | | | | | | | | | | | | |
Net investment income (loss) | | | (0.04 | )(a) | | | (0.03 | )(a) | | | 0.07 | (a) | | | 0.01 | (a) | | | (0.02 | )(a) |
Net realized and unrealized gain on investments | | | 0.33 | | | | 0.03 | | | | 2.34 | | | | 1.01 | | | | 0.66 | |
| | | | | | | | | | | | | | | | | | | | |
Total from investment operations | | | 0.29 | | | | — | | | | 2.41 | | | | 1.02 | | | | 0.64 | |
| | | | | | | | | | | | | | | | | | | | |
Less Distributions: | | | | | | | | | | | | | | | | | | | | |
Distributions from net investment income | | | — | | | | (0.02 | ) | | | (0.12 | ) | | | — | | | | (0.03 | ) |
Distributions from net realized gains on investments | | | (1.43 | ) | | | (1.49 | ) | | | (0.51 | ) | | | (2.06 | ) | | | (0.08 | ) |
| | | | | | | | | | | | | | | | | | | | |
Total distributions | | | (1.43 | ) | | | (1.51 | ) | | | (0.63 | ) | | | (2.06 | ) | | | (0.11 | ) |
| | | | | | | | | | | | | | | | | | | | |
Net increase (decrease) in net asset value | | | (1.14 | ) | | | (1.51 | ) | | | 1.78 | | | | (1.04 | ) | | | 0.53 | |
| | | | | | | | | | | | | | | | | | | | |
Net Asset Value, End of Period | | $ | 7.63 | | | $ | 8.77 | | | $ | 10.28 | | | $ | 8.50 | | | $ | 9.54 | |
| | | | | | | | | | | | | | | | | | | | |
Total Return (b) | | | 3.26 | % | | | (0.23 | )% | | | 30.44 | % | | | 12.87 | % | | | 7.12 | % |
| | | | | |
Ratios/Supplemental Data: | | | | | | | | | | | | | | | | | | | | |
Net Assets, End of Period (in 000’s) | | $ | 5,038 | | | $ | 8,388 | | | $ | 19,099 | | | $ | 6,270 | | | $ | 13,160 | |
Ratios of expenses to average net assets: | | | | | | | | | | | | | | | | | | | | |
Before expense reimbursement and/or fee waiver, or recoupment by Adviser | | | 1.49 | % | | | 1.45 | % | | | 1.46 | % | | | 1.43 | %(c) | | | 1.42 | %(c) |
After expense reimbursement and/or fee waiver, or recoupment by Adviser | | | 1.49 | % | | | 1.45 | % | | | 1.46 | % | | | 1.43 | %(c) | | | 1.42 | %(c) |
Ratios of net investment income (loss) to average net assets: | | | | | | | | | | | | | | | | | | | | |
Before expense reimbursement and/or fee waiver, or recoupment by Adviser | | | (0.52 | )% | | | (0.36 | )% | | | 0.78 | % | | | 0.07 | % | | | (0.18 | )% |
After expense reimbursement and/or fee waiver, or recoupment by Adviser | | | (0.52 | )% | | | (0.36 | )% | | | 0.78 | % | | | 0.07 | % | | | (0.18 | )% |
Portfolio Turnover | | | 58.97 | % | | | 64.44 | % | | | 71.01 | % | | | 38.84 | % | | | 48.22 | % |
| | (a) | The selected per share data was calculated using the weighted average shares outstanding method for the period. |
| | (b) | The total return is calculated using the Net Asset Value used for trading at the close of business at period end. |
| | (c) | Ratios of expenses to average net assets include interest expense of less than 0.005% for each of the years ended October 31, 2012 and October 31, 2011, which are not included in the contractual expense limitation. The interest expense is from utilizing the line of credit, as discussed in Note H to the Financial Statements. |
See accompanying Notes to Financial Statements.
| | |
| |
| ASTON/River Road Select Value Fund – Class I | | October 31, 2015 |
| |
| Financial Highlights | | |
| | | | | | | | | | | | | | | | | | | | |
| | | Year
Ended
10/31/15 | | | Year
Ended
10/31/14 | | | Year
Ended
10/31/13 | | | Year
Ended
10/31/12 | | | Year
Ended
10/31/11 | |
Net Asset Value, Beginning of Period | | $ | 8.88 | | | $ | 10.38 | | | $ | 8.58 | | | $ | 9.59 | | | $ | 9.04 | |
| | | | | | | | | | | | | | | | | | | | |
Income from Investment Operations: | | | | | | | | | | | | | | | | | | | | |
Net investment income (loss) | | | (0.02 | )(a) | | | (0.01 | )(a) | | | 0.10 | (a) | | | 0.03 | (a) | | | 0.01 | (a) |
Net realized and unrealized gain on investments | | | 0.33 | | | | 0.04 | | | | 2.36 | | | | 1.02 | | | | 0.67 | |
| | | | | | | | | | | | | | | | | | | | |
Total from investment operations | | | 0.31 | | | | 0.03 | | | | 2.46 | | | | 1.05 | | | | 0.68 | |
| | | | | | | | | | | | | | | | | | | | |
Less Distributions: | | | | | | | | | | | | | | | | | | | | |
Distributions from net investment income | | | — | | | | (0.04 | ) | | | (0.15 | ) | | | — | | | | (0.05 | ) |
Distributions from net realized gains on investments | | | (1.43 | ) | | | (1.49 | ) | | | (0.51 | ) | | | (2.06 | ) | | | (0.08 | ) |
| | | | | | | | | | | | | | | | | | | | |
Total distributions | | | (1.43 | ) | | | (1.53 | ) | | | (0.66 | ) | | | (2.06 | ) | | | (0.13 | ) |
| | | | | | | | | | | | | | | | | | | | |
Net increase (decrease) in net asset value | | | (1.12 | ) | | | (1.50 | ) | | | 1.80 | | | | (1.01 | ) | | | 0.55 | |
| | | | | | | | | | | | | | | | | | | | |
Net Asset Value, End of Period | | $ | 7.76 | | | $ | 8.88 | | | $ | 10.38 | | | $ | 8.58 | | | $ | 9.59 | |
| | | | | | | | | | | | | | | | | | | | |
Total Return (b) | | | 3.60 | % | | | 0.00 | % | | | 30.74 | % | | | 13.18 | % | | | 7.56 | % |
| | | | | |
Ratios/Supplemental Data: | | | | | | | | | | | | | | | | | | | | |
Net Assets, End of Period (in 000’s) | | $ | 92,073 | | | $ | 176,166 | | | $ | 198,220 | | | $ | 156,510 | | | $ | 130,527 | |
Ratios of expenses to average net assets: | | | | | | | | | | | | | | | | | | | | |
Before expense reimbursement and/or fee waiver, or recoupment by Adviser | | | 1.24 | % | | | 1.20 | % | | | 1.21 | % | | | 1.18 | %(c) | | | 1.17 | %(c) |
After expense reimbursement and/or fee waiver, or recoupment by Adviser | | | 1.24 | % | | | 1.20 | % | | | 1.21 | % | | | 1.18 | %(c) | | | 1.17 | %(c) |
Ratios of net investment income (loss) to average net assets: | | | | | | | | | | | | | | | | | | | | |
Before expense reimbursement and/or fee waiver, or recoupment by Adviser | | | (0.27 | )% | | | (0.11 | )% | | | 1.03 | % | | | 0.32 | % | | | 0.07 | % |
After expense reimbursement and/or fee waiver, or recoupment by Adviser | | | (0.27 | )% | | | (0.11 | )% | | | 1.03 | % | | | 0.32 | % | | | 0.07 | % |
Portfolio Turnover | | | 58.97 | % | | | 64.44 | % | | | 71.01 | % | | | 38.84 | % | | | 48.22 | % |
| | (a) | The selected per share data was calculated using the weighted average shares outstanding method for the period. |
| | (b) | The total return is calculated using the Net Asset Value used for trading at the close of business at period end. |
| | (c) | Ratios of expenses to average net assets include interest expense of less than 0.005% for each of the years ended October 31, 2012 and October 31, 2011, which are not included in the contractual expense limitation. The interest expense is from utilizing the line of credit, as discussed in Note H to the Financial Statements. |
See accompanying Notes to Financial Statements.
| | |
| |
| ASTON/River Road Small Cap Value Fund – Class N | | October 31, 2015 |
| |
| Financial Highlights | | |
| | | | | | | | | | | | | | | | | | | | |
| | | Year
Ended
10/31/15 | | | Year
Ended
10/31/14 | | | Year
Ended
10/31/13 | | | Year
Ended
10/31/12 | | | Year
Ended
10/31/11 | |
| | | | | | | | | | | | | | | | | | | | |
Net Asset Value, Beginning of Period | | $ | 13.53 | | | $ | 17.05 | | | $ | 13.56 | | | $ | 12.20 | | | $ | 11.60 | |
| | | | | | | | | | | | | | | | | | | | |
Income from Investment Operations: | | | | | | | | | | | | | | | | | | | | |
Net investment income (loss) | | | (0.06 | )(a) | | | (0.04 | )(a) | | | 0.16 | | | | 0.03 | (a) | | | (0.03 | ) |
Net realized and unrealized gain on investments | | | 0.72 | | | | 0.14 | | | | 3.98 | | | | 1.33 | | | | 0.67 | |
| | | | | | | | | | | | | | | | | | | | |
Total from investment operations | | | 0.66 | | | | 0.10 | | | | 4.14 | | | | 1.36 | | | | 0.64 | |
| | | | | | | | | | | | | | | | | | | | |
Less Distributions: | | | | | | | | | | | | | | | | | | | | |
Distributions from and in excess of net investment income | | | — | | | | (0.04 | ) | | | (0.22 | ) | | | — | | | | (0.04 | ) |
Distributions from net realized gain on investments | | | (1.99 | ) | | | (3.58 | ) | | | (0.43 | ) | | | — | | | | — | |
| | | | | | | | | | | | | | | | | | | | |
Total distributions | | | (1.99 | ) | | | (3.62 | ) | | | (0.65 | ) | | | — | | | | (0.04 | ) |
| | | | | | | | | | | | | | | | | | | | |
Net increase (decrease) in net asset value | | | (1.33 | ) | | | (3.52 | ) | | | 3.49 | | | | 1.36 | | | | 0.60 | |
| | | | | | | | | | | | | | | | | | | | |
Net Asset Value, End of Period | | $ | 12.20 | | | $ | 13.53 | | | $ | 17.05 | | | $ | 13.56 | | | $ | 12.20 | |
| | | | | | | | | | | | | | | | | | | | |
Total Return (b) | | | 5.15 | % | | | (0.05 | )% | | | 31.98 | % | | | 11.15 | % | | | 5.46 | % |
| | | | | |
Ratios/Supplemental Data: | | | | | | | | | | | | | | | | | | | | |
Net Assets, End of Period (in 000’s) | | $ | 25,246 | | | $ | 49,049 | | | $ | 56,793 | | | $ | 49,154 | | | $ | 91,347 | |
Ratios of expenses to average net assets: | | | | | | | | | | | | | | | | | | | | |
Before expense reimbursement and/or fee waiver by Adviser | | | 1.34 | % | | | 1.33 | % | | | 1.34 | % | | | 1.37 | % | | | 1.37 | %(c) |
After expense reimbursement and/or fee waiver by Adviser | | | 1.34 | % | | | 1.33 | % | | | 1.34 | % | | | 1.37 | % | | | 1.37 | %(c) |
Ratios of net investment income (loss) to average net assets: | | | | | | | | | | | | | | | | | | | | |
Before expense reimbursement and/or fee waiver by Adviser | | | (0.45 | )% | | | (0.26 | )% | | | 1.03 | % | | | 0.22 | % | | | (0.13 | )% |
After expense reimbursement and/or fee waiver by Adviser | | | (0.45 | )% | | | (0.26 | )% | | | 1.03 | % | | | 0.22 | % | | | (0.13 | )% |
Portfolio Turnover | | | 60.94 | % | | | 66.22 | % | | | 56.08 | % | | | 26.95 | % | | | 42.29 | % |
| | (a) | The selected per share data was calculated using the weighted average shares outstanding method for the period. |
| | (b) | The total return is calculated using the Net Asset Value used for trading at the close of business at period end. |
| | (c) | Ratios of expenses to average net assets include interest expense of less than 0.005% for the year ended October 31, 2011, which are not included in the contractual expense limitation. The interest expense is from utilizing the line of credit, as discussed in Note H to the Financial Statements. |
See accompanying Notes to Financial Statements.
| | |
| |
| ASTON/River Road Small Cap Value Fund – Class I | | October 31, 2015 |
| |
| Financial Highlights | | |
| | | | | | | | | | | | | | | | | | | | |
| | | Year
Ended
10/31/15 | | | Year
Ended
10/31/14 | | | Year
Ended
10/31/13 | | | Year
Ended
10/31/12 | | | Year
Ended
10/31/11 | |
| | | | | | | | | | | | | | | | | | | | |
Net Asset Value, Beginning of Period | | $ | 13.60 | | | $ | 17.13 | | | $ | 13.62 | | | $ | 12.22 | | | $ | 11.62 | |
| | | | | | | | | | | | | | | | | | | | |
Income from Investment Operations: | | | | | | | | | | | | | | | | | | | | |
Net investment income (loss) | | | (0.03 | )(a) | | | (— | )(a)(b) | | | 0.19 | | | | 0.06 | (a) | | | 0.01 | |
Net realized and unrealized gain on investments | | | 0.73 | | | | 0.13 | | | | 4.01 | | | | 1.34 | | | | 0.65 | |
| | | | | | | | | | | | | | | | | | | | |
Total from investment operations | | | 0.70 | | | | 0.13 | | | | 4.20 | | | | 1.40 | | | | 0.66 | |
| | | | | | | | | | | | | | | | | | | | |
Less Distributions: | | | | | | | | | | | | | | | | | | | | |
Distributions from and in excess of net investment income | | | — | | | | (0.08 | ) | | | (0.26 | ) | | | — | | | | (0.06 | ) |
Distributions from net realized gain on investments | | | (1.99 | ) | | | (3.58 | ) | | | (0.43 | ) | | | — | | | | — | |
| | | | | | | | | | | | | | | | | | | | |
Total distributions | | | (1.99 | ) | | | (3.66 | ) | | | (0.69 | ) | | | — | | | | (0.06 | ) |
| | | | | | | | | | | | | | | | | | | | |
Net increase (decrease) in net asset value | | | (1.29 | ) | | | (3.53 | ) | | | 3.51 | | | | 1.40 | | | | 0.60 | |
| | | | | | | | | | | | | | | | | | | | |
Net Asset Value, End of Period | | $ | 12.31 | | | $ | 13.60 | | | $ | 17.13 | | | $ | 13.62 | | | $ | 12.22 | |
| | | | | | | | | | | | | | | | | | | | |
Total Return (c) | | | 5.45 | % | | | 0.16 | % | | | 32.36 | % | | | 11.46 | % | | | 5.70 | % |
| | | | | |
Ratios/Supplemental Data: | | | | | | | | | | | | | | | | | | | | |
Net Assets, End of Period (in 000’s) | | $ | 245,192 | | | $ | 250,173 | | | $ | 252,804 | | | $ | 240,075 | | | $ | 246,141 | |
Ratios of expenses to average net assets: | | | | | | | | | | | | | | | | | | | | |
Before expense reimbursement and/or fee waiver by Adviser | | | 1.09 | % | | | 1.08 | % | | | 1.09 | % | | | 1.12 | % | | | 1.12 | %(d) |
After expense reimbursement and/or fee waiver by Adviser | | | 1.09 | % | | | 1.08 | % | | | 1.09 | % | | | 1.12 | % | | | 1.12 | %(d) |
Ratios of net investment income (loss) to average net assets: | | | | | | | | | | | | | | | | | | | | |
Before expense reimbursement and/or fee waiver by Adviser | | | (0.20 | )% | | | (0.01 | )% | | | 1.28 | % | | | 0.47 | % | | | 0.12 | % |
After expense reimbursement and/or fee waiver by Adviser | | | (0.20 | )% | | | (0.01 | )% | | | 1.28 | % | | | 0.47 | % | | | 0.12 | % |
Portfolio Turnover | | | 60.94 | % | | | 66.22 | % | | | 56.08 | % | | | 26.95 | % | | | 42.29 | % |
| | (a) | The selected per share data was calculated using the weighted average shares outstanding method for the period. |
| | (b) | Represents less than $(0.005) per share. |
| | (c) | The total return is calculated using the Net Asset Value used for trading at the close of business at period end. |
| | (d) | Ratios of expenses to average net assets include interest expense of less than 0.005% for the year ended October 31, 2011, which are not included in the contractual expense limitation. The interest expense is from utilizing the line of credit, as discussed in Note H to the Financial Statements. |
See accompanying Notes to Financial Statements.
| | |
| |
| ASTON/Silvercrest Small Cap Fund – Class N | | October 31, 2015 |
| |
| Financial Highlights | | |
| | | | | | | | | | | | | | | | |
| | | Year
Ended
10/31/15 | | | Year
Ended
10/31/14 | | | Year
Ended
10/31/13 | | | Period
Ended
10/31/12(a) | |
| | | | |
| | | | |
| | | | |
Net Asset Value, Beginning of Period | | $ | 15.20 | | | $ | 14.54 | | | $ | 10.90 | | | $ | 10.00 | |
| | | | | | | | | | | | | | | | |
Income from Investment Operations: | | | | | | | | | | | | | | | | |
Net investment income | | | 0.01 | (b) | | | 0.01 | | | | 0.01 | (b) | | | 0.01 | |
Net realized and unrealized gain on investments | | | 0.31 | | | | 1.16 | | | | 3.77 | | | | 0.89 | |
| | | | | | | | | | | | | | | | |
Total from investment operations | | | 0.32 | | | | 1.17 | | | | 3.78 | | | | 0.90 | |
| | | | | | | | | | | | | | | | |
Less Distributions: | | | | | | | | | | | | | | | | |
Distributions from and in excess of net investment income | | | (0.02 | ) | | | — | (c) | | | (0.11 | ) | | | — | |
Distributions from net realized gains on investments | | | (0.30 | ) | | | (0.51 | ) | | | (0.03 | ) | | | — | |
| | | | | | | | | | | | | | | | |
Total distributions | | | (0.32 | ) | | | (0.51 | ) | | | (0.14 | ) | | | — | |
| | | | | | | | | | | | | | | | |
Net increase in net asset value | | | 0.00 | | | | 0.66 | | | | 3.64 | | | | 0.90 | |
| | | | | | | | | | | | | | | | |
Net Asset Value, End of Period | | $ | 15.20 | | | $ | 15.20 | | | $ | 14.54 | | | $ | 10.90 | |
| | | | | | | | | | | | | | | | |
Total Return (d) | | | 2.14 | % | | | 8.18 | % | | | 35.09 | % | | | 9.00 | %(e) |
| | | | |
Ratios/Supplemental Data: | | | | | | | | | | | | | | | | |
Net Assets, End of Period (in 000’s) | | $ | 19,061 | | | $ | 6,673 | | | $ | 4,049 | | | $ | 750 | |
Ratios of expenses to average net assets: | | | | | | | | | | | | | | | | |
Before expense reimbursement and/or fee waiver by Adviser | | | 1.47 | % | | | 1.61 | % | | | 2.05 | % | | | 5.10 | %(f) |
After expense reimbursement and/or fee waiver by Adviser | | | 1.40 | % | | | 1.40 | % | | | 1.40 | % | | | 1.40 | %(f) |
Ratios of net investment income (loss) to average net assets: | | | | | | | | | | | | | | | | |
Before expense reimbursement and/or fee waiver by Adviser | | | (0.03 | )% | | | (0.17 | )% | | | (0.61 | )% | | | (3.51 | )%(f) |
After expense reimbursement and/or fee waiver by Adviser | | | 0.04 | % | | | 0.04 | % | | | 0.04 | % | | | 0.19 | %(f) |
Portfolio Turnover | | | 36.02 | % | | | 31.68 | % | | | 36.82 | % | | | 26.22 | %(e)(g) |
| | (a) | The commencement of investment operations for Silvercrest Small Cap Fund Class N shares is December 26, 2011. |
| | (b) | The selected per share data was calculated using the weighted average shares outstanding method for the period. |
| | (c) | Represents less than $(0.005) per share. |
| | (d) | The total return is calculated using the Net Asset Value used for trading at the close of business at period end. |
| | (g) | Portfolio turnover rate excludes securities delivered from processing a redemption-in-kind. |
See accompanying Notes to Financial Statements.
| | |
| |
| ASTON/Silvercrest Small Cap Fund – Class I | | October 31, 2015 |
| |
| Financial Highlights | | |
| | | | | | | | | | | | | | | | |
| | | Year
Ended
10/31/15 | | | Year
Ended
10/31/14 | | | Year
Ended
10/31/13 | | | Period
Ended
10/31/12(a) | |
| | | | |
| | | | |
| | | | |
Net Asset Value, Beginning of Period | | $ | 15.27 | | | $ | 14.59 | | | $ | 10.93 | | | $ | 10.00 | |
| | | | | | | | | | | | | | | | |
Income from Investment Operations: | | | | | | | | | | | | | | | | |
Net investment income | | | 0.04 | (b) | | | 0.05 | | | | 0.04 | (b) | | | 0.03 | |
Net realized and unrealized gain on investments | | | 0.32 | | | | 1.17 | | | | 3.78 | | | | 0.90 | |
| | | | | | | | | | | | | | | | |
Total from investment operations | | | 0.36 | | | | 1.22 | | | | 3.82 | | | | 0.93 | |
| | | | | | | | | | | | | | | | |
Less Distributions: | | | | | | | | | | | | | | | | |
Distributions from and in excess of net investment income | | | (0.03 | ) | | | (0.03 | ) | | | (0.13 | ) | | | — | |
Distributions from net realized gains on investments | | | (0.30 | ) | | | (0.51 | ) | | | (0.03 | ) | | | — | |
| | | | | | | | | | | | | | | | |
Total distributions | | | (0.33 | ) | | | (0.54 | ) | | | (0.16 | ) | | | — | |
| | | | | | | | | | | | | | | | |
Net increase in net asset value | | | 0.03 | | | | 0.68 | | | | 3.66 | | | | 0.93 | |
| | | | | | | | | | | | | | | | |
Net Asset Value, End of Period | | $ | 15.30 | | | $ | 15.27 | | | $ | 14.59 | | | $ | 10.93 | |
| | | | | | | | | | | | | | | | |
Total Return (c) | | | 2.37 | % | | | 8.47 | % | | | 35.39 | % | | | 9.30 | %(d) |
| | | | |
Ratios/Supplemental Data: | | | | | | | | | | | | | | | | |
Net Assets, End of Period (in 000’s) | | $ | 145,402 | | | $ | 62,215 | | | $ | 29,219 | | | $ | 4,962 | |
Ratios of expenses to average net assets: | | | | | | | | | | | | | | | | |
Before expense reimbursement and/or fee waiver by Adviser | | | 1.22 | % | | | 1.36 | % | | | 1.80 | % | | | 4.85 | %(e) |
After expense reimbursement and/or fee waiver by Adviser | | | 1.15 | % | | | 1.15 | % | | | 1.15 | % | | | 1.15 | %(e) |
Ratios of net investment income (loss) to average net assets: | | | | | | | | | | | | | | | | |
Before expense reimbursement and/or fee waiver by Adviser | | | 0.22 | % | | | 0.08 | % | | | (0.36 | )% | | | (3.26 | )%(e) |
After expense reimbursement and/or fee waiver by Adviser | | | 0.29 | % | | | 0.29 | % | | | 0.29 | % | | | 0.44 | %(e) |
Portfolio Turnover | | | 36.02 | % | | | 31.68 | % | | | 36.82 | % | | | 26.22 | %(d)(f) |
| | (a) | The commencement of investment operations for Silvercrest Small Cap Fund Class I shares is December 26, 2011. |
| | (b) | The selected per share data was calculated using the weighted average shares outstanding method for the period. |
| | (c) | The total return is calculated using the Net Asset Value used for trading at the close of business at period end. |
| | (f) | Portfolio turnover rate excludes securities delivered from processing a redemption-in-kind. |
See accompanying Notes to Financial Statements.
| | |
| |
| ASTON/TAMRO Small Cap Fund – Class N | | October 31, 2015 |
| |
| Financial Highlights | | |
| | | | | | | | | | | | | | | | | | | | |
| | | Year
Ended
10/31/15 | | | Year
Ended
10/31/14 | | | Year
Ended
10/31/13 | | | Year
Ended
10/31/12 | | | Year
Ended
10/31/11 | |
Net Asset Value, Beginning of Period | | $ | 22.07 | | | $ | 24.06 | | | $ | 20.52 | | | $ | 20.57 | | | $ | 19.42 | |
| | | | | | | | | | | | | | | | | | | | |
Income from Investment Operations: | | | | | | | | | | | | | | | | | | | | |
Net investment loss | | | (0.12 | )(a) | | | (0.13 | )(a) | | | (0.03 | )(a) | | | (0.12 | )(a) | | | (0.15 | )(a) |
Net realized and unrealized gain (loss) on investments | | | (0.62 | ) | | | 0.30 | | | | 5.55 | | | | 2.09 | | | | 1.75 | |
| | | | | | | | | | | | | | | | | | | | |
Total from investment operations | | | (0.74 | ) | | | 0.17 | | | | 5.52 | | | | 1.97 | | | | 1.60 | |
| | | | | | | | | | | | | | | | | | | | |
Less Distributions: | | | | | | | | | | | | | | | | | | | | |
Distributions from net realized gain on investments | | | (2.74 | ) | | | (2.16 | ) | | | (1.98 | ) | | | (2.02 | ) | | | (0.45 | ) |
| | | | | | | | | | | | | | | | | | | | |
Total distributions | | | (2.74 | ) | | | (2.16 | ) | | | (1.98 | ) | | | (2.02 | ) | | | (0.45 | ) |
| | | | | | | | | | | | | | | | | | | | |
Net increase (decrease) in net asset value | | | (3.48 | ) | | | (1.99 | ) | | | 3.54 | | | | (0.05 | ) | | | 1.15 | |
| | | | | | | | | | | | | | | | | | | | |
Net Asset Value, End of Period | | $ | 18.59 | | | $ | 22.07 | | | $ | 24.06 | | | $ | 20.52 | | | $ | 20.57 | |
| | | | | | | | | | | | | | | | | | | | |
Total Return (b) | | | (4.12 | )% | | | 0.57 | % | | | 29.52 | % | | | 10.70 | % | | | 8.16 | % |
| | | | | |
Ratios/Supplemental Data: | | | | | | | | | | | | | | | | | | | | |
Net Assets, End of Period (in 000’s) | | $ | 241,283 | | | $ | 336,350 | | | $ | 533,627 | | | $ | 389,125 | | | $ | 375,969 | |
Ratios of expenses to average net assets: | | | | | | | | | | | | | | | | | | | | |
Before expense reimbursement and/or fee waiver by Adviser | | | 1.31 | % | | | 1.31 | % | | | 1.31 | % | | | 1.28 | %(c) | | | 1.29 | % |
After expense reimbursement and/or fee waiver by Adviser | | | 1.31 | % | | | 1.31 | % | | | 1.31 | % | | | 1.28 | %(c) | | | 1.29 | % |
Ratios of net investment loss to average net assets: | | | | | | | | | | | | | | | | | | | | |
Before expense reimbursement and/or fee waiver by Adviser | | | (0.58 | )% | | | (0.57 | )% | | | (0.16 | )% | | | (0.59 | )% | | | (0.69 | )% |
After expense reimbursement and/or fee waiver by Adviser | | | (0.58 | )% | | | (0.57 | )% | | | (0.16 | )% | | | (0.59 | )% | | | (0.69 | )% |
Portfolio Turnover | | | 64.94 | % | | | 69.72 | % | | | 71.28 | %(d)(e) | | | 48.22 | %(d) | | | 47.25 | % |
| | (a) | The selected per share data was calculated using the weighted average shares outstanding method for the period. |
| | (b) | The total return is calculated using the Net Asset Value used for trading at the close of business at period end. |
| | (c) | Ratios of expenses to average net assets include interest expense of less than 0.005% for the year ended October 31, 2012, which is not included in the contractual expense limitation. The interest expense is from utilizing the line of credit, as discussed in Note H to the Financial Statements. |
| | (d) | Portfolio turnover rate excludes securities delivered from processing a redemption-in-kind. |
| | (e) | Portfolio turnover rate excludes securities received from processing a subscription-in-kind. |
See accompanying Notes to Financial Statements.
| | |
| |
| ASTON/TAMRO Small Cap Fund – Class I | | October 31, 2015 |
| |
| Financial Highlights | | |
| | | | | | | | | | | | | | | | | | | | |
| | | Year
Ended
10/31/15 | | | Year
Ended
10/31/14 | | | Year
Ended
10/31/13 | | | Year
Ended
10/31/12 | | | Year
Ended
10/31/11 | |
| | | | | | | | | | | | | | | | | | | | |
Net Asset Value, Beginning of Period | | $ | 22.76 | | | $ | 24.69 | | | $ | 20.96 | | | $ | 20.91 | | | $ | 19.69 | |
| | | | | | | | | | | | | | | | | | | | |
Income from Investment Operations: | | | | | | | | | | | | | | | | | | | | |
Net investment income (loss) | | | (0.07 | )(a) | | | (0.07 | )(a) | | | 0.02 | (a) | | | (0.07 | )(a) | | | (0.09 | )(a) |
Net realized and unrealized gain (loss) on investments | | | (0.65 | ) | | | 0.30 | | | | 5.69 | | | | 2.14 | | | | 1.76 | |
| | | | | | | | | | | | | | | | | | | | |
Total from investment operations | | | (0.72 | ) | | | 0.23 | | | | 5.71 | | | | 2.07 | | | | 1.67 | |
| | | | | | | | | | | | | | | | | | | | |
Less Distributions: | | | | | | | | | | | | | | | | | | | | |
Distributions from net realized gain on investments | | | (2.74 | ) | | | (2.16 | ) | | | (1.98 | ) | | | (2.02 | ) | | | (0.45 | ) |
| | | | | | | | | | | | | | | | | | | | |
Total distributions | | | (2.74 | ) | | | (2.16 | ) | | | (1.98 | ) | | | (2.02 | ) | | | (0.45 | ) |
| | | | | | | | | | | | | | | | | | | | |
Net increase (decrease) in net asset value | | | (3.46 | ) | | | (1.93 | ) | | | 3.73 | | | | 0.05 | | | | 1.22 | |
| | | | | | | | | | | | | | | | | | | | |
Net Asset Value, End of Period | | $ | 19.30 | | | $ | 22.76 | | | $ | 24.69 | | | $ | 20.96 | | | $ | 20.91 | |
| | | | | | | | | | | | | | | | | | | | |
Total Return (b) | | | (3.93 | )% | | | 0.86 | % | | | 29.84 | % | | | 10.98 | % | | | 8.40 | % |
| | | | | |
Ratios/Supplemental Data: | | | | | | | | | | | | | | | | | | | | |
Net Assets, End of Period (in 000’s) | | $ | 307,403 | | | $ | 469,518 | | | $ | 792,172 | | | $ | 635,663 | | | $ | 625,315 | |
Ratios of expenses to average net assets: | | | | | | | | | | | | | | | | | | | | |
Before expense reimbursement and/or fee waiver by Adviser | | | 1.06 | % | | | 1.06 | % | | | 1.06 | % | | | 1.03 | %(c) | | | 1.04 | % |
After expense reimbursement and/or fee waiver by Adviser | | | 1.06 | % | | | 1.06 | % | | | 1.06 | % | | | 1.03 | %(c) | | | 1.04 | % |
Ratios of net investment income (loss) to average net assets: | | | | | | | | | | | | | | | | | | | | |
Before expense reimbursement and/or fee waiver by Adviser | | | (0.33 | )% | | | (0.32 | )% | | | 0.09 | % | | | (0.34 | )% | | | (0.44 | )% |
After expense reimbursement and/or fee waiver by Adviser | | | (0.33 | )% | | | (0.32 | )% | | | 0.09 | % | | | (0.34 | )% | | | (0.44 | )% |
Portfolio Turnover | | | 64.94 | % | | | 69.72 | % | | | 71.28 | %(d)(e) | | | 48.22 | %(d) | | | 47.25 | % |
| | (a) | The selected per share data was calculated using the weighted average shares outstanding method for the period. |
| | (b) | The total return is calculated using the Net Asset Value used for trading at the close of business at period end. |
| | (c) | Ratios of expenses to average net assets include interest expense of less than 0.005% for the year ended October 31, 2012, which is not included in the contractual expense limitation. The interest expense is from utilizing the line of credit, as discussed in Note H to the Financial Statements. |
| | (d) | Portfolio turnover rate excludes securities delivered from processing a redemption-in-kind. |
| | (e) | Portfolio turnover rate excludes securities received from processing a subscription-in-kind. |
See accompanying Notes to Financial Statements.
| | |
| |
| ASTON/DoubleLine Core Plus Fixed Income Fund – Class N | | October 31, 2015 |
| |
| Financial Highlights | | |
| | | | | | | | | | | | | | | | | | | | |
| | | Year
Ended
10/31/15 | | | Year
Ended
10/31/14 | | | Year
Ended
10/31/13 | | | Year
Ended
10/31/12 | | | Period
Ended
10/31/11(a) | |
Net Asset Value, Beginning of Period | | $ | 10.86 | | | $ | 10.65 | | | $ | 11.10 | | | $ | 10.44 | | | $ | 10.00 | |
| | | | | | | | | | | | | | | | | | | | |
Income from Investment Operations: | | | | | | | | | | | | | | | | | | | | |
Net investment income | | | 0.38 | | | | 0.40 | | | | 0.30 | | | | 0.33 | (b) | | | 0.12 | (b) |
Net realized and unrealized gain (loss) on investments | | | (0.27 | ) | | | 0.22 | | | | (0.33 | ) | | | 0.72 | | | | 0.41 | |
| | | | | | | | | | | | | | | | | | | | |
Total from investment operations | | | 0.11 | | | | 0.62 | | | | (0.03 | ) | | | 1.05 | | | | 0.53 | |
| | | | | | | | | | | | | | | | | | | | |
Less Distributions: | | | | | | | | | | | | | | | | | | | | |
Distributions from and in excess of net investment income | | | (0.37 | ) | | | (0.41 | ) | | | (0.36 | ) | | | (0.37 | ) | | | (0.09 | ) |
Distributions from net realized gain on investments | | | — | | | | — | | | | (0.06 | ) | | | (0.02 | ) | | | — | |
| | | | | | | | | | | | | | | | | | | | |
Total distributions | | | (0.37 | ) | | | (0.41 | ) | | | (0.42 | ) | | | (0.39 | ) | | | (0.09 | ) |
| | | | | | | | | | | | | | | | | | | | |
Net increase (decrease) in net asset value | | | (0.26 | ) | | | 0.21 | | | | (0.45 | ) | | | 0.66 | | | | 0.44 | |
| | | | | | | | | | | | | | | | | | | | |
Net Asset Value, End of Period | | $ | 10.60 | | | $ | 10.86 | | | $ | 10.65 | | | $ | 11.10 | | | $ | 10.44 | |
| | | | | | | | | | | | | | | | | | | | |
Total Return (c) | | | 1.04 | % | | | 5.96 | % | | | (0.28 | )% | | | 10.25 | % | | | 5.33 | %(d) |
| | | | | |
Ratios/Supplemental Data: | | | | | | | | | | | | | | | | | | | | |
Net Assets, End of Period (in 000’s) | | $ | 188,286 | | | $ | 49,147 | | | $ | 66,368 | | | $ | 71,546 | | | $ | 22,657 | |
Ratios of expenses to average net assets: | | | | | | | | | | | | | | | | | | | | |
Before expense reimbursement and/or fee waiver by Adviser | | | 1.05 | % | | | 1.08 | % | | | 1.04 | % | | | 1.35 | % | | | 3.16 | %(e) |
After expense reimbursement and/or fee waiver by Adviser | | | 0.94 | % | | | 0.94 | % | | | 0.94 | % | | | 0.94 | % | | | 0.94 | %(e) |
Ratios of net investment income to average net assets: | | | | | | | | | | | | | | | | | | | | |
Before expense reimbursement and/or fee waiver by Adviser | | | 3.21 | % | | | 3.58 | % | | | 2.66 | % | | | 2.59 | % | | | 1.63 | %(e) |
After expense reimbursement and/or fee waiver by Adviser | | | 3.32 | % | | | 3.72 | % | | | 2.77 | % | | | 3.01 | % | | | 3.85 | %(e) |
Portfolio Turnover | | | 59.42 | % | | | 117.18 | % | | | 125.07 | % | | | 118.67 | % | | | 38.49 | %(d) |
| | (a) | The commencement of investment operations for DoubleLine Core Plus Fixed Income Fund Class N shares is July 17, 2011. |
| | (b) | The selected per share data was calculated using the weighted average shares outstanding method for the period. |
| | (c) | The total return is calculated using the Net Asset Value used for trading at the close of business at period end. |
See accompanying Notes to Financial Statements.
| | |
| |
| ASTON/DoubleLine Core Plus Fixed Income Fund – Class I | | October 31, 2015 |
| |
| Financial Highlights | | |
| | | | | | | | | | | | | | | | | | | | |
| | | Year
Ended
10/31/15 | | | Year
Ended
10/31/14 | | | Year
Ended
10/31/13 | | | Year
Ended
10/31/12 | | | Period
Ended
10/31/11(a) | |
Net Asset Value, Beginning of Period | | $ | 10.86 | | | $ | 10.65 | | | $ | 11.10 | | | $ | 10.44 | | | $ | 10.00 | |
| | | | | | | | | | | | | | | | | | | | |
Income from Investment Operations: | | | | | | | | | | | | | | | | | | | | |
Net investment income | | | 0.41 | | | | 0.44 | | | | 0.33 | | | | 0.35 | (b) | | | 0.13 | (b) |
Net realized and unrealized gain (loss) on investments | | | (0.27 | ) | | | 0.21 | | | | (0.33 | ) | | | 0.73 | | | | 0.41 | |
| | | | | | | | | | | | | | | | | | | | |
Total from investment operations | | | 0.14 | | | | 0.65 | | | | — | | | | 1.08 | | | | 0.54 | |
| | | | | | | | | | | | | | | | | | | | |
Less Distributions: | | | | | | | | | | | | | | | | | | | | |
Distributions from and in excess of net investment income | | | (0.40 | ) | | | (0.44 | ) | | | (0.39 | ) | | | (0.40 | ) | | | (0.10 | ) |
Distributions from net realized gain on investments | | | — | | | | — | | | | (0.06 | ) | | | (0.02 | ) | | | — | |
| | | | | | | | | | | | | | | | | | | | |
Total distributions | | | (0.40 | ) | | | (0.44 | ) | | | (0.45 | ) | | | (0.42 | ) | | | (0.10 | ) |
| | | | | | | | | | | | | | | | | | | | |
Net increase (decrease) in net asset value | | | (0.26 | ) | | | 0.21 | | | | (0.45 | ) | | | 0.66 | | | | 0.44 | |
| | | | | | | | | | | | | | | | | | | | |
Net Asset Value, End of Period | | $ | 10.60 | | | $ | 10.86 | | | $ | 10.65 | | | $ | 11.10 | | | $ | 10.44 | |
| | | | | | | | | | | | | | | | | | | | |
Total Return (c) | | | 1.28 | % | | | 6.22 | % | | | (0.03 | )% | | | 10.52 | % | | | 5.38 | %(d) |
| | | | | |
Ratios/Supplemental Data: | | | | | | | | | | | | | | | | | | | | |
Net Assets, End of Period (in 000’s) | | $ | 304,051 | | | $ | 158,198 | | | $ | 110,018 | | | $ | 105,335 | | | $ | 4,486 | |
Ratios of expenses to average net assets: | | | | | | | | | | | | | | | | | | | | |
Before expense reimbursement and/or fee waiver by Adviser | | | 0.80 | % | | | 0.83 | % | | | 0.79 | % | | | 1.10 | % | | | 2.91 | %(e) |
After expense reimbursement and/or fee waiver by Adviser | | | 0.69 | % | | | 0.69 | % | | | 0.69 | % | | | 0.69 | % | | | 0.69 | %(e) |
Ratios of net investment income to average net assets: | | | | | | | | | | | | | | | | | | | | |
Before expense reimbursement and/or fee waiver by Adviser | | | 3.46 | % | | | 3.83 | % | | | 2.91 | % | | | 2.84 | % | | | 1.88 | %(e) |
After expense reimbursement and/or fee waiver by Adviser | | | 3.57 | % | | | 3.97 | % | | | 3.02 | % | | | 3.26 | % | | | 4.10 | %(e) |
Portfolio Turnover | | | 59.42 | % | | | 117.18 | % | | | 125.07 | % | | | 118.67 | % | | | 38.49 | %(d) |
| | (a) | The commencement of investment operations for DoubleLine Core Plus Fixed Income Fund Class I shares is July 17, 2011. |
| | (b) | The selected per share data was calculated using the weighted average shares outstanding method for the period. |
| | (c) | The total return is calculated using the Net Asset Value used for trading at the close of business at period end. |
See accompanying Notes to Financial Statements.
| | |
| |
| ASTON/TCH Fixed Income Fund – Class N | | October 31, 2015 |
| |
| Financial Highlights | | |
| | | | | | | | | | | | | | | | | | | | |
| | | Year
Ended
10/31/15 | | | Year
Ended
10/31/14 | | | Year
Ended
10/31/13 | | | Year
Ended
10/31/12 | | | Year
Ended
10/31/11 | |
Net Asset Value, Beginning of Period | | $ | 10.85 | | | $ | 10.67 | | | $ | 11.11 | | | $ | 10.59 | | | $ | 10.49 | |
| | | | | | | | | | | | | | | | | | | | |
Income from Investment Operations: | | | | | | | | | | | | | | | | | | | | |
Net investment income | | | 0.29 | | | | 0.35 | (a) | | | 0.40 | (a) | | | 0.45 | (a) | | | 0.47 | (a) |
Net realized and unrealized gain (loss) on investments | | | (0.46 | ) | | | 0.23 | | | | (0.39 | ) | | | 0.56 | | | | 0.10 | |
| | | | | | | | | | | | | | | | | | | | |
Total from investment operations | | | (0.17 | ) | | | 0.58 | | | | 0.01 | | | | 1.01 | | | | 0.57 | |
| | | | | | | | | | | | | | | | | | | | |
Less Distributions: | | | | | | | | | | | | | | | | | | | | |
Distributions from and in excess of net investment income | | | (0.33 | ) | | | (0.40 | ) | | | (0.45 | ) | | | (0.49 | ) | | | (0.47 | ) |
| | | | | | | | | | | | | | | | | | | | |
Total distributions | | | (0.33 | ) | | | (0.40 | ) | | | (0.45 | ) | | | (0.49 | ) | | | (0.47 | ) |
| | | | | | | | | | | | | | | | | | | | |
Net increase (decrease) in net asset value | | | (0.50 | ) | | | 0.18 | | | | (0.44 | ) | | | 0.52 | | | | 0.10 | |
| | | | | | | | | | | | | | | | | | | | |
Net Asset Value, End of Period | | $ | 10.35 | | | $ | 10.85 | | | $ | 10.67 | | | $ | 11.11 | | | $ | 10.59 | |
| | | | | | | | | | | | | | | | | | | | |
Total Return (b) | | | (1.61 | )% | | | 5.48 | % | | | 0.13 | % | | | 9.74 | % | | | 5.62 | % |
| | | | | |
Ratios/Supplemental Data: | | | | | | | | | | | | | | | | | | | | |
Net Assets, End of Period (in 000’s) | | $ | 35,023 | | | $ | 36,950 | | | $ | 45,771 | | | $ | 59,772 | | | $ | 62,346 | |
Ratios of expenses to average net assets: | | | | | | | | | | | | | | | | | | | | |
Before expense reimbursement and/or fee waiver by Adviser | | | 1.18 | % | | | 1.17 | % | | | 1.02 | % | | | 1.02 | % | | | 1.14 | % |
After expense reimbursement and/or fee waiver by Adviser | | | 0.94 | % | | | 0.94 | % | | | 0.84 | % | | | 0.86 | % | | | 0.88 | %(c) |
Ratios of net investment income to average net assets: | | | | | | | | | | | | | | | | | | | | |
Before expense reimbursement and/or fee waiver by Adviser | | | 2.52 | % | | | 3.04 | % | | | 3.49 | % | | | 4.03 | % | | | 4.20 | % |
After expense reimbursement and/or fee waiver by Adviser | | | 2.76 | % | | | 3.26 | % | | | 3.67 | % | | | 4.19 | % | | | 4.46 | % |
Portfolio Turnover | | | 28.51 | % | | | 36.31 | % | | | 53.77 | % | | | 57.43 | % | | | 37.51 | % |
| | (a) | The selected per share data was calculated using the weighted average shares outstanding method for the period. |
| | (b) | The total return is calculated using the Net Asset Value used for trading at the close of business at period end. |
| | (c) | Effective March 1, 2011, the contractual expense limitation was increased from 0.74% to 0.94%, excluding interest, taxes, investment-related costs (such as brokerage commissions), extraordinary expenses and acquired fund fees and expenses. |
See accompanying Notes to Financial Statements.
| | |
| |
| ASTON/TCH Fixed Income Fund – Class I | | October 31, 2015 |
| |
| Financial Highlights | | |
| | | | | | | | | | | | | | | | | | | | |
| | | Year
Ended
10/31/15 | | | Year
Ended
10/31/14 | | | Year
Ended
10/31/13 | | | Year
Ended
10/31/12 | | | Year
Ended
10/31/11 | |
Net Asset Value, Beginning of Period | | $ | 10.85 | | | $ | 10.67 | | | $ | 11.11 | | | $ | 10.59 | | | $ | 10.49 | |
| | | | | | | | | | | | | | | | | | | | |
Income from Investment Operations: | | | | | | | | | | | | | | | | | | | | |
Net investment income | | | 0.32 | | | | 0.38 | (a) | | | 0.42 | (a) | | | 0.47 | (a) | | | 0.49 | (a) |
Net realized and unrealized gain (loss) on investments | | | (0.46 | ) | | | 0.22 | | | | (0.39 | ) | | | 0.55 | | | | 0.11 | |
| | | | | | | | | | | | | | | | | | | | |
Total from investment operations | | | (0.14 | ) | | | 0.60 | | | | 0.03 | | | | 1.02 | | | | 0.60 | |
| | | | | | | | | | | | | | | | | | | | |
Less Distributions: | | | | | | | | | | | | | | | | | | | | |
Distributions from and in excess of net investment income | | | (0.36 | ) | | | (0.42 | ) | | | (0.47 | ) | | | (0.50 | ) | | | (0.50 | ) |
| | | | | | | | | | | | | | | | | | | | |
Total distributions | | | (0.36 | ) | | | (0.42 | ) | | | (0.47 | ) | | | (0.50 | ) | | | (0.50 | ) |
| | | | | | | | | | | | | | | | | | | | |
Net increase (decrease) in net asset value . | | | (0.50 | ) | | | 0.18 | | | | (0.44 | ) | | | 0.52 | | | | 0.10 | |
| | | | | | | | | | | | | | | | | | | | |
Net Asset Value, End of Period | | $ | 10.35 | | | $ | 10.85 | | | $ | 10.67 | | | $ | 11.11 | | | $ | 10.59 | |
| | | | | | | | | | | | | | | | | | | | |
Total Return (b) | | | (1.37 | )% | | | 5.75 | % | | | 0.28 | % | | | 9.93 | % | | | 5.89 | % |
| | | | | |
Ratios/Supplemental Data: | | | | | | | | | | | | | | | | | | | | |
Net Assets, End of Period (in 000’s) | | $ | 14,808 | | | $ | 15,199 | | | $ | 8,742 | | | $ | 10,396 | | | $ | 10,423 | |
Ratios of expenses to average net assets: | | | | | | | | | | | | | | | | | | | | |
Before expense reimbursement and/or fee waiver by Adviser | | | 0.93 | % | | | 0.92 | % | | | 0.87 | % | | | 0.85 | % | | | 0.89 | % |
After expense reimbursement and/or fee waiver by Adviser | | | 0.69 | % | | | 0.69 | % | | | 0.69 | % | | | 0.69 | % | | | 0.63 | %(c) |
Ratios of net investment income to average net assets: | | | | | | | | | | | | | | | | | | | | |
Before expense reimbursement and/or fee waiver by Adviser | | | 2.77 | % | | | 3.29 | % | | | 3.64 | % | | | 4.20 | % | | | 4.45 | % |
After expense reimbursement and/or fee waiver by Adviser | | | 3.01 | % | | | 3.51 | % | | | 3.82 | % | | | 4.36 | % | | | 4.71 | % |
Portfolio Turnover | | | 28.51 | % | | | 36.31 | % | | | 53.77 | % | | | 57.43 | % | | | 37.51 | % |
| | (a) | The selected per share data was calculated using the weighted average shares outstanding method for the period. |
| | (b) | The total return is calculated using the Net Asset Value used for trading at the close of business at period end. |
| | (c) | Effective March 1, 2011, the contractual expense limitation was increased from 0.49% to 0.69%, excluding interest, taxes, investment-related costs (such as brokerage commissions), extraordinary expenses and acquired fund fees and expenses. |
See accompanying Notes to Financial Statements.
| | |
| |
| ASTON/Anchor Capital Enhanced Equity Fund – Class N | | October 31, 2015 |
| |
| Financial Highlights | | |
| | | | | | | | | | | | | | | | | | | | |
| | | Year
Ended
10/31/15 | | | Year
Ended
10/31/14 | | | Year
Ended
10/31/13 | | | Year
Ended
10/31/12 | | | Year
Ended
10/31/11 | |
| | | | | | | | | | | | | | | | | | | | |
Net Asset Value, Beginning of Period | | $ | 9.49 | | | $ | 9.39 | | | $ | 8.68 | | | $ | 9.61 | | | $ | 9.41 | |
| | | | | | | | | | | | | | | | | | | | |
Income from Investment Operations: | | | | | | | | | | | | | | | | | | | | |
Net investment income | | | 0.18 | | | | 0.17 | | | | 0.20 | | | | 0.16 | | | | 0.14 | |
Net realized and unrealized gain (loss) on investments | | | (0.36 | ) | | | 0.09 | | | | 0.86 | | | | 0.11 | | | | 0.56 | |
| | | | | | | | | | | | | | | | | | | | |
Total from investment operations | | | (0.18 | ) | | | 0.26 | | | | 1.06 | | | | 0.27 | | | | 0.70 | |
| | | | | | | | | | | | | | | | | | | | |
Less Distributions: | | | | | | | | | | | | | | | | | | | | |
Distributions from and in excess of net investment income | | | (0.17 | ) | | | (0.16 | ) | | | (0.20 | ) | | | (0.16 | ) | | | (0.13 | ) |
Distributions from net realized gain on investments | | | — | | | | — | | | | (0.15 | ) | | | (1.04 | ) | | | (0.37 | ) |
| | | | | | | | | | | | | | | | | | | | |
Total distributions | | | (0.17 | ) | | | (0.16 | ) | | | (0.35 | ) | | | (1.20 | ) | | | (0.50 | ) |
| | | | | | | | | | | | | | | | | | | | |
Net increase (decrease) in net asset value | | | (0.35 | ) | | | 0.10 | | | | 0.71 | | | | (0.93 | ) | | | 0.20 | |
| | | | | | | | | | | | | | | | | | | | |
Net Asset Value, End of Period | | $ | 9.14 | | | $ | 9.49 | | | $ | 9.39 | | | $ | 8.68 | | | $ | 9.61 | |
| | | | | | | | | | | | | | | | | | | | |
Total Return (a) | | | (1.86 | )% | | | 2.68 | % | | | 12.60 | % | | | 3.12 | % | | | 7.69 | % |
| | | | | |
Ratios/Supplemental Data: | | | | | | | | | | | | | | | | | | | | |
Net Assets, End of Period (in 000’s) | | $ | 84,994 | | | $ | 101,980 | | | $ | 101,663 | | | $ | 106,191 | | | $ | 48,365 | |
Ratios of expenses to average net assets: | | | | | | | | | | | | | | | | | | | | |
Before earnings credit, expense reimbursement and/or fee waiver, or recoupment by the Adviser | | | 1.19 | % | | | 1.19 | % | | | 1.23 | %(b) | | | 1.22 | %(b)(c) | | | 1.24 | %(c) |
After earnings credit, expense reimbursement and/or fee waiver, or recoupment by the Adviser | | | 1.19 | % | | | 1.19 | % | | | 1.23 | %(b) | | | 1.27 | %(b)(c) | | | 1.33 | %(c) |
Ratios of net investment income to average net assets: | | | | | | | | | | | | | | | | | | | | |
Before earnings credit, expense reimbursement and/or fee waiver, or recoupment by the Adviser | | | 1.78 | % | | | 1.81 | % | | | 2.24 | % | | | 1.82 | % | | | 1.51 | % |
After earnings credit, expense reimbursement and/or fee waiver, or recoupment by the Adviser | | | 1.78 | % | | | 1.81 | % | | | 2.24 | % | | | 1.78 | % | | | 1.41 | % |
Portfolio Turnover | | | 33.30 | % | | | 41.24 | % | | | 77.70 | % | | | 56.33 | % | | | 87.37 | % |
| | (a) | The total return is calculated using the Net Asset Value used for trading at the close of business at period end. |
| | (b) | Ratios of expenses to average net assets include Earnings Credits of less than 0.005% for each of the years ended October 31, 2013 and October 31, 2012, which are not included in the contractual expense limitation. See Note I to the Financial Statements. |
| | (c) | Ratios of expenses to average net assets include interest expense of less than 0.005% for each of the years ended October 31, 2012 and October 31, 2011, which are not included in the contractual expense limitation. The interest expense is from utilizing the line of credit, as discussed in Note H to the Financial Statements. |
See accompanying Notes to Financial Statements.
| | |
| |
| ASTON/Anchor Capital Enhanced Equity Fund – Class I | | October 31, 2015 |
| |
| Financial Highlights | | |
| | | | | | | | | | | | | | | | | | | | |
| | | Year
Ended
10/31/15 | | | Year
Ended
10/31/14 | | | Year
Ended
10/31/13 | | | Year
Ended
10/31/12 | | | Year
Ended
10/31/11 | |
| | | | | | | | | | | | | | | | | | | | |
Net Asset Value, Beginning of Period | | $ | 9.50 | | | $ | 9.40 | | | $ | 8.69 | | | $ | 9.62 | | | $ | 9.41 | |
| | | | | | | | | | | | | | | | | | | | |
Income from Investment Operations: | | | | | | | | | | | | | | | | | | | | |
Net investment income | | | 0.19 | | | | 0.18 | | | | 0.22 | | | | 0.18 | | | | 0.16 | |
Net realized and unrealized gain (loss) on investments | | | (0.35 | ) | | | 0.10 | | | | 0.86 | | | | 0.11 | | | | 0.57 | |
| | | | | | | | | | | | | | | | | | | | |
Total from investment operations | | | (0.16 | ) | | | 0.28 | | | | 1.08 | | | | 0.29 | | | | 0.73 | |
| | | | | | | | | | | | | | | | | | | | |
Less Distributions: | | | | | | | | | | | | | | | | | | | | |
Distributions from and in excess of net investment income | | | (0.19 | ) | | | (0.18 | ) | | | (0.22 | ) | | | (0.18 | ) | | | (0.15 | ) |
Distributions from net realized gain on investments | | | — | | | | — | | | | (0.15 | ) | | | (1.04 | ) | | | (0.37 | ) |
| | | | | | | | | | | | | | | | | | | | |
Total distributions | | | (0.19 | ) | | | (0.18 | ) | | | (0.37 | ) | | | (1.22 | ) | | | (0.52 | ) |
| | | | | | | | | | | | | | | | | | | | |
Net increase (decrease) in net asset value | | | (0.35 | ) | | | 0.10 | | | | 0.71 | | | | (0.93 | ) | | | 0.21 | |
| | | | | | | | | | | | | | | | | | | | |
Net Asset Value, End of Period | | $ | 9.15 | | | $ | 9.50 | | | $ | 9.40 | | | $ | 8.69 | | | $ | 9.62 | |
| | | | | | | | | | | | | | | | | | | | |
Total Return (a) | | | (1.60 | )% | | | 2.94 | % | | | 12.88 | % | | | 3.46 | % | | | 7.97 | % |
| | | | | |
Ratios/Supplemental Data: | | | | | | | | | | | | | | | | | | | | |
Net Assets, End of Period (in 000’s) | | $ | 83,475 | | | $ | 108,985 | | | $ | 58,099 | | | $ | 71,618 | | | $ | 64,840 | |
Ratios of expenses to average net assets: | | | | | | | | | | | | | | | | | | | | |
Before earnings credit, expense reimbursement and/or fee waiver, or recoupment by the Adviser | | | 0.94 | % | | | 0.94 | % | | | 0.98 | %(b) | | | 0.97 | %(b)(c) | | | 0.99 | %(c) |
After earnings credit, expense reimbursement and/or fee waiver, or recoupment by the Adviser | | | 0.94 | % | | | 0.94 | % | | | 0.98 | %(b) | | | 1.02 | %(b)(c) | | | 1.08 | %(c) |
Ratios of net investment income to average net assets: | | | | | | | | | | | | | | | | | | | | |
Before earnings credit, expense reimbursement and/or fee waiver, or recoupment by the Adviser | | | 2.03 | % | | | 2.06 | % | | | 2.49 | % | | | 2.07 | % | | | 1.76 | % |
After earnings credit, expense reimbursement and/or fee waiver, or recoupment by the Adviser | | | 2.03 | % | | | 2.06 | % | | | 2.49 | % | | | 2.03 | % | | | 1.66 | % |
Portfolio Turnover | | | 33.30 | % | | | 41.24 | % | | | 77.70 | % | | | 56.33 | % | | | 87.37 | % |
| | (a) | The total return is calculated using the Net Asset Value used for trading at the close of business at period end. |
| | (b) | Ratios of expenses to average net assets include Earnings Credits of less than 0.005% for each of the years ended October 31, 2013 and October 31, 2012, which are not included in the contractual expense limitation. See Note I to the Financial Statements. |
| | (c) | Ratios of expenses to average net assets include interest expense of less than 0.005% for each of the years ended October 31, 2012 and October 31, 2011, which are not included in the contractual expense limitation. The interest expense is from utilizing the line of credit, as discussed in Note H to the Financial Statements. |
See accompanying Notes to Financial Statements.
| | |
| |
| ASTON/Lake Partners LASSO Alternatives Fund – Class N | | October 31, 2015 |
| |
| Financial Highlights | | |
| | | | | | | | | | | | | | | | | | | | |
| | | Year
Ended
10/31/15 | | | Year
Ended
10/31/14 | | | Year
Ended
10/31/13 | | | Year
Ended
10/31/12 | | | Year
Ended
10/31/11 | |
Net Asset Value, Beginning of Period | | $ | 13.64 | | | $ | 13.34 | | | $ | 12.39 | | | $ | 11.94 | | | $ | 11.97 | |
| | | | | | | | | | | | | | | | | | | | |
Income from Investment Operations: | | | | | | | | | | | | | | | | | | | | |
Net investment income (loss) | | | (0.04 | )(a) | | | (0.07 | )(a) | | | — | (a)(b) | | | 0.04 | (a) | | | (0.01 | )(a) |
Net realized and unrealized gain (loss) on investments | | | (0.34 | ) | | | 0.50 | (c) | | | 1.11 | | | | 0.59 | | | | 0.13 | |
| | | | | | | | | | | | | | | | | | | | |
Total from investment operations | | | (0.38 | ) | | | 0.43 | | | | 1.11 | | | | 0.63 | | | | 0.12 | |
| | | | | | | | | | | | | | | | | | | | |
Less Distributions: | | | | | | | | | | | | | | | | | | | | |
Distributions from and in excess of net investment income | | | — | (b) | | | (0.09 | ) | | | (0.16 | ) | | | (0.18 | ) | | | (0.08 | ) |
Distributions from net realized gain on investments | | | (0.50 | ) | | | (0.04 | ) | | | — | | | | — | | | | (0.07 | ) |
| | | | | | | | | | | | | | | | | | | | |
Total distributions | | | (0.50 | ) | | | (0.13 | ) | | | (0.16 | ) | | | (0.18 | ) | | | (0.15 | ) |
| | | | | | | | | | | | | | | | | | | | |
Net increase (decrease) in net asset value | | | (0.88 | ) | | | 0.30 | | | | 0.95 | | | | 0.45 | | | | (0.03 | ) |
| | | | | | | | | | | | | | | | | | | | |
Net Asset Value, End of Period | | $ | 12.76 | | | $ | 13.64 | | | $ | 13.34 | | | $ | 12.39 | | | $ | 11.94 | |
| | | | | | | | | | | | | | | | | | | | |
Total Return (d) | | | (2.87 | )% | | | 3.27 | % | | | 9.05 | % | | | 5.34 | % | | | 0.92 | % |
| | | | | |
Ratios/Supplemental Data: | | | | | | | | | | | | | | | | | | | | |
Net Assets, End of Period (in 000’s) | | $ | 40,667 | | | $ | 44,386 | | | $ | 54,388 | | | $ | 33,719 | | | $ | 17,626 | |
Ratios of expenses to average net assets: | | | | | | | | | | | | | | | | | | | | |
Before earnings credit, expense reimbursement and/or fee waiver, or recoupment by the Adviser (e) | | | 1.43 | %(f) | | | 1.41 | % | | | 1.43 | %(g) | | | 1.41 | %(g)(h) | | | 1.53 | % |
After earnings credit, expense reimbursement and/or fee waiver, or recoupment by the Adviser (e) | | | 1.41 | %(f) | | | 1.43 | % | | | 1.45 | %(g) | | | 1.45 | %(g)(h) | | | 1.45 | % |
Ratios of net investment income (loss) to average net assets: | | | | | | | | | | | | | | | | | | | | |
Before earnings credit, expense reimbursement and/or fee waiver, or recoupment by the Adviser | | | (0.33 | )% | | | (0.51 | )% | | | — | %(b) | | | 0.36 | %(h) | | | (0.17 | )% |
After earnings credit, expense reimbursement and/or fee waiver, or recoupment by the Adviser | | | (0.31 | )% | | | (0.53 | )% | | | (0.03 | )% | | | 0.32 | %(h) | | | (0.10 | )% |
Portfolio Turnover | | | 72.73 | % | | | 45.91 | % | | | 43.55 | % | | | 45.60 | % | | | 79.77 | % |
| | (a) | The selected per share data was calculated using the weighted average shares outstanding method for the period. |
| | (b) | Represents less than ($0.005) or $0.005 per share or less than 0.005%. |
| | (c) | Includes capital contribution of less than $0.005 per share. |
| | (d) | The total return is calculated using the Net Asset Value used for trading at the close of business at period end. |
| | (e) | Does not include expenses of the underlying funds in which the Fund invests. |
| | (f) | Effective February 28, 2015, the contractual expense limitation was decreased from 1.45% to 1.40%, excluding interest, taxes, investment-related costs (such as brokerage commissions), extraordinary expenses and acquired fund fees and expenses. |
| | (g) | Ratios of expenses to average net assets includes Earnings Credits of less than 0.005% for each of the years ended October 31, 2013 and October 31, 2012, which are not included in the contractual expense limitation. See Note I to the Financial Statements. |
| | (h) | Ratios of expenses and net investment income to average net assets include advisory fee waiver of less than 0.005% for the year ended October 31, 2012. |
See accompanying Notes to Financial Statements.
| | |
| |
| ASTON/Lake Partners LASSO Alternatives Fund – Class I | | October 31, 2015 |
| |
| Financial Highlights | | |
| | | | | | | | | | | | | | | | | | | | |
| | | Year
Ended
10/31/15 | | | Year
Ended
10/31/14 | | | Year
Ended
10/31/13 | | | Year
Ended
10/31/12 | | | Year
Ended
10/31/11 | |
| | | | | | | | | | | | | | | | | | | | |
Net Asset Value, Beginning of Period | | $ | 13.69 | | | $ | 13.38 | | | $ | 12.42 | | | $ | 11.97 | | | $ | 11.98 | |
| | | | | | | | | | | | | | | | | | | | |
Income from Investment Operations: | | | | | | | | | | | | | | | | | | | | |
Net investment income (loss) | | | (0.01 | ) | | | (0.04 | )(a) | | | 0.03 | (a) | | | 0.07 | (a) | | | 0.02 | (a) |
Net realized and unrealized gain (loss) on investments | | | (0.33 | )(b) | | | 0.51 | (b) | | | 1.11 | | | | 0.59 | | | | 0.13 | |
| | | | | | | | | | | | | | | | | | | | |
Total from investment operations | | | (0.34 | ) | | | 0.47 | | | | 1.14 | | | | 0.66 | | | | 0.15 | |
| | | | | | | | | | | | | | | | | | | | |
Less Distributions: | | | | | | | | | | | | | | | | | | | | |
Distributions from and in excess of net investment income | | | (0.04 | ) | | | (0.12 | ) | | | (0.18 | ) | | | (0.21 | ) | | | (0.09 | ) |
Distributions from net realized gain on investments | | | (0.50 | ) | | | (0.04 | ) | | | — | | | | — | | | | (0.07 | ) |
| | | | | | | | | | | | | | | | | | | | |
Total distributions | | | (0.54 | ) | | | (0.16 | ) | | | (0.18 | ) | | | (0.21 | ) | | | (0.16 | ) |
| | | | | | | | | | | | | | | | | | | | |
Net increase (decrease) in net asset value | | | (0.88 | ) | | | 0.31 | | | | 0.96 | | | | 0.45 | | | | (0.01 | ) |
| | | | | | | | | | | | | | | | | | | | |
Net Asset Value, End of Period | | $ | 12.81 | | | $ | 13.69 | | | $ | 13.38 | | | $ | 12.42 | | | $ | 11.97 | |
| | | | | | | | | | | | | | | | | | | | |
Total Return (c) | | | (2.62 | )% | | | 3.56 | % | | | 9.31 | % | | | 5.56 | % | | | 1.22 | % |
| | | | | |
Ratios/Supplemental Data: | | | | | | | | | | | | | | | | | | | | |
Net Assets, End of Period (in 000’s) | | $ | 169,072 | | | $ | 477,157 | | | $ | 416,475 | | | $ | 253,343 | | | $ | 189,999 | |
Ratios of expenses to average net assets: | | | | | | | | | | | | | | | | | | | | |
Before earnings credit, expense reimbursement and/or fee waiver, or recoupment by the Adviser (d) | | | 1.18 | %(e) | | | 1.16 | % | | | 1.18 | %(f) | | | 1.16 | %(f)(g) | | | 1.28 | % |
After earnings credit, expense reimbursement and/or fee waiver, or recoupment by the Adviser (d) | | | 1.16 | %(e) | | | 1.18 | % | | | 1.20 | %(f) | | | 1.20 | %(f)(g) | | | 1.20 | % |
Ratios of net investment income (loss) to average net assets: | | | | | | | | | | | | | | | | | | | | |
Before earnings credit, expense reimbursement and/or fee waiver, or recoupment by the Adviser | | | (0.08 | )% | | | (0.26 | )% | | | 0.25 | % | | | 0.61 | %(g) | | | 0.08 | % |
After earnings credit, expense reimbursement and/or fee waiver, or recoupment by the Adviser | | | (0.06 | )% | | | (0.28 | )% | | | 0.22 | % | | | 0.57 | %(g) | | | 0.15 | % |
Portfolio Turnover | | | 72.73 | % | | | 45.91 | % | | | 43.55 | % | | | 45.60 | % | | | 79.77 | % |
| | (a) | The selected per share data was calculated using the weighted average shares outstanding method for the period. |
| | (b) | Includes capital contribution of less than $0.005 per share. |
| | (c) | The total return is calculated using the Net Asset Value used for trading at the close of business at period end. |
| | (d) | Does not include expenses of the underlying funds in which the Fund invests. |
| | (e) | Effective February 28, 2015, the contractual expense limitation was decreased from 1.20% to 1.15%, excluding interest, taxes, investment-related costs (such as brokerage commissions), extraordinary expenses and acquired fund fees and expenses. |
| | (f) | Ratios of expenses to average net assets include Earnings Credits of less than 0.005% for each of the years ended October 31, 2013 and October 31, 2012, which are not included in the contractual expense limitation. See Note I to the Financial Statements. |
| | (g) | Ratios of expenses and net investment income to average net assets include advisory fee waiver of less than 0.005% for the year ended October 31, 2012. |
See accompanying Notes to Financial Statements.
| | |
| |
| ASTON/River Road Long-Short Fund – Class N | | October 31, 2015 |
| |
| Financial Highlights | | |
| | | | | | | | | | | | | | | | | | | | |
| | | Year
Ended
10/31/15 | | | Year
Ended
10/31/14 | | | Year
Ended
10/31/13 | | | Year
Ended
10/31/12 | | | Period
Ended
10/31/11(a) | |
| | | | | | | | | | | | | | | | | | | | |
Net Asset Value, Beginning of Period | | $ | 11.35 | | | $ | 12.02 | | | $ | 10.73 | | | $ | 9.91 | | | $ | 10.00 | |
| | | | | | | | | | | | | | | | | | | | |
Income from Investment Operations: | | | | | | | | | | | | | | | | | | | | |
Net investment loss | | | (0.14 | )(b) | | | (0.19 | ) | | | (0.17 | )(b) | | | (0.18 | ) | | | (0.04 | )(b) |
Net realized and unrealized gain (loss) on investments | | | 0.57 | | | | (0.19 | ) | | | 2.02 | | | | 1.00 | | | | (0.05 | ) |
| | | | | | | | | | | | | | | | | | | | |
Total from investment operations | | | 0.43 | | | | (0.38 | ) | | | 1.85 | | | | 0.82 | | | | (0.09 | ) |
| | | | | | | | | | | | | | | | | | | | |
Less Distributions: | | | | | | | | | | | | | | | | | | | | |
Distributions from net realized gain on investments | | | (0.30 | ) | | | (0.29 | ) | | | (0.56 | ) | | | — | | | | — | |
| | | | | | | | | | | | | | | | | | | | |
Total distributions | | | (0.30 | ) | | | (0.29 | ) | | | (0.56 | ) | | | — | | | | — | |
| | | | | | | | | | | | | | | | | | | | |
Net increase (decrease) in net asset value | | | 0.13 | | | | (0.67 | ) | | | 1.29 | | | | 0.82 | | | | (0.09 | ) |
| | | | | | | | | | | | | | | | | | | | |
Net Asset Value, End of Period | | $ | 11.48 | | | $ | 11.35 | | | $ | 12.02 | | | $ | 10.73 | | | $ | 9.91 | |
| | | | | | | | | | | | | | | | | | | | |
Total Return (c) | | | 3.79 | % | | | (3.27 | )% | | | 18.14 | % | | | 8.17 | % | | | (0.80 | )%(d) |
| | | | | |
Ratios/Supplemental Data: | | | | | | | | | | | | | | | | | | | | |
Net Assets, End of Period (in 000’s) | | $ | 27,983 | | | $ | 109,140 | | | $ | 108,966 | | | $ | 7,506 | | | $ | 4,594 | |
Ratios of expenses to average net assets: | | | | | | | | | | | | | | | | | | | | |
Before expense reimbursement and/or fee waiver, or recoupment by Adviser, including interest and dividend expense for securities sold short | | | 2.87 | % | | | 2.53 | % | | | 2.54 | % | | | 5.03 | % | | | 8.68 | %(e) |
After expense reimbursement and/or fee waiver, or recoupment by Adviser, including interest and dividend expense for securities sold short | | | 2.89 | % | | | 2.58 | % | | | 2.38 | % | | | 3.11 | % | | | 2.72 | %(e) |
After expense reimbursement and/or fee waiver, or recoupment by Adviser, excluding interest and dividend expense for securities sold short | | | 1.70 | % | | | 1.70 | % | | | 1.70 | % | | | 1.70 | % | | | 1.70 | %(e) |
Ratios of net investment loss to average net assets: | | | | | | | | | | | | | | | | | | | | |
Before expense reimbursement and/or fee waiver, or recoupment by Adviser | | | (1.16 | )% | | | (1.55 | )% | | | (1.62 | )% | | | (3.63 | )% | | | (6.80 | )%(e) |
After expense reimbursement and/or fee waiver, or recoupment by Adviser | | | (1.19 | )% | | | (1.59 | )% | | | (1.46 | )% | | | (1.71 | )% | | | (0.84 | )%(e) |
Portfolio Turnover | | | 278.88 | % | | | 303.04 | % | | | 291.36 | % | | | 277.72 | % | | | 127.32 | %(d) |
| | (a) | The commencement of investment operations for River Road Long-Short Fund Class N shares is May 3, 2011. |
| | (b) | The selected per share data was calculated using the weighted average shares outstanding method for the period. |
| | (c) | The total return is calculated using the Net Asset Value used for trading at the close of business at period end. |
See accompanying Notes to Financial Statements.
| | |
| |
| ASTON/River Road Long-Short Fund – Class I | | October 31, 2015 |
| |
| Financial Highlights | | |
| | | | | | | | | | | | |
| | | Year
Ended
10/31/15 | | | Year
Ended
10/31/14 | | | Period
Ended
10/31/13(a) | |
Net Asset Value, Beginning of Period | | $ | 11.40 | | | $ | 12.05 | | | $ | 10.96 | |
| | | | | | | | | | | | |
Income from Investment Operations: | | | | | | | | | | | | |
Net investment loss | | | (0.11 | )(b) | | | (0.16 | ) | | | (0.10 | )(b) |
Net realized and unrealized gain (loss) on investments | | | 0.57 | | | | (0.20 | ) | | | 1.19 | |
| | | | | | | | | | | | |
Total from investment operations | | | 0.46 | | | | (0.36 | ) | | | 1.09 | |
| | | | | | | | | | | | |
Less Distributions: | | | | | | | | | | | | |
Distributions from net realized gain on investments | | | (0.30 | ) | | | (0.29 | ) | | | — | |
| | | | | | | | | | | | |
Total distributions | | | (0.30 | ) | | | (0.29 | ) | | | — | |
| | | | | | | | | | | | |
Net increase (decrease) in net asset value | | | 0.16 | | | | (0.65 | ) | | | 1.09 | |
| | | | | | | | | | | | |
Net Asset Value, End of Period | | $ | 11.56 | | | $ | 11.40 | | | $ | 12.05 | |
| | | | | | | | | | | | |
Total Return (c) | | | 4.04 | % | | | (3.01 | )% | | | 9.85 | %(d) |
| | | |
Ratios/Supplemental Data: | | | | | | | | | | | | |
Net Assets, End of Period (in 000’s) | | $ | 49,088 | | | $ | 110,271 | | | $ | 71,175 | |
Ratios of expenses to average net assets: | | | | | | | | | | | | |
Before expense reimbursement and/or fee waiver, or recoupment by Adviser, including interest and dividend expense for securities sold short | | | 2.62 | % | | | 2.28 | % | | | 2.20 | %(e) |
After expense reimbursement and/or fee waiver, or recoupment by Adviser, including interest and dividend expense for securities sold short | | | 2.64 | % | | | 2.33 | % | | | 2.10 | %(e) |
After expense reimbursement and/or fee waiver, or recoupment by Adviser, excluding interest and dividend expense for securities sold short | | | 1.45 | % | | | 1.45 | % | | | 1.45 | %(e) |
Ratios of net investment loss to average net assets: | | | | | | | | | | | | |
Before expense reimbursement and/or fee waiver, or recoupment by Adviser | | | (0.91 | )% | | | (1.30 | )% | | | (1.44 | )%(e) |
After expense reimbursement and/or fee waiver, or recoupment by Adviser | | | (0.94 | )% | | | (1.34 | )% | | | (1.33 | )%(e) |
Portfolio Turnover | | | 278.88 | % | | | 303.04 | % | | | 291.36 | %(d) |
| | (a) | The commencement of investment operations for River Road Long-Short Fund Class I shares is March 1, 2013. |
| | (b) | The selected per share data was calculated using the weighted average shares outstanding method for the period. |
| | (c) | The total return is calculated using the Net Asset Value used for trading at the close of business at period end. |
See accompanying Notes to Financial Statements.
| | |
| |
| ASTON/Barings International Fund – Class N | | October 31, 2015 |
| |
| Financial Highlights | | |
| | | | | | | | | | | | | | | | | | | | |
| | | Year
Ended
10/31/15 | | | Year
Ended
10/31/14 | | | Year
Ended
10/31/13 | | | Year
Ended
10/31/12 | | | Year
Ended
10/31/11 | |
Net Asset Value, Beginning of Period | | $ | 6.98 | | | $ | 7.81 | | | $ | 6.87 | | | $ | 6.81 | | | $ | 7.24 | |
| | | | | | | | | | | | | | | | | | | | |
Income from Investment Operations: | | | | | | | | | | | | | | | | | | | | |
Net investment income | | | 0.05 | (a) | | | 0.14 | (a) | | | 0.11 | (a) | | | 0.10 | (a) | | | 0.07 | (a) |
Net realized and unrealized gain (loss) on investments | | | 0.20 | | | | (0.31 | ) | | | 1.00 | | | | 0.17 | | | | (0.37 | ) |
| | | | | | | | | | | | | | | | | | | | |
Total from investment operations | | | 0.25 | | | | (0.17 | ) | | | 1.11 | | | | 0.27 | | | | (0.30 | ) |
| | | | | | | | | | | | | | | | | | | | |
Less Distributions: | | | | | | | | | | | | | | | | | | | | |
Distributions from and in excess of net investment income | | | (0.14 | ) | | | (0.18 | ) | | | (0.09 | ) | | | (0.04 | ) | | | (0.13 | ) |
Distributions from net realized gain on investments | | | (0.88 | ) | | | (0.48 | ) | | | (0.08 | ) | | | (0.17 | ) | | | — | |
| | | | | | | | | | | | | | | | | | | | |
Total distributions | | | (1.02 | ) | | | (0.66 | ) | | | (0.17 | ) | | | (0.21 | ) | | | (0.13 | ) |
| | | | | | | | | | | | | | | | | | | | |
Net increase (decrease) in net asset value | | | (0.77 | ) | | | (0.83 | ) | | | 0.94 | | | | 0.06 | | | | (0.43 | ) |
| | | | | | | | | | | | | | | | | | | | |
Net Asset Value, End of Period | | $ | 6.21 | | | $ | 6.98 | | | $ | 7.81 | | | $ | 6.87 | | | $ | 6.81 | |
| | | | | | | | | | | | | | | | | | | | |
Total Return (b) | | | 4.47 | % | | | (2.62 | )% | | | 16.64 | % | | | 4.28 | % | | | (4.22 | )% |
| | | | | |
Ratios/Supplemental Data: | | | | | | | | | | | | | | | | | | | | |
Net Assets, End of Period (in 000’s) | | $ | 399 | | | $ | 331 | | | $ | 477 | | | $ | 421 | | | $ | 393 | |
Ratios of expenses to average net assets: | | | | | | | | | | | | | | | | | | | | |
Before expense reimbursement and/or fee waiver by Adviser | | | 2.11 | % | | | 1.95 | % | | | 1.67 | % | | | 1.60 | % | | | 1.68 | %(c) |
After expense reimbursement and/or fee waiver by Adviser | | | 1.40 | % | | | 1.40 | % | | | 1.40 | % | | | 1.40 | % | | | 1.40 | %(c) |
Ratios of net investment income to average net assets: | | | | | | | | | | | | | | | | | | | | |
Before expense reimbursement and/or fee waiver by Adviser | | | 0.12 | % | | | 1.42 | % | | | 1.26 | % | | | 1.30 | % | | | 0.76 | %(c) |
After expense reimbursement and/or fee waiver by Adviser | | | 0.83 | % | | | 1.97 | % | | | 1.53 | % | | | 1.50 | % | | | 1.04 | %(c) |
Portfolio Turnover | | | 37.56 | % | | | 53.14 | % | | | 55.78 | % | | | 33.48 | % | | | 58.96 | % |
| | (a) | The selected per share data was calculated using the weighted average shares outstanding method for the period. |
| | (b) | The total return is calculated using the Net Asset Value used for trading at the close of business at period end. |
| | (c) | For the period November 1, 2010 through February 28, 2011, the Adviser voluntarily waived management fees and/or reimbursed expenses so that the net expense ratio did not exceed 1.40%, excluding interest, taxes, investment-related costs (such as brokerage commissions), extraordinary expenses and acquired fund fees and expenses. Effective March 1, 2011, the expense limitation became contractual and was decreased from 1.50% to 1.40%, excluding interest, taxes, investment-related costs (such as brokerage commissions), extraordinary expenses and acquired fund fees and expenses. |
See accompanying Notes to Financial Statements.
| | |
| |
| ASTON/Barings International Fund – Class I | | October 31, 2015 |
| |
| Financial Highlights | | |
| | | | | | | | | | | | | | | | | | | | |
| | | Year
Ended
10/31/15 | | | Year
Ended
10/31/14 | | | Year
Ended
10/31/13 | | | Year
Ended
10/31/12 | | | Year
Ended
10/31/11 | |
| | | | | | | | | | | | | | | | | | | | |
Net Asset Value, Beginning of Period | | $ | 6.99 | | | $ | 7.82 | | | $ | 6.89 | | | $ | 6.82 | | | $ | 7.26 | |
| | | | | | | | | | | | | | | | | | | | |
Income from Investment Operations: | | | | | | | | | | | | | | | | | | | | |
Net investment income | | | 0.07 | (a) | | | 0.16 | (a) | | | 0.13 | (a) | | | 0.12 | (a) | | | 0.09 | (a) |
Net realized and unrealized gain (loss) on investments | | | 0.20 | | | | (0.31 | ) | | | 0.99 | | | | 0.18 | | | | (0.38 | ) |
| | | | | | | | | | | | | | | | | | | | |
Total from investment operations | | | 0.27 | | | | (0.15 | ) | | | 1.12 | | | | 0.30 | | | | (0.29 | ) |
| | | | | | | | | | | | | | | | | | | | |
Less Distributions: | | | | | | | | | | | | | | | | | | | | |
Distributions from and in excess of net investment income | | | (0.16 | ) | | | (0.20 | ) | | | (0.11 | ) | | | (0.06 | ) | | | (0.15 | ) |
Distributions from net realized gain on investments | | | (0.88 | ) | | | (0.48 | ) | | | (0.08 | ) | | | (0.17 | ) | | | — | |
| | | | | | | | | | | | | | | | | | | | |
Total distributions | | | (1.04 | ) | | | (0.68 | ) | | | (0.19 | ) | | | (0.23 | ) | | | (0.15 | ) |
| | | | | | | | | | | | | | | | | | | | |
Net increase (decrease) in net asset value | | | (0.77 | ) | | | (0.83 | ) | | | 0.93 | | | | 0.07 | | | | (0.44 | ) |
| | | | | | | | | | | | | | | | | | | | |
Net Asset Value, End of Period | | $ | 6.22 | | | $ | 6.99 | | | $ | 7.82 | | | $ | 6.89 | | | $ | 6.82 | |
| | | | | | | | | | | | | | | | | | | | |
Total Return (b) | | | 4.78 | % | | | (2.37 | )% | | | 16.72 | % | | | 4.72 | % | | | (4.09 | )% |
| | | | | |
Ratios/Supplemental Data: | | | | | | | | | | | | | | | | | | | | |
Net Assets, End of Period (in 000’s) | | $ | 20,338 | | | $ | 21,260 | | | $ | 37,507 | | | $ | 61,662 | | | $ | 52,390 | |
Ratios of expenses to average net assets: | | | | | | | | | | | | | | | | | | | | |
Before expense reimbursement and/or fee waiver by Adviser | | | 1.86 | % | | | 1.70 | % | | | 1.42 | % | | | 1.35 | % | | | 1.43 | %(c) |
After expense reimbursement and/or fee waiver by Adviser | | | 1.15 | % | | | 1.15 | % | | | 1.15 | % | | | 1.15 | % | | | 1.15 | %(c) |
Ratios of net investment income to average net assets: | | | | | | | | | | | | | | | | | | | | |
Before expense reimbursement and/or fee waiver by Adviser | | | 0.37 | % | | | 1.67 | % | | | 1.51 | % | | | 1.55 | % | | | 1.01 | %(c) |
After expense reimbursement and/or fee waiver by Adviser | | | 1.08 | % | | | 2.22 | % | | | 1.78 | % | | | 1.75 | % | | | 1.29 | %(c) |
Portfolio Turnover | | | 37.56 | % | | | 53.14 | % | | | 55.78 | % | | | 33.48 | % | | | 58.96 | % |
| | (a) | The selected per share data was calculated using the weighted average shares outstanding method for the period. |
| | (b) | The total return is calculated using the Net Asset Value used for trading at the close of business at period end. |
| | (c) | For the period November 1, 2010 through February 28, 2011, the Adviser voluntarily waived management fees and/or reimbursed expenses so that the net expense ratio did not exceed 1.15%, excluding interest, taxes, investment related costs (such as brokerage commissions), extraordinary expenses and acquired fund fees and expenses. Effective March 1, 2011, the expense limitation became contractual and was decreased from 1.25% to 1.15%, excluding interest, taxes, investment-related costs (such as brokerage commissions), extraordinary expenses and acquired fund fees and expenses. |
See accompanying Notes to Financial Statements.
| | |
| |
| ASTON/Guardian Capital Global Dividend Fund – Class N | | October 31, 2015 |
| |
| Financial Highlights | | |
| | | | | | | | |
| | | Year
Ended
10/31/15 | | | Period
Ended
10/31/14(a) | |
Net Asset Value, Beginning of Period | | $ | 10.51 | | | $ | 10.00 | |
| | | | | | | | |
Income from Investment Operations: | | | | | | | | |
Net investment income | | | 0.24 | | | | 0.13 | |
Net realized and unrealized gain (loss) on investments | | | (0.23 | ) | | | 0.49 | |
| | | | | | | | |
Total from investment operations | | | 0.01 | | | | 0.62 | |
| | | | | | | | |
Less Distributions: | | | | | | | | |
Distributions from and in excess of net investment income | | | (0.22 | ) | | | (0.11 | ) |
| | | | | | | | |
Total Distributions | | | (0.22 | ) | | | (0.11 | ) |
| | | | | | | | |
Net increase (decrease) in net asset value | | | (0.21 | ) | | | 0.51 | |
| | | | | | | | |
Net Asset Value, End of Period | | $ | 10.30 | | | $ | 10.51 | |
| | | | | | | | |
Total Return (b) | | | 0.07 | % | | | 6.17 | %(c) |
| | |
Ratios/Supplemental Data: | | | | | | | | |
Net Assets, End of Period (in 000’s) | | $ | 1,054 | | | $ | 1,052 | |
Ratios of expenses to average net assets: | | | | | | | | |
Before expense reimbursement and/or fee waiver by Adviser | | | 4.10 | % | | | 5.21 | %(d) |
After expense reimbursement and/or fee waiver by Adviser | | | 1.30 | % | | | 1.30 | %(d) |
Ratios of net investment income (loss) to average net assets: | | | | | | | | |
Before expense reimbursement and/or fee waiver by Adviser | | | (0.53 | )% | | | (1.74 | )%(d) |
After expense reimbursement and/or fee waiver by Adviser | | | 2.28 | % | | | 2.17 | %(d) |
Portfolio Turnover | | | 28.46 | % | | | 15.97 | %(c) |
| | (a) | The commencement of investment operations for Guardian Capital Global Dividend Fund Class N shares is April 11, 2014. |
| | (b) | The total return is calculated using the Net Asset Value used for trading at the close of business at period end. |
See accompanying Notes to Financial Statements.
| | |
| |
| ASTON/Guardian Capital Global Dividend Fund – Class I | | October 31, 2015 |
| |
| Financial Highlights | | |
| | | | | | | | |
| | | Year
Ended
10/31/15 | | | Period
Ended
10/31/14(a) | |
| | | | | | | | |
Net Asset Value, Beginning of Period | | $ | 10.52 | | | $ | 10.00 | |
| | | | | | | | |
Income from Investment Operations: | | | | | | | | |
Net investment income | | | 0.27 | | | | 0.14 | |
Net realized and unrealized gain (loss) on investments | | | (0.25 | ) | | | 0.50 | |
| | | | | | | | |
Total from investment operations | | | 0.02 | | | | 0.64 | |
| | | | | | | | |
Less Distributions: | | | | | | | | |
Distributions from and in excess of net investment income | | | (0.26 | ) | | | (0.12 | ) |
| | | | | | | | |
Total Distributions | | | (0.26 | ) | | | (0.12 | ) |
| | | | | | | | |
Net increase (decrease) in net asset value | | | (0.24 | ) | | | 0.52 | |
| | | | | | | | |
Net Asset Value, End of Period | | $ | 10.28 | | | $ | 10.52 | |
| | | | | | | | |
Total Return (b) | | | 0.14 | % | | | 6.39 | %(c) |
| | |
Ratios/Supplemental Data: | | | | | | | | |
Net Assets, End of Period (in 000’s) | | $ | 3,292 | | | $ | 3,211 | |
Ratios of expenses to average net assets: | | | | | | | | |
Before expense reimbursement and/or fee waiver by Adviser | | | 3.85 | % | | | 4.96 | %(d) |
After expense reimbursement and/or fee waiver by Adviser | | | 1.05 | % | | | 1.05 | %(d) |
Ratios of net investment income (loss) to average net assets: | | | | | | | | |
Before expense reimbursement and/or fee waiver by Adviser | | | (0.28 | )% | | | (1.49 | )%(d) |
After expense reimbursement and/or fee waiver by Adviser | | | 2.52 | % | | | 2.42 | %(d) |
Portfolio Turnover | | | 28.46 | % | | | 15.97 | %(c) |
| | (a) | The commencement of investment operations for Guardian Capital Global Dividend Fund Class I shares is April 11, 2014. |
| | (b) | The total return is calculated using the Net Asset Value used for trading at the close of business at period end. |
See accompanying Notes to Financial Statements.
| | |
| |
| ASTON/LMCG Emerging Markets Fund – Class N | | October 31, 2015 |
| |
| Financial Highlights | | |
| | | | | | | | | | | | |
| | | Year
Ended
10/31/15 | | | Year
Ended
10/31/14 | | | Period
Ended
10/31/13(a) | |
Net Asset Value, Beginning of Period | | $ | 9.55 | | | $ | 9.65 | | | $ | 10.00 | |
| | | | | | | | | | | | |
Income from Investment Operations: | | | | | | | | | | | | |
Net investment income | | | 0.09 | (b) | | | 0.11 | | | | 0.08 | (b) |
Net realized and unrealized loss on investments | | | (1.71 | ) | | | (0.07 | ) | | | (0.43 | ) |
| | | | | | | | | | | | |
Total from investment operations | | | (1.62 | ) | | | 0.04 | | | | (0.35 | ) |
| | | | | | | | | | | | |
Less Distributions: | | | | | | | | | | | | |
Distributions from and in excess of net investment income | | | (0.05 | ) | | | (0.14 | ) | | | — | |
| | | | | | | | | | | | |
Total distributions | | | (0.05 | ) | | | (0.14 | ) | | | — | |
| | | | | | | | | | | | |
Net decrease in net asset value | | | (1.67 | ) | | | (0.10 | ) | | | (0.35 | ) |
| | | | | | | | | | | | |
Net Asset Value, End of Period | | $ | 7.88 | | | $ | 9.55 | | | $ | 9.65 | |
| | | | | | | | | | | | |
Total Return (c) | | | (17.02 | )% | | | 0.49 | % | | | (3.50 | )%(d) |
| | | |
Ratios/Supplemental Data: | | | | | | | | | | | | |
Net Assets, End of Period (in 000’s) | | $ | 605 | | | $ | 725 | | | $ | 675 | |
Ratios of expenses to average net assets: | | | | | | | | | | | | |
Before expense reimbursement and/or fee waiver by Adviser | | | 6.27 | % | | | 5.96 | % | | | 7.24 | %(e) |
After expense reimbursement and/or fee waiver by Adviser | | | 1.43 | % | | | 1.57 | % | | | 1.65 | %(e) |
Ratios of net investment income (loss) to average net assets: | | | | | | | | | | | | |
Before expense reimbursement and/or fee waiver by Adviser | | | (3.79 | )% | | | (3.24 | )% | | | (4.13 | )%(e) |
After expense reimbursement and/or fee waiver by Adviser | | | 1.05 | % | | | 1.15 | % | | | 1.46 | %(e) |
Portfolio Turnover | | | 64.35 | % | | | 63.48 | % | | | 101.96 | %(d) |
| | (a) | The commencement of investment operations for LMCG Emerging Markets Fund Class N shares is March 27, 2013. |
| | (b) | The selected per share data was calculated using the weighted average shares outstanding method for the period. |
| | (c) | The total return is calculated using the Net Asset Value used for trading at the close of business at period end. |
See accompanying Notes to Financial Statements.
| | |
| |
| ASTON/LMCG Emerging Markets Fund – Class I | | October 31, 2015 |
| |
| Financial Highlights | | |
| | | | | | | | | | | | |
| | | Year
Ended
10/31/15 | | | Year
Ended
10/31/14 | | | Period
Ended
10/31/13 (a)
| |
| | | | | | | | | | | | |
Net Asset Value, Beginning of Period | | $ | 9.58 | | | $ | 9.67 | | | $ | 10.00 | |
| | | | | | | | | | | | |
Income from Investment Operations: | | | | | | | | | | | | |
Net investment income | | | 0.12 | (b) | | | 0.14 | | | | 0.10 | (b) |
Net realized and unrealized loss on investments | | | (1.72 | ) | | | (0.07 | ) | | | (0.43 | ) |
| | | | | | | | | | | | |
Total from investment operations | | | (1.60 | ) | | | 0.07 | | | | (0.33 | ) |
| | | | | | | | | | | | |
Less Distributions: | | | | | | | | | | | | |
Distributions from and in excess of net investment income | | | (0.07 | ) | | | (0.16 | ) | | | — | |
| | | | | | | | | | | | |
Total distributions | | | (0.07 | ) | | | (0.16 | ) | | | — | |
| | | | | | | | | | | | |
Net decrease in net asset value | | | (1.67 | ) | | | (0.09 | ) | | | (0.33 | ) |
| | | | | | | | | | | | |
Net Asset Value, End of Period | | $ | 7.91 | | | $ | 9.58 | | | $ | 9.67 | |
| | | | | | | | | | | | |
Total Return (c) | | | (16.77 | )% | | | 0.79 | % | | | (3.30 | )%(d) |
| | | |
Ratios/Supplemental Data: | | | | | | | | | | | | |
Net Assets, End of Period (in 000’s) | | $ | 1,449 | | | $ | 3,188 | | | $ | 3,307 | |
Ratios of expenses to average net assets: | | | | | | | | | | | | |
Before expense reimbursement and/or fee waiver by Adviser | | | 6.02 | % | | | 5.71 | % | | | 6.99 | %(e) |
After expense reimbursement and/or fee waiver by Adviser | | | 1.18 | % | | | 1.33 | % | | | 1.40 | %(e) |
Ratios of net investment income (loss) to average net assets: | | | | | | | | | | | | |
Before expense reimbursement and/or fee waiver by Adviser | | | (3.54 | )% | | | (2.99 | )% | | | (3.88 | )%(e) |
After expense reimbursement and/or fee waiver by Adviser | | | 1.30 | % | | | 1.40 | % | | | 1.71 | %(e) |
Portfolio Turnover | | | 64.35 | % | | | 63.48 | % | | | 101.96 | %(d) |
| | (a) | The commencement of investment operations for LMCG Emerging Markets Fund Class I shares is March 27, 2013. |
| | (b) | The selected per share data was calculated using the weighted average shares outstanding method for the period. |
| | (c) | The total return is calculated using the Net Asset Value used for trading at the close of business at period end. |
See accompanying Notes to Financial Statements.
| | |
| |
| ASTON/Pictet International Fund – Class N | | October 31, 2015 |
| |
| Financial Highlights | | |
| | | | | | | | |
| | | Year
Ended
10/31/15 | | | Period
Ended
10/31/14(a) | |
Net Asset Value, Beginning of Period | | $ | 9.34 | | | $ | 10.00 | |
| | | | | | | | |
Income from Investment Operations: | | | | | | | | |
Net investment income | | | 0.10 | (b) | | | 0.09 | |
Net realized and unrealized gain (loss) on investments | | | 0.17 | (c) | | | (0.75 | ) |
| | | | | | | | |
Total from investment operations | | | 0.27 | | | | (0.66 | ) |
| | | | | | | | |
Less Distributions: | | | | | | | | |
Distributions from and in excess of net investment income | | | (0.03 | ) | | | — | |
Distributions from net realized gain on investments | | | (0.02 | ) | | | — | |
| | | | | | | | |
Total distributions | | | (0.05 | ) | | | — | |
| | | | | | | | |
Net increase (decrease) in net asset value | | | 0.22 | | | | (0.66 | ) |
| | | | | | | | |
Net Asset Value, End of Period | | $ | 9.56 | | | $ | 9.34 | |
| | | | | | | | |
Total Return (d) | | | 3.02 | % | | | (6.60 | )%(e) |
| | |
Ratios/Supplemental Data: | | | | | | | | |
Net Assets, End of Period (in 000’s) | | $ | 1,056 | | | $ | 984 | |
Ratios of expenses to average net assets: | | | | | | | | |
Before expense reimbursement and/or fee waiver by Adviser | | | 1.92 | % | | | 3.26 | %(f) |
After expense reimbursement and/or fee waiver by Adviser | | | 1.40 | % | | | 1.40 | %(f) |
Ratios of net investment income (loss) to average net assets: | | | | | | | | |
Before expense reimbursement and/or fee waiver by Adviser | | | 0.53 | % | | | (0.25 | )%(f) |
After expense reimbursement and/or fee waiver by Adviser | | | 1.06 | % | | | 1.61 | %(f) |
Portfolio Turnover | | | 53.26 | % | | | 25.82 | %(e) |
| | (a) | The commencement of investment operations for Pictet International Fund Class N shares is April 11, 2014. |
| | (b) | The selected per share data was calculated using the weighted average shares outstanding method for the period. |
| | (c) | Includes capital contribution of $0.01 per share. |
| | (d) | The total return is calculated using the Net Asset Value used for trading at the close of business at period end. |
See accompanying Notes to Financial Statements.
| | |
| |
| ASTON/Pictet International Fund – Class I | | October 31, 2015 |
| |
| Financial Highlights | | |
| | | | | | | | |
| | | Year
Ended
10/31/15 | | | Period
Ended
10/31/14(a) | |
| | | | | | | | |
Net Asset Value, Beginning of Period | | $ | 9.36 | | | $ | 10.00 | |
| | | | | | | | |
Income from Investment Operations: | | | | | | | | |
Net investment income | | | 0.12 | (b) | | | 0.10 | |
Net realized and unrealized gain (loss) on investments | | | 0.19 | (c) | | | (0.74 | ) |
| | | | | | | | |
Total from investment operations | | | 0.31 | | | | (0.64 | ) |
| | | | | | | | |
Less Distributions: | | | | | | | | |
Distributions from and in excess of net investment income | | | (0.05 | ) | | | — | |
Distributions from net realized gain on investments | | | (0.02 | ) | | | — | |
| | | | | | | | |
Total distributions | | | (0.07 | ) | | | — | |
| | | | | | | | |
Net increase (decrease) in net asset value | | | 0.24 | | | | (0.64 | ) |
| | | | | | | | |
Net Asset Value, End of Period | | $ | 9.60 | | | $ | 9.36 | |
| | | | | | | | |
Total Return (d) | | | 3.43 | % | | | (6.40 | )%(e) |
| | |
Ratios/Supplemental Data: | | | | | | | | |
Net Assets, End of Period (in 000’s) | | $ | 49,803 | | | $ | 8,467 | |
Ratios of expenses to average net assets: | | | | | | | | |
Before expense reimbursement and/or fee waiver by Adviser | | | 1.67 | % | | | 3.01 | %(f) |
After expense reimbursement and/or fee waiver by Adviser | | | 1.15 | % | | | 1.15 | %(f) |
Ratios of net investment income (loss) to average net assets: | | | | | | | | |
Before expense reimbursement and/or fee waiver by Adviser | | | 0.78 | % | | | — | %(f)(g) |
After expense reimbursement and/or fee waiver by Adviser | | | 1.31 | % | | | 1.86 | %(f) |
Portfolio Turnover | | | 53.26 | % | | | 25.82 | %(e) |
| | (a) | The commencement of investment operations for Pictet International Fund Class I shares is April 11, 2014. |
| | (b) | The selected per share data was calculated using the weighted average shares outstanding method for the period. |
| | (c) | Includes capital contribution of $0.01 per share. |
| | (d) | The total return is calculated using the Net Asset Value used for trading at the close of business at period end. |
| | (g) | Represents less than 0.005%. |
See accompanying Notes to Financial Statements.
| | |
| |
| ASTON/TAMRO International Small Cap Fund – Class N | | October 31, 2015 |
| |
| Financial Highlights | | |
| | | | |
| | | Period
Ended
10/31/15(a) | |
| | | | |
Net Asset Value, Beginning of Period | | $ | 10.00 | |
| | | | |
Income from Investment Operations: | | | | |
Net investment income | | | 0.13 | |
Net realized and unrealized loss on investments | | | (0.12 | ) |
| | | | |
Total from investment operations | | | 0.01 | |
| | | | |
Net increase in net asset value | | | 0.01 | |
| | | | |
Net Asset Value, End of Period | | $ | 10.01 | |
| | | | |
Total Return (b) | | | 0.10 | %(c) |
| |
Ratios/Supplemental Data: | | | | |
Net Assets, End of Period (in 000’s) | | $ | 1,059 | |
Ratios of expenses to average net assets: | | | | |
Before expense reimbursement and/or fee waiver by Adviser | | | 11.56 | %(d) |
After expense reimbursement and/or fee waiver by Adviser | | | 1.50 | %(d) |
Ratios of net investment income (loss) to average net assets: | | | | |
Before expense reimbursement and/or fee waiver by Adviser | | | (8.48 | )%(d) |
After expense reimbursement and/or fee waiver by Adviser | | | 1.58 | %(d) |
Portfolio Turnover | | | 55.16 | %(c) |
| | (a) | The commencement of investment operations for TAMRO International Small Cap Fund Class N shares is December 22, 2014. |
| | (b) | The total return is calculated using the Net Asset Value used for trading at the close of business at period end. |
See accompanying Notes to Financial Statements.
| | |
| |
| ASTON/TAMRO International Small Cap Fund – Class I | | October 31, 2015 |
| |
| Financial Highlights | | |
| | | | |
| | | Period
Ended
10/31/15(a) | |
Net Asset Value, Beginning of Period | | $ | 10.00 | |
| | | | |
Income from Investment Operations: | | | | |
Net investment income | | | 0.15 | |
Net realized and unrealized loss on investments | | | (0.12 | ) |
| | | | |
Total from investment operations | | | 0.03 | |
| | | | |
Net increase in net asset value | | | 0.03 | |
| | | | |
Net Asset Value, End of Period | | $ | 10.03 | |
| | | | |
Total Return (b) | | | 0.30 | %(c) |
| |
Ratios/Supplemental Data: | | | | |
Net Assets, End of Period (in 000’s) | | $ | 667 | |
Ratios of expenses to average net assets: | | | | |
Before expense reimbursement and/or fee waiver by Adviser | | | 11.31 | %(d) |
After expense reimbursement and/or fee waiver by Adviser | | | 1.25 | %(d) |
Ratios of net investment income (loss) to average net assets: | | | | |
Before expense reimbursement and/or fee waiver by Adviser | | | (8.23 | )%(d) |
After expense reimbursement and/or fee waiver by Adviser | | | 1.83 | %(d) |
Portfolio Turnover | | | 55.16 | %(c) |
| | (a) | The commencement of investment operations for TAMRO International Small Cap Fund Class I shares is December 22, 2014. |
| | (b) | The total return is calculated using the Net Asset Value used for trading at the close of business at period end. |
See accompanying Notes to Financial Statements.
| | |
| |
| ASTON/Harrison Street Real Estate Fund – Class N | | October 31, 2015 |
| |
| Financial Highlights | | |
| | | | | | | | | | | | | | | | | | | | |
| | | Year
Ended
10/31/15 | | | Year
Ended
10/31/14 | | | Year
Ended
10/31/13 | | | Year
Ended
10/31/12 | | | Year
Ended
10/31/11 | |
| | | | | | | | | | | | | | | | | | | | |
Net Asset Value, Beginning of Period | | $ | 12.63 | | | $ | 11.29 | | | $ | 10.49 | | | $ | 8.97 | | | $ | 8.16 | |
| | | | | | | | | | | | | | | | | | | | |
Income from Investment Operations: | | | | | | | | | | | | | | | | | | | | |
Net investment income | | | 0.17 | (a) | | | 0.10 | (a) | | | 0.17 | (a) | | | 0.15 | (a) | | | 0.15 | (a) |
Net realized and unrealized gain on investments | | | 0.13 | | | | 1.37 | | | | 0.79 | (b) | | | 1.44 | | | | 0.79 | |
| | | | | | | | | | | | | | | | | | | | |
Total from investment operations | | | 0.30 | | | | 1.47 | | | | 0.96 | | | | 1.59 | | | | 0.94 | |
| | | | | | | | | | | | | | | | | | | | |
Less Distributions: | | | | | | | | | | | | | | | | | | | | |
Distributions from and in excess of net investment income | | | (0.15 | ) | | | (0.13 | ) | | | (0.16 | ) | | | (0.07 | ) | | | (0.13 | ) |
| | | | | | | | | | | | | | | | | | | | |
Total distributions | | | (0.15 | ) | | | (0.13 | ) | | | (0.16 | ) | | | (0.07 | ) | | | (0.13 | ) |
| | | | | | | | | | | | | | | | | | | | |
Net increase in net asset value . | | | 0.15 | | | | 1.34 | | | | 0.80 | | | | 1.52 | | | | 0.81 | |
| | | | | | | | | | | | | | | | | | | | |
Net Asset Value, End of Period | | $ | 12.78 | | | $ | 12.63 | | | $ | 11.29 | | | $ | 10.49 | | | $ | 8.97 | |
| | | | | | | | | | | | | | | | | | | | |
Total Return (c) | | | 2.38 | % | | | 13.19 | % | | | 9.30 | % | | | 17.85 | % | | | 11.66 | % |
| | | | | |
Ratios/Supplemental Data: | | | | | | | | | | | | | | | | | | | | |
Net Assets, End of Period (in 000’s) | | $ | 10,408 | | | $ | 12,852 | | | $ | 13,093 | | | $ | 10,381 | | | $ | 6,287 | |
Ratios of expenses to average net assets: | | | | | | | | | | | | | | | | | | | | |
Before expense reimbursement and/or fee waiver by Adviser | | | 2.20 | % | | | 2.16 | % | | | 2.22 | % | | | 2.36 | % | | | 1.61 | %(d) |
After expense reimbursement and/or fee waiver by Adviser | | | 1.37 | % | | | 1.37 | % | | | 1.37 | % | | | 1.37 | % | | | 1.29 | %(d) |
Ratios of net investment income to average net assets: | | | | | | | | | | | | | | | | | | | | |
Before expense reimbursement and/or fee waiver by Adviser | | | 0.51 | % | | | 0.08 | % | | | 0.67 | % | | | 0.53 | % | | | 1.36 | % |
After expense reimbursement and/or fee waiver by Adviser | | | 1.34 | % | | | 0.87 | % | | | 1.52 | % | | | 1.52 | % | | | 1.68 | % |
Portfolio Turnover | | | 150.16 | % | | | 162.93 | % | | | 159.14 | % | | | 86.62 | %(e) | | | 143.86 | % |
| | (a) | The selected per share data was calculated using the weighted average shares outstanding method for the period. |
| | (b) | Includes capital contribution of less than $0.005 per share. |
| | (c) | The total return is calculated using the Net Asset Value used for trading at the close of business at period end. |
| | (d) | Ratios of expenses to average net assets include interest expense of less than 0.005% for the year ended October 31, 2011, which is not included in the contractual expense limitation. The interest expense is from utilizing the line of credit as discussed in Note H to the Financial Statements. |
| | (e) | Portfolio turnover rate excludes securities delivered from processing a redemption-in-kind. |
See accompanying Notes to Financial Statements.
| | |
| |
| ASTON/Harrison Street Real Estate Fund – Class I | | October 31, 2015 |
| |
| Financial Highlights | | |
| | | | | | | | | | | | | | | | | | | | |
| | | Year
Ended
10/31/15 | | | Year
Ended
10/31/14 | | | Year
Ended
10/31/13 | | | Year
Ended
10/31/12 | | | Year
Ended
10/31/11 | |
| | | | | | | | | | | | | | | | | | | | |
Net Asset Value, Beginning of Period | | $ | 12.57 | | | $ | 11.24 | | | $ | 10.44 | | | $ | 8.92 | | | $ | 8.12 | |
| | | | | | | | | | | | | | | | | | | | |
Income from Investment Operations: | | | | | | | | | | | | | | | | | | | | |
Net investment income | | | 0.20 | (a) | | | 0.13 | (a) | | | 0.20 | (a) | | | 0.15 | (a) | | | 0.16 | (a) |
Net realized and unrealized gain on investments | | | 0.14 | | | | 1.35 | | | | 0.79 | (b) | | | 1.46 | | | | 0.79 | |
| | | | | | | | | | | | | | | | | | | | |
Total from investment operations | | | 0.34 | | | | 1.48 | | | | 0.99 | | | | 1.61 | | | | 0.95 | |
| | | | | | | | | | | | | | | | | | | | |
Less Distributions: | | | | | | | | | | | | | | | | | | | | |
Distributions from and in excess of net investment income | | | (0.19 | ) | | | (0.15 | ) | | | (0.19 | ) | | | (0.09 | ) | | | (0.15 | ) |
| | | | | | | | | | | | | | | | | | | | |
Total distributions | | | (0.19 | ) | | | (0.15 | ) | | | (0.19 | ) | | | (0.09 | ) | | | (0.15 | ) |
| | | | | | | | | | | | | | | | | | | | |
Net increase in net asset value . | | | 0.15 | | | | 1.33 | | | | 0.80 | | | | 1.52 | | | | 0.80 | |
| | | | | | | | | | | | | | | | | | | | |
Net Asset Value, End of Period | | $ | 12.72 | | | $ | 12.57 | | | $ | 11.24 | | | $ | 10.44 | | | $ | 8.92 | |
| | | | | | | | | | | | | | | | | | | | |
Total Return (c) | | | 2.65 | % | | | 13.45 | % | | | 9.58 | % | | | 18.16 | % | | | 11.82 | % |
| | | | | |
Ratios/Supplemental Data: | | | | | | | | | | | | | | | | | | | | |
Net Assets, End of Period (in 000’s) | | $ | 507 | | | $ | 732 | | | $ | 532 | | | $ | 166 | | | $ | 32,925 | |
Ratios of expenses to average net assets: | | | | | | | | | | | | | | | | | | | | |
Before expense reimbursement and/or fee waiver by Adviser | | | 1.95 | % | | | 1.91 | % | | | 1.97 | % | | | 2.11 | % | | | 1.44 | %(d) |
After expense reimbursement and/or fee waiver by Adviser | | | 1.12 | % | | | 1.12 | % | | | 1.12 | % | | | 1.12 | % | | | 1.12 | %(d) |
Ratios of net investment income to average net assets: | | | | | | | | | | | | | | | | | | | | |
Before expense reimbursement and/or fee waiver by Adviser | | | 0.76 | % | | | 0.33 | % | | | 0.92 | % | | | 0.78 | % | | | 1.53 | % |
After expense reimbursement and/or fee waiver by Adviser | | | 1.59 | % | | | 1.12 | % | | | 1.77 | % | | | 1.77 | % | | | 1.85 | % |
Portfolio Turnover | | | 150.16 | % | | | 162.93 | % | | | 159.14 | % | | | 86.62 | %(e) | | | 143.86 | % |
| | (a) | The selected per share data was calculated using the weighted average shares outstanding method for the period. |
| | (b) | Includes capital contribution of less than $0.005 per share. |
| | (c) | The total return is calculated using the Net Asset Value used for trading at the close of business at period end. |
| | (d) | Ratios of expenses to average net assets include interest expense of less than 0.005% for the year ended October 31, 2011, which is not included in the contractual expense limitation. The interest expense is from utilizing the line of credit as discussed in Note H to the Financial Statements. |
| | (e) | Portfolio turnover rate excludes securities delivered from processing a redemption-in-kind. |
See accompanying Notes to Financial Statements.
| | |
| |
| ASTON/Montag & Caldwell Balanced Fund – Class N | | October 31, 2015 |
| |
| Financial Highlights | | |
| | | | | | | | | | | | | | | | | | | | |
| | | Year
Ended
10/31/15 | | | Year
Ended
10/31/14 | | | Year
Ended
10/31/13 | | | Year
Ended
10/31/12 | | | Year
Ended
10/31/11 | |
| | | | | | | | | | | | | | | | | | | | |
Net Asset Value, Beginning of Period | | $ | 24.68 | | | $ | 23.81 | | | $ | 21.46 | | | $ | 20.09 | | | $ | 19.13 | |
| | | | | | | | | | | | | | | | | | | | |
Income from Investment Operations: | | | | | | | | | | | | | | | | | | | | |
Net investment income | | | 0.10 | (a) | | | 0.12 | (a) | | | 0.21 | (a) | | | 0.16 | (a) | | | 0.15 | (a) |
Net realized and unrealized gain on investments | | | 1.31 | | | | 1.70 | | | | 2.43 | | | | 1.45 | | | | 1.03 | |
| | | | | | | | | | | | | | | | | | | | |
Total from investment operations | | | 1.41 | | | | 1.82 | | | | 2.64 | | | | 1.61 | | | | 1.18 | |
| | | | | | | | | | | | | | | | | | | | |
Less Distributions: | | | | | | | | | | | | | | | | | | | | |
Distributions from and in excess of net investment income | | | (0.18 | ) | | | (0.21 | ) | | | (0.29 | ) | | | (0.24 | ) | | | (0.22 | ) |
Distributions from net realized gain on investments | | | (2.08 | ) | | | (0.74 | ) | | | — | | | | — | | | | — | |
| | | | | | | | | | | | | | | | | | | | |
Total distributions | | | (2.26 | ) | | | (0.95 | ) | | | (0.29 | ) | | | (0.24 | ) | | | (0.22 | ) |
| | | | | | | | | | | | | | | | | | | | |
Net increase (decrease) in net asset value. | | | (0.85 | ) | | | 0.87 | | | | 2.35 | | | | 1.37 | | | | 0.96 | |
| | | | | | | | | | | | | | | | | | | | |
Net Asset Value, End of Period | | $ | 23.83 | | | $ | 24.68 | | | $ | 23.81 | | | $ | 21.46 | | | $ | 20.09 | |
| | | | | | | | | | | | | | | | | | | | |
Total Return (b) | | | 6.01 | % | | | 7.83 | % | | | 12.40 | % | | | 8.03 | % | | | 6.20 | % |
| | | | | |
Ratios/Supplemental Data: | | | | | | | | | | | | | | | | | | | | |
Net Assets, End of Period (in 000’s) | | $ | 26,607 | | | $ | 20,446 | | | $ | 22,425 | | | $ | 31,536 | | | $ | 23,315 | |
Ratios of expenses to average net assets: | | | | | | | | | | | | | | | | | | | | |
Before expense reimbursement and/or fee waiver by Adviser | | | 1.44 | % | | | 1.43 | % | | | 1.37 | % | | | 1.42 | % | | | 1.57 | %(c) |
After expense reimbursement and/or fee waiver by Adviser | | | 1.20 | % | | | 1.20 | % | | | 1.20 | % | | | 1.22 | % | | | 1.35 | %(c) |
Ratios of net investment income to average net assets: | | | | | | | | | | | | | | | | | | | | |
Before expense reimbursement and/or fee waiver by Adviser | | | 0.19 | % | | | 0.26 | % | | | 0.77 | % | | | 0.57 | % | | | 0.53 | % |
After expense reimbursement and/or fee waiver by Adviser | | | 0.43 | % | | | 0.50 | % | | | 0.94 | % | | | 0.77 | % | | | 0.76 | % |
Portfolio Turnover | | | 35.78 | % | | | 27.43 | % | | | 34.62 | % | | | 35.48 | % | | | 40.31 | % |
| | (a) | The selected per share data was calculated using the weighted average shares outstanding method for the period. |
| | (b) | The total return is calculated using the Net Asset Value used for trading at the close of business at period end. |
| | (c) | Ratios of expenses to average net assets include interest expense of less than 0.005% for the year ended October 31, 2011, which is not included in the voluntary expense limitation. The interest expense is from utilizing the line of credit as discussed in Note H to the Financial Statements. |
See accompanying Notes to Financial Statements.
| | |
| |
| ASTON/Montag & Caldwell Balanced Fund – Class I | | October 31, 2015 |
| |
| Financial Highlights | | |
| | | | | | | | | | | | | | | | | | | | |
| | | Year
Ended
10/31/15 | | | Year
Ended
10/31/14 | | | Year
Ended
10/31/13 | | | Year
Ended
10/31/12 | | | Year
Ended
10/31/11 | |
| | | | | | | | | | | | | | | | | | | | |
Net Asset Value, Beginning of Period | | $ | 24.60 | | | $ | 23.76 | | | $ | 21.41 | | | $ | 20.05 | | | $ | 19.08 | |
| | | | | | | | | | | | | | | | | | | | |
Income from Investment Operations: | | | | | | | | | | | | | | | | | | | | |
Net investment income | | | 0.12 | (a) | | | 0.14 | (a) | | | 0.23 | (a) | | | 0.19 | (a) | | | 0.20 | (a) |
Net realized and unrealized gain on investments | | | 1.31 | | | | 1.70 | | | | 2.43 | | | | 1.44 | | | | 1.04 | |
| | | | | | | | | | | | | | | | | | | | |
Total from investment operations | | | 1.43 | | | | 1.84 | | | | 2.66 | | | | 1.63 | | | | 1.24 | |
| | | | | | | | | | | | | | | | | | | | |
Less Distributions: | | | | | | | | | | | | | | | | | | | | |
Distributions from and in excess of net investment income | | | (0.20 | ) | | | (0.26 | ) | | | (0.31 | ) | | | (0.27 | ) | | | (0.27 | ) |
Distributions from net realized gain on investments | | | (2.08 | ) | | | (0.74 | ) | | | — | | | | — | | | | — | |
| | | | | | | | | | | | | | | | | | | | |
Total distributions | | | (2.28 | ) | | | (1.00 | ) | | | (0.31 | ) | | | (0.27 | ) | | | (0.27 | ) |
| | | | | | | | | | | | | | | | | | | | |
Net increase (decrease) in net asset value . | | | (0.85 | ) | | | 0.84 | | | | 2.35 | | | | 1.36 | | | | 0.97 | |
| | | | | | | | | | | | | | | | | | | | |
Net Asset Value, End of Period | | $ | 23.75 | | | $ | 24.60 | | | $ | 23.76 | | | $ | 21.41 | | | $ | 20.05 | |
| | | | | | | | | | | | | | | | | | | | |
Total Return (b) | | | 6.13 | % | | | 7.92 | % | | | 12.53 | % | | | 8.14 | % | | | 6.52 | % |
| | | | | |
Ratios/Supplemental Data: | | | | | | | | | | | | | | | | | | | | |
Net Assets, End of Period (in 000’s) | | $ | 3,518 | | | $ | 1,934 | | | $ | 1,839 | | | $ | 1,930 | | | $ | 1,415 | |
Ratios of expenses to average net assets: | | | | | | | | | | | | | | | | | | | | |
Before expense reimbursement and/or fee waiver by Adviser | | | 1.34 | % | | | 1.33 | % | | | 1.27 | % | | | 1.30 | % | | | 1.32 | %(c) |
After expense reimbursement and/or fee waiver by Adviser | | | 1.10 | % | | | 1.10 | % | | | 1.10 | % | | | 1.10 | % | | | 1.10 | %(c) |
Ratios of net investment income to average net assets: | | | | | | | | | | | | | | | | | | | | |
Before expense reimbursement and/or fee waiver by Adviser | | | 0.29 | % | | | 0.36 | % | | | 0.87 | % | | | 0.69 | % | | | 0.79 | % |
After expense reimbursement and/or fee waiver by Adviser | | | 0.53 | % | | | 0.60 | % | | | 1.04 | % | | | 0.89 | % | | | 1.02 | % |
Portfolio Turnover | | | 35.78 | % | | | 27.43 | % | | | 34.62 | % | | | 35.48 | % | | | 40.31 | % |
| | (a) | The selected per share data was calculated using the weighted average shares outstanding method for the period. |
| | (b) | The total return is calculated using the Net Asset Value used for trading at the close of business at period end. |
| | (c) | Ratios of expenses to average net assets include interest expense of less than 0.005% for the year ended October 31, 2011, which is not included in the voluntary expense limitation. The interest expense is from utilizing the line of credit as discussed in Note H to the Financial Statements. |
See accompanying Notes to Financial Statements.
| | |
| |
| | October 31, 2015 |
| |
| Notes to Financial Statements | | |
Note (A) Fund Organization: Aston Funds (the “Trust”) was organized as a Delaware statutory trust under a Declaration of Trust dated September 10, 1993. The Trust is registered under the Investment Company Act of 1940, as amended (the “1940 Act”) as an open-end management investment company with 26 separate portfolios (each, a “Fund” and collectively, the “Funds”) as of October 31, 2015.
Aston Asset Management, LLC (“Aston” or the “Adviser”), the investment adviser and the administrator, manages each Fund by retaining one or more subadvisers (each, a “Subadviser”) to manage each Fund’s portfolio on a subadvisory basis. The following 26 portfolios of the Trust are included in these financial statements:
|
ASTON/Cornerstone Large Cap Value Fund
(the “Cornerstone Large Cap Value Fund”) |
ASTON/Fairpointe Focused Equity Fund
(the “Fairpointe Focused Equity Fund”) |
ASTON/Herndon Large Cap Value Fund
(the “Herndon Large Cap Value Fund”) |
ASTON/Montag & Caldwell Growth Fund
(the “Montag & Caldwell Growth Fund”) |
ASTON/River Road Dividend All Cap Value Fund
(the “River Road Dividend All Cap Value Fund”) |
ASTON/River Road Dividend All Cap Value Fund II
(the “River Road Dividend All Cap Value Fund II”) |
| ASTON/Fairpointe Mid Cap Fund (the “Fairpointe Mid Cap Fund”) |
ASTON/Montag & Caldwell Mid Cap Growth Fund
(the “Montag & Caldwell Mid Cap Growth Fund”) |
ASTON/LMCG Small Cap Growth Fund
(the “LMCG Small Cap Growth Fund”) |
ASTON/River Road Independent Value Fund
(the “River Road Independent Value Fund”) |
ASTON/River Road Select Value Fund
(the “River Road Select Value Fund”) |
ASTON/River Road Small Cap Value Fund
(the “River Road Small Cap Value Fund”) |
| ASTON/Silvercrest Small Cap Fund (the “Silvercrest Small Cap Fund”) |
| ASTON/TAMRO Small Cap Fund (the “TAMRO Small Cap Fund”) |
ASTON/DoubleLine Core Plus Fixed Income Fund
(the “DoubleLine Core Plus Fixed Income Fund”) |
| ASTON/TCH Fixed Income Fund (the “TCH Fixed Income Fund”) |
ASTON/Anchor Capital Enhanced Equity Fund
(the “Anchor Capital Enhanced Equity Fund”) |
ASTON/Lake Partners LASSO Alternatives Fund
(the “Lake Partners LASSO Alternatives Fund”) |
| ASTON/River Road Long-Short Fund (the “River Road Long-Short Fund”) |
| ASTON/Barings International Fund (the “Barings International Fund”) |
ASTON/Guardian Capital Global Dividend Fund
(the “Guardian Capital Global Dividend Fund”) |
ASTON/LMCG Emerging Markets Fund
(the “LMCG Emerging Markets Fund”) |
|
| ASTON/Pictet International Fund (the “Pictet International Fund”) |
ASTON/TAMRO International Small Cap Fund
(the “TAMRO International Small Cap Fund”) |
ASTON/Harrison Street Real Estate Fund (the “Harrison Street Real Estate Fund”) |
ASTON/Montag & Caldwell Balanced Fund
(the “Montag & Caldwell Balanced Fund”) |
Each Fund, except Montag & Caldwell Growth Fund, is authorized to issue two classes of shares (Class N shares and Class I shares). Montag & Caldwell Growth Fund is authorized to issue three classes of shares (Class N shares, Class I shares and Class R shares). Each class of shares is substantially the same except that certain classes of shares bear class specific expenses that include distribution and services fees. River Road Dividend All Cap Value Fund and Fairpointe Mid Cap Fund are closed to new investors until further notice.
The Funds are investment companies that follow accounting and reporting guidance in FASB Accounting Standards Codification Topic No. 946, Financial Services-Investment Companies.
The investment objectives of the Funds are as follows:
| | |
Cornerstone Large Cap Value Fund Total return through long-term capital appreciation and current income. |
Fairpointe Focused Equity Fund Long-term total return through capital appreciation. |
Herndon Large Cap Value Fund Long-term capital appreciation. |
Montag & Caldwell Growth Fund Long-term capital appreciation and, secondarily, current income, by investing primarily in common stocks and convertible securities. |
River Road Dividend All Cap Value Fund High current income and, secondarily, long-term capital appreciation. |
River Road Dividend All Cap Value Fund II Long-term capital appreciation and high current income. |
Fairpointe Mid Cap Fund Long-term total return through capital appreciation by investing primarily in common and preferred stocks and convertible securities. |
Montag & Caldwell Mid Cap Growth Fund Long-term capital appreciation, and secondarily, current income, by investing primarily in common stocks and convertible securities. |
LMCG Small Cap Growth Fund Long-term capital appreciation. |
River Road Independent Value Fund Long-term total return. |
River Road Select Value Fund Long-term capital appreciation. |
River Road Small Cap Value Fund Long-term capital appreciation. |
Silvercrest Small Cap Fund Long-term capital appreciation. |
| | |
| |
| | October 31, 2015 |
| |
| Notes to Financial Statements – continued | | |
| | |
TAMRO Small Cap Fund Long-term capital appreciation. |
DoubleLine Core Plus Fixed Income Fund Maximize total return. |
TCH Fixed Income Fund High current income consistent with prudent risk of capital. |
Anchor Capital Enhanced Equity Fund Total return through a combination of a high level of current income and capital appreciation. |
Lake Partners LASSO Alternatives Fund Long term total return with reduced correlation to the conventional stock and bond markets. |
River Road Long-Short Fund Absolute return while minimizing volatility over a full market cycle. |
Barings International Fund Total return. |
Guardian Capital Global Dividend Fund Long-term capital appreciation and current income. |
LMCG Emerging Markets Fund Long-term capital appreciation. |
Pictet International Fund Capital appreciation. |
TAMRO International Small Cap Fund Long-term capital appreciation. |
Harrison Street Real Estate Fund Total return through a combination of growth and income. |
Montag & Caldwell Balanced Fund Long-term total return. |
Note (B) Summary of Significant Accounting Policies: The following is a summary of the significant accounting policies consistently followed by each Fund in the preparation of its financial statements. These policies are in conformity with U.S. generally accepted accounting principles (“U.S. GAAP”).
(1) Valuation of Investments: Equity securities, closed-end funds, exchange-traded funds, index options traded on a national securities exchange, and over-the-counter securities listed on the NASDAQ National Market System are valued at the last sale price or the NASDAQ Official Closing Price (“NOCP”), if applicable. If no last sale price or NOCP, if applicable, is reported, the last quoted bid price may be used. Fixed income securities, except short-term investments, are valued on the basis of mean prices provided by an independent pricing service when such prices are believed by the Adviser to reflect the current market value of such securities, in accordance with guidelines adopted by the Board of Trustees of the Trust (the “Board”). The pricing service provider may employ methodologies that utilize actual market transactions, broker-dealer supplied valuations, or other techniques. Such techniques generally consider factors such as composite security prices, yields, maturities, call features, credit ratings and developments relating to specific securities, in arriving at valuations. If accurate market quotations are not available, securities are valued at fair values in accordance with guidelines adopted by the Board. Short-term investments, that is, those with maturities of 60 days or less, are valued at amortized cost, which approximates fair market value. Repurchase
agreements are valued at cost. Investments in money market funds and other mutual funds are valued at the underlying fund’s net asset value (“NAV”) at the date of valuation. Foreign equity securities are valued at the last official closing price on the primary exchange where the security is traded. Under the fair valuation procedures adopted by the Board, the Funds may utilize the services of an independent pricing service to determine fair value prices for foreign securities.
Certain Funds invest in securities of other investment companies, including open-end funds, closed-end funds and exchange-traded funds (“ETFs”). Open-end funds are investment companies that issue new shares continuously and redeem shares daily. Closed-end funds are investment companies that typically issue a fixed number of shares that trade on a securities exchange or over-the-counter. An ETF is an investment company. Typically, an ETF seeks to track the performance of an index by holding in its portfolio shares of all the companies, or a representative sample of the companies, that are components of a particular index; however, some ETFs are actively managed. ETFs are traded on securities exchanges based on their market values. The risks of investment in other investment companies typically reflect the risks of the types of securities in which investment companies invest. Investments in ETFs and closed-end funds are subject to the additional risk that shares of the fund may trade at a premium or discount to their NAV per share. When a Fund invests in another investment company, shareholders of the Fund bear their proportionate shares of the other investment company’s fees and expenses, including operating, registration, trustee, licensing and marketing, as well as their shares of the Fund’s fees and expenses.
Fair Value Measurements - The inputs and valuation techniques used to measure fair value of the Funds’ net assets are summarized into three levels as described in the hierarchy below:
| | |
• Level 1 – | | unadjusted quoted prices in active markets for identical assets or liabilities |
• Level 2 – | | other significant observable inputs (including quoted prices for similar securities, interest rates, prepayment speeds, credit risk, etc.) |
• Level 3 – | | significant unobservable inputs (including the Funds’ own assumptions in determining the fair value of investments) |
| | |
| |
| | October 31, 2015 |
| |
| Notes to Financial Statements – continued | | |
The inputs or methodology used for valuing securities are not necessarily an indication of the risk associated with investing in those securities. Transfers in and out of the levels are recognized at the market value at the end of the period. The summary of each Fund’s investments that are measured at fair value by Level within the fair value hierarchy as of October 31, 2015 is as follows:
| | | | | | | | | | | | | | | | |
Funds | | Total
Value at
10/31/15 | | | Level 1
Quoted
Prices | | | Level 2
Significant
Observable
Inputs | | | Level 3
Significant
Unobservable
Inputs | |
| | | | | | | | | | | | | | | | |
| Cornerstone Large Cap Value Fund | | | | | | | | | | | | | | | | |
| Assets | | | | | | | | | | | | | | | | |
Investments in Securities* | | $ | 129,119,287 | | | $ | 129,119,287 | | | $ | — | | | $ | — | |
| | | | | | | | | | | | | | | | |
| Fairpointe Focused Equity Fund | | | | | | | | | | | | | | | | |
| Assets | | | | | | | | | | | | | | | | |
Investments in Securities* | | $ | 6,479,648 | | | $ | 6,479,648 | | | $ | — | | | $ | — | |
| | | | | | | | | | | | | | | | |
| Herndon Large Cap Value Fund | | | | | | | | | | | | | | | | |
| Assets | | | | | | | | | | | | | | | | |
Investments in Securities* | | $ | 120,655,199 | | | $ | 120,655,199 | | | $ | — | | | $ | — | |
| | | | | | | | | | | | | | | | |
| Montag & Caldwell Growth Fund | | | | | | | | | | | | | | | | |
| Assets | | | | | | | | | | | | | | | | |
Investments in Securities* | | $ | 2,160,789,299 | | | $ | 2,160,789,299 | | | $ | — | | | $ | — | |
| | | | | | | | | | | | | | | | |
| River Road Dividend All Cap Value Fund | | | | | | | | | | | | | | | | |
| Assets | | | | | | | | | | | | | | | | |
Investments in Securities* | | $ | 845,332,857 | | | $ | 845,332,857 | | | $ | — | | | $ | — | |
| | | | | | | | | | | | | | | | |
| River Road Dividend All Cap Value Fund II | | | | | | | | | | | | | | | | |
| Assets | | | | | | | | | | | | | | | | |
Investments in Securities* | | $ | 123,248,601 | | | $ | 123,248,601 | | | $ | — | | | $ | — | |
| | | | | | | | | | | | | | | | |
| Fairpointe Mid Cap Fund | | | | | | | | | | | | | | | | |
| Assets | | | | | | | | | | | | | | | | |
Investments in Securities* | | $ | 4,394,338,924 | | | $ | 4,394,338,924 | | | $ | — | | | $ | — | |
| | | | | | | | | | | | | | | | |
| Montag & Caldwell Mid Cap Growth Fund | | | | | | | | | | | | | | | | |
| Assets | | | | | | | | | | | | | | | | |
Investments in Securities* | | $ | 10,841,824 | | | $ | 10,841,824 | | | $ | — | | | $ | — | |
| | | | | | | | | | | | | | | | |
| LMCG Small Cap Growth Fund | | | | | | | | | | | | | | | | |
| Assets | | | | | | | | | | | | | | | | |
Investment in Securities* | | $ | 231,338,767 | | | $ | 231,338,767 | | | $ | — | | | $ | — | |
| | | | | | | | | | | | | | | | |
| River Road Independent Value Fund | | | | | | | | | | | | | | | | |
| Assets | | | | | | | | | | | | | | | | |
Investments in Securities* | | $ | 358,820,583 | | | $ | 358,820,583 | | | $ | — | | | $ | — | |
| | | | | | | | | | | | | | | | |
| River Road Select Value Fund | | | | | | | | | | | | | | | | |
| Assets | | | | | | | | | | | | | | | | |
Investments in Securities* | | $ | 97,823,577 | | | $ | 97,823,577 | | | $ | — | | | $ | — | |
| | | | | | | | | | | | | | | | |
| | |
| |
| | October 31, 2015 |
| |
| Notes to Financial Statements – continued | | |
| | | | | | | | | | | | | | | | |
Funds | | Total
Value at
10/31/15 | | | Level 1
Quoted
Prices | | | Level 2
Significant
Observable
Inputs | | | Level 3
Significant
Unobservable
Inputs | |
| | | | | | | | | | | | | | | | |
| River Road Small Cap Value Fund | | | | | | | | | | | | | | | | |
| Assets | | | | | | | | | | | | | | | | |
Common Stocks* | | | | | | | | | | | | | | | | |
Consumer Discretionary | | $ | 57,529,454 | | | $ | 55,919,042 | | | $ | 1,610,412 | | | $ | — | |
Consumer Staples | | | 14,000,147 | | | | 14,000,147 | | | | — | | | | — | |
Energy | | | 9,521,308 | | | | 5,384,944 | | | | 4,136,364 | | | | — | |
Financials | | | 39,305,363 | | | | 39,305,363 | | | | — | | | | — | |
Healthcare | | | 7,952,782 | | | | 7,952,782 | | | | — | | | | — | |
Industrials | | | 67,273,334 | | | | 67,273,334 | | | | — | | | | — | |
Information Technology | | | 45,025,506 | | | | 37,382,670 | | | | 7,642,836 | | | | — | |
Telecommunication Services | | | 9,671,457 | | | | 9,671,457 | | | | — | | | | — | |
| | | | | | | | | | | | | | | | |
Total Common Stocks | | | 250,279,351 | | | | 236,889,739 | | | | 13,389,612 | | | | — | |
Investment Company* | | | 22,075,021 | | | | 22,075,021 | | | | — | | | | — | |
| | | | | | | | | | | | | | | | |
Total | | $ | 272,354,372 | | | $ | 258,964,760 | | | $ | 13,389,612 | | | $ | — | |
| | | | | | | | | | | | | | | | |
| Silvercrest Small Cap Fund | | | | | | | | | | | | | | | | |
| Assets | | | | | | | | | | | | | | | | |
Investments in Securities* | | $ | 163,568,229 | | | $ | 163,568,229 | | | $ | — | | | $ | — | |
| | | | | | | | | | | | | | | | |
| TAMRO Small Cap Fund | | | | | | | | | | | | | | | | |
| Assets | | | | | | | | | | | | | | | | |
Investments in Securities* | | $ | 550,504,492 | | | $ | 550,504,492 | | | $ | — | | | $ | — | |
| | | | | | | | | | | | | | | | |
| DoubleLine Core Plus Fixed Income Fund | | | | | | | | | | | | | | | | |
| Assets | | | | | | | | | | | | | | | | |
Corporate Notes and Bonds | | $ | 145,907,241 | | | $ | — | | | $ | 145,907,241 | | | $ | — | |
Collateralized Mortgage-Backed Securities | | | 81,531,197 | | | | — | | | | 81,531,197 | | | | — | |
U.S. Government and Agency Obligations | | | 176,897,559 | | | | — | | | | 176,897,559 | | | | — | |
Other Mortgage and Asset-Backed Securities | | | 33,130,502 | | | | — | | | | 33,130,502 | | | | — | |
Municipal Bonds | | | 18,826,412 | | | | — | | | | 18,826,412 | | | | — | |
Foreign Government Bonds | | | 3,126,045 | | | | — | | | | 3,126,045 | | | | — | |
Investment Companies* | | | 34,616,165 | | | | 34,616,165 | | | | — | | | | — | |
| | | | | | | | | | | | | | | | |
Total | | $ | 494,035,121 | | | $ | 34,616,165 | | | $ | 459,418,956 | | | $ | — | |
| | | | | | | | | | | | | | | | |
| TCH Fixed Income Fund | | | | | | | | | | | | | | | | |
| Assets | | | | | | | | | | | | | | | | |
Corporate Notes and Bonds | | $ | 22,937,787 | | | $ | — | | | $ | 22,937,787 | | | $ | — | |
U.S. Government and Agency Obligations | | | 23,043,048 | | | | — | | | | 23,043,048 | | | | — | |
Commercial Mortgage-Backed Security | | | 290,761 | | | | — | | | | 290,761 | | | | — | |
Foreign Government Bond | | | 451,875 | | | | — | | | | 451,875 | | | | — | |
Investment Company* | | | 3,152,143 | | | | 3,152,143 | | | | — | | | | — | |
| | | | | | | | | | | | | | | | |
Total | | $ | 49,875,614 | | | $ | 3,152,143 | | | $ | 46,723,471 | | | $ | — | |
| | | | | | | | | | | | | | | | |
| Anchor Capital Enhanced Equity Fund | | | | | | | | | | | | | | | | |
| Assets | | | | | | | | | | | | | | | | |
Common Stocks* | | $ | 168,813,999 | | | $ | 168,813,999 | | | $ | — | | | $ | — | |
Purchased Options | | | 1,237,000 | | | | 1,237,000 | | | | — | | | | — | |
Investment Company* | | | 1,851,341 | | | | 1,851,341 | | | | — | | | | — | |
| | | | | | | | | | | | | | | | |
Total Assets | | | 171,902,340 | | | | 171,902,340 | | | | — | | | | — | |
| | | | | | | | | | | | | | | | |
| Liabilities | | | | | | | | | | | | | | | | |
Written Options | | | (6,783,099 | ) | | | (6,783,099 | ) | | | — | | | | — | |
| | | | | | | | | | | | | | | | |
Total Liabilities | | | (6,783,099 | ) | | | (6,783,099 | ) | | | — | | | | — | |
| | | | | | | | | | | | | | | | |
Total | | $ | 165,119,241 | | | $ | 165,119,241 | | | $ | — | | | $ | — | |
| | | | | | | | | | | | | | | | |
| Lake Partners LASSO Alternative Fund | | | | | | | | | | | | | | | | |
| Assets | | | | | | | | | | | | | | | | |
Investments in Securities* | | $ | 211,513,684 | | | $ | 211,513,684 | | | $ | — | | | $ | — | |
| | | | | | | | | | | | | | | | |
| | |
| |
| | October 31, 2015 |
| |
| Notes to Financial Statements – continued | | |
| | | | | | | | | | | | | | | | |
Funds | | Total
Value at
10/31/15 | | | Level 1
Quoted
Prices | | | Level 2
Significant
Observable
Inputs | | | Level 3
Significant
Unobservable
Inputs | |
| | | | | | | | | | | | | | | | |
| River Road Long-Short Fund | | | | | | | | | | | | | | | | |
| Assets | | | | | | | | | | | | | | | | |
Investments in Securities* | | $ | 96,616,007 | | | $ | 96,616,007 | | | $ | — | | | $ | — | |
| | | | | | | | | | | | | | | | |
Total Assets | | | 96,616,007 | | | | 96,616,007 | | | | — | | | | — | |
| | | | | | | | | | | | | | | | |
| Liabilities | | | | | | | | | | | | | | | | |
Securities Sold Short* | | | (25,107,970 | ) | | | (25,107,970 | ) | | | — | | | | — | |
Exchange Traded Funds | | | (14,129,940 | ) | | | (14,129,940 | ) | | | — | | | | — | |
| | | | | | | | | | | | | | | | |
Total Liabilities | | | (39,237,910 | ) | | | (39,237,910 | ) | | | — | | | | — | |
| | | | | | | | | | | | | | | | |
Total | | $ | 57,378,097 | | | $ | 57,378,097 | | | $ | — | | | $ | — | |
| | | | | | | | | | | | | | | | |
| Barings International Fund | | | | | | | | | | | | | | | | |
| Assets | | | | | | | | | | | | | | | | |
Common Stocks* | | | | | | | | | | | | | | | | |
Australia | | $ | 707,634 | | | $ | — | | | $ | 707,634 | | | $ | — | |
Bermuda | | | 197,457 | | | | — | | | | 197,457 | | | | — | |
France | | | 1,935,844 | | | | — | | | | 1,935,844 | | | | — | |
Germany | | | 2,599,317 | | | | — | | | | 2,599,317 | | | | — | |
Hong Kong | | | 478,085 | | | | — | | | | 478,085 | | | | — | |
Japan | | | 5,880,470 | | | | 43,537 | | | | 5,836,933 | | | | — | |
Netherlands | | | 1,656,720 | | | | — | | | | 1,656,720 | | | | — | |
Spain | | | 336,805 | | | | — | | | | 336,805 | | | | — | |
Sweden | | | 344,528 | | | | — | | | | 344,528 | | | | — | |
Switzerland | | | 1,514,584 | | | | — | | | | 1,514,584 | | | | — | |
United Kingdom | | | 4,509,390 | | | | 238,975 | | | | 4,270,415 | | | | — | |
| | | | | | | | | | | | | | | | |
Total Common Stocks | | | 20,160,834 | | | | 282,512 | | | | 19,878,322 | | | | — | |
Investment Company* | | | 313,701 | | | | 313,701 | | | | — | | | | — | |
| | | | | | | | | | | | | | | | |
Total | | $ | 20,474,535 | | | $ | 596,213 | | | $ | 19,878,322 | | | $ | — | |
| | | | | | | | | | | | | | | | |
| Guardian Capital Global Dividend Fund | | | | | | | | | | | | | | | | |
| Assets | | | | | | | | | | | | | | | | |
Common Stocks* | | | | | | | | | | | | | | | | |
Australia | | $ | 136,710 | | | $ | — | | | $ | 136,710 | | | $ | — | |
Belgium | | | 151,428 | | | | 78,758 | | | | 72,670 | | | | — | |
Canada | | | 65,093 | | | | 65,093 | | | | — | | | | — | |
Denmark | | | 29,887 | | | | 29,887 | | | | — | | | | — | |
Finland | | | 23,397 | | | | — | | | | 23,397 | | | | — | |
France | | | 108,076 | | | | — | | | | 108,076 | | | | — | |
Germany | | | 278,377 | | | | — | | | | 278,377 | | | | — | |
Ireland | | | 49,748 | | | | 49,748 | | | | — | | | | — | |
Israel | | | 50,785 | | | | 50,785 | | | | — | | | | — | |
Italy | | | 32,007 | | | | — | | | | 32,007 | | | | — | |
Japan | | | 83,860 | | | | — | | | | 83,860 | | | | — | |
Netherlands | | | 65,369 | | | | 65,369 | | | | — | | | | — | |
Spain | | | 135,396 | | | | — | | | | 135,396 | | | | — | |
Sweden | | | 60,143 | | | | — | | | | 60,143 | | | | — | |
Switzerland | | | 261,708 | | | | 82,291 | | | | 179,417 | | | | — | |
United Kingdom | | | 447,960 | | | | 111,665 | | | | 336,295 | | | | — | |
United States | | | 2,360,251 | | | | 2,360,251 | | | | — | | | | — | |
| | | | | | | | | | | | | | | | |
Total Common Stocks | | | 4,340,195 | | | | 2,893,847 | | | | 1,446,348 | | | | — | |
Rights | | | 182 | | | | 182 | | | | — | | | | — | |
Investment Company* | | | 1,827 | | | | 1,827 | | | | — | | | | — | |
| | | | | | | | | | | | | | | | |
Total | | $ | 4,342,204 | | | $ | 2,895,856 | | | $ | 1,446,348 | | | $ | — | |
| | | | | | | | | | | | | | | | |
| | |
| |
| | October 31, 2015 |
| |
| Notes to Financial Statements – continued | | |
| | | | | | | | | | | | | | | | |
Funds | | Total
Value at
10/31/15 | | | Level 1
Quoted
Prices | | | Level 2
Significant
Observable
Inputs | | | Level 3
Significant
Unobservable
Inputs | |
| | | | | | | | | | | | | | | | |
| LMCG Emerging Markets Fund | | | | | | | | | | | | | | | | |
| Assets | | | | | | | | | | | | | | | | |
Common Stocks* | | | | | | | | | | | | | | | | |
Brazil | | $ | 171,815 | | | $ | 171,815 | | | $ | — | | | $ | — | |
Cayman Islands | | | 28,324 | | | | — | | | | 28,324 | | | | — | |
China | | | 303,333 | | | | — | | | | 303,333 | | | | — | |
Czech Republic | | | 9,790 | | | | — | | | | 9,790 | | | | — | |
Egypt | | | 10,964 | | | | — | | | | 10,964 | | | | — | |
Hong Kong | | | 79,675 | | | | — | | | | 79,675 | | | | — | |
India | | | 111,637 | | | | 111,637 | | | | — | | | | — | |
Indonesia | | | 17,220 | | | | — | | | | 17,220 | | | | — | |
Malaysia | | | 28,107 | | | | — | | | | 28,107 | | | | — | |
Mexico | | | 137,813 | | | | 137,813 | | | | — | | | | — | |
Poland | | | 27,662 | | | | — | | | | 27,662 | | | | — | |
Russia | | | 55,919 | | | | 16,061 | | | | 39,858 | | | | — | |
South Africa | | | 115,405 | | | | — | | | | 115,405 | | | | — | |
South Korea | | | 396,324 | | | | 33,443 | | | | 362,881 | | | | — | |
Taiwan | | | 278,141 | | | | — | | | | 278,141 | | | | — | |
Thailand | | | 36,353 | | | | — | | | | 36,353 | | | | — | |
Turkey | | | 88,115 | | | | — | | | | 88,115 | | | | — | |
| | | | | | | | | | | | | | | | |
Total Common Stocks | | | 1,896,597 | | | | 470,769 | | | | 1,425,828 | | | | — | |
| | | | | | | | | | | | | | | | |
Exchange Traded Funds | | | 92,577 | | | | 92,577 | | | | — | | | | — | |
Investment Company* | | | 81,048 | | | | 81,048 | | | | — | | | | — | |
| | | | | | | | | | | | | | | | |
Total | | $ | 2,070,222 | | | $ | 644,394 | | | $ | 1,425,828 | | | $ | — | |
| | | | | | | | | | | | | | | | |
| Pictet International Fund | | | | | | | | | | | | | | | | |
| Assets | | | | | | | | | | | | | | | | |
Common Stocks* | | | | | | | | | | | | | | | | |
Australia | | $ | 2,561,331 | | | $ | — | | | $ | 2,561,331 | | | $ | — | |
Austria | | | 633,101 | | | | — | | | | 633,101 | | | | — | |
Belgium | | | 1,025,190 | | | | — | | | | 1,025,190 | | | | — | |
Bermuda | | | 619,782 | | | | — | | | | 619,782 | | | | — | |
Cayman Islands | | | 1,849,511 | | | | — | | | | 1,849,511 | | | | — | |
Denmark | | | 2,189,175 | | | | — | | | | 2,189,175 | | | | — | |
Finland | | | 1,689,813 | | | | — | | | | 1,689,813 | | | | — | |
France | | | 4,370,934 | | | | 585,488 | | | | 3,785,446 | | | | — | |
Hong Kong | | | 745,394 | | | | — | | | | 745,394 | | | | — | |
Italy | | | 2,034,146 | | | | — | | | | 2,034,146 | | | | — | |
Japan | | | 8,216,023 | | | | — | | | | 8,216,023 | | | | — | |
Luxembourg | | | 569,340 | | | | — | | | | 569,340 | | | | — | |
Netherlands | | | 1,644,677 | | | | — | | | | 1,644,677 | | | | — | |
New Zealand | | | 510,326 | | | | — | | | | 510,326 | | | | — | |
Papua New Guinea | | | 329,044 | | | | — | | | | 329,044 | | | | — | |
Philippines | | | 373,972 | | | | — | | | | 373,972 | | | | — | |
Portugal | | | 447,566 | | | | — | | | | 447,566 | | | | — | |
Russia | | | 901,249 | | | | 901,249 | | | | — | | | | — | |
South Korea | | | 1,533,471 | | | | — | | | | 1,533,471 | | | | — | |
Spain | | | 2,661,930 | | | | — | | | | 2,661,930 | | | | — | |
Sweden | | | 1,200,925 | | | | — | | | | 1,200,925 | | | | — | |
Switzerland | | | 3,435,116 | | | | — | | | | 3,435,116 | | | | — | |
United Kingdom | | | 10,121,234 | | | | 685,260 | | | | 9,435,974 | | | | — | |
| | | | | | | | | | | | | | | | |
Total Common Stocks | | | 49,663,250 | | | | 2,171,997 | | | | 47,491,253 | | | | — | |
| | | | | | | | | | | | | | | | |
Investment Company* | | | 1,040,842 | | | | 1,040,842 | | | | — | | | | — | |
| | | | | | | | | | | | | | | | |
Total | | $ | 50,704,092 | | | $ | 3,212,839 | | | $ | 47,491,253 | | | $ | — | |
| | | | | | | | | | | | | | | | |
| | |
| |
| | October 31, 2015 |
| |
| Notes to Financial Statements – continued | | |
| | | | | | | | | | | | | | | | |
Funds | | Total
Value at
10/31/15 | | | Level 1
Quoted
Prices | | | Level 2
Significant
Observable
Inputs | | | Level 3
Significant
Unobservable
Inputs | |
| | | | | | | | | | | | | | | | |
| TAMRO International Small Cap | | | | | | | | | | | | | | | | |
| Assets | | | | | | | | | | | | | | | | |
Common Stocks* | | | | | | | | | | | | | | | | |
Australia | | $ | 66,905 | | | $ | — | | | $ | 66,905 | | | $ | — | |
Bermuda | | | 30,461 | | | | 30,461 | | | | — | | | | — | |
Brazil | | | 31,500 | | | | 31,500 | | | | — | | | | — | |
Canada | | | 47,244 | | | | 47,244 | | | | — | | | | — | |
China | | | 95,692 | | | | — | | | | 95,692 | | | | — | |
France | | | 250,120 | | | | 113,830 | | | | 136,290 | | | | — | |
Germany | | | 61,750 | | | | — | | | | 61,750 | | | | — | |
Hong Kong | | | 72,495 | | | | 41,536 | | | | 30,959 | | | | — | |
Italy | | | 104,259 | | | | — | | | | 104,259 | | | | — | |
Japan | | | 521,553 | | | | — | | | | 521,553 | | | | — | |
Mexico | | | 51,207 | | | | 51,207 | | | | — | | | | — | |
Norway | | | 25,512 | | | | — | | | | 25,512 | | | | — | |
Poland | | | 17,464 | | | | — | | | | 17,464 | | | | — | |
Switzerland | | | 43,429 | | | | — | | | | 43,429 | | | | — | |
Thailand | | | 13,487 | | | | 13,487 | | | | — | | | | — | |
United Kingdom | | | 214,487 | | | | 64,144 | | | | 150,343 | | | | — | |
Virgin Islands (British) | | | 27,103 | | | | 27,103 | | | | — | | | | — | |
| | | | | | | | | | | | | | | | |
Total Common Stocks | | | 1,674,668 | | | | 420,512 | | | | 1,254,156 | | | | — | |
Preferred Stock | | | 22,163 | | | | — | | | | 22,163 | | | | — | |
Rights | | | — | | | | — | | | | — | | | | — | |
Investment Company* | | | 71,004 | | | | 71,004 | | | | — | | | | — | |
| | | | | | | | | | | | | | | | |
Total | | $ | 1,767,835 | | | $ | 491,516 | | | $ | 1,276,319 | | | $ | — | |
| | | | | | | | | | | | | | | | |
| Harrison Street Real Estate Fund | | | | | | | | | | | | | | | | |
| Assets | | | | | | | | | | | | | | | | |
Investments in Securities* | | $ | 10,930,034 | | | $ | 10,930,034 | | | $ | — | | | $ | — | |
| | | | | | | | | | | | | | | | |
| Montag & Caldwell Balanced Fund | | | | | | | | | | | | | | | | |
| Assets | | | | | | | | | | | | | | | | |
Common Stocks* | | $ | 16,913,147 | | | $ | 16,913,147 | | | $ | — | | | $ | — | |
Corporate Notes and Bonds | | | 6,428,980 | | | | — | | | | 6,428,980 | | | | — | |
U.S. Government and Agency Obligations | | | 4,712,000 | | | | — | | | | 4,712,000 | | | | — | |
Investment Company* | | | 1,703,074 | | | | 1,703,074 | | | | — | | | | — | |
| | | | | | | | | | | | | | | | |
Total | | $ | 29,757,201 | | | $ | 18,616,221 | | | $ | 11,140,980 | | | $ | — | |
| | | | | | | | | | | | | | | | |
| * | | All Common Stocks and Investment Companies are Level 1. Please refer to the Schedule of Investments for industry, sector or country breakout. |
At the end of each fiscal quarter, management evaluates the Level 2 and 3 assets and liabilities for changes in liquidity, including but not limited to: whether a broker is willing to execute at a quoted price, the depth and consistency of prices from third party services, and the existence of contemporaneous, observable trades in the market. Additionally, management evaluates the Level 1 and 2 assets and liabilities on a quarterly basis for changes in listings or delistings on national exchanges. Due to the inherent uncertainty of determining the fair values of investments that do not have readily available market values, the fair values of the Funds’ investments may fluctuate from period to period. Additionally, the fair values of investments may differ significantly from the values that would have been used had a ready market existed for such investments and may differ materially from the values the Funds may ultimately realize upon the disposition of such investments. Further, such investments may be subject to legal and other restrictions on resale or they may be otherwise less liquid than publicly-traded securities.
With respect to foreign equity securities and certain foreign fixed income securities, the Board has adopted a policy that securities
held in a Fund that can be fair valued by the applicable fair value pricing service are fair valued on each business day provided that each individual price exceeds a pre-established confidence level.
Certain securities that were held at October 31, 2015 and since the beginning of the fiscal year in Barings International Fund, River Road Independent Value Fund, River Road Small Cap Value Fund, and Pictet International Fund had changes in liquidity assessments which resulted in a transfer between Levels. Transfers between Levels, if any, are recognized as of the last day of the fiscal quarter in which the event or change in circumstances that resulted in reclassification occurred.
| | | | | | | | |
Funds | | Transfer from
Level 1 to Level 2 | | | Transfer from
Level 2 to Level 1 | |
| Barings International Fund | | $ | 240,528 | | | $ | — | |
| River Road Independent Value Fund | | | — | | | | 1,722,737 | |
| River Road Small Cap Value | | | — | | | | 6,697,537 | |
| Pictet International Fund | | | 607,347 | | | | — | |
| | |
| |
| | October 31, 2015 |
| |
| Notes to Financial Statements – continued | | |
The following is a reconciliation of Level 3 holdings since the beginning of the year. As of October 31, 2015, there were no Level 3 securities for which significant unobservable inputs or Adviser assumptions used in determining fair value:
| | | | | | | | | | | | |
| DoubleLine Core Plus Fixed Income Fund | | | Total | | |
| Corporate
Bonds |
| |
| Asset-
Backed |
|
Fair Value, beginning of period | | $ | 640,628 | | | $ | 154,500 | | | $ | 486,128 | |
Purchases | | | 732,900 | | | | 732,900 | | | | — | |
Sales | | | (236,925 | ) | | | — | | | | (236,925 | ) |
Transfer out | | | (1,119,733 | ) | | | (888,305 | ) | | | (231,428 | ) |
Amortization | | | (284 | ) | | | (1,573 | ) | | | 1,289 | |
Realized Gain/(Loss) | | | (492 | ) | | | — | | | | (492 | ) |
Change in unrealized appreciation (depreciation) | | | (16,094 | ) | | | 2,478 | | | | (18,572 | ) |
| | | | | | | | | | | | |
Fair value, end of period | | $ | — | | | $ | — | | | $ | — | |
| | | | | | | | | | | | |
Change in net unrealized appreciation (depreciation) on Level 3 holdings held at end of period | | $ | (16,094 | ) | | $ | 2,478 | | | $ | (18,572 | ) |
| | | | | | | | | | | | |
(2) Repurchase Agreements: Each Fund may enter into repurchase agreements with financial institutions deemed to be creditworthy by the Fund’s Adviser or Subadviser, subject to the seller’s agreement to repurchase and the Fund’s agreement to sell such securities at a mutually agreed upon price. Securities purchased subject to repurchase agreements are deposited with the Fund’s custodian and, pursuant to the terms of the repurchase agreement, must have an aggregate market value greater than or equal to the repurchase price plus accrued interest at all times. If the value of the underlying securities falls below the value of the repurchase price plus accrued interest, the Fund will require the seller to deposit additional collateral by the next business day. If the request for additional collateral is not met, or the seller defaults on its repurchase obligation, the Fund has the right to sell the underlying securities at market value and may claim any resulting loss against the seller. During the year ended October 31, 2015, the Funds did not hold any repurchase agreements.
(3) When Issued/Delayed Delivery Securities: Each Fund may purchase and sell securities on a “when issued” or “delayed delivery” basis, with settlement to occur at a later date. The value of any security so purchased is subject to market fluctuations during the applicable period. The Funds segregate assets having an aggregate value at least equal to the amount of when issued or delayed delivery purchase commitments until payment is made. During the year ended October 31, 2015, DoubleLine Core Plus Fixed Income Fund owned delayed delivery securities.
(4) Mortgage-Backed Securities: Montag & Caldwell Balanced Fund, DoubleLine Core Plus Fixed Income Fund and TCH Fixed Income Fund may invest in mortgage-backed securities (“MBS”). These securities represent interests in pools of mortgage loans and they provide shareholders with payments consisting of both principal and interest as the mortgages in the underlying mortgage pools are paid. The timely payment of principal and interest on MBS issued or guaranteed by Ginnie Mae (formerly known as the Government National Mortgage Association) is backed by Ginnie Mae and the full faith and credit of the U.S. government. MBS issued by U.S.
government agencies or instrumentalities other than Ginnie Mae are not “full faith and credit” obligations. Certain obligations, such as those issued by the Federal Home Loan Banks, Fannie Mae (formerly known as the Federal National Mortgage Association) and Freddie Mac (formerly known as the Federal Home Loan Mortgage Corporation) are supported only by the credit of the issuer. MBS issued by private issuers are not government securities and are not directly guaranteed by any government agency. They are secured by the underlying collateral of the private issuer. Yields on privately issued MBS tend to be higher than those of government-backed issues. However, risk of loss due to default and sensitivity to interest rate fluctuations are also higher. Montag & Caldwell Balanced Fund, DoubleLine Core Plus Fixed Income Fund and TCH Fixed Income Fund may also invest in collateralized mortgage obligations (“CMOs”), collateralized loan obligations (“CLOs”) and real estate mortgage investment conduits (“REMICs”). A CMO and/or REMIC is a bond that is collateralized by a pool of MBS. A CLO is a bond that is collateralized by a financial institution’s receivables from loans. These MBS pools are divided into classes with each class having its own characteristics. The different classes are retired in sequence as the underlying mortgages are repaid.
(5) Securities Sold Short: River Road Long-Short Fund utilizes short sales as part of its overall portfolio management strategy. A short sale involves the sale of a security that is borrowed from a broker or other institution. A gain, limited to the price at which the Fund sold the security short, or a loss, unlimited in size, will be recognized upon closing a short sale. Short sales expose the Fund to the risk that it will be required to acquire, convert or exchange securities to replace the borrowed securities at a time when the securities sold short have appreciated in value, thus resulting in a loss to the Fund. The Fund making a short sale must segregate liquid assets, or otherwise cover its position in a permissible manner. The Subadviser determines the liquidity of assets, in accordance with procedures established by the Board. Cash segregated as collateral for short sales is shown in the Statement of Assets and Liabilities as segregated cash. Security positions segregated as collateral for short sales are included in the Total Investments on the Statement of Assets and Liabilities.
(6) Options Contracts: In the normal course of pursuing its investment objectives, certain Funds are subject to price volatility risk. Certain Funds may write and/or purchase call and put options on securities for hedging purposes, to seek capital appreciation, to mitigate risk and/or to increase exposure. Writing put options or purchasing call options tends to increase a Fund’s exposure to the underlying instrument. Writing call options or purchasing put options tends to decrease a Fund’s exposure to the underlying instrument. When a Fund writes or purchases a call or put option, an amount equal to the premium received or paid by the Fund is included in a Fund’s Statement of Assets and Liabilities as a liability or an investment and subsequently adjusted to the current market value based on the quoted daily settlement price of the option written or purchased. Premiums received or paid from writing or purchasing options that expire unexercised are treated by the Fund on the expiration date as realized gains or losses. The difference between the premium and the amount paid or received on a closing purchase or sale transaction, including brokerage commissions, is also treated as a realized gain or loss. If an option
| | |
| |
| | October 31, 2015 |
| |
| Notes to Financial Statements – continued | | |
is exercised, the premium paid or received is added to the cost of the purchase or proceeds from the sale in determining whether the Fund has realized a gain or loss on investment transactions. If the Fund writes a covered call option, the Fund forgoes, in exchange for the premium, the opportunity to profit during the option period from an increase in the market value of the underlying security above the exercise price. If the Fund writes a put option, it accepts the risk of a decline in the market value of the underlying security below the exercise price. There is the risk a Fund may not be able to enter into a closing transaction because of an illiquid market. The risk associated with purchasing put and call options is limited to the premium paid. Options were traded during the period in Anchor Capital Enhanced Equity Fund. See the Schedule of Investments for open options contracts held by Anchor Capital Enhanced Equity Fund at October 31, 2015. During the year ended October 31, 2015, the average* volume of derivative activities were as follows:
| | | | | | | | |
Funds | | Purchased
Options
(Premium Paid) | | | Written Options
(Premiums Received) | |
| Anchor Capital Enhanced Equity Fund | | $ | 2,072,896 | | | $ | 5,160,134 | |
| * | estimated based on quarter-end holdings |
(7) Forward Foreign Currency Contracts: In the normal course of pursuing their investment objectives, certain Funds are subject to foreign investment and currency risk. Certain Funds may enter into forward foreign currency contracts (“forward contracts”) for purposes of hedging, duration management, as a substitute for securities, to increase returns, for currency hedging or risk management, or to otherwise help achieve a Fund’s investment goal. These contracts are marked-to-market daily at the applicable forward exchange rates. A Fund records realized gains or losses at the time the forward contract is closed. A forward contract is extinguished through a closing transaction or upon delivery of the currency or entering an offsetting contract. Risks may arise upon entering these contracts from the potential inability of a counterparty to meet the terms of its contracts and from unanticipated movements in the value of a foreign currency relative to the U.S. dollar or other currencies. During the year ended October 31, 2015, the Funds did not enter into any forward foreign currency contracts.
(8) Disclosures about Derivative Instruments: The following is a table summarizing the fair value of derivatives held at October 31, 2015, by primary risk exposure:
| | | | | | | | |
| | | Asset Derivative
Investments Value | | | Liability Derivative
Investments Value | |
| | | Equity
Contracts(a) | | | Equity
Contracts(a) | |
| Anchor Capital Enhanced Equity Fund | | $ | 1,237,000 | | | $ | (6,783,099 | ) |
| (a) | Statement of Assets and Liabilities location: Total investments at value for purchase options and call options written, at value for written options. |
The effect of derivative instruments on the Statement of Operations for the year ended October 31, 2015:
| | | | | | | | |
| | | Amount of
Realized Gain (Loss)
on Derivatives
Investments Value | | | Change in Unrealized
Appreciation
(Depreciation)
on Derivatives
Investments Value | |
| | | Equity
Contracts (a) | | | Equity
Contracts (b) | |
| Anchor Capital Enhanced Equity Fund | | $ | (13,224,046 | ) | | $ | 2,587,832 | |
| (a) | Statement of Operations location: Net realized loss on purchased options and net realized loss on written options. |
| (b) | Statement of Operations location: Net change in unrealized appreciation (depreciation) on purchased options and net change in unrealized appreciation (depreciation) on written options. |
(9) Investment Income and Securities Transactions: Dividend income is recorded on the ex-dividend date, except for certain dividends from foreign securities where the ex-dividend date may have passed, which are recorded as soon as a Fund is informed of the ex-dividend date. Interest income is accrued daily. Dividend income and interest income are recorded in the Statement of Operations as investment income. Premiums and discounts are amortized or accreted on an effective yield method on fixed income securities. The Funds may be subject to foreign taxes on income, gains on investments, securities transactions or currency repatriation, some of which may be recoverable in part. The Funds will accrue such taxes and reclaims as applicable, based upon their current interpretation of tax rules and regulations that exist in the markets in which the Funds invest. Transactions in securities are accounted for on a trade date basis. The cost of securities sold is determined using the identified cost method.
(10) Foreign Currency: Foreign currencies, investments and other assets and liabilities are translated into U.S. dollars at the exchange rates at the close of the regular trading session on the New York Stock Exchange. Fluctuations in the value of the foreign currencies and other assets and liabilities resulting from changes in exchange rates are recorded as unrealized foreign currency gains (losses). Realized gains (losses) and unrealized appreciation (depreciation) on investment securities and income and expenses are translated on the respective dates of such transactions. The effects of changes in foreign currency exchange rates on investments in securities are segregated from the effects of changes in market prices of those securities, and are included with the net realized gain (loss) on investments, and net change in unrealized appreciation (depreciation) on investment on the Statement of Operations.
(11) Federal Income Taxes: The Funds have elected to be treated as “regulated investment companies” under Subchapter M of the Internal Revenue Code of 1986, as amended, and to distribute substantially all of their respective net taxable income. Accordingly, no provisions for federal income taxes have been made in the accompanying financial statements. The Funds intend to utilize provisions of the federal income tax laws, which allow them to carry a realized capital loss forward for eight years following the year of the loss and offset such losses against any future realized capital gains.
| | |
| |
| | October 31, 2015 |
| |
| Notes to Financial Statements – continued | | |
At October 31, 2015, the following Funds had available realized capital loss carryforwards to offset future net capital gains through the fiscal year ended:
| | | | | | | | | | | | | | | | | | | | | | | | | | | | |
| | | Capital Loss Carryforwards: | |
| | | 2016 | | | 2017 | | | 2018 | | | 2019 | | | No Expiration
Short Term* | | | No Expiration
Long Term* | | | Total | |
| | | | | | | | | | | | | | | | | | | | | | | | | | | | |
| Cornerstone Large Cap Value Fund | | $ | — | | | $ | 7,545,482 | | | $ | 6,819,813 | | | $ | — | | | $ | — | | | $ | — | | | $ | 14,365,295 | |
| Fairpointe Focused Equity Fund | | | — | | | | — | | | | — | | | | — | | | | 135,558 | | | | — | | | | 135,558 | |
| Montag & Caldwell Growth Fund | | | — | | | | 2,530,371 | | | | — | | | | — | | | | — | | | | — | | | | 2,530,371 | |
| LMCG Small Cap Growth Fund | | | 561,605 | ** | | | — | | | | — | | | | — | | | | — | | | | — | | | | 561,605 | |
| River Road Independent Value Fund | | | — | | | | — | | | | — | | | | — | | | | 4,834,393 | | | | — | | | | 4,834,393 | |
| DoubleLine Core Plus Fixed Income Fund | | | — | | | | — | | | | — | | | | — | | | | 2,853,818 | | | | 1,207,345 | | | | 4,061,163 | |
| TCH Fixed Income Fund | | | 1,961,275 | | | | 1,270,780 | | | | — | | | | — | | | | — | | | | — | | | | 3,232,055 | |
| Guardian Capital Global Dividend Fund | | | — | | | | — | | | | — | | | | — | | | | 80,836 | | | | 39,734 | | | | 120,570 | |
| LMCG Emerging Markets Fund | | | — | | | | — | | | | — | | | | — | | | | 428,582 | | | | 37,443 | | | | 466,025 | |
| TAMRO International Small Cap Fund | | | — | | | | — | | | | — | | | | — | | | | 31,717 | | | | — | | | | 31,717 | |
| Harrison Street Real Estate Fund | | | — | | | | 10,893,731 | | | | — | | | | — | | | | — | | | | — | | | | 10,893,731 | |
| * | On December 22, 2010, the Regulated Investment Company Modernization Act of 2010 (the “Modernization Act”) was signed into law. Under the Modernization Act, the Funds are permitted to carry forward capital losses incurred for an unlimited period. However, any losses incurred during those future taxable years will be required to be utilized prior to the losses incurred in pre-enactment taxable years. As a result of this ordering rule, pre-enactment capital loss carryforwards may be more likely to expire unused. Additionally, post-enactment capital losses that are carried forward will retain their character as either short-term or long-term capital losses rather than being considered all short-term as under previous law. |
| ** | This capital loss carryforward amount was acquired in the reorganization of the Aston Small Cap Fund into the LMCG Small Cap Growth Fund on April 19, 2013. The Fund’s ability to utilize the capital loss carryforwards is limited under Internal Revenue Service regulations. |
For the year ended October 31, 2015, the following Funds utilized capital losses as follows:
| | | | | | | | | | | | | | | | | | | | |
| | | | | | Utilized Capital Losses (with Expiration Year) | | | | |
Fund | | 2016 | | | 2017 | | | 2018 | | | 2019 | | | No Expiration | |
| | | | | | | | | | | | | | | | | | | | |
| Cornerstone Large Cap Value Fund | | $ | — | | | $ | 3,579,111 | | | $ | — | | | $ | — | | | $ | — | |
| Montag & Caldwell Growth Fund | | | — | | | | 3,189,231 | | | | — | | | | — | | | | — | |
| LMCG Small Cap Growth Fund | | | 561,605 | | | | — | | | | — | | | | — | | | | — | |
| DoubleLine Core Plus Fixed Income Fund | | | — | | | | — | | | | — | | | | — | | | | 177,911 | |
| TCH Fixed Income Fund | | | 693,642 | | | | — | | | | — | | | | — | | | | — | |
| Anchor Capital Enhanced Equity Fund | | | — | | | | — | | | | — | | | | — | | | | 441,599 | |
| Harrison Street Real Estate Fund | | | 606,778 | | | | 334,369 | | | | — | | | | — | | | | — | |
Under current laws, certain capital losses realized after October 31 may be deferred (and certain ordinary losses after January 1st may be deferred) and treated as occurring on the first day of the following fiscal year. During the year ended October 31, 2015, the Funds elected to defer the following losses incurred from November 1, 2014 through October 31, 2015:
| | | | | | | | | | | | |
| | | Long-Term
Realized
Capital Losses | | | Short-Term
Realized
Capital Losses | | | Late-Year
Ordinary
Losses | |
| Montag & Caldwell Mid Cap Growth Fund | | $ | — | | | $ | — | | | $ | 44,348 | |
| LMCG Small Cap Growth Fund | | | — | | | | — | | | | 1,157,118 | |
| River Road Independent Value Fund | | | — | | | | — | | | | 3,602,333 | |
| River Road Select Value Fund | | | — | | | | — | | | | 404,126 | |
| TAMRO Small Cap Fund | | | — | | | | — | | | | 2,699,597 | |
| Lake Partners LASSO Alternatives Fund | | | — | | | | — | | | | 1,030,882 | |
Management has analyzed the Funds’ tax positions for all open tax years (current and prior three tax years), as well as potential exposure to foreign capital gains withholding taxes, and has concluded that no provision for federal, state, or international income tax is required in the Funds’ financial statements. The Funds’ federal income and excise tax returns for tax years for which the applicable statutes of limitations have not expired are subject to examination by the Internal Revenue Service.
| | |
| |
| | October 31, 2015 |
| |
| Notes to Financial Statements – continued | | |
(12) Multi-Class Operations: Each class offered by a Fund that is authorized to offer multiple classes of shares has equal rights as to the Fund’s net assets.
Income, fund and trust level expenses, and realized and unrealized capital gains and losses, if any, are allocated to each class of shares based on the relative net assets of each class. Class specific expenses are charged to each class.
(13) Offering Costs: Certain costs were incurred in connection with the offering of the following Funds, as disclosed in the table below. The costs associated have been capitalized and are being amortized on a straight-line basis over twelve months based on the commencement date of the Funds, stated below.
| | | | | | | | |
Fund | | Inception Date | | | Original
Offering Costs | |
| Fairpointe Focused Equity Fund | | | December 24, 2014 | | | $ | 49,967 | |
| Guardian Capital Global Dividend Fund | | | April 14, 2014 | | | | 59,779 | |
| Pictet International Fund | | | April 14, 2014 | | | | 72,702 | |
| TAMRO International Small Cap fund | | | December 23, 2014 | | | | 50,521 | |
(14) Use of Estimates: The preparation of financial statements in conformity with U.S. GAAP requires management to make estimates and assumptions that affect the reported amounts of assets and liabilities and disclosure of contingent assets and liabilities at the date of the financial statements and the reported amounts of revenues and expenses during the reporting period. Actual results could differ from those estimates.
(15) Commitments and Contingencies: In the normal course of business, the Trust enters into contracts on behalf of the Funds that contain a variety of provisions for general indemnifications. Each Fund’s maximum exposure under these arrangements is unknown, as this would involve future claims that may be made against each Fund that are not known at this time. However, based on experience, the Funds believe the risk of loss is remote.
Note (C) Dividends from Net Investment Income and Distributions of Capital Gains: Dividends and distributions to shareholders are recorded on the ex-dividend date. River Road Dividend All Cap Value Fund, River Road Dividend All Cap Value Fund II, DoubleLine Core Plus Fixed Income Fund and TCH Fixed Income Fund distribute dividends from net investment income to shareholders monthly and net realized gains from investment transactions, if any, are generally distributed annually, usually in December.
Anchor Capital Enhanced Equity Fund, Guardian Capital Global Dividend Fund, and Montag & Caldwell Balanced Fund distribute dividends from net investment income to shareholders quarterly
and net realized gains from investment transactions, if any, are generally distributed annually, usually in December.
The following Funds distribute dividends from net investment income to shareholders annually and net realized gains from investment transactions, if any, are generally distributed annually, usually in December: Fairpointe Focused Equity Fund, Montag & Caldwell Growth Fund, Herndon Large Cap Value Fund, Cornerstone Large Cap Value Fund, Fairpointe Mid Cap Fund, Montag & Caldwell Mid Cap Growth Fund, LMCG Small Cap Growth Fund, Silvercrest Small Cap Fund, TAMRO Small Cap Fund, River Road Select Value Fund, River Road Small Cap Value Fund, River Road Independent Value Fund, Lake Partners LASSO Alternatives Fund, River Road Long-Short Fund, Barings International Fund, LMCG Emerging Markets Fund, Pictet International Fund, TAMRO International Small Cap Fund and Harrison Street Real Estate Fund.
Dividends and distributions are automatically reinvested in additional Fund shares on ex-date at that day’s ending NAV for the respective Fund for those shareholders who have elected the reinvestment option.
Differences in dividends per share between classes of the Funds are due to different class expenses.
Net investment income and realized gains and losses for federal income tax purposes may differ from those reported on the financial statements because of temporary and permanent book and tax basis differences. Permanent differences, such as redesignation of dividends paid, partnership reclasses, disallowed capitalized dividends on short sales, reclass of short-term gain to ordinary income, write off of capital loss carryovers, return of capital adjustments, non-deductible tax paid and long term undistributed gains, premium reversals, paydown reclasses, passive foreign investment company reclasses, foreign currency reclasses, adjustments for business development corporations, disallowed expenses, non-deductible 12b-1 fee, Fund level over distributions, the use of equalization and net operating loss reclasses are reclassified among capital accounts in the financial statements to reflect their character. Temporary differences, such as deferrals on losses relating to wash sales transactions, amortization of offering costs, premium amortization, current year dividends payable, passive foreign investment company adjustments, qualified late-year losses deferred, prior year partnership basis adjustment, and capital loss carryovers, arise when income, expenses, gains or losses are recognized in different periods for financial statement and tax purposes; these differences may reverse at some time in the future.
| | |
| |
| | October 31, 2015 |
| |
| Notes to Financial Statements – continued | | |
Permanent differences between book and tax basis reporting for the 2015 fiscal year have been identified and appropriately reclassified as indicated below. These reclassifications have no impact on net assets.
| | | | | | | | | | | | |
| | | Accumulated
Undistributed Net
Investment Income | | | Accumulated Net
Realized Gain (Loss) | | | Paid-in Capital | |
| Fairpointe Focused Equity Fund | | $ | 11,478 | | | $ | — | | | $ | (11,478 | ) |
| Herndon Large Cap Value Fund | | | (711 | ) | | | 711 | | | | — | |
| Montag & Caldwell Growth Fund | | | (2,491,774 | ) | | | (187,762,178 | ) | | | 190,253,952 | |
| River Road Dividend All Cap Value Fund | | | (1,885,701 | ) | | | (6,112,677 | ) | | | 7,998,378 | |
| River Road Dividend All Cap Value Fund II | | | (138,240 | ) | | | 195,449 | | | | (57,209 | ) |
| Fairpointe Mid Cap Fund | | | (4,105,915 | ) | | | (79,773,583 | ) | | | 83,879,498 | |
| Montag & Caldwell Mid Cap Growth Fund | | | 7,141 | | | | — | | | | (7,141 | ) |
| LMCG Small Cap Growth Fund | | | 68,074 | | | | — | | | | (68,074 | ) |
| River Road Independent Value Fund | | | 926,714 | | | | 3,405 | | | | (930,119 | ) |
| River Road Select Value Fund | | | (19,989 | ) | | | (1,814,438 | ) | | | 1,834,427 | |
| River Road Small Cap Value Fund | | | 643,900 | | | | (149,385 | ) | | | (494,515 | ) |
| TAMRO Small Cap Fund | | | 4,937,003 | | | | (19,969,278 | ) | | | 15,032,275 | |
| DoubleLine Core Plus Fixed Income Fund | | | 626,461 | | | | (626,461 | ) | | | — | |
| TCH Fixed Income Fund | | | 73,744 | | | | (73,744 | ) | | | — | |
| Lake Partners LASSO Alternatives Fund | | | 2,309,549 | | | | (5,080,824 | ) | | | 2,771,275 | |
| River Road Long-Short Fund | | | 1,588,101 | | | | (1,588,101 | ) | | | — | |
| Barings International Fund | | | (4,046 | ) | | | 4,046 | | | | — | |
| Guardian Capital Global Dividend Fund | | | 4,537 | | | | 537 | | | | (5,074 | ) |
| LMCG Emerging Markets Fund | | | (13,849 | ) | | | 13,849 | | | | — | |
| Pictet International Fund | | | (45,771 | ) | | | 62,053 | | | | (16,282 | ) |
| TAMRO International Small Cap Fund | | | 3,863 | | | | 774 | | | | (4,637 | ) |
| Harrison Street Real Estate Fund | | | (75 | ) | | | 75 | | | | — | |
| Montag & Caldwell Balanced Fund | | | 63,957 | | | | (63,957 | ) | | | — | |
Distributions from net realized gains for book purposes may include short-term capital gains, which are classified as ordinary income for shareholder tax purposes.
The tax character of distributions paid during the fiscal years ended 2015 and 2014 was as follows:
| | | | | | | | | | | | | | | | |
| | | Distributions Paid-in 2015 | | | Distributions Paid-in 2014 | |
| | | Ordinary Income | | | Long-Term
Capital Gains | | | Ordinary Income | | | Long-Term
Capital Gains | |
| | | | | | | | | | | | | | | | |
| Cornerstone Large Cap Value Fund | | $ | 1,369,629 | | | $ | — | | | $ | 400,233 | | | $ | — | |
| Herndon Large Cap Value Fund | | | 2,334,787 | | | | 7,726,222 | | | | 3,419,118 | | | | 6,349 | |
| Montag & Caldwell Growth Fund | | | 44,398,227 | | | | 627,221,330 | | | | 45,645,316 | | | | 341,924,841 | |
| River Road Dividend All Cap Value Fund | | | 18,975,031 | | | | 89,326,656 | | | | 46,656,555 | | | | 64,851,857 | |
| River Road Dividend All Cap Value Fund II | | | 3,652,872 | | | | 3,141,523 | | | | 4,391,126 | | | | 86,891 | |
| Fairpointe Mid Cap Fund | | | 158,253,393 | | | | 770,919,534 | | | | 3,375,463 | | | | 458,048,169 | |
| Montag & Caldwell Mid Cap Growth Fund | | | 22,455 | | | | 696,350 | | | | 54,000 | | | | 1,654,527 | |
| LMCG Small Cap Growth Fund | | | 1,396,041 | | | | 1,078,763 | | | | 4,567,533 | | | | 960,263 | |
| River Road Independent Value Fund | | | 13,126,283 | | | | 21,661,599 | | | | 27,428,053 | | | | 833,833 | |
| River Road Select Value Fund | | | 7,895,744 | | | | 17,043,425 | | | | 5,039,706 | | | | 26,824,144 | |
| River Road Small Cap Value Fund | | | 9,289,576 | | | | 31,938,623 | | | | 10,537,955 | | | | 56,872,092 | |
| Silvercrest Small Cap Fund | | | 494,555 | | | | 1,198,029 | | | | 723,403 | | | | 562,187 | |
| TAMRO Small Cap Fund | | | — | | | | 94,016,613 | | | | — | | | | 116,418,951 | |
| DoubleLine Core Plus Fixed Income Fund | | | 12,876,362 | | | | — | | | | 5,696,835 | | | | — | |
| TCH Fixed Income Fund | | | 1,676,460 | | | | — | | | | 1,961,530 | | | | — | |
| Anchor Capital Enhanced Equity Fund | | | 3,854,267 | | | | — | | | | 3,308,423 | | | | — | |
| Lake Partners LASSO Alternatives Fund | | | 1,031,209 | | | | 15,080,709 | | | | 4,167,016 | | | | 1,590,997 | |
| River Road Long-Short Fund | | | 4,922,443 | | | | 335,340 | | | | 4,915,054 | | | | 28,902 | |
| Barings International Fund | | | 773,676 | | | | 2,360,468 | | | | 2,458,302 | | | | 944,009 | |
| Guardian Capital Global Dividend Fund | | | 102,970 | | | | — | | | | 46,620 | | | | — | |
| LMCG Emerging Markets Fund | | | 28,599 | | | | — | | | | 64,574 | | | | — | |
| Pictet International Fund | | | 188,437 | | | | — | | | | — | | | | — | |
| Harrison Street Real Estate Fund | | | 164,358 | | | | — | | | | 147,567 | | | | — | |
| Montag & Caldwell Balanced Fund | | | 241,984 | | | | 1,808,010 | | | | 208,332 | | | | 740,641 | |
| | |
| |
| | October 31, 2015 |
| |
| Notes to Financial Statements – continued | | |
As of October 31, 2015, the most recent tax year end, the components of distributable earnings on a tax basis were as follows:
| | | | | | | | | | | | | | | | | | | | |
| | | | | | | | | | | | | | | | | | | | |
| | | Accumulated Capital and
Other Losses | | | Undistributed
Ordinary
Income | | | Undistributed Long-Term Gain | | | Appreciation
(Depreciation) | | | Total | |
| Cornerstone Large Cap Value Fund | | $ | (14,365,295 | ) | | $ | 999,888 | | | $ | — | | | $ | (11,255,609 | ) | | $ | (24,621,016 | ) |
| Fairpointe Focused Equity Fund | | | (135,558 | ) | | | 54,030 | | | | — | | | | (322,512 | ) | | | (404,040 | ) |
| Herndon Large Cap Value Fund | | | — | | | | 963,616 | | | | 156,441 | | | | 9,123,495 | | | | 10,243,552 | |
| Montag & Caldwell Growth Fund | | | (2,530,371 | ) | | | 5,987,336 | | | | 453,313,303 | | | | 282,576,306 | | | | 739,346,574 | |
| River Road Dividend All Cap Value Fund | | | — | | | | — | | | | 68,842,050 | | | | 139,805,427 | | | | 208,647,477 | |
| River Road Dividend All Cap Value Fund II | | | — | | | | — | | | | 1,666,697 | | | | 8,623,205 | | | | 10,289,902 | |
| Fairpointe Mid Cap Fund | | | — | | | | 12,066,800 | | | | 234,496,728 | | | | 403,129,667 | | | | 649,693,195 | |
| Montag & Caldwell Mid Cap Growth Fund | | | (44,348 | ) | | | — | | | | 1,215,154 | | | | 1,367,116 | | | | 2,537,922 | |
| LMCG Small Cap Growth Fund | | | (1,718,723 | ) | | | — | | | | 25,386 | | | | (6,196,532 | ) | | | (7,889,869 | ) |
| River Road Independent Value Fund | | | (8,436,726 | ) | | | — | | | | — | | | | (25,777,073 | ) | | | (34,213,799 | ) |
| River Road Select Value Fund | | | (404,126 | ) | | | — | | | | 7,969,023 | | | | 2,982,812 | | | | 10,547,709 | |
| River Road Small Cap Value Fund | | | — | | | | 1,531,982 | | | | 13,692,607 | | | | 36,538,627 | | | | 51,763,216 | |
| Silvercrest Small Cap Fund | | | — | | | | 259,867 | | | | 6,208,067 | | | | 3,156,437 | | | | 9,624,371 | |
| TAMRO Small Cap Fund | | | (2,699,597 | ) | | | — | | | | 127,883,451 | | | | 71,601,080 | | | | 196,784,934 | |
| DoubleLine Core Plus Fixed Income Fund | | | (4,061,163 | ) | | | 244,629 | | | | — | | | | (7,489,005 | ) | | | 11,305,539 | |
| TCH Fixed Income Fund | | | (3,232,055 | ) | | | 12,396 | | | | — | | | | (19,474 | ) | | | (3,239,133 | ) |
| Anchor Capital Enhanced Equity Fund | | | — | | | | 368,674 | | | | 590,164 | | | | 78,903 | | | | 1,037,741 | |
| Lake Partners LASSO Alternatives Fund | | | (1,030,882 | ) | | | — | | | | 11,177,682 | | | | 4,356,028 | | | | 14,502,828 | |
| River Road Long-Short Fund | | | — | | | | 1,302,018 | | | | 544,844 | | | | (3,308,012 | ) | | | (1,461,150 | ) |
| Barings International Fund | | | — | | | | 220,278 | | | | 304,678 | | | | 1,209,342 | | | | 1,734,298 | |
| Guardian Capital Global Dividend Fund | | | (120,570 | ) | | | 28,570 | | | | — | | | | 215,561 | | | | 123,561 | |
| LMCG Emerging Markets Fund | | | (466,025 | ) | | | 19,918 | | | | — | | | | (156,009 | ) | | | (602,116 | ) |
| Pictet International Fund | | | — | | | | 973,948 | | | | — | | | | (88,522 | ) | | | 885,426 | |
| TAMRO International Small Cap Fund | | | (31,716 | ) | | | 27,902 | | | | — | | | | (21,507 | ) | | | (25,321 | ) |
| Harrison Street Real Estate Fund | | | (10,893,730 | ) | | | 122,213 | | | | — | | | | 238,319 | | | | (10,533,198 | ) |
| Montag & Caldwell Balanced Fund | | | — | | | | 11,392 | | | | 1,324,571 | | | | 2,593,122 | | | | 3,929,085 | |
Note (D) Shares of Beneficial Interest: Each Fund is authorized to issue an unlimited number of shares of beneficial interest with no par value. Share transactions of the Funds were as follows:
Year Ended October 31, 2015
| | | | | | | | | | | | | | | | |
Class N | | Sold | | | Proceeds From
Reinvestment
of Distributions | | | Redeemed | | | Net Increase
(Decrease) in
Shares Outstanding | |
| Cornerstone Large Cap Value Fund | | | 1,788,633 | | | | 28,081 | | | | (1,491,371 | ) | | | 325,343 | |
| Fairpointe Focused Equity Fund (a)(b) | | | 263,764 | | | | — | | | | (17,767 | ) | | | 245,997 | |
| Herndon Large Cap Value Fund | | | 204,863 | | | | 62,690 | | | | (555,307 | ) | | | (287,754 | ) |
| Montag & Caldwell Growth Fund | | | 7,138,882 | | | | 8,194,054 | | | | (29,417,908 | ) | | | (14,084,972 | ) |
| River Road Dividend All Cap Value Fund | | | 3,166,753 | | | | 2,107,691 | | | | (13,241,566 | ) | | | (7,967,122 | ) |
| River Road Dividend All Cap Value Fund II | | | 73,197 | | | | 22,350 | | | | (384,147 | ) | | | (288,600 | ) |
| Fairpointe Mid Cap Fund | | | 10,093,808 | | | | 9,137,627 | | | | (21,538,445 | ) | | | (2,307,010 | ) |
| Montag & Caldwell Mid Cap Growth Fund | | | 22,197 | | | | 34,984 | | | | (271,296 | ) | | | (214,115 | ) |
| LMCG Small Cap Growth Fund | | | 10,550,961 | | | | 105,407 | | | | (2,502,649 | ) | | | 8,153,719 | |
| River Road Independent Value Fund | | | 5,681,604 | | | | 1,563,007 | | | | (9,309,358 | ) | | | (2,064,747 | ) |
| River Road Select Value Fund | | | 73,126 | | | | 156,298 | | | | (525,281 | ) | | | (295,857 | ) |
| River Road Small Cap Value Fund | | | 397,814 | | | | 503,817 | | | | (2,457,631 | ) | | | (1,556,000 | ) |
| Silvercrest Small Cap Fund | | | 1,007,117 | | | | 9,374 | | | | (201,402 | ) | | | 815,089 | |
| TAMRO Small Cap Fund | | | 941,849 | | | | 2,105,009 | | | | (6,664,523 | ) | | | (3,617,665 | ) |
| DoubleLine Core Plus Fixed Income Fund | | | 17,140,542 | | | | 330,780 | | | | (4,242,057 | ) | | | 13,229,265 | |
| TCH Fixed Income Fund | | | 486,398 | | | | 101,645 | | | | (609,564 | ) | | | (21,521 | ) |
| Anchor Capital Enhanced Equity Fund | | | 2,092,810 | | | | 175,479 | | | | (3,722,695 | ) | | | (1,454,406 | ) |
| Lake Partners LASSO Alternatives Fund | | | 2,643,650 | | | | 133,278 | | | | (2,843,208 | ) | | | (66,280 | ) |
| River Road Long-Short Fund | | | 2,159,459 | | | | 231,451 | | | | (9,572,482 | ) | | | (7,181,572 | ) |
| Barings International Fund | | | 12,218 | | | | 8,119 | | | | (3,483 | ) | | | 16,854 | |
| Guardian Capital Global Dividend Fund | | | 3,342 | | | | 32 | | | | (1,156 | ) | | | 2,218 | |
| LMCG Emerging Markets Fund | | | 2,222 | | | | 426 | | | | (1,711 | ) | | | 937 | |
| Pictet International Fund | | | 6,850 | | | | 34 | | | | (1,762 | ) | | | 5,122 | |
| TAMRO International Small Cap Fund (c) | | | 112,581 | | | | — | | | | (6,729 | ) | | | 105,852 | |
| Harrison Street Real Estate Fund | | | 152,499 | | | | 11,379 | | | | (367,136 | ) | | | (203,258 | ) |
| Montag & Caldwell Balanced Fund | | | 377,132 | | | | 78,257 | | | | (167,264 | ) | | | 288,125 | |
| | |
| |
| | October 31, 2015 |
| |
| Notes to Financial Statements – continued | | |
| | | | | | | | | | | | | | | | |
Class I | | Sold | | | Proceeds From
Reinvestment
of Distributions | | | Redeemed | | | Net Increase
(Decrease) in
Shares Outstanding | |
| Cornerstone Large Cap Value Fund | | | 1,038,073 | | | | 56,356 | | | | (2,604,193 | ) | | | (1,509,764 | ) |
| Fairpointe Focused Equity Fund (a)(b) | | | 445,153 | | | | — | | | | (1 | ) | | | 445,152 | |
| Herndon Large Cap Value Fund | | | 1,504,825 | | | | 624,457 | | | | (2,898,699 | ) | | | (769,417 | ) |
| Montag & Caldwell Growth Fund | | | 9,136,847 | | | | 14,272,154 | | | | (66,732,284 | ) | | | (43,323,283 | ) |
| River Road Dividend All Cap Value Fund | | | 6,894,934 | | | | 4,086,211 | | | | (16,988,277 | ) | | | (6,007,132 | ) |
| River Road Dividend All Cap Value Fund II | | | 1,954,180 | | | | 444,366 | | | | (2,238,283 | ) | | | 160,263 | |
| Fairpointe Mid Cap Fund | | | 21,809,966 | | | | 10,047,970 | | | | (31,979,189 | ) | | | (121,253 | ) |
| Montag & Caldwell Mid Cap Growth Fund | | | 194,128 | | | | 27,469 | | | | (13,014 | ) | | | 208,583 | |
| LMCG Small Cap Growth Fund | | | 5,014,447 | | | | 52,633 | | | | (820,163 | ) | | | 4,246,917 | |
| River Road Independent Value Fund | | | 2,378,112 | | | | 1,546,766 | | | | (27,022,115 | ) | | | (23,097,237 | ) |
| River Road Select Value Fund | | | 725,982 | | | | 2,999,976 | | | | (11,708,876 | ) | | | (7,982,918 | ) |
| River Road Small Cap Value Fund | | | 4,076,490 | | | | 2,833,551 | | | | (5,385,952 | ) | | | 1,524,089 | |
| Silvercrest Small Cap Fund | | | 7,917,658 | | | | 100,934 | | | | (2,591,868 | ) | | | 5,426,724 | |
| TAMRO Small Cap Fund | | | 2,927,154 | | | | 2,381,469 | | | | (10,007,368 | ) | | | (4,698,745 | ) |
| DoubleLine Core Plus Fixed Income Fund | | | 18,070,549 | | | | 742,838 | | | | (4,697,945 | ) | | | 14,115,442 | |
| TCH Fixed Income Fund | | | 681,573 | | | | 49,603 | | | | (701,252 | ) | | | 29,924 | |
| Anchor Capital Enhanced Equity Fund | | | 4,045,214 | | | | 165,598 | | | | (6,567,499 | ) | | | (2,356,687 | ) |
| Lake Partners LASSO Alternatives Fund | | | 6,903,527 | | | | 804,316 | | | | (29,352,862 | ) | | | (21,645,019 | ) |
| River Road Long-Short Fund | | | 1,845,983 | | | | 160,137 | | | | (7,436,665 | ) | | | (5,430,545 | ) |
| Barings International Fund | | | 168,034 | | | | 526,718 | | | | (467,167 | ) | | | 227,585 | |
| Guardian Capital Global Dividend Fund | | | 10,042 | | | | 5,543 | | | | (731 | ) | | | 14,854 | |
| LMCG Emerging Markets Fund | | | — | | | | 2,687 | | | | (152,256 | ) | | | (149,569 | ) |
| Pictet International Fund | | | 5,060,181 | | | | 5,369 | | | | (781,788 | ) | | | 4,283,762 | |
| TAMRO International Small Cap Fund (c) | | | 66,529 | | | | — | | | | (1 | ) | | | 66,528 | |
| Harrison Street Real Estate Fund | | | 9,993 | | | | 565 | | | | (28,917 | ) | | | (18,359 | ) |
| Montag & Caldwell Balanced Fund | | | 94,050 | | | | 3,852 | | | | (28,359 | ) | | | 69,543 | |
| (a) | The commencement of investment operations for Fairpointe Focused Equity Fund is December 23, 2014. |
| (b) | Fairpointe Focused Equity Fund had a subscription-in-kind in the amount of $2,333,718 on December 23, 2014. The subscription was comprised of securities, cash and dividends accrued in the amount of $2,305,531, $26,148 and $2,039, respectively. |
| (c) | The commencement of investment operations for TAMRO International Small Cap Fund is December 22, 2014. |
| | | | | | | | | | | | | | | | |
Class R | | Sold | | | Proceeds From
Reinvestment
of Distributions | | | Redeemed | | | Net Decrease in
Shares Outstanding | |
| Montag & Caldwell Growth Fund | | | 35,243 | | | | 43,433 | | | | (118,215 | ) | | | (39,539 | ) |
Year Ended October 31, 2014
| | | | | | | | | | | | | | | | |
Class N | | Sold | | | Proceeds From
Reinvestment
of Distributions | | | Redeemed | | | Net Increase
(Decrease) in
Shares Outstanding | |
| Cornerstone Large Cap Value Fund | | | 3,048,364 | | | | 6,618 | | | | (840,585 | ) | | | 2,214,397 | |
| Herndon Large Cap Value Fund | | | 774,911 | | | | 78,380 | | | | (2,949,039 | ) | | | (2,095,748 | ) |
| Montag & Caldwell Growth Fund | | | 7,516,258 | | | | 5,582,826 | | | | (44,037,900 | ) | | | (30,938,816 | ) |
| River Road Dividend All Cap Value Fund | | | 4,595,497 | | | | 2,941,808 | | | | (14,719,302 | ) | | | (7,181,997 | ) |
| River Road Dividend All Cap Value Fund II | | | 308,070 | | | | 16,347 | | | | (92,224 | ) | | | 232,193 | |
| Fairpointe Mid Cap Fund | | | 13,219,533 | | | | 4,903,545 | | | | (18,453,660 | ) | | | (330,582 | ) |
| Montag & Caldwell Mid Cap Growth Fund | | | 35,309 | | | | 147,172 | | | | (438,462 | ) | | | (255,981 | ) |
| LMCG Small Cap Growth Fund | | | 615,033 | | | | 304,695 | | | | (585,882 | ) | | | 333,846 | |
| River Road Independent Value Fund | | | 6,616,331 | | | | 1,167,151 | | | | (11,067,285 | ) | | | (3,283,803 | ) |
| River Road Select Value Fund | | | 215,257 | | | | 295,283 | | | | (1,412,098 | ) | | | (901,558 | ) |
| River Road Small Cap Value Fund | | | 695,985 | | | | 871,062 | | | | (1,272,564 | ) | | | 294,483 | |
| Silvercrest Small Cap Fund | | | 318,690 | | | | 9,961 | | | | (168,205 | ) | | | 160,446 | |
| TAMRO Small Cap Fund | | | 2,156,386 | | | | 1,983,756 | | | | (9,725,416 | ) | | | (5,585,274 | ) |
| DoubleLine Core Plus Fixed Income Fund | | | 2,161,225 | | | | 141,089 | | | | (4,006,735 | ) | | | (1,704,421 | ) |
| TCH Fixed Income Fund | | | 549,014 | | | | 133,538 | | | | (1,567,315 | ) | | | (884,763 | ) |
| Anchor Capital Enhanced Equity Fund | | | 3,747,280 | | | | 184,255 | | | | (4,009,865 | ) | | | (78,330 | ) |
| Lake Partners LASSO Alternatives Fund | | | 1,605,400 | | | | 40,597 | | | | (2,469,534 | ) | | | (823,537 | ) |
| River Road Long-Short Fund | | | 8,014,551 | | | | 238,102 | | | | (7,696,381 | ) | | | 556,272 | |
| Barings International Fund | | | 8,221 | | | | 5,415 | | | | (27,372 | ) | | | (13,736 | ) |
| Guardian Capital Global Dividend Fund (a) | | | 100,106 | | | | — | | | | — | | | | 100,106 | |
| LMCG Emerging Markets Fund | | | 6,335 | | | | 1,079 | | | | (1,378 | ) | | | 6,036 | |
| Pictet International Fund (b) | | | 105,262 | | | | — | | | | — | | | | 105,262 | |
| Harrison Street Real Estate Fund | | | 374,724 | | | | 12,655 | | | | (529,928 | ) | | | (142,549 | ) |
| Montag & Caldwell Balanced Fund | | | 49,674 | | | | 35,776 | | | | (198,637 | ) | | | (113,187 | ) |
| | |
| |
| | October 31, 2015 |
| |
| Notes to Financial Statements – continued | | |
| | | | | | | | | | | | | | | | |
Class I | | Sold | | | Proceeds From
Reinvestment
of Distributions | | | Redeemed | | | Net Increase
(Decrease) in
Shares Outstanding | |
| Cornerstone Large Cap Value Fund | | | 4,871,810 | | | | 19,747 | | | | (993,206 | ) | | | 3,898,351 | |
| Herndon Large Cap Value Fund | | | 5,946,567 | | | | 145,491 | | | | (2,674,050 | ) | | | 3,418,008 | |
| Montag & Caldwell Growth Fund | | | 24,146,473 | | | | 5,932,472 | | | | (41,799,885 | ) | | | (11,720,940 | ) |
| River Road Dividend All Cap Value Fund | | | 9,868,160 | | | | 3,439,419 | | | | (12,909,103 | ) | | | 398,476 | |
| River Road Dividend All Cap Value Fund II | | | 3,185,525 | | | | 293,676 | | | | (990,015 | ) | | | 2,489,186 | |
| Fairpointe Mid Cap Fund | | | 30,513,534 | | | | 3,826,779 | | | | (15,079,903 | ) | | | 19,260,410 | |
| Montag & Caldwell Mid Cap Growth Fund (c) | | | 322,300 | | | | — | | | | (14 | ) | | | 322,286 | |
| LMCG Small Cap Growth Fund | | | 696,705 | | | | 82,467 | | | | (339,984 | ) | | | 439,188 | |
| River Road Independent Value Fund | | | 13,556,500 | | | | 1,311,396 | | | | (13,609,667 | ) | | | 1,258,229 | |
| River Road Select Value Fund | | | 3,281,294 | | | | 3,175,257 | | | | (5,705,277 | ) | | | 751,274 | |
| River Road Small Cap Value Fund | | | 6,333,689 | | | | 3,935,519 | | | | (6,638,474 | ) | | | 3,630,734 | |
| Silvercrest Small Cap Fund | | | 2,326,474 | | | | 76,930 | | | | (331,458 | ) | | | 2,071,946 | |
| TAMRO Small Cap Fund | | | 5,439,909 | | | | 2,400,215 | | | | (19,301,842 | ) | | | (11,461,718 | ) |
| DoubleLine Core Plus Fixed Income Fund | | | 10,159,407 | | | | 317,973 | | | | (6,234,468 | ) | | | 4,242,912 | |
| TCH Fixed Income Fund | | | 885,168 | | | | 40,165 | | | | (343,869 | ) | | | 581,464 | |
| Anchor Capital Enhanced Equity Fund | | | 7,598,733 | | | | 122,231 | | | | (2,426,538 | ) | | | 5,294,426 | |
| Lake Partners LASSO Alternatives Fund | | | 9,990,525 | | | | 329,595 | | | | (6,588,040 | ) | | | 3,732,080 | |
| River Road Long-Short Fund | | | 9,063,711 | | | | 164,164 | | | | (5,460,015 | ) | | | 3,767,860 | |
| Barings International Fund | | | 775,349 | | | | 457,485 | | | | (2,987,094 | ) | | | (1,754,260 | ) |
| Guardian Capital Global Dividend Fund (a) | | | 302,975 | | | | 2,366 | | | | — | | | | 305,341 | |
| LMCG Emerging Markets Fund | | | 26,107 | | | | 5,932 | | | | (41,200 | ) | | | (9,161 | ) |
| Pictet International Fund (b) | | | 904,851 | | | | — | | | | — | | | | 904,851 | |
| Harrison Street Real Estate Fund | | | 29,872 | | | | 396 | | | | (19,438 | ) | | | 10,830 | |
| Montag & Caldwell Balanced Fund | | | 14,759 | | | | 1,333 | | | | (14,900 | ) | | | 1,192 | |
| (a) | The commencement of investment operations for Guardian Capital Global Dividend Fund is April 11, 2014. |
| (b) | The commencement of investment operations for Pictet International Fund is April 11, 2014. |
| (c) | The commencement of investment operations for Montag & Caldwell Mid Cap Growth Fund Class I is May 13, 2014. |
| | | | | | | | | | | | | | | | |
Class R | | Sold | | | Proceeds From
Reinvestment
of Distributions | | | Redeemed | | | Net
Decrease in
Shares Outstanding | |
| Montag & Caldwell Growth Fund | | | 43,265 | | | | 20,886 | | | | (156,936 | ) | | | (92,785 | ) |
Note (E) Investment Transactions: Aggregate purchases and proceeds from sales and maturities of investment securities (other than short-term investments) for the year ended October 31, 2015 were as follows:
| | | | | | | | | | | | | | | | |
| | | Purchases | | | Proceeds from Sales | |
| | | | |
| | | U.S Government | | | Other | | | U.S Government | | | Other | |
| Cornerstone Large Cap Value Fund | | $ | — | | | $ | 82,484,485 | | | $ | — | | | $ | 101,398,715 | |
| Fairpointe Focused Equity Fund | | | — | | | | 1,217,288 | | | | — | | | | 46,064 | |
| Herndon Large Cap Value Fund | | | — | | | | 82,610,175 | | | | — | | | | 103,059,624 | |
| Montag & Caldwell Growth Fund | | | — | | | | 337,620,193 | | | | — | | | | 766,720,917 | |
| River Road Dividend All Cap Value Fund | | | — | | | | 256,256,225 | | | | — | | | | 504,657,427 | |
| River Road Dividend All Cap Value Fund II | | | — | | | | 45,516,700 | | | | — | | | | 48,650,312 | |
| Fairpointe Mid Cap Fund | | | — | | | | 1,673,808,483 | | | | — | | | | 2,721,532,124 | |
| Montag & Caldwell Mid Cap Growth Fund | | | — | | | | 5,987,097 | | | | — | | | | 6,975,216 | |
| LMCG Small Cap Growth Fund | | | — | | | | 294,555,281 | | | | — | | | | 101,472,929 | |
| River Road Independent Value Fund | | | — | | | | 56,128,651 | | | | — | | | | 155,410,152 | |
| River Road Select Value Fund | | | — | | | | 78,107,472 | | | | — | | | | 169,016,907 | |
| River Road Small Cap Value Fund | | | — | | | | 155,443,230 | | | | — | | | | 196,514,395 | |
| Silvercrest Small Cap Fund | | | — | | | | 130,892,039 | | | | — | | | | 38,599,648 | |
| TAMRO Small Cap Fund | | | — | | | | 445,639,756 | | | | — | | | | 736,750,318 | |
| DoubleLine Core Plus Fixed Income Fund | | | 189,995,122 | | | | 305,971,253 | | | | 68,017,830 | | | | 116,480,326 | |
| TCH Fixed Income Fund | | | 4,871,188 | | | | 9,387,428 | | | | 6,215,401 | | | | 8,394,452 | |
| Anchor Capital Enhanced Equity Fund | | | — | | | | 67,098,080 | | | | — | | | | 112,953,725 | |
| Lake Partners LASSO Alternatives Fund | | | — | | | | 229,658,305 | | | | — | | | | 514,905,677 | |
| River Road Long-Short Fund | | | — | | | | 378,543,685 | | | | — | | | | 504,320,396 | |
| Barings International Fund | | | — | | | | 7,692,729 | | | | — | | | | 9,122,340 | |
| Guardian Capital Global Dividend Fund | | | — | | | | 1,481,085 | | | | — | | | | 1,294,355 | |
| LMCG Emerging Markets Fund | | | — | | | | 2,008,602 | | | | — | | | | 3,340,216 | |
| Pictet International Fund | | | — | | | | 55,998,309 | | | | — | | | | 17,079,189 | |
| TAMRO International Small Cap Fund | | | — | | | | 2,540,676 | | | | — | | | | 791,006 | |
| Harrison Street Real Estate Fund | | | — | | | | 18,913,068 | | | | — | | | | 21,570,180 | |
| Montag & Caldwell Balanced Fund | | | 1,674,863 | | | | 13,604,486 | | | | 889,716 | | | | 8,957,927 | |
| | |
| |
| | October 31, 2015 |
| |
| Notes to Financial Statements – continued | | |
Note (F) Redemption Fees: In accordance with the prospectus, certain Funds may assess a redemption fee on Fund share redemptions and exchanges within specified time periods. The redemption fees are indicated in the following table for the year ended October 31, 2015 and are included in the Cost of Shares Redeemed on the Statements of Changes in Net Assets:
| | | | | | |
Fund Name | | Time Period | | Amount | |
| Barings International Fund | | 2% Within 90 Days | | $ | 210 | |
| Guardian Capital Global Dividend Fund | | 2% Within 90 Days | | | 50 | |
| LMCG Emerging Markets Fund | | 2% Within 90 Days | | | — | |
| Pictet International Fund | | 2% Within 90 Days | | | 972 | |
| Harrison Street Real Estate Fund | | 2% Within 90 Days | | | 5,024 | |
Note (G) Advisory, Administration, Affiliated Investments, Distribution Services and Trustee Arrangements:
Advisory. Aston serves as investment adviser and administrator to the Funds. Under the terms of the investment advisory agreement for the Funds (the “Investment Advisory Agreement”), fees are accrued daily and paid monthly, at specified annual rates of average daily net assets. The factors considered by the Board in approving the current Investment Advisory Agreement are included in the Funds’ annual or semi-annual report to shareholders covering the period during which the approval occurred.
Certain Funds are subject to an expense limitation agreement with the Adviser, pursuant to which annual ordinary operating expenses for Class N and Class I shareholders are capped at certain specified annual rates of average daily net assets. There are no contractual expense limitations for Class R shareholders.
The contractual expense limitations for the Funds are effective through February 29, 2016. The advisory rates and contractual expense limitations for the year ended October 31, 2015 were as follows:
| | | | | | |
| | | | | Contractual Expense Limitations |
Fund Name | | Advisory Fees | | Class N | | Class I |
| Cornerstone Large Cap Value Fund | | 0.80% | | 1.30% | | 1.05% |
| Fairpointe Focused Equity Fund (a) | | 0.80% | | 1.15% | | 0.90% |
| Herndon Large Cap Value Fund | | 0.80% | | 1.30% | | 1.05% |
| Montag & Caldwell Growth Fund | | 0.80% on first $800,000,000 | | | | |
| | 0.60% over $800,000,000 up to $6 billion | | | | |
| | 0.55% over $6 billion up to $12 billion
0.50% over $12 billion | | N/A | | N/A |
| River Road Dividend All Cap Value Fund | | 0.70% | | 1.30% | | 1.05% |
| River Road Dividend All Cap Value Fund II | | 0.70% | | 1.30% | | 1.05% |
| Fairpointe Mid Cap Fund | | 0.80% on first $100,000,000 | | | | |
| | 0.75% next $300,000,000 | | | | |
| | 0.70% over $400,000,000 | | N/A | | N/A |
| Montag & Caldwell Mid Cap Growth Fund | | 0.85% | | 1.25% | | 1.00% |
| LMCG Small Cap Growth Fund | | 1.00% | | 1.35% | | 1.10% |
| River Road Independent Value Fund | | 1.00% | | 1.42% | | 1.17% |
| River Road Select Value Fund | | 1.00% | | 1.50% | | 1.25% |
| River Road Small Cap Value Fund | | 0.90% | | N/A | | N/A |
| Silvercrest Small Cap Fund | | 1.00% | | 1.40% | | 1.15% |
| TAMRO Small Cap Fund | | 0.90% | | N/A | | N/A |
| DoubleLine Core Plus Fixed Income Fund | | 0.55% | | 0.94% | | 0.69% |
| TCH Fixed Income Fund | | 0.55% | | 0.94% | | 0.69% |
| Anchor Capital Enhanced Equity Fund | | 0.70% | | 1.40% | | 1.15% |
| Lake Partners LASSO Alternatives Fund (b) | | 1.00% | | 1.40% | | 1.15% |
| River Road Long-Short Fund | | 1.20% | | 1.70% | | 1.45% |
| Barings International Fund | | 1.00% | | 1.40% | | 1.15% |
| Guardian Capital Global Dividend Fund | | 0.80% | | 1.30% | | 1.05% |
| LMCG Emerging Markets Fund | | 1.05% | | 1.43% | | 1.18% |
| Pictet International Fund | | 0.90% | | 1.40% | | 1.15% |
| TAMRO International Small Cap Fund (c) | | 1.00% | | 1.50% | | 1.25% |
| Harrison Street Real Estate Fund | | 1.00% | | 1.37% | | 1.12% |
| Montag & Caldwell Balanced Fund | | 0.75% | | 1.35% | | 1.10% |
| (a) | The commencement of investment operations for Fairpointe Focused Equity Fund is December 23, 2014. |
| (b) | Prior to February 28, 2015, the contractual expense limitation was 1.45% and 1.20% for Class N and Class I, respectively. |
| (c) | The commencement of investment operations for TAMRO International Small Cap Fund is December 22, 2014. |
| | |
| |
| | October 31, 2015 |
| |
| Notes to Financial Statements – continued | | |
Pursuant to a contractual expense reimbursement agreement between the Adviser and the Trust, for a period of up to three years from the fiscal year end during which the Adviser waived its advisory fees or reimbursed expenses for each of: Fairpointe Focused Equity Fund-Classes N and I, Herndon Large Cap Value Fund-Classes N and I, River Road Dividend All Cap Value Fund II-Classes N and I, LMCG Small Cap Growth Fund-Classes N and I, River Road Independent Value Fund-Classes N and I, Silvercrest Small Cap Fund-Classes N and I, DoubleLine Core Plus Fixed Income Fund-Classes N and I, River Road Long-Short Fund-Classes N and I, Guardian Capital Global Dividend Fund-Classes N and I, LMCG Emerging Markets Fund-Classes N and I, Pictet International Fund-Classes N and I, and TAMRO International Small Cap Fund-Classes N and I, the Adviser is entitled to be reimbursed by each Fund for such previously waived fees and reimbursed expenses from commencement of operations through the completion of the first three full fiscal years, to the extent that each Fund’s expense ratio (not including interest, taxes, other investment-related costs (such as brokerage commissions), extraordinary expenses and acquired fund fees and expenses) remains below the operating expense cap after such reimbursement.
The cumulative reimbursement amounts as of October 31, 2015 that are entitled to be recouped for each Fund are as follows:
| | | | | | | | | | | | |
| | | Expiration | |
| | | 2016 | | | 2017 | | | 2018 | |
| Fairpointe Focused Equity Fund | | | N/A | | | | N/A | | | $ | 128,683 | |
| Herndon Large Cap Value Fund | | $ | — | | | | N/A | | | | N/A | |
| River Road Dividend All Cap Value Fund II | | | — | | | $ | — | | | | — | |
| LMCG Small Cap Growth Fund | | | 157,143 | | | | 131,012 | | | | N/A | |
| River Road Independent Value Fund | | | 59,855 | | | | 25,960 | | | | N/A | |
| Silvercrest Small Cap Fund | | | 116,435 | | | | 108,554 | | | | 77,805 | |
| DoubleLine Core Plus Fixed Income Fund | | | 205,067 | | | | 183,865 | | | | N/A | |
| River Road Long-Short Fund | | | 76,699 | | | | — | | | | N/A | |
| Guardian Capital Global Dividend Fund | | | N/A | | | | 89,764 | | | | 122,164 | |
| LMCG Emerging Markets Fund | | | 119,333 | | | | 173,395 | | | | 156,268 | |
| Pictet International Fund | | | N/A | | | | 102,208 | | | | 175,077 | |
| TAMRO International Small Cap Fund | | | N/A | | | | N/A | | | | 141,989 | |
| | | | | | | | | | | | |
| Total | | $ | 734,532 | | | $ | 814,758 | | | $ | 801,986 | |
| | | | | | | | | | | | |
For the year ended October 31, 2015, the Adviser was reimbursed $42,793 by the Herndon Large Cap Value Fund and $34,948 by the River Road Long-Short Fund for recoupment of prior year fee waivers. No other Fund in the above table reimbursed the Adviser for the period.
During the year ended October 31, 2015, the following Funds were reimbursed by the respective Subadviser for losses incurred on transactions not meeting the Funds’ investment guidelines:
| | | | |
| | | Capital Contribution | |
| Guardian Capital Global Dividend Fund | | $ | 441 | |
| Pictet International Fund | | | 23,298 | |
On November 25, 2014, Instinet LLC contributed $60 of capital to the following Fund to mitigate the negative impact to Shareholders from a trade execution error.
| | | | |
| | | Capital Contribution | |
| River Road Dividend All Cap Value Fund | | $ | 60 | |
On March 13, 2015, BNY Mellon contributed $872 of capital to the following Fund to mitigate the negative impact to Shareholders from an incorrect calculation of net asset value.
| | | | |
| | | Capital Contribution | |
| Lake Partners LASSO Alternatives Fund | | $ | 872 | |
On September 28, 2015, State Street Bank contributed to the LASSO Alternatives Fund 9,777 shares of Blackrock Global Long/Short Equity Fund (an investment held by the Fund) with a fair market value of $115,466. The contribution was made to mitigate the negative impact to the Fund resulting from an incorrect calculation of the Blackrock Fund’s net asset value.
The Adviser manages each Fund by retaining one or more Subadvisers to manage each Fund, as follows:
| | |
| Fund | | Subadviser |
Cornerstone Large Cap Value Fund | | Cornerstone Investment Partners, LLC |
Fairpointe Focused Equity Fund | | Fairpointe Capital LLC |
Herndon Large Cap Value Fund | | Herndon Capital Management, LLC |
Montag & Caldwell Growth Fund | | Montag & Caldwell, LLC |
River Road Dividend All Cap Value Fund | | River Road Asset Management, LLC |
River Road Dividend All Cap Value Fund II | | River Road Asset Management, LLC |
Fairpointe Mid Cap Fund | | Fairpointe Capital LLC |
Montag & Caldwell Mid Cap Growth Fund | | Montag & Caldwell, LLC |
LMCG Small Cap Growth Fund | | LMCG Investments, LLC |
River Road Independent Value Fund | | River Road Asset Management, LLC |
River Road Select Value Fund | | River Road Asset Management, LLC |
River Road Small Cap Value Fund | | River Road Asset Management, LLC |
Silvercrest Small Cap Fund | | Silvercrest Asset Management Group LLC |
TAMRO Small Cap Fund | | TAMRO Capital Partners LLC |
DoubleLine Core Plus Fixed Income Fund | | DoubleLine Capital LP |
TCH Fixed Income Fund | | Taplin, Canida & Habacht, LLC |
Anchor Capital Enhanced Equity Fund | | Anchor Capital Advisors LLC |
Lake Partners LASSO Alternatives Fund | | Lake Partners, Inc. |
River Road Long-Short Fund | | River Road Asset Management, LLC |
Barings International Fund | | Baring International Investment Limited |
Guardian Capital Global Dividend Fund | | Guardian Capital LP |
LMCG Emerging Markets Fund | | LMCG Investments, LLC |
Pictet International Fund | | Pictet Asset Management Limited |
TAMRO International Small Cap Fund | | TAMRO Capital Partners LLC |
Harrison Street Real Estate Fund | | Harrison Street Securities, LLC |
Montag & Caldwell Balanced Fund | | Montag & Caldwell, LLC |
Subadvisory fees are paid monthly by Aston. The factors considered by the Board in approving the current sub-investment advisory agreements for the Funds (each, a “Sub-Investment Advisory Agreement”) are included in the additional information section of the Funds’ annual or semi-annual report to shareholders covering the period in which such approval occurred.
| | |
| |
| | October 31, 2015 |
| |
| Notes to Financial Statements – continued | | |
Administration. Under the terms of the administration agreement between the Trust and Aston, the Funds’ administrator (the “Administration Agreement”), administration fees are accrued daily and paid monthly, based on a specified percentage of average daily net assets of the Trust, and base fees are fixed at an annual rate of $12,000 per Fund. The fee is allocated to each Fund based on the relative net assets of the Trust. Administration expenses also include pricing agent fees and compliance-related expenses. The administration fee arrangement is as follows:
| | |
Administration Fees at Trust Level | | Annual Rate |
| |
| First $7.4 billion | | 0.0437% |
| Over $7.4 billion | | 0.0412% |
BNY Mellon Investment Servicing (US) Inc. (“BNY Mellon”) provides certain administrative services to the Funds pursuant to a Sub-administration and Accounting Services Agreement between Aston and BNY Mellon (the “Sub-Administration Agreement”).
Distribution Services. Foreside Funds Distributors LLC (the “Distributor”) serves as principal underwriter and distributor of the Funds’ shares. Pursuant to Rule 12b-1 distribution and service plans (the “Plans”) adopted by the Funds, with respect to Class N shares and Class R shares, the Funds pay certain expenses associated with the distribution and servicing of their shares. Under the Plans, each Fund may pay actual expenses not exceeding, on an annual basis, 0.25% of each participating Fund’s Class N average daily net assets and 0.50% of each participating Fund’s Class R average daily net assets. The Class I shares do not have Rule 12b-1 plans. Effective January 1, 2012 and ending October 31, 2013, the TCH Fixed Income Fund
12b-1 fee was reduced to 0.15%. Effective January 1, 2012, Montag & Caldwell Balanced Fund reduced its 12b-1 fees to 0.10%.
Trustees. The Trustees of the Trust who are not affiliated with the Adviser or a Subadviser receive an annual retainer and per meeting fees, and they are reimbursed for out-of-pocket expenses for each meeting of the Board they attend. The Chairman of the Board and the Audit Committee Chair receive additional retainers. No officer or employee of the Adviser, of a Subadviser, or of their affiliates receives any compensation from the Funds for acting as a Trustee of the Trust. The officers of the Trust receive no compensation directly from the Funds for performing the duties of their offices, except that the Funds compensate the Administrator for providing an officer to serve as the Funds’ Chief Compliance Officer. The aggregate remuneration paid to the Trustees during the year ended October 31, 2015 was $758,588.
Effective May 30, 2014, Aston became an indirect, wholly-owned subsidiary of Affiliated Managers Group, Inc. (“AMG”), the interests in which are held by AMG through its wholly-owned subsidiary, AMG Funds LLC. AMG Funds LLC serves as investment adviser to the AMG Funds family of mutual funds (“AMG Funds”) and the same trustees serve on the Boards of Trustees of both the Trust and AMG Funds. Effective January 1, 2015, the Trustees’ fees and expenses are generally allocated among all of the Funds and the funds within AMG Funds based on the relative net assets of such funds. Before January 1, 2015, the Trustees’ fees and expenses were allocated among the Aston Funds. The “Trustees fees and related expenses” shown in the financial statements represents each Fund’s allocated portion of the total fees and expenses paid to the Trustees of the Trust.
Affiliated Investments: Certain Funds may invest in affiliated funds subject to compliance with each Fund’s policies.
A summary of each Fund’s investment, as applicable, in affiliated funds for the year ended October 31, 2015, is as follows:
DoubleLine Core Plus Fixed Income Fund
| | | | | | | | | | | | | | | | | | | | |
Underlying Fund | | Purchases | | | Proceeds
from Sales | | | Market Value
10/31/2015 | | | Dividend
Income | | | Realized
Gain | |
| DoubleLine Floating Rate Fund | | $ | 11,200,000 | | | $ | 4,000,000 | | | $ | 9,589,931 | | | $ | 301,078 | | | $ | 23,712 | |
Note (H) Credit Agreement: Effective July 6, 2010 and as amended August 29, 2014 and July 29, 2015, the Trust entered into a Credit Agreement with The Bank of New York Mellon (the “Bank”) which provides the Trust with a revolving line of credit facility of up to $50 million. The facility is shared by each series of the Trust and is available for temporary, emergency purposes including liquidity needs in meeting redemptions. The interest rate on outstanding Alternate Base Rate Loans is equal to the greater of the Prime Rate plus 1.25% or 0.50% plus the Federal Funds Effective Rate plus 1.25%. The interest rate on outstanding Overnight Loans is equal to the greater of the Federal Funds Effective Rate plus 1.25% or the One Month LIBOR Rate plus 1.25%. Effective July 29, 2015, the Trust pays a commitment fee on the unutilized commitment amount of 0.15% per annum, included in Other Expenses on
the Statement of Operations. Prior to July 29, 2015, the Trust paid a commitment fee of 0.12% per annum. The Funds did not utilize the line of credit during the year ended October 31, 2015.
Note (I) Fund Closure: ASTON/TAMRO Diversified Equity Fund was liquidated on October 29, 2015.
Note (J) Significant Concentrations: Certain Funds may invest a significant percentage of their assets in securities of foreign issuers. These investments may involve certain considerations and risks not typically associated with investments in the United States as a result of, among other factors, the possibility of future political and economic developments and the level of governmental supervision and regulation of securities markets in
| | |
| |
| | October 31, 2015 |
| |
| Notes to Financial Statements – continued | | |
the respective countries. Some countries in which the Funds invest may require government approval for repatriation of investment income, capital or the proceeds for sales of securities by foreign investors. In addition, if there is deterioration in a country’s balance of payments or for other reasons, a country may impose temporary restrictions on foreign capital remittances abroad. In addition, changes in currency exchange rates will affect the value of investments denominated in a foreign currency, as well as investment income derived from those securities.
Note (K) Subsequent Events: Management has evaluated the impact of all subsequent events on the Funds through the date the financial statements were issued, and has determined that there were no subsequent events requiring recognition or disclosure in the financial statements, except as follows:
The Trust filed a Post-Effective Amendment to its Registration Statement on August 18, 2015 for the purpose of adding a new series to the Trust, ASTON/River Road Focused Absolute Value Fund. This new fund commenced investment operations on November 3, 2015.
The Trust filed a Post-Effective Amendment to its Registration Statement on October 1, 2015 for the purpose of adding a new series to the Trust, ASTON/Value Partners Asia Dividend Fund. This new fund commenced investment operations on December 16, 2015.
| | |
| |
| | |
| |
| Report of Independent Registered Public Accounting Firm | | |
The Board of Trustees and Shareholders of Aston Funds
We have audited the accompanying statements of assets and liabilities, including the schedules of investments, of Aston Funds (the “Trust”) (comprising, respectively, ASTON/Cornerstone Large Cap Value Fund, ASTON/Fairpointe Focused Equity Fund, ASTON/Herndon Large Cap Value Fund, ASTON/Montag & Caldwell Growth Fund, ASTON/River Road Dividend All Cap Value Fund, ASTON/River Road Dividend All Cap Value Fund II, ASTON/Fairpointe Mid Cap Fund, ASTON/Montag & Caldwell Mid Cap Growth Fund, ASTON/LMCG Small Cap Growth Fund, ASTON/River Road Independent Value Fund, ASTON/River Road Select Value Fund, ASTON/River Road Small Cap Value Fund, ASTON/Silvercrest Small Cap Fund, ASTON/TAMRO Small Cap Fund, ASTON/DoubleLine Core Plus Fixed Income Fund, ASTON/TCH Fixed Income Fund, ASTON/Anchor Capital Enhanced Equity Fund, ASTON/Lake Partners LASSO Alternatives Fund, ASTON/River Road Long-Short Fund, ASTON/Barings International Fund, ASTON/Guardian Capital Global Dividend Fund, ASTON/LMCG Emerging Markets Fund, ASTON/Pictet International Fund, ASTON/TAMRO International Small Cap Fund, ASTON/Harrison Street Real Estate Fund, and ASTON/Montag & Caldwell Balanced Fund (the “Funds”)) as of October 31, 2015, and the related statements of operations, changes in net assets, and the financial highlights for the periods indicated therein. These financial statements and financial highlights are the responsibility of the Trust’s management. Our responsibility is to express an opinion on these financial statements and financial highlights based on our audits.
We conducted our audits in accordance with the standards of the Public Company Accounting Oversight Board (United States). Those standards require that we plan and perform the audits to obtain reasonable assurance about whether the financial statements and financial highlights are free of material misstatement. We were not engaged to perform an audit of the Trust’s internal control over financial reporting. Our audits included consideration of internal control over financial reporting as a basis for designing audit procedures that are appropriate in the circumstances, but not for the purpose of expressing an opinion on the effectiveness of the Trust’s internal control over financial reporting. Accordingly, we express no such opinion. An audit also includes examining, on a test basis, evidence supporting the amounts and disclosures in the financial statements and financial highlights, assessing the accounting principles used and significant estimates made by management, and evaluating the overall financial statement presentation. Our procedures included confirmation of securities owned as of October 31, 2015, by correspondence with the custodian and brokers, or by other appropriate auditing procedures where replies from brokers were not received. We believe that our audits provide a reasonable basis for our opinion.
In our opinion, the financial statements and financial highlights referred to above present fairly, in all material respects, the financial position of each of the respective portfolios constituting the Aston Funds at October 31, 2015, and the results of their operations, the changes in their net assets, and the financial highlights for the periods indicated therein, in conformity with U.S. generally accepted accounting principles.

Chicago, Illinois
December 22, 2015
| | |
| |
| | October 31, 2015 |
| |
| Additional Information (unaudited) | | |
Form N-Q: The Trust files complete schedules of portfolio holdings for the Funds with the Securities and Exchange Commission (the “SEC”) for the Trust’s first and third quarters of each fiscal year on Form N-Q. The Trust’s Form N-Q are available on the SEC’s website at www.sec.gov and are available for review and copying at the SEC’s Public Reference Room in Washington, DC. Information on the operations of the Public Reference Room may be obtained by calling the SEC at 202-942-8090.
Proxy Voting: The Trust’s Proxy Voting Policies and Procedures, used to determine how to vote proxies relating to portfolio securities, are included in the Trust’s Statement of Additional Information, which is available (i) upon request, without charge, by calling 800-992-8151; (ii) on Aston Funds’ website at www.astonfunds.com; and (iii) on the SEC’s website at www.sec.gov. The Funds’ Proxy Voting Record for the most recent twelve-month period ended June 30 is available without charge (i) on the Funds’ website at www.astonfunds.com; and (ii) on the SEC’s website at www.sec.gov.
CONSIDERATIONS OF THE BOARD OF TRUSTEES IN CONNECTION WITH THE APPROVAL OF THE INVESTMENT ADVISORY AGREEMENT FOR ASTON/VALUE PARTNERS ASIA DIVIDEND FUND
At an in-person meeting on September 17, 2015, the Board of Trustees (the “Board”) of Aston Funds (the “Trust”), including the trustees who are not “interested persons,” as defined in Section 2(a)(19) of the Investment Company Act of 1940, as amended (the “Independent Trustees”), determined that the terms of the Investment Advisory Agreement between the Trust and Aston Asset Management, LLC (“Aston”) with respect to the ASTON/Value Partners Asia Dividend Fund (the “New Fund”) are fair and reasonable and approved the Investment Advisory Agreement for the New Fund as being in the best interests of the New Fund. In making such determinations, the Board, including the Independent Trustees, considered materials received and discussions held with respect to the approval of the Investment Advisory Agreement at the September 17, 2015 meeting. The Independent Trustees met separately from the Trustees who are “interested persons” of the Trust as defined in Section 2(a)(19) of the Investment Company Act of 1940, as amended, and any officers of Aston or its affiliates to consider approval of the Investment Advisory Agreement with respect to the New Fund and were assisted by independent legal counsel in their deliberations.
In evaluating the Investment Advisory Agreement on behalf of the New Fund, the Board reviewed, among other things, information regarding: (1) the nature, quality and extent of the services to be provided to the New Fund; (2) the management fees to be charged and estimated total expense ratio of the New Fund compared to a peer group of funds; (3) fee waivers or expenses to be reimbursed by Aston and/or the New Fund’s subadviser; and (4) potential benefits to be received by Aston or its affiliates from Aston’s relationship with the New Fund. In considering the Investment Advisory Agreement on behalf of the New Fund, the Board, including the Independent Trustees, did not identify any single factor or group of factors as all-important or controlling, but considered all factors together. The following summary does not detail all the matters considered.
Nature, Quality and Extent of Services. The Board considered the nature, quality and extent of the services to be provided by Aston, including investment advisory services and administrative services. The Board considered that Aston is a manager-of-managers, and that in its role as investment adviser to the New Fund it intends to delegate the day-to-day responsibility for managing the New Fund’s investments to a subadviser. Accordingly, the Board considered Aston’s capabilities and processes with respect to the selection and monitoring of subadvisers on an ongoing basis, as well as information regarding the composition, experience and role of its Investment Committee. In this regard, the Board noted the responsibilities and experience of Aston personnel, the resources made available to such personnel, the ability of Aston to attract and retain high quality personnel and the organizational depth and stability of Aston.
In addition to investment advisory services, the Board considered the quality of other services provided by Aston including the oversight of service providers, regulatory administration and Board support, fund administration and operational support, compliance services, shareholder servicing and platform management and distribution- and marketing-related services. The Board also considered the nature, quality and extent of the services provided by Aston with respect to other series of the Trust. On the basis of this evaluation, the Board concluded that the nature, quality and extent of the services to be provided by Aston are expected to be satisfactory.
Fees and Expenses. The Board considered the New Fund’s proposed management fee rate and total net expense ratio after contractual expense reimbursements and fee waivers. As a part of this analysis, the Board compared the proposed management fees and total net expenses to those of a relevant peer group for the New Fund. The Board concluded that the proposed management fees were reasonable and appropriate in light of the nature, quality and extent of the services to be provided by Aston.
Costs and Profitability. With respect to the costs of the services to be provided and the profits expected to be realized by Aston, the Board considered the resources involved in managing the New Fund in light of Aston’s business model as well as fees to be waived or expenses to be reimbursed under an Expense Reimbursement Agreement with Aston. The Board noted that Aston and the subadviser each will bear a portion of any fee waivers or expense reimbursements with respect to the New Fund. Because the New Fund has not yet commenced operations, profitability information was not available. However, based upon projected asset size and the impact of fee waivers or expenses to be reimbursed by Aston, the Board concluded that profitability was not expected to be unreasonable.
Economies of Scale. The Board considered the extent to which economies of scale would be realized as the New Fund grows. The Board considered the potential asset size of the New Fund, as well as the terms of the Expense Reimbursement Agreement, and concluded that at this time the potential for economies of scale are limited.
| | |
| |
| | October 31, 2015 |
| |
| Additional Information (unaudited) – continued | | |
Other Benefits to the Investment Adviser. The Board considered the nature and amount of fees to be paid by the New Fund for services to be provided by Aston for administration services. The Board noted that Aston currently does not intend to manage the New Fund directly, and therefore will not benefit from the use of “soft” commission dollars to pay for research or brokerage services. The Board concluded that any other benefits to be received by Aston from its relationship with the New Fund were not expected to be unreasonable.
Conclusion. Based upon its evaluation of all material factors and assisted by the advice of independent legal counsel, the Board, including all of the Independent Trustees, concluded that the terms of the Investment Advisory Agreement for the New Fund, including the proposed management fees, were fair and reasonable, that the approval of the Investment Advisory Agreement was in the best interests of the New Fund and that the Investment Advisory Agreement on behalf of the New Fund should be approved.
CONSIDERATIONS OF THE BOARD OF TRUSTEES IN CONNECTION WITH THE APPROVAL OF THE SUB-INVESTMENT ADVISORY AGREEMENT FOR ASTON/VALUE PARTNERS ASIA DIVIDEND FUND
At an in-person meeting on September 17, 2015, the Board of Trustees (the “Board”) of Aston Funds (the “Trust”), including the trustees who are not “interested persons,” as defined in Section 2(a)(19) of the Investment Company Act of 1940, as amended (the “Independent Trustees”), considered the approval of a Sub-Investment Advisory Agreement between Aston Asset Management, LLC (“Aston”) and Value Partners Hong Kong Limited (“Value Partners”) with respect to the ASTON/Value Partners Asia Dividend Fund (the “New Fund”). The Board considered information provided and discussions held at the September 17, 2015 meeting. The Independent Trustees met separately from the Trustees who are “interested persons” of the Trust as defined in Section 2(a)(19) of the Investment Company Act of 1940, as amended, and any officers of Aston, Value Partners or their respective affiliates to consider approval of the Sub-Investment Advisory Agreement and were assisted by independent legal counsel in their deliberations.
In evaluating the Sub-Investment Advisory Agreement for the New Fund, the Board considered, among other things, the factors described below. In considering the Sub-Investment Advisory Agreement for the New Fund, the Board, including the Independent Trustees, did not identify any single factor or group of factors as all-important or controlling, but considered all factors together.
Nature, Quality and Extent of Services. The Board considered the nature, quality and extent of the services expected to be provided under the Sub-Investment Advisory Agreement. The Board considered the reputation, qualifications and background of Value Partners and its operational and compliance infrastructures. The Board also considered information provided regarding Value Partners’ investment approach, the experience and skills of senior management and investment personnel of
Value Partners, the resources made available to such personnel, the ability of Value Partners to attract and retain high-quality personnel and the organizational depth of Value Partners. The Board also considered the historical composite performance of Value Partners in the proposed investment strategy for the New Fund for the year-to-date, one-year, three-year and since inception (September 2, 2002) periods ended June 30, 2015, as well as for the calendar year 2014, in each case compared to a Morningstar peer group and an appropriate benchmark index. The Board noted that the composite performance outperformed the benchmark and ranked in the first quartile of the Morningstar peer group for each of these periods. On the basis of this evaluation, the Board concluded that the nature, quality and extent of the services to be provided by Value Partners are expected to be satisfactory.
Fees, Profitability and Economies of Scale. The Board considered the subadvisory fee rate under the Sub-Investment Advisory Agreement as well as the overall management fee structure of the New Fund, noting that the subadvisory fee rate is fifty percent (50%) of the investment advisory fee less certain third-party payments, fee waivers and expense reimbursements incurred by Aston. The Board considered that Aston would compensate Value Partners from the investment advisory fees it receives from the New Fund. The Board noted that Aston’s ultimate parent company owns a minority equity interest in Value Partners. As part of its review of the investment advisory agreement with Aston, the Board considered whether there will be economies of scale with respect to the overall fee structure of the New Fund and whether the New Fund will benefit from any economies of scale.
The Board determined that profitability information with respect to Value Partners was not material to its considerations in light of the fee model used by Aston. The Board concluded that the proposed subadvisory fee rate was reasonable in light of the nature, quality and extent of the services to be provided and that economies of scale were limited at this time.
Other Benefits to the Subadviser. The Board also considered the character and amount of other incidental benefits expected to be received by Value Partners and its affiliates. The Board considered potential benefits to Value Partners from the use of “soft dollars” to pay for research services generated by parties other than the executing broker-dealer. The Board concluded that the subadvisory fees were reasonable, taking into account any other benefits expected to be received by Value Partners from its relationship with the New Fund.
Conclusion. Based upon its evaluation of all material factors and assisted by the advice of independent legal counsel, the Board, including all of the Independent Trustees, concluded that the terms of the Sub-Investment Advisory Agreement for the New Fund, including the proposed subadvisory fees, were fair and reasonable, that the approval of the Sub-Investment Advisory Agreement was in the best interests of the New Fund and that the Sub-Investment Advisory Agreement for the New Fund should be approved.
| | |
| |
| | October 31, 2015 |
| |
| Additional Information (unaudited) – continued | | |
CONSIDERATIONS OF THE BOARD OF TRUSTEES IN CONNECTION WITH THE APPROVAL OF THE INVESTMENT ADVISORY AGREEMENT FOR ASTON/RIVER ROAD FOCUSED ABSOLUTE VALUE FUND
At an in-person meeting held on September 17, 2015, the Board of Trustees (the “Board”) of Aston Funds (the “Trust”), and separately the trustees who are not “interested persons,” as defined in Section 2(a)(19) of the Investment Company Act of 1940, as amended (the “Independent Trustees”), determined that the terms of the Investment Advisory Agreement between the Trust and Aston Asset Management, LLC (“Aston”) with respect to ASTON/River Road Focused Absolute Value Fund (the “New Fund”) are fair and reasonable and approved the Investment Advisory Agreement for the New Fund as being in the best interests of the New Fund. In making such determinations, the Board, including the Independent Trustees, considered materials received and discussions held with respect to the approval of the Investment Advisory Agreement at the June 25, 2015 and September 17, 2015 meetings and prior meetings. The Independent Trustees met separately from the Trustees who are “interested persons” of the Trust as defined in Section 2(a)(19) of the Investment Company Act of 1940, as amended, and any officers of Aston or its affiliates to consider approval of the Investment Advisory Agreement with respect to the New Fund. The Independent Trustees were assisted by independent legal counsel in their deliberations.
In evaluating the Investment Advisory Agreement on behalf of the New Fund, the Board reviewed information regarding: (1) the nature, quality and extent of the services to be provided to the New Fund; (2) the investment advisory fees to be charged and estimated total expense ratio of the New Fund compared to a peer group of funds; (3) fee waivers or expenses to be reimbursed by Aston and/or the New Fund’s subadviser; and (4) potential benefits to be received by Aston or its affiliates from Aston’s relationship with the New Fund. In considering the Investment Advisory Agreement on behalf of the New Fund, the Board, including the Independent Trustees, did not identify any single factor or group of factors as all-important or controlling, and with each Trustee not necessarily attributing the same weight to each factor, but considered all factors together. The following summary does not detail all the matters considered.
Nature, Quality and Extent of Services. The Board considered the nature, quality and extent of services to be provided by Aston, including investment advisory services and administrative services. The Board considered that Aston is a manager-of-managers, and that in its role as investment adviser to the New Fund it intends to delegate the day-to-day responsibility for managing the New Fund’s investments to a subadviser. Accordingly, the Board considered Aston’s capabilities and processes with respect to the selection and monitoring of subadvisers on an ongoing basis, as well as information regarding the composition, experience and role of its Investment Committee. In this regard, the Board noted the responsibilities and experience of Aston personnel, the resources made available to such personnel, the ability of Aston to attract and retain high quality personnel and the organizational depth and stability of Aston.
In considering the nature, extent and quality of the services to be provided by Aston under the Investment Advisory Agreement, the Board took into account information provided periodically throughout the previous year by Aston in Board meetings relating to Aston’s financial information, operations and personnel, the performance of its duties with respect to other funds in the Aston complex, the quality of the performance of Aston’s duties and the Trustees’ knowledge of Aston’s management team.
In addition to investment advisory services, the Board considered the quality of other services provided by Aston including oversight of service providers, regulatory administration and Board support, fund administration and operational support, compliance services, shareholder servicing and platform management and distribution- and marketing-related services. The Board also considered Aston’s risk management processes. On the basis of this evaluation, the Board concluded that the nature, quality and extent of services to be provided by Aston are expected to be satisfactory.
Fees and Expenses. The Board considered the New Fund’s proposed management fee rate and total net expense ratio after contractual expense reimbursements and fee waivers. As a part of this analysis, the Board compared the proposed investment advisory fees and total net expenses to those of a relevant peer group for the New Fund. The Board noted that a portion of the management fee paid to Aston would be paid in turn to the subadviser and that Aston could indirectly benefit from such fees because Aston and the subadviser are affiliated. The Board also considered the amount of the management fee to be retained by Aston after payment of the subadvisory fee in light of the services to be rendered for those amounts. The Board concluded that the proposed investment advisory fees were reasonable and appropriate in light of the nature, quality and extent of services to be provided by Aston.
Costs and Profitability. With respect to the costs of services to be provided and profits expected to be realized by Aston, the Board considered the resources involved in managing the New Fund in light of Aston’s business model as well as fees to be waived or expenses to be reimbursed under an Expense Reimbursement Agreement with Aston. The Board noted that, with respect to the New Fund, Aston and the subadviser each will bear a portion of any fee waivers or expense reimbursements. Because the New Fund has not yet commenced operations, profitability information was not available. However, based upon projected asset size and the impact of fee waivers or expenses to be reimbursed by Aston, the Board concluded that profitability was not expected to be unreasonable.
Economies of Scale. The Board considered the extent to which economies of scale would be realized as the New Fund grows. The Board considered the potential asset size of the New Fund, as well as the terms of the Expense Reimbursement Agreement, and concluded that at this time the potential for economies of scale are limited.
| | |
| |
| | October 31, 2015 |
| |
| Additional Information (unaudited) – continued | | |
Other Benefits to the Investment Adviser. The Board considered the nature and amount of fees to be paid by the New Fund for administration services to be provided by Aston. The Board noted that Aston currently does not intend to manage the New Fund directly, and therefore, will not directly benefit from the use of “soft” commission dollars to pay for research and brokerage services. The Board concluded that any other benefits to be received by the Aston from its relationship with the New Fund were not expected to be unreasonable.
Conclusion. Based upon its evaluation of all material factors and assisted by the advice of independent legal counsel, the Board, including all of the Independent Trustees, concluded that the terms of the Investment Advisory Agreement for the New Fund, including the proposed investment advisory fee, were fair and reasonable, and that the Investment Advisory Agreement on behalf of the New Fund should be approved.
CONSIDERATIONS OF THE BOARD OF TRUSTEES IN CONNECTION WITH THE APPROVAL OF THE SUB-INVESTMENT ADVISORY AGREEMENT FOR ASTON/RIVER ROAD FOCUSED ABSOLUTE VALUE FUND
At an in-person meeting held on June 25, 2015, the Board of Trustees (the “Board”) of Aston Funds (the “Trust”), and separately the trustees who are not “interested persons,” as defined in Section 2(a)(19) of the Investment Company Act of 1940, as amended (the “Independent Trustees”), considered the approval of a Sub-Investment Advisory Agreement (the “Sub-Investment Advisory Agreement”) between Aston Asset Management, LLC (“Aston”) and River Road Asset Management, LLC (“River Road”) with respect to ASTON/River Road Focused Absolute Value Fund (the “New Fund”). The Board considered information provided and discussions held at the June 25, 2015 meeting and at prior meetings. The Independent Trustees met separately from the Trustees who are “interested persons” of the Trust as defined in Section 2(a)(19) of the Investment Company Act of 1940, as amended, and any officers of Aston, River Road or their respective affiliates to consider approval of the Sub-Investment Advisory Agreement. The Independent Trustees were assisted by independent legal counsel in their deliberations.
Among the matters considered by the Board, including the Independent Trustees, in connection with its approval of the Sub-Investment Advisory Agreement were the following:
Nature, Quality and Extent of Services. The Board considered the nature, quality and extent of services expected to be provided under the Sub-Investment Advisory Agreement. The Board considered the reputation, qualifications and background of River Road and its operational and compliance infrastructures. The Board also considered information provided regarding River Road’s investment approach, the experience and skills of senior management and investment personnel of River Road, the resources made available to such personnel, the ability of River Road to attract and retain high-quality personnel and the organizational depth of River Road. The Board also considered the nature and quality of services provided by River Road with respect to other series of the Trust. The Board also considered
River Road’s risk management processes. On the basis of this evaluation, the Board concluded that the nature, quality and extent of services to be provided by River Road are expected to be satisfactory.
Performance. Because the New Fund has not yet commenced operations, the Board noted that they could not draw any conclusions regarding the performance of the New Fund.
Fees, Profitability and Economies of Scale. The Board considered the subadvisory fee rate under the Sub-Investment Advisory Agreement as well as the overall management fee structure of the New Fund, including the amount of management fee to be retained by Aston after payment of the subadvisory fee. The Board noted that a portion of the management fee paid to Aston would be paid in turn to the subadviser and that Aston could indirectly benefit from such fees because Aston and the subadviser are affiliated. As part of its review of the investment advisory agreement with Aston, the Board considered whether there will be economies of scale with respect to the overall fee structure of the New Fund and whether the New Fund will benefit from any economies of scale.
In considering the anticipated profitability of River Road with respect to the provision of subadvisory services to the New Fund, although recognizing that profitability with respect to the New Fund is speculative, the Trustees considered information regarding River Road’s organization, management and financial stability. The Trustees noted that, because River Road is an affiliate of Aston, such anticipated profitability might be directly or indirectly shared by Aston. The Trustees also noted that the subadvisory fees are to be paid by Aston out of its management fee. The Board took into account management’s discussion of the proposed subadvisory fee structure, and the services River Road is expected to provide in performing its functions under the Sub-Investment Advisory Agreement. The Trustees also considered the anticipated net assets of the New Fund for its first year of operations. Based on the foregoing, the Trustees concluded that the profitability to River Road is not expected to be unreasonable. The Board concluded that the proposed subadvisory fee rate was reasonable in light of the nature, quality and extent of services to be provided and that the potential for economies of scale was limited at this time.
Other Benefits to the Subadviser. The Board also considered the character and amount of other incidental benefits expected to be received by River Road and its affiliates. The Board considered potential benefits to River Road from the use of “soft dollars” to pay for research services generated by parties other than the executing broker-dealer. The Board concluded that the subadvisory fees were reasonable, taking into account any other benefits expected to be received by River Road from its relationship with the New Fund.
Conclusion. Based on all of the information considered and the conclusions reached, the Board, and separately all of the Independent Trustees, determined that the terms of the Sub-Investment Advisory Agreement are fair and reasonable, and
| | |
| |
| | October 31, 2015 |
| |
| Additional Information (unaudited) – continued | | |
that the approval of the Sub-Investment Advisory Agreement is in the best interests of the New Fund. No single factor was determinative in the Board’s analysis and each Trustee may have given different weight to the various factors.
Tax Information: In accordance with Federal tax law, the following Funds hereby make the designations indicated below regarding their fiscal year ended October 31, 2015:
The following are the estimated percentages of the income dividends qualifying for the dividends received deduction available to corporations:
| | | | |
Fund | | Percentage | |
| Cornerstone Large Cap Value Fund | | | 100.00 | % |
| Herndon Large Cap Value Fund | | | 100.00 | % |
| Montag & Caldwell Growth Fund | | | 100.00 | % |
| River Road Dividend All Cap Value Fund | | | 97.46 | % |
| River Road Dividend All Cap Value Fund II | | | 82.83 | % |
| Fairpointe Mid Cap Fund | | | 35.45 | % |
| Montag & Caldwell Mid Cap Growth Fund | | | 100.00 | % |
| LMCG Small Cap Growth Fund | | | 7.68 | % |
| River Road Independent Value Fund | | | 11.69 | % |
| River Road Select Value Fund | | | 18.39 | % |
| River Road Small Cap Value Fund | | | 22.81 | % |
| Silvercrest Small Cap Fund | | | 100.00 | % |
| Anchor Capital Enhanced Equity Fund | | | 100.00 | % |
| Lake Partners LASSO Alternatives Fund | | | 49.64 | % |
| River Road Long-Short Fund | | | 34.10 | % |
| Guardian Capital Global Dividend Fund | | | 67.26 | % |
| LMCG Emerging Markets Fund | | | 2.62 | % |
| Harrison Street Real Estate Fund | | | 4.32 | % |
| Montag & Caldwell Balanced Fund | | | 90.15 | % |
For the fiscal year ended October 31, 2015, certain dividends may be subject to a maximum tax rate of 15%, as qualified dividend income (“QDI”) under the Jobs and Growth Tax Relief Reconciliation Act of 2003. For individual shareholders, a percentage of their ordinary income dividends (dividend income plus short-term gains, if any) may qualify for a maximum tax rate of 15%. Complete information is computed and reported in conjunction with your Form 1099-DIV.
The following percentages of ordinary dividends paid during the fiscal year ended October 31, 2015 are designated as QDI:
| | | | |
Fund | | Percentage | |
| Cornerstone Large Cap Value Fund | | | 100.00 | % |
| Herndon Large Cap Value Fund | | | 100.00 | % |
| Montag & Caldwell Growth Fund | | | 100.00 | % |
| River Road Dividend All Cap Value Fund | | | 98.74 | % |
| River Road Dividend All Cap Value Fund II | | | 87.90 | % |
| Fairpointe Mid Cap Fund | | | 36.48 | % |
| Montag & Caldwell Mid Cap Growth Fund | | | 100.00 | % |
| LMCG Small Cap Growth Fund | | | 7.68 | % |
| River Road Independent Value Fund | | | 22.72 | % |
| River Road Select Value Fund | | | 21.24 | % |
| River Road Small Cap Value Fund | | | 25.93 | % |
| Silvercrest Small Cap Fund | | | 100.00 | % |
| Anchor Capital Enhanced Equity Fund | | | 100.00 | % |
| Lake Partners LASSO Alternatives Fund | | | 100.00 | % |
| River Road Long-Short Fund | | | 41.90 | % |
| Barings International Fund | | | 71.47 | % |
| | | | |
Fund | | Percentage | |
| Guardian Capital Global Dividend Fund | | | 100.00 | % |
| LMCG Emerging Markets Fund | | | 100.00 | % |
| Pictet International Fund | | | 90.21 | % |
| Harrison Street Real Estate Fund | | | 4.32 | % |
| Montag & Caldwell Balanced Fund | | | 91.25 | % |
Each Fund designates 100%, or if subsequently different, of “QDI” to qualify for the lower tax rates applicable to individual shareholders; and 100%, or if subsequently different, of ordinary income dividends to qualify for the “DRD” for corporate shareholders. The actual percentage of QDI and DRD for the calendar year will be designated in year-end tax statements.
The following Funds designated the listed amounts as long-term capital gain dividends during the year ended October 31, 2015. Distributable long-term gains are based on net realized long term gains determined on a tax basis and may differ from such amounts for financial reporting purposes.
| | | | |
Fund | | Amount | |
| Herndon Large Cap Value Fund | | $ | 7,726,222 | |
| Montag & Caldwell Growth Fund | | | 814,995,176 | |
| River Road Dividend All Cap Value Fund | | | 98,089,972 | |
| River Road Dividend All Cap Value Fund II | | | 3,141,523 | |
| Fairpointe Mid Cap Fund | | | 850,693,976 | |
| Montag & Caldwell Mid Cap Growth Fund | | | 1,250,512 | |
| LMCG Small Cap Growth Fund | | | 1,078,763 | |
| River Road Independent Value Fund | | | 21,661,599 | |
| River Road Select Value Fund | | | 19,171,424 | |
| River Road Small Cap Value Fund | | | 31,938,623 | |
| Silvercrest Small Cap Fund | | | 6,208,342 | |
| TAMRO Small Cap Fund | | | 147,855,799 | |
| Anchor Capital Enhanced Equity Fund | | | 590,164 | |
| Lake Partners LASSO Alternatives Fund | | | 17,851,984 | |
| River Road Long-Short Fund | | | 545,512 | |
| Barings International Fund | | | 2,360,468 | |
| Montag & Caldwell Balanced Fund | | | 1,808,010 | |
Shareholders should not use the above tax information to prepare their tax returns. The information will be included with your Form 1099 DIV which will be sent to you separately in January 2015.
Disclosure of Fund Expenses: We believe it is important for you to understand the impact of fees regarding your investment. All mutual funds have operating expenses. As a shareholder of a mutual fund, you incur ongoing costs, which include costs for portfolio management, administrative services, and shareholder reports (like this one), among others. Operating expenses, which are deducted from a fund’s gross income, directly reduce the investment return of the fund. A fund’s expenses are expressed as a percentage of its average daily net assets. This figure is known as the expense ratio. The following examples are intended to help you understand the ongoing fees (in dollars) of investing in your Fund and to compare these costs with those of other mutual funds. The examples are based on an investment of $1,000 made at the beginning of the period shown and held for the entire period.
| | |
| |
| | October 31, 2015 |
| |
| Additional Information (unaudited) – continued | | |
The below table illustrates each Fund’s costs in two ways:
Actual Fund Return: This section helps you to estimate the actual expenses, after any applicable fee waivers, that you paid over the period. The “Ending Account Value” shown is derived from the Fund’s actual return for the past six-month period, the “Expense Ratio” column shows the period’s annualized expense ratio, and the “Expenses Paid During Period” column shows the dollar amount that would have been paid by an investor who started with $1,000 in the Fund at the beginning of the period. You may use the information here, together with your account value, to estimate the expenses that you paid over the period. To do so, simply divide your account value by $1,000 (for example, an $8,600 account value divided by $1,000 = 8.6), then multiply the result by the number given for your Fund in the first line under the heading entitled “Expenses Paid During Period.”
Hypothetical 5% Return: This section is intended to help you compare your Fund’s costs with those of other mutual funds. It assumes that the Fund had an annual return of 5% before expenses, but that the expense ratio is unchanged. In this case, because the return used is not the Fund’s actual return, the results do not apply to your investment. This example is useful in making comparisons to other mutual funds because the SEC requires all mutual funds to calculate expenses based on an assumed 5% annual return. You can assess your Fund’s costs by comparing this hypothetical example with the hypothetical examples that appear in shareholder reports of other funds.
Please note that the expenses shown in the table are meant to highlight and help you compare your ongoing costs only and do not reflect any transactional costs such as sales charges (loads) and redemption fees, which are described in the prospectus. If these costs were applied to your account, your costs would be higher.
| | | | | | | | | | | | | | | | |
| | | Beginning
Account
Value
5/1/15 | | | Ending
Account
Value
10/31/15 | | | Expense
Ratio(1) | | | Expenses
Paid During
Period(2) | |
| Cornerstone Large Cap Value Fund | | | | | | | | | | | | | |
Actual Fund Return | | | | | | | | | | | | | | | | |
Class N | | | $1,000 | | | | $909.60 | | | | 1.30 | % | | | $6.26 | |
Class I | | | 1,000 | | | | 911.10 | | | | 1.05 | % | | | 5.06 | |
Hypothetical 5% Return | | | | | | | | | | | | | | | | |
Class N | | | $1,000 | | | | $1,018.65 | | | | 1.30 | % | | | $6.61 | |
Class I | | | 1,000 | | | | 1,019.91 | | | | 1.05 | % | | | 5.35 | |
| Fairpointe Focused Equity Fund(3) | | | | | | | | | | | | | |
Actual Fund Return | | | | | | | | | | | | | | | | |
Class N | | | $1,000 | | | | $892.00 | | | | 1.15 | % | | | $5.48 | |
Class I | | | 1,000 | | | | 893.00 | | | | 0.90 | % | | | 4.29 | |
Hypothetical 5% Return | | | | | | | | | | | | | | | | |
Class N | | | $1,000 | | | | $1,019.41 | | | | 1.15 | % | | | $5.85 | |
Class I | | | 1,000 | | | | 1,020.67 | | | | 0.90 | % | | | 4.58 | |
| Herndon Large Cap Value Fund | | | | | | | | | | | | | |
Actual Fund Return | | | | | | | | | | | | | | | | |
Class N | | | $1,000 | | | | $929.30 | | | | 1.29 | % | | | $6.27 | |
Class I | | | 1,000 | | | | 929.80 | | | | 1.04 | % | | | 5.06 | |
Hypothetical 5% Return | | | | | | | | | | | | | | | | |
Class N | | | $1,000 | | | | $1,018.70 | | | | 1.29 | % | | | $6.56 | |
Class I | | | 1,000 | | | | 1,019.96 | | | | 1.04 | % | | | 5.30 | |
| | | | | | | | | | | | | | | | |
| | | Beginning
Account
Value
5/1/15 | | | Ending
Account
Value
10/31/15 | | | Expense
Ratio(1) | | | Expenses
Paid During
Period(2) | |
| Montag & Caldwell Growth Fund | | | | | | | | | | | | | |
Actual Fund Return | | | | | | | | | | | | | | | | |
Class N | | | $1,000 | | | | $1,045.90 | | | | 1.08 | % | | | $5.57 | |
Class I | | | 1,000 | | | | 1,047.70 | | | | 0.82 | % | | | 4.23 | |
Class R | | | 1,000 | | | | 1,045.10 | | | | 1.32 | % | | | 6.80 | |
Hypothetical 5% Return | | | | | | | | | | | | | | | | |
Class N | | | $1,000 | | | | $1,019.76 | | | | 1.08 | % | | | $5.50 | |
Class I | | | 1,000 | | | | 1,021.07 | | | | 0.82 | % | | | 4.18 | |
Class R | | | 1,000 | | | | 1,018.55 | | | | 1.32 | % | | | 6.72 | |
| River Road Dividend All Cap Value Fund | | | | | | | | | | | | | |
Actual Fund Return | | | | | | | | | | | | | | | | |
Class N | | | $1,000 | | | | $962.70 | | | | 1.10 | % | | | $5.44 | |
Class I | | | 1,000 | | | | 963.90 | | | | 0.85 | % | | | 4.21 | |
Hypothetical 5% Return | | | | | | | | | | | | | | | | |
Class N | | | $1,000 | | | | $1,019.66 | | | | 1.10 | % | | | $5.60 | |
Class I | | | 1,000 | | | | 1,020.92 | | | | 0.85 | % | | | 4.33 | |
| River Road Dividend All Cap Value Fund II | | | | | | | | | | | | | |
Actual Fund Return | | | | | | | | | | | | | | | | |
Class N | | | $1,000 | | | | $964.00 | | | | 1.15 | % | | | $5.69 | |
Class I | | | 1,000 | | | | 965.30 | | | | 0.90 | % | | | 4.46 | |
Hypothetical 5% Return | | | | | | | | | | | | | | | | |
Class N | | | $1,000 | | | | $1,019.41 | | | | 1.15 | % | | | $5.85 | |
Class I | | | 1,000 | | | | 1,020.67 | | | | 0.90 | % | | | 4.58 | |
| Fairpointe Mid Cap Fund | | | | | | | | | | | | | |
Actual Fund Return | | | | | | | | | | | | | | | | |
Class N | | | $1,000 | | | | $886.50 | | | | 1.11 | % | | | $5.28 | |
Class I | | | 1,000 | | | | 887.60 | | | | 0.86 | % | | | 4.09 | |
Hypothetical 5% Return | | | | | | | | | | | | | | | | |
Class N | | | $1,000 | | | | $1,019.61 | | | | 1.11 | % | | | $5.65 | |
Class I | | | 1,000 | | | | 1,020.87 | | | | 0.86 | % | | | 4.38 | |
| Montag & Caldwell Mid Cap Growth Fund | | | | | | | | | | | | | |
Actual Fund Return | | | | | | | | | | | | | | | | |
Class N | | | $1,000 | | | | $978.80 | | | | 1.25 | % | | | $6.23 | |
Class I | | | 1,000 | | | | 979.70 | | | | 1.00 | % | | | 4.99 | |
Hypothetical 5% Return | | | | | | | | | | | | | | | | |
Class N | | | $1,000 | | | | $1,018.90 | | | | 1.25 | % | | | $6.36 | |
Class I | | | 1,000 | | | | 1,020.16 | | | | 1.00 | % | | | 5.09 | |
| LMCG Small Cap Growth Fund | | | | | | | | | | | | | |
Actual Fund Return | | | | | | | | | | | | | | | | |
Class N | | | $1,000 | | | | $939.60 | | | | 1.35 | % | | | $6.60 | |
Class I | | | 1,000 | | | | 941.50 | | | | 1.10 | % | | | 5.38 | |
Hypothetical 5% Return | | | | | | | | | | | | | | | | |
Class N | | | $1,000 | | | | $1,018.40 | | | | 1.35 | % | | | $6.87 | |
Class I | | | 1,000 | | | | 1,019.66 | | | | 1.10 | % | | | 5.60 | |
| River Road Independent Value Fund | | | | | | | | | | | | | |
Actual Fund Return | | | | | | | | | | | | | | | | |
Class N | | | $1,000 | | | | $960.20 | | | | 1.42 | % | | | $7.02 | |
Class I | | | 1,000 | | | | 960.60 | | | | 1.17 | % | | | 5.78 | |
Hypothetical 5% Return | | | | | | | | | | | | | | | | |
Class N | | | $1,000 | | | | $1,018.05 | | | | 1.42 | % | | | $7.22 | |
Class I | | | 1,000 | | | | 1,019.31 | | | | 1.17 | % | | | 5.96 | |
| River Road Select Value Fund | | | | | | | | | | | | | |
Actual Fund Return | | | | | | | | | | | | | | | | |
Class N | | | $1,000 | | | | $979.50 | | | | 1.51 | % | | | $7.53 | |
Class I | | | 1,000 | | | | 981.00 | | | | 1.26 | % | | | 6.29 | |
Hypothetical 5% Return | | | | | | | | | | | | | | | | |
Class N | | | $1,000 | | | | $1,017.59 | | | | 1.51 | % | | | $7.68 | |
Class I | | | 1,000 | | | | 1,018.85 | | | | 1.26 | % | | | 6.41 | |
| River Road Small Cap Value Fund | | | | | | | | | | | | | |
Actual Fund Return | | | | | | | | | | | | | | | | |
Class N | | | $1,000 | | | | $999.20 | | | | 1.35 | % | | | $6.80 | |
Class I | | | 1,000 | | | | 1,000.80 | | | | 1.10 | % | | | 5.55 | |
Hypothetical 5% Return | | | | | | | | | | | | | | | | |
Class N | | | $1,000 | | | | $1,018.40 | | | | 1.35 | % | | | $6.87 | |
Class I | | | 1,000 | | | | 1,019.66 | | | | 1.10 | % | | | 5.60 | |
| | |
| |
| | October 31, 2015 |
| |
| Additional Information (unaudited) – continued | | |
| | | | | | | | | | | | | | | | |
| | | Beginning
Account
Value
5/1/15 | | | Ending
Account
Value
10/31/15 | | | Expense
Ratio(1) | | | Expenses
Paid During
Period(2) | |
| Silvercrest Small Cap Fund | | | | | | | | | | | | | |
Actual Fund Return | | | | | | | | | | | | | | | | |
Class N | | | $1,000 | | | | $1,000.70 | | | | 1.40 | % | | | $7.06 | |
Class I | | | 1,000 | | | | 1,002.00 | | | | 1.15 | % | | | 5.80 | |
Hypothetical 5% Return | | | | | | | | | | | | | | | | |
Class N | | | $1,000 | | | | $1,018.15 | | | | 1.40 | % | | | $7.12 | |
Class I | | | 1,000 | | | | 1,019.41 | | | | 1.15 | % | | | 5.85 | |
| TAMRO Small Cap Fund | | | | | | | | | | | | | |
Actual Fund Return | | | | | | | | | | | | | | | | |
Class N | | | $1,000 | | | | $941.80 | | | | 1.31 | % | | | $6.41 | |
Class I | | | 1,000 | | | | 942.80 | | | | 1.06 | % | | | 5.19 | |
Hypothetical 5% Return | | | | | | | | | | | | | | | | |
Class N | | | $1,000 | | | | $1,018.60 | | | | 1.31 | % | | | $6.67 | |
Class I | | | 1,000 | | | | 1,019.86 | | | | 1.06 | % | | | 5.40 | |
| DoubleLine Core Plus Fixed Income Fund | | | | | | | | | | | | | |
Actual Fund Return | | | | | | | | | | | | | | | | |
Class N | | | $1,000 | | | | $991.40 | | | | 0.94 | % | | | $4.72 | |
Class I | | | 1,000 | | | | 992.60 | | | | 0.69 | % | | | 3.47 | |
Hypothetical 5% Return | | | | | | | | | | | | | | | | |
Class N | | | $1,000 | | | | $1,020.47 | | | | 0.94 | % | | | $4.79 | |
Class I | | | 1,000 | | | | 1,021.73 | | | | 0.69 | % | | | 3.52 | |
| TCH Fixed Income Fund | | | | | | | | | |
Actual Fund Return | | | | | | | | | | | | | | | | |
Class N | | | $1,000 | | | | $970.30 | | | | 0.94 | % | | | $4.67 | |
Class I | | | 1,000 | | | | 971.50 | | | | 0.69 | % | | | 3.43 | |
Hypothetical 5% Return | | | | | | | | | | | | | | | | |
Class N | | | $1,000 | | | | $1,020.47 | | | | 0.94 | % | | | $4.79 | |
Class I | | | 1,000 | | | | 1,021.73 | | | | 0.69 | % | | | 3.52 | |
| Anchor Capital Enhanced Equity Fund | | | | | | | | | |
Actual Fund Return | | | | | | | | | | | | | | | | |
Class N | | | $1,000 | | | | $948.90 | | | | 1.21 | % | | | $5.94 | |
Class I | | | 1,000 | | | | 950.20 | | | | 0.96 | % | | | 4.72 | |
Hypothetical 5% Return | | | | | | | | | | | | | | | | |
Class N | | | $1,000 | | | | $1,019.11 | | | | 1.21 | % | | | $6.16 | |
Class I | | | 1,000 | | | | 1,020.37 | | | | 0.96 | % | | | 4.89 | |
| Lake Partners LASSO Alternatives Fund | | | | | | | | | |
Actual Fund Return | | | | | | | | | | | | | | | | |
Class N | | | $1,000 | | | | $969.60 | | | | 1.40 | % | | | $6.95 | |
Class I | | | 1,000 | | | | 971.20 | | | | 1.15 | % | | | 5.71 | |
Hypothetical 5% Return | | | | | | | | | | | | | | | | |
Class N | | | $1,000 | | | | $1,018.15 | | | | 1.40 | % | | | $7.12 | |
Class I | | | 1,000 | | | | 1,019.41 | | | | 1.15 | % | | | 5.85 | |
| River Road Long-Short Fund(4) | | | | | | | | |
Actual Fund Return | | | | | | | | | | | | | | | | |
Class N | | | $1,000 | | | | $994.80 | | | | 1.70 | % | | | $8.55 | |
Class I | | | 1,000 | | | | 995.70 | | | | 1.45 | % | | | 7.29 | |
Hypothetical 5% Return | | | | | | | | | | | | | | | | |
Class N | | | $1,000 | | | | $1,016.64 | | | | 1.70 | % | | | $8.64 | |
Class I | | | 1,000 | | | | 1,017.90 | | | | 1.45 | % | | | 7.37 | |
| Barings International Fund | | | | | | | | | |
Actual Fund Return | | | | | | | | | | | | | | | | |
Class N | | | $1,000 | | | | $964.30 | | | | 1.40 | % | | | $6.93 | |
Class I | | | 1,000 | | | | 965.80 | | | | 1.15 | % | | | 5.70 | |
Hypothetical 5% Return | | | | | | | | | | | | | | | | |
Class N | | | $1,000 | | | | $1,018.15 | | | | 1.40 | % | | | $7.12 | |
Class I | | | 1,000 | | | | 1,019.41 | | | | 1.15 | % | | | 5.85 | |
| Guardian Capital Global Dividend Fund | | | | | | | | | |
Actual Fund Return | | | | | | | | | | | | | | | | |
Class N | | | $1,000 | | | | $974.00 | | | | 1.30 | % | | | $6.47 | |
Class I | | | 1,000 | | | | 975.70 | | | | 1.05 | % | | | 5.23 | |
Hypothetical 5% Return | | | | | | | | | | | | | | | | |
Class N | | | $1,000 | | | | $1,018.65 | | | | 1.30 | % | | | $6.61 | |
Class I | | | 1,000 | | | | 1,019.91 | | | | 1.05 | % | | | 5.35 | |
| | | | | | | | | | | | | | | | |
| | | Beginning
Account
Value
5/1/15 | | | Ending
Account
Value
10/31/15 | | | Expense
Ratio(1) | | | Expenses
Paid During
Period(2) | |
| LMCG Emerging Markets Fund | | | | | | | | | |
Actual Fund Return | | | | | | | | | | | | | | | | |
Class N | | | $1,000 | | | | $804.10 | | | | 1.43 | % | | | $6.50 | |
Class I | | | 1,000 | | | | 804.70 | | | | 1.18 | % | | | 5.37 | |
Hypothetical 5% Return | | | | | | | | | | | | | | | | |
Class N | | | $1,000 | | | | $1,018.00 | | | | 1.43 | % | | | $7.27 | |
Class I | | | 1,000 | | | | 1,019.26 | | | | 1.18 | % | | | 6.01 | |
| Pictet International Fund | | | | | | | | | |
Actual Fund Return | | | | | | | | | | | | | | | | |
Class N | | | $1,000 | | | | $959.80 | | | | 1.40 | % | | | $6.92 | |
Class I | | | 1,000 | | | | 961.90 | | | | 1.15 | % | | | 5.69 | |
Hypothetical 5% Return | | | | | | | | | | | | | | | | |
Class N | | | $1,000 | | | | $1,018.15 | | | | 1.40 | % | | | $7.12 | |
Class I | | | 1,000 | | | | 1,019.41 | | | | 1.15 | % | | | 5.85 | |
| TAMRO International Small Cap Fund(5) | | | | | | | | | | | | | |
Actual Fund Return | | | | | | | | | | | | | | | | |
Class N | | | $1,000 | | | | $928.60 | | | | 1.50 | % | | | $7.29 | |
Class I | | | 1,000 | | | | 929.60 | | | | 1.25 | % | | | 6.08 | |
Hypothetical 5% Return | | | | | | | | | | | | | | | | |
Class N | | | $1,000 | | | | $1,017.64 | | | | 1.50 | % | | | $7.63 | |
Class I | | | 1,000 | | | | 1,018.90 | | | | 1.25 | % | | | 6.36 | |
| Harrison Street Real Estate Fund | | | | | | | | | | | | | |
Actual Fund Return | | | | | | | | | | | | | | | | |
Class N | | | $1,000 | | | | $1,029.80 | | | | 1.37 | % | | | $7.01 | |
Class I | | | 1,000 | | | | 1,030.80 | | | | 1.12 | % | | | 5.73 | |
Hypothetical 5% Return | | | | | | | | | | | | | | | | |
Class N | | | $1,000 | | | | $1,018.30 | | | | 1.37 | % | | | $6.97 | |
Class I | | | 1,000 | | | | 1,019.56 | | | | 1.12 | % | | | 5.70 | |
| Montag & Caldwell Balanced Fund | | | | | | | | | | | | | |
Actual Fund Return | | | | | | | | | | | | | | | | |
Class N | | | $1,000 | | | | $1,032.60 | | | | 1.20 | % | | | $6.15 | |
Class I | | | 1,000 | | | | 1,033.10 | | | | 1.10 | % | | | 5.64 | |
Hypothetical 5% Return | | | | | | | | | | | | | | | | |
Class N | | | $1,000 | | | | $1,019.16 | | | | 1.20 | % | | | $6.11 | |
Class I | | | 1,000 | | | | 1,019.66 | | | | 1.10 | % | | | 5.60 | |
| (1) | Annualized, based on the Fund’s most recent fiscal half-year expenses. |
| (2) | Expenses are equal to the Fund’s annualized expense ratio multiplied by the average account value over the period, multiplied by the number of days in the most recent fiscal half-year (184) or partial year, if applicable, for the actual return and multiplied by the most recent fiscal half-year for the hypothetical 5% return, then divided by 365. Expense ratios do not include interest expense, if applicable. |
| (3) | The commencement of investment operations for Fairpointe Focused Equity Fund is December 23, 2014. |
| (4) | Excludes interest expense and dividends on short positions. If included, your annualized expense ratios would be 3.28% and 3.03% for Class N and Class I, respectively and your actual and hypothetical expenses paid during the period would be $16.49 and $16.61 and $15.24 and $15.35 for Class N and Class I, respectively. |
| (5) | The commencement of investment operations for TAMRO International Small Cap Fund is December 22, 2014. |
| | |
| |
| | October 31, 2015 |
| |
| Additional Information (unaudited) – continued | | |
TRUSTEES AND OFFICERS OF THE TRUST
Under Delaware law, the business and affairs of the Trust are managed under the direction of the Board. Information pertaining to the Trustees and officers of the Trust is set forth below. The term “officer” means the president, vice president, secretary, treasurer, controller or any other officer who performs a policy making function.
| | | | | | | | | | | | |
Name, Address, Age and Position(s) with Trust | | Term of
Office 1 and
Length of
Time Served | | Principal Occupation(s) During Past Five Years | | Number of
Portfolios in
Fund Complex 2
Overseen by
Trustee | | | Other Trusteeships/
Directorships Held by Trustee During Past Five Years | | Experience,
Qualifications,
Attributes, Skills
for Board
Membership |
| | | | |
| INDEPENDENT TRUSTEES | | | | | | | | | | |
Bruce B. Bingham c/o Aston Funds 120 N. LaSalle Street Chicago, IL 60602 DOB: 12/1/48 Trustee | | Since 2014 | | Partner, Hamilton Partners (real estate development firm) (1987-present) | | | 28 | | | Director of The Yacktman Funds, Inc. (2 portfolios); Trustee of AMG Funds, AMG Funds I, AMG Funds II and AMG Funds III (45 portfolios) | | Significant mutual fund board experience; business experience as a partner of a real estate development and investment firm; familiar with financial statements. |
| | | | | |
William E. Chapman, II c/o Aston Funds 120 N. LaSalle Street Chicago, IL 60602 DOB: 9/23/41 Trustee; Independent Chairman | | Since 2010 | | President and Owner, Longboat Retirement Planning Solutions (1998-present); Formerly Trustee of Bowdoin College (2002-2013); Hewitt Associates, LLC (part time) (provider of Retirement and Investment Education Seminars) (2002-2009) | | | 28 | | | Director of Harding, Loevner Funds, Inc. (6 portfolios); Trustee of Third Avenue Trust (5 portfolios); Trustee of Third Avenue Variable Trust (1 portfolio); Trustee of AMG Funds, AMG Funds I, AMG Funds II and AMG Funds III (45 portfolios) | | Significant mutual fund board experience; significant executive experience with several financial services firms; continuing service as Independent Chairman of the Board and Chairman of the Trust’s Governance Committee. |
| | | | | |
Edward J. Kaier c/o Aston Funds 120 N. LaSalle Street Chicago, IL 60602 DOB: 9/23/45 Trustee | | Since 2010 | | Attorney at Law and Partner, Teeters Harvey Marrone & Kaier LLP (2007-present); Attorney at Law and Partner, Hepburn Willcox Hamilton & Putnam, LLP (1977-2007) | | | 28 | | | Trustee of Third Avenue Trust (5 portfolios); Trustee of Third Avenue Variable Trust (1 portfolio); Trustee of AMG Funds, AMG Funds I, AMG Funds II and AMG Funds III (45 portfolios) | | Significant mutual fund board experience; practicing attorney; Chairman of the Trust’s Audit Committee. |
| | |
| |
| | October 31, 2015 |
| |
| Additional Information (unaudited) – continued | | |
| | | | | | | | | | | | |
Name, Address, Age and Position(s) with Trust | | Term of
Office 1 and
Length of
Time Served | | Principal Occupation(s) During Past Five Years | | Number of
Portfolios in
Fund Complex 2
Overseen by
Trustee | | | Other Trusteeships/
Directorships Held by Trustee During Past Five Years | | Experience,
Qualifications,
Attributes, Skills
for Board
Membership |
| | | | |
| INDEPENDENT TRUSTEES (continued) | | | | | | | | | | |
Kurt Keilhacker c/o Aston Funds 120 N. LaSalle Street Chicago, IL 60602 DOB: 10/5/63 Trustee | | Since 2014 | | Managing Member, TechFund Europe (2000-present); Managing Member, TechFund Capital (1997-Present); Managing Member, Clapham Partners I LLC (2013-present) | | | 28 | | | Trustee of AMG Funds, AMG Funds I, AMG Funds II and: AMG Funds III (45 portfolios); Trustee of Gordon College and Board Member for 6wind SA | | Significant board experience, including as a board member of private companies; significant experience as a managing member of private companies; significant experience in the venture capital industry; significant experience as co-founder of a number of technology companies. |
| | | | | |
Steven J. Paggioli c/o Aston Funds 120 N. LaSalle Street Chicago, IL 60602 DOB: 4/3/50 Trustee | | Since 2010 | | Independent Consultant (2001-present); Formerly, Executive Vice President and Director, The Wadsworth Group (1986-2001); Executive Vice President, Secretary and Director, Investment Company Administration, LLC (1990-2001); Vice President, Secretary and Director, First Fund Distributors, Inc. (1991-2001) | | | 28 | | | Trustee, Professionally Managed Portfolios (45 portfolios); Advisory Board Member, Sustainable Growth Advisors, LP; Independent Director, Chase Investment Counsel. Trustee of AMG Funds, AMG Funds I, AMG Funds II and AMG Funds III (45 portfolios) | | Significant board experience, including as a board member of mutual funds; significant executive experience with several financial services firms; former service with financial service regulator; Audit Committee financial expert. |
| | | | | |
Richard F. Powers III c/o Aston Funds 120 N. LaSalle Street Chicago, IL 60602 DOB: 2/2/46 Trustee | | Since 2014 | | Adjunct Professor, Boston College (2011-present) | | | 28 | | | Director of Ameriprise Financial Inc. (2005-2009); Trustee of AMG Funds, AMG Funds I, AMG Funds II and AMG Fund III (45 portfolios) | | Significant board experience; significant executive experience with several financial services firms; significant experience as President and Chief Executive Officer of a mutual fund complex. |
| | |
| |
| | October 31, 2015 |
| |
| Additional Information (unaudited) – continued | | |
| | | | | | | | | | | | |
Name, Address, Age and Position(s) with Trust | | Term of
Office 1 and
Length of
Time Served | | Principal Occupation(s) During Past Five Years | | Number of
Portfolios in
Fund Complex 2
Overseen by
Trustee | | | Other Trusteeships/
Directorships Held by Trustee During Past Five Years | | Experience,
Qualifications,
Attributes, Skills
for Board
Membership |
| | | | |
| INDEPENDENT TRUSTEES (continued) | | | | | | | | | | |
Eric Rakowski c/o Aston Funds 120 N. LaSalle Street Chicago, IL 60602 DOB: 6/5/58 Trustee | | Since 2010 | | Professor, University of California at Berkeley School of Law (1990-present) | | | 28 | | | Director of Harding, Loevner Funds, Inc. (6 portfolios); Trustee of Third Avenue Trust (5 portfolios); Trustee of Third Avenue Variable Trust (1 portfolio); Trustee of AMG Funds, AMG Funds I, AMG Funds II and AMG Funds III (45 portfolios) | | Significant mutual fund board experience; former practicing attorney; currently professor of law. |
| | | | | |
Victoria Sassine c/o Aston Funds 120 N. LaSalle Street Chicago, IL 60602 DOB: 8/11/65 Trustee | | Since 2014 | | Lecturer, Babson College (2007-present) | | | 28 | | | Trustee of AMG Funds, AMG Funds I, AMG Funds II and AMG Funds III (45 portfolios) | | Currently professor of finance; significant business and finance experience in strategic financial and operation management positions in a variety of industries; accounting experience in a global accounting firm; experience as a board member of various organizations; Certified Public Accountant (inactive). |
| | | | | |
Thomas R. Schneeweis c/o Aston Funds 120 N. LaSalle Street Chicago, IL 60602 DOB: 5/10/47 Trustee | | Since 2010 | | Professor Emeritus, University of Massachusetts (2013-present); Director, CISDM at the University of Massachusetts, (1996-2013); President, TRS Associates (1982-present); President, Alternative Investment Analytics, LLC (formerly Schneeweis Partners, LLC) (2001-2013); Partner, S Capital Management, LLC (2007-present); Professor of Finance, University of Massachusetts (1977-2013); Partner, White Bear Partners, LLC (2007-2010); Partner, Northampton Capital Management, LLC (2004- 2010) | | | 28 | | | Trustee of AMG Funds, AMG Funds I, AMG Funds II and AMG Funds III (45 portfolios) | | Significant mutual fund board experience; professor Emeritus of finance; significant executive experience with several investment partnerships. |
| | |
| |
| | October 31, 2015 |
| |
| Additional Information (unaudited) – continued | | |
| | | | | | | | | | | | |
Name, Address, Age and Position(s) with Trust | | Term of
Office 1 and
Length of
Time Served | | Principal Occupation(s) During Past Five Years | | Number of
Portfolios in
Fund Complex 2
Overseen by
Trustee | | | Other Trusteeships/
Directorships Held by Trustee During Past Five Years | | Experience,
Qualifications,
Attributes, Skills
for Board
Membership |
| | | | |
| INTERESTED TRUSTEES | | | | | | | | | | |
Christine C. Carsman3 c/o Aston Funds 120 N. LaSalle Street Chicago, IL 60602 DOB: 4/2/52 | | Since 2014 | | Senior Vice President (2007-present) and Deputy General Counsel (2011-present); Senior Vice President and Chief Regulatory Counsel Affiliated Managers Group, Inc. (2007-2011), Vice President (2004-2007), and Chief Regulatory Counsel, Affiliated Managers Group, Inc.; Chief Legal Officer, Aston Funds (2010-2014); Senior Counsel, Vice President and Director of Operational Risk Management and Compliance, Wellington Management Company, LLP (1995-2004) | | | 28 | | | Trustee of AMG Funds, AMG Funds I, AMG Funds II and AMG Funds III (45 portfolios) | | Significant business, legal and risk management experience with several financial services firms; former practicing attorney at private law firm; significant experience as Chief Legal Officer. |
| | | | |
| OFFICER(S) WHO ARE NOT TRUSTEES | | | | | | | | | | |
Jeffrey T. Cerutti c/o Aston Funds 120 N. LaSalle Street Chicago, IL 60602 Age: 47 Chief Executive Officer and President | | Since 2015 | | Chief Executive Officer and President, Aston Funds (2015-present); Chief Executive Officer, AMG Funds LLC (2014-Present); Director, President and Principal, AMG Distributors, Inc. (2014-Present); President and Principal Executive Officer, AMG Funds, AMG Funds I, AMG Funds II, and AMG Funds III (2014-Present); President, VP Distributors (2011-2014); Executive Vice President, Head of Distribution, Virtus Investment Partners, Inc. (2010-2014); Managing Director, Head of Sales, UBS Global Asset Management (2001-2010) | | | N/A | | | N/A | | N/A |
| | | | | |
Gerald F. Dillenburg, CPA c/o Aston Funds 120 N. LaSalle Street Chicago, IL 60602 Age: 48 Senior Vice President, Chief Operating Officer and Chief Compliance Officer | | Since 1996 | | Chief Compliance Officer, Aston Asset Management, LLC (2006-present); Chief Financial Officer, Aston Asset Management, LLC (2006-2010) | | | N/A | | | N/A | | N/A |
| | |
| |
| | October 31, 2015 |
| |
| Additional Information (unaudited) – continued | | |
| | | | | | | | | | | | |
Name, Address, Age and Position(s) with Trust | | Term of
Office 1 and
Length of
Time Served | | Principal Occupation(s) During Past Five Years | | Number of
Portfolios in
Fund Complex 2
Overseen by
Trustee | | | Other Trusteeships/
Directorships Held by Trustee During Past Five Years | | Experience,
Qualifications,
Attributes, Skills
for Board
Membership |
| | | |
| OFFICER(S) WHO ARE NOT TRUSTEES (continued) | | | | | | | | |
Mark J. Duggan c/o Aston Funds 120 N. LaSalle Street Chicago, IL 60602 Age: 50 Secretary and Chief Legal Officer | | Since 2015 | | Secretary and Chief Legal Officer, AMG Funds, AMG Funds I, AMG Funds II and AMG Funds III (2015-Present); Senior Vice President and Senior Counsel, AMG Funds LLC (2015-Present); Attorney, K&L Gates, LLP (2009-2015) | | | N/A | | | N/A | | N/A |
| | | | | |
Laura M. Curylo, CPA c/o Aston Funds 120 N. LaSalle Street Chicago, IL 60602 Age: 46 Chief Financial Officer and Treasurer | | Since 2010 | | Chief Financial Officer, Aston Asset Management, LLC (2010-present); Vice President and Controller, Aston Asset Management, LLC (2006-present) | | | N/A | | | N/A | | N/A |
| 1 | | A Trustee serves for an indefinite term until the earliest of: (i) removal by two-thirds of the Board or shareholders, (ii) resignation, death or incapacity, (iii) the election and qualification of his successor, in accordance with the By-Laws of the Trust, or (iv) the last day of the fiscal year in which he attains the age of 75 years. Officers serve for an indefinite term until the earliest of: (i) removal by the Board, (ii) resignation, death or incapacity, or (iii) the election and qualification of their successors, in accordance with the By-Laws of the Trust. |
| 2 | | The term “Fund Complex” includes all series of Aston Funds. |
| 3 | | “Interested person” of the Trust as defined in the 1940 Act. Ms. Carsman is considered an “interested person” because of her affiliation with Affiliated Managers Group, Inc., the ultimate parent of the investment adviser. |
Aston Funds
ADVISER
Aston Asset Management, LLC
120 N. LaSalle Street, 25th Floor
Chicago, IL 60602
SUBADVISERS
Anchor Capital Advisors LLC
One Post Office Square, Suite 3850
Boston, MA 02109
Baring International Investment Limited
155 Bishopsgate
London, EC2M 3XY UK
Cornerstone Investment Partners, LLC
Phipps Tower
3438 Peachtree Road NE, Suite 900
Atlanta, GA 30326
DoubleLine Capital LP
333 South Grand Avenue, Suite 1800
Los Angeles, CA 90071
Fairpointe Capital LLC
One North Franklin, Suite 3300
Chicago, IL 60606
Guardian Capital LP
199 Bay Street, Suite 3100
Toronto, ON, M5L 1E8
Harrison Street Securities, LLC
71 South Wacker Drive, Suite 3575
Chicago, IL 60606
Herndon Capital Management, LLC
191 Peachtree Street, NE, Suite 2500
Atlanta, GA 30303
Lake Partners, Inc.
4 High Ridge Park, Suite 300
Stamford, CT 06905
LMCG Investments, LLC
200 Clarendon Street, 28th Floor
Boston, MA 02116
SUBADVISERS - continued
Montag & Caldwell, LLC
3455 Peachtree Road NE, Suite 1200
Atlanta, GA 30326
Pictet Asset Management Limited
120 London Wall
London, EC2Y 5ET UK
River Road Asset Management, LLC
Meidinger Tower, Suite 2000
462 South Fourth Street
Louisville, KY 40202
Silvercrest Asset Management Group LLC
1330 Avenue of the Americas, 38th Floor
New York, NY 10019
TAMRO Capital Partners LLC
1701 Duke St., Suite 250
Alexandria, VA 22314
Taplin, Canida & Habacht LLC
1001 Brickell Bay Drive, Suite 2100
Miami, FL 33131
SHAREHOLDER SERVICES
Aston Funds
P.O. Box 9765
Providence, RI 02940
DISTRIBUTOR
Foreside Funds Distributors LLC
400 Berwyn Park
899 Cassatt Road
Berwyn, PA 19312
OFFICERS
Jeffrey T. Cerutti, President and Chief Executive Officer
Gerald F. Dillenburg, Senior Vice President, Chief Operating Officer and Chief Compliance Officer
Mark J. Duggan, Secretary and Chief Legal Officer
Laura M. Curylo, Treasurer and Chief Financial Officer
Juli A. Braun, Assistant Treasurer
Michael A. Cozzi, Assistant Treasurer
James A. Dimmick, Assistant Secretary
Marc J. Peirce, Assistant Secretary
Diana R. Podgorny, Assistant Secretary
CUSTODIAN
The Bank of New York Mellon
One Wall Street
New York, New York 10286
LEGAL COUNSEL
Vedder Price P.C.
222 N. LaSalle Street
Chicago, IL 60601
INDEPENDENT REGISTERED PUBLIC ACCOUNTING FIRM
Ernst & Young LLP
155 N. Wacker Drive
Chicago, IL 60606
THE STATEMENT OF ADDITIONAL INFORMATION INCLUDES ADDITIONAL INFORMATION ABOUT FUND TRUSTEES AND IS AVAILABLE UPON REQUEST WITHOUT CHARGE BY CALLING 800-992-8151.
Guide to Shareholder Benefits
We’re delighted to offer all Aston Funds shareholders a variety of services and convenient options. To receive more information about any of these benefits, simply call an Investor Services Associate Monday through Friday, 9 a.m. – 7 p.m. Eastern Time.
THE EASY WAY TO ADD TO YOUR ACCOUNT: START AN AUTOMATIC INVESTMENT PLAN
For Class N shareholders, systematic investing is an easy, effortless way to help reach any investment goal. Just choose a fixed amount, and we’ll automatically deduct it from your checking or savings account on a regular schedule and invest it in your Aston Funds account. Periodic investment plans involve continuous investments in securities regardless of price. You should consider your financial ability to continue to purchase shares through periods of both high and low price levels. This plan does not assure a profit and does not protect against loss in declining markets.
COMPOUND YOUR EARNINGS WITH AUTOMATIC DIVIDEND REINVESTMENT
By automatically reinvesting dividends into your Fund account, profits have the opportunity to mount. Monthly and quarterly dividends and annual capital gain distributions are reinvested at no charge.
ACCESS INFORMATION AND MAKE TRANSACTIONS ONLINE AT OUR WEBSITE
You can open a new account, access account balances, view statements, obtain fund information, and make transactions online 24 hours a day, 7 days a week.
| | |
| | www.astonfunds.com |
| |
| | Our Automated Shareholder Services Line Is at Your Service 24 Hours a Day |
| | 800-992-8151 |
Investor Services
Associates are available to assist you Monday – Friday 9 a.m. to 7 p.m., Eastern Time. Or, call any time, day or night, for automated account information to make exchanges or check fund performance.

Aston Funds
P.O. Box 9765
Providence, RI 02940
ATAN 15
Item 2. Code of Ethics.
| | (a) | The registrant, as of the end of the period covered by this report, has adopted a code of ethics that applies to the registrant’s principal executive officer, principal financial officer, principal accounting officer or controller, or persons performing similar functions, regardless of whether these individuals are employed by the registrant or a third party. |
| | (c) | Attached is the Code of Ethics for the Registrant’s Principal Executive and Principal Financial Officers, which reflects the name of the recently appointed PEO. |
| | (d) | The registrant has not granted any waivers, including an implicit waiver, from a provision of the code of ethics that applies to the registrant’s principal executive officer, principal financial officer, principal accounting officer or controller, or persons performing similar functions, regardless of whether these individuals are employed by the registrant or a third party, that relates to one or more of the items set forth in paragraph (b) of this item’s instructions. |
Item 3. Audit Committee Financial Expert.
The registrant’s board of trustees has determined that Edward J. Kaier is qualified to serve as the registrant’s audit committee financial expert and that he is “independent,” as defined by the Securities and Exchange Commission.
Item 4. Principal Accountant Fees and Services.
Audit Fees
| | (a) | The aggregate fees billed for each of the last two fiscal years for professional services rendered by the principal accountant for the audit of the registrant’s annual financial statements or services that are normally provided by the accountant in connection with statutory and regulatory filings or engagements for those fiscal years are $473,452 for 2015 and $444,500 for 2014. |
Audit-Related Fees
| | (b) | The aggregate fees billed in each of the last two fiscal years for assurance and related services by the principal accountant that are reasonably related to the performance of the audit of the registrant’s financial statements and are not reported under paragraph (a) of this Item are $28,905 for 2015 and $28,200 for 2014. Such fees were related to agreed upon procedures for the April 30, 2015 and April 30, 2014 unaudited semi-annual reports. |
Tax Fees
| | (c) | The aggregate fees billed in each of the last two fiscal years for professional services rendered by the principal accountant for tax compliance, tax advice, and tax planning are $0 for 2015 and $0 for 2014. |
All Other Fees
| | (d) | The aggregate fees billed in each of the last two fiscal years for products and services provided by the principal accountant, other than the services reported in paragraphs (a) through (c) of this Item are $0 for 2015 and $0 for 2014. |
| (e)(1) | Disclose the audit committee’s pre-approval policies and procedures described in paragraph (c)(7) of Rule 2-01 of Regulation S-X. |
In accordance with Audit Committee Charter, the Audit Committee shall:
| | 1. | Pre-approve any engagement of the independent auditors to provide any non-prohibited services to the Fund, including the fees and other compensation to be paid to the independent auditors.1 |
| | • | | The Chairman of the Audit Committee may grant the pre-approval of services to the Fund for non-prohibited services. All such delegated pre-approvals shall be presented to the Audit Committee no later than the next Audit Committee meeting. |
| | 2. | Pre-approve any engagement of the independent auditors, including the fees and other compensation to be paid to the independent auditors, to provide any non-audit services to the Adviser (or any “control affiliate”2 of the Adviser providing ongoing services to the |
1 Pre-approval of non-audit services for the Fund pursuant to Section IV.C. 2 is not required, if:
| | (a) | the aggregate amount of all non-audit services provided to the Fund is no more than 5% of the total fees paid by the Fund to the independent auditors during the fiscal year in which the non-audit services are provided; |
| | (b) | the services were not recognized by Fund management at the time of the engagement as non-audit services; and |
| | (c) | such services are promptly brought to the attention of the Audit Committee by Fund management and the Audit Committee approves them (which may be by delegation) prior to the completion of the audit. |
2 “Control affiliate” means any entity controlling, controlled by, or under common control with the Adviser.
| | Fund), if the engagement relates directly to the operations and financial reporting of the Funds.3 |
| | • | | The Chairman of the Audit Committee may grant the pre-approval for non-prohibited services to the Adviser. All such delegated pre-approvals shall be presented to the Audit Committee no later than the next Audit Committee meeting. |
| (e)(2) | The percentage of services described in each of paragraphs (b) through (d) of this Item that were approved by the audit committee pursuant to paragraph (c)(7)(i)(C) of Rule 2-01 of Regulation S-X are as follows: |
(b) 100%
(c) N/A
(d) N/A
| | (f) | The percentage of hours expended on the principal accountant’s engagement to audit the registrant’s financial statements for the most recent fiscal year that were attributed to work performed by persons other than the principal accountant’s full-time, permanent employees was 0%. |
| | (g) | The aggregate non-audit fees billed by the registrant’s accountant for services rendered to the registrant, and rendered to the registrant’s investment adviser (not including any sub-adviser whose role is primarily portfolio management and is subcontracted with or overseen by another investment adviser), and any entity controlling, controlled by, or under common control with the adviser that provides ongoing services to the registrant for each of the last two fiscal years of the registrant was $0 for 2015 and $0 for 2014. |
| | (h) | The registrant’s audit committee of the board of trustees has considered whether the provision of non-audit services that were rendered to the registrant’s investment adviser (not including any sub-adviser whose role is primarily portfolio management and is subcontracted with or overseen by another investment adviser), and any entity controlling, controlled by, or under common |
| 3 | Pre-approval of non-audit services for the Adviser (or any affiliate of the Adviser providing ongoing services to the Fund) pursuant to Section IV.C.3 is not required, if: |
| | (a) | the aggregate amount of all non-audit services provided is no more than 5% of the total fees paid by the Fund, the Adviser and any “control affiliate” of the Adviser providing ongoing services to the Fund to the independent auditors during the fiscal year in which the non-audit services are provided; |
| | (b) | the services were not recognized by Fund management at the time of the engagement as non-audit services; and |
| | (c) | such services are promptly brought to the attention of the Audit Committee by Fund management and the Audit Committee approves them (which may be by delegation) prior to the completion of the audit. |
| | control with the investment adviser that provides ongoing services to the registrant that were not pre-approved pursuant to paragraph (c)(7)(ii) of Rule 2-01 of Regulation S-X is compatible with maintaining the principal accountant’s independence. |
Item 5. Audit Committee of Listed Registrants.
Not applicable.
Item 6. Investments.
| (a) | Schedule of Investments in securities of unaffiliated issuers as of the close of the reporting period is included as part of the report to shareholders filed under Item 1 of this form. |
| Item 7. | Disclosure of Proxy Voting Policies and Procedures for Closed-End Management Investment Companies. |
Not applicable.
Item 8. Portfolio Managers of Closed-End Management Investment Companies.
Not applicable.
| Item 9. | Purchases of Equity Securities by Closed-End Management Investment Company and Affiliated Purchasers. |
Not applicable.
Item 10. Submission of Matters to a Vote of Security Holders.
There have been no material changes to the procedures by which the shareholders may recommend nominees to the registrant’s board of directors, where those changes were implemented after the registrant last provided disclosure in response to the requirements of Item 407(c)(2)(iv) of Regulation S-K (17 CFR 229.407) (as required by Item 22(b)(15) of Schedule 14A (17 CFR 240.14a-101)), or this Item.
Item 11. Controls and Procedures.
| | (a) | The registrant’s principal executive and principal financial officers, or persons performing similar functions, have concluded that the registrant’s disclosure controls and procedures (as defined in Rule 30a-3(c) under the Investment Company Act of 1940, as amended (the “1940 Act”) (17 CFR 270.30a-3(c))) are effective, as of a date within 90 days of the filing date of the report that includes the disclosure required by this paragraph, based on their evaluation of these controls and procedures required by Rule 30a-3(b) under the 1940 Act (17 CFR 270.30a-3(b)) and Rules 13a-15(b) or 15d-15(b) under the Securities Exchange Act of 1934, as amended (17 CFR 240.13a-15(b) or 240.15d-15(b)). |
| | (b) | There were no changes in the registrant’s internal control over financial reporting (as defined in Rule 30a-3(d) under the 1940 Act (17 CFR 270.30a-3(d))) that occurred during the registrant’s second fiscal quarter of the period covered by this report that has materially affected, or is reasonably likely to materially affect, the registrant’s internal control over financial reporting. |
Item 12. Exhibits.
| | (a)(1) | Code of ethics, or any amendment thereto, that is the subject of disclosure required by Item 2 is attached hereto. |
| | (a)(2) | Certifications pursuant to Rule 30a-2(a) under the 1940 Act and Section 302 of the Sarbanes-Oxley Act of 2002 are attached hereto. |
| | (b) | Certifications pursuant to Rule 30a-2(b) under the 1940 Act and Section 906 of the Sarbanes- Oxley Act of 2002 are attached hereto. |
(12.other) Not applicable.
SIGNATURES
Pursuant to the requirements of the Securities Exchange Act of 1934 and the Investment Company Act of 1940, the registrant has duly caused this report to be signed on its behalf by the undersigned, thereunto duly authorized.
| | | | |
| | |
By (Signature and Title)* | | /s/ Jeffrey T. Cerutti | | |
| | Jeffrey T. Cerutti, Chief Executive Officer and President | | |
| | (principal executive officer) | | |
Pursuant to the requirements of the Securities Exchange Act of 1934 and the Investment Company Act of 1940, this report has been signed below by the following persons on behalf of the registrant and in the capacities and on the dates indicated.
| | | | |
By (Signature and Title)* | | /s/ Jeffrey T. Cerutti | | |
| | Jeffrey T. Cerutti, Chief Executive Officer and President | | |
| | (principal executive officer) | | |
| | | | |
| | |
By (Signature and Title)* | | /s/ Laura M. Curylo | | |
| | Laura M. Curylo, Treasurer and Chief Financial Officer | | |
| | (principal financial officer) | | |
| * | Print the name and title of each signing officer under his or her signature. |