UNITED STATES
SECURITIES AND EXCHANGE COMMISSION
Washington, D.C. 20549
FORM N-CSR
CERTIFIED SHAREHOLDER REPORT OF REGISTERED MANAGEMENT
INVESTMENT COMPANIES
Investment Company Act file number 811-08004
Aston Funds
(Exact name of registrant as specified in charter)
120 North LaSalle Street, 25th Floor
Chicago, IL 60602
(Address of principal executive offices) (Zip code)
Kenneth C. Anderson, President
Aston Funds
120 North LaSalle Street, 25th Floor
Chicago, IL 60602
(Name and address of agent for service)
Registrant’s telephone number, including area code: (312) 268-1400
Date of fiscal year end: October 31
Date of reporting period: October 31, 2013
Form N-CSR is to be used by management investment companies to file reports with the Commission not later than 10 days after the transmission to stockholders of any report that is required to be transmitted to stockholders under Rule 30e-1 under the Investment Company Act of 1940 (17 CFR 270.30e-1). The Commission may use the information provided on Form N-CSR in its regulatory, disclosure review, inspection, and policymaking roles.
A registrant is required to disclose the information specified by Form N-CSR, and the Commission will make this information public. A registrant is not required to respond to the collection of information contained in Form N-CSR unless the Form displays a currently valid Office of Management and Budget (“OMB”) control number. Please direct comments concerning the accuracy of the information collection burden estimate and any suggestions for reducing the burden to Secretary, Securities and Exchange Commission, 100 F Street, NE, Washington, DC 20549. The OMB has reviewed this collection of information under the clearance requirements of 44 U.S.C. § 3507.
Item 1. Reports to Stockholders.
The Report to Shareholders is attached herewith.

Annual Report 2013
October 31, 2013
Class N, I & R Shares
Equity
Fixed Income
Alternative
International
Sector
Balanced
Aston Funds
Dear Fellow Shareholder:
As I reflect on the past 12 months, ending October 31, 2013, I am reminded of one of the most memorable quotes by the great Russian author Leo Tolstoy: “The strongest of all warriors are these two—Time and Patience.”
About a year ago, it was beginning to dawn on much of the investment community that the world was not coming to an end. Although bearish sentiment and uncertainty still ran high, there were reasons to be hopeful that with time and patience, the global economy and world financial markets could continue healing from the deep wounds sustained during the Great Recession. In the summer, this optimism was further bolstered by evidence that the global economy—led by growth in developed nations such as the United States—was accelerating and corporate earnings were improving. Against this backdrop, the Standard & Poor’s 500 Index, a broad gauge of the U.S. stock market, was up 27% for the period, finishing at a new high and marking one of the index’s best 12-month periods since 2003. Small stocks soared even higher, with the Russell 2000 Index up 36%. Developed market equities tended to fare best, while foreign equity markets produced significantly divergent results for the year, and emerging markets securities lagged amid worries about growth in those nations.
Bonds, meanwhile, charted a more volatile course. After a multi-year period of outperformance of equities, the improving global economy significantly dampened investors’ aversion to risk and their appetite for “risk-free” government securities. The growing likelihood that the Federal Reserve would begin to taper its purchases of Treasury and agency mortgage-backed securities was another chief concern. Since these accommodative policies were largely credited with keeping interest rates low, the prospects of a higher interest rates weighed heavily on U.S. investment-grade bonds, as measured by the -1.1% return of the Barclays U.S. Aggregate Bond Index.
Although the future is inherently uncertain, we believe that our talented investment managers have proven their ability to persevere across multiple market cycles. They may, at times, be overshadowed in the short term by those who are temporarily lifted by prevailing market trends. But in our view, our investors are best served by Aston’s skilled, active managers who have exhibited the patience to survive and thrive over time.
We are pleased to present you with the Aston Funds annual report and appreciate your continued support of the Aston Funds family.
Sincerely,

Kenneth C. Anderson
President
Aston Funds
|
| The views expressed in this report reflect those of the portfolio managers only, through the end of the period covered and do not necessarily represent the views of Aston Funds or Aston Asset Management, LP. Any such views are subject to change at any time based upon market or other conditions and Aston Funds and Aston Asset Management, LP disclaim any responsibility to update such views. These views may not be relied on as investment advice and, because investment decisions for an Aston Fund are based on numerous factors, may not be relied on as an indication of trading intent on behalf of any Aston Fund. |
Aston Funds
Large Cap Funds
ASTON/Montag & Caldwell Growth Fund
ASTON/TAMRO Diversified Equity Fund
ASTON/Herndon Large Cap Value Fund
ASTON/Cornerstone Large Cap Value Fund
Equity Income Funds
ASTON/River Road Dividend All Cap Value Fund
ASTON/River Road Dividend All Cap Value Fund II
Mid Cap Funds
ASTON/Fairpointe Mid Cap Fund
ASTON/Montag & Caldwell Mid Cap Growth Fund
Table of Contents
Small Cap Funds
ASTON/LMCG Small Cap Growth Fund
(formerly, ASTON Small Cap Growth Fund)
ASTON/Silvercrest Small Cap Fund
ASTON/TAMRO Small Cap Fund
ASTON/River Road Select Value Fund
ASTON/River Road Small Cap Value Fund
ASTON/River Road Independent Value Fund
Fixed Income Funds
ASTON/DoubleLine Core Plus Fixed Income Fund ASTON/TCH Fixed Income Fund
Alternative Funds
ASTON/Lake Partners LASSO Alternatives Fund
ASTON/Anchor Capital Enhanced Equity Fund
ASTON/River Road Long-Short Fund
International Funds
ASTON/Barings International Fund
ASTON/LMCG Emerging Markets Fund
Sector Fund
ASTON/Harrison Street Real Estate Fund
Balanced Fund
ASTON/Montag & Caldwell Balanced Fund
This report is submitted for general information to the shareholders of the funds. It is not authorized for distribution to prospective investors in the funds unless preceded or accompanied by an effective prospectus which includes details regarding the funds’ objectives, policies, expenses and other information.
Aston Funds are distributed by Foreside Funds Distributors LLC, 400 Berwyn Park, 899 Cassatt Road, Berwyn, PA 19312
Shareholder Services 800-992-8151 • www.astonfunds.com
NOT FDIC INSURED • NO BANK GUARANTEE • MAY LOSE VALUE
ASTON/Montag & Caldwell Growth Fund
| | |
| |
| Portfolio Manager Commentary (unaudited) | | October 31, 2013 |
| | Ronald E. Canakaris, CFA, CIC |
| Q. | What were the most significant market factors affecting Fund performance and returns relative to the benchmark during the past 12 months? |
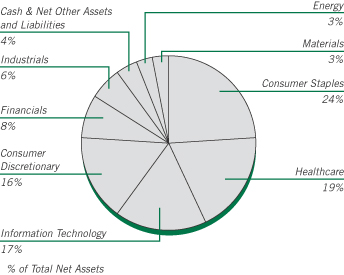
| A. | The Class N Shares of the Fund gained 22.61% during the past year, trailing the Russell 1000 Growth Index gain of 28.30% and the S&P 500 Index, which rose 27.16%. The Fund benefited from good stock selection in the Consumer Discretionary, Information Technology and Financial sectors, as well as an underweight position to the Information Technology sector. The Fund lagged the benchmark due to an overweight position to the Consumer Staples sector, an underweight position to the Consumer Discretionary sector and its cash reserve. Adverse stock section in the Healthcare, Industrials and Energy sectors also detracted from performance relative to the benchmark. |
| Q. | What were the best performing holdings for the Fund during the period? |
| A. | Biogen was the Fund’s top performing stock, as the company enjoyed stable demand in its major franchises and the company launched Tecfidera, an oral therapy for the treatment of multiple sclerosis. Starbucks rose strongly during the period, as the company delivered top- and bottom-line results that far surpassed peers within the restaurant industry, as well as investor expectations. Johnson Controls surged, as the company reported better than expected results driven by ongoing improvement in the global automotive business and benefits from cost restructuring actions taken by management earlier this year. Amerisource Bergen gained, as the company is benefiting from increased scale and purchasing power as a result of its agreement with Walgreen/Alliance Boots. Nike was a top performer as the company is benefiting from growing enthusiasm around its innovative new product cycle, which should allow double digit earnings growth in fiscal year 2014, as well as improvement in gross margins and robust growth in direct consumer sales. |
| Q. | What were the weakest performing holdings? |
| A. | Express Scripts fell in the fourth quarter of 2012 and the position was eliminated in the first quarter of 2013 as benefits from the company’s merger with Medco were waning and earnings growth was expected to decelerate sharply, reflecting the roll-off of additional United Health claims and the fully consolidated post-merger comparisons. EMC was slightly negative during the period as investors became concerned that capital spending will be reduced on storage as it is shifted from on-premise capacity to infrastructure as a service by cloud providers, negatively impacting demand for EMC’s products. Allergan was unchanged during the period, which significantly lagged the gains in the Healthcare sector. The company experienced a delay in the clinical trials of an age-related macular degeneration product and the stock declined following the release of draft guidance from the FDA for generic Restasis bioequivalence. Coca-Cola and Philip Morris were up single digits during the period, lagging the market. Both companies have had their earnings impacted by a slow-down in emerging markets and adverse currency movements. |
| Q. | How was the Fund positioned as of October 31, 2013? |
| A. | We believe the high quality growth stocks held in the Fund are well positioned for the period ahead. They are reasonably valued, and in our opinion offer more assured earnings growth due to their global diversification and financial strength. In addition, many of the Fund’s holdings have above average dividend yields and dividend growth prospects. We expect economic growth to continue to be more moderate than generally assumed as the developed world deleverages, and for the Federal Reserve to keep short term interest rates low for a long time. |
Growth of a Hypothetical
$10,000 Investment—Class N
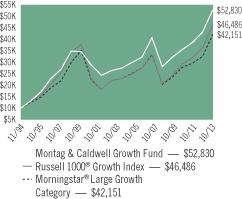
All dividends and capital gains are reinvested. Indexes are unmanaged and do not take into account fees, expenses or other costs.
Returns shown in the chart and table do not reflect taxes that a shareholder would pay on Fund distributions or on the sale of the Fund shares.
RETURNSFOR PERIOD ENDED 10/31/13
Average Annual Total Returns - Class N
| | | | |
One Year | | | 22.61 | % |
Five Year | | | 13.46 | % |
Ten Year | | | 7.16 | % |
Since Inception | | | 9.16 | % |
Inception Date 11/02/94
Average Annual Total Returns - Class I
| | | | |
One Year | | | 22.95 | % |
Five Year | | | 13.75 | % |
Ten Year | | | 7.44 | % |
Since Inception | | | 7.57 | % |
Inception Date 06/28/96
Average Annual Total Returns - Class R
| | | | |
One Year | | | 22.30 | % |
Five Year | | | 13.18 | % |
Ten Year | | | 6.91 | % |
Since Inception | | | 7.42 | % |
Inception Date 12/31/02
The performance data quoted represents past performance. Past performance does not guarantee future results. Investment return and principal value will fluctuate so that an investor’s shares, upon redemption, may be worth more or less than their original cost. Current performance may be lower or higher than the performance data quoted. For performance data current to the most recent month-end, please visit our website at www.astonfunds.com.
The total expense ratios for Class N, Class I and Class R Shares are 1.06%, 0.81% and 1.31% respectively, as disclosed in the prospectus dated February 28, 2013. Please refer to the Financial Highlights section in this report for more information.
| | |
| |
| ASTON/Montag & Caldwell Growth Fund | | October 31, 2013 |
| |
| Schedule of Investments | | |
| | | | | | | | |
Shares | | | | | Market
Value | |
|
| | COMMON STOCKS – 95.83% | |
| |
| | | | Consumer Discretionary – 16.00% | |
| | 1,189,030 | | | Bed Bath & Beyond * | | $ | 91,935,800 | |
| | 3,119,700 | | | Johnson Controls | | | 143,974,155 | |
| | 2,416,400 | | | NIKE, Class B | | | 183,066,464 | |
| | 91,046 | | | Priceline.com * | | | 95,947,006 | |
| | 318,063 | | | Ralph Lauren | | | 52,683,955 | |
| | 1,633,300 | | | Starbucks | | | 132,378,965 | |
| | 2,264,600 | | | TJX | | | 137,665,034 | |
| | | | | | | | |
| | | | | | | 837,651,379 | |
| | | | | | | | |
| | |
| | | | Consumer Staples – 23.99% | | | | |
| | 4,229,400 | | | Coca-Cola | | | 167,357,358 | |
| | 2,510,000 | | | Colgate-Palmolive | | | 162,472,300 | |
| | 659,900 | | | Costco Wholesale | | | 77,868,200 | |
| | 2,435,200 | | | Estee Lauder, Class A | | | 172,801,792 | |
| | 5,133,700 | | | Mondelez International, Class A | | | 172,697,668 | |
| | 2,004,500 | | | PepsiCo | | | 168,558,405 | |
| | 1,867,000 | | | Philip Morris International | | | 166,387,040 | |
| | 2,079,800 | | | Procter & Gamble | | | 167,943,850 | |
| | | | | | | | |
| | | | | | | 1,256,086,613 | |
| | | | | | | | |
| | |
| | | | Energy – 3.36% | | | | |
| | 1,833,100 | | | Occidental Petroleum | | | 176,124,248 | |
| | | | | | | | |
| | |
| | | | Financials – 7.69% | | | | |
| | 1,160,000 | | | American Express | | | 94,888,000 | |
| | 798,000 | | | Franklin Resources | | | 42,980,280 | |
| | 1,572,200 | | | State Street | | | 110,164,054 | |
| | 3,619,600 | | | Wells Fargo | | | 154,520,724 | |
| | | | | | | | |
| | | | | | | 402,553,058 | |
| | | | | | | | |
| | |
| | | | Healthcare – 18.50% | | | | |
| | 4,807,700 | | | Abbott Laboratories | | | 175,721,435 | |
| | 1,840,000 | | | Allergan | | | 166,722,400 | |
| | | | | | | | |
Shares | | | | | Market
Value | |
| | |
| | | | Healthcare (continued) | | | | |
| | 1,879,800 | | | AmerisourceBergen | | $ | 122,807,334 | |
| | 662,967 | | | Biogen Idec * | | | 161,889,912 | |
| | 1,811,100 | | | Gilead Sciences * | | | 128,569,989 | |
| | 2,033,900 | | | Sanofi, ADR | | | 108,772,972 | |
| | 1,411,800 | | | Stryker | | | 104,275,548 | |
| | | | | | | | |
| | | | | | | 968,759,590 | |
| | | | | | | | |
| | |
| | | | Industrials – 6.35% | | | | |
| | 7,072,800 | | | General Electric | | | 184,882,992 | |
| | 1,499,800 | | | United Parcel Service, Class B | | | 147,340,352 | |
| | | | | | | | |
| | | | | | | 332,223,344 | |
| | | | | | | | |
| |
| | | | Information Technology – 16.84% | |
| | 544,500 | | | Accenture, Class A (Ireland) | | | 40,020,750 | |
| | 2,561,800 | | | eBay * | | | 135,032,478 | |
| | 1,496,500 | | | EMC | | | 36,020,755 | |
| | 415,200 | | | F5 Networks * | | | 33,842,952 | |
| | 256,662 | | | Google, Class A * | | | 264,510,724 | |
| | 4,851,000 | | | Juniper Networks * | | | 90,422,640 | |
| | 2,258,000 | | | QUALCOMM | | | 156,863,260 | |
| | 634,900 | | | Visa, Class A | | | 124,865,783 | |
| | | | | | | | |
| | | | | | | 881,579,342 | |
| | | | | | | | |
| | |
| | | | Materials – 3.10% | | | | |
| | 1,549,800 | | | Monsanto | | | 162,543,024 | |
| | | | | | | | |
| | |
| | | | Total Common Stocks
(Cost $3,987,546,489) | | | 5,017,520,598 | |
| | | | | | | | |
|
| INVESTMENT COMPANY – 4.19%
|
|
| | |
| | 219,503,319 | | | BlackRock Liquidity Funds
TempCash Portfolio | | | 219,503,319 | |
| | | | | | | | |
| | |
| | | | Total Investment Company
(Cost $219,503,319) | | | 219,503,319 | |
| | | | | | | | |
| Total Investments – 100.02%
(Cost $4,207,049,808)** | | | 5,237,023,917 | |
| | | | | | | | |
| Net Other Assets and Liabilities – (0.02)% | | | (1,227,241 | ) |
| | | | | | | | |
| Net Assets – 100.00% | | $ | 5,235,796,676 | |
| | | | | | | | |
| * | | Non-income producing security. |
| ** | | Aggregate cost for Federal income tax purposes is $4,213,183,141. |
| | | | |
Gross unrealized appreciation | | $ | 1,043,014,106 | |
Gross unrealized depreciation | | | (19,173,330 | ) |
| | | | |
Net unrealized appreciation | | $ | 1,023,840,776 | |
| | | | |
| ADR | | American Depositary Receipt |
See accompanying Notes to Financial Statements.
ASTON/TAMRO Diversified Equity Fund
| | |
| |
| Portfolio Manager Commentary (unaudited) | | October 31, 2013 |
Philip D. Tasho, CFA & Timothy A. Holland, CFA
| Q. | What were the most significant market factors affecting Fund performance and returns relative to the benchmark during the past 12 months? |
| A. | The fiscal year ended October 31, 2013 was a robust year for equities across the market cap spectrum due to slow, but steady economic growth, an ongoing housing rebound that boosted consumer sentiment and spending, little to no inflation and accommodative monetary policy. While providing a healthy return of 24.29% for Class N Shares on an absolute basis, the Fund trailed its benchmark, the Russell 1000 Index for two primary reasons. First, many of the year’s big winners — stocks with 100%+ returns — were at the extremes of the growth/value spectrum. These companies typically did not dovetail with our investment philosophy, either because of fundamentals or valuation, and we could not justify owning them. The second reason was stock selection. We owned a number of companies that simply did not execute in line with our expectations. In some cases, we sold the positions to fund higher-confidence opportunities. In other cases, where we believe the long-term opportunity remains, we added to those positions on weakness. |
| Q. | What were the best performing holdings for the Fund during the period? |
| A. | The three holdings that contributed the most to performance were Chicago Bridge & Iron, Amazon.com and Boeing. Chicago Bridge & Iron reported better-than-expected revenues and earnings and an improving backlog from energy-related infrastructure projects globally. The significant investments Amazon.com made in technology, digital content and fulfillment centers to support future growth began to bear fruit, resulting in improving sales and gross margins. Shares of Boeing moved higher due to strengthening operating margins and an increased backlog for its aircraft that now represents nearly six years of production. |
| Q. | What were the weakest performing holdings? |
| A. | Increased competition weighed on Apple shares, as revenue and earnings came in |
| | below consensus estimates and the company’s new guidance range was lower than anticipated. Royal Gold corrected in sympathy with the price of gold. Carnival, the largest global cruise company, experienced several cruise mishaps that caused significant negative publicity and resulted in lowered guidance to reflect weaker ticket pricing and costs for ship repair. |
| Q. | How was the Fund positioned as of October 31, 2013? |
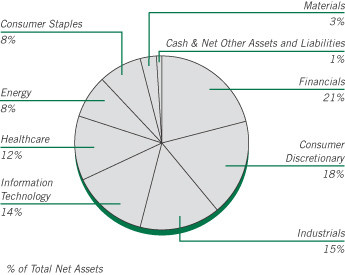
| A. | The Fund’s investment process focuses on individual, bottom-up stock selection to identify companies that we believe possess a sustainable competitive advantage and are attractively valued. Our approach to portfolio management is opportunistic and broadly diversified, with sector weights determined by where we see opportunities at the stock level. |
While we remain positive toward the equity markets, we believe this is not an average economic recovery where a rising tide will lift all boats. In this environment, valuations for companies that are executing may go higher than in recent years —i.e. multiples will expand. We need to differentiate between speculative stocks and those that are truly out-executing their peers and should resonate long term. We are closely looking at historical valuations and are ever watchful for opportunities as they dovetail with our three investment categories: Leaders, Laggards, and Innovators.
We continue to orient the portfolio toward better-capitalized, better-run companies that participate in more domestic facing industries such as Consumer Discretionary and Financial Services. As the U.S. consumer, U.S. housing and the U.S. economy continue to come back, these companies should be well positioned. As of October 31, 2013, Financials, Consumer Discretionary and Industrials were the largest sectors in the Fund. Among our investment categories, Leaders and Innovators, which tend to be higher quality companies with leading market share and tenured management teams, comprised 80% of the portfolio. Laggards, or companies undergoing restructuring, made up 20%.
Growth of a Hypothetical
$10,000 Investment—Class N
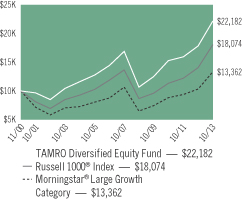
All dividends and capital gains are reinvested. Indexes are unmanaged and do not take into account fees, expenses or other costs.
Returns shown in the chart and table do not reflect taxes that a shareholder would pay on Fund distributions or on the sale of the Fund shares.
RETURNSFOR PERIOD ENDED 10/31/13
Average Annual Total Returns - Class N
| | | | |
One Year | | | 24.29 | % |
Five Year | | | 15.70 | % |
Ten Year | | | 7.81 | % |
Since Inception | | | 6.36 | % |
Inception Date 11/30/00
Average Annual Total Returns - Class I
| | | | |
One Year | | | 24.64 | % |
Since Inception | | | 15.50 | % |
Inception date 03/02/12
The performance data quoted represents past performance. Past performance does not guarantee future results. Investment return and principal value will fluctuate so that an investor’s shares, upon redemption, may be worth more or less than their original cost. Current performance may be lower or higher than the performance data quoted. For performance data current to the most recent month-end, please visit our website at www.astonfunds.com.
The performance quoted would have been lower if fee waivers and/or expense reimbursements had not been in effect.
The total expense ratios for Class N and Class I Shares are 1.68% and 1.43% respectively, as disclosed in the prospectus dated February 28, 2013. Please refer to the Financial Highlights section in this report for more information.
| | |
| |
| ASTON/TAMRO Diversified Equity Fund | | October 31, 2013 |
| |
| Schedule of Investments | | |
| | | | | | | | |
Shares | | | | | Market
Value | |
|
| | COMMON STOCKS – 99.82% | |
| | |
| | | | Consumer Discretionary – 17.78% | | | | |
| | 4,979 | | | Amazon.com * | | $ | 1,812,505 | |
| | 22,655 | | | Arcos Dorados Holdings, Class A
(Argentina) | | | 272,766 | |
| | 15,100 | | | Bed Bath & Beyond * | | | 1,167,532 | |
| | 39,493 | | | Best Buy | | | 1,690,300 | |
| | 21,493 | | | CarMax * | | | 1,009,956 | |
| | 14,455 | | | Coach | | | 732,579 | |
| | 12,209 | | | GNC Holdings, Class A | | | 718,133 | |
| | 10,730 | | | Home Depot | | | 835,760 | |
| | 17,667 | | | Macy’s | | | 814,625 | |
| | 11,076 | | | Red Robin Gourmet Burgers * | | | 843,770 | |
| | | | | | | | |
| | | | | | | 9,897,926 | |
| | | | | | | | |
| | | | Consumer Staples – 7.74% | | | | |
| | 25,148 | | | Mondelez International, Class A | | | 845,979 | |
| | 22,947 | | | Safeway | | | 800,850 | |
| | 19,340 | | | United Natural Foods * | | | 1,381,843 | |
| | 21,647 | | | Walgreen | | | 1,282,368 | |
| | | | | | | | |
| | | | | | | 4,311,040 | |
| | | | | | | | |
| | | | Energy – 8.17% | | | | |
| | 11,118 | | | Continental Resources * | | | 1,266,340 | |
| | 22,143 | | | Kinder Morgan | | | 781,869 | |
| | 6,039 | | | Occidental Petroleum | | | 580,227 | |
| | 8,635 | | | Phillips 66 | | | 556,353 | |
| | 14,491 | | | Range Resources | | | 1,097,114 | |
| | 14,572 | | | Ultra Petroleum (Canada) * | | | 267,542 | |
| | | | | | | | |
| | | | | | | 4,549,445 | |
| | | | | | | | |
| | | | Financials – 20.91% | | | | |
| | 14,337 | | | American Express | | | 1,172,767 | |
| | 27,228 | | | American International Group | | | 1,406,326 | |
| | 16,733 | | | American Tower, REIT | | | 1,327,764 | |
| | 16,229 | | | Bank of the Ozarks | | | 803,011 | |
| | 9,073 | | | Berkshire Hathaway, Class B * | | | 1,044,121 | |
| | | | | | | | |
Shares | | | | | Market
Value | |
| | |
| | | | Financials (continued) | | | | |
| | 29,063 | | | Citigroup | | $ | 1,417,693 | |
| | 49,923 | | | FirstMerit | | | 1,121,271 | |
| | 78,004 | | | Itau Unibanco Holding SA (Brazil), ADR | | | 1,202,042 | |
| | 12,006 | | | Ocwen Financial Corp * | | | 675,097 | |
| | 13,562 | | | Portfolio Recovery Associates * | | | 806,261 | |
| | 38,019 | | | Redwood Trust, REIT | | | 666,093 | |
| | | | | | | | |
| | | | | | | 11,642,446 | |
| | | | | | | | |
| | |
| | | | Healthcare – 12.01% | | | | |
| | 10,600 | | | Allergan | | | 960,466 | |
| | 5,101 | | | Athenahealth * | | | 681,035 | |
| | 19,170 | | | Catamaran (Canada) * | | | 900,223 | |
| | 19,056 | | | DaVita HealthCare Partners * | | | 1,071,138 | |
| | 15,303 | | | Edwards Lifesciences * | | | 997,603 | |
| | 16,717 | | | Express Scripts * | | | 1,045,147 | |
| | 11,153 | | | Johnson & Johnson | | | 1,032,879 | |
| | | | | | | | |
| | | | | | | 6,688,491 | |
| | | | | | | | |
| | |
| | | | Industrials – 15.73% | | | | |
| | 8,180 | | | Boeing | | | 1,067,490 | |
| | 13,703 | | | C.H. Robinson Worldwide | | | 818,617 | |
| | 21,136 | | | Chicago Bridge & Iron (Netherlands) | | | 1,565,966 | |
| | 15,458 | | | Cintas | | | 831,177 | |
| | 21,542 | | | Colfax * | | | 1,205,490 | |
| | 13,703 | | | Danaher | | | 987,849 | |
| | 3,860 | | | Middleby * | | | 878,729 | |
| | 63,883 | | | US Airways Group * | | | 1,403,510 | |
| | | | | | | | |
| | | | | | | 8,758,828 | |
| | | | | | | | |
| | |
| | | | Information Technology – 13.93% | | | | |
| | 6,768 | | | Baidu, SP ADR * | | | 1,088,971 | |
| | 27,306 | | | Facebook, Class A * | | | 1,372,400 | |
| | 1,200 | | | Google, Class A * | | | 1,236,696 | |
| | 25,530 | | | Hewlett-Packard | | | 622,166 | |
| | 10,730 | | | MICROS Systems * | | | 582,103 | |
| | 16,186 | | | QUALCOMM | | | 1,124,441 | |
| | 23,597 | | | Seagate Technology (Ireland) | | | 1,148,702 | |
| | 22,395 | | | Skyworks Solutions * | | | 577,343 | |
| | | | | | | | |
| | | | | | | 7,752,822 | |
| | | | | | | | |
| | |
| | | | Materials – 3.55% | | | | |
| | 4,616 | | | CF Industries Holdings | | | 995,210 | |
| | 9,341 | | | Monsanto | | | 979,684 | |
| | | | | | | | |
| | | | | | | 1,974,894 | |
| | | | | | | | |
| | |
| | | | Total Common Stocks
(Cost $45,528,595) | | | 55,575,892 | |
| | | | | | | | |
|
| | INVESTMENT COMPANY – 0.83% | |
| | |
| | 461,680 | | | BlackRock Liquidity Funds TempCash Portfolio | | | 461,680 | |
| | | | | | | | |
| | |
| | | | Total Investment Company
(Cost $461,680) | | | 461,680 | |
| | | | | | | | |
| Total Investments – 100.65%
(Cost $45,990,275)** | | | 56,037,572 | |
| | | | | | | | |
| Net Other Assets and Liabilities – (0.65)% | | | (360,545 | ) |
| | | | | | | | |
| Net Assets – 100.00% | | $ | 55,677,027 | |
| | | | | | | | |
See accompanying Notes to Financial Statements.
| | |
| |
| ASTON/TAMRO Diversified Equity Fund | | October 31, 2013 |
| |
| Schedule of Investments – continued | | |
| * | | Non-income producing security. |
| ** | | Aggregate cost for Federal income tax purposes is $46,032,483. |
| | | | |
Gross unrealized appreciation | | $ | 10,512,559 | |
Gross unrealized depreciation | | | (507,470 | ) |
| | | | |
Net unrealized appreciation | | $ | 10,005,089 | |
| | | | |
| ADR | | American Depositary Receipt |
| REIT | | Real Estate Investment Trust |
| SP ADR | | Sponsored American Depositary Receipt |
See accompanying Notes to Financial Statements.
ASTON/Herndon Large Cap Value Fund
| | |
| |
| Portfolio Manager Commentary (unaudited) | | October 31, 2013 |
| | Randell A. Cain, Jr., CFA |
| Q. | What were the most significant market factors affecting Fund performance and returns relative to the benchmark during the past 12 months? |
| A. | Over the past 12 months, the Russell 1000 Value Index increased nearly 30%. The key drivers of this uptrend have been increased share buybacks, corporate dividends and merger activity. These positives have outweighed market headwinds brought on by political wrangling in Washington D.C. and increased concern about market volatility and potentially decelerating earnings growth. |
The Fund underperformed the Russell 1000 Value Index by more than 500 basis points during the period. While allocation effect was slightly negative, stock selection was the primary driver of the relative underperformance for the period. The portfolio’s top performing sectors were Healthcare, Energy and Financials, which all benefitted from positive stock selection. The sectors with the greatest negative contribution to relative performance were Consumer Discretionary, Consumer Staples and Materials. The portfolio was overweight each of these sectors, which only compounded their negative contribution, as each sector suffered from poor stock selection.
| Q. | What were the best performing holdings for the Fund during the period? |
| A. | The greatest individual stock performers during the period were Western Digital Corp. (+107% return), Waddell & Reed Financial Inc. (+96%) and CBOE Holdings Inc. (+71%). Western Digital is a holding from the Information Technology sector, while Waddell & Reed and CBOE are holdings from the Financials sector. |
| Q. | What were the weakest performing holdings? |
| A. | The weakest individual stock performers over the period were Cliffs Natural Resources (-50% return), Herbalife Ltd. (-26%) and American Capital Agency (-23%). These securities represent holdings from the Materials, Consumer Staples and Financials sectors, respectively. |
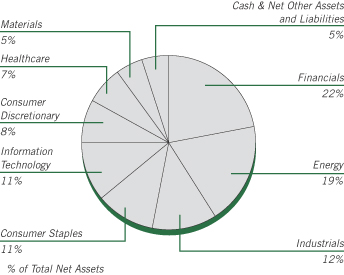
| Q. | How was the Fund positioned as of October 31, 2013? |
| A. | As of October 31, 2013, the Fund was overweight in the Energy, Consumer Staples, Materials, Industrials and Information Technology sectors. The underweight sectors were Financials, Utilities, Telecommunications and Healthcare. |
Growth of a Hypothetical
$10,000 Investment—Class N
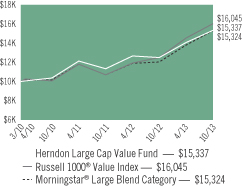
All dividends and capital gains are reinvested. Indexes are unmanaged and do not take into account fees, expenses or other costs.
Returns shown in the chart and table do not reflect taxes that a shareholder would pay on Fund distributions or on the sale of the Fund shares.
Value investing involves the risk that a Fund’s investments in companies believed to be undervalued will not appreciate as anticipated.
RETURNSFOR PERIOD ENDED 10/31/13
Average Annual Total Returns - Class N
| | | | |
1 Year | | | 22.58 | % |
Since Inception | | | 12.66 | % |
Inception Date 03/31/10
Average Annual Total Returns - Class I
| | | | |
1 Year | | | 22.94 | % |
Since Inception | | | 11.68 | % |
Inception Date 03/02/11
The performance data quoted represents past performance. Past performance does not guarantee future results. Investment return and principal value will fluctuate so that an investor’s shares, upon redemption, may be worth more or less than their original cost. Current performance may be lower or higher than the performance data quoted. For performance data current to the most recent month-end, please visit our website at www.astonfunds.com.
The performance quoted would have been lower if fee waivers and/or expense reimbursements had not been in effect.
| | |
| |
| ASTON/Herndon Large Cap Value Fund | | October 31, 2013 |
| |
| Schedule of Investments | | |
| | | | | | | | |
Shares | | | | | Market
Value | |
|
| | COMMON STOCKS – 95.10% | |
| | |
| | | | Consumer Discretionary – 7.81% | | | | |
| | 41,849 | | | Coach | | $ | 2,120,907 | |
| | 16,149 | | | Ross Stores | | | 1,249,125 | |
| | 65,010 | | | TJX | | | 3,951,958 | |
| | 33,046 | | | Yum! Brands | | | 2,234,571 | |
| | | | | | | | |
| | | | | | | 9,556,561 | |
| | | | | | | | |
| | | | Consumer Staples – 10.83% | | | | |
| | 78,097 | | | Altria Group | | | 2,907,551 | |
| | 52,111 | | | Campbell Soup | | | 2,218,365 | |
| | 47,686 | | | Colgate-Palmolive | | | 3,086,715 | |
| | 39,349 | | | Kellogg | | | 2,488,824 | |
| | 28,668 | | | Philip Morris International | | | 2,554,892 | |
| | | | | | | | |
| | | | | | | 13,256,347 | |
| | | | | | | | |
| | | | Energy – 19.37% | | | | |
| | 29,139 | | | Apache | | | 2,587,543 | |
| | 17,841 | | | Chevron | | | 2,140,206 | |
| | 22,642 | | | Continental Resources * | | | 2,578,924 | |
| | 28,150 | | | Exxon Mobil | | | 2,522,803 | |
| | 57,572 | | | HollyFrontier | | | 2,651,766 | |
| | 42,273 | | | Marathon Petroleum | | | 3,029,283 | |
| | 18,453 | | | Murphy Oil | | | 1,113,085 | |
| | 118,063 | | | Patterson-UTI Energy | | | 2,864,208 | |
| | 171,634 | | | RPC | | | 3,147,768 | |
| | 58,722 | | | Ultra Petroleum (Canada) * | | | 1,078,136 | |
| | | | | | | | |
| | | | | | | 23,713,722 | |
| | | | | | | | |
| | | | Financials – 21.67% | | | | |
| | 57,619 | | | Aflac | | | 3,744,083 | |
| | 74,848 | | | American Capital Agency, REIT | | | 1,625,699 | |
| | 88,171 | | | Apartment Investment & Management, Class A, REIT | | | 2,467,025 | |
| | 70,282 | | | CBOE Holdings | | | 3,408,677 | |
| | 58,466 | | | Discover Financial Services | | | 3,033,216 | |
| | 63,645 | | | Eaton Vance | | | 2,660,997 | |
| | 86,899 | | | Federated Investors, Class B | | | 2,356,701 | |
| | 35,258 | | | McGraw-Hill | | | 2,456,777 | |
| | | | | | | | |
Shares | | | | | Market
Value | |
| | |
| | | | Financials (continued) | | | | |
| | 53,241 | | | SLM | | $ | 1,350,724 | |
| | 55,359 | | | Waddell & Reed Financial, Class A | | | 3,418,418 | |
| | | | | | | | |
| | | | | | | 26,522,317 | |
| | | | | | | | |
| | |
| | | | Healthcare – 7.21% | | | | |
| | 15,063 | | | Baxter International | | | 992,200 | |
| | 69,858 | | | Endo Health Solutions * | | | 3,054,890 | |
| | 68,493 | | | Mylan * | | | 2,593,830 | |
| | 24,733 | | | United Therapeutics * | | | 2,189,365 | |
| | | | | | | | |
| | | | | | | 8,830,285 | |
| | | | | | | | |
| | |
| | | | Industrials – 12.18% | | | | |
| | 18,359 | | | Caterpillar | | | 1,530,407 | |
| | 8,506 | | | Copa Holdings SA, Class A (Panama) | | | 1,271,987 | |
| | 54,277 | | | Joy Global | | | 3,080,220 | |
| | 41,684 | | | Landstar System | | | 2,304,708 | |
| | 23,537 | | | Lockheed Martin | | | 3,138,424 | |
| | 15,487 | | | Rockwell Collins | | | 1,081,457 | |
| | 25,420 | | | United Parcel Service, Class B | | | 2,497,261 | |
| | | | | | | | |
| | | | | | | 14,904,464 | |
| | | | | | | | |
| |
| | | | Information Technology – 10.75% | |
| | 6,637 | | | Apple | | | 3,466,837 | |
| | 11,015 | | | International Business Machines | | | 1,973,998 | |
| | 77,390 | | | Microsoft | | | 2,735,737 | |
| | 55,218 | | | Western Digital | | | 3,844,829 | |
| | 66,502 | | | Western Union | | | 1,131,864 | |
| | | | | | | | |
| | | | | | | 13,153,265 | |
| | | | | | | | |
| | |
| | | | Materials – 5.28% | | | | |
| | 10,403 | | | CF Industries Holdings | | | 2,242,888 | |
| | 18,453 | | | Lyondellbasell Industries NV Class A (Netherlands) | | | 1,376,594 | |
| | 7,579 | | | Newmarket | | | 2,359,797 | |
| | 17,276 | | | Southern Copper | | | 482,864 | |
| | | | | | | | |
| | | | | | | 6,462,143 | |
| | | | | | | | |
| | |
| | | | Total Common Stocks
(Cost $100,757,829) | | | 116,399,104 | |
| | | | | | | | |
|
| | INVESTMENT COMPANY – 5.51% | |
| | |
| | 6,740,441 | | | BlackRock Liquidity Funds TempCash Portfolio | | | 6,740,441 | |
| | | | | | | | |
| | |
| | | | Total Investment Company
(Cost $6,740,441) | | | 6,740,441 | |
| | | | | | | | |
| Total Investments – 100.61%
(Cost $107,498,270)** | | | 123,139,545 | |
| | | | | | | | |
| Net Other Assets and Liabilities – (0.61)% | | | (744,464 | ) |
| | | | | | | | |
| Net Assets – 100.00% | | $ | 122,395,081 | |
| | | | | | | | |
| * | | Non-income producing security. |
| ** | | Aggregate cost for Federal income tax purposes is $108,309,361. |
| | | | |
Gross unrealized appreciation | | $ | 17,389,154 | |
Gross unrealized depreciation | | | (2,558,970 | ) |
| | | | |
Net unrealized appreciation | | $ | 14,830,184 | |
| | | | |
| REIT | | Real Estate Investment Trust |
See accompanying Notes to Financial Statements.
ASTON/Cornerstone Large Cap Value Fund
| | |
| |
| Portfolio Manager Commentary (unaudited) | | October 31, 2013 |
John Campbell, CFA; Rick van Nostrand, CFA; Cameron Clement, CFA; & Dean Morris, CFA
| Q. | What were the most significant market factors affecting Fund performance and returns relative to the benchmark during the past 12 months? |
| A. | Despite an increasing barrage of negative news, the past 12 months saw the continuation of strong equity returns experienced since the beginning of 2012. Continued Federal Reserve intervention, turmoil in the Middle East, concerns over the most recent political standoff, the initial rollout of the Affordable Care Act and a myriad of other headline news have dominated the press. Given this backdrop, the Russell 1000 Value Index posted a 28.29% return. Despite the negative headlines, we continue to see positives in the underlying corporate fundamentals that determine value and drive stock prices over the long-term, and this is where we continue to direct our focus. |
| Q. | What were the best performing holdings for the Fund during the period? |
| A. | Western Digital (+107.5%) was a strong contributor in the Information Technology space. The stock delivered strong quarterly results with margins holding steady despite weakness in overall global PC demand. Investors rewarded the stock as inventory levels continue to decline quarter-over-quarter. |
Hess (+50.3%) was also a strong contributor to performance. The company announced plans to sell its U.S. oil storage terminal network as well as its refining business. The market viewed this positively, as the company intends to focus on its core strength, Exploration and Production, going forward. Additionally, an activist investor, Elliott Management, proposed a number of initiatives which should spur management to continue to streamline the company which could be viewed favorably by the market.
Eaton (+40.9%) was the best performer within the Industrials sector and our third best stock in the portfolio. Following the completed acquisition of Cooper Industries, Eaton’s revenue mix is more diversified and will primarily be derived from its electrical business, which is viewed as being less cyclical. As a result, the market has begun re-rating Eaton’s
prospects and has begun rewarding the company with a higher Price/Earnings multiple.
| Q. | What were the weakest performing holdings? |
| A. | Royal Dutch Shell (+1.9%) was the biggest detractor to performance. Management reported disappointing quarterly results and the market penalized the stock accordingly. Specifically, results were consistently below consensus expectations, as capital expenditures continue to weigh on near-term results and the outlook into 2013 and beyond was muted. |
Wal-Mart (+4.8%), a stock that traded at an all-time high in early October 2012, was a laggard during the period. The market remains concerned that overall consumer spending remains constrained and, as a result, that Wal-Mart will have trouble achieving near-term sales targets.
Teva Pharmaceuticals (-6.2%) was a weak overall performer. At Teva’s annual Investor Day in December 2012, new CEO Jeremy Levin laid out Teva’s strategy going forward. While the plan seemed reasonable, it could take some time to bear fruit. As a result, investors seemed disappointed overall with the firm’s outlook and penalized the firm.
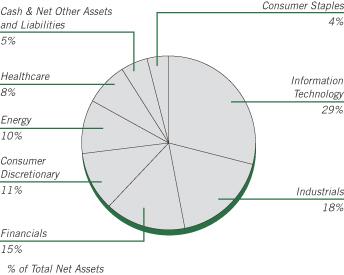
| Q. | How was the Fund positioned as of October 31, 2013? |
| A. | Cornerstone’s actively constructed 800 stock universe is trading at 82% of fair value based on our proprietary Fair Value Model. Despite strong market returns, the Fair Value Model still indicates that 442 of the 800 stocks in the universe are undervalued. Should markets continue to appreciate and the number of under-valued businesses shrinks, we believe active management becomes increasingly important, as investors need to be discerning when looking for attractive opportunities. We will not be swayed by the “noise” in the market, which appears to be changing quarter to quarter, and we continue to focus on finding companies with strong and improving fundamentals that trade at attractive valuations. |
Growth of a Hypothetical
$10,000 Investment—Class N
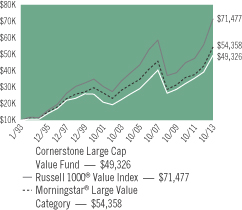
All dividends and capital gains are reinvested. Indexes are unmanaged and do not take into account fees, expenses or other costs.
Returns shown in the chart and table do not reflect taxes that a shareholder would pay on Fund distributions or on the sale of the Fund shares.
Value investing involves the risk that a Fund’s investments in companies believed to be undervalued will not appreciate as anticipated.
RETURNSFOR PERIOD ENDED 10/31/13
Average Annual Total Returns - Class N
| | | | |
One Year | | | 25.72 | % |
Five Year | | | 13.35 | % |
Ten Year | | | 8.18 | % |
Since Inception | | | 7.97 | % |
Inception Date 01/04/93
Average Annual Total Returns - Class I
| | | | |
One Year | | | 26.08 | % |
Five Year | | | 13.69 | % |
Since Inception | | | 6.81 | % |
Inception Date 09/20/05
The performance data quoted represents past performance. Past performance does not guarantee future results. Investment return and principal value will fluctuate so that an investor’s shares, upon redemption, may be worth more or less than their original cost. Current performance may be lower or higher than the performance data quoted. For performance data current to the most recent month-end, please visit our website at www.astonfunds.com.
The performance quoted would have been lower if fee waivers and/or expense reimbursements had not been in effect.
The total expense ratios for Class N and Class I Shares are 1.59% and 1.34%, respectively, as disclosed in the prospectus dated February 28, 2013. Please refer to the Financial Highlights section in this report for more information.
| | |
| |
| ASTON/Cornerstone Large Cap Value Fund | | October 31, 2013 |
| |
| Schedule of Investments | | |
| | | | | | | | |
Shares | | | | | Market
Value | |
| |
| | COMMON STOCKS – 95.15% | | | | |
| | |
| | | | Consumer Discretionary – 10.64% | | | | |
| | 28,510 | | | Bed Bath & Beyond * | | $ | 2,204,393 | |
| | 36,850 | | | Hasbro | | | 1,903,303 | |
| | 57,675 | | | Mattel | | | 2,559,040 | |
| | | | | | | | |
| | | | | | | 6,666,736 | |
| | | | | | | | |
| | |
| | | | Consumer Staples – 3.75% | | | | |
| | 30,600 | | | Wal-Mart Stores | | | 2,348,550 | |
| | | | | | | | |
| | |
| | | | Energy – 9.90% | | | | |
| | 17,150 | | | Chevron | | | 2,057,314 | |
| | 19,725 | | | Exxon Mobil | | | 1,767,755 | |
| | 35,625 | | | Royal Dutch Shell PLC, ADR | | | 2,374,762 | |
| | | | | | | | |
| | | | | | | 6,199,831 | |
| | | | | | | | |
| | |
| | | | Financials – 15.49% | | | | |
| | 20,025 | | | ACE (Switzerland) | | | 1,911,186 | |
| | 29,300 | | | Capital One Financial | | | 2,012,031 | |
| | 45,525 | | | Citigroup | | | 2,220,709 | |
| | 37,225 | | | JPMorgan Chase | | | 1,918,577 | |
| | 51,800 | | | Unum Group | | | 1,644,132 | |
| | | | | | | | |
| | | | | | | 9,706,635 | |
| | | | | | | | |
| | |
| | | | Healthcare – 7.67% | | | | |
| | 18,350 | | | Baxter International | | | 1,208,714 | |
| | 20,825 | | | Johnson & Johnson | | | 1,928,603 | |
| | 22,600 | | | Stryker | | | 1,669,236 | |
| | | | | | | | |
| | | | | | | 4,806,553 | |
| | | | | | | | |
| | |
| | | | Industrials – 18.23% | | | | |
| | 17,700 | | | 3M | | | 2,227,545 | |
| | 16,575 | | | Cummins | | | 2,105,356 | |
| | 28,575 | | | Emerson Electric | | | 1,913,668 | |
| | 11,800 | | | General Dynamics | | | 1,022,234 | |
| | | | | | | | |
Shares | | | | | Market
Value | |
| | |
| | | | Industrials (continued) | | | | |
| | 23,225 | | | Norfolk Southern | | $ | 1,997,815 | |
| | 18,425 | | | Parker Hannifin | | | 2,150,566 | |
| | | | | | | | |
| | | | | | | 11,417,184 | |
| | | | | | | | |
| |
| | | | Information Technology – 29.47% | |
| | 3,780 | | | Apple | | | 1,974,483 | |
| | 44,600 | | | EMC | | | 1,073,522 | |
| | 2,385 | | | Google, Class A * | | | 2,457,933 | |
| | 86,700 | | | Intel | | | 2,118,081 | |
| | 6,910 | | | International Business Machines | | | 1,238,341 | |
| | 70,950 | | | Microsoft | | | 2,508,083 | |
| | 75,100 | | | Oracle | | | 2,515,850 | |
| | 33,900 | | | QUALCOMM | | | 2,355,033 | |
| | 31,925 | | | Western Digital | | | 2,222,938 | |
| | | | | | | | |
| | | | | | | 18,464,264 | |
| | | | | | | | |
| | |
| | | | Total Common Stocks
(Cost $52,766,899) | | | 59,609,753 | |
| | | | | | | | |
| |
| | INVESTMENT COMPANY – 4.49% | | | | |
| | |
| | 2,811,444 | | | BlackRock Liquidity Funds TempCash Portfolio | | | 2,811,444 | |
| | | | | | | | |
| | |
| | | | Total Investment Company
(Cost $2,811,444) | | | 2,811,444 | |
| | | | | | | | |
| Total Investments – 99.64%
(Cost $55,578,343)** | | | 62,421,197 | |
| | | | | | | | |
| Net Other Assets and Liabilities – 0.36% | | | 227,181 | |
| | | | | | | | |
| Net Assets – 100.00% | | $ | 62,648,378 | |
| | | | | | | | |
| * | | Non-income producing security. |
| ** | | Aggregate cost for Federal income tax purposes is $55,677,959. |
| | | | |
Gross unrealized appreciation | | $ | 7,101,610 | |
Gross unrealized depreciation | | | (358,372 | ) |
| | | | |
Net unrealized appreciation | | $ | 6,743,238 | |
| | | | |
| ADR | | American Depositary Receipt |
See accompanying Notes to Financial Statements.
ASTON/River Road Dividend All Cap Value Fund
| | |
| |
| Portfolio Manager Commentary (unaudited) | | October 31, 2013 |
Henry W. Sanders, III, CFA; Thomas S. Forsha, CFA & James C. Shircliff, CFA
| Q. | What were the most significant market factors affecting Fund performance and returns relative to the benchmark during the past 12 months? |
| A. | Over the last 12 months, the most significant market factor affecting absolute performance was the ongoing extraordinary monetary policy (quantitative easing). Additionally, according to Ned Davis Research*, among S&P 500 companies, performance declined as dividend yield increased, creating a significant relative headwind for a dividend-oriented strategy. The Energy sector had the highest impact on relative results, due to an underweight allocation in that sector. The Consumer Discretionary sector had the most negative impact on relative results, as weak stock selection offset the positive impact of the significant overweight in the sector. |
| Q. | What were the best performing holdings for the Fund during the period? |
| A. | The two holdings with the largest positive contribution to the Fund’s total return were Walgreen Co., the drugstore chain, and BlackRock Inc., a leading investment management company. In the summer of 2012, Walgreen settled its dispute with Express Scripts and launched a joint venture with a leading drugstore chain in Europe, Alliance Boots. These actions, combined with the March announcement of a new distribution agreement with, and investment in, AmerisourceBergen, provided significant momentum to the firm over the period. |
BlackRock benefitted substantially from the strong market returns and continued inflows into its retail and exchange-traded fund (ETF) businesses. The firm increased the dividend payment in March, and has increased its annual rate over the last five years.
| Q. | What were the weakest performing holdings? |
| A. | The two holdings with the lowest contribution to the Fund’s total return during |
| | the period were Iron Mountain Inc., a document storage company, and Entergy Corp., an integrated utility. Iron Mountain’s plans to convert to a real estate investment trust (REIT) on January 1, 2014, were put at risk when the firm received a “tentatively adverse” preliminary finding on the proposal from the IRS. The firm appears to have a strong case, but if allowed, the conversion is now likely to be delayed to January 2015. |
In November 2012, Entergy released poor Q3 results and announced its intention to conduct a tax-free spin-off of its transmission assets. In addition, the company softened its support for the dividend going forward. Coupled with concerns surrounding the contentious relicensing of the Indian Point nuclear plant, our conviction in the position declined and we exited the position in the period.
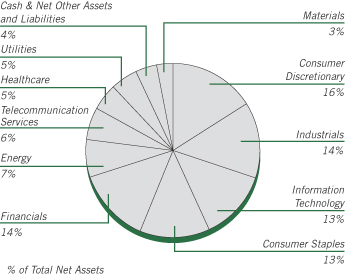
| Q. | How was the Fund positioned as of October 31, 2013? |
| A. | The overall positioning of the Fund has changed modestly over the period. The Fund is significantly overweight in Consumer stocks, both Staples and Cyclicals, and is significantly underweight in Financials, Healthcare, and Energy. Turnover increased in the period as we dealt with numerous overvalued positions as stocks have surged despite anemic revenue and earnings growth. The average yield of the Fund holdings has declined over the last twelve months as continued low interest rates increased valuation pressure on higher yielding stocks. While providing an attractive yield is a key goal, we must also maintain the potential for attractive capital gains, otherwise the potential total return for investors will suffer. We will continue to focus on stocks with high and growing dividends and healthy balance sheets but we are very mindful of the valuations of individual securities in the Fund. |
*Ned Davis Research, Inc., examined S&P 500 Stock Constituents ranked by quartiles (Dividend Yield) for the twelve months ended October 31, 2013.
Growth of a Hypothetical
$10,000 Investment—Class N
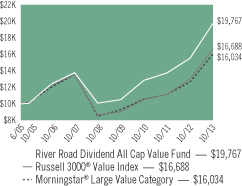
All dividends and capital gains are reinvested. Indexes are unmanaged and do not take into account fees, expenses or other costs.
Returns shown in the chart and table do not reflect taxes that a shareholder would pay on Fund distributions or on the sale of the Fund shares.
Value investing involves the risk that a Fund’s investments in companies believed to be undervalued will not appreciate as anticipated.
Small-cap and mid-cap stocks may be subject to a higher degree of market risk than the securities of more established companies because they tend to be more volatile and less liquid.
RETURNSFOR PERIOD ENDED 10/31/13
Average Annual Total Returns - Class N
| | | | |
One Year | | | 27.47 | % |
Five Year | | | 14.44 | % |
Since Inception | | | 8.51 | % |
Inception Date 06/28/05
Average Annual Total Returns - Class I
| | | | |
One Year | | | 27.81 | % |
Five Year | | | 14.74 | % |
Since Inception | | | 5.86 | % |
Inception Date 06/28/07
The performance data quoted represents past performance. Past performance does not guarantee future results. Investment return and principal value will fluctuate so that an investor’s shares, upon redemption, may be worth more or less than their original cost. Current performance may be lower or higher than the performance data quoted. For performance data current to the most recent month-end, please visit our website at www.astonfunds.com.
| | |
| |
| ASTON/River Road Dividend All Cap Value Fund | | October 31, 2013 |
| |
| Schedule of Investments | | |
| | | | | | | | |
Shares | | | | | Market
Value | |
| |
| | COMMON STOCKS – 96.45% | | | | |
| |
| | | | Consumer Discretionary – 16.03% | |
| | 441,680 | | | Bob Evans Farms | | $ | 25,215,511 | |
| | 348,650 | | | Coach | | | 17,669,582 | |
| | 331,595 | | | Darden Restaurants | | | 17,087,090 | |
| | 484,515 | | | Hasbro | | | 25,025,200 | |
| | 329,775 | | | Hillenbrand | | | 9,306,250 | |
| | 459,900 | | | Kohl’s | | | 26,122,320 | |
| | 677,690 | | | National CineMedia | | | 11,873,129 | |
| | 1,263,035 | | | Staples | | | 20,360,124 | |
| | 350,345 | | | Target | | | 22,698,853 | |
| | 576,665 | | | Thomson Reuters (Canada) | | | 21,665,304 | |
| | | | | | | | |
| | | | | | | 197,023,363 | |
| | | | | | | | |
| | |
| | | | Consumer Staples – 13.10% | | | | |
| | 565,575 | | | Dr Pepper Snapple Group | | | 26,779,976 | |
| | 135,955 | | | General Mills | | | 6,854,851 | |
| | 219,905 | | | Kimberly-Clark | | | 23,749,740 | |
| | 294,235 | | | Molson Coors Brewing, Class B | | | 15,888,690 | |
| | 261,075 | | | PepsiCo | | | 21,953,797 | |
| | 190,730 | | | Procter & Gamble | | | 15,401,448 | |
| | 616,655 | | | Sysco | | | 19,942,623 | |
| | 238,930 | | | Wal-Mart Stores | | | 18,337,878 | |
| | 204,290 | | | Walgreen | | | 12,102,140 | |
| | | | | | | | |
| | | | | | | 161,011,143 | |
| | | | | | | | |
| | |
| | | | Energy – 7.25% | | | | |
| | 169,985 | | | Chevron | | | 20,391,401 | |
| | 587,150 | | | Memorial Production Partners LP | | | 12,218,591 | |
| | 317,940 | | | Occidental Petroleum | | | 30,547,675 | |
| | 149,990 | | | Transmontaigne Partners LP | | | 6,328,078 | |
| | 381,005 | | | Williams Partners LP | | | 19,591,277 | |
| | | | | | | | |
| | | | | | | 89,077,022 | |
| | | | | | | | |
| | | | | | | | |
Shares | | | | | Market
Value | |
| | |
| | | | Financials – 13.84% | | | | |
| | 64,485 | | | BlackRock | | $ | 19,397,733 | |
| | 310,545 | | | CME Group | | | 23,045,544 | |
| | 411,905 | | | Compass Diversified Holdings | | | 7,900,338 | |
| | 529,675 | | | Geo Group, REIT | | | 18,681,637 | |
| | 359,905 | | | OneBeacon Insurance Group, Class A (Bermuda) | | | 5,744,084 | |
| | 196,425 | | | PartnerRe (Bermuda) | | | 19,683,749 | |
| | 305,990 | | | PNC Financial Services Group | | | 22,499,445 | |
| | 808,559 | | | Sabra Health Care, REIT | | | 21,750,237 | |
| | 203,200 | | | Safety Insurance Group (a) | | | 11,113,008 | |
| | 542,055 | | | U.S. Bancorp | | | 20,251,175 | |
| | | | | | | | |
| | | | | | | 170,066,950 | |
| | | | | | | | |
| | |
| | | | Healthcare – 4.79% | | | | |
| | 151,360 | | | Becton, Dickinson | | | 15,912,477 | |
| | 127,995 | | | Medtronic | | | 7,346,913 | |
| | 516,827 | | | Owens & Minor | | | 19,339,666 | |
| | 530,585 | | | Pfizer | | | 16,278,348 | |
| | | | | | | | |
| | | | | | | 58,877,404 | |
| | | | | | | | |
| | |
| | | | Industrials – 14.02% | | | | |
| | 257,071 | | | ABM Industries | | | 7,072,023 | |
| | 668,470 | | | Aircastle (Bermuda) | | | 12,614,029 | |
| | 299,605 | | | Emerson Electric | | | 20,064,547 | |
| | 234,825 | | | General Dynamics | | | 20,342,890 | |
| | 486,369 | | | Iron Mountain | | | 12,908,233 | |
| | 118,290 | | | Lockheed Martin | | | 15,772,789 | |
| | 291,230 | | | Norfolk Southern | | | 25,051,605 | |
| | 226,915 | | | Raytheon | | | 18,690,989 | |
| | 431,775 | | | Republic Services | | | 14,451,509 | |
| | 257,705 | | | United Parcel Service, Class B | | | 25,316,939 | |
| | | | | | | | |
| | | | | | | 172,285,553 | |
| | | | | | | | |
| |
| | | | Information Technology – 13.27% | |
| | 578,105 | | | CA | | | 18,360,615 | |
| | 1,380,075 | | | Corning | | | 23,585,482 | |
| | 1,344,185 | �� | | Intel | | | 32,838,439 | |
| | 353,695 | | | j2 Global | | | 19,446,151 | |
| | 527,795 | | | Microsoft | | | 18,657,553 | |
| | 299,085 | | | Paychex | | | 12,639,332 | |
| | 227,200 | | | QUALCOMM | | | 15,783,584 | |
| | 1,280,020 | | | Western Union | | | 21,785,940 | |
| | | | | | | | |
| | | | | | | 163,097,096 | |
| | | | | | | | |
| | |
| | | | Materials – 3.13% | | | | |
| | 344,480 | | | Bemis | | | 13,744,752 | |
| | 167,925 | | | Innophos Holdings | | | 8,416,401 | |
| | 315,230 | | | Nucor | | | 16,319,457 | |
| | | | | | | | |
| | | | | | | 38,480,610 | |
| | | | | | | | |
| |
| | | | Telecommunication Services – 6.29% | |
| | 134,800 | | | Atlantic Tele-Network | | | 7,470,616 | |
| | 598,995 | | | Rogers Communications, Class B (Canada) | | | 27,200,363 | |
| | 444,125 | | | Verizon Communications | | | 22,432,754 | |
See accompanying Notes to Financial Statements.
| | |
| |
| ASTON/River Road Dividend All Cap Value Fund | | October 31, 2013 |
| |
| Schedule of Investments – continued | | |
| | | | | | | | |
Shares | | | | | Market
Value | |
| |
| | | | Telecommunication Services (continued) | |
| | 549,260 | | | Vodafone Group, SP ADR (United Kingdom) | | $ | 20,223,753 | |
| | | | | | | | |
| | | | | | | 77,327,486 | |
| | | | | | | | |
| | |
| | | | Utilities – 4.73% | | | | |
| | 357,895 | | | AmeriGas Partners LP | | | 16,130,328 | |
| | 448,645 | | | Avista | | | 12,467,844 | |
| | 413,175 | | | National Fuel Gas | | | 29,562,671 | |
| | | | | | | | |
| | | | | | | 58,160,843 | |
| | | | | | | | |
| | |
| | | | Total Common Stocks
(Cost $933,224,911) | | | 1,185,407,470 | |
| | | | | | | | |
|
| | INVESTMENT COMPANY – 3.40% | |
| | |
| | 41,773,450 | | | BlackRock Liquidity Funds TempCash Portfolio | | | 41,773,450 | |
| | | | | | | | |
| | |
| | | | Total Investment Company
(Cost $41,773,450) | | | 41,773,450 | |
| | | | | | | | |
| Total Investments – 99.85%
(Cost $974,998,361)* | | | 1,227,180,920 | |
| | | | | | | | |
| Net Other Assets and Liabilities – 0.15% | | | 1,807,605 | |
| | | | | | | | |
| Net Assets – 100.00% | | $ | 1,228,988,525 | |
| | | | | | | | |
| (a) | | This security has been determined by the Subadviser to be an illiquid security. At October 31, 2013, this security amounted to $11,113,008 or 0.90% of net assets. |
| * | | Aggregate cost for Federal income tax purposes is $974,039,641. |
| | | | |
Gross unrealized appreciation | | $ | 259,236,122 | |
Gross unrealized depreciation | | | (6,094,843 | ) |
| | | | |
Net unrealized appreciation | | $ | 253,141,279 | |
| | | | |
| REIT | | Real Estate Investment Trust |
| SP ADR | | Sponsored American Depositary Receipt |
See accompanying Notes to Financial Statements.
ASTON/River Road Dividend All Cap Value Fund II
| | |
| |
| Portfolio Manager Commentary (unaudited) | | October 31, 2013 |
Henry W. Sanders, III, CFA; Thomas S. Forsha, CFA & James C. Shircliff, CFA
| Q. | What were the most significant market factors affecting Fund performance and returns relative to the benchmark during the past 12 months? |
| A. | Over the last 12 months, the most significant market factor affecting absolute performance was the ongoing extraordinary monetary policy (quantitative easing). Additionally, according to Ned Davis Research*, among S&P 500 companies, performance declined as dividend yield increased, creating a significant relative headwind for a dividend-oriented strategy. The Utilities sector had the highest impact on relative results, due to both strong stock selection and the modest underweight allocation in that sector. The Consumer Discretionary sector had the most negative impact on relative results, as weak stock selection offset the positive impact of the significant overweight in the sector. |
| Q. | What were the best performing holdings for the Fund during the period? |
| A. | The two holdings with the largest positive contribution to the Fund’s total return were Walgreen Co., the drugstore chain, and BlackRock Inc., a leading investment management company. In the summer of 2012, Walgreen settled its dispute with Express Scripts and launched a joint venture with a leading drugstore chain in Europe, Alliance Boots. These actions, combined with the March announcement of a new distribution agreement with, and investment in, AmerisourceBergen, provided significant momentum to the firm over the period. |
BlackRock benefitted substantially from the strong market returns and continued inflows into its retail and exchange-traded funds (ETF) businesses. The firm increased the dividend payment in March, and has increased its annual rate over the last five years.
| Q. | What were the weakest performing holdings? |
| A. | The two holdings with the lowest contribution to the Fund’s total return during |
| | the period were Iron Mountain Inc., a document storage company, and Entergy Corp., an integrated utility. Iron Mountain’s plan to convert to a real estate investment trust (REIT) on January 1, 2014 was put at risk when the firm received a “tentatively adverse” preliminary finding on the proposal from the IRS. The firm appears to have a strong case, but if allowed, the conversion is now likely to be delayed to January 2015. |
In November 2012, Entergy released poor Q3 results and announced its intention to conduct a tax-free spin-off of its transmission assets. In addition, the company softened its support for the dividend going forward. Coupled with concerns surrounding the contentious relicensing of the Indian Point nuclear plant, our conviction in the position declined and we exited the position.
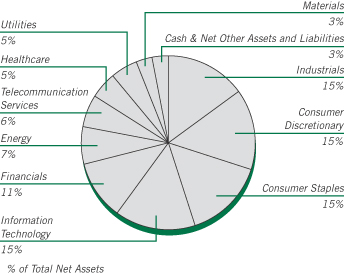
| Q. | How was the Fund positioned as of October 31, 2013? |
| A. | The overall positioning of the Fund has changed modestly over the period. The Fund is significantly overweight in Consumer stocks, both Staples and Cyclicals, and is significantly underweight in Financials, Healthcare, and Energy. Turnover increased in the period as we dealt with numerous overvalued positions as stocks have surged despite anemic revenue and earnings growth. The average yield of the Fund holdings has declined over the last twelve months as continued low interest rates increased valuation pressure on higher yielding stocks. While providing an attractive yield is a key goal, we must also maintain the potential for attractive capital gains, otherwise the potential total return for investors will suffer. We will continue to focus on stocks with high and growing dividends and healthy balance sheets but we are very mindful of the valuations of individual securities in the Fund. |
*Ned Davis Research, Inc., examined S&P 500 Stock Constituents ranked by quartiles (Dividend Yield) for the twelve months ended October 31, 2013.
Growth of a Hypothetical
$10,000 Investment—Class N
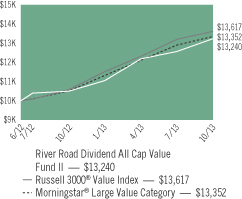
All dividends and capital gains are reinvested. Indexes are unmanaged and do not take into account fees, expenses or other costs.
Returns shown in the chart and table do not reflect taxes that a shareholder would pay on Fund distributions or on the sale of the Fund shares.
Value investing involves the risk that a Fund’s investments in companies believed to be undervalued will not appreciate as anticipated.
Small-cap and mid-cap stocks may be subject to a higher degree of market risk than the securities of more established companies because they tend to be more volatile and less liquid.
RETURNSFOR PERIOD ENDED 10/31/13
Average Annual Total Returns - Class N
| | | | |
One-Year | | | 25.99 | % |
Since Inception | | | 23.15 | % |
Inception Date 06/27/12
Average Annual Total Returns - Class I
| | | | |
One Year | | | 26.30 | % |
Since Inception | | | 23.44 | % |
Inception Date 06/27/12
The performance data quoted represents past performance. Past performance does not guarantee future results. Investment return and principal value will fluctuate so that an investor’s shares, upon redemption, may be worth more or less than their original cost. Current performance may be lower or higher than the performance data quoted. For performance data current to the most recent month-end, please visit our website at www.astonfunds.com.
The performance quoted would have been lower if fee waivers and/or expense reimbursements had not been in effect.
| | |
| |
| ASTON/River Road Dividend All Cap Value Fund II | | October 31, 2013 |
| |
| Schedule of Investments | | |
| | | | | | | | |
Shares | | | | | Market
Value | |
|
| | COMMON STOCKS – 97.03% | |
| | |
| | | | Consumer Discretionary – 15.21% | | | | |
| | 16,720 | | | Bob Evans Farms | | $ | 954,545 | |
| | 28,770 | | | Coach | | | 1,458,064 | |
| | 28,135 | | | Darden Restaurants | | | 1,449,797 | |
| | 39,575 | | | Hasbro | | | 2,044,049 | |
| | 10,635 | | | Hillenbrand | | | 300,120 | |
| | 37,830 | | | Kohl’s | | | 2,148,744 | |
| | 102,625 | | | Staples | | | 1,654,315 | |
| | 28,865 | | | Target | | | 1,870,163 | |
| | 47,620 | | | Thomson Reuters (Canada) | | | 1,789,083 | |
| | | | | | | | |
| | | | | | | 13,668,880 | |
| | | | | | | | |
| | | | Consumer Staples – 14.67% | | | | |
| | 45,980 | | | Dr Pepper Snapple Group | | | 2,177,153 | |
| | 11,225 | | | General Mills | | | 565,965 | |
| | 18,005 | | | Kimberly-Clark | | | 1,944,540 | |
| | 24,440 | | | Molson Coors Brewing, Class B | | | 1,319,760 | |
| | 21,580 | | | PepsiCo | | | 1,814,662 | |
| | 15,595 | | | Procter & Gamble | | | 1,259,296 | |
| | 50,705 | | | Sysco | | | 1,639,800 | |
| | 19,510 | | | Wal-Mart Stores | | | 1,497,393 | |
| | 16,330 | | | Walgreen | | | 967,389 | |
| | | | | | | | |
| | | | | | | 13,185,958 | |
| | | | | | | | |
| | | | Energy – 6.95% | | | | |
| | 14,180 | | | Chevron | | | 1,701,033 | |
| | 21,695 | | | Memorial Production Partners LP | | | 451,473 | |
| | 25,820 | | | Occidental Petroleum | | | 2,480,786 | |
| | 31,305 | | | Williams Partners LP | | | 1,609,703 | |
| | | | | | | | |
| | | | | | | 6,242,995 | |
| | | | | | | | |
| | | | Financials – 11.14% | | | | |
| | 5,225 | | | BlackRock | | | 1,571,732 | |
| | 25,320 | | | CME Group | | | 1,878,997 | |
| | 43,074 | | | Geo Group, REIT | | | 1,519,220 | |
| | 15,795 | | | PartnerRe (Bermuda) | | | 1,582,817 | |
| | | | | | | | |
Shares | | | | | Market
Value | |
| | |
| | | | Financials (continued) | | | | |
| | 24,815 | | | PNC Financial Services Group | | $ | 1,824,647 | |
| | 43,820 | | | U.S. Bancorp | | | 1,637,115 | |
| | | | | | | | |
| | | | | | | 10,014,528 | |
| | | | | | | | |
| | |
| | | | Healthcare – 4.93% | | | | |
| | 12,350 | | | Becton, Dickinson | | | 1,298,355 | |
| | 10,160 | | | Medtronic | | | 583,184 | |
| | 33,510 | | | Owens & Minor | | | 1,253,944 | |
| | 42,055 | | | Pfizer | | | 1,290,247 | |
| | | | | | | | |
| | | | | | | 4,425,730 | |
| | | | | | | | |
| | |
| | | | Industrials – 15.41% | | | | |
| | 18,725 | | | ABM Industries | | | 515,124 | |
| | 49,145 | | | Aircastle (Bermuda) | | | 927,366 | |
| | 24,405 | | | Emerson Electric | | | 1,634,403 | |
| | 19,355 | | | General Dynamics | | | 1,676,724 | |
| | 40,115 | | | Iron Mountain | | | 1,064,652 | |
| | 9,165 | | | Lockheed Martin | | | 1,222,061 | |
| | 23,375 | | | Norfolk Southern | | | 2,010,718 | |
| | 18,930 | | | Raytheon | | | 1,559,264 | |
| | 35,335 | | | Republic Services | | | 1,182,662 | |
| | 20,965 | | | United Parcel Service, Class B | | | 2,059,602 | |
| | | | | | | | |
| | | | | | | 13,852,576 | |
| | | | | | | | |
| | |
| | | | Information Technology – 14.57% | | | | |
| | 46,710 | | | CA | | | 1,483,510 | |
| | 113,555 | | | Corning | | | 1,940,655 | |
| | 109,335 | | | Intel | | | 2,671,054 | |
| | 25,950 | | | j2 Global | | | 1,426,731 | |
| | 44,220 | | | Microsoft | | | 1,563,177 | |
| | 21,830 | | | Paychex | | | 922,536 | |
| | 18,585 | | | QUALCOMM | | | 1,291,100 | |
| | 105,700 | | | Western Union | | | 1,799,014 | |
| | | | | | | | |
| | | | | | | 13,097,777 | |
| | | | | | | | |
| | |
| | | | Materials – 3.16% | | | | |
| | 27,390 | | | Bemis | | | 1,092,861 | |
| | 8,140 | | | Innophos Holdings | | | 407,977 | |
| | 25,870 | | | Nucor | | | 1,339,290 | |
| | | | | | | | |
| | | | | | | 2,840,128 | |
| | | | | | | | |
| |
| | | | Telecommunication Services – 6.36% | |
| | 48,855 | | | Rogers Communications, Class B (Canada) | | | 2,218,506 | |
| | 36,940 | | | Verizon Communications | | | 1,865,839 | |
| | 44,390 | | | Vodafone Group, SP ADR (United Kingdom) | | | 1,634,440 | |
| | | | | | | | |
| | | | | | | 5,718,785 | |
| | | | | | | | |
| | |
| | | | Utilities – 4.63% | | | | |
| | 21,860 | | | AmeriGas Partners LP | | | 985,230 | |
| | 27,715 | | | Avista | | | 770,199 | |
| | 33,565 | | | National Fuel Gas | | | 2,401,576 | |
| | | | | | | | |
| | | | | | | 4,157,005 | |
| | | | | | | | |
| | |
| | | | Total Common Stocks
(Cost $77,979,133) | | | 87,204,362 | |
| | | | | | | | |
See accompanying Notes to Financial Statements.
| | |
| |
| ASTON/River Road Dividend All Cap Value Fund II | | October 31, 2013 |
| |
| Schedule of Investments – continued | | |
| | | | | | | | |
Shares | | | | | Market
Value | |
|
| | INVESTMENT COMPANY – 2.82% | |
| | |
| | 2,537,440 | | | BlackRock Liquidity Funds TempCash Portfolio | | $ | 2,537,440 | |
| | | | | | | | |
| | |
| | | | Total Investment Company
(Cost $2,537,440) | | | 2,537,440 | |
| | | | | | | | |
| Total Investments – 99.85%
(Cost $80,516,573)* | | | 89,741,802 | |
| | | | | | | | |
| Net Other Assets and Liabilities – 0.15% | | | 131,860 | |
| | | | | | | | |
| Net Assets – 100.00% | | $ | 89,873,662 | |
| | | | | | | | |
| * | | Aggregate cost for Federal income tax purposes is $80,608,747. |
| | | | |
Gross unrealized appreciation | | $ | 9,655,649 | |
Gross unrealized depreciation | | | (522,594 | ) |
| | | | |
Net unrealized appreciation | | $ | 9,133,055 | |
| | | | |
| REIT | | Real Estate Investment Trust |
| SP ADR | | Sponsored American Depositary Receipt |
See accompanying Notes to Financial Statements.
ASTON/Fairpointe Mid Cap Fund
| | |
| |
| Portfolio Manager Commentary (unaudited) | | October 31, 2013 |
Thyra E. Zerhusen, Marie L. Lorden & Mary L. Pierson
| Q. | What were the most significant market factors affecting Fund performance and returns relative to the benchmark during the past 12 months? |
| A. | This past year was filled with market moving headlines both on the global front and out of Washington. Each new headline can cause a significant move in stocks either up or down. Operating in this environment of volatility creates opportunities as stocks overreact to short-term concerns. We strive to take advantage of these opportunities by buying stocks when short-term concerns cause companies with strong long-term fundamentals to become temporarily undervalued and by selling or trimming stocks that achieve our valuation targets. |
Within the context of this market volatility, our stock selection was the most significant contributor to our performance during the past 12 months, with 90% of our holdings increasing in value during the period. Also contributing to performance were two acquisitions. Gannett Company agreed to buy Belo Corporation in June 2013. Both media stocks were held in the portfolio and both jumped on the acquisition announcement. Molex, another portfolio holding, agreed to be acquired at a significant premium by Koch Industries.
Class N Shares of the Fund gained 42.88% during the past year, outperforming the S&P 400 Index, up 33.48% and the broader market, S&P 500 Index, up 27.16%.
| Q. | What were the best performing holdings for the Fund during the period? |
| A. | The Fund’s top contributors to performance for the past twelve months included Boston Scientific, a medical device company specializing in cardiovascular, endosurgery, neurovascular, and neuro modulation markets. After a couple of difficult years, Boston Scientific’s revenues have stabilized and we expect modest revenue growth with increasing operating margins going forward. Another top contributor was Cree, Inc., a producer of semiconductors and LED (light-emitting diode) components, LED chips and LED lighting products. We expect |
| | Cree to grow significantly over the next several years as LED lighting is adopted more widely. |
| Q. | What were the weakest performing holdings? |
| A. | Our weakest performing stocks included McDermott International, a global engineering and construction company serving offshore oil and gas markets, which was down from our initial purchase in the first quarter 2013. We believe that the company will rebound as it addresses recent execution issues. The stock of Nuance Communications, the leader in speech recognition technology (speech-to-text) also declined. We believe Nuance’s scale and competitive position remain attractive, especially in the healthcare vertical where the company participates in electronic health record management. |
| Q. | How was the Fund positioned as of October 31, 2013? |
| A. | While equity valuations have moved up and no longer trade at depressed levels, the Fund remains attractively valued. The Fund’s P/E of 15.1x and P/S of 0.9x compare favorably with the S&P 400 Index P/E of 16.4x and P/S of 1.2x. |
U.S. equities have performed well and continue to be supported by a stronger and relatively stable U.S. economy. We are also seeing a resurgence of manufacturing in North America due to lower energy costs, more competitive labor rates and available capital. We continually re-balance the portfolio to keep the overall valuation attractive relative to our own history and to the mid-cap benchmarks. Our mid-cap holdings are well-diversified, have the ability to grow market share, and in many cases represent “must have” products or services that make their clients more efficient.
Note: Price/Earnings (P/E) and Price/Sales (P/S) of a fund are the weighted averages of the P/E and P/S ratios of all the companies in the portfolio. P/E is determined by the price of the company’s stock divided by its estimated earnings. P/S is the price of the company divided by estimated sales.
Growth of a Hypothetical
$10,000 Investment—Class N
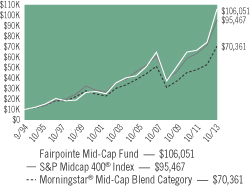
All dividends and capital gains are reinvested. Indexes are unmanaged and do not take into account fees, expenses or other costs.
Returns shown in the chart and table do not reflect taxes that a shareholder would pay on Fund distributions or on the sale of the Fund shares.
Small-cap and mid-cap stocks may be subject to a higher degree of market risk than the securities of more established companies because they tend to be more volatile and less liquid.
RETURNSFOR PERIOD ENDED 10/31/13
Average Annual Total Returns - Class N
| | | | |
One Year | | | 42.88 | % |
Five Year | | | 23.20 | % |
Ten Year | | | 11.61 | % |
Since Inception | | | 13.15 | % |
Inception Date 09/19/94
Average Annual Total Returns - Class I
| | | | |
One Year | | | 43.23 | % |
Five Year | | | 23.52 | % |
Since Inception | | | 10.85 | % |
Inception Date 07/06/04
The performance data quoted represents past performance. Past performance does not guarantee future results. Investment return and principal value will fluctuate so that an investor’s shares, upon redemption, may be worth more or less than their original cost. Current performance may be lower or higher than the performance data quoted. For performance data current to the most recent month-end, please visit our website at www.astonfunds.com.
The total expense ratios for Class N and Class I Shares are 1.11% and 0.86% respectively, as disclosed in the prospectus dated February 28, 2013. Please refer to the Financial Highlights section in this report for more information.
| | |
| |
| ASTON/Fairpointe Mid Cap Fund | | October 31, 2013 |
| |
| Schedule of Investments | | |
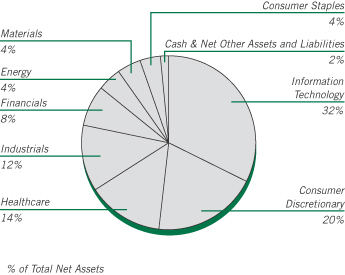
| | | | | | | | |
Shares | | | | | Market
Value | |
| |
| | COMMON STOCKS – 98.59% | | | | |
| |
| | | | Consumer Discretionary – 19.52% | |
| | 4,007,000 | | | Belo, Class A | | $ | 55,016,110 | |
| | 416,000 | | | BorgWarner | | | 42,902,080 | |
| | 4,345,300 | | | DeVry | | | 155,996,270 | |
| | 3,357,700 | | | Gannett | | | 92,907,559 | |
| | 1,065,800 | | | H&R Block | | | 30,311,351 | |
| | 7,795,168 | | | Interpublic Group | | | 130,958,822 | |
| | 915,500 | | | Lear | | | 70,850,543 | |
| | 11,148,854 | | | New York Times, Class A * | | | 154,188,651 | |
| | 2,531,598 | | | Scholastic | | | 72,631,547 | |
| | 9,242,700 | | | Staples | | | 148,992,324 | |
| | | | | | | | |
| | | | | | | 954,755,257 | |
| | | | | | | | |
| | |
| | | | Consumer Staples – 3.80% | | | | |
| | 1,069,100 | | | Bunge | | | 87,805,183 | |
| | 1,820,386 | | | Molson Coors Brewing, Class B | | | 98,300,844 | |
| | | | | | | | |
| | | | | | | 186,106,027 | |
| | | | | | | | |
| | |
| | | | Energy – 4.43% | | | | |
| | 251,078 | | | CGG, SP ADR (France) * | | | 5,511,162 | |
| | 2,668,992 | | | FMC Technologies * | | | 134,917,546 | |
| | 10,787,200 | | | McDermott International * | | | 76,265,504 | |
| | | | | | | | |
| | | | | | | 216,694,212 | |
| | | | | | | | |
| | |
| | | | Financials – 7.61% | | | | |
| | 1,124,400 | | | Cincinnati Financial | | | 56,220,000 | |
| | 1,343,985 | | | Eaton Vance | | | 56,192,013 | |
| | 868,600 | | | McGraw-Hill | | | 60,524,048 | |
| | 1,629,800 | | | Northern Trust | | | 91,953,317 | |
| | 2,352,900 | | | Raymond James Financial | | | 107,409,885 | |
| | | | | | | | |
| | | | | | | 372,299,263 | |
| | | | | | | | |
| | | | | | | | |
Shares | | | | | Market
Value | |
| | |
| | | | Healthcare – 14.11% | | | | |
| | 10,131,550 | | | Boston Scientific * | | $ | 118,437,820 | |
| | 1,755,919 | | | Charles River Laboratories * | | | 86,408,774 | |
| | 1,766,000 | | | Edwards Lifesciences * | | | 115,125,540 | |
| | 1,837,518 | | | Forest Laboratories * | | | 86,418,472 | |
| | 3,911,476 | | | Hospira * | | | 158,493,008 | |
| | 1,728,100 | | | Varian Medical Systems * | | | 125,425,498 | |
| | | | | | | | |
| | | | | | | 690,309,112 | |
| | | | | | | | |
| | |
| | | | Industrials – 12.36% | | | | |
| | 1,804,600 | | | AGCO | | | 105,352,548 | |
| | 1,747,400 | | | Con-way | | | 71,992,880 | |
| | 1,112,244 | | | ManpowerGroup | | | 86,866,256 | |
| | 4,913,200 | | | Southwest Airlines | | | 84,605,304 | |
| | 4,034,800 | | | Werner Enterprises | | | 93,445,968 | |
| | 4,703,500 | | | Xylem | | | 162,270,750 | |
| | | | | | | | |
| | | | | | | 604,533,706 | |
| | | | | | | | |
| |
| | | | Information Technology – 32.35% | |
| | 2,886,500 | | | Akamai Technologies * | | | 129,142,010 | |
| | 2,159,100 | | | Citrix Systems * | | | 122,593,698 | |
| | 1,754,600 | | | Cree * | | | 106,591,950 | |
| | 430,200 | | | FactSet Research Systems | | | 46,865,988 | |
| | 1,888,900 | | | First Solar * | | | 94,955,003 | |
| | 986,300 | | | Harris | | | 61,111,148 | |
| | 2,966,298 | | | Itron * | | | 126,571,936 | |
| | 5,782,900 | | | Jabil Circuit | | | 120,631,294 | |
| | 8,556,000 | | | Juniper Networks * | | | 159,483,840 | |
| | 2,357,600 | | | Lexmark International, Class A | | | 83,812,680 | |
| | 1,745,586 | | | Molex | | | 67,379,620 | |
| | 1,915,064 | | | Molex, Class A | | | 73,729,964 | |
| | 6,896,000 | | | Nuance Communications * | | | 107,301,760 | |
| | 7,623,500 | | | NVIDIA | | | 115,724,730 | |
| | 3,621,328 | | | Unisys * | | | 95,421,993 | |
| | 1,479,159 | | | Zebra Technologies, Class A * | | | 71,458,171 | |
| | | | | | | | |
| | | | | | | 1,582,775,785 | |
| | | | | | | | |
| | |
| | | | Materials – 4.41% | | | | |
| | 11,545,000 | | | Alcoa | | | 107,022,150 | |
| | 579,400 | | | FMC | | | 42,157,144 | |
| | 771,800 | | | Sigma-Aldrich | | | 66,706,674 | |
| | | | | | | | |
| | | | | | | 215,885,968 | |
| | | | | | | | |
| | |
| | | | Total Common Stocks
(Cost $3,470,936,286) | | | 4,823,359,330 | |
| | | | | | | | |
|
| | INVESTMENT COMPANY – 4.96% | |
| | |
| | 242,569,462 | | | BlackRock Liquidity Funds TempCash Portfolio | | | 242,569,462 | |
| | | | | | | | |
| | |
| | | | Total Investment Company
(Cost $242,569,462) | | | 242,569,462 | |
| | | | | | | | |
| Total Investments – 103.55%
(Cost $3,713,505,748)** | | | 5,065,928,792 | |
| | | | | | | | |
| Net Other Assets and Liabilities – (3.55)% | | | (173,680,732 | ) |
| | | | | | | | |
| Net Assets – 100.00% | | $ | 4,892,248,060 | |
| | | | | | | | |
See accompanying Notes to Financial Statements.
| | |
| |
| ASTON/Fairpointe Mid Cap Fund | | October 31, 2013 |
| |
| Schedule of Investments – continued | | |
| * | | Non-income producing security. |
| ** | | Aggregate cost for Federal income tax purposes is $3,714,621,859. |
| | | | |
Gross unrealized appreciation | | $ | 1,422,905,695 | |
Gross unrealized depreciation | | | (71,598,762 | ) |
| | | | |
Net unrealized appreciation | | $ | 1,351,306,933 | |
| | | | |
| SP ADR | | Sponsored American Depositary Receipt |
See accompanying Notes to Financial Statements.
ASTON/Montag & Caldwell Mid Cap Growth Fund
| | |
| |
| Portfolio Manager Commentary (unaudited) | | October 31, 2013 |
| | M. Scott Thompson, CFA & Andrew W. Jung, CFA |
| Q. | What were the most significant market factors affecting Fund performance and returns relative to the benchmark during the past 12 months? |
| A. | Over the last 12 months the Fund underperformed its benchmark due mostly to stock selection and, to a lesser extent, sector allocation. Stock selection in the Financials sector was a positive contributor to performance. A single holding (Ecolab) in the Materials sector and the Fund’s Energy holdings were also positive contributors to performance. This was more than offset, however, by stock selection in the Consumer Staples, Industrials, Technology and Healthcare sectors. |
| Q. | What were the best performing holdings for the Fund during the period? |
| A. | Two of best performing stocks were oil service companies Core Labs and Oceaneering, which rose 82% and 66%, respectively. Core Labs benefitted from ongoing strength in demand for the company’s products and services. Oceaneering benefitted from continued growth in deepwater oil and gas development. LKQ, a provider of aftermarket, recycled, and refurbished auto parts to collision and mechanical repair shops, also performed well during the year. |
| Q. | What were the weakest performing holdings? |
| A. | Teradata was our single worst performer over the past 12 months, losing just over a third of its value. The company suffered disappointing earnings results due primarily to cyclical weakness for its enterprise data warehousing solutions as customer uncertainty about the economy caused them to defer large spending commitments. While we reduced the size of our position, we continue to hold the stock based on our expectation that sales and earnings growth will reaccelerate in 2014. Edwards Lifesciences shares lost nearly 17% during the period as the company’s U.S. launch of their transcatheter heart valve, Sapien, failed to live |
| | up to management and investor expectations. We eliminated the holding during the period as a result. The Fresh Market, an operator of specialty grocery stores, was also a disappointing stock. Despite generating above average earnings growth, results fell short of investor expectations which caused earnings estimates to be reduced and the stock’s premium valuation to come under pressure. While we remain attracted to the company’s significant long-term unit growth opportunity and return potential, consistent with our sell discipline, we exited the position given the lack of visibility into near-term results. |
| Q. | How was the Fund positioned as of October 31, 2013? |
| A. | We continue to maintain a balance between both high quality cyclical and non-cyclical growth stocks. The outlook for the stock market continues to be generally favorable. The risk of a recession is low; monetary policy is very expansive; market valuations are fair to full, but not extreme; and investors are optimistic but not euphoric. Over the near term, however, the market may be more volatile as we believe it is fairly valued and that consensus economic and earnings expectations remain too high. Also, while the Federal Reserve’s bond buying program (the third round of Quantitative Easing, or QE3) should continue to support the stock market, this added liquidity has both reduced investors’ sensitivity to risk and significantly helped boost bond and stock prices. |
While we are pleased with the Fund’s 24.51% absolute return for the 12 month period, we are well aware of the lagging relative performance. Against the backdrop of easy money policies, the higher quality growth companies we favor have failed to keep pace with the broader market averages. Even so, we remain resolute in our belief that our process, with its emphasis on quality, valuation, and earnings growth, will serve shareholders well over the course of a full market cycle.
Growth of a Hypothetical $10,000 Investment—Class N
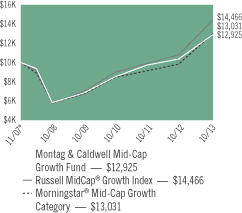
All dividends and capital gains are reinvested. Indexes are unmanaged and do not take into account fees, expenses or other costs.
Returns shown in the chart and table do not reflect taxes that a shareholder would pay on Fund distributions or on the sale of the Fund shares.
Mid-cap stocks may be subject to a higher degree of market risk than the securities of more established companies because they tend to be more volatile and less liquid.
RETURNSFOR PERIOD ENDED 10/31/13
Average Annual Total Returns - Class N
| | | | |
One Year | | | 24.51 | % |
Five Year | | | 17.18 | % |
Since Inception | | | 4.37 | % |
Inception Date 11/02/07
The performance data quoted represents past performance. Past performance does not guarantee future results. Investment return and principal value will fluctuate so that an investor’s shares, upon redemption, may be worth more or less than their original cost. Current performance may be lower or higher than the performance data quoted. For performance data current to the most recent month-end, please visit our website at www.astonfunds.com.
The performance quoted would have been lower if fee waivers and/or expense reimbursements had not been in effect.
| | |
| |
| ASTON/Montag & Caldwell Mid Cap Growth Fund | | October 31, 2013 |
| |
| Schedule of Investments | | |
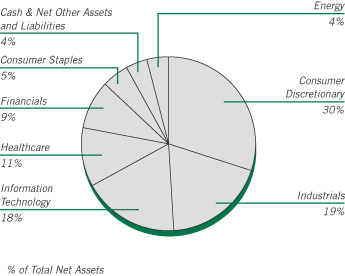
| | | | | | | | |
Shares | | | | | Market
Value | |
|
| | COMMON STOCKS – 95.58% | |
| | |
| | | | Consumer Discretionary – 29.50% | | | | |
| | 2,340 | | | BorgWarner | | $ | 241,324 | |
| | 3,980 | | | Dick’s Sporting Goods | | | 211,776 | |
| | 5,270 | | | Dollar Tree * | | | 307,768 | |
| | 4,000 | | | Dunkin’ Brands Group | | | 190,720 | |
| | 2,740 | | | Harman International Industries | | | 221,995 | |
| | 12,420 | | | LKQ * | | | 410,233 | |
| | 3,940 | | | Marriott International, Class A | | | 177,615 | |
| | 2,350 | | | Michael Kors Holdings (Hong Kong) * | | | 180,832 | |
| | 2,150 | | | O’Reilly Automotive * | | | 266,192 | |
| | 1,430 | | | Panera Bread, Class A * | | | 225,826 | |
| | 2,190 | | | PVH | | | 272,808 | |
| | 1,040 | | | Ralph Lauren | | | 172,266 | |
| | 4,080 | | | Ross Stores | | | 315,588 | |
| | 2,370 | | | Tractor Supply | | | 169,100 | |
| | | | | | | | |
| | | | | | | 3,364,043 | |
| | | | | | | | |
| | |
| | | | Consumer Staples – 5.26% | | | | |
| | 4,260 | | | Church & Dwight | | | 277,539 | |
| | 2,240 | | | Mead Johnson Nutrition | | | 182,918 | |
| | 2,440 | | | Monster Beverage * | | | 139,641 | |
| | | | | | | | |
| | | | | | | 600,098 | |
| | | | | | | | |
| | |
| | | | Energy – 3.73% | | | | |
| | 960 | | | Core Laboratories (Netherlands) | | | 179,731 | |
| | 2,860 | | | Oceaneering International | | | 245,617 | |
| | | | | | | | |
| | | | | | | 425,348 | |
| | | | | | | | |
| | |
| | | | Financials – 8.70% | | | | |
| | 6,830 | | | First Republic Bank | | | 348,808 | |
| | 940 | | | IntercontinentalExchange * | | | 181,166 | |
| | 5,430 | | | Raymond James Financial | | | 247,880 | |
| | 2,100 | | | Signature Bank New York NY * | | | 213,822 | |
| | | | | | | | |
| | | | | | | 991,676 | |
| | | | | | | | |
| | | | | | | | |
Shares | | | | | Market
Value | |
| | |
| | | | Healthcare – 11.47% | | | | |
| | 2,070 | | | Henry Schein * | | $ | 232,730 | |
| | 2,090 | | | IDEXX Laboratories * | | | 225,427 | |
| | 1,520 | | | MEDNAX * | | | 165,710 | |
| | 1,480 | | | Perrigo | | | 204,077 | |
| | 5,180 | | | ResMed | | | 268,013 | |
| | 2,100 | | | Waters * | | | 211,932 | |
| | | | | | | | |
| | | | | | | 1,307,889 | |
| | | | | | | | |
| | |
| | | | Industrials – 19.30% | | | | |
| | 5,875 | | | AMETEK | | | 281,001 | |
| | 6,450 | | | Donaldson | | | 255,484 | |
| | 5,750 | | | Expeditors International Washington | | | 260,417 | |
| | 1,990 | | | J.B. Hunt Transport Services | | | 149,310 | |
| | 4,080 | | | Jacobs Engineering Group * | | | 248,146 | |
| | 8,080 | | | Robert Half International | | | 311,322 | |
| | 1,190 | | | Roper Industries | | | 150,904 | |
| | 2,530 | | | Stericycle * | | | 293,986 | |
| | 3,640 | | | Verisk Analytics, Class A * | | | 249,413 | |
| | | | | | | | |
| | | | | | | 2,199,983 | |
| | | | | | | | |
| | |
| | | | Information Technology – 17.62% | | | | |
| | 3,880 | | | Altera | | | 130,368 | |
| | 2,210 | | | Amphenol, Class A | | | 177,441 | |
| | 1,860 | | | ANSYS * | | | 162,657 | |
| | 2,940 | | | F5 Networks * | | | 239,639 | |
| | 2,150 | | | FactSet Research Systems | | | 234,221 | |
| | 12,970 | | | Juniper Networks * | | | 241,761 | |
| | 3,794 | | | Teradata * | | | 167,202 | |
| | 5,650 | | | Trimble Navigation * | | | 161,421 | |
| | 2,740 | | | WEX * | | | 255,779 | |
| | 5,260 | | | Xilinx | | | 238,909 | |
| | | | | | | | |
| | | | | | | 2,009,398 | |
| | | | | | | | |
| | |
| | | | Total Common Stocks
(Cost $9,132,139) | | | 10,898,435 | |
| | | | | | | | |
|
| | INVESTMENT COMPANY – 5.41% | |
| | |
| | 617,041 | | | BlackRock Liquidity Funds TempCash Portfolio | | | 617,041 | |
| | | | | | | | |
| | |
| | | | Total Investment Company
(Cost $617,041) | | | 617,041 | |
| | | | | | | | |
| Total Investments – 100.99%
(Cost $9,749,180)** | | | 11,515,476 | |
| | | | | | | | |
| Net Other Assets and Liabilities – (0.99)% | | | (113,289 | ) |
| | | | | | | | |
| Net Assets – 100.00% | | $ | 11,402,187 | |
| | | | | | | | |
| * | | Non-income producing security. |
| ** | | Aggregate cost for Federal income tax purposes is $9,774,111. |
| | | | |
Gross unrealized appreciation | | $ | 1,859,141 | |
Gross unrealized depreciation | | | (117,776 | ) |
| | | | |
Net unrealized appreciation | | $ | 1,741,365 | |
| | | | |
See accompanying Notes to Financial Statements.
ASTON/LMCG Small Cap Growth Fund
| | |
| |
| Portfolio Manager Commentary (unaudited) | | October 31, 2013 |
(formerly, the ASTON Small Cap
Growth Fund) | | Andrew Morey, CFA |
| | |
| Q. | What were the most significant market factors affecting Fund performance and returns relative to the benchmark during the past 12 months? |
| A. | The ongoing focus in the market on growth-oriented stocks, and the breadth of the market’s willingness to pay for revenue growth, margin expansion, and positive earnings continued to be keys to Fund performance over the past year. We also saw merger and acquisition (M&A) activity pick up in the last 12 months, especially in areas outside of the ‘traditional’ Consumer and Information Technology sectors. Certainly in Healthcare, the election outcome and the rollout of the Affordable Care Act contributed to an increase in deals involving hospitals and medical technology companies during the past year. |
| Q. | What were the best performing holdings for the Fund during the period? |
| A. | At the sector level, Consumer Discretionary was a strong area for the Fund, especially among our specialty retailers, where M&A activity between OfficeMax and Office Depot helped boost returns. GNC was another top-performing stock in the specialty retailer space, as investors have responded to strong revenue and comparable store sales numbers, along with new store openings globally. Energy was a strong sector for the strategy; Magnum Hunter Resources and Gulfport Energy both contributed significantly to performance. Magnum Hunter is an exploration and production company, and production out of the Marcellus field in West Virginia has been particularly strong. Gulfport Energy operates primarily along the Louisiana coast and in Ohio’s Utica Shale, and the stock has performed well, especially given that company had |
| | reduced production guidance due to unexpected pipeline delays and downtime. In Financials, we have held a meaningful position in GEO Group, a private prison operator whose shares have risen steadily on key state contract extensions and positive earnings releases. Lastly, in Healthcare, Health Management Associates was the most significant positive contributor to the Fund’s return comparison for the year. |
| Q. | What were the weakest performing holdings? |
| A. | Information Technology was our weakest sector for the year, with particular weakness in internet software and services companies. Among individual holdings, Liquidity Services and Millennial Media were among our weakest names for the period and key detractors from relative performance. For Liquidity Services, which operates online auction facilities for commercial and government surpluses, the uneven nature of its business has led to a slight slowdown in revenue growth. Triumph Group, in Industrials, detracted from performance for the year as well. |
| Q. | How was the Fund positioned as of October 31, 2013? |
| A. | The investment team continues to capitalize on inefficiencies in the small cap growth universe, to identify companies that are growing revenues and expanding margins, and exhibiting sustainability in these growth characteristics based upon their competitive positions. On a stock by stock basis, the Fund is well positioned beginning the new fiscal year, and we remain optimistic for the medium term and longer. |
Growth of a Hypothetical $10,000 Investment—Class N
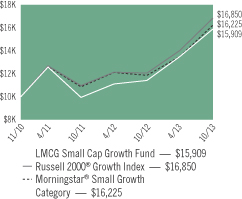
All dividends and capital gains are reinvested. Indexes are unmanaged and do not take into account fees, expenses or other costs.
Returns shown in the chart and table do not reflect taxes that a shareholder would pay on Fund distributions or on the sale of the Fund shares.
Small company stocks may be subject to a higher degree of market risk than the securities of more established companies because they tend to be more volatile and less liquid.
RETURNSFOR PERIOD ENDED 10/31/13
Average Annual Total Returns - Class N
| | | | |
One Year | | | 39.31 | % |
Since Inception | | | 16.77 | % |
Inception Date 11/03/10
Average Annual Total Returns - Class I
| | | | |
One Year | | | 39.72 | % |
Since Inception | | | 11.15 | % |
Inception Date 06/01/11
The performance data quoted represents past performance. Past performance does not guarantee future results. Investment return and principal value will fluctuate so that an investor’s shares, upon redemption, may be worth more or less than their original cost. Current performance may be lower or higher than the performance data quoted. For performance data current to the most recent month-end, please visit our website at www.astonfunds.com.
The performance quoted would have been lower if fee waivers and/or expense reimbursements had not been in effect.
| | |
| |
| ASTON/LMCG Small Cap Growth Fund | | October 31, 2013 |
| |
| Schedule of Investments | | |
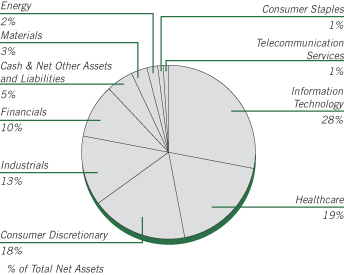
| | | | | | | | |
Shares | | | | | Market
Value | |
|
| | COMMON STOCKS – 94.62% | |
| | |
| | | | Consumer Discretionary – 17.67% | | | | |
| | 16,343 | | | Black Diamond * | | $ | 243,675 | |
| | 8,574 | | | Brunswick | | | 386,945 | |
| | 56,442 | | | Del Frisco’s Restaurant Group * | | | 1,021,600 | |
| | 10,565 | | | GNC Holdings, Class A | | | 621,433 | |
| | 12,345 | | | Hibbett Sports * | | | 720,084 | |
| | 16,207 | | | HSN | | | 849,247 | |
| | 9,763 | | | Lithia Motors, Class A | | | 613,605 | |
| | 70,513 | | | OfficeMax | | | 1,056,285 | |
| | 8,383 | | | Ryland Group | | | 336,997 | |
| | 9,322 | | | Sinclair Broadcast Group, Class A | | | 298,863 | |
| | 21,595 | | | Vitamin Shoppe * | | | 1,013,021 | |
| | | | | | | | |
| | | | | | | 7,161,755 | |
| | | | | | | | |
| | |
| | | | Consumer Staples – 1.24% | | | | |
| | 9,167 | | | Susser Holdings * | | | 502,718 | |
| | | | | | | | |
| | |
| | | | Energy – 2.03% | | | | |
| | 8,627 | | | Carrizo Oil & Gas * | | | 378,208 | |
| | 7,595 | | | Gulfport Energy * | | | 445,751 | |
| | | | | | | | |
| | | | | | | 823,959 | |
| | | | | | | | |
| | |
| | | | Financials – 10.19% | | | | |
| | 37,685 | | | CyrusOne, REIT | | | 734,481 | |
| | 12,365 | | | Encore Capital Group * | | | 604,030 | |
| | 50,516 | | | Geo Group, REIT | | | 1,781,699 | |
| | 16,129 | | | Ryman Hospitality Properties, REIT | | | 595,321 | |
| | 29,825 | | | WisdomTree Investments * | | | 414,568 | |
| | | | | | | | |
| | | | | | | 4,130,099 | |
| | | | | | | | |
| | |
| | | | Healthcare – 18.72% | | | | |
| | 9,854 | | | Acadia Pharmaceuticals * | | | 223,981 | |
| | 10,856 | | | Bio-Reference Labs * | | | 351,843 | |
| | 8,241 | | | Bluebird Bio * | | | 175,121 | |
| | 4,927 | | | Cepheid * | | | 200,627 | |
| | 37,614 | | | Community Health Systems | | | 1,641,099 | |
| | | | | | | | |
Shares | | | | | Market
Value | |
| | |
| | | | Healthcare (continued) | | | | |
| | 12,973 | | | HeartWare International * | | $ | 941,321 | |
| | 3,826 | | | Intercept Pharmaceuticals * | | | 207,522 | |
| | 305,898 | | | Merge Healthcare * | | | 776,981 | |
| | 25,267 | | | Premier, Class A * | | | 778,476 | |
| | 4,715 | | | Puma Biotechnology * | | | 180,632 | |
| | 7,214 | | | Team Health Holdings * | | | 313,376 | |
| | 20,317 | | | Theravance * | | | 744,415 | |
| | 4,779 | | | Universal Health Services, Class B | | | 384,996 | |
| | 9,973 | | | Vascular Solutions * | | | 195,670 | |
| | 15,022 | | | Volcano * | | | 287,972 | |
| | 2,807 | | | WellCare Health Plans * | | | 187,171 | |
| | | | | | | | |
| | | | | | | 7,591,203 | |
| | | | | | | | |
| | |
| | | | Industrials – 13.33% | | | | |
| | 2,489 | | | Acuity Brands | | | 250,169 | |
| | 43,608 | | | Builders FirstSource * | | | 323,135 | |
| | 14,014 | | | Herman Miller | | | 425,185 | |
| | 9,752 | | | Hexcel * | | | 412,607 | |
| | 38,228 | | | Kelly Services, Class A | | | 797,436 | |
| | 24,893 | | | Kforce | | | 490,143 | |
| | 5,526 | | | Trimas * | | | 209,214 | |
| | 22,728 | | | Triumph Group | | | 1,628,461 | |
| | 31,810 | | | USG * | | | 868,731 | |
| | | | | | | | |
| | | | | | | 5,405,081 | |
| | | | | | | | |
| | |
| | | | Information Technology – 27.77% | | | | |
| | 10,743 | | | ACI Worldwide * | | | 592,154 | |
| | 33,743 | | | Aruba Networks * | | | 633,019 | |
| | 11,016 | | | Cardtronics * | | | 432,378 | |
| | 5,780 | | | CommVault Systems * | | | 451,302 | |
| | 2,648 | | | CoStar Group * | | | 468,670 | |
| | 26,653 | | | ExlService Holdings | | | 770,538 | |
| | 18,580 | | | Fleetmatics Group PLC (Ireland) * | | | 589,915 | |
| | 20,653 | | | Fortinet * | | | 415,332 | |
| | 24,327 | | | Global Eagle Entertainment * | | | 247,649 | |
| | 8,521 | | | Heartland Payment Systems | | | 344,674 | |
| | 10,807 | | | iGATE * | | | 344,095 | |
| | 216,319 | | | Internap Network Services * | | | 1,572,639 | |
| | 19,730 | | | Liquidity Services * | | | 515,150 | |
| | 7,614 | | | Microsemi * | | | 191,340 | |
| | 15,319 | | | Netscout Systems * | | | 433,834 | |
| | 75,022 | | | RF Micro Devices * | | | 393,866 | |
| | 18,438 | | | Semtech * | | | 573,606 | |
| | 10,419 | | | Synchronoss Technologies * | | | 360,706 | |
| | 1,280 | | | Ultimate Software Group * | | | 197,734 | |
| | 62,845 | | | Vantiv, Class A * | | | 1,728,238 | |
| | | | | | | | |
| | | | | | | 11,256,839 | |
| | | | | | | | |
| | |
| | | | Materials – 3.18% | | | | |
| | 32,057 | | | Boise Cascade * | | | 820,980 | |
| | 4,779 | | | Martin Marietta Materials | | | 468,772 | |
| | | | | | | | |
| | | | | | | 1,289,752 | |
| | | | | | | | |
| | |
| | | | Telecommunication Services – 0.49% | | | | |
| | 26,330 | | | InContact * | | | 199,845 | |
| | | | | | | | |
| | |
| | | | Total Common Stocks
(Cost $36,218,195) | | | 38,361,251 | |
| | | | | | | | |
See accompanying Notes to Financial Statements.
| | |
| |
| ASTON/LMCG Small Cap Growth Fund | | October 31, 2013 |
| |
| Schedule of Investments – continued | | |
| | | | | | | | |
Shares | | | | | Market
Value | |
|
| | WARRANTS – 0.00% | |
| | |
| | | | Energy – 0.00% | | | | |
| | 11,820 | | | Magnum Hunter Resoursces,
Strike Price $8.50, Expiration 04/15/16 | | $ | 0 | |
| | | | | | | | |
| | |
| | | | Total Warrants
(Cost $—) | | | 0 | |
| | | | | | | | |
|
| | INVESTMENT COMPANY – 5.41% | |
| | |
| | 2,191,174 | | | BlackRock Liquidity Funds TempCash Portfolio | | | 2,191,174 | |
| | | | | | | | |
| | |
| | | | Total Investment Company
(Cost $2,191,174) | | | 2,191,174 | |
| | | | | | | | |
| Total Investments – 100.03%
(Cost $38,409,369)** | | | 40,552,425 | |
| | | | | | | | |
| Net Other Assets and Liabilities – (0.03)% | | | (11,785 | ) |
| | | | | | | | |
| Net Assets – 100.00% | | $ | 40,540,640 | |
| | | | | | | | |
| * | | Non-income producing security. |
| ** | | Aggregated cost for Federal income tax purposes is $38,427,618. |
| | | | |
Gross unrealized appreciation | | $ | 3,189,727 | |
Gross unrealized depreciation | | | (1,064,920 | ) |
| | | | |
Net unrealized appreciation | | $ | 2,124,807 | |
| | | | |
| REIT | | Real Estate Investment Trust |
See accompanying Notes to Financial Statements.
ASTON/Silvercrest Small Cap Fund
| | |
| |
| Portfolio Manager Commentary (unaudited) | | October 31, 2013 |
| | Roger W. Vogel, CFA |
| Q. | What were the most significant market factors affecting Fund performance and returns relative to the benchmark during the past 12 months? |
| A. | The most significant factor impacting Fund performance during the past 12 months relative to the Russell 2000 Value Index was our outperformance and underweight exposure in the Financials sector. Our stock holdings selection within the sector gained 43% versus a 27% gain within the index sector. Much of the outperformance was driven by two sub-sectors, Banks and Real Estate Investment Trusts (REITs). Our banks gained 45% versus 34% for the benchmark’s banks, while our REITs were up 20% versus a gain of 15% for the benchmark REITs. However, our average weighting of 23% was far below the benchmark’s 38%, and given that Financial Services was the third worst performing sector in the benchmark, this underexposure contributed roughly 85 bps of relative performance. |
| Q. | What were the best performing holdings for the Fund during the period? |
| A. | Our biggest contributors to return for the period were Lithia Motors, which posted our largest percentage gain at 86%, Altra Holdings, Inc. (+71%), Protective Life (+73%), FirstMerit Corporation (+68%) and West Pharmaceutical Services, Inc. (+82%). All tended to report earnings above expectations. |
| Q. | What were the weakest performing holdings? |
| A. | Our worst contributors to return included Swift Energy, our biggest decliner at (-24%), Vishay Intertechnology Inc. (-16%), ReachLocal, Inc. (-18%), Cubic Corporation (-10%) and Invacare Corporation (-4%). All tended to have disappointing fundamental results. We have eliminated our holdings of Swift Energy, Cubic Corporation and Invacare Corporation. |
| Q. | How was the Fund positioned as of October 31, 2013? |
| A. | As we look forward, we continue to favor modestly the cyclical areas of the market, as we see the U.S. economy slowly improving. Recent earnings reports from major home builders confirmed that the U.S. housing market’s recovery troops along, with tight supply-demand conditions and rising prices. The wealth effect of housing strength should buoy consumer confidence, by our reckoning. Farther afield, some of our management teams are even starting to talk about stabilization in the beleaguered European region. |
Despite the equity market’s short-term preoccupation, we continue to hunt for those hard-to-find companies that earn high returns on capital and have a track record of deploying those returns profitably and in shareholder-friendly ways. We remind investors that we will adhere to our core investment tenets that have served our clients well for many years: company quality, solid businesses, and attractive value. Selling at around 16x next twelve month estimated earnings, we think the portfolio remains attractively valued, although we are cognizant that some higher growth segments of the small-cap market appear somewhat generously valued. As we have said over the past few quarters, we continue to believe there is a fair amount of pent up merger and acquisition demand in the small-cap arena, and remain hopeful that we will catch our share as it unfolds.
Note: A basis point (bps) is a unit of measure. 1 bps = .01%.
Growth of a Hypothetical
$10,000 Investment—Class N
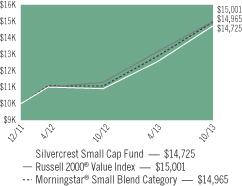
All dividends and capital gains are reinvested. Indexes are unmanaged and do not take into account fees, expenses or other costs.
Returns shown in the chart and table do not reflect taxes that a shareholder would pay on Fund distributions or on the sale of the Fund shares.
Small-cap stocks may be subject to a higher degree of market risk than the securities of more established companies because they tend to be more volatile and less liquid.
RETURNSFOR PERIOD ENDED 10/31/13
Average Annual Total Returns - Class N
| | | | |
One Year | | | 35.09 | % |
Since Inception | | | 23.27 | % |
Inception Date 12/27/11
Average Annual Total Returns - Class I
| | | | |
One Year | | | 35.39 | % |
Since Inception | | | 23.61 | % |
Inception Date 12/27/11
The performance data quoted represents past performance. Past performance does not guarantee future results. Investment return and principal value will fluctuate so that an investor’s shares, upon redemption, may be worth more or less than their original cost. Current performance may be lower or higher than the performance data quoted. For performance data current to the most recent month-end, please visit our website at www.astonfunds.com.
The performance quoted would have been lower if fee waivers and/or expense reimbursements had not been in effect.
The total expense ratio for the Class N and Class I Shares is 5.11% and 4.86% respectively, as disclosed in the prospectus dated February 28, 2013. Please refer to the Financial Highlights section in the report for more information.
| | |
| |
| ASTON/Silvercrest Small Cap Fund | | October 31, 2013 |
| |
| Schedule of Investments | | |
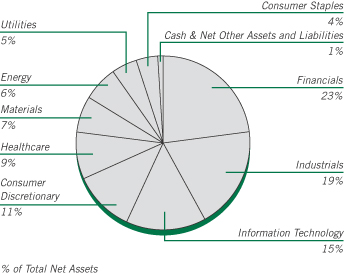
| | | | | | | | |
Shares | | | | | Market
Value | |
|
| | COMMON STOCKS – 98.92% | |
| | |
| | | | Consumer Discretionary – 11.34% | | | | |
| | 5,782 | | | AFC Enterprises * | | $ | 257,755 | |
| | 10,740 | | | Bob Evans Farms | | | 613,147 | |
| | 6,087 | | | Core-Mark Holding | | | 430,534 | |
| | 8,405 | | | Drew Industries | | | 422,435 | |
| | 17,380 | | | Hillenbrand | | | 490,464 | |
| | 27,120 | | | La-Z-Boy | | | 625,930 | |
| | 9,330 | | | Lithia Motors, Class A | | | 586,391 | |
| | 28,040 | | | ReachLocal * | | | 344,612 | |
| | | | | | | | |
| | | | | | | 3,771,268 | |
| | | | | | | | |
| | |
| | | | Consumer Staples – 3.73% | | | | |
| | 6,514 | | | J & J Snack Foods | | | 557,403 | |
| | 8,234 | | | Lancaster Colony | | | 683,340 | |
| | | | | | | | |
| | | | | | | 1,240,743 | |
| | | | | | | | |
| | |
| | | | Energy – 6.49% | | | | |
| | 14,410 | | | Bonanza Creek Energy * | | | 728,281 | |
| | 20,470 | | | Forum Energy Technologies * | | | 598,952 | |
| | 13,889 | | | Rosetta Resources * | | | 832,507 | |
| | | | | | | | |
| | | | | | | 2,159,740 | |
| | | | | | | | |
| | |
| | | | Financials – 22.87% | | | | |
| | 35,150 | | | BancorpSouth | | | 776,815 | |
| | 12,558 | | | EastGroup Properties, REIT | | | 799,442 | |
| | 22,478 | | | FirstMerit | | | 504,856 | |
| | 31,354 | | | Horace Mann Educators | | | 868,506 | |
| | 7,899 | | | Iberiabank | | | 461,539 | |
| | 21,833 | | | Independent Bank/Rockland MA | | | 783,368 | |
| | 9,594 | | | Mid-America Apartment Communities, REIT | | | 637,042 | |
| | 19,560 | | | PacWest Bancorp | | | 744,258 | |
| | 23,140 | | | Pebblebrook Hotel Trust, REIT | | | 698,828 | |
| | 8,272 | | | Prosperity Bancshares | | | 516,586 | |
| | 6,768 | | | Protective Life | | | 311,869 | |
| | 12,330 | | | Stifel Financial * | | | 504,914 | |
| | | | | | | | |
| | | | | | | 7,608,023 | |
| | | | | | | | |
| | | | | | | | |
Shares | | | | | Market
Value | |
| | |
| | | | Healthcare – 8.73% | | | | |
| | 6,337 | | | Analogic | | $ | 584,462 | |
| | 7,964 | | | ICU Medical * | | | 492,175 | |
| | 10,810 | | | Integra LifeSciences Holdings * | | | 494,882 | |
| | 12,550 | | | STERIS | | | 567,135 | |
| | 15,856 | | | West Pharmaceutical Services | | | 766,638 | |
| | | | | | | | |
| | | | | | | 2,905,292 | |
| | | | | | | | |
| | |
| | | | Industrials – 19.51% | | | | |
| | 25,065 | | | Altra Holdings | | | 761,224 | |
| | 12,963 | | | Applied Industrial Technologies | | | 613,280 | |
| | 11,880 | | | Beacon Roofing Supply * | | | 412,355 | |
| | 12,406 | | | EMCOR Group | | | 459,766 | |
| | 32,590 | | | EnerNOC * | | | 541,972 | |
| | 12,289 | | | Mine Safety Appliances | | | 591,838 | |
| | 12,850 | | | TAL International Group | | | 620,784 | |
| | 4,880 | | | Teledyne Technologies * | | | 433,442 | |
| | 14,360 | | | United Stationers | | | 638,158 | |
| | 24,389 | | | US Ecology | | | 867,029 | |
| | 9,520 | | | Watts Water Technologies, Class A | | | 550,066 | |
| | | | | | | | |
| | | | | | | 6,489,914 | |
| | | | | | | | |
| | |
| | | | Information Technology – 14.82% | | | | |
| | 7,579 | | | ACI Worldwide * | | | 417,754 | |
| | 48,400 | | | Entegris * | | | 500,940 | |
| | 10,150 | | | Fair Isaac | | | 581,392 | |
| | 6,737 | | | FEI | | | 600,132 | |
| | 9,415 | | | Littelfuse | | | 800,557 | |
| | 29,920 | | | M/A-COM Technology Solutions
Holdings * | | | 516,718 | |
| | 24,670 | | | Mentor Graphics | | | 544,714 | |
| | 15,265 | | | MKS Instruments | | | 452,455 | |
| | 42,020 | | | Vishay Intertechnology * | | | 515,585 | |
| | | | | | | | |
| | | | | | | 4,930,247 | |
| | | | | | | | |
| | |
| | | | Materials – 6.74% | | | | |
| | 19,420 | | | Chemtura * | | | 475,790 | |
| | 8,642 | | | HB Fuller | | | 413,693 | |
| | 33,733 | | | PH Glatfelter | | | 883,805 | |
| | 8,989 | | | Sensient Technologies | | | 468,597 | |
| | | | | | | | |
| | | | | | | 2,241,885 | |
| | | | | | | | |
| | |
| | | | Utilities – 4.69% | | | | |
| | 8,632 | | | MGE Energy | | | 486,068 | |
| | 19,919 | | | Portland General Electric | | | 571,675 | |
| | 13,063 | | | UIL Holdings | | | 503,187 | |
| | | | | | | | |
| | | | | | | 1,560,930 | |
| | | | | | | | |
| | |
| | | | Total Common Stocks
(Cost $28,387,050) | | | 32,908,042 | |
| | | | | | | | |
| Total Investments – 98.92%
(Cost $28,387,050)** | | | 32,908,042 | |
| | | | | | | | |
| Net Other Assets and Liabilities – 1.08% | | | 359,400 | |
| | | | | | | | |
| Net Assets – 100.00% | | $ | 33,267,442 | |
| | | | | | | | |
See accompanying Notes to Financial Statements.
| | |
| |
| ASTON/Silvercrest Small Cap Fund | | October 31, 2013 |
| |
| Schedule of Investments – continued | | |
| * | | Non-income producing security. |
| ** | | Aggregate cost for Federal income tax purposes is $28,405,342. |
| | | | |
Gross unrealized appreciation | | $ | 4,734,641 | |
Gross unrealized depreciation | | | (231,941 | ) |
| | | | |
Net unrealized appreciation | | $ | 4,502,700 | |
| | | | |
| REIT | | Real Estate Investment Trust |
See accompanying Notes to Financial Statements.
ASTON/TAMRO Small Cap Fund
| | |
| |
| Portfolio Manager Commentary (unaudited) | | October 31, 2013 |
Philip D. Tasho, CFA & Timothy A. Holland, CFA
| Q. | What were the most significant market factors affecting Fund performance and returns relative to the benchmark during the past 12 months? |
| A. | It was a robust year for equities in general and for small-cap stocks largely due to slow, but steady economic growth, an ongoing rebound in the housing market that boosted consumer sentiment and spending, little to no inflation and accommodative monetary policy. While providing a healthy return of 29.52% for Class N Shares on an absolute basis, the Fund trailed its benchmark, the Russell 2000 Index for two primary reasons. First, many of the year’s big winners — stocks with 200+% returns — were at the extremes of the growth/value spectrum. These companies, the majority with no earnings and many quite levered, do not dovetail with our philosophy and so we could not justify owning them. The second reason for the underperformance was stock selection. We owned a number of companies that simply did not execute in line with our expectations. In some cases, we have sold the positions to fund higher-confidence opportunities. In other cases, where we believe the long-term opportunity remains, we added to the positions on weakness. |
| Q. | What were the best performing holdings for the Fund during the period? |
| A. | The three holdings that contributed the most to performance during the year were Glacier Bancorp, Grand Canyon Education and DexCom. Glacier, a regional bank headquartered in Montana, benefited from loan growth and net interest margin improvement. Grand Canyon Education experienced strong student enrollment growth for its online and campus-based graduate and undergraduate degree programs. DexCom saw strong new patient adoption of its continuous glucose monitoring systems for diabetics. |
| Q. | What were the weakest performing holdings? |
| A. | Disappointing same-store sales and weak guidance impacted grocery retailer The |
| | Fresh Market during the time it was in the portfolio. Increased competition for Apple, the company’s major client, weighed on shares of Cirrus Logic in the first quarter. Healthways, a well-being solutions provider, was negatively impacted by a delayed ramp-up in newly signed contracts, reducing near-term operating performance and visibility. |
| Q. | How was the Fund positioned as of October 31, 2013? |
| A. | The Fund’s investment process focuses on individual, bottom-up stock selection to identify companies that we believe possess a sustainable competitive advantage and are attractively valued. Our approach to portfolio management is opportunistic and broadly diversified, with sector weights determined by where we see opportunities at the stock level. |
While we remain constructive toward the equity markets, we believe this is not a typical economic recovery where a rising tide will lift all boats. In this environment, valuations for companies that are executing may go higher than in recent years – i.e. multiples will expand. We need to differentiate between speculative stocks and those that are truly out executing their peers and should resonate long term. We are closely looking at historical valuations and are ever watchful for opportunities as they dovetail with our three investment categories: Leaders, Laggards, and Innovators.
We continue to orient the portfolio toward better-capitalized, better-run companies that participate in more domestic facing industries such as Consumer Discretionary and Financial Services. As the U.S. consumer, U.S. housing and the U.S. economy continue to come back, these companies should be well positioned. As of October 31, 2013, Financials, Consumer Discretionary and Industrials were the largest sectors in the Fund. Among our investment categories, Leaders and Innovators, which tend to be higher quality companies with leading market share and tenured management teams, comprised 72% of the portfolio. Laggards, or companies undergoing restructuring, made up 28%.
Growth of a Hypothetical
$10,000 Investment—Class N
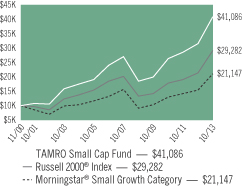
All dividends and capital gains are reinvested. Indexes are unmanaged and do not take into account fees, expenses or other costs.
Returns shown in the chart and table do not reflect taxes that a shareholder would pay on Fund distributions or on the sale of the Fund shares.
Small-cap and mid-cap stocks may be subject to a higher degree of market risk than the securities of more established companies because they tend to be more volatile and less liquid.
RETURNSFOR PERIOD ENDED 10/31/13
Average Annual Total Returns - Class N
| | | | |
One Year | | | 29.52 | % |
Five Year | | | 17.16 | % |
Ten Year | | | 9.95 | % |
Since Inception | | | 11.56 | % |
Inception Date 11/30/00
Average Annual Total Returns - Class I
| | | | |
One Year | | | 29.84 | % |
Five Year | | | 17.46 | % |
Since Inception | | | 9.57 | % |
Inception Date 01/04/05
The performance data quoted represents past performance. Past performance does not guarantee future results. Investment return and principal value will fluctuate so that an investor’s shares, upon redemption, may be worth more or less than their original cost. Current performance may be lower or higher than the performance data quoted. For performance data current to the most recent month-end, please visit our website at www.astonfunds.com.
The total expense ratios for Class N and Class I Shares are 1.28% and 1.03% respectively, as disclosed in the prospectus dated February 28, 2013. Please refer to the Financial Highlights section in this report for more information.
| | |
| |
| ASTON/TAMRO Small Cap Fund | | October 31, 2013 |
| |
| Schedule of Investments | | |
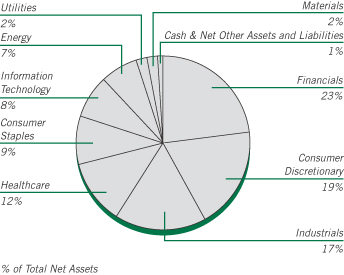
| | | | | | | | |
Shares | | | | | Market
Value | |
| |
| | COMMON STOCKS – 98.82% | | | | |
| |
| | | | Consumer Discretionary – 18.99% | |
| | 1,373,617 | | | Arcos Dorados Holdings, Class A (Argentina) | | $ | 16,538,350 | |
| | 1,286,220 | | | Chico’s FAS | | | 22,058,673 | |
| | 276,370 | | | Five Below * | | | 13,337,616 | |
| | 351,793 | | | Francesca’s Holdings * | | | 6,328,756 | |
| | 571,787 | | | Grand Canyon Education * | | | 27,028,371 | |
| | 269,814 | | | Harman International Industries | | | 21,860,330 | |
| | 518,095 | | | Monro Muffler Brake | | | 23,832,370 | |
| | 458,096 | | | Pool | | | 24,911,260 | |
| | 2,338,640 | | | Quiksilver * | | | 19,457,485 | |
| | 373,556 | | | Red Robin Gourmet Burgers * | | | 28,457,496 | |
| | 1,006,430 | | | Texas Roadhouse | | | 27,596,311 | |
| | 688,050 | | | Zumiez * | | | 20,393,802 | |
| | | | | | | | |
| | | | | | | 251,800,820 | |
| | | | | | | | |
| | |
| | | | Consumer Staples – 8.75% | | | | |
| | 1,272,887 | | | Cott (Canada) | | | 10,437,673 | |
| | 405,981 | | | Diamond Foods * | | | 9,909,996 | |
| | 370,770 | | | Sanderson Farms | | | 23,436,372 | |
| | 629,475 | | | Tootsie Roll Industries (a) | | | 20,143,200 | |
| | 251,571 | | | TreeHouse Foods * | | | 18,430,091 | |
| | 471,504 | | | United Natural Foods * | | | 33,688,961 | |
| | | | | | | | |
| | | | | | | 116,046,293 | |
| | | | | | | | |
| | |
| | | | Energy – 6.93% | | | | |
| | 776,322 | | | Carrizo Oil & Gas * | | | 34,033,956 | |
| | 1,432,447 | | | Precision Drilling (Canada) | | | 15,169,614 | |
| | 227,301 | | | SEACOR Holdings | | | 22,230,038 | |
| | 397,153 | | | Unit * | | | 20,417,636 | |
| | | | | | | | |
| | | | | | | 91,851,244 | |
| | | | | | | | |
| | |
| | | | Financials – 22.82% | | | | |
| | 646,390 | | | Bank of the Ozarks | | | 31,983,377 | |
| | 1,300,407 | | | Colony Financial, REIT | | | 26,307,234 | |
| | | | | | | | |
Shares | | | | | Market
Value | |
| | |
| | | | Financials (continued) | | | | |
| | 470,411 | | | First Cash Financial Services * | | $ | 28,455,161 | |
| | 1,237,316 | | | FirstMerit | | | 27,790,117 | |
| | 1,260,132 | | | Glacier Bancorp | | | 34,817,447 | |
| | 317,116 | | | Greenhill | | | 16,268,051 | |
| | 319,151 | | | Hanover Insurance Group (The) | | | 18,683,100 | |
| | 1,022,673 | | | LaSalle Hotel Properties, REIT | | | 31,753,997 | |
| | 1,159,526 | | | National Penn Bancshares | | | 12,024,285 | |
| | 464,419 | | | Portfolio Recovery Associates * | | | 27,609,710 | |
| | 1,169,979 | | | Redwood Trust, REIT | | | 20,498,032 | |
| | 642,039 | | | Stifel Financial * | | | 26,291,497 | |
| | | | | | | | |
| | | | | | | 302,482,008 | |
| | | | | | | | |
| | |
| | | | Healthcare – 12.20% | | | | |
| | 286,951 | | | Analogic | | | 26,465,491 | |
| | 144,677 | | | Athenahealth * | | | 19,315,826 | |
| | 529,487 | | | Auxilium Pharmaceuticals * | | | 9,112,471 | |
| | 1,107,165 | | | Bruker * | | | 22,641,524 | |
| | 595,915 | | | Cepheid * | | | 24,265,659 | |
| | 1,088,447 | | | DexCom * | | | 31,271,082 | |
| | 660,205 | | | Healthways * | | | 6,357,774 | |
| | 1,055,072 | | | HMS Holdings * | | | 22,293,671 | |
| | | | | | | | |
| | | | | | | 161,723,498 | |
| | | | | | | | |
| | |
| | | | Industrials – 17.30% | | | | |
| | 332,568 | | | Advisory Board * | | | 22,814,165 | |
| | 129,378 | | | Applied Industrial Technologies | | | 6,120,873 | |
| | 195,534 | | | Chart Industries * | | | 21,014,039 | |
| | 381,229 | | | Corporate Executive Board | | | 27,791,594 | |
| | 242,754 | | | Foster Wheeler AG (Switzerland) * | | | 6,551,930 | |
| | 589,548 | | | Franklin Electric | | | 22,314,392 | |
| | 349,414 | | | Landstar System | | | 19,319,100 | |
| | 265,160 | | | Morningstar | | | 21,289,696 | |
| | 329,485 | | | Polypore International * | | | 14,892,722 | |
| | 132,385 | | | Proto Labs * | | | 11,101,806 | |
| | 293,037 | | | Raven Industries | | | 9,775,714 | |
| | 1,305,079 | | | US Airways Group * | | | 28,672,586 | |
| | 757,878 | | | Westport Innovations (Canada) * | | | 17,757,082 | |
| | | | | | | | |
| | | | | | | 229,415,699 | |
| | | | | | | | |
| |
| | | | Information Technology – 8.52% | |
| | 535,523 | | | Cavium * | | | 21,586,932 | |
| | 353,758 | | | CommVault Systems * | | | 27,621,425 | |
| | 596,736 | | | Ixia * | | | 8,461,716 | |
| | 281,595 | | | Netgear * | | | 8,098,672 | |
| | 1,006,799 | | | OmniVision Technologies * | | | 14,105,254 | |
| | 186,187 | | | OpenTable * | | | 12,936,273 | |
| | 63,568 | | | Tech Data * | | | 3,309,350 | |
| | 173,723 | | | Tyler Technologies * | | | 16,800,751 | |
| | | | | | | | |
| | | | | | | 112,920,373 | |
| | | | | | | | |
| | |
| | | | Materials – 1.60% | | | | |
| | 577,037 | | | LSB Industries * | | | 21,188,799 | |
| | | | | | | | |
| | |
| | | | Utilities – 1.71% | | | | |
| | 522,462 | | | Northwest Natural Gas | | | 22,690,525 | |
| | | | | | | | |
| | |
| | | | Total Common Stocks
(Cost $950,496,706) | | | 1,310,119,259 | |
| | | | | | | | |
See accompanying Notes to Financial Statements.
| | |
| |
| ASTON/TAMRO Small Cap Fund | | October 31, 2013 |
| |
| Schedule of Investments – continued | | |
| | | | | | | | |
Shares | | | | | Market
Value | |
|
| | INVESTMENT COMPANY – 1.30% | |
| | |
| | 17,208,046 | | | BlackRock Liquidity Funds TempCash Portfolio | | $ | 17,208,046 | |
| | | | | | | | |
| | |
| | | | Total Investment Company
(Cost $17,208,046) | | | 17,208,046 | |
| | | | | | | | |
| Total Investments – 100.12%
(Cost $967,704,752) ** | | | 1,327,327,305 | |
| | | | | | | | |
| Net Other Assets and Liabilities – (0.12)% | | | (1,527,929 | ) |
| | | | | | | | |
| Net Assets – 100.00% | | $ | 1,325,799,376 | |
| | | | | | | | |
| * | | Non-income producing security. |
| ** | | Aggregate cost for Federal income tax purposes is $968,845,966. |
| | | | |
Gross unrealized appreciation | | $ | 382,899,818 | |
Gross unrealized depreciation | | | (24,418,479 | ) |
| | | | |
Net unrealized appreciation | | $ | 358,481,339 | |
| | | | |
| (a) | | This security has been determined by the Subadviser to be an illiquid security. At October 31, 2013, this security amounted to $20,143,200 or 1.52% of net assets. |
| REIT | | Real Estate Investment Trust |
See accompanying Notes to Financial Statements.
ASTON/River Road Select Value Fund
| | |
| |
| Portfolio Manager Commentary (unaudited) | | October 31, 2013 |
James C. Shircliff, CFA; R. Andrew Beck & J. Justin Akin
| Q. | What were the most significant market factors affecting Fund performance and returns relative to the benchmark during the past 12 months? |
| A. | The Fund’s return lagged the benchmark Russell 2500 Value Index during the period. The period was distinguished by sharply rising equity prices and strong leadership from high beta securities. Historically, the latter has been a significant headwind for the strategy’s low volatility investment approach. However, a record level of merger and acquisitions (M&A) activity within the Fund during the period helped the strategy to largely keep pace with the market’s robust returns. |
Six of 10 sectors contributed positively to relative Fund performance. The largest positive contribution was from the Financials sector, which benefited from an underweight allocation. The largest negative contributor was the Materials sector, which lagged due to poor stock selection. The Fund’s cash position, which averaged approximately 5% during the period, was also a negative contributor to performance.
| Q. | What were the best performing holdings for the Fund during the period? |
| A. | The two holdings with the largest positive contribution to relative return were GEO Group Inc. and Madison Square Garden Co. (MSG). GEO Group is the second largest private prison operator in the United States. In 2013, the company converted into a Real Estate Investment Trust (REIT). This change significantly improved GEO’s tax efficiency and lowered its cost of capital. These factors attracted income-oriented investors and led to multiple expansion. MSG owns the New York Knicks, the New York Rangers, the MSG regional sports cable network, plus the real estate of the “World’s Most Famous Arena.” The company received higher affiliate fees from its TV networks due to a new deal with Time Warner Cable. Also, MSG recently concluded its renovation of the Garden at a cost of $1 B. MSG’s operating results improved due to revenue increases from its new corporate suites and higher sponsorship fees. |
| Q. | What were the weakest performing holdings? |
| A. | The two holdings with the largest negative contribution to relative return were Tower Group International Ltd. and Pan American Silver Corp. Tower Group is a Bermuda-based property and casualty insurer. Poor underwriting in its worker’s compensation and commercial auto lines led to large increases in its loss reserves, which were significantly above management’s previous estimates. This erased enough equity where investors became concerned Tower would be forced to raise capital or sell the company in a distressed state. Pan American Silver is one of the world’s largest silver producers, operating seven mines primarily in Latin America. Despite reporting solid operating results and having a cash-rich balance sheet, their share price declined with other miners as silver prices declined sharply. We exited the position due to unrealized losses later in the year. |
| Q. | How was the Fund positioned as of October 31, 2013? |
| A. | We continue to position the Fund in shares of high quality companies that we believe will perform well in a sustained period of weak economic growth. Rapidly rising equity prices paired with modest earnings growth over the prior twelve months has resulted in unattractive valuations in the broader small-cap market. As a result, identifying companies to replace those that are being sold at their assessed Absolute Values is more difficult than twelve months ago. Thus, cash in the Fund is at the higher end of its historical range. |
If returns do moderate over the coming months we expect the Fund’s holdings and low volatility approach to be well positioned. Further, whether markets rise or fall, we believe M&A activity within the Fund will continue to support relative performance.
Note: Beta is a measure of risk which shows a Fund’s volatility relative to its benchmark index.
Growth of a Hypothetical
$10,000 Investment—Class N
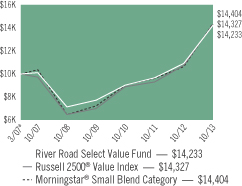
All dividends and capital gains are reinvested. Indexes are unmanaged and do not take into account fees, expenses or other costs.
Returns shown in the chart and table do not reflect taxes that a shareholder would pay on Fund distributions or on the sale of the Fund shares.
Small-cap and mid-cap stocks may be subject to a higher degree of market risk than the securities of more established companies because they tend to be more volatile and less liquid.
Value investing involves the risk that a Fund’s investments in companies believed to be undervalued will not appreciate as anticipated.
RETURNSFOR PERIOD ENDED 10/31/13
Average Annual Total Returns - Class N
| | | | |
One Year | | | 30.44 | % |
Five Year | | | 14.83 | % |
Since Inception | | | 5.50 | % |
Inception Date 03/29/07
Average Annual Total Returns - Class I
| | | | |
One Year | | | 30.74 | % |
Five Year | | | 15.15 | % |
Since Inception | | | 5.17 | % |
Inception Date 06/28/07
The performance data quoted represents past performance. Past performance does not guarantee future results. Investment return and principal value will fluctuate so that an investor’s shares, upon redemption, may be worth more or less than their original cost. Current performance may be lower or higher than the performance data quoted. For performance data current to the most recent month-end, please visit our website at www.astonfunds.com.
| | |
| |
| ASTON/River Road Select Value Fund | | October 31, 2013 |
| |
| Schedule of Investments | | |
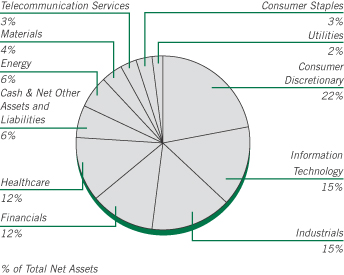
| | | | | | | | |
Shares | | | | | Market
Value | |
|
| | COMMON STOCKS – 93.85% | |
| | |
| | | | Consumer Discretionary – 21.78% | | | | |
| | 142,800 | | | Aaron’s | | $ | 4,051,236 | |
| | 98,350 | | | Abercrombie & Fitch, Class A | | | 3,686,158 | |
| | 254,130 | | | Ascena Retail Group * | | | 5,029,233 | |
| | 33,980 | | | Ascent Capital Group, Class A * | | | 2,868,592 | |
| | 176,050 | | | Big Lots * | | | 6,401,178 | |
| | 55,270 | | | Bob Evans Farms | | | 3,155,364 | |
| | 9,110 | | | CEC Entertainment | | | 422,248 | |
| | 75,660 | | | Fred’s, Class A | | | 1,225,692 | |
| | 100,420 | | | International Speedway, Class A | | | 3,284,738 | |
| | 25,980 | | | Madison Square Garden, Class A * | | | 1,572,310 | |
| | 27,330 | | | Murphy USA * | | | 1,109,051 | |
| | 52,310 | | | Outerwall * | | | 3,399,104 | |
| | 174,360 | | | Pep Boys—Manny, Moe, & Jack * | | | 2,256,218 | |
| | 182,810 | | | Regis | | | 2,650,745 | |
| | 129,260 | | | Rent-A-Center | | | 4,425,862 | |
| | 86,360 | | | Stage Stores | | | 1,783,334 | |
| | | | | | | | |
| | | | | | | 47,321,063 | |
| | | | | | | | |
| | | | Consumer Staples – 2.60% | | | | |
| | 20,490 | | | Harris Teeter Supermarkets | | | 1,010,567 | |
| | 44,430 | | | Industrias Bachoco, SP ADR (Mexico) | | | 1,821,186 | |
| | 76,970 | | | Village Super Market, Class A | | | 2,821,720 | |
| | | | | | | | |
| | | | | | | 5,653,473 | |
| | | | | | | | |
| | | | Energy – 5.86% | | | | |
| | 122,010 | | | Cloud Peak Energy * | | | 1,904,576 | |
| | 233,079 | | | Miller Energy Resources * | | | 1,575,614 | |
| | 123,980 | | | Ocean Rig UDW (Cyprus) * | | | 2,173,369 | |
| | 136,070 | | | Resolute Energy * | | | 1,276,337 | |
| | 161,000 | | | TETRA Technologies * | | | 2,088,170 | |
| | 152,780 | | | Vaalco Energy * | | | 805,151 | |
| | 131,610 | | | WPX Energy * | | | 2,913,845 | |
| | | | | | | | |
| | | | | | | 12,737,062 | |
| | | | | | | | |
| | | | | | | | |
Shares | | | | | Market
Value | |
| | |
| | | | Financials – 12.41% | | | | |
| | 8,595 | | | Alleghany * | | $ | 3,484,585 | |
| | 80,664 | | | Capital Southwest | | | 2,651,426 | |
| | 106,720 | | | Dime Community Bancshares | | | 1,745,939 | |
| | 117,254 | | | Geo Group, REIT | | | 4,135,549 | |
| | 139,240 | | | Hilltop Holdings * | | | 2,414,422 | |
| | 23,800 | | | Navigators Group * | | | 1,338,512 | |
| | 150,830 | | | PICO Holdings * | | | 3,541,488 | |
| | 13,125 | | | White Mountains Insurance Group (Bermuda) | | | 7,665,919 | |
| | | | | | | | |
| | | | | | | 26,977,840 | |
| | | | | | | | |
| | |
| | | | Healthcare – 11.79% | | | | |
| | 62,170 | | | Air Methods | | | 2,718,072 | |
| | 78,377 | | | Ensign Group | | | 3,337,293 | |
| | 58,080 | | | Hill-Rom Holdings | | | 2,398,123 | |
| | 19,560 | | | ICU Medical * | | | 1,208,808 | |
| | 79,560 | | | Myriad Genetics * | | | 1,939,673 | |
| | 516,270 | | | Nordion (Canada) * | | | 4,269,553 | |
| | 43,740 | | | Orthofix International (Curacao) * | | | 896,233 | |
| | 131,900 | | | Owens & Minor | | | 4,935,698 | |
| | 45,370 | | | Quality Systems | | | 1,035,343 | |
| | 63,840 | | | STERIS | | | 2,884,930 | |
| | | | | | | | |
| | | | | | | 25,623,726 | |
| | | | | | | | |
| | |
| | | | Industrials – 15.05% | | | | |
| | 255,410 | | | Air Transport Services Group * | | | 1,849,168 | |
| | 133,070 | | | Aircastle (Bermuda) | | | 2,511,031 | |
| | 64,580 | | | Cubic | | | 3,390,450 | |
| | 72,210 | | | Forward Air | | | 2,923,061 | |
| | 164,000 | | | Heartland Express | | | 2,355,040 | |
| | 110,470 | | | Insperity | | | 4,271,875 | |
| | 81,050 | | | Korn/Ferry International * | | | 1,928,990 | |
| | 66,590 | | | Layne Christensen * | | | 1,287,851 | |
| | 111,280 | | | Marten Transport | | | 1,962,979 | |
| | 114,123 | | | Standard Parking * | | | 3,020,836 | |
| | 43,510 | | | Unifirst | | | 4,473,698 | |
| | 117,540 | | | Werner Enterprises | | | 2,722,226 | |
| | | | | | | | |
| | | | | | | 32,697,205 | |
| | | | | | | | |
| | |
| | | | Information Technology – 15.13% | | | | |
| | 176,790 | | | Convergys | | | 3,489,835 | |
| | 138,430 | | | CSG Systems International | | | 3,856,660 | |
| | 123,280 | | | Daktronics | | | 1,474,429 | |
| | 91,630 | | | Dolby Laboratories, Class A | | | 3,274,856 | |
| | 86,730 | | | DST Systems | | | 7,352,102 | |
| | 95,550 | | | Heartland Payment Systems | | | 3,864,997 | |
| | 32,920 | | | Ituran Location and Control (Israel) | | | 602,436 | |
| | 28,060 | | | j2 Global | | | 1,542,739 | |
| | 97,410 | | | NeuStar, Class A * | | | 4,473,067 | |
| | 98,710 | | | Total System Services | | | 2,944,519 | |
| | | | | | | | |
| | | | | | | 32,875,640 | |
| | | | | | | | |
| | |
| | | | Materials – 3.51% | | | | |
| | 322,330 | | | AuRico Gold (Canada) | | | 1,324,776 | |
| | 53,870 | | | Innophos Holdings | | | 2,699,964 | |
| | 76,600 | | | Intrepid Potash | | | 1,137,510 | |
| | 116,110 | | | Kraton Performance Polymers * | | | 2,469,660 | |
| | | | | | | | |
| | | | | | | 7,631,910 | |
| | | | | | | | |
See accompanying Notes to Financial Statements.
| | |
| |
| ASTON/River Road Select Value Fund | | October 31, 2013 |
| |
| Schedule of Investments – continued | | |
| | | | | | | | |
Shares | | | | | Market
Value | |
| |
| | | | Telecommunication Services – 3.35% | |
| | 51,070 | | | Atlantic Tele-Network | | $ | 2,830,299 | |
| | 142,660 | | | Telephone & Data Systems | | | 4,448,139 | |
| | | | | | | | |
| | | | | | | 7,278,438 | |
| | | | | | | | |
| | |
| | | | Utilities – 2.37% | | | | |
| | 31,890 | | | Avista | | | 886,223 | |
| | 59,630 | | | National Fuel Gas | | | 4,266,527 | |
| | | | | | | | |
| | | | | | | 5,152,750 | |
| | | | | | | | |
| | |
| | | | Total Common Stocks
(Cost $166,024,932) | | | 203,949,107 | |
| | | | | | | | |
|
| | INVESTMENT COMPANY – 6.41% | |
| | |
| | 13,925,350 | | | BlackRock Liquidity Funds TempCash Portfolio | | | 13,925,350 | |
| | | | | | | | |
| | |
| | | | Total Investment Company
(Cost $13,925,350) | | | 13,925,350 | |
| | | | | | | | |
| Total Investments – 100.26%
(Cost $179,950,282)** | | | 217,874,457 | |
| | | | | | | | |
| Net Other Assets and Liabilities – (0.26)% | | | (555,955 | ) |
| | | | | | | | |
| Net Assets – 100.00% | | $ | 217,318,502 | |
| | | | | | | | |
| * | | Non-income producing security. |
| ** | | Aggregate cost for Federal income tax purposes is $181,597,236. |
| | | | |
Gross unrealized appreciation | | $ | 40,489,235 | |
Gross unrealized depreciation | | | (4,212,014 | ) |
| | | | |
Net unrealized appreciation | | $ | 36,277,221 | |
| | | | |
| ADR | | American Depositary Receipt |
| REIT | | Real Estate Investment Trust |
| SP ADR | | Sponsored American Depositary Receipt |
See accompanying Notes to Financial Statements.
ASTON/River Road Small Cap Value Fund
| | |
| |
| Portfolio Manager Commentary (unaudited) | | October 31, 2013 |
| James C. Shircliff, CFA; R. Andrew Beck & J. Justin Akin |
| Q. | What were the most significant market factors affecting Fund performance and returns relative to the benchmark during the past 12 months? |
| A. | The Fund’s return modestly underperformed the benchmark Russell 2000 Value Index. The period was distinguished by sharply rising equity prices and strong leadership from high beta securities. Historically, the latter has been a significant headwind for the strategy’s low volatility investment approach. However, a record level of merger and acquisitions (M&A) activity within the Fund during the period helped the strategy to largely keep pace with the market’s robust returns. |
Five of 10 sectors contributed positively to relative Fund performance. The largest positive contribution was from the Consumer Discretionary sector, which benefitted from an overweight allocation. The largest negative contributor was the Materials sector, which lagged due to poor security selection. The Fund’s cash position, which averaged approximately 6% during the period, was also a negative contributor to performance.
| Q. | What were the best performing holdings for the Fund during the period? |
| A. | The two holdings with the largest positive contribution to relative return were GEO Group Inc. and Motorcar Parts of America Inc. (MPAA). GEO Group is the second largest private prison operator in the United States. In 2013, the company converted into a Real Estate Investment Trust (REIT). This change significantly improved GEO’s tax efficiency and lowered its cost of capital. The company also signed new contracts for most of its idle facilities. These factors attracted income-oriented investors and led to multiple expansion. Motorcar Parts of America manufactures replacement alternators and starters for cars and trucks, selling to the largest auto parts retailers in the United States. Its core business lines continue to grow at double-digit rates which resulted in margin improvement and significant cash flow growth. Also, MPAA shuttered a poorly performing acquisition it made in 2011, which removed significant downside risk for the company. |
| Q. | What were the weakest performing holdings? |
| A. | The two holdings with the largest negative contribution to relative return were Tower Group International Ltd. and Ascena Retail Group Inc. Tower Group is a Bermuda-based property and casualty insurer. Poor underwriting in its worker’s compensation and commercial auto lines led to large increases in its loss reserves, which were significantly above management’s previous estimates. This erased enough equity causing investors to become concerned that Tower would be forced to raise capital or sell the company in a distressed state. Ascena Retail Group is a specialty apparel retailer that operates the dressbarn, Justice, maurices, Catherines, and Lane Bryant concept stores. Ascena is still digesting its 2012 acquisition of Charming Shoppes, which included the Catherines and Lane Bryant brands. As a result, its operating results were negatively impacted by several one-time items during this transition period. |
| Q. | How was the Fund positioned as of October 31, 2013? |
| A. | We continue to position the Fund in shares of high quality companies that we believe will perform well in a sustained period of weak economic growth. Rapidly rising equity prices paired with modest earnings growth over the prior twelve months has resulted in unattractive valuations in the broader small-cap market. As a result, identifying companies to replace those that are being sold at their assessed Absolute Values is more difficult than twelve months ago. Thus, cash in the fund is at the higher end of its historical range. |
If returns do moderate over the coming months we expect the Fund’s holdings and low volatility approach to be well positioned. Further, whether markets rise or fall, we believe M&A activity within the Fund will continue to support relative performance.
Note: Beta is a measure of risk which shows a Fund’s volatility relative to its benchmark.
Growth of a Hypothetical
$10,000 Investment—Class N
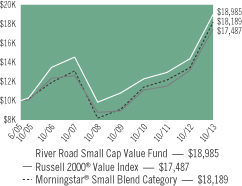
All dividends and capital gains are reinvested. Indexes are unmanaged and do not take into account fees, expenses or other costs.
Returns shown in the chart and table do not reflect taxes that a shareholder would pay on Fund distributions or on the sale of the Fund shares.
Small-cap and mid-cap stocks may be subject to a higher degree of market risk than the securities of more established companies because they tend to be more volatile and less liquid.
Value investing involves the risk that a Fund’s investments in companies believed to be undervalued will not appreciate as anticipated.
RETURNSFOR PERIOD ENDED 10/31/13
Average Annual Total Returns - Class N
| | | | |
One Year | | | 31.98 | % |
Five Year | | | 14.09 | % |
Since Inception | | | 7.98 | % |
Inception Date 06/28/05
Average Annual Total Returns - Class I
| | | | |
One Year | | | 32.36 | % |
Five Year | | | 14.38 | % |
Since Inception | | | 4.75 | % |
Inception Date 12/13/06
The performance data quoted represents past performance. Past performance does not guarantee future results. Investment return and principal value will fluctuate so that an investor’s shares, upon redemption, may be worth more or less than their original cost. Current performance may be lower or higher than the performance data quoted. For performance data current to the most recent month-end, please visit our website at www.astonfunds.com.
| | |
| |
| ASTON/River Road Small Cap Value Fund | | October 31, 2013 |
| |
| Schedule of Investments | | |
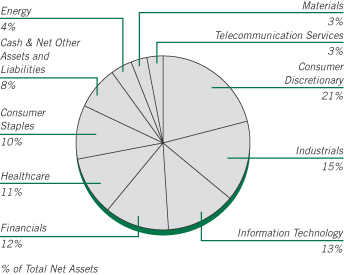
| | | | | | | | |
Shares | | | | | Market
Value | |
|
| | COMMON STOCKS – 89.46% | |
| | |
| | | | Consumer Discretionary – 21.32% | | | | |
| | 179,150 | | | Aaron’s | | $ | 5,082,485 | |
| | 132,400 | | | Abercrombie & Fitch, Class A | | | 4,962,352 | |
| | 359,078 | | | Ascena Retail Group * | | | 7,106,154 | |
| | 44,070 | | | Ascent Capital Group, Class A * | | | 3,720,389 | |
| | 250,180 | | | Big Lots * | | | 9,096,545 | |
| | 63,350 | | | Bob Evans Farms | | | 3,616,652 | |
| | 12,830 | | | CEC Entertainment | | | 594,671 | |
| | 118,450 | | | International Speedway, Class A | | | 3,874,500 | |
| | 37,150 | | | Mac-Gray | | | 783,122 | |
| | 120,459 | | | Monarch Casino & Resort * | | | 2,036,962 | |
| | 351,030 | | | Motorcar Parts of America * | | | 4,802,090 | |
| | 38,600 | | | Murphy USA * | | | 1,566,388 | |
| | 72,850 | | | Outerwall * | | | 4,733,793 | |
| | 247,700 | | | Pep Boys - Manny, Moe, & Jack * | | | 3,205,238 | |
| | 259,166 | | | Regis | | | 3,757,907 | |
| | 132,179 | | | Rent-A-Center | | | 4,525,809 | |
| | 123,010 | | | Stage Stores | | | 2,540,157 | |
| | | | | | | | |
| | | | | | | 66,005,214 | |
| | | | | | | | |
| | |
| | | | Consumer Staples – 4.48% | | | | |
| | 95,143 | | | Industrias Bachoco, SP ADR
(Mexico) (a) | | | 3,899,912 | |
| | 164,849 | | | Ingles Markets, Class A | | | 4,254,753 | |
| | 155,681 | | | Village Super Market, Class A (a) | | | 5,707,265 | |
| | | | | | | | |
| | | | | | | 13,861,930 | |
| | | | | | | | |
| | |
| | | | Energy – 7.44% | | | | |
| | 174,440 | | | Cloud Peak Energy * | | | 2,723,008 | |
| | 536,803 | | | Evolution Petroleum * (a) | | | 6,473,844 | |
| | 682,488 | | | Miller Energy Resources * | | | 4,613,619 | |
| | 176,540 | | | Ocean Rig UDW (Cyprus) * | | | 3,094,746 | |
| | 219,230 | | | Resolute Energy * | | | 2,056,377 | |
| | | | | | | | |
Shares | | | | | Market
Value | |
| | |
| | | | Energy (continued) | | | | |
| | 226,499 | | | TETRA Technologies * | | $ | 2,937,692 | |
| | 213,605 | | | Vaalco Energy * | | | 1,125,698 | |
| | | | | | | | |
| | | | | | | 23,024,984 | |
| | | | | | | | |
| | |
| | | | Financials – 14.29% | | | | |
| | 47,780 | | | 1st Source | | | 1,499,336 | |
| | 121,254 | | | Capital Southwest | | | 3,985,619 | |
| | 200,212 | | | Dime Community Bancshares | | | 3,275,468 | |
| | 18,795 | | | First Citizens BancShares, Class A | | | 3,979,465 | |
| | 188,145 | | | Geo Group, REIT | | | 6,635,874 | |
| | 206,270 | | | Hilltop Holdings * | | | 3,576,722 | |
| | 38,417 | | | Navigators Group * | | | 2,160,572 | |
| | 218,435 | | | PICO Holdings * | | | 5,128,854 | |
| | 263,370 | | | SWS Group * | | | 1,482,773 | |
| | 30,538 | | | Tompkins Financial | | | 1,506,134 | |
| | 18,838 | | | White Mountains Insurance Group (Bermuda) | | | 11,002,711 | |
| | | | | | | | |
| | | | | | | 44,233,528 | |
| | | | | | | | |
| | |
| | | | Healthcare – 10.16% | | | | |
| | 89,840 | | | Air Methods | | | 3,927,805 | |
| | 71,162 | | | Ensign Group | | | 3,030,078 | |
| | 75,590 | | | Hill-Rom Holdings | | | 3,121,111 | |
| | 16,423 | | | ICU Medical * | | | 1,014,941 | |
| | 122,400 | | | Myriad Genetics * | | | 2,984,112 | |
| | 736,490 | | | Nordion (Canada) * | | | 6,090,772 | |
| | 37,300 | | | Orthofix International (Curacao) * | | | 764,277 | |
| | 156,080 | | | Owens & Minor | | | 5,840,514 | |
| | 64,490 | | | Quality Systems | | | 1,471,662 | |
| | 70,770 | | | STERIS | | | 3,198,096 | |
| | | | | | | | |
| | | | | | | 31,443,368 | |
| | | | | | | | |
| | |
| | | | Industrials – 12.87% | | | | |
| | 427,710 | | | Air Transport Services Group * | | | 3,096,620 | |
| | 187,890 | | | Aircastle (Bermuda) | | | 3,545,484 | |
| | 81,417 | | | Cubic | | | 4,274,393 | |
| | 85,420 | | | Forward Air | | | 3,457,802 | |
| | 176,590 | | | Heartland Express | | | 2,535,832 | |
| | 132,628 | | | Insperity | | | 5,128,725 | |
| | 95,450 | | | Korn/Ferry International * | | | 2,271,710 | |
| | 166,351 | | | Marten Transport | | | 2,934,432 | |
| | 161,363 | | | Standard Parking * | | | 4,271,279 | |
| | 44,523 | | | Unifirst | | | 4,577,855 | |
| | 162,300 | | | Werner Enterprises | | | 3,758,868 | |
| | | | | | | | |
| | | | | | | 39,853,000 | |
| | | | | | | | |
| | |
| | | | Information Technology – 12.83% | | | | |
| | 117,231 | | | Computer Services | | | 3,780,700 | |
| | 245,750 | | | Convergys | | | 4,851,105 | |
| | 192,960 | | | CSG Systems International | | | 5,375,866 | |
| | 174,370 | | | Daktronics | | | 2,085,465 | |
| | 109,557 | | | DST Systems | | | 9,287,147 | |
| | 156,993 | | | Electro Rent | | | 2,847,853 | |
| | 127,220 | | | Heartland Payment Systems | | | 5,146,049 | |
| | 138,220 | | | NeuStar, Class A * | | | 6,347,062 | |
| | | | | | | | |
| | | | | | | 39,721,247 | |
| | | | | | | | |
See accompanying Notes to Financial Statements.
| | |
| |
| ASTON/River Road Small Cap Value Fund | | October 31, 2013 |
| |
| Schedule of Investments – continued | | |
| | | | | | | | |
Shares | | | | | Market
Value | |
| | |
| | | | Materials – 2.85% | | | | |
| | 331,900 | | | AuRico Gold (Canada) | | $ | 1,364,109 | |
| | 45,090 | | | Innophos Holdings | | | 2,259,911 | |
| | 108,300 | | | Intrepid Potash * | | | 1,608,255 | |
| | 169,470 | | | Kraton Performance Polymers * | | | 3,604,627 | |
| | | | | | | | |
| | | | | | | 8,836,902 | |
| | | | | | | | |
| |
| | | | Telecommunication Services – 3.22% | |
| | 65,470 | | | Atlantic Tele-Network | | | 3,628,347 | |
| | 203,680 | | | Telephone & Data Systems | | | 6,350,742 | |
| | | | | | | | |
| | | | | | | 9,979,089 | |
| | | | | | | | |
| | |
| | | | Total Common Stocks
(Cost $192,253,418) | | | 276,959,262 | |
| | | | | | | | |
|
| | INVESTMENT COMPANY – 9.90% | |
| | |
| | 30,641,935 | | | BlackRock Liquidity Funds TempFund Portfolio | | | 30,641,935 | |
| | | | | | | | |
| | |
| | | | Total Investment Company
(Cost $30,641,935) | | | 30,641,935 | |
| | | | | | | | |
| Total Investments – 99.36%
(Cost $222,895,353)** | | | 307,601,197 | |
| | | | | | | | |
| Net Other Assets and Liabilities – 0.64% | | | 1,995,974 | |
| | | | | | | | |
| Net Assets – 100.00% | | $ | 309,597,171 | |
| | | | | | | | |
| * | | Non-income producing security. |
| ** | | Aggregate cost for Federal income tax purposes is $225,625,423. |
| | | | |
Gross unrealized appreciation | | $ | 87,663,871 | |
Gross unrealized depreciation | | | (5,688,097 | ) |
| | | | |
Net unrealized appreciation | | $ | 81,975,774 | |
| | | | |
| (a) | | These securities have been determined by the Subadviser to be illiquid securities. At October 31, 2013, these securities amounted to $16,081,021 or 5.19% of net assets. |
| REIT | | Real Estate Investment Trust |
| SP ADR | | Sponsored American Depositary Receipt |
See accompanying Notes to Financial Statements.
ASTON/River Road Independent Value Fund
| | |
| |
| Portfolio Manager Commentary (unaudited) | | October 31, 2013 |
| | Eric K. Cinnamond, CFA |
| Q. | What were the most significant market factors affecting Fund performance and returns relative to the benchmark during the past 12 months? |
| A. | Class N Shares of the Fund returned +6.37% during the past twelve months versus +32.83% for the Russell 2000 Value benchmark index. The Fund’s high cash levels, which averaged 58%, were a driver of the underperformance during the period. Cash remained at above average levels throughout the last twelve months as the majority of the stocks on our possible buy list traded over our calculated valuations. On average, we did not believe we were being appropriately compensated relative to risk assumed during the year and opted to remain flexible until prices become more advantageous. Furthermore, equity performance has lagged the small-cap market as we sell stocks with strong price momentum and rotate into out-of-favor areas of the small-cap market that continues to perform poorly. |
| Q. | What were the best performing holdings for the Fund during the period? |
| A. | WPX Energy Inc. and FLIR Systems Inc. were the largest positive contributors during the period. WPX Energy is a top 10 domestic natural gas producer. WPX Energy benefited from the combination of appreciating natural gas prices and its attractively valued high quality reserves. FLIR Systems is a market leading supplier of infrared technology. During the year, FLIR reported positive organic revenue growth and improving backlogs. FLIR continued to generate meaningful cash flow during the year and maintained its investment grade balance sheet. |
| Q. | What were the weakest performing holdings? |
| A. | Pan American Silver Corp. and AuRico Gold Inc. were the largest negative contributors in the period. Pan American Silver is the second largest primary silver mining company in the world with 317 million ounces of silver reserves and seven mines in production. AuRico Gold is a precious metals miner with 6.8 million ounces of proven and probable gold reserves in Canada and Mexico. Pan American Silver and AuRico Gold were both negatively impacted by the decline in gold and silver prices. Precious metal mining stocks declined approximately 50% over the past year, and it is an area where we continue to find value and have increased exposure. |
| Q. | How was the Fund positioned as of October 31, 2013? |
| A. | The Fund remained defensively positioned throughout the year. The Fund’s cash position hit record levels during the year (exceeding 60%) as most high-quality small-cap stocks continue to be expensive, in our opinion. We continue to focus on maintaining a portfolio of companies with strong balance sheets and limited financial risk. Furthermore, during the year we rotated out of overvalued small-cap stocks and into smallcap stocks that we believe are attractively priced, but considered out-of-favor. We expect to maintain our contrarian and defensive positioning until small-cap prices accurately reflect their underlying risks. |
Growth of a Hypothetical $10,000 Investment—Class N
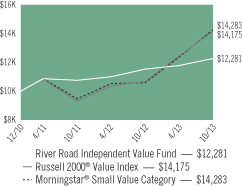
All dividends and capital gains are reinvested. Indexes are unmanaged and do not take into account fees, expenses or other costs.
Returns shown in the chart and table do not reflect taxes that a shareholder would pay on Fund distributions or on the sale of the Fund shares.
Small-cap stocks may be subject to a higher degree of market risk than the securities of more established companies because they tend to be more volatile and less liquid.
Value investing involves the risk that a Fund’s investments in companies believed to be undervalued will not appreciate as anticipated.
RETURNSFOR PERIOD ENDED 10/31/13
Average Annual Total Returns - Class N
| | | | |
One Year | | | 6.37 | % |
Since Inception | | | 7.52 | % |
Inception Date 12/31/10
Average Annual Total Returns - Class I
| | | | |
One Year | | | 6.62 | % |
Since Inception | | | 5.23 | % |
The performance data quoted represents past performance. Past performance does not guarantee future results. Investment return and principal value will fluctuate so that an investor’s shares, upon redemption, may be worth more or less than their original cost. Current performance may be lower or higher than the performance data quoted. For performance data current to the most recent month-end, please visit our website at www.astonfunds.com.
The performance quoted would have been lower if fee waivers and/or expense reimbursements had not been in effect.
| | |
| |
| ASTON/River Road Independent Value Fund | | October 31, 2013 |
| |
| Schedule of Investments | | |
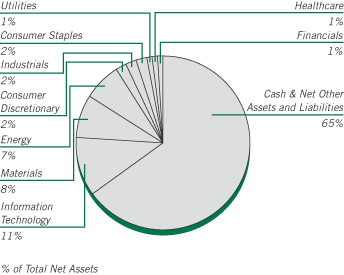
| | | | | | | | |
Shares | | | | | Market
Value | |
|
| | COMMON STOCKS – 35.41% | |
| | |
| | | | Consumer Discretionary – 2.38% | | | | |
| | 339,077 | | | Aaron’s | | $ | 9,619,614 | |
| | 209,976 | | | Big Lots * | | | 7,634,727 | |
| | | | | | | | |
| | | | | | | 17,254,341 | |
| | | | | | | | |
| | |
| | | | Consumer Staples – 1.93% | | | | |
| | 44,940 | | | Cott (Canada) | | | 368,508 | |
| | 204,261 | | | Harris Teeter Supermarkets | | | 10,074,152 | |
| | 69,975 | | | Weis Markets | | | 3,580,621 | |
| | | | | | | | |
| | | | | | | 14,023,281 | |
| | | | | | | | |
| | |
| | | | Energy – 6.85% | | | | |
| | 50,108 | | | Contango Oil & Gas * | | | 2,147,128 | |
| | 626,826 | | | QEP Resources | | | 20,722,868 | |
| | 205,722 | | | Unit * | | | 10,576,168 | |
| | 732,796 | | | WPX Energy * | | | 16,224,103 | |
| | | | | | | | |
| | | | | | | 49,670,267 | |
| | | | | | | | |
| | |
| | | | Financials – 0.86% | | | | |
| | 188,202 | | | Baldwin & Lyons, Class B (a) | | | 5,143,561 | |
| | 26,979 | | | Potlatch, REIT | | | 1,101,553 | |
| | | | | | | | |
| | | | | | | 6,245,114 | |
| | | | | | | | |
| | |
| | | | Healthcare – 0.90% | | | | |
| | 174,817 | | | Owens & Minor | | | 6,541,652 | |
| | | | | | | | |
| | |
| | | | Industrials – 2.09% | | | | |
| | 179,530 | | | FTI Consulting * | | | 7,285,327 | |
| | 341,418 | | | Orbital Sciences * | | | 7,876,513 | |
| | | | | | | | |
| | | | | | | 15,161,840 | |
| | | | | | | | |
| | |
| | | | Information Technology – 10.93% | | | | |
| | 275,716 | | | Benchmark Electronics * | | | 6,267,025 | |
| | 1,023,492 | | | CSG Systems International | | | 28,514,487 | |
| | | | | | | | |
Shares | | | | | Market
Value | |
| |
| | | | Information Technology (continued) | |
| | 549,191 | | | EPIQ Systems | | $ | 8,215,897 | |
| | 158,007 | | | FLIR Systems | | | 4,500,039 | |
| | 261,336 | | | Mantech International, Class A | | | 7,301,728 | |
| | 1,307,948 | | | Sykes Enterprises * (a) | | | 24,484,787 | |
| | | | | | | | |
| | | | | | | 79,283,963 | |
| | | | | | | | |
| | |
| | | | Materials – 8.41% | | | | |
| | 5,199,579 | | | AuRico Gold (Canada) | | | 21,370,270 | |
| | 1,965,761 | | | New Gold * | | | 11,499,702 | |
| | 1,492,308 | | | Pan American Silver (Canada) | | | 15,833,388 | |
| | 347,907 | | | Primero Mining * | | | 1,990,028 | |
| | 1,831,475 | | | Silver Standard Resources (Canada) * | | | 10,292,889 | |
| | | | | | | | |
| | | | | | | 60,986,277 | |
| | | | | | | | |
| | |
| | | | Utilities – 1.06% | | | | |
| | 127,092 | | | Artesian Resources, Class A (a) | | | 2,910,407 | |
| | 78,964 | | | Avista | | | 2,194,410 | |
| | 132,770 | | | Pepco Holdings | | | 2,559,806 | |
| | | | | | | | |
| | | | | | | 7,664,623 | |
| | | | | | | | |
| | |
| | | | Total Common Stocks
(Cost $229,809,666) | | | 256,831,358 | |
| | | | | | | | |
|
| | INVESTMENT COMPANY – 64.82% | |
| | |
| | 470,195,880 | | | BlackRock Liquidity Funds Treasury Trust Fund Portfolio | | | 470,195,880 | |
| | | | | | | | |
| | |
| | | | Total Investment Company
(Cost $470,195,880) | | | 470,195,880 | |
| | | | | | | | |
| Total Investments – 100.23%
(Cost $700,005,546)** | | | 727,027,238 | |
| | | | | | | | |
| Net Other Assets and Liabilities – (0.23)% | | | (1,671,377 | ) |
| | | | | | | | |
| Net Assets – 100.00% | | $ | 725,355,861 | |
| | | | | | | | |
| * | | Non-income producing security. |
| ** | | Aggregate cost for Federal income tax purposes is $708,241,542. |
| | | | |
Gross unrealized appreciation | | $ | 43,784,214 | |
Gross unrealized depreciation | | | (24,998,518 | ) |
| | | | |
Net unrealized appreciation | | $ | 18,785,696 | |
| | | | |
| (a) | | These securities have been determined by the Subadviser to be illiquid securities. At October 31, 2013, these securities amounted to $32,538,755 or 4.49% of net assets. |
| REIT | | Real Estate Investment Trust |
See accompanying Notes to Financial Statements.
ASTON/DoubleLine Core Plus Fixed Income Fund
| | |
| |
| Portfolio Manager Commentary (unaudited) | | October 31, 2013 |
Jeffrey E. Gundlach; Philip A. Barach; Bonnie Baha, CFA & Luz M. Padilla
| Q. | What were the most significant market factors affecting Fund performance and returns relative to the benchmark during the past 12 months? |
| A. | The Fund outperformed the Barclays Capital U.S. Aggregate Bond Index’s return of -1.08% over the twelve months ending October 31, 2013. This outperformance was driven by both sector allocation among the varying sectors of the fixed income market as well as security selection within each of the respective sectors. The fixed income market saw an increase in volatility over the past year, particularly the latter half. In general, longer duration assets hindered Fund performance as interest rates rose, with the 10-year U.S. Treasury interest rate rising approximately 86 basis points (bps) over the period. Commercial mortgage-backed securities (CMBS) and non-Agency residential mortgage-backed securities (MBS) performed well over the year. The Fund was overweight CMBS versus the index which helped boost relative performance, and was also overweight MBS, including non-Agency MBS. U.S. Government and U.S. Corporate securities were the worst performing sectors of the benchmark. The Fund also held non-benchmark securities such as High Yield and U.S. dollar-denominated Emerging Markets. High Yield rallied over the last year and was the best performing sector within the Fund from a total return perspective. Emerging Markets had a volatile year and the Fund’s Emerging Markets securities detracted from performance, but the sector continues to offer diversification benefits. |
| Q. | What were the best performing holdings for the Fund during the period? |
| A. | Over the period, CMBS and High Yield debt were the best performers on an absolute basis. MBS also performed well with non-Agency MBS contributing to most of the gains from that sector. MBS securities backed by both Prime and Alt-A collateral contributed relatively high returns to the Fund over the twelve-month period versus lower credit non-Agency MBS. Collateralized loan obligations (CLO) additionally, contributed strong performance over the period. |
| Q. | What were the weakest performing holdings? |
| A. | The Fund’s weakest holdings were in U.S. Government debt as well as U.S. Investment Grade Corporate securities. As interest rates rose close to 100 bps within six months, it was no surprise that these sectors underperformed. |
| Q. | How was the Fund positioned as of October 31, 2012? |
| A. | Over the last year, the Fund has decreased allocation to U.S. Government bonds and has increased its exposure to floating-rate securities such as Bank Loans and CLOs which have added strong returns to the Fund. The Fund also has increased exposure to the High Yield debt market, and has slightly increased its allocation to Emerging Markets. Relative to the index, the Fund is underweight U.S. Corporate debt. The non-Agency MBS allocation still has limited exposure to Subprime bonds and is predominately focused on higher credit MBS. |
Note: A basis point (bps) is a unit of measure. 1 bps = .01%.
Growth of a Hypothetical $10,000 Investment—Class N
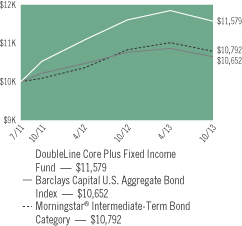
All dividends and capital gains are reinvested. Indexes are unmanaged and do not take into account fees, expenses or other costs.
Returns shown in the chart and table do not reflect taxes that a shareholder would pay on Fund distributions or on the sale of the Fund shares.
Bond funds have the same interest rate, high yield and credit risks associated with the underlying bonds in the portfolio, all of which could reduce the Fund’s value. As interest rates rise, the value of the Fund can decline and an investor can lose principal.
RETURNSFOR PERIOD ENDED 10/31/13
Average Annual Total Returns - Class N
| | | | |
One Year | | | -0.28 | % |
Since Inception | | | 6.61 | % |
Inception Date 07/18/11
Average Annual Total Returns - Class I
| | | | |
One Year | | | -0.03 | % |
Since Inception | | | 6.87 | % |
Inception Date 07/18/11
The performance data quoted represents past performance. Past performance does not guarantee future results. Investment return and principal value will fluctuate so that an investor’s shares, upon redemption, may be worth more or less than their original cost. Current performance may be lower or higher than the performance data quoted. For performance data current to the most recent month-end, please visit our website at www.astonfunds.com.
The performance quoted would have been lower if fee waivers and/or expense reimbursements had not been in effect.
| | |
| |
| ASTON/DoubleLine Core Plus Fixed Income Fund | | October 31, 2013 |
| |
| Schedule of Investments | | |
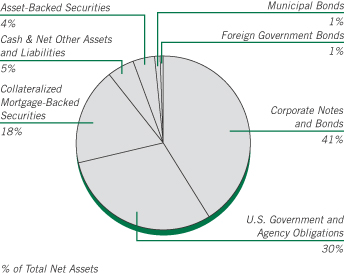
At October 31, 2013, 28% of the Total Net Assets of the Fund were comprised of securities of issuers located outside the United States.
| | | | | | | | |
Par Value | | | | | Market
Value | |
|
| | CORPORATE NOTES AND BONDS – 41.44% | |
| | | | Consumer Discretionary – 2.66% | | | | |
| | $ 325,000 | | | ADT
Senior Unsecured Notes 3.500%, 07/15/22 | | $ | 285,400 | |
| | 160,000 | | | American Axle & Manufacturing
6.625%, 10/15/22 | | | 169,600 | |
| | 200,000 | | | Automotores Gildemeister SA (Chile) 8.250%, 05/24/21 | | | 185,000 | |
| | 90,000 | | | Cinemark USA
7.375%, 06/15/21 | | | 99,000 | |
| | 140,000 | | | Claire’s Stores
7.750%, 06/01/20 (a) | | | 140,000 | |
| | 300,000 | | | Cosan Luxembourg SA (Luxembourg)
5.000%, 03/14/23 (a) | | | 280,500 | |
| | 255,000 | | | DIRECTV Holdings
5.000%, 03/01/21 | | | 267,668 | |
| | 415,000 | | | Ford Motor
Senior Unsecured Notes
7.450%, 07/16/31 | | | 519,070 | |
| | 155,000 | | | Gannett
5.125%, 07/15/20 (a) | | | 159,262 | |
| | 130,000 | | | Goodyear Tire & Rubber 7.000%, 05/15/22 | | | 140,400 | |
| | 145,000 | | | Hawk Acquisition Sub
Secured Notes
4.250%, 10/15/20 (a) | | | 140,650 | |
| | 135,000 | | | HD Supply
7.500%, 07/15/20 (a) | | | 142,762 | |
| | 320,000 | | | Macy’s Retail Holdings
2.875%, 02/15/23 | | | 291,061 | |
| | | | | | | | |
Par Value | | | | | Market
Value | |
| | |
| | | | Consumer Discretionary (continued) | | | | |
| | $ 250,000 | | | Mattel
Senior Unsecured Notes
2.500%, 11/01/16 | | $ | 258,588 | |
| | 135,000 | | | MGM Resorts International
6.625%, 12/15/21 | | | 144,450 | |
| | 40,000 | | | NCL (Bermuda)
5.000%, 02/15/18 (a) | | | 40,550 | |
| | 135,000 | | | Sally Holdings/Sally Capital 5.750%, 06/01/22 | | | 140,738 | |
| | 140,000 | | | Service Corporation International
Senior Unsecured Notes
5.375%, 01/15/22 (a) | | | 141,750 | |
| | 145,000 | | | Sirius XM Radio
Senior Unsecured Notes 4.250%, 05/15/20 (a) | | | 138,656 | |
| | 135,000 | | | Sun Merger Sub
Senior Unsecured Notes 5.875%, 08/01/21 (a) | | | 141,412 | |
| | 280,000 | | | Teva Pharmaceutical Finance Co BV (Cook Islands)
2.950%, 12/18/22 | | | 260,075 | |
| | 135,000 | | | Toll Brothers Finance 5.875%, 02/15/22 | | | 143,100 | |
| | 155,000 | | | WCI Communities
6.875%, 08/15/21 (a) | | | 151,512 | |
| | 270,000 | | | Wynn Las Vegas
7.750%, 08/15/20 | | | 305,775 | |
| | | | | | | | |
| | | | | | | 4,686,979 | |
| | | | | | | | |
| | |
| | | | Consumer Staples – 3.41% | | | | |
| | 595,000 | | | Altria Group
2.850%, 08/09/22 | | | 553,455 | |
| | 400,000 | | | Anadolu Efes Biracilik Ve Malt Sanayii AS (Turkey)
Senior Unsecured Notes
3.375%, 11/01/22 (a) | | | 342,000 | |
| | 265,000 | | | Coca-Cola
Senior Unsecured Notes
1.800%, 09/01/16 | | | 273,177 | |
| | 355,000 | | | ConAgra Foods
Senior Unsecured Notes
3.200%, 01/25/23 | | | 339,247 | |
| | 100,000 | | | Corp Lindley (Peru)
Senior Unsecured Notes
6.750%, 11/23/21 (a) | | | 109,250 | |
| | 300,000 | | | Corp Lindley SA (Peru)
Senior Unsecured Notes
4.625%, 04/12/23 (a) | | | 287,250 | |
| | | | Corp Pesquera Inca (Peru) | | | | |
| | 100,000 | | | 9.000%, 02/10/17 (a) | | | 101,000 | |
| | 200,000 | | | 9.000%, 02/10/17 | | | 202,000 | |
| | 250,000 | | | Diageo Capital (United Kingdom)
1.500%, 05/11/17 | | | 251,434 | |
| | 100,000 | | | Glencore Funding
2.500%, 01/15/19 (a) | | | 96,335 | |
| | 400,000 | | | IOI Investment L Bhd (Malaysia)
4.375%, 06/27/22 | | | 385,599 | |
| | 203,000 | | | Kellogg
Senior Unsecured Notes 7.450%, 04/01/31 | | | 260,482 | |
See accompanying Notes to Financial Statements.
| | |
| |
| ASTON/DoubleLine Core Plus Fixed Income Fund | | October 31, 2013 |
| |
| Schedule of Investments – continued | | |
| | | | | | | | |
Par Value | | | | | Market
Value | |
| | |
| | | | Consumer Staples (continued) | | | | |
| | $ 240,000 | | | Kraft Foods
Senior Unsecured Notes 5.375%, 02/10/20 | | $ | 272,704 | |
| | 460,000 | | | Kroger
Senior Unsecured Notes 3.400%, 04/15/22 | | | 450,921 | |
| | 400,000 | | | Minerva Luxembourg SA (Luxembourg) 7.750%, 01/31/23 | | | 389,000 | |
| | 150,000 | | | Post Holdings
7.375%, 02/15/22 (a) | | | 160,688 | |
| | 160,000 | | | Revlon Consumer Products
5.750%, 02/15/21 (a) | | | 158,600 | |
| | 150,000 | | | Reynolds Group Issuer 9.875%, 08/15/19 | | | 166,687 | |
| | 130,000 | | | Safway Group Holding
Secured Notes
7.000%, 05/15/18 (a) | | | 135,200 | |
| | 129,000 | | | Spectrum Brands Escrow
6.625%, 11/15/22 (a) | | | 138,030 | |
| | 255,000 | | | Tyson Foods
4.500%, 06/15/22 | | | 264,836 | |
| | 130,000 | | | US Foods
8.500%, 06/30/19 | | | 140,075 | |
| | 515,000 | | | Wal-Mart Stores
Senior Unsecured Notes 3.250%, 10/25/20 | | | 536,101 | |
| | | | | | | | |
| | | | | | | 6,014,071 | |
| | | | | | | | |
| | |
| | | | Energy – 7.13% | | | | |
| | 145,000 | | | Atlas Pipeline Partners 4.750%, 11/15/21 (a) | | | 137,025 | |
| | | | BP Capital Markets (United Kingdom) | | | | |
| | 155,000 | | | 4.750%, 03/10/19 | | | 174,062 | |
| | 100,000 | | | 2.500%, 11/06/22 | | | 92,601 | |
| | 210,000 | | | ConocoPhillips
6.500%, 02/01/39 | | | 269,378 | |
| | | | Devon Energy
Senior Unsecured Notes | | | | |
| | 200,000 | | | 6.300%, 01/15/19 | | | 234,430 | |
| | 255,000 | | | 4.000%, 07/15/21 | | | 262,890 | |
| | 1,400,000 | | | Gazprom OAO Via Gaz Capital SA (Luxembourg)
Senior Unsecured Notes 4.950%, 02/06/28 | | | 1,274,000 | |
| | 245,000 | | | Halliburton
Senior Unsecured Notes 6.150%, 09/15/19 | | | 294,908 | |
| | | | Kinder Morgan Energy Partners
Senior Unsecured Notes | | | | |
| | 225,000 | | | 2.650%, 02/01/19 | | | 225,955 | |
| | 175,000 | | | 6.950%, 01/15/38 | | | 205,688 | |
| | 75,000 | | | 6.500%, 09/01/39 | | | 84,538 | |
| | 800,000 | | | Lukoil International Finance BV (Netherlands)
4.563%, 04/24/23 | | | 767,000 | |
| | 240,000 | | | Marathon Petroleum
Senior Secured Notes
5.125%, 03/01/21 | | | 263,463 | |
| | | | | | | | |
Par Value | | | | | Market
Value | |
| | |
| | | | Energy (continued) | | | | |
| | $ 135,000 | | | Newfield Exploration
Senior Unsecured Notes 5.750%, 01/30/22 | | $ | 142,425 | |
| | 155,000 | | | Oasis Petroleum
6.875%, 03/15/22 (a) | | | 168,175 | |
| | 251,000 | | | ONEOK Partners
6.125%, 02/01/41 | | | 270,195 | |
| | | | Pacific Rubiales Energy (Canada) | | | | |
| | 115,000 | | | 7.250%, 12/12/21 (a) | | | 127,075 | |
| | 1,200,000 | | | 7.250%, 12/12/21 | | | 1,326,000 | |
| | 480,000 | | | Pemex Project Funding Master Trust
6.625%, 06/15/35 | | | 523,200 | |
| | 135,000 | | | Penn Virginia Resource Partners
8.250%, 04/15/18 | | | 144,112 | |
| | 600,000 | | | Petrobras Global Finance BV (Netherlands)
4.375%, 05/20/23 | | | 560,227 | |
| | 230,000 | | | Phillips 66
5.875%, 05/01/42 | | | 253,848 | |
| | 135,000 | | | Regency Energy Partners
5.500%, 04/15/23 | | | 135,338 | |
| | 250,000 | | | Reliance Holdings USA
5.400%, 02/14/22 (a) | | | 255,944 | |
| | 1,200,000 | | | Rosneft Oil Co via Rosneft International Finance (Ireland)
Senior Unsecured Notes
4.199%, 03/06/22 | | | 1,128,000 | |
| | 125,000 | | | SM Energy
Senior Unsecured Notes
5.000%, 01/15/24 (a) | | | 122,813 | |
| | 140,000 | | | Targa Resources Partners
4.250%, 11/15/23 (a) | | | 131,600 | |
| | 265,000 | | | Transocean (Cayman Islands)
6.000%, 03/15/18 | | | 300,011 | |
| | 1,000,000 | | | Transportadora de Gas Internacional SA ESP (Colombia)
Senior Unsecured Notes
5.700%, 03/20/22 | | | 1,047,500 | |
| | | | Tupras Turkiye Petrol Rafinerileri AS (Turkey)
Senior Unsecured Notes | | | | |
| | 700,000 | | | 4.125%, 05/02/18 (a) | | | 673,750 | |
| | 700,000 | | | 4.125%, 05/02/18 | | | 673,750 | |
| | 260,000 | | | Valero Energy
6.125%, 02/01/20 | | | 300,717 | |
| | | | | | | | |
| | | | | | | 12,570,618 | |
| | | | | | | | |
| | |
| | | | Financials – 12.28% | | | | |
| | 525,000 | | | American Express Credit
Senior Unsecured Notes 2.125%, 07/27/18 | | | 531,917 | |
| | 475,000 | | | Australia & New Zealand Banking Group (Australia)
Senior Unsecured Notes 4.875%, 01/12/21 (a) | | | 526,540 | |
| | | | Banco de Bogota SA (Colombia) | | | | |
| | 400,000 | | | 5.375%, 02/19/23 | | | 398,000 | |
| | 600,000 | | | 5.375%, 02/19/23 (a) | | | 597,000 | |
See accompanying Notes to Financial Statements.
| | |
| |
| ASTON/DoubleLine Core Plus Fixed Income Fund | | October 31, 2013 |
| |
| Schedule of Investments – continued | | |
| | | | | | | | |
Par Value | | | | | Market
Value | |
| | |
| | | | Financials (continued) | | | | |
| | | | Banco de Credito del Peru (Peru) | | | | |
| | $ 100,000 | | | 4.250%, 04/01/23 | | $ | 95,750 | |
| | | | Senior Subordinate Notes | | | | |
| | 350,000 | | | 6.125%, 04/24/27 (a) (b) | | | 367,500 | |
| | | | Senior Unsecured Notes | | | | |
| | 1,000,000 | | | 4.250%, 04/01/23 (a) | | | 957,500 | |
| | | | Banco do Brasil SA/Cayman Islands (Belize) | | | | |
| | 500,000 | | | 5.875%, 01/19/23 | | | 496,250 | |
| | 400,000 | | | 8.500%, 10/20/99 (b) | | | 455,000 | |
| | 300,000 | | | Banco GNB Sudameris SA (Colombia) Senior Unsecured Notes 3.875%, 05/02/18 (a) | | | 285,000 | |
| | 100,000 | | | Banco Inter del Peru (Peru) 8.500%, 04/23/70 (b) | | | 108,000 | |
| | 1,000,000 | | | Bancolombia SA (Colombia)
Senior Unsecured Notes 5.950%, 06/03/21 | | | 1,061,000 | |
| | 550,000 | | | Bank of Montreal (Canada)
Senior Unsecured Notes 1.400%, 09/11/17 | | | 547,895 | |
| | 215,000 | | | BB&T
Senior Unsecured Notes 1.600%, 08/15/17 | | | 215,057 | |
| | 1,200,000 | | | BBVA Bancomer SA/Texas (Mexico) 6.500%, 03/10/21 | | | 1,305,000 | |
| | 250,000 | | | Boston Properties
Senior Unsecured Notes, REIT 4.125%, 05/15/21 | | | 261,629 | |
| | 250,000 | | | Caixa Economica Federal (Belize)
Senior Unsecured Notes 3.500%, 11/07/22 | | | 219,063 | |
| | 140,000 | | | CIT Group
Senior Unsecured Notes 5.000%, 08/15/22 | | | 142,369 | |
| | 1,000,000 | | | Corpbanca (Chile)
3.125%, 01/15/18 | | | 946,444 | |
| | 250,000 | | | CorpGroup Banking (Chile) 6.750%, 03/15/23 (a) | | | 224,375 | |
| | 250,000 | | | CorpGroup Banking SA (Chile) 6.750%, 03/15/23 | | | 224,375 | |
| | 500,000 | | | General Electric Capital
Senior Unsecured Notes 2.900%, 01/09/17 | | | 525,099 | |
| | 175,000 | | | Goldman Sachs Group
Senior Unsecured Notes 5.750%, 01/24/22 | | | 198,705 | |
| | | | Grupo Aval (Cayman Islands) | | | | |
| | 200,000 | | | 4.750%, 09/26/22 (a) | | | 188,250 | |
| | 1,100,000 | | | 4.750%, 09/26/22 | | | 1,035,375 | |
| | | | Industrial Senior Trust (Cayman Islands) | | | | |
| | 300,000 | | | 5.500%, 11/01/22 (a) | | | 279,000 | |
| | 500,000 | | | 5.500%, 11/01/22 | | | 465,000 | |
| | 700,000 | | | Itau Unibanco Holding SA/Cayman Island (Belize)
5.500%, 08/06/22 | | | 693,000 | |
| | | | | | | | |
Par Value | | | | | Market
Value | |
| | |
| | | | Financials (continued) | | | | |
| | | | JPMorgan Chase
Senior Unsecured Notes | | | | |
| | $ 350,000 | | | 4.500%, 01/24/22 | | $ | 373,411 | |
| | 150,000 | | | 3.250%, 09/23/22 | | | 145,105 | |
| | 475,000 | | | Korea Development Bank (South Korea)
Senior Unsecured Notes 4.375%, 08/10/15 | | | 502,791 | |
| | 399,000 | | | Liberty Mutual
6.500%, 05/01/42 (a) | | | 447,049 | |
| | | | MetLife
Senior Unsecured Notes | | | | |
| | 175,000 | | | 5.700%, 06/15/35 | | | 199,642 | |
| | 125,000 | | | 5.875%, 02/06/41 | | | 147,534 | |
| | 250,000 | | | 4.125%, 08/13/42 | | | 228,352 | |
| | 225,000 | | | Morgan Stanley
Senior Unsecured Notes 3.750%, 02/25/23 | | | 222,486 | |
| | 25,000 | | | MPT Operating Partnership, REIT 6.375%, 02/15/22 | | | 25,938 | |
| | 445,000 | | | National Rural Utilities Cooperative Finance Collateral Trust
10.375%, 11/01/18 | | | 611,111 | |
| | 155,000 | | | Nuveen Investments
Senior Unsecured Notes
9.500%, 10/15/20 (a) | | | 148,412 | |
| | | | PNC Funding | | | | |
| | 211,000 | | | 4.375%, 08/11/20 | | | 229,533 | |
| | 300,000 | | | 3.300%, 03/08/22 | | | 296,672 | |
| | 700,000 | | | Sberbank of Russia Via SB Capital SA (Luxembourg)
5.125%, 10/29/22 | | | 676,375 | |
| | | | Scotiabank Peru SA (Peru) | | | | |
| | 600,000 | | | 4.500%, 12/13/27 (b) | | | 543,000 | |
| | 800,000 | | | 4.500%, 12/13/27 (a) (b) | | | 724,000 | |
| | | | Simon Property Group
Senior Unsecured Notes | | | | |
| | 75,000 | | | 5.650%, 02/01/20 | | | 86,604 | |
| | 110,000 | | | 4.375%, 03/01/21 | | | 118,311 | |
| | 1,000,000 | | | Tanner Servicios Financieros SA (Chile)
4.375%, 03/13/18 (a) | | | 978,940 | |
| | 1,000,000 | | | VTB Bank OJSC Via VTB Capital SA (Luxembourg)
6.950%, 10/17/22 | | | 1,030,000 | |
| | | | Wells Fargo
Senior Unsecured Notes | | | | |
| | 450,000 | | | 4.600%, 04/01/21 | | | 496,422 | |
| | 75,000 | | | 3.500%, 03/08/22 | | | 76,228 | |
| | | | | | | | |
| | | | | | | 21,658,009 | |
| | | | | | | | |
| | |
| | | | Healthcare – 1.59% | | | | |
| | 135,000 | | | Alere
6.500%, 06/15/20 | | | 139,725 | |
| | 135,000 | | | Baxter International
Senior Unsecured Notes
3.200%, 06/15/23 | | | 133,085 | |
| | 330,000 | | | Becton Dickinson
Senior Unsecured Notes 3.125%, 11/08/21 | | | 329,564 | |
See accompanying Notes to Financial Statements.
| | |
| |
| ASTON/DoubleLine Core Plus Fixed Income Fund | | October 31, 2013 |
| |
| Schedule of Investments – continued | | |
| | | | | | | | |
Par Value | | | | | Market
Value | |
| | |
| | | | Healthcare (continued) | | | | |
| | $ 350,000 | | | Biogen Idec
Senior Unsecured Notes 6.875%, 03/01/18 | | $ | 418,015 | |
| | 325,000 | | | Celgene
Senior Unsecured Notes 3.250%, 08/15/22 | | | 312,134 | |
| | 370,000 | | | Covidien International Finance SA (Luxembourg)
2.950%, 06/15/23 | | | 352,516 | |
| | 135,000 | | | DaVita HealthCare Partners 5.750%, 08/15/22 | | | 139,219 | |
| | 135,000 | | | IASIS Healthcare
8.375%, 05/15/19 | | | 143,775 | |
| | 75,000 | | | Novartis Capital
2.400%, 09/21/22 | | | 70,763 | |
| | 165,000 | | | Select Medical
6.375%, 06/01/21 | | | 160,050 | |
| | 145,000 | | | VPII Escrow (Canada)
Senior Unsecured Notes 7.500%, 07/15/21 (a) | | | 161,675 | |
| | | | WellPoint
Senior Unsecured Notes | | | | |
| | 150,000 | | | 5.250%, 01/15/16 | | | 163,650 | |
| | 100,000 | | | 2.375%, 02/15/17 | | | 102,391 | |
| | 175,000 | | | 2.300%, 07/15/18 | | | 175,833 | |
| | | | | | | | |
| | | | | | | 2,802,395 | |
| | | | | | | | |
| | |
| | | | Industrials – 6.36% | | | | |
| | 145,000 | | | Avis Budget Car Rental/Avis Budget Finance
5.500%, 04/01/23 | | | 142,825 | |
| | 190,000 | | | Boeing
Senior Unsecured Notes 6.875%, 03/15/39 | | | 257,999 | |
| | 320,000 | | | Burlington Northern Santa Fe
Senior Unsecured Notes 3.000%, 03/15/23 | | | 303,043 | |
| | 100,000 | | | Cemex Espana Luxembourg (Spain) Senior Secured Notes 9.250%, 05/12/20 | | | 109,500 | |
| | | | Cemex Sab de CV (Mexico) Senior Secured Notes | | | | |
| | 100,000 | | | 9.000%, 01/11/18 | | | 109,250 | |
| | 200,000 | | | 5.875%, 03/25/19 (a) | | | 196,250 | |
| | 1,000,000 | | | Cencosud SA (Colombia) 4.875%, 01/20/23 (a) | | | 965,206 | |
| | | | CFR International SPA (Colombia) | | | | |
| | 600,000 | | | 5.125%, 12/06/22 | | | 571,885 | |
| | 400,000 | | | 5.125%, 12/06/22 (a) | | | 381,257 | |
| | 500,000 | | | Embraer Overseas (Cayman Islands) 5.696%, 09/16/23 (a) | | | 508,750 | |
| | | | ESAL GmbH (American Samoa) | | | | |
| | 200,000 | | | 6.250%, 02/05/23 | | | 183,000 | |
| | 800,000 | | | 6.250%, 02/05/23 (a) | | | 732,000 | |
| | 200,000 | | | Ferreycorp SAA (Peru) 4.875%, 04/26/20 (a) | | | 192,500 | |
| | | | | | | | |
Par Value | | | | | Market
Value | |
| | |
| | | | Industrials (continued) | | | | |
| | | | Grupo KUO SAB De CV (Mexico) | | | | |
| | $ 500,000 | | | 6.250%, 12/04/22 (a) | | $ | 508,750 | |
| | 700,000 | | | 6.250%, 12/04/22 | | | 712,250 | |
| | | | Illinois Tool Works
Senior Unsecured Notes | | | | |
| | 80,000 | | | 6.250%, 04/01/19 | | | 95,963 | |
| | 175,000 | | | 3.375%, 09/15/21 | | | 178,553 | |
| | 115,000 | | | Manitowoc
8.500%, 11/01/20 | | | 131,100 | |
| | 700,000 | | | Noble Group (Bermuda)
Senior Unsecured Notes 6.750%, 01/29/20 | | | 744,625 | |
| | 225,000 | | | Novartis Capital
4.400%, 04/24/20 | | | 248,608 | |
| | 400,000 | | | OAS Financial (Belize) 8.875%, 04/29/49 (a) (b) | | | 370,000 | |
| | | | Odebrecht Finance (Cayman Islands) | | | | |
| | 400,000 | | | 7.125%, 06/26/42 | | | 394,000 | |
| | 500,000 | | | 7.500%, 09/29/49 | | | 502,500 | |
| | | | Pesquera Exalmar S.A.A. (Peru)
Senior Unsecured Notes | | | | |
| | 400,000 | | | 7.375%, 01/31/20 | | | 370,000 | |
| | 200,000 | | | 7.375%, 01/31/20 (a) | | | 185,000 | |
| | 150,000 | | | RR Donnelley & Sons
Senior Unsecured Notes 7.875%, 03/15/21 | | | 168,000 | |
| | 400,000 | | | SACI Falabella (Colombia)
Senior Unsecured Notes 3.750%, 04/30/23 (a) | | | 371,000 | |
| | 200,000 | | | SMU SA (Colombia) 7.750%, 02/08/20 (a) | | | 113,000 | |
| | | | Southwest Airlines
Senior Unsecured Notes | | | | |
| | 126,000 | | | 5.750%, 12/15/16 | | | 141,218 | |
| | 225,000 | | | 5.125%, 03/01/17 | | | 248,229 | |
| | 135,000 | | | Terex
6.000%, 05/15/21 | | | 141,750 | |
| | 120,000 | | | United Rentals North America
7.625%, 04/15/22 | | | 135,000 | |
| | 200,000 | | | United Technologies
Senior Unsecured Notes
3.100%, 06/01/22 | | | 197,860 | |
| | 200,000 | | | Volcan Cia Minera SAA (Peru)
5.375%, 02/02/22 | | | 197,000 | |
| | 355,000 | | | Waste Management 6.125%, 11/30/39 | | | 410,240 | |
| | | | | | | | |
| | | | | | | 11,218,111 | |
| | | | | | | | |
| | |
| | | | Information Technology – 1.24% | | | | |
| | 135,000 | | | Activision Blizzard
5.625%, 09/15/21 (a) | | | 140,063 | |
| | 290,000 | | | Arrow Electronics
Senior Unsecured Notes 3.375%, 11/01/15 | | | 299,909 | |
| | 85,000 | | | BMC Software Finance
Senior Unsecured Notes
8.125%, 07/15/21 (a) | | | 90,312 | |
See accompanying Notes to Financial Statements.
| | |
| |
| ASTON/DoubleLine Core Plus Fixed Income Fund | | October 31, 2013 |
| |
| Schedule of Investments – continued | | |
| | | | | | | | |
Par Value | | | | | Market
Value | |
| | |
| | | | Information Technology (continued) | | | | |
| | $ 120,000 | | | Equinix
Senior Unsecured Notes 7.000%, 07/15/21 | | $ | 131,550 | |
| | 290,000 | | | Microsoft
Senior Unsecured Notes 2.125%, 11/15/22 | | | 265,642 | |
| | 350,000 | | | Motorola Solutions
Senior Unsecured Notes 6.000%, 11/15/17 | | | 402,123 | |
| | | | Oracle
Senior Unsecured Notes | | | | |
| | 375,000 | | | 1.200%, 10/15/17 | | | 370,386 | |
| | 175,000 | | | 2.375%, 01/15/19 | | | 177,938 | |
| | 300,000 | | | Xerox
Senior Unsecured Notes 4.250%, 02/15/15 | | | 312,610 | |
| | | | | | | | |
| | | | | | | 2,190,533 | |
| | | | | | | | |
| | |
| | | | Materials – 3.64% | | | | |
| | 400,000 | | | Alfa Bank OJSC Via Alfa Bond Issuance (Iran)
7.500%, 09/26/19 | | | 428,000 | |
| | | | Alpek SA de CV (Mexico) | | | | |
| | 300,000 | | | 5.375%, 08/08/23 | | | 301,500 | |
| | 200,000 | | | 5.375%, 08/08/23 (a) | | | 201,000 | |
| | | | Senior Unsecured Notes | | | | |
| | 200,000 | | | 4.500%, 11/20/22 (a) | | | 193,750 | |
| | 145,000 | | | Ashland
4.750%, 08/15/22 | | | 139,925 | |
| | 135,000 | | | Celanese US Holdings 4.625%, 11/15/22 | | | 133,144 | |
| | 800,000 | | | Cia Minera Milpo SAA (Peru)
Senior Unsecured Notes
4.625%, 03/28/23 (a) | | | 746,000 | |
| | 275,000 | | | Dow Chemical
Senior Unsecured Notes 3.000%, 11/15/22 | | | 258,846 | |
| | 265,000 | | | Ecolab
Senior Unsecured Notes 1.000%, 08/09/15 | | | 265,822 | |
| | 550,000 | | | Inversiones CMPC (Chile) 4.500%, 04/25/22 | | | 530,314 | |
| | | | Mexichem SAB de CV (Mexico) | | | | |
| | 800,000 | | | 6.750%, 09/19/42 | | | 788,000 | |
| | | | Senior Unsecured Notes | | | | |
| | 400,000 | | | 4.875%, 09/19/22 (a) | | | 397,000 | |
| | 600,000 | | | Polyus Gold International (Jersey) 5.625%, 04/29/20 (a) | | | 600,000 | |
| | 145,000 | | | Sealed Air
6.500%, 12/01/20 (a) | | | 158,231 | |
| | | | Vedanta Resources PLC (United Kingdom)
Senior Unsecured Notes | | | | |
| | 500,000 | | | 8.250%, 06/07/21 | | | 517,188 | |
| | 800,000 | | | 7.125%, 05/31/23 (a) | | | 766,000 | |
| | | | | | | | |
| | | | | | | 6,424,720 | |
| | | | | | | | |
| | | | | | | | |
Par Value | | | | | Market
Value | |
| | |
| | | | Telecommunications – 1.87% | | | | |
| | $ 300,000 | | | AT&T
Senior Unsecured Notes 5.350%, 09/01/40 | | $ | 290,633 | |
| | 421,000 | | | British Telecom (United Kingdom)
Senior Unsecured Notes 5.950%, 01/15/18 | | | 485,034 | |
| | 150,000 | | | CCO Holdings
5.250%, 09/30/22 | | | 141,750 | |
| | 25,000 | | | Deutsche Telekom International Finance BV (Netherlands)
8.750%, 06/15/30 | | | 35,832 | |
| | 200,000 | | | ENTEL Chile SA (Chile)
Senior Unsecured Notes 4.875%, 10/30/24 (a) | | | 200,435 | |
| | 290,000 | | | France Telecom (France)
Senior Unsecured Notes 2.750%, 09/14/16 | | | 300,566 | |
| | | | Globo Comunicacao e Participacoes (Belize) | | | | |
| | 200,000 | | | 5.307%, 05/11/22 (a) (c) | | | 208,000 | |
| | | | Senior Unsecured Notes | | | | |
| | 200,000 | | | 5.307%, 05/11/22 (c) | | | 208,000 | |
| | 130,000 | | | Intelsat Luxembourg SA (Luxembourg) 7.750%, 06/01/21 (a) | | | 137,637 | |
| | 200,000 | | | Koninklijke KPN NV (Netherlands)
Senior Unsecured Notes 8.375%, 10/01/30 | | | 252,608 | |
| | 155,000 | | | SBA Communications
Senior Unsecured Notes 5.625%, 10/01/19 | | | 160,037 | |
| | 200,000 | | | Telefonica Celular del Paraguay (Paraguay)
Senior Unsecured Notes 6.750%, 12/13/22 (a) | | | 202,500 | |
| | 200,000 | | | TV Azteca SAB de CV (Mexico) 7.500%, 05/25/18 | | | 204,500 | |
| | 175,000 | | | Verizon Communications
Senior Unsecured Notes 2.500%, 09/15/16 | | | 181,710 | |
| | 300,000 | | | VimpelCom Holdings BV (Netherlands) 5.950%, 02/13/23 (a) | | | 290,250 | |
| | | | | | | | |
| | | | | | | 3,299,492 | |
| | | | | | | | |
| | |
| | | | Utilities – 1.26% | | | | |
| | 500,000 | | | AES Andres Dominicana (Cayman Islands)
Senior Secured Notes 9.500%, 11/12/20 | | | 535,000 | |
| | 300,000 | | | Duke Energy
Senior Unsecured Notes 3.550%, 09/15/21 | | | 306,740 | |
| | 200,000 | | | Instituto Costarricense de Electricidad (Costa Rica)
Senior Unsecured Notes 6.950%, 11/10/21 (a) | | | 212,200 | |
| | 375,000 | | | Midamerican Energy Holdings
Senior Unsecured Notes 6.500%, 09/15/37 | | | 444,336 | |
See accompanying Notes to Financial Statements.
| | |
| |
| ASTON/DoubleLine Core Plus Fixed Income Fund | | October 31, 2013 |
| |
| Schedule of Investments – continued | | |
| | | | | | | | |
Par Value | | | | | Market
Value | |
| | |
| | | | Utilities (continued) | | | | |
| | $ 400,000 | | | Southern Copper
Senior Unsecured Notes 5.250%, 11/08/42 | | $ | 332,614 | |
| | 375,000 | | | Southern Power
Senior Unsecured Notes 4.875%, 07/15/15 | | | 400,188 | |
| | | | | | | | |
| | | | | | | 2,231,078 | |
| | | | | | | | |
| | |
| | | | Total Corporate Notes and Bonds
(Cost $74,777,734) | | | 73,096,006 | |
| | | | | | | | |
|
| | COLLATERALIZED MORTGAGE-BACKED SECURITIES – 18.17% | |
| | |
| | 1,072,000 | | | American General Mortgage Loan Trust
Series 2010-1A, Class A3 5.650%, 03/25/58 (a) (b) | | | 1,118,840 | |
| | 350,000 | | | Banc of America Commercial Mortgage Trust
Series 2007-4, Class AM
5.811%, 02/10/51 (b) | | | 387,402 | |
| | 776,927 | | | Banc of America Funding
Series 2010-R9, Class 3A3
5.500%, 12/26/35 (a) | | | 631,935 | |
| | 899,797 | | | Banc of America Funding
Series 2006-B, Class 7A1
5.553%, 03/20/36 (b) | | | 856,043 | |
| | 816,053 | | | Banc of America Funding
Series 2012-R4, Class A
0.428%, 03/04/39 (a) (b) | | | 796,230 | |
| | 75,000 | | | Banc of America Merrill Lynch Commercial Mortgage
Series 2006-4, Class AM
5.675%, 07/10/46 | | | 82,555 | |
| | 100,000 | | | Banc of America Re-REMIC Trust
Series 2012-CLRN, Class B
1.774%, 08/15/29 (a) (b) | | | 100,211 | |
| | 100,000 | | | Banc of America Re-REMIC Trust
Series 2012-CLRN, Class D
2.874%, 08/15/29 (a) (b) | | | 100,372 | |
| | 446,018 | | | Bear Stearns Asset Backed Securities Trust
Series 2004-AC2, Class 2A
5.000%, 05/25/34 | | | 449,549 | |
| | 125,000 | | | Bear Stearns Commercial Mortgage Securities
Series 2006-PW14, Class AM
5.243%, 12/11/38 | | | 136,710 | |
| | 98,897 | | | Bear Stearns Commercial Mortgage Securities
Series 2005-PWR8, Class A4
4.674%, 06/11/41 | | | 103,544 | |
| | 100,000 | | | Bear Stearns Commercial Mortgage Securities
Series 2005-T18, Class AJ
5.005%, 02/13/42 (b) | | | 104,333 | |
| | 231,304 | | | Citicorp Mortgage Securities
Series 2007-2, Class 3A1
5.500%, 02/25/37 | | | 226,037 | |
| | | | | | | | |
Par Value | | | | | Market
Value | |
| | $ 350,000 | | | Citigroup Commercial Mortgage Trust
2.738%, 01/12/18 (a) | | $ | 350,190 | |
| | 350,000 | | | Citigroup Commercial Mortgage Trust
2.911%, 01/12/18 (a) | | | 345,997 | |
| | 986,344 | | | Citigroup Commercial Mortgage Trust
Series 2012-GC8, Class XA
2.244%, 09/10/45 (a) (b) | | | 117,982 | |
| | 130,000 | | | Citigroup Commercial Mortgage Trust
Series 2006-C5, Class AM
5.462%, 10/15/49 | | | 143,127 | |
| | 6,752,866 | | | Citigroup/Deutsche Bank Commercial Mortgage Trust
Series 2007-CD5, Class XP
0.168%, 11/15/44 (a) (b) | | | 13,688 | |
| | 340,000 | | | Citigroup/Deutsche Bank Commercial Mortgage Trust
Series 2007-CD4, Class AMFX
5.366%, 12/11/49 (b) | | | 350,225 | |
| | 200,000 | | | Commercial Mortgage Pass Through Certificates
Series 2007-TFLA, Class B
0.324%, 02/15/22 (a) (b) | | | 196,734 | |
| | 275,000 | | | Commercial Mortgage Pass Through Certificates
Series 2006-C4, Class AM
5.509%, 09/15/39 | | | 297,864 | |
| | 300,000 | | | Commercial Mortgage Pass Through Certificates
Series 2006-C5, Class AM
5.343%, 12/15/39 | | | 320,561 | |
| | 1,976,885 | | | Commercial Mortgage Pass Through Certificates
Series 2012-CR3, Class XA
2.204%, 10/15/45 (b) | | | 254,741 | |
| | 350,000 | | | Commercial Mortgage Pass Through Certificates
Series 2006-C7, Class AM
5.779%, 06/10/46 (b) | | | 378,268 | |
| | 171,048 | | | Commercial Mortgage Pass Through Certificates
Series 2010-C1, Class XPA
2.353%, 07/10/46 (a) (b) | | | 7,139 | |
| | 1,566,896 | | | Countrywide Alternative Loan Trust
Series 2005-J8, Class 1A5
5.500%, 07/25/35 | | | 1,497,948 | |
| | 1,917,961 | | | Countrywide Alternative Loan Trust
Series 2005-86CB, Class A5
5.500%, 02/25/36 | | | 1,669,365 | |
| | 554,489 | | | Countrywide Alternative Loan Trust
Series 2006-J1, Class 2A1
7.000%, 02/25/36 | | | 256,993 | |
| | 117,719 | | | Countrywide Alternative Loan Trust
Series 2007-18CB, Class 2A17
6.000%, 08/25/37 | | | 103,414 | |
| | 454,673 | | | Countrywide Alternative Loan Trust
Series 2007-23CB, Class A3
0.670%, 09/25/37 (b) | | | 269,620 | |
| | 434,137 | | | Countrywide Alternative Loan Trust
Series 2007-23CB, Class A4 6.330%, 09/25/37 (b) (e) | | | 94,260 | |
See accompanying Notes to Financial Statements.
| | |
| |
| ASTON/DoubleLine Core Plus Fixed Income Fund | | October 31, 2013 |
| |
| Schedule of Investments – continued | | |
| | | | | | | | |
Par Value | | | | | Market
Value | |
| | $1,578,845 | | | Countrywide Home Loan Mortgage Pass Through Trust
Series 2007-12, Class A9
5.750%, 08/25/37 | | $ | 1,508,803 | |
| | 1,062,724 | | | Countrywide Home Loan Mortgage Pass Through Trust
Series 2005-HYB8, Class 4A1
4.468%, 12/20/35 (b) | | | 913,537 | |
| | 930,987 | | | Countrywide Home Loan Mortgage Pass Through Trust
Series 2007-2, Class A13
6.000%, 03/25/37 | | | 847,090 | |
| | 215,823 | | | Countrywide Home Loan Mortgage Pass Through Trust
Series 2007-7, Class A4
5.750%, 06/25/37 | | | 194,999 | |
| | 83,200 | | | Credit Suisse First Boston Mortgage Securities
Series 1998-C2 Class F
6.750%, 11/15/30 (a) (b) | | | 86,621 | |
| | 2,343,815 | | | Credit Suisse First Boston Mortgage Securities
Series 1997-C2, Class AX
0.271%, 01/17/35 (b) | | | 745 | |
| | 140,161 | | | Credit Suisse First Boston Mortgage Securities
Series 2005-8, Class 9A4
5.500%, 09/25/35 | | | 123,660 | |
| | 250,000 | | | Credit Suisse First Boston Mortgage Securities
Series 2005-C6, Class AJ
5.230%, 12/15/40 (b) | | | 265,639 | |
| | 184,855 | | | Credit Suisse Mortgage Capital Certificates
Series 2006-TF2A, Class A2
0.344%, 10/15/21 (a) (b) | | | 184,174 | |
| | 406,216 | | | Credit Suisse Mortgage Capital Certificates
Series 2006-7, Class 1A3
5.000%, 08/25/36 | | | 330,181 | |
| | 265,962 | | | Credit Suisse Mortgage Capital Certificates
Series 2009-13R, Class 2A1
6.000%, 01/26/37 (a) | | | 271,666 | |
| | 1,380,006 | | | Credit Suisse Mortgage Capital Certificates
Series 2007-1, Class 5A4
6.000%, 02/25/37 | | | 1,237,983 | |
| | 250,000 | | | Credit Suisse Mortgage Capital Certificates
Series 2009-RR2, Class IQB
5.695%, 04/16/49 (a) (b) | | | 273,007 | |
| | 200,000 | | | DBRR Trust
Series 2012-EZ1, Class A
1.393%, 09/25/45 (a) (d) | | | 200,500 | |
| | 150,000 | | | Del Coronado Trust
2.124%, 03/15/26 (a) (b) | | | 148,833 | |
| | | | | | | | |
Par Value | | | | | Market
Value | |
| | $ 150,000 | | | Del Coronado Trust
2.824%, 03/15/26 (a) (b) | | $ | 147,617 | |
| | 100,000 | | | GE Capital Commercial Mortgage
Series 2005-C2, Class B
5.113%, 05/10/43 (b) | | | 104,578 | |
| | 250,000 | | | Greenwich Capital Commercial Funding
Series 2007-GG11, Class AM
5.867%, 12/10/49 (b) | | | 276,627 | |
| | 100,000 | | | GS Mortgage Securities Corp II
Series 2006-GG6, Class AM
5.622%, 04/10/38 (b) | | | 108,671 | |
| | 350,000 | | | GS Mortgage Securities Trust
Series 2006-GG6, Class AJ
5.631%, 04/10/38 (b) | | | 342,988 | |
| | 923,091 | | | GSR Mortgage Loan Trust
Series 2006-AR1, Class 3A1
3.154%, 01/25/36 (b) | | | 808,762 | |
| | 107,671 | | | HSBC Asset Loan Obligation
Series 2007-2, Class 1A1
5.500%, 09/25/37 | | | 108,119 | |
| | 300,000 | | | JPMorgan Chase Commercial Mortgage Securities
1.840%, 10/15/25 (a) (b) | | | 301,672 | |
| | 2,160,824 | | | JPMorgan Chase Commercial Mortgage Securities Trust
Series 2006-LDP8, Class X
0.546%, 05/15/45 (b) | | | 30,442 | |
| | 979,088 | | | JPMorgan Chase Commercial Mortgage Securities Trust
Series 2012-CBX, Class XA
2.020%, 06/15/45 (b) | | | 100,442 | |
| | 2,412,873 | | | JPMorgan Chase Commercial Mortgage Securities Trust
Series 2012-C8, Class XA
2.162%, 10/15/45 (b) | | | 286,601 | |
| | 1,229,341 | | | JPMorgan Chase Commercial Mortgage Securities Trust
Series 2011-C4, Class XA
1.519%, 07/15/46 (a) (b) | | | 70,817 | |
| | 350,000 | | | JPMorgan Chase Commercial Mortgage Securities Trust
Series 2007-CB17 Class AM
5.706%, 02/12/49 (b) | | | 378,000 | |
| | 77,774 | | | JPMorgan Chase Commercial Mortgage Securities Trust
Series 2007-C1, Class ASB
5.857%, 02/15/51 | | | 83,532 | |
| | 250,000 | | | JPMorgan Chase Commercial Mortgage Securities Trust
Series 2007-LD12, Class AM
5.997%, 02/15/51 (b) | | | 280,395 | |
| | 250,000 | | | LB Commercial Mortgage Trust
Series 2007-C3, Class AMFL 5.884%, 07/15/44 (a) (b) | | | 280,514 | |
| | 350,000 | | | LB-UBS Commercial Mortgage Trust
Series 2006-C6, Class AM 5.413%, 09/15/39 | | | 387,623 | |
See accompanying Notes to Financial Statements.
| | |
| |
| ASTON/DoubleLine Core Plus Fixed Income Fund | | October 31, 2013 |
| |
| Schedule of Investments – continued | | |
| | | | | | | | |
Par Value | | | | | Market
Value | |
| | $ 350,000 | | | LB-UBS Commercial Mortgage Trust
Series 2007-C1, Class AJ
5.484%, 02/15/40 | | $ | 358,936 | |
| | 50,000 | | | LB-UBS Commercial Mortgage Trust
Series 2005-C3, Class AM
4.794%, 07/15/40 | | | 52,843 | |
| | 250,000 | | | Merrill Lynch Mortgage Trust
Series 2005-CIP1, Class AM
5.107%, 07/12/38 (b) | | | 265,294 | |
| | 350,000 | | | Merrill Lynch Mortgage Trust
Series 2006-C2, Class AJ
5.802%, 08/12/43 (b) | | | 347,309 | |
| | 250,000 | | | ML-CFC Commercial Mortgage Trust
Series 2007-5, Class AM
5.419%, 08/12/48 | | | 264,875 | |
| | 984,616 | | | Morgan Stanley Bank of America Merrill Lynch Trust
Series 2012-C5, Class XA
1.892%, 08/15/45 (a) (b) | | | 97,023 | |
| | 250,000 | | | Morgan Stanley Capital I
Series 2007-IQ13, Class AM
5.406%, 03/15/44 | | | 270,847 | |
| | 1,446,084 | | | Morgan Stanley Capital I
Series 2011-C1, Class XA
0.943%, 09/15/47 (a) (b) | | | 37,174 | |
| | 300,000 | | | Morgan Stanley Capital I Trust
Series 2007-HQ11, Class AJ
5.508%, 02/12/44 (b) | | | 315,719 | |
| | 300,000 | | | Morgan Stanley Capital I Trust
Series 2006-HQ8, Class AJ
5.496%, 03/12/44 (b) | | | 308,772 | |
| | 1,331,566 | | | Morgan Stanley Mortgage Loan Trust
Series 2005-3AR, Class 2A2
2.483%, 07/25/35 (b) | | | 1,141,102 | |
| | 200,000 | | | Morgan Stanley Re-REMIC Trust
Series 2010-HQ4, Class AJ
4.970%, 04/15/40 (a) | | | 205,571 | |
| | 300,000 | | | Nomura Asset Acceptance
Series 2005-AP3, Class A3
5.318%, 08/25/35 (b) | | | 229,226 | |
| | 263,296 | | | Residential Asset Securitization Trust
Series 2006-A6, Class 1A1
6.500%, 07/25/36 | | | 173,091 | |
| | 652,227 | | | Residential Asset Securitization Trust
Series 2007-A1, Class A8
6.000%, 03/25/37 | | | 510,946 | |
| | 128,880 | | | RREF
Series 2013-LT2, Class A
2.833%, 05/22/28 (a) | | | 129,049 | |
| | 58,071 | | | SMA Issuer I
Series 2012-LV1, Class A
3.500%, 08/20/25 (a) | | | 58,314 | |
| | 449,604 | | | Structured Adjustable Rate Mortgage Loan Trust
Series 2006-1, Class 2A2
2.555%, 02/25/36 (b) | | | 390,611 | |
| | 192,505 | | | Structured Asset Securities
Series 2005-10, Class 1A1
5.750%, 06/25/35 | | | 188,519 | |
| | | | | | | | |
Par Value | | | | | Market
Value | |
| | $ 100,000 | | | TIAA Seasoned Commercial Mortgage Trust
Series 2007-C4 Class AJ 5.560%, 08/15/39 (b) | | $ | 107,250 | |
| | 1,964,775 | | | UBS-Barclays Commercial Mortgage Trust
Series 2012-C3, Class XA 2.177%, 08/10/49 (a) (b) | | | 249,906 | |
| | 300,000 | | | Wachovia Bank Commercial Mortgage Trust
Series 2006-C28, Class AJ 5.632%, 10/15/48 (b) | | | 283,004 | |
| | 250,000 | | | Wachovia Bank Commercial Mortgage Trust
Series 2007-C33, Class AM 5.925%, 02/15/51 (b) | | | 280,056 | |
| | 350,000 | | | Wachovia Bank Commercial Mortgage Trust
Series
Series 2007-C30, Class AMFL 0.380%, 12/15/43 (a) (b) | | | 325,094 | |
| | 443,349 | | | Wells Fargo Alternative Loan Trust
Series 2007-PA2, Class 1A1 6.000%, 06/25/37 | | | 402,286 | |
| | 1,042,672 | | | Wells Fargo Mortgage Backed Securities Trust
Series 2006-AR2, Class 2A5 2.633%, 03/25/36 (b) | | | 1,011,346 | |
| | 692,346 | | | Wells Fargo Mortgage Backed Securities Trust
Series 2007-8, Class 1A16 6.000%, 07/25/37 | | | 661,540 | |
| | 635,628 | | | Wells Fargo Mortgage Backed Securities Trust
Series 2007-13, Class A6 6.000%, 09/25/37 | | | 636,934 | |
| | 985,716 | | | WF-RBS Commercial Mortgage Trust
Series 2012-C8, Class XA 2.235%, 08/15/45 (a) (b) | | | 119,798 | |
| | 1,474,382 | | | WF-RBS Commercial Mortgage Trust
Series 2012-C9, Class XA 2.261%, 11/15/45 (a) (b) | | | 189,979 | |
| | | | | | | | |
| | |
| | | | Total Collateralized Mortgage-Backed Securities
(Cost $29,978,041) | | | 32,059,129 | |
| | | | | | | | |
|
| | AGENCY COLLATERALIZED MORTGAGE OBLIGATIONS – 11.77% | |
| | |
| | | | Fannie Mae – 4.66% | | | | |
| | 996,458 | | | 5.000%, 09/25/33
Series 2003-92, Class PZ, REMIC | | | 1,092,824 | |
| | 706,101 | | | 5.630%, 09/25/36 (b) (e)
Series 2009-86, Class CI, REMIC | | | 90,083 | |
| | 417,030 | | | 6.450%, 10/25/36 (b) (e)
Series 2007-57, Class SX, REMIC | | | 64,685 | |
| | 204,709 | | | 5.500%, 03/25/38
Series 2008-14, Class ZA, REMIC | | | 224,472 | |
| | 295,535 | | | 4.000%, 01/25/41
Series 2010-156, Class ZC, REMIC | | | 252,405 | |
See accompanying Notes to Financial Statements.
| | |
| |
| ASTON/DoubleLine Core Plus Fixed Income Fund | | October 31, 2013 |
| |
| Schedule of Investments – continued | | |
| | | | | | | | |
Par Value | | | | | Market
Value | |
| | |
| | | | Freddie Mac (continued) | | | | |
| | $ 444,946 | | | 4.000%, 03/25/41
Series 2011-18, Class UZ, REMIC | | $ | 444,638 | |
| | 88,647 | | | 8.941%, 09/25/41 (b)
Series 2011-88, Class SB, REMIC | | | 88,577 | |
| | 698,330 | | | 4.500%, 12/25/41
Series 2011-121, Class JP, REMIC | | | 735,707 | |
| | 1,059,978 | | | 3.500%, 03/25/42
Series 2012-20, Class ZT, REMIC | | | 956,635 | |
| | 1,597,905 | | | 4.000%, 04/25/42
Series 2012-31, Class Z, REMIC | | | 1,575,742 | |
| | 1,038,587 | | | 3.500%, 10/25/42
Series 2012-105, Class Z, REMIC | | | 888,743 | |
| | 432,285 | | | 1.500%, 02/25/43
Series 2013-6, Class ZH, REMIC | | | 359,894 | |
| | 1,330,929 | | | 4.448%, 11/25/49 (b)
Series 2012-144, Class PT, REMIC | | | 1,442,931 | |
| | | | | | | | |
| | | | | | | 8,217,336 | |
| | | | | | | | |
| | |
| | | | Freddie Mac – 5.46% | | | | |
| | 2,815,269 | | | 3.000%, 08/15/42
Series 269, Class 30, STRIP | | | 2,713,338 | |
| | 776,935 | | | 5.000%, 12/15/34
Series 2909, Class Z, REMIC | | | 863,448 | |
| | 1,718,338 | | | 5.000%, 03/15/35
Series 2945, Class CZ, REMIC | | | 1,863,900 | |
| | 493,082 | | | 5.500%, 08/15/36
Series 3626, Class AZ, REMIC | | | 548,569 | |
| | 288,814 | | | 5.926%, 04/15/37 (b) (e)
Series 3301, Class MS, REMIC | | | 34,128 | |
| | 217,235 | | | 5.826%, 11/15/37 (b) (e)
Series 3382, Class SB, REMIC | | | 25,227 | |
| | 205,951 | | | 6.216%, 11/15/37 (b) (e)
Series 3384, Class S, REMIC | | | 26,434 | |
| | 1,500,000 | | | 4.000%, 12/15/38
Series 3738, Class BP, REMIC | | | 1,587,968 | |
| | 630,972 | | | 5.346%, 01/15/39 (b) (e)
Series 3500, Class SA, REMIC | | | 79,301 | |
| | 111,607 | | | 4.000%, 01/15/41
Series 3795, Class VZ, REMIC | | | 112,130 | |
| | 159,115 | | | 4.000%, 06/15/41
Series 3872, Class BA, REMIC | | | 168,115 | |
| | 218,802 | | | 4.000%, 07/15/41
Series 3888, Class ZG, REMIC | | | 224,722 | |
| | 387,168 | | | 4.500%, 07/15/41
Series 3894, Class ZA, REMIC | | | 419,313 | |
| | 14,901 | | | 9.201%, 09/15/41 (b)
Series 3924, Class US, REMIC | | | 15,059 | |
| | 534,640 | | | 3.500%, 11/15/41
Series 3957, Class DZ, REMIC | | | 507,619 | |
| | 485,795 | | | 4.000%, 11/15/41
Series 3957, Class HZ, REMIC | | | 454,904 | |
| | | | | | | | |
| | | | | | | 9,644,175 | |
| | | | | | | | |
| | | | | | | | |
Par Value | | | | | Market
Value | |
| |
| | | | Government National Mortgage Association – 1.65% | |
| | $ 53,019 | | | 31.379%, 03/20/34 (b)
Series 2004-35, Class SA | | $ | 95,226 | |
| | 850,285 | | | 7.458%, 08/20/38 (b) (e)
Series 2008-69, Class SB | | | 156,255 | |
| | 729,174 | | | 5.925%, 03/20/39 (b) (e)
Series 2010-98, Class IA | | | 78,670 | |
| | 935,360 | | | 4.500%, 05/16/39
Series 2009-32, Class ZE | | | 1,005,247 | |
| | 609,712 | | | 4.500%, 05/20/39
Series 2009-35, Class DZ | | | 669,470 | |
| | 600,651 | | | 4.500%, 09/20/39
Series 2009-75, Class GZ | | | 658,382 | |
| | 1,963,777 | | | 5.278%, 06/20/41 (b) (e)
Series 2011-89, Class SA | | | 246,037 | |
| | | | | | | | |
| | | | | | | 2,909,287 | |
| | | | | | | | |
| | |
| | | | Total Agency Collateralized Mortgage Obligations
(Cost $21,121,525) | | | 20,770,798 | |
| | | | | | | | |
|
| | U.S. GOVERNMENT OBLIGATIONS – 10.08% | |
| | |
| | | | U.S. Treasury Bonds – 1.95% | | | | |
| | 950,000 | | | 4.250%, 05/15/39 | | | 1,066,227 | |
| | 2,300,000 | | | 3.750%, 08/15/41 | | | 2,363,071 | |
| | | | | | | | |
| | | | | | | 3,429,298 | |
| | | | | | | | |
| | |
| | | | U.S. Treasury Notes – 8.13% | | | | |
| | 1,810,000 | | | 0.250%, 05/31/14 | | | 1,811,520 | |
| | 4,830,000 | | | 1.000%, 08/31/19 | | | 4,664,722 | |
| | 3,680,000 | | | 1.875%, 06/30/20 | | | 3,682,587 | |
| | 4,460,000 | | | 1.625%, 08/15/22 | | | 4,188,217 | |
| | | | | | | | |
| | | | | | | 14,347,046 | |
| | | | | | | | |
| | |
| | | | Total U.S. Government Obligations
(Cost $18,226,901) | | | 17,776,344 | |
| | | | | | | | |
|
| | U.S. GOVERNMENT MORTGAGE-BACKED SECURITIES – 7.37% | |
| | |
| | | | Fannie Mae – 5.20% | | | | |
| | 405,517 | | | 4.000%, 09/01/31
Pool # MA3894 | | | 431,874 | |
| | 940,953 | | | 3.500%, 12/01/31
Pool # MA0919 | | | 979,170 | |
| | 822,061 | | | 3.500%, 01/01/32
Pool # MA0949 | | | 855,431 | |
| | 1,958,742 | | | 3.000%, 06/01/33
Pool # MA1459 | | | 1,976,214 | |
| | 520,373 | | | 4.000%, 02/01/42
Pool # AK4039 | | | 540,738 | |
| | 372,755 | | | 4.500%, 03/01/42
Pool # MA1050 | | | 393,365 | |
| | 1,119,387 | | | 3.500%, 05/01/42
Pool # MA1068 | | | 1,136,527 | |
| | 774,020 | | | 4.000%, 06/01/42
Pool # AB5459 | | | 805,432 | |
| | 2,027,424 | | | 3.500%, 07/01/42
Pool # MA1117 | | | 2,058,562 | |
| | | | | | | | |
| | | | | | | 9,177,313 | |
| | | | | | | | |
See accompanying Notes to Financial Statements.
| | |
| |
| ASTON/DoubleLine Core Plus Fixed Income Fund | | October 31, 2013 |
| |
| Schedule of Investments – continued | | |
| | | | | | | | |
Par Value | | | | | Market
Value | |
| | |
| | | | Freddie Mac – 2.17% | | | | |
| | $1,898,699 | | | 3.000%, 01/01/33
Gold Pool # C91594 | | $ | 1,913,861 | |
| | 67,856 | | | 5.000%, 07/01/35
Gold Pool # G01840 | | | 73,465 | |
| | 25,224 | | | 5.500%, 12/01/38
Gold Pool # G06172 | | | 27,261 | |
| | 369,526 | | | 4.000%, 10/01/41
Gold Pool # T60392 | | | 383,134 | |
| | 1,407,298 | | | 3.500%, 10/01/42
Gold Pool # T65110 | | | 1,426,558 | |
| | | | | | | | |
| | | | | | | 3,824,279 | |
| | | | | | | | |
| | |
| | | | Total U.S. Government Mortgage-Backed Securities
(Cost $13,247,183) | | | 13,001,592 | |
| | | | | | | | |
| |
| | ASSET-BACKED SECURITIES – 4.41% | | | | |
| | |
| | 250,000 | | | ALM IV (Cayman Islands)
Series 2011-A4, Class C 2.994%, 07/18/22 (a) (b) | | | 242,067 | |
| | 250,000 | | | ARES CLO (Cayman Islands)
Series 2012-2A, Class D 4.874%, 10/12/23 (a) (b) | | | 249,278 | |
| | 500,000 | | | ARES XXVI CLO (Cayman Islands)
Series 2013-1A, Class D 3.994%, 04/15/25 (a) (b) | | | 475,607 | |
| | 1,311,522 | | | Bayview Financial Acquisition Trust
Series 2007-A, Class 1A5 6.101%, 05/28/37 (c) | | | 1,319,844 | |
| | 250,000 | | | BlueMountain CLO (Cayman Islands)
Series 2012-1A, Class E 5.742%, 07/20/23 (a) (b) | | | 239,734 | |
| | | | Brookside Mill CLO (Cayman Islands)
Series 2013-1A, Class D | | | | |
| | 250,000 | | | 3.294%, 04/17/25 (a) (b) | | | 228,731 | |
| | | | Series 2013-1A, Class E | | | | |
| | 250,000 | | | 4.644%, 04/17/25 (a) (b) | | | 223,709 | |
| | | | Cent CLO 18
Series 2013-18A, Class D | | | | |
| | 250,000 | | | 3.700%, 07/23/25 (a) (b) | | | 235,181 | |
| | | | Series 2013-18A, Class E | | | | |
| | 250,000 | | | 4.850%, 07/23/25 (a) (b) | | | 224,067 | |
| | 100,000 | | | Credit-Based Asset Servicing and Securitization
Series 2007-MX1, Class A4
6.231%, 12/25/36 (a) (c) | | | 77,155 | |
| | 250,000 | | | Dryden XXIV Senior Loan Fund (Cayman Islands)
Series 2012-24A, Class D
5.014%, 11/15/23 (a) (b) | | | 249,998 | |
| | 250,000 | | | GoldenTree Loan Opportunities VI (Cayman Islands)
Series 2012-6A, Class D
4.444%, 04/17/22 (a) (b) | | | 246,109 | |
| | 757,000 | | | GSAA Trust
Series 2006-15, Class AF3B
5.933%, 09/25/36 (b) | | | 138,889 | |
| | | | | | | | |
Par Value | | | | | Market
Value | |
| | | | LCM XI (Cayman Islands)
Series 10A, Class D | | | | |
| | $ 500,000 | | | 4.844%, 04/15/22 (a) (b) | | $ | 497,311 | |
| | | | Series 11A, Class D | | | | |
| | 250,000 | | | 4.216%, 04/19/22 (a) (b) | | | 241,610 | |
| | | | Nomad CLO (Cayman Islands)
Series 2013-1A, Class B | | | | |
| | 250,000 | | | 3.218%, 01/15/25 (a) (b) | | | 245,692 | |
| | | | Series 2013-1A, Class C | | | | |
| | 250,000 | | | 3.768%, 01/15/25 (a) (b) | | | 237,092 | |
| | | | Octagon Investment Partners XVI (Cayman Islands)
Series 2013-1A, Class D | | | | |
| | 250,000 | | | 3.622%, 07/17/25 (a) (b) | | | 235,568 | |
| | | | Series 2013-1A, Class E | | | | |
| | 250,000 | | | 4.772%, 07/17/25 (a) (b) | | | 223,940 | |
| | 250,000 | | | OHA Intrepid Leveraged Loan Fund (Cayman Islands)
Series 2011-1AR, Class DR
3.292%, 04/20/21 (a) (b) | | | 246,344 | |
| | 319,298 | | | Residential Asset Mortgage Products
Series 2006-RS5, Class A3
0.340%, 09/25/36 (b) | | | 302,681 | |
| | | | Residential Asset Securities | | | | |
| | 500,000 | | | Series 2004-KS6, Class A15 5.850%, 07/25/34 (b) | | | 534,491 | |
| | 381,106 | | | Series 2005-KS4, Class M1 0.580%, 05/25/35 (b) | | | 376,049 | |
| | 250,000 | | | WhiteHorse III (Cayman Islands)
Series 2006-1A, Class B1L
2.115%, 05/01/18 (a) (b) | | | 245,099 | |
| | 250,000 | | | Wind River CLO (Cayman Islands)
Series 2013-1A, Class C
3.642%, 04/20/25 (a) (b) | | | 236,618 | |
| | | | | | | | |
| | |
| | | | Total Asset-Backed Securities
(Cost $7,696,047) | | | 7,772,864 | |
| | | | | | | | |
|
| | MUNICIPAL BONDS – 0.92% | |
| | 650,000 | | | New York City, G O, SubSeries G-1
5.000%, 04/01/27 | | | 721,949 | |
| | 730,000 | | | NY State Dormitory Authority Rev., State Personal Income Tax,
Series B (AMBAC Insured) 5.500%, 03/15/27 | | | 896,133 | |
| | | | | | | | |
| | |
| | | | Total Municipal Bonds
(Cost $1,530,550) | | | 1,618,082 | |
| | | | | | | | |
|
| | FOREIGN GOVERNMENT BONDS – 0.61% | |
| | 200,000 | | | Brazilian Government International Bond
4.250%, 01/07/25 | | | 195,650 | |
| | 500,000 | | | Corp Andina de Fomento
Senior Unsecured Notes
3.750%, 01/15/16 | | | 525,613 | |
| | 350,000 | | | Mexico Government International Bond
4.000%, 10/02/23 | | | 355,863 | |
| | | | | | | | |
| | |
| | | | Total Foreign Government Bonds
(Cost $1,065,054) | | | 1,077,126 | |
| | | | | | | | |
See accompanying Notes to Financial Statements.
| | |
| |
| ASTON/DoubleLine Core Plus Fixed Income Fund | | October 31, 2013 |
| |
| Schedule of Investments – continued | | |
| | | | | | | | |
Par Value | | | | | Market
Value | |
|
| | INVESTMENT COMPANIES – 4.64% | |
| | |
| | $3,642,018 | | | BlackRock Liquidity Funds TempCash Portfolio | | $ | 3,642,018 | |
| | 447,316 | | | DoubleLine Floating Rate Fund 0.002%, | | | 4,535,785 | |
| | | | | | | | |
| | |
| | | | Total Investment Companies
(Cost $8,142,018) | | | 8,177,803 | |
| | | | | | | | |
| Total Investments – 99.41%
(Cost $175,785,053)* | | | 175,349,744 | |
| | | | | | | | |
| Net Other Assets and Liabilities – 0.59% | | | 1,036,120 | |
| | | | | | | | |
| Net Assets – 100.00% | | $ | 176,385,864 | |
| | | | | | | | |
| * | | Aggregate cost for Federal income tax purposes is $176,457,816. |
| | | | |
Gross unrealized appreciation | | $ | 4,604,419 | |
Gross unrealized depreciation | | | (5,712,491 | ) |
| | | | |
Net unrealized depreciation | | $ | (1,108,072 | ) |
| | | | |
| (a) | | Securities exempt from registration under Rule 144A of the Securities Act of 1933, as amended. These securities are purchased in accordance with guidelines approved by the Fund’s Board of Trustees and may only be resold, in transactions exempt from registration, to qualified institutional buyers. At October 31, 2013, these securities amounted to $31,831,678 or 18.05% of net assets. These securities have not been determined by the Subadviser to be illiquid securities. |
| (b) | | Variable rate bond. The interest rate shown reflects the rate in effect at October 31, 2013. |
| (c) | | Step Coupon. Security becomes interest bearing at a future date. |
| (d) | | Security with a total aggregate market value of $200,500 or 0.11% of the net assets, was valued under the fair value procedures established by the Fund’s Board of Trustees. |
| (e) | | Interest only security. This type of security represents the right to receive the monthly interest payments on an underlying pool of mortgages. Payments of principal on the pool reduce the value of the “interest only” holding. |
| REIT | | Real Estate Investment Trust |
| REMIC | | Real Estate Mortgage Investment Conduit |
| STRIP | | Separate Trading of Registered Interest and Principal |
| | | | |
Portfolio Composition | | | | |
U.S. Government Obligations | | | 10% | |
U.S. Government Agency Obligations | | | 19% | |
Corporate Notes and Bonds | | | | |
(S&P Ratings unaudited) | | | | |
AAA | | | 2% | |
AA | | | 4% | |
A | | | 9% | |
BBB | | | 27% | |
BB | | | 9% | |
B | | | 4% | |
Lower than B | | | 10% | |
Not Rated | | | 6% | |
| | | | |
| | | 100% | |
| | | | |
See accompanying Notes to Financial Statements.
ASTON/TCH Fixed Income Fund
| | |
| |
| Portfolio Manager Commentary (unaudited) | | October 31, 2013 |
| Tere Alvarez Canida, CFA; Alan M. Habacht, William J. Canida, CFA; & Scott M. Kimball |
| Q. | What were the most significant market factors affecting Fund performance and returns relative to the benchmark during the past 12 months? |
| A. | During the fiscal year ended October 31, 2013, sector, quality and security selection benefitted the portfolio, while yield curve selection modestly detracted from returns. The Fund is overweight credit securities which outperformed duration matched Treasuries by 108 basis points over the trailing twelve months. Within credit, the fund is overweight lower quality investment grade securities which were the best performing quality bucket on a duration-adjusted basis. BBB rated securities outperformed AAA rated securities* by 102 basis points of excess return during the period. The Fund also benefitted from an allocation to floating rate notes which outperformed in the rising interest rate environment of the last year. Floating-rate securities as measured by the Barclays Capital Floating Rate Note Index rose 1.3% in the past year. Offsetting some of the positive factors was our above-benchmark exposure to longer dated securities. Although the Fund has a below-benchmark duration profile overall, our barbelled portfolio structure modestly detracted from returns as longer duration securities underperformed. |
| Q. | What were the best performing holdings for the Fund during the period? |
| A. | Corporate debt securities were the best performing holdings during the year. Despite rising interest rates, corporates benefitted from their embedded carry advantage and from modestly tighter spreads at year end. |
| Q. | What were the weakest performing holdings? |
| A. | Treasury securities were the weakest performing holdings in the Fund during the trailing 12 months as interest rose during the year. In addition, our exposure to Treasury Inflation-Protected Securities (TIPS) detracted from returns as TIPS underperformed nominal securities during the last year as signs of a significant increase in inflation remain muted. |
| Q. | How was the Fund positioned as of October 31, 2013? |
| A. | We believe that U.S. investment grade credit offers excellent relative value, opting for certain non-U.S. corporate bonds as a means of diversification in lieu of moving significantly lower in credit quality. Within our yield curve exposure, we continue to believe an allocation to floating rate securities is warranted. On October 30, 2013, the Federal Reserve (Fed) announced that it will continue its $85 billion per month purchase of U.S. Treasury and Agency mortgage-backed securities (MBS). The central bank cited a slowing housing recovery and uncertainty surrounding fiscal policy as constraints to U.S. economic growth. |
However, the Fed removed a sentence from its previous statement in September that tighter financial conditions could slow the improvement in the economy. We view the removal of this statement as another attempt by the Fed to prepare market participants for the removal of some of the accommodation in 2014.
Note: A basis point (bps) is a unit of measure. 1bps = .01%.
*S&P assigns a credit quality rating from AAA (highest quality) to D (lowest quality). Credit quality ratings refer to the underlying bonds in the Fund’s portfolio and not of the Fund itself.
Growth of a Hypothetical
$10,000 Investment—Class N
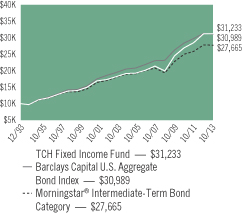
All dividends and capital gains are reinvested. Indexes are unmanaged and do not take into account fees, expenses or other costs.
Returns shown in the chart and table do not reflect taxes that a shareholder would pay on Fund distributions or on the sale of the Fund shares.
Bond funds have the same interest rate, high yield and credit risks associated with the underlying bonds in the portfolio, all of which could reduce the Fund’s value. As interest rates rise, the value of the Fund can decline and an investor can lose principal.
RETURNSFOR PERIOD ENDED 10/31/13
Average Annual Total Returns - Class N
| | | | |
One Year | | | 0.13 | % |
Five Year | | | 9.44 | % |
Ten Year | | | 5.60 | % |
Since Inception | | | 5.90 | % |
Inception Date 12/13/93
Average Annual Total Returns - Class I
| | | | |
One Year | | | 0.28 | % |
Five Year | | | 9.62 | % |
Ten Year | | | 5.83 | % |
Since Inception | | | 6.19 | % |
Inception Date 07/31/00
The performance data quoted represents past performance. Past performance does not guarantee future results. Investment return and principal value will fluctuate so that an investor’s shares, upon redemption, may be worth more or less than their original cost. Current performance may be lower or higher than the performance data quoted. For performance data current to the most recent month-end, please visit our website at www.astonfunds.com.
The performance quoted would have been lower if fee waivers and/or expense reimbursements had not been in effect.
The total expense ratios for Class N and Class I Shares are 1.11% and 0.86%, respectively, as disclosed in the prospectus dated February 28, 2013. Please refer to the Financial Highlights section in this report for more information.
| | |
| |
| ASTON/TCH Fixed Income Fund | | October 31, 2013 |
| |
| Schedule of Investments | | |
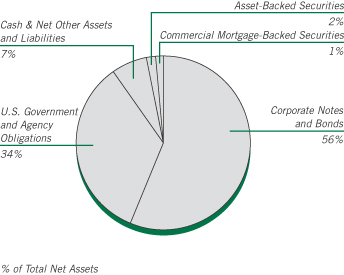
| | | | | | | | |
Par Value | | | | | Market
Value | |
|
| | CORPORATE NOTES AND BONDS – 56.36% | |
| | |
| | | | Consumer Discretionary – 5.41% | | | | |
| | $ 350,000 | | | ADT
Senior Unsecured Notes
4.875%, 07/15/42 | | $ | 271,871 | |
| | 250,000 | | | Arcos Dorados Holdings (British Virgin Islands)
6.625%, 09/27/23 (b) | | | 255,000 | |
| | 865,000 | | | L Brands
Senior Unsecured Notes
7.600%, 07/15/37 | | | 884,463 | |
| | 100,000 | | | Macy’s Retail Holdings
7.875%, 07/15/15 (a) | | | 111,318 | |
| | | | QVC | | | | |
| | 200,000 | | | 5.125%, 07/02/22 | | | 203,078 | |
| | 500,000 | | | 5.950%, 03/15/43 | | | 449,416 | |
| | 250,000 | | | Staples
Senior Unsecured Notes
9.750%, 01/15/14 | | | 254,423 | |
| | 500,000 | | | Whirlpool, MTN
Senior Unsecured Notes
8.600%, 05/01/14 | | | 519,694 | |
| | | | | | | | |
| | | | | | | 2,949,263 | |
| | | | | | | | |
| | |
| | | | Consumer Staples – 2.08% | | | | |
| | | | Altria Group | | | | |
| | 500,000 | | | 8.500%, 11/10/13 | | | 500,550 | |
| | 200,000 | | | 10.200%, 02/06/39 | | | 319,471 | |
| | 150,000 | | | PepsiCo
Senior Unsecured Notes
7.900%, 11/01/18 | | | 191,227 | |
| | 100,000 | | | Reynolds American
7.750%, 06/01/18 | | | 122,099 | |
| | | | | | | | |
| | | | | | | 1,133,347 | |
| | | | | | | | |
| | | | | | | | |
Par Value | | | | | Market
Value | |
| | |
| | | | Energy – 6.88% | | | | |
| | | | Chesapeake Energy
| | | | |
| | $ 250,000 | | | 6.625%, 08/15/20 | | $ | 283,125 | |
| | 250,000 | | | 6.125%, 02/15/21 | | | 274,375 | |
| | 250,000 | | | Energy Transfer Partners
Senior Unsecured Notes
9.000%, 04/15/19 | | | 320,151 | |
| | 250,000 | | | Hess
Senior Unsecured Notes
8.125%, 02/15/19 | | | 315,263 | |
| | 250,000 | | | KazMunayGas National (Kazakhstan)
Senior Unsecured Notes
5.750%, 04/30/43 (b) | | | 227,788 | |
| | 400,000 | | | Kinder Morgan Energy Partners
Senior Unsecured Notes
9.000%, 02/01/19 | | | 515,687 | |
| | 250,000 | | | Petrobras Global Finance BV (Netherlands)
5.625%, 05/20/43 | | | 214,871 | |
| | 250,000 | | | Pride International
Senior Unsecured Notes
6.875%, 08/15/20 | | | 300,272 | |
| | 250,000 | | | Puget Energy
5.625%, 07/15/22 | | | 270,508 | |
| | 250,000 | | | Rockies Express Pipeline
Senior Unsecured Notes
6.875%, 04/15/40 (b) | | | 190,000 | |
| | 250,000 | | | Valero Energy
9.375%, 03/15/19 | | | 326,596 | |
| | 400,000 | | | Weatherford International (Bermuda)
9.625%, 03/01/19 | | | 510,780 | |
| | | | | | | | |
| | | | | | | 3,749,416 | |
| | | | | | | | |
| | |
| | | | Financials – 18.00% | | | | |
| | 250,000 | | | AFLAC
Senior Unsecured Notes
8.500%, 05/15/19 | | | 325,600 | |
| | 450,000 | | | American Financial Group
Senior Unsecured Notes
9.875%, 06/15/19 | | | 589,670 | |
| | 250,000 | | | Banco Bradesco SA/Cayman Islands (Brazil) Subordinated Notes
5.750%, 03/01/22 (b) | | | 253,125 | |
| | | | Bancolombia SA (Colombia)
Senior Unsecured Notes | | | | |
| | 250,000 | | | 5.950%, 06/03/21 | | | 265,250 | |
| | | | Subordinated Notes | | | | |
| | 250,000 | | | 5.125%, 09/11/22 | | | 240,000 | |
| | 550,000 | | | Barrick North America Finance
5.700%, 05/30/41 | | | 466,377 | |
| | | | Blackstone Holdings Finance | | | | |
| | 150,000 | | | 6.625%, 08/15/19 (b) (d) | | | 178,442 | |
| | 250,000 | | | 6.250%, 08/15/42 (b) (d) | | | 275,940 | |
| | 250,000 | | | Bunge Ltd Finance
8.500%, 06/15/19 | | | 312,551 | |
| | 175,000 | | | Capital One Financial
Senior Unsecured Notes
6.250%, 11/15/13 | | | 175,287 | |
See accompanying Notes to Financial Statements.
| | |
| |
| ASTON/TCH Fixed Income Fund | | October 31, 2013 |
| |
| Schedule of Investments – continued | | |
| | | | | | | | |
Par Value | | | | | Market
Value | |
| | |
| | | | Financials (continued) | | | | |
| | $ 500,000 | | | Daimler Finance
1.024%, 04/10/14 (b) (c) | | $ | 501,390 | |
| | 250,000 | | | Discover Bank
Subordinated Notes
7.000%, 04/15/20 | | | 295,439 | |
| | 1,000,000 | | | General Electric Capital, MTN
Senior Unsecured Notes
0.938%, 04/24/14 (c) | | | 1,004,251 | |
| | 800,000 | | | Goldman Sachs Capital I
6.345%, 02/15/34 | | | 802,617 | |
| | 400,000 | | | Itau Unibanco Holding SA (Brazil)
Subordinated Notes
5.500%, 08/06/22 (b) | | | 396,000 | |
| | | | Jefferies Group
Senior Unsecured Notes
| | | | |
| | 200,000 | | | 8.500%, 07/15/19 | | | 244,294 | |
| | 250,000 | | | 6.500%, 01/20/43 | | | 249,205 | |
| | 500,000 | | | JPMorgan Chase, MTN
Senior Unsecured Notes
1.038%, 01/24/14 (c) | | | 501,019 | |
| | 250,000 | | | KKR Group Finance
5.500%, 02/01/43 (b) | | | 234,633 | |
| | 200,000 | | | Leucadia National
5.500%, 10/18/23 | | | 202,228 | |
| | 300,000 | | | Marsh & McLennan
Senior Unsecured Notes
9.250%, 04/15/19 | | | 394,898 | |
| | 750,000 | | | Merrill Lynch, MTN
Senior Unsecured Notes
6.875%, 04/25/18 | | | 891,424 | |
| | 250,000 | | | Nomura Holdings (Japan), MTN
Senior Unsecured Notes
1.704%, 09/13/16 (c) | | | 254,541 | |
| | 250,000 | | | Royal Bank of Canada (Canada), GMTN
Senior Unsecured Notes
0.936%, 10/30/14 (c) | | | 251,760 | |
| | 500,000 | | | Wells Fargo
Senior Unsecured Notes
1.170%, 06/26/15 (c) | | | 506,009 | |
| | | | | | | | |
| | | | | | | 9,811,950 | |
| | | | | | | | |
| | |
| | | | Healthcare – 2.73% | | | | |
| | 310,000 | | | Endo Health Solutions
7.000%, 07/15/19 | | | 332,475 | |
| | 250,000 | | | Humana
Senior Unsecured Notes
8.150%, 06/15/38 | | | 334,778 | |
| | 500,000 | | | Lorillard Tobacco
8.125%, 05/01/40 | | | 620,983 | |
| | 200,000 | | | Quest Diagnostics
1.100%, 03/24/14 (c) | | | 200,539 | |
| | | | | | | | |
| | | | | | | 1,488,775 | |
| | | | | | | | |
| | |
| | | | Industrials – 4.50% | | | | |
| | 370,000 | | | Burlington Northern Santa Fe
Senior Unsecured Notes
7.000%, 02/01/14 | | | 375,738 | |
| | | | | | | | |
Par Value | | | | | Market
Value | |
| | |
| | | | Industrials (continued) | | | | |
| | $ 250,000 | | | FedEx
Senior Notes
8.000%, 01/15/19 | | $ | 314,457 | |
| | 500,000 | | | Mexichem SAB de CV (Mexico)
6.750%, 09/19/42 (b) | | | 492,500 | |
| | 200,000 | | | Nissan Motor Acceptance
0.950%, 09/26/16 (b) (c) | | | 200,451 | |
| | 500,000 | | | Southern Copper
7.500%, 07/27/35 | | | 537,265 | |
| | 250,000 | | | Vale SA (Brazil)
Senior Unsecured Notes
5.625%, 09/11/42 | | | 226,775 | |
| | 250,000 | | | Waste Management
7.375%, 03/11/19 | | | 305,301 | |
| | | | | | | | |
| | | | | | | 2,452,487 | |
| | | | | | | | |
| | |
| | | | Information Technology – 2.05% | | | | |
| | 490,000 | | | DIRECTV Holdings / DIRECTV Financing
6.350%, 03/15/40 | | | 506,236 | |
| | 600,000 | | | Telecom Italia Capital SA (Luxembourg)
7.721%, 06/04/38 | | | 612,976 | |
| | | | | | | | |
| | | | | | | 1,119,212 | |
| | | | | | | | |
| | |
| | | | Materials – 4.11% | | | | |
| | 100,000 | | | Allegheny Technologies
Senior Unsecured Notes
5.875%, 08/15/23 | | | 103,011 | |
| | 400,000 | | | ArcelorMittal (Luxembourg)
Senior Unsecured Notes
7.500%, 10/15/39 (a) | | | 397,000 | |
| | 250,000 | | | Braskem America Finance
7.125%, 07/22/41 (b) | | | 241,875 | |
| | 250,000 | | | Dow Chemical (The)
Senior Unsecured Notes
8.550%, 05/15/19 | | | 323,847 | |
| | 250,000 | | | International Paper
Senior Unsecured Notes
8.700%, 06/15/38 | | | 353,032 | |
| | 550,000 | | | Rio Tinto Finance (Australia)
8.950%, 05/01/14 | | | 572,331 | |
| | 250,000 | | | Teck Resources (Canada)
6.250%, 07/15/41 | | | 248,178 | |
| | | | | | | | |
| | | | | | | 2,239,274 | |
| | | | | | | | |
| | |
| | | | Telecommunication Services – 7.19% | | | | |
| | 500,000 | | | British Telecommunications (United Kingdom)
Senior Unsecured Notes
1.378%, 12/20/13 (c) | | | 500,725 | |
| | | | CenturyLink
Senior Unsecured Notes
| | | | |
| | 500,000 | | | 7.600%, 09/15/39 | | | 468,750 | |
| | 500,000 | | | 7.650%, 03/15/42 | | | 466,250 | |
| | 400,000 | | | Expedia
5.950%, 08/15/20 | | | 425,036 | |
| | 350,000 | | | Frontier Communications
Senior Unsecured Notes
9.000%, 08/15/31 | | | 364,000 | |
See accompanying Notes to Financial Statements.
| | |
| |
| ASTON/TCH Fixed Income Fund | | October 31, 2013 |
| |
| Schedule of Investments – continued | | |
| | | | | | | | |
Par Value | | | | | Market
Value | |
| | |
| | | | Telecommunication Services (continued) | | | | |
| | $ 500,000 | | | Telefonica Europe BV (Netherlands)
8.250%, 09/15/30 | | $ | 603,396 | |
| | 450,000 | | | Time Warner Cable
8.250%, 02/14/14 | | | 459,127 | |
| | 100,000 | | | Verizon Communications
1.782%, 09/15/16 (c) | | | 102,823 | |
| | 500,000 | | | Windstream
7.500%, 06/01/22 | | | 526,250 | |
| | | | | | | | |
| | | | | | | 3,916,357 | |
| | | | | | | | |
| | |
| | | | Utilities – 3.41% | | | | |
| | 500,000 | | | Dubai Electricity & Water Authority (United Arab Emirates)
Senior Unsecured Notes
8.500%, 04/22/15 (b) | | | 550,000 | |
| | 450,000 | | | FPL Group Capital
7.875%, 12/15/15 | | | 513,419 | |
| | 150,000 | | | Pacific Gas & Electric
Senior Unsecured Notes
8.250%, 10/15/18 | | | 191,787 | |
| | 450,000 | | | Sempra Energy
Senior Unsecured Notes
9.800%, 02/15/19 | | | 605,552 | |
| | | | | | | | |
| | | | | | | 1,860,758 | |
| | | | | | | | |
| | |
| | | | Total Corporate Notes and Bonds
(Cost $28,447,143) | | | 30,720,839 | |
| | | | | | | | |
|
| | U.S. GOVERNMENT AND AGENCY OBLIGATIONS – 33.94% | |
| | |
| | | | Fannie Mae – 7.04% | | | | |
| | 214,900 | | | 6.000%, 11/01/17,
Pool # 662854 | | | 230,818 | |
| | 72,696 | | | 6.000%, 04/01/18,
Pool # 725175 | | | 76,919 | |
| | 192,085 | | | 5.500%, 11/01/18,
Pool # 748886 | | | 204,114 | |
| | 71,860 | | | 4.500%, 06/01/19,
Pool # 747860 | | | 76,947 | |
| | 360,429 | | | 6.000%, 01/01/21,
Pool # 850787 | | | 399,263 | |
| | 106,866 | | | 6.000%, 09/01/32,
Pool # 847899 | | | 117,097 | |
| | 90,638 | | | 6.000%, 02/01/34,
Pool # 771952 | | | 100,635 | |
| | 79,577 | | | 7.500%, 02/01/35,
Pool # 787557 | | | 92,590 | |
| | 19,032 | | | 7.500%, 04/01/35,
Pool # 819231 | | | 20,475 | |
| | 138,464 | | | 6.000%, 11/01/35,
Pool # 844078 | | | 151,654 | |
| | 137,204 | | | 5.000%, 05/01/36,
Pool # 745581 | | | 149,234 | |
| | 84,134 | | | 6.000%, 12/01/36,
Pool # 888029 | | | 92,424 | |
| | 112,259 | | | 5.500%, 06/01/37,
Pool # 918778 | | | 122,411 | |
| | | | | | | | |
Par Value | | | | | Market
Value | |
| | |
| | | | Fannie Mae (continued) | | | | |
| | $ 116,060 | | | 6.500%, 10/01/37,
Pool # 888890 | | $ | 128,293 | |
| | 343,834 | | | 5.500%, 03/01/38,
Pool # 962344 | | | 374,929 | |
| | 274,258 | | | 4.000%, 02/01/41,
Pool # AE0949 | | | 289,039 | |
| | 234,076 | | | 4.000%, 02/01/41,
Pool # AH5695 | | | 247,174 | |
| | 976,896 | | | 3.000%, 03/01/43,
Pool # AB8615 | | | 964,868 | |
| | | | | | | | |
| | | | | | | 3,838,884 | |
| | | | | | | | |
| | |
| | | | Freddie Mac – 8.76% | | | | |
| | 345,313 | | | 5.500%, 11/01/20,
Gold Pool # G18083 | | | 375,903 | |
| | 71,291 | | | 5.500%, 12/01/20,
Gold Pool # G11820 | | | 77,591 | |
| | 54,385 | | | 6.000%, 10/01/35,
Gold Pool # A47772 | | | 60,023 | |
| | 134,526 | | | 5.500%, 05/01/37,
Gold Pool # A60048 | | | 145,620 | |
| | 242,997 | | | 5.500%, 09/01/37,
Gold Pool # G03202 | | | 263,037 | |
| | 210,360 | | | 5.000%, 02/01/38,
Gold Pool # A73409 | | | 226,802 | |
| | 471,815 | | | 5.000%, 04/01/38,
Gold Pool # G04334 | | | 509,608 | |
| | 255,783 | | | 4.000%, 12/01/39,
Gold Pool # G06935 | | | 268,918 | |
| | 125,056 | | | 4.000%, 05/01/41,
Gold Pool # Q00870 | | | 131,540 | |
| | 751,302 | | | 4.000%, 11/01/41,
Gold Pool # Q04550 | | | 790,477 | |
| | 974,699 | | | 3.000%, 04/01/43,
Gold Pool # V80006 | | | 957,796 | |
| | 981,897 | | | 3.000%, 05/01/43,
Gold Pool # G08525 | | | 966,393 | |
| | | | | | | | |
| | | | | | | 4,773,708 | |
| | | | | | | | |
| |
| | | | Government National Mortgage Association – 2.21% | |
| | 166,551 | | | 5.000%, 05/20/37,
Pool # 782156 | | | 182,331 | |
| | 354,831 | | | 5.000%, 08/20/37,
Pool # 4015 | | | 387,341 | |
| | 301,300 | | | 6.000%, 07/20/38,
Pool # 4195 | | | 336,811 | |
| | 190,944 | | | 5.500%, 08/20/38,
Pool # 4215 | | | 201,322 | |
| | 88,467 | | | 6.000%, 01/15/39,
Pool # 698036 | | | 97,859 | |
| | | | | | | | |
| | | | | | | 1,205,664 | |
| | | | | | | | |
| |
| | | | U.S. Treasury Inflation Index Bonds – 5.59% | |
| | 1,626,795 | | | 1.375%, 07/15/18 | | | 1,793,795 | |
| | 1,116,330 | | | 1.750%, 01/15/28 | | | 1,255,261 | |
| | | | | | | | |
| | | | | | | 3,049,056 | |
| | | | | | | | |
See accompanying Notes to Financial Statements.
| | |
| |
| ASTON/TCH Fixed Income Fund | | October 31, 2013 |
| |
| Schedule of Investments – continued | | |
| | | | | | | | |
Par Value | | | | | Market
Value | |
| | |
| | | | U.S. Treasury Note – 10.34% | | | | |
| | $1,500,000 | | | 4.000%, 02/15/15 | | $ | 1,573,359 | |
| | 1,000,000 | | | 2.125%, 05/31/15 | | | 1,029,688 | |
| | 1,500,000 | | | 2.000%, 01/31/16 | | | 1,554,962 | |
| | 1,500,000 | | | 2.000%, 11/15/21 | | | 1,476,797 | |
| | | | | | | | |
| | | | | | | 5,634,806 | |
| | | | | | | | |
| | |
| | | | Total U.S. Government and Agency Obligations
(Cost $17,957,297) | | | 18,502,118 | |
| | | | | | | | |
| |
| | ASSET-BACKED SECURITIES – 1.71% | | | | |
| | |
| | 269,675 | | | Ford Credit Auto Owner Trust
Series 2010-A, Class A4
2.150%, 06/15/15 | | | 270,838 | |
| | 152,664 | | | Hyundai Auto Receivables Trust
Series 2010-A, Class A4
2.450%, 12/15/16 | | | 154,590 | |
| | 500,000 | | | Volkswagen Auto Loan Enhanced Trust
Series 2011-1, Class A4
1.980%, 09/20/17 | | | 506,440 | |
| | | | | | | | |
| | |
| | | | Total Asset-Backed Securities
(Cost $931,876) | | | 931,868 | |
| | | | | | | | |
|
| | COMMERCIAL MORTGAGE-BACKED SECURITIES – 1.38% | |
| | |
| | 275,000 | | | Bear Stearns Commercial Mortgage Securities
Series 2007-T28, Class A4
5.742%, 09/11/42 (c) | | | 313,610 | |
| | 432,971 | | | Citigroup Commercial Mortgage
Series 2004-C1, Class A4
5.432%, 04/15/40 (c) | | | 438,242 | |
| | | | | | | | |
| | |
| | | | Total Commercial Mortgage-Backed Securities
(Cost $638,396) | | | 751,852 | |
| | | | | | | | |
| Total Investments – 93.39%
(Cost $47,974,712)* | | | 50,906,677 | |
| | | | | | | | |
| Net Other Assets and Liabilities – 6.61% | | | 3,605,983 | |
| | | | | | | | |
| Net Assets – 100.00% | | $ | 54,512,660 | |
| | | | | | | | |
| * | | Aggregate cost for Federal income tax purposes is $47,772,348. |
| | | | |
Gross unrealized appreciation | | $ | 3,712,313 | |
Gross unrealized depreciation | | | (577,984 | ) |
| | | | |
Net unrealized appreciation | | $ | 3,134,329 | |
| | | | |
| (a) | | Step Coupon. A bond that pays an initial coupon rate for the first period and then a higher coupon rate for the following periods until maturity. The coupon rate shown will be accrual rate until maturity. |
| (b) | | Securities exempt from registration under Rule 144A of the Securities Act of 1933, as amended. These securities are purchased in accordance with guidelines approved by the Fund’s Board of Trustees and may only be resold, in transactions exempt from registration, to qualified institutional buyers. At October 31, 2013, these securities amounted to $3,997,144 or 7.33% of net assets. These securities have not been determined by the Subadviser to be illiquid securities. |
| (c) | | Variable rate bond. The interest rate shown reflects the rate in effect at October 31, 2013. |
| (d) | | S&P credit ratings are used in the absence of a rating by Moody’s Investors, Inc. |
| GMTN | | Global Medium Term Note |
| | | | |
Portfolio Composition | | | | |
U.S. Government and Agency Obligations | | | 34% | |
Asset-Backed Securities | | | 2% | |
Commercial Mortgage-Backed Securities | | | 1% | |
Net Other Assets and Liabilities | | | 7% | |
Corporate Notes and Bonds
(Moody’s Ratings (d) unaudited) | | | | |
Aa | | | 1% | |
A | | | 9% | |
Baa | | | 32% | |
Ba | | | 13% | |
B | | | 1% | |
| | | | |
| | | 100% | |
| | | | |
See accompanying Notes to Financial Statements.
ASTON/Lake Partners LASSO Alternatives Fund
| | |
| |
| Portfolio Manager Commentary (unaudited) | | October 31, 2013 |
| Frederick C. Lake & Ronald A. Lake |
| Q. | What were the most significant market factors affecting Fund performance and returns relative to the benchmark during the past 12 months? |
| A. | Class I Shares of the Fund gained 9.31%. Although the benchmark (the HFRX Equity Hedge Index) gained 9.29%, it was more volatile. |
Generally, the Fund’s strategic diversification and moderate equity exposure enabled it to participate in the stock market’s upside while it sought to dampen downside volatility. Stocks have benefited from excess liquidity, low rates, improving corporate profitability, and expanding price/earnings multiples. For the S&P 500, this has meant a banner increase of 27.2% for the fiscal year. Considering that the Fund’s composite net equity exposure averaged around 30%, its return of 9.31% for the period is higher than might otherwise have been expected.
Although equities have done well, markets have had to contend with a series of political and policy uncertainties, including Washington’s dysfunction over the budget and debt ceiling, the Federal Reserve’s (Fed) mixed signals about “tapering,” the overhang of debt and austerity in Europe, doubts over the structural reforms promised under “Abenomics” in Japan, and China’s struggle to reign in financial excesses. Such uncertainties have triggered bouts of downside volatility. Most notably, the S&P 500 suffered three corrections starting in May, when the Fed first raised the likelihood of “tapering.” This led to a drop of -5.6% from May 21 through June 24. The S&P 500 then lost -4.5% during most of August, again on “tapering” concerns. The index corrected -4.0% between September 18 and October 8, this time in anticipation of the debt ceiling debate.
Bond markets also have faced volatility. The Barclays U.S. Bond Aggregate was flat for much of the first half of the fiscal year, and then tumbled over -4.0% from mid-May through early September. Although the index subsequently recovered much of this drop, it finished the fiscal year down -1.08%. In contrast, the Fund’s allocations to strategic fixed income and hedged credit contributed
positively to returns, despite feeling some of the bond market’s knock-on effects.
| Q. | What were the best performing holdings for the Fund during the period? |
| A. | The bulk of the Fund’s gains came from the core equity-oriented strategies, which included long-biased, U.S. multi-asset, and hedged-equity managers. Secondarily, arbitrage-related allocations also contributed. |
| Q. | What were the weakest performing holdings? |
| A. | Global macro, strategic fixed income, and hedged credit were modestly positive or flat. |
| Q. | How was the Fund positioned as of October 31, 2013? |
| A. | Equity-oriented funds (long-biased; hedged; multi-asset; global strategies) accounted for nearly 54% of the portfolio. Other allocations included 15% to strategic fixed income, 8% to hedged credit, 18% to arbitrage (merger arbitrage; convertible arbitrage) and 5% to global macro. |
Throughout the year, we positioned the portfolio to dampen the risk of conventional asset classes while aiming for relatively stable returns, by:
| | • | | Diversifying across a mix of less correlated strategies, combining strategic fixed income, hedged credit, arbitrage, and global macro with long/short and long-biased equities. |
| | • | | Maintaining moderate composite net equity exposures. |
| | • | | Being proactive in adjusting the mix of strategies incrementally to take advantage of opportunities or to sidestep potential risks. |
Volatility is likely to remain a feature of the investment landscape, as unresolved policy and political issues create uncertainty for investors. We therefore intend to maintain a diversified mix of strategies in an effort to mitigate volatility, while maintaining the potential to generate attractive risk-adjusted returns.
Growth of a Hypothetical
$10,000 Investment—Class I
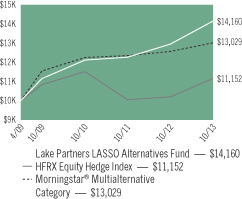
All dividends and capital gains are reinvested. Indexes are unmanaged and do not take into account fees, expenses or other costs.
Returns shown in the chart and table do not reflect taxes that a shareholder would pay on Fund distributions or on the sale of the Fund shares.
A fund-of-funds that invests in funds using alternative or hedging strategies may be exposed to potentially dramatic changes in the value of certain of its portfolio holdings. Investments in a fund-of-funds are subject to higher costs than investing directly in the underlying funds.
RETURNSFOR PERIOD ENDED 10/31/13
Average Annual Total Returns - Class N
| | | | |
One Year | | | 9.05 | % |
Since Inception | | | 5.31 | % |
Inception Date 03/03/10
Average Annual Total Returns - Class I
| | | | |
One Year | | | 9.31 | % |
Since Inception | | | 7.88 | % |
Inception Date 04/01/09*
* The Fund commenced operations on April 1, 2009. Because the Fund invests primarily in open-end investment companies which are priced as of the close of the NYSE, performance is shown from April 2, 2009.
The performance data quoted represents past performance. Past performance does not guarantee future results. Investment return and principal value will fluctuate so that an investor’s shares, upon redemption, may be worth more or less than their original cost. Current performance may be lower or higher than the performance data quoted. For performance data current to the most recent month-end, please visit our website at www.astonfunds.com.
The performance quoted would have been lower if fee waivers and/or expense reimbursements had not been in effect.
The oldest Share Class, Class I, is being shown in the above chart. Performance would have been lower for Class N Shares, due to higher fees and expenses.
| | |
| |
| ASTON/Lake Partners LASSO Alternatives Fund | | October 31, 2013 |
| |
| Schedule of Investments | | |
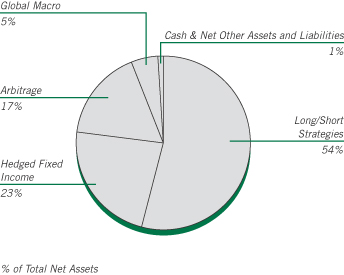
| | | | | | | | |
Shares | | | | | Market
Value | |
|
| | INVESTMENT COMPANIES – 99.91% | |
| | |
| | | | Long/Short Strategies – 53.75% | | | | |
| | 502,873 | | | BlackRock Emerging Markets Long/Short Equity Fund-IS | | $ | 5,431,032 | |
| | 1,411,761 | | | Blackrock Global Long/Short Equity Fund-IS | | | 16,447,015 | |
| | 1,455,460 | | | Convergence Core Plus Fund | | | 24,859,252 | |
| | 1,157,118 | | | Driehaus Emerging Markets Small Cap Growth Fund | | | 14,035,840 | |
| | 1,529,273 | | | FPA Crescent Fund-I | | | 50,450,702 | |
| | 365,476 | | | Gotham Absolute Return Fund | | | 4,652,507 | |
| | 3,079,094 | | | Robeco Boston Partners Long/Short Equity Fund-IS | | | 66,631,592 | |
| | 4,430,087 | | | The Weitz Funds - Partners III Opportunity Fund | | | 70,571,283 | |
| | | | | | | | |
| | | | | | | 253,079,223 | |
| | | | | | | | |
| |
| | | | Hedged Credit and Strategic Fixed Income – 22.91% | |
| | 2,079,200 | | | Avenue Credit Strategies Fund | | | 23,411,794 | |
| | 1,479,948 | | | BlackRock Global Long/Short Credit Fund-INS * | | | 15,894,637 | |
| | 2,607 | | | Driehaus Active Income Fund | | | 28,082 | |
| | 607,624 | | | Guggenheim - Macro Opportunities Fund | | | 16,266,094 | |
| | 1,361,444 | | | Metropolitan West Unconstrained Bond Fund | | | 16,024,202 | |
| | 925,196 | | | PIMCO Income Fund | | | 11,453,927 | |
| | 794,614 | | | PIMCO Mortgage Opportunities Fund | | | 8,756,644 | |
| | 1,352,927 | | | Scout Unconstrained Bond Fund | | | 16,032,189 | |
| | | | | | | | |
| | | | | | | 107,867,569 | |
| | | | | | | | |
| | |
| | | | Arbitrage – 17.53% | | | | |
| | 1,863,058 | | | Calamos Market Neutral Income Fund | | | 24,163,857 | |
| | 5,245,527 | | | Touchstone Merger Arbitrage Fund | | | 58,382,716 | |
| | | | | | | | |
| | | | | | | 82,546,573 | |
| | | | | | | | |
| | | | | | | | |
Shares | | | | | Market
Value | |
| | |
| | | | Global Macro – 4.95% | | | | |
| | 2,118,580 | | | John Hancock Funds II - Global Absolute Return Strategies Fund | | $ | 23,325,565 | |
| | | | | | | | |
| | |
| | | | Money Market – 0.77% | | | | |
| | 3,610,939 | | | Blackrock Liquidity Funds Treasury Trust Fund Portfolio | | | 3,610,939 | |
| | | | | | | | |
| | |
| | | | Total Investment Companies
(Cost $442,546,622) | | | 470,429,869 | |
| | | | | | | | |
| Total Investments – 99.91%
(Cost $442,546,622)** | | | 470,429,869 | |
| | | | | | | | |
| Net Other Assets and Liabilities – 0.09% | | | 432,924 | |
| | | | | | | | |
| Net Assets – 100.00% | | $ | 470,862,793 | |
| | | | | | | | |
| * | | Non-income producing security. |
| ** | | Aggregate cost for Federal income tax purposes is $442,644,082. |
| | | | |
Gross unrealized appreciation | | $ | 28,773,545 | |
Gross unrealized depreciation | | | (987,758 | ) |
| | | | |
Net unrealized appreciation | | $ | 27,785,787 | |
| | | | |
See accompanying Notes to Financial Statements.
ASTON/Anchor Capital Enhanced Equity Fund
| | |
| |
| Portfolio Manager Commentary (unaudited) | | October 31, 2013 |
| | Ronald L. Altman |
| Q. | What were the most significant market factors affecting Fund performance and returns relative to the benchmark during the past 12 months? |
| A. | The Fund’s Class N Shares posted a solid 12.60% gain for the 12 months ending October 31, 2013, but significantly lagged its long-only S&P 500 Index benchmark. Our strategy of selling call options and buying index puts as a hedge against potential market volatility weighed on results amid a strong equity rally for most of the period. Putting the Fund’s performance into perspective relative to its risk profile versus the benchmark, however, we think illuminates the quality of its returns. The Fund’s beta (a measure of volatility) in the past year was 0.45, meaning that it delivered its returns with less than half the market’s volatility. This was highlighted during the brief stock selloff from mid-May to mid-June 2013, when the Fund declined less dramatically than the sharply declining S&P 500. Thus, on a risk-adjusted basis, we believe the Fund’s returns were roughly in line with the benchmark the past year. |
| Q. | What were the best performing holdings for the Fund during the period? |
| A. | The stock-only returns were better than average compared with the benchmark the past 12 months, highlighting the negative effect of our hedging strategy amid the market rally. We were aggressive in terms of rotating the holdings once an individual position came close to our calculation of its intrinsic value. The best performing areas in the portfolio included durable goods within Consumer Discretionary, and the Energy and Technology sectors. |
| Q. | What were the weakest performing holdings? |
| A. | Other than the notable drag from our hedging strategy, the portfolio fell materially short of the benchmark in Utilities. Stock-picking in all the other major segments of the equity market were either equal or better than the index. |
| Q. | How was the Fund positioned as of October 31, 2013? |
| A. | We are comfortable with the current positioning in the portfolio, as we believe the mix of stocks owned is well positioned fundamentally. Given that correlations between sectors of the market are extremely low relative to historical norms, the data suggests that this is a stock-pickers market. Overall, we continue to focus on those companies with above-average dividend yields where fundamentals suggest that those dividends can increase. The combination of high-yield and attractive valuations relative to cash flow and revenue have always been a critical aspect of our investment process, and will remain so. We are maintaining our strategy of hedging the portfolio by selling call options on individual holdings in seeking to capture incremental income and buying index put options to help guard against a meaningful market decline, as we believe that minimizing volatility is the best avenue towards delivering strong long-term results. |
Growth of a Hypothetical
$10,000 Investment—Class N
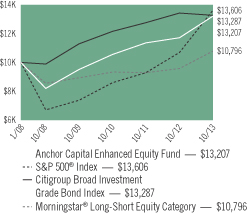
All dividends and capital gains are reinvested. Indexes are unmanaged and do not take into account fees, expenses or other costs.
Returns shown in the chart and table do not reflect taxes that a shareholder would pay on Fund distributions or on the sale of the Fund shares.
By selling covered call options, the Fund limits its opportunity to profit from an increase in the price of the underlying stock above the exercise price, but continues to bear the risk of a decline in the stock. A liquid market may not exist for options held by the Fund. If the Fund is not able to close out an options transaction, it will not be able to sell the underlying security until the option expires or is exercised. If the Fund receives premiums for writing the call options, the price it realizes from the exercise of an option could be substantially below a stock’s current market price. Premiums from the Fund’s sale of call options typically will result in short-term capital gains for federal income tax purposes.
RETURNSFOR PERIOD ENDED 10/31/13
Average Annual Total Returns - Class N
| | | | |
One Year | | | 12.60 | % |
Five Year | | | 9.98 | % |
Since Inception | | | 4.92 | % |
Inception Date 01/15/08
Average Annual Total Returns - Class I
| | | | |
One Year | | | 12.88 | % |
Since Inception | | | 7.98 | % |
Inception Date 03/03/10
The performance data quoted represents past performance. Past performance does not guarantee future results. Investment return and principal value will fluctuate so that an investor’s shares, upon redemption, may be worth more or less than their original cost. Current performance may be lower or higher than the performance data quoted. For performance data current to the most recent month-end, please visit our website at www.astonfunds.com.
| | |
| |
| ASTON/Anchor Capital Enhanced Equity Fund | | October 31, 2013 |
| |
| Schedule of Investments | | |
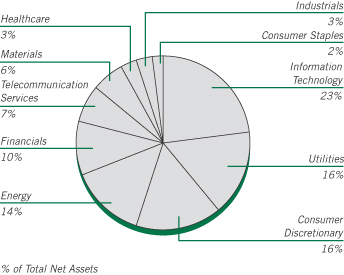
| | | | | | | | |
Shares | | | | | Market
Value | |
|
| | COMMON STOCKS – 101.08% | |
| | |
| | | | Consumer Discretionary – 15.61% | | | | |
| | 65,000 | | | Coach (a) | | $ | 3,294,200 | |
| | 431,500 | | | Ford Motor (a) | | | 7,382,965 | |
| | 109,200 | | | Kohl’s (a) | | | 6,202,560 | |
| | 500,000 | | | Staples (a) | | | 8,060,000 | |
| | | | | | | | |
| | | | | | | 24,939,725 | |
| | | | | | | | |
| | |
| | | | Consumer Staples – 2.39% | | | | |
| | 120,000 | | | ConAgra Foods (a) | | | 3,817,200 | |
| | | | | | | | |
| | |
| | | | Energy – 13.95% | | | | |
| | 45,000 | | | Anadarko Petroleum (a) | | | 4,288,050 | |
| | 61,000 | | | Apache (a) | | | 5,416,800 | |
| | 75,000 | | | Devon Energy (a) | | | 4,741,500 | |
| | 27,000 | | | Occidental Petroleum (a) | | | 2,594,160 | |
| | 185,000 | | | Peabody Energy (a) | | | 3,603,800 | |
| | 35,000 | | | Transcocean (Switzerland) (a) | | | 1,647,450 | |
| | | | | | | | |
| | | | | | | 22,291,760 | |
| | | | | | | | |
| | |
| | | | Financials – 10.01% | | | | |
| | 140,000 | | | BB&T (a) | | | 4,755,800 | |
| | 140,000 | | | Hartford Financial Services Group (a) | | | 4,718,000 | |
| | 550,000 | | | Huntington Bancshares (a) | | | 4,840,000 | |
| | 50,000 | | | SunTrust Banks (a) | | | 1,682,000 | |
| | | | | | | | |
| | | | | | | 15,995,800 | |
| | | | | | | | |
| | |
| | | | Healthcare – 3.53% | | | | |
| | 15,000 | | | Abbott Laboratories (a) | | | 548,250 | |
| | 85,000 | | | Quest Diagnostics (a) | | | 5,092,350 | |
| | | | | | | | |
| | | | | | | 5,640,600 | |
| | | | | | | | |
| | |
| | | | Industrials – 3.33% | | | | |
| | 65,000 | | | Deere (a) | | | 5,319,600 | |
| | | | | | | | |
| | | | | | | | |
Shares | | | | | Market
Value | |
| |
| | | | Information Technology – 23.48% | |
| | 165,000 | | | Applied Materials (a) | | $ | 2,945,250 | |
| | 230,000 | | | Cisco Systems (a) | | | 5,175,000 | |
| | 460,000 | | | Corning (a) | | | 7,861,400 | |
| | 280,000 | | | Intel (a) | | | 6,840,400 | |
| | 195,000 | | | Microsoft (a) | | | 6,893,250 | |
| | 416,300 | | | Nokia OYJ, SP ADR * (a) | | | 3,176,369 | |
| | 95,000 | | | Seagate Technology (Ireland) (a) | | | 4,624,600 | |
| | | | | | | | |
| | | | | | | 37,516,269 | |
| | | | | | | | |
| | |
| | | | Materials – 6.11% | | | | |
| | 370,000 | | | Alcoa (a) | | | 3,429,900 | |
| | 90,000 | | | Dow Chemical (a) | | | 3,552,300 | |
| | 120,000 | | | Huntsman (a) | | | 2,786,400 | |
| | | | | | | | |
| | | | | | | 9,768,600 | |
| | | | | | | | |
| |
| | | | Telecommunication Services – 7.12% | |
| | 155,000 | | | AT&T (a) | | | 5,611,000 | |
| | 170,000 | | | CenturyLink (a) | | | 5,756,200 | |
| | | | | | | | |
| | | | | | | 11,367,200 | |
| | | | | | | | |
| | |
| | | | Utilities – 15.55% | | | | |
| | 73,000 | | | Entergy (a) | | | 4,724,560 | |
| | 160,000 | | | Exelon (a) | | | 4,566,400 | |
| | 130,000 | | | FirstEnergy (a) | | | 4,923,100 | |
| | 150,000 | | | PPL (a) | | | 4,594,500 | |
| | 180,000 | | | Public Service Enterprise Group (a) | | | 6,030,000 | |
| | | | | | | | |
| | | | | | | 24,838,560 | |
| | | | | | | | |
| | |
| | | | Total Common Stocks
(Cost $151,689,285) | | | 161,495,314 | |
| | | | | | | | |
Number of
Contracts | | | | | | |
| |
| | PURCHASED OPTIONS – 0.19% | | | | |
| | |
| | | | SPDR S&P 500 ETF Trust | | | | |
| | 500 | | | Strike @ $148 Exp 11/13 | | | 1,500 | |
| | 250 | | | Strike @ $149 Exp 11/13 | | | 1,000 | |
| | 250 | | | Strike @ $150 Exp 11/13 | | | 750 | |
| | 1,000 | | | Strike @ $145 Exp 12/13 | | | 17,500 | |
| | 1,500 | | | Strike @ $146 Exp 12/13 | | | 25,000 | |
| | 1,500 | | | Strike @ $147 Exp 12/13 | | | 27,000 | |
| | 4,250 | | | Strike @ $148 Exp 12/13 | | | 67,000 | |
| | 3,750 | | | Strike @ $149 Exp 12/13 | | | 65,125 | |
| | 3,750 | | | Strike @ $150 Exp 12/13 | | | 70,000 | |
| | 1,500 | | | Strike @ $151 Exp 12/13 | | | 27,000 | |
| | | | | | | | |
| | |
| | | | Total Purchased Options
(Cost $1,444,839) | | | 301,875 | |
| | | | | | | | |
See accompanying Notes to Financial Statements.
| | |
| |
| ASTON/Anchor Capital Enhanced Equity Fund | | October 31, 2013 |
| |
| Schedule of Investments – continued | | |
| | | | | | | | |
Shares | | | | | Market
Value | |
| |
| | INVESTMENT COMPANY – 3.44% | | | | |
| | |
| | 5,497,242 | | | BlackRock Liquidity Funds TempCash Portfolio | | $ | 5,497,242 | |
| | | | | | | | |
| | |
| | | | Total Investment Company
(Cost $5,497,242) | | | 5,497,242 | |
| | | | | | | | |
| Total Investments – 104.71%
(Cost $158,631,366)** | | | 167,294,431 | |
| Net Other Assets and Liabilities – (4.71)% | | | (7,532,507 | ) |
| | | | | | | | |
| Net Assets – 100.00% | | $ | 159,761,924 | |
| | | | | | | | |
| * | | Non-income producing security. |
| ** | | Aggregate cost for Federal income tax purposes is $158,663,149. |
| | | | |
Gross unrealized appreciation | | $ | 14,437,691 | |
Gross unrealized depreciation | | | (5,806,409 | ) |
| | | | |
Net unrealized appreciation | | $ | 8,631,282 | |
| | | | |
| (a) | | All of these securities are pledged as collateral for written options. |
| SP ADR | | Sponsored American Depositary Receipt |
| SPDR | | Standard & Poor’s Depositary Receipt |
Transactions in written call options for the period ended October 31, 2013 were as follows:
| | | | | | | | |
| Contracts | | Number of Contracts | | | Premium | |
Outstanding, October 31, 2012 | | | 56,326 | | | $ | 3,939,696 | |
Call Options Written | | | 273,634 | | | | 19,259,884 | |
Call Options Closed or Expired | | | (269,813 | ) | | | (18,879,298 | ) |
Call Options Exercised | | | (1,317 | ) | | | (159,380 | ) |
| | | | | | | | |
Outstanding, October 31, 2013 | | | 58,830 | | | $ | 4,160,902 | |
| | | | | | | | |
Premiums received and value of written call equity options outstanding as of October 31, 2013.
| | | | | | | | | | | | |
Number of
Contracts | | | Description | | Premium
Received | | | Market
Value | |
| | | | Abbott Laboratories | | | | | | | | |
| | 100 | | | Strike @ $39 Exp 5/14 | | | $ 8,500 | | | | $ 10,100 | |
| | 50 | | | Strike @ $40 Exp 5/14 | | | 3,700 | | | | 3,125 | |
| | | |
| | | | Alcoa | | | | | | | | |
| | 2,450 | | | Strike @ $10 Exp 4/14 | | | 41,629 | | | | 105,350 | |
| | 500 | | | Strike @ $11 Exp 4/14 | | | 10,482 | | | | 11,500 | |
| | 650 | | | Strike @ $9 Exp 4/14 | | | 24,777 | | | | 57,850 | |
| | | |
| | | | Anadarko Petroleum | | | | | | | | |
| | 450 | | | Strike @ $110 Exp 5/14 | | | 113,369 | | | | 122,400 | |
| | | |
| | | | Apache | | | | | | | | |
| | 610 | | | Strike @ $90 Exp 4/14 | | | 95,750 | | | | 295,850 | |
| | | |
| | | | Applied Materials | | | | | | | | |
| | 650 | | | Strike @ $16 Exp 4/14 | | | 51,460 | | | | 148,525 | |
| | 1,000 | | | Strike @ $17 Exp 4/14 | | | 66,960 | | | | 168,000 | |
| | | | | | | | | | | | |
Number of
Contracts | | | Description | | Premium
Received | | | Market
Value | |
| | | | AT&T | | | | | | | | |
| | 50 | | | Strike @ $36 Exp 4/14 | | | $ 2,800 | | | | $ 7,600 | |
| | 1,150 | | | Strike @ $37 Exp 4/14 | | | 62,538 | | | | 113,850 | |
| | 350 | | | Strike @ $38 Exp 4/14 | | | 14,510 | | | | 22,750 | |
| | | |
| | | | BB&T | | | | | | | | |
| | 100 | | | Strike @ $37 Exp 6/14 | | | 6,496 | | | | 6,050 | |
| | 1,250 | | | Strike @ $38 Exp 6/14 | | | 62,204 | | | | 49,375 | |
| | | |
| | | | CenturyLink | | | | | | | | |
| | 1,500 | | | Strike @ $38 Exp 4/14 | | | 44,989 | | | | 41,250 | |
| | | |
| | | | Cisco Systems | | | | | | | | |
| | 101 | | | Strike @ $25 Exp 4/14 | | | 7,167 | | | | 5,454 | |
| | 900 | | | Strike @ $25 Exp 7/14 | | | 65,020 | | | | 67,500 | |
| | 10 | | | Strike @ $26 Exp 7/14 | | | 500 | | | | 540 | |
| | 589 | | | Strike @ $27 Exp 7/14 | | | 22,128 | | | | 22,971 | |
| | | |
| | | | Coach | | | | | | | | |
| | 250 | | | Strike @ $55 Exp 5/14 | | | 45,741 | | | | 50,000 | |
| | 350 | | | Strike @ $57.50 Exp 5/14 | | | 46,217 | | | | 45,500 | |
| | 50 | | | Strike @ $60 Exp 5/14 | | | 4,698 | | | | 4,300 | |
| | | |
| | | | ConAgra Foods | | | | | | | | |
| | 150 | | | Strike @ $33 Exp 3/14 | | | 8,969 | | | | 12,150 | |
| | 150 | | | Strike @ $34 Exp 3/14 | | | 6,595 | | | | 6,375 | |
| | 250 | | | Strike @ $35 Exp 3/14 | | | 10,941 | | | | 6,250 | |
| | 200 | | | Strike @ $36 Exp 3/14 | | | 6,793 | | | | 2,500 | |
| | 50 | | | Strike @ $33 Exp 6/14 | | | 4,448 | | | | 6,000 | |
| | 100 | | | Strike @ $34 Exp 6/14 | | | 6,971 | | | | 8,100 | |
| | 200 | | | Strike @ $35 Exp 6/14 | | | 11,443 | | | | 10,000 | |
| | | |
| | | | Corning | | | | | | | | |
| | 4,600 | | | Strike @ $19 Exp 5/14 | | | 66,135 | | | | 276,000 | |
| | | |
| | | | Deere | | | | | | | | |
| | 300 | | | Strike @ $95 Exp 6/14 | | | 52,088 | | | | 36,600 | |
| | | |
| | | | Devon Energy | | | | | | | | |
| | 250 | | | Strike @ $65 Exp 4/14 | | | 46,241 | | | | 80,000 | |
| | 500 | | | Strike @ $70 Exp 4/14 | | | 44,360 | | | | 79,000 | |
| | | |
| | | | Dow Chemical | | | | | | | | |
| | 600 | | | Strike @ $37 Exp 1/14 | | | 55,065 | | | | 201,000 | |
| | 300 | | | Strike @ $38 Exp 1/14 | | | 32,699 | | | | 73,200 | |
| | | |
| | | | Entergy | | | | | | | | |
| | 730 | | | Strike @ $72.50 Exp 5/14 | | | 50,140 | | | | 25,550 | |
| | | |
| | | | Exelon | | | | | | | | |
| | 434 | | | Strike @ $35 Exp 4/14 | | | 14,361 | | | | 4,340 | |
| | 1,066 | | | Strike @ $36 Exp 4/14 | | | 25,807 | | | | 5,330 | |
| | | |
| | | | FirstEnergy | | | | | | | | |
| | 60 | | | Strike @ $43 Exp 1/14 | | | 2,340 | | | | 750 | |
| | 1,040 | | | Strike @ $43 Exp 4/14 | | | 37,895 | | | | 29,120 | |
| | | |
| | | | Ford Motor | | | | | | | | |
| | 200 | | | Strike @ $15 Exp 3/14 | | | 38,717 | | | | 49,400 | |
| | 800 | | | Strike @ $16 Exp 3/14 | | | 60,679 | | | | 144,000 | |
| | 2,800 | | | Strike @ $18 Exp 6/14 | | | 344,294 | | | | 285,600 | |
| | 515 | | | Strike @ $19 Exp 6/14 | | | 46,233 | | | | 36,565 | |
| | |
| | | | Hartford Financial Services | | | | | |
| | 400 | | | Strike @ $38 Exp 6/14 | | | 43,487 | | | | 44,000 | |
| | 1,000 | | | Strike @ $39 Exp 6/14 | | | 107,998 | | | | 85,500 | |
See accompanying Notes to Financial Statements.
| | |
| |
| ASTON/Anchor Capital Enhanced Equity Fund | | October 31, 2013 |
| |
| Schedule of Investments – continued | | |
| | | | | | | | | | | | |
Number of
Contracts | | | Description | | Premium
Received | | | Market
Value | |
| | | | Huntington Bancshares | | | | | | | | |
| | 2,800 | | | Strike @ $10 Exp 4/14 | | | $ 47,505 | | | | $ 44,800 | |
| | 1,000 | | | Strike @ $11 Exp 4/14 | | | 4,964 | | | | 6,500 | |
| | 1,600 | | | Strike @ $9 Exp 4/14 | | | 53,243 | | | | 75,200 | |
| | | |
| | | | Huntsman | | | | | | | | |
| | 700 | | | Strike @ $23 Exp 5/14 | | | 87,848 | | | | 161,000 | |
| | 425 | | | Strike @ $24 Exp 5/14 | | | 54,026 | | | | 72,250 | |
| | 75 | | | Strike @ $25 Exp 5/14 | | | 6,972 | | | | 10,125 | |
| | | |
| | | | Intel | | | | | | | | |
| | 1,800 | | | Strike @ $28 Exp 7/14 | | | 66,963 | | | | 81,000 | |
| | 1,000 | | | Strike @ $29 Exp 7/14 | | | 27,964 | | | | 31,000 | |
| | | |
| | | | Kohl’s | | | | | | | | |
| | 651 | | | Strike @ $52.50 Exp 4/14 | | | 172,837 | | | | 390,600 | |
| | 441 | | | Strike @ $57.50 Exp 4/14 | | | 49,356 | | | | 136,710 | |
| | | |
| | | | Microsoft | | | | | | | | |
| | 1,100 | | | Strike @ $33 Exp 4/14 | | | 184,374 | | | | 368,500 | |
| | 500 | | | Strike @ $36 Exp 5/14 | | | 79,981 | | | | 108,000 | |
| | 350 | | | Strike @ $37 Exp 7/14 | | | 42,796 | | | | 61,600 | |
| | | |
| | | | Nokia OYJ | | | | | | | | |
| | 1,163 | | | Strike @ $6 Exp 4/14 | | | 36,418 | | | | 209,340 | |
| | 3,000 | | | Strike @ $8 Exp 4/14 | | | 72,972 | | | | 183,000 | |
| | | |
| | | | Occidental Petroleum | | | | | | | | |
| | 50 | | | Strike @ $90 Exp 1/14 | | | 9,650 | | | | 39,250 | |
| | 50 | | | Strike @ $95 Exp 1/14 | | | 9,500 | | | | 22,250 | |
| | 150 | | | Strike @ $100 Exp 2/14 | | | 23,450 | | | | 45,000 | |
| | 20 | | | Strike @ $95 Exp 2/14 | | | 3,660 | | | | 9,600 | |
| | | |
| | | | Peabody Energy | | | | | | | | |
| | 100 | | | Strike @ $21 Exp 3./14 | | | 10,199 | | | | 13,000 | |
| | 150 | | | Strike @ $22 Exp 3/14 | | | 10,619 | | | | 17,250 | |
| | 300 | | | Strike @ $23 Exp 3/14 | | | 25,609 | | | | 19,650 | |
| | 1,300 | | | Strike @ $25 Exp 6/14 | | | 93,473 | | | | 96,200 | |
| | | |
| | | | PPL | | | | | | | | |
| | 400 | | | Strike @ $31 Exp 1/14 | | | 21,585 | | | | 20,400 | |
| | 597 | | | Strike @ $32 Exp 4/14 | | | 20,456 | | | | 29,850 | |
| | 503 | | | Strike @ $33 Exp 4/14 | | | 12,052 | | | | 10,060 | |
| | |
| | | | Public Service Enterprise Group | | | | | |
| | 1,800 | | | Strike @ $35 Exp 3/14 | | | 175,897 | | | | 108,000 | |
| | | |
| | | | Quest Diagnostics | | | | | | | | |
| | 300 | | | Strike @ $65 Exp 2/14 | | | 45,407 | | | | 33,000 | |
| | | |
| | | | Seagate Technology | | | | | | | | |
| | 600 | | | Strike @ $43 Exp 3/14 | | | 177,274 | | | | 420,000 | |
| | 300 | | | Strike @ $44 Exp 3/14 | | | 105,887 | | | | 189,750 | |
| | 50 | | | Strike @ $46 Exp 3/14 | | | 14,182 | | | | 25,250 | |
| | | |
| | | | Staples | | | | | | | | |
| | 1,600 | | | Strike @ $16 Exp 6/14 | | | 233,651 | | | | 236,800 | |
| | 400 | | | Strike @ $18 Exp 6/14 | | | 29,985 | | | | 30,400 | |
| | 1,500 | | | Strike @ $19 Exp 6/14 | | | 70,445 | | | | 72,000 | |
| | 1,500 | | | Strike @ $20 Exp 6/14 | | | 48,398 | | | | 48,000 | |
| | | |
| | | | SunTrust Banks | | | | | | | | |
| | 500 | | | Strike @ $30 Exp 1/14 | | | 72,480 | | | | 210,000 | |
| | | |
| | | | Transocean | | | | | | | | |
| | 50 | | | Strike @ $62.50 Exp 1/14 | | | 5,398 | | | | 225 | |
| | 100 | | | Strike @ $50 Exp 2/14 | | | 16,796 | | | | 11,700 | |
| | 100 | | | Strike @ $55 Exp 5/14 | | | 10,296 | | | | 6,900 | |
| | | | | | | | | | | | |
| | | |
| | | | Total Written Call Options | | | $4,160,902 | | | | $6,521,330 | |
| | | | | | | | | | | | |
See accompanying Notes to Financial Statements.
ASTON/River Road Long-Short Fund
| | |
| |
| Portfolio Manager Commentary (unaudited) | | October 31, 2013 |
| | |
| | Matthew W. Moran, CFA & Daniel R. Johnson, CFA, CPA |
| Q. | What were the most significant market factors affecting Fund performance and returns relative to the benchmark during the past 12 months? |
| A. | In the last 12 months, the Russell 3000 has returned +28.99%. The Class N Shares of the Fund returned +18.14%, capturing 70% of the market’s return with only 51% net exposure to the market over the same time period. Strong stock selection results in the long portfolio overcame weaker results in the short portfolio. The long portfolio returned +40.79% (outperforming the benchmark by 1,180 bps) and the short portfolio returned +31.36% (underperforming the benchmark by 237 bps). |
| Q. | What were the best performing holdings for the Fund during the period? |
| A. | The holdings with the largest positive contribution to total return during the period were Viacom Inc., DIRECTV, and Harris Teeter Supermarkets Inc. Viacom is a leading entertainment company that owns six of the top 25 cable networks based on subscribers. Strong results from its Nickelodeon franchise improved free cash flows and supported increasing share buybacks. DIRECTV is the world’s largest pay-TV company with a stable U.S. business and a rapidly growing Latin American segment. DIRECTV continues to maintain its U.S. subscriber base while investing for growth in Latin America and using its free cash flow to repurchase shares. Harris Teeter Supermarkets is an upscale grocery store that operates primarily in North Carolina. The company has been busy over the last few years – it sold its industrial thread business, changed its name from Ruddick Corp. to Harris Teeter Supermarkets Inc., and sold out in 2013. |
| Q. | What were the weakest performing holdings? |
| A. | The two holdings with the largest negative contribution to the Fund’s total return were a long position in Pan American Silver Corp. and a short position in Saks Inc. Pan American Silver is the fifth largest producer of silver in the world with a geographically diverse asset base and a long reserve life of 15 years. The stock |
| | declined along with falling precious metals prices and we eliminated the position due to our unrealized loss discipline. Saks is a luxury retailer that generates more than 20% of its sales from its New York City flagship store. Historically, the Saks brand has not resonated nationally, which has limited both growth prospects and leverage opportunities. We eliminated the position as it hit our stop-loss price after announcing it had hired Goldman Sachs to explore “strategic alternatives”. |
| Q. | How was the Fund positioned as of October 31, 2013? |
| A. | The Fund was below the low end of its normal net market exposure range (50 - 70%) at 43% at the end of October. Our proactive discount-to-Absolute-Value indicator was flashing extremely overvalued and the portfolio was positioned conservatively. |
Note: A basis point (bps) is a unit of measure. 1 bps = .01%.
Growth of a Hypothetical
$10,000 Investment—Class N
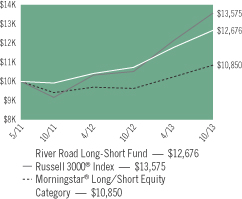
All dividends and capital gains are reinvested. Indexes are unmanaged and do not take into account fees, expenses or other costs.
Returns shown in the chart and table do not reflect taxes that a shareholder would pay on Fund distributions or on the sale of the Fund shares.
RETURNSFOR PERIOD ENDED 10/31/13
Average Annual Total Returns - Class N
| | | | |
One Year | | | 18.14 | % |
Since Inception | | | 9.97 | % |
Inception Date 05/04/11
Total Return - Class I
| | | | |
Cumulative Since Inception | | | 9.85 | % |
Inception Date 03/04/13
Short sales may involve the risk that the Fund will incur a loss by subsequently buying a security at a higher price than that at which it was previously sold short. Losses incurred on a short sale result from increases in the values of the securities, thus losses on a short sale are theoretically unlimited.
Value investing often involves buying the stocks of companies that are currently out-of-favor that may decline further. Investing in exchange-traded and closed-end funds subjects the Fund to the additional risk that shares of the underlying fund may trade at a premium or discount to their net asset value.
The performance data quoted represents past performance. Past performance does not guarantee future results. Investment return and principal value will fluctuate so that an investor’s shares, upon redemption, may be worth more or less than their original cost. Current performance may be lower or higher than the performance data quoted. For performance data current to the most recent month-end, please visit our website at www.astonfunds.com.
The performance quoted would have been lower if fee waivers and/or expense reimbursements had not been in effect.
The total expense ratio for the Class N and Class I Shares is 5.08% and 4.83% respectively, as disclosed in the prospectus dated February 28, 2013. Please refer to the Financial Highlights section in this report for more information.
| | |
| |
| ASTON/River Road Long-Short Fund | | October 31, 2013 |
| |
| Schedule of Investments | | |
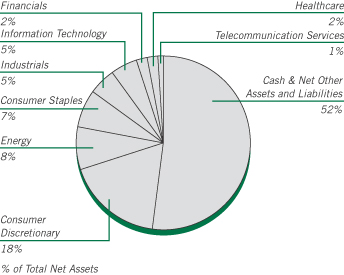
| | | | | | | | |
Shares | | | | | Market
Value | |
|
| | COMMON STOCKS – 72.17% | |
| | |
| | | | Consumer Discretionary – 25.88% | | | | |
| | 99,414 | | | Abercrombie & Fitch, Class A (a) | | $ | 3,726,036 | |
| | 40,661 | | | Ascent Capital Group, Class A * (a) | | | 3,432,601 | |
| | 67,401 | | | Coach (a) | | | 3,415,883 | |
| | 139,163 | | | Comcast, Class A (a) | | | 6,621,376 | |
| | 70,026 | | | DIRECTV * (a) | | | 4,375,925 | |
| | 130,826 | | | General Motors * (a) | | | 4,834,021 | |
| | 154,838 | | | International Speedway, Class A (a) | | | 5,064,751 | |
| | 207,565 | | | News, Class A * (a) | | | 3,653,144 | |
| | 181,287 | | | Quebecor, Class A (a) | | | 4,482,404 | |
| | 53,052 | | | Tribune, Class A * (a) | | | 3,551,831 | |
| | 41,572 | | | Viacom, Class B (a) | | | 3,462,532 | |
| | | | | | | | |
| | | | | | | 46,620,504 | |
| | | | | | | | |
| | |
| | | | Consumer Staples – 8.38% | | | | |
| | 95,314 | | | Dr Pepper Snapple Group (a) | | | 4,513,118 | |
| | 96,253 | | | Molson Coors Brewing, Class B (a) | | | 5,197,662 | |
| | 74,399 | | | Nestle, SP ADR (Switzerland) (a) | | | 5,387,232 | |
| | | | | | | | |
| | | | | | | 15,098,012 | |
| | | | | | | | |
| | |
| | | | Energy – 8.37% | | | | |
| | 81,381 | | | BP, SP ADR (a) | | | 3,784,217 | |
| | 67,487 | | | Devon Energy (a) | | | 4,266,528 | |
| | 46,002 | | | Occidental Petroleum (a) | | | 4,419,872 | |
| | 68,353 | | | World Fuel Services (a) | | | 2,607,667 | |
| | | | | | | | |
| | | | | | | 15,078,284 | |
| | | | | | | | |
| | |
| | | | Financials – 5.88% | | | | |
| | 115,351 | | | Loews (a) | | | 5,572,607 | |
| | 8,587 | | | White Mountains Insurance Group (Bermuda) (a) | | | 5,015,409 | |
| | | | | | | | |
| | | | | | | 10,588,016 | |
| | | | | | | | |
| | | | | | | | |
Shares | | | | | Market
Value | |
| | |
| | | | Healthcare – 1.98% | | | | |
| | 57,047 | | | Express Scripts * (a) | | $ | 3,566,578 | |
| | | | | | | | |
| | |
| | | | Industrials – 9.11% | | | | |
| | 146,303 | | | ADT (a) | | | 6,345,161 | |
| | 74,455 | | | Expeditors International of Washington (a) | | | 3,372,067 | |
| | 27,131 | | | FedEx (a) | | | 3,554,161 | |
| | 117,634 | | | Spirit AeroSystems Holdings, Class A * (a) | | | 3,139,651 | |
| | | | | | | | |
| | | | | | | 16,411,040 | |
| | | | | | | | |
| |
| | | | Information Technology – 7.32% | |
| | 98,788 | | | Microsoft (a) | | | 3,492,156 | |
| | 158,088 | | | Oracle (a) | | | 5,295,948 | |
| | 63,426 | | | QUALCOMM (a) | | | 4,406,204 | |
| | | | | | | | |
| | | | | | | 13,194,308 | |
| | | | | | | | |
| | |
| | | | Telecommunication Services – 2.80% | | | | |
| | 111,012 | | | Rogers Communications, Class B (Canada) (a) | | | 5,041,055 | |
| | | | | | | | |
| | |
| | | | Utilities – 2.45% | | | | |
| | 61,738 | | | National Fuel Gas (a) | | | 4,417,354 | |
| | | | | | | | |
| | |
| | | | Total Common Stocks
(Cost $122,619,952) | | | 130,015,151 | |
| | | | | | | | |
|
| | INVESTMENT COMPANY – 27.98% | |
| | |
| | 50,400,509 | | | BlackRock Liquidity Funds TempCash Portfolio | | | 50,400,509 | |
| | | | | | | | |
| | |
| | | | Total Investment Company
(Cost $50,400,509) | | | 50,400,509 | |
| | | | | | | | |
| Total Investments – 100.15%
(Cost $173,020,461)** | | | 180,415,660 | |
| | | | | | | | |
| $50,291,334 in cash and $55,280,742 in securities was segregated or
on deposit with a prime broker to cover short sales as of October 31,
2013 and are included in “Net Other Assets and Liabilities”. |
|
|
| | SHORT SALES – (29.25)% | |
|
| | COMMON STOCKS – (27.20)% | |
| |
| | | | Consumer Discretionary – (7.39)% | |
| | (33,436) | | | Dick’s Sporting Goods | | | (1,779,131 | ) |
| | (37,782) | | | Finish Line, Class A | | | (946,062 | ) |
| | (27,797) | | | Garmin (Switzerland) | | | (1,299,511 | ) |
| | (49,681) | | | Hyatt Hotels Corp, Class A * | | | (2,364,816 | ) |
| | (38,889) | | | Leggett & Platt | | | (1,156,559 | ) |
| | (17,903) | | | Life Time Fitness * | | | (813,154 | ) |
| | (27,830) | | | Mattress Firm Holding * | | | (836,570 | ) |
| | (30,418) | | | Monro Muffler Brake | | | (1,399,228 | ) |
| | (74,614) | | | PulteGroup | | | (1,316,937 | ) |
| | (29,748) | | | Vitamin Shoppe * | | | (1,395,479 | ) |
| | | | | | | | |
| | | | | | | (13,307,447 | ) |
| | | | | | | | |
See accompanying Notes to Financial Statements.
| | |
| |
| ASTON/River Road Long-Short Fund | | October 31, 2013 |
| |
| Schedule of Investments – continued | | |
| | | | | | | | |
Shares | | | | | Market
Value | |
| | |
| | | | Consumer Staples – (1.23)% | | | | |
| | (113,246) | | | Dean Foods * | | $ | (2,208,297 | ) |
| | | | | | | | |
| | | | | | | (2,208,297 | ) |
| | | | | | | | |
| | |
| | | | Financials – (3.89)% | | | | |
| | (49,792) | | | Amtrust Financial Services | | | (1,910,021 | ) |
| | (44,569) | | | CBL & Associates Properties, REIT | | | (882,912 | ) |
| | (74,776) | | | Equity One, REIT | | | (1,802,849 | ) |
| | (25,865) | | | Mercury General | | | (1,204,274 | ) |
| | (13,154) | | | Toronto-Dominion Bank (Canada) | | | (1,206,485 | ) |
| | | | | | | | |
| | | | | | | (7,006,541 | ) |
| | | | | | | | |
| | |
| | | | Industrials – (3.76)% | | | | |
| | (147,164) | | | ACCO Brands * | | | (860,909 | ) |
| | (16,153) | | | Caterpillar | | | (1,346,514 | ) |
| | (33,773) | | | Tetra Tech * | | | (882,488 | ) |
| | (78,230) | | | United Continental Holdings * | | | (2,655,909 | ) |
| | (37,794) | | | USG * | | | (1,032,154 | ) |
| | | | | | | | |
| | | | | | | (6,777,974 | ) |
| | | | | | | | |
| | |
| | | | Information Technology – (2.45)% | | | | |
| | (34,986) | | | Ezchip Semiconductor * | | | (906,137 | ) |
| | (105,647) | | | Global Cash Access Holdings * | | | (876,870 | ) |
| | (52,216) | | | RealPage * | | | (1,280,858 | ) |
| | (27,899) | | | Zebra Technologies, Class A * | | | (1,347,801 | ) |
| | | | | | | | |
| | | | | | | (4,411,666 | ) |
| | | | | | | | |
| | |
| | | | Materials – (2.16)% | | | | |
| | (92,724) | | | Alcoa | | | (859,551 | ) |
| | (54,749) | | | Cliffs Natural Resources | | | (1,405,954 | ) |
| | (60,869) | | | Teck Resources, Class B | | | (1,627,637 | ) |
| | | | | | | | |
| | | | | | | (3,893,142 | ) |
| | | | | | | | |
| | |
| | | | Telecommunication Services – (2.74)% | | | | |
| | (79,475) | | | CenturyLink | | | (2,691,024 | ) |
| | (72,113) | | | Consolidated Communications Holdings | | | (1,343,465 | ) |
| | (203,912) | | | Frontier Communications | | | (899,252 | ) |
| | | | | | | | |
| | | | | | | (4,933,741 | ) |
| | | | | | | | |
| | |
| | | | Utilities – (3.58)% | | | | |
| | (19,967) | | | DTE Energy | | | (1,380,518 | ) |
| | (51,670) | | | Otter Tail | | | (1,541,316 | ) |
| | (29,428) | | | South Jersey Industries | | | (1,752,437 | ) |
| | (46,213) | | | UIL Holdings | | | (1,780,124 | ) |
| | | | | | | | |
| | | | | | | (6,454,395 | ) |
| | | | | | | | |
| | | | Total Common Stocks
(Cost $47,325,268) | | | (48,993,203 | ) |
| | | | | | | | |
|
| | EXCHANGE TRADED FUNDS – (2.05)% | |
| | |
| | (96,390) | | | United States Natural Gas Fund LP * | | | (1,712,850 | ) |
| | (57,173) | | | United States Oil Fund LP * | | | (1,983,331 | ) |
| | | | | | | | |
| | |
| | | | Total Exchange Traded Funds
(Cost $3,974,865) | | | (3,696,181 | ) |
| | | | | | | | |
| Total Short Sales – (29.25)%
(Proceeds $51,300,133) | | | (52,689,384 | ) |
| | | | | | | | |
| Net Other Assets and Liabilities – 29.10% | | | 52,414,883 | |
| | | | | | | | |
| Net Assets – 100.00% | | $ | 180,141,159 | |
| | | | | | | | |
| * | | Non-income producing security. |
| ** | | Aggregate cost for Federal income tax purposes is $173,306,843. |
| | | | |
Gross unrealized appreciation | | $ | 7,437,882 | |
Gross unrealized depreciation | | | (329,065 | ) |
| | | | |
Net unrealized appreciation | | $ | 7,108,817 | |
| | | | |
| (a) | | Security position is either entirely or partially held in a segregated account as collateral for securities sold short. |
| REIT | | Real Estate Investment Trust |
| SP ADR | | Sponsored American Depositary Receipt |
See accompanying Notes to Financial Statements.
ASTON/Barings International Fund
| | |
| |
| Portfolio Manager Commentary (unaudited) | | October 31, 2013 |
David Bertocchi, CFA
| Q. | What were the most significant market factors affecting Fund performance and returns relative to the benchmark during the past 12 months? |
| A. | There were three main factors which impacted Fund performance and returns relative to the benchmark during the last 12 months. First, our gold mining names significantly underperformed the market, on the back of falling precious metals prices, increased costs, and political instability in some of the geographies in which they operate. Second, our overweight position to global emerging markets produced a drag on relative performance, as emerging markets underperformed developed markets, particularly during the first three quarters of 2013. And finally, the strong performance of peripheral European banks (an area the portfolio is underweight), particularly in the third quarter of 2013, weighed on performance relative to benchmark. |
Our overweight position to Japan was beneficial to the portfolio, particularly during the first quarter of 2013.
| Q. | What were the best performing holdings for the Fund during the period? |
| A. | Our holding in WPP, a global advertising company, performed well during the period. The company is a leader in online advertising techniques, and benefitted from the shift towards online advertising. Our holding in Resolution, a UK-listed financial services company, also delivered strong performance during the year. The company had specialized in buying closed books of insurance business, but now it is increasingly focused on a number of interesting growth areas in the markets in which it operates. In the Technology sector, our holding in ASML, a Dutch-listed manufacturer of lithography equipment which it supplies to the semiconductor industry, performed very strongly. The company occupies a dominant market position, orders for its products remain strong, and it is making progress towards a novel tool that utilizes ultraviolet light. |
| Q. | What were the weakest performing holdings? |
| A. | The weakest performing holdings in the portfolio were our gold mining positions of Fresnillo, Randgold Resources, and Newcrest Mining. A fall in the price of precious metals, coupled with a general increase in the costs of mining (both operating and capital expenditure), led to a share price decrease in these names. Our holding in Israel Chemical, an Israeli-listed producer of potash, performed poorly during the period, and particularly in the third quarter of 2013. The volume maximization strategy of a competitor looks to have disrupted the market for potash, and could cause the price of potash to fall in the future. This has negatively impacted the share prices of all listed potash producers in developed equity markets. |
| Q. | How was the Fund positioned as of October 31, 2013? |
| A. | The Fund has an overweight position in global emerging markets. The underperformance of emerging markets over the first nine months of 2013 has led to some interesting investment opportunities, in our view. The Fund also has a small overweight position in Japanese equities. We remain underweight the continental European equity market, although to a smaller degree than earlier this year. We have added some names we believe will benefit not only from a potential improvement in the global economy, but from self-help and restructuring too. The Fund remains underweight in the Pacific, excluding Japan, region, especially Australia. |
The Fund remains overweight in the Healthcare sector, where we are invested in a number of interesting opportunities. The Fund is underweight in the Consumer Staples sector. We believe that the sector contains a number of great companies with compelling growth prospects; however, we think that current share prices are too high, and reflect overly ambitious expectations for growth.
Growth of a Hypothetical
$10,000 Investment—Class I
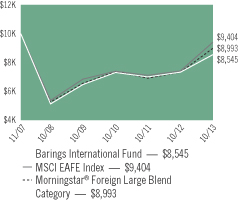
All dividends and capital gains are reinvested. Indexes are unmanaged and do not take into account fees, expenses or other costs.
Returns shown in the chart and table do not reflect taxes that a shareholder would pay on Fund distributions or on the sale of the Fund shares.
The securities of foreign companies may be less liquid and may fluctuate more widely than those traded in U.S. markets.
Emerging market securities may be subject to additional risks such as price volatility, currency fluctuation, financial reporting requirements, as well as political and economic instability.
RETURNSFOR PERIOD ENDED 10/31/13
Average Annual Total Returns - Class N
| | | | |
One Year | | | 16.64 | % |
Since Inception | | | 7.46 | % |
Inception Date 03/03/10
Average Annual Total Returns - Class I
| | | | |
One Year | | | 16.72 | % |
Five Year | | | 10.96 | % |
Since Inception | | | -2.59 | % |
Inception Date 11/02/07
The performance data quoted represents past performance. Past performance does not guarantee future results. Investment return and principal value will fluctuate so that an investor’s shares, upon redemption, may be worth more or less than their original cost. Current performance may be lower or higher than the performance data quoted. For performance data current to the most recent month-end, please visit our website at www.astonfunds.com.
The performance quoted would have been lower if fee waivers and/or expense reimbursements had not been in effect.
The oldest Share Class, Class I, is being shown. Performance would have been lower for Class N Shares, due to higher fees and expenses.
| | |
| |
| ASTON/Barings International Fund | | October 31, 2013 |
| |
| Schedule of Investments | | |
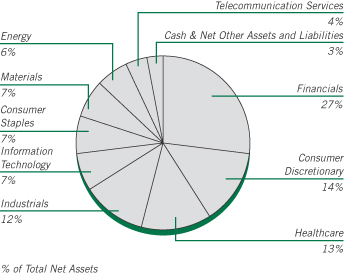
| | | | | | | | |
Shares | | | | | Market
Value | |
|
| | COMMON STOCKS – 96.55% | |
| | |
| | | | China – 0.66% | | | | |
| | 69,200 | | | China Pacific Insurance Group | | $ | 249,916 | |
| | | | | | | | |
| | |
| | | | France – 9.13% | | | | |
| | 3,730 | | | Air Liquide | | | 507,962 | |
| | 19,911 | | | AXA | | | 497,430 | |
| | 5,072 | | | BNP Paribas | | | 375,591 | |
| | 5,556 | | | Sanofi | | | 592,481 | |
| | 10,358 | | | Scor Se | | | 366,146 | |
| | 15,619 | | | SES | | | 454,673 | |
| | 10,955 | | | Total | | | 673,281 | |
| | | | | | | | |
| | | | | | | 3,467,564 | |
| | | | | | | | |
| | |
| | | | Germany – 11.67% | | | | |
| | 4,334 | | | Adidas | | | 494,770 | |
| | 5,875 | | | Bayer | | | 730,197 | |
| | 4,659 | | | Bayerische Motoren Werke | | | 528,456 | |
| | 5,789 | | | Daimler | | | 475,061 | |
| | 8,960 | | | Deutsche Boerse | | | 674,576 | |
| | 4,172 | | | Fresenius | | | 542,268 | |
| | 1,913 | | | Muenchener Rueckversicherungs-Gesellschaft | | | 399,738 | |
| | 7,472 | | | SAP | | | 586,998 | |
| | | | | | | | |
| | | | | | | 4,432,064 | |
| | | | | | | | |
| | |
| | | | Hong Kong – 0.99% | | | | |
| | 73,800 | | | AIA Group | | | 374,569 | |
| | | | | | | | |
| | |
| | | | Italy – 0.75% | | | | |
| | 37,647 | | | UniCredit | | | 283,179 | |
| | | | | | | | |
| | |
| | | | Japan – 23.79% | | | | |
| | 8,200 | | | Astellas Pharma | | | 455,324 | |
| | 11,500 | | | Denso | | | 550,264 | |
| | | | | | | | |
Shares | | | | | Market
Value | |
| | |
| | | | Japan (continued) | | | | |
| | 5,900 | | | East Japan Railway | | $ | 510,617 | |
| | 3,000 | | | FANUC | | | 479,609 | |
| | 30,000 | | | Hitachi Metals | | | 402,726 | |
| | 72,000 | | | Isuzu Motors | | | 445,195 | |
| | 18,400 | | | Japan Tobacco | | | 664,294 | |
| | 10,400 | | | KDDI | | | 561,619 | |
| | 19,300 | | | Komatsu | | | 420,035 | |
| | 11,700 | | | Kyocera | | | 604,454 | |
| | 19,400 | | | Mitsubishi | | | 391,038 | |
| | 46,000 | | | Mitsubishi Electric | | | 502,898 | |
| | 73,800 | | | Mitsubishi UFJ Financial Group | | | 465,331 | |
| | 46,200 | | | Rakuten | | | 600,464 | |
| | 87,000 | | | Sumitomo Mitsui Trust Holdings | | | 426,462 | |
| | 8,400 | | | Takeda Pharmaceutical | | | 398,515 | |
| | 15,500 | | | Tokio Marine Holdings | | | 505,212 | |
| | 10,100 | | | Toyota Motor | | | 653,270 | |
| | | | | | | | |
| | | | | | | 9,037,327 | |
| | | | | | | | |
| | |
| | | | Mexico – 0.63% | | | | |
| | 15,410 | | | Fresnillo | | | 241,032 | |
| | | | | | | | |
| | |
| | | | Netherlands – 5.41% | | | | |
| | 4,537 | | | ASML Holding NV | | | 430,716 | |
| | 4,021 | | | European Aeronautic Defence and Space NV | | | 276,307 | |
| | 14,946 | | | Koninklijke Philips NV | | | 529,241 | |
| | 19,038 | | | Royal Dutch Shell, Class A | | | 634,979 | |
| | 4,997 | | | Yandex NV, Class A * | | | 184,189 | |
| | | | | | | | |
| | | | | | | 2,055,432 | |
| | | | | | | | |
| | |
| | | | Norway – 2.03% | | | | |
| | 18,374 | | | Subsea 7 | | | 388,588 | |
| | 8,833 | | | Yara International | | | 381,331 | |
| | | | | | | | |
| | | | | | | 769,919 | |
| | | | | | | | |
| | |
| | | | Russia – 1.96% | | | | |
| | 12,584 | | | Mobile TeleSystems, SP ADR | | | 286,915 | |
| | 35,771 | | | Sberbank of Russia, ADR | | | 456,796 | |
| | | | | | | | |
| | | | | | | 743,711 | |
| | | | | | | | |
| | |
| | | | Singapore – 3.08% | | | | |
| | 30,000 | | | DBS Group Holdings | | | 404,283 | |
| | 580,000 | | | Golden Agri-Resources | | | 280,148 | |
| | 55,700 | | | Keppel | | | 486,512 | |
| | | | | | | | |
| | | | | | | 1,170,943 | |
| | | | | | | | |
| | |
| | | | South Korea – 1.20% | | | | |
| | 329 | | | Samsung Electronics | | | 454,381 | |
| | | | | | | | |
| | |
| | | | Sweden – 0.95% | | | | |
| | 24,563 | | | Elekta AB, B Shares | | | 362,377 | |
| | | | | | | | |
| | |
| | | | Switzerland – 8.22% | | | | |
| | 14,525 | | | Credit Suisse Group | | | 451,918 | |
| | 9,952 | | | Julius Baer Group | | | 489,072 | |
| | 2,382 | | | Roche Holding | | | 659,457 | |
See accompanying Notes to Financial Statements.
| | |
| |
| ASTON/Barings International Fund | | October 31, 2013 |
| |
| Schedule of Investments – continued | | |
| | | | | | | | |
Shares | | | | | Market
Value | |
| | |
| | | | Switzerland (continued) | | | | |
| | 1,090 | | | Syngenta | | $ | 440,277 | |
| | 22,450 | | | UBS | | | 434,476 | |
| | 2,346 | | | Zurich Financial Services | | | 648,715 | |
| | | | | | | | |
| | | | | | | 3,123,915 | |
| | | | | | | | |
| | |
| | | | Taiwan – 1.18% | | | | |
| | 24,400 | | | Taiwan Semiconductor Manufacturing, SP ADR | | | 449,204 | |
| | | | | | | | |
| | |
| | | | United Kingdom – 24.90% | | | | |
| | 27,399 | | | Admiral Group | | | 561,889 | |
| | 102,791 | | | Barclays | | | 434,456 | |
| | 20,397 | | | BG Group | | | 416,496 | |
| | 14,907 | | | BHP Billiton | | | 461,429 | |
| | 10,230 | | | British American Tobacco | | | 563,604 | |
| | 112,890 | | | BT Group | | | 682,405 | |
| | 25,239 | | | Experian | | | 513,950 | |
| | 89,781 | | | GKN | | | 529,614 | |
| | 22,574 | | | GlaxoSmithKline | | | 594,872 | |
| | 28,481 | | | Prudential | | | 584,078 | |
| | 2,168 | | | Randgold Resources | | | 161,296 | |
| | 6,403 | | | Reckitt Benckiser Group | | | 497,727 | |
| | 88,910 | | | Resolution | | | 509,507 | |
| | 32,524 | | | Rolls-Royce Holdings | | | 599,718 | |
| | 2,797,064 | | | Rolls-Royce Holdings, C Shares * (a) (b) | | | 4,485 | |
| | 11,825 | | | SABMiller | | | 616,970 | |
| | 11,687 | | | Shire | | | 515,512 | |
| | 20,198 | | | Standard Chartered | | | 485,624 | |
| | 34,122 | | | WPP | | | 724,929 | |
| | | | | | | | |
| | | | | | | 9,458,561 | |
| | | | | | | | |
| | |
| | | | Total Common Stocks
(Cost $31,420,450) | | | 36,674,094 | |
| | | | | | | | |
|
| | INVESTMENT COMPANY – 2.53% | |
| | |
| | 961,228 | | | BlackRock Liquidity Funds TempCash Portfolio | | | 961,228 | |
| | | | | | | | |
| | |
| | | | Total Investment Company
(Cost $961,228) | | | 961,228 | |
| | | | | | | | |
| Total Investments – 99.08%
(Cost $32,381,678)** | | | 37,635,322 | |
| | | | | | | | |
| Net Other Assets and Liabilities – 0.92% | | | 349,098 | |
| | | | | | | | |
| Net Assets – 100.00% | | $ | 37,984,420 | |
| | | | | | | | |
| * | | Non-income producing security. |
| ** | | Aggregate cost for Federal income tax purposes is $32,539,457. |
| | | | |
Gross unrealized appreciation | | $ | 5,681,437 | |
Gross unrealized depreciation | | | (585,572 | ) |
| | | | |
Net unrealized appreciation | | $ | 5,095,865 | |
| | | | |
| (a) | | This security has been determined by the Subadviser to be an illiquid security. At October 31, 2013, this security amounted to $4,485 or 0.00 % of net assets. |
| (b) | | Security with a total aggregate market value of $4,485 or 0.00% of the net assets was valued under the fair value procedures established by the Fund’s Board of Trustees. |
| ADR | | American Depositary Receipt |
| SP ADR | | Sponsored American Depositary Receipt |
See accompanying Notes to Financial Statements.
ASTON/LMCG Emerging Markets Fund
| | |
| |
| Portfolio Manager Commentary (unaudited) | | October 31, 2013 |
| | Gordon Johnson, PhD, CFA; Shannon Ericson, CFA & Vikram Srimurthy, PhD, CFA |
| Q. | What were the most significant market factors affecting Fund performance and returns relative to the benchmark during the past 12 months? |
| A. | Since inception, emerging markets have lagged U.S. and developed market equities. Concerns about slower economic growth versus developed markets combined with increased geo-political risks due to the civil war in Syria have created substantial uncertainty. Given this backdrop, the emerging market asset class continues to fluctuate between risk-on and risk off compared to developed markets which have been more consistently biased toward risk-on. When we look at the volatility of our stock selection factors as well as various risk factors, we found it was nearly 40% higher during the last several months among emerging markets than it was earlier in the year, making it a difficult environment for active stock selection. |
| Q. | What were the best performing holdings for the Fund during the period? |
| A. | In terms of individual holdings, the best performing holdings during the period were Wuxi Pharmaceuticals, KCC Corp. and LG Uplus Corp. All three stocks were up over 50% during the period on earnings-related news. Chinese healthcare company, Wuxi Pharmaceuticals, announced strong second quarter earnings and provided a positive outlook for the remainder of the year. Korean industrial, KCC Corp., also had a good quarter, surpassing Wall Street expectations. Finally, Korean telecom, LG Uplus Corp., was up on better than expected earnings due primarily to strong handset profits. |
| Q. | What were the weakest performing holdings? |
| A. | The biggest negative contributions from individual stocks came from not owning TenCent Holdings in China and Naspers, |
| | a South African company, which owns a stake in TenCent. TenCent’s benchmark weight has been steadily increasing as positive performance from the success of the company’s online social network, WeChat. We did not own the stock due to its poor ranking on our stock selection model primarily due to its high valuation and poor earnings quality. Holdings that most negatively impacted performance were Companhia de Saneamento Basico and Quality Houses Public. Companhia de Saneamento Basico, a Brazilian water company, was negatively impacted by news related to uncertainty over proposed tariffs and their impact on company earnings. Quality Houses Public, a Thai real estate company, announced earnings that were in line with expectations. Despite the report, the stock sold off likely due to its valuation which had become a bit less attractive versus peers following strong year-to-date performance. |
| Q. | How was the Fund positioned as of October 31, 2013? |
| A. | We can’t predict whether emerging markets will rebound over the next twelve months. But, we are hopeful that the volatility in the equity markets will subside and corporate fundamentals will matter again. We believe that in the current market environment it is important to balance the portfolio against either an up or down market by having more equal exposures across all of our major factor components — Market Dynamics, Value and Quality. In addition, we believe it is particularly important, given the volatility in the market, to manage risk in the portfolio and ensure that we do not have any unintended risks or style bets. |
We believe that as the emerging market asset class finds its new valuation level and market participants revise their expectations about the asset class, stock selection strategies will come to the forefront again and the strategy will add value versus the benchmark.
Growth of a Hypothetical
$10,000 Investment—Class N
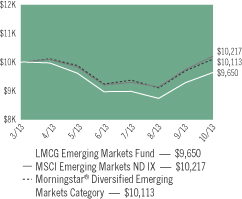
All dividends and capital gains are reinvested. Indexes are unmanaged and do not take into account fees, expenses or other costs.
Returns shown in the chart and table do not reflect taxes that a shareholder would pay on Fund distributions or on the sale of the Fund shares.
The securities of foreign companies may be less liquid and may fluctuate more widely than those traded in U.S. markets.
Emerging market securities may be subject to additional risks such as price volatility, currency fluctuation, financial reporting requirements as well as political and economic instability.
RETURNSFOR PERIOD ENDED 10/31/13
Total Return - Class N
| | | | |
Cumulative Since Inception | | | -3.50 | % |
Inception Date 03/28/13
Total Return - Class I
| | | | |
Cumulative Since Inception | | | -3.30 | % |
Inception Date 03/28/13
The performance data quoted represents past performance. Past performance does not guarantee future results. Investment return and principal value will fluctuate so that an investor’s shares, upon redemption, may be worth more or less than their original cost. Current performance may be lower or higher than the performance data quoted. For performance data current to the most recent month-end, please visit our website at www.astonfunds.com.
The performance quoted would have been lower if fee waivers and/or expense reimbursements had not been in effect.
| | |
| |
| ASTON/LMCG Emerging Markets Fund | | October 31, 2013 |
| |
| Schedule of Investments | | |
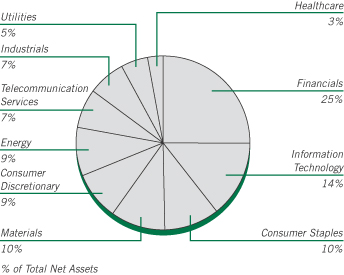
| | | | | | | | |
Shares | | | | | Market
Value | |
|
| | COMMON STOCKS – 92.53% | |
| | |
| | | | Bermuda – 0.94% | | | | |
| | 2,598 | | | VimpelCom, SP ADR | | $ | 37,385 | |
| | | | | | | | |
| | |
| | | | Brazil – 9.77% | | | | |
| | 3,476 | | | Banco Bradesco, ADR | | | 50,123 | |
| | 4,000 | | | Braskem, Preference A * | | | 35,497 | |
| | 519 | | | Cia Brasileira de Distribuicao Grupo Pao de Acucar, SP ADR | | | 26,167 | |
| | 2,100 | | | Cia Paranaense de Energia, Preference B | | | 29,285 | |
| | 4,000 | | | Cyrela Brazil Realty SA Empreendimentos e Participacoes | | | 29,908 | |
| | 5,000 | | | Gerdau, Preference | | | 39,438 | |
| | 1,079 | | | Grupo BTG Pactual | | | 14,435 | |
| | 4,700 | | | Hypermarcas | | | 41,016 | |
| | 9,800 | | | JBS | | | 35,216 | |
| | 10,300 | | | Suzano Papel e Celulose, Preference A | | | 41,748 | |
| | 3,145 | | | Vale, SP ADR | | | 46,043 | |
| | | | | | | | |
| | | | | | | 388,876 | |
| | | | | | | | |
| | |
| | | | Chile – 0.63% | | | | |
| | 1,521 | | | Enersis, SP ADR | | | 25,097 | |
| | | | | | | | |
| | |
| | | | China – 7.37% | | | | |
| | 42,000 | | | Angang Steel, Class H * | | | 25,461 | |
| | 146,000 | | | Bank of China, Class H | | | 68,358 | |
| | 30,000 | | | China Communications Construction, Class H | | | 24,494 | |
| | 52,000 | | | China Construction Bank, Class H | | | 40,377 | |
| | 3,082 | | | Giant Interactive Group, ADR | | | 27,276 | |
| | 30,000 | | | Huaneng Power International, Class H | | | 31,343 | |
| | 58,000 | | | Industrial and Commercial Bank of China, | | | | |
| | | | Class H | | | 40,622 | |
| | 1,210 | | | WuXi PharmaTech Cayman, ADR * | | | 35,393 | |
| | | | | | | | |
| | | | | | | 293,324 | |
| | | | | | | | |
| | | | | | | | |
Shares | | | | | Market
Value | |
| | |
| | | | Hong Kong – 6.37% | | | | |
| | 6,000 | | | China Mobile | | $ | 62,995 | |
| | 71,000 | | | China Power International Development | | | 27,840 | |
| | 44,000 | | | China Resources Cement Holdings | | | 29,454 | |
| | 20,000 | | | COSCO Pacific | | | 29,150 | |
| | 65,000 | | | Geely Automobile Holdings | | | 32,781 | |
| | 250,000 | | | GOME Electrical Appliances Holding | | | 38,695 | |
| | 13,000 | | | Shimao Property Holdings | | | 32,731 | |
| | | | | | | | |
| | | | | | | 253,646 | |
| | | | | | | | |
| | |
| | | | Hungary – 0.73% | | | | |
| | 425 | | | MOL Hungarian Oil and Gas | | | 29,085 | |
| | | | | | | | |
| | |
| | | | India – 3.55% | | | | |
| | 985 | | | ICICI Bank, SP ADR | | | 36,760 | |
| | 1,579 | | | Reliance Industries, GDR | | | 47,165 | |
| | 1,320 | | | Sesa Sterlite, ADR | | | 17,028 | |
| | 1,292 | | | Tata Motors, SP ADR | | | 40,465 | |
| | | | | | | | |
| | | | | | | 141,418 | |
| | | | | | | | |
| | |
| | | | Indonesia – 0.99% | | | | |
| | 93,000 | | | Bank Negara Indonesia Persero Tbk | | | 39,601 | |
| | | | | | | | |
| | |
| | | | Malaysia – 4.50% | | | | |
| | 12,800 | | | AMMB Holdings | | | 29,976 | |
| | 16,000 | | | IJM | | | 29,409 | |
| | 20,300 | | | IOI | | | 34,996 | |
| | 22,200 | | | Malaysia Building Society | | | 19,699 | |
| | 12,700 | | | Tenaga Nasional | | | 37,952 | |
| | 45,000 | | | YTL Power International | | | 27,095 | |
| | | | | | | | |
| | | | | | | 179,127 | |
| | | | | | | | |
| | |
| | | | Mexico – 2.51% | | | | |
| | 5,200 | | | Fomento Economico Mexicano | | | 48,603 | |
| | 6,200 | | | Grupo Aeroportuario del Pacifico | | | 32,285 | |
| | 6,100 | | | Grupo Comercial Chedraui | | | 19,010 | |
| | | | | | | | |
| | | | | | | 99,898 | |
| | | | | | | | |
| | |
| | | | Philippines – 1.49% | | | | |
| | 46,500 | | | Alliance Global Group | | | 28,356 | |
| | 14,960 | | | Metropolitan Bank & Trust | | | 30,813 | |
| | | | | | | | |
| | | | | | | 59,169 | |
| | | | | | | | |
| | |
| | | | Poland – 0.87% | | | | |
| | 2,458 | | | Polski Koncern Naftowy Orlen | | | 34,711 | |
| | | | | | | | |
| | |
| | | | Russia – 5.64% | | | | |
| | 6,986 | | | Gazprom, SP ADR | | | 65,179 | |
| | 604 | | | Lukoil, SP ADR | | | 39,544 | |
| | 4,850 | | | Sberbank, SP ADR | | | 61,935 | |
| | 1,695 | | | Severstal, GDR | | | 14,797 | |
| | 1,050 | | | Tatneft, SP ADR | | | 43,166 | |
| | | | | | | | |
| | | | | | | 224,621 | |
| | | | | | | | |
| | |
| | | | South Africa – 9.87% | | | | |
| | 2,260 | | | African Rainbow Minerals | | | 43,285 | |
| | 1,787 | | | Imperial Holdings | | | 37,970 | |
See accompanying Notes to Financial Statements.
| | |
| |
| ASTON/LMCG Emerging Markets Fund | | October 31, 2013 |
| |
| Schedule of Investments – continued | | |
| | | | | | | | |
Shares | | | | | Market
Value | |
| | |
| | | | South Africa (continued) | | | | |
| | 2,531 | | | Liberty Holdings | | $ | 31,263 | |
| | 5,117 | | | Mediclinic International | | | 38,561 | |
| | 2,271 | | | Mondi | | | 40,573 | |
| | 3,419 | | | MTN Group | | | 67,959 | |
| | 16,099 | | | Netcare | | | 39,964 | |
| | 591 | | | Sasol | | | 30,195 | |
| | 8,989 | | | Steinhoff International Holdings * | | | 34,752 | |
| | 2,492 | | | Vodacom Group | | | 28,547 | |
| | | | | | | | |
| | | | | | | 393,069 | |
| | | | | | | | |
| | |
| | | | South Korea – 18.09% | | | | |
| | 99 | | | CJ CheilJedang | | | 24,033 | |
| | 167 | | | E-Mart | | | 39,989 | |
| | 950 | | | Hanwha | | | 35,958 | |
| | 300 | | | Hyundai Motor | | | 71,553 | |
| | 69 | | | KCC | | | 27,678 | |
| | 691 | | | Kia Motors | | | 40,193 | |
| | 1,340 | | | LG Display * | | | 31,518 | |
| | 531 | | | LG Electronics | | | 34,040 | |
| | 2,620 | | | LG Uplus * | | | 30,010 | |
| | 940 | | | Samsung Card | | | 34,826 | |
| | 139 | | | Samsung Electronics | | | 191,973 | |
| | 1,180 | | | Shinhan Financial Group | | | 51,561 | |
| | 145 | | | SK Holdings | | | 26,314 | |
| | 1,710 | | | SK Hynix * | | | 51,506 | |
| | 137 | | | SK Telecom | | | 29,318 | |
| | | | | | | | |
| | | | | | | 720,470 | |
| | | | | | | | |
| | |
| | | | Taiwan – 9.99% | | | | |
| | 36,000 | | | Advanced Semiconductor Engineering | | | 35,351 | |
| | 73,000 | | | Au Optronics * | | | 24,176 | |
| | 5,000 | | | Catcher Technology | | | 29,102 | |
| | 10,000 | | | Chong Hong Construction | | | 32,812 | |
| | 65,000 | | | Innolux * | | | 25,775 | |
| | 52,000 | | | King Yuan Electronics | | | 36,195 | |
| | 20,000 | | | Pegatron | | | 27,843 | |
| | 5,000 | | | President Chain Store | | | 36,420 | |
| | 16,000 | | | Taiwan Semiconductor Manufacturing | | | 59,633 | |
| | 30,740 | | | Uni-President Enterprises | | | 58,593 | |
| | 75,000 | | | United Microelectronics | | | 31,782 | |
| | | | | | | | |
| | | | | | | 397,682 | |
| | | | | | | | |
| | |
| | | | Thailand – 4.29% | | | | |
| | 18,300 | | | Bangchak Petroleum | | | 19,549 | |
| | 5,700 | | | PTT Exploration & Production | | | 30,858 | |
| | 14,800 | | | PTT Global Chemical | | | 37,327 | |
| | 265,600 | | | Quality Houses | | | 25,941 | |
| | 6,700 | | | Siam Commercial Bank Public, Foreign Registered | | | 35,410 | |
| | 33,300 | | | Thai Airways International | | | 21,719 | |
| | | | | | | | |
| | | | | | | 170,804 | |
| | | | | | | | |
| | |
| | | | Turkey – 3.81% | | | | |
| | 19,881 | | | Emlak Konut Gayrimenkul Yatirim Ortakligi REIT | | | 28,384 | |
| | 3,738 | | | Tav Havalimanlari Holding | | | 27,151 | |
| | | | | | | | |
Shares | | | | | Market
Value | |
| | |
| | | | Turkey (continued) | | | | |
| | 8,339 | | | Turk Hava Yollari | | $ | 32,666 | |
| | 5,409 | | | Turkcell Iletisim Hizmetleri * | | | 33,599 | |
| | 10,856 | | | Turkiye Is Bankasi | | | 29,801 | |
| | | | | | | | |
| | | | | | | 151,601 | |
| | | | | | | | |
| | |
| | | | United Kingdom – 1.12% | | | | |
| | 856 | | | SABMiller | | | 44,469 | |
| | | | | | | | |
| | |
| | | | Total Common Stocks
(Cost $3,609,345) | | | 3,684,053 | |
| | | | | | | | |
|
| | EXCHANGE TRADED FUNDS – 7.09% | |
| | |
| | | | United States – 7.09% | | | | |
| | 1,595 | | | iPath MSCI India Index Fund * | | | 89,256 | |
| | 2,550 | | | iShares MSCI Emerging Markets Index Fund | | | 108,273 | |
| | 3,490 | | | iShares MSCI India | | | 84,947 | |
| | | | | | | | |
| | | | | | | 282,476 | |
| | | | | | | | |
| | |
| | | | Total Exchange Traded Funds
(Cost $267,453) | | | 282,476 | |
| | | | | | | | |
|
| | INVESTMENT COMPANY – 0.91% | |
| | |
| | 36,164 | | | BlackRock Liquidity Funds TempCash Portfolio | | | 36,164 | |
| | | | | | | | |
| | |
| | | | Total Investment Company
(Cost $36,164) | | | 36,164 | |
| | | | | | | | |
| Total Investments – 100.53%
(Cost $3,912,962)** | | | 4,002,693 | |
| | | | | | | | |
| Net Other Assets and Liabilities – (0.53)% | | | (21,035 | ) |
| | | | | | | | |
| Net Assets – 100.00% | | $ | 3,981,658 | |
| | | | | | | | |
| * | | Non-income producing security. |
| ** | | Aggregate cost for Federal income tax purposes is $3,924,930. |
| | | | |
Gross unrealized appreciation | | $ | 250,617 | |
Gross unrealized depreciation | | | (172,854 | ) |
| | | | |
Net unrealized appreciation | | $ | 77,763 | |
| | | | |
| ADR | | American Depositary Receipt |
| GDR | | Global Depositary Receipt |
| MSCI | | Morgan Stanley Capital International |
| REIT | | Real Estate Investment Trust |
| SP ADR | | Sponsored American Depositary Receipt |
See accompanying Notes to Financial Statements.
ASTON/Harrison Street Real Estate Fund
| | |
| |
| Portfolio Manager Commentary (unaudited) | | October 31, 2013 |
| | | | |
| | | James H. Kammert, CFA & Reagan A. Pratt | |
| Q. | What were the most significant market factors affecting Fund performance and returns relative to the benchmark during the past 12 months? |
| A. | Real estate investment trusts (REITs), as represented by the FTSE/NAREIT All Equity REITs Total Return Index, largely kept pace with the broader equity markets and financial stocks from October 2012 through May 2013 delivering a cumulative total return of nearly 20%. However, REITs deteriorated sharply as the 10-year Treasury rates spiked by 100 basis points on the heels of the Federal Reserve’s murky comments regarding the direction and magnitude of prospective monetary policy. REITs reacted strongly and adversely to the rate spike, as is typically the case for REITs across shorter term horizons, erasing all of the gains by the end of August. By fiscal year-end, REITs have recovered a bit. Regrettably though, the market appears to be driven by headlines, and many market participants are ignoring the firming property fundamentals, constrained levels of new property supply, rising dividend payments and strong balance sheet metrics that characterize the REIT sector. |
| Q. | What were the best performing holdings for the Fund during the period? |
| A. | Apartment landlord Essex Property Trust, NYC office landlord SL Green Realty, as well as smaller capitalization industrial property owner Stag Industrial and healthcare property operator Sabra Healthcare were among the strongest positive contributors to performance. Strong property fundamentals aided Essex and SL Green among other factors. STAG and Sabra enjoyed solid portfolio metrics as well and accessed attractively priced capital to expand their respective portfolios, adding to overall per share cash flow growth and dividends. As is typical, positive performance contributors spanned the various property types. |
| Q. | What were the weakest performing holdings? |
| A. | Data center owner Digital Realty Trust was the largest detractor from performance. Despite continued sound operating |
| | and financial performance, some investor expectations (particularly among more technology oriented, non-REIT dedicated investors) were not met. In addition, poor communication by management regarding leasing trends fueled apprehension regarding potential slackening of data center space demand across corporate users. This apprehension has yet to be confirmed or denied, but the stock has severely underperformed. Document storage company Iron Mountain plunged alongside the REIT sector in May and compounded the fall due to the temporary suspension of Iron Mountain’s application for REIT conversion before the IRS. Despite numerous internal organizational and financial steps undertaken to convert to REIT election on January 1, 2014, the IRS unexpectedly questioned Iron Mountain’s suitability. Iron Mountain remains intent on converting to a REIT. |
| Q. | How was the Fund positioned as of October 31, 2013? |
| A. | Within the over-arching investment thesis of identifying relative value among the REITs and investing accordingly, it is notable that several large-cap REITs exhibit appealing relative value as well as above average dividend growth and prospective per share cash flow growth — auguring sustained heightened dividend growth. Given this circumstance, the Fund reflects a higher than typical exposure to several large-cap REITs (close to the 50% maximum proportion of the portfolio within our stated 30% to 50% portfolio construction rule/limitation). This large cap ‘tilt’ is not indicative of a macro theme/premise but rather a natural fall out of our modeling and relative value identification process. Also, as REITs have materially underperformed broader equities through October, the large-cap exposure may prove beneficial as fund flows return to REITs. Large cap names tend to capture a disproportionate share of that flow initially. |
Growth of a Hypothetical
$10,000 Investment—Class N
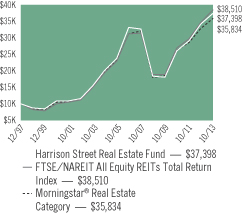
All dividends and capital gains are reinvested. Indexes are unmanaged and do not take into account fees, expenses or other costs.
Returns shown in the chart and table do not reflect taxes that a shareholder would pay on Fund distributions or on the sale of the Fund shares.
Real estate funds may be subject to a higher degree of market risk than diversified funds because of the concentration in a specific industry or geographical sector. Risks also include declines in the value of real estate, general and economic conditions, changes in the value of underlying properties and defaults by borrowers.
RETURNSFOR PERIOD ENDED 10/31/13
Average Annual Total Returns - Class N
| | | | |
One Year | | | 9.30 | % |
Five Year | | | 15.30 | % |
Ten Year | | | 9.27 | % |
Since Inception | | | 8.69 | % |
Inception Date 12/30/97
Average Annual Total Returns - Class I
| | | | |
One Year | | | 9.58 | % |
Five Year | | | 15.55 | % |
Since Inception | | | 5.66 | % |
Inception Date 09/20/05
The performance data quoted represents past performance. Past performance does not guarantee future results. Investment return and principal value will fluctuate so that an investor’s shares, upon redemption, may be worth more or less than their original cost. Current performance may be lower or higher than the performance data quoted. For performance data current to the most recent month-end, please visit our website at www.astonfunds.com.
The performance quoted would have been lower if fee waivers and/or expense reimbursements had not been in effect.
The total expense ratios for Class N and Class I Shares are 2.36% and 2.11% respectively, as disclosed in the prospectus dated February 28, 2013. Please refer to the Financial Highlights section in this report for more information.
| | |
| |
| ASTON/Harrison Street Real Estate Fund | | October 31, 2013 |
| |
| Schedule of Investments | | |

| | | | | | | | |
Shares | | | | | Market
Value | |
|
| | COMMON STOCKS – 97.86% | |
| | |
| | | | Diversified – 21.22% | | | | |
| | 13,145 | | | American Tower | | $ | 1,043,056 | |
| | 6,511 | | | Digital Realty Trust | | | 310,314 | |
| | 7,060 | | | Rayonier | | | 331,961 | |
| | 6,095 | | | Vornado Realty Trust | | | 542,821 | |
| | 21,800 | | | Weyerhaeuser | | | 662,720 | |
| | | | | | | | |
| | | | | | | 2,890,872 | |
| | | | | | | | |
| | |
| | | | Healthcare – 12.76% | | | | |
| | 10,716 | | | Health Care, REIT | | | 694,933 | |
| | 17,000 | | | Healthcare Realty Trust | | | 408,170 | |
| | 9,730 | | | Ventas | | | 634,785 | |
| | | | | | | | |
| | | | | | | 1,737,888 | |
| | | | | | | | |
| | |
| | | | Hotels – 6.40% | | | | |
| | 10,723 | | | Chesapeake Lodging Trust | | | 252,741 | |
| | 8,000 | | | Hyatt Hotels, Class A * | | | 380,800 | |
| | 7,918 | | | Pebblebrook Hotel Trust | | | 239,124 | |
| | | | | | | | |
| | | | | | | 872,665 | |
| | | | | | | | |
| | |
| | | | Industrial – 4.25% | | | | |
| | 10,145 | | | Iron Mountain | | | 269,248 | |
| | 14,790 | | | STAG Industrial | | | 309,259 | |
| | | | | | | | |
| | | | | | | 578,507 | |
| | | | | | | | |
| | |
| | | | Office Properties – 10.45% | | | | |
| | 4,761 | | | Alexandria Real Estate Equities | | | 313,178 | |
| | 19,056 | | | BioMed Realty Trust | | | 379,596 | |
| | 21,400 | | | Brandywine Realty Trust | | | 304,522 | |
| | 4,513 | | | SL Green Realty | | | 426,794 | |
| | | | | | | | |
| | | | | | | 1,424,090 | |
| | | | | | | | |
| | | | | | | | |
Shares | | | | | Market
Value | |
| | |
| | | | Residential – 13.61% | | | | |
| | 7,500 | | | Camden Property Trust | | $ | 481,500 | |
| | 2,942 | | | Essex Property Trust | | | 473,662 | |
| | 6,300 | | | Mid-America Apartment Communities | | | 418,320 | |
| | 19,405 | | | UDR | | | 481,438 | |
| | | | | | | | |
| | | | | | | 1,854,920 | |
| | | | | | | | |
| | |
| | | | Retail – 20.62% | | | | |
| | 3,380 | | | Federal Realty Investment Trust | | | 350,168 | |
| | 24,500 | | | General Growth Properties | | | 520,135 | |
| | 15,202 | | | Ramco-Gershenson Properties Trust | | | 247,185 | |
| | 23,550 | | | Retail Opportunity Investments | | | 348,540 | |
| | 8,694 | | | Simon Property Group | | | 1,343,658 | |
| | | | | | | | |
| | | | | | | 2,809,686 | |
| | | | | | | | |
| | |
| | | | Storage – 8.55% | | | | |
| | 7,900 | | | Extra Space Storage | | | 363,321 | |
| | 4,800 | | | Public Storage | | | 801,456 | |
| | | | | | | | |
| | | | | | | 1,164,777 | |
| | | | | | | | |
| | |
| | | | Total Common Stocks
(Cost $13,260,022) | | | 13,333,405 | |
| | | | | | | | |
|
| | INVESTMENT COMPANY – 1.78% | |
| | |
| | 242,270 | | | BlackRock Liquidity Funds TempCash Portfolio | | | 242,270 | |
| | | | | | | | |
| | |
| | | | Total Investment Company
(Cost $242,270) | | | 242,270 | |
| | | | | | | | |
| Total Investments – 99.64%
(Cost $13,502,292)** | | | 13,575,675 | |
| | | | | | | | |
| Net Other Assets and Liabilities – 0.36% | | | 49,480 | |
| | | | | | | | |
| Net Assets – 100.00% | | $ | 13,625,155 | |
| | | | | | | | |
| * | | Non-income producing security. |
| ** | | Aggregate cost for Federal income tax purposes is $13,606,284. |
| | | | |
Gross unrealized appreciation | | $ | 420,211 | |
Gross unrealized depreciation | | | (450,820 | ) |
| | | | |
Net unrealized depreciation | | $ | (30,609 | ) |
| | | | |
| REIT | | Real Estate Investment Trust |
See accompanying Notes to Financial Statements.
ASTON/Montag & Caldwell Balanced Fund
| | |
| |
| Portfolio Manager Commentary (unaudited) | | October 31, 2013 |
Ronald E. Canakaris, CFA, CIC & Helen M. Donahue, CFA
| Q. | What were the most significant market factors affecting Fund performance and returns relative to the benchmark during the past 12 months? |
| A. | The Class N Shares of the Fund gained 12.40% during the past year, with the equity returns trailing the S&P 500 Index, which rose 27.16%. The Fund benefited from stock selection in the Consumer Discretionary, Information Technology and Financial sectors and an underweight position to the Information Technology sector. The Fund lagged the benchmark due to an overweight position to the Consumer Staples sector, an underweight position to the Consumer Discretionary sector and its cash reserve. Adverse stock section in the Healthcare, Industrials and Energy sectors also detracted from performance relative to the benchmark. The fixed income returns lagged the Barclays Capital U.S. Government Credit Bond Index, as long maturity corporate bonds, which the Fund is underweight, significantly outperformed comparable maturity Treasury bonds. In addition, the Fund cannot own bonds rated less than A and lower quality BBB bonds, which comprise 16% of the Barclays Capital U.S. Government Credit Bond Index, and which outperformed during the period. |
| Q. | What were the best performing holdings for the Fund during the period? |
| A. | Biogen was the Fund’s top performing stock as the company launched Tecfidera, an oral therapy for the treatment of multiple sclerosis. Starbucks rose strongly during the period as the company delivered top- and bottom-line results that far surpassed peers within the restaurant industry. Johnson Controls surged as the company reported better than expected results driven by ongoing improvement in the global automotive business and benefits from cost restructuring actions taken by management earlier this year. Amerisource Bergen gained as the company is benefiting from increased scale and purchasing power as a result of its agreement with Walgreen/Alliance Boots. Nike rose as the company is benefiting from growing enthusiasm around its innovative new product cycle, which should allow double digit earnings growth in fiscal year 2014. |
| Q. | What were the weakest performing holdings? |
| A. | Express Scripts fell in the fourth quarter of 2012 and the position was eliminated in the first quarter of 2013 as benefits from the company’s merger with Medco were waning and earnings growth was expected to decelerate sharply. EMC was slightly negative during the period as investors became concerned that capital spending will be reduced on storage as it is shifted from on-premise capacity to infrastructure as a service by cloud providers, negatively impacting demand for EMC’s products. Allergan was unchanged during the period, which significantly lagged the gains in the Healthcare sector. The company experienced a delay in the clinical trials of an age-related macular degeneration product and the stock declined following the release of draft guidance from the FDA for generic Restasis bioequivalence. Coca-Cola and Philip Morris were up single digits during the period as both companies have had earnings impacted by a slow-down in emerging markets and adverse currency movements. |
| Q. | How was the Fund positioned as of October 31, 2013? |
| A. | We believe the high quality growth stocks held in the Fund are well positioned for the period ahead. They are reasonably valued, and in our opinion offer more assured earnings growth due to their global diversification and financial strength. We expect economic growth to continue to be more moderate than generally assumed as the developed world deleverages. The bond portion of the Fund is slightly shorter in duration than the Barclays Capital U.S. Government Credit Bond Index and is overweight high quality intermediate corporate bonds. |
Note: S&P assigns a credit quality rating from AAA (highest quality) to D (lowest quality). Credit quality ratings refer to the underlying bonds in the Fund’s portfolio and not of the Fund itself.
Growth of a Hypothetical
$10,000 Investment—Class N
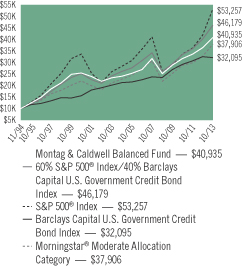
All dividends and capital gains are reinvested. Indexes are unmanaged and do not take into account fees, expenses or other costs.
Returns shown in the chart and table do not reflect taxes that a shareholder would pay on Fund distributions or on the sale of the Fund shares.
The Fund is subject to interest rate risk associated with the underlying bond holdings in the portfolio. The value of the Fund can decline as interest rates rise and an investor can lose principal.
RETURNSFOR PERIOD ENDED 10/31/13
Average Annual Total Returns - Class N
| | | | |
One Year | | | 12.40 | % |
Five Year | | | 10.25 | % |
Ten Year | | | 5.78 | % |
Since Inception | | | 7.70 | % |
Inception Date 11/02/94
Average Annual Total Returns - Class I
| | | | |
One Year | | | 12.53 | % |
Five Year | | | 10.41 | % |
Ten Year | | | 5.98 | % |
Since Inception | | | 4.06 | % |
Inception Date 12/31/98
The performance data quoted represents past performance. Past performance does not guarantee future results. Investment return and principal value will fluctuate so that an investor’s shares, upon redemption, may be worth more or less than their original cost. Current performance may be lower or higher than the performance data quoted. For performance data current to the most recent month-end, please visit our website at www.astonfunds.com.
The performance quoted would have been lower if fee waivers and/or expense reimbursements had not been in effect.
The total expense ratios for N class and I class are 1.56% and 1.31% respectively, as disclosed in the prospectus dated February 28, 2013. Please refer to the Financial Highlights section in this report for more information.
| | |
| |
| ASTON/Montag & Caldwell Balanced Fund | | October 31, 2013 |
| |
| Schedule of Investments | | |
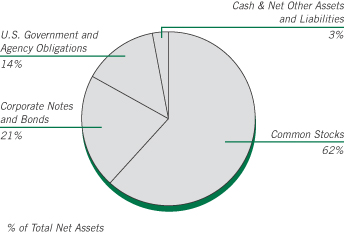
| | | | | | | | |
Shares | | | | | Market
Value | |
|
| | COMMON STOCKS – 61.68% | |
| | |
| | | | Consumer Discretionary – 10.40% | | | | |
| | 3,475 | | | Bed Bath & Beyond * | | $ | 268,687 | |
| | 9,864 | | | Johnson Controls | | | 455,224 | |
| | 7,400 | | | NIKE, Class B | | | 560,624 | |
| | 262 | | | Priceline.com * | | | 276,103 | |
| | 895 | | | Ralph Lauren | | | 148,248 | |
| | 4,600 | | | Starbucks | | | 372,830 | |
| | 7,250 | | | TJX | | | 440,728 | |
| | | | | | | | |
| | | | | | | 2,522,444 | |
| | | | | | | | |
| | |
| | | | Consumer Staples – 15.41% | | | | |
| | 12,100 | | | Coca-Cola | | | 478,797 | |
| | 7,800 | | | Colgate-Palmolive | | | 504,894 | |
| | 2,300 | | | Costco Wholesale | | | 271,400 | |
| | 7,100 | | | Estee Lauder, Class A | | | 503,816 | |
| | 15,750 | | | Mondelez International, Class A | | | 529,830 | |
| | 5,820 | | | PepsiCo | | | 489,404 | |
| | 5,400 | | | Philip Morris International | | | 481,248 | |
| | 5,950 | | | Procter & Gamble | | | 480,463 | |
| | | | | | | | |
| | | | | | | 3,739,852 | |
| | | | | | | | |
| | |
| | | | Energy – 2.06% | | | | |
| | 5,200 | | | Occidental Petroleum | | | 499,616 | |
| | | | | | | | |
| | |
| | | | Financials – 5.27% | | | | |
| | 3,700 | | | American Express | | | 302,660 | |
| | 2,300 | | | Franklin Resources | | | 123,878 | |
| | 4,800 | | | State Street | | | 336,336 | |
| | 12,100 | | | Wells Fargo | | | 516,549 | |
| | | | | | | | |
| | | | | | | 1,279,423 | |
| | | | | | | | |
| | |
| | | | Healthcare – 11.58% | | | | |
| | 13,950 | | | Abbott Laboratories | | | 509,873 | |
| | 5,450 | | | Allergan | | | 493,825 | |
| | 5,650 | | | AmerisourceBergen | | | 369,115 | |
| | 1,896 | | | Biogen Idec * | | | 462,984 | |
| | | | | | | | |
Shares | | | | | Market
Value | |
| | |
| | | | Healthcare (continued) | | | | |
| | 5,200 | | | Gilead Sciences * | | $ | 369,148 | |
| | 5,700 | | | Sanofi, ADR (France) | | | 304,836 | |
| | 4,050 | | | Stryker | | | 299,133 | |
| | | | | | | | |
| | | | | | | 2,808,914 | |
| | | | | | | | |
| | |
| | | | Industrials – 3.98% | | | | |
| | 19,700 | | | General Electric | | | 514,958 | |
| | 4,600 | | | United Parcel Service, Class B | | | 451,904 | |
| | | | | | | | |
| | | | | | | 966,862 | |
| | | | | | | | |
| | |
| | | | Information Technology – 10.97% | | | | |
| | 1,950 | | | Accenture, Class A (Ireland) | | | 143,325 | |
| | 8,100 | | | eBay * | | | 426,951 | |
| | 4,200 | | | EMC | | | 101,094 | |
| | 1,200 | | | F5 Networks * | | | 97,812 | |
| | 746 | | | Google, Class A * | | | 768,813 | |
| | 15,800 | | | Juniper Networks * | | | 294,512 | |
| | 6,500 | | | QUALCOMM | | | 451,555 | |
| | 1,919 | | | Visa, Class A | | | 377,410 | |
| | | | | | | | |
| | | | | | | 2,661,472 | |
| | | | | | | | |
| | |
| | | | Materials – 2.01% | | | | |
| | 4,650 | | | Monsanto | | | 487,692 | |
| | | | | | | | |
| | |
| | | | Total Common Stocks
(Cost $11,778,123) | | | 14,966,275 | |
| | | | | | | | |
Par Value | | | | | | |
|
| | CORPORATE NOTES AND BONDS – 21.36% | |
| | |
| | | | Consumer Staples – 4.42% | | | | |
| | $300,000 | | | Coca-Cola
Senior Unsecured Notes
5.350%, 11/15/17 | | | 346,855 | |
| | 325,000 | | | PepsiCo
Senior Unsecured Notes
5.000%, 06/01/18 | | | 370,101 | |
| | 350,000 | | | Wal-Mart Stores
Senior Unsecured Notes
3.200%, 05/15/14 | | | 355,738 | |
| | | | | | | | |
| | | | | | | 1,072,694 | |
| | | | | | | | |
| | |
| | | | Energy – 0.40% | | | | |
| | 95,000 | | | ConocoPhillips
4.750%, 02/01/14 | | | 95,990 | |
| | | | | | | | |
| | |
| | | | Financials – 7.04% | | | | |
| | 300,000 | | | General Electric Capital
Senior Unsecured Notes, MTN
4.375%, 09/16/20 | | | 327,084 | |
| | 300,000 | | | Goldman Sachs Group
Senior Unsecured Notes
3.625%, 02/07/16 | | | 316,799 | |
| | 350,000 | | | JPMorgan Chase
Senior Unsecured Notes
4.350%, 08/15/21 | | | 371,711 | |
See accompanying Notes to Financial Statements.
| | |
| |
| ASTON/Montag & Caldwell Balanced Fund | | October 31, 2013 |
| |
| Schedule of Investments – continued | | |
| | | | | | | | |
Par Value | | | | | Market
Value | |
| | |
| | | | Financials (continued) | | | | |
| | $350,000 | | | U.S. Bancorp
Subordinated Notes, MTN
2.950%, 07/15/22 | | $ | 333,040 | |
| | 350,000 | | | Wells Fargo
Senior Unsecured Notes, MTN, Series 1
3.750%, 10/01/14 | | | 360,671 | |
| | | | | | | | |
| | | | | | | 1,709,305 | |
| | | | | | | | |
| | |
| | | | Healthcare – 2.87% | | | | |
| | 250,000 | | | Johnson & Johnson
Senior Unsecured Notes
5.950%, 08/15/37 | | | 308,240 | |
| | 375,000 | | | Medtronic
Senior Unsecured Notes
3.000%, 03/15/15 | | | 387,845 | |
| | | | | | | | |
| | | | | | | 696,085 | |
| | | | | | | | |
| | |
| | | | Industrials – 1.58% | | | | |
| | 375,000 | | | United Parcel Service
Senior Unsecured Notes
3.125%, 01/15/21 | | | 383,774 | |
| | | | | | | | |
| | |
| | | | Information Technology – 5.05% | | | | |
| | 300,000 | | | Apple
Senior Unsecured Notes
1.000%, 05/03/18 | | | 291,554 | |
| | 300,000 | | | Cisco Systems
Senior Unsecured Notes
5.500%, 02/22/16 | | | 332,945 | |
| | 300,000 | | | Google
Senior Unsecured Notes
3.625%, 05/19/21 | | | 318,312 | |
| | 300,000 | | | Oracle
Senior Unsecured Notes
2.500%, 10/15/22 | | | 281,678 | |
| | | | | | | | |
| | | | | | | 1,224,489 | |
| | | | | | | | |
| | |
| | | | Total Corporate Notes and Bonds
(Cost $5,094,676) | | | 5,182,337 | |
| | | | | | | | |
|
| | U.S. GOVERNMENT AND AGENCY OBLIGATIONS – 13.98% | |
| | |
| | | | Fannie Mae – 0.18% | | | | |
| | 12,476 | | | 7.500%, 02/01/35,
Pool # 787557 | | | 14,516 | |
| | 2,985 | | | 7.500%, 04/01/35,
Pool # 819231 | | | 3,211 | |
| | 24,635 | | | 6.000%, 11/01/35,
Pool # 844078 | | | 26,981 | |
| | | | | | | | |
| | | | | | | 44,708 | |
| | | | | | | | |
| | |
| | | | Freddie Mac – 1.60% | | | | |
| | 12,678 | | | 5.500%, 12/01/20,
Gold Pool # G11820 | | | 13,799 | |
| | 375,000 | | | 1.000%, 09/29/17 | | | 373,979 | |
| | | | | | | | |
| | | | | | | 387,778 | |
| | | | | | | | |
| | | | | | | | |
Par Value | | | | | Market
Value | |
| |
| | | | Government National Mortgage Association – 0.06% | |
| | $ 12,554 | | | 5.500%, 02/15/39,
Pool # 698060 | | $ | 13,758 | |
| | | | | | | | |
| | |
| | | | U.S. Treasury Bonds – 3.79% | | | | |
| | 300,000 | | | 5.375%, 02/15/31 | | | 385,523 | |
| | 400,000 | | | 3.500%, 02/15/39 | | | 396,875 | |
| | 150,000 | | | 3.125%, 11/15/41 | | | 136,770 | |
| | | | | | | | |
| | | | | | | 919,168 | |
| | | | | | | | |
| | |
| | | | U.S. Treasury Notes – 8.35% | | | | |
| | 325,000 | | | 4.000%, 02/15/15 | | | 340,894 | |
| | 275,000 | | | 0.250%, 02/15/15 | | | 275,193 | |
| | 300,000 | | | 4.500%, 02/15/16 | | | 328,289 | |
| | 325,000 | | | 2.625%, 04/30/16 | | | 342,723 | |
| | 325,000 | | | 4.625%, 02/15/17 | | | 366,184 | |
| | 375,000 | | | 2.125%, 08/15/21 | | | 374,326 | |
| | | | | | | | |
| | | | | | | 2,027,609 | |
| | | | | | | | |
| | |
| | | | Total U.S. Government and Agency Obligations
(Cost $3,362,688) | | | 3,393,021 | |
| | | | | | | | |
Shares | | | | | | |
|
| | INVESTMENT COMPANY – 2.97% | |
| | |
| | 721,029 | | | BlackRock Liquidity Funds TempCash Portfolio | | | 721,029 | |
| | | | | | | | |
| | |
| | | | Total Investment Company
(Cost $721,029) | | | 721,029 | |
| | | | | | | | |
| Total Investments – 99.99%
(Cost $20,956,516)** | | | 24,262,662 | |
| | | | | | | | |
| Net Other Assets and Liabilities – 0.01% | | | 1,711 | |
| | | | | | | | |
| Net Assets – 100.00% | | $ | 24,264,373 | |
| | | | | | | | |
| * | | Non-income producing security. |
| ** | | Aggregate cost for Federal income tax purposes is $21,264,058. |
| | | | |
Gross unrealized appreciation | | $ | 3,424,790 | |
Gross unrealized depreciation | | | (426,186 | ) |
| | | | |
Net unrealized appreciation | | $ | 2,998,604 | |
| | | | |
| ADR | | American Depositary Receipt |
| | | | |
Portfolio Composition | | | | |
Common Stocks | | | 62% | |
Investment Company | | | 3% | |
U.S. Government and Agency Obligations | | | 14% | |
Corporate Notes and Bonds
(Moody’s Ratings Unaudited) | | | | |
AAA | | | 1% | |
AA | | | 8% | |
A | | | 12% | |
| | | | |
| | | 100% | |
| | | | |
See accompanying Notes to Financial Statements.
| | |
| |
| | October 31, 2013 |
| |
| Statements of Assets and Liabilities | | |
| | | | | | | | |
| | |
| | | Montag & Caldwell
Growth Fund | | | TAMRO
Diversified
Equity Fund | |
| | | | | | | | |
| | |
ASSETS: | | | | | | | | |
Investments: | | | | | | | | |
Investments at cost | | $ | 4,207,049,808 | | | $ | 45,990,275 | |
Net unrealized appreciation | | | 1,029,974,109 | | | | 10,047,297 | |
| | | | | | | | |
Total investments at value | | | 5,237,023,917 | | | | 56,037,572 | |
Cash | | | — | | | | — | |
Receivables: | | | | | | | | |
Dividends and interest | | | 3,518,774 | | | | 13,229 | |
Dividend reclaims | | | — | | | | — | |
Fund shares sold | | | 5,827,857 | | | | 18,371 | |
Investments sold | | | 9,195,158 | | | | 838,816 | |
Other assets | | | 20,397 | | | | 120 | |
| | | | | | | | |
Total assets | | | 5,255,586,103 | | | | 56,908,108 | |
| | | | | | | | |
| | |
LIABILITIES: | | | | | | | | |
Payables: | | | | | | | | |
Dividend distribution | | | — | | | | — | |
Investments purchased | | | 5,105,850 | | | | 979,934 | |
Fund shares redeemed | | | 10,542,687 | | | | 177,083 | |
Due to Adviser, net (Note G) | | | 2,742,241 | | | | 36,064 | |
Administration fees (Note G) | | | 202,107 | | | | 4,758 | |
Distribution fees (Note G) | | | 120,965 | | | | 1,477 | |
Audit and tax fees | | | 20,869 | | | | 11,630 | |
Transfer agent fees | | | 821,152 | | | | 10,837 | |
Registration fees | | | 37,307 | | | | 6,956 | |
Accrued expenses and other payables | | | 196,249 | | | | 2,342 | |
| | | | | | | | |
Total liabilities | | | 19,789,427 | | | | 1,231,081 | |
| | | | | | | | |
NET ASSETS | | $ | 5,235,796,676 | | | $ | 55,677,027 | |
| | | | | | | | |
| | |
NET ASSETS CONSIST OF: | | | | | | | | |
Paid in capital | | $ | 3,840,418,223 | | | $ | 44,026,270 | |
Accumulated undistributed (distribution in excess of) net investment income (loss) | | | 29,594,965 | | | | 14,401 | |
Accumulated net realized gain (loss) on investments | | | 335,809,379 | | | | 1,589,059 | |
Net unrealized appreciation on investments | | | 1,029,974,109 | | | | 10,047,297 | |
| | | | | | | | |
TOTAL NET ASSETS | | $ | 5,235,796,676 | | | $ | 55,677,027 | |
| | | | | | | | |
Class N: | | | | | | | | |
Net Assets | | $ | 2,190,073,885 | | | $ | 26,796,825 | |
Shares of beneficial interest outstanding (unlimited authorization) | | | 76,364,383 | | | | 1,599,474 | |
NET ASSET VALUE Offering and redemption price per share
(Net Assets/Shares Outstanding) | | $ | 28.68 | | | $ | 16.75 | |
| | | | | | | | |
Class I: | | | | | | | | |
Net Assets | | $ | 3,035,623,327 | | | $ | 28,880,202 | |
Shares of beneficial interest outstanding (unlimited authorization) | | | 105,159,548 | | | | 1,720,800 | |
NET ASSET VALUE Offering and redemption price per share
(Net Assets/Shares Outstanding) | | $ | 28.87 | | | $ | 16.78 | |
| | | | | | | | |
Class R: | | | | | | | | |
Net Assets | | $ | 10,099,464 | | | $ | — | |
Shares of beneficial interest outstanding (unlimited authorization) | | | 356,451 | | | | — | |
NET ASSET VALUE Offering and redemption price per share
(Net Assets/Shares Outstanding) | | $ | 28.33 | | | $ | — | |
| | | | | | | | |
See accompanying Notes to Financial Statements.
| | | | | | | | | | | | | | | | | | | | | | | | | | |
| | | | | | |
Herndon
Large Cap
Value Fund | | | Cornerstone
Large Cap
Value Fund | | | River Road
Dividend All
Cap Value Fund | | | River Road
Dividend All
Cap Value Fund II | | | Fairpointe
Mid Cap
Fund | | | Montag & Caldwell
Mid Cap
Growth Fund | | | LMCG
Small Cap
Growth Fund | |
| | | | | | | | | | | | | | | | | | | | | | | | | | |
| | | | | | |
| | | | | | | | | | | | | | | | | | | | | | | | | | |
| | | | | | | | | | | | | | | | | | | | | | | | | | |
| $ | 107,498,270 | | | $ | 55,578,343 | | | $ | 974,998,361 | | | $ | 80,516,573 | | | $ | 3,713,505,748 | | | $ | 9,749,180 | | | $ | 38,409,369 | |
| | 15,641,275 | | | | 6,842,854 | | | | 252,182,559 | | | | 9,225,229 | | | | 1,352,423,044 | | | | 1,766,296 | | | | 2,143,056 | |
| | | | | | | | | | | | | | | | | | | | | | | | | | |
| | 123,139,545 | | | | 62,421,197 | | | | 1,227,180,920 | | | | 89,741,802 | | | | 5,065,928,792 | | | | 11,515,476 | | | | 40,552,425 | |
| | — | | | | — | | | | — | | | | 103,743 | | | | — | | | | — | | | | — | |
| | | | | | | | | | | | | | | | | | | | | | | | | | |
| | 76,176 | | | | 41,333 | | | | 2,233,257 | | | | 144,987 | | | | 1,644,256 | | | | 1,667 | | | | 1,870 | |
| | — | | | | 851 | | | | 9,544 | | | | — | | | | — | | | | — | | | | — | |
| | 208,764 | | | | 538,894 | | | | 751,024 | | | | 108,892 | | | | 10,864,215 | | | | — | | | | — | |
| | 1,782,980 | | | | 437,909 | | | | 1,577,024 | | | | 28,308 | | | | 25,683,488 | | | | 25,740 | | | | 944,946 | |
| | 290 | | | | 130 | | | | 4,316 | | | | 89 | | | | 15,058 | | | | 44 | | | | 11,889 | |
| | | | | | | | | | | | | | | | | | | | | | | | | | |
| | 125,207,755 | | | | 63,440,314 | | | | 1,231,756,085 | | | | 90,127,821 | | | | 5,104,135,809 | | | | 11,542,927 | | | | 41,511,130 | |
| | | | | | | | | | | | | | | | | | | | | | | | | | |
| | | | | | |
| | | | | | | | | | | | | | | | | | | | | | | | | | |
| | | | | | | | | | | | | | | | | | | | | | | | | | |
| | — | | | | — | | | | 300,814 | | | | 7,514 | | | | — | | | | — | | | | — | |
| | 2,425,444 | | | | 714,552 | | | | 373,898 | | | | 103,743 | | | | 201,123,002 | | | | 112,763 | | | | 882,570 | |
| | 238,016 | | | | 2,873 | | | | 1,058,034 | | | | 33,492 | | | | 6,342,125 | | | | — | | | | 17,351 | |
| | 103,676 | | | | 29,611 | | | | 710,215 | | | | 69,103 | | | | 2,889,269 | | | | 4,576 | | | | 24,865 | |
| | 7,125 | | | | 4,677 | | | | 49,337 | | | | 5,996 | | | | 190,308 | | | | 3,016 | | | | 4,114 | |
| | 2,308 | | | | 1,311 | | | | 24,628 | | | | 199 | | | | 130,476 | | | | 624 | | | | 1,775 | |
| | 11,762 | | | | 13,958 | | | | 14,407 | | | | 13,958 | | | | 20,869 | | | | 11,630 | | | | 14,980 | |
| | 12,057 | | | | 10,829 | | | | 191,830 | | | | 8,089 | | | | 908,679 | | | | 3,154 | | | | 12,063 | |
| | 8,016 | | | | 7,179 | | | | 13,926 | | | | 9,052 | | | | 44,692 | | | | 3,044 | | | | 9,303 | |
| | 4,270 | | | | 6,946 | | | | 30,471 | | | | 3,013 | | | | 238,329 | | | | 1,933 | | | | 3,469 | |
| | | | | | | | | | | | | | | | | | | | | | | | | | |
| | 2,812,674 | | | | 791,936 | | | | 2,767,560 | | | | 254,159 | | | | 211,887,749 | | | | 140,740 | | | | 970,490 | |
| | | | | | | | | | | | | | | | | | | | | | | | | | |
| $ | 122,395,081 | | | $ | 62,648,378 | | | $ | 1,228,988,525 | | | $ | 89,873,662 | | | $ | 4,892,248,060 | | | $ | 11,402,187 | | | $ | 40,540,640 | |
| | | | | | | | | | | | | | | | | | | | | | | | | | |
| | | | | | |
| | | | | | | | | | | | | | | | | | | | | | | | | | |
| $ | 104,518,678 | | | $ | 80,340,453 | | | $ | 903,055,325 | | | $ | 79,611,737 | | | $ | 3,081,282,019 | | | $ | 7,979,942 | | | $ | 34,577,863 | |
| | 655,279 | | | | 194,302 | | | | (30,952 | ) | | | 20,099 | | | | 1,616,865 | | | | — | | | | 9,496 | |
| | 1,579,849 | | | | (24,729,231 | ) | | | 73,781,593 | | | | 1,016,597 | | | | 456,926,132 | | | | 1,655,949 | | | | 3,810,225 | |
| | 15,641,275 | | | | 6,842,854 | | | | 252,182,559 | | | | 9,225,229 | | | | 1,352,423,044 | | | | 1,766,296 | | | | 2,143,056 | |
| | | | | | | | | | | | | | | | | | | | | | | | | | |
| $ | 122,395,081 | | | $ | 62,648,378 | | | $ | 1,228,988,525 | | | $ | 89,873,662 | | | $ | 4,892,248,060 | | | $ | 11,402,187 | | | $ | 40,540,640 | |
| | | | | | | | | | | | | | | | | | | | | | | | | | |
| | | | | | | | | | | | | | | | | | | | | | | | | | |
| $ | 41,860,798 | | | $ | 23,913,348 | | | $ | 449,129,765 | | | $ | 3,633,974 | | | $ | 2,370,431,946 | | | $ | 11,402,187 | | | $ | 32,044,831 | |
| | 3,024,141 | | | | 1,739,815 | | | | 32,096,979 | | | | 281,925 | | | | 52,210,680 | | | | 892,629 | | | | 2,178,779 | |
| | | | | | | | | | | | | | | | | | | | | | | | | | |
| $ | 13.84 | | | $ | 13.74 | | | $ | 13.99 | | | $ | 12.89 | | | $ | 45.40 | | | $ | 12.77 | | | $ | 14.71 | |
| | | | | | | | | | | | | | | | | | | | | | | | | | |
| | | | | | | | | | | | | | | | | | | | | | | | | | |
| $ | 80,534,283 | | | $ | 38,735,030 | | | $ | 779,858,760 | | | $ | 86,239,688 | | | $ | 2,521,816,114 | | | $ | — | | | $ | 8,495,809 | |
| | 5,806,098 | | | | 2,811,555 | | | | 55,765,471 | | | | 6,689,289 | | | | 54,700,041 | | | | — | | | | 573,801 | |
| | | | | | | | | | | | | | | | | | | | | | | | | | |
| $ | 13.87 | | | $ | 13.78 | | | $ | 13.98 | | | $ | 12.89 | | | $ | 46.10 | | | $ | — | | | $ | 14.81 | |
| | | | | | | | | | | | | | | | | | | | | | | | | | |
| | | | | | | | | | | | | | | | | | | | | | | | | | |
| $ | — | | | $ | — | | | $ | — | | | $ | — | | | $ | — | | | $ | — | | | $ | — | |
| | — | | | | — | | | | — | | | | — | | | | — | | | | — | | | | — | |
| | | | | | | | | | | | | | | | | | | | | | | | | | |
| $ | — | | | $ | — | | | $ | — | | | $ | — | | | $ | — | | | $ | — | | | $ | — | |
| | | | | | | | | | | | | | | | | | | | | | | | | | |
See accompanying Notes to Financial Statements.
| | |
| |
| | October 31, 2013 |
| |
| Statements of Assets and Liabilities – continued | | |
| | | | | | | | |
| | |
| | | Silvercrest
Small Cap
Fund | | | TAMRO
Small Cap
Fund | |
| | | | | | | | |
| | |
ASSETS: | | | | | | | | |
Investments: | | | | | | | | |
Investments at cost | | $ | 28,387,050 | | | $ | 967,704,752 | |
Affiliated Investment at cost | | | — | | | | — | |
Net unrealized appreciation (depreciation) | | | 4,520,992 | | | | 359,622,553 | |
| | | | | | | | |
Total investments at value | | | 32,908,042 | | | | 1,327,327,305 | |
Receivables: | | | | | | | | |
Dividends and interest | | | 4,977 | | | | 402,933 | |
Fund shares sold | | | 686 | | | | 1,701,282 | |
Investments sold | | | 636,692 | | | | 25,397,448 | |
Other assets | | | 41 | | | | 4,824 | |
| | | | | | | | |
Total assets | | | 33,550,438 | | | | 1,354,833,792 | |
| | | | | | | | |
| | |
LIABILITIES: | | | | | | | | |
Payables: | | | | | | | | |
Due to custodian | | | 223,896 | | | | — | |
Dividend distribution | | | — | | | | — | |
Investments purchased | | | — | | | | 25,122,306 | |
Fund shares redeemed | | | 558 | | | | 2,446,615 | |
Due to Adviser, net (Note G) | | | 10,789 | | | | 1,004,314 | |
Administration fees (Note G) | | | 3,902 | | | | 53,923 | |
Distribution fees (Note G) | | | 247 | | | | 29,650 | |
Audit and tax fees | | | 11,630 | | | | 14,090 | |
Transfer agent fees | | | 9,807 | | | | 300,133 | |
Registration fees | | | 19,569 | | | | 12,424 | |
Accrued expenses and other payables | | | 2,598 | | | | 50,961 | |
Call options written, at value (premiums received $4,160,902) | | | — | | | | — | |
| | | | | | | | |
Total liabilities | | | 282,996 | | | | 29,034,416 | |
| | | | | | | | |
NET ASSETS | | $ | 33,267,442 | | | $ | 1,325,799,376 | |
| | | | | | | | |
| | |
NET ASSETS CONSIST OF: | | | | | | | | |
Paid in capital | | $ | 27,536,660 | | | $ | 853,329,554 | |
Accumulated undistributed (distribution in excess of) net investment income (loss) | | | (847 | ) | | | (56,283 | ) |
Accumulated net realized gain (loss) on investments, purchased options, written options and capital gain distributions received | | | 1,210,637 | | | | 112,903,552 | |
Net unrealized appreciation (depreciation) on investments, purchased options and written options | | | 4,520,992 | | | | 359,622,553 | |
| | | | | | | | |
TOTAL NET ASSETS | | $ | 33,267,442 | | | $ | 1,325,799,376 | |
| | | | | | | | |
Class N: | | | | | | | | |
Net Assets | | $ | 4,048,658 | | | $ | 533,627,448 | |
Shares of beneficial interest outstanding (unlimited authorization) | | | 278,462 | | | | 22,181,487 | |
NET ASSET VALUE Offering and redemption price per share
(Net Assets/Shares Outstanding) | | $ | 14.54 | | | $ | 24.06 | |
| | | | | | | | |
Class I: | | | | | | | | |
Net Assets | | $ | 29,218,784 | | | $ | 792,171,928 | |
Shares of beneficial interest outstanding (unlimited authorization) | | | 2,002,422 | | | | 32,090,453 | |
NET ASSET VALUE Offering and redemption price per share
(Net Assets/Shares Outstanding) | | $ | 14.59 | | | $ | 24.69 | |
| | | | | | | | |
See accompanying Notes to Financial Statements.
| | | | | | | | | | | | | | | | | | | | | | | | | | |
| | | | | | |
River Road
Select Value
Fund | | | River Road
Small Cap
Value Fund | | | River Road
Independent
Value Fund | | | DoubleLine Core
Plus Fixed
Income Fund | | | TCH
Fixed Income
Fund | | | Lake Partners
LASSO
Alternatives Fund | | | Anchor Capital
Enhanced Equity
Fund | |
| | | | | | | | | | | | | | | | | | | | | | | | | | |
| | | | | | |
| | | | | | | | | | | | | | | | | | | | | | | | | | |
| | | | | | | | | | | | | | | | | | | | | | | | | | |
| $ | 179,950,282 | | | $ | 222,895,353 | | | $ | 700,005,546 | | | $ | 171,285,053 | | | $ | 47,974,712 | | | $ | 442,546,622 | | | $ | 158,631,366 | |
| | — | | | | — | | | | — | | | | 4,500,000 | | | | — | | | | — | | | | — | |
| | 37,924,175 | | | | 84,705,844 | | | | 27,021,692 | | | | (435,309 | ) | | | 2,931,965 | | | | 27,883,247 | | | | 8,663,065 | |
| | | | | | | | | | | | | | | | | | | | | | | | | | |
| | 217,874,457 | | | | 307,601,197 | | | | 727,027,238 | | | | 175,349,744 | | | | 50,906,677 | | | | 470,429,869 | | | | 167,294,431 | |
| | | | | | | | | | | | | | | | | | | | | | | | | | |
| | — | | | | 12,215 | | | | 70,433 | | | | 1,384,960 | | | | 560,030 | | | | 253,285 | | | | 178,738 | |
| | 23,800 | | | | 1,677,493 | | | | 3,321,759 | | | | 224,357 | | | | 6,369 | | | | 1,126,843 | | | | 689,727 | |
| | 538,548 | | | | 2,963,071 | | | | 98,613 | | | | 367,325 | | | | 4,023,760 | | | | — | | | | 1,000,151 | |
| | 774 | | | | 1,377 | | | | 20,515 | | | | 907 | | | | 320 | | | | 1,422 | | | | 780 | |
| | | | | | | | | | | | | | | | | | | | | | | | | | |
| | 218,437,579 | | | | 312,255,353 | | | | 730,538,558 | | | | 177,327,293 | | | | 55,497,156 | | | | 471,811,419 | | | | 169,163,827 | |
| | | | | | | | | | | | | | | | | | | | | | | | | | |
| | | | | | |
| | | | | | | | | | | | | | | | | | | | | | | | | | |
| | | | | | | | | | | | | | | | | | | | | | | | | | |
| | — | | | | — | | | | — | | | | — | | | | 868,528 | | | | — | | | | 17,662 | |
| | — | | | | — | | | | — | | | | 71,262 | | | | 9,281 | | | | — | | | | — | |
| | 733,008 | | | | 1,979,781 | | | | 2,912,088 | | | | 239,042 | | | | — | | | | 204,577 | | | | 2,451,403 | |
| | 127,769 | | | | 292,538 | | | | 1,393,441 | | | | 479,773 | | | | 36,546 | | | | 216,447 | | | | 229,211 | |
| | 182,186 | | | | 232,550 | | | | 603,320 | | | | 58,209 | | | | 22,684 | | | | 400,075 | | | | 92,595 | |
| | 11,143 | | | | 14,761 | | | | 29,921 | | | | 24,382 | | | | 9,169 | | | | 20,352 | | | | 9,400 | |
| | 1,048 | | | | 3,140 | | | | 18,693 | | | | 3,631 | | | | 1,507 | | | | 2,992 | | | | 5,558 | |
| | 13,958 | | | | 13,958 | | | | 11,630 | | | | 15,552 | | | | 15,552 | | | | 13,179 | | | | 13,179 | |
| | 34,020 | | | | 100,265 | | | | 161,436 | | | | 27,508 | | | | 10,848 | | | | 61,875 | | | | 25,337 | |
| | 6,575 | | | | 10,834 | | | | 17,864 | | | | 7,841 | | | | 7,438 | | | | 16,688 | | | | 17,159 | |
| | 9,370 | | | | 10,355 | | | | 34,304 | | | | 14,229 | | | | 2,943 | | | | 12,441 | | | | 19,069 | |
| | — | | | | — | | | | — | | | | — | | | | — | | | | — | | | | 6,521,330 | |
| | | | | | | | | | | | | | | | | | | | | | | | | | |
| | 1,119,077 | | | | 2,658,182 | | | | 5,182,697 | | | | 941,429 | | | | 984,496 | | | | 948,626 | | | | 9,401,903 | |
| | | | | | | | | | | | | | | | | | | | | | | | | | |
| $ | 217,318,502 | | | $ | 309,597,171 | | | $ | 725,355,861 | | | $ | 176,385,864 | | | $ | 54,512,660 | | | $ | 470,862,793 | | | $ | 159,761,924 | |
| | | | | | | | | | | | | | | | | | | | | | | | | | |
| | | | | | |
| | | | | | | | | | | | | | | | | | | | | | | | | | |
| $ | 149,287,482 | | | $ | 160,213,712 | | | $ | 678,353,433 | | | $ | 180,529,492 | | | $ | 56,220,011 | | | $ | 441,277,715 | | | $ | 154,371,368 | |
| | (290,213 | ) | | | (136,215 | ) | | | (40,199 | ) | | | (583,993 | ) | | | 209,053 | | | | 210,610 | | | | 141,432 | |
|
30,397,058 |
| | | 64,813,830 | | | | 20,020,935 | | | | (3,124,326 | ) | | | (4,848,369 | ) | | | 1,491,221 | | | | (1,053,513 | ) |
| | 37,924,175 | | | | 84,705,844 | | | | 27,021,692 | | | | (435,309 | ) | | | 2,931,965 | | | | 27,883,247 | | | | 6,302,637 | |
| | | | | | | | | | | | | | | | | | | | | | | | | | |
| $ | 217,318,502 | | | $ | 309,597,171 | | | $ | 725,355,861 | | | $ | 176,385,864 | | | $ | 54,512,660 | | | $ | 470,862,793 | | | $ | 159,761,924 | |
| | | | | | | | | | | | | | | | | | | | | | | | | | |
| | | | | | | | | | | | | | | | | | | | | | | | | | |
| $ | 19,098,969 | | | $ | 56,793,480 | | | $ | 339,087,585 | | | $ | 66,367,719 | | | $ | 45,771,131 | | | $ | 54,388,109 | | | $ | 101,662,849 | |
| | 1,857,430 | | | | 3,330,626 | | | | 29,551,875 | | | | 6,231,583 | | | | 4,291,217 | | | | 4,077,280 | | | | 10,828,888 | |
| | | | | | | | | | | | | | | | | | | | | | | | | | |
| $ | 10.28 | | | $ | 17.05 | | | $ | 11.47 | | | $ | 10.65 | | | $ | 10.67 | | | $ | 13.34 | | | $ | 9.39 | |
| | | | | | | | | | | | | | | | | | | | | | | | | | |
| | | | | | | | | | | | | | | | | | | | | | | | | | |
| $ | 198,219,533 | | | $ | 252,803,691 | | | $ | 386,268,276 | | | $ | 110,018,145 | | | $ | 8,741,529 | | | $ | 416,474,684 | | | $ | 58,099,075 | |
| | 19,097,135 | | | | 14,761,043 | | | | 33,467,374 | | | | 10,330,270 | | | | 819,504 | | | | 31,116,354 | | | | 6,182,558 | |
| | | | | | | | | | | | | | | | | | | | | | | | | | |
| $ | 10.38 | | | $ | 17.13 | | | $ | 11.54 | | | $ | 10.65 | | | $ | 10.67 | | | $ | 13.38 | | | $ | 9.40 | |
| | | | | | | | | | | | | | | | | | | | | | | | | | |
See accompanying Notes to Financial Statements.
| | |
| |
| | October 31, 2013 |
| |
| Statements of Assets and Liabilities – continued | | |
| | | | | | | | |
| | |
| | | River Road
Long-Short
Fund | | | Barings
International
Fund | |
| | | | | | | | |
| | |
ASSETS: | | | | | | | | |
Investments: | | | | | | | | |
Investments at cost | | $ | 173,020,461 | | | $ | 32,381,678 | |
Net unrealized appreciation | | | 7,395,199 | | | | 5,253,644 | |
| | | | | | | | |
Total investments at value | | | 180,415,660 | | | | 37,635,322 | |
Foreign currency (Cost $8,636 and $3,388, respectively) | | | — | | | | — | |
Cash | | | 282,402 | | | | — | |
Segregated Cash (Note B) | | | 50,291,334 | | | | — | |
Receivables: | | | | | | | | |
Dividends and interest | | | 19,395 | | | | 91,150 | |
Dividend reclaims | | | — | | | | 95,910 | |
Fund shares sold | | | 1,397,949 | | | | — | |
Investments sold | | | 8,567,385 | | | | 292,159 | |
Deferred offering costs (Note B-13) | | | — | | | | — | |
Other assets | | | 75 | | | | 286 | |
| | | | | | | | |
Total assets | | | 240,974,200 | | | | 38,114,827 | |
| | | | | | | | |
| | |
LIABILITIES: | | | | | | | | |
Payables: | | | | | | | | |
Interest and dividends on securities sold short | | | 71,709 | | | | — | |
Investments purchased | | | 6,985,997 | | | | 75,125 | |
Fund shares redeemed | | | 837,040 | | | | — | |
Due to Adviser, net (Note G) | | | 155,652 | | | | 11,812 | |
Administration fees (Note G) | | | 8,952 | | | | 9,638 | |
Distribution fees (Note G) | | | 5,913 | | | | 29 | |
Audit and tax fees | | | 13,311 | | | | 13,958 | |
Transfer agent fees | | | 28,306 | | | | 3,572 | |
Registration fees | | | 24,830 | | | | 5,038 | |
Offering costs (Note B-13) | | | — | | | | — | |
Accrued expenses and other payables | | | 11,947 | | | | 11,235 | |
Securities sold short, at value (proceeds $51,300,133) | | | 52,689,384 | | | | — | |
| | | | | | | | |
Total liabilities | | | 60,833,041 | | | | 130,407 | |
| | | | | | | | |
NET ASSETS | | $ | 180,141,159 | | | $ | 37,984,420 | |
| | | | | | | | |
| | |
NET ASSETS CONSIST OF: | | | | | | | | |
Paid in capital | | $ | 169,512,834 | | | $ | 29,485,895 | |
Accumulated undistributed (distribution in excess of) net investment income (loss) | | | (27,513 | ) | | | 997,891 | |
Accumulated net realized gain (loss) on investments, securities sold short and foreign currency transactions | | | 4,649,890 | | | | 2,244,757 | |
Net unrealized appreciation on investments, securities sold short and translation of assets and liabilities denominated in foreign currency | | | 6,005,948 | | | | 5,255,877 | |
| | | | | | | | |
TOTAL NET ASSETS | | $ | 180,141,159 | | | $ | 37,984,420 | |
| | | | | | | | |
Class N: | | | | | | | | |
Net Assets | | $ | 108,966,110 | | | $ | 477,201 | |
Shares of beneficial interest outstanding (unlimited authorization) | | | 9,063,042 | | | | 61,122 | |
NET ASSET VALUE Offering and redemption price per share
(Net Assets/Shares Outstanding) | | $ | 12.02 | | | $ | 7.81 | |
| | | | | | | | |
Class I: | | | | | | | | |
Net Assets | | $ | 71,175,049 | | | $ | 37,507,219 | |
Shares of beneficial interest outstanding (unlimited authorization) | | | 5,909,050 | | | | 4,794,159 | |
NET ASSET VALUE Offering and redemption price per share
(Net Assets/Shares Outstanding) | | $ | 12.05 | | | $ | 7.82 | |
| | | | | | | | |
See accompanying Notes to Financial Statements.
| | | | | | | | | | |
| | |
LMCG
Emerging
Markets Fund | | | Harrison Street
Real Estate
Fund | | | Montag & Caldwell
Balanced Fund | |
| | | | | | | | | | |
| | |
| | | | | | | | | | |
| | | | | | | | | | |
| $ | 3,912,962 | | | $ | 13,502,292 | | | $ | 20,956,516 | |
| | 89,731 | | | | 73,383 | | | | 3,306,146 | |
| | | | | | | | | | |
| | 4,002,693 | | | | 13,575,675 | | | | 24,262,662 | |
| | 8,643 | | | | 3,383 | | | | — | |
| | — | | | | — | | | | 319,572 | |
| | — | | | | — | | | | — | |
| | | | | | | | | | |
| | 3,458 | | | | 6,277 | | | | 80,896 | |
| | — | | | | 2,271 | | | | — | |
| | — | | | | 142,558 | | | | 8,697 | |
| | 25,475 | | | | — | | | | 26,015 | |
| | 29,147 | | | | — | | | | — | |
| | 3 | | | | 51 | | | | 147 | |
| | | | | | | | | | |
| | 4,069,419 | | | | 13,730,215 | | | | 24,697,989 | |
| | | | | | | | | | |
| | |
| | | | | | | | | | |
| | | | | | | | | | |
| | — | | | | — | | | | — | |
| | 16,436 | | | | — | | | | 319,572 | |
| | — | | | | 67,297 | | | | 55,697 | |
| | 8,637 | | | | 5,651 | | | | 19,612 | |
| | 6,190 | | | | 2,873 | | | | 4,271 | |
| | 37 | | | | 727 | | | | 492 | |
| | 14,962 | | | | 12,085 | | | | 15,552 | |
| | 2,020 | | | | 4,918 | | | | 4,869 | |
| | 5,286 | | | | 9,695 | | | | 12,138 | |
| | 28,737 | | | | — | | | | — | |
| | 5,456 | | | | 1,814 | | | | 1,413 | |
| | — | | | | — | | | | — | |
| | | | | | | | | | |
| | 87,761 | | | | 105,060 | | | | 433,616 | |
| | | | | | | | | | |
| $ | 3,981,658 | | | $ | 13,625,155 | | | $ | 24,264,373 | |
| | | | | | | | | | |
| | |
| | | | | | | | | | |
| $ | 4,083,121 | | | $ | 25,658,268 | | | $ | 20,500,968 | |
| | 40,296 | | | | 147,489 | | | | (229,961 | ) |
|
(231,272 |
) | | | (12,253,968 | ) | | | 687,220 | |
|
89,513 |
| | | 73,366 | | | | 3,306,146 | |
| | | | | | | | | | |
| $ | 3,981,658 | | | $ | 13,625,155 | | | $ | 24,264,373 | |
| | | | | | | | | | |
| | | | | | | | | | |
| $ | 674,586 | | | $ | 13,092,898 | | | $ | 22,425,240 | |
| | 69,890 | | | | 1,159,909 | | | | 941,663 | |
| | | | | | | | | | |
| $ | 9.65 | | | $ | 11.29 | | | $ | 23.81 | |
| | | | | | | | | | |
| | | | | | | | | | |
| $ | 3,307,072 | | | $ | 532,257 | | | $ | 1,839,133 | |
| | 341,891 | | | | 47,367 | | | | 77,407 | |
| | | | | | | | | | |
| $ | 9.67 | | | $ | 11.24 | | | $ | 23.76 | |
| | | | | | | | | | |
See accompanying Notes to Financial Statements.
| | |
| |
| For the Year Ended October 31, 2013 | | |
| |
| Statements of Operations | | |
| | | | | | | | |
| | |
| | | Montag & Caldwell
Growth Fund | | | TAMRO
Diversified
Equity Fund | |
| | | | | | | | |
INVESTMENT INCOME: | | | | | | | | |
Dividends | | $ | 93,027,292 | | | $ | 484,497 | |
Less: foreign taxes withheld | | | (1,377,900 | ) | | | (1,249 | ) |
| | | | | | | | |
Total investment income | | | 91,649,392 | | | | 483,248 | |
| | | | | | | | |
EXPENSES: | | | | | | | | |
Investment advisory fees (Note G) | | | 30,285,020 | | | | 303,963 | |
Distribution expenses (Note G)(a) | | | 5,282,384 | | | | 61,302 | |
Transfer agent fees | | | 3,866,966 | | | | 60,315 | |
Administration fees (Note G) | | | 2,138,413 | | | | 32,957 | |
Registration expenses | | | 117,299 | | | | 29,417 | |
Custodian fees | | | 122,690 | | | | 3,847 | |
Audit and tax fees | | | 29,550 | | | | 16,850 | |
Legal fees | | | 103,757 | | | | 737 | |
Amortization of offering costs (Note B-13) | | | — | | | | — | |
Reports to shareholder expense | | | 372,045 | | | | 2,782 | |
Trustees fees and related expenses (Note G) | | | 285,611 | | | | 2,038 | |
Other expenses | | | 217,246 | | | | 6,207 | |
| | | | | | | | |
Total expenses before waivers/reimbursements | | | 42,820,981 | | | | 520,415 | |
| | | | | | | | |
Less: Investment advisory fees waived (Note G) | | | — | | | | (98,160 | ) |
Plus: Expenses recouped (Note G) | | | — | | | | — | |
| | | | | | | | |
Net expenses | | | 42,820,981 | | | | 422,255 | |
| | | | | | | | |
NET INVESTMENT INCOME (LOSS) | | | 48,828,411 | | | | 60,993 | |
| | | | | | | | |
NET REALIZED AND UNREALIZED GAIN (LOSS) ON INVESTMENTS: | | | | | | | | |
Net realized gain on investments | | | 355,430,426 | | | | 1,715,984 | |
Net change in unrealized appreciation (depreciation) of investments | | | 562,807,119 | | | | 5,679,740 | |
| | | | | | | | |
NET REALIZED AND UNREALIZED GAIN ON INVESTMENTS | | | 918,237,545 | | | | 7,395,724 | |
| | | | | | | | |
| | |
NET INCREASE IN NET ASSETS FROM OPERATIONS | | $ | 967,065,956 | | | $ | 7,456,717 | |
| | | | | | | | |
| (a) | Distribution expense is incurred at the Class N level for all funds except Montag & Caldwell Growth Fund. The distribution expense for Class N and R of the Montag & Caldwell Growth Fund is $5,233,548 and $48,836, respectively. |
| (b) | Change in unrealized appreciation does not include unrealized depreciation of $(45,176) of the merged fund in connection with the Reorganization (Note J). |
See accompanying Notes to Financial Statements.
| | | | | | | | | | | | | | | | | | | | | | | | | | |
| | | | | | |
Herndon
Large Cap
Value Fund | | | Cornerstone
Large Cap
Value Fund | | | River Road
Dividend All
Cap Value Fund | | | River Road
Dividend All Cap
Value Fund II | | | Fairpointe
Mid Cap
Fund | | | Montag & Caldwell
Mid Cap
Growth Fund | | | LMCG
Small Cap
Growth Fund | |
| | | | | | | | | | | | | | | | | | | | | | | | | | |
| | | | | | | | | | | | | | | | | | | | | | | | | | |
| $ | 2,209,436 | | | $ | 855,195 | | | $ | 36,881,968 | | | $ | 1,476,224 | | | $ | 59,417,133 | | | $ | 82,378 | | | $ | 314,984 | |
| | (1,154 | ) | | | (23,496 | ) | | | (137,188 | ) | | | (7,111 | ) | | | (9,758 | ) | | | (263 | ) | | | — | |
| | | | | | | | | | | | | | | | | | | | | | | | | | |
| | 2,208,282 | | | | 831,699 | | | | 36,744,780 | | | | 1,469,113 | | | | 59,407,375 | | | | 82,115 | | | | 314,984 | |
| | | | | | | | | | | | | | | | | | | | | | | | | | |
| | | | | | | | | | | | | | | | | | | | | | | | | | |
| | 705,132 | | | | 331,250 | | | | 7,397,487 | | | | 336,356 | | | | 27,440,028 | | | | 104,268 | | | | 229,872 | |
| | 80,111 | | | | 57,326 | | | | 969,723 | | | | 5,425 | | | | 4,848,213 | | | | 30,667 | | | | 47,454 | |
| | 56,150 | | | | 57,797 | | | | 752,530 | | | | 43,249 | | | | 3,207,424 | | | | 20,156 | | | | 48,267 | |
| | 54,938 | | | | 33,405 | | | | 485,951 | | | | 38,130 | | | | 1,737,315 | | | | 21,368 | | | | 26,771 | |
| | 34,039 | | | | 32,241 | | | | 51,529 | | | | 34,951 | | | | 120,809 | | | | 17,126 | | | | 35,196 | |
| | 10,051 | | | | 20,274 | | | | 31,612 | | | | 20,911 | | | | 105,337 | | | | 10,013 | | | | 14,531 | |
| | 17,100 | | | | 20,050 | | | | 20,900 | | | | 20,050 | | | | 29,550 | | | | 16,850 | | | | 24,600 | |
| | 1,851 | | | | 930 | | | | 22,120 | | | | 943 | | | | 80,708 | | | | 281 | | | | 17,211 | |
| | — | | | | — | | | | — | | | | 35,095 | | | | — | | | | — | | | | — | |
| | 4,843 | | | | 2,624 | | | | 43,593 | | | | 2,557 | | | | 392,161 | | | | 797 | | | | 6,936 | |
| | 4,870 | | | | 2,237 | | | | 62,191 | | | | 2,308 | | | | 223,005 | | | | 718 | | | | 1,144 | |
| | 8,158 | | | | 6,391 | | | | 51,394 | | | | 6,002 | | | | 147,962 | | | | 4,808 | | | | 5,474 | |
| | | | | | | | | | | | | | | | | | | | | | | | | | |
| | 977,243 | | | | 564,525 | | | | 9,889,030 | | | | 545,977 | | | | 38,332,512 | | | | 227,052 | | | | 457,456 | |
| | | | | | | | | | | | | | | | | | | | | | | | | | |
| | — | | | | (72,432 | ) | | | — | | | | (36,018 | ) | | | — | | | | (73,717 | ) | | | (157,143 | ) |
| | 28,353 | | | | — | | | | — | | | | — | | | | — | | | | — | | | | — | |
| | | | | | | | | | | | | | | | | | | | | | | | | | |
| | 1,005,596 | | | | 492,093 | | | | 9,889,030 | | | | 509,959 | | | | 38,332,512 | | | | 153,335 | | | | 300,313 | |
| | | | | | | | | | | | | | | | | | | | | | | | | | |
| | 1,202,686 | | | | 339,606 | | | | 26,855,750 | | | | 959,154 | | | | 21,074,863 | | | | (71,220 | ) | | | 14,671 | |
| | | | | | | | | | | | | | | | | | | | | | | | | | |
| | | | | | | | | | | | | | | | | | | | | | | | | | |
| | 2,027,557 | | | | 3,586,687 | | | | 71,272,919 | | | | 1,009,469 | | | | 458,514,910 | | | | 1,788,900 | | | | 5,887,360 | |
| | 14,781,516 | | | | 5,212,950 | | | | 159,132,800 | | | | 9,272,582 | | | | 865,571,634 | | | | 893,311 | | | | 1,825,778 | (b) |
| | | | | | | | | | | | | | | | | | | | | | | | | | |
| | 16,809,073 | | | | 8,799,637 | | | | 230,405,719 | | | | 10,282,051 | | | | 1,324,086,544 | | | | 2,682,211 | | | | 7,713,138 | |
| | | | | | | | | | | | | | | | | | | | | | | | | | |
| | | | | | |
| $ | 18,011,759 | | | $ | 9,139,243 | | | $ | 257,261,469 | | | $ | 11,241,205 | | | $ | 1,345,161,407 | | | $ | 2,610,991 | | | $ | 7,727,809 | |
| | | | | | | | | | | | | | | | | | | | | | | | | | |
See accompanying Notes to Financial Statements.
| | |
| |
| For the Year Ended October 31, 2013 | | |
| |
| Statements of Operations – continued | | |
| | | | | | | | |
| | |
| | | Silvercrest
Small Cap
Fund | | | TAMRO
Small Cap
Fund | |
| | | | | | | | |
INVESTMENT INCOME: | | | | | | | | |
Dividends | | $ | 258,136 | | | $ | 13,251,768 | |
Dividends from affiliated security | | | — | | | | — | |
Less: foreign taxes withheld | | | — | | | | (120,720 | ) |
Interest | | | — | | | | — | |
| | | | | | | | |
Total investment income | | | 258,136 | | | | 13,131,048 | |
| | | | | | | | |
EXPENSES: | | | | | | | | |
Investment advisory fees (Note G) | | | 179,070 | | | | 10,245,165 | |
Distribution expenses (Note G) | | | 5,976 | | | | 1,125,970 | |
Transfer agent fees | | | 38,893 | | | | 942,965 | |
Administration fees (Note G) | | | 24,054 | | | | 521,706 | |
Registration expenses | | | 32,551 | | | | 51,964 | |
Custodian fees | | | 14,253 | | | | 38,054 | |
Audit and tax fees | | | 16,950 | | | | 20,300 | |
Legal fees | | | 2,030 | | | | 23,157 | |
Amortization of offering costs (Note B-13) | | | 7,179 | | | | — | |
Reports to shareholder expense | | | 1,150 | | | | 93,864 | |
Trustees fees and related expenses (Note G) | | | 876 | | | | 66,923 | |
Other expenses | | | 5,359 | | | | 57,263 | |
| | | | | | | | |
Total expenses before waivers/reimbursements | | | 328,341 | | | | 13,187,331 | |
| | | | | | | | |
Less: Investment advisory fees waived (Note G) | | | (116,435 | ) | | | — | |
Less: Earnings credit (Note I) | | | — | | | | — | |
Plus: Expenses recouped (Note G) | | | — | | | | — | |
| | | | | | | | |
Net expenses | | | 211,906 | | | | 13,187,331 | |
| | | | | | | | |
NET INVESTMENT INCOME (LOSS) | | | 46,230 | | | | (56,283 | ) |
| | | | | | | | |
NET REALIZED AND UNREALIZED GAIN (LOSS) ON INVESTMENTS: | | | | | | | | |
Net realized gain (loss) on investments | | | 1,218,605 | | | | 124,824,787 | (a) |
Net realized gain (loss) on purchased options | | | — | | | | — | |
Net realized gain (loss) on written option transactions | | | — | | | | — | |
Capital gain distributions received | | | — | | | | — | |
Net change in unrealized appreciation (depreciation) on investments | | | 4,409,811 | | | | 169,676,168 | |
Net change in unrealized appreciation (depreciation) on purchased options | | | — | | | | — | |
Net change in unrealized appreciation (depreciation) on written options | | | — | | | | — | |
| | | | | | | | |
NET REALIZED AND UNREALIZED GAIN (LOSS) ON INVESTMENTS | | | 5,628,416 | | | | 294,500,955 | |
| | | | | | | | |
| | |
NET INCREASE (DECREASE) IN NET ASSETS FROM OPERATIONS | | $ | 5,674,646 | | | $ | 294,444,672 | |
| | | | | | | | |
| (a) | On January 15, 2013, TAMRO Small Cap Fund had a redemption-in-kind of securities in the amount of $51,794,423. The net realized gain on the transaction of $8,390,446 will not be realized by the Fund for tax purposes. |
See accompanying Notes to Financial Statements.
| | | | | | | | | | | | | | | | | | | | | | | | | | |
| | | | | | |
River Road
Select Value
Fund | | | River Road
Small Cap
Value Fund | | | River Road
Independent
Value Fund | | | DoubleLine Core
Plus Fixed Income
Fund | | | TCH
Fixed Income
Fund | | | Lake Partners
LASSO
Alternatives Fund | | | Anchor Capital
Enhanced Equity
Fund | |
| | | | | | | | | | | | | | | | | | | | | | | | | | |
| | | | | | | | | | | | | | | | | | | | | | | | | | |
| $ | 4,281,738 | | | $ | 7,516,894 | | | $ | 6,132,115 | | | $ | 6,485 | | | $ | 11,559 | | | $ | 5,349,708 | | | $ | 5,218,933 | |
| | — | | | | — | | | | — | | | | 33,929 | | | | — | | | | — | | | | — | |
| | (21,370 | ) | | | (31,070 | ) | | | (200,872 | ) | | | — | | | | (169 | ) | | | — | | | | — | |
| | — | | | | — | | | | — | | | | 7,626,503 | | | | 2,943,408 | | | | — | | | | — | |
| | | | | | | | | | | | | | | | | | | | | | | | | | |
| | 4,260,368 | | | | 7,485,824 | | | | 5,931,243 | | | | 7,666,917 | | | | 2,954,798 | | | | 5,349,708 | | | | 5,218,933 | |
| | | | | | | | | | | | | | | | | | | | | | | | | | |
| | | | | | | | | | | | | | | | | | | | | | | | | | |
| | 1,903,483 | | | | 2,849,791 | | | | 7,204,360 | | | | 1,138,006 | | | | 360,324 | | | | 3,757,977 | | | | 1,055,060 | |
| | 31,983 | | | | 133,336 | | | | 868,783 | | | | 212,049 | | | | 83,461 | | | | 115,634 | | | | 231,782 | |
| | 180,334 | | | | 293,532 | | | | 690,379 | | | | 176,985 | | | | 68,846 | | | | 303,704 | | | | 152,810 | |
| | 101,522 | | | | 157,758 | | | | 334,945 | | | | 168,840 | | | | 63,214 | | | | 181,268 | | | | 86,078 | |
| | 33,099 | | | | 39,504 | | | | 43,946 | | | | 43,723 | | | | 30,103 | | | | 80,562 | | | | 36,715 | |
| | 16,678 | | | | 16,725 | | | | 25,097 | | | | 31,866 | | | | 9,258 | | | | 9,064 | | | | 69,900 | |
| | 20,050 | | | | 20,050 | | | | 16,850 | | | | 22,240 | | | | 22,240 | | | | 23,980 | | | | 18,980 | |
| | 4,234 | | | | 6,454 | | | | 15,918 | | | | 14,557 | | | | 1,422 | | | | 7,755 | | | | 8,681 | |
| | — | | | | — | | | | — | | | | — | | | | — | | | | — | | | | — | |
| | 14,032 | | | | 14,510 | | | | 74,678 | | | | 19,569 | | | | 3,099 | | | | 20,029 | | | | 23,849 | |
| | 11,236 | | | | 19,337 | | | | 44,001 | | | | 12,501 | | | | 4,111 | | | | 21,439 | | | | 9,461 | |
| | 13,105 | | | | 19,559 | | | | 38,788 | | | | 12,035 | | | | 7,575 | | | | 18,176 | | | | 11,088 | |
| | | | | | | | | | | | | | | | | | | | | | | | | | |
| | 2,329,756 | | | | 3,570,556 | | | | 9,357,745 | | | | 1,852,371 | | | | 653,653 | | | | 4,539,588 | | | | 1,704,404 | |
| | | | | | | | | | | | | | | | | | | | | | | | | | |
| | — | | | | — | | | | (59,855 | ) | | | (212,638 | ) | | | (118,148 | ) | | | — | | | | — | |
| | — | | | | — | | | | (77,099 | ) | | | — | | | | — | | | | (1,803 | ) | | | (139 | ) |
| | — | | | | — | | | | — | | | | — | | | | — | | | | 85,619 | | | | — | |
| | | | | | | | | | | | | | | | | | | | | | | | | | |
| | 2,329,756 | | | | 3,570,556 | | | | 9,220,791 | | | | 1,639,733 | | | | 535,505 | | | | 4,623,404 | | | | 1,704,265 | |
| | | | | | | | | | | | | | | | | | | | | | | | | | |
| | 1,930,612 | | | | 3,915,268 | | | | (3,289,548 | ) | | | 6,027,184 | | | | 2,419,293 | | | | 726,304 | | | | 3,514,668 | |
| | | | | | | | | | | | | | | | | | | | | | | | | | |
| | | | | | | | | | | | | | | | | | | | | | | | | | |
| | 31,063,046 | | | | 66,663,383 | | | | 32,206,753 | | | | (2,244,975 | ) | | | 1,655,009 | | | | 2,431,751 | | | | 22,553,315 | |
| | — | | | | — | | | | — | | | | — | | | | — | | | | — | | | | (10,206,234 | ) |
| | — | | | | — | | | | — | | | | — | | | | — | | | | — | | | | (13,133,167 | ) |
| | — | | | | — | | | | — | | | | — | | | | — | | | | 7,581,352 | | | | — | |
| | 16,377,768 | | | | 17,066,486 | | | | 16,741,054 | | | | (5,562,851 | ) | | | (4,215,928 | ) | | | 19,339,867 | | | | 15,508,996 | |
| | — | | | | — | | | | — | | | | — | | | | — | | | | — | | | | (354,613 | ) |
| | — | | | | — | | | | — | | | | — | | | | — | | | | — | | | | (478,809 | ) |
| | | | | | | | | | | | | | | | | | | | | | | | | | |
| | 47,440,814 | | | | 83,729,869 | | | | 48,947,807 | | | | (7,807,826 | ) | | | (2,560,919 | ) | | | 29,352,970 | | | | 13,889,488 | |
| | | | | | | | | | | | | | | | | | | | | | | | | | |
| | | | | | |
| $ | 49,371,426 | | | $ | 87,645,137 | | | $ | 45,658,259 | | | $ | (1,780,642 | ) | | $ | (141,626 | ) | | $ | 30,079,274 | | | $ | 17,404,156 | |
| | | | | | | | | | | | | | | | | | | | | | | | | | |
| | | | | | | | | | | | | | | | | | | | | | | | | | |
See accompanying Notes to Financial Statements.
| | |
| |
| For the Year Ended October 31, 2013 | | |
| |
| Statements of Operations – continued | | |
| | | | | | | | |
| | |
| | | River Road
Long-Short
Fund | | | Barings
International
Fund | |
| | | | | | | | |
INVESTMENT INCOME: | | | | | | | | |
Dividends | | $ | 502,429 | | | $ | 1,800,199 | |
Less: foreign taxes withheld | | | (11,348 | ) | | | (148,645 | ) |
Interest | | | — | | | | — | |
| | | | | | | | |
Total investment income | | | 491,081 | | | | 1,651,554 | |
| | | | | | | | |
EXPENSES: | | | | | | | | |
Investment advisory fees (Note G) | | | 685,328 | | | | 563,044 | |
Distribution expenses (Note G) | | | 89,504 | | | | 1,121 | |
Transfer agent fees | | | 70,605 | | | | 42,502 | |
Administration fees (Note G) | | | 41,541 | | | | 63,814 | |
Registration expenses | | | 47,240 | | | | 29,949 | |
Custodian fees | | | 22,412 | | | | 68,306 | |
Audit and tax fees | | | 18,230 | | | | 20,050 | |
Legal fees | | | 902 | | | | 1,427 | |
Interest and dividend expense on securities sold-short | | | 383,017 | | | | — | |
Amortization of offering costs (Note B-13) | | | — | | | | — | |
Reports to shareholder expense | | | 9,744 | | | | 1,645 | |
Trustees fees and related expenses (Note G) | | | 2,239 | | | | 3,639 | |
Other expenses | | | 6,563 | | | | 7,367 | |
| | | | | | | | |
Total expenses before waivers/reimbursements | | | 1,377,325 | | | | 802,864 | |
| | | | | | | | |
Less: Investment advisory fees waived (Note G) | | | (76,699 | ) | | | (154,242 | ) |
Less: Expenses reimbursed (Note G) | | | — | | | | — | |
| | | | | | | | |
Net expenses | | | 1,300,626 | | | | 648,622 | |
| | | | | | | | |
NET INVESTMENT INCOME (LOSS) | | | (809,545 | ) | | | 1,002,932 | |
| | | | | | | | |
NET REALIZED AND UNREALIZED GAIN (LOSS) ON INVESTMENTS: | | | | | | | | |
Net realized gain (loss) on investments | | | 7,229,451 | | | | 2,560,002 | |
Net realized gain (loss) on securities sold short | | | (1,715,682 | ) | | | — | |
Net realized gain (loss) on foreign currency transactions | | | 92 | | | | (4,859 | ) |
Net change in unrealized appreciation (depreciation) on investments | | | 7,320,581 | | | | 4,145,650 | |
Net change in unrealized appreciation (depreciation) on securities sold short | | | (1,357,185 | ) | | | — | |
Net change in unrealized appreciation (depreciation) on translation of assets and liabilities denominated in foreign currency | | | — | | | | 4,858 | |
| | | | | | | | |
NET REALIZED AND UNREALIZED GAIN (LOSS) ON INVESTMENTS | | | 11,477,257 | | | | 6,705,651 | |
| | | | | | | | |
| | |
NET INCREASE (DECREASE) IN NET ASSETS FROM OPERATIONS | | $ | 10,667,712 | | | $ | 7,708,583 | |
| | | | | | | | |
| (a) | The inception date for the LMCG Emerging Markets Fund is March 28, 2013. |
See accompanying Notes to Financial Statements.
| | | | | | | | | | |
| | |
LMCG
Emerging
Markets Fund(a) | | | Harrison Street
Real Estate
Fund | | | Montag & Caldwell
Balanced Fund | |
| | | | | | | | | | |
| | | | | | | | | | |
| $ | 75,561 | | | $ | 355,252 | | | $ | 345,677 | |
| | (9,097 | ) | | | (1,447 | ) | | | (4,662 | ) |
| | — | | | | — | | | | 240,567 | |
| | | | | | | | | | |
| | 66,464 | | | | 353,805 | | | | 581,582 | |
| | | | | | | | | | |
| | | | | | | | | | |
| | 22,414 | | | | 122,463 | | | | 203,906 | |
| | 963 | | | | 29,822 | | | | 25,407 | |
| | 14,066 | | | | 37,764 | | | | 44,268 | |
| | 17,106 | | | | 20,535 | | | | 31,669 | |
| | 8,866 | | | | 29,256 | | | | 28,899 | |
| | 21,252 | | | | 5,088 | | | | 3,986 | |
| | 20,300 | | | | 17,710 | | | | 22,240 | |
| | 145 | | | | 224 | | | | 655 | |
| | — | | | | — | | | | — | |
| | 43,226 | | | | — | | | | — | |
| | 75 | | | | 2,099 | | | | 1,878 | |
| | 99 | | | | 717 | | | | 1,710 | |
| | 1,670 | | | | 5,250 | | | | 5,572 | |
| | | | | | | | | | |
| | 150,182 | | | | 270,928 | | | | 370,190 | |
| | | | | | | | | | |
| | (22,414 | ) | | | (103,949 | ) | | | (45,721 | ) |
| | (96,919 | ) | | | — | | | | — | |
| | | | | | | | | | |
| | 30,849 | | | | 166,979 | | | | 324,469 | |
| | | | | | | | | | |
| | 35,615 | | | | 186,826 | | | | 257,113 | |
| | | | | | | | | | |
| | | | | | | | | | |
| | (231,272 | ) | | | 1,055,517 | | | | 2,639,428 | |
| | — | | | | — | | | | — | |
| | (9,824 | ) | | | 173 | | | | — | |
| | 89,731 | | | | (505,975 | ) | | | 325,469 | |
| | — | | | | — | | | | — | |
| (218 | ) | | | 22 | | | | — | |
| | | | | | | | | | |
| | (151,583 | ) | | | 549,737 | | | | 2,964,897 | |
| | | | | | | | | | |
| | |
| $ | (115,968 | ) | | $ | 736,563 | | | $ | 3,222,010 | |
| | | | | | | | | | |
| | | | | | | | | | |
See accompanying Notes to Financial Statements.
| | |
| |
| | |
| |
| Statements of Changes in Net Assets | | |
| | | | | | | | | | | | | | | | |
| | |
| | | Montag & Caldwell
Growth Fund | | | TAMRO Diversified
Equity Fund | |
| | | Years Ended October 31, | | | Years Ended October 31, | |
| | | 2013 | | | 2012 | | | 2013 | | | 2012 | |
| | | | | | | | | | | | | | | | |
NET ASSETS at Beginning of Period | | $ | 4,323,578,881 | | | $ | 3,441,019,426 | | | $ | 22,548,977 | | | $ | 24,353,652 | |
| | | | | | | | | | | | | | | | |
Increase in net assets from operations: | | | | | | | | | | | | | | | | |
Net investment income | | | 48,828,411 | | | | 27,731,344 | | | | 60,993 | | | | 830 | |
Net realized gain (loss) on investments | | | 355,430,426 | | | | 287,451,677 | | | | 1,715,984 | | | | (34,026 | ) |
Net change in unrealized appreciation (depreciation) on investments | | | 562,807,119 | | | | 78,274,829 | | | | 5,679,740 | | | | 2,549,855 | |
| | | | | | | | | | | | | | | | |
Net increase in net assets from operations | | | 967,065,956 | | | | 393,457,850 | | | | 7,456,717 | | | | 2,516,659 | |
| | | | | | | | | | | | | | | | |
Distributions to shareholders from: | | | | | | | | | | | | | | | | |
Net investment income: | | | | | | | | | | | | | | | | |
Class N | | | (16,441,713 | ) | | | (8,653,266 | ) | | | (44,731 | ) | | | — | |
Class I | | | (26,011,984 | ) | | | (13,404,436 | ) | | | (2,691 | ) | | | — | |
Class R | | | (54,774 | ) | | | (23,730 | ) | | | — | | | | — | |
Net realized gain on investments: | | | | | | | | | | | | | | | | |
Class N | | | (127,477,429 | ) | | | (125,020,421 | ) | | | (25,121 | ) | | | (473,355 | ) |
Class I | | | (157,688,991 | ) | | | (132,016,151 | ) | | | (682 | ) | | | — | |
Class R | | | (604,214 | ) | | | (653,567 | ) | | | — | | | | — | |
| | | | | | | | | | | | | | | | |
Total distributions | | | (328,279,105 | ) | | | (279,771,571 | ) | | | (73,225 | ) | | | (473,355 | ) |
| | | | | | | | | | | | | | | | |
Capital share transactions: | | | | | | | | | | | | | | | | |
Proceeds from sales of shares: | | | | | | | | | | | | | | | | |
Class N | | | 404,653,774 | | | | 441,340,857 | | | | 4,026,762 | | | | 2,735,793 | |
Class I | | | 843,422,410 | | | | 1,079,995,284 | | | | 30,561,715 | | | | 584,348 | |
Class R | | | 2,159,268 | | | | 2,438,971 | | | | — | | | | — | |
Proceeds from reinvestment of distributions: | | | | | | | | | | | | | | | | |
Class N | | | 140,514,488 | | | | 130,056,898 | | | | 68,008 | | | | 461,380 | |
Class I | | | 139,367,182 | | | | 100,607,628 | | | | 3,373 | | | | — | |
Class R | | | 504,660 | | | | 530,624 | | | | — | | | | — | |
Cost of shares redeemed: | | | | | | | | | | | | | | | | |
Class N | | | (539,421,701 | ) | | | (404,459,339 | ) | | | (4,531,450 | ) | | | (7,598,556 | ) |
Class I | | | (715,137,195 | ) | | | (578,526,415 | ) | | | (4,383,850 | ) | | | (30,944 | ) |
Class R | | | (2,631,942 | ) | | | (3,111,332 | ) | | | — | | | | — | |
| | | | | | | | | | | | | | | | |
Net increase (decrease) from capital share transactions | | | 273,430,944 | | | | 768,873,176 | | | | 25,744,558 | | | | (3,847,979 | ) |
| | | | | | | | | | | | | | | | |
Total increase (decrease) in net assets | | | 912,217,795 | | | | 882,559,455 | | | | 33,128,050 | | | | (1,804,675 | ) |
| | | | | | | | | | | | | | | | |
NET ASSETS at End of Period | | $ | 5,235,796,676 | | | $ | 4,323,578,881 | | | $ | 55,677,027 | | | $ | 22,548,977 | |
| | | | | | | | | | | | | | | | |
Undistributed net investment income | | $ | 29,594,965 | | | $ | 23,270,805 | | | $ | 14,401 | | | $ | 830 | |
| | | | | | | | | | | | | | | | |
See accompanying Notes to Financial Statements.
| | | | | | | | | | | | | | | | | | | | | | |
| | |
Herndon Large Cap
Value Fund | | | Cornerstone Large Cap
Value Fund | | | River Road Dividend
All Cap Value Fund | |
| Years Ended October 31, | | | Years Ended October 31, | | | Years Ended October 31, | |
| 2013 | | | 2012 | | | 2013 | | | 2012 | | | 2013 | | | 2012 | |
| | | | | | | | | | | | | | | | | | | | | | |
| $ | 55,406,952 | | | $ | 17,969,968 | | | $ | 26,502,868 | | | $ | 24,756,738 | | | $ | 924,209,368 | | | $ | 620,152,985 | |
| | | | | | | | | | | | | | | | | | | | | | |
| | | | | | | | | | | | | | | | | | | | | | |
| | 1,202,686 | | | | 698,262 | | | | 339,606 | | | | 240,995 | | | | 26,855,750 | | | | 23,469,901 | |
| | 2,027,557 | | | | 930,577 | | | | 3,586,687 | | | | 1,056,316 | | | | 71,272,919 | | | | 35,184,296 | |
|
14,781,516 |
| | | 984,335 | | | | 5,212,950 | | | | 1,197,003 | | | | 159,132,800 | | | | 38,094,587 | |
| | | | | | | | | | | | | | | | | | | | | | |
| | 18,011,759 | | | | 2,613,174 | | | | 9,139,243 | | | | 2,494,314 | | | | 257,261,469 | | | | 96,748,784 | |
| | | | | | | | | | | | | | | | | | | | | | |
| | | | | | | | | | | | | | | | | | | | | | |
| | | | | | | | | | | | | | | | | | | | | | |
| | (435,807 | ) | | | (69,391 | ) | | | (213,973 | ) | | | (110,362 | ) | | | (8,135,227 | ) | | | (8,876,757 | ) |
| | (712,891 | ) | | | (154,780 | ) | | | (61,387 | ) | | | (577 | ) | | | (15,660,122 | ) | | | (14,324,347 | ) |
| | — | | | | — | | | | — | | | | — | | | | — | | | | — | |
| | | | | | | | | | | | | | | | | | | | | | |
| | (431,437 | ) | | | (340,506 | ) | | | — | | | | — | | | | (12,882,031 | ) | | | (2,301,513 | ) |
| | (650,587 | ) | | | (604,334 | ) | | | — | | | | — | | | | (21,478,515 | ) | | | (2,349,496 | ) |
| | — | | | | — | | | | — | | | | — | | | | — | | | | — | |
| | | | | | | | | | | | | | | | | | | | | | |
| | (2,230,722 | ) | | | (1,169,011 | ) | | | (275,360 | ) | | | (110,939 | ) | | | (58,155,895 | ) | | | (27,852,113 | ) |
| | | | | | | | | | | | | | | | | | | | | | |
| | | | | | | | | | | | | | | | | | | | | | |
| | | | | | | | | | | | | | | | | | | | | | |
| | 21,511,589 | | | | 19,089,187 | | | | 6,812,232 | | | | 5,930,111 | | | | 65,379,486 | | | | 113,881,567 | |
| | 42,373,328 | | | | 26,894,024 | | | | 31,748,633 | | | | 5,334,807 | | | | 198,076,860 | | | | 274,730,584 | |
| | — | | | | — | | | | — | | | | — | | | | — | | | | — | |
| | | | | | | | | | | | | | | | | | | | | | |
| | 867,244 | | | | 409,897 | | | | 205,857 | | | | 106,566 | | | | 20,850,811 | | | | 11,027,472 | |
| | 959,131 | | | | 759,114 | | | | 60,827 | | | | 577 | | | | 26,813,238 | | | | 11,799,898 | |
| | — | | | | — | | | | — | | | | — | | | | — | | | | — | |
| | | | | | | | | | | | | | | | | | | | | | |
| | (6,933,068 | ) | | | (5,463,083 | ) | | | (9,246,465 | ) | | | (11,895,211 | ) | | | (48,451,006 | ) | | | (117,659,249 | ) |
| | (7,571,132 | ) | | | (5,696,318 | ) | | | (2,299,457 | ) | | | (114,095 | ) | | | (156,995,806 | ) | | | (58,620,560 | ) |
| | — | | | | — | | | | — | | | | — | | | | — | | | | — | |
| | | | | | | | | | | | | | | | | | | | | | |
|
51,207,092 |
| | | 35,992,821 | | | | 27,281,627 | | | | (637,245 | ) | | | 105,673,583 | | | | 235,159,712 | |
| | | | | | | | | | | | | | | | | | | | | | |
| | 66,988,129 | | | | 37,436,984 | | | | 36,145,510 | | | | 1,746,130 | | | | 304,779,157 | | | | 304,056,383 | |
| | | | | | | | | | | | | | | | | | | | | | |
| $ | 122,395,081 | | | $ | 55,406,952 | | | $ | 62,648,378 | | | $ | 26,502,868 | | | $ | 1,228,988,525 | | | $ | 924,209,368 | |
| | | | | | | | | | | | | | | | | | | | | | |
| $ | 655,279 | | | $ | 601,291 | | | $ | 194,302 | | | $ | 130,056 | | | $ | (30,952 | ) | | $ | 132,637 | |
| | | | | | | | | | | | | | | | | | | | | | |
See accompanying Notes to Financial Statements.
| | |
| |
| | |
| |
| Statements of Changes in Net Assets – continued | | |
| | | | | | | | | | | | | | | | |
| | |
| | | River Road Dividend
All Cap Value Fund II | | | Fairpointe Mid Cap Fund | |
| | | Year Ended October 31, | | | Period Ended
October 31, | | | Years Ended October 31, | |
| | | 2013 | | | 2012(a) | | | 2013 | | | 2012 | |
| | | | | | | | | | | | | | | | |
NET ASSETS at Beginning of Period | | $ | 10,419,240 | | | $ | — | | | $ | 3,025,731,632 | | | $ | 2,841,488,832 | |
| | | | | | | | | | | | | | | | |
Increase in net assets from operations: | | | | | | | | | | | | | | | | |
Net investment income (loss) | | | 959,154 | | | | 43,321 | | | | 21,074,863 | | | | 18,064,492 | |
Net realized gain on investments | | | 1,009,469 | | | | 5,681 | | | | 458,514,910 | | | | 70,142,404 | |
Net change in unrealized appreciation (depreciation) on investments | | | 9,272,582 | | | | (47,353 | ) | | | 865,571,634 | | | | 207,549,967 | |
| | | | | | | | | | | | | | | | |
Net increase in net assets from operations | | | 11,241,205 | | | | 1,649 | | | | 1,345,161,407 | | | | 295,756,863 | |
| | | | | | | | | | | | | | | | |
Distributions to shareholders from: | | | | | | | | | | | | | | | | |
Net investment income: | | | | | | | | | | | | | | | | |
Class N | | | (39,408 | ) | | | (4,217 | ) | | | (14,340,582 | ) | | | (2,661,253 | ) |
Class I | | | (923,962 | ) | | | (38,951 | ) | | | (17,097,297 | ) | | | (5,501,975 | ) |
Net realized gain on investments: | | | | | | | | | | | | | | | | |
Class N | | | (484 | ) | | | — | | | | (34,919,881 | ) | | | (10,321,076 | ) |
Class I | | | (6,506 | ) | | | — | | | | (32,705,189 | ) | | | (8,446,694 | ) |
| | | | | | | | | | | | | | | | |
Total distributions | | | (970,360 | ) | | | (43,168 | ) | | | (99,062,949 | ) | | | (26,930,998 | ) |
| | | | | | | | | | | | | | | | |
Capital share transactions: | | | | | | | | | | | | | | | | |
Proceeds from sales of shares: | | | | | | | | | | | | | | | | |
Class N | | | 2,923,816 | | | | 1,042,531 | | | | 718,022,853 | | | | 442,895,376 | |
Class I | | | 70,639,727 | | | | 9,388,289 | | | | 934,002,570 | | | | 655,170,800 | |
Proceeds from reinvestment of distributions: | | | | | | | | | | | | | | | | |
Class N | | | 39,064 | | | | 3,909 | | | | 47,067,455 | | | | 12,395,039 | |
Class I | | | 826,079 | | | | 36,423 | | | | 34,143,433 | | | | 9,858,507 | |
Cost of shares redeemed: | | | | | | | | | | | | | | | | |
Class N | | | (807,796 | ) | | | (414 | ) | | | (578,805,723 | ) | | | (540,581,863 | ) |
Class I | | | (4,437,313 | ) | | | (9,979 | ) | | | (534,012,618 | ) | | | (664,320,924 | )(d) |
Issued due to merger: (C) | | | | | | | | | | | | | | | | |
Class N | | | — | | | | — | | | | — | | | | — | |
Class I | | | — | | | | — | | | | — | | | | — | |
| | | | | | | | | | | | | | | | |
Net increase (decrease) from capital share transactions | | | 69,183,577 | | | | 10,460,759 | | | | 620,417,970 | | | | (84,583,065 | ) |
| | | | | | | | | | | | | | | | |
Total increase (decrease) in net assets | | | 79,454,422 | �� | | | 10,419,240 | | | | 1,866,516,428 | | | | 184,242,800 | |
| | | | | | | | | | | | | | | | |
NET ASSETS at End of Period | | $ | 89,873,662 | | | $ | 10,419,240 | | | $ | 4,892,248,060 | | | $ | 3,025,731,632 | |
| | | | | | | | | | | | | | | | |
Undistributed (distributions in excess of)
net investment income (loss) | | $ | 20,099 | | | $ | 7,776 | | | $ | 1,616,865 | | | $ | 11,980,487 | |
| | | | | | | | | | | | | | | | |
| (a) | The inception date for the River Road Dividend All Cap Value Fund II is June 27, 2012. |
| (b) | The inception date for the Silvercrest Small Cap Fund is December 27, 2011. |
| (c) | See Note J in the Notes to Financial Statements. |
| (d) | Fairpointe Mid Cap Fund had a redemption-in-kind in the amount of $38,722,763 on January 13, 2012. The redemption was comprised of securities and cash in the amounts of $38,179,960 and $542,803, respectively. |
| (e) | LMCG Small Cap Growth Fund had a redemption-in-kind in the amount of $2,554,935 on September 25, 2012. The redemption was comprised of securities and cash in the amounts of $2,419,213 and $135,182, respectively. |
| (f) | Silvercrest Small Cap Fund had a redemption-in-kind in the amount of $2,608,977 on April 26, 2012. The redemption was comprised of securities and cash in the amount of $2,579,146 and $29,831, respectively. |
See accompanying Notes to Financial Statements.
| | | | | | | | | | | | | | | | | | | | | | |
| | |
Montag & Caldwell
Mid Cap Growth Fund | | | LMCG Small Cap
Growth Fund | | | Silvercrest
Small Cap Fund | |
| Years Ended October 31, | | | Years Ended October 31, | | | Year Ended October 31, | | | Period Ended
October 31, | |
| 2013 | | | 2012 | | | 2013 | | | 2012 | | | 2013 | | | 2012(b) | |
| | | | | | | | | | | | | | | | | | | | | | |
| $ | 7,368,950 | | | $ | 4,507,024 | | | $ | 6,413,230 | | | $ | 7,961,781 | | | $ | 5,711,567 | | | $ | — | |
| | | | | | | | | | | | | | | | | | | | | | |
| | | | | | | | | | | | | | | | | | | | | | |
| | (71,220 | ) | | | (39,008 | ) | | | 14,671 | | | | (88,866 | ) | | | 46,230 | | | | 16,120 | |
| | 1,788,900 | | | | 426,097 | | | | 5,887,360 | | | | 793,830 | | | | 1,218,605 | | | | 226,287 | |
|
893,311 |
| | | (74,900 | ) | | | 1,825,778 | | | | 504,009 | | | | 4,409,811 | | | | 111,181 | |
| | | | | | | | | | | | | | | | | | | | | | |
| | 2,610,991 | | | | 312,189 | | | | 7,727,809 | | | | 1,208,973 | | | | 5,674,646 | | | | 353,588 | |
| | | | | | | | | | | | | | | | | | | | | | |
| | | | | | | | | | | | | | | | | | | | | | |
| | | | | | | | | | | | | | | | | | | | | | |
| | — | | | | — | | | | — | | | | — | | | | (9,878 | ) | | | — | |
| | — | | | | — | | | | — | | | | — | | | | (78,421 | ) | | | — | |
| | | | | | | | | | | | | | | | | | | | | | |
| | (92,399 | ) | | | — | | | | (425,537 | ) | | | — | | | | (2,878 | ) | | | — | |
| | — | | | | — | | | | (58,662 | ) | | | — | | | | (19,730 | ) | | | — | |
| | | | | | | | | | | | | | | | | | | | | | |
| | (92,399 | ) | | | — | | | | (484,199 | ) | | | — | | | | (110,907 | ) | | | — | |
| | | | | | | | | | | | | | | | | | | | | | |
| | | | | | | | | | | | | | | | | | | | | | |
| | | | | | | | | | | | | | | | | | | | | | |
| | 6,618,730 | | | | 3,071,452 | | | | 5,855,202 | | | | 1,039,380 | | | | 4,010,938 | | | | 706,680 | |
| | — | | | | — | | | | 6,748,727 | | | | 297,740 | | | | 20,994,880 | | | | 7,290,194 | |
| | | | | | | | | | | | | | | | | | | | | | |
| | 81,176 | | | | — | | | | 425,537 | | | | — | | | | 12,756 | | | | — | |
| | — | | | | — | | | | 58,662 | | | | — | | | | 98,151 | | | | — | |
| | | | | | | | | | | | | | | | | | | | | | |
| | (5,185,261 | ) | | | (521,715 | ) | | | (4,777,656 | ) | | | (1,540,249 | ) | | | (1,427,987 | ) | | | (3,366 | ) |
| | — | | | | — | | | | (1,271,372 | ) | | | (2,554,395 | )(e) | | | (1,696,602 | ) | | | (2,635,529 | )(f) |
| | | | | | | | | | | | | | | | | | | | | | |
| | — | | | | — | | | | 18,799,852 | | | | — | | | | — | | | | — | |
| | — | | | | — | | | | 1,044,848 | | | | — | | | | — | | | | — | |
| | | | | | | | | | | | | | | | | | | | | | |
|
1,514,645 |
| | | 2,549,737 | | | | 26,883,800 | | | | (2,757,524 | ) | | | 21,992,136 | | | | 5,357,979 | |
| | | | | | | | | | | | | | | | | | | | | | |
| | 4,033,237 | | | | 2,861,926 | | | | 34,127,410 | | | | (1,548,551 | ) | | | 27,555,875 | | | | 5,711,567 | |
| | | | | | | | | | | | | | | | | | | | | | |
| $ | 11,402,187 | | | $ | 7,368,950 | | | $ | 40,540,640 | | | $ | 6,413,230 | | | $ | 33,267,442 | | | $ | 5,711,567 | |
| | | | | | | | | | | | | | | | | | | | | | |
$ |
— |
| | $ | (37,681 | ) | | $ | 9,496 | | | $ | (5,175 | ) | | $ | (847 | ) | | $ | 35,727 | |
| | | | | | | | | | | | | | | | | | | | | | |
See accompanying Notes to Financial Statements.
| | |
| |
| | |
| |
| Statements of Changes in Net Assets – continued | | |
| | | | | | | | | | | | | | | | |
| | |
| | | TAMRO
Small Cap Fund | | | River Road
Select Value Fund | |
| | | Years Ended October 31, | | | Years Ended October 31, | |
| | | 2013 | | | 2012 | | | 2013 | | | 2012 | |
| | | | | | | | | | | | | | | | |
NET ASSETS at Beginning of Period | | $ | 1,024,788,083 | | | $ | 1,001,284,211 | | | $ | 162,779,864 | | | $ | 143,687,434 | |
| | | | | | | | | | | | | | | | |
Increase (decrease) in net assets from operations: | | | | | | | | | | | | | | | | |
Net investment income (loss) | | | (56,283 | ) | | | (4,509,026 | ) | | | 1,930,612 | | | | 454,084 | |
Net realized gain (loss) on investments | | | 124,824,787 | | | | 104,050,686 | | | | 31,063,046 | | | | 10,079,561 | |
Net change in unrealized appreciation (depreciation) on investments | | | 169,676,168 | | | | 6,000,858 | | | | 16,377,768 | | | | 7,191,158 | |
| | | | | | | | | | | | | | | | |
Net increase (decrease) in net assets from operations | | | 294,444,672 | | | | 105,542,518 | | | | 49,371,426 | | | | 17,724,803 | |
| | | | | | | | | | | | | | | | |
Distributions to shareholders from: | | | | | | | | | | | | | | | | |
Net investment income: | | | | | | | | | | | | | | | | |
Class N | | | — | | | | — | | | | (95,581 | ) | | | — | |
Class I | | | — | | | | — | | | | (2,552,798 | ) | | | — | |
Net realized gain on investments: | | | | | | | | | | | | | | | | |
Class N | | | (36,352,900 | ) | | | (37,105,939 | ) | | | (391,684 | ) | | | (2,638,084 | ) |
Class I | | | (59,453,402 | ) | | | (60,086,992 | ) | | | (8,873,103 | ) | | | (26,691,130 | ) |
| | | | | | | | | | | | | | | | |
Total distributions | | | (95,806,302 | ) | | | (97,192,931 | ) | | | (11,913,166 | ) | | | (29,329,214 | ) |
| | | | | | | | | | | | | | | | |
Capital share transactions: | | | | | | | | | | | | | | | | |
Proceeds from sales of shares: | | | | | | | | | | | | | | | | |
Class N | | | 146,473,113 | | | | 100,985,943 | | | | 14,915,498 | | | | 2,113,833 | |
Class I | | | 191,669,363 | (a) | | | 155,633,470 | | | | 56,912,818 | | | | 50,275,199 | |
Proceeds from reinvestment of distributions: | | | | | | | | | | | | | | | | |
Class N | | | 35,759,291 | | | | 36,431,124 | | | | 459,196 | | | | 2,564,966 | |
Class I | | | 43,230,709 | | | | 41,999,122 | | | | 10,087,922 | | | | 23,172,373 | |
Cost of shares redeemed: | | | | | | | | | | | | | | | | |
Class N | | | (117,639,649 | ) | | | (126,301,603 | ) | | | (5,019,206 | ) | | | (10,015,665 | ) |
Class I | | | (197,119,904 | )(c) | | | (193,593,771 | )(d) | | | (60,275,850 | ) | | | (37,413,865 | ) |
| | | | | | | | | | | | | | | | |
Net increase (decrease) from capital share transactions | | | 102,372,923 | | | | 15,154,285 | | | | 17,080,378 | | | | 30,696,841 | |
| | | | | | | | | | | | | | | | |
Total increase (decrease) in net assets | | | 301,011,293 | | | | 23,503,872 | | | | 54,538,638 | | | | 19,092,430 | |
| | | | | | | | | | | | | | | | |
NET ASSETS at End of Period | | $ | 1,325,799,376 | | | $ | 1,024,788,083 | | | $ | 217,318,502 | | | $ | 162,779,864 | |
| | | | | | | | | | | | | | | | |
Undistributed (distributions in excess of)
net investment income (loss) | | $ | (56,283 | ) | | $ | — | | | $ | (290,213 | ) | | $ | 460,063 | |
| | | | | | | | | | | | | | | | |
| (a) | TAMRO Small Cap Fund had a subscription-in-kind in the amount of $2,677,538 on April 25, 2013. The subscription was comprised of securities, cash and dividends accrued in the amounts of $2,657,373, $19,712 and $453, respectively. |
| (b) | River Road Independent Value Fund had a subscription-in-kind in the amount of $597,548 on March 27, 2013. The subscription was comprised of securities, cash and dividends accrued in the amounts of $258,478, $338,808 and $262, respectively. |
| (c) | TAMRO Small Cap Fund had a redemption-in-kind in the amount of $52,573,290 on January 15, 2013. The redemption was comprised of securities and cash in the amount of $51,794,423 and $778,867, respectively. |
| (d) | TAMRO Small Cap Fund had redemptions-in-kind in the amounts of $40,667,980 on May 1, 2012 and $7,010,475 on June 27, 2012. The redemptions were comprised of securities and cash in the amounts of $39,335,174 and $6,762,586, respectively and $1,332,806 and $247,889, respectively. |
See accompanying Notes to Financial Statements.
| | | | | | | | | | | | | | | | | | | | | | |
| | |
River Road
Small Cap Value Fund | | | River Road
Independent Value Fund | | | DoubleLine Core Plus
Fixed Income Fund | |
| Years Ended October 31, | | | Years Ended October 31, | | | Years Ended October 31, | |
| 2013 | | | 2012 | | | 2013 | | | 2012 | | | 2013 | | | 2012 | |
| | | | | | | | | | | | | | | | | | | | | | |
| $ | 289,229,188 | | | $ | 337,488,064 | | | $ | 700,649,463 | | | $ | 391,700,125 | | | $ | 176,881,578 | | | $ | 27,143,189 | |
| | | | | | | | | | | | | | | | | | | | | | |
| | | | | | | | | | | | | | | | | | | | | | |
| | 3,915,268 | | | | 1,258,684 | | | | (3,289,548 | ) | | | (4,006,369 | ) | | | 6,027,184 | | | | 2,987,256 | |
| | 66,663,383 | | | | 21,254,625 | | | | 32,206,753 | | | | 36,018,328 | | | | (2,244,975 | ) | | | 1,032,232 | |
|
17,066,486 |
| | | 11,176,504 | | | | 16,741,054 | | | | 10,854,961 | | | | (5,562,851 | ) | | | 4,872,717 | |
| | | | | | | | | | | | | | | | | | | | | | |
|
87,645,137 |
| | | 33,689,813 | | | | 45,658,259 | | | | 42,866,920 | | | | (1,780,642 | ) | | | 8,892,205 | |
| | | | | | | | | | | | | | | | | | | | | | |
| | | | | | | | | | | | | | | | | | | | | | |
| | | | | | | | | | | | | | | | | | | | | | |
| | (768,062 | ) | | | — | | | | — | | | | — | | | | (2,744,975 | ) | | | (1,317,861 | ) |
| | (4,548,794 | ) | | | — | | | | — | | | | — | | | | (4,353,733 | ) | | | (2,043,553 | ) |
| | | | | | | | | | | | | | | | | | | | | | |
| | (1,497,083 | ) | | | — | | | | (20,379,878 | ) | | | (3,623,431 | ) | | | (491,620 | ) | | | (34,851 | ) |
| | (7,569,096 | ) | | | — | | | | (19,173,208 | ) | | | (2,074,734 | ) | | | (597,665 | ) | | | (24,248 | ) |
| | | | | | | | | | | | | | | | | | | | | | |
| | (14,383,035 | ) | | | — | | | | (39,553,086 | ) | | | (5,698,165 | ) | | | (8,187,993 | ) | | | (3,420,513 | ) |
| | | | | | | | | | | | | | | | | | | | | | |
| | | | | | | | | | | | | | | | | | | | | | |
| | | | | | | | | | | | | | | | | | | | | | |
| | 8,370,448 | | | | 11,250,505 | | | | 134,123,913 | | | | 202,967,411 | | | | 53,008,348 | | | | 71,060,094 | |
| | 61,492,823 | | | | 47,334,504 | | | | 133,619,629 | (b) | | | 276,507,471 | | | | 60,045,064 | | | | 103,044,113 | |
| | | | | | | | | | | | | | | | | | | | | | |
| | 2,244,845 | | | | — | | | | 20,310,806 | | | | 3,615,800 | | | | 3,178,568 | | | | 1,344,828 | |
| | 12,089,609 | | | | — | | | | 18,660,298 | | | | 2,024,439 | | | | 4,306,487 | | | | 1,929,366 | |
| | | | | | | | | | | | | | | | | | | | | | |
| | (15,330,517 | ) | | | (61,115,685 | ) | | | (178,942,382 | ) | | | (170,062,099 | ) | | | (57,207,650 | ) | | | (25,676,534 | ) |
| | (121,761,327 | ) | | | (79,418,013 | ) | | | (109,171,039 | ) | | | (43,272,439 | ) | | | (53,857,896 | ) | | | (7,435,170 | ) |
| | | | | | | | | | | | | | | | | | | | | | |
|
(52,894,119 |
) | | | (81,948,689 | ) | | | 18,601,225 | | | | 271,780,583 | | | | 9,472,921 | | | | 144,266,697 | |
| | | | | | | | | | | | | | | | | | | | | | |
| | 20,367,983 | | | | (48,258,876 | ) | | | 24,706,398 | | | | 308,949,338 | | | | (495,714 | ) | | | 149,738,389 | |
| | | | | | | | | | | | | | | | | | | | | | |
| $ | 309,597,171 | | | $ | 289,229,188 | | | $ | 725,355,861 | | | $ | 700,649,463 | | | $ | 176,385,864 | | | $ | 176,881,578 | |
| | | | | | | | | | | | | | | | | | | | | | |
$ |
(136,215 |
) | | $ | 1,294,664 | | | $ | (40,199 | ) | | $ | (43,461 | ) | | $ | (583,993 | ) | | $ | (380,739 | ) |
| | | | | | | | | | | | | | | | | | | | | | |
See accompanying Notes to Financial Statements.
| | |
| |
| | |
| |
| Statements of Changes in Net Assets – continued | | |
| | | | | | | | | | | | | | | | |
| | |
| | | TCH Fixed Income Fund | | | Lake Partners
LASSO Alternatives Fund | |
| | | Years Ended October 31, | | | Years Ended October 31, | |
| | | 2013 | | | 2012 | | | 2013 | | | 2012 | |
| | | | | | | | | | | | | | | | |
NET ASSETS at Beginning of Period | | $ | 70,167,760 | | | $ | 72,769,324 | | | $ | 287,061,601 | | | $ | 207,625,322 | |
| | | | | | | | | | | | | | | | |
Increase (decrease) in net assets from operations: | | | | | | | | | | | | | | | | |
Net investment income (loss) | | | 2,419,293 | | | | 3,011,666 | | | | 726,304 | | | | 1,365,720 | |
Net realized gain (loss) on investments, purchased options, written options, securities sold short, foreign currency transactions and capital gain distributions | | | 1,655,009 | | | | 1,541,463 | | | | 10,013,103 | | | | 1,557,869 | |
Net change in unrealized appreciation (depreciation) on investments, purchased options, written options, securities sold short and translation of assets and liabilities denominated in foreign currency | | | (4,215,928 | ) | | | 2,125,017 | | | | 19,339,867 | | | | 10,167,273 | |
| | | | | | | | | | | | | | | | |
Net increase (decrease) in net assets from operations | | | (141,626 | ) | | | 6,678,146 | | | | 30,079,274 | | | | 13,090,862 | |
| | | | | | | | | | | | | | | | |
Distributions to shareholders from: | | | | | | | | | | | | | | | | |
Net investment income: | | | | | | | | | | | | | | | | |
Class N | | | (2,291,411 | ) | | | (2,752,487 | ) | | | (472,420 | ) | | | (255,933 | ) |
Class I | | | (422,043 | ) | | | (479,605 | ) | | | (3,732,874 | ) | | | (3,425,003 | ) |
Net realized gain on investments: | | | | | | | | | | | | | | | | |
Class N | | | — | | | | — | | | | — | | | | — | |
Class I | | | — | | | | — | | | | — | | | | — | |
| | | | | | | | | | | | | | | | |
Total distributions | | | (2,713,454 | ) | | | (3,232,092 | ) | | | (4,205,294 | ) | | | (3,680,936 | ) |
| | | | | | | | | | | | | | | | |
Capital share transactions: | | | | | | | | | | | | | | | | |
Proceeds from sales of shares: | | | | | | | | | | | | | | | | |
Class N | | | 10,518,750 | | | | 11,970,554 | | | | 54,094,179 | | | | 20,838,852 | |
Class I | | | 1,280,566 | | | | 3,311,240 | | | | 218,417,490 | | | | 104,018,117 | |
Proceeds from reinvestment of distributions: | | | | | | | | | | | | | | | | |
Class N | | | 2,192,348 | | | | 2,642,277 | | | | 452,219 | | | | 254,528 | |
Class I | | | 381,111 | | | | 384,209 | | | | 3,236,441 | | | | 1,747,717 | |
Cost of shares redeemed: | | | | | | | | | | | | | | | | |
Class N | | | (24,265,442 | ) | | | (20,139,538 | ) | | | (36,923,554 | ) | | | (5,931,093 | ) |
Class I | | | (2,907,353 | ) | | | (4,216,360 | ) | | | (81,349,563 | ) | | | (50,901,768 | ) |
| | | | | | | | | | | | | | | | |
Net increase (decrease) from capital share transactions | | | (12,800,020 | ) | | | (6,047,618 | ) | | | 157,927,212 | | | | 70,026,353 | |
| | | | | | | | | | | | | | | | |
Total increase (decrease) in net assets | | | (15,655,100 | ) | | | (2,601,564 | ) | | | 183,801,192 | | | | 79,436,279 | |
| | | | | | | | | | | | | | | | |
NET ASSETS at End of Period | | $ | 54,512,660 | | | $ | 70,167,760 | | | $ | 470,862,793 | | | $ | 287,061,601 | |
| | | | | | | | | | | | | | | | |
Undistributed (distributions in excess of)
net investment income (loss) | | $ | 209,053 | | | $ | 257,283 | | | $ | 210,610 | | | $ | 781,026 | |
| | | | | | | | | | | | | | | | |
See accompanying Notes to Financial Statements.
| | | | | | | | | | | | | | | | | | | | | | |
| | |
Anchor Capital
Enhanced Equity Fund | | | River Road
Long-Short Fund | | | Barings
International Fund | |
| Years Ended October 31, | | | Years Ended October 31, | | | Years Ended October 31, | |
| 2013 | | | 2012 | | | 2013 | | | 2012 | | | 2013 | | | 2012 | |
| | | | | | | | | | | | | | | | | | | | | | |
| $ | 177,809,320 | | | $ | 113,205,174 | | | $ | 7,506,387 | | | $ | 4,593,930 | | | $ | 62,083,656 | | | $ | 52,782,652 | |
| | | | | | | | | | | | | | | | | | | | | | |
| | | | | | | | | | | | | | | | | | | | | | |
| | 3,514,668 | | | | 2,759,375 | | | | (809,545 | ) | | | (98,537 | ) | | | 1,002,932 | | | | 1,043,951 | |
|
(786,086 |
) | | | 2,854,278 | | | | 5,513,861 | | | | 613,267 | | | | 2,555,143 | | | | 883,136 | |
|
14,675,574 |
| | | (1,004,621 | ) | | | 5,963,396 | | | | (73,523 | ) | | | 4,150,508 | | | | 760,195 | |
| | | | | | | | | | | | | | | | | | | | | | |
| | 17,404,156 | | | | 4,609,032 | | | | 10,667,712 | | | | 441,207 | | | | 7,708,583 | | | | 2,687,282 | |
| | | | | | | | | | | | | | | | | | | | | | |
| | | | | | | | | | | | | | | | | | | | | | |
| | | | | | | | | | | | | | | | | | | | | | |
| | (2,040,791 | ) | | | (1,259,013 | ) | | | — | | | | — | | | | (5,702 | ) | | | (2,517 | ) |
| | (1,460,057 | ) | | | (1,453,347 | ) | | | — | | | | — | | | | (986,921 | ) | | | (507,253 | ) |
| | | | | | | | | | | | | | | | | | | | | | |
| | (1,672,759 | ) | | | (5,377,824 | ) | | | (437,571 | ) | | | — | | | | (5,125 | ) | | | (9,564 | ) |
| | (1,243,698 | ) | | | (6,563,185 | ) | | | — | | | | — | | | | (754,174 | ) | | | (1,371,156 | ) |
| | | | | | | | | | | | | | | | | | | | | | |
| | (6,417,305 | ) | | | (14,653,369 | ) | | | (437,571 | ) | | | — | | | | (1,751,922 | ) | | | (1,890,490 | ) |
| | | | | | | | | | | | | | | | | | | | | | |
| | | | | | | | | | | | | | | | | | | | | | |
| | | | | | | | | | | | | | | | | | | | | | |
| | 44,682,440 | | | | 89,657,148 | | | | 110,536,773 | | | | 3,037,084 | | | | 17,634 | | | | 11,495 | |
| | 35,763,522 | | | | 42,752,026 | | | | 72,413,856 | | | | — | | | | 10,658,884 | | | | 17,971,181 | |
| | | | | | | | | | | | | | | | | | | | | | |
| | 3,679,250 | | | | 6,562,788 | | | | 437,571 | | | | — | | | | 10,574 | | | | 12,081 | |
| | 1,901,112 | | | | 5,836,625 | | | | — | | | | — | | | | 1,523,863 | | | | 1,167,329 | |
| | | | | | | | | | | | | | | | | | | | | | |
| | (59,806,848 | ) | | | (34,343,989 | ) | | | (16,146,675 | ) | | | (565,834 | ) | | | (30,668 | ) | | | (271 | ) |
| | (55,253,723 | ) | | | (35,816,115 | ) | | | (4,836,894 | ) | | | — | | | | (42,236,184 | ) | | | (10,657,603 | ) |
| | | | | | | | | | | | | | | | | | | | | | |
| | (29,034,247 | ) | | | 74,648,483 | | | | 162,404,631 | | | | 2,471,250 | | | | (30,055,897 | ) | | | 8,504,212 | |
| | | | | | | | | | | | | | | | | | | | | | |
| | (18,047,396 | ) | | | 64,604,146 | | | | 172,634,772 | | | | 2,912,457 | | | | (24,099,236 | ) | | | 9,301,004 | |
| | | | | | | | | | | | | | | | | | | | | | |
| $ | 159,761,924 | | | $ | 177,809,320 | | | $ | 180,141,159 | | | $ | 7,506,387 | | | $ | 37,984,420 | | | $ | 62,083,656 | |
| | | | | | | | | | | | | | | | | | | | | | |
$ | 141,432 | | | $ | 127,535 | | | $ | (27,513 | ) | | $ | (29,732 | ) | | $ | 997,891 | | | $ | 992,441 | |
| | | | | | | | | | | | | | | | | | | | | | |
See accompanying Notes to Financial Statements.
| | |
| |
| | |
| |
| Statements of Changes in Net Assets – continued | | |
| | | | | | | | | | | | |
| | |
| | | LMCG Emerging
Markets Fund | | | Harrison Street
Real Estate Fund | |
| | | Period Ended
October 31,
2013(a) | | | Years Ended October 31, | |
| | | | 2013 | | | 2012 | |
| | | | | | | | | | | | |
NET ASSETS at Beginning of Period | | $ | — | | | $ | 10,546,604 | | | $ | 39,212,065 | |
| | | | | | | | | | | | |
Increase (decrease) in net assets from operations: | | | | | | | | | | | | |
Net investment income | | | 35,615 | | | | 186,826 | | | | 173,143 | |
Net realized gain (loss) on investments and foreign currency transactions | | | (241,096 | ) | | | 1,055,690 | | | | 1,929,157 | |
Net change in unrealized appreciation (depreciation) on investments and translation of assets and liabilities denominated in foreign currency | | | 89,513 | | | | (505,953 | ) | | | (2,376,608 | ) |
| | | | | | | | | | | | |
Net increase (decrease) in net assets from operations | | | (115,968 | ) | | | 736,563 | | | | (274,308 | ) |
| | | | | | | | | | | | |
Distributions to shareholders from: | | | | | | | | | | | | |
Net investment income: | | | | | | | | | | | | |
Class N | | | — | | | | (162,129 | ) | | | (46,752 | ) |
Class I | | | — | | | | (2,875 | ) | | | (823 | ) |
| | | | | | | | | | | | |
Total distributions | | | — | | | | (165,004 | ) | | | (47,575 | ) |
| | | | | | | | | | | | |
Capital share transactions: | | | | | | | | | | | | |
Proceeds from sales of shares: | | | | | | | | | | | | |
Class N | | | 697,622 | | | | 10,524,296 | | | | 6,295,128 | |
Class I | | | 3,400,004 | | | | 375,294 | | | | 208,772 | |
Proceeds from reinvestment of distributions: | | | | | | | | | | | | |
Class N | | | — | | | | 153,598 | | | | 44,264 | |
Class I | | | — | | | | 1,904 | | | | 539 | |
Cost of shares redeemed: | | | | | | | | | | | | |
Class N | | | — | | | | (8,524,363 | ) | | | (3,336,601 | ) |
Class I | | | — | | | | (23,833 | ) | | | (31,555,680 | )(b) |
Capital Contribution (Note G): | | | | | | | | | | | | |
Class N | | | — | | | | 93 | | | | — | |
Class I | | | — | | | | 3 | | | | — | |
| | | | | | | | | | | | |
Net increase (decrease) from capital share transactions | | | 4,097,626 | | | | 2,506,992 | | | | (28,343,578 | ) |
| | | | | | | | | | | | |
Total increase (decrease) in net assets | | | 3,981,658 | | | | 3,078,551 | | | | (28,665,461 | ) |
| | | | | | | | | | | | |
NET ASSETS at End of Period | | $ | 3,981,658 | | | $ | 13,625,155 | | | $ | 10,546,604 | |
| | | | | | | | | | | | |
Undistributed (distributions in excess of) net investment income (loss) | | $ | 40,296 | | | $ | 147,489 | | | $ | 125,494 | |
| | | | | | | | | | | | |
| (a) | The inception date for the LMCG Emerging Markets Fund is March 28, 2013. |
| (b) | Harrison Street Real Estate Fund had a redemption-in-kind in the amount of $31,399,368 on December 2, 2011. The redemption was comprised of securities and cash in the amounts of $30,913,574 and $485,794, respectively. |
See accompanying Notes to Financial Statements.
| | | | | | |
|
Montag & Caldwell
Balanced Fund | |
Years Ended October 31, | |
| 2013 | | | 2012 | |
| | | | | | |
| $ | 33,466,255 | | | $ | 24,729,716 | |
| | | | | | |
| | | | | | |
| | 257,113 | | | | 227,101 | |
| | 2,639,428 | | | | 1,435,094 | |
|
325,469 |
| | | 422,708 | |
| | | | | | |
| | 3,222,010 | | | | 2,084,903 | |
| | | | | | |
| | | | | | |
| | | | | | |
| | (342,684 | ) | | | (309,427 | ) |
| | (24,117 | ) | | | (22,048 | ) |
| | | | | | |
| | (366,801 | ) | | | (331,475 | ) |
| | | | | | |
| | | | | | |
| | | | | | |
| | 2,507,724 | | | | 12,344,202 | |
| | 150,496 | | | | 641,711 | |
| | | | | | |
| | 333,389 | | | | 301,482 | |
| | 10,537 | | | | 9,037 | |
| | | | | | |
| | (14,627,334 | ) | | | (6,067,796 | ) |
| | (431,903 | ) | | | (245,525 | ) |
| | | | | | |
| | — | | | | — | |
| | — | | | | — | |
| | | | | | |
| | (12,057,091 | ) | | | 6,983,111 | |
| | | | | | |
| | (9,201,882 | ) | | | 8,736,539 | |
| | | | | | |
| $ | 24,264,373 | | | $ | 33,466,255 | |
| | | | | | |
| $ | (229,961 | ) | | $ | (230,949 | ) |
| | | | | | |
See accompanying Notes to Financial Statements.
| | |
| |
| ASTON/Montag & Caldwell Growth Fund – Class N | | October 31, 2013 |
| |
| Financial Highlights | | |
| | | | | | | | | | | | | | | | | | | | |
| | | Year
Ended
10/31/13 | | | Year
Ended
10/31/12 | | | Year
Ended
10/31/11 | | | Year
Ended
10/31/10 | | | Year
Ended
10/31/09 | |
Net Asset Value, Beginning of Period | | $ | 25.31 | | | $ | 24.72 | | | $ | 22.92 | | | $ | 20.87 | | | $ | 18.84 | |
| | | | | | | | | | | | | | | | | | | | |
Income from Investment Operations: | | | | | | | | | | | | | | | | | | | | |
Net investment income | | | 0.23 | (a) | | | 0.15 | (a) | | | 0.14 | (a) | | | 0.12 | (a) | | | 0.08 | (a) |
Net realized and unrealized gain on investments | | | 5.07 | | | | 2.45 | | | | 1.83 | | | | 2.01 | (b) | | | 2.61 | |
| | | | | | | | | | | | | | | | | | | | |
Total from investment operations | | | 5.30 | | | | 2.60 | | | | 1.97 | | | | 2.13 | | | | 2.69 | |
| | | | | | | | | | | | | | | | | | | | |
Less Distributions: | | | | | | | | | | | | | | | | | | | | |
Distributions from and in excess of net investment income | | | (0.22 | ) | | | (0.13 | ) | | | (0.13 | ) | | | (0.08 | ) | | | (0.06 | ) |
Distributions from net realized gain on investments | | | (1.71 | ) | | | (1.88 | ) | | | (0.04 | ) | | | — | | | | (0.60 | ) |
| | | | | | | | | | | | | | | | | | | | |
Total distributions | | | (1.93 | ) | | | (2.01 | ) | | | (0.17 | ) | | | (0.08 | ) | | | (0.66 | ) |
| | | | | | | | | | | | | | | | | | | | |
Net increase in net asset value | | | 3.37 | | | | 0.59 | | | | 1.80 | | | | 2.05 | | | | 2.03 | |
| | | | | | | | | | | | | | | | | | | | |
Net Asset Value, End of Period | | $ | 28.68 | | | $ | 25.31 | | | $ | 24.72 | | | $ | 22.92 | | | $ | 20.87 | |
| | | | | | | | | | | | | | | | | | | | |
Total Return (c) | | | 22.61 | % | | | 11.40 | % | | | 8.56 | % | | | 10.20 | % | | | 15.08 | % |
| | | | | |
Ratios/Supplemental Data: | | | | | | | | | | | | | | | | | | | | |
Net Assets, End of Period (in 000’s) | | $ | 2,190,074 | | | $ | 1,908,663 | | | $ | 1,683,183 | | | $ | 1,506,075 | | | $ | 1,277,346 | |
Ratios of expenses to average net assets: | | | | | | | | | | | | | | | | | | | | |
Before expense reimbursement and/or fee waiver by Adviser | | | 1.04 | % | | | 1.05 | % | | | 1.06 | % | | | 1.08 | %(d) | | | 1.11 | % |
After expense reimbursement and/or fee waiver by Adviser | | | 1.04 | % | | | 1.05 | % | | | 1.06 | % | | | 1.08 | %(d) | | | 1.11 | % |
Ratios of net investment income to average net assets: | | | | | | | | | | | | | | | | | | | | |
Before expense reimbursement and/or fee waiver by Adviser | | | 0.88 | % | | | 0.60 | % | | | 0.59 | % | | | 0.56 | % | | | 0.41 | % |
After expense reimbursement and/or fee waiver by Adviser | | | 0.88 | % | | | 0.60 | % | | | 0.59 | % | | | 0.56 | % | | | 0.41 | % |
Portfolio Turnover | | | 50.57 | % | | | 46.42 | % | | | 63.48 | % | | | 57.39 | %(e) | | | 35.09 | %(f) |
| | (a) | The selected per share data was calculated using the weighted average shares outstanding method for the period. |
| | (b) | Includes payments by affiliates of less than $0.005 per share. |
| | (c) | The total return is calculated using the Net Asset Value used for trading at the close of business at period end. |
| | (d) | Ratios of expenses to average net assets include interest expense of less than 0.005% for the year ended October 31, 2010. The interest expense is from utilizing the line of credit as discussed in Note H to the Financial Statements. |
| | (e) | Portfolio turnover rate excludes securities received from a reorganization. |
| | (f) | Portfolio turnover rate excludes securities received from processing a subscription-in-kind. |
See accompanying Notes to Financial Statements.
| | |
| |
| ASTON/Montag & Caldwell Growth Fund – Class I | | October 31, 2013 |
| |
| Financial Highlights | | |
| | | | | | | | | | | | | | | | | | | | |
| | | Year
Ended
10/31/13 | | | Year
Ended
10/31/12 | | | Year
Ended
10/31/11 | | | Year
Ended
10/31/10 | | | Year
Ended
10/31/09 | |
Net Asset Value, Beginning of Period | | $ | 25.46 | | | $ | 24.85 | | | $ | 23.05 | | | $ | 20.97 | | | $ | 18.94 | |
| | | | | | | | | | | | | | | | | | | | |
Income from Investment Operations: | | | | | | | | | | | | | | | | | | | | |
Net investment income | | | 0.30 | (a) | | | 0.21 | (a) | | | 0.21 | (a) | | | 0.18 | (a) | | | 0.12 | (a) |
Net realized and unrealized gain on investments | | | 5.10 | | | | 2.47 | | | | 1.82 | | | | 2.02 | (b) | | | 2.62 | |
| | | | | | | | | | | | | | | | | | | | |
Total from investment operations | | | 5.40 | | | | 2.68 | | | | 2.03 | | | | 2.20 | | | | 2.74 | |
| | | | | | | | | | | | | | | | | | | | |
Less Distributions: | | | | | | | | | | | | | | | | | | | | |
Distributions from and in excess of net investment income | | | (0.28 | ) | | | (0.19 | ) | | | (0.19 | ) | | | (0.12 | ) | | | (0.11 | ) |
Distributions from net realized gain on investments | | | (1.71 | ) | | | (1.88 | ) | | | (0.04 | ) | | | — | | | | (0.60 | ) |
| | | | | | | | | | | | | | | | | | | | |
Total distributions | | | (1.99 | ) | | | (2.07 | ) | | | (0.23 | ) | | | (0.12 | ) | | | (0.71 | ) |
| | | | | | | | | | | | | | | | | | | | |
Net increase in net asset value | | | 3.41 | | | | 0.61 | | | | 1.80 | | | | 2.08 | | | | 2.03 | |
| | | | | | | | | | | | | | | | | | | | |
Net Asset Value, End of Period | | $ | 28.87 | | | $ | 25.46 | | | $ | 24.85 | | | $ | 23.05 | | | $ | 20.97 | |
| | | | | | | | | | | | | | | | | | | | |
Total Return (c) | | | 22.95 | % | | | 11.67 | % | | | 8.82 | % | | | 10.49 | % | | | 15.36 | % |
| | | | | |
Ratios/Supplemental Data: | | | | | | | | | | | | | | | | | | | | |
Net Assets, End of Period (in 000’s) | | $ | 3,035,623 | | | $ | 2,406,145 | | | $ | 1,749,183 | | | $ | 1,528,981 | | | $ | 1,205,637 | |
Ratios of expenses to average net assets: | | | | | | | | | | | | | | | | | | | | |
Before expense reimbursement and/or fee waiver by Adviser | | | 0.79 | % | | | 0.80 | % | | | 0.81 | % | | | 0.83 | %(d) | | | 0.86 | % |
After expense reimbursement and/or fee waiver by Adviser | | | 0.79 | % | | | 0.80 | % | | | 0.81 | % | | | 0.83 | %(d) | | | 0.86 | % |
Ratios of net investment income to average net assets: | | | | | | | | | | | | | | | | | | | | |
Before expense reimbursement and/or fee waiver by Adviser | | | 1.13 | % | | | 0.85 | % | | | 0.84 | % | | | 0.81 | % | | | 0.66 | % |
After expense reimbursement and/or fee waiver by Adviser | | | 1.13 | % | | | 0.85 | % | | | 0.84 | % | | | 0.81 | % | | | 0.66 | % |
Portfolio Turnover | | | 50.57 | % | | | 46.42 | % | | | 63.48 | % | | | 57.39 | %(e) | | | 35.09 | %(f) |
| | (a) | The selected per share data was calculated using the weighted average shares outstanding method for the period. |
| | (b) | Includes payments by affiliates of less than $0.005 per share. |
| | (c) | The total return is calculated using the Net Asset Value used for trading at the close of business at period end. |
| | (d) | Ratios of expenses to average net assets include interest expense of less than 0.005% for the year ended October 31, 2010. The interest expense is from utilizing the line of credit as discussed in Note H to the Financial Statements. |
| | (e) | Portfolio turnover rate excludes securities received from a reorganization. |
| | (f) | Portfolio turnover rate excludes securities received from processing a subscription-in-kind. |
See accompanying Notes to Financial Statements.
| | |
| |
| ASTON/Montag & Caldwell Growth Fund – Class R | | October 31, 2013 |
| |
| Financial Highlights | | |
| | | | | | | | | | | | | | | | | | | | |
| | | Year
Ended
10/31/13 | | | Year
Ended
10/31/12 | | | Year
Ended
10/31/11 | | | Year
Ended
10/31/10 | | | Year
Ended
10/31/09 | |
Net Asset Value, Beginning of Period | | $ | 25.02 | | | $ | 24.45 | | | $ | 22.70 | | | $ | 20.73 | | | $ | 18.69 | |
| | | | | | | | | | | | | | | | | | | | |
Income from Investment Operations: | | | | | | | | | | | | | | | | | | | | |
Net investment income | | | 0.16 | (a) | | | 0.09 | (a) | | | 0.08 | (a) | | | 0.07 | (a) | | | 0.03 | (a) |
Net realized and unrealized gain on investments | | | 5.01 | | | | 2.43 | | | | 1.80 | | | | 1.98 | (b) | | | 2.61 | |
| | | | | | | | | | | | | | | | | | | | |
Total from investment operations | | | 5.17 | | | | 2.52 | | | | 1.88 | | | | 2.05 | | | | 2.64 | |
| | | | | | | | | | | | | | | | | | | | |
Less Distributions: | | | | | | | | | | | | | | | | | | | | |
Distributions from and in excess of net investment income | | | (0.15 | ) | | | (0.07 | ) | | | (0.09 | ) | | | (0.08 | ) | | | — | |
Distributions from net realized gain on investments | | | (1.71 | ) | | | (1.88 | ) | | | (0.04 | ) | | | — | | | | (0.60 | ) |
| | | | | | | | | | | | | | | | | | | | |
Total distributions | | | (1.86 | ) | | | (1.95 | ) | | | (0.13 | ) | | | (0.08 | ) | | | (0.60 | ) |
| | | | | | | | | | | | | | | | | | | | |
Net increase in net asset value . | | | 3.31 | | | | 0.57 | | | | 1.75 | | | | 1.97 | | | | 2.04 | |
| | | | | | | | | | | | | | | | | | | | |
Net Asset Value, End of Period | | $ | 28.33 | | | $ | 25.02 | | | $ | 24.45 | | | $ | 22.70 | | | $ | 20.73 | |
| | | | | | | | | | | | | | | | | | | | |
Total Return (c) | | | 22.30 | % | | | 11.10 | % | | | 8.29 | % | | | 9.90 | % | | | 14.87 | % |
| | | | | |
Ratios/Supplemental Data: | | | | | | | | | | | | | | | | | | | | |
Net Assets, End of Period (in 000’s) | | $ | 10,099 | | | $ | 8,771 | | | $ | 8,654 | | | $ | 7,292 | | | $ | 3,840 | |
Ratios of expenses to average net assets: | | | | | | | | | | | | | | | | | | | | |
Before expense reimbursement and/or fee waiver by Adviser | | | 1.29 | % | | | 1.30 | % | | | 1.31 | % | | | 1.33 | %(d) | | | 1.36 | % |
After expense reimbursement and/or fee waiver by Adviser | | | 1.29 | % | | | 1.30 | % | | | 1.31 | % | | | 1.33 | %(d) | | | 1.36 | % |
Ratios of net investment income to average net assets: | | | | | | | | | | | | | | | | | | | | |
Before expense reimbursement and/or fee waiver by Adviser | | | 0.63 | % | | | 0.35 | % | | | 0.34 | % | | | 0.31 | % | | | 0.16 | % |
After expense reimbursement and/or fee waiver by Adviser | | | 0.63 | % | | | 0.35 | % | | | 0.34 | % | | | 0.31 | % | | | 0.16 | % |
Portfolio Turnover | | | 50.57 | % | | | 46.42 | % | | | 63.48 | % | | | 57.39 | %(e) | | | 35.09 | %(f) |
| | (a) | The selected per share data was calculated using the weighted average shares outstanding method for the period. |
| | (b) | Includes payments by affiliates of less than $0.005 per share. |
| | (c) | The total return is calculated using the Net Asset Value used for trading at the close of business at period end. |
| | (d) | Ratios of expenses to average net assets include interest expense of less than 0.005% for the year ended October 31, 2010. The interest expense is from utilizing the line of credit as discussed in Note H to the Financial Statements. |
| | (e) | Portfolio turnover rate excludes securities received from a reorganization. |
| | (f) | Portfolio turnover rate excludes securities received from processing a subscription-in-kind. |
See accompanying Notes to Financial Statements.
| | |
| |
| ASTON/TAMRO Diversified Equity Fund – Class N | | October 31, 2013 |
| |
| Financial Highlights | | |
| | | | | | | | | | | | | | | | | | | | |
| | | Year
Ended
10/31/13 | | | Year
Ended
10/31/12 | | | Year
Ended
10/31/11 | | | Year
Ended
10/31/10 | | | Year
Ended
10/31/09 | |
Net Asset Value, Beginning of Period | | $ | 13.52 | | | $ | 12.34 | | | $ | 11.83 | | | $ | 9.72 | | | $ | 8.34 | |
| | | | | | | | | | | | | | | | | | | | |
Income from Investment Operations: | | | | | | | | | | | | | | | | | | | | |
Net investment income (loss) | | | 0.01 | (a) | | | — | (b) | | | (0.02 | ) | | | — | (b) | | | — | (b) |
Net realized and unrealized gain on investments | | | 3.27 | | | | 1.44 | | | | 0.53 | | | | 2.13 | | | | 1.42 | |
| | | | | | | | | | | | | | | | | | | | |
Total from investment operations | | | 3.28 | | | | 1.44 | | | | 0.51 | | | | 2.13 | | | | 1.42 | |
| | | | | | | | | | | | | | | | | | | | |
Less Distributions: | | | | | | | | | | | | | | | | | | | | |
Distributions from and in excess of net investment income | | | (0.03 | ) | | | — | | | | — | | | | (0.02 | ) | | | (0.04 | ) |
Distributions from net realized gain on investments | | | (0.02 | ) | | | (0.26 | ) | | | — | | | | — | | | | — | |
| | | | | | | | | | | | | | | | | | | | |
Total distributions | | | (0.05 | ) | | | (0.26 | ) | | | — | | | | (0.02 | ) | | | (0.04 | ) |
| | | | | | | | | | | | | | | | | | | | |
Net increase in net asset value . | | | 3.23 | | | | 1.18 | | | | 0.51 | | | | 2.11 | | | | 1.38 | |
| | | | | | | | | | | | | | | | | | | | |
Net Asset Value, End of Period | | $ | 16.75 | | | $ | 13.52 | | | $ | 12.34 | | | $ | 11.83 | | | $ | 9.72 | |
| | | | | | | | | | | | | | | | | | | | |
Total Return (c) | | | 24.29 | % | | | 11.94 | % | | | 4.31 | % | | | 21.95 | % | | | 17.13 | % |
| | | | | |
Ratios/Supplemental Data: | | | | | | | | | | | | | | | | | | | | |
Net Assets, End of Period (in 000’s) | | $ | 26,797 | | | $ | 21,980 | | | $ | 24,354 | | | $ | 15,670 | | | $ | 10,486 | |
Ratios of expenses to average net assets: | | | | | | | | | | | | | | | | | | | | |
Before expense reimbursement and/or fee waiver by Adviser | | | 1.46 | % | | | 1.68 | %(d) | | | 1.62 | %(d) | | | 1.63 | % | | | 1.95 | % |
After expense reimbursement and/or fee waiver by Adviser | | | 1.20 | % | | | 1.20 | %(d) | | | 1.20 | %(d) | | | 1.20 | % | | | 1.20 | % |
Ratios of net investment income (loss) to average net assets: | | | | | | | | | | | | | | | | | | | | |
Before expense reimbursement and/or fee waiver by Adviser | | | (0.19 | )% | | | (0.47 | )% | | | (0.63 | )% | | | (0.45 | )% | | | (0.77 | )% |
After expense reimbursement and/or fee waiver by Adviser | | | 0.07 | % | | | — | %(b) | | | (0.21 | )% | | | (0.02 | )% | | | (0.02 | )% |
Portfolio Turnover | | | 79.61 | % | | | 52.56 | % | | | 65.96 | % | | | 81.75 | % | | | 85.49 | % |
| | (a) | The selected per share data was calculated using the weighted average shares outstanding method for the period. |
| | (b) | Represents less than $(0.005) per share or less than (0.005)%. |
| | (c) | The total return is calculated using the Net Asset Value used for trading at the close of business at period end. |
| | (d) | Ratios of expenses to average net assets include interest expense of less than 0.005% for each of the years ended October 31, 2012 and October 31, 2011, which are not included in the contractual expense limitation. The interest expense is from utilizing the line of credit as discussed in Note H to the Financial Statements. |
See accompanying Notes to Financial Statements.
| | |
| |
| ASTON/TAMRO Diversified Equity Fund – Class I | | October 31, 2013 |
| |
| Financial Highlights | | |
| | | | | | | | |
| | | Year
Ended
10/31/13 | | | Period
Ended
10/31/12(a) | |
Net Asset Value, Beginning of Period | | $ | 13.55 | | | $ | 13.27 | |
| | | | | | | | |
Income from Investment Operations: | | | | | | | | |
Net investment income (loss) | | | 0.05 | (b) | | | (0.05 | ) |
Net realized and unrealized gain on investments | | | 3.26 | | | | 0.33 | |
| | | | | | | | |
Total from investment operations | | | 3.31 | | | | 0.28 | |
| | | | | | | | |
Less Distributions: | | | | | | | | |
Distributions from and in excess of net investment income | | | (0.06 | ) | | | — | |
Distributions from net realized gain on investments | | | (0.02 | ) | | | — | |
| | | | | | | | |
Total Distributions | | | (0.08 | ) | | | — | |
| | | | | | | | |
Net increase in net asset value | | | 3.23 | | | | 0.28 | |
| | | | | | | | |
Net Asset Value, End of Period | | $ | 16.78 | | | $ | 13.55 | |
| | | | | | | | |
Total Return (c) | | | 24.64 | % | | | 2.04 | %(d) |
| | |
Ratios/Supplemental Data: | | | | | | | | |
Net Assets, End of Period (in 000’s) | | $ | 28,880 | | | $ | 569 | |
Ratios of expenses to average net assets: | | | | | | | | |
Before expense reimbursement and/or fee waiver by Adviser | | | 1.21 | % | | | 1.45 | %(e)(f) |
After expense reimbursement and/or fee waiver by Adviser | | | 0.95 | % | | | 0.95 | %(e)(f) |
Ratios of net investment income (loss) to average net assets: | | | | | | | | |
Before expense reimbursement and/or fee waiver by Adviser | | | 0.06 | % | | | (1.11 | )%(f) |
After expense reimbursement and/or fee waiver by Adviser | | | 0.32 | % | | | (0.61 | )%(f) |
Portfolio Turnover | | | 79.61 | % | | | 52.56 | %(d) |
| | (a) | The inception date for the TAMRO Diversified Equity Fund Class I shares is March 2, 2012. |
| | (b) | The selected per share data was calculated using the weighted average shares outstanding method for the period. |
| | (c) | The total return is calculated using the Net Asset Value used for trading at the close of business at period end. |
| | (e) | Ratios of expenses to average net assets include interest expense of less than 0.005% for the year ended October 31, 2013, which is not included in the contractual expense limitation. The interest expense is from utilizing the line of credit as discussed in Note H to the Financial Statements. |
See accompanying Notes to Financial Statements.
| | |
| |
| ASTON/Herndon Large Cap Value Fund – Class N | | October 31, 2013 |
| |
| Financial Highlights | | |
| | | | | | | | | | | | | | | | |
| | | Year
Ended
10/31/13 | | | Year
Ended
10/31/12 | | | Year
Ended
10/31/11 | | | Period
Ended
10/31/10(a) | |
Net Asset Value, Beginning of Period | | $ | 11.73 | | | $ | 11.31 | | | $ | 10.39 | | | $ | 10.00 | |
| | | | | | | | | | | | | | | | |
Income from Investment Operations: | | | | | | | | | | | | | | | | |
Net investment income | | | 0.15 | (b) | | | 0.18 | (b) | | | 0.12 | (b) | | | 0.03 | |
Net realized and unrealized gain on investments | | | 2.40 | | | | 0.91 | | | | 0.81 | | | | 0.36 | |
| | | | | | | | | | | | | | | | |
Total from investment operations | | | 2.55 | | | | 1.09 | | | | 0.93 | | | | 0.39 | |
| | | | | | | | | | | | | | | | |
Less Distributions: | | | | | | | | | | | | | | | | |
Distributions from and in excess of net investment income | | | (0.22 | ) | | | (0.11 | ) | | | (0.01 | ) | | | — | |
Distributions from net realized gain on investments | | | (0.22 | ) | | | (0.56 | ) | | | — | | | | — | |
| | | | | | | | | | | | | | | | |
Total distributions | | | (0.44 | ) | | | (0.67 | ) | | | (0.01 | ) | | | — | |
| | | | | | | | | | | | | | | | |
Net increase in net asset value | | | 2.11 | | | | 0.42 | | | | 0.92 | | | | 0.39 | |
| | | | | | | | | | | | | | | | |
Net Asset Value, End of Period | | $ | 13.84 | | | $ | 11.73 | | | $ | 11.31 | | | $ | 10.39 | |
| | | | | | | | | | | | | | | | |
Total Return (c) | | | 22.58 | % | | | 10.39 | % | | | 9.09 | % | | | 3.90 | %(d) |
| | | | |
Ratios/Supplemental Data: | | | | | | | | | | | | | | | | |
Net Assets, End of Period (in 000’s) | | $ | 41,861 | | | $ | 20,832 | | | $ | 6,089 | | | $ | 1,472 | |
Ratios of expenses to average net assets: | | | | | | | | | | | | | | | | |
Before expense reimbursement and/or fee waiver, or recoupment by Adviser | | | 1.27 | % | | | 1.41 | % | | | 2.38 | % | | | 13.84 | %(e) |
After expense reimbursement and/or fee waiver, or recoupment by Adviser | | | 1.30 | % | | | 1.30 | % | | | 1.30 | % | | | 1.30 | %(e) |
Ratios of net investment income (loss) to average net assets: | | | | | | | | | | | | | | | | |
Before expense reimbursement and/or fee waiver, or recoupment by Adviser | | | 1.24 | % | | | 1.44 | % | | | (0.05 | )% | | | (11.94 | )%(e) |
After expense reimbursement and/or fee waiver, or recoupment by Adviser | | | 1.21 | % | | | 1.55 | % | | | 1.03 | % | | | 0.60 | %(e) |
Portfolio Turnover | | | 69.51 | % | | | 80.56 | % | | | 189.70 | % | | | 38.64 | %(d) |
| | (a) | The inception date for the Herndon Large Cap Value Fund Class N shares is March 31, 2010. |
| | (b) | The selected per share data was calculated using the weighted average shares outstanding method for the period. |
| | (c) | The total return is calculated using the Net Asset Value used for trading at the close of business at period end. |
See accompanying Notes to Financial Statements.
| | |
| |
| ASTON/Herndon Large Cap Value Fund – Class I | | October 31, 2013 |
| |
| Financial Highlights | | |
| | | | | | | | | | | | |
| | | Year
Ended
10/31/13 | | | Year
Ended
10/31/12 | | | Period
Ended
10/31/11(a) | |
Net Asset Value, Beginning of Period | | $ | 11.75 | | | $ | 11.33 | | | $ | 11.48 | |
| | | | | | | | | | | | |
Income from Investment Operations: | | | | | | | | | | | | |
Net investment income | | | 0.19 | (b) | | | 0.21 | (b) | | | 0.10 | (b) |
Net realized and unrealized gain (loss) on investments | | | 2.39 | | | | 0.91 | | | | (0.25 | ) |
| | | | | | | | | | | | |
Total from investment operations | | | 2.58 | | | | 1.12 | | | | (0.15 | ) |
| | | | | | | | | | | | |
Less Distributions: | | | | | | | | | | | | |
Distributions from and in excess of net investment income | | | (0.24 | ) | | | (0.14 | ) | | | — | |
Distributions from net realized gain on investments | | | (0.22 | ) | | | (0.56 | ) | | | — | |
| | | | | | | | | | | | |
Total distributions | | | (0.46 | ) | | | (0.70 | ) | | | — | |
| | | | | | | | | | | | |
Net increase (decrease) in net asset value | | | 2.12 | | | | 0.42 | | | | (0.15 | ) |
| | | | | | | | | | | | |
Net Asset Value, End of Period | | $ | 13.87 | | | $ | 11.75 | | | $ | 11.33 | |
| | | | | | | | | | | | |
Total Return (c) | | | 22.94 | % | | | 10.69 | % | | | (1.31 | )%(d) |
| | | |
Ratios/Supplemental Data: | | | | | | | | | | | | |
Net Assets, End of Period (in 000’s) | | $ | 80,534 | | | $ | 34,575 | | | $ | 11,881 | |
Ratios of expenses to average net assets: | | | | | | | | | | | | |
Before expense reimbursement and/or fee waiver, or recoupment by Adviser | | | 1.02 | % | | | 1.16 | % | | | 2.13 | %(e) |
After expense reimbursement and/or fee waiver, or recoupment by Adviser | | | 1.05 | % | | | 1.05 | % | | | 1.05 | %(e) |
Ratios of net investment income to average net assets: | | | | | | | | | | | | |
Before expense reimbursement and/or fee waiver, or recoupment by Adviser | | | 1.49 | % | | | 1.69 | % | | | 0.20 | %(e) |
After expense reimbursement and/or fee waiver, or recoupment by Adviser | | | 1.46 | % | | | 1.80 | % | | | 1.28 | %(e) |
Portfolio Turnover | | | 69.51 | % | | | 80.56 | % | | | 189.70 | %(d) |
| | (a) | The inception date for the Herndon Large Cap Value Fund Class I shares is March 2, 2011. |
| | (b) | The selected per share data was calculated using the weighted average shares outstanding method for the period. |
| | (c) | The total return is calculated using the Net Asset Value used for trading at the close of business at period end. |
See accompanying Notes to Financial Statements.
| | |
| |
| ASTON/Cornerstone Large Cap Value Fund – Class N | | October 31, 2013 |
| |
| Financial Highlights | | |
| | | | | | | | | | | | | | | | | | | | |
| | | Year
Ended
10/31/13 | | | Year
Ended
10/31/12 | | | Year
Ended
10/31/11 | | | Year
Ended
10/31/10 | | | Year
Ended
10/31/09 | |
Net Asset Value, Beginning of Period | | $ | 11.04 | | | $ | 10.04 | | | $ | 9.20 | | | $ | 8.31 | | | $ | 9.07 | |
| | | | | | | | | | | | | | | | | | | | |
Income from Investment Operations: | | | | | | | | | | | | | | | | | | | | |
Net investment income | | | 0.09 | (a) | | | 0.10 | (a) | | | 0.12 | (a) | | | 0.13 | | | | 0.15 | |
Net realized and unrealized gain on investments | | | 2.72 | | | | 0.94 | | | | 0.83 | | | | 0.89 | | | | 0.41 | |
| | | | | | | | | | | | | | | | | | | | |
Total from investment operations | | | 2.81 | | | | 1.04 | | | | 0.95 | | | | 1.02 | | | | 0.56 | |
| | | | | | | | | | | | | | | | | | | | |
Less Distributions: | | | | | | | | | | | | | | | | | | | | |
Distributions from and in excess of net investment income | | | (0.11 | ) | | | (0.04 | ) | | | (0.11 | ) | | | (0.13 | ) | | | (0.15 | ) |
Distributions from net realized gain on investments | | | — | | | | — | | | | — | | | | — | | | | (1.17 | ) |
| | | | | | | | | | | | | | | | | | | | |
Total distributions | | | (0.11 | ) | | | (0.04 | ) | | | (0.11 | ) | | | (0.13 | ) | | | (1.32 | ) |
| | | | | | | | | | | | | | | | | | | | |
Net increase (decrease) in net asset value . | | | 2.70 | | | | 1.00 | | | | 0.84 | | | | 0.89 | | | | (0.76 | ) |
| | | | | | | | | | | | | | | | | | | | |
Net Asset Value, End of Period | | $ | 13.74 | | | $ | 11.04 | | | $ | 10.04 | | | $ | 9.20 | | | $ | 8.31 | |
| | | | | | | | | | | | | | | | | | | | |
Total Return (b) | | | 25.72 | % | | | 10.43 | % | | | 10.44 | % | | | 12.37 | % | | | 8.60 | % |
| | | | | |
Ratios/Supplemental Data: | | | | | | | | | | | | | | | | | | | | |
Net Assets, End of Period (in 000’s) | | $ | 23,913 | | | $ | 21,105 | | | $ | 24,631 | | | $ | 19,984 | | | $ | 20,173 | |
Ratios of expenses to average net assets: | | | | | | | | | | | | | | | | | | | | |
Before expense reimbursement and/or fee waiver by Adviser | | | 1.48 | % | | | 1.58 | % | | | 1.61 | % | | | 1.19 | %(d) | | | 1.21 | % |
After expense reimbursement and/or fee waiver by Adviser | | | 1.30 | % | | | 1.26 | %(c) | | | 1.14 | %(c) | | | 1.07 | %(d) | | | 1.07 | %(e) |
Ratios of net investment income to average net assets: | | | | | | | | | | | | | | | | | | | | |
Before expense reimbursement and/or fee waiver by Adviser | | | 0.53 | % | | | 0.60 | % | | | 0.80 | % | | | 1.32 | % | | | 1.77 | % |
After expense reimbursement and/or fee waiver by Adviser | | | 0.71 | % | | | 0.92 | % | | | 1.27 | % | | | 1.44 | % | | | 1.91 | % |
Portfolio Turnover | | | 58.24 | % | | | 58.21 | % | | | 59.07 | %(f) | | | 37.44 | % | | | 39.00 | % |
| | (a) | The selected per share data was calculated using the weighted average shares outstanding method for the period. |
| | (b) | The total return is calculated using the Net Asset Value used for trading at the close of business at period end. |
| | (c) | Effective March 22, 2011, the Adviser changed the voluntary expense limitation from 1.07% to 1.19%. Subsequently, on February 29, 2012, the Adviser removed the voluntary expense limitation and replaced it with a contractual expense limitation of 1.30%. |
| | (d) | Ratios of expenses to average net assets include interest expense of less than 0.005% for the year ended October 31, 2010, which is not included in the contractual expense limitation. The interest expense is from utilizing the line of credit, as discussed in Note H to the Financial Statements. |
| | (e) | The contractual expense limitation of 1.07%, which excludes interest, taxes, investment-related costs (such as brokerage commissions), extraordinary expenses and acquired fund fees and expenses, was removed by the Adviser and replaced with a voluntary expense limitation of 1.07% effective March 1, 2009. Voluntary expense waivers can be terminated by the Adviser at any time. |
| | (f) | Portfolio turnover rate excludes securities delivered from processing a redemption-in-kind. |
See accompanying Notes to Financial Statements.
| | |
| |
| ASTON/Cornerstone Large Cap Value Fund – Class I | | October 31, 2013 |
| |
| Financial Highlights | | |
| | | | | | | | | | | | | | | | | | | | |
| | | Year
Ended
10/31/13 | | | Year
Ended
10/31/12 | | | Year
Ended
10/31/11 | | | Year
Ended
10/31/10 | | | Year
Ended
10/31/09 | |
Net Asset Value, Beginning of Period | | $ | 11.07 | | | $ | 10.05 | | | $ | 9.19 | | | $ | 8.31 | | | $ | 9.06 | |
| | | | | | | | | | | | | | | | | | | | |
Income from Investment Operations: | | | | | | | | | | | | | | | | | | | | |
Net investment income | | | 0.12 | (a) | | | 0.11 | (a) | | | 0.16 | (a) | | | 0.15 | | | | 0.17 | |
Net realized and unrealized gain on investments | | | 2.73 | | | | 0.96 | | | | 0.84 | | | | 0.88 | | | | 0.42 | |
| | | | | | | | | | | | | | | | | | | | |
Total from investment operations | | | 2.85 | | | | 1.07 | | | | 1.00 | | | | 1.03 | | | | 0.59 | |
| | | | | | | | | | | | | | | | | | | | |
Less Distributions: | | | | | | | | | | | | | | | | | | | | |
Distributions from and in excess of net investment income | | | (0.14 | ) | | | (0.05 | ) | | | (0.14 | ) | | | (0.15 | ) | | | (0.17 | ) |
Distributions from net realized gain on investments | | | — | | | | — | | | | — | | | | — | | | | (1.17 | ) |
| | | | | | | | | | | | | | | | | | | | |
Total distributions | | | (0.14 | ) | | | (0.05 | ) | | | (0.14 | ) | | | (0.15 | ) | | | (1.34 | ) |
| | | | | | | | | | | | | | | | | | | | |
Net increase (decrease) in net asset value . | | | 2.71 | | | | 1.02 | | | | 0.86 | | | | 0.88 | | | | (0.75 | ) |
| | | | | | | | | | | | | | | | | | | | |
Net Asset Value, End of Period | | $ | 13.78 | | | $ | 11.07 | | | $ | 10.05 | | | $ | 9.19 | | | $ | 8.31 | |
| | | | | | | | | | | | | | | | | | | | |
Total Return (b) | | | 26.08 | % | | | 10.66 | % | | | 10.95 | % | | | 12.53 | % | | | 9.01 | % |
| | | | | |
Ratios/Supplemental Data: | | | | | | | | | | | | | | | | | | | | |
Net Assets, End of Period (in 000’s) | | $ | 38,735 | | | $ | 5,397 | | | $ | 126 | | | $ | 204,051 | | | $ | 205,580 | |
Ratios of expenses to average net assets: | | | | | | | | | | | | | | | | | | | | |
Before expense reimbursement and/or fee waiver by Adviser | | | 1.23 | % | | | 1.33 | % | | | 1.36 | % | | | 0.94 | %(d) | | | 0.96 | % |
After expense reimbursement and/or fee waiver by Adviser | | | 1.05 | % | | | 1.01 | %(c) | | | 0.89 | %(c) | | | 0.82 | %(d) | | | 0.82 | %(e) |
Ratios of net investment income to average net assets: | | | | | | | | | | | | | | | | | | | | |
Before expense reimbursement and/or fee waiver by Adviser | | | 0.78 | % | | | 0.85 | % | | | 1.05 | % | | | 1.57 | % | | | 2.02 | % |
After expense reimbursement and/or fee waiver by Adviser | | | 0.96 | % | | | 1.17 | % | | | 1.52 | % | | | 1.69 | % | | | 2.16 | % |
Portfolio Turnover | | | 58.24 | % | | | 58.21 | % | | | 59.07 | %(f) | | | 37.44 | % | | | 39.00 | % |
| | (a) | The selected per share data was calculated using the weighted average shares outstanding method for the period. |
| | (b) | The total return is calculated using the Net Asset Value used for trading at the close of business at period end. |
| | (c) | Effective March 22, 2011, the Adviser changed the voluntary expense limitation from 0.82% to 0.94%. Subsequently, on February 29, 2012, the Adviser removed the voluntary expense limitation and replaced it with a contractual expense limitation of 1.05%. |
| | (d) | Ratios of expense to average net assets included interest expense of less than 0.005% for the year ended October 31, 2010, which is not included in the contractual expense limitation. The interest expense is from utilizing the line of credit, as discussed in Note H to the Financial Statements. |
| | (e) | The contractual expense limitation of 0.82%, which excludes interest, taxes, investment-related costs (such as brokerage commissions), extraordinary expenses and acquired fund fees and expenses, was removed by the Adviser and replaced with a voluntary expense limitation of 0.82% effective March 1, 2009. Voluntary expense waivers can be terminated by the Adviser at any time. |
| | (f) | Portfolio turnover rate excludes securities delivered from processing a redemption-in-kind. |
See accompanying Notes to Financial Statements.
| | |
| |
| ASTON/River Road Dividend All Cap Value Fund – Class N | | October 31, 2013 |
| |
| Financial Highlights | | |
| | | | | | | | | | | | | | | | | | | | |
| | | Year
Ended
10/31/13 | | | Year
Ended
10/31/12 | | | Year
Ended
10/31/11 | | | Year
Ended
10/31/10 | | | Year
Ended
10/31/09 | |
Net Asset Value, Beginning of Period | | $ | 11.67 | | | $ | 10.68 | | | $ | 10.23 | | | $ | 8.58 | | | $ | 8.43 | |
| | | | | | | | | | | | | | | | | | | | |
Income from Investment Operations: | | | | | | | | | | | | | | | | | | | | |
Net investment income | | | 0.30 | | | | 0.31 | (a) | | | 0.29 | (a) | | | 0.26 | (a) | | | 0.26 | (a) |
Net realized and unrealized gain on investments | | | 2.73 | | | | 1.05 | | | | 0.42 | | | | 1.62 | | | | 0.08 | |
| | | | | | | | | | | | | | | | | | | | |
Total from investment operations | | | 3.03 | | | | 1.36 | | | | 0.71 | | | | 1.88 | | | | 0.34 | |
| | | | | | | | | | | | | | | | | | | | |
Less Distributions: | | | | | | | | | | | | | | | | | | | | |
Distributions from and in excess of net investment income | | | (0.27 | ) | | | (0.30 | ) | | | (0.26 | ) | | | (0.23 | ) | | | (0.19 | ) |
Distributions from net realized gain on investments | | | (0.44 | ) | | | (0.07 | ) | | | — | | | | — | | | | — | |
| | | | | | | | | | | | | | | | | | | | |
Total distributions | | | (0.71 | ) | | | (0.37 | ) | | | (0.26 | ) | | | (0.23 | ) | | | (0.19 | ) |
| | | | | | | | | | | | | | | | | | | | |
Net increase in net asset value | | | 2.32 | | | | 0.99 | | | | 0.45 | | | | 1.65 | | | | 0.15 | |
| | | | | | | | | | | | | | | | | | | | |
Net Asset Value, End of Period | | $ | 13.99 | | | $ | 11.67 | | | $ | 10.68 | | | $ | 10.23 | | | $ | 8.58 | |
| | | | | | | | | | | | | | | | | | | | |
Total Return (b) | | | 27.47 | % | | | 12.96 | % | | | 6.94 | % | | | 22.20 | % | | | 4.33 | % |
| | | | | |
Ratios/Supplemental Data: | | | | | | | | | | | | | | | | | | | | |
Net Assets, End of Period (in 000’s) | | $ | 449,130 | | | $ | 338,166 | | | $ | 301,290 | | | $ | 135,544 | | | $ | 81,842 | |
Ratios of expenses to average net assets: | | | | | | | | | | | | | | | | | | | | |
Before expense reimbursement and/or fee waiver by Adviser | | | 1.09 | % | | | 1.12 | % | | | 1.12 | % | | | 1.14 | % | | | 1.21 | % |
After expense reimbursement and/or fee waiver by Adviser | | | 1.09 | % | | | 1.12 | % | | | 1.12 | % | | | 1.14 | % | | | 1.21 | % |
Ratios of net investment income to average net assets: | | | | | | | | | | | | | | | | | | | | |
Before expense reimbursement and/or fee waiver by Adviser | | | 2.38 | % | | | 2.74 | % | | | 2.70 | % | | | 2.69 | % | | | 3.36 | % |
After expense reimbursement and/or fee waiver by Adviser | | | 2.38 | % | | | 2.74 | % | | | 2.70 | % | | | 2.69 | % | | | 3.36 | % |
Portfolio Turnover | | | 35.18 | % | | | 28.17 | % | | | 24.65 | % | | | 29.92 | % | | | 47.34 | % |
| | (a) | The selected per share data was calculated using the weighted average shares outstanding method for the period. |
| | (b) | The total return is calculated using the Net Asset Value used for trading at the close of business at period end. |
See accompanying Notes to Financial Statements.
| | |
| |
| ASTON/River Road Dividend All Cap Value Fund – Class I | | October 31, 2013 |
| |
| Financial Highlights | | |
| | | | | | | | | | | | | | | | | | | | |
| | | Year
Ended
10/31/13 | | | Year
Ended
10/31/12 | | | Year
Ended
10/31/11 | | | Year
Ended
10/31/10 | | | Year
Ended
10/31/09 | |
Net Asset Value, Beginning of Period | | $ | 11.66 | | | $ | 10.67 | | | $ | 10.22 | | | $ | 8.57 | | | $ | 8.42 | |
| | | | | | | | | | | | | | | | | | | | |
Income from Investment Operations: | | | | | | | | | | | | | | | | | | | | |
Net investment income | | | 0.34 | | | | 0.34 | (a) | | | 0.32 | (a) | | | 0.28 | (a) | | | 0.29 | (a) |
Net realized and unrealized gain on investments | | | 2.72 | | | | 1.05 | | | | 0.42 | | | | 1.63 | | | | 0.07 | |
| | | | | | | | | | | | | | | | | | | | |
Total from investment operations | | | 3.06 | | | | 1.39 | | | | 0.74 | | | | 1.91 | | | | 0.36 | |
| | | | | | | | | | | | | | | | | | | | |
Less Distributions: | | | | | | | | | | | | | | | | | | | | |
Distributions from and in excess of net investment income | | | (0.30 | ) | | | (0.33 | ) | | | (0.29 | ) | | | (0.26 | ) | | | (0.21 | ) |
Distributions from net realized gain on investments | | | (0.44 | ) | | | (0.07 | ) | | | — | | | | — | | | | — | |
| | | | | | | | | | | | | | | | | | | | |
Total distributions | | | (0.74 | ) | | | (0.40 | ) | | | (0.29 | ) | | | (0.26 | ) | | | (0.21 | ) |
| | | | | | | | | | | | | | | | | | | | |
Net increase in net asset value . | | | 2.32 | | | | 0.99 | | | | 0.45 | | | | 1.65 | | | | 0.15 | |
| | | | | | | | | | | | | | | | | | | | |
Net Asset Value, End of Period | | $ | 13.98 | | | $ | 11.66 | | | $ | 10.67 | | | $ | 10.22 | | | $ | 8.57 | |
| | | | | | | | | | | | | | | | | | | | |
Total Return (b) | | | 27.81 | % | | | 13.25 | % | | | 7.21 | % | | | 22.53 | % | | | 4.59 | % |
| | | | | |
Ratios/Supplemental Data: | | | | | | | | | | | | | | | | | | | | |
Net Assets, End of Period (in 000’s) | | $ | 779,859 | | | $ | 586,043 | | | $ | 318,863 | | | $ | 137,629 | | | $ | 77,185 | |
Ratios of expenses to average net assets: | | | | | | | | | | | | | | | | | | | | |
Before expense reimbursement and/or fee waiver by Adviser | | | 0.84 | % | | | 0.87 | % | | | 0.87 | % | | | 0.89 | % | | | 0.96 | % |
After expense reimbursement and/or fee waiver by Adviser | | | 0.84 | % | | | 0.87 | % | | | 0.87 | % | | | 0.89 | % | | | 0.96 | % |
Ratios of net investment income to average net assets: | | | | | | | | | | | | | | | | | | | | |
Before expense reimbursement and/or fee waiver by Adviser | | | 2.63 | % | | | 2.99 | % | | | 2.95 | % | | | 2.94 | % | | | 3.61 | % |
After expense reimbursement and/or fee waiver by Adviser | | | 2.63 | % | | | 2.99 | % | | | 2.95 | % | | | 2.94 | % | | | 3.61 | % |
Portfolio Turnover | | | 35.18 | % | | | 28.17 | % | | | 24.65 | % | | | 29.92 | % | | | 47.34 | % |
| | (a) | The selected per share data was calculated using the weighted average shares outstanding method for the period. |
| | (b) | The total return is calculated using the Net Asset Value used for trading at the close of business at period end. |
See accompanying Notes to Financial Statements.
| | |
| |
| ASTON/River Road Dividend All Cap Value Fund II – Class N | | October 31, 2013 |
| |
| Financial Highlights | | |
| | | | | | | | |
| | | Year
Ended
10/31/13 | | | Period
Ended
10/31/12(a) | |
Net Asset Value, Beginning of Period | | $ | 10.44 | | | $ | 10.00 | |
| | | | | | | | |
Income from Investment Operations: | | | | | | | | |
Net investment income | | | 0.22 | | | | 0.09 | (b) |
Net realized and unrealized gain on investments | | | 2.46 | | | | 0.41 | |
| | | | | | | | |
Total from investment operations | | | 2.68 | | | | 0.50 | |
| | | | | | | | |
Less Distributions: | | | | | | | | |
Distributions from and in excess of net investment income | | | (0.23 | ) | | | (0.06 | ) |
Distributions from net realized gain on investments | | | — | (c) | | | — | |
| | | | | | | | |
Total distributions | | | (0.23 | ) | | | (0.06 | ) |
| | | | | | | | |
Net increase in net asset value | | | 2.45 | | | | 0.44 | |
| | | | | | | | |
Net Asset Value, End of Period | | $ | 12.89 | | | $ | 10.44 | |
| | | | | | | | |
Total Return (d) | | | 25.99 | % | | | 5.09 | %(e) |
| | |
Ratios/Supplemental Data: | | | | | | | | |
Net Assets, End of Period (in 000’s) | | $ | 3,634 | | | $ | 1,049 | |
Ratios of expenses to average net assets: | | | | | | | | |
Before expense reimbursement and/or fee waiver by Adviser | | | 1.37 | % | | | 4.99 | %(f) |
After expense reimbursement and/or fee waiver by Adviser | | | 1.30 | % | | | 1.30 | %(f) |
Ratios of net investment income (loss) to average net assets: | | | | | | | | |
Before expense reimbursement and/or fee waiver by Adviser | | | 1.68 | % | | | (1.24 | )%(f) |
After expense reimbursement and/or fee waiver by Adviser | | | 1.76 | % | | | 2.45 | %(f) |
Portfolio Turnover | | | 27.80 | % | | | 5.58 | %(e)(g) |
| | (a) | The inception date for the River Road Dividend All Cap Value Fund II Class N shares is June 27, 2012. |
| | (b) | The selected per share data was calculated using the weighted average shares outstanding method for the period. |
| | (c) | Represents less than $(0.005) per share. |
| | (d) | The total return is calculated using the Net Asset Value used for trading at the close of business at period end. |
| | (g) | Portfolio turnover excludes securities received from processing a subscription-in-kind. |
See accompanying Notes to Financial Statements.
| | |
| |
| ASTON/River Road Dividend All Cap Value Fund II – Class I | | October 31, 2013 |
| |
| Financial Highlights | | |
| | | | | | | | |
| | | Year
Ended
10/31/13 | | | Period
Ended
10/31/12(a) | |
Net Asset Value, Beginning of Period | | $ | 10.45 | | | $ | 10.00 | |
| | | | | | | | |
Income from Investment Operations: | | | | | | | | |
Net investment income | | | 0.25 | | | | 0.10 | (b) |
Net realized and unrealized gain on investments | | | 2.45 | | | | 0.42 | |
| | | | | | | | |
Total from investment operations | | | 2.70 | | | | 0.52 | |
| | | | | | | | |
Less Distributions: | | | | | | | | |
Distributions from and in excess of net investment income | | | (0.26 | ) | | | (0.07 | ) |
Distributions from net realized gain on investments | | | — | (c) | | | — | |
| | | | | | | | |
Total distributions | | | (0.26 | ) | | | (0.07 | ) |
| | | | | | | | |
Net increase in net asset value | | | 2.44 | | | | 0.45 | |
| | | | | | | | |
Net Asset Value, End of Period | | $ | 12.89 | | | $ | 10.45 | |
| | | | | | | | |
Total Return (d) | | | 26.30 | % | | | 5.17 | %(e) |
| | |
Ratios/Supplemental Data: | | | | | | | | |
Net Assets, End of Period (in 000’s) | | $ | 86,240 | | | $ | 9,370 | |
Ratios of expenses to average net assets: | | | | | | | | |
Before expense reimbursement and/or fee waiver by Adviser | | | 1.12 | % | | | 4.74 | %(f) |
After expense reimbursement and/or fee waiver by Adviser | | | 1.05 | % | | | 1.05 | %(f) |
Ratios of net investment income (loss) to average net assets: | | | | | | | | |
Before expense reimbursement and/or fee waiver by Adviser | | | 1.93 | % | | | (0.99 | )%(f) |
After expense reimbursement and/or fee waiver by Adviser | | | 2.01 | % | | | 2.70 | %(f) |
Portfolio Turnover | | | 27.80 | % | | | 5.58 | %(e)(g) |
| | (a) | The inception date for the River Road Dividend All Cap Value Fund II Class I shares is June 27, 2012. |
| | (b) | The selected per share data was calculated using the weighted average shares outstanding method for the period. |
| | (c) | Represents less than $(0.005) per share. |
| | (d) | The total return is calculated using the Net Asset Value used for trading at the close of business at period end. |
| | (g) | Portfolio turnover excludes securities received from processing a subscription-in-kind. |
See accompanying Notes to Financial Statements.
| | |
| |
| ASTON/Fairpointe Mid Cap Fund – Class N | | October 31, 2013 |
| |
| Financial Highlights | | |
| | | | | | | | | | | | | | | | | | | | |
| | | Year
Ended
10/31/13 | | | Year
Ended
10/31/12 | | | Year
Ended
10/31/11 | | | Year
Ended
10/31/10 | | | Year
Ended
10/31/09 | |
Net Asset Value, Beginning of Period | | $ | 32.79 | | | $ | 29.76 | | | $ | 29.04 | | | $ | 22.73 | | | $ | 17.25 | |
| | | | | | | | | | | | | | | | | | | | |
Income from Investment Operations: | | | | | | | | | | | | | | | | | | | | |
Net investment income | | | 0.17 | | | | 0.16 | | | | 0.06 | (a) | | | 0.01 | | | | 0.09 | |
Net realized and unrealized gain on investments | | | 13.48 | | | | 3.13 | | | | 0.82 | | | | 6.35 | | | | 5.82 | |
| | | | | | | | | | | | | | | | | | | | |
Total from investment operations | | | 13.65 | | | | 3.29 | | | | 0.88 | | | | 6.36 | | | | 5.91 | |
| | | | | | | | | | | | | | | | | | | | |
Less Distributions: | | | | | | | | | | | | | | | | | | | | |
Distributions from and in excess of net investment income | | | (0.30 | ) | | | (0.05 | ) | | | (0.08 | ) | | | (0.05 | ) | | | (0.14 | ) |
Distributions from net realized gain on investments | | | (0.74 | ) | | | (0.21 | ) | | | (0.08 | ) | | | — | | | | (0.29 | ) |
| | | | | | | | | | | | | | | | | | | | |
Total distributions | | | (1.04 | ) | | | (0.26 | ) | | | (0.16 | ) | | | (0.05 | ) | | | (0.43 | ) |
| | | | | | | | | | | | | | | | | | | | |
Net increase in net asset value . | | | 12.61 | | | | 3.03 | | | | 0.72 | | | | 6.31 | | | | 5.48 | |
| | | | | | | | | | | | | | | | | | | | |
Net Asset Value, End of Period | | $ | 45.40 | | | $ | 32.79 | | | $ | 29.76 | | | $ | 29.04 | | | $ | 22.73 | |
| | | | | | | | | | | | | | | | | | | | |
Total Return (b) | | | 42.88 | % | | | 11.15 | % | | | 2.98 | % | | | 28.01 | % | | | 35.60 | % |
| | | | | |
Ratios/Supplemental Data: | | | | | | | | | | | | | | | | | | | | |
Net Assets, End of Period (in 000’s) | | $ | 2,370,432 | | | $ | 1,561,510 | | | $ | 1,502,266 | | | $ | 1,469,354 | | | $ | 842,233 | |
Ratios of expenses to average net assets: | | | | | | | | | | | | | | | | | | | | |
Before expense reimbursement and/or fee waiver by Adviser | | | 1.11 | % | | | 1.11 | %(c) | | | 1.14 | %(c) | | | 1.14 | %(c) | | | 1.20 | %(c) |
After expense reimbursement and/or fee waiver by Adviser | | | 1.11 | % | | | 1.11 | %(c) | | | 1.14 | %(c) | | | 1.14 | %(c) | | | 1.20 | %(c) |
Ratios of net investment income to average net assets: | | | | | | | | | | | | | | | | | | | | |
Before expense reimbursement and/or fee waiver by Adviser | | | 0.42 | % | | | 0.50 | % | | | 0.21 | % | | | — | %(d) | | | 0.46 | % |
After expense reimbursement and/or fee waiver by Adviser | | | 0.42 | % | | | 0.50 | % | | | 0.21 | % | | | — | %(d) | | | 0.46 | % |
Portfolio Turnover | | | 36.98 | % | | | 28.06 | %(e) | | | 11.20 | % | | | 13.82 | % | | | 17.72 | % |
| | (a) | The selected per share data was calculated using the weighted average shares outstanding method for the period. |
| | (b) | The total return is calculated using the Net Asset Value used for trading at the close of business at period end. |
| | (c) | Ratios of expenses to average net assets include interest expense of less than 0.005% for each of the years ended October 31, 2012, October 31, 2011, October 31, 2010 and October 31, 2009, which are not included in the contractual expense limitation. The interest expense is from utilizing the line of credit, as discussed in Note H to the Financial Statements. |
| | (d) | Represents less than 0.005%. |
| | (e) | Portfolio turnover rate excludes securities delivered from processing a redemption-in-kind. |
See accompanying Notes to Financial Statements.
| | |
| |
| ASTON/Fairpointe Mid Cap Fund – Class I | | October 31, 2013 |
| |
| Financial Highlights | | |
| | | | | | | | | | | | | | | | | | | | |
| | | Year
Ended
10/31/13 | | | Year
Ended
10/31/12 | | | Year
Ended
10/31/11 | | | Year
Ended
10/31/10 | | | Year
Ended
10/31/09 | |
Net Asset Value, Beginning of Period | | $ | 33.28 | | | $ | 30.20 | | | $ | 29.41 | | | $ | 23.00 | | | $ | 17.47 | |
| | | | | | | | | | | | | | | | | | | | |
Income from Investment Operations: | | | | | | | | | | | | | | | | | | | | |
Net investment income | | | 0.28 | | | | 0.24 | | | | 0.14 | (a) | | | 0.07 | | | | 0.13 | |
Net realized and unrealized gain on investments | | | 13.67 | | | | 3.18 | | | | 0.82 | | | | 6.43 | | | | 5.89 | |
| | | | | | | | | | | | | | | | | | | | |
Total from investment operations | | | 13.95 | | | | 3.42 | | | | 0.96 | | | | 6.50 | | | | 6.02 | |
| | | | | | | | | | | | | | | | | | | | |
Less Distributions: | | | | | | | | | | | | | | | | | | | | |
Distributions from and in excess of net investment income | | | (0.39 | ) | | | (0.13 | ) | | | (0.09 | ) | | | (0.09 | ) | | | (0.20 | ) |
Distributions from net realized gain on investment | | | (0.74 | ) | | | (0.21 | ) | | | (0.08 | ) | | | — | | | | (0.29 | ) |
| | | | | | | | | | | | | | | | | | | | |
Total distributions | | | (1.13 | ) | | | (0.34 | ) | | | (0.17 | ) | | | (0.09 | ) | | | (0.49 | ) |
| | | | | | | | | | | | | | | | | | | | |
Net increase in net asset value | | | 12.82 | | | | 3.08 | | | | 0.79 | | | | 6.41 | | | | 5.53 | |
| | | | | | | | | | | | | | | | | | | | |
Net Asset Value, End of Period | | $ | 46.10 | | | $ | 33.28 | | | $ | 30.20 | | | $ | 29.41 | | | $ | 23.00 | |
| | | | | | | | | | | | | | | | | | | | |
Total Return (b) | | | 43.23 | % | | | 11.46 | % | | | 3.22 | % | | | 28.31 | % | | | 35.97 | % |
| | | | | |
Ratios/Supplemental Data: | | | | | | | | | | | | | | | | | | | | |
Net Assets, End of Period (in 000’s) | | $ | 2,521,876 | | | $ | 1,464,222 | | | $ | 1,339,223 | | | $ | 499,651 | | | $ | 150,953 | |
Ratios of expenses to average net assets: | | | | | | | | | | | | | | | | | | | | |
Before expense reimbursement and/or fee waiver by Adviser | | | 0.86 | % | | | 0.86 | %(c) | | | 0.89 | %(c) | | | 0.89 | %(c) | | | 0.95 | %(c) |
After expense reimbursement and/or fee waiver by Adviser | | | 0.86 | % | | | 0.86 | %(c) | | | 0.89 | %(c) | | | 0.89 | %(c) | | | 0.95 | %(c) |
Ratios of net investment income to average net assets: | | | | | | | | | | | | | | | | | | | | |
Before expense reimbursement and/or fee waiver by Adviser | | | 0.67 | % | | | 0.75 | % | | | 0.46 | % | | | 0.25 | % | | | 0.71 | % |
After expense reimbursement and/or fee waiver by Adviser | | | 0.67 | % | | | 0.75 | % | | | 0.46 | % | | | 0.25 | % | | | 0.71 | % |
Portfolio Turnover | | | 36.98 | % | | | 28.06 | %(d) | | | 11.20 | % | | | 13.82 | % | | | 17.72 | % |
| | (a) | The selected per share data was calculated using the weighted average shares outstanding method for the period. |
| | (b) | The total return is calculated using the Net Asset Value used for trading at the close of business at period end. |
| | (c) | Ratios of expenses to average net assets include interest expense of less than 0.005% for each of the years ended October 31, 2012, October 31, 2011, October 31, 2010 and October 31, 2009, which are not included in the contractual expense limitation. The interest expense is from utilizing the line of credit, as discussed in Note H to the Financial Statements. |
| | (d) | Portfolio turnover rate excludes securities delivered from processing a redemption-in-kind. |
See accompanying Notes to Financial Statements.
| | |
| |
| ASTON/Montag & Caldwell Mid Cap Growth Fund – Class N | | October 31, 2013 |
| |
| Financial Highlights | | |
| | | | | | | | | | | | | | | | | | | | |
| | | Year
Ended
10/31/13 | | | Year
Ended
10/31/12 | | | Year
Ended
10/31/11 | | | Year
Ended
10/31/10 | | | Year
Ended
10/31/09 | |
Net Asset Value, Beginning of Period | | $ | 10.36 | | | $ | 9.71 | | | $ | 8.51 | | | $ | 6.83 | | | $ | 5.85 | |
| | | | | | | | | | | | | | | | | | | | |
Income from Investment Operations: | | | | | | | | | | | | | | | | | | | | |
Net investment loss | | | (0.07 | ) | | | (0.07 | )(a) | | | (0.07 | ) | | | (0.04 | ) | | | (0.04 | ) |
Net realized and unrealized gain on investments | | | 2.58 | | | | 0.72 | | | | 1.27 | | | | 1.74 | | | | 1.02 | |
| | | | | | | | | | | | | | | | | | | | |
Total from investment operations | | | 2.51 | | | | 0.65 | | | | 1.20 | | | | 1.70 | | | | 0.98 | |
| | | | | | | | | | | | | | | | | | | | |
Less Distributions: | | | | | | | | | | | | | | | | | | | | |
Distributions from and in excess of net investment income | | | — | | | | — | | | | — | | | | (0.02 | ) | | | — | |
Distributions from net realized gain on investments | | | (0.10 | ) | | | — | | | | — | | | | — | | | | — | |
| | | | | | | | | | | | | | | | | | | | |
Total distributions | | | (0.10 | ) | | | — | | | | — | | | | (0.02 | ) | | | — | |
| | | | | | | | | | | | | | | | | | | | |
Net increase in net asset value | | | 2.41 | | | | 0.65 | | | | 1.20 | | | | 1.68 | | | | 0.98 | |
| | | | | | | | | | | | | | | | | | | | |
Net Asset Value, End of Period | | $ | 12.77 | | | $ | 10.36 | | | $ | 9.71 | | | $ | 8.51 | | | $ | 6.83 | |
| | | | | | | | | | | | | | | | | | | | |
Total Return (b) | | | 24.51 | % | | | 6.70 | % | | | 14.10 | % | | | 24.85 | % | | | 16.75 | % |
| | | | | |
Ratios/Supplemental Data: | | | | | | | | | | | | | | | | | | | | |
Net Assets, End of Period (in 000’s) | | $ | 11,402 | | | $ | 7,369 | | | $ | 4,507 | | | $ | 3,399 | | | $ | 2,959 | |
Ratios of expenses to average net assets: | | | | | | | | | | | | | | | | | | | | |
Before expense reimbursement and/or fee waiver by Adviser | | | 1.85 | % | | | 2.50 | % | | | 3.07 | % | | | 3.55 | % | | | 5.02 | % |
After expense reimbursement and/or fee waiver by Adviser | | | 1.25 | % | | | 1.25 | %(c) | | | 1.39 | %(c) | | | 1.40 | % | | | 1.40 | % |
Ratios of net investment loss to average net assets: | | | | | | | | | | | | | | | | | | | | |
Before expense reimbursement and/or fee waiver by Adviser | | | (1.18 | )% | | | (1.88 | )% | | | (2.39 | )% | | | (2.75 | )% | | | (4.13 | )% |
After expense reimbursement and/or fee waiver by Adviser | | | (0.58 | )% | | | (0.63 | )% | | | (0.71 | )% | | | (0.60 | )% | | | (0.51 | )% |
Portfolio Turnover | | | 74.24 | % | | | 36.60 | % | | | 29.31 | % | | | 31.49 | % | | | 54.37 | % |
| | (a) | The selected per share data was calculated using the weighted average shares outstanding method for the period. |
| | (b) | The total return is calculated using the Net Asset Value used for trading at the close of business at period end. |
| | (c) | For the period November 1, 2010 through September 29, 2011 the Adviser contractually waived management fees and/or reimbursed expenses so that the net expense ratio did not exceed 1.40%, excluding interest, taxes, investment-related costs (such as brokerage commissions), extraordinary expenses and acquired fund fees and expenses. Effective September 30, 2011, the Adviser implemented a voluntary expense limitation of 1.25%. Subsequently, on February 29, 2012, the Adviser removed the voluntary expense limitation and replaced it with a contractual expense limitation of 1.25%. |
See accompanying Notes to Financial Statements.
| | |
| |
| ASTON/LMCG Small Cap Growth Fund – Class N (formerly, ASTON Small Cap Growth Fund) | | October 31, 2013 |
| |
| Financial Highlights | | |
| | | | | | | | | | | | |
| | | Year
Ended
10/31/13 | | | Year
Ended
10/31/12 | | | Period
Ended
10/31/11(a) | |
| | | |
| | | |
| | | |
Net Asset Value, Beginning of Period | | $ | 11.42 | | | $ | 9.95 | | | $ | 10.00 | |
| | | | | | | | | | | | |
Income from Investment Operations: | | | | | | | | | | | | |
Net investment income (loss) | | | — | (b)(c) | | | (0.12 | )(c) | | | (0.04 | ) |
Net realized and unrealized gain (loss) on investments | | | 4.18 | | | | 1.59 | | | | (0.01 | ) |
| | | | | | | | | | | | |
Total from investment operations | | | 4.18 | | | | 1.47 | | | | (0.05 | ) |
| | | | | | | | | | | | |
Less Distributions: | | | | | | | | | | | | |
Distributions from net realized gains on investments | | | (0.89 | ) | | | — | | | | — | |
| | | | | | | | | | | | |
Total distributions | | | (0.89 | ) | | | — | | | | — | |
| | | | | | | | | | | | |
Net increase (decrease) in net asset value | | | 3.29 | | | | 1.47 | | | | (0.05 | ) |
| | | | | | | | | | | | |
Net Asset Value, End of Period | | $ | 14.71 | | | $ | 11.42 | | | $ | 9.95 | |
| | | | | | | | | | | | |
Total Return (d) | | | 39.31 | % | | | 14.77 | % | | | (0.50 | )%(e) |
| | | |
Ratios/Supplemental Data: | | | | | | | | | | | | |
Net Assets, End of Period (in 000’s) | | $ | 32,045 | | | $ | 5,659 | | | $ | 5,411 | |
Ratios of expenses to average net assets: | | | | | | | | | | | | |
Before expense reimbursement and/or fee waiver by Adviser | | | 2.03 | % | | | 2.86 | % | | | 8.27 | %(f) |
After expense reimbursement and/or fee waiver by Adviser | | | 1.35 | % | | | 1.35 | % | | | 1.35 | %(f) |
Ratios of net investment income (loss) to average net assets: | | | | | | | | | | | | |
Before expense reimbursement and/or fee waiver by Adviser | | | (0.66 | )% | | | (2.68 | )% | | | (8.14 | )%(f) |
After expense reimbursement and/or fee waiver by Adviser | | | 0.02 | % | | | (1.17 | )% | | | (1.21 | )%(f) |
Portfolio Turnover | | | 186.40 | %(g) | | | 168.05 | %(h) | | | 205.85 | %(e) |
| | (a) | The inception date for the LMCG Small Cap Growth Fund Class N shares is November 3, 2010. |
| | (b) | Represents less than $0.005 per share. |
| | (c) | The selected per share data was calculated using the weighted average shares outstanding method for the period. |
| | (d) | The total return is calculated using the Net Asset Value used for trading at the close of business at period end. |
| | (g) | Portfolio turnover rate excludes securities received from the Reorganization, as discussed in Note J to the Financial Statements. |
| | (h) | Portfolio turnover rate excludes securities delivered from processing a redemption-in-kind. |
See accompanying Notes to Financial Statements.
| | |
| |
| ASTON/LMCG Small Cap Growth Fund – Class I (formerly, ASTON Small Cap Growth Fund) | | October 31, 2013 |
| |
| Financial Highlights | | |
| | | | | | | | | | | | |
| | | Year
Ended
10/31/13 | | | Year
Ended
10/31/12 | | | Period
Ended
10/31/11(a) | |
| | | |
| | | |
| | | |
Net Asset Value, Beginning of Period | | $ | 11.46 | | | $ | 9.97 | | | $ | 12.40 | |
| | | | | | | | | | | | |
Income from Investment Operations: | | | | | | | | | | | | |
Net investment income (loss) | | | 0.04 | (b) | | | (0.10 | )(b) | | | (0.04 | ) |
Net realized and unrealized gain (loss) on investments | | | 4.20 | | | | 1.59 | | | | (2.39 | ) |
| | | | | | | | | | | | |
Total from investment operations | | | 4.24 | | | | 1.49 | | | | (2.43 | ) |
| | | | | | | | | | | | |
Less Distributions: | | | | | | | | | | | | |
Distributions from net realized gains on investments | | | (0.89 | ) | | | — | | | | — | |
| | | | | | | | | | | | |
Total distributions | | | (0.89 | ) | | | — | | | | — | |
| | | | | | | | | | | | |
Net increase (decrease) in net asset value | | | 3.35 | | | | 1.49 | | | | (2.43 | ) |
| | | | | | | | | | | | |
Net Asset Value, End of Period | | $ | 14.81 | | | $ | 11.46 | | | $ | 9.97 | |
| | | | | | | | | | | | |
Total Return (c) | | | 39.72 | % | | | 14.95 | % | | | (19.60 | )%(d) |
| | | |
Ratios/Supplemental Data: | | | | | | | | | | | | |
Net Assets, End of Period (in 000’s) | | $ | 8,496 | | | $ | 755 | | | $ | 2,551 | |
Ratios of expenses to average net assets: | | | | | | | | | | | | |
Before expense reimbursement and/or fee waiver by Adviser | | | 1.78 | % | | | 2.61 | % | | | 6.25 | %(e) |
After expense reimbursement and/or fee waiver by Adviser | | | 1.10 | % | | | 1.10 | % | | | 1.10 | %(e) |
Ratios of net investment income (loss) to average net assets: | | | | | | | | | | | | |
Before expense reimbursement and/or fee waiver by Adviser | | | (0.41 | )% | | | (2.43 | )% | | | (6.11 | )%(e) |
After expense reimbursement and/or fee waiver by Adviser | | | 0.27 | % | | | (0.92 | )% | | | (0.96 | )%(e) |
Portfolio Turnover | | | 186.40 | %(f) | | | 168.05 | %(g) | | | 205.85 | %(d) |
| | (a) | The inception date for the LMCG Small Cap Growth Fund Class I shares is June 1, 2011. |
| | (b) | The selected per share data was calculated using the weighted average shares outstanding method for the period. |
| | (c) | The total return is calculated using the Net Asset Value used for trading at the close of business at period end. |
| | (f) | Portfolio turnover rate excludes securities received from the Reorganization, as discussed in Note J to the Financial Statements. |
| | (g) | Portfolio turnover rate excludes securities delivered from processing a redemption-in-kind. |
See accompanying Notes to Financial Statements.
| | |
| |
| ASTON/Silvercrest Small Cap Fund – Class N | | October 31, 2013 |
| |
| Financial Highlights | | |
| | | | | | | | |
| | | Year
Ended
10/31/13 | | | Period
Ended
10/31/12(a) | |
| | |
| | |
| | |
Net Asset Value, Beginning of Period | | $ | 10.90 | | | $ | 10.00 | |
| | | | | | | | |
Income from Investment Operations: | | | | | | | | |
Net investment income | | | 0.01 | (b) | | | 0.01 | |
Net realized and unrealized gain on investments | | | 3.77 | | | | 0.89 | |
| | | | | | | | |
Total from investment operations | | | 3.78 | | | | 0.90 | |
| | | | | | | | |
Less Distributions: | | | | | | | | |
Distributions from and in excess of net investment income | | | (0.11 | ) | | | — | |
Distributions from net realized gains on investments | | | (0.03 | ) | | | — | |
| | | | | | | | |
Total distributions | | | (0.14 | ) | | | — | |
| | | | | | | | |
Net increase in net asset value | | | 3.64 | | | | 0.90 | |
| | | | | | | | |
Net Asset Value, End of Period | | $ | 14.54 | | | $ | 10.90 | |
| | | | | | | | |
Total Return (c) | | | 35.09 | % | | | 9.00 | %(d) |
| | |
Ratios/Supplemental Data: | | | | | | | | |
Net Assets, End of Period (in 000’s) | | $ | 4,049 | | | $ | 750 | |
Ratios of expenses to average net assets: | | | | | | | | |
Before expense reimbursement and/or fee waiver by Adviser | | | 2.05 | % | | | 5.10 | %(e) |
After expense reimbursement and/or fee waiver by Adviser | | | 1.40 | % | | | 1.40 | %(e) |
Ratios of net investment income (loss) to average net assets: | | | | | | | | |
Before expense reimbursement and/or fee waiver by Adviser | | | (0.61 | )% | | | (3.51 | )%(e) |
After expense reimbursement and/or fee waiver by Adviser | | | 0.04 | % | | | 0.19 | %(e) |
Portfolio Turnover | | | 36.82 | % | | | 26.22 | %(d)(f) |
| | (a) | The inception date for the Silvercrest Small Cap Fund Class N shares is December 27, 2011. |
| | (b) | The selected per share data was calculated using the weighted average shares outstanding method for the period. |
| | (c) | The total return is calculated using the Net Asset Value used for trading at the close of business at period end. |
| | (f) | Portfolio turnover rate excludes securities delivered from processing a redemption-in-kind. |
See accompanying Notes to Financial Statements.
| | |
| |
| ASTON/Silvercrest Small Cap Fund – Class I | | October 31, 2013 |
| |
| Financial Highlights | | |
| | | | | | | | |
| | | Year
Ended
10/31/13 | | | Period
Ended
10/31/12(a) | |
| | |
| | |
| | |
Net Asset Value, Beginning of Period | | $ | 10.93 | | | $ | 10.00 | |
| | | | | | | | |
Income from Investment Operations: | | | | | | | | |
Net investment income | | | 0.04 | (b) | | | 0.03 | |
Net realized and unrealized gain on investments | | | 3.78 | | | | 0.90 | |
| | | | | | | | |
Total from investment operations | | | 3.82 | | | | 0.93 | |
| | | | | | | | |
Less Distributions: | | | | | | | | |
Distributions from and in excess of net investment income | | | (0.13 | ) | | | — | |
Distributions from net realized gains on investments | | | (0.03 | ) | | | — | |
| | | | | | | | |
Total distributions | | | (0.16 | ) | | | — | |
| | | | | | | | |
Net increase in net asset value | | | 3.66 | | | | 0.93 | |
| | | | | | | | |
Net Asset Value, End of Period | | $ | 14.59 | | | $ | 10.93 | |
| | | | | | | | |
Total Return (c) | | | 35.39 | % | | | 9.30 | %(d) |
| | |
Ratios/Supplemental Data: | | | | | | | | |
Net Assets, End of Period (in 000’s) | | $ | 29,219 | | | $ | 4,962 | |
Ratios of expenses to average net assets: | | | | | | | | |
Before expense reimbursement and/or fee waiver by Adviser | | | 1.80 | % | | | 4.85 | %(e) |
After expense reimbursement and/or fee waiver by Adviser | | | 1.15 | % | | | 1.15 | %(e) |
Ratios of net investment income (loss) to average net assets: | | | | | | | | |
Before expense reimbursement and/or fee waiver by Adviser | | | (0.36 | )% | | | (3.26 | )%(e) |
After expense reimbursement and/or fee waiver by Adviser | | | 0.29 | % | | | 0.44 | %(e) |
Portfolio Turnover | | | 36.82 | % | | | 26.22 | %(d)(f) |
| | (a) | The inception date for the Silvercrest Small Cap Fund Class I shares is December 27, 2011. |
| | (b) | The selected per share data was calculated using the weighted average shares outstanding method for the period. |
| | (c) | The total return is calculated using the Net Asset Value used for trading at the close of business at period end. |
| | (f) | Portfolio turnover rate excludes securities delivered from processing a redemption-in-kind. |
See accompanying Notes to Financial Statements.
| | |
| |
| ASTON/TAMRO Small Cap Fund – Class N | | October 31, 2013 |
| |
| Financial Highlights | | |
| | | | | | | | | | | | | | | | | | | | |
| | | Year
Ended
10/31/13 | | | Year
Ended
10/31/12 | | | Year
Ended
10/31/11 | | | Year
Ended
10/31/10 | | | Year
Ended
10/31/09 | |
Net Asset Value, Beginning of Period | | $ | 20.52 | | | $ | 20.57 | | | $ | 19.42 | | | $ | 14.67 | | | $ | 13.64 | |
| | | | | | | | | | | | | | | | | | | | |
Income from Investment Operations: | | | | | | | | | | | | | | | | | | | | |
Net investment loss | | | (0.03 | )(a) | | | (0.12 | )(a) | | | (0.15 | )(a) | | | (0.08 | )(a) | | | (0.05 | )(a) |
Net realized and unrealized gain on investments | | | 5.55 | | | | 2.09 | | | | 1.75 | | | | 4.83 | | | | 1.08 | |
| | | | | | | | | | | | | | | | | | | | |
Total from investment operations | | | 5.52 | | | | 1.97 | | | | 1.60 | | | | 4.75 | | | | 1.03 | |
| | | | | | | | | | | | | | | | | | | | |
Less Distributions: | | | | | | | | | | | | | | | | | | | | |
Distributions from net realized gain on investments | | | (1.98 | ) | | | (2.02 | ) | | | (0.45 | ) | | | — | | | | — | |
| | | | | | | | | | | | | | | | | | | | |
Total distributions | | | (1.98 | ) | | | (2.02 | ) | | | (0.45 | ) | | | — | | | | — | |
| | | | | | | | | | | | | | | | | | | | |
Net increase (decrease) in net asset value | | | 3.54 | | | | (0.05 | ) | | | 1.15 | | | | 4.75 | | | | 1.03 | |
| | | | | | | | | | | | | | | | | | | | |
Net Asset Value, End of Period | | $ | 24.06 | | | $ | 20.52 | | | $ | 20.57 | | | $ | 19.42 | | | $ | 14.67 | |
| | | | | | | | | | | | | | | | | | | | |
Total Return (b) | | | 29.52 | % | | | 10.70 | % | | | 8.16 | % | | | 32.29 | % | | | 7.63 | % |
| | | | | |
Ratios/Supplemental Data: | | | | | | | | | | | | | | | | | | | | |
Net Assets, End of Period (in 000’s) | | $ | 533,627 | | | $ | 389,125 | | | $ | 375,969 | | | $ | 335,809 | | | $ | 241,524 | |
Ratios of expenses to average net assets: | | | | | | | | | | | | | | | | | | | | |
Before expense reimbursement and/or fee waiver by Adviser | | | 1.31 | % | | | 1.28 | %(c) | | | 1.29 | % | | | 1.34 | % | | | 1.37 | % |
After expense reimbursement and/or fee waiver by Adviser | | | 1.31 | % | | | 1.28 | %(c) | | | 1.29 | % | | | 1.34 | % | | | 1.36 | %(d) |
Ratios of net investment loss to average net assets: | | | | | | | | | | | | | | | | | | | | |
Before expense reimbursement and/or fee waiver by Adviser | | | (0.16 | )% | | | (0.59 | )% | | | (0.69 | )% | | | (0.49 | )% | | | (0.41 | )% |
After expense reimbursement and/or fee waiver by Adviser | | | (0.16 | )% | | | (0.59 | )% | | | (0.69 | )% | | | (0.49 | )% | | | (0.40 | )% |
Portfolio Turnover | | | 71.28 | %(e)(f) | | | 48.22 | %(e) | | | 47.25 | % | | | 62.13 | % | | | 89.92 | % |
��
| | (a) | The selected per share data was calculated using the weighted average shares outstanding method for the period. |
| | (b) | The total return is calculated using the Net Asset Value used for trading at the close of business at period end. |
| | (c) | Ratios of expenses to average net assets include interest expense of less than 0.005% for the year ended October 31, 2012, which is not included in the contractual expense limitation. The interest expense is from utilizing the line of credit, as discussed in Note H to the Financial Statements. |
| | (d) | The Adviser removed the contractual expense limitation of 1.30%, excluding interest, taxes, investment-related costs (such as brokerage commissions), extraordinary expenses and acquired fund fees and expenses, effective March 1, 2009. |
| | (e) | Portfolio turnover rate excludes securities delivered from processing redemptions-in-kind. |
| | (f) | Portfolio turnover rate excludes securities received from processing a subscription-in-kind. |
See accompanying Notes to Financial Statements.
| | |
| |
| ASTON/TAMRO Small Cap Fund – Class I | | October 31, 2013 |
| |
| Financial Highlights | | |
| | | | | | | | | | | | | | | | | | | | |
| | | Year
Ended
10/31/13 | | | Year
Ended
10/31/12 | | | Year
Ended
10/31/11 | | | Year
Ended
10/31/10 | | | Year
Ended
10/31/09 | |
| | | | | | | | | | | | | | | | | | | | |
Net Asset Value, Beginning of Period | | $ | 20.96 | | | $ | 20.91 | | | $ | 19.69 | | | $ | 14.87 | | | $ | 13.79 | |
| | | | | | | | | | | | | | | | | | | | |
Income from Investment Operations: | | | | | | | | | | | | | | | | | | | | |
Net investment income (loss) | | | 0.02 | (a) | | | (0.07 | )(a) | | | (0.09 | )(a) | | | (0.04 | )(a) | | | (0.02 | )(a) |
Net realized and unrealized gain on investments | | | 5.69 | | | | 2.14 | | | | 1.76 | | | | 4.87 | | | | 1.12 | |
| | | | | | | | | | | | | | | | | | | | |
Total from investment operations | | | 5.71 | | | | 2.07 | | | | 1.67 | | | | 4.83 | | | | 1.10 | |
| | | | | | | | | | | | | | | | | | | | |
Less Distributions: | | | | | | | | | | | | | | | | | | | | |
Distributions from and in excess of net investment income | | | — | | | | — | | | | — | | | | (0.01 | ) | | | (0.02 | ) |
Distributions from net realized gain on investments | | | (1.98 | ) | | | (2.02 | ) | | | (0.45 | ) | | | — | | | | — | |
| | | | | | | | | | | | | | | | | | | | |
Total distributions | | | (1.98 | ) | | | (2.02 | ) | | | (0.45 | ) | | | (0.01 | ) | | | (0.02 | ) |
| | | | | | | | | | | | | | | | | | | | |
Net increase in net asset value | | | 3.73 | | | | 0.05 | | | | 1.22 | | | | 4.82 | | | | 1.08 | |
| | | | | | | | | | | | | | | | | | | | |
Net Asset Value, End of Period | | $ | 24.69 | | | $ | 20.96 | | | $ | 20.91 | | | $ | 19.69 | | | $ | 14.87 | |
| | | | | | | | | | | | | | | | | | | | |
Total Return (b) | | | 29.84 | % | | | 10.98 | % | | | 8.40 | % | | | 32.62 | % | | | 7.94 | % |
| | | | | |
Ratios/Supplemental Data: | | | | | | | | | | | | | | | | | | | | |
Net Assets, End of Period (in 000’s) | | $ | 792,172 | | | $ | 635,663 | | | $ | 625,315 | | | $ | 549,627 | | | $ | 515,592 | |
Ratios of expenses to average net assets: | | | | | | | | | | | | | | | | | | | | |
Before expense reimbursement and/or fee waiver by Adviser | | | 1.06 | % | | | 1.03 | %(c) | | | 1.04 | % | | | 1.09 | % | | | 1.12 | % |
After expense reimbursement and/or fee waiver by Adviser | | | 1.06 | % | | | 1.03 | %(c) | | | 1.04 | % | | | 1.09 | % | | | 1.11 | %(d) |
Ratios of net investment income (loss) to average net assets: | | | | | | | | | | | | | | | | | | | | |
Before expense reimbursement and/or fee waiver by Adviser | | | 0.09 | % | | | (0.34 | )% | | | (0.44 | )% | | | (0.24 | )% | | | (0.16 | )% |
After expense reimbursement and/or fee waiver by Adviser | | | 0.09 | % | | | (0.34 | )% | | | (0.44 | )% | | | (0.24 | )% | | | (0.15 | )% |
Portfolio Turnover | | | 71.28 | %(e)(f) | | | 48.22 | %(e) | | | 47.25 | % | | | 62.13 | % | | | 89.92 | % |
| | (a) | The selected per share data was calculated using the weighted average shares outstanding method for the period. |
| | (b) | The total return is calculated using the Net Asset Value used for trading at the close of business at period end. |
| | (c) | Ratios of expenses to average net assets include interest expense of less than 0.005% for the year ended October 31, 2012, which is not included in the contractual expense limitation. The interest expense is from utilizing the line of credit, as discussed in Note H to the Financial Statements. |
| | (d) | The Adviser removed the contractual expense limitation of 1.05%, excluding interest, taxes, investment-related costs (such as brokerage commissions), extraordinary expenses and acquired fund fees and expenses, effective March 1, 2009. |
| | (e) | Portfolio turnover rate excludes securities delivered from processing redemptions-in-kind. |
| | (f) | Portfolio turnover rate excludes securities received from processing a subscription-in-kind. |
See accompanying Notes to Financial Statements.
| | |
| |
| ASTON/River Road Select Value Fund – Class N | | October 31, 2013 |
| |
| Financial Highlights | | |
| | | | | | | | | | | | | | | | | | | | |
| | | Year
Ended
10/31/13 | | | Year
Ended
10/31/12 | | | Year
Ended
10/31/11 | | | Year
Ended
10/31/10 | | | Year
Ended
10/31/09 | |
| | | | | | | | | | | | | | | | | | | | |
Net Asset Value, Beginning of Period | | $ | 8.50 | | | $ | 9.54 | | | $ | 9.01 | | | $ | 7.71 | | | $ | 7.13 | |
| | | | | | | | | | | | | | | | | | | | |
Income from Investment Operations: | | | | | | | | | | | | | | | | | | | | |
Net investment income (loss) | | | 0.07 | (a) | | | 0.01 | (a) | | | (0.02 | )(a) | | | 0.02 | (a) | | | — | (a)(b) |
Net realized and unrealized gain on investments | | | 2.34 | | | | 1.01 | | | | 0.66 | | | | 1.28 | | | | 0.59 | |
| | | | | | | | | | | | | | | | | | | | |
Total from investment operations | | | 2.41 | | | | 1.02 | | | | 0.64 | | | | 1.30 | | | | 0.59 | |
| | | | | | | | | | | | | | | | | | | | |
Less Distributions: | | | | | | | | | | | | | | | | | | | | |
Distributions from net investment income | | | (0.12 | ) | | | — | | | | (0.03 | ) | | | — | | | | (0.01 | ) |
Distributions from net realized gains on investments | | | (0.51 | ) | | | (2.06 | ) | | | (0.08 | ) | | | — | | | | — | |
| | | | | | | | | | | | | | | | | | | | |
Total distributions | | | (0.63 | ) | | | (2.06 | ) | | | (0.11 | ) | | | — | | | | (0.01 | ) |
| | | | | | | | | | | | | | | | | | | | |
Net increase (decrease) in net asset value | | | 1.78 | | | | (1.04 | ) | | | 0.53 | | | | 1.30 | | | | 0.58 | |
| | | | | | | | | | | | | | | | | | | | |
Net Asset Value, End of Period | | $ | 10.28 | | | $ | 8.50 | | | $ | 9.54 | | | $ | 9.01 | | | $ | 7.71 | |
| | | | | | | | | | | | | | | | | | | | |
Total Return (c) | | | 30.44 | % | | | 12.87 | % | | | 7.12 | % | | | 16.86 | % | | | 8.33 | % |
| | | | | |
Ratios/Supplemental Data: | | | | | | | | | | | | | | | | | | | | |
Net Assets, End of Period (in 000’s) | | $ | 19,099 | | | $ | 6,270 | | | $ | 13,160 | | | $ | 52,522 | | | $ | 41,801 | |
Ratios of expenses to average net assets: | | | | | | | | | | | | | | | | | | | | |
Before expense reimbursement and/or fee waiver, or recoupment by Adviser | | | 1.46 | % | | | 1.43 | %(d) | | | 1.42 | %(d) | | | 1.41 | %(d) | | | 1.44 | % |
After expense reimbursement and/or fee waiver, or recoupment by Adviser | | | 1.46 | % | | | 1.43 | %(d) | | | 1.42 | %(d) | | | 1.43 | %(d) | | | 1.50 | % |
Ratios of net investment income (loss) to average net assets: | | | | | | | | | | | | | | | | | | | | |
Before expense reimbursement and/or fee waiver, or recoupment by Adviser | | | 0.78 | % | | | 0.07 | % | | | (0.18 | )% | | | 0.31 | % | | | 0.04 | % |
After expense reimbursement and/or fee waiver, or recoupment by Adviser | | | 0.78 | % | | | 0.07 | % | | | (0.18 | )% | | | 0.29 | % | | | (0.02 | )% |
Portfolio Turnover | | | 71.01 | % | | | 38.84 | % | | | 48.22 | % | | | 53.73 | % | | | 44.09 | % |
| | (a) | The selected per share data was calculated using the weighted average shares outstanding method for the period. |
| | (b) | Represents less than $(0.005) per share. |
| | (c) | The total return is calculated using the Net Asset Value used for trading at the close of business at period end. |
| | (d) | Ratios of expenses to average net assets include interest expense of less than 0.005% for each of the years ended October 31, 2012, October 31, 2011 and October 31, 2010, which are not included in the contractual expense limitation. The interest expense is from utilizing the line of credit as discussed in Note H to the Financial Statements. |
See accompanying Notes to Financial Statements.
| | |
| |
| ASTON/River Road Select Value Fund – Class I | | October 31, 2013 |
| |
| Financial Highlights | | |
| | | | | | | | | | | | | | | | | | | | |
| | | Year
Ended
10/31/13 | | | Year
Ended
10/31/12 | | | Year
Ended
10/31/11 | | | Year
Ended
10/31/10 | | | Year
Ended
10/31/09 | |
| | | | | | | | | | | | | | | | | | | | |
Net Asset Value, Beginning of Period | | $ | 8.58 | | | $ | 9.59 | | | $ | 9.04 | | | $ | 7.73 | | | $ | 7.14 | |
| | | | | | | | | | | | | | | | | | | | |
Income from Investment Operations: | | | | | | | | | | | | | | | | | | | | |
Net investment income | | | 0.10 | (a) | | | 0.03 | (a) | | | 0.01 | (a) | | | 0.05 | (a) | | | 0.02 | (a) |
Net realized and unrealized gain on investments | | | 2.36 | | | | 1.02 | | | | 0.67 | | | | 1.28 | | | | 0.59 | |
| | | | | | | | | | | | | | | | | | | | |
Total from investment operations | | | 2.46 | | | | 1.05 | | | | 0.68 | | | | 1.33 | | | | 0.61 | |
| | | | | | | | | | | | | | | | | | | | |
Less Distributions: | | | | | | | | | | | | | | | | | | | | |
Distributions from net investment income | | | (0.15 | ) | | | — | | | | (0.05 | ) | | | (0.02 | ) | | | (0.02 | ) |
Distributions from net realized gains on investments | | | (0.51 | ) | | | (2.06 | ) | | | (0.08 | ) | | | — | | | | — | |
| | | | | | | | | | | | | | | | | | | | |
Total distributions | | | (0.66 | ) | | | (2.06 | ) | | | (0.13 | ) | | | (0.02 | ) | | | (0.02 | ) |
| | | | | | | | | | | | | | | | | | | | |
Net increase (decrease) in net asset value | | | 1.80 | | | | (1.01 | ) | | | 0.55 | | | | 1.31 | | | | 0.59 | |
| | | | | | | | | | | | | | | | | | | | |
Net Asset Value, End of Period | | $ | 10.38 | | | $ | 8.58 | | | $ | 9.59 | | | $ | 9.04 | | | $ | 7.73 | |
| | | | | | | | | | | | | | | | | | | | |
Total Return (b) | | | 30.74 | % | | | 13.18 | % | | | 7.56 | % | | | 17.19 | % | | | 8.52 | % |
| | | | | |
Ratios/Supplemental Data: | | | | | | | | | | | | | | | | | | | | |
Net Assets, End of Period (in 000’s) | | $ | 198,220 | | | $ | 156,510 | | | $ | 130,527 | | | $ | 163,232 | | | $ | 167,334 | |
Ratios of expenses to average net assets: | | | | | | | | | | | | | | | | | | | | |
Before expense reimbursement and/or fee waiver, or recoupment by Adviser | | | 1.21 | % | | | 1.18 | %(c) | | | 1.17 | %(c) | | | 1.16 | %(c) | | | 1.19 | % |
After expense reimbursement and/or fee waiver, or recoupment by Adviser | | | 1.21 | % | | | 1.18 | %(c) | | | 1.17 | %(c) | | | 1.18 | %(c) | | | 1.25 | % |
Ratios of net investment income to average net assets: | | | | | | | | | | | | | | | | | | | | |
Before expense reimbursement and/or fee waiver, or recoupment by Adviser | | | 1.03 | % | | | 0.32 | % | | | 0.07 | % | | | 0.56 | % | | | 0.29 | % |
After expense reimbursement and/or fee waiver, or recoupment by Adviser | | | 1.03 | % | | | 0.32 | % | | | 0.07 | % | | | 0.54 | % | | | 0.23 | % |
Portfolio Turnover | | | 71.01 | % | | | 38.84 | % | | | 48.22 | % | | | 53.73 | % | | | 44.09 | % |
| | (a) | The selected per share data was calculated using the weighted average shares outstanding method for the period. |
| | (b) | The total return is calculated using the Net Asset Value used for trading at the close of business at period end. |
| | (c) | Ratios of expenses to average net assets include interest expense of less than 0.005% for each of the years ended October 31, 2012, October 31, 2011 and October 31, 2010, which are not included in the contractual expense limitation. The interest expense is from utilizing the line of credit, as discussed in Note H to the Financial Statements. |
See accompanying Notes to Financial Statements.
| | |
| |
| ASTON/River Road Small Cap Value Fund – Class N | | October 31, 2013 |
| |
| Financial Highlights | | |
| | | | | | | | | | | | | | | | | | | | |
| | | Year
Ended
10/31/13 | | | Year
Ended
10/31/12 | | | Year
Ended
10/31/11 | | | Year
Ended
10/31/10 | | | Year
Ended
10/31/09 | |
| | | | | | | | | | | | | | | | | | | | |
Net Asset Value, Beginning of Period | | $ | 13.56 | | | $ | 12.20 | | | $ | 11.60 | | | $ | 10.22 | | | $ | 9.30 | |
| | | | | | | | | | | | | | | | | | | | |
Income from Investment Operations: | | | | | | | | | | | | | | | | | | | | |
Net investment income (loss) | | | 0.16 | | | | 0.03 | (a) | | | (0.03 | ) | | | 0.03 | | | | 0.01 | |
Net realized and unrealized gain on investments | | | 3.98 | | | | 1.33 | | | | 0.67 | | | | 1.36 | | | | 0.92 | |
| | | | | | | | | | | | | | | | | | | | |
Total from investment operations | | | 4.14 | | | | 1.36 | | | | 0.64 | | | | 1.39 | | | | 0.93 | |
| | | | | | | | | | | | | | | | | | | | |
Less Distributions: | | | | | | | | | | | | | | | | | | | | |
Distributions from and in excess of net investment income | | | (0.22 | ) | | | — | | | | (0.04 | ) | | | (0.01 | ) | | | (0.01 | ) |
Distributions from net realized gain on investments | | | (0.43 | ) | | | — | | | | — | | | | — | | | | — | |
| | | | | | | | | | | | | | | | | | | | |
Total distributions | | | (0.65 | ) | | | — | | | | (0.04 | ) | | | (0.01 | ) | | | (0.01 | ) |
| | | | | | | | | | | | | | | | | | | | |
Net increase in net asset value | | | 3.49 | | | | 1.36 | | | | 0.60 | | | | 1.38 | | | | 0.92 | |
| | | | | | | | | | | | | | | | | | | | |
Net Asset Value, End of Period | | $ | 17.05 | | | $ | 13.56 | | | $ | 12.20 | | | $ | 11.60 | | | $ | 10.22 | |
| | | | | | | | | | | | | | | | | | | | |
Total Return (b) | | | 31.98 | % | | | 11.15 | % | | | 5.46 | % | | | 13.60 | % | | | 9.99 | % |
| | | | | |
Ratios/Supplemental Data: | | | | | | | | | | | | | | | | | | | | |
Net Assets, End of Period (in 000’s) | | $ | 56,793 | | | $ | 49,154 | | | $ | 91,347 | | | $ | 213,326 | | | $ | 216,221 | |
Ratios of expenses to average net assets: | | | | | | | | | | | | | | | | | | | | |
Before expense reimbursement and/or fee waiver by Adviser | | | 1.34 | % | | | 1.37 | % | | | 1.37 | %(c) | | | 1.39 | %(c) | | | 1.40 | % |
After expense reimbursement and/or fee waiver by Adviser | | | 1.34 | % | | | 1.37 | % | | | 1.37 | %(c) | | | 1.39 | %(c) | | | 1.40 | %(d) |
Ratios of net investment income (loss) to average net assets: | | | | | | | | | | | | | | | | | | | | |
Before expense reimbursement and/or fee waiver by Adviser | | | 1.03 | % | | | 0.22 | % | | | (0.13 | )% | | | 0.27 | % | | | 0.05 | % |
After expense reimbursement and/or fee waiver by Adviser | | | 1.03 | % | | | 0.22 | % | | | (0.13 | )% | | | 0.27 | % | | | 0.05 | % |
Portfolio Turnover | | | 56.08 | % | | | 26.95 | % | | | 42.29 | % | | | 51.05 | % | | | 35.83 | % |
| | (a) | The selected per share data was calculated using the weighted average shares outstanding method for the period. |
| | (b) | The total return is calculated using the Net Asset Value used for trading at the close of business at period end. |
| | (c) | Ratios of expenses to average net assets include interest expense of less than 0.005% for each of the years ended October 31, 2011 and October 31, 2010, which are not included in the contractual expense limitation. The interest expense is from utilizing the line of credit, as discussed in Note H to the Financial Statements. |
| | (d) | The Adviser removed the contractual expense limitation of 1.50%, excluding interest, taxes, investment-related costs (such as brokerage commissions), extraordinary expenses and acquired fund fees and expenses, effective March 1, 2009. |
See accompanying Notes to Financial Statements.
| | |
| |
| ASTON/River Road Small Cap Value Fund – Class I | | October 31, 2013 |
| |
| Financial Highlights | | |
| | | | | | | | | | | | | | | | | | | | |
| | | Year
Ended
10/31/13 | | | Year
Ended
10/31/12 | | | Year
Ended
10/31/11 | | | Year
Ended
10/31/10 | | | Year
Ended
10/31/09 | |
| | | | | | | | | | | | | | | | | | | | |
Net Asset Value, Beginning of Period | | $ | 13.62 | | | $ | 12.22 | | | $ | 11.62 | | | $ | 10.24 | | | $ | 9.32 | |
| | | | | | | | | | | | | | | | | | | | |
Income from Investment Operations: | | | | | | | | | | | | | | | | | | | | |
Net investment income | | | 0.19 | | | | 0.06 | (a) | | | 0.01 | | | | 0.06 | | | | 0.03 | |
Net realized and unrealized gain on investments | | | 4.01 | | | | 1.34 | | | | 0.65 | | | | 1.35 | | | | 0.92 | |
| | | | | | | | | | | | | | | | | | | | |
Total from investment operations | | | 4.20 | | | | 1.40 | | | | 0.66 | | | | 1.41 | | | | 0.95 | |
| | | | | | | | | | | | | | | | | | | | |
Less Distributions: | | | | | | | | | | | | | | | | | | | | |
Distributions from and in excess of net investment income | | | (0.26 | ) | | | — | | | | (0.06 | ) | | | (0.03 | ) | | | (0.03 | ) |
Distributions from net realized gain on investments | | | (0.43 | ) | | | — | | | | — | | | | — | | | | — | |
| | | | | | | | | | | | | | | | | | | | |
Total distributions | | | (0.69 | ) | | | — | | | | (0.06 | ) | | | (0.03 | ) | | | (0.03 | ) |
| | | | | | | | | | | | | | | | | | | | |
Net increase in net asset value | | | 3.51 | | | | 1.40 | | | | 0.60 | | | | 1.38 | | | | 0.92 | |
| | | | | | | | | | | | | | | | | | | | |
Net Asset Value, End of Period | | $ | 17.13 | | | $ | 13.62 | | | $ | 12.22 | | | $ | 11.62 | | | $ | 10.24 | |
| | | | | | | | | | | | | | | | | | | | |
Total Return (b) | | | 32.36 | % | | | 11.46 | % | | | 5.70 | % | | | 13.80 | % | | | 10.31 | % |
| | | | | |
Ratios/Supplemental Data: | | | | | | | | | | | | | | | | | | | | |
Net Assets, End of Period (in 000’s) | | $ | 252,804 | | | $ | 240,075 | | | $ | 246,141 | | | $ | 255,344 | | | $ | 282,542 | |
Ratios of expenses to average net assets: | | | | | | | | | | | | | | | | | | | | |
Before expense reimbursement and/or fee waiver by Adviser | | | 1.09 | % | | | 1.12 | % | | | 1.12 | %(c) | | | 1.14 | %(c) | | | 1.15 | % |
After expense reimbursement and/or fee waiver by Adviser | | | 1.09 | % | | | 1.12 | % | | | 1.12 | %(c) | | | 1.14 | %(c) | | | 1.15 | %(d) |
Ratios of net investment income to average net assets: | | | | | | | | | | | | | | | | | | | | |
Before expense reimbursement and/or fee waiver by Adviser | | | 1.28 | % | | | 0.47 | % | | | 0.12 | % | | | 0.52 | % | | | 0.30 | % |
After expense reimbursement and/or fee waiver by Adviser | | | 1.28 | % | | | 0.47 | % | | | 0.12 | % | | | 0.52 | % | | | 0.30 | % |
Portfolio Turnover | | | 56.08 | % | | | 26.95 | % | | | 42.29 | % | | | 51.05 | % | | | 35.83 | % |
| | (a) | The selected per share data was calculated using the weighted average shares outstanding method for the period. |
| | (b) | The total return is calculated using the Net Asset Value used for trading at the close of business at period end. |
| | (c) | Ratios of expenses to average net assets include interest expense of less than 0.005% for each of the years ended October 31, 2011 and October 31, 2010, which are not included in the contractual expense limitation. The interest expense is from utilizing the line of credit, as discussed in Note H to the Financial Statements. |
| | (d) | The Adviser removed the contractual expense limitation of 1.25%, excluding interest, taxes, investment-related costs (such as brokerage commissions), extraordinary expenses and acquired fund fees and expenses, effective March 1, 2009. |
See accompanying Notes to Financial Statements.
| | |
| |
| ASTON/River Road Independent Value Fund – Class N | | October 31, 2013 |
| |
| Financial Highlights | | |
| | | | | | | | | | | | |
| | | Year
Ended
10/31/13 | | | Year
Ended
10/31/12 | | | Period
Ended
10/31/11(a) | |
Net Asset Value, Beginning of Period | | $ | 11.42 | | | $ | 10.75 | | | $ | 10.00 | |
| | | | | | | | | | | | |
Income from Investment Operations: | | | | | | | | | | | | |
Net investment loss | | | (0.07 | ) | | | (0.09 | )(b) | | | (0.07 | )(b) |
Net realized and unrealized gain on investments | | | 0.75 | | | | 0.88 | | | | 0.82 | |
| | | | | | | | | | | | |
Total from investment operations | | | 0.68 | | | | 0.79 | | | | 0.75 | |
| | | | | | | | | | | | |
Less Distributions: | | | | | | | | | | | | |
Distributions from net realized gain on investments | | | (0.63 | ) | | | (0.12 | ) | | | — | |
| | | | | | | | | | | | |
Total distributions | | | (0.63 | ) | | | (0.12 | ) | | | — | |
| | | | | | | | | | | | |
Net increase in net asset value | | | 0.05 | | | | 0.67 | | | | 0.75 | |
| | | | | | | | | | | | |
Net Asset Value, End of Period | | $ | 11.47 | | | $ | 11.42 | | | $ | 10.75 | |
| | | | | | | | | | | | |
Total Return (c) | | | 6.37 | % | | | 7.41 | % | | | 7.50 | %(d) |
| | | |
Ratios/Supplemental Data: | | | | | | | | | | | | |
Net Assets, End of Period (in 000’s) | | $ | 339,088 | | | $ | 362,416 | | | $ | 306,223 | |
Ratios of expenses to average net assets: | | | | | | | | | | | | |
Before earnings credit, expense reimbursement and/or fee waiver, or recoupment by the Adviser | | | 1.43 | %(e) | | | 1.44 | %(e) | | | 1.59 | %(f) |
After earnings credit, expense reimbursement and/or fee waiver, or recoupment by the Adviser | | | 1.41 | %(e) | | | 1.42 | %(e) | | | 1.42 | %(f) |
Ratios of net investment loss to average net assets: | | | | | | | | | | | | |
Before earnings credit, expense reimbursement and/or fee waiver, or recoupment by the Adviser | | | (0.61 | )% | | | (0.81 | )% | | | (0.98 | )%(f) |
After earnings credit, expense reimbursement and/or fee waiver, or recoupment by the Adviser | | | (0.59 | )% | | | (0.79 | )% | | | (0.80 | )%(f) |
Portfolio Turnover | | | 82.24 | %(g) | | | 141.17 | % | | | 105.69 | %(d) |
| | (a) | The inception date for the River Road Independent Value Fund Class N shares is December 31, 2010. |
| | (b) | The selected per share data was calculated using the weighted average shares outstanding method for the period. |
| | (c) | The total return is calculated using the Net Asset Value used for trading at the close of business at period end. |
| | (e) | Ratios of expenses to average net assets include Earnings Credits of 0.01% for the year ended October 31, 2013 and less than 0.005% for the year ended October 31, 2012, which are not included in the contractual expense limitation. See Note I to the Financial Statements. |
| | (g) | Portfolio turnover rate excludes securities received from processing a subscription-in-kind. |
See accompanying Notes to Financial Statements.
| | |
| |
| ASTON/River Road Independent Value Fund – Class I | | October 31, 2013 |
| |
| Financial Highlights | | |
| | | | | | | | | | | | |
| | | Year
Ended
10/31/13 | | | Year
Ended
10/31/12 | | | Period
Ended
10/31/11(a) | |
Net Asset Value, Beginning of Period | | $ | 11.46 | | | $ | 10.75 | | | $ | 10.92 | |
| | | | | | | | | | | | |
Income from Investment Operations: | | | | | | | | | | | | |
Net investment loss | | | (0.04 | ) | | | (0.06 | )(b) | | | (0.02 | )(b) |
Net realized and unrealized gain (loss) on investments | | | 0.75 | | | | 0.89 | | | | (0.15 | ) |
| | | | | | | | | | | | |
Total from investment operations | | | 0.71 | | | | 0.83 | | | | (0.17 | ) |
| | | | | | | | | | | | |
Less Distributions: | | | | | | | | | | | | |
Distributions from net realized gain on investments | | | (0.63 | ) | | | (0.12 | ) | | | — | |
| | | | | | | | | | | | |
Total distributions | | | (0.63 | ) | | | (0.12 | ) | | | — | |
| | | | | | | | | | | | |
Net increase (decrease) in net asset value | | | 0.08 | | | | 0.71 | | | | (0.17 | ) |
| | | | | | | | | | | | |
Net Asset Value, End of Period | | $ | 11.54 | | | $ | 11.46 | | | $ | 10.75 | |
| | | | | | | | | | | | |
Total Return (c) | | | 6.62 | % | | | 7.68 | % | | | (1.47 | )%(d) |
| | | |
Ratios/Supplemental Data: | | | | | | | | | | | | |
Net Assets, End of Period (in 000’s) | | $ | 386,268 | | | $ | 338,234 | | | $ | 85,478 | |
Ratios of expenses to average net assets: | | | | | | | | | | | | |
Before earnings credit, expense reimbursement and/or fee waiver, or recoupment by the Adviser | | | 1.18 | %(e) | | | 1.19 | %(e) | | | 1.34 | %(f) |
After earnings credit, expense reimbursement and/or fee waiver, or recoupment by the Adviser | | | 1.16 | %(e) | | | 1.17 | %(e) | | | 1.17 | %(f) |
Ratios of net investment loss to average net assets: | | | | | | | | | | | | |
Before earnings credit, expense reimbursement and/or fee waiver, or recoupment by the Adviser | | | (0.36 | )% | | | (0.56 | )% | | | (0.73 | )%(f) |
After earnings credit, expense reimbursement and/or fee waiver, or recoupment by the Adviser | | | (0.34 | )% | | | (0.54 | )% | | | (0.55 | )%(f) |
Portfolio Turnover | | | 82.24 | %(g) | | | 141.17 | % | | | 105.69 | %(d) |
| | (a) | The inception date for the River Road Independent Value Fund Class I shares is June 1, 2011. |
| | (b) | The selected per share data was calculated using the weighted average shares outstanding method for the period. |
| | (c) | The total return is calculated using the Net Asset Value used for trading at the close of business at period end. |
| | (e) | Ratios of expenses to average net assets include Earnings Credits of 0.01% for the year ended October 31, 2013 and less than 0.005% for the year ended October 31, 2012, which are not included in the contractual expense limitation. See Note I to the Financial Statements. |
| | (g) | Portfolio turnover rate excludes securities received from processing a subscription-in-kind. |
See accompanying Notes to Financial Statements.
| | |
| |
| ASTON/DoubleLine Core Plus Fixed Income Fund – Class N | | October 31, 2013 |
| |
| Financial Highlights | | |
| | | | | | | | | | | | |
| | | Year
Ended
10/31/13 | | | Year
Ended
10/31/12 | | | Period
Ended
10/31/11(a) | |
Net Asset Value, Beginning of Period | | $ | 11.10 | | | $ | 10.44 | | | $ | 10.00 | |
| | | | | | | | | | | | |
Income from Investment Operations: | | | | | | | | | | | | |
Net investment income | | | 0.30 | | | | 0.33 | (b) | | | 0.12 | (b) |
Net realized and unrealized gain (loss) on investments | | | (0.33 | ) | | | 0.72 | | | | 0.41 | |
| | | | | | | | | | | | |
Total from investment operations | | | (0.03 | ) | | | 1.05 | | | | 0.53 | |
| | | | | | | | | | | | |
Less Distributions: | | | | | | | | | | | | |
Distributions from and in excess of net investment income | | | (0.36 | ) | | | (0.37 | ) | | | (0.09 | ) |
Distributions from net realized gain on investments | | | (0.06 | ) | | | (0.02 | ) | | | — | |
| | | | | | | | | | | | |
Total distributions | | | (0.42 | ) | | | (0.39 | ) | | | (0.09 | ) |
| | | | | | | | | | | | |
Net increase (decrease) in net asset value | | | (0.45 | ) | | | 0.66 | | | | 0.44 | |
| | | | | | | | | | | | |
Net Asset Value, End of Period | | $ | 10.65 | | | $ | 11.10 | | | $ | 10.44 | |
| | | | | | | | | | | | |
Total Return (c) | | | (0.28 | )% | | | 10.25 | % | | | 5.33 | %(d) |
| | | |
Ratios/Supplemental Data: | | | | | | | | | | | | |
Net Assets, End of Period (in 000’s) | | $ | 66,368 | | | $ | 71,546 | | | $ | 22,657 | |
Ratios of expenses to average net assets: | | | | | | | | | | | | |
Before expense reimbursement and/or fee waiver by Adviser | | | 1.04 | % | | | 1.35 | % | | | 3.16 | %(e) |
After expense reimbursement and/or fee waiver by Adviser | | | 0.94 | % | | | 0.94 | % | | | 0.94 | %(e) |
Ratios of net investment income to average net assets: | | | | | | | | | | | | |
Before expense reimbursement and/or fee waiver by Adviser | | | 2.66 | % | | | 2.59 | % | | | 1.63 | %(e) |
After expense reimbursement and/or fee waiver by Adviser | | | 2.77 | % | | | 3.01 | % | | | 3.85 | %(e) |
Portfolio Turnover | | | 125.07 | % | | | 118.67 | % | | | 38.49 | %(d) |
| | (a) | The inception date for the DoubleLine Core Plus Fixed Income Fund Class N shares is July 18, 2011. |
| | (b) | The selected per share data was calculated using the weighted average shares outstanding method for the period. |
| | (c) | The total return is calculated using the Net Asset Value used for trading at the close of business at period end. |
See accompanying Notes to Financial Statements.
| | |
| |
| ASTON/DoubleLine Core Plus Fixed Income Fund – Class I | | October 31, 2013 |
| |
| Financial Highlights | | |
| | | | | | | | | | | | |
| | | Year
Ended
10/31/13 | | | Year
Ended
10/31/12 | | | Period
Ended
10/31/11(a) | |
Net Asset Value, Beginning of Period | | $ | 11.10 | | | $ | 10.44 | | | $ | 10.00 | |
| | | | | | | | | | | | |
Income from Investment Operations: | | | | | | | | | | | | |
Net investment income | | | 0.33 | | | | 0.35 | (b) | | | 0.13 | (b) |
Net realized and unrealized gain (loss) on investments | | | (0.33 | ) | | | 0.73 | | | | 0.41 | |
| | | | | | | | | | | | |
Total from investment operations | | | — | | | | 1.08 | | | | 0.54 | |
| | | | | | | | | | | | |
Less Distributions: | | | | | | | | | | | | |
Distributions from and in excess of net investment income | | | (0.39 | ) | | | (0.40 | ) | | | (0.10 | ) |
Distributions from net realized gain on investments | | | (0.06 | ) | | | (0.02 | ) | | | — | |
| | | | | | | | | | | | |
Total distributions | | | (0.45 | ) | | | (0.42 | ) | | | (0.10 | ) |
| | | | | | | | | | | | |
Net increase (decrease) in net asset value | | | (0.45 | ) | | | 0.66 | | | | 0.44 | |
| | | | | | | | | | | | |
Net Asset Value, End of Period | | $ | 10.65 | | | $ | 11.10 | | | $ | 10.44 | |
| | | | | | | | | | | | |
Total Return (c) | | | (0.03 | )% | | | 10.52 | % | | | 5.38 | %(d) |
| | | |
Ratios/Supplemental Data: | | | | | | | | | | | | |
Net Assets, End of Period (in 000’s) | | $ | 110,018 | | | $ | 105,335 | | | $ | 4,486 | |
Ratios of expenses to average net assets: | | | | | | | | | | | | |
Before expense reimbursement and/or fee waiver by Adviser | | | 0.79 | % | | | 1.10 | % | | | 2.91 | %(e) |
After expense reimbursement and/or fee waiver by Adviser | | | 0.69 | % | | | 0.69 | % | | | 0.69 | %(e) |
Ratios of net investment income to average net assets: | | | | | | | | | | | | |
Before expense reimbursement and/or fee waiver by Adviser | | | 2.91 | % | | | 2.84 | % | | | 1.88 | %(e) |
After expense reimbursement and/or fee waiver by Adviser | | | 3.02 | % | | | 3.26 | % | | | 4.10 | %(e) |
Portfolio Turnover | | | 125.07 | % | | | 118.67 | % | | | 38.49 | %(d) |
| | (a) | The inception date for the DoubleLine Core Plus Fixed Income Fund Class I shares is July 18, 2011. |
| | (b) | The selected per share data was calculated using the weighted average shares outstanding method for the period. |
| | (c) | The total return is calculated using the Net Asset Value used for trading at the close of business at period end. |
See accompanying Notes to Financial Statements.
| | |
| |
| ASTON/TCH Fixed Income Fund – Class N | | October 31, 2013 |
| |
| Financial Highlights | | |
| | | | | | | | | | | | | | | | | | | | |
| | | Year
Ended
10/31/13 | | | Year
Ended
10/31/12 | | | Year
Ended
10/31/11 | | | Year
Ended
10/31/10 | | | Year
Ended
10/31/09 | |
Net Asset Value, Beginning of Period | | $ | 11.11 | | | $ | 10.59 | | | $ | 10.49 | | | $ | 10.02 | | | $ | 8.60 | |
| | | | | | | | | | | | | | | | | | | | |
Income from Investment Operations: | | | | | | | | | | | | | | | | | | | | |
Net investment income | | | 0.40 | (a) | | | 0.45 | (a) | | | 0.47 | (a) | | | 0.50 | (a) | | | 0.49 | (a) |
Net realized and unrealized gain (loss) on investments | | | (0.39 | ) | | | 0.56 | | | | 0.10 | | | | 0.47 | | | | 1.44 | |
| | | | | | | | | | | | | | | | | | | | |
Total from investment operations | | | 0.01 | | | | 1.01 | | | | 0.57 | | | | 0.97 | | | | 1.93 | |
| | | | | | | | | | | | | | | | | | | | |
Less Distributions: | | | | | | | | | | | | | | | | | | | | |
Distributions from and in excess of net investment income | | | (0.45 | ) | | | (0.49 | ) | | | (0.47 | ) | | | (0.50 | ) | | | (0.51 | ) |
| | | | | | | | | | | | | | | | | | | | |
Total distributions | | | (0.45 | ) | | | (0.49 | ) | | | (0.47 | ) | | | (0.50 | ) | | | (0.51 | ) |
| | | | | | | | | | | | | | | | | | | | |
Net increase (decrease) in net asset value | | | (0.44 | ) | | | 0.52 | | | | 0.10 | | | | 0.47 | | | | 1.42 | |
| | | | | | | | | | | | | | | | | | | | |
Net Asset Value, End of Period | | $ | 10.67 | | | $ | 11.11 | | | $ | 10.59 | | | $ | 10.49 | | | $ | 10.02 | |
| | | | | | | | | | | | | | | | | | | | |
Total Return (b) | | | 0.13 | % | | | 9.74 | % | | | 5.62 | % | | | 9.98 | % | | | 22.99 | % |
| | | | | |
Ratios/Supplemental Data: | | | | | | | | | | | | | | | | | | | | |
Net Assets, End of Period (in 000’s) | | $ | 45,771 | | | $ | 59,772 | | | $ | 62,346 | | | $ | 46,274 | | | $ | 47,008 | |
Ratios of expenses to average net assets: | | | | | | | | | | | | | | | | | | | | |
Before expense reimbursement and/or fee waiver by Adviser | | | 1.02 | % | | | 1.02 | % | | | 1.14 | % | | | 0.98 | % | | | 0.96 | % |
After expense reimbursement and/or fee waiver by Adviser | | | 0.84 | % | | | 0.86 | % | | | 0.88 | %(c) | | | 0.62 | % | | | 0.61 | % |
Ratios of net investment income to average net assets: | | | | | | | | | | | | | | | | | | | | |
Before expense reimbursement and/or fee waiver by Adviser | | | 3.49 | % | | | 4.03 | % | | | 4.20 | % | | | 4.51 | % | | | 4.93 | % |
After expense reimbursement and/or fee waiver by Adviser | | | 3.67 | % | | | 4.19 | % | | | 4.46 | % | | | 4.87 | % | | | 5.28 | % |
Portfolio Turnover | | | 53.77 | % | | | 57.43 | % | | | 37.51 | % | | | 23.92 | % | | | 40.81 | % |
| | (a) | The selected per share data was calculated using the weighted average shares outstanding method for the period. |
| | (b) | The total return is calculated using the Net Asset Value used for trading at the close of business at period end. |
| | (c) | Effective March 1, 2011, the contractual expense limitation was increased from 0.74% to 0.94%, excluding interest, taxes, investment-related costs (such as brokerage commissions), extraordinary expenses and acquired fund fees and expenses. |
See accompanying Notes to Financial Statements.
| | |
| |
| ASTON/TCH Fixed Income Fund – Class I | | October 31, 2013 |
| |
| Financial Highlights | | |
| | | | | | | | | | | | | | | | | | | | |
| | | Year
Ended
10/31/13 | | | Year
Ended
10/31/12 | | | Year
Ended
10/31/11 | | | Year
Ended
10/31/10 | | | Year
Ended
10/31/09 | |
Net Asset Value, Beginning of Period | | $ | 11.11 | | | $ | 10.59 | | | $ | 10.49 | | | $ | 10.02 | | | $ | 8.60 | |
| | | | | | | | | | | | | | | | | | | | |
Income from Investment Operations: | | | | | | | | | | | | | | | | | | | | |
Net investment income | | | 0.42 | (a) | | | 0.47 | (a) | | | 0.49 | (a) | | | 0.51 | (a) | | | 0.50 | (a) |
Net realized and unrealized gain (loss) on investments | | | (0.39 | ) | | | 0.55 | | | | 0.11 | | | | 0.48 | | | | 1.44 | |
| | | | | | | | | | | | | | | | | | | | |
Total from investment operations | | | 0.03 | | | | 1.02 | | | | 0.60 | | | | 0.99 | | | | 1.94 | |
| | | | | | | | | | | | | | | | | | | | |
Less Distributions: | | | | | | | | | | | | | | | | | | | | |
Distributions from and in excess of net investment income | | | (0.47 | ) | | | (0.50 | ) | | | (0.50 | ) | | | (0.52 | ) | | | (0.52 | ) |
| | | | | | | | | | | | | | | | | | | | |
Total distributions | | | (0.47 | ) | | | (0.50 | ) | | | (0.50 | ) | | | (0.52 | ) | | | (0.52 | ) |
| | | | | | | | | | | | | | | | | | | | |
Net increase (decrease) in net asset value . | | | (0.44 | ) | | | 0.52 | | | | 0.10 | | | | 0.47 | | | | 1.42 | |
| | | | | | | | | | | | | | | | | | | | |
Net Asset Value, End of Period | | $ | 10.67 | | | $ | 11.11 | | | $ | 10.59 | | | $ | 10.49 | | | $ | 10.02 | |
| | | | | | | | | | | | | | | | | | | | |
Total Return (b) | | | 0.28 | % | | | 9.93 | % | | | 5.89 | % | | | 10.11 | % | | | 23.14 | % |
| | | | | |
Ratios/Supplemental Data: | | | | | | | | | | | | | | | | | | | | |
Net Assets, End of Period (in 000’s) | | $ | 8,742 | | | $ | 10,396 | | | $ | 10,423 | | | $ | 14,881 | | | $ | 20,276 | |
Ratios of expenses to average net assets: | | | | | | | | | | | | | | | | | | | | |
Before expense reimbursement and/or fee waiver by Adviser | | | 0.87 | % | | | 0.85 | % | | | 0.89 | % | | | 0.85 | % | | | 0.84 | % |
After expense reimbursement and/or fee waiver by Adviser | | | 0.69 | % | | | 0.69 | % | | | 0.63 | %(c) | | | 0.49 | % | | | 0.49 | % |
Ratios of net investment income to average net assets: | | | | | | | | | | | | | | | | | | | | |
Before expense reimbursement and/or fee waiver by Adviser | | | 3.64 | % | | | 4.20 | % | | | 4.45 | % | | | 4.64 | % | | | 5.05 | % |
After expense reimbursement and/or fee waiver by Adviser | | | 3.82 | % | | | 4.36 | % | | | 4.71 | % | | | 5.00 | % | | | 5.40 | % |
Portfolio Turnover | | | 53.77 | % | | | 57.43 | % | | | 37.51 | % | | | 23.92 | % | | | 40.81 | % |
| | (a) | The selected per share data was calculated using the weighted average shares outstanding method for the period. |
| | (b) | The total return is calculated using the Net Asset Value used for trading at the close of business at period end. |
| | (c) | Effective March 1, 2011, the contractual expense limitation was increased from 0.49% to 0.69%, excluding interest, taxes, investment-related costs (such as brokerage commissions), extraordinary expenses and acquired fund fees and expenses. |
See accompanying Notes to Financial Statements.
| | |
| |
| ASTON/Lake Partners LASSO Alternatives Fund – Class N | | October 31, 2013 |
| |
| Financial Highlights | | |
| | | | | | | | | | | | | | | | |
| | | Year
Ended
10/31/13 | | | Year
Ended
10/31/12 | | | Year
Ended
10/31/11 | | | Period Ended
10/31/10(a) | |
Net Asset Value, Beginning of Period | | $ | 12.39 | | | $ | 11.94 | | | $ | 11.97 | | | $ | 11.48 | |
| | | | | | | | | | | | | | | | |
Income from Investment Operations: | | | | | | | | | | | | | | | | |
Net investment income (loss) | | | — | (b)(c) | | | 0.04 | (b) | | | (0.01 | )(b) | | | 0.04 | (b) |
Net realized and unrealized gain on investments | | | 1.11 | | | | 0.59 | | | | 0.13 | | | | 0.45 | |
| | | | | | | | | | | | | | | | |
Total from investment operations | | | 1.11 | | | | 0.63 | | | | 0.12 | | | | 0.49 | |
| | | | | | | | | | | | | | | | |
Less Distributions: | | | | | | | | | | | | | | | | |
Distributions from and in excess of net investment income | | | (0.16 | ) | | | (0.18 | ) | | | (0.08 | ) | | | — | |
Distributions from capital gains | | | — | | | | — | | | | (0.07 | ) | | | — | |
| | | | | | | | | | | | | | | | |
Total distributions | | | (0.16 | ) | | | (0.18 | ) | | | (0.15 | ) | | | — | |
| | | | | | | | | | | | | | | | |
Net increase (decrease) in net asset value | | | 0.95 | | | | 0.45 | | | | (0.03 | ) | | | 0.49 | |
| | | | | | | | | | | | | | | | |
Net Asset Value, End of Period | | $ | 13.34 | | | $ | 12.39 | | | $ | 11.94 | | | $ | 11.97 | |
| | | | | | | | | | | | | | | | |
Total Return (d) | | | 9.05 | % | | | 5.34 | % | | | 0.92 | % | | | 4.27 | %(e) |
| | | | |
Ratios/Supplemental Data: | | | | | | | | | | | | | | | | |
Net Assets, End of Period (in 000’s) | | $ | 54,388 | | | $ | 33,719 | | | $ | 17,626 | | | $ | 8,296 | |
Ratios of expenses to average net assets: | | | | | | | | | | | | | | | | |
Before earnings credit, expense reimbursement and/or fee waiver, or recoupment by the Adviser (f) | | | 1.43 | %(g) | | | 1.41 | %(g)(h) | | | 1.53 | % | | | 2.19 | %(i) |
After earnings credit, expense reimbursement and/or fee waiver, or recoupment by the Adviser (f) | | | 1.45 | %(g) | | | 1.45 | %(g)(h) | | | 1.45 | % | | | 1.45 | %(i)(j) |
Ratios of net investment income (loss) to average net assets: | | | | | | | | | | | | | | | | |
Before earnings credit, expense reimbursement and/or fee waiver, or recoupment by the Adviser | | | — | %(c) | | | 0.36 | %(h) | | | (0.17 | )% | | | (0.25 | )%(i) |
After earnings credit, expense reimbursement and/or fee waiver, or recoupment by the Adviser | | | (0.03 | )% | | | 0.32 | %(h) | | | (0.10 | )% | | | 0.49 | %(i) |
Portfolio Turnover | | | 43.55 | % | | | 45.60 | % | | | 79.77 | % | | | 116.68 | %(e) |
| | (a) | The inception date for the Lake Partners LASSO Alternatives Fund Class N shares is March 3, 2010. |
| | (b) | The selected per share data was calculated using the weighted average shares outstanding method for the period. |
| | (c) | Represents less than $0.005 per share or less than 0.005%. |
| | (d) | The total return is calculated using the Net Asset Value used for trading at the close of business at period end. |
| | (f) | Does not include expenses of the underlying funds in which the Fund invests. |
| | (g) | Ratios of expenses to average net assets includes Earnings Credits of less than 0.005% for each of the years ended October 31, 2013 and October 31, 2012, which are not included in the contractual expense limitation. See Note I to the Financial Statements. |
| | (h) | Ratios of expenses and net investment income to average net assets include advisory fee waiver of less than 0.005% for the year ended October 31, 2012. |
| | (j) | Effective March 30, 2010, the contractual expense limitation was decreased from 1.60% to 1.45%, excluding interest, taxes, investment-related costs (such as brokerage commissions), extraordinary expenses and acquired fund fees and expenses. |
See accompanying Notes to Financial Statements.
| | |
| |
| ASTON/Lake Partners LASSO Alternatives Fund – Class I | | October 31, 2013 |
| |
| Financial Highlights | | |
| | | | | | | | | | | | | | | | | | | | |
| | | Year
Ended
10/31/13 | | | Year
Ended
10/31/12 | | | Year
Ended
10/31/11 | | | Year
Ended
10/31/10 | | | Period
Ended
10/31/09(a) | |
| | | | | | | | | | | | | | | | | | | | |
Net Asset Value, Beginning of Period | | $ | 12.42 | | | $ | 11.97 | | | $ | 11.98 | | | $ | 11.15 | | | $ | 10.00 | |
| | | | | | | | | | | | | | | | | | | | |
Income from Investment Operations: | | | | | | | | | | | | | | | | | | | | |
Net investment income (loss) | | | 0.03 | (b) | | | 0.07 | (b) | | | 0.02 | (b) | | | 0.08 | (b) | | | (— | )(c) |
Net realized and unrealized gain on investments | | | 1.11 | | | | 0.59 | | | | 0.13 | | | | 0.89 | | | | 1.15 | |
| | | | | | | | | | | | | | | | | | | | |
Total from investment operations | | | 1.14 | | | | 0.66 | | | | 0.15 | | | | 0.97 | | | | 1.15 | |
| | | | | | | | | | | | | | | | | | | | |
Less Distributions: | | | | | | | | | | | | | | | | | | | | |
Distributions from and in excess of net investment income | | | (0.18 | ) | | | (0.21 | ) | | | (0.09 | ) | | | (0.07 | ) | | | — | |
Distributions from net realized gain on investments | | | — | | | | — | | | | (0.07 | ) | | | (0.07 | ) | | | — | |
| | | | | | | | | | | | | | | | | | | | |
Total distributions | | | (0.18 | ) | | | (0.21 | ) | | | (0.16 | ) | | | (0.14 | ) | | | — | |
| | | | | | | | | | | | | | | | | | | | |
Net increase (decrease) in net asset value | | | 0.96 | | | | 0.45 | | | | (0.01 | ) | | | 0.83 | | | | 1.15 | |
| | | | | | | | | | | | | | | | | | | | |
Net Asset Value, End of Period | | $ | 13.38 | | | $ | 12.42 | | | $ | 11.97 | | | $ | 11.98 | | | $ | 11.15 | |
| | | | | | | | | | | | | | | �� | | | | | |
Total Return (d) | | | 9.31 | % | | | 5.56 | % | | | 1.22 | % | | | 8.74 | % | | | 11.50 | %(e) |
| | | | | |
Ratios/Supplemental Data: | | | | | | | | | | | | | | | | | | | | |
Net Assets, End of Period (in 000’s) | | $ | 416,475 | | | $ | 253,343 | | | $ | 189,999 | | | $ | 19,723 | | | $ | 1,845 | |
Ratios of expenses to average net assets: | | | | | | | | | | | | | | | | | | | | |
Before earnings credit, expense reimbursement and/or fee waiver, or recoupment by the Adviser (f) | | | 1.18 | %(g) | | | 1.16 | %(g)(h) | | | 1.28 | % | | | 2.32 | % | | | 18.16 | %(i) |
After earnings credit, expense reimbursement and/or fee waiver, or recoupment by the Adviser (f) | | | 1.20 | %(g) | | | 1.20 | %(g)(h) | | | 1.20 | % | | | 1.24 | %(j) | | | 1.35 | %(i) |
Ratios of net investment income (loss) to average net assets: | | | | | | | | | | | | | | | | | | | | |
Before earnings credit, expense reimbursement and/or fee waiver, or recoupment by the Adviser | | | 0.25 | % | | | 0.61 | %(h) | | | 0.08 | % | | | (0.41 | )% | | | (16.92 | )%(i) |
After earnings credit, expense reimbursement and/or fee waiver, or recoupment by the Adviser | | | 0.22 | % | | | 0.57 | %(h) | | | 0.15 | % | | | 0.67 | % | | | (0.11 | )%(i) |
Portfolio Turnover | | | 43.55 | % | | | 45.60 | % | | | 79.77 | % | | | 116.68 | % | | | 65.93 | %(e) |
| | (a) | The inception date for the Lake Partners LASSO Alternatives Fund Class I shares is April 1, 2009. |
| | (b) | The selected per share data was calculated using the weighted average shares outstanding method for the period. |
| | (c) | Represents less than $(0.005) per share. |
| | (d) | The total return is calculated using the Net Asset Value used for trading at the close of business at period end. |
| | (f) | Does not include expenses of the underlying funds in which the Fund invests. |
| | (g) | Ratios of expenses to average net assets include Earnings Credits of less than 0.005% for each of the years ended October 31, 2013 and October 31, 2012, which are not included in the contractual expense limitation. See Note I to the Financial Statements. |
| | (h) | Ratios of expenses and net investment income to average net assets include advisory fee waiver of less than 0.005% for the year ended October 31, 2012. |
| | (j) | Effective March 30, 2010, the contractual expense limitation was decreased from 1.35% to 1.20%, excluding interest, taxes, investment-related costs (such as brokerage commissions), extraordinary expenses and acquired fund fees and expenses. |
See accompanying Notes to Financial Statements.
| | |
| |
| ASTON/Anchor Capital Enhanced Equity Fund – Class N | | October 31, 2013 |
| |
| Financial Highlights | | |
| | | | | | | | | | | | | | | | | | | | |
| | | Year
Ended
10/31/13 | | | Year
Ended
10/31/12 | | | Year
Ended
10/31/11 | | | Year
Ended
10/31/10 | | | Year
Ended
10/31/09 | |
| | | | | | | | | | | | | | | | | | | | |
Net Asset Value, Beginning of Period | | $ | 8.68 | | | $ | 9.61 | | | $ | 9.41 | | | $ | 8.57 | | | $ | 8.09 | |
| | | | | | | | | | | | | | | | | | | | |
Income from Investment Operations: | | | | | | | | | | | | | | | | | | | | |
Net investment income | | | 0.20 | | | | 0.16 | | | | 0.14 | | | | 0.10 | | | | 0.11 | |
Net realized and unrealized gain on investments | | | 0.86 | | | | 0.11 | | | | 0.56 | | | | 0.84 | | | | 1.02 | |
| | | | | | | | | | | | | | | | | | | | |
Total from investment operations | | | 1.06 | | | | 0.27 | | | | 0.70 | | | | 0.94 | | | | 1.13 | |
| | | | | | | | | | | | | | | | | | | | |
Less Distributions: | | | | | | | | | | | | | | | | | | | | |
Distributions from and in excess of net investment income | | | (0.20 | ) | | | (0.16 | ) | | | (0.13 | ) | | | (0.10 | ) | | | (0.13 | ) |
Distributions from net realized gain on investments | | | (0.15 | ) | | | (1.04 | ) | | | (0.37 | ) | | | — | | | | (0.52 | ) |
| | | | | | | | | | | | | | | | | | | | |
Total distributions | | | (0.35 | ) | | | (1.20 | ) | | | (0.50 | ) | | | (0.10 | ) | | | (0.65 | ) |
| | | | | | | | | | | | | | | | | | | | |
Net increase (decrease) in net asset value | | | 0.71 | | | | (0.93 | ) | | | 0.20 | | | | 0.84 | | | | 0.48 | |
| | | | | | | | | | | | | | | | | | | | |
Net Asset Value, End of Period | | $ | 9.39 | | | $ | 8.68 | | | $ | 9.61 | | | $ | 9.41 | | | $ | 8.57 | |
| | | | | | | | | | | | | | | | | | | | |
Total Return (a) | | | 12.60 | % | | | 3.12 | % | | | 7.69 | % | | | 11.05 | % | | | 15.86 | % |
| | | | | |
Ratios/Supplemental Data: | | | | | | | | | | | | | | | | | | | | |
Net Assets, End of Period (in 000’s) | | $ | 101,663 | | | $ | 106,191 | | | $ | 48,365 | | | $ | 46,423 | | | $ | 22,552 | |
Ratios of expenses to average net assets: | | | | | | | | | | | | | | | | | | | | |
Before earnings credit, expense reimbursement and/or fee waiver, or recoupment by the Adviser | | | 1.23 | %(b) | | | 1.22 | %(b)(c) | | | 1.24 | %(c) | | | 1.37 | % | | | 2.11 | % |
After earnings credit, expense reimbursement and/or fee waiver, or recoupment by the Adviser | | | 1.23 | %(b) | | | 1.27 | %(b)(c) | | | 1.33 | %(c) | | | 1.40 | % | | | 1.25 | %(d) |
Ratios of net investment income to average net assets: | | | | | | | | | | | | | | | | | | | | |
Before earnings credit, expense reimbursement and/or fee waiver, or recoupment by the Adviser | | | 2.24 | % | | | 1.82 | % | | | 1.51 | % | | | 1.20 | % | | | 0.55 | % |
After earnings credit, expense reimbursement and/or fee waiver, or recoupment by the Adviser | | | 2.24 | % | | | 1.78 | % | | | 1.41 | % | | | 1.17 | % | | | 1.41 | % |
Portfolio Turnover | | | 77.70 | % | | | 56.33 | % | | | 87.37 | % | | | 41.33 | % | | | 51.56 | % |
| | (a) | The total return is calculated using the Net Asset Value used for trading at the close of business at period end. |
| | (b) | Ratios of expenses to average net assets include Earnings Credits of less than 0.005% for each of the years ended October 31, 2013 and October 31, 2012, which are not included in the contractual expense limitation. See Note I to the Financial Statements. |
| | (c) | Ratios of expenses to average net assets include interest expense of less than 0.005% for each of the years ended October 31, 2012 and October 31, 2011, which are not included in the contractual expense limitation. The interest expense is from utilizing the line of credit as discussed in Note H to the Financial Statements. |
| | (d) | Effective June 1, 2009, due to the change in Subadviser, the contractual expense limitation was increased from 1.10% to 1.40%, excluding interest, taxes, investment-related costs (such as brokerage commissions), extraordinary expenses and acquired fund fees and expenses. |
See accompanying Notes to Financial Statements.
| | |
| |
| ASTON/Anchor Capital Enhanced Equity Fund – Class I | | October 31, 2013 |
| |
| Financial Highlights | | |
| | | | | | | | | | | | | | | | |
| | | Year
Ended
10/31/13 | | | Year
Ended
10/31/12 | | | Year
Ended
10/31/11 | | | Period
Ended
10/31/10(a) | |
| | | | | | | | | | | | | | | | |
Net Asset Value, Beginning of Period | | $ | 8.69 | | | $ | 9.62 | | | $ | 9.41 | | | $ | 9.04 | |
| | | | | | | | | | | | | | | | |
Income from Investment Operations: | | | | | | | | | | | | | | | | |
Net investment income | | | 0.22 | | | | 0.18 | | | | 0.16 | | | | 0.09 | |
Net realized and unrealized gain on investments | | | 0.86 | | | | 0.11 | | | | 0.57 | | | | 0.37 | |
| | | | | | | | | | | | | | | | |
Total from investment operations | | | 1.08 | | | | 0.29 | | | | 0.73 | | | | 0.46 | |
| | | | | | | | | | | | | | | | |
Less Distributions: | | | | | | | | | | | | | | | | |
Distributions from and in excess of net investment income | | | (0.22 | ) | | | (0.18 | ) | | | (0.15 | ) | | | (0.09 | ) |
Distributions from net realized gain on investments | | | (0.15 | ) | | | (1.04 | ) | | | (0.37 | ) | | | — | |
| | | | | | | | | | | | | | | | |
Total distributions | | | (0.37 | ) | | | (1.22 | ) | | | (0.52 | ) | | | (0.09 | ) |
| | | | | | | | | | | | | | | | |
Net increase (decrease) in net asset value | | | 0.71 | | | | (0.93 | ) | | | 0.21 | | | | 0.37 | |
| | | | | | | | | | | | | | | | |
Net Asset Value, End of Period | | $ | 9.40 | | | $ | 8.69 | | | $ | 9.62 | | | $ | 9.41 | |
| | | | | | | | | | | | | | | | |
Total Return (b) | | | 12.88 | % | | | 3.46 | % | | | 7.97 | % | | | 5.10 | %(c) |
| | | | |
Ratios/Supplemental Data: | | | | | | | | | | | | | | | | |
Net Assets, End of Period (in 000’s) | | $ | 58,099 | | | $ | 71,618 | | | $ | 64,840 | | | $ | 46,140 | |
Ratios of expenses to average net assets: | | | | | | | | | | | | | | | | |
Before earnings credit, expense reimbursement and/or fee waiver, or recoupment by the Adviser | | | 0.98 | %(e) | | | 0.97 | %(e)(f) | | | 0.99 | %(f) | | | 1.10 | %(d) |
After earnings credit, expense reimbursement and/or fee waiver, or recoupment by the Adviser | | | 0.98 | %(e) | | | 1.02 | %(e)(f) | | | 1.08 | %(f) | | | 1.15 | %(d) |
Ratios of net investment income to average net assets: | | | | | | | | | | | | | | | | |
Before earnings credit, expense reimbursement and/or fee waiver, or recoupment by the Adviser | | | 2.49 | % | | | 2.07 | % | | | 1.76 | % | | | 1.37 | %(d) |
After earnings credit, expense reimbursement and/or fee waiver, or recoupment by the Adviser | | | 2.49 | % | | | 2.03 | % | | | 1.66 | % | | | 1.32 | %(d) |
Portfolio Turnover | | | 77.70 | % | | | 56.33 | % | | | 87.37 | % | | | 41.33 | %(c) |
| | (a) | The inception date for the Anchor Capital Enhanced Equity Fund Class I shares is March 3, 2010. |
| | (b) | The total return is calculated using the Net Asset Value used for trading at the close of business at period end. |
| | (e) | Ratios of expenses to average net assets include Earnings Credits of less than 0.005% for each of the years ended October 31, 2013 and October 31, 2012, which are not included in the contractual expense limitation. See Note I to the Financial Statements. |
| | (f) | Ratios of expenses to average net assets include interest expenses of less than 0.005% for each of the years ended October 31, 2012 and October 31, 2011, which are not included in the contractual expense limitation. The interest expenses are from utilizing the line of credit as discussed in Note H to the Financial Statements. |
See accompanying Notes to Financial Statements.
| | |
| |
| ASTON/River Road Long-Short Fund – Class N | | October 31, 2013 |
| |
| Financial Highlights | | |
| | | | | | | | | | | | |
| | | Year
Ended
10/31/13 | | | Year
Ended
10/31/12 | | | Period
Ended
10/31/11(a) | |
| | | | | | | | | | | | |
Net Asset Value, Beginning of Period | | $ | 10.73 | | | $ | 9.91 | | | $ | 10.00 | |
| | | | | | | | | | | | |
Income from Investment Operations: | | | | | | | | | | | | |
Net investment loss | | | (0.17 | )(b) | | | (0.18 | ) | | | (0.04 | )(b) |
Net realized and unrealized gain (loss) on investments | | | 2.02 | | | | 1.00 | | | | (0.05 | ) |
| | | | | | | | | | | | |
Total from investment operations | | | 1.85 | | | | 0.82 | | | | (0.09 | ) |
| | | | | | | | | | | | |
Less Distributions: | | | | | | | | | | | | |
Distributions from net realized gain on investments | | | (0.56 | ) | | | — | | | | — | |
| | | | | | | | | | | | |
Total distributions | | | (0.56 | ) | | | — | | | | — | |
| | | | | | | | | | | | |
Net increase (decrease) in net asset value | | | 1.29 | | | | 0.82 | | | | (0.09 | ) |
| | | | | | | | | | | | |
Net Asset Value, End of Period | | $ | 12.02 | | | $ | 10.73 | | | $ | 9.91 | |
| | | | | | | | | | | | |
Total Return (c) | | | 18.14 | % | | | 8.17 | % | | | (0.80 | )%(d) |
| | | |
Ratios/Supplemental Data: | | | | | | | | | | | | |
Net Assets, End of Period (in 000’s) | | $ | 108,966 | | | $ | 7,506 | | | $ | 4,594 | |
Ratios of expenses to average net assets: | | | | | | | | | | | | |
Before expense reimbursement and/or fee waiver by Adviser, including interest and
dividend expense for securities sold short | | | 2.54 | % | | | 5.03 | % | | | 8.68 | %(e) |
After expense reimbursement and/or fee waiver by Adviser, including interest and
dividend expense for securities sold short | | | 2.38 | % | | | 3.11 | % | | | 2.72 | %(e) |
After expense reimbursement and/or fee waiver by Adviser, excluding interest and
dividend expense for securities sold short | | | 1.70 | % | | | 1.70 | % | | | 1.70 | %(e) |
Ratios of net investment loss to average net assets: | | | | | | | | | | | | |
Before expense reimbursement and/or fee waiver by Adviser | | | (1.62 | )% | | | (3.63 | )% | | | (6.80 | )%(e) |
After expense reimbursement and/or fee waiver by Adviser | | | (1.46 | )% | | | (1.71 | )% | | | (0.84 | )%(e) |
Portfolio Turnover | | | 291.36 | % | | | 277.72 | % | | | 127.32 | %(d) |
| | (a) | The inception date for the River Road Long-Short Fund Class N shares is May 4, 2011. |
| | (b) | The selected per share data was calculated using the weighted average shares outstanding method for the period. |
| | (c) | The total return is calculated using the Net Asset Value used for trading at the close of business at period end. |
See accompanying Notes to Financial Statements.
| | |
| |
| ASTON/River Road Long-Short Fund – Class I | | October 31, 2013 |
| |
| Financial Highlights | | |
| | | | |
| | | Period
Ended
10/31/13(a) | |
Net Asset Value, Beginning of Period | | $ | 10.96 | |
| | | | |
Income from Investment Operations: | | | | |
Net investment loss | | | (0.10 | )(b) |
Net realized and unrealized gain on investments | | | 1.19 | |
| | | | |
Total from investment operations | | | 1.09 | |
| | | | |
Net increase in net asset value | | | 1.09 | |
| | | | |
Net Asset Value, End of Period | | $ | 12.05 | |
| | | | |
Total Return (c) | | | 9.85 | %(d) |
| |
Ratios/Supplemental Data: | | | | |
Net Assets, End of Period (in 000’s) | | $ | 71,175 | |
Ratios of expenses to average net assets: | | | | |
Before expense reimbursement and/or fee waiver by Adviser, including interest and
dividend expense for securities sold short | | | 2.20 | %(e) |
After expense reimbursement and/or fee waiver by Adviser, including interest and
dividend expense for securities sold short | | | 2.10 | %(e) |
After expense reimbursement and/or fee waiver by Adviser, excluding interest and
dividend expense for securities sold short | | | 1.45 | %(e) |
Ratios of net investment loss to average net assets: | | | | |
Before expense reimbursement and/or fee waiver by Adviser | | | (1.44 | )%(e) |
After expense reimbursement and/or fee waiver by Adviser | | | (1.33 | )%(e) |
Portfolio Turnover | | | 291.36 | %(d) |
| | (a) | The inception date for the River Road Long-Short Fund Class I shares is March 4, 2013. |
| | (b) | The selected per share data was calculated using the weighted average shares outstanding method for the period. |
| | (c) | The total return is calculated using the Net Asset Value used for trading at the close of business at period end. |
See accompanying Notes to Financial Statements.
| | |
| |
| ASTON/Barings International Fund – Class N | | October 31, 2013 |
| |
| Financial Highlights | | |
| | | | | | | | | | | | | | | | |
| | | Year
Ended
10/31/13 | | | Year
Ended
10/31/12 | | | Year
Ended
10/31/11 | | | Period
Ended
10/31/10(a) | |
Net Asset Value, Beginning of Period | | $ | 6.87 | | | $ | 6.81 | | | $ | 7.24 | | | $ | 6.48 | |
| | | | | | | | | | | | | | | | |
Income from Investment Operations: | | | | | | | | | | | | | | | | |
Net investment income | | | 0.11 | (b) | | | 0.10 | (b) | | | 0.07 | (b) | | | 0.06 | (b) |
Net realized and unrealized gain (loss) on investments | | | 1.00 | | | | 0.17 | | | | (0.37 | ) | | | 0.70 | |
| | | | | | | | | | | | | | | | |
Total from investment operations | | | 1.11 | | | | 0.27 | | | | (0.30 | ) | | | 0.76 | |
| | | | | | | | | | | | | | | | |
Less Distributions: | | | | | | | | | | | | | | | | |
Distributions from and in excess of net investment income | | | (0.09 | ) | | | (0.04 | ) | | | (0.13 | ) | | | — | |
Distributions from net realized gain on investments | | | (0.08 | ) | | | (0.17 | ) | | | — | | | | — | |
| | | | | | | | | | | | | | | | |
Total distributions | | | (0.17 | ) | | | (0.21 | ) | | | (0.13 | ) | | | — | |
| | | | | | | | | | | | | | | | |
Net increase (decrease) in net asset value | | | 0.94 | | | | 0.06 | | | | (0.43 | ) | | | 0.76 | |
| | | | | | | | | | | | | | | | |
Net Asset Value, End of Period | | $ | 7.81 | | | $ | 6.87 | | | $ | 6.81 | | | $ | 7.24 | |
| | | | | | | | | | | | | | | | |
Total Return (c) | | | 16.64 | % | | | 4.28 | % | | | (4.22 | )% | | | 11.73 | %(d) |
| | | | |
Ratios/Supplemental Data: | | | | | | | | | | | | | | | | |
Net Assets, End of Period (in 000’s) | | $ | 477 | | | $ | 421 | | | $ | 393 | | | $ | 184 | |
Ratios of expenses to average net assets: | | | | | | | | | | | | | | | | |
Before expense reimbursement and/or fee waiver by Adviser | | | 1.67 | % | | | 1.60 | % | | | 1.68 | %(e) | | | 1.72 | %(f) |
After expense reimbursement and/or fee waiver by Adviser | | | 1.40 | % | | | 1.40 | % | | | 1.40 | %(e) | | | 1.40 | %(f) |
Ratios of net investment income to average net assets: | | | | | | | | | | | | | | | | |
Before expense reimbursement and/or fee waiver by Adviser | | | 1.26 | % | | | 1.30 | % | | | 0.76 | %(e) | | | 1.07 | %(f) |
After expense reimbursement and/or fee waiver by Adviser | | | 1.53 | % | | | 1.50 | % | | | 1.04 | %(e) | | | 1.39 | %(f) |
Portfolio Turnover | | | 55.78 | % | | | 33.48 | % | | | 58.96 | % | | | 65.32 | %(d) |
| | (a) | The inception date for the Barings International Fund Class N shares is March 3, 2010. |
| | (b) | The selected per share data was calculated using the weighted average shares outstanding method for the period. |
| | (c) | The total return is calculated using the Net Asset Value used for trading at the close of business at period end. |
| | (e) | For the period November 1, 2010 through February 28, 2011, the Adviser voluntarily waived management fees and/or reimbursed expenses at 1.40%. Effective March 1, 2011, the contractual expense limitation was decreased from 1.50% to 1.40%, excluding interest, taxes, investment-related costs (such as brokerage commissions), extraordinary expenses and acquired fund fees and expenses. |
See accompanying Notes to Financial Statements.
| | |
| |
| ASTON/Barings International Fund – Class I | | October 31, 2013 |
| |
| Financial Highlights | | |
| | | | | | | | | | | | | | | | | | | | |
| | | Year
Ended
10/31/13 | | | Year
Ended
10/31/12 | | | Year
Ended
10/31/11 | | | Year
Ended
10/31/10 | | | Year
Ended
10/31/09 | |
| | | | | | | | | | | | | | | | | | | | |
Net Asset Value, Beginning of Period | | $ | 6.89 | | | $ | 6.82 | | | $ | 7.26 | | | $ | 6.44 | | | $ | 5.08 | |
| | | | | | | | | | | | | | | | | | | | |
Income from Investment Operations: | | | | | | | | | | | | | | | | | | | | |
Net investment income | | | 0.13 | (a) | | | 0.12 | (a) | | | 0.09 | (a) | | | 0.06 | (a) | | | 0.10 | (a) |
Net realized and unrealized gain (loss) on investments | | | 0.99 | | | | 0.18 | | | | (0.38 | ) | | | 0.78 | | | | 1.27 | (b) |
| | | | | | | | | | | | | | | | | | | | |
Total from investment operations | | | 1.12 | | | | 0.30 | | | | (0.29 | ) | | | 0.84 | | | | 1.37 | |
| | | | | | | | | | | | | | | | | | | | |
Less Distributions: | | | | | | | | | | | | | | | | | | | | |
Distributions from and in excess of net investment income | | | (0.11 | ) | | | (0.06 | ) | | | (0.15 | ) | | | (0.02 | ) | | | (0.01 | ) |
Distributions from net realized gain on investments | | | (0.08 | ) | | | (0.17 | ) | | | — | | | | — | | | | — | |
| | | | | | | | | | | | | | | | | | | | |
Total distributions | | | (0.19 | ) | | | (0.23 | ) | | | (0.15 | ) | | | (0.02 | ) | | | (0.01 | ) |
| | | | | | | | | | | | | | | | | | | | |
Net increase (decrease) in net asset value | | | 0.93 | | | | 0.07 | | | | (0.44 | ) | | | 0.82 | | | | 1.36 | |
| | | | | | | | | | | | | | | | | | | | |
Net Asset Value, End of Period | | $ | 7.82 | | | $ | 6.89 | | | $ | 6.82 | | | $ | 7.26 | | | $ | 6.44 | |
| | | | | | | | | | | | | | | | | | | | |
Total Return (c) | | | 16.72 | % | | | 4.72 | % | | | (4.09 | )% | | | 12.89 | % | | | 27.11 | % |
| | | | | |
Ratios/Supplemental Data: | | | | | | | | | | | | | | | | | | | | |
Net Assets, End of Period (in 000’s) | | $ | 37,507 | | | $ | 61,662 | | | $ | 52,390 | | | $ | 47,985 | | | $ | 28,277 | |
Ratios of expenses to average net assets: | | | | | | | | | | | | | | | | | | | | |
Before expense reimbursement and/or fee waiver by Adviser | | | 1.42 | % | | | 1.35 | % | | | 1.43 | %(d) | | | 1.47 | % | | | 2.01 | % |
After expense reimbursement and/or fee waiver by Adviser | | | 1.15 | % | | | 1.15 | % | | | 1.15 | %(d) | | | 1.15 | % | | | 1.15 | % |
Ratios of net investment income to average net assets: | | | | | | | | | | | | | | | | | | | | |
Before expense reimbursement and/or fee waiver by Adviser | | | 1.51 | % | | | 1.55 | % | | | 1.01 | % | | | 0.63 | % | | | 0.80 | % |
After expense reimbursement and/or fee waiver by Adviser | | | 1.78 | % | | | 1.75 | % | | | 1.29 | % | | | 0.95 | % | | | 1.66 | % |
Portfolio Turnover | | | 55.78 | % | | | 33.48 | % | | | 58.96 | % | | | 65.32 | % | | | 115.51 | % |
| | (a) | The selected per share data was calculated using the weighted average shares outstanding method for the period. |
| | (b) | Includes payments by affiliates of less than $0.005 per share. |
| | (c) | The total return is calculated using the Net Asset Value used for trading at the close of business at period end. |
| | (d) | For the period November 1, 2010 through February 28, 2011, the Adviser voluntarily waived management fees and/or reimbursed expenses at 1.15%. Effective March 1, 2011, the contractual expense limitation was decreased from 1.25% to 1.15%, excluding interest, taxes, investment-related costs (such as brokerage commissions), extraordinary expenses and acquired fund fees and expenses. |
See accompanying Notes to Financial Statements.
| | |
| |
| ASTON/LMCG Emerging Markets Fund – Class N | | October 31, 2013 |
| |
| Financial Highlights | | |
| | | | |
| | | Period
Ended
10/31/13(a) | |
Net Asset Value, Beginning of Period | | $ | 10.00 | |
| | | | |
Income from Investment Operations: | | | | |
Net investment income | | | 0.08 | (b) |
Net realized and unrealized loss on investments | | | (0.43 | ) |
| | | | |
Total from investment operations | | | (0.35 | ) |
| | | | |
Net decrease in net asset value | | | (0.35 | ) |
| | | | |
Net Asset Value, End of Period | | $ | 9.65 | |
| | | | |
Total Return (c) | | | (3.50 | )%(d) |
| |
Ratios/Supplemental Data: | | | | |
Net Assets, End of Period (in 000’s) | | $ | 675 | |
Ratios of expenses to average net assets: | | | | |
Before expense reimbursement and/or fee waiver by Adviser | | | 7.24 | %(e) |
After expense reimbursement and/or fee waiver by Adviser | | | 1.65 | %(e) |
Ratios of net investment income (loss) to average net assets: | | | | |
Before expense reimbursement and/or fee waiver by Adviser | | | (4.13 | )%(e) |
After expense reimbursement and/or fee waiver by Adviser | | | 1.46 | %(e) |
Portfolio Turnover | | | 101.96 | %(d) |
| | (a) | The inception date for the LMCG Emerging Markets Fund Class N shares is March 28, 2013. |
| | (b) | The selected per share data was calculated using the weighted average shares outstanding method for the period. |
| | (c) | The total return is calculated using the Net Asset Value used for trading at the close of business at period end. |
See accompanying Notes to Financial Statements.
| | |
| |
| ASTON/LMCG Emerging Markets Fund – Class I | | October 31, 2013 |
| |
| Financial Highlights | | |
| | | | |
| | | Period
Ended
10/31/13 (a)
| |
| | | | |
Net Asset Value, Beginning of Period | | $ | 10.00 | |
| | | | |
Income from Investment Operations: | | | | |
Net investment income | | | 0.10 | (b) |
Net realized and unrealized loss on investments | | | (0.43 | ) |
| | | | |
Total from investment operations | | | (0.33 | ) |
| | | | |
Net decrease in net asset value | | | (0.33 | ) |
| | | | |
Net Asset Value, End of Period | | $ | 9.67 | |
| | | | |
Total Return (c) | | | (3.30 | )%(d) |
| |
Ratios/Supplemental Data: | | | | |
Net Assets, End of Period (in 000’s) | | $ | 3,307 | |
Ratios of expenses to average net assets: | | | | |
Before expense reimbursement and/or fee waiver by Adviser | | | 6.99 | %(e) |
After expense reimbursement and/or fee waiver by Adviser | | | 1.40 | %(e) |
Ratios of net investment income (loss) to average net assets: | | | | |
Before expense reimbursement and/or fee waiver by Adviser | | | (3.88 | )%(e) |
After expense reimbursement and/or fee waiver by Adviser | | | 1.71 | %(e) |
Portfolio Turnover | | | 101.96 | %(d) |
| | (a) | The inception date for the LMCG Emerging Markets Fund Class I shares is March 28, 2013. |
| | (b) | The selected per share data was calculated using the weighted average shares outstanding method for the period. |
| | (c) | The total return is calculated using the Net Asset Value used for trading at the close of business at period end. |
See accompanying Notes to Financial Statements.
| | |
| |
| ASTON/Harrison Street Real Estate Fund – Class N | | October 31, 2013 |
| |
| Financial Highlights | | |
| | | | | | | | | | | | | | | | | | | | |
| | | Year
Ended
10/31/13 | | | Year
Ended
10/31/12 | | | Year
Ended
10/31/11 | | | Year
Ended
10/31/10 | | | Year
Ended
10/31/09 | |
| | | | | | | | | | | | | | | | | | | | |
Net Asset Value, Beginning of Period | | $ | 10.49 | | | $ | 8.97 | | | $ | 8.16 | | | $ | 5.77 | | | $ | 6.08 | |
| | | | | | | | | | | | | | | | | | | | |
Income from Investment Operations: | | | | | | | | | | | | | | | | | | | | |
Net investment income | | | 0.17 | (a) | | | 0.15 | (a) | | | 0.15 | (a) | | | 0.14 | (a) | | | 0.15 | (a) |
Net realized and unrealized gain (loss) on investments | | | 0.79 | (b) | | | 1.44 | | | | 0.79 | | | | 2.36 | | | | (0.28 | ) |
| | | | | | | | | | | | | | | | | | | | |
Total from investment operations | | | 0.96 | | | | 1.59 | | | | 0.94 | | | | 2.50 | | | | (0.13 | ) |
| | | | | | | | | | | | | | | | | | | | |
Less Distributions: | | | | | | | | | | | | | | | | | | | | |
Distributions from and in excess of net investment income | | | (0.16 | ) | | | (0.07 | ) | | | (0.13 | ) | | | (0.11 | ) | | | (0.18 | ) |
| | | | | | | | | | | | | | | | | | | | |
Total distributions | | | (0.16 | ) | | | (0.07 | ) | | | (0.13 | ) | | | (0.11 | ) | | | (0.18 | ) |
| | | | | | | | | | | | | | | | | | | | |
Net increase (decrease) in net asset value . | | | 0.80 | | | | 1.52 | | | | 0.81 | | | | 2.39 | | | | (0.31 | ) |
| | | | | | | | | | | | | | | | | | | | |
Net Asset Value, End of Period | | $ | 11.29 | | | $ | 10.49 | | | $ | 8.97 | | | $ | 8.16 | | | $ | 5.77 | |
| | | | | | | | | | | | | | | | | | | | |
Total Return (c) | | | 9.30 | % | | | 17.85 | % | | | 11.66 | % | | | 43.77 | % | | | (1.44 | )% |
| | | | | |
Ratios/Supplemental Data: | | | | | | | | | | | | | | | | | | | | |
Net Assets, End of Period (in 000’s) | | $ | 13,093 | | | $ | 10,381 | | | $ | 6,287 | | | $ | 6,158 | | | $ | 4,011 | |
Ratios of expenses to average net assets: | | | | | | | | | | | | | | | | | | | | |
Before expense reimbursement and/or fee waiver by Adviser | | | 2.22 | % | | | 2.36 | % | | | 1.61 | %(d) | | | 1.68 | %(d) | | | 1.94 | % |
After expense reimbursement and/or fee waiver by Adviser | | | 1.37 | % | | | 1.37 | % | | | 1.29 | %(d) | | | 1.37 | %(d) | | | 1.37 | % |
Ratios of net investment income to average net assets: | | | | | | | | | | | | | | | | | | | | |
Before expense reimbursement and/or fee waiver by Adviser | | | 0.67 | % | | | 0.53 | % | | | 1.36 | % | | | 1.65 | % | | | 2.55 | % |
After expense reimbursement and/or fee waiver by Adviser | | | 1.52 | % | | | 1.52 | % | | | 1.68 | % | | | 1.96 | % | | | 3.12 | % |
Portfolio Turnover | | | 159.14 | % | | | 86.62 | %(e) | | | 143.86 | % | | | 75.30 | % | | | 139.76 | % |
| | (a) | The selected per share data was calculated using the weighted average shares outstanding method for the period. |
| | (b) | Includes capital contribution of less than $0.005 per share. |
| | (c) | The total return is calculated using the Net Asset Value used for trading at the close of business at period end. |
| | (d) | Ratios of expenses to average net assets include interest expense of less than 0.005% for each of the years ended October 31, 2011 and October 31, 2010, which are not included in the contractual expense limitation. The interest expense is from utilizing the line of credit as discussed in Note H to the Financial Statements. |
| | (e) | Portfolio turnover rate excludes securities delivered from processing a redemption-in-kind. |
See accompanying Notes to Financial Statements.
| | |
| |
| ASTON/Harrison Street Real Estate Fund – Class I | | October 31, 2013 |
| |
| Financial Highlights | | |
| | | | | | | | | | | | | | | | | | | | |
| | | Year
Ended
10/31/13 | | | Year
Ended
10/31/12 | | | Year
Ended
10/31/11 | | | Year
Ended
10/31/10 | | | Year
Ended
10/31/09 | |
| | | | | | | | | | | | | | | | | | | | |
Net Asset Value, Beginning of Period | | $ | 10.44 | | | $ | 8.92 | | | $ | 8.12 | | | $ | 5.74 | | | $ | 6.08 | |
| | | | | | | | | | | | | | | | | | | | |
Income from Investment Operations: | | | | | | | | | | | | | | | | | | | | |
Net investment income | | | 0.20 | (a) | | | 0.15 | (a) | | | 0.16 | (a) | | | 0.16 | (a) | | | 0.16 | (a) |
Net realized and unrealized gain (loss) on investments | | | 0.79 | (b) | | | 1.46 | | | | 0.79 | | | | 2.34 | | | | (0.28 | ) |
| | | | | | | | | | | | | | | | | | | | |
Total from investment operations | | | 0.99 | | | | 1.61 | | | | 0.95 | | | | 2.50 | | | | (0.12 | ) |
| | | | | | | | | | | | | | | | | | | | |
Less Distributions: | | | | | | | | | | | | | | | | | | | | |
Distributions from and in excess of net investment income | | | (0.19 | ) | | | (0.09 | ) | | | (0.15 | ) | | | (0.12 | ) | | | (0.22 | ) |
| | | | | | | | | | | | | | | | | | | | |
Total distributions | | | (0.19 | ) | | | (0.09 | ) | | | (0.15 | ) | | | (0.12 | ) | | | (0.22 | ) |
| | | | | | | | | | | | | | | | | | | | |
Net increase (decrease) in net asset value . | | | 0.80 | | | | 1.52 | | | | 0.80 | | | | 2.38 | | | | (0.34 | ) |
| | | | | | | | | | | | | | | | | | | | |
Net Asset Value, End of Period | | $ | 11.24 | | | $ | 10.44 | | | $ | 8.92 | | | $ | 8.12 | | | $ | 5.74 | |
| | | | | | | | | | | | | | | | | | | | |
Total Return (c) | | | 9.58 | % | | | 18.16 | % | | | 11.82 | % | | | 44.14 | % | | | (1.27 | )% |
| | | | | |
Ratios/Supplemental Data: | | | | | | | | | | | | | | | | | | | | |
Net Assets, End of Period (in 000’s) | | $ | 532 | | | $ | 166 | | | $ | 32,925 | | | $ | 29,425 | | | $ | 21,905 | |
Ratios of expenses to average net assets: | | | | | | | | | | | | | | | | | | | | |
Before expense reimbursement and/or fee waiver by Adviser | | | 1.97 | % | | | 2.11 | % | | | 1.44 | %(d) | | | 1.43 | %(d) | | | 1.69 | % |
After expense reimbursement and/or fee waiver by Adviser | | | 1.12 | % | | | 1.12 | % | | | 1.12 | %(d) | | | 1.12 | %(d) | | | 1.12 | % |
Ratios of net investment income to average net assets: | | | | | | | | | | | | | | | | | | | | |
Before expense reimbursement and/or fee waiver by Adviser | | | 0.92 | % | | | 0.78 | % | | | 1.53 | % | | | 1.90 | % | | | 2.80 | % |
After expense reimbursement and/or fee waiver by Adviser | | | 1.77 | % | | | 1.77 | % | | | 1.85 | % | | | 2.21 | % | | | 3.37 | % |
Portfolio Turnover | | | 159.14 | % | | | 86.62 | %(e) | | | 143.86 | % | | | 75.30 | % | | | 139.76 | % |
| | (a) | The selected per share data was calculated using the weighted average shares outstanding method for the period. |
| | (b) | Includes capital contribution of less than $0.005 per share. |
| | (c) | The total return is calculated using the Net Asset Value used for trading at the close of business at period end. |
| | (d) | Ratios of expenses to average net assets include interest expense of less than 0.005% for each of the years ended October 31, 2011 and October 31, 2010, which are not included in the contractual expense limitation. The interest expense is from utilizing the line of credit as discussed in Note H to the Financial Statements. |
| | (e) | Portfolio turnover rate excludes securities delivered from processing a redemption-in-kind. |
See accompanying Notes to Financial Statements.
| | |
| |
| ASTON/Montag & Caldwell Balanced Fund – Class N | | October 31, 2013 |
| |
| Financial Highlights | | |
| | | | | | | | | | | | | | | | | | | | |
| | | Year
Ended
10/31/13 | | | Year
Ended
10/31/12 | | | Year
Ended
10/31/11 | | | Year
Ended
10/31/10 | | | Year
Ended
10/31/09 | |
| | | | | | | | | | | | | | | | | | | | |
Net Asset Value, Beginning of Period | | $ | 21.46 | | | $ | 20.09 | | | $ | 19.13 | | | $ | 17.73 | | | $ | 15.61 | |
| | | | | | | | | | | | | | | | | | | | |
Income from Investment Operations: | | | | | | | | | | | | | | | | | | | | |
Net investment income | | | 0.21 | (a) | | | 0.16 | (a) | | | 0.15 | (a) | | | 0.21 | (a) | | | 0.21 | (a) |
Net realized and unrealized gain on investments | | | 2.43 | | | | 1.45 | | | | 1.03 | | | | 1.47 | | | | 2.15 | |
| | | | | | | | | | | | | | | | | | | | |
Total from investment operations | | | 2.64 | | | | 1.61 | | | | 1.18 | | | | 1.68 | | | | 2.36 | |
| | | | | | | | | | | | | | | | | | | | |
Less Distributions: | | | | | | | | | | | | | | | | | | | | |
Distributions from and in excess of net investment income | | | (0.29 | ) | | | (0.24 | ) | | | (0.22 | ) | | | (0.28 | ) | | | (0.24 | ) |
| | | | | | | | | | | | | | | | | | | | |
Total distributions | | | (0.29 | ) | | | (0.24 | ) | | | (0.22 | ) | | | (0.28 | ) | | | (0.24 | ) |
| | | | | | | | | | | | | | | | | | | | |
Net increase in net asset value. | | | 2.35 | | | | 1.37 | | | | 0.96 | | | | 1.40 | | | | 2.12 | |
| | | | | | | | | | | | | | | | | | | | |
Net Asset Value, End of Period | | $ | 23.81 | | | $ | 21.46 | | | $ | 20.09 | | | $ | 19.13 | | | $ | 17.73 | |
| | | | | | | | | | | | | | | | | | | | |
Total Return (b) | | | 12.40 | % | | | 8.03 | % | | | 6.20 | % | | | 9.54 | % | | | 15.32 | % |
| | | | | |
Ratios/Supplemental Data: | | | | | | | | | | | | | | | | | | | | |
Net Assets, End of Period (in 000’s) | | $ | 22,425 | | | $ | 31,536 | | | $ | 23,315 | | | $ | 29,194 | | | $ | 14,938 | |
Ratios of expenses to average net assets: | | | | | | | | | | | | | | | | | | | | |
Before expense reimbursement and/or fee waiver by Adviser | | | 1.37 | % | | | 1.42 | % | | | 1.57 | %(c) | | | 1.38 | % | | | 1.73 | % |
After expense reimbursement and/or fee waiver by Adviser | | | 1.20 | % | | | 1.22 | % | | | 1.35 | %(c) | | | 1.13 | % | | | 1.26 | % |
Ratios of net investment income to average net assets: | | | | | | | | | | | | | | | | | | | | |
Before expense reimbursement and/or fee waiver by Adviser | | | 0.77 | % | | | 0.57 | % | | | 0.53 | % | | | 0.89 | % | | | 0.81 | % |
After expense reimbursement and/or fee waiver by Adviser | | | 0.94 | % | | | 0.77 | % | | | 0.76 | % | | | 1.15 | % | | | 1.28 | % |
Portfolio Turnover | | | 34.62 | % | | | 35.48 | % | | | 40.31 | % | | | 51.68 | %(d) | | | 38.72 | % |
| | (a) | The selected per share data was calculated using the weighed average shares outstanding method for the period. |
| | (b) | The total return is calculated using the Net Asset Value used for trading at the close of business at period end. |
| | (c) | Ratios of expenses to average net assets include interest expense of less than 0.005% for the year ended October 31, 2011, which is not included in the voluntary expense limitation. The interest expense is from utilizing the line of credit as discussed in Note H to the Financial Statements. |
| | (d) | Portfolio turnover rate excludes securities received from a reorganization. |
See accompanying Notes to Financial Statements.
| | |
| |
| ASTON/Montag & Caldwell Balanced Fund – Class I | | October 31, 2013 |
| |
| Financial Highlights | | |
| | | | | | | | | | | | | | | | | | | | |
| | | Year
Ended
10/31/13 | | | Year
Ended
10/31/12 | | | Year
Ended
10/31/11 | | | Year
Ended
10/31/10 | | | Year
Ended
10/31/09 | |
| | | | | | | | | | | | | | | | | | | | |
Net Asset Value, Beginning of Period | | $ | 21.41 | | | $ | 20.05 | | | $ | 19.08 | | | $ | 17.68 | | | $ | 15.57 | |
| | | | | | | | | | | | | | | | | | | | |
Income from Investment Operations: | | | | | | | | | | | | | | | | | | | | |
Net investment income | | | 0.23 | (a) | | | 0.19 | (a) | | | 0.20 | (a) | | | 0.22 | (a) | | | 0.23 | (a) |
Net realized and unrealized gain on investments | | | 2.43 | | | | 1.44 | | | | 1.04 | | | | 1.46 | | | | 2.16 | |
| | | | | | | | | | | | | | | | | | | | |
Total from investment operations | | | 2.66 | | | | 1.63 | | | | 1.24 | | | | 1.68 | | | | 2.39 | |
| | | | | | | | | | | | | | | | | | | | |
Less Distributions: | | | | | | | | | | | | | | | | | | | | |
Distributions from and in excess of net investment income | | | (0.31 | ) | | | (0.27 | ) | | | (0.27 | ) | | | (0.28 | ) | | | (0.28 | ) |
| | | | | | | | | | | | | | | | | | | | |
Total distributions | | | (0.31 | ) | | | (0.27 | ) | | | (0.27 | ) | | | (0.28 | ) | | | (0.28 | ) |
| | | | | | | | | | | | | | | | | | | | |
Net increase in net asset value . | | | 2.35 | | | | 1.36 | | | | 0.97 | | | | 1.40 | | | | 2.11 | |
| | | | | | | | | | | | | | | | | | | | |
Net Asset Value, End of Period | | $ | 23.76 | | | $ | 21.41 | | | $ | 20.05 | | | $ | 19.08 | | | $ | 17.68 | |
| | | | | | | | | | | | | | | | | | | | |
Total Return (b) | | | 12.53 | % | | | 8.14 | % | | | 6.52 | % | | | 9.57 | % | | | 15.53 | % |
| | | | | |
Ratios/Supplemental Data: | | | | | | | | | | | | | | | | | | | | |
Net Assets, End of Period (in 000’s) | | $ | 1,839 | | | $ | 1,930 | | | $ | 1,415 | | | $ | 1,362 | | | $ | 1,149 | |
Ratios of expenses to average net assets: | | | | | | | | | | | | | | | | | | | | |
Before expense reimbursement and/or fee waiver by Adviser | | | 1.27 | % | | | 1.30 | % | | | 1.32 | %(c) | | | 1.35 | % | | | 1.57 | % |
After expense reimbursement and/or fee waiver by Adviser | | | 1.10 | % | | | 1.10 | % | | | 1.10 | %(c) | | | 1.10 | % | | | 1.10 | % |
Ratios of net investment income to average net assets: | | | | | | | | | | | | | | | | | | | | |
Before expense reimbursement and/or fee waiver by Adviser | | | 0.87 | % | | | 0.69 | % | | | 0.79 | % | | | 0.92 | % | | | 0.97 | % |
After expense reimbursement and/or fee waiver by Adviser | | | 1.04 | % | | | 0.89 | % | | | 1.02 | % | | | 1.17 | % | | | 1.44 | % |
Portfolio Turnover | | | 34.62 | % | | | 35.48 | % | | | 40.31 | % | | | 51.68 | %(d) | | | 38.72 | % |
| | (a) | The selected per share data was calculated using the weighted average shares outstanding method for the period. |
| | (b) | The total return is calculated using the Net Asset Value used for trading at the close of business at period end. |
| | (c) | Ratios of expenses to average net assets include interest expense of less than 0.005% for the year ended October 31, 2011, which is not included in the voluntary expense limitation. The interest expense is from utilizing the line of credit as discussed in Note H to the Financial Statements. |
| | (d) | Portfolio turnover rate includes securities received from a reorganization. |
See accompanying Notes to Financial Statements.
| | |
| |
| | October 31, 2013 |
| |
| Notes to Financial Statements | | |
Note (A) Fund Organization: Aston Funds (the “Trust”) was organized as a Delaware statutory trust under a Declaration of Trust dated September 10, 1993. The Trust is registered under the Investment Company Act of 1940, as amended (the “1940 Act”) as an open-end management investment company with 23 separate portfolios (each, a “Fund” and collectively, the “Funds”) as of October 31, 2013.
Aston Asset Management, LP (“Aston” or the “Adviser”), the investment adviser and the administrator, manages each Fund by retaining one or more subadvisers (each, a “Subadviser”) to manage each Fund’s portfolio on a subadvisory basis. The following 23 portfolios of the Trust are included in these financial statements:
|
| ASTON/Montag & Caldwell Growth Fund (the “M&C Growth Fund”) |
ASTON/TAMRO Diversified Equity Fund (the “TAMRO Diversified Equity Fund”) |
ASTON/Herndon Large Cap Value Fund
(the “Herndon Large Cap Value Fund”) |
ASTON/Cornerstone Large Cap Value Fund
(the “Cornerstone Large Cap Value Fund”) |
ASTON/River Road Dividend All Cap Value Fund
(the “River Road Dividend All Cap Value Fund”) |
ASTON/River Road Dividend All Cap Value Fund II
(the “River Road Dividend All Cap Value Fund II”) |
| ASTON/Fairpointe Mid Cap Fund (the “Fairpointe Mid Cap Fund”) |
ASTON/Montag & Caldwell Mid Cap Growth Fund
(the “M&C Mid Cap Growth Fund”) |
| ASTON/LMCG Small Cap Growth Fund (formerly, ASTON Small Cap Growth Fund) (the “LMCG Small Cap Growth Fund”) |
| ASTON/Silvercrest Small Cap Fund (the “Silvercrest Small Cap Fund”) |
| ASTON/TAMRO Small Cap Fund (the “TAMRO Small Cap Fund”) |
ASTON/River Road Select Value Fund
(the “River Road Select Value Fund”) |
ASTON/River Road Small Cap Value Fund
(the “River Road Small Cap Value Fund”) |
ASTON/River Road Independent Value Fund
(the “River Road Independent Value Fund”) |
ASTON/DoubleLine Core Plus Fixed Income Fund
(the “DoubleLine Core Plus Fixed Income Fund”) |
| ASTON/TCH Fixed Income Fund (the “TCH Fixed Income Fund”) |
ASTON/Lake Partners LASSO Alternatives Fund
(the “Lake Partners LASSO Alternatives Fund”) |
ASTON/Anchor Capital Enhanced Equity Fund
(the “Anchor Capital Enhanced Equity Fund”) |
| ASTON/River Road Long-Short Fund (the “River Road Long-Short Fund”) |
| ASTON/Barings International Fund (the “Barings International Fund”) |
ASTON/LMCG Emerging Markets Fund
(the “LMCG Emerging Markets Fund”) |
ASTON/Harrison Street Real Estate Fund (the “Harrison Street Real Estate Fund”) |
| ASTON/Montag & Caldwell Balanced Fund (the “M&C Balanced Fund”) |
M&C Growth Fund is authorized to issue three classes of shares (Class N shares, Class I shares and Class R shares). The following Funds are each authorized to issue two classes of shares (Class N shares and Class I shares): TAMRO Diversified Equity Fund, Herndon Large Cap Value Fund, Cornerstone Large Cap Value Fund, River Road Dividend All Cap Value Fund, River Road Dividend All Cap Value Fund II, Fairpointe Mid Cap Fund, LMCG Small Cap Growth Fund, Silvercrest Small Cap Fund, TAMRO Small Cap Fund, River Road Select Value Fund, River Road Small Cap Value Fund, River Road Independent Value Fund, DoubleLine Core Plus Fixed Income Fund, TCH Fixed Income Fund, Lake Partners LASSO Alternatives Fund, Anchor Capital Enhanced Equity Fund, River Road Long-Short Fund, Barings International Fund, LMCG Emerging Markets Fund, Harrison Street Real Estate Fund and M&C Balanced Fund. The M&C Mid Cap Growth Fund is authorized to issue Class N shares and Class I shares, but presently is only offering Class N shares. Each class of shares is substantially the same except that certain classes of shares bear class specific expenses that include distribution and services fees. TAMRO Small Cap Fund, River Road Dividend All Cap Value Fund, Fairpointe Mid Cap Fund and River Road Independent Value Fund are closed to new investors until further notice.
The investment objectives of the Funds are as follows:
| | |
M&C Growth Fund Long-term capital appreciation and, secondarily, current income, by investing primarily in common stocks and convertible securities. |
TAMRO Diversified Equity Fund Long-term capital appreciation. |
Herndon Large Cap Value Fund Long-term capital appreciation. |
Cornerstone Large Cap Value Fund Total return through long-term capital appreciation and current income. |
River Road Dividend All Cap Value Fund High current income and, secondarily, long-term capital appreciation. |
River Road Dividend All Cap Value Fund II Long-term capital appreciation and high current income. |
Fairpointe Mid Cap Fund Long-term total return through capital appreciation by investing primarily in common and preferred stocks and convertible securities. |
M&C Mid Cap Growth Fund Long-term capital appreciation and secondarily, current income, by investing primarily in common stocks and convertible securities. |
LMCG Small Cap Growth Fund Long-term capital appreciation. |
Silvercrest Small Cap Fund Long-term capital appreciation. |
TAMRO Small Cap Fund Long-term capital appreciation. |
River Road Select Value Fund Long-term capital appreciation. |
River Road Small Cap Value Fund Long-term capital appreciation. |
| | |
| |
| | October 31, 2013 |
| |
| Notes to Financial Statements – continued | | |
| | |
River Road Independent Value Fund Long-term total return. |
DoubleLine Core Plus Fixed Income Fund Maximize total return. |
TCH Fixed Income Fund High current income consistent with prudent risk of capital. |
Lake Partners LASSO Alternatives Fund Long term total return with reduced correlation to the conventional stock and bond markets. |
Anchor Capital Enhanced Equity Fund Total return through a combination of a high level of current income and capital appreciation. |
River Road Long-Short Fund Absolute return while minimizing volatility over a full market cycle. |
Barings International Fund Total return. |
LMCG Emerging Markets Fund Long-term capital appreciation. |
Harrison Street Real Estate Fund Total return through a combination of growth and income. |
M&C Balanced Fund Long-term total return. |
Note (B) Significant Accounting Policies: The following is a summary of the significant accounting policies consistently followed by each Fund in the preparation of its financial statements. These policies are in conformity with U.S. generally accepted accounting principles (“U.S. GAAP”).
(1) Security Valuation: Equity securities, closed-end funds, exchange-traded funds, index options traded on a national securities exchange, and over-the-counter securities listed on the NASDAQ National Market System are valued at the last sale price or the NASDAQ Official Closing Price (“NOCP”), if applicable. If no last sale price or NOCP, if applicable, is reported, the mean of the last bid and asked prices may be used. Fixed income securities, except short-term investments, are valued on the basis of mean prices provided by an independent pricing service when such prices are believed by the Adviser to reflect the current market value of such securities, in accordance with guidelines adopted by the Board of Trustees. The pricing service provider may employ methodologies that utilize actual market transactions, broker-dealer supplied valuations, or other electronic data processing techniques. Such techniques generally consider factors such as composite security prices, yields, maturities, call features, credit ratings and developments relating to specific securities in arriving at valuations. If accurate market quotations are not available, securities are valued at fair values in accordance with guidelines adopted by the Board of Trustees. Short-term investments, that is, those with maturities of 60 days or less, are valued at amortized cost, which approximates fair market value. Repurchase agreements are valued at cost. Investments in money market funds and other mutual funds are valued at the underlying fund’s net asset value (“NAV”) at the date of valuation. Foreign securities are valued at the last sales price on the primary exchange where the security is traded. Under the fair valuation procedures adopted by the
Board of Trustees, the Funds may utilize the services of an independent pricing service to determine fair value prices for foreign securities held by Barings International Fund and LMCG Emerging Markets Fund if certain market events occur.
Certain Funds invest in securities of other investment companies, including open-end funds, closed-end funds and exchange-traded funds (“ETFs”). Open-end funds are investment companies that issue new shares continuously and redeem shares daily. Closed-end funds are investment companies that typically issue a fixed number of shares that trade on a securities exchange or over-the-counter. An ETF is an investment company. ETF shares are traded on a securities exchange. Typically, an ETF seeks to track the performance of an index by holding in its portfolio shares of all the companies, or a representative sample of the companies, that are components of a particular index. ETFs are traded on a securities exchange based on their market values. The risks of investment in other investment companies typically reflect the risks of the types of securities in which investment companies invest. Investments in ETFs and closed-end funds are subject to the additional risk that shares of the fund may trade at a premium or discount to their NAV per share. When a Fund invests in another investment company, shareholders of the Fund bear their proportionate shares of the other investment company’s fees and expenses, including operating, registration, trustee, licensing and marketing, as well as their shares of the Fund’s fees and expenses.
Fair Value Measurements - The inputs and valuation techniques used to measure fair value of the Funds’ net assets are summarized into three levels as described in the hierarchy below:
| | |
• Level 1 – | | unadjusted quoted prices in active markets for identical assets or liabilities |
• Level 2 – | | other significant observable inputs (including quoted prices for similar securities, interest rates, prepayment speeds, credit risk, etc.) |
• Level 3 – | | significant unobservable inputs (including the Funds’ own assumptions in determining the fair value of investments) |
| | |
| |
| | October 31, 2013 |
| |
| Notes to Financial Statements – continued | | |
The inputs or methodology used for valuing securities are not necessarily an indication of the risk associated with investing in those securities. Transfers in and out of the levels are recognized at the market value at the end of the period. The summary of each Fund’s investments that are measured at fair value by Level within the fair value hierarchy as of October 31, 2013 is as follows:
| | | | | | | | | | | | | | | | |
Funds | | Total
Value at
10/31/13 | | | Level 1
Quoted
Prices | | | Level 2
Significant
Observable
Inputs | | | Level 3
Significant
Unobservable
Inputs | |
M&C Growth Fund | | | | | | | | | | | | | | | | |
Assets | | | | | | | | | | | | | | | | |
Investments in Securities* | | $ | 5,237,023,917 | | | $ | 5,237,023,917 | | | $ | — | | | $ | — | |
| | | | | | | | | | | | | | | | |
TAMRO Diversified Equity Fund | | | | | | | | | | | | | | | | |
Assets | | | | | | | | | | | | | | | | |
Investments in Securities* | | $ | 56,037,572 | | | $ | 56,037,572 | | | $ | — | | | $ | — | |
| | | | | | | | | | | | | | | | |
Herndon Large Cap Value Fund | | | | | | | | | | | | | | | | |
Assets | | | | | | | | | | | | | | | | |
Investments in Securities* | | $ | 123,139,545 | | | $ | 123,139,545 | | | $ | — | | | $ | — | |
| | | | | | | | | | | | | | | | |
Cornerstone Large Cap Value Fund | | | | | | | | | | | | | | | | |
Assets | | | | | | | | | | | | | | | | |
Investments in Securities* | | $ | 62,421,197 | | | $ | 62,421,197 | | | $ | — | | | $ | — | |
| | | | | | | | | | | | | | | | |
River Road Dividend All Cap Value Fund | | | | | | | | | | | | | | | | |
Assets | | | | | | | | | | | | | | | | |
Common Stocks | | | | | | | | | | | | | | | | |
Consumer Discretionary | | $ | 197,023,363 | | | $ | 197,023,363 | | | $ | — | | | $ | — | |
Consumer Staples | | | 161,011,143 | | | | 161,011,143 | | | | — | | | | — | |
Energy | | | 89,077,022 | | | | 89,077,022 | | | | — | | | | — | |
Financials | | | 170,066,950 | | | | 158,953,942 | | | | 11,113,008 | | | | — | |
Healthcare | | | 58,877,404 | | | | 58,877,404 | | | | — | | | | — | |
Industrials | | | 172,285,553 | | | | 172,285,553 | | | | — | | | | — | |
Information Technology | | | 163,097,096 | | | | 163,097,096 | | | | — | | | | — | |
Materials | | | 38,480,610 | | | | 38,480,610 | | | | — | | | | — | |
Telecommunication Services | | | 77,327,486 | | | | 77,327,486 | | | | — | | | | — | |
Utilities | | | 58,160,843 | | | | 58,160,843 | | | | — | | | | — | |
| | | | | | | | | | | | | | | | |
Total Common Stocks | | | 1,185,407,470 | | | | 1,174,294,462 | | | | 11,113,008 | | | | — | |
| | | | | | | | | | | | | | | | |
Investment Company | | | 41,773,450 | | | | 41,773,450 | | | | — | | | | — | |
| | | | | | | | | | | | | | | | |
Total | | $ | 1,227,180,920 | | | $ | 1,216,067,912 | | | $ | 11,113,008 | | | $ | — | |
| | | | | | | | | | | | | | | | |
River Road Dividend All Cap Value Fund II | | | | | | | | | | | | | | | | |
Assets | | | | | | | | | | | | | | | | |
Investments in Securities* | | $ | 89,741,802 | | | $ | 89,741,802 | | | $ | — | | | $ | — | |
| | | | | | | | | | | | | | | | |
Fairpointe Mid Cap Fund | | | | | | | | | | | | | | | | |
Assets | | | | | | | | | | | | | | | | |
Investments in Securities* | | $ | 5,065,928,792 | | | $ | 5,065,928,792 | | | $ | — | | | $ | — | |
| | | | | | | | | | | | | | | | |
| M&C Mid Cap Growth Fund | | | | | | | | | | | | | | | | |
| Assets | | | | | | | | | | | | | | | | |
Investments in Securities* | | $ | 11,515,476 | | | $ | 11,515,476 | | | $ | — | | | $ | — | |
| | | | | | | | | | | | | | | | |
| LMCG Small Cap Growth Fund | | | | | | | | | | | | | | | | |
| Assets | | | | | | | | | | | | | | | | |
Investment in Securities* | | $ | 40,552,425 | | | $ | 40,552,425 | | | $ | — | | | $ | — | |
| | | | | | | | | | | | | | | | |
| Silvercrest Small Cap Fund | | | | | | | | | | | | | | | | |
| Assets | | | | | | | | | | | | | | | | |
Investments in Securities* | | $ | 32,908,042 | | | $ | 32,908,042 | | | $ | — | | | $ | — | |
| | | | | | | | | | | | | | | | |
| TAMRO Small Cap Fund | | | | | | | | | | | | | | | | |
| Assets | | | | | | | | | | | | | | | | |
Common Stocks | | | | | | | | | | | | | | | | |
Consumer Discretionary | | $ | 251,800,820 | | | $ | 251,800,820 | | | $ | — | | | $ | — | |
Consumer Staples | | | 116,046,293 | | | | 95,903,093 | | | | 20,143,200 | | | | — | |
Energy | | | 91,851,244 | | | | 91,851,244 | | | | — | | | | — | |
Financials | | | 302,482,008 | | | | 302,482,008 | | | | — | | | | — | |
Healthcare | | | 161,723,498 | | | | 161,723,498 | | | | — | | | | — | |
Industrials | | | 229,415,699 | | | | 229,415,699 | | | | — | | | | — | |
Information Technology | | | 112,920,373 | | | | 112,920,373 | | | | — | | | | — | |
Materials | | | 21,188,799 | | | | 21,188,799 | | | | — | | | | — | |
Utilities | | | 22,690,525 | | | | 22,690,525 | | | | — | | | | — | |
| | | | | | | | | | | | | | | | |
Total Common Stocks | | | 1,310,119,259 | | | | 1,289,976,059 | | | | 20,143,200 | | | | — | |
| | | | | | | | | | | | | | | | |
Investment Company | | | 17,208,046 | | | | 17,208,046 | | | | — | | | | — | |
| | | | | | | | | | | | | | | | |
Total | | $ | 1,327,327,305 | | | $ | 1,307,184,105 | | | $ | 20,143,200 | | | $ | — | |
| | | | | | | | | | | | | | | | |
| | |
| |
| | October 31, 2013 |
| |
| Notes to Financial Statements – continued | | |
| | | | | | | | | | | | | | | | |
Funds | | Total
Value at
10/31/13 | | | Level 1
Quoted
Prices | | | Level 2
Significant
Observable
Inputs | | | Level 3
Significant
Unobservable
Inputs | |
| River Road Select Value Fund | | | | | | | | | | | | | | | | |
| Assets | | | | | | | | | | | | | | | | |
Investments in Securities* | | $ | 217,874,457 | | | $ | 217,874,457 | | | $ | — | | | $ | — | |
| | | | | | | | | | | | | | | | |
| River Road Small Cap Value Fund | | | | | | | | | | | | | | | | |
| Assets | | | | | | | | | | | | | | | | |
Common Stocks | | | | | | | | | | | | | | | | |
Consumer Discretionary | | $ | 66,005,214 | | | $ | 66,005,214 | | | $ | — | | | $ | — | |
Consumer Staples | | | 13,861,930 | | | | 4,254,753 | | | | 9,607,177 | | | | — | |
Energy | | | 23,024,984 | | | | 16,551,140 | | | | 6,473,844 | | | | — | |
Financials | | | 44,233,528 | | | | 44,233,528 | | | | — | | | | — | |
Healthcare | | | 31,443,368 | | | | 31,443,368 | | | | — | | | | — | |
Industrials | | | 39,853,000 | | | | 39,853,000 | | | | — | | | | — | |
Information Technology | | | 39,721,247 | | | | 39,721,247 | | | | — | | | | — | |
Materials | | | 8,836,902 | | | | 8,836,902 | | | | — | | | | — | |
Telecommunication Services | | | 9,979,089 | | | | 9,979,089 | | | | — | | | | — | |
| | | | | | | | | | | | | | | | |
Total Common Stocks | | | 276,959,262 | | | | 260,878,241 | | | | 16,081,021 | | | | — | |
| | | | | | | | | | | | | | | | |
Investment Company | | | 30,641,935 | | | | 30,641,935 | | | | — | | | | — | |
| | | | | | | | | | | | | | | | |
Total | | $ | 307,601,197 | | | $ | 291,520,176 | | | $ | 16,081,021 | | | $ | — | |
| | | | | | | | | | | | | | | | |
| River Road Independent Value Fund | | | | | | | | | | | | | | | | |
| Assets | | | | | | | | | | | | | | | | |
Common Stocks | | | | | | | | | | | | | | | | |
Consumer Discretionary | | $ | 17,254,341 | | | $ | 17,254,341 | | | $ | — | | | $ | — | |
Consumer Staples | | | 14,023,281 | | | | 14,023,281 | | | | — | | | | — | |
Energy | | | 49,670,267 | | | | 49,670,267 | | | | — | | | | — | |
Financials | | | 6,245,114 | | | | 1,101,553 | | | | 5,143,561 | | | | — | |
Health Care | | | 6,541,652 | | | | 6,541,652 | | | | — | | | | — | |
Industrials | | | 15,161,840 | | | | 15,161,840 | | | | — | | | | — | |
Information Technology | | | 79,283,963 | | | | 54,799,176 | | | | 24,484,787 | | | | — | |
Materials | | | 60,986,277 | | | | 60,986,277 | | | | — | | | | — | |
Utilities | | | 7,664,623 | | | | 4,754,216 | | | | 2,910,407 | | | | — | |
| | | | | | | | | | | | | | | | |
Total Common Stocks | | | 256,831,358 | | | | 224,292,603 | | | | 32,538,755 | | | | — | |
| | | | | | | | | | | | | | | | |
Investment Company | | | 470,195,880 | | | | 470,195,880 | | | | — | | | | — | |
| | | | | | | | | | | | | | | | |
Total | | $ | 727,027,238 | | | $ | 694,488,483 | | | $ | 32,538,755 | | | $ | — | |
| | | | | | | | | | | | | | | | |
| DoubleLine Core Plus Fixed Income Fund | | | | | | | | | | | | | | | | |
| Assets | | | | | | | | | | | | | | | | |
Corporate Notes and Bonds | | $ | 73,096,006 | | | $ | — | | | $ | 73,096,006 | | | $ | — | |
Collateralized Mortgage-Backed Securities | | | 32,059,129 | | | | — | | | | 32,059,129 | | | | — | |
Agency Collateralized Mortgage Obligations | | | 20,770,798 | | | | — | | | | 20,770,798 | | | | — | |
U.S. Government Obligations | | | 17,776,344 | | | | — | | | | 17,776,344 | | | | — | |
U.S. Government Mortgage-Backed Securities | | | 13,001,592 | | | | — | | | | 13,001,592 | | | | — | |
Asset-Backed Securities | | | 7,772,864 | | | | — | | | | 7,772,864 | | | | — | |
Municipal Bonds | | | 1,618,082 | | | | — | | | | 1,618,082 | | | | — | |
Foreign Government Bonds | | | 1,077,126 | | | | — | | | | 1,077,126 | | | | — | |
Investment Companies | | | 8,177,803 | | | | 8,177,803 | | | | — | | | | — | |
| | | | | | | | | | | | | | | | |
Total | | $ | 175,349,744 | | | $ | 8,177,803 | | | $ | 167,171,941 | | | $ | — | |
| | | | | | | | | | | | | | | | |
| TCH Fixed Income Fund | | | | | | | | | | | | | | | | |
| Assets | | | | | | | | | | | | | | | | |
Corporate Notes and Bonds | | $ | 30,720,839 | | | $ | — | | | $ | 30,720,839 | | | $ | — | |
U.S. Government and Agency Obligations | | | 18,502,118 | | | | — | | | | 18,502,118 | | | | — | |
Asset-Backed Securities | | | 931,868 | | | | — | | | | 931,868 | | | | — | |
Commercial Mortgage-Backed Securities | | | 751,852 | | | | — | | | | 751,852 | | | | — | |
| | | | | | | | | | | | | | | | |
Total | | $ | 50,906,677 | | | $ | — | | | $ | 50,906,677 | | | $ | — | |
| | | | | | | | | | | | | | | | |
| | |
| |
| | October 31, 2013 |
| |
| Notes to Financial Statements – continued | | |
| | | | | | | | | | | | | | | | |
Funds | | Total
Value at
10/31/13 | | | Level 1
Quoted
Prices | | | Level 2
Significant
Observable
Inputs | | | Level 3
Significant
Unobservable
Inputs | |
| Lake Partners LASSO Alternative Fund | | | | | | | | | | | | | | | | |
| Assets | | | | | | | | | | | | | | | | |
Investments in Securities* | | $ | 470,429,869 | | | $ | 470,429,869 | | | $ | — | | | $ | — | |
| | | | | | | | | | | | | | | | |
| Anchor Capital Enhanced Equity Fund | | | | | | | | | | | | | | | | |
| Assets | | | | | | | | | | | | | | | | |
Common Stocks* | | $ | 161,495,314 | | | $ | 161,495,314 | | | $ | — | | | $ | — | |
Derivatives | | | | | | | | | | | | | | | | |
Equity Contracts | | | 301,875 | | | | 301,875 | | | | — | | | | — | |
Investment Company* | | | 5,497,242 | | | | 5,497,242 | | | | — | | | | — | |
| | | | | | | | | | | | | | | | |
Total Assets | | $ | 167,294,431 | | | $ | 167,294,431 | | | $ | — | | | $ | — | |
| | | | | | | | | | | | | | | | |
| Liabilities | | | | | | | | | | | | | | | | |
Derivatives | | | | | | | | | | | | | | | | |
Equity Covered Call Contracts | | $ | (6,521,330 | ) | | $ | (6,521,330 | ) | | $ | — | | | $ | — | |
| | | | | | | | | | | | | | | | |
Total Liabilities | | | (6,521,330 | ) | | | (6,521,330 | ) | | | — | | | | — | |
| | | | | | | | | | | | | | | | |
Total | | $ | 160,773,101 | | | $ | 160,773,101 | | | $ | — | | | $ | — | |
| | | | | | | | | | | | | | | | |
| River Road Long-Short Fund | | | | | | | | | | | | | | | | |
| Assets | | | | | | | | | | | | | | | | |
Investments in Securities* | | $ | 180,415,660 | | | $ | 180,415,660 | | | $ | — | | | $ | — | |
| | | | | | | | | | | | | | | | |
Total Assets | | $ | 180,415,660 | | | $ | 180,415,660 | | | $ | — | | | $ | — | |
| | | | | | | | | | | | | | | | |
| Liabilities | | | | | | | | | | | | | | | | |
Securities Sold Short* | | $ | (52,689,384 | ) | | $ | (52,689,384 | ) | | $ | — | | | $ | — | |
| | | | | | | | | | | | | | | | |
Total Liabilities | | | (52,689,384 | ) | | | (52,689,384 | ) | | | — | | | | — | |
| | | | | | | | | | | | | | | | |
Total | | $ | 127,726,276 | | | $ | 127,726,276 | | | $ | — | | | $ | — | |
| | | | | | | | | | | | | | | | |
| Barings International Fund | | | | | | | | | | | | | | | | |
| Assets | | | | | | | | | | | | | | | | |
Common Stocks | | | | | | | | | | | | | | | | |
China | | $ | 249,916 | | | $ | 249,916 | | | $ | — | | | $ | — | |
France | | | 3,467,564 | | | | 3,467,564 | | | | — | | | | — | |
Germany | | | 4,432,064 | | | | 4,432,064 | | | | — | | | | — | |
Hong Kong | | | 374,569 | | | | 374,569 | | | | — | | | | — | |
Italy | | | 283,179 | | | | 283,179 | | | | — | | | | — | |
Japan | | | 9,037,327 | | | | 9,037,327 | | | | — | | | | — | |
Mexico | | | 241,032 | | | | 241,032 | | | | — | | | | — | |
Netherlands | | | 2,055,432 | | | | 2,055,432 | | | | — | | | | — | |
Norway | | | 769,919 | | | | 769,919 | | | | — | | | | — | |
Russia | | | 743,711 | | | | 743,711 | | | | — | | | | — | |
Singapore | | | 1,170,943 | | | | 1,170,943 | | | | — | | | | — | |
South Korea | | | 454,381 | | | | 454,381 | | | | — | | | | — | |
Sweden | | | 362,377 | | | | 362,377 | | | | — | | | | — | |
Switzerland | | | 3,123,915 | | | | 3,123,915 | | | | — | | | | — | |
Taiwan | | | 449,204 | | | | 449,204 | | | | — | | | | — | |
United Kingdom | | | 9,458,561 | | | | 9,454,076 | | | | — | | | | 4,485 | |
| | | | | | | | | | | | | | | | |
Total Common Stocks | | | 36,674,094 | | | | 36,669,609 | | | | — | | | | 4,485 | |
| | | | | | | | | | | | | | | | |
Investment Company | | | 961,228 | | | | 961,228 | | | | — | | | | — | |
| | | | | | | | | | | | | | | | |
Total | | $ | 37,635,322 | | | $ | 37,630,837 | | | $ | — | | | $ | 4,485 | |
| | | | | | | | | | | | | | | | |
| LMCG Emerging Markets Fund | | | | | | | | | | | | | | | | |
| Assets | | | | | | | | | | | | | | | | |
Investments in Securities* | | $ | 4,002,693 | | | $ | 4,002,693 | | | $ | — | | | $ | — | |
| | | | | | | | | | | | | | | | |
| Harrison Street Real Estate Fund | | | | | | | | | | | | | | | | |
| Assets | | | | | | | | | | | | | | | | |
Investments in Securities* | | $ | 13,575,675 | | | $ | 13,575,675 | | | $ | — | | | $ | — | |
| | | | | | | | | | | | | | | | |
| M&C Balanced Fund | | | | | | | | | | | | | | | | |
| Assets | | | | | | | | | | | | | | | | |
Common Stocks* | | $ | 14,966,275 | | | $ | 14,966,275 | | | $ | — | | | $ | — | |
Corporate Notes and Bonds | | | 5,182,337 | | | | — | | | | 5,182,337 | | | | — | |
U.S. Government and Agency Obligations | | | 3,393,021 | | | | — | | | | 3,393,021 | | | | — | |
Investment Company | | | 721,029 | | | | 721,029 | | | | — | | | | — | |
| | | | | | | | | | | | | | | | |
Total | | $ | 24,262,662 | | | $ | 15,687,304 | | | $ | 8,575,358 | | | $ | — | |
| | | | | | | | | | | | | | | | |
| * | | All Common Stocks and Investment Companies are Level 1. Please refer to the Schedule of Investments for industry, sector or country breakout. |
| | |
| |
| | October 31, 2013 |
| |
| Notes to Financial Statements – continued | | |
At the end of each calendar quarter, management evaluates the Level 2 and 3 assets and liabilities for changes in liquidity, including but not limited to: whether a broker is willing to execute at a quoted price, the depth and consistency of prices from third party services, and the existence of contemporaneous, observable trades in the market. Additionally, management evaluates the Level 1 and 2 assets and liabilities on a quarterly basis for changes in listings or delistings on national exchanges. Due to the inherent uncertainty of determining the fair values of investments that do not have readily available market values, the fair values of the Funds’ investments may fluctuate from period to period. Additionally, the fair values of investments may differ significantly from the values that would have been used had a ready market existed for such investments and may differ materially from the values the Funds may ultimately realize upon the disposition of such investments. Further, such investments may be subject to legal and other restrictions on resale or they may be otherwise less liquid than publicly-traded securities.
Barings International Fund and LMCG Emerging Markets Fund may utilize an external pricing service to fair value certain foreign securities if certain market events occur. Such fair valuations are categorized as Level 2 in the hierarchy. Because such market events were not deemed to have occurred at October 31, 2013, Barings International Fund and LMCG Emerging Markets Fund did not utilize the external pricing service adjustments.
Certain securities that were held at October 31, 2013 and since the beginning of the fiscal year in River Road Dividend All Cap Value Fund, TAMRO Small Cap Fund, River Road Small Cap Value Fund and River Road Independent Value Fund had changes in liquidity assessments which resulted in a transfer between levels. Transfers between Levels, if any, are recognized as of the last day of the fiscal quarter in which the event or change in circumstances that resulted in reclassification occurred.
| | | | | | | | |
Funds | | Transfer from
Level 1 to Level 2 | | | Transfer from
Level 2 to Level 1 | |
| River Road Dividend All Cap Value Fund | | $ | 11,113,008 | | | $ | — | |
| TAMRO Small Cap Fund | | | 20,143,200 | | | | — | |
| River Road Small Cap Value Fund | | | 16,081,021 | | | | 2,820,084 | |
| River Road Independent Value Fund | | | 5,143,561 | | | | — | |
Level 3 holdings were valued using internal valuation techniques that took into consideration factors including previous experience with similar securities of the same issuer, conversion ratio and security terms.
The following is a reconciliation of Level 3 holdings for which significant unobservable inputs were used in determining fair value as of October 31, 2013:
| | | | |
| Barings International Fund | | | Common Stocks | |
| | | | |
Fair Value, beginning of period | | $ | 7,049 | |
Purchases | | | 4,522 | |
Sales | | | (7,005 | ) |
Net realized gains | | | 3 | |
Change in unrealized appreciation (depreciation) | | | (84 | ) |
| | | | |
Fair Value, end of period | | $ | 4,485 | |
| | | | |
Change in net unrealized appreciation (depreciation)
on Level 3 holdings held at end of period | | $ | (37 | ) |
| | | | |
(2) Repurchase Agreements: Each Fund may enter into repurchase agreements with financial institutions deemed to be
creditworthy by the Fund’s Adviser or Subadviser, subject to the
seller’s agreement to repurchase and the Fund’s agreement to sell such securities at a mutually agreed upon price. Securities purchased subject to repurchase agreements are deposited with the Fund’s custodian and, pursuant to the terms of the repurchase agreement, must have an aggregate market value greater than or equal to the repurchase price plus accrued interest at all times. If the value of the underlying securities falls below the value of the repurchase price plus accrued interest, the Fund will require the seller to deposit additional collateral by the next business day. If the request for additional collateral is not met, or the seller defaults on its repurchase obligation, the Fund has the right to sell the underlying securities at market value and may claim any resulting loss against the seller. As of and during the year ended October 31, 2013, the Funds did not hold any repurchase agreements.
(3) When Issued/Delayed Delivery Securities: Each Fund may purchase and sell securities on a “when issued” or “delayed delivery” basis, with settlement to occur at a later date. The value of any security so purchased is subject to market fluctuations during the applicable period. The Funds segregate assets having an aggregate value at least equal to the amount of when issued or delayed delivery purchase commitments until payment is made. During the year ended October 31, 2013, DoubleLine Core Plus Fixed Income Fund and TCH Fixed Income Fund owned delayed delivery securities. At October 31, 2013, only DoubleLine Core Plus Fixed Income Fund owned delayed delivery securities.
(4) Mortgage-Backed Securities: M&C Balanced Fund, DoubleLine Core Plus Fixed Income Fund and TCH Fixed Income Fund may invest in mortgage-backed securities (“MBS”). These securities represent interests in pools of mortgage loans and they provide shareholders with payments consisting of both principal and interest as the mortgages in the underlying mortgage pools are paid. The timely payment of principal and interest on MBS issued or guaranteed by Ginnie Mae (formerly known as the Government National Mortgage Association) is backed by Ginnie Mae and the full faith and credit of the U.S. government. MBS issued by U.S. government agencies or instrumentalities other than Ginnie Mae are not “full faith and credit” obligations. Certain obligations, such as those issued by the Federal Home Loan Banks, Fannie Mae (formerly known as the Federal National Mortgage Association) and Freddie Mac (formerly known as the Federal Home Loan Mortgage Corporation) are supported only by the credit of the issuer. MBS issued by private issuers are not government securities and are not directly guaranteed by any government agency. They are secured by the underlying collateral of the private issuer. Yields on privately issued MBS tend to be higher than those of government-backed issues. However, risk of loss due to default and sensitivity to interest rate fluctuations are also higher. M&C Balanced Fund, DoubleLine Core Plus Fixed Income Fund and TCH Fixed Income Fund may also invest in collateralized mortgage obligations (“CMOs”), collateralized loan obligations (“CLOs”) and real estate mortgage investment conduits (“REMICs”). A CMO and/or REMIC is a bond that is collateralized by a pool of MBS. A CLO is a bond that is collateralized by a financial institution’s receivables from loans. These MBS pools are divided into classes with each class having its own characteristics. The different classes are retired in sequence as the underlying mortgages are repaid.
(5) Securities Sold Short: River Road Long-Short Fund utilizes short sales as part of its overall portfolio management strategy. A short sale involves the sale of a security that is borrowed from a broker or other institution. A gain, limited to the price
| | |
| |
| | October 31, 2013 |
| |
| Notes to Financial Statements – continued | | |
at which the Fund sold the security short, or a loss, unlimited in size, will be recognized upon closing a short sale. Short sales expose the Fund to the risk that it will be required to acquire, convert or exchange securities to replace the borrowed securities at a time when the securities sold short have appreciated in value, thus resulting in a loss to the Fund. The Fund making a short sale must segregate liquid assets, or otherwise cover its position in a permissible manner. The Subadviser determines the liquidity of assets, in accordance with procedures established by the Board of Trustees. Cash segregated for short sales is shown in the Statement of Assets and Liabilities as segregated cash as collateral. Security positions segregated as collateral for short sales are included in the Total Investments on the Statement of Assets and Liabilities.
(6) Options Contracts: In the normal course of pursuing its investment objectives, certain Funds are subject to price volatility risk. Certain Funds may write and/or purchase call and put options on securities for hedging purposes, to seek capital appreciation, to mitigate risk and/or to increase exposure. Writing put options or purchasing call options tends to increase a Fund’s exposure to the underlying instrument. Writing call options or purchasing put options tends to decrease a Fund’s exposure to the underlying instrument. When a Fund writes or purchases a call or put option, an amount equal to the premium received or paid by the Fund is included in a Fund’s Statement of Assets and Liabilities as a liability or an investment and subsequently adjusted to the current market value based on the quoted daily settlement price of the option written or purchased. Premiums received or paid from writing or purchasing options that expire unexercised are treated by the Fund on the expiration date as realized gains or losses. The difference between the premium and the amount paid or received on a closing purchase or sale transaction, including brokerage commissions, is also treated as a realized gain or loss. If an option is exercised, the premium paid or received is added to the cost of the purchase or proceeds from the sale in determining whether the Fund has realized a gain or loss on investment transactions. If the Fund writes a covered call option, the Fund forgoes, in exchange for the premium, the opportunity to profit during the option period from an increase in the market value of the underlying security above the exercise price. If the Fund writes a put option, it accepts the risk of a decline in the market value of the underlying security below the exercise price. There is the risk a Fund may not be able to enter into a closing transaction because of an illiquid market. The risk associated with purchasing put and call options is limited to the premium paid. Options were traded during the period in Anchor Capital Enhanced Equity Fund. See the Schedule of Investments for open options contracts held by Anchor Capital Enhanced Equity Fund at October 31, 2013. For the year ended October 31, 2013, the average* volume of derivative activities were as follows:
| | | | | | | | |
Funds | | Purchased
Options
(Cost) | | | Written
Options
(Premiums Received) | |
| Anchor Capital Enhanced Equity Fund | | $ | 1,450,833 | | | $ | 4,115,673 | |
| * | estimate based on quarter-end holdings |
(7) Forward Foreign Currency Contracts: In the normal course of pursuing their investment objectives, certain Funds are subject to foreign investment and currency risk. Certain Funds may enter
into forward foreign currency contracts (“forward contracts”) for purposes of hedging, duration management, as a substitute for securities, to increase returns, for currency hedging or risk management, or to otherwise help achieve a Fund’s investment goal. These contracts are marked-to-market daily at the applicable exchange rates. A Fund records realized gains or losses at the time the forward contract is closed. A forward contract is extinguished through a closing transaction or upon delivery of the currency or entering an offsetting contract. Risks may arise upon entering these contracts from the potential inability of a counterparty to meet the terms of its contracts and from unanticipated movements in the value of a foreign currency relative to the U.S. dollar or other currencies. During the year ended October 31, 2013, the Funds did not enter into any forward foreign currency contracts.
(8) Disclosures about Derivative Instruments: The following is a table summarizing the fair value of derivatives held at October 31, 2013, by primary risk exposure:
| | | | | | | | |
| | | Asset Derivative
Investments Value | | | Liability Derivative
Investments Value | |
Fund | | Equity
Contracts (a) | | | Equity
Contracts(a) | |
| | | | | | | | |
| Anchor Capital Enhanced Equity Fund | | $ | 301,875 | | | $ | (6,521,330 | ) |
| (a) | Statement of Assets and Liabilities location: Total investments at value for purchased options and call options written, at value for written options. |
The effect of derivative instruments on the Statement of Operations for the year ended October 31, 2013:
| | | | | | | | |
| | | Amount of
Realized Gain (Loss)
on Derivatives | | | Change in Unrealized
Appreciation
(Depreciation)
on Derivatives | |
Fund | | Equity
Contracts(a) | | | Equity
Contracts(b) | |
| Anchor Capital Enhanced Equity Fund | | $ | (23,339,401 | ) | | $ | (833,422 | ) |
| (a) | Statement of Operations location: Net realized loss on purchased options and net realized loss on written option transactions. |
| (b) | Statement of Operations location: Net change in unrealized appreciation (depreciation) on purchased options and net change in unrealized appreciation (depreciation) on written options. |
(9) Investment Income and Securities Transactions: Dividend income is recorded on the ex-dividend date, except for certain dividends from foreign securities where the ex-dividend date may have passed, which are recorded as soon as a Fund is informed of the ex-dividend date. Interest income is accrued daily. Dividend income and interest income are recorded in the Statement of Operations as investment income. Premiums and discounts are amortized or accreted on an effective yield method on fixed income securities. The Funds may be subject to foreign taxes on income, gains on investments, securities transactions or currency repatriation, some of which may be recoverable in part. The Funds will accrue such taxes and reclaims as applicable, based upon their current interpretation of tax rules and regulations that exist in the markets in which the Funds invest. Transactions in securities are accounted for on a trade date basis. The cost of securities sold is determined using the identified cost method for the Fairpointe Mid Cap Fund and first in first out (“FIFO”) method for all other Funds.
| | |
| |
| | October 31, 2013 |
| |
| Notes to Financial Statements – continued | | |
(10) Foreign Currency: Foreign currencies, investments and other assets and liabilities are translated into U.S. dollars at the exchange rates at the close of the regular trading session on the New York Stock Exchange. Fluctuations in the value of the foreign currencies and other assets and liabilities resulting from changes in exchange rates are recorded as unrealized foreign currency gains (losses). Realized gains (losses) and unrealized appreciation (depreciation) on investment securities and income and expenses are translated on the respective dates of such transactions. The effects of changes in foreign currency exchange rates on investments in securities are segregated from the effects of changes in market prices of those securities, and are included with the net realized and net change in unrealized gain or loss on investment securities on the Statement of Operations.
(11) Federal Income Taxes: The Funds have elected to be treated as “regulated investment companies” under Subchapter M of the Internal Revenue Code of 1986, as amended, and to distribute substantially all of their respective net taxable income. Accordingly, no provisions for federal income taxes have been made in the accompanying financial statements. The Funds intend to utilize provisions of the federal income tax laws, which allow them to carry a realized capital loss forward for eight years following the year of the loss and offset such losses against any future realized capital gains.
At October 31, 2013, the following Funds had available realized capital loss carryforwards to offset future net capital gains through the fiscal year ended:
| | | | | | | | | | | | | | | | | | | | | | | | | | | | |
| | | Capital Loss Carryforwards: | |
Fund | | 2014 | | | 2016 | | | 2017 | | | 2018 | | | No Expiration
Short Term* | | | No Expiration
Long Term* | | | Total | |
| | | | | | | | | | | | | | | | | | | | | | | | | | | | |
| M&C Growth Fund | | $ | — | | | $ | — | | | $ | 8,908,833 | | | $ | — | | | $ | — | | | $ | — | | | $ | 8,908,833 | |
| Cornerstone Large Cap Value Fund | | | — | | | | — | | | | 17,809,802 | | | | 6,819,813 | | | | — | | | | — | | | | 24,629,615 | |
| LMCG Small Cap Growth Fund | | | — | | | | 1,684,815 | ** | | | — | | | | — | | | | — | | | | — | | | | 1,684,815 | |
| DoubleLine Core Plus Fixed Income Fund | | | — | | | | — | | | | — | | | | — | | | | 2,919,807 | | | | — | | | | 2,919,807 | |
| TCH Fixed Income Fund | | | 922,672 | | | | 2,654,917 | | | | 1,270,780 | | | | — | | | | — | | | | — | | | | 4,848,369 | |
| Anchor Capital Enhanced Equity Fund | | | — | | | | — | | | | — | | | | — | | | | 1,021,730 | | | | — | | | | 1,021,730 | |
| LMCG Emerging Markets Fund | | | — | | | | — | | | | — | | | | — | | | | 219,304 | | | | — | | | | 219,304 | |
| Harrison Street Real Estate Fund | | | — | | | | 921,876 | | | | 11,228,100 | | | | — | | | | — | | | | — | | | | 12,149,976 | |
| * | On December 22, 2010, the Regulated Investment Company Modernization Act of 2010 (the “Modernization Act”) was signed into law. Under the Modernization Act the Funds are permitted to carry forward capital losses incurred for an unlimited period. However, any losses incurred during those future taxable years will be required to be utilized prior to the losses incurred in pre-enactment taxable years. As a result of this ordering rule, pre-enactment capital loss carryforwards may be more likely to expire unused. Additionally, post-enactment capital losses that are carried forward will retain their character as either short-term or long-term capital losses rather than being considered all short-term as under previous law. |
| ** | This capital loss carryforward amount was acquired in the Reorganization of the Aston Small Cap Fund into the LMCG Small Cap Growth Fund on April 19, 2013 (Note J). The Fund’s ability to utilize the capital loss carryforwards is limited under Internal Revenue Service regulations. |
For the year ended October 31, 2013, the following Funds utilized capital losses as follows:
| | | | | | | | | | | | | | | | | | | | | | | | |
| | | Utilized Capital Losses (with Expiration Year) | |
Fund | | 2014 | | | 2015 | | | 2016 | | | 2017 | | | 2018 | | | 2019 | |
| | | | | | | | | | | | | | | | | | | | | | | | |
| M&C Growth Fund | | $ | — | | | $ | — | | | $ | — | | | $ | 3,189,231 | | | $ | — | | | $ | — | |
| Cornerstone Large Cap Growth Fund | | | — | | | | — | | | | — | | | | 3,455,486 | | | | — | | | | — | |
| LMCG Small Cap Growth Fund | | | — | | | | — | | | | 300,036 | | | | — | | | | — | | | | — | |
| TCH Fixed Income Fund | | | 1,409,078 | | | | — | | | | — | | | | — | | | | — | | | | — | |
| Lake Partners LASSO Alternatives Fund | | | — | | | | — | | | | — | | | | — | | | | — | | | | 4,140,503 | |
| Harrison Street Real Estate Fund | | | — | | | | — | | | | 1,027,495 | | | | — | | | | — | | | | — | |
| M&C Balanced Fund | | | — | | | | — | | | | — | | | | 1,726,376 | | | | — | | | | — | |
For the year ended October 31, 2013, the following Fund had capital losses that expired:
| | | | |
Fund | | Expired
Capital Losses | |
| | | | |
| LMCG Small Cap Growth Fund | | $ | 13,089,501 | |
Under current laws, certain capital losses realized after October 31 may be deferred (and certain ordinary losses after January 1st may be deferred) and treated as occurring on the first day of the following fiscal year. For the fiscal year ended October 31, 2013, the Funds elected to defer the following losses incurred from November 1, 2012 through October 31, 2013:
| | | | | | | | | | |
| | | Long-Term
Realized
Capital Losses | | | Short-Term
Realized
Capital Losses | | | Late-Year
Ordinary
Losses |
| | | | | | | | | | |
| TAMRO Small Cap Fund | | $ | — | | | $ | — | | | $56,283 |
| | |
| |
| | October 31, 2013 |
| |
| Notes to Financial Statements – continued | | |
Management has analyzed the Funds’ tax positions for all open tax years (current and prior three tax years), as well as potential exposure to foreign capital gains withholding taxes, and has concluded that no provision for federal, state, or international income tax is required in the Funds’ financial statements. The Funds’ federal income and excise tax returns for tax years for which the applicable statutes of limitations have not expired are subject to examination by the Internal Revenue Service.
(12) Multi-Class Operations: Each class offered by a Fund that is authorized to offer multiple classes of shares has equal rights as to the Fund’s net assets.
Income, fund and trust level expenses, and realized and unrealized capital gains and losses, if any, are allocated to each class of shares based on the relative net assets of each class. Class specific expenses are allocated to each class.
(13) Offering Costs: Certain costs were incurred in connection with the offering of the following Funds, as disclosed in the table below. The costs associated have been capitalized and are being amortized on a straight-line basis over twelve months based on the commencement date of the Funds, stated below.
| | | | | | | | |
Fund | | Commencement Date | | | Original
Offering Costs | |
| River Road Dividend All Cap Value Fund II | | | June 27, 2012 | | | $ | 57,711 | |
| Silvercrest Small Cap Fund | | | December 27, 2011 | | | | 63,821 | |
| LMCG Emerging Markets Fund | | | March 28, 2013 | | | | 72,373 | |
(14) Use of Estimates: The preparation of financial statements in conformity with U.S. GAAP requires management to make estimates and assumptions that affect the reported amounts of assets and liabilities and disclosure of contingent assets and liabilities at the date of the financial statements and the reported amounts of revenues and expenses during the reporting period. Actual results could differ from those estimates.
(15) Commitments and Contingencies: In the normal course of business, the Trust enters into contracts on behalf of the Funds that contain a variety of provisions for general indemnifications. Each Fund’s maximum exposure under these arrangements is unknown, as this would involve future claims that may be made against each Fund that are not known at this time. However, based on experience, the Funds believe the risk of loss is remote.
(16) Recent Accounting Pronouncements: In December 2011, the Financial Accounting Standards Board (the “FASB”) issued ASU No. 2011-11, Disclosures about Offsetting Assets and Liabilities. ASU 2011-11 requires disclosures to make financial statements that are prepared under U.S. GAAP more comparable to those prepared under the International Financial Reporting Standards (“IFRS”). The new disclosure requirements mandate that entities disclose both gross and net information about instruments and transactions eligible for offset in the Statement of Assets and Liabilities as well as instruments and transactions subject to an agreement similar to a master netting arrangement. In addition, ASU 2011-11 requires disclosure of collateral received and
posted in connection with master netting agreements or similar arrangements. In January 2013, the FASB issued ASU No. 2013-01, “Clarifying the Scope of Disclosures about Offsetting Assets and Liabilities.” This update limits the scope of ASU No. 2011-11 to derivatives, repurchase agreements, reverse repurchase agreements, securities borrowing and securities lending transactions that are either offset in the Statement of Assets and Liabilities or subject to an enforceable master netting arrangement or similar agreement. New disclosures are required for annual reporting periods beginning on or after January 1, 2013, and interim periods within those annual periods. The Funds have adopted ASU No. 2013-01. The adoption of the pronouncement did not have an effect on the Funds’ financial statements as of October 31, 2013.
Note (C) Dividends from Net Investment Income and Distributions of Capital Gains: Dividends and distributions to shareholders are recorded on the ex-dividend date. River Road Dividend All Cap Value Fund, River Road Dividend All Cap Value Fund II, DoubleLine Core Plus Fixed Income Fund and TCH Fixed Income Fund distribute dividends from net investment income to shareholders monthly and net realized gains from investment transactions, if any, are generally distributed annually, usually in December.
Anchor Capital Enhanced Equity Fund and M&C Balanced Fund distribute dividends from net investment income to shareholders quarterly and net realized gains from investment transactions, if any, are generally distributed annually, usually in December.
The following Funds distribute dividends from net investment income to shareholders annually and net realized gains from investment transactions, if any, are generally distributed annually, usually in December: M&C Growth Fund, TAMRO Diversified Equity Fund, Herndon Large Cap Value Fund, Cornerstone Large Cap Value Fund, Fairpointe Mid Cap Fund, M&C Mid Cap Growth Fund, LMCG Small Cap Growth Fund, Silvercrest Small Cap Fund, TAMRO Small Cap Fund, River Road Select Value Fund, River Road Small Cap Value Fund, River Road Independent Value Fund, Lake Partners LASSO Alternatives Fund, River Road Long-Short Fund, Barings International Fund, LMCG Emerging Markets Fund and Harrison Street Real Estate Fund.
Dividends and distributions are automatically reinvested in additional Fund shares on ex-date at that day’s ending NAV for the respective Fund for those shareholders who have elected the reinvestment option.
Differences in dividends per share between classes of the following Funds are due to different class expenses: M&C Growth Fund, TAMRO Diversified Equity Fund, Herndon Large Cap Value Fund, Cornerstone Large Cap Value Fund, River Road Dividend All Cap Value Fund, River Road Dividend All Cap Value Fund II, Fairpointe Mid Cap Fund, LMCG Small Cap Growth Fund, Silvercrest Small Cap Fund, TAMRO Small Cap Fund, River Road Select Value Fund, River Road Small Cap Value Fund, River Road Independent Value Fund, DoubleLine Core Plus Fixed Income Fund, TCH Fixed Income Fund, Lake Partners LASSO Alternatives Fund, Anchor Capital Enhanced Equity
| | |
| |
| | October 31, 2013 |
| |
| Notes to Financial Statements – continued | | |
Fund, River Road Long-Short Fund, Barings International Fund, LMCG Emerging Markets Fund, Harrison Street Real Estate Fund and M&C Balanced Fund.
Net investment income and realized gains and losses for federal income tax purposes may differ from those reported on the financial statements because of temporary and permanent book and tax basis differences. Permanent differences, such as redesignation of dividends paid, partnership reclasses, disallowed expenses, reclass of short-term gain to ordinary income, write off of capital loss carryovers, merger reclasses, in-kind distribution for redemptions, adjustment for Real Estate Investment Trusts, return of capital adjustments, premium reversals, paydown reclasses, undistributed capital gains received, passive foreign investment company reclasses, foreign currency reclasses, and
net operating loss reclasses are reclassified among capital accounts in the financial statements to reflect their character. Temporary differences, such as deferrals on losses relating to wash sales transactions, amortization of offering costs, premium amortization, current year dividends payable, passive foreign investment company adjustments and capital loss carryovers, arise when income, expenses, gains or losses are recognized in different periods for financial statement and tax purposes; these differences will reverse at some time in the future.
Permanent differences between book and tax basis reporting for the 2013 fiscal year have been identified and appropriately reclassified as indicated below. These reclassifications have no impact on net assets.
| | | | | | | | | | | | |
| | | Accumulated
Undistributed Net
Investment Income | | | Accumulated Net
Realized Gain (Loss) | | | Paid in Capital | |
| | | | | | | | | | | | |
| M&C Growth Fund | | $ | 4,220 | | | $ | (4,220 | ) | | $ | — | |
| River Road Dividend All Cap Value Fund | | | (3,223,990 | ) | | | 3,223,990 | | | | — | |
| River Road Dividend All Cap Value Fund II | | | 16,539 | | | | 8,437 | | | | (24,976 | ) |
| Fairpointe Mid Cap Fund | | | (606 | ) | | | 606 | | | | — | |
| M&C Mid Cap Growth Fund | | | 108,901 | | | | (108,901 | ) | | | — | |
| LMCG Small Cap Growth Fund | | | — | | | | (2,001,622 | ) | | | 2,001,622 | |
| Silvercrest Small Cap Fund | | | 5,495 | | | | — | | | | (5,495 | ) |
| TAMRO Small Cap Fund | | | — | | | | (8,394,374 | ) | | | 8,394,374 | |
| River Road Select Value Fund | | | (32,509 | ) | | | 37,263 | | | | (4,754 | ) |
| River Road Small Cap Value Fund | | | (29,291 | ) | | | 37,797 | | | | (8,506 | ) |
| River Road Independent Value Fund | | | 3,292,810 | | | | (3,292,810 | ) | | | — | |
| DoubleLine Core Plus Fixed Income Fund | | | 868,270 | | | | (868,270 | ) | | | — | |
| TCH Fixed Income Fund | | | 245,931 | | | | (245,931 | ) | | | — | |
| Lake Partners LASSO Alternatives Fund | | | 2,908,574 | | | | (2,908,574 | ) | | | — | |
| Anchor Capital Enhanced Equity Fund | | | 77 | | | | (77 | ) | | | — | |
| River Road Long-Short Fund | | | 811,764 | | | | (811,764 | ) | | | — | |
| Barings International Fund | | | (4,859 | ) | | | 4,600 | | | | 259 | |
| LMCG Emerging Markets Fund | | | 4,681 | | | | 9,824 | | | | (14,505 | ) |
| Harrison Street Real Estate Fund | | | 173 | | | | (173 | ) | | | — | |
| M&C Balanced Fund | | | 110,676 | | | | (110,676 | ) | | | — | |
Distributions from net realized gains for book purposes may include short-term capital gains, which are classified as ordinary income for tax purposes.
The tax character of distributions paid during the fiscal years ended 2013 and 2012 was as follows:
| | | | | | | | | | | | | | | | |
| | | Distributions Paid in 2013 | | | Distributions Paid in 2012 | |
| | | Ordinary Income | | | Long-Term
Capital Gains | | | Ordinary Income | | | Long-Term
Capital Gains | |
| | | | | | | | | | | | | | | | |
| M&C Growth Fund | | $ | 53,175,678 | | | $ | 275,103,427 | | | $ | 22,081,432 | | | $ | 257,690,139 | |
| TAMRO Diversified Equity Fund | | | 47,422 | | | | 25,803 | | | | — | | | | 473,355 | |
| Herndon Large Cap Value Fund | | | 2,225,740 | | | | 4,982 | | | | 1,044,862 | | | | 124,149 | |
| Cornerstone Large Cap Value Fund | | | 275,360 | | | | — | | | | 110,939 | | | | — | |
| River Road Dividend All Cap Value Fund | | | 31,709,319 | | | | 26,566,474 | | | | 22,890,654 | | | | 4,651,009 | |
| River Road Dividend All Cap Value Fund II | | | 964,010 | | | | — | | | | 42,004 | | | | — | |
| Fairpointe Mid Cap Fund | | | 33,005,046 | | | | 66,057,903 | | | | 8,163,228 | | | | 18,767,770 | |
| M&C Mid Cap Growth Fund | | | — | | | | 92,399 | | | | — | | | | — | |
| LMCG Small Cap Growth Fund | | | 436,931 | | | | 47,268 | | | | — | | | | — | |
| Silvercrest Small Cap Fund | | | 110,190 | | | | 717 | | | | — | | | | — | |
| TAMRO Small Cap Fund | | | 18,818,417 | | | | 76,987,885 | | | | — | | | | 97,192,931 | |
| River Road Select Value Fund | | | 3,212,685 | | | | 8,700,481 | | | | 1,196,413 | | | | 28,132,801 | |
| River Road Small Cap Value Fund | | | 5,316,856 | | | | 9,066,179 | | | | — | | | | — | |
| River Road Independent Value Fund | | | 39,553,086 | | | | — | | | | 5,597,522 | | | | 100,643 | |
| DoubleLine Core Plus Fixed Income Fund | | | 8,127,489 | | | | 22,764 | | | | 3,389,167 | | | | — | |
| TCH Fixed Income Fund | | | 2,721,001 | | | | — | | | | 3,234,814 | | | | — | |
| Lake Partners LASSO Alternatives Fund | | | 4,205,294 | | | | — | | | | 3,680,936 | | | | — | |
| Anchor Capital Enhanced Equity Fund | | | 5,860,687 | | | | 556,618 | | | | 12,244,228 | | | | 2,409,141 | |
| River Road Long-Short Fund | | | 415,810 | | | | 21,761 | | | | — | | | | — | |
| Barings International Fund | | | 1,201,521 | | | | 550,401 | | | | 509,770 | | | | 1,380,720 | |
| Harrison Street Real Estate Fund | | | 165,004 | | | | — | | | | 47,575 | | | | — | |
| M&C Balanced Fund | | | 366,801 | | | | — | | | | 331,475 | | | | — | |
| | |
| |
| | October 31, 2013 |
| |
| Notes to Financial Statements – continued | | |
As of October 31, 2013, the most recent tax year end, the components of distributable earnings on a tax basis were as follows:
| | | | | | | | | | | | | | | | | | | | |
| | | | | | | | | | | | | | | | | | | | |
| | | Accumulated
Capital and
Other Losses | | | Undistributed
Ordinary Income | | | Undistributed
Long-Term Gain | | | Unrealized
Appreciation
(Depreciation) | | | Total | |
| M&C Growth Fund | | $ | (8,908,833 | ) | | $ | 38,528,779 | | | $ | 341,917,731 | | | $ | 1,023,840,776 | | | $ | 1,395,378,453 | |
| TAMRO Diversified Equity Fund | | | — | | | | 14,401 | | | | 1,631,267 | | | | 10,005,089 | | | | 11,650,757 | |
| Herndon Large Cap Value Fund | | | — | | | | 3,040,210 | | | | 6,009 | | | | 14,830,184 | | | | 17,876,403 | |
| Cornerstone Large Cap Value Fund | | | (24,629,615 | ) | | | 194,302 | | | | — | | | | 6,743,238 | | | | (17,692,075 | ) |
| River Road Dividend All Cap Value Fund | | | — | | | | 8,243,688 | | | | 64,849,047 | | | | 253,141,279 | | | | 326,234,014 | |
| River Road Dividend All Cap Value Fund II | | | — | | | | 1,061,195 | | | | 86,668 | | | | 9,133,055 | | | | 10,280,918 | |
| Fairpointe Mid Cap Fund | | | — | | | | 1,616,865 | | | | 458,042,243 | | | | 1,351,306,933 | | | | 1,810,966,041 | |
| M&C Mid Cap Growth Fund | | | — | | | | 26,432 | | | | 1,654,448 | | | | 1,741,365 | | | | 3,422,245 | |
| LMCG Small Cap Growth Fund | | | (1,684,815 | ) | | | 4,567,509 | | | | 960,053 | | | | 2,124,807 | | | | 5,967,554 | |
| Silvercrest Small Cap Fund | | | — | | | | 677,353 | | | | 562,115 | | | | 4,502,700 | | | | 5,742,168 | |
| TAMRO Small Cap Fund | | | (56,283 | ) | | | — | | | | 114,044,766 | | | | 358,481,339 | | | | 472,469,822 | |
| River Road Select Value Fund | | | — | | | | 4,930,269 | | | | 26,823,530 | | | | 36,277,221 | | | | 68,031,020 | |
| River Road Small Cap Value Fund | | | — | | | | 10,535,946 | | | | 56,871,739 | | | | 81,975,774 | | | | 149,383,459 | |
| River Road Independent Value Fund | | | — | | | | 27,424,159 | | | | 832,772 | | | | 18,785,696 | | | | 47,042,627 | |
| DoubleLine Core Plus Fixed Income Fund | | | (2,919,807 | ) | | | 97,083 | | | | — | | | | (1,108,072 | ) | | | (3,930,796 | ) |
| TCH Fixed Income Fund | | | (4,848,369 | ) | | | 15,970 | | | | — | | | | 3,134,329 | | | | (1,698,070 | ) |
| Lake Partners LASSO Alternatives Fund | | | — | | | | 210,610 | | | | 1,588,681 | | | | 27,785,787 | | | | 29,585,078 | |
| Anchor Capital Enhanced Equity Fund | | | (1,021,730 | ) | | | 141,432 | | | | — | | | | 6,270,854 | | | | 5,390,556 | |
| River Road Long-Short Fund | | | — | | | | 4,908,263 | | | | 28,009 | | | | 5,719,566 | | | | 10,655,838 | |
| Barings International Fund | | | — | | | | 2,456,896 | | | | 943,531 | | | | 5,098,098 | | | | 8,498,525 | |
| LMCG Emerging Markets Fund | | | (219,304 | ) | | | 48,938 | | | | — | | | | 77,545 | | | | (92,821 | ) |
| Harrison Street Real Estate Fund | | | (12,149,976 | ) | | | 147,489 | | | | — | | | | (30,626 | ) | | | (12,033,113 | ) |
| M&C Balanced Fund | | | — | | | | 24,140 | | | | 740,661 | | | | 2,998,604 | | | | 3,763,405 | |
Note (D) Shares of Beneficial Interest: Each Fund is authorized to issue an unlimited number of shares of beneficial interest with no par value. Share transactions of the Funds were as follows:
Year Ended October 31, 2013
| | | | | | | | | | | | | | | | |
Class N | | Sold | | | Proceeds From
Reinvestment
of Distributions | | | Redeemed | | | Net Increase
(Decrease) in
Shares Outstanding | |
| M&C Growth Fund | | | 15,308,565 | | | | 5,984,433 | | | | (20,341,948 | ) | | | 951,050 | |
| TAMRO Diversified Equity Fund | | | 272,293 | | | | 5,056 | | | | (303,307 | ) | | | (25,958 | ) |
| Herndon Large Cap Value Fund | | | 1,724,473 | | | | 77,295 | | | | (553,437 | ) | | | 1,248,331 | |
| Cornerstone Large Cap Value Fund | | | 556,632 | | | | 18,800 | | | | (747,212 | ) | | | (171,780 | ) |
| River Road Dividend All Cap Value Fund | | | 5,156,129 | | | | 1,828,175 | | | | (3,861,426 | ) | | | 3,122,878 | |
| River Road Dividend All Cap Value Fund II | | | 254,219 | | | | 3,387 | | | | (76,152 | ) | | | 181,454 | |
| Fairpointe Mid Cap Fund | | | 18,070,132 | | | | 1,435,859 | | | | (14,913,034 | ) | | | 4,592,957 | |
| M&C Mid Cap Growth Fund | | | 597,270 | | | | 7,828 | | | | (423,852 | ) | | | 181,246 | |
| LMCG Small Cap Growth Fund | | | 2,004,046 | | | | 38,933 | | | | (359,721 | ) | | | 1,683,258 | |
| Silvercrest Small Cap Fund | | | 314,297 | | | | 1,162 | | | | (105,758 | ) | | | 209,701 | |
| TAMRO Small Cap Fund | | | 6,816,406 | | | | 1,892,026 | | | | (5,489,343 | ) | | | 3,219,089 | |
| River Road Select Value Fund | | | 1,588,871 | | | | 56,761 | | | | (525,762 | ) | | | 1,119,870 | |
| River Road Small Cap Value Fund | | | 544,887 | | | | 169,935 | | | | (1,009,533 | ) | | | (294,711 | ) |
| River Road Independent Value Fund | | | 11,980,826 | | | | 1,889,378 | | | | (16,056,650 | ) | | | (2,186,446 | ) |
| DoubleLine Core Plus Fixed Income Fund | | | 4,823,072 | | | | 292,494 | | | | (5,329,639 | ) | | | (214,073 | ) |
| TCH Fixed Income Fund | | | 953,216 | | | | 201,498 | | | | (2,241,661 | ) | | | (1,086,947 | ) |
| Lake Partners LASSO Alternatives Fund | | | 4,155,866 | | | | 36,352 | | | | (2,837,160 | ) | | | 1,355,058 | |
| Anchor Capital Enhanced Equity Fund | | | 4,989,293 | | | | 427,532 | | | | (6,819,244 | ) | | | (1,402,419 | ) |
| River Road Long-Short Fund | | | 9,748,334 | | | | 42,565 | | | | (1,427,562 | ) | | | 8,363,337 | |
| Barings International Fund | | | 2,509 | | | | 1,555 | | | | (4,238 | ) | | | (174 | ) |
| LMCG Emerging Markets Fund (a) | | | 69,890 | | | | — | | | | — | | | | 69,890 | |
| Harrison Street Real Estate Fund | | | 926,494 | | | | 14,559 | | | | (770,368 | ) | | | 170,685 | |
| M&C Balanced Fund | | | 112,753 | | | | 15,050 | | | | (655,765 | ) | | | (527,962 | ) |
| (a) | LMCG Emerging Markets Fund began issuing Class N shares on March 27, 2013. |
| | |
| |
| | October 31, 2013 |
| |
| Notes to Financial Statements – continued | | |
| | | | | | | | | | | | | | | | |
Class I | | Sold | | | Proceeds From
Reinvestment
of Distributions | | | Redeemed | | | Net Increase
(Decrease) in
Shares Outstanding | |
M&C Growth Fund | | | 31,773,722 | | | | 5,907,893 | | | | (27,016,572 | ) | | | 10,665,043 | |
TAMRO Diversified Equity Fund | | | 1,954,469 | | | | 251 | | | | (275,939 | ) | | | 1,678,781 | |
Herndon Large Cap Value Fund | | | 3,369,141 | | | | 85,484 | | | | (592,116 | ) | | | 2,862,509 | |
Cornerstone Large Cap Value Fund | | | 2,506,727 | | | | 5,555 | | | | (188,320 | ) | | | 2,323,962 | |
River Road Dividend All Cap Value Fund | | | 15,887,474 | | | | 2,343,933 | | | | (12,706,308 | ) | | | 5,525,099 | |
River Road Dividend All Cap Value Fund II | | | 6,086,481 | | | | 70,708 | | | | (364,705 | ) | | | 5,792,484 | |
Fairpointe Mid Cap Fund | | | 23,358,073 | | | | 1,027,797 | | | | (13,678,107 | ) | | | 10,707,763 | |
LMCG Small Cap Growth Fund | | | 595,578 | | | | 5,342 | | | | (92,943 | ) | | | 507,977 | |
Sillvercrest Small Cap Fund | | | 1,662,372 | | | | 8,931 | | | | (122,970 | ) | | | 1,548,333 | |
TAMRO Small Cap Fund (a) | | | 8,715,782 | | | | 2,234,145 | | | | (9,190,853 | ) | | | 1,759,074 | |
River Road Select Value Fund | | | 6,134,305 | | | | 1,237,782 | | | | (6,524,564 | ) | | | 847,523 | |
River Road Small Cap Value Fund | | | 3,987,576 | | | | 913,112 | | | | (7,768,151 | ) | | | (2,867,463 | ) |
River Road Independent Value Fund (b) | | | 11,939,790 | | | | 1,729,407 | | | | (9,727,757 | ) | | | 3,941,440 | |
DoubleLine Core Plus Fixed Income Fund | | | 5,482,743 | | | | 397,260 | | | | (5,039,350 | ) | | | 840,653 | |
TCH Fixed Income Fund | | | 116,289 | | | | 35,075 | | | | (267,227 | ) | | | (115,863 | ) |
Lake Partners LASSO Alternatives Fund | | | 16,747,896 | | | | 259,746 | | | | (6,288,030 | ) | | | 10,719,612 | |
Anchor Capital Enhanced Equity Fund | | | 4,030,307 | | | | 220,773 | | | | (6,308,808 | ) | | | (2,057,728 | ) |
| River Road Long-Short Fund (c) | | | 6,329,701 | | | | — | | | | (420,651 | ) | | | 5,909,050 | |
Barings International Fund | | | 1,521,858 | | | | 224,097 | | | | (5,907,075 | ) | | | (4,161,120 | ) |
LMCG Emerging Markets Fund (d) | | | 341,891 | | | | — | | | | — | | | | 341,891 | |
Harrison Street Real Estate Fund | | | 33,502 | | | | 181 | | | | (2,189 | ) | | | 31,494 | |
M&C Balanced Fund | | | 6,701 | | | | 473 | | | | (19,931 | ) | | | (12,757 | ) |
| (a) | TAMRO Small Cap Fund had a subscription-in-kind in the amount of $2,677,538 on April 25, 2013. The subscription was comprised of securities, cash and dividends accrued in the amounts of $2,657,373, $19,712 and $453, respectively. The Fund also had a redemption-in-kind in the amount of $52,573,290 on January 15, 2013. The redemption was comprised of securities and cash in the amounts of $51,794,423 and $778,867, respectively. |
| (b) | River Road Independent Value Fund had a subscription-in-kind in the amount of $597,548 on March 27, 2013. The subscription was comprised of securities, cash and dividends accrued in the amounts of $258,478, $338,808 and $262, respectively. |
| (c) | The inception date for the River Road Long-Short Fund Class I shares is March 4, 2013. |
| (d) | The inception date for the LMCG Emerging Markets Fund Class I shares is March 28, 2013. |
| | | | | | | | | | | | | | | | |
Class R | | Sold | | | Proceeds From
Reinvestment of
Distributions | | | Redeemed | | | Net
Increase in
Shares Outstanding | |
| M&C Growth Fund | | | 83,728 | | | | 21,706 | | | | (99,541 | ) | | | 5,893 | |
Year Ended October 31, 2012
| | | | | | | | | | | | | | | | |
Class N | | Sold | | | Proceeds From
Reinvestment
of Distributions | | | Redeemed | | | Net Increase
(Decrease) in
Shares Outstanding | |
| M&C Growth Fund | | | 18,041,363 | | | | 5,664,499 | | | | (16,394,064 | ) | | | 7,311,798 | |
| TAMRO Diversified Equity Fund | | | 210,627 | | | | 38,289 | | | | (597,734 | ) | | | (348,818 | ) |
| Herndon Large Cap Value Fund | | | 1,664,603 | | | | 39,719 | | | | (466,689 | ) | | | 1,237,633 | |
| Cornerstone Large Cap Value Fund | | | 574,279 | | | | 10,721 | | | | (1,126,860 | ) | | | (541,860 | ) |
| River Road Dividend All Cap Value Fund | | | 10,262,549 | | | | 985,104 | | | | (10,485,646 | ) | | | 762,007 | |
| River Road Dividend All Cap Value Fund II (a) | | | 100,138 | | | | 373 | | | | (40 | ) | | | 100,471 | |
| Fairpointe Mid Cap Fund | | | 13,920,692 | | | | 417,341 | | | | (17,204,213 | ) | | | (2,866,180 | ) |
| M&C Mid Cap Growth Fund | | | 296,901 | | | | — | | | | (49,540 | ) | | | 247,361 | |
| LMCG Small Cap Growth Fund | | | 94,914 | | | | — | | | | (143,050 | ) | | | (48,136 | ) |
| Silvercrest Small Cap Fund (b) | | | 69,067 | | | | — | | | | (306 | ) | | | 68,761 | |
| TAMRO Small Cap Fund | | | 4,990,377 | | | | 1,982,107 | | | | (6,291,677 | ) | | | 680,807 | |
| River Road Select Value Fund | | | 248,746 | | | | 332,250 | | | | (1,222,289 | ) | | | (641,293 | ) |
| River Road Small Cap Value Fund | | | 862,257 | | | | — | | | | (4,725,116 | ) | | | (3,862,859 | ) |
| River Road Independent Value Fund | | | 18,469,468 | | | | 339,193 | | | | (15,564,710 | ) | | | 3,243,951 | |
| DoubleLine Core Plus Fixed Income Fund | | | 6,542,470 | | | | 124,012 | | | | (2,391,890 | ) | | | 4,274,592 | |
| TCH Fixed Income Fund | | | 1,111,218 | | | | 245,495 | | | | (1,865,034 | ) | | | (508,321 | ) |
| Lake Partners LASSO Alternatives Fund | | | 1,713,847 | | | | 21,588 | | | | (489,123 | ) | | | 1,246,312 | |
| Anchor Capital Enhanced Equity Fund | | | 10,363,817 | | | | 763,094 | | | | (3,930,442 | ) | | | 7,196,469 | |
| River Road Long-Short Fund | | | 290,834 | | | | — | | | | (54,850 | ) | | | 235,984 | |
| Barings International Fund | | | 1,673 | | | | 1,945 | | | | (43 | ) | | | 3,575 | |
| Harrison Street Real Estate Fund | | | 621,290 | | | | 4,957 | | | | (337,947 | ) | | | 288,300 | |
| M&C Balanced Fund | | | 584,267 | | | | 14,308 | | | | (289,262 | ) | | | 309,313 | |
| (a) | The inception date for the River Road Dividend All Cap Value Fund II Class N shares is June 27, 2012. |
| (b) | The inception date for the Silvercrest Small Cap Fund Class N shares is December 27, 2011. |
| | |
| |
| | October 31, 2013 |
| |
| Notes to Financial Statements – continued | | |
| | | | | | | | | | | | | | | | |
Class I | | Sold | | | Proceeds From
Reinvestment
of Distributions | | | Redeemed | | | Net Increase
(Decrease) in
Shares Outstanding | |
| M&C Growth Fund | | | 43,042,995 | | | | 4,364,756 | | | | (23,294,443 | ) | | | 24,113,308 | |
| TAMRO Diversified Equity Fund (a) | | | 44,338 | | | | — | | | | (2,319 | ) | | | 42,019 | |
| Herndon Large Cap Value Fund | | | 2,306,966 | | | | 73,629 | | | | (485,691 | ) | | | 1,894,904 | |
| Cornerstone Large Cap Value Fund | | | 485,538 | | | | 58 | | | | (10,500 | ) | | | 475,096 | |
| River Road Dividend All Cap Value Fund | | | 24,480,603 | | | | 1,049,359 | | | | (5,161,671 | ) | | | 20,368,291 | |
| River Road Dividend All Cap Value Fund II (b) | | | 894,279 | | | | 3,478 | | | | (952 | ) | | | 896,805 | |
| Fairpointe Mid Cap Fund (c) | | | 20,254,334 | | | | 327,743 | | | | (20,929,526 | ) | | | (347,449 | ) |
| LMCG Small Cap Growth Fund (d) | | | 25,824 | | | | — | | | | (215,934 | ) | | | (190,110 | ) |
| Silvercrest Small Cap Fund (e) (f) | | | 694,135 | | | | — | | | | (240,046 | ) | | | 454,089 | |
| TAMRO Small Cap Fund (g) | | | 7,501,659 | | | | 2,242,345 | | | | (9,314,452 | ) | | | 429,552 | |
| River Road Select Value Fund | | | 6,030,361 | | | | 2,982,288 | | | | (4,372,992 | ) | | | 4,639,657 | |
| River Road Small Cap Value Fund | | | 3,570,354 | | | | — | | | | (6,081,336 | ) | | | (2,510,982 | ) |
| River Road Independent Value Fund | | | 25,305,662 | | | | 189,732 | | | | (3,918,323 | ) | | | 21,577,071 | |
| DoubleLine Core Plus Fixed Income Fund | | | 9,567,318 | | | | 177,202 | | | | (684,564 | ) | | | 9,059,956 | |
| TCH Fixed Income Fund | | | 308,748 | | | | 35,661 | | | | (393,122 | ) | | | (48,713 | ) |
| Lake Partners LASSO Alternatives Fund | | | 8,580,923 | | | | 148,112 | | | | (4,201,794 | ) | | | 4,527,241 | |
| Anchor Capital Enhanced Equity Fund | | | 4,796,811 | | | | 678,182 | | | | (3,978,006 | ) | | | 1,496,987 | |
| Barings International Fund | | | 2,684,137 | | | | 187,976 | | | | (1,593,922 | ) | | | 1,278,191 | |
| Harrison Street Real Estate Fund (h) | | | 20,224 | | | | 61 | | | | (3,696,962 | ) | | | (3,676,677 | ) |
| M&C Balanced Fund | | | 30,540 | | | | 428 | | | | (11,383 | ) | | | 19,585 | |
| (a) | The inception date for the TAMRO Diversified Equity Fund Class I shares is March 2, 2012. |
| (b) | The inception date for the River Road Dividend All Cap Value Fund II Class I shares is June 27, 2012. |
| (c) | Fairpointe Mid Cap Fund had a redemption-in-kind in the amount of $38,722,763 on January 13, 2012. The redemption was comprised of securities and cash in the amounts of $38,179,960 and $542,803, respectively. |
| (d) | LMCG Small Cap Growth Fund had a redemption-in-kind in the amount of $2,554,395 on September 25, 2012. The redemption was comprised of securities and cash in the amounts of $2,419,219 and $135,175, respectively. |
| (e) | The inception date for the Silvercrest Small Cap Fund Class I shares is December 27, 2011. |
| (f) | Silvercrest Small Cap Fund had a redemption-in-kind in the amount of $2,608,977 on April 26, 2012. The redemption was comprised of securities and cash in the amounts of $2,579,146 and $29,831, respectively. |
| (g) | TAMRO Small Cap Fund had redemptions-in-kind in the amounts of $40,667,980 on May 1, 2012 and $7,010,475 on June 27, 2012. The May 1, 2012 redemption was comprised of securities and cash in the amounts of $39,335,174 and $6,762,586, respectively and the June 27, 2012 redemption was comprised of securities and cash in the amounts of $1,332,806 and $247,889, respectively. |
| (h) | Harrison Street Real Estate Fund had a redemption-in-kind in the amount of $31,399,368 on December 2, 2011. The redemption was comprised of securities and cash in the amounts of $30,913,574 and $485,794, respectively. |
| | | | | | | | | | | | | | | | |
Class R | | Sold | | | Proceeds From
Reinvestment of
Distributions | | | Redeemed | | | Net
Decrease in
Shares Outstanding | |
| M&C Growth Fund | | | 100,372 | | | | 23,324 | | | | (127,056 | ) | | | (3,360 | ) |
Note (E) Investment Transactions: Aggregate purchases and proceeds from sales and maturities of investment securities (other than short-term investments) for the year ended October 31, 2013 were as follows:
| | | | | | | | | | | | | | | | |
| | | Aggregate Purchases | | | Proceeds from Sales | |
| | | U.S. Government | | | Other | | | U.S. Government | | | Other | |
| M&C Growth Fund | | $ | — | | | $ | 2,469,955,015 | | | $ | — | | | $ | 2,306,385,133 | |
| TAMRO Diversified Equity Fund | | | — | | | | 55,496,778 | | | | — | | | | 29,652,776 | |
| Herndon Large Cap Value Fund | | | — | | | | 105,094,113 | | | | — | | | | 58,100,728 | |
| Cornerstone Large Cap Value Fund | | | — | | | | 48,493,163 | | | | — | | | | 23,159,053 | |
| River Road Dividend All Cap Value Fund | | | — | | | | 426,579,777 | | | | — | | | | 360,221,839 | |
| River Road Dividend All Cap Value Fund II | | | — | | | | 79,613,228 | | | | — | | | | 12,611,096 | |
| Fairpointe Mid Cap Fund | | | — | | | | 1,882,507,879 | | | | — | | | | 1,380,665,203 | |
| M&C Mid Cap Growth Fund | | | — | | | | 9,935,890 | | | | — | | | | 8,669,937 | |
| LMCG Small Cap Growth Fund (a) | | | — | | | | 46,520,832 | | | | — | | | | 41,333,057 | |
| Silvercrest Small Cap Fund | | | — | | | | 28,332,063 | | | | — | | | | 6,592,985 | |
| TAMRO Small Cap Fund (b) | | | — | | | | 845,620,132 | | | | — | | | | 797,995,404 | |
| River Road Select Value Fund | | | — | | | | 129,783,687 | | | | — | | | | 127,791,592 | |
| River Road Small Cap Value Fund | | | — | | | | 164,832,223 | | | | — | | | | 243,988,336 | |
| River Road Independent Value Fund (c) | | | — | | | | 248,996,759 | | | | — | | | | 385,342,578 | |
| DoubleLine Core Plus Fixed Income Fund | | | 150,069,791 | | | | 110,398,160 | | | | 157,102,898 | | | | 87,503,535 | |
| TCH Fixed Income Fund | | | 15,501,062 | | | | 18,013,117 | | | | 13,411,551 | | | | 32,651,702 | |
| Lake Partners LASSO Alternatives Fund | | | — | | | | 329,447,235 | | | | — | | | | 158,223,429 | |
| Anchor Capital Enhanced Equity Fund | | | — | | | | 118,905,956 | | | | — | | | | 173,894,423 | |
| River Road Long-Short Fund | | | — | | | | 235,570,737 | | | | — | | | | 125,570,102 | |
Barings International Fund | | | — | | | | 30,353,764 | | | | — | | | | 60,709,398 | |
LMCG Emerging Markets Fund | | | — | | | | 7,632,855 | | | | — | | | | 3,462,580 | |
Harrison Street Real Estate Fund | | | — | | | | 21,546,353 | | | | — | | | | 19,139,891 | |
M&C Balanced Fund | | | 402,063 | | | | 8,649,754 | | | | 1,743,992 | | | | 17,810,004 | |
| | |
| |
| | October 31, 2013 |
| |
| Notes to Financial Statements – continued | | |
| (a) | The cost of purchases excludes securities received from the Reorganization (Note J). |
| (b) | TAMRO Small Cap Fund had a subscription-in-kind in the amount of $2,677,538 on April 25, 2013, which is excluded from the aggregate purchases above. The subscription was comprised of securities, cash and dividends accrued in the amounts of $2,657,373, $19,712 and $453, respectively. The Fund also had a redemption-in-kind in the amount of $52,573,290 on January 15, 2013, which is excluded from the proceeds from sales above. The redemption was comprised of securities and cash in the amounts of $51,794,423 and $778,867, respectively. |
| (c) | River Road Independent Value Fund had a subscription-in-kind in the amount of $597,548 on March 27, 2013, which is excluded from the aggregate purchases above. The subscription was comprised of securities, cash and dividends accrued in the amounts of $258,478, $338,808 and $262, respectively. |
Note (F) Redemption Fees: In accordance with the prospectus, certain Funds assessed a redemption fee on Fund share redemptions and exchanges within specified time periods, as indicated in the following table for the year ended October 31, 2013 and included in the Cost of Shares redeemed on the Statements of Changes in Net Assets:
| | | | | | |
Fund Name | | Time Period | | Amount | |
| Barings International Fund | | 2% Within 90 Days | | $ | 3,498 | |
| Harrison Street Real Estate Fund | | 2% Within 90 Days | | | 5,154 | |
| LMCG Emerging Markets Fund | | 2% Within 90 Days | | | — | |
Note (G) Advisory, Administration, Distribution Services and Trustee Agreements:
Advisory. Aston serves as investment adviser and administrator to the Funds. Under the terms of the investment advisory agreement for the Funds (the “Investment Advisory Agreement”), fees are accrued daily and paid monthly, at specified annual rates of average daily net assets. The factors considered by the Board of Trustees in approving the current Investment Advisory Agreement are included in the Funds’ annual or semi-annual report to shareholders covering the period during which the approval occurred.
Certain Funds are subject to an expense limitation agreement with the Adviser, pursuant to which annual ordinary operating expenses for Class N and Class I shareholders are capped at certain specified annual rates of average daily net assets. There are no contractual expense limitations for Class R shareholders.
The contractual expense limitations for the Funds are effective through February 28, 2014, except as noted below. The advisory rates and contractual expense limitations for the year ended October 31, 2013 were as follows:
| | | | | | |
| | | | | Contractual Expense Limitations |
Fund Name | | Advisory Fees | | Class N | | Class I |
| M&C Growth Fund | | 0.80% on first $800,000,000 | | | | |
| | 0.60% over $800,000,000 up to $6 billion | | | | |
| | 0.55% over $6 billion up to $12 billion
0.50% over $12 billion | | N/A | | N/A |
| TAMRO Diversified Equity Fund | | 0.80% | | 1.20% | | 0.95% |
| Herndon Large Cap Value Fund | | 0.80% | | 1.30%(a) | | 1.05%(a) |
| Cornerstone Large Cap Value Fund | | 0.80% | | 1.30% | | 1.05% |
| River Road Dividend All Cap Value Fund | | 0.70% | | 1.30% | | 1.05% |
| River Road Dividend All Cap Value Fund II | | 0.70% | | 1.30%(a) | | 1.05%(a) |
| Fairpointe Mid Cap Fund | | 0.80% on first $100,000,000 | | | | |
| | 0.75% next $300,000,000 | | | | |
| | 0.70% over $400,000,000 | | N/A | | N/A |
| M&C Mid Cap Growth Fund | | 0.85% | | 1.25%(a) | | N/A |
| LMCG Small Cap Growth Fund | | 1.00% | | 1.35%(a) | | 1.10%(a) |
| Silvercrest Small Cap Growth | | 1.00% | | 1.40%(a) | | 1.15%(a) |
| TAMRO Small Cap Fund | | 0.90% | | N/A | | N/A |
| River Road Select Value Fund | | 1.00% | | 1.50%(a) | | 1.25%(a) |
| River Road Small Cap Value Fund | | 0.90% | | N/A | | N/A |
| River Road Independent Value Fund | | 1.00% | | 1.42%(a) | | 1.17%(a) |
| DoubleLine Core Plus Fixed Income Fund | | 0.55% | | 0.94%(a) | | 0.69%(a) |
| TCH Fixed Income Fund | | 0.55% | | 0.94% | | 0.69% |
| Lake Partners LASSO Alternatives Fund | | 1.00% | | 1.45%(a) | | 1.20%(a) |
| Anchor Capital Enhanced Equity Fund | | 0.70% | | 1.40% | | 1.15% |
| River Road Long-Short Fund (b) | | 1.20% | | 1.70%(a) | | 1.45%(a) |
| Barings International Fund | | 1.00% | | 1.40%(a) | | 1.15%(a) |
| LMCG Emerging Markets Fund (c) | | 1.05% | | 1.65%(a)* | | 1.40%(a)* |
| Harrison Street Real Estate Fund | | 1.00% | | 1.37% | | 1.12% |
| M&C Balanced Fund | | 0.75% | | 1.35% | | 1.10% |
| (a) | Pursuant to a contractual expense reimbursement agreement between the Adviser and the Trust, with respect to the Fund, from commencement of operations through the completion of the first three full fiscal years for a period up to three years from the fiscal year end during which such amount was waived or reduced, the Adviser is entitled to be reimbursed by the Fund for previously waived fees and reimbursed expenses to the extent that the Fund’s expense ratio (not including interest, taxes, other investment-related costs (such as brokerage commissions), extraordinary expenses and acquired fund fees and expenses) remains below the operating expense cap after such reimbursement. |
| | |
| |
| | October 31, 2013 |
| |
| Notes to Financial Statements – continued | | |
| (b) | The inception date for the River Road Long-Short Fund Class I shares is March 4, 2013. |
| (c) | The inception date for the LMCG Emerging Markets Fund Class N and Class I shares is March 28, 2013. |
| * | The contractual expense limitation for LMCG Emerging Markets Fund is in effect through March 31, 2014. |
Pursuant to a contractual expense reimbursement agreement between the Adviser and the Trust, from commencement of operations through the completion of the first three full fiscal years for a period of up to three years from the fiscal year end during which the Advisor waived its advisory fees or reimbursed expenses for each of Herndon Large Cap Value Fund-Classes N and I, River Road Dividend All Cap Value Fund II-Classes N and I, M&C Mid Cap Growth Fund-Class N, LMCG Small Cap Growth Fund-Classes N and I, Silvercrest Small Cap Fund-Classes N and I, River Road Select Value Fund-Classes N and I, River Road Independent Value Fund-Classes N and I, DoubleLine Core Plus Fixed Income Fund-Classes N and I, Lake Partners LASSO Alternatives Fund-Classes N and I, River Road Long-Short Fund-Classes N and I, Barings International Fund-Classes N and I and LMCG Emerging Markets Fund-Classes N and I, the Adviser is entitled to be reimbursed by each Fund for such previously waived fees and reimbursed expenses to the extent that each Fund’s expense ratio (not including interest, taxes, other investment-related costs (such as brokerage commissions), extraordinary expenses and acquired fund fees and expenses) remains below the operating expense cap after such reimbursement.
As of October 31, 2013, the cumulative amounts that are subject to recoupment by the Adviser from each Fund are as follows:
| | | | | | | | | | | | |
| | | Expiration | |
| | | 2014 | | | 2015 | | | 2016 | |
| Herndon Large Cap Value Fund | | $ | 129,816 | | | $ | 42,793 | | | | N/A | |
| River Road Dividend All Cap Value Fund II | | | N/A | | | | 59,860 | | | $ | 36,018 | |
| Montag & Caldwell Mid Cap Growth Fund | | | 72,010 | | | | N/A | | | | N/A | |
| LMCG Small Cap Growth Fund | | | 190,704 | | | | 123,269 | | | | 157,143 | |
| Silvercrest Small Cap Fund | | | N/A | | | | 147,166 | | | | 116,435 | |
| River Road Select Value Fund | | | N/A | | | | N/A | | | | N/A | |
| River Road Independent Value Fund | | | 244,471 | | | | 143,528 | | | | 59,855 | |
| DoubleLine Core Plus Fixed Income Fund | | | 105,633 | | | | 389,195 | | | | 205,067 | |
| Lake Partners LASSO Alternatives Fund | | | 87,814 | | | | N/A | | | | N/A | |
| River Road Long-Short Fund | | | 97,108 | | | | 110,750 | | | | 76,699 | |
| Barings International Fund | | $ | 147,896 | | | $ | N/A | | | $ | N/A | |
| LMCG Emerging Markets Fund (1) | | | N/A | | | | N/A | | | | 119,333 | |
| | | | | | | | | | | | |
| Total | | $ | 1,075,452 | | | $ | 1,016,561 | | | $ | 770,550 | |
| | | | | | | | | | | | |
| (1) | The Fund commenced operations in the current fiscal year. |
For the year ended October 31, 2013, the Adviser was reimbursed $28,353 by the Herndon Large Cap Value Fund and $85,619 by the Lake Partners LASSO Alternatives Fund as recoupment of prior year fee waivers. No other Fund in the above table reimbursed the Adviser for the period.
During the year ended October 31, 2013, the following Fund was reimbursed by the Subadviser for losses incurred on transactions not meeting the Fund’s investment guidelines:
| | | | |
| | | Capital Contribution | |
| Harrison Street Real Estate Fund | | $ | 96 | |
The Adviser manages each Fund by retaining one or more Subadvisers to manage each Fund, as follows:
| | |
| Fund | | Subadviser |
M&C Growth Fund | | Montag & Caldwell, LLC |
TAMRO Diversified Equity Fund | | TAMRO Capital Partners LLC |
Herndon Large Cap Value Fund | | Herndon Capital Management, LLC |
Cornerstone Large Cap Value Fund | | Cornerstone Investment Partners, LLC |
River Road Dividend All Cap Value Fund | | River Road Asset Management, LLC |
River Road Dividend All Cap Value Fund II | | River Road Asset Management, LLC |
Fairpointe Mid Cap Fund | | Fairpointe Capital LLC |
M&C Mid Cap Growth Fund | | Montag & Caldwell, LLC |
LMCG Small Cap Growth Fund | | Lee Munder Capital Group, LLC |
Silvercrest Small Cap Fund | | Silvercrest Asset Management Group LLC |
TAMRO Small Cap Fund | | TAMRO Capital Partners LLC |
River Road Select Value Fund | | River Road Asset Management, LLC |
River Road Small Cap Value Fund | | River Road Asset Management, LLC |
River Road Independent Value Fund | | River Road Asset Management, LLC |
DoubleLine Core Plus Fixed Income Fund | | DoubleLine Capital LP |
TCH Fixed Income Fund | | Taplin, Canida & Habacht LLC |
Lake Partners LASSO Alternatives Fund | | Lake Partners, Inc. |
Anchor Capital Enhanced Equity Fund | | Anchor Capital Advisors LLC |
River Road Long-Short Fund | | River Road Asset Management, LLC |
Barings International Fund | | Baring International Investment Limited |
LMCG Emerging Markets Fund | | Lee Munder Capital Group, LLC |
Harrison Street Real Estate Fund | | Harrison Street Securities, LLC |
M&C Balanced Fund | | Montag & Caldwell, LLC |
Subadvisory fees are paid monthly by Aston. The factors considered by the Board of Trustees in approving the current sub-investment advisory agreements for the Funds (each, a “Sub-Investment Advisory Agreement”) are included in the additional information section of the Funds’ annual or semi-annual report to shareholders covering the period in which such approval occurred.
Administration. Under the terms of the administration agreement between the Trust and Aston, the Funds’ administrator (the “Administration Agreement”), administration fees are accrued daily and paid monthly, based on a specified percentage of average daily net assets of the Trust, and base fees are fixed at an annual rate of $12,000 per Fund. The fee is allocated to each Fund based on the relative net assets of the Trust. Administration expenses also include pricing agent fees and compliance-related expenses. The administration fee arrangement is as follows:
| | |
Administration Fees at Trust Level | | Annual Rate |
| |
| First $7.4 billion | | 0.0437% |
| Over $7.4 billion | | 0.0412% |
| | |
| |
| | October 31, 2013 |
| |
| Notes to Financial Statements – continued | | |
BNY Mellon Investment Servicing (US) Inc. (“BNY Mellon”) provides certain administrative services to the Funds pursuant to a Sub-administration and Accounting Services Agreement between Aston and BNY Mellon (the “Sub-Administration Agreement”). Under the terms of the Sub-Administration Agreement, sub-administration fees (inclusive of tax services fees), which are paid by Aston, are accrued daily and paid monthly, at a rate of 0.0167% of average daily net assets of the Trust and a base fee at an annual rate of $12,000 per Fund. The fees may be subject to an annual increase by BNY Mellon, in an amount not to exceed the cumulative percentage increase in the Consumer Price Index for All Urban Consumers (CPI-U) U.S. City Average, all items (unadjusted) published since the last such increase in fees. The first such annual increase, of 1.7%, was effective October 1, 2013.
Distribution Services. Foreside Funds Distributors LLC (the “Distributor”) serves as principal underwriter and distributor of the Funds’ shares. Pursuant to Rule 12b-1 distribution and service plans (the “Plans”) adopted by the Funds, with respect to Class N shares and Class R shares, the Funds pay certain expenses associated with the distribution of their shares. Under the Plans, each Fund may pay actual expenses not exceeding, on an annual basis, 0.25% of each participating Fund’s Class N average daily net assets and 0.50% of each participating Fund’s Class R average daily net assets. The Class I shares do not have Rule 12b-1 plans. Effective January 1, 2012 the TCH Fixed Income Fund and M&C Balanced Fund reduced their 12b-1 fees to 0.15% and 0.10%, respectively.
Trustees. The Trustees of the Trust who are not affiliated with the Adviser or Subadviser receive an annual retainer and per meeting fees, and they are reimbursed for out-of-pocket expenses for each meeting of the Board of Trustees they attend. The Chairman of the Board and Committee Chairs receive an additional retainer. No officer or employee of the Adviser, of a Subadviser, or of their affiliates receives any compensation from the Funds for acting as a Trustee of the Trust. The officers of the Trust receive no compensation directly from the Funds for performing the duties of their offices, except that the Funds compensate the Administrator for providing an officer to serve as the Funds’ Chief Compliance Officer. The aggregate remuneration paid to the Trustees during the year ended October 31, 2013 was $704,500.
Note (H) Credit Agreement: Effective July 6, 2010 and as amended August 30, 2013, the Trust entered into a Credit Agreement with The Bank of New York Mellon (the “Bank”) which provides the Trust with a revolving line of credit facility of up to $50 million. The facility is shared by each series of the Trust and is available for temporary, emergency purposes including liquidity needs in meeting redemptions. The interest rate on outstanding Alternate Base Rate Loans is equal to the greater of the Prime Rate plus 1.25% or 0.50% plus the Federal Funds Effective Rate plus 1.25%. The interest rate on outstanding Overnight Loans is equal to the greater of the Federal Funds Effective Rate plus 1.25% or the One Month LIBOR Rate plus 1.25%. The Trust pays a commitment fee on the unutilized commitment amount of 0.12% per annum. The Funds did not utilize the line of credit during the fiscal year ended October 31, 2013.
Note (I) Fully FDIC-insured Uninvested Deposit Balance Program: Effective July 3, 2012, the Trust entered into a program under which cash that is currently held in custody and trust accounts by the Bank, as custodian for the Trust, would be held in non-interest bearing transaction accounts at the Bank that are fully covered by the FDIC. River Road Independent Value Fund, Lake Partners LASSO Alternatives Fund and Anchor Capital Enhanced Equity Fund have accrued Earnings Credits to offset the Funds’ respective custody and transfer agency fees (including overdraft charges) based on the specified Earnings Credit Rate. The Earnings Credit Rate was 8 basis points on positive balances, subject to adjustment by the Bank. The term of this agreement was June 1, 2012 through December 31, 2012. For the year ended October 31, 2013, the Funds’ accrued Earnings Credits as follows:
| | | | |
Fund | | Earnings
Credit to Custody
and Transfer
Agency Fees | |
| River Road Independent Value Fund | | $ | 77,099 | |
| Lake Partners LASSO Alternatives Fund | | | 1,803 | |
| Anchor Capital Enhanced Equity Fund | | | 139 | |
Note (J) Reorganization: On December 13, 2012, the Board of Trustees approved an agreement and plan of reorganization (and the related transactions) (the “Agreement”), which provided for (i) the transfer of all the assets of ASTON Small Cap Fund (formerly ASTON/Veredus Small Cap Growth Fund) (the “Small Cap Fund”) to the LMCG Small Cap Growth Fund in exchange solely for shares of beneficial interest of the LMCG Small Cap Growth Fund and the assumption by the LMCG Small Cap Growth Fund of all the liabilities of the Small Cap Fund; and (ii) the distribution by the Small Cap Fund of all the shares of each class of the LMCG Small Cap Growth Fund received by the Small Cap Fund to the holders of shares of the corresponding class of the Small Cap Fund in complete liquidation and termination of the Small Cap Fund. At a special meeting of shareholders of the Small Cap Fund held on April 16, 2013, the shareholders of the Small Cap Fund voted to approve the Agreement. The closing date of the reorganization was April 22, 2013.
The result of the voting was as follows:
| | | | | | | | | | | | |
| | | For | | | Against | | | Abstain | |
| ASTON Small Cap Fund | | | 800,546.220 | | | | 28,635.759 | | | | 38,341.525 | |
The acquisition was accomplished by a tax-free exchange of shares on April 19, 2013. For financial reporting purposes, assets received and shares issued by the Small Cap Fund were recorded at fair value on April 19, 2013; however, the cost basis of the investments received from LMCG Small Cap Growth Fund were carried forward to align ongoing reporting of the Small Cap Fund’s realized and unrealized gains and losses with amounts distributable to shareholders for tax purposes. Prior to the merger, the Small Cap Fund had unused capital loss carryforwards. A portion of these capital loss carryforwards can be utilized by LMCG Small Cap Growth Fund in future periods.
| | |
| |
| | October 31, 2013 |
| |
| Notes to Financial Statements – continued | | |
The net assets and net unrealized appreciation immediately before the acquisition were as follows:
| | | | | | | | | | | | | | | | | | | | | | | | | | |
Merged Fund | | Acquiring Fund | | Class N
Shares Issued | | | Class N
Net Asset
Value | | | Class N
Conversion
Ratio | | | Class I
Shares Issued | | | Class I
Net Asset
Value | | | Class I
Conversion
Ratio | |
| Small Cap Fund | | LMCG Small Cap Growth Fund | | | 1,557,689 | | | $ | 12.07 | | | | 1.16622 | | | | 86,108 | | | $ | 12.13 | | | | 1.20650 | |
| | | | | | | | | | | | | | |
Merged Fund | | Net Assets | | | Unrealized Depreciation | | | Acquiring Fund | | Net Assets | |
| Small Cap Fund | | $ | 19,844,700 | | | $ | (45,176 | ) | | LMCG Small Cap Growth Fund | | $ | 11,343,723 | |
Assuming the acquisition had been completed on November 1, 2012, the Fund’s results of operations for the year ended October 31, 2013 are as follows:
| | | | | | |
| Net investment income | | $ | 87,467 | | | |
| Net realized and unrealized gain on investments | | | 9,462,168 | | | |
| | | | | | |
| Net increase in assets from operations | | $ | 9,549,635 | | | |
Because the combined investment portfolios have been managed as a single portfolio since the acquisition was completed, it is not practicable to separate the amounts of revenue and earnings of the Small Cap Fund that have been included in LMCG Small Cap Growth Fund’s statement of operations since April 19, 2013.
Note (K) Liquidations: ASTON/Veredus Select Growth Fund and ASTON Dynamic Allocation Fund were terminated and liquidated on January 30, 2013.
Note (L) Significant Concentrations: Certain Funds may invest a significant percentage of their assets in securities of foreign issuers. These investments may involve certain considerations and risks not typically associated with investments in the United States as a result of, among other factors, the possibility of future political and economic developments and the level of governmental supervision and regulation of securities markets in
the respective countries. Some countries in which the Funds invest may require government approval for repatriation of investment income, capital or the proceeds for sales of securities by foreign investors. In addition, if there is deterioration in a country’s balance of payments or for other reasons, a country may impose temporary restrictions on foreign capital remittances abroad. In addition, changes in currency exchange rates will affect the value of investments denominated in a foreign currency, as well as investment income derived from those securities.
Note (M) Subsequent Events: Management has evaluated the impact of all subsequent events on the Funds through the date the financial statements were issued, and has determined that there were no subsequent events requiring recognition or disclosure in the financial statements.
| | |
| |
| | |
| |
| Report of Independent Registered Public Accounting Firm | | |
To the Shareholders and Board of Trustees of
Aston Funds
We have audited the accompanying statements of assets and liabilities, including the schedules of investments, of Aston Funds (the “Trust”) (comprising, respectively, ASTON/Montag & Caldwell Growth Fund, ASTON/Barings International Fund, ASTON/Cornerstone Large Cap Value Fund, ASTON/DoubleLine Core Plus Fixed Income Fund, ASTON/Fairpointe Mid Cap Fund, ASTON/Harrison Street Real Estate Fund, ASTON/Herndon Large Cap Value Fund, ASTON/Lake Partners LASSO Alternatives Fund, ASTON/Anchor Capital Enhanced Equity Fund, ASTON/Montag & Caldwell Balanced Fund, ASTON/Montag & Caldwell Mid Cap Growth Fund, ASTON/LMCG Emerging Markets Fund, ASTON/River Road Dividend All Cap Value Fund, ASTON/River Road Dividend All Cap Value Fund II, ASTON/River Road Independent Value Fund, ASTON/River Road Long-Short Fund, ASTON/River Road Select Value Fund, ASTON/River Road Small Cap Value Fund, ASTON/Silvercrest Small Cap Fund, ASTON/LMCG Small Cap Growth Fund, ASTON/TAMRO Diversified Equity Fund, ASTON/TAMRO Small Cap Fund, and ASTON/TCH Fixed Income Fund, (the “Funds”)) as of October 31, 2013, and the related statements of operations, statements of changes in net assets, and financial highlights for the periods indicated therein. These financial statements and financial highlights are the responsibility of the Trust’s management. Our responsibility is to express an opinion on these financial statements and financial highlights based on our audits.
We conducted our audits in accordance with the standards of the Public Company Accounting Oversight Board (United States). Those standards require that we plan and perform the audit to obtain reasonable assurance about whether the financial statements and financial highlights are free of material misstatement. We were not engaged to perform an audit of the Trust’s internal control over financial reporting. Our audits included consideration of internal control over financial reporting as a basis for designing audit procedures that are appropriate in the circumstances, but not for the purpose of expressing an opinion on the effectiveness of the Trust’s internal control over financial reporting. Accordingly, we express no such opinion. An audit also includes examining, on a test basis, evidence supporting the amounts and disclosures in the financial statements and financial highlights, assessing the accounting principles used and significant estimates made by management, and evaluating the overall financial statement presentation. Our procedures included confirmation of securities owned as of October 31, 2013, by correspondence with the custodian and brokers or by other appropriate auditing procedures where replies from brokers were not received. We believe that our audits provide a reasonable basis for our opinion.
In our opinion, the financial statements and financial highlights referred to above present fairly, in all material respects, the financial position of each of the respective portfolios constituting the Aston Funds at October 31, 2013, and the results of their operations, the changes in their net assets, and the financial highlights for the periods indicated therein, in conformity with U.S. generally accepted accounting principles.

Chicago, Illinois
December 19, 2013
| | |
| |
| | October 31, 2013 |
| |
| Additional Information (unaudited) | | |
Form N-Q: The Trust files complete schedules of portfolio holdings for the Funds with the Securities and Exchange Commission (the “SEC”) for the Trust’s first and third quarters of each fiscal year on Form N-Q. The Trust’s Form N-Q are available on the SEC’s website at www.sec.gov and are available for review and copying at the SEC’s Public Reference Room in Washington, DC. Information on the operations of the Public Reference Room may be obtained by calling the SEC at 202-942-8090.
Proxy Voting: The Trust’s Proxy Voting Policies and Procedures, used to determine how to vote proxies relating to portfolio securities, are included in the Trust’s Statement of Additional Information, which is available (i) upon request, without charge, by calling 800-992-8151; (ii) on Aston Funds’ website at www. astonfunds.com; and (iii) on the SEC’s website at www.sec.gov. The Funds’ Proxy Voting Record for the most recent twelve-month period ended June 30 is available without charge (i) on the Funds’ website at www.astonfunds.com; and (ii) on the SEC’s website at www.sec.gov.
Tax Information: In accordance with Federal tax law, the following Funds hereby make the designations indicated below regarding their fiscal year ended October 31, 2013:
The following are the estimated percentages of the income dividends qualifying for the dividends received deduction (“DRD”) available to corporations:
| | | | |
Fund | | Percentage | |
| M&C Growth Fund | | | 100.00 | % |
| TAMRO Diversified Equity Fund | | | 100.00 | % |
| Herndon Large Cap Value Fund | | | 44.66 | % |
| Cornerstone Large Cap Value Fund | | | 100.00 | % |
| River Road Dividend All Cap Value Fund | | | 85.73 | % |
| River Road Dividend All Cap Value Fund II | | | 58.96 | % |
| Fairpointe Mid Cap Fund | | | 100.00 | % |
| LMCG Small Cap Growth Fund | | | 3.49 | % |
| Silvercrest Small Cap Fund | | | 62.54 | % |
| TAMRO Small Cap Fund | | | 35.57 | % |
| River Road Select Value Fund | | | 53.36 | % |
| River Road Small Cap Value Fund | | | 45.41 | % |
| River Road Independent Value Fund | | | 9.58 | % |
| Lake Partners LASSO Alternatives Fund | | | 25.98 | % |
| Anchor Capital Enhanced Equity Fund | | | 10.40 | % |
| River Road Long-Short Fund | | | 14.89 | % |
| Harrison Street Real Estate Fund | | | 23.30 | % |
| M&C Balanced Fund | | | 85.27 | % |
For the fiscal year ended October 31, 2013, certain dividends may be subject to a maximum tax rate of 15%, as qualified dividend income (“QDI”) under the Jobs and Growth Tax Relief Reconciliation Act of 2003. For individual shareholders, a percentage of their ordinary income dividends (dividend income plus short-term gains, if any) may qualify for a maximum tax rate of 15%. Complete information is computed and reported in conjunction with your Form 1099-DIV.
The following percentages of ordinary dividends paid during the fiscal year ended October 31, 2013 are designated as QDI:
| | | | |
Fund | | Percentage | |
| M&C Growth Fund | | | 100.00 | % |
| TAMRO Diversified Equity Fund | | | 100.00 | % |
| Herndon Large Cap Value Fund | | | 44.56 | % |
| Cornerstone Large Cap Value Fund | | | 100.00 | % |
| River Road Dividend All Cap Value Fund | | | 92.73 | % |
| River Road Dividend All Cap Value Fund II | | | 63.22 | % |
| Fairpointe Mid Cap Fund | | | 100.00 | % |
| LMCG Small Cap Growth Fund | | | 3.42 | % |
| Silvercrest Small Cap Fund | | | 62.32 | % |
| TAMRO Small Cap Fund | | | 36.02 | % |
| River Road Select Value Fund | | | 54.73 | % |
| River Road Small Cap Value Fund | | | 47.35 | % |
| River Road Independent Value Fund | | | 9.83 | % |
| Lake Partners LASSO Alternatives Fund | | | 36.19 | % |
| Anchor Capital Enhanced Equity Fund | | | 10.38 | % |
| River Road Long-Short Fund | | | 15.80 | % |
| Barings International Fund | | | 99.99 | % |
| Harrison Street Real Estate Fund | | | 23.30 | % |
| M&C Balanced Fund | | | 95.74 | % |
Each Fund designates 100%, or if subsequently different, of QDI to qualify for the lower tax rates applicable to individual shareholders; and 100%, or if subsequently different, of ordinary income dividends to qualify for the DRD for corporate shareholders. The actual percentage of QDI and DRD for the calendar year will be designated in year-end tax statements.
The following Funds designated the listed amounts as long-term capital gain dividends during the year ended October 31, 2013. Distributable long-term gains are based on net realized long term gains determined on a tax basis and may differ from such amounts for financial reporting purposes.
| | | | |
Fund | | Amount | |
| M&C Growth Fund | | $ | 341,922,100 | |
| TAMRO Diversified Equity Fund | | | 1,631,314 | |
| Herndon Large Cap Value Fund | | | 6,483 | |
| River Road Dividend All Cap Value Fund | | | 64,855,863 | |
| River Road Dividend All Cap Value Fund II | | | 86,668 | |
| Fairpointe Mid Cap Fund | | | 458,050,258 | |
| M&C Mid Cap Growth Fund | | | 1,654,468 | |
| LMCG Small Cap Growth Fund | | | 960,056 | |
| Silvercrest Small Cap Fund | | | 562,183 | |
| TAMRO Small Cap Fund | | | 116,226,665 | |
| River Road Select Value Fund | | | 26,825,243 | |
| River Road Small Cap Value Fund | | | 56,871,822 | |
| River Road Independent Value Fund | | | 832,772 | |
| DoubleLine Core Plus Fixed Income Fund | | | 22,764 | |
| Lake Partners LASSO Alternatives Fund | | | 1,588,681 | |
| Anchor Capital Enhanced Equity Fund | | | 556,618 | |
| River Road Long-Short Fund | | | 28,077 | |
| Barings International Fund | | | 944,241 | |
| M&C Balanced Fund | | | 740,661 | |
Shareholders should not use the above tax information to prepare their tax returns. The information will be included with your Form 1099-DIV which will be sent to you separately in January 2014.
| | |
| |
| | October 31, 2013 |
| |
| Additional Information (unaudited) – continued | | |
FACTORS CONSIDERED BY THE BOARD OF TRUSTEES IN APPROVING THE CONTINUATION OF THE EXISTING SUB-INVESTMENT ADVISORY AGREEMENT FOR ASTON/SILVERCREST SMALL CAP FUND
The Board of Trustees (the “Board”) of Aston Funds (the “Trust”), including the trustees who are not “interested persons” as defined in Section 2(a)(9) of the Investment Company Act of 1940, as amended (the “Independent Trustees”), considered the approval of the continuation of the Sub-Investment Advisory Agreement (the “Sub-Investment Advisory Agreement”) between Aston Asset Management, LP (“Aston”) and Silvercrest Small Cap Asset Management Group LLC (“Silvercrest”) with respect to the ASTON/Silvercrest Small Cap Fund (the “Fund”), at an in-person meeting on September 20, 2012.
The Board considered information provided and discussions held at the September 20, 2012 meeting regarding anticipated ownership changes of Silvercrest as a result of an initial public offering of its affiliated company (the “Transaction”). The Board considered that the Transaction may be deemed to result in an assignment of the Sub-Investment Advisory Agreement which would result in its automatic termination.
The Independent Trustees met separately from the “interested” Trustees of the Trust and any officers of Aston, Silvercrest or their affiliates to consider approval of the continuation of the Sub-Investment Advisory Agreement and were assisted by independent legal counsel in their deliberations.
In determining whether to approve the continuation of the Sub-Investment Advisory Agreement, the Board noted that at its December 15, 2011 meeting, it had determined to approve the Sub-Investment Advisory Agreement on the same terms, including the fees payable to Silvercrest. The Board noted that, with respect to the Sub-investment Advisory Agreement, it had considered: (i) the nature, extent and quality of services to be provided; (ii) the sub-advisory fee rate and overall fee structure of the Fund; and (iii) other potential benefits to be received by Silvercrest. The Board considered that at its December 15, 2011 meeting, it had determined that the terms of the Sub-Investment Advisory Agreement were fair and reasonable and that the approval of the Sub-Investment Advisory Agreement was in the best interests of the Fund.
The Board also considered whether the Transaction would result in any change in personnel of Silvercrest and whether it would impact the nature, extent or quality of services provided to the Fund. Based on the information provided by Silvercrest, it was noted that the Transaction would not impact the nature, extent or quality of services provided by Silvercrest and that the Fund’s current portfolio management team would not change as a result.
Conclusion. Based on all of the information considered and the conclusions reached, the Board determined that the terms of the Sub-Investment Advisory Agreement were fair and reasonable, and that the approval of the continuation of the Sub-Investment Advisory Agreement was in the best interests of the Fund. No single factor was determinative in the Board’s analysis.
Disclosure of Fund Expenses: We believe it is important for you to understand the impact of fees regarding your investment. All mutual funds have operating expenses. As a shareholder of a mutual fund, you incur ongoing costs, which include costs for portfolio management, administrative services, and shareholder reports (like this one), among others. Operating expenses, which are deducted from a fund’s gross income, directly reduce the investment return of the fund. A fund’s expenses are expressed as a percentage of its average daily net assets. This figure is known as the expense ratio. The following examples are intended to help you understand the ongoing fees (in dollars) of investing in your Fund and to compare these costs with those of other mutual funds. The examples are based on an investment of $1,000 made at the beginning of the period shown and held for the entire period.
The below table illustrates each Fund’s costs in two ways:
Actual Fund Return: This section helps you to estimate the actual expenses, after any applicable fee waivers, that you paid over the period. The “Ending Account Value” shown is derived from the Fund’s actual return for the past six-month period, the “Expense Ratio” column shows the period’s annualized expense ratio, and the “Expenses Paid During Period” column shows the dollar amount that would have been paid by an investor who started with $1,000 in the Fund at the beginning of the period. You may use the information here, together with your account value, to estimate the expenses that you paid over the period. To do so, simply divide your account value by $1,000 (for example, an $8,600 account value divided by $1,000 = 8.6), then multiply the result by the number given for your Fund in the first line under the heading entitled “Expenses Paid During Period.”
Hypothetical 5% Return: This section is intended to help you compare your Fund’s costs with those of other mutual funds. It assumes that the Fund had an annual return of 5% before expenses, but that the expense ratio is unchanged. In this case, because the return used is not the Fund’s actual return, the results do not apply to your investment. This example is useful in making comparisons to other mutual funds because the SEC requires all mutual funds to calculate expenses based on an assumed 5% annual return. You can assess your Fund’s costs by comparing this hypothetical example with the hypothetical examples that appear in shareholder reports of other funds.
| | |
| |
| | October 31, 2013 |
| |
| Additional Information (unaudited) – continued | | |
Please note that the expenses shown in the table are meant to highlight and help you compare your ongoing costs only and do not reflect any transactional costs such as sales charges (loads) and redemption fees, which are described in the prospectus. If these costs were applied to your account, your costs would be higher.
| | | | | | | | | | | | | | | | |
| | | Beginning
Account
Value
05/01/13 | | | Ending
Account
Value
10/31/13 | | | Expense
Ratio(1) | | | Expenses
Paid During
Period(2) | |
| M&C Growth Fund | | | | | | | | | |
Actual Fund Return | | | | | | | | | | | | | | | | |
Class N | | | $1,000 | | | | $1,072.10 | | | | 1.03% | | | | $5.38 | |
Class I | | | 1,000 | | | | 1,073.70 | | | | 0.78% | | | | 4.08 | |
Class R | | | 1,000 | | | | 1,070.70 | | | | 1.28% | | | | 6.68 | |
Hypothetical 5% Return | | | | | | | | | | | | | | | | |
Class N | | | $1,000 | | | | $1,020.01 | | | | 1.03% | | | | $5.24 | |
Class I | | | 1,000 | | | | 1,021.27 | | | | 0.78% | | | | 3.97 | |
Class R | | | 1,000 | | | | 1,018.75 | | | | 1.28% | | | | 6.51 | |
| TAMRO Diversified Equity Fund | |
Actual Fund Return | | | | | | | | | | | | | | | | |
Class N | | | $1,000 | | | | $1,107.80 | | | | 1.20% | | | | $6.38 | |
Class I | | | 1,000 | | | | 1,109.10 | | | | 0.95% | | | | 5.05 | |
Hypothetical 5% Return | | | | | | | | | | | | | | | | |
Class N | | | $1,000 | | | | $1,019.16 | | | | 1.20% | | | | $6.11 | |
Class I | | | 1,000 | | | | 1,020.42 | | | | 0.95% | | | | 4.84 | |
| Herndon Large Cap Value Fund | |
Actual Fund Return | | | | | | | | | | | | | | | | |
Class N | | | $1,000 | | | | $1,088.10 | | | | 1.30% | | | | $6.84 | |
Class I | | | 1,000 | | | | 1,089.60 | | | | 1.05% | | | | 5.53 | |
Hypothetical 5% Return | | | | | | | | | | | | | | | | |
Class N | | | $1,000 | | | | $1,018.65 | | | | 1.30% | | | | $6.61 | |
Class I | | | 1,000 | | | | 1,019.91 | | | | 1.05% | | | | 5.35 | |
| Cornerstone Large Cap Value Fund | |
Actual Fund Return | | | | | | | | | | | | | | | | |
Class N | | | $1,000 | | | | $1,102.70 | | | | 1.30% | | | | $6.89 | |
Class I | | | 1,000 | | | | 1,105.10 | | | | 1.05% | | | | 5.57 | |
Hypothetical 5% Return | | | | | | | | | | | | | | | | |
Class N | | | $1,000 | | | | $1,018.65 | | | | 1.30% | | | | $6.61 | |
Class I | | | 1,000 | | | | 1,019.91 | | | | 1.05% | | | | 5.35 | |
| River Road Dividend All Cap Value Fund | | | | | | | | | | | | | |
Actual Fund Return | | | | | | | | | | | | | | | | |
Class N | | | $1,000 | | | | $1,091.30 | | | | 1.10% | | | | $5.80 | |
Class I | | | 1,000 | | | | 1,092.20 | | | | 0.85% | | | | 4.48 | |
Hypothetical 5% Return | | | | | | | | | | | | | | | | |
Class N | | | $1,000 | | | | $1,019.66 | | | | 1.10% | | | | $5.60 | |
Class I | | | 1,000 | | | | 1,020.92 | | | | 0.85% | | | | 4.33 | |
| River Road Dividend All Cap Value Fund II | | | | | |
Actual Fund Return | | | | | | | | | | | | | | | | |
Class N | | | $1,000 | | | | $1,086.90 | | | | 1.30% | | | | $6.84 | |
Class I | | | 1,000 | | | | 1,088.20 | | | | 1.05% | | | | 5.53 | |
Hypothetical 5% Return | | | | | | | | | | | | | | | | |
Class N | | | $1,000 | | | | $1,018.65 | | | | 1.30% | | | | $6.61 | |
Class I | | | 1,000 | | | | 1,019.91 | | | | 1.05% | | | | 5.35 | |
| Fairpointe Mid Cap Fund | | | | | | | | | |
Actual Fund Return | | | | | | | | | | | | | | | | |
Class N | | | $1,000 | | | | $1,182.90 | | | | 1.12% | | | | $6.16 | |
Class I | | | 1,000 | | | | 1,184.20 | | | | 0.87% | | | | 4.79 | |
Hypothetical 5% Return | | | | | | | | | | | | | | | | |
Class N | | | $1,000 | | | | $1,019.56 | | | | 1.12% | | | | $5.70 | |
Class I | | | 1,000 | | | | 1,020.82 | | | | 0.87% | | | | 4.43 | |
| M&C Mid Cap Growth Fund | | | | | | | | | |
Actual Fund Return | | | | | | | | | | | | | | | | |
Class N | | | $1,000 | | | | $1,128.10 | | | | 1.25% | | | | $6.70 | |
Hypothetical 5% Return | | | | | | | | | | | | | | | | |
Class N | | | $1,000 | | | | $1,018.90 | | | | 1.25% | | | | $6.36 | |
| | | | | | | | | | | | | | | | |
| | | Beginning
Account
Value
05/01/13 | | | Ending
Account
Value
10/31/13 | | | Expense
Ratio(1) | | | Expenses
Paid During
Period(2) | |
| LMCG Small Cap Growth Fund | | | | | | | | | |
Actual Fund Return | | | | | | | | | | | | | | | | |
Class N | | | $1,000 | | | | $1,178.70 | | | | 1.35% | | | | $7.41 | |
Class I | | | 1,000 | | | | 1,180.10 | | | | 1.10% | | | | 6.04 | |
Hypothetical 5% Return | | | | | | | | | | | | | | | | |
Class N | | | $1,000 | | | | $1,018.40 | | | | 1.35% | | | | $6.87 | |
Class I | | | 1,000 | | | | 1,019.66 | | | | 1.10% | | | | 5.60 | |
| Silvercrest Small Cap Fund | | | | | | | | | |
Actual Fund Return | | | | | | | | | | | | | | | | |
Class N | | | $1,000 | | | | $1,171.60 | | | | 1.40% | | | | $7.66 | |
Class I | | | 1,000 | | | | 1,172.80 | | | | 1.15% | | | | 6.30 | |
Hypothetical 5% Return | | | | | | | | | | | | | | | | |
Class N | | | $1,000 | | | | $1,018.15 | | | | 1.40% | | | | $7.12 | |
Class I | | | 1,000 | | | | 1,019.41 | | | | 1.15% | | | | 5.85 | |
| TAMRO Small Cap Fund | | | | | | | | | |
Actual Fund Return | | | | | | | | | | | | | | | | |
Class N | | | $1,000 | | | | $1,132.80 | | | | 1.32% | | | | $7.10 | |
Class I | | | 1,000 | | | | 1,133.70 | | | | 1.07% | | | | 5.75 | |
Hypothetical 5% Return | | | | | | | | | | | | | | | | |
Class N | | | $1,000 | | | | $1,018.55 | | | | 1.32% | | | | $6.72 | |
Class I | | | 1,000 | | | | 1,019.81 | | | | 1.07% | | | | 5.45 | |
| River Road Select Value Fund | |
Actual Fund Return | | | | | | | | | | | | | | | | |
Class N | | | $1,000 | | | | $1,106.60 | | | | 1.46% | | | | $7.75 | |
Class I | | | 1,000 | | | | 1,107.80 | | | | 1.21% | | | | 6.43 | |
Hypothetical 5% Return | | | | | | | | | | | | | | | | |
Class N | | | $1,000 | | | | $1,017.85 | | | | 1.46% | | | | $7.43 | |
Class I | | | 1,000 | | | | 1,019.11 | | | | 1.21% | | | | 6.16 | |
| River Road Small Cap Value Fund | |
Actual Fund Return | | | | | | | | | | | | | | | | |
Class N | | | $1,000 | | | | $1,126.90 | | | | 1.33% | | | | $7.13 | |
Class I | | | 1,000 | | | | 1,128.50 | | | | 1.08% | | | | 5.79 | |
Hypothetical 5% Return | | | | | | | | | | | | | | | | |
Class N | | | $1,000 | | | | $1,018.50 | | | | 1.33% | | | | $6.77 | |
Class I | | | 1,000 | | | | 1,019.76 | | | | 1.08% | | | | 5.50 | |
| River Road Independent Value Fund(3) | |
Actual Fund Return | | | | | | | | | | | | | | | | |
Class N | | | $1,000 | | | | $1,041.80 | | | | 1.42% | | | | $7.31 | |
Class I | | | 1,000 | | | | 1,043.40 | | | | 1.17% | | | | 6.03 | |
Hypothetical 5% Return | | | | | | | | | | | | | | | | |
Class N | | | $1,000 | | | | $1,018.05 | | | | 1.42% | | | | $7.22 | |
Class I | | | 1,000 | | | | 1,019.31 | | | | 1.17% | | | | 5.96 | |
| DoubleLine Core Plus Fixed Income Fund | |
Actual Fund Return | | | | | | | | | | | | | | | | |
Class N | | | $1,000 | | | | $976.50 | | | | 0.94% | | | | $4.68 | |
Class I | | | 1,000 | | | | 977.80 | | | | 0.69% | | | | 3.44 | |
Hypothetical 5% Return | | | | | | | | | | | | | | | | |
Class N | | | $1,000 | | | | $1,020.47 | | | | 0.94% | | | | $4.79 | |
Class I | | | 1,000 | | | | 1,021.73 | | | | 0.69% | | | | 3.52 | |
| TCH Fixed Income Fund | | | | | | | | | | | | | | | | |
Actual Fund Return | | | | | | | | | | | | | | | | |
Class N | | | $1,000 | | | | $976.90 | | | | 0.84% | | | | $4.19 | |
Class I | | | 1,000 | | | | 977.60 | | | | 0.69% | | | | 3.44 | |
Hypothetical 5% Return | | | | | | | | | | | | | | | | |
Class N | | | $1,000 | | | | $1,020.97 | | | | 0.84% | | | | $4.28 | |
Class I | | | 1,000 | | | | 1,021.73 | | | | 0.69% | | | | 3.52 | |
| Lake Partners LASSO Alternatives Fund(3) | |
Actual Fund Return | | | | | | | | | | | | | | | | |
Class N | | | $1,000 | | | | $1,018.30 | | | | 1.45% | | | | $7.38 | |
Class I | | | 1,000 | | | | 1,019.00 | | | | 1.20% | | | | 6.11 | |
Hypothetical 5% Return | | | | | | | | | | | | | | | | |
Class N | | | $1,000 | | | | $1,017.90 | | | | 1.45% | | | | $7.37 | |
Class I | | | 1,000 | | | | 1,019.16 | | | | 1.20% | | | | 6.11 | |
| | |
| |
| | October 31, 2013 |
| |
| Additional Information (unaudited) – continued | | |
| | | | | | | | | | | | | | | | |
| | | Beginning
Account
Value
05/01/13 | | | Ending
Account
Value
10/31/13 | | | Expense
Ratio(1) | | | Expenses
Paid During
Period(2) | |
| Anchor Capital Enhanced Equity Fund(3) | |
Actual Fund Return | | | | | | | | | | | | | | | | |
Class N | | | $1,000 | | | | $1,050.60 | | | | 1.24% | | | | $6.41 | |
Class I | | | 1,000 | | | | 1,051.80 | | | | 0.98% | | | | 5.07 | |
Hypothetical 5% Return | | | | | | | | | | | | | | | | |
Class N | | | $1,000 | | | | $1,018.95 | | | | 1.24% | | | | $6.31 | |
Class I | | | 1,000 | | | | 1,020.27 | | | | 0.98% | | | | 4.99 | |
| River Road Long-Short Fund(4)(5) | |
Actual Fund Return | | | | | | | | | | | | | | | | |
Class N | | | $1,000 | | | | $1,076.10 | | | | 1.70% | | | | $8.90 | |
Class I | | | 1,000 | | | | 1,077.90 | | | | 1.45% | | | | 7.59 | |
Hypothetical 5% Return | | | | | | | | | | | | | | | | |
Class N | | | $1,000 | | | | $1,016.64 | | | | 1.70% | | | | $8.64 | |
Class I | | | 1,000 | | | | 1,017.90 | | | | 1.45% | | | | 7.37 | |
| Barings International Fund | | | | | | | | | | | | | | | | |
Actual Fund Return | | | | | | | | | | | | | | | | |
Class N | | | $1,000 | | | | $1,077.20 | | | | 1.40% | | | | $7.33 | |
Class I | | | 1,000 | | | | 1,078.60 | | | | 1.15% | | | | 6.03 | |
Hypothetical 5% Return | | | | | | | | | | | | | | | | |
Class N | | | $1,000 | | | | $1,018.15 | | | | 1.40% | | | | $7.12 | |
Class I | | | 1,000 | | | | 1,019.41 | | | | 1.15% | | | | 5.85 | |
| LMCG Emerging Markets Fund(6) | |
Actual Fund Return | | | | | | | | | | | | | | | | |
Class N | | | $1,000 | | | | $966.90 | | | | 1.65% | | | | $8.18 | |
Class I | | | 1,000 | | | | 968.90 | | | | 1.40% | | | | 6.95 | |
Hypothetical 5% Return | | | | | | | | | | | | | | | | |
Class N | | | $1,000 | | | | $1,016.89 | | | | 1.65% | | | | $8.39 | |
Class I | | | 1,000 | | | | 1,018.15 | | | | 1.40% | | | | 7.12 | |
| Harrison Street Real Estate Fund | |
Actual Fund Return | | | | | | | | | | | | | | | | |
Class N | | | $1,000 | | | | $927.70 | | | | 1.37% | | | | $6.66 | |
Class I | | | 1,000 | | | | 928.90 | | | | 1.12% | | | | 5.45 | |
Hypothetical 5% Return | | | | | | | | | | | | | | | | |
Class N | | | $1,000 | | | | $1,018.30 | | | | 1.37% | | | | $6.97 | |
Class I | | | 1,000 | | | | 1,019.56 | | | | 1.12% | | | | 5.70 | |
| M&C Balanced Fund | | | | | | | | | | | | | | | | |
Actual Fund Return | | | | | | | | | | | | | | | | |
Class N | | | $1,000 | | | | $1,034.00 | | | | 1.20% | | | | $6.15 | |
Class I | | | 1,000 | | | | 1,034.60 | | | | 1.10% | | | | 5.64 | |
Hypothetical 5% Return | | | | | | | | | | | | | | | | |
Class N | | | $1,000 | | | | $1,019.16 | | | | 1.20% | | | | $6.11 | |
Class I | | | 1,000 | | | | 1,019.66 | | | | 1.10% | | | | 5.60 | |
| (1) | Annualized, based on the Fund’s most recent fiscal half-year expenses. |
| (2) | Expenses are equal to the Fund’s annualized expense ratio multiplied by the average account value over the period, multiplied by the number of days in the most recent fiscal half-year (184) or partial year, if applicable, for the actual return and multiplied by the most recent fiscal half-year for the hypothetical 5% return, then divided by 365. Expense ratios do not include interest expense, if applicable. |
| (3) | Earnings Credit did not affect the six months expense ratio for the six months ended October 31, 2013, except for the River Road Independent Value Fund. If included, your annualized expense ratios for the River Road Independent Value Fund would be 1.40% and 1.15% for Class N and Class I, respectively and your actual and hypothetical expenses paid during the period would be $7.21 and $7.12 and $5.92 and $5.85 for Class N and Class I, respectively. |
| (4) | Excludes interest expense and dividends on short positions. If included, your annualized expense ratios would be 2.35% and 2.10% for Class N and Class I, respectively and your actual and hypothetical expenses paid during the period would be $12.30 and $11.93 and $11.00 and $10.66 for Class N and Class I, respectively. |
| (5) | The inception date for the River Road Long-Short Fund Class I shares is March 4, 2013. |
| (6) | The inception date for the LMCG Emerging Markets Fund is March 28, 2013. |
| | |
| |
| | October 31, 2013 |
| |
| Additional Information (unaudited) – continued | | |
TRUSTEES AND OFFICERS OF THE TRUST
Under Delaware law, the business and affairs of the Trust are managed under the direction of the Board. Information pertaining to the Trustees and officers of the Trust is set forth below. The term “officer” means the president, vice president, secretary, treasurer, controller or any other officer who performs a policy making function.
| | | | | | | | | | | | |
Name, Address, Age and Position(s) with Trust | | Term of Office 1 and Length of Time Served | | Principal Occupation(s) During Past Five Years | | Number of Portfolios in Fund Complex 2 Overseen by Trustee | | | Other Trusteeships/ Directorships Held by Trustee During Past Five Years | | Experience, Qualifications, Attributes, Skills for Board Membership |
| | | | |
| INDEPENDENT TRUSTEES | | | | | | | | | | |
William E. Chapman, II c/o Aston Funds 120 N. LaSalle Street Chicago, IL 60602 Age: 72 Trustee; Independent Chairman | | Since 2010 | | President and Owner, Longboat Retirement Planning Solutions (1998-present); Trustee of Bowdoin College (2002-present); Hewitt Associates, LLC (part time) (provider of Retirement and Investment Education Seminars) (2002-2009) | | | 23 | | | Director of Harding, Loevner Funds, Inc. (6 portfolios); Trustee of Third Avenue Trust (5 portfolios); Trustee of Third Avenue Variable Trust (1 portfolio); Trustee of The Managers Funds, Managers AMG Funds, Managers Trust I and Managers Trust II (36 portfolios) | | Significant board experience; significant executive experience with several financial services firms; continuing service as Independent Chairman of the Board. |
| | | | | |
Edward J. Kaier c/o Aston Funds 120 N. LaSalle Street Chicago, IL 60602 Age: 68 Trustee | | Since 2010 | | Attorney at Law and Partner, Teeters Harvey Gilboy & Kaier LLP (2007-present); Attorney at Law and Partner, Hepburn Willcox Hamilton & Putnam, LLP (1977-2007) | | | 23 | | | Trustee of Third Avenue Trust (5 portfolios); Trustee of Third Avenue Variable Trust (1 portfolio); Trustee of The Managers Funds, Managers AMG Funds, Managers Trust I and Managers Trust II (36 portfolios) | | Significant board experience; practicing attorney. |
| | | | | |
Gregory T. Mutz c/o Aston Funds 120 N. LaSalle Street Chicago, IL 60602 Age: 68 Trustee | | Since 1993 | | Chairman and CEO of AMLI Residential Properties Trust (a Multifamily REIT), a successor company to AMLI Realty Co. (2004-present); Vice Chairman of UICI (NYSE: UCI) (an insurance holding company) (2003-2004) | | | 23 | | | Member of Board of Genesis Financial Solutions (a privately-held company based in Portland, Oregon providing debt recovery, consumer lending and credit card services) (2005-present); a member of the Board of WAN S.A., a residential real estate company headquartered in Warsaw, Poland (2008-present); a member of the Board of Suknip International Limited, a residential real estate company headquartered in St. Petersburg, Russia (2008-present); Formerly, Director of Alico, Inc. (NASDAQ: ALCO) (agribusiness) (2005-2009) | | Significant board experience; previous service as lead independent trustee; significant executive experience with several financial services firms. |
| | |
| |
| | October 31, 2013 |
| |
| Additional Information (unaudited) – continued | | |
| | | | | | | | | | | | |
Name, Address, Age and Position(s) with Trust | | Term of Office 1 and Length of Time Served | | Principal Occupation(s) During Past Five Years | | Number of Portfolios in Fund Complex 2 Overseen by Trustee | | | Other Trusteeships/ Directorships Held by Trustee During Past Five Years | | Experience, Qualifications, Attributes, Skills for Board Membership |
| | | | |
| INDEPENDENT TRUSTEES (continued) | | | | | | | | | | |
Steven J. Paggioli c/o Aston Funds 120 N. LaSalle Street Chicago, IL 60602 Age: 63 Trustee | | Since 2010 | | Independent Consultant (2002-present); formerly Executive Vice President and Director, The Wadsworth Group (1986-2001); Executive Vice President, Secretary and Director, Investment Company Administration, LLC (1990-2001); Vice President, Secretary and Director, First Fund Distributors, Inc. (1991-2001) | | | 23 | | | Trustee, Professionally Managed Portfolios (43 portfolios); Trustee of The Managers Funds, Managers AMG Funds, Managers Trust I and Managers Trust II (36 portfolios); Advisory Board Member, Sustainable Growth Advisors, LP; Independent Director, Chase Investment Counsel | | Significant board experience; significant executive experience with several financial services firms; former service with financial service regulator. |
| | | | | |
Eric Rakowski c/o Aston Funds 120 N. LaSalle Street Chicago, IL 60602 Age: 55 Trustee | | Since 2010 | | Professor, University of California at Berkeley School of Law (1990-present) | | | 23 | | | Director of Harding, Loevner Funds, Inc. (6 portfolios); Trustee of Third Avenue Trust (5 portfolios); Trustee of Third Avenue Variable Trust (1 portfolio); Trustee of The Managers Funds, Managers AMG Funds, Managers Trust I and Managers Trust II (36 portfolios) | | Significant board experience; former practicing attorney; currently professor of law. |
| | | | | |
Robert B. Scherer c/o Aston Funds 120 N. LaSalle Street Chicago, IL 60602 Age: 72 Trustee | | Since 1999 | | President of The Rockridge Group, Ltd. (title insurance industry consulting services) (1994-present) | | | 23 | | | Director, Title Reinsurance Company (insurance for title agents)(1998-present) | | Significant board experience; continuing service as Chair of the Audit Committee; significant executive experience as chief financial officer of insurance and financial services firm. |
| | |
| |
| | October 31, 2013 |
| |
| Additional Information (unaudited) – continued | | |
| | | | | | | | | | | | |
Name, Address, Age and Position(s) with Trust | | Term of Office 1 and Length of Time Served | | Principal Occupation(s) During Past Five Years | | Number of Portfolios in Fund Complex 2 Overseen by Trustee | | | Other Trusteeships/ Directorships Held by Trustee During Past Five Years | | Experience, Qualifications, Attributes, Skills for Board Membership |
| | | | |
| INDEPENDENT TRUSTEES (continued) | | | | | | | | | | |
Thomas R. Schneeweis, c/o Aston Funds 120 N. LaSalle Street Chicago, IL 60602 Age: 66 Trustee | | Since 2010 | | Professor of Finance, University of Massachusetts (1977-present); Director, CISDM at the University of Massachusetts, (1996-present); President, TRS Associates (1982-present); President, Alternative Investment Analytics, LLC (formerly Schneeweis Partners, LLC) (2001-2012); Partner, White Bear Partners, LLC (2007-2010); Partner, S Capital Management, LLC (2007-present); Partner, Northampton Capital Management, LLC (2004-2010) | | | 23 | | | Trustee of The Managers Funds, Managers AMG Funds, Managers Trust I and Managers Trust II (36 portfolios) | | Significant board experience; currently professor of finance; significant executive experience with several investment partnerships. |
| | | | |
| INTERESTED TRUSTEES | | | | | | | | | | |
Stuart D. Bilton, CFA3 c/o Aston Funds 120 N. LaSalle Street Chicago, IL 60602 Age: 67 Trustee; Chief Executive Officer | | Trustee since 1993; Chief Executive Officer since 2010 | | Chief Executive Officer, Aston Asset Management, LP (2006-present); Chairman, Aston Funds (1993-2010) | | | 23 | | | Director, Baldwin & Lyons, Inc. (property and casualty insurance firm) (1987-present); Director, Highbury Financial Inc. (2009-2010) | | Significant board experience; significant executive experience with several financial services firms; former Chairman of the Board. |
| | | | | |
Jeffrey S. Murphy3 c/o Aston Funds 120 N. LaSalle Street Chicago, IL 60602 Age: 47 Trustee | | Since 2010 | | Senior Vice President, Affiliated Managers Group, Inc. (2007-present); Vice President, Affiliated Managers Group, Inc. (1995-2007) | | | 23 | | | N/A | | Significant financial industry experience; significant executive experience with several financial services firms. |
| | | | |
| OFFICER(S) WHO ARE NOT TRUSTEES | | | | | | | | | | |
Kenneth C. Anderson c/o Aston Funds 120 N. LaSalle Street Chicago, IL 60602 Age: 49 President | | Since 1993 | | President, Aston Asset Management, LP (2006-present); Director, Highbury Financial Inc. (2009-2010); CPA | | | N/A | | | N/A | | N/A |
| | |
| |
| | October 31, 2013 |
| |
| Additional Information (unaudited) – continued | | |
| | | | | | | | | | | | |
Name, Address, Age and Position(s) with Trust | | Term of Office 1 and Length of Time Served | | Principal Occupation(s) During Past Five Years | | Number of Portfolios in Fund Complex 2 Overseen by Trustee | | | Other Trusteeships/ Directorships Held by Trustee During Past Five Years | | Experience, Qualifications, Attributes, Skills for Board Membership |
| | | | |
| OFFICER(S) WHO ARE NOT TRUSTEES (continued) | | | | | | | | | | |
Gerald F. Dillenburg c/o Aston Funds 120 N. LaSalle Street Chicago, IL 60602 Age: 47 Senior Vice President, Secretary, Chief Operating Officer and Chief Compliance Officer | | Since 1996 | | Chief Compliance Officer, Aston Asset Management, LP (2006-present); Chief Financial Officer, Aston Asset Management, LP (2006-2010); CPA | | | N/A | | | N/A | | N/A |
| | | | | |
Laura M. Curylo c/o Aston Funds 120 N. LaSalle Street Chicago, IL 60602 Age: 45 Chief Financial Officer and Treasurer | | Since 2010 | | Chief Financial Officer, Aston Asset Management, LP (2010-present); Vice President and Controller, Aston Asset Management, LP (2006-present); CPA | | | N/A | | | N/A | | N/A |
| | | | | |
Christine C. Carsman c/o Aston Funds 120 N. LaSalle Street Chicago, IL 60602 Age: 61 Chief Legal Officer | | Since 2010 | | Senior Vice President (2007-present) and Deputy General Counsel (2011-present), Chief Regulatory Counsel (2004-2011), Vice President (2004-2007), Affiliated Managers Group, Inc.; Trustee, Managers AMG Funds, The Managers Funds, Managers Trust I and Managers Trust II (2011-present); Senior Counsel, Vice President and Director of Operational Risk Management and Compliance, Wellington Management Company, LLP (1995-2004) | | | N/A | | | N/A | | N/A |
| 1 | | A Trustee serves for an indefinite term until the earliest of: (i) removal by two-thirds of the Board or shareholders, (ii) resignation, death or incapacity, (iii) the election and qualification of his successor, in accordance with the By-Laws of the Trust, or (iv) the last day of the fiscal year in which he attains the age of 75 years. Officers serve for an indefinite term until the earliest of: (i) removal by the Board, (ii) resignation, death or incapacity, or (iii) the election and qualification of their successors, in accordance with the By-Laws of the Trust. |
| 2 | | The term “Fund Complex” includes all series of Aston Funds. |
| 3 | | “Interested person” of the Trust as defined in the 1940 Act. Mr. Bilton is considered an “interested person” because of his affiliation with Aston Asset Management, LP which acts as the Funds’ investment adviser. Mr. Murphy is considered an “interested person” because of his affiliation with Affiliated Managers Group, Inc., the ultimate parent of the investment adviser, and related entities. |
Aston Funds
ADVISER
Aston Asset Management, LP
120 N. LaSalle Street, 25th Floor
Chicago, IL 60602
SUBADVISERS
Anchor Capital Advisors LLC
One Post Office Square, Suite 3850
Boston, MA 02109
Baring International Investment Limited
155 Bishopsgate
London, EC2M 3XY UK
Cornerstone Investment Partners, LLC
Phipps Tower
3438 Peachtree Road NE, Suite 900
Atlanta, GA 30326
DoubleLine Capital LP
333 South Grand Avenue, Suite 1800
Los Angeles, CA 90071
Fairpointe Capital LLC
One North Franklin, Suite 3300
Chicago, IL 60606
Harrison Street Securities, LLC
71 South Wacker Drive, Suite 3575
Chicago, IL 60606
Herndon Capital Management, LLC
191 Peachtree Street, NE, Suite 2500
Atlanta, GA 30303
Lake Partners, Inc.
4 High Ridge Park, Suite 300
Stamford, CT 06905
Lee Munder Capital Group, LLC
200 Clarendon Street, 28th Floor
Boston, MA 02116
SUBADVISERS - continued
Montag & Caldwell, LLC
3455 Peachtree Road NE, Suite 1200
Atlanta, GA 30326
River Road Asset Management, LLC
Meidinger Tower, Suite 1600
462 South Fourth Street
Louisville, KY 40202
Silvercrest Asset Management Group LLC
1330 Avenue of the Americas, 38th Floor
New York, NY 10019
TAMRO Capital Partners LLC
1701 Duke St., Suite 250
Alexandria, VA 22314
Taplin, Canida & Habacht LLC
1001 Brickell Bay Drive, Suite 2100
Miami, FL 33131
SHAREHOLDER SERVICES
Aston Funds
P.O. Box 9765
Providence, RI 02940
DISTRIBUTOR
Foreside Funds Distributors LLC
400 Berwyn Park
899 Cassatt Road
Berwyn, PA 19312
OFFICERS
Stuart D. Bilton, Chief Executive Officer
Kenneth C. Anderson, President
Gerald F. Dillenburg, Senior Vice President and Secretary, Chief Operating Officer and Chief Compliance Officer
Christine C. Carsman, Chief Legal Officer
Laura M. Curylo, Treasurer and Chief Financial Officer
Juli A. Braun, Assistant Treasurer
Michael A. Cozzi, Assistant Treasurer
James A. Dimmick, Assistant Secretary
Marc J. Peirce, Assistant Secretary
Diana R. Podgorny, Assistant Secretary
CUSTODIAN
The Bank of New York Mellon
One Wall Street
New York, New York 10286
LEGAL COUNSEL
Vedder Price P.C.
222 N. LaSalle Street
Chicago, IL 60601
INDEPENDENT REGISTERED PUBLIC ACCOUNTING FIRM
Ernst & Young LLP
155 N. Wacker Drive
Chicago, IL 60606
THE STATEMENT OF ADDITIONAL INFORMATION INCLUDES ADDITIONAL INFORMATION ABOUT FUND TRUSTEES AND IS AVAILABLE UPON REQUEST WITHOUT CHARGE BY CALLING 800-992-8151.
Guide to Shareholder Benefits
We’re delighted to offer all Aston Funds shareholders a variety of services and convenient options. To receive more information about any of these benefits, simply call an Investor Services Associate Monday through Friday, 9 a.m. – 7 p.m. Eastern Time.
THE EASY WAY TO ADD TO YOUR ACCOUNT: START AN AUTOMATIC INVESTMENT PLAN
For Class N shareholders, systematic investing is an easy, effortless way to help reach any investment goal. Just choose a fixed amount, and we’ll automatically deduct it from your checking or savings account on a regular schedule and invest it in your Aston Funds account. Periodic investment plans involve continuous investments in securities regardless of price. You should consider your financial ability to continue to purchase shares through periods of both high and low price levels. This plan does not assure a profit and does not protect against loss in declining markets.
COMPOUND YOUR EARNINGS WITH AUTOMATIC DIVIDEND REINVESTMENT
By automatically reinvesting dividends into your Fund account, profits have the opportunity to mount. Monthly and quarterly dividends and annual capital gain distributions are reinvested at no charge.
ACCESS INFORMATION AND MAKE TRANSACTIONS ONLINE AT OUR WEBSITE
You can open a new account, access account balances, view statements, obtain fund information, and make transactions online 24 hours a day, 7 days a week.
| | |
| | www.astonfunds.com |
| |
| | Our Automated Shareholder Services Line Is at Your Service 24 Hours a Day |
| | 800-992-8151 |
Investor Services
Associates are available to assist you Monday – Friday 9 a.m. to 7 p.m., Eastern Time. Or, call any time, day or night, for automated account information to make exchanges or check fund performance.

Aston Funds
P.O. Box 9765
Providence, RI 02940
ATAN 13
Item 2. Code of Ethics.
| | (a) | The registrant, as of the end of the period covered by this report, has adopted a code of ethics that applies to the registrant’s principal executive officer, principal financial officer, principal accounting officer or controller, or persons performing similar functions, regardless of whether these individuals are employed by the registrant or a third party. |
| | (c) | There have been no amendments, during the period covered by this report, to a provision of the code of ethics that applies to the registrant’s principal executive officer, principal financial officer, principal accounting officer or controller, or persons performing similar functions, regardless of whether these individuals are employed by the registrant or a third party, and that relates to any element of the code of ethics description. |
| | (d) | The registrant has not granted any waivers, including an implicit waiver, from a provision of the code of ethics that applies to the registrant’s principal executive officer, principal financial officer, principal accounting officer or controller, or persons performing similar functions, regardless of whether these individuals are employed by the registrant or a third party, that relates to one or more of the items set forth in paragraph (b) of this item’s instructions. |
Item 3. Audit Committee Financial Expert.
The registrant’s board of trustees has determined that Robert B. Scherer is qualified to serve as the registrant’s audit committee financial expert and that he is “independent,” as defined by the Securities and Exchange Commission.
Item 4. Principal Accountant Fees and Services.
Audit Fees
| | (a) | The aggregate fees billed for each of the last two fiscal years for professional services rendered by the principal accountant for the audit of the registrant’s annual financial statements or services that are normally provided by the accountant in connection with statutory and regulatory filings or engagements for those fiscal years are $403,670 for 2013 and $400,750 for 2012. |
Audit-Related Fees
| | (b) | The aggregate fees billed in each of the last two fiscal years for assurance and related services by the principal accountant that are reasonably related to the performance of the audit of the registrant’s financial statements and are not reported under paragraph (a) of this Item are $26,910 for 2013 and $26,000 for 2012. Such fees were related to agreed upon procedures for the April 30, 2013 and April 30, 2012 unaudited semi-annual reports. |
Tax Fees
| | |
| (c) | | The aggregate fees billed in each of the last two fiscal years for professional services rendered by the principal accountant for tax compliance, tax advice, and tax planning $0 for 2013 and $0 for 2012. |
All Other Fees
| | |
| (d) | | The aggregate fees billed in each of the last two fiscal years for products and services provided by the principal accountant, other than the services reported in paragraphs (a) through (c) of this Item are $0 for 2013 and $0 for 2012. |
| |
| (e)(1) | | Disclose the audit committee’s pre-approval policies and procedures described in paragraph (c)(7) of Rule 2-01 of Regulation S-X. |
In accordance with Audit Committee Charter, the Audit Committee shall:
| | 1. | Pre-approve any engagement of the independent auditors to provide any non-prohibited services to the Fund, including the fees and other compensation to be paid to the independent auditors.1 |
| | — | | The Chairman of the Audit Committee may grant the pre-approval of services to the Fund for non-prohibited services. All such delegated pre-approvals shall be presented to the Audit Committee no later than the next Audit Committee meeting. |
| | 2. | Pre-approve any engagement of the independent auditors, including the fees and other compensation to be paid to the independent auditors, to provide any non-audit services to the Adviser (or any “control affiliate”2 of the Adviser providing ongoing services to the Fund), if the engagement relates directly to the operations and financial reporting of the Funds.3 |
| 1 | Pre-approval of non-audit services for the Fund pursuant to Section IV.C. 2 is not required, if: |
| | (a) | the aggregate amount of all non-audit services provided to the Fund is no more than 5% of the total fees paid by the Fund to the independent auditors during the fiscal year in which the non-audit services are provided; |
| | (b) | the services were not recognized by Fund management at the time of the engagement as non-audit services; and |
| | (c) | such services are promptly brought to the attention of the Audit Committee by Fund management and the Audit Committee approves them (which may be by delegation) prior to the completion of the audit. |
| 2 | “Control affiliate” means any entity controlling, controlled by, or under common control with the Adviser. |
| 3 | Pre-approval of non-audit services for the Adviser (or any affiliate of the Adviser providing ongoing services to the Fund) pursuant to Section IV.C.3 is not required, if: |
| | — | | The Chairman of the Audit Committee may grant the pre-approval for non-prohibited services to the Adviser. All such delegated pre-approvals shall be presented to the Audit Committee no later than the next Audit Committee meeting. |
| (e)(2) | The percentage of services described in each of paragraphs (b) through (d) of this Item that were approved by the audit committee pursuant to paragraph (c)(7)(i)(C) of Rule 2-01 of Regulation S-X are as follows: |
(b) 100%
(c) N/A
(d) N/A
| | (f) | The percentage of hours expended on the principal accountant’s engagement to audit the registrant’s financial statements for the most recent fiscal year that were attributed to work performed by persons other than the principal accountant’s full-time, permanent employees was zero percent. |
| | (g) | The aggregate non-audit fees billed by the registrant’s accountant for services rendered to the registrant, and rendered to the registrant’s investment adviser (not including any sub-adviser whose role is primarily portfolio management and is subcontracted with or overseen by another investment adviser), and any entity controlling, controlled by, or under common control with the adviser that provides ongoing services to the registrant for each of the last two fiscal years of the registrant was $0 for 2013 and $0 for 2012. |
| | (h) | The registrant’s audit committee of the board of directors has considered whether the provision of non-audit services that were rendered to the registrant’s investment adviser (not including any sub-adviser whose role is primarily portfolio management and is subcontracted with or overseen by another investment adviser), and any entity controlling, controlled by, or under common control with the investment adviser that provides ongoing services to the registrant that were not pre-approved pursuant to paragraph (c)(7)(ii) of Rule 2-01 of Regulation S-X is compatible with maintaining the principal accountant’s independence. |
| | (a) | the aggregate amount of all non-audit services provided is no more than 5% of the total fees paid by the Fund, the Adviser and any “control affiliate” of the Adviser providing ongoing services to the Fund to the independent auditors during the fiscal year in which the non-audit services are provided; |
| | (b) | the services were not recognized by Fund management at the time of the engagement as non-audit services; and |
| | (c) | such services are promptly brought to the attention of the Audit Committee by Fund management and the Audit Committee approves them (which may be by delegation) prior to the completion of the audit. |
Item 5. Audit Committee of Listed registrants.
Not applicable.
Item 6. Investments.
| (a) | Schedule of Investments in securities of unaffiliated issuers as of the close of the reporting period is included as part of the report to shareholders filed under Item 1 of this form. |
| Item 7. | Disclosure of Proxy Voting Policies and Procedures for Closed-End Management Investment Companies. |
Not applicable.
Item 8. Portfolio Managers of Closed-End Management Investment Companies.
Not applicable.
| Item 9. | Purchases of Equity Securities by Closed-End Management Investment Company and Affiliated Purchasers. |
Not applicable.
| Item 10. | Submission of Matters to a Vote of Security Holders. |
There have been no material changes to the procedures by which the shareholders may recommend nominees to the registrant’s board of directors, where those changes were implemented after the registrant last provided disclosure in response to the requirements of Item 407(c)(2)(iv) of Regulation S-K (17 CFR 229.407) (as required by Item 22(b)(15) of Schedule 14A (17 CFR 240.14a-101)), or this Item.
| Item 11. | Controls and Procedures. |
| | (a) | The registrant’s principal executive and principal financial officers, or persons performing similar functions, have concluded that the registrant’s disclosure controls and procedures (as defined in Rule 30a-3(c) under the Investment Company Act of 1940, as amended (the “1940 Act”) (17 CFR 270.30a-3(c))) are effective, as of a date within 90 days of the filing date of the report that includes the disclosure required by this paragraph, based on their evaluation of these controls and procedures required by Rule 30a-3(b) under the 1940 Act (17 CFR 270.30a-3(b)) and Rules 13a-15(b) or 15d-15(b) under the Securities Exchange Act of 1934, as amended (17 CFR 240.13a-15(b) or 240.15d-15(b)). |
| | (b) | There were no changes in the registrant’s internal control over financial reporting (as defined in Rule 30a-3(d) under the 1940 Act (17 CFR 270.30a-3(d)) that occurred during the registrant’s second fiscal quarter of the period covered by this report that has materially affected, or is reasonably likely to materially affect, the registrant’s internal control over financial reporting. |
Item 12. Exhibits.
| | |
| |
| (a)(1) | | Code of ethics, or any amendment thereto, that is the subject of disclosure required by Item 2 is attached hereto. |
| |
| (a)(2) | | Certifications pursuant to Rule 30a-2(a) under the 1940 Act and Section 302 of the Sarbanes-Oxley Act of 2002 are attached hereto. |
| |
| (a)(3) | | Not applicable. |
| |
| (b) | | Certifications pursuant to Rule 30a-2(b) under the 1940 Act and Section 906 of the Sarbanes- Oxley Act of 2002 are attached hereto. |
(12.other) Not applicable.
SIGNATURES
Pursuant to the requirements of the Securities Exchange Act of 1934 and the Investment Company Act of 1940, the registrant has duly caused this report to be signed on its behalf by the undersigned, thereunto duly authorized.
| | | | |
(registrant) Aston Funds | | |
| |
By (Signature and Title)* /s/ Stuart D. Bilton | | |
| | Stuart D. Bilton, Chief Executive Officer | | |
| | (principal executive officer) | | |
| |
Date 01/03/14 | | |
Pursuant to the requirements of the Securities Exchange Act of 1934 and the Investment Company Act of 1940, this report has been signed below by the following persons on behalf of the registrant and in the capacities and on the dates indicated.
| | | | |
By (Signature and Title)* /s/ Stuart D. Bilton | | |
| | Stuart D. Bilton, Chief Executive Officer | | |
| | (principal executive officer) | | |
| |
Date 01/03/14 | | |
| |
By (Signature and Title)* /s/ Laura M. Curylo | | |
| | Laura M. Curylo, Treasurer and Chief Financial Officer | | |
| | (principal financial officer) | | |
| |
Date 01/03/14 | | |
* Print the name and title of each signing officer under his or her signature.