UNITED STATES
SECURITIES AND EXCHANGE COMMISSION
Washington, D.C. 20549
FORM N-CSR
CERTIFIED SHAREHOLDER REPORT OF REGISTERED MANAGEMENT
INVESTMENT COMPANIES
Investment Company Act file number 811-08004
Aston Funds
(Exact name of registrant as specified in charter)
120 North LaSalle Street, 25th Floor
Chicago, IL 60602
(Address of principal executive offices) (Zip code)
Stuart D. Bilton, President
Aston Funds
120 North LaSalle Street, 25th Floor
Chicago, IL 60602
(Name and address of agent for service)
Registrant’s telephone number, including area code: (312) 268-1400
Date of fiscal year end: October 31
Date of reporting period: October 31, 2014
Form N-CSR is to be used by management investment companies to file reports with the Commission not later than 10 days after the transmission to stockholders of any report that is required to be transmitted to stockholders under Rule 30e-1 under the Investment Company Act of 1940 (17 CFR 270.30e-1). The Commission may use the information provided on Form N-CSR in its regulatory, disclosure review, inspection, and policymaking roles.
A registrant is required to disclose the information specified by Form N-CSR, and the Commission will make this information public. A registrant is not required to respond to the collection of information contained in Form N-CSR unless the Form displays a currently valid Office of Management and Budget (“OMB”) control number. Please direct comments concerning the accuracy of the information collection burden estimate and any suggestions for reducing the burden to Secretary, Securities and Exchange Commission, 100 F Street, NE, Washington, DC 20549. The OMB has reviewed this collection of information under the clearance requirements of 44 U.S.C. § 3507.
Item 1. Reports to Stockholders.
The Report to Shareholders is attached herewith.

Annual Report 2014
October 31, 2014
Class N, I & R Shares
Equity
Fixed Income
Alternative
International
Sector
Balanced
Aston Funds
Dear Fellow Shareholder:
Global investment markets exhibited surprising resiliency during the past 12 months, with most major markets generating gains for the year. This occurred despite concerns about equity market valuation, or fears of higher interest rates, slowing economic conditions in emerging markets, Europe and China, escalating tensions in the Ukraine and Middle East and uncertainties created by the Ebola epidemic.
As we entered the period, the unusually large gains global stock markets enjoyed during the prior year stimulated a vigorous debate about whether equity prices had become overvalued and were poised for a correction. Yet the U.S. stock market—despite a meaningful uptick in volatility—closed near an all-time high on October 31, 2014, supported by improving economic conditions, growing corporate profits and low interest rates. The large-cap S&P 500 Index gained 17.24%, with growth stocks leading value-oriented names. The technology-laden Nasdaq Composite Index advanced 19.58%, while the small-cap Russell 2000 Index returned 8.06%. Global equities posted healthy gains as well, with the MSCI World Index rising 8.67%, helped by better earnings results in many places, and easy monetary policies in Japan and the Eurozone, as well as increased economic stimulus in China.
Bonds, too, posted gains, despite widespread worries at the beginning of 2014 that they would suffer losses due to rising interest rates. Instead, the Federal Reserve’s commitment to keep borrowing costs near historically low levels, low inflation and periodic worries over various geopolitical tensions helped foster ongoing demand for fixed-income asset classes during much of the past year. The Barclays U.S. Aggregate Bond index rose 4.14%.
Regardless of what economic challenges may lie ahead, we remain confident that our talented and experienced investment managers will hold fast to their disciplined investment processes, and navigate the markets effectively for our shareholders.
We are pleased to present you with the Aston Funds annual report and appreciate your continued support of the Aston Funds family.
Sincerely,

Stuart D. Bilton
Chief Executive Officer and President
Aston Funds
|
| The views expressed in this report reflect those of the portfolio managers only, through the end of the period covered and do not necessarily represent the views of Aston Funds or Aston Asset Management, LLC. Any such views are subject to change at any time based upon market or other conditions and Aston Funds and Aston Asset Management, LLC disclaim any responsibility to update such views. These views may not be relied on as investment advice and, because investment decisions for an Aston Fund are based on numerous factors, may not be relied on as an indication of trading intent on behalf of any Aston Fund. |
Aston Funds
Large Cap Funds
ASTON/Cornerstone Large Cap Value Fund
ASTON/Herndon Large Cap Value Fund
ASTON/Montag & Caldwell Growth Fund
ASTON/TAMRO Diversified Equity Fund
Equity Income Funds
ASTON/River Road Dividend All Cap Value Fund
ASTON/River Road Dividend All Cap Value Fund II
Mid Cap Funds
ASTON/Fairpointe Mid Cap Fund
ASTON/Montag & Caldwell Mid Cap Growth Fund
Table of Contents
Small Cap Funds
ASTON/LMCG Small Cap Growth Fund
ASTON/River Road Independent Value Fund
ASTON/River Road Select Value Fund
ASTON/River Road Small Cap Value Fund
ASTON/Silvercrest Small Cap Fund
ASTON/TAMRO Small Cap Fund
Fixed Income Funds
ASTON/DoubleLine Core Plus Fixed Income Fund ASTON/TCH Fixed Income Fund
Alternative Funds
ASTON/Anchor Capital Enhanced Equity Fund
ASTON/Lake Partners LASSO Alternatives Fund
ASTON/River Road Long-Short Fund
International Funds
ASTON/Barings International Fund
ASTON/Guardian Capital Global Dividend Fund
ASTON/LMCG Emerging Markets Fund
ASTON/Pictet International Fund
Sector Fund
ASTON/Harrison Street Real Estate Fund
Balanced Fund
ASTON/Montag & Caldwell Balanced Fund
This report is submitted for general information to the shareholders of the funds. It is not authorized for distribution to prospective investors in the funds unless preceded or accompanied by an effective prospectus which includes details regarding the funds’ objectives, policies, expenses and other information.
Aston Funds are distributed by Foreside Funds Distributors LLC, 400 Berwyn Park, 899 Cassatt Road, Berwyn, PA 19312
Shareholder Services 800-992-8151 • www.astonfunds.com
NOT FDIC INSURED • NO BANK GUARANTEE • MAY LOSE VALUE
ASTON/Cornerstone Large Cap Value Fund
| | |
| |
| Portfolio Manager Commentary (unaudited) | | October 31, 2014 |
| John Campbell, CFA; Rick van Nostrand, CFA; Cameron Clement, CFA; & Dean Morris, CFA |
| Q. | What were the most significant market factors affecting Fund performance and returns relative to the benchmark during the past 12 months? |
| A. | The Russell 1000 Value Index continued its recent multi-year run, posting a strong 16.46% return during a period of volatility. Our investment process focuses on valuation, as measured by Cornerstone Investment Partners’ proprietary valuation tool, paired with rigorous fundamental analysis. However, there are periods when short-term non-fundamental factors, such as price momentum, earnings estimate revisions, or oversized company-sponsored share repurchases drive market performance. During these periods, it is not uncommon for expensive stocks to outperform their more attractively valued peers. As disciplined investors, we continue to stick to our investment philosophy, which is simple, sensible and has proven its worth over the long-term. |
| Q. | What were the best performing holdings for the Fund during the period? |
| A. | Western Digital (+43.5%) was the best-performing position, as it also was during 2013. The market rewarded Western Digital for its continued growth and diversification, and improving fundamentals in the PC market supported increased valuations for component suppliers. Microsoft (+36.4%) was a strong performer. A combination of factors, including a new CEO, successful growth in cloud and subscription services, a refresh cycle for Windows, and PC market improvement led to the stock’s renewed performance. Norfolk Southern (+30.8%) also outperformed as investors rewarded the company for its strong position in energy-related merchandise (crude, sand), and intermodal operations, along with confidence that recent service issues were short-term in nature. In addition, improvements in U.S. manufacturing investment are expected to support further growth. |
| Q. | What were the weakest performing holdings? |
| A. | Mattel (-27.2%) was the weakest stock. It released weaker-than expected results, particularly for the Barbie and Fisher-Price brands. However, we believe the |
| | market is discounting the long-term stability and longevity of its brand positioning and we think that Mattel’s size and scale should allow it to continue to be a market leader. Bed Bath & Beyond (-12.9%) performed weakly behind market concerns around couponing and online competition. However, it recently rebounded behind strong same-store-sales and omnichannel initiatives. We believe that the market does not fully appreciate the company’s long-term stability, high free cash flow, and experienced management. Ensco (-24.0%) was also a large underperformer. Declining oil prices and a period of oversupply in the offshore drilling industry have led to price declines across the Energy sector. However, Ensco is well-positioned in the significantly more stable edges of the industry, and we see this dip as a short-term overreaction compared to a long-term business cycle shift. Ensco’s strong valuation opportunity reflects the unusually high level of near-term uncertainty in the Energy sector. |
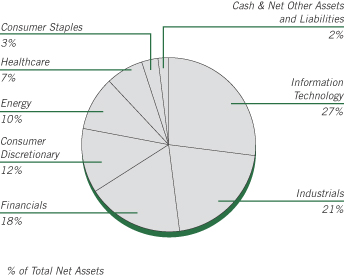
| Q. | How was the Fund positioned as of October 31, 2014? |
| A. | Our actively constructed 800 stock universe is trading at 86% of fair value based on our proprietary Fair Value Model. Within the universe, approximately 390 stocks still remain undervalued, with the median stock price trading near our fair value estimate. Generally speaking, the five-and-a-half-year bull market has put the overall market close to fair value. Nevertheless, we believe we are able to find attractive value in those companies that have shown long-term profitability, and this upcoming period is one where active security selection should help drive performance. Despite the market’s overall valuation level, our work indicates there are attractive values in the Technology and Industrial sectors, and we have increased our exposure. We continue to believe that volatile periods, when the stock prices diverge from the companies’ fundamental values, create compelling opportunities for long-term performance. We believe we are well-positioned for 2015 and beyond. |
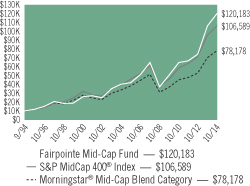
Growth of a Hypothetical
$10,000 Investment—Class N
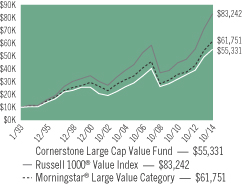
All dividends and capital gains are reinvested. Indexes are unmanaged and do not take into account fees, expenses or other costs.
Returns shown in the chart and table do not reflect taxes that a shareholder would pay on Fund distributions or on the sale of the Fund shares.
Value investing involves the risk that a Fund’s investments in companies believed to be undervalued will not appreciate as anticipated.
RETURNSFOR PERIOD ENDED 10/31/14
Average Annual Total Returns - Class N
| | | | |
One Year | | | 12.17 | % |
Five Year | | | 14.08 | % |
Ten Year | | | 7.83 | % |
Since Inception | | | 8.16 | % |
Inception Date 01/04/93
Average Annual Total Returns - Class I
| | | | |
One Year | | | 12.33 | % |
Five Year | | | 14.37 | % |
Since Inception | | | 7.40 | % |
Inception Date 09/20/05
The performance data quoted represents past performance. Past performance does not guarantee future results. Investment return and principal value will fluctuate so that an investor’s shares, upon redemption, may be worth more or less than their original cost. Current performance may be lower or higher than the performance data quoted. For performance data current to the most recent month-end, please visit our website at www.astonfunds.com.
The total expense ratios for Class N and Class I shares are 1.49% and 1.24%, respectively, as disclosed in the prospectus dated February 28, 2014. Please refer to the Financial Highlights section in this report for more information.
| | |
| |
| ASTON/Cornerstone Large Cap Value Fund | | October 31, 2014 |
| |
| Schedule of Investments | | |
| | | | | | | | |
Shares | | | | | Market Value | |
| |
| | COMMON STOCKS – 97.91% | | | | |
| | |
| | | | Consumer Discretionary – 12.28% | | | | |
| | 95,410 | | | Bed Bath & Beyond * | | $ | 6,424,909 | |
| | 137,750 | | | Gap | | | 5,219,347 | |
| | 168,987 | | | Mattel | | | 5,250,426 | |
| | 31,875 | | | TRW Automotive Holdings * | | | 3,230,531 | |
| | | | | | | | |
| | | | | | | 20,125,213 | |
| | | | | | | | |
| | |
| | | | Consumer Staples – 3.31% | | | | |
| | 71,025 | | | Wal-Mart Stores | | | 5,417,077 | |
| | | | | | | | |
| | |
| | | | Energy – 9.97% | | | | |
| | 52,200 | | | Chevron | | | 6,261,390 | |
| | 94,975 | | | Ensco, Class A (United Kingdom) | | | 3,855,035 | |
| | 35,075 | | | Exxon Mobil | | | 3,392,103 | |
| | 39,475 | | | Royal Dutch Shell PLC, ADR | | | 2,833,910 | |
| | | | | | | | |
| | | | | | | 16,342,438 | |
| | | | | | | | |
| | |
| | | | Financials – 17.89% | | | | |
| | 55,875 | | | ACE (Switzerland) | | | 6,107,138 | |
| | 75,300 | | | Capital One Financial | | | 6,232,581 | |
| | 105,250 | | | Citigroup | | | 5,634,032 | |
| | 104,800 | | | JPMorgan Chase | | | 6,338,304 | |
| | 149,725 | | | Unum Group | | | 5,009,799 | |
| | | | | | | | |
| | | | | | | 29,321,854 | |
| | | | | | | | |
| | |
| | | | Healthcare – 6.83% | | | | |
| | 76,150 | | | Baxter International | | | 5,341,161 | |
| | 54,325 | | | Johnson & Johnson | | | 5,855,149 | |
| | | | | | | | |
| | | | | | | 11,196,310 | |
| | | | | | | | |
| | |
| | | | Industrials – 20.40% | | | | |
| | 28,545 | | | 3M | | | 4,389,365 | |
| | 42,350 | | | Cummins | | | 6,190,723 | |
| | 96,250 | | | Emerson Electric | | | 6,165,775 | |
| | | | | | | | |
Shares | | | | | Market Value | |
| | |
| | | | Industrials (continued) | | | | |
| | 45,775 | | | Norfolk Southern | | $ | 5,064,546 | |
| | 56,475 | | | Parker Hannifin | | | 7,174,019 | |
| | 18,065 | | | WW Grainger | | | 4,458,442 | |
| | | | | | | | |
| | | | | | | 33,442,870 | |
| | | | | | | | |
| | |
| | | | Information Technology – 27.23% | | | | |
| | 22,810 | | | Apple | | | 2,463,480 | |
| | 231,875 | | | Cisco Systems | | | 5,673,981 | |
| | 206,500 | | | EMC | | | 5,932,745 | |
| | 157,225 | | | Intel | | | 5,347,222 | |
| | 134,325 | | | Microsoft | | | 6,306,559 | |
| | 162,775 | | | Oracle | | | 6,356,364 | |
| | 86,850 | | | QUALCOMM | | | 6,818,594 | |
| | 58,300 | | | Western Digital | | | 5,734,971 | |
| | | | | | | | |
| | | | | | | 44,633,916 | |
| | | | | | | | |
| | |
| | | | Total Common Stocks
(Cost $151,083,987) | | | 160,479,678 | |
| | | | | | | | |
| |
| | INVESTMENT COMPANY – 1.79% | | | | |
| | |
| | 2,937,292 | | | BlackRock Liquidity Funds TempCash Portfolio | | | 2,937,292 | |
| | | | | | | | |
| | |
| | | | Total Investment Company
(Cost $2,937,292) | | | 2,937,292 | |
| | | | | | | | |
| Total Investments – 99.70%
(Cost $154,021,279)** | | | 163,416,970 | |
| | | | | | | | |
| Net Other Assets and Liabilities – 0.30% | | | 493,690 | |
| | | | | | | | |
| Net Assets – 100.00% | | $ | 163,910,660 | |
| | | | | | | | |
| * | | Non-income producing security. |
| ** | | Aggregate cost for Federal income tax purposes is $154,102,609. |
| | | | |
Gross unrealized appreciation | | $ | 12,119,292 | |
Gross unrealized depreciation | | | (2,804,931 | ) |
| | | | |
Net unrealized appreciation | | $ | 9,314,361 | |
| | | | |
| ADR | | American Depositary Receipt |
See accompanying Notes to Financial Statements.
ASTON/Herndon Large Cap Value Fund
| | |
| |
| Portfolio Manager Commentary (unaudited) | | October 31, 2014 |
| | Randell A. Cain, Jr., CFA |
| Q. | What were the most significant market factors affecting Fund performance and returns relative to the benchmark during the past 12 months? |
| A. | Over the past 12 months, the Russell 1000 Value Index increased 16.46%. The key drivers of this uptrend have been improving economic fundamentals in the U.S. economy and rising corporate profits. Market headwinds were brought on by political turmoil in the Middle East and Eastern Europe, slower growth in China and a stronger U.S. Dollar. Despite these headwinds, markets have continued to achieve new highs. We believe that the market is poised to continue this positive trend. |
The Fund underperformed the Russell 1000 Value Index by more than 400 basis points (bps) during the period. Both stock selection and sector allocation were negative. The portfolio’s top performing sectors were Healthcare, Materials and Telecommunications, which all benefited from positive stock selection. The sectors with the greatest negative contribution to relative performance were Financials, Energy and Consumer Discretionary. Stock selection was negative for each of these sectors, which coupled with overweight positions in the Energy and Consumer Discretionary sectors, compounded their negative contribution.
| Q. | What were the best performing holdings for the Fund during the period? |
| A. | The greatest individual stock performers during the period were Apple Inc. (+48% return), Endo International PLC (+44%) and Lockheed Martin Corp. (+48%). Apple is a holding from the Information Technology sector, Endo International is a holding from the Healthcare sector and Lockheed Martin is a holding from the Industrials sector. |
| Q. | What were the weakest performing holdings? |
| A. | The weakest individual stock performers over the period were SM Energy Co. (-37% return), Oasis Petroleum Inc. (-35%) and Coach Inc. (-28%). SM Energy and Oasis Petroleum, both oil and gas explorer and producers, are holdings from the Energy sector. Coach is a holding from the Consumer Discretionary sector. |
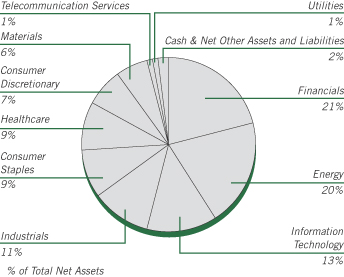
| Q. | How was the Fund positioned as of October 31, 2014? |
| A. | As of October 31, 2014, the Fund was overweight in the Energy, Information Technology, Materials and Consumer Staples sectors. The underweight sectors were Financials, Utilities, Healthcare and Telecommunications. From a portfolio construction standpoint, the Fund traditionally and currently has similar earnings growth and higher return on equity metrics coupled with lower valuation multiples than our benchmark, the Russell 1000 Value Index. We believe that continuing to maintain this relationship over time should yield a better than average return over the long-run. |
Note: A basis point (bps) is a unit of measure. 1 bps = .01%.
Growth of a Hypothetical
$10,000 Investment—Class N
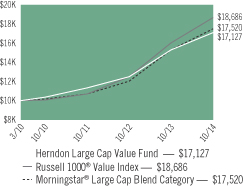
All dividends and capital gains are reinvested. Indexes are unmanaged and do not take into account fees, expenses or other costs.
Returns shown in the chart and table do not reflect taxes that a shareholder would pay on Fund distributions or on the sale of the Fund shares.
Value investing involves the risk that a Fund’s investments in companies believed to be undervalued will not appreciate as anticipated.
RETURNSFOR PERIOD ENDED 10/31/14
Average Annual Total Returns - Class N
| | | | |
1 Year | | | 11.67 | % |
Since Inception | | | 12.44 | % |
Inception Date 03/31/10
Average Annual Total Returns - Class I
| | | | |
1 Year | | | 11.94 | % |
Since Inception | | | 11.75 | % |
Inception Date 03/02/11
The performance data quoted represents past performance. Past performance does not guarantee future results. Investment return and principal value will fluctuate so that an investor’s shares, upon redemption, may be worth more or less than their original cost. Current performance may be lower or higher than the performance data quoted. For performance data current to the most recent month-end, please visit our website at www.astonfunds.com.
| | |
| |
| ASTON/Herndon Large Cap Value Fund | | October 31, 2014 |
| |
| Schedule of Investments | | |
| | | | | | | | |
Shares | | | | | Market Value | |
|
| | COMMON STOCKS – 97.93% | |
| | |
| | | | Consumer Discretionary – 6.82% | | | | |
| | 38,737 | | | Ross Stores | | $ | 3,126,851 | |
| | 73,564 | | | TJX | | | 4,658,072 | |
| | 37,315 | | | Yum! Brands | | | 2,680,336 | |
| | | | | | | | |
| | | | | | | 10,465,259 | |
| | | | | | | | |
| | | | Consumer Staples – 8.79% | | | | |
| | 88,490 | | | Altria Group | | | 4,277,607 | |
| | 58,994 | | | Campbell Soup | | | 2,605,765 | |
| | 55,795 | | | Colgate-Palmolive | | | 3,731,570 | |
| | 32,340 | | | Philip Morris International | | | 2,878,583 | |
| | | | | | | | |
| | | | | | | 13,493,525 | |
| | | | | | | | |
| | | | Energy – 20.18% | | | | |
| | 33,051 | | | Apache | | | 2,551,537 | |
| | 72,503 | | | Atwood Oceanics * | | | 2,947,247 | |
| | 40,869 | | | ConocoPhillips | | | 2,948,698 | |
| | 50,465 | | | Continental Resources * | | | 2,844,712 | |
| | 31,629 | | | Exxon Mobil | | | 3,058,841 | |
| | 47,977 | | | Marathon Petroleum | | | 4,361,109 | |
| | 110,531 | | | Oasis Petroleum * | | | 3,311,509 | |
| | 51,179 | | | Oil States International * | | | 3,057,433 | |
| | 47,622 | | | SM Energy | | | 2,681,119 | |
| | 63,973 | | | Valero Energy | | | 3,204,408 | |
| | | | | | | | |
| | | | | | | 30,966,613 | |
| | | | | | | | |
| | | | Financials – 21.11% | | | | |
| | 65,391 | | | Aflac | | | 3,905,804 | |
| | 99,862 | | | Apartment Investment & Management, Class A, REIT | | | 3,574,061 | |
| | 79,606 | | | CBOE Holdings | | | 4,691,978 | |
| | 66,101 | | | Discover Financial Services | | | 4,215,922 | |
| | 72,143 | | | Eaton Vance | | | 2,657,027 | |
| | 39,803 | | | McGraw-Hill | | | 3,601,375 | |
| | 35,183 | | | Moody’s | | | 3,491,209 | |
| | 93,116 | | | Nationstar Mortgage Holdings * | | | 3,270,234 | |
| | 62,548 | | | Waddell & Reed Financial, Class A | | | 2,986,042 | |
| | | | | | | | |
| | | | | | | 32,393,652 | |
| | | | | | | | |
| | | | | | | | |
Shares | | | | | Market Value | |
| | | | Healthcare – 8.65% | | | | |
| | 23,811 | | | AmerisourceBergen | | $ | 2,033,698 | |
| | 36,249 | | | Gilead Sciences * | | | 4,059,888 | |
| | 77,474 | | | Mylan * | | | 4,148,733 | |
| | 23,100 | | | United Therapeutics * | | | 3,025,407 | |
| | | | | | | | |
| | | | | | | 13,267,726 | |
| | | | | | | | |
| | | | Industrials – 11.09% | | | | |
| | 33,051 | | | Caterpillar | | | 3,351,702 | |
| | 8,530 | | | Copa Holdings SA, Class A (Panama) | | | 997,328 | |
| | 26,654 | | | Lockheed Martin | | | 5,079,453 | |
| | 35,894 | | | Rockwell Collins | | | 3,020,480 | |
| | 28,786 | | | United Parcel Service, Class B | | | 3,019,939 | |
| | 24,877 | | | Verisk Analytics, Class A * | | | 1,551,081 | |
| | | | | | | | |
| | | | | | | 17,019,983 | |
| | | | | | | | |
| | | | Information Technology – 13.39% | | | | |
| | 52,241 | | | Apple | | | 5,642,028 | |
| | 18,480 | | | International Business Machines | | | 3,038,112 | |
| | 87,780 | | | Microsoft | | | 4,121,271 | |
| | 45,845 | | | Western Digital | | | 4,509,773 | |
| | 190,840 | | | Western Union | | | 3,236,646 | |
| | | | | | | | |
| | | | | | | 20,547,830 | |
| | | | | | | | |
| | | | Materials – 5.95% | | | | |
| | 11,728 | | | CF Industries Holdings | | | 3,049,280 | |
| | 30,208 | | | LyondellBasell Industries NV, Class A, (Netherlands) | | | 2,767,959 | |
| | 8,530 | | | Newmarket | | | 3,309,725 | |
| | | | | | | | |
| | | | | | | 9,126,964 | |
| | | | | | | | |
| | | | Telecommunication Services – 1.05% | |
| | 31,985 | | | Verizon Communications | | | 1,607,246 | |
| | | | | | | | |
| | |
| | | | Utilities – 0.90% | | | | |
| | 97,730 | | | AES | | | 1,375,061 | |
| | | | | | | | |
| | |
| | | | Total Common Stocks
(Cost $131,056,956) | | | 150,263,859 | |
| | | | | | | | |
|
| | INVESTMENT COMPANY – 2.24% | |
| | |
| | 3,437,188 | | | BlackRock Liquidity Funds TempCash Portfolio | | | 3,437,188 | |
| | | | | | | | |
| | |
| | | | Total Investment Company
(Cost $3,437,188) | | | 3,437,188 | |
| | | | | | | | |
| Total Investments – 100.17%
(Cost $134,494,144)** | | | 153,701,047 | |
| | | | | | | | |
| Net Other Assets and Liabilities – (0.17)% | | | (256,001 | ) |
| | | | | | | | |
| Net Assets – 100.00% | | $ | 153,445,046 | |
| | | | | | | | |
| * | | Non-income producing security. |
| ** | | Aggregate cost for Federal income tax purposes is $134,767,591. |
| | | | |
Gross unrealized appreciation | | $ | 23,569,565 | |
Gross unrealized depreciation | | | (4,636,109 | ) |
| | | | |
Net unrealized appreciation | | $ | 18,933,456 | |
| | | | |
| REIT | | Real Estate Investment Trust |
See accompanying Notes to Financial Statements.
ASTON/Montag & Caldwell Growth Fund
| | |
| |
| Portfolio Manager Commentary (unaudited) | | October 31, 2014 |
| | Ronald E. Canakaris, CFA, CIC |
| Q. | What were the most significant market factors affecting Fund performance and returns relative to the benchmark during the past 12 months? |
| A. | The Fund benefited from an overweight allocation to Healthcare and underweight positions in the Consumer Discretionary and Energy sectors. The biggest detractor from results relative to the Russell 1000 Growth Index was not owning Apple, which was the largest position in the Russell 1000 Growth Index. Apple rose just under 48% for the year ending October 31, 2014 as investors eagerly anticipated the release of the iPhone 6. While Apple has been undervalued in our work, we continue to have questions about the company’s ability to sustain an above average earnings growth rate due to the absolute size of the company and the already sizable market penetration of its main products. The Fund’s cash reserve also detracted from relative results, as the equity markets were strong over the period. |
| Q. | What were the best performing holdings for the Fund during the period? |
| A. | Allergan was the Fund’s top performing stock as the company is benefiting from approval of new indications for its Botox franchise and the company has marketing exclusivity for Restasis through 2024. Gilead Sciences rose strongly after the company launched Solvaldi, the company’s Hepatitis C treatment. AmerisourceBergen gained on positive results from its partnership with Walgreens and Alliance Boots. Biogen had another year of strong gains as Tecfidera, the company’s oral treatment for multiple sclerosis (MS), received European approval for launch and the company has several promising products in development. Union Pacific enjoyed strong gains, as the company is benefiting from secular rail pricing power and margin improvements driven by ongoing productivity initiatives. |
| Q. | What were the weakest performing holdings? |
| A. | Occidental Petroleum was the biggest detractor from relative performance, as Energy was the worst performing sector over the period. The weighting was reduced during the period because the weak oil price environment could complicate efforts to reduce the company’s exposure in the Middle East and pressure the valuation of the California Resources spin-off. Walgreens sold off in early August after the company provided disappointing earnings guidance related to Medicare reimbursement pressures and generic drug inflation. Ralph Lauren was essentially unchanged during the period, lagging the market as ongoing heavy investments in stores, infrastructure and technology have depressed earnings growth. Starbucks declined slightly during the period following the previous year’s strong gains as the price/earnings multiple compressed due to a slowdown in same store sales comparisons. eBay was weak during the period and was eliminated from the Fund as weakness in the Marketplaces division weighed on investor sentiment. |
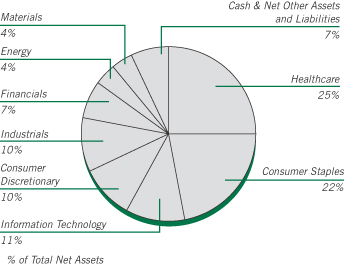
| Q. | How was the Fund positioned as of October 31, 2014? |
| A. | Because the high quality growth stocks in the Fund are reasonably valued and have sound earnings prospects, we believe they will do relatively well in a more volatile environment, which may occur as quantitative easing ends in the United States. Longer term, the Fund is well positioned to benefit from the ongoing synchronized global recovery as these companies have strong global franchises and in most cases derive 40% or more of their earnings from international markets. We have a moderate amount of buying reserves that will enable us to take advantage of better opportunities that may appear as share prices respond to free market forces. |
Growth of a Hypothetical
$10,000 Investment—Class N
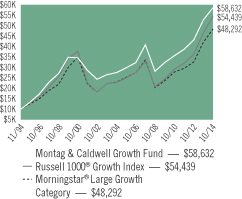
All dividends and capital gains are reinvested. Indexes are unmanaged and do not take into account fees, expenses or other costs.
Returns shown in the chart and table do not reflect taxes that a shareholder would pay on Fund distributions or on the sale of the Fund shares.
RETURNSFOR PERIOD ENDED 10/31/14
Average Annual Total Returns - Class N
| | | | |
One Year | | | 10.98 | % |
Five Year | | | 12.64 | % |
Ten Year | | | 7.87 | % |
Since Inception | | | 9.25 | % |
Inception Date 11/02/94
Average Annual Total Returns - Class I
| | | | |
One Year | | | 11.26 | % |
Five Year | | | 12.93 | % |
Ten Year | | | 8.15 | % |
Since Inception | | | 7.77 | % |
Inception Date 06/28/96
Average Annual Total Returns - Class R
| | | | |
One Year | | | 10.74 | % |
Five Year | | | 12.36 | % |
Ten Year | | | 7.62 | % |
Since Inception | | | 7.70 | % |
Inception Date 12/31/02
The performance data quoted represents past performance. Past performance does not guarantee future results. Investment return and principal value will fluctuate so that an investor’s shares, upon redemption, may be worth more or less than their original cost. Current performance may be lower or higher than the performance data quoted. For performance data current to the most recent month-end, please visit our website at www.astonfunds.com.
The total expense ratios for Class N, Class I and Class R shares are 1.05%, 0.80% and 1.30% respectively, as disclosed in the prospectus dated February 28, 2014. Please refer to the Financial Highlights section in this report for more information.
| | |
| |
| ASTON/Montag & Caldwell Growth Fund | | October 31, 2014 |
| |
| Schedule of Investments | | |
| | | | | | | | |
Shares | | | | | Market
Value | |
|
| | COMMON STOCKS – 93.17% | |
| | |
| | | | Consumer Discretionary – 10.25% | | | | |
| | 704,800 | | | NIKE, Class B | | $ | 65,525,256 | |
| | 83,355 | | | Priceline.com * | | | 100,543,634 | |
| | 481,493 | | | Ralph Lauren | | | 79,369,306 | |
| | 1,622,400 | | | Starbucks | | | 122,588,544 | |
| | 881,700 | | | TJX Companies | | | 55,829,244 | |
| | | | | | | | |
| | | | | | | 423,855,984 | |
| | | | | | | | |
| | |
| | | | Consumer Staples – 22.17% | | | | |
| | 1,757,100 | | | Colgate-Palmolive | | | 117,514,848 | |
| | 690,400 | | | Costco Wholesale | | | 92,078,648 | |
| | 1,720,600 | | | Estee Lauder, Class A | | | 129,354,708 | |
| | 4,332,200 | | | Mondelez International, Class A | | | 152,753,372 | |
| | 1,986,400 | | | PepsiCo | | | 191,032,088 | |
| | 1,477,900 | | | Procter & Gamble | | | 128,976,333 | |
| | 1,643,800 | | | Walgreen | | | 105,564,836 | |
| | | | | | | | |
| | | | | | | 917,274,833 | |
| | | | | | | | |
| | |
| | | | Energy – 4.22% | | | | |
| | 622,300 | | | Occidental Petroleum | | | 55,341,139 | |
| | 1,206,400 | | | Schlumberger | | | 119,023,424 | |
| | | | | | | | |
| | | | | | | 174,364,563 | |
| | | | | | | | |
| | |
| | | | Financials – 6.89% | | | | |
| | 1,499,000 | | | American Express | | | 134,835,050 | |
| | 1,020,165 | | | State Street | | | 76,981,651 | |
| | 1,382,600 | | | Wells Fargo & Co | | | 73,402,234 | |
| | | | | | | | |
| | | | | | | 285,218,935 | |
| | | | | | | | |
| | |
| | | | Healthcare – 25.11% | | | | |
| | 3,079,300 | | | Abbott Laboratories | | | 134,226,687 | |
| | 642,251 | | | Allergan | | | 122,066,225 | |
| | 1,181,500 | | | AmerisourceBergen | | | 100,911,915 | |
| | 507,873 | | | Biogen Idec * | | | 163,067,863 | |
| | | | | | | | |
Shares | | | | | Market
Value | |
| | |
| | | | Healthcare (continued) | | | | |
| | 1,873,900 | | | Gilead Sciences * | | $ | 209,876,800 | |
| | 866,261 | | | McKesson | | | 176,206,150 | |
| | 1,125,100 | | | Thermo Fisher Scientific | | | 132,278,007 | |
| | | | | | | | |
| | | | | | | 1,038,633,647 | |
| | | | | | | | |
| | |
| | | | Industrials – 9.84% | | | | |
| | 4,778,700 | | | General Electric | | | 123,338,247 | |
| | 688,400 | | | Union Pacific | | | 80,164,180 | |
| | 1,231,700 | | | United Parcel Service, Class B | | | 129,217,647 | |
| | 301,354 | | | WW Grainger | | | 74,374,167 | |
| | | | | | | | |
| | | | | | | 407,094,241 | |
| | | | | | | | |
| |
| | | | Information Technology – 11.17% | |
| | 953,200 | | | Accenture PLC, Class A (Ireland) | | | 77,323,584 | |
| | 663,800 | | | Facebook, Class A * | | | 49,778,362 | |
| | 219,463 | | | Google, Class A * | | | 124,626,454 | |
| | 778,900 | | | QUALCOMM | | | 61,151,439 | |
| | 618,692 | | | Visa, Class A | | | 149,370,810 | |
| | | | | | | | |
| | | | | | | 462,250,649 | |
| | | | | | | | |
| | |
| | | | Materials – 3.52% | | | | |
| | 1,264,600 | | | Monsanto | | | 145,479,584 | |
| | | | | | | | |
| | |
| | | | Total Common Stocks
(Cost $3,168,493,351) | | | 3,854,172,436 | |
| | | | | | | | |
|
| | INVESTMENT COMPANY – 6.08% | |
| | |
| | 251,494,763 | | | BlackRock Liquidity Funds TempCash Portfolio | | | 251,494,763 | |
| | | | | | | | |
| | |
| | | | Total Investment Company
(Cost $251,494,763) | | | 251,494,763 | |
| | | | | | | | |
| Total Investments – 99.25%
(Cost $3,419,988,114)** | | | 4,105,667,199 | |
| | | | | | | | |
| Net Other Assets and Liabilities – 0.75% | | | 31,000,697 | |
| | | | | | | | |
| Net Assets – 100.00% | | $ | 4,136,667,896 | |
| | | | | | | | |
| * | | Non-income producing security. |
| ** | | Aggregate cost for Federal income tax purposes is $3,422,929,368. |
| | | | |
Gross unrealized appreciation | | $ | 710,302,082 | |
Gross unrealized depreciation | | | (27,564,251 | ) |
| | | | |
Net unrealized appreciation | | $ | 682,737,831 | |
| | | | |
See accompanying Notes to Financial Statements.
ASTON/TAMRO Diversified Equity Fund
| | |
| |
| Portfolio Manager Commentary (unaudited) | | October 31, 2014 |
Philip D. Tasho, CFA & Timothy A. Holland, CFA
| Q. | What were the most significant market factors affecting Fund performance and returns relative to the benchmark during the past 12 months? |
| A. | The fiscal year ended October 31, 2014 was a year with above-average returns for large cap stocks and modest returns for small caps. The economic environment was accommodative to investors with robust monetary policy offsetting fiscal policy constraints of higher taxes and regulations. Inflation was negligible and interest rates remained at historic lows. While the U.S. economy may not be growing at warp speed, it seems to be easily outdistancing many of its peers. Absolute returns were strong, but the Fund lagged its benchmark, the Russell 1000 Index, due to weak stock selection in the Consumer Discretionary and Financials sectors. While U.S. consumers have significantly improved their financial profile following the Great Recession, spending remains modest relative to previous recoveries and evolving e-commerce offerings have upended traditional spending patterns. At the same time, the new regulatory construct continues to weigh on returns within Financial Services. We are approaching both sectors more judiciously as we work to differentiate between the long-term winners and losers in these two very important segments of our economy. |
| Q. | What were the best performing holdings for the Fund during the period? |
| A. | The three holdings that contributed the most to performance were American Airlines Group, Gilead Sciences and Allergan. American Airlines benefitted from improving industry fundamentals, better capacity utilization and progress in the integration of US Airways. Gilead Sciences, which develops and commercializes innovative therapeutics for patients suffering from life-threatening diseases, saw strong results from the launch of a Hepatitis C treatment. While revenues and earnings were strong, Allergan shares moved higher primarily due to a hostile takeover attempt by Valeant Pharmaceuticals. |
| Q. | What were the weakest performing holdings? |
| A. | Ocwen Financial, Best Buy and Amazon.com were the biggest detractors from portfolio performance during the year. Mortgage servicer Ocwen Financial was impacted by New York regulator’s decision to halt the onboarding of mortgage servicing rights from Wells Fargo and higher operating costs. Increased competition led to sales shortfalls and margin compression for retailer Best Buy. Investors in Amazon.com were disappointed by slowing revenue growth and continued capital investments on infrastructure and content that negatively impacted earnings. |
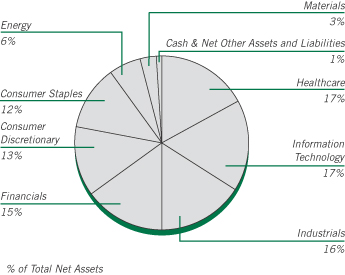
| Q. | How was the Fund positioned as of October 31, 2014? |
| A. | Our investment process focuses on individual, bottom-up stock selection to identify companies that we believe possess a sustainable competitive advantage and are attractively valued. These companies also fit into one of three fundamental categories: Leaders, Laggards and Innovators. Our approach to portfolio management is opportunistic and broadly diversified, with sector weights determined by where we see opportunities at the stock level. The best performing sectors in the Fund last year, Healthcare and Information Technology, represent the largest sector weights at year end. We have maintained our focus on “buying the best when they’re depressed,” as Leaders and Innovators now comprise 90% of the portfolio, their greatest representation since the Fund’s inception. With a goal of identifying the large cap companies of tomorrow, we seek to invest in best-in-class companies down the market cap spectrum. We took advantage of attractive valuations in small cap, increasing the portfolio’s investments in small and mid-cap companies to 22%. From a macro perspective, we don’t expect much change in trend. The U.S. economy should continue its slow and steady recovery, while nominally tighter monetary policy should be offset by historically low interest rates and lower energy prices. Moving forward, a portfolio of well-capitalized, well-positioned companies should resonate in a still tepid environment. |
Growth of a Hypothetical
$10,000 Investment—Class N
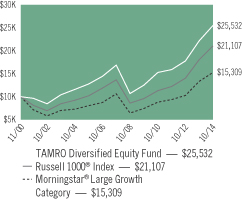
All dividends and capital gains are reinvested. Indexes are unmanaged and do not take into account fees, expenses or other costs.
Returns shown in the chart and table do not reflect taxes that a shareholder would pay on Fund distributions or on the sale of the Fund shares.
RETURNSFOR PERIOD ENDED 10/31/14
Average Annual Total Returns - Class N
| | | | |
One Year | | | 15.10 | % |
Five Year | | | 15.29 | % |
Ten Year | | | 8.18 | % |
Since Inception | | | 6.97 | % |
Inception Date 11/30/00
Average Annual Total Returns - Class I
| | | | |
One Year | | | 15.40 | % |
Since Inception | | | 15.46 | % |
Inception date 03/02/12
The performance data quoted represents past performance. Past performance does not guarantee future results. Investment return and principal value will fluctuate so that an investor’s shares, upon redemption, may be worth more or less than their original cost. Current performance may be lower or higher than the performance data quoted. For performance data current to the most recent month-end, please visit our website at www.astonfunds.com.
The performance quoted would have been lower if fee waivers and/or expense reimbursements had not been in effect.
The total expense ratios for Class N and Class I shares are 1.46% and 1.21% respectively, as disclosed in the prospectus dated February 28, 2014. Please refer to the Financial Highlights section in this report for more information.
| | |
| |
| ASTON/TAMRO Diversified Equity Fund | | October 31, 2014 |
| |
| Schedule of Investments | | |
| | | | | | | | |
Shares | | | | | Market
Value | |
|
| | COMMON STOCKS – 99.47% | |
| | |
| | | | Consumer Discretionary – 13.20% | | | | |
| | 5,221 | | | Amazon.com * | | $ | 1,594,808 | |
| | 19,263 | | | CarMax * | | | 1,076,994 | |
| | 8,557 | | | Grand Canyon Education * | | | 409,880 | |
| | 8,450 | | | Home Depot | | | 824,044 | |
| | 33,915 | | | Live Nation Entertainment * | | | 881,790 | |
| | 13,912 | | | Macy’s | | | 804,392 | |
| | 412 | | | NVR * | | | 505,763 | |
| | 10,884 | | | Red Robin Gourmet Burgers * | | | 598,293 | |
| | | | | | | | |
| | | | | | | 6,695,964 | |
| | | | | | | | |
| | |
| | | | Consumer Staples – 12.39% | | | | |
| | 24,489 | | | Coca-Cola | | | 1,025,599 | |
| | 11,356 | | | Constellation Brands, Class A * | | | 1,039,528 | |
| | 6,667 | | | Keurig Green Mountain | | | 1,011,717 | |
| | 14,564 | | | Nu Skin Enterprises, Class A | | | 769,416 | |
| | 13,273 | | | Sysco | | | 511,541 | |
| | 16,300 | | | United Natural Foods * | | | 1,108,726 | |
| | 12,702 | | | Walgreen | | | 815,722 | |
| | | | | | | | |
| | | | | | | 6,282,249 | |
| | | | | | | | |
| | |
| | | | Energy – 6.38% | | | | |
| | 14,785 | | | Continental Resources * | | | 833,430 | |
| | 14,211 | | | Kinder Morgan | | | 549,966 | |
| | 4,757 | | | Occidental Petroleum | | | 423,040 | |
| | 6,800 | | | Phillips 66 | | | 533,800 | |
| | 13,134 | | | Range Resources | | | 898,366 | |
| | | | | | | | |
| | | | | | | 3,238,602 | |
| | | | | | | | |
| | |
| | | | Financials – 15.02% | | | | |
| | 11,292 | | | American Express | | | 1,015,715 | |
| | 21,442 | | | American International Group | | | 1,148,648 | |
| | 11,718 | | | American Tower, REIT | | | 1,142,505 | |
| | 31,668 | | | Bank of the Ozarks | | | 1,115,980 | |
| | | | | | | | |
Shares | | | | | Market
Value | |
| | |
| | | | Financials (continued) | | | | |
| | 8,066 | | | Berkshire Hathaway, Class B * | | $ | 1,130,531 | |
| | 20,389 | | | Citigroup | | | 1,091,423 | |
| | 15,356 | | | Portfolio Recovery Associates * | | | 971,267 | |
| | | | | | | | |
| | | | | | | 7,616,069 | |
| | | | | | | | |
| | |
| | | | Healthcare – 16.67% | | | | |
| | 2,926 | | | Allergan | | | 556,116 | |
| | 12,814 | | | DaVita HealthCare Partners * | | | 1,000,389 | |
| | 23,689 | | | DexCom * | | | 1,064,821 | |
| | 9,549 | | | Edwards Lifesciences * | | | 1,154,665 | |
| | 13,165 | | | Express Scripts * | | | 1,011,335 | |
| | 18,288 | | | Gilead Sciences * | | | 2,048,256 | |
| | 1,624 | | | Intuitive Surgical * | | | 805,179 | |
| | 7,581 | | | Johnson & Johnson | | | 817,080 | |
| | | | | | | | |
| | | | | | | 8,457,841 | |
| | | | | | | | |
| | |
| | | | Industrials – 16.11% | | | | |
| | 16,128 | | | Advisory Board * | | | 865,590 | |
| | 32,507 | | | American Airlines Group | | | 1,344,165 | |
| | 7,350 | | | Boeing | | | 918,089 | |
| | 15,425 | | | Chicago Bridge & Iron (Netherlands) | | | 842,822 | |
| | 13,916 | | | Cintas | | | 1,019,208 | |
| | 14,434 | | | Colfax * | | | 784,921 | |
| | 10,791 | | | Danaher | | | 867,596 | |
| | 9,227 | | | Middleby * | | | 816,590 | |
| | 9,714 | | | Spirit Airlines * | | | 710,191 | |
| | | | | | | | |
| | | | | | | 8,169,172 | |
| | | | | | | | |
| | |
| | | | Information Technology – 16.43% | | | | |
| | 3,936 | | | Baidu, SP ADR * | | | 939,799 | |
| | 38,315 | | | Cisco Systems | | | 937,568 | |
| | 16,677 | | | Facebook, Class A * | | | 1,250,608 | |
| | 945 | | | Google, Class A * | | | 536,637 | |
| | 945 | | | Google, Class C * | | | 528,331 | |
| | 25,370 | | | Hewlett-Packard | | | 910,276 | |
| | 16,848 | | | Pandora Media * | | | 324,829 | |
| | 12,747 | | | QUALCOMM | | | 1,000,767 | |
| | 16,564 | | | Seagate Technology (Ireland) | | | 1,040,716 | |
| | 18,779 | | | Yahoo! * | | | 864,773 | |
| | | | | | | | |
| | | | | | | 8,334,304 | |
| | | | | | | | |
| | |
| | | | Materials – 3.27% | | | | |
| | 3,636 | | | CF Industries Holdings | | | 945,360 | |
| | 6,202 | | | Monsanto | | | 713,478 | |
| | | | | | | | |
| | | | | | | 1,658,838 | |
| | | | | | | | |
| | |
| | | | Total Common Stocks
(Cost $35,903,682) | | | 50,453,039 | |
| | | | | | | | |
See accompanying Notes to Financial Statements.
| | |
| |
| ASTON/TAMRO Diversified Equity Fund | | October 31, 2014 |
| |
| Schedule of Investments – continued | | |
| | | | | | | | |
Shares | | | | | Market
Value | |
|
| | INVESTMENT COMPANY – 0.77% | |
| | |
| | 392,168 | | | BlackRock Liquidity Funds TempCash Portfolio | | $ | 392,168 | |
| | | | | | | | |
| | |
| | | | Total Investment Company
(Cost $392,168) | | | 392,168 | |
| | | | | | | | |
| Total Investments – 100.24%
(Cost $36,295,850)** | | | 50,845,207 | |
| | | | | | | | |
| Net Other Assets and Liabilities – (0.24)% | | | (123,784 | ) |
| | | | | | | | |
| Net Assets – 100.00% | | $ | 50,721,423 | |
| | | | | | | | |
| * | | Non-income producing security. |
| ** | | Aggregate cost for Federal income tax purposes is $36,357,118. |
| | | | |
Gross unrealized appreciation | | $ | 14,937,371 | |
Gross unrealized depreciation | | | (449,282 | ) |
| | | | |
Net unrealized appreciation | | $ | 14,488,089 | |
| | | | |
| REIT | | Real Estate Investment Trust |
| SP ADR | | Sponsored American Depositary Receipt |
See accompanying Notes to Financial Statements.
ASTON/River Road Dividend All Cap Value Fund
| | |
| |
| Portfolio Manager Commentary (unaudited) | | October 31, 2014 |
Henry W. Sanders, III, CFA; Thomas S. Forsha, CFA & James C. Shircliff, CFA
| Q. | What were the most significant market factors affecting Fund performance and returns relative to the benchmark during the past 12 months? |
Over the last 12 months, the most significant market factor affecting absolute performance was the Federal Reserve’s tapering of quantitative easing and the resulting volatility in interest rates. Additionally, according to Ned Davis Research*, among S&P 500 companies, performance declined as dividend yield increased, creating a significant relative headwind for a dividend-oriented strategy. The Industrials sector had the highest positive impact on relative results, primarily due to strong stock selection. The Consumer Discretionary sector accounted for the majority of the underperformance due to weak stock selection and an overweight allocation.
| Q. | What were the best performing holdings for the Fund during the period? |
The two holdings with the largest positive contribution to the Fund’s total return were Intel Corp., the world’s largest semiconductor company, and Dr. Pepper Snapple Group, Inc., the #3 North American beverage company. Intel’s shares surged on positive quarterly results and a $20 billion increase to its share repurchase plan. Management credited an improving economy, the PC refresh cycle, form factor innovation, and the Windows XP transition for the strong top-line results. Dr. Pepper shares rallied throughout the year, as buyout rumors swirled and were further boosted by results that surpassed Wall Street’s expectations. We reduced the position multiple times over the period at a premium to River Road’s assessed Absolute Value.
| Q. | What were the weakest performing holdings? |
The two holdings with the lowest contribution to the Fund’s total return during the period were Staples, Inc., a leading office products retailer, and Ensco plc, a global offshore drilling contractor. In the spring, Staples reported disappointing results driven by the
continued deterioration of the company’s retail segment. Ensco shares slumped as the supply/demand dynamic for offshore drilling rigs weakened further. Compounding the issue further, the firm continues to invest in new rigs despite the oversupply, reducing the expected free cash flow, and bringing the affordability of the dividend into question. In both cases, our conviction declined, and we reduced and ultimately eliminated the positions due to accumulated unrealized losses.
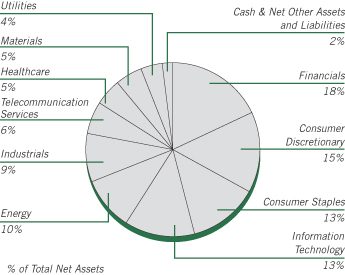
| Q. | How was the Fund positioned as of October 31, 2014? |
The overall positioning of the Fund changed modestly over the period. The Fund remains significantly overweight in Consumer stocks, both Staples and Discretionary, and significantly underweight in Financials and Healthcare. The underweight in Energy decreased meaningfully from -724 basis points (bps) to -141 bps versus the Russell 3000 Value Index benchmark, a combination of additions to the Fund and a decline in the benchmark weight. Turnover increased as we dealt with numerous overvalued positions and the average yield of Fund holdings increased marginally. We were pleased to see that the Fund largely behaved as expected over the duration of the brief pullback in October and were equally pleased with the participation in the sharp recovery. Valuations present an ongoing challenge that we will continue to manage, but as we move through Q3 earnings season, we are evaluating our conviction around numerous positions and suspect this may prompt action to reduce riskier positions as well.
| * | | Ned Davis Research, Inc., examined S&P 500 Stock Constituents ranked by quartiles (Dividend Yield) for the twelve months ended October 31, 2014. |
Note: A basis point (bps) is a unit of measure. 1 bps = .01%.
Growth of a Hypothetical
$10,000 Investment—Class N
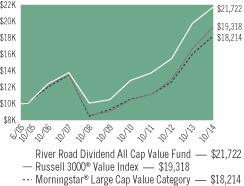
All dividends and capital gains are reinvested. Indexes are unmanaged and do not take into account fees, expenses or other costs.
Returns shown in the chart and table do not reflect taxes that a shareholder would pay on Fund distributions or on the sale of the Fund shares.
Value investing involves the risk that a Fund’s investments in companies believed to be undervalued will not appreciate as anticipated.
Small-cap and mid-cap stocks may be subject to a higher degree of market risk than the securities of more established companies because they tend to be more volatile and less liquid.
RETURNSFOR PERIOD ENDED 10/31/14
Average Annual Total Returns - Class N
| | | | |
One Year | | | 9.89 | % |
Five Year | | | 15.64 | % |
Since Inception | | | 8.65 | % |
Inception Date 06/28/05
Average Annual Total Returns - Class I
| | | | |
One Year | | | 10.18 | % |
Five Year | | | 15.94 | % |
Since Inception | | | 6.44 | % |
Inception Date 06/28/07
The performance data quoted represents past performance. Past performance does not guarantee future results. Investment return and principal value will fluctuate so that an investor’s shares, upon redemption, may be worth more or less than their original cost. Current performance may be lower or higher than the performance data quoted. For performance data current to the most recent month-end, please visit our website at www.astonfunds.com.
| | |
| |
| ASTON/River Road Dividend All Cap Value Fund | | October 31, 2014 |
| |
| Schedule of Investments | | |
| | | | | | | | |
Shares | | | | | Market
Value | |
|
| | COMMON STOCKS – 97.67% | |
| | |
| | | | Consumer Discretionary – 14.43% | | | | |
| | 442,663 | | | Bob Evans Farms | | $ | 21,624,088 | |
| | 479,020 | | | Cinemark Holdings | | | 16,918,986 | |
| | 422,284 | | | Hasbro | | | 24,293,999 | |
| | 399,145 | | | Kohl’s | | | 21,641,642 | |
| | 588,773 | | | National CineMedia | | | 9,361,491 | |
| | 242,588 | | | Omnicom Group | | | 17,432,374 | |
| | 605,297 | | | Shaw Communications, Class B (Canada) | | | 15,544,027 | |
| | 303,654 | | | Target | | | 18,771,890 | |
| | 499,861 | | | Thomson Reuters (Canada) | | | 18,604,826 | |
| | | | | | | | |
| | | | | | | 164,193,323 | |
| | | | | | | | |
| | |
| | | | Consumer Staples – 13.04% | | | | |
| | 213,573 | | | Dr Pepper Snapple Group | | | 14,789,930 | |
| | 138,569 | | | Energizer Holdings | | | 16,995,488 | |
| | 190,648 | | | Kimberly-Clark | | | 21,785,347 | |
| | 296,032 | | | Molson Coors Brewing, Class B | | | 22,018,860 | |
| | 130,761 | | | PepsiCo | | | 12,575,285 | |
| | 115,385 | | | Procter & Gamble | | | 10,069,649 | |
| | 610,157 | | | Sysco | | | 23,515,451 | |
| | 395,705 | | | Unilever, SP ADR (Great Britain) | | | 15,919,212 | |
| | 141,574 | | | Wal-Mart Stores | | | 10,797,849 | |
| | | | | | | | |
| | | | | | | 148,467,071 | |
| | | | | | | | |
| | |
| | | | Energy – 10.33% | | | | |
| | 190,839 | | | Chevron | | | 22,891,138 | |
| | 509,185 | | | Memorial Production Partners LP | | | 10,657,242 | |
| | 299,323 | | | National-Oilwell Varco | | | 21,742,823 | |
| | 361,394 | | | Occidental Petroleum | | | 32,138,768 | |
| | 196,234 | | | Transmontaigne Partners LP | | | 7,348,963 | |
| | 442,106 | | | Williams Partners LP | | | 22,790,564 | |
| | | | | | | | |
| | | | | | | 117,569,498 | |
| | | | | | | | |
| | | | | | | | |
Shares | | | | | Market
Value | |
| | |
| | | | Financials – 17.92% | | | | |
| | 30,069 | | | BlackRock | | $ | 10,256,837 | |
| | 269,310 | | | CME Group | | | 22,570,871 | |
| | 357,096 | | | Compass Diversified Holdings | | | 6,588,421 | |
| | 551,884 | | | CyrusOne, REIT | | | 15,071,952 | |
| | 459,572 | | | Geo Group, REIT | | | 18,355,306 | |
| | 984,253 | | | Iron Mountain, REIT | | | 35,501,992 | |
| | 170,213 | | | PartnerRe (Bermuda) | | | 19,691,942 | |
| | 368,487 | | | PNC Financial Services Group | | | 31,833,592 | |
| | 436,927 | | | Sabra Health Care, REIT | | | 12,483,004 | |
| | 542,001 | | | U.S. Bancorp | | | 23,089,243 | |
| | 161,700 | | | Wells Fargo | | | 8,584,653 | |
| | | | | | | | |
| | | | | | | 204,027,813 | |
| | | | | | | | |
| | |
| | | | Healthcare – 5.09% | | | | |
| | 131,197 | | | Becton, Dickinson | | | 16,885,054 | |
| | 448,089 | | | Owens & Minor | | | 14,930,325 | |
| | 411,342 | | | Quest Diagnostics | | | 26,103,763 | |
| | | | | | | | |
| | | | | | | 57,919,142 | |
| | | | | | | | |
| | |
| | | | Industrials – 9.08% | | | | |
| | 182,619 | | | ABM Industries | | | 5,047,589 | |
| | 741,336 | | | ADT | | | 26,569,482 | |
| | 741,486 | | | Aircastle (Bermuda) | | | 14,147,552 | |
| | 259,756 | | | Emerson Electric | | | 16,639,969 | |
| | 457,409 | | | Republic Services | | | 17,564,506 | |
| | 223,372 | | | United Parcel Service, Class B | | | 23,433,957 | |
| | | | | | | | |
| | | | | | | 103,403,055 | |
| | | | | | | | |
| |
| | | | Information Technology – 13.16% | |
| | 229,843 | | | CSG Systems International | | | 6,093,138 | |
| | 973,060 | | | Intel | | | 33,093,771 | |
| | 306,080 | | | j2 Global | | | 16,555,867 | |
| | 818,452 | | | Microsoft | | | 38,426,321 | |
| | 133,183 | | | Motorola Solutions | | | 8,590,304 | |
| | 358,558 | | | QUALCOMM | | | 28,150,389 | |
| | 1,110,949 | | | Western Union | | | 18,841,695 | |
| | | | | | | | |
| | | | | | | 149,751,485 | |
| | | | | | | | |
| | |
| | | | Materials – 4.33% | | | | |
| | 298,559 | | | Bemis | | | 11,485,565 | |
| | 130,409 | | | Compass Minerals International | | | 11,173,443 | |
| | 145,739 | | | Innophos Holdings | | | 8,307,123 | |
| | 427,349 | | | Myers Industries (a) | | | 6,384,594 | |
| | 220,700 | | | Nucor | | | 11,931,042 | |
| | | | | | | | |
| | | | | | | 49,281,767 | |
| | | | | | | | |
| |
| | | | Telecommunication Services – 6.11% | |
| | 116,861 | | | Atlantic Tele-Network | | | 7,851,891 | |
| | 583,719 | | | Rogers Communications, Class B (Canada) | | | 21,977,020 | |
| | 619,271 | | | Verizon Communications | | | 31,118,368 | |
| | 260,027 | | | Vodafone Group, SP ADR (Great Britain) | | | 8,638,097 | |
| | | | | | | | |
| | | | | | | 69,585,376 | |
| | | | | | | | |
See accompanying Notes to Financial Statements.
| | |
| |
| ASTON/River Road Dividend All Cap Value Fund | | October 31, 2014 |
| |
| Schedule of Investments – continued | | |
| | | | | | | | |
Shares | | | | | Market
Value | |
| | |
| | | | Utilities – 4.18% | | | | |
| | 310,550 | | | AmeriGas Partners LP | | $ | 14,331,883 | |
| | 479,849 | | | National Fuel Gas | | | 33,219,946 | |
| | | | | | | | |
| | | | | | | 47,551,829 | |
| | | | | | | | |
| | |
| | | | Total Common Stocks
(Cost $882,209,913) | | | 1,111,750,359 | |
| | | | | | | | |
| Total Investments – 97.67%
(Cost $881,023,986)* | | | 1,111,750,359 | |
| | | | | | | | |
| Net Other Assets and Liabilities – 2.33% | | | 26,508,586 | |
| | | | | | | | |
| Net Assets – 100.00% | | $ | 1,138,258,945 | |
| | | | | | | | |
| * | | Aggregate cost for Federal income tax purposes is $880,652,538. |
| | | | |
Gross unrealized appreciation | | $ | 245,582,774 | |
Gross unrealized depreciation | | | (14,484,953 | ) |
| | | | |
Net unrealized appreciation | | $ | 231,097,821 | |
| | | | |
| (a) | | This security has been determined by the Subadviser to be an illiquid security. At October 31, 2014, this security amounted to $6,384,594 or 0.56% of net assets. |
| REIT | | Real Estate Investment Trust |
| SP ADR | | Sponsored American Depositary Receipt |
See accompanying Notes to Financial Statements.
ASTON/River Road Dividend All Cap Value Fund II
| | |
| |
| Portfolio Manager Commentary (unaudited) | | October 31, 2014 |
Henry W. Sanders, III, CFA; Thomas S. Forsha, CFA & James C. Shircliff, CFA
| Q. | What were the most significant market factors affecting Fund performance and returns relative to the benchmark during the past 12 months? |
| A. | Over the last 12 months, the most significant market factor affecting absolute performance was the Federal Reserve’s tapering of quantitative easing and the resulting volatility in interest rates. Additionally, according to Ned Davis Research*, among S&P 500 companies, performance declined as dividend yield increased, creating a significant relative headwind for a dividend-oriented strategy. The Industrials sector had the highest positive impact on relative results, primarily due to strong stock selection. The Consumer Discretionary sector accounted for the majority of the underperformance due to weak stock selection and an overweight allocation. |
| Q. | What were the best performing holdings for the Fund during the period? |
| A. | The two holdings with the largest positive contribution to the Fund’s total return were Intel Corp., the world’s largest semiconductor company, and Dr. Pepper Snapple Group, Inc., the #3 North American beverage company. Intel’s shares surged on positive quarterly results and a $20 billion increase to its share repurchase plan. Management credited an improving economy, the PC refresh cycle, form factor innovation, and the Windows XP transition for the strong top-line results. Dr. Pepper shares rallied throughout the year, as buyout rumors swirled and were further boosted by results that surpassed Wall Street’s expectations. We reduced the position multiple times over the period at a premium to River Road’s assessed Absolute Value. |
| Q. | What were the weakest performing holdings? |
| A. | The two holdings with the lowest contribution to the Fund’s total return during the period were Staples, Inc., a leading office products retailer, and Ensco plc, a global offshore drilling contractor. In the spring, Staples reported disappointing results driven by the continued deterioration of the company’s retail segment. |
| | Ensco shares slumped as the supply/demand dynamic for offshore drilling rigs weakened further. Compounding the issue further, the firm continues to invest in new rigs despite the oversupply, reducing the expected free cash flow, and bringing the affordability of the dividend into question. In both cases, our conviction declined, and we reduced and ultimately eliminated the positions due to accumulated unrealized losses. |
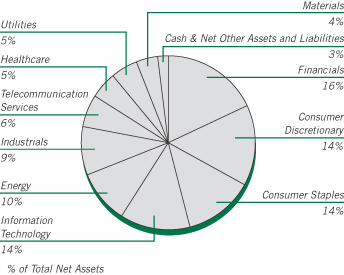
| Q. | How was the Fund positioned as of October 31, 2014? |
| A. | The overall positioning of the Fund changed modestly over the period. The Fund remains significantly overweight in Consumer stocks, both Staples and Discretionary, and significantly underweight in Financials and Healthcare. The underweight in Energy decreased meaningfully from -724 basis points (bps) to -141 bps versus the Russell 3000 Value Index benchmark, a combination of additions to the Fund and a decline in the benchmark weight. Turnover increased as we dealt with numerous overvalued positions and the average yield of Fund holdings increased marginally. We were pleased to see that the Fund largely behaved as expected over the duration of the brief pullback in October and were equally pleased with the participation in the sharp recovery. Valuations present an ongoing challenge that we will continue to manage, but as we move through Q3 earnings season, we are evaluating our conviction around numerous positions and suspect this will prompt action to reduce riskier positions as well. |
| * | | Ned Davis Research, Inc., examined S&P 500 Stock Constituents ranked by quartiles (Dividend Yield) for the twelve months ended October 31, 2014. |
Note: A basis point (bps) is a unit of measure. 1 bps = .01%.
Growth of a Hypothetical
$10,000 Investment—Class N
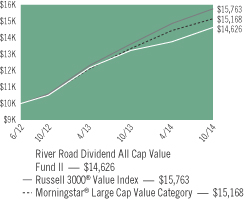
All dividends and capital gains are reinvested. Indexes are unmanaged and do not take into account fees, expenses or other costs.
Returns shown in the chart and table do not reflect taxes that a shareholder would pay on Fund distributions or on the sale of the Fund shares.
Value investing involves the risk that a Fund’s investments in companies believed to be undervalued will not appreciate as anticipated.
Small-cap and mid-cap stocks may be subject to a higher degree of market risk than the securities of more established companies because they tend to be more volatile and less liquid.
RETURNSFOR PERIOD ENDED 10/31/14
Average Annual Total Returns - Class N
| | | | |
One-Year | | | 10.46 | % |
Since Inception | | | 17.58 | % |
Inception Date 06/27/12
Average Annual Total Returns - Class I
| | | | |
One Year | | | 10.73 | % |
Since Inception | | | 17.86 | % |
Inception Date 06/27/12
The performance data quoted represents past performance. Past performance does not guarantee future results. Investment return and principal value will fluctuate so that an investor’s shares, upon redemption, may be worth more or less than their original cost. Current performance may be lower or higher than the performance data quoted. For performance data current to the most recent month-end, please visit our website at www.astonfunds.com.
The performance quoted would have been lower if fee waivers and/or expense reimbursements had not been in effect.
| | |
| |
| ASTON/River Road Dividend All Cap Value Fund II | | October 31, 2014 |
| |
| Schedule of Investments | | |
| | | | | | | | |
Shares | | | | | Market
Value | |
|
| | COMMON STOCKS – 97.34% | |
| | |
| | | | Consumer Discretionary – 14.43% | | | | |
| | 52,083 | | | Bob Evans Farms | | $ | 2,544,255 | |
| | 59,587 | | | Cinemark Holdings | | | 2,104,613 | |
| | 51,795 | | | Hasbro | | | 2,979,766 | |
| | 49,524 | | | Kohl’s | | | 2,685,191 | |
| | 31,535 | | | Omnicom Group | | | 2,266,105 | |
| | 74,656 | | | Shaw Communications, Class B (Canada) | | | 1,917,166 | |
| | 37,788 | | | Target | | | 2,336,054 | |
| | 62,345 | | | Thomson Reuters (Canada) | | | 2,320,481 | |
| | | | | | | | |
| | | | | | | 19,153,631 | |
| | | | | | | | |
| | |
| | | | Consumer Staples – 14.05% | | | | |
| | 26,842 | | | Dr Pepper Snapple Group | | | 1,858,808 | |
| | 17,217 | | | Energizer Holdings | | | 2,111,665 | |
| | 23,557 | | | Kimberly-Clark | | | 2,691,858 | |
| | 36,056 | | | Molson Coors Brewing, Class B | | | 2,681,845 | |
| | 16,523 | | | PepsiCo | | | 1,589,017 | |
| | 15,189 | | | Procter & Gamble | | | 1,325,544 | |
| | 78,418 | | | Sysco | | | 3,022,230 | |
| | 51,155 | | | Unilever, SP ADR (Great Britain) | | | 2,057,966 | |
| | 17,099 | | | Wal-Mart Stores | | | 1,304,141 | |
| | | | | | | | |
| | | | | | | 18,643,074 | |
| | | | | | | | |
| | |
| | | | Energy – 10.21% | | | | |
| | 24,495 | | | Chevron | | | 2,938,175 | |
| | 41,278 | | | Memorial Production Partners LP | | | 863,949 | |
| | 38,421 | | | National-Oilwell Varco | | | 2,790,901 | |
| | 46,476 | | | Occidental Petroleum | | | 4,133,111 | |
| | 54,852 | | | Williams Partners LP | | | 2,827,621 | |
| | | | | | | | |
| | | | | | | 13,553,757 | |
| | | | | | | | |
| | |
| | | | Financials – 16.16% | | | | |
| | 3,795 | | | BlackRock | | | 1,294,512 | |
| | 33,154 | | | CME Group | | | 2,778,637 | |
| | | | | | | | |
Shares | | | | | Market
Value | |
| | |
| | | | Financials (continued) | | | | |
| | 56,364 | | | Geo Group, REIT | | $ | 2,251,178 | |
| | 126,778 | | | Iron Mountain, REIT | | | 4,572,885 | |
| | 20,659 | | | PartnerRe (Bermuda) | | | 2,390,040 | |
| | 47,326 | | | PNC Financial Services Group | | | 4,088,493 | |
| | 69,940 | | | U.S. Bancorp | | | 2,979,444 | |
| | 20,485 | | | Wells Fargo | | | 1,087,549 | |
| | | | | | | | |
| | | | | | | 21,442,738 | |
| | | | | | | | |
| | |
| | | | Healthcare – 5.43% | | | | |
| | 16,162 | | | Becton, Dickinson | | | 2,080,049 | |
| | 52,832 | | | Owens & Minor | | | 1,760,362 | |
| | 52,904 | | | Quest Diagnostics | | | 3,357,288 | |
| | | | | | | | |
| | | | | | | 7,197,699 | |
| | | | | | | | |
| | |
| | | | Industrials – 9.22% | | | | |
| | 23,674 | | | ABM Industries | | | 654,349 | |
| | 94,334 | | | ADT | | | 3,380,931 | |
| | 61,118 | | | Aircastle (Bermuda) | | | 1,166,131 | |
| | 30,161 | | | Emerson Electric | | | 1,932,114 | |
| | 57,985 | | | Republic Services | | | 2,226,624 | |
| | 27,428 | | | United Parcel Service, Class B | | | 2,877,471 | |
| | | | | | | | |
| | | | | | | 12,237,620 | |
| | | | | | | | |
| | |
| | | | Information Technology – 13.66% | | | | |
| | 124,382 | | | Intel | | | 4,230,232 | |
| | 34,789 | | | j2 Global | | | 1,881,737 | |
| | 106,037 | | | Microsoft | | | 4,978,437 | |
| | 17,135 | | | Motorola Solutions | | | 1,105,207 | |
| | 45,697 | | | QUALCOMM | | | 3,587,671 | |
| | 138,285 | | | Western Union | | | 2,345,314 | |
| | | | | | | | |
| | | | | | | 18,128,598 | |
| | | | | | | | |
| | |
| | | | Materials – 3.69% | | | | |
| | 35,863 | | | Bemis | | | 1,379,650 | |
| | 16,735 | | | Compass Minerals International | | | 1,433,855 | |
| | 11,110 | | | Innophos Holdings | | | 633,270 | |
| | 26,895 | | | Nucor | | | 1,453,944 | |
| | | | | | | | |
| | | | | | | 4,900,719 | |
| | | | | | | | |
| | |
| | | | Telecommunication Services – 5.90% | | | | |
| | 73,531 | | | Rogers Communications, Class B (Canada) | | | 2,768,442 | |
| | 79,738 | | | Verizon Communications | | | 4,006,835 | |
| | 31,682 | | | Vodafone Group, SP ADR (Great Britain) | | | 1,052,476 | |
| | | | | | | | |
| | | | | | | 7,827,753 | |
| | | | | | | | |
| | |
| | | | Utilities – 4.59% | | | | |
| | 39,211 | | | AmeriGas Partners LP | | | 1,809,588 | |
| | 61,737 | | | National Fuel Gas | | | 4,274,053 | |
| | | | | | | | |
| | | | | | | 6,083,641 | |
| | | | | | | | |
| | |
| | | | Total Common Stocks
(Cost $115,876,963) | | | 129,169,230 | |
| | | | | | | | |
See accompanying Notes to Financial Statements.
| | |
| |
| ASTON/River Road Dividend All Cap Value Fund II | | October 31, 2014 |
| |
| Schedule of Investments – continued | | |
| | | | | | | | |
Shares | | | | | Market
Value | |
|
| | INVESTMENT COMPANY – 2.33% | |
| | |
| | 3,086,058 | | | BlackRock Liquidity Funds
TempCash Portfolio | | $ | 3,086,058 | |
| | | | | | | | |
| | |
| | | | Total Investment Company
(Cost $3,086,058) | | | 3,086,058 | |
| | | | | | | | |
| Total Investments – 99.67%
(Cost $118,963,021)* | | | 132,255,288 | |
| | | | | | | | |
| Net Other Assets and Liabilities – 0.33% | | | 441,665 | |
| | | | | | | | |
| Net Assets – 100.00% | | $ | 132,696,953 | |
| | | | | | | | |
| * | | Aggregate cost for Federal income tax purposes is $118,958,469. |
| | | | |
Gross unrealized appreciation | | $ | 14,944,562 | |
Gross unrealized depreciation | | | (1,647,743 | ) |
| | | | |
Net unrealized appreciation | | $ | 13,296,819 | |
| | | | |
| REIT | | Real Estate Investment Trust |
| SP ADR | | Sponsored American Depositary Receipt |
See accompanying Notes to Financial Statements.
ASTON/Fairpointe Mid Cap Fund
| | |
| |
| Portfolio Manager Commentary (unaudited) | | October 31, 2014 |
Thyra E. Zerhusen; Marie L. Lorden & Mary L. Pierson
| Q. | What were the most significant market factors affecting Fund performance and returns relative to the benchmark during the past 12 months? |
| A. | In the first half of the year, equity market valuations went up as investors focused on the improving U.S. economy and increasing corporate earnings. The markets became choppier in the second half of the year as geopolitical events and world tensions escalated. We utilized the market volatility to trim or sell holdings which met our valuation targets and used the cash to buy stocks of companies with strong long-term fundamentals that had become undervalued in the market. Stock selection was the most important factor in the Fund’s performance with 70% of the holdings in positive territory during the year. One holding, Forest Laboratories, Inc. was acquired by Actavis plc, which also contributed to the positive performance. Class N Shares of the Fund returned 13.32% compared to the S&P MidCap 400 Index return of 11.65%. |
| Q. | What were the best performing holdings for the Fund during the period? |
| A. | The Fund’s top contributors to performance were Alcoa Inc., United States Steel Corp., and Edwards Lifesciences Corp. Alcoa is the largest global aluminum producer generating ten percent of the world’s aluminum, with a leading position in the automotive and aerospace industries. The stock came under selling pressure after being eliminated from the Dow Jones Industrial Average allowing us an attractive entry point. United States Steel Corporation, an integrated steel producer of flat-rolled and tubular products, is in the midst of a multi-year plan to realign operations and reduce costs. Edwards Lifesciences, a previously-owned stock purchased back into the Fund, is the leading manufacturer of tissue heart valves. The company started shipping a new heart valve in the United States and the stock price was up significantly as a result. |
| Q. | What were the weakest performing holdings? |
| A. | Our weakest performing stocks this year included Cree, Inc., a producer of semiconductors and LED (light-emitting diode) components, LED chips and LED lighting products. A top performer in 2013, we believe Cree will grow significantly over the next several years as LED lighting is more widely adopted. McDermott International, Inc., a global engineering and construction company serving offshore oil and gas markets, was also down during the year. McDermott’s strategic move into subsea services has been plagued with execution issues. The company’s new CEO is addressing these issues, building the management team and changing the company’s culture. Financial restructuring in the spring of 2014 has prefunded the company’s capital needs for the next two years. Owens Corning, a world leader in glass fiber technology, was also down during the year. Results in the first half of 2014 were negatively impacted by severe weather in the United States and an excess inventory of roofing materials. We believe the company will benefit from increased U.S. residential and commercial construction as the economy continues to improve. |
| Q. | How was the Fund positioned as of October 31, 2014? |
| A. | We continue to take a long-term approach as we position the Fund in focused companies that trade at attractive valuations. We actively rebalance the portfolio on a stock by stock basis to keep the overall valuation attractive relative to the Fund’s benchmark and the S&P 500 Index. |
We are cautiously positive on the market with manufacturing returning to North America as companies align their production closer to demand to take advantage of lower transportation and energy costs and a more favorable labor environment. As capacity utilization in the United States increases, we look for additional capital spending and subsequent growth throughout the economy.
Growth of a Hypothetical
$10,000 Investment—Class N
All dividends and capital gains are reinvested. Indexes are unmanaged and do not take into account fees, expenses or other costs.
Returns shown in the chart and table do not reflect taxes that a shareholder would pay on Fund distributions or on the sale of the Fund shares.
Small-cap and mid-cap stocks may be subject to a higher degree of market risk than the securities of more established companies because they tend to be more volatile and less liquid.
RETURNSFOR PERIOD ENDED 10/31/14
Average Annual Total Returns - Class N
| | | | |
One Year | | | 13.32 | % |
Five Year | | | 18.86 | % |
Ten Year | | | 11.54 | % |
Since Inception | | | 13.16 | % |
Inception Date 09/19/94
Average Annual Total Returns - Class I
| | | | |
One Year | | | 13.61 | % |
Five Year | | | 19.16 | % |
Ten Years | |
| 11.82
| %
|
Since Inception | | | 11.12 | % |
Inception Date 07/06/04
The performance data quoted represents past performance. Past performance does not guarantee future results. Investment return and principal value will fluctuate so that an investor’s shares, upon redemption, may be worth more or less than their original cost. Current performance may be lower or higher than the performance data quoted. For performance data current to the most recent month-end, please visit our website at www.astonfunds.com.
The total expense ratios for Class N and Class I shares are 1.12% and 0.87% respectively, as disclosed in the prospectus dated February 28, 2014. Please refer to the Financial Highlights section in this report for more information.
| | |
| |
| ASTON/Fairpointe Mid Cap Fund | | October 31, 2014 |
| |
| Schedule of Investments | | |
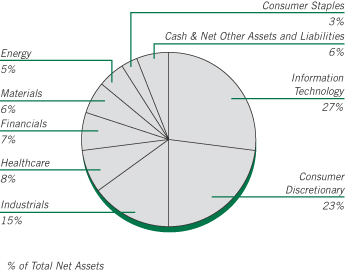
| | | | | | | | |
Shares | | | | | Market
Value | |
|
| | COMMON STOCKS – 93.67% | |
| | |
| | | | Consumer Discretionary – 23.18% | | | | |
| | 651,000 | | | BorgWarner | | $ | 37,120,020 | |
| | 5,278,900 | | | Cooper Tire & Rubber | | | 170,033,369 | |
| | 2,812,200 | | | DeVry | | | 136,138,602 | |
| | 3,517,500 | | | Gannett | | | 110,801,250 | |
| | 6,394,300 | | | Interpublic Group | | | 123,985,477 | |
| | 935,000 | | | Lear | | | 86,487,500 | |
| | 5,039,700 | | | Mattel | | | 156,583,479 | |
| | 10,751,254 | | | New York Times, Class A | | | 138,046,101 | |
| | 2,611,898 | | | Scholastic | | | 90,920,169 | |
| | 16,213,900 | | | Staples | | | 205,592,252 | |
| | 5,616,322 | | | Time * | | | 126,872,714 | |
| | | | | | | | |
| | | | | | | 1,382,580,933 | |
| | | | | | | | |
| | |
| | | | Consumer Staples – 2.98% | | | | |
| | 1,340,500 | | | Bunge | | | 118,835,325 | |
| | 790,850 | | | Molson Coors Brewing, Class B | | | 58,823,423 | |
| | | | | | | | |
| | | | | | | 177,658,748 | |
| | | | | | | | |
| | |
| | | | Energy – 4.64% | | | | |
| | 2,848,192 | | | FMC Technologies * | | | 159,612,680 | |
| | 10,539,800 | | | McDermott International * | | | 40,472,832 | |
| | 2,563,500 | | | Transocean Ltd. (Switzerland) | | | 76,469,205 | |
| | | | | | | | |
| | | | | | | 276,554,717 | |
| | | | | | | | |
| | |
| | | | Financials – 6.82% | | | | |
| | 1,347,900 | | | Cincinnati Financial | | | 68,028,513 | |
| | 1,650,085 | | | Eaton Vance | | | 60,772,631 | |
| | 1,963,400 | | | Northern Trust | | | 130,173,420 | |
| | 2,631,900 | | | Raymond James Financial | | | 147,728,547 | |
| | | | | | | | |
| | | | | | | 406,703,111 | |
| | | | | | | | |
| | | | | | | | |
Shares | | | | | Market
Value | |
| | |
| | | | Healthcare – 8.20% | | | | |
| | 1,257,719 | | | Charles River Laboratories * | | $ | 79,437,532 | |
| | 345,100 | | | Edwards Lifesciences * | | | 41,729,492 | |
| | 1,833,495 | | | Hospira * | | | 98,458,681 | |
| | 2,131,100 | | | Quest Diagnostics | | | 135,239,606 | |
| | 1,592,300 | | | Varian Medical Systems * | | | 133,944,276 | |
| | | | | | | | |
| | | | | | | 488,809,587 | |
| | | | | | | | |
| | |
| | | | Industrials – 14.58% | | | | |
| | 3,952,300 | | | AGCO | | | 175,126,413 | |
| | 1,828,600 | | | Con-way | | | 79,306,382 | |
| | 708,244 | | | ManpowerGroup | | | 47,275,287 | |
| | 5,376,900 | | | Owens Corning | | | 172,383,414 | |
| | 3,779,710 | | | Polypore International * | | | 166,004,863 | |
| | 3,672,200 | | | Werner Enterprises | | | 101,132,388 | |
| | 3,527,800 | | | Xylem | | | 128,270,808 | |
| | | | | | | | |
| | | | | | | 869,499,555 | |
| | | | | | | | |
| |
| | | | Information Technology – 27.13% | |
| | 2,449,600 | | | Akamai Technologies * | | | 147,710,880 | |
| | 1,993,600 | | | Citrix Systems * | | | 128,048,928 | |
| | 4,526,392 | | | Cree * | | | 142,490,820 | |
| | 692,600 | | | FactSet Research Systems | | | 91,035,344 | |
| | 4,879,900 | | | Finisar * | | | 81,591,928 | |
| | 177,100 | | | Harris | | | 12,326,160 | |
| | 3,015,848 | | | Itron * | | | 117,406,963 | |
| | 6,987,200 | | | Jabil Circuit | | | 146,381,840 | |
| | 8,169,100 | | | Juniper Networks | | | 172,122,937 | |
| | 680,700 | | | Lexmark International, Class A | | | 29,379,012 | |
| | 10,984,200 | | | Nuance Communications * | | | 169,486,206 | |
| | 5,370,900 | | | NVIDIA | | | 104,947,386 | |
| | 3,797,300 | | | Teradata * | | | 160,701,736 | |
| | 4,471,118 | | | Unisys * | | | 114,639,466 | |
| | | | | | | | |
| | | | | | | 1,618,269,606 | |
| | | | | | | | |
| | |
| | | | Materials – 6.14% | | | | |
| | 3,909,100 | | | Alcoa | | | 65,516,516 | |
| | 1,961,512 | | | FMC | | | 112,492,713 | |
| | 23,409,000 | | | Gerdau SA, SP ADR | | | 106,042,770 | |
| | 2,052,100 | | | United States Steel | | | 82,166,084 | |
| | | | | | | | |
| | | | | | | 366,218,083 | |
| | | | | | | | |
| | |
| | | | Total Common Stocks
(Cost $4,623,660,720) | | | 5,586,294,340 | |
| | | | | | | | |
|
| | INVESTMENT COMPANY – 5.06% | |
| | |
| | 301,783,581 | | | BlackRock Liquidity Funds
TempCash Portfolio | | | 301,783,581 | |
| | | | | | | | |
| | |
| | | | Total Investment Company
(Cost $301,783,581) | | | 301,783,581 | |
| | | | | | | | |
| Total Investments – 98.73%
(Cost $4,925,444,301)** | | | 5,888,077,921 | |
| | | | | | | | |
| Net Other Assets and Liabilities – 1.27% | | | 75,851,289 | |
| | | | | | | | |
| Net Assets – 100.00% | | $ | 5,963,929,210 | |
| | | | | | | | |
See accompanying Notes to Financial Statements.
| | |
| |
| ASTON/Fairpointe Mid Cap Fund | | October 31, 2014 |
| |
| Schedule of Investments – continued | | |
| * | | Non-income producing security. |
| ** | | Aggregate cost for Federal income tax purposes is $4,925,956,605. |
| | | | |
Gross unrealized appreciation | | $ | 1,262,409,740 | |
Gross unrealized depreciation | | | (300,288,424 | ) |
| | | | |
Net unrealized appreciation | | $ | 962,121,316 | |
| | | | |
| SP ADR | | Sponsored American Depositary Receipt |
See accompanying Notes to Financial Statements.
ASTON/Montag & Caldwell Mid Cap Growth Fund
| | |
| |
| Portfolio Manager Commentary (unaudited) | | October 31, 2014 |
Andrew W. Jung, CFA; M. Scott Thompson, CFA & Jeffrey S. Wilson, CFA, CPA |
| Q. | What were the most significant market factors affecting Fund performance and returns relative to the benchmark during the past 12 months? |
| A. | Against the backdrop of easy monetary policies, the higher quality growth companies we favor have failed to keep up with the broader market averages. Over the last 12 months the Fund underperformed its benchmark primarily due to stock selection, and to a lesser extent sector allocation. Stock selection was most challenged in the Healthcare sector, which was more a function of what we did not own, than what we did own. Our investment process precluded us from owning any of the high-flying biotech companies since many of them are not yet profitable. Additionally, after being strong performers for several years prior to 2014, a number of our Consumer Discretionary holdings struggled this past year due to higher valuations and weaker consumer spending trends. |
| Q. | What were the best performing holdings for the Fund during the period? |
| A. | The Fund’s top three performing stocks over the past 12 months were Monster Beverage, +76%; Marriott International, +70%; and F5 Networks, +51%. Monster shares appreciated strongly after Coca-Cola announced it would purchase a 16.7% equity interest in Monster and enter into an exclusive global distribution agreement. Marriott shares climbed steadily on the back of robust earnings growth and an expanding price-to-earnings (P/E) multiple. And F5 shares were propelled higher by a strong reacceleration in product sales growth. |
| Q. | What were the weakest performing holdings? |
| A. | Interestingly, two of our worst performing stocks this past year were two of our top performing holdings the prior year—Core Labs and Oceaneering. Core Labs fell 25% this past year after rising 82% the year before, while Oceaneering shares dropped 17% after being up 66% last year. Both stocks were negatively impacted by falling oil prices and the adverse effect on oil company spending. We reduced the size of both positions as |
| | the near-term earnings outlook deteriorated, but continue to hold the shares based on solid long-term earnings growth prospects and our expectation for an oil price recovery. Shares of Discovery Communications dropped by 21% as investors worried about weakening U.S. cable television advertising trends as well as the negative impact on Discovery’s international profits from a strengthening dollar. We added to our initial position following the stock decline on our belief that despite the near-term headwinds, the company may deliver mid-teens earnings-per-share (EPS) growth or better for the next several years. |
| Q. | How was the Fund positioned as of October 31, 2014? |
| A. | Equity markets are precariously positioned near record levels. While the economic outlook appears relatively sanguine, near-term risk is to the downside as asset prices have been bid up to levels that leave little margin for error, investor sentiment remains bullish, and the Federal Reserve has ended its bond purchases. These crosscurrents could prove disruptive in the short-to-intermediate term. At a minimum, we believe that the termination of quantitative easing (QE) will lead to a pick-up in volatility, as was the case after the previous two QE programs. In such an environment, we believe the reasonably valued, high quality growth stocks in the Fund’s portfolio have the potential to perform relatively well. |
We continue to emphasize owning high-quality mid cap companies with sustainable growth and return characteristics trading at reasonable valuations. We believe this investment approach will serve shareholders well over the course of a full market cycle.
Growth of a Hypothetical $10,000 Investment—Class N
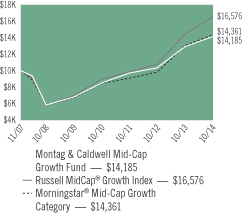
All dividends and capital gains are reinvested. Indexes are unmanaged and do not take into account fees, expenses or other costs.
Returns shown in the chart and table do not reflect taxes that a shareholder would pay on Fund distributions or on the sale of the Fund shares.
Mid-cap stocks may be subject to a higher degree of market risk than the securities of more established companies because they tend to be more volatile and less liquid.
RETURNSFOR PERIOD ENDED 10/31/14
Average Annual Total Returns - Class N
| | | | |
One Year | | | 9.75 | % |
Five Year | | | 15.74 | % |
Since Inception | | | 5.12 | % |
Inception Date 11/02/07
Total Return - Class I
| | | | |
Cumulative Since Inception | | | 5.63 | % |
Inception Date 05/14/14
The performance data quoted represents past performance. Past performance does not guarantee future results. Investment return and principal value will fluctuate so that an investor’s shares, upon redemption, may be worth more or less than their original cost. Current performance may be lower or higher than the performance data quoted. For performance data current to the most recent month-end, please visit our website at www.astonfunds.com.
The performance quoted would have been lower if fee waivers and/or expense reimbursements had not been in effect.
| | |
| |
| ASTON/Montag & Caldwell Mid Cap Growth Fund | | October 31, 2014 |
| |
| Schedule of Investments | | |
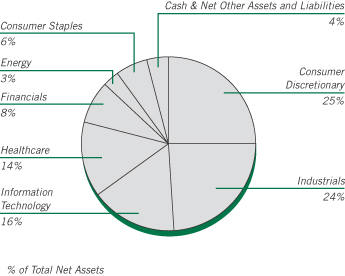
| | | | | | | | |
Shares | | | | | Market
Value | |
|
| | COMMON STOCKS – 96.52% | |
| | |
| | | | Consumer Discretionary – 25.09% | | | | |
| | 3,420 | | | BorgWarner | | $ | 195,008 | |
| | 4,520 | | | Discovery Communications Inc ‘A’ * | | | 159,782 | |
| | 4,810 | | | Dollar Tree * | | | 291,342 | |
| | 6,120 | | | Dunkin’ Brands Group | | | 278,338 | |
| | 2,500 | | | Harman International Industries | | | 268,350 | |
| | 9,550 | | | LKQ * | | | 272,844 | |
| | 1,970 | | | Marriott International, Class A | | | 149,228 | |
| | 2,090 | | | Michael Kors Holdings (Hong Kong) * | | | 164,253 | |
| | 1,506 | | | O’Reilly Automotive * | | | 264,875 | |
| | 496 | | | Panera Bread, Class A * | | | 80,173 | |
| | 2,000 | | | PVH | | | 228,700 | |
| | 952 | | | Ralph Lauren | | | 156,928 | |
| | 2,700 | | | Ross Stores | | | 217,944 | |
| | 2,160 | | | Tractor Supply | | | 158,155 | |
| | | | | | | | |
| | | | | | | 2,885,920 | |
| | | | | | | | |
| | |
| | | | Consumer Staples – 6.11% | | | | |
| | 2,920 | | | Church & Dwight | | | 211,437 | |
| | 2,630 | | | Mead Johnson Nutrition | | | 261,185 | |
| | 2,280 | | | Monster Beverage * | | | 230,006 | |
| | | | | | | | |
| | | | | | | 702,628 | |
| | | | | | | | |
| | |
| | | | Energy – 3.18% | | | | |
| | 955 | | | Core Laboratories (Netherlands) | | | 133,251 | |
| | 3,310 | | | Oceaneering International | | | 232,594 | |
| | | | | | | | |
| | | | | | | 365,845 | |
| | | | | | | | |
| | |
| | | | Financials – 8.15% | | | | |
| | 3,520 | | | First Republic Bank | | | 179,274 | |
| | 1,179 | | | Intercontinental Exchange | | | 245,574 | |
| | 4,970 | | | Raymond James Financial | | | 278,966 | |
| | 1,930 | | | Signature Bank New York NY * | | | 233,781 | |
| | | | | | | | |
| | | | | | | 937,595 | |
| | | | | | | | |
| | | | | | | | |
Shares | | | | | Market
Value | |
| | |
| | | | Healthcare – 14.33% | | | | |
| | 3,210 | | | AmerisourceBergen | | $ | 274,166 | |
| | 703 | | | Cooper Companies | | | 115,222 | |
| | 1,880 | | | Henry Schein * | | | 225,656 | |
| | 1,240 | | | IDEXX Laboratories * | | | 175,671 | |
| | 3,980 | | | MEDNAX * | | | 248,471 | |
| | 1,768 | | | Perrigo (Ireland) | | | 285,444 | |
| | 2,480 | | | Quintiles Transnational Holdings * | | | 145,179 | |
| | 3,410 | | | ResMed | | | 178,070 | |
| | | | | | | | |
| | | | | | | 1,647,879 | |
| | | | | | | | |
| | |
| | | | Industrials – 24.21% | | | | |
| | 5,375 | | | AMETEK | | | 280,306 | |
| | 3,140 | | | Copart * | | | 105,002 | |
| | 3,930 | | | Donaldson | | | 163,409 | |
| | 5,650 | | | Fastenal | | | 248,826 | |
| | 1,880 | | | IHS, Class A * | | | 246,336 | |
| | 2,550 | | | J.B. Hunt Transport Services | | | 203,414 | |
| | 2,140 | | | Nordson Corp. | | | 163,817 | |
| | 1,350 | | | Pall | | | 123,417 | |
| | 4,980 | | | Robert Half International | | | 272,804 | |
| | 1,091 | | | Roper Industries | | | 172,705 | |
| | 2,280 | | | Stericycle * | | | 287,280 | |
| | 3,340 | | | Verisk Analytics, Class A * | | | 208,249 | |
| | 3,570 | | | Wabtec | | | 308,091 | |
| | | | | | | | |
| | | | | | | 2,783,656 | |
| | | | | | | | |
| | |
| | | | Information Technology – 15.45% | | | | |
| | 5,150 | | | Amphenol, Class A | | | 260,487 | |
| | 2,420 | | | ANSYS * | | | 190,115 | |
| | 2,370 | | | F5 Networks * | | | 291,463 | |
| | 2,470 | | | FactSet Research Systems | | | 324,657 | |
| | 3,590 | | | Trimble Navigation * | | | 96,427 | |
| | 3,000 | | | WEX * | | | 340,680 | |
| | 6,130 | | | Xilinx | | | 272,663 | |
| | | | | | | | |
| | | | | | | 1,776,492 | |
| | | | | | | | |
| | |
| | | | Total Common Stocks
(Cost $9,013,008) | | | 11,100,015 | |
| | | | | | | | |
|
| | INVESTMENT COMPANY – 2.99% | |
| | |
| | 343,867 | | | BlackRock Liquidity Funds TempFund Portfolio | | | 343,867 | |
| | | | | | | | |
| | |
| | | | Total Investment Company
(Cost $343,867) | | | 343,867 | |
| | | | | | | | |
| Total Investments – 99.51%
(Cost $9,356,875)** | | | 11,443,882 | |
| | | | | | | | |
| Net Other Assets and Liabilities – 0.49% | | | 56,383 | |
| | | | | | | | |
| Net Assets – 100.00% | | $ | 11,500,265 | |
| | | | | | | | |
| * | | Non-income producing security. |
| ** | | Aggregate cost for Federal income tax purposes is $9,358,641. |
| | | | |
Gross unrealized appreciation | | $ | 2,146,331 | |
Gross unrealized depreciation | | | (61,090 | ) |
| | | | |
Net unrealized appreciation | | $ | 2,085,241 | |
| | | | |
See accompanying Notes to Financial Statements.
ASTON/LMCG Small Cap Growth Fund
| | |
| |
| Portfolio Manager Commentary (unaudited) | | October 31, 2014 |
| | Andrew Morey, CFA |
| Q. | What were the most significant market factors affecting Fund performance and returns relative to the benchmark during the past 12 months? |
| A. | Small cap growth and small cap value stocks performing essentially in line this year masks that the style indexes have shown some meaningful and pronounced return patterns over the last 12 months. These moves have generally been shorter lived and in both directions, thus creating new investment opportunities that we have been able to capitalize on, to the benefit of strong relative performance. We have also benefited from strong performance in the traditional growth sectors, including Healthcare and Information Technology. |
| Q. | What were the best performing holdings for the Fund during the period? |
| A. | At the sector level, Healthcare was a very strong area for the Fund, especially among our biotech holdings. Intercept Pharmaceuticals was up sharply for the period after a clinical trial involving the company’s liver disease drug showed such effectiveness that the trial was halted early, potentially putting approval on the fast track. Puma Biotechnology was another top-performing stock, helped by positive study data from its breast cancer drug. Also in Healthcare, we have a meaningful position in Parexel, which offers a broad range of services in the life sciences segment, and the Fund benefited from strong performance in the stock. Information Technology was another strong sector for the period, and Synchronoss Technologies (cloud solutions and software-based activation) was among the largest contributors to performance. We have a meaningful position in Synchronoss, and the stock advanced on solid growth in cloud services. |
| Q. | What were the weakest performing holdings? |
| A. | Fairway Group Holdings and SeaWorld Entertainment were among the largest individual detractors from index-relative performance for the 12-month period. |
| | Shares of upscale supermarket chain Fairway Group steadily declined on disappointing earnings reports and management changes, and we exited the position in the first half of 2014. Sea World’s stock dropped in late summer amid lower reported park attendance and subsequent cuts in ticket prices. We continue to believe in the name and have maintained our position in the Fund. |
| Q. | How was the Fund positioned as of October 31, 2014? |
| A. | We continue to find unrecognized, underappreciated growth opportunities across our universe and, in particular, have been able to take advantage of recent volatility and recent weakness. With our index up 40% or more last year, the pullback we saw during the third (calendar) quarter was arguably relatively benign—and we believe many investors would have expected a more severe downturn. Small and small-mid caps retraced more sharply than larger cap stocks, but, to us, that relative weakness only served to remove an above average valuation premium on small growth stocks relative to the broader market (S&P 500). |
That said, the macro and geopolitical cross-currents are real and important, and certainly have left investors vulnerable for more than three months now. Russia and Ukraine continue to take headlines, and while Russian equities have sold off, the larger concern is actually Germany, given its position in the broader Eurozone and as Russia’s largest trading partner. The possibility that the Eurozone drops back into recession is a concern, and we continue to monitor that closely. For us, however, those concerns are also offset by the improving macro backdrop in the United States, led by firmer housing numbers and, more importantly, the improving jobs picture, which now include new signs of actual wage expansion.
Growth of a Hypothetical
$10,000 Investment—Class N
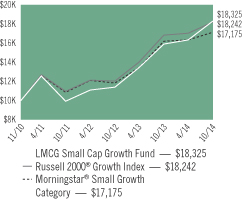
All dividends and capital gains are reinvested. Indexes are unmanaged and do not take into account fees, expenses or other costs.
Returns shown in the chart and table do not reflect taxes that a shareholder would pay on Fund distributions or on the sale of the Fund shares.
Small company stocks may be subject to a higher degree of market risk than the securities of more established companies because they tend to be more volatile and less liquid.
RETURNSFOR PERIOD ENDED 10/31/14
Average Annual Total Returns - Class N
| | | | |
One Year | | | 15.18 | % |
Since Inception | | | 16.37 | % |
Inception Date 11/03/10
Average Annual Total Returns - Class I
| | | | |
One Year | | | 15.51 | % |
Since Inception | | | 12.41 | % |
Inception Date 06/01/11
The performance data quoted represents past performance. Past performance does not guarantee future results. Investment return and principal value will fluctuate so that an investor’s shares, upon redemption, may be worth more or less than their original cost. Current performance may be lower or higher than the performance data quoted. For performance data current to the most recent month-end, please visit our website at www.astonfunds.com.
The performance quoted would have been lower if fee waivers and/or expense reimbursements had not been in effect.
| | |
| |
| ASTON/LMCG Small Cap Growth Fund | | October 31, 2014 |
| |
| Schedule of Investments | | |
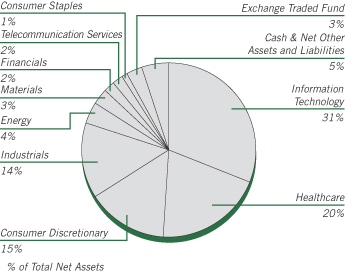
| | | | | | | | |
Shares | | | | | Market
Value | |
| | | | | | | | |
|
| | COMMON STOCKS – 92.25% | |
| | |
| | | | Consumer Discretionary – 15.03% | | | | |
| | 7,945 | | | Asbury Automotive Group * | | $ | 556,468 | |
| | 15,908 | | | Brunswick | | | 744,494 | |
| | 31,069 | | | Del Frisco’s Restaurant Group * | | | 721,422 | |
| | 11,001 | | | Life Time Fitness * | | | 613,526 | |
| | 18,722 | | | Lithia Motors, Class A | | | 1,453,202 | |
| | 9,473 | | | Nexstar Broadcasting Group, Class A | | | 427,422 | |
| | 128,034 | | | Office Depot * | | | 668,337 | |
| | 26,954 | | | Shutterfly * | | | 1,127,486 | |
| | 38,525 | | | Sotheby’s | | | 1,527,902 | |
| | | | | | | | |
| | | | | | | 7,840,259 | |
| | | | | | | | |
| | |
| | | | Consumer Staples – 1.34% | | | | |
| | 2,806 | | | Boston Beer, Class A * | | | 698,694 | |
| | | | | | | | |
| | |
| | | | Energy – 3.67% | | | | |
| | 4,262 | | | Clayton Williams Energy * | | | 354,343 | |
| | 9,045 | | | Gulfport Energy * | | | 453,878 | |
| | 167,865 | | | Halcon Resources * | | | 522,060 | |
| | 22,125 | | | Rice Energy * | | | 584,764 | |
| | | | | | | | |
| | | | | | | 1,915,045 | |
| | | | | | | | |
| | |
| | | | Financials – 1.89% | | | | |
| | 66,959 | | | WisdomTree Investments | | | 987,645 | |
| | | | | | | | |
| | |
| | | | Healthcare – 20.24% | | | | |
| | 17,285 | | | Acadia Pharmaceuticals * | | | 478,795 | |
| | 5,876 | | | Alere * | | | 234,864 | |
| | 14,087 | | | Align Technology * | | | 741,258 | |
| | 6,582 | | | Alnylam Pharmaceuticals * | | | 610,415 | |
| | 13,885 | | | Amsurg * | | | 749,929 | |
| | 34,156 | | | Community Health Systems * | | | 1,877,555 | |
| | 12,809 | | | ICON PLC (Ireland) * | | | 673,881 | |
| | 1,936 | | | Intercept Pharmaceuticals * | | | 500,243 | |
| | | | | | | | |
Shares | | | | | Market
Value | |
| | | | | | | | |
| | |
| | | | Healthcare (continued) | | | | |
| | 12,177 | | | LifePoint Hospitals * | | $ | 852,390 | |
| | 301,898 | | | Merge Healthcare * | | | 830,220 | |
| | 30,799 | | | PAREXEL International * | | | 1,672,694 | |
| | 32,897 | | | Premier, Class A * | | | 1,098,102 | |
| | 964 | | | Puma Biotechnology * | | | 241,578 | |
| | | | | | | | |
| | | | | | | 10,561,924 | |
| | | | | | | | |
| | |
| | | | Industrials – 14.26% | | | | |
| | 14,751 | | | Advisory Board * | | | 791,686 | |
| | 3,730 | | | Generac Holdings * | | | 169,118 | |
| | 15,143 | | | Herman Miller | | | 484,576 | |
| | 32,984 | | | Hexcel * | | | 1,381,700 | |
| | 52,599 | | | Kelly Services, Class A | | | 927,320 | |
| | 68,271 | | | Kforce | | | 1,580,474 | |
| | 20,386 | | | Korn/Ferry International * | | | 569,381 | |
| | 20,714 | | | USG * | | | 556,378 | |
| | 8,566 | | | Woodward | | | 438,665 | |
| | 13,614 | | | XPO Logistics * | | | 543,471 | |
| | | | | | | | |
| | | | | | | 7,442,769 | |
| | | | | | | | |
| | |
| | | | Information Technology – 31.28% | | | | |
| | 25,309 | | | Aruba Networks * | | | 546,168 | |
| | 10,796 | | | Aspen Technology * | | | 398,696 | |
| | 35,661 | | | Cardtronics * | | | 1,369,026 | |
| | 5,078 | | | Cavium * | | | 260,552 | |
| | 27,602 | | | Dealertrack Technologies * | | | 1,298,674 | |
| | 55,219 | | | ExlService Holdings * | | | 1,545,580 | |
| | 10,695 | | | Fleetmatics Group PLC (Ireland) * | | | 397,212 | |
| | 35,577 | | | Global Eagle Entertainment * | | | 435,107 | |
| | 29,276 | | | Heartland Payment Systems | | | 1,512,105 | |
| | 289,199 | | | Internap Network Services * | | | 2,316,484 | |
| | 44,555 | | | MAXIMUS | | | 2,159,135 | |
| | 28,395 | | | SciQuest * | | | 423,369 | |
| | 42,760 | | | Synchronoss Technologies * | | | 2,209,409 | |
| | 4,207 | | | Tableau Software, Class A * | | | 347,456 | |
| | 1,612 | | | Ultimate Software Group * | | | 242,622 | |
| | 33,385 | | | WNS Holdings, ADR (Jersey) * | | | 674,711 | |
| | 3,109 | | | Yelp * | | | 186,540 | |
| | | | | | | | |
| | | | | | | 16,322,846 | |
| | | | | | | | |
| | |
| | | | Materials – 2.77% | | | | |
| | 40,098 | | | Boise Cascade * | | | 1,445,934 | |
| | | | | | | | |
| | |
| | | | Telecommunication Services – 1.77% | | | | |
| | |
| | 27,159 | | | Cogent Communications Holdings | | | 921,776 | |
| | | | | | | | |
| | |
| | | | Total Common Stocks
(Cost $42,581,596) | | | 48,136,892 | |
| | | | | | | | |
|
| | EXCHANGE TRADED FUND – 2.64% | |
| | |
| | 10,031 | | | iShares Russell 2000 Growth Index Fund | | | 1,380,567 | |
| | | | | | | | |
| | |
| | | | Total Exchange Traded Fund
(Cost $1,363,594) | | | 1,380,567 | |
| | | | | | | | |
See accompanying Notes to Financial Statements.
| | |
| |
| ASTON/LMCG Small Cap Growth Fund | | October 31, 2014 |
| |
| Schedule of Investments – continued | | |
| | | | | | | | |
Shares | | | | | Market
Value | |
| | | | | | | | |
|
| | WARRANTS – 0% | |
| | |
| | | | Energy – 0.00% | | | | |
| | 11,820 | | | Magnum Hunter Resources, Strike Price $8.50, Expiration 04/15/16 | | $ | 0 | |
| | | | | | | | |
| | |
| | | | Total Warrants
(Cost $—) | | | 0 | |
| | | | | | | | |
|
| | INVESTMENT COMPANY – 4.86% | |
| | |
| | 2,534,134 | | | BlackRock Liquidity Funds TempCash Portfolio | | | 2,534,134 | |
| | | | | | | | |
| | |
| | | | Total Investment Company
(Cost $2,534,134) | | | 2,534,134 | |
| | | | | | | | |
| Total Investments – 99.75%
(Cost $46,479,324)** | | | 52,051,593 | |
| | | | | | | | |
| Net Other Assets and Liabilities – 0.25% | | | 129,544 | |
| | | | | | | | |
| Net Assets – 100.00% | | $ | 52,181,137 | |
| | | | | | | | |
| * | | Non-income producing security. |
| ** | | Aggregated cost for Federal income tax purposes is $46,496,569. |
| | | | |
Gross unrealized appreciation | | $ | 6,136,871 | |
Gross unrealized depreciation | | | (581,847 | ) |
| | | | |
Net unrealized appreciation | | $ | 5,555,024 | |
| | | | |
| ADR | | American Depositary Receipt |
See accompanying Notes to Financial Statements.
ASTON/River Road Independent Value Fund
| | |
| |
| Portfolio Manager Commentary (unaudited) | | October 31, 2014 |
| | Eric K. Cinnamond, CFA |
| Q. | What were the most significant market factors affecting Fund performance and returns relative to the benchmark during the past 12 months? |
| A. | The Class N Shares of the Fund returned -1.24% during the past 12 months versus +7.89% for the Russell 2000 Value Index. Unfavorable relative and absolute performance over the past year was driven by higher than average cash levels and an increased allocation to out-of-favor industries of the small cap market that have performed poorly. On average, we did not believe we were being appropriately compensated relative to risk assumed during the year, as prices for the majority of stocks on our possible buy list traded over our calculated valuations. We have responded by selling positions that have appreciated over valuation, and allocating the proceeds between out-of-favor companies selling at large discounts-to-value and the Fund’s cash balance. Cash remained at above average levels, averaging 71% over the past twelve months. |
| Q. | What were the best performing holdings for the Fund during the period? |
| A. | Sykes Enterprises Inc. and Silver Standard Resources Inc. were the largest positive contributors during the period. Sykes Enterprises is a market-leading outsourced call center operator with approximately $1.3 billion in revenue. The company benefitted from strong demand early in the year as well as improved margins, as past capacity initiatives designed to boost profitability began to take effect. Silver Standard Resources Inc. is a precious metals mining company that operates both a silver and a gold mine. Despite the stock being down over the past year, Silver Standard’s positive contribution is a result of opportunistically reducing the position throughout the year when the shares were periodically in favor and the discount-to-value was reduced through stock appreciation. |
| Q. | What were the weakest performing holdings? |
| A. | New Gold Inc. and AuRico Gold Inc., both precious metal miners, were the largest negative contributors during the period. New Gold Inc.’s business consists of four operating gold mines and three development projects with a combined 18 million ounces of proven and probable gold reserves. AuRico Gold Inc. has two operating mines in Canada and Mexico with a combined 6.5 million ounces of gold reserves. While both companies performed well operationally over the past year, their stocks suffered from reduced cash flow estimates and declining sentiment caused by falling gold prices. We continue to hold a meaningful position in the precious metal mining industry, including New Gold and AuRico, as we believe many trade at large discounts to the replacement cost of their assets and remain out-of-favor by investors. |
| Q. | How was the Fund positioned as of October 31, 2014? |
| A. | The Fund continues to be defensively positioned, with above average cash levels (exceeding 70%), as most high-quality small cap stocks remain expensive, in our opinion. We continue to focus on maintaining a portfolio of companies with strong balance sheets and limited financial risk. Our rotation into out-of-favor small cap stocks continues, especially with regard to commodity producers. While the mix of the commodity position has changed throughout the past twelve months based on fluctuations in available discounts-to-value, the overall commodity position remains similarly sized to a year ago. We expect to maintain our contrarian and defensive positioning until small cap prices accurately reflect their underlying risks. |
Growth of a Hypothetical
$10,000 Investment—Class N
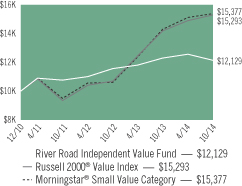
All dividends and capital gains are reinvested. Indexes are unmanaged and do not take into account fees, expenses or other costs.
Returns shown in the chart and table do not reflect taxes that a shareholder would pay on Fund distributions or on the sale of the Fund shares.
Small-cap stocks may be subject to a higher degree of market risk than the securities of more established companies because they tend to be more volatile and less liquid.
Value investing involves the risk that a Fund’s investments in companies believed to be undervalued will not appreciate as anticipated.
RETURNSFOR PERIOD ENDED 10/31/14
Average Annual Total Returns - Class N
| | | | |
One Year | | | -1.24 | % |
Since Inception | | | 5.16 | % |
Inception Date 12/31/10
Average Annual Total Returns - Class I
| | | | |
One Year | | | -1.05 | % |
Since Inception | | | 3.35 | % |
The performance data quoted represents past performance. Past performance does not guarantee future results. Investment return and principal value will fluctuate so that an investor’s shares, upon redemption, may be worth more or less than their original cost. Current performance may be lower or higher than the performance data quoted. For performance data current to the most recent month-end, please visit our website at www.astonfunds.com.
The performance quoted would have been lower if fee waivers and/or expense reimbursements had not been in effect.
| | |
| |
| ASTON/River Road Independent Value Fund | | October 31, 2014 |
| |
| Schedule of Investments | | |
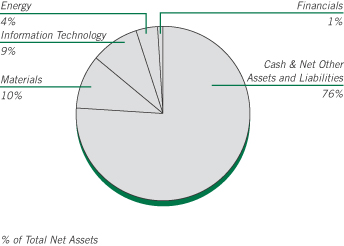
| | | | | | | | |
Shares | | | | | Market
Value | |
| | | | | | | | |
|
| | COMMON STOCKS – 23.89% | |
| | |
| | | | Consumer Staples – 0.48% | | | | |
| | 523,194 | | | Cott (Canada) | | $ | 3,175,788 | |
| | | | | | | | |
| | |
| | | | Energy – 3.67% | | | | |
| | 224,773 | | | Contango Oil & Gas * | | | 8,219,948 | |
| | 305,981 | | | QEP Resources | | | 7,670,943 | |
| | 73,691 | | | Unit * | | | 3,568,118 | |
| | 263,033 | | | WPX Energy * | | | 5,029,191 | |
| | | | | | | | |
| | | | | | | 24,488,200 | |
| | | | | | | | |
| | |
| | | | Financials – 0.57% | | | | |
| | 139,978 | | | Baldwin & Lyons, Class B (a) | | | 3,768,208 | |
| | | | | | | | |
| | |
| | | | Information Technology – 8.84% | | | | |
| | 397,375 | | | Benchmark Electronics * | | | 9,425,735 | |
| | 733,664 | | | Convergys | | | 14,798,003 | |
| | 455,494 | | | CSG Systems International | | | 12,075,146 | |
| | 134,045 | | | Mantech International, Class A | | | 3,774,707 | |
| | 879,103 | | | Sykes Enterprises * | | | 18,935,879 | |
| | | | | | | | |
| | | | | | | 59,009,470 | |
| | | | | | | | |
| | |
| | | | Materials – 10.33% | | | | |
| | 458,745 | | | American Vanguard | | | 5,293,917 | |
| | 5,962,602 | | | AuRico Gold (Canada) (a) | | | 19,139,952 | |
| | 5,371,301 | | | New Gold (Canada) * | | | 19,336,684 | |
| | 2,093,743 | | | Pan American Silver (Canada) | | | 19,325,248 | |
| | 1,338,021 | | | Silver Standard Resources (Canada) * | | | 5,847,152 | |
| | | | | | | | |
| | | | | | | 68,942,953 | |
| | | | | | | | |
| | |
| | | | Total Common Stocks
(Cost $170,472,749) | | | 159,384,619 | |
| | | | | | | | |
| | | | | | | | |
Shares | | | | | Market
Value | |
| | | | | | | | |
|
| | INVESTMENT COMPANY – 76.28% | |
| | |
| | 509,010,642 | | | BlackRock Liquidity Funds Treasury Trust Fund Portfolio | | $ | 509,010,642 | |
| | | | | | | | |
| | |
| | | | Total Investment Company
(Cost $509,010,642) | | | 509,010,642 | |
| | | | | | | | |
| Total Investments – 100.17%
(Cost $679,483,391)** | | | 668,395,261 | |
| | | | | | | | |
| Net Other Assets and Liabilities – (0.17)% | | | (1,157,259 | ) |
| | | | | | | | |
| Net Assets – 100.00% | | $ | 667,238,002 | |
| | | | | | | | |
| * | | Non-income producing security. |
| ** | | Aggregate cost for Federal income tax purposes is $690,926,991. |
| | | | |
Gross unrealized appreciation | | $ | 12,605,362 | |
Gross unrealized depreciation | | | (35,137,092 | ) |
| | | | |
Net unrealized depreciation | | $ | (22,531,730 | ) |
| | | | |
| (a) | | These securities have been determined by the Subadviser to be illiquid securities. At October 31, 2014, these securities amounted to $22,908,160 or 3.43% of net assets. |
See accompanying Notes to Financial Statements.
ASTON/River Road Select Value Fund
| | |
| |
| Portfolio Manager Commentary (unaudited) | | October 31, 2014 |
James C. Shircliff, CFA; R. Andrew Beck & J. Justin Akin
| Q. | What were the most significant market factors affecting Fund performance and returns relative to the benchmark during the past 12 months? |
| A. | The Fund’s return underperformed the benchmark Russell 2500 Value Index during the period. The largest positive contribution was from the Healthcare sector, which benefited from an overweight allocation and strong stock selection. The largest negative contributor was the Consumer Discretionary sector, which lagged due to poor security selection and an overweight allocation. The Fund’s cash position, which averaged approximately 4% during the period, was also a negative contributor to performance. |
| Q. | What were the best performing holdings for the Fund during the period? |
| A. | The two holdings with the largest positive contribution to relative return were Blackhawk Network Holdings Inc. and Nordion Inc. Blackhawk operates a prepaid network that offers a broad selection of gift cards and payment services at over 180,000 retail locations. It has experienced significant organic revenue growth while the management team has used the company’s strong balance sheet for accretive acquisitions. This has resulted in cash flow growth and acceleration of free cash flow. Nordion manufactures and distributes medical isotopes used for the prevention and diagnosis of disease. In August, Sterigenics closed a deal to acquire Nordion at our assessed Absolute Value. |
| Q. | What were the weakest performing holdings? |
| A. | The two holdings with the largest negative contribution to relative return were NeuStar Inc. (Class A) and Ascena Retail Group Inc. NeuStar is the exclusive provider of telephone number portability in the United States. This contract is 50% of company revenues and is being re-bid for the first time in its 18-year history. An advisory committee to the Federal Communications Commission (FCC) recommended that the rival bidder should win the next contract. In our view, the request for proposal (RFP) process was |
| | marred by various shortcomings and the rival bidder does not meet many of the contract requirements. NeuStar is currently advocating for a new round of bidding, which would be a significant catalyst for the shares. Ascena Retail Group is a specialty apparel retailer that operates dressbarn, Justice, maurices, Catherines, and Lane Bryant concept stores. Ascena’s 2012 acquisition of Charming Shoppes (Catherines and Lane Bryant) has not generated acceptable returns on capital post integration. Also, sustained weakness in the U.S. retail consumer and high competitive activity in the teen space has negatively impacted the profitability of Justice. |
| Q. | How was the Fund positioned as of October 31, 2014? |
| A. | We continue to position the Fund in shares of high quality companies that we believe will perform well in a sustained period of weak economic growth. Rapidly rising equity prices paired with modest earnings growth over the past several years have resulted in unattractive valuations in the broader small cap market. As a result, identifying companies to replace those that are being sold at their assessed Absolute Value is more difficult. Thus, cash in the Fund is at the higher end of its historical range. |
As a result, if returns do moderate over the coming months we view the Fund’s holdings and low volatility approach to be well positioned. Further, whether markets rise or fall, we believe merger and acquisition activity within the Fund holdings will continue to support relative performance.
Growth of a Hypothetical
$10,000 Investment—Class N
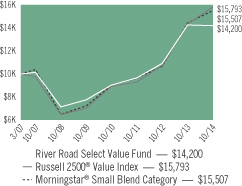
All dividends and capital gains are reinvested. Indexes are unmanaged and do not take into account fees, expenses or other costs.
Returns shown in the chart and table do not reflect taxes that a shareholder would pay on Fund distributions or on the sale of the Fund shares.
Small-cap and mid-cap stocks may be subject to a higher degree of market risk than the securities of more established companies because they tend to be more volatile and less liquid.
Value investing involves the risk that a Fund’s investments in companies believed to be undervalued will not appreciate as anticipated.
RETURNSFOR PERIOD ENDED 10/31/14
Average Annual Total Returns - Class N
| | | | |
One Year | | | -0.23 | % |
Five Year | | | 12.95 | % |
Since Inception | | | 4.73 | % |
Inception Date 03/29/07
Average Annual Total Returns - Class I
| | | | |
One Year | | | 0.00 | % |
Five Year | | | 13.28 | % |
Since Inception | | | 4.45 | % |
Inception Date 06/28/07
The performance data quoted represents past performance. Past performance does not guarantee future results. Investment return and principal value will fluctuate so that an investor’s shares, upon redemption, may be worth more or less than their original cost. Current performance may be lower or higher than the performance data quoted. For performance data current to the most recent month-end, please visit our website at www.astonfunds.com.
| | |
| |
| ASTON/River Road Select Value Fund | | October 31, 2014 |
| |
| Schedule of Investments | | |
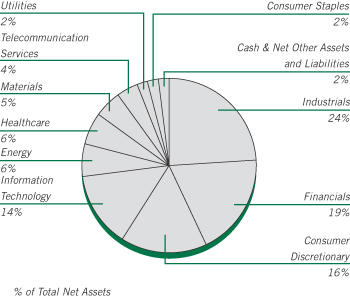
| | | | | | | | |
Shares | | | | | Market
Value | |
| | | | | | | | |
|
| | COMMON STOCKS – 98.75% | |
| | |
| | | | Consumer Discretionary – 16.13% | | | | |
| | 59,930 | | | Abercrombie & Fitch, Class A | | $ | 2,006,456 | |
| | 229,350 | | | Ascena Retail Group * | | | 2,855,408 | |
| | 50,500 | | | Ascent Capital Group, Class A * | | | 3,247,150 | |
| | 35,690 | | | Bob Evans Farms | | | 1,743,456 | |
| | 48,150 | | | Children’s Place Retail Stores | | | 2,371,387 | |
| | 39,120 | | | Coach | | | 1,344,946 | |
| | 167,380 | | | Francesca’s Holdings * | | | 1,993,496 | |
| | 113,270 | | | International Speedway, Class A | | | 3,548,749 | |
| | 31,710 | | | Madison Square Garden, Class A * | | | 2,402,350 | |
| | 54,530 | | | Outerwall * | | | 3,450,113 | |
| | 25,690 | | | PetSmart | | | 1,858,672 | |
| | 71,650 | | | Remy International | | | 1,324,092 | |
| | 96,570 | | | Stage Stores | | | 1,629,136 | |
| | | | | | | | |
| | | | | | | 29,775,411 | |
| | | | | | | | |
| | |
| | | | Consumer Staples – 1.89% | | | | |
| | 45,763 | | | Ingles Markets, Class A | | | 1,231,025 | |
| | 81,470 | | | Village Super Market, Class A | | | 2,260,793 | |
| | | | | | | | |
| | | | | | | 3,491,818 | |
| | | | | | | | |
| | |
| | | | Energy – 6.18% | | | | |
| | 231,290 | | | Denbury Resources | | | 2,867,996 | |
| | 190,780 | | | Evolution Petroleum | | | 1,804,779 | |
| | 321,401 | | | Miller Energy Resources * | | | 1,118,475 | |
| | 71,028 | | | Nuverra Environmental Solutions * | | | 672,635 | |
| | 120,200 | | | Ocean Rig UDW (Cyprus) | | | 1,652,750 | |
| | 196,310 | | | TETRA Technologies * | | | 1,870,834 | |
| | 74,160 | | | WPX Energy * | | | 1,417,939 | |
| | | | | | | | |
| | | | | | | 11,405,408 | |
| | | | | | | | |
| | | | | | | | |
Shares | | | | | Market
Value | |
| | | | | | | | |
| | |
| | | | Financials – 19.03% | | | | |
| | 8,125 | | | Alleghany * | | $ | 3,609,775 | |
| | 87,100 | | | Brown & Brown | | | 2,775,006 | |
| | 80,574 | | | Capital Southwest | | | 2,953,843 | |
| | 82,720 | | | Dime Community Bancshares | | | 1,302,840 | |
| | 304,620 | | | FNFV Group * | | | 4,094,093 | |
| | 144,290 | | | Forest City Enterprises, Class A * | | | 3,014,218 | |
| | 45,604 | | | Geo Group, REIT | | | 1,821,424 | |
| | 92,820 | | | Hilltop Holdings * | | | 2,044,825 | |
| | 23,800 | | | Navigators Group * | | | 1,620,542 | |
| | 142,130 | | | PICO Holdings * | | | 3,141,073 | |
| | 59,440 | | | Walter Investment Management * | | | 1,350,477 | |
| | 11,825 | | | White Mountains Insurance Group (Bermuda) | | | 7,389,679 | |
| | | | | | | | |
| | | | | | | 35,117,795 | |
| | | | | | | | |
| | |
| | | | Healthcare – 5.65% | | | | |
| | 25,578 | | | Bio-Rad Laboratories, Class A * | | | 2,885,710 | |
| | 110,255 | | | Myriad Genetics * | | | 4,353,970 | |
| | 95,770 | | | Owens & Minor | | | 3,191,056 | |
| | | | | | | | |
| | | | | | | 10,430,736 | |
| | | | | | | | |
| | |
| | | | Industrials – 23.80% | | | | |
| | 198,210 | | | ADT | | | 7,103,846 | |
| | 313,210 | | | Air Transport Services Group * | | | 2,562,058 | |
| | 134,834 | | | Brink’s | | | 2,831,514 | |
| | 25,234 | | | Clean Harbors * | | | 1,252,363 | |
| | 60,580 | | | Cubic | | | 2,922,379 | |
| | 28,230 | | | Forward Air | | | 1,351,370 | |
| | 129,099 | | | GenCorp * | | | 2,189,519 | |
| | 104,230 | | | Insperity | | | 3,289,499 | |
| | 142,013 | | | Marten Transport | | | 2,786,295 | |
| | 119,210 | | | Progressive Waste Solutions (Canada) | | | 3,484,508 | |
| | 139,583 | | | SP Plus * | | | 3,045,701 | |
| | 53,920 | | | UniFirst | | | 6,015,315 | |
| | 181,310 | | | UTI Worldwide (British Virgin Islands) * | | | 1,981,718 | |
| | 112,800 | | | Werner Enterprises | | | 3,106,512 | |
| | | | | | | | |
| | | | | | | 43,922,597 | |
| | | | | | | | |
| | |
| | | | Information Technology – 14.37% | | | | |
| | 168,480 | | | Blackhawk Network Holdings * | | | 5,627,232 | |
| | 187,629 | | | Convergys | | | 3,784,477 | |
| | 198,620 | | | CSG Systems International | | | 5,265,416 | |
| | 96,600 | | | Knowles * | | | 1,879,836 | |
| | 124,434 | | | NeuStar, Class A * | | | 3,286,302 | |
| | 181,719 | | | Rovi * | | | 3,794,293 | |
| | 134,120 | | | Sykes Enterprises * | | | 2,888,945 | |
| | | | | | | | |
| | | | | | | 26,526,501 | |
| | | | | | | | |
| | |
| | | | Materials – 5.29% | | | | |
| | 118,230 | | | American Vanguard | | | 1,364,374 | |
| | 54,770 | | | AptarGroup | | | 3,408,885 | |
| | 83,851 | | | Kraton Performance Polymers * | | | 1,500,094 | |
| | 106,750 | | | Myers Industries | | | 1,594,845 | |
| | 66,090 | | | Rayonier Advanced Materials | | | 1,885,548 | |
| | | | | | | | |
| | | | | | | 9,753,746 | |
| | | | | | | | |
See accompanying Notes to Financial Statements.
| | |
| |
| ASTON/River Road Select Value Fund | | October 31, 2014 |
| |
| Schedule of Investments – continued | | |
| | | | | | | | |
Shares | | | | | Market
Value | |
| | | | | | | | |
| |
| | | | Telecommunication Services – 4.01% | |
| | 34,668 | | | Atlantic Tele-Network | | $ | 2,329,343 | |
| | 131,590 | | | NTELOS Holdings | | | 1,326,427 | |
| | 145,650 | | | Telephone & Data Systems | | | 3,734,466 | |
| | | | | | | | |
| | | | | | | 7,390,236 | |
| | | | | | | | |
| | |
| | | | Utilities – 2.40% | | | | |
| | 64,090 | | | National Fuel Gas | | | 4,436,951 | |
| | | | | | | | |
| | |
| | | | Total Common Stocks
(Cost $174,117,108) | | | 182,251,199 | |
| | | | | | | | |
|
| | INVESTMENT COMPANY – 1.24% | |
| | |
| | 2,277,797 | | | BlackRock Liquidity Funds TempCash Portfolio | | | 2,277,797 | |
| | | | | | | | |
| | |
| | | | Total Investment Company
(Cost $2,277,797) | | | 2,277,797 | |
| | | | | | | | |
| Total Investments – 99.99%
(Cost $176,394,905)** | | | 184,528,996 | |
| | | | | | | | |
| Net Other Assets and Liabilities – 0.01% | | | 24,980 | |
| | | | | | | | |
| Net Assets – 100.00% | | $ | 184,553,976 | |
| | | | | | | | |
| * | | Non-income producing security. |
| ** | | Aggregate cost for Federal income tax purposes is $176,976,023. |
| | | | |
Gross unrealized appreciation | | $ | 20,518,117 | |
Gross unrealized depreciation | | | (12,955,144 | ) |
| | | | |
Net unrealized appreciation | | $ | 7,552,973 | |
| | | | |
| REIT | | Real Estate Investment Trust |
See accompanying Notes to Financial Statements.
ASTON/River Road Small Cap Value Fund
| | |
| |
| Portfolio Manager Commentary (unaudited) | | October 31, 2014 |
| James C. Shircliff, CFA; R. Andrew Beck & J. Justin Akin |
| Q. | What were the most significant market factors affecting Fund performance and returns relative to the benchmark during the past 12 months? |
| A. | The Fund’s return underperformed the benchmark Russell 2000 Value Index during the period. The largest positive contribution was from the Healthcare sector, which benefited from an overweight allocation and strong stock selection. The largest negative contributor was the Consumer Discretionary sector, which lagged due to poor security selection and an overweight allocation. The Fund’s cash position, which averaged approximately 9% during the period, was also a negative contributor to performance. |
| Q. | What were the best performing holdings for the Fund during the period? |
| A. | The two holdings with the largest positive contribution to relative return were Blackhawk Network Holdings Inc. and Motorcar Parts of America Inc. Blackhawk operates a prepaid network that offers a broad selection of gift cards and payment services at over 180,000 retail locations. It has experienced significant organic revenue growth while the management team has used the company’s strong balance sheet for accretive acquisitions. This has resulted in cash flow growth and acceleration of free cash flow. Motorcar Parts of America manufactures replacement alternators and starters for cars and trucks, selling to the largest auto parts retailers in the United States. Its core business lines continued to grow significantly, which drove margin improvement and significant cash flow growth. After shuttering a poorly performing acquisition it made in 2011, the company successfully expanded into new product lines. This position exceeded our assessed Absolute Value and it was eliminated from the Fund. |
| Q. | What were the weakest performing holdings? |
| A. | The two holdings with the largest negative contribution to relative return were NeuStar Inc. (CI A) and Ascena Retail Group Inc. NeuStar is the exclusive provider of telephone number portability in |
| | the United States. This contract is 50% of company revenues and is being re-bid for the first time in its 18-year history. An advisory committee to the Federal Communications Commission recommended that the rival bidder should win the next contract. In our view, the request for proposal process was marred by various shortcomings and the rival bidder does not meet many of the contract requirements. NeuStar is currently advocating for a new round of bidding, which would be a significant catalyst for the shares. Ascena Retail Group is a specialty apparel retailer that operates dressbarn, Justice, maurices, Catherines, and Lane Bryant concept stores. Ascena’s 2012 acquisition of Charming Shoppes (Catherines and Lane Bryant) has not generated acceptable returns on capital post integration. Also, sustained weakness in the U.S. retail consumer and high competitive activity in the teen space has negatively impacted the profitability of Justice. |
| Q. | How was the Fund positioned as of October 31, 2014? |
| A. | We continue to position the Fund in shares of high quality companies that we believe will perform well in a sustained period of weak-to-moderate economic growth. Rapidly rising equity prices paired with modest earnings growth over the past several years have resulted in unattractive valuations in the broader small cap market. As a result, identifying companies to replace those that are being sold at their assessed Absolute Value is more difficult. Thus, cash in the fund is at the higher end of its historical range. |
As a result, if returns do moderate over the coming months we view the Fund’s holdings and low volatility approach to be well positioned. Further, whether markets rise or fall, we believe merger and acquisition activity within the Fund’s holdings will continue to support relative performance.
Growth of a Hypothetical
$10,000 Investment—Class N
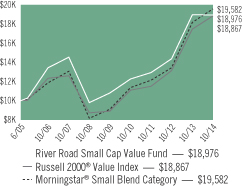
All dividends and capital gains are reinvested. Indexes are unmanaged and do not take into account fees, expenses or other costs.
Returns shown in the chart and table do not reflect taxes that a shareholder would pay on Fund distributions or on the sale of the Fund shares.
Small-cap and mid-cap stocks may be subject to a higher degree of market risk than the securities of more established companies because they tend to be more volatile and less liquid.
Value investing involves the risk that a Fund’s investments in companies believed to be undervalued will not appreciate as anticipated.
RETURNSFOR PERIOD ENDED 10/31/14
Average Annual Total Returns - Class N
| | | | |
One Year | | | -0.05 | % |
Five Year | | | 11.93 | % |
Since Inception | | | 7.09 | % |
Inception Date 06/28/05
Average Annual Total Returns - Class I
| | | | |
One Year | | | 0.16 | % |
Five Year | | | 12.19 | % |
Since Inception | | | 4.15 | % |
Inception Date 12/13/06
The performance data quoted represents past performance. Past performance does not guarantee future results. Investment return and principal value will fluctuate so that an investor’s shares, upon redemption, may be worth more or less than their original cost. Current performance may be lower or higher than the performance data quoted. For performance data current to the most recent month-end, please visit our website at www.astonfunds.com.
| | |
| |
| ASTON/River Road Small Cap Value Fund | | October 31, 2014 |
| |
| Schedule of Investments | | |
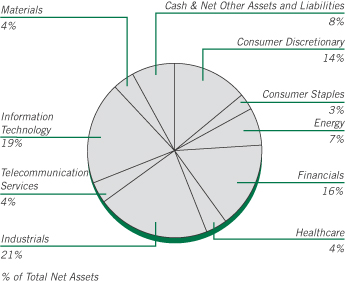
| | | | | | | | |
Shares | | | | | Market
Value | |
| | | | | | | | |
|
| | COMMON STOCKS – 92.24% | |
| | |
| | | | Consumer Discretionary – 14.44% | | | | |
| | 83,750 | | | Abercrombie & Fitch, Class A | | $ | 2,803,950 | |
| | 386,428 | | | Ascena Retail Group * | | | 4,811,029 | |
| | 85,984 | | | Ascent Capital Group, Class A * | | | 5,528,771 | |
| | 59,940 | | | Bob Evans Farms | | | 2,928,069 | |
| | 84,410 | | | Children’s Place Retail Stores | | | 4,157,192 | |
| | 288,160 | | | Francesca’s Holdings * | | | 3,431,986 | |
| | 182,010 | | | International Speedway, Class A | | | 5,702,373 | |
| | 233,552 | | | Monarch Casino & Resort * (a) | | | 3,799,891 | |
| | 84,170 | | | Outerwall * | | | 5,325,436 | |
| | 115,640 | | | Remy International | | | 2,137,027 | |
| | 153,000 | | | Stage Stores | | | 2,581,110 | |
| | | | | | | | |
| | | | | | | 43,206,834 | |
| | | | | | | | |
| | |
| | | | Consumer Staples – 3.14% | | | | |
| | 193,369 | | | Ingles Markets, Class A | | | 5,201,626 | |
| | 151,311 | | | Village Super Market, Class A (a) | | | 4,198,880 | |
| | | | | | | | |
| | | | | | | 9,400,506 | |
| | | | | | | | |
| | |
| | | | Energy – 6.54% | | | | |
| | 591,983 | | | Evolution Petroleum (a) | | | 5,600,159 | |
| | 682,488 | | | Miller Energy Resources * (a) | | | 2,375,058 | |
| | 118,141 | | | Nuverra Environmental Solutions * | | | 1,118,795 | |
| | 166,040 | | | Ocean Rig UDW (Cyprus) | | | 2,283,050 | |
| | 100,063 | | | PHI * | | | 4,476,819 | |
| | 390,439 | | | TETRA Technologies * | | | 3,720,884 | |
| | | | | | | | |
| | | | | | | 19,574,765 | |
| | | | | | | | |
| | |
| | | | Financials – 15.90% | | | | |
| | 83,970 | | | 1st Source | | | 2,627,421 | |
| | 152,784 | | | Capital Southwest | | | 5,601,061 | |
| | 132,473 | | | Dime Community Bancshares | | | 2,086,450 | |
| | 12,655 | | | First Citizens BancShares, Class A | | | 3,179,063 | |
| | | | | | | | |
Shares | | | | | Market
Value | |
| | | | | | | | |
| | |
| | | | Financials (continued) | | | | |
| | 485,430 | | | FNFV Group * | | $ | 6,524,179 | |
| | 78,195 | | | Geo Group, REIT | | | 3,123,108 | |
| | 166,120 | | | Hilltop Holdings * | | | 3,659,624 | |
| | 44,227 | | | Navigators Group * | | | 3,011,416 | |
| | 239,475 | | | PICO Holdings * | | | 5,292,398 | |
| | 100,900 | | | Walter Investment Management | | | 2,292,448 | |
| | 16,268 | | | White Mountains Insurance Group (Bermuda) | | | 10,166,199 | |
| | | | | | | | |
| | | | | | | 47,563,367 | |
| | | | | | | | |
| | |
| | | | Healthcare – 4.01% | | | | |
| | 171,648 | | | Myriad Genetics * | | | 6,778,380 | |
| | 156,770 | | | Owens & Minor | | | 5,223,576 | |
| | | | | | | | |
| | | | | | | 12,001,956 | |
| | | | | | | | |
| | |
| | | | Industrials – 20.71% | | | | |
| | 585,739 | | | Air Transport Services Group * | | | 4,791,345 | |
| | 234,984 | | | Brink’s | | | 4,934,664 | |
| | 41,809 | | | Clean Harbors * | | | 2,074,981 | |
| | 111,137 | | | Cubic | | | 5,361,249 | |
| | 46,300 | | | Forward Air | | | 2,216,381 | |
| | 209,047 | | | GenCorp * | | | 3,545,437 | |
| | 152,718 | | | Insperity | | | 4,819,780 | |
| | 259,986 | | | Marten Transport | | | 5,100,925 | |
| | 198,600 | | | Progressive Waste Solutions (Canada) | | | 5,805,078 | |
| | 270,779 | | | SP Plus * | | | 5,908,398 | |
| | 81,136 | | | UniFirst | | | 9,051,532 | |
| | 301,890 | | | UTI Worldwide (British Virgin Islands) * | | | 3,299,658 | |
| | 183,930 | | | Werner Enterprises | | | 5,065,432 | |
| | | | | | | | |
| | | | | | | 61,974,860 | |
| | | | | | | | |
| | |
| | | | Information Technology – 19.13% | | | | |
| | 274,610 | | | Blackhawk Network Holdings * | | | 9,171,974 | |
| | 136,555 | | | Computer Services (a) | | | 5,598,755 | |
| | 319,780 | | | Convergys | | | 6,449,963 | |
| | 326,350 | | | CSG Systems International | | | 8,651,539 | |
| | 21,374 | | | DST Systems | | | 2,059,385 | |
| | 179,813 | | | Electro Rent | | | 2,740,350 | |
| | 49,788 | | | ePlus Inc. * | | | 3,040,553 | |
| | 108,040 | | | Knowles * | | | 2,102,458 | |
| | 201,460 | | | NeuStar, Class A * | | | 5,320,559 | |
| | 320,290 | | | Rovi * | | | 6,687,655 | |
| | 251,183 | | | Sykes Enterprises * | | | 5,410,482 | |
| | | | | | | | |
| | | | | | | 57,233,673 | |
| | | | | | | | |
| | |
| | | | Materials – 3.94% | | | | |
| | 195,470 | | | American Vanguard | | | 2,255,724 | |
| | 181,410 | | | Kraton Performance Polymers * | | | 3,245,425 | |
| | 229,910 | | | Myers Industries | | | 3,434,855 | |
| | 99,860 | | | Rayonier Advanced Materials | | | 2,849,006 | |
| | | | | | | | |
| | | | | | | 11,785,010 | |
| | | | | | | | |
| | |
| | | | Telecommunication Services – 4.43% | | | | |
| | 68,970 | | | Atlantic Tele-Network | | | 4,634,094 | |
| | 215,191 | | | NTELOS Holdings | | | 2,169,125 | |
See accompanying Notes to Financial Statements.
| | |
| |
| ASTON/River Road Small Cap Value Fund | | October 31, 2014 |
| |
| Schedule of Investments – continued | | |
| | | | | | | | |
Shares | | | | | Market
Value | |
| | | | | | | | |
| | |
| | | | Telecommunication Services (continued) | | | | |
| | 252,160 | | | Telephone & Data Systems | | $ | 6,465,382 | |
| | | | | | | | |
| | | | | | | 13,268,601 | |
| | | | | | | | |
| | |
| | | | Total Common Stocks
(Cost $237,467,239) | | | 276,009,572 | |
| | | | | | | | |
|
| | INVESTMENT COMPANY – 7.61% | |
| | |
| | 22,754,928 | | | BlackRock Liquidity Funds TempFund Portfolio | | | 22,754,928 | |
| | | | | | | | |
| | |
| | | | Total Investment Company
(Cost $22,754,928) | | | 22,754,928 | |
| | | | | | | | |
| Total Investments – 99.85%
(Cost $260,222,167)** | | | 298,764,500 | |
| | | | | | | | |
| Net Other Assets and Liabilities – 0.15% | | | 456,837 | |
| | | | | | | | |
| Net Assets – 100.00% | | $ | 299,221,337 | |
| | | | | | | | |
| * | | Non-income producing security. |
| ** | | Aggregate cost for Federal income tax purposes is $262,516,430. |
| | | | |
Gross unrealized appreciation | | $ | 51,621,116 | |
Gross unrealized depreciation | | | (15,373,046 | ) |
| | | | |
Net unrealized appreciation | | $ | 36,248,070 | |
| | | | |
| (a) | | These securities have been determined by the Subadviser to be illiquid securities. At October 31, 2014, these securities amounted to $21,572,743 or 7.21% of net assets. |
| REIT | | Real Estate Investment Trust |
See accompanying Notes to Financial Statements.
ASTON/Silvercrest Small Cap Fund
| | |
| |
| Portfolio Manager Commentary (unaudited) | | October 31, 2014 |
| | Roger W. Vogel, CFA |
| Q. | What were the most significant market factors affecting Fund performance and returns relative to the benchmark during the past 12 months? |
| A. | Our sharp underweighting in Financials (23% vs. 40%) and within the sector, Real Estate Investment Trusts (REITs), had the largest negative impact on our performance relative to the Russell 2000 Value Index. While underweighted, however, our stock selection within Financials was superior to the benchmark sector return. Our stocks outperformed in six of the nine Russell sectors, led by Producer Durables, which enabled us to overcome our small sector allocation underperformance to best the Russell 2000 Value Index over the past twelve months. |
| Q. | What were the best performing holdings for the Fund during the period? |
| A. | The largest contributors to return included U.S. Ecology (+44%), Pebblebrook Hotel Trust (+45%), Standex International (+54%), STERIS Corp. (+39%), and Lithia Motors (+25%). All tended to report earnings above expectations. |
| Q. | What were the weakest performing holdings? |
| A. | The worst contributors to return included Rosetta Resources (-37%), ReachLocal Inc. (-50%), Analogic Corp. (-21%), H.B. Fuller (-14%), and Beacon Roofing Supply (-22%). All tended to have disappointing fundamental results. We eliminated all except for Analogic Corp. |
| Q. | How was the Fund positioned as of October 31, 2014? |
| A. | Our portfolio is selling at about 18x estimated next twelve month earnings per share estimates, a fair valuation given the current level of interest rates and inflation. Balance sheets in general are in great shape, and companies seem to be more willing to pursue mergers and acquisitions and encouragingly, in many cases the acquirers are seeing their share prices rise. In our dialogues with company managements, it does appear that Europe has taken a step back recently, while the U.S. continues to slowly improve. China remains a wildcard, but sentiment seems mostly negative over the near term. A stronger United States economy and dollar should favor the greater U.S. orientation of small cap companies. We remain overweighted in the more economically sensitive areas of the market. |
We remain constructive on our portfolio, and with balance sheets strong, cash generation solid, and a more fertile environment for deals, we continue to find opportunities to invest in some quality franchises available at reasonable valuations.
Note: Earnings per share is the portion of a company’s profit allocated to each outstanding share of common stock.
Growth of a Hypothetical
$10,000 Investment—Class N
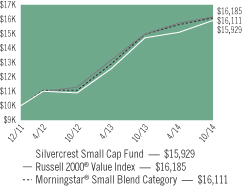
All dividends and capital gains are reinvested. Indexes are unmanaged and do not take into account fees, expenses or other costs.
Returns shown in the chart and table do not reflect taxes that a shareholder would pay on Fund distributions or on the sale of the Fund shares.
Small-cap stocks may be subject to a higher degree of market risk than the securities of more established companies because they tend to be more volatile and less liquid.
RETURNSFOR PERIOD ENDED 10/31/14
Average Annual Total Returns - Class N
| | | | |
One Year | | | 8.18 | % |
Since Inception | | | 17.75 | % |
Inception Date 12/27/11
Average Annual Total Returns - Class I
| | | | |
One Year | | | 8.47 | % |
Since Inception | | | 18.07 | % |
Inception Date 12/27/11
The performance data quoted represents past performance. Past performance does not guarantee future results. Investment return and principal value will fluctuate so that an investor’s shares, upon redemption, may be worth more or less than their original cost. Current performance may be lower or higher than the performance data quoted. For performance data current to the most recent month-end, please visit our website at www.astonfunds.com.
The performance quoted would have been lower if fee waivers and/or expense reimbursements had not been in effect.
| | |
| |
| ASTON/Silvercrest Small Cap Fund | | October 31, 2014 |
| |
| Schedule of Investments | | |
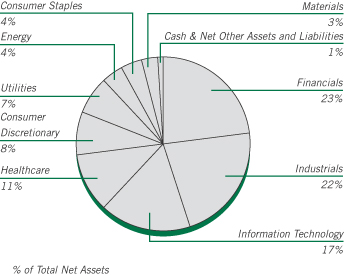
| | | | | | | | |
Shares | | | | | Market
Value | |
|
| | COMMON STOCKS – 98.77% | |
| | |
| | | | Consumer Discretionary – 7.91% | | | | |
| | 52,470 | | | EW Scripps, Class A * | | $ | 1,007,424 | |
| | 43,540 | | | Hillenbrand | | | 1,449,447 | |
| | 56,500 | | | La-Z-Boy | | | 1,291,590 | |
| | 10,750 | | | Lithia Motors, Class A | | | 834,415 | |
| | 31,940 | | | Wolverine World Wide | | | 866,852 | |
| | | | | | | | |
| | | | | | | 5,449,728 | |
| | | | | | | | |
| | |
| | | | Consumer Staples – 4.07% | | | | |
| | 12,324 | | | J & J Snack Foods | | | 1,269,742 | |
| | 16,774 | | | Lancaster Colony | | | 1,534,653 | |
| | | | | | | | |
| | | | | | | 2,804,395 | |
| | | | | | | | |
| | |
| | | | Energy – 4.47% | | | | |
| | 20,650 | | | Bonanza Creek Energy * | | | 934,206 | |
| | 42,660 | | | Forum Energy Technologies * | | | 1,164,618 | |
| | 40,430 | | | Matador Resources * | | | 981,236 | |
| | | | | | | | |
| | | | | | | 3,080,060 | |
| | | | | | | | |
| | |
| | | | Financials – 23.26% | | | | |
| | 44,940 | | | BancorpSouth | | | 1,034,968 | |
| | 40,100 | | | Bank of the Ozarks | | | 1,413,124 | |
| | 80,170 | | | CVB Financial | | | 1,265,083 | |
| | 23,778 | | | EastGroup Properties, REIT | | | 1,637,353 | |
| | 59,394 | | | Horace Mann Educators | | | 1,806,172 | |
| | 16,469 | | | Iberiabank | | | 1,134,055 | |
| | 41,353 | | | Independent Bank/Rockland MA | | | 1,687,202 | |
| | 13,244 | | | Mid-America Apartment Communities, REIT | | | 935,821 | |
| | 28,350 | | | PacWest Bancorp | | | 1,209,411 | |
| | 43,830 | | | Pebblebrook Hotel Trust, REIT | | | 1,867,158 | |
| | 70,872 | | | Physicians Realty Trust, REIT | | | 1,087,176 | |
| | 19,870 | | | Stifel Financial * | | | 944,024 | |
| | | | | | | | |
| | | | | | | 16,021,547 | |
| | | | | | | | |
| | | | | | | | |
Shares | | | | | Market
Value | |
| | |
| | | | Healthcare – 10.60% | | | | |
| | 16,717 | | | Analogic | | $ | 1,219,338 | |
| | 43,180 | | | Cambrex * | | | 910,234 | |
| | 24,420 | | | Greatbatch * | | | 1,225,640 | |
| | 20,994 | | | ICU Medical * | | | 1,488,475 | |
| | 24,770 | | | Integra LifeSciences Holdings * | | | 1,265,995 | |
| | 19,260 | | | STERIS | | | 1,190,268 | |
| | | | | | | | |
| | | | | | | 7,299,950 | |
| | | | | | | | |
| | |
| | | | Industrials – 21.68% | | | | |
| | 40,365 | | | Altra Holdings | | | 1,272,305 | |
| | 22,103 | | | Applied Industrial Technologies | | | 1,078,847 | |
| | 113,470 | | | CBIZ * | | | 1,047,328 | |
| | 14,900 | | | CIRCOR International | | | 1,119,735 | |
| | 29,726 | | | EMCOR Group | | | 1,311,808 | |
| | 64,590 | | | Knoll | | | 1,284,695 | |
| | 23,279 | | | MSA Safety | | | 1,337,844 | |
| | 13,530 | | | Standex International | | | 1,166,963 | |
| | 29,490 | | | United Stationers | | | 1,231,797 | |
| | 38,319 | | | US Ecology | | | 1,926,679 | |
| | 20,730 | | | Watts Water Technologies, Class A | | | 1,256,860 | |
| | 50,520 | | | Wesco Aircraft Holdings * | | | 896,730 | |
| | | | | | | | |
| | | | | | | 14,931,591 | |
| | | | | | | | |
| | |
| | | | Information Technology – 16.67% | | | | |
| | 71,697 | | | ACI Worldwide * | | | 1,379,450 | |
| | 100,850 | | | Entegris * | | | 1,369,543 | |
| | 10,557 | | | FEI | | | 889,744 | |
| | 21,990 | | | Itron * | | | 856,071 | |
| | 17,835 | | | Littelfuse | | | 1,739,626 | |
| | 68,610 | | | M/A-COM Technology Solutions Holdings * | | | 1,508,734 | |
| | 53,871 | | | Mentor Graphics | | | 1,141,526 | |
| | 38,955 | | | MKS Instruments | | | 1,417,962 | |
| | 87,560 | | | Vishay Intertechnology | | | 1,182,936 | |
| | | | | | | | |
| | | | | | | 11,485,592 | |
| | | | | | | | |
| | |
| | | | Materials – 3.45% | | | | |
| | 54,313 | | | PH Glatfelter | | | 1,370,317 | |
| | 17,029 | | | Sensient Technologies | | | 1,007,776 | |
| | | | | | | | |
| | | | | | | 2,378,093 | |
| | | | | | | | |
| | |
| | | | Utilities – 6.66% | | | | |
| | 29,193 | | | MGE Energy | | | 1,298,213 | |
| | 27,980 | | | ONE Gas | | | 1,061,841 | |
| | 24,809 | | | Portland General Electric | | | 903,296 | |
| | 32,223 | | | UIL Holdings | | | 1,325,654 | |
| | | | | | | | |
| | | | | | | 4,589,004 | |
| | | | | | | | |
| | |
| | | | Total Common Stocks
(Cost $61,073,377) | | | 68,039,960 | |
| | | | | | | | |
See accompanying Notes to Financial Statements.
| | |
| |
| ASTON/Silvercrest Small Cap Fund | | October 31, 2014 |
| |
| Schedule of Investments – continued | | |
| | | | | | | | |
Shares | | | | | Market
Value | |
|
| | INVESTMENT COMPANY – 2.67% | |
| | 1,840,323 | | | BlackRock Liquidity Funds
TempCash Portfolio | | $ | 1,840,323 | |
| | | | | | | | |
| | |
| | | | Total Investment Company
(Cost $1,840,323) | | | 1,840,323 | |
| | | | | | | | |
| Total Investments – 101.44%
(Cost $62,913,700)** | | | 69,880,283 | |
| | | | | | | | |
| Net Other Assets and Liabilities – (1.44)% | | | (992,149 | ) |
| | | | | | | | |
| Net Assets – 100.00% | | $ | 68,888,134 | |
| | | | | | | | |
| * | | Non-income producing security. |
| ** | | Aggregate cost for Federal income tax purposes is $62,928,337. |
| | | | |
Gross unrealized appreciation | | $ | 7,465,087 | |
Gross unrealized depreciation | | | (513,141 | ) |
| | | | |
Net unrealized appreciation | | $ | 6,951,946 | |
| | | | |
| REIT | | Real Estate Investment Trust |
See accompanying Notes to Financial Statements.
ASTON/TAMRO Small Cap Fund
| | |
| |
| Portfolio Manager Commentary (unaudited) | | October 31, 2014 |
Philip D. Tasho, CFA & Timothy A. Holland, CFA
| Q. | What were the most significant market factors affecting Fund performance and returns relative to the benchmark during the past 12 months? |
| A. | The pattern we saw develop in fiscal year 2013 of more speculative, less profitable, higher beta companies outdistancing the small cap universe continued into fiscal year 2014. Our belief is the Federal Reserve’s unprecedented open ended Quantitative Easing program drove a torrent of liquidity into the extreme ends of the market. Given the Fund’s focus on owning high quality, best-in-class companies, keeping pace with the benchmark Russell 2000 Index in this type of environment proved difficult. While disappointed with the Fund’s relative performance of late, we remain committed to our time-tested investment philosophy and process and believe, as always, that quality companies shine through over the long term. Encouragingly, we began to see an improvement in performance as the end of Quantitative Easing drew near. Today, the Fund holds companies that are nearly twice as profitable and much less levered than the Russell 2000 Index. We are confident these types of companies will find favor with investors as we enter a period of more normalized monetary policy and our economy continues its slow and steady recovery. |
| Q. | What were the best performing holdings for the Fund during the period? |
| A. | The three holdings that contributed the most to performance during the year were DexCom, Bank of the Ozarks and OpenTable. DexCom delivered strong sales growth and received FDA approval of the company’s continuous glucose monitoring technology for pediatric Type 1 diabetics. Operating in Arkansas, eastern Texas and the Southeast, Bank of the Ozarks benefitted from robust organic loan growth and strategic acquisitions. OpenTable, the online dining reservation company, was acquired by Priceline for $103 a share, a healthy premium to our average purchase price. |
| Q. | What were the weakest performing holdings? |
| A. | Quiksilver, CommVault Systems and Francesca’s Holdings were the biggest detractors from portfolio performance during the year. Apparel retailer Quiksilver saw increased competitive pressure, which led to price reductions and sales and earnings coming in below expectations. Slowing growth impacted CommVault, a data integration and management software company. Weak customer traffic and merchandising miscues drove disappointing results at Francesca’s. |
| Q. | How was the Fund positioned as of October 31, 2014? |
| A. | Our investment process focuses on individual, bottom-up stock selection to identify companies that we believe possess a sustainable competitive advantage and are attractively valued. These companies also fit into one of three fundamental categories: Leaders, Laggards and Innovators. Our approach to portfolio management is opportunistic and broadly diversified, with sector weights determined by where we see opportunities at the stock level. As investors recently embraced more speculative companies and shunned higher quality stocks, we remained true to the TAMRO mantra of “buy the best when they’re depressed.” This effort has led to Leaders representing more of the portfolio than at any point in the Fund’s 14-year history, and a much stronger financial profile for the Fund relative to the benchmark. For most of calendar 2014 small cap stocks have been out of favor. Our experience tells us that a high quality portfolio in a universe that is out of vogue has a high possibility of success in the future. We are increasingly confident in the renaissance of small cap stocks and our strategy in particular. |
Note: Beta is a measure of the volatility, or systematic risk, of a security in comparison to market as a whole.
Growth of a Hypothetical
$10,000 Investment—Class N
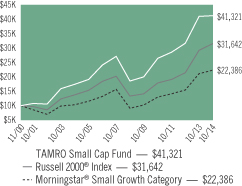
All dividends and capital gains are reinvested. Indexes are unmanaged and do not take into account fees, expenses or other costs.
Returns shown in the chart and table do not reflect taxes that a shareholder would pay on Fund distributions or on the sale of the Fund shares.
Small-cap and mid-cap stocks may be subject to a higher degree of market risk than the securities of more established companies because they tend to be more volatile and less liquid.
RETURNSFOR PERIOD ENDED 10/31/14
Average Annual Total Returns - Class N
| | | | |
One Year | | | 0.57 | % |
Five Year | | | 15.59 | % |
Ten Year | | | 8.95 | % |
Since Inception | | | 10.73 | % |
Inception Date 11/30/00
Average Annual Total Returns - Class I
| | | | |
One Year | | | 0.86 | % |
Five Year | | | 15.88 | % |
Since Inception | | | 8.65 | % |
Inception Date 01/04/05
The performance data quoted represents past performance. Past performance does not guarantee future results. Investment return and principal value will fluctuate so that an investor’s shares, upon redemption, may be worth more or less than their original cost. Current performance may be lower or higher than the performance data quoted. For performance data current to the most recent month-end, please visit our website at www.astonfunds.com.
The total expense ratios for Class N and Class I shares are 1.31% and 1.06% respectively, as disclosed in the prospectus dated February 28, 2014. Please refer to the Financial Highlights section in this report for more information.
| | |
| |
| ASTON/TAMRO Small Cap Fund | | October 31, 2014 |
| |
| Schedule of Investments | | |
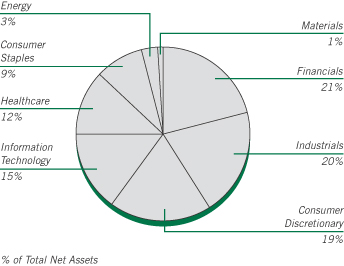
| | | | | | | | |
Shares | | | | | Market
Value | |
|
| | COMMON STOCKS – 100.77% | |
| | |
| | | | Consumer Discretionary – 18.71% | | | | |
| | 212,502 | | | Dorman Products * | | $ | 9,851,593 | |
| | 384,503 | | | Five Below * | | | 15,330,135 | |
| | 447,236 | | | Grand Canyon Education * | | | 21,422,604 | |
| | 370,377 | | | Iconix Brand Group * | | | 14,818,784 | |
| | 348,617 | | | Monro Muffler Brake | | | 18,630,092 | |
| | 288,536 | | | Pool | | | 17,225,599 | |
| | 290,011 | | | Red Robin Gourmet Burgers * | | | 15,941,905 | |
| | 346,471 | | | Steven Madden * | | | 10,861,866 | |
| | 228,789 | | | Strayer Education * | | | 16,745,067 | |
| | 538,160 | | | Texas Roadhouse | | | 15,536,679 | |
| | | | | | | | |
| | | | | | | 156,364,324 | |
| | | | | | | | |
| | |
| | | | Consumer Staples – 9.25% | | | | |
| | 247,515 | | | Nu Skin Enterprises, Class A | | | 13,076,217 | |
| | 133,847 | | | Sanderson Farms | | | 11,240,471 | |
| | 439,786 | | | Tootsie Roll Industries (a) | | | 13,039,655 | |
| | 199,430 | | | TreeHouse Foods * | | | 16,985,453 | |
| | 337,870 | | | United Natural Foods * | | | 22,981,917 | |
| | | | | | | | |
| | | | | | | 77,323,713 | |
| | | | | | | | |
| | |
| | | | Energy – 3.63% | | | | |
| | 245,719 | | | Carrizo Oil & Gas * | | | 12,762,645 | |
| | 110,403 | | | SEACOR Holdings * | | | 9,102,727 | |
| | 175,951 | | | Unit * | | | 8,519,547 | |
| | | | | | | | |
| | | | | | | 30,384,919 | |
| | | | | | | | |
| | |
| | | | Financials – 20.67% | | | | |
| | 695,353 | | | Bank of the Ozarks | | | 24,504,240 | |
| | 218,154 | | | BofI Holding * | | | 16,802,221 | |
| | 365,769 | | | Colony Financial, REIT | | | 8,149,333 | |
| | 295,686 | | | First Cash Financial Services * | | | 17,469,129 | |
| | 203,352 | | | First Financial Bankshares | | | 6,462,526 | |
| | 216,544 | | | Geo Group, REIT | | | 8,648,767 | |
| | | | | | | | |
Shares | | | | | Market
Value | |
| | |
| | | | Financials (continued) | | | | |
| | 647,791 | | | Glacier Bancorp | | $ | 18,585,124 | |
| | 221,284 | | | Greenhill | | | 9,957,780 | |
| | 274,559 | | | Hanover Insurance Group | | | 18,378,979 | |
| | 442,268 | | | LaSalle Hotel Properties, REIT | | | 17,341,328 | |
| | 373,585 | | | Stifel Financial * | | | 17,749,023 | |
| | 122,098 | | | World Acceptance * | | | 8,749,543 | |
| | | | | | | | |
| | | | | | | 172,797,993 | |
| | | | | | | | |
| | |
| | | | Healthcare – 11.74% | | | | |
| | 810,394 | | | Bruker * | | | 16,799,468 | |
| | 367,485 | | | Cepheid * | | | 19,480,380 | |
| | 96,251 | | | Clovis Oncology * | | | 5,742,335 | |
| | 459,990 | | | DexCom * | | | 20,676,551 | |
| | 840,627 | | | HMS Holdings * | | | 19,527,765 | |
| | 58,824 | | | ICU Medical * | | | 4,170,622 | |
| | 69,050 | | | MWI Veterinary Supply * | | | 11,714,678 | |
| | | | | | | | |
| | | | | | | 98,111,799 | |
| | | | | | | | |
| | |
| | | | Industrials – 19.86% | | | | |
| | 325,337 | | | Advisory Board * | | | 17,460,837 | |
| | 196,107 | | | Applied Industrial Technologies | | | 9,571,983 | |
| | 357,116 | | | Barnes Group | | | 13,056,161 | |
| | 199,474 | | | Corporate Executive Board | | | 14,701,234 | |
| | 325,006 | | | Franklin Electric | | | 12,135,724 | |
| | 813,868 | | | Hawaiian Holdings * | | | 14,112,471 | |
| | 391,178 | | | Healthcare Services Group | | | 11,649,281 | |
| | 225,321 | | | Landstar System | | | 16,676,007 | |
| | 275,659 | | | Polypore International * | | | 12,106,943 | |
| | 199,494 | | | Proto Labs * | | | 13,040,923 | |
| | 218,481 | | | Simpson Manufacturing | | | 7,227,351 | |
| | 181,507 | | | Team * | | | 7,648,705 | |
| | 671,291 | | | TrueBlue * | | | 16,594,313 | |
| | | | | | | | |
| | | | | | | 165,981,933 | |
| | | | | | | | |
| | |
| | | | Information Technology – 15.59% | | | | |
| | 478,466 | | | Cardtronics * | | | 18,368,310 | |
| | 117,636 | | | Cavium * | | | 6,035,903 | |
| | 248,397 | | | CommVault Systems * | | | 11,013,923 | |
| | 49,959 | | | Interactive Intelligence Group * | | | 2,411,021 | |
| | 508,569 | | | Manhattan Associates * | | | 20,398,703 | |
| | 352,152 | | | Solarwinds * | | | 16,744,828 | |
| | 258,971 | | | Synaptics * | | | 17,721,386 | |
| | 188,660 | | | Tyler Technologies * | | | 21,114,827 | |
| | 444,060 | | | VeriFone Systems * | | | 16,545,676 | |
| | | | | | | | |
| | | | | | | 130,354,577 | |
| | | | | | | | |
| | |
| | | | Materials – 1.32% | | | | |
| | 170,279 | | | Balchem * | | | 11,017,051 | |
| | | | | | | | |
| | |
| | | | Total Common Stocks
(Cost $600,286,428) | | | 842,336,309 | |
| | | | | | | | |
See accompanying Notes to Financial Statements.
| | |
| |
| ASTON/TAMRO Small Cap Fund | | October 31, 2014 |
| |
| Schedule of Investments – continued | | |
| | | | | | | | |
Shares | | | | | Market
Value | |
|
| | INVESTMENT COMPANY – 0.80% | |
| | 6,697,362 | | | BlackRock Liquidity Funds
TempCash Portfolio | | $ | 6,697,362 | |
| | | | | | | | |
| | |
| | | | Total Investment Company
(Cost $6,697,362) | | | 6,697,362 | |
| | | | | | | | |
| Total Investments – 101.57%
(Cost $606,983,790)** | | | 849,033,671 | |
| | | | | | | | |
| Net Other Assets and Liabilities – (1.57)% | | | (13,164,915 | ) |
| | | | | | | | |
| Net Assets – 100.00% | | $ | 835,868,756 | |
| | | | | | | | |
| * | | Non-income producing security. |
| ** | | Aggregate cost for Federal income tax purposes is $613,759,877. |
| | | | |
Gross unrealized appreciation | | $ | 248,672,458 | |
Gross unrealized depreciation | | | (13,398,664 | ) |
| | | | |
Net unrealized appreciation | | $ | 235,273,794 | |
| | | | |
| (a) | | This security has been determined by the Subadviser to be an illiquid security. At October 31, 2014, this security amounted to $13,039,655 or 1.56% of net assets. |
| REIT | | Real Estate Investment Trust |
See accompanying Notes to Financial Statements.
ASTON/DoubleLine Core Plus Fixed Income Fund
| | |
| |
| Portfolio Manager Commentary (unaudited) | | October 31, 2014 |
Jeffrey E. Gundlach; Philip A. Barach; Bonnie Baha, CFA & Luz M. Padilla
| Q. | What were the most significant market factors affecting Fund performance and returns relative to the benchmark during the past 12 months? |
| A. | The Fund outperformed the Barclays Capital U.S. Aggregate Bond Index’s return of 4.14% over the twelve months ending October 31, 2014. The outperformance was driven by both sector allocation amongst the varying sectors of the fixed income market as well as security selection within each of the respective sectors. The U.S. Treasury curve flattened over the period with the longer end of the curve declining, intermediate rates increasing meaningfully and the shorter end only mildly increasing. Longer duration assets generally outperformed shorter duration counterparts with non-benchmark sectors, such as Emerging Market Fixed Income leading the outperformance. Agency Mortgage-Backed Securities (MBS) also contributed strong returns to the Fund as Collateralized Mortgage Obligations (CMOs), which constitutes a majority of the Agency MBS exposure within the Fund, performing well due to the longer duration of the securities. While still adding positive returns, Collateralized Loan Obligations (CLO) and Bank Loan debt lagged behind other sectors of the Fund which dampened portfolio performance. These two sectors, however, offer floating rate exposure to the Fund. The Fund’s overweight in Commercial Mortgage-Backed Securities (CMBS) and MBS continued to enhance returns. |
| Q. | What were the best performing holdings for the Fund during the period? |
| A. | U.S. dollar denominated Emerging Market Fixed Income performed the best over the period, as well as Agency Residential Mortgage-Backed Securities (RMBS) and High Yield. Longer duration sectors generally performed better than shorter duration sectors. |
| Q. | What were the weakest performing holdings? |
| A. | Shorter duration sectors, such as CLO and Bank Loans, performed the worst during the period. Heavy new issuance and low London Interbank Offered Rates (LIBOR) have put downward pressures on these sectors from a valuation standpoint. |
| Q. | How was the Fund positioned as of October 31, 2014? |
| A. | Over the last twelve month period, the Fund decreased its exposure to Investment Grade Corporate debt and Non-Agency RMBS, while it increased exposure to Agency MBS, Treasuries, CLO, CMBS and High Yield. The Fund remains underweight U.S. Corporate debt, MBS and Treasuries versus the Index. |
Growth of a Hypothetical
$10,000 Investment—Class N
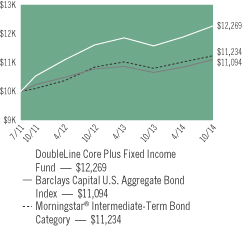
All dividends and capital gains are reinvested. Indexes are unmanaged and do not take into account fees, expenses or other costs.
Returns shown in the chart and table do not reflect taxes that a shareholder would pay on Fund distributions or on the sale of the Fund shares.
Bond funds have the same interest rate, high yield and credit risks associated with the underlying bonds in the portfolio, all of which could reduce the Fund’s value. As interest rates rise, the value of the Fund can decline and an investor can lose principal.
RETURNSFOR PERIOD ENDED 10/31/14
Average Annual Total Returns - Class N
| | | | |
One Year | | | 5.96 | % |
Since Inception | | | 6.41 | % |
Inception Date 07/18/11
Average Annual Total Returns - Class I
| | | | |
One Year | | | 6.22 | % |
Since Inception | | | 6.68 | % |
Inception Date 07/18/11
The performance data quoted represents past performance. Past performance does not guarantee future results. Investment return and principal value will fluctuate so that an investor’s shares, upon redemption, may be worth more or less than their original cost. Current performance may be lower or higher than the performance data quoted. For performance data current to the most recent month-end, please visit our website at www.astonfunds.com.
The performance quoted would have been lower if fee waivers and/or expense reimbursements had not been in effect.
| | |
| |
| ASTON/DoubleLine Core Plus Fixed Income Fund | | October 31, 2014 |
| |
| Schedule of Investments | | |
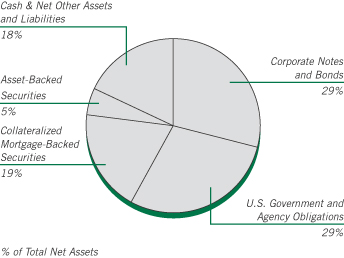
At October 31, 2014, 24.56% of the Total Net Assets of the Fund were comprised of securities of issuers located outside the United States.
| | | | | | | | |
Par Value | | | | | Market
Value | |
| | | | | | | | |
|
| | CORPORATE NOTES AND BONDS – 28.89% | |
| | | | Consumer Discretionary – 1.44% | | | | |
| | $ 90,000 | | | American Axle & Manufacturing
6.625%, 10/15/22 | | $ | 96,525 | |
| | 140,000 | | | Cinemark USA
7.375%, 06/15/21 | | | 150,850 | |
| | 105,000 | | | DIRECTV Holdings
4.450%, 04/01/24 | | | 109,715 | |
| | 150,000 | | | Ford Motor
Senior Unsecured Notes
7.450%, 07/16/31 | | | 201,429 | |
| | 155,000 | | | Goodyear Tire & Rubber
7.000%, 05/15/22 | | | 169,337 | |
| | 120,000 | | | Gray Television
7.500%, 10/01/20 | | | 126,150 | |
| | 600,000 | | | Grupo Idesa SA de CV (Mexico)
7.875%, 12/18/20 (a) | | | 648,000 | |
| | 50,000 | | | InRetail Shopping Malls (Peru)
6.500%, 07/09/21 (a) | | | 53,500 | |
| | 250,000 | | | 6.500%, 07/09/21 | | | 267,500 | |
| | 135,000 | | | Macy’s Retail Holdings
2.875%, 02/15/23 | | | 129,633 | |
| | 80,000 | | | Mattel
Senior Unsecured Notes
2.500%, 11/01/16 | | | 82,204 | |
| | 155,000 | | | MGM Resorts International
6.625%, 12/15/21 | | | 170,500 | |
| | 100,000 | | | NCL (Bermuda)
5.000%, 02/15/18 | | | 100,500 | |
| | 150,000 | | | Regal Entertainment Group
Senior Unsecured Notes
5.750%, 03/15/22 | | | 147,375 | |
| | | | | | | | |
| | | | | | | | |
Par Value | | | | | Market
Value | |
| | |
| | | | Consumer Discretionary (continued) | | | | |
| | $ 85,000 | | | Sally Holdings
5.750%, 06/01/22 | | $ | 90,950 | |
| | 100,000 | | | Smithfield Foods
Senior Unsecured Notes
5.875%, 08/01/21 (a) | | | 106,250 | |
| | 115,000 | | | Teva Pharmaceutical Finance Co BV (Cook Islands)
2.950%, 12/18/22 | | | 111,669 | |
| | 145,000 | | | Viking Cruises (Bermuda)
Senior Unsecured Notes
8.500%, 10/15/22 (a) | | | 157,688 | |
| | 65,000 | | | Wynn Las Vegas
Senior Unsecured Notes
7.750%, 08/15/20 | | | 70,200 | |
| | | | | | | | |
| | | | | | | 2,989,975 | |
| | | | | | | | |
| |
| | | | Consumer Staples – 2.56% | |
| | 200,000 | | | Ajecorp BV (Netherlands)
6.500%, 05/14/22 | | | 185,000 | |
| | 225,000 | | | Altria Group
2.850%, 08/09/22 | | | 218,332 | |
| | 150,000 | | | Camposol SA (Peru)
9.875%, 02/02/17 (a) | | | 158,250 | |
| | 600,000 | | | Central American Bottling (British Virgin Islands)
6.750%, 02/09/22 | | | 637,500 | |
| | 110,000 | | | Coca-Cola
Senior Unsecured Notes
1.800%, 09/01/16 | | | 112,336 | |
| | 400,000 | | | Corp Azucarera del Peru SA (Peru)
6.375%, 08/02/22 | | | 384,400 | |
| | 100,000 | | | Corp Pesquera Inca SAC (Peru)
9.000%, 02/10/17 (a) | | | 100,100 | |
| | 200,000 | | | 9.000%, 02/10/17 | | | 200,200 | |
| | 125,000 | | | Glencore Funding
3.125%, 04/29/19 (a) | | | 126,456 | |
| | 88,000 | | | Kellogg
Senior Unsecured Notes
7.450%, 04/01/31 | | | 115,750 | |
| | 150,000 | | | Kroger
Senior Unsecured Notes
3.400%, 04/15/22 | | | 152,010 | |
| | 200,000 | | | Maestro Peru SA (Peru)
6.750%, 09/26/19 | | | 218,000 | |
| | 500,000 | | | Marfrig Holding Europe BV (Netherlands)
6.875%, 06/24/19 (a) | | | 506,875 | |
| | 300,000 | | | 6.875%, 06/24/19 | | | 305,250 | |
| | 400,000 | | | Minerva Luxembourg SA (Luxembourg)
7.750%, 01/31/23 | | | 419,000 | |
| | 300,000 | | | 8.750%, 12/29/49 (a) (b) | | | 315,000 | |
| | 200,000 | | | 8.750%, 12/29/49 (b) | | | 210,000 | |
| | 125,000 | | | Post Holdings
7.375%, 02/15/22 | | | 128,125 | |
| | 155,000 | | | Revlon Consumer Products
5.750%, 02/15/21 | | | 155,775 | |
| | | | | | | | |
See accompanying Notes to Financial Statements.
| | |
| |
| ASTON/DoubleLine Core Plus Fixed Income Fund | | October 31, 2014 |
| |
| Schedule of Investments – continued | | |
| | | | | | | | |
Par Value | | | | | Market
Value | |
| | |
| | | | Consumer Staples (continued) | | | | |
| | $ 195,000 | | | Safway Group Holding
Secured Notes
7.000%, 05/15/18 (a) | | $ | 202,312 | |
| | 100,000 | | | Service Corp International
Senior Unsecured Notes
5.375%, 01/15/22 | | | 104,080 | |
| | 125,000 | | | Spectrum Brands
6.750%, 03/15/20 | | | 132,500 | |
| | 215,000 | | | Tyson Foods
3.950%, 08/15/24 | | | 219,620 | |
| | | | | | | | |
| | | | | | | 5,306,871 | |
| | | | | | | | |
| | |
| | | | Energy – 2.80% | | | | |
| | 145,000 | | | Athlon Holdings
7.375%, 04/15/21 | | | 159,500 | |
| | 150,000 | | | Atlas Pipeline Partners
4.750%, 11/15/21 | | | 150,375 | |
| | 115,000 | | | BP Capital Markets (United Kingdom)
2.500%, 11/06/22 | | | 109,303 | |
| | 85,000 | | | ConocoPhillips
6.500%, 02/01/39 | | | 113,045 | |
| | 140,000 | | | Delek & Avner Tamar Bond (Israel)
Senior Secured Notes
5.412%, 12/30/25 (a) | | | 143,235 | |
| | 170,000 | | | Devon Energy
Senior Unsecured Notes
6.300%, 01/15/19 | | | 196,787 | |
| | 105,000 | | | Ecolab
Senior Unsecured Notes
3.000%, 12/08/16 | | | 109,055 | |
| | 240,000 | | | Ecopetrol SA (Colombia)
Senior Unsecured Notes
4.125%, 01/16/25 | | | 234,600 | |
| | 50,000 | | | 5.875%, 05/28/45 | | | 51,625 | |
| | 180,000 | | | Energy XXI Gulf Coast
7.500%, 12/15/21 | | | 150,300 | |
| | 70,000 | | | Halliburton
Senior Unsecured Notes
6.150%, 09/15/19 | | | 82,730 | |
| | 70,000 | | | Kinder Morgan Energy Partners, MTN
Senior Unsecured Notes
6.950%, 01/15/38 | | | 80,575 | |
| | 145,000 | | | Memorial Production Partners
Senior Unsecured Notes
6.875%, 08/01/22 (a) | | | 131,950 | |
| | 71,000 | | | ONEOK Partners
6.125%, 02/01/41 | | | 80,722 | |
| | 750,000 | | | Pacific Rubiales Energy (Canada)
5.125%, 03/28/23 | | | 721,875 | |
| | 500,000 | | | 5.625%, 01/19/25 (a) | | | 476,725 | |
| | 500,000 | | | Petrobras Global Finance BV (Netherlands)
4.875%, 03/17/20 | | | 509,350 | |
| | 500,000 | | | Petroleos Mexicanos (Mexico)
5.500%, 01/21/21 | | | 555,275 | |
| | 165,000 | | | 6.625%, 06/15/35 | | | 195,525 | |
| | | | | | | | |
| | | | | | | | |
Par Value | | | | | Market
Value | |
| | |
| | | | Energy (continued) | | | | |
| | $ 70,000 | | | Phillips 66
5.875%, 05/01/42 | | $ | 83,900 | |
| | 133,000 | | | Plains Exploration & Production
6.500%, 11/15/20 | | | 145,569 | |
| | 500,000 | | | Reliance Industries (India)
Senior Unsecured Notes
5.875%, 02/28/49 | | | 492,500 | |
| | 145,000 | | | Sanchez Energy
6.125%, 01/15/23 (a) | | | 138,475 | |
| | 130,000 | | | Seven Generations Energy (Canada)
Senior Unsecured Notes
8.250%, 05/15/20 (a) | | | 137,150 | |
| | 135,000 | | | Southern Star Central
Senior Unsecured Notes
5.125%, 07/15/22 (a) | | | 137,363 | |
| | 155,000 | | | Tesoro Logistics
Senior Unsecured Notes
6.250%, 10/15/22 (a) | | | 160,812 | |
| | 105,000 | | | TransCanada PipeLines (Canada)
Senior Unsecured Notes
4.625%, 03/01/34 | | | 110,639 | |
| | 140,000 | | | Ultra Petroleum (Canada)
Senior Unsecured Notes
5.750%, 12/15/18 (a) | | | 139,300 | |
| | | | | | | | |
| | | | | | | 5,798,260 | |
| | | | | | | | |
| | |
| | | | Financials – 7.70% | | | | |
| | 400,000 | | | Agromercantil Senior Trust (Cayman Islands)
6.250%, 04/10/19 (a) | | | 417,000 | |
| | 500,000 | | | 6.250%, 04/10/19 | | | 519,500 | |
| | 125,000 | | | American Express Credit GMTN,
Senior Unsecured Notes
2.250%, 08/15/19 | | | 125,316 | |
| | 145,000 | | | Senior Unsecured Notes
2.125%, 03/18/19 | | | 145,037 | |
| | 150,000 | | | Australia & New Zealand Banking Group, EMTN (Australia)
Senior Unsecured Notes
4.875%, 01/12/21 (a) | | | 169,452 | |
| | 400,000 | | | Banco de Bogota SA (Colombia)
Subordinated Notes
5.375%, 02/19/23 | | | 419,000 | |
| | 200,000 | | | 5.375%, 02/19/23 (a) | | | 209,500 | |
| | 500,000 | | | Banco do Brasil SA/Cayman Islands (Brazil)
9.000%, 06/29/49 (a) (b) | | | 494,000 | |
| | 300,000 | | | 8.500%, 10/29/49 (b) | | | 347,040 | |
| | 250,000 | | | Banco GNB Sudameris SA (Colombia)
Subordinated Notes
7.500%, 07/30/22 | | | 272,738 | |
| | 300,000 | | | Banco Internacional del Peru SAA (Peru)
8.500%, 04/23/70 (b) | | | 337,341 | |
| | 150,000 | | | Subordinated Notes
6.625%, 03/19/29 (a) (b) | | | 163,500 | |
| | | | | | | | |
See accompanying Notes to Financial Statements.
| | |
| |
| ASTON/DoubleLine Core Plus Fixed Income Fund | | October 31, 2014 |
| |
| Schedule of Investments – continued | | |
| | | | | | | | |
Par Value | | | | | Market
Value | |
| | |
| | | | Financials (continued) | | | | |
| | $ 400,000 | | | Banco Nacional de Costa Rica (Costa Rica)
Senior Unsecured Notes
6.250%, 11/01/23 | | $ | 410,960 | |
| | 150,000 | | | Banco Regional SAECA (Paraguay)
Senior Unsecured Notes
8.125%, 01/24/19 (a) | | | 163,500 | |
| | 450,000 | | | 8.125%, 01/24/19 | | | 490,500 | |
| | 300,000 | | | Bancolombia SA (Colombia)
Subordinated Notes
5.125%, 09/11/22 | | | 307,500 | |
| | 155,000 | | | Bank of America
Senior Unsecured Notes
2.000%, 01/11/18 | | | 155,458 | |
| | 170,000 | | | Bank of Montreal, MTN (Canada)
Senior Unsecured Notes
1.400%, 09/11/17 | | | 170,243 | |
| | 50,000 | | | 2.375%, 01/25/19 | | | 50,585 | |
| | 150,000 | | | Bantrab Senior Trust (Cayman Islands)
Senior Secured Notes
9.000%, 11/14/20 | | | 160,259 | |
| | 135,000 | | | BB&T, MTN
Senior Unsecured Notes
2.250%, 02/01/19 | | | 136,051 | |
| | 200,000 | | | BBVA Banco Continental SA (Peru)
Subordinated Notes
5.250%, 09/22/29 (a) (b) | | | 202,800 | |
| | 105,000 | | | Boston Properties, REIT
Senior Unsecured Notes
4.125%, 05/15/21 | | | 111,985 | |
| | 200,000 | | | Cementos Progreso Trust (Cayman Islands)
7.125%, 11/06/23 | | | 215,500 | |
| | 300,000 | | | 7.125%, 11/06/23 (a) | | | 323,250 | |
| | 200,000 | | | CIMPOR Financial Operations BV (Netherlands)
5.750%, 07/17/24 (a) | | | 192,800 | |
| | 155,000 | | | Citigroup
Senior Unsecured Notes
1.750%, 05/01/18 | | | 153,682 | |
| | 300,000 | | | Comcel Trust (Cayman Islands)
6.875%, 02/06/24 (a) | | | 321,750 | |
| | 400,000 | | | 6.875%, 02/06/24 | | | 429,000 | |
| | 200,000 | | | Corp Financiera de Desarrollo SA (Peru)
Subordinated Notes
5.250%, 07/15/29 (a) (b) | | | 205,600 | |
| | 250,000 | | | CorpGroup Banking SA (Chile)
Senior Unsecured Notes
6.750%, 03/15/23 | | | 250,780 | |
| | 250,000 | | | 6.750%, 03/15/23 (a) | | | 250,696 | |
| | 200,000 | | | Credito Real SAB de CV (Mexico)
Senior Unsecured Notes
7.500%, 03/13/19 (a) | | | 211,500 | |
| | 200,000 | | | 7.500%, 03/13/19 | | | 211,500 | |
| | 110,000 | | | ERP Operating, REIT
Senior Unsecured Notes
4.500%, 07/01/44 | | | 110,789 | |
| | | | | | | | |
| | | | | | | | |
Par Value | | | | | Market
Value | |
| | |
| | | | Financials (continued) | | | | |
| | $ 215,000 | | | General Electric Capital
Senior Unsecured Notes
2.900%, 01/09/17 | | $ | 223,974 | |
| | 110,000 | | | General Motors Financial
3.000%, 09/25/17 | | | 112,338 | |
| | 500,000 | | | Global Bank (Panama)
Senior Unsecured Notes
5.125%, 10/30/19 (a) (c) | | | 502,780 | |
| | 95,000 | | | Goldman Sachs Group
Senior Unsecured Notes
5.750%, 01/24/22 | | | 109,506 | |
| | 600,000 | | | Grupo Aval (Cayman Islands)
4.750%, 09/26/22 | | | 601,020 | |
| | 500,000 | | | GrupoSura Finance SA (Cayman Islands)
5.700%, 05/18/21 | | | 547,500 | |
| | 170,000 | | | Icahn Enterprises
4.875%, 03/15/19 | | | 173,400 | |
| | 500,000 | | | Industrial Senior Trust (Cayman Islands)
5.500%, 11/01/22 | | | 498,750 | |
| | 300,000 | | | 5.500%, 11/01/22 (a) | | | 299,250 | |
| | 270,000 | | | JPMorgan Chase
Senior Unsecured Notes
3.625%, 05/13/24 | | | 273,580 | |
| | 160,000 | | | Korea Development Bank (South Korea)
Senior Unsecured Notes
4.375%, 08/10/15 | | | 164,530 | |
| | 124,000 | | | Liberty Mutual Group
6.500%, 05/01/42 (a) | | | 150,132 | |
| | 500,000 | | | Magnesita Finance
(British Virgin Islands)
8.625%, 04/29/49 | | | 502,500 | |
| | 220,000 | | | MetLife
Senior Unsecured Notes
4.125%, 08/13/42 | | | 214,813 | |
| | 110,000 | | | Morgan Stanley
Senior Unsecured Notes
3.750%, 02/25/23 | | | 111,564 | |
| | 25,000 | | | MPT Operating Partnership, REIT
6.375%, 02/15/22 | | | 26,688 | |
| | 180,000 | | | National Rural Utilities Cooperative Finance
10.375%, 11/01/18 | | | 237,165 | |
| | 500,000 | | | Oversea-Chinese Banking, EMTN (Singapore)
Subordinated Notes
4.000%, 10/15/24 (b) | | | 509,860 | |
| | 85,000 | | | PNC Funding
3.300%, 03/08/22 | | | 86,509 | |
| | 250,000 | | | Rio Oil Finance Trust
Senior Secured Notes
6.250%, 07/06/24 | | | 261,047 | |
| | 125,000 | | | Simon Property Group, REIT
Senior Unsecured Notes
5.650%, 02/01/20 | | | 144,735 | |
| | | | | | | | |
See accompanying Notes to Financial Statements.
| | |
| |
| ASTON/DoubleLine Core Plus Fixed Income Fund | | October 31, 2014 |
| |
| Schedule of Investments – continued | | |
| | | | | | | | |
Par Value | | | | | Market
Value | |
| | |
| | | | Financials (continued) | | | | |
| | $ 400,000 | | | SUAM Finance BV (Netherlands)
4.875%, 04/17/24 | | $ | 411,000 | |
| | 110,000 | | | Synchrony Financial
Senior Unsecured Notes
3.000%, 08/15/19 | | | 111,281 | |
| | 110,000 | | | TIAA Asset Management Finance
Senior Unsecured Notes
2.950%, 11/01/19 (a) | | | 110,337 | |
| | 200,000 | | | Unifin Financiera SA de CV (Mexico)
6.250%, 07/22/19 (a) | | | 196,000 | |
| | 300,000 | | | United Overseas Bank, EMTN (Singapore)
Subordinated Notes
3.750%, 09/19/24 (b) | | | 303,876 | |
| | 80,000 | | | Wells Fargo, GMTN
Senior Unsecured Notes
4.600%, 04/01/21 | | | 88,461 | |
| | 125,000 | | | 3.500%, 03/08/22 | | | 129,335 | |
| | | | | | | | |
| | | | | | | 15,958,043 | |
| | | | | | | | |
| | |
| | | | Healthcare – 0.64% | | | | |
| | 85,000 | | | Actavis Funding SCS (Luxembourg)
4.850%, 06/15/44 (a) | | | 80,459 | |
| | 140,000 | | | Alere
6.500%, 06/15/20 | | | 145,250 | |
| | 150,000 | | | Becton Dickinson
Senior Unsecured Notes
3.125%, 11/08/21 | | | 149,997 | |
| | 100,000 | | | Biomet
6.500%, 08/01/20 | | | 107,250 | |
| | 160,000 | | | Covidien International Finance SA (Luxembourg)
2.950%, 06/15/23 | | | 155,591 | |
| | 170,000 | | | Gilead Sciences
Senior Unsecured Notes
3.700%, 04/01/24 | | | 175,061 | |
| | 175,000 | | | HCA
Senior Secured Notes
4.250%, 10/15/19 | | | 178,062 | |
| | 75,000 | | | LifePoint Hospitals
5.500%, 12/01/21 | | | 78,938 | |
| | 150,000 | | | Select Medical
6.375%, 06/01/21 | | | 154,125 | |
| | 110,000 | | | WellPoint
Senior Unsecured Notes
2.300%, 07/15/18 | | | 110,997 | |
| | | | | | | | |
| | | | | | | 1,335,730 | |
| | | | | | | | |
| | |
| | | | Industrials – 5.07% | | | | |
| | 150,000 | | | Aeropuerto Internacional de Tocumen SA
Senior Secured Notes
5.750%, 10/09/23 (c) | | | 154,500 | |
| | 200,000 | | | Aeropuertos Dominicanos Siglo XXI SA
(Dominican Republic)
Senior Secured Notes
9.750%, 11/13/19 (a) (d) | | | 192,000 | |
| | | | | | | | |
| | | | | | | | |
Par Value | | | | | Market
Value | |
| | |
| | | | Industrials (continued) | | | | |
| | $ 400,000 | | | Avianca Holdings SA (Panama)
8.375%, 05/10/20 (a) | | $ | 421,000 | |
| | 200,000 | | | 8.375%, 05/10/20 | | | 210,500 | |
| | 205,000 | | | Avis Budget Car Rental
5.500%, 04/01/23 | | | 207,050 | |
| | 200,000 | | | Berry Plastics
Secured Notes
5.500%, 05/15/22 | | | 201,000 | |
| | 60,000 | | | Boeing
Senior Unsecured Notes
6.875%, 03/15/39 | | | 85,609 | |
| | 110,000 | | | Burlington Northern Santa Fe
Senior Unsecured Notes
4.550%, 09/01/44 | | | 112,229 | |
| | 300,000 | | | Cemex Finance
Senior Secured Notes
6.000%, 04/01/24 | | | 306,660 | |
| | 200,000 | | | Cemex SAB de CV (Mexico)
Senior Secured Notes
5.700%, 01/11/25 | | | 196,440 | |
| | 400,000 | | | 5.700%, 01/11/25 (a) | | | 392,880 | |
| | 600,000 | | | Cencosud SA (Chile)
4.875%, 01/20/23 (a) | | | 601,147 | |
| | 105,000 | | | Delphi
4.150%, 03/15/24 | | | 107,887 | |
| | 200,000 | | | ESAL GmbH (American Samoa)
6.250%, 02/05/23 | | | 205,000 | |
| | 600,000 | | | 6.250%, 02/05/23 (a) | | | 615,000 | |
| | 200,000 | | | Ferreycorp SAA (Peru)
4.875%, 04/26/20 | | | 198,500 | |
| | 205,000 | | | Gates Global
6.000%, 07/15/22 (a) | | | 199,875 | |
| | 400,000 | | | Gol LuxCo SA (Luxembourg)
8.875%, 01/24/22 (a) | | | 394,000 | |
| | 600,000 | | | Grupo Cementos de Chihuahua SAB de CV (Mexico)
Senior Secured Notes
8.125%, 02/08/20 | | | 658,200 | |
| | 250,000 | | | Grupo Elektra SAB de CV (Mexico)
7.250%, 08/06/18 | | | 262,812 | |
| | 700,000 | | | Grupo KUO SAB de CV (Mexico)
6.250%, 12/04/22 | | | 721,609 | |
| | 140,000 | | | HD Supply
7.500%, 07/15/20 | | | 149,800 | |
| | 150,000 | | | Hexion US Finance
Senior Secured Notes
6.625%, 04/15/20 | | | 150,750 | |
| | 80,000 | | | Illinois Tool Works
Senior Unsecured Notes
3.375%, 09/15/21 | | | 83,913 | |
| | 145,000 | | | Louisiana-Pacific
7.500%, 06/01/20 | | | 155,875 | |
| | 75,000 | | | Manitowoc
8.500%, 11/01/20 | | | 81,563 | |
| | 170,000 | | | Milacron
7.750%, 02/15/21 (a) | | | 177,650 | |
| | | | | | | | |
See accompanying Notes to Financial Statements.
| | |
| |
| ASTON/DoubleLine Core Plus Fixed Income Fund | | October 31, 2014 |
| |
| Schedule of Investments – continued | | |
| | | | | | | | |
Par Value | | | | | Market
Value | |
| | |
| | | | Industrials (continued) | | | | |
| | $ 200,000 | | | Minsur SA (Peru)
Senior Unsecured Notes
6.250%, 02/07/24 (a) | | $ | 221,500 | |
| | 200,000 | | | OAS Financial (British Virgin Islands)
8.875%, 04/29/49 (b) | | | 180,500 | |
| | 400,000 | | | 8.875%, 04/29/49 (a) (b) | | | 361,000 | |
| | 400,000 | | | Odebrecht Finance (Cayman Island)
7.125%, 06/26/42 | | | 421,800 | |
| | 200,000 | | | Pesquera Exalmar S.A.A. (Peru)
Senior Unsecured Notes
7.375%, 01/31/20 (a) | | | 177,000 | |
| | 400,000 | | | 7.375%, 01/31/20 | | | 354,000 | |
| | 195,000 | | | Plastipak Holdings
Senior Unsecured Notes
6.500%, 10/01/21 (a) | | | 201,825 | |
| | 115,000 | | | Reynolds Group Issuer
9.000%, 04/15/19 | | | 120,750 | |
| | 135,000 | | | RR Donnelley & Sons
Senior Unsecured Notes
7.875%, 03/15/21 | | | 152,550 | |
| | 165,000 | | | Southwest Airlines
Senior Unsecured Notes
5.125%, 03/01/17 | | | 178,227 | |
| | 100,000 | | | Terex
6.000%, 05/15/21 | | | 104,500 | |
| | 165,000 | | | TransDigm
6.000%, 07/15/22 | | | 167,681 | |
| | 200,000 | | | Union Andina de Cementos SAA (Peru)
Senior Unsecured Notes
5.875%, 10/30/21 (a) | | | 203,540 | |
| | 155,000 | | | United Rentals North America
7.625%, 04/15/22 | | | 173,600 | |
| | 90,000 | | | United Technologies
Senior Unsecured Notes
3.100%, 06/01/22 | | | 91,643 | |
| | 125,000 | | | Waste Management
6.125%, 11/30/39 | | | 157,644 | |
| | | | | | | | |
| | | | | | | 10,511,209 | |
| | | | | | | | |
| | |
| | | | Information Technology – 0.44% | | | | |
| | 130,000 | | | Activision Blizzard
5.625%, 09/15/21 (a) | | | 138,612 | |
| | 80,000 | | | Arrow Electronics
Senior Unsecured Notes
3.375%, 11/01/15 | | | 81,966 | |
| | 145,000 | | | CDW
6.000%, 08/15/22 | | | 153,700 | |
| | 215,000 | | | Oracle
Senior Unsecured Notes
2.375%, 01/15/19 | | | 218,803 | |
| | 220,000 | | | Seagate HDD Cayman (Cayman Islands)
4.750%, 01/01/25 (a) | | | 223,575 | |
| | 100,000 | | | Xerox
Senior Unsecured Notes
2.950%, 03/15/17 | | | 103,531 | |
| | | | | | | | |
| | | | | | | 920,187 | |
| | | | | | | | |
| | | | | | | | |
| | | | | | | | |
Par Value | | | | | Market
Value | |
| | |
| | | | Materials – 2.73% | | | | |
| | $ 90,000 | | | Ashland
4.750%, 08/15/22 | | $ | 91,125 | |
| | 200,000 | | | Braskem America Finance
7.125%, 07/22/41 | | | 205,000 | |
| | 600,000 | | | Cia Minera Ares SAC (Peru)
7.750%, 01/23/21 | | | 639,000 | |
| | 300,000 | | | Cia Minera Milpo SAA (Peru)
Senior Unsecured Notes
4.625%, 03/28/23 (a) | | | 301,500 | |
| | 500,000 | | | Corp Nacional del Cobre de Chile (Chile)
Senior Unsecured Notes
3.750%, 11/04/20 | | | 517,000 | |
| | 110,000 | | | Dow Chemical
Senior Unsecured Notes
3.000%, 11/15/22 | | | 107,458 | |
| | 85,000 | | | Freeport-McMoRan
3.100%, 03/15/20 | | | 84,567 | |
| | 300,000 | | | Fresnillo (United Kingdom)
Senior Unsecured Notes
5.500%, 11/13/23 | | | 317,010 | |
| | 200,000 | | | Klabin Finance SA (Luxembourg)
5.250%, 07/16/24 (a) | | | 196,400 | |
| | 600,000 | | | Mexichem SAB De CV (Mexico)
6.750%, 09/19/42 | | | 658,500 | |
| | 200,000 | | | OCP SA (Morocco)
Senior Unsecured Notes
5.625%, 04/25/24 (a) | | | 210,290 | |
| | 205,000 | | | Signode Industrial Group Lux SA
Senior Unsecured Notes
6.375%, 05/01/22 (a) | | | 199,362 | |
| | 200,000 | | | Southern Copper
Senior Unsecured Notes
6.750%, 04/16/40 | | | 222,900 | |
| | 280,000 | | | 5.250%, 11/08/42 | | | 263,962 | |
| | 90,000 | | | Steel Dynamics
5.125%, 10/01/21 (a) | | | 93,150 | |
| | 800,000 | | | Vedanta Resources (United Kingdom)
Senior Unsecured Notes
7.125%, 05/31/23 (a) | | | 816,000 | |
| | 200,000 | | | 7.125%, 05/31/23 | | | 204,000 | |
| | 400,000 | | | Volcan Cia Minera SAA (Peru)
5.375%, 02/02/22 | | | 397,500 | |
| | 125,000 | | | WCI Communities
6.875%, 08/15/21 | | | 126,563 | |
| | 15,000 | | | 6.875%, 08/15/21 (a) | | | 15,188 | |
| | | | | | | | |
| | | | | | | 5,666,475 | |
| | | | | | | | |
| | |
| | | | Telecommunications – 3.47% | | | | |
| | 150,000 | | | 21st Century Fox America
4.750%, 09/15/44 (a) | | | 155,684 | |
| | 500,000 | | | B Communications (Israel)
Senior Secured Notes
7.375%, 02/15/21 (a) | | | 535,050 | |
See accompanying Notes to Financial Statements.
| | |
| |
| ASTON/DoubleLine Core Plus Fixed Income Fund | | October 31, 2014 |
| |
| Schedule of Investments – continued | | |
| | | | | | | | |
Par Value | | | | | Market
Value | |
| | |
| | | | Telecommunications (continued) | | | | |
| | $ 151,000 | | | British Telecommunications (United Kingdom)
Senior Unsecured Notes
5.950%, 01/15/18 | | $ | 170,195 | |
| | 75,000 | | | CCO Holdings
5.250%, 09/30/22 | | | 75,750 | |
| | 80,000 | | | CCOH Safari
5.500%, 12/01/22 | | | 80,700 | |
| | 200,000 | | | Columbus International (Barbados)
7.375%, 03/30/21 (a) | | | 212,750 | |
| | 400,000 | | | 7.375%, 03/30/21 | | | 425,500 | |
| | 110,000 | | | Comcast
4.200%, 08/15/34 | | | 111,393 | |
| | 70,000 | | | CommScope
5.000%, 06/15/21 (a) | | | 70,175 | |
| | 300,000 | | | Digicel Group (Bermuda)
Senior Unsecured Notes
7.125%, 04/01/22 (a) | | | 302,250 | |
| | 800,000 | | | 7.125%, 04/01/22 | | | 806,000 | |
| | 300,000 | | | ENTEL Chile SA (Chile)
Senior Unsecured Notes
4.750%, 08/01/26 (a) | | | 304,994 | |
| | 180,000 | | | Frontier Communications
Senior Unsecured Notes
8.500%, 04/15/20 | | | 208,350 | |
| | 200,000 | | | Gannett
4.875%, 09/15/21 (a) | | | 202,000 | |
| | 205,000 | | | Intelsat Jackson Holdings SA (Luxembourg)
5.500%, 08/01/23 | | | 206,281 | |
| | 120,000 | | | Koninklijke KPN NV (Netherlands)
Senior Unsecured Notes
8.375%, 10/01/30 | | | 167,827 | |
| | 700,000 | | | Millicom International Cellular SA (Luxembourg)
Senior Unsecured Notes
4.750%, 05/22/20 | | | 694,750 | |
| | 600,000 | | | 6.625%, 10/15/21 | | | 645,000 | |
| | 105,000 | | | Orange SA (France)
Senior Unsecured Notes
2.750%, 09/14/16 | | | 108,195 | |
| | 95,000 | | | SBA Communications
Senior Unsecured Notes
5.625%, 10/01/19 | | | 99,275 | |
| | 200,000 | | | Telefonica Celular del Paraguay SA (Paraguay)
Senior Unsecured Notes
6.750%, 12/13/22 (a) | | | 211,000 | |
| | 400,000 | | | 6.750%, 12/13/22 | | | 422,000 | |
| | 300,000 | | | TV Azteca SAB de CV, EMTN (Mexico)
7.625%, 09/18/20 | | | 315,750 | |
| | 135,000 | | | Verizon Communications
Senior Unsecured Notes
4.400%, 11/01/34 | | | 132,264 | |
| | 500,000 | | | VTR Finance BV (Netherlands)
Senior Secured Notes
6.875%, 01/15/24 | | | 526,250 | |
| | | | | | | | |
| | | | | | | 7,189,383 | |
| | | | | | | | |
| | | | | | | | |
| | | | | | | | |
Par Value | | | | | Market
Value | |
| | |
| | | | Utilities – 2.04% | | | | |
| | $ 600,000 | | | Abengoa Transmision Sur SA (Peru)
Senior Secured Notes
6.875%, 04/30/43 (a) | | $ | 667,440 | |
| | 500,000 | | | AES Andres Dominicana (Cayman Island)
Senior Secured Notes
9.500%, 11/12/20 | | | 542,500 | |
| | 300,000 | | | AES El Salvador Trust II (Panama)
6.750%, 03/28/23 | | | 288,000 | |
| | 105,000 | | | Duke Energy
Senior Unsecured Notes
3.550%, 09/15/21 | | | 109,511 | |
| | 600,000 | | | Fermaca Enterprises S de RL de CV (Mexico)
Senior Secured Notes
6.375%, 03/30/38 (a) | | | 635,250 | |
| | 200,000 | | | GNL Quintero SA (Chile)
Senior Unsecured Notes
4.634%, 07/31/29 (a) | | | 206,554 | |
| | 200,000 | | | 4.634%, 07/31/29 | | | 206,672 | |
| | 200,000 | | | Instituto Costarricense de Electricidad (Costa Rica)
Senior Unsecured Notes
6.950%, 11/10/21 (a) | | | 212,500 | |
| | 400,000 | | | Mexico Generadora de Energia S de rl (Mexico)
Senior Secured Notes
5.500%, 12/06/32 | | | 415,000 | |
| | 95,000 | | | Midamerican Energy Holdings
Senior Unsecured Notes
6.500%, 09/15/37 | | | 125,464 | |
| | 274,223 | | | Nakilat (Marshall Islands)
Secured Notes
6.267%, 12/31/33 | | | 315,357 | |
| | 300,000 | | | Senior Secured Notes
6.067%, 12/31/33 | | | 343,500 | |
| | 25,000 | | | Southern
Senior Unsecured Notes
1.950%, 09/01/16 | | | 25,443 | |
| | 125,000 | | | Southern Power
Senior Unsecured Notes
4.875%, 07/15/15 | | | 128,561 | |
| | | | | | | | |
| | | | | | | 4,221,752 | |
| | | | | | | | |
| | |
| | | | Total Corporate Notes and Bonds
(Cost $59,025,882) | | | 59,897,885 | |
| | | | | | | | |
|
| | COLLATERALIZED MORTGAGE-BACKED SECURITIES – 18.52% | |
| | 3,614,863 | | | Alternative Loan Trust
Series 2007-J2, Class 2A1
6.000%, 07/25/37 | | | 3,524,841 | |
| | 1,072,000 | | | American General Mortgage Loan Trust
Series 2010-1A, Class A3
5.650%, 03/25/58 (a) (b) | | | 1,110,535 | |
| | | | | | | | |
See accompanying Notes to Financial Statements.
| | |
| |
| ASTON/DoubleLine Core Plus Fixed Income Fund | | October 31, 2014 |
| |
| Schedule of Investments – continued | | |
| | | | | | | | |
Par Value | | | | | Market
Value | |
| | $ 350,000 | | | Banc of America Commercial Mortgage Trust
Series 2007-4, Class AM
5.821%, 02/10/51 (b) | | $ | 384,213 | |
| | 725,998 | | | Banc of America Funding
Series 2006-B, Class 7A1
5.637%, 03/20/36 (b) | | | 667,413 | |
| | 759,836 | | | Banc of America Funding
Series 2010-R9, Class 3A3
5.500%, 12/01/35 (a) | | | 600,342 | |
| | 504,948 | | | Banc of America Funding
Series 2012-R4, Class A
0.417%, 03/04/39 (a) (b) | | | 495,946 | |
| | 359,917 | | | Bear Stearns Asset Backed Securities I Trust
Series 2004-AC2, Class 2A
5.000%, 05/25/34 | | | 363,184 | |
| | 2,235,795 | | | CHL Mortgage Pass-Through Trust
Series 2007-14, Class A15
6.500%, 09/25/37 | | | 2,194,217 | |
| | 158,015 | | | Citicorp Mortgage Securities Trust
Series 2007-2, Class 3A1
5.500%, 02/25/37 | | | 158,007 | |
| | 972,271 | | | Citigroup Commercial Mortgage Trust
Series 2012-GC8, Class XA
2.216%, 09/10/45 (a) (b) | | | 100,859 | |
| | 350,000 | | | Citigroup Commercial Mortgage Trust
Series 2013-SMP, Class C
2.738%, 01/12/30 (a) | | | 355,526 | |
| | 350,000 | | | Citigroup Commercial Mortgage Trust
Series 2013-SMP, Class D
2.911%, 01/12/30 (a) (b) | | | 353,120 | |
| | 4,961,000 | | | Citigroup Commercial Mortgage Trust
Series 2014-GC25, Class XA
1.257%, 10/10/47 (b) | | | 408,918 | |
| | 340,000 | | | Citigroup/Deutsche Bank Commercial Mortgage Trust
Series 2007-CD4, Class AMFX
5.366%, 12/11/49 (b) | | | 356,261 | |
| | 6,161,223 | | | Citigroup/Deutsche Bank Commercial Mortgage Trust
Series 2007-CD5, Class XP
0.162%, 11/15/44 (a) (b) | | | 62 | |
| | 300,000 | | | COBALT CMBS Commercial Mortgage Trust
Series 2007-C2, Class AFJX
5.568%, 04/15/47 (b) | | | 306,123 | |
| | 149,246 | | | Commercial Mortgage Pass Through Certificates
Series 2010-C1, Class XPA
2.294%, 07/10/46 (a) (b) | | | 3,557 | |
| | 1,950,039 | | | Commercial Mortgage Pass Through Certificates
Series 2012-CR3, Class XA
2.177%, 10/15/45 (b) | | | 224,462 | |
| | 350,000 | | | Commercial Mortgage Pass Through Certificates
Series 2014-CCRE19, Class C
4.721%, 08/10/47 (b) | | | 362,714 | |
| | | | | | | | |
| | | | | | | | |
Par Value | | | | | Market
Value | |
| | $ 3,743,658 | | | Commercial Mortgage Pass Through Certificates
Series 2014-CCRE19, Class XA
1.323%, 08/10/47 (b) | | $ | 306,267 | |
| | 300,000 | | | Commercial Mortgage Pass Through Certificates
Series 2014-CR20, Class C
4.658%, 11/10/47 (b) (c) | | | 303,739 | |
| | 350,000 | | | Commercial Mortgage Pass Through Certificates
Series 2014-KYO, Class E
2.503%, 06/11/27 (a) (b) | | | 349,660 | |
| | 300,000 | | | Commercial Mortgage Pass Through Certificates
Series 2014-KYO, Class F
3.653%, 06/11/27 (a) (b) | | | 299,813 | |
| | 350,000 | | | Commercial Mortgage Trust
Series 2006-GG7, Class AJ
5.819%, 07/10/38 (b) | | | 361,831 | |
| | 300,000 | | | Commercial Mortgage Trust
Series 2007-GG11, Class AJ
6.051%, 12/10/49 (b) | | | 314,413 | |
| | 102,680 | | | Countrywide Alternative Loan Trust
Series 2007-18CB, Class 2A17
6.000%, 08/25/37 | | | 93,887 | |
| | 391,975 | | | Countrywide Alternative Loan Trust
Series 2007-23CB, Class A3
0.652%, 09/25/37 (b) | | | 277,336 | |
| | 374,271 | | | Countrywide Alternative Loan Trust
Series 2007-23CB, Class A4
6.348%, 09/25/37 (b) (e) | | | 88,374 | |
| | 1,686,741 | | | Countrywide Alternative Loan Trust
Series 2005-86CB, Class A5
5.500%, 02/25/36 | | | 1,513,462 | |
| | 531,786 | | | Countrywide Alternative Loan Trust
Series 2006-J1, Class 2A1
7.000%, 02/25/36 | | | 228,315 | |
| | 171,488 | | | Countrywide Home Loan Mortgage Pass Through Trust
Series 2007-7, Class A4
5.750%, 06/25/37 | | | 158,388 | |
| | 848,079 | | | Countrywide Home Loan Mortgage Pass Through Trust
Series 2005-HYB8, Class 4A1
4.339%, 12/20/35 (b) | | | 747,071 | |
| | 739,233 | | | Countrywide Home Loan Mortgage Pass Through Trust
Series 2007-2, Class A13
6.000%, 03/25/37 | | | 673,040 | |
| | 275,000 | | | Credit Suisse Commercial Mortgage Trust
Series 2006-C4, Class AM
5.509%, 09/15/39 | | | 293,981 | |
| | 67,134 | | | Credit Suisse First Boston Mortgage Securities
Series 1998-C2, Class F
6.750%, 11/15/30 (a) (b) | | | 69,696 | |
| | | | | | | | |
See accompanying Notes to Financial Statements.
| | |
| |
| ASTON/DoubleLine Core Plus Fixed Income Fund | | October 31, 2014 |
| |
| Schedule of Investments – continued | | |
| | | | | | | | |
Par Value | | | | | Market
Value | |
| | $ 2,350,651 | | | Credit Suisse First Boston Mortgage Securities
Series 2005-9, Class 5A9
5.500%, 10/25/35 | | $ | 2,082,105 | |
| | 1,190,130 | | | Credit Suisse Mortgage Capital Certificates
Series 2007-1, Class 5A4
6.000%, 02/25/37 | | | 1,078,616 | |
| | 106,802 | | | Credit Suisse Mortgage Capital Certificates
Series 2009-13R, Class 2A1
6.000%, 01/26/37 (a) | | | 107,824 | |
| | 250,000 | | | Credit Suisse Mortgage Capital Certificates
Series 2009-RR2, Class IQB
5.695%, 04/16/49 (a) (b) | | | 266,245 | |
| | 150,000 | | | Del Coronado Trust
Series 2013-HDC, Class D
2.104%, 03/15/26 (a) (b) | | | 149,750 | |
| | 150,000 | | | Del Coronado Trust
Series 2013-HDC, Class E
2.804%, 03/15/26 (a) (b) | | | 149,401 | |
| | 100,000 | | | GE Capital Commercial Mortgage
Series 2005-C2, Class B
5.113%, 05/10/43 (b) | | | 101,610 | |
| | 350,000 | | | GS Mortgage Securities Trust
Series 2006-GG6, Class AJ
5.521%, 04/10/38 (b) | | | 360,223 | |
| | 400,000 | | | GS Mortgage Securities Trust
Series 2006-GG8, Class AJ
5.622%, 11/10/39 | | | 411,913 | |
| | 818,180 | | | GSR Mortgage Loan Trust
Series 2006-AR1, Class 3A1
2.878%, 01/25/36 (b) | | | 752,994 | |
| | 69,317 | | | HSI Asset Loan Obligation Trust
Series 2007-2, Class 1A1
5.500%, 09/25/37 | | | 67,943 | |
| | 350,000 | | | JP Morgan Chase Commercial Mortgage Securities Trust
Series 2007-CB19 Class AM
5.703%, 02/12/49 (b) | | | 371,637 | |
| | 1,209,664 | | | JP Morgan Chase Commercial Mortgage Securities Trust
Series 2011-C4, Class XA
1.485%, 07/15/46 (a) (b) | | | 54,445 | |
| | 250,000 | | | JP Morgan Chase Commercial Mortgage Securities Trust
Series 2005-CB12, Class B
4.971%, 09/12/37 (b) | | | 240,216 | |
| | 2,020,394 | | | JP Morgan Chase Commercial Mortgage Securities Trust
Series 2006-LDP8, Class X
0.536%, 05/15/45 (b) | | | 16,763 | |
| | 350,000 | | | JP Morgan Chase Commercial Mortgage Securities Trust
Series 2006-LDP9, Class AM
5.372%, 05/15/47 | | | 364,488 | |
| | | | | | | | |
| | | | | | | | |
Par Value | | | | | Market
Value | |
| | $ 350,000 | | | JP Morgan Chase Commercial Mortgage Securities Trust
Series 2007-CB20, Class AJ
6.074%, 02/12/51 (b) | | $ | 369,898 | |
| | 250,000 | | | JP Morgan Chase Commercial Mortgage Securities Trust
Series 2007-LD12, Class AM
6.002%, 02/15/51 (b) | | | 275,289 | |
| | 2,372,175 | | | JP Morgan Chase Commercial Mortgage Securities Trust
Series 2012-C8, Class XA
2.130%, 10/15/45 (b) | | | 245,753 | |
| | 808,908 | | | JP Morgan Chase Commercial Mortgage Securities Trust
Series 2012-CBX, Class XA
1.759%, 06/15/45 (b) | | | 65,626 | |
| | 5,956,505 | | | JP Morgan Chase Commercial Mortgage Securities Trust
Series 2014-C18, Class XA
1.165%, 02/15/47 (b) | | | 405,105 | |
| | 300,000 | | | JP Morgan Chase Commercial Mortgage Securities Trust
Series 2014-C21, Class C
4.661%, 08/15/47 (b) | | | 310,874 | |
| | 3,744,943 | | | JP Morgan Chase Commercial Mortgage Securities Trust
Series 2014-C21, Class XA
1.131%, 08/15/47 (b) | | | 300,247 | |
| | 330,824 | | | JP Morgan Chase Commercial Mortgage Securities Trust
Series 2014-C23, Class C
4.461%, 09/15/47 (b) | | | 337,927 | |
| | 300,000 | | | JP Morgan Chase Commercial Mortgage Securities Trust
Series 2014-DSTY, Class A
3.429%, 06/10/27 (a) | | | 309,111 | |
| | 250,000 | | | LB Commercial Mortgage Trust
Series 2007-C3, Class AMFL
5.903%, 07/15/44 (a) (b) | | | 275,955 | |
| | 350,000 | | | LB-UBS Commercial Mortgage Trust
Series 2007-C1, Class AJ
5.484%, 02/15/40 | | | 364,964 | |
| | 350,000 | | | Merrill Lynch Mortgage Trust
Series 2006-C2, Class AJ
5.802%, 08/12/43 (b) | | | 356,829 | |
| | 300,000 | | | Merrill Lynch Mortgage Trust
Series 2005-CIP1, Class AM
5.107%, 07/12/38 (b) | | | 307,277 | |
| | 250,000 | | | ML-CFC Commercial Mortgage Trust
Series 2007-5, Class AM
5.419%, 08/12/48 | | | 263,308 | |
| | 300,000 | | | ML-CFC Commercial Mortgage Trust
Series 2006-1, Class AJ
5.566%, 02/12/39 (b) | | | 311,192 | |
| | 969,945 | | | Morgan Stanley Bank of America Merrill Lynch Trust
Series 2012-C5, Class XA
1.862%, 08/15/45 (a) (b) | | | 82,372 | |
| | | | | | | | |
See accompanying Notes to Financial Statements.
| | |
| |
| ASTON/DoubleLine Core Plus Fixed Income Fund | | October 31, 2014 |
| |
| Schedule of Investments – continued | | |
| | | | | | | | |
Par Value | | | | | Market
Value | |
| | $ 550,000 | | | Morgan Stanley Bank of America Merrill Lynch Trust
Series 2014-C14, Class D
4.835%, 02/15/47 (a) (b) | | $ | 530,679 | |
| | 300,000 | | | Morgan Stanley Bank of America Merrill Lynch Trust
Series 2014-C18, Class C
4.489%, 10/15/47 | | | 306,648 | |
| | 300,000 | | | Morgan Stanley Capital I Trust
Series 2006-HQ8, Class AJ
5.492%, 03/12/44 (b) | | | 310,331 | |
| | 300,000 | | | Morgan Stanley Capital I Trust
Series 2007-HQ11, Class AJ
5.508%, 02/12/44 (b)
| | | 314,495 | |
| | 250,000 | | | Morgan Stanley Capital I Trust
Series 2007-IQ13, Class AM
5.406%, 03/15/44 | | | 268,721 | |
| | 1,420,308 | | | Morgan Stanley Capital I Trust
Series 2011-C1, Class XA
0.911%, 09/15/47 (a) (b) | | | 24,468 | |
| | 250,000 | | | Morgan Stanley Capital I Trust
Series 2014-CPT, Class E
3.446%, 07/13/29 (a) (b) | | | 245,545 | |
| | 1,150,943 | | | Morgan Stanley Mortgage Loan Trust
Series 2005-3AR, Class 2A2
2.847%, 07/25/35 (b) | | | 1,071,466 | |
| | 300,000 | | | Nomura Asset Acceptance Corp Alternative Loan Trust
Series 2005-AP3, Class A3
5.318%, 08/25/35 (b) | | | 229,100 | |
| | 243,068 | | | Residential Asset Securitization Trust
Series 2006-A6, Class 1A1
6.500%, 07/25/36 | | | 151,531 | |
| | 573,817 | | | Residential Asset Securitization Trust
Series 2007-A1, Class A8
6.000%, 03/25/37 | | | 442,361 | |
| | 3,051,589 | | | Sequoia Mortgage Trust
Series 2013-1, Class 2A1
1.855%, 02/25/43 (b) | | | 2,754,379 | |
| | 400,045 | | | Structured Adjustable Rate Mortgage Loan Trust
Series 2006-1, Class 2A2
2.435%, 02/25/36 (b) | | | 356,784 | |
| | 1,928,943 | | | UBS-Barclays Commercial Mortgage Trust
Series 2012-C3, Class XA
2.138%, 08/10/49 (a) (b) | | | 220,032 | |
| | 350,000 | | | Wachovia Bank Commercial Mortgage Trust
Series 2007-C30, Class AMFL
0.357%, 12/15/43 (a) (b) | | | 339,067 | |
| | 300,000 | | | Wachovia Bank Commercial Mortgage Trust
Series 2007-C33, Class AJ
5.941%, 02/15/51 (b) | | | 316,100 | |
| | 496,296 | | | Wells Fargo Mortgage Backed Securities Trust
Series 2007-13, Class A6
6.000%, 09/25/37 | | | 518,306 | |
| | | | | | | | |
| | | | | | | | |
Par Value | | | | | Market
Value | |
| | $ 529,179 | | | Wells Fargo Mortgage Backed Securities Trust
Series 2007-8, Class 1A16
6.000%, 07/25/37 | | $ | 525,018 | |
| | 971,234 | | | WF-RBS Commercial Mortgage Trust
Series 2012-C8, Class XA
2.207%, 08/15/45 (a) (b) | | | 103,035 | |
| | 1,443,252 | | | WF-RBS Commercial Mortgage Trust
Series 2012-C9, Class XA
2.221%, 11/15/45 (a) (b) | | | 165,734 | |
| | | | | | | | |
| | |
| | | | Total Collateralized Mortgage-Backed Securities
(Cost $36,810,719) | | | 38,401,273 | |
| | | | | | | | |
|
| | U.S. GOVERNMENT OBLIGATIONS – 16.73% | |
| | |
| | | | U.S. Treasury Bonds – 2.94% | | | | |
| | 5,490,000 | | | 3.625%, 02/15/44 | | | 6,094,757 | |
| | | | | | | | |
| | |
| | | | U.S. Treasury Notes – 13.79% | | | | |
| | 1,830,000 | | | 0.250%, 01/31/15 | | | 1,830,858 | |
| | 3,820,000 | | | 0.250%, 02/28/15 | | | 3,822,387 | |
| | 6,510,000 | | | 0.250%, 03/31/15 | | | 6,514,069 | |
| | 4,080,000 | | | 1.000%, 08/31/19 | | | 3,964,295 | |
| | 1,650,000 | | | 1.875%, 06/30/20 | | | 1,656,574 | |
| | 5,620,000 | | | 1.750%, 10/31/20 | | | 5,573,461 | |
| | 1,530,000 | | | 1.625%, 08/15/22 | | | 1,474,179 | |
| | 3,620,000 | | | 2.750%, 11/15/23 | | | 3,764,518 | |
| | | | | | | | |
| | | | | | | | |
| | | | | | | 28,600,341 | |
| | | | | | | | |
| | |
| | | | Total U.S. Government Obligations
(Cost $34,447,692) | | | 34,695,098 | |
| | | | | | | | |
|
| | AGENCY COLLATERALIZED MORTGAGE OBLIGATIONS – 8.69% | |
| | |
| | | | Fannie Mae – 2.75% | | | | |
| | 558,217 | | | 5.646%, 09/25/36 (b) (e)
Series 2009-86, Class CI, REMIC | | | 64,454 | |
| | 304,823 | | | 6.468%, 10/25/36 (b) (e)
Series 2007-57, Class SX, REMIC | | | 47,934 | |
| | 307,576 | | | 4.000%, 01/25/41
Series 2010-156, Class ZC, REMIC | | | 315,645 | |
| | 463,074 | | | 4.000%, 03/25/41
Series 2011-18, Class UZ, REMIC | | | 479,083 | |
| | 47,576 | | | 8.987%, 09/25/41 (b)
Series 2011-88, Class SB, REMIC | | | 47,808 | |
| | 552,959 | | | 4.500%, 12/25/41
Series 2011-121, Class JP, REMIC | | | 598,464 | |
| | 1,097,678 | | | 3.500%, 03/25/42
Series 2012-20, Class ZT, REMIC | | | 1,071,117 | |
| | 1,663,006 | | | 4.000%, 04/25/42
Series 2012-31, Class Z, REMIC | | | 1,715,957 | |
| | 1,075,527 | | | 3.500%, 10/25/42
Series 2012-105, Class Z, REMIC | | | 1,024,284 | |
| | 428,273 | | | 1.500%, 02/25/43
Series 2013-6, Class ZH, REMIC | | | 334,386 | |
| | | | | | | | |
| | | | | | | 5,699,132 | |
| | | | | | | | |
| | | | | | | | |
See accompanying Notes to Financial Statements.
| | |
| |
| ASTON/DoubleLine Core Plus Fixed Income Fund | | October 31, 2014 |
| |
| Schedule of Investments – continued | | |
| | | | | | | | |
Par Value | | | | | Market
Value | |
| | |
| | | | Freddie Mac – 4.69% | | | | |
| | $ 724,568 | | | 5.000%, 12/15/34
Series 2909, Class Z, REMIC | | $ | 791,145 | |
| | 355,146 | | | 5.500%, 08/15/36
Series 3626, Class AZ, REMIC | | | 389,348 | |
| | 205,327 | | | 5.947%, 04/15/37 (b) (e)
Series 3301, Class MS, REMIC | | | 26,557 | |
| | 122,378 | | | 5.847%, 11/15/37 (b) (e)
Series 3382, Class SB, REMIC | | | 14,236 | |
| | 124,058 | | | 6.237%, 11/15/37 (b) (e)
Series 3384, Class S, REMIC | | | 18,893 | |
| | 1,500,000 | | | 4.000%, 12/15/38
Series 3738, Class BP, REMIC | | | 1,599,263 | |
| | 405,829 | | | 5.367%, 01/15/39 (b) (e)
Series 3500, Class SA, REMIC | | | 48,265 | |
| | 116,154 | | | 4.000%, 01/15/41
Series 3795, Class VZ, REMIC | | | 120,967 | |
| | 101,918 | | | 4.000%, 06/15/41
Series 3872, Class BA, REMIC | | | 106,462 | |
| | 227,716 | | | 4.000%, 07/15/41
Series 3888, Class ZG, REMIC | | | 237,953 | |
| | 404,955 | | | 4.500%, 07/15/41
Series 3894, Class ZA, REMIC | | | 439,413 | |
| | 14,901 | | | 9.247%, 09/15/41 (b)
Series 3924, Class US, REMIC | | | 14,770 | |
| | 553,656 | | | 3.500%, 11/15/41
Series 3957, Class DZ, REMIC | | | 532,580 | |
| | 505,587 | | | 4.000%, 11/15/41
Series 3957, Class HZ, REMIC | | | 523,873 | |
| | 4,683,216 | | | 3.000%, 06/15/40
Series 4323, Class GA, REMIC | | | 4,863,496 | |
| | | | | | | | |
| | | | | | | 9,727,221 | |
| | | | | | | | |
| |
| | | | Ginnie Mae – 1.25% | |
| | 44,790 | | | 31.480%, 03/20/34 (b)
Series 2004-35, Class SA | | | 71,171 | |
| | 612,221 | | | 7.473%, 08/20/38 (b) (e)
Series 2008-69, Class SB | | | 116,458 | |
| | 416,649 | | | 5.903%, 03/20/39 (b) (e)
Series 2010-98, Class IA | | | 40,639 | |
| | 727,022 | | | 4.500%, 05/16/39
Series 2009-32, Class ZE | | | 786,282 | |
| | 637,722 | | | 4.500%, 05/20/39
Series 2009-35, Class DZ | | | 693,376 | |
| | 628,245 | | | 4.500%, 09/20/39
Series 2009-75, Class GZ | | | 675,963 | |
| | 1,565,368 | | | 5.293%, 06/20/41 (b) (e)
Series 2011-89, Class SA | | | 204,023 | |
| | | | | | | | |
| | | | | | | 2,587,912 | |
| | | | | | | | |
| | |
| | | | Total Agency Collateralized Mortgage Obligations
(Cost $17,815,947) | | | 18,014,265 | |
| | | | | | | | |
| | | | | | | | |
| | | | | | | | |
Par Value | | | | | Market
Value | |
|
| | U.S. GOVERNMENT MORTGAGE-BACKED SECURITIES – 4.01% | |
| | |
| | | | Fannie Mae – 2.28% | | | | |
| | $ 340,266 | | | 4.000%, 09/01/31
Pool # MA3894 | | $ | 365,165 | |
| | 823,992 | | | 3.500%, 12/01/31
Pool # MA0919 | | | 865,645 | |
| | 725,987 | | | 3.500%, 01/01/32
Pool # MA0949 | | | 762,685 | |
| | 1,810,393 | | | 3.000%, 06/01/33
Pool # MA1459 | | | 1,853,904 | |
| | 330,899 | | | 4.500%, 03/01/42
Pool # MA1050 | | | 353,642 | |
| | 498,681 | | | 4.000%, 06/01/42
Pool # AB5459 | | | 524,890 | |
| | | | | | | | |
| | | | | | | 4,725,931 | |
| | | | | | | | |
| | |
| | | | Freddie Mac – 1.73% | | | | |
| | 1,738,286 | | | 3.000%, 01/01/33
Gold Pool # C91594 | | | 1,780,305 | |
| | 52,245 | | | 5.000%, 07/01/35
Gold Pool # G01840 | | | 57,932 | |
| | 16,978 | | | 5.500%, 12/01/38
Gold Pool # G06172 | | | 18,934 | |
| | 339,754 | | | 4.000%, 10/01/41
Gold Pool # T60392 | | | 357,313 | |
| | 1,338,955 | | | 3.500%, 10/01/42
Gold Pool # T65110 | | | 1,370,196 | |
| | | | | | | | |
| | | | | | | 3,584,680 | |
| | | | | | | | |
| | |
| | | | Total U.S. Government Mortgage-Backed Securities
(Cost $8,341,675) | | | 8,310,611 | |
| | | | | | | | |
|
| | OTHER ASSET-BACKED SECURITIES – 4.64% | |
| | 250,000 | | | Adams Mill CLO (Cayman Islands)
Series 2014-1A, Class D1
3.697%, 07/15/26 (a) (b) | | | 230,748 | |
| | 250,000 | | | Series 2014-1A, Class E1
5.197%, 07/15/26 (a) (b) | | | 221,229 | |
| | 250,000 | | | ALM IV (Cayman Islands)
Series 2011-A4, Class C
2.978%, 07/18/22 (a) (b) | | | 249,995 | |
| | 250,000 | | | Apidos CLO XVIII (Cayman Islands)
Series 2014-18A, Class C
3.884%, 07/22/26 (a) (b) | | | 236,783 | |
| | 250,000 | | | Series 2014-18A, Class D
5.434%, 07/22/26 (a) (b) | | | 227,257 | |
| | 250,000 | | | ARES CLO (Cayman Islands)
Series 2012-2A, Class D
4.930%, 10/12/23 (a) (b) | | | 250,039 | |
| | 500,000 | | | ARES XXVI CLO (Cayman Islands)
Series 2013-1A, Class D
3.981%, 04/15/25 (a) (b) | | | 468,179 | |
| | 250,000 | | | Babson CLO (Cayman Islands)
Series 2014-3A, Class E2
6.732%, 01/15/26 (a) (b) (c) | | | 250,000 | |
| | | | | | | | |
See accompanying Notes to Financial Statements.
| | |
| |
| ASTON/DoubleLine Core Plus Fixed Income Fund | | October 31, 2014 |
| |
| Schedule of Investments – continued | | |
| | | | | | | | |
Par Value | | | | | Market
Value | |
| | $ 250,000 | | | Ballyrock CLO (Cayman Islands)
Series 2014-1A, Class C
3.981%, 10/20/26 (a) (b) (c) | | $ | 236,128 | |
| | 1,025,221 | | | Bayview Financial Acquisition Trust
Series 2007-A, Class 1A5
6.101%, 05/28/37 (d) | | | 1,030,941 | |
| | | | Birchwood Park CLO (Cayman Islands) | | | | |
| | 250,000 | | | Series 2014-1A, Class C2
3.384%, 07/15/26 (a) (b) | | | 244,459 | |
| | 250,000 | | | Series 2014-1A, Class D2
4.434%, 07/15/26 (a) (b) | | | 243,059 | |
| | 250,000 | | | BlueMountain CLO (Cayman Islands)
Series 2012-1A, Class E
5.731%, 07/20/23 (a) (b) | | | 237,055 | |
| | 250,000 | | | Brookside Mill CLO (Cayman Islands)
Series 2013-1A, Class D
3.278%, 04/17/25 (a) (b) | | | 224,322 | |
| | 250,000 | | | Series 2013-1A, Class E
4.628%, 04/17/25 (a) (b) | | | 216,513 | |
| | 100,000 | | | Credit-Based Asset Servicing and Securitization
Series 2007-MX1, Class A4
6.231%, 12/25/36 (a) (d) | | | 95,484 | |
| | 250,000 | | | Eaton Vance CDO VIII (Cayman Islands)
Series 2006-8A, Class B
0.884%, 08/15/22 (a) (b) (c) | | | 239,688 | |
| | 250,000 | | | Emerson Park CLO (Cayman Islands)
Series 2013-1A, Class C1
2.981%, 07/15/25 (a) (b) | | | 240,837 | |
| | 250,000 | | | Flatiron CLO (Cayman Islands)
Series 2014-1A, Class B
3.086%, 07/17/26 (a) (b) | | | 239,659 | |
| | 250,000 | | | Series 2014-1A, Class C
3.536%, 07/17/26 (a) (b) | | | 227,723 | |
| | 250,000 | | | Goldentree Loan Opportunities VI (Cayman Islands)
Series 2012-6A, Class D
4.428%, 04/17/22 (a) (b) | | | 248,813 | |
| | 757,000 | | | GSAA Home Equity Trust
Series 2006-15, Class AF3B
5.933%, 09/25/36 (b) | | | 186,346 | |
| | 250,000 | | | Halcyon Loan Advisors Funding (Cayman Islands)
Series 2013-2A, Class C
2.932%, 08/01/25 (a) (b) | | | 236,980 | |
| | 500,000 | | | LCM VI (Cayman Islands)
Series 6A, Class C
1.038%, 05/28/19 (a) (b) | | | 484,570 | |
| | 250,000 | | | LCM XI (Cayman Islands)
Series 11A, Class D
4.180%, 04/19/22 (a) (b) | | | 244,924 | |
| | 250,000 | | | LCM XIV (Cayman Islands)
Series 14A, Class D
3.731%, 07/15/25 (a) (b) | | | 232,217 | |
| | 250,000 | | | LCM XV (Cayman Islands)
Series 15A, Class C
3.335%, 08/25/24 (a) (b) | | | 244,406 | |
| | | | | | | | |
| | | | | | | | |
Par Value | | | | | Market
Value | |
| | $ 350,000 | | | Madison Park Funding IV (Cayman Islands)
Series 2007-4A, Class D
1.663%, 03/22/21 (a) (b) | | $ | 334,250 | |
| | 250,000 | | | Nomad CLO (Cayman Islands)
Series 2013-1A, Class B
3.181%, 01/15/25 (a) (b) | | | 240,794 | |
| | 250,000 | | | Series 2013-1A, Class C
3.731%, 01/15/25 (a) (b) | | | 232,061 | |
| | 250,000 | | | Octagon Investment Partners XVI (Cayman Islands)
Series 2013-1A, Class D
3.578%, 07/17/25 (a) (b) | | | 229,969 | |
| | 250,000 | | | Series 2013-1A, Class E
4.728%, 07/17/25 (a) (b) | | | 218,099 | |
| | 250,000 | | | Octagon Investment Partners XXI (Cayman Islands)
Series 2014-1A, Class C
3.884%, 11/14/26 (a) (b) (c) | | | 239,390 | |
| | 182,597 | | | Residential Asset Mortgage Products Series 2006-RS5, Class A3
0.322%, 09/25/36 (b) | | | 177,165 | |
| | 250,000 | | | WhiteHorse III (Cayman Islands)
Series 2006-1A, Class B1L
2.082%, 05/01/18 (a) (b) | | | 244,448 | |
| | 250,000 | | | Wind River CLO (Cayman Islands)
Series 2013-1A, Class C
3.631%, 04/20/25 (a) (b) | | | 226,683 | |
| | | | | | | | |
| | |
| | | | Total Asset-Backed Securities
(Cost $9,793,917) | | | 9,631,213 | |
| | | | | | | | |
|
| | FOREIGN GOVERNMENT BONDS – 0.30% | |
| | 225,000 | | | Corp Andina de Fomento
Senior Unsecured Notes
3.750%, 01/15/16 | | | 232,904 | |
| | 200,000 | | | Costa Rica Government International Bond
Senior Unsecured Notes
7.000%, 04/04/44 (a) | | | 207,000 | |
| | 170,000 | | | Mexico Government International Bond
Senior Unsecured Notes
4.000%, 10/02/23 | | | 178,118 | |
| | | | | | | | |
| | |
| | | | Total Foreign Government Bonds
(Cost $604,056) | | | 618,022 | |
| | | | | | | | |
See accompanying Notes to Financial Statements.
| | |
| |
| ASTON/DoubleLine Core Plus Fixed Income Fund | | October 31, 2014 |
| |
| Schedule of Investments – continued | | |
| | | | | | | | |
Share | | | | | Market
Value | |
|
| | INVESTMENT COMPANIES – 8.93% | |
| | |
| | 15,994,686 | | | BlackRock Liquidity Funds TempCash Portfolio | | $ | 15,994,686 | |
| | 250,173 | | | DoubleLine Floating Rate Fund (f) | | | 2,514,243 | |
| | | | | | | | |
| | |
| | | | Total Investment Companies
(Cost $18,511,431) | | | 18,508,929 | |
| | | | | | | | |
| Total Investments – 90.71%
(Cost $185,351,319)* | | | 188,077,296 | |
| | | | | | | | |
| Net Other Assets and Liabilities – 9.29% | | | 19,268,328 | |
| | | | | | | | |
| Net Assets – 100.00% | | $ | 207,345,624 | |
| | | | | | | | |
| * | | Aggregate cost for Federal income tax purposes is $185,704,367. |
| | | | |
Gross unrealized appreciation | | $ | 4,041,931 | |
Gross unrealized depreciation | | | (1,669,002 | ) |
| | | | |
Net unrealized appreciation | | $ | 2,372,929 | |
| | | | |
| (a) | | Securities exempt from registration under Rule 144A of the Securities Act of 1933, as amended. These securities are purchased in accordance with guidelines approved by the Funds’ Board of Trustees and may only be resold, in transactions exempt from registration, to qualified institutional buyers. At October 31, 2014, these securities amounted to $33,778,428 or 16.29% of net assets. These securities have not been determined by the Subadviser to be illiquid securities. |
| (b) | | Variable rate bond. The interest rate shown reflects the rate in effect at October 31, 2014. |
| (c) | | Securities with a total aggregate market value of $1,926,225 or 0.93% of the net assets, were valued under the fair value procedures established by the Funds’ Board of Trustees. |
| (d) | | Step Coupon. Security becomes interest bearing at a future date. |
| (e) | | Interest only security. This type of security represents the right to receive the monthly interest payments on an underlying pool of mortgages. Payments of principal on the pool reduces the value of the “interest only” holding. |
| (f) | | Affiliated Fund. See Note G in Notes to Financial Statements. |
| EMTN | | Euro Medium Term Note |
| GMTN | | Global Medium Term Note |
| REIT | | Real Estate Investment Trust |
| REMIC | | Real Estate Mortgage Investment Conduit |
| | | | |
Portfolio Composition | | | | |
U.S. Government Obligations | | | 17% | |
U.S. Government Agency Obligations | | | 30% | |
Corporate Notes and Bonds | | | | |
(S&P Ratings (unaudited)) | | | | |
AAA | | | 3% | |
AA | | | 2% | |
A | | | 6% | |
BBB | | | 12% | |
BB | | | 15% | |
B | | | 6% | |
Lower than B | | | 9% | |
| | | | |
| | | 100% | |
| | | | |
For financial reporting purposes, credit quality ratings shown are assigned by Standard & Poor’s. This rating agency is an independent, nationally recognized statistical rating organization and is widely used. Investment grade ratings are credit ratings of BBB or higher. Below investment grade ratings are credit ratings of BB or lower. Credit quality ratings are subject to change.
See accompanying Notes to Financial Statements.
ASTON/TCH Fixed Income Fund
| | |
| |
| Portfolio Manager Commentary (unaudited) | | October 31, 2014 |
Tere Alvarez Canida, CFA; Alan M. Habacht, William J. Canida, CFA; & Scott M. Kimball |
| Q. | What were the most significant market factors affecting Fund performance and returns relative to the benchmark during the past 12 months? |
| A. | Despite fears surrounding the Federal Reserve’s tapering program, fixed income broadly performed well during the trailing twelve months. Diversified sources of alpha drove the portfolio’s outperformance versus its benchmark. Yield curve positioning, sector and quality selection, and security selection all contributed to the Fund’s outperformance. |
The Fund’s barbelled position on the yield curve emphasizing longer maturity securities paired with high quality floating rate notes contributed to performance as the yield curve flattened. A sector overweight to Credit securities benefited the Fund. Credit was the best performing fixed income sector, delivering 206 basis points (bps) of excess return. Within Credit, the Fund was overweight lower quality investment grade securities, which outperformed higher quality securities with BBB rated securities outperforming AAA rated securities* by 256 bps of excess return. Finally, performance was enhanced by favorable individual security selection.
| Q. | What were the best performing holdings for the Fund during the period? |
| A. | Corporate Bonds was the best performing sector held in the portfolio. Corporates benefited from the overall decline in interest rates during the period, tightening spreads versus Treasuries and the embedded carry of the bonds. Security selection within this sector contributed to performance. |
| Q. | What were the weakest performing holdings? |
| A. | Our exposure to Treasury Inflation-Protected Securities (TIPS) detracted from returns as TIPS underperformed nominal securities during the last year, as signs of a significant increase in inflation remain muted. |
| Q. | How was the Fund positioned as of October 31, 2014? |
| A. | Despite recent flattening, the yield curve remains steep. The portfolio is positioned with a barbell structure in anticipation of further yield curve flattening. Now that the Federal Reserve has announced the end of new asset purchases from its quantitative easing program, market expectations are that the launch date for the next Federal Funds rate hike cycle is approaching. Our perspective is that much like the other recent Federal Funds rate hike cycles, the next cycle will result in a flattening yield curve. Within our yield curve exposure, we continue to believe an allocation to floating rate securities is warranted. |
The portfolio remains overweight non-government sectors. Over the past year, the Fund increased its holdings in agency mortgage-backed securities to reduce positions in credits that we believe had become rich in terms of valuation. Nonetheless, we continue to believe broadly that U.S. investment grade credit offers excellent relative value, opting for certain non-U.S. corporate bonds as a means of diversification in lieu of moving significantly lower in credit quality. The improving domestic outlook for growth remains supportive of spread sectors in fixed income. While inflation has remained contained, we maintain a modest allocation to TIPS to protect against increased inflation expectations. We believe the interest rate volatility and spread widening in the most recent quarter have provided an opportunity to invest in credits at more attractive levels than a few months prior. As yields remain low and we do not believe we can rely on spread tightening in the credit or mortgage sectors, we expect that security selection and relative value decisions will play an even more important role in the portfolio in the coming year.
Note: A basis point (bps) is a unit of measure. 1bps = .01%.
| * | | Standard and Poor’s assigns a credit quality rating from AAA (highest quality) to D (lowest quality). Credit quality ratings refer to the underlying bonds in the Fund’s portfolio and not of the Fund itself. |
Growth of a Hypothetical
$10,000 Investment—Class N
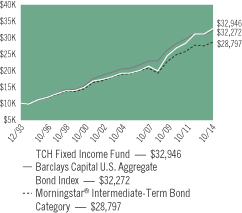
All dividends and capital gains are reinvested. Indexes are unmanaged and do not take into account fees, expenses or other costs.
Returns shown in the chart and table do not reflect taxes that a shareholder would pay on Fund distributions or on the sale of the Fund shares.
Bond funds have the same interest rate, high yield and credit risks associated with the underlying bonds in the portfolio, all of which could reduce the Fund’s value. As interest rates rise, the value of the Fund can decline and an investor can lose principal.
RETURNSFOR PERIOD ENDED 10/31/14
Average Annual Total Returns - Class N
| | | | |
One Year | | | 5.48 | % |
Five Year | | | 6.13 | % |
Ten Year | | | 5.59 | % |
Since Inception | | | 5.88 | % |
Inception Date 12/13/93
Average Annual Total Returns - Class I
| | | | |
One Year | | | 5.75 | % |
Five Year | | | 6.33 | % |
Ten Year | | | 5.81 | % |
Since Inception | | | 6.16 | % |
Inception Date 07/31/00
The performance data quoted represents past performance. Past performance does not guarantee future results. Investment return and principal value will fluctuate so that an investor’s shares, upon redemption, may be worth more or less than their original cost. Current performance may be lower or higher than the performance data quoted. For performance data current to the most recent month-end, please visit our website at www.astonfunds.com.
The performance quoted would have been lower if fee waivers and/or expense reimbursements had not been in effect.
The total expense ratios for Class N and Class I shares are 1.13% and 0.88%, respectively, as disclosed in the prospectus dated February 28, 2014. Please refer to the Financial Highlights section in this report for more information.
| | |
| |
| ASTON/TCH Fixed Income Fund | | October 31, 2014 |
| |
| Schedule of Investments | | |
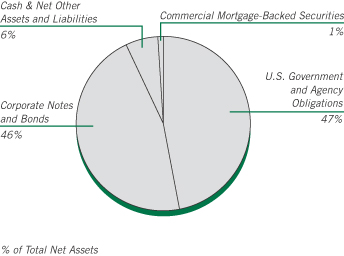
| | | | | | | | |
Par Value | | | | | Market
Value | |
| | | | | | | | |
|
| | CORPORATE NOTES AND BONDS – 46.42% | |
| | |
| | | | Consumer Discretionary – 3.08% | | | | |
| | $ 350,000 | | | ADT
Senior Unsecured Notes
4.875%, 07/15/42 | | $ | 295,312 | |
| | 865,000 | | | L Brands
Senior Unsecured Notes
7.600%, 07/15/37 | | | 947,175 | |
| | 100,000 | | | Macy’s Retail Holdings
7.875%, 07/15/15 (b) | | | 104,970 | |
| | 250,000 | | | Nabisco
Senior Unsecured Notes
7.550%, 06/15/15 | | | 260,460 | |
| | | | | | | | |
| | | | | | | 1,607,917 | |
| | | | | | | | |
| | |
| | | | Consumer Staples – 0.80% | | | | |
| | 65,000 | | | Altria Group
10.200%, 02/06/39 | | | 111,699 | |
| | 150,000 | | | PepsiCo
Senior Unsecured Notes
7.900%, 11/01/18 | | | 184,584 | |
| | 100,000 | | | Reynolds American
7.750%, 06/01/18 | | | 118,609 | |
| | | | | | | | |
| | | | | | | 414,892 | |
| | | | | | | | |
| | |
| | | | Energy – 3.69% | | | | |
| | | | Chesapeake Energy | | | | |
| | 250,000 | | | 6.625%, 08/15/20 | | | 283,125 | |
| | 250,000 | | | 6.125%, 02/15/21 | | | 278,750 | |
| | 250,000 | | | Energy Transfer Partners
Senior Unsecured Notes
9.000%, 04/15/19 | | | 313,945 | |
| | 250,000 | | | KazMunayGas National (Kazakhstan)
Senior Unsecured Notes
5.750%, 04/30/43 (a) | | | 244,375 | |
| | | | | | | | |
Par Value | | | | | Market
Value | |
| | | | | | | | |
| | |
| | | | Energy (continued) | | | | |
| | $ 250,000 | | | Pride International
6.875%, 08/15/20 | | $ | 292,582 | |
| | 400,000 | | | Weatherford International (Bermuda)
9.625%, 03/01/19 | | | 511,628 | |
| | | | | | | | |
| | | | | | | 1,924,405 | |
| | | | | | | | |
| | |
| | | | Financials – 14.68% | | | | |
| | 250,000 | | | AerCap Ireland Capital (Ireland)
4.500%, 05/15/21 (a) | | | 252,812 | |
| | 450,000 | | | American Financial Group
Senior Unsecured Notes
9.875%, 06/15/19 | | | 580,960 | |
| | 250,000 | | | Banco Bradesco SA/Cayman Islands (Brazil)
Subordinated Notes
5.750%, 03/01/22 (a) | | | 264,850 | |
| | 250,000 | | | Bancolombia SA (Colombia)
Senior Unsecured Notes | | | | |
| | | | 5.950%, 06/03/21 | | | 278,437 | |
| | 250,000 | | | Subordinated Notes
5.125%, 09/11/22 | | | 256,250 | |
| | 580,000 | | | Bank of America
Senior Unsecured Notes
1.271%, 01/15/19 (c) | | | 587,752 | |
| | 250,000 | | | Barrick North America Finance
5.700%, 05/30/41 | | | 240,553 | |
| | | | Blackstone Holdings Finance | | | | |
| | 150,000 | | | 6.625%, 08/15/19 (a) (d) | | | 178,786 | |
| | 250,000 | | | 6.250%, 08/15/42 (a) (d) | | | 312,215 | |
| | 250,000 | | | Bunge Ltd Finance
8.500%, 06/15/19 | | | 309,902 | |
| | 500,000 | | | Credit Suisse New York (Switzerland), MTN Senior Unsecured Notes
0.535%, 03/11/16 (c) | | | 499,898 | |
| | 250,000 | | | Discover Bank Subordinated Notes
7.000%, 04/15/20 | | | 296,244 | |
| | 500,000 | | | Ford Motor
Senior Unsecured Notes
1.162%, 11/04/19 (c) | | | 501,092 | |
| | 375,000 | | | Goldman Sachs Group
Senior Unsecured Notes
1.251%, 10/23/19 (c) | | | 376,715 | |
| | 500,000 | | | Goldman Sachs Group, MTN
Senior Unsecured Notes
1.334%, 11/15/18 (c) | | | 505,614 | |
| | 400,000 | | | Itau Unibanco Holding SA (Brazil) Subordinated Notes
5.500%, 08/06/22 (a) | | | 412,880 | |
| | | | Jefferies Group | | | | |
| | | | Senior Unsecured Notes | | | | |
| | 200,000 | | | 8.500%, 07/15/19 | | | 249,080 | |
| | 250,000 | | | 6.500%, 01/20/43 | | | 281,096 | |
| | 200,000 | | | Leucadia National
Senior Unsecured Notes
5.500%, 10/18/23 | | | 210,156 | |
| | 250,000 | | | Nomura Holdings (Japan), MTN
Senior Unsecured Notes
1.684%, 09/13/16 (c) | | | 254,549 | |
See accompanying Notes to Financial Statements.
| | |
| |
| ASTON/TCH Fixed Income Fund | | October 31, 2014 |
| |
| Schedule of Investments – continued | | |
| | | | | | | | |
Par Value | | | | | Market
Value | |
| | | | | | | | |
| | |
| | | | Financials (continued) | | | | |
| | $ 300,000 | | | Turkiye Halk Bankasi AS (Turkey)
Senior Unsecured Notes
4.750%, 06/04/19 (a) | | $ | 301,621 | |
| | 500,000 | | | Wells Fargo
Senior Unsecured Notes
1.155%, 06/26/15 (c) | | | 502,783 | |
| | | | | | | | |
| | | | | | | 7,654,245 | |
| | | | | | | | |
| | |
| | | | Healthcare – 3.60% | | | | |
| | 500,000 | | | Bayer US Finance
0.482%, 10/07/16 (a) (c) | | | 500,620 | |
| | 310,000 | | | Endo Finance
7.000%, 07/15/19 (a) | | | 327,437 | |
| | 250,000 | | | Humana
Senior Unsecured Notes
8.150%, 06/15/38 | | | 357,711 | |
| | 500,000 | | | Lorillard Tobacco
8.125%, 05/01/40 | | | 693,106 | |
| | | | | | | | |
| | | | | | | 1,878,874 | |
| | | | | | | | |
| | |
| | | | Industrials – 5.63% | | | | |
| | 500,000 | | | Ball Corp
5.000%, 03/15/22 | | | 526,250 | |
| | 250,000 | | | FedEx
Senior Notes
8.000%, 01/15/19 | | | 307,064 | |
| | 200,000 | | | Jaguar Land Rover Automotive
(United Kingdom)
4.125%, 12/15/18 (a) | | | 204,500 | |
| | 500,000 | | | Mexichem SAB de CV (Mexico)
6.750%, 09/19/42 (a) | | | 548,750 | |
| | 200,000 | | | Nissan Motor Acceptance
0.935%, 09/26/16 (a) (c) | | | 201,372 | |
| | 500,000 | | | Southern Copper
Senior Unsecured Notes
7.500%, 07/27/35 | | | 596,855 | |
| | 250,000 | | | Vale SA (Brazil)
Senior Unsecured Notes
5.625%, 09/11/42 | | | 248,300 | |
| | 250,000 | | | Waste Management
7.375%, 03/11/19 | | | 302,297 | |
| | | | | | | | |
| | | | | | | 2,935,388 | |
| | | | | | | | |
| | |
| | | | Information Technology – 2.38% | | | | |
| | 150,000 | | | Hewlett-Packard
Senior Unsecured Notes
1.170%, 01/14/19 (c) | | | 149,604 | |
| | 250,000 | | | Micron Technology
Senior Unsecured Notes
5.500%, 02/01/25 (a) | | | 253,750 | |
| | 150,000 | | | Netflix Inc.
Senior Unsecured Notes
5.750%, 03/01/24 (a) | | | 157,875 | |
| | 600,000 | | | Telecom Italia Capital SA (Luxembourg)
7.721%, 06/04/38 | | | 681,000 | |
| | | | | | | | |
| | | | | | | 1,242,229 | |
| | | | | | | | |
| | | | | | | | |
Par Value | | | | | Market
Value | |
| | | | | | | | |
| | |
| | | | Materials – 4.60% | | | | |
| | $ 100,000 | | | Allegheny Technologies
Senior Unsecured Notes
6.125%, 08/15/23 | | $ | 105,583 | |
| | 400,000 | | | ArcelorMittal (Luxembourg)
Senior Unsecured Notes
7.500%, 10/15/39 (b) | | | 429,000 | |
| | 500,000 | | | Braskem America Finance
7.125%, 07/22/41 (a) | | | 512,500 | |
| | 250,000 | | | Dow Chemical (The)
Senior Unsecured Notes
8.550%, 05/15/19 | | | 315,178 | |
| | 400,000 | | | GTL Trade Finance (Virgin Islands)
7.250%, 04/16/44 (a) | | | 417,000 | |
| | 250,000 | | | International Paper
Senior Unsecured Notes
8.700%, 06/15/38 | | | 369,732 | |
| | 250,000 | | | Teck Resources (Canada)
6.250%, 07/15/41 | | | 249,474 | |
| | | | | | | | |
| | | | | | | 2,398,467 | |
| | | | | | | | |
| | |
| | | | Telecommunication Services – 5.69% | | | | |
| | | | CenturyLink | | | | |
| | | | Senior Unsecured Notes | | | | |
| | 500,000 | | | 7.600%, 09/15/39 | | | 507,500 | |
| | 500,000 | | | 7.650%, 03/15/42 | | | 503,750 | |
| | 350,000 | | | Frontier Communications
Senior Unsecured Notes
9.000%, 08/15/31 | | | 381,500 | |
| | 250,000 | | | Telecom Italia Capital SA (Luxembourg)
6.375%, 11/15/33 | | | 253,750 | |
| | 500,000 | | | Telefonica Europe BV (Netherlands)
8.250%, 09/15/30 | | | 684,152 | |
| | 100,000 | | | Verizon Communications
Senior Unsecured Notes
1.764%, 09/15/16 (c) | | | 102,305 | |
| | 500,000 | | | Windstream
7.500%, 06/01/22 | | | 533,125 | |
| | | | | | | | |
| | | | | | | 2,966,082 | |
| | | | | | | | |
| | |
| | | | Utilities – 2.27% | | | | |
| | 500,000 | | | Dubai Electricity & Water Authority
(United Arab Emirates)
Senior Unsecured Notes
8.500%, 04/22/15 (a) | | | 516,125 | |
| | 450,000 | | | FPL Group Capital
7.875%, 12/15/15 | | | 485,676 | |
| | 150,000 | | | Pacific Gas & Electric | | | | |
| | | | Senior Unsecured Notes | | | | |
| | | | 8.250%, 10/15/18 | | | 183,064 | |
| | | | | | | | |
| | | | | | | 1,184,865 | |
| | | | | | | | |
| | |
| | | | Total Corporate Notes and Bonds
(Cost $21,902,431) | | | 24,207,364 | |
| | | | | | | | |
See accompanying Notes to Financial Statements.
| | |
| |
| ASTON/TCH Fixed Income Fund | | October 31, 2014 |
| |
| Schedule of Investments – continued | | |
| | | | | | | | |
Par Value | | | | | Market
Value | |
| | | | | | | | |
|
| | U.S. GOVERNMENT AND AGENCY OBLIGATIONS – 47.19% | |
| | |
| | | | Fannie Mae – 12.04% | | | | |
| | $ 139,211 | | | 6.000%, 11/01/17,
Pool # 662854 | | $ | 147,376 | |
| | 40,407 | | | 6.000%, 04/01/18,
Pool # 725175 | | | 42,095 | |
| | 145,210 | | | 5.500%, 11/01/18,
Pool # 748886 | | | 155,911 | |
| | 48,998 | | | 4.500%, 06/01/19,
Pool # 747860 | | | 52,008 | |
| | 255,587 | | | 6.000%, 01/01/21,
Pool # 850787 | | | 276,708 | |
| | 103,880 | | | 6.000%, 09/01/32,
Pool # 847899 | | | 117,423 | |
| | 75,017 | | | 6.000%, 02/01/34,
Pool # 771952 | | | 85,464 | |
| | 77,799 | | | 7.500%, 02/01/35,
Pool # 787557 | | | 90,386 | |
| | 18,624 | | | 7.500%, 04/01/35,
Pool # 819231 | | | 19,960 | |
| | 135,050 | | | 6.000%, 11/01/35,
Pool # 844078 | | | 153,458 | |
| | 102,506 | | | 5.000%, 05/01/36,
Pool # 745581 | | | 113,654 | |
| | 55,937 | | | 6.000%, 12/01/36,
Pool # 888029 | | | 63,432 | |
| | 75,801 | | | 5.500%, 06/01/37,
Pool # 918778 | | | 84,470 | |
| | 79,939 | | | 6.500%, 10/01/37,
Pool # 888890 | | | 90,809 | |
| | 242,566 | | | 5.500%, 03/01/38,
Pool # 962344 | | | 270,377 | |
| | 242,021 | | | 4.000%, 02/01/41,
Pool # AE0949 | | | 257,451 | |
| | 215,197 | | | 4.000%, 02/01/41,
Pool # AH5695 | | | 228,851 | |
| | 942,983 | | | 3.000%, 03/01/43,
Pool # AB8615 | | | 945,119 | |
| | 544,849 | | | 3.500%, 05/01/43,
Pool # AB9512 | | | 564,105 | |
| | 565,745 | | | 3.000%, 07/01/43,
Pool # AU1629 | | | 566,917 | |
| | 949,894 | | | 3.000%, 08/01/43,
Pool # AS0331 | | | 951,826 | |
| | 1,000,000 | | | 3.000%, 09/01/44,
Pool # AX7336 | | | 1,001,462 | |
| | | | | | | | |
| | | | | | | 6,279,262 | |
| | | | | | | | |
| | |
| | | | Freddie Mac – 13.87% | | | | |
| | 264,912 | | | 5.500%, 11/01/20,
Gold Pool # G18083 | | | 287,167 | |
| | 52,916 | | | 5.500%, 12/01/20,
Gold Pool # G11820 | | | 57,355 | |
| | 34,625 | | | 6.000%, 10/01/35,
Gold Pool # A47772 | | | 39,082 | |
| | 85,456 | | | 5.500%, 05/01/37,
Gold Pool # A60048 | | | 95,420 | |
| | | | | | | | |
Par Value | | | | | Market
Value | |
| | | | | | | | |
| | |
| | | | Fannie Mae (continued) | | | | |
| | $ 164,059 | | | 5.500%, 09/01/37,
Gold Pool # G03202 | | $ | 183,131 | |
| | 130,671 | | | 5.000%, 02/01/38,
Gold Pool # A73409 | | | 144,357 | |
| | 374,030 | | | 5.000%, 04/01/38,
Gold Pool # G04334 | | | 416,523 | |
| | 224,451 | | | 4.000%, 12/01/39,
Gold Pool # G06935 | | | 238,396 | |
| | 109,527 | | | 4.000%, 05/01/41,
Gold Pool # Q00870 | | | 116,332 | |
| | 687,112 | | | 4.000%, 11/01/41,
Gold Pool # Q04550 | | | 729,804 | |
| | 918,188 | | | 3.000%, 04/01/43,
Gold Pool # V80006 | | | 922,205 | |
| | 926,478 | | | 3.000%, 05/01/43,
Gold Pool # G08525 | | | 928,665 | |
| | 473,866 | | | 3.000%, 09/01/43,
Gold Pool # G08544 | | | 474,874 | |
| | 847,011 | | | 3.500%, 10/01/43,
Gold Pool # G08554 | | | 874,922 | |
| | 329,683 | | | 3.500%, 11/01/43,
Gold Pool # G08557 | | | 340,547 | |
| | 763,802 | | | 3.500%, 01/01/44,
Gold Pool # G08562 | | | 788,971 | |
| | 577,621 | | | 3.500%, 02/01/44,
Gold Pool # G08572 | | | 596,655 | |
| | | | | | | | |
| | | | | | | 7,234,406 | |
| | | | | | | | |
| |
| | | | Ginnie Mae – 1.60% | |
| | 119,799 | | | 5.000%, 05/01/37,
Pool # 782156 | | | 132,204 | |
| | 244,955 | | | 5.000%, 08/01/37,
Pool # 4015 | | | 271,783 | |
| | 206,766 | | | 6.000%, 07/01/38,
Pool # 4195 | | | 232,790 | |
| | 126,553 | | | 5.500%, 08/01/38,
Pool # 4215 | | | 135,507 | |
| | 54,726 | | | 6.000%, 01/01/39,
Pool # 698036 | | | 61,746 | |
| | | | | | | | |
| | | | | | | 834,030 | |
| | | | | | | | |
| |
| | | | U.S. Treasury Inflation Index Bonds – 5.85% | |
| | 1,654,515 | | | 1.375%, 07/15/18 | | | 1,763,093 | |
| | 1,135,350 | | | 1.750%, 01/15/28 | | | 1,289,509 | |
| | | | | | | | |
| | | | | | | 3,052,602 | |
| | | | | | | | |
| |
| | | | U.S. Treasury Notes – 13.83% | |
| | 750,000 | | | 4.000%, 02/15/15 | | | 758,408 | |
| | 1,000,000 | | | 4.125%, 05/15/15 | | | 1,021,641 | |
| | 1,000,000 | | | 2.125%, 05/31/15 | | | 1,011,797 | |
| | 1,500,000 | | | 2.000%, 01/31/16 | | | 1,533,516 | |
| | 500,000 | | | 2.000%, 04/30/16 | | | 512,344 | |
| | 500,000 | | | 3.000%, 08/31/16 | | | 523,164 | |
| | 350,000 | | | 2.000%, 11/30/20 | | | 351,805 | |
| | 1,500,000 | | | 2.000%, 11/15/21 | | | 1,496,837 | |
| | | | | | | | |
| | | | | | | 7,209,512 | |
| | | | | | | | |
| | |
| | | | Total U.S. Government and Agency Obligations
(Cost $23,939,676) | | | 24,609,812 | |
| | | | | | | | |
See accompanying Notes to Financial Statements.
| | |
| |
| ASTON/TCH Fixed Income Fund | | October 31, 2014 |
| |
| Schedule of Investments – continued | | |
| | | | | | | | |
Par Value | | | | | Market
Value | |
| | | | | | | | |
| |
| | OTHER ASSET-BACKED SECURITY – 0.48% | | | | |
| | $ 251,214 | | | Volkswagen Auto Loan Enhanced Trust
2011-1, Class A4
1.980%, 09/20/17 | | $ | 251,713 | |
| | | | | | | | |
| | |
| | | | Total Asset-Backed Security
(Cost $252,933) | | | 251,713 | |
| | | | | | | | |
|
| | COMMERCIAL MORTGAGE-BACKED SECURITY – 0.58% | |
| | 275,000 | | | Bear Stearns Commercial Mortgage
Securities
Series 2007-T28, Class A4
5.742%, 09/01/42 (c) | | | 303,026 | |
| | | | | | | | |
| | |
| | | | Total Commercial Mortgage-Backed Security
(Cost $191,891) | | | 303,026 | |
| | | | | | | | |
Shares | | | | | | |
|
| | INVESTMENT COMPANY – 5.54% | |
| | 2,888,784 | | | BlackRock Liquidity Funds
TempCash Portfolio | | | 2,888,784 | |
| | | | | | | | |
| | |
| | | | Total Investment Company
(Cost $2,888,784) | | | 2,888,784 | |
| | | | | | | | |
| Total Investments – 100.21%
(Cost $49,175,715)* | | | 52,260,699 | |
| | | | | | | | |
| Net Other Assets and Liabilities – (0.21)% | | | (111,719 | ) |
| | | | | | | | |
| Net Assets – 100.00% | | $ | 52,148,980 | |
| | | | | | | | |
| * | | Aggregate cost for Federal income tax purposes is $49,081,309. |
| | | | |
Gross unrealized appreciation | | $ | 3,357,972 | |
Gross unrealized depreciation | | | (178,582 | ) |
| | | | |
Net unrealized appreciation | | $ | 3,179,390 | |
| | | | |
| (a) | | Securities exempt from registration under Rule 144A of the Securities Act of 1933, as amended. These securities are purchased in accordance with guidelines approved by the Funds’ Board of Trustees and may only be resold, in transactions exempt from registration, to qualified institutional buyers. At October 31, 2014, these securities amounted to $5,607,468 or 10.75% of net assets. These securities have not been determined by the Subadviser to be illiquid securities. |
| (b) | | Step Coupon. A bond that pays an initial coupon rate for the first period and then a higher coupon rate for the following periods until maturity. The coupon rate shown will be accrual rate until maturity. |
| (c) | | Variable rate bond. The interest rate shown reflects the rate in effect at October 31, 2014. |
| (d) | | S&P credit ratings are used in the absence of a rating by Moody’s Investors, Inc. |
| | | | |
Portfolio Composition | | | | |
U.S. Government and Agency Obligations | | | 47% | |
Commercial Mortgage-Backed Securities | | | 1% | |
Investment Company | | | 6% | |
Corporate Notes and Bonds | | | | |
(Moody’s Ratings (d) (unaudited)) | | | | |
A | | | 4% | |
Baa | | | 27% | |
Ba | | | 13% | |
B | | | 1% | |
NR | | | 1% | |
| | | | |
| | | 100% | |
| | | | |
For financial reporting purposes, credit quality ratings shown are assigned by Moody’s Investors Service. If a Moody’s credit quality rating is not available the credit quality ratings shown are assigned by Standard & Poor’s. These rating agencies are independent, nationally recognized statistical rating organizations and are widely used. Investment grade ratings are credit ratings of Baa/ BBB or higher. Below investment grade ratings are credit ratings of Ba/BB or lower. Investments designated N/R are not rated by either rating agency. Credit quality ratings are subject to change.
See accompanying Notes to Financial Statements.
ASTON/Anchor Capital Enhanced Equity Fund
| | |
| |
| Portfolio Manager Commentary (unaudited) | | October 31, 2014 |
Ronald L. Altman; Adam D. Neves & David J. Watson |
| Q. | What were the most significant market factors affecting Fund performance and returns relative to the benchmark during the past 12 months? |
| A. | To a great extent our strategy of selling call options on each stock we hold in the portfolio and buying put options on the SPY Index was the primary reason for our returns lagging behind the S&P 500 Index for the year that ended October 31, 2014. Given the markets steady advance over the last twelve months without as much as a 10% correction, the put options were a continuous drag on our up capture. In the most recent quarter, we did get some benefit from the puts, but the pullback was short in both duration and magnitude; therefore, we were only able to derive a small benefit from holding those options. On a more positive note, calendar year-to-date the Fund outperformed its Morningstar category. |
In addition, our stock selection was negative during the first two months of the fiscal year but recovered in the ensuing 10 months. For the fiscal year as a whole our underlying portfolio of stocks trailed the S&P 500 Index. The Consumer Discretionary segment was the primary culprit accounting over 600 basis points (bps) of underperformance.
| Q. | What were the best performing holdings for the Fund during the period? |
| A. | On the positive side, Dr. Pepper Snapple Group, Inc.; Alcoa, Inc.; and Entergy Corp. were the three biggest contributors, adding almost 250 bps to the Fund’s performance. Alcoa alone added 130 bps, which is an example of a company in the middle of a positive transformation that investors began to recognize. |
| Q. | What were the weakest performing holdings? |
| A. | The three stocks that represented almost all the of the underperformance for the year were: Coach, Inc.; Ford Motor Co.; and Staples, Inc. In our opinion, these companies are all in transformation mode, which we believe will be resolved favorably over the next several years. On that basis, the holdings are still in our Fund. |
| Q. | How was the Fund positioned as of October 31, 2014? |
| A. | In our opinion, the outlook for the current fiscal year remains uncertain given all the cross currents in terms of the global economy, interest rates, and the risk of deflation. It is our belief that our strategy is well suited for a potentially more volatile equity environment. |
Note: A basis point (bps) is a unit of measure. 1 bps = .01%.
Growth of a Hypothetical
$10,000 Investment—Class N
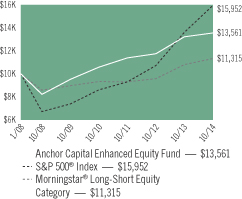
All dividends and capital gains are reinvested. Indexes are unmanaged and do not take into account fees, expenses or other costs.
Returns shown in the chart and table do not reflect taxes that a shareholder would pay on Fund distributions or on the sale of the Fund shares.
By selling covered call options, the Fund limits its opportunity to profit from an increase in the price of the underlying stock above the exercise price, but continues to bear the risk of a decline in the stock. A liquid market may not exist for options held by the Fund. If the Fund is not able to close out an options transaction, it will not be able to sell the underlying security until the option expires or is exercised. If the Fund receives premiums for writing the call options, the price it realizes from the exercise of an option could be substantially below a stock’s current market price. Premiums from the Fund’s sale of call options typically will result in short-term capital gains for federal income tax purposes.
RETURNSFOR PERIOD ENDED 10/31/14
Average Annual Total Returns - Class N
| | | | |
One Year | | | 2.68 | % |
Five Year | | | 7.35 | % |
Since Inception | | | 4.58 | % |
Inception Date 01/15/08
Average Annual Total Returns - Class I
| | | | |
One Year | | | 2.94 | % |
Since Inception | | | 6.88 | % |
Inception Date 03/03/10
The performance data quoted represents past performance. Past performance does not guarantee future results. Investment return and principal value will fluctuate so that an investor’s shares, upon redemption, may be worth more or less than their original cost. Current performance may be lower or higher than the performance data quoted. For performance data current to the most recent month-end, please visit our website at www.astonfunds.com.
| | |
| |
| ASTON/Anchor Capital Enhanced Equity Fund | | October 31, 2014 |
| |
| Schedule of Investments | | |
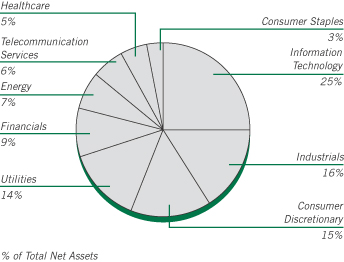
| | | | | | | | |
Shares | | | | | Market
Value | |
|
| | COMMON STOCKS – 99.95% | |
| | |
| | | | Consumer Discretionary – 15.11% | | | | |
| | 120,000 | | | Coach (a) | | $ | 4,125,600 | |
| | 485,000 | | | Ford Motor (a) | | | 6,833,650 | |
| | 225,000 | | | General Motors (a) | | | 7,065,000 | |
| | 115,000 | | | Kohl’s (a) | | | 6,235,300 | |
| | 600,000 | | | Staples (a) | | | 7,608,000 | |
| | | | | | | | |
| | | | | | | 31,867,550 | |
| | | | | | | | |
| | |
| | | | Consumer Staples – 2.97% | | | | |
| | 102,500 | | | ConAgra Foods (a) | | | 3,520,875 | |
| | 5,000 | | | Dr Pepper Snapple Group (a) | | | 346,250 | |
| | 25,000 | | | PepsiCo (a) | | | 2,404,250 | |
| | | | | | | | |
| | | | | | | 6,271,375 | |
| | | | | | | | |
| | |
| | | | Energy – 6.87% | | | | |
| | 29,000 | | | Anadarko Petroleum (a) | | | 2,661,620 | |
| | 70,000 | | | Apache (a) | | | 5,404,000 | |
| | 85,000 | | | Devon Energy (a) | | | 5,100,000 | |
| | 15,000 | | | Occidental Petroleum (a) | | | 1,333,950 | |
| | | | | | | | |
| | | | | | | 14,499,570 | |
| | | | | | | | |
| | |
| | | | Financials – 9.19% | | | | |
| | 150,000 | | | BB&T (a) | | | 5,682,000 | |
| | 180,000 | | | Hartford Financial Services Group (a) | | | 7,124,400 | |
| | 665,000 | | | Huntington Bancshares (a) | | | 6,590,150 | |
| | | | | | | | |
| | | | | | | 19,396,550 | |
| | | | | | | | |
| | |
| | | | Healthcare – 4.96% | | | | |
| | 40,000 | | | Abbott Laboratories (a) | | | 1,743,600 | |
| | 13,000 | | | Laboratory Corp. of America
Holdings * (a) | | | 1,420,770 | |
| | 115,000 | | | Quest Diagnostics (a) | | | 7,297,900 | |
| | | | | | | | |
| | | | | | | 10,462,270 | |
| | | | | | | | |
| | | | | | | | |
Shares | | | | | Market
Value | |
| | |
| | | | Industrials – 16.07% | | | | |
| | 200,000 | | | ADT (a) | | $ | 7,168,000 | |
| | 80,000 | | | Deere (a) | | | 6,843,200 | |
| | 260,000 | | | General Electric (a) | | | 6,710,600 | |
| | 165,000 | | | Republic Services (a) | | | 6,336,000 | |
| | 140,000 | | | Waste Management (a) | | | 6,844,600 | |
| | | | | | | | |
| | | | | | | 33,902,400 | |
| | | | | | | | |
| | |
| | | | Information Technology – 24.45% | | | | |
| | 200,000 | | | Altera (a) | | | 6,874,000 | |
| | 280,000 | | | Cisco Systems (a) | | | 6,851,600 | |
| | 350,000 | | | Corning (a) | | | 7,150,500 | |
| | 245,000 | | | EMC (a) | | | 7,038,850 | |
| | 280,000 | | | Intel (a) | | | 9,522,800 | |
| | 145,000 | | | Paychex (a) | | | 6,806,300 | |
| | 165,000 | | | Xilinx (a) | | | 7,339,200 | |
| | | | | | | | |
| | | | | | | 51,583,250 | |
| | | | | | | | |
| | |
| | | | Materials – 0.16% | | | | |
| | 20,000 | | | Alcoa (a) | | | 335,200 | |
| | | | | | | | |
| | |
| | | | Telecommunication Services – 6.21% | | | | |
| | 200,000 | | | AT&T (a) | | | 6,968,000 | |
| | 147,700 | | | CenturyLink (a) | | | 6,126,596 | |
| | | | | | | | |
| | | | | | | 13,094,596 | |
| | | | | | | | |
| | |
| | | | Utilities – 13.96% | | | | |
| | 87,000 | | | Entergy (a) | | | 7,309,740 | |
| | 195,000 | | | Exelon (a) | | | 7,135,050 | |
| | 200,000 | | | FirstEnergy (a) | | | 7,468,000 | |
| | 180,000 | | | PPL (a) | | | 6,298,200 | |
| | 30,000 | | | Public Service Enterprise Group (a) | | | 1,239,300 | |
| | | | | | | | |
| | | | | | | 29,450,290 | |
| | | | | | | | |
| | |
| | | | Total Common Stocks
(Cost $196,383,118) | | | 210,863,051 | |
| | | | | | | | |
Number of
Contracts | | | | | | |
| |
| | PURCHASED OPTIONS – 0.26% | | | | |
| | |
| | | | SPDR S&P 500 ETF TRUST | | | | |
| | 1,000 | | | Strike @ $168 Exp 11/14 | | | 6,000 | |
| | 1,000 | | | Strike @ $169 Exp 11/14 | | | 6,500 | |
| | 2,000 | | | Strike @ $170 Exp 11/14 | | | 14,000 | |
| | 500 | | | Strike @ $170 Exp 12/14 | | | 18,000 | |
| | 500 | | | Strike @ $171 Exp 12/14 | | | 19,500 | |
| | 1,900 | | | Strike @ $174 Exp 12/14 | | | 66,500 | |
| | 1,900 | | | Strike @ $175 Exp 12/14 | | | 68,400 | |
| | 3,900 | | | Strike @ $176 Exp 12/14 | | | 144,300 | |
| | 3,900 | | | Strike @ $177 Exp 12/14 | | | 159,900 | |
| | 1,000 | | | Strike @ $178 Exp 12/14 | | | 44,000 | |
| | | | | | | | |
| | |
| | | | Total Purchased Options
(Cost $1,995,608) | | | 547,100 | |
| | | | | | | | |
See accompanying Notes to Financial Statements.
| | |
| |
| ASTON/Anchor Capital Enhanced Equity Fund | | October 31, 2014 |
| |
| Schedule of Investments – continued | | |
| | | | | | | | |
Shares | | | | | Market
Value | |
| |
| | INVESTMENT COMPANY – 5.13% | | | | |
| | |
| | 10,825,389 | | | BlackRock Liquidity Funds TempCash Portfolio | | $ | 10,825,389 | |
| | | | | | | | |
| | |
| | | | Total Investment Company
(Cost $10,825,389) | | | 10,825,389 | |
| | | | | | | | |
| Total Investments – 105.34%
(Cost $209,204,115)** | | | 222,235,540 | |
| | | | | | | | |
| Net Other Assets and Liabilities – (5.34)% | | | (11,270,991 | ) |
| | | | | | | | |
| Net Assets – 100.00% | | $ | 210,964,549 | |
| | | | | | | | |
| * | | Non-income producing security. |
| ** | | Aggregate cost for Federal income tax purposes is $210,303,583. |
| | | | |
Gross unrealized appreciation | | $ | 21,151,354 | |
Gross unrealized depreciation | | | (9,219,397 | ) |
| | | | |
Net unrealized appreciation | | $ | 11,931,957 | |
| | | | |
| (a) | | Security position is either partially or entirely pledged as collateral for written call options. |
| SPDR | | Standard & Poor’s Depositary Receipt |
Transactions in written call options for the period ended October 31, 2014 were as follows:
| | | | | | | | |
| Contracts | | Number of
Contracts | | | Premium | |
Outstanding, October 31, 2013 | | | 58,830 | | | $ | 4,160,902 | |
Call Options Written | | | 245,090 | | | | 22,100,606 | |
Call Options Closed or Expired | | | (242,788 | ) | | | (20,736,932 | ) |
Call Options Exercised | | | (1,964 | ) | | | (293,810 | ) |
| | | | | | | | |
Outstanding, October 31, 2014 | | | 59,168 | | | $ | 5,230,766 | |
| | | | | | | | |
Premiums received and value of written call options outstanding as of October 31, 2014.
| | | | | | | | | | | | |
Number of
Contracts | | | Description | | Premium
Received | | | Market
Value | |
| | | |
| | | | Abbott Laboratories | | | | | | | | |
| | 400 | | | Strike @ $42 Exp 1/15 | | | $ 33,803 | | | | $ 94,000 | |
| | | |
| | | | ADT | | | | | | | | |
| | 300 | | | Strike @ $36 Exp 4/15 | | | 89,609 | | | | 72,750 | |
| | 37 | | | Strike @ $37 Exp 4/15 | | | 3,995 | | | | 7,770 | |
| | 663 | | | Strike @ $39 Exp 4/15 | | | 53,925 | | | | 79,560 | |
| | 1,000 | | | Strike @ $41 Exp 4/15 | | | 108,959 | | | | 77,500 | |
| | | |
| | | | Alcoa | | | | | | | | |
| | 200 | | | Strike @ $15 Exp 1/15 | | | 12,792 | | | | 42,200 | |
| | | |
| | | | Altera | | | | | | | | |
| | 291 | | | Strike @ $38 Exp 6/15 | | | 30,926 | | | | 34,920 | |
| | 139 | | | Strike @ $39 Exp 3/15 | | | 6,811 | | | | 6,950 | |
| | 374 | | | Strike @ $39 Exp 6/15 | | | 26,179 | | | | 35,530 | |
| | 846 | | | Strike @ $41 Exp 6/15 | | | 43,544 | | | | 46,530 | |
| | | | | | | | | | | | |
Number of
Contracts | | | Description | | Premium
Received | | | Market
Value | |
| | | |
| | | | Anadarko Petroleum | | | | | | | | |
| | 290 | | | Strike @ $85 Exp 5/15 | | | $ 254,603 | | | | $ 362,500 | |
| | | |
| | | | Apache | | | | | | | | |
| | 610 | | | Strike @ $75 Exp 4/15 | | | 302,864 | | | | 425,475 | |
| | | |
| | | | AT&T | | | | | | | | |
| | 400 | | | Strike @ $37 Exp 7/15 | | | 22,267 | | | | 23,200 | |
| | 971 | | | Strike @ $38 Exp 7/15 | | | 31,926 | | | | 36,898 | |
| | | |
| | | | BB&T | | | | | | | | |
| | 450 | | | Strike @ $35 Exp 3/15 | | | 93,131 | | | | 149,625 | |
| | 1,000 | | | Strike @ $36 Exp 3/15 | | | 247,954 | | | | 251,000 | |
| | 50 | | | Strike @ $39 Exp 6/15 | | | 4,448 | | | | 6,375 | |
| | | |
| | | | CenturyLink | | | | | | | | |
| | 1,477 | | | Strike @ $38 Exp 1/15 | | | 75,789 | | | | 590,800 | |
| | | |
| | | | Cisco Systems | | | | | | | | |
| | 123 | | | Strike @ $27 Exp 7/15 | | | 6,268 | | | | 7,380 | |
| | 2,677 | | | Strike @ $30 Exp 4/15 | | | 85,817 | | | | 20,078 | |
| | | |
| | | | Coach | | | | | | | | |
| | 1,150 | | | Strike @ $38 Exp 5/15 | | | 188,402 | | | | 173,650 | |
| | | |
| | | | ConAgra Foods | | | | | | | | |
| | 775 | | | Strike @ $30 Exp 1/15 | | | 84,442 | | | | 341,000 | |
| | 250 | | | Strike @ $35 Exp 3/15 | | | 15,310 | | | | 31,250 | |
| | | |
| | | | Corning | | | | | | | | |
| | 3,500 | | | Strike @ $19 Exp 5/15 | | | 308,871 | | | | 742,000 | |
| | | |
| | | | Deere | | | | | | | | |
| | 450 | | | Strike @ $92.5 Exp 6/15 | | | 89,081 | | | | 92,700 | |
| | 350 | | | Strike @ $95 Exp 6/15 | | | 50,036 | | | | 50,750 | |
| | | |
| | | | Devon Energy | | | | | | | | |
| | 500 | | | Strike @ $62.5 Exp 4/15 | | | 93,979 | | | | 135,000 | |
| | 250 | | | Strike @ $65 Exp 4/15 | | | 61,012 | | | | 60,000 | |
| | |
| | | | Dr Pepper Snapple Group | | | | | |
| | 50 | | | Strike @ $60 Exp 11/14 | | | 2,948 | | | | 46,250 | |
| | | |
| | | | EMC | | | | | | | | |
| | 20 | | | Strike @ $31 Exp 1/15 | | | 540 | | | | 760 | |
| | 890 | | | Strike @ $32 Exp 4/15 | | | 70,316 | | | | 49,840 | |
| | 1,540 | | | Strike @ $33 Exp 4/15 | | | 139,662 | | | | 62,370 | |
| | | |
| | | | Entergy | | | | | | | | |
| | 870 | | | Strike @ $70 Exp 1/15 | | | 104,473 | | | | 1,222,350 | |
| | | |
| | | | Exelon | | | | | | | | |
| | 1,125 | | | Strike @ $36 Exp 4/15 | | | 58,620 | | | | 241,875 | |
| | 825 | | | Strike @ $37 Exp 4/15 | | | 29,196 | | | | 136,125 | |
| | | |
| | | | FirstEnergy | | | | | | | | |
| | 150 | | | Strike @ $37 Exp 4/15 | | | 7,350 | | | | 24,000 | |
| | 150 | | | Strike @ $38 Exp 4/15 | | | 5,679 | | | | 17,250 | |
| | 1,700 | | | Strike @ $39 Exp 4/15 | | | 40,184 | | | | 140,250 | |
| | | |
| | | | Ford Motor | | | | | | | | |
| | 850 | | | Strike @ $16 Exp 6/15 | | | 33,467 | | | | 34,000 | |
| | 2,500 | | | Strike @ $17 Exp 6/15 | | | 85,353 | | | | 60,000 | |
| | | |
| | | | General Electric | | | | | | | | |
| | 250 | | | Strike @ $28 Exp 6/15 | | | 8,740 | | | | 8,500 | |
| | 1,500 | | | Strike @ $29 Exp 6/15 | | | 26,387 | | | | 30,000 | |
| | 300 | | | Strike @ $30 Exp 6/15 | | | 3,213 | | | | 3,900 | |
See accompanying Notes to Financial Statements.
| | |
| |
| ASTON/Anchor Capital Enhanced Equity Fund | | October 31, 2014 |
| |
| Schedule of Investments – continued | | |
| | | | | | | | | | | | |
Number of
Contracts | | | Description | | Premium
Received | | | Market
Value | |
| | | |
| | | | General Motors | | | | | | | | |
| | 1,100 | | | Strike @ $35 Exp 3/15 | | | $ 53,857 | | | | $ 63,800 | |
| | 550 | | | Strike @ $41 Exp 3/15 | | | 75,376 | | | | 6,325 | |
| | 200 | | | Strike @ $42 Exp 3/15 | | | 11,444 | | | | 2,200 | |
| | 200 | | | Strike @ $43 Exp 3/15 | | | 6,692 | | | | 1,800 | |
| | |
| | | | Hartford Financial Services Group | | | | | |
| | 50 | | | Strike @ $38 Exp 1/15 | | | 4,328 | | | | 11,000 | |
| | 50 | | | Strike @ $40 Exp 3/15 | | | 2,698 | | | | 7,875 | |
| | 700 | | | Strike @ $41 Exp 3/15 | | | 32,059 | | | | 84,700 | |
| | 1,000 | | | Strike @ $42 Exp 6/15 | | | 75,438 | | | | 144,500 | |
| | | |
| | | | Huntington Bancshares | | | | | | | | |
| | 1,076 | | | Strike @ $10 Exp 1/15 | | | 30,870 | | | | 30,128 | |
| | 424 | | | Strike @ $11 Exp 1/15 | | | 7,037 | | | | 2,968 | |
| | 5,150 | | | Strike @ $11 Exp 4/15 | | | 69,752 | | | | 46,350 | |
| | | |
| | | | Intel | | | | | | | | |
| | 2,800 | | | Strike @ $35 Exp 7/15 | | | 363,765 | | | | 588,000 | |
| | | |
| | | | Kohl’s | | | | | | | | |
| | 374 | | | Strike @ $52.5 Exp 4/15 | | | 172,081 | | | | 155,210 | |
| | 726 | | | Strike @ $55 Exp 4/15 | | | 365,099 | | | | 254,100 | |
| | 50 | | | Strike @ $57.5 Exp 4/15 | | | 10,937 | | | | 11,600 | |
| | |
| | | | Laboratory Corp. of America Holdings | | | | | |
| | 130 | | | Strike @ $110 Exp 5/15 | | | 36,134 | | | | 83,850 | |
| | | |
| | | | Occidental Petroleum | | | | | | | | |
| | 150 | | | Strike @ $87.5 Exp 5/15 | | | 76,320 | | | | 88,875 | |
| | | |
| | | | Paychex | | | | | | | | |
| | 1,050 | | | Strike @ $45 Exp 3/15 | | | 68,981 | | | | 288,750 | |
| | 200 | | | Strike @ $46 Exp 3/15 | | | 13,800 | | | | 42,000 | |
| | 150 | | | Strike @ $47 Exp 3/15 | | | 8,850 | | | | 22,500 | |
| | 50 | | | Strike @ $48 Exp 6/15 | | | 4,900 | | | | 7,750 | |
| | | |
| | | | PepsiCo | | | | | | | | |
| | 250 | | | Strike @ $87.50 Exp 1/15 | | | 53,880 | | | | 215,000 | |
| | | |
| | | | PPL | | | | | | | | |
| | 1,207 | | | Strike @ $35 Exp 1/15 | | | 53,308 | | | | 90,525 | |
| | 200 | | | Strike @ $36 Exp 1/15 | | | 7,792 | | | | 6,400 | |
| | 143 | | | Strike @ $36 Exp 4/15 | | | 8,487 | | | | 8,580 | |
| | 250 | | | Strike @ $37 Exp 1/15 | | | 9,740 | | | | 3,125 | |
| | |
| | | | Public Service Enterprise Group | | | | | |
| | 241 | | | Strike @ $35 Exp 3/15 | | | 54,716 | | | | 142,190 | |
| | 59 | | | Strike @ $40 Exp 3/15 | | | 2,889 | | | | 13,275 | |
| | | |
| | | | Quest Diagnostics | | | | | | | | |
| | 1,150 | | | Strike @ $70 Exp 5/15 | | | 103,162 | | | | 178,250 | |
| | | |
| | | | Republic Services | | | | | | | | |
| | 1,000 | | | Strike @ $41 Exp 4/15 | | | 63,960 | | | | 41,000 | |
| | 650 | | | Strike @ $42 Exp 4/15 | | | 26,325 | | | | 17,875 | |
| | | |
| | | | Staples | | | | | | | | |
| | 2,545 | | | Strike @ $16 Exp 6/15 | | | 59,534 | | | | 63,625 | |
| | | |
| | | | Waste Management | | | | | | | | |
| | 200 | | | Strike @ $47 Exp 1/15 | | | 11,792 | | | | 43,000 | |
| | 800 | | | Strike @ $49 Exp 4/15 | | | 63,706 | | | | 128,000 | |
| | 400 | | | Strike @ $50 Exp 4/15 | | | 20,014 | | | | 32,000 | |
| | | | | | | | | | | | |
Number of
Contracts | | | Description | | Premium
Received | | | Market
Value | |
| | | |
| | | | Xilinx | | | | | | | | |
| | 200 | | | Strike @ $48 Exp 6/15 | | | $ 19,593 | | | | $ 32,200 | |
| | 1,450 | | | Strike @ $49 Exp 6/15 | | | 138,579 | | | | 191,400 | |
| | | | | | | | | | | | |
| | | |
| | | | Total Written Call Options | | | $5,230,766 | | | | $9,225,587 | |
| | | | | | | | | | | | |
See accompanying Notes to Financial Statements.
ASTON/Lake Partners LASSO Alternatives Fund
| | |
| |
| Portfolio Manager Commentary (unaudited) | | October 31, 2014 |
| Frederick C. Lake & Ronald A. Lake |
| Q. | What were the most significant market factors affecting Fund performance and returns relative to the benchmark during the past 12 months? |
| A. | Class I shares of the Fund gained 3.56%, outperforming its benchmark (the HFRX Equity Hedge Index), which gained 3.33%. The Fund also outperformed its peer group (the Morningstar Multialternative category), which gained 2.66%. |
Throughout the year we positioned the portfolio to help dampen the risk of conventional asset classes while aiming for relatively stable returns, by:
| | • | | Diversifying among: 1) a core of long/short and long-biased equity strategies, and 2) a mix of less correlated strategies (strategic fixed income, hedged credit, arbitrage, and global macro). |
| | • | | Maintaining moderate composite net equity exposures. |
| | • | | Being proactive in adjusting the mix of strategies incrementally to take advantage of opportunities or sidestep potential risks. |
The investment environment was characterized by a general uptrend in risk assets, particularly U.S. equities and corporate credit, which was supported by excess liquidity and continued, albeit slow improvement in the U.S. economy. However, this was accompanied by 1) increasingly full valuations for the stock market, 2) historically tight credit spreads and the prevalence of “covenant lite” issuance, and 3) a potential “sea change” in monetary policy, as the Federal Reserve steadily scaled back quantitative easing.
Consequently, there was a growing risk of downside volatility as the year progressed. This risk manifested itself first with the selloff in tech and social media stocks in April, then in a broader slump in small-cap stocks in the summer, followed by the sharp decline for the market generally and energy stocks particularly, during September and October. As a result, the S&P 500 Index moved sideways in a trading range for the last third of the year. Under the surface, though, investment conditions were much more challenging. For example, the Russell 2000 Index fell -12.9% from its peak on July 3 through October 13, while the
S&P 500 Energy Index fell -17.8%. The S&P 500 fell -5.1% in that period.
Reflecting the generally positive trend for risk assets, the composite net equity exposure of the Fund trended upwards from 31% at September 30, 2013 to 41% at June 30, 2014. However, this was reduced to 32% at September 30, 2014 in recognition of increased potential risk.
| Q. | What were the best performing holdings for the Fund during the period? |
| A. | Most of the Fund’s gains came from U.S. Equity-Oriented strategies (Long-Biased, U.S. Multi-Asset, and Hedged Equity). Global Hedged Equity also contributed, as did Strategic Fixed Income and Global Macro allocations. |
| Q. | What were the weakest performing holdings? |
| A. | Arbitrage and Event-Driven strategies collectively detracted from performance, but the impact was limited. |
| Q. | How was the Fund positioned as of October 31, 2014? |
| A. | Equity-Oriented funds (Long-Biased, Hedged Equity, U.S. Multi-Asset, and Global Hedged Equity) accounted for nearly 52% of the portfolio. Other allocations included 20% Hedged Credit, 10% Strategic Fixed Income, 10% Global Macro, and 5% Arbitrage. |
Much of the investment landscape continues to be shaped by the “tectonic forces” of excess liquidity and stimulus emanating from central bank policies in the United States, Europe, Japan and China. Looking forward, though, these “tectonic forces” are creating mounting tensions under the surface of the markets due to the divergence among the large “continental plates”: tapering and eventual tightening in the United States (and United Kingdom) in response to slowly improving economic conditions, versus ongoing stimulus in Europe and Japan (and China) aimed at ameliorating mounting evidence of economic deterioration. Consequently, the appearance of sudden “fissures” (as well as “new peaks”) is becoming more likely; in other words, investors should be prepared for a heightened degree of volatility, as well as more modest returns from conventional asset classes.
Growth of a Hypothetical
$10,000 Investment—Class I
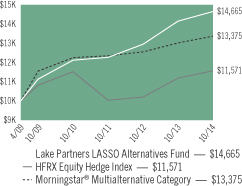
All dividends and capital gains are reinvested. Indexes are unmanaged and do not take into account fees, expenses or other costs.
Returns shown in the chart and table do not reflect taxes that a shareholder would pay on Fund distributions or on the sale of the Fund shares.
A fund-of-funds that invests in funds using alternative or hedging strategies may be exposed to potentially dramatic changes in the value of certain of its portfolio holdings. Investments in a fund-of-funds are subject to higher costs than investing directly in the underlying funds.
RETURNSFOR PERIOD ENDED 10/31/14
Average Annual Total Returns - Class N
| | | | |
One Year | | | 3.27 | % |
Since Inception | | | 4.87 | % |
Inception Date 03/03/10
Average Annual Total Returns - Class I
| | | | |
One Year | | | 3.56 | % |
Five Year | | | 5.63 | % |
Since Inception | | | 7.10 | % |
Inception Date 04/01/09*
* Because the Fund invests primarily in open-end investment companies which are priced as of the close of the NYSE, performance is shown from April 2, 2009.
The performance data quoted represents past performance. Past performance does not guarantee future results. Investment return and principal value will fluctuate so that an investor’s shares, upon redemption, may be worth more or less than their original cost. Current performance may be lower or higher than the performance data quoted. For performance data current to the most recent month-end, please visit our website at www.astonfunds.com.
The performance quoted would have been lower if fee waivers and/or expense reimbursements had not been in effect.
The oldest share Class, Class I, is being shown in the above chart. Performance would have been lower for Class N shares, due to higher fees and expenses.
| | |
| |
| ASTON/Lake Partners LASSO Alternatives Fund | | October 31, 2014 |
| |
| Schedule of Investments | | |
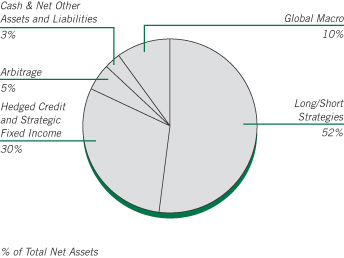
| | | | | | | | |
Shares | | | | | Market
Value | |
|
| | INVESTMENT COMPANIES – 100.16% | |
| | |
| | | | Long/Short Strategies – 51.81% | | | | |
| | 2,492,515 | | | Blackrock Global Long/Short Equity Fund-IS | | $ | 29,536,306 | |
| | 1,477,396 | | | Convergence Core Plus Fund | | | 27,110,220 | |
| | 1,186,364 | | | Driehaus Emerging Markets Small Cap Growth Fund | | | 16,193,864 | |
| | 1,599,398 | | | FPA Crescent Fund-I | | | 54,731,392 | |
| | 1,884,923 | | | Gotham Absolute Return Fund | | | 26,143,883 | |
| | 280,311 | | | Putnam Equity Spectrum Fund | | | 12,297,222 | |
| | 2,389,527 | | | Robeco Boston Partners Long/Short Equity Fund-IS | | | 51,613,786 | |
| | 3,169,268 | | | The Weitz Funds - Partners III Opportunity Fund | | | 52,578,161 | |
| | | | | | | | |
| | | | | | | 270,204,834 | |
| | | | | | | | |
| |
| | | | Hedged Credit and Strategic Fixed Income – 29.88% | |
| | 4,576,836 | | | Avenue Credit Strategies Fund | | | 51,901,324 | |
| | 4,768,870 | | | Legg Mason BW Alternative Credit Fund | | | 51,980,685 | |
| | 4,347,069 | | | Metropolitan West Unconstrained Bond Fund | | | 51,990,948 | |
| | | | | | | | |
| | | | | | | 155,872,957 | |
| | | | | | | | |
| | |
| | | | Global Macro – 10.13% | | | | |
| | 1,173,743 | | | John Hancock Funds II - Global Absolute Return Strategies Fund | | | 13,509,779 | |
| | 3,494,015 | | | Western Asset Macro Opportunities Fund | | | 39,307,667 | |
| | | | | | | | |
| | | | | | | 52,817,446 | |
| | | | | | | | |
| | |
| | | | Arbitrage – 4.95% | | | | |
| | 1,988,739 | | | Calamos Market Neutral Income Fund | | | 25,833,717 | |
| | | | | | | | |
| | | | | | | | |
Shares | | | | | Market
Value | |
| | | | Money Market – 3.39% | | | | |
| | 17,667,707 | | | Blackrock Liquidity Funds Treasury Trust Fund Portfolio | | $ | 17,667,707 | |
| | | | | | | | |
| | |
| | | | Total Investment Companies
(Cost $494,961,779) | | | 522,396,661 | |
| | | | | | | | |
| Total Investments – 100.16%
(Cost $494,961,779)* | | | 522,396,661 | |
| | | | | | | | |
| Net Other Assets and Liabilities – (0.16)% | | | (854,001 | ) |
| | | | | | | | |
| Net Assets – 100.00% | | $ | 521,542,660 | |
| | | | | | | | |
| * | | Aggregate cost for Federal income tax purposes is $495,044,166. |
| | | | |
Gross unrealized appreciation | | $ | 28,793,246 | |
Gross unrealized depreciation | | | (1,440,751 | ) |
| | | | |
Net unrealized appreciation | | $ | 27,352,495 | |
| | | | |
See accompanying Notes to Financial Statements.
ASTON/River Road Long-Short Fund
| | |
| |
| Portfolio Manager Commentary (unaudited) | | October 31, 2014 |
| Matthew W. Moran, CFA & Daniel R. Johnson, CFA, CPA |
| Q. | What were the most significant market factors affecting Fund performance and returns relative to the benchmark during the past 12 months? |
| A. | In the last 12 months, the Russell 3000 has returned +16.07%. Class N shares of the Fund returned just -3.27%, capturing significantly less than our expectations. The long portfolio and the short equity portfolio underperformed the benchmark. Our method for capital protection—the drawdown plan—also cost the portfolio. |
| Q. | What were the best performing holdings for the Fund during the period? |
| A. | The holdings with the largest positive contribution to total return during the period were long positions in Time Warner Inc., Molson Coors Brewing Co. (Class B), and PetSmart Inc. Time Warner is a leading media company with a collection of top cable networks (e.g. TNT, TBS, and CNN), the leading premium pay-TV channel HBO and a highly profitable studio. Strong operating results were punctuated with news that content competitor Twenty-First Century Fox had approached Time Warner with an acquisition proposal during the summer and subsequently, that Time Warner intends to offer HBO as a stand-alone over-the-top option. Molson Coors Brewing is the fifth-largest brewer in the world. The company successfully digested its purchase of Eastern European brewer Starbev, raised the dividend by +16% and put itself in a position to consider a transformational purchase of SABMiller’s 58% economic stake in the MillerCoors JV. PetSmart is the largest specialty pet retailer in North America. Activist Jana Partners established a 9.9% ownership position and urged management to consider strategic alternatives including a sale of the company. |
| Q. | What were the weakest performing holdings? |
| A. | Some of the holdings with the largest negative contribution to the Fund’s total return were long positions in ADT Corp., Ascent Capital Group Inc. (Class A), and Dundee Corp. (Class A). ADT is the largest home security provider in North America with a market share more than six times its nearest competitor. The stock declined after reporting that it cost more-than-expected to add fewer-than-expected new customers in the fourth quarter of 2013 and intensified concerns that new competition (e.g. cable and telecom companies) was pressuring the business. Ascent Capital operates Monitronics, the second largest home security firm in the United States, Ascent fell in sympathy with ADT results. We reduced our position in ADT and eliminated our position in Ascent to reduce our exposure to the home security industry. Dundee is a holding company that invests primarily in hard asset industries like mining, beef production, oil and gas exploration, and real estate. Falling precious metal prices weighed on the stock and we eliminated it due to our unrealized loss discipline. |
| Q. | How was the Fund positioned as of October 31, 2014? |
| A. | The Fund was below the low end of its normal net market exposure range (50 - 70%) at 30% at the end of October. The portfolio was in the drawdown plan and maintained a sizeable short position in the S&P 500 Exchange Traded Fund (ETF) as a hedge. |
Growth of a Hypothetical
$10,000 Investment—Class N
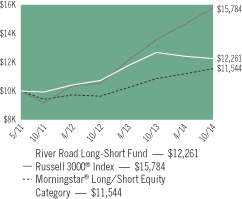
All dividends and capital gains are reinvested. Indexes are unmanaged and do not take into account fees, expenses or other costs.
Returns shown in the chart and table do not reflect taxes that a shareholder would pay on Fund distributions or on the sale of the Fund shares.
RETURNSFOR PERIOD ENDED 10/31/14
Average Annual Total Returns - Class N
| | | | |
One Year | | | -3.27 | % |
Since Inception | | | 6.01 | % |
Inception Date 05/04/11
Average Annual Total Returns - Class I
| | | | |
One Year | | | -3.01 | % |
Since Inception | | | 3.87 | % |
Inception Date 03/04/13
Short sales may involve the risk that the Fund will incur a loss by subsequently buying a security at a higher price than that at which it was previously sold short. Losses incurred on a short sale result from increases in the values of the securities, thus losses on a short sale are theoretically unlimited.
Value investing often involves buying the stocks of companies that are currently out-of-favor that may decline further. Investing in exchange-traded and closed-end funds subjects the Fund to the additional risk that shares of the underlying fund may trade at a premium or discount to their net asset value.
The performance data quoted represents past performance. Past performance does not guarantee future results. Investment return and principal value will fluctuate so that an investor’s shares, upon redemption, may be worth more or less than their original cost. Current performance may be lower or higher than the performance data quoted. For performance data current to the most recent month-end, please visit our website at www.astonfunds.com.
The performance quoted would have been lower if fee waivers and/or expense reimbursements had not been in effect.
| | |
| |
| ASTON/River Road Long-Short Fund | | October 31, 2014 |
| |
| Schedule of Investments | | |
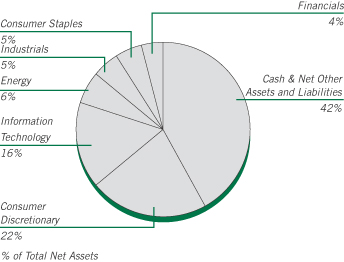
The chart represents total investments in the Fund. Materials, Utilities, and Exchange Traded Funds are negative 1.05%, 2.56%, and 26.10%, respectively, and cannot be represented in the pie chart format.
| | | | | | | | |
Shares | | | | | Market Value | |
|
| | COMMON STOCKS – 87.33% | |
| | |
| | | | Consumer Discretionary – 32.67% | | | | |
| | 163,430 | | | Comcast, Class A (a) | | $ | 9,045,851 | |
| | 148,956 | | | General Motors (a) | | | 4,677,218 | |
| | 227,663 | | | International Speedway, Class A (a) | | | 7,132,682 | |
| | 132,915 | | | Liberty Interactive, Class A (a) * | | | 3,474,398 | |
| | 143,912 | | | Liberty Media, Class C * | | | 6,897,702 | |
| | 115,080 | | | Liberty Ventures * | | | 4,039,308 | |
| | 163,493 | | | Lvmh Moet Hennessy Louis Vuitton SA, ADR (a) | | | 5,529,333 | |
| | 49,601 | | | McDonald’s | | | 4,649,102 | |
| | 414,610 | | | News, Class A (a) * | | | 6,418,163 | |
| | 217,439 | | | Quebecor, Class B (Canada) | | | 5,581,394 | |
| | 70,415 | | | Time Warner | | | 5,595,880 | |
| | 250,532 | | | Twenty-First Century Fox | | | 8,638,343 | |
| | | | | | | | |
| | | | | | | 71,679,374 | |
| | | | | | | | |
| | |
| | | | Consumer Staples – 5.88% | | | | |
| | 107,412 | | | Nestle, SP ADR (a) | | | 7,876,522 | |
| | 127,702 | | | Whole Foods Market | | | 5,022,520 | |
| | | | | | | | |
| | | | | | | 12,899,042 | |
| | | | | | | | |
| | |
| | | | Energy – 7.34% | | | | |
| | 82,593 | | | National-Oilwell Varco | | | 5,999,556 | |
| | 75,102 | | | Occidental Petroleum (a) | | | 6,678,821 | |
| | 34,625 | | | Schlumberger | | | 3,416,103 | |
| | | | | | | | |
| | | | | | | 16,094,480 | |
| | | | | | | | |
| | | | | | | | |
Shares | | | | | Market Value | |
| | |
| | | | Financials – 8.85% | | | | |
| | 425,745 | | | FNFV Group * | | $ | 5,722,013 | |
| | 170,268 | | | Oaktree Capital Group | | | 8,084,325 | |
| | 165,994 | | | Weyerhaeuser, REIT (a) | | | 5,620,557 | |
| | | | | | | | |
| | | | | | | 19,426,895 | |
| | | | | | | | |
| | |
| | | | Industrials – 13.76% | | | | |
| | 136,366 | | | ADT (a) | | | 4,887,357 | |
| | 116,629 | | | Brink’s | | | 2,449,209 | |
| | 64,226 | | | Deere | | | 5,493,892 | |
| | 224,620 | | | GenCorp (a) * | | | 3,809,555 | |
| | 372,181 | | | Wesco Aircraft Holdings * | | | 6,606,213 | |
| | 28,164 | | | WW Grainger | | | 6,950,875 | |
| | | | | | | | |
| | | | | | | 30,197,101 | |
| | | | | | | | |
| | |
| | | | Information Technology – 18.83% | | | | |
| | 230,974 | | | CSG Systems International | | | 6,123,121 | |
| | 171,959 | | | eBay (a) * | | | 9,027,848 | |
| | 135,721 | | | Microsoft (a) | | | 6,372,101 | |
| | 97,583 | | | Motorola Solutions | | | 6,294,104 | |
| | 169,468 | | | Oracle (a) | | | 6,617,725 | |
| | 87,570 | | | QUALCOMM (a) | | | 6,875,121 | |
| | | | | | | | |
| | | | | | | 41,310,020 | |
| | | | | | | | |
| | |
| | | | Total Common Stocks
(Cost $188,894,936) | | | 191,606,912 | |
| | | | | | | | |
|
| | INVESTMENT COMPANY – 7.27% | |
| | |
| | 15,960,086 | | | BlackRock Liquidity Funds TempCash Portfolio | | | 15,960,086 | |
| | | | | | | | |
| | |
| | | | Total Investment Company
(Cost $15,960,086) | | | 15,960,086 | |
| | | | | | | | |
| Total Investments – 94.60%
(Cost $204,855,022)** | | | 207,566,998 | |
| | | | | | | | |
| $130,129,225 in cash and $51,033,851 in securities was segregated
or on deposit with a prime broker to cover short sales as of October 31,
2014 and are included in “Net Other Assets and Liabilities”. |
|
|
| | SHORT SALES – (57.83)% | |
|
| | COMMON STOCK – (31.73)% | |
| |
| | | | Consumer Discretionary – (10.66)% | |
| | (33,973) | | | Best Buy | | | (1,159,838 | ) |
| | (211,228) | | | Callaway Golf | | | (1,656,028 | ) |
| | (62,463) | | | Chuy’s Holdings * | | | (1,868,268 | ) |
| | (65,227) | | | Clubcorp Holdings | | | (1,243,227 | ) |
| | (100,311) | | | D.R. Horton | | | (2,286,088 | ) |
| | (50,162) | | | Five Below * | | | (1,999,959 | ) |
| | (40,195) | | | Men’s Wearhouse | | | (1,890,371 | ) |
| | (47,965) | | | Newell Rubbermaid | | | (1,598,673 | ) |
| | (94,085) | | | PulteGroup | | | (1,805,491 | ) |
| | (309,753) | | | Ruby Tuesday * | | | (2,378,903 | ) |
| | (53,830) | | | Sonic * | | | (1,357,054 | ) |
See accompanying Notes to Financial Statements.
| | |
| |
| ASTON/River Road Long-Short Fund | | October 31, 2014 |
| |
| Schedule of Investments – continued | | |
| | | | | | | | |
Shares | | | | | Market Value | |
| |
| | | | Consumer Discretionary – (continued) | |
| | (127,185) | | | Sony, SP ADR * | | $ | (2,520,807 | ) |
| | (9,478) | | | Whirlpool | | | (1,630,690 | ) |
| | | | | | | | |
| | | | | | | (23,395,397 | ) |
| | | | | | | | |
| | |
| | | | Consumer Staples – (0.52)% | | | | |
| | (77,022) | | | Dean Foods | | | (1,132,994 | ) |
| | | | | | | | |
| | | | | | | (1,132,994 | ) |
| | | | | | | | |
| | |
| | | | Energy – (1.02)% | | | | |
| | (28,980) | | | Atwood Oceanics * | | | (1,178,037 | ) |
| | (215,996) | | | Paragon Offshore PLC | | | (1,051,901 | ) |
| | | | | | | | |
| | | | | | | (2,229,938 | ) |
| | | | | | | | |
| | |
| | | | Financials – (4.49)% | | | | |
| | (23,014) | | | BofI Holding * | | | (1,772,538 | ) |
| | (47,998) | | | Mercury General | | | (2,549,654 | ) |
| | (99,068) | | | Pennsylvania Real Estate Investment Trust, REIT | | | (2,123,027 | ) |
| | (40,865) | | | Plum Creek Timber, REIT | | | (1,675,874 | ) |
| | (94,575) | | | Rouse Properties | | | (1,722,211 | ) |
| | | | | | | | |
| | | | | | | (9,843,304 | ) |
| | | | | | | | |
| | |
| | | | Industrials – (8.75)% | | | | |
| | (139,584) | | | ACCO Brands * | | | (1,148,776 | ) |
| | (62,214) | | | Albany International, Class A | | | (2,350,445 | ) |
| | (16,851) | | | Caterpillar | | | (1,708,860 | ) |
| | (74,051) | | | DigitalGlobe * | | | (2,117,118 | ) |
| | (31,162) | | | Masonite International * | | | (1,684,618 | ) |
| | (68,743) | | | Pitney Bowes | | | (1,700,702 | ) |
| | (97,530) | | | Quad Graphics | | | (2,150,537 | ) |
| | (164,616) | | | RR Donnelley & Sons | | | (2,872,549 | ) |
| | (40,424) | | | TAL International Group | | | (1,743,487 | ) |
| | (64,654) | | | Tetra Tech | | | (1,733,374 | ) |
| | | | | | | | |
| | | | | | | (19,210,466 | ) |
| | | | | | | | |
| | |
| | | | Information Technology – (2.68)% | | | | |
| | (55,847) | | | CANON, SP ADR | | | (1,732,374 | ) |
| | (47,199) | | | Dealertrack Technologies * | | | (2,220,713 | ) |
| | (15,998) | | | Stratasys * | | | (1,925,519 | ) |
| | | | | | | | |
| | | | | | | (5,878,606 | ) |
| | | | | | | | |
| | |
| | | | Materials – (1.05)% | | | | |
| | (94,605) | | | ArcelorMittal, ADR | | | (1,245,002 | ) |
| | (67,861) | | | Teck Resources, Class B (Canada) | | | (1,070,847 | ) |
| | | | | | | | |
| | | | | | | (2,315,849 | ) |
| | | | | | | | |
| | |
| | | | Utilities – (2.56)% | | | | |
| | (38,859) | | | South Jersey Industries | | | (2,278,692 | ) |
| | (80,957) | | | UIL Holdings | | | (3,330,571 | ) |
| | | | | | | | |
| | | | | | | (5,609,263 | ) |
| | | | | | | | |
| | | | Total Common Stock
(Proceeds $67,307,859) | | | (69,615,817 | ) |
| | | | | | | | |
| | | | | | | | |
Shares | | | | | Market Value | |
|
| | EXCHANGE TRADED FUNDS – (26.10)% | |
| | |
| | (268,818) | | | SPDR S&P 500 ETF Trust | | $ | (54,209,838 | ) |
| | (69,718) | | | United States Natural Gas Fund LP * | | | (1,413,881 | ) |
| | (53,533) | | | United States Oil Fund LP * | | | (1,639,716 | ) |
| | | | | | | | |
| | |
| | | | Total Exchange Traded Funds
(Proceeds $54,207,800) | | | (57,263,435 | ) |
| | | | | | | | |
| Total Short Sales – (57.83)%
(Proceeds $121,515,659) | | | (126,879,252 | ) |
| | | | | | | | |
| Net Other Assets and Liabilities – 63.23% | | | 138,722,875 | |
| | | | | | | | |
| Net Assets – 100.00% | | $ | 219,410,621 | |
| | | | | | | | |
| * | | Non-income producing security. |
| ** | | Aggregate cost for Federal income tax purposes is $211,244,212. |
| | | | |
Gross unrealized appreciation | | $ | 7,406,817 | |
Gross unrealized depreciation | | | (11,084,031 | ) |
| | | | |
Net unrealized depreciation | | $ | (3,677,214 | ) |
| | | | |
| (a) | | Security position is either entirely or partially held in a segregated account as collateral for securities sold short. |
| ADR | | American Depositary Receipt |
| REIT | | Real Estate Investment Trust |
| SP ADR | | Sponsored American Depositary Receipt |
| SPDR | | Standard & Poor’s Depositary Receipt |
See accompanying Notes to Financial Statements.
ASTON/Barings International Fund
| | |
| |
| Portfolio Manager Commentary (unaudited) | | October 31, 2014 |
David Bertocchi, CFA
| Q. | What were the most significant market factors affecting Fund performance and returns relative to the benchmark during the past 12 months? |
| A. | There were three main factors impacting Fund performance and returns relative to the benchmark during the last 12 months. First, the continuing rally in peripheral European stocks detracted from relative performance, as the Fund remained underweight these stocks. The strong rally in European banks was the main area where this was manifested, although these names gave back some of their gains as European economic data began to worsen in the second quarter of 2014. Second, the Fund’s emerging market holdings weighed on relative performance as emerging market currencies, in particular, came under pressure. Third, the Fund benefited from an overweight position in Japanese equities. The Japanese market has shown the strongest earnings growth of all international equity markets. This was not rewarded by the market in the first quarter of 2014. However, the Japanese market rallied particularly strongly in the third quarter of 2014, which aided the relative performance of the Fund. |
| Q. | What were the best performing holdings for the Fund during the period? |
| A. | Our holding in Shire Plc, a UK-listed pharmaceuticals company, performed well over the period. The company was the subject of a bid from AbbVie, its U.S. pharmaceuticals peer. AbbVie eventually withdrew its offer, on fears that the combined entity would be unable to harvest the benefit of potentially lowering its tax rate, and avoid the payment of U.S. taxes on its international (non-U.S.) earnings. However, the bid served to highlight the strong growth and earnings potential of the business. Our holding in Rakuten, a Japanese e-commerce company, performed well. The company experienced strong earnings growth over the year, and delivered strong share performance as a result. |
| Q. | What were the weakest performing holdings? |
| A. | Our holding in Adidas AG, a German-listed manufacturer and seller of sporting goods, including sports footwear, weighed on relative investment performance over the year. The company was adversely impacted by general weakness in emerging market currencies. Although the company has made strong progress in emerging markets, a weakness in emerging market currencies means the company’s earnings in those regions are worth less when translated into Euros. In addition, the company also experienced significant competitive pressure in the United States market. |
| Q. | How was the Fund positioned as of October 31, 2014? |
| A. | The Fund is positioned in companies which we expect to grow earnings strongly, and where valuation is inexpensive taking into account the anticipated earnings growth. |
This approach leads us to have heavy weightings in both the Healthcare and Information Technology sectors. In both instances, we find many companies that we expect to be able to show healthy earnings growth over the next five years. This approach also leads us to hold fewer companies in the Banks sector, because we hold concerns over the ability of these companies to generate long-term earnings growth.
As mentioned earlier, the Japanese equity market has shown strong earnings growth, the best among international equity markets. We anticipate this to continue, and so Japanese companies occupy a significant part of the portfolio. By contrast, given the economic woes in Europe, we find it difficult to find European companies who will be able to show strong earnings growth over the longer term. The Fund is therefore underweight the continental European equity market. We have similar difficulty in finding Australian companies who will produce strong earnings growth in the long-term. As usual, the Fund is invested in some emerging market companies, which we believe has the potential to produce strong growth in earnings.
Growth of a Hypothetical
$10,000 Investment—Class I
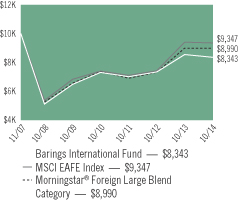
All dividends and capital gains are reinvested. Indexes are unmanaged and do not take into account fees, expenses or other costs.
Returns shown in the chart and table do not reflect taxes that a shareholder would pay on Fund distributions or on the sale of the Fund shares.
The securities of foreign companies may be less liquid and may fluctuate more widely than those traded in U.S. markets.
Emerging market securities may be subject to additional risks such as price volatility, currency fluctuation, financial reporting requirements, as well as political and economic instability.
RETURNSFOR PERIOD ENDED 10/31/14
Average Annual Total Returns - Class N
| | | | |
One Year | | | -2.62 | % |
Since Inception | | | 5.21 | % |
Inception Date 03/03/10
Average Annual Total Returns - Class I
| | | | |
One Year | | | -2.37 | % |
Five Year | | | 5.26 | % |
Since Inception | | | -2.56 | % |
Inception Date 11/02/07
The performance data quoted represents past performance. Past performance does not guarantee future results. Investment return and principal value will fluctuate so that an investor’s shares, upon redemption, may be worth more or less than their original cost. Current performance may be lower or higher than the performance data quoted. For performance data current to the most recent month-end, please visit our website at www.astonfunds.com.
The performance quoted would have been lower if fee waivers and/or expense reimbursements had not been in effect.
The oldest share Class, Class I, is being shown. Performance would have been lower for Class N shares, due to higher fees and expenses.
| | |
| |
| ASTON/Barings International Fund | | October 31, 2014 |
| |
| Schedule of Investments | | |
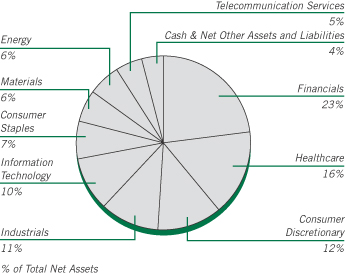
| | | | | | | | |
Shares | | | | | Market Value | |
|
| | COMMON STOCKS – 96.37% | |
| | |
| | | | Australia – 1.12% | | | | |
| | 23,239 | | | Amcor (a) | | $ | 241,380 | |
| | | | | | | | |
| | |
| | | | France – 8.96% | | | | |
| | 2,544 | | | Air Liquide (a) | | | 307,100 | |
| | 11,561 | | | AXA (a) | | | 267,042 | |
| | 3,815 | | | BNP Paribas (a) | | | 239,742 | |
| | 2,488 | | | Sanofi (a) | | | 225,761 | |
| | 8,920 | | | SES (a) | | | 307,956 | |
| | 5,182 | | | Total (a) | | | 309,382 | |
| | 4,868 | | | Vinci (a) | | | 277,857 | |
| | | | | | | | |
| | | | | | | 1,934,840 | |
| | | | | | | | |
| | |
| | | | Germany – 10.71% | | | | |
| | 2,896 | | | Bayer (a) | | | 414,191 | |
| | 2,663 | | | Bayerische Motoren Werke (a) | | | 285,574 | |
| | 3,590 | | | Daimler (a) | | | 279,908 | |
| | 5,359 | | | Deutsche Boerse (a) | | | 366,787 | |
| | 7,318 | | | Fresenius (a) | | | 376,555 | |
| | 4,519 | | | SAP (a) | | | 307,904 | |
| | 7,822 | | | Wirecard (a) | | | 280,647 | |
| | | | | | | | |
| | | | | | | 2,311,566 | |
| | | | | | | | |
| | |
| | | | Hong Kong – 2.26% | | | | |
| | 37,600 | | | AIA Group (a) | | | 209,824 | |
| | 27,200 | | | HSBC Holdings (a) | | | 278,327 | |
| | | | | | | | |
| | | | | | | 488,151 | |
| | | | | | | | |
| | |
| | | | India – 1.02% | | | | |
| | 3,294 | | | Infosys, SP ADR | | | 220,237 | |
| | | | | | | | |
| | |
| | | | Italy – 1.05% | | | | |
| | 31,257 | | | UniCredit (a) | | | 226,386 | |
| | | | | | | | |
| | | | | | | | |
Shares | | | | | Market Value | |
| | |
| | | | Japan – 25.76% | | | | |
| | 24,200 | | | Astellas Pharma (a) | | $ | 375,596 | |
| | 4,200 | | | Daikin Industries (a) | | | 262,534 | |
| | 7,700 | | | Denso (a) | | | 352,919 | |
| | 1,100 | | | FANUC (a) | | | 193,859 | |
| | 40,000 | | | Hitachi (a) | | | 314,299 | |
| | 18,000 | | | Hitachi Metals (a) | | | 303,890 | |
| | 21,600 | | | Isuzu Motors (a) | | | 281,823 | |
| | 11,400 | | | Japan Tobacco (a) | | | 388,957 | |
| | 11,000 | | | JGC (a) | | | 282,698 | |
| | 5,300 | | | KDDI (a) | | | 348,048 | |
| | 12,200 | | | Mitsubishi (a) | | | 239,222 | |
| | 29,000 | | | Mitsubishi Electric (a) | | | 373,920 | |
| | 55,300 | | | Mitsubishi UFJ Financial Group (a) | | | 322,356 | |
| | 9,000 | | | Mitsui Fudosan (a) | | | 289,498 | |
| | 67,000 | | | Sumitomo Mitsui Trust Holdings (a) | | | 273,543 | |
| | 6,400 | | | Takeda Pharmaceutical (a) | | | 277,429 | |
| | 9,600 | | | Tokio Marine Holdings (a) | | | 307,854 | |
| | 6,200 | | | Toyota Motor (a) | | | 373,099 | |
| | | | | | | | |
| | | | | | | 5,561,544 | |
| | | | | | | | |
| | |
| | | | Netherlands – 6.46% | | | | |
| | 4,132 | | | Airbus Group NV (a) | | | 246,685 | |
| | 2,439 | | | ASML Holding NV (a) | | | 243,198 | |
| | 18,606 | | | Koninklijke Ahold NV (a) | | | 311,623 | |
| | 9,650 | | | Koninklijke Philips NV (a) | | | 269,795 | |
| | 9,044 | | | Royal Dutch Shell, Class A (a) | | | 323,417 | |
| | | | | | | | |
| | | | | | | 1,394,718 | |
| | | | | | | | |
| | |
| | | | Papua New Guinea – 1.09% | | | | |
| | 30,849 | | | Oil Search (a) | | | 236,542 | |
| | | | | | | | |
| | |
| | | | Singapore – 1.20% | | | | |
| | 18,000 | | | DBS Group Holdings (a) | | | 258,938 | |
| | | | | | | | |
| | |
| | | | South Korea – 0.48% | | | | |
| | 657 | | | SK Holdings (a) | | | 102,984 | |
| | | | | | | | |
| | |
| | | | Sweden – 0.98% | | | | |
| | 3,988 | | | Assa Abloy AB, Class B (a) | | | 211,701 | |
| | | | | | | | |
| | |
| | | | Switzerland – 9.49% | | | | |
| | 3,146 | | | Actelion (a) | | | 374,674 | |
| | 4,947 | | | Julius Baer Group (a) | | | 216,865 | |
| | 3,194 | | | Novartis (a) | | | 296,412 | |
| | 1,082 | | | Roche Holding (a) | | | 319,300 | |
| | 1,016 | | | Syngenta (a) | | | 314,206 | |
| | 14,352 | | | UBS (a) | | | 249,555 | |
| | 922 | | | Zurich Financial Services (a) | | | 279,024 | |
| | | | | | | | |
| | | | | | | 2,050,036 | |
| | | | | | | | |
| | |
| | | | Taiwan – 1.61% | | | | |
| | 15,800 | | | Taiwan Semiconductor Manufacturing, SP ADR | | | 347,916 | |
| | | | | | | | |
| | |
| | | | United Kingdom – 24.18% | | | | |
| | 15,534 | | | Admiral Group (a) | | | 332,382 | |
| | 31,492 | | | ARM Holdings (a) | | | 445,842 | |
See accompanying Notes to Financial Statements.
| | |
| |
| ASTON/Barings International Fund | | October 31, 2014 |
| |
| Schedule of Investments – continued | | |
| | | | | | | | |
Shares | | | | | Market Value | |
| | |
| | | | United Kingdom (continued) | | | | |
| | 4,435 | | | AstraZeneca (a) | | $ | 323,968 | |
| | 64,279 | | | Barclays (a) | | | 247,211 | |
| | 21,427 | | | BG Group (a) | | | 357,101 | |
| | 8,567 | | | BHP Billiton (a) | | | 221,341 | |
| | 6,113 | | | British American Tobacco (a) | | | 346,469 | |
| | 68,094 | | | BT Group (a) | | | 401,435 | |
| | 52,433 | | | GKN (a) | | | 267,928 | |
| | 13,687 | | | Prudential (a) | | | 316,935 | |
| | 3,766 | | | Reckitt Benckiser Group (a) | | | 317,184 | |
| | 53,877 | | | Friends Life Group (a) | | | 279,406 | |
| | 3,774 | | | SABMiller (a) | | | 213,468 | |
| | 6,904 | | | Shire (a) | | | 463,235 | |
| | 82,376 | | | Vodafone Group (a) | | | 273,938 | |
| | 21,129 | | | WPP (a) | | | 412,703 | |
| | | | | | | | |
| | | | | | | 5,220,546 | |
| | | | | | | | |
| | |
| | | | Total Common Stocks
(Cost $19,893,039) | | | 20,807,485 | |
| | | | | | | | |
|
| | INVESTMENT COMPANY – 2.93% | |
| | |
| | 632,161 | | | BlackRock Liquidity Funds TempFund Portfolio | | | 632,161 | |
| | | | | | | | |
| | |
| | | | Total Investment Company
(Cost $632,161) | | | 632,161 | |
| | | | | | | | |
| Total Investments – 99.30%
(Cost $20,525,200)* | | | 21,439,646 | |
| | | | | | | | |
| Net Other Assets and Liabilities – 0.70% | | | 150,657 | |
| | | | | | | | |
| Net Assets – 100.00% | | $ | 21,590,303 | |
| | | | | | | | |
| * | | Aggregated cost for Federal income tax purposes is $20,690,345. |
| | | | |
Gross unrealized appreciation | | $ | 2,668,499 | |
Gross unrealized depreciation | | | (1,919,198 | ) |
| | | | |
Net unrealized appreciation | | $ | 749,301 | |
| | | | |
| (a) | | Securities with a total aggregate market value of $20,239,332 or 93.74% of the net assets, were valued under the fair value procedures established by the Funds’ Board of Trustees. |
| SP ADR | | Sponsored American Depositary Receipt |
See accompanying Notes to Financial Statements.
ASTON/Guardian Capital Global Dividend Fund
| | |
| |
| Portfolio Manager Commentary (unaudited) | | October 31, 2014 |
Srikanth Iyer & Fiona Wilson, CFA |
| Q. | What were the most significant market factors affecting Fund performance and returns relative to the benchmark during the past 12 months? |
| A. | Since the Fund’s inception, the benchmark, MSCI World Index has returned +3.26%. Significant returns came from the Healthcare and Information Technology sectors. All of the other sectors except Materials and Energy had positive returns. The last few years have been characterized by very strong equity markets aided by unprecedented stimulus. This led to a benign volatility regime with the VIX* hovering in the low double digits. In the latter part of 2014, volatility returned as the markets corrected. |
The Class N shares of the Fund returned +6.17% since inception, outperforming the benchmark by +2.91%. Stock selection was the key driver of outperformance. The portfolio’s top performing sectors were Industrials, Energy, Consumer Staples, Information Technology and Materials. The largest negative stock selection came from the Financials sector followed by the Healthcare and Consumer Discretionary sectors.
| Q. | What were the best performing holdings for the Fund during the period? |
| A. | The strongest stock performers during the period were Williams Companies (+41% return), General Dynamics Corporation (+34%), Keyera Corporation (+27%), Lockheed Martin Corporation (+26%) and Air Products and Chemicals Inc. (+18%). Williams and Keyera are both from the Energy sector, while General Dynamics and Lockheed Martin are from the Industrials sector. Air Products and Dow Chemicals also performed well against their peer group within the Materials sector. |
| Q. | What were the weakest performing holdings? |
| A. | The weakest individual stock performers over the period were Seadrill Ltd. (-27%), Electricite De France (-24%), Glaxosmithkline PLC (-10%), Wynn Resorts Ltd. (-9%) and Neopost SA (-4%). Seadrill, an offshore drilling contractor in the Energy sector has seen significant supply chain weakness as well as heightened sensitivity to dividend sustainability. Glaxosmithkline, a global pharmaceutical company with head offices in the United Kingdom, is plagued by weak earnings while maintaining a healthy dividend yield. Wynn Resorts, in the Consumer Discretionary sector, develops and operates casino resorts and provides indirect participation in hard real estate. Electricte De France, a French Utility company and Neopost SA, from the Information Technology sector, have underperformed due to the weak Euro. |
| Q. | How was the Fund positioned as of October 31, 2014? |
| A. | In seeking to provide a higher dividend yield than the benchmark, the Fund has an overweight tilt in Consumer Staples, Utilities, and Telecommunications, while also maintaining critical exposure to other cash flow positive sectors, like Industrials and Technology. The sectors with small underweights to the benchmark were Financials, Consumer Discretionary and Information Technology. |
| * | | Chicago Board Options Exchange (CBOE) Volatility Index, which shows the market’s expectation of 30-day volatility. |
Growth of a Hypothetical
$10,000 Investment—Class N
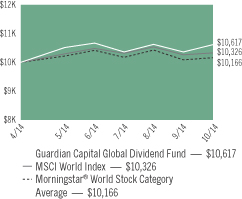
All dividends and capital gains are reinvested. Indexes are unmanaged and do not take into account fees, expenses or other costs.
Returns shown in the chart and table do not reflect taxes that a shareholder would pay on Fund distributions or on the sale of the Fund shares.
The securities of foreign companies may be less liquid and may fluctuate more widely than those traded in U.S. markets.
Emerging market securities may be subject to additional risks such as price volatility, currency fluctuation, financial reporting requirements as well as political and economic instability.
RETURNSFOR PERIOD ENDED 10/31/14
Total Return - Class N
| | | | |
Cumulative Since Inception | | | 6.17 | % |
Inception Date 04/14/14
Total Return - Class I
| | | | |
Cumulative Since Inception | | | 6.39 | % |
Inception Date 04/14/14
The performance data quoted represents past performance. Past performance does not guarantee future results. Investment return and principal value will fluctuate so that an investor’s shares, upon redemption, may be worth more or less than their original cost. Current performance may be lower or higher than the performance data quoted. For performance data current to the most recent month-end, please visit our website at www.astonfunds.com.
The performance quoted would have been lower if fee waivers and/or expense reimbursements had not been in effect.
| | |
| |
| ASTON/Guardian Capital Global Dividend Fund | | October 31, 2014 |
| |
| Schedule of Investments | | |
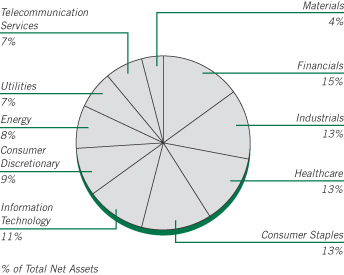
| | | | | | | | |
Shares | | | | | Market
Value | |
|
| | COMMON STOCKS – 99.93% | |
| | |
| | | | Australia – 5.04% | | | | |
| | 2,300 | | | Australia & New Zealand Banking Group (a) | | $ | 68,058 | |
| | 300 | | | Commonwealth Bank of Australia (a) | | | 21,333 | |
| | 1,100 | | | Sonic Healthcare (a) | | | 18,204 | |
| | 5,200 | | | Sydney Airport (a) | | | 20,216 | |
| | 10,100 | | | Telstra (a) | | | 50,259 | |
| | 1,200 | | | Westpac Banking (a) | | | 36,833 | |
| | | | | | | | |
| | | | | | | 214,903 | |
| | | | | | | | |
| | |
| | | | Belgium – 2.67% | | | | |
| | 480 | | | Anheuser-Busch InBev, SP ADR | | | 53,270 | |
| | 1,600 | | | Belgacom SA (a) | | | 60,430 | |
| | | | | | | | |
| | | | | | | 113,700 | |
| | | | | | | | |
| | |
| | | | Canada – 2.44% | | | | |
| | 350 | | | DH Corp | | | 11,180 | |
| | 610 | | | Keyera | | | 48,527 | |
| | 690 | | | Pembina Pipeline | | | 28,627 | |
| | 520 | | | Westshore Terminals Investment | | | 15,848 | |
| | | | | | | | |
| | | | | | | 104,182 | |
| | | | | | | | |
| | |
| | | | France – 3.50% | | | | |
| | 2,600 | | | AXA (a) | | | 60,056 | |
| | 1,400 | | | Electricite de France (a) | | | 41,340 | |
| | 800 | | | Total (a) | | | 47,763 | |
| | | | | | | | |
| | | | | | | 149,159 | |
| | | | | | | | |
| | |
| | | | Germany – 4.87% | | | | |
| | 500 | | | BASF (a) | | | 44,180 | |
| | 300 | | | Bayer (a) | | | 42,906 | |
| | 200 | | | Daimler (a) | | | 15,594 | |
| | 1,900 | | | Deutsche Telekom (a) | | | 28,639 | |
| | 100 | | | Muenchener Rueckversicherungs-Gesellschaft (a) | | | 19,689 | |
| | | | | | | | |
Shares | | | | | Market
Value | |
| | |
| | | | Germany (continued) | | | | |
| | 1,400 | | | ProSiebenSat.1 Media (a) | | $ | 56,555 | |
| | | | | | | | |
| | | | | | | 207,563 | |
| | | | | | | | |
| | |
| | | | Ireland – 1.84% | | | | |
| | 1,250 | | | Seagate Technology | | | 78,538 | |
| | | | | | | | |
| | |
| | | | Israel – 0.77% | | | | |
| | 580 | | | Teva Pharmaceutical Industries, SP ADR | | | 32,753 | |
| | | | | | | | |
| | |
| | | | Italy – 0.60% | | | | |
| | 1,200 | | | Eni (a) | | | 25,566 | |
| | | | | | | | |
| | |
| | | | Netherlands – 1.03% | | | | |
| | 1,130 | | | Unilever | | | 43,765 | |
| | | | | | | | |
| | |
| | | | Norway – 0.43% | | | | |
| | 2,400 | | | Orkla ASA (a) | | | 18,350 | |
| | | | | | | | |
| | |
| | | | Spain – 2.73% | | | | |
| | 3,337 | | | Banco Santander, SP ADR | | | 29,265 | |
| | 4,267 | | | Ferrovial (a) | | | 87,239 | |
| | | | | | | | |
| | | | | | | 116,504 | |
| | | | | | | | |
| | |
| | | | Sweden – 1.70% | | | | |
| | 4,200 | | | Skandinaviska Enskilda Banken AB (a) | | | 53,946 | |
| | 700 | | | Swedbank AB, Class A (a) | | | 18,550 | |
| | | | | | | | |
| | | | | | | 72,496 | |
| | | | | | | | |
| | |
| | | | Switzerland – 5.28% | | | | |
| | 590 | | | Garmin | | | 32,733 | |
| | 1,000 | | | Nestle (a) | | | 73,334 | |
| | 650 | | | Novartis, ADR | | | 60,249 | |
| | 100 | | | Swisscom (a) | | | 58,952 | |
| | | | | | | | |
| | | | | | | 225,268 | |
| | | | | | | | |
| | |
| | | | United Kingdom – 10.47% | | | | |
| | 600 | | | AstraZeneca (a) | | | 43,829 | |
| | 3,300 | | | BAE Systems (a) | | | 24,302 | |
| | 540 | | | British American Tobacco, SP ADR | | | 61,322 | |
| | 660 | | | GlaxoSmithKline, SP ADR | | | 30,023 | |
| | 1,500 | | | Imperial Tobacco Group (a) | | | 65,162 | |
| | 5,500 | | | Legal & General Group (a) | | | 20,385 | |
| | 5,000 | | | National Grid (a) | | | 74,199 | |
| | 920 | | | Prudential, ADR | | | 42,624 | |
| | 500 | | | Royal Dutch Shell, Class A (a) | | | 17,861 | |
| | 2,600 | | | SSE (a) | | | 66,640 | |
| | | | | | | | |
| | | | | | | 446,347 | |
| | | | | | | | |
| | |
| | | | United States – 56.56% | | | | |
| | 1,090 | | | AbbVie | | | 69,171 | |
| | 440 | | | Air Products & Chemicals | | | 59,250 | |
| | 1,500 | | | Altria Group | | | 72,510 | |
| | 740 | | | Ameren | | | 31,332 | |
| | 700 | | | Apple | | | 75,600 | |
| | 1,979 | | | AT&T | | | 68,948 | |
| | 860 | | | Automatic Data Processing | | | 70,331 | |
| | 211 | | | Chevron | | | 25,309 | |
See accompanying Notes to Financial Statements.
| | |
| |
| ASTON/Guardian Capital Global Dividend Fund | | October 31, 2014 |
| |
| Schedule of Investments – continued | | |
| | | | | | | | |
Shares | | | | | Market
Value | |
| | |
| | | | United States (continued) | | | | |
| | 430 | | | ConocoPhillips | | $ | 31,025 | |
| | 1,400 | | | CSX | | | 49,882 | |
| | 1,390 | | | Dow Chemical | | | 68,666 | |
| | 490 | | | Dr Pepper Snapple Group | | | 33,932 | |
| | 770 | | | Duke Energy | | | 63,255 | |
| | 830 | | | Eaton | | | 56,764 | |
| | 880 | | | Emerson Electric | | | 56,373 | |
| | 270 | | | Entergy | | | 22,685 | |
| | 390 | | | Exxon Mobil | | | 37,717 | |
| | 1,990 | | | Fifth Third Bancorp | | | 39,780 | |
| | 560 | | | General Dynamics | | | 78,266 | |
| | 220 | | | Genuine Parts | | | 21,358 | |
| | 1,460 | | | Hospitality Properties Trust, REIT | | | 43,231 | |
| | 850 | | | Illinois Tool Works | | | 77,393 | |
| | 760 | | | Intel | | | 25,848 | |
| | 1,030 | | | Johnson & Johnson | | | 111,013 | |
| | 1,230 | | | JPMorgan Chase | | | 74,390 | |
| | 270 | | | Kimberly-Clark | | | 30,853 | |
| | 680 | | | KLA-Tencor | | | 53,822 | |
| | 360 | | | Lockheed Martin | | | 68,605 | |
| | 1,330 | | | Lorillard | | | 81,795 | |
| | 330 | | | Macy’s | | | 19,081 | |
| | 220 | | | McDonald’s | | | 20,621 | |
| | 730 | | | Medtronic | | | 49,757 | |
| | 740 | | | Merck | | | 42,876 | |
| | 1,250 | | | Microsoft | | | 58,688 | |
| | 540 | | | Newell Rubbermaid | | | 17,998 | |
| | 290 | | | Omnicom Group | | | 20,839 | |
| | 1,080 | | �� | Pfizer | | | 32,346 | |
| | 380 | | | Philip Morris International | | | 33,824 | |
| | 370 | | | Procter & Gamble | | | 32,290 | |
| | 700 | | | Reynolds American | | | 44,037 | |
| | 1,380 | | | Six Flags Entertainment | | | 55,614 | |
| | 3,490 | | | Spirit Realty Capital, REIT | | | 41,531 | |
| | 170 | | | Targa Resources Partners | | | 10,384 | |
| | 1,570 | | | Texas Instruments | | | 77,966 | |
| | 360 | | | Valero Energy | | | 18,032 | |
| | 210 | | | Verizon Communications | | | 10,553 | |
| | 480 | | | VF | | | 32,486 | |
| | 740 | | | Waste Management | | | 36,179 | |
| | 1,540 | | | Wells Fargo | | | 81,759 | |
| | 769 | | | Williams | | | 42,687 | |
| | 170 | | | Wynn Resorts | | | 32,302 | |
| | | | | | | | |
| | | | | | | 2,410,954 | |
| | | | | | | | |
| | |
| | | | Total Common Stocks
(Cost $4,025,786) | | | 4,260,048 | |
| | | | | | | | |
| | | | | | | | |
Shares | | | | | Market
Value | |
|
| | INVESTMENT COMPANY – 0.50% | |
| | |
| | 21,167 | | | BlackRock Liquidity Funds TempCash Portfolio | | $ | 21,167 | |
| | | | | | | | |
| | |
| | | | Total Investment Company
(Cost $21,167) | | | 21,167 | |
| | | | | | | | |
| Total Investments – 100.43%
(Cost $4,046,953)* | | | 4,281,215 | |
| | | | | | | | |
| Net Other Assets and Liabilities – (0.43)% | | | (18,191 | ) |
| | | | | | | | |
| Net Assets – 100.00% | | $ | 4,263,024 | |
| | | | | | | | |
| * | | At October 31, 2014, cost is identical for book and Federal income tax purposes. |
| | | | |
Gross unrealized appreciation | | $ | 380,976 | |
Gross unrealized depreciation | | | (146,714 | ) |
| | | | |
Net unrealized appreciation | | $ | 234,262 | |
| | | | |
| (a) | | Securities with a total aggregate market value of $1,280,370 or 30.03% of the net assets, were valued under the fair value procedures established by the Funds’ Board of Trustees. |
| ADR | | American Depositary Receipt |
| REIT | | Real Estate Investment Trust |
| SP ADR | | Sponsored American Depositary Receipt |
See accompanying Notes to Financial Statements.
ASTON/LMCG Emerging Markets Fund
| | |
| |
| Portfolio Manager Commentary (unaudited) | | October 31, 2014 |
Gordon Johnson, PhD, CFA; Shannon Ericson, CFA & Vikram Srimurthy, PhD, CFA |
| Q. | What were the most significant market factors affecting Fund performance and returns relative to the benchmark during the past 12 months? |
| A. | The past twelve months were volatile for emerging market equities due to continued political and economic uncertainties in many of the countries. The payoffs among our three major stock selection components, Valuation, Market Dynamics and Earnings Quality were volatile from month-to-month and often moved in different directions. The current environment is consistent with what we have been seeing for the last few quarters. Investors continue to focus more on the macro environment and less on company fundamentals, which is a difficult environment for active stock pickers such as we are. |
| Q. | What were the best performing holdings for the Fund during the period? |
| A. | The best performing holdings during the period were Amorepacific Corp., ICICI Bank and KCC Corp. All three stocks were up strongly during the period on positive earnings-related news. Korean Consumer Staples company, Amorepacific, announced earnings that surpassed Wall Street expectations on strong overseas sales of its cosmetics products, particularly in China. Indian bank, ICICI Bank, announced strong earnings and provided positive guidance for next year. Finally, profits at the Korean Industrial, KCC Corp., were stronger on a recovery in the company’s building materials division. |
| Q. | What were the weakest performing holdings? |
| A. | The biggest negative contributions from individual stocks came from an overweight position in China Mobile and underweight positions in TenCent Holdings in China, and Naspers, a South African company, which owns a stake in TenCent. China Mobile reported disappointing earnings primarily due to a greater than expected increase in capital spending. TenCent continues to benefit from the success of the company’s online |
| | social network, WeChat. Due to this strong performance, the stock’s weight in the benchmark has grown substantially over the last couple of years. We owned TenCent during the period for risk control purposes given its large weight in the benchmark. However, we held the position at an underweight due to its poor ranking on our stock selection model, primarily caused by its high valuation and poor earnings quality. |
| Q. | How was the Fund positioned as of October 31, 2014? |
| A. | All eyes seem to be on the Federal Reserve these days and emerging market investors seem to be hinging on Janet Yellen’s every word. We were hopeful that markets had started to pick up earlier in the year and look through a rate increase. Given how they responded in September, however, it appears the volatility will continue. In this type of environment, we continue to believe that it is important to balance the portfolio against either an up or down market by having more equal exposures across all of the major factor components. In addition, we have put additional emphasis on risk control to ensure that we do not have any unwanted biases. We believe this approach has allowed us to keep pace with the benchmark this year despite a difficult environment for stock picking. We will continue to monitor where we are in the market cycle by looking at valuation spreads, alpha factor performance and stock correlations, and adjust the strategy’s exposures as necessary. |
Growth of a Hypothetical
$10,000 Investment—Class N
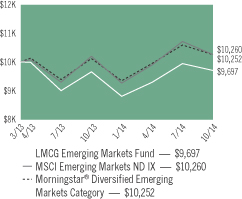
All dividends and capital gains are reinvested. Indexes are unmanaged and do not take into account fees, expenses or other costs.
Returns shown in the chart and table do not reflect taxes that a shareholder would pay on Fund distributions or on the sale of the Fund shares.
The securities of foreign companies may be less liquid and may fluctuate more widely than those traded in U.S. markets.
Emerging market securities may be subject to additional risks such as price volatility, currency fluctuation, financial reporting requirements as well as political and economic instability.
RETURNSFOR PERIOD ENDED 10/31/14
Average Annual Total Returns - Class N
| | | | |
One Year | | | 0.49 | % |
Since Inception | | | -1.91 | % |
Inception Date 03/28/13
Average Annual Total Returns - Class I
| | | | |
One Year | | | 0.79 | % |
Since Inception | | | -1.60 | % |
Inception Date 03/28/13
The performance data quoted represents past performance. Past performance does not guarantee future results. Investment return and principal value will fluctuate so that an investor’s shares, upon redemption, may be worth more or less than their original cost. Current performance may be lower or higher than the performance data quoted. For performance data current to the most recent month-end, please visit our website at www.astonfunds.com.
The performance quoted would have been lower if fee waivers and/or expense reimbursements had not been in effect.
| | |
| |
| ASTON/LMCG Emerging Markets Fund | | October 31, 2014 |
| |
| Schedule of Investments | | |
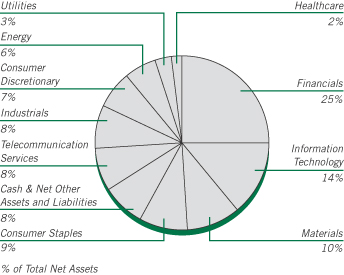
| | | | | | | | |
Shares | | | | | Market
Value | |
|
| | COMMON STOCKS – 92.25% | |
| | |
| | | | Brazil – 6.74% | | | | |
| | 3,400 | | | Banco do Brasil SA | | $ | 38,049 | |
| | 3,900 | | | Braskem, Preference A | | | 28,535 | |
| | 502 | | | Cia Brasileira de Distribuicao Grupo Pao de Acucar, SP ADR | | | 20,984 | |
| | 3,900 | | | Cyrela Brazil Realty SA Empreendimentos e Participacoes | | | 19,391 | |
| | 3,900 | | | Hypermarcas * | | | 27,244 | |
| | 9,500 | | | JBS | | | 42,365 | |
| | 2,200 | | | Porto Seguro SA | | | 26,369 | |
| | 8,100 | | | Suzano Papel e Celulose, Preference A | | | 34,193 | |
| | 3,042 | | | Vale, SP ADR | | | 26,648 | |
| | | | | | | | |
| | | | | | | 263,778 | |
| | | | | | | | |
| | |
| | | | China – 12.63% | | | | |
| | 63,000 | | | Agricultural Bank of China, Class H (a) | | | 29,276 | |
| | 42,000 | | | Angang Steel, Class H (a) | | | 30,877 | |
| | 141,000 | | | Bank of China, Class H (a) | | | 67,490 | |
| | 50,000 | | | China CITIC Bank, Class H (a) | | | 32,573 | |
| | 51,000 | | | China Construction Bank, Class H (a) | | | 38,051 | |
| | 30,000 | | | China Railway Construction, Class H (a) | | | 31,518 | |
| | 57,000 | | | China Railway Group (a) | | | 35,163 | |
| | 63,000 | | | Chongqing Rural Commerical Bank, Class H (a) | | | 30,320 | |
| | 68,000 | | | Evergrande Real Estate, Class H (a) | | | 26,131 | |
| | 30,000 | | | Huaneng Power International, Class H (a) | | | 36,883 | |
| | 113,000 | | | Industrial and Commercial Bank of China, (a) | | | 75,027 | |
| | 3,800 | | | Tencent Holdings (a) | | | 61,075 | |
| | | | | | | | |
| | | | | | | 494,384 | |
| | | | | | | | |
| | |
| | | | Egypt – 0.76% | | | | |
| | 4,351 | | | Commerical International Bank SAE, GDR (a) | | | 29,706 | |
| | | | | | | | |
| | | | | | | | |
Shares | | | | | Market
Value | |
| | |
| | | | Hong Kong – 6.39% | | | | |
| | 5,000 | | | China Mobile (a) | | $ | 62,213 | |
| | 68,000 | | | China Power International Development (a) | | | 30,717 | |
| | 44,000 | | | China Resources Cement Holdings (a) | | | 29,920 | |
| | 18,000 | | | CITIC (a) | | | 31,539 | |
| | 243,000 | | | GOME Electrical Appliances Holding (a) | | | 38,284 | |
| | 13,000 | | | Shimao Property Holdings (a) | | | 27,979 | |
| | 34,000 | | | Tianjin Development Holdings (a) | | | 29,519 | |
| | | | | | | | |
| | | | | | | 250,171 | |
| | | | | | | | |
| | |
| | | | India – 4.64% | | | | |
| | 954 | | | ICICI Bank, SP ADR | | | 53,767 | |
| | 1,528 | | | Reliance Industries, GDR (a) | | | 49,388 | |
| | 1,017 | | | Tata Motors, SP ADR | | | 47,901 | |
| | 2,485 | | | Wipro, ADR | | | 30,317 | |
| | | | | | | | |
| | | | | | | 181,373 | |
| | | | | | | | |
| | |
| | | | Indonesia – 3.29% | | | | |
| | 306,300 | | | Adaro Energy Tbk PT (a) | | | 28,804 | |
| | 90,000 | | | Bank Negara Indonesia Persero Tbk (a) | | | 44,358 | |
| | 55,800 | | | Indofood Sukses Makmur Tbk PT (a) | | | 31,518 | |
| | 148,100 | | | Perusahaan Perkebunan London Sumatra (a) | | | 23,843 | |
| | | | | | | | |
| | | | | | | 128,523 | |
| | | | | | | | |
| | |
| | | | Malaysia – 3.40% | | | | |
| | 20,600 | | | DiGi.Com (a) | | | 38,778 | |
| | 7,400 | | | Hong Leong Bank | | | 32,891 | |
| | 15,500 | | | IJM | | | 32,609 | |
| | 57,200 | | | YTL | | | 28,867 | |
| | | | | | | | |
| | | | | | | 133,145 | |
| | | | | | | | |
| | |
| | | | Mexico – 5.24% | | | | |
| | 63,300 | | | America Movil | | | 77,420 | |
| | 4,500 | | | Arca Continental | | | 28,972 | |
| | 15,400 | | | Compartamos | | | 34,308 | |
| | 5,000 | | | Grupo Aeroportuario del Pacifico | | | 34,148 | |
| | 8,700 | | | Grupo Comercial Chedraui | | | 30,171 | |
| | | | | | | | |
| | | | | | | 205,019 | |
| | | | | | | | |
| | |
| | | | Philippines – 1.93% | | | | |
| | 15,600 | | | BDO Unibank (a) | | | 34,051 | |
| | 9,990 | | | Universal Robina (a) | | | 41,381 | |
| | | | | | | | |
| | | | | | | 75,432 | |
| | | | | | | | |
| | |
| | | | Poland – 0.62% | | | | |
| | 1,019 | | | PKP Cargo SA (a) | | | 24,097 | |
| | | | | | | | |
| | |
| | | | Russia – 3.89% | | | | |
| | 5,723 | | | Gazprom, SP ADR | | | 37,760 | |
| | 2,976 | | | Gazprom, SP GDR (a) | | | 19,718 | |
| | 39 | | | Lukoil, SP GDR (a) | | | 1,912 | |
| | 546 | | | Lukoil, SP ADR | | | 26,781 | |
| | 1,882 | | | MMC Norilsk Nickel OJSC, ADR (a) | | | 35,117 | |
| | 870 | | | Tatneft, SP ADR (a) | | | 31,096 | |
| | | | | | | | |
| | | | | | | 152,384 | |
| | | | | | | | |
See accompanying Notes to Financial Statements.
| | |
| |
| ASTON/LMCG Emerging Markets Fund | | October 31, 2014 |
| |
| Schedule of Investments – continued | | |
| | | | | | | | |
Shares | | | | | Market
Value | |
| | |
| | | | South Africa – 8.42% | | | | |
| | 2,987 | | | Barloworld (a) | | $ | 25,950 | |
| | 7,665 | | | Gold Fields (a) | | | 24,855 | |
| | 2,449 | | | Liberty Holdings (a) | | | 28,340 | |
| | 4,950 | | | Mediclinic International (a) | | | 44,253 | |
| | 3,074 | | | MTN Group (a) | | | 68,068 | |
| | 14,130 | | | Netcare (a) | | | 42,749 | |
| | 7,848 | | | Sappi (a) * | | | 31,083 | |
| | 572 | | | Sasol (a) | | | 28,563 | |
| | 1,188 | | | Tiger Brands (a) | | | 35,757 | |
| | | | | | | | |
| | | | | | | 329,618 | |
| | | | | | | | |
| | |
| | | | South Korea – 13.11% | | | | |
| | 567 | | | Dongbu Insurance (a) | | | 31,699 | |
| | 130 | | | E-Mart (a) | | | 24,121 | |
| | 536 | | | Hankook Tire (a) | | | 27,617 | |
| | 920 | | | Hanwha (a) | | | 23,573 | |
| | 310 | | | Hyundai Hysco (a) | | | 20,126 | |
| | 291 | | | Hyundai Motor (a) | | | 46,176 | |
| | 2,464 | | | Industrial Bank of Korea (a) | | | 36,032 | |
| | 1,088 | | | LG Display (a) * | | | 32,030 | |
| | 463 | | | LG Electronics (a) | | | 28,276 | |
| | 411 | | | LS (a) | | | 23,013 | |
| | 1,475 | | | Nexen Tire (a) | | | 18,065 | |
| | 73 | | | Samsung Electronics (a) | | | 85,128 | |
| | 847 | | | Shinhan Financial Group (a) | | | 39,865 | |
| | 140 | | | SK Holdings (a) | | | 21,945 | |
| | 133 | | | SK Telecom (a) | | | 33,330 | |
| | 1,198 | | | SL (a) | | | 22,061 | |
| | | | | | | | |
| | | | | | | 513,057 | |
| | | | | | | | |
| | |
| | | | Taiwan – 11.98% | | | | |
| | 31,000 | | | Advanced Semiconductor Engineering (a) | | | 37,397 | |
| | 71,000 | | | Au Optronics (a) | | | 33,837 | |
| | 5,000 | | | Catcher Technology (a) | | | 42,209 | |
| | 13,000 | | | Cheng Uei Precision Industry (a) | | | 21,709 | |
| | 10,000 | | | Chicony Electronics (a) | | | 28,797 | |
| | 22,400 | | | Hon Hai Precision Industry (a) | | | 70,896 | |
| | 28,000 | | | King Yuan Electronics (a) | | | 22,183 | |
| | 20,000 | | | Pou Chen (a) | | | 22,054 | |
| | 16,000 | | | Ruentex Development (a) | | | 23,884 | |
| | 64,000 | | | Taishin Financial Holdings (a) | | | 30,530 | |
| | 15,000 | | | Taiwan Semiconductor Manufacturing (a) | | | 65,023 | |
| | 21,984 | | | Uni-President Enterprises (a) | | | 37,802 | |
| | 73,000 | | | United Microelectronics (a) | | | 32,412 | |
| | | | | | | | |
| | | | | | | 468,733 | |
| | | | | | | | |
| | |
| | | | Thailand – 4.88% | | | | |
| | 205,600 | | | Hemaraj Land and Development, NVDR (a) | | | 30,197 | |
| | 5,300 | | | Kasikornbank (a) | | | 38,429 | |
| | 5,500 | | | PTT Exploration & Production (a) | | | 24,727 | |
| | 14,300 | | | PTT Global Chemical (a) | | | 27,143 | |
| | 257,000 | | | Quality Houses (a) | | | 33,964 | |
| | 6,700 | | | Siam Commercial Bank (a) | | | 36,535 | |
| | | | | | | | |
| | | | | | | 190,995 | |
| | | | | | | | |
| | | | | | | | |
Shares | | | | | Market
Value | |
| | |
| | | | Turkey – 4.33% | | | | |
| | 23,034 | | | Eregli Demir ve Celik Fabrikalari TAS (a) | | $ | 48,008 | |
| | 34,847 | | | Kardemir Karabuk Demir Celik Sanayi ve Ticaret, Class D (a) * | | | 38,868 | |
| | 8,068 | | | Turk Hava Yollari (a) * | | | 26,443 | |
| | 5,233 | | | Turkcell Iletisim Hizmetleri (a) * | | | 30,421 | |
| | 11,880 | | | Turkiye Vakiflar Bankasi Tao, Class D (a) | | | 25,532 | |
| | | | | | | | |
| | | | | | | 169,272 | |
| | | | | | | | |
| | |
| | | | Total Common Stocks
(Cost $3,515,333) | | | 3,609,687 | |
| | | | | | | | |
|
| | EXCHANGE TRADED FUNDS – 5.11% | |
| | |
| | | | United States – 5.11% | | | | |
| | 606 | | | iPath MSCI India Index Fund * | | | 44,844 | |
| | 1,780 | | | iShares MSCI Emerging Markets Index Fund | | | 75,027 | |
| | 2,513 | | | iShares MSCI India | | | 80,114 | |
| | | | | | | | |
| | | | | | | 199,985 | |
| | | | | | | | |
| | |
| | | | Total Exchange Traded Funds
(Cost $157,290) | | | 199,985 | |
| | | | | | | | |
|
| | INVESTMENT COMPANY – 2.45% | |
| | |
| | 96,035 | | | BlackRock Liquidity Funds TempCash Portfolio | | | 96,035 | |
| | | | | | | | |
| | |
| | | | Total Investment Company
(Cost $96,035) | | | 96,035 | |
| | | | | | | | |
| Total Investments – 99.81%
(Cost $3,768,658)** | | | 3,905,707 | |
| | | | | | | | |
| Net Other Assets and Liabilities – 0.19% | | | 7,319 | |
| | | | | | | | |
| Net Assets – 100.00% | | $ | 3,913,026 | |
| | | | | | | | |
| * | | Non-income producing security. |
| ** | | Aggregate cost for Federal income tax purposes is $3,778,089. |
| | | | |
Gross unrealized appreciation | | $ | 438,130 | |
Gross unrealized depreciation | | | (310,512 | ) |
| | | | |
Net unrealized appreciation | | $ | 127,618 | |
| | | | |
| (a) | | Securities with a total aggregate market value of $2,849,997 or 72.83% of the net assets, were valued under the fair value procedures established by the Funds’ Board of Trustees. |
| ADR | | American Depositary Receipt |
| GDR | | Global Depositary Receipt |
| MSCI | | Morgan Stanley Capital International |
| NVDR | | Non-Voting Depositary Receipt |
| SP ADR | | Sponsored American Depositary Receipt |
See accompanying Notes to Financial Statements.
ASTON/Pictet International Fund
| | |
| |
| Portfolio Manager Commentary (unaudited) | | October 31, 2014 |
Fabio Paolini, CFA; Swee-Kheng Lee, PhD. & Benjamin Beneche, CFA |
| Q. | What were the most significant market factors affecting Fund performance and returns relative to the benchmark during the past 12 months? |
| A. | Since the Fund’s inception, international equity markets posted a modest decline, but their path was volatile. The main negative influence was Europe, where growth remains weak and the specter of deflation looms. The Class N shares of the Fund fell by -6.60% over the period, trailing the benchmark’s decline of -3.45%. While the Fund benefitted from holding an overweight position in Japan and the Pacific ex Japan region, adverse stock selection in Europe—particularly within the Financial, Consumer Discretionary and Healthcare sectors—was the main driver of the underperformance. |
| Q. | What were the best performing holdings for the Fund during the period? |
| A. | PCCW was the Fund’s top performer after the company announced the acquisition of Hong Kong telecommunication rival CSL. The move increases PCCW’s scope to bundle services, creates significant cost synergies and should bring better pricing order to a competitive market. Tsuruha rose significantly as it expanded geographically and as the earnings benefits of its role as a consolidator in the fragmented Japanese drugstore sector became apparent. Japanese employment agency Temp Holdings appreciated on strong earnings and news of reforms that should encourage greater labor market flexibility. NTT gained on a shift in Japanese telecommunication regulation that will allow it to compete more effectively with companies like Softbank and KDDI, which have been favored over NTT since its monopoly was broken in the mid-2000s. New Zealand power generator Mighty River posted strong gains following a general election result that buried Green/Labor party proposals to renationalize power companies, and after it announced both a special dividend and a share buy-back. |
| Q. | What were the weakest performing holdings? |
| A. | Airport retailer World Duty Free (Italy) and supermarket operator DIA (Spain) suffered from general weakness in the Spanish economy, and in WDF’s case, slow initial growth from newly awarded concessions to run duty free outlets at Spanish airports. Belgian biotech company Thrombogenics fell sharply and was sold from the Fund after poorly executing the launch of its key vitreomacular adhesion drug, Jetrea, in the United States, and losing the support of Novartis’ eye care division, Alcon. Norwegian oil services company Odfjell Drilling declined as a weakening oil price compounded the negative impact of increased capacity in the offshore rig market. Although successful in ramping up production at its key new assets in NW Australia, iron ore miner Fortescue Metals weakened through the period as the commodity’s price reacted negatively to slowing demand growth in China. |
| Q. | How was the Fund positioned as of October 31, 2014? |
| A. | The Fund is run to an investment process that focuses on bottom-up stock selection and seeks to hold companies that are both capable of sustaining profitable cash flow growth and trade at a discount to our assessment of their underlying (intrinsic) value. Region, sector and market capitalization positions are by-products of stock selection. |
Reflecting international equity valuations that in general remain above their 10-year averages (and in the case of Europe, close to 10-year highs), the Fund has a defensive stance that emphasizes future cash flow visibility and downside protection. At a regional level it is overweight the Pacific ex Japan and Japan, and underweight Europe. At sector level it is biased in favor of Telecommunications, Consumer Staples and Healthcare, and against Materials and Financials. However, it retains a tilt towards less efficiently priced smaller companies at the expense of their larger, better covered counterparts.
Growth of a Hypothetical
$10,000 Investment—Class N
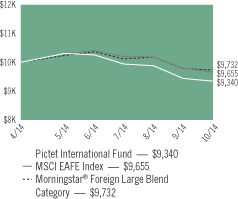
All dividends and capital gains are reinvested. Indexes are unmanaged and do not take into account fees, expenses or other costs.
Returns shown in the chart and table do not reflect taxes that a shareholder would pay on Fund distributions or on the sale of the Fund shares.
The securities of foreign companies may be less liquid and may fluctuate more widely than those traded in U.S. markets.
Emerging market securities may be subject to additional risks such as price volatility, currency fluctuation, financial reporting requirements as well as political and economic instability.
RETURNSFOR PERIOD ENDED 10/31/14
Total Return - Class N
| | | | |
Cumulative Since Inception | | | -6.60 | % |
Inception Date 04/14/14
Total Return - Class I
| | | | |
Cumulative Since Inception | | | -6.40 | % |
Inception Date 04/14/14
The performance data quoted represents past performance. Past performance does not guarantee future results. Investment return and principal value will fluctuate so that an investor’s shares, upon redemption, may be worth more or less than their original cost. Current performance may be lower or higher than the performance data quoted. For performance data current to the most recent month-end, please visit our website at www.astonfunds.com.
The performance quoted would have been lower if fee waivers and/or expense reimbursements had not been in effect.
| | |
| |
| ASTON/Pictet International Fund | | October 31, 2014 |
| |
| Schedule of Investments | | |
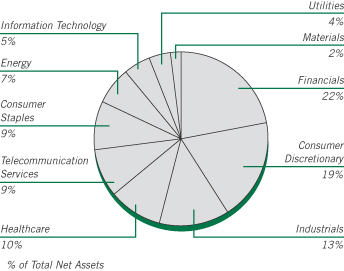
| | | | | | | | |
Shares | | | | | Market
Value | |
|
| | COMMON STOCKS – 98.39% | |
| | |
| | | | Australia – 5.19% | | | | |
| | 14,334 | | | Asciano (a) | | $ | 79,288 | |
| | 7,968 | | | Computershare (a) | | | 86,479 | |
| | 30,093 | | | Fortescue Metals Group (a) | | | 92,878 | |
| | 32,518 | | | Healthscope Ltd (a) * | | | 72,727 | |
| | 51,494 | | | Spotless Group Holdings (a) * | | | 87,127 | |
| | 11,702 | | | UGL (a) | | | 72,382 | |
| | | | | | | | |
| | | | | | | 490,881 | |
| | | | | | | | |
| | |
| | | | Austria – 2.62% | | | | |
| | 5,446 | | | Erste Group Bank (a) | | | 138,968 | |
| | 5,055 | | | Raiffeisen Bank International (a) | | | 108,237 | |
| | | | | | | | |
| | | | | | | 247,205 | |
| | | | | | | | |
| | |
| | | | Belgium – 0.90% | | | | |
| | 2,551 | | | Ageas (a) | | | 85,275 | |
| | | | | | | | |
| | |
| | | | Bermuda – 2.00% | | | | |
| | 2,400 | | | Jardine Matheson Holdings (a) | | | 143,827 | |
| | 15,402 | | | Odfjell Drilling (a) | | | 45,179 | |
| | | | | | | | |
| | | | | | | 189,006 | |
| | | | | | | | |
| | |
| | | | Cayman Islands – 0.95% | | | | |
| | 28,000 | | | MGM China Holdings (a) | | | 90,014 | |
| | | | | | | | |
| | |
| | | | Denmark – 4.38% | | | | |
| | 2,564 | | | Carlsberg, Class B (a) | | | 226,141 | |
| | 5,746 | | | H Lundbeck (a) | | | 121,846 | |
| | 2,986 | | | Matas (a) | | | 65,649 | |
| | | | | | | | |
| | | | | | | 413,636 | |
| | | | | | | | |
| | |
| | | | Finland – 1.47% | | | | |
| | 16,670 | | | Nokia (a) | | | 139,293 | |
| | | | | | | | |
| | | | | | | | |
Shares | | | | | Market
Value | |
| | |
| | | | France – 5.87% | | | | |
| | 245 | | | Bollore SA (a) | | $ | 116,155 | |
| | 1,973 | | | Faurecia (a) | | | 63,909 | |
| | 1,803 | | | Orpea (a) | | | 110,005 | |
| | 878 | | | Rubis (a) | | | 51,661 | |
| | 4,414 | | | Societe Generale (a) | | | 212,715 | |
| | | | | | | | |
| | | | | | | 554,445 | |
| | | | | | | | |
| | |
| | | | Germany – 3.27% | | | | |
| | 709 | | | Allianz (a) | | | 112,747 | |
| | 1,370 | | | Bayer (a) | | | 195,940 | |
| | | | | | | | |
| | | | | | | 308,687 | |
| | | | | | | | |
| | |
| | | | Hong Kong – 4.44% | | | | |
| | 26,800 | | | AIA Group (a) | | | 149,555 | |
| | 9,000 | | | Hutchison Whampoa (a) | | | 114,125 | |
| | 245,074 | | | PCCW (a) | | | 155,797 | |
| | | | | | | | |
| | | | | | | 419,477 | |
| | | | | | | | |
| | |
| | | | Italy – 4.80% | | | | |
| | 6,399 | | | Astaldi (a) | | | 44,765 | |
| | 16,418 | | | Cerved Information Solutions (a) * | | | 90,712 | |
| | 13,774 | | | Snam (a) | | | 74,483 | |
| | 44,987 | | | UnipolSai (a) | | | 120,958 | |
| | 14,411 | | | World Duty Free (a) * | | | 122,361 | |
| | | | | | | | |
| | | | | | | 453,279 | |
| | | | | | | | |
| | |
| | | | Japan – 22.31% | | | | |
| | 3,400 | | | Daiichikosho (a) | | | 85,804 | |
| | 7,400 | | | Fujitec (a) | | | 73,881 | |
| | 9,800 | | | GMO Internet (a) | | | 82,286 | |
| | 17,100 | | | Inpex (a) | | | 218,717 | |
| | 6,200 | | | Japan Tobacco (a) | | | 211,538 | |
| | 4,500 | | | LIXIL Group Corp (a) | | | 98,687 | |
| | 1,900 | | | Miraca Holdings (a) | | | 79,761 | |
| | 5,200 | | | Mitsubishi (a) | | | 101,963 | |
| | 2,100 | | | Nippon Telegraph & Telephone (a) | | | 130,660 | |
| | 11,600 | | | NKSJ Holdings (a) | | | 292,095 | |
| | 2,600 | | | SoftBank (a) | | | 189,278 | |
| | 1,500 | | | Sohgo Security Services Co Ltd (a) | | | 35,078 | |
| | 9,300 | | | Sony (a) | | | 183,613 | |
| | 3,200 | | | Sumitomo Mitsui Financial Group (a) | | | 130,505 | |
| | 3,300 | | | Tsuruha Holdings (a) | | | 194,835 | |
| | | | | | | | |
| | | | | | | 2,108,701 | |
| | | | | | | | |
| | |
| | | | Malaysia – 1.04% | | | | |
| | 33,200 | | | Genting (a) | | | 98,427 | |
| | | | | | | | |
| | |
| | | | Netherlands – 2.10% | | | | |
| | 2,182 | | | Airbus Group NV (a) | | | 130,268 | |
| | 2,982 | | | Delta Lloyd NV (a) * | | | 67,969 | |
| | | | | | | | |
| | | | | | | 198,237 | |
| | | | | | | | |
| | |
| | | | New Zealand – 1.24% | | | | |
| | 33,024 | | | Mighty River Power (a) | | | 72,593 | |
| | 14,431 | | | Trade Me Group (a) | | | 44,317 | |
| | | | | | | | |
| | | | | | | 116,910 | |
| | | | | | | | |
See accompanying Notes to Financial Statements.
| | |
| |
| ASTON/Pictet International Fund | | October 31, 2014 |
| |
| Schedule of Investments – continued | | |
| | | | | | | | |
Shares | | | | | Market
Value | |
| | |
| | | | Papua New Guinea – 0.91% | | | | |
| | 11,166 | | | Oil Search (a) | | $ | 85,619 | |
| | | | | | | | |
| | |
| | | | Philippines – 0.85% | | | | |
| | 713,000 | | | Metro Pacific Investments (a) | | | 80,688 | |
| | | | | | | | |
| | |
| | | | Portugal – 3.80% | | | | |
| | 14,281 | | | Galp Energia (a) | | | 207,052 | |
| | 26,558 | | | NOS (a) | | | 152,365 | |
| | | | | | | | |
| | | | | | | 359,417 | |
| | | | | | | | |
| | |
| | | | Singapore – 1.76% | | | | |
| | 24,000 | | | First Resources (a) | | | 38,882 | |
| | 1,567 | | | Millicom International Cellular, SA (a) | | | 127,891 | |
| | | | | | | | |
| | | | | | | 166,773 | |
| | | | | | | | |
| | |
| | | | South Korea – 1.72% | | | | |
| | 139 | | | Samsung Electronics (a) | | | 162,094 | |
| | | | | | | | |
| | |
| | | | Spain – 3.06% | | | | |
| | 24,703 | | | Distribuidora Internacional de Alimentacion (a) | | | 156,957 | |
| | 3,950 | | | Enagas (a) | | | 132,561 | |
| | | | | | | | |
| | | | | | | 289,518 | |
| | | | | | | | |
| | |
| | | | Sweden – 1.33% | | | | |
| | 8,874 | | | Com Hem Holding * | | | 65,977 | |
| | 1,931 | | | Modern Times Group, Class B (a) | | | 59,699 | |
| | | | | | | | |
| | | | | | | 125,676 | |
| | | | | | | | |
| | |
| | | | Switzerland – 9.58% | | | | |
| | 1,498 | | | Cie Financiere Richemont (a) | | | 126,302 | |
| | 6,560 | | | Gategroup Holding (a) | | | 147,819 | |
| | 3,537 | | | Nestle (a) | | | 259,383 | |
| | 755 | | | Roche Holding (a) | | | 222,802 | |
| | 8,584 | | | UBS (a) | | | 149,260 | |
| | | | | | | | |
| | | | | | | 905,566 | |
| | | | | | | | |
| | |
| | | | United Kingdom – 12.80% | | | | |
| | 2,035 | | | AstraZeneca (a) * | | | 148,653 | |
| | 7,482 | | | BBA Aviation (a) | | | 42,354 | |
| | 4,879 | | | BG Group (a) | | | 81,313 | |
| | 56,567 | | | Enterprise Inns (a) * | | | 115,890 | |
| | 24,146 | | | HSBC Holdings (a) | | | 246,176 | |
| | 16,735 | | | Inmarsat (a) | | | 183,748 | |
| | 1,887 | | | Jazztel (a) * | | | 30,169 | |
| | 2,915 | | | Rio Tinto (a) | | | 138,699 | |
| | 7,281 | | | Standard Chartered (a) | | | 109,598 | |
| | 19,577 | | | William Hill (a) | | | 113,056 | |
| | | | | | | | |
| | | | | | | 1,209,656 | |
| | | | | | | | |
| | |
| | | | Total Common Stocks
(Cost $10,069,206) | | | 9,298,480 | |
| | | | | | | | |
| | | | | | | | |
Shares | | | | | Market
Value | |
|
| | PREFERRED STOCK – 1.25% | |
| | |
| | | | Germany – 1.25% | | | | |
| | 552 | | | Volkswagen (a) | | $ | 118,046 | |
| | | | | | | | |
| | | | | | | 118,046 | |
| | | | | | | | |
| | |
| | | | Total Preferred Stock
(Cost $146,778) | | | 118,046 | |
| | | | | | | | |
| Total Investments – 99.64%
(Cost $10,215,984)** | | | 9,416,526 | |
| | | | | | | | |
| Net Other Assets and Liabilities – 0.36% | | | 34,443 | |
| | | | | | | | |
| Net Assets – 100.00% | | $ | 9,450,969 | |
| | | | | | | | |
| * | | Non-income producing security. |
| ** | | Aggregate cost for Federal income tax purposes is $10,221,324. |
| | | | |
Gross unrealized appreciation | | $ | 517,935 | |
Gross unrealized depreciation | | | (1,322,733 | ) |
| | | | |
Net unrealized depreciation | | $ | (804,798 | ) |
| | | | |
| (a) | | Securities with a total aggregate market value of $9,350,549 or 98.94% of the net assets, were valued under the fair value procedures established by the Funds’ Board of Trustees. |
See accompanying Notes to Financial Statements.
ASTON/Harrison Street Real Estate Fund
| | |
| |
| Portfolio Manager Commentary (unaudited) | | October 31, 2014 |
| | | | |
| | | James H. Kammert, CFA & Reagan A. Pratt | |
| Q. | What were the most significant market factors affecting Fund performance and returns relative to the benchmark during the past 12 months? |
| A. | Following considerable swings in the second half of 2013, related to market interpretations of evolving Federal Reserve interest rate policy/statements as well as emerging gross domestic product (GDP) trends, equity Real Estate Investment Trusts (REITs) steadily gained traction beginning in mid-December 2013 through early September 2014, capturing an annualized total return of 34%. The interest rate and GDP fears subsided and investor focus returned to healthy commercial real estate fundamentals—rising occupancy, growing rents and property portfolio cash flows accompanied by low double digit REIT dividend increases and balance sheet leverage reduction. The eve of the completion of the quantitative easing in mid-September 2013 triggered interest rate fears anew and the equity REITs dipped. However, investors stayed the course and the equity REITs surged again to a calendar 2014 high at the close of October, and an 18% total return for the twelve months ended October 31, 2014. |
| Q. | What were the best performing holdings for the Fund during the period? |
| A. | High barrier to entry office landlords such as NYC-centric SL Green and coastal Boston Properties were among the best performing portfolio holdings, reflecting the sound real estate fundamentals and numerous data points of private market asset sales and purchases that validated the net asset value of such central business district (CBD) office portfolios. In addition, a couple mid-cap hotel holdings, Strategic Hotels and Chesapeake Lodging, aided portfolio results as their cash flow growth and dividend increases were noted by investors and lifted the stocks off low valuations. Further, the recoveries in business travel and economic activity in general aided key hotel portfolio metrics like revenue per available room and operating margins that came in above expectations over the year. |
| Q. | What were the weakest performing holdings? |
| A. | While the ‘value’ theme worked in lodging, it did not in class B malls embodied by Washington Prime. It did not hold its own, in terms of share performance, against continued investor preference for the class A mall owners, relative valuation notwithstanding. More value oriented net lease holdings, such as EPR Properties and WP Carey, delivered as expected financial results but lagged the returns of the net lease peers and impaired relative performance. A similar circumstance unfolded as regards to large cap cell tower owner/operator Crown Castle, the apparent value play that did not keep pace with the benchmark nor its large cap REIT competitor American Tower. In short, the relative poor performers in the portfolio, as a group generally did not fall short on earnings and other reported metrics. Rather, the market preferred the ‘leaders’ across a number of sectors and placed more weight on cash flow growth, despite our perception that the growth was more than priced into the share prices. |
| Q. | How was the Fund positioned as of October 31, 2014? |
| A. | As the REIT sector performed well, valuations are more full, but not stretched. Further the rapacious flow of global institutional capital into U.S. commercial real estate (pension funds, private equity, sovereign wealth funds, etc.) supports net asset values as capitalization rates appear to remain low. However, comparative internal growth potential (ability to raise rents) and visible highly pre-leased development pipelines represent the salient drivers of total cash flow growth and the focus of portfolio positioning at present. Acquisition-dependent business models hold less appeal as property pricing has come up, narrowing spreads over the cost of capital. |
Growth of a Hypothetical
$10,000 Investment—Class N
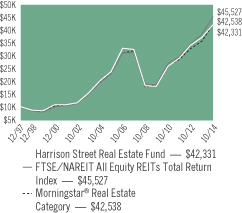
All dividends and capital gains are reinvested. Indexes are unmanaged and do not take into account fees, expenses or other costs.
Returns shown in the chart and table do not reflect taxes that a shareholder would pay on Fund distributions or on the sale of the Fund shares.
Real estate funds may be subject to a higher degree of market risk than diversified funds because of the concentration in a specific industry or geographical sector. Risks also include declines in the value of real estate, general and economic conditions, changes in the value of underlying properties and defaults by borrowers.
RETURNSFOR PERIOD ENDED 10/31/14
Average Annual Total Returns - Class N
| | | | |
One Year | | | 13.19 | % |
Five Year | | | 18.54 | % |
Ten Year | | | 7.71 | % |
Since Inception | | | 8.95 | % |
Inception Date 12/30/97
Average Annual Total Returns - Class I
| | | | |
One Year | | | 13.45 | % |
Five Year | | | 18.81 | % |
Since Inception | | | 6.49 | % |
Inception Date 09/20/05
The performance data quoted represents past performance. Past performance does not guarantee future results. Investment return and principal value will fluctuate so that an investor’s shares, upon redemption, may be worth more or less than their original cost. Current performance may be lower or higher than the performance data quoted. For performance data current to the most recent month-end, please visit our website at www.astonfunds.com.
The performance quoted would have been lower if fee waivers and/or expense reimbursements had not been in effect.
The total expense ratios for Class N and Class I shares are 2.22% and 1.97% respectively, as disclosed in the prospectus dated February 28, 2014. Please refer to the Financial Highlights section in this report for more information.
| | |
| |
| ASTON/Harrison Street Real Estate Fund | | October 31, 2014 |
| |
| Schedule of Investments | | |
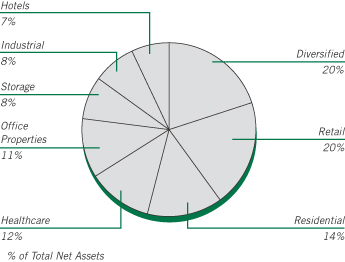
| | | | | | | | |
Shares | | | | | Market
Value | |
|
| | COMMON STOCKS – 100.32% | |
| | |
| | | | Diversified – 20.36% | | | | |
| | 12,070 | | | Crown Castle International | | $ | 942,908 | |
| | 9,602 | | | DuPont Fabros Technology | | | 297,374 | |
| | 8,483 | | | EPR Properties | | | 475,896 | |
| | 15,366 | | | Weyerhaeuser | | | 520,293 | |
| | 7,806 | | | WP Carey | | | 528,622 | |
| | | | | | | | |
| | | | | | | 2,765,093 | |
| | | | | | | | |
| | |
| | | | Healthcare – 11.66% | | | | |
| | 12,892 | | | HCP | | | 566,861 | |
| | 7,278 | | | LTC Properties | | | 305,239 | |
| | 10,379 | | | Ventas | | | 711,065 | |
| | | | | | | | |
| | | | | | | 1,583,165 | |
| | | | | | | | |
| | |
| | | | Hotels – 7.30% | | | | |
| | 11,540 | | | Chesapeake Lodging Trust | | | 381,282 | |
| | 4,708 | | | Hyatt Hotels, Class A * | | | 278,808 | |
| | 25,767 | | | Strategic Hotels & Resorts * | | | 331,106 | |
| | | | | | | | |
| | | | | | | 991,196 | |
| | | | | | | | |
| | |
| | | | Industrial – 7.74% | | | | |
| | 13,642 | | | Prologis | | | 568,189 | |
| | 19,826 | | | STAG Industrial | | | 483,754 | |
| | | | | | | | |
| | | | | | | 1,051,943 | |
| | | | | | | | |
| | |
| | | | Office Properties – 11.13% | | | | |
| | 4,098 | | | Boston Properties | | | 519,422 | |
| | 8,927 | | | Corporate Office Properties Trust | | | 244,064 | |
| | 29,360 | | | New York | | | 329,419 | |
| | 3,621 | | | SL Green Realty | | | 418,950 | |
| | | | | | | | |
| | | | | | | 1,511,855 | |
| | | | | | | | |
| | | | | | | | |
Shares | | | | | Market
Value | |
| | |
| | | | Residential – 13.65% | | | | |
| | 8,120 | | | Camden Property Trust | | $ | 622,561 | |
| | 8,345 | | | Mid-America Apartment Communities | | | 589,658 | |
| | 21,231 | | | UDR | | | 641,813 | |
| | | | | | | | |
| | | | | | | 1,854,032 | |
| | | | | | | | |
| | |
| | | | Retail – 20.16% | | | | |
| | 15,769 | | | Kimco Realty | | | 393,437 | |
| | 15,143 | | | Ramco-Gershenson Properties Trust | | | 264,700 | |
| | 19,965 | | | Retail Opportunity Investments | | | 326,228 | |
| | 7,029 | | | Simon Property Group | | | 1,259,666 | |
| | 28,050 | | | Washington Prime Group | | | 494,522 | |
| | | | | | | | |
| | | | | | | 2,738,553 | |
| | | | | | | | |
| | |
| | | | Storage – 8.32% | | | | |
| | 10,956 | | | Extra Space Storage | | | 637,201 | |
| | 5,800 | | | Sovran Self Storage | | | 493,522 | |
| | | | | | | | |
| | | | | | | 1,130,723 | |
| | | | | | | | |
| | |
| | | | Total Common Stocks
(Cost $12,496,822) | | | 13,626,560 | |
| | | | | | | | |
|
| | INVESTMENT COMPANY – 0.41% | |
| | |
| | 55,696 | | | BlackRock Provident Institutional TempFund Portfolio | | | 55,696 | |
| | | | | | | | |
| | |
| | | | Total Investment Company
(Cost $55,696) | | | 55,696 | |
| | | | | | | | |
| Total Investments – 100.73%
(Cost $12,528,283)** | | | 13,682,256 | |
| | | | | | | | |
| Net Other Assets and Liabilities – (0.73)% | | | (99,019 | ) |
| | | | | | | | |
| Net Assets – 100.00% | | $ | 13,583,237 | |
| | | | | | | | |
| * | | Non-income producing security. |
| ** | | Aggregate cost for Federal income tax purposes is $12,548,303. |
| | | | |
Gross unrealized appreciation | | $ | 1,200,366 | |
Gross unrealized depreciation | | | (66,413 | ) |
| | | | |
Net unrealized appreciation | | $ | 1,133,953 | |
| | | | |
See accompanying Notes to Financial Statements.
ASTON/Montag & Caldwell Balanced Fund
| | |
| |
| Portfolio Manager Commentary (unaudited) | | October 31, 2014 |
Ronald E. Canakaris, CFA, CIC & Helen M. Donahue, CFA
| Q. | What were the most significant market factors affecting Fund performance and returns relative to the benchmark during the past 12 months? |
| A. | The Fund benefited from an overweight allocation to Healthcare and underweight positions in the Consumer Discretionary and Energy sectors. The Fund’s biggest detractor from results relative to the benchmark was not owning Apple, which was the largest position in the Russell 1000 Growth and the S&P 500 Indexes. Apple rose just under 48% for the year ending October 31, 2014, as investors eagerly anticipated the release of the iPhone 6. While Apple has been undervalued in our work, we continue to have questions about the company’s ability to sustain an above average earnings growth rate due to the absolute size of the company and the already sizable market penetration of its main products. The fixed income returns lagged the Barclays Government Credit Bond Index as lower quality bonds outperformed and the Fund cannot own bonds rated less than A. |
| Q. | What were the best performing holdings for the Fund during the period? |
| A. | Allergan was the Fund’s top performing stock as the company is benefiting from approval of new indications for its Botox franchise and the company has marketing exclusivity for Restasis through 2024. Gilead Sciences rose strongly after the company launched Solvaldi, the company’s Hepatitis C treatment. AmerisourceBergen gained on positive results from its partnership with Walgreens and Alliance Boots. Biogen had another year of strong gains as Tecfidera, the company’s oral treatment for multiple sclerosis (MS), received European approval for launch and the company has several promising products in development. Union Pacific enjoyed strong gains, as the company is benefiting from secular rail pricing power and margin improvements driven by ongoing productivity initiatives. |
| Q. | What were the weakest performing holdings? |
| A. | Occidental Petroleum was the biggest detractor from relative performance, as Energy was the worst performing sector over the period. The weighting was reduced because the weak oil price environment could complicate efforts to reduce the company’s exposure in the Middle East and pressure the valuation of the California Resources spin-off. Walgreens sold off in early August after the company provided disappointing earnings guidance related to Medicare reimbursement pressures and generic drug inflation. Ralph Lauren was essentially unchanged during the period, lagging the market as ongoing heavy investments in stores, infrastructure and technology have depressed earnings growth. Starbucks declined slightly during the period following the previous year’s strong gains as the price/earnings multiple compressed due to a slowdown in same store sales comparisons. eBay was weak during the period and was eliminated from the Fund, as weakness in the Marketplaces division weighed on investor sentiment. |
| Q. | How was the Fund positioned as of October 31, 2014? |
| A. | Because the high quality growth stocks in the Fund are reasonably valued and have sound earnings prospects, we believe they will do relatively well in a more volatile environment, which may occur as quantitative easing ends in the United States Longer term, the Fund is well positioned to benefit from the ongoing synchronized global recovery, as these companies have strong global franchises and in most cases derive 40% or more of their earnings from international markets. We have a moderate amount of buying reserves that will enable us to take advantage of better opportunities that may appear as share prices respond to free market forces. The bond portion of the Fund is slightly shorter in duration than the Barclays Government Credit Bond Index and is overweight high quality intermediate corporate bonds. |
Growth of a Hypothetical
$10,000 Investment—Class N
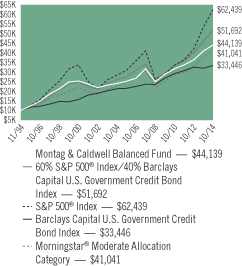
All dividends and capital gains are reinvested. Indexes are unmanaged and do not take into account fees, expenses or other costs.
Returns shown in the chart and table do not reflect taxes that a shareholder would pay on Fund distributions or on the sale of the Fund shares.
The Fund is subject to interest rate risk associated with the underlying bond holdings in the portfolio. The value of the Fund can decline as interest rates rise and an investor can lose principal.
RETURNSFOR PERIOD ENDED 10/31/14
Average Annual Total Returns - Class N
| | | | |
One Year | | | 7.83 | % |
Five Year | | | 8.78 | % |
Ten Year | | | 6.25 | % |
Since Inception | | | 7.71 | % |
Inception Date 11/02/94
Average Annual Total Returns - Class I
| | | | |
One Year | | | 7.92 | % |
Five Year | | | 8.92 | % |
Ten Year | | | 6.43 | % |
Since Inception | | | 4.30 | % |
Inception Date 12/31/98
The performance data quoted represents past performance. Past performance does not guarantee future results. Investment return and principal value will fluctuate so that an investor’s shares, upon redemption, may be worth more or less than their original cost. Current performance may be lower or higher than the performance data quoted. For performance data current to the most recent month-end, please visit our website at www.astonfunds.com.
The performance quoted would have been lower if fee waivers and/or expense reimbursements had not been in effect.
The total expense ratios for Class N shares and Class I shares are 1.53% and 1.28% respectively, as disclosed in the prospectus dated February 28, 2014. Please refer to the Financial Highlights section in this report for more information.
| | |
| |
| ASTON/Montag & Caldwell Balanced Fund | | October 31, 2014 |
| |
| Schedule of Investments | | |
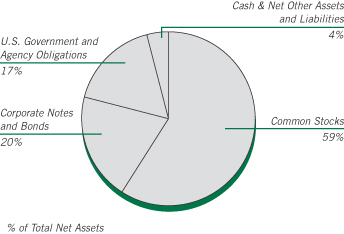
| | | | | | | | |
Shares | | | | | Market
Value | |
|
| | COMMON STOCKS – 58.61% | |
| | |
| | | | Consumer Discretionary – 6.36% | | | | |
| | 2,300 | | | NIKE, Class B | | $ | 213,831 | |
| | 303 | | | Priceline.com * | | | 365,482 | |
| | 1,562 | | | Ralph Lauren | | | 257,480 | |
| | 5,300 | | | Starbucks | | | 400,468 | |
| | 2,950 | | | TJX Companies | | | 186,794 | |
| | | | | | | | |
| | | | | | | 1,424,055 | |
| | | | | | | | |
| | |
| | | | Consumer Staples – 13.92% | | | | |
| | 6,600 | | | Colgate-Palmolive | | | 441,408 | |
| | 2,200 | | | Costco Wholesale | | | 293,414 | |
| | 5,850 | | | Estee Lauder, Class A | | | 439,803 | |
| | 15,750 | | | Mondelez International, Class A | | | 555,345 | |
| | 6,420 | | | PepsiCo | | | 617,411 | |
| | 4,750 | | | Procter & Gamble | | | 414,532 | |
| | 5,500 | | | Walgreen | | | 353,210 | |
| | | | | | | | |
| | | | | | | 3,115,123 | |
| | | | | | | | |
| | |
| | | | Energy – 2.68% | | | | |
| | 2,300 | | | Occidental Petroleum | | | 204,539 | |
| | 4,000 | | | Schlumberger | | | 394,640 | |
| | | | | | | | |
| | | | | | | 599,179 | |
| | | | | | | | |
| | |
| | | | Financials – 4.19% | | | | |
| | 4,900 | | | American Express | | | 440,755 | |
| | 3,333 | | | State Street | | | 251,508 | |
| | 4,600 | | | Wells Fargo & Co | | | 244,214 | |
| | | | | | | | |
| | | | | | | 936,477 | |
| | | | | | | | |
| | |
| | | | Healthcare – 15.80% | | | | |
| | 11,250 | | | Abbott Laboratories | | | 490,388 | |
| | 2,063 | | | Allergan | | | 392,094 | |
| | 4,250 | | | AmerisourceBergen | | | 362,993 | |
| | 1,780 | | | Biogen Idec * | | | 571,522 | |
| | 6,100 | | | Gilead Sciences * | | | 683,200 | |
| | 2,900 | | | McKesson | | | 589,889 | |
| | | | | | | | |
Shares | | | | | Market
Value | |
| | |
| | | | Healthcare (continued) | | | | |
| | 3,800 | | | Thermo Fisher Scientific | | $ | 446,766 | |
| | | | | | | | |
| | | | | | | 3,536,852 | |
| | | | | | | | |
| | |
| | | | Industrials – 6.28% | | | | |
| | 15,550 | | | General Electric | | | 401,346 | |
| | 2,696 | | | Union Pacific | | | 313,949 | |
| | 4,200 | | | United Parcel Service, Class B | | | 440,622 | |
| | 1,013 | | | WW Grainger | | | 250,008 | |
| | | | | | | | |
| | | | | | | 1,405,925 | |
| | | | | | | | |
| | |
| | | | Information Technology – 7.07% | | | | |
| | 3,650 | | | Accenture PLC, Class A (Ireland) | | | 296,088 | |
| | 2,200 | | | Facebook, Class A * | | | 164,978 | |
| | 727 | | | Google, Class A * | | | 412,841 | |
| | 2,700 | | | QUALCOMM | | | 211,977 | |
| | 2,054 | | | Visa, Class A | | | 495,897 | |
| | | | | | | | |
| | | | | | | 1,581,781 | |
| | | | | | | | |
| | |
| | | | Materials – 2.31% | | | | |
| | 4,500 | | | Monsanto | | | 517,680 | |
| | | | | | | | |
| | |
| | | | Total Common Stocks
(Cost $10,291,589) | | | 13,117,072 | |
| | | | | | | | |
Par Value | | | | | | |
|
| | CORPORATE NOTES AND BONDS – 20.01% | |
| | |
| | | | Consumer Staples – 3.12% | | | | |
| | $300,000 | | | Coca-Cola
Senior Unsecured Notes
5.350%, 11/15/17 | | | 336,565 | |
| | 325,000 | | | PepsiCo
Senior Unsecured Notes
5.000%, 06/01/18 | | | 361,853 | |
| | | | | | | | |
| | | | | | | 698,418 | |
| | | | | | | | |
| | |
| | | | Financials – 5.84% | | | | |
| | 300,000 | | | General Electric Capital
Senior Unsecured Notes, MTN
4.375%, 09/16/20 | | | 329,747 | |
| | 300,000 | | | Goldman Sachs Group
Senior Unsecured Notes
3.625%, 02/07/16 | | | 309,718 | |
| | 300,000 | | | JPMorgan Chase
Senior Unsecured Notes
4.350%, 08/15/21 | | | 322,558 | |
| | 350,000 | | | U.S. Bancorp
Subordinated Notes, MTN
2.950%, 07/15/22 | | | 343,823 | |
| | | | | | | | |
| | | | | | | 1,305,846 | |
| | | | | | | | |
| | |
| | | | Healthcare – 4.18% | | | | |
| | 250,000 | | | Johnson & Johnson
Senior Unsecured Notes
5.950%, 08/15/37 | | | 333,475 | |
See accompanying Notes to Financial Statements.
| | |
| |
| ASTON/Montag & Caldwell Balanced Fund | | October 31, 2014 |
| |
| Schedule of Investments – continued | | |
| | | | | | | | |
Par Value | | | | | Market
Value | |
| | |
| | | | Healthcare (continued) | | | | |
| | $300,000 | | | Medtronic
Senior Unsecured Notes
3.000%, 03/15/15 | | $ | 302,848 | |
| | 300,000 | | | Pfizer
Senior Unsecured Notes
1.100%, 05/15/17 | | | 300,235 | |
| | | | | | | | |
| | | | | | | 936,558 | |
| | | | | | | | |
| | |
| | | | Industrials – 1.40% | | | | |
| | 300,000 | | | United Parcel Service
Senior Unsecured Notes
3.125%, 01/15/21 | | | 312,438 | |
| | | | | | | | |
| | |
| | | | Information Technology – 5.47% | | | | |
| | 300,000 | | | Apple
Senior Unsecured Notes
1.000%, 05/03/18 | | | 294,473 | |
| | 300,000 | | | Cisco Systems
Senior Unsecured Notes
5.500%, 02/22/16 | | | 319,141 | |
| | 300,000 | | | Google
Senior Unsecured Notes
3.625%, 05/19/21 | | | 321,167 | |
| | 300,000 | | | Oracle
Senior Unsecured Notes
2.500%, 10/15/22 | | | 290,078 | |
| | | | | | | | |
| | | | | | | 1,224,859 | |
| | | | | | | | |
| | |
| | | | Total Corporate Notes and Bonds
(Cost $4,351,529) | | | 4,478,119 | |
| | | | | | | | |
|
| | U.S. GOVERNMENT AND AGENCY OBLIGATIONS – 17.05% | |
| | |
| | | | Fannie Mae – 0.20% | | | | |
| | 12,197 | | | 7.500%, 02/01/35,
Pool # 787557 | | | 14,170 | |
| | 2,921 | | | 7.500%, 04/01/35,
Pool # 819231 | | | 3,130 | |
| | 24,027 | | | 6.000%, 11/01/35,
Pool # 844078 | | | 27,302 | |
| | | | | | | | |
| | | | | | | 44,602 | |
| | | | | | | | |
| | |
| | | | Freddie Mac – 1.72% | | | | |
| | 375,000 | | | 1.000%, 09/29/17 | | | 374,695 | |
| | 9,411 | | | 5.500%, 12/01/20,
Gold Pool # G11820 | | | 10,200 | |
| | | | | | | | |
| | | | | | | 384,895 | |
| | | | | | | | |
| |
| | | | Ginnie Mae – 0.03% | |
| | 7,428 | | | 5.500%, 02/15/39,
Pool # 698060 | | | 8,273 | |
| | | | | | | | |
| | |
| | | | U.S. Treasury Bonds – 3.75% | | | | |
| | 225,000 | | | 5.375%, 02/15/31 | | | 304,137 | |
| | 350,000 | | | 3.500%, 02/15/39 | | | 381,938 | |
| | 150,000 | | | 3.125%, 11/15/41 | | | 152,813 | |
| | | | | | | | |
| | | | | | | 838,888 | |
| | | | | | | | |
| | | | | | | | |
Par Value | | | | | Market
Value | |
| | |
| | | | U.S. Treasury Notes – 11.35% | | | | |
| | $325,000 | | | 4.000%, 02/15/15 | | $ | 328,644 | |
| | 275,000 | | | 0.250%, 02/15/15 | | | 275,150 | |
| | 225,000 | | | 4.500%, 02/15/16 | | | 237,287 | |
| | 325,000 | | | 2.625%, 04/30/16 | | | 336,070 | |
| | 325,000 | | | 4.625%, 02/15/17 | | | 354,326 | |
| | 300,000 | | | 1.500%, 01/31/19 | | | 300,586 | |
| | 375,000 | | | 2.125%, 08/15/21 | | | 377,637 | |
| | 325,000 | | | 2.500%, 05/15/24 | | | 330,205 | |
| | | | | | | | |
| | | | | | | 2,539,905 | |
| | | | | | | | |
| | |
| | | | Total U.S. Government and Agency Obligations
(Cost $3,736,630) | | | 3,816,563 | |
| | | | | | | | |
Shares | | | | | | |
|
| | INVESTMENT COMPANY – 4.42% | |
| | |
| | 989,036 | | | BlackRock Liquidity Funds TempCash Portfolio | | | 989,036 | |
| | | | | | | | |
| | |
| | | | Total Investment Company
(Cost $989,036) | | | 989,036 | |
| | | | | | | | |
| Total Investments – 100.09%
(Cost $19,368,784)** | | | 22,400,790 | |
| | | | | | | | |
| Net Other Assets and Liabilities – (0.09)% | | | (21,103 | ) |
| | | | | | | | |
| Net Assets – 100.00% | | $ | 22,379,687 | |
| | | | | | | | |
| * | | Non-income producing security. |
| ** | | Aggregated cost for Federal Income tax purpose is $19,700,684. |
| | | | |
Gross unrealized appreciation | | $ | 3,129,437 | |
Gross unrealized depreciation | | | (429,331 | ) |
| | | | |
Net unrealized appreciation | | $ | 2,700,106 | |
| | | | |
| | | | |
Portfolio Composition | | | | |
Common Stocks | | | 59% | |
Investment Company | | | 5% | |
U.S. Government and Agency Obligations | | | 17% | |
Corporate Notes and Bonds | | | | |
(Moody’s Ratings (unaudited)) | | | | |
AAA | | | 1% | |
AA | | | 6% | |
A | | | 11% | |
BBB | | | 1% | |
| | | | |
| | | 100% | |
| | | | |
For financial reporting purposes, credit quality ratings shown are assigned by Moody’s Investors Service. If a Moody’s credit quality rating is not available the credit quality ratings shown are assigned by Standard & Poor’s. These rating agencies are independent, nationally recognized statistical rating organizations and are widely used. Investment grade ratings are credit ratings of Baa/ BBB or higher. Below investment grade ratings are credit ratings of Ba/BB or lower. Credit quality ratings are subject to change.
See accompanying Notes to Financial Statements.
This page intentionally left blank.
| | |
| |
| | October 31, 2014 |
| |
| Statements of Assets and Liabilities | | |
| | | | | | | | |
| | |
| | | Cornerstone
Large Cap
Value Fund | | | Herndon
Large Cap
Value Fund | |
| | | | | | | | |
| | |
ASSETS: | | | | | | | | |
Investments: | | | | | | | | |
Investments at cost | | $ | 154,021,279 | | | $ | 134,494,144 | |
Net unrealized appreciation | | | 9,395,691 | | | | 19,206,903 | |
| | | | | | | | |
Total investments at value | | | 163,416,970 | | | | 153,701,047 | |
Cash | | | — | | | | — | |
Receivables: | | | | | | | | |
Dividends and interest | | | 25,847 | | | | 196,371 | |
Dividend reclaims | | | 5,317 | | | | — | |
Fund shares sold | | | 90,143 | | | | 287,116 | |
Investments sold | | | 721,033 | | | | — | |
Due from Adviser, net (Note G) | | | — | | | | — | |
Other assets | | | 220 | | | | 415 | |
| | | | | | | | |
Total assets | | | 164,259,530 | | | | 154,184,949 | |
| | | | | | | | |
| | |
LIABILITIES: | | | | | | | | |
Payables: | | | | | | | | |
Due to custodian | | | — | | | | — | |
Dividend distribution | | | — | | | | — | |
Investments purchased | | | 73,444 | | | | — | |
Fund shares redeemed | | | 85,088 | | | | 551,005 | |
Due to Adviser, net (Note G) | | | 122,035 | | | | 129,029 | |
Administration fees (Note G) | | | 7,188 | | | | 7,307 | |
Distribution fees (Note G) | | | 2,038 | | | | 483 | |
Audit and tax fees | | | 9,787 | | | | 8,433 | |
Transfer agent fees | | | 35,502 | | | | 32,826 | |
Registration fees | | | 5,482 | | | | 4,932 | |
Accrued expenses and other payables | | | 8,306 | | | | 5,888 | |
| | | | | | | | |
Total liabilities | | | 348,870 | | | | 739,903 | |
| | | | | | | | |
NET ASSETS | | $ | 163,910,660 | | | $ | 153,445,046 | |
| | | | | | | | |
| | |
NET ASSETS CONSIST OF: | | | | | | | | |
Paid in capital | | $ | 171,730,525 | | | $ | 124,809,800 | |
Accumulated undistributed (distribution in excess of) net investment income (loss) | | | 811,840 | | | | 1,050,704 | |
Accumulated net realized gain (loss) on investments | | | (18,027,396 | ) | | | 8,377,639 | |
Net unrealized appreciation on investments | | | 9,395,691 | | | | 19,206,903 | |
| | | | | | | | |
TOTAL NET ASSETS | | $ | 163,910,660 | | | $ | 153,445,046 | |
| | | | | | | | |
Class N: | | | | | | | | |
Net Assets | | $ | 60,682,829 | | | $ | 13,997,318 | |
Shares of beneficial interest outstanding (unlimited authorization) | | | 3,954,212 | | | | 928,393 | |
NET ASSET VALUE Offering and redemption price per share
(Net Assets/Shares Outstanding) | | $ | 15.35 | | | $ | 15.08 | |
| | | | | | | | |
Class I: | | | | | | | | |
Net Assets | | $ | 103,227,831 | | | $ | 139,447,728 | |
Shares of beneficial interest outstanding (unlimited authorization) | | | 6,709,906 | | | | 9,224,106 | |
NET ASSET VALUE Offering and redemption price per share
(Net Assets/Shares Outstanding) | | $ | 15.38 | | | $ | 15.12 | |
| | | | | | | | |
Class R: | | | | | | | | |
Net Assets | | $ | — | | | $ | — | |
Shares of beneficial interest outstanding (unlimited authorization) | | | — | | | | — | |
NET ASSET VALUE Offering and redemption price per share
(Net Assets/Shares Outstanding) | | $ | — | | | $ | — | |
| | | | | | | | |
See accompanying Notes to Financial Statements.
| | | | | | | | | | | | | | | | | | | | | | | | | | |
| | | | | | |
Montag & Caldwell
Growth Fund | | | TAMRO
Diversified
Equity Fund | | | River Road
Dividend All
Cap Value Fund | | | River Road
Dividend All
Cap Value Fund II | | | Fairpointe
Mid Cap
Fund | | | Montag & Caldwell
Mid Cap
Growth Fund | | | LMCG
Small Cap
Growth Fund | |
| | | | | | | | | | | | | | | | | | | | | | | | | | |
| | | | | | |
| | | | | | | | | | | | | | | | | | | | | | | | | | |
| | | | | | | | | | | | | | | | | | | | | | | | | | |
| $ | 3,419,988,114 | | | $ | 36,295,850 | | | $ | 881,023,986 | | | $ | 118,963,021 | | | $ | 4,925,444,301 | | | $ | 9,356,875 | | | $ | 46,479,324 | |
| | 685,679,085 | | | | 14,549,357 | | | | 230,726,373 | | | | 13,292,267 | | | | 962,633,620 | | | | 2,087,007 | | | | 5,572,269 | |
| | | | | | | | | | | | | | | | | | | | | | | | | | |
| | 4,105,667,199 | | | | 50,845,207 | | | | 1,111,750,359 | | | | 132,255,288 | | | | 5,888,077,921 | | | | 11,443,882 | | | | 52,051,593 | |
| | — | | | | — | | | | — | | | | — | | | | 637,725 | | | | — | | | | — | |
| | | | | | | | | | | | | | | | | | | | | | | | | | |
| | 3,738,343 | | | | 12,661 | | | | 4,772,122 | | | | 545,279 | | | | 2,237,168 | | | | 2,731 | | | | 451 | |
| | — | | | | — | | | | 9,545 | | | | — | | | | — | | | | — | | | | — | |
| | 4,871,006 | | | | 82 | | | | 1,193,118 | | | | 214,175 | | | | 9,093,248 | | | | — | | | | 299,089 | |
| | 56,545,425 | | | | — | | | | 49,424,294 | | | | 1,213,375 | | | | 114,503,829 | | | | 71,551 | | | | 1,988,025 | |
| | — | | | | — | | | | — | | | | — | | | | — | | | | 2,938 | | | | — | |
| | 17,037 | | | | 179 | | | | 3,964 | | | | 300 | | | | 16,088 | | | | 37 | | | | 133 | |
| | | | | | | | | | | | | | | | | | | | | | | | | | |
| | 4,170,839,010 | | | | 50,858,129 | | | | 1,167,153,402 | | | | 134,228,417 | | | | 6,014,565,979 | | | | 11,521,139 | | | | 54,339,291 | |
| | | | | | | | | | | | | | | | | | | | | | | | | | |
| | | | | | |
| | | | | | | | | | | | | | | | | | | | | | | | | | |
| | | | | | | | | | | | | | | | | | | | | | | | | | |
| | — | | | | — | | | | 12,256,610 | | | | — | | | | — | | | | — | | | | — | |
| | — | | | | — | | | | 934,058 | | | | 26,438 | | | | — | | | | — | | | | — | |
| | 9,456,082 | | | | — | | | | 10,809,577 | | | | 1,345,040 | | | | 34,125,177 | | | | — | | | | 2,076,953 | |
| | 20,979,351 | | | | 77,297 | | | | 3,798,256 | | | | 35,859 | | | | 10,853,153 | | | | 173 | | | | 22,537 | |
| | 2,259,764 | | | | 25,849 | | | | 668,974 | | | | 76,349 | | | | 3,407,693 | | | | — | | | | 25,827 | |
| | 158,128 | | | | 3,209 | | | | 43,776 | | | | 6,227 | | | | 215,571 | | | | 1,742 | | | | 3,170 | |
| | 46,812 | | | | 873 | | | | 11,991 | | | | 238 | | | | 81,463 | | | | 256 | | | | 1,210 | |
| | 14,257 | | | | 8,271 | | | | 10,273 | | | | 10,273 | | | | 14,251 | | | | 8,271 | | | | 8,271 | |
| | 1,066,688 | | | | 13,624 | | | | 322,194 | | | | 21,784 | | | | 1,707,572 | | | | 4,840 | | | | 12,427 | |
| | 9,860 | | | | 5,232 | | | | 5,232 | | | | 4,932 | | | | 8,057 | | | | 4,932 | | | | 4,932 | |
| | 180,172 | | | | 2,351 | | | | 33,516 | | | | 4,324 | | | | 223,832 | | | | 660 | | | | 2,827 | |
| | | | | | | | | | | | | | | | | | | | | | | | | | |
| | 34,171,114 | | | | 136,706 | | | | 28,894,457 | | | | 1,531,464 | | | | 50,636,769 | | | | 20,874 | | | | 2,158,154 | |
| | | | | | | | | | | | | | | | | | | | | | | | | | |
| $ | 4,136,667,896 | | | $ | 50,721,423 | | | $ | 1,138,258,945 | | | $ | 132,696,953 | | | $ | 5,963,929,210 | | | $ | 11,500,265 | | | $ | 52,181,137 | |
| | | | | | | | | | | | | | | | | | | | | | | | | | |
| | | | | | |
| | | | | | | | | | | | | | | | | | | | | | | | | | |
| $ | 2,792,628,587 | | | $ | 32,865,186 | | | $ | 817,464,474 | | | $ | 115,232,942 | | | $ | 4,079,498,407 | | | $ | 8,731,577 | | | $ | 45,307,977 | |
| | 13,249,668 | | | | — | | | | (1,086,948 | ) | | | (73,053 | ) | | | — | | | | — | | | | (4,379 | ) |
| | 645,110,556 | | | | 3,306,880 | | | | 91,155,046 | | | | 4,244,797 | | | | 921,797,183 | | | | 681,681 | | | | 1,305,270 | |
| | 685,679,085 | | | | 14,549,357 | | | | 230,726,373 | | | | 13,292,267 | | | | 962,633,620 | | | | 2,087,007 | | | | 5,572,269 | |
| | | | | | | | | | | | | | | | | | | | | | | | | | |
| $ | 4,136,667,896 | | | $ | 50,721,423 | | | $ | 1,138,258,945 | | | $ | 132,696,953 | | | $ | 5,963,929,210 | | | $ | 11,500,265 | | | $ | 52,181,137 | |
| | | | | | | | | | | | | | | | | | | | | | | | | | |
| | | | | | | | | | | | | | | | | | | | | | | | | | |
| $ | 1,344,316,869 | | | $ | 26,021,807 | | | $ | 349,936,856 | | | $ | 7,037,138 | | | $ | 2,432,815,082 | | | $ | 7,632,857 | | | $ | 37,098,507 | |
| | 45,425,567 | | | | 1,389,269 | | | | 24,914,982 | | | | 514,118 | | | | 51,880,098 | | | | 636,648 | | | | 2,512,625 | |
| | | | | | | | | | | | | | | | | | | | | | | | | | |
| $ | 29.59 | | | $ | 18.73 | | | $ | 14.05 | | | $ | 13.69 | | | $ | 46.89 | | | $ | 11.99 | | | $ | 14.76 | |
| | | | | | | | | | | | | | | | | | | | | | | | | | |
| | | | | | | | | | | | | | | | | | | | | | | | | | |
| $ | 2,784,650,000 | | | $ | 24,699,616 | | | $ | 788,322,089 | | | $ | 125,659,815 | | | $ | 3,531,114,128 | | | $ | 3,867,408 | | | $ | 15,082,630 | |
| | 93,438,608 | | | | 1,313,789 | | | | 56,163,947 | | | | 9,178,475 | | | | 73,960,451 | | | | 322,286 | | | | 1,012,989 | |
| | | | | | | | | | | | | | | | | | | | | | | | | | |
| $ | 29.80 | | | $ | 18.80 | | | $ | 14.04 | | | $ | 13.69 | | | $ | 47.74 | | | $ | 12.00 | | | $ | 14.89 | |
| | | | | | | | | | | | | | | | | | | | | | | | | | |
| | | | | | | | | | | | | | | | | | | | | | | | | | |
| $ | 7,701,027 | | | $ | — | | | $ | — | | | $ | — | | | $ | — | | | $ | — | | | $ | — | |
| | 263,666 | | | | — | | | | — | | | | — | | | | — | | | | — | | | | — | |
$ | 29.21 | | | $ | — | | | $ | — | | | $ | — | | | $ | — | | | $ | — | | | $ | — | |
| | | | | | | | | | | | | | | | | | | | | | | | | | |
See accompanying Notes to Financial Statements.
| | |
| |
| | October 31, 2014 |
| |
| Statements of Assets and Liabilities – continued | | |
| | | | | | | | |
| | |
| | | River Road
Independent
Value Fund | | | River Road
Select Value
Fund | |
| | | | | | | | |
| | |
ASSETS: | | | | | | | | |
Investments: | | | | | | | | |
Investments at cost | | $ | 679,483,391 | | | $ | 176,394,905 | |
Affiliated Investment at cost (Note G) | | | — | | | | — | |
Net unrealized appreciation (depreciation) | | | (11,088,130 | ) | | | 8,134,091 | |
| | | | | | | | |
Total investments at value | | | 668,395,261 | | | | 184,528,996 | |
Total affiliated investment at value (Note G) | | | — | | | | — | |
Cash | | | — | | | | — | |
Receivables: | | | | | | | | |
Dividends and interest | | | 426 | | | | 77,573 | |
Fund shares sold | | | 902,961 | | | | 101,227 | |
Investments sold | | | 3,087,249 | | | | 1,513,948 | |
Other assets | | | 2,328 | | | | 698 | |
| | | | | | | | |
Total assets | | | 672,388,225 | | | | 186,222,442 | |
| | | | | | | | |
| | |
LIABILITIES: | | | | | | | | |
Payables: | | | | | | | | |
Dividend distribution | | | — | | | | — | |
Investments purchased | | | 1,788,142 | | | | 746,958 | |
Fund shares redeemed | | | 2,418,490 | | | | 690,330 | |
Due to Adviser, net (Note G) | | | 584,367 | | | | 152,865 | |
Administration fees (Note G) | | | 26,773 | | | | 8,261 | |
Distribution fees (Note G) | | | 9,911 | | | | 283 | |
Audit and tax fees | | | 8,271 | | | | 9,787 | |
Transfer agent fees | | | 259,179 | | | | 46,222 | |
Registration fees | | | 22,078 | | | | 4,932 | |
Accrued expenses and other payables | | | 33,012 | | | | 8,828 | |
Call options written, at value (premiums received $5,230,766) | | | — | | | | — | |
| | | | | | | | |
Total liabilities | | | 5,150,223 | | | | 1,668,466 | |
| | | | | | | | |
NET ASSETS | | $ | 667,238,002 | | | $ | 184,553,976 | |
| | | | | | | | |
| | |
NET ASSETS CONSIST OF: | | | | | | | | |
Paid in capital | | $ | 655,022,192 | | | $ | 152,064,851 | |
Accumulated undistributed (distribution in excess of) net investment income (loss) | | | (36,937 | ) | | | — | |
Accumulated net realized gain (loss) on investments, purchased and written options and capital gain distributions received | | | 23,340,877 | | | | 24,355,034 | |
Net unrealized appreciation (depreciation) on investments and purchased and written options | | | (11,088,130 | ) | | | 8,134,091 | |
| | | | | | | | |
TOTAL NET ASSETS | | $ | 667,238,002 | | | $ | 184,553,976 | |
| | | | | | | | |
Class N: | | | | | | | | |
Net Assets | | $ | 285,948,715 | | | $ | 8,387,524 | |
Shares of beneficial interest outstanding (unlimited authorization) | | | 26,268,072 | | | | 955,872 | |
NET ASSET VALUE Offering and redemption price per share
(Net Assets/Shares Outstanding) | | $ | 10.89 | | | $ | 8.77 | |
| | | | | | | | |
Class I: | | | | | | | | |
Net Assets | | $ | 381,289,287 | | | $ | 176,166,452 | |
Shares of beneficial interest outstanding (unlimited authorization) | | | 34,725,603 | | | | 19,848,409 | |
NET ASSET VALUE Offering and redemption price per share
(Net Assets/Shares Outstanding) | | $ | 10.98 | | | $ | 8.88 | |
| | | | | | | | |
See accompanying Notes to Financial Statements.
| | | | | | | | | | | | | | | | | | | | | | | | | | |
| | | | | | |
River Road
Small Cap
Value Fund | | | Silvercrest
Small Cap
Fund | | | TAMRO
Small Cap
Fund | | | DoubleLine Core
Plus Fixed
Income Fund | | | TCH
Fixed Income
Fund | | | Anchor Capital
Enhanced Equity
Fund | | | Lake Partners
LASSO
Alternatives Fund | |
| | | | | | | | | | | | | | | | | | | | | | | | | | |
| | | | | | |
| | | | | | | | | | | | | | | | | | | | | | | | | | |
| | | | | | | | | | | | | | | | | | | | | | | | | | |
| $ | 260,222,167 | | | $ | 62,913,700 | | | $ | 606,983,790 | | | $ | 182,834,574 | | | $ | 49,175,715 | | | $ | 209,204,115 | | | $ | 494,961,779 | |
| | — | | | | — | | | | — | | | | 2,516,745 | | | | — | | | | — | | | | — | |
| | 38,542,333 | | | | 6,966,583 | | | | 242,049,881 | | | | 2,725,977 | | | | 3,084,984 | | | | 13,031,425 | | | | 27,434,882 | |
| | | | | | | | | | | | | | | | | | | | | | | | | | |
| | 298,764,500 | | | | 69,880,283 | | | | 849,033,671 | | | | 185,563,053 | | | | 52,260,699 | | | | 222,235,540 | | | | 522,396,661 | |
| | — | | | | — | | | | — | | | | 2,514,243 | | | | — | | | | — | | | | — | |
| | — | | | | — | | | | — | | | | 924,644 | | | | — | | | | — | | | | — | |
| | | | | | | | | | | | | | | | | | | | | | | | | | |
| | 32,615 | | | | 13,583 | | | | 280 | | | | 1,267,524 | | | | 446,661 | | | | 344,431 | | | | 165,810 | |
| | 198,821 | | | | 82,411 | | | | 411,058 | | | | 33,654,199 | | | | 27,120 | | | | 279,125 | | | | 986,154 | |
| | 2,443,644 | | | | — | | | | 16,526,229 | | | | 141,435 | | | | — | | | | 897,102 | | | | — | |
| | 1,027 | | | | 114 | | | | 4,219 | | | | 522 | | | | 171 | | | | 508 | | | | 1,541 | |
| | | | | | | | | | | | | | | | | | | | | | | | | | |
| | 301,440,607 | | | | 69,976,391 | | | | 865,975,457 | | | | 224,065,620 | | | | 52,734,651 | | | | 223,756,706 | | | | 523,550,166 | |
| | | | | | | | | | | | | | | | | | | | | | | | | | |
| | | | | | |
| | | | | | | | | | | | | | | | | | | | | | | | | | |
| | | | | | | | | | | | | | | | | | | | | | | | | | |
| | — | | | | — | | | | — | | | | 34,139 | | | | 6,066 | | | | — | | | | — | |
| | 219,725 | | | | 958,265 | | | | 12,524,467 | | | | 15,599,005 | | | | 500,000 | | | | 2,465,548 | | | | 171,205 | |
| | 1,586,708 | | | | 20,703 | | | | 16,505,731 | | | | 937,074 | | | | 19,986 | | | | 870,324 | | | | 1,215,081 | |
| | 223,984 | | | | 52,395 | | | | 616,989 | | | | 70,332 | | | | 19,546 | | | | 122,592 | | | | 453,416 | |
| | 12,457 | | | | 3,748 | | | | 31,833 | | | | 16,410 | | | | 5,534 | | | | 9,006 | | | | 20,473 | |
| | 1,640 | | | | 221 | | | | 12,600 | | | | 1,712 | | | | 1,266 | | | | 3,483 | | | | 1,509 | |
| | 9,787 | | | | 8,271 | | | | 9,949 | | | | 14,205 | | | | 11,445 | | | | 9,235 | | | | 9,235 | |
| | 139,109 | | | | 22,106 | | | | 352,392 | | | | 32,389 | | | | 13,260 | | | | 50,879 | | | | 117,387 | |
| | 10,457 | | | | 20,028 | | | | 10,007 | | | | 4,932 | | | | 6,232 | | | | 15,653 | | | | 5,632 | |
| | 15,403 | | | | 2,520 | | | | 42,733 | | | | 9,798 | | | | 2,336 | | | | 19,850 | | | | 13,568 | |
| | — | | | | — | | | | — | | | | — | | | | — | | | | 9,225,587 | | | | — | |
| | | | | | | | | | | | | | | | | | | | | | | | | | |
| | 2,219,270 | | | | 1,088,257 | | | | 30,106,701 | | | | 16,719,996 | | | | 585,671 | | | | 12,792,157 | | | | 2,007,506 | |
| | | | | | | | | | | | | | | | | | | | | | | | | | |
| $ | 299,221,337 | | | $ | 68,888,134 | | | $ | 835,868,756 | | | $ | 207,345,624 | | | $ | 52,148,980 | | | $ | 210,964,549 | | | $ | 521,542,660 | |
| | | | | | | | | | | | | | | | | | | | | | | | | | |
| | | | | | |
| | | | | | | | | | | | | | | | | | | | | | | | | | |
| $ | 221,747,576 | | | $ | 60,321,380 | | | $ | 511,149,089 | | | $ | 209,319,874 | | | $ | 52,888,265 | | | $ | 203,141,143 | | | $ | 481,107,161 | |
| | — | | | | 77,751 | | | | (4,567,670 | ) | | | (376,971 | ) | | | 101,428 | | | | 327,869 | | | | (1,997,170 | ) |
| | | | | | | | | | | | | | | | | | | | | | | | | | |
| | 38,931,428 | | | | 1,522,420 | | | | 87,237,456 | | | | (4,323,256 | ) | | | (3,925,697 | ) | | | (1,541,067 | ) | | | 14,997,787 | |
| | 38,542,333 | | | | 6,966,583 | | | | 242,049,881 | | | | 2,725,977 | | | | 3,084,984 | | | | 9,036,604 | | | | 27,434,882 | |
| | | | | | | | | | | | | | | | | | | | | | | | | | |
| $ | 299,221,337 | | | $ | 68,888,134 | | | $ | 835,868,756 | | | $ | 207,345,624 | | | $ | 52,148,980 | | | $ | 210,964,549 | | | $ | 521,542,660 | |
| | | | | | | | | | | | | | | | | | | | | | | | | | |
| | | | | | | | | | | | | | | | | | | | | | | | | | |
| $ | 49,048,839 | | | $ | 6,672,691 | | | $ | 366,350,360 | | | $ | 49,147,180 | | | $ | 36,949,564 | | | $ | 101,979,781 | | | $ | 44,385,927 | |
| | 3,625,109 | | | | 438,908 | | | | 16,596,213 | | | | 4,527,162 | | | | 3,406,454 | | | | 10,750,558 | | | | 3,253,743 | |
| | | | | | | | | | | | | | | | | | | | | | | | | | |
| $ | 13.53 | | | $ | 15.20 | | | $ | 22.07 | | | $ | 10.86 | | | $ | 10.85 | | | $ | 9.49 | | | $ | 13.64 | |
| | | | | | | | | | | | | | | | | | | | | | | | | | |
| | | | | | | | | | | | | | | | | | | | | | | | | | |
| $ | 250,172,498 | | | $ | 62,215,443 | | | $ | 469,518,396 | | | $ | 158,198,444 | | | $ | 15,199,416 | | | $ | 108,984,768 | | | $ | 477,156,733 | |
| | 18,391,777 | | | | 4,074,368 | | | | 20,628,735 | | | | 14,573,182 | | | | 1,400,968 | | | | 11,476,984 | | | | 34,848,434 | |
| | | | | | | | | | | | | | | | | | | | | | | | | | |
| $ | 13.60 | | | $ | 15.27 | | | $ | 22.76 | | | $ | 10.86 | | | $ | 10.85 | | | $ | 9.50 | | | $ | 13.69 | |
| | | | | | | | | | | | | | | | | | | | | | | | | | |
See accompanying Notes to Financial Statements.
| | |
| |
| | October 31, 2014 |
| |
| Statements of Assets and Liabilities – continued | | |
| | | | | | | | |
| | |
| | | River Road
Long-Short
Fund | | | Barings
International
Fund | |
| | | | | | | | |
| | |
ASSETS: | | | | | | | | |
Investments: | | | | | | | | |
Investments at cost | | $ | 204,855,022 | | | $ | 20,525,200 | |
Net unrealized appreciation (depreciation) | | | 2,711,976 | | | | 914,446 | |
| | | | | | | | |
Total investments at value | | | 207,566,998 | | | | 21,439,646 | |
Foreign currency (Cost $231,402, $267, $8,554, $66,840, respectively) | | | 230,636 | | | | — | |
Cash | | | 8,191,450 | | | | — | |
Segregated Cash (Note B) | | | 130,129,225 | | | | — | |
Receivables: | | | | | | | | |
Dividends and interest | | | 88,905 | | | | 55,303 | |
Dividend reclaims | | | — | | | | 108,898 | |
Fund shares sold | | | 4,250,580 | | | | — | |
Investments sold | | | 25,258,745 | | | | 248,092 | |
Due from Adviser, net (Note G) | | | — | | | | — | |
Deferred offering costs (Note B-13) | | | — | | | | — | |
Other assets | | | 649 | | | | 122 | |
| | | | | | | | |
Total assets | | | 375,717,188 | | | | 21,852,061 | |
| | | | | | | | |
| | |
LIABILITIES: | | | | | | | | |
Payables: | | | | | | | | |
Due to custodian | | | — | | | | — | |
Interest and dividends on securities sold short | | | 9,622 | | | | — | |
Investments purchased | | | 26,737,343 | | | | 211,740 | |
Fund shares redeemed | | | 2,278,613 | | | | — | |
Due to Adviser, net (Note G) | | | 287,457 | | | | 15,324 | |
Administration fees (Note G) | | | 10,756 | | | | 6,095 | |
Distribution fees (Note G) | | | 3,774 | | | | 11 | |
Audit and tax fees | | | 9,721 | | | | 9,787 | |
Transfer agent fees | | | 55,398 | | | | 6,868 | |
Registration fees | | | 24,003 | | | | 4,932 | |
Offering costs | | | — | | | | — | |
Accrued expenses and other payables | | | 10,628 | | | | 7,001 | |
Securities sold short, at value (proceeds $121,515,659) | | | 126,879,252 | | | | — | |
| | | | | | | | |
Total liabilities | | | 156,306,567 | | | | 261,758 | |
| | | | | | | | |
NET ASSETS | | $ | 219,410,621 | | | $ | 21,590,303 | |
| | | | | | | | |
| | |
NET ASSETS CONSIST OF: | | | | | | | | |
Paid in capital | | $ | 223,227,321 | | | $ | 17,716,719 | |
Accumulated undistributed (distribution in excess of) net investment income (loss) | | | (25,371 | ) | | | 471,531 | |
Accumulated net realized gain (loss) on investments, securities sold short and foreign currency transactions | | | (1,138,946 | ) | | | 2,496,192 | |
Net unrealized appreciation (depreciation) on investments, securities sold short and translation of assets and liabilities in foreign currency | | | (2,652,383 | ) | | | 905,861 | |
| | | | | | | | |
TOTAL NET ASSETS | | $ | 219,410,621 | | | $ | 21,590,303 | |
| | | | | | | | |
Class N: | | | | | | | | |
Net Assets | | $ | 109,139,823 | | | $ | 330,651 | |
Shares of beneficial interest outstanding (unlimited authorization) | | | 9,619,314 | | | | 47,386 | |
NET ASSET VALUE Offering and redemption price per share
(Net Assets/Shares Outstanding) | | $ | 11.35 | | | $ | 6.98 | |
| | | | | | | | |
Class I: | | | | | | | | |
Net Assets | | $ | 110,270,798 | | | $ | 21,259,652 | |
Shares of beneficial interest outstanding (unlimited authorization) | | | 9,676,910 | | | | 3,039,899 | |
NET ASSET VALUE Offering and redemption price per share
(Net Assets/Shares Outstanding) | | $ | 11.40 | | | $ | 6.99 | |
| | | | | | | | |
See accompanying Notes to Financial Statements.
| | | | | | | | | | | | | | | | | | |
| | | | |
Guardian
Capital Global
Dividend Fund | | | LMCG
Emerging
Markets Fund | | | Pictet
International
Fund | | | Harrison Street
Real Estate
Fund | | | Montag & Caldwell
Balanced Fund | |
| | | | | | | | | | | | | | | | | | |
| | | | |
| | | | | | | | | | | | | | | | | | |
| | | | | | | | | | | | | | | | | | |
| $ | 4,046,953 | | | $ | 3,768,658 | | | $ | 10,215,984 | | | $ | 12,528,283 | | | $ | 19,368,784 | |
| | 234,262 | | | | 137,049 | | | | (799,458 | ) | | | 1,153,973 | | | | 3,032,006 | |
| | | | | | | | | | | | | | | | | | |
| | 4,281,215 | | | | 3,905,707 | | | | 9,416,526 | | | | 13,682,256 | | | | 22,400,790 | |
| | 268 | | | | 8,453 | | | | 66,706 | | | | — | | | | — | |
| | — | | | | — | | | | — | | | | — | | | | — | |
| | — | | | | — | | | | — | | | | — | | | | — | |
| | | | | | | | | | | | | | | | | | |
| | 5,305 | | | | 4,631 | | | | 18,983 | | | | 9,056 | | | | 78,417 | |
| | 1,224 | | | | — | | | | 5,888 | | | | 2,324 | | | | — | |
| | 890 | | | | — | | | | — | | | | 1,289 | | | | 900 | |
| | 49,347 | | | | — | | | | 41,690 | | | | 59,645 | | | | — | |
| | — | | | | 24,340 | | | | — | | | | — | | | | — | |
| | 24,002 | | | | — | | | | 33,422 | | | | — | | | | — | |
| | — | | | | 12 | | | | — | | | | 40 | | | | 78 | |
| | | | | | | | | | | | | | | | | | |
| | 4,362,251 | | | | 3,943,143 | | | | 9,583,215 | | | | 13,754,610 | | | | 22,480,185 | |
| | | | | | | | | | | | | | | | | | |
| | | | |
| | | | | | | | | | | | | | | | | | |
| | | | | | | | | | | | | | | | | | |
| | — | | | | — | | | | 2,632 | | | | — | | | | — | |
| | — | | | | — | | | | — | | | | — | | | | — | |
| | 31,779 | | | | — | | | | 51,313 | | | | 78,109 | | | | 32,557 | |
| | — | | | | — | | | | — | | | | 46,463 | | | | 23,072 | |
| | 4,197 | | | | — | | | | 5,689 | | | | 18,893 | | | | 12,758 | |
| | 2,560 | | | | 3,814 | | | | 3,420 | | | | 1,705 | | | | 2,758 | |
| | 35 | | | | 24 | | | | 33 | | | | 438 | | | | 278 | |
| | 9,787 | | | | 9,949 | | | | 9,787 | | | | 8,757 | | | | 11,445 | |
| | 2,011 | | | | 2,196 | | | | 5,225 | | | | 5,985 | | | | 5,452 | |
| | 4,932 | | | | 4,932 | | | | 4,932 | | | | 9,182 | | | | 10,982 | |
| | 42,309 | | | | — | | | | 44,105 | | | | — | | | | — | |
| | 1,617 | | | | 9,202 | | | | 5,110 | | | | 1,841 | | | | 1,196 | |
| | — | | | | — | | | | — | | | | — | | | | — | |
| | | | | | | | | | | | | | | | | | |
| | 99,227 | | | | 30,117 | | | | 132,246 | | | | 171,373 | | | | 100,498 | |
| | | | | | | | | | | | | | | | | | |
| $ | 4,263,024 | | | $ | 3,913,026 | | | $ | 9,450,969 | | | $ | 13,583,237 | | | $ | 22,379,687 | |
| | | | | | | | | | | | | | | | | | |
| | | | |
| | | | | | | | | | | | | | | | | | |
| $ | 4,050,428 | | | $ | 4,027,313 | | | $ | 10,092,187 | | | $ | 24,168,875 | | | $ | 17,788,010 | |
| | 16,335 | | | | 18,436 | | | | 102,611 | | | | 115,470 | | | | (304,404 | ) |
| | | | | | | | | | | | | | | | | | |
| | (37,885 | ) | | | (269,645 | ) | | | 56,784 | | | | (11,855,036 | ) | | �� | 1,864,075 | |
| | | | | | | | | | | | | | | | | | |
| | 234,146 | | | | 136,922 | | | | (800,613 | ) | | | 1,153,928 | | | | 3,032,006 | |
| | | | | | | | | | | | | | | | | | |
| $ | 4,263,024 | | | $ | 3,913,026 | | | $ | 9,450,969 | | | $ | 13,583,237 | | | $ | 22,379,687 | |
| | | | | | | | | | | | | | | | | | |
| | | | | | | | | | | | | | | | | | |
| $ | 1,052,303 | | | $ | 725,399 | | | $ | 983,659 | | | $ | 12,851,634 | | | $ | 20,446,069 | |
| | 100,106 | | | | 75,926 | | | | 105,262 | | | | 1,017,360 | | | | 828,476 | |
| | | | | | | | | | | | | | | | | | |
| $ | 10.51 | | | $ | 9.55 | | | $ | 9.34 | | | $ | 12.63 | | | $ | 24.68 | |
| | | | | | | | | | | | | | | | | | |
| | | | | | | | | | | | | | | | | | |
| $ | 3,210,721 | | | $ | 3,187,627 | | | $ | 8,467,310 | | | $ | 731,603 | | | $ | 1,933,618 | |
| | 305,341 | | | | 332,730 | | | | 904,851 | | | | 58,197 | | | | 78,599 | |
| | | | | | | | | | | | | | | | | | |
| $ | 10.52 | | | $ | 9.58 | | | $ | 9.36 | | | $ | 12.57 | | | $ | 24.60 | |
| | | | | | | | | | | | | | | | | | |
See accompanying Notes to Financial Statements.
| | |
| |
| For the Year Ended October 31, 2014 | | |
| |
| Statements of Operations | | |
| | | | | | | | |
| | |
| | | Cornerstone
Large Cap
Value Fund | | | Herndon
Large Cap
Value Fund | |
| | | | | | | | |
| | | | | | | | |
INVESTMENT INCOME: | | | | | | | | |
Dividends | | $ | 2,285,718 | | | $ | 3,097,464 | |
Less: foreign taxes withheld | | | (22,920 | ) | | | — | |
| | | | | | | | |
Total investment income | | | 2,262,798 | | | | 3,097,464 | |
| | | | | | | | |
EXPENSES: | | | | | | | | |
Investment advisory fees (Note G) | | | 892,254 | | | | 1,195,947 | |
Distribution expenses (Note G)(a) | | | 79,374 | | | | 98,582 | |
Transfer agent fees | | | 109,952 | | | | 99,474 | |
Administration fees (Note G) | | | 63,055 | | | | 80,727 | |
Custodian fees | | | 25,477 | | | | 9,609 | |
Audit and tax fees | | | 23,191 | | | | 19,761 | |
Legal fees | | | 1,411 | | | | 2,023 | |
Registration expenses | | | 32,563 | | | | 34,288 | |
Reports to shareholder expense | | | 5,284 | | | | 7,208 | |
Trustees fees and related expenses (Note G) | | | 6,928 | | | | 9,450 | |
Other expenses | | | 5,538 | | | | 7,401 | |
| | | | | | | | |
Total expenses before waivers/reimbursement/recoupment | | | 1,245,027 | | | | 1,564,470 | |
| | | | | | | | |
Less: Investment advisory fees waived (Note G) | | | — | | | | — | |
Less: Expenses reimbursed (Note G) | | | — | | | | — | |
Plus: Expenses Recouped (Note G) | | | — | | | | 103,793 | |
| | | | | | | | |
Net expenses | | | 1,245,027 | | | | 1,668,263 | |
| | | | | | | | |
NET INVESTMENT INCOME (LOSS) | | | 1,017,771 | | | | 1,429,201 | |
| | | | | | | | |
NET REALIZED AND UNREALIZED GAIN (LOSS) ON INVESTMENTS: | | | | | | | | |
Net realized gain on investments | | | 6,701,835 | | | | 9,189,481 | |
Net change in unrealized appreciation (depreciation) on investments | | | 2,552,837 | | | | 3,565,628 | |
| | | | | | | | |
NET REALIZED AND UNREALIZED GAIN ON INVESTMENTS | | | 9,254,672 | | | | 12,755,109 | |
| | | | | | | | |
| | |
NET INCREASE IN NET ASSETS FROM OPERATIONS | | $ | 10,272,443 | | | $ | 14,184,310 | |
| | | | | | | | |
| (a) | Distribution expense is incurred at the Class N level for all funds except the Montag & Caldwell Growth Fund. The distribution expenses for Class N and Class R of the Montag & Caldwell Growth Fund are $5,039,489 and $45,992, respectively. |
See accompanying Notes to Financial Statements.
| | | | | | | | | | | | | | | | | | | | | | | | | | |
| | | | | | |
Montag & Caldwell
Growth Fund | | | TAMRO
Diversified
Equity Fund | | | River Road
Dividend All
Cap Value Fund | | | River Road
Dividend All Cap
Value Fund II | | | Fairpointe
Mid Cap
Fund | | | Montag & Caldwell
Mid Cap
Growth Fund | | | LMCG
Small Cap
Growth Fund | |
| | | | | | | | | | | | | | | | | | | | | | | | | | |
| | | | | | | | | | | | | | | | | | | | | | | | | | |
| $ | 66,881,301 | | | $ | 442,897 | | | $ | 49,954,051 | | | $ | 4,462,183 | | | $ | 54,462,172 | | | $ | 76,517 | | | $ | 183,411 | |
| | — | | | | (621 | ) | | | (343,705 | ) | | | (33,906 | ) | | | — | | | | (259 | ) | | | — | |
| | | | | | | | | | | | | | | | | | | | | | | | | | |
| | 66,881,301 | | | | 442,276 | | | | 49,610,346 | | | | 4,428,277 | | | | 54,462,172 | | | | 76,258 | | | | 183,411 | |
| | | | | | | | | | | | | | | | | | | | | | | | | | |
| | | | | | | | | | | | | | | | | | | | | | | | | | |
| | 30,903,650 | | | | 442,820 | | | | 8,585,900 | | | | 779,615 | | | | 39,145,259 | | | | 96,871 | | | | 411,763 | |
| | 5,085,481 | | | | 66,919 | | | | 1,104,647 | | | | 15,121 | | | | 6,242,418 | | | | 25,924 | | | | 80,489 | |
| | 3,776,495 | | | | 73,318 | | | | 827,074 | | | | 83,225 | | | | 4,395,299 | | | | 24,748 | | | | 62,141 | |
| | 2,167,204 | | | | 39,417 | | | | 556,218 | | | | 64,208 | | | | 2,464,258 | | | | 19,718 | | | | 33,720 | |
| | 131,576 | | | | 5,567 | | | | 37,208 | | | | 7,356 | | | | 155,710 | | | | 3,819 | | | | 7,304 | |
| | 34,160 | | | | 19,461 | | | | 24,091 | | | | 24,091 | | | | 34,164 | | | | 19,461 | | | | 21,175 | |
| | 64,453 | | | | 696 | | | | 15,986 | | | | 1,469 | | | | 73,052 | | | | 14,603 | | | | 546 | |
| | 72,329 | | | | 29,698 | | | | 40,651 | | | | 43,495 | | | | 101,337 | | | | 31,932 | | | | 34,125 | |
| | 309,465 | | | | 3,528 | | | | 40,044 | | | | 5,850 | | | | 431,616 | | | | 6,415 | | | | 4,675 | |
| | 319,712 | | | | 3,616 | | | | 79,755 | | | | 7,030 | | | | 355,419 | | | | 739 | | | | 2,603 | |
| | 209,084 | | | | 4,095 | | | | 51,646 | | | | 5,927 | | | | 173,623 | | | | 2,851 | | | | 5,899 | |
| | | | | | | | | | | | | | | | | | | | | | | | | | |
| | 43,073,609 | | | | 689,135 | | | | 11,363,220 | | | | 1,037,387 | | | | 53,572,155 | | | | 247,081 | | | | 664,440 | |
| | | | | | | | | | | | | | | | | | | | | | | | | | |
| | — | | | | (96,367 | ) | | | — | | | | — | | | | — | | | | (96,871 | ) | | | (131,012 | ) |
| | — | | | | — | | | | — | | | | — | | | | — | | | | (10,320 | ) | | | — | |
| | — | | | | — | | | | — | | | | 95,878 | | | | — | | | | — | | | | — | |
| | | | | | | | | | | | | | | | | | | | | | | | | | |
| | 43,073,609 | | | | 592,768 | | | | 11,363,220 | | | | 1,133,265 | | | | 53,572,155 | | | | 139,890 | | | | 533,428 | |
| | | | | | | | | | | | | | | | | | | | | | | | | | |
| | 23,807,692 | | | | (150,492 | ) | | | 38,247,126 | | | | 3,295,012 | | | | 890,017 | | | | (63,632 | ) | | | (350,017 | ) |
| | | | | | | | | | | | | | | | | | | | | | | | | | |
| | | | | | | | | | | | | | | | | | | | | | | | | | |
| | 830,078,413 | | | | 3,506,744 | | | | 100,414,252 | | | | 4,129,826 | | | | 1,049,016,350 | | | | 797,891 | | | | 3,358,983 | |
| | (344,295,024 | ) | | | 4,502,060 | | | | (21,456,186 | ) | | | 4,067,038 | | | | (389,789,424 | ) | | | 320,711 | | | | 3,429,213 | |
| | | | | | | | | | | | | | | | | | | | | | | | | | |
| | 485,783,389 | | | | 8,008,804 | | | | 78,958,066 | | | | 8,196,864 | | | | 659,226,926 | | | | 1,118,602 | | | | 6,788,196 | |
| | | | | | | | | | | | | | | | | | | | | | | | | | |
| | | | | | |
| $ | 509,591,081 | | | $ | 7,858,312 | | | $ | 117,205,192 | | | $ | 11,491,876 | | | $ | 660,116,943 | | | $ | 1,054,970 | | | $ | 6,438,179 | |
| | | | | | | | | | | | | | | | | | | | | | | | | | |
See accompanying Notes to Financial Statements.
| | |
| |
| For the Year Ended October 31, 2014 | | |
| |
| Statements of Operations – continued | | |
| | | | | | | | |
| | |
| | | River Road
Independent
Value Fund | | | River Road
Select Value
Fund | |
| | | | | | | | |
INVESTMENT INCOME: | | | | | | | | |
Dividends | | $ | 3,008,875 | | | $ | 2,266,033 | |
Dividends from affiliated security | | | — | | | | — | |
Less: foreign taxes withheld | | | (217,235 | ) | | | (11,750 | ) |
Interest | | | — | | | | — | |
| | | | | | | | |
Total investment income | | | 2,791,640 | | | | 2,254,283 | |
| | | | | | | | |
EXPENSES: | | | | | | | | |
Investment advisory fees (Note G) | | | 7,200,653 | | | | 2,068,965 | |
Distribution expenses (Note G)(a) | | | 785,247 | | | | 36,878 | |
Transfer agent fees | | | 674,644 | | | | 206,383 | |
Administration fees (Note G) | | | 331,098 | | | | 106,956 | |
Custodian fees | | | 22,386 | | | | 12,213 | |
Audit and tax fees | | | 19,461 | | | | 23,191 | |
Legal fees | | | 9,383 | | | | 2,579 | |
Registration expenses | | | 50,692 | | | | 30,466 | |
Reports to shareholder expense | | | 63,437 | | | | 12,874 | |
Trustees fees and related expenses (Note G) | | | 46,912 | | | | 13,509 | |
Other expenses | | | 32,057 | | | | 10,367 | |
| | | | | | | | |
Total expenses before waivers/earning credit/recoupment | | | 9,235,970 | | | | 2,524,381 | |
| | | | | | | | |
Less: Investment advisory fees waived (Note G) | | | (25,960 | ) | | | — | |
Less: Earnings credit (Note I) | | | (30,229 | ) | | | — | |
Plus: Net expenses recouped (Note G) | | | — | | | | — | |
| | | | | | | | |
Net expenses | | | 9,179,781 | | | | 2,524,381 | |
| | | | | | | | |
NET INVESTMENT INCOME (LOSS) | | | (6,388,141 | ) | | | (270,098 | ) |
| | | | | | | | |
NET REALIZED AND UNREALIZED GAIN (LOSS) ON INVESTMENTS: | | | | | | | | |
Net realized gain (loss) on investments | | | 37,973,231 | | | | 30,115,873 | |
Net realized gain on affiliated investments | | | — | | | | — | |
Net realized loss on purchased options | | | — | | | | — | |
Net realized loss on written option | | | — | | | | — | |
Capital gain distributions received | | | — | | | | — | |
Net change in unrealized appreciation (depreciation) on investments | | | (38,109,822 | ) | | | (29,790,084 | ) |
Net change in unrealized appreciation/(depreciation) on purchased options | | | — | | | | — | |
Net change in unrealized appreciation (depreciation) on written options | | | — | | | | — | |
| | | | | | | | |
NET REALIZED AND UNREALIZED GAIN (LOSS) ON INVESTMENTS | | | (136,591 | ) | | | 325,789 | |
| | | | | | | | |
| | |
NET INCREASE (DECREASE) IN NET ASSETS FROM OPERATIONS | | $ | (6,524,732 | ) | | $ | 55,691 | |
| | | | | | | | |
| (a) | Distribution expense is incurred at the Class N level. |
See accompanying Notes to Financial Statements.
| | | | | | | | | | | | | | | | | | | | | | | | | | |
| | | | | | |
River Road
Small Cap
Value Fund | | | Silvercrest
Small Cap
Fund | | | TAMRO
Small Cap
Fund | | | DoubleLine Core
Plus Fixed Income
Fund | | | TCH
Fixed Income
Fund | | | Anchor Capital
Enhanced Equity
Fund | | | Lake Partners
LASSO
Alternatives Fund | |
| | | | | | | | | | | | | | | | | | | | | | | | | | |
| | | | | | | | | | | | | | | | | | | | | | | | | | |
| $ | 3,295,524 | | | $ | 732,238 | | | $ | 8,410,681 | | | $ | 13,138 | | | $ | 4,920 | | | $ | 5,472,624 | | | $ | 4,499,825 | |
| | — | | | | — | | | | — | | | | 100,845 | | | | — | | | | — | | | | — | |
| | (16,263 | ) | | | — | | | | (10,653 | ) | | | — | | | | (165 | ) | | | (1,500 | ) | | | — | |
| | — | | | | — | | | | — | | | | 6,504,577 | | | | 2,214,003 | | | | — | | | | — | |
| | | | | | | | | | | | | | | | | | | | | | | | | | |
| | 3,279,261 | | | | 732,238 | | | | 8,400,028 | | | | 6,618,560 | | | | 2,218,758 | | | | 5,471,124 | | | | 4,499,825 | |
| | | | | | | | | | | | | | | | | | | | | | | | | | |
| | | | | | | | | | | | | | | | | | | | | | | | | | |
| | 2,744,055 | | | | 508,608 | | | | 10,310,818 | | | | 780,471 | | | | 290,359 | | | | 1,276,609 | | | | 4,969,301 | |
| | 135,106 | | | | 12,334 | | | | 1,178,101 | | | | 111,149 | | | | 103,987 | | | | 258,743 | | | | 122,048 | |
| | 286,423 | | | | 66,087 | | | | 939,388 | | | | 134,957 | | | | 64,118 | | | | 184,184 | | | | 419,207 | |
| | 150,080 | | | | 37,498 | | | | 520,770 | | | | 128,134 | | | | 51,535 | | | | 96,145 | | | | 232,430 | |
| | 14,467 | | | | 8,458 | | | | 44,968 | | | | 25,028 | | | | 7,297 | | | | 61,534 | | | | 12,928 | |
| | 23,191 | | | | 19,461 | | | | 23,491 | | | | 45,552 | | | | 28,671 | | | | 21,841 | | | | 21,841 | |
| | 3,771 | | | | 638 | | | | 15,514 | | | | 1,695 | | | | 703 | | | | 2,411 | | | | 6,512 | |
| | 31,323 | | | | 43,370 | | | | 39,979 | | | | 36,014 | | | | 30,990 | | | | 33,261 | | | | 51,496 | |
| | 14,715 | | | | 2,550 | | | | 76,354 | | | | 11,893 | | | | 2,557 | | | | 21,113 | | | | 23,697 | |
| | 19,626 | | | | 3,123 | | | | 75,474 | | | | 9,109 | | | | 3,434 | | | | 11,592 | | | | 31,927 | |
| | 20,084 | | | | 3,660 | | | | 51,712 | | | | 6,253 | | | | 3,505 | | | | 8,831 | | | | 17,562 | |
| | | | | | | | | | | | | | | | | | | | | | | | | | |
| | 3,442,841 | | | | 705,787 | | | | 13,276,569 | | | | 1,290,255 | | | | 587,156 | | | | 1,976,264 | | | | 5,908,949 | |
| | | | | | | | | | | | | | | | | | | | | | | | | | |
| | — | | | | (108,554 | ) | | | — | | | | (199,971 | ) | | | (118,901 | ) | | | — | | | | — | |
| | — | | | | — | | | | — | | | | — | | | | — | | | | — | | | | — | |
| | — | | | | — | | | | — | | | | — | | | | — | | | | — | | | | 87,814 | |
| | | | | | | | | | | | | | | | | | | | | | | | | | |
| | 3,442,841 | | | | 597,233 | | | | 13,276,569 | | | | 1,090,284 | | | | 468,255 | | | | 1,976,264 | | | | 5,996,763 | |
| | | | | | | | | | | | | | | | | | | | | | | | | | |
| | (163,580 | ) | | | 135,005 | | | | (4,876,541 | ) | | | 5,528,276 | | | | 1,750,503 | | | | 3,494,860 | | | | (1,496,938 | ) |
| | | | | | | | | | | | | | | | | | | | | | | | | | |
| | | | | | | | | | | | | | | | | | | | | | | | | | |
| | 48,359,630 | | | | 1,540,966 | | | | 116,264,947 | | | | (877,217 | ) | | | 937,543 | | | | 12,015,289 | | | | 9,724,682 | |
| | — | | | | — | | | | — | | | | 16,745 | | | | — | | | | — | | | | — | |
| | — | | | | — | | | | — | | | | — | | | | — | | | | (6,221,334 | ) | | | — | |
| | — | | | | — | | | | — | | | | — | | | | — | | | | (6,281,509 | ) | | | — | |
| | — | | | | — | | | | — | | | | — | | | | — | | | | — | | | | 8,829,055 | |
| | (46,163,511 | ) | | | 2,445,591 | | | | (117,572,672 | ) | | | 3,161,286 | | | | 153,019 | | | | 4,673,904 | | | | (448,365 | ) |
| | — | | | | — | | | | — | | | | — | | | | — | | | | (305,544 | ) | | | — | |
| | — | | | | — | | | | — | | | | — | | | | — | | | | (1,634,393 | ) | | | — | |
| | | | | | | | | | | | | | | | | | | | | | | | | | |
| | 2,196,119 | | | | 3,986,557 | | | | (1,307,725 | ) | | | 2,300,814 | | | | 1,090,562 | | | | 2,246,413 | | | | 18,105,372 | |
| | | | | | | | | | | | | | | | | | | | | | | | | | |
| | | | | | |
| $ | 2,032,539 | | | $ | 4,121,562 | | | $ | (6,184,266 | ) | | $ | 7,829,090 | | | $ | 2,841,065 | | | $ | 5,741,273 | | | $ | 16,608,434 | |
| | | | | | | | | | | | | | | | | | | | | | | | | | |
See accompanying Notes to Financial Statements.
| | |
| |
| For the Year Ended October 31, 2014 | | |
| |
| Statements of Operations – continued | | |
| | | | | | | | |
| | |
| | | River Road
Long-Short
Fund | | | Barings
International
Fund | |
| | | | | | | | |
INVESTMENT INCOME: | | | | | | | | |
Dividends | | $ | 2,314,637 | | | $ | 1,013,842 | |
Less: foreign taxes withheld | | | (90,487 | ) | | | (71,285 | ) |
Interest | | | — | | | | — | |
| | | | | | | | |
Total investment income | | | 2,224,150 | | | | 942,557 | |
| | | | | | | | |
EXPENSES: | | | | | | | | |
Investment advisory fees (Note G) | | | 2,708,366 | | | | 279,884 | |
Distribution expenses (Note G)(c) | | | 283,929 | | | | 1,090 | |
Transfer agent fees | | | 206,757 | | | | 37,410 | |
Administration fees (Note G) | | | 115,300 | | | | 51,368 | |
Custodian fees | | | 21,558 | | | | 50,009 | |
Audit and tax fees | | | 22,741 | | | | 23,192 | |
Legal fees | | | 3,054 | | | | 365 | |
Registration expenses | | | 54,769 | | | | 27,153 | |
Interest and dividend expense on securities sold short | | | 1,979,326 | | | | — | |
Amortization of offering costs (Note B-13) | | | — | | | | — | |
Reports to shareholder expense | | | 11,958 | | | | 1,421 | |
Trustees fees and related expenses (Note G) | | | 14,297 | | | | 1,867 | |
Other expenses | | | 10,093 | | | | 3,328 | |
| | | | | | | | |
Total expenses before waivers/reimbursement/recoupment | | | 5,432,148 | | | | 477,087 | |
| | | | | | | | |
Less: Investment advisory fees waived (Note G) | | | — | | | | (154,130 | ) |
Less: Expenses reimbursed (Note G) | | | — | | | | — | |
Plus: Net expenses recouped (Note G) | | | 103,715 | | | | — | |
| | | | | | | | |
Net expenses | | | 5,535,863 | | | | 322,957 | |
| | | | | | | | |
NET INVESTMENT INCOME (LOSS) | | | (3,311,713 | ) | | | 619,600 | |
| | | | | | | | |
NET REALIZED AND UNREALIZED GAIN (LOSS) ON INVESTMENTS: | | | | | | | | |
Net realized gain (loss) on investments | | | 13,913,023 | | | | 3,363,472 | |
Net realized loss on securities sold short | | | (11,481,839 | ) | | | — | |
Net realized gain (loss) on foreign currency transactions | | | 37,713 | | | | 13,550 | |
Net change in unrealized appreciation (depreciation) on investments | | | (4,683,223 | ) | | | (4,339,198 | ) |
Net change in unrealized appreciation (depreciation) on securities sold short | | | (3,974,342 | ) | | | — | |
Net change in unrealized appreciation (depreciation) on translation of assets and liabilities denominated in foreign currency | | | (766 | ) | | | (10,818 | ) |
| | | | | | | | |
NET REALIZED AND UNREALIZED GAIN (LOSS) ON INVESTMENTS | | | (6,189,434 | ) | | | (972,994 | ) |
| | | | | | | | |
| | |
NET INCREASE (DECREASE) IN NET ASSETS FROM OPERATIONS | | $ | (9,501,147 | ) | | $ | (353,394 | ) |
| | | | | | | | |
| (a) | The inception date for the Guardian Capital Global Dividend Fund is April 14, 2014. |
| (b) | The inception date for the Pictet International Fund is April 14, 2014. |
| (c) | Distribution expense is incurred at the Class N level. |
See accompanying Notes to Financial Statements.
| | | | | | | | | | | | | | | | | | |
| | | | |
Guardian
Capital Global
Dividend Fund(a) | | | LMCG
Emerging
Markets Fund | | | Pictet
International
Fund(b) | | | Harrison Street
Real Estate
Fund | | | Montag & Caldwell
Balanced Fund | |
| | | | | | | | | | | | | | | | | | |
| | | | | | | | | | | | | | | | | | |
| $ | 84,175 | | | $ | 120,746 | | | $ | 185,209 | | | $ | 293,635 | | | $ | 203,428 | |
| | (4,527 | ) | | | (13,041 | ) | | | (19,723 | ) | | | — | | | | — | |
| | 9 | | | | — | | | | — | | | | — | | | | 194,229 | |
| | | | | | | | | | | | | | | | | | |
| | 79,657 | | | | 107,705 | | | | 165,486 | | | | 293,635 | | | | 397,657 | |
| | | | | | | | | | | | | | | | | | |
| | | | | | | | | | | | | | | | | | |
| | 18,362 | | | | 41,491 | | | | 49,454 | | | | 130,889 | | | | 175,829 | |
| | 1,430 | | | | 1,698 | | | | 1,399 | | | | 31,342 | | | | 21,619 | |
| | 14,045 | | | | 24,395 | | | | 17,267 | | | | 38,162 | | | | 40,162 | |
| | 11,825 | | | | 29,287 | | | | 15,144 | | | | 19,643 | | | | 28,432 | |
| | 4,016 | | | | 38,097 | | | | 14,019 | | | | 5,230 | | | | 3,286 | |
| | 21,804 | | | | 28,991 | | | | 21,804 | | | | 20,362 | | | | 28,671 | |
| | 29 | | | | 288 | | | | 69 | | | | 162 | | | | 290 | |
| | 6,246 | | | | 28,960 | | | | 6,246 | | | | 29,873 | | | | 29,253 | |
| | — | | | | — | | | | — | | | | — | | | | — | |
| | 35,777 | | | | 29,147 | | | | 39,280 | | | | — | | | | — | |
| | 82 | | | | 2,770 | | | | 200 | | | | 2,786 | | | | 2,075 | |
| | 142 | | | | 259 | | | | 345 | | | | 848 | | | | 1,529 | |
| | 1,538 | | | | 2,092 | | | | 1,572 | | | | 2,370 | | | | 2,879 | |
| | | | | | | | | | | | | | | | | | |
| | 115,296 | | | | 227,475 | | | | 166,799 | | | | 281,667 | | | | 334,025 | |
| | | | | | | | | | | | | | | | | | |
| | (18,362 | ) | | | (41,491 | ) | | | (49,454 | ) | | | (103,728 | ) | | | (54,524 | ) |
| | (71,402 | ) | | | (131,904 | ) | | | (52,754 | ) | | | — | | | | — | |
| | — | | | | — | | | | — | | | | — | | | | — | |
| | | | | | | | | | | | | | | | | | |
| | 25,532 | | | | 54,080 | | | | 64,591 | | | | 177,939 | | | | 279,501 | |
| | | | | | | | | | | | | | | | | | |
| | 54,125 | | | | 53,625 | | | | 100,895 | | | | 115,696 | | | | 118,156 | |
| | | | | | | | | | | | | | | | | | |
| | | | | | | | | | | | | | | | | | |
| | (37,885 | ) | | | (42,385 | ) | | | 55,522 | | | | 398,784 | | | | 1,933,249 | |
| | — | | | | — | | | | — | | | | — | | | | — | |
| | 3,111 | | | | (1,985 | ) | | | (7,555 | ) | | | — | | | | — | |
| | 234,262 | | | | 47,318 | | | | (799,458 | ) | | | 1,080,590 | | | | (274,140 | ) |
| | — | | | | — | | | | — | | | | — | | | | — | |
|
(116 |
) | | | 91 | | | | (1,155 | ) | | | (28 | ) | | | — | |
| | | | | | | | | | | | | | | | | | |
| | 199,372 | | | | 3,039 | | | | (752,646 | ) | | | 1,479,346 | | | | 1,659,109 | |
| | | | | | | | | | | | | | | | | | |
| | | | |
| $ | 253,497 | | | $ | 56,664 | | | $ | (651,751 | ) | | $ | 1,595,042 | | | $ | 1,777,265 | |
| | | | | | | | | | | | | | | | | | |
See accompanying Notes to Financial Statements.
| | |
| |
| | |
| |
| Statements of Changes in Net Assets | | |
| | | | | | | | | | | | | | | | |
| | |
| | | Cornerstone Large Cap
Value Fund | | | Herndon Large Cap
Value Fund | |
| | | Year Ended October 31, | | | Year Ended October 31, | |
| | | 2014 | | | 2013 | | | 2014 | | | 2013 | |
| | | | | | | | | | | | | | | | |
NET ASSETS at Beginning of Period | | $ | 62,648,378 | | | $ | 26,502,868 | | | $ | 122,395,081 | | | $ | 55,406,952 | |
| | | | | | | | | | | | | | | | |
Increase in net assets from operations: | | | | | | | | | | | | | | | | |
Net investment income (loss) | | | 1,017,771 | | | | 339,606 | | | | 1,429,201 | | | | 1,202,686 | |
Net realized gain on investments | | | 6,701,835 | | | | 3,586,687 | | | | 9,189,481 | | | | 2,027,557 | |
Net change in unrealized appreciation (depreciation) on investments | | | 2,552,837 | | | | 5,212,950 | | | | 3,565,628 | | | | 14,781,516 | |
| | | | | | | | | | | | | | | | |
Net increase in net assets from operations | | | 10,272,443 | | | | 9,139,243 | | | | 14,184,310 | | | | 18,011,759 | |
| | | | | | | | | | | | | | | | |
Distributions to shareholders from: | | | | | | | | | | | | | | | | |
Net investment income: | | | | | | | | | | | | | | | | |
Class N | | | (102,489 | ) | | | (213,973 | ) | | | (300,533 | ) | | | (435,807 | ) |
Class I | | | (297,744 | ) | | | (61,387 | ) | | | (733,243 | ) | | | (712,891 | ) |
Class R | | | — | | | | — | | | | — | | | | — | |
Net realized gain on investments: | | | | | | | | | | | | | | | | |
Class N | | | — | | | | — | | | | (829,848 | ) | | | (431,437 | ) |
Class I | | | — | | | | — | | | | (1,561,843 | ) | | | (650,587 | ) |
Class R | | | — | | | | — | | | | — | | | | — | |
| | | | | | | | | | | | | | | | |
Total distributions | | | (400,233 | ) | | | (275,360 | ) | | | (3,425,467 | ) | | | (2,230,722 | ) |
| | | | | | | | | | | | | | | | |
Capital share transactions: | | | | | | | | | | | | | | | | |
Proceeds from sales of shares: | | | | | | | | | | | | | | | | |
Class N | | | 46,807,591 | | | | 6,812,232 | | | | 11,262,099 | | | | 21,511,589 | |
Class I | | | 71,518,302 | | | | 31,748,633 | | | | 88,729,125 | | | | 42,373,328 | |
Class R | | | — | | | | — | | | | — | | | | — | |
Proceeds from reinvestment of distributions: | | | | | | | | | | | | | | | | |
Class N | | | 97,214 | | | | 205,857 | | | | 1,130,230 | | | | 867,244 | |
Class I | | | 290,077 | | | | 60,827 | | | | 2,099,431 | | | | 959,131 | |
Class R | | | — | | | | — | | | | — | | | | — | |
Cost of shares redeemed: | | | | | | | | | | | | | | | | |
Class N | | | (12,358,613 | ) | | | (9,246,465 | ) | | | (44,133,670 | ) | | | (6,933,068 | ) |
Class I | | | (14,964,499 | ) | | | (2,299,457 | ) | | | (38,796,093 | ) | | | (7,571,132 | ) |
Class R | | | — | | | | — | | | | — | | | | — | |
| | | | | | | | | | | | | | | | |
Net increase (decrease) from capital share transactions | | | 91,390,072 | | | | 27,281,627 | | | | 20,291,122 | | | | 51,207,092 | |
| | | | | | | | | | | | | | | | |
Total increase (decrease) in net assets | | | 101,262,282 | | | | 36,145,510 | | | | 31,049,965 | | | | 66,988,129 | |
| | | | | | | | | | | | | | | | |
NET ASSETS at End of Period | | $ | 163,910,660 | | | $ | 62,648,378 | | | $ | 153,445,046 | | | $ | 122,395,081 | |
| | | | | | | | | | | | | | | | |
Undistributed (distributions in excess of) net investment income (loss) | | $ | 811,840 | | | $ | 194,302 | | | $ | 1,050,704 | | | $ | 655,279 | |
| | | | | | | | | | | | | | | | |
See accompanying Notes to Financial Statements.
| | | | | | | | | | | | | | | | | | | | | | |
| | |
Montag & Caldwell
Growth Fund | | | TAMRO Diversified
Equity Fund | | | River Road Dividend All Cap
Value Fund | |
Year Ended October 31, | | | Year Ended October 31, | | | Year Ended October 31, | |
| 2014 | | | 2013 | | | 2014 | | | 2013 | | | 2014 | | | 2013 | |
| | | | | | | | | | | | | | | | | | | | | | |
| $ | 5,235,796,676 | | | $ | 4,323,578,881 | | | $ | 55,677,027 | | | $ | 22,548,977 | | | $ | 1,228,988,525 | | | $ | 924,209,368 | |
| | | | | | | | | | | | | | | | | | | | | | |
| | | | | | | | | | | | | | | | | | | | | | |
| | 23,807,692 | | | | 48,828,411 | | | | (150,492 | ) | | | 60,993 | | | | 38,247,126 | | | | 26,855,750 | |
| | 830,078,413 | | | | 355,430,426 | | | | 3,506,744 | | | | 1,715,984 | | | | 100,414,252 | | | | 71,272,919 | |
| (344,295,024 | ) | | | 562,807,119 | | | | 4,502,060 | | | | 5,679,740 | | | | (21,456,186 | ) | | | 159,132,800 | |
| | | | | | | | | | | | | | | | | | | | | | |
| | 509,591,081 | | | | 967,065,956 | | | | 7,858,312 | | | | 7,456,717 | | | | 117,205,192 | | | | 257,261,469 | |
| | | | | | | | | | | | | | | | | | | | | | |
| | | | | | | | | | | | | | | | | | | | | | |
| | | | | | | | | | | | | | | | | | | | | | |
| | (12,394,334 | ) | | | (16,441,713 | ) | | | — | | | | (44,731 | ) | | | (13,621,324 | ) | | | (8,135,227 | ) |
| | (24,280,948 | ) | | | (26,011,984 | ) | | | (21,488 | ) | | | (2,691 | ) | | | (26,859,558 | ) | | | (15,660,122 | ) |
| | (34,093 | ) | | | (54,774 | ) | | | — | | | | — | | | | — | | | | — | |
| | | | | | | | | | | | | | | | | | | | | | |
| | (147,918,291 | ) | | | (127,477,429 | ) | | | (786,608 | ) | | | (25,121 | ) | | | (26,590,807 | ) | | | (12,882,031 | ) |
| | (202,241,647 | ) | | | (157,688,991 | ) | | | (844,736 | ) | | | (682 | ) | | | (45,069,967 | ) | | | (21,478,515 | ) |
| | (700,844 | ) | | | (604,214 | ) | | | — | | | | — | | | | — | | | | — | |
| | | | | | | | | | | | | | | | | | | | | | |
| | (387,570,157 | ) | | | (328,279,105 | ) | | | (1,652,832 | ) | | | (73,225 | ) | | | (112,141,656 | ) | | | (58,155,895 | ) |
| | | | | | | | | | | | | | | | | | | | | | |
| | | | | | | | | | | | | | | | | | | | | | |
| | | | | | | | | | | | | | | | | | | | | | |
| | 215,113,264 | | | | 404,653,774 | | | | 3,394,402 | | | | 4,026,762 | | | | 62,653,200 | | | | 65,379,486 | |
| | 694,385,708 | | | | 843,422,410 | | | | 3,934,241 | | | | 30,561,715 | | | | 134,042,328 | | | | 198,076,860 | |
| | 1,218,147 | | | | 2,159,268 | | | | — | | | | — | | | | — | | | | — | |
| | | | | | | | | | | | | | | | | | | | | | |
| | 156,933,268 | | | | 140,514,488 | | | | 725,967 | | | | 68,008 | | | | 39,949,265 | | | | 20,850,811 | |
| | 167,592,670 | | | | 139,367,182 | | | | 864,408 | | | | 3,373 | | | | 46,719,016 | | | | 26,813,238 | |
| | 580,629 | | | | 504,660 | | | | — | | | | — | | | | — | | | | — | |
| | | | | | | | | | | | | | | | | | | | | | |
| | (1,264,451,943 | ) | | | (539,421,701 | ) | | | (7,815,171 | ) | | | (4,531,450 | ) | | | (202,510,406 | ) | | | (48,451,006 | ) |
| | (1,188,092,282 | ) | | | (715,137,195 | ) | | | (12,264,931 | ) | | | (4,383,850 | ) | | | (176,646,519 | ) | | | (156,995,806 | ) |
| | (4,429,165 | ) | | | (2,631,942 | ) | | | — | | | | — | | | | — | | | | — | |
| | | | | | | | | | | | | | | | | | | | | | |
|
(1,221,149,704 |
) | | | 273,430,944 | | | | (11,161,084 | ) | | | 25,744,558 | | | | (95,793,116 | ) | | | 105,673,583 | |
| | | | | | | | | | | | | | | | | | | | | | |
| | (1,099,128,780 | ) | | | 912,217,795 | | | | (4,955,604 | ) | | | 33,128,050 | | | | (90,729,580 | ) | | | 304,779,157 | |
| | | | | | | | | | | | | | | | | | | | | | |
| $ | 4,136,667,896 | | | $ | 5,235,796,676 | | | $ | 50,721,423 | | | $ | 55,677,027 | | | $ | 1,138,258,945 | | | $ | 1,228,988,525 | |
| | | | | | | | | | | | | | | | | | | | | | |
$ | 13,249,668 | | | $ | 29,594,965 | | | $ | — | | | $ | 14,401 | | | $ | (1,086,948 | ) | | $ | (30,952 | ) |
| | | | | | | | | | | | | | | | | | | | | | |
See accompanying Notes to Financial Statements.
| | |
| |
| | |
| |
| Statements of Changes in Net Assets – continued | | |
| | | | | | | | | | | | | | | | |
| | |
| | | River Road Dividend
All Cap Value Fund II | | | Fairpointe Mid Cap Fund | |
| | | Year Ended October 31, | | | Year Ended October 31, | |
| | | 2014 | | | 2013 | | | 2014 | | | 2013 | |
| | | | | | | | | | | | | | | | |
NET ASSETS at Beginning of Period | | $ | 89,873,662 | | | $ | 10,419,240 | | | $ | 4,892,248,060 | | | $ | 3,025,731,632 | |
| | | | | | | | | | | | | | | | |
Increase in net assets from operations: | | | | | | | | | | | | | | | | |
Net investment income (loss) | | | 3,295,012 | | | | 959,154 | | | | 890,017 | | | | 21,074,863 | |
Net realized gain on investments | | | 4,129,826 | | | | 1,009,469 | | | | 1,049,016,350 | | | | 458,514,910 | |
Net change in unrealized appreciation (depreciation) on investments | | | 4,067,038 | | | | 9,272,582 | | | | (389,789,424 | ) | | | 865,571,634 | |
| | | | | | | | | | | | | | | | |
Net increase in net assets from operations | | | 11,491,876 | | | | 11,241,205 | | | | 660,116,943 | | | | 1,345,161,407 | |
| | | | | | | | | | | | | | | | |
Distributions to shareholders from: | | | | | | | | | | | | | | | | |
Net investment income: | | | | | | | | | | | | | | | | |
Class N | | | (173,767 | ) | | | (39,408 | ) | | | — | | | | (14,340,582 | ) |
Class I | | | (3,298,001 | ) | | | (923,962 | ) | | | (3,375,463 | ) | | | (17,097,297 | ) |
Net realized gain on investments: | | | | | | | | | | | | | | | | |
Class N | | | (43,196 | ) | | | (484 | ) | | | (223,568,950 | ) | | | (34,919,881 | ) |
Class I | | | (981,977 | ) | | | (6,506 | ) | | | (234,479,219 | ) | | | (32,705,189 | ) |
| | | | | | | | | | | | | | | | |
Total distributions | | | (4,496,941 | ) | | | (970,360 | ) | | | (461,423,632 | ) | | | (99,062,949 | ) |
| | | | | | | | | | | | | | | | |
Capital share transactions: | | | | | | | | | | | | | | | | |
Proceeds from sales of shares: | | | | | | | | | | | | | | | | |
Class N | | | 3,999,728 | | | | 2,923,816 | | | | 611,134,453 | | | | 718,022,853 | |
Class I | | | 41,902,478 | | | | 70,639,727 | | | | 1,427,015,336 | | | | 934,002,570 | |
Proceeds from reinvestment of distributions: | | | | | | | | | | | | | | | | |
Class N | | | 215,899 | | | | 39,064 | | | | 215,069,467 | | | | 47,067,455 | |
Class I | | | 3,879,481 | | | | 826,079 | | | | 170,521,263 | | | | 34,143,433 | |
Cost of shares redeemed: | | | | | | | | | | | | | | | | |
Class N | | | (1,213,066 | ) | | | (807,796 | ) | | | (850,386,062 | ) | | | (578,805,723 | ) |
Class I | | | (12,956,164 | ) | | | (4,437,313 | ) | | | (700,366,618 | ) | | | (534,012,618 | ) |
Issued due to merger: (a) | | | | | | | | | | | | | | | | |
Class N | | | — | | | | — | | | | — | | | | — | |
Class I | | | — | | | | — | | | | — | | | | — | |
| | | | | | | | | | | | | | | | |
Net increase (decrease) from capital share transactions | | | 35,828,356 | | | | 69,183,577 | | | | 872,987,839 | | | | 620,417,970 | |
| | | | | | | | | | | | | | | | |
Total increase (decrease) in net assets | | | 42,823,291 | | | | 79,454,422 | | | | 1,071,681,150 | | | | 1,866,516,428 | |
| | | | | | | | | | | | | | | | |
NET ASSETS at End of Period | | $ | 132,696,953 | | | $ | 89,873,662 | | | $ | 5,963,929,210 | | | $ | 4,892,248,060 | |
| | | | | | | | | | | | | | | | |
Undistributed (distributions in excess of) net investment income (loss) | | $ | (73,053 | ) | | $ | 20,099 | | | $ | — | | | $ | 1,616,865 | |
| | | | | | | | | | | | | | | | |
| (a) | Effective April 22, 2013, the LMCG Small Cap Growth Fund received capital shares of the corresponding classes of Aston Small Cap Fund as part of the merger of the Aston Small Cap Fund with, and into, the LMCG Small Cap Growth Fund, in a complete liquidation and termination of the Aston Small Cap Fund. |
| (b) | River Road Independent Value Fund had a subscription-in-kind in the amount of $597,548 on March 27, 2013. The subscription was comprised of securities, cash and dividends accrued in the amounts of $258,478, $338,808, and $262, respectively. |
See accompanying Notes to Financial Statements.
| | | | | | | | | | | | | | | | | | | | | | |
| | |
Montag & Caldwell
Mid Cap Growth Fund | | | LMCG Small Cap
Growth Fund | | | River Road
Independent Value Fund | |
Year Ended October 31, | | | Year Ended October 31, | | | Year Ended October 31, | |
| 2014 | | | 2013 | | | 2014 | | | 2013 | | | 2014 | | | 2013 | |
| | | | | | | | | | | | | | | | | | | | | | |
| $ | 11,402,187 | | | $ | 7,368,950 | | | $ | 40,540,640 | | | $ | 6,413,230 | | | $ | 725,355,861 | | | $ | 700,649,463 | |
| | | | | | | | | | | | | | | | | | | | | | |
| | | | | | | | | | | | | | | | | | | | | | |
| | (63,632 | ) | | | (71,220 | ) | | | (350,017 | ) | | | 14,671 | | | | (6,388,141 | ) | | | (3,289,548 | ) |
| | 797,891 | | | | 1,788,900 | | | | 3,358,983 | | | | 5,887,360 | | | | 37,973,231 | | | | 32,206,753 | |
|
320,711 |
| | | 893,311 | | | | 3,429,213 | | | | 1,825,778 | | | | (38,109,822 | ) | | | 16,741,054 | |
| | | | | | | | | | | | | | | | | | | | | | |
| | 1,054,970 | | | | 2,610,991 | | | | 6,438,179 | | | | 7,727,809 | | | | (6,524,732 | ) | | | 45,658,259 | |
| | | | | | | | | | | | | | | | | | | | | | |
| | | | | | | | | | | | | | | | | | | | | | |
| | | | | | | | | | | | | | | | | | | | | | |
| | — | | | | — | | | | — | | | | — | | | | — | | | | — | |
| | — | | | | — | | | | (14,282 | ) | | | — | | | | — | | | | — | |
| | | | | | | | | | | | | | | | | | | | | | |
| | (1,708,527 | ) | | | (92,399 | ) | | | (4,374,487 | ) | | | (425,537 | ) | | | (13,027,499 | ) | | | (20,379,878 | ) |
| | — | | | | — | | | | (1,139,027 | ) | | | (58,662 | ) | | | (15,234,387 | ) | | | (19,173,208 | ) |
| | | | | | | | | | | | | | | | | | | | | | |
| | (1,708,527 | ) | | | (92,399 | ) | | | (5,527,796 | ) | | | (484,199 | ) | | | (28,261,886 | ) | | | (39,553,086 | ) |
| | | | | | | | | | | | | | | | | | | | | | |
| | | | | | | | | | | | | | | | | | | | | | |
| | | | | | | | | | | | | | | | | | | | | | |
| | 411,838 | | | | 6,618,730 | | | | 8,647,070 | | | | 5,855,202 | | | | 74,910,227 | | | | 134,123,913 | |
| | 3,668,445 | | | | — | | | | 9,672,810 | | | | 6,748,727 | | | | 154,544,987 | | | | 133,619,629 | (b) |
| | | | | | | | | | | | | | | | | | | | | | |
| | 1,673,347 | | | | 81,176 | | | | 4,189,554 | | | | 425,537 | | | | 12,978,719 | | | | 20,310,806 | |
| | — | | | | — | | | | 1,140,513 | | | | 58,662 | | | | 14,687,638 | | | | 18,660,298 | |
| | | | | | | | | | | | | | | | | | | | | | |
| | (5,001,822 | ) | | | (5,185,261 | ) | | | (8,150,286 | ) | | | (4,777,656 | ) | | | (125,071,162 | ) | | | (178,942,382 | ) |
| | (173 | ) | | | — | | | | (4,769,547 | ) | | | (1,271,372 | ) | | | (155,381,650 | ) | | | (109,171,039 | ) |
| | | | | | | | | | | | | | | | | | | | | | |
| | — | | | | — | | | | — | | | | 18,799,852 | | | | — | | | | — | |
| | — | | | | — | | | | — | | | | 1,044,848 | | | | — | | | | — | |
| | | | | | | | | | | | | | | | | | | | | | |
| 751,635 | | | | 1,514,645 | | | | 10,730,114 | | | | 26,883,800 | | | | (23,331,241 | ) | | | 18,601,225 | |
| | | | | | | | | | | | | | | | | | | | | | |
| | 98,078 | | | | 4,033,237 | | | | 11,640,497 | | | | 34,127,410 | | | | (58,117,859 | ) | | | 24,706,398 | |
| | | | | | | | | | | | | | | | | | | | | | |
| $ | 11,500,265 | | | $ | 11,402,187 | | | $ | 52,181,137 | | | $ | 40,540,640 | | | $ | 667,238,002 | | | $ | 725,355,861 | |
| | | | | | | | | | | | | | | | | | | | | | |
$ | — | | | $ | — | | | $ | (4,379 | ) | | $ | 9,496 | | | $ | (36,937 | ) | | $ | (40,199 | ) |
| | | | | | | | | | | | | | | | | | | | | | |
See accompanying Notes to Financial Statements.
| | |
| |
| | |
| |
| Statements of Changes in Net Assets – continued | | |
| | | | | | | | | | | | | | | | |
| | |
| | | River Road
Select Value Fund | | | River Road
Small Cap Value Fund | |
| | | Year Ended October 31, | | | Year Ended October 31, | |
| | | 2014 | | | 2013 | | | 2014 | | | 2013 | |
| | | | | | | | | | | | | | | | |
NET ASSETS at Beginning of Period | | $ | 217,318,502 | | | $ | 162,779,864 | | | $ | 309,597,171 | | | $ | 289,229,188 | |
| | | | | | | | | | | | | | | | |
Increase (decrease) in net assets from operations: | | | | | | | | | | | | | | | | |
Net investment income (loss) | | | (270,098 | ) | | | 1,930,612 | | | | (163,580 | ) | | | 3,915,268 | |
Net realized gain (loss) on investments and affiliated investments | | | 30,115,873 | | | | 31,063,046 | | | | 48,359,630 | | | | 66,663,383 | |
Net change in unrealized appreciation (depreciation) on investments and affiliated investments | | | (29,790,084 | ) | | | 16,377,768 | | | | (46,163,511 | ) | | | 17,066,486 | |
| | | | | | | | | | | | | | | | |
Net increase (decrease) in net assets from operations | | | 55,691 | | | | 49,371,426 | | | | 2,032,539 | | | | 87,645,137 | |
| | | | | | | | | | | | | | | | |
Distributions to shareholders from: | | | | | | | | | | | | | | | | |
Net investment income: | | | | | | | | | | | | | | | | |
Class N | | | (30,707 | ) | | | (95,581 | ) | | | (125,993 | ) | | | (768,062 | ) |
Class I | | | (702,476 | ) | | | (2,552,798 | ) | | | (1,180,379 | ) | | | (4,548,794 | ) |
Net realized gain on investments: | | | | | | | | | | | | | | | | |
Class N | | | (2,748,770 | ) | | | (391,684 | ) | | | (12,061,338 | ) | | | (1,497,083 | ) |
Class I | | | (28,381,897 | ) | | | (8,873,103 | ) | | | (54,042,337 | ) | | | (7,569,096 | ) |
| | | | | | | | | | | | | | | | |
Total distributions | | | (31,863,850 | ) | | | (11,913,166 | ) | | | (67,410,047 | ) | | | (14,383,035 | ) |
| | | | | | | | | | | | | | | | |
Capital share transactions: | | | | | | | | | | | | | | | | |
Proceeds from sales of shares: | | | | | | | | | | | | | | | | |
Class N | | | 1,992,585 | | | | 14,915,498 | | | | 10,064,979 | | | | 8,370,448 | |
Class I | | | 29,881,645 | | | | 56,912,818 | | | | 87,864,652 | | | | 61,492,823 | |
Proceeds from reinvestment of distributions: | | | | | | | | | | | | | | | | |
Class N | | | 2,654,598 | | | | 459,196 | | | | 12,142,608 | | | | 2,244,845 | |
Class I | | | 28,799,580 | | | | 10,087,922 | | | | 55,057,909 | | | | 12,089,609 | |
Cost of shares redeemed: | | | | | | | | | | | | | | | | |
Class N | | | (12,614,171 | ) | | | (5,019,206 | ) | | | (17,845,889 | ) | | | (15,330,517 | ) |
Class I | | | (51,670,604 | ) | | | (60,275,850 | ) | | | (92,282,585 | ) | | | (121,761,327 | ) |
| | | | | | | | | | | | | | | | |
Net increase (decrease) from capital share transactions | | | (956,367 | ) | | | 17,080,378 | | | | 55,001,674 | | | | (52,894,119 | ) |
| | | | | | | | | | | | | | | | |
Total increase (decrease) in net assets | | | (32,764,526 | ) | | | 54,538,638 | | | | (10,375,834 | ) | | | 20,367,983 | |
| | | | | | | | | | | | | | | | |
NET ASSETS at End of Period | | $ | 184,553,976 | | | $ | 217,318,502 | | | $ | 299,221,337 | | | $ | 309,597,171 | |
| | | | | | | | | | | | | | | | |
Undistributed (distributions in excess of) net investment income (loss) | | $ | — | | | $ | (290,213 | ) | | $ | — | | | $ | (136,215 | ) |
| | | | | | | | | | | | | | | | |
| (a) | TAMRO Small Cap Fund had a subscription-in-kind in the amount of $2,677,538 on April 25, 2013. The subscription was comprised of securities, cash and dividends accrued in the amounts of $2,657,373, $19,712 and $453, respectively. |
| (b) | TAMRO Small Cap Fund had a redemption-in-kind in the amount of $52,573,290 on January 15, 2013. The redemption was comprised of securities and cash in the amounts of $51,794,423 and $778,867, respectively. |
See accompanying Notes to Financial Statements.
| | | | | | | | | | | | | | | | | | | | | | |
| | |
Silvercrest
Small Cap Fund | | | TAMRO
Small Cap Fund | | | DoubleLine Core Plus
Fixed Income Fund | |
Year Ended October 31, | | | Year Ended October 31, | | | Year Ended October 31, | |
| 2014 | | | 2013 | | | 2014 | | | 2013 | | | 2014 | | | 2013 | |
| | | | | | | | | | | | | | | | | | | | | | |
| $ | 33,267,442 | | | $ | 5,711,567 | | | $ | 1,325,799,376 | | | $ | 1,024,788,083 | | | $ | 176,385,864 | | | $ | 176,881,578 | |
| | | | | | | | | | | | | | | | | | | | | | |
| | | | | | | | | | | | | | | | | | | | | | |
| | 135,005 | | | | 46,230 | | | | (4,876,541 | ) | | | (56,283 | ) | | | 5,528,276 | | | | 6,027,184 | |
| | | | | |
| | 1,540,966 | | | | 1,218,605 | | | | 116,264,947 | | | | 124,824,787 | | | | (860,472 | ) | | | (2,244,975 | ) |
| | | | | |
| | 2,445,591 | | | | 4,409,811 | | | | (117,572,672 | ) | | | 169,676,168 | | | | 3,161,286 | | | | (5,562,851 | ) |
| | | | | | | | | | | | | | | | | | | | | | |
| | | | | |
| | 4,121,562 | | | | 5,674,646 | | | | (6,184,266 | ) | | | 294,444,672 | | | | 7,829,090 | | | | (1,780,642 | ) |
| | | | | | | | | | | | | | | | | | | | | | |
| | | | | | | | | | | | | | | | | | | | | | |
| | | | | | | | | | | | | | | | | | | | | | |
| | (229 | ) | | | (9,878 | ) | | | — | | | | — | | | | (1,658,186 | ) | | | (2,744,975 | ) |
| | (56,178 | ) | | | (78,421 | ) | | | — | | | | — | | | | (4,001,526 | ) | | | (4,353,733 | ) |
| | | | | | | | | | | | | | | | | | | | | | |
| | (146,801 | ) | | | (2,878 | ) | | | (47,504,176 | ) | | | (36,352,900 | ) | | | — | | | | (491,620 | ) |
| | (1,082,382 | ) | | | (19,730 | ) | | | (68,914,775 | ) | | | (59,453,402 | ) | | | — | | | | (597,665 | ) |
| | | | | | | | | | | | | | | | | | | | | | |
| | (1,285,590 | ) | | | (110,907 | ) | | | (116,418,951 | ) | | | (95,806,302 | ) | | | (5,659,712 | ) | | | (8,187,993 | ) |
| | | | | | | | | | | | | | | | | | | | | | |
| | | | | | | | | | | | | | | | | | | | | | |
| | | | | | | | | | | | | | | | | | | | | | |
| | 4,648,830 | | | | 4,010,938 | | | | 48,233,449 | | | | 146,473,113 | | | | 23,358,553 | | | | 53,008,348 | |
| | 34,184,068 | | | | 20,994,880 | | | | 124,353,293 | | | | 191,669,363 | (a) | | | 109,666,232 | | | | 60,045,064 | |
| | | | | | | | | | | | | | | | | | | | | | |
| | 147,030 | | | | 12,756 | | | | 44,495,639 | | | | 35,759,291 | | | | 1,513,332 | | | | 3,178,568 | |
| | 1,138,560 | | | | 98,151 | | | | 55,420,970 | | | | 43,230,709 | | | | 3,409,741 | | | | 4,306,487 | |
| | | | | | | | | | | | | | | | | | | | | | |
| | (2,442,586 | ) | | | (1,427,987 | ) | | | (211,736,661 | ) | | | (117,639,649 | ) | | | (42,728,442 | ) | | | (57,207,650 | ) |
| | (4,891,182 | ) | | | (1,696,602 | ) | | | (428,094,093 | ) | | | (197,119,904 | )(b) | | | (66,429,034 | ) | | | (53,857,896 | ) |
| | | | | | | | | | | | | | | | | | | | | | |
| | | | | |
| | 32,784,720 | | | | 21,992,136 | | | | (367,327,403 | ) | | | 102,372,923 | | | | 28,790,382 | | | | 9,472,921 | |
| | | | | | | | | | | | | | | | | | | | | | |
| | 35,620,692 | | | | 27,555,875 | | | | (489,930,620 | ) | | | 301,011,293 | | | | 30,959,760 | | | | (495,714 | ) |
| | | | | | | �� | | | | | | | | | | | | | | | |
| $ | 68,888,134 | | | $ | 33,267,442 | | | $ | 835,868,756 | | | $ | 1,325,799,376 | | | $ | 207,345,624 | | | $ | 176,385,864 | |
| | | | | | | | | | | | | | | | | | | | | | |
| | | | | |
| $ | 77,751 | | | $ | (847 | ) | | $ | (4,567,670 | ) | | $ | (56,283 | ) | | $ | (376,971 | ) | | $ | (583,993 | ) |
| | | | | | | | | | | | | | | | | | | | | | |
See accompanying Notes to Financial Statements.
| | |
| |
| | |
| |
| Statements of Changes in Net Assets – continued | | |
| | | | | | | | | | | | | | | | |
| | |
| | | TCH Fixed Income Fund | | | Anchor Capital
Enhanced Equity Fund | |
| | | Year Ended October 31, | | | Year Ended October 31, | |
| | | 2014 | | | 2013 | | | 2014 | | | 2013 | |
| | | | | | | | | | | | | | | | |
NET ASSETS at Beginning of Period | | $ | 54,512,660 | | | $ | 70,167,760 | | | $ | 159,761,924 | | | $ | 177,809,320 | |
| | | | | | | | | | | | | | | | |
Increase (decrease) in net assets from operations: | | | | | | | | | | | | | | | | |
Net investment income (loss) | | | 1,750,503 | | | | 2,419,293 | | | | 3,494,860 | | | | 3,514,668 | |
Net realized gain (loss) on investments,
purchased options, written options, capital gains distributions, securities sold short and foreign currency transactions | | | 937,543 | | | | 1,655,009 | | | | (487,554 | ) | | | (786,086 | ) |
Net change in unrealized appreciation (depreciation)
on investments, purchased options, written options, securities sold short and translation of assets and liabilities denominated in foreign currency | | | 153,019 | | | | (4,215,928 | ) | | | 2,733,967 | | | | 14,675,574 | |
| | | | | | | | | | | | | | | | |
Net increase (decrease) in net assets from
operations | | | 2,841,065 | | | | (141,626 | ) | | | 5,741,273 | | | | 17,404,156 | |
| | | | | | | | | | | | | | | | |
Distributions to shareholders from: | | | | | | | | | | | | | | | | |
Net investment income: | | | | | | | | | | | | | | | | |
Class N | | | (1,513,765 | ) | | | (2,291,411 | ) | | | (1,760,434 | ) | | | (2,040,791 | ) |
Class I | | | (444,550 | ) | | | (422,043 | ) | | | (1,547,989 | ) | | | (1,460,057 | ) |
Net realized gain on investments: | | | | | | | | | | | | | | | | |
Class N | | | — | | | | — | | | | — | | | | (1,672,759 | ) |
Class I | | | — | | | | — | | | | — | | | | (1,243,698 | ) |
| | | | | | | | | | | | | | | | |
Total distributions | | | (1,958,315 | ) | | | (2,713,454 | ) | | | (3,308,423 | ) | | | (6,417,305 | ) |
| | | | | | | | | | | | | | | | |
Capital share transactions: | | | | | | | | | | | | | | | | |
Proceeds from sales of shares: | | | | | | | | | | | | | | | | |
Class N | | | 5,903,056 | | | | 10,518,750 | | | | 35,023,834 | | | | 44,682,440 | |
Class I | | | 9,601,364 | | | | 1,280,566 | | | | 71,169,669 | | | | 35,763,522 | |
Proceeds from reinvestment of distributions: | | | | | | | | | | | | | | | | |
Class N | | | 1,435,599 | | | | 2,192,348 | | | | 1,731,451 | | | | 3,679,250 | |
Class I | | | 433,047 | | | | 381,111 | | | | 1,151,589 | | | | 1,901,112 | |
Cost of shares redeemed: | | | | | | | | | | | | | | | | |
Class N | | | (16,909,433 | ) | | | (24,265,442 | ) | | | (37,674,832 | ) | | | (59,806,848 | ) |
Class I | | | (3,710,063 | ) | | | (2,907,353 | ) | | | (22,631,936 | ) | | | (55,253,723 | ) |
Capital Contribution (Note G): | | | | | | | | | | | | | | | | |
Class N | | | — | | | | — | | | | — | | | | — | |
Class I | | | — | | | | — | | | | — | | | | — | |
| | | | | | | | | | | | | | | | |
Net increase (decrease) from capital share transactions | | | (3,246,430 | ) | | | (12,800,020 | ) | | | 48,769,775 | | | | (29,034,247 | ) |
| | | | | | | | | | | | | | | | |
Total increase (decrease) in net assets | | | (2,363,680 | ) | | | (15,655,100 | ) | | | 51,202,625 | | | | (18,047,396 | ) |
| | | | | | | | | | | | | | | | |
NET ASSETS at End of Period | | $ | 52,148,980 | | | $ | 54,512,660 | | | $ | 210,964,549 | | | $ | 159,761,924 | |
| | | | | | | | | | | | | | | | |
Undistributed (distributions in excess of)
net investment income (loss) | | $ | 101,428 | | | $ | 209,053 | | | $ | 327,869 | | | $ | 141,432 | |
| | | | | | | | | | | | | | | | |
See accompanying Notes to Financial Statements.
| | | | | | | | | | | | | | | | | | | | | | |
| | |
Lake Partners
LASSO Alternatives Fund | | | River Road
Long-Short Fund | | | Barings
International Fund | |
Year Ended October 31, | | | Year Ended October 31, | | | Year Ended October 31, | |
| 2014 | | | 2013 | | | 2014 | | | 2013 | | | 2014 | | | 2013 | |
| | | | | | | | | | | | | | | | | | | | | | |
| $ | 470,862,793 | | | $ | 287,061,601 | | | $ | 180,141,159 | | | $ | 7,506,387 | | | $ | 37,984,420 | | | $ | 62,083,656 | |
| | | | | | | | | | | | | | | | | | | | | | |
| | | | | | | | | | | | | | | | | | | | | | |
| | (1,496,938 | ) | | | 726,304 | | | | (3,311,713 | ) | | | (809,545 | ) | | | 619,600 | | | | 1,002,932 | |
|
18,553,737 |
| | | 10,013,103 | | | | 2,468,897 | | | | 5,513,861 | | | | 3,377,022 | | | | 2,555,143 | |
|
(448,365 |
) | | | 19,339,867 | | | | (8,658,331 | ) | | | 5,963,396 | | | | (4,350,016 | ) | | | 4,150,508 | |
| | | | | | | | | | | | | | | | | | | | | | |
|
16,608,434 |
| | | 30,079,274 | | | | (9,501,147 | ) | | | 10,667,712 | | | | (353,394 | ) | | | 7,708,583 | |
| | | | | | | | | | | | | | | | | | | | | | |
| | | | | | | | | | | | | | | | | | | | | | |
| | | | | | | | | | | | | | | | | | | | | | |
| | (378,809 | ) | | | (472,420 | ) | | | — | | | | — | | | | (10,891 | ) | | | (5,702 | ) |
| | (3,788,207 | ) | | | (3,732,874 | ) | | | — | | | | — | | | | (988,215 | ) | | | (986,921 | ) |
| | | | | | | | | | | | | | | | | | | | | | |
| | (186,666 | ) | | | — | | | | (2,911,026 | ) | | | (437,571 | ) | | | (28,909 | ) | | | (5,125 | ) |
| | (1,404,331 | ) | | | — | | | | (2,032,930 | ) | | | — | | | | (2,374,296 | ) | | | (754,174 | ) |
| | | | | | | | | | | | | | | | | | | | | | |
| | (5,758,013 | ) | | | (4,205,294 | ) | | | (4,943,956 | ) | | | (437,571 | ) | | | (3,402,311 | ) | | | (1,751,922 | ) |
| | | | | | | | | | | | | | | | | | | | | | |
| | | | | | | | | | | | | | | | | | | | | | |
| | | | | | | | | | | | | | | | | | | | | | |
| | 21,759,727 | | | | 54,094,179 | | | | 94,199,671 | | | | 110,536,773 | | | | 61,141 | | | | 17,634 | |
| | 136,099,370 | | | | 218,417,490 | | | | 106,897,007 | | | | 72,413,856 | | | | 5,876,501 | | | | 10,658,884 | |
| | | | | | | | | | | | | | | | | | | | | | |
| | 544,810 | | | | 452,219 | | | | 2,838,180 | | | | 437,571 | | | | 39,800 | | | | 10,574 | |
| | 4,429,761 | | | | 3,236,441 | | | | 1,960,122 | | | | — | | | | 3,362,511 | | | | 1,523,863 | |
| | | | | | | | | | | | | | | | | | | | | | |
| | (33,487,553 | ) | | | (36,923,554 | ) | | | (89,100,715 | ) | | | (16,146,675 | ) | | | (202,001 | ) | | | (30,668 | ) |
| | (89,517,183 | ) | | | (81,349,563 | ) | | | (63,079,700 | ) | | | (4,836,894 | ) | | | (21,776,364 | ) | | | (42,236,184 | ) |
| | | | | | | | | | | | | | | | | | | | | | |
| | 45 | | | | — | | | | — | | | | — | | | | — | | | | — | |
| | 469 | | | | — | | | | — | | | | — | | | | — | | | | — | |
| | | | | | | | | | | | | | | | | | | | | | |
| | 39,829,446 | | | | 157,927,212 | | | | 53,714,565 | | | | 162,404,631 | | | | (12,638,412 | ) | | | (30,055,897 | ) |
| | | | | | | | | | | | | | | | | | | | | | |
| | 50,679,867 | | | | 183,801,192 | | | | 39,269,462 | | | | 172,634,772 | | | | (16,394,117 | ) | | | (24,099,236 | ) |
| | | | | | | | | | | | | | | | | | | | | | |
| $ | 521,542,660 | | | $ | 470,862,793 | | | $ | 219,410,621 | | | $ | 180,141,159 | | | $ | 21,590,303 | | | $ | 37,984,420 | |
| | | | | | | | | | | | | | | | | | | | | | |
| | | | | |
| $ | (1,997,170 | ) | | $ | 210,610 | | | $ | (25,371 | ) | | $ | (27,513 | ) | | $ | 471,531 | | | $ | 997,891 | |
| | | | | | | | | | | | | | | | | | | | | | |
See accompanying Notes to Financial Statements.
| | |
| |
| | |
| |
| Statements of Changes in Net Assets – continued | | |
| | | | | | | | | | | | |
| | |
| | | Guardian
Capital Global
Dividend Fund | | | LMCG Emerging
Markets Fund | |
| | | Period Ended
October 31,
2014(a) | | | Year Ended
October 31,
2014 | | | Period Ended
October 31,
2013(b) | |
| | | |
| | | | | | | | | | | | |
NET ASSETS at Beginning of Period | | $ | — | | | $ | 3,981,658 | | | $ | — | |
| | | | | | | | | | | | |
Increase (decrease) in net assets from operations: | | | | | | | | | | | | |
Net investment income | | | 54,125 | | | | 53,625 | | | | 35,615 | |
Net realized gain (loss) on investments and foreign currency transactions | | | (34,774 | ) | | | (44,370 | ) | | | (241,096 | ) |
Net change in unrealized appreciation (depreciation) on
investments and translation of assets and
liabilities denominated in foreign currency | | | 234,146 | | | | 47,409 | | | | 89,513 | |
| | | | | | | | | | | | |
Net increase (decrease) in net assets from operations | | | 253,497 | | | | 56,664 | | | | (115,968 | ) |
| | | | | | | | | | | | |
Distributions to shareholders from: | | | | | | | | | | | | |
Net investment income: | | | | | | | | | | | | |
Class N | | | (10,791 | ) | | | (9,940 | ) | | | — | |
Class I | | | (35,829 | ) | | | (54,634 | ) | | | — | |
Net realized gain on investments: | | | | | | | | | | | | |
Class N | | | — | | | | — | | | | — | |
Class I | | | — | | | | — | | | | — | |
| | | | | | | | | | | | |
Total distributions | | | (46,620 | ) | | | (64,574 | ) | | | — | |
| | | | | | | | | | | | |
Capital share transactions: | | | | | | | | | | | | |
Proceeds from sales of shares: | | | | | | | | | | | | |
Class N | | | 1,001,103 | | | | 58,981 | | | | 697,622 | |
Class I | | | 3,029,962 | | | | 225,396 | | | | 3,400,004 | |
Proceeds from reinvestment of distributions: | | | | | | | | | | | | |
Class N | | | 1 | | | | 9,940 | | | | — | |
Class I | | | 25,081 | | | | 54,634 | | | | — | |
Cost of shares redeemed: | | | | | | | | | | | | |
Class N | | | — | | | | (12,775 | ) | | | — | |
Class I | | | — | | | | (396,898 | ) | | | — | |
Capital Contribution (Note G): | | | | | | | | | | | | |
Class N | | | — | | | | — | | | | — | |
Class I | | | — | | | | — | | | | — | |
| | | | | | | | | | | | |
Net increase (decrease) from capital share transactions | | | 4,056,147 | | | | (60,722 | ) | | | 4,097,626 | |
| | | | | | | | | | | | |
Total increase (decrease) in net assets | | | 4,263,024 | | | | (68,632 | ) | | | 3,981,658 | |
| | | | | | | | | | | | |
NET ASSETS at End of Period | | $ | 4,263,024 | | | $ | 3,913,026 | | | $ | 3,981,658 | |
| | | | | | | | | | | | |
Undistributed (distributions in excess of) net investment income (loss) | | $ | 16,335 | | | $ | 18,436 | | | $ | 40,296 | |
| | | | | | | | | | | | |
See accompanying Notes to Financial Statements.
| | | | | | | | | | | | | | | | | | |
| | |
Pictet
International Fund | | | Harrison Street
Real Estate Fund | | | Montag & Caldwell
Balanced Fund | |
Period Ended
October 31,
2014(c) | | | Year Ended October 31, | | | Year Ended October 31, | |
| | 2014 | | | 2013 | | | 2014 | | | 2013 | |
| | | | | | | | | | | | | | | | | | |
| $ | — | | | $ | 13,625,155 | | | $ | 10,546,604 | | | $ | 24,264,373 | | | $ | 33,466,255 | |
| | | | | | | | | | | | | | | | | | |
| | | | | | | | | | | | | | | | | | |
| | 100,895 | | | | 115,696 | | | | 186,826 | | | | 118,156 | | | | 257,113 | |
| | 47,967 | | | | 398,784 | | | | 1,055,690 | | | | 1,933,249 | | | | 2,639,428 | |
|
(800,613 |
) | | | 1,080,562 | | | | (505,953 | ) | | | (274,140 | ) | | | 325,469 | |
| | | | | | | | | | | | | | | | | | |
| | (651,751 | ) | | | 1,595,042 | | | | 736,563 | | | | 1,777,265 | | | | 3,222,010 | |
| | | | | | | | | | | | | | | | | | |
| | | | | | | | | | | | | | | | | | |
| | | | | | | | | | | | | | | | | | |
| | — | | | | (140,263 | ) | | | (162,129 | ) | | | (189,116 | ) | | | (342,684 | ) |
| | — | | | | (7,304 | ) | | | (2,875 | ) | | | (19,216 | ) | | | (24,117 | ) |
| | | | | | | | | | | | | | | | | | |
| | — | | | | — | | | | — | | | | (686,237 | ) | | | — | |
| | — | | | | — | | | | — | | | | (54,424 | ) | | | — | |
| | | | | | | | | | | | | | | | | | |
| | — | | | | (147,567 | ) | | | (165,004 | ) | | | (948,993 | ) | | | (366,801 | ) |
| | | | | | | | | | | | | | | | | | |
| | | | | | | | | | | | | | | | | | |
| | | | | | | | | | | | | | | | | | |
| | 1,052,710 | | | | 4,328,824 | | | | 10,524,296 | | | | 1,181,819 | | | | 2,507,724 | |
| | 9,050,010 | | | | 356,754 | | | | 375,294 | | | | 356,063 | | | | 150,496 | |
| | | | | | | | | | | | | | | | | | |
| | — | | | | 136,039 | | | | 153,598 | | | | 851,885 | | | | 333,389 | |
| | — | | | | 4,230 | | | | 1,904 | | | | 31,658 | | | | 10,537 | |
| | | | | | | | | | | | | | | | | | |
| | — | | | | (6,092,762 | ) | | | (8,524,363 | ) | | | (4,776,971 | ) | | | (14,627,334 | ) |
| | — | | | | (222,478 | ) | | | (23,833 | ) | | | (357,412 | ) | | | (431,903 | ) |
| | | | | | | | | | | | | | | | | | |
| | — | | | | — | | | | 93 | | | | — | | | | — | |
| | — | | | | — | | | | 3 | | | | — | | | | — | |
| | | | | | | | | | | | | | | | | | |
| | 10,102,720 | | | | (1,489,393 | ) | | | 2,506,992 | | | | (2,712,958 | ) | | | (12,057,091 | ) |
| | | | | | | | | | | | | | | | | | |
| | 9,450,969 | | | | (41,918 | ) | | | 3,078,551 | | | | (1,884,686 | ) | | | (9,201,882 | ) |
| | | | | | | | | | | | | | | | | | |
| $ | 9,450,969 | | | $ | 13,583,237 | | | $ | 13,625,155 | | | $ | 22,379,687 | | | $ | 24,264,373 | |
| | | | | | | | | | | | | | | | | | |
| $ | 102,611 | | | $ | 115,470 | | | $ | 147,489 | | | $ | (304,404 | ) | | $ | (229,961 | ) |
| | | | | | | | | | | | | | | | | | |
See accompanying Notes to Financial Statements.
| | |
| |
| ASTON/Cornerstone Large Cap Value Fund – Class N | | October 31, 2014 |
| |
| Financial Highlights | | |
| | | | | | | | | | | | | | | | | | | | |
| | | Year
Ended
10/31/14 | | | Year
Ended
10/31/13 | | | Year
Ended
10/31/12 | | | Year
Ended
10/31/11 | | | Year
Ended
10/31/10 | |
Net Asset Value, Beginning of Period | | $ | 13.74 | | | $ | 11.04 | | | $ | 10.04 | | | $ | 9.20 | | | $ | 8.31 | |
| | | | | | | | | | | | | | | | | | | | |
Income from Investment Operations: | | | | | | | | | | | | | | | | | | | | |
Net investment income | | | 0.11 | (a) | | | 0.09 | (a) | | | 0.10 | (a) | | | 0.12 | (a) | | | 0.13 | |
Net realized and unrealized gain on investments | | | 1.56 | | | | 2.72 | | | | 0.94 | | | | 0.83 | | | | 0.89 | |
| | | | | | | | | | | | | | | | | | | | |
Total from investment operations | | | 1.67 | | | | 2.81 | | | | 1.04 | | | | 0.95 | | | | 1.02 | |
| | | | | | | | | | | | | | | | | | | | |
Less Distributions: | | | | | | | | | | | | | | | | | | | | |
Distributions from and in excess of net investment income | | | (0.06 | ) | | | (0.11 | ) | | | (0.04 | ) | | | (0.11 | ) | | | (0.13 | ) |
| | | | | | | | | | | | | | | | | | | | |
Total distributions | | | (0.06 | ) | | | (0.11 | ) | | | (0.04 | ) | | | (0.11 | ) | | | (0.13 | ) |
| | | | | | | | | | | | | | | | | | | | |
Net increase in net asset value . | | | 1.61 | | | | 2.70 | | | | 1.00 | | | | 0.84 | | | | 0.89 | |
| | | | | | | | | | | | | | | | | | | | |
Net Asset Value, End of Period | | $ | 15.35 | | | $ | 13.74 | | | $ | 11.04 | | | $ | 10.04 | | | $ | 9.20 | |
| | | | | | | | | | | | | | | | | | | | |
Total Return (b) | | | 12.17 | % | | | 25.72 | % | | | 10.43 | % | | | 10.44 | % | | | 12.37 | % |
| | | | | |
Ratios/Supplemental Data: | | | | | | | | | | | | | | | | | | | | |
Net Assets, End of Period (in 000’s) | | $ | 60,683 | | | $ | 23,913 | | | $ | 21,105 | | | $ | 24,631 | | | $ | 19,984 | |
Ratios of expenses to average net assets: | | | | | | | | | | | | | | | | | | | | |
Before expense reimbursement and/or fee waiver by Adviser | | | 1.30 | % | | | 1.48 | % | | | 1.58 | % | | | 1.61 | % | | | 1.19 | %(d) |
After expense reimbursement and/or fee waiver by Adviser | | | 1.30 | % | | | 1.30 | % | | | 1.26 | %(c) | | | 1.14 | %(c) | | | 1.07 | %(d) |
Ratios of net investment income to average net assets: | | | | | | | | | | | | | | | | | | | | |
Before expense reimbursement and/or fee waiver by Adviser | | | 0.73 | % | | | 0.53 | % | | | 0.60 | % | | | 0.80 | % | | | 1.32 | % |
After expense reimbursement and/or fee waiver by Adviser | | | 0.73 | % | | | 0.71 | % | | | 0.92 | % | | | 1.27 | % | | | 1.44 | % |
Portfolio Turnover | | | 30.03 | % | | | 58.24 | % | | | 58.21 | % | | | 59.07 | %(e) | | | 37.44 | % |
| | (a) | The selected per share data was calculated using the weighted average shares outstanding method for the period. |
| | (b) | The total return is calculated using the Net Asset Value used for trading at the close of business at period end. |
| | (c) | Effective March 22, 2011, the Adviser changed the voluntary expense limitation from 1.07% to 1.19%. Subsequently, on February 29, 2012, the Adviser removed the voluntary expense limitation and replaced it with a contractual expense limitation of 1.30%. |
| | (d) | Ratios of expenses to average net assets include interest expense of less than 0.005% for the year ended October 31, 2010, which is not included in the contractual expense limitation. The interest expense is from utilizing the line of credit, as discussed in Note H to the Financial Statements. |
| | (e) | Portfolio turnover rate excludes securities delivered from processing a redemption-in-kind. |
See accompanying Notes to Financial Statements.
| | |
| |
| ASTON/Cornerstone Large Cap Value Fund – Class I | | October 31, 2014 |
| |
| Financial Highlights | | |
| | | | | | | | | | | | | | | | | | | | |
| | | Year
Ended
10/31/14 | | | Year
Ended
10/31/13 | | | Year
Ended
10/31/12 | | | Year
Ended
10/31/11 | | | Year
Ended
10/31/10 | |
Net Asset Value, Beginning of Period | | $ | 13.78 | | | $ | 11.07 | | | $ | 10.05 | | | $ | 9.19 | | | $ | 8.31 | |
| | | | | | | | | | | | | | | | | | | | |
Income from Investment Operations: | | | | | | | | | | | | | | | | | | | | |
Net investment income | | | 0.15 | (a) | | | 0.12 | (a) | | | 0.11 | (a) | | | 0.16 | (a) | | | 0.15 | |
Net realized and unrealized gain on investments | | | 1.54 | | | | 2.73 | | | | 0.96 | | | | 0.84 | | | | 0.88 | |
| | | | | | | | | | | | | | | | | | | | |
Total from investment operations | | | 1.69 | | | | 2.85 | | | | 1.07 | | | | 1.00 | | | | 1.03 | |
| | | | | | | | | | | | | | | | | | | | |
Less Distributions: | | | | | | | | | | | | | | | | | | | | |
Distributions from and in excess of net investment income | | | (0.09 | ) | | | (0.14 | ) | | | (0.05 | ) | | | (0.14 | ) | | | (0.15 | ) |
| | | | | | | | | | | | | | | | | | | | |
Total distributions | | | (0.09 | ) | | | (0.14 | ) | | | (0.05 | ) | | | (0.14 | ) | | | (0.15 | ) |
| | | | | | | | | | | | | | | | | | | | |
Net increase in net asset value . | | | 1.60 | | | | 2.71 | | | | 1.02 | | | | 0.86 | | | | 0.88 | |
| | | | | | | | | | | | | | | | | | | | |
Net Asset Value, End of Period | | $ | 15.38 | | | $ | 13.78 | | | $ | 11.07 | | | $ | 10.05 | | | $ | 9.19 | |
| | | | | | | | | | | | | | | | | | | | |
Total Return (b) | | | 12.33 | % | | | 26.08 | % | | | 10.66 | % | | | 10.95 | % | | | 12.53 | % |
| | | | | |
Ratios/Supplemental Data: | | | | | | | | | | | | | | | | | | | | |
Net Assets, End of Period (in 000’s) | | $ | 103,228 | | | $ | 38,735 | | | $ | 5,397 | | | $ | 126 | | | $ | 204,051 | |
Ratios of expenses to average net assets: | | | | | | | | | | | | | | | | | | | | |
Before expense reimbursement and/or fee waiver by Adviser | | | 1.05 | % | | | 1.23 | % | | | 1.33 | % | | | 1.36 | % | | | 0.94 | %(d) |
After expense reimbursement and/or fee waiver by Adviser | | | 1.05 | % | | | 1.05 | % | | | 1.01 | %(c) | | | 0.89 | %(c) | | | 0.82 | %(d) |
Ratios of net investment income to average net assets: | | | | | | | | | | | | | | | | | | | | |
Before expense reimbursement and/or fee waiver by Adviser | | | 0.98 | % | | | 0.78 | % | | | 0.85 | % | | | 1.05 | % | | | 1.57 | % |
After expense reimbursement and/or fee waiver by Adviser | | | 0.98 | % | | | 0.96 | % | | | 1.17 | % | | | 1.52 | % | | | 1.69 | % |
Portfolio Turnover | | | 30.03 | % | | | 58.24 | % | | | 58.21 | % | | | 59.07 | %(e) | | | 37.44 | % |
| | (a) | The selected per share data was calculated using the weighted average shares outstanding method for the period. |
| | (b) | The total return is calculated using the Net Asset Value used for trading at the close of business at period end. |
| | (c) | Effective March 22, 2011, the Adviser changed the voluntary expense limitation from 0.82% to 0.94%. Subsequently, on February 29, 2012, the Adviser removed the voluntary expense limitation and replaced it with a contractual expense limitation of 1.05%. |
| | (d) | Ratios of expense to average net assets included interest expense of less than 0.005% for the year ended October 31, 2010, which is not included in the contractual expense limitation. The interest expense is from utilizing the line of credit, as discussed in Note H to the Financial Statements. |
| | (e) | Portfolio turnover rate excludes securities delivered from processing a redemption-in-kind. |
See accompanying Notes to Financial Statements.
| | |
| |
| ASTON/Herndon Large Cap Value Fund – Class N | | October 31, 2014 |
| |
| Financial Highlights | | |
| | | | | | | | | | | | | | | | | | | | |
| | | Year
Ended
10/31/14 | | | Year
Ended
10/31/13 | | | Year
Ended
10/31/12 | | | Year
Ended
10/31/11 | | | Period
Ended
10/31/10(a) | |
Net Asset Value, Beginning of Period | | $ | 13.84 | | | $ | 11.73 | | | $ | 11.31 | | | $ | 10.39 | | | $ | 10.00 | |
| | | | | | | | | | | | | | | | | | | | |
Income from Investment Operations: | | | | | | | | | | | | | | | | | | | | |
Net investment income | | | 0.11 | (b) | | | 0.15 | (b) | | | 0.18 | (b) | | | 0.12 | (b) | | | 0.03 | |
Net realized and unrealized gain on investments | | | 1.49 | | | | 2.40 | | | | 0.91 | | | | 0.81 | | | | 0.36 | |
| | | | | | | | | | | | | | | | | | | | |
Total from investment operations | | | 1.60 | | | | 2.55 | | | | 1.09 | | | | 0.93 | | | | 0.39 | |
| | | | | | | | | | | | | | | | | | | | |
Less Distributions: | | | | | | | | | | | | | | | | | | | | |
Distributions from and in excess of net investment income | | | (0.10 | ) | | | (0.22 | ) | | | (0.11 | ) | | | (0.01 | ) | | | — | |
Distributions from net realized gain on investments | | | (0.26 | ) | | | (0.22 | ) | | | (0.56 | ) | | | — | | | | — | |
| | | | | | | | | | | | | | | | | | | | |
Total distributions | | | (0.36 | ) | | | (0.44 | ) | | | (0.67 | ) | | | (0.01 | ) | | | — | |
| | | | | | | | | | | | | | | | | | | | |
Net increase in net asset value | | | 1.24 | | | | 2.11 | | | | 0.42 | | | | 0.92 | | | | 0.39 | |
| | | | | | | | | | | | | | | | | | | | |
Net Asset Value, End of Period | | $ | 15.08 | | | $ | 13.84 | | | $ | 11.73 | | | $ | 11.31 | | | $ | 10.39 | |
| | | | | | | | | | | | | | | | | | | | |
Total Return (c) | | | 11.67 | % | | | 22.58 | % | | | 10.39 | % | | | 9.09 | % | | | 3.90 | %(d) |
| | | | | |
Ratios/Supplemental Data: | | | | | | | | | | | | | | | | | | | | |
Net Assets, End of Period (in 000’s) | | $ | 13,997 | | | $ | 41,861 | | | $ | 20,832 | | | $ | 6,089 | | | $ | 1,472 | |
Ratios of expenses to average net assets: | | | | | | | | | | | | | | | | | | | | |
Before expense reimbursement and/or fee waiver, or recoupment by Adviser | | | 1.23 | % | | | 1.27 | % | | | 1.41 | % | | | 2.38 | % | | | 13.84 | %(e) |
After expense reimbursement and/or fee waiver, or recoupment by Adviser | | | 1.30 | % | | | 1.30 | % | | | 1.30 | % | | | 1.30 | % | | | 1.30 | %(e) |
Ratios of net investment income (loss) to average net assets: | | | | | | | | | | | | | | | | | | | | |
Before expense reimbursement and/or fee waiver, or recoupment by Adviser | | | 0.84 | % | | | 1.24 | % | | | 1.44 | % | | | (0.05 | )% | | | (11.94 | )%(e) |
After expense reimbursement and/or fee waiver, or recoupment by Adviser | | | 0.77 | % | | | 1.21 | % | | | 1.55 | % | | | 1.03 | % | | | 0.60 | %(e) |
Portfolio Turnover | | | 75.46 | % | | | 69.51 | % | | | 80.56 | % | | | 189.70 | % | | | 38.64 | %(d) |
| | (a) | The inception date for the Herndon Large Cap Value Fund Class N shares is March 31, 2010. |
| | (b) | The selected per share data was calculated using the weighted average shares outstanding method for the period. |
| | (c) | The total return is calculated using the Net Asset Value used for trading at the close of business at period end. |
See accompanying Notes to Financial Statements.
| | |
| |
| ASTON/Herndon Large Cap Value Fund – Class I | | October 31, 2014 |
| |
| Financial Highlights | | |
| | | | | | | | | | | | | | | | |
| | | Year
Ended
10/31/14 | | | Year
Ended
10/31/13 | | | Year
Ended
10/31/12 | | | Period
Ended
10/31/11(a) | |
Net Asset Value, Beginning of Period | | $ | 13.87 | | | $ | 11.75 | | | $ | 11.33 | | | $ | 11.48 | |
| | | | | | | | | | | | | | | | |
Income from Investment Operations: | | | | | | | | | | | | | | | | |
Net investment income | | | 0.15 | (b) | | | 0.19 | (b) | | | 0.21 | (b) | | | 0.10 | (b) |
Net realized and unrealized gain (loss) on investments | | | 1.48 | | | | 2.39 | | | | 0.91 | | | | (0.25 | ) |
| | | | | | | | | | | | | | | | |
Total from investment operations | | | 1.63 | | | | 2.58 | | | | 1.12 | | | | (0.15 | ) |
| | | | | | | | | | | | | | | | |
Less Distributions: | | | | | | | | | | | | | | | | |
Distributions from and in excess of net investment income | | | (0.12 | ) | | | (0.24 | ) | | | (0.14 | ) | | | — | |
Distributions from net realized gain on investments | | | (0.26 | ) | | | (0.22 | ) | | | (0.56 | ) | | | — | |
| | | | | | | | | | | | | | | | |
Total distributions | | | (0.38 | ) | | | (0.46 | ) | | | (0.70 | ) | | | — | |
| | | | | | | | | | | | | | | | |
Net increase (decrease) in net asset value | | | 1.25 | | | | 2.12 | | | | 0.42 | | | | (0.15 | ) |
| | | | | | | | | | | | | | | | |
Net Asset Value, End of Period | | $ | 15.12 | | | $ | 13.87 | | | $ | 11.75 | | | $ | 11.33 | |
| | | | | | | | | | | | | | | | |
Total Return (c) | | | 11.94 | % | | | 22.94 | % | | | 10.69 | % | | | (1.31 | )%(d) |
| | | | |
Ratios/Supplemental Data: | | | | | | | | | | | | | | | | |
Net Assets, End of Period (in 000’s) | | $ | 139,448 | | | $ | 80,534 | | | $ | 34,575 | | | $ | 11,881 | |
Ratios of expenses to average net assets: | | | | | | | | | | | | | | | | |
Before expense reimbursement and/or fee waiver, or recoupment by Adviser | | | 0.98 | % | | | 1.02 | % | | | 1.16 | % | | | 2.13 | %(e) |
After expense reimbursement and/or fee waiver, or recoupment by Adviser | | | 1.05 | % | | | 1.05 | % | | | 1.05 | % | | | 1.05 | %(e) |
Ratios of net investment income to average net assets: | | | | | | | | | | | | | | | | |
Before expense reimbursement and/or fee waiver, or recoupment by Adviser | | | 1.09 | % | | | 1.49 | % | | | 1.69 | % | | | 0.20 | %(e) |
After expense reimbursement and/or fee waiver, or recoupment by Adviser | | | 1.02 | % | | | 1.46 | % | | | 1.80 | % | | | 1.28 | %(e) |
Portfolio Turnover | | | 75.46 | % | | | 69.51 | % | | | 80.56 | % | | | 189.70 | %(d) |
| | (a) | The inception date for the Herndon Large Cap Value Fund Class I shares is March 2, 2011. |
| | (b) | The selected per share data was calculated using the weighted average shares outstanding method for the period. |
| | (c) | The total return is calculated using the Net Asset Value used for trading at the close of business at period end. |
See accompanying Notes to Financial Statements.
| | |
| |
| ASTON/Montag & Caldwell Growth Fund – Class N | | October 31, 2014 |
| |
| Financial Highlights | | |
| | | | | | | | | | | | | | | | | | | | |
| | | Year
Ended
10/31/14 | | | Year
Ended
10/31/13 | | | Year
Ended
10/31/12 | | | Year
Ended
10/31/11 | | | Year
Ended
10/31/10 | |
Net Asset Value, Beginning of Period | | $ | 28.68 | | | $ | 25.31 | | | $ | 24.72 | | | $ | 22.92 | | | $ | 20.87 | |
| | | | | | | | | | | | | | | | | | | | |
Income from Investment Operations: | | | | | | | | | | | | | | | | | | | | |
Net investment income | | | 0.10 | (a) | | | 0.23 | (a) | | | 0.15 | (a) | | | 0.14 | (a) | | | 0.12 | (a) |
Net realized and unrealized gain on investments | | | 2.93 | | | | 5.07 | | | | 2.45 | | | | 1.83 | | | | 2.01 | (b) |
| | | | | | | | | | | | | | | | | | | | |
Total from investment operations | | | 3.03 | | | | 5.30 | | | | 2.60 | | | | 1.97 | | | | 2.13 | |
| | | | | | | | | | | | | | | | | | | | |
Less Distributions: | | | | | | | | | | | | | | | | | | | | |
Distributions from and in excess of net investment income | | | (0.16 | ) | | | (0.22 | ) | | | (0.13 | ) | | | (0.13 | ) | | | (0.08 | ) |
Distributions from net realized gain on investments | | | (1.96 | ) | | | (1.71 | ) | | | (1.88 | ) | | | (0.04 | ) | | | — | |
| | | | | | | | | | | | | | | | | | | | |
Total distributions | | | (2.12 | ) | | | (1.93 | ) | | | (2.01 | ) | | | (0.17 | ) | | | (0.08 | ) |
| | | | | | | | | | | | | | | | | | | | |
Net increase in net asset value | | | 0.91 | | | | 3.37 | | | | 0.59 | | | | 1.80 | | | | 2.05 | |
| | | | | | | | | | | | | | | | | | | | |
Net Asset Value, End of Period | | $ | 29.59 | | | $ | 28.68 | | | $ | 25.31 | | | $ | 24.72 | | | $ | 22.92 | |
| | | | | | | | | | | | | | | | | | | | |
Total Return (c) | | | 10.98 | % | | | 22.61 | % | | | 11.40 | % | | | 8.56 | % | | | 10.20 | % |
| | | | | |
Ratios/Supplemental Data: | | | | | | | | | | | | | | | | | | | | |
Net Assets, End of Period (in 000’s) | | $ | 1,344,317 | | | $ | 2,190,074 | | | $ | 1,908,663 | | | $ | 1,683,183 | | | $ | 1,506,075 | |
Ratios of expenses to average net assets: | | | | | | | | | | | | | | | | | | | | |
Before expense reimbursement and/or fee waiver by Adviser | | | 1.03 | % | | | 1.04 | % | | | 1.05 | % | | | 1.06 | % | | | 1.08 | %(d) |
After expense reimbursement and/or fee waiver by Adviser | | | 1.03 | % | | | 1.04 | % | | | 1.05 | % | | | 1.06 | % | | | 1.08 | %(d) |
Ratios of net investment income to average net assets: | | | | | | | | | | | | | | | | | | | | |
Before expense reimbursement and/or fee waiver by Adviser | | | 0.34 | % | | | 0.88 | % | | | 0.60 | % | | | 0.59 | % | | | 0.56 | % |
After expense reimbursement and/or fee waiver by Adviser | | | 0.34 | % | | | 0.88 | % | | | 0.60 | % | | | 0.59 | % | | | 0.56 | % |
Portfolio Turnover | | | 47.31 | % | | | 50.57 | % | | | 46.42 | % | | | 63.48 | % | | | 57.39 | %(e) |
| | (a) | The selected per share data was calculated using the weighted average shares outstanding method for the period. |
| | (b) | Includes payments by affiliates of less than $0.005 per share. |
| | (c) | The total return is calculated using the Net Asset Value used for trading at the close of business at period end. |
| | (d) | Ratios of expenses to average net assets include interest expense of less than 0.005% for the year ended October 31, 2010. The interest expense is from utilizing the line of credit as discussed in Note H to the Financial Statements. |
| | (e) | Portfolio turnover rate excludes securities received from a reorganization. |
See accompanying Notes to Financial Statements.
| | |
| |
| ASTON/Montag & Caldwell Growth Fund – Class I | | October 31, 2014 |
| |
| Financial Highlights | | |
| | | | | | | | | | | | | | | | | | | | |
| | | Year
Ended
10/31/14 | | | Year
Ended
10/31/13 | | | Year
Ended
10/31/12 | | | Year
Ended
10/31/11 | | | Year
Ended
10/31/10 | |
Net Asset Value, Beginning of Period | | $ | 28.87 | | | $ | 25.46 | | | $ | 24.85 | | | $ | 23.05 | | | $ | 20.97 | |
| | | | | | | | | | | | | | | | | | | | |
Income from Investment Operations: | | | | | | | | | | | | | | | | | | | | |
Net investment income | | | 0.17 | (a) | | | 0.30 | (a) | | | 0.21 | (a) | | | 0.21 | (a) | | | 0.18 | (a) |
Net realized and unrealized gain on investments | | | 2.96 | | | | 5.10 | | | | 2.47 | | | | 1.82 | | | | 2.02 | (b) |
| | | | | | | | | | | | | | | | | | | | |
Total from investment operations | | | 3.13 | | | | 5.40 | | | | 2.68 | | | | 2.03 | | | | 2.20 | |
| | | | | | | | | | | | | | | | | | | | |
Less Distributions: | | | | | | | | | | | | | | | | | | | | |
Distributions from and in excess of net investment income | | | (0.24 | ) | | | (0.28 | ) | | | (0.19 | ) | | | (0.19 | ) | | | (0.12 | ) |
Distributions from net realized gain on investments | | | (1.96 | ) | | | (1.71 | ) | | | (1.88 | ) | | | (0.04 | ) | | | — | |
| | | | | | | | | | | | | | | | | | | | |
Total distributions | | | (2.20 | ) | | | (1.99 | ) | | | (2.07 | ) | | | (0.23 | ) | | | (0.12 | ) |
| | | | | | | | | | | | | | | | | | | | |
Net increase in net asset value | | | 0.93 | | | | 3.41 | | | | 0.61 | | | | 1.80 | | | | 2.08 | |
| | | | | | | | | | | | | | | | | | | | |
Net Asset Value, End of Period | | $ | 29.80 | | | $ | 28.87 | | | $ | 25.46 | | | $ | 24.85 | | | $ | 23.05 | |
| | | | | | | | | | | | | | | | | | | | |
Total Return (c) | | | 11.26 | % | | | 22.95 | % | | | 11.67 | % | | | 8.82 | % | | | 10.49 | % |
| | | | | |
Ratios/Supplemental Data: | | | | | | | | | | | | | | | | | | | | |
Net Assets, End of Period (in 000’s) | | $ | 2,784,650 | | | $ | 3,035,623 | | | $ | 2,406,145 | | | $ | 1,749,183 | | | $ | 1,528,981 | |
Ratios of expenses to average net assets: | | | | | | | | | | | | | | | | | | | | |
Before expense reimbursement and/or fee waiver by Adviser | | | 0.78 | % | | | 0.79 | % | | | 0.80 | % | | | 0.81 | % | | | 0.83 | %(d) |
After expense reimbursement and/or fee waiver by Adviser | | | 0.78 | % | | | 0.79 | % | | | 0.80 | % | | | 0.81 | % | | | 0.83 | %(d) |
Ratios of net investment income to average net assets: | | | | | | | | | | | | | | | | | | | | |
Before expense reimbursement and/or fee waiver by Adviser | | | 0.59 | % | | | 1.13 | % | | | 0.85 | % | | | 0.84 | % | | | 0.81 | % |
After expense reimbursement and/or fee waiver by Adviser | | | 0.59 | % | | | 1.13 | % | | | 0.85 | % | | | 0.84 | % | | | 0.81 | % |
Portfolio Turnover | | | 47.31 | % | | | 50.57 | % | | | 46.42 | % | | | 63.48 | % | | | 57.39 | %(e) |
| | (a) | The selected per share data was calculated using the weighted average shares outstanding method for the period. |
| | (b) | Includes payments by affiliates of less than $0.005 per share. |
| | (c) | The total return is calculated using the Net Asset Value used for trading at the close of business at period end. |
| | (d) | Ratios of expenses to average net assets include interest expense of less than 0.005% for the year ended October 31, 2010. The interest expense is from utilizing the line of credit as discussed in Note H to the Financial Statements. |
| | (e) | Portfolio turnover rate excludes securities received from a reorganization. |
See accompanying Notes to Financial Statements.
| | |
| |
| ASTON/Montag & Caldwell Growth Fund – Class R | | October 31, 2014 |
| |
| Financial Highlights | | |
| | | | | | | | | | | | | | | | | | | | |
| | | Year
Ended
10/31/14 | | | Year
Ended
10/31/13 | | | Year
Ended
10/31/12 | | | Year
Ended
10/31/11 | | | Year
Ended
10/31/10 | |
Net Asset Value, Beginning of Period | | $ | 28.33 | | | $ | 25.02 | | | $ | 24.45 | | | $ | 22.70 | | | $ | 20.73 | |
| | | | | | | | | | | | | | | | | | | | |
Income from Investment Operations: | | | | | | | | | | | | | | | | | | | | |
Net investment income | | | 0.03 | (a) | | | 0.16 | (a) | | | 0.09 | (a) | | | 0.08 | (a) | | | 0.07 | (a) |
Net realized and unrealized gain on investments | | | 2.91 | | | | 5.01 | | | | 2.43 | | | | 1.80 | | | | 1.98 | (b) |
| | | | | | | | | | | | | | | | | | | | |
Total from investment operations | | | 2.94 | | | | 5.17 | | | | 2.52 | | | | 1.88 | | | | 2.05 | |
| | | | | | | | | | | | | | | | | | | | |
Less Distributions: | | | | | | | | | | | | | | | | | | | | |
Distributions from and in excess of net investment income | | | (0.10 | ) | | | (0.15 | ) | | | (0.07 | ) | | | (0.09 | ) | | | (0.08 | ) |
Distributions from net realized gain on investments | | | (1.96 | ) | | | (1.71 | ) | | | (1.88 | ) | | | (0.04 | ) | | | — | |
| | | | | | | | | | | | | | | | | | | | |
Total distributions | | | (2.06 | ) | | | (1.86 | ) | | | (1.95 | ) | | | (0.13 | ) | | | (0.08 | ) |
| | | | | | | | | | | | | | | | | | | | |
Net increase in net asset value . | | | 0.88 | | | | 3.31 | | | | 0.57 | | | | 1.75 | | | | 1.97 | |
| | | | | | | | | | | | | | | | | | | | |
Net Asset Value, End of Period | | $ | 29.21 | | | $ | 28.33 | | | $ | 25.02 | | | $ | 24.45 | | | $ | 22.70 | |
| | | | | | | | | | | | | | | | | | | | |
Total Return (c) | | | 10.74 | % | | | 22.30 | % | | | 11.10 | % | | | 8.29 | % | | | 9.90 | % |
| | | | | |
Ratios/Supplemental Data: | | | | | | | | | | | | | | | | | | | | |
Net Assets, End of Period (in 000’s) | | $ | 7,701 | | | $ | 10,099 | | | $ | 8,771 | | | $ | 8,654 | | | $ | 7,292 | |
Ratios of expenses to average net assets: | | | | | | | | | | | | | | | | | | | | |
Before expense reimbursement and/or fee waiver by Adviser | | | 1.28 | % | | | 1.29 | % | | | 1.30 | % | | | 1.31 | % | | | 1.33 | %(d) |
After expense reimbursement and/or fee waiver by Adviser | | | 1.28 | % | | | 1.29 | % | | | 1.30 | % | | | 1.31 | % | | | 1.33 | %(d) |
Ratios of net investment income to average net assets: | | | | | | | | | | | | | | | | | | | | |
Before expense reimbursement and/or fee waiver by Adviser | | | 0.09 | % | | | 0.63 | % | | | 0.35 | % | | | 0.34 | % | | | 0.31 | % |
After expense reimbursement and/or fee waiver by Adviser | | | 0.09 | % | | | 0.63 | % | | | 0.35 | % | | | 0.34 | % | | | 0.31 | % |
Portfolio Turnover | | | 47.31 | % | | | 50.57 | % | | | 46.42 | % | | | 63.48 | % | | | 57.39 | %(e) |
| | (a) | The selected per share data was calculated using the weighted average shares outstanding method for the period. |
| | (b) | Includes payments by affiliates of less than $0.005 per share. |
| | (c) | The total return is calculated using the Net Asset Value used for trading at the close of business at period end. |
| | (d) | Ratios of expenses to average net assets include interest expense of less than 0.005% for the year ended October 31, 2010. The interest expense is from utilizing the line of credit as discussed in Note H to the Financial Statements. |
| | (e) | Portfolio turnover rate excludes securities received from a reorganization. |
See accompanying Notes to Financial Statements.
| | |
| |
| ASTON/TAMRO Diversified Equity Fund – Class N | | October 31, 2014 |
| |
| Financial Highlights | | |
| | | | | | | | | | | | | | | | | | | | |
| | | Year
Ended
10/31/14 | | | Year
Ended
10/31/13 | | | Year
Ended
10/31/12 | | | Year
Ended
10/31/11 | | | Year
Ended
10/31/10 | |
Net Asset Value, Beginning of Period | | $ | 16.75 | | | $ | 13.52 | | | $ | 12.34 | | | $ | 11.83 | | | $ | 9.72 | |
| | | | | | | | | | | | | | | | | | | | |
Income from Investment Operations: | | | | | | | | | | | | | | | | | | | | |
Net investment income (loss) | | | (0.08 | ) | | | 0.01 | (a) | | | — | (b) | | | (0.02 | ) | | | — | (b) |
Net realized and unrealized gain on investments | | | 2.56 | | | | 3.27 | | | | 1.44 | | | | 0.53 | | | | 2.13 | |
| | | | | | | | | | | | | | | | | | | | |
Total from investment operations | | | 2.48 | | | | 3.28 | | | | 1.44 | | | | 0.51 | | | | 2.13 | |
| | | | | | | | | | | | | | | | | | | | |
Less Distributions: | | | | | | | | | | | | | | | | | | | | |
Distributions from and in excess of net investment income | | | — | | | | (0.03 | ) | | | — | | | | — | | | | (0.02 | ) |
Distributions from net realized gain on investments | | | (0.50 | ) | | | (0.02 | ) | | | (0.26 | ) | | | — | | | | — | |
| | | | | | | | | | | | | | | | | | | | |
Total distributions | | | (0.50 | ) | | | (0.05 | ) | | | (0.26 | ) | | | — | | | | (0.02 | ) |
| | | | | | | | | | | | | | | | | | | | |
Net increase in net asset value . | | | 1.98 | | | | 3.23 | | | | 1.18 | | | | 0.51 | | | | 2.11 | |
| | | | | | | | | | | | | | | | | | | | |
Net Asset Value, End of Period | | $ | 18.73 | | | $ | 16.75 | | | $ | 13.52 | | | $ | 12.34 | | | $ | 11.83 | |
| | | | | | | | | | | | | | | | | | | | |
Total Return (c) | | | 15.10 | % | | | 24.29 | % | | | 11.94 | % | | | 4.31 | % | | | 21.95 | % |
| | | | | |
Ratios/Supplemental Data: | | | | | | | | | | | | | | | | | | | | |
Net Assets, End of Period (in 000’s) | | $ | 26,022 | | | $ | 26,797 | | | $ | 21,980 | | | $ | 24,354 | | | $ | 15,670 | |
Ratios of expenses to average net assets: | | | | | | | | | | | | | | | | | | | | |
Before expense reimbursement and/or fee waiver by Adviser | | | 1.37 | % | | | 1.46 | % | | | 1.68 | %(d) | | | 1.62 | %(d) | | | 1.63 | % |
After expense reimbursement and/or fee waiver by Adviser | | | 1.20 | % | | | 1.20 | % | | | 1.20 | %(d) | | | 1.20 | %(d) | | | 1.20 | % |
Ratios of net investment income (loss) to average net assets: | | | | | | | | | | | | | | | | | | | | |
Before expense reimbursement and/or fee waiver by Adviser | | | (0.58 | )% | | | (0.19 | )% | | | (0.47 | )% | | | (0.63 | )% | | | (0.45 | )% |
After expense reimbursement and/or fee waiver by Adviser | | | (0.40 | )% | | | 0.07 | % | | | — | %(b) | | | (0.21 | )% | | | (0.02 | )% |
Portfolio Turnover | | | 40.41 | % | | | 79.61 | % | | | 52.56 | % | | | 65.96 | % | | | 81.75 | % |
| | (a) | The selected per share data was calculated using the weighted average shares outstanding method for the period. |
| | (b) | Represents less than $(0.005) per share or less than (0.005)%. |
| | (c) | The total return is calculated using the Net Asset Value used for trading at the close of business at period end. |
| | (d) | Ratios of expenses to average net assets include interest expense of less than 0.005% for each of the years ended October 31, 2012 and October 31, 2011, which are not included in the contractual expense limitation. The interest expense is from utilizing the line of credit as discussed in Note H to the Financial Statements. |
See accompanying Notes to Financial Statements.
| | |
| |
| ASTON/TAMRO Diversified Equity Fund – Class I | | October 31, 2014 |
| |
| Financial Highlights | | |
| | | | | | | | | | | | |
| | | Year
Ended
10/31/14 | | | Year
Ended
10/31/13 | | | Period
Ended
10/31/12(a) | |
Net Asset Value, Beginning of Period | | $ | 16.78 | | | $ | 13.55 | | | $ | 13.27 | |
| | | | | | | | | | | | |
Income from Investment Operations: | | | | | | | | | | | | |
Net investment income (loss) | | | (0.03 | ) | | | 0.05 | (b) | | | (0.05 | ) |
Net realized and unrealized gain on investments | | | 2.56 | | | | 3.26 | | | | 0.33 | |
| | | | | | | | | | | | |
Total from investment operations | | | 2.53 | | | | 3.31 | | | | 0.28 | |
| | | | | | | | | | | | |
Less Distributions: | | | | | | | | | | | | |
Distributions from and in excess of net investment income | | | (0.01 | ) | | | (0.06 | ) | | | — | |
Distributions from net realized gain on investments | | | (0.50 | ) | | | (0.02 | ) | | | — | |
| | | | | | | | | | | | |
Total Distributions | | | (0.51 | ) | | | (0.08 | ) | | | — | |
| | | | | | | | | | | | |
Net increase in net asset value | | | 2.02 | | | | 3.23 | | | | 0.28 | |
| | | | | | | | | | | | |
Net Asset Value, End of Period | | $ | 18.80 | | | $ | 16.78 | | | $ | 13.55 | |
| | | | | | | | | | | | |
Total Return (c) | | | 15.40 | % | | | 24.64 | % | | | 2.04 | %(d) |
| | | |
Ratios/Supplemental Data: | | | | | | | | | | | | |
Net Assets, End of Period (in 000’s) | | $ | 24,700 | | | $ | 28,880 | | | $ | 569 | |
Ratios of expenses to average net assets: | | | | | | | | | | | | |
Before expense reimbursement and/or fee waiver by Adviser | | | 1.12 | % | | | 1.21 | % | | | 1.45 | %(e)(f) |
After expense reimbursement and/or fee waiver by Adviser | | | 0.95 | % | | | 0.95 | % | | | 0.95 | %(e)(f) |
Ratios of net investment income (loss) to average net assets: | | | | | | | | | | | | |
Before expense reimbursement and/or fee waiver by Adviser | | | (0.33 | )% | | | 0.06 | % | | | (1.11 | )%(f) |
After expense reimbursement and/or fee waiver by Adviser | | | (0.15 | )% | | | 0.32 | % | | | (0.61 | )%(f) |
Portfolio Turnover | | | 40.41 | % | | | 79.61 | % | | | 52.56 | % |
| | (a) | The inception date for the TAMRO Diversified Equity Fund Class I shares is March 2, 2012. |
| | (b) | The selected per share data was calculated using the weighted average shares outstanding method for the period. |
| | (c) | The total return is calculated using the Net Asset Value used for trading at the close of business at period end. |
| | (e) | Ratios of expenses to average net assets include interest expense of less than 0.005% for the year ended October 31, 2012, which is not included in the contractual expense limitation. The interest expense is from utilizing the line of credit as discussed in Note H to the Financial Statements. |
See accompanying Notes to Financial Statements.
| | |
| |
| ASTON/River Road Dividend All Cap Value Fund – Class N | | October 31, 2014 |
| |
| Financial Highlights | | |
| | | | | | | | | | | | | | | | | | | | |
| | | Year
Ended
10/31/14 | | | Year
Ended
10/31/13 | | | Year
Ended
10/31/12 | | | Year
Ended
10/31/11 | | | Year
Ended
10/31/10 | |
Net Asset Value, Beginning of Period | | $ | 13.99 | | | $ | 11.67 | | | $ | 10.68 | | | $ | 10.23 | | | $ | 8.58 | |
| | | | | | | | | | | | | | | | | | | | |
Income from Investment Operations: | | | | | | | | | | | | | | | | | | | | |
Net investment income | | | 0.42 | | | | 0.30 | | | | 0.31 | (a) | | | 0.29 | (a) | | | 0.26 | (a) |
Net realized and unrealized gain on investments | | | 0.89 | | | | 2.73 | | | | 1.05 | | | | 0.42 | | | | 1.62 | |
| | | | | | | | | | | | | | | | | | | | |
Total from investment operations | | | 1.31 | | | | 3.03 | | | | 1.36 | | | | 0.71 | | | | 1.88 | |
| | | | | | | | | | | | | | | | | | | | |
Less Distributions: | | | | | | | | | | | | | | | | | | | | |
Distributions from and in excess of net investment income | | | (0.44 | ) | | | (0.27 | ) | | | (0.30 | ) | | | (0.26 | ) | | | (0.23 | ) |
Distributions from net realized gain on investments | | | (0.81 | ) | | | (0.44 | ) | | | (0.07 | ) | | | — | | | | — | |
| | | | | | | | | | | | | | | | | | | | |
Total distributions | | | (1.25 | ) | | | (0.71 | ) | | | (0.37 | ) | | | (0.26 | ) | | | (0.23 | ) |
| | | | | | | | | | | | | | | | | | | | |
Net increase in net asset value | | | 0.06 | | | | 2.32 | | | | 0.99 | | | | 0.45 | | | | 1.65 | |
| | | | | | | | | | | | | | | | | | | | |
Net Asset Value, End of Period | | $ | 14.05 | | | $ | 13.99 | | | $ | 11.67 | | | $ | 10.68 | | | $ | 10.23 | |
| | | | | | | | | | | | | | | | | | | | |
Total Return (b) | | | 9.89 | % | | | 27.47 | % | | | 12.96 | % | | | 6.94 | % | | | 22.20 | % |
| | | | | |
Ratios/Supplemental Data: | | | | | | | | | | | | | | | | | | | | |
Net Assets, End of Period (in 000’s) | | $ | 349,937 | | | $ | 449,130 | | | $ | 338,166 | | | $ | 301,290 | | | $ | 135,544 | |
Ratios of expenses to average net assets: | | | | | | | | | | | | | | | | | | | | |
Before expense reimbursement and/or fee waiver by Adviser | | | 1.09 | % | | | 1.09 | % | | | 1.12 | % | | | 1.12 | % | | | 1.14 | % |
After expense reimbursement and/or fee waiver by Adviser | | | 1.09 | % | | | 1.09 | % | | | 1.12 | % | | | 1.12 | % | | | 1.14 | % |
Ratios of net investment income to average net assets: | | | | | | | | | | | | | | | | | | | | |
Before expense reimbursement and/or fee waiver by Adviser | | | 2.96 | % | | | 2.38 | % | | | 2.74 | % | | | 2.70 | % | | | 2.69 | % |
After expense reimbursement and/or fee waiver by Adviser | | | 2.96 | % | | | 2.38 | % | | | 2.74 | % | | | 2.70 | % | | | 2.69 | % |
Portfolio Turnover | | | 31.78 | % | | | 35.18 | % | | | 28.17 | % | | | 24.65 | % | | | 29.92 | % |
| | (a) | The selected per share data was calculated using the weighted average shares outstanding method for the period. |
| | (b) | The total return is calculated using the Net Asset Value used for trading at the close of business at period end. |
See accompanying Notes to Financial Statements.
| | |
| |
| ASTON/River Road Dividend All Cap Value Fund – Class I | | October 31, 2014 |
| |
| Financial Highlights | | |
| | | | | | | | | | | | | | | | | | | | |
| | | Year
Ended
10/31/14 | | | Year
Ended
10/31/13 | | | Year
Ended
10/31/12 | | | Year
Ended
10/31/11 | | | Year
Ended
10/31/10 | |
Net Asset Value, Beginning of Period | | $ | 13.98 | | | $ | 11.66 | | | $ | 10.67 | | | $ | 10.22 | | | $ | 8.57 | |
| | | | | | | | | | | | | | | | | | | | |
Income from Investment Operations: | | | | | | | | | | | | | | | | | | | | |
Net investment income | | | 0.44 | | | | 0.34 | | | | 0.34 | (a) | | | 0.32 | (a) | | | 0.28 | (a) |
Net realized and unrealized gain on investments | | | 0.90 | | | | 2.72 | | | | 1.05 | | | | 0.42 | | | | 1.63 | |
| | | | | | | | | | | | | | | | | | | | |
Total from investment operations | | | 1.34 | | | | 3.06 | | | | 1.39 | | | | 0.74 | | | | 1.91 | |
| | | | | | | | | | | | | | | | | | | | |
Less Distributions: | | | | | | | | | | | | | | | | | | | | |
Distributions from and in excess of net investment income | | | (0.47 | ) | | | (0.30 | ) | | | (0.33 | ) | | | (0.29 | ) | | | (0.26 | ) |
Distributions from net realized gain on investments | | | (0.81 | ) | | | (0.44 | ) | | | (0.07 | ) | | | — | | | | — | |
| | | | | | | | | | | | | | | | | | | | |
Total distributions | | | (1.28 | ) | | | (0.74 | ) | | | (0.40 | ) | | | (0.29 | ) | | | (0.26 | ) |
| | | | | | | | | | | | | | | | | | | | |
Net increase in net asset value . | | | 0.06 | | | | 2.32 | | | | 0.99 | | | | 0.45 | | | | 1.65 | |
| | | | | | | | | | | | | | | | | | | | |
Net Asset Value, End of Period | | $ | 14.04 | | | $ | 13.98 | | | $ | 11.66 | | | $ | 10.67 | | | $ | 10.22 | |
| | | | | | | | | | | | | | | | | | | | |
Total Return (b) | | | 10.18 | % | | | 27.81 | % | | | 13.25 | % | | | 7.21 | % | | | 22.53 | % |
| | | | | |
Ratios/Supplemental Data: | | | | | | | | | | | | | | | | | | | | |
Net Assets, End of Period (in 000’s) | | $ | 788,322 | | | $ | 779,859 | | | $ | 586,043 | | | $ | 318,863 | | | $ | 137,629 | |
Ratios of expenses to average net assets: | | | | | | | | | | | | | | | | | | | | |
Before expense reimbursement and/or fee waiver by Adviser | | | 0.84 | % | | | 0.84 | % | | | 0.87 | % | | | 0.87 | % | | | 0.89 | % |
After expense reimbursement and/or fee waiver by Adviser | | | 0.84 | % | | | 0.84 | % | | | 0.87 | % | | | 0.87 | % | | | 0.89 | % |
Ratios of net investment income to average net assets: | | | | | | | | | | | | | | | | | | | | |
Before expense reimbursement and/or fee waiver by Adviser | | | 3.21 | % | | | 2.63 | % | | | 2.99 | % | | | 2.95 | % | | | 2.94 | % |
After expense reimbursement and/or fee waiver by Adviser | | | 3.21 | % | | | 2.63 | % | | | 2.99 | % | | | 2.95 | % | | | 2.94 | % |
Portfolio Turnover | | | 31.78 | % | | | 35.18 | % | | | 28.17 | % | | | 24.65 | % | | | 29.92 | % |
| | (a) | The selected per share data was calculated using the weighted average shares outstanding method for the period. |
| | (b) | The total return is calculated using the Net Asset Value used for trading at the close of business at period end. |
See accompanying Notes to Financial Statements.
| | |
| |
| ASTON/River Road Dividend All Cap Value Fund II – Class N | | October 31, 2014 |
| |
| Financial Highlights | | |
| | | | | | | | | | | | |
| | | Year
Ended
10/31/14 | | | Year
Ended
10/31/13 | | | Period
Ended
10/31/12(a) | |
Net Asset Value, Beginning of Period | | $ | 12.89 | | | $ | 10.44 | | | $ | 10.00 | |
| | | | | | | | | | | | |
Income from Investment Operations: | | | | | | | | | | | | |
Net investment income | | | 0.36 | | | | 0.22 | | | | 0.09 | (b) |
Net realized and unrealized gain on investments | | | 0.96 | | | | 2.46 | | | | 0.41 | |
| | | | | | | | | | | | |
Total from investment operations | | | 1.32 | | | | 2.68 | | | | 0.50 | |
| | | | | | | | | | | | |
Less Distributions: | | | | | | | | | | | | |
Distributions from and in excess of net investment income | | | (0.38 | ) | | | (0.23 | ) | | | (0.06 | ) |
Distributions from net realized gain on investments | | | (0.14 | ) | | | — | (c) | | | — | |
| | | | | | | | | | | | |
Total distributions | | | (0.52 | ) | | | (0.23 | ) | | | (0.06 | ) |
| | | | | | | | | | | | |
Net increase in net asset value | | | 0.80 | | | | 2.45 | | | | 0.44 | |
| | | | | | | | | | | | |
Net Asset Value, End of Period | | $ | 13.69 | | | $ | 12.89 | | | $ | 10.44 | |
| | | | | | | | | | | | |
Total Return (d) | | | 10.46 | % | | | 25.99 | % | | | 5.09 | %(e) |
| | | |
Ratios/Supplemental Data: | | | | | | | | | | | | |
Net Assets, End of Period (in 000’s) | | $ | 7,037 | | | $ | 3,634 | | | $ | 1,049 | |
Ratios of expenses to average net assets: | | | | | | | | | | | | |
Before expense reimbursement and/or fee waiver, or recoupment by Adviser | | | 1.17 | % | | | 1.37 | % | | | 4.99 | %(f) |
After expense reimbursement and/or fee waiver, or recoupment by Adviser | | | 1.25 | % | | | 1.30 | % | | | 1.30 | %(f) |
Ratios of net investment income (loss) to average net assets: | | | | | | | | | | | | |
Before expense reimbursement and/or fee waiver, or recoupment by Adviser | | | 2.81 | % | | | 1.68 | % | | | (1.24 | )%(f) |
After expense reimbursement and/or fee waiver, or recoupment by Adviser | | | 2.72 | % | | | 1.76 | % | | | 2.45 | %(f) |
Portfolio Turnover | | | 29.42 | % | | | 27.80 | % | | | 5.58 | %(e)(g) |
| | (a) | The inception date for the River Road Dividend All Cap Value Fund II Class N shares is June 27, 2012. |
| | (b) | The selected per share data was calculated using the weighted average shares outstanding method for the period. |
| | (c) | Represents less than $(0.005) per share. |
| | (d) | The total return is calculated using the Net Asset Value used for trading at the close of business at period end. |
| | (g) | Portfolio turnover excludes securities received from processing a subscription-in-kind. |
See accompanying Notes to Financial Statements.
| | |
| |
| ASTON/River Road Dividend All Cap Value Fund II – Class I | | October 31, 2014 |
| |
| Financial Highlights | | |
| | | | | | | | | | | | |
| | | Year
Ended
10/31/14 | | | Year
Ended
10/31/13 | | | Period
Ended
10/31/12(a) | |
Net Asset Value, Beginning of Period | | $ | 12.89 | | | $ | 10.45 | | | $ | 10.00 | |
| | | | | | | | | | | | |
Income from Investment Operations: | | | | | | | | | | | | |
Net investment income | | | 0.39 | | | | 0.25 | | | | 0.10 | (b) |
Net realized and unrealized gain on investments | | | 0.96 | | | | 2.45 | | | | 0.42 | |
| | | | | | | | | | | | |
Total from investment operations | | | 1.35 | | | | 2.70 | | | | 0.52 | |
| | | | | | | | | | | | |
Less Distributions: | | | | | | | | | | | | |
Distributions from and in excess of net investment income | | | (0.41 | ) | | | (0.26 | ) | | | (0.07 | ) |
Distributions from net realized gain on investments | | | (0.14 | ) | | | — | (c) | | | — | |
| | | | | | | | | | | | |
Total distributions | | | (0.55 | ) | | | (0.26 | ) | | | (0.07 | ) |
| | | | | | | | | | | | |
Net increase in net asset value | | | 0.80 | | | | 2.44 | | | | 0.45 | |
| | | | | | | | | | | | |
Net Asset Value, End of Period | | $ | 13.69 | | | $ | 12.89 | | | $ | 10.45 | |
| | | | | | | | | | | | |
Total Return (d) | | | 10.73 | % | | | 26.30 | % | | | 5.17 | %(e) |
| | | |
Ratios/Supplemental Data: | | | | | | | | | | | | |
Net Assets, End of Period (in 000’s) | | $ | 125,660 | | | $ | 86,240 | | | $ | 9,370 | |
Ratios of expenses to average net assets: | | | | | | | | | | | | |
Before expense reimbursement and/or fee waiver, or recoupment by Adviser | | | 0.92 | % | | | 1.12 | % | | | 4.74 | %(f) |
After expense reimbursement and/or fee waiver, or recoupment by Adviser | | | 1.00 | % | | | 1.05 | % | | | 1.05 | %(f) |
Ratios of net investment income (loss) to average net assets: | | | | | | | | | | | | |
Before expense reimbursement and/or fee waiver, or recoupment by Adviser | | | 3.06 | % | | | 1.93 | % | | | (0.99 | )%(f) |
After expense reimbursement and/or fee waiver, or recoupment by Adviser | | | 2.97 | % | | | 2.01 | % | | | 2.70 | %(f) |
Portfolio Turnover | | | 29.42 | % | | | 27.80 | % | | | 5.58 | %(e)(g) |
| | (a) | The inception date for the River Road Dividend All Cap Value Fund II Class I shares is June 27, 2012. |
| | (b) | The selected per share data was calculated using the weighted average shares outstanding method for the period. |
| | (c) | Represents less than $(0.005) per share. |
| | (d) | The total return is calculated using the Net Asset Value used for trading at the close of business at period end. |
| | (g) | Portfolio turnover excludes securities received from processing a subscription-in-kind. |
See accompanying Notes to Financial Statements.
| | |
| |
| ASTON/Fairpointe Mid Cap Fund – Class N | | October 31, 2014 |
| |
| Financial Highlights | | |
| | | | | | | | | | | | | | | | | | | | |
| | | Year
Ended
10/31/14 | | | Year
Ended
10/31/13 | | | Year
Ended
10/31/12 | | | Year
Ended
10/31/11 | | | Year
Ended
10/31/10 | |
Net Asset Value, Beginning of Period | | $ | 45.40 | | | $ | 32.79 | | | $ | 29.76 | | | $ | 29.04 | | | $ | 22.73 | |
| | | | | | | | | | | | | | | | | | | | |
Income from Investment Operations: | | | | | | | | | | | | | | | | | | | | |
Net investment income (loss) | | | (0.06 | ) | | | 0.17 | | | | 0.16 | | | | 0.06 | (a) | | | 0.01 | |
Net realized and unrealized gain on investments | | | 5.82 | | | | 13.48 | | | | 3.13 | | | | 0.82 | | | | 6.35 | |
| | | | | | | | | | | | | | | | | | | | |
Total from investment operations | | | 5.76 | | | | 13.65 | | | | 3.29 | | | | 0.88 | | | | 6.36 | |
| | | | | | | | | | | | | | | | | | | | |
Less Distributions: | | | | | | | | | | | | | | | | | | | | |
Distributions from and in excess of net investment income | | | — | | | | (0.30 | ) | | | (0.05 | ) | | | (0.08 | ) | | | (0.05 | ) |
Distributions from net realized gain on investments | | | (4.27 | ) | | | (0.74 | ) | | | (0.21 | ) | | | (0.08 | ) | | | — | |
| | | | | | | | | | | | | | | | | | | | |
Total distributions | | | (4.27 | ) | | | (1.04 | ) | | | (0.26 | ) | | | (0.16 | ) | | | (0.05 | ) |
| | | | | | | | | | | | | | | | | | | | |
Net increase in net asset value . | | | 1.49 | | | | 12.61 | | | | 3.03 | | | | 0.72 | | | | 6.31 | |
| | | | | | | | | | | | | | | | | | | | |
Net Asset Value, End of Period | | $ | 46.89 | | | $ | 45.40 | | | $ | 32.79 | | | $ | 29.76 | | | $ | 29.04 | |
| | | | | | | | | | | | | | | | | | | | |
Total Return (b) | | | 13.32 | % | | | 42.88 | % | | | 11.15 | % | | | 2.98 | % | | | 28.01 | % |
| | | | | |
Ratios/Supplemental Data: | | | | | | | | | | | | | | | | | | | | |
Net Assets, End of Period (in 000’s) | | $ | 2,432,815 | | | $ | 2,370,432 | | | $ | 1,561,510 | | | $ | 1,502,266 | | | $ | 1,469,354 | |
Ratios of expenses to average net assets: | | | | | | | | | | | | | | | | | | | | |
Before expense reimbursement and/or fee waiver by Adviser | | | 1.10 | % | | | 1.11 | % | | | 1.11 | %(c) | | | 1.14 | %(c) | | | 1.14 | %(c) |
After expense reimbursement and/or fee waiver by Adviser | | | 1.10 | % | | | 1.11 | % | | | 1.11 | %(c) | | | 1.14 | %(c) | | | 1.14 | %(c) |
Ratios of net investment income (loss) to average net assets: | | | | | | | | | | | | | | | | | | | | |
Before expense reimbursement and/or fee waiver by Adviser | | | (0.12 | )% | | | 0.42 | % | | | 0.50 | % | | | 0.21 | % | | | — | %(d) |
After expense reimbursement and/or fee waiver by Adviser | | | (0.12 | )% | | | 0.42 | % | | | 0.50 | % | | | 0.21 | % | | | — | %(d) |
Portfolio Turnover | | | 50.25 | % | | | 36.98 | % | | | 28.06 | %(e) | | | 11.20 | % | | | 13.82 | % |
| | (a) | The selected per share data was calculated using the weighted average shares outstanding method for the period. |
| | (b) | The total return is calculated using the Net Asset Value used for trading at the close of business at period end. |
| | (c) | Ratios of expenses to average net assets include interest expense of less than 0.005% for each of the years ended October 31, 2012, October 31, 2011, and October 31, 2010, which are not included in the contractual expense limitation. The interest expense is from utilizing the line of credit, as discussed in Note H to the Financial Statements. |
| | (d) | Represents less than 0.005%. |
| | (e) | Portfolio turnover rate excludes securities delivered from processing a redemption-in-kind. |
See accompanying Notes to Financial Statements.
| | |
| |
| ASTON/Fairpointe Mid Cap Fund – Class I | | October 31, 2014 |
| |
| Financial Highlights | | |
| | | | | | | | | | | | | | | | | | | | |
| | | Year
Ended
10/31/14 | | | Year
Ended
10/31/13 | | | Year
Ended
10/31/12 | | | Year
Ended
10/31/11 | | | Year
Ended
10/31/10 | |
Net Asset Value, Beginning of Period | | $ | 46.10 | | | $ | 33.28 | | | $ | 30.20 | | | $ | 29.41 | | | $ | 23.00 | |
| | | | | | | | | | | | | | | | | | | | |
Income from Investment Operations: | | | | | | | | | | | | | | | | | | | | |
Net investment income | | | 0.05 | | | | 0.28 | | | | 0.24 | | | | 0.14 | (a) | | | 0.07 | |
Net realized and unrealized gain on investments | | | 5.92 | | | | 13.67 | | | | 3.18 | | | | 0.82 | | | | 6.43 | |
| | | | | | | | | | | | | | | | | | | | |
Total from investment operations | | | 5.97 | | | | 13.95 | | | | 3.42 | | | | 0.96 | | | | 6.50 | |
| | | | | | | | | | | | | | | | | | | | |
Less Distributions: | | | | | | | | | | | | | | | | | | | | |
Distributions from and in excess of net investment income | | | (0.06 | ) | | | (0.39 | ) | | | (0.13 | ) | | | (0.09 | ) | | | (0.09 | ) |
Distributions from net realized gain on investment | | | (4.27 | ) | | | (0.74 | ) | | | (0.21 | ) | | | (0.08 | ) | | | — | |
| | | | | | | | | | | | | | | | | | | | |
Total distributions | | | (4.33 | ) | | | (1.13 | ) | | | (0.34 | ) | | | (0.17 | ) | | | (0.09 | ) |
| | | | | | | | | | | | | | | | | | | | |
Net increase in net asset value | | | 1.64 | | | | 12.82 | | | | 3.08 | | | | 0.79 | | | | 6.41 | |
| | | | | | | | | | | | | | | | | | | | |
Net Asset Value, End of Period | | $ | 47.74 | | | $ | 46.10 | | | $ | 33.28 | | | $ | 30.20 | | | $ | 29.41 | |
| | | | | | | | | | | | | | | | | | | | |
Total Return (b) | | | 13.61 | % | | | 43.23 | % | | | 11.46 | % | | | 3.22 | % | | | 28.31 | % |
| | | | | |
Ratios/Supplemental Data: | | | | | | | | | | | | | | | | | | | | |
Net Assets, End of Period (in 000’s) | | $ | 3,531,114 | | | $ | 2,521,876 | | | $ | 1,464,222 | | | $ | 1,339,223 | | | $ | 499,651 | |
Ratios of expenses to average net assets: | | | | | | | | | | | | | | | | | | | | |
Before expense reimbursement and/or fee waiver by Adviser | | | 0.85 | % | | | 0.86 | % | | | 0.86 | %(c) | | | 0.89 | %(c) | | | 0.89 | %(c) |
After expense reimbursement and/or fee waiver by Adviser | | | 0.85 | % | | | 0.86 | % | | | 0.86 | %(c) | | | 0.89 | %(c) | | | 0.89 | %(c) |
Ratios of net investment income to average net assets: | | | | | | | | | | | | | | | | | | | | |
Before expense reimbursement and/or fee waiver by Adviser | | | 0.13 | % | | | 0.67 | % | | | 0.75 | % | | | 0.46 | % | | | 0.25 | % |
After expense reimbursement and/or fee waiver by Adviser | | | 0.13 | % | | | 0.67 | % | | | 0.75 | % | | | 0.46 | % | | | 0.25 | % |
Portfolio Turnover | | | 50.25 | % | | | 36.98 | % | | | 28.06 | %(d) | | | 11.20 | % | | | 13.82 | % |
| | (a) | The selected per share data was calculated using the weighted average shares outstanding method for the period. |
| | (b) | The total return is calculated using the Net Asset Value used for trading at the close of business at period end. |
| | (c) | Ratios of expenses to average net assets include interest expense of less than 0.005% for each of the years ended October 31, 2012, October 31, 2011, and October 31, 2010, which are not included in the contractual expense limitation. The interest expense is from utilizing the line of credit, as discussed in Note H to the Financial Statements. |
| | (d) | Portfolio turnover rate excludes securities delivered from processing a redemption-in-kind. |
See accompanying Notes to Financial Statements.
| | |
| |
| ASTON/Montag & Caldwell Mid Cap Growth Fund – Class N | | October 31, 2014 |
| |
| Financial Highlights | | |
| | | | | | | | | | | | | | | | | | | | |
| | | Year
Ended
10/31/14 | | | Year
Ended
10/31/13 | | | Year
Ended
10/31/12 | | | Year
Ended
10/31/11 | | | Year
Ended
10/31/10 | |
Net Asset Value, Beginning of Period | | $ | 12.77 | | | $ | 10.36 | | | $ | 9.71 | | | $ | 8.51 | | | $ | 6.83 | |
| | | | | | | | | | | | | | | | | | | | |
Income from Investment Operations: | | | | | | | | | | | | | | | | | | | | |
Net investment loss | | | (0.06 | )(a) | | | (0.07 | ) | | | (0.07 | )(a) | | | (0.07 | ) | | | (0.04 | ) |
Net realized and unrealized gain on investments | | | 1.20 | | | | 2.58 | | | | 0.72 | | | | 1.27 | | | | 1.74 | |
| | | | | | | | | | | | | | | | | | | | |
Total from investment operations | | | 1.14 | | | | 2.51 | | | | 0.65 | | | | 1.20 | | | | 1.70 | |
| | | | | | | | | | | | | | | | | | | | |
Less Distributions: | | | | | | | | | | | | | | | | | | | | |
Distributions from and in excess of net investment income | | | — | | | | — | | | | — | | | | — | | | | (0.02 | ) |
Distributions from net realized gain on investments | | | (1.92 | ) | | | (0.10 | ) | | | — | | | | — | | | | — | |
| | | | | | | | | | | | | | | | | | | | |
Total distributions | | | (1.92 | ) | | | (0.10 | ) | | | — | | | | — | | | | (0.02 | ) |
| | | | | | | | | | | | | | | | | | | | |
Net increase (decrease) in net asset value | | | (0.78 | ) | | | 2.41 | | | | 0.65 | | | | 1.20 | | | | 1.68 | |
| | | | | | | | | | | | | | | | | | | | |
Net Asset Value, End of Period | | $ | 11.99 | | | $ | 12.77 | | | $ | 10.36 | | | $ | 9.71 | | | $ | 8.51 | |
| | | | | | | | | | | | | | | | | | | | |
Total Return (b) | | | 9.75 | % | | | 24.51 | % | | | 6.70 | % | | | 14.10 | % | | | 24.85 | % |
| | | | | |
Ratios/Supplemental Data: | | | | | | | | | | | | | | | | | | | | |
Net Assets, End of Period (in 000’s) | | $ | 7,633 | | | $ | 11,402 | | | $ | 7,369 | | | $ | 4,507 | | | $ | 3,399 | |
Ratios of expenses to average net assets: | | | | | | | | | | | | | | | | | | | | |
Before expense reimbursement and/or fee waiver by Adviser | | | 2.16 | % | | | 1.85 | % | | | 2.50 | % | | | 3.07 | % | | | 3.55 | % |
After expense reimbursement and/or fee waiver by Adviser | | | 1.25 | % | | | 1.25 | % | | | 1.25 | %(c) | | | 1.39 | %(c) | | | 1.40 | % |
Ratios of net investment loss to average net assets: | | | | | | | | | | | | | | | | | | | | |
Before expense reimbursement and/or fee waiver by Adviser | | | (1.45 | )% | | | (1.18 | )% | | | (1.88 | )% | | | (2.39 | )% | | | (2.75 | )% |
After expense reimbursement and/or fee waiver by Adviser | | | (0.55 | )% | | | (0.58 | )% | | | (0.63 | )% | | | (0.71 | )% | | | (0.60 | )% |
Portfolio Turnover | | | 32.96 | % | | | 74.24 | % | | | 36.60 | % | | | 29.31 | % | | | 31.49 | % |
| | (a) | The selected per share data was calculated using the weighted average shares outstanding method for the period. |
| | (b) | The total return is calculated using the Net Asset Value used for trading at the close of business at period end. |
| | (c) | For the period November 1, 2010 through September 29, 2011 the Adviser contractually waived management fees and/or reimbursed expenses so that the net expense ratio did not exceed 1.40%, excluding interest, taxes, investment-related costs (such as brokerage commissions), extraordinary expenses and acquired fund fees and expenses. Effective September 30, 2011, the Adviser implemented a voluntary expense limitation of 1.25%. Subsequently, on February 29, 2012, the Adviser removed the voluntary expense limitation and replaced it with a contractual expense limitation of 1.25%. |
See accompanying Notes to Financial Statements.
| | |
| |
| ASTON/Montag & Caldwell Mid Cap Growth Fund – Class I | | October 31, 2014 |
| |
| Financial Highlights | | |
| | | | |
| | | Period
Ended
10/31/14(a) | |
| | | | |
Net Asset Value, Beginning of Period | | $ | 11.36 | |
| | | | |
Income from Investment Operations: | | | | |
Net investment loss | | | (0.04 | )(b) |
Net realized and unrealized gain on investments | | | 0.68 | |
| | | | |
Total from investment operations | | | 0.64 | |
| | | | |
Net increase in net asset value | | | 0.64 | |
| | | | |
Net Asset Value, End of Period | | $ | 12.00 | |
| | | | |
Total Return (c) | | | 5.63 | %(d) |
| |
Ratios/Supplemental Data: | | | | |
Net Assets, End of Period (in 000’s) | | $ | 3,867 | |
Ratios of expenses to average net assets: | | | | |
Before expense reimbursement and/or fee waiver by Adviser | | | 2.27 | %(e) |
After expense reimbursement and/or fee waiver by Adviser | | | 1.00 | %(e) |
Ratios of net investment loss to average net assets: | | | | |
Before expense reimbursement and/or fee waiver by Adviser | | | (1.95 | )%(e) |
After expense reimbursement and/or fee waiver by Adviser | | | (0.68 | )%(e) |
Portfolio Turnover | | | 32.96 | %(d) |
| | (a) | The inception date for the Montag & Caldwell Mid Cap Growth Fund Class I shares is May 14, 2014. |
| | (b) | The selected per share data was calculated using the weighted average shares outstanding method for the period. |
| | (c) | The total return is calculated using the Net Asset Value used for trading at the close of business at period end. |
See accompanying Notes to Financial Statements.
| | |
| |
| ASTON/LMCG Small Cap Growth Fund – Class N | | October 31, 2014 |
| |
| Financial Highlights | | |
| | | | | | | | | | | | | | | | |
| | | Year
Ended
10/31/14 | | | Year
Ended
10/31/13 | | | Year
Ended
10/31/12 | | | Period
Ended
10/31/11(a) | |
| | | | |
| | | | |
| | | | |
Net Asset Value, Beginning of Period | | $ | 14.71 | | | $ | 11.42 | | | $ | 9.95 | | | $ | 10.00 | |
| | | | | | | | | | | | | | | | |
Income from Investment Operations: | | | | | | | | | | | | | | | | |
Net investment income (loss) | | | (0.13 | )(b) | | | — | (b)(c) | | | (0.12 | )(b) | | | (0.04 | ) |
Net realized and unrealized gain (loss) on investments | | | 2.21 | | | | 4.18 | | | | 1.59 | | | | (0.01 | ) |
| | | | | | | | | | | | | | | | |
Total from investment operations | | | 2.08 | | | | 4.18 | | | | 1.47 | | | | (0.05 | ) |
| | | | | | | | | | | | | | | | |
Less Distributions: | | | | | | | | | | | | | | | | |
Distributions from net realized gains on investments | | | (2.03 | ) | | | (0.89 | ) | | | — | | | | — | |
| | | | | | | | | | | | | | | | |
Total distributions | | | (2.03 | ) | | | (0.89 | ) | | | — | | | | — | |
| | | | | | | | | | | | | | | | |
Net increase (decrease) in net asset value | | | 0.05 | | | | 3.29 | | | | 1.47 | | | | (0.05 | ) |
| | | | | | | | | | | | | | | | |
Net Asset Value, End of Period | | $ | 14.76 | | | $ | 14.71 | | | $ | 11.42 | | | $ | 9.95 | |
| | | | | | | | | | | | | | | | |
Total Return (d) | | | 15.18 | % | | | 39.31 | % | | | 14.77 | % | | | (0.50 | )%(e) |
| | | | |
Ratios/Supplemental Data: | | | | | | | | | | | | | | | | |
Net Assets, End of Period (in 000’s) | | $ | 37,099 | | | $ | 32,045 | | | $ | 5,659 | | | $ | 5,411 | |
Ratios of expenses to average net assets: | | | | | | | | | | | | | | | | |
Before expense reimbursement and/or fee waiver by Adviser | | | 1.67 | % | | | 2.03 | % | | | 2.86 | % | | | 8.27 | %(f) |
After expense reimbursement and/or fee waiver by Adviser | | | 1.35 | % | | | 1.35 | % | | | 1.35 | % | | | 1.35 | %(f) |
Ratios of net investment income (loss) to average net assets: | | | | | | | | | | | | | | | | |
Before expense reimbursement and/or fee waiver by Adviser | | | (1.22 | )% | | | (0.66 | )% | | | (2.68 | )% | | | (8.14 | )%(f) |
After expense reimbursement and/or fee waiver by Adviser | | | (0.90 | )% | | | 0.02 | % | | | (1.17 | )% | | | (1.21 | )%(f) |
Portfolio Turnover | | | 143.99 | % | | | 186.40 | %(g) | | | 168.05 | %(h) | | | 205.85 | %(e) |
| | (a) | The inception date for the LMCG Small Cap Growth Fund Class N shares is November 3, 2010. |
| | (b) | The selected per share data was calculated using the weighted average shares outstanding method for the period. |
| | (c) | Represents less than $0.005 per share. |
| | (d) | The total return is calculated using the Net Asset Value used for trading at the close of business at period end. |
| | (g) | Portfolio turnover rate excludes securities received from the reorganization. |
| | (h) | Portfolio turnover rate excludes securities delivered from processing a redemption-in-kind. |
See accompanying Notes to Financial Statements.
| | |
| |
| ASTON/LMCG Small Cap Growth Fund – Class I | | October 31, 2014 |
| |
| Financial Highlights | | |
| | | | | | | | | | | | | | | | |
| | | Year
Ended
10/31/14 | | | Year
Ended
10/31/13 | | | Year
Ended
10/31/12 | | | Period
Ended
10/31/11(a) | |
| | | | |
| | | | |
| | | | |
Net Asset Value, Beginning of Period | | $ | 14.81 | | | $ | 11.46 | | | $ | 9.97 | | | $ | 12.40 | |
| | | | | | | | | | | | | | | | |
Income from Investment Operations: | | | | | | | | | | | | | | | | |
Net investment income (loss) | | | (0.09 | )(b) | | | 0.04 | (b) | | | (0.10 | )(b) | | | (0.04 | ) |
Net realized and unrealized gain (loss) on investments | | | 2.23 | | | | 4.20 | | | | 1.59 | | | | (2.39 | ) |
| | | | | | | | | | | | | | | | |
Total from investment operations | | | 2.14 | | | | 4.24 | | | | 1.49 | | | | (2.43 | ) |
| | | | | | | | | | | | | | | | |
Less Distributions: | | | | | | | | | | | | | | | | |
Distributions from and in excess of net investment income | | | (0.03 | ) | | | — | | | | — | | | | — | |
Distributions from net realized gains on investments | | | (2.03 | ) | | | (0.89 | ) | | | — | | | | — | |
| | | | | | | | | | | | | | | | |
Total distributions | | | (2.06 | ) | | | (0.89 | ) | | | — | | | | — | |
| | | | | | | | | | | | | | | | |
Net increase (decrease) in net asset value | | | 0.08 | | | | 3.35 | | | | 1.49 | | | | (2.43 | ) |
| | | | | | | | | | | | | | | | |
Net Asset Value, End of Period | | $ | 14.89 | | | $ | 14.81 | | | $ | 11.46 | | | $ | 9.97 | |
| | | | | | | | | | | | | | | | |
Total Return (c) | | | 15.51 | % | | | 39.72 | % | | | 14.95 | % | | | (19.60 | )%(d) |
| | | | |
Ratios/Supplemental Data: | | | | | | | | | | | | | | | | |
Net Assets, End of Period (in 000’s) | | $ | 15,083 | | | $ | 8,496 | | | $ | 755 | | | $ | 2,551 | |
Ratios of expenses to average net assets: | | | | | | | | | | | | | | | | |
Before expense reimbursement and/or fee waiver by Adviser | | | 1.42 | % | | | 1.78 | % | | | 2.61 | % | | | 6.25 | %(e) |
After expense reimbursement and/or fee waiver by Adviser | | | 1.10 | % | | | 1.10 | % | | | 1.10 | % | | | 1.10 | %(e) |
Ratios of net investment income (loss) to average net assets: | | | | | | | | | | | | | | | | |
Before expense reimbursement and/or fee waiver by Adviser | | | (0.97 | )% | | | (0.41 | )% | | | (2.43 | )% | | | (6.11 | )%(e) |
After expense reimbursement and/or fee waiver by Adviser | | | (0.65 | )% | | | 0.27 | % | | | (0.92 | )% | | | (0.96 | )%(e) |
Portfolio Turnover | | | 143.99 | % | | | 186.40 | %(f) | | | 168.05 | %(g) | | | 205.85 | %(d) |
| | (a) | The inception date for the LMCG Small Cap Growth Fund Class I shares is June 1, 2011. |
| | (b) | The selected per share data was calculated using the weighted average shares outstanding method for the period. |
| | (c) | The total return is calculated using the Net Asset Value used for trading at the close of business at period end. |
| | (f) | Portfolio turnover rate excludes securities received from the reorganization. |
| | (g) | Portfolio turnover rate excludes securities delivered from processing a redemption-in-kind. |
See accompanying Notes to Financial Statements.
| | |
| |
| ASTON/River Road Independent Value Fund – Class N | | October 31, 2014 |
| |
| Financial Highlights | | |
| | | | | | | | | | | | | | | | |
| | | Year
Ended
10/31/14 | | | Year
Ended
10/31/13 | | | Year
Ended
10/31/12 | | | Period
Ended
10/31/11(a) | |
Net Asset Value, Beginning of Period | | $ | 11.47 | | | $ | 11.42 | | | $ | 10.75 | | | $ | 10.00 | |
| | | | | | | | | | | | | | | | |
Income from Investment Operations: | | | | | | | | | | | | | | | | |
Net investment loss | | | (0.12 | )(b) | | | (0.07 | ) | | | (0.09 | )(b) | | | (0.07 | )(b) |
Net realized and unrealized gain (loss) on investments | | | (0.01 | ) | | | 0.75 | | | | 0.88 | | | | 0.82 | |
| | | | | | | | | | | | | | | | |
Total from investment operations | | | (0.13 | ) | | | 0.68 | | | | 0.79 | | | | 0.75 | |
| | | | | | | | | | | | | | | | |
Less Distributions: | | | | | | | | | | | | | | | | |
Distributions from net realized gain on investments | | | (0.45 | ) | | | (0.63 | ) | | | (0.12 | ) | | | — | |
| | | | | | | | | | | | | | | | |
Total distributions | | | (0.45 | ) | | | (0.63 | ) | | | (0.12 | ) | | | — | |
| | | | | | | | | | | | | | | | |
Net increase (decrease) in net asset value | | | (0.58 | ) | | | 0.05 | | | | 0.67 | | | | 0.75 | |
| | | | | | | | | | | | | | | | |
Net Asset Value, End of Period | | $ | 10.89 | | | $ | 11.47 | | | $ | 11.42 | | | $ | 10.75 | |
| | | | | | | | | | | | | | | | |
Total Return (c) | | | (1.24 | )% | | | 6.37 | % | | | 7.41 | % | | | 7.50 | %(d) |
| | | | |
Ratios/Supplemental Data: | | | | | | | | | | | | | | | | |
Net Assets, End of Period (in 000’s) | | $ | 285,949 | | | $ | 339,088 | | | $ | 362,416 | | | $ | 306,223 | |
Ratios of expenses to average net assets: | | | | | | | | | | | | | | | | |
Before earnings credit, expense reimbursement and/or fee waiver, by the Adviser | | | 1.42 | %(e) | | | 1.43 | %(e) | | | 1.44 | %(e) | | | 1.59 | %(f) |
After earnings credit, expense reimbursement and/or fee waiver, by the Adviser | | | 1.42 | %(e) | | | 1.41 | %(e) | | | 1.42 | %(e) | | | 1.42 | %(f) |
Ratios of net investment loss to average net assets: | | | | | | | | | | | | | | | | |
Before earnings credit, expense reimbursement and/or fee waiver, by the Adviser | | | (1.04 | )% | | | (0.61 | )% | | | (0.81 | )% | | | (0.98 | )%(f) |
After earnings credit, expense reimbursement and/or fee waiver, by the Adviser | | | (1.03 | )% | | | (0.59 | )% | | | (0.79 | )% | | | (0.80 | )%(f) |
Portfolio Turnover | | | 91.10 | % | | | 82.24 | %(g) | | | 141.17 | % | | | 105.69 | %(d) |
| | (a) | The inception date for the River Road Independent Value Fund Class N shares is December 31, 2010. |
| | (b) | The selected per share data was calculated using the weighted average shares outstanding method for the period. |
| | (c) | The total return is calculated using the Net Asset Value used for trading at the close of business at period end. |
| | (e) | Ratios of expenses to average net assets include Earnings Credits of 0.01% for the year ended October 31, 2013 and less than 0.005% for the years ended October 31, 2014 and 2012, which are not included in the contractual expense limitation. See Note I to the Financial Statements. |
| | (g) | Portfolio turnover rate excludes securities received from processing a subscription-in-kind. |
See accompanying Notes to Financial Statements.
| | |
| |
| ASTON/River Road Independent Value Fund – Class I | | October 31, 2014 |
| |
| Financial Highlights | | |
| | | | | | | | | | | | | | | | |
| | | Year
Ended
10/31/14 | | | Year
Ended
10/31/13 | | | Year
Ended
10/31/12 | | | Period
Ended
10/31/11(a) | |
Net Asset Value, Beginning of Period | | $ | 11.54 | | | $ | 11.46 | | | $ | 10.75 | | | $ | 10.92 | |
| | | | | | | | | | | | | | | | |
Income from Investment Operations: | | | | | | | | | | | | | | | | |
Net investment loss | | | (0.09 | )(b) | | | (0.04 | ) | | | (0.06 | )(b) | | | (0.02 | )(b) |
Net realized and unrealized gain (loss) on investments | | | (0.02 | ) | | | 0.75 | | | | 0.89 | | | | (0.15 | ) |
| | | | | | | | | | | | | | | | |
Total from investment operations | | | (0.11 | ) | | | 0.71 | | | | 0.83 | | | | (0.17 | ) |
| | | | | | | | | | | | | | | | |
Less Distributions: | | | | | | | | | | | | | | | | |
Distributions from net realized gain on investments | | | (0.45 | ) | | | (0.63 | ) | | | (0.12 | ) | | | — | |
| | | | | | | | | | | | | | | | |
Total distributions | | | (0.45 | ) | | | (0.63 | ) | | | (0.12 | ) | | | — | |
| | | | | | | | | | | | | | | | |
Net increase (decrease) in net asset value | | | (0.56 | ) | | | 0.08 | | | | 0.71 | | | | (0.17 | ) |
| | | | | | | | | | | | | | | | |
Net Asset Value, End of Period | | $ | 10.98 | | | $ | 11.54 | | | $ | 11.46 | | | $ | 10.75 | |
| | | | | | | | | | | | | | | | |
Total Return (c) | | | (1.05 | )% | | | 6.62 | % | | | 7.68 | % | | | (1.47 | )%(d) |
| | | | |
Ratios/Supplemental Data: | | | | | | | | | | | | | | | | |
Net Assets, End of Period (in 000’s) | | $ | 381,289 | | | $ | 386,268 | | | $ | 338,234 | | | $ | 85,478 | |
Ratios of expenses to average net assets: | | | | | | | | | | | | | | | | |
Before earnings credit, expense reimbursement and/or fee waiver, by the Adviser | | | 1.17 | %(e) | | | 1.18 | %(e) | | | 1.19 | %(e) | | | 1.34 | %(f) |
After earnings credit, expense reimbursement and/or fee waiver, by the Adviser | | | 1.17 | %(e) | | | 1.16 | %(e) | | | 1.17 | %(e) | | | 1.17 | %(f) |
Ratios of net investment loss to average net assets: | | | | | | | | | | | | | | | | |
Before earnings credit, expense reimbursement and/or fee waiver, by the Adviser | | | (0.79 | )% | | | (0.36 | )% | | | (0.56 | )% | | | (0.73 | )%(f) |
After earnings credit, expense reimbursement and/or fee waiver, by the Adviser | | | (0.78 | )% | | | (0.34 | )% | | | (0.54 | )% | | | (0.55 | )%(f) |
Portfolio Turnover | | | 91.10 | % | | | 82.24 | %(g) | | | 141.17 | % | | | 105.69 | %(d) |
| | (a) | The inception date for the River Road Independent Value Fund Class I shares is June 1, 2011. |
| | (b) | The selected per share data was calculated using the weighted average shares outstanding method for the period. |
| | (c) | The total return is calculated using the Net Asset Value used for trading at the close of business at period end. |
| | (e) | Ratios of expenses to average net assets include Earnings Credits of 0.01% for the year ended October 31, 2013 and less than 0.005% for the years ended October 31, 2014 and 2012, which are not included in the contractual expense limitation. See Note I to the Financial Statements. |
| | (g) | Portfolio turnover rate excludes securities received from processing a subscription-in-kind. |
See accompanying Notes to Financial Statements.
| | |
| |
| ASTON/River Road Select Value Fund – Class N | | October 31, 2014 |
| |
| Financial Highlights | | |
| | | | | | | | | | | | | | | | | | | | |
| | | Year
Ended
10/31/14 | | | Year
Ended
10/31/13 | | | Year
Ended
10/31/12 | | | Year
Ended
10/31/11 | | | Year
Ended
10/31/10 | |
| | | | | | | | | | | | | | | | | | | | |
Net Asset Value, Beginning of Period | | $ | 10.28 | | | $ | 8.50 | | | $ | 9.54 | | | $ | 9.01 | | | $ | 7.71 | |
| | | | | | | | | | | | | | | | | | | | |
Income from Investment Operations: | | | | | | | | | | | | | | | | | | | | |
Net investment income (loss) | | | (0.03 | )(a) | | | 0.07 | (a) | | | 0.01 | (a) | | | (0.02 | )(a) | | | 0.02 | (a) |
Net realized and unrealized gain on investments | | | 0.03 | | | | 2.34 | | | | 1.01 | | | | 0.66 | | | | 1.28 | |
| | | | | | | | | | | | | | | | | | | | |
Total from investment operations | | | — | | | | 2.41 | | | | 1.02 | | | | 0.64 | | | | 1.30 | |
| | | | | | | | | | | | | | | | | | | | |
Less Distributions: | | | | | | | | | | | | | | | | | | | | |
Distributions from net investment income | | | (0.02 | ) | | | (0.12 | ) | | | — | | | | (0.03 | ) | | | — | |
Distributions from net realized gains on investments | | | (1.49 | ) | | | (0.51 | ) | | | (2.06 | ) | | | (0.08 | ) | | | — | |
| | | | | | | | | | | | | | | | | | | | |
Total distributions | | | (1.51 | ) | | | (0.63 | ) | | | (2.06 | ) | | | (0.11 | ) | | | — | |
| | | | | | | | | | | | | | | | | | | | |
Net increase (decrease) in net asset value | | | (1.51 | ) | | | 1.78 | | | | (1.04 | ) | | | 0.53 | | | | 1.30 | |
| | | | | | | | | | | | | | | | | | | | |
Net Asset Value, End of Period | | $ | 8.77 | | | $ | 10.28 | | | $ | 8.50 | | | $ | 9.54 | | | $ | 9.01 | |
| | | | | | | | | | | | | | | | | | | | |
Total Return (b) | | | (0.23 | )% | | | 30.44 | % | | | 12.87 | % | | | 7.12 | % | | | 16.86 | % |
| | | | | |
Ratios/Supplemental Data: | | | | | | | | | | | | | | | | | | | | |
Net Assets, End of Period (in 000’s) | | $ | 8,388 | | | $ | 19,099 | | | $ | 6,270 | | | $ | 13,160 | | | $ | 52,522 | |
Ratios of expenses to average net assets: | | | | | | | | | | | | | | | | | | | | |
Before expense reimbursement and/or fee waiver, or recoupment by Adviser | | | 1.45 | % | | | 1.46 | % | | | 1.43 | %(c) | | | 1.42 | %(c) | | | 1.41 | %(c) |
After expense reimbursement and/or fee waiver, or recoupment by Adviser | | | 1.45 | % | | | 1.46 | % | | | 1.43 | %(c) | | | 1.42 | %(c) | | | 1.43 | %(c) |
Ratios of net investment income (loss) to average net assets: | | | | | | | | | | | | | | | | | | | | |
Before expense reimbursement and/or fee waiver, or recoupment by Adviser | | | (0.36 | )% | | | 0.78 | % | | | 0.07 | % | | | (0.18 | )% | | | 0.31 | % |
After expense reimbursement and/or fee waiver, or recoupment by Adviser | | | (0.36 | )% | | | 0.78 | % | | | 0.07 | % | | | (0.18 | )% | | | 0.29 | % |
Portfolio Turnover | | | 64.44 | % | | | 71.01 | % | | | 38.84 | % | | | 48.22 | % | | | 53.73 | % |
| | (a) | The selected per share data was calculated using the weighted average shares outstanding method for the period. |
| | (b) | The total return is calculated using the Net Asset Value used for trading at the close of business at period end. |
| | (c) | Ratios of expenses to average net assets include interest expense of less than 0.005% for each of the years ended October 31, 2012, October 31, 2011 and October 31, 2010, which are not included in the contractual expense limitation. The interest expense is from utilizing the line of credits, as discussed in Note H to the Financial Statements. |
See accompanying Notes to Financial Statements.
| | |
| |
| ASTON/River Road Select Value Fund – Class I | | October 31, 2014 |
| |
| Financial Highlights | | |
| | | | | | | | | | | | | | | | | | | | |
| | | Year
Ended
10/31/14 | | | Year
Ended
10/31/13 | | | Year
Ended
10/31/12 | | | Year
Ended
10/31/11 | | | Year
Ended
10/31/10 | |
| | | | | | | | | | | | | | | | | | | | |
Net Asset Value, Beginning of Period | | $ | 10.38 | | | $ | 8.58 | | | $ | 9.59 | | | $ | 9.04 | | | $ | 7.73 | |
| | | | | | | | | | | | | | | | | | | | |
Income from Investment Operations: | | | | | | | | | | | | | | | | | | | | |
Net investment income (loss) | | | (0.01 | )(a) | | | 0.10 | (a) | | | 0.03 | (a) | | | 0.01 | (a) | | | 0.05 | (a) |
Net realized and unrealized gain on investments | | | 0.04 | | | | 2.36 | | | | 1.02 | | | | 0.67 | | | | 1.28 | |
| | | | | | | | | | | | | | | | | | | | |
Total from investment operations | | | 0.03 | | | | 2.46 | | | | 1.05 | | | | 0.68 | | | | 1.33 | |
| | | | | | | | | | | | | | | | | | | | |
Less Distributions: | | | | | | | | | | | | | | | | | | | | |
Distributions from net investment income | | | (0.04 | ) | | | (0.15 | ) | | | — | | | | (0.05 | ) | | | (0.02 | ) |
Distributions from net realized gains on investments | | | (1.49 | ) | | | (0.51 | ) | | | (2.06 | ) | | | (0.08 | ) | | | — | |
| | | | | | | | | | | | | | | | | | | | |
Total distributions | | | (1.53 | ) | | | (0.66 | ) | | | (2.06 | ) | | | (0.13 | ) | | | (0.02 | ) |
| | | | | | | | | | | | | | | | | | | | |
Net increase (decrease) in net asset value | | | (1.50 | ) | | | 1.80 | | | | (1.01 | ) | | | 0.55 | | | | 1.31 | |
| | | | | | | | | | | | | | | | | | | | |
Net Asset Value, End of Period | | $ | 8.88 | | | $ | 10.38 | | | $ | 8.58 | | | $ | 9.59 | | | $ | 9.04 | |
| | | | | | | | | | | | | | | | | | | | |
Total Return (b) | | | 0.00 | % | | | 30.74 | % | | | 13.18 | % | | | 7.56 | % | | | 17.19 | % |
| | | | | |
Ratios/Supplemental Data: | | | | | | | | | | | | | | | | | | | | |
Net Assets, End of Period (in 000’s) | | $ | 176,166 | | | $ | 198,220 | | | $ | 156,510 | | | $ | 130,527 | | | $ | 163,232 | |
Ratios of expenses to average net assets: | | | | | | | | | | | | | | | | | | | | |
Before expense reimbursement and/or fee waiver, or recoupment by Adviser | | | 1.20 | % | | | 1.21 | % | | | 1.18 | %(c) | | | 1.17 | %(c) | | | 1.16 | %(c) |
After expense reimbursement and/or fee waiver, or recoupment by Adviser | | | 1.20 | % | | | 1.21 | % | | | 1.18 | %(c) | | | 1.17 | %(c) | | | 1.18 | %(c) |
Ratios of net investment income (loss) to average net assets: | | | | | | | | | | | | | | | | | | | | |
Before expense reimbursement and/or fee waiver, or recoupment by Adviser | | | (0.11 | )% | | | 1.03 | % | | | 0.32 | % | | | 0.07 | % | | | 0.56 | % |
After expense reimbursement and/or fee waiver, or recoupment by Adviser | | | (0.11 | )% | | | 1.03 | % | | | 0.32 | % | | | 0.07 | % | | | 0.54 | % |
Portfolio Turnover | | | 64.44 | % | | | 71.01 | % | | | 38.84 | % | | | 48.22 | % | | | 53.73 | % |
| | (a) | The selected per share data was calculated using the weighted average shares outstanding method for the period. |
| | (b) | The total return is calculated using the Net Asset Value used for trading at the close of business at period end. |
| | (c) | Ratios of expenses to average net assets include interest expense of less than 0.005% for each of the years ended October 31, 2012, October 31, 2011 and October 31, 2010, which are not included in the contractual expense limitation. The interest expense is from utilizing the line of credit, as discussed in Note H to the Financial Statements. |
See accompanying Notes to Financial Statements.
| | |
| |
| ASTON/River Road Small Cap Value Fund – Class N | | October 31, 2014 |
| |
| Financial Highlights | | |
| | | | | | | | | | | | | | | | | | | | |
| | | Year
Ended
10/31/14 | | | Year
Ended
10/31/13 | | | Year
Ended
10/31/12 | | | Year
Ended
10/31/11 | | | Year
Ended
10/31/10 | |
| | | | | | | | | | | | | | | | | | | | |
Net Asset Value, Beginning of Period | | $ | 17.05 | | | $ | 13.56 | | | $ | 12.20 | | | $ | 11.60 | | | $ | 10.22 | |
| | | | | | | | | | | | | | | | | | | | |
Income from Investment Operations: | | | | | | | | | | | | | | | | | | | | |
Net investment income (loss) | | | (0.04 | )(a) | | | 0.16 | | | | 0.03 | (a) | | | (0.03 | ) | | | 0.03 | |
Net realized and unrealized gain on investments | | | 0.14 | | | | 3.98 | | | | 1.33 | | | | 0.67 | | | | 1.36 | |
| | | | | | | | | | | | | | | | | | | | |
Total from investment operations | | | 0.10 | | | | 4.14 | | | | 1.36 | | | | 0.64 | | | | 1.39 | |
| | | | | | | | | | | | | | | | | | | | |
Less Distributions: | | | | | | | | | | | | | | | | | | | | |
Distributions from and in excess of net investment income | | | (0.04 | ) | | | (0.22 | ) | | | — | | | | (0.04 | ) | | | (0.01 | ) |
Distributions from net realized gain on investments | | | (3.58 | ) | | | (0.43 | ) | | | — | | | | — | | | | — | |
| | | | | | | | | | | | | | | | | | | | |
Total distributions | | | (3.62 | ) | | | (0.65 | ) | | | — | | | | (0.04 | ) | | | (0.01 | ) |
| | | | | | | | | | | | | | | | | | | | |
Net increase (decrease) in net asset value | | | (3.52 | ) | | | 3.49 | | | | 1.36 | | | | 0.60 | | | | 1.38 | |
| | | | | | | | | | | | | | | | | | | | |
Net Asset Value, End of Period | | $ | 13.53 | | | $ | 17.05 | | | $ | 13.56 | | | $ | 12.20 | | | $ | 11.60 | |
| | | | | | | | | | | | | | | | | | | | |
Total Return (b) | | | (0.05 | )% | | | 31.98 | % | | | 11.15 | % | | | 5.46 | % | | | 13.60 | % |
| | | | | |
Ratios/Supplemental Data: | | | | | | | | | | | | | | | | | | | | |
Net Assets, End of Period (in 000’s) | | $ | 49,049 | | | $ | 56,793 | | | $ | 49,154 | | | $ | 91,347 | | | $ | 213,326 | |
Ratios of expenses to average net assets: | | | | | | | | | | | | | | | | | | | | |
Before expense reimbursement and/or fee waiver by Adviser | | | 1.33 | % | | | 1.34 | % | | | 1.37 | % | | | 1.37 | %(c) | | | 1.39 | %(c) |
After expense reimbursement and/or fee waiver by Adviser | | | 1.33 | % | | | 1.34 | % | | | 1.37 | % | | | 1.37 | %(c) | | | 1.39 | %(c) |
Ratios of net investment income (loss) to average net assets: | | | | | | | | | | | | | | | | | | | | |
Before expense reimbursement and/or fee waiver by Adviser | | | (0.26 | )% | | | 1.03 | % | | | 0.22 | % | | | (0.13 | )% | | | 0.27 | % |
After expense reimbursement and/or fee waiver by Adviser | | | (0.26 | )% | | | 1.03 | % | | | 0.22 | % | | | (0.13 | )% | | | 0.27 | % |
Portfolio Turnover | | | 66.22 | % | | | 56.08 | % | | | 26.95 | % | | | 42.29 | % | | | 51.05 | % |
| | (a) | The selected per share data was calculated using the weighted average shares outstanding method for the period. |
| | (b) | The total return is calculated using the Net Asset Value used for trading at the close of business at period end. |
| | (c) | Ratios of expenses to average net assets include interest expense of less than 0.005% for each of the years ended October 31, 2011 and October 31, 2010, which are not included in the contractual expense limitation. The interest expense is from utilizing the line of credit, as discussed in Note H to the Financial Statements. |
See accompanying Notes to Financial Statements.
| | |
| |
| ASTON/River Road Small Cap Value Fund – Class I | | October 31, 2014 |
| |
| Financial Highlights | | |
| | | | | | | | | | | | | | | | | | | | |
| | | Year
Ended
10/31/14 | | | Year
Ended
10/31/13 | | | Year
Ended
10/31/12 | | | Year
Ended
10/31/11 | | | Year
Ended
10/31/10 | |
| | | | | | | | | | | | | | | | | | | | |
Net Asset Value, Beginning of Period | | $ | 17.13 | | | $ | 13.62 | | | $ | 12.22 | | | $ | 11.62 | | | $ | 10.24 | |
| | | | | | | | | | | | | | | | | | | | |
Income from Investment Operations: | | | | | | | | | | | | | | | | | | | | |
Net investment income (loss) | | | (— | )(a)(b) | | | 0.19 | | | | 0.06 | (a) | | | 0.01 | | | | 0.06 | |
Net realized and unrealized gain on investments | | | 0.13 | | | | 4.01 | | | | 1.34 | | | | 0.65 | | | | 1.35 | |
| | | | | | | | | | | | | | | | | | | | |
Total from investment operations | | | 0.13 | | | | 4.20 | | | | 1.40 | | | | 0.66 | | | | 1.41 | |
| | | | | | | | | | | | | | | | | | | | |
Less Distributions: | | | | | | | | | | | | | | | | | | | | |
Distributions from and in excess of net investment income | | | (0.08 | ) | | | (0.26 | ) | | | — | | | | (0.06 | ) | | | (0.03 | ) |
Distributions from net realized gain on investments | | | (3.58 | ) | | | (0.43 | ) | | | — | | | | — | | | | — | |
| | | | | | | | | | | | | | | | | | | | |
Total distributions | | | (3.66 | ) | | | (0.69 | ) | | | — | | | | (0.06 | ) | | | (0.03 | ) |
| | | | | | | | | | | | | | | | | | | | |
Net increase (decrease) in net asset value | | | (3.53 | ) | | | 3.51 | | | | 1.40 | | | | 0.60 | | | | 1.38 | |
| | | | | | | | | | | | | | | | | | | | |
Net Asset Value, End of Period | | $ | 13.60 | | | $ | 17.13 | | | $ | 13.62 | | | $ | 12.22 | | | $ | 11.62 | |
| | | | | | | | | | | | | | | | | | | | |
Total Return (c) | | | 0.16 | % | | | 32.36 | % | | | 11.46 | % | | | 5.70 | % | | | 13.80 | % |
| | | | | |
Ratios/Supplemental Data: | | | | | | | | | | | | | | | | | | | | |
Net Assets, End of Period (in 000’s) | | $ | 250,173 | | | $ | 252,804 | | | $ | 240,075 | | | $ | 246,141 | | | $ | 255,344 | |
Ratios of expenses to average net assets: | | | | | | | | | | | | | | | | | | | | |
Before expense reimbursement and/or fee waiver by Adviser | | | 1.08 | % | | | 1.09 | % | | | 1.12 | % | | | 1.12 | %(d) | | | 1.14 | %(d) |
After expense reimbursement and/or fee waiver by Adviser | | | 1.08 | % | | | 1.09 | % | | | 1.12 | % | | | 1.12 | %(d) | | | 1.14 | %(d) |
Ratios of net investment income (loss) to average net assets: | | | | | | | | | | | | | | | | | | | | |
Before expense reimbursement and/or fee waiver by Adviser | | | (0.01 | )% | | | 1.28 | % | | | 0.47 | % | | | 0.12 | % | | | 0.52 | % |
After expense reimbursement and/or fee waiver by Adviser | | | (0.01 | )% | | | 1.28 | % | | | 0.47 | % | | | 0.12 | % | | | 0.52 | % |
Portfolio Turnover | | | 66.22 | % | | | 56.08 | % | | | 26.95 | % | | | 42.29 | % | | | 51.05 | % |
| | (a) | The selected per share data was calculated using the weighted average shares outstanding method for the period. |
| | (b) | Represents less than $(0.005) per share. |
| | (c) | The total return is calculated using the Net Asset Value used for trading at the close of business at period end. |
| | (d) | Ratios of expenses to average net assets include interest expense of less than 0.005% for each of the years ended October 31, 2011 and October 31, 2010, which are not included in the contractual expense limitation. The interest expense is from utilizing the line of credit, as discussed in Note H to the Financial Statements. |
See accompanying Notes to Financial Statements.
| | |
| |
| ASTON/Silvercrest Small Cap Fund – Class N | | October 31, 2014 |
| |
| Financial Highlights | | |
| | | | | | | | | | | | |
| | | Year
Ended
10/31/14 | | | Year
Ended
10/31/13 | | | Period
Ended
10/31/12(a) | |
| | | |
| | | |
| | | |
Net Asset Value, Beginning of Period | | $ | 14.54 | | | $ | 10.90 | | | $ | 10.00 | |
| | | | | | | | | | | | |
Income from Investment Operations: | | | | | | | | | | | | |
Net investment income | | | 0.01 | | | | 0.01 | (b) | | | 0.01 | |
Net realized and unrealized gain on investments | | | 1.16 | | | | 3.77 | | | | 0.89 | |
| | | | | | | | | | | | |
Total from investment operations | | | 1.17 | | | | 3.78 | | | | 0.90 | |
| | | | | | | | | | | | |
Less Distributions: | | | | | | | | | | | | |
Distributions from and in excess of net investment income | | | — | (c) | | | (0.11 | ) | | | — | |
Distributions from net realized gains on investments | | | (0.51 | ) | | | (0.03 | ) | | | — | |
| | | | | | | | | | | | |
Total distributions | | | (0.51 | ) | | | (0.14 | ) | | | — | |
| | | | | | | | | | | | |
Net increase in net asset value | | | 0.66 | | | | 3.64 | | | | 0.90 | |
| | | | | | | | | | | | |
Net Asset Value, End of Period | | $ | 15.20 | | | $ | 14.54 | | | $ | 10.90 | |
| | | | | | | | | | | | |
Total Return (d) | | | 8.18 | % | | | 35.09 | % | | | 9.00 | %(e) |
| | | |
Ratios/Supplemental Data: | | | | | | | | | | | | |
Net Assets, End of Period (in 000’s) | | $ | 6,673 | | | $ | 4,049 | | | $ | 750 | |
Ratios of expenses to average net assets: | | | | | | | | | | | | |
Before expense reimbursement and/or fee waiver by Adviser | | | 1.61 | % | | | 2.05 | % | | | 5.10 | %(f) |
After expense reimbursement and/or fee waiver by Adviser | | | 1.40 | % | | | 1.40 | % | | | 1.40 | %(f) |
Ratios of net investment income (loss) to average net assets: | | | | | | | | | | | | |
Before expense reimbursement and/or fee waiver by Adviser | | | (0.17 | )% | | | (0.61 | )% | | | (3.51 | )%(f) |
After expense reimbursement and/or fee waiver by Adviser | | | 0.04 | % | | | 0.04 | % | | | 0.19 | %(f) |
Portfolio Turnover | | | 31.68 | % | | | 36.82 | % | | | 26.22 | %(e)(g) |
| | (a) | The inception date for the Silvercrest Small Cap Fund Class N shares is December 27, 2011. |
| | (b) | The selected per share data was calculated using the weighted average shares outstanding method for the period. |
| | (c) | Represents less than $(0.005) per share. |
| | (d) | The total return is calculated using the Net Asset Value used for trading at the close of business at period end. |
| | (g) | Portfolio turnover rate excludes securities delivered from processing a redemption-in-kind. |
See accompanying Notes to Financial Statements.
| | |
| |
| ASTON/Silvercrest Small Cap Fund – Class I | | October 31, 2014 |
| |
| Financial Highlights | | |
| | | | | | | | | | | | |
| | | Year
Ended
10/31/14 | | | Year
Ended
10/31/13 | | | Period
Ended
10/31/12(a) | |
| | | |
| | | |
| | | |
Net Asset Value, Beginning of Period | | $ | 14.59 | | | $ | 10.93 | | | $ | 10.00 | |
| | | | | | | | | | | | |
Income from Investment Operations: | | | | | | | | | | | | |
Net investment income | | | 0.05 | | | | 0.04 | (b) | | | 0.03 | |
Net realized and unrealized gain on investments | | | 1.17 | | | | 3.78 | | | | 0.90 | |
| | | | | | | | | | | | |
Total from investment operations | | | 1.22 | | | | 3.82 | | | | 0.93 | |
| | | | | | | | | | | | |
Less Distributions: | | | | | | | | | | | | |
Distributions from and in excess of net investment income | | | (0.03 | ) | | | (0.13 | ) | | | — | |
Distributions from net realized gains on investments | | | (0.51 | ) | | | (0.03 | ) | | | — | |
| | | | | | | | | | | | |
Total distributions | | | (0.54 | ) | | | (0.16 | ) | | | — | |
| | | | | | | | | | | | |
Net increase in net asset value | | | 0.68 | | | | 3.66 | | | | 0.93 | |
| | | | | | | | | | | | |
Net Asset Value, End of Period | | $ | 15.27 | | | $ | 14.59 | | | $ | 10.93 | |
| | | | | | | | | | | | |
Total Return (c) | | | 8.47 | % | | | 35.39 | % | | | 9.30 | %(d) |
| | | |
Ratios/Supplemental Data: | | | | | | | | | | | | |
Net Assets, End of Period (in 000’s) | | $ | 62,215 | | | $ | 29,219 | | | $ | 4,962 | |
Ratios of expenses to average net assets: | | | | | | | | | | | | |
Before expense reimbursement and/or fee waiver by Adviser | | | 1.36 | % | | | 1.80 | % | | | 4.85 | %(e) |
After expense reimbursement and/or fee waiver by Adviser | | | 1.15 | % | | | 1.15 | % | | | 1.15 | %(e) |
Ratios of net investment income (loss) to average net assets: | | | | | | | | | | | | |
Before expense reimbursement and/or fee waiver by Adviser | | | 0.08 | % | | | (0.36 | )% | | | (3.26 | )%(e) |
After expense reimbursement and/or fee waiver by Adviser | | | 0.29 | % | | | 0.29 | % | | | 0.44 | %(e) |
Portfolio Turnover | | | 31.68 | % | | | 36.82 | % | | | 26.22 | %(d)(f) |
| | (a) | The inception date for the Silvercrest Small Cap Fund Class I shares is December 27, 2011. |
| | (b) | The selected per share data was calculated using the weighted average shares outstanding method for the period. |
| | (c) | The total return is calculated using the Net Asset Value used for trading at the close of business at period end. |
| | (f) | Portfolio turnover rate excludes securities delivered from processing a redemption-in-kind. |
See accompanying Notes to Financial Statements.
| | |
| |
| ASTON/TAMRO Small Cap Fund – Class N | | October 31, 2014 |
| |
| Financial Highlights | | |
| | | | | | | | | | | | | | | | | | | | |
| | | Year
Ended
10/31/14 | | | Year
Ended
10/31/13 | | | Year
Ended
10/31/12 | | | Year
Ended
10/31/11 | | | Year
Ended
10/31/10 | |
Net Asset Value, Beginning of Period | | $ | 24.06 | | | $ | 20.52 | | | $ | 20.57 | | | $ | 19.42 | | | $ | 14.67 | |
| | | | | | | | | | | | | | | | | | | | |
Income from Investment Operations: | | | | | | | | | | | | | | | | | | | | |
Net investment loss | | | (0.13 | )(a) | | | (0.03 | )(a) | | | (0.12 | )(a) | | | (0.15 | )(a) | | | (0.08 | )(a) |
Net realized and unrealized gain on investments | | | 0.30 | | | | 5.55 | | | | 2.09 | | | | 1.75 | | | | 4.83 | |
| | | | | | | | | | | | | | | | | | | | |
Total from investment operations | | | 0.17 | | | | 5.52 | | | | 1.97 | | | | 1.60 | | | | 4.75 | |
| | | | | | | | | | | | | | | | | | | | |
Less Distributions: | | | | | | | | | | | | | | | | | | | | |
Distributions from net realized gain on investments | | | (2.16 | ) | | | (1.98 | ) | | | (2.02 | ) | | | (0.45 | ) | | | — | |
| | | | | | | | | | | | | | | | | | | | |
Total distributions | | | (2.16 | ) | | | (1.98 | ) | | | (2.02 | ) | | | (0.45 | ) | | | — | |
| | | | | | | | | | | | | | | | | | | | |
Net increase (decrease) in net asset value | | | (1.99 | ) | | | 3.54 | | | | (0.05 | ) | | | 1.15 | | | | 4.75 | |
| | | | | | | | | | | | | | | | | | | | |
Net Asset Value, End of Period | | $ | 22.07 | | | $ | 24.06 | | | $ | 20.52 | | | $ | 20.57 | | | $ | 19.42 | |
| | | | | | | | | | | | | | | | | | | | |
Total Return (b) | | | 0.57 | % | | | 29.52 | % | | | 10.70 | % | | | 8.16 | % | | | 32.29 | % |
| | | | | |
Ratios/Supplemental Data: | | | | | | | | | | | | | | | | | | | | |
Net Assets, End of Period (in 000’s) | | $ | 336,350 | | | $ | 533,627 | | | $ | 389,125 | | | $ | 375,969 | | | $ | 335,809 | |
Ratios of expenses to average net assets: | | | | | | | | | | | | | | | | | | | | |
Before expense reimbursement and/or fee waiver by Adviser | | | 1.31 | % | | | 1.31 | % | | | 1.28 | %(c) | | | 1.29 | % | | | 1.34 | % |
After expense reimbursement and/or fee waiver by Adviser | | | 1.31 | % | | | 1.31 | % | | | 1.28 | %(c) | | | 1.29 | % | | | 1.34 | % |
Ratios of net investment loss to average net assets: | | | | | | | | | | | | | | | | | | | | |
Before expense reimbursement and/or fee waiver by Adviser | | | (0.57 | )% | | | (0.16 | )% | | | (0.59 | )% | | | (0.69 | )% | | | (0.49 | )% |
After expense reimbursement and/or fee waiver by Adviser | | | (0.57 | )% | | | (0.16 | )%(d) | | | (0.59 | )% | | | (0.69 | )% | | | (0.49 | )% |
Portfolio Turnover | | | 69.72 | % | | | 71.28 | %(d)(e) | | | 48.22 | %(d) | | | 47.25 | % | | | 62.13 | % |
| | (a) | The selected per share data was calculated using the weighted average shares outstanding method for the period. |
| | (b) | The total return is calculated using the Net Asset Value used for trading at the close of business at period end. |
| | (c) | Ratios of expenses to average net assets include interest expense of less than 0.005% for the year ended October 31, 2012, which is not included in the contractual expense limitation. The interest expense is from utilizing the line of credit, as discussed in Note H to the Financial Statements. |
| | (d) | Portfolio turnover rate excludes securities delivered from processing redemptions-in-kind. |
| | (e) | Portfolio turnover rate excludes securities received from processing a subscription-in-kind. |
See accompanying Notes to Financial Statements.
| | |
| |
| ASTON/TAMRO Small Cap Fund – Class I | | October 31, 2014 |
| |
| Financial Highlights | | |
| | | | | | | | | | | | | | | | | | | | |
| | | Year
Ended
10/31/14 | | | Year
Ended
10/31/13 | | | Year
Ended
10/31/12 | | | Year
Ended
10/31/11 | | | Year
Ended
10/31/10 | |
| | | | | | | | | | | | | | | | | | | | |
Net Asset Value, Beginning of Period | | $ | 24.69 | | | $ | 20.96 | | | $ | 20.91 | | | $ | 19.69 | | | $ | 14.87 | |
| | | | | | | | | | | | | | | | | | | | |
Income from Investment Operations: | | | | | | | | | | | | | | | | | | | | |
Net investment income (loss) | | | (0.07 | )(a) | | | 0.02 | (a) | | | (0.07 | )(a) | | | (0.09 | )(a) | | | (0.04 | )(a) |
Net realized and unrealized gain on investments | | | 0.30 | | | | 5.69 | | | | 2.14 | | | | 1.76 | | | | 4.87 | |
| | | | | | | | | | | | | | | | | | | | |
Total from investment operations | | | 0.23 | | | | 5.71 | | | | 2.07 | | | | 1.67 | | | | 4.83 | |
| | | | | | | | | | | | | | | | | | | | |
Less Distributions: | | | | | | | | | | | | | | | | | | | | |
Distributions from and in excess of net investment income | | | — | | | | — | | | | — | | | | — | | | | (0.01 | ) |
Distributions from net realized gain on investments | | | (2.16 | ) | | | (1.98 | ) | | | (2.02 | ) | | | (0.45 | ) | | | — | |
| | | | | | | | | | | | | | | | | | | | |
Total distributions | | | (2.16 | ) | | | (1.98 | ) | | | (2.02 | ) | | | (0.45 | ) | | | (0.01 | ) |
| | | | | | | | | | | | | | | | | | | | |
Net increase (decrease) in net asset value | | | (1.93 | ) | | | 3.73 | | | | 0.05 | | | | 1.22 | | | | 4.82 | |
| | | | | | | | | | | | | | | | | | | | |
Net Asset Value, End of Period | | $ | 22.76 | | | $ | 24.69 | | | $ | 20.96 | | | $ | 20.91 | | | $ | 19.69 | |
| | | | | | | | | | | | | | | | | | | | |
Total Return (b) | | | 0.86 | % | | | 29.84 | % | | | 10.98 | % | | | 8.40 | % | | | 32.62 | % |
| | | | | |
Ratios/Supplemental Data: | | | | | | | | | | | | | | | | | | | | |
Net Assets, End of Period (in 000’s) | | $ | 469,518 | | | $ | 792,172 | | | $ | 635,663 | | | $ | 625,315 | | | $ | 549,627 | |
Ratios of expenses to average net assets: | | | | | | | | | | | | | | | | | | | | |
Before expense reimbursement and/or fee waiver by Adviser | | | 1.06 | % | | | 1.06 | % | | | 1.03 | %(c) | | | 1.04 | % | | | 1.09 | % |
After expense reimbursement and/or fee waiver by Adviser | | | 1.06 | % | | | 1.06 | % | | | 1.03 | %(c) | | | 1.04 | % | | | 1.09 | % |
Ratios of net investment income (loss) to average net assets: | | | | | | | | | | | | | | | | | | | | |
Before expense reimbursement and/or fee waiver by Adviser | | | (0.32 | )% | | | 0.09 | % | | | (0.34 | )% | | | (0.44 | )% | | | (0.24 | )% |
After expense reimbursement and/or fee waiver by Adviser | | | (0.32 | )% | | | 0.09 | %(d) | | | (0.34 | )% | | | (0.44 | )% | | | (0.24 | )% |
Portfolio Turnover | | | 69.72 | % | | | 71.28 | %(d)(e) | | | 48.22 | %(d) | | | 47.25 | % | | | 62.13 | % |
| | (a) | The selected per share data was calculated using the weighted average shares outstanding method for the period. |
| | (b) | The total return is calculated using the Net Asset Value used for trading at the close of business at period end. |
| | (c) | Ratios of expenses to average net assets include interest expense of less than 0.005% for the year ended October 31, 2012, which is not included in the contractual expense limitation. The interest expense is from utilizing the line of credit, as discussed in Note H to the Financial Statements. |
| | (d) | Portfolio turnover rate excludes securities delivered from processing redemptions-in-kind. |
| | (e) | Portfolio turnover rate excludes securities received from processing a subscription-in-kind. |
See accompanying Notes to Financial Statements.
| | |
| |
| ASTON/DoubleLine Core Plus Fixed Income Fund – Class N | | October 31, 2014 |
| |
| Financial Highlights | | |
| | | | | | | | | | | | | | | | |
| | | Year
Ended
10/31/14 | | | Year
Ended
10/31/13 | | | Year
Ended
10/31/12 | | | Period
Ended
10/31/11(a) | |
Net Asset Value, Beginning of Period | | $ | 10.65 | | | $ | 11.10 | | | $ | 10.44 | | | $ | 10.00 | |
| | | | | | | | | | | | | | | | |
Income from Investment Operations: | | | | | | | | | | | | | | | | |
Net investment income | | | 0.40 | | | | 0.30 | | | | 0.33 | (b) | | | 0.12 | (b) |
Net realized and unrealized gain (loss) on investments | | | 0.22 | | | | (0.33 | ) | | | 0.72 | | | | 0.41 | |
| | | | | | | | | | | | | | | | |
Total from investment operations | | | 0.62 | | | | (0.03 | ) | | | 1.05 | | | | 0.53 | |
| | | | | | | | | | | | | | | | |
Less Distributions: | | | | | | | | | | | | | | | | |
Distributions from and in excess of net investment income | | | (0.41 | ) | | | (0.36 | ) | | | (0.37 | ) | | | (0.09 | ) |
Distributions from net realized gain on investments | | | — | | | | (0.06 | ) | | | (0.02 | ) | | | — | |
| | | | | | | | | | | | | | | | |
Total distributions | | | (0.41 | ) | | | (0.42 | ) | | | (0.39 | ) | | | (0.09 | ) |
| | | | | | | | | | | | | | | | |
Net increase (decrease) in net asset value | | | 0.21 | | | | (0.45 | ) | | | 0.66 | | | | 0.44 | |
| | | | | | | | | | | | | | | | |
Net Asset Value, End of Period | | $ | 10.86 | | | $ | 10.65 | | | $ | 11.10 | | | $ | 10.44 | |
| | | | | | | | | | | | | | | | |
Total Return (c) | | | 5.96 | % | | | (0.28 | )% | | | 10.25 | % | | | 5.33 | %(d) |
| | | | |
Ratios/Supplemental Data: | | | | | | | | | | | | | | | | |
Net Assets, End of Period (in 000’s) | | $ | 49,147 | | | $ | 66,368 | | | $ | 71,546 | | | $ | 22,657 | |
Ratios of expenses to average net assets: | | | | | | | | | | | | | | | | |
Before expense reimbursement and/or fee waiver by Adviser | | | 1.08 | % | | | 1.04 | % | | | 1.35 | % | | | 3.16 | %(e) |
After expense reimbursement and/or fee waiver by Adviser | | | 0.94 | % | | | 0.94 | % | | | 0.94 | % | | | 0.94 | %(e) |
Ratios of net investment income to average net assets: | | | | | | | | | | | | | | | | |
Before expense reimbursement and/or fee waiver by Adviser | | | 3.58 | % | | | 2.66 | % | | | 2.59 | % | | | 1.63 | %(e) |
After expense reimbursement and/or fee waiver by Adviser | | | 3.72 | % | | | 2.77 | % | | | 3.01 | % | | | 3.85 | %(e) |
Portfolio Turnover | | | 117.18 | % | | | 125.07 | % | | | 118.67 | % | | | 38.49 | %(d) |
| | (a) | The inception date for the DoubleLine Core Plus Fixed Income Fund Class N shares is July 18, 2011. |
| | (b) | The selected per share data was calculated using the weighted average shares outstanding method for the period. |
| | (c) | The total return is calculated using the Net Asset Value used for trading at the close of business at period end. |
See accompanying Notes to Financial Statements.
| | |
| |
| ASTON/DoubleLine Core Plus Fixed Income Fund – Class I | | October 31, 2014 |
| |
| Financial Highlights | | |
| | | | | | | | | | | | | | | | |
| | | Year
Ended
10/31/14 | | | Year
Ended
10/31/13 | | | Year
Ended
10/31/12 | | | Period
Ended
10/31/11(a) | |
Net Asset Value, Beginning of Period | | $ | 10.65 | | | $ | 11.10 | | | $ | 10.44 | | | $ | 10.00 | |
| | | | | | | | | | | | | | | | |
Income from Investment Operations: | | | | | | | | | | | | | | | | |
Net investment income | | | 0.44 | | | | 0.33 | | | | 0.35 | (b) | | | 0.13 | (b) |
Net realized and unrealized gain (loss) on investments | | | 0.21 | | | | (0.33 | ) | | | 0.73 | | | | 0.41 | |
| | | | | | | | | | | | | | | | |
Total from investment operations | | | 0.65 | | | | — | | | | 1.08 | | | | 0.54 | |
| | | | | | | | | | | | | | | | |
Less Distributions: | | | | | | | | | | | | | | | | |
Distributions from and in excess of net investment income | | | (0.44 | ) | | | (0.39 | ) | | | (0.40 | ) | | | (0.10 | ) |
Distributions from net realized gain on investments | | | — | | | | (0.06 | ) | | | (0.02 | ) | | | — | |
| | | | | | | | | | | | | | | | |
Total distributions | | | (0.44 | ) | | | (0.45 | ) | | | (0.42 | ) | | | (0.10 | ) |
| | | | | | | | | | | | | | | | |
Net increase (decrease) in net asset value | | | 0.21 | | | | (0.45 | ) | | | 0.66 | | | | 0.44 | |
| | | | | | | | | | | | | | | | |
Net Asset Value, End of Period | | $ | 10.86 | | | $ | 10.65 | | | $ | 11.10 | | | $ | 10.44 | |
| | | | | | | | | | | | | | | | |
Total Return (c) | | | 6.22 | % | | | (0.03 | )% | | | 10.52 | % | | | 5.38 | %(d) |
| | | | |
Ratios/Supplemental Data: | | | | | | | | | | | | | | | | |
Net Assets, End of Period (in 000’s) | | $ | 158,198 | | | $ | 110,018 | | | $ | 105,335 | | | $ | 4,486 | |
Ratios of expenses to average net assets: | | | | | | | | | | | | | | | | |
Before expense reimbursement and/or fee waiver by Adviser | | | 0.83 | % | | | 0.79 | % | | | 1.10 | % | | | 2.91 | %(e) |
After expense reimbursement and/or fee waiver by Adviser | | | 0.69 | % | | | 0.69 | % | | | 0.69 | % | | | 0.69 | %(e) |
Ratios of net investment income to average net assets: | | | | | | | | | | | | | | | | |
Before expense reimbursement and/or fee waiver by Adviser | | | 3.83 | % | | | 2.91 | % | | | 2.84 | % | | | 1.88 | %(e) |
After expense reimbursement and/or fee waiver by Adviser | | | 3.97 | % | | | 3.02 | % | | | 3.26 | % | | | 4.10 | %(e) |
Portfolio Turnover | | | 117.18 | % | | | 125.07 | % | | | 118.67 | % | | | 38.49 | %(d) |
| | (a) | The inception date for the DoubleLine Core Plus Fixed Income Fund Class I shares is July 18, 2011. |
| | (b) | The selected per share data was calculated using the weighted average shares outstanding method for the period. |
| | (c) | The total return is calculated using the Net Asset Value used for trading at the close of business at period end. |
See accompanying Notes to Financial Statements.
| | |
| |
| ASTON/TCH Fixed Income Fund – Class N | | October 31, 2014 |
| |
| Financial Highlights | | |
| | | | | | | | | | | | | | | | | | | | |
| | | Year
Ended
10/31/14 | | | Year
Ended
10/31/13 | | | Year
Ended
10/31/12 | | | Year
Ended
10/31/11 | | | Year
Ended
10/31/10 | |
Net Asset Value, Beginning of Period | | $ | 10.67 | | | $ | 11.11 | | | $ | 10.59 | | | $ | 10.49 | | | $ | 10.02 | |
| | | | | | | | | | | | | | | | | | | | |
Income from Investment Operations: | | | | | | | | | | | | | | | | | | | | |
Net investment income | | | 0.35 | (a) | | | 0.40 | (a) | | | 0.45 | (a) | | | 0.47 | (a) | | | 0.50 | (a) |
Net realized and unrealized gain (loss) on investments | | | 0.23 | | | | (0.39 | ) | | | 0.56 | | | | 0.10 | | | | 0.47 | |
| | | | | | | | | | | | | | | | | | | | |
Total from investment operations | | | 0.58 | | | | 0.01 | | | | 1.01 | | | | 0.57 | | | | 0.97 | |
| | | | | | | | | | | | | | | | | | | | |
Less Distributions: | | | | | | | | | | | | | | | | | | | | |
Distributions from and in excess of net investment income | | | (0.40 | ) | | | (0.45 | ) | | | (0.49 | ) | | | (0.47 | ) | | | (0.50 | ) |
| | | | | | | | | | | | | | | | | | | | |
Total distributions | | | (0.40 | ) | | | (0.45 | ) | | | (0.49 | ) | | | (0.47 | ) | | | (0.50 | ) |
| | | | | | | | | | | | | | | | | | | | |
Net increase (decrease) in net asset value | | | 0.18 | | | | (0.44 | ) | | | 0.52 | | | | 0.10 | | | | 0.47 | |
| | | | | | | | | | | | | | | | | | | | |
Net Asset Value, End of Period | | $ | 10.85 | | | $ | 10.67 | | | $ | 11.11 | | | $ | 10.59 | | | $ | 10.49 | |
| | | | | | | | | | | | | | | | | | | | |
Total Return (b) | | | 5.48 | % | | | 0.13 | % | | | 9.74 | % | | | 5.62 | % | | | 9.98 | % |
| | | | | |
Ratios/Supplemental Data: | | | | | | | | | | | | | | | | | | | | |
Net Assets, End of Period (in 000’s) | | $ | 36,950 | | | $ | 45,771 | | | $ | 59,772 | | | $ | 62,346 | | | $ | 46,274 | |
Ratios of expenses to average net assets: | | | | | | | | | | | | | | | | | | | | |
Before expense reimbursement and/or fee waiver by Adviser | | | 1.17 | % | | | 1.02 | % | | | 1.02 | % | | | 1.14 | % | | | 0.98 | % |
After expense reimbursement and/or fee waiver by Adviser | | | 0.94 | % | | | 0.84 | % | | | 0.86 | % | | | 0.88 | %(c) | | | 0.62 | % |
Ratios of net investment income to average net assets: | | | | | | | | | | | | | | | | | | | | |
Before expense reimbursement and/or fee waiver by Adviser | | | 3.04 | % | | | 3.49 | % | | | 4.03 | % | | | 4.20 | % | | | 4.51 | % |
After expense reimbursement and/or fee waiver by Adviser | | | 3.26 | % | | | 3.67 | % | | | 4.19 | % | | | 4.46 | % | | | 4.87 | % |
Portfolio Turnover | | | 36.31 | % | | | 53.77 | % | | | 57.43 | % | | | 37.51 | % | | | 23.92 | % |
| | (a) | The selected per share data was calculated using the weighted average shares outstanding method for the period. |
| | (b) | The total return is calculated using the Net Asset Value used for trading at the close of business at period end. |
| | (c) | Effective March 1, 2011, the contractual expense limitation was increased from 0.74% to 0.94%, excluding interest, taxes, investment-related costs (such as brokerage commissions), extraordinary expenses and acquired fund fees and expenses. |
See accompanying Notes to Financial Statements.
| | |
| |
| ASTON/TCH Fixed Income Fund – Class I | | October 31, 2014 |
| |
| Financial Highlights | | |
| | | | | | | | | | | | | | | | | | | | |
| | | Year
Ended
10/31/14 | | | Year
Ended
10/31/13 | | | Year
Ended
10/31/12 | | | Year
Ended
10/31/11 | | | Year
Ended
10/31/10 | |
Net Asset Value, Beginning of Period | | $ | 10.67 | | | $ | 11.11 | | | $ | 10.59 | | | $ | 10.49 | | | $ | 10.02 | |
| | | | | | | | | | | | | | | | | | | | |
Income from Investment Operations: | | | | | | | | | | | | | | | | | | | | |
Net investment income | | | 0.38 | (a) | | | 0.42 | (a) | | | 0.47 | (a) | | | 0.49 | (a) | | | 0.51 | (a) |
Net realized and unrealized gain (loss) on investments | | | 0.22 | | | | (0.39 | ) | | | 0.55 | | | | 0.11 | | | | 0.48 | |
| | | | | | | | | | | | | | | | | | | | |
Total from investment operations | | | 0.60 | | | | 0.03 | | | | 1.02 | | | | 0.60 | | | | 0.99 | |
| | | | | | | | | | | | | | | | | | | | |
Less Distributions: | | | | | | | | | | | | | | | | | | | | |
Distributions from and in excess of net investment income | | | (0.42 | ) | | | (0.47 | ) | | | (0.50 | ) | | | (0.50 | ) | | | (0.52 | ) |
| | | | | | | | | | | | | | | | | | | | |
Total distributions | | | (0.42 | ) | | | (0.47 | ) | | | (0.50 | ) | | | (0.50 | ) | | | (0.52 | ) |
| | | | | | | | | | | | | | | | | | | | |
Net increase (decrease) in net asset value . | | | 0.18 | | | | (0.44 | ) | | | 0.52 | | | | 0.10 | | | | 0.47 | |
| | | | | | | | | | | | | | | | | | | | |
Net Asset Value, End of Period | | $ | 10.85 | | | $ | 10.67 | | | $ | 11.11 | | | $ | 10.59 | | | $ | 10.49 | |
| | | | | | | | | | | | | | | | | | | | |
Total Return (b) | | | 5.75 | % | | | 0.28 | % | | | 9.93 | % | | | 5.89 | % | | | 10.11 | % |
| | | | | |
Ratios/Supplemental Data: | | | | | | | | | | | | | | | | | | | | |
Net Assets, End of Period (in 000’s) | | $ | 15,199 | | | $ | 8,742 | | | $ | 10,396 | | | $ | 10,423 | | | $ | 14,881 | |
Ratios of expenses to average net assets: | | | | | | | | | | | | | | | | | | | | |
Before expense reimbursement and/or fee waiver by Adviser | | | 0.92 | % | | | 0.87 | % | | | 0.85 | % | | | 0.89 | % | | | 0.85 | % |
After expense reimbursement and/or fee waiver by Adviser | | | 0.69 | % | | | 0.69 | % | | | 0.69 | % | | | 0.63 | %(c) | | | 0.49 | % |
Ratios of net investment income to average net assets: | | | | | | | | | | | | | | | | | | | | |
Before expense reimbursement and/or fee waiver by Adviser | | | 3.29 | % | | | 3.64 | % | | | 4.20 | % | | | 4.45 | % | | | 4.64 | % |
After expense reimbursement and/or fee waiver by Adviser | | | 3.51 | % | | | 3.82 | % | | | 4.36 | % | | | 4.71 | % | | | 5.00 | % |
Portfolio Turnover | | | 36.31 | % | | | 53.77 | % | | | 57.43 | % | | | 37.51 | % | | | 23.92 | % |
| | (a) | The selected per share data was calculated using the weighted average shares outstanding method for the period. |
| | (b) | The total return is calculated using the Net Asset Value used for trading at the close of business at period end. |
| | (c) | Effective March 1, 2011, the contractual expense limitation was increased from 0.49% to 0.69%, excluding interest, taxes, investment-related costs (such as brokerage commissions), extraordinary expenses and acquired fund fees and expenses. |
See accompanying Notes to Financial Statements.
| | |
| |
| ASTON/Anchor Capital Enhanced Equity Fund – Class N | | October 31, 2014 |
| |
| Financial Highlights | | |
| | | | | | | | | | | | | | | | | | | | |
| | | Year
Ended
10/31/14 | | | Year
Ended
10/31/13 | | | Year
Ended
10/31/12 | | | Year
Ended
10/31/11 | | | Year
Ended
10/31/10 | |
| | | | | | | | | | | | | | | | | | | | |
Net Asset Value, Beginning of Period | | $ | 9.39 | | | $ | 8.68 | | | $ | 9.61 | | | $ | 9.41 | | | $ | 8.57 | |
| | | | | | | | | | | | | | | | | | | | |
Income from Investment Operations: | | | | | | | | | | | | | | | | | | | | |
Net investment income | | | 0.17 | | | | 0.20 | | | | 0.16 | | | | 0.14 | | | | 0.10 | |
Net realized and unrealized gain on investments | | | 0.09 | | | | 0.86 | | | | 0.11 | | | | 0.56 | | | | 0.84 | |
| | | | | | | | | | | | | | | | | | | | |
Total from investment operations | | | 0.26 | | | | 1.06 | | | | 0.27 | | | | 0.70 | | | | 0.94 | |
| | | | | | | | | | | | | | | | | | | | |
Less Distributions: | | | | | | | | | | | | | | | | | | | | |
Distributions from and in excess of net investment income | | | (0.16 | ) | | | (0.20 | ) | | | (0.16 | ) | | | (0.13 | ) | | | (0.10 | ) |
Distributions from net realized gain on investments | | | — | | | | (0.15 | ) | | | (1.04 | ) | | | (0.37 | ) | | | — | |
| | | | | | | | | | | | | | | | | | | | |
Total distributions | | | (0.16 | ) | | | (0.35 | ) | | | (1.20 | ) | | | (0.50 | ) | | | (0.10 | ) |
| | | | | | | | | | | | | | | | | | | | |
Net increase (decrease) in net asset value | | | 0.10 | | | | 0.71 | | | | (0.93 | ) | | | 0.20 | | | | 0.84 | |
| | | | | | | | | | | | | | | | | | | | |
Net Asset Value, End of Period | | $ | 9.49 | | | $ | 9.39 | | | $ | 8.68 | | | $ | 9.61 | | | $ | 9.41 | |
| | | | | | | | | | | | | | | | | | | | |
Total Return (a) | | | 2.68 | % | | | 12.60 | % | | | 3.12 | % | | | 7.69 | % | | | 11.05 | % |
| | | | | |
Ratios/Supplemental Data: | | | | | | | | | | | | | | | | | | | | |
Net Assets, End of Period (in 000’s) | | $ | 101,980 | | | $ | 101,663 | | | $ | 106,191 | | | $ | 48,365 | | | $ | 46,423 | |
Ratios of expenses to average net assets: | | | | | | | | | | | | | | | | | | | | |
Before earnings credit, expense reimbursement and/or fee waiver, or recoupment by the Adviser | | | 1.19 | % | | | 1.23 | %(b) | | | 1.22 | %(b)(c) | | | 1.24 | %(c) | | | 1.37 | % |
After earnings credit, expense reimbursement and/or fee waiver, or recoupment by the Adviser | | | 1.19 | % | | | 1.23 | %(b) | | | 1.27 | %(b)(c) | | | 1.33 | %(c) | | | 1.40 | % |
Ratios of net investment income to average net assets: | | | | | | | | | | | | | | | | | | | | |
Before earnings credit, expense reimbursement and/or fee waiver, or recoupment by the Adviser | | | 1.81 | % | | | 2.24 | % | | | 1.82 | % | | | 1.51 | % | | | 1.20 | % |
After earnings credit, expense reimbursement and/or fee waiver, or recoupment by the Adviser | | | 1.81 | % | | | 2.24 | % | | | 1.78 | % | | | 1.41 | % | | | 1.17 | % |
Portfolio Turnover | | | 41.24 | % | | | 77.70 | % | | | 56.33 | % | | | 87.37 | % | | | 41.33 | % |
| | (a) | The total return is calculated using the Net Asset Value used for trading at the close of business at period end. |
| | (b) | Ratios of expenses to average net assets include Earnings Credits of less than 0.005% for each of the years ended October 31, 2013 and October 31, 2012, which are not included in the contractual expense limitation. See Note I to the Financial Statements. |
| | (c) | Ratios of expenses to average net assets include interest expense of less than 0.005% for each of the years ended October 31, 2012 and October 31, 2011, which are not included in the contractual expense limitation. The interest expense is from utilizing the line of credit, as discussed in Note H to the Financial Statements. |
See accompanying Notes to Financial Statements.
| | |
| |
| ASTON/Anchor Capital Enhanced Equity Fund – Class I | | October 31, 2014 |
| |
| Financial Highlights | | |
| | | | | | | | | | | | | | | | | | | | |
| | | Year
Ended
10/31/14 | | | Year
Ended
10/31/13 | | | Year
Ended
10/31/12 | | | Year
Ended
10/31/11 | | | Period
Ended
10/31/10(a) | |
| | | | | | | | | | | | | | | | | | | | |
Net Asset Value, Beginning of Period | | $ | 9.40 | | | $ | 8.69 | | | $ | 9.62 | | | $ | 9.41 | | | $ | 9.04 | |
| | | | | | | | | | | | | | | | | | | | |
Income from Investment Operations: | | | | | | | | | | | | | | | | | | | | |
Net investment income | | | 0.18 | | | | 0.22 | | | | 0.18 | | | | 0.16 | | | | 0.09 | |
Net realized and unrealized gain on investments | | | 0.10 | | | | 0.86 | | | | 0.11 | | | | 0.57 | | | | 0.37 | |
| | | | | | | | | | | | | | | | | | | | |
Total from investment operations | | | 0.28 | | | | 1.08 | | | | 0.29 | | | | 0.73 | | | | 0.46 | |
| | | | | | | | | | | | | | | | | | | | |
Less Distributions: | | | | | | | | | | | | | | | | | | | | |
Distributions from and in excess of net investment income | | | (0.18 | ) | | | (0.22 | ) | | | (0.18 | ) | | | (0.15 | ) | | | (0.09 | ) |
Distributions from net realized gain on investments | | | — | | | | (0.15 | ) | | | (1.04 | ) | | | (0.37 | ) | | | — | |
| | | | | | | | | | | | | | | | | | | | |
Total distributions | | | (0.18 | ) | | | (0.37 | ) | | | (1.22 | ) | | | (0.52 | ) | | | (0.09 | ) |
| | | | | | | | | | | | | | | | | | | | |
Net increase (decrease) in net asset value | | | 0.10 | | | | 0.71 | | | | (0.93 | ) | | | 0.21 | | | | 0.37 | |
| | | | | | | | | | | | | | | | | | | | |
Net Asset Value, End of Period | | $ | 9.50 | | | $ | 9.40 | | | $ | 8.69 | | | $ | 9.62 | | | $ | 9.41 | |
| | | | | | | | | | | | | | | | | | | | |
Total Return (b) | | | 2.94 | % | | | 12.88 | % | | | 3.46 | % | | | 7.97 | % | | | 5.10 | %(c) |
| | | | | |
Ratios/Supplemental Data: | | | | | | | | | | | | | | | | | | | | |
Net Assets, End of Period (in 000’s) | | $ | 108,985 | | | $ | 58,099 | | | $ | 71,618 | | | $ | 64,840 | | | $ | 46,140 | |
Ratios of expenses to average net assets: | | | | | | | | | | | | | | | | | | | | |
Before earnings credit, expense reimbursement and/or fee waiver, or recoupment by the Adviser | | | 0.94 | % | | | 0.98 | %(e) | | | 0.97 | %(e)(f) | | | 0.99 | %(f) | | | 1.10 | %(d) |
After earnings credit, expense reimbursement and/or fee waiver, or recoupment by the Adviser | | | 0.94 | % | | | 0.98 | %(e) | | | 1.02 | %(e)(f) | | | 1.08 | %(f) | | | 1.15 | %(d) |
Ratios of net investment income to average net assets: | | | | | | | | | | | | | | | | | | | | |
Before earnings credit, expense reimbursement and/or fee waiver, or recoupment by the Adviser | | | 2.06 | % | | | 2.49 | % | | | 2.07 | % | | | 1.76 | % | | | 1.37 | %(d) |
After earnings credit, expense reimbursement and/or fee waiver, or recoupment by the Adviser | | | 2.06 | % | | | 2.49 | % | | | 2.03 | % | | | 1.66 | % | | | 1.32 | %(d) |
Portfolio Turnover | | | 41.24 | % | | | 77.70 | % | | | 56.33 | % | | | 87.37 | % | | | 41.33 | % |
| | (a) | The inception date for the Anchor Capital Enhanced Equity Fund Class I shares is March 3, 2010. |
| | (b) | The total return is calculated using the Net Asset Value used for trading at the close of business at period end. |
| | (e) | Ratios of expenses to average net assets include Earnings Credits of less than 0.005% for each of the years ended October 31, 2013 and October 31, 2012, which are not included in the contractual expense limitation. See Note I to the Financial Statements. |
| | (f) | Ratios of expenses to average net assets include interest expenses of less than 0.005% for each of the years ended October 31, 2012 and October 31, 2011, which are not included in the contractual expense limitation. The interest expenses are from utilizing the line of credit, as discussed in Note H to the Financial Statements. |
See accompanying Notes to Financial Statements.
| | |
| |
| ASTON/Lake Partners LASSO Alternatives Fund – Class N | | October 31, 2014 |
| |
| Financial Highlights | | |
| | | | | | | | | | | | | | | | | | | | |
| | | Year
Ended
10/31/14 | | | Year
Ended
10/31/13 | | | Year
Ended
10/31/12 | | | Year
Ended
10/31/11 | | | Period
Ended
10/31/10(a) | |
Net Asset Value, Beginning of Period | | $ | 13.34 | | | $ | 12.39 | | | $ | 11.94 | | | $ | 11.97 | | | $ | 11.48 | |
| | | | | | | | | | | | | | | | | | | | |
Income from Investment Operations: | | | | | | | | | | | | | | | | | | | | |
Net investment income (loss) | | | (0.07 | )(b) | | | — | (b)(c) | | | 0.04 | (b) | | | (0.01 | )(b) | | | 0.04 | (b) |
Net realized and unrealized gain on investments | | | 0.50 | (d) | | | 1.11 | | | | 0.59 | | | | 0.13 | | | | 0.45 | |
| | | | | | | | | | | | | | | | | | | | |
Total from investment operations | | | 0.43 | | | | 1.11 | | | | 0.63 | | | | 0.12 | | | | 0.49 | |
| | | | | | | | | | | | | | | | | | | | |
Less Distributions: | | | | | | | | | | | | | | | | | | | | |
Distributions from and in excess of net investment income | | | (0.09 | ) | | | (0.16 | ) | | | (0.18 | ) | | | (0.08 | ) | | | — | |
Distributions from capital gains | | | (0.04 | ) | | | — | | | | — | | | | (0.07 | ) | | | — | |
| | | | | | | | | | | | | | | | | | | | |
Total distributions | | | (0.13 | ) | | | (0.16 | ) | | | (0.18 | ) | | | (0.15 | ) | | | — | |
| | | | | | | | | | | | | | | | | | | | |
Net increase (decrease) in net asset value | | | 0.30 | | | | 0.95 | | | | 0.45 | | | | (0.03 | ) | | | 0.49 | |
| | | | | | | | | | | | | | | | | | | | |
Net Asset Value, End of Period | | $ | 13.64 | | | $ | 13.34 | | | $ | 12.39 | | | $ | 11.94 | | | $ | 11.97 | |
| | | | | | | | | | | | | | | | | | | | |
Total Return (e) | | | 3.27 | % | | | 9.05 | % | | | 5.34 | % | | | 0.92 | % | | | 4.27 | %(f) |
| | | | | |
Ratios/Supplemental Data: | | | | | | | | | | | | | | | | | | | | |
Net Assets, End of Period (in 000’s) | | $ | 44,386 | | | $ | 54,388 | | | $ | 33,719 | | | $ | 17,626 | | | $ | 8,296 | |
Ratios of expenses to average net assets: | | | | | | | | | | | | | | | | | | | | |
Before earnings credit, expense reimbursement and/or fee waiver, or recoupment by the Adviser (g) | | | 1.41 | % | | | 1.43 | %(h) | | | 1.41 | %(h)(i) | | | 1.53 | % | | | 2.19 | %(j) |
After earnings credit, expense reimbursement and/or fee waiver, or recoupment by the Adviser (g) | | | 1.43 | % | | | 1.45 | %(h) | | | 1.45 | %(h)(i) | | | 1.45 | % | | | 1.45 | %(j)(k) |
Ratios of net investment income (loss) to average net assets: | | | | | | | | | | | | | | | | | | | | |
Before earnings credit, expense reimbursement and/or fee waiver, or recoupment by the Adviser | | | (0.51 | )% | | | — | %(c) | | | 0.36 | %(i) | | | (0.17 | )% | | | (0.25 | )%(j) |
After earnings credit, expense reimbursement and/or fee waiver, or recoupment by the Adviser | | | (0.53 | )% | | | (0.03 | )% | | | 0.32 | %(i) | | | (0.10 | )% | | | 0.49 | %(j) |
Portfolio Turnover | | | 45.91 | % | | | 43.55 | % | | | 45.60 | % | | | 79.77 | % | | | 116.68 | %(f) |
| | (a) | The inception date for the Lake Partners LASSO Alternatives Fund Class N shares is March 3, 2010. |
| | (b) | The selected per share data was calculated using the weighted average shares outstanding method for the period. |
| | (c) | Represents less than $0.005 per share or less than 0.005%. |
| | (d) | Includes capital contribution of less than $0.005 per share. |
| | (e) | The total return is calculated using the Net Asset Value used for trading at the close of business at period end. |
| | (g) | Does not include expenses of the underlying funds in which the Fund invests. |
| | (h) | Ratios of expenses to average net assets includes Earnings Credits of less than 0.005% for each of the years ended October 31, 2013 and October 31, 2012, which are not included in the contractual expense limitation. See Note I to the Financial Statements. |
| | (i) | Ratios of expenses and net investment income to average net assets include advisory fee waiver of less than 0.005% for the year ended October 31, 2012. |
| | (k) | Effective March 30, 2010, the contractual expense limitation was decreased from 1.60% to 1.45%, excluding interest, taxes, investment-related costs (such as brokerage commissions), extraordinary expenses and acquired fund fees and expenses. |
See accompanying Notes to Financial Statements.
| | |
| |
| ASTON/Lake Partners LASSO Alternatives Fund – Class I | | October 31, 2014 |
| |
| Financial Highlights | | |
| | | | | | | | | | | | | | | | | | | | |
| | | Year
Ended
10/31/14 | | | Year
Ended
10/31/13 | | | Year
Ended
10/31/12 | | | Year
Ended
10/31/11 | | | Year
Ended
10/31/10 | |
| | | | | | | | | | | | | | | | | | | | |
Net Asset Value, Beginning of Period | | $ | 13.38 | | | $ | 12.42 | | | $ | 11.97 | | | $ | 11.98 | | | $ | 11.15 | |
| | | | | | | | | | | | | | | | | | | | |
Income from Investment Operations: | | | | | | | | | | | | | | | | | | | | |
Net investment income (loss) | | | (0.04 | )(a) | | | 0.03 | (a) | | | 0.07 | (a) | | | 0.02 | (a) | | | 0.08 | (a) |
Net realized and unrealized gain on investments | | | 0.51 | (b) | | | 1.11 | | | | 0.59 | | | | 0.13 | | | | 0.89 | |
| | | | | | | | | | | | | | | | | | | | |
Total from investment operations | | | 0.47 | | | | 1.14 | | | | 0.66 | | | | 0.15 | | | | 0.97 | |
| | | | | | | | | | | | | | | | | | | | |
Less Distributions: | | | | | | | | | | | | | | | | | | | | |
Distributions from and in excess of net investment income | | | (0.12 | ) | | | (0.18 | ) | | | (0.21 | ) | | | (0.09 | ) | | | (0.07 | ) |
Distributions from net realized gain on investments | | | (0.04 | ) | | | — | | | | — | | | | (0.07 | ) | | | (0.07 | ) |
| | | | | | | | | | | | | | | | | | | | |
Total distributions | | | (0.16 | ) | | | (0.18 | ) | | | (0.21 | ) | | | (0.16 | ) | | | (0.14 | ) |
| | | | | | | | | | | | | | | | | | | | |
Net increase (decrease) in net asset value | | | 0.31 | | | | 0.96 | | | | 0.45 | | | | (0.01 | ) | | | 0.83 | |
| | | | | | | | | | | | | | | | | | | | |
Net Asset Value, End of Period | | $ | 13.69 | | | $ | 13.38 | | | $ | 12.42 | | | $ | 11.97 | | | $ | 11.98 | |
| | | | | | | | | | | | | | | | | | | | |
Total Return (c) | | | 3.56 | % | | | 9.31 | % | | | 5.56 | % | | | 1.22 | % | | | 8.74 | % |
| | | | | |
Ratios/Supplemental Data: | | | | | | | | | | | | | | | | | | | | |
Net Assets, End of Period (in 000’s) | | $ | 477,157 | | | $ | 416,475 | | | $ | 253,343 | | | $ | 189,999 | | | $ | 19,723 | |
Ratios of expenses to average net assets: | | | | | | | | | | | | | | | | | | | | |
Before earnings credit, expense reimbursement and/or fee waiver, or recoupment by the Adviser (d) | | | 1.16 | % | | | 1.18 | %(e) | | | 1.16 | %(e)(f) | | | 1.28 | % | | | 2.32 | % |
After earnings credit, expense reimbursement and/or fee waiver, or recoupment by the Adviser (d) | | | 1.18 | % | | | 1.20 | %(e) | | | 1.20 | %(e)(f) | | | 1.20 | % | | | 1.24 | %(g) |
Ratios of net investment income (loss) to average net assets: | | | | | | | | | | | | | | | | | | | | |
Before earnings credit, expense reimbursement and/or fee waiver, or recoupment by the Adviser | | | (0.26 | )% | | | 0.25 | % | | | 0.61 | %(f) | | | 0.08 | % | | | (0.41 | )% |
After earnings credit, expense reimbursement and/or fee waiver, or recoupment by the Adviser | | | (0.28 | )% | | | 0.22 | % | | | 0.57 | %(f) | | | 0.15 | % | | | 0.67 | % |
Portfolio Turnover | | | 45.91 | % | | | 43.55 | % | | | 45.60 | % | | | 79.77 | % | | | 116.68 | % |
| | (a) | The selected per share data was calculated using the weighted average shares outstanding method for the period. |
| | (b) | Includes capital contribution of less than $0.005 per share. |
| | (c) | The total return is calculated using the Net Asset Value used for trading at the close of business at period end. |
| | (d) | Does not include expenses of the underlying funds in which the Fund invests. |
| | (e) | Ratios of expenses to average net assets include Earnings Credits of less than 0.005% for each of the years ended October 31, 2013 and October 31, 2012, which are not included in the contractual expense limitation. See Note I to the Financial Statements. |
| | (f) | Ratios of expenses and net investment income to average net assets include advisory fee waiver of less than 0.005% for the year ended October 31, 2012. |
| | (g) | Effective March 30, 2010, the contractual expense limitation was decreased from 1.35% to 1.20%, excluding interest, taxes, investment-related costs (such as brokerage commissions), extraordinary expenses and acquired fund fees and expenses. |
See accompanying Notes to Financial Statements.
| | |
| |
| ASTON/River Road Long-Short Fund – Class N | | October 31, 2014 |
| |
| Financial Highlights | | |
| | | | | | | | | | | | | | | | |
| | | Year
Ended
10/31/14 | | | Year
Ended
10/31/13 | | | Year
Ended
10/31/12 | | | Period
Ended
10/31/11(a) | |
| | | | | | | | | | | | | | | | |
Net Asset Value, Beginning of Period | | $ | 12.02 | | | $ | 10.73 | | | $ | 9.91 | | | $ | 10.00 | |
| | | | | | | | | | | | | | | | |
Income from Investment Operations: | | | | | | | | | | | | | | | | |
Net investment loss | | | (0.19 | ) | | | (0.17 | )(b) | | | (0.18 | ) | | | (0.04 | )(b) |
Net realized and unrealized gain (loss) on investments | | | (0.19 | ) | | | 2.02 | | | | 1.00 | | | | (0.05 | ) |
| | | | | | | | | | | | | | | | |
Total from investment operations | | | (0.38 | ) | | | 1.85 | | | | 0.82 | | | | (0.09 | ) |
| | | | | | | | | | | | | | | | |
Less Distributions: | | | | | | | | | | | | | | | | |
Distributions from net realized gain on investments | | | (0.29 | ) | | | (0.56 | ) | | | — | | | | — | |
| | | | | | | | | | | | | | | | |
Total distributions | | | (0.29 | ) | | | (0.56 | ) | | | — | | | | — | |
| | | | | | | | | | | | | | | | |
Net increase (decrease) in net asset value | | | (0.67 | ) | | | 1.29 | | | | 0.82 | | | | (0.09 | ) |
| | | | | | | | | | | | | | | | |
Net Asset Value, End of Period | | $ | 11.35 | | | $ | 12.02 | | | $ | 10.73 | | | $ | 9.91 | |
| | | | | | | | | | | | | | | | |
Total Return (c) | | | (3.27 | )% | | | 18.14 | % | | | 8.17 | % | | | (0.80 | )%(d) |
| | | | |
Ratios/Supplemental Data: | | | | | | | | | | | | | | | | |
Net Assets, End of Period (in 000’s) | | $ | 109,140 | | | $ | 108,966 | | | $ | 7,506 | | | $ | 4,594 | |
Ratios of expenses to average net assets: | | | | | | | | | | | | | | | | |
Before expense reimbursement and/or fee waiver, or recoupment by Adviser, including interest and dividend expense for securities sold short | | | 2.53 | % | | | 2.54 | % | | | 5.03 | % | | | 8.68 | %(e) |
After expense reimbursement and/or fee waiver, or recoupment by Adviser, including interest and dividend expense for securities sold short | | | 2.58 | % | | | 2.38 | % | | | 3.11 | % | | | 2.72 | %(e) |
After expense reimbursement and/or fee waiver, or recoupment by Adviser, excluding interest and dividend expense for securities sold short | | | 1.70 | % | | | 1.70 | % | | | 1.70 | % | | | 1.70 | %(e) |
Ratios of net investment loss to average net assets: | | | | | | | | | | | | | | | | |
Before expense reimbursement and/or fee waiver, or recoupment by Adviser | | | (1.55 | )% | | | (1.62 | )% | | | (3.63 | )% | | | (6.80 | )%(e) |
After expense reimbursement and/or fee waiver, or recoupment by Adviser | | | (1.59 | )% | | | (1.46 | )% | | | (1.71 | )% | | | (0.84 | )%(e) |
Portfolio Turnover | | | 303.04 | % | | | 291.36 | % | | | 277.72 | % | | | 127.32 | %(d) |
| | (a) | The inception date for the River Road Long-Short Fund Class N shares is May 4, 2011. |
| | (b) | The selected per share data was calculated using the weighted average shares outstanding method for the period. |
| | (c) | The total return is calculated using the Net Asset Value used for trading at the close of business at period end. |
See accompanying Notes to Financial Statements.
| | |
| |
| ASTON/River Road Long-Short Fund – Class I | | October 31, 2014 |
| |
| Financial Highlights | | |
| | | | | | | | |
| | | Year
Ended
10/31/14 | | | Period
Ended
10/31/13(a) | |
Net Asset Value, Beginning of Period | | $ | 12.05 | | | $ | 10.96 | |
| | | | | | | | |
Income from Investment Operations: | | | | | | | | |
Net investment loss | | | (0.16 | ) | | | (0.10 | )(b) |
Net realized and unrealized gain (loss) on investments | | | (0.20 | ) | | | 1.19 | |
| | | | | | | | |
Total from investment operations | | | (0.36 | ) | | | 1.09 | |
| | | | | | | | |
Less Distributions: | | | | | | | | |
Distributions from net realized gain (loss) on investments | | | (0.29 | ) | | | — | |
| | | | | | | | |
Total distributions | | | (0.29 | ) | | | — | |
| | | | | | | | |
Net increase (decrease) in net asset value | | | (0.65 | ) | | | 1.09 | |
| | | | | | | | |
Net Asset Value, End of Period | | $ | 11.40 | | | $ | 12.05 | |
| | | | | | | | |
Total Return (c) | | | (3.01 | )% | | | 9.85 | %(d) |
| | |
Ratios/Supplemental Data: | | | | | | | | |
Net Assets, End of Period (in 000’s) | | $ | 110,271 | | | $ | 71,175 | |
Ratios of expenses to average net assets: | | | | | | | | |
Before expense reimbursement and/or fee waiver, or recoupment by Adviser, including interest and
dividend expense for securities sold short | | | 2.28 | % | | | 2.20 | %(e) |
After expense reimbursement and/or fee waiver, or recoupment by Adviser, including interest and
dividend expense for securities sold short | | | 2.33 | % | | | 2.10 | %(e) |
After expense reimbursement and/or fee waiver, or recoupment by Adviser, excluding interest and
dividend expense for securities sold short | | | 1.45 | % | | | 1.45 | %(e) |
Ratios of net investment loss to average net assets: | | | | | | | | |
Before expense reimbursement and/or fee waiver, or recoupment by Adviser | | | (1.30 | )% | | | (1.44 | )%(e) |
After expense reimbursement and/or fee waiver, or recoupment by Adviser | | | (1.34 | )% | | | (1.33 | )%(e) |
Portfolio Turnover | | | 303.04 | % | | | 291.36 | %(d) |
| | (a) | The inception date for the River Road Long-Short Fund Class I shares is March 4, 2013. |
| | (b) | The selected per share data was calculated using the weighted average shares outstanding method for the period. |
| | (c) | The total return is calculated using the Net Asset Value used for trading at the close of business at period end. |
See accompanying Notes to Financial Statements.
| | |
| |
| ASTON/Barings International Fund – Class N | | October 31, 2014 |
| |
| Financial Highlights | | |
| | | | | | | | | | | | | | | | | | | | |
| | | Year
Ended
10/31/14 | | | Year
Ended
10/31/13 | | | Year
Ended
10/31/12 | | | Year
Ended
10/31/11 | | | Period
Ended
10/31/10(a) | |
Net Asset Value, Beginning of Period | | $ | 7.81 | | | $ | 6.87 | | | $ | 6.81 | | | $ | 7.24 | | | $ | 6.48 | |
| | | | | | | | | | | | | | | | | | | | |
Income from Investment Operations: | | | | | | | | | | | | | | | | | | | | |
Net investment income | | | 0.14 | (b) | | | 0.11 | (b) | | | 0.10 | (b) | | | 0.07 | (b) | | | 0.06 | (b) |
Net realized and unrealized gain (loss) on investments | | | (0.31 | ) | | | 1.00 | | | | 0.17 | | | | (0.37 | ) | | | 0.70 | |
| | | | | | | | | | | | | | | | | | | | |
Total from investment operations | | | (0.17 | ) | | | 1.11 | | | | 0.27 | | | | (0.30 | ) | | | 0.76 | |
| | | | | | | | | | | | | | | | | | | | |
Less Distributions: | | | | | | | | | | | | | | | | | | | | |
Distributions from and in excess of net investment income | | | (0.18 | ) | | | (0.09 | ) | | | (0.04 | ) | | | (0.13 | ) | | | — | |
Distributions from net realized gain on investments | | | (0.48 | ) | | | (0.08 | ) | | | (0.17 | ) | | | — | | | | — | |
| | | | | | | | | | | | | | | | | | | | |
Total distributions | | | (0.66 | ) | | | (0.17 | ) | | | (0.21 | ) | | | (0.13 | ) | | | — | |
| | | | | | | | | | | | | | | | | | | | |
Net increase (decrease) in net asset value | | | (0.83 | ) | | | 0.94 | | | | 0.06 | | | | (0.43 | ) | | | 0.76 | |
| | | | | | | | | | | | | | | | | | | | |
Net Asset Value, End of Period | | $ | 6.98 | | | $ | 7.81 | | | $ | 6.87 | | | $ | 6.81 | | | $ | 7.24 | |
| | | | | | | | | | | | | | | | | | | | |
Total Return (c) | | | (2.62 | )% | | | 16.64 | % | | | 4.28 | % | | | (4.22 | )% | | | 11.73 | %(d) |
| | | | | |
Ratios/Supplemental Data: | | | | | | | | | | | | | | | | | | | | |
Net Assets, End of Period (in 000’s) | | $ | 331 | | | $ | 477 | | | $ | 421 | | | $ | 393 | | | $ | 184 | |
Ratios of expenses to average net assets: | | | | | | | | | | | | | | | | | | | | |
Before expense reimbursement and/or fee waiver by Adviser | | | 1.95 | % | | | 1.67 | % | | | 1.60 | % | | | 1.68 | %(e) | | | 1.72 | %(f) |
After expense reimbursement and/or fee waiver by Adviser | | | 1.40 | % | | | 1.40 | % | | | 1.40 | % | | | 1.40 | %(e) | | | 1.40 | %(f) |
Ratios of net investment income to average net assets: | | | | | | | | | | | | | | | | | | | | |
Before expense reimbursement and/or fee waiver by Adviser | | | 1.42 | % | | | 1.26 | % | | | 1.30 | % | | | 0.76 | %(e) | | | 1.07 | %(f) |
After expense reimbursement and/or fee waiver by Adviser | | | 1.97 | % | | | 1.53 | % | | | 1.50 | % | | | 1.04 | %(e) | | | 1.39 | %(f) |
Portfolio Turnover | | | 53.14 | % | | | 55.78 | % | | | 33.48 | % | | | 58.96 | % | | | 65.32 | % |
| | (a) | The inception date for the Barings International Fund Class N shares is March 3, 2010. |
| | (b) | The selected per share data was calculated using the weighted average shares outstanding method for the period. |
| | (c) | The total return is calculated using the Net Asset Value used for trading at the close of business at period end. |
| | (e) | For the period November 1, 2010 through February 28, 2011, the Adviser voluntarily waived management fees and/or reimbursed expenses so that the net expense ratio did not exceed 1.40%, excluding interest, taxes, investment-related costs (such as brokerage commissions), extraordinary expenses and acquired fund fees and expenses. Effective March 1, 2011, the expense limitation became contractual and was decreased from 1.50% to 1.40%, excluding interest, taxes, investment-related costs (such as brokerage commissions), extraordinary expenses and acquired fund fees and expenses. |
See accompanying Notes to Financial Statements.
| | |
| |
| ASTON/Barings International Fund – Class I | | October 31, 2014 |
| |
| Financial Highlights | | |
| | | | | | | | | | | | | | | | | | | | |
| | | Year
Ended
10/31/14 | | | Year
Ended
10/31/13 | | | Year
Ended
10/31/12 | | | Year
Ended
10/31/11 | | | Year
Ended
10/31/10 | |
| | | | | | | | | | | | | | | | | | | | |
Net Asset Value, Beginning of Period | | $ | 7.82 | | | $ | 6.89 | | | $ | 6.82 | | | $ | 7.26 | | | $ | 6.44 | |
| | | | | | | | | | | | | | | | | | | | |
Income from Investment Operations: | | | | | | | | | | | | | | | | | | | | |
Net investment income | | | 0.16 | (a) | | | 0.13 | (a) | | | 0.12 | (a) | | | 0.09 | (a) | | | 0.06 | (a) |
Net realized and unrealized gain (loss) on investments | | | (0.31 | ) | | | 0.99 | | | | 0.18 | | | | (0.38 | ) | | | 0.78 | |
| | | | | | | | | | | | | | | | | | | | |
Total from investment operations | | | (0.15 | ) | | | 1.12 | | | | 0.30 | | | | (0.29 | ) | | | 0.84 | |
| | | | | | | | | | | | | | | | | | | | |
Less Distributions: | | | | | | | | | | | | | | | | | | | | |
Distributions from and in excess of net investment income | | | (0.20 | ) | | | (0.11 | ) | | | (0.06 | ) | | | (0.15 | ) | | | (0.02 | ) |
Distributions from net realized gain on investments | | | (0.48 | ) | | | (0.08 | ) | | | (0.17 | ) | | | — | | | | — | |
| | | | | | | | | | | | | | | | | | | | |
Total distributions | | | (0.68 | ) | | | (0.19 | ) | | | (0.23 | ) | | | (0.15 | ) | | | (0.02 | ) |
| | | | | | | | | | | | | | | | | | | | |
Net increase (decrease) in net asset value | | | (0.83 | ) | | | 0.93 | | | | 0.07 | | | | (0.44 | ) | | | 0.82 | |
| | | | | | | | | | | | | | | | | | | | |
Net Asset Value, End of Period | | $ | 6.99 | | | $ | 7.82 | | | $ | 6.89 | | | $ | 6.82 | | | $ | 7.26 | |
| | | | | | | | | | | | | | | | | | | | |
Total Return (b) | | | (2.37 | )% | | | 16.72 | % | | | 4.72 | % | | | (4.09 | )% | | | 12.89 | % |
| | | | | |
Ratios/Supplemental Data: | | | | | | | | | | | | | | | | | | | | |
Net Assets, End of Period (in 000’s) | | $ | 21,260 | | | $ | 37,507 | | | $ | 61,662 | | | $ | 52,390 | | | $ | 47,985 | |
Ratios of expenses to average net assets: | | | | | | | | | | | | | | | | | | | | |
Before expense reimbursement and/or fee waiver by Adviser | | | 1.70 | % | | | 1.42 | % | | | 1.35 | % | | | 1.43 | %(c) | | | 1.47 | % |
After expense reimbursement and/or fee waiver by Adviser | | | 1.15 | % | | | 1.15 | % | | | 1.15 | % | | | 1.15 | %(c) | | | 1.15 | % |
Ratios of net investment income to average net assets: | | | | | | | | | | | | | | | | | | | | |
Before expense reimbursement and/or fee waiver by Adviser | | | 1.67 | % | | | 1.51 | % | | | 1.55 | % | | | 1.01 | % | | | 0.63 | % |
After expense reimbursement and/or fee waiver by Adviser | | | 2.22 | % | | | 1.78 | % | | | 1.75 | % | | | 1.29 | % | | | 0.95 | % |
Portfolio Turnover | | | 53.14 | % | | | 55.78 | % | | | 33.48 | % | | | 58.96 | % | | | 65.32 | % |
| | (a) | The selected per share data was calculated using the weighted average shares outstanding method for the period. |
| | (b) | The total return is calculated using the Net Asset Value used for trading at the close of business at period end. |
| | (c) | For the period November 1, 2010 through February 28, 2011, the Adviser voluntarily waived management fees and/or reimbursed expenses so that the net expense ratio did not exceed 1.15%, excluding interest, taxes, investment related costs (such as brokerage commissions), extraordinary expenses and acquired fund fees and expenses. Effective March 1, 2011, the expense limitation became contractual and was decreased from 1.25% to 1.15%, excluding interest, taxes, investment-related costs (such as brokerage commissions), extraordinary expenses and acquired fund fees and expenses. |
See accompanying Notes to Financial Statements.
| | |
| |
| ASTON/Guardian Capital Global Dividend Fund – Class N | | October 31, 2014 |
| |
| Financial Highlights | | |
| | | | |
| | | Period
Ended
10/31/14(a) | |
Net Asset Value, Beginning of Period | | $ | 10.00 | |
| | | | |
Income from Investment Operations: | | | | |
Net investment income | | | 0.13 | |
Net realized and unrealized gain on investments | | | 0.49 | |
| | | | |
Total from investment operations | | | 0.62 | |
| | | | |
Less Distributions: | | | | |
Distributions from and in excess of net investment income | | | (0.11 | ) |
Distributions from net realized gains on investment | | | — | |
| | | | |
Total Distributions | | | (0.11 | ) |
| | | | |
Net increase in net asset value | | | 0.51 | |
| | | | |
Net Asset Value, End of Period | | $ | 10.51 | |
| | | | |
Total Return (b) | | | 6.17 | %(c) |
| |
Ratios/Supplemental Data: | | | | |
Net Assets, End of Period (in 000’s) | | $ | 1,052 | |
Ratios of expenses to average net assets: | | | | |
Before expense reimbursement and/or fee waiver by Adviser | | | 5.21 | %(d) |
After expense reimbursement and/or fee waiver by Adviser | | | 1.30 | %(d) |
Ratios of net investment income (loss) to average net assets: | | | | |
Before expense reimbursement and/or fee waiver by Adviser | | | (1.74 | )%(d) |
After expense reimbursement and/or fee waiver by Adviser | | | 2.17 | %(d) |
Portfolio Turnover | | | 15.97 | %(c) |
| | (a) | The inception date for the Guardian Capital Global Dividend Fund Class N shares is April 14, 2014. |
| | (b) | The total return is calculated using the Net Asset Value used for trading at the close of business at period end. |
See accompanying Notes to Financial Statements.
| | |
| |
| ASTON/Guardian Capital Global Dividend Fund – Class I | | October 31, 2014 |
| |
| Financial Highlights | | |
| | | | |
| | | Period
Ended
10/31/14(a) | |
| | | | |
Net Asset Value, Beginning of Period | | $ | 10.00 | |
| | | | |
Income from Investment Operations: | | | | |
Net investment income | | | 0.14 | |
Net realized and unrealized gain on investments | | | 0.50 | |
| | | | |
Total from investment operations | | | 0.64 | |
| | | | |
Less Distributions: | | | | |
Distributions from and in excess of net investment income | | | (0.12 | ) |
Distributions from net realized gain on investment | | | — | |
| | | | |
Total Distributions | | | (0.12 | ) |
| | | | |
Net increase in net asset value | | | 0.52 | |
| | | | |
Net Asset Value, End of Period | | $ | 10.52 | |
| | | | |
Total Return (b) | | | 6.39 | %(c) |
| |
Ratios/Supplemental Data: | | | | |
Net Assets, End of Period (in 000’s) | | $ | 3,211 | |
Ratios of expenses to average net assets: | | | | |
Before expense reimbursement and/or fee waiver by Adviser | | | 4.96 | %(d) |
After expense reimbursement and/or fee waiver by Adviser | | | 1.05 | %(d) |
Ratios of net investment income (loss) to average net assets: | | | | |
Before expense reimbursement and/or fee waiver by Adviser | | | (1.49 | )%(d) |
After expense reimbursement and/or fee waiver by Adviser | | | 2.42 | %(d) |
Portfolio Turnover | | | 15.97 | %(c) |
| | (a) | The inception date for the Guardian Capital Global Dividend Fund Class I shares is April 14, 2014. |
| | (b) | The total return is calculated using the Net Asset Value used for trading at the close of business at period end. |
See accompanying Notes to Financial Statements.
| | |
| |
| ASTON/LMCG Emerging Markets Fund – Class N | | October 31, 2014 |
| |
| Financial Highlights | | |
| | | | | | | | |
| | | Year
Ended
10/31/14 | | | Period
Ended
10/31/13(a) | |
Net Asset Value, Beginning of Period | | $ | 9.65 | | | $ | 10.00 | |
| | | | | | | | |
Income from Investment Operations: | | | | | | | | |
Net investment income | | | 0.11 | | | | 0.08 | (b) |
Net realized and unrealized loss on investments | | | (0.07 | ) | | | (0.43 | ) |
| | | | | | | | |
Total from investment operations | | | 0.04 | | | | (0.35 | ) |
| | | | | | | | |
Less Distributions: | | | | | | | | |
Distributions from and in excess of net investment income | | | (0.14 | ) | | | — | |
| | | | | | | | |
Total distributions | | | (0.14 | ) | | | — | |
| | | | | | | | |
Net decrease in net asset value | | | (0.10 | ) | | | (0.35 | ) |
| | | | | | | | |
Net Asset Value, End of Period | | $ | 9.55 | | | $ | 9.65 | |
| | | | | | | | |
Total Return (c) | | | 0.49 | % | | | (3.50 | )%(d) |
| | |
Ratios/Supplemental Data: | | | | | | | | |
Net Assets, End of Period (in 000’s) | | $ | 725 | | | $ | 675 | |
Ratios of expenses to average net assets: | | | | | | | | |
Before expense reimbursement and/or fee waiver by Adviser | | | 5.96 | % | | | 7.24 | %(e) |
After expense reimbursement and/or fee waiver by Adviser | | | 1.57 | % | | | 1.65 | %(e) |
Ratios of net investment income (loss) to average net assets: | | | | | | | | |
Before expense reimbursement and/or fee waiver by Adviser | | | (3.24 | )% | | | (4.13 | )%(e) |
After expense reimbursement and/or fee waiver by Adviser | | | 1.15 | % | | | 1.46 | %(e) |
Portfolio Turnover | | | 63.48 | % | | | 101.96 | %(d) |
| | (a) | The inception date for the LMCG Emerging Markets Fund Class N shares is March 28, 2013. |
| | (b) | The selected per share data was calculated using the weighted average shares outstanding method for the period. |
| | (c) | The total return is calculated using the Net Asset Value used for trading at the close of business at period end. |
See accompanying Notes to Financial Statements.
| | |
| |
| ASTON/LMCG Emerging Markets Fund – Class I | | October 31, 2014 |
| |
| Financial Highlights | | |
| | | | | | | | |
| | | Year
Ended
10/31/14 | | | Period
Ended
10/31/13 (a)
| |
| | | | | | | | |
Net Asset Value, Beginning of Period | | $ | 9.67 | | | $ | 10.00 | |
| | | | | | | | |
Income from Investment Operations: | | | | | | | | |
Net investment income | | | 0.14 | | | | 0.10 | (b) |
Net realized and unrealized loss on investments | | | (0.07 | ) | | | (0.43 | ) |
| | | | | | | | |
Total from investment operations | | | 0.07 | | | | (0.33 | ) |
| | | | | | | | |
Less Distributions: | | | | | | | | |
Distributions from and in excess of net investment income | | | (0.16 | ) | | | — | |
| | | | | | | | |
Total distributions | | | (0.16 | ) | | | — | |
| | | | | | | | |
Net decrease in net asset value | | | (0.09 | ) | | | (0.33 | ) |
| | | | | | | | |
Net Asset Value, End of Period | | $ | 9.58 | | | $ | 9.67 | |
| | | | | | | | |
Total Return (c) | | | 0.79 | % | | | (3.30 | )%(d) |
| | |
Ratios/Supplemental Data: | | | | | | | | |
Net Assets, End of Period (in 000’s) | | $ | 3,188 | | | $ | 3,307 | |
Ratios of expenses to average net assets: | | | | | | | | |
Before expense reimbursement and/or fee waiver by Adviser | | | 5.71 | % | | | 6.99 | %(e) |
After expense reimbursement and/or fee waiver by Adviser | | | 1.33 | % | | | 1.40 | %(e) |
Ratios of net investment income (loss) to average net assets: | | | | | | | | |
Before expense reimbursement and/or fee waiver by Adviser | | | (2.99 | )% | | | (3.88 | )%(e) |
After expense reimbursement and/or fee waiver by Adviser | | | 1.40 | % | | | 1.71 | %(e) |
Portfolio Turnover | | | 63.48 | % | | | 101.96 | %(d) |
| | (a) | The inception date for the LMCG Emerging Markets Fund Class I shares is March 28, 2013. |
| | (b) | The selected per share data was calculated using the weighted average shares outstanding method for the period. |
| | (c) | The total return is calculated using the Net Asset Value used for trading at the close of business at period end. |
See accompanying Notes to Financial Statements.
| | |
| |
| ASTON/Pictet International Fund – Class N | | October 31, 2014 |
| |
| Financial Highlights | | |
| | | | |
| | | Period
Ended
10/31/14(a) | |
Net Asset Value, Beginning of Period | | $ | 10.00 | |
| | | | |
Income from Investment Operations: | | | | |
Net investment income | | | 0.09 | |
Net realized and unrealized loss on investments | | | (0.75 | ) |
| | | | |
Total from investment operations | | | (0.66 | ) |
| | | | |
Net decrease in net asset value | | | (0.66 | ) |
| | | | |
Net Asset Value, End of Period | | $ | 9.34 | |
| | | | |
Total Return (b) | | | (6.60) | %(c) |
| |
Ratios/Supplemental Data: | | | | |
Net Assets, End of Period (in 000’s) | | $ | 984 | |
Ratios of expenses to average net assets: | | | | |
Before expense reimbursement and/or fee waiver by Adviser | | | 3.26 | %(d) |
After expense reimbursement and/or fee waiver by Adviser | | | 1.40 | %(d) |
Ratios of net investment income (loss) to average net assets: | | | | |
Before expense reimbursement and/or fee waiver by Adviser | | | (0.25 | )%(d) |
After expense reimbursement and/or fee waiver by Adviser | | | 1.61 | %(d) |
Portfolio Turnover | | | 25.82 | %(c) |
| | (a) | The inception date for the Pictet International Fund Class N shares is April 14, 2014. |
| | (b) | The total return is calculated using the Net Asset Value used for trading at the close of business at period end. |
See accompanying Notes to Financial Statements.
| | |
| |
| ASTON/Pictet International Fund – Class I | | October 31, 2014 |
| |
| Financial Highlights | | |
| | | | |
| | | Period
Ended
10/31/14(a) | |
| | | | |
Net Asset Value, Beginning of Period | | $ | 10.00 | |
| | | | |
Income from Investment Operations: | | | | |
Net investment income | | | 0.10 | |
Net realized and unrealized loss on investments | | | (0.74 | ) |
| | | | |
Total from investment operations | | | (0.64 | ) |
| | | | |
Net decrease in net asset value | | | (0.64 | ) |
| | | | |
Net Asset Value, End of Period | | $ | 9.36 | |
| | | | |
Total Return (b) | | | (6.40 | )%(c) |
| |
Ratios/Supplemental Data: | | | | |
Net Assets, End of Period (in 000’s) | | $ | 8,467 | |
Ratios of expenses to average net assets: | | | | |
Before expense reimbursement and/or fee waiver by Adviser | | | 3.01 | %(d) |
After expense reimbursement and/or fee waiver by Adviser | | | 1.15 | %(d) |
Ratios of net investment income (loss) to average net assets: | | | | |
Before expense reimbursement and/or fee waiver by Adviser | | | — | %(d)(e) |
After expense reimbursement and/or fee waiver by Adviser | | | 1.86 | %(d) |
Portfolio Turnover | | | 25.82 | %(c) |
| | (a) | The inception date for the Pictet International Fund Class I shares is April 14, 2014. |
| | (b) | The total return is calculated using the Net Asset Value used for trading at the close of business at period end. |
| | (e) | Represents less than 0.005%. |
See accompanying Notes to Financial Statements.
| | |
| |
| ASTON/Harrison Street Real Estate Fund – Class N | | October 31, 2014 |
| |
| Financial Highlights | | |
| | | | | | | | | | | | | | | | | | | | |
| | | Year
Ended
10/31/14 | | | Year
Ended
10/31/13 | | | Year
Ended
10/31/12 | | | Year
Ended
10/31/11 | | | Year
Ended
10/31/10 | |
| | | | | | | | | | | | | | | | | | | | |
Net Asset Value, Beginning of Period | | $ | 11.29 | | | $ | 10.49 | | | $ | 8.97 | | | $ | 8.16 | | | $ | 5.77 | |
| | | | | | | | | | | | | | | | | | | | |
Income from Investment Operations: | | | | | | | | | | | | | | | | | | | | |
Net investment income | | | 0.10 | (a) | | | 0.17 | (a) | | | 0.15 | (a) | | | 0.15 | (a) | | | 0.14 | (a) |
Net realized and unrealized gain on investments | | | 1.37 | | | | 0.79 | (b) | | | 1.44 | | | | 0.79 | | | | 2.36 | |
| | | | | | | | | | | | | | | | | | | | |
Total from investment operations | | | 1.47 | | | | 0.96 | | | | 1.59 | | | | 0.94 | | | | 2.50 | |
| | | | | | | | | | | | | | | | | | | | |
Less Distributions: | | | | | | | | | | | | | | | | | | | | |
Distributions from and in excess of net investment income | | | (0.13 | ) | | | (0.16 | ) | | | (0.07 | ) | | | (0.13 | ) | | | (0.11 | ) |
| | | | | | | | | | | | | | | | | | | | |
Total distributions | | | (0.13 | ) | | | (0.16 | ) | | | (0.07 | ) | | | (0.13 | ) | | | (0.11 | ) |
| | | | | | | | | | | | | | | | | | | | |
Net increase in net asset value . | | | 1.34 | | | | 0.80 | | | | 1.52 | | | | 0.81 | | | | 2.39 | |
| | | | | | | | | | | | | | | | | | | | |
Net Asset Value, End of Period | | $ | 12.63 | | | $ | 11.29 | | | $ | 10.49 | | | $ | 8.97 | | | $ | 8.16 | |
| | | | | | | | | | | | | | | | | | | | |
Total Return (c) | | | 13.19 | % | | | 9.30 | % | | | 17.85 | % | | | 11.66 | % | | | 43.77 | % |
| | | | | |
Ratios/Supplemental Data: | | | | | | | | | | | | | | | | | | | | |
Net Assets, End of Period (in 000’s) | | $ | 12,852 | | | $ | 13,093 | | | $ | 10,381 | | | $ | 6,287 | | | $ | 6,158 | |
Ratios of expenses to average net assets: | | | | | | | | | | | | | | | | | | | | |
Before expense reimbursement and/or fee waiver by Adviser | | | 2.16 | % | | | 2.22 | % | | | 2.36 | % | | | 1.61 | %(d) | | | 1.68 | %(d) |
After expense reimbursement and/or fee waiver by Adviser | | | 1.37 | % | | | 1.37 | % | | | 1.37 | % | | | 1.29 | %(d) | | | 1.37 | %(d) |
Ratios of net investment income to average net assets: | | | | | | | | | | | | | | | | | | | | |
Before expense reimbursement and/or fee waiver by Adviser | | | 0.08 | % | | | 0.67 | % | | | 0.53 | % | | | 1.36 | % | | | 1.65 | % |
After expense reimbursement and/or fee waiver by Adviser | | | 0.87 | % | | | 1.52 | % | | | 1.52 | % | | | 1.68 | % | | | 1.96 | % |
Portfolio Turnover | | | 162.93 | % | | | 159.14 | % | | | 86.62 | %(e) | | | 143.86 | % | | | 75.30 | % |
| | (a) | The selected per share data was calculated using the weighted average shares outstanding method for the period. |
| | (b) | Includes capital contribution of less than $0.005 per share. |
| | (c) | The total return is calculated using the Net Asset Value used for trading at the close of business at period end. |
| | (d) | Ratios of expenses to average net assets include interest expense of less than 0.005% for each of the years ended October 31, 2011 and October 31, 2010, which are not included in the contractual expense limitation. The interest expense is from utilizing the line of credit as discussed in Note H to the Financial Statements. |
| | (e) | Portfolio turnover rate excludes securities delivered from processing a redemption-in-kind. |
See accompanying Notes to Financial Statements.
| | |
| |
| ASTON/Harrison Street Real Estate Fund – Class I | | October 31, 2014 |
| |
| Financial Highlights | | |
| | | | | | | | | | | | | | | | | | | | |
| | | Year
Ended
10/31/14 | | | Year
Ended
10/31/13 | | | Year
Ended
10/31/12 | | | Year
Ended
10/31/11 | | | Year
Ended
10/31/10 | |
| | | | | | | | | | | | | | | | | | | | |
Net Asset Value, Beginning of Period | | $ | 11.24 | | | $ | 10.44 | | | $ | 8.92 | | | $ | 8.12 | | | $ | 5.74 | |
| | | | | | | | | | | | | | | | | | | | |
Income from Investment Operations: | | | | | | | | | | | | | | | | | | | | |
Net investment income | | | 0.13 | (a) | | | 0.20 | (a) | | | 0.15 | (a) | | | 0.16 | (a) | | | 0.16 | (a) |
Net realized and unrealized gain on investments | | | 1.35 | | | | 0.79 | (b) | | | 1.46 | | | | 0.79 | | | | 2.34 | |
| | | | | | | | | | | | | | | | | | | | |
Total from investment operations | | | 1.48 | | | | 0.99 | | | | 1.61 | | | | 0.95 | | | | 2.50 | |
| | | | | | | | | | | | | | | | | | | | |
Less Distributions: | | | | | | | | | | | | | | | | | | | | |
Distributions from and in excess of net investment income | | | (0.15 | ) | | | (0.19 | ) | | | (0.09 | ) | | | (0.15 | ) | | | (0.12 | ) |
| | | | | | | | | | | | | | | | | | | | |
Total distributions | | | (0.15 | ) | | | (0.19 | ) | | | (0.09 | ) | | | (0.15 | ) | | | (0.12 | ) |
| | | | | | | | | | | | | | | | | | | | |
Net increase in net asset value . | | | 1.33 | | | | 0.80 | | | | 1.52 | | | | 0.80 | | | | 2.38 | |
| | | | | | | | | | | | | | | | | | | | |
Net Asset Value, End of Period | | $ | 12.57 | | | $ | 11.24 | | | $ | 10.44 | | | $ | 8.92 | | | $ | 8.12 | |
| | | | | | | | | | | | | | | | | | | | |
Total Return (c) | | | 13.45 | % | | | 9.58 | % | | | 18.16 | % | | | 11.82 | % | | | 44.14 | % |
| | | | | |
Ratios/Supplemental Data: | | | | | | | | | | | | | | | | | | | | |
Net Assets, End of Period (in 000’s) | | $ | 732 | | | $ | 532 | | | $ | 166 | | | $ | 32,925 | | | $ | 29,425 | |
Ratios of expenses to average net assets: | | | | | | | | | | | | | | | | | | | | |
Before expense reimbursement and/or fee waiver by Adviser | | | 1.91 | % | | | 1.97 | % | | | 2.11 | % | | | 1.44 | %(d) | | | 1.43 | %(d) |
After expense reimbursement and/or fee waiver by Adviser | | | 1.12 | % | | | 1.12 | % | | | 1.12 | % | | | 1.12 | %(d) | | | 1.12 | %(d) |
Ratios of net investment income to average net assets: | | | | | | | | | | | | | | | | | | | | |
Before expense reimbursement and/or fee waiver by Adviser | | | 0.33 | % | | | 0.92 | % | | | 0.78 | % | | | 1.53 | % | | | 1.90 | % |
After expense reimbursement and/or fee waiver by Adviser | | | 1.12 | % | | | 1.77 | % | | | 1.77 | % | | | 1.85 | % | | | 2.21 | % |
Portfolio Turnover | | | 162.93 | % | | | 159.14 | % | | | 86.62 | %(e) | | | 143.86 | % | | | 75.30 | % |
| | (a) | The selected per share data was calculated using the weighted average shares outstanding method for the period. |
| | (b) | Includes capital contribution of less than $0.005 per share. |
| | (c) | The total return is calculated using the Net Asset Value used for trading at the close of business at period end. |
| | (d) | Ratios of expenses to average net assets include interest expense of less than 0.005% for each of the years ended October 31, 2011 and October 31, 2010, which are not included in the contractual expense limitation. The interest expense is from utilizing the line of credit as discussed in Note H to the Financial Statements. |
| | (e) | Portfolio turnover rate excludes securities delivered from processing a redemption-in-kind. |
See accompanying Notes to Financial Statements.
| | |
| |
| ASTON/Montag & Caldwell Balanced Fund – Class N | | October 31, 2014 |
| |
| Financial Highlights | | |
| | | | | | | | | | | | | | | | | | | | |
| | | Year
Ended
10/31/14 | | | Year
Ended
10/31/13 | | | Year
Ended
10/31/12 | | | Year
Ended
10/31/11 | | | Year
Ended
10/31/10 | |
| | | | | | | | | | | | | | | | | | | | |
Net Asset Value, Beginning of Period | | $ | 23.81 | | | $ | 21.46 | | | $ | 20.09 | | | $ | 19.13 | | | $ | 17.73 | |
| | | | | | | | | | | | | | | | | | | | |
Income from Investment Operations: | | | | | | | | | | | | | | | | | | | | |
Net investment income | | | 0.12 | (a) | | | 0.21 | (a) | | | 0.16 | (a) | | | 0.15 | (a) | | | 0.21 | (a) |
Net realized and unrealized gain on investments | | | 1.70 | | | | 2.43 | | | | 1.45 | | | | 1.03 | | | | 1.47 | |
| | | | | | | | | | | | | | | | | | | | |
Total from investment operations | | | 1.82 | | | | 2.64 | | | | 1.61 | | | | 1.18 | | | | 1.68 | |
| | | | | | | | | | | | | | | | | | | | |
Less Distributions: | | | | | | | | | | | | | | | | | | | | |
Distributions from and in excess of net investment income | | | (0.21 | ) | | | (0.29 | ) | | | (0.24 | ) | | | (0.22 | ) | | | (0.28 | ) |
Distributions from net realized gain on investments | | | (0.74 | ) | | | — | | | | — | | | | — | | | | — | |
| | | | | | | | | | | | | | | | | | | | |
Total distributions | | | (0.95 | ) | | | (0.29 | ) | | | (0.24 | ) | | | (0.22 | ) | | | (0.28 | ) |
| | | | | | | | | | | | | | | | | | | | |
Net increase in net asset value. | | | 0.87 | | | | 2.35 | | | | 1.37 | | | | 0.96 | | | | 1.40 | |
| | | | | | | | | | | | | | | | | | | | |
Net Asset Value, End of Period | | $ | 24.68 | | | $ | 23.81 | | | $ | 21.46 | | | $ | 20.09 | | | $ | 19.13 | |
| | | | | | | | | | | | | | | | | | | | |
Total Return (b) | | | 7.83 | % | | | 12.40 | % | | | 8.03 | % | | | 6.20 | % | | | 9.54 | % |
| | | | | |
Ratios/Supplemental Data: | | | | | | | | | | | | | | | | | | | | |
Net Assets, End of Period (in 000’s) | | $ | 20,446 | | | $ | 22,425 | | | $ | 31,536 | | | $ | 23,315 | | | $ | 29,194 | |
Ratios of expenses to average net assets: | | | | | | | | | | | | | | | | | | | | |
Before expense reimbursement and/or fee waiver by Adviser | | | 1.43 | % | | | 1.37 | % | | | 1.42 | % | | | 1.57 | %(c) | | | 1.38 | % |
After expense reimbursement and/or fee waiver by Adviser | | | 1.20 | % | | | 1.20 | % | | | 1.22 | % | | | 1.35 | %(c) | | | 1.13 | % |
Ratios of net investment income to average net assets: | | | | | | | | | | | | | | | | | | | | |
Before expense reimbursement and/or fee waiver by Adviser | | | 0.26 | % | | | 0.77 | % | | | 0.57 | % | | | 0.53 | % | | | 0.89 | % |
After expense reimbursement and/or fee waiver by Adviser | | | 0.50 | % | | | 0.94 | % | | | 0.77 | % | | | 0.76 | % | | | 1.15 | % |
Portfolio Turnover | | | 27.43 | % | | | 34.62 | % | | | 35.48 | % | | | 40.31 | % | | | 51.68 | %(d) |
| | (a) | The selected per share data was calculated using the weighted average shares outstanding method for the period. |
| | (b) | The total return is calculated using the Net Asset Value used for trading at the close of business at period end. |
| | (c) | Ratios of expenses to average net assets include interest expense of less than 0.005% for the year ended October 31, 2011, which is not included in the voluntary expense limitation. The interest expense is from utilizing the line of credit as discussed in Note H to the Financial Statements. |
| | (d) | Portfolio turnover rate excludes securities received from a reorganization. |
See accompanying Notes to Financial Statements.
| | |
| |
| ASTON/Montag & Caldwell Balanced Fund – Class I | | October 31, 2014 |
| |
| Financial Highlights | | |
| | | | | | | | | | | | | | | | | | | | |
| | | Year
Ended
10/31/14 | | | Year
Ended
10/31/13 | | | Year
Ended
10/31/12 | | | Year
Ended
10/31/11 | | | Year
Ended
10/31/10 | |
| | | | | | | | | | | | | | | | | | | | |
Net Asset Value, Beginning of Period | | $ | 23.76 | | | $ | 21.41 | | | $ | 20.05 | | | $ | 19.08 | | | $ | 17.68 | |
| | | | | | | | | | | | | | | | | | | | |
Income from Investment Operations: | | | | | | | | | | | | | | | | | | | | |
Net investment income | | | 0.14 | (a) | | | 0.23 | (a) | | | 0.19 | (a) | | | 0.20 | (a) | | | 0.22 | (a) |
Net realized and unrealized gain on investments | | | 1.70 | | | | 2.43 | | | | 1.44 | | | | 1.04 | | | | 1.46 | |
| | | | | | | | | | | | | | | | | | | | |
Total from investment operations | | | 1.84 | | | | 2.66 | | | | 1.63 | | | | 1.24 | | | | 1.68 | |
| | | | | | | | | | | | | | | | | | | | |
Less Distributions: | | | | | | | | | | | | | | | | | | | | |
Distributions from and in excess of net investment income | | | (0.26 | ) | | | (0.31 | ) | | | (0.27 | ) | | | (0.27 | ) | | | (0.28 | ) |
Distributions from net realized gain on investments | | | (0.74 | ) | | | — | | | | — | | | | — | | | | — | |
| | | | | | | | | | | | | | | | | | | | |
Total distributions | | | (1.00 | ) | | | (0.31 | ) | | | (0.27 | ) | | | (0.27 | ) | | | (0.28 | ) |
| | | | | | | | | | | | | | | | | | | | |
Net increase in net asset value . | | | 0.84 | | | | 2.35 | | | | 1.36 | | | | 0.97 | | | | 1.40 | |
| | | | | | | | | | | | | | | | | | | | |
Net Asset Value, End of Period | | $ | 24.60 | | | $ | 23.76 | | | $ | 21.41 | | | $ | 20.05 | | | $ | 19.08 | |
| | | | | | | | | | | | | | | | | | | | |
Total Return (b) | | | 7.92 | % | | | 12.53 | % | | | 8.14 | % | | | 6.52 | % | | | 9.57 | % |
| | | | | |
Ratios/Supplemental Data: | | | | | | | | | | | | | | | | | | | | |
Net Assets, End of Period (in 000’s) | | $ | 1,934 | | | $ | 1,839 | | | $ | 1,930 | | | $ | 1,415 | | | $ | 1,362 | |
Ratios of expenses to average net assets: | | | | | | | | | | | | | | | | | | | | |
Before expense reimbursement and/or fee waiver by Adviser | | | 1.33 | % | | | 1.27 | % | | | 1.30 | % | | | 1.32 | %(c) | | | 1.35 | % |
After expense reimbursement and/or fee waiver by Adviser | | | 1.10 | % | | | 1.10 | % | | | 1.10 | % | | | 1.10 | %(c) | | | 1.10 | % |
Ratios of net investment income to average net assets: | | | | | | | | | | | | | | | | | | | | |
Before expense reimbursement and/or fee waiver by Adviser | | | 0.36 | % | | | 0.87 | % | | | 0.69 | % | | | 0.79 | % | | | 0.92 | % |
After expense reimbursement and/or fee waiver by Adviser | | | 0.60 | % | | | 1.04 | % | | | 0.89 | % | | | 1.02 | % | | | 1.17 | % |
Portfolio Turnover | | | 27.43 | % | | | 34.62 | % | | | 35.48 | % | | | 40.31 | % | | | 51.68 | %(d) |
| | (a) | The selected per share data was calculated using the weighted average shares outstanding method for the period. |
| | (b) | The total return is calculated using the Net Asset Value used for trading at the close of business at period end. |
| | (c) | Ratios of expenses to average net assets include interest expense of less than 0.005% for the year ended October 31, 2011, which is not included in the voluntary expense limitation. The interest expense is from utilizing the line of credit as discussed in Note H to the Financial Statements. |
| | (d) | Portfolio turnover rate includes securities received from a reorganization. |
See accompanying Notes to Financial Statements.
| | |
| |
| | October 31, 2014 |
| |
| Notes to Financial Statements | | |
Note (A) Fund Organization: Aston Funds (the “Trust”) was organized as a Delaware statutory trust under a Declaration of Trust dated September 10, 1993. The Trust is registered under the Investment Company Act of 1940, as amended (the “1940 Act”) as an open-end management investment company with 25 separate portfolios (each, a “Fund” and collectively, the “Funds”) as of October 31, 2014.
Aston Asset Management, LLC (“Aston” or the “Adviser”), the investment adviser and the administrator, manages each Fund by retaining one or more subadvisers (each, a “Subadviser”) to manage each Fund’s portfolio on a subadvisory basis. The following 25 portfolios of the Trust are included in these financial statements:
|
ASTON/Cornerstone Large Cap Value Fund
(the “Cornerstone Large Cap Value Fund”) |
ASTON/Herndon Large Cap Value Fund
(the “Herndon Large Cap Value Fund”) |
| ASTON/Montag & Caldwell Growth Fund (the “M&C Growth Fund”) |
ASTON/TAMRO Diversified Equity Fund (the “TAMRO Diversified Equity Fund”) |
ASTON/River Road Dividend All Cap Value Fund
(the “River Road Dividend All Cap Value Fund”) |
ASTON/River Road Dividend All Cap Value Fund II
(the “River Road Dividend All Cap Value Fund II”) |
| ASTON/Fairpointe Mid Cap Fund (the “Fairpointe Mid Cap Fund”) |
ASTON/Montag & Caldwell Mid Cap Growth Fund
(the “M&C Mid Cap Growth Fund”) |
ASTON/LMCG Small Cap Growth Fund
(the “LMCG Small Cap Growth Fund”) |
ASTON/River Road Independent Value Fund
(the “River Road Independent Value Fund”) |
ASTON/River Road Select Value Fund
(the “River Road Select Value Fund”) |
ASTON/River Road Small Cap Value Fund
(the “River Road Small Cap Value Fund”) |
| ASTON/Silvercrest Small Cap Fund (the “Silvercrest Small Cap Fund”) |
| ASTON/TAMRO Small Cap Fund (the “TAMRO Small Cap Fund”) |
ASTON/DoubleLine Core Plus Fixed Income Fund
(the “DoubleLine Core Plus Fixed Income Fund”) |
| ASTON/TCH Fixed Income Fund (the “TCH Fixed Income Fund”) |
ASTON/Anchor Capital Enhanced Equity Fund
(the “Anchor Capital Enhanced Equity Fund”) |
ASTON/Lake Partners LASSO Alternatives Fund
(the “Lake Partners LASSO Alternatives Fund”) |
| ASTON/River Road Long-Short Fund (the “River Road Long-Short Fund”) |
| ASTON/Barings International Fund (the “Barings International Fund”) |
ASTON/Guardian Capital Global Dividend Fund
(the “Guardian Capital Global Dividend Fund”) |
ASTON/LMCG Emerging Markets Fund
(the “LMCG Emerging Markets Fund”) |
| ASTON/Pictet International Fund (the “Pictet International Fund”) |
ASTON/Harrison Street Real Estate Fund (the “Harrison Street Real Estate Fund”) |
| ASTON/Montag & Caldwell Balanced Fund (the “M&C Balanced Fund”) |
Each Fund, except M&C Growth Fund, is authorized to issue two classes of shares (Class N shares and Class I shares). M&C Growth Fund is authorized to issue three classes of shares (Class N shares, Class I shares and Class R shares). Each class of shares is substantially the same except that certain classes of shares bear class specific expenses that include distribution and services fees. TAMRO Small Cap Fund, River Road Dividend All Cap Value Fund, Fairpointe Mid Cap Fund and River Road Independent Value Fund are closed to new investors until further notice.
The investment objectives of the Funds are as follows:
| | |
Cornerstone Large Cap Value Fund Total return through long-term capital appreciation and current income. |
Herndon Large Cap Value Fund Long-term capital appreciation. |
M&C Growth Fund Long-term capital appreciation and, secondarily, current income, by investing primarily in common stocks and convertible securities. |
TAMRO Diversified Equity Fund Long-term capital appreciation. |
River Road Dividend All Cap Value Fund High current income and, secondarily, long-term capital appreciation. |
River Road Dividend All Cap Value Fund II Long-term capital appreciation and high current income. |
Fairpointe Mid Cap Fund Long-term total return through capital appreciation by investing primarily in common and preferred stocks and convertible securities. |
M&C Mid Cap Growth Fund Long-term capital appreciation, and secondarily, current income, by investing primarily in common stocks and convertible securities. |
LMCG Small Cap Growth Fund Long-term capital appreciation. |
River Road Independent Value Fund Long-term total return. |
River Road Select Value Fund Long-term capital appreciation. |
River Road Small Cap Value Fund Long-term capital appreciation. |
Silvercrest Small Cap Fund Long-term capital appreciation. |
TAMRO Small Cap Fund Long-term capital appreciation. |
DoubleLine Core Plus Fixed Income Fund Maximize total return. |
TCH Fixed Income Fund High current income consistent with prudent risk of capital. |
Anchor Capital Enhanced Equity Fund Total return through a combination of a high level of current income and capital appreciation. |
Lake Partners LASSO Alternatives Fund Long term total return with reduced correlation to the conventional stock and bond markets. |
| | |
| |
| | October 31, 2014 |
| |
| Notes to Financial Statements – continued | | |
| | |
River Road Long-Short Fund Absolute return while minimizing volatility over a full market cycle. |
Barings International Fund Total return. |
Guardian Capital Global Dividend Fund Long-term capital appreciation and current income. |
LMCG Emerging Markets Fund Long-term capital appreciation. |
Pictet International Fund Capital appreciation. |
Harrison Street Real Estate Fund Total return through a combination of growth and income. |
M&C Balanced Fund Long-term total return. |
Note (B) Significant Accounting Policies: The following is a summary of the significant accounting policies consistently followed by each Fund in the preparation of its financial statements. These policies are in conformity with U.S. generally accepted accounting principles (“U.S. GAAP”).
(1) Security Valuation: Equity securities, closed-end funds, exchange-traded funds, index options traded on a national securities exchange, and over-the-counter securities listed on the NASDAQ National Market System are valued at the last sale price or the NASDAQ Official Closing Price (“NOCP”), if applicable. If no last sale price or NOCP, if applicable, is reported, the mean of the last bid and asked prices may be used. Fixed income securities, except short-term investments, are valued on the basis of mean prices provided by an independent pricing service when such prices are believed by the Adviser to reflect the current market value of such securities, in accordance with guidelines adopted by the Board of Trustees. The pricing service provider may employ methodologies that utilize actual market transactions, broker-dealer supplied valuations, or other techniques. Such techniques generally consider factors such as composite security prices, yields, maturities, call features, credit ratings and developments relating to specific securities, in arriving at valuations. If accurate market quotations are not available, securities are valued at fair values in accordance with guidelines adopted by the Board of Trustees. Short-term investments, that is, those with maturities of 60 days or less, are valued at amortized cost, which approximates fair market value. Repurchase agreements are valued at cost. Investments in money market funds and other mutual funds are valued at the underlying fund’s net asset value (“NAV”) at the date of valuation. Foreign equity securities are valued at the last sales price on the primary exchange where the security is traded. Under the fair valuation procedures adopted by the Board of Trustees, the Funds may utilize the services of an independent pricing service to determine fair value prices for foreign equity securities held by Barings International Fund, Guardian Capital Global Dividend Fund, LMCG Emerging Markets Fund and Pictet International Fund, if certain market events occur.
Certain Funds invest in securities of other investment companies, including open-end funds, closed-end funds and exchange-
traded funds (“ETFs”). Open-end funds are investment companies that issue new shares continuously and redeem shares daily. Closed-end funds are investment companies that typically issue a fixed number of shares that trade on a securities exchange or over-the-counter. An ETF is an investment company. Typically, an ETF seeks to track the performance of an index by holding in its portfolio shares of all the companies, or a representative sample of the companies, that are components of a particular index; however, some ETFs are actively managed. ETFs are traded on securities exchanges based on their market values. The risks of investment in other investment companies typically reflect the risks of the types of securities in which investment companies invest. Investments in ETFs and closed-end funds are subject to the additional risk that shares of the fund may trade at a premium or discount to their NAV per share. When a Fund invests in another investment company, shareholders of the Fund bear their proportionate shares of the other investment company’s fees and expenses, including operating, registration, trustee, licensing and marketing, as well as their shares of the Fund’s fees and expenses.
Fair Value Measurements - The inputs and valuation techniques used to measure fair value of the Funds’ net assets are summarized into three levels as described in the hierarchy below:
| | |
•Level 1 – | | unadjusted quoted prices in active markets for identical assets or liabilities |
•Level 2 – | | other significant observable inputs (including quoted prices for similar securities, interest rates, prepayment speeds, credit risk, etc.) |
•Level 3 – | | significant unobservable inputs (including the Funds’ own assumptions in determining the fair value of investments) |
| | |
| |
| | October 31, 2014 |
| |
| Notes to Financial Statements – continued | | |
The inputs or methodology used for valuing securities are not necessarily an indication of the risk associated with investing in those securities. Transfers in and out of the levels are recognized at the market value at the end of the period. The summary of each Fund’s investments that are measured at fair value by Level within the fair value hierarchy as of October 31, 2014 is as follows:
| | | | | | | | | | | | | | | | |
Funds | | Total
Value at
10/31/14 | | | Level 1
Quoted
Prices | | | Level 2
Significant
Observable
Inputs | | | Level 3
Significant
Unobservable
Inputs | |
| | | | | | | | | | | | | | | | |
| Cornerstone Large Cap Value Fund | | | | | | | | | | | | | | | | |
| Assets | | | | | | | | | | | | | | | | |
Investments in Securities* | | $ | 163,416,970 | | | $ | 163,416,970 | | | $ | — | | | $ | — | |
| | | | | | | | | | | | | | | | |
| Herndon Large Cap Value Fund | | | | | | | | | | | | | | | | |
| Assets | | | | | | | | | | | | | | | | |
Investments in Securities* | | $ | 153,701,047 | | | $ | 153,701,047 | | | $ | — | | | $ | — | |
| | | | | | | | | | | | | | | | |
| M&C Growth Fund | | | | | | | | | | | | | | | | |
| Assets | | | | | | | | | | | | | | | | |
Investments in Securities* | | $ | 4,105,667,199 | | | $ | 4,105,667,199 | | | $ | — | | | $ | — | |
| | | | | | | | | | | | | | | | |
| TAMRO Diversified Equity Fund | | | | | | | | | | | | | | | | |
| Assets | | | | | | | | | | | | | | | | |
Investments in Securities* | | $ | 50,845,207 | | | $ | 50,845,207 | | | $ | — | | | $ | — | |
| | | | | | | | | | | | | | | | |
| River Road Dividend All Cap Value Fund | | | | | | | | | | | | | | | | |
| Assets | | | | | | | | | | | | | | | | |
Common Stocks | | | | | | | | | | | | | | | | |
Consumer Discretionary | | $ | 164,193,323 | | | $ | 164,193,323 | | | $ | — | | | $ | — | |
Consumer Staples | | | 148,467,071 | | | | 148,467,071 | | | | — | | | | — | |
Energy | | | 117,569,498 | | | | 117,569,498 | | | | — | | | | — | |
Financials | | | 168,525,821 | | | | 168,525,821 | | | | — | | | | — | |
Healthcare | | | 57,919,142 | | | | 57,919,142 | | | | — | | | | — | |
Industrials | | | 138,905,047 | | | | 138,905,047 | | | | — | | | | — | |
Information Technology | | | 149,751,485 | | | | 143,366,891 | | | | 6,384,594 | | | | — | |
Materials | | | 49,281,767 | | | | 49,281,767 | | | | — | | | | — | |
Telecommunication Services | | | 69,585,376 | | | | 69,585,376 | | | | — | | | | — | |
Utilities | | | 47,551,829 | | | | 47,551,829 | | | | — | | | | — | |
| | | | | | | | | | | | | | | | |
Total Common Stocks | | $ | 1,111,750,359 | | | $ | 1,105,365,765 | | | $ | 6,384,594 | | | $ | — | |
| | | | | | | | | | | | | | | | |
| River Road Dividend All Cap Value Fund II | | | | | | | | | | | | | | | | |
| Assets | | | | | | | | | | | | | | | | |
Investments in Securities* | | $ | 132,255,288 | | | $ | 132,255,288 | | | $ | — | | | $ | — | |
| | | | | | | | | | | | | | | | |
| Fairpointe Mid Cap Fund | | | | | | | | | | | | | | | | |
| Assets | | | | | | | | | | | | | | | | |
Investments in Securities* | | $ | 5,888,077,921 | | | $ | 5,888,077,921 | | | $ | — | | | $ | — | |
| | | | | | | | | | | | | | | | |
| M&C Mid Cap Growth Fund | | | | | | | | | | | | | | | | |
| Assets | | | | | | | | | | | | | | | | |
Investments in Securities* | | $ | 11,443,882 | | | $ | 11,443,882 | | | $ | — | | | $ | — | |
| | | | | | | | | | | | | | | | |
| LMCG Small Cap Growth Fund | | | | | | | | | | | | | | | | |
| Assets | | | | | | | | | | | | | | | | |
Investment in Securities* | | $ | 52,051,593 | | | $ | 52,051,593 | | | $ | — | | | $ | — | |
| | | | | | | | | | | | | | | | |
| River Road Independent Value | | | | | | | | | | | | | | | | |
| Assets | | | | | | | | | | | | | | | | |
Common Stocks | | | | | | | | | | | | | | | | |
Consumer Staples | | $ | 3,175,788 | | | $ | 3,175,788 | | | $ | — | | | $ | — | |
Energy | | | 24,488,200 | | | | 24,488,200 | | | | — | | | | — | |
Financials | | | 3,768,208 | | | | — | | | | 3,768,208 | | | | — | |
Information Technology | | | 59,009,470 | | | | 59,009,470 | | | | — | | | | — | |
Materials | | | 68,942,953 | | | | 49,803,001 | | | | 19,139,952 | | | | — | |
| | | | | | | | | | | | | | | | |
Total Common Stocks | | | 159,384,619 | | | | 136,476,459 | | | | 22,908,160 | | | | — | |
| | | | | | | | | | | | | | | | |
Investment Company* | | | 509,010,642 | | | | 509,010,642 | | | | — | | | | — | |
Total | | $ | 668,395,261 | | | $ | 645,487,101 | | | $ | 22,908,160 | | | $ | — | |
| | | | | | | | | | | | | | | | |
| River Road Select Value Fund | | | | | | | | | | | | | | | | |
| Assets | | | | | | | | | | | | | | | | |
Investments in Securities* | | $ | 184,528,996 | | | $ | 184,528,996 | | | $ | — | | | $ | — | |
| | | | | | | | | | | | | | | | |
| | |
| |
| | October 31, 2014 |
| |
| Notes to Financial Statements – continued | | |
| | | | | | | | | | | | | | | | |
Funds | | Total
Value at
10/31/14 | | | Level 1
Quoted
Prices | | | Level 2
Significant
Observable
Inputs | | | Level 3
Significant
Unobservable
Inputs | |
| | | | | | | | | | | | | | | | |
| River Road Small Cap Value Fund | | | | | | | | | | | | | | | | |
| Assets | | | | | | | | | | | | | | | | |
Common Stocks | | | | | | | | | | | | | | | | |
Consumer Discretionary | | $ | 43,206,834 | | | $ | 39,406,943 | | | $ | 3,799,891 | | | $ | — | |
Consumer Staples | | | 9,400,506 | | | | 5,201,626 | | | | 4,198,880 | | | | — | |
Energy | | | 19,574,765 | | | | 11,599,548 | | | | 7,975,217 | | | | — | |
Financials | | | 47,563,367 | | | | 47,563,367 | | | | — | | | | — | |
Healthcare | | | 12,001,956 | | | | 12,001,956 | | | | — | | | | — | |
Industrials | | | 61,974,860 | | | | 61,974,860 | | | | — | | | | — | |
Information Technology | | | 57,233,673 | | | | 51,634,918 | | | | 5,598,755 | | | | — | |
Materials | | | 11,785,010 | | | | 11,785,010 | | | | — | | | | — | |
Telecommunication Services | | | 13,268,601 | | | | 13,268,601 | | | | — | | | | — | |
| | | | | | | | | | | | | | | | |
Total Common Stocks | | | 276,009,572 | | | | 254,436,829 | | | | 21,572,743 | | | | — | |
Investment Company* | | | 22,754,928 | | | | 22,754,928 | | | | — | | | | — | |
| | | | | | | | | | | | | | | | |
Total | | $ | 298,764,500 | | | $ | 277,191,757 | | | $ | 21,572,743 | | | $ | — | |
| | | | | | | | | | | | | | | | |
| Silvercrest Small Cap Fund | | | | | | | | | | | | | | | | |
| Assets | | | | | | | | | | | | | | | | |
Investments in Securities* | | $ | 69,880,283 | | | $ | 69,880,283 | | | $ | — | | | $ | — | |
| | | | | | | | | | | | | | | | |
| TAMRO Small Cap Fund | | | | | | | | | | | | | | | | |
| Assets | | | | | | | | | | | | | | | | |
Common Stocks | | | | | | | | | | | | | | | | |
Consumer Discretionary | | $ | 156,364,324 | | | $ | 156,364,324 | | | $ | — | | | $ | — | |
Consumer Staples | | | 77,323,713 | | | | 64,284,058 | | | | 13,030,655 | | | | — | |
Energy | | | 30,384,919 | | | | 30,384,919 | | | | — | | | | — | |
Financial | | | 172,797,993 | | | | 172,797,993 | | | | — | | | | — | |
Healthcare | | | 98,111,799 | | | | 98,111,799 | | | | — | | | | — | |
Industrials | | | 165,981,933 | | | | 165,981,933 | | | | — | | | | — | |
Information Technology | | | 130,354,577 | | | | 130,354,577 | | | | — | | | | — | |
Materials | | | 11,017,051 | | | | 11,017,051 | | | | — | | | | — | |
| | | | | | | | | | | | | | | | |
Total Common Stocks | | | 842,336,309 | | | | 829,296,654 | | | | — | | | | — | |
Investment Company* | | | 6,697,362 | | | | 6,697,362 | | | | — | | | | — | |
| | | | | | | | | | | | | | | | |
Total | | $ | 849,033,671 | | | $ | 835,994,016 | | | $ | 13,039,655 | | | $ | — | |
| | | | | | | | | | | | | | | | |
| | | | |
| DoubleLine Core Plus Fixed Income Fund | | | | | | | | | | | | | | | | |
| Assets | | | | | | | | | | | | | | | | |
Corporate Notes and Bonds | | $ | 59,897,885 | | | $ | — | | | $ | 59,897,885 | | | $ | 154,500 | |
Collateralized Mortgage-Backed Securities | | | 38,401,273 | | | | — | | | | 38,401,273 | | | | — | |
U.S. Government Obligations | | | 34,695,098 | | | | — | | | | 34,695,098 | | | | — | |
Agency Collateralized Mortgage Obligations | | | 18,014,265 | | | | — | | | | 17,859,765 | | | | — | |
U.S. Government Mortgage-Backed Securities | | | 8,310,611 | | | | — | | | | 8,310,611 | | | | — | |
Asset-Backed Security | | | 9,631,213 | | | | — | | | | 9,145,085 | | | | 486,128 | |
Foreign Government Bonds | | | 618,022 | | | | — | | | | 618,022 | | | | — | |
Investment Companies* | | | 18,508,929 | | | | 18,508,929 | | | | — | | | | — | |
| | | | | | | | | | | | | | | | |
Total | | $ | 188,077,296 | | | $ | 18,508,929 | | | $ | 168,927,739 | | | $ | 640,628 | |
| | | | | | | | | | | | | | | | |
| TCH Fixed Income Fund | | | | | | | | | | | | | | | | |
| Assets | | | | | | | | | | | | | | | | |
Corporate Notes and Bonds | | $ | 24,207,364 | | | $ | — | | | $ | 24,207,364 | | | $ | — | |
U.S. Government and Agency Obligations | | | 24,609,812 | | | | — | | | | 24,609,812 | | | | — | |
Asset-Backed Security | | | 251,713 | | | | — | | | | 251,713 | | | | — | |
Commercial Mortgage-Backed Security | | | 303,026 | | | | — | | | | 303,026 | | | | — | |
Investment Company* | | | 2,888,784 | | | | 2,888,784 | | | | — | | | | — | |
| | | | | | | | | | | | | | | | |
Total | | $ | 52,260,699 | | | $ | 2,888,784 | | | $ | 49,371,915 | | | $ | — | |
| | | | | | | | | | | | | | | | |
| Anchor Capital Enhanced Equity Fund | | | | | | | | | | | | | | | | |
| Assets | | | | | | | | | | | | | | | | |
Common Stocks* | | $ | 210,863,051 | | | $ | 210,863,051 | | | $ | — | | | $ | — | |
Purchase Options | | | 547,100 | | | | 547,100 | | | | — | | | | — | |
Investment Company* | | | 10,825,389 | | | | 10,825,389 | | | | — | | | | — | |
| | | | | | | | | | | | | | | | |
Total Assets | | | 222,235,540 | | | | 222,235,540 | | | | — | | | | — | |
| | | | | | | | | | | | | | | | |
| | |
| |
| | October 31, 2014 |
| |
| Notes to Financial Statements – continued | | |
| | | | | | | | | | | | | | | | |
Funds | | Total
Value at
10/31/14 | | | Level 1
Quoted
Prices | | | Level 2
Significant
Observable
Inputs | | | Level 3
Significant
Unobservable
Inputs | |
| | | | | | | | | | | | | | | | |
| Anchor Capital Enhanced Equity Fund (continued) | | | | | | | | | | | | | | | | |
| Liabilities | | | | | | | | | | | | | | | | |
Written Options | | $ | (9,225,587 | ) | | $ | (9,225,587 | ) | | $ | — | | | $ | — | |
| | | | | | | | | | | | | | | | |
Total Liabilities | | | (9,225,587 | ) | | | (9,225,587 | ) | | | — | | | | — | |
| | | | | | | | | | | | | | | | |
Total | | $ | 213,009,953 | | | $ | 213,009,953 | | | $ | — | | | $ | — | |
| | | | | | | | | | | | | | | | |
| Lake Partners LASSO Alternatives Fund | | | | | | | | | | | | | | | | |
| Assets | | | | | | | | | | | | | | | | |
Investments Companies* | | $ | 522,396,661 | | | $ | 522,396,661 | | | $ | — | | | $ | — | |
| | | | | | | | | | | | | | | | |
| River Road Long-Short Fund | | | | | | | | | | | | | | | | |
| Assets | | | | | | | | | | | | | | | | |
Investments Companies* | | $ | 207,566,998 | | | $ | 207,566,998 | | | $ | — | | | $ | — | |
| | | | | | | | | | | | | | | | |
Total Assets | | | 207,566,998 | | | | 207,566,998 | | | | — | | | | — | |
| | | | | | | | | | | | | | | | |
| Liabilities | | | | | | | | | | | | | | | | |
Securities Sold Short* | | | (69,615,817 | ) | | | (69,615,817 | ) | | | — | | | | — | |
Exchange Traded Funds | | | (57,263,435 | ) | | | (57,263,435 | ) | | | — | | | | — | |
| | | | | | | | | | | | | | | | |
Total Liabilities | | | (126,879,252 | ) | | | (126,879,252 | ) | | | — | | | | — | |
| | | | | | | | | | | | | | | | |
Total | | $ | 80,687,746 | | | $ | 80,687,746 | | | $ | — | | | $ | — | |
| | | | | | | | | | | | | | | | |
| Barings International Fund | | | | | | | | | | | | | | | | |
| Assets | | | | | | | | | | | | | | | | |
Common Stocks | | | | | | | | | | | | | | | | |
Australia | | $ | 241,380 | | | $ | — | | | $ | 241,380 | | | $ | — | |
France | | | 1,934,840 | | | | — | | | | 1,934,840 | | | | — | |
Germany | | | 2,311,566 | | | | — | | | | 2,311,566 | | | | — | |
Hong Kong | | | 488,151 | | | | — | | | | 488,151 | | | | — | |
India | | | 220,237 | | | | — | | | | 220,237 | | | | — | |
Italy | | | 226,386 | | | | — | | | | 226,386 | | | | — | |
Japan | | | 5,561,544 | | | | — | | | | 5,561,544 | | | | — | |
Netherlands | | | 1,394,718 | | | | — | | | | 1,394,718 | | | | — | |
Papua New Guinea | | | 236,542 | | | | — | | | | 236,542 | | | | — | |
Singapore | | | 258,938 | | | | — | | | | 258,938 | | | | — | |
South Korea | | | 102,984 | | | | — | | | | 102,984 | | | | — | |
Sweden | | | 211,701 | | | | — | | | | 211,701 | | | | — | |
Switzerland | | | 2,050,036 | | | | — | | | | 2,050,036 | | | | — | |
Taiwan | | | 347,916 | | | | — | | | | 347,916 | | | | — | |
United Kingdom | | | 5,220,546 | | | | — | | | | 5,220,546 | | | | — | |
| | | | | | | | | | | | | | | | |
Total Common Stocks | | | 20,807,485 | | | | — | | | | 20,807,485 | | | | — | |
Investment Company* | | | 632,161 | | | | 632,161 | | | | — | | | | — | |
| | | | | | | | | | | | | | | | |
Total | | $ | 21,439,646 | | | $ | 632,161 | | | $ | 20,807,485 | | | $ | — | |
| | | | | | | | | | | | | | | | |
| Guardian Capital Global Dividend Fund | | | | | | | | | | | | | | | | |
| Assets | | | | | | | | | | | | | | | | |
Common Stocks | | | | | | | | | | | | | | | | |
Australia | | $ | 214,903 | | | $ | — | | | $ | 214,903 | | | $ | — | |
Belgium | | | 113,700 | | | | 53,270 | | | | 60,430 | | | | — | |
Canada | | | 104,182 | | | | 104,182 | | | | — | | | | — | |
France | | | 149,159 | | | | — | | | | 149,159 | | | | — | |
Germany | | | 207,563 | | | | — | | | | 207,563 | | | | — | |
Ireland | | | 78,538 | | | | 78,538 | | | | — | | | | — | |
Israel | | | 32,753 | | | | 32,753 | | | | — | | | | — | |
Italy | | | 25,566 | | | | — | | | | 25,566 | | | | — | |
Netherlands | | | 43,765 | | | | 43,765 | | | | — | | | | — | |
Norway | | | 18,350 | | | | — | | | | 18,350 | | | | — | |
Spain | | | 116,504 | | | | 29,265 | | | | 87,239 | | | | — | |
Sweden | | | 72,496 | | | | — | | | | 72,496 | | | | — | |
Switzerland | | | 225,268 | | | | 92,982 | | | | 132,286 | | | | — | |
United Kingdom | | | 446,347 | | | | 133,969 | | | | 312,378 | | | | — | |
United States | | | 2,410,954 | | | | 2,410,954 | | | | — | | | | — | |
| | | | | | | | | | | | | | | | |
Total Common Stocks | | | 4,260,048 | | | | 2,979,678 | | | | 1,280,370 | | | | — | |
Investment Company* | | | 21,167 | | | | 21,167 | | | | — | | | | — | |
| | | | | | | | | | | | | | | | |
Total | | $ | 4,281,215 | | | $ | 3,000,845 | | | $ | 1,280,370 | | | $ | — | |
| | | | | | | | | | | | | | | | |
| | |
| |
| | October 31, 2014 |
| |
| Notes to Financial Statements – continued | | |
| | | | | | | | | | | | | | | | |
Funds | | Total
Value at
10/31/14 | | | Level 1
Quoted
Prices | | | Level 2
Significant
Observable
Inputs | | | Level 3
Significant
Unobservable
Inputs | |
| | | | | | | | | | | | | | | | |
| LMCG Emerging Markets Fund | | | | | | | | | | | | | | | | |
| Assets | | | | | | | | | | | | | | | | |
Common Stocks | | | | | | | | | | | | | | | | |
Brazil | | $ | 263,778 | | | $ | 263,778 | | | $ | — | | | $ | — | |
China | | | 494,384 | | | | — | | | | 494,384 | | | | — | |
Egypt | | | 29,706 | | | | — | | | | 29,706 | | | | — | |
Hong Kong | | | 250,171 | | | | — | | | | 250,171 | | | | — | |
India | | | 181,373 | | | | 131,985 | | | | 49,388 | | | | — | |
Indonesia | | | 128,523 | | | | — | | | | 128,523 | | | | — | |
Malaysia | | | 133,145 | | | | 94,367 | | | | 38,778 | | | | — | |
Mexico | | | 205,019 | | | | 205,019 | | | | — | | | | — | |
Philippines | | | 75,432 | | | | — | | | | 75,432 | | | | — | |
Poland | | | 24,097 | | | | — | | | | 24,097 | | | | — | |
Russia | | | 152,384 | | | | 64,541 | | | | 87,843 | | | | — | |
South Africa | | | 329,618 | | | | — | | | | 329,618 | | | | — | |
South Korea | | | 513,057 | | | | — | | | | 513,057 | | | | — | |
Taiwan | | | 468,733 | | | | — | | | | 468,733 | | | | — | |
Thailand | | | 190,995 | | | | — | | | | 190,995 | | | | — | |
Turkey | | | 169,272 | | | | — | | | | 169,272 | | | | — | |
| | | | | | | | | | | | | | | | |
Total Common Stocks | | | 3,609,687 | | | | 759,690 | | | | 2,849,997 | | | | — | |
Exchange Traded Funds | | | 199,985 | | | | 199,985 | | | | — | | | | — | |
Investment Company* | | | 96,035 | | | | 96,035 | | | | — | | | | — | |
| | | | | | | | | | | | | | | | |
Total | | $ | 3,905,707 | | | $ | 1,055,710 | | | $ | 2,849,997 | | | $ | — | |
| | | | | | | | | | | | | | | | |
| Pictet International Fund | | | | | | | | | | | | | | | | |
| Assets | | | | | | | | | | | | | | | | |
Common Stocks | | | | | | | | | | | | | | | | |
Australia | | $ | 490,881 | | | $ | — | | | $ | 490,881 | | | $ | — | |
Austria | | | 247,205 | | | | — | | | | 247,205 | | | | — | |
Belgium | | | 85,275 | | | | — | | | | 85,275 | | | | — | |
Bermuda | | | 189,006 | | | | — | | | | 189,006 | | | | — | |
Cayman Islands | | | 90,014 | | | | — | | | | 90,014 | | | | — | |
Denmark | | | 413,636 | | | | — | | | | 413,636 | | | | — | |
Finland | | | 139,293 | | | | — | | | | 139,293 | | | | — | |
France | | | 554,445 | | | | — | | | | 554,445 | | | | — | |
Germany | | | 308,687 | | | | — | | | | 308,687 | | | | — | |
Hong Kong | | | 419,477 | | | | — | | | | 419,477 | | | | — | |
Italy | | | 453,279 | | | | — | | | | 453,279 | | | | — | |
Japan | | | 2,108,701 | | | | — | | | | 2,108,701 | | | | — | |
Malaysia | | | 98,427 | | | | — | | | | 98,427 | | | | — | |
Netherlands | | | 198,237 | | | | — | | | | 198,237 | | �� | | — | |
New Zealand | | | 116,910 | | | | — | | | | 116,910 | | | | — | |
Papua New Guinea | | | 85,619 | | | | — | | | | 85,619 | | | | — | |
Philippines | | | 80,688 | | | | — | | | | 80,688 | | | | — | |
Portugal | | | 359,417 | | | | — | | | | 359,417 | | | | — | |
Singapore | | | 166,773 | | | | — | | | | 166,773 | | | | — | |
South Korea | | | 162,094 | | | | — | | | | 162,094 | | | | — | |
Spain | | | 289,518 | | | | — | | | | 289,518 | | | | — | |
Sweden | | | 125,676 | | | | 65,977 | | | | 59,699 | | | | — | |
Switzerland | | | 905,566 | | | | — | | | | 905,566 | | | | — | |
United Kingdom | | | 1,209,656 | | | | — | | | | 1,209,656 | | | | — | |
| | | | | | | | | | | | | | | | |
Total Common Stocks | | | 9,298,480 | | | | 65,977 | | | | 9,232,503 | | | | — | |
Preferred Stock | | | 118,046 | | | | — | | | | 118,046 | | | | — | |
| | | | | | | | | | | | | | | | |
Total | | $ | 9,416,526 | | | $ | 65,977 | | | $ | 9,350,549 | | | $ | — | |
| | | | | | | | | | | | | | | | |
| Harrison Street Real Estate Fund | | | | | | | | | | | | | | | | |
| Assets | | | | | | | | | | | | | | | | |
Investments in Securities* | | $ | 13,682,256 | | | $ | 13,682,256 | | | $ | — | | | $ | — | |
| | | | | | | | | | | | | | | | |
| M&C Balanced Fund | | | | | | | | | | | | | | | | |
| Assets | | | | | | | | | | | | | | | | |
Common Stocks* | | $ | 13,117,072 | | | $ | 13,117,072 | | | $ | — | | | $ | — | |
Corporate Notes and Bonds | | | 4,478,119 | | | | — | | | | 4,478,119 | | | | — | |
U.S. Government and Agency Obligations | | | 3,816,563 | | | | — | | | | 3,816,563 | | | | — | |
Investment Company* | | | 989,036 | | | | 989,036 | | | | — | | | | — | |
| | | | | | | | | | | | | | | | |
Total | | $ | 22,400,790 | | | $ | 14,106,108 | | | $ | 8,294,682 | | | $ | — | |
| | | | | | | | | | | | | | | | |
| * | | All Common Stocks and Investment Companies are Level 1. Please refer to the Schedule of Investments for industry, sector or country breakout. |
| | |
| |
| | October 31, 2014 |
| |
| Notes to Financial Statements – continued | | |
At the end of each fiscal quarter, management evaluates the Level 2 and 3 assets and liabilities for changes in liquidity, including but not limited to: whether a broker is willing to execute at a quoted price, the depth and consistency of prices from third party services, and the existence of contemporaneous, observable trades in the market. Additionally, management evaluates the Level 1 and 2 assets and liabilities on a quarterly basis for changes in listings or delistings on national exchanges. Due to the inherent uncertainty of determining the fair values of investments that do not have readily available market values, the fair values of the Funds’ investments may fluctuate from period to period. Additionally, the fair values of investments may differ significantly from the values that would have been used had a ready market existed for such investments and may differ materially from the values the Funds may ultimately realize upon the disposition of such investments. Further, such investments may be subject to legal and other restrictions on resale or they may be otherwise less liquid than publicly-traded securities.
Barings International Fund, Guardian Capital Global Dividend Fund, LMCG Emerging Markets Fund, and Pictet International Fund may utilize an external pricing service to fair value certain foreign securities if certain market events occur. Such fair valuations are categorized as Level 2 in the hierarchy. Because such market events were deemed to have occurred at October 31, 2014, Barings International Fund, Guardian Capital Global Dividend Fund, LMCG Emerging Markets Fund and Pictet International Fund utilized the external pricing service adjustments. As a result, Barings International Fund and LMCG Emerging Market Fund owned certain securities during the period ended October 31, 2014 that were still owned as of October 31, 2014 and were transferred from Level 1 to Level 2.
Certain securities that were held at October 31, 2014 and since the beginning of the fiscal year in Barings International Fund, LMCG Emerging Markets Fund and River Road Independent Value Fund had changes in liquidity assessments which resulted in a transfer between levels. Transfers between Levels, if any, are recognized as of the last day of the fiscal quarter in which the event or change in circumstances that resulted in reclassification occurred.
| | | | | | | | |
Funds | | Transfer from
Level 1 to Level 2 | | | Transfer from
Level 2 to Level 1 | |
Barings International Fund | | $ | — | | | $ | 15,474,367 | |
| LMCG Emerging Markets Fund | | | 1,552,260 | | | | — | |
| River Road Independent Value Fund | | | 19,139,952 | | | | 18,935,879 | |
Level 3 holdings were valued using internal valuation techniques that took into consideration factors including previous experience with similar securities of the same issuer, conversion ratio, purchase price and security terms.
The following is a reconciliation of Level 3 holdings for which significant unobservable inputs and Adviser assumptions were used in determining fair value as of October 31, 2014:
| | | | | | | | | | | | |
| DoubleLine Core Plus Fixed Income Fund | | | Total | | |
| Corporate
Notes |
| |
| Asset-
Backed |
|
Fair value, beginning of period | | $ | — | | | $ | — | | | $ | — | |
Purchases | | | 636,128 | | | | 150,000 | | | | 486,128 | |
Sales | | | — | | | | — | | | | — | |
Change in unrealized appreciation (depreciation) | | | 4,500 | | | | 4,500 | | | | — | |
| | | | | | | | | | | | |
Fair value, end of period | | $ | 640,628 | | | $ | 154,500 | | | $ | 486,128 | |
| | | | | | | | | | | | |
Change in net unrealized appreciation (depreciation) on Level 3 holdings held at end of period | | $ | 4,500 | | | $ | 4,500 | | | $ | — | |
| | | | | | | | | | | | |
| | | | |
| Barings International Fund | | | Common Stocks | |
| | | | |
Fair value, beginning of period | | $ | 4,485 | |
Sales | | | (4,599 | ) |
Net realized gains | | | 76 | |
Change in unrealized appreciation (depreciation) | | | 38 | |
| | | | |
Fair Value, end of period | | $ | — | |
| | | | |
(2) Repurchase Agreements: Each Fund may enter into repurchase agreements with financial institutions deemed to be creditworthy by the Fund’s Adviser or Subadviser, subject to the seller’s agreement to repurchase and the Fund’s agreement to sell such securities at a mutually agreed upon price. Securities purchased subject to repurchase agreements are deposited with the Fund’s custodian and, pursuant to the terms of the repurchase agreement, must have an aggregate market value greater than or equal to the repurchase price plus accrued interest at all times. If the value of the underlying securities falls below the value of the repurchase price plus accrued interest, the Fund will require the seller to deposit additional collateral by the next business day. If the request for additional collateral is not met, or the seller defaults on its repurchase obligation, the Fund has the right to sell the underlying securities at market value and may claim any resulting loss against the seller. As of and during the year ended October 31, 2014, the Funds did not hold any repurchase agreements.
(3) When Issued/Delayed Delivery Securities: Each Fund may purchase and sell securities on a “when issued” or “delayed delivery” basis, with settlement to occur at a later date. The value of any security so purchased is subject to market fluctuations during the applicable period. The Funds segregate assets having an aggregate value at least equal to the amount of when issued or delayed delivery purchase commitments until payment is made. During the year ended and at October 31, 2014, DoubleLine Core Plus Fixed Income Fund and TCH Fixed Income Fund owned delayed delivery securities.
(4) Mortgage-Backed Securities: M&C Balanced Fund, DoubleLine Core Plus Fixed Income Fund and TCH Fixed Income Fund may invest in mortgage-backed securities (“MBS”). These securities represent interests in pools of mortgage loans and they provide shareholders with payments consisting of both principal and interest as the mortgages in the underlying mortgage pools are paid. The timely payment of principal and interest on MBS issued or guaranteed by Ginnie Mae (formerly known as the Government National Mortgage Association) is backed by Ginnie Mae
| | |
| |
| | October 31, 2014 |
| |
| Notes to Financial Statements – continued | | |
and the full faith and credit of the U.S. government. MBS issued by U.S. government agencies or instrumentalities other than Ginnie Mae are not “full faith and credit” obligations. Certain obligations, such as those issued by the Federal Home Loan Banks, Fannie Mae (formerly known as the Federal National Mortgage Association) and Freddie Mac (formerly known as the Federal Home Loan Mortgage Corporation) are supported only by the credit of the issuer. MBS issued by private issuers are not government securities and are not directly guaranteed by any government agency. They are secured by the underlying collateral of the private issuer. Yields on privately issued MBS tend to be higher than those of government-backed issues. However, risk of loss due to default and sensitivity to interest rate fluctuations are also higher. M&C Balanced Fund, DoubleLine Core Plus Fixed Income Fund and TCH Fixed Income Fund may also invest in collateralized mortgage obligations (“CMOs”), collateralized loan obligations (“CLOs”) and real estate mortgage investment conduits (“REMICs”). A CMO and/or REMIC is a bond that is collateralized by a pool of MBS. A CLO is a bond that is collateralized by a financial institution’s receivables from loans. These MBS pools are divided into classes with each class having its own characteristics. The different classes are retired in sequence as the underlying mortgages are repaid.
(5) Securities Sold Short: River Road Long-Short Fund utilizes short sales as part of its overall portfolio management strategy. A short sale involves the sale of a security that is borrowed from a broker or other institution. A gain, limited to the price at which the Fund sold the security short, or a loss, unlimited in size, will be recognized upon closing a short sale. Short sales expose the Fund to the risk that it will be required to acquire, convert or exchange securities to replace the borrowed securities at a time when the securities sold short have appreciated in value, thus resulting in a loss to the Fund. The Fund making a short sale must segregate liquid assets, or otherwise cover its position in a permissible manner. The Subadviser determines the liquidity of assets, in accordance with procedures established by the Board of Trustees. Cash segregated as collateral for short sales is shown in the Statement of Assets and Liabilities as segregated cash. Security positions segregated as collateral for short sales are included in the Total Investments on the Statement of Assets and Liabilities.
(6) Options Contracts: In the normal course of pursuing its investment objectives, certain Funds are subject to price volatility risk. Certain Funds may write and/or purchase call and put options on securities for hedging purposes, to seek capital appreciation, to mitigate risk and/or to increase exposure. Writing put options or purchasing call options tends to increase a Fund’s exposure to the underlying instrument. Writing call options or purchasing put options tends to decrease a Fund’s exposure to the underlying instrument. When a Fund writes or purchases a call or put option, an amount equal to the premium received or paid by the Fund is included in a Fund’s Statement of Assets and Liabilities as a liability or an investment and subsequently adjusted to the current market value based on the quoted daily settlement price of the option written or purchased. Premiums received or paid from writing or purchasing options that expire unexercised are treated by the Fund on the expiration date as realized gains or losses. The
difference between the premium and the amount paid or received on a closing purchase or sale transaction, including brokerage commissions, is also treated as a realized gain or loss. If an option is exercised, the premium paid or received is added to the cost of the purchase or proceeds from the sale in determining whether the Fund has realized a gain or loss on investment transactions. If the Fund writes a covered call option, the Fund forgoes, in exchange for the premium, the opportunity to profit during the option period from an increase in the market value of the underlying security above the exercise price. If the Fund writes a put option, it accepts the risk of a decline in the market value of the underlying security below the exercise price. There is the risk a Fund may not be able to enter into a closing transaction because of an illiquid market. The risk associated with purchasing put and call options is limited to the premium paid. Options were traded during the period in Anchor Capital Enhanced Equity Fund. See the Schedule of Investments for open options contracts held by Anchor Capital Enhanced Equity Fund at October 31, 2014. As of and during the year ended October 31, 2014, the average* volume of derivative activities were as follows:
| | | | | | | | |
Funds | | Purchased
Options
(Premiums Paid) | | | Written
Options
(Premiums Received) | |
| Anchor Capital Enhanced Equity Fund | | $ | 1,633,276 | | | $ | 4,702,612 | |
| * | estimated based on quarter end holdings |
(7) Forward Foreign Currency Contracts: In the normal course of pursuing their investment objectives, certain Funds are subject to foreign investment and currency risk. Certain Funds may enter into forward foreign currency contracts (“forward contracts”) for purposes of hedging, duration management, as a substitute for securities, to increase returns, for currency hedging or risk management, or to otherwise help achieve a Fund’s investment goal. These contracts are marked-to-market daily at the applicable exchange rates. A Fund records realized gains or losses at the time the forward contract is closed. A forward contract is extinguished through a closing transaction or upon delivery of the currency or entering an offsetting contract. Risks may arise upon entering these contracts from the potential inability of a counterparty to meet the terms of its contracts and from unanticipated movements in the value of a foreign currency relative to the U.S. dollar or other currencies. During the year ended October 31, 2014, the Funds did not enter into any forward foreign currency contracts.
(8) Disclosures about Derivative Instruments: The following is a table summarizing the fair value of derivatives held at October 31, 2014, by primary risk exposure:
| | | | | | | | |
| | | Asset Derivative
Investments Value | | | Liability Derivative
Investments Value | |
Fund | | Equity Contracts(a) | | | Equity
Contracts(a) | |
| | | | | | | | |
| Anchor Capital Enhanced Equity Fund | | $ | 547,100 | | | $ | (9,225,587 | ) |
| (a) | Statement of Assets and Liabilities location: Total investments at value for purchased options and call options written, at value for written options. |
| | |
| |
| | October 31, 2014 |
| |
| Notes to Financial Statements – continued | | |
The effect of derivative instruments on the Statement of Operations for the year ended October 31, 2014:
| | | | | | | | |
| | | Amount of
Realized Gain (Loss)
on Derivatives
Investments Value | | | Change in Unrealized
Appreciation
(Depreciation)
on Derivatives
Investments Value | |
| | | Equity
Contracts(a) | | | Equity
Contracts(b) | |
| Anchor Capital Enhanced Equity Fund | | $ | (12,502,843 | ) | | $ | (1,939,937 | ) |
| (a) | Statement of Operations location: Net realized loss on purchased options and net realized loss on written options. |
| (b) | Statement of Operations location: Net change in unrealized appreciation (depreciation) on purchased options and net change in unrealized appreciation (depreciation) on written options. |
(9) Investment Income and Securities Transactions: Dividend income is recorded on the ex-dividend date, except for certain dividends from foreign securities where the ex-dividend date may have passed, which are recorded as soon as a Fund is informed of the ex-dividend date. Interest income is accrued daily. Dividend income and interest income are recorded in the Statement of Operations as investment income. Premiums and discounts are amortized or accreted on an effective yield method on fixed income securities. The Funds may be subject to foreign taxes on income, gains on investments, securities transactions or currency repatriation, some of which may be recoverable in part. The Funds will accrue such taxes and reclaims as applicable, based upon their current interpretation of tax rules and regulations that exist in the markets in which the Funds invest. Transactions in
securities are accounted for on a trade date basis. The cost of securities sold is determined using the identified cost method.
(10) Foreign Currency: Foreign currencies, investments and other assets and liabilities are translated into U.S. dollars at the exchange rates at the close of the regular trading session on the New York Stock Exchange. Fluctuations in the value of the foreign currencies and other assets and liabilities resulting from changes in exchange rates are recorded as unrealized foreign currency gains (losses). Realized gains (losses) and unrealized appreciation (depreciation) on investment securities and income and expenses are translated on the respective dates of such transactions. The effects of changes in foreign currency exchange rates on investments in securities are segregated from the effects of changes in market prices of those securities, and are included with the net realized and net change in unrealized gain or loss on investment securities on the Statement of Operations.
(11) Federal Income Taxes: The Funds have elected to be treated as “regulated investment companies” under Subchapter M of the Internal Revenue Code of 1986, as amended, and to distribute substantially all of their respective net taxable income. Accordingly, no provisions for federal income taxes have been made in the accompanying financial statements. The Funds intend to utilize provisions of the federal income tax laws, which allow them to carry a realized capital loss forward for eight years following the year of the loss and offset such losses against any future realized capital gains.
At October 31, 2014, the following Funds had available realized capital loss carryforwards to offset future net capital gains through the fiscal year ended:
| | | | | | | | | | | | | | | | | | | | | | | | | | | | |
| | | Capital Loss Carryforwards: | |
Fund | | 2016 | | | 2017 | | | 2018 | | | 2019 | | | No Expiration
Short Term* | | | No Expiration
Long Term* | | | Total | |
| | | | | | | | | | | | | | | | | | | | | | | | | | | | |
| Cornerstone Large Cap Value Fund | | $ | — | | | $ | 11,124,593 | | | $ | 6,819,813 | | | $ | — | | | $ | — | | | $ | — | | | $ | 17,944,406 | |
| M&C Growth Fund | | | — | | | | 5,719,602 | | | | — | | | | — | | | | — | | | | — | | | | 5,719,602 | |
| LMCG Small Cap Growth Fund | | | 1,123,210 | ** | | | — | | | | — | | | | — | | | | — | | | | — | | | | 1,123,210 | |
| DoubleLine Core Plus Fixed Income Fund | | | — | | | | — | | | | — | | | | — | | | | 2,938,510 | | | | 1,300,564 | | | | 4,239,074 | |
| TCH Fixed Income Fund | | | 2,654,917 | | | | 1,270,780 | | | | — | | | | — | | | | — | | | | — | | | | 3,925,697 | |
| Anchor Capital Enhanced Equity Fund | | | — | | | | — | | | | — | | | | — | | | | 441,599 | | | | — | | | | 441,599 | |
| Guardian Capital Global Dividend Fund | | | — | | | | — | | | | — | | | | — | | | | 37,885 | | | | — | | | | 37,885 | |
| LMCG Emerging Markets Fund | | | — | | | | — | | | | — | | | | — | | | | 260,214 | | | | — | | | | 260,214 | |
| Harrison Street Real Estate Fund | | | 606,778 | | | | 11,228,100 | | | | — | | | | — | | | | — | | | | — | | | | 11,834,878 | |
| * | On December 22, 2010, the Regulated Investment Company Modernization Act of 2010 (the “Modernization Act”) was signed into law. Under the Modernization Act, the Funds are permitted to carry forward capital losses incurred for an unlimited period. However, any losses incurred during those future taxable years will be required to be utilized prior to the losses incurred in pre-enactment taxable years. As a result of this ordering rule, pre-enactment capital loss carryforwards may be more likely to expire unused. Additionally, post-enactment capital losses that are carried forward will retain their character as either short-term or long-term capital losses rather than being considered all short-term as under previous law. |
| ** | This capital loss carryforward amount was acquired in the reorganization of the Aston Small Cap Fund into the LMCG Small Cap Growth Fund on April 19, 2013. The Fund’s ability to utilize the capital loss carryforwards is limited under Internal Revenue Service regulations. |
For the year ended October 31, 2014, the following Funds utilized capital losses as follows:
| | | | | | | | | | | | | | | | | | | | | | | | | | | | |
| | | Utilized Capital Losses (with Expiration Year) | | | | |
Fund | | 2014 | | | 2015 | | | 2016 | | | 2017 | | | 2018 | | | 2019 | | | No Expiration | |
| | | | | | | | | | | | | | | | | | | | | | | | | | | | |
| Cornerstone Large Cap Growth Fund | | $ | — | | | $ | — | | | $ | — | | | $ | 6,683,549 | | | $ | — | | | $ | — | | | $ | — | |
| M&C Growth Fund | | | — | | | | — | | | | — | | | | 3,189,231 | | | | — | | | | — | | | | — | |
| LMCG Small Cap Growth Fund | | | — | | | | — | | | | 561,605 | | | | — | | | | — | | | | — | | | | — | |
| TCH Fixed Income Fund | | | 837,356 | | | | — | | | | — | | | | — | | | | — | | | | — | | | | — | |
| Anchor Capital Enhanced Equity Fund | | | — | | | | — | | | | — | | | | — | | | | — | | | | — | | | | 580,131 | |
| Harrison Street Real Estate Fund | | | — | | | | — | | | | 314,960 | | | | — | | | | — | | | | — | | | | — | |
| | |
| |
| | October 31, 2014 |
| |
| Notes to Financial Statements – continued | | |
For the year ended October 31, 2014, the following Fund had capital losses that expired:
| | | | |
Fund | | Expired
Capital Losses | |
| | | | |
| TCH Fixed Income Fund | | $ | 85,316 | |
Under current laws, certain capital losses realized after October 31 may be deferred (and certain ordinary losses after January 1st may be deferred) and treated as occurring on the first day of the following fiscal year. For the fiscal year ended October 31, 2014, the Funds elected to defer the following losses incurred from November 1, 2013 through October 31, 2014:
| | | | | | | | | | | | |
| | | Long-Term
Realized
Capital Losses | | | Short-Term
Realized
Capital Losses | | | Late-Year
Ordinary
Losses | |
| | | | | | | | | | | | |
| TAMRO Small Cap Fund | | $ | — | | | $ | — | | | $ | 4,567,670 | |
| Lake Partners LASSO Alternatives Fund | | | — | | | | — | | | | 1,997,170 | |
Management has analyzed the Funds’ tax positions for all open tax years (current and prior three tax years), as well as potential exposure to foreign capital gains witholding taxes, and has concluded that no provision for federal, state, or international income tax is required in the Funds’ financial statements. The Funds’ federal income and excise tax returns for tax years for which the applicable statutes of limitations have not expired are subject to examination by the Internal Revenue Service.
(12) Multi-Class Operations: Each class offered by a Fund that is authorized to offer multiple classes of shares has equal rights as to the Fund’s net assets.
Income, fund and trust level expenses, and realized and unrealized capital gains and losses, if any, are allocated to each class of shares based on the relative net assets of each class. Class specific expenses are allocated to each class.
(13) Offering Costs: Certain costs were incurred in connection with the offering of the following Funds, as disclosed in the table below. The costs associated have been capitalized and are being amortized on a straight-line basis over twelve months based on the commencement date of the Funds, stated below.
| | | | | | | | |
Fund | | Inception Date | | | Original
Offering Costs | |
| Guardian Capital Global Dividend Fund | | | April 14, 2014 | | | $ | 59,779 | |
| LMCG Emerging Markets Fund | | | March 28, 2013 | | | | 72,373 | |
| Pictet International Fund | | | April 14, 2014 | | | | 72,702 | |
(14) Use of Estimates: The preparation of financial statements in conformity with U.S. GAAP requires management to make estimates and assumptions that affect the reported amounts of assets and liabilities and disclosure of contingent assets and liabilities at the date of the financial statements and the reported amounts of revenues and expenses during the reporting period. Actual results could differ from those estimates.
(15) Commitments and Contingencies: In the normal course of business, the Trust enters into contracts on behalf of the Funds that contain a variety of provisions for general indemnifications. Each Fund’s maximum exposure under these arrangements is
unknown, as this would involve future claims that may be made against each Fund that are not known at this time. However, based on experience, the Funds believe the risk of loss is remote.
Note (C) Dividends from Net Investment Income and Distributions of Capital Gains: Dividends and distributions to shareholders are recorded on the ex-dividend date. River Road Dividend All Cap Value Fund, River Road Dividend All Cap Value Fund II, DoubleLine Core Plus Fixed Income Fund and TCH Fixed Income Fund distribute dividends from net investment income to shareholders monthly and net realized gains from investment transactions, if any, are generally distributed annually, usually in December.
Anchor Capital Enhanced Equity Fund, Guardian Capital Global Dividend Fund, and M&C Balanced Fund distribute dividends from net investment income to shareholders quarterly and net realized gains from investment transactions, if any, are generally distributed annually, usually in December.
The following Funds distribute dividends from net investment income to shareholders annually and net realized gains from investment transactions, if any, are generally distributed annually, usually in December: M&C Growth Fund, TAMRO Diversified Equity Fund, Herndon Large Cap Value Fund, Cornerstone Large Cap Value Fund, Fairpointe Mid Cap Fund, M&C Mid Cap Growth Fund, LMCG Small Cap Growth Fund, Silvercrest Small Cap Fund, TAMRO Small Cap Fund, River Road Select Value Fund, River Road Small Cap Value Fund, River Road Independent Value Fund, Lake Partners LASSO Alternatives Fund, River Road Long-Short Fund, Barings International Fund, LMCG Emerging Markets Fund, Pictet International Fund and Harrison Street Real Estate Fund.
Dividends and distributions are automatically reinvested in additional Fund shares on ex-date at that day’s ending NAV for the respective Fund for those shareholders who have elected the reinvestment option.
Differences in dividends per share between classes of the Funds are due to different class expenses.
| | |
| |
| | October 31, 2014 |
| |
| Notes to Financial Statements – continued | | |
Net investment income and realized gains and losses for federal income tax purposes may differ from those reported on the financial statements because of temporary and permanent book and tax basis differences. Permanent differences, such as redesignation of dividends paid, partnership reclasses, disallowed capitalized dividends on short sales, reclass of short-term gain to ordinary income, write off of capital loss carryovers, return of capital adjustments, premium reversals, paydown reclasses, passive foreign investment company reclasses, foreign currency reclasses, adjustments for business development corporations,
the use of equalization and net operating loss reclasses are reclassified among capital accounts in the financial statements to reflect their character. Temporary differences, such as deferrals on losses relating to wash sales transactions, amortization of offering costs, premium amortization, current year dividends payable, passive foreign investment company adjustments and capital loss carryovers, arise when income, expenses, gains or losses are recognized in different periods for financial statement and tax purposes; these differences will reverse at some time in the future.
Permanent differences between book and tax basis reporting for the 2014 fiscal year have been identified and appropriately reclassified as indicated below. These reclassifications have no impact on net assets.
| | | | | | | | | | | | |
| | | Accumulated
Undistributed Net
Investment Income | | | Accumulated Net
Realized Gain (Loss) | | | Paid in Capital | |
| | | | | | | | | | | | |
| M&C Growth Fund | | $ | (3,443,614 | ) | | $ | (169,916,454 | ) | | $ | 173,360,068 | |
| TAMRO Diversified Equity Fund | | | 157,579 | | | | (157,579 | ) | | | — | |
| River Road Dividend All Cap Value Fund | | | 1,177,760 | | | | (11,380,025 | ) | | | 10,202,265 | |
| River Road Dividend All Cap Value Fund II | | | 83,604 | | | | 123,547 | | | | (207,151 | ) |
| Fairpointe Mid Cap Fund | | | 868,581 | | | | (126,097,130 | ) | | | 125,228,549 | |
| M&C Mid Cap Growth Fund | | | 63,632 | | | | (63,632 | ) | | | — | |
| LMCG Small Cap Growth Fund | | | 350,424 | | | | (350,424 | ) | | | — | |
| River Road Independent Value Fund | | | 6,391,403 | | | | (6,391,403 | ) | | | — | |
| River Road Select Value Fund | | | 1,293,494 | | | | (5,027,230 | ) | | | 3,733,736 | |
| River Road Small Cap Value Fund | | | 1,606,167 | | | | (8,138,357 | ) | | | 6,532,190 | |
| TAMRO Small Cap Fund | | | 365,154 | | | | (25,512,092 | ) | | | 25,146,938 | |
| DoubleLine Core Plus Fixed Income Fund | | | 338,458 | | | | (338,458 | ) | | | — | |
| TCH Fixed Income Fund | | | 100,187 | | | | (14,871 | ) | | | (85,316 | ) |
| Lake Partners LASSO Alternatives Fund | | | 3,456,174 | | | | (3,456,174 | ) | | | — | |
| River Road Long-Short Fund | | | 3,313,855 | | | | (3,313,777 | ) | | | (78 | ) |
| Barings International Fund | | | (146,854 | ) | | | (722,382 | ) | | | 869,236 | |
| Guardian Capital Global Dividend Fund | | | 8,830 | | | | (3,111 | ) | | | (5,719 | ) |
| LMCG Emerging Markets Fund | | | (10,911 | ) | | | 5,997 | | | | 4,914 | |
| Pictet International Fund | | | 1,716 | | | | 8,817 | | | | (10,533 | ) |
| Harrison Street Real Estate Fund | | | (148 | ) | | | 148 | | | | — | |
| M&C Balanced Fund | | | 15,733 | | | | (15,733 | ) | | | — | |
Distributions from net realized gains for book purposes may include short-term capital gains, which are classified as ordinary income for tax purposes.
The tax character of distributions paid during the fiscal years ended 2014 and 2013 was as follows:
| | | | | | | | | | | | | | | | |
| | | Distributions Paid in 2014 | | | Distributions Paid in 2013 | |
| | | Ordinary Income | | | Long-Term
Capital Gains | | | Ordinary Income | | | Long-Term
Capital Gains | |
| | | | | | | | | | | | | | | | |
| Cornerstone Large Cap Value Fund | | $ | 400,233 | | | $ | — | | | $ | 275,360 | | | $ | — | |
| Herndon Large Cap Value Fund | | | 3,419,118 | | | | 6,349 | | | | 2,225,740 | | | | 4,982 | |
| M&C Growth Fund | | | 45,645,316 | | | | 341,924,841 | | | | 53,175,678 | | | | 275,103,427 | |
| TAMRO Diversified Equity Fund | | | 21,488 | | | | 1,631,344 | | | | 47,422 | | | | 25,803 | |
| River Road Dividend All Cap Value Fund | | | 46,656,555 | | | | 64,851,857 | | | | 31,709,319 | | | | 26,566,474 | |
| River Road Dividend All Cap Value Fund II | | | 4,391,126 | | | | 86,891 | | | | 964,010 | | | | — | |
| Fairpointe Mid Cap Fund | | | 3,375,463 | | | | 458,048,169 | | | | 33,005,046 | | | | 66,057,903 | |
| M&C Mid Cap Growth Fund | | | 54,000 | | | | 1,654,527 | | | | — | | | | 92,399 | |
| LMCG Small Cap Growth Fund | | | 4,567,533 | | | | 960,263 | | | | 436,931 | | | | 47,268 | |
| River Road Independent Value Fund | | | 27,428,053 | | | | 833,833 | | | | 39,553,086 | | | | — | |
| River Road Select Value Fund | | | 5,039,706 | | | | 26,824,144 | | | | 3,212,685 | | | | 8,700,481 | |
| River Road Small Cap Value Fund | | | 10,537,955 | | | | 56,872,092 | | | | 5,316,856 | | | | 9,066,179 | |
| Silvercrest Small Cap Fund | | | 723,403 | | | | 562,187 | | | | 110,190 | | | | 717 | |
| TAMRO Small Cap Fund | | | — | | | | 116,418,951 | | | | 18,818,417 | | | | 76,987,885 | |
| DoubleLine Core Plus Fixed Income Fund | | | 5,696,835 | | | | — | | | | 8,127,489 | | | | 22,764 | |
| TCH Fixed Income Fund | | | 1,961,530 | | | | — | | | | 2,721,001 | | | | — | |
| Anchor Capital Enhanced Equity Fund | | | 3,308,423 | | | | — | | | | 5,860,687 | | | | 556,618 | |
| Lake Partners LASSO Alternatives Fund | | | 4,167,016 | | | | 1,590,997 | | | | 4,205,294 | | | | — | |
| River Road Long-Short Fund | | | 4,915,054 | | | | 28,902 | | | | 415,810 | | | | 21,761 | |
| Barings International Fund | | | 2,458,302 | | | | 944,009 | | | | 1,201,521 | | | | 550,401 | |
Guardian Capital Global Dividend Fund | | | 46,620 | | | | — | | | | — | | | | — | |
LMCG Emerging Markets Fund | | | 64,574 | | | | — | | | | — | | | | — | |
| Harrison Street Real Estate Fund | | | 147,567 | | | | — | | | | 165,004 | | | | — | |
| M&C Balanced Fund | | | 208,332 | | | | 740,661 | | | | 366,801 | | | | — | |
| | |
| |
| | October 31, 2014 |
| |
| Notes to Financial Statements – continued | | |
As of October 31, 2014, the most recent tax year end, the components of distributable earnings on a tax basis were as follows:
| | | | | | | | | | | | | | | | | | | | |
| | | | | | | | | | | | | | | | | | | | |
| | | Accumulated Capital and
Other Losses | | | Undistributed
Ordinary
Income | | | Undistributed Long-Term Gain | | | Unrealized Appreciation
(Depreciation) | | | Total | |
| Cornerstone Large Cap Value Fund | | $ | (17,944,406 | ) | | $ | 811,840 | | | $ | — | | | $ | 9,312,701 | | | $ | (7,819,865 | ) |
| Herndon Large Cap Value Fund | | | — | | | | 2,077,706 | | | | 7,725,697 | | | | 18,831,843 | | | | 28,635,246 | |
| M&C Growth Fund | | | (5,719,602 | ) | | | 39,806,758 | | | | 627,214,322 | | | | 682,737,831 | | | | 1,344,039,309 | |
| TAMRO Diversified Equity Fund | | | — | | | | 1,330,732 | | | | 2,037,416 | | | | 14,488,089 | | | | 17,856,237 | |
| River Road Dividend All Cap Value Fund | | | — | | | | 1,450,183 | | | | 89,180,525 | | | | 231,097,821 | | | | 321,728,529 | |
| River Road Dividend All Cap Value Fund II | | | — | | | | 1,313,975 | | | | 2,890,310 | | | | 13,296,819 | | | | 17,501,104 | |
| Fairpointe Mid Cap Fund | | | — | | | | 151,395,419 | | | | 770,914,068 | | | | 962,121,316 | | | | 1,884,430,803 | |
| M&C Mid Cap Growth Fund | | | — | | | | 22,455 | | | | 660,992 | | | | 2,085,241 | | | | 2,768,688 | |
| LMCG Small Cap Growth Fund | | | (1,123,210 | ) | | | 1,396,041 | | | | 1,049,684 | | | | 5,555,024 | | | | 6,877,539 | |
| River Road Independent Value Fund | | | — | | | | 13,123,488 | | | | 21,660,989 | | | | (22,531,730 | ) | | | 12,252,747 | |
| River Road Select Value Fund | | | — | | | | 7,894,025 | | | | 17,042,127 | | | | 7,552,973 | | | | 32,489,125 | |
| River Road Small Cap Value Fund | | | — | | | | 9,288,601 | | | | 31,937,090 | | | | 36,248,070 | | | | 77,473,761 | |
| Silvercrest Small Cap Fund | | | — | | | | 427,578 | | | | 1,197,754 | | | | 6,951,946 | | | | 8,577,278 | |
| TAMRO Small Cap Fund | | | (4,567,670 | ) | | | — | | | | 94,013,543 | | | | 235,273,794 | | | | 324,719,667 | |
| DoubleLine Core Plus Fixed Income Fund | | | (4,239,074 | ) | | | 56,676 | | | | — | | | | 2,372,929 | | | | (1,809,469 | ) |
| TCH Fixed Income Fund | | | (3,925,697 | ) | | | 13,088 | | | | — | | | | 3,179,390 | | | | (733,219 | ) |
| Anchor Capital Enhanced Equity Fund | | | (441,599 | ) | | | 327,869 | | | | — | | | | 7,937,136 | | | | 7,823,406 | |
| Lake Partners LASSO Alternatives Fund | | | (1,997,170 | ) | | | — | | | | 15,080,174 | | | | 27,352,495 | | | | 40,435,499 | |
| River Road Long-Short Fund | | | — | | | | 4,915,572 | | | | 334,672 | | | | (9,041,573 | ) | | | (3,791,329 | ) |
| Barings International Fund | | | — | | | | 772,590 | | | | 2,360,278 | | | | 740,716 | | | | 3,873,584 | |
| Guardian Capital Global Dividend Fund | | | (37,885 | ) | | | 16,335 | | | | — | | | | 234,146 | | | | 212,596 | |
| LMCG Emerging Markets Fund | | | (260,214 | ) | | | 22,462 | | | | — | | | | 127,491 | | | | (110,261 | ) |
| Pictet International Fund | | | — | | | | 170,163 | | | | — | | | | (805,564 | ) | | | (635,401 | ) |
| Harrison Street Real Estate Fund | | | (11,834,878 | ) | | | 115,470 | | | | — | | | | 1,133,770 | | | | (10,585,638 | ) |
| M&C Balanced Fund | | | — | | | | 83,638 | | | | 1,807,933 | | | | 2,700,106 | | | | 4,591,677 | |
Note (D) Shares of Beneficial Interest: Each Fund is authorized to issue an unlimited number of shares of beneficial interest with no par value. Share transactions of the Funds were as follows:
Year Ended October 31, 2014
| | | | | | | | | | | | | | | | |
Class N | | Sold | | | Proceeds From
Reinvestment
of Distributions | | | Redeemed | | | Net Increase
(Decrease) in
Shares Outstanding | |
| Cornerstone Large Cap Value Fund | | | 3,048,364 | | | | 6,618 | | | | (840,585 | ) | | | 2,214,397 | |
| Herndon Large Cap Value Fund | | | 774,911 | | | | 78,380 | | | | (2,949,039 | ) | | | (2,095,748 | ) |
| M&C Growth Fund | | | 7,516,258 | | | | 5,582,826 | | | | (44,037,900 | ) | | | (30,938,816 | ) |
| TAMRO Diversified Equity Fund | | | 192,994 | | | | 42,330 | | | | (445,529 | ) | | | (210,205 | ) |
| River Road Dividend All Cap Value Fund | | | 4,595,497 | | | | 2,941,808 | | | | (14,719,302 | ) | | | (7,181,997 | ) |
| River Road Dividend All Cap Value Fund II | | | 308,070 | | | | 16,347 | | | | (92,224 | ) | | | 232,193 | |
| Fairpointe Mid Cap Fund | | | 13,219,533 | | | | 4,903,545 | | | | (18,453,660 | ) | | | (330,582 | ) |
| M&C Mid Cap Growth Fund | | | 35,309 | | | | 147,172 | | | | (438,462 | ) | | | (255,981 | ) |
| LMCG Small Cap Growth Fund | | | 615,033 | | | | 304,695 | | | | (585,882 | ) | | | 333,846 | |
| River Road Independent Value Fund | | | 6,616,331 | | | | 1,167,151 | | | | (11,067,285 | ) | | | (3,283,803 | ) |
| River Road Select Value Fund | | | 215,257 | | | | 295,283 | | | | (1,412,098 | ) | | | (901,558 | ) |
| River Road Small Cap Value Fund | | | 695,985 | | | | 871,062 | | | | (1,272,564 | ) | | | 294,483 | |
| Silvercrest Small Cap Fund | | | 318,690 | | | | 9,961 | | | | (168,205 | ) | | | 160,446 | |
| TAMRO Small Cap Fund | | | 2,156,386 | | | | 1,983,756 | | | | (9,725,416 | ) | | | (5,585,274 | ) |
| DoubleLine Core Plus Fixed Income Fund | | | 2,161,225 | | | | 141,089 | | | | (4,006,735 | ) | | | (1,704,421 | ) |
| TCH Fixed Income Fund | | | 549,014 | | | | 133,538 | | | | (1,567,315 | ) | | | (884,763 | ) |
| Anchor Capital Enhanced Equity Fund | | | 3,747,280 | | | | 184,255 | | | | (4,009,865 | ) | | | (78,330 | ) |
| Lake Partners LASSO Alternatives Fund | | | 1,605,400 | | | | 40,597 | | | | (2,469,534 | ) | | | (823,537 | ) |
| River Road Long-Short Fund | | | 8,014,551 | | | | 238,102 | | | | (7,696,381 | ) | | | 556,272 | |
| Barings International Fund | | | 8,221 | | | | 5,415 | | | | (27,372 | ) | | | (13,736 | ) |
| Guardian Capital Global Dividend Fund (a) | | | 100,106 | | | | — | | | | — | | | | 100,106 | |
| LMCG Emerging Markets Fund | | | 6,335 | | | | 1,079 | | | | (1,378 | ) | | | 6,036 | |
| Pictet International Fund (b) | | | 105,262 | | | | — | | | | — | | | | 105,262 | |
| Harrison Street Real Estate Fund | | | 374,724 | | | | 12,655 | | | | (529,928 | ) | | | (142,549 | ) |
| M&C Balanced Fund | | | 49,674 | | | | 35,776 | | | | (198,637 | ) | | | (113,187 | ) |
| | | | | | | | | | | | | | | | |
Class I | | Sold | | | Proceeds From
Reinvestment
of Distributions | | | Redeemed | | | Net Increase
(Decrease) in
Shares Outstanding | |
| Cornerstone Large Cap Value Fund | | | 4,871,810 | | | | 19,747 | | | | (993,206 | ) | | | 3,898,351 | |
| Herndon Large Cap Value Fund | | | 5,946,567 | | | | 145,491 | | | | (2,674,050 | ) | | | 3,418,008 | |
| M&C Growth Fund | | | 24,146,473 | | | | 5,932,472 | | | | (41,799,885 | ) | | | (11,720,940 | ) |
| TAMRO Diversified Equity Fund | | | 222,404 | | | | 50,315 | | | | (679,730 | ) | | | (407,011 | ) |
| River Road Dividend All Cap Value Fund | | | 9,868,160 | | | | 3,439,419 | | | | (12,909,103 | ) | | | 398,476 | |
| | |
| |
| | October 31, 2014 |
| |
| Notes to Financial Statements – continued | | |
| | | | | | | | | | | | | | | | |
Class I | | Sold | | | Proceeds From
Reinvestment
of Distributions | | | Redeemed | | | Net Increase
(Decrease) in
Shares Outstanding | |
| River Road Dividend All Cap Value Fund II | | | 3,185,525 | | | | 293,676 | | | | (990,015 | ) | | | 2,489,186 | |
| Fairpointe Mid Cap Fund | | | 30,513,534 | | | | 3,826,779 | | | | (15,079,903 | ) | | | 19,260,410 | |
| M&C Mid Cap Growth Fund (c) | | | 322,300 | | | | — | | | | (14 | ) | | | 322,286 | |
| LMCG Small Cap Growth Fund | | | 696,705 | | | | 82,467 | | | | (339,984 | ) | | | 439,188 | |
| River Road Independent Value Fund | | | 13,556,500 | | | | 1,311,396 | | | | (13,609,667 | ) | | | 1,258,229 | |
| River Road Select Value Fund | | | 3,281,294 | | | | 3,175,257 | | | | (5,705,277 | ) | | | 751,274 | |
| River Road Small Cap Value Fund | | | 6,333,689 | | | | 3,935,519 | | | | (6,638,474 | ) | | | 3,630,734 | |
| Silvercrest Small Cap Fund | | | 2,326,474 | | | | 76,930 | | | | (331,458 | ) | | | 2,071,946 | |
| TAMRO Small Cap Fund | | | 5,439,909 | | | | 2,400,215 | | | | (19,301,842 | ) | | | (11,461,718 | ) |
| DoubleLine Core Plus Fixed Income Fund | | | 10,159,407 | | | | 317,973 | | | | (6,234,468 | ) | | | 4,242,912 | |
| TCH Fixed Income Fund | | | 885,168 | | | | 40,165 | | | | (343,869 | ) | | | 581,464 | |
| Anchor Capital Enhanced Equity Fund | | | 7,598,733 | | | | 122,231 | | | | (2,426,538 | ) | | | 5,294,426 | |
| Lake Partners LASSO Alternatives Fund | | | 9,990,525 | | | | 329,595 | | | | (6,588,040 | ) | | | 3,732,080 | |
| River Road Long-Short Fund | | | 9,063,711 | | | | 164,164 | | | | (5,460,015 | ) | | | 3,767,860 | |
| Barings International Fund | | | 775,349 | | | | 457,485 | | | | (2,987,094 | ) | | | (1,754,260 | ) |
| Guardian Capital Global Dividend Fund (a) | | | 302,975 | | | | 2,366 | | | | — | | | | 305,341 | |
| LMCG Emerging Markets Fund | | | 26,107 | | | | 5,932 | | | | (41,200 | ) | | | (9,161 | ) |
| Pictet International Fund (b) | | | 904,851 | | | | — | | | | — | | | | 904,851 | |
| Harrison Street Real Estate Fund | | | 29,872 | | | | 396 | | | | (19,438 | ) | | | 10,830 | |
| M&C Balanced Fund | | | 14,759 | | | | 1,333 | | | | (14,900 | ) | | | 1,192 | |
| (a) | The inception date for the Guardian Capital Global Dividend Fund is April 14, 2014. |
| (b) | The inception date for the Pictet International Fund is April 14, 2014. |
| (c) | The inception date for M&C Mid Cap Growth Fund Class I is May 14, 2014. |
| | | | | | | | | | | | | | | | |
Class R | | Sold | | | Proceeds From
Reinvestment
of Distributions | | | Redeemed | | | Net
Decrease in
Shares Outstanding | |
| M&C Growth Fund | | | 43,265 | | | | 20,886 | | | | (156,936 | ) | | | (92,785 | ) |
Year Ended October 31, 2013
| | | | | | | | | | | | | | | | |
Class N | | Sold | | | Proceeds From
Reinvestment
of Distributions | | | Redeemed | | | Net Increase
(Decrease) in
Shares Outstanding | |
| Cornerstone Large Cap Value Fund | | | 556,632 | | | | 18,800 | | | | (747,212 | ) | | | (171,780 | ) |
| Herndon Large Cap Value Fund | | | 1,724,473 | | | | 77,295 | | | | (553,437 | ) | | | 1,248,331 | |
| M&C Growth Fund | | | 15,308,565 | | | | 5,984,433 | | | | (20,341,948 | ) | | | 951,050 | |
| TAMRO Diversified Equity Fund | | | 272,293 | | | | 5,056 | | | | (303,307 | ) | | | (25,958 | ) |
| River Road Dividend All Cap Value Fund | | | 5,156,129 | | | | 1,828,175 | | | | (3,861,426 | ) | | | 3,122,878 | |
| River Road Dividend All Cap Value Fund II | | | 254,219 | | | | 3,387 | | | | (76,152 | ) | | | 181,454 | |
| Fairpointe Mid Cap Fund | | | 18,070,132 | | | | 1,435,859 | | | | (14,913,034 | ) | | | 4,592,957 | |
| M&C Mid Cap Growth Fund | | | 597,270 | | | | 7,828 | | | | (423,852 | ) | | | 181,246 | |
| LMCG Small Cap Growth Fund | | | 2,004,046 | | | | 38,933 | | | | (359,721 | ) | | | 1,683,258 | |
| River Road Independent Value Fund | | | 11,980,826 | | | | 1,889,378 | | | | (16,056,650 | ) | | | (2,186,446 | ) |
| River Road Select Value Fund | | | 1,588,871 | | | | 56,761 | | | | (525,762 | ) | | | 1,119,870 | |
| River Road Small Cap Value Fund | | | 544,887 | | | | 169,935 | | | | (1,009,533 | ) | | | (294,711 | ) |
| Silvercrest Small Cap Fund | | | 314,297 | | | | 1,162 | | | | (105,758 | ) | | | 209,701 | |
| TAMRO Small Cap Fund | | | 6,816,406 | | | | 1,892,026 | | | | (5,489,343 | ) | | | 3,219,089 | |
| DoubleLine Core Plus Fixed Income Fund | | | 4,823,072 | | | | 292,494 | | | | (5,329,639 | ) | | | (214,073 | ) |
| TCH Fixed Income Fund | | | 953,216 | | | | 201,498 | | | | (2,241,661 | ) | | | (1,086,947 | ) |
| Anchor Capital Enhanced Equity Fund | | | 4,989,293 | | | | 427,532 | | | | (6,819,244 | ) | | | (1,402,419 | ) |
| Lake Partners LASSO Alternatives Fund | | | 4,155,866 | | | | 36,352 | | | | (2,837,160 | ) | | | 1,355,058 | |
| River Road Long-Short Fund | | | 9,748,334 | | | | 42,565 | | | | (1,427,562 | ) | | | 8,363,337 | |
| Barings International Fund | | | 2,509 | | | | 1,555 | | | | (4,238 | ) | | | (174 | ) |
| LMCG Emerging Markets Fund (a) | | | 69,890 | | | | — | | | | — | | | | 69,890 | |
| Harrison Street Real Estate Fund | | | 926,494 | | | | 14,559 | | | | (770,368 | ) | | | 170,685 | |
| M&C Balanced Fund | | | 112,753 | | | | 15,050 | | | | (655,765 | ) | | | (527,962 | ) |
| (a) | The inception date for the LMCG Emerging Markets Fund is March 28, 2013. |
| | | | | | | | | | | | | | | | |
Class I | | Sold | | | Proceeds From
Reinvestment
of Distributions | | | Redeemed | | | Net Increase
(Decrease) in
Shares Outstanding | |
| Cornerstone Large Cap Value Fund | | | 2,506,727 | | | | 5,555 | | | | (188,320 | ) | | | 2,323,962 | |
| Herndon Large Cap Value Fund | | | 3,369,141 | | | | 85,484 | | | | (592,116 | ) | | | 2,862,509 | |
| M&C Growth Fund | | | 31,773,722 | | | | 5,907,893 | | | | (27,016,572 | ) | | | 10,665,043 | |
| TAMRO Diversified Equity Fund | | | 1,954,469 | | | | 251 | | | | (275,939 | ) | | | 1,678,781 | |
| | |
| |
| | October 31, 2014 |
| |
| Notes to Financial Statements – continued | | |
| | | | | | | | | | | | | | | | |
Class I | | Sold | | | Proceeds From
Reinvestment
of Distributions | | | Redeemed | | | Net Increase
(Decrease) in
Shares Outstanding | |
| River Road Dividend All Cap Value Fund | | | 15,887,474 | | | | 2,343,933 | | | | (12,706,308 | ) | | | 5,525,099 | |
| River Road Dividend All Cap Value Fund II | | | 6,086,481 | | | | 70,708 | | | | (364,705 | ) | | | 5,792,484 | |
| Fairpointe Mid Cap Fund | | | 23,358,073 | | | | 1,027,797 | | | | (13,678,107 | ) | | | 10,707,763 | |
| LMCG Small Cap Growth Fund | | | 595,578 | | | | 5,342 | | | | (92,943 | ) | | | 507,977 | |
| River Road Independent Value Fund (a) | | | 11,939,790 | | | | 1,729,407 | | | | (9,727,757 | ) | | | 3,941,440 | |
| River Road Select Value Fund | | | 6,134,305 | | | | 1,237,782 | | | | (6,524,564 | ) | | | 847,523 | |
| River Road Small Cap Value Fund | | | 3,987,576 | | | | 913,112 | | | | (7,768,151 | ) | | | (2,867,463 | ) |
| Sillvercrest Small Cap Fund | | | 1,662,372 | | | | 8,931 | | | | (122,970 | ) | | | 1,548,333 | |
| TAMRO Small Cap Fund (b) | | | 8,715,782 | | | | 2,234,145 | | | | (9,190,853 | ) | | | 1,759,074 | |
| DoubleLine Core Plus Fixed Income Fund | | | 5,482,743 | | | | 397,260 | | | | (5,039,350 | ) | | | 840,653 | |
| TCH Fixed Income Fund | | | 116,289 | | | | 35,075 | | | | (267,227 | ) | | | (115,863 | ) |
| Anchor Capital Enhanced Equity Fund | | | 4,030,307 | | | | 220,773 | | | | (6,308,808 | ) | | | (2,057,728 | ) |
| Lake Partners LASSO Alternatives Fund | | | 16,747,896 | | | | 259,746 | | | | (6,288,030 | ) | | | 10,719,612 | |
| River Road Long-Short Fund (c) | | | 6,329,701 | | | | — | | | | (420,651 | ) | | | 5,909,050 | |
| Barings International Fund | | | 1,521,858 | | | | 224,097 | | | | (5,907,075 | ) | | | (4,161,120 | ) |
| LMCG Emerging Markets Fund (d) | | | 341,891 | | | | — | | | | — | | | | 341,891 | |
| Harrison Street Real Estate Fund | | | 33,502 | | | | 181 | | | | (2,189 | ) | | | 31,494 | |
| M&C Balanced Fund | | | 6,701 | | | | 473 | | | | (19,931 | ) | | | (12,757 | ) |
| (a) | River Road Independent Value Fund had a subscription-in-kind in the amount of $597,549 on March 27, 2013. The subscription was comprised of securities, cash and dividends accrued in the amounts of $258,478, $338,808 and $262, respectively. |
| (b) | TAMRO Small Cap Fund had a subscription-in-kind in the amount of $2,677,538 on April 25, 2013. The subscription was comprised of securities, cash and dividends accrued in the amounts of $2,657,373, $19,712 and $453, respectively. The Fund also had a redemption-in-kind in the amount of $52,573,290 on January 15, 2013. The redemption was comprised of securities and cash in the amounts of $51,794,423 and $778,867, respectively. |
| (c) | The inception date for the River Road Long-Short Fund Class I shares is March 4, 2013. |
| (d) | The inception date for the LMCG Emerging Markets Fund is March 28, 2013. |
| | | | | | | | | | | | | | | | |
Class R | | Sold | | | Proceeds From
Reinvestment
of Distributions | | | Redeemed | | | Net
Increase in
Shares Outstanding | |
| M&C Growth Fund | | | 83,728 | | | | 21,706 | | | | (99,541 | ) | | | 5,893 | |
Note (E) Investment Transactions: Aggregate purchases and proceeds from sales and maturities of investment securities (other than short-term investments) for the year ended October 31, 2014 were as follows:
| | | | | | | | | | | | | | | | |
| | | Aggregate Purchases | | | Proceeds from Sales | |
| | | | |
| | | U.S. Government | | | Other | | | U.S. Government | | | Other | |
| Cornerstone Large Cap Value Fund | | $ | — | | | $ | 124,706,499 | | | $ | — | | | $ | 33,015,276 | |
| Herndon Large Cap Value Fund | | | — | | | | 129,877,026 | | | | — | | | | 108,695,592 | |
| M&C Growth Fund | | | — | | | | 2,184,456,459 | | | | — | | | | 3,833,584,349 | |
| TAMRO Diversified Equity Fund | | | — | | | | 22,196,986 | | | | — | | | | 35,311,114 | |
| River Road Dividend All Cap Value Fund | | | — | | | | 380,771,420 | | | | — | | | | 529,430,397 | |
| River Road Dividend All Cap Value Fund II | | | — | | | | 65,442,144 | | | | — | | | | 31,466,926 | |
| Fairpointe Mid Cap Fund | | | — | | | | 2,772,696,137 | | | | — | | | | 2,667,369,801 | |
| M&C Mid Cap Growth Fund | | | — | | | | 3,653,557 | | | | — | | | | 4,570,516 | |
| LMCG Small Cap Growth Fund | | | — | | | | 62,337,920 | | | | — | | | | 57,946,395 | |
| River Road Independent Value Fund | | | — | | | | 189,512,034 | | | | — | | | | 285,667,577 | |
| River Road Select Value Fund | | | — | | | | 128,262,211 | | | | — | | | | 150,271,191 | |
| River Road Small Cap Value Fund | | | — | | | | 183,361,282 | | | | — | | | | 186,146,427 | |
| Silvercrest Small Cap Fund | | | — | | | | 46,955,559 | | | | — | | | | 15,779,127 | |
| TAMRO Small Cap Fund | | | — | | | | 791,052,495 | | | | — | | | | 1,257,365,226 | |
| DoubleLine Core Plus Fixed Income Fund | | | 81,536,852 | | | | 78,463,412 | | | | 72,801,286 | | | | 89,120,545 | |
| TCH Fixed Income Fund | | | 9,044,325 | | | | 9,136,181 | | | | 2,967,601 | | | | 17,696,837 | |
| Anchor Capital Enhanced Equity Fund | | | — | | | | 107,548,579 | | | | — | | | | 74,869,642 | |
| Lake Partners LASSO Alternatives Fund | | | — | | | | 256,949,497 | | | | — | | | | 224,654,975 | |
| River Road Long-Short Fund | | | — | | | | 589,982,610 | | | | — | | | | 537,588,175 | |
| Barings International Fund | | | — | | | | 15,014,192 | | | | — | | | | 29,934,586 | |
| Guardian Capital Global Dividend Fund | | | — | | | | 4,650,951 | | | | — | | | | 586,272 | |
| LMCG Emerging Markets Fund | | | — | | | | 2,461,485 | | | | — | | | | 2,625,454 | |
| Pictet International Fund | | | — | | | | 12,399,641 | | | | — | | | | 2,240,376 | |
| Harrison Street Real Estate Fund | | | — | | | | 21,105,881 | | | | — | | | | 22,085,133 | |
| M&C Balanced Fund | | | 681,489 | | | | 5,469,588 | | | | 290,815 | | | | 9,566,160 | |
| | |
| |
| | October 31, 2014 |
| |
| Notes to Financial Statements – continued | | |
Note (F) Redemption Fees: In accordance with the prospectus, certain Funds may assess a redemption fee on Fund share redemptions and exchanges within specified time periods. The redemption fees are indicated in the following table for the year ended October 31, 2014 and are included in the Cost of Shares Redeemed on the Statements of Changes in Net Assets:
| | | | | | |
Fund Name | | Time Period | | Amount | |
| Barings International Fund | | 2% Within 90 Days | | $ | 2,418 | |
| Guardian Capital Dividend Fund | | 2% Within 90 Days | | | — | |
| LMCG Emerging Markets Fund | | 2% Within 90 Days | | | — | |
| Pictet International Fund | | 2% Within 90 Days | | | — | |
| Harrison Street Real Estate Fund | | 2% Within 90 Days | | | 1,361 | |
Note (G) Advisory, Administration, Distribution Services and Trustee Agreements:
Advisory. Aston serves as investment adviser and administrator to the Funds. Under the terms of the investment advisory agreement for the Funds (the “Investment Advisory Agreement”), fees are accrued daily and paid monthly, at specified annual rates of average daily net assets. The factors considered by the Board of Trustees in approving the current Investment Advisory Agreement are included in the Funds’ annual or semi-annual report to shareholders covering the period during which the approval occurred.
Certain Funds are subject to an expense limitation agreement with the Adviser, pursuant to which annual ordinary operating expenses for Class N and Class I shareholders are capped at certain specified annual rates of average daily net assets. There are no contractual expense limitations for Class R shareholders.
The contractual expense limitations for the Funds are effective through February 28, 2015, except as noted below. The advisory rates and contractual expense limitations for the year ended October 31, 2014 were as follows:
| | | | | | |
| | | | | Contractual Expense Limitations |
Fund Name | | Advisory Fees | | Class N | | Class I |
| Cornerstone Large Cap Value Fund | | 0.80% | | 1.30% | | 1.05% |
| Herndon Large Cap Value Fund | | 0.80% | | 1.30%(a) | | 1.05%(a) |
| M&C Growth Fund | | 0.80% on first $800,000,000 | | | | |
| | 0.60% over $800,000,000 up to $6 billion | | | | |
| | 0.55% over $6 billion up to $12 billion
0.50% over $12 billion | | N/A | | N/A |
| TAMRO Diversified Equity Fund | | 0.80% | | 1.20% | | 0.95% |
| River Road Dividend All Cap Value Fund | | 0.70% | | 1.30% | | 1.05% |
| River Road Dividend All Cap Value Fund II | | 0.70% | | 1.30%(a) | | 1.05%(a) |
| Fairpointe Mid Cap Fund | | 0.80% on first $100,000,000 | | | | |
| | 0.75% next $300,000,000 | | | | |
| | 0.70% over $400,000,000 | | N/A | | N/A |
| M&C Mid Cap Growth Fund | | 0.85% | | 1.25%(a) | | 1.00%(a)(b) |
| LMCG Small Cap Growth Fund | | 1.00% | | 1.35%(a) | | 1.10%(a) |
| River Road Independent Value Fund | | 1.00% | | 1.42%(a) | | 1.17%(a) |
| River Road Select Value Fund | | 1.00% | | 1.50% | | 1.25% |
| River Road Small Cap Value Fund | | 0.90% | | N/A | | N/A |
| Silvercrest Small Cap Growth | | 1.00% | | 1.40%(a) | | 1.15%(a) |
| TAMRO Small Cap Fund | | 0.90% | | N/A | | N/A |
| DoubleLine Core Plus Fixed Income Fund | | 0.55% | | 0.94%(a) | | 0.69%(a) |
| TCH Fixed Income Fund | | 0.55% | | 0.94% | | 0.69% |
| Anchor Capital Enhanced Equity Fund | | 0.70% | | 1.40% | | 1.15% |
| Lake Partners LASSO Alternatives Fund | | 1.00% | | 1.45%(a) | | 1.20%(a) |
| River Road Long-Short Fund | | 1.20% | | 1.70%(a) | | 1.45%(a) |
| Barings International Fund | | 1.00% | | 1.40%(a) | | 1.15%(a) |
| Guardian Capital Global Dividend Fund (c) | | 0.80% | | 1.30%(a) | | 1.05%(a) |
| LMCG Emerging Markets Fund (d) | | 1.05% | | 1.43%(a) | | 1.18%(a) |
| Pictet International Fund (c) | | 0.90% | | 1.40%(a) | | 1.15%(a) |
| Harrison Street Real Estate Fund | | 1.00% | | 1.37% | | 1.12% |
| M&C Balanced Fund | | 0.75% | | 1.35% | | 1.10% |
| (a) | Pursuant to a contractual expense reimbursement agreement between the Adviser and the Trust, with respect to the Fund for a period up to three years from the end of the fiscal year end during which fees were waived or expenses were reimbursed, the Adviser is entitled to be reimbursed by the Fund for previously waived fees and reimbursed expenses, from commencement of operations through the completion of the first three full fiscal years to the extent that the Fund’s expense ratio (not including interest, taxes, other investment-related costs (such as brokerage commissions), extraordinary expenses and acquired fund fees and expenses) remains below the operating expense cap after such reimbursement. The contractual expense limitation is in effect through February 28, 2015 for the Funds except for Guardian Capital Global Dividend Fund and Pictet International Fund, which is through April 9, 2015, and M&C Mid Cap Growth Fund Class I Shares, which is through May 31, 2015. |
| (b) | The inception date for M&C Mid Cap Growth Fund Class I is May 14, 2014. |
| (c) | The inception date for the Guardian Capital Global Dividend Fund and Pictet International Fund is April 14, 2014. |
| (d) | Prior to July 1, 2014 the contractual expense limitation was 1.65% and 1.40% for Class N and Class I, respectively. |
| | |
| |
| | October 31, 2014 |
| |
| Notes to Financial Statements – continued | | |
Pursuant to a contractual expense reimbursement agreement between the Adviser and the Trust, for a period of up to three years from the fiscal year end during which the Adviser waived its advisory fees or reimbursed expenses for each of Herndon Large Cap Value Fund-Classes N and I, River Road Dividend All Cap Value Fund II-Classes N and I, M&C Mid Cap Growth Fund-Classes N and I, LMCG Small Cap Growth Fund-Classes N and I, River Road Independent Value Fund-Classes N and I, River Road Select Value Fund-Classes N and I, Silvercrest Small Cap Fund-Classes N and I, DoubleLine Core Plus Fixed Income Fund-Classes N and I, Lake Partners LASSO Alternatives Fund-Classes N and I, River Road Long-Short Fund-Classes N and I, Barings International Fund-Classes N and I, Guardian Capital Global Dividend Fund-Classes N and I, LMCG Emerging Markets Fund-Classes N and I, and Pictet International Fund-Classes N and I, the Adviser is entitled to be reimbursed by each Fund for such previously waived fees and reimbursed expenses from commencement of operations through the completion of the first three full fiscal years, to the extent that each Fund’s expense ratio (not including interest, taxes, other investment-related costs (such as brokerage commissions), extraordinary expenses and acquired fund fees and expenses) remains below the operating expense cap after such reimbursement.
The cumulative reimbursement amounts as of October 31, 2014 that are entitled to be recouped for each Fund are as follows:
| | | | | | | | | | | | |
| | | Expiration | |
| | | 2015 | | | 2016 | | | 2017 | |
| Herndon Large Cap Value Fund | | $ | 42,793 | | | $ | — | | | | N/A | |
| River Road Dividend All Cap Value Fund II | | | — | | | | — | | | $ | — | |
| LMCG Small Cap Growth Fund | | | 123,269 | | | | 157,143 | | | | 131,012 | |
| Silvercrest Small Cap Fund | | | 147,166 | | | | 116,435 | | | | 108,554 | |
| River Road Independent Value Fund | | | 143,528 | | | | 59,855 | | | | 25,960 | |
| DoubleLine Core Plus Fixed Income Fund | | | 389,195 | | | | 205,067 | | | | 183,865 | |
| Lake Partners Lasso Alternatives Fund | | | — | | | | N/A | | | | N/A | |
| River Road Long-Short Fund | | | 104,143 | | | | 76,699 | | | | — | |
| LMCG Emerging Markets Fund | | | N/A | | | | 119,333 | | | | 173,395 | |
| Pictet International Fund(1) | | | N/A | | | | N/A | | | | 102,208 | |
| Guardian Capital Global Dividend Fund(1) | | | N/A | | | | N/A | | | | 89,764 | |
| | | | | | | | | | | | |
| Total | | $ | 950,094 | | | $ | 734,532 | | | $ | 814,758 | |
| | | | | | | | | | | | |
| (1) | The Fund commenced operations in the current fiscal year. |
For the year ended October 31, 2014, the Adviser was reimbursed $103,793 by the Herndon Large Cap Value Fund, $95,878 by the River Road Dividend All Cap Value Fund II, $87,814 by the Lake Partners LASSO Alternatives Fund and $103,715 by the River Road Long-Short Fund for recoupment of prior year fee waivers. No other Fund in the above table reimbursed the Adviser for the period.
During the year ended October 31, 2013, the following Fund was reimbursed by the Subadviser for losses incurred on transactions not meeting the Fund’s investment guidelines:
| | | | |
| | | Capital Contribution | |
| Harrison Street Real Estate Fund | | $ | 96 | |
On July 1, 2014, BNY Mellon contributed $514 of capital to the following Fund to mitigate the negative impact to Shareholders from an incorrect calculation of net asset value.
| | | | |
| | | Capital Contribution | |
| Lake Partners LASSO Alternative | | $ | 514 | |
The Adviser manages each Fund by retaining one or more Subadvisers to manage each Fund, as follows:
| | |
| Fund | | Subadviser |
Cornerstone Large Cap Value Fund | | Cornerstone Investment Partners, LLC |
Herndon Large Cap Value Fund | | Herndon Capital Management, LLC |
M&C Growth Fund | | Montag & Caldwell, LLC |
TAMRO Diversified Equity Fund | | TAMRO Capital Partners LLC |
River Road Dividend All Cap Value Fund | | River Road Asset Management, LLC |
River Road Dividend All Cap Value Fund II | | River Road Asset Management, LLC |
Fairpointe Mid Cap Fund | | Fairpointe Capital LLC |
M&C Mid Cap Growth Fund | | Montag & Caldwell, LLC |
LMCG Small Cap Growth Fund | | Lee Munder Capital Group, LLC |
River Road Independent Value Fund | | River Road Asset Management, LLC |
River Road Select Value Fund | | River Road Asset Management, LLC |
River Road Small Cap Value Fund | | River Road Asset Management, LLC |
Silvercrest Small Cap Fund | | Silvercrest Asset Management Group LLC |
TAMRO Small Cap Fund | | TAMRO Capital Partners LLC |
DoubleLine Core Plus Fixed Income Fund | | DoubleLine Capital LP |
TCH Fixed Income Fund | | Taplin, Canida & Habacht, LLC |
Anchor Capital Enhanced Equity Fund | | Anchor Capital Advisors LLC |
Lake Partners LASSO Alternatives Fund | | Lake Partners, Inc. |
River Road Long-Short Fund | | River Road Asset Management, LLC |
Barings International Fund | | Baring International Investment Limited |
Guardian Capital Global Dividend Fund | | Guardian Capital LP |
LMCG Emerging Markets Fund | | Lee Munder Capital Group, LLC |
Pictet International Fund | | Pictet Asset Management Limited |
Harrison Street Real Estate Fund | | Harrison Street Securities, LLC |
M&C Balanced Fund | | Montag & Caldwell, LLC |
Subadvisory fees are paid monthly by Aston. The factors considered by the Board of Trustees in approving the current sub-investment advisory agreements for the Funds (each, a “Sub-Investment Advisory Agreement”) are included in the additional information section of the Funds’ annual or semi-annual report to shareholders covering the period in which such approval occurred.
Matters Related to AMG. Effective May 30, 2014, Aston became an indirect, wholly-owned subsidiary of Affiliated Managers Group, Inc. (“AMG”), the interests in which are held by AMG through its wholly-owned subsidiary, AMG Funds LLC (the “Transaction”). As part of the Transaction, Aston was converted to a Delaware limited liability company and changed its name to “Aston Asset Management, LLC.”
As required by the 1940 Act, the investment advisory agreement for each Fund provides for its automatic termination in the event of its assignment, which in turn causes the automatic termination of the subadvisory agreement. The completion of the Transaction constituted an “assignment” as that term is defined under the 1940 Act, of each Fund’s then current investment advisory
| | |
| |
| | October 31, 2014 |
| |
| Notes to Financial Statements – continued | | |
agreement. At an in-person meeting held on December 18-19, 2013, (and March 20, 2014 with respect to the Guardian Global Dividend Fund and Pictet International Fund) the Board of Trustees (the “Board”), including all of the trustees who are not “interested persons” of the Trust, as defined in the 1940 Act (the “Interested Trustees”) approved a new investment advisory agreement and subadvisory agreements with respect to each Fund on substantially the same terms as currently in effect, including the fee rates payable under the agreements. In addition, the new investment advisory agreement was approved by the shareholders of each Fund other than Harrison Street Real Estate Fund and TAMRO Diversified Equity Fund at the Funds’ special meeting of shareholders held on April 17, 2014; by the shareholders of Harrison Street Real Estate Fund at the reconvened special meeting of shareholders held on April 30, 2014; and by the shareholders of TAMRO Diversified Equity Fund at the reconvened special meeting of shareholders held on May 28, 2014.
The new Investment Advisory Agreement and Sub-Investment Advisory Agreement(s) with respect to each Fund took effect on May 30, 2014.
River Road Transaction. River Road Asset Management, LLC (“River Road”) serves as the Subadviser to the River Road Dividend All Cap Value Fund, River Road Dividend All Cap Value Fund II, River Road Independent Value Fund, River Road Long-Short Fund, River Road Select Value Fund and River Road Small Cap Value Fund (each, a “River Road Fund” and collectively, the “River Road Funds”) pursuant to sub-investment advisory agreements between Aston and River Road. Effective as of June 30, 2014, AMG, the parent company of Aston acquired an indirect, majority equity interest in River Road, while River Road’s existing management team holds a substantial minority equity interest in River Road. The River Road transaction did not result in any material changes in River Road’s management, personnel or investment processes, the way in which River Road manages the River Road Funds or the fees and expenses of the River Road Funds.
As required by the 1940 Act, the sub-investment advisory agreement for each Fund provides for its automatic termination in the event of its assignment. The completion of the River Road Transaction and the related issuance of equity to management was deemed to constitute an “assignment,” as that term is defined in the 1940 Act. The Board, including all the Interested Trustees, met in-person on March 20, 2014 and approved a new sub-investment advisory agreement with respect to each River Road Fund on substantially the same terms as currently in effect, including the fee rates payable under the agreements (the “River Road Sub-Advisory Agreements”).
The River Road Sub-Advisory Agreements were approved by shareholders of each River Road Fund, other than River Road Select Value Fund, at a special meeting of shareholders held on June 18, 2014, and by the shareholders of the River Road Select Value Fund at the reconvened special meeting of shareholders held on June 25, 2014.
The River Road Sub-Advisory Agreements with respect to each River Road Fund took effect on June 30, 2014.
A discussion regarding the Board’s basis for approving the investment advisory and sub-investment advisory agreements, as applicable, in connection with the Transaction and the River Road Transaction, respectively, are available in the additional information section of the Funds’ semi-annual Report dated April 30, 2014.
Administration. Under the terms of the administration agreement between the Trust and Aston, the Funds’ administrator (the “Administration Agreement”), administration fees are accrued daily and paid monthly, based on a specified percentage of average daily net assets of the Trust, and base fees are fixed at an annual rate of $12,000 per Fund. The fee is allocated to each Fund based on the relative net assets of the Trust. Administration expenses also include pricing agent fees and compliance-related expenses. The administration fee arrangement is as follows:
| | |
Administration Fees at Trust Level | | Annual Rate |
| |
| First $7.4 billion | | 0.0437% |
| Over $7.4 billion | | 0.0412% |
BNY Mellon Investment Servicing (US) Inc. (“BNY Mellon”) provides certain administrative services to the Funds pursuant to a Sub-administration and Accounting Services Agreement between Aston and BNY Mellon (the “Sub-Administration Agreement”). Under the terms of the Sub-Administration Agreement, sub-administration fees (inclusive of tax services fees), which are paid by Aston, are accrued daily and paid monthly, at a rate of 0.0167% of average daily net assets of the Trust and a base fee at an annual rate of $12,000 per Fund. The fees may be subject to an annual increase by BNY Mellon, in an amount not to exceed the cumulative percentage increase in the Consumer Price Index for All Urban Consumers (CPI-U) U.S. City Average, all items (unadjusted) published since the last such increase in fees. The last such annual increase, of 1.5%, was effective October 1, 2014.
Distribution Services. Foreside Funds Distributors LLC (the “Distributor”) serves as principal underwriter and distributor of the Funds’ shares. Pursuant to Rule 12b-1 distribution and service plans (the “Plans”) adopted by the Funds, with respect to Class N shares and Class R shares, the Funds pay certain expenses associated with the distribution of their shares. Under the Plans, each Fund may pay actual expenses not exceeding, on an annual basis, 0.25% of each participating Fund’s Class N average daily net assets and 0.50% of each participating Fund’s Class R average daily net assets. The Class I shares do not have Rule 12b-1 plans. Effective January 1, 2012, and ending October 31, 2013, the TCH Fixed Income Fund 12b-1 fee was reduced to 0.15%. Effective January 1, 2012 M&C Balanced Fund reduced its 12b-1 fees to 0.10%.
| | |
| |
| | October 31, 2014 |
| |
| Notes to Financial Statements – continued | | |
Trustees. The Trustees of the Trust who are not affiliated with the Adviser or Subadviser receive an annual retainer and per meeting fees, and they are reimbursed for out-of-pocket expenses for each meeting of the Board of Trustees they attend. The Chairman of the Board and Committee Chairs receive additional retainers. No officer or employee of the Adviser, of a Subadviser, or of their affiliates receives any compensation from
the Funds for acting as a Trustee of the Trust. The officers of the Trust receive no compensation directly from the Funds for performing the duties of their offices, except that the Funds compensate the Administrator for providing an officer to serve as the Funds’ Chief Compliance Officer. The aggregate remuneration paid to the Trustees during the year ended October 31, 2014 was $912,625.
Affiliated Investments: Certain Funds may invest in affiliated funds subject to compliance with each Fund’s policies.
A summary of each Fund’s investment, as applicable, in affiliated funds for the year ended October 31, 2014, is as follows:
DoubleLine Core Plus Fixed Income Fund
| | | | | | | | | | | | | | | | |
Underlying Fund | | Proceeds
from Sales | | | Market Value
10/31/2014 | | | Dividend
Income | | | Realized
Gain | |
| DoubleLine Floating Rate Fund | | $ | 2,000,000 | | | $ | 2,514,243 | | | $ | 100,845 | | | | 16,745 | |
Note (H) Credit Agreement: Effective July 6, 2010 and as amended August 29, 2014, the Trust entered into a Credit Agreement with The Bank of New York Mellon (the “Bank”) which provides the Trust with a revolving line of credit facility of up to $50 million. The facility is shared by each series of the Trust and is available for temporary, emergency purposes including liquidity needs in meeting redemptions. The interest rate on outstanding Alternate Base Rate Loans is equal to the greater of the Prime Rate plus 1.25% or 0.50% plus the Federal Funds Effective Rate plus 1.25%. The interest rate on out standing Overnight Loans is equal to the greater of the Federal Funds Effective Rate plus 1.25% or the One Month LIBOR Rate plus 1.25%. The Trust pays a commitment fee on the unutilized commitment amount of 0.12% per annum, included in Other Expenses on the Statement of Operations. The Funds did not utilize the line of credit during the year ended October 31, 2014.
Note (I) Fully FDIC-insured Uninvested Deposit Balance Program: Effective July 3, 2012, the Trust entered into a program under which cash that was then held in custody and trust accounts by the Bank, as custodian for the Trust, would be held in non-interest bearing transaction accounts at the Bank that were fully covered by the FDIC. River Road Independent Value Fund accrued Earnings Credits to offset the Funds’ respective custody and transfer agency fees (including overdraft charges) based on the specified Earnings Credit Rate. The Earnings Credit Rate was 8 basis points on positive balances, subject to adjustment by the Bank. The term of this agreement was June 1, 2012,
through December 31, 2012. At October 31, 2014, the Fund’s accrued Earnings Credits are as follows:
| | | | |
Fund | | Earnings
Credit to Custody
and Transfer
Agency Fees | |
| River Road Independent Value Fund | | $ | 30,229 | |
Note (J) Significant Concentrations: Certain Funds may invest a significant percentage of their assets in securities of foreign issuers. These investments may involve certain considerations and risks not typically associated with investments in the United States as a result of, among other factors, the possibility of future political and economic developments and the level of governmental supervision and regulation of securities markets in the respective countries. Some countries in which the Funds invest may require government approval for repatriation of investment income, capital or the proceeds for sales of securities by foreign investors. In addition, if there is deterioration in a country’s balance of payments or for other reasons, a country may impose temporary restrictions on foreign capital remittances abroad. In addition, changes in currency exchange rates will affect the value of investments denominated in a foreign currency, as well as investment income derived from those securities.
Note (K) Subsequent Events: Management has evaluated the impact of all subsequent events on the Funds through the date the financial statements were issued, and has determined that there were no subsequent events requiring recognition or disclosure in the financial statements.
| | |
| |
| | |
| |
| Report of Independent Registered Public Accounting Firm | | |
To the Shareholders and Board of Trustees of
Aston Funds
We have audited the accompanying statements of assets and liabilities, including the schedules of investments, of Aston Funds (the “Trust”) (comprising, respectively, ASTON/Cornerstone Large Cap Value Fund, ASTON/Herndon Large Cap Value Fund, ASTON/Montag & Caldwell Growth Fund, ASTON/TAMRO Diversified Equity Fund, ASTON/River Road Dividend All Cap Value Fund, ASTON/River Road Dividend All Cap Value Fund II, ASTON/Fairpointe Mid Cap Fund, ASTON/Montag & Caldwell Mid Cap Growth Fund, ASTON/LMCG Small Cap Growth Fund, ASTON/River Road Independent Value Fund, ASTON/River Road Select Value Fund, ASTON/River Road Small Cap Value Fund, ASTON/Silvercrest Small Cap Fund, ASTON/TAMRO Small Cap Fund, ASTON/DoubleLine Core Plus Fixed Income Fund, ASTON/TCH Fixed Income Fund, ASTON/Anchor Capital Enhanced Equity Fund, ASTON/Lake Partners LASSO Alternatives Fund, ASTON/River Road Long-Short Fund, ASTON/Barings International Fund, ASTON/Guardian Capital Global Dividend Fund, ASTON/LMCG Emerging Markets Fund, ASTON/Pictet International Fund, ASTON/Harrison Street Real Estate Fund, ASTON/Montag & Caldwell Balanced Fund, (the “Funds”)) as of October 31, 2014, and the related statements of operations, statements of changes in net assets, and financial highlights for the periods indicated therein. These financial statements and financial highlights are the responsibility of the Trust’s management. Our responsibility is to express an opinion on these financial statements and financial highlights based on our audits.
We conducted our audits in accordance with the standards of the Public Company Accounting Oversight Board (United States). Those standards require that we plan and perform the audit to obtain reasonable assurance about whether the financial statements and financial highlights are free of material misstatement. We were not engaged to perform an audit of the Trust’s internal control over financial reporting. Our audits included consideration of internal control over financial reporting as a basis for designing audit procedures that are appropriate in the circumstances, but not for the purpose of expressing an opinion on the effectiveness of the Trust’s internal control over financial reporting. Accordingly, we express no such opinion. An audit also includes examining, on a test basis, evidence supporting the amounts and disclosures in the financial statements and financial highlights, assessing the accounting principles used and significant estimates made by management, and evaluating the overall financial statement presentation. Our procedures included confirmation of securities owned as of October 31, 2014, by correspondence with the custodian and brokers or by other appropriate auditing procedures where replies from brokers were not received. We believe that our audits provide a reasonable basis for our opinion.
In our opinion, the financial statements and financial highlights referred to above present fairly, in all material respects, the financial position of each of the respective portfolios constituting the Aston Funds at October 31, 2014, and the results of their operations, the changes in their net assets, and the financial highlights for the periods indicated therein, in conformity with U.S. generally accepted accounting principles.

Chicago, Illinois
December 22, 2014
| | |
| |
| | October 31, 2014 |
| |
| Additional Information (unaudited) | | |
Form N-Q: The Trust files complete schedules of portfolio holdings for the Funds with the Securities and Exchange Commission (the “SEC”) for the Trust’s first and third quarters of each fiscal year on Form N-Q. The Trust’s Form N-Q are available on the SEC’s website at www.sec.gov and are available for review and copying at the SEC’s Public Reference Room in Washington, DC. Information on the operations of the Public Reference Room may be obtained by calling the SEC at 202-942-8090.
Proxy Voting: The Trust’s Proxy Voting Policies and Procedures, used to determine how to vote proxies relating to portfolio securities, are included in the Trust’s Statement of Additional Information, which is available (i) upon request, without charge, by calling 800-992-8151; (ii) on Aston Funds’ website at www. astonfunds.com; and (iii) on the SEC’s website at www.sec.gov. The Funds’ Proxy Voting Record for the most recent twelve-month period ended June 30 is available without charge (i) on the Funds’ website at www.astonfunds.com; and (ii) on the SEC’s website at www.sec.gov.
Shareholder Voting Results: A combined meeting of shareholders of the Trust with respect to each River Road Fund listed below was held on June 18, 2014 for the purpose of approving a new Sub-Investment Advisory Agreement between Aston and each River Road Fund (“Proposal 1”).
The shareholders meeting was reconvened with respect to Proposal 1 for the River Road Select Value Fund on June 25, 2014. Proposal 1 was approved by the shareholders of each Fund. The results of the voting are as follows:
Proposal 1: Approval of a new Sub-Investment Advisory Agreement
| | | | | | | | | | | | |
| | | For | | | Against | | | Abstain | |
| ASTON/River Road Dividend All Cap Value Fund | | | 70,079,035.820 | | | | 223,595.594 | | | | 789,236.308 | |
| ASTON/River Road Dividend All Cap Value Fund II | | | 4,448,103.577 | | | | 70,753.000 | | | | 69,464.276 | |
| ASTON/River Road Independent Value Fund | | | 36,763,420.018 | | | | 188,774.000 | | | | 342,557.273 | |
| ASTON/River Road Long-Short Fund | | | 11,461,658.947 | | | | 47,068.000 | | | | 72,819.000 | |
| ASTON/River Road Select Value Fund | | | 12,116,643.402 | | | | 20,659.000 | | | | 242,353.000 | |
| ASTON/River Road Small Cap Value Fund | | | 14,407,188.103 | | | | 151,648.130 | | | | 37,088.260 | |
Tax Information: In accordance with Federal tax law, the following Funds hereby make the designations indicated below regarding their fiscal year ended October 31, 2014:
The following are the estimated percentages of the income dividends qualifying for the dividends received deduction available to corporations:
| | | | |
Fund | | Percentage | |
| Cornerstone Large Cap Value Fund | | | 100.00 | % |
| Herndon Large Cap Value Fund | | | 58.48 | % |
| M&C Growth Fund | | | 100.00 | % |
| TAMRO Diversified Equity Fund | | | 76.66 | % |
| River Road Dividend All Cap Value Fund | | | 70.56 | % |
| River Road Dividend All Cap Value Fund II | | | 53.81 | % |
| Fairpointe Mid Cap Fund | | | 35.46 | % |
| M&C Mid Cap Growth Fund | | | 100.00 | % |
| LMCG Small Cap Growth Fund | | | 3.15 | % |
| River Road Independent Value Fund | | | 17.17 | % |
| River Road Select Value Fund | | | 28.45 | % |
| | | | |
Fund | | Percentage | |
| River Road Small Cap Value Fund | | | 26.68 | % |
| Silvercrest Small Cap Fund | | | 36.25 | % |
| Anchor Capital Enhanced Equity Fund | | | 96.29 | % |
| Lake Partners LASSO Alternatives Fund | | | 33.17 | % |
| River Road Long-Short Fund | | | 7.08 | % |
| Guardian Capital Global Dividend Fund | | | 58.55 | % |
| LMCG Emerging Markets Fund | | | 1.10 | % |
| Harrison Street Real Estate Fund | | | 4.97 | % |
| M&C Balanced Fund | | | 73.15 | % |
For the fiscal year ended October 31, 2014, certain dividends may be subject to a maximum tax rate of 15%, as qualified dividend income (“QDI”) under the Jobs and Growth Tax Relief Reconciliation Act of 2003. For individual shareholders, a percentage of their ordinary income dividends (dividend income plus short-term gains, if any) may qualify for a maximum tax rate of 15%. Complete information is computed and reported in conjunction with your Form 1099-DIV.
The following percentages of ordinary dividends paid during the fiscal year ended October 31, 2014 are designated as QDI:
| | | | |
Fund | | Percentage | |
| Cornerstone Large Cap Value Fund | | | 100.00 | % |
| Herndon Large Cap Value Fund | | | 58.72 | % |
| M&C Growth Fund | | | 100.00 | % |
| TAMRO Diversified Equity Fund | | | 77.68 | % |
| River Road Dividend All Cap Value Fund | | | 85.61 | % |
| River Road Dividend All Cap Value Fund II | | | 65.61 | % |
| Fairpointe Mid Cap Fund | | | 36.48 | % |
| M&C Mid Cap Growth Fund | | | 100.00 | % |
| LMCG Small Cap Growth Fund | | | 3.13 | % |
| River Road Independent Value Fund | | | 21.45 | % |
| River Road Select Value Fund | | | 30.65 | % |
| River Road Small Cap Value Fund | | | 29.32 | % |
| Silvercrest Small Cap Fund | | | 36.25 | % |
| Anchor Capital Enhanced Equity Fund | | | 96.27 | % |
| Lake Partners LASSO Alternatives Fund | | | 54.00 | % |
| River Road Long-Short Fund | | | 9.06 | % |
| Barings International Fund | | | 64.61 | % |
| Guardian Capital Global Dividend Fund | | | 100.00 | % |
| LMCG Emerging Markets Fund | | | 98.62 | % |
| Harrison Street Real Estate Fund | | | 4.97 | % |
| M&C Balanced Fund | | | 77.20 | % |
Each Fund designates 100%, or if subsequently different, of “QDI” to qualify for the lower tax rates applicable to individual shareholders; and 100%, or if subsequently different, of ordinary income dividends to qualify for the “DRD” for corporate shareholders. The actual percentage of QDI and DRD for the calendar year will be designated in year-end tax statements.
| | |
| |
| | October 31, 2014 |
| |
| Additional Information (unaudited) – continued | | |
The following Funds designated the listed amounts as long-term capital gain dividends during the year ended October 31, 2014. Distributable long-term gains are based on net realized long term gains determined on a tax basis and may differ from such amounts for financial reporting purposes.
| | | | |
Fund | | Amount | |
| Herndon Large Cap Value Fund | | $ | 7,624,424 | |
| M&C Growth Fund | | | 790,235,647 | |
| TAMRO Diversified Equity Fund | | | 2,037,493 | |
| River Road Dividend All Cap Value Fund | | | 101,691,847 | |
| River Road Dividend All Cap Value Fund II | | | 2,890,533 | |
| Fairpointe Mid Cap Fund | | | 875,592,505 | |
| M&C Mid Cap Growth Fund | | | 1,654,527 | |
| LMCG Small Cap Growth Fund | | | 1,049,894 | |
| River Road Independent Value Fund | | | 21,662,050 | |
| River Road Select Value Fund | | | 29,375,893 | |
| River Road Small Cap Value Fund | | | 61,932,508 | |
| Silvercrest Small Cap Fund | | | 1,197,826 | |
| TAMRO Small Cap Fund | | | 141,931,043 | |
| Lake Partners LASSO Alternatives Fund | | | 15,082,490 | |
| River Road Long-Short Fund | | | 335,565 | |
| Barings International Fund | | | 3,015,632 | |
| M&C Balanced Fund | | | 1,807,933 | |
Shareholders should not use the above tax information to prepare their tax returns. The information will be included with your Form 1099 DIV which will be sent to you separately in January 2015.
Disclosure of Fund Expenses: We believe it is important for you to understand the impact of fees regarding your investment. All mutual funds have operating expenses. As a shareholder of a mutual fund, you incur ongoing costs, which include costs for portfolio management, administrative services, and shareholder reports (like this one), among others. Operating expenses, which are deducted from a fund’s gross income, directly reduce the investment return of the fund. A fund’s expenses are expressed as a percentage of its average daily net assets. This figure is known as the expense ratio. The following examples are intended to help you understand the ongoing fees (in dollars) of investing in your Fund and to compare these costs with those of other mutual funds. The examples are based on an investment of $1,000 made at the beginning of the period shown and held for the entire period.
The below table illustrates each Fund’s costs in two ways:
Actual Fund Return: This section helps you to estimate the actual expenses, after any applicable fee waivers, that you paid over the period. The “Ending Account Value” shown is derived from the Fund’s actual return for the past six-month period, the “Expense Ratio” column shows the period’s annualized expense ratio, and the “Expenses Paid During Period” column shows the dollar amount that would have been paid by an investor who started with $1,000 in the Fund at the beginning of the period. You may use the information here, together with your account value, to estimate the expenses that you paid over the period. To do so, simply divide your account value by $1,000 (for example, an $8,600 account value divided by $1,000 = 8.6), then multiply the result by the number given for your Fund in the first line under the heading entitled “Expenses Paid During Period.”
Hypothetical 5% Return: This section is intended to help you compare your Fund’s costs with those of other mutual funds. It assumes that the Fund had an annual return of 5% before expenses, but that the expense ratio is unchanged. In this case, because the return used is not the Fund’s actual return, the results do not apply to your investment. This example is useful in making comparisons to other mutual funds because the SEC requires all mutual funds to calculate expenses based on an assumed 5% annual return. You can assess your Fund’s costs by comparing this hypothetical example with the hypothetical examples that appear in shareholder reports of other funds.
| | |
| |
| | October 31, 2014 |
| |
| Additional Information (unaudited) – continued | | |
Please note that the expenses shown in the table are meant to highlight and help you compare your ongoing costs only and do not reflect any transactional costs such as sales charges (loads) and redemption fees, which are described in the prospectus. If these costs were applied to your account, your costs would be higher.
| | | | | | | | | | | | | | | | |
| | | Beginning
Account
Value
05/01/14 | | | Ending
Account
Value
10/31/14 | | | Expense
Ratio(1) | | | Expenses
Paid During
Period(2) | |
| Cornerstone Large Cap Value Fund | |
Actual Fund Return | | | | | | | | | | | | | | | | |
Class N | | | $1,000 | | | | $1,032.30 | | | | 1.29% | | | | $6.61 | |
Class I | | | 1,000 | | | | 1,033.60 | | | | 1.04% | | | | 5.33 | |
Hypothetical 5% Return | | | | | | | | | | | | | | | | |
Class N | | | $1,000 | | | | $1,018.70 | | | | 1.29% | | | | $6.56 | |
Class I | | | 1,000 | | | | 1,019.96 | | | | 1.04% | | | | 5.30 | |
Herndon Large Cap Value Fund | |
Actual Fund Return | | | | | | | | | | | | | | | | |
Class N | | | $1,000 | | | | $1,017.50 | | | | 1.30% | | | | $6.61 | |
Class I | | | 1,000 | | | | 1,018.90 | | | | 1.05% | | | | 5.34 | |
Hypothetical 5% Return | | | | | | | | | | | | | | | | |
Class N | | | $1,000 | | | | $1,018.65 | | | | 1.30% | | | | $6.61 | |
Class I | | | 1,000 | | | | 1,019.91 | | | | 1.05% | | | | 5.35 | |
| M&C Growth Fund | | | | | | | | | | | | | |
Actual Fund Return | | | | | | | | | | | | | | | | |
Class N | | | $1,000 | | | | $1,060.60 | | | | 1.03% | | | | $5.35 | |
Class I | | | 1,000 | | | | 1,062.00 | | | | 0.78% | | | | 4.05 | |
Class R | | | 1,000 | | | | 1,059.50 | | | | 1.28% | | | | 6.64 | |
Hypothetical 5% Return | | | | | | | | | | | | | | | | |
Class N | | | $1,000 | | | | $1,020.01 | | | | 1.03% | | | | $5.24 | |
Class I | | | 1,000 | | | | 1,021.27 | | | | 0.78% | | | | 3.97 | |
Class R | | | 1,000 | | | | 1,018.75 | | | | 1.28% | | | | 6.51 | |
| TAMRO Diversified Equity Fund | | | | | | | | | | | | | |
Actual Fund Return | | | | | | | | | | | | | | | | |
Class N | | | $1,000 | | | | $1,083.90 | | | | 1.20% | | | | $6.30 | |
Class I | | | 1,000 | | | | 1,084.80 | | | | 0.95% | | | | 4.99 | |
Hypothetical 5% Return | | | | | | | | | | | | | | | | |
Class N | | | $1,000 | | | | $1,019.16 | | | | 1.20% | | | | $6.11 | |
Class I | | | 1,000 | | | | 1,020.42 | | | | 0.95% | | | | 4.84 | |
| River Road Dividend All Cap Value Fund | | | | | | | | | | | | | |
Actual Fund Return | | | | | | | | | | | | | | | | |
Class N | | | $1,000 | | | | $1,057.30 | | | | 1.09% | | | | $5.65 | |
Class I | | | 1,000 | | | | 1,058.70 | | | | 0.84% | | �� | | 4.36 | |
Hypothetical 5% Return | | | | | | | | | | | | | | | | |
Class N | | | $1,000 | | | | $1,019.71 | | | | 1.09% | | | | $5.55 | |
Class I | | | 1,000 | | | | 1,020.97 | | | | 0.84% | | | | 4.28 | |
| River Road Dividend All Cap Value Fund II | | | | | | | | | | | | | |
Actual Fund Return | | | | | | | | | | | | | | | | |
Class N | | | $1,000 | | | | $1,062.70 | | | | 1.22% | | | | $6.34 | |
Class I | | | 1,000 | | | | 1,064.00 | | | | 0.97% | | | | 5.05 | |
Hypothetical 5% Return | | | | | | | | | | | | | | | | |
Class N | | | $1,000 | | | | $1,019.06 | | | | 1.22% | | | | $6.21 | |
Class I | | | 1,000 | | | | 1,020.32 | | | | 0.97% | | | | 4.94 | |
| Fairpointe Mid Cap Fund | | | | | | | | | | | | | |
Actual Fund Return | | | | | | | | | | | | | | | | |
Class N | | | $1,000 | | | | $1,025.30 | | | | 1.10% | | | | $5.62 | |
Class I | | | 1,000 | | | | 1,026.70 | | | | 0.85% | | | | 4.34 | |
Hypothetical 5% Return | | | | | | | | | | | | | | | | |
Class N | | | $1,000 | | | | $1,019.66 | | | | 1.10% | | | | $5.60 | |
Class I | | | 1,000 | | | | 1,020.92 | | | | 0.85% | | | | 4.33 | |
| M&C Mid Cap Growth Fund(3) | | | | | | | | | | | | | |
Actual Fund Return | | | | | | | | | | | | | | | | |
Class N | | | $1,000 | | | | $1,046.30 | | | | 1.25% | | | | $6.45 | |
Class I | | | 1,000 | | | | 1,056.30 | | | | 1.00% | | | | 4.82 | |
Hypothetical 5% Return | | | | | | | | | | | | | | | | |
Class N | | | $1,000 | | | | $1,018.90 | | | | 1.25% | | | | $6.36 | |
Class I | | | 1,000 | | | | 1,020.16 | | | | 1.00% | | | | 5.09 | |
| | | | | | | | | | | | | | | | |
| | | Beginning
Account
Value
05/01/14 | | | Ending
Account
Value
10/31/14 | | | Expense
Ratio(1) | | | Expenses
Paid During
Period(2) | |
| LMCG Small Cap Growth Fund | | | | | | | | | |
Actual Fund Return | | | | | | | | | | | | | | | | |
Class N | | | $1,000 | | | | $1,120.70 | | | | 1.35% | | | | $7.22 | |
Class I | | | 1,000 | | | | 1,122.90 | | | | 1.10% | | | | 5.89 | |
Hypothetical 5% Return | | | | | | | | | | | | | | | | |
Class N | | | $1,000 | | | | $1,018.40 | | | | 1.35% | | | | $6.87 | |
Class I | | | 1,000 | | | | 1,019.66 | | | | 1.10% | | | | 5.60 | |
| River Road Independent Value Fund | | | | | | | | | | | | | |
Actual Fund Return | | | | | | | | | | | | | | | | |
Class N | | | $1,000 | | | | $967.10 | | | | 1.42% | | | | $7.04 | |
Class I | | | 1,000 | | | | 968.20 | | | | 1.17% | | | | 5.80 | |
Hypothetical 5% Return | | | | | | | | | | | | | | | | |
Class N | | | $1,000 | | | | $1,018.05 | | | | 1.42% | | | | $7.22 | |
Class I | | | 1,000 | | | | 1,019.31 | | | | 1.17% | | | | 5.96 | |
| River Road Select Value Fund | | | | | | | | | | | | | |
Actual Fund Return | | | | | | | | | | | | | | | | |
Class N | | | $1,000 | | | | $996.60 | | | | 1.45% | | | | $7.30 | |
Class I | | | 1,000 | | | | 997.80 | | | | 1.20% | | | | 6.04 | |
Hypothetical 5% Return | | | | | | | | | | | | | | | | |
Class N | | | $1,000 | | | | $1,017.90 | | | | 1.45% | | | | $7.37 | |
Class I | | | 1,000 | | | | 1,019.16 | | | | 1.20% | | | | 6.11 | |
| River Road Small Cap Value Fund | | | | | | | | | | | | | |
Actual Fund Return | | | | | | | | | | | | | | | | |
Class N | | | $1,000 | | | | $985.40 | | | | 1.34% | | | | $6.71 | |
Class I | | | 1,000 | | | | 986.20 | | | | 1.09% | | | | 5.46 | |
Hypothetical 5% Return | | | | | | | | | | | | | | | | |
Class N | | | $1,000 | | | | $1,018.45 | | | | 1.34% | | | | $6.82 | |
Class I | | | 1,000 | | | | 1,019.71 | | | | 1.09% | | | | 5.55 | |
| Silvercrest Small Cap Fund | | | | | | | | | | | | | |
Actual Fund Return | | | | | | | | | | | | | | | | |
Class N | | | $1,000 | | | | $1,054.80 | | | | 1.40% | | | | $7.25 | |
Class I | | | 1,000 | | | | 1,056.80 | | | | 1.15% | | | | 5.96 | |
Hypothetical 5% Return | | | | | | | | | | | | | | | | |
Class N | | | $1,000 | | | | $1,018.15 | | | | 1.40% | | | | $7.12 | |
Class I | | | 1,000 | | | | 1,019.41 | | | | 1.15% | | | | 5.85 | |
| TAMRO Small Cap Fund | | | | | | | | | | | | | |
Actual Fund Return | | | | | | | | | | | | | | | | |
Class N | | | $1,000 | | | | $1,053.50 | | | | 1.31% | | | | $6.78 | |
Class I | | | 1,000 | | | | 1,055.20 | | | | 1.06% | | | | 5.49 | |
Hypothetical 5% Return | | | | | | | | | | | | | | | | |
Class N | | | $1,000 | | | | $1,018.60 | | | | 1.31% | | | | $6.67 | |
Class I | | | 1,000 | | | | 1,019.86 | | | | 1.06% | | | | 5.40 | |
DoubleLine Core Plus Fixed Income Fund | | | | | | | | | |
Actual Fund Return | | | | | | | | | | | | | | | | |
Class N | | | $1,000 | | | | $1,032.20 | | | | 0.94% | | | | $4.81 | |
Class I | | | 1,000 | | | | 1,033.50 | | | | 0.69% | | | | 3.54 | |
Hypothetical 5% Return | | | | | | | | | | | | | | | | |
Class N | | | $1,000 | | | | $1,020.47 | | | | 0.94% | | | | $4.79 | |
Class I | | | 1,000 | | | | 1,021.73 | | | | 0.69% | | | | 3.52 | |
| TCH Fixed Income Fund | | | | | | | | | | | | | | | | |
Actual Fund Return | | | | | | | | | | | | | | | | |
Class N | | | $1,000 | | | | $1,024.80 | | | | 0.94% | | | | $4.80 | |
Class I | | | 1,000 | | | | 1,026.10 | | | | 0.69% | | | | 3.52 | |
Hypothetical 5% Return | | | | | | | | | | | | | | | | |
Class N | | | $1,000 | | | | $1,020.47 | | | | 0.94% | | | | $4.79 | |
Class I | | | 1,000 | | | | 1,021.73 | | | | 0.69% | | | | 3.52 | |
| Anchor Capital Enhanced Equity Fund | | | | | | | | | | | | | |
Actual Fund Return | | | | | | | | | | | | | | | | |
Class N | | | $1,000 | | | | $1,017.60 | | | | 1.18% | | | | $6.00 | |
Class I | | | 1,000 | | | | 1,018.90 | | | | 0.93% | | | | 4.73 | |
Hypothetical 5% Return | | | | | | | | | | | | | | | | |
Class N | | | $1,000 | | | | $1,019.26 | | | | 1.18% | | | | $6.01 | |
Class I | | | 1,000 | | | | 1,020.52 | | | | 0.93% | | | | 4.74 | |
| | |
| |
| | October 31, 2014 |
| |
| Additional Information (unaudited) – continued | | |
| | | | | | | | | | | | | | | | |
| | | Beginning
Account
Value
05/01/14 | | | Ending
Account
Value
10/31/14 | | | Expense
Ratio(1) | | | Expenses
Paid During
Period(2) | |
| Lake Partners LASSO Alternatives Fund | |
Actual Fund Return | | | | | | | | | | | | | | | | |
Class N | | | $1,000 | | | | $999.30 | | | | 1.42% | | | | $7.16 | |
Class I | | | 1,000 | | | | 1,000.70 | | | | 1.17% | | | | 5.90 | |
Hypothetical 5% Return | | | | | | | | | | | | | | | | |
Class N | | | $1,000 | | | | $1,018.05 | | | | 1.42% | | | | $7.22 | |
Class I | | | 1,000 | | | | 1,019.31 | | | | 1.17% | | | | 5.96 | |
| River Road Long-Short Fund(4) | | | | | | | | | | | | | |
Actual Fund Return | | | | | | | | | | | | | | | | |
Class N | | | $1,000 | | | | $987.00 | | | | 1.70% | | | | $8.51 | |
Class I | | | 1,000 | | | | 987.90 | | | | 1.45% | | | | 7.27 | |
Hypothetical 5% Return | | | | | | | | | | | | | | | | |
Class N | | | $1,000 | | | | $1,016.64 | | | | 1.70% | | | | $8.64 | |
Class I | | | 1,000 | | | | 1,017.90 | | | | 1.45% | | | | 7.37 | |
| Barings International Fund | | | | | | | | | | | | | | | | |
Actual Fund Return | | | | | | | | | | | | | | | | |
Class N | | | $1,000 | | | | $957.50 | | | | 1.40% | | | | $6.91 | |
Class I | | | 1,000 | | | | 957.50 | | | | 1.15% | | | | 5.67 | |
Hypothetical 5% Return | | | | | | | | | | | | | | | | |
Class N | | | $1,000 | | | | $1,018.15 | | | | 1.40% | | | | $7.12 | |
Class I | | | 1,000 | | | | 1,019.41 | | | | 1.15% | | | | 5.85 | |
| Guardian Capital Global Dividend Fund | | | | | | | | | | | | | |
Actual Fund Return | | | | | | | | | | | | | | | | |
Class N | | | $1,000 | | | | $1,025.80 | | | | 1.30% | | | | $6.64 | |
Class I | | | 1,000 | | | | 1,027.90 | | | | 1.05% | | | | 5.37 | |
Hypothetical 5% Return | | | | | | | | | | | | | | | | |
Class N | | | $1,000 | | | | $1,018.65 | | | | 1.30% | | | | $6.61 | |
Class I | | | 1,000 | | | | 1,019.91 | | | | 1.05% | | | | 5.35 | |
| LMCG Emerging Markets Fund | | | | | | | | | | | | | |
Actual Fund Return | | | | | | | | | | | | | | | | |
Class N | | | $1,000 | | | | $1,044.90 | | | | 1.50% | | | | $7.73 | |
Class I | | | 1,000 | | | | 1,045.90 | | | | 1.26% | | | | 6.50 | |
Hypothetical 5% Return | | | | | | | | | | | | | | | | |
Class N | | | $1,000 | | | | $1,017.64 | | | | 1.50% | | | | $7.63 | |
Class I | | | 1,000 | | | | 1,018.85 | | | | 1.26% | | | | 6.41 | |
| Pictet International Fund | | | | | | | | | | | | | |
Actual Fund Return | | | | | | | | | | | | | | | | |
Class N | | | $1,000 | | | | $916.60 | | | | 1.40% | | | | $6.76 | |
Class I | | | 1,000 | | | | 918.50 | | | | 1.15% | | | | 5.56 | |
Hypothetical 5% Return | | | | | | | | | | | | | | | | |
Class N | | | $1,000 | | | | $1,018.15 | | | | 1.40% | | | | $7.12 | |
Class I | | | 1,000 | | | | 1,019.41 | | | | 1.15% | | | | 5.85 | |
| Harrison Street Real Estate Fund | | | | | | | | | | | | | |
Actual Fund Return | | | | | | | | | | | | | | | | |
Class N | | | $1,000 | | | | $1,083.20 | | | | 1.37% | | | | $7.19 | |
Class I | | | 1,000 | | | | 1,084.60 | | | | 1.12% | | | | 5.88 | |
Hypothetical 5% Return | | | | | | | | | | | | | | | | |
Class N | | | $1,000 | | | | $1,018.30 | | | | 1.37% | | | | $6.97 | |
Class I | | | 1,000 | | | | 1,019.56 | | | | 1.12% | | | | 5.70 | |
| M&C Balanced Fund | | | | | | | | | | | | | | | | |
Actual Fund Return | | | | | | | | | | | | | | | | |
Class N | | | $1,000 | | | | $1,044.10 | | | | 1.20% | | | | $6.18 | |
Class I | | | 1,000 | | | | 1,044.30 | | | | 1.10% | | | | 5.67 | |
Hypothetical 5% Return | | | | | | | | | | | | | | | | |
Class N | | | $1,000 | | | | $1,019.16 | | | | 1.20% | | | | $6.11 | |
Class I | | | 1,000 | | | | 1,019.66 | | | | 1.10% | | | | 5.60 | |
| (1) | Annualized, based on the Fund’s most recent fiscal half-year expenses. |
| (2) | Expenses are equal to the Fund’s annualized expense ratio multiplied by the average account value over the period, multiplied by the number of days in the most recent fiscal half-year (184) or partial year, if applicable, for the actual return and multiplied by the most recent fiscal half-year for the hypothetical 5% return, then divided by 365. Expense ratios do not include interest expense, if applicable. |
| (3) | The inception date for the M&C Mid Cap Growth Fund Class I is May 14, 2014. |
| (4) | Excludes interest expense and dividends on short positions. If included, your annualized expense ratios would be 2.65% and 2.40% for Class N and Class I, respectively and your actual and hypothetical expenses paid during the period would be $13.27 and $13.44 and $12.03 and $12.18 for Class N and Class I, respectively. |
| | |
| |
| | October 31, 2014 |
| |
| Additional Information (unaudited) – continued | | |
TRUSTEES AND OFFICERS OF THE TRUST
Under Delaware law, the business and affairs of the Trust are managed under the direction of the Board. Information pertaining to the Trustees and officers of the Trust is set forth below. The term “officer” means the president, vice president, secretary, treasurer, controller or any other officer who performs a policy making function.
| | | | | | | | | | | | |
Name, Address, Age and Position(s) with Trust | | Term of
Office 1 and
Length of
Time Served | | Principal Occupation(s) During Past Five Years | | Number of
Portfolios in
Fund Complex 2
Overseen by
Trustee | | | Other Trusteeships/
Directorships Held by Trustee During Past Five Years | | Experience,
Qualifications,
Attributes, Skills
for Board
Membership |
| | | | |
| INDEPENDENT TRUSTEES | | | | | | | | | | |
Bruce B. Bingham c/o Aston Funds 120 N. LaSalle Street Chicago, IL 60602 DOB: 12/1/48 Trustee | | Since 2014 | | Partner, Hamilton Partners (real estate development firm) (1987-present) | | | 25 | | | Director of The Yacktman Funds, Inc. (2 portfolios); Trustee of AMG Funds, AMG Funds I, AMG Funds II and AMG Funds III (45 portfolios) | | Significant mutual fund board experience; business experience as a partner of a real estate development and investment firm; familiar with financial statements. |
| | | | | |
William E. Chapman, II c/o Aston Funds 120 N. LaSalle Street Chicago, IL 60602 DOB: 9/23/41 Trustee; Independent Chairman | | Since 2010 | | President and Owner, Longboat Retirement Planning Solutions (1998-present); Formerly Trustee of Bowdoin College (2002-2013); Hewitt Associates, LLC (part time) (provider of Retirement and Investment Education Seminars) (2002-2009) | | | 25 | | | Director of Harding, Loevner Funds, Inc. (6 portfolios); Trustee of Third Avenue Trust (5 portfolios); Trustee of Third Avenue Variable Trust (1 portfolio); Trustee of AMG Funds, AMG Funds I, AMG Funds II and AMG Funds III (45 portfolios) | | Significant mutual fund board experience; significant executive experience with several financial services firms; continuing service as Independent Chairman of the Board and Chairman of the Trust’s Nominating and Governance Committee. |
| | | | | |
Edward J. Kaier c/o Aston Funds 120 N. LaSalle Street Chicago, IL 60602 DOB: 9/23/45 Trustee | | Since 2010 | | Attorney at Law and Partner, Teeters Harvey Marrone & Kaier LLP (2007-present); Attorney at Law and Partner, Hepburn Willcox Hamilton & Putnam, LLP (1977-2007) | | | 25 | | | Trustee of Third Avenue Trust (5 portfolios); Trustee of Third Avenue Variable Trust (1 portfolio); Trustee of AMG Funds, AMG Funds I, AMG Funds II and AMG Funds III (45 portfolios) | | Significant experience as a board member of mutual funds; practicing attorney; Chairman of the Trust’s Audit Committee. |
| | |
| |
| | October 31, 2014 |
| |
| Additional Information (unaudited) – continued | | |
| | | | | | | | | | | | |
Name, Address, Age and Position(s) with Trust | | Term of
Office 1 and
Length of
Time Served | | Principal Occupation(s) During Past Five Years | | Number of
Portfolios in
Fund Complex 2
Overseen by
Trustee | | | Other Trusteeships/
Directorships Held by Trustee During Past Five Years | | Experience,
Qualifications,
Attributes, Skills
for Board
Membership |
| | | | |
| INDEPENDENT TRUSTEES (continued) | | | | | | | | | | |
Kurt Keilhacker c/o Aston Funds 120 N. LaSalle Street Chicago, IL 60602 DOB: 10/5/63 Trustee | | Since 2014 | | Managing Member, TechFund Europe (2000-present); Managing Member, TechFund Capital (1997-Present); Managing Member, Clapham Partners I LLC (2013-present) | |
| 25
|
| | Trustee of AMG Funds, AMG Funds I, AMG Funds II and: AMG Funds III (45 portfolios); Trustee of Gordon College and Board Member for 6wind SA | | Significant board experience, including as a board member of private companies; significant experience as a managing member of private companies; significant experience in the venture capital industry; significant experience as co-founder of a number of technology companies. |
| | | | | |
Steven J. Paggioli c/o Aston Funds 120 N. LaSalle Street Chicago, IL 60602 DOB: 4/3/50 Trustee | | Since 2010 | | Independent Consultant (2001-present); Formerly, Executive Vice President and Director, The Wadsworth Group (1986-2001); Executive Vice President, Secretary and Director, Investment Company Administration, LLC (1990-2001); Vice President, Secretary and Director, First Fund Distributors, Inc. (1991-2001) | | | 25 | | | Trustee, Professionally Managed Portfolios (45 portfolios); Advisory Board Member, Sustainable Growth Advisors, LP; Independent Director, Chase Investment Counsel. Trustee of AMG Funds, AMG Funds I, AMG Funds II and AMG Funds III (45 portfolios) | | Significant board experience, including as a board member of mutual funds; significant executive experience with several financial services firms; former service with financial service regulator; Audit Committee financial expert. |
| | | | | |
Richard F. Powers III c/o Aston Funds 120 N. LaSalle Street Chicago, IL 60602 DOB: 2/2/46 Trustee | | Since 2014 | | Adjunct Professor, Boston College (2011-present) President and CEO of Van Kampen Investments Inc. (1998-2003) | | | 25 | | | Director of Ameriprise Financial Inc. (2005-2009); Trustee of AMG Funds, AMG Funds I, AMG Funds II and AMG Fund III (45 portfolios) | | Significant board experience; significant executive experience with several financial services firms; significant experience as President and Chief Executive Officer of a mutual fund complex. |
| | |
| |
| | October 31, 2014 |
| |
| Additional Information (unaudited) – continued | | |
| | | | | | | | | | | | |
Name, Address, Age and Position(s) with Trust | | Term of
Office 1 and
Length of
Time Served | | Principal Occupation(s) During Past Five Years | | Number of
Portfolios in
Fund Complex 2
Overseen by
Trustee | | | Other Trusteeships/
Directorships Held by Trustee During Past Five Years | | Experience,
Qualifications,
Attributes, Skills
for Board
Membership |
| | | | |
| INDEPENDENT TRUSTEES (continued) | | | | | | | | | | |
Eric Rakowski c/o Aston Funds 120 N. LaSalle Street Chicago, IL 60602 DOB: 6/5/58 Trustee | | Since 2010 | | Professor, University of California at Berkeley School of Law (1990-present) | | | 25 | | | Director of Harding, Loevner Funds, Inc. (6 portfolios); Trustee of Third Avenue Trust (5 portfolios); Trustee of Third Avenue Variable Trust (1 portfolio); Trustee of AMG Funds, AMG Funds I, AMG Funds II and AMG Funds III (45 portfolios) | | Significant experience as a board member of mutual funds; former practicing attorney; currently professor of law. |
| | | | | |
Victoria Sassine c/o Aston Funds 120 N. LaSalle Street Chicago, IL 60602 DOB: 8/11/65 Trustee | | Since 2014 | | Lecturer, Babson College (2007-present) | |
| 25
|
| | Trustee of AMG Funds, AMG Funds I, AMG Funds II and AMG Funds III (45 portfolios) | | Currently professor of finance; significant business and finance experience in strategic financial and operation management positions in a variety of industries; accounting experience in a global accounting firm; experience as a board member of various organizations; Certified Public Accountant (inactive). |
| | | | | |
Thomas R. Schneeweis c/o Aston Funds 120 N. LaSalle Street Chicago, IL 60602 DOB: 5/10/47 Trustee | | Since 2010 | | Professor Emeritus, University of Massachusetts (2013-present); Director, CISDM at the University of Massachusetts, (1996-2013); President, TRS Associates (1982-present); President, Alternative Investment Analytics, LLC (formerly Schneeweis Partners, LLC) (2001-2013); Partner, S Capital Management, LLC (2007-present); Professor of Finance, University of Massachusetts (1977-2013); Partner, White Bear Partners, LLC (2007-2010); Partner, Northampton Capital Management, LLC (2004- 2010) | | | 25 | | | Trustee of AMG Funds, AMG Funds I, AMG Funds II and AMG Funds III (45 portfolios) | | Significant experience as a board member of mutual funds; professor Emeritus of finance; significant executive experience with several investment partnerships. |
| | |
| |
| | October 31, 2014 |
| |
| Additional Information (unaudited) – continued | | |
| | | | | | | | | | | | |
Name, Address, Age and Position(s) with Trust | | Term of
Office 1 and
Length of
Time Served | | Principal Occupation(s) During Past Five Years | | Number of
Portfolios in
Fund Complex 2
Overseen by
Trustee | | | Other Trusteeships/
Directorships Held by Trustee During Past Five Years | | Experience,
Qualifications,
Attributes, Skills
for Board
Membership |
| | | | |
| INTERESTED TRUSTEES | | | | | | | | | | |
Christine C. Carsman3 c/o Aston Funds 120 N. LaSalle Street Chicago, IL 60602 DOB: 4/2/52 | | Since 2014 | | Senior Vice President (2007-present) and Deputy General Counsel (2011-present); Senior Vice President and Chief Regulatory Counsel Affiliated Managers Group, Inc. (2007-2011), Vice President (2004-2007), and Chief Regulatory Counsel, Affiliated Managers Group, Inc.; Chief Legal Officer, Aston Funds (2010-2014); Senior Counsel, Vice President and Director of Operational Risk Management and Compliance, Wellington Management Company, LLP (1995-2004) | | | 25 | | | Trustee of AMG Funds, AMG Funds I, AMG Funds II and AMG Funds III (45 portfolios) | | Significant business, legal and risk management experience with several financial services firms; former practicing attorney at private law firm; significant experience as Chief Legal Officer. |
| | | | |
| OFFICER(S) WHO ARE NOT TRUSTEES | | | | | | | | | | |
Stuart D. Bilton, CFA c/o Aston Funds 120 N. LaSalle Street Chicago, IL 60602 Age: 68 Chief Executive Officer and President | | Chief Executive Officer since 2010, President since 2014 | | Chief Executive Officer and Chairman, Aston Asset Management, LLC (2006- present) | | | N/A | | | N/A | | N/A |
| | | | | |
Gerald F. Dillenburg, CPA c/o Aston Funds 120 N. LaSalle Street Chicago, IL 60602 Age: 48 Senior Vice President, Secretary, Chief Operating Officer and Chief Compliance Officer | | Since 1996 | | Chief Compliance Officer, Aston Asset Management, LLC (2006-present); Chief Financial Officer, Aston Asset Management, LLC (2006-2010) | | | N/A | | | N/A | | N/A |
| | | | | |
Laura M. Curylo, CPA c/o Aston Funds 120 N. LaSalle Street Chicago, IL 60602 Age: 46 Chief Financial Officer and Treasurer | | Since 2010 | | Chief Financial Officer, Aston Asset Management, LLC (2010-present); Vice President and Controller, Aston Asset Management, LLC (2006-present) | | | N/A | | | N/A | | N/A |
| 1 | | A Trustee serves for an indefinite term until the earliest of: (i) removal by two-thirds of the Board or shareholders, (ii) resignation, death or incapacity, (iii) the election and qualification of his successor, in accordance with the By-Laws of the Trust, or (iv) the last day of the fiscal year in which he attains the age of 75 years. Officers serve for an indefinite term until the earliest of: (i) removal by the Board, (ii) resignation, death or incapacity, or (iii) the election and qualification of their successors, in accordance with the By-Laws of the Trust. |
| 2 | | The term “Fund Complex” includes all series of Aston Funds. |
| 3 | | “Interested person” of the Trust as defined in the 1940 Act. Ms. Carsman is considered an “interested person” because of her affiliation with Affiliated Managers Group, Inc., the ultimate parent of the investment adviser, and related entities. |
Aston Funds
ADVISER
Aston Asset Management, LLC
120 N. LaSalle Street, 25th Floor
Chicago, IL 60602
SUBADVISERS
Anchor Capital Advisors LLC
One Post Office Square, Suite 3850
Boston, MA 02109
Baring International Investment Limited
155 Bishopsgate
London, EC2M 3XY UK
Cornerstone Investment Partners, LLC
Phipps Tower
3438 Peachtree Road NE, Suite 900
Atlanta, GA 30326
DoubleLine Capital LP
333 South Grand Avenue, Suite 1800
Los Angeles, CA 90071
Fairpointe Capital LLC
One North Franklin, Suite 3300
Chicago, IL 60606
Guardian Capital LP
199 Bay Street, Suite 3100
Toronto, ON, M5L 1E8
Harrison Street Securities, LLC
71 South Wacker Drive, Suite 3575
Chicago, IL 60606
Herndon Capital Management, LLC
191 Peachtree Street, NE, Suite 2500
Atlanta, GA 30303
Lake Partners, Inc.
4 High Ridge Park, Suite 300
Stamford, CT 06905
Lee Munder Capital Group, LLC
200 Clarendon Street, 28th Floor
Boston, MA 02116
SUBADVISERS - continued
Montag & Caldwell, LLC
3455 Peachtree Road NE, Suite 1200
Atlanta, GA 30326
Pictet Asset Management Limited
120 London Wall
London, EC2Y 5ET UK
River Road Asset Management, LLC
Meidinger Tower, Suite 1600
462 South Fourth Street
Louisville, KY 40202
Silvercrest Asset Management Group LLC
1330 Avenue of the Americas, 38th Floor
New York, NY 10019
TAMRO Capital Partners LLC
1701 Duke St., Suite 250
Alexandria, VA 22314
Taplin, Canida & Habacht LLC
1001 Brickell Bay Drive, Suite 2100
Miami, FL 33131
SHAREHOLDER SERVICES
Aston Funds
P.O. Box 9765
Providence, RI 02940
DISTRIBUTOR
Foreside Funds Distributors LLC
400 Berwyn Park
899 Cassatt Road
Berwyn, PA 19312
OFFICERS
Stuart D. Bilton, President and Chief Executive Officer
Gerald F. Dillenburg, Senior Vice President and Secretary, Chief Operating Officer and Chief Compliance Officer
Laura M. Curylo, Treasurer and Chief Financial Officer
Juli A. Braun, Assistant Treasurer
Michael A. Cozzi, Assistant Treasurer
James A. Dimmick, Assistant Secretary
Marc J. Peirce, Assistant Secretary
Diana R. Podgorny, Assistant Secretary
CUSTODIAN
The Bank of New York Mellon
One Wall Street
New York, New York 10286
LEGAL COUNSEL
Vedder Price P.C.
222 N. LaSalle Street
Chicago, IL 60601
INDEPENDENT REGISTERED PUBLIC ACCOUNTING FIRM
Ernst & Young LLP
155 N. Wacker Drive
Chicago, IL 60606
THE STATEMENT OF ADDITIONAL INFORMATION INCLUDES ADDITIONAL INFORMATION ABOUT FUND TRUSTEES AND IS AVAILABLE UPON REQUEST WITHOUT CHARGE BY CALLING 800-992-8151.
Guide to Shareholder Benefits
We’re delighted to offer all Aston Funds shareholders a variety of services and convenient options. To receive more information about any of these benefits, simply call an Investor Services Associate Monday through Friday, 9 a.m. – 7 p.m. Eastern Time.
THE EASY WAY TO ADD TO YOUR ACCOUNT: START AN AUTOMATIC INVESTMENT PLAN
For Class N shareholders, systematic investing is an easy, effortless way to help reach any investment goal. Just choose a fixed amount, and we’ll automatically deduct it from your checking or savings account on a regular schedule and invest it in your Aston Funds account. Periodic investment plans involve continuous investments in securities regardless of price. You should consider your financial ability to continue to purchase shares through periods of both high and low price levels. This plan does not assure a profit and does not protect against loss in declining markets.
COMPOUND YOUR EARNINGS WITH AUTOMATIC DIVIDEND REINVESTMENT
By automatically reinvesting dividends into your Fund account, profits have the opportunity to mount. Monthly and quarterly dividends and annual capital gain distributions are reinvested at no charge.
ACCESS INFORMATION AND MAKE TRANSACTIONS ONLINE AT OUR WEBSITE
You can open a new account, access account balances, view statements, obtain fund information, and make transactions online 24 hours a day, 7 days a week.
| | |
| | www.astonfunds.com |
| |
| | Our Automated Shareholder Services Line Is at Your Service 24 Hours a Day |
| | 800-992-8151 |
Investor Services
Associates are available to assist you Monday – Friday 9 a.m. to 7 p.m., Eastern Time. Or, call any time, day or night, for automated account information to make exchanges or check fund performance.

Aston Funds
P.O. Box 9765
Providence, RI 02940
ATAN 14
Item 2. Code of Ethics.
| | |
| (a) | | The registrant, as of the end of the period covered by this report, has adopted a code of ethics that applies to the registrant’s principal executive officer, principal financial officer, principal accounting officer or controller, or persons performing similar functions, regardless of whether these individuals are employed by the registrant or a third party. |
| |
| (c) | | There have been no amendments, during the period covered by this report, to a provision of the code of ethics that applies to the registrant’s principal executive officer, principal financial officer, principal accounting officer or controller, or persons performing similar functions, regardless of whether these individuals are employed by the registrant or a third party, and that relates to any element of the code of ethics description. |
| |
| (d) | | The registrant has not granted any waivers, including an implicit waiver, from a provision of the code of ethics that applies to the registrant’s principal executive officer, principal financial officer, principal accounting officer or controller, or persons performing similar functions, regardless of whether these individuals are employed by the registrant or a third party, that relates to one or more of the items set forth in paragraph (b) of this item’s instructions. |
Item 3. Audit Committee Financial Expert.
The registrant’s board of trustees has determined that Edward J. Kaier is qualified to serve as the registrant’s audit committee financial expert and that he is “independent,” as defined by the Securities and Exchange Commission.
Item 4. Principal Accountant Fees and Services.
| | |
| Audit Fees |
| |
| (a) | | The aggregate fees billed for each of the last two fiscal years for professional services rendered by the principal accountant for the audit of the registrant’s annual financial statements or services that are normally provided by the accountant in connection with statutory and regulatory filings or engagements for those fiscal years are $444,500 for 2014 and $403,670 for 2013. |
|
| Audit-Related Fees |
| |
| (b) | | The aggregate fees billed in each of the last two fiscal years for assurance and related services by the principal accountant that are reasonably related to the performance of the audit of the |
| | |
| | registrant’s financial statements and are not reported under paragraph (a) of this Item are $28,200 for 2014 and $26,910 for 2013. Such fees were related to agreed upon procedures for the April 30, 2014 and April 30, 2013 unaudited semi-annual reports. |
|
| Tax Fees |
| |
| (c) | | The aggregate fees billed in each of the last two fiscal years for professional services rendered by the principal accountant for tax compliance, tax advice, and tax planning $0 for 2014 and $0 for 2013. |
|
| All Other Fees |
| |
| (d) | | The aggregate fees billed in each of the last two fiscal years for products and services provided by the principal accountant, other than the services reported in paragraphs (a) through (c) of this Item are $0 for 2014 and $0 for 2013. |
| |
| (e)(1) | | Disclose the audit committee’s pre-approval policies and procedures described in paragraph (c)(7) of Rule 2-01 of Regulation S-X. |
| |
| | In accordance with Audit Committee Charter, the Audit Committee shall: |
| |
| | 1. Pre-approve any engagement of the independent auditors to provide any non-prohibited services to the Fund, including the fees and other compensation to be paid to the independent auditors.1 |
| | Ÿ The Chairman of the Audit Committee may grant the pre-approval of services to the Fund for non-prohibited services. All such delegated pre-approvals shall be presented to the Audit Committee no later than the next Audit Committee meeting. |
| |
| | 2. Pre-approve any engagement of the independent auditors, including the fees and other compensation to be paid to the independent auditors, to provide any non-audit services to the Adviser (or any “control affiliate”2 of the Adviser providing ongoing services to the Fund), if the engagement relates directly to the operations and financial reporting of the Funds.3 |
1 Pre-approval of non-audit services for the Fund pursuant to Section IV.C. 2 is not required, if:
| | (a) | the aggregate amount of all non-audit services provided to the Fund is no more than 5% of the total fees paid by the Fund to the independent auditors during the fiscal year in which the non-audit services are provided; |
| | (b) | the services were not recognized by Fund management at the time of the engagement as non-audit services; and |
| | (c) | such services are promptly brought to the attention of the Audit Committee by Fund management and the Audit Committee approves them (which may be by delegation) prior to the completion of the audit. |
2 “Control affiliate” means any entity controlling, controlled by, or under common control with the Adviser.
| 3 | Pre-approval of non-audit services for the Adviser (or any affiliate of the Adviser providing ongoing services to the Fund) pursuant to Section IV.C.3 is not required, if: |
| | (a) | the aggregate amount of all non-audit services provided is no more than 5% of the total fees paid by the Fund, the Adviser and any “control affiliate” of the Adviser providing ongoing services to the Fund to the independent auditors during the fiscal year in which the non-audit services are provided; |
| | (b) | the services were not recognized by Fund management at the time of the engagement as non-audit services; and |
| | (c) | such services are promptly brought to the attention of the Audit Committee by Fund management and the Audit Committee approves them (which may be by delegation) prior to the completion of the audit. |
| | |
| | Ÿ The Chairman of the Audit Committee may grant the pre-approval for non-prohibited services to the Adviser. All such delegated pre-approvals shall be presented to the Audit Committee no later than the next Audit Committee meeting. |
| |
| (e)(2) | | The percentage of services described in each of paragraphs (b) through (d) of this Item that were approved by the audit committee pursuant to paragraph (c)(7)(i)(C) of Rule 2-01 of Regulation S-X are as follows: |
| |
| | (b) 100% |
| |
| | (c) N/A |
| |
| | (d) N/A |
| |
| (f) | | The percentage of hours expended on the principal accountant’s engagement to audit the registrant’s financial statements for the most recent fiscal year that were attributed to work performed by persons other than the principal accountant’s full-time, permanent employees was 0%. |
| |
| (g) | | The aggregate non-audit fees billed by the registrant’s accountant for services rendered to the registrant, and rendered to the registrant’s investment adviser (not including any sub-adviser whose role is primarily portfolio management and is subcontracted with or overseen by another investment adviser), and any entity controlling, controlled by, or under common control with the adviser that provides ongoing services to the registrant for each of the last two fiscal years of the registrant was $0 for 2014 and $0 for 2013. |
| |
| (h) | | The registrant’s audit committee of the board of directors has considered whether the provision of non-audit services that were rendered to the registrant’s investment adviser (not including any sub-adviser whose role is primarily portfolio management and is subcontracted with or overseen by another investment adviser), and any entity controlling, controlled by, or under common control with the investment adviser that provides ongoing services to the registrant that were not pre-approved pursuant to paragraph (c)(7)(ii) of Rule 2-01 of Regulation S-X is compatible with maintaining the principal accountant’s independence. |
Item 5. Audit Committee of Listed Registrants.
Not applicable.
Item 6. Investments.
| (a) | Schedule of Investments in securities of unaffiliated issuers as of the close of the reporting period is included as part of the report to shareholders filed under Item 1 of this form. |
| Item 7. | Disclosure of Proxy Voting Policies and Procedures for Closed-End Management Investment |
Not applicable.
Item 8. Portfolio Managers of Closed-End Management Investment Companies.
Not applicable.
| Item 9. | Purchases of Equity Securities by Closed-End Management Investment Company and Affiliated |
Not applicable.
Item 10. Submission of Matters to a Vote of Security Holders.
There have been no material changes to the procedures by which the shareholders may recommend nominees to the registrant’s board of directors, where those changes were implemented after the registrant last provided disclosure in response to the requirements of Item 407(c)(2)(iv) of Regulation S-K (17 CFR 229.407) (as required by Item 22(b)(15) of Schedule 14A (17 CFR 240.14a-101)), or this Item.
Item 11. Controls and Procedures.
| | |
| (a) | | The registrant’s principal executive and principal financial officers, or persons performing similar functions, have concluded that the registrant’s disclosure controls and procedures (as defined in Rule 30a-3(c) under the Investment Company Act of 1940, as amended (the “1940 Act”) (17 CFR 270.30a-3(c))) are effective, as of a date within 90 days of the filing date of the report that includes the disclosure required by this paragraph, based on their evaluation of these controls and procedures required by Rule 30a-3(b) under the 1940 Act (17 CFR 270.30a-3(b)) and Rules 13a-15(b) or 15d-15(b) under the Securities Exchange Act of 1934, as amended (17 CFR 240.13a-15(b) or 240.15d-15(b)). |
| |
| (b) | | There were no changes in the registrant’s internal control over financial reporting (as defined in Rule 30a-3(d) under the 1940 Act (17 CFR 270.30a-3(d)) that occurred during the registrant’s second fiscal quarter of the period covered by this report that has materially affected, or is reasonably likely to materially affect, the registrant’s internal control over financial reporting. |
|
Item 12. Exhibits. |
| |
(a)(1) | | Code of ethics, or any amendment thereto, that is the subject of disclosure required by Item 2 is attached hereto. |
| |
(a)(2) | | Certifications pursuant to Rule 30a-2(a) under the 1940 Act and Section 302 of the Sarbanes-Oxley Act of 2002 are attached hereto. |
| |
(a)(3) | | Not applicable. |
| |
(b) | | Certifications pursuant to Rule 30a-2(b) under the 1940 Act and Section 906 of the Sarbanes-Oxley Act of 2002 are attached hereto. |
(12.other) Not applicable.
SIGNATURES
Pursuant to the requirements of the Securities Exchange Act of 1934 and the Investment Company Act of 1940, the registrant has duly caused this report to be signed on its behalf by the undersigned, thereunto duly authorized.
| | |
| |
By (Signature and Title)* | | /s/ Stuart D. Bilton |
| | Stuart D. Bilton, Chief Executive Officer and President |
| | (principal executive officer) |
Pursuant to the requirements of the Securities Exchange Act of 1934 and the Investment Company Act of 1940, this report has been signed below by the following persons on behalf of the registrant and in the capacities and on the dates indicated.
| | |
By (Signature and Title)* | | /s/ Stuart D. Bilton |
| | Stuart D. Bilton, Chief Executive Officer and President |
| | (principal executive officer) |
| | |
| |
By (Signature and Title)* | | /s/ Laura M. Curylo |
| | Laura M. Curylo, Treasurer and Chief Financial Officer |
| | (principal financial officer) |
| * | Print the name and title of each signing officer under his or her signature. |