UNITED STATES
SECURITIES AND EXCHANGE COMMISSION
Washington, D.C. 20549
FORM N-CSR
CERTIFIED SHAREHOLDER REPORT OF REGISTERED
MANAGEMENT INVESTMENT COMPANIES
Investment Company Act file number 811-08004
AMG Funds IV
(Exact name of registrant as specified in charter)
600 Steamboat Road, Suite 300
Greenwich, CT 06830
(Address of principal executive offices) (Zip code)
Jeffrey T. Cerutti, President, Chief Executive Officer and Principal Executive Officer
AMG Funds IV
600 Steamboat Road, Suite 300
Greenwich, CT 06830
(Name and address of agent for service)
Registrant’s telephone number, including area code: (203) 299-3500
Date of fiscal year end: October 31
Date of reporting period: November 1, 2015 - October 31, 2016
Item 1. Reports to Stockholders.

| | | | |
| | Annual Report 2016 | | October 31, 2016 |
| | |
| | AMG Funds (formerly Aston Funds) Class N, I & R Shares Equity Fixed Income Alternative International Balanced |
Dear Shareholder:
While the period got off to a rocky start, overall U.S. equity investors enjoyed modest returns for the 12-months ended October 31, 2016. The S&P 500 Index, a widely followed barometer of the U.S. equity market, returned 4.5% during the prior twelve months, with most of the gains coming in the middle of the period. The year was also marked by the three major U.S. indices, the Dow Jones Industrial Average, NASDAQ and the S&P 500, all closing at all-time highs on the same day in August; the first time this has occurred since 1999. Small-cap investors were equally fortunate, with a 4.1% return for the small-cap Russell 2000® Index for the fiscal year. Investors had to balance the first rate increase from the U.S. Federal Reserve (+0.25%) in nearly six years, a contentious U.S. presidential election season, continued slowing of growth in China and the implications for global economic growth along with the impact of commodity prices falling to lows not seen since 2009. Oil prices have since recovered, lending some support to the beleaguered energy industry. During the year, most sectors of the S&P 500 were positive. However, there was some dispersion in performance across sectors, with utilities, information technology and telecommunication services returning 17%, 11% and 11%, respectively, while companies within the consumer discretionary and health care sectors returned (2.0)% and (4.0)%, respectively. Meanwhile, international stocks lagged the U.S., returning 0.2%, as measured by the MSCI ACWI ex USA (in U.S. Dollar terms).
The Bloomberg Barclays U.S. Aggregate Bond Index, a broad U.S. bond market benchmark, returned 4.4% for the year ended October 31, 2016. Interest rates and credit spreads gyrated during 2015 and 2016, at times putting some pressure on bond prices. Investors’ appetite for risk declined sharply during the latter part of 2015 and early 2016, before rebounding significantly as oil prices recovered, reflected in the 10.1% return for the Bloomberg Barclays U.S. Corporate High Yield Index.
We are excited to announce as of October 1, the AMG Funds family of mutual funds fully integrated the former Aston Funds. AMG Funds and Aston Funds shareholders will now have access to the differentiated solutions of AMG Funds, which represents a single point of access to one of the largest line-ups of boutique managers and products in the world.
AMG Funds appreciates the privilege of providing investment solutions to you and your clients. Our foremost goal at AMG Funds is to provide investment solutions that help our shareholders successfully reach their long-term investment goals. By partnering with AMG’s affiliated investment boutiques, AMG Funds provides access to a distinctive array of actively-managed return-oriented investment strategies. Additionally, we oversee and distribute a number of complementary open-architecture mutual funds subadvised by unaffiliated investment managers. We thank you for your continued confidence and investment in AMG Funds. You can rest assured that under all market conditions our team is focused on delivering excellent investment management services for your benefit.
Respectfully,

Jeffrey Cerutti
President
AMG Funds
| | | | | | | | | | | | | | |
Average Annual Total Returns | | Periods ended October 31, 2016* | |
| | | | | 1 Year | | | 3 Years | | | 5 Years | |
Stocks: | | | | | | | | | | | | | | |
Large Caps | | (S&P 500 Index) | | | 4.51 | % | | | 8.84 | % | | | 13.57 | % |
Small Caps | | (Russell 2000® Index) | | | 4.11 | % | | | 4.12 | % | | | 11.51 | % |
International | | (MSCI All Country World Index ex USA) | | | 0.22 | % | | | (1.49 | )% | | | 3.64 | % |
Bonds: | | | | | | | | | | | | | | |
Investment Grade | | (Bloomberg Barclays U.S. Aggregate Bond Index) | | | 4.37 | % | | | 3.48 | % | | | 2.90 | % |
High Yield | | (Bloomberg Barclays U.S. Corporate High Yield Index) | | | 10.14 | % | | | 4.55 | % | | | 7.17 | % |
Tax-exempt | | (Bloomberg Barclays Municipal Bond Index) | | | 4.06 | % | | | 4.89 | % | | | 4.34 | % |
Treasury Bills | | (BofA Merrill Lynch 6 Month U.S. Treasury Bill) | | | 0.64 | % | | | 0.32 | % | | | 0.26 | % |
| * | Source: FactSet. Past performance is no guarantee of future results. |
Large Cap Funds
AMG Managers Fairpointe Focused Equity Fund
AMG River Road Focused Absolute Value Fund
AMG Managers Montag & Caldwell Growth Fund
Equity Income Funds
AMG River Road Dividend All Cap Value Fund
AMG River Road Dividend All Cap Value Fund II
Mid Cap Funds
AMG Managers Fairpointe Mid Cap Fund
AMG Managers Montag & Caldwell Mid Cap Growth Fund
Small Cap Funds
AMG Managers LMCG Small Cap Growth Fund
AMG River Road Select Value Fund
AMG River Road Small Cap Value Fund
AMG Managers Silvercrest Small Cap Fund
AMG GW&K U.S. Small Cap Growth Fund
Fixed Income Fund
AMG Managers DoubleLine Core Plus Bond Fund
Alternative Funds
AMG Managers Anchor Capital Enhanced Equity Fund
AMG Managers Lake Partners LASSO Alternatives Fund
AMG River Road Long-Short Fund
International Funds
AMG Managers Guardian Capital Global Dividend Fund
AMG Managers Pictet International Fund
AMG Managers Value Partners Asia Dividend Fund
Balanced Fund
AMG Managers Montag & Caldwell Balanced Fund
Table of Contents
Nothing contained herein is to be considered an offer, sale or solicitation of an offer to buy shares of any series of the AMG Funds family of mutual funds. Such offering is made only by prospectus, which includes details as to offering price and other material information.
AMG Funds are distributed by AMG Distributors, Inc., member FINRA/SIPC, 600 Steamboat Road, Suite 300, Greenwich, CT 06830
Shareholder Services 800-835-3879 • www.amgfunds.com
NOT FDIC INSURED • NO BANK GUARANTEE • MAY LOSE VALUE
AMG Managers Fairpointe Focused Equity Fund
Portfolio Manager’s Comments (unaudited)
THE YEAR IN REVIEW
U.S. equity markets posted modest positive performance for the fiscal year ending October 31, 2016. The AMG Managers Fairpointe Focused Equity Fund1 (the “Fund”) Class N shares returned 4.4% for the fiscal year, slightly outperforming the benchmark returns of 4.3% for the Russell 1000® Index, 4.2% for the Russell Midcap® Index, and in-line with the return of 4.5% for the S&P 500 Index. Good stock selection in technology, health care, industrials and materials, partially offset by under-performance in consumer discretionary, contributed to our positive absolute returns and relative outperformance during the year. The Fund is characterized by a long-term view, a high-conviction concentrated portfolio, a focus on purchasing securities at a significant discount to fair value and a willingness to hold (and add to) positions through volatile markets.
FISCAL 2016 REVIEW
The performance contribution for the fiscal year was positive, with fourteen stocks up more than 10% and seven stocks down more than 10%. Our largest contributors were Hewlett Packard Enterprise, Greif, WalMart, Apache and HP Inc. Hewlett Packard Enterprise, in separate transactions, announced that it would spin off its enterprise services business and merge it into Computer Sciences and spin off its software business and merge it into Micro Focus. Hewlett Packard Enterprise shareholders will own a majority of outstanding shares of Computer Sciences and Micro Focus, respectively, upon the completion of each of those transactions. The remaining Hewlett Packard Enterprise will include servers, storage, networking and tech services. We believe Hewlett Packard Enterprise will be more focused and possess a very strong balance sheet with solid and improving cash flow generation
from its core technology infrastructure units. Industrial packaging producer Greif expanded year-over-year margins in its most recent reported financial results despite a sluggish industrial economy. Management remains focused on the business levers within its control – customer service excellence, disciplined commercial and operational execution and greater financial discipline. Energy exploration and production company Apache rebounded with the increase in oil prices. Printing and computer maker HP Inc. rounded out our top five contributors for the year. We reduced our positions in Greif and Apache during the fiscal year as our estimates of the gap between price and fair value narrowed.
Our largest detractors for the fiscal year were Legg Mason, Transocean, Staples, News Corp. and Liberty Interactive. Asset manager Legg Mason declined as investors remain concerned regarding global equity markets and the potential for increased volatility in the profitability and cash flows generated by Legg Mason. We were pleased to see multiple insiders (including the CEO, CFO and several board members) purchase shares during the year. Along with Legg Mason’s significant share repurchase activity, these actions signal management’s belief that Legg Mason shares are undervalued, a view with which we concur. Offshore driller Transocean declined on continued fears of oversupply of offshore drilling rigs and lower current demand for such rigs due to low oil prices. Transocean has highlighted that it expects to have cash and bank revolver capacity resulting in liquidity exceeding $3 billion at the end of calendar year 2018. This should provide sufficient time for oil markets to recover and allow Transocean to begin its economic recovery. Office supply retailer Staples declined after the federal court decision granting the U.S. Federal Trade
Commission’s preliminary injunction against Staples acquisition of Office Depot. While we were disappointed with the court’s logic and decision, we view Staples’ stock as undervalued at its current quote, which provides a 6.5% dividend yield and even greater annual free cash flow yield. Media company News Corp.’s stock price declined during the year as uncertainty regarding future secular changes in its media properties, particularly print advertising, has weighed on the stock and industry. News Corp. also suffered from the negative impact of foreign currency fluctuations during the year. Liberty Interactive declined as the company experienced weak sales in QVC’s U.S. business in its most recent quarter, which sales decline we believe is temporary in nature. We added to our positions in Legg Mason, Staples and Liberty Interactive during the year as our estimates of the gap between price and fair value widened.
ADDITIONS AND ELIMINATIONS
We added five new stocks to the Fund during the fiscal year—Hewlett Packard Enterprise, EMC Corp., Baker Hughes, VMware and Quanta Services. Hewlett Packard Enterprise currently encompasses the enterprise group, enterprise services, software and financial services units of the former Hewlett-Packard. The markets in which Hewlett Packard Enterprise operate are large and offer significant growth potential. Margins should improve through the implementation of further cost cuts. The company generates strong free cash flow and trades at an attractive 11x forward earnings, a substantial discount to the market multiple. EMC, a global leader in data storage, management, protection and analysis, was bought and sold during the fiscal year, resulting in an attractive gain. Oilfield services provider Baker Hughes was added to the Fund after its stock price declined in connection with its terminated merger
2
AMG Managers Fairpointe Focused Equity Fund
Portfolio Manager’s Comments (continued)
deal with Halliburton, due to significant regulatory opposition. Subsequent to the Fund’s investment, GE’s energy services unit and Baker Hughes agreed to combine, which should allow the combined company to cut costs and improve its operating margin profile. VMware, a global leader in cloud infrastructure and business mobility, delivers information technology solutions that are fluid, instant and more secure. We capitalized on an opportunity to invest in VMware, as the stock significantly declined earlier this year over concerns relating to EMC’s pending acquisition by Dell. EMC had owned 80% of VMware prior to EMC’s acquisition by Dell. Quanta Services provides engineering, procurement and construction services for comprehensive infrastructure needs in the electric power and oil and natural gas industries. Its stock significantly underperformed the market in the year prior to the Fund’s investment, primarily resulting from weakened activity in several of the largest end markets that it serves, as well as a self-inflicted wound from cost over-runs at an Alaska power plant project. Quanta Services repurchased $1.7 billion of its stock in the 18 months preceding the Fund’s investment, reducing its shares outstanding by 32%. We view these repurchases positively, evidencing management’s confidence in its own business.
The Fund remains overweighted relative to its benchmarks in consumer discretionary, technology, industrials, materials and energy. This outcome is driven by our fundamental, bottom up valuation-based approach to stock selection. As our holding period is generally three to five years, we advocate patience to allow the discount between current prices of these securities and our estimates of fair value to narrow.
We eliminated six holdings during the fiscal year—Boston Scientific, EMC, Interpublic Group, Itron, Quest Diagnostics and VCA. We sold our remaining position in Boston Scientific as it reached our price target. Management provided strong stewardship and unlocked significant shareholder value at Boston Scientific during the last few years. Dell completed its acquisition of EMC in the third quarter. As shareholders of EMC, we received $24.05 in cash per share, plus additional shares of a tracking stock of VMware, which we also sold during the quarter. While the investment in the Fund was short-lived, we took advantage of an opportunistic mispricing of EMC shares in early 2016 and realized a strong gain on our investment. Itron was sold to provide a source of funds for other opportunities, while Quest and VCA were sold as they reached or approached our sell targets. Quest and VCA provided attractive returns for the portfolio and were replaced with securities we believe to be more undervalued.
OUTLOOK
While near-term macroeconomic issues (e.g., U.S. elections, interest rates, Brexit, European banks) exist, the U.S. economy continues its recovery (e.g. further job growth, increases in consumer spending, strengthening housing market). It would not surprise us to see increased volatility in global equity markets due to the greater perceived near-term uncertainties and higher equity valuations, yet we would seek to capitalize on opportunities that may emerge due to any near-term disruptions.
We believe the Fund remains attractively positioned relative to its equity benchmarks and other asset classes (e.g. fixed income). As of October 31, 2016, the Fund’s holdings on average trade at
15.3x 2017 consensus earnings estimates, while the Russell 1000®, the S&P 500 and the Russell Midcap® indices trade at 16.3, 16.0 and 17.2x 2017 consensus earnings estimates, respectively2. Moreover, the Fund trades at 1.0x enterprise value/trailing 12 months’ revenue, which is a substantial discount to the Russell 1000®, the S&P 500 and the Russell Midcap® indices of 2.3, 2.4 and 2.1x enterprise value/trailing 12 months’ revenue, respectively2.
The views expressed represent the opinions of Fairpointe Capital LLC, as of October 31, 2016, and are not intended as a forecast or guarantee of future results and are subject to change without notice.
| 1 | Prior to October 1, 2016, the Fund was known as ASTON/Fairpointe Focused Equity Fund. |
| 2 | FactSet, Standard & Poors, Russell Investments |
3
AMG Managers Fairpointe Focused Equity Fund
Portfolio Manager’s Comments (continued)
CUMULATIVE TOTAL RETURN PERFORMANCE
The AMG Managers Fairpointe Focused Equity Fund’s cumulative total return is based on the daily change in net asset value (NAV), and assumes that all dividends and distributions were reinvested. The chart compares a hypothetical $10,000 investment made in AMG Managers Fairpointe Focused Equity Fund’s Class N on December 24, 2014, to a $10,000 investment made in the Russell 1000® Index for the same time period. The graph and table do not reflect the deduction of taxes that a shareholder would pay on a Fund distribution or redemption of shares. The listed returns for the Fund are net of expenses and the returns for the index exclude expenses. Total returns would have been lower had certain expenses not been reduced.
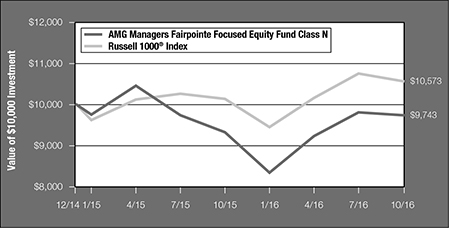
The table below shows the average annual total returns for AMG Managers Fairpointe Focused Equity Fund and the Russell 1000® Index for the same time periods ended October 31, 2016.
| | | | | | | | | | | | |
| Average Annual Total Returns1 | | One
Year | | | Since
Inception | | | Inception
Date | |
AMG Managers Fairpointe Focused Equity Fund2,3,4,5 | | | | | | | | | | | | |
Class N | | | 4.43 | % | | | (1.39 | )% | | | 12/24/14 | |
Class I | | | 4.65 | % | | | (1.16 | )% | | | 12/24/14 | |
Russell 1000® Index6 | | | 4.26 | % | | | 3.06 | % | | | 12/24/14 | † |
The performance data shown represents past performance. Past performance is not a guarantee of future results. Current performance may be lower or higher than the performance data quoted. The investment return and the principal value of an investment will fluctuate so that an investor’s shares, when redeemed, may be worth more or less than their original cost.
Investors should carefully consider the Fund’s investment objectives, risks, charges and expenses before investing. For performance information through the most recent month end, current net asset values per share for the Fund and other information, please call (800) 835-3879 or visit our website at www.amgfunds.com for a free prospectus. Read it carefully before investing or sending money.
Distributed by AMG Distributors, Inc., member FINRA/SIPC.
| † | Date reflects the inception date of the Fund, not the index. |
| 1 | Total return equals income yield plus share price change and assumes reinvestment of all dividends and capital gain distributions. Returns are net of fees and may reflect offsets of Fund expenses as described in the prospectus. No adjustment has been made for taxes payable by shareholders on their reinvested dividends and capital gain distributions. Returns for periods greater than one year are annualized. The listed returns on the Fund are net of expenses and based on the published NAV as of October 31, 2016. All returns are in U.S. dollars ($). |
| 2 | Investments in international securities are subject to certain risks of overseas investing including currency fluctuations and changes in political and economic conditions, which could result in significant market fluctuations. |
| 3 | The Fund is subject to risks associated with investments in mid-capitalization companies such as greater price volatility, lower trading volume, and less liquidity than the stocks of larger, more established companies. |
| 4 | The Fund is subject to risks associated with investments in small-capitalization companies, such as erratic earnings patterns, competitive conditions, limited earnings history and a reliance on one or a limited number of products. |
| 5 | The Fund invests in value stocks, which may perform differently from the market as a whole and may be undervalued by the market for a long period of time. |
| 6 | The Russell 1000® Index measures the performance of approximately 1,000 of the largest securities based on a combination of their market cap and current index membership. The Russell 1000 represents approximately 92% of the U.S. market. Unlike the Fund, the Russell 1000® Index is unmanaged, is not available for investment and does not incur expenses. |
The Russell Indices are a trademark of the London Stock Exchange Group Companies.
Not FDIC insured, nor bank guaranteed. May lose value.
4
AMG Funds
| | |
| AMG Managers Fairpointe Focused Equity Fund | | October 31, 2016 |
| |
| Schedule of Investments | | |
% of Net Assets
| | | | | | | | |
Shares | | | | | Market
Value | |
| COMMON STOCKS – 99.6% | | | | |
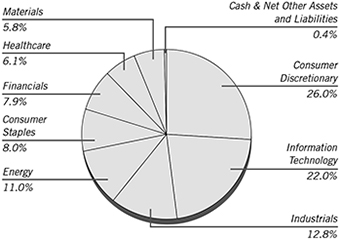
| | | | Consumer Discretionary – 26.0% | | | | |
| | 6,400 | | | Carnival Corp. (Panama) | | $ | 314,240 | |
| | 12,000 | | | Discovery Communications, Inc., Class C * | | | 301,320 | |
| | 12,700 | | | Liberty Interactive Corp. QVC Group, Class A * | | | 234,823 | |
| | 17,900 | | | News Corp., Class A | | | 216,948 | |
| | 5,700 | | | Scholastic Corp. | | | 218,025 | |
| | 27,800 | | | Staples, Inc. | | | 205,720 | |
| | 12,700 | | | Twenty-First Century Fox, Inc., Class A | | | 333,629 | |
| | | | | | | | |
| | | | | | | 1,824,705 | |
| | | | | | | | |
| | | | Consumer Staples – 8.0% | | | | |
| | 1,400 | | | PepsiCo, Inc. | | | 150,080 | |
| | 2,800 | | | Unilever PLC, Sponsored ADR (United Kingdom) | | | 116,676 | |
| | 4,200 | | | Wal-Mart Stores, Inc. | | | 294,084 | |
| | | | | | | | |
| | | | | | | 560,840 | |
| | | | | | | | |
| | | | Energy – 11.0% | | | | |
| | 2,000 | | | Apache Corp. | | | 118,960 | |
| | 4,400 | | | Baker Hughes, Inc. | | | 243,760 | |
| | 8,000 | | | BP PLC, Sponsored ADR (United Kingdom) | | | 284,400 | |
| | 13,400 | | | Transocean, Ltd. (Switzerland) * | | | 128,774 | |
| | | | | | | | |
| | | | | | | 775,894 | |
| | | | | | | | |
| | | | Financials – 7.9% | | | | |
| | 9,500 | | | Legg Mason, Inc. | | | 272,840 | |
| | 3,900 | | | Northern Trust Corp. | | | 282,438 | |
| | | | | | | | |
| | | | | | | 555,278 | |
| | | | | | | | |
| | | | Healthcare – 6.1% | | | | |
| | 4,900 | | | Hologic, Inc. * | | | 176,449 | |
| | 2,800 | | | Varian Medical Systems, Inc. * | | | 254,044 | |
| | | | | | | | |
| | | | | | | 430,493 | |
| | | | | | | | |
| | | | | | |
Shares | | | | Market
Value | |
| | Industrials – 12.8% | | | | |
3,200 | | AGCO Corp. | | $ | 163,456 | |
3,800 | | Fluor Corp. | | | 197,562 | |
11,100 | | Kennametal, Inc. | | | 314,241 | |
7,800 | | Quanta Services, Inc. * | | | 224,250 | |
| | | | | | |
| | | | | 899,509 | |
| | | | | | |
| | Information Technology – 22.0% | | | | |
6,900 | | Cisco Systems, Inc. | | | 211,692 | |
12,700 | | Cree, Inc. * | | | 283,210 | |
15,300 | | Hewlett Packard Enterprise Co. | | | 343,791 | |
15,500 | | HP, Inc. | | | 224,595 | |
10,700 | | Teradata Corp. * | | | 288,472 | |
2,500 | | VMware, Inc., Class A * | | | 196,500 | |
| | | | | | |
| | | | | 1,548,260 | |
| | | | | | |
| | Materials – 5.8% | | | | |
5,800 | | FMC Corp. | | | 271,962 | |
2,900 | | Greif, Inc., Class A | | | 135,894 | |
| | | | | | |
| | | | | 407,856 | |
| | | | | | |
| | Total Common Stocks
(Cost $7,025,556) | | | 7,002,835 | |
| | | | | | |
INVESTMENT COMPANY – 2.1% | | | | |
149,437 | | Dreyfus Government Cash Management Fund, Institutional Class Shares, 0.28%** | | | 149,437 | |
| | | | | | |
| | Total Investment Company
(Cost $149,437) | | | 149,437 | |
| | | | | | |
Total Investments – 101.7%
(Cost $7,174,993)*** | | | 7,152,272 | |
| | | | | | |
Net Other Assets and Liabilities – (1.7)% | | | (117,532 | ) |
| | | | | | |
Net Assets – 100.0% | | $ | 7,034,740 | |
| | | | | | |
| * | Non-income producing security. |
| ** | Yield shown represents the October 31, 2016, seven-day average yield, which refers to the sum of the previous seven days’ dividends paid, expressed as an annual percentage. |
| *** | At October 31, 2016, the aggregate cost for Federal income tax purposes is $7,179,714. |
| | | | |
Gross unrealized appreciation | | $ | 629,557 | |
Gross unrealized depreciation | | | (656,999 | ) |
| | | | |
Net unrealized depreciation | | $ | (27,442 | ) |
| | | | |
ADR American Depositary Receipt
The accompanying notes are an integral part of these financial statements.
5
AMG River Road Focused Absolute Value Fund
Portfolio Manager’s Comments (unaudited)
The AMG River Road Focused Absolute Value Fund1 (the “Fund”) Class N shares outperformed the Russell 3000® Value Index benchmark over the period since inception (November 3, 2015) and ending October 31, 2016, with a return of +8.50% versus +5.03% for the Index. The largest positive contribution to relative return was from the financials sector, which benefited primarily from strong stock selection. This was partially offset by negative stock selection in energy and a lack of exposure to the utilities sector. From a market cap perspective, the Fund outperformed across the spectrum with small- and mid-cap holdings delivering the largest contributions to relative return.
The two holdings with the largest positive contribution to the Fund’s return were Rackspace Hosting Inc. (RAX) and Communications Sales & Leasing Inc. (CSAL). Rackspace is a global provider of managed cloud and related IT services. We initiated our position earlier this year as RAX was transitioning its business model from only providing services and raw cloud computing capacity to support customized cloud and software applications. By leveraging other cloud platforms, former competitors such as Amazon Web Services and Microsoft Azure were transformed into Rackspace partners. In August, private-equity firm Apollo Global signed a deal to acquire Rackspace for $32 per share, which was a +38% premium to the unaffected stock price. The Fund exited the position near the deal price.
CSAL is a real estate investment trust (REIT) focused on telecom network infrastructure (the pipes). CSAL was founded last year as a tax-free spin-off from Windstream Holdings. Concurrent with the spinoff, Windstream executed a 15-year triple net lease for the entirety of CSAL’s network assets and retained a 19.6% ownership stake in CSAL. As the first and only REIT of its kind, CSAL initially suffered from skepticism around the concentration and quality of Windstream as its only tenant. During Q2, CSAL rallied on several transactions that
supported our thesis—including reducing revenue dependence on Windstream. The Fund exited the position as the stock approached our assessed valuation.
The two holdings with the largest negative contribution to return were American Express Co. (AXP) and Rolls-Royce Holdings PLC Sponsored ADR (RYCEY). American Express is a global provider of charge and credit card products. We introduced AXP following the announcement of the loss of its Costco relationship, based on the belief that the non-renewal as Costco’s sole credit card provider was priced into the stock. Our investment thesis relied on AXP’s ability to leverage its brand strength and global network to take advantage of the secular growth tailwinds in electronic payments. However, we underestimated the impact the loss of Costco would have on the business, which led to margin pressure from heavier investment to replace the lost Costco business and disappointing guidance for 2016 and 2017. As such, our thesis was weakened and the Fund exited the position.
Rolls-Royce makes and maintains engines primarily for wide-body (more than one aisle) aircraft. Aftermarket services account for half of the company’s revenue. Our investment thesis relied on Rolls-Royce’s ability to increase its installed base of engines in coming years, which would provide a long runway of growth in the highly-profitable after-market services. Last November, Rolls-Royce lowered profit and free cash flow guidance, citing weakness in after-market services for regional jets and wide-body aircraft. The weakness in aftermarket services threatened our investment thesis; thus, the Fund exited the position.
The Fund invests in companies that we believe represent the most attractive combination of risk (conviction) and reward (discount) available. The largest change to positioning in the Fund over the last year was the shift away from larger-cap securities to smaller-cap. The allocation to smaller-cap securities was driven by bottom-up opportunities
throughout our universe as we found more attractive combinations of risk/reward within the smaller-cap space. From a sector perspective, exposure to Information technology decreased, as several names were sold as they approached assessed valuation. The largest increases in sector exposure were within consumer discretionary and health care.
The views expressed represent the opinions of River Road Asset Management LLC , as of October 31, 2016, and are not intended as a forecast or guarantee of future results and are subject to change without notice.
| 1 | Prior to October 1, 2016, the Fund was known as ASTON/River Road Focused Absolute Value Fund. |
6
AMG River Road Focused Absolute Value Fund
Portfolio Manager’s Comments (continued)
CUMULATIVE TOTAL RETURN PERFORMANCE
The AMG River Road Focused Absolute Value Fund’s cumulative total return is based on the daily change in net asset value (NAV), and assumes that all dividends and distributions were reinvested. The chart compares a hypothetical $10,000 investment made in AMG River Road Focused Absolute Value Fund’s Class N on November 3, 2015, to a $10,000 investment made in the Russell 3000® Value Index for the same time period. The graph and table do not reflect the deduction of taxes that a shareholder would pay on a Fund distribution or redemption of shares. The listed returns for the Fund are net of expenses and the returns for the index exclude expenses. Total returns would have been lower had certain expenses not been reduced.
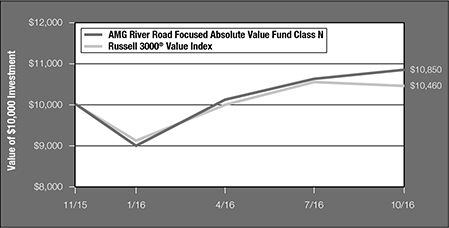
The table below shows the average annual total returns for AMG River Road Focused Absolute Value Fund and the Russell 3000® Value Index for the same time periods ended October 31, 2016.
| | | | | | | | |
| | | Since | | | Inception | |
| Average Annual Total Returns1 | | Inception | | | Date | |
AMG River Road Focused Absolute Value Fund2,3,4,5,6,7,8 | | | | | | | | |
Class N | | | 8.50 | % | | | 11/03/15 | |
Class I | | | 8.80 | % | | | 11/03/15 | |
Russell 3000® Value Index9 | | | 5.03 | % | | | 11/03/15 | † |
The performance data shown represents past performance. Past performance is not a guarantee of future results. Current performance may be lower or higher than the performance data quoted. The investment return and the principal value of an investment will fluctuate so that an investor’s shares, when redeemed, may be worth more or less than their original cost.
Investors should carefully consider the Fund’s investment objectives, risks, charges and expenses before investing. For performance information through the most recent month end, current net asset values per share for the Fund and other information, please call (800) 835-3879 or visit our website at www.amgfunds.com for a free prospectus. Read it carefully before investing or sending money.
Distributed by AMG Distributors, Inc., member FINRA/SIPC.
| † | Date reflects the inception date of the Fund, not the index. |
| 1 | Total return equals income yield plus share price change and assumes reinvestment of all dividends and capital gain distributions. Returns are net of fees and may reflect offsets of Fund expenses as described in the prospectus. No adjustment has been made for taxes payable by shareholders on their reinvested dividends and capital gain distributions. Returns for periods greater than one year are annualized. The listed returns on the Fund are net of expenses and based on the published NAV as of October 31, 2016. All returns are in U.S. dollars ($). |
| 2 | The Fund is subject to risks associated with investments in small-capitalization companies, such as erratic earnings patterns, competitive conditions, limited earnings history and a reliance on one or a limited number of products. |
| 3 | The Fund is subject to risks associated with investments in mid-capitalization companies such as greater price volatility, lower trading volume, and less liquidity than the stocks of larger, more established companies. |
| 4 | Active and frequent trading of a fund may result in higher transaction costs and increased tax liability. |
| 5 | A greater percentage of the Fund’s holdings may be focused in a smaller number of securities which may place the Fund at greater risk than a more diversified fund. |
| 6 | Investments in international securities are subject to certain risks of overseas investing including currency fluctuations and changes in political and economic conditions, which could result in significant market fluctuations. These risks are magnified in emerging markets. |
| 7 | The Fund is subject to special risk considerations similar to those associated with the direct ownership of real estate. Real estate valuations may be subject to factors such as changing general and local economic, financial, competitive, and environmental conditions. |
| 8 | The Fund invests in value stocks, which may perform differently from the market as a whole and may be undervalued by the market for a long period of time. |
| 9 | The Russell 3000® Value Index measures the performance of the broad value segment of the U.S. equity universe. It includes those Russell 3000 companies with lower price-to-book ratios and lower forecasted growth values. Unlike the Fund, the Russell 3000® Value Index is unmanaged, is not available for investment and does not incur expenses. |
The Russell Indices are a trademark of the London Stock Exchange Group Companies.
Not FDIC insured, nor bank guaranteed. May lose value.
7
AMG Funds
| | |
| AMG River Road Focused Absolute Value Fund | | October 31, 2016 |
| |
| Schedule of Investments | | |
% of Net Assets
| | | | | | | | |
Shares | | | | | Market
Value | |
| COMMON STOCKS – 99.2% | | | | |
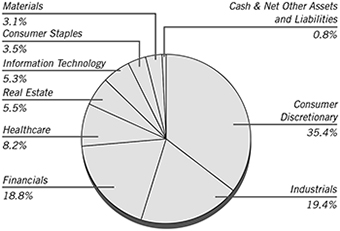
| | | | Consumer Discretionary – 35.4% | | | | |
| | 8,193 | | | Comcast Corp., Class A | | $ | 506,491 | |
| | 11,291 | | | General Motors Co. | | | 356,796 | |
| | 11,097 | | | International Speedway Corp., Class A | | | 365,091 | |
| | 6,126 | | | L Brands, Inc. | | | 442,236 | |
| | 5,031 | | | Liberty Broadband Corp., Class C * | | | 335,316 | |
| | 14,396 | | | Liberty Media Corp-Liberty SiriusXM, Class C * | | | 477,803 | |
| | 13,787 | | | Liberty Ventures, Class A * | | | 550,101 | |
| | 3,929 | | | Polaris Industries, Inc. | | | 301,001 | |
| | 3,851 | | | Ralph Lauren Corp. | | | 377,783 | |
| | 5,295 | | | Time Warner, Inc. | | | 471,202 | |
| | | | | | | | |
| | | | | | | 4,183,820 | |
| | | | | | | | |
| | | | Consumer Staples – 3.5% | | | | |
| | 10,417 | | | Ingles Markets, Inc., Class A | | | 411,471 | |
| | | | | | | | |
| | | | Financials – 18.8% | | | | |
| | 12,803 | | | CNA Financial Corp. | | | 468,206 | |
| | 37,836 | | | FNFV Group * | | | 455,924 | |
| | 8,997 | | | Oaktree Capital Group LLC, MLP | | | 374,275 | |
| | 10,929 | | | U.S. Bancorp | | | 489,182 | |
| | 9,361 | | | Wells Fargo & Co. | | | 430,700 | |
| | | | | | | | |
| | | | | | | 2,218,287 | |
| | | | | | | | |
| | | | Healthcare – 8.2% | | | | |
| | 6,683 | | | DaVita, Inc. * | | | 391,757 | |
| | 18,195 | | | Premier, Inc., Class A * | | | 579,329 | |
| | | | | | | | |
| | | | | | | 971,086 | |
| | | | | | | | |
| | | | Industrials – 19.4% | | | | |
| | 21,943 | | | Air Transport Services Group, Inc. * | | | 290,306 | |
| | 10,878 | | | Cubic Corp. | | | 464,491 | |
| | 21,319 | | | Resources Connection, Inc. | | | 316,587 | |
| | | | | | |
Shares | | | | Market
Value | |
| | Industrials (continued) | | | | |
12,426 | | SP Plus Corp. * | | $ | 313,135 | |
9,063 | | Spirit AeroSystems Holdings, Inc., Class A * | | | 456,413 | |
3,644 | | UniFirst Corp./MA | | | 446,390 | |
| | | | | | |
| | | | | 2,287,322 | |
| | | | | | |
| | Information Technology – 5.3% | | | | |
9,134 | | Blackhawk Network Holdings, Inc. * | | | 314,666 | |
20,114 | | VeriFone Systems, Inc. * | | | 311,365 | |
| | | | | | |
| | | | | 626,031 | |
| | | | | | |
| | Materials – 3.1% | | | | |
3,106 | | Praxair, Inc. | | | 363,588 | |
| | | | | | |
| | Real Estate – 5.5% | | | | |
12,226 | | The GEO Group, Inc. | | | 292,935 | |
15,349 | | Realogy Holdings Corp. | | | 351,339 | |
| | | | | | |
| | | | | 644,274 | |
| | | | | | |
| | Total Common Stocks
(Cost $11,197,685) | | | 11,705,879 | |
| | | | | | |
Total Investments – 99.2%
(Cost $11,197,685)** | | | 11,705,879 | |
Net Other Assets and Liabilities – 0.8% | | | 95,090 | |
| | | | | | |
Net Assets – 100.0% | | $ | 11,800,969 | |
| | | | | | |
| * | Non-income producing security. |
| ** | At October 31, 2016, the aggregate cost for Federal income tax purposes is $11,280,866. |
| | | | |
Gross unrealized appreciation | | $ | 783,510 | |
Gross unrealized depreciation | | | (358,497 | ) |
| | | | |
Net unrealized appreciation | | $ | 425,013 | |
| | | | |
| MLP | Master Limited Partnership |
The accompanying notes are an integral part of these financial statements.
8
AMG Managers Montag & Caldwell Growth Fund
Portfolio Manager’s Comments (unaudited)
THE YEAR IN REVIEW
For the fiscal year ended October 31, 2016, the AMG Managers Montag & Caldwell Growth Fund1 (the “Fund”) Class N shares returned (1.77)%, compared to the 2.28% return for its benchmark, the Russell 1000® Growth Index. The Fund is managed using fundamental valuation techniques that focus on a company’s future earnings and dividend growth rates. The process is primarily bottom up and utilizes a present valuation model in which the current price of the stock is related to the risk-adjusted present value of the company’s estimated future earnings stream. The Fund seeks to invest in growth stocks selling at a discount to estimates of fair value and at a time when relative earnings-per-share growth is visible for the intermediate term.
MARKET ENVIRONMENT
Stocks were generally positive for the year ended October 31, 2016, without a significant bias in market capitalization. The Russell 1000® (large-cap) Index was up 4.26%, the Russell Midcap® Index (mid cap) was up 4.17% and the Russell 2000® Index (small-cap) was up 4.11%. There was, however, a significant head-wind to growth, as value outperformed growth in each size segment, but particularly in the small-cap space. The Russell 2000® Value Index (small-cap value) was up 8.81% vs. a -0.49% return for the Russell 2000® Growth Index (small-cap growth). The spread of value over growth was similar in the mid-cap space and, although not as pronounced, in the large-cap space where the Russell 1000® Value Index (large-cap value) was up 6.37% vs. a 2.28% return for the Russell 1000® Growth Index (large-cap growth).
PERFORMANCE REVIEW
The Fund declined 1.77% vs. a 2.28% increase for the Russell 1000® Growth Index for the year ended October 31, 2016. The markets ended the last quarter of 2015 with increased levels of volatility that accomplished very little in terms of improving overall market valuations. The volatility continued into the start of the year with a big draw down. During this
market decline, the Fund held up much better than the benchmark and peer group. However, this was short lived as the market bounced back during the second half of the first quarter. This was one of the largest intra-quarter reversals in market history. Unfortunately, while the market recovered, fundamentals continued to deteriorate (S&P 500 Index rallied while earnings estimates for 2016 declined—causing market price-to-earnings multiples to expand further). Again, market volatility failed to make progress on valuation and the Fund underperformed.
From the February lows through the end of the second quarter, bond yields fell in anticipation of further economic weakness and the now-predictable response of central banks extending support to the market by injecting additional liquidity and suppressing interest rates. The leg down in bond yields contributed to significant outperformance in the equity markets by the bond proxies (utilities, telecom and REITs) as investors sought out high and stable dividend yields as a substitute for bonds in an income-starved world. As a result, investors rotated into high-quality large-cap value stocks that offered above-average yields. Furthermore, given that the Fund’s consumer staples exposure, generally speaking, is oriented toward higher growth rather than higher yield names, its exposure didn’t participate to the degree that the Russell 1000® Growth Index did.
The stock market continued its post-Brexit rally in July, hitting new all-time highs, before settling into a mostly calm, sideways trading pattern through August, after central bankers promised additional support in response to any dislocations caused by the decision of U.K. voters to leave the European Union. September ushered in a minor bout of volatility, with stocks dipping about 3% on fears that central banks might begin to withdraw monetary stimulus, before rebounding into quarter-end when those fears proved premature. Generally speaking, the Fund has been disadvantaged in this environment by a mix of high beta, lower-quality, and smaller-cap cyclical bias in the
market. Most of the names that benefited from this theme did not fit within our investment discipline.
The Fund held up better than the benchmark and peer group as the markets sold off in October. Investors grappled with high valuations, a volatile political environment, mixed economic data and an uncertain earnings outlook.
OUTLOOK
After moderate gains in the third quarter, the stock market advance may pause as investors discount various economic and political uncertainties, particularly with stock market median valuations near or at all-time highs. The median price-to-earnings valuation ratio for the S&P 500 is higher than 90% of all historical periods going back to 1984, while the price-to-sales ratio is at a record high for the same time period. With economic data clearly turning mixed, national election uncertainties on the horizon and the U.S. Federal Reserve signaling a desire to raise interest rates in December into what appears to be slowing growth, investors may hesitate at these unusually high valuation levels. Unprecedented Central Bank policies and historically-low interest rates will likely continue to support these unusually high valuations and, with recession risk still low, downside market risk should also be limited.
In the low growth, low inflation and low interest-rate world that is likely to persist longer term, we believe the Fund’s holdings are well positioned to provide attractive investment returns. These holdings are, in our opinion, attractively valued and, due to their financial strength and global diversification, their earnings growth is more assured in what is likely to be a slow and uneven global economy.
The views expressed represent the opinions of Montag & Caldwell LLC, as of October 31, 2016, and are not intended as a forecast or guarantee of future results and are subject to change without notice.
| 1 | Prior to October 1, 2016, the Fund was known as ASTON/Montag & Caldwell Growth Fund. |
9
AMG Managers Montag & Caldwell Growth Fund
Portfolio Manager’s Comments (continued)
CUMULATIVE TOTAL RETURN PERFORMANCE
The AMG Managers Montag & Caldwell Growth Fund’s cumulative total return is based on the daily change in net asset value (NAV), and assumes that all dividends and distributions were reinvested. The chart compares a hypothetical $10,000 investment made in the AMG Managers Montag & Caldwell Growth Fund’s Class N on October 31, 2006, to a $10,000 investment made in the Russell 1000® Growth Index for the same time period. The graph and table do not reflect the deduction of taxes that a shareholder would pay on a Fund distribution or redemption of shares. The listed returns for the Fund are net of expenses and the returns for the index exclude expenses. Total returns would have been lower had certain expenses not been reduced.

The table below shows the average annual total returns for AMG Managers Montag and Caldwell Growth Fund and the Russell 1000® Growth Index for the same time periods ended October 31, 2016.
| | | | | | | | | | | | |
| | | One | | | Five | | | Ten | |
| Average Annual Total Returns1 | | Year | | | Years | | | Years | |
AMG Managers Montag and Caldwell Growth Fund2,3 | | | | | | | | | | | | |
Class N | | | (1.77 | )% | | | 9.95 | % | | | 6.77 | % |
Class I | | | (1.51 | )% | | | 10.24 | % | | | 7.04 | % |
Class R | | | (2.02 | )% | | | 9.68 | % | | | 6.51 | % |
Russell 1000® Growth Index4 | | | 2.28 | % | | | 13.65 | % | | | 8.22 | % |
The performance data shown represents past performance. Past performance is not a guarantee of future results. Current performance may be lower or higher than the performance data quoted. The investment return and the principal value of an investment will fluctuate so that an investor’s shares, when redeemed, may be worth more or less than their original cost.
Investors should carefully consider the Fund’s investment objectives, risks, charges and expenses before investing. For performance information through the most recent month end, current net asset values per share for the Fund and other information, please call (800) 835-3879 or visit our website at www.amgfunds.com for a free prospectus. Read it carefully before investing or sending money.
Distributed by AMG Distributors, Inc., member FINRA/SIPC.
| 1 | Total return equals income yield plus share price change and assumes reinvestment of all dividends and capital gain distributions. Returns are net of fees and may reflect offsets of Fund expenses as described in the prospectus. No adjustment has been made for taxes payable by shareholders on their reinvested dividends and capital gain distributions. Returns for periods greater than one year are the average annual returns. The listed returns on the Fund are net of expenses and based on the published NAV as of October 31, 2016. All returns are in U.S. dollars ($). |
| 2 | The Fund invests in growth stocks, which may be more sensitive to market movements because their prices tend to reflect future investor expectations rather than just current profits. |
| 3 | Investments in international securities are subject to certain risks of overseas investing including currency fluctuations and changes in political and economic conditions, which could result in significant market fluctuations. These risks are magnified in emerging markets. |
| 4 | The Russell 1000® Growth Index is a market capitalization weighted index that measures the performance of those Russell 1000® companies with higher price-to-book ratios and higher forecasted growth values. Unlike the Fund, the Russell 1000® Growth Index is unmanaged, is not available for investment and does not incur expenses. |
The Russell Indices are a trademark of the London Stock Exchange Group companies.
Not FDIC insured, nor bank guaranteed. May lose value.
10
AMG Funds
| | |
| AMG Managers Montag & Caldwell Growth Fund | | October 31, 2016 |
| |
| Schedule of Investments | | |
| | | | | | |
% of Net Assets | | | | |
| | | | | | | | |
Shares | | | | | Market
Value | |
| COMMON STOCKS – 93.1% | | | | |
| | | | Consumer Discretionary – 10.3% | | | | |
| | 651,500 | | | Dollar Tree, Inc. * | | $ | 49,220,825 | |
| | 24,979 | | | The Priceline Group, Inc. * | | | 36,824,791 | |
| | 557,800 | | | Starbucks Corp. | | | 29,602,446 | |
| | 317,500 | | | The TJX Cos, Inc. | | | 23,415,625 | |
| | | | | | | | |
| | | | | | | 139,063,687 | |
| | | | | | | | |
| | | | Consumer Staples – 23.9% | | | | |
| | 238,200 | | | Colgate-Palmolive Co. | | | 16,997,953 | |
| | 139,289 | | | Costco Wholesale Corp. | | | 20,596,664 | |
| | 235,700 | | | The Estee Lauder Cos, Inc., Class A | | | 20,536,541 | |
| | 618,300 | | | The Kraft Heinz Co. | | | 54,997,785 | |
| | 1,217,000 | | | Mondelez International, Inc., Class A | | | 54,691,980 | |
| | 224,300 | | | Monster Beverage Corp. * | | | 32,375,462 | |
| | 579,200 | | | PepsiCo, Inc. | | | 62,090,240 | |
| | 713,100 | | | Walgreens Boots Alliance, Inc. | | | 58,994,763 | |
| | | | | | | | |
| | | | | | | 321,281,388 | |
| | | | | | | | |
| | | | Energy – 1.6% | | | | |
| | 295,800 | | | Occidental Petroleum Corp. | | | 21,566,778 | |
| | | | | | | | |
| | | | Financials – 3.0% | | | | |
| | 149,216 | | | Intercontinental Exchange, Inc. | | | 40,346,514 | |
| | | | | | | | |
| | | | Healthcare – 21.5% | | | | |
| | 116,982 | | | Allergan PLC (Ireland) * | | | 24,442,219 | |
| | 195,472 | | | Amgen, Inc. | | | 27,592,828 | |
| | 337,900 | | | Bristol-Myers Squibb Co. | | | 17,202,489 | |
| | 428,200 | | | Celgene Corp. * | | | 43,753,476 | |
| | 594,600 | | | Danaher Corp. | | | 46,705,830 | |
| | 676,700 | | | Medtronic PLC (Ireland) | | | 55,502,934 | |
| | 307,730 | | | Thermo Fisher Scientific, Inc. | | | 45,245,542 | |
| | | | | | |
Shares | | | | Market
Value | |
| | Healthcare (continued) | | | | |
202,800 | | UnitedHealth Group, Inc. | | $ | 28,661,724 | |
| | | | | | |
| | | | | 289,107,042 | |
| | | | | | |
| | Industrials – 6.0% | | | | |
426,100 | | Honeywell International, Inc. | | | 46,734,648 | |
314,600 | | United Parcel Service, Inc., Class B | | | 33,901,296 | |
| | | | | | |
| | | | | 80,635,944 | |
| | | | | | |
| | Information Technology – 26.8% | | | | |
243,200 | | Accenture PLC, Class A (Ireland) | | | 28,269,568 | |
75,357 | | Alphabet, Inc., Class A * | | | 61,031,634 | |
470,000 | | Apple, Inc. | | | 53,363,800 | |
438,900 | | Facebook, Inc., Class A * | | | 57,491,511 | |
215,000 | | Fidelity National Information Services, Inc. | | | 15,892,800 | |
288,300 | | MasterCard, Inc., Class A | | | 30,853,866 | |
762,500 | | QUALCOMM, Inc. | | | 52,399,000 | |
738,200 | | Visa, Inc., Class A | | | 60,908,882 | |
| | | | | | |
| | | | | 360,211,061 | |
| | | | | | |
| | Total Common Stocks
(Cost $1,115,717,490) | | | 1,252,212,414 | |
| | | | | | |
INVESTMENT COMPANY – 6.7% | | | | |
89,795,475 | | Dreyfus Government Cash Management Fund, Institutional Class Shares, 0.28%** | | | 89,795,475 | |
| | | | | | |
| | Total Investment Company
(Cost $89,795,475) | | | 89,795,475 | |
| | | | | | |
Total Investments – 99.8%
(Cost $1,205,512,965)*** | | | 1,342,007,889 | |
| | | | | | |
Net Other Assets and Liabilities – 0.2% | | | 2,776,697 | |
| | | | | | |
Net Assets – 100.0% | | $ | 1,344,784,586 | |
| | | | | | |
| * | Non-income producing security. |
| ** | Yield shown represents the October 31, 2016, seven-day average yield, which refers to the sum of the previous seven days’ dividends paid, expressed as an annual percentage. |
| *** | At October 31, 2016, the aggregate cost for Federal income tax purposes is $1,207,637,272. |
| | | | |
Gross unrealized appreciation | | $ | 165,935,605 | |
Gross unrealized depreciation | | | (31,564,988 | ) |
| | | | |
Net unrealized appreciation | | $ | 134,370,617 | |
| | | | |
| PLC | Public Limited Company |
The accompanying notes are an integral part of these financial statements.
11
AMG River Road Dividend All Cap Value Fund
Portfolio Manager’s Comments (unaudited)
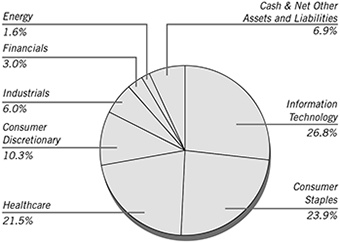
Over the 12-month period ending October 31, 2016, the AMG River Road Dividend All Cap Value Fund1 (the “Fund”) Class N shares returned 7.88%, outperforming the Russell 3000® Value Index, which returned 6.55%.
The most significant market factors affecting absolute returns were the steady improvement in corporate earnings growth and uncertainty about the timing of monetary tightening by the U.S. Federal Reserve (the Fed). Additionally, according to Ned Davis Research, among S&P 500 companies, those with below average yields significantly outperformed those with above average yields, creating a significant relative headwind for a dividend-oriented fund. Despite these challenges, the Fund outperformed significantly during the period due to both sector allocation and stock selection. The financials sector had the most significant positive impact on relative results in the period, primarily due to the strong performance of numerous real estate investment trust (REIT) holdings. The materials sector had the most significant negative impact on relative results due to weak stock selection.
The two holdings with the largest positive contribution to the Fund’s total return were ADT Corp. (ADT), the number one provider of electronic security and monitoring services in North America, and Microsoft Corp. (MSFT), the multinational technology company behind the Windows operating software. In February, ADT agreed to be acquired by funds affiliated with Apollo Global Management for $42/share in cash, or a +56% premium to the previous closing price. The acquisition price represented a discount to our $50 assessed value. The position was reduced and eventually eliminated due to the acquisition. In October 2015, MSFT announced strong fiscal Q1 2016 results driven by robust cloud revenue growth and much better-than-expected margins. The company also reported strong quarterly results in Q3 2016 with +5% constant currency growth driven by the cloud. In September, MSFT raised its dividend
+8% and announced a new $40B share repurchase program. We reduced the position during the period as it reached its assessed value, but it remained the largest position in the Fund.
The two holdings with the lowest contribution to the Fund’s total return during the period were Martin Midstream Partners LP (MMLP), a diversified master limited partnership with operations focused primarily in the United States Gulf Coast region, and Wells Fargo & Co. (WFC), the third-largest commercial bank in the United States. Shares of MMLP were down at the end of 2015 after the company reported a mixed quarter in which total revenue declined -40% due to lower product sales revenue and operating income decreased -9%. We eliminated the position in Q1 2016 due to unrealized losses. WFC underperformed in light of the macro environment for banks in the beginning of 2016. Economic uncertainty increased around expectations that the Fed could raise interest rates, which caused the banking industry to broadly underperform the market. We trimmed the position on two occasions during the period due to unrealized losses.
The Fund is significantly overweighted in consumer discretionary, real estate and information technology, and is significantly underweighted in financials, health care, energy and consumer staples. Consumer staples went from +438 bps overweight to -330 bps underweight versus the Russell 3000® Value benchmark, driven by the elimination of two holdings from the Fund in this sector. Real estate was broken out from financials as a separate sector during the year and it ended the period at +523 bps overweight versus the benchmark. Telecommunication services went from +234 bps overweight to -97 bps underweight versus the benchmark, also due to the elimination of two positions from the Fund in this sector. Turnover remained elevated as we dealt with both overvalued positions and accumulated losses, and the average yield of Fund holdings increased modestly. We were pleased to
see that the valuation-driven shift from more defensive sectors toward cyclicals was positive as interest rates moved higher in the later part of the period.
The views expressed represent the opinions of River Road Asset Management LLC, as of October 31, 2016, and are not intended as a forecast or guarantee of future results and are subject to change without notice.
| 1 | Prior to October 1, 2016, the Fund was known as ASTON/River Road Dividend All Cap Value Fund. |
12
AMG River Road Dividend All Cap Value Fund
Portfolio Manager’s Comments (continued)
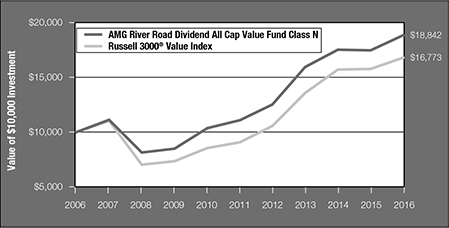
CUMULATIVE TOTAL RETURN PERFORMANCE
The AMG River Road Dividend All Cap Value Fund’s cumulative total return is based on the daily change in net asset value (NAV), and assumes that all dividends and distributions were reinvested. The chart compares a hypothetical $10,000 investment made in AMG River Road Dividend All Cap Value Fund’s Class N on October 31, 2006, to a $10,000 investment made in the Russell 3000® Value Index for the same time period. The graph and table do not reflect the deduction of taxes that a shareholder would pay on a Fund distribution or redemption of shares. The listed returns for the Fund are net of expenses and the returns for the index exclude expenses. Total returns would have been lower had certain expenses not been reduced.
The table below shows the average annual total returns for AMG River Road Dividend All Cap Value Fund and the Russell 3000® Value Index for the same time periods ended October 31, 2016.
| | | | | | | | | | | | | | | | | | | | |
| | | One | | | Five | | | Ten | | | Since | | | Inception | |
| Average Annual Total Returns1 | | Year | | | Years | | | Years | | | Inception | | | Date | |
AMG River Road Dividend All Cap Value Fund2,3,4,5,6 | | | | | | | | | | | | | | | | | |
Class N | | | 7.88 | % | | | 11.24 | % | | | 6.54 | % | | | 7.78 | % | | | 06/28/05 | |
Class I | | | 8.15 | % | | | 11.52 | % | | | — | | | | 5.92 | % | | | 06/28/07 | |
Russell 3000® Value Index7 | | | 6.55 | % | | | 13.17 | % | | | 5.31 | % | | | 6.53 | % | | | 06/28/05 | † |
The performance data shown represents past performance. Past performance is not a guarantee of future results. Current performance may be lower or higher than the performance data quoted. The investment return and the principal value of an investment will fluctuate so that an investor’s shares, when redeemed, may be worth more or less than their original cost.
Investors should carefully consider the Fund’s investment objectives, risks, charges and expenses before investing. For performance information through the most recent month end, current net asset values per share for the Fund and other information, please call (800) 835-3879 or visit our website at www.amgfunds.com for a free prospectus. Read it carefully before investing or sending money.
Distributed by AMG Distributors, Inc., member FINRA/SIPC.
| † | Date reflects the inception date of the Fund, not the index. |
| 1 | Total return equals income yield plus share price change and assumes reinvestment of all dividends and capital gain distributions. Returns are net of fees and may reflect offsets of Fund expenses as described in the prospectus. No adjustment has been made for taxes payable by shareholders on their reinvested dividends and capital gain distributions. Returns for periods greater than one year are annualized. The listed returns on the Fund are net of expenses and based on the published NAV as of October 31, 2016. All returns are in U.S. dollars ($). |
| 2 | Investments in international securities are subject to certain risks of overseas investing including currency fluctuations and changes in political and economic conditions, which could result in significant market fluctuations. These risks are magnified in emerging markets. |
| 3 | The Fund is subject to risks associated with investments in mid-capitalization companies such as greater price volatility, lower trading volume, and less liquidity than the stocks of larger, more established companies. |
| 4 | The Fund is subject to special risk considerations similar to those associated with the direct ownership of real estate. Real estate valuations may be subject to factors such as changing general and local economic, financial, competitive, and environmental conditions. |
| 5 | The Fund is subject to risks associated with investments in small-capitalization companies, such as erratic earnings patterns, competitive conditions, limited earnings history and a reliance on one or a limited number of products. |
| 6 | The Fund invests in value stocks, which may perform differently from the market as a whole and may be undervalued by the market for a long period of time. |
| 7 | The Russell 3000® Value Index measures the performance of the broad value segment of the U.S. equity universe. It includes those Russell 3000 companies with lower price-to-book ratios and lower forecasted growth values. Unlike the Fund, the Russell 3000® Value Index is unmanaged, is not available for investment and does not incur expenses. |
The Russell Indices are a trademark of the London Stock Exchange Group Companies.
Not FDIC insured, nor bank guaranteed. May lose value.
13
AMG Funds
| | |
| AMG River Road Dividend All Cap Value Fund | | October 31, 2016 |
| |
| Schedule of Investments | | |
% of Net Assets
| | | | | | | | |
Shares | | | | | Market
Value | |
| COMMON STOCKS – 96.4% | | | | |
| | | | Consumer Discretionary – 11.6% | | | | |
| | 28,023 | | | Adient PLC (Ireland) * | | $ | 1,275,313 | |
| | 222,586 | | | Cedar Fair LP | | | 12,654,014 | |
| | 468,364 | | | Cinemark Holdings, Inc. | | | 18,640,887 | |
| | 109,830 | | | DineEquity, Inc. | | | 8,687,553 | |
| | 420,308 | | | National CineMedia, Inc. | | | 5,829,672 | |
| | 257,014 | | | Omnicom Group, Inc. | | | 20,514,857 | |
| | 89,783 | | | Polaris Industries, Inc. | | | 6,878,276 | |
| | 224,196 | | | Target Corp. | | | 15,408,991 | |
| | 98,328 | | | Time Warner, Inc. | | | 8,750,209 | |
| | | | | | | | |
| | | | | | | 98,639,772 | |
| | | | | | | | |
| | | | Consumer Staples – 5.2% | | | | |
| | 54,805 | | | Kimberly-Clark Corp. | | | 6,270,240 | |
| | 93,735 | | | PepsiCo, Inc. | | | 10,048,392 | |
| | 282,559 | | | Unilever PLC, Sponsored ADR
(United Kingdom) | | | 11,774,234 | |
| | 227,012 | | | Wal-Mart Stores, Inc. | | | 15,895,380 | |
| | | | | | | | |
| | | | | | | 43,988,246 | |
| | | | | | | | |
| | | | Energy – 9.3% | | | | |
| | 94,031 | | | Chevron Corp. | | | 9,849,747 | |
| | 157,433 | | | Exxon Mobil Corp. | | | 13,117,318 | |
| | 161,647 | | | Magellan Midstream Partners LP | | | 10,867,528 | |
| | 223,037 | | | Occidental Petroleum Corp. | | | 16,261,628 | |
| | 270,051 | | | Spectra Energy Partners LP | | | 11,514,975 | |
| | 212,298 | | | TransMontaigne Partners LP | | | 8,283,868 | |
| | 157,935 | | | Valero Energy Corp. | | | 9,356,069 | |
| | | | | | | | |
| | | | | | | 79,251,133 | |
| | | | | | | | |
| | | | Financials – 16.9% | | | | |
| | 233,163 | | | Allied World Assurance Co. Holdings AG (Switzerland) | | | 10,021,346 | |
| | 545,938 | | | BB&T Corp. | | | 21,400,770 | |
| | | | | | | | |
Shares | | | | | Market
Value | |
| | | | Financials (continued) | | | | |
| | 84,894 | | | CME Group, Inc. | | $ | 8,497,889 | |
| | 160,883 | | | CNA Financial Corp. | | | 5,883,491 | |
| | 256,571 | | | MetLife, Inc. | | | 12,048,574 | |
| | 262,852 | | | The PNC Financial Services Group, Inc. | | | 25,128,651 | |
| | 347,382 | | | Thomson Reuters Corp. (Canada) | | | 13,690,325 | |
| | 492,088 | | | U.S. BanCorp. | | | 22,025,859 | |
| | 73,578 | | | Washington Trust Bancorp, Inc. | | | 3,377,230 | |
| | 355,224 | | | Wells Fargo & Co. | | | 16,343,856 | |
| | 166,991 | | | WesBanco, Inc. | | | 5,495,674 | |
| | | | | | | | |
| | | | | | | 143,913,665 | |
| | | | | | | | |
| | | | Healthcare – 4.0% | | | | |
| | 90,900 | | | Amgen, Inc. | | | 12,831,444 | |
| | 160,116 | | | Cardinal Health, Inc. | | | 10,998,368 | |
| | 320,474 | | | Owens & Minor, Inc. | | | 10,399,381 | |
| | | | | | | | |
| | | | | | | 34,229,193 | |
| | | | | | | | |
| | | | Industrials – 12.3% | | | | |
| | 634,731 | | | Aircastle, Ltd. (Bermuda) | | | 13,043,723 | |
| | 244,359 | | | Emerson Electric Co. | | | 12,384,114 | |
| | 436,800 | | | Fastenal Co. | | | 17,026,464 | |
| | 280,227 | | | Johnson Controls International PLC (Ireland) | | | 11,298,753 | |
| | 131,283 | | | MSC Industrial Direct Co., Inc., Class A | | | 9,557,402 | |
| | 85,708 | | | Parker-Hannifin Corp. | | | 10,520,657 | |
| | 155,412 | | | Union Pacific Corp. | | | 13,704,230 | |
| | 159,235 | | | United Parcel Service, Inc., Class B | | | 17,159,164 | |
| | | | | | | | |
| | | | | | | 104,694,507 | |
| | | | | | | | |
| | | | Information Technology – 14.9% | | | | |
| | 785,385 | | | Corning, Inc. | | | 17,836,093 | |
| | 168,044 | | | CSG Systems International, Inc. | | | 6,390,713 | |
| | 375,693 | | | Intel Corp. | | | 13,100,415 | |
| | 509,164 | | | Microsoft Corp. | | | 30,509,107 | |
| | 263,991 | | | Motorola Solutions, Inc. | | | 19,160,467 | |
| | 163,495 | | | QUALCOMM, Inc. | | | 11,235,376 | |
| | 206,672 | | | TE Connectivity, Ltd. (Switzerland) | | | 12,993,469 | |
| | 793,346 | | | The Western Union Co. | | | 15,922,454 | |
| | | | | | | | |
| | | | | | | 127,148,094 | |
| | | | | | | | |
| | | | Materials – 4.5% | | | | |
| | 174,496 | | | Compass Minerals International, Inc. | | | 12,537,538 | |
| | 104,085 | | | LyondellBasell Industries NV, Class A (Netherlands) | | | 8,279,962 | |
| | 146,323 | | | Praxair, Inc. | | | 17,128,570 | |
| | | | | | | | |
| | | | | | | 37,946,070 | |
| | | | | | | | |
| | | | Real Estate – 10.6% | | | | |
| | 397,417 | | | Communications Sales & Leasing, Inc. | | | 11,298,565 | |
| | 327,950 | | | The GEO Group, Inc. | | | 7,857,682 | |
| | 773,419 | | | Iron Mountain, Inc. | | | 26,087,410 | |
| | 176,635 | | | Ryman Hospitality Properties, Inc. | | | 8,905,937 | |
| | 505,761 | | | Sabra Health Care REIT, Inc. | | | 11,784,231 | |
The accompanying notes are an integral part of these financial statements.
14
AMG Funds
| | |
| AMG River Road Dividend All Cap Value Fund | | October 31, 2016 |
| |
| Schedule of Investments – continued | | |
| | | | | | |
Shares | | | | Market
Value | |
| | Real Estate (continued) | | | | |
191,323 | | Ventas, Inc. | | $ | 12,962,133 | |
371,613 | | Weyerhaeuser Co. | | | 11,122,377 | |
| | | | | | |
| | | | | 90,018,335 | |
| | | | | | |
| | Telecommunication Services – 2.5% | | | | |
442,714 | | Verizon Communications, Inc. | | | 21,294,543 | |
| | | | | | |
| | Utilities – 4.6% | | | | |
334,548 | | AmeriGas Partners LP | | | 15,974,667 | |
306,447 | | National Fuel Gas Co. | | | 16,051,694 | |
144,815 | | Vectren Corp. | | | 7,285,643 | |
| | | | | | |
| | | | | 39,312,004 | |
| | | | | | |
| | Total Common Stocks
(Cost $708,121,484) | | | 820,435,562 | |
| | | | | | |
| INVESTMENT COMPANY – 3.7% | | | | |
31,615,358 | | Dreyfus Government Cash Management Fund, Institutional Class Shares, 0.28%** | | | 31,615,358 | |
| | | | | | |
| | Total Investment Company
(Cost $31,615,358) | | | 31,615,358 | |
| | | | | | |
Total Investments – 100.1%
(Cost $739,736,842)*** | | | 852,050,920 | |
| | | | | | |
Net Other Assets and Liabilities – (0.1)% | | | (1,189,683 | ) |
| | | | | | |
Net Assets – 100.0% | | $ | 850,861,237 | |
| | | | | | |
| * | Non-income producing security. |
| ** | Yield shown represents the October 31, 2016, seven-day average yield, which refers to the sum of the previous seven days’ dividends paid, expressed as an annual percentage. |
| *** | At October 31, 2016, the aggregate cost for Federal income tax purposes is $743,643,159. |
| | | | |
Gross unrealized appreciation | | $ | 128,209,924 | |
Gross unrealized depreciation | | | (19,802,163 | ) |
| | | | |
Net unrealized appreciation | | $ | 108,407,671 | |
| | | | |
| | |
| ADR | | American Depositary Receipt |
| LP | | Limited Partnership |
| PLC | | Public Limited Company |
| REIT | | Real Estate Investment Trust |
The accompanying notes are an integral part of these financial statements.
15
AMG River Road Dividend All Cap Value Fund II
Portfolio Manager’s Comments (unaudited)
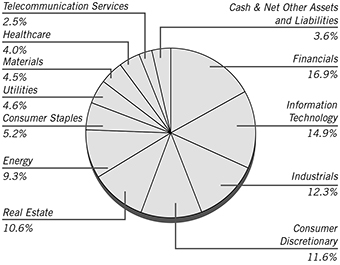
Over 12-month period ending October 31, 2016, the AMG River Road Dividend All Cap Value Fund II1 (the “Fund”) Class N shares returned 7.61%, outperforming the Russell 3000® Value Index, which returned 6.55%.
The most significant market factors affecting absolute returns were the steady improvement in corporate earnings growth and uncertainty about the timing of monetary tightening by the U.S. Federal Reserve (the Fed). Additionally, according to Ned Davis Research, among S&P 500 companies, those with below average yields significantly outperformed those with above average yields, creating a significant relative headwind for a dividend-oriented fund. Despite these challenges, the Fund outperformed significantly during the period due to both sector allocation and stock selection. The financials sector had the most significant positive impact on relative results in the period, primarily due to the strong performance of certain real estate investment trust (REIT) holdings. The utilities sector had the most significant negative impact on relative results due to both relatively weak stock selection and an underweight allocation.
The two holdings with the largest positive contribution to the Fund’s total return were ADT Corp. (ADT), the number one provider of electronic security and monitoring services in North America, and Microsoft Corp. (MSFT), the multinational technology company behind the Windows operating software. In February, ADT agreed to be acquired by funds affiliated with Apollo Global Management for $42/share in cash, or a +56% premium to the previous closing price. The acquisition price represented a discount to our $50 assessed value. The position was reduced and eventually eliminated due to the acquisition. In October 2015, MSFT
announced strong fiscal Q1 2016 results driven by robust cloud revenue growth and much better-than-expected margins. The company also reported strong quarterly results in Q3 2016 with +5% constant currency growth driven by the cloud. In September, MSFT raised its dividend +8% and announced a new $40B share repurchase program. We reduced the position during the period as it reached it assessed value, but it remained the largest position in the Fund.
The two holdings with the lowest contribution to the Fund’s total return during the period were Wells Fargo & Co. (WFC), the third-largest commercial bank in the United States, and Kohl’s Corp. (KSS). WFC underperformed in light of the macro environment for banks in the beginning of 2016. Economic uncertainty increased around expectations that the Fed could raise interest rates, which caused the banking industry to broadly underperform the market. We trimmed the position on two occasions during the period due to unrealized losses. In Q2 2016, KSS reported a weak quarter with comparable sales down -4%. The sales decline was steeper than expected and put an abrupt end to Kohl’s six quarters of positive sales growth. Management comments indicated that Kohl’s free cash flow generation, central to our thesis, could be in a very slow decline. We exited the position due to accumulated losses and a decreased conviction.
The Fund is significantly overweight in consumer discretionary, real estate and information technology, and is significantly underweight in financials, health care, energy and consumer staples. Consumer staples went from +520 bps overweight to -266 bps underweight versus the Russell 3000® Value benchmark, driven by the elimination of two holdings from the Fund in this sector. Real estate was broken out from financials as a
separate sector during the year, and it ended the period at +557 bps overweight versus the benchmark. The underweight in energy went from -643 bps to -348 bps versus the benchmark due to three new holdings and one elimination from the Fund in this sector. Turnover remained elevated as we dealt with both overvalued positions and accumulated losses, and the average yield of Fund holdings increased modestly. We were pleased to see that the valuation-driven shift from more defensive sectors toward cyclicals was positive as interest rates moved higher in the later part of the period.
The views expressed represent the opinions of River Road Asset Management LLC , as of October 31, 2016, and are not intended as a forecast or guarantee of future results and are subject to change without notice.
| 1 | Prior to October 1, 2016, the Fund was known as ASTON/River Road Dividend All Cap Value Fund II. |
16
AMG River Road Dividend All Cap Value Fund II
Portfolio Manager’s Comments (continued)
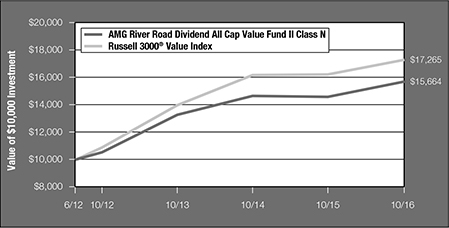
CUMULATIVE TOTAL RETURN PERFORMANCE
The AMG River Road Dividend All Cap Value Fund II’s cumulative total return is based on the daily change in net asset value (NAV), and assumes that all dividends and distributions were reinvested. The chart compares a hypothetical $10,000 investment made in AMG River Road Dividend All Cap Value Fund II’s Class N on June 27, 2012, to a $10,000 investment made in the Russell 3000® Value Index for the same time period. The graph and table do not reflect the deduction of taxes that a shareholder would pay on a Fund distribution or redemption of shares. The listed returns for the Fund are net of expenses and the returns for the index exclude expenses. Total returns would have been lower had certain expenses not been reduced.
The table below shows the average annual total returns for AMG River Road Dividend All Cap Value Fund II and the Russell 3000® Value Index for the same time periods ended October 31, 2016.
| | | | | | | | | | | | |
| | | One | | | Since | | | Inception | |
| Average Annual Total Returns1 | | Year | | | Inception | | | Date | |
AMG River Road Dividend All Cap Value Fund II2,3,4,5,6 | | | | | | | | | | | | |
Class N | | | 7.61 | % | | | 10.87 | % | | | 06/27/12 | |
Class I | | | 7.87 | % | | | 11.16 | % | | | 06/27/12 | |
Russell 3000® Value Index7 | | | 6.55 | % | | | 13.70 | % | | | 06/27/12 | † |
The performance data shown represents past performance. Past performance is not a guarantee of future results. Current performance may be lower or higher than the performance data quoted. The investment return and the principal value of an investment will fluctuate so that an investor’s shares, when redeemed, may be worth more or less than their original cost.
Investors should carefully consider the Fund’s investment objectives, risks, charges and expenses before investing. For performance information through the most recent month end, current net asset values per share for the Fund and other information, please call (800) 835-3879 or visit our website at www.amgfunds.com for a free prospectus. Read it carefully before investing or sending money.
Distributed by AMG Distributors, Inc., member FINRA/SIPC.
| † | Date reflects the inception date of the Fund, not the index. |
| 1 | Total return equals income yield plus share price change and assumes reinvestment of all dividends and capital gain distributions. Returns are net of fees and may reflect offsets of Fund expenses as described in the prospectus. No adjustment has been made for taxes payable by shareholders on their reinvested dividends and capital gain distributions. Returns for periods greater than one year are annualized. The listed returns on the Fund are net of expenses and based on the published NAV as of October 31, 2016. All returns are in U.S. dollars ($). |
| 2 | Investments in international securities are subject to certain risks of overseas investing including currency fluctuations and changes in political and economic conditions, which could result in significant market fluctuations. These risks are magnified in emerging markets. |
| 3 | The Fund is subject to risks associated with investments in mid-capitalization companies such as greater price volatility, lower trading volume, and less liquidity than the stocks of larger, more established companies. |
| 4 | The Fund is subject to special risk considerations similar to those associated with the direct ownership of real estate. Real estate valuations may be subject to factors such as changing general and local economic, financial, competitive, and environmental conditions. |
| 5 | The Fund is subject to risks associated with investments in small-capitalization companies, such as erratic earnings patterns, competitive conditions, limited earnings history and a reliance on one or a limited number of products. |
| 6 | The Fund invests in value stocks, which may perform differently from the market as a whole and may be undervalued by the market for a long period of time. |
| 7 | The Russell 3000® Value Index measures the performance of the broad value segment of the U.S. equity universe. It includes those Russell 3000 companies with lower price-to-book ratios and lower forecasted growth values. Unlike the Fund, the Russell 3000® Value Index is unmanaged, is not available for investment and does not incur expenses. |
The Russell Indices are a trademark of the London Stock Exchange Group Companies.
Not FDIC insured, nor bank guaranteed. May lose value.
17
AMG Funds
| | |
| AMG River Road Dividend All Cap Value Fund II | | October 31, 2016 |
| |
| Schedule of Investments | | |
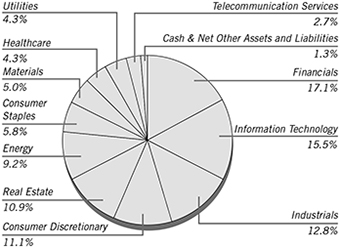
% of Net Assets
| | | | | | | | |
| | | | | | Market | |
Shares | | | | | Value | |
| COMMON STOCKS – 98.7% | | | | |
| | | | Consumer Discretionary – 11.1% | | | | |
| | 4,312 | | | Adient PLC (Ireland) * | | $ | 196,221 | |
| | 16,199 | | | Cedar Fair LP | | | 920,913 | |
| | 71,469 | | | Cinemark Holdings, Inc. | | | 2,844,466 | |
| | 16,565 | | | DineEquity, Inc. | | | 1,310,292 | |
| | 38,557 | | | Omnicom Group, Inc. | | | 3,077,620 | |
| | 13,710 | | | Polaris Industries, Inc. | | | 1,050,323 | |
| | 34,162 | | | Target Corp. | | | 2,347,954 | |
| | 14,831 | | | Time Warner, Inc. | | | 1,319,811 | |
| | | | | | | | |
| | | | | | | 13,067,600 | |
| | | | | | | | |
| | | | Consumer Staples – 5.8% | | | | |
| | 9,339 | | | Kimberly-Clark Corp. | | | 1,068,475 | |
| | 13,961 | | | PepsiCo, Inc. | | | 1,496,619 | |
| | 43,419 | | | Unilever PLC, Sponsored ADR (United Kingdom) | | | 1,809,270 | |
| | 35,333 | | | Wal-Mart Stores, Inc. | | | 2,474,017 | |
| | | | | | | | |
| | | | | | | 6,848,381 | |
| | | | | | | | |
| | | | Energy – 9.2% | | | | |
| | 14,463 | | | Chevron Corp. | | | 1,514,999 | |
| | 23,739 | | | Exxon Mobil Corp. | | | 1,977,933 | |
| | 24,943 | | | Magellan Midstream Partners LP | | | 1,676,918 | |
| | 34,605 | | | Occidental Petroleum Corp. | | | 2,523,051 | |
| | 40,585 | | | Spectra Energy Partners LP | | | 1,730,544 | |
| | 23,840 | | | Valero Energy Corp. | | | 1,412,282 | |
| | | | | | | | |
| | | | | | | 10,835,727 | |
| | | | | | | | |
| | | | Financials – 17.1% | | | | |
| | 35,266 | | | Allied World Assurance Co. Holdings AG (Switzerland) | | | 1,515,733 | |
| | 83,102 | | | BB&T Corp. | | | 3,257,598 | |
| | 13,149 | | | CME Group, Inc. | | | 1,316,215 | |
| | 14,391 | | | CNA Financial Corp. | | | 526,279 | |
| | | | | | | | |
| | | | | | Market | |
Shares | | | | | Value | |
| | | | Financials (continued) | | | | |
| | 38,340 | | | MetLife, Inc. | | $ | 1,800,446 | |
| | 40,258 | | | The PNC Financial Services Group, Inc. | | | 3,848,665 | |
| | 52,965 | | | Thomson Reuters Corp. (Canada) | | | 2,087,351 | |
| | 75,136 | | | U.S. BanCorp. | | | 3,363,087 | |
| | 52,820 | | | Wells Fargo & Co. | | | 2,430,248 | |
| | | | | | | | |
| | | | | | | 20,145,622 | |
| | | | | | | | |
| | | | Healthcare – 4.3% | | | | |
| | 14,005 | | | Amgen, Inc. | | | 1,976,946 | |
| | 24,365 | | | Cardinal Health, Inc. | | | 1,673,632 | |
| | 45,158 | | | Owens & Minor, Inc. | | | 1,465,377 | |
| | | | | | | | |
| | | | | | | 5,115,955 | |
| | | | | | | | |
| | | | Industrials – 12.8% | | | | |
| | 52,335 | | | Aircastle, Ltd. (Bermuda) | | | 1,075,484 | |
| | 37,984 | | | Emerson Electric Co. | | | 1,925,029 | |
| | 65,627 | | | Fastenal Co. | | | 2,558,140 | |
| | 43,116 | | | Johnson Controls International PLC (Ireland) | | | 1,738,437 | |
| | 20,716 | | | MSC Industrial Direct Co., Inc., Class A | | | 1,508,125 | |
| | 13,139 | | | Parker-Hannifin Corp. | | | 1,612,812 | |
| | 24,276 | | | Union Pacific Corp. | | | 2,140,658 | |
| | 23,316 | | | United Parcel Service, Inc., Class B | | | 2,512,532 | |
| | | | | | | | |
| | | | | | | 15,071,217 | |
| | | | | | | | |
| | | | Information Technology – 15.5% | | | | |
| | 122,801 | | | Corning, Inc. | | | 2,788,811 | |
| | 57,952 | | | Intel Corp. | | | 2,020,786 | |
| | 75,266 | | | Microsoft Corp. | | | 4,509,939 | |
| | 39,069 | | | Motorola Solutions, Inc. | | | 2,835,628 | |
| | 25,721 | | | QUALCOMM, Inc. | | | 1,767,547 | |
| | 31,151 | | | TE Connectivity, Ltd. (Switzerland) | | | 1,958,463 | |
| | 117,461 | | | The Western Union Co. | | | 2,357,442 | |
| | | | | | | | |
| | | | | | | 18,238,616 | |
| | | | | | | | |
| | | | Materials – 5.0% | | | | |
| | 27,021 | | | Compass Minerals International, Inc. | | | 1,941,459 | |
| | 15,720 | | | LyondellBasell Industries NV, Class A (Netherlands) | | | 1,250,526 | |
| | 22,849 | | | Praxair, Inc. | | | 2,674,704 | |
| | | | | | | | |
| | | | | | | 5,866,689 | |
| | | | | | | | |
| | | | Real Estate – 10.9% | | | | |
| | 58,742 | | | Communications Sales & Leasing, Inc. | | | 1,670,035 | |
| | 49,968 | | | The GEO Group, Inc. | | | 1,197,233 | |
| | 114,840 | | | Iron Mountain, Inc. | | | 3,873,556 | |
| | 26,146 | | | Ryman Hospitality Properties, Inc. | | | 1,318,281 | |
| | 48,555 | | | Sabra Health Care REIT, Inc. | | | 1,131,332 | |
| | 28,884 | | | Ventas, Inc. | | | 1,956,891 | |
| | 57,288 | | | Weyerhaeuser Co. | | | 1,714,630 | |
| | | | | | | | |
| | | | | | | 12,861,958 | |
| | | | | | | | |
| | | | Telecommunication Services – 2.7% | | | | |
| | 67,794 | | | Verizon Communications, Inc. | | | 3,260,891 | |
| | | | | | | | |
The accompanying notes are an integral part of these financial statements.
18
AMG Funds
| | |
| AMG River Road Dividend All Cap Value Fund II | | October 31, 2016 |
| |
| Schedule of Investments – continued | | |
| | | | | | |
| | | | | Market | |
Shares | | | | Value | |
| | Utilities – 4.3% | | | | |
33,289 | | AmeriGas Partners LP | | $ | 1,589,550 | |
45,425 | | National Fuel Gas Co. | | | 2,379,362 | |
21,962 | | Vectren Corp. | | | 1,104,908 | |
| | | | | | |
| | | | | 5,073,820 | |
| | | | | | |
| | Total Common Stocks
(Cost $106,782,310) | | | 116,386,476 | |
| | | | | | |
INVESTMENT COMPANY – 1.3% | | | | |
1,537,314 | | Dreyfus Government Cash Management Fund, Institutional Class Shares, 0.28%** | | | 1,537,314 | |
| | | | | | |
| | Total Investment Company
(Cost $1,537,314) | | | 1,537,314 | |
| | | | | | |
Total Investments – 100.0%
(Cost $108,319,624)*** | | | 117,923,790 | |
| | | | | | |
Net Other Assets and Liabilities – 0.0%# | | | 2,200 | |
| | | | | | |
Net Assets – 100.0% | | $ | 117,925,990 | |
| | | | | | |
| | | | |
| * | | Non-income producing security. | | |
| ** | | Yield shown represents the October 31, 2016, seven-day average yield, which refers to the sum of the previous seven days’ dividends paid, expressed as an annual percentage. |
| *** | | At October 31, 2016, the aggregate cost for Federal income tax purposes is $108,524,326. |
| | | | |
| Gross unrealized appreciation | | $ | 13,476,632 | |
| Gross unrealized depreciation | | | (4,077,168 | ) |
| | | | |
| Net unrealized appreciation | | $ | 9,399,464 | |
| | | | |
| | |
| |
| ADR | | American Depositary Receipt |
| LP | | Limited Partnership |
| PLC | | Public Limited Company |
| REIT | | Real Estate Investment Trust |
The accompanying notes are an integral part of these financial statements.
19
AMG Managers Fairpointe Mid Cap Fund
Portfolio Manager’s Comments (unaudited)
YEAR IN REVIEW
The 12 months ended October 31, 2016, were positive for equity markets, but the year witnessed two large macro related sell-offs. Fears about China’s economy caused global markets to plunge in the first fiscal quarter (November 2015 to January 2016). Markets rebounded in the second quarter as corporate earnings announcements eased investors’ concerns. Markets again sold-off post the U.K.’s surprising vote to exit the European Union in June. Post “Brexit”, the AMG Managers Fairpointe Mid Cap Fund1 (the “Fund”) Class N rebounded over 8% in July, driven by better-than-expected earnings growth for the Fund’s holdings. The Fund’s strong earnings growth and relative outperformance continued in the fourth quarter. For the year, the Fund returned 6.0%, in line with the S&P MidCap 400 Index (+6.0%), and ahead of the Russell Midcap® Index (+4.2%) and the S&P 500 Index (+4.5%). Performance was broad based, led, in particular, by strong stock selection in the materials and industrial sectors as well as in the health care and financial sectors.
FISCAL YEAR REVIEW
The top five contributors to the Fund’s performance were: Copa Holdings (CPA), United States Steel (U.S. Steel), Mattel (MAT), Gerdau (GGB) and NVIDIA (NVDA). We highlight three contributors below.
Copa Holdings, an airline based in Panama and serving destinations in South, Central and North America, was our top contributor for the year. Copa’s financial performance improved due to an aggressive capacity management strategy that significantly improved passenger load factor.
U.S. Steel’s shares rebounded due to the benefits of its “Carnegie Way” restructuring program, balance sheet improvement and higher steel prices.
Mattel’s performance was driven by a revitalized product portfolio under new leadership.
Detractors from performance included: Office Depot (ODP), Transocean (RIG), Time (TIME), Juniper Networks (JNPR) and TEGNA (TGNA). We highlight three detractors below.
Office Depot declined after the U.S. Federal Trade Commission challenged the company’s merger with Staples on anticompetitive grounds. Office Depot received a $250 million break-up fee and authorized the repurchase of up to $100 million of stock. The company continues to cut costs and increase profitability and recently announced the sale of its money-losing European business. We believe the stock appears undervalued at current levels.
Time, a media company with leading brands including People, Sports Illustrated, Fortune and Food & Wine, spun out of Time Warner two years ago. The company reported disappointing advertising revenues and reduced its near-term revenue growth projection. Time assembled an impressive management team and is focused on maximizing digital advertising opportunities. While the transition is taking longer than anticipated, we believe the stock is significantly undervalued.
TEGNA is a media company with operations in local television and internet properties, Cars.com and CareerBuilder. The stock was pressured due to disappointing 2016 political advertising. The company announced its intention to spin-off its Cars.com business into a separate public company and the sale of CareerBuilder. We consider TEGNA shares undervalued and expect the separation to create shareholder value.
PERSPECTIVE AND OUTLOOK
We believe the U.S. continues to offer an attractive destination for investments as the domestic economy outperforms other developed countries. Unemployment has remained at or below 5%2—near full employment—and a more stable energy sector will be less of a drag on industrial production going forward. The U.S. Federal Reserve is expected to raise
interest rates at its December meeting, which would signal a strengthening economy.
The recent OPEC oil policy shift toward limiting production signals a potential stabilization of oil prices close to $50. This price point is emerging as a key threshold for various industry participants, including shale producers in the U.S. and oil majors, globally. Cost-cutting in the face of the “lower for even longer” oil price reality has brought down the break-even level at which oil companies are willing to expand production.
We believe the overall Fund remains attractively valued relative to the indices. The current price-to-revenue multiple of .7x is near its historical low versus the S&P MidCap 400 Index at 1.2x and S&P 500 Index at 1.7x. The price-to-earnings (P/E) multiple is 14.3x compared to the S&P MidCap 400 Index at 16.9x and 16.0x for the S&P 500 Index3.
The views expressed represent the opinions of Fairpointe Capital LLC, as of October 31, 2016, and are not intended as a forecast or guarantee of future results and are subject to change without notice.
| 1 | Prior to October 1, 2016, the Fund was known as ASTON/Fairpointe Mid Cap Fund. |
| 2 | US Bureau of Labor Statistics |
| 3 | Standard & Poors, FactSet |
20
AMG Managers Fairpointe Mid Cap Fund
Portfolio Manager’s Comments (continued)
CUMULATIVE TOTAL RETURN PERFORMANCE
The AMG Managers Faripointe Mid Cap Fund’s cumulative total return is based on the daily change in net asset value (NAV), and assumes that all dividends and distributions were reinvested. The chart compares a hypothetical $10,000 investment made in AMG Managers Faripointe Mid Cap Fund’s Class N on October 31, 2006, to a $10,000 investment made in the S&P Mid Cap 400 Index for the same time period. The graph and table do not reflect the deduction of taxes that a shareholder would pay on a Fund distribution or redemption of shares. The listed returns for the Fund are net of expenses and the returns for the index exclude expenses. Total returns would have been lower had certain expenses not been reduced.
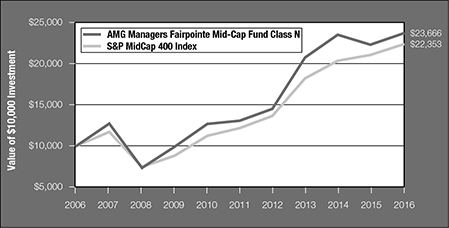
The table below shows the average annual total returns for AMG Managers Fairpointe Mid Cap Fund and the S&P Mid Cap 400 Index for the same time periods ended October 31, 2016.
| | | | | | | | | | | | |
| | | One | | | Five | | | Ten | |
| Average Annual Total Returns1 | | Year | | | Years | | | Years | |
AMG Managers Fairpointe Mid Cap Fund2,3,4,5 | | | | | | | | | | | | |
Class N | | | 6.01 | % | | | 12.63 | % | | | 9.00 | % |
Class I | | | 6.26 | % | | | 12.91 | % | | | 9.27 | % |
S&P Mid Cap 400 Index6 | | | 6.26 | % | | | 12.92 | % | | | 8.38 | % |
The performance data shown represents past performance. Past performance is not a guarantee of future results. Current performance may be lower or higher than the performance data quoted. The investment return and the principal value of an investment will fluctuate so that an investor’s shares, when redeemed, may be worth more or less than their original cost.
Investors should carefully consider the Fund’s investment objectives, risks, charges and expenses before investing. For performance information through the most recent month end, current net asset values per share for the Fund and other information, please call (800) 835-3879 or visit our website at www.amgfunds.com for a free prospectus. Read it carefully before investing or sending money.
Distributed by AMG Distributors, Inc., member FINRA/SIPC.
| 1 | Total return equals income yield plus share price change and assumes reinvestment of all dividends and capital gain distributions. Returns are net of fees and may reflect offsets of Fund expenses as described in the prospectus. No adjustment has been made for taxes payable by shareholders on their reinvested dividends and capital gain distributions. Returns for periods greater than one year are annualized. The listed returns on the Fund are net of expenses and based on the published NAV as of October 31, 2016. All returns are in U.S. dollars ($). |
| 2 | The Fund is subject to risks associated with investments in mid-capitalization companies such as greater price volatility, lower trading volume, and less liquidity than the stocks of larger, more established companies. |
| 3 | The Fund is subject to risks associated with investments in small-capitalization companies, such as erratic earnings patterns, competitive conditions, limited earnings history and a reliance on one or a limited number of products. |
| 4 | The Fund may invest in derivatives such as options and futures; the complexity and rapidly changing structure of derivatives markets may increase the possibility of market losses. |
| 5 | Investments in international securities are subject to certain risks of overseas investing including currency fluctuations and changes in political and economic conditions, which could result in significant market fluctuations. |
| 6 | The S&P MidCap 400 Index provides investors with a benchmark for mid-sized companies. The Index, which is distinct from the large-cap S&P 500, measures the performance of mid-sized companies, reflecting the distinctive risk and return characteristics of this market segment. Unlike the Fund, the S&P MidCap 400 Index is unmanaged, is not available for investment and does not incur expenses. |
The S&P Index is proprietary data of Standard & Poor’s, a division of McGraw-Hill Companies, Inc.
Not FDIC insured, nor bank guaranteed. May lose value.
21
AMG Funds
| | |
| AMG Managers Fairpointe Mid Cap Fund | | October 31, 2016 |
| |
| Schedule of Investments | | |
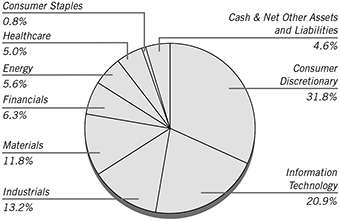
% of Net Assets
| | | | | | | | |
Shares | | | | | Market
Value | |
| COMMON STOCKS – 95.4% | | | | |
| | | | Consumer Discretionary – 31.8% | | | | |
| | 1,606,100 | | | BorgWarner, Inc. | | $ | 57,562,624 | |
| | 1,802,620 | | | Cooper Tire & Rubber Co. | | | 66,246,285 | |
| | 4,438,700 | | | DeVry Education Group, Inc. (a) | | | 100,758,490 | |
| | 5,902,500 | | | Gentex Corp. | | | 99,811,275 | |
| | 1,164,800 | | | The Interpublic Group of Cos, Inc. | | | 26,079,872 | |
| | 664,200 | | | Lear Corp. | | | 81,550,476 | |
| | 4,994,947 | | | Lions Gate Entertainment Corp. (Canada) | | | 101,697,121 | |
| | 2,669,500 | | | Mattel, Inc. | | | 84,169,335 | |
| | 9,605,254 | | | The New York Times Co., Class A (a) | | | 104,697,269 | |
| | 23,305,800 | | | Office Depot, Inc. | | | 73,413,270 | |
| | 1,440,101 | | | Scholastic Corp. (a) | | | 55,083,863 | |
| | 5,745,000 | | | TEGNA, Inc. | | | 112,716,900 | |
| | 7,751,742 | | | Time, Inc. (a) | | | 100,772,646 | |
| | 350,000 | | | Whirlpool Corp. | | | 52,437,000 | |
| | | | | | | | |
| | | | | | | 1,116,996,426 | |
| | | | | | | | |
| | | | Consumer Staples – 0.8% | | | | |
| | 458,200 | | | Bunge, Ltd. (Bermuda) | | | 28,412,982 | |
| | | | | | | | |
| | | | Energy – 5.6% | | | | |
| | 2,956,892 | | | FMC Technologies, Inc. * | | | 95,418,905 | |
| | 13,745,000 | | | McDermott International, Inc. (Panama) * | | | 70,649,300 | |
| | 3,269,400 | | | Transocean, Ltd. (Switzerland) * | | | 31,418,934 | |
| | | | | | | | |
| | | | | | | 197,487,139 | |
| | | | | | | | |
| | | | Financials – 6.3% | | | | |
| | 218,600 | | | Cincinnati Financial Corp. | | | 15,472,508 | |
| | 1,262,700 | | | Northern Trust Corp. | | | 91,444,734 | |
| | 1,914,200 | | | Raymond James Financial, Inc. | | | 115,081,704 | |
| | | | | | | | |
| | | | | | | 221,998,946 | |
| | | | | | | | |
| | | | Healthcare – 5.0% | | | | |
| | 825,000 | | | Quest Diagnostics, Inc. | | | 67,188,000 | |
| | 1,177,900 | | | Varian Medical Systems Inc. * | | | 106,870,867 | |
| | | | | | | | |
| | | | | | | 174,058,867 | |
| | | | | | | | |
| | | | | | |
Shares | | | | Market
Value | |
| | Industrials – 13.2% | | | | |
1,523,100 | | AGCO Corp. | | $ | 77,799,948 | |
1,552,500 | | Chicago Bridge & Iron Co. NV (Netherlands) | | | 49,711,050 | |
1,548,435 | | Copa Holdings SA, Class A (Panama) | | | 142,812,160 | |
994,300 | | Donaldson Co., Inc. | | | 36,311,836 | |
1,178,900 | | Stericycle, Inc. * | | | 94,418,101 | |
2,589,300 | | Werner Enterprises, Inc. | | | 62,272,665 | |
| | | | | | |
| | | | | 463,325,760 | |
| | | | | | |
| | Information Technology – 20.9% | | | | |
1,448,100 | | Akamai Technologies, Inc. * | | | 100,599,507 | |
4,029,300 | | Cree, Inc. * | | | 89,853,390 | |
1,167,448 | | Itron, Inc. * | | | 62,925,447 | |
4,539,300 | | Jabil Circuit, Inc. | | | 96,868,662 | |
6,013,500 | | Juniper Networks, Inc. | | | 158,395,590 | |
4,402,500 | | Nuance Communications, Inc. * | | | 61,723,050 | |
195,400 | | NVIDIA Corp. | | | 13,904,664 | |
3,781,000 | | Teradata Corp. * | | | 101,935,760 | |
4,552,288 | | Unisys Corp. * (a) | | | 47,571,410 | |
| | | | | | |
| | | | | 733,777,480 | |
| | | | | | |
| | Materials – 11.8% | | | | |
3,847,034 | | Alcoa Inc. | | | 110,486,815 | |
2,223,504 | | Domtar Corp. | | | 79,934,969 | |
1,983,850 | | FMC Corp. | | | 93,022,727 | |
20,245,000 | | Gerdau SA, Sponsored ADR (Brazil) | | | 69,440,350 | |
3,180,400 | | United States Steel Corp. | | | 61,508,936 | |
| | | | | | |
| | | | | 414,393,797 | |
| | | | | | |
| | Total Common Stocks
(Cost $2,973,746,775) | | | 3,350,451,397 | |
| | | | | | |
INVESTMENT COMPANY – 4.1% | | | | |
144,500,637 | | Dreyfus Government Cash Management Fund, Institutional Class Shares, 0.28%** | | | 144,500,637 | |
| | | | | | |
| | Total Investment Company
(Cost $144,500,637) | | | 144,500,637 | |
| | | | | | |
Total Investments – 99.5%
(Cost $3,118,247,412)*** | | | 3,494,952,034 | |
| | | | | | |
Net Other Assets and Liabilities – 0.5% | | | 16,027,714 | |
| | | | | | |
Net Assets – 100.00% | | $ | 3,510,979,748 | |
| | | | | | |
| * | Non-income producing security. |
| ** | Yield shown represents the October 31, 2016, seven-day average yield, which refers to the sum of the previous seven days’ dividends paid, expressed as an annual percentage. |
| *** | At October 31, 2016, the aggregate cost for Federal income tax purposes is $3,118,748,841. The aggregate gross unrealized appreciation and depreciation were as follows: |
| | | | |
| Gross unrealized appreciation | | $ | 667,005,605 | |
| Gross unrealized depreciation | | | (290,802,412 | ) |
| | | | |
| Net unrealized appreciation | | $ | 376,203,193 | |
| | | | |
| | | | |
| |
| (a) | | These securities have been determined to be illiquid securities. At October 31, 2016, these securities amounted to $408,883,678, or 11.7% of net assets. These securities were valued using a quote from the primary exchange and management has determined these securities are traded in active markets. Therefore, it has been determined that these securities are valued using Level 1 pricing inputs. |
| |
| ADR | | American Depositary Receipt |
The accompanying notes are an integral part of these financial statements.
22
AMG Managers Montag & Caldwell Mid Cap Growth Fund
Portfolio Manager’s Comments (unaudited)
THE YEAR IN REVIEW
For the fiscal year ended October 31, 2016, the AMG Managers Montag & Caldwell Mid Cap Growth Fund1 (the “Fund”) Class N shares returned (0.60)%, compared to the 0.40% return for its benchmark, the Russell Midcap® Growth Index. The Fund is managed using fundamental valuation techniques that focus on a company’s future earnings and dividend growth rates. The process is primarily bottom up and utilizes a present valuation model in which the current price of the stock is related to the risk-adjusted present value of the company’s estimated future earnings stream. The Fund seeks to invest in mid-cap growth stocks selling at a discount to estimates of fair value and whose earnings-per-share are growing faster than the market.
MARKET ENVIRONMENT
Stocks were generally positive for the year ended October 31, 2016, without a significant bias in market capitalization. The Russell 1000® Index (large-cap) was up 4.26%, the Russell Midcap® Index (mid cap) was up 4.17%, and the Russell 2000® Index (small cap) was up 4.11%. There was, however, a significant headwind to growth, as value outperformed growth in each size segment, but particularly in the small- and mid-cap segments. The Russell 2000® Value Index (small-cap value) was up 8.81% vs. a -0.49% return for the Russell 2000® Growth Index (small-cap growth), while the Russell Midcap® Value Index was up 7.84% vs. 0.40% for the Russell Midcap® Growth Index. The spread of value over growth was not as pronounced in the large-cap space where the Russell 1000® Value Index (large-cap value) was up 6.37% vs. a 2.28% return for the Russell 1000® Growth Index (large-cap growth).
PERFORMANCE REVIEW
Having recovered from its late summer 2015 bout of volatility, the stock market experienced another very similar bout of volatility at the outset of 2016, with the S&P 500 Index declining about 11% before bottoming in early February. Much like the experience in 2015, the Fund held up much better than the benchmark and peer group during this market decline. However, this was short lived, as
the market bounced back strongly during the latter half of the first quarter, marking one of the largest intra-quarter reversals in market history. The market continued its rally into August, interrupted only briefly by a two-day swoon in late June following the surprising Brexit vote in the U.K. While the market recovered, fundamentals continued to deteriorate. 2016 S&P 500 earnings estimates steadily declined, causing S&P 500 price-to-earnings multiples to expand further. The Fund had a difficult time keeping pace during this cyclical post-February rally, which was led by smaller-cap, higher-beta, lesser-quality shares. Such names do not fit well within our investment discipline.
Another particularly strong headwind for relative performance in the first half of 2016 was the sharp decline in bond yields, which fell in anticipation of further economic weakness and the expectation that central bankers would continue to support the market by injecting additional liquidity and suppressing interest rates. The leg down in bond yields contributed to significant stock market outperformance by the bond proxies (utilities, telecom and REITs) as investors sought out high and stable dividend yields as a substitute for bonds in an income-starved world. Given that the Fund’s holdings are oriented toward higher growth rather than higher yield names, it did not hold any utilities, telecoms or REITs, and thus did not participate in this bond proxy rally to the degree that the Russell Midcap® Growth index did with its sizable REIT exposure.
After hitting all-time highs in August, the stock market settled into a mostly calm, low-volatility sideways trading pattern through September before succumbing in October to mounting investor worries about high valuations, mixed economic data, an uncertain election outcome and the prospect of a December U.S. Federal Reserve (the Fed) rate hike. The Fund once again held up better than the benchmark and peer group as the markets weakened in October.
The Fund underperformed its benchmark during the period. Stock selection equally offset sector allocation in their contributions to relative performance. Strong
individual stock performances by Copart, WEX, Dollar Tree, Arista Networks and Dunkin Brands contributed most heavily to the Fund’s performance for the year, while Stericycle, Tractor Supply, EPAM Systems, Harman International and AmerisourceBergen were the biggest detractors from performance.
OUTLOOK
Following the move to new highs, the stock market advance may pause as investors discount various economic and political uncertainties, particularly with stock market median valuations near or at all-time highs. The median price-to-earnings (P/E) valuation ratio for the S&P 500 is higher than 90% of all historical periods going back to 1984 (the bubble years of the late-1990s and early-2000 was the only period when P/Es were higher), while the price-to-sales ratio is at a record high for the same time period2. With economic data clearly turning mixed, national election uncertainties on the horizon and the Fed signaling a desire to raise interest rates in December into what appears to be slowing growth, investors may hesitate at these unusually high valuation levels. Unprecedented Central Bank accommodation and historically-low interest rates will likely continue to support asset prices and, with recession risk still low, downside market risk should also be limited.
In the low growth, low inflation and low interest rate world that is likely to persist, we believe the Fund’s holdings are well positioned to provide attractive investment returns. These holdings are, in our opinion, attractively valued on our work and offer faster, more assured earnings growth due to the strength of their balance sheets and cash flows. We think this makes them ideal holdings in what is likely to be a slow and uneven economy
The views expressed represent the opinions of Montag & Caldwell LLC, as of October 31, 2016, and are not intended as a forecast or guarantee of future results and are subject to change without notice.
| 1 | Prior to October 1, 2016, the Fund was known as ASTON/Montag & Caldwell Mid Cap Growth Fund. |
| 2 | Standard & Poors, FactSet |
23
| | |
| AMG Managers Montag & Caldwell Mid Cap Growth Fund |
| Portfolio Manager’s Comments (continued) | | |
CUMULATIVE TOTAL RETURN PERFORMANCE
The AMG Managers Montag & Caldwell Mid Cap Growth Fund’s cumulative total return is based on the daily change in net asset value (NAV), and assumes that all dividends and distributions were reinvested. The chart compares a hypothetical $10,000 investment made in AMG Managers Montag & Caldwell Mid Cap Growth Fund’s Class N on November 2, 2007, to a $10,000 investment made in the Russell Mid Cap® Growth Index for the same time period. The graph and table do not reflect the deduction of taxes that a shareholder would pay on a Fund distribution or redemption of shares. The listed returns for the Fund are net of expenses and the returns for the index exclude expenses. Total returns would have been lower had certain expenses not been reduced.
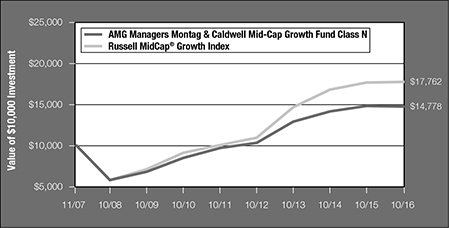
The table below shows the average annual total returns for AMG Managers Montag & Caldwell Mid Cap Growth Fund and the Russell MidCap® Growth Index for the same time periods ended October 31, 2016.
| | | | | | | | | | | | | | | | |
| | | One | | | Five | | | Since | | | Inception | |
| Average Annual Total Returns1 | | Year | | | Years | | | Inception | | | Date | |
AMG Managers Montag & Caldwell Mid Cap Growth Fund2,3,4 | | | | | | | | | | | | | |
Class N | | | (0.60 | )% | | | 8.72 | % | | | 4.44 | % | | | 11/02/07 | |
Class I | | | (0.41 | )% | | | — | | | | 4.14 | % | | | 05/14/14 | |
Russell MidCap® Growth Index5 | | | 0.40 | % | | | 12.02 | % | | | 6.65 | % | | | 11/02/07 | † |
The performance data shown represents past performance. Past performance is not a guarantee of future results. Current performance may be lower or higher than the performance data quoted. The investment return and the principal value of an investment will fluctuate so that an investor’s shares, when redeemed, may be worth more or less than their original cost.
Investors should carefully consider the Fund’s investment objectives, risks, charges and expenses before investing. For performance information through the most recent month end, current net asset values per share for the Fund and other information, please call (800) 835-3879 or visit our website at www.amgfunds.com for a free prospectus. Read it carefully before investing or sending money.
Distributed by AMG Distributors, Inc., member FINRA/SIPC.
| † | Date reflects the inception date of the Fund, not the index. |
| 1 | Total return equals income yield plus share price change and assumes reinvestment of all dividends and capital gain distributions. Returns are net of fees and may reflect offsets of Fund expenses as described in the prospectus. No adjustment has been made for taxes payable by shareholders on their reinvested dividends and capital gain distributions. Returns for periods greater than one year are annualized. The listed returns on the Fund are net of expenses and based on the published NAV as of October 31, 2016. All returns are in U.S. dollars ($). |
| 2 | The Fund is subject to risks associated with investments in mid-capitalization companies such as greater price volatility, lower trading volume, and less liquidity than the stocks of larger, more established companies. |
| 3 | The Fund invests in growth stocks, which may be more sensitive to market movements because their prices tend to reflect future investor expectations rather than just current profits. |
| 4 | Investments in international securities are subject to certain risks of overseas investing including currency fluctuations and changes in political and economic conditions, which could result in significant market fluctuations. These risks are magnified in emerging markets. |
| 5 | The Russell Midcap® Growth Index measures the performance of those Russell Midcap companies with higher price/ book ratios and higher forecasted growth values. The stocks are also members of the Russell 1000® Growth Index. Unlike the Fund, the Russell Midcap® Growth Index is unmanaged, is not available for investment and does not incur expenses. |
The Russell Indices are a trademark of the London Stock Exchange Group Companies.
Not FDIC insured, nor bank guaranteed. May lose value.
24
AMG Funds
| | |
| AMG Managers Montag & Caldwell Mid Cap Growth Fund | | October 31, 2016 |
| |
| Schedule of Investments | | |
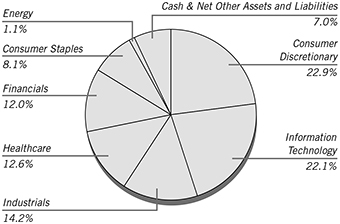
% of Net Assets
| | | | | | | | |
Shares | | | | | Market
Value | |
| COMMON STOCKS – 93.0% | | | | |
| | | | Consumer Discretionary – 22.9% | | | | |
| | 3,520 | | | Dollar Tree, Inc. * | | $ | 265,936 | |
| | 4,890 | | | Dunkin’ Brands Group, Inc. | | | 236,481 | |
| | 1,820 | | | Expedia, Inc. | | | 235,199 | |
| | 8,660 | | | Hanesbrands, Inc. | | | 222,562 | |
| | 1,080 | | | Harman International Industries, Inc. | | | 86,087 | |
| | 9,250 | | | LKQ Corp. * | | | 298,590 | |
| | 328 | | | O’Reilly Automotive, Inc. * | | | 86,736 | |
| | 771 | | | Panera Bread Co., Class A * | | | 147,076 | |
| | 2,610 | | | Ross Stores, Inc. | | | 163,230 | |
| | 3,900 | | | ServiceMaster Global Holdings, Inc. * | | | 139,581 | |
| | | | | | | | |
| | | | | | | 1,881,478 | |
| | | | | | | | |
| | | | Consumer Staples – 8.1% | | | | |
| | 7,220 | | | Blue Buffalo Pet Products, Inc. * | | | 181,366 | |
| | 1,820 | | | Mead Johnson Nutrition Co. | | | 136,081 | |
| | 1,290 | | | Molson Coors Brewing Co., Class B | | | 133,915 | |
| | 1,480 | | | Monster Beverage Corp. * | | | 213,623 | |
| | | | | | | | |
| | | | | | | 664,985 | |
| | | | | | | | |
| | | | Energy – 1.1% | | | | |
| | 960 | | | Core Laboratories NV (Netherlands) | | | 93,091 | |
| | | | | | | | |
| | | | Financials – 12.0% | | | | |
| | 777 | | | FactSet Research Systems, Inc. | | | 120,218 | |
| | 2,610 | | | First Republic Bank | | | 194,262 | |
| | 808 | | | Intercontinental Exchange, Inc. | | | 218,475 | |
| | 4,060 | | | Raymond James Financial, Inc. | | | 244,087 | |
| | 1,718 | | | Signature Bank New York NY * | | | 207,122 | |
| | | | | | | | |
| | | | | | | 984,164 | |
| | | | | | | | |
| | | | Healthcare – 12.6% | | | | |
| | 3,440 | | | Cerner Corp. * | | | 201,515 | |
| | 1,740 | | | Edwards Lifesciences Corp. * | | | 165,683 | |
| | 576 | | | Henry Schein, Inc. * | | | 85,939 | |
| | 1,740 | | | Laboratory Corp. of America Holdings * | | | 218,092 | |
| | | | | | |
Shares | | | | Market
Value | |
| | Healthcare (continued) | | | | |
2,280 | | Quintiles IMS Holdings, Inc. * | | $ | 163,567 | |
3,190 | | VCA, Inc. * | | | 196,058 | |
| | | | | | |
| | | | | 1,030,854 | |
| | | | | | |
| | Industrials – 14.2% | | | | |
1,990 | | AMETEK, Inc. | | | 87,759 | |
3,730 | | Copart, Inc. * | | | 195,713 | |
3,280 | | HD Supply Holdings, Inc. * | | | 108,240 | |
5,985 | | IHS Markit, Ltd. (United Kingdom) * | | | 220,188 | |
2,700 | | J.B. Hunt Transport Services, Inc. | | | 220,347 | |
923 | | Snap-On, Inc. | | | 142,234 | |
2,320 | | Verisk Analytics, Inc. * | | | 189,196 | |
| | | | | | |
| | | | | 1,163,677 | |
| | | | | | |
| | Information Technology – 22.1% | | | | |
2,820 | | Amphenol Corp., Class A | | | 185,923 | |
1,660 | | ANSYS, Inc. * | | | 151,641 | |
2,320 | | Arista Networks, Inc. * | | | 196,620 | |
3,240 | | EPAM Systems, Inc. * | | | 208,559 | |
870 | | F5 Networks, Inc. * | | | 120,243 | |
2,820 | | Fidelity National Information Services, Inc. | | | 208,454 | |
966 | | FleetCor Technologies, Inc. * | | | 169,340 | |
4,790 | | M/A-COM Technology Solutions Holdings, Inc.* | | | 176,080 | |
1,330 | | Skyworks Solutions, Inc. | | | 102,330 | |
2,650 | | WEX, Inc. * | | | 289,115 | |
| | | | | | |
| | | | | 1,808,305 | |
| | | | | | |
| | Total Common Stocks
(Cost $6,865,069) | | | 7,626,554 | |
| | | | | | |
INVESTMENT COMPANY – 5.9% | | | | |
481,132 | | Dreyfus Government Cash Management Fund, Institutional Class Shares, 0.28%** | | | 481,132 | |
| | | | | | |
| | Total Investment Company
(Cost $481,132) | | | 481,132 | |
| | | | | | |
Total Investments – 98.9%
(Cost $7,346,201)*** | | | 8,107,686 | |
| | | | | | |
Net Other Assets and Liabilities – 1.1% | | | 90,277 | |
| | | | | | |
Net Assets – 100.0% | | $ | 8,197,963 | |
| | | | | | |
|
* Non-income producing security. |
** Yield shown represents the October 31, 2016, seven-day average yield, which refers to the sum of the previous seven days’ dividends paid, expressed as an annual percentage. |
*** At October 31, 2016, the aggregate cost for Federal income tax purposes is $7,350,338. |
| | | | |
Gross unrealized appreciation | | $ | 920,671 | |
Gross unrealized depreciation | | | (163,323 | ) |
| | | | |
Net unrealized appreciation | | $ | 757,348 | |
| | | | |
The accompanying notes are an integral part of these financial statements.
25
AMG Managers LMCG Small Cap Growth Fund
Portfolio Manager’s Comments (unaudited)
The AMG Managers LMCG Small Cap Growth Fund1 (the “Fund”) Class N shares returned (15.7)% for the fiscal year ended October 31, 2016, compared with a (0.5)% return for its benchmark, the Russell 2000® Growth Index.
Stocks closed out 2015 with full-year returns falling in a range of modest losses to modest gains for most market segments. 2016 followed with persistent global growth concerns, the United Kingdom’s decision to leave the Euro Zone and uncertainty around U.S. presidential election results, leading to increased volatility and perpetuating a challenging landscape for investors. Among U.S. small caps, growth stocks lagged their value counterparts in the twelve months ending 10/31/2016; the Russell 2000® Growth Index returned -0.5% for the period, vs. 8.8% for the Russell 2000® Value Index. From a size perspective, large-caps, mid-caps and small-caps posted comparable returns for the period. The Russell 1000® Index returned 4.3%, while the Russell Midcap® Index finished at 4.2% and the Russell 2000® Index finished at 4.1%.
The Fund underperformed in the period as a result of several factors. The Fund’s growth strategy seeks to identify unrecognized growth potential, wherever it exists, across all sectors and industries. As volatility increased early in 2016, investors shunned anything misunderstood or unrecognized and bid up stocks considered to offer more safety and steady growth, regardless of valuation. The Fund has historically had a negative correlation to momentum which has hurt past performance
comparisons, and though momentum as a factor has abated somewhat, those headwinds have made it difficult for the Fund to outperform lately. Small- and SMID-Cap indices in particular were down significantly after the U.K. referendum results were released. While these declines are not unexpected in times of macro stress, the vast majority of our holdings that have little or no sales in the U.K. still sold off as correlations spiked higher.
While these environmental factors affected the Fund’s performance, performance over the long-term is generally a result of stock selection. Relative performance at the sector level was weakest in information technology and industrials, and strongest in telecommunication services and energy. Stock selection detracted from performance in information technology, particularly in the internet software and services segment. Advisory Board Company, the largest detractor in industrials, provides best-practices research and consulting services and traded lower on slower-than-expected revenue growth in its key education and health care segments. The Fund’s overweight to telecommunication services, along with good stock selection within the sector, helped performance. Internet service provider Cogent Communications was the strongest individual contributor in telecom in the period, as revenue growth reaccelerated due to bandwidth demand from enterprise and media companies (e.g., Netflix). The Fund had limited exposure to the energy sector, and benefitted as a result of oil prices trading to below $30 per barrel in February 2016.
Historically, market volatility has created stock-specific opportunities across multiple sectors and industries. These opportunities, combined with our ability to identify companies offering under-appreciated, unrecognized growth potential, leave us optimistic going forward. As we enter the last two months of 2016, the Fund is overweighted in the information technology and health care sectors. Semiconductors continue to be a meaningful weight in our information technology allocation while medical devices has moved higher as a weight in health care vs. health care services, which is lower after trims in several positions. Our largest underweights are in consumer discretionary and materials, largely as a result of softer bottom-up fundamentals in large parts of the consumer sector. We also remain underweight industrials, although that underweight has decreased as we
have found new opportunities in that sector in recent months.
The views expressed represent the opinions of LMCG Investments LLC, as of October 31, 2016, and are not intended as a forecast or guarantee of future results and are subject to change without notice.
| 1 | Prior to October 1, 2016, the Fund was known as ASTON/LMCG Small Cap Growth Fund. |
26
AMG Managers LMCG Small Cap Growth Fund
Portfolio Manager’s Comments (continued)
CUMULATIVE TOTAL RETURN PERFORMANCE
The AMG Managers LMCG Small Cap Growth Fund’s cumulative total return is based on the daily change in net asset value (NAV), and assumes that all dividends and distributions were reinvested. The chart compares a hypothetical $10,000 investment made in AMG Managers LMCG Small Cap Growth Fund’s Class N on November 3, 2010, to a $10,000 investment made in the Russell 2000® Growth Index for the same time period. The graph and table do not reflect the deduction of taxes that a shareholder would pay on a Fund distribution or redemption of shares. The listed returns for the Fund are net of expenses and the returns for the index exclude expenses. Total returns would have been lower had certain expenses not been reduced.
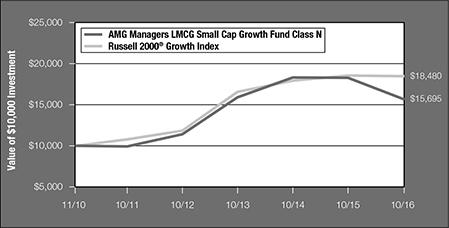
The table below shows the average annual total returns for AMG Managers LMCG Small Cap Growth Fund and the Russell 2000® Growth Index for the same time periods ended October 31, 2016.
| | | | | | | | | | | | | | | | |
| | | One | | | Five | | | Since | | | Inception | |
| Average Annual Total Returns1 | | Year | | | Years | | | Inception | | | Date | |
AMG Managers LMCG Small Cap Growth Fund2,3,4,5,6,7,8 | | | | | | | | | | | | | | | | |
Class N | | | (15.74 | )% | | | 9.54 | % | | | 7.81 | % | | | 11/03/10 | |
Class I | | | (15.56 | )% | | | 9.81 | % | | | 4.72 | % | | | 06/01/11 | |
Russell 2000® Growth Index9 | | | (0.49 | )% | | | 11.34 | % | | | 10.86 | % | | | 11/03/10 | † |
The performance data shown represents past performance. Past performance is not a guarantee of future results. Current performance may be lower or higher than the performance data quoted. The investment return and the principal value of an investment will fluctuate so that an investor’s shares, when redeemed, may be worth more or less than their original cost.
Investors should carefully consider the Fund’s investment objectives, risks, charges and expenses before investing. For performance information through the most recent month end, current net asset values per share for the Fund and other information, please call (800) 835-3879 or visit our website at www.amgfunds.com for a free prospectus. Read it carefully before investing or sending money.
Distributed by AMG Distributors, Inc., member FINRA/SIPC.
† Date reflects the inception date of the Fund, not the index.
| 1 | Total return equals income yield plus share price change and assumes reinvestment of all dividends and capital gain distributions. Returns are net of fees and may reflect offsets of Fund expenses as described in the prospectus. No adjustment has been made for taxes payable by shareholders on their reinvested dividends and capital gain distributions. Returns for periods greater than one year are annualized. The listed returns on the Fund are net of expenses and based on the published NAV as of October 31, 2016. All returns are in U.S. dollars ($). |
| 2 | The Fund is subject to risks associated with investments in small-capitalization companies, such as erratic earnings patterns, competitive conditions, limited earnings history and a reliance on one or a limited number of products. |
| 3 | Active and frequent trading of a fund may result in higher transaction costs and increased tax liability. |
| 4 | The Fund invests in growth stocks, which may be more sensitive to market movements because their prices tend to reflect future investor expectations rather than just current profits. |
| 5 | Investments in international securities are subject to certain risks of overseas investing including currency fluctuations and changes in political and economic conditions, which could result in significant market fluctuations. These risks are magnified in emerging markets. |
| 6 | Investing in initial public offerings (IPOs) is risky and the prices of stocks purchased in IPOs tend to fluctuate more widely than stocks of companies that have been publicly traded for a longer period of time. Stocks purchased in IPOs generally do not have a trading history, and information about the companies may be available for very limited periods. |
| 7 | The Fund is subject to risks associated with investments in mid-capitalization companies such as greater price volatility, lower trading volume, and less liquidity than the stocks of larger, more established companies. |
| 8 | The Fund is subject to special risk considerations similar to those associated with the direct ownership of real estate. Real estate valuations may be subject to factors such as changing general and local economic, financial, competitive, and environmental conditions. |
| 9 | The Russell 2000® Growth Index measures the performance of the Russell 2000 companies with higher price-to-book ratios and higher forecasted growth values. Unlike the Fund, the Russell 2000® Growth Index is unmanaged, is not available for investment and does not incur expenses. |
The Russell Indices are a trademark of the London Stock Exchange Group Companies.
Not FDIC insured, nor bank guaranteed. May lose value.
27
AMG Funds
| | |
| AMG Managers LMCG Small Cap Growth Fund | | October 31, 2016 |
| |
| Schedule of Investments | | |
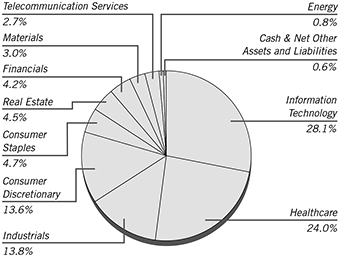
% of Net Assets
| | | | | | | | |
Shares | | | | | Market
Value | |
| COMMON STOCKS – 99.4% | | | | |
| | | | Consumer Discretionary – 13.6% | | | | |
| | 18,418 | | | CalAtlantic Group, Inc. | | $ | 595,270 | |
| | 40,099 | | | Dave & Buster’s Entertainment, Inc. * | | | 1,658,094 | |
| | 74,201 | | | ILG, Inc. | | | 1,215,412 | |
| | 66,426 | | | Monro Muffler Brake, Inc. | | | 3,653,430 | |
| | 106,423 | | | Nexstar Broadcasting Group, Inc., Class A | | | 5,193,442 | |
| | 52,862 | | | Sonic Corp. | | | 1,211,068 | |
| | 6,314 | | | Vail Resorts, Inc. | | | 1,006,704 | |
| | 18,564 | | | Wayfair, Inc., Class A * | | | 618,738 | |
| | | | | | | | |
| | | | | | | 15,152,158 | |
| | | | | | | | |
| | | | Consumer Staples – 4.7% | | | | |
| | 18,040 | | | Casey’s General Stores, Inc. | | | 2,038,340 | |
| | 66,804 | | | National Beverage Corp. * | | | 3,155,821 | |
| | | | | | | | |
| | | | | | | 5,194,161 | |
| | | | | | | | |
| | | | Energy – 0.8% | | | | |
| | 26,812 | | | Carrizo Oil & Gas, Inc. * | | | 907,050 | |
| | | | | | | | |
| | | | Financials – 4.2% | | | | |
| | 23,512 | | | BofI Holding, Inc. * | | | 438,029 | |
| | 29,263 | | | Pinnacle Financial Partners, Inc. | | | 1,509,971 | |
| | 18,926 | | | Primerica, Inc. | | | 1,035,252 | |
| | 45,754 | | | Western Alliance Bancorp * | | | 1,709,369 | |
| | | | | | | | |
| | | | | | | 4,692,621 | |
| | | | | | | | |
| | | | Healthcare – 24.0% | | | | |
| | 24,048 | | | Alder Biopharmaceuticals, Inc. * | | | 583,164 | |
| | 126,207 | | | Allscripts Healthcare Solutions, Inc. * | | | 1,515,746 | |
| | 68,052 | | | AMN Healthcare Services, Inc. * | | | 2,232,106 | |
| | 50,559 | | | Amsurg Corp. * | | | 3,020,900 | |
| | 12,084 | | | athenahealth, Inc. * | | | 1,248,519 | |
| | | | | | | | |
Shares | | | | | Market
Value | |
| | | | Healthcare (continued) | | | | |
| | 28,105 | | | Clovis Oncology, Inc. * | | $ | 817,293 | |
| | 128,022 | | | Cross Country Healthcare, Inc. * | | | 1,430,006 | |
| | 27,749 | | | Depomed, Inc. * | | | 620,468 | |
| | 50,902 | | | HealthSouth Corp. | | | 2,043,715 | |
| | 63,711 | | | Heron Therapeutics, Inc. * | | | 946,108 | |
| | 46,496 | | | INC Research Holdings, Inc., Class A * | | | 2,124,867 | |
| | 19,398 | | | Nevro Corp. * | | | 1,783,064 | |
| | 27,704 | | | NuVasive, Inc. * | | | 1,654,760 | |
| | 47,247 | | | Pacira Pharmaceuticals, Inc. * | | | 1,502,455 | |
| | 38,327 | | | Radius Health, Inc. * | | | 1,644,995 | |
| | 87,087 | | | Tenet Healthcare Corp. * | | | 1,716,485 | |
| | 5,046 | | | TESARO, Inc. * | | | 609,961 | |
| | 22,682 | | | Ultragenyx Pharmaceutical, Inc. * | | | 1,338,011 | |
| | | | | | | | |
| | | | | | | 26,832,623 | |
| | | | | | | | |
| | | | Industrials – 13.8% | | | | |
| | 37,322 | | | Apogee Enterprises, Inc. | | | 1,520,872 | |
| | 46,386 | | | Beacon Roofing Supply, Inc. * | | | 1,950,067 | |
| | 22,841 | | | Dycom Industries, Inc. * | | | 1,757,158 | |
| | 71,757 | | | Echo Global Logistics, Inc. * | | | 1,521,248 | |
| | 16,598 | | | Generac Holdings, Inc. * | | | 632,218 | |
| | 38,824 | | | Healthcare Services Group, Inc. | | | 1,435,323 | |
| | 78,917 | | | Manitowoc Foodservice, Inc. * | | | 1,192,436 | |
| | 40,588 | | | Masonite International Corp. * | | | 2,309,457 | |
| | 5,963 | | | RBC Bearings Inc. * | | | 425,460 | |
| | 47,232 | | | SiteOne Landscape Supply, Inc. * | | | 1,472,694 | |
| | 21,037 | | | WageWorks, Inc. * | | | 1,240,131 | |
| | | | | | | | |
| | | | | | | 15,457,064 | |
| | | | | | | | |
| | | | Information Technology – 28.1% | | | | |
| | 90,319 | | | Advanced Micro Devices, Inc. * | | | 653,006 | |
| | 21,969 | | | Belden, Inc. | | | 1,423,811 | |
| | 50,939 | | | Cavium, Inc. * | | | 2,875,507 | |
| | 27,722 | | | Euronet Worldwide, Inc. * | | | 2,205,285 | |
| | 61,230 | | | Fabrinet* | | | 2,324,291 | |
| | 106,237 | | | GTT Communications, Inc. * | | | 2,390,333 | |
| | 30,127 | | | HubSpot, Inc. * | | | 1,580,161 | |
| | 30,545 | | | Imperva, Inc. * | | | 1,127,111 | |
| | 251,544 | | | Internap Corp. * | | | 314,430 | |
| | 31,694 | | | InterXion Holding NV * | | | 1,179,968 | |
| | 12,642 | | | LogMeIn, Inc. | | | 1,200,990 | |
| | 30,809 | | | MACOM Technology Solutions Holdings, Inc.* | | | 1,132,539 | |
| | 37,942 | | | Microsemi Corp. * | | | 1,598,496 | |
| | 109,016 | | | MINDBODY, Inc., Class A * | | | 2,256,631 | |
| | 62,451 | | | NeoPhotonics Corp. * | | | 874,314 | |
| | 62,003 | | | Paylocity Holding Corp. * | | | 2,696,511 | |
| | 101,219 | | | Synchronoss Technologies, Inc. * | | | 3,715,749 | |
| | 5,809 | | | Tyler Technologies, Inc. * | | | 931,764 | |
| | 36,574 | | | Zendesk, Inc. * | | | 961,530 | |
| | | | | | | | |
| | | | | | | 31,442,427 | |
| | | | | | | | |
| | | | Materials – 3.0% | | | | |
| | 177,263 | | | Summit Materials, Inc., Class A * | | | 3,321,909 | |
| | | | | | | | |
The accompanying notes are an integral part of these financial statements.
28
AMG Funds
| | |
| AMG Managers LMCG Small Cap Growth Fund | | October 31, 2016 |
| |
| Schedule of Investments – continued | | |
| | | | | | |
Shares | | | | Market
Value | |
| | Real Estate – 4.5% | | | | |
40,953 | | DuPont Fabros Technology, Inc. | | $ | 1,671,292 | |
101,213 | | National Storage Affiliates Trust | | | 1,981,751 | |
31,091 | | QTS Realty Trust, Inc., Class A | | | 1,428,942 | |
| | | | | | |
| | | | | 5,081,985 | |
| | | | | | |
| | Telecommunication Services – 2.7% | | | | |
295,842 | | Vonage Holdings Corp. * | | | 2,029,476 | |
31,158 | | Zayo Group Holdings, Inc. * | | | 1,002,664 | |
| | | | | | |
| | | | | 3,032,140 | |
| | | | | | |
| | Total Common Stocks
(Cost $114,557,209) | | | 111,114,138 | |
| | | | | | |
RIGHTS – 0.0%# | | | | |
| | Healthcare – 0.0%# | | | | |
99,639 | | Dyax Corp., CVR Expiration 12/31/19 * (a) (b) | | | 996 | |
| | | | | | |
| | Total Rights
(Cost $0) | | | 996 | |
| | | | | | |
Total Investments – 99.4%
(Cost $114,557,209)** | | | 111,115,134 | |
| | | | | | |
Net Other Assets and Liabilities – 0.6% | | | 721,245 | |
| | | | | | |
Net Assets – 100.0% | | $ | 111,836,379 | |
| | | | | | |
|
* Non-income producing security. |
** At October 31, 2016, the aggregate cost for Federal income tax purposes is $115,109,741. |
| | | | |
Gross unrealized appreciation | | $ | 6,378,590 | |
Gross unrealized depreciation | | | (10,373,197 | ) |
| | | | |
Net unrealized depreciation | | $ | (3,994,607 | ) |
| | | | |
|
# Less than 0.05% |
(a) Securities with a total aggregate market value of $996, or less than 0.05% of net assets, were valued under fair value procedures established by the Fund’s Board of Trustees. |
(b) The security is restricted for resale. |
|
CVR Contingent Value Rights |
The accompanying notes are an integral part of these financial statements.
29
AMG River Road Select Value Fund
Portfolio Manager’s Comments (unaudited)
The AMG River Road Select Value Fund1 (the “Fund”) Class N shares outperformed the Russell 2500® Value Index benchmark during the fiscal year ended October 31, 2016, returning +8.55% versus +7.78% for the Index. The largest positive contribution was from the industrials sector, which benefited from strong stock selection and an overweight allocation. The largest negative contributor was the health care sector, which lagged due to poor stock selection.
The two holdings with the largest positive contribution to the Fund’s return were Insperity Inc. (NSP) and Dolby Laboratories Inc. (DLB). Insperity is a professional employment organization that provides outsourced human resources to small- and medium-sized business. Insperity delivered several consecutive quarters of accelerated revenue and margin growth due to high customer retention rates and new client wins. These strong results, coupled with management’s favorable outlook, led to higher earnings estimates and multiple expansion. The position was significantly trimmed as the stock approached our assessed value. Dolby develops and licenses audio technology to manufacturers of entertainment and consumer devices. Dolby reported strong FY16 results driven by growth of high-margin licensing revenues and the leveraging of corporate expenses. Investors are excited about the next generation of Dolby products recently introduced to the marketplace after several years of significant investment. Looking ahead, cash flow and free cash flow growth should accelerate, and with Dolby fortress-like balance sheet, we believe returns of capital to shareholders are likely. We trimmed the position as it approached our assessed value.
The two holdings with the largest negative contribution to the Fund’s return were Outerwall Inc. (OUTR) and Rent-A-Center Inc. (RCII). Outerwall owns and operates a national network of automated retail kiosks for home video rental (Redbox) and coin counting (Coinstar). Outerwall reduced its outlook due to weakness at Redbox. While a soft Q4 was expected due to mediocre DVD content, high
promotional activity compounded the negative revenue and margin impact as renters took advantage of the promotions and had little incentive for additional rentals. Despite the tremendous amount of free cash flow generated by Outerwall, we did not approve of management’s decision to aggressively repurchase shares rather than reducing debt and/or paying dividends. We eliminated the position in accordance with our sell discipline. Rent-A-Center is the largest rent-to-own (RTO) retailer in the U.S., with 40% of all RTO stores. In early 2016, Rent-A-Center reported weak Q4 results, cut its dividend, and initiated 2016 guidance below our expectations. Although we believed the issues experienced by Rent-A-Center in 2015 were transitory (core same-store sales declines, slowing growth at Acceptance Now), the guidance suggested they were getting worse. This news impaired our investment thesis and we eliminated the position in accordance with our sell discipline.
We continue to position the Fund in shares of high-quality companies that we believe will perform well in a sustained period of weak-to-moderate economic growth. Rapidly rising equity prices paired with modest earnings growth over the past several years has resulted in unattractive valuations in the broader small-cap market. As a result, identifying companies to replace those that are being sold at their assessed valuation is challenging. If returns do moderate over the coming months, we expect the Fund’s holdings and low-volatility approach to be well positioned.
The views expressed represent the opinions of River Road Asset Management LLC , as of October 31, 2016, and are not intended as a forecast or guarantee of future results and are subject to change without notice.
| 1 | Prior to October 1, 2016, the Fund was known as ASTON/River Road Select Value Fund. |
30
AMG River Road Select Value Fund
Portfolio Manager’s Comments (continued)
CUMULATIVE TOTAL RETURN PERFORMANCE
The AMG River Road Select Value Fund’s cumulative total return is based on the daily change in net asset value (NAV), and assumes that all dividends and distributions were reinvested. The chart compares a hypothetical $10,000 investment made in AMG River Road Select Value Fund’s Class N on March 29, 2007, to a $10,000 investment made in the Russell 2500® Value Index for the same time period. The graph and table do not reflect the deduction of taxes that a shareholder would pay on a Fund distribution or redemption of shares. The listed returns for the Fund are net of expenses and the returns for the index exclude expenses. Total returns would have been lower had certain expenses not been reduced.
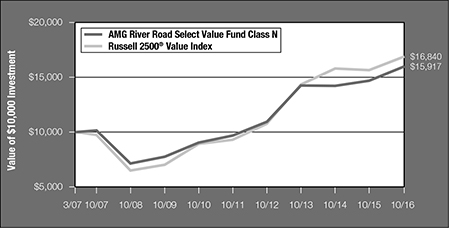
The table below shows the average annual total returns for AMG River Road Select Value Fund and the Russell 2500® Value Index for the same time periods ended October 31, 2016.
| | | | | | | | | | | | | | | | |
| | | One | | | Five | | | Since | | | Inception | |
| Average Annual Total Returns1 | | Year | | | Years | | | Inception | | | Date | |
AMG River Road Select Value Fund2,3,4,5,6 | | | | | | | | | | | | | | | | |
Class N | | | 8.55 | % | | | 10.49 | % | | | 4.97 | % | | | 03/29/07 | |
Class I | | | 8.64 | % | | | 10.74 | % | | | 4.80 | % | | | 06/28/07 | |
Russell 2500® Value Index7 | | | 7.78 | % | | | 12.61 | % | | | 5.60 | % | | | 03/29/07 | † |
The performance data shown represents past performance. Past performance is not a guarantee of future results. Current performance may be lower or higher than the performance data quoted. The investment return and the principal value of an investment will fluctuate so that an investor’s shares, when redeemed, may be worth more or less than their original cost.
Investors should carefully consider the Fund’s investment objectives, risks, charges and expenses before investing. For performance information through the most recent month end, current net asset values per share for the Fund and other information, please call (800) 835-3879 or visit our website at www.amgfunds.com for a free prospectus. Read it carefully before investing or sending money.
Distributed by AMG Distributors, Inc., member FINRA/SIPC.
| † | Date reflects the inception date of the Fund, not the index. |
| 1 | Total return equals income yield plus share price change and assumes reinvestment of all dividends and capital gain distributions. Returns are net of fees and may reflect offsets of Fund expenses as described in the prospectus. No adjustment has been made for taxes payable by shareholders on their reinvested dividends and capital gain distributions. Returns for periods greater than one year are annualized. The listed returns on the Fund are net of expenses and based on the published NAV as of October 31, 2016. All returns are in U.S. dollars ($). |
| 2 | Investments in international securities are subject to certain risks of overseas investing including currency fluctuations and changes in political and economic conditions, which could result in significant market fluctuations. These risks are magnified in emerging markets. |
| 3 | The Fund is subject to risks associated with investments in mid-capitalization companies such as greater price volatility, lower trading volume, and less liquidity than the stocks of larger, more established companies. |
| 4 | The Fund is subject to special risk considerations similar to those associated with the direct ownership of real estate. Real estate valuations may be subject to factors such as changing general and local economic, financial, competitive, and environmental conditions. |
| 5 | The Fund is subject to risks associated with investments in small-capitalization companies, such as erratic earnings patterns, competitive conditions, limited earnings history and a reliance on one or a limited number of products. |
| 6 | The Fund invests in value stocks, which may perform differently from the market as a whole and may be undervalued by the market for a long period of time. |
| 7 | The Russell 2500® Value Index measures the performance of the Russell 2500 companies with lower price-to-book ratios and lower forecasted growth values. The Russell 2500® Value Index is an unmanaged, market-value weighted, value-oriented index comprised of small stocks that have relatively low price-to-book ratios and lower forecasted growth values. Unlike the Fund, the indices are unmanaged, are not available for investment and do not incur expenses. |
The Russell Indices are a trademark of the London Stock Exchange Group Companies.
Not FDIC insured, nor bank guaranteed. May lose value.
31
AMG Funds
| | |
| AMG River Road Select Value Fund | | October 31, 2016 |
| |
| Schedule of Investments | | |
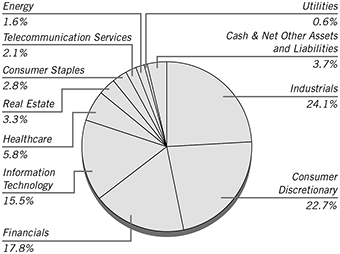
% of Net Assets
| | | | | | | | |
Shares | | | | | Market
Value | |
| COMMON STOCKS – 96.3% | | | | |
| | | | Consumer Discretionary – 22.7% | | | | |
| | 1,998 | | | Biglari Holdings, Inc. * | | $ | 875,484 | |
| | 28,217 | | | Bloomin’ Brands, Inc. | | | 488,154 | |
| | 23,077 | | | International Speedway Corp., Class A | | | 759,233 | |
| | 26,331 | | | J Alexander’s Holdings, Inc. * | | | 236,979 | |
| | 62,970 | | | La Quinta Holdings, Inc. * | | | 630,330 | |
| | 10,554 | | | Liberty Broadband Corp., Class C * | | | 703,424 | |
| | 37,021 | | | Liberty Ventures, Class A * | | | 1,477,138 | |
| | 2,699 | | | The Madison Square Garden Co., Class A * | | | 446,657 | |
| | 26,220 | | | Motorcar Parts of America, Inc. * | | | 688,013 | |
| | 8,943 | | | Murphy USA, Inc. * | | | 615,100 | |
| | 20,709 | | | News Corp., Class A | | | 250,993 | |
| | 5,440 | | | Polaris Industries, Inc. | | | 416,758 | |
| | 14,251 | | | SeaWorld Entertainment, Inc. | | | 199,657 | |
| | 22,031 | | | SodaStream International, Ltd. (Israel) * | | | 570,162 | |
| | 21,207 | | | Tribune Media Co., Class A | | | 691,348 | |
| | | | | | | | |
| | | | | | | 9,049,430 | |
| | | | | | | | |
| | | | Consumer Staples – 2.8% | | | | |
| | 28,193 | | | Ingles Markets, Inc., Class A | | | 1,113,624 | |
| | | | | | | | |
| | | | Energy – 1.6% | | | | |
| | 10,997 | | | Evolution Petroleum Corp. | | | 84,677 | |
| | 39,820 | | | Gran Tierra Energy, Inc. * | | | 115,876 | |
| | 13,545 | | | PBF Energy, Inc., Class A | | | 295,281 | |
| | 8,123 | | | PHI, Inc. * | | | 126,556 | |
| | | | | | | | |
| | | | | | | 622,390 | |
| | | | | | | | |
| | | | Financials – 17.8% | | | | |
| | 1,083 | | | Alleghany Corp. * | | | 559,055 | |
| | 17,103 | | | Allied World Assurance Co. Holdings AG (Switzerland) | | | 735,087 | |
| | | | | | | | |
Shares | | | | | Market
Value | |
| | | | Financials (continued) | | | | |
| | 1,501 | | | American National Insurance Co. | | $ | 175,857 | |
| | 32,567 | | | Capital Southwest Corp. (BDC) | | | 469,942 | |
| | 23,570 | | | CNA Financial Corp. | | | 861,955 | |
| | 143,595 | | | FNFV Group * | | | 1,730,320 | |
| | 27,499 | | | Leucadia National Corp. | | | 513,406 | |
| | 51,432 | | | PICO Holdings, Inc. * | | | 622,327 | |
| | 1,722 | | | White Mountains Insurance Group, Ltd. (Bermuda) | | | 1,428,778 | |
| | | | | | | | |
| | | | | | | 7,096,727 | |
| | | | | | | | |
| | | | Healthcare – 5.8% | | | | |
| | 16,759 | | | Air Methods Corp. * | | | 443,276 | |
| | 20,982 | | | Akorn, Inc. * | | | 502,519 | |
| | 42,950 | | | Premier, Inc., Class A * | | | 1,367,528 | |
| | | | | | | | |
| | | | | | | 2,313,323 | |
| | | | | | | | |
| | | | Industrials – 24.1% | | | | |
| | 62,710 | | | Air Transport Services Group, Inc. * | | | 829,653 | |
| | 17,583 | | | Cubic Corp. | | | 750,794 | |
| | 17,199 | | | Forward Air Corp. | | | 710,663 | |
| | 4,739 | | | Insperity, Inc. | | | 356,373 | |
| | 6,682 | | | Kansas City Southern | | | 586,412 | |
| | 16,325 | | | Kelly Services, Inc., Class A | | | 305,767 | |
| | 14,563 | | | KLX, Inc. * | | | 501,258 | |
| | 36,249 | | | Resources Connection, Inc. | | | 538,298 | |
| | 26,256 | | | SP Plus Corp. * | | | 661,651 | |
| | 16,166 | | | Spirit AeroSystems Holdings, Inc., Class A * | | | 814,120 | |
| | 18,738 | | | TriNet Group, Inc. * | | | 351,712 | |
| �� | 14,636 | | | UniFirst Corp. | | | 1,792,910 | |
| | 11,374 | | | US Ecology, Inc. | | | 480,552 | |
| | 21,805 | | | Viad Corp. | | | 904,908 | |
| | | | | | | | |
| | | | | | | 9,585,071 | |
| | | | | | | | |
| | | | Information Technology – 15.5% | | | | |
| | 38,620 | | | Blackhawk Network Holdings, Inc. * | | | 1,330,459 | |
| | 18,809 | | | CSG Systems International, Inc. | | | 715,306 | |
| | 13,610 | | | Dolby Laboratories, Inc., Class A | | | 647,700 | |
| | 8,106 | | | ePlus, Inc. * | | | 742,104 | |
| | 14,765 | | | Match Group, Inc. * | | | 266,656 | |
| | 2,490 | | | MicroStrategy, Inc., Class A * | | | 485,077 | |
| | 37,763 | | | NeuStar, Inc., Class A * | | | 847,779 | |
| | 5,330 | | | OSI Systems, Inc. * | | | 373,793 | |
| | 50,260 | | | VeriFone Systems, Inc. * | | | 778,025 | |
| | | | | | | | |
| | | | | | | 6,186,899 | |
| | | | | | | | |
| | | | Real Estate – 3.3% | | | | |
| | 22,065 | | | The GEO Group, Inc. | | | 528,677 | |
| | 8,550 | | | Marcus & Millichap, Inc. * | | | 200,327 | |
| | 26,350 | | | Realogy Holdings Corp. | | | 603,151 | |
| | | | | | | | |
| | | | | | | 1,332,155 | |
| | | | | | | | |
| | | | Telecommunication Services – 2.1% | | | | |
| | 6,493 | | | ATN International, Inc. | | | 439,187 | |
| | 15,543 | | | Telephone & Data Systems, Inc. | | | 401,631 | |
| | | | | | | | |
| | | | | | | 840,818 | |
| | | | | | | | |
The accompanying notes are an integral part of these financial statements.
32
AMG Funds
| | |
| AMG River Road Select Value Fund | | October 31, 2016 |
| |
| Schedule of Investments – continued | | |
| | | | | | |
Shares | | | | Market
Value | |
| | Utilities – 0.6% | | | | |
| | 4,268 National Fuel Gas Co. | | $ | 223,558 | |
| | | | | | |
| | Total Common Stocks
(Cost $36,774,053) | | | 38,363,995 | |
| | | | | | |
INVESTMENT COMPANY – 3.2% | | | | |
| 1,278,078 | | Dreyfus Government Cash Management Fund, Institutional Class Shares, 0.28%** | | | 1,278,078 | |
| | | | | | |
| | Total Investment Company
(Cost $1,278,078) | | | 1,278,078 | |
| | | | | | |
Total Investments – 99.5%
(Cost $38,052,131)*** | | | 39,642,073 | |
| | | | | | |
Net Other Assets and Liabilities – 0.5% | | | 212,329 | |
| | | | | | |
Net Assets – 100.0% | | $ | 39,854,402 | |
| | | | | | |
| * | Non-income producing security. |
| ** | Yield shown represents the October 31, 2016, seven-day average yield, which refers to the sum of the previous seven days’ dividends paid, expressed as an annual percentage. |
| *** | At October 31, 2016, the aggregate cost for Federal income tax purposes is $38,303,518. |
| | | | |
Gross unrealized appreciation | | $ | 4,043,962 | |
Gross unrealized depreciation | | | (2,705,407 | ) |
| | | | |
Net unrealized appreciation | | $ | 1,338,555 | |
| | | | |
| BDC | Business Development Company |
The accompanying notes are an integral part of these financial statements.
33
AMG River Road Small Cap Value Fund
Portfolio Manager’s Comments (unaudited)
The AMG River Road Small Cap Value Fund1 (the “Fund”) Class N shares modestly underperformed the Russell 2000® Value benchmark during the 12- month period ending October 31, 2016, with a return of +7.22% versus +8.81% for the Index. The largest positive contribution was from the industrials sector, which benefited from strong stock selection. The largest negative contributor was the consumer discretionary sector, which lagged due to an overweight allocation. The Fund’s cash position, which averaged approximately 7% during the period, was also a negative contributor to performance.
The two holdings with the largest positive contribution to the Fund’s return were Insperity Inc. (NSP) and Rackspace Hosting Inc. (RAX). Insperity is a professional employment organization that provides outsourced human resources to small-and medium-sized business. NSP delivered several consecutive quarters of accelerated revenue and margin growth due to high customer retention rates and new client wins. These strong results, coupled with management’s favorable outlook, led to higher earnings estimates and multiple expansion. The position was significantly trimmed as the stock approached our assessed value. Rack-space is a global provider of managed cloud and related IT services. We initiated our position earlier this year as RAX was transitioning its business model to support customized cloud and software applications instead of just providing services and raw cloud computing capacity. By leveraging other cloud platforms, former competitors like Amazon Web Services and Microsoft Azure were transformed into Rackspace partners. In August, private equity firm Apollo Global signed a deal to acquire Rackspace for $32 per share, which was a +38% premium to the unaffected stock price.
The two holdings with the largest negative contribution to return were Outerwall Inc. (OUTR) and Rent-A-Center Inc. (RCII). Outerwall owns and operates a national network of automated retail kiosks for home video rental (Redbox) and coin counting (Coinstar). Outerwall reduced its
outlook due to weakness at Redbox. While a soft Q4 was expected due to mediocre DVD content, high promotional activity compounded the negative revenue and margin impact as renters took advantage of the promotions and had little incentive for additional rentals. Despite the tremendous amount of free cash flow generated by the company, we did not approve of management’s decision to aggressively repurchase shares rather than reducing debt and/or paying dividends. We eliminated the position in accordance with our sell discipline. Rent-A-Center is the largest rent-to-own (RTO) retailer in the U.S. with 40% of all RTO stores. In early 2016, Rent-A-Center reported weak Q4 results, cut its dividend and initiated 2016 guidance below our expectations. Although we believed the issues experienced by RCII in 2015 were transitory (core same-store sales declines, slowing growth at Acceptance Now), the guidance suggested they were getting worse. This news impaired our investment thesis and we eliminated the position in accordance with our sell discipline.
We continue to position the Fund in shares of high-quality companies that we believe will perform well in a sustained period of weak-to-moderate economic growth. Rapidly rising equity prices paired with modest earnings growth over the past several years has resulted in what we believe are unattractive valuations in the broader small-cap market. As a result, identifying companies to replace those that are being sold at their assessed valuation is challenging. Thus, cash in the Fund is at the higher end of its historical range. If returns do moderate over the coming months, we expect the Fund’s holdings and low volatility approach to be well positioned.
The views expressed represent the opinions of River Road Asset Management LLC, as of October 31, 2016, and are not intended as a forecast or guarantee of future results and are subject to change without notice.
| 1 | Prior to October 1, 2016, the Fund was known as ASTON/River Road Small Cap Value Fund. |
34
AMG River Road Small Cap Value Fund
Portfolio Manager’s Comments (continued)
CUMULATIVE TOTAL RETURN PERFORMANCE
The AMG River Road Small Cap Value Fund’s cumulative total return is based on the daily change in net asset value (NAV), and assumes that all dividends and distributions were reinvested. The chart compares a hypothetical $10,000 investment made in AMG River Road Small Cap Value Fund’s Class N on October 31, 2006, to a $10,000 investment made in the Russell 2000® Value Index for the same time period. The graph and table do not reflect the deduction of taxes that a shareholder would pay on a Fund distribution or redemption of shares. The listed returns for the Fund are net of expenses and the returns for the index exclude expenses. Total returns would have been lower had certain expenses not been reduced.
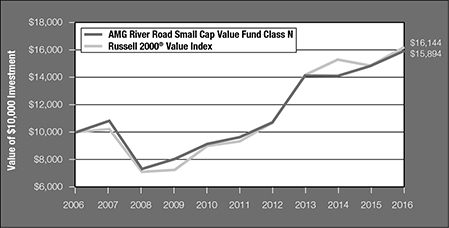
The table below shows the average annual total returns for AMG River Road Small Cap Value Fund and the Russell 2000® Value Index for the same time periods ended October 31, 2016.
| | | | | | | | | | | | | | | | | | | | |
| | | One | | | Five | | | Ten | | | Since | | | Inception | |
| Average Annual Total Returns1 | | Year | | | Years | | | Years | | | Inception | | | Date | |
AMG River Road Small Cap Value Fund2,3,4,5,6 | | | | | | | | | | | | | | | | | | | | |
Class N | | | 7.22 | % | | | 10.57 | % | | | 4.74 | % | | | 6.93 | % | | | 06/28/05 | |
Class I | | | 7.50 | % | | | 10.87 | % | | | — | | | | 4.62 | % | | | 12/13/06 | |
Russell 2000® Value Index7 | | | 8.81 | % | | | 11.63 | % | | | 4.91 | % | | | 6.24 | % | | | 06/28/05 | † |
The performance data shown represents past performance. Past performance is not a guarantee of future results. Current performance may be lower or higher than the performance data quoted. The investment return and the principal value of an investment will fluctuate so that an investor’s shares, when redeemed, may be worth more or less than their original cost.
Investors should carefully consider the Fund’s investment objectives, risks, charges and expenses before investing. For performance information through the most recent month end, current net asset values per share for the Fund and other information, please call (800) 835-3879 or visit our website at www.amgfunds.com for a free prospectus. Read it carefully before investing or sending money.
Distributed by AMG Distributors, Inc., member FINRA/SIPC.
| † | Date reflects the inception date of the Fund, not the index. |
| 1 | Total return equals income yield plus share price change and assumes reinvestment of all dividends and capital gain distributions. Returns are net of fees and may reflect offsets of Fund expenses as described in the prospectus. No adjustment has been made for taxes payable by shareholders on their reinvested dividends and capital gain distributions. Returns for periods greater than one year are annualized. The listed returns on the Fund are net of expenses and based on the published NAV as of October 31, 2016. All returns are in U.S. dollars ($). |
| 2 | The Fund is subject to risks associated with investments in small-capitalization companies, such as erratic earnings patterns, competitive conditions, limited earnings history and a reliance on one or a limited number of products. |
| 3 | The Fund is subject to risks associated with investments in mid-capitalization companies such as greater price volatility, lower trading volume, and less liquidity than the stocks of larger, more established companies. |
| 4 | The Fund invests in value stocks, which may perform differently from the market as a whole and may be undervalued by the market for a long period of time. |
| 5 | The Fund is subject to special risk considerations similar to those associated with the direct ownership of real estate. Real estate valuations may be subject to factors such as changing general and local economic, financial, competitive, and environmental conditions. |
| 6 | Investments in international securities are subject to certain risks of overseas investing including currency fluctuations and changes in political and economic conditions, which could result in significant market fluctuations. |
| 7 | The Russell 2000® Value Index is an unmanaged, market-value weighted, value-oriented index comprised of small stocks that have relatively low price-to-book ratios and lower forecasted growth values. Unlike the Fund, the Russell 2000® Value Index is unmanaged, is not available for investment and does not incur expenses. |
The Russell Indices are a trademark of the London Stock Exchange Group Companies.
Not FDIC insured, nor bank guaranteed. May lose value.
35
AMG Funds
| | |
| AMG River Road Small Cap Value Fund | | October 31, 2016 |
| |
| Schedule of Investments | | |
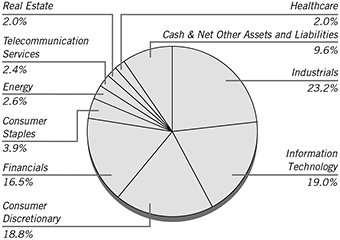
% of Net Assets
| | | | | | | | |
Shares | | | | | Market
Value | |
| COMMON STOCKS – 90.4% | | | | |
| | | | Consumer Discretionary – 18.8% | | | | |
| | 13,249 | | | Biglari Holdings, Inc. * | | $ | 5,805,447 | |
| | 230,040 | | | Bloomin’ Brands, Inc. | | | 3,979,692 | |
| | 171,950 | | | International Speedway Corp., Class A | | | 5,657,155 | |
| | 317,645 | | | J Alexander’s Holdings, Inc. * (a) | | | 2,858,805 | |
| | 393,960 | | | La Quinta Holdings, Inc. * | | | 3,943,540 | |
| | 135,180 | | | The Marcus Corp. | | | 3,582,270 | |
| | 135,641 | | | Monarch Casino & Resort, Inc. * | | | 3,207,910 | |
| | 176,706 | | | Motorcar Parts of America, Inc. * | | | 4,636,765 | |
| | 70,500 | | | Murphy USA, Inc. * | | | 4,848,990 | |
| | 87,454 | | | SeaWorld Entertainment, Inc. | | | 1,225,231 | |
| | 151,512 | | | SodaStream International, Ltd. (Israel) * | | | 3,921,131 | |
| | 135,864 | | | Tribune Media Co., Class A | | | 4,429,166 | |
| | 254,360 | | | UCP, Inc., Class A * (a) | | | 2,314,676 | |
| | | | | | | | |
| | | | | | | 50,410,778 | |
| | | | | | | | |
| | | | Consumer Staples – 3.9% | | | | |
| | 201,220 | | | Ingles Markets, Inc., Class A | | | 7,948,190 | |
| | 203,340 | | | Natural Grocers by Vitamin Cottage, Inc.* | | | 2,415,679 | |
| | | | | | | | |
| | | | | | | 10,363,869 | |
| | | | | | | | |
| | | | Energy – 2.6% | | | | |
| | 402,433 | | | Evolution Petroleum Corp. | | | 3,098,734 | |
| | 517,120 | | | Gran Tierra Energy, Inc. * | | | 1,504,819 | |
| | 92,660 | | | PBF Energy, Inc., Class A | | | 2,019,988 | |
| | 26,610 | | | PHI, Inc. * | | | 414,584 | |
| | | | | | | | |
| | | | | | | 7,038,125 | |
| | | | | | | | |
| | | | | | | | |
Shares | | | | | Market
Value | |
| | | | Financials – 16.5% | | | | |
| | 65,020 | | | 1st Source Corp. | | $ | 2,247,091 | |
| | 138,210 | | | Allied World Assurance Co. Holdings AG (Switzerland) | | | 5,940,266 | |
| | 31,780 | | | American National Insurance Co. | | | 3,723,345 | |
| | 219,054 | | | Capital Southwest Corp. (BDC) (a) | | | 3,160,949 | |
| | 7,185 | | | First Citizens BancShares, Inc., Class A | | | 2,090,835 | |
| | 945,465 | | | FNFV Group * | | | 11,392,853 | |
| | 345,294 | | | PICO Holdings, Inc. * | | | 4,178,057 | |
| | 13,968 | | | White Mountains Insurance Group, Ltd. (Bermuda) | | | 11,589,529 | |
| | | | | | | | |
| | | | | | | 44,322,925 | |
| | | | | | | | |
| | | | Healthcare – 2.0% | | | | |
| | 102,266 | | | Air Methods Corp. * | | | 2,704,936 | |
| | 107,628 | | | Akorn, Inc. * | | | 2,577,691 | |
| | | | | | | | |
| | | | | | | 5,282,627 | |
| | | | | | | | |
| | | | Industrials – 23.2% | | | | |
| | 483,223 | | | Air Transport Services Group, Inc. * | | | 6,393,040 | |
| | 43,844 | | | Barrett Business Services, Inc. | | | 1,965,527 | |
| | 118,757 | | | Cubic Corp. | | | 5,070,924 | |
| | 133,820 | | | Forward Air Corp. | | | 5,529,442 | |
| | 33,269 | | | Insperity, Inc. | | | 2,501,829 | |
| | 155,950 | | | Kelly Services, Inc., Class A | | | 2,920,944 | |
| | 114,107 | | | KLX, Inc. * | | | 3,927,563 | |
| | 244,643 | | | Resources Connection, Inc. | | | 3,632,949 | |
| | 245,369 | | | SP Plus Corp. * | | | 6,183,299 | |
| | 148,673 | | | TriNet Group, Inc. * | | | 2,790,592 | |
| | 95,877 | | | UniFirst Corp. | | | 11,744,933 | |
| | 79,325 | | | US Ecology, Inc. | | | 3,351,481 | |
| | 149,224 | | | Viad Corp. | | | 6,192,796 | |
| | | | | | | | |
| | | | | | | 62,205,319 | |
| | | | | | | | |
| | | | Information Technology – 19.0% | | | | |
| | 254,076 | | | Blackhawk Network Holdings, Inc. * | | | 8,752,918 | |
| | 133,105 | | | Computer Services, Inc. (a) | | | 5,057,990 | |
| | 123,320 | | | CSG Systems International, Inc. | | | 4,689,860 | |
| | 60,069 | | | ePlus, Inc. * | | | 5,499,313 | |
| | 160,578 | | | Ituran Location and Control, Ltd. (Israel) | | | 4,271,375 | |
| | 138,836 | | | Match Group, Inc. * | | | 2,507,378 | |
| | 25,750 | | | MicroStrategy, Inc., Class A * | | | 5,016,358 | |
| | 200,552 | | | NeuStar, Inc., Class A * | | | 4,502,392 | |
| | 38,540 | | | OSI Systems, Inc. * | | | 2,702,810 | |
| | 85,640 | | | Rackspace Hosting, Inc. * | | | 2,735,342 | |
| | 337,060 | | | VeriFone Systems, Inc. * | | | 5,217,689 | |
| | | | | | | | |
| | | | | | | 50,953,425 | |
| | | | | | | | |
| | | | Real Estate – 2.0% | | | | |
| | 146,255 | | | The GEO Group, Inc. | | | 3,504,270 | |
| | 83,090 | | | Marcus & Millichap, Inc. * | | | 1,946,799 | |
| | | | | | | | |
| | | | | | | 5,451,069 | |
| | | | | | | | |
The accompanying notes are an integral part of these financial statements.
36
AMG Funds
| | |
| AMG River Road Small Cap Value Fund | | October 31, 2016 |
| |
| Schedule of Investments – continued | | |
| | | | | | |
Shares | | | | Market
Value | |
| | Telecommunication Services – 2.4% | | | | |
| 43,690 | | ATN International, Inc. | | $ | 2,955,192 | |
| 139,240 | | Telephone & Data Systems, Inc. | | | 3,597,962 | |
| | | | | | |
| | | | | 6,553,154 | |
| | | | | | |
| | Total Common Stocks
(Cost $202,156,397) | | | 242,581,291 | |
| | | | | | |
INVESTMENT COMPANY – 9.4% | | | | |
| 25,270,396 | | Dreyfus Government Cash Management Fund, Institutional Class Shares, 0.28%** | | | 25,270,396 | |
| | | | | | |
| | Total Investment Company
(Cost $25,270,396) | | | 25,270,396 | |
| | | | | | |
Total Investments – 99.8%
(Cost $227,426,793)*** | | | 267,851,687 | |
| | | | | | |
Net Other Assets and Liabilities – 0.2% | | | 666,373 | |
| | | | | | |
Net Assets – 100.0% | | $ | 268,518,060 | |
| | | | | | |
| * | Non-income producing security. |
| ** | Yield shown represents the October 31, 2016, seven-day average yield, which refers to the sum of the previous seven days’ dividends paid, expressed as an annual percentage. |
| *** | At October 31, 2016, the aggregate cost for Federal income tax purposes is $227,798,438. |
| | | | |
Gross unrealized appreciation | | $ | 49,428,461 | |
Gross unrealized depreciation | | | (9,375,212 | ) |
| | | | |
Net unrealized appreciation | | $ | 40,053,249 | |
| | | | |
| (a) | These securities have been determined to be illiquid securities. At October 31, 2016, these securities amounted to $13,392,420, or 5.0% of net assets. These securities were valued using a quote from the primary exchange and management has determined these securities are traded in active markets. Therefore, it has been determined that these securities are valued using Level 1 pricing inputs. |
| BDC | Business Development Company |
The accompanying notes are an integral part of these financial statements.
37
AMG Managers Silvercrest Small Cap Fund
Portfolio Manager’s Comments (unaudited)
REVIEW AND OUTLOOK
The AMG Managers Silvercrest Small Cap Fund1 (the “Fund”) Class N shares returned 5.7% for the fiscal year ended October 31, 2016, compared with an 8.8% return for its benchmark, the Russell 2000® Value Index.
As is typical, the Fund’s various sector over/under weights versus the Russell 2000® Value Index did not have a significant impact on our relative performance. The Fund had relatively poor stock selection in two sectors, consumer discretionary and financial services, which explains the bulk of our under-performance. In consumer discretionary, we had several poor performers, some of which had poor fundamental results, and some mired in negative sentiment. In financial services, our underweight in real estate investment trusts (REITs) (roughly half-weighted) did hurt. Despite relatively poor performance over the past three months, on a year-ending October basis, REITs performed relatively well.
The largest contributors to return included Littelfuse Inc., MKS Instruments Inc., MGE Energy Inc., ONE Gas Inc. and MSA Safety Inc. All tended to report solid earnings results. Additionally, MGE Energy and ONE Gas benefitted from the “quest for yield” in an ultra-low interest rate environment. We have cut back our utility exposure sharply as we find most sector issues generously valued. We would also note G&K Services Inc. and FEI Co., both of which were targets of acquisition bids from larger companies at nice premiums. As we write this, another of our holdings, Mentor Graphics, has been the subject of takeover rumors due to the involvement of activist shareholders who have been pushing management to seek and consider takeover bids from other larger entities.
The largest detractors from return included Integer Holdings Corp., Men’s Wearhouse Inc., Pebblebrook Hotel Trust, E.W. Scripps Company and ACI Worldwide Inc. All reported disappointing earnings and/or forward guidance. Additionally, Pebblebrook and Scripps are in two generally un-loved industries of late, hotel lodging and TV media.
As we look forward, we generally do not anticipate making many dramatic changes at the sector level to the Fund. In the lead up to the U.S. presidential election, to occur in early November, the market has been roiled by negative campaign rhetoric and animosity between the candidates in general, and particularly the potential election of Donald Trump as President. Similar to Brexit, we believe much of the knee-jerk reactions will prove to be premature, and somewhat overdone, as we think it will take some time to see how a President Trump or President Clinton differs from Candidate Trump or Candidate Clinton, and the willingness of Congress to forward either of their agendas. What we do know, however, is that our dialogue with companies suggests a reasonably constructive outlook for next year, with a pervasive sense of continuing slow growth, with perhaps a growing chorus that the “bottom may be in” for some more challenged industries, including oil and gas, mining and agriculture. We continue to find most companies extremely well capitalized, and cash flow remains fairly robust. We are pleased to note that three of our companies have been targeted for acquisition this calendar year, and we continue to believe the Fund offers substantial value in that respect. While we are hard-pressed to forecast what will happen following the election, small caps may indeed benefit more strongly from a stronger U.S. Dollar, and an economy focused more on domestic issues. The Value benchmarks, with their larger weighting in financial services, would likely benefit from the perception that a stronger U.S. economy would lead to an uptick in yields. We shall see, but in a volatile environment, we continue to believe the Fund is reasonably valued.
The views expressed represent the opinions of Silvercrest Asset Management Group LLC, as of October 31, 2016, and are not intended as a forecast or guarantee of future results and are subject to change without notice.
| 1 | Prior to October 1, 2016, the Fund was known as ASTON/Silvercrest Small Cap Fund. |
38
AMG Managers Silvercrest Small Cap Fund
Portfolio Manager’s Comments (continued)
CUMULATIVE TOTAL RETURN PERFORMANCE
The AMG Managers Silvercrest Small Cap Fund’s cumulative total return is based on the daily change in net asset value (NAV), and assumes that all dividends and distributions were reinvested. The chart compares a hypothetical $10,000 investment made in AMG Managers Silvercrest Small Cap Fund’s Class N on December 27, 2011, to a $10,000 investment made in the Russell 2000® Value Index for the same time period. The graph and table do not reflect the deduction of taxes that a shareholder would pay on a Fund distribution or redemption of shares. The listed returns for the Fund are net of expenses and the returns for the index exclude expenses. Total returns would have been lower had certain expenses not been reduced.

The table below shows the average annual total returns for AMG Managers Silvercrest Small Cap Fund and the Russell 2000® Value Index for the same time periods ended October 31, 2016.
| | | | | | | | | | | | |
| | | One | | | Since | | | Inception | |
| Average Annual Total Returns1 | | Year | | | Inception | | | Date | |
AMG Managers Silvercrest Small Cap Fund2,3,4,5 | | | | | | | | | | | | |
Class N | | | 5.73 | % | | | 11.84 | % | | | 12/27/11 | |
Class I | | | 6.04 | % | | | 12.13 | % | | | 12/27/11 | |
Russell 2000® Value Index6,7 | | | 8.81 | % | | | 11.48 | % | | | 12/27/11 | † |
The performance data shown represents past performance. Past performance is not a guarantee of future results. Current performance may be lower or higher than the performance data quoted. The investment return and the principal value of an investment will fluctuate so that an investor’s shares, when redeemed, may be worth more or less than their original cost.
Investors should carefully consider the Fund’s investment objectives, risks, charges and expenses before investing. For performance information through the most recent month end, current net asset values per share for the Fund and other information, please call (800) 835-3879 or visit our website at www.amgfunds.com for a free prospectus. Read it carefully before investing or sending money.
Distributed by AMG Distributors, Inc., member FINRA/SIPC.
| † | Date reflects the inception date of the Fund, not the index. |
| 1 | Total return equals income yield plus share price change and assumes reinvestment of all dividends and capital gain distributions. Returns are net of fees and may reflect offsets of Fund expenses as described in the prospectus. No adjustment has been made for taxes payable by shareholders on their reinvested dividends and capital gain distributions. Returns for periods greater than one year are annualized. The listed returns on the Fund are net of expenses and based on the published NAV as of October 31, 2016. All returns are in U.S. dollars ($). |
| 2 | The Fund is subject to risks associated with investments in small-capitalization companies, such as erratic earnings patterns, competitive conditions, limited earnings history and a reliance on one or a limited number of products. |
| 3 | The Fund is subject to risks associated with investments in mid-capitalization companies such as greater price volatility, lower trading volume, and less liquidity than the stocks of larger, more established companies. |
| 4 | The Fund is subject to special risk considerations similar to those associated with the direct ownership of real estate. Real estate valuations may be subject to factors such as changing general and local economic, financial, competitive, and environmental conditions. |
| 5 | The Fund invests in value stocks, which may perform differently from the market as a whole and may be undervalued by the market for a long period of time. |
| 6 | The Russell 2000® Index is composed of the 2000 smallest stocks in the Russell 3000® Index and is widely regarded in the industry as the premier measure of small-cap stock performance. |
| 7 | The Russell 2000® Value Index is an unmanaged, market-value weighted, value-oriented index comprised of small stocks that have relatively low price-to-book ratios and lower forecasted growth values. Unlike the Fund, the indices are unmanaged, are not available for investment and do not incur expenses. |
The Russell Indices are a trademark of the London Stock Exchange Group Companies.
Not FDIC insured, nor bank guaranteed. May lose value.
39
AMG Funds
| | |
| AMG Managers Silvercrest Small Cap Fund | | October 31, 2016 |
| |
| Schedule of Investments | | |
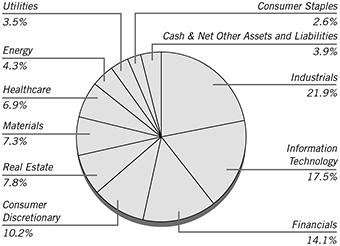
% of Net Assets
| | | | | | | | |
Shares | | | | | Market
Value | |
| COMMON STOCKS – 96.1% | | | | |
| | | | Consumer Discretionary – 10.2% | | | | |
| | 142,690 | | | The EW Scripps Co., Class A * | | $ | 1,892,069 | |
| | 122,870 | | | The Finish Line, Inc., Class A | | | 2,419,310 | |
| | 142,330 | | | Fox Factory Holding Corp. * | | | 3,088,561 | |
| | 162,710 | | | La-Z-Boy, Inc. | | | 3,807,414 | |
| | 38,480 | | | Lithia Motors, Inc., Class A | | | 3,300,814 | |
| | 55,620 | | | Meredith Corp. | | | 2,522,367 | |
| | 166,000 | | | Wolverine World Wide, Inc. | | | 3,544,100 | |
| | | | | | | | |
| | | | | | | 20,574,635 | |
| | | | | | | | |
| | | | Consumer Staples – 2.6% | | | | |
| | 25,654 | | | J & J Snack Foods Corp. | | | 3,133,636 | |
| | 16,034 | | | Lancaster Colony Corp. | | | 2,094,842 | |
| | | | | | | | |
| | | | | | | 5,228,478 | |
| | | | | | | | |
| | | | Energy – 4.3% | | | | |
| | 235,400 | | | Callon Petroleum Co. * | | | 3,057,846 | |
| | 139,190 | | | Forum Energy Technologies, Inc. * | | | 2,505,420 | |
| | 146,360 | | | Matador Resources Co. * | | | 3,192,112 | |
| | | | | | | | |
| | | | | | | 8,755,378 | |
| | | | | | | | |
| | | | Financials – 14.1% | | | | |
| | 247,790 | | | BancorpSouth, Inc. | | | 5,823,065 | |
| | 286,790 | | | CVB Financial Corp. | | | 4,812,336 | |
| | 161,444 | | | Horace Mann Educators Corp. | | | 5,803,912 | |
| | 89,809 | | | Iberiabank Corp. | | | 5,895,961 | |
| | 111,273 | | | Independent Bank Corp./MA | | | 6,136,706 | |
| | | | | | | | |
| | | | | | | 28,471,980 | |
| | | | | | | | |
| | | | Healthcare – 6.9% | | | | |
| | 45,447 | | | Analogic Corp. | | | 3,719,837 | |
| | 40,804 | | | ICU Medical, Inc. * | | | 5,683,997 | |
| | 101,170 | | | INC Research Holdings, Inc., Class A * | | | 4,623,469 | |
| | | | | | | | |
| | | | | | | 14,027,303 | |
| | | | | | | | |
| | | | | | | | |
Shares | | | | | Market
Value | |
| | | | Industrials – 21.9% | | | | |
| | 117,435 | | | Altra Industrial Motion Corp. | | $ | 3,464,333 | |
| | 208,050 | | | Babcock & Wilcox Enterprises, Inc. * | | | 3,274,707 | |
| | 42,820 | | | CIRCOR International, Inc. | | | 2,302,860 | |
| | 88,916 | | | EMCOR Group, Inc. | | | 5,375,861 | |
| | 91,430 | | | ESCO Technologies, Inc. | | | 4,073,207 | |
| | 61,660 | | | Hillenbrand, Inc. | | | 1,871,381 | |
| | 158,050 | | | Knoll, Inc. | | | 3,420,202 | |
| | 76,579 | | | MSA Safety, Inc. | | | 4,464,556 | |
| | 300,670 | | | Mueller Water Products, Inc., Class A | | | 3,704,254 | |
| | 168,550 | | | Quanex Building Products Corp. | | | 2,747,365 | |
| | 42,320 | | | Standex International Corp. | | | 3,233,248 | |
| | 95,099 | | | US Ecology, Inc. | | | 4,017,933 | |
| | 38,030 | | | Watts Water Technologies, Inc., Class A | | | 2,281,800 | |
| | | | | | | | |
| | | | | | | 44,231,707 | |
| | | | | | | | |
| | | | Information Technology – 17.5% | | | | |
| | 89,097 | | | ACI Worldwide, Inc. * | | | 1,614,438 | |
| | 301,630 | | | Entegris, Inc. * | | | 4,795,917 | |
| | 21,160 | | | Itron, Inc. * | | | 1,140,524 | |
| | 48,495 | | | Littelfuse, Inc. | | | 6,765,053 | |
| | 107,820 | | | M/A-COM Technology Solutions Holdings, Inc. * | | | 3,963,463 | |
| | 153,710 | | | Mentor Graphics Corp. | | | 4,442,219 | |
| | 82,760 | | | Methode Electronics, Inc. | | | 2,582,112 | |
| | 128,155 | | | MKS Instruments, Inc. | | | 6,465,420 | |
| | 131,670 | | | NetScout Systems, Inc. * | | | 3,614,342 | |
| | | | | | | | |
| | | | | | | 35,383,488 | |
| | | | | | | | |
| | | | Materials – 7.3% | | | | |
| | 80,740 | | | H.B. Fuller Co. | | | 3,396,732 | |
| | 78,780 | | | Ingevity Corp. * | | | 3,261,492 | |
| | 66,710 | | | Minerals Technologies, Inc. | | | 4,482,912 | |
| | 162,453 | | | PH Glatfelter Co. | | | 3,609,706 | |
| | | | | | | | |
| | | | | | | 14,750,842 | |
| | | | | | | | |
| | | | Real Estate – 7.8% | | | | |
| | 64,658 | | | EastGroup Properties, Inc. | | | 4,390,925 | |
| | 174,490 | | | Pebblebrook Hotel Trust | | | 4,236,617 | |
| | 206,440 | | | Physicians Realty Trust | | | 4,081,319 | |
| | 67,490 | | | QTS Realty Trust, Inc., Class A | | | 3,101,840 | |
| | | | | | | | |
| | | | | | | 15,810,701 | |
| | | | | | | | |
| | | | Utilities – 3.5% | | | | |
| | 41,193 | | | MGE Energy, Inc. | | | 2,407,731 | |
| | 34,600 | | | ONE Gas, Inc. | | | 2,120,287 | |
| | 59,339 | | | Portland General Electric Co. | | | 2,589,553 | |
| | | | | | | | |
| | | | | | | 7,117,571 | |
| | | | | | | | |
| | | | Total Common Stocks
(Cost $181,683,352) | | | 194,352,083 | |
| | | | | | | | |
The accompanying notes are an integral part of these financial statements.
40
AMG Funds
| | |
| AMG Managers Silvercrest Small Cap Fund | | October 31, 2016 |
| |
| Schedule of Investments – continued | | |
| | | | | | |
Shares | | | | Market
Value | |
INVESTMENT COMPANY – 3.4% | | | | |
6,850,096 | | Dreyfus Government Cash Management
Fund, Institutional Class Shares, 0.28%** | | $ | 6,850,096 | |
| | | | | | |
| | Total Investment Company
(Cost $6,850,096) | | | 6,850,096 | |
| | | | | | |
Total Investments – 99.5%
(Cost $188,533,448)*** | | | 201,202,179 | |
| | | | | | |
| Net Other Assets and Liabilities – 0.5% | | | 990,059 | |
| | | | | | |
| Net Assets – 100.0% | | $ | 202,192,238 | |
| | | | | | |
| * | Non-income producing security. |
| ** | Yield shown represents the October 31, 2016, seven-day average yield, which refers to the sum of the previous seven days’ dividends paid, expressed as an annual percentage. |
| *** | At October 31, 2016, the aggregate cost for Federal income tax purposes is $189,000,445. |
| | | | |
Gross unrealized appreciation | | $ | 20,899,886 | |
Gross unrealized depreciation | | | (8,698,152 | ) |
| | | | |
Net unrealized appreciation | | $ | 12,201,734 | |
| | | | |
The accompanying notes are an integral part of these financial statements.
41
AMG GW&K U.S. Small Cap Growth Fund
Portfolio Manager’s Comments (unaudited)
THE YEAR IN REVIEW
For the fiscal year ending October 31, 2016, the AMG GW&K U.S. Small Cap Growth Fund1 (the “Fund”) Class N shares returned (4.4)% compared to the return of 4.1% for the Russell 2000® Index. Over the same period, the Russell 2000® Growth Index returned (0.5)%.
Effective February 1, 2016, GW&K Investment Management, LLC (“GW&K”) was appointed as the new subadvisor to the Fund. In connection with this change, the Fund changed its name to ASTON Small Cap Fund and effective October 1, 2016, to AMG GW&K U.S. Small Cap Growth Fund.
This measurement period ended much as it began—with a precipitous decline. The first few days of our management tenure caught the tail end of the dramatic decline in equity markets that defined the beginning of the 2016 calendar year. Specifically, the Russell 2000® Growth Index dropped -9.1% between February 1 and February 11. In a similar vein, the Index finished the fiscal year with a decline of -6.2% in the month of October. While the beginning and end proved to be busts of dramatic proportions, albeit mercifully brief, the interim was nothing short of a boom. From February 11 through the end of September, the Russell 2000® Growth Index raced higher by 32.6%. The aggregate of these countervailing winds for small cap growth stocks during the period February 1 through October 31 was an overall return of 13.0%—a heady gain for such a short timeframe by anyone’s definition.
As one might expect with a rally of such force, the market action had a decidedly risk-on flavor. Indeed, animal spirits were evident in virtually every style factor that we track: companies at the lower end of the market cap spectrum outperformed, as did non-earners, high beta did better than low beta, high financial leverage beat low leverage, and the most stable earnings per share (EPS) growers lagged the market. The only style factor that did not mesh with these trends was the market-beating returns of dividend payers. Investors hunted for yield as the
10-Year U.S. Treasury Note yield sank below 2% at the end of January and languished there for almost the entire measurement period. Aside from this yield-chasing dynamic, investors clearly moved out on the risk curve during the period. We think this was a function of 1) most active investors adjusting positions after being overly cautious earlier this year, 2) global central bank policy remaining very accommodative, and 3) the global economy holding together post the surprise Brexit vote.
On a sector basis, growth and commodity-oriented groups charged forward with the greatest determination. Materials (+29.2%) and energy (+25.7%) led the way, followed by information technology (+19.4%) and industrials (+19.1%). At the other end of the spectrum, utilities was the worst of the bunch but still managed a respectable return (+3.8%). However, utilities is an almost immaterial portion of the Index at 0.4%. Of the more meaningful sectors, the biggest laggards were consumer discretionary (+6.2%) and health care (+6.7%).
The Fund produced a strong absolute return from the time that GW&K became the subadvisor. However, this was not enough to keep up with the sharp move higher in the Index. At GW&K, we have a strategic preference for higher-quality companies that can not only grow, but could grow profitably. We believe our long-term track record demonstrates that assembling a portfolio of leading companies gives our investors a good opportunity to outperform over a market cycle. However, this approach puts us at a disadvantage during risk-on rallies like the one covering this measurement period. Indeed, the sharp market move higher, especially its lower-quality nature, accounted for about a third of our under-performance according to the style factors that we track. The remainder of the underperformance can be attributed to stock selection.
Most of this weakness came from our holdings in the information technology and health care sectors. We had a number of strong performers in information
technology during the period, with four stocks posting very robust gains of more than 50%—Interactive Intelligence Group Inc. (ININ), FEI Company (FEIC), Cognex Corporation (CGNX) and LogMeIn Inc. (LOGM). CGNX and LOGM remain in the portfolio, while we sold ININ on news that the company was exploring strategic alternatives, and we exited our position in FEIC after that company announced plans to be acquired. The most notable offsets to these winners were Cavium Inc. (CAVM), Super Micro Computer, Inc. (SMCI), EPAM Systems Inc. (EPAM), VeriFone Systems Inc. (PAY) and COM-SCORE, Inc. (SCOR). We exited our positions in three of these companies (CAVM, SMCI and SCOR) after losing confidence in the long-term outlook for each. The specific catalysts for our sell decisions were: a large, slow-growing acquisition that dramatically changed CAVM’s growth and risk profile, more intense competition that led to a sizable earnings miss for SMCI and accounting issues at SCOR. As for the other two prominent offenders in information technology, EPAM and PAY, we believe exogenous factors played significantly roles in the declines for both stocks. EPAM suffered along with many other IT service providers from a tempered spending environment, while PAY was hurt by the payment industry’s slow certification of new point-of-sale terminals. These created disappointing setbacks for both companies, but we still believe each has the ability to generate solid returns for shareholders. The story in health care was analogous to that of information technology in that we had a number of strong stocks that were more than offset by some weak performers. We did not have any health care stocks post a return of greater than 50% like we had in information technology, but we did own a total of seven stocks that reported gains of 20% or better—Retrophin Inc. (RTRX), DBV Technologies SA (DBVT), ABIOMED, Inc. (ABMD), Endologix, Inc. (ELGX), West Pharmaceutical Services Inc. (WST), Align Technology, Inc. (ALGN) and ICU Medical, Inc. (ICUI). We maintain positions in all of these companies with the exception of ALGN which we sold because it exceeded our market cap parameters.
42
AMG GW&K U.S. Small Cap Growth Fund
Portfolio Manager’s Comments (continued)
On the other side of the ledger, the biggest detractors in Health Care were Acadia Healthcare Co., Inc. (ACHC), Impax Laboratories, Inc. (IPXL), and Dynavax Technologies Corp. (DVAX). IPXL was largely hurt by a difficult pricing environment for generic drugs, while we believe the main factor in ACHC’s decline was its UK business. More specifically, ACHC suffered from the depreciation of the pound and an extended regulatory review by UK authorities which is now complete. We continue to maintain modest positions in both IPXL and ACHC, however, the same cannot be said of DVAX. We sold our position in DVAX after we were spooked by news that the FDA had cancelled an advisory panel meeting for DVAX’s lead drug candidate. Other investors were spooked as well leading to the stock taking a large hit. While our investment in DVAX was disappointing, we take some solace in knowing that we avoided significantly greater losses as the stock is now trading at less than half the level at which we sold.
Our trading activity was fairly normal during the period as our long-term approach leads to relatively low turnover. At a high level, the most notable effect of this trading activity was to reduce our industrials weight compared to the benchmark, and the inverse for consumer discretionary. The industrials sector was one of the best performing groups during the period, despite suffering through a very weak demand environment. As such, we faded our industrials exposure by selling and trimming some positions where we thought there were significant disconnects between the fundamentals and the share price. Conversely, consumer discretionary was the worst performing meaningful sector in the benchmark, which created some opportunities for us to add to our exposure. The net result was that our modest overweight in industrials became a modest underweight, and our modest underweight in consumer discretionary became a modest overweight. Indeed, “modest” is often a good way to describe our sector weightings versus the Index, as we prefer to let individual stock selection drive our returns. The fact that
our benchmark consists of over 1,000 stocks means that there are ample potential investments from which to choose. Our goal, as always, is to scour this investment universe for high quality businesses run by experienced managers that can generate attractive returns for our investors over a multi-year period.
The views expressed represent the opinions of GW&K Investment Management LLC, as of October 31, 2016, and are not intended as a forecast or guarantee of future results and are subject to change without notice.
| 1 | Prior to October 1, 2016, the Fund was known as ASTON Small Cap Fund. |
43
AMG GW&K U.S. Small Cap Growth Fund
Portfolio Manager’s Comments (continued)
CUMULATIVE TOTAL RETURN PERFORMANCE
The AMG GW&K U.S. Small Cap Growth Fund’s cumulative total return is based on the daily change in net asset value (NAV), and assumes that all dividends and distributions were reinvested. The chart compares a hypothetical $10,000 investment made in AMG GW&K U.S. Small Cap Growth Fund’s Class N on October 31, 2006, to a $10,000 investment made in the Russell 2000® Index and the Russell 2000® Growth Index for the same time period. The graph and table do not reflect the deduction of taxes that a shareholder would pay on a Fund distribution or redemption of shares. The listed returns for the Fund are net of expenses and the returns for the index exclude expenses. Total returns would have been lower had certain expenses not been reduced.
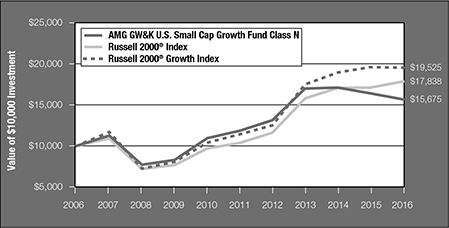
The table below shows the average annual total returns for AMG GW&K U.S. Small Cap Growth Fund, the Russell 2000® Index and Russell 2000® Growth Index for the same time periods ended October 31, 2016.
| | | | | | | | | | | | |
| | | One | | | Five | | | Ten | |
| Average Annual Total Returns1 | | Year | | | Years | | | Years | |
AMG GW&K U.S. Small Cap Growth Fund2,3,4,5 | | | | | | | | | | | | |
Class N | | | (4.39 | )% | | | 5.74 | % | | | 4.60 | % |
Class I | | | (4.27 | )% | | | 5.97 | % | | | 4.85 | % |
Russell 2000® Index6 | | | 4.11 | % | | | 11.51 | % | | | 5.96 | % |
Russell 2000® Growth Index7 | | | (0.49 | )% | | | 11.34 | % | | | 6.92 | % |
The performance data shown represents past performance. Past performance is not a guarantee of future results. Current performance may be lower or higher than the performance data quoted. The investment return and the principal value of an investment will fluctuate so that an investor’s shares, when redeemed, may be worth more or less than their original cost.
Investors should carefully consider the Fund’s investment objectives, risks, charges and expenses before investing. For performance information through the most recent month end, current net asset values per share for the Fund and other information, please call (800) 835-3879 or visit our website at www.amgfunds.com for a free prospectus. Read it carefully before investing or sending money.
Distributed by AMG Distributors, Inc., member FINRA/SIPC.
| 1 | Total return equals income yield plus share price change and assumes reinvestment of all dividends and capital gain distributions. Returns are net of fees and may reflect offsets of Fund expenses as described in the prospectus. No adjustment has been made for taxes payable by shareholders on their reinvested dividends and capital gain distributions. Returns for periods greater than one year are annualized. The listed returns on the Fund are net of expenses and based on the published NAV as of October 31, 2016. All returns are in U.S. dollars ($). |
| 2 | The Fund is subject to risks associated with investments in small-capitalization companies, such as erratic earnings patterns, competitive conditions, limited earnings history and a reliance on one or a limited number of products. |
| 3 | The Fund invests in growth stocks, which may be more sensitive to market movements because their prices tend to reflect future investor expectations rather than just current profits. Growth stocks may underperform value stocks during given periods. |
| 4 | The Fund is subject to risks associated with investments in mid-capitalization companies such as greater price volatility, lower trading volume, and less liquidity than the stocks of larger, more established companies. |
| 5 | The Fund is subject to special risk considerations similar to those associated with the direct ownership of real estate. Real estate valuations may be subject to factors such as changing general and local economic, financial, competitive, and environmental conditions. |
| 6 | The Russell 2000® Index is composed of the 2000 smallest stocks in the Russell 3000® Index and is widely regarded in the industry as the premier measure of small-cap stock performance. Unlike the Fund, the Russell 2000® Index is unmanaged, is not available for investment and does not incur expenses. |
| 7 | The Russell 2000® Growth Index measures the performance of the Russell 2000 companies with higher price-to-book ratios and higher forecasted growth values. Unlike the Fund, the Russell 2000® Growth Index is unmanaged, is not available for investment and does not incur expenses. |
The Russell Indices are a trademark of London Stock Exchange Group companies.
Not FDIC insured, nor bank guaranteed. May lose value.
44
AMG Funds
| | |
| AMG GW&K U.S. Small Cap Growth Fund | | October 31, 2016 |
| |
| Schedule of Investments | | |
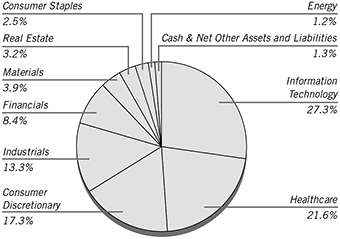
% of Net Assets
| | | | | | | | |
Shares | | | | | Market
Value | |
| COMMON STOCKS – 98.7% | | | | |
| | | | Consumer Discretionary – 17.3% | | | | |
| | 33,348 | | | Build-A-Bear Workshop, Inc. * | | $ | 450,198 | |
| | 13,503 | | | Burlington Stores, Inc. * | | | 1,011,915 | |
| | 23,778 | | | Chuy’s Holdings, Inc. * | | | 675,295 | |
| | 16,000 | | | Dave & Buster’s Entertainment, Inc. * | | | 661,600 | |
| | 21,296 | | | Five Below, Inc. * | | | 800,304 | |
| | 23,850 | | | Fox Factory Holding Corp. * | | | 517,545 | |
| | 26,823 | | | Grand Canyon Education, Inc. * | | | 1,170,556 | |
| | 10,423 | | | Hibbett Sports, Inc. * | | | 404,934 | |
| | 8,850 | | | Oxford Industries, Inc. | | | 555,072 | |
| | 9,502 | | | Pool Corp. | | | 879,695 | |
| | 5,982 | | | Vitamin Shoppe, Inc. * | | | 149,849 | |
| | | | | | | | |
| | | | | | | 7,276,963 | |
| | | | | | | | |
| | | | Consumer Staples – 2.5% | | | | |
| | 28,030 | | | Amplify Snack Brands, Inc. * | | | 406,155 | |
| | 6,920 | | | PriceSmart, Inc | | | 629,374 | |
| | | | | | | | |
| | | | | | | 1,035,529 | |
| | | | | | | | |
| | | | Energy – 1.2% | | | | |
| | 23,771 | | | Matador Resources Co. * | | | 518,446 | |
| | | | | | | | |
| | | | Financials – 8.4% | | | | |
| | 16,411 | | | Encore Capital Group, Inc. * | | | 325,758 | |
| | 8,212 | | | Greenhill & Co., Inc. | | | 192,571 | |
| | 20,133 | | | Heritage Insurance Holdings, Inc. | | | 237,368 | |
| | 7,160 | | | MarketAxess Holdings, Inc. | | | 1,079,442 | |
| | 1,877 | | | Pinnacle Financial Partners, Inc. | | | 96,853 | |
| | 16,312 | | | PrivateBancorp, Inc. | | | 737,955 | |
| | 9,241 | | | Stifel Financial Corp. * | | | 361,693 | |
| | 8,293 | | | Texas Capital Bancshares, Inc. * | | | 491,775 | |
| | | | | | | | |
| | | | | | | 3,523,415 | |
| | | | | | | | |
| | | | | | | | |
Shares | | | | | Market
Value | |
| | | | Healthcare – 21.6% | | | | |
| | 4,314 | | | ABIOMED, Inc. * | | $ | 452,927 | |
| | 11,523 | | | Acadia Healthcare Co., Inc. * | | | 414,367 | |
| | 68,935 | | | Amicus Therapeutics, Inc. * | | | 475,652 | |
| | 15,118 | | | Bruker Corp. | | | 309,768 | |
| | 23,719 | | | Catalent, Inc. * | | | 541,030 | |
| | 18,038 | | | DBV Technologies SA, Sponsored ADR * | | | 619,245 | |
| | 28,169 | | | Endologix, Inc. * | | | 294,648 | |
| | 25,074 | | | Globus Medical, Inc., Class A * | | | 554,888 | |
| | 4,823 | | | ICU Medical, Inc. * | | | 671,844 | |
| | 15,385 | | | Impax Laboratories, Inc. * | | | 309,239 | |
| | 13,165 | | | INC Research Holdings, Inc., Class A * | | | 601,641 | |
| | 52,126 | | | Inotek Pharmaceuticals Corp. * | | | 364,882 | |
| | 15,471 | | | Medidata Solutions, Inc. * | | | 742,453 | |
| | 14,200 | | | Neurocrine Biosciences, Inc. * | | | 621,534 | |
| | 23,327 | | | Retrophin, Inc. * | | | 439,714 | |
| | 11,006 | | | Team Health Holdings, Inc. * | | | 471,607 | |
| | 7,691 | | | West Pharmaceutical Services, Inc. | | | 584,747 | |
| | 28,342 | | | Wright Medical Group NV (Netherlands) * | | | 620,973 | |
| | | | | | | | |
| | | | | | | 9,091,159 | |
| | | | | | | | |
| | | | Industrials – 13.3% | | | | |
| | 8,985 | | | CEB, Inc. | | | 437,120 | |
| | 9,309 | | | Exponent, Inc. | | | 532,940 | |
| | 7,572 | | | Graco, Inc. | | | 567,143 | |
| | 11,379 | | | HEICO Corp. | | | 768,765 | |
| | 13,878 | | | Knight Transportation, Inc. | | | 405,932 | |
| | 3,081 | | | Proto Labs, Inc. * | | | 137,721 | |
| | 29,344 | | | Ritchie Bros Auctioneers, Inc. (Canada) | | | 1,015,009 | |
| | 13,240 | | | Thermon Group Holdings, Inc. * | | | 242,689 | |
| | 15,681 | | | WageWorks, Inc. * | | | 924,395 | |
| | 9,410 | | | Woodward, Inc. | | | 555,002 | |
| | | | | | | | |
| | | | | | | 5,586,716 | |
| | | | | | | | |
| | | | Information Technology – 27.3% | | | | |
| | 9,954 | | | Blackbaud, Inc. | | | 611,176 | |
| | 15,134 | | | Bottomline Technologies de, Inc. * | | | 343,390 | |
| | 7,714 | | | Cabot Microelectronics Corp. | | | 426,270 | |
| | 28,203 | | | Callidus Software, Inc. * | | | 514,705 | |
| | 11,268 | | | Cardtronics PLC, Class A (United Kingdom) * | | | 563,400 | |
| | 10,304 | | | Cognex Corp. | | | 531,686 | |
| | 8,740 | | | CyberArk Software, Ltd. (Israel) * | | | 408,595 | |
| | 11,642 | | | EPAM Systems, Inc. * | | | 749,396 | |
| | 8,934 | | | ExlService Holdings, Inc. * | | | 393,364 | |
| | 17,773 | | | Forrester Research, Inc. | | | 662,044 | |
| | 13,290 | | | HubSpot, Inc. * | | | 697,061 | |
| | 25,043 | | | Intralinks Holdings, Inc. * | | | 229,644 | |
| | 11,794 | | | LogMeIn, Inc. | | | 1,120,430 | |
| | 13,135 | | | MACOM Technology Solutions Holdings, Inc.* | | | 482,843 | |
| | 7,780 | | | MAXIMUS, Inc. | | | 405,027 | |
| | 16,030 | | | Mimecast Ltd. (Jersey) * | | | 324,447 | |
| | 16,249 | | | Power Integrations, Inc. | | | 1,047,248 | |
| | 5,960 | | | Tyler Technologies, Inc. * | | | 955,984 | |
| | 20,036 | | | VeriFone Systems, Inc. * | | | 310,157 | |
| | 21,894 | | | Xactly Corp. * | | | 282,433 | |
The accompanying notes are an integral part of these financial statements.
45
AMG Funds
| | |
| AMG GW&K U.S. Small Cap Growth Fund | | October 31, 2016 |
| |
| Schedule of Investments – continued | | |
| | | | | | | | |
Shares | | | | | Market
Value | |
| | | | Information Technology (continued) | |
| | 6,252 | | | Zebra Technologies Corp., Class A * | | $ | 411,632 | |
| | | | | | | | |
| | | | | | | 11,470,932 | |
| | | | | | | | |
| | | | Materials – 3.9% | | | | |
| | 12,351 | | | Balchem Corp. | | | 937,441 | |
| | 24,014 | | | Flotek Industries, Inc. * | | | 282,885 | |
| | 21,767 | | | KapStone Paper and Packaging Corp. | | | 394,853 | |
| | | | | | | | |
| | | | | | | 1,615,179 | |
| | | | | | | | |
| | | | Real Estate – 3.2% | | | | |
| | 26,367 | | | STAG Industrial, Inc. | | | 608,287 | |
| | 9,453 | | | Sun Communities, Inc. | | | 727,219 | |
| | | | | | | | |
| | | | | | | 1,335,506 | |
| | | | | | | | |
| | | | Total Common Stocks
(Cost $36,459,907) | | | 41,453,845 | |
| | | | | | | | |
| INVESTMENT COMPANY – 2.2% | | | | |
| | 912,379 | | | Dreyfus Government Cash Management
Fund, Institutional Class Shares,
0.28%** | | | 912,379 | |
| | | | | | | | |
| | | | Total Investment Company
(Cost $912,379) | | | 912,379 | |
| | | | | | | | |
| Total Investments – 100.9%
(Cost $37,372,286)*** | | | 42,366,224 | |
| | | | | | | | |
| Net Other Assets and Liabilities – (0.9)% | | | (357,143 | ) |
| | | | | | | | |
| Net Assets – 100.0% | | $ | 42,009,081 | |
| | | | | | | | |
| * | Non-income producing security. |
| ** | Yield shown represents the October 31, 2016, seven-day average yield, which refers to the sum of the previous seven days’ dividends paid, expressed as an annual percentage. |
| *** | At October 31, 2016, the aggregate cost for Federal income tax purposes is $37,515,018. |
| | | | |
Gross unrealized appreciation | | $ | 6,926,958 | |
Gross unrealized depreciation | | | (2,075,752 | ) |
| | | | |
Net unrealized appreciation | | $ | 4,851,206 | |
| | | | |
| ADR American | Depositary Receipt |
| PLC Public | Limited Company |
The accompanying notes are an integral part of these financial statements.
46
AMG Managers DoubleLine Core Plus Bond Fund
Portfolio Manager’s Comments (unaudited)
The AMG Managers DoubleLine Core Plus Bond Fund1 (the “Fund”) Class N shares returned 4.62% over the trailing 12 months ending October 31, 2016, outperforming the Bloomberg Barclays U.S. Aggregate Bond Index’s return of 4.37%.
Credit sectors, despite increased volatility over the period, performed well on an absolute basis. The best performing sectors held in the Fund were Emerging Market fixed income and investment-grade domestic corporate credit. Structured credit, including RMBS, CMBS and ABS, slightly outperformed the Index and beat their respective sector indices. Both RMBS and ABS have performed well for the period with limited volatility; however, CMBS did experience relatively higher volatility as demand for the product waned given the exit of key players in the market. However, the investment team views this as an opportunity to purchase discounted assets within the securitized products space. Bank loans held within the Fund underperformed other asset classes as the sector struggled most of the period due to a back-up in commodity prices and general volatility within the credit space. Questions surrounding future CLO formation in the face of risk retention rules also modestly caused a decline in bank loans.
The past year has been a roller coaster ride for global financial markets, as a rocky end to 2015 led to a rough start at the turn of the year. Although the December rate hike caught some investors by surprise, we believed that it was not so much the 25 basis point (bps) rate hike that caused an upheaval, but rather the rhetoric of four more hikes, as displayed in the U.S. Federal Reserve’s (the Fed’s) “dot plot” in 2016 and 2017 that had the market spooked. With gross domestic product (GDP) running below 2% year-over-year2, it was hard to see any rationale behind their intended hikes.
On February 11, the market finally capitulated as investors became fearful over new lows in commodities prices, a decline in across the major equity indices and lower U.S. Treasury (UST) yields. The
market eventually regained momentum in the coming weeks as commodity prices stabilized in addition to positive news that the People’s Bank of China would defend the Yuan, assuaging concerns of a large devaluation while providing stability across global banking shares. For the next few months, demand for credit risk became insatiable as investors piled back into asset classes they were so fearful of just a few months earlier.
With all eyes focused on the Fed during the summer months, the Federal Open Market Committee voted to leave the target range for the federal funds rate unchanged during June. Citing low inflation measures and weak business investment, Fed Chair Janet Yellen’s tone was perceived as dovish in a release that included further downward versions to the Fed’s popular dot plot projection. It was the E.U. Referendum on June 23 that ultimately stole the show and set the tone for the third quarter after citizens of the U.K. voted to leave the European Union by capturing 52% of the vote. The British exit or “Brexit” immediately caused shockwaves across financial markets as risk assets sold off. In addition to the global equity selloff that occurred over the following two days, the British Pound fell to the lowest level in over 30 years3. By month end, over $12 trillion of global sovereign debt was trading with negative yields4. It was this time that Mr. Gundlach and the investment team at Double-Line turned maximum negative on U.S. Treasury yields. By July 5, we reached a new all-time low on the 10-year UST yield3.
As we moved closer to year end, global markets focused on the U.S. presidential election as the race tightened significantly late in October with polls showing Hillary Clinton’s lead over Donald Trump narrowing. It was our opinion that regardless of the outcome of the U.S. election, yields were still likely to move higher as we maintained our cautious stance toward U.S. government bonds in favor of TIPS if rates and inflation expectations continue to move higher.
As expected, rates continued to move higher with the benchmark 10-year U.S.
Treasury ending October at 1.83%, nearly 50 bps off the lows. All eyes will be focused on the U.S. election as we await the future economic plan announced by our new president elect.
The views expressed represent the opinions of DoubleLine Capital LP, as of October 31, 2016, and are not intended as a forecast or guarantee of future results and are subject to change without notice.
| 1 | Prior to October 1, 2016, the Fund was known as ASTON/DoubleLine Core Plus Fixed Income Fund. |
| 2 | US Bureau of Economic Analysis |
| 4 | Financial Times, August 12, 2016 |
47
AMG Managers DoubleLine Core Plus Bond Fund
Portfolio Manager’s Comments (continued)
CUMULATIVE TOTAL RETURN PERFORMANCE
The AMG Managers DoubleLine Core Plus Bond Fund’s cumulative total return is based on the daily change in net asset value (NAV), and assumes that all dividends and distributions were reinvested. The chart compares a hypothetical $10,000 investment made in AMG Managers DoubleLine Core Plus Bond Fund’s Class N on July 18, 2011, to a $10,000 investment made in the Bloomberg Barclays U.S. Aggregate Bond Index for the same time period. The graph and table do not reflect the deduction of taxes that a shareholder would pay on a Fund distribution or redemption of shares. The listed returns for the Fund are net of expenses and the returns for the index exclude expenses. Total returns would have been lower had certain expenses not been reduced.
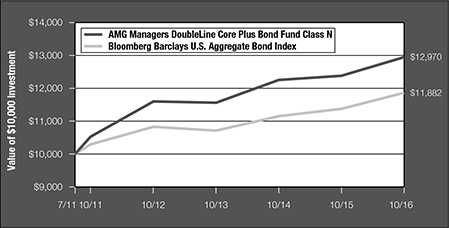
The table below shows the average annual total returns for AMG Managers DoubleLine Core Plus Bond Fund and Bloomberg Barclays U.S. Aggregate Bond Index for the same time periods ended October 31, 2016.
| | | | | | | | | | | | | | | | |
| Average Annual Total Returns1 | | One
Year | | | Five
Year | | | Since
Inception | | | Inception
Date | |
AMG Managers DoubleLine Core Plus Bond Fund2,3,4,5,6,7,8 | | | | | | | | | | | | | | | | |
Class N | | | 4.62 | % | | | 4.25 | % | | | 5.04 | % | | | 07/18/11 | |
Class I | | | 4.79 | % | | | 4.49 | % | | | 5.28 | % | | | 07/18/11 | |
Bloomberg Barclays U.S. Aggregate Bond Index9 | | | 4.37 | % | | | 2.90 | % | | | 3.30 | % | |
| 07/18/11
| †
|
The performance data shown represents past performance. Past performance is not a guarantee of future results. Current performance may be lower or higher than the performance data quoted. The investment return and the principal value of an investment will fluctuate so that an investor’s shares, when redeemed, may be worth more or less than their original cost.
Investors should carefully consider the Fund’s investment objectives, risks, charges and expenses before investing. For performance information through the most recent month end, current net asset values per share for the Fund and other information, please call (800) 835-3879 or visit our website at www.amgfunds.com for a free prospectus. Read it carefully before investing or sending money.
Distributed by AMG Distributors, Inc., member FINRA/SIPC.
| † | Date reflects the inception date of the Fund, not the index. |
| 1 | Total return equals income yield plus share price change and assumes reinvestment of all dividends and capital gain distributions. Returns are net of fees and may reflect offsets of Fund expenses as described in the prospectus. No adjustment has been made for taxes payable by shareholders on their reinvested dividends and capital gain distributions. Returns for periods greater than one year are annualized. The listed returns on the Fund are net of expenses and based on the published NAV as of October 31, 2016. All returns are in U.S. dollars ($). |
| 2 | The Fund is subject to the risks associated with investments in debt securities, such as default risk and fluctuations in the perception of the debtor’s ability to pay its creditors. Changing interest rates |
| | may adversely affect the value of an investment. An increase in interest rates typically causes the value of bonds and other fixed income securities to fall. |
| 3 | Investments in international securities are subject to certain risks of overseas investing including currency fluctuations and changes in political and economic conditions, which could result in significant market fluctuations. |
| 4 | The Fund is subject to the risks associated with investments in emerging markets, such as erratic earnings patterns, economic and political instability, changing exchange controls, limitations on repatriation of foreign capital and changes in local governmental attitudes toward private investment, possibly leading to nationalization or confiscation of investor assets. |
| 5 | To the extent that the Fund invests in asset-backed or mortgage-backed securities, its exposure to prepayment and extension risks may be greater than investments in other fixed income securities. |
| 6 | High-yield bonds (also known as “junk bonds”) may be subject to greater levels of interest rate, credit, and liquidity risk than investments in higher rated securities. These securities are considered predominantly speculative with respect to the issuer’s continuing ability to make principal and interest payments. |
| 7 | The issuers of the Fund’s holdings may be involved in bankruptcy proceedings, reorganizations, or financial restructurings, and are not as strong financially as higher-rated issuers. Factors unique to the municipal bond market may negatively affect the value in municipal bonds. |
| 8 | Obligations of certain government agencies are not backed by the full faith and credit of the U.S. government. If one of these agencies defaulted on a loan, there is no guarantee that the U.S. government would provide financial support. Additionally, debt securities of the U.S. government may be affected by changing interest rates and subject to prepayment risk. |
| 9 | The Bloomberg Barclays U.S. Aggregate Bond Index is an index of the U.S. investment-grade fixed-rate bond market, including both government and corporate bonds. Effective August 24, 2016, the Barclays indices were renamed Bloomberg Barclays indices. Unlike the Fund, the Bloomberg Barclays U.S. Aggregate Bond Index is unmanaged, is not available for investment and does not incur expenses. |
Not FDIC insured, nor bank guaranteed. May lose value.
48
AMG Funds
| | |
| AMG Managers DoubleLine Core Plus Bond Fund | | October 31, 2016 |
| |
| Schedule of Investments | | |
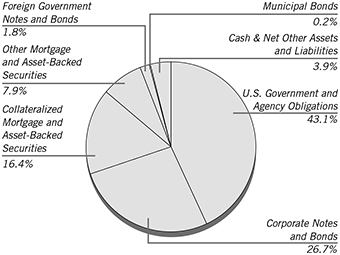
% of Net Assets
| | | | | | |
Par Value | | | | | Market Value |
| CORPORATE NOTES AND BONDS – 26.7% | | |
| | | | Basic Materials – 0.1% | | |
| $ | 330,000 | | | International Paper Co.
Senior Unsecured Notes
3.000%, 02/15/27 | | $325,556 |
| | 300,000 | | | Inversiones CMPC SA (Chile)
4.500%, 04/25/22 | | 317,833 |
| | 115,000 | | | PQ Corp.
Senior Secured Notes
6.750%, 11/15/22 (a) | | 124,344 |
| | | | | | |
| | | | | | 767,733 |
| | | | | | |
| | | | Consumer Discretionary – 1.5% | | |
| | 2,000,000 | | | Adani Ports & Special Economic Zone, Ltd. (India) Senior Unsecured Notes
3.500%, 07/29/20 | | 2,018,192 |
| | 90,000 | | | Allison Transmission, Inc.
5.000%, 10/01/24 (a) | | 92,025 |
| | 255,000 | | | Amazon.com, Inc.
Senior Unsecured Notes
3.800%, 12/05/24 | | 279,990 |
| | 70,000 | | | AMC Entertainment Holding, Inc.
Senior Subordinated
5.875%, 11/15/26 (a) (b) | | 70,700 |
| | 230,000 | | | American Axle & Manufacturing, Inc.
6.625%, 10/15/22 | | 243,225 |
| | 130,000 | | | Asbury Automotive Group, Inc.
6.000%, 12/15/24 | | 134,550 |
| | 430,000 | | | Camposol SA (Peru)
Senior Secured Notes
10.500%, 07/15/21 (a) | | 402,050 |
| | | | | | | | |
Par Value | | | | | Market
Value | |
| | | | Consumer Discretionary (continued) | |
| $ | 350,000 | | | Celgene Corp.
Senior Unsecured Notes
3.875%, 08/15/25 | | $ | 368,428 | |
| | 370,000 | | | CVS Health Corp.
Senior Unsecured Notes
2.875%, 06/01/26 | | | 368,194 | |
| | 65,000 | | | Dollar Tree, Inc.
5.750%, 03/01/23 | | | 69,306 | |
| | 565,000 | | | Ford Motor Co.
Senior Unsecured Notes
7.450%, 07/16/31 | | | 744,565 | |
| | 80,000 | | | GLP Capital LP
5.375%, 04/15/26 | | | 85,000 | |
| | 245,000 | | | The Goodyear Tire & Rubber Co.
5.125%, 11/15/23 | | | 254,187 | |
| | 600,000 | | | Grupo Idesa SA de CV (Mexico)
7.875%, 12/18/20 (a) | | | 579,000 | |
| | 175,000 | | | Hilton Domestic Operating Co., Inc.
Senior Unsecured Notes
4.250%, 09/01/24 (a) | | | 176,312 | |
| | | | The Home Depot, Inc.
Senior Unsecured Notes | | | | |
| | 260,000 | | | 3.350%, 09/15/25 | | | 277,253 | |
| | 440,000 | | | 3.000%, 04/01/26 | | | 457,316 | |
| | 200,000 | | | Hutchison Whampoa
International 12 II,
Ltd. (Cayman Islands)
3.250%, 11/08/22 | | | 210,566 | |
| | 300,000 | | | Hutchison Whampoa International 12, Ltd. (Cayman Islands)
6.000%, 05/29/49 (c) | | | 306,975 | |
| | 165,000 | | | Levi Strauss & Co.
Senior Unsecured Notes
5.000%, 05/01/25 | | | 172,012 | |
| | 180,000 | | | Live Nation Entertainment, Inc.
4.875%, 11/01/24 (a) | | | 180,000 | |
| | 245,000 | | | MGM Resorts International
4.625%, 09/01/26 | | | 237,037 | |
| | 270,000 | | | NCL Corp., Ltd. (Bermuda)
Senior Unsecured Notes
5.250%, 11/15/19 (a) | | | 276,075 | |
| | 170,000 | | | Newell Brands, Inc.
Senior Unsecured Notes
3.150%, 04/01/21 | | | 177,220 | |
| | 255,000 | | | Pilgrim’s Pride Corp.
5.750%, 03/15/25 (a) | | | 262,013 | |
| | 175,000 | | | Pinnacle Entertainment, Inc.
Senior Unsecured Notes
5.625%, 05/01/24 (a) | | | 176,137 | |
| | 30,000 | | | Revlon Consumer Products Corp.
6.250%, 08/01/24 (a) | | | 30,975 | |
| | 345,000 | | | S&P Global, Inc.
4.400%, 02/15/26 | | | 383,429 | |
| | 225,000 | | | Sally Holdings LLC
5.750%, 06/01/22 | | | 235,125 | |
| | 165,000 | | | Station Casinos LLC
7.500%, 03/01/21 | | | 173,726 | |
The accompanying notes are an integral part of these financial statements.
49
AMG Funds
| | |
| AMG Managers DoubleLine Core Plus Bond Fund | | October 31, 2016 |
| |
| Schedule of Investments – continued | | |
| | | | | | | | |
Par Value | | | | | Market
Value | |
| | | | Consumer Discretionary (continued) | | | | |
| $ | 280,000 | | | Tenet Healthcare Corp.
Senior Unsecured Notes
6.750%, 06/15/23 | | $ | 257,600 | |
| | 550,000 | | | Teva Pharmaceutical Finance Co. BV
(Cook Islands)
2.950%, 12/18/22 | | | 557,036 | |
| | 255,000 | | | Viking Cruises, Ltd. (Bermuda)
Senior Unsecured Notes
8.500%, 10/15/22 (a) | | | 258,188 | |
| | 220,000 | | | WMG Acquisition Corp.
6.750%, 04/15/22 (a) | | | 233,200 | |
| | | | | | | | |
| | | | | | | 10,747,607 | |
| | | | | | | | |
| | | | Consumer Staples – 2.3% | | | | |
| | 400,000 | | | Ajecorp BV (Netherlands)
6.500%, 05/14/22 | | | 222,000 | |
| | 65,000 | | | Albertsons Cos LLC / Safeway, Inc.
Senior Unsecured Notes
5.750%, 03/15/25 (a) | | | 64,330 | |
| | 600,000 | | | Central American Bottling Corp.
(British Virgin Islands)
6.750%, 02/09/22 | | | 624,000 | |
| | | | The Coca-Cola Co.
Senior Unsecured Notes | | | | |
| | 170,000 | | | 1.875%, 10/27/20 | | | 171,897 | |
| | 500,000 | | | 1.550%, 09/01/21 | | | 496,641 | |
| | 500,000 | | | Corp Azucarera del Peru SA (Peru)
6.375%, 08/02/22 | | | 493,750 | |
| | 2,500,000 | | | Cosan Overseas, Ltd.
(Cayman Islands)
8.250%, 11/29/49 | | | 2,515,625 | |
| | 140,000 | | | Dana Holding, Inc.
Senior Unsecured Notes
5.500%, 12/15/24 | | | 145,600 | |
| | 1,902,842 | | | ENA Norte Trust (Panama)
4.950%, 04/25/23 | | | 1,988,470 | |
| | 225,000 | | | Express Scripts Holding Co.
4.500%, 02/25/26 | | | 241,648 | |
| | 125,000 | | | HCA, Inc.
5.875%, 02/15/26 | | | 131,562 | |
| | 500,000 | | | IOI Investment L Bhd, EMTN (Malaysia)
4.375%, 06/27/22 | | | 526,091 | |
| | 135,000 | | | JBS USA Finance, Inc.
5.750%, 06/15/25 (a) | | | 132,975 | |
| | | | Kraft Heinz Foods Co.
| | | | |
| | 460,000 | | | 1.600%, 06/30/17 | | | 461,030 | |
| | 265,000 | | | 2.000%, 07/02/18 | | | 267,010 | |
| | 860,000 | | | The Kroger Co.
Senior Unsecured Notes
3.400%, 04/15/22 | | | 905,824 | |
| | 85,000 | | | Kronos Acquisition Holding, Inc.
Senior Unsecured Notes
9.000%, 08/15/23 (a) | | | 87,550 | |
| | | | Laboratory Corp.
Senior Unsecured Notes | | | | |
| | 670,000 | | | 2.500%, 11/01/18 | | | 680,728 | |
| | 725,000 | | | 4.700%, 02/01/45 | | | 770,844 | |
| | | | | | | | |
Par Value | | | | | Market
Value | |
| | | | Consumer Staples (continued) | | | | |
| $ | 500,000 | | | Marfrig Holdings Europe BV (Netherlands)
8.000%, 06/08/23 (a) | | $ | 517,500 | |
| | | | Minerva Luxembourg SA (Luxembourg) | | | | |
| | 300,000 | | | 8.750%, 12/29/49 (a) (c) | | | 307,125 | |
| | 400,000 | | | 8.750%, 12/29/49 (c) | | | 409,500 | |
| | 725,000 | | | PepsiCo, Inc.
Senior Unsecured Notes
3.450%, 10/06/46 | | | 693,801 | |
| | 90,000 | | | Post Holdings, Inc.
5.000%, 08/15/26 (a) | | | 87,525 | |
| | 240,000 | | | Prime Security Services Borrower LLC Secured Notes
9.250%, 05/15/23 (a) | | | 255,096 | |
| | 90,000 | | | RegionalCare Hospital Partners Holdings, Inc.
Senior Secured Notes
8.250%, 05/01/23 (a) | | | 91,462 | |
| | 175,000 | | | Revlon Consumer Products Corp.
5.750%, 02/15/21 | | | 177,625 | |
| | 170,000 | | | Rite Aid Corp.
6.125%, 04/01/23 (a) | | | 180,305 | |
| | 165,000 | | | Scientific Games International, Inc.
Senior Secured Notes
7.000%, 01/01/22 (a) | | | 176,137 | |
| | 250,000 | | | Spectrum Brands, Inc.
5.750%, 07/15/25 | | | 271,875 | |
| | 85,000 | | | TreeHouse Foods, Inc.
6.000%, 02/15/24 (a) | | | 91,715 | |
| | 1,370,000 | | | Tyson Foods, Inc.
3.950%, 08/15/24 | | | 1,457,025 | |
| | 170,000 | | | Vizient, Inc.
Senior Unsecured Notes
10.375%, 03/01/24 (a) | | | 189,975 | |
| | 270,000 | | | Zimmer Biomet Holdings, Inc.
Senior Unsecured Notes
2.700%, 04/01/20 | | | 274,779 | |
| | | | | | | | |
| | | | | | | 16,109,020 | |
| | | | | | | | |
| | | | Energy – 3.3% | | | | |
| | 390,000 | | | Apache Corp.
Senior Unsecured Notes
4.750%, 04/15/43 | | | 415,153 | |
| | 300,000 | | | Bharat Petroleum Corp., Ltd. (India)
Senior Unsecured Notes
4.625%, 10/25/22 | | | 325,350 | |
| | 245,000 | | | BP Capital Markets PLC
3.017%, 01/16/27 | | | 246,107 | |
| | | | BP Capital Markets PLC (United Kingdom) | | | | |
| | 305,000 | | | 3.062%, 03/17/22 | | | 318,123 | |
| | 140,000 | | | 3.119%, 05/04/26 | | | 141,889 | |
| | 131,000 | | | Chevron Corp.
Senior Unsecured Notes
1.790%, 11/16/18 | | | 132,157 | |
The accompanying notes are an integral part of these financial statements.
50
AMG Funds
| | |
| AMG Managers DoubleLine Core Plus Bond Fund | | October 31, 2016 |
| |
| Schedule of Investments – continued | | |
| | | | | | | | |
| | | | | | Market | |
Par Value | | | | | Value | |
| | | | Energy (continued) | | | | |
| $ | 500,000 | | | CNOOC Finance 2011, Ltd.
4.250%, 01/26/21 | | $ | 537,050 | |
| | 1,600,000 | | | CNOOC Finance 2015 Australia
Property, Ltd. (Australia)
2.625%, 05/05/20 | | | 1,627,867 | |
| | 1,000,000 | | | CNPC General Capital, Ltd.
2.750%, 05/14/19 | | | 1,020,551 | |
| | 2,000,000 | | | Delek & Avner Tamar Bond, Ltd.
(Israel)
Senior Secured Notes
4.435%, 12/30/20 (a) | | | 2,112,500 | |
| | 750,000 | | | Energy Transfer Partners LP
Senior Unsecured Notes
4.750%, 01/15/26 | | | 774,694 | |
| | | | Energy XXI Gulf Coast, Inc. | | | | |
| | 330,000 | | | 9.250%, 12/15/17 (d) | | | 33,000 | |
| | 45,000 | | | 7.500%, 12/15/21 (d) | | | 4,612 | |
| | | | Secured Notes | | | | |
| | 44,000 | | | 11.000%, 03/15/20 (a) (d) | | | 20,020 | |
| | 340,000 | | | EOG Resources, Inc.
Senior Unsecured Notes
4.150%, 01/15/26 | | | 370,170 | |
| | 115,000 | | | EPL Oil & Gas, Inc.
8.250%, 02/15/18 (d) | | | 15,237 | |
| | | | Inkia Energy, Ltd. (Peru)
Senior Unsecured Notes | | | | |
| | 200,000 | | | 8.375%, 04/04/21 (a) | | | 209,000 | |
| | 600,000 | | | 8.375%, 04/04/21 | | | 627,000 | |
| | 1,200,000 | | | Instituto Costarricense de Electricidad
(Costa Rica)
Senior Unsecured Notes 6.950%, 11/10/21 | | | 1,285,800 | |
| | 590,000 | | | Kinder Morgan Energy Partners LP,
MTN
6.950%, 01/15/38 | | | 676,246 | |
| | 315,000 | | | Memorial Production Partners LP
6.875%, 08/01/22 | | | 127,575 | |
| | 180,000 | | | Occidental Petroleum Corp.
Senior Unsecured Notes
3.400%, 04/15/26 | | | 187,743 | |
| | 1,500,000 | | | ONGC Videsh, Ltd.
3.250%, 07/15/19 | | | 1,540,482 | |
| | | | Pacific Exploration and Production
Corp. (Canada) (d) | | | | |
| | 750,000 | | | 5.125%, 03/28/23 | | | 153,750 | |
| | 500,000 | | | 5.625%, 01/19/25 (a) | | | 102,500 | |
| | 300,000 | | | 5.625%, 01/19/25 | | | 61,500 | |
| | 60,000 | | | PDC Energy, Inc. | | | | |
| | | | 6.125%, 09/15/24 (a) | | | 62,550 | |
| | 730,000 | | | Petroleos Mexicanos
6.750%, 09/21/47 (a) | | | 724,452 | |
| | 2,500,000 | | | Petronas Global Sukuk, Ltd. (Morocco)
Senior Unsecured Notes
2.707%, 03/18/20 | | | 2,543,973 | |
| | | | Phillips 66 | | | | |
| | 181,000 | | | 5.875%, 05/01/42 | | | 222,072 | |
| | 75,000 | | | 4.875%, 11/15/44 | | | 80,681 | |
| | | | | | | | |
| | | | | | Market | |
Par Value | | | | | Value | |
| | | | Energy (continued) | | | | |
| | | | Reliance Holding USA, Inc. | | | | |
| $ | 850,000 | | | 4.500%, 10/19/20 | | $ | 913,806 | |
| | 650,000 | | | 5.400%, 02/14/22 | | | 726,354 | |
| | 100,000 | | | Sanchez Energy Corp.
6.125%, 01/15/23 | | | 86,000 | |
| | | | Sandridge Energy, Inc. | | | | |
| | 9,036 | | | Zero Coupon, 10/04/20 (e) (f) | | | 11,114 | |
| | 365,000 | | | Schlumberger Holdings Corp. Senior Unsecured Notes
2.350%, 12/21/18 (a) | | | 370,853 | |
| | 1,600,000 | | | Sinopec Group Overseas Development
2016, Ltd.
2.000%, 09/29/21 (a) | | | 1,574,086 | |
| | 1,000,000 | | | Sunoco Logistics Partners
3.900%, 07/15/26 | | | 1,015,490 | |
| | 180,000 | | | Targa Resources Partners LP
5.375%, 02/01/27 (a) | | | 180,450 | |
| | 1,400,000 | | | Transportadora de Gas Internacional
SA ESP (Colombia)
Senior Unsecured Notes
5.700%, 03/20/22 | | | 1,454,600 | |
| | | | | | | | |
| | | | | | | 23,032,557 | |
| | | | | | | | |
| | | | Financials – 9.4% | | | | |
| | | | Agromercantil Senior Trust
(Cayman Islands) | | | | |
| | 400,000 | | | 6.250%, 04/10/19 (a) | | | 421,000 | |
| | 900,000 | | | 6.250%, 04/10/19 | | | 947,250 | |
| | 710,000 | | | Air Lease Corp.
Senior Unsecured Notes
3.750%, 02/01/22 | | | 748,104 | |
| | | | Ally Financial, Inc.
Senior Unsecured Notes | | | | |
| | 545,000 | | | 4.125%, 03/30/20 | | | 555,219 | |
| | 180,000 | | | 4.250%, 04/15/21 | | | 182,025 | |
| | 225,000 | | | American Express Credit Corp.,
GMTN
Senior Unsecured Notes
2.250%, 08/15/19 | | | 228,791 | |
| | 1,205,000 | | | American Express Credit Corp.,
MTN
Senior Unsecured Notes
2.250%, 05/05/21 | | | 1,217,969 | |
| | 1,000,000 | | | American Tower Corp.
Senior Unsecured Notes
4.400%, 02/15/26 | | | 1,078,982 | |
| | 175,000 | | | Anheuser-Busch InBev Finance, Inc. 4.900%, 02/01/46 | | | 201,243 | |
| | 665,000 | | | Australia & New Zealand Banking Group, Ltd. EMTN (Australia)
Senior Unsecured Notes
4.875%, 01/12/21 (a) | | | 738,846 | |
| | 200,000 | | | Banco de Bogota SA (Colombia)
Subordinated Notes
5.375%, 02/19/23 | | | 204,400 | |
| | 1,500,000 | | | Banco de Costa Rica (Costa Rica)
5.250%, 08/12/18 | | | 1,537,170 | |
The accompanying notes are an integral part of these financial statements.
51
AMG Funds
| | |
| AMG Managers DoubleLine Core Plus Bond Fund | | October 31, 2016 |
| |
| Schedule of Investments – continued | | |
| | | | | | | | |
Par Value | | | | | Market
Value | |
| | | | Financials (continued) | | | | |
| $ | 200,000 | | | Banco de Credito del Peru (Panama)
Senior Unsecured Notes
2.250%, 10/25/19 (a) | | $ | 201,030 | |
| | | | Banco de Reservas De La Republica
Dominicana (Dominican Republic)
Subordinated Notes | | | | |
| | 300,000 | | | 7.000%, 02/01/23 (a) | | | 307,500 | |
| | 200,000 | | | 7.000%, 02/01/23 | | | 205,000 | |
| | 500,000 | | | Banco do Brasil SA (Brazil)
9.000%, 06/29/49 (a) (c) | | | 465,000 | |
| | 200,000 | | | Banco GNB Sudameris SA (Colombia)
Senior Unsecured Notes
3.875%, 05/02/18 | | | 199,500 | |
| | | | Subordinated Notes | | | | |
| | 200,000 | | | 7.500%, 07/30/22 | | | 216,500 | |
| | 500,000 | | | Banco Internacional del Peru SAA
Interbank (Peru)
8.500%, 04/23/70 (c) | | | 555,000 | |
| | 1,900,000 | | | Banco Latinoamericano de Comercio
Exterior SA (Panama)
Senior Unsecured Notes
3.250%, 05/07/20 | | | 1,938,000 | |
| | 1,500,000 | | | Banco Mercantil del Norte SA
Subordinated Notes
5.750%, 10/04/31 (a) (c) | | | 1,453,125 | |
| | 1,000,000 | | | Banco Nacional de Comercio Exterior
SNC (Cayman Islands)
Subordinated Notes
3.800%, 08/11/26 (c) | | | 988,750 | |
| | 1,000,000 | | | Banco Nacional de Costa Rica
(Costa Rica)
Senior Unsecured Notes
4.875%, 11/01/18 | | | 1,019,620 | |
| | 1,200,000 | | | Banco Nacional de Costa Rica
(Costa Rica)
Senior Unsecured Notes
5.875%, 04/25/21 (a) | | | 1,247,880 | |
| | | | Banco Regional SAECA (Paraguay)
Senior Unsecured Notes | | | | |
| | 150,000 | | | 8.125%, 01/24/19 (a) | | | 162,780 | |
| | 950,000 | | | 8.125%, 01/24/19 | | | 1,030,940 | |
| | 2,500,000 | | | Banco Santander Mexico SA
Institucion de Banca Multiple Grupo
Financiero Santand (Mexico)
Subordinated Notes
5.950%, 01/30/24 (c) | | | 2,615,625 | |
| | 1,300,000 | | | Bancolombia SA (Colombia)
Subordinated Notes
6.125%, 07/26/20 | | | 1,398,800 | |
| | 535,000 | | | Bank of America Corp.
Senior Unsecured Notes
2.000%, 01/11/18 | | | 537,838 | |
| | 400,000 | | | Bank of America Corp., MTN
Senior Unsecured Notes
2.503%, 10/21/22 | | | 399,888 | |
| | 735,000 | | | Bank of Montreal, MTN
Senior Unsecured Notes
1.900%, 08/27/21 | | | 727,530 | |
| | | | | | | | |
Par Value | | | | | Market
Value | |
| | | | Financials (continued) | | | | |
| $ | 150,000 | | | Bantrab Senior Trust
(Cayman Islands)
Senior Secured Notes
9.000%, 11/14/20 | | $ | 137,250 | |
| | | | BB&T Corp., MTN Senior Unsecured Notes | | | | |
| | 635,000 | | | 2.450%, 01/15/20 | | | 648,133 | |
| | 450,000 | | | 2.050%, 05/10/21 | | | 451,959 | |
| | | | BBVA Bancomer SA
Subordinated Notes | | | | |
| | 300,000 | | | 5.350%, 11/12/29 (a) (c) | | | 304,500 | |
| | 500,000 | | | 5.350%, 11/12/29 (c) | | | 507,500 | |
| | 1,000,000 | | | BBVA Bancomer SA (Cayman Islands)
Subordinated Notes
6.008%, 05/17/22 (c) | | | 996,000 | |
| | 676,000 | | | Boston Properties LP
Senior Unsecured Notes
4.125%, 05/15/21 | | | 732,026 | |
| | 500,000 | | | Cementos Progreso Trust
(Cayman Islands)
7.125%, 11/06/23 | | | 531,250 | |
| | | | CIMPOR Financial Operations BV
(Netherlands) | | | | |
| | 200,000 | | | 5.750%, 07/17/24 (a) | | | 174,258 | |
| | 200,000 | | | 5.750%, 07/17/24 | | | 174,258 | |
| | | | Citigroup, Inc.
Senior Unsecured Notes | | | | |
| | 215,000 | | | 2.650%, 10/26/20 | | | 218,674 | |
| | 835,000 | | | 2.700%, 03/30/21 | | | 849,906 | |
| | | | CorpGroup Banking SA (Chile)
Senior Unsecured Notes | | | | |
| | 250,000 | | | 6.750%, 03/15/23 (a) | | | 238,925 | |
| | 500,000 | | | 6.750%, 03/15/23 | | | 477,850 | |
| | 400,000 | | | Credito Real SAB de CV SOFOM ER
(Mexico)
Senior Unsecured Notes
7.250%, 07/20/23 (a) | | | 414,000 | |
| | 1,200,000 | | | DBS Bank, Ltd.
Subordinated Notes
3.625%, 09/21/22 (c) | | | 1,218,089 | |
| | 1,000,000 | | | DBS Group Holdings, Ltd., GMTN
Subordinated Notes
3.600%, 12/29/49 (c) | | | 997,557 | |
| | 175,000 | | | Double Eagle Acquisition
Senior Unsecured Notes
7.500%, 10/01/24 (a) | | | 180,687 | |
| | 165,000 | | | Equinix, Inc.
Senior Unsecured Notes
5.875%, 01/15/26 | | | 175,674 | |
| | 260,000 | | | ESH Hospitality, Inc.
5.250%, 05/01/25 (a) | | | 258,050 | |
| | 1,400,000 | | | Export-Import Bank Of India, EMTN
(India)
Senior Unsecured Notes
3.125%, 07/20/21 | | | 1,434,399 | |
| | 345,000 | | | General Motors Financial Co., Inc.
3.200%, 07/13/20 | | | 351,222 | |
The accompanying notes are an integral part of these financial statements.
52
AMG Funds
| | |
| AMG Managers DoubleLine Core Plus Bond Fund | | October 31, 2016 |
| |
| Schedule of Investments – continued | | |
| | | | | | | | |
Par Value | | | | | Market
Value | |
| | | | Financials (continued) | | | | |
| $ | 1,500,000 | | | Global Bank Corp. (Panama)
Senior Unsecured Notes
5.125%, 10/30/19 | | $ | 1,548,000 | |
| | 790,000 | | | The Goldman Sachs Group, Inc.
Senior Unsecured Notes
2.350%, 11/15/21 | | | 786,842 | |
| | 1,900,000 | | | Grupo Aval, Ltd.
(Cayman Islands)
4.750%, 09/26/22 | | | 1,878,625 | |
| | 1,000,000 | | | GrupoSura Finance SA
(Cayman Islands)
5.700%, 05/18/21 | | | 1,088,750 | |
| | 1,784,585 | | | Guanay Finance, Ltd.
(Cayman Islands)
Senior Secured Notes
6.000%, 12/15/20 | | | 1,831,430 | |
| | 1,900,000 | | | Industrial Senior Trust
(Cayman Islands)
5.500%, 11/01/22 | | | 1,901,254 | |
| | 1,211,392 | | | Interoceanica IV Finance
Senior Secured Notes
11/30/25 (e) | | | 996,309 | |
| | 645,000 | | | JPMorgan Chase & Co.
Senior Unsecured Notes
2.400%, 06/07/21 | | | 650,944 | |
| | 595,000 | | | Subordinated Notes
4.250%, 10/01/27 | | | 634,523 | |
| | 909,000 | | | Liberty Mutual Group, Inc.
6.500%, 05/01/42 (a) | | | 1,113,021 | |
| | 700,000 | | | Magnesita Finance, Ltd.
(British Virgin Islands)
8.625%, 04/29/49 | | | 676,900 | |
| | 1,000,000 | | | Malayan Banking Bhd, EMTN (Malaysia)
Subordinated Notes
3.250%, 09/20/22 (c) | | | 1,010,150 | |
| | 55,000 | | | MGM Growth Properties Operating Partnership LP
5.625%, 05/01/24 (a) | | | 58,679 | |
| | 370,000 | | | Morgan Stanley
Senior Unsecured Notes
2.650%, 01/27/20 | | | 376,743 | |
| | | | Morgan Stanley, GMTN
Senior Unsecured Notes | | | | |
| | 220,000 | | | 2.500%, 04/21/21 | | | 221,822 | |
| | 430,000 | | | 3.875%, 01/27/26 | | | 454,153 | |
| | 240,000 | | | Morgan Stanley, MTN
Senior Unsecured Notes
3.125%, 07/27/26 | | | 240,019 | |
| | 720,000 | | | MUFG Americas Holdings Corp.
Senior Unsecured Notes
1.625%, 02/09/18 | | | 721,588 | |
| | 990,000 | | | National Rural Utilities Cooperative Finance Corp.
2.000%, 01/27/20 | | | 996,983 | |
| | 95,000 | | | OPE KAG Finance Sub, Inc.
Senior Unsecured Notes
7.875%, 07/31/23 (a) | | | 90,250 | |
| | | | | | | | |
Par Value | | | | | Market
Value | |
| | | | Financials (continued) | | | | |
| $ | 2,000,000 | | | Oversea-Chinese Banking Corp., Ltd.
EMTN (Singapore)
Subordinated Notes
4.000%, 10/15/24 (c) | | $ | 2,086,046 | |
| | 400,000 | | | Peru Enhanced Pass-Through Finance, Ltd.
(Cayman Islands)
06/02/25 (e) (g) | | | 334,188 | |
| | 190,000 | | | PetSmart, Inc.
Senior Unsecured Notes
7.125%, 03/15/23 (a) | | | 199,262 | |
| | 735,000 | | | The PNC Financial Services Group, Inc.
Senior Unsecured Notes
3.300%, 03/08/22 | | | 779,327 | |
| | 180,000 | | | Royal Bank of Canada, GMTN
Senior Unsecured Notes
2.500%, 01/19/21 | | | 184,760 | |
| | 690,000 | | | Simon Property Group LP
Senior Unsecured Notes
3.300%, 01/15/26 | | | 722,627 | |
| | | | State Street Corp.
Senior Unsecured Notes | | | | |
| | 345,000 | | | 3.550%, 08/18/25 | | | 371,720 | |
| | 340,000 | | | 2.650%, 05/19/26 | | | 340,366 | |
| | | | Sumitomo Mitsui Financial Group, Inc. (Japan)
Senior Unsecured Notes | | | | |
| | 620,000 | | | 2.934%, 03/09/21 | | | 635,083 | |
| | 445,000 | | | 2.058%, 07/14/21 | | | 438,956 | |
| | 725,000 | | | Synchrony Financial
Senior Unsecured Notes
3.000%, 08/15/19 | | | 741,373 | |
| | 1,000,000 | | | Tanner Servicios Financieros SA (Chile)
Senior Unsecured Notes
4.375%, 03/13/18 | | | 1,026,700 | |
| | 740,000 | | | TIAA Asset Management Finance Co. LLC
Senior Unsecured Notes
2.950%, 11/01/19 (a) | | | 761,653 | |
| | | | United Overseas Bank, Ltd. EMTN (Singapore)
Subordinated Notes | | | | |
| | 1,000,000 | | | 3.750%, 09/19/24 (c) | | | 1,034,050 | |
| | 1,000,000 | | | 3.500%, 09/16/26 (c) | | | 1,021,762 | |
| | 1,105,000 | | | The Toronto-Dominion Bank (Canada)
Senior Unsecured Notes
1.800%, 07/13/21 | | | 1,098,925 | |
| | | | Wells Fargo & Co.
Senior Unsecured Notes | | | | |
| | 605,000 | | | 3.000%, 04/22/26 | | | 602,712 | |
| | 580,000 | | | 3.000%, 10/23/26 | | | 577,928 | |
| | | | Wells Fargo & Co., MTN
Senior Unsecured Notes | | | | |
| | 245,000 | | | 3.550%, 09/29/25 | | | 254,687 | |
The accompanying notes are an integral part of these financial statements.
53
AMG Funds
| | |
| AMG Managers DoubleLine Core Plus Bond Fund | | October 31, 2016 |
| |
| Schedule of Investments – continued | | |
| | | | | | | | |
Par Value | | | | | Market
Value | |
| | | | Financials (continued) | | | | |
| | | | Westpac Banking Corp.
Senior Unsecured Notes | | | | |
| $ | 555,000 | | | 2.600%, 11/23/20 | | $ | 567,885 | |
| | 155,000 | | | 2.000%, 08/19/21 | | | 154,498 | |
| | | | | | | | |
| | | | | | | 66,414,965 | |
| | | | | | | | |
| | | | Healthcare – 1.0% | | | | |
| | 653,000 | | | AbbVie, Inc.
Senior Unsecured Notes
4.700%, 05/14/45 | | | 677,058 | |
| | 180,000 | | | Acadia Healthcare Co., Inc.
5.625%, 02/15/23 | | | 181,125 | |
| | 738,000 | | | Actavis Funding SCS (Luxembourg)
2.350%, 03/12/18 | | | 745,531 | |
| | 735,000 | | | Anthem, Inc.
Senior Unsecured Notes
2.300%, 07/15/18 | | | 741,278 | |
| | 565,000 | | | AstraZeneca PLC
Senior Unsecured Notes
2.375%, 11/16/20 | | | 575,551 | |
| | 695,000 | | | Cardinal Health, Inc.
Senior Unsecured Notes
1.950%, 06/15/18 | | | 701,013 | |
| | | | Centene Corp.
Senior Unsecured Notes | | | | |
| | 220,000 | | | 5.625%, 02/15/21 | | | 232,100 | |
| | 180,000 | | | 4.750%, 01/15/25 (b) | | | 180,000 | |
| | 435,000 | | | Eli Lilly & Co.
Senior Unsecured Notes
3.700%, 03/01/45 | | | 449,335 | |
| | 200,000 | | | Endo Finance LLC
5.375%, 01/15/23 (a) | | | 171,000 | |
| | 175,000 | | | LifePoint Health, Inc.
5.375%, 05/01/24 (a) | | | 174,352 | |
| | 240,000 | | | MPH Acquisition Holdings LLC
Senior Unsecured Notes
7.125%, 06/01/24 (a) | | | 257,376 | |
| | 175,000 | | | Quintiles Transnational Corp.
4.875%, 05/15/23 (a) | | | 180,906 | |
| | 250,000 | | | Select Medical Corp.
6.375%, 06/01/21 | | | 249,609 | |
| | 730,000 | | | Shire Acquisitions Investments (Ireland)
2.875%, 09/23/23 | | | 719,387 | |
| | 115,000 | | | Team Health, Inc.
7.250%, 12/15/23 (a) | | | 130,237 | |
| | 421,000 | | | Zimmer Biomet Holdings, Inc.
Senior Unsecured Notes
1.450%, 04/01/17 | | | 421,250 | |
| | | | | | | | |
| | | | | | | 6,787,108 | |
| | | | | | | | |
| | | | Industrials – 3.2% | | | | |
| | 1,850,000 | | | Aeropuerto Internacional de Tocumen SA (Panama)
Senior Secured Notes
5.750%, 10/09/23 | | | 2,016,500 | |
| | | | | | | | |
Par Value | | | | | Market
Value | |
| | | | Industrials (continued) | | | | |
| | | | Aeropuertos Dominicanos Siglo XXI SA
(Domican Republic)
Senior Secured Notes | | | | |
| $ | 200,000 | | | 9.750%, 11/13/19 (a) | | $ | 210,500 | |
| | 200,000 | | | 9.750%, 11/13/19 | | | 210,500 | |
| | 280,000 | | | Air Medical Merger Sub Corp.
Senior Unsecured Notes
6.375%, 05/15/23 (a) | | | 271,600 | |
| | | | Avianca Holdings SA (Panama) | | | | |
| | 400,000 | | | 8.375%, 05/10/20 (a) | | | 396,000 | |
| | 800,000 | | | 8.375%, 05/10/20 | | | 792,000 | |
| | 170,000 | | | Berry Plastics Corp.
Secured Notes
5.500%, 05/15/22 | | | 177,650 | |
| | 357,000 | | | The Boeing Co.
Senior Unsecured Notes
6.875%, 03/15/39 | | | 525,740 | |
| | 31,000 | | | Builders FirstSource, Inc.
Senior Secured Notes
5.625%, 09/01/24 (a) | | | 31,234 | |
| | 690,000 | | | Burlington Northern Santa Fe LLC
Senior Unsecured Notes
4.550%, 09/01/44 | | | 765,500 | |
| | 610,000 | | | Chevron Corp.
Senior Unsecured Notes
1.561%, 05/16/19 | | | 612,485 | |
| | 725,000 | | | CSX Corp.
Senior Unsecured Notes
3.800%, 11/01/46 | | | 709,892 | |
| | 299,000 | | | Delphi Automotive PLC
4.250%, 01/15/26 | | | 324,178 | |
| | 390,000 | | | Delphi Corp.
4.150%, 03/15/24 | | | 418,394 | |
| | 200,000 | | | Eldorado International Finance (Austria)
8.625%, 06/16/21 (a) | | | 162,750 | |
| | 220,000 | | | Energy Transfer Equity LP
Senior Secured Notes
5.500%, 06/01/27 | | | 215,600 | |
| | 155,000 | | | Express Scripts Holdings Co.
3.400%, 03/01/27 | | | 152,570 | |
| | 90,000 | | | Extraction Oil & Gas Holdings LLC
7.875%, 07/15/21 (a) | | | 95,625 | |
| | 635,000 | | | FedEx Corp.
4.750%, 11/15/45 | | | 694,027 | |
| | 165,000 | | | Gates Global LLC
6.000%, 07/15/22 (a) | | | 156,750 | |
| | | | General Motors Financial Co., Inc. | | | | |
| | 580,000 | | | 2.400%, 05/09/19 | | | 580,891 | |
| | 165,000 | | | 3.200%, 07/06/21 | | | 166,883 | |
| | 200,000 | | | Grupo Cementos de Chihuahua SAB de CV (Mexico)
Senior Secured Notes
8.125%, 02/08/20 | | | 211,000 | |
| | 750,000 | | | Grupo Elektra SAB de CV (Mexico)
7.250%, 08/06/18 | | | 760,125 | |
| | 200,000 | | | Grupo Posadas SAB de CV (Mexico)
7.875%, 06/30/22 (a) | | | 207,000 | |
The accompanying notes are an integral part of these financial statements.
54
AMG Funds
| | |
| AMG Managers DoubleLine Core Plus Bond Fund | | October 31, 2016 |
| |
| Schedule of Investments – continued | | |
| | | | | | | | |
Par Value | | | | | Market
Value | |
| | | | Industrials (continued) | | | | |
| $ | 500,000 | | | Latam Airlines Group SA (Chile)
Senior Unsecured Notes
7.250%, 06/09/20 (a) | | $ | 515,000 | |
| | 1,000,000 | | | Lima Metro Line 2 Finance
(Cayman Islands)
Senior Secured Notes
5.875%, 07/05/34 | | | 1,112,500 | |
| | 650,000 | | | Lockheed Martin Corp.
Senior Unsecured Notes
4.700%, 05/15/46 | | | 741,649 | |
| | 175,000 | | | Lundin Mining Corp. (Canada)
Senior Secured Notes
7.500%, 11/01/20 (a) | | | 186,812 | |
| | 500,000 | | | Mexico City Airport Trust
Senior Secured Notes
4.250%, 10/31/26 (a) | | | 510,750 | |
| | 40,000 | | | Microsemi Corp.
9.125%, 04/15/23 (a) | | | 46,300 | |
| | 230,000 | | | Milacron LLC / Mcron Finance Corp.
7.750%, 02/15/21 (a) | | | 236,325 | |
| | 700,000 | | | Mylan NV (Netherlands)
3.150%, 06/15/21 (a) | | | 712,592 | |
| | | | Novelis Corp. | | | | |
| | 120,000 | | | 6.250%, 08/15/24 (a) | | | 125,100 | |
| | 55,000 | | | 5.875%, 09/30/26 (a) | | | 55,825 | |
| | | | OAS Financial, Ltd. (British Virgin Islands) | | | | |
| | 400,000 | | | 8.875%, 04/29/49 (a) (d) | | | 17,000 | |
| | 600,000 | | | 8.875%, 04/29/49 (d) | | | 25,500 | |
| | 400,000 | | | Odebrecht Finance, Ltd.
(Cayman Island)
7.125%, 06/26/42 | | | 202,000 | |
| | | | Pesquera Exalmar S.A.A. (Peru)
Senior Unsecured Notes | | | | |
| | 200,000 | | | 7.375%, 01/31/20 (a) | | | 159,000 | |
| | 400,000 | | | 7.375%, 01/31/20 | | | 318,000 | |
| | 2,400,000 | | | Petroleos Mexicanos (Mexico)
3.500%, 07/18/18 | | | 2,445,000 | |
| | 165,000 | | | Plastipak Holdings, Inc.
Senior Unsecured Notes
6.500%, 10/01/21 (a) | | | 171,600 | |
| | 665,000 | | | Reynolds American, Inc.
4.000%, 06/12/22 | | | 716,291 | |
| | 385,000 | | | Reynolds Group Issuer, Inc.
8.250%, 02/15/21 | | | 402,518 | |
| | 735,000 | | | Shell International Finance BV (Netherlands)
1.375%, 05/10/19 | | | 730,860 | |
| | 225,000 | | | Terex Corp.
6.000%, 05/15/21 | | | 229,781 | |
| | 265,000 | | | Teva Pharmaceutical Finance
Netherlands III (Netherlands)
2.800%, 07/21/23 | | | 261,154 | |
| | 1,025,000 | | | Thermo Fisher Scientific, Inc.
Senior Unsecured Notes
3.300%, 02/15/22 | | | 1,073,869 | |
| | | | | | | | |
Par Value | | | | | Market
Value | |
| | | | Industrials (continued) | | | | |
| $ | 255,000 | | | TransDigm, Inc.
6.000%, 07/15/22 | | $ | 267,431 | |
| | 580,000 | | | Waste Management, Inc.
4.100%, 03/01/45 | | | 615,269 | |
| | 255,000 | | | Williams Partners LP/ACMP Finance Corp.
Senior Unsecured Notes
4.875%, 03/15/24 | | | 261,794 | |
| | | | | | | | |
| | | | | | | 23,005,314 | |
| | | | | | | | |
| | | | Information Technology – 1.2% | | | | |
| | 130,000 | | | Camelot Finance SA
Senior Unsecured Notes
7.875%, 10/15/24 (a) | | | 133,250 | |
| | 135,000 | | | Cengage Learning, Inc.
Senior Unsecured Notes
9.500%, 06/15/24 (a) | | | 126,225 | |
| | 730,000 | | | Cisco Systems, Inc.
Senior Unsecured Notes
1.850%, 09/20/21 | | | 729,315 | |
| | 90,000 | | | CSC Holdings LLC
5.500%, 04/15/27 (a) | | | 91,519 | |
| | 85,000 | | | Senior Unsecured Notes
5.250%, 06/01/24 | | | 79,687 | |
| | 185,000 | | | Diamond 1 Finance Corp./Diamond 2 Finance Corp.
7.125%, 06/15/24 (a) | | | 202,856 | |
| | 530,000 | | | Fidelity National Information Services, Inc.
Senior Unsecured Notes
3.625%, 10/15/20 | | | 559,603 | |
| | 130,000 | | | First Data Corp.
7.000%, 12/01/23 (a) | | | 136,987 | |
| | 135,000 | | | Secured Notes
5.750%, 01/15/24 (a) | | | 137,869 | |
| | | | Gray Television, Inc. | | | | |
| | 100,000 | | | 5.125%, 10/15/24 (a) | | | 97,250 | |
| | 135,000 | | | 5.875%, 07/15/26 (a) | | | 134,662 | |
| | 540,000 | | | Hewlett Packard Enterprise Co.
Senior Unsecured Notes
3.850%, 10/15/20 (a) | | | 572,695 | |
| | 175,000 | | | Infor US, Inc.
6.500%, 05/15/22 | | | 182,000 | |
| | 345,000 | | | Intel Corp.
Senior Unsecured Notes
4.100%, 05/19/46 | | | 356,230 | |
| | 640,000 | | | Microsoft Corp.
Senior Unsecured Notes
4.450%, 11/03/45 | | | 706,196 | |
| | 225,000 | | | Nexstar Escrow Corp.
5.625%, 08/01/24 (a) | | | 223,875 | |
| | 245,000 | | | NVIDIA Corp.
Senior Unsecured Notes
3.200%, 09/16/26 | | | 245,727 | |
| | 195,000 | | | NXP Funding LLC (Netherlands)
4.125%, 06/01/21 (a) | | | 208,650 | |
| | 95,000 | | | Senior Unsecured Notes
3.875%, 09/01/22 (a) | | | 100,344 | |
The accompanying notes are an integral part of these financial statements.
55
AMG Funds
| | |
| AMG Managers DoubleLine Core Plus Bond Fund | | October 31, 2016 |
| |
| Schedule of Investments – continued | | |
| | | | | | | | |
Par Value | | | | | Market
Value | |
| | | | Information Technology (continued) | | | | |
| $ | 165,000 | | | Open Text Corp. (Canada)
5.875%, 06/01/26 (a)
| | $ | 176,137 | |
| | | | Oracle Corp.
Senior Unsecured Notes | | | | |
| | 270,000 | | | 2.375%, 01/15/19 | | | 276,046 | |
| | 489,000 | | | 2.250%, 10/08/19 | | | 500,064 | |
| | 720,000 | | | 1.900%, 09/15/21 | | | 718,268 | |
| | 735,000 | | | 4.125%, 05/15/45 | | | 744,332 | |
| | 180,000 | | | Sabre Global, Inc.
Senior Secured Notes
5.250%, 11/15/23 (a) | | | 185,625 | |
| | 255,000 | | | Sinclair Television Group, Inc.
5.625%, 08/01/24 (a) | | | 260,100 | |
| | 130,000 | | | Solera LLC
Senior Unsecured Notes
10.500%, 03/01/24 (a) | | | 145,967 | |
| | 275,000 | | | Sophia LP / Sophia Finance, Inc.
Senior Unsecured Notes
9.000%, 09/30/23 (a) | | | 290,125 | |
| | 55,000 | | | Western Digital Corp.
Senior Secured Notes
7.375%, 04/01/23 (a) | | | 60,362 | |
| | 450,000 | | | Xerox Corp.
Senior Unsecured Notes
2.950%, 03/15/17 | | | 452,659 | |
| | | | | | | | |
| | | | | | | 8,834,625 | |
| | | | | | | | |
| | | | Materials – 0.6% | | | | |
| | 230,000 | | | Ashland LLC
4.750%, 08/15/22 | | | 238,480 | |
| | 1,000,000 | | | Celulosa Arauco y Constitucion SA (Chile)
Senior Unsecured Notes
5.000%, 01/21/21 | | | 1,081,169 | |
| | 300,000 | | | Colbun SA (Chile)
Senior Unsecured Notes
6.000%, 01/21/20 | | | 333,985 | |
| | 1,360,000 | | | Georgia-Pacific LLC
Senior Unsecured Notes
3.600%, 03/01/25 (a) | | | 1,429,783 | |
| | 600,000 | | | Grupo Idesa SA de CV (Mexico)
7.875%, 12/18/20 | | | 579,000 | |
| | 175,000 | | | Signode Industrial Group Lux SA
6.375%, 05/01/22 (a) | | | 177,625 | |
| | 200,000 | | | SINOPEC Group Overseas
Development, Ltd. (British Virgin Islands)
2.500%, 04/28/20 (a) | | | 203,317 | |
| | | | | | | | |
| | | | | | | 4,043,359 | |
| | | | | | | | |
| | | | Telecommunications – 2.0% | | | | |
| | 325,000 | | | 21st Century Fox America, Inc.
4.750%, 09/15/44 | | | 346,905 | |
| | 1,000,000 | | | Axiata SPV2 Bhd
Senior Unsecured Notes
3.466%, 11/19/20 | | | 1,041,733 | |
| | | | | | | | |
Par Value | | | | | Market
Value | |
| | | | Telecommunications (continued) | | | | |
| $ | 500,000 | | | Bharti Airtel, Ltd. (India)
Senior Unsecured Notes
4.375%, 06/10/25 | | $ | 513,800 | |
| | 1,306,000 | | | British Telecommunications PLC
(United Kingdom)
Senior Unsecured Notes
5.950%, 01/15/18 | | | 1,376,130 | |
| | | | CCO Holdings LLC | | | | |
| | | | Senior Unsecured Notes | | | | |
| | 130,000 | | | 5.250%, 09/30/22 | | | 135,687 | |
| | 60,000 | | | 5.125%, 05/01/23 (a) | | | 62,250 | |
| | 250,000 | | | Cequel Communications Holdings I LLC
Senior Unsecured Notes
6.375%, 09/15/20 (a) | | | 258,438 | |
| | | | Comcast Corp. | | | | |
| | 120,000 | | | 4.200%, 08/15/34 | | | 128,944 | |
| | 570,000 | | | 4.400%, 08/15/35 | | | 630,072 | |
| | 400,000 | | | Comcel Trust Via Comunicaciones
Celulares SA (Cayman Islands)
6.875%, 02/06/24 | | | 411,000 | |
| | 235,000 | | | CommScope, Inc.
5.000%, 06/15/21 (a) | | | 242,344 | |
| | | | Digicel Group, Ltd. (Bermuda)
Senior Unsecured Notes | | | | |
| | 300,000 | | | 7.125%, 04/01/22 (a) | | | 240,750 | |
| | 1,700,000 | | | 7.125%, 04/01/22 | | | 1,355,240 | |
| | 135,000 | | | Embarq Corp.
Senior Unsecured Notes
7.995%, 06/01/36 | | | 137,362 | |
| | 150,000 | | | Intelsat Jackson Holdings SA
(Luxembourg)
5.500%, 08/01/23 | | | 100,125 | |
| | 90,000 | | | Senior Secured Notes
8.000%, 02/15/24 (a) | | | 91,620 | |
| | 250,000 | | | Level 3 Communications, Inc.
Senior Unsecured Notes
5.750%, 12/01/22 | | | 258,125 | |
| | 755,000 | | | Omnicom Group, Inc.
3.600%, 04/15/26 | | | 786,197 | |
| | 1,000,000 | | | Ooredoo Tamweel, Ltd.
Senior Unsecured Notes
3.039%, 12/03/18 | | | 1,022,894 | |
| | 704,000 | | | Orange SA (France)
Senior Unsecured Notes
2.750%, 02/06/19 | | | 721,009 | |
| | 255,000 | | | Sirius XM Radio, Inc.
5.375%, 07/15/26 (a) | | | 259,702 | |
| | 200,000 | | | Sixsigma Networks Mexico SA de CV
(Mexico)
8.250%, 11/07/21 (a) | | | 197,000 | |
| | 260,000 | | | TEGNA, Inc.
4.875%, 09/15/21 (a) | | | 271,700 | |
| | 1,000,000 | | | Telefonica Celular del Paraguay SA
(Paraguay)
Senior Unsecured Notes
6.750%, 12/13/22 | | | 1,047,500 | |
The accompanying notes are an integral part of these financial statements.
56
AMG Funds
| | |
| AMG Managers DoubleLine Core Plus Bond Fund | | October 31, 2016 |
| |
| Schedule of Investments – continued | | |
| | | | | | | | |
Par Value | | | | | Market
Value | |
| | | | Telecommunications (continued) | | | | |
| $ | 200,000 | | | TV Azteca SAB de CV (Mexico)
7.500%, 05/25/18 | | $ | 173,500 | |
| | 500,000 | | | TV Azteca SAB de CV, EMTN (Mexico)
7.625%, 09/18/20 | | | 391,250 | |
| | 1,275,000 | | | Verizon Communications, Inc.
Senior Unsecured Notes
4.400%, 11/01/34 | | | 1,297,761 | |
| | 500,000 | | | VTR Finance BV (Netherlands)
Senior Secured Notes
6.875%, 01/15/24 | | | 523,750 | |
| | | | | | | | |
| | | | | | | 14,022,788 | |
| | | | | | | | |
| | | | Utilities – 2.1% | | | | |
| | | | Abengoa Transmision Sur SA (Peru)
Senior Secured Notes | | | | |
| | 300,000 | | | 6.875%, 04/30/43 (a) | | | 324,000 | |
| | 700,000 | | | 6.875%, 04/30/43 | | | 756,000 | |
| | 1,000,000 | | | AES Andres/Dominican Power
Partners/Empresa Generadora De
Electricidad IT (Netherlands)
7.950%, 05/11/26 (a) | | | 1,063,750 | |
| | 300,000 | | | AES El Salvador Trust II
6.750%, 03/28/23 | | | 282,750 | |
| | 703,000 | | | Berkshire Hathaway Energy Co.
Senior Unsecured Notes
6.500%, 09/15/37 | | | 960,704 | |
| | 65,000 | | | Calpine Corp.
Senior Unsecured Notes
5.750%, 01/15/25 | | | 63,456 | |
| | 110,000 | | | Duke Energy Corp.
Senior Unsecured Notes
3.750%, 09/01/46 | | | 105,420 | |
| | 465,000 | | | Duke Energy Progress LLC
4.150%, 12/01/44 | | | 498,426 | |
| | 1,700,000 | | | Empresa de Energia de Bogota SA ESP
(Colombia)
Senior Unsecured Notes
6.125%, 11/10/21 | | | 1,753,125 | |
| | 600,000 | | | Empresas Publicas de Medellin ESP
(Colombia)
Senior Unsecured Notes
7.625%, 07/29/19 | | | 682,500 | |
| | 1,420,000 | | | Exelon Corp.
Senior Unsecured Notes
3.400%, 04/15/26 | | | 1,469,785 | |
| | 524,542 | | | Fermaca Enterprises S de RL de CV
(Mexico)
Senior Secured Notes
6.375%, 03/30/38 (a) | | | 548,146 | |
| | 260,000 | | | Fortis, Inc.
Senior Unsecured Notes
2.100%, 10/04/21 (a) | | | 258,426 | |
| | 2,000,000 | | | Israel Electric Corp., Ltd. (Israel)
Senior Secured Notes
5.625%, 06/21/18 | | | 2,102,500 | |
| | 1,000,000 | | | ITC Holdings Corp.
Senior Unsecured Notes
3.250%, 06/30/26 | | | 1,010,669 | |
| | | | | | |
Par Value | | | | Market
Value | |
| | Utilities (continued) | | | | |
$1,800,000 | | National Gas Co. of Trinidad &
Tobago, Ltd. (Trinidad)
Senior Unsecured Notes
6.050%, 01/15/36 | | $ | 1,912,500 | |
90,000 | | NGL Energy Partners LP / NGL
Energy Finance Corp.
7.500%, 11/01/23 (a) | | | 90,675 | |
180,000 | | NRG Energy, Inc.
7.250%, 05/15/26 (a) | | | 177,750 | |
1,070,000 | | The Southern Co.
Senior Unsecured Notes
2.450%, 09/01/18 | | | 1,088,408 | |
| | | | | | |
| | | | | 15,148,990 | |
| | | | | | |
| | Total Corporate Notes and Bonds
(Cost $188,424,395) | | | 188,914,066 | |
| | | | | | |
COLLATERALIZED MORTGAGE AND ASSET-BACKED SECURITIES – 16.4% | |
2,275,901 | | Alternative Loan Trust
Series 2007-J2, Class 2A1
6.000%, 07/25/37 | | | 2,201,938 | |
350,000 | | Banc of America Commercial
Mortgage Trust
Series 2007-4, Class AM
5.813%, 02/10/51 (c) | | | 359,755 | |
414,471 | | Banc of America Funding Trust
Series 2006-B, Class 7A1
3.168%, 03/20/36 (c) | | | 372,209 | |
592,094 | | Banc of America Funding Trust
Series 2010-R9, Class 3A3
5.500%, 12/26/35 (a) | | | 490,253 | |
630,000 | | BBCMS Trust
Series 2015-STP, Class D
4.284%, 09/10/28 (a) (c) | | | 630,673 | |
201,892 | | Bear Stearns Asset Backed
Securities I Trust
Series 2004-AC2, Class 2A
5.000%, 05/25/34 | | | 201,054 | |
450,000 | | Bear Stearns Commercial Mortgage
Securities Trust
Series 2007-T26, Class AJ
5.566%, 01/12/45 (c) | | | 434,158 | |
403,500 | | CDGJ Commercial Mortage Trust
Series 2014-BXCH, Class B
2.385%, 12/15/27 (a) (c) | | | 399,883 | |
858,000 | | CFCRE Commercial Mortage Trust
Series 2016-C4, Class C
4.878%, 05/10/58 (c) | | | 883,600 | |
85,999 | | Citicorp Mortgage Securities Trust
Series 2007-2, Class 3A1
5.500%, 02/25/37 | | | 85,772 | |
450,000 | | Citigroup Commercial Mortgage Trust
Series 2007-C6, Class AM
5.711%, 12/10/49 (c) | | | 456,617 | |
The accompanying notes are an integral part of these financial statements.
57
AMG Funds
| | |
| AMG Managers DoubleLine Core Plus Bond Fund | | October 31, 2016 |
| |
| Schedule of Investments – continued | | |
| | | | | | | | |
Par Value | | | | | Market
Value | |
| $ | 936,608 | | | Citigroup Commercial Mortgage Trust
Series 2012-GC8, Class XA
2.140%, 09/10/45 (a) (c) (h) | | $ | 62,783 | |
| | 350,000 | | | Citigroup Commercial Mortgage Trust
Series 2013-SMP, Class C
2.738%, 01/12/30 (a) | | | 349,962 | |
| | 350,000 | | | Citigroup Commercial Mortgage Trust
Series 2013-SMP, Class D
2.911%, 01/12/30 (a) (c) | | | 348,624 | |
| | 4,897,202 | | | Citigroup Commercial Mortgage Trust
Series 2014-GC25, Class XA
1.080%, 10/10/47 (c) (h) | | | 317,413 | |
| | 440,700 | | | Citigroup Commercial Mortgage Trust
Series 2015-GC27, Class D
4.429%, 02/10/48 (a) (c) | | | 353,168 | |
| | 780,000 | | | Citigroup Commercial Mortgage Trust
Series 2015-GC31, Class C
4.064%, 06/10/48 (c) | | | 778,004 | |
| | 235,000 | | | Citigroup Commercial Mortgage Trust
Series 2015-GC35, Class C
4.652%, 11/10/48 | | | 237,840 | |
| | 7,500,279 | | | Citigroup Commercial Mortgage Trust
Series 2015-GC35, Class XA
0.905%, 11/10/48 (c) (h) | | | 408,762 | |
| | 7,770,174 | | | Citigroup Commercial Mortgage Trust
Series 2016-GC36, Class XA
1.351%, 02/10/49 (c) (h) | | | 705,316 | |
| | 5,503,512 | | | Citigroup Commercial Mortgage Trust
Series 2016-P3, Class XA
1.716%, 04/15/49 (c) (h) | | | 632,871 | |
| | 6,746,210 | | | Citigroup Commercial Mortgage Trust
Series 2016-P4, Class XA
2.018%, 07/10/49 (c) (h) | | | 935,829 | |
| | 952,000 | | | Citigroup Commercial Mortgage Trust
Series 2016-SMPL, Class D
3.520%, 09/10/31 (a) | | | 950,482 | |
| | 1,776,479 | | | Citigroup Mortgage Loan Trust
Series 2006-AR2, Class 1A2
2.990%, 03/25/36 (c) | | | 1,739,199 | |
| | 1,750,000 | | | Citigroup Mortgage Loan Trust
Series 2010-7, Class 11A1
5.509%, 07/25/36 (a) (c) | | | 1,756,846 | |
| | 340,000 | | | Citigroup/Deutsche Bank Commercial Mortgage Trust
Series 2007-CD4, Class AMFX
5.366%, 12/11/49 (c) | | | 342,362 | |
| | 300,000 | | | COBALT Commercial Mortgage Trust
Series 2007-C2, Class AJFX
5.568%, 04/15/47 (c) | | | 299,238 | |
| | 453,000 | | | COMM Mortgage Trust
Series 2016-DC2, Class C
4.643%, 02/10/49 (c) | | | 446,529 | |
| | 6,790,133 | | | COMM Mortgage Trust
Series 2016-DC2, Class XA
1.080%, 02/10/49 (c) (h) | | | 488,194 | |
| | 55,613 | | | Commercial Mortgage Pass Through Certificates
Series 2010-C1, Class XPA
1.561%, 07/10/46 (a) (c) (h) | | | 900 | |
| | | | | | | | |
Par Value | | | | | Market
Value | |
| $ | 1,844,993 | | | Commercial Mortgage Pass Through Certificates
Series 2012-CR3, Class XA
2.079%, 10/15/45 (c) (h) | | $ | 147,218 | |
| | 20,334,401 | | | Commercial Mortgage Pass Through Certificates
Series 2013-CR10, Class XA
0.933%, 08/10/46 (c) (h) | | | 780,022 | |
| | 300,000 | | | Commercial Mortgage Pass Through Certificates
Series 2014-CR20, Class C
4.506%, 11/10/47 (c) | | | 307,175 | |
| | 350,000 | | | Commercial Mortgage Pass Through Certificates
Series 2015-CR23, Class D
4.256%, 05/10/48 (c) | | | 266,947 | |
| | 470,000 | | | Commercial Mortgage Pass Through Certificates
Series 2015-CR25, Class C
4.547%, 08/10/48 (c) | | | 481,598 | |
| | 600,000 | | | Commercial Mortgage Pass Through Certificates
Series 2015-CR26, Class B
4.495%, 10/10/48 (c) | | | 633,317 | |
| | 8,347,568 | | | Commercial Mortgage Pass Through Certificates
Series 2015-CR26, Class XA
1.059%, 10/10/48 (c) (h) | | | 558,373 | |
| | 585,000 | | | Commercial Mortgage Pass Through Certificates
Series 2015-LC23, Class C
4.646%, 10/10/53 (c) | | | 600,058 | |
| | 9,118,793 | | | Commercial Mortgage Pass Through Certificates
Series 2016-C3, Class XA
1.093%, 01/10/48 (c) (h) | | | 693,576 | |
| | 807,000 | | | Commercial Mortgage Pass Through Certificates
Series 2016-CR28, Class C
4.648%, 02/10/49 (c) | | | 812,915 | |
| | 650,000 | | | Commercial Mortgage Trust
Series 2007-GG11, Class AJ
6.031%, 12/10/49 (c) | | | 650,430 | |
| | 500,000 | | | Core Industrial Trust
Series 2015-CALW, Class D
3.850%, 02/10/34 (a) (c) | | | 516,468 | |
| | 1,111,987 | | | Countrywide Alternative Loan Trust
Series 2005-86CB, Class A5
5.500%, 02/25/36 | | | 968,469 | |
| | 466,420 | | | Countrywide Alternative Loan Trust
Series 2006-J1, Class 2A1
7.000%, 02/25/36 | | | 179,140 | |
| | 70,690 | | | Countrywide Alternative Loan Trust
Series 2007-18CB, Class 2A17
6.000%, 08/25/37 | | | 64,262 | |
| | 284,997 | | | Countrywide Alternative Loan Trust
Series 2007-23CB, Class A3
1.034%, 09/25/37 (c) | | | 152,190 | |
The accompanying notes are an integral part of these financial statements.
58
AMG Funds
| | |
| AMG Managers DoubleLine Core Plus Bond Fund | | October 31, 2016 |
| |
| Schedule of Investments – continued | | |
| | | | | | | | |
Par Value | | | | | Market
Value | |
| $ | 272,124 | | | Countrywide Alternative Loan Trust
Series 2007-23CB, Class A4
5.966%, 09/25/37 (c) (h) | | $ | 75,170 | |
| | 528,698 | | | Countrywide Home Loan Mortgage
Pass Through Trust
Series 2005-HYB8, Class 4A1
2.814%, 12/20/35 (c) | | | 439,926 | |
| | 1,344,995 | | | Countrywide Home Loan Mortgage
Pass Through Trust
Series 2007-14, Class A15
6.500%, 09/25/37 | | | 1,231,023 | |
| | 494,356 | | | Countrywide Home Loan Mortgage
Pass Through Trust
Series 2007-2, Class A13
6.000%, 03/25/37 | | | 442,999 | |
| | 104,264 | | | Countrywide Home Loan Mortgage
Pass Through Trust
Series 2007-7, Class A4
5.750%, 06/25/37 | | | 94,593 | |
| | 625,000 | | | Credit Suisse Commercial Mortgage Trust
Series 2007-C4, Class A1AM
5.936%, 09/15/39 (c) | | | 640,133 | |
| | 6,701 | | | Credit Suisse First Boston Mortgage
Securities Corp.
Series 1998-C2, Class F
6.750%, 11/15/30 (a) (c) | | | 6,730 | |
| | 1,573,358 | | | Credit Suisse First Boston Mortgage
Securities Corp.
Series 2005-9, Class 5A9
5.500%, 10/25/35 | | | 1,373,687 | |
| | 783,398 | | | Credit Suisse Mortgage Capital Certificates
Series 2007-1, Class 5A4
6.000%, 02/25/37 | | | 679,016 | |
| | 250,000 | | | Credit Suisse Mortgage Capital Certificates
Series 2009-RR2, Class IQB
5.695%, 04/16/49 (a) (c) | | | 251,616 | |
| | 6,991,032 | | | CSAIL Commercial Mortgage Trust
Series 2016-C6, Class XA
1.817%, 01/15/49 (c) (h) | | | 824,714 | |
| | 3,563,865 | | | CSMC Trust
Series 2013-IVR4, Class A11
3.490%, 07/25/43 (a) (c) | | | 3,634,693 | |
| | 3,563,865 | | | CSMC Trust
Series 2013-IVR4, Class A2
3.000%, 07/25/43 (a) (c) | | | 3,598,110 | |
| | 534,000 | | | DBJPM
Series 2016-C1, Class C
3.352%, 05/10/49 (c) | | | 503,995 | |
| | 7,705,949 | | | DBJPM
Series 2016-C1, Class XA
1.506%, 05/10/49 (c) (h) | | | 815,453 | |
| | 569,000 | | | FHLMC Multifamily Structured
Pass Through Certificates
Series K050, Class A2
3.334%, 08/25/25 (c) | | | 617,902 | |
| | | | | | | | |
Par Value | | | | | Market
Value | |
| $ | 766,000 | | | FHLMC Multifamily Structured Pass
Through Certificates
Series K053, Class A2
2.995%, 12/25/25 | | $ | 811,251 | |
| | 831,000 | | | FHLMC Multifamily Structured Pass
Through Certificates
Series K054, Class A2
2.745%, 01/25/26 | | | 862,632 | |
| | 12,351,046 | | | FHLMC Multifamily Structured Pass
Through Certificates
Series K722, Class X1
1.312%, 03/25/23 (c) (h) | | | 848,083 | |
| | 3,215,573 | | | First Horizon Alternative
Series 2006-AA7, Class A1
2.696%, 01/25/37 (c) | | | 2,730,142 | |
| | 2,746,619 | | | First Horizon Alternative
Mortgage Securities Trust
Series 2005-FA4, Class 1A6
5.500%, 06/25/35 | | | 2,491,781 | |
| | 1,543,916 | | | First Horizon Mortgage Pass-Through Trust
Series 2006-2, Class 1A3
6.000%, 08/25/36 | | | 1,436,680 | |
| | 5,606,264 | | | Firstkey Mortgage Trust
Series 2014-1, Class A8
3.500%, 11/25/44 (a) (c) | | | 5,720,542 | |
| | 831,000 | | | FREMF 2016-K54 Mortgage Trust
Series 2016-K54, Class B
4.051%, 02/25/26 (a) (c) | | | 838,775 | |
| | 762,000 | | | GS Mortgage Securities Corp. Trust
Series 2016-ICE2, Class A
2.465%, 02/15/33 (a) (c) | | | 766,494 | |
| | 525,131 | | | GS Mortgage Securities Trust
Series 2007-GG10, Class A4
5.794%, 08/10/45 (c) | | | 531,474 | |
| | 391,000 | | | GS Mortgage Securities Trust
Series 2014-GC26, Class C
4.511%, 11/10/47 (c) | | | 399,275 | |
| | 6,461,106 | | | GS Mortgage Securities Trust
Series 2015-GC34, Class XA
1.372%, 10/10/48 (c) (h) | | | 570,207 | |
| | 10,742,148 | | | GS Mortgage Securities Trust
Series 2015-GS1, Class XA
0.838%, 11/10/48 (c) (h) | | | 628,595 | |
| | 7,339,898 | | | GS Mortgage Securities Trust
Series 2016-GS2, Class XA
1.672%, 05/10/49 (c) (h) | | | 832,010 | |
| | 434,938 | | | GSR Mortgage Loan Trust
Series 2006-AR1, Class 3A1
3.158%, 01/25/36 (c) | | | 395,253 | |
| | 29,510 | | | HSI Asset Loan Obligation Trust
Series 2007-2, Class 1A1
5.500%, 09/25/37 | | | 28,385 | |
| | 2,406,974 | | | JP Morgan Chase Commercial
Mortgage Securities Trust
Series 2006-A2, Class 2A1
2.861%, 04/25/36 (c) | | | 2,227,959 | |
The accompanying notes are an integral part of these financial statements.
59
AMG Funds
| | |
| AMG Managers DoubleLine Core Plus Bond Fund | | October 31, 2016 |
| |
| Schedule of Investments – continued | | |
| | | | | | | | |
Par Value | | | | | Market
Value | |
| $ | 350,000 | | | JP Morgan Chase Commercial
Mortgage Securities Trust
Series 2006-LDP9, Class AM
5.372%, 05/15/47 | | $ | 351,053 | |
| | 350,000 | | | JP Morgan Chase Commercial
Mortgage Securities Trust
Series 2007-CB19, Class AM
5.715%, 02/12/49 (c) | | | 355,276 | |
| | 537,200 | | | JP Morgan Chase Commercial
Mortgage Securities Trust
Series 2007-CB20, Class AJ
6.079%, 02/12/51 (c) | | | 540,447 | |
| | 250,000 | | | JP Morgan Chase Commercial
Mortgage Securities Trust
Series 2007-LD12, Class AM
6.040%, 02/15/51 (c) | | | 257,447 | |
| | 657,016 | | | JP Morgan Chase Commercial
Mortgage Securities Trust
Series 2008-C2, Class A4
6.068%, 02/12/51 | | | 672,664 | |
| | 796,375 | | | JP Morgan Chase Commercial
Mortgage Securities Trust
Series 2011-C4, Class XA
1.363%, 07/15/46 (a) (c) (h) | | | 23,081 | |
| | 2,166,322 | | | JP Morgan Chase Commercial
Mortgage Securities Trust
Series 2012-C8, Class XA
2.008%, 10/15/45 (c) (h) | | | 152,796 | |
| | 669,790 | | | JP Morgan Chase Commercial
Mortgage Securities Trust
Series 2012-CBX, Class XA
1.662%, 06/15/45 (c) (h) | | | 40,693 | |
| | 5,756,030 | | | JP Morgan Chase Commercial
Mortgage Securities Trust
Series 2014-C18, Class XA
1.087%, 02/15/47 (c) (h) | | | 283,226 | |
| | 300,000 | | | JP Morgan Chase Commercial
Mortgage Securities Trust
Series 2014-C21, Class C
4.661%, 08/15/47 (c) | | | 306,024 | |
| | 3,689,282 | | | JP Morgan Chase Commercial
Mortgage Securities Trust
Series 2014-C21, Class XA
1.097%, 08/15/47 (c) (h) | | | 229,933 | |
| | 330,824 | | | JP Morgan Chase Commercial
Mortgage Securities Trust
Series 2014-C23, Class C
4.459%, 09/15/47 (c) | | | 340,572 | |
| | 450,000 | | | JP Morgan Chase Commercial
Mortgage Securities Trust
Series 2014-C25, Class C
4.448%, 11/15/47 (c) | | | 455,083 | |
| | 6,485,123 | | | JP Morgan Chase Commercial
Mortgage Securities Trust
Series 2014-C25, Class XA
1.000%, 11/15/47 (c) (h) | | | 357,734 | |
| | | | | | | | |
Par Value | | | | | Market
Value | |
| $ | 5,266,840 | | | JP Morgan Chase Commercial
Mortgage Securities Trust
Series 2014-C26, Class XA
1.174%, 01/15/48 (c) (h) | | $ | 306,209 | |
| | 300,000 | | | JP Morgan Chase Commercial
Mortgage Securities Trust
Series 2014-DSTY, Class A
3.429%, 06/10/27 (a) | | | 309,430 | |
| | 4,403,078 | | | JP Morgan Chase Commercial
Mortgage Securities Trust
Series 2015-C27, Class XA
1.376%, 02/15/48 (c) (h) | | | 318,556 | |
| | 7,934,807 | | | JP Morgan Chase Commercial
Mortgage Securities Trust
Series 2015-C28, Class XA
1.197%, 10/15/48 (c) (h) | | | 497,434 | |
| | 650,000 | | | JP Morgan Chase Commercial
Mortgage Securities Trust
Series 2015-C32, Class C
4.668%, 11/15/48 (c) | | | 607,428 | |
| | 670,000 | | | JP Morgan Chase Commercial
Mortgage Securities Trust
Series 2015-C33, Class C
4.619%, 12/15/48 (c) | | | 685,839 | |
| | 8,364,101 | | | JP Morgan Chase Commercial
Mortgage Securities Trust
Series 2015-JP1, Class XA
1.153%, 01/15/49 (c) (h) | | | 520,265 | |
| | 320,000 | | | JP Morgan Chase Commercial
Mortgage Securities Trust
Series 2016-JP2, Class B
3.460%, 08/15/49 (c) | | | 325,188 | |
| | 246,000 | | | JP Morgan Chase Commercial
Mortgage Securities Trust
Series 2016-JP2, Class C
3.948%, 08/15/49 (c) | | | 238,461 | |
| | 7,144,677 | | | JP Morgan Chase Commercial
Mortgage Securities Trust
Series 2016-JP2, Class XA
1.868%, 08/15/49 (c) (h) | | | 981,443 | |
| | 755,000 | | | JPMBB Commercial Mortgage
Securities Trust
Series 2016-C1, Class C
4.747%, 03/15/49 (c) | | | 782,911 | |
| | 7,723,565 | | | JPMDB Commercial Mortgage
Securities Trust
Series 2016-C2, Class XA
1.714%, 06/15/49 (c) (h) | | | 822,131 | |
| | 485,000 | | | LB Commercial Mortgage Trust
Series 2007-C3, Class AMB
5.189%, 07/15/44 | | | 493,243 | |
| | 250,000 | | | LB Commercial Mortgage Trust
Series 2007-C3, Class AMFL
5.916%, 07/15/44 (a) (c) | | | 255,138 | |
| | 586,445 | | | LB-UBS Commercial Mortgage Trust
Series 2007-C1, Class AJ
5.484%, 02/15/40 | | | 587,337 | |
The accompanying notes are an integral part of these financial statements.
60
AMG Funds
| | |
| AMG Managers DoubleLine Core Plus Bond Fund | | October 31, 2016 |
| |
| Schedule of Investments – continued | | |
| | | | | | | | |
Par Value | | | | | Market
Value | |
| $ | 747,000 | | | LB-UBS Commercial Mortgage Trust
Series 2007-C7, Class AJ
6.245%, 09/15/45 (c) | | $ | 756,742 | |
| | 588,000 | | | LSTAR Commercial Mortgage Trust
Series 2016-4, Class C
4.549%, 03/10/49 (a) (c) | | | 566,442 | |
| | 23,742 | | | Merrill Lynch Mortgage Trust
Series 2006-C2, Class AJ
5.802%, 08/12/43 (c) | | | 23,772 | |
| | 250,000 | | | ML-CFC Commercial Mortgage Trust
Series 2007-5, Class AM
5.419%, 08/12/48 | | | 251,524 | |
| | 884,475 | | | Morgan Stanley Bank of America
Merrill Lynch Trust
Series 2012-C5, Class XA
1.722%, 08/15/45 (a) (c) (h) | | | 49,990 | |
| | 5,881,478 | | | Morgan Stanley Bank of America
Merrill Lynch Trust
Series 2014-C14, Class XA
1.259%, 02/15/47 (c) (h) | | | 291,946 | |
| | 300,000 | | | Morgan Stanley Bank of America
Merrill Lynch Trust
Series 2014-C18, Class C
4.486%, 10/15/47 (c) | | | 310,751 | |
| | 413,500 | | | Morgan Stanley Bank of America
Merrill Lynch Trust
Series 2014-C19, Class C
4.000%, 12/15/47 | | | 392,559 | |
| | 785,000 | | | Morgan Stanley Bank of America
Merrill Lynch Trust
Series 2015-C25, Class C
4.529%, 10/15/48 (c) | | | 811,423 | |
| | 800,000 | | | Morgan Stanley Bank of America
Merrill Lynch Trust
Series 2015-C26, Class D
3.060%, 10/15/48 (a) | | | 573,500 | |
| | 80,000 | | | Morgan Stanley Bank of America
Merrill Lynch Trust
Series 2015-C27, Class C
4.537%, 12/15/47 (c) | | | 79,587 | |
| | 8,485,905 | | | Morgan Stanley Bank of America
Merrill Lynch Trust
Series 2016-C28, Class XA
1.293%, 01/15/49 (c) (h) | | | 722,503 | |
| | 844,000 | | | Morgan Stanley Bank of America
Merrill Lynch Trust
Series 2016-C29, Class C
4.753%, 05/15/49 (c) | | | 851,296 | |
| | 104,321 | | | Morgan Stanley Capital I Trust
Series 2006-HQ8, Class AJ
5.422%, 03/12/44 (c) | | | 104,825 | |
| | 300,000 | | | Morgan Stanley Capital I Trust
Series 2007-HQ11, Class AJ
5.508%, 02/12/44 (c) | | | 298,766 | |
| | 250,000 | | | Morgan Stanley Capital I Trust
Series 2007-IQ13, Class AM
5.406%, 03/15/44 | | | 251,562 | |
| | | | | | | | |
Par Value | | | | | Market
Value | |
| $ | 375,100 | | | Morgan Stanley Capital I Trust
Series 2007-IQ16, Class AMA
6.049%, 12/12/49 (c) | | $ | 387,452 | |
| | 626,177 | | | Morgan Stanley Capital I Trust
Series 2011-C1, Class XA
0.463%, 09/15/47 (a) (c) (h) | | | 9,518 | |
| | 250,000 | | | Morgan Stanley Capital I Trust
Series 2014-CPT, Class E
3.446%, 07/13/29 (a) (c) | | | 251,425 | |
| | 350,000 | | | Morgan Stanley Capital I Trust
Series 2014-MP, Class D
3.693%, 08/11/29 (a) (c) | | | 352,100 | |
| | 588,000 | | | Morgan Stanley Capital I Trust
Series 2015-XLF2, Class AFSC
3.535%, 08/15/26 (a) (c) | | | 587,898 | |
| | 2,884,607 | | | Morgan Stanley Capital I Trust
Series 2016-UB11, Class XA
1.686%, 08/15/49 (c) (h) | | | 317,020 | |
| | 751,821 | | | Morgan Stanley Mortgage Loan Trust
Series 2005-3AR, Class 2A2
2.926%, 07/25/35 (c) | | | 669,062 | |
| | 6,219,504 | | | Morgan Stanley Mortgage Loan Trust
Series 2005-9AR, Class 2A
3.104%, 12/25/35 (c) | | | 5,318,982 | |
| | 1,734,418 | | | Morgan Stanley Mortgage Loan Trust
Series 2007-14AR, Class 1A3
3.089%, 10/25/37 (c) | | | 1,514,054 | |
| | 258,838 | | | Nomura Asset Acceptance Corp.
Alternative Loan Trust
Series 2005-AP3, Class A3
5.318%, 08/25/35 (c) | | | 168,301 | |
| | 2,399,667 | | | PR Mortgage Loan Trust (c)
Series 2014-1, Class APT
5.912%, 10/25/49 | | | 2,388,970 | |
| | 1,360,214 | | | RALI Trust
Series 2005-QA10, Class A31
4.013%, 09/25/35 (c) | | | 1,155,797 | |
| | 4,115,866 | | | RALI Trust
Series 2006-QS7, Class A2
6.000%, 06/25/36 | | | 3,484,998 | |
| | 214,421 | | | Residential Asset Securitization Trust
Series 2006-A6, Class 1A1
6.500%, 07/25/36 | | | 113,114 | |
| | 472,726 | | | Residential Asset Securitization Trust
Series 2007-A1, Class A8
6.000%, 03/25/37 | | | 320,857 | |
| | 1,688,942 | | | Sequoia Mortgage Trust
Series 2013-1, Class 2A1
1.855%, 02/25/43 (c) | | | 1,642,639 | |
| | 7,355,327 | | | SG Commercial Mortgage Securities
Trust
Series 2016-C5, Class XA
2.035%, 10/10/48 (c) (h) | | | 966,594 | |
| | 250,942 | | | Structured Adjustable Rate Mortgage
Loan Trust Series 2006-1, Class 2A2
3.035%, 02/25/36 (c) | | | 219,980 | |
The accompanying notes are an integral part of these financial statements.
61
AMG Funds
| | |
| AMG Managers DoubleLine Core Plus Bond Fund | | October 31, 2016 |
| |
| Schedule of Investments – continued | | |
| | | | | | | | |
Par Value | | | | | Market
Value | |
| $ | 1,851,512 | | | UBS-Barclays Commercial Mortgage
Trust
Series 2012-C3, Class XA
2.051%, 08/10/49 (a) (c) (h) | | $ | 148,540 | |
| | 977,000 | | | Wachovia Bank Commercial
Series 2006-C26, Class AM
6.079%, 06/15/45 (c) | | | 979,183 | |
| | 500,000 | | | Wachovia Bank Commercial Mortgage
Trust
Series 2007-C32, Class AMFX
5.703%, 06/15/49 (a) | | | 507,143 | |
| | 47,077 | | | Wachovia Bank Commercial Mortgage
Trust
Series 2006-C24, Class AJ
5.658%, 03/15/45 (c) | | | 47,012 | |
| | 540,000 | | | Wachovia Bank Commercial Mortgage
Trust
Series 2006-C28, Class AJ
5.632%, 10/15/48 (c) | | | 538,365 | |
| | 1,063,000 | | | Wachovia Bank Commercial Mortgage
Trust
Series 2007-C30, Class AJ
5.413%, 12/15/43 (c) | | | 1,063,225 | |
| | 250,000 | | | Wachovia Bank Commercial Mortgage
Trust
Series 2007-C30, Class AM
5.383%, 12/15/43 | | | 251,578 | |
| | 350,000 | | | Wachovia Bank Commercial Mortgage
Trust
Series 2007-C30, Class AMFL
0.735%, 12/15/43 (a) (c) | | | 344,738 | |
| | 300,000 | | | Wachovia Bank Commercial Mortgage
Trust
Series 2007-C33, Class AJ
5.959%, 02/15/51 (c) | | | 300,528 | |
| | 580,000 | | | Wachovia Bank Commercial Mortgage
Trust
Series 2007-C33, Class AM
5.959%, 02/15/51 (c) | | | 590,613 | |
| | 1,984,031 | | | Washington Mutual Mortgage
Pass-Through Certificates WMALT
Trust
Series 2005-8, Class 2CB1
5.500%, 10/25/35 | | | 1,950,934 | |
| | 6,340,000 | | | Wells Fargo Commercial Mo
Series 2016-NXS6, Class XA
1.808%, 11/15/49 (c) (h) | | | 695,354 | |
| | 471,800 | | | Wells Fargo Commercial Mortgage
Trust
Series 2015-C26, Class D
3.586%, 02/15/48 (a) | | | 344,988 | |
| | 725,000 | | | Wells Fargo Commercial Mortgage
Trust
Series 2014-LC16, Class D
3.938%, 08/15/50 (a) | | | 588,637 | |
| | 512,000 | | | Wells Fargo Commercial Mortgage
Trust
Series 2014-LC18, Class B
3.959%, 12/15/47 | | | 542,078 | |
| | | | | | | | |
Par Value | | | | | Market
Value | |
| $ | 400,000 | | | Wells Fargo Commercial Mortgage
Trust
Series 2015-C28, Class C
4.136%, 05/15/48 (c) | | $ | 371,367 | |
| | 585,000 | | | Wells Fargo Commercial Mortgage
Trust
Series 2015-C31, Class C
4.612%, 11/15/48 (c) | | | 601,048 | |
| | 8,441,854 | | | Wells Fargo Commercial Mortgage
Trust
Series 2015-C31, Class XA
1.115%, 11/15/48 (c) (h) | | | 617,797 | |
| | 480,000 | | | Wells Fargo Commercial Mortgage
Trust
Series 2015-LC22, Class C
4.540%, 09/15/58 (c) | | | 490,986 | |
| | 4,447,533 | | | Wells Fargo Commercial Mortgage
Trust
Series 2015-NXS1, Class XA
1.196%, 05/15/48 (c) (h) | | | 303,013 | |
| | 610,000 | | | Wells Fargo Commercial Mortgage
Trust
Series 2015-NXS3, Class C
4.489%, 09/15/57 (c) | | | 580,117 | |
| | 558,000 | | | Wells Fargo Commercial Mortgage
Trust
Series 2016-C32, Class C
4.721%, 01/15/59 (c) | | | 538,035 | |
| | 517,000 | | | Wells Fargo Commercial Mortgage
Trust
Series 2016-C33, Class C
3.896%, 03/15/59 | | | 495,718 | |
| | 5,338,328 | | | Wells Fargo Commercial Mortgage
Trust
Series 2016-C33, Class XA
1.814%, 03/15/59 (c) (h) | | | 623,403 | |
| | 303,755 | | | Wells Fargo Mortgage Backed
Securities Trust
Series 2007-13, Class A6
6.000%, 09/25/37 | | | 306,577 | |
| | 298,692 | | | Wells Fargo Mortgage Backed
Securities Trust
Series 2007-8, Class 1A16
6.000%, 07/25/37 | | | 299,905 | |
| | 815,176 | | | WF-RBS Commercial Mortgage Trust
Series 2012-C8, Class XA
1.993%, 08/15/45 (a) (c) (h) | | | 61,826 | |
| | 1,364,039 | | | WF-RBS Commercial Mortgage Trust
Series 2012-C9, Class XA
2.118%, 11/15/45 (a) (c) (h) | | | 111,418 | |
| | 6,253,130 | | | WFRBS Commercial Mortgage Trust
Series 2014-C21, Class XA
1.162%, 08/15/47 (c) (h) | | | 386,610 | |
| | | | | | | | |
| | | | Total Collateralized Mortgage and
Asset-Backed Securities
(Cost $117,100,578) | | | 115,815,417 | |
| | | | | | | | |
The accompanying notes are an integral part of these financial statements.
62
AMG Funds
| | |
| AMG Managers DoubleLine Core Plus Bond Fund | | October 31, 2016 |
| |
| Schedule of Investments – continued | | |
| | | | | | |
Par Value | | | | Market
Value | |
U.S. GOVERNMENT AND AGENCY OBLIGATIONS – 43.1% | |
| | Fannie Mae – 12.8% | | | | |
$ 13,301,334 | | 3.000%, 09/01/46
Pool # MA2737 | | $ | 13,711,130 | |
330,538 | | 4.000%, 06/01/42
Pool # AB5459 | | | 350,436 | |
3,732,359 | | 3.000%, 10/01/34
Pool # AS3456 | | | 3,886,924 | |
3,847,601 | | 3.000%, 01/01/35
Pool # AS4281 | | | 4,007,093 | |
3,477,517 | | 3.000%, 03/01/45
Pool # AS4645 | | | 3,584,654 | |
9,798,105 | | 3.500%, 03/01/46
Pool # BC0281 | | | 10,402,957 | |
545,679 | | 3.500%, 12/01/31
Pool # MA0919 | | | 579,069 | |
478,889 | | 3.500%, 01/01/32
Pool # MA0949 | | | 508,199 | |
166,174 | | 4.500%, 03/01/42
Pool # MA1050 | | | 176,884 | |
1,369,243 | | 3.000%, 06/01/33
Pool # MA1459 | | | 1,426,682 | |
4,377,954 | | 3.000%, 04/01/45
Pool # MA2248 | | | 4,460,360 | |
208,615 | | 4.000%, 09/01/31
Pool # MA3894 | | | 225,282 | |
186,881 | | 6.086%, 10/25/36 (c) (h)
Series 2007-57, Class SX, REMIC | | | 38,413 | |
360,118 | | 5.266%, 09/25/36 (c) (h)
Series 2009-86, Class CI, REMIC | | | 52,433 | |
333,148 | | 4.000%, 01/25/41
Series 2010-156, Class ZC,
REMIC | | | 383,202 | |
254,283 | | 4.500%, 12/25/41
Series 2011-121, Class JP,
REMIC | | | 273,522 | |
501,576 | | 4.000%, 03/25/41
Series 2011-18, Class UZ,
REMIC | | | 539,137 | |
1,153,394 | | 3.500%, 10/25/42
Series 2012-105, Class Z, REMIC | | | 1,185,859 | |
2,209,172 | | 2.750%, 11/25/42
Series 2012-127, Class PA,
REMIC | | | 2,244,170 | |
4,237,790 | | 3.500%, 03/25/42
Series 2012-20, Class ZT, REMIC | | | 4,492,296 | |
1,801,273 | | 4.000%, 04/25/42
Series 2012-31, Class Z, REMIC | | | 1,982,040 | |
7,492,793 | | 2.000%, 08/25/42
Series 2013-5, Class EZ, REMIC | | | 7,075,761 | |
5,332,424 | | 3.000%, 02/25/43
Series 2013-8, Class Z, REMIC | | | 5,260,703 | |
5,308,785 | | 3.000%, 11/25/44
Series 2014-73, Class CZ, REMIC | | | 5,173,733 | |
7,028,279 | | 3.000%, 01/25/45
Series 2015-9, Class HA, REMIC | | | 7,339,007 | |
4,975,100 | | 3.000%, 08/25/42
Series 2015-95, Class AP,
REMIC | | | 5,113,586 | |
| | | | | | | | |
Par Value | | | | | Market
Value | |
| | | | Fannie Mae (continued) | | | | |
| $ | 5,522,873 | | | 3.000%, 05/25/46
Series 2016-24, Class NZ, REMIC | | $ | 5,481,334 | |
| | 757,000 | | | 2.702%, 02/25/26
Series 2016-M3, Class A2 | | | 781,254 | |
| | | | | | | | |
| | | | | | | 90,736,120 | |
| | | | | | | | |
| | | | Freddie Mac – 5.7% | | | | |
| | 3,241,433 | | | 3.000%, 03/15/44
Series 4316, Class BZ, REMIC | | | 3,235,187 | |
| | 1,273,106 | | | 3.000%, 01/01/33
Gold Pool # C91594 | | | 1,327,934 | |
| | 30,759 | | | 5.000%, 07/01/35
Gold Pool # G01840 | | | 34,393 | |
| | 8,685 | | | 5.500%, 12/01/38
Gold Pool # G06172 | | | 9,850 | |
| | 5,720,035 | | | 3.500%, 02/01/45
Gold Pool # Q31596 | | | 6,007,075 | |
| | 163,302 | | | 4.000%, 10/01/41
Gold Pool # T60392 | | | 170,712 | |
| | 875,575 | | | 3.500%, 10/01/42
Gold Pool # T65110 | | | 905,918 | |
| | 3,615,722 | | | 3.000%, 07/01/45
Pool # G08653 | | | 3,726,726 | |
| | 4,535,495 | | | 3.000%, 08/01/45
Pool # G08658 | | | 4,674,736 | |
| | 417,261 | | | 5.000%, 12/15/34
Series 2909, Class Z, REMIC | | | 465,726 | |
| | 114,983 | | | 5.565%, 04/15/37 (c) (h)
Series 3301, Class MS, REMIC | | | 17,965 | |
| | 48,721 | | | 5.465%, 11/15/37 (c) (h)
Series 3382, Class SB, REMIC | | | 6,409 | |
| | 81,333 | | | 5.855%, 11/15/37 (c) (h)
Series 3384, Class S, REMIC | | | 12,500 | |
| | 177,594 | | | 4.985%, 01/15/39 (c) (h)
Series 3500, Class SA, REMIC | | | 20,551 | |
| | 200,842 | | | 5.500%, 08/15/36
Series 3626, Class AZ, REMIC | | | 222,216 | |
| | 1,322,147 | | | 4.000%, 12/15/38
Series 3738, Class BP, REMIC | | | 1,370,706 | |
| | 125,812 | | | 4.000%, 01/15/41
Series 3795, Class VZ, REMIC | | | 137,797 | |
| | 54,433 | | | 4.000%, 06/15/41
Series 3872, Class BA, REMIC | | | 57,132 | |
| | 246,649 | | | 4.000%, 07/15/41
Series 3888, Class ZG, REMIC | | | 265,348 | |
| | 443,016 | | | 4.500%, 07/15/41
Series 3894, Class ZA, REMIC | | | 463,893 | |
| | 591,903 | | | 3.500%, 11/15/41
Series 3957, Class DZ, REMIC | | | 615,654 | |
| | 547,623 | | | 4.000%, 11/15/41
Series 3957, Class HZ, REMIC | | | 596,498 | |
| | 1,250,365 | | | 8.791%, 01/15/41 (c)
Series 3792, Class SE, REMIC | | | 1,346,777 | |
| | 2,161,527 | | | 4.000%, 03/15/42
Series 4016, Class KZ, REMIC | | | 2,443,386 | |
| | 5,351,402 | | | 4.965%, 07/15/42 (c) (g) (h)
Series 4075, Class S, REMIC | | | 759,175 | |
The accompanying notes are an integral part of these financial statements.
63
AMG Funds
| | |
| AMG Managers DoubleLine Core Plus Bond Fund | | October 31, 2016 |
| |
| Schedule of Investments – continued | | |
| | | | | | | | |
Par Value | | | | | Market
Value | |
| | | | Freddie Mac (continued) | | | | |
| $ | 3,505,664 | | | 2.250%, 03/15/38
Series 4215, Class KC, REMIC | | $ | 3,554,255 | |
| | 2,955,066 | | | 3.000%, 06/15/40
Series 4323, Class GA, REMIC | | | 3,053,534 | |
| | 4,216,405 | | | 3.000%, 01/15/41
Series 4511, Class QA, REMIC | | | 4,329,549 | |
| | | | | | | | |
| | | | | | | 39,831,602 | |
| | | | | | | | |
| | | | Ginnie Mae – 0.4% | | | | |
| | 30,062 | | | 29.083%, 03/20/34 (c)
Series 2004-35, Class SA | | | 48,936 | |
| | 378,634 | | | 7.104%, 08/20/38 (c)
(h) Series 2008-69, Class SB | | | 78,182 | |
| | 435,536 | | | 4.500%, 05/16/39
Series 2009-32, Class ZE | | | 480,249 | |
| | 489,184 | | | 4.500%, 05/20/39
Series 2009-35, Class DZ | | | 533,989 | |
| | 518,485 | | | 4.500%, 09/20/39
Series 2009-75, Class GZ | | | 559,514 | |
| | 143,010 | | | 5.826%, 03/20/39 (c) (h)
Series 2010-98, Class IA | | | 14,814 | |
| | 880,140 | | | 4.924%, 06/20/41 (c) (h)
Series 2011-89, Class SA | | | 117,801 | |
| | 3,588,795 | | | 5.724%, 10/20/44 (c) (h)
Series 2014-156, Class PS | | | 584,696 | |
| | 3,503,260 | | | 5.624%, 07/20/43 (c) (h)
Series 2014-5, Class PS | | | 537,403 | |
| | | | | | | | |
| | | | | | | 2,955,584 | |
| | | | | | | | |
| | | | U.S. Treasury Bonds – 0.4% | | | | |
| | 2,680,000 | | | 2.750%, 11/15/42 | | | 2,785,002 | |
| | | | | | | | |
| | | | U.S. Treasury Inflation Index Bonds – 7.1% | |
| | 30,043,520 | | | 0.125%, 07/15/26 | | | 30,143,565 | |
| | 4,969,365 | | | 0.125%, 04/15/21 | | | 5,071,714 | |
| | 13,783,740 | | | 1.000%, 02/15/46 | | | 14,894,296 | |
| | | | | | | | |
| | | | | | | 50,109,575 | |
| | | | | | | | |
| | | | U.S. Treasury Notes – 16.7% | | | | |
| | 7,650,000 | | | 0.500%, 11/30/16 | | | 7,651,966 | |
| | 12,940,000 | | | 0.500%, 01/31/17 | | | 12,947,182 | |
| | 16,370,000 | | | 1.000%, 02/15/18 | | | 16,423,710 | |
| | 2,400,000 | | | 1.000%, 05/15/18 | | | 2,407,265 | |
| | 800,000 | | | 1.000%, 11/30/19 | | | 799,453 | |
| | 20,970,000 | | | 2.000%, 11/30/20 | | | 21,618,770 | |
| | 10,240,000 | | | 2.125%, 01/31/21 | | | 10,608,599 | |
| | 21,790,000 | | | 2.250%, 03/31/21 | | | 22,696,922 | |
| | 1,060,000 | | | 1.875%, 11/30/21 | | | 1,086,355 | |
| | 9,670,000 | | | 1.750%, 03/31/22 | | | 9,835,067 | |
| | 9,460,000 | | | 1.500%, 03/31/23 | | | 9,426,370 | |
| | 670,000 | | | 2.375%, 08/15/24 | | | 703,722 | |
| | 2,300,000 | | | 2.125%, 05/15/25 | | | 2,366,261 | |
| | | | | | | | |
| | | | | | | 118,571,642 | |
| | | | | | | | |
| | | | Total U.S. Government and Agency
Obligations
(Cost $303,733,594) | | | 304,989,525 | |
| | | | | | | | |
| | | | | | |
Par Value | | | | Market
Value | |
OTHER MORTGAGE AND ASSET-BACKED SECURITIES – 7.9% | |
$ 250,000 | | Adams Mill CLO, Ltd. (Cayman
Islands)
Series 2014-1A, Class D1
4.380%, 07/15/26 (a) (c) | | $ | 228,746 | |
250,000 | | Adams Mill CLO, Ltd. (Cayman
Islands)
Series 2014-1A, Class E1
5.880%, 07/15/26 (a) (c) | | | 201,799 | |
500,000 | | ALM XI, Ltd. (Cayman Islands)
Series 2014-11A, Class C
4.380%, 10/17/26 (a) (c) | | | 495,116 | |
1,000,000 | | ALM XIV, Ltd. (Cayman Islands)
Series 2014-14A, Class C
4.340%, 07/28/26 (a) (c) | | | 971,213 | |
500,000 | | ALM XIX, Ltd. (Cayman Islands)
Series 2016-19A, Class B
3.634%, 07/15/28 (a) (c) | | | 503,882 | |
500,000 | | ALM XIX, Ltd. (Cayman Islands)
Series 2016-19A, Class C
4.984%, 07/15/28 (a) (c) | | | 502,078 | |
500,000 | | Apidos CLO XVI (Cayman Islands)
Series 2013-16A, Class B
3.678%, 01/19/25 (a) (c) | | | 500,717 | |
250,000 | | Apidos CLO XVIII (Cayman Islands)
Series 2014-18A, Class C
4.532%, 07/22/26 (a) (c) | | | 249,063 | |
250,000 | | Apidos CLO XVIII (Cayman Islands)
Series 2014-18A, Class D
6.082%, 07/22/26 (a) (c) | | | 224,503 | |
500,000 | | Apidos CLO XX (Cayman Islands)
Series 2015-20A, Class B
4.080%, 01/16/27 (a) (c) | | | 505,767 | |
500,000 | | Apidos CLO XX (Cayman Islands)
Series 2015-20A, Class C
4.580%, 01/16/27 (a) (c) | | | 493,511 | |
500,000 | | Apidos CLO XXI (Cayman Islands)
Series 2015-21A, Class C
4.432%, 07/18/27 (a) (c) | | | 478,126 | |
500,000 | | ARES XXVI CLO, Ltd.
(Cayman Islands)
Series 2013-1A, Class D
4.630%, 04/15/25 (a) (c) | | | 484,690 | |
500,000 | | Atrium V (Cayman Islands)
Series 5A, Class A4
1.201%, 07/20/20 (a) (c) | | | 499,343 | |
141,907 | | AVANT Loans Funding Trust
Series 2016-B, Class A
3.920%, 08/15/19 (a) | | | 142,717 | |
500,000 | | Babson CLO, Ltd. (Cayman Islands)
Series 2012-2A, Class CR
4.417%, 05/15/23 (a) (c) | | | 500,045 | |
250,000 | | Babson CLO, Ltd. (Cayman Islands)
Series 2014-3A, Class E2
7.380%, 01/15/26 (a) (c) | | | 232,465 | |
500,000 | | Babson CLO, Ltd. (Cayman Islands)
Series 2015-2A, Class D
4.681%, 07/20/27 (a) (c) | | | 492,797 | |
The accompanying notes are an integral part of these financial statements.
64
AMG Funds
| | |
| AMG Managers DoubleLine Core Plus Bond Fund | | October 31, 2016 |
| |
| Schedule of Investments – continued | | |
| | | | | | | | |
Par Value | | | | | Market
Value | |
| $ | 250,000 | | | Babson CLO, Ltd. (Cayman Islands)
Series 2015-IA, Class D1
4.331%, 04/20/27 (a) (c) | | $ | 241,227 | |
| | 449,286 | | | Bayview Financial Acquisition Trust
Series 2007-A, Class 1A5
6.101%, 05/28/37 (i) | | | 451,818 | |
| | 250,000 | | | Birchwood Park CLO, Ltd.
(Cayman Islands)
Series 2014-1A, Class C2
4.030%, 07/15/26 (a) (c) | | | 250,185 | |
| | 250,000 | | | Birchwood Park CLO, Ltd.
(Cayman Islands)
Series 2014-1A, Class D2
5.080%, 07/15/26 (a) (c) | | | 249,854 | |
| | 250,000 | | | BlueMountain CLO, Ltd.
(Cayman Islands)
Series 2012-1A, Class E
6.381%, 07/20/23 (a) (c) | | | 249,954 | |
| | 750,000 | | | BlueMountain CLO, Ltd.
(Cayman Islands)
Series 2012-2A, Class C
3.561%, 11/20/24 (a) (c) | | | 751,895 | |
| | 500,000 | | | BlueMountain CLO, Ltd.
(Cayman Islands)
Series 2015-2A, Class C
3.582%, 07/18/27 (a) (c) | | | 502,580 | |
| | 1,000,000 | | | BlueMountain CLO, Ltd.
(Cayman Islands)
Series 2015-2A, Class D
4.432%, 07/18/27 (a) (c) | | | 956,192 | |
| | 1,000,000 | | | BlueMountain CLO, Ltd.
(Cayman Islands)
Series 2016-2A, Class C
4.800%, 08/20/28 (a) (c) | | | 1,007,837 | |
| | 250,000 | | | Brookside Mill CLO, Ltd.
(Cayman Islands)
Series 2013-1A, Class D
3.930%, 04/17/25 (a) (c) | | | 232,686 | |
| | 250,000 | | | Brookside Mill CLO, Ltd.
(Cayman Islands)
Series 2013-1A, Class E
5.280%, 04/17/25 (a) (c) | | | 187,261 | |
| | 194,612 | | | Callidus Debt Partners CLO Fund VI, Ltd.
(Cayman Islands)
Series 6A, Class A1T
1.142%, 10/23/21 (a) (c) | | | 193,101 | |
| | 500,000 | | | Canyon Capital CLO, Ltd.
(Cayman Islands)
Series 2014-1A, Class B
3.537%, 04/30/25 (a) (c) | | | 494,388 | |
| | 500,000 | | | Carlyle Global Market Strategies CLO, Ltd.
(Cayman Islands)
Series 2014-1A, Class C
3.880%, 04/17/25 (a) (c) | | | 501,322 | |
| | 924,520 | | | Carlyle High Yield Partners X, Ltd.
(Cayman Islands)
Series 2007-10A, Class A1
1.103%, 04/19/22 (a) (c) | | | 924,553 | |
| | | | | | | | |
Par Value | | | | | Market
Value | |
| $ | 997,115 | | | Castle Aircraft Securitiz
Series 2015-1A, Class A
4.703%, 12/15/40 (a) | | $ | 1,014,498 | |
| | 250,000 | | | Catamaran CLO, Ltd.
(Cayman Islands)
Series 2015-1A, Class C1
3.982%, 04/22/27 (a) (c) | | | 248,648 | |
| | 953,400 | | | CLI Funding V LLC
Series 2013-2A, Class NOTE
3.220%, 06/18/28 (a) | | | 927,376 | |
| | 2,388,869 | | | Credit Suisse Commercial Mortgage Trust
Series 2015-PR2, Class A1
4.250%, 07/26/55 (a) (i) | | | 2,398,304 | |
| | 100,000 | | | Credit-Based Asset Servicing & Securitization LLC
Series 2007-MX1, Class A4
6.231%, 12/25/36 (a) (i) | | | 101,449 | |
| | 750,000 | | | Dryden XXIV Senior Loan Fund
(Cayman Islands)
Series 2012-24RA, Class DR
4.517%, 11/15/23 (a) (c) | | | 738,166 | |
| | 250,000 | | | Eaton Vance CDO VIII, Ltd.
(Cayman Islands)
Series 2006-8A, Class B
1.467%, 08/15/22 (a) (c) | | | 246,709 | |
| | 819,277 | | | ECAF I, Ltd.
Series 2015-1A, Class A1
3.473%, 06/15/40 (a) | | | 817,843 | |
| | 250,000 | | | Emerson Park CLO, Ltd.
(Cayman Islands)
Series 2013-1A, Class C1
3.630%, 07/15/25 (a) (c) | | | 249,442 | |
| | 250,000 | | | Flatiron CLO, Ltd.
(Cayman Islands)
Series 2014-1A, Class C
4.180%, 07/17/26 (a) (c) | | | 229,388 | |
| | 500,000 | | | FREMF Mortgage Trust
Series 2016-KF22, Class B
5.581%, 07/25/23 (a) (c) | | | 501,958 | |
| | 500,000 | | | Galaxy XVIII CLO, Ltd.
(Cayman Islands)
Series 2014-18A, Class D1
4.580%, 10/15/26 (a) (c) | | | 472,597 | |
| | 1,000,000 | | | Galaxy XXII CLO, Ltd.
(Cayman Islands)
Series 2016-22A, Class D
5.106%, 07/16/28 (a) (c) | | | 1,005,000 | |
| | 500,000 | | | Goldentree Loan Opportunities X, Ltd.
(Cayman Islands)
Series 2015-10A, Class D
4.231%, 07/20/27 (a) (c) | | | 471,299 | |
| | 757,000 | | | GSAA Home Equity Trust
Series 2006-15, Class AF3B
5.933%, 09/25/36 (c) | | | 131,405 | |
| | 250,000 | | | Halcyon Loan Advisors Funding, Ltd.
(Cayman Islands)
Series 2013-2A, Class C
3.586%, 08/01/25 (a) (c) | | | 246,724 | |
The accompanying notes are an integral part of these financial statements.
65
AMG Funds
| | |
| AMG Managers DoubleLine Core Plus Bond Fund | | October 31, 2016 |
| |
| Schedule of Investments – continued | | |
| | | | | | | | |
Par Value | | | | | Market
Value | |
| $ | 500,000 | | | ING Investment Management CLO II, Ltd.
(Cayman Islands)
Series 2006-2X, Class D
2.486%, 08/01/20 (c) | | $ | 499,982 | |
| | 250,000 | | | LCM XI LP (Cayman Islands)
Series 11A, Class D2
4.828%, 04/19/22 (a) (c) | | | 250,148 | |
| | 500,000 | | | LCM XII LP (Cayman Islands)
Series 12A, Class DR
4.578%, 10/19/22 (a) (c) | | | 497,507 | |
| | 250,000 | | | LCM XIV LP (Cayman Islands)
Series 14A, Class D
4.380%, 07/15/25 (a) (c) | | | 246,432 | |
| | 500,000 | | | LCM XV LP (Cayman Islands)
Series 15A, Class C
3.925%, 08/25/24 (a) (c) | | | 500,609 | |
| | 1,000,000 | | | LCM XVIII LP (Cayman Islands)
Series 19A, Class D
4.330%, 07/15/27 (a) (c) | | | 913,544 | |
| | 1,000,000 | | | Madison Park Funding IV, Ltd.
(Cayman Islands)
Series 2007-4A, Class A1B
1.166%, 03/22/21 (a) (c) | | | 968,650 | |
| | 350,000 | | | Madison Park Funding IV, Ltd.
(Cayman Islands)
Series 2007-4A, Class D
2.296%, 03/22/21 (a) (c) | | | 339,504 | |
| | 500,000 | | | Madison Park Funding XIV, Ltd.
(Cayman Islands)
Series 2014-14A, Class D
4.481%, 07/20/26 (a) (c) | | | 497,399 | |
| | 500,000 | | | Madison Park Funding XV, Ltd.
(Cayman Islands)
Series 2014-15A, Class C
4.586%, 01/27/26 (a) (c) | | | 497,996 | |
| | 1,500,000 | | | Madison Park Funding XVI, Ltd.
(Cayman Islands)
Series 2015-16A, Class B
3.881%, 04/20/26 (a) (c) | | | 1,505,767 | |
| | 750,000 | | | Madison Park Funding, Ltd.
(Cayman Islands)
Series 2007-6A, Class C
1.884%, 07/26/21 (a) (c) | | | 722,978 | |
| | 500,000 | | | Magnetite IX, Ltd. (Cayman Islands)
Series 2014-9A, Class B
3.882%, 07/25/26 (a) (c) | | | 500,396 | |
| | 500,000 | | | Magnetite XI, Ltd. (Cayman Islands)
Series 2014-11A, Class C
4.279%, 01/18/27 (a) (c) | | | 497,532 | |
| | 231,641 | | | Nautique Funding, Ltd.
(Cayman Islands)
Series 2006-1A, Class A3
1.270%, 04/15/20 (a) (c) | | | 231,539 | |
| | 250,000 | | | Nomad CLO, Ltd. (Cayman Islands)
Series 2013-1A, Class B
3.830%, 01/15/25 (a) (c) | | | 250,167 | |
| | | | | | | | |
Par Value | | | | | Market
Value | |
| $ | 250,000 | | | Nomad CLO, Ltd. (Cayman Islands)
Series 2013-1A, Class C
4.380%, 01/15/25 (a) (c) | | $ | 245,808 | |
| | 250,000 | | | Octagon Investment Partners XVI, Ltd.
(Cayman Islands)
Series 2013-1A, Class D
4.230%, 07/17/25 (a) (c) | | | 243,101 | |
| | 250,000 | | | Octagon Investment Partners XVI, Ltd.
(Cayman Islands)
Series 2013-1A, Class E
5.380%, 07/17/25 (a) (c) | | | 214,163 | |
| | 1,000,000 | | | Octagon Investment Partners XX, Ltd.
(Cayman Islands)
Series 2014-1A, Class D
4.468%, 08/12/26 (a) (c) | | | 969,604 | |
| | 250,000 | | | Octagon Investment Partners XXI, Ltd.
(Cayman Islands)
Series 2014-1A, Class C
4.467%, 11/14/26 (a) (c) | | | 245,166 | |
| | 250,000 | | | Octagon Investment Partners XXII, Ltd.
(Cayman Islands)
Series 2014-1A, Class C2
4.382%, 11/25/25 (a) (c) | | | 250,503 | |
| | 250,000 | | | Octagon Investment Partners XXII, Ltd.
(Cayman Islands)
Series 2014-1A, Class D2
5.462%, 11/25/25 (a) (c) | | | 251,343 | |
| | 250,000 | | | Octagon Investment Partners XXVII, Ltd.
(Cayman Islands)
Series 2016-1A, Class C
3.662%, 07/15/27 (a) (c) | | | 250,181 | |
| | 500,000 | | | Octagon Investment Partners XXVII, Ltd.
(Cayman Islands)
Series 2016-1A, Class D
5.412%, 07/15/27 (a) (c) | | | 500,353 | |
| | 2,000,000 | | | OneMain Financial Issuance Trust
Series 2015-1A, Class A
3.190%, 03/18/26 (a) | | | 2,021,636 | |
| | 701,000 | | | OneMain Financial Issuance Trust
Series 2015-2A, Class A
2.570%, 07/18/25 (a) | | | 704,203 | |
| | 500,000 | | | Race Point VII CLO, Ltd.
(Cayman Islands)
Series 2012-7A, Class A
2.208%, 11/08/24 (a) (c) | | | 500,242 | |
| | 1,800,000 | | | SpringCastle America Funding LLC
Series 2016-AA, Class A
3.050%, 04/25/29 (a) | | | 1,819,802 | |
| | 2,000,000 | | | Springleaf Funding Trust
Series 2015-AA, Class A
3.160%, 11/15/24 (a) | | | 2,020,743 | |
| | 500,000 | | | Symphony CLO XI, Ltd.
(Cayman Islands)
Series 2013-11A, Class C
4.030%, 01/17/25 (a) (c) | | | 500,983 | |
| | 750,000 | | | Symphony CLO XIV, Ltd.
(Cayman Islands)
Series 2014-14A, Class D2
4.481%, 07/14/26 (a) (c) | | | 738,865 | |
The accompanying notes are an integral part of these financial statements.
66
AMG Funds
| | |
| AMG Managers DoubleLine Core Plus Bond Fund | | October 31, 2016 |
| |
| Schedule of Investments – continued | | |
| | | | | | |
Par Value | | | | Market
Value | |
$ 750,000 | | TCI-FLATIRON CLO, Ltd.
(Cayman Islands)
Series 2016-1A, Class C
3.712%, 07/17/28 (a) (c) | | $ | 751,516 | |
1,000,000 | | TCI-Symphony CLO, Ltd.
Series 2016-1A, Class D
4.719%, 10/13/29 (a) (c) | | | 988,076 | |
988,000 | | Textainer Marine Containe
Series 2014-1A, Class A
3.270%, 10/20/39 (a) | | | 955,577 | |
250,000 | | THL Credit Wind River CLO, Ltd.
(Cayman Islands)
Series 2013-1A, Class C
4.281%, 04/20/25 (a) (c) | | | 245,514 | |
500,000 | | THL Credit Wind River CLO, Ltd.
(Cayman Islands)
Series 2016-1A, Class C
4.080%, 07/15/28 (a) (c) | | | 503,518 | |
250,000 | | THL Credit Wind River CLO, Ltd.
(Cayman Islands)
Series 2016-1A, Class D
5.530%, 07/15/28 (a) (c) | | | 244,778 | |
4,269,500 | | Towd Point Mortgage Trust
Series 2015-6, Class A1B
2.750%, 04/25/55 (a) (c) | | | 4,343,543 | |
1,015,063 | | Trinity Rail Leasing 2010
Series 2010-1A, Class A
5.194%, 10/16/40 (a) | | | 999,521 | |
480,856 | | Venture VIII CDO, Ltd.
(Cayman Islands)
Series 2007-8A, Class A1A
1.162%, 07/22/21 (a) (c) | | | 473,712 | |
500,000 | | Venture XI CLO, Ltd.
Series 2012-11A, Class AR
2.117%, 11/14/22 (a) (c) | | | 500,654 | |
1,000,000 | | Westcott Park CLO, Ltd.
(Cayman Islands)
Series 2016-1A, Class D
5.046%, 07/20/28 (a) (c) | | | 1,005,094 | |
| | | | | | |
| | Total Other Mortgage and Asset-Backed Securities
(Cost $55,899,539) | | | 56,110,586 | |
| | | | | | |
| | | | | | |
MUNICIPAL BONDS – 0.2% | |
| | California – 0.1% | | | | |
500,000 | | State of California GO
5.000%, 08/01/33 | | | 591,770 | |
| | | | | | |
| | | | | 591,770 | |
| | | | | | |
| | New York – 0.1% | | | | |
500,000 | | New York State Dormitory Authority RB,
Series A
5.000%, 03/15/33 | | | 593,830 | |
| | | | | | |
| | Total Municipal Bonds
(Cost $1,138,356) | | | 1,185,600 | |
| | | | | | |
| | | | | | |
Par Value | | | | Market
Value | |
FOREIGN GOVERNMENT NOTES AND BONDS – 1.8% | |
$ 500,000 | | Costa Rica Government
Senior Unsecured Notes
9.995%, 08/01/20 | | $ | 604,810 | |
| | Dominican Republic International
Bond
Senior Unsecured Notes | | | | |
1,100,000 | | 7.500%, 05/06/21 | | | 1,212,970 | |
655,786 | | 9.040%, 01/23/18 | | | 683,657 | |
| | Hungary Government International
Bond
Senior Unsecured Notes | | | | |
1,500,000 | | 6.250%, 01/29/20 | | | 1,682,067 | |
600,000 | | 4.000%, 03/25/19 | | | 628,350 | |
2,000,000 | | Indonesia Government International Bond
Senior Unsecured Notes
5.875%, 03/13/20 | | | 2,229,946 | |
994,000 | | Mexico Government International Bond
Senior Unsecured Notes
4.000%, 10/02/23 | | | 1,045,191 | |
700,000 | | Panama Government International
Bond (Panama)
Senior Unsecured Notes
5.200%, 01/30/20 | | | 772,625 | |
1,500,000 | | Poland Government International Bond
Senior Unsecured Notes
5.125%, 04/21/21 | | | 1,696,185 | |
2,200,000 | | Qatar Government International Bond
Senior Unsecured Notes
2.375%, 06/02/21 | | | 2,212,080 | |
| | | | | | |
| | Total Foreign Government Notes and Bonds
(Cost $12,738,957) | | | 12,767,881 | |
| | | | | | |
| | |
Shares | | | | | |
COMMON STOCKS – 0.0%# | |
| | Energy | | | | |
383 | | Sandridge Energy, Inc.
(Cost $8,177) | | | 8,820 | |
| | | | | | |
INVESTMENT COMPANIES – 3.2% | |
792,458 | | DoubleLine Floating Rate Fund (j) | | | 7,837,407 | |
14,687,532 | | Dreyfus Government Cash
Management Fund, Institutional
Class Shares, 0.28% * (k) | | | 14,687,532 | |
| | | | | | |
| | Total Investment Companies
(Cost $22,699,279) | | | 22,524,939 | |
| | | | | | |
Total Investments – 99.3%
(Cost $701,734,698)** | | | 702,316,834 | |
| | | | | | |
Net Other Assets and Liabilities – 0.7% | | | 4,899,345 | |
| | | | | | |
Net Assets – 100.0% | | $ | 707,216,179 | |
| | | | | | |
The accompanying notes are an integral part of these financial statements.
67
AMG Funds
| | |
| AMG Managers DoubleLine Core Plus Bond Fund | | October 31, 2016 |
| |
| Schedule of Investments – continued | | |
| * | Yield shown represents the October 31, 2016, seven-day average yield, which refers to the sum of the previous seven days’ dividends paid, expressed as an annual percentage. |
| ** | At October 31, 2016, the aggregate cost for Federal income tax purposes is $703,017,404. |
| | | | |
Gross unrealized appreciation | | $ | 11,090,002 | |
Gross unrealized depreciation | | | (11,790,572 | ) |
| | | | |
Net unrealized appreciation | | $ | (700,570 | ) |
| | | | |
| (a) | Securities exempt from registration under Rule 144A of the Securities Act of 1933, as amended. These securities are purchased in accordance with guidelines approved by the Board of Trustees and may only be resold, in transactions exempt from registration, to qualified institutional buyers. At October 31, 2016, these securities amounted to $114,343,174, or 16.2% of net assets. |
| (b) | Delayed delivery security. See Note 6 in Notes to Financial Statements. |
| (c) | Variable rate bond. The interest rate shown reflects the rate in effect at October 31, 2016. |
| (g) | Security with a total aggregate market value of $334,188, or 0.1% of net assets, was valued under fair value procedures established by the Fund’s Board of Trustees. |
| (h) | Interest only security. This type of security represents the right to receive the monthly interest payments on an underlying pool of mortgages. Payments of principal on the pool reduce the value of the “interest only” holding. |
| (i) | Step Coupon. Security becomes interest bearing at a future date. |
| (j) | Affiliated issuer. A summary of this affiliated investment transaction for the fiscal year ended October 31, 2016 is as follows: |
| | | | | | | | | | | | | | | | | | |
Beginning
Market Value | | | Proceeds
from Sales | | | Dividend
Income | | | Realized
(Loss) | | | Ending
Market Value | |
| $ | 9,589,931 | | | $ | 1,700,000 | | | $ | 297,022 | | | $ | (28,713 | ) | | $ | 7,837,407 | |
| | |
| (k) | | Some of this security has been pledged as collateral for |
| | delayed delivery securities. |
| |
| CDO | | Collateralized Debt Obligation |
| CLO | | Collateralized Loan Obligation |
| EMTN | | Euro Medium Term Note |
| GMTN | | Global Medium Term Note |
| GO | | General Obligation |
| LP | | Limited Partnership |
| MTN | | Medium Term Note |
| PLC | | Public Limited Company |
| RB | | Revenue Bond |
| REMIC | | Real Estate Mortgage Investment Conduit |
| S&P | | Standard & Poor |
| | | | |
| Rating (unaudited)** | | | |
U.S. Government and Agency Obligations | | | 44.9 | % |
AAA | | | 3.6 | % |
AA | | | 4.5 | % |
A | | | 9.3 | % |
BBB | | | 16.1 | % |
BB | | | 7.0 | % |
B | | | 2.9 | % |
Lower than B | | | 5.5 | % |
Not Rated | | | 6.2 | % |
| | | | |
| | | 100 | % |
| | | | |
| ** | As a percentage of market value of fixed-income securities. |
Credit quality ratings shown above reflect the highest rating assigned by either Standard & Poor’s (“S&P”) or Moody’s Investors Service, Inc. (“Moody’s”). These rating agencies are independent, nationally recognized statistical rating organizations and are widely used. Investment grade ratings are credit ratings of BBB/Baa or higher. Below investment grade ratings are credit ratings of BB/Ba or lower. Investments designated N/R are not rated by either rating agency. Unrated investments do not necessarily indicate low credit quality. Credit quality ratings are subject to change.
The accompanying notes are an integral part of these financial statements.
68
AMG Managers Anchor Capital Enhanced Equity Fund
Portfolio Manager’s Comments (unaudited)
For the fiscal year ended October 31, 2016, the AMG Managers Anchor Capital Enhanced Equity Fund1 (the “Fund”) Class N shares returned (1.7)% versus the S&P 500 Index which returned +4.5%. Towards the end of calendar year 2015, investors seemed to favor large-cap growth companies, which acted as a headwind to the Fund’s performance as the Fund maintains a relative tilt towards a large-cap value style. This trend saw somewhat of a reversal beginning in January 2016, as large-cap value companies began to outperform; evidenced by the Russell 1000® Value Index (+1.0%) and the Russell 1000® Growth Index (0.7%) over the first quarter ending March 31, 2016.
From a positioning standpoint, the Fund reduced its allocation to information technology and materials, choosing to shift to a more overweight position in the consumer discretionary and financials sectors. These changes reflect the Fund’s bottom up approach to stock selection, which has resulted in exposure to higher income-producing equities trading at what is deemed as favorable valuations.
During the last twelve months, selling covered call options was additive to performance; however, this overlay strategy also somewhat detracted from performance as it limited some of the Fund’s upside capture. Additionally, the Fund buys index put options as a form of insurance against notable market downturns. Over the period, this exposure resulted in a headwind to the Fund’s overall performance as markets have generally trended upwards. As a response to the negative cost associated with this exposure, the Fund has reduced its allocation, choosing instead to increase exposure to higher- premium call options. Higher-premium call options typically have shorter durations with strike prices closer to the money, which can offer potentially more of an offset to market volatility compared to longer-duration call options.
In our opinion, future market outperformance is not likely, due to the overall trend in profits and profit margins plus the meaningful increase in corporate
leverage. If profits keep declining, companies are likely to respond by reducing hiring and/or capital spending which could negatively impact equity prices. In light of this uncertainty, the Fund continues to maintain a defensive posture to seek to protect and grow investor capital.
The views expressed represent the opinions of Anchor capital Advisors LLC, as of October 31, 2016, and are not intended as a forecast or guarantee of future results and are subject to change without notice.
| 1 | Prior to October 1, 2016, the Fund was known as ASTON/Anchor Capital Enhanced Equity Fund. |
69
AMG Managers Anchor Capital Enhanced Equity Fund
Portfolio Manager’s Comments (continued)
CUMULATIVE TOTAL RETURN PERFORMANCE
The AMG Managers Anchor Capital Enhanced Equity Fund’s cumulative total return is based on the daily change in net asset value (NAV), and assumes that all dividends and distributions were reinvested. The chart compares a hypothetical $10,000 investment made in AMG Managers Anchor Capital Enhanced Equity Fund’s Class N on January 15, 2008, to a $10,000 investment made in the S&P 500 Index for the same time period. The graph and table do not reflect the deduction of taxes that a shareholder would pay on a Fund distribution or redemption of shares. The listed returns for the Fund are net of expenses and the returns for the index exclude expenses. Total returns would have been lower had certain expenses not been reduced.
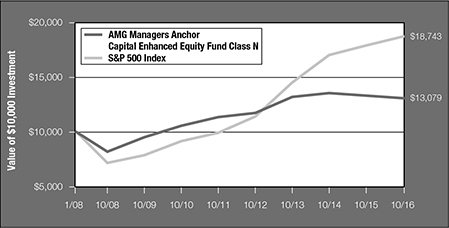
The table below shows the average annual total returns for AMG Managers Anchor Capital Enhanced Equity Fund and the S&P 500 Index for the same time periods ended October 31, 2016.
| | | | | | | | | | | | | | | | |
| | | One | | | Five | | | Since | | | Inception | |
| Average Annual Total Returns1 | | Year | | | Years | | | Inception | | | Date | |
AMG Managers Anchor Capital Enhanced Equity Fund2,3,4,5 | | | | | | | | | | | | | | | | |
Class N | | | (1.74 | )% | | | 2.83 | % | | | 3.10 | % | | | 01/15/08 | |
Class I | | | (1.47 | )% | | | 3.11 | % | | | 4.29 | % | | | 03/03/10 | |
S&P 500 Index6 | | | 4.51 | % | | | 13.57 | % | | | 7.34 | % | | | 01/15/08 | † |
The performance data shown represents past performance. Past performance is not a guarantee of future results. Current performance may be lower or higher than the performance data quoted. The investment return and the principal value of an investment will fluctuate so that an investor’s shares, when redeemed, may be worth more or less than their original cost.
Investors should carefully consider the Fund’s investment objectives, risks, charges and expenses before investing. For performance information through the most recent month end, current net asset values per share for the Fund and other information, please call (800) 835-3879 or visit our website at www.amgfunds.com for a free prospectus. Read it carefully before investing or sending money.
Distributed by AMG Distributors, Inc., member FINRA/SIPC.
| † | Date reflects the inception date of the Fund, not the index. |
| 1 | Total return equals income yield plus share price change and assumes reinvestment of all dividends and capital gain distributions. Returns are net of fees and may reflect offsets of Fund expenses as described in the prospectus. No adjustment has been made for taxes payable by shareholders on their reinvested dividends and capital gain distributions. Returns for periods greater than one year are annualized. The listed returns on the Fund are net of expenses and based on the published NAV as of October 31, 2016. All returns are in U.S. dollars ($). |
| 2 | By selling covered call options, the Fund limits its opportunity to profit from an increase in the price of the underlying stock above the exercise price, but continues to bear the risk of a decline in the value of the underlying stock. A liquid market may not exist for options held by the Fund. If the Fund is not able to close out an options transaction, it will not be able to sell the underlying security until the option expires or is exercised. While the Fund receives premiums for writing the call options, the price it realizes from the exercise of an option could be substantially below a stock’s current market price. Premiums from the Fund’s sale of call options typically will result in short term capital gain taxes, making it ill-suited for investors seeking a tax efficient investment. |
| 3 | The Fund may invest in derivatives such as options and futures; the complexity and rapidly changing structure of derivatives markets may increase the possibility of market losses. |
| 4 | Investments in international securities are subject to certain risks of overseas investing including currency fluctuations and changes in political and economic conditions, which could result in significant market fluctuations. |
| 5 | The Fund is subject to risks associated with investments in mid-capitalization companies such as greater price volatility, lower trading volume, and less liquidity than the stocks of larger, more established companies. |
| 6 | The S&P 500 Index is capitalization-weighted index of 500 stocks. The S&P 500 Index is designed to measure performance of the broad domestic economy through changes in the aggregate market value of 500 stocks representing all major industries. Unlike the Fund, the S&P 500 Index is unmanaged, is not available for investment and does not incur expenses. |
The S&P Index is proprietary data of Standard & Poor’s, a division of McGraw-Hill Companies, Inc.
Not FDIC insured, nor bank guaranteed. May lose value.
70
| | |
| AMG Funds | | |
| |
AMG Managers Anchor Capital Enhanced Equity Fund | | October 31, 2016 |
| |
Schedule of Investments | | |
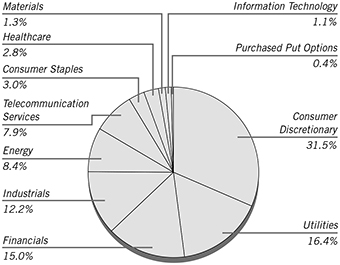
% of Market Value
The chart represents percentage of market value excluding written options of 1,705,114, or 2.7% of net assets.
| | | | | | | | |
Shares | | | | | Market
Value | |
| COMMON STOCKS – 101.9% | | | | |
| | | | Consumer Discretionary – 32.3% | | | | |
| | 25,000 | | | Bed Bath & Beyond, Inc. (a) | | $ | 1,010,500 | |
| | 27,000 | | | Carnival Corp. (Panama) (a) | | | 1,325,700 | |
| | 27,000 | | | Coach, Inc. (a) | | | 969,030 | |
| | 20,000 | | | Darden Restaurants, Inc. (a) | | | 1,295,800 | |
| | 270,000 | | | Ford Motor Co. | | | 3,169,800 | |
| | 98,200 | | | General Motors Co. (a) | | | 3,103,120 | |
| | 45,000 | | | Kohl’s Corp. (a) | | | 1,968,750 | |
| | 84,000 | | | Macy’s, Inc. (a) | | | 3,065,160 | |
| | 400,000 | | | Staples, Inc. (a) | | | 2,960,000 | |
| | 18,000 | | | Target Corp. (a) | | | 1,237,140 | |
| | | | | | | | |
| | | | | | | 20,105,000 | |
| | | | | | | | |
| | | | Consumer Staples – 3.1% | | | | |
| | 45,000 | | | The Coca-Cola Co. (a) | | | 1,908,000 | |
| | | | | | | | |
| | | | Energy – 8.6% | | | | |
| | 14,000 | | | Exxon Mobil Corp. (a) | | | 1,166,480 | |
| | 40,000 | | | Halliburton Co. (a) | | | 1,840,000 | |
| | 30,000 | | | Schlumberger, Ltd. (Curacao) (a) | | | 2,346,900 | |
| | | | | | | | |
| | | | | | | 5,353,380 | |
| | | | | | | | |
| | | | Financials – 15.4% | | | | |
| | 10,000 | | | BB&T Corp. (a) | | | 392,000 | |
| | 300,000 | | | Huntington Bancshares, Inc./OH (a) | | | 3,180,000 | |
| | 55,000 | | | MetLife, Inc. (a) | | | 2,582,800 | |
| | 280,000 | | | Regions Financial Corp. (a) | | | 2,998,800 | |
| | 10,000 | | | The Hartford Financial Services Group, Inc. (a) | | | 441,100 | |
| | | | | | | | |
| | | | | | | 9,594,700 | |
| | | | | | | | |
| | | | Healthcare – 2.8% | | | | |
| | 20,000 | | | AbbVie, Inc. (a) | | | 1,115,600 | |
| | 20,000 | | | Pfizer, Inc. (a) | | | 634,200 | |
| | | | | | | | |
| | | | | | | 1,749,800 | |
| | | | | | | | |
| | | | | | | | |
Shares | | | | | Market
Value | |
| | | | Industrials – 12.4% | | | | |
| | 25,000 | | | Deere & Co. (a) | | $ | 2,207,500 | |
| | 50,000 | | | Fastenal Co. (a) | | | 1,949,000 | |
| | 50,000 | | | General Electric Co. (a) | | | 1,455,000 | |
| | 15,000 | | | The Boeing Co. (a) | | | 2,136,450 | |
| | | | | | | | |
| | | | | | | 7,747,950 | |
| | | | | | | | |
| | | | Information Technology – 1.1% | | | | |
| | 20,000 | | | Intel Corp. (a) | | | 697,400 | |
| | | | | | | | |
| | | | Materials – 1.3% | | | | |
| | 10,000 | | | LyondellBasell Industries NV, Class A (Netherlands) (a) | | | 795,500 | |
| | | | | | | | |
| | | | Telecommunication Services – 8.1% | | | | |
| | 45,000 | | | AT&T, Inc. (a) | | | 1,655,550 | |
| | 90,000 | | | CenturyLink, Inc. (a) | | | 2,392,200 | |
| | 20,000 | | | Verizon Communications, Inc. (a) | | | 962,000 | |
| | | | | | | | |
| | | | | | | 5,009,750 | |
| | | | | | | | |
| | | | Utilities – 16.8% | | | | |
| | 12,000 | | | Entergy Corp. (a) | | | 884,160 | |
| | 90,000 | | | Exelon Corp. (a) | | | 3,066,300 | |
| | 100,000 | | | FirstEnergy Corp. (a) | | | 3,429,000 | |
| | 90,000 | | | PPL Corp. (a) | | | 3,090,600 | |
| | | | | | | | |
| | | | | | | 10,470,060 | |
| | | | | | | | |
| | | | Total Common Stocks
(Cost $65,041,203) | | | 63,431,540 | |
| | | | | | | | |
| | |
Number of
Contracts | | | | | | |
| PURCHASED PUT OPTIONS – 0.4% | | | | |
| | | | SPDR S&P 500 ETF Trust | | | | |
| | 2,250 | | | Strike @ $195 Exp 11/16 | | | 76,500 | |
| | 2,250 | | | Strike @ $196 Exp 11/16 | | | 87,750 | |
| | 2,250 | | | Strike @ $197 Exp 11/16 | | | 103,500 | |
| | | | | | | | |
| | | | Total Purchased Put Options
(Cost $426,038) | | | 267,750 | |
| | | | | | | | |
| | |
Shares | | | | | | |
| INVESTMENT COMPANY – 0.2% | | | | |
| | 85,209 | | | Dreyfus Government Cash Management Fund, Institutional Class Shares, 0.28%* | | | 85,209 | |
| | | | | | | | |
| | | | Total Investment Company
(Cost $85,209) | | | 85,209 | |
| | | | | | | | |
| Total Investments – 102.5%
(Cost $65,552,450)** | | | 63,784,499 | |
| | | | | | | | |
| Net Other Assets and Liabilities – (2.5)% | | | (1,541,849 | ) |
| | | | | | | | |
| Net Assets – 100.0% | | $ | 62,242,650 | |
| | | | | | | | |
| * | Yield shown represents the October 31, 2016, seven-day average yield, which refers to the sum of the previous seven days’ dividends paid, expressed as an annual percentage. |
| ** | At October 31, 2016, the aggregate cost for Federal income tax purposes is $65,556,446. |
| | | | |
Gross unrealized appreciation | | $ | 3,084,926 | |
Gross unrealized depreciation | | | (4,856,873 | ) |
| | | | |
Net unrealized depreciation | | $ | (1,771,947 | ) |
| | | | |
The accompanying notes are an integral part of these financial statements.
71
AMG Funds
| | |
| AMG Managers Anchor Capital Enhanced Equity Fund | | October 31, 2016 |
| |
| Schedule of Investments – continued | | |
| | |
| (a) | | These securities are pledged as collateral for call options |
| | written. |
| ETF | | Exchange-Traded Fund |
| S&P | | Standard & Poor’s |
| SPDR | | Standard & Poor’s Depositary Receipt |
Transactions in written call options for the fiscal year ended October 31, 2016 were as follows:
| | | | | | | | |
Contracts | | Number of
Contracts | | | Premium | |
Outstanding, October 31, 2015 | | | 51,353 | | | $ | 4,263,438 | |
Call Options Written | | | 123,351 | | | | 13,142,456 | |
Call Options Closed or Expired | | | (156,702 | ) | | | (15,944,378 | ) |
| | | | | | | | |
Outstanding, October 31, 2016 | | | 18,002 | | | $ | 1,461,516 | |
| | | | | | | | |
Premiums received and value of written call equity options outstanding as of October 31, 2016.
| | | | | | | | | | | | |
| Number of | | | | | Premium | | | Market | |
Contracts | | | Description | | Received | | | Value | |
| | | | AbbVie, Inc. | | | | | | | | |
| | 200 | | | Strike @ $62.5 Exp 01/17 | | $ | 11,698 | | | $ | 10,000 | |
| | | | AT&T, Inc. | | | | | | | | |
| | 50 | | | Strike @ $41 Exp 11/16 | | | 1,200 | | | | 50 | |
| | 300 | | | Strike @ $41 Exp 12/16 | | | 12,250 | | | | 900 | |
| | | | BB&T Corp. | | | | | | | | |
| | 50 | | | Strike @ $39 Exp 11/16 | | | 2,000 | | | | 3,400 | |
| | 50 | | | Strike @ $40 Exp 01/17 | | | 2,700 | | | | 4,850 | |
| | | | Bed Bath & Beyond, Inc. | | | | | | | | |
| | 150 | | | Strike @ $47.5 Exp 01/17 | | | 15,799 | | | | 4,575 | |
| | 100 | | | Strike @ $50 Exp 01/17 | | | 11,333 | | | | 1,300 | |
| | | | Carnival Corp. | | | | | | | | |
| | 200 | | | Strike @ $50 Exp 01/17 | | | 16,500 | | | | 33,800 | |
| | 70 | | | Strike @ $52.5 Exp 01/17 | | | 4,130 | | | | 5,180 | |
| | | | CenturyLink, Inc. | | | | | | | | |
| | 900 | | | Strike @ $30 Exp 01/17 | | | 65,698 | | | | 27,000 | |
| | | | Coach, Inc. | | | | | | | | |
| | 120 | | | Strike @ $39 Exp 11/16 | | | 6,220 | | | | 3,960 | |
| | 50 | | | Strike @ $40 Exp 01/17 | | | 3,700 | | | | 2,500 | |
| | 100 | | | Strike @ $41 Exp 01/17 | | | 5,900 | | | | 3,500 | |
| | | | Darden Restaurants, Inc. | | | | | | | | |
| | 100 | | | Strike @ $65 Exp 01/17 | | | 11,270 | | | | 24,000 | |
| | 100 | | | Strike @ $67.5 Exp 01/17 | | | 8,900 | | | | 11,500 | |
| | | | Deere & Co. | | | | | | | | |
| | 250 | | | Strike @ $80 Exp 12/16 | | | 113,498 | | | | 240,000 | |
| | | | Entergy Corp. | | | | | | | | |
| | 120 | | | Strike @ $75 Exp 03/17 | | | 19,470 | | | | 23,400 | |
| | | | Exelon Corp. | | | | | | | | |
| | 500 | | | Strike @ $36 Exp 04/17 | | | 51,499 | | | | 45,000 | |
| | 400 | | | Strike @ $37 Exp 04/17 | | | 30,599 | | | | 22,000 | |
| | | | Exxon Mobil Corp. | | | | | | | | |
| | 20 | | | Strike @ $87.5 Exp 01/17 | | | 3,602 | | | | 2,000 | |
| | 120 | | | Strike @ $90 Exp 01/17 | | | 16,320 | | | | 5,880 | |
| | | | Fastenal Co. | | | | | | | | |
| | 500 | | | Strike @ $44 Exp 01/17 | | | 58,999 | | | | 11,250 | |
| | | | FirstEnergy Corp. | | | | | | | | |
| | 1,000 | | | Strike @ $35 Exp 01/17 | | | 80,498 | | | | 99,000 | |
| | | | General Electric Co. | | | | | | | | |
| | 50 | | | Strike @ $30 Exp 01/17 | | | 1,300 | | | | 2,200 | |
| | | | | | | | | | | | |
| Number of | | | | | Premium | | | Market | |
Contracts | | | Description | | Received | | | Value | |
| | 200 | | | Strike @ $31 Exp 12/16 | | $ | 5,000 | | | $ | 1,600 | |
| | 250 | | | Strike @ $31 Exp 01/17 | | | 8,500 | | | | 4,250 | |
| | | | General Motors Co. | | | | | | | | |
| | 982 | | | Strike @ $34 Exp 01/17 | | | 44,493 | | | | 40,262 | |
| | | | Halliburton Co. | | | | | | | | |
| | 400 | | | Strike @ $39 Exp 01/17 | | | 222,379 | | | | 310,000 | |
| | | | Huntington Bancshares, Inc./OH | | | | | | | | |
| | 3,000 | | | Strike @ $11 Exp 04/17 | | | 77,998 | | | | 147,000 | |
| | | | Intel Corp. | | | | | | | | |
| | 200 | | | Strike @ $32 Exp 01/17 | | | 27,591 | | | | 63,800 | |
| | | | Kohl’s Corp. | | | | | | | | |
| | 250 | | | Strike @ $47.5 Exp 01/17 | | | 37,804 | | | | 31,250 | |
| | 200 | | | Strike @ $50 Exp 01/17 | | | 13,792 | | | | 14,000 | |
| | | | LyondellBasell Industries NV | | | | | | | | |
| | 44 | | | Strike @ $85 Exp 01/17 | | | 6,073 | | | | 7,700 | |
| | 56 | | | Strike @ $87.5 Exp 12/16 | | | 10,288 | | | | 3,780 | |
| | | | Macy’s, Inc. | | | | | | | | |
| | 340 | | | Strike @ $45 Exp 01/17 | | | 16,513 | | | | 7,820 | |
| | 300 | | | Strike @ $47.5 Exp 01/17 | | | 22,766 | | | | 3,900 | |
| | 200 | | | Strike @ $49 Exp 01/17 | | | 15,300 | | | | 1,800 | |
| | | | MetLife, Inc. | | | | | | | | |
| | 250 | | | Strike @ $45 Exp 01/17 | | | 19,749 | | | | 83,750 | |
| | 300 | | | Strike @ $47.5 Exp 12/16 | | | 45,983 | | | | 40,200 | |
| | | | PPL Corp. | | | | | | | | |
| | 900 | | | Strike @ $38 Exp 01/17 | | | 28,349 | | | | 6,750 | |
| | | | Regions Financial Corp. | | | | | | | | |
| | 500 | | | Strike @ $9 Exp 11/16 | | | 17,188 | | | | 86,750 | |
| | 500 | | | Strike @ $10 Exp 11/16 | | | 13,014 | | | | 40,250 | |
| | 1,094 | | | Strike @ $11 Exp 11/16 | | | 25,567 | | | | 15,316 | |
| | 472 | | | Strike @ $11 Exp 01/17 | | | 14,114 | | | | 17,936 | |
| | 234 | | | Strike @ $11 Exp 02/17 | | | 4,776 | | | | 10,530 | |
| | | | Schlumberger, Ltd. | | | | | | | | |
| | 300 | | | Strike @ $80 Exp 11/16 | | | 87,916 | | | | 24,000 | |
| | | | Staples, Inc. | | | | | | | | |
| | 500 | | | Strike @ $11 Exp 12/16 | | | 16,979 | | | | 1,250 | |
| | | | Target Corp. | | | | | | | | |
| | 150 | | | Strike @ $70 Exp 01/17 | | | 63,109 | | | | 27,600 | |
| | 30 | | | Strike @ $72.5 Exp 11/16 | | | 1,170 | | | | 900 | |
| | | | The Boeing Co. | | | | | | | | |
| | 50 | | | Strike @ $135 Exp 11/16 | | | 6,550 | | | | 39,350 | |
| | 100 | | | Strike @ $145 Exp 02/17 | | | 20,212 | | | | 47,500 | |
| | | | The Coca-Cola Co. | | | | | | | | |
| | 125 | | | Strike @ $43 Exp 12/16 | | | 5,500 | | | | 5,000 | |
| | 100 | | | Strike @ $44 Exp 11/16 | | | 3,420 | | | | 500 | |
| | 225 | | | Strike @ $44 Exp 01/17 | | | 7,650 | | | | 6,975 | |
| | | | The Hartford Financial Services
Group, Inc. | | | | | | | | |
| | 100 | | | Strike @ $42 Exp 12/16 | | | 11,500 | | | | 26,000 | |
| | | | Verizon Communications, Inc. | | | | | | | | |
| | 150 | | | Strike @ $52.5 Exp 11/16 | | | 5,190 | | | | 150 | |
| | | | | | | | | | | | |
| | | | Total Written Call Options | | $ | 1,461,516 | | | $ | 1,705,114 | |
| | | | | | | | | | | | |
The accompanying notes are an integral part of these financial statements.
72
AMG Managers Lake Partners LASSO Alternatives Fund
Portfolio Manager’s Comments (unaudited)
The AMG Managers Lake Partners LASSO Alternatives Fund1 (the “Fund”) Class N shares finished the 12-month period ending October 31, 2016, with a small decline of (1.18)%, reflecting a challenging macro environment and dramatic swings in equity markets. However, the Fund outperformed its benchmark, the HFRX Equity Hedge Index, which fell (2.57)%. The Fund also outperformed its peer group, the Morningstar Multi-alternative Category, which was off (1.5)%.
Since its inception on April 1, 2009, the Fund has generated a cumulative gain of 41.5%, outperforming its benchmark, which was up only 11.7%.
Regarding the investment backdrop, U.S. equities began the fiscal year struggling sideways in November/December 2015, as investors were wary of a “profits recession” in the U.S. and widespread economic malaise globally. Stocks then suffered sharp corrections in January/ February. For example, from the end of October 2015 through mid-February 2016, the S&P 500 Index declined over -11%, while the Russell 2000® Growth Index fell -20%. The triggers for these moves included a sudden selloff in Chinese equities and a steep slide in oil prices. Of course, just as sentiment reached its bleakest point, markets turned around. Oil prices began to recover, and so too did equities. Markets were buoyed further when the U.S. Federal Reserve (the Fed) signaled its intention to take a wait-and-see approach to interest rate hikes. Consequently, by mid-May, the S&P 500 was back to where it had started the year. Although this was followed by some rockiness during June in the wake of the “Brexit” vote in the U.K., U.S. equities rallied again through July and August, on hopes that the Fed would take a slow, deliberate approach to increasing interest rates. However, the rally stalled and stocks lost a bit of ground in September and October on concerns about financial conditions in Europe, uncertainty about the U.S. presidential election and renewed weakness in oil prices.
Regarding the Fund’s performance attribution by investment strategy, the largest positive contributors included alternative fixed income, hedged equity, discretionary macro and convertible arbitrage. Of the Fund’s two alternative fixed-income underlying fund managers, one capitalized on mortgage-related opportunities while the other benefited from a defensive approach to credit and duration. In hedged equity, one fund manager did well with an emphasis on financials and value-oriented stocks, while the other took a very eclectic approach to both longs and shorts. In discretionary macro, one fund manager captured some of the moves in Emerging Markets, but this was partially offset by our other fund manager, who struggled to gain traction.
Among the detractors, long-biased and global hedged equity fund managers had mixed results. Although one core long-biased manager did quite well, others were tripped up by sharp industry rotation within the market. Managed futures allocations were effective early in the year, as they posted gains during the equity correction, but they finished the fiscal year in negative territory due to reversals in fixed income and currencies. The Fund’s merger arbitrage fund managers had mixed results, with only a minor impact on overall performance. A relatively small allocation to an options strategy had a small negative contribution.
Equity-related investment strategies have been the core of the Fund, with an allocation of 41% as of October 31st. This broad category encompasses a diverse mix of long-biased, hedged, multi-asset and global strategies. Global macro, which includes both discretionary and systematic approaches, is the next largest allocation, at 23%. Alternative fixed income accounts at 17%, while arbitrage is 14%.
The views expressed represent the opinions of Lake Partners Inc., as of October 31, 2016, and are not intended as a forecast or guarantee of future results and are subject to change without notice.
| 1 | Prior to October 1, 2016, the Fund was known as ASTON/Lake Partners LASSO Alternatives Fund. |
73
AMG Managers Lake Partners LASSO Alternatives Fund
Portfolio Manager’s Comments (continued)
CUMULATIVE TOTAL RETURN PERFORMANCE
The AMG Managers Lake Partners LASSO Alternatives Fund’s cumulative total return is based on the daily change in net asset value (NAV), and assumes that all dividends and distributions were reinvested. The chart compares a hypothetical $10,000 investment made in AMG Managers Lake Partners LASSO Alternatives Fund’s Class N on March 3, 2010, to a $10,000 investment made in the HFRX Equity Hedge Index for the same time period. The graph and table do not reflect the deduction of taxes that a shareholder would pay on a Fund distribution or redemption of shares. The listed returns for the Fund are net of expenses and the returns for the index exclude expenses. Total returns would have been lower had certain expenses not been reduced.
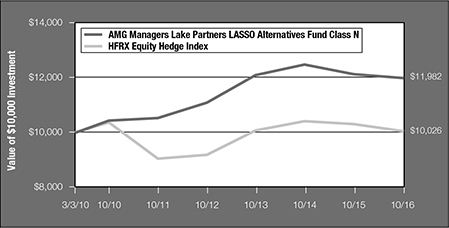
The table below shows the average annual total returns for AMG Managers Lake Partners LASSO Alternatives Fund and the HFRX Equity Hedge Index for the same time periods ended October 31, 2016.
| | | | | | | | | | | | | | | | |
| | | One | | | Five | | | Since | | | Inception | |
| Average Annual Total Returns1 | | Year | | | Years | | | Inception | | | Date | |
AMG Managers Lake Partners LASSO Alternatives Fund2,3,4,5,6,7,8,9 | | | | | | | | | | | | | | | | |
Class N | | | (1.18 | )% | | | 2.63 | % | | | 2.75 | % | | | 03/03/10 | |
Class I | | | (0.91 | )% | | | 2.89 | % | | | 4.68 | % | | | 04/01/09 | |
HFRX Equity Hedge Index10 | | | (2.57 | )% | | | 2.14 | % | | | 1.46 | % | | | 04/01/09 | † |
The performance data shown represents past performance. Past performance is not a guarantee of future results. Current performance may be lower or higher than the performance data quoted. The investment return and the principal value of an investment will fluctuate so that an investor’s shares, when redeemed, may be worth more or less than their original cost.
Investors should carefully consider the Fund’s investment objectives, risks, charges and expenses before investing. For performance information through the most recent month end, current net asset values per share for the Fund and other information, please call (800) 835-3879 or visit our website at www.amgfunds.com for a free prospectus. Read it carefully before investing or sending money.
Distributed by AMG Distributors, Inc., member FINRA/SIPC.
| † | Date reflects the inception date of the Fund, not the index. |
| 1 | Total return equals income yield plus share price change and assumes reinvestment of all dividends and capital gain distributions. Returns are net of fees and may reflect offsets of Fund expenses as described in the prospectus. No adjustment has been made for taxes payable by shareholders on their reinvested dividends and capital gain distributions. Returns for periods greater than one year are annualized. The |
| | listed returns on the Fund are net of expenses and based on the published NAV as of October 31, 2016. All returns are in U.S. dollars ($). |
| 2 | The Fund may suffer significant losses on assets that it sells short. Unlike the possible loss on a security that is purchased, there is no limit on the amount of loss on an appreciating security that is sold short. |
| 3 | Alternative investments are speculative, subject to high return volatility and involve aggressive investment techniques and a high degree of risk including, but not limited to, the risks associated with leverage, derivative instruments such as options and futures, commodities, and distressed securities may be illiquid on a long term basis and short sales. There can be no assurance that these types of strategies will achieve their objectives or avoid substantial losses. |
| 4 | The Fund is subject to currency risk resulting from fluctuations in exchange rates that may affect the total loss or gain on a non-U.S. Dollar investment when converted back to U.S. Dollars. |
| 5 | The Fund is subject to the risks associated with investments in debt securities, such as default risk and fluctuations in the perception of the debtor’s ability to pay its creditors. Changing interest rates may adversely affect the value of an investment. An increase in interest rates typically causes the value of bonds and other fixed income securities to fall. |
| 6 | The Fund may invest in derivatives such as options and futures; the complexity and rapidly changing structure of derivatives markets may increase the possibility of market losses. |
| 7 | A greater percentage of the Fund’s holdings may be focused in a smaller number of securities which may place the Fund at greater risk than a more diversified fund. |
| 8 | The Fund is subject to the risks of any underlying fund in which the Fund invests. There are expenses associated with the underlying funds in addition to the Fund’s expenses. |
| 9 | Investments in international securities are subject to certain risks of overseas investing including currency fluctuations and changes in political and economic conditions, which could result in significant market fluctuations. |
| 10 | The HFRX Equity Hedge Index is an unmanaged index designed to measure daily performance representative of long-short equity hedge funds. Source: Hedge Fund Research, Inc. (HFR). Indices are adjusted for the reinvestment of capital gains, income, and dividends. Unlike the Fund, the HFRX Equity Hedge Index is unmanaged, is not available for investment and does not incur expenses. |
Not FDIC insured, nor bank guaranteed. May lose value.
74
AMG Funds
| | |
| AMG Managers Lake Partners LASSO Alternatives Fund | | October 31, 2016 |
| |
| Schedule of Investments | | |
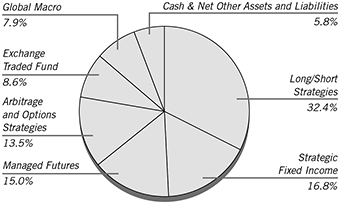
% of Net Assets
| | | | | | | | |
Shares | | | | | Market
Value | |
| INVESTMENT COMPANIES – 91.7% | | | | |
| | | | Long/Short Strategies – 32.4% | | | | |
| | 545,074 | | | 361 Global Long/Short Equity Fund-Class Y | | $ | 5,908,607 | |
| | 327,651 | | | Boston Partners Long/Short Equity Fund- Institutional Class | | | 6,533,356 | |
| | 101 | | | Diamond Hill Long/Short Fund-Class I | | | 2,531 | |
| | 97,607 | | | FPA Crescent Fund | | | 3,158,566 | |
| | 14,160 | | | John Hancock Seaport Fund-Class I | | | 149,390 | |
| | 930,129 | | | Mainstay U.S. Equity Opportunities Fund-Class I | | | 8,082,823 | |
| | 761,133 | | | Otter Creek Long/Short Opportunity Fund- Institutional Class * | | | 9,377,158 | |
| | | | | | | | |
| | | | | | | 33,212,431 | |
| | | | | | | | |
| | | | Strategic Fixed Income – 16.8% | | | | |
| | 678,968 | | | Metropolitan West Unconstrained Bond Fund-Class I | | | 8,079,717 | |
| | 820,784 | | | PIMCO Mortgage Opportunities Fund- Institutional Class | | | 9,184,570 | |
| | | �� | | | | | |
| | | | | | | 17,264,287 | |
| | | | | | | | |
| | | | Managed Futures – 15.0% | | | | |
| | 238,414 | | | 361 Managed Futures Fund-Class I * | | | 2,675,000 | |
| | 1,121,250 | | | Abbey Capital Futures Strategy Fund-Class I | | | 12,759,821 | |
| | | | | | | | |
| | | | | | | 15,434,821 | |
| | | | | | | | |
| | | | Arbitrage and Options Strategies – 13.5% | | | | |
| | 464,902 | | | Calamos Market Neutral Income Fund-Class I | | | 6,034,428 | |
| | 473,901 | | | Kellner Merger Fund-Institutional Class | | | 4,881,177 | |
| | 284,312 | | | Touchstone Arbitrage Fund-Institutional Class | | | 2,956,848 | |
| | | | | | | | |
| | | | | | | 13,872,453 | |
| | | | | | | | |
| | | | | | | | |
Shares | | | | | Market
Value | |
| | | | Global Macro – 7.9% | | | | |
| | 743,016 | | | Western Asset Macro Opportunities Fund-Class IS | | $ | 8,113,737 | |
| | | | | | | | |
| | | | Money Market – 6.1% | | | | |
| | 6,298,716 | | | Dreyfus Government Cash Management Fund, Institutional Class Shares, 0.28%** | | | 6,298,716 | |
| | | | | | | | |
| | | | Total Investment Companies
(Cost $93,692,319) | | | 94,196,445 | |
| | | | | | | | |
| EXCHANGE TRADED FUND – 8.6% | | | | |
| | | | Long/Short Strategies – 8.6% | | | | |
| | 169,260 | | | ProShares Large Cap Core Plus | | | 8,834,153 | |
| | | | | | | | |
| | | | Total Exchange Traded Fund
(Cost $8,636,253) | | | 8,834,153 | |
| | | | | | | | |
| Total Investments – 100.3%
(Cost $102,328,572)*** | | | 103,030,598 | |
| | | | | | | | |
| Net Other Assets and Liabilities – (0.3)% | | | (346,547 | ) |
| | | | | | | | |
| Net Assets – 100.0% | | $ | 102,684,051 | |
| | | | | | | | |
| * | Non-income producing security. |
| ** | Yield shown represents the October 31, 2016, seven-day average yield, which refers to the sum of the previous seven days’ dividends paid, expressed as an annual percentage. |
| *** | At October 31, 2016, the aggregate cost for Federal income tax purposes is $102,532,817. |
| | | | |
Gross unrealized appreciation | | $ | 1,492,757 | |
Gross unrealized depreciation | | | (994,976 | ) |
| | | | |
Net unrealized appreciation | | $ | 497,781 | |
| | | | |
The accompanying notes are an integral part of these financial statements.
75
AMG River Road Long-Short Fund
Portfolio Manager’s Comments (unaudited)
In the 12 months ended October 31, 2016, the Russell 3000® returned +4.24%. The AMG River Road Long-Short Fund1 (the “Fund”) Class N shares returned (0.52)%, while maintaining 58% average net market exposure. Our method for seeking capital protection—the Drawdown Plan—cost -101 basis points of relative performance.
The holdings with the largest positive contribution to total return during the period were Alamos Gold Inc. (AGI, long), KLX Inc. (KLXI, long) and Fidelity National Financial Inc. – FNFV Group (FNFV, long). Alamos Gold is a leading gold producer that rebounded from historically cheap valuation levels. KLX is a leading aerospace supplier. KLX improved after a strong quarter and as investors become more comfortable with the bullish outlook. Fidelity National Financial is an investment vehicle that tracks various businesses including restaurants, digital insurance and human resource outsourcing. The stock increased as more investors became aware of the security and consistent buybacks raised the value per share. Both AGI and KLX were sold during the period after their prices appreciated.
The holdings with the largest negative contribution to the Fund’s total return were American Express Co. (AXP, long), Realogy Holdings Corp. (RLGY, long) and Quad/Graphics Inc. (QUAD, short). AXP is a major credit card provider that declined as competitors aggressively targeted its customer base with comparable rewards and services. Realogy is the country’s largest real estate broker. The stock declined as its overexposure to slowing, expensive coastal markets weighed on results. QUAD is a paper manufacturer. The stock increased as the company did a better job than expected in managing costs and squeezing more cash out of its working capital investments.
The Fund ended October within its normal net market exposure range (50 - 70%) at 63%.
The Drawdown Plan is River Road’s methodology for reactively reducing net equity exposure in declining equity markets.
The views expressed represent the opinions of River Road Asset Management LLC, as of October 31, 2016, and are not intended as a forecast or guarantee of future results and are subject to change without notice.
| 1 | Prior to October 1, 2016, the Fund was known as ASTON/River Road Long-Short Fund. |
76
AMG River Road Long-Short Fund
Portfolio Manager’s Comments (continued)
CUMULATIVE TOTAL RETURN PERFORMANCE
The AMG River Road Long-Short Fund’s cumulative total return is based on the daily change in net asset value (NAV), and assumes that all dividends and distributions were reinvested. The chart compares a hypothetical $10,000 investment made in AMG River Road Long-Short Fund’s Class N on May 4, 2011, to a $10,000 investment made in the Russell 3000® Index and the 50% Russell 3000®/50% BofA Merrill Lynch U.S. T-Bill (1-3 mo) for the same time period. The graph and table do not reflect the deduction of taxes that a shareholder would pay on a Fund distribution or redemption of shares. The listed returns for the Fund are net of expenses and the returns for the index exclude expenses. Total returns would have been lower had certain expenses not been reduced.
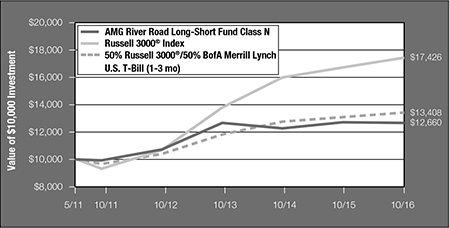
The table below shows the average annual total returns for AMG River Road Long-Short Fund, the Russell 3000® Index, and the 50% Russell 3000®/50% BofA Merrill Lynch U.S. T-Bill (1-3 mo) for the same time periods ended October 31, 2016.
| | | | | | | | | | | | | | | | |
| | | One | | | Five | | | Since | | | Inception | |
| Average Annual Total Returns1 | | Year | | | Years | | | Inception | | | Date | |
AMG River Road Long-Short Fund2,3,4,5,6,7,8 | | | | | | | | | | | | | | | | |
Class N | | | (0.52 | )% | | | 5.00 | % | | | 4.39 | % | | | 05/04/11 | |
Class I | | | (0.24 | )% | | | — | | | | 2.78 | % | | | 03/04/13 | |
Russell 3000® Index9 | | | 4.24 | % | | | 13.35 | % | | | 10.48 | % | | | 05/04/11 | † |
50% Russell 3000®/50% BofA Merrill Lynch U.S.
T-Bill (1-3 mo)10 | | | 2.47 | % | | | 6.76 | % | | | 5.48 | % | | | 05/04/11 | † |
The performance data shown represents past performance. Past performance is not a guarantee of future results. Current performance may be lower or higher than the performance data quoted. The investment return and the principal value of an investment will fluctuate so that an investor’s shares, when redeemed, may be worth more or less than their original cost.
Investors should carefully consider the Fund’s investment objectives, risks, charges and expenses before investing. For performance information through the most recent month end, current net asset values per share for the Fund and other information, please call (800) 835-3879 or visit our website at www.amgfunds.com for a free prospectus. Read it carefully before investing or sending money.
Distributed by AMG Distributors, Inc., member FINRA/SIPC.
| † | Date reflects the inception date of the Fund, not the index. |
| 1 | Total return equals income yield plus share price change and assumes reinvestment of all dividends and capital gain distributions. Returns are net of fees and may reflect offsets of Fund expenses as described in the prospectus. No adjustment has been made for taxes payable by shareholders on their reinvested dividends and capital gain distributions. Returns for periods greater than one year are annualized. The listed returns on the Fund are net of expenses and based on the published NAV as of October 31, 2016. All returns are in U.S. dollars ($). |
| 2 | The Fund may suffer significant losses on assets that it sells short. Unlike the possible loss on a security that is purchased, there is no limit on the amount of loss on an appreciating security that is sold short. |
| 3 | Active and frequent trading of a fund may result in higher transaction costs and increased tax liability. |
| 4 | The Fund may invest in derivatives such as options and futures; the complexity and rapidly changing structure of derivatives markets may increase the possibility of market losses. |
| 5 | A greater percentage of the Fund’s holdings may be focused in a smaller number of securities which may place the Fund at greater risk than a more diversified fund. |
| 6 | Investments in international securities are subject to certain risks of overseas investing including currency fluctuations and changes in political and economic conditions, which could result in significant market fluctuations. These risks are magnified in emerging markets. |
| 7 | The Fund is subject to special risk considerations similar to those associated with the direct ownership of real estate. Real estate valuations may be subject to factors such as changing general and local economic, financial, competitive, and environmental conditions. |
| 8 | The Fund invests in value stocks, which may perform differently from the market as a whole and may be undervalued by the market for a long period of time. |
| 9 | The Russell 3000® Index is composed of the 3000 largest U.S. companies as measured by market capitalization, and represents about 98% of the U.S. stock market. |
| 10 | The benchmark is composed of 50% Russell 3000® Index and 50% BofA Merrill Lynch U.S. T-Bill (1-3 mo). The Russell 3000® Index is composed of the 3000 largest U.S. companies as measured by market capitalization, and represents about 98% of the U.S. stock market. The BofA Merrill Lynch 1-3 Month U.S. Treasury Index: Is a subset of The Bank of America Merrill Lynch 0-1 Year U.S. Treasury Index including all securities with a remaining term to final maturity less than 3 months. Unlike the Fund, the indices are unmanaged, are not available for investment and do not incur expenses. |
The Russell Indices are a trademark of the London Stock Exchange Group Companies.
Not FDIC insured, nor bank guaranteed. May lose value.
77
AMG Funds
| | |
| AMG River Road Long-Short Fund | | October 31, 2016 |
| |
| Schedule of Investments | | |
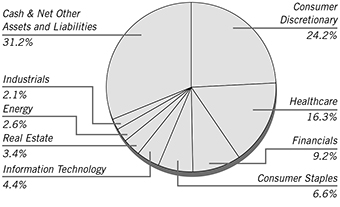
% of Net Assets
The chart represents total investments, including short sales in the Fund. Percentage of net assets of the Materials, Utilities, Telecommunication Services and Exchange Traded Funds are negative 1.5%, 1.4%, 0.9%, and 1.8%, respectively, and are represented in the pie chart by reducing cash and Net Other Assets and Liabilities to 31.2%.
| | | | | | | | |
Shares | | | | | Market
Value | |
| COMMON STOCKS – 94.0% | | | | |
| | | | Consumer Discretionary – 30.3% | | | | |
| | 1,768 | | | Cable One, Inc. | | $ | 1,019,676 | |
| | 26,127 | | | Comcast Corp., Class A (a) | | | 1,615,171 | |
| | 22,858 | | | General Motors Co. (a) | | | 722,313 | |
| | 95,531 | | | Hudson’s Bay Co. (Canada) | | | 1,173,750 | |
| | 37,021 | | | International Speedway Corp., Class A (a) | | | 1,217,991 | |
| | 43,986 | | | Liberty Media Corp., Class C (a) * | | | 1,459,895 | |
| | 41,528 | | | Liberty Ventures, Class A (a) * | | | 1,656,967 | |
| | 15,354 | | | Polaris Industries, Inc. (a) | | | 1,176,270 | |
| | 9,004 | | | Ralph Lauren Corp. (a) | | | 883,292 | |
| | 13,638 | | | Sturm Ruger & Co., Inc. (a) | | | 838,737 | |
| | 13,033 | | | Target Corp. (a) | | | 895,758 | |
| | 52,278 | | | Twenty-First Century Fox, Inc., Class A (a) | | | 1,373,343 | |
| | | | | | | | |
| | | | | | | 14,033,163 | |
| | | | | | | | |
| | | | Consumer Staples – 6.6% | | | | |
| | 15,153 | | | CVS Health Corp. (a) . | | | 1,274,367 | |
| | 28,361 | | | Ingles Markets, Inc., Class A (a) | | | 1,120,260 | |
| | 24,027 | | | Whole Foods Market, Inc. (a) | | | 679,724 | |
| | | | | | | | |
| | | | | | | 3,074,351 | |
| | | | | | | | |
| | | | Energy – 2.6% | | | | |
| | 47,849 | | | HollyFrontier Corp. | | | 1,193,833 | |
| | | | | | | | |
| | | | Financials – 14.8% | | | | |
| | 60,315 | | | Blackstone Group LP (a) | | | 1,509,684 | |
| | 13,074 | | | CNA Financial Corp. (a) | | | 478,116 | |
| | 74,259 | | | FNFV Group (a) * | | | 894,821 | |
| | 37,564 | | | Oaktree Capital Group LLC, MLP (a) | | | 1,562,662 | |
| | 35,470 | | | Wells Fargo & Co. (a) | | | 1,631,975 | |
| | | | | | | | |
Shares | | | | | Market
Value | |
| | | | Financials (continued) | | | | |
| | 958 | | | White Mountains Insurance Group, Ltd. (Bermuda) (a) | | $ | 794,872 | |
| | | | | | | | |
| | | | | | | 6,872,130 | |
| | | | | | | | |
| | | | Healthcare – 16.9% | | | | |
| | 6,335 | | | Allergan PLC (Ireland) (a) * | | | 1,323,635 | |
| | 9,925 | | | AmerisourceBergen Corp. | | | 697,926 | |
| | 11,261 | | | Anthem, Inc. | | | 1,372,266 | |
| | 21,684 | | | DaVita, Inc. (a) * | | | 1,271,116 | |
| | 17,406 | | | Express Scripts Holding Co. (a) * | | | 1,173,164 | |
| | 7,133 | | | McKesson Corp. | | | 907,104 | |
| | 33,879 | | | Premier, Inc., Class A (a) * | | | 1,078,707 | |
| | | | | | | | |
| | | | | | | 7,823,918 | |
| | | | | | | | |
| | | | Industrials – 8.4% | | | | |
| | 24,228 | | | CEB, Inc. (a) | | | 1,178,692 | |
| | 19,407 | | | Spirit AeroSystems Holdings, Inc.,
Class A (a) * | | | 977,337 | |
| | 13,976 | | | UniFirst Corp. (a) | | | 1,712,060 | |
| | | | | | | | |
| | | | | | | 3,868,089 | |
| | | | | | | | |
| | | | Information Technology – 5.9% | | | | |
| | 44,242 | | | Blackhawk Network Holdings, Inc. (a) * | | | 1,524,137 | |
| | 76,258 | | | VeriFone Systems, Inc. (a) * | | | 1,180,474 | |
| | | | | | | | |
| | | | | | | 2,704,611 | |
| | | | | | | | |
| | | | Real Estate – 5.4% | | | | |
| | 4,280 | | | Alexander & Baldwin Inc. | | | 178,861 | |
| | 59,990 | | | Realogy Holdings Corp. (a) | | | 1,373,171 | |
| | 18,291 | | | The Ryman Hospitality Properties, Inc. (a) | | | 922,232 | |
| | | | | | | | |
| | | | | | | 2,474,264 | |
| | | | | | | | |
| | | | Utilities – 3.1% | | | | |
| | 27,545 | | | National Fuel Gas Co. (a) | | | 1,442,807 | |
| | | | | | | | |
| | | | Total Common Stocks
(Cost $43,816,323) | | | 43,487,166 | |
| | | | | | | | |
| INVESTMENT COMPANY – 43.8% | | | | |
| | 20,274,300 | | | Dreyfus Government Cash Management Fund, Institutional Class Shares, 0.28%** | | | 20,274,300 | |
| | | | | | | | |
| | | | Total Investment Company
(Cost $20,274,300) | | | 20,274,300 | |
| | | | | | | | |
| Total Investments – 137.8%
(Cost $64,090,623)*** | | | 63,761,466 | |
| | | | | | | | |
| SHORT SALES (b) – (30.8)% | | | | |
| Common Stocks – (29.0)% | | | | |
| | | | Consumer Discretionary – (6.1)% | | | | |
| | (10,516 | ) | | Best Buy Co., Inc. | | | (409,178 | ) |
| | (29,065 | ) | | ClubCorp Holdings, Inc. | | | (335,701 | ) |
| | (7,814 | ) | | Dave & Buster’s Entertainment, Inc. * | | | (323,109 | ) |
The accompanying notes are an integral part of these financial statements.
78
AMG Funds
| | |
| AMG River Road Long-Short Fund | | October 31, 2016 |
| |
| Schedule of Investments – continued | | |
| | | | | | | | |
Shares | | | | | Market
Value | |
| | | | Consumer Discretionary (continued) | | | | |
| | (3,558 | ) | | Delphi Automotive PLC (Jersey) | | $ | (231,519 | ) |
| | (7,495 | ) | | Dick’s Sporting Goods, Inc. | | | (417,097 | ) |
| | (11,517 | ) | | MarineMax, Inc. * | | | (229,764 | ) |
| | (12,205 | ) | | Regal Entertainment Group, Class A | | | (262,530 | ) |
| | (1,843 | ) | | TESLA Motors, Inc. * | | | (364,416 | ) |
| | (1,586 | ) | | Whirlpool Corp. | | | (237,615 | ) |
| | | | | | | | |
| | | | | | | (2,810,929 | ) |
| | | | | | | | |
| | | | Financials – (5.6)% | | | | |
| | (19,833 | ) | | AmTrust Financial Services, Inc. | | | (523,393 | ) |
| | (14,022 | ) | | BofI Holding, Inc. * | | | (261,230 | ) |
| | (13,296 | ) | | Deutsche Bank AG (Germany) | | | (191,329 | ) |
| | (15,980 | ) | | Donnelley Financial Solutions, Inc. * | | | (342,771 | ) |
| | (8,642 | ) | | Equitable Group, Inc. (Canada) | | | (340,448 | ) |
| | (21,442 | ) | | Genworth MI Canada, Inc. (Canada) | | | (465,672 | ) |
| | (25,151 | ) | | Home Capital Group, Inc. (Canada) | | | (497,845 | ) |
| | | | | | | | |
| | | | | | | (2,622,688 | ) |
| | | | | | | | |
| | | | Healthcare – (0.6)% | | | | |
| | (4,523 | ) | | Mallinckrodt PLC (Ireland) * | | | (268,033 | ) |
| | | | | | | | |
| | | | Industrials – (6.3)% | | | | |
| | (12,429 | ) | | American Airlines Group, Inc. | | | (504,617 | ) |
| | (6,048 | ) | | Ball Corp. | | | (466,119 | ) |
| | (9,270 | ) | | Delta Air Lines, Inc. | | | (387,208 | ) |
| | (10,635 | ) | | Echo Global Logistics, Inc. * | | | (225,462 | ) |
| | (14,917 | ) | | LSC Communications, Inc. * | | | (361,588 | ) |
| | (9,531 | ) | | Quad/Graphics, Inc. | | | (226,457 | ) |
| | (4,734 | ) | | Snap-On, Inc. | | | (729,509 | ) |
| | | | | | | | |
| | | | | | | (2,900,960 | ) |
| | | | | | | | |
| | | | Information Technology – (1.5)% | | | | |
| | (11,915 | ) | | Ciena Corp. * | | | (230,913 | ) |
| | (33,092 | ) | | HP, Inc. | | | (479,503 | ) |
| | | | | | | | |
| | | | | | | (710,416 | ) |
| | | | | | | | |
| | | | Materials – (1.5)% | | | | |
| | (4,988 | ) | | Deere & Co. | | | (440,440 | ) |
| | (13,330 | ) | | Louisiana-Pacific Corp. * | | | (244,606 | ) |
| | | | | | | | |
| | | | | | | (685,046 | ) |
| | | | | | | | |
| | | | Real Estate – (2.0)% | | | | |
| | (11,964 | ) | | Boardwalk Real Estate Investment Trust (Canada) | | | (439,028 | ) |
| | (22,528 | ) | | Canadian Apartment Properties (Canada) | | | (492,448 | ) |
| | | | | | | | |
| | | | | | | (931,476 | ) |
| | | | | | | | |
| | | | Telecommunication Services – (0.9)% | | | | |
| | (16,938 | ) | | Consolidated Communications Holdings, Inc. | | | (405,326 | ) |
| | | | | | | | |
| | | | Utilities – (4.5)% | | | | |
| | (3,233 | ) | | American Water Works Co., Inc. | | | (239,371 | ) |
| | (4,715 | ) | | Consolidated Edison, Inc. | | | (356,218 | ) |
| | (4,173 | ) | | DTE Energy Co. | | | (400,650 | ) |
| | | | | | | | |
Shares | | | | | Market
Value | |
| | | | Utilities (continued) | | | | |
| | (5,086 | ) | | Edison International | | $ | (373,719 | ) |
| | (5,804 | ) | | PG&E Corp. | | | (360,544 | ) |
| | (8,877 | ) | | Xcel Energy, Inc. | | | (368,839 | ) |
| | | | | | | | |
| | | | | | | (2,099,341 | ) |
| | | | | | | | |
| | | | Total Common Stocks
(Proceeds $13,724,859) | | | (13,434,215 | ) |
| | | | | | | | |
| | | | Exchange Traded Funds – (1.8)% | | | | |
| | (46,986 | ) | | United States Natural Gas Fund LP * | | | (379,647 | ) |
| | (43,024 | ) | | United States Oil Fund LP * | | | (453,043 | ) |
| | | | | | | | |
| | | | Total Exchange Traded Funds
(Proceeds $846,050) | | | (832,690 | ) |
| | | | | | | | |
| Total Short Sales – (30.8)%
(Proceeds $14,570,909) | | | (14,266,905 | ) |
| | | | | | | | |
| Net Other Assets and Liabilities – (7.0)% | | | (3,233,054 | ) |
| | | | | | | | |
| Net Assets – 100.0% | | $ | 46,261,507 | |
| | | | | | | | |
| * | Non-income producing security. |
| ** | Yield shown represents the October 31, 2016, seven-day average yield, which refers to the sum of the previous seven days’ dividends paid, expressed as an annual percentage. |
| *** | At October 31, 2016, the aggregate cost for Federal income tax purposes is $64,487,140. |
| | | | |
Gross unrealized appreciation | | $ | 1,058,736 | |
Gross unrealized depreciation | | | (1,784,410 | ) |
| | | | |
Net unrealized depreciation | | $ | (725,674 | ) |
| | | | |
| (a) | Security position is either entirely or partially held in a segregated account as collateral for securities sold short. As of October 31, 2016, $27,678,191 in securities was segregated or on deposit with prime brokers to cover short sales. |
| (b) | The Fund is contractually responsible to the lender for any dividends payable and interest accrued on securities while those securities are outstanding in short position. These dividends and interest amounts are recorded as dividend expense on the Statement of Operations. |
| MLP | Master Limited Partnership |
| PLC | Public Limited Company |
The accompanying notes are an integral part of these financial statements.
79
AMG Managers Guardian Capital Global Dividend Fund
Portfolio Manager’s Comments (unaudited)
The AMG Managers Guardian Capital Global Dividend Fund1 (the “Fund”) Class N shares returned (3.9)% for the fiscal year ended October 31, 2016, compared with a 1.2% return for its benchmark, the MSCI World Index.
GLOBAL MARKETS REVIEW
The U.S. Federal Reserve (the Fed) has remained cautious as the pace of normalization has been hindered by domestic and global conditions that have not been conducive to an interest rate hike. At its September meeting, the Fed held its federal funds target rate steady in the range of 0.25%-0.5%, where it has remained since the last hike in December 2015. Overall, Fed Chair Janet Yellen noted that risks to the economic outlook appear “roughly balanced” and although the case for raising interest rates has strengthened, the economy has “further room to run than previously thought.” Recently, U.S. data has been mixed. Slowing GDP, business investment and corporate profitability contribute to the Fed’s cautious stance. Inflation appears manageable, as the core personal consumption expenditure index has been moving higher since the start of the year and was 1.7% year-over-year in August. Despite uncertainty from the U.S. presidential election, a strong U.S. Dollar, slowing global growth and Fed policy, conditions for continued expansion exist and we believe the economy remains on track for annual growth in the neighborhood of 2%.
Since the Brexit vote, the Bank of England (BOE) has been proactively communicating to the markets that it is prepared to provide monetary stimulus, including interest rate cuts and quantitative easing (“QE”), in order to maintain liquidity and confidence in the U.K.’s economy and financial markets. In early July, the BOE eased capital requirements for banks, which have been hit hard by the markets, in order to ensure lending activity continues. In August, the BOE cut its key interest rate, the first time in seven years, to a record low 0.25% in order to stave off a depression in business investment and consumer confidence.
Brexit creates another headwind for the European Central Bank’s (ECB) easing efforts to generate sustainable growth and inflation. Similar to the BOE, the ECB has been active in assuring markets that liquidity is available and markets have responded well so far. In September, the ECB decided to keep its stimulus program unchanged while noting that the “economic recovery in the Euro Area is expected to be dampened by subdued foreign demand, partly related to the U.K. referendum.” Recent data indicates economic growth has slowed from earlier in the year while inflation remains stubbornly below the ECB’s 2% target, registering 0.4% annual inflation, in September.
In Japan, the Bank of Japan (BOJ) continues to struggle with sustainable growth and fears of falling into deflation. The third quarter saw the BOJ adjust its stimulus framework to include a focus on the yield curve, pledging to keep the nominal ten-year government bond yield around 0%, while keeping the key policy rate at (0.1)% and maintaining its monetary expansion target of 80 trillion Yen. It is too early to evaluate the BOJ’s most recent measures, but the existing program has been producing mixed results as the Yen strengthened versus most trading partners this year, while inflation remains low and GDP growth inconsistent.
Emerging Market (EM) equities enjoyed a good year, with returns comfortably outstripping those in developed markets (DM). Earnings surprises ran ahead of those in DM, which is a positive sign for the equities that had flat-lined for the past five years. Asia significantly outperformed other regions, benefitting from its high exposure to technology, particularly U.S.-listed internet giants like Alibaba, Baidu and Tencent. Foreign investors are becoming a bit more sanguine about China’s growth outlook, which is expressing itself through interest in the drivers of the new economy and diminishing concern about the old economy hitting a brick wall in the near future.
In Canada, expectations for a rebound later in the year remain. Second-quarter GDP was weak in the aftermath of the wildfires and was slower than consensus estimates, falling 1.6% annualized, posting the weakest economic performance since 2009. However, June’s monthly GDP report was the strongest monthly increase since 2013. This was followed by stronger-than-expected growth in July, marking the best two consecutive monthly gains in five years. Consumers continued to increase spending, as retail sales rose by 2.2% year-over-year in July. Sales of cars and auto parts lifted exports to a gain of 3.4% in July, while, excluding energy products, the increase was 4.1%. On this news, the S&P/TSX Composite Index, which tracks the Canadian equity market, rallied in the third quarter, outperforming all other markets save for the EM.
When considering factors affecting performance, in the aftermath of Brexit, we saw QE-driven low-yield contagion spread into equities that fueled a low-volatility and high-quality plus dividend yield factor outperformance. This dislocation of equities faced a reversal in 3Q 2016 given its structural dependence on expanding central bank balance sheets and falling bond yields. Cash deployment lagged in 3Q 2016; consequently, dividend growth and share repurchase posted negative results for the quarter but remain leading factor groups year-to-date. Additionally, under performance in good quality, dividend factors and buybacks are perceived to have relatively higher multiples or as being pricier than other factors like growth and value. With central banks turning marginally less dovish and with global nominal growth firming, the quality plus yield factors have consolidated in 3Q 2016 amidst a significant jump in high-risk sections of the market. High risk/high beta was the best performing group in 3Q 2016 by a wide margin. Furthermore, the small size factor also beat the Index for 3Q. Deep value or low price (i.e., distressed stocks) has led performance this year.
80
AMG Managers Guardian Capital Global Dividend Fund
Portfolio Manager’s Comments (continued)
PERFORMANCE ATTRIBUTION 2016
The AMG Managers Guardian Capital Global Dividend Fund was under exposed to the growth, low quality and high beta factors that outperformed over the Fund’s past fiscal year ended October 31, 2016. This underexposure resulted in the Fund’s relative underperformance.
As non-dividend-paying and high beta stocks have rallied, negative attribution came from sectors traditionally associated with higher yields and those likely to deliver sustainable dividend growth. The Fund underperformed in nine of 11 sectors, with the worst underperformance coming from financials, energy, telecommunication services and utilities.
Within financials, negative attribution came from the private prison companies and capital markets. CoreCivic Inc. (CXW) and GEO Group (GEO) are responsible for a large portion of the negative alpha. Both companies are U.S. private prisons whose main sources of revenue are the state and federal governments. Our initial response to the August 18 federal announcement of not renewing the existing contracts was to remain in the stocks as the federal government represented only 9% of revenues, and declining. However, the risk was that U.S. Immigration and Customs Enforcement (ICE) and the individual states would follow suit and also put contract renewal under review. Unfortunately, a few days later, ICE announced that they will also consider eliminating the private prison contracts, at which point we significantly reduced our weight in the stocks as their main revenue source was endangered. Capital markets lagged as the central banks signaled an easing monetary policy for most of the third quarter, reversing course mid-September.
Quality and low volatility decoupled from momentum and some of the higher valuations reverted. Although the Fund benefitted from an overweight position in telecommunication services, stock selection in the sector hurt performance with negative returns from Bezeq Israeli Telecommunication Corp and Proximus being among the largest detractors.
Within energy, negative attribution came from Valero Energy Corp, Williams Companies and Enterprise Products Partners.
In health care, global gorillas like Johnson & Johnson, Sonic and Medtronic outperformed.
FUND ACTIVITY
Turnover was not excessive throughout the year. The Fund added PPL, Macquarie Infrastructure, Vodafone, Amgen, Analog Devices and Telus while selling Proximus, Lyondellbasel, Swiss-com, Bayer and CoreCivic Inc.
POSITIONING
The Fund is systematically over-exposed to quality, cash flow and dividend growth. Stocks of companies with the largest share of overseas sales (high foreign exposure) continue to do well. Low-volatility stocks have underperformed the market significantly over the last three months. The strong positive correlation between low volatility and momentum decoupled in 3Q 2016.
The Fund remains underweight financials (-6.29%) and information technology (-5.13%). Overweight sectors are consumer staples (+7.74%) and telecommunication services (+7.43%).
Geographically, the Fund is underweight Japan/Asia Pacific with Japan being the lowest yielding country in the index, underweight North America and overweight Europe. The Fund does not have a weight in Emerging Markets at this time. In terms of characteristics, the Fund has a large-cap, high-quality bias.
Within the lower volatility space, staples, utilities and telecommunication services underperformed for the year ending October 31, 2016. Real estate investment trusts (“REITs”) especially continue to see further downside risk amidst the possibility of further U.S. central bank tightening. Consequently we have stayed underweight U.S. REITs. We feel a significant part of the YTD quality, low volatility, and sustainable dividend growth outperformance has already been
reversed, while we continue to stay cautious and further immunize the Fund to rising interest rates on a relative basis to our peer group. Our allocation by yielding buckets is also more diversified and we are not chasing yield as the highest yielding buckets are underweighted compared to peers.
OUTLOOK
The current unique backdrop has become increasingly sensitive to central bank actions as well as expectations, and has created unintended hidden risks and noise within the market. We feel, under these circumstances, that staying disciplined and systematically exposing the Fund to greater earnings and cash flow visibility, plus a sustained growth in dividends and a reasonable yield carry, is critical to survive the uncertainties of the market. Growth and value factors have traditionally been very volatile and have failed to provide a long-term duration runway. Low beta is not cheap but we believe is necessary to protect the downside when one would see both fixed income and equity volatility rise at the same time. We continue to stay rooted in the longer-term picture by maintaining a systematic exposure to quality stocks that can sustain a positive cash flow yield that results in a sustainable dividend payout. The resulting Fund is a combination of dividend payers that provide a positive yield carry over the benchmark, while the consistent exposure to dividend growth allow for the sustainability of the dividends into the future supported by dividend achievers that have lower payout ratios and a very low probability of a dividend cut.
The views expressed represent the opinions of Guardian Capital LP, as of October 31, 2016, and are not intended as a forecast or guarantee of future results and are subject to change without notice.
| 1 | Prior to October 1, 2016, the Fund was known as ASTON/Guardian Capital Global Dividend Fund. |
81
AMG Managers Guardian Capital Global Dividend Fund
Portfolio Manager’s Comments (continued)
CUMULATIVE TOTAL RETURN PERFORMANCE
The AMG Managers Guardian Capital Global Dividend Fund’s cumulative total return is based on the daily change in net asset value (NAV), and assumes that all dividends and distributions were reinvested. The chart compares a hypothetical $10,000 investment made in AMG Managers Guardian Capital Global Dividend Fund’s Class N on April 14, 2014, to a $10,000 investment made in the MSCI World Index for the same time period. The graph and table do not reflect the deduction of taxes that a shareholder would pay on a Fund distribution or redemption of shares. The listed returns for the Fund are net of expenses and the returns for the index exclude expenses. Total returns would have been lower had certain expenses not been reduced.
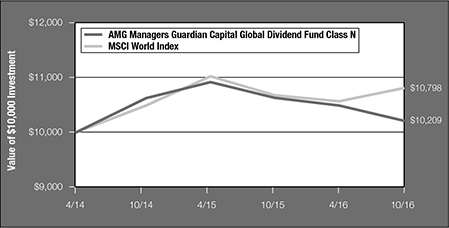
The table below shows the average annual total returns for AMG Managers Guardian Capital Global Dividend Fund and the MSCI World Index for the same time periods ended October 31, 2016.
| | | | | | | | | | | | |
| | | One | | | Since | | | Inception | |
| Average Annual Total Returns1 | | Year | | | Inception | | | Date | |
AMG Managers Guardian Capital Global Dividend Fund2,3,4,5,6,7,8 | | | | | | | | | | | | |
Class N | | | (3.91 | )% | | | 0.82 | % | | | 04/14/14 | |
Class I | | | (3.68 | )% | | | 1.02 | % | | | 04/14/14 | |
MSCI World Index9 | | | 1.18 | % | | | 3.12 | % | | | 04/14/14 | † |
The performance data shown represents past performance. Past performance is not a guarantee of future results. Current performance may be lower or higher than the performance data quoted. The investment return and the principal value of an investment will fluctuate so that an investor’s shares, when redeemed, may be worth more or less than their original cost.
Investors should carefully consider the Fund’s investment objectives, risks, charges and expenses before investing. For performance information through the most recent month end, current net asset values per share for the Fund and other information, please call (800) 835-3879 or visit our website at www.amgfunds.com for a free prospectus. Read it carefully before investing or sending money.
Distributed by AMG Distributors, Inc., member FINRA/SIPC.
| † | Date reflects the inception date of the Fund, not the index. |
| 1 | Total return equals income yield plus share price change and assumes reinvestment of all dividends and capital gain distributions. Returns are net of fees and may reflect offsets of Fund expenses as described in the prospectus. No adjustment has been made for taxes payable by shareholders on their reinvested dividends and capital gain distributions. Returns for periods greater than one year are annualized. The listed returns on the Fund are net of expenses and based on the published NAV as of October 31, 2016. All returns are in U.S. dollars ($). |
| 2 | Investments in international securities are subject to certain risks of overseas investing including currency fluctuations and changes in political and economic conditions, which could result in significant market fluctuations. |
| 3 | The Fund is subject to the risks associated with investments in emerging markets, such as erratic earnings patterns, economic and political instability, changing exchange controls, limitations on repatriation of foreign capital and changes in local governmental attitudes toward private investment, possibly leading to nationalization or confiscation of investor assets. |
| 4 | A short-term redemption fee of 2% will be charged on shares held for less than 90 days. |
| 5 | An issuer of a security may be unwilling or unable to pay income on a security. Common stocks do not assure dividend payments and are paid only when declared by an issuer’s board of directors. |
| 6 | The Fund is subject to risks associated with investments in mid-capitalization companies such as greater price volatility, lower trading volume, and less liquidity than the stocks of larger, more established companies. |
| 7 | The Fund is subject to special risk considerations similar to those associated with the direct ownership of real estate. Real estate valuations may be subject to factors such as changing general and local economic, financial, competitive, and environmental conditions. |
| 8 | The Fund is subject to risks associated with investments in small-capitalization companies, such as erratic earnings patterns, competitive conditions, limited earnings history and a reliance on one or a limited number of products. |
| 9 | The MSCI World Index is a free float-adjusted market capitalization weighted index that is designed to measure the equity market performance of developed markets. The MSCI World Index consists of the following 23 developed market country indices: Australia, Austria, Belgium, Canada, Denmark, Finland, France, Germany, Hong Kong, Ireland, Israel, Italy, Japan, Netherlands, New Zealand, Norway, Portugal, Singapore, Spain, Sweden, Switzerland, the United Kingdom and the United States. Unlike the Fund, the MSCI World Index is unmanaged, is not available for investment and does not incur expenses. All MSCI data is provided “as is.” The product described herein is not sponsored or endorsed and has not been reviewed or passed on by MSCI. In no event shall MSCI, its affiliates, or any MSCI data provider have any liability of any kind in connection with the MSCI data or the product described herein. Copying or redistributing the MSCI data is strictly prohibited. |
Not FDIC insured, nor bank guaranteed. May lose value.
82
AMG Funds
| | |
AMG Managers Guardian Capital Global Dividend Fund | | October 31, 2016 |
| |
Schedule of Investments | | |
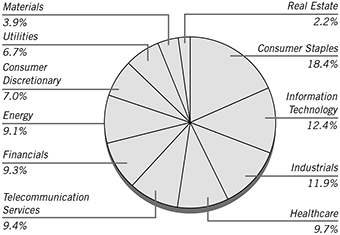
% of Net Assets
| | | | | | | | |
Shares | | | | | Market
Value | |
| COMMON STOCKS – 100.0% | | | | |
| | | | Australia – 3.2% | | | | |
| | 9,300 | | | Sonic Healthcare, Ltd. (a) | | $ | 144,638 | |
| | 65,551 | | | Sydney Airport (a) | | | 311,616 | |
| | 71,400 | | | Telstra Corp., Ltd. (a) | | | 270,031 | |
| | 8,500 | | | Westpac Banking Corp. (a) | | | 196,562 | |
| | | | | | | | |
| | | | | | | 922,847 | |
| | | | | | | | |
| | | | Belgium – 1.9% | | | | |
| | 4,694 | | | Anheuser-Busch InBev SA/NV, Sponsored ADR | | | 542,110 | |
| | | | | | | | |
| | | | Bermuda – 1.0% | | | | |
| | 5,442 | | | Validus Holdings, Ltd. | | | 278,086 | |
| | | | | | | | |
| | | | Canada – 3.8% | | | | |
| | 3,217 | | | BCE, Inc. | | | 146,160 | |
| | 11,311 | | | Enbridge Income Fund Holdings, Inc. | | | 287,055 | |
| | 3,640 | | | Rogers Communications, Inc., Class B | | | 146,436 | |
| | 4,653 | | | Royal Bank of Canada | | | 290,704 | |
| | 6,715 | | | TELUS Corp. | | | 217,425 | |
| | | | | | | | |
| | | | | | | 1,087,780 | |
| | | | | | | | |
| | | | France – 4.5% | | | | |
| | 6,693 | | | AXA SA (a) | | | 151,010 | |
| | 4,080 | | | ICADE (a) | | | 292,998 | |
| | 7,526 | | | SCOR SE (a) | | | 243,720 | |
| | 5,800 | | | TOTAL SA (a) | | | 277,850 | |
| | 1,466 | | | Unibail-Rodamco SE (a) | | | 347,979 | |
| | | | | | | | |
| | | | | | | 1,313,557 | |
| | | | | | | | |
| | | | Germany – 3.1% | | | | |
| | 5,142 | | | BASF SE (a) | | | 453,927 | |
| | 10,000 | | | Deutsche Telekom AG (a) | | | 163,153 | |
| | 1,459 | | | Muenchener Rueckversicherungs-Gesellschaft AG in Muenchen (a) | | | 283,280 | |
| | | | | | | | |
| | | | | | | 900,360 | |
| | | | | | | | |
| | | | | | | | |
Shares | | | | | Market
Value | |
| | | | Ireland – 2.1% | | | | |
| | 1,891 | | | Accenture PLC, Class A | | $ | 219,810 | |
| | 4,788 | | | Medtronic PLC | | | 392,712 | |
| | | | | | | | |
| | | | | | | 612,522 | |
| | | | | | | | |
| | | | | | | | |
| | | | Israel – 1.3% | | | | |
| | 119,948 | | | Bezeq The Israeli Telecommunication Corp., Ltd. (a) | | | 217,874 | |
| | 3,471 | | | Teva Pharmaceutical Industries, Ltd., Sponsored ADR | | | 148,351 | |
| | | | | | | | |
| | | | | | | 366,225 | |
| | | | | | | | |
| | | | Netherlands – 1.0% | | | | |
| | 7,136 | | | Unilever NV | | | 298,428 | |
| | | | | | | | |
| | | | New Zealand – 1.2% | | | | |
| | 129,626 | | | Spark New Zealand, Ltd. (a) | | | 339,021 | |
| | | | | | | | |
| | | | Norway – 2.0% | | | | |
| | 34,787 | | | Statoil ASA, Sponsored ADR | | | 564,941 | |
| | | | | | | | |
| | | | Singapore – 1.5% | | | | |
| | 2,637 | | | Broadcom, Ltd. | | | 449,028 | |
| | | | | | | | |
| | | | Spain – 1.9% | | | | |
| | 3,000 | | | Amadeus IT Group SA (a) | | | 141,192 | |
| | 21,551 | | | Ferrovial SA (a) | | | 418,692 | |
| | | | | | | | |
| | | | | | | 559,884 | |
| | | | | | | | |
| | | | Switzerland – 3.1% | | | | |
| | 7,300 | | | Nestle SA (a) | | | 529,352 | |
| | 2,006 | | | Novartis AG, Sponsored ADR | | | 142,466 | |
| | 2,560 | | | Swiss Re AG (a) | | | 237,598 | |
| | | | | | | | |
| | | | | | | 909,416 | |
| | | | | | | | |
| | | | United Kingdom – 12.7% | | | | |
| | 4,200 | | | AstraZeneca PLC (a) | | | 235,180 | |
| | 38,491 | | | BAE Systems PLC (a) | | | 255,033 | |
| | 5,227 | | | British American Tobacco PLC, Sponsored ADR | | | 600,530 | |
| | 2,972 | | | GlaxoSmithKline PLC, Sponsored ADR | | | 118,910 | |
| | 10,753 | | | Imperial Brands PLC (a) | | | 520,145 | |
| | 42,176 | | | National Grid PLC (a) | | | 548,618 | |
| | 23,170 | | | Royal Dutch Shell PLC, Class A (a) | | | 577,098 | |
| | 28,147 | | | SSE PLC (a) | | | 547,266 | |
| | 10,037 | | | Vodafone Group PLC, Sponsored ADR | | | 279,430 | |
| | | | | | | | |
| | | | | | | 3,682,210 | |
| | | | | | | | |
| | | | United States – 55.7% | | | | |
| | 5,279 | | | AbbVie, Inc. | | | 294,463 | |
| | 2,069 | | | Air Products & Chemicals, Inc. | | | 276,046 | |
| | 9,027 | | | Altria Group, Inc. | | | 596,865 | |
| | 5,909 | | | Ameren Corp. | | | 295,155 | |
| | 1,347 | | | Amgen, Inc. | | | 190,143 | |
| | 6,430 | | | Analog Devices, Inc. | | | 412,163 | |
| | 5,160 | | | Apple, Inc. | | | 585,866 | |
| | 13,995 | | | AT&T, Inc. | | | 514,876 | |
| | 5,167 | | | Automatic Data Processing, Inc. | | | 449,839 | |
The accompanying notes are an integral part of these financial statements.
83
AMG Funds
| | |
AMG Managers Guardian Capital Global Dividend Fund | | October 31, 2016 |
| |
Schedule of Investments – continued | | |
| | | | | | |
Shares | | | | Market
Value | |
| | United States (continued) | | | | |
4,735 | | Dr Pepper Snapple Group, Inc. | | $ | 415,686 | |
3,376 | | Duke Energy Corp. | | | 270,148 | |
24,981 | | Energy Transfer Equity LP | | | 372,966 | |
10,839 | | Enterprise Products Partners LP | | | 273,576 | |
5,630 | | Illinois Tool Works, Inc. | | | 639,399 | |
2,212 | | Ingredion, Inc. | | | 290,148 | |
3,915 | | Intel Corp. | | | 136,516 | |
5,104 | | Johnson & Johnson | | | 592,013 | |
7,373 | | JPMorgan Chase & Co. | | | 510,654 | |
1,421 | | Kimberly-Clark Corp. | | | 162,577 | |
1,842 | | Lockheed Martin Corp. | | | 453,832 | |
4,066 | | Macquarie Infrastructure Corp. | | | 332,639 | |
2,987 | | McDonald’s Corp. | | | 336,247 | |
2,449 | | Merck & Co., Inc. | | | 143,805 | |
8,409 | | Microsoft Corp. | | | 503,867 | |
5,919 | | ONEOK, Inc. | | | 286,657 | |
6,098 | | Paychex, Inc. | | | 336,610 | |
6,231 | | Pfizer, Inc. | | | 197,585 | |
6,305 | | Philip Morris International, Inc. | | | 608,054 | |
8,198 | | PPL Corp. | | | 281,519 | |
3,199 | | Raytheon Co. | | | 437,015 | |
5,442 | | Republic Services, Inc. | | | 286,412 | |
10,753 | | Reynolds American, Inc. | | | 592,275 | |
11,465 | | Six Flags Entertainment Corp. | | | 638,027 | |
10,207 | | Starbucks Corp. | | | 541,685 | |
1,921 | | Stryker Corp. | | | 221,587 | |
5,079 | | Texas Instruments, Inc. | | | 359,847 | |
7,188 | | The Dow Chemical Co. | | | 386,786 | |
2,130 | | The Procter & Gamble Co. | | | 184,884 | |
5,359 | | The Walt Disney Co. | | | 496,726 | |
8,991 | | Verizon Communications, Inc. | | | 432,467 | |
4,583 | | Waste Management, Inc. | | | 300,920 | |
11,047 | | Wells Fargo & Co. | | | 508,272 | |
| | | | | | |
| | | | | 16,146,817 | |
| | | | | | |
| | Total Common Stocks
(Cost $28,983,804) | | | 28,973,232 | |
| | | | | | |
RIGHTS – 0.0% # | | | | |
| | Spain – 0.0% | | | | |
21,551 | | Ferrovial SA Expiration 11/03/16 * | | | 9,227 | |
| | | | | | |
| | Total Rights
(Cost $9,659) | | | 9,227 | |
| | | | | | |
INVESTMENT COMPANY – 28.3% | | | | |
8,209,984 | | Dreyfus Government Cash Management Fund, Institutional Class Shares, 0.28%** | | | 8,209,984 | |
| | | | | | |
| | Total Investment Company
(Cost $8,209,984) | | | 8,209,984 | |
| | | | | | |
Total Investments – 128.3%
(Cost $37,203,447)*** | | | 37,192,443 | |
| | | | | | |
Net Other Assets and Liabilities – (28.3)% | | | (8,208,759 | ) |
| | | | | | |
Net Assets – 100.0% | | $ | 28,983,684 | |
| | | | | | |
| * | Non-income producing security. |
| ** | Yield shown represents the October 31, 2016, seven-day average yield, which refers to the sum of the previous seven days’ dividends paid, expressed as an annual percentage. |
| *** | At October 31, 2016, the aggregate cost for Federal income tax purposes is $37,221,705. |
| | | | |
Gross unrealized appreciation | | $ | 410,631 | |
Gross unrealized depreciation | | | (439,893 | ) |
| | | | |
Net unrealized depreciation | | $ | (29,262 | ) |
| | | | |
| (a) | Securities with a total aggregate market value of $7,703,833, or 26.6% of net assets, were valued under fair value procedures established by the Fund’s Board of Trustees. |
| ADR | American Depositary Receipt |
| PLC | Public Limited Company |
The accompanying notes are an integral part of these financial statements.
84
AMG Managers Pictet International Fund
Portfolio Manager’s Comments (unaudited)
The AMG Managers Pictet International Fund1 (the “Fund”) Class N shares returned 1.4% for the fiscal year ended October 31, 2016, compared with a (3.2)% return for its benchmark, the MSCI EAFE Index.
MARKET COMMENTARY
The MSCI EAFE Index return for the 12-month period ended October 31, 2016, suggests that it was a relatively benign period in international equity markets. The reality is that it was a volatile year peppered with significant, market moving events—economic panic, central bank assurances and political shock and uncertainty.
A short period of relative calm at the end of 2015 gave way to savage market declines in the first few days of 2016, catalysed by weak U.S. economic data, China and other Emerging Market concerns and a sharp fall in the oil price. From their high at the start of the period, markets had fallen over 15% by mid-February. Central Bank assurances of continued monetary support catalysed a bounce through Q2, but it became increasingly ‘nervous’ as the U.K. approached its June referendum on whether to remain a member of the European Union. The decision (by a small margin) to leave sent more shockwaves through currency and stock markets. The U.K. Pound fell more than 10% relative to the U.S. Dollar overnight, and nearly 15% relative to the Japanese Yen, which investors saw as a ‘safe haven’ from the European turmoil. The move created major uncertainty about the future of the U.K.’s relationship with Europe, and indeed spawned concerns about the future of the E.U. as a whole. Despite this, markets soon recovered from their post-‘Brexit’ lows as a raft of more positive macro and company-level releases, particularly in Europe, buoyed investor sentiment. Defensive sectors, which had been stronger prior to the U.K. vote, declined, as cyclical companies took up the running. Commodity prices, and most notably the oil price, recovered, and were close to 12-month highs by mid-October.
Brexit and the vacuum of information about what it will actually look like meant that European markets were the weakest performers over the period. Currency strength and a greater sensitivity to rising commodity prices later in the period drove Pacific ex-Japan markets (particularly Australia) to be the best performers. Japan was also ahead of the Index.
At a sector level, the post-Brexit rotation out of defensive sectors meant that cyclical groups were the best performers over the period. The advance was led by resources companies, IT and industrials. The exception to this pattern was financial companies (especially banks) for which ultra-low interest rates remain a major headwind. They were among the main benchmark laggards despite a late recovery. Health care companies were the weakest over the period, mainly due to the increasing scrutiny of drug pricing practices in the U.S. market.
PERFORMANCE REVIEW
In an environment that has proved tough for many active managers, the Fund outperformed the benchmark over the period. Stock selection was the overriding driver of this performance, but at an aggregate level, the underweight positions in financials and the Pacific ex-Japan region, and the overweight position in industrials, were positive. At an individual stock level, the main positive contributions were made by:
Royal Dutch Shell (“RDS”) (integrated oil/ gas, Netherlands/U.K.) performed strongly throughout the period as a result of three drivers. First was the Q1 completion of its acquisition of gas Exploration & Production (E&P) rival, BG Group (U.K.). In the prevailing environment of weak oil prices, the deal confirms RDS as the global leader in the natural gas/liquefied natural gas (LNG) market, and marries its infrastructure-rich, but reserve-poor business with BG’s vast future reserves. It is now by some way the lowest cost LNG producer globally. The significant strategic logic allowed RDS’ stock to outperform the oil price decline early in the year.
Later on, the U.K.’s Brexit vote created another tail wind as the sharp decline of the U.K. Pound favored groups like RDS that deal in U.S. Dollar markets, but both report in, and have a disproportionate amount of their cost base in U.K. Pounds.
BBA Aviation (“BBA”) (U.S. airport services, U.K.) rose steadily through the period. The main underlying driver of performance was the move towards, and then completion of, a major acquisition of U.S. private company, Landmark. The deal elevates BBA to being the dominant provider of ground-based services (refuelling, ground handling, maintenance, cleaning, etc.) at private jet airports in North America. At the same time as achieving this position in a high-return, less-cyclical market, BBA announced the disposal of its lower margin, more volatile commercial airport services business ASIG; a transaction that will it complete in 2017. While U.K. listed, BBA’s revenues are overwhelmingly earned in U.S. Dollars, so it, too, was a beneficiary of the U.K. Pound’s decline following the Brexit vote in June. The share price rise reflects both the increase to the scale of the private airport operations, and the higher rating accorded to future earnings as management executes its strategy to focus operations on higher-quality, lower-volatility areas of the market. With further scope for the disposal of other non-core businesses, the Fund remains holders.
H. Lundbeck (pharmaceuticals, Denmark). Although its path was volatile, and it was sold from the Fund mid Q2 2016, H. Lundbeck made a significant positive contribution to relative performance. The company specializes in the development of drugs to treat neurological and psychological disorders. In mid-2015, the stock received a triple boost: first, from the appointment of a new CEO, Kare Schultz, after a highly successful period as COO of Novo Nordisk; second, from the approval and early sales success of key depression/ schizophrenia drug brexpiprazole (marketed as ‘Rexulti’ in the U.S.) and third, from the expectation that during 2016 the FDA would grant an extension
85
AMG Managers Pictet International Fund
Portfolio Manager’s Comments (continued)
to their existing approval of depression drug Brintellix, that moved it ahead of competitors. Shortly after his appointment, Schultz announced a major cost cutting program designed to bridge a potential two-year profit dip as sales of legacy drugs come off patent before sales of newly approved drugs could grow to compensate. The positive effects of these moves, and updates on their progress, drove the stock up steadily through the early part of the period. By mid Q1, the shares were trading at close to our assessment of intrinsic value and, having already taken some profit, the rest of the holding was sold. Subsequently, not holding the stock has also been a positive. At the end of March, the FDA rejected an extension to Brintellix’s approval, causing a sharp sell-off. Although the stock recovered, it then sold off sharply again in September, when an Alzheimer’s drug in H. Lundbeck’s development pipeline failed its first stage of phase III clinical trials and was abandoned.
While failing to offset these positives, notable negative contributions to relative performance were made by:
Inmarsat (satellite communications services, U.K.), which declined from end 2015 highs as investors were frustrated by the mixed start the company has made to monetizing its investment in a newly complete array of satellites. The ‘Global Xpress’ (GX) service it can now offer is unique: global, seamless high bandwidth satellite data services for a maritime, aviation and government (military) customer base. Two developments have caused the share price retreat. First, rival providers of less technologically advanced services have announced plans to invest heavily in new satellite capacity. These plans will take years to yield a capability that can rival GX, but even the suggestion spooked investors. Second, the market had expected Inmarsat to start winning contracts in the fast growing aviation data market where their capabilities got them awarded the whole contract. The reality of the first win is that airlines are blending GX’s intercontinental data capabilities over oceans with cheaper ground-based
offerings over land. Our view, based on longer-term considerations, is that while the initial transition from technological risk and cash burn (launching and commissioning satellites) to commercial risk and cash generation (marketing and selling the services) is disappointing some investors, Inmarsat has the long-term potential to generate high rates of return on a unique asset in a market with huge barriers to entry. Having added to the position on underperformance, Inmarsat remains one of the larger positions in the Fund.
Nokia (cellular network infrastructure, Finland) is also a company undergoing a transition, and conditions in its main market, rather than problems with this transition, have caused its stock to be weak. In early 2015, Nokia completed the acquisition of rival cellular network infrastructure (‘CNI’) group, Alcatel. The strategic logic of the combination is compelling in a market that now has only three major players, and we believe both the cost savings of the merger will yield over the coming several years and the greater vertical integration it brings to the company make it more attractive still. Progress updates on the integration plan have all been positive; it is either on or ahead of schedule in all areas. That said, the market is a cyclical one, and as the global roll out of 4G services peaks, Nokia is now entering a tougher period in its main field of activity. It is this fact that is weighing on the stock. Away from CNI, Nokia sold its digital mapping database (‘HERE’) to a consortium of German auto OEMs, and is progressing well with the generation of new royalty streams from its cellular intellectual property assets. What management has under its control it is delivering on, and we like the longer-term implications of better order in the CNI market, a deeper and more focused CNI business and the Alcatel merger synergies that should be realized by the time the next cellular technology generation kicks in. As with Inmarsat, the Fund has added to the position on weakness and remains a holder.
FUND ACTIVITY
Given the relatively rich valuation of markets and the potential for further volatility, the Fund started the period with relatively defensive positioning. This was the by-product of an increasing stock level focus through 2014/15 on buying business models with longer-duration, more visible future cash flow generation profiles. While industrial companies comprised the biggest overweight, few of the holdings were traditional deep cyclical manufacturers. Rather, the exposure was tilted towards long contract industrial service names like Elis (contract supplier of linen to hospitality trade, France) and Fujitec (elevator manufacturing and contract maintenance, Japan), and ‘utility-like’ companies such as Vinci (contractor and toll road operator, France). This exposure has remained broadly unchanged over the period.
Offsetting this industrials overweight were underweight positions in other cyclical sectors: materials, consumer discretionary and financials. The consumer discretionary position was the only one to change meaningfully over the period, as the sector proved to be fertile ground for stock selection. Key new additions included Vivendi (broadcast and online media, France) and JD.com (online retailer, China), and Japanese companies ABC-Mart (shoe retailer), NGK Sparkplug (auto parts), Rakuten (online retailer) and Sony (consumer electronics and media). The Fund ended the period with an overweight to the consumer discretionary sector.
Other important overweights maintained through the period were in IT and tele-coms, while positioning in the health care sector moved from neutral to overweight thanks to outperformance, and the addition of Grifols (blood products, Spain), Hoya (ophthalmic glass, Japan) and Teva (generic pharmaceuticals, Israel). The underweight in financials increased through the period as a number of holdings, particularly banks, either achieved our assessment of their intrinsic value, or had their investment case revised down, and were sold.
86
AMG Managers Pictet International Fund
Portfolio Manager’s Comments (continued)
At a regional level, the balance of stock-level activity reduced an initially underweight position in Japan closer to neutral and reduced the overweight position in the Pacific ex-Japan. Exposure to Europe fell modestly to leave the Fund a little underweight. The all-cap profile that has been a consistent feature of the Fund was maintained, although the aggregate weighting in mid- and smaller-cap companies (sub US$10 million market capitalization) fell over the period.
MARKET OUTLOOK
The result of the U.S. presidential election is another surprise for equity investors. As we write, the immediate market reaction has been somewhat benign. In the face of a steepening yield curve, this reaction suggests the result is perceived as being positive for nominal growth; at least in the short-term. If this is the case, we would expect interest rate sensitive stocks (banks) and cyclical growth sensitive companies (industrials) to continue their trend of the last few months and outperform. Defensive sectors are likely to continue to lag. We already believe that this post-Brexit shift has opened a clear valuation gap between defensive stocks we considered expensive only a few months ago, and their more cyclical counterparts. If this scenario continues to play out post-U.S. election (particularly the defensive sell off) it should begin to yield some highly attractive opportunities for stock pickers of a ‘contrarian’ persuasion.
At the time of this writing, the U.S. election has ended in favored of Donald Trump. The challenge faced by investors following Mr. Trump’s surprise victory is rather different from
that following other recent political events (Brexit, Euro crisis, etc.). Notwithstanding the early reaction of markets, we have virtually no clarity as to the future policy of the U.S. administration and its impact on the world economy and financial markets. We have campaign headlines, but little idea as to how they will translate into practical action. Away from the U.S., the next important political event is the Italian referendum on constitutional reforms. The referendum in itself doesn’t represent
a significant economic event but will allow the Italian people to serve judgment on the current government’s intention to push ahead with much needed reforms. ‘Defeat’ and the likely subsequent demise of the Italian government, could once again create a negative chain reaction across the European periphery. While at the time of writing a negative outcome seems to be partly priced in, each victory for populism /isolationism /anti-establishmentarianism (Brexit, Trump) potentially emboldens support for similar movements in other countries. Perhaps markets should be according shorter odds to ‘left field’ outcomes in Italy and in the 2017 German, French and Dutch general elections?
In the short-to-medium term, the most likely market scenario is ‘more of the same:’ a broadly sideways trend, but with considerable volatility. While recent periods have proved that this is an environment in which we can remain optimistic about both the prospects for the Fund’s holdings, and the likelihood of seizing new opportunities, we also remain wary of the increasing political risk.
FUND STRATEGY
We continue to seek to exploit market volatility, aware of the uncertain future that recent events have created. However, we believe the risks linked to the Italian referendum are partly priced in, as companies have been affected by a ‘zip code’ effect. At the same time, whilst the increased expectations of changes in monetary policy have the potential to sustain the pro-cyclical rally that we have seen, the recent sell off in defensive names has the potential to offer attractive opportunities for the long term.
Having made few significant changes to the Fund over recent quarters, it retains an underweight position in financials (banks in particular), materials and consumer staples (where valuations remain stretched), whilst remaining overweight industrials (particularly utility-like infrastructure operations with long duration assets and high cash flow visibility), and IT stocks. The Fund remains highly active
versus the benchmark with distinctive ‘growth at a reasonable price’ characteristics (active share remains close to 90%).
The views expressed represent the opinions of Pictet Asset Management Limited, as of October 31, 2016, and are not intended as a forecast or guarantee of future results and are subject to change without notice.
| 1 | Prior to October 1, 2016, the Fund was known as ASTON/Pictet International Fund. |
87
AMG Managers Pictet International Fund
Portfolio Manager’s Comments (continued)
CUMULATIVE TOTAL RETURN PERFORMANCE
The AMG Managers Pictet International Fund’s cumulative total return is based on the daily change in net asset value (NAV), and assumes that all dividends and distributions were reinvested. The chart compares a hypothetical $10,000 investment made in AMG Managers Pictet International Fund’s Class N on April 14, 2014, to a $10,000 investment made in the MSCI EAFE Index for the same time period. The graph and table do not reflect the deduction of taxes that a shareholder would pay on a Fund distribution or redemption of shares. The listed returns for the Fund are net of expenses and the returns for the index exclude expenses. Total returns would have been lower had certain expenses not been reduced.
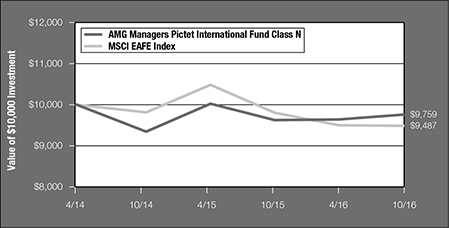
The table below shows the average annual total returns for AMG Managers Pictet International Fund and the MSCI EAFE Index for the same time periods ended October 31, 2016.
| | | | | | | | | | | | |
| Average Annual Total Returns1 | | One
Year | | | Since
Inception | | | Inception
Date | |
AMG Managers Pictet International Fund2,3,4,5,6,7 | | | | | | | | | | | | |
Class N | | | 1.42 | % | | | (0.95 | )% | | | 04/14/14 | |
Class I | | | 1.67 | % | | | (0.62 | )% | | | 04/14/14 | |
MSCI EAFE Index8 | | | (3.23 | )% | | | (2.25 | )% | | | 04/14/14 | † |
The performance data shown represents past performance. Past performance is not a guarantee of future results. Current performance may be lower or higher than the performance data quoted. The investment return and the principal value of an investment will fluctuate so that an investor’s shares, when redeemed, may be worth more or less than their original cost.
Investors should carefully consider the Fund’s investment objectives, risks, charges and expenses before investing. For performance information through the most recent month end, current net asset values per share for the Fund and other information, please call (800) 835-3879 or visit our website at www.amgfunds.com for a free prospectus. Read it carefully before investing or sending money.
Distributed by AMG Distributors, Inc., member FINRA/SIPC.
| † | Date reflects the inception date of the Fund, not the index. |
| 1 | Total return equals income yield plus share price change and assumes reinvestment of all dividends and capital gain distributions. Returns are net of fees and may reflect offsets of Fund expenses as described in the prospectus. No adjustment has been made for taxes payable by shareholders on their reinvested dividends and capital gain distributions. Returns for periods greater than one year are annualized. The listed returns on the Fund are net of expenses and based on the published NAV as of October 31, 2016. All returns are in U.S. dollars ($). |
| 2 | A short-term redemption fee of 2% will be charged on shares held for less than 90 days. |
| 3 | Investments in international securities are subject to certain risks of overseas investing including currency fluctuations and changes in political and economic conditions, which could result in significant market fluctuations. |
| 4 | The Fund is subject to the risks associated with investments in emerging markets, such as erratic earnings patterns, economic and political instability, changing exchange controls, limitations on repatriation of foreign capital and changes in local governmental attitudes toward private investment, possibly leading to nationalization or confiscation of investor assets. |
| 5 | Investing in initial public offerings (IPOs) is risky and the prices of stocks purchased in IPOs tend to fluctuate more widely than stocks of companies that have been publicly traded for a longer period of time. Stocks purchased in IPOs generally do not have a trading history, and information about the companies may be available for very limited periods. |
| 6 | The Fund is subject to risks associated with investments in mid-capitalization companies such as greater price volatility, lower trading volume, and less liquidity than the stocks of larger, more established companies. |
| 7 | The Fund is subject to risks associated with investments in small-capitalization companies, such as erratic earnings patterns, competitive conditions, limited earnings history and a reliance on one or a limited number of products. |
| 8 | The MSCI EAFE Index (Europe, Australasia, Far East) is a free float-adjusted market capitalization index that is designed to measure the equity market performance of developed markets, excluding the U.S. & Canada. The MSCI EAFE Index consists of the following 21 developed market country indices: Australia, Austria, Belgium, Denmark, Finland, France, Germany, Hong Kong, Ireland, Israel, Italy, Japan, Netherlands, New Zealand, Norway, Portugal, Singapore, Spain, Sweden, Switzerland and the United Kingdom. Unlike the Fund, the MSCI EAFE Index is unmanaged, is not available for investment and does not incur expenses. All MSCI data is provided ‘as is.’ The product described herein is not sponsored or endorsed and has not been reviewed or passed on by MSCI. In no event shall MSCI, its affiliates, or any MSCI data provider have any liability of any kind in connection with the MSCI data or the product described herein. Copying or redistributing the MSCI data is strictly prohibited. |
Not FDIC insured, nor bank guaranteed. May lose value.
88
AMG Funds
| | |
AMG Managers Pictet International Fund | | October 31, 2016 |
| |
Schedule of Investments | | |
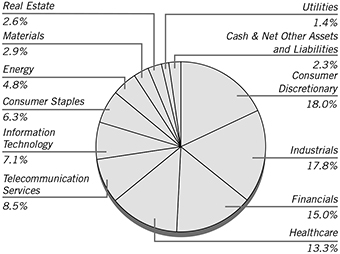
% of Net Assets
| | | | | | | | |
Shares | | | | | Market
Value | |
| COMMON STOCKS – 97.7% | | | | |
| | | | Australia – 4.2% | | | | |
| | 2,500,209 | | | Computershare, Ltd. (a) | | $ | 20,027,422 | |
| | 3,372,320 | | | Estia Health, Ltd. (a) | | | 6,870,531 | |
| | 1,416,000 | | | Oil Search, Ltd. (a) | | | 7,097,862 | |
| | 4,243,972 | | | Primary Health Care, Ltd. (a) (b) | | | 12,370,250 | |
| | 262,753 | | | REA Group, Ltd. (a) | | | 10,190,181 | |
| | | | | | | | |
| | | | | | | 56,556,246 | |
| | | | | | | | |
| | | | Belgium – 5.1% | | | | |
| | 580,962 | | | Ageas (a) | | | 21,224,636 | |
| | 284,140 | | | Anheuser-Busch InBev SA/NV | | | 32,610,832 | |
| | 447,553 | | | Ontex Group NV (a) (b) | | | 13,537,752 | |
| | | | | | | | |
| | | | | | | 67,373,220 | |
| | | | | | | | |
| | | | Bermuda – 1.1% | | | | |
| | 242,806 | | | Jardine Matheson Holdings, Ltd. | | | 14,789,313 | |
| | | | | | | | |
| | | | Cayman Islands – 6.5% | | | | |
| | 2,592,748 | | | Cheung Kong Property Holdings, Ltd. (a) | | | 19,167,313 | |
| | 3,198,748 | | | CK Hutchison Holdings, Ltd. (a) | | | 39,498,241 | |
| | 601,491 | | | JD.com, Inc., ADR * | | | 15,608,691 | |
| | 7,797,200 | | | MGM China Holdings, Ltd. (a) | | | 12,864,066 | |
| | | | | | | | |
| | | | | | | 87,138,311 | |
| | | | | | | | |
| | | | Denmark – 1.5% | | | | |
| | 302,217 | | | DSV A/S (a) | | | 14,633,309 | |
| | 306,563 | | | Matas A/S (a) (b) | | | 5,949,673 | |
| | | | | | | | |
| | | | | | | 20,582,982 | |
| | | | | | | | |
| | | | Finland – 1.8% | | | | |
| | 5,312,580 | | | Nokia OYJ (a) | | | 23,718,443 | |
| | | | | | | | |
| | | | | | | | |
Shares | | | | | Market
Value | |
| | | | France – 9.2% | | | | |
| | 23,921 | | | Bollore SA - New * (a) (b) | | $ | 78,754 | |
| | 5,863,089 | | | Bollore SA (a) (b) | | | 19,302,851 | |
| | 678,644 | | | Elis SA (a) (b) | | | 11,274,951 | |
| | 365,152 | | | Orpea (a) (b) | | | 30,391,027 | |
| | 200,787 | | | Rubis SCA (a) | | | 18,310,073 | |
| | 417,456 | | | Vinci SA (a) | | | 30,232,103 | |
| | 678,149 | | | Vivendi SA (a) | | | 13,726,171 | |
| | | | | | | | |
| | | | | | | 123,315,930 | |
| | | | | | | | |
| | | | Germany – 1.6% | | | | |
| | 125,513 | | | Linde AG (a) | | | 20,730,656 | |
| | | | | | | | |
| | | | Hong Kong - 1.0% | | | | |
| | 22,408,309 | | | PCCW, Ltd. (a) | | | 13,338,485 | |
| | | | | | | | |
| | | | Israel - 1.2% | | | | |
| | 387,768 | | | Teva Pharmaceutical Industries, Ltd., Sponsored ADR | | | 16,573,204 | |
| | | | | | | | |
| | | | Italy - 2.4% | | | | |
| | 2,007,131 | | | Banca Popolare dell’Emilia Romagna SC (a) | | | 9,431,694 | |
| | 721,553 | | | Cerved Information Solutions SpA (a) | | | 5,807,761 | |
| | 1,415,037 | | | Leonardo-Finmeccanica SpA * (a) | | | 17,230,195 | |
| | | | | | | | |
| | | | | | | 32,469,650 | |
| | | | | | | | |
| | | | Japan - 22.6% | | | | |
| | 340,800 | | | ABC-Mart, Inc. (a) | | | 20,736,644 | |
| | 690,600 | | | Bandai Namco Holdings, Inc. (a) | | | 20,687,617 | |
| | 119,000 | | | cocokara fine, Inc. (a) | | | 4,603,024 | |
| | 553,200 | | | CyberAgent, Inc. (a) | | | 16,071,888 | |
| | 725,300 | | | Fujitec Co., Ltd. (a) (b) | | | 8,297,440 | |
| | 499,800 | | | Hoya Corp. (a) | | | 20,853,653 | |
| | 1,616,500 | | | Inpex Corp. (a) | | | 15,079,954 | |
| | 851,800 | | | Japan Tobacco, Inc. (a) | | | 32,385,544 | |
| | 820,200 | | | LIXIL Group Corp. (a) | | | 18,838,612 | |
| | 285,400 | | | Miraca Holdings, Inc. (a) | | | 13,778,022 | |
| | 1,251,800 | | | NGK Spark Plug Co., Ltd. (a) | | | 24,842,395 | |
| | 1,179,000 | | | Rakuten, Inc. (a) | | | 13,592,287 | |
| | 1,459,600 | | | SKY Perfect JSAT Holdings, Inc. (a) (b) | | | 7,233,114 | |
| | 539,300 | | | SoftBank Group Corp. (a) | | | 33,965,719 | |
| | 1,059,800 | | | Sompo Japan Nipponkoa Holdings,
Inc. (a) | | | 34,291,734 | |
| | 529,200 | | | Sony Corp. (a) | | | 16,679,457 | |
| | | | | | | | |
| | | | | | | 301,937,104 | |
| | | | | | | | |
| | | | Luxembourg - 1.2% | | | | |
| | 362,000 | | | Millicom International Cellular SA, SDR (a) (b) | | | 15,905,111 | |
| | | | | | | | |
| | | | Netherlands - 6.4% | | | | |
| | 333,597 | | | ASML Holding NV (a) | | | 35,292,717 | |
| | 277,992 | | | Koninklijke DSM NV (a) | | | 17,867,879 | |
| | 1,251,826 | | | Royal Dutch Shell PLC, Class B (a) | | | 32,287,871 | |
| | | | | | | | |
| | | | | | | 85,448,467 | |
| | | | | | | | |
The accompanying notes are an integral part of these financial statements.
89
AMG Funds
| | |
| AMG Managers Pictet International Fund | | October 31, 2016 |
| |
| Schedule of Investments – continued | | |
| | | | | | |
Shares | | | | Market
Value | |
| | South Korea – 1.2% | | | | |
11,577 | | Samsung Electronics Co., Ltd. (a) | | $ | 16,558,912 | |
| | | | | | |
| | Spain – 5.4% | | | | |
4,383,420 | | Banco Bilbao Vizcaya Argentaria SA (a) | | | 31,555,013 | |
1,092,231 | | Grifols SA, ADR | | | 15,607,981 | |
1,362,927 | | Merlin Properties Socimi SA (a) | | | 15,291,809 | |
2,460,001 | | Obrascon Huarte Lain SA (a) | | | 9,860,295 | |
| | | | | | |
| | | | | 72,315,098 | |
| | | | | | |
| | Sweden – 2.3% | | | | |
1,070,432 | | Alfa Laval AB (a) | | | 15,357,141 | |
1,714,837 | | Com Hem Holding AB (a) (b) | | | 15,431,786 | |
| | | | | | |
| | | | | 30,788,927 | |
| | | | | | |
| | Switzerland – 6.2% | | | | |
370,867 | | Cie Financiere Richemont SA (a) | | | 23,843,006 | |
131,006 | | Gategroup Holding AG * (a) (b) | | | 6,890,872 | |
460,079 | | Nestle SA (a) | | | 33,362,128 | |
1,270,231 | | UBS Group AG * (a) | | | 17,958,100 | |
| | | | | | |
| | | | | 82,054,106 | |
| | | | | | |
| | United Kingdom – 16.8% | | | | |
9,943,396 | | BBA Aviation PLC (a) (b) | | | 31,441,427 | |
1,691,496 | | Enterprise Inns PLC * (a) (b) | | | 1,909,944 | |
1,914,496 | | GlaxoSmithKline PLC (a) | | | 37,819,721 | |
2,600,254 | | Informa PLC (a) | | | 21,392,632 | |
4,129,502 | | Inmarsat PLC (a) | | | 35,423,246 | |
413,799 | | LivaNova PLC * (a) | | | 23,157,150 | |
1,030,089 | | Petrofac, Ltd. (a) | | | 10,144,911 | |
1,507,920 | | Prudential PLC (a) | | | 24,607,644 | |
2,708,911 | | Saga PLC (a) | | | 6,570,755 | |
1,936,549 | | Standard Chartered PLC * (a) | | | 16,840,121 | |
4,023,372 | | William Hill PLC (a) | | | 14,554,460 | |
| | | | | | |
| | | | | 223,862,011 | |
| | | | | | |
| | Total Common Stocks
(Cost $1,278,541,613) | | | 1,305,456,176 | |
| | | | | | |
INVESTMENT COMPANY – 1.7% | | | | |
22,156,405 | | Dreyfus Government Cash Management Fund, Institutional Class Shares,
0.28%** | | | 22,156,405 | |
| | | | | | |
| | Total Investment Company
(Cost $22,156,405) | | | 22,156,405 | |
| | | | | | |
Total Investments – 99.4%
(Cost $1,300,698,018)*** | | | 1,327,612,581 | |
| | | | | | |
Net Other Assets and Liabilities – 0.6% | | | 8,568,545 | |
| | | | | | |
Net Assets – 100.0% | | $ | 1,336,181,126 | |
| | | | | | |
| * | Non-income producing security. |
| ** | Yield shown represents the October 31, 2016, seven-day average yield, which refers to the sum of the previous seven days’ dividends paid, expressed as an annual percentage. |
| *** | At October 31, 2016, the aggregate cost for Federal income tax purposes is $1,305,660,440. |
| | | | |
Gross unrealized appreciation | | $ | 85,019,691 | |
Gross unrealized depreciation | | | (63,067,550 | ) |
| | | | |
Net unrealized appreciation | | $ | 21,952,141 | |
| | | | |
| (a) | Securities with a total aggregate market value of $1,210,266,155, or 90.6% of net assets, were valued under fair value procedures established by the Fund’s Board of Trustees. |
| (b) | These securities have been determined to be illiquid securities. At October 31, 2016, these securities amounted to $180,014,952, or 13.5% of net assets. |
| | |
| ADR | | American Depositary Receipt |
| PLC | | Public Limited Company |
| SDR | | Sponsored Depositary Receipt |
The accompanying notes are an integral part of these financial statements.
90
AMG Managers Value Partners Asia Dividend Fund
Portfolio Manager’s Comments (unaudited)
MARKET REVIEW
2016 has been a year of uncertainty, as Asian ex-Japan equities started the year with a volatile first quarter, putting investors’ psychology to the test; even more so for value investors whose success relies on prices converging with long-term fundamentals. Volatility heightened further in the second quarter as the Brexit shock came at a time when the global economy was struggling with weak economic and profit growth. The extended period of uncertainty not only weighed on developing countries but also the developed world. With Asian companies reporting stronger third-quarter earnings, Asian markets, particularly Hong Kong and China, staged a rally in the third quarter. In October, Asian markets were under pressure again—the markets slid with global counterparts as opinion polls of the U.S. Presidential Election pointed to a tight race.
CHINA: SIGNS OF STABILIZATION
Amongst all major economies around the world, China is one of the very few that is still growing at a decent pace. In the 2016 annual meeting of the National People’s Congress, the government announced a growth target of 6.5% to 7% for 20161. While China’s economic growth has moderated from its peak, we don’t believe it is entering into an economic hard-landing or debt-driven crisis. In fact, economic data continued to improve during the year. Gross Domestic Product (GDP) growth in the third quarter was stable at 6.7%, in line with forecasts. Fixed-asset investments and retail sales both grew better-than-expected at 8.8% and 10.7% year-on-year (YoY) in September, respectively1. September Producer Price Index (PPI) rose 0.1% YoY, ending 54 months of PPI deflation1. Meanwhile, social stability in China remains relatively intact, and the government is carefully walking a tightrope between managing growth and pressing ahead with structural reforms. Based on the recent encouraging figures, the authorities should have no problem achieving their growth target this year.
With the Renminbi (RMB) finally joined the International Monetary Fund’s special drawing rights and the imminent launch of the Shenzhen-Hong Kong Stock Connect program expected in the fourth quarter, China’s financial reforms are on track to bring the country onto the global center stage.
Year-to-date as of September 30, the China and Hong Kong stock markets recorded US$24 billion of aggregate net inflow. The two key sources of inflows were the passive monies of Emerging Market ETFs and the southbound flows driven by the yield-chasing demand in mainland China. Active funds, which are based more on expectations towards China’s growth, have registered 13 consecutive months of outflow since July 20152. As the valuation gap between large-caps and small-caps widens, and along with the economic outlook of China stabilizing, global investors who are underweight on China, particularly on its smaller- and mid-cap names, may change course anytime and turn the tide.
SOUTH KOREA: FISCAL AND MONETARY SUPPORT AMID POLITICAL AND CORPORATE WOES
South Korea started the year with green shoots emerging. Industrial production rebounded strongly by 3.3% in February from a month earlier, marking the biggest monthly increase since late 2014. Meanwhile, Korea’s GDP rose by 0.7% in the fourth quarter of 2015, slightly faster than expected3. Responding to the prolonged export weakness and the growing pressure to ease policies, the Bank of Korea surprised the market with a rate cut in early June. The base rate was lowered by 25 basis points to a historical low level of 1.25%, marking the first rate cut in a year4.
Entering the second half of the year, volatility increased in the market because of weaker-than-expected third-quarter earnings, negative sentiment on Chinese tourist-driven names, as well as a series of corporate woes. In late October, the controversy of Korea’s President Park Geun-hye dealt the latest blow to the
export-dependent nation, plaguing its economy, which was already hit by Samsung Electronics Co.’s smartphone recall, worker strikes at Korea’s largest auto-maker and the bankruptcy of the country’s biggest shipping firm. In the third quarter of 2016, Korea’s real GDP expanded 2.7% YoY, slower than the annual growth rate of 3.3% in the second quarter but beating market expectations5. While downside risks remain, Korea has both monetary and fiscal policy tools to support growth. Fiscal stimulus is possible, as government debt stands at less than 40% of Korea’s GDP6. The stimulus package of 28 trillion Won should also help bolster domestic activities.
TAIWAN: MACRO ENVIRONMENT STRENGTHENING
The Taiwan stock market declined sharply in the early part of the first quarter amid worries on global macro situations and weak demand. The market, however, rebounded strongly and ended high towards the end of the quarter, driven by improving sentiment and strong foreign fund inflows.
In the second quarter, political uncertainties clouded Taiwan’s stock market as investors were worried that President Tsai Ing-wen may send unexpected signals in her inaugural speech that may add tension to the cross-straits relationship. Her lukewarm speech on May 20, however, showed that she struck a balance of interests between her own party and China. This was welcomed by the market and relieved political concerns. Meanwhile, the Central Bank of the Republic of China on June 30 announced to cut the discount rate by 12.5 basis points to 1.375% amid persistent global stagnation and heightened uncertainties after the “Brexit” vote.
Taiwan’s stock market extended the gain in the third quarter with five consecutive months of monthly increase since May 2016. The expectation on prolonged period of low-rate environment after Brexit referendum incentivized market sentiments. Signs of economic recovery also continued to emerge in the second
91
AMG Managers Value Partners Asia Dividend Fund
Portfolio Manager’s Comments (continued)
half of the year. In the third quarter, Taiwan’s government revised up the 2016 real GDP growth rate to 1.22% from 1.06%, after three consecutive downward revisions in the last 12 months7.
FUND PERFORMANCE REVIEW
Since its inception on December 16, 2015, AMG Managers Value Partners Asia Dividend Fund8 (the “Fund”) Class N shares delivered a return of 8.4% as of October 31, 2016, compared with the MSCI All Country Asia ex-Japan Index, which rose 12.1%.
From a bottom-up perspective, our stock picks in technology and industrial sectors contributed the most. On the technology side, our topped-up positions in a leading smartphone lens manufacturer in Taiwan generated positive relative performance for the Fund, as we had expected solid margin expansion in light of the dual cam and lens upgrade cycle for high-end smartphones. The Fund’s holdings in a Korean DRAM producer also yielded positively, bolstered by rising personal computer (PC) DRAM prices in September. Looking forward, DRAM prices are expected to climb further and favor top-line growth of the Korean DRAM producer as PC original equipment manufacturers were rushing to secure inventory for the peak season in the fourth quarter. Meanwhile, the share price of an optical fiber and cable company—another top contributor of the Fund—went up 32% in September after announcing a set strong results that beat both top-line and bottom-line estimates. The robust results and share price performance were driven by sustained growth outlook from new production capacity coming on stream and accelerating fixed broadband-related fibre and cable demand in China.
Chinese insurers were among the Fund’s key detractors during the period. As Chinese insurers were generally viewed as a China A-share proxy trade, disappointing performance of China A Shares created market concerns on insurers’ investment return and put negative pressure on their share prices. The utility sector, which consists of independent power producers (IPPs), was another key performance drag
for the Fund. The IPPs suffered during the period as moderating China growth led to slower demand and literally translated to lower utilization rate for IPPs. Lastly, the Fund’s holdings in auto names suffered from market concerns on the sales of their domestic brands, which offset their respective solid sales on joint venture’s brands.
OUTLOOK
We remain constructive in Asia ex Japan, as there have been signs of improvements in earnings momentum, corporate profits and balance sheet healthiness which are crucial to drive dividend growth. Policies in the region shall remain accommodative, while fiscal spending should be supportive, particularly in China. While near-term volatility will likely remain, given the heightened uncertainties under the new U.S. political landscape post Trump’s presidential victory, this may generate renewed investment opportunities for the region which showcases stronger economic stability relative to other parts of the world.
VALUE PARTNERS HONG KONG LIMITED NOVEMBER 21, 2016
The views expressed represent the opinions of Value Partners Hong Kong Limited, as of October 31, 2016, and are not intended as a forecast or guarantee of future results and are subject to change without notice.
| 1 | National Bureau of Statistics of China |
| 3 | Statistics Korea interest |
| 6 | Ministry of Strategy and Finance, South Korea |
| 8 | Prior to October 1, 2016, the Fund was named ASTON/ Value Partners Asia Dividend Fund |
.
92
AMG Managers Value Partners Asia Dividend Fund
Portfolio Manager’s Comments (continued)
CUMULATIVE TOTAL RETURN PERFORMANCE
The AMG Managers Value Partners Asia Dividend Fund’s cumulative total return is based on the daily change in net asset value (NAV), and assumes that all dividends and distributions were reinvested. The chart compares a hypothetical $10,000 investment made in AMG Managers Value Partners Asia Dividend Fund’s Class N on December 16, 2015, to a $10,000 investment made in the MSCI All Country Asia Ex-Japan Index for the same time period. The graph and table do not reflect the deduction of taxes that a shareholder would pay on a Fund distribution or redemption of shares. The listed returns for the Fund are net of expenses and the returns for the index exclude expenses. Total returns would have been lower had certain expenses not been reduced.
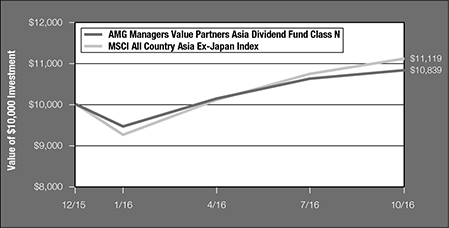
The table below shows the average annual total returns for AMG Managers Value Partners Asia Dividend Fund and the MSCI All Country Asia Ex-Japan Index for the same time periods ended October 31, 2016.
| | | | | | | | |
| | | Since | | | Inception | |
| Average Annual Total Returns1 | | Inception | | | Date | |
AMG Managers Value Partners Asia Dividend Fund2,3,4,5,6,7,8,9,10,11,12 | | | | | | | | |
Class N | | | 8.39 | % | | | 12/16/15 | |
Class I | | | 8.60 | % | | | 12/16/15 | |
MSCI All Country Asia Ex-Japan Index13 | | | 12.12 | % | | | 12/16/15 | † |
The performance data shown represents past performance. Past performance is not a guarantee of future results. Current performance may be lower or higher than the performance data quoted. The investment return and the principal value of an investment will fluctuate so that an investor’s shares, when redeemed, may be worth more or less than their original cost.
Investors should carefully consider the Fund’s investment objectives, risks, charges and expenses before investing. For performance information through the most recent month end, current net asset values per share for the Fund and other information, please call (800) 835-3879 or visit our website at www.amgfunds.com for a free prospectus. Read it carefully before investing or sending money.
Distributed by AMG Distributors, Inc., member FINRA/SIPC.
| † | Date reflects the inception date of the Fund, not the index. |
| 1 | Total return equals income yield plus share price change and assumes reinvestment of all dividends and capital gain distributions. Returns are net of fees and may reflect offsets of Fund expenses as described in the prospectus. No adjustment has been made for taxes payable by shareholders on their reinvested dividends and capital gain distributions. Returns for periods greater than one year are annualized. The listed returns on the Fund are net of expenses and based on the published NAV as of October 31, 2016. All returns are in U.S. dollars ($). |
| 2 | The Fund is subject to the risks associated with investments in debt securities, such as default risk and fluctuations in the perception of the debtor’s ability to pay its creditors. Changing interest rates may adversely affect the value of an investment. An increase in interest rates typically causes the value of bonds and other fixed income securities to fall. |
| 3 | The Fund may invest in derivatives such as options and futures; the complexity and rapidly changing structure of derivatives markets may increase the possibility of market losses. |
| 4 | A short-term redemption fee of 2% will be charged on shares held for less than 90 days. |
| 5 | Investments in international securities are subject to certain risks of overseas investing including currency fluctuations and changes in political and economic conditions, which could result in significant market fluctuations. These risks are magnified in emerging markets. |
| 6 | High-yield bonds (also known as “junk bonds”) may be subject to greater levels of interest rate, credit, and liquidity risk than investments in higher rated securities. These securities are considered predominantly speculative with respect to the issuer’s continuing ability to make principal and interest payments. The issuers of the Fund’s holdings may be involved in bankruptcy proceedings, reorganizations, or financial restructurings, and are not as strong financially as higher-rated issuers. |
93
AMG Managers Value Partners Asia Dividend Fund
Portfolio Manager’s Comments (continued)
| 7 | The Fund is subject to the risks associated with investments in emerging markets, such as erratic earnings patterns, economic and political instability, changing exchange controls, limitations on repatriation of foreign capital and changes in local governmental attitudes toward private investment, possibly leading to nationalization or confiscation of investor assets. |
| 8 | The Fund is subject to risks associated with investments in mid-capitalization companies such as greater price volatility, lower trading volume, and less liquidity than the stocks of larger, more established companies. |
| 9 | The Fund is subject to special risk considerations similar to those associated with the direct ownership of real estate. Real estate valuations may be subject to factors such as changing general and local economic, financial, competitive, and environmental conditions. |
| 10 | The Fund may suffer significant losses on assets that it sells short. Unlike the possible loss on a security that is purchased, there is no limit on the amount of loss on an appreciating security that is sold short. |
| 11 | The Fund is subject to risks associated with investments in small-capitalization companies, such as erratic earnings patterns, competitive conditions, limited earnings history and a reliance on one or a limited number of products. |
| 12 | The Fund invests in value stocks, which may perform differently from the market as a whole and may be undervalued by the market for a long period of time. |
| 13 | The MSCI All Country (AC) Asia ex-Japan Index captures large- and mid-cap representation across 2 of 3 Developed Markets countries (excluding Japan) and eight (8) Emerging Markets countries in Asia. With 625 constituents, the index covers approximately 85% of the free float-adjusted market capitalization in each country. Developed Markets countries in the index include: Hong Kong and Singapore. Emerging Markets countries include: China, India, Indonesia, Korea, Malaysia, the Philippines, Taiwan and Thailand. Unlike the Fund, the MSCI All Country (AC) Asia ex-Japan Index is unmanaged, is not available for investment and does not incur expenses. All MSCI data is provided ‘as is.’ The product described herein is not sponsored or |
| | endorsed and has not been reviewed or passed on by MSCI. In no event shall MSCI, its affiliates, or any MSCI data provider have any liability of any kind in connection with the MSCI data or the product described herein. Copying or redistributing the MSCI data is strictly prohibited. |
Not FDIC insured, nor bank guaranteed. May lose value.
94
AMG Funds
| | |
| AMG Managers Value Partners Asia Dividend Fund | | October 31, 2016 |
| |
| Schedule of Investments | | |
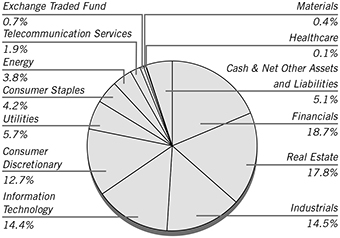
% of Net Assets
| | | | | | | | |
Shares | | | | | Market
Value | |
| COMMON STOCKS – 83.4% | | | | |
| | | | China – 37.7% | | | | |
| | 97,000 | | | Agricultural Bank of China, Ltd., Class H (a) | | $ | 40,805 | |
| | 121,000 | | | Belle International Holdings, Ltd. (a) | | | 73,070 | |
| | 382,000 | | | China Construction Bank Corp., Class H (a) | | | 278,954 | |
| | 65,000 | | | China Life Insurance Co., Ltd., Class H (a) | | | 160,923 | |
| | 147,000 | | | China Lilang, Ltd. (a) | | | 82,815 | |
| | 95,000 | | | China Machinery Engineering Corp., Class H (a) | | | 56,684 | |
| | 84,000 | | | China Overseas Land & Investment, Ltd. (a) | | | 257,871 | |
| | 302,000 | | | China Power International Development, Ltd. (a) | | | 109,821 | |
| | 70,000 | | | China Resources Power Holdings Co., Ltd. (a) | | | 118,605 | |
| | 126,000 | | | China State Construction International Holdings, Ltd. (a) | | | 183,815 | |
| | 87,963 | | | Chongqing Changan Automobile Co., Ltd., Class B (a) | | | 134,119 | |
| | 306,000 | | | CIFI Holdings Group Co., Ltd. (a) | | | 90,018 | |
| | 289,512 | | | Far East Consortium International, Ltd. (a) | | | 118,507 | |
| | 102,000 | | | Goldpac Group, Ltd. (a) | | | 30,217 | |
| | 15,000 | | | Haitian International Holdings, Ltd. (a) | | | 30,921 | |
| | 66,500 | | | Intime Retail Group Co., Ltd. (a) | | | 52,072 | |
| | 386,000 | | | Jiangnan Group, Ltd. (a) | | | 63,615 | |
| | 170,500 | | | Longfor Properties Co., Ltd. (a) | | | 226,301 | |
| | 418,000 | | | PetroChina Co., Ltd., Class H (a) | | | 286,010 | |
| | 189,000 | | | Qingdao Port International Co., Ltd., Class H (a) | | | 115,046 | |
| | 125,000 | | | Sinopec Engineering Group Co., Ltd., Class H (a) | | | 110,356 | |
| | 140,000 | | | SITC International Holdings Co., Ltd. (a) | | | 82,787 | |
| | 106,000 | | | Springland International Holdings, Ltd. (a) | | | 16,400 | |
| | | | | | | | |
Shares | | | | | Market
Value | |
| | | | China (continued) | | | | |
| | 54,800 | | | Xinjiang Goldwind Science & Technology Co., Ltd., Class H (a) | | $ | 75,550 | |
| | 71,500 | | | Yangtze Optical Fibre and Cable Joint Stock Co., Ltd., Class H (a) | | | 139,260 | |
| | 80,700 | | | Yangzijiang Shipbuilding Holdings, Ltd. (a) | | | 43,143 | |
| | 62,000 | | | Zhejiang Expressway Co., Ltd., Class H (a) | | | 64,911 | |
| | 513 | | | ZTO Express Cayman Inc. * | | | 8,685 | |
| | | | | | | | |
| | | | | | | 3,051,281 | |
| | | | | | | | |
| | | | Hong Kong – 16.1% | | | | |
| | 32,500 | | | BOC Hong Kong Holdings, Ltd. (a) | | | 115,838 | |
| | 8,000 | | | Cheung Kong Property Holdings, Ltd. (a) | | | 59,141 | |
| | 22,000 | | | Chow Sang Sang Holdings International, Ltd. (a) | | | 38,842 | |
| | 7,500 | | | CK Hutchison Holdings, Ltd. (a) | | | 92,610 | |
| | 30,000 | | | Convenience Retail Asia, Ltd. (a) | | | 16,011 | |
| | 1,170,000 | | | CSI Properties, Ltd. (a) | | | 42,090 | |
| | 188,000 | | | EGL Holdings Co., Ltd. (a) | | | 33,635 | |
| | 188,000 | | | Far East Horizon, Ltd. (a) | | | 171,235 | |
| | 159,000 | | | FSE Engineering Holdings, Ltd. | | | 51,254 | |
| | 60,000 | | | Hui Xian Real Estate Investment Trust, REIT (a) | | | 28,357 | |
| | 116,000 | | | Hutchison Telecommunications Hong Kong Holdings, Ltd. (a) | | | 37,359 | |
| | 14,000 | | | IT, Ltd. (a) | | | 5,155 | |
| | 115,000 | | | Langham Hospitality Investments, Ltd, REIT | | | 45,968 | |
| | 98,000 | | | Lee & Man Chemical Co., Ltd. | | | 30,706 | |
| | 126,000 | | | Nameson Holdings, Ltd. * (a) | | | 26,136 | |
| | 451,049 | | | Oi Wah Pawnshop Credit Holdings, Ltd. (a) | | | 31,923 | |
| | 66,000 | | | Pico Far East Holdings, Ltd. (a) | | | 20,076 | |
| | 68,000 | | | Shimao Property Holdings, Ltd. (a) | | | 90,705 | |
| | 216,000 | | | Skyworth Digital Holdings, Ltd. (a) | | | 139,422 | |
| | 47,000 | | | SmarTone Telecommunications Holdings, Ltd. (a) | | | 70,948 | |
| | 166,000 | | | TK Group Holdings, Ltd. (a) | | | 44,959 | |
| | 114,000 | | | Wasion Group Holdings, Ltd. (a) | | | 66,992 | |
| | 152,000 | | | Wonderful Sky Financial Group Holdings, Ltd. (a) | | | 45,572 | |
| | | | | | | | |
| | | | | | | 1,304,934 | |
| | | | | | | | |
| | | | Indonesia – 2.8% | | | | |
| | 59,600 | | | Bank Mandiri Persero (a) | | | 52,499 | |
| | 430,400 | | | Bank Pan Indonesia * (a) | | | 26,371 | |
| | 89,800 | | | Indosat* | | | 45,423 | |
| | 161,800 | | | Media Nusantara Citra (a) | | | 26,025 | |
| | 1,474,600 | | | Panin Financial * (a) | | | 21,584 | |
| | 279,100 | | | Perusahaan Gas Negara Persero (a) | | | 54,670 | |
| | | | | | | | |
| | | | | | | 226,572 | |
| | | | | | | | |
| | | | Japan – 0.4% | | | | |
| | 1,100 | | | Japan Airlines Co., Ltd. (a) | | | 32,463 | |
| | | | | | | | |
| | | | Malaysia – 2.2% | | | | |
| | 36,200 | | | CIMB Group Holdings (a) | | | 43,367 | |
| | 112,000 | | | Mah Sing Group | | | 40,849 | |
| | 11,900 | | | Tenaga Nasional | | | 40,678 | |
| | 50,600 | | | UOA Development (a) | | | 31,033 | |
| | 25,200 | | | ViTrox Corp. | | | 22,407 | |
| | | | | | | | |
| | | | | | | 178,334 | |
| | | | | | | | |
The accompanying notes are an integral part of these financial statements.
95
AMG Funds
| | |
| AMG Managers Value Partners Asia Dividend Fund | | October 31, 2016 |
| |
| Schedule of Investments – continued | | |
| | | | | | | | |
Shares | | | | | Market
Value | |
| | | | Philippines – 0.4% | | | | |
| | 19,200 | | | Metropolitan Bank & Trust Co. (a) | | $ | 32,244 | |
| | | | | | | | |
| | | | Singapore – 5.8% | | | | |
| | 83,600 | | | AIMS AMP Capital Industrial, REIT | | | 82,924 | |
| | 62,900 | | | Asian Pay Television Trust, REIT (a) | | | 23,274 | |
| | 37,362 | | | CapitaLand Retail China Trust, REIT (a) | | | 40,212 | |
| | 143,783 | | | Croesus Retail Trust, REIT (a) | | | 88,906 | |
| | 9,479 | | | DBS Group Holdings, Ltd. (a) | | | 102,170 | |
| | 83,200 | | | Ezion Holdings, Ltd. * (a) | | | 17,826 | |
| | 40,172 | | | Frasers Commercial Trust, REIT (a) | | | 39,391 | |
| | 259,300 | | | IPS Securex Holdings, Ltd. | | | 32,057 | |
| | 73,200 | | | Viva Industrial Trust, REIT | | | 42,092 | |
| | | | | | | | |
| | | | | | | 468,852 | |
| | | | | | | | |
| | | | South Korea – 10.8% | | | | |
| | 2,523 | | | Dongbu Insurance Co., Ltd. (a) | | | 156,510 | |
| | 339 | | | Fila Korea Ltd. (a) | | | 25,826 | |
| | 3,442 | | | GS Retail Co., Ltd. (a) | | | 146,608 | |
| | 2,255 | | | KB Financial Group, Inc. (a) | | | 83,473 | |
| | 2,365 | | | Korea Electric Power Corp. (a) | | | 102,311 | |
| | 4,855 | | | Macquarie Korea Infrastructure Fund | | | 37,380 | |
| | 908 | | | Maeil Dairy Industry Co., Ltd. (a) | | | 26,865 | |
| | 674 | | | Nong Woo Bio Co., Ltd. * (a) | | | 12,322 | |
| | 85 | | | Samsung Biologics Co. Ltd. * (a) | | | 10,103 | |
| | 1,620 | | | Sekonix Co., Ltd. (a) | | | 18,179 | |
| | 7,060 | | | SK Hynix, Inc. (a) | | | 252,512 | |
| | | | | | | | |
| | | | | | | 872,089 | |
| | | | | | | | |
| | | | Taiwan – 4.8% | | | | |
| | 12,000 | | | Basso Industry Corp. (a) | | | 32,272 | |
| | 5,000 | | | Kerry TJ Logistics Co. Ltd. (a) | | | 6,558 | |
| | 2,000 | | | Largan Precision Co., Ltd. (a) | | | 235,950 | |
| | 59,000 | | | Mega Financial Holding Co., Ltd. (a) | | | 40,337 | |
| | 4,000 | | | Rechi Precision Co., Ltd. (a) | | | 4,560 | |
| | 22,932 | | | Win Semiconductors Corp. (a) (b) | | | 63,685 | |
| | | | | | | | |
| | | | | | | 383,362 | |
| | | | | | | | |
| | | | Thailand – 2.2% | | | | |
| | 222,000 | | | AP Thailand PCL (a) | | | 44,965 | |
| | 18,100 | | | Banpu Power PCL * (a) | | | 14,610 | |
| | 40,700 | | | Hana Microelectronics PCL (a) | | | 37,169 | |
| | 29,500 | | | SPCG PCL (a) | | | 17,176 | |
| | 96,300 | | | Supalai PCL (a) | | | 67,109 | |
| | | | | | | | |
| | | | | | | 181,029 | |
| | | | | | | | |
| | | | United States – 0.2% | | | | |
| | 500 | | | Yum China Holdings Inc. * | | | 12,120 | |
| | | | | | | | |
| | | | Total Common Stocks
(Cost $6,611,255) | | | 6,743,280 | |
| | | | | | | | |
| PREFERRED STOCKS – 7.8% | | | | |
| | | | South Korea – 7.8% | | | | |
| | 485 | | | Amorepacific Corp. (a) | | | 84,658 | |
| | 427 | | | Amorepacific Group (a) | | | 24,343 | |
| | 217 | | | CJ CheilJedang Corp. (a) | | | 33,331 | |
| | 3,069 | | | LG Corp. (a) | | | 105,668 | |
| | 233 | | | Samsung Electronics Co., Ltd. (a) | | | 267,897 | |
| | | | | | |
Shares | | | | Market
Value | |
| | South Korea (continued) | | | | |
715 | | Samsung Fire & Marine Insurance Co., Ltd. (a) | | $ | 117,926 | |
| | | | | | |
| | | | | 633,823 | |
| | | | | | |
| | Total Preferred Stocks
(Cost $632,507) | | | 633,823 | |
| | | | | | |
PARTICIPATION NOTES – 3.0% | | | | |
| | China – 3.0% | | | | |
20,300 | | Gree Electric Appliances, Expiring 12/02/16 (BNP Paribas) * (a) (b) | | | 67,159 | |
10,850 | | Midea Group Co., Ltd., Expiring 05/08/18 (HSBC Bank) * (a) | | | 43,451 | |
33,500 | | Midea Group Co., Ltd., Expiring 09/23/23 (HSBC Bank) * (a) | | | 134,157 | |
| | | | | | |
| | | | | 244,767 | |
| | | | | | |
| | Total Participation Notes
(Cost $207,267) | | | 244,767 | |
| | | | | | |
WARRANTS – 0.0%# | | | | |
| | Singapore – 0.0% | | | | |
18,520 | | Ezion Holdings, Ltd., Expiring 04/24/20* | | | 879 | |
| | | | | | |
| | | | | 879 | |
| | | | | | |
| | Total Warrants
(Cost $0) | | | 879 | |
| | | | | | |
EXCHANGE TRADED FUND – 0.7% | | | | |
| | United States – 0.7% | | | | |
2,000 | | iShares MSCI India | | | 58,080 | |
| | | | | | |
| | Total Exchange Traded Fund
(Cost $58,426) | | | 58,080 | |
| | | | | | |
INVESTMENT COMPANY – 1.7% | | | | |
133,233 | | Dreyfus Government Cash Management Fund, Institutional Class Shares, 0.28%** | | | 133,233 | |
| | | | | | |
| | Total Investment Company
(Cost $133,233) | | | 133,233 | |
| | | | | | |
Total Investments – 96.6%
(Cost $7,642,688)*** | | | 7,814,062 | |
| | | | | | |
Net Other Assets and Liabilities – 3.4% | | | 276,819 | |
| | | | | | |
Net Assets – 100.0% | | $ | 8,090,881 | |
| | | | | | |
| * | Non-income producing security. |
| ** | Yield shown represents the October 31, 2016, seven-day average yield, which refers to the sum of the previous seven days’ dividends paid, expressed as an annual percentage. |
| *** | At October 31, 2016, the aggregate cost for Federal income tax purposes is $7,662,340. |
| | | | |
Gross unrealized appreciation | | $ | 599,041 | |
Gross unrealized depreciation | | | (447,319 | ) |
| | | | |
Net unrealized appreciation | | $ | 151,722 | |
| | | | |
| (a) | Securities with a total aggregate market value of $7,129,327, or 88.1% of net assets, were valued under fair value procedures established by the Fund’s Board of Trustees. |
| (b) | This security has been determined to be illiquid securities. At October 31, 2016, these securities amounted to $130,844, or 1.6% of net assets. |
| | |
MSCI | | Morgan Stanley Capital International |
PCL | | Public Company Limited |
REIT | | Real Estate Investment Trust |
The accompanying notes are an integral part of these financial statements.
96
AMG Managers Montag & Caldwell Balanced Fund
Portfolio Manager’s Comments (unaudited)
For the fiscal year ended October 31, 2016, the AMG Managers Montag & Caldwell Balanced Fund1 (the “Fund”) Class N shares returned (0.28)%, compared to the 4.94% return for its benchmark, which is 60% S&P 500 Index and 40% Bloomberg Barclays U.S. Government Credit Bond Index. The Fund seeks high-quality growth stocks at attractive valuations, coupled with a core bond portfolio that aims to maximize total return and minimize volatility. Typically, 50% to 70% of assets are devoted to stocks and at least 25% to fixed income.
MARKET ENVIRONMENT
Stocks were generally positive for the year ended October 31, 2016, without a significant bias in market capitalization. The Russell 1000® (large-cap) Index was up 4.26%, the Russell Midcap® Index (mid-cap) was up 4.17% and the Russell 2000® Index (small-cap) was up 4.11%. There was, however, a significant headwind to growth, as value outperformed growth in each size segment, but particularly in the small-cap space. The Russell 2000® Value Index (small-cap value) was up 8.81% vs. a -0.49% return for the Russell 2000® Growth Index (small-cap growth). The spread of value over growth was similar in the mid-cap space and, although not as pronounced, in the large-cap space where the Russell 1000® Value Index (large-cap value) was up 6.37% vs. a 2.28% return for the Russell 1000® Growth Index (large-cap growth).
Performance in the bond market was mixed during the period. Yields on Treasury bonds maturing in two years or less rose as the U.S. Federal Reserve (the Fed) raised the Fed Funds target for the first time in nearly a decade in December 2015, and signaled its intent to continue to raise rates at a gradual pace. The yield curve flattened during the period, with longer maturity Treasury bonds experiencing a decrease in yields, largely driven by low-to-negative yields in other developed markets as foreign central banks adopted negative interest-rate policies. This resulted in long maturity bonds significantly outperforming, with a total return of 9.7% for the 30-year Treasury
compared to just a 0.7% return for the two-year Treasury. The yield differential between corporate and Treasury bonds narrowed in the period, leading corporate bonds to outperform, with lower-quality bonds outperforming as investors continued to seek out incremental yield in a low-interest-rate environment. BBB-rated corporate bonds gained 8.2% for the period, compared to the 5.4% gain for bonds rated AA2.
PERFORMANCE REVIEW
The Fund declined (0.28)% vs. a 4.94% increase for the benchmark, which is comprised of 60% S&P 500 Index and 40% Bloomberg Barclays Government Credit Bond Index. The equity markets ended the last quarter of 2015 with increased levels of volatility that accomplished very little in terms of improving overall market valuations. The volatility continued into the start of 2016 with a big draw down. During this market decline, the Fund held up much better than the benchmark and peer group. However, this was short lived as the market bounced back during the second half of the first quarter. This was one of the largest intra-quarter reversals in market history. Unfortunately, while the market recovered, fundamentals continued to deteriorate (S&P 500 Index rallied while earnings estimates for 2016 declined—causing market price to earnings multiples to expand further). Again, market volatility failed to make progress on valuation and the Fund underperformed.
From the February lows through the end of the second quarter, bond yields fell in anticipation of further economic weakness and the now predictable response of central banks extending support to the market by injecting additional liquidity and suppressing interest rates. The leg down in bond yields contributed to significant outperformance in the equity markets by the bond proxies (utilities, telecom and REITs) as investors sought out high and stable dividend yields as a substitute for bonds in an income-starved world. As a result, investors rotated into high-quality large-cap value stocks that offered above average yields. Furthermore, given that
the Fund’s consumer staples exposure, generally speaking, is oriented toward higher-growth rather than higher-yield names, its exposure didn’t participate to the degree that the Russell 1000® Growth Index did.
The stock market continued its post-Brexit rally in July, hitting new all-time highs before settling into a mostly calm, sideways trading pattern through August, after central bankers promised additional support in response to any dislocations caused by the decision of U.K. voters to leave the European Union. September ushered in a minor bout of volatility, with stocks dipping about 3% on fears that central banks might begin to withdraw monetary stimulus, before rebounding into quarter-end when those fears proved premature. Generally speaking, the Fund has been disadvantaged in this environment by a mix of high beta, lower-quality, and smaller-cap cyclical bias in the market. Most of the names that benefited from this theme did not fit within our investment discipline.
The equities in the Fund held up better than the benchmark and peer group as the markets sold off in October. Investors grappled with high valuations, a volatile political environment, mixed economic data and an uncertain earnings outlook.
The fixed-income portion of the Fund rose just over 4% during the period, lagging the 4.84% return for the Bloomberg Barclays U.S. Government Credit Bond Index. The Fund benefited from its overweight position to corporate bonds, but results lagged because the Fund did not own bonds rated BBB, and due to an underweight position in long-maturity corporate bonds, which gained 12.5% compared to intermediate corporate bonds, which gained 2.0%3.
OUTLOOK
After moderate gains in the third quarter, the stock market advance may pause as investors discount various economic and political uncertainties, particularly with stock market median valuations near or at all-time highs. The median price-to-earnings valuation ratio for the S&P 500
97
AMG Managers Montag & Caldwell Balanced Fund
Portfolio Manager’s Comments (continued)
is higher than 90% of all historical periods going back to 1984, while the price-to-sales ratio is at a record high for the same time period3. With economic data clearly turning mixed, national election uncertainties on the horizon and the Fed signaling a desire to raise interest rates in December into what appears to be slowing growth, investors may hesitate at these unusually high valuation levels. Unprecedented Central Bank policies and historically-low interest rates will likely continue to support these unusually high valuations and, with recession risk still low, downside market risk should also be limited.
We expect Treasury yields to remain range-bound at current low levels, as any increases in Treasury yields will be constrained by the fact that U.S. yields remain attractive relative to other developed sovereign bonds. Investors remain starved for yield, which should continue to benefit corporate bonds. Accordingly, we remain cautiously-positioned for interest rate risk by maintaining duration in the Fund’s bond portfolio that is shorter than the benchmark, while favoring high-quality corporate bonds.
In the low growth, low inflation and low interest rate world that is likely to persist longer term, we believe the Fund’s holdings are well-positioned to provide attractive investment returns. These holdings are, in our opinion, attractively valued and, due to their financial strength and global diversification, their earnings growth is more assured in what is likely to be a slow and uneven global economy.
The views expressed represent the opinions of Montag & Caldwell LLC, as of October 31, 2016, and are not intended as a forecast or guarantee of future results and are subject to change without notice.
| 1 | Prior to October 1, 2016, the Fund was known as ASTON/Montag & Caldwell Balanced Fund. |
| 3 | Standard & Poors, FactSet |
98
AMG Managers Montag & Caldwell Balanced Fund
Portfolio Manager’s Comments (continued)
CUMULATIVE TOTAL RETURN PERFORMANCE
The AMG Managers Montag & Caldwell Balanced Fund’s cumulative total return is based on the daily change in net asset value (NAV), and assumes that all dividends and distributions were reinvested. The chart compares a hypothetical $10,000 investment made in AMG Managers Montag & Caldwell Balanced Fund’s Class N on October 31, 2006, to a $10,000 investment made in the 60% S&P 500 Index/40% Bloomberg Barclays U.S. Government Credit Bond Index, S&P 500 Index and Bloomberg Barclays U.S. Government Credit Bond Index for the same time period. The graph and table do not reflect the deduction of taxes that a shareholder would pay on a Fund distribution or redemption of shares. The listed returns for the Fund are net of expenses and the returns for the index exclude expenses. Total returns would have been lower had certain expenses not been reduced.
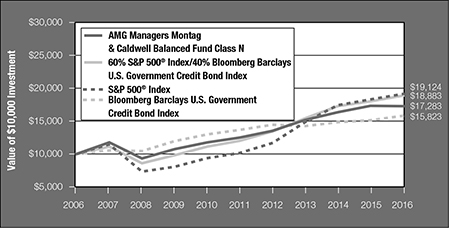
The table below shows the average annual total returns for AMG Managers Montag & Cald-well Balanced Fund, the 60% S&P 500 Index/40% Bloomberg Barclays U.S. Government Credit Bond Index, S&P 500 Index and Bloomberg Barclays U.S. Government Credit Bond Index for the same time periods ended October 31, 2016.
| | | | | | | | | | | | |
| | | One | | | Five | | | Ten | |
| Average Annual Total Returns1 | | Year | | | Years | | | Years | |
AMG Managers Montag & Caldwell Balanced Fund2,3,4,5,6 | | | | | | | | | | | | |
Class N | | | (0.28 | )% | | | 6.72 | % | | | 5.62 | % |
Class I | | | (0.19 | )% | | | 6.83 | % | | | 5.77 | % |
60% S&P 500 Index/40% Bloomberg Barclays U.S. Government Credit Bond Index7 | | | 4.94 | % | | | 9.52 | % | | | 6.56 | % |
S&P 500 Index7 | | | 4.51 | % | | | 13.57 | % | | | 6.70 | % |
Bloomberg Barclays U.S. Government Credit Bond Index7 | | | 4.84 | % | | | 3.01 | % | | | 4.70 | % |
The performance data shown represents past performance. Past performance is not a guarantee of future results. Current performance may be lower or higher than the performance data quoted. The investment return and the principal value of an investment will fluctuate so that an investor’s shares, when redeemed, may be worth more or less than their original cost.
Investors should carefully consider the Fund’s investment objectives, risks, charges and expenses before investing. For performance information through the most recent month end, current net asset values per share for the Fund and other information, please call (800) 835-3879 or visit our website at www.amgfunds.com for a free prospectus. Read it carefully before investing or sending money.
Distributed by AMG Distributors, Inc., member FINRA/SIPC.
| 1 | Total return equals income yield plus share price change and assumes reinvestment of all dividends and capital gain distributions. Returns are net of fees and may reflect offsets of Fund expenses as |
| | described in the prospectus. No adjustment has been made for taxes payable by shareholders on their reinvested dividends and capital gain distributions. Returns for periods greater than one year are annualized. The listed returns on the Fund are net of expenses and based on the published NAV as of October 31, 2016. All returns are in U.S. dollars ($). |
| 2 | To the extent that the Fund invests in asset-backed or mortgage-backed securities, its exposure to prepayment and extension risks may be greater than investments in other fixed income securities. |
| 3 | The Fund is subject to the risks associated with investments in debt securities, such as default risk and fluctuations in the perception of the debtor’s ability to pay its creditors. Changing interest rates may adversely affect the value of an investment. An increase in interest rates typically causes the value of bonds and other fixed income securities to fall. |
| 4 | The Fund invests in growth stocks, which may be more sensitive to market movements because their prices tend to reflect future investor expectations rather than just current profits. |
| 5 | Investments in international securities are subject to certain risks of overseas investing including currency fluctuations and changes in political and economic conditions, which could result in significant market fluctuations. These risks are magnified in emerging markets. |
| 6 | Obligations of certain government agencies are not backed by the full faith and credit of the U.S. government. If one of these agencies defaulted on a loan, there is no guarantee that the U.S. government would provide financial support. Additionally, debt securities of the U.S. government may be affected by changing interest rates and subject to prepayment risk. |
| 7 | The benchmark is composed of 60% S&P 500 Index and 40% Bloomberg Barclays U.S. Government Credit Bond Index. The S&P 500 Index is a capitalization-weighted index of 500 stocks. The S&P 500 Index is designed to measure performance of the broad domestic economy through changes in the aggregate market value of 500 stocks representing all major industries. The Bloomberg Barclays U.S. Government Credit Bond Index is an Index of investment grade government and corporate bonds with a maturity date of more than one year. Effective August 24, 2016, the Barclays indices were renamed Bloomberg Barclays indices. Unlike the Fund, the indices are unmanaged, are not available for investment and do not incur expenses. |
The S&P Index is proprietary data of Standard & Poor’s, a division of McGraw-Hill Companies, Inc.
Not FDIC insured, nor bank guaranteed. May lose value.
99
AMG Funds
| | |
| AMG Managers Montag & Caldwell Balanced Fund | | October 31, 2016 |
| |
| Schedule of Investments | | |
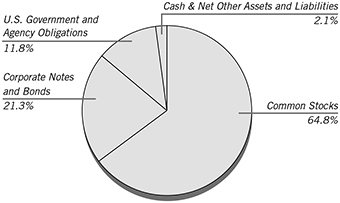
% of Net Assets
| | | | | | | | |
Shares | | | | | Market
Value | |
| COMMON STOCKS – 64.8% | | | | |
| | | | Consumer Discretionary – 6.3% | | | | |
| | 8,600 | | | Dollar Tree, Inc. * | | $ | 649,730 | |
| | 303 | | | The Priceline Group, Inc. * | | | 446,692 | |
| | 7,900 | | | Starbucks Corp. | | | 419,253 | |
| | 3,800 | | | The TJX Cos, Inc. | | | 280,250 | |
| | | | | | | | |
| | | | | | | 1,795,925 | |
| | | | | | | | |
| | | | Consumer Staples – 21.2% | | | | |
| | 10,000 | | | The Coca-Cola Co. | | | 424,000 | |
| | 3,000 | | | Colgate-Palmolive Co. | | | 214,080 | |
| | 1,618 | | | Costco Wholesale Corp. | | | 239,253 | |
| | 2,950 | | | The Estee Lauder Cos, Inc., Class A | | | 257,034 | |
| | 8,500 | | | The Kraft Heinz Co. | | | 756,075 | |
| | 17,500 | | | Mondelez International, Inc., Class A | | | 786,450 | |
| | 3,170 | | | Monster Beverage Corp. * | | | 457,558 | |
| | 8,500 | | | PepsiCo, Inc. | | | 911,200 | |
| | 6,100 | | | Philip Morris International, Inc. | | | 588,284 | |
| | 6,500 | | | The Procter & Gamble Co. | | | 564,200 | |
| | 10,100 | | | Walgreens Boots Alliance, Inc. | | | 835,573 | |
| | | | | | | | |
| | | | | | | 6,033,707 | |
| | | | | | | | |
| | | | Energy – 1.3% | | | | |
| | 4,900 | | | Occidental Petroleum Corp. | | | 357,259 | |
| | | | | | | | |
| | | | Financials – 2.0% | | | | |
| | 2,066 | | | Intercontinental Exchange, Inc. | | | 558,626 | |
| | | | | | | | |
| | | | Healthcare – 14.1% | | | | |
| | 1,507 | | | Allergan PLC (Ireland) * | | | 314,872 | |
| | 3,486 | | | Amgen, Inc. | | | 492,084 | |
| | 4,300 | | | Bristol-Myers Squibb Co. | | | 218,913 | |
| | 5,200 | | | Celgene Corp. * | | | 531,336 | |
| | 8,200 | | | Danaher Corp. | | | 644,110 | |
| | 9,100 | | | Medtronic PLC (Ireland) | | | 746,382 | |
| | 4,453 | | | Thermo Fisher Scientific, Inc. | | | 654,724 | |
| | 2,900 | | | UnitedHealth Group, Inc. | | | 409,857 | |
| | | | | | | | |
| | | | | | | 4,012,278 | |
| | | | | | | | |
| | | | | | | | |
Shares | | | | | Market
Value | |
| | | | Industrials – 3.4% | | | | |
| | 5,000 | | | Honeywell International, Inc. | | $ | 548,400 | |
| | 4,000 | | | United Parcel Service, Inc., Class B | | | 431,040 | |
| | | | | | | | |
| | | | | | | 979,440 | |
| | | | | | | | |
| | | | Information Technology – 16.5% | | | | |
| | 2,950 | | | Accenture PLC, Class A (Ireland) | | | 342,908 | |
| | 990 | | | Alphabet, Inc., Class A * | | | 801,801 | |
| | 6,000 | | | Apple, Inc. | | | 681,240 | |
| | 6,100 | | | Facebook, Inc., Class A * | | | 799,039 | |
| | 3,100 | | | Fidelity National Information Services, Inc. | | | 229,152 | |
| | 3,800 | | | MasterCard, Inc., Class A | | | 406,676 | |
| | 10,700 | | | QUALCOMM, Inc. | | | 735,304 | |
| | 8,600 | | | Visa, Inc., Class A | | | 709,586 | |
| | | | | | | | |
| | | | | | | 4,705,706 | |
| | | | | | | | |
| | | | Total Common Stocks
(Cost $17,628,409) | | | 18,442,941 | |
| | | | | | | | |
| | |
Par Value | | | | | | |
| CORPORATE NOTES AND BONDS – 21.3% | | | |
| | | | Consumer Staples – 2.6% | | | | |
| $ | 350,000 | | | PepsiCo, Inc.
Senior Unsecured Notes
5.000%, 06/01/18 | | | 371,118 | |
| | 350,000 | | | Wal-Mart Stores, Inc.
Senior Unsecured Notes
3.250%, 10/25/20 | | | 373,006 | |
| | | | | | | | |
| | | | | | | 744,124 | |
| | | | | | | | |
| | | | Energy – 1.2% | | | | |
| | 350,000 | | | Chevron Corp.
Senior Unsecured Notes
1.718%, 06/24/18 | | | 352,474 | |
| | | | Financials – 7.4% | | | | |
| | 325,000 | | | Berkshire Hathaway, Inc.
Senior Unsecured Notes
3.125%, 03/15/26 | | | 337,832 | |
| | 300,000 | | | General Electric Co.
Senior Unsecured Notes, MTN
4.375%, 09/16/20 | | | 330,008 | |
| | 325,000 | | | JPMorgan Chase & Co.
Senior Unsecured Notes
4.350%, 08/15/21 | | | 355,202 | |
| | 350,000 | | | State Street Corp.
Senior Unsecured Notes
2.550%, 08/18/20 | | | 360,716 | |
| | 350,000 | | | US Bancorp
Subordinated Notes, MTN
2.950%, 07/15/22 | | | 363,220 | |
| | 350,000 | | | Wells Fargo & Co.
Senior Unsecured Notes, MTN
2.150%, 01/30/20 | | | 352,939 | |
| | | | | | | | |
| | | | | | | 2,099,917 | |
| | | | | | | | |
The accompanying notes are an integral part of these financial statements.
100
AMG Funds
| | |
| AMG Managers Montag & Caldwell Balanced Fund | | October 31, 2016 |
| |
| Schedule of Investments – continued | | |
| | | | | | | | |
Par Value | | | | | Market
Value | |
| | | | Healthcare – 3.7% | | | | |
| | 250,000 | | | Johnson & Johnson
Senior Unsecured Notes
5.950%, 08/15/37 | | $ | 354,290 | |
| | 350,000 | | | Merck & Co., Inc.
Senior Unsecured Notes
2.350%, 02/10/22 | | | 356,654 | |
| | 350,000 | | | Pfizer, Inc.
Senior Unsecured Notes
1.100%, 05/15/17 | | | 350,475 | |
| | | | | | | | |
| | | | | | | 1,061,419 | |
| | | | | | | | |
| | | | Industrials – 1.3% | | | | |
| | 350,000 | | | United Parcel Service, Inc.
Senior Unsecured Notes
3.125%, 01/15/21 | | | 372,739 | |
| | | | | | | | |
| | | | Information Technology – 5.1% | | | | |
| | 350,000 | | | Alphabet, Inc.
Senior Unsecured Notes
3.625%, 05/19/21 | | | 382,324 | |
| | 350,000 | | | Apple, Inc.
Senior Unsecured Notes
1.000%, 05/03/18 | | | 349,616 | |
| | 350,000 | | | Oracle Corp.
Senior Unsecured Notes
2.500%, 10/15/22 | | | 356,142 | |
| | 350,000 | | | QUALCOMM, Inc.
Senior Unsecured Notes
2.250%, 05/20/20 | | | 355,967 | |
| | | | | | | | |
| | | | | | | 1,444,049 | |
| | | | | | | | |
| | | | Total Corporate Notes and Bonds
(Cost $5,962,334) | | | 6,074,722 | |
| | | | | | | | |
| U.S. GOVERNMENT AND AGENCY OBLIGATIONS – 11.8% | |
| | | | Fannie Mae – 0.1% | | | | |
| | 7,940 | | | 7.500%, 02/01/35
Pool # 787557 | | | 8,689 | |
| | 2,761 | | | 7.500%, 04/01/35
Pool # 819231 | | | 2,912 | |
| | 9,999 | | | 6.000%, 11/01/35
Pool # 844078 | | | 11,459 | |
| | | | | | | | |
| | | | | | | 23,060 | |
| | | | | | | | |
| | | | Freddie Mac – 1.0% | | | | |
| | 275,000 | | | 1.000%, 09/29/17 | | | 275,781 | |
| | 4,610 | | | 5.500%, 12/01/20
Gold Pool # G11820 | | | 4,904 | |
| | | | | | | | |
| | | | | | | 280,685 | |
| | | | | | | | |
| | | | Ginnie Mae – 0.00%# | | | | |
| | 3,740 | | | 5.500%, 02/15/39
Pool # 698060 | | | 4,241 | |
| | | | | | | | |
| | | | U.S. Treasury Bonds – 3.6% | | | | |
| | 200,000 | | | 5.375%, 02/15/31 | | | 284,289 | |
| | 425,000 | | | 3.500%, 02/15/39 | | | 506,248 | |
| | 225,000 | | | 3.125%, 11/15/41 | | | 250,550 | |
| | | | | | | | |
| | | | | | | 1,041,087 | |
| | | | | | | | |
| | | | | | |
Par Value | | | | Market
Value | |
| | U.S. Treasury Notes – 7.1% | | | | |
225,000 | | 4.625%, 02/15/17 | | $ | 227,795 | |
350,000 | | 1.000%, 12/15/17 | | | 351,059 | |
350,000 | | 1.375%, 09/30/18 | | | 353,329 | |
325,000 | | 1.500%, 01/31/19 | | | 329,228 | |
375,000 | | 2.500%, 05/15/24 | | | 397,463 | |
350,000 | | 2.125%, 05/15/25 | | | 360,083 | |
| | | | | | |
| | | | | 2,018,957 | |
| | | | | | |
| | Total U.S. Government and Agency Obligations
(Cost $3,297,334) | | | 3,368,030 | |
| | | | | | |
| | |
Shares | | | | | |
INVESTMENT COMPANY – 2.6% | | | | |
729,573 | | Dreyfus Government Cash Management | | | | |
| | Fund, Institutional Class Shares, 0.28%** | | | 729,573 | |
| | | | | | |
| | Total Investment Company
(Cost $729,573) | | | 729,573 | |
| | | | | | |
Total Investments – 100.5%
(Cost $27,617,650)*** | | | 28,615,266 | |
| | | | | | |
Net Other Assets and Liabilities – (0.5)% | | | (151,229 | ) |
| | | | | | |
Net Assets – 100.0% | | $ | 28,464,037 | |
| | | | | | |
| * | Non-income producing security. |
| ** | Yield shown represents the October 31, 2016, seven-day average yield, which refers to the sum of the previous seven days’ dividends paid, expressed as an annual percentage. |
| *** | At October 31, 2016, the aggregate cost for Federal income tax purposes is $28,008,243. |
| | | | |
Gross unrealized appreciation | | $ | 1,426,789 | |
Gross unrealized depreciation | | | (819,766 | ) |
| | | | |
Net unrealized appreciation | | $ | 607,023 | |
| | | | |
| | | | |
| | # | | | Less than 0.05% |
| | MTN | | | Medium Term Note |
| | PLC | | | Public Limited Company |
Rating (unaudited)****
| | | | |
Common Stocks | | | 66.1 | % |
U.S. Government and Agency Obligations | | | 12.1 | % |
Aaa | | | 1.3 | % |
Aa | | | 11.4 | % |
A | | | 9.1 | % |
| | | | |
| | | 100 | % |
| | | | |
**** As a percentage of market value excluding investment company.
Credit quality ratings shown above reflect the highest rating assigned by either Standard & Poor’s (“S&P”) or Moody’s Investors Service, Inc. (“Moody’s”). These rating agencies are independent, nationally recognized statistical rating organizations and are widely used. Investment grade ratings are credit ratings of BBB/Baa or higher. Below investment grade ratings are credit ratings of BB/Ba or lower. Investments designated N/R are not rated by either rating agency. Unrated investments do not necessarily indicate low credit quality. Credit quality ratings are subject to change.
The accompanying notes are an integral part of these financial statements.
101
AMG Funds
October 31, 2016
Notes to Schedule of Investments
The summary of each Fund’s investments that are measured at fair value by Level within the fair value hierarchy as of October 31, 2016 is as follows:
| | | | | | | | | | | | | | | | |
Funds | | Total
Value | | | Level 1
Quoted
Prices | | | Level 2
Significant
Observable
Inputs | | | Level 3
Significant
Unobservable
Inputs | |
AMG Managers Fairpointe Focused Equity Fund | | | | | | | | | | | | | | | | |
Assets | | | | | | | | | | | | | | | | |
Investments in Securities* | | $ | 7,152,272 | | | $ | 7,152,272 | | | $ | — | | | $ | — | |
| | | | | | | | | | | | | | | | |
AMG River Road Focused Absolute Value Fund | | | | | | | | | | | | | | | | |
Assets | | | | | | | | | | | | | | | | |
Investments in Securities* | | $ | 11,705,879 | | | $ | 11,705,879 | | | $ | — | | | $ | — | |
| | | | | | | | | | | | | | | | |
AMG Managers Montag & Caldwell Growth Fund | | | | | | | | | | | | | | | | |
Assets | | | | | | | | | | | | | | | | |
Investments in Securities* | | $ | 1,342,007,889 | | | $ | 1,342,007,889 | | | $ | — | | | $ | — | |
| | | | | | | | | | | | | | | | |
AMG River Road Dividend All Cap Value Fund | | | | | | | | | | | | | | | | |
Assets | | | | | | | | | | | | | | | | |
Investments in Securities* | | $ | 852,050,920 | | | $ | 852,050,920 | | | $ | — | | | $ | — | |
| | | | | | | | | | | | | | | | |
AMG River Road Dividend All Cap Value Fund II | | | | | | | | | | | | | | | | |
Assets | | | | | | | | | | | | | | | | |
Investments in Securities* | | $ | 117,923,790 | | | $ | 117,923,790 | | | $ | — | | | $ | — | |
| | | | | | | | | | | | | | | | |
AMG Managers Fairpointe Mid Cap Fund | | | | | | | | | | | | | | | | |
Assets | | | | | | | | | | | | | | | | |
Investments in Securities* | | $ | 3,494,952,034 | | | $ | 3,494,952,034 | | | $ | — | | | $ | — | |
| | | | | | | | | | | | | | | | |
AMG Managers Montag & Caldwell Mid Cap Growth Fund | | | | | | | | | | | | | | | | |
Assets | | | | | | | | | | | | | | | | |
Investments in Securities* | | $ | 8,107,686 | | | $ | 8,107,686 | | | $ | — | | | $ | — | |
| | | | | | | | | | | | | | | | |
AMG Managers LMCG Small Cap Growth Fund | | | | | | | | | | | | | | | | |
Assets | | | | | | | | | | | | | | | | |
Common Stocks | | | | | | | | | | | | | | | | |
Consumer Discretionary | | $ | 15,152,158 | | | $ | 15,152,158 | | | $ | — | | | $ | — | |
Consumer Staples | | | 5,194,161 | | | | 5,194,161 | | | | — | | | | — | |
Energy | | | 907,050 | | | | 907,050 | | | | — | | | | — | |
Financials | | | 4,692,621 | | | | 4,692,621 | | | | — | | | | — | |
Healthcare | | | 26,832,623 | | | | 26,832,623 | | | | — | | | | — | |
Industrials | | | 15,457,064 | | | | 15,457,064 | | | | — | | | | — | |
Information Technology | | | 31,442,427 | | | | 31,442,427 | | | | — | | | | — | |
Materials | | | 3,321,909 | | | | 3,321,909 | | | | — | | | | — | |
Real Estate | | | 5,081,985 | | | | 5,081,985 | | | | — | | | | — | |
Telecommunication Services | | | 3,032,140 | | | | 3,032,140 | | | | — | | | | — | |
| | | | | | | | | | | | | | | | |
Total Common Stocks | | | 111,114,138 | | | | 111,114,138 | | | | — | | | | — | |
Rights | | | 996 | | | | — | | | | — | | | | 996 | |
| | | | | | | | | | | | | | | | |
Total | | $ | 111,115,134 | | | $ | 111,114,138 | | | $ | — | | | $ | 996 | |
| | | | | | | | | | | | | | | | |
AMG River Road Select Value Fund | | | | | | | | | | | | | | | | |
Assets | | | | | | | | | | | | | | | | |
Investments in Securities* | | $ | 39,642,073 | | | $ | 39,642,073 | | | $ | — | | | $ | — | |
| | | | | | | | | | | | | | | | |
AMG River Road Small Cap Value Fund | | | | | | | | | | | | | | | | |
Assets | | | | | | | | | | | | | | | | |
Investments in securities* | | $ | 267,851,687 | | | $ | 267,851,687 | | | $ | — | | | $ | — | |
| | | | | | | | | | | | | | | | |
AMG Managers Silvercrest Small Cap Fund | | | | | | | | | | | | | | | | |
Assets | | | | | | | | | | | | | | | | |
Investments in Securities* | | $ | 201,202,179 | | | $ | 201,202,179 | | | $ | — | | | $ | — | |
| | | | | | | | | | | | | | | | |
AMG GW&K U.S. Small Cap Growth Fund | | | | | | | | | | | | | | | | |
Assets | | | | | | | | | | | | | | | | |
Investments in Securities* | | $ | 42,366,224 | | | $ | 42,366,224 | | | $ | — | | | $ | — | |
| | | | | | | | | | | | | | | | |
102
AMG Funds
October 31, 2016
Notes to Schedule of Investments – continued
| | | | | | | | | | | | | | | | |
Funds | | Total
Value | | | Level 1
Quoted
Prices | | | Level 2
Significant
Observable
Inputs | | | Level 3
Significant
Unobservable
Inputs | |
AMG Managers DoubleLine Core Plus Bond Fund | | | | | | | | | | | | | | | | |
Assets | | | | | | | | | | | | | | | | |
Corporate Bonds and Notes ** | | $ | 188,914,066 | | | $ | — | | | $ | 188,914,066 | | | $ | — | |
Collateralized Mortgage and Asset-Backed Securities | | | 115,815,417 | | | | — | | | | 115,815,417 | | | | — | |
U.S. Government and Agency Obligations** | | | 304,989,525 | | | | — | | | | 304,989,525 | | | | — | |
Other Mortgage and Asset-Backed Securities | | | 56,110,586 | | | | — | | | | 56,110,586 | | | | — | |
Municipal Bonds | | | 1,185,600 | | | | — | | | | 1,185,600 | | | | — | |
Foreign Government Notes and Bonds | | | 12,767,881 | | | | — | | | | 12,767,881 | | | | — | |
Common Stock | | | 8,820 | | | | 8,820 | | | | — | | | | — | |
Investment Companies* | | | 22,524,939 | | | | 22,524,939 | | | | — | | | | — | |
| | | | | | | | | | | | | | | | |
Total | | $ | 702,316,834 | | | $ | 22,533,759 | | | $ | 679,783,075 | | | $ | — | |
| | | | | | | | | | | | | | | | |
AMG Managers Anchor Capital Enhanced Equity Fund | | | | | | | | | | | | | | | | |
Assets | | | | | | | | | | | | | | | | |
Common Stocks* | | $ | 63,431,540 | | | $ | 63,431,540 | | | $ | — | | | $ | — | |
Purchased Options | | | 267,750 | | | | 267,750 | | | | — | | | | — | |
Investment Company* | | | 85,209 | | | | 85,209 | | | | — | | | | — | |
| | | | | | | | | | | | | | | | |
Total Assets | | | 63,784,499 | | | | 63,784,499 | | | | — | | | | — | |
| | | | | | | | | | | | | | | | |
Liabilities | | | | | | | | | | | | | | | | |
Written Options | | | (1,705,114 | ) | | | (1,697,114 | ) | | | (8,000 | ) | | | — | |
| | | | | | | | | | | | | | | | |
Total Liabilities | | | (1,705,114 | ) | | | (1,697,114 | ) | | | (8,000 | ) | | | — | |
| | | | | | | | | | | | | | | | |
AMG Managers Lake Partners LASSO Alternative Fund | | | | | | | | | | | | | | | | |
Assets | | | | | | | | | | | | | | | | |
Investments in Securities* | | $ | 103,030,598 | | | $ | 103,030,598 | | | $ | — | | | $ | — | |
| | | | | | | | | | | | | | | | |
AMG River Road Long-Short Fund | | | | | | | | | | | | | | | | |
Assets | | | | | | | | | | | | | | | | |
Investments in Securities* | | $ | 63,761,466 | | | $ | 63,761,466 | | | $ | — | | | $ | — | |
| | | | | | | | | | | | | | | | |
Total Assets | | | 63,761,466 | | | | 63,761,466 | | | | — | | | | — | |
| | | | | | | | | | | | | | | | |
Liabilities | | | | | | | | | | | | | | | | |
Common Stocks* | | | (13,434,215 | ) | | | (13,434,215 | ) | | | — | | | | — | |
Exchange Traded Funds | | | (832,690 | ) | | | (832,690 | ) | | | — | | | | — | |
| | | | | | | | | | | | | | | | |
Total Liabilities | | | (14,266,905 | ) | | | (14,266,905 | ) | | | — | | | | — | |
| | | | | | | | | | | | | | | | |
AMG Managers Guardian Capital Global Dividend Fund | | | | | | | | | | | | | | | | |
Assets | | | | | | | | | | | | | | | | |
Common Stocks | | | | | | | | | | | | | | | | |
Australia | | $ | 922,847 | | | $ | — | | | $ | 922,847 | | | $ | — | |
Belgium | | | 542,110 | | | | 542,110 | | | | — | | | | — | |
Bermuda | | | 278,086 | | | | 278,086 | | | | — | | | | — | |
Canada | | | 1,087,780 | | | | 1,087,780 | | | | — | | | | — | |
France | | | 1,313,557 | | | | — | | | | 1,313,557 | | | | — | |
Germany | | | 900,360 | | | | — | | | | 900,360 | | | | — | |
Ireland | | | 612,522 | | | | 612,522 | | | | — | | | | — | |
Israel | | | 366,225 | | | | 148,351 | | | | 217,874 | | | | — | |
Netherlands | | | 298,428 | | | | 298,428 | | | | — | | | | — | |
New Zealand | | | 339,021 | | | | — | | | | 339,021 | | | | — | |
Norway | | | 564,941 | | | | 564,941 | | | | — | | | | — | |
Singapore | | | 449,028 | | | | 449,028 | | | | — | | | | — | |
Spain | | | 559,884 | | | | — | | | | 559,884 | | | | — | |
Switzerland | | | 909,416 | | | | 142,466 | | | | 766,950 | | | | — | |
United Kingdom | | | 3,682,210 | | | | 998,870 | | | | 2,683,340 | | | | — | |
United States | | | 16,146,817 | | | | 16,146,817 | | | | — | | | | — | |
| | | | | | | | | | | | | | | | |
Total Common Stocks | | | 28,973,232 | | | | 21,269,399 | | | | 7,703,833 | | | | — | |
Rights | | | 9,227 | | | | 9,227 | | | | — | | | | — | |
Investment Company* | | | 8,209,984 | | | | 8,209,984 | | | | — | | | | — | |
| | | | | | | | | | | | | | | | |
Total | | $ | 37,192,443 | | | $ | 29,488,610 | | | $ | 7,703,833 | | | $ | — | |
| | | | | | | | | | | | | | | | |
103
AMG Funds
October 31, 2016
Notes to Schedule of Investments – continued
| | | | | | | | | | | | | | | | |
| | | | | | | | | Level 2 | | | Level 3 | |
| | | | | | Level 1 | | | Significant | | | Significant | |
| | | Total | | | Quoted | | | Observable | | | Unobservable | |
Funds | | Value | | | Prices | | | Inputs | | | Inputs | |
AMG Managers Pictet International Fund | | | | | | | | | | | | | | | | |
Assets | | | | | | | | | | | | | | | | |
Common Stocks | | | | | | | | | | | | | | | | |
Australia | | $ | 56,556,246 | | | $ | — | | | $ | 56,556,246 | | | $ | — | |
Belgium | | | 67,373,220 | | | | 32,610,832 | | | | 34,762,388 | | | | — | |
Bermuda | | | 14,789,313 | | | | 14,789,313 | | | | — | | | | — | |
Cayman Islands | | | 87,138,311 | | | | 15,608,691 | | | | 71,529,620 | | | | — | |
Denmark | | | 20,582,982 | | | | — | | | | 20,582,982 | | | | — | |
Finland | | | 23,718,443 | | | | — | | | | 23,718,443 | | | | — | |
France | | | 123,315,930 | | | | — | | | | 123,315,930 | | | | — | |
Germany | | | 20,730,656 | | | | — | | | | 20,730,656 | | | | — | |
Hong Kong | | | 13,338,485 | | | | — | | | | 13,338,485 | | | | — | |
Israel | | | 16,573,204 | | | | 16,573,204 | | | | — | | | | — | |
Italy | | | 32,469,650 | | | | — | | | | 32,469,650 | | | | — | |
Japan | | | 301,937,104 | | | | — | | | | 301,937,104 | | | | — | |
Luxembourg | | | 15,905,111 | | | | — | | | | 15,905,111 | | | | — | |
Netherlands | | | 85,448,467 | | | | — | | | | 85,448,467 | | | | — | |
South Korea | | | 16,558,912 | | | | — | | | | 16,558,912 | | | | — | |
Spain | | | 72,315,098 | | | | 15,607,981 | | | | 56,707,117 | | | | — | |
Sweden | | | 30,788,927 | | | | — | | | | 30,788,927 | | | | — | |
Switzerland | | | 82,054,106 | | | | — | | | | 82,054,106 | | | | — | |
United Kingdom | | | 223,862,011 | | | | — | | | | 223,862,011 | | | | — | |
| | | | | | | | | | | | | | | | |
Total Common Stocks | | | 1,305,456,176 | | | | 95,190,021 | | | | 1,210,266,155 | | | | — | |
Investment Company* | | | 22,156,405 | | | | 22,156,405 | | | | — | | | | — | |
| | | | | | | | | | | | | | | | |
Total | | $ | 1,327,612,581 | | | $ | 117,346,426 | | | $ | 1,210,266,155 | | | $ | — | |
| | | | | | | | | | | | | | | | |
AMG Managers Value Partners Asia Dividend Fund | | | | | | | | | | | | | | | | |
Assets | | | | | | | | | | | | | | | | |
Common Stocks | | | | | | | | | | | | | | | | |
China | | $ | 3,051,281 | | | $ | 8,685 | | | $ | 3,042,596 | | | $ | — | |
Hong Kong | | | 1,304,934 | | | | 127,928 | | | | 1,177,006 | | | | — | |
Indonesia | | | 226,572 | | | | 45,423 | | | | 181,149 | | | | — | |
Japan | | | 32,463 | | | | — | | | | 32,463 | | | | — | |
Malaysia | | | 178,334 | | | | 103,934 | | | | 74,400 | | | | — | |
Philippines | | | 32,244 | | | | — | | | | 32,244 | | | | — | |
Singapore | | | 468,852 | | | | 157,073 | | | | 311,779 | | | | — | |
South Korea | | | 872,089 | | | | 37,380 | | | | 834,709 | | | | — | |
Taiwan | | | 383,362 | | | | — | | | | 383,362 | | | | — | |
Thailand | | | 181,029 | | | | — | | | | 181,029 | | | | — | |
United States | | | 12,120 | | | | 12,120 | | | | — | | | | — | |
| | | | | | | | | | | | | | | | |
Total Common Stocks | | | 6,743,280 | | | | 492,543 | | | | 6,250,737 | | | | — | |
Preferred Stocks | | | | | | | | | | | | | | | | |
South Korea | | | 633,823 | | | | — | | | | 633,823 | | | | — | |
Participation Notes | | | | | | | | | | | | | | | | |
China | | | 244,767 | | | | — | | | | 244,767 | | | | — | |
Warrants | | | | | | | | | | | | | | | | |
Singapore | | | 879 | | | | 879 | | | | — | | | | — | |
Exchange Traded Fund | | | 58,080 | | | | 58,080 | | | | — | | | | — | |
Investment Company* | | | 133,233 | | | | 133,233 | | | | — | | | | — | |
| | | | | | | | | | | | | | | | |
Total | | $ | 7,814,062 | | | $ | 684,735 | | | $ | 7,129,327 | | | $ | — | |
| | | | | | | | | | | | | | | | |
AMG Managers Montag & Caldwell Balanced Fund | | | | | | | | | | | | | | | | |
Assets | | | | | | | | | | | | | | | | |
Common Stocks* | | $ | 18,442,941 | | | $ | 18,442,941 | | | $ | — | | | $ | — | |
Corporate Notes and Bonds** | | | 6,074,722 | | | | — | | | | 6,074,722 | | | | — | |
U.S. Government and Agency Obligations** | | | 3,368,030 | | | | — | | | | 3,368,030 | | | | — | |
Investment Company* | | | 729,573 | | | | 729,573 | | | | — | | | | — | |
| | | | | | | | | | | | | | | | |
Total | | $ | 28,615,266 | | | $ | 19,172,514 | | | $ | 9,442,752 | | | $ | — | |
| | | | | | | | | | | | | | | | |
| * | All Common Stocks and Investment Company are Level 1. Please refer to the respective Schedule of Investments for industry, sector or country breakout. |
| ** | All corporate notes and bonds and U.S. government and agency obligations held in the Funds are Level 2 securities. For a detailed breakout of the corporate notes and bonds and U.S. government and agency obligations; by major industry or agency classification, please refer to the respective Schedule of Investments. |
104
AMG Funds
October 31, 2016
Notes to Schedule of Investments – continued
As of October 31, 2016, transfers between Level 1 and Level 2 are as follows:
| | | | | | | | |
Funds | | Transfer from
Level 1 to
Level 2 | | | Transfer from
Level 2 to
Level 1 | |
AMG Managers Pictet International Fund | | $ | 34,432,101 | | | $ | 14,789,313 | |
As of October 31, 2016, there were no Level 3 securities for which significant unobservable inputs or Investment Manager assumptions used in determining fair value except for AMG Managers LMCG Small Cap Growth Fund, which received rights at no cost as a result of a corporate action.
105
AMG Funds
October 31, 2016
Statements of Assets and Liabilities
| | | | | | | | |
| | | AMG Managers
Fairpointe
Focused
Equity Fund | | | AMG River
Road Focused
Absolute
Value Fund | |
ASSETS: | | | | | | | | |
Investments at value* | | $ | 7,152,272 | | | $ | 11,705,879 | �� |
Receivables: | | | | | | | | |
Dividends, interest and other | | | 2,728 | | | | 8,341 | |
Fund shares sold | | | 10,000 | | | | 1,659 | |
Investments sold | | | — | | | | 1,070,003 | |
Receivable from Affiliates | | | 14,777 | | | | 24,881 | |
Prepaid expenses | | | 18 | | | | 9 | |
| | | | | | | | |
Total assets | | | 7,179,795 | | | | 12,810,772 | |
| | | | | | | | |
LIABILITIES: | | | | | | | | |
Payables: | | | | | | | | |
Due to Custodian | | | — | | | | 328,836 | |
Investments purchased | | | 82,389 | | | | 586,147 | |
Fund shares redeemed | | | — | | | | — | |
Investment advisory and management fees | | | 4,181 | | | | 6,033 | |
Administration fees | | | 896 | | | | 1,508 | |
Distribution fees | | | 409 | | | | 103 | |
Shareholder servicing fees - Fund Level | | | 958 | | | | 1,127 | |
Shareholder servicing fees - Class N | | | 131 | | | | 16 | |
Shareholder servicing fees - Class I | | | 347 | | | | 386 | |
Shareholder servicing fees - Class R | | | — | | | | — | |
Professional fees | | | 22,525 | | | | 17,826 | |
Custodian fees | | | 1,229 | | | | 5,507 | |
Transfer agent fees | | | 4,168 | | | | 4,204 | |
Registration fees | | | 26,259 | | | | 7,813 | |
Trustees fees | | | 145 | | | | 238 | |
Due to Affiliate | | | — | | | | 42,999 | |
Accrued expenses and other payables | | | 1,418 | | | | 7,060 | |
| | | | | | | | |
Total liabilities | | | 145,055 | | | | 1,009,803 | |
| | | | | | | | |
NET ASSETS | | $ | 7,034,740 | | | $ | 11,800,969 | |
| | | | | | | | |
NET ASSETS CONSIST OF: | | | | | | | | |
Paid-in capital | | $ | 7,155,144 | | | $ | 10,389,414 | |
Accumulated undistributed (distributions in excess of) net investment income (loss) | | | 54,543 | | | | 77,538 | |
Accumulated net realized gain (loss) on investments | | | (152,226 | ) | | | 825,823 | |
Net unrealized appreciation (depreciation) on investments | | | (22,721 | ) | | | 508,194 | |
| | | | | | | | |
TOTAL NET ASSETS | | $ | 7,034,740 | | | $ | 11,800,969 | |
| | | | | | | | |
Class N: | | | | | | | | |
Net Assets | | $ | 545,932 | | | $ | 488,942 | |
Shares of beneficial interest outstanding (unlimited authorization) | | | 56,588 | | | | 45,048 | |
Net asset value, offering and redemption price per share | | $ | 9.65 | | | $ | 10.85 | |
| | | | | | | | |
Class I: | | | | | | | | |
Net Assets | | $ | 6,488,808 | | | $ | 11,312,027 | |
Shares of beneficial interest outstanding (unlimited authorization) | | | 671,070 | | | | 1,039,891 | |
Net asset value, offering and redemption price per share | | $ | 9.67 | | | $ | 10.88 | |
| | | | | | | | |
Class R: | | | | | | | | |
Net Assets | | $ | — | | | $ | — | |
Shares of beneficial interest outstanding (unlimited authorization) | | | — | | | | — | |
Net asset value, offering and redemption price per share | | $ | — | | | $ | — | |
| | | | | | | | |
* Investments at cost | | $ | 7,174,993 | | | $ | 11,197,685 | |
The accompanying notes are an integral part of these financial statements.
106
| | | | | | | | | | | | | | | | | | | | | | | | | | |
AMG Managers
Montag &
Caldwell
Growth Fund | | | AMG River
Road Dividend
All Cap
Value Fund | | | AMG River
Road Dividend
All Cap
Value Fund II | | | AMG Managers
Fairpointe Mid
Cap Fund | | | AMG Managers
Montag & Caldwell
Mid Cap
Growth Fund | | | AMG Managers
LMCG Small
Cap Growth
Fund | | | AMG River
Road Select
Value Fund | |
| $ | 1,342,007,889 | | | $ | 852,050,920 | | | $ | 117,923,790 | | | $ | 3,494,952,034 | | | $ | 8,107,686 | | | $ | 111,115,134 | | | $ | 39,642,073 | |
| | 802,515 | | | | 1,260,300 | | | | 167,933 | | | | 244,190 | | | | 964 | | | | 10,700 | | | | 14,625 | |
| | 1,077,482 | | | | 2,807,645 | | | | 149,556 | | | | 2,639,112 | | | | 46 | | | | 54,697 | | | | 783 | |
| | 7,782,917 | | | | — | | | | — | | | | 33,310,062 | | | | 167,846 | | | | 3,746,715 | | | | 393,768 | |
| | 7,107 | | | | 3,840 | | | | — | | | | 19,387 | | | | 9,129 | | | | — | | | | — | |
| | 5,731 | | | | 2,234 | | | | 332 | | | | 12,616 | | | | 32 | | | | 641 | | | | 158 | |
| | | | | | | | | | | | | | | | | | | | | | | | | | |
| | 1,351,683,641 | | | | 856,124,939 | | | | 118,241,611 | | | | 3,531,177,401 | | | | 8,285,703 | | | | 114,927,887 | | | | 40,051,407 | |
| | | | | | | | | | | | | | | | | | | | | | | | | | |
| | — | | | | — | | | | — | | | | — | | | | — | | | | 699,144 | | | | — | |
| | — | | | | 1,050,993 | | | | 153,561 | | | | 7,064,862 | | | | 40,467 | | | | 1,310,303 | | | | 60,978 | |
| | 5,264,712 | | | | 3,286,880 | | | | 4,430 | | | | 9,130,492 | | | | — | | | | 853,540 | | | | 29,164 | |
| | 718,049 | | | | 434,732 | | | | 60,317 | | | | 1,810,700 | | | | 5,295 | | | | 93,200 | | | | 42,308 | |
| | 174,759 | | | | 108,683 | | | | 15,079 | | | | 447,381 | | | | 1,059 | | | | 15,328 | | | | 5,128 | |
| | 114,671 | | | | 62,613 | | | | 703 | | | | 294,643 | | | | 909 | | | | 12,491 | | | | 1,059 | |
| | 176,902 | | | | 117,240 | | | | 14,845 | | | | 551,814 | | | | 1,018 | | | | 14,961 | | | | 4,210 | |
| | 26,960 | | | | 15,027 | | | | 169 | | | | 94,286 | | | | 182 | | | | 3,498 | | | | 254 | |
| | 42,663 | | | | 28,446 | | | | 5,863 | | | | 144,317 | | | | 171 | | | | 3,133 | | | | 1,797 | |
| | 234 | | | | — | | | | — | | | | — | | | | — | | | | — | | | | — | |
| | 48,882 | | | | 34,561 | | | | 26,090 | | | | 61,743 | | | | 22,559 | | | | 23,760 | | | | 23,235 | |
| | 44,680 | | | | 22,408 | | | | 5,749 | | | | 102,005 | | | | 2,221 | | | | 10,695 | | | | 6,416 | |
| | 75,461 | | | | 17,506 | | | | 9,446 | | | | 104,925 | | | | 4,481 | | | | 14,707 | | | | 9,467 | |
| | 18,829 | | | | 8,493 | | | | 7,513 | | | | 13,238 | | | | 7,393 | | | | 7,763 | | | | 7,393 | |
| | 29,484 | | | | 17,637 | | | | 2,493 | | | | 73,288 | | | | 212 | | | | 2,671 | | | | 843 | |
| | — | | | | — | | | | — | | | | — | | | | — | | | | — | | | | — | |
| | 162,769 | | | | 58,483 | | | | 9,363 | | | | 303,959 | | | | 1,773 | | | | 26,314 | | | | 4,753 | |
| | | | | | | | | | | | | | | | | | | | | | | | | | |
| | 6,899,055 | | | | 5,263,702 | | | | 315,621 | | | | 20,197,653 | | | | 87,740 | | | | 3,091,508 | | | | 197,005 | |
| | | | | | | | | | | | | | | | | | | | | | | | | | |
| $ | 1,344,784,586 | | | $ | 850,861,237 | | | $ | 117,925,990 | | | $ | 3,510,979,748 | | | $ | 8,197,963 | | | $ | 111,836,379 | | | $ | 39,854,402 | |
| | | | | | | | | | | | | | | | | | | | | | | | | | |
| $ | 1,093,896,487 | | | $ | 681,599,347 | | | $ | 103,734,876 | | | $ | 2,963,994,075 | | | $ | 6,896,881 | | | $ | 151,243,746 | | | $ | 35,503,903 | |
| | 4,018,189 | | | | (374,380 | ) | | | (158,107 | ) | | | 13,117,515 | | | | (45,628 | ) | | | (983,642 | ) | | | — | |
| | 110,374,986 | | | | 57,322,192 | | | | 4,745,055 | | | | 157,163,536 | | | | 585,225 | | | | (34,981,650 | ) | | | 2,760,557 | |
| | 136,494,924 | | | | 112,314,078 | | | | 9,604,166 | | | | 376,704,622 | | | | 761,485 | | | | (3,442,075 | ) | | | 1,589,942 | |
| | | | | | | | | | | | | | | | | | | | | | | | | | |
| $ | 1,344,784,586 | | | $ | 850,861,237 | | | $ | 117,925,990 | | | $ | 3,510,979,748 | | | $ | 8,197,963 | | | $ | 111,836,379 | | | $ | 39,854,402 | |
| | | | | | | | | | | | | | | | | | | | | | | | | | |
| $ | 519,008,302 | | | $ | 295,796,849 | | | $ | 3,394,204 | | | $ | 1,374,982,045 | | | $ | 4,215,569 | | | $ | 53,816,068 | | | $ | 4,941,740 | |
| | 26,527,483 | | | | 24,289,894 | | | | 251,092 | | | | 36,689,370 | | | | 413,871 | | | | 4,413,841 | | | | 702,221 | |
| $ | 19.56 | | | $ | 12.18 | | | $ | 13.52 | | | $ | 37.48 | | | $ | 10.19 | | | $ | 12.19 | | | $ | 7.04 | |
| | | | | | | | | | | | | | | | | | | | | | | | | | |
| $ | 820,317,792 | | | $ | 555,064,388 | | | $ | 114,531,786 | | | $ | 2,135,997,703 | | | $ | 3,982,394 | | | $ | 58,020,311 | | | $ | 34,912,662 | |
| | 41,646,230 | | | | 45,619,311 | | | | 8,467,309 | | | | 55,637,809 | | | | 388,492 | | | | 4,694,390 | | | | 4,873,911 | |
| $ | 19.70 | | | $ | 12.17 | | | $ | 13.53 | | | $ | 38.39 | | | $ | 10.25 | | | $ | 12.36 | | | $ | 7.16 | |
| | | | | | | | | | | | | | | | | | | | | | | | | | |
| $ | 5,458,492 | | | $ | — | | | $ | — | | | $ | — | | | $ | — | | | $ | — | | | $ | — | |
| | 285,158 | | | | — | | | | — | | | | — | | | | — | | | | — | | | | — | |
| $ | 19.14 | | | $ | — | | | $ | — | | | $ | — | | | $ | — | | | $ | — | | | $ | — | |
| | | | | | | | | | | | | | | | | | | | | | | | | | |
| $ | 1,205,512,965 | | | $ | 739,736,842 | | | $ | 108,319,624 | | | $ | 3,118,247,412 | | | $ | 7,346,201 | | | $ | 114,557,209 | | | $ | 38,052,131 | |
107
AMG Funds
October 31, 2016
Statements of Assets and Liabilities – continued
| | | | | | | | |
| | | AMG River
Road Small
Cap Value
Fund | | | AMG
Managers
Silvercrest
Small Cap
Fund | |
ASSETS: | | | | | | | | |
Unaffiliated investments at value* | | $ | 267,851,687 | | | $ | 201,202,179 | |
Affiliated investment at value** | | | — | | | | — | |
Foreign currency (Cost $2,544,386 and $22,870) | | | — | | | | — | |
Cash | | | — | | | | — | |
Segregated Cash | | | — | | | | — | |
Receivables: | | | | | | | | |
Dividends, interest and other | | | 116,349 | | | | 40,838 | |
Fund shares sold | | | 296,017 | | | | 468,483 | |
Investments sold | | | 1,393,409 | | | | 2,621,058 | |
Receivable from Affiliates | | | 506 | | | | 16,248 | |
Prepaid expenses | | | 735 | | | | 477 | |
| | | | | | | | |
Total assets | | | 269,658,703 | | | | 204,349,283 | |
| | | | | | | | |
LIABILITIES: | | | | | | | | |
Payables: | | | | | | | | |
Due to broker | | | — | | | | — | |
Interest and dividends on securities sold short | | | — | | | | — | |
Investments purchased | | | 166,721 | | | | 1,545,504 | |
Fund shares redeemed | | | 598,735 | | | | 296,765 | |
Investment advisory and management fees | | | 184,113 | | | | 156,671 | |
Administration fees | | | 34,521 | | | | 26,112 | |
Distribution fees | | | 4,767 | | | | 4,377 | |
Shareholder servicing fees – Fund Level | | | 52,817 | | | | 26,868 | |
Shareholder servicing fees - Class N | | | 1,716 | | | | 1,226 | |
Shareholder servicing fees - Class I | | | 18,997 | | | | 10,960 | |
Professional fees | | | 26,398 | | | | 24,754 | |
Custodian fees | | | 10,453 | | | | 8,964 | |
Transfer agent fees | | | 8,270 | | | | 6,552 | |
Registration fees | | | 7,393 | | | | 27,309 | |
Trustees fees | | | 5,630 | | | | 4,211 | |
Accrued expenses and other payables | | | 20,112 | | | | 16,772 | |
Securities sold short, at value (proceeds $14,570,909) | | | — | | | | — | |
Call options written, at value (premiums received $1,461,516) | | | — | | | | — | |
| | | | | | | | |
Total liabilities | | | 1,140,643 | | | | 2,157,045 | |
| | | | | | | | |
NET ASSETS | | $ | 268,518,060 | | | $ | 202,192,238 | |
| | | | | | | | |
NET ASSETS CONSIST OF: | | | | | | | | |
Paid-in capital | | $ | 214,201,934 | | | $ | 187,958,337 | |
Accumulated undistributed (distributions in excess of) net investment income (loss) | | | — | | | | 256,102 | |
Accumulated net realized gain (loss) on investments | | | 13,891,232 | | | | 1,309,068 | |
Net unrealized appreciation (depreciation) on investments | | | 40,424,894 | | | | 12,668,731 | |
| | | | | | | | |
TOTAL NET ASSETS | | $ | 268,518,060 | | | $ | 202,192,238 | |
| | | | | | | | |
Class N: | | | | | | | | |
Net Assets | | $ | 21,764,709 | | | $ | 20,228,131 | |
Shares of beneficial interest outstanding (unlimited authorization) | | | 1,770,368 | | | | 1,310,869 | |
Net asset value, offering and redemption price per share | | $ | 12.29 | | | $ | 15.43 | |
| | | | | | | | |
Class I: | | | | | | | | |
Net Assets | | $ | 246,753,351 | | | $ | 181,964,107 | |
Shares of beneficial interest outstanding (unlimited authorization) | | | 19,831,344 | | | | 11,696,026 | |
Net asset value, offering and redemption price per share | | $ | 12.44 | | | $ | 15.56 | |
| | | | | | | | |
* Investments at cost | | $ | 227,426,793 | | | $ | 188,533,448 | |
** Affiliated investment at cost | | | — | | | | — | |
The accompanying notes are an integral part of these financial statements.
108
| | | | | | | | | | | | | | | | | | | | | | | | | | |
AMG GW&K
U.S. Small
Cap Growth
Fund | | | AMG
Managers
DoubleLine
Core Plus Bond
Fund | | | AMG Managers
Anchor Capital
Enhanced
Equity Fund | | | AMG Managers
Lake Partners
LASSO
Alternatives
Fund | | | AMG River
Road Long-
Short Fund | | | AMG Managers
Guardian
Capital Global
Dividend Fund | | | AMG Managers
Pictet
International
Fund | |
| $ | 42,366,224 | | | $ | 694,479,427 | | | $ | 63,784,499 | | | $ | 103,030,598 | | | $ | 63,761,466 | | | $ | 37,192,443 | | | $ | 1,327,612,581 | |
| | — | | | | 7,837,407 | | | | — | | | | — | | | | — | | | | — | | | | — | |
| | — | | | | — | | | | — | | | | — | | | | 2,470,039 | | | | — | | | | 23,037 | |
| | — | | | | 985,498 | | | | — | | | | — | | | | — | | | | — | | | | — | |
| | — | | | | — | | | | — | | | | — | | | | 3,839,023 | | | | — | | | | — | |
| | 8,236 | | | | 4,068,276 | | | | 115,943 | | | | 42,389 | | | | 92,049 | | | | 33,121 | | | | 3,530,727 | |
| | 3,496 | | | | 2,004,578 | | | | 24,156 | | | | 19,622 | | | | 33,549 | | | | 90 | | | | 2,186,100 | |
| | 1,750,029 | | | | 965,447 | | | | 2,230,302 | | | | — | | | | 5,495,559 | | | | 457,014 | | | | 7,428,188 | |
| | 17,026 | | | | 151,588 | | | | — | | | | — | | | | — | | | | 11,634 | | | | 6,322 | |
| | 2,942 | | | | 1,496 | | | | 432 | | | | 542 | | | | 169 | | | | 12 | | | | 213 | |
| | | | | | | | | | | | | | | | | | | | | | | | | | |
| | 44,147,953 | | | | 710,493,717 | | | | 66,155,332 | | | | 103,093,151 | | | | 75,691,854 | | | | 37,694,314 | | | | 1,340,787,168 | |
| | | | | | | | | | | | | | | | | | | | | | | | | | |
| | — | | | | — | | | | — | | | | — | | | | 11,422,556 | | | | — | | | | — | |
| | — | | | | — | | | | — | | | | — | | | | 16,432 | | | | — | | | | — | |
| | 1,906,810 | | | | 1,680,840 | | | | 952,341 | | | | 40,725 | | | | 3,411,254 | | | | 8,656,907 | | | | 1,538,104 | |
| | 72,882 | | | | 760,947 | | | | 1,107,204 | | | | 174,958 | | | | 179,078 | | | | — | | | | 1,234,666 | |
| | 37,985 | | | | 269,011 | | | | 32,900 | | | | 87,880 | | | | 48,595 | | | | 8,358 | | | | 994,560 | |
| | 7,122 | | | | 89,670 | | | | 8,225 | | | | 13,289 | | | | 5,795 | | | | 1,791 | | | | 172,422 | |
| | 6,802 | | | | 65,530 | | | | 10,195 | | | | 6,951 | | | | 1,928 | | | | 213 | | | | 27 | |
| | 12,256 | | | | 106,063 | | | | 11,915 | | | | 12,866 | | | | 6,471 | | | | 30 | | | | 176,906 | |
| | 1,905 | | | | 20,970 | | | | 3,262 | | | | 1,668 | | | | 617 | | | | — | | | | 8 | |
| | 1,419 | | | | 25,444 | | | | 1,124 | | | | 3,647 | | | | 2,474 | | | | — | | | | 80,456 | |
| | 23,147 | | | | 51,162 | | | | 26,775 | | | | 25,334 | | | | 30,107 | | | | 25,280 | | | | 37,746 | |
| | 9,693 | | | | 104,110 | | | | 14,246 | | | | 4,021 | | | | 6,387 | | | | 5,087 | | | | 111,828 | |
| | 12,808 | | | | 22,993 | | | | 6,345 | | | | 17,568 | | | | 5,564 | | | | 4,106 | | | | 139,429 | |
| | 25,739 | | | | 8,913 | | | | 18,314 | | | | 7,393 | | | | 19,834 | | | | 7,388 | | | | 37,895 | |
| | 1,616 | | | | 14,412 | | | | 1,428 | | | | 2,244 | | | | 904 | | | | 147 | | | | 23,428 | |
| | 18,688 | | | | 57,473 | | | | 13,294 | | | | 10,556 | | | | 5,446 | | | | 1,323 | | | | 58,567 | |
| | — | | | | — | | | | — | | | | — | | | | 14,266,905 | | | | — | | | | — | |
| | — | | | | — | | | | 1,705,114 | | | | — | | | | — | | | | — | | | | — | |
| | | | | | | | | | | | | | | | | | | | | | | | | | |
| | 2,138,872 | | | | 3,277,538 | | | | 3,912,682 | | | | 409,100 | | | | 29,430,347 | | | | 8,710,630 | | | | 4,606,042 | |
| | | | | | | | | | | | | | | | | | | | | | | | | | |
| $ | 42,009,081 | | | $ | 707,216,179 | | | $ | 62,242,650 | | | $ | 102,684,051 | | | $ | 46,261,507 | | | $ | 28,983,684 | | | $ | 1,336,181,126 | |
| | | | | | | | | | | | | | | | | | | | | | | | | | |
| $ | 37,702,502 | | | $ | 705,016,348 | | | $ | 67,861,330 | | | $ | 102,271,601 | | | $ | 50,584,509 | | | $ | 29,288,500 | | | $ | 1,266,979,015 | |
| | (603,111 | ) | | | 417,962 | | | | 48,923 | | | | (472,938 | ) | | | (717,392 | ) | | | 26,396 | | | | 17,081,975 | |
| | (84,248 | ) | | | 1,199,733 | | | | (3,656,054 | ) | | | 183,362 | | | | (3,506,116 | ) | | | (319,639 | ) | | | 25,318,606 | |
| | 4,993,938 | | | | 582,136 | | | | (2,011,549 | ) | | | 702,026 | | | | (99,494 | ) | | | (11,573 | ) | | | 26,801,530 | |
| | | | | | | | | | | | | | | | | | | | | | | | | | |
| $ | 42,009,081 | | | $ | 707,216,179 | | | $ | 62,242,650 | | | $ | 102,684,051 | | | $ | 46,261,507 | | | $ | 28,983,684 | | | $ | 1,336,181,126 | |
| | | | | | | | | | | | | | | | | | | | | | | | | | |
| $ | 30,976,671 | | | $ | 308,702,609 | | | $ | 46,651,580 | | | $ | 32,630,121 | | | $ | 8,712,900 | | | $ | 997,358 | | | $ | 130,932 | |
| | 8,661,153 | | | | 28,665,644 | | | | 5,367,175 | | | | 2,762,139 | | | | 789,345 | | | | 103,150 | | | | 13,624 | |
| $ | 3.58 | | | $ | 10.77 | | | $ | 8.69 | | | $ | 11.81 | | | $ | 11.04 | | | $ | 9.67 | | | $ | 9.61 | |
| | | | | | | | | | | | | | | | | | | | | | | | | | |
| $ | 11,032,410 | | | $ | 398,513,570 | | | $ | 15,591,070 | | | $ | 70,053,930 | | | $ | 37,548,607 | | | $ | 27,986,326 | | | $ | 1,336,050,194 | |
| | 2,581,874 | | | | 37,021,116 | | | | 1,792,263 | | | | 5,907,363 | | | | 3,368,599 | | | | 2,899,797 | | | | 138,500,819 | |
| $ | 4.27 | | | $ | 10.76 | | | $ | 8.70 | | | $ | 11.86 | | | $ | 11.15 | | | $ | 9.65 | | | $ | 9.65 | |
| | | | | | | | | | | | | | | | | | | | | | | | | | |
| $ | 37,372,286 | | | $ | 693,722,951 | | | $ | 65,552,450 | | | $ | 102,328,572 | | | $ | 64,090,623 | | | $ | 37,203,447 | | | $ | 1,300,698,018 | |
| | — | | | | 8,011,747 | | | | — | | | | — | | | | — | | | | — | | | | — | |
109
AMG Funds
October 31, 2016
Statements of Assets and Liabilities – continued
| | | | | | | | |
| | | AMG Managers
Value Partners
Asia Dividend
Fund | | | AMG Managers
Montag &
Caldwell
Balanced Fund | |
ASSETS: | | | | | | | | |
Unaffiliated Investments at value* | | $ | 7,814,062 | | | $ | 28,615,266 | |
Foreign currency (Cost $ 441,950) | | | 441,868 | | | | — | |
Cash | | | 12,216 | | | | — | |
Receivables: | | | | | | | | |
Dividends, interest and other | | | 2,812 | | | | 80,900 | |
Fund shares sold | | | — | | | | 3,254 | |
Investments sold | | | 98,667 | | | | — | |
Receivable from Affiliates | | | 34,102 | | | | 11,974 | |
Prepaid expenses | | | 7,743 | | | | 86 | |
| | | | | | | | |
Total assets | | | 8,411,470 | | | | 28,711,480 | |
| | | | | | | | |
LIABILITIES: | | | | | | | | |
Payables: | | | | | | | | |
Investments purchased | | | 162,999 | | | | — | |
Fund shares redeemed | | | — | | | | 157,506 | |
Investment advisory and management fees | | | 5,593 | | | | 16,751 | |
Administration fees | | | 1,049 | | | | 3,866 | |
Distribution fees | | | 175 | | | | 2,314 | |
Shareholder servicing fees - Fund Level | | | — | | | | 3,563 | |
Shareholder servicing fees - Class N | | | — | | | | 1,388 | |
Shareholder servicing fees - Class I | | | — | | | | 158 | |
Professional fees | | | 18,829 | | | | 26,603 | |
Custodian fees | | | 35,499 | | | | 4,302 | |
Transfer agent fees | | | 4,120 | | | | 9,165 | |
Registration fees | | | 25,759 | | | | 16,503 | |
Trustees fees | | | 170 | | | | 716 | |
Due to Affiliate | | | 64,933 | | | | — | |
Accrued expenses and other payables | | | 1,463 | | | | 4,608 | |
| | | | | | | | |
Total liabilities | | | 320,589 | | | | 247,443 | |
| | | | | | | | |
NET ASSETS | | $ | 8,090,881 | | | $ | 28,464,037 | |
| | | | | | | | |
NET ASSETS CONSIST OF: | | | | | | | | |
Paid-in capital | | $ | 7,602,477 | | | $ | 25,690,032 | |
Accumulated undistributed (distributions in excess of) net investment income (loss) | | | 90,750 | | | | (325,337 | ) |
Accumulated net realized gain (loss) on investments | | | 226,416 | | | | 2,101,726 | |
Net unrealized appreciation (depreciation) on investments | | | 171,238 | | | | 997,616 | |
| | | | | | | | |
TOTAL NET ASSETS | | $ | 8,090,881 | | | $ | 28,464,037 | |
| | | | | | | | |
Class N: | | | | | | | | |
Net Assets | | $ | 808,006 | | | $ | 25,373,423 | |
Shares of beneficial interest outstanding (unlimited authorization) | | | 76,043 | | | | 1,123,776 | |
Net asset value, offering and redemption price per share | | $ | 10.63 | | | $ | 22.58 | |
| | | | | | | | |
Class I: | | | | | | | | |
Net Assets | | $ | 7,282,875 | | | $ | 3,090,614 | |
Shares of beneficial interest outstanding (unlimited authorization) | | | 685,194 | | | | 137,368 | |
Net asset value, offering and redemption price per share | | $ | 10.63 | | | $ | 22.50 | |
| | | | | | | | |
* Investments at cost | | $ | 7,642,688 | | | $ | 27,617,650 | |
The accompanying notes are an integral part of these financial statements.
110
This page intentionally left blank.
AMG Funds
Statements of Operations
For the Fiscal Year Ended October 31, 2016
| | | | | | | | |
| | | AMG Managers
Fairpointe
Focused Equity
Fund | | | AMG River
Road Focused
Absolute
Value Fund(a) | |
INVESTMENT INCOME: | | | | | | | | |
Dividends | | $ | 131,530 | | | $ | 122,751 | |
Foreign taxes withheld | | | — | | | | — | |
| | | | | | | | |
Total investment income | | | 131,530 | | | | 122,751 | |
| | | | | | | | |
EXPENSES: | | | | | | | | |
Investment advisory and management fees | | | 51,946 | | | | 54,381 | |
Distribution fees - Class N | | | 5,512 | | | | 801 | |
Distribution fees - Class R | | | — | | | | — | |
Shareholder servicing fees - Fund Level | | | 4,925 | | | | 2,737 | |
Shareholder servicing fees - Class N | | | 131 | | | | 16 | |
Shareholder servicing fees - Class I | | | 347 | | | | 386 | |
Shareholder servicing fees - Class R | | | — | | | | — | |
Transfer agent fees | | | 16,318 | | | | 16,372 | |
Administrative fees | | | 15,759 | | | | 16,502 | |
Custodian fees | | | 2,274 | | | | 10,253 | |
Professional fees | | | 22,369 | | | | 18,371 | |
Registration fees | | | 36,617 | | | | 33,294 | |
Offering expense | | | 6,131 | | | | 53,793 | |
Organizational expense | | | — | | | | 6,638 | |
Reports to shareholders | | | 2,540 | | | | 13,733 | |
Trustees fees and expenses | | | 448 | | | | 470 | |
Miscellaneous | | | 2,359 | | | | 2,526 | |
| | | | | | | | |
Total expenses before offsets | | | 167,676 | | | | 230,273 | |
| | | | | | | | |
Expense reimbursements | | | (103,052 | ) | | | (170,129 | ) |
Expense reductions | | | — | | | | (148 | ) |
Fees waivers | | | — | | | | — | |
| | | | | | | | |
Net expenses | | | 64,624 | | | | 59,996 | |
| | | | | | | | |
NET INVESTMENT INCOME (LOSS) | | | 66,906 | | | | 62,755 | |
| | | | | | | | |
NET REALIZED AND UNREALIZED GAIN (LOSS) ON INVESTMENTS: | | | | | | | | |
Net realized gain (loss) on investments | | | (14,597 | ) | | | 711,183 | |
Net change in unrealized appreciation (depreciation) on investments | | | 297,720 | | | | 508,194 | |
| | | | | | | | |
NET REALIZED AND UNREALIZED GAIN (LOSS) ON INVESTMENTS | | | 283,123 | | | | 1,219,377 | |
| | | | | | | | |
NET INCREASE (DECREASE) IN NET ASSETS RESULTING FROM OPERATIONS | | $ | 350,029 | | | $ | 1,282,132 | |
| | | | | | | | |
| (a) | The commencement of investment operations for the AMG River Road Focused Absolute Value Fund was November 3, 2015. |
The accompanying notes are an integral part of these financial statements.
112
| | | | | | | | | | | | | | | | | | | | | | | | | | |
AMG Managers
Montag &
Caldwell
Growth Fund | | | AMG River
Road Dividend
All Cap Value
Fund | | | AMG River
Road
Dividend All
Cap Value
Fund II | | | AMG
Managers
Fairpointe Mid
Cap Fund | | | AMG Managers
Montag &
Caldwell Mid
Cap Growth
Fund | | | AMG
Managers
LMCG Small
Cap Growth
Fund | | | AMG River
Road Select
Value Fund | |
| $ | 21,924,165 | | | $ | 24,279,114 | | | $ | 3,726,605 | | | $ | 59,093,180 | | | $ | 63,301 | | | $ | 821,048 | | | $ | 474,135 | |
| | — | | | | (90,038 | ) | | | (14,423 | ) | | | (262,902 | ) | | | (381 | ) | | | — | | | | (559 | ) |
| | | | | | | | | | | | | | | | | | | | | | | | | | |
| | 21,924,165 | | | | 24,189,076 | | | | 3,712,182 | | | | 58,830,278 | | | | 62,920 | | | | 821,048 | | | | 473,576 | |
| | | | | | | | | | | | | | | | | | | | | | | | | | |
| | 11,121,715 | | | | 5,328,517 | | | | 811,217 | | | | 26,481,785 | | | | 86,825 | | | | 1,602,242 | | | | 465,377 | |
| | 1,670,838 | | | | 600,037 | | | | 7,541 | | | | 3,849,182 | | | | 11,138 | | | | 236,501 | | | | 12,095 | |
| | 28,835 | | | | — | | | | — | | | | — | | | | — | | | | — | | | | — | |
| | 907,100 | | | | 406,178 | | | | 58,024 | | | | 2,555,473 | | | | 4,501 | | | | 101,209 | | | | 27,575 | |
| | 26,960 | | | | 15,027 | | | | 169 | | | | 94,286 | | | | 182 | | | | 3,498 | | | | 254 | |
| | 42,663 | | | | 28,446 | | | | 5,863 | | | | 144,317 | | | | 171 | | | | 3,133 | | | | 1,797 | |
| | 234 | | | | — | | | | — | | | | — | | | | — | | | | — | | | | — | |
| | 184,237 | | | | 40,139 | | | | 28,977 | | | | 242,044 | | | | 17,004 | | | | 41,539 | | | | 29,893 | |
| | 844,975 | | | | 429,634 | | | | 75,183 | | | | 2,000,546 | | | | 17,962 | | | | 95,189 | | | | 37,326 | |
| | 69,870 | | | | 37,711 | | | | 10,746 | | | | 159,674 | | | | 3,806 | | | | 18,856 | | | | 15,406 | |
| | 136,680 | | | | 75,810 | | | | 31,840 | | | | 269,941 | | | | 22,619 | | | | 32,281 | | | | 25,380 | |
| | 139,011 | | | | 55,095 | | | | 39,538 | | | | 100,998 | | | | 32,315 | | | | 50,831 | | | | 31,628 | |
| | — | | | | — | | | | — | | | | — | | | | — | | | | — | | | | — | |
| | — | | | | — | | | | — | | | | — | | | | — | | | | — | | | | — | |
| | 217,277 | | | | 54,547 | | | | 10,062 | | | | 447,545 | | | | 2,924 | | | | 46,082 | | | | 5,424 | |
| | 121,038 | | | | 54,161 | | | | 8,109 | | | | 275,856 | | | | 725 | | | | 12,257 | | | | 3,771 | |
| | 107,643 | | | | 52,482 | | | | 9,321 | | | | 172,777 | | | | 2,669 | | | | 11,672 | | | | 4,840 | |
| | | | | | | | | | | | | | | | | | | | | | | | | | |
| | 15,619,076 | | | | 7,177,784 | | | | 1,096,590 | | | | 36,794,424 | | | | 202,841 | | | | 2,255,290 | | | | 660,766 | |
| | | | | | | | | | | | | | | | | | | | | | | | | | |
| | — | | | | — | | | | — | | | | — | | | | (88,726 | ) | | | (245,604 | ) | | | (62,677 | ) |
| | (32,876 | ) | | | (739 | ) | | | (82 | ) | | | — | | | | (323 | ) | | | — | | | | (447 | ) |
| | (7,107 | ) | | | (3,840 | ) | | | — | | | | (19,387 | ) | | | — | | | | — | | | | — | |
| | | | | | | | | | | | | | | | | | | | | | | | | | |
| | 15,579,093 | | | | 7,173,205 | | | | 1,096,508 | | | | 36,775,037 | | | | 113,792 | | | | 2,009,686 | | | | 597,642 | |
| | | | | | | | | | | | | | | | | | | | | | | | | | |
| | 6,345,072 | | | | 17,015,871 | | | | 2,615,674 | | | | 22,055,241 | | | | (50,872 | ) | | | (1,188,638 | ) | | | (124,066 | ) |
| | | | | | | | | | | | | | | | | | | | | | | | | | |
| | 114,108,879 | | | | 59,263,397 | | | | 4,771,695 | | | | 157,821,250 | | | | 629,604 | | | | (34,954,281 | ) | | | 3,630,244 | |
| | (147,303,621 | ) | | | (25,544,317 | ) | | | 1,173,678 | | | | (27,081,901 | ) | | | (611,887 | ) | | | 2,727,088 | | | | (1,228,248 | ) |
| | | | | | | | | | | | | | | | | | | | | | | | | | |
| | (33,194,742 | ) | | | 33,719,080 | | | | 5,945,373 | | | | 130,739,349 | | | | 17,717 | | | | (32,227,193 | ) | | | 2,401,996 | |
| | | | | | | | | | | | | | | | | | | | | | | | | | |
| $ | (26,849,670 | ) | | $ | 50,734,951 | | | $ | 8,561,047 | | | $ | 152,794,590 | | | $ | (33,155 | ) | | $ | (33,415,831 | ) | | $ | 2,277,930 | |
| | | | | | | | | | | | | | | | | | | | | | | | | | |
113
AMG Funds
Statements of Operations – continued
For the Fiscal Year Ended October 31, 2016
| | | | | | | | |
| | | AMG River
Road Small
Cap Value
Fund | | | AMG
Managers
Silvercrest
Small Cap
Fund | |
INVESTMENT INCOME: | | | | | | | | |
Dividends | | $ | 2,697,093 | | | $ | 2,781,491 | |
Dividends from affiliated security | | | — | | | | — | |
Interest | | | — | | | | — | |
Foreign taxes withheld | | | (35,896 | ) | | | — | |
| | | | | | | | |
Total investment income | | | 2,661,197 | | | | 2,781,491 | |
| | | | | | | | |
EXPENSES: | | | | | | | | |
Investment advisory and management fees | | | 2,316,173 | | | | 1,777,234 | |
Distribution fees - Class N | | | 53,164 | | | | 48,244 | |
Shareholder servicing fees - Fund Level | | | 177,557 | | | | 103,798 | |
Shareholder servicing fees - Class N | | | 1,716 | | | | 1,226 | |
Shareholder servicing fees - Class I | | | 18,997 | | | | 10,960 | |
Transfer agent fees | | | 22,602 | | | | 19,475 | |
Administrative fees | | | 151,841 | | | | 110,408 | |
Custodian fees | | | 17,717 | | | | 16,589 | |
Professional fees | | | 40,056 | | | | 33,892 | |
Registration fees | | | 28,712 | | | | 42,502 | |
Interest and dividend expense on securities sold-short | | | — | | | | — | |
Reports to shareholders | | | 20,781 | | | | 21,308 | |
Trustees fees and expenses | | | 17,931 | | | | 12,240 | |
Miscellaneous | | | 18,260 | | | | 13,371 | |
Expense repayments | | | — | | | | — | |
| | | | | | | | |
Total expenses before offsets | | | 2,885,507 | | | | 2,211,247 | |
| | | | | | | | |
Expense reimbursements | | | — | | | | (99,164 | ) |
Expense reductions | | | (3,854 | ) | | | (2,437 | ) |
Fees waivers | | | (506 | ) | | | — | |
| | | | | | | | |
Net expenses | | | 2,881,147 | | | | 2,109,646 | |
| | | | | | | | |
NET INVESTMENT INCOME (LOSS) | | | (219,950 | ) | | | 671,845 | |
| | | | | | | | |
NET REALIZED AND UNREALIZED GAIN (LOSS) ON INVESTMENTS: | | | | | | | | |
Net realized gain (loss) on investments | | | 14,928,166 | | | | 1,621,595 | |
Net realized (loss) on purchased options | | | — | | | | — | |
Net realized (loss) on written option transactions | | | — | | | | — | |
Net realized (loss) on securities sold short | | | — | | | | — | |
Net realized gain (loss) on foreign currency transactions | | | — | | | | — | |
Net realized (loss) on affiliated investment | | | — | | | | — | |
Capital gain distributions received | | | — | | | | — | |
Net change in unrealized appreciation (depreciation) on investments | | | 3,659,498 | | | | 9,200,867 | |
Net change in unrealized appreciation on purchased options | | | — | | | | — | |
Net change in unrealized appreciation on written options | | | — | | | | — | |
Net change in unrealized appreciation on securities sold short | | | — | | | | — | |
Net change in unrealized appreciation (depreciation) on translation of assets and liabilities denominated in foreign currency | | | — | | | | — | |
| | | | | | | | |
NET REALIZED AND UNREALIZED GAIN (LOSS) ON INVESTMENTS | | | 18,587,664 | | | | 10,822,462 | |
| | | | | | | | |
NET INCREASE (DECREASE) IN NET ASSETS RESULTING FROM OPERATIONS | | $ | 18,367,714 | | | $ | 11,494,307 | |
| | | | | | | | |
| (a) | Includes realized gain from a redemption in-kind of $34,396,511. |
The accompanying notes are an integral part of these financial statements.
114
| | | | | | | | | | | | | | | | | | | | | | | | | | |
AMG GW&K
U.S. Small Cap
Growth Fund | | | AMG Managers
DoubleLine
Core Plus Bond
Fund | | | AMG Managers
Anchor Capital
Enhanced
Equity Fund | | | AMG Managers
Lake Partners
LASSO
Alternatives
Fund | | | AMG River
Road Long-
Short Fund | | | AMG Managers
Guardian
Capital Global
Dividend Fund | | | AMG Managers
Pictet
International
Fund | |
| $ | 848,990 | | | $ | 142,928 | | | $ | 4,056,881 | | | $ | 2,337,322 | | | $ | 794,604 | | | $ | 193,227 | | | $ | 26,631,396 | |
| | — | | | | 297,022 | | | | — | | | | — | | | | — | | | | — | | | | — | |
| | — | | | | 24,394,967 | | | | — | | | | — | | | | 7,317 | | | | — | | | | — | |
| | (8,858 | ) | | | — | | | | — | | | | — | | | | (13,731 | ) | | | (12,543 | ) | | | (2,013,935 | ) |
| | | | | | | | | | | | | | | | | | | | | | | | | | |
| | 840,132 | | | | 24,834,917 | | | | 4,056,881 | | | | 2,337,322 | | | | 788,190 | | | | 180,684 | | | | 24,617,461 | |
| | | | | | | | | | | | | | | | | | | | | | | | | | |
| | 1,283,334 | | | | 3,546,353 | | | | 751,247 | | | | 1,391,733 | | | | 582,698 | | | | 41,246 | | | | 6,635,291 | |
| | 147,497 | | | | 717,004 | | | | 151,692 | | | | 89,088 | | | | 34,137 | | | | 2,553 | | | | 1,246 | |
| | 77,471 | | | | 495,307 | | | | 84,990 | | | | 81,192 | | | | 35,206 | | | | 102 | | | | 424,328 | |
| | 1,905 | | | | 20,970 | | | | 3,262 | | | | 1,668 | | | | 617 | | | | — | | | | 8 | |
| | 1,419 | | | | 25,444 | | | | 1,124 | | | | 3,647 | | | | 2,474 | | | | — | | | | 80,456 | |
| | 33,426 | | | | 38,243 | | | | 19,941 | | | | 31,638 | | | | 19,017 | | | | 16,198 | | | | 311,708 | |
| | 81,377 | | | | 430,412 | | | | 67,298 | | | | 83,194 | | | | 39,232 | | | | 23,149 | | | | 474,226 | |
| | 25,344 | | | | 132,406 | | | | 41,340 | | | | 6,386 | | | | 12,863 | | | | 7,497 | | | | 223,824 | |
| | 31,393 | | | | 85,926 | | | | 32,428 | | | | 32,632 | | | | 34,263 | | | | 24,999 | | | | 74,796 | |
| | 40,217 | | | | 115,807 | | | | 34,477 | | | | 42,118 | | | | 37,170 | | | | 34,242 | | | | 110,000 | |
| | — | | | | — | | | | — | | | | — | | | | 870,035 | | | | — | | | | — | |
| | 45,871 | | | | 99,503 | | | | 23,307 | | | | 17,433 | | | | 11,186 | | | | 2,334 | | | | 66,548 | |
| | 14,666 | | | | 41,160 | | | | 8,388 | | | | 10,776 | | | | 3,690 | | | | 350 | | | | 39,227 | |
| | 10,500 | | | | 27,176 | | | | 6,755 | | | | 9,532 | | | | 5,212 | | | | 2,234 | | | | 28,019 | |
| | — | | | | — | | | | — | | | | — | | | | — | | | | — | | | | 156,874 | |
| | | | | | | | | | | | | | | | | | | | | | | | | | |
| | 1,794,420 | | | | 5,775,711 | | | | 1,226,249 | | | | 1,801,037 | | | | 1,687,800 | | | | 154,904 | | | | 8,626,551 | |
| | | | | | | | | | | | | | | | | | | | | | | | | | |
| | (38,534 | ) | | | (494,265 | ) | | | — | | | | (101,268 | ) | | | (74,866 | ) | | | (96,649 | ) | | | — | |
| | (23,119 | ) | | | — | | | | — | | | | — | | | | (115 | ) | | | — | | | | — | |
| | — | | | | (44,903 | ) | | | — | | | | — | | | | — | | | | — | | | | (6,322 | ) |
| | | | | | | | | | | | | | | | | | | | | | | | | | |
| | 1,732,767 | | | | 5,236,543 | | | | 1,226,249 | | | | 1,699,769 | | | | 1,612,819 | | | | 58,255 | | | | 8,620,229 | |
| | | | | | | | | | | | | | | | | | | | | | | | | | |
| | (892,635 | ) | | | 19,598,374 | | | | 2,830,632 | | | | 637,553 | | | | (824,629 | ) | | | 122,429 | | | | 15,997,232 | |
| | | | | | | | | | | | | | | | | | | | | | | | | | |
| | 57,625,496 | (a) | | | 7,086,804 | | | | 7,574,859 | | | | (2,554,452 | ) | | | 975,484 | | | | (199,838 | ) | | | 25,550,905 | |
| | — | | | | — | | | | (7,247,986 | ) | | | — | | | | — | | | | — | | | | — | |
| | — | | | | — | | | | (3,579,518 | ) | | | — | | | | — | | | | — | | | | — | |
| | — | | | | — | | | | — | | | | — | | | | (1,725,681 | ) | | | — | | | | — | |
| | — | | | | — | | | | — | | | | — | | | | (15,408 | ) | | | (1,605 | ) | | | 487,927 | |
| | — | | | | (28,713 | ) | | | — | | | | — | | | | — | | | | — | | | | — | |
| | — | | | | — | | | | — | | | | 3,233,485 | | | | — | | | | — | | | | — | |
| | (74,735,996 | ) | | | 7,311,823 | | | | (4,947,472 | ) | | | (3,892,607 | ) | | | (1,424,766 | ) | | | (226,492 | ) | | | 26,770,435 | |
| | — | | | | — | | | | 177,548 | | | | — | | | | — | | | | — | | | | — | |
| | — | | | | — | | | | 2,276,063 | | | | — | | | | — | | | | — | | | | — | |
| | — | | | | — | | | | — | | | | — | | | | 1,995,771 | | | | — | | | | — | |
| | — | | | | — | | | | — | | | | — | | | | (72,370 | ) | | | (373 | ) | | | (112,425 | ) |
| | | | | | | | | | | | | | | | | | | | | | | | | | |
| | (17,110,500 | ) | | | 14,369,914 | | | | (5,746,506 | ) | | | (3,213,574 | ) | | | (266,970 | ) | | | (428,308 | ) | | | 52,696,842 | |
| | | | | | | | | | | | | | | | | | | | | | | | | | |
| $ | (18,003,135 | ) | | $ | 33,968,288 | | | $ | (2,915,874 | ) | | $ | (2,576,021 | ) | | $ | (1,091,599 | ) | | $ | (305,879 | ) | | $ | 68,694,074 | |
| | | | | | | | | | | | | | | | | | | | | | | | | | |
115
AMG Funds
Statements of Operations – continued
For the Fiscal Year Ended October 31, 2016
| | | | | | | | |
| | | AMG Managers
Value Partners
Asia Dividend
Fund(a) | | | AMG Managers
Montag &
Caldwell
Balanced Fund | |
INVESTMENT INCOME: | | | | | | | | |
Dividends | | $ | 292,970 | | | $ | 324,343 | |
Interest | | | — | | | | 271,813 | |
Foreign taxes withheld | | | (16,269 | ) | | | — | |
| | | | | | | | |
Total investment income | | | 276,701 | | | | 596,156 | |
| | | | | | | | |
EXPENSES: | | | | | | | | |
Investment advisory and management fees | | | 59,488 | | | | 267,323 | |
Distribution fees - Class N | | | 1,667 | | | | 32,134 | |
Shareholder servicing fees - Fund Level | | | — | | | | 18,493 | |
Shareholder servicing fees - Class N | | | — | | | | 1,388 | |
Shareholder servicing fees - Class I | | | — | | | | 158 | |
Transfer agent fees | | | 14,167 | | | | 28,027 | |
Administrative fees | | | 21,744 | | | | 33,371 | |
Custodian fees | | | 51,809 | | | | 7,898 | |
Professional fees | | | 19,320 | | | | 28,097 | |
Registration fees | | | 31,806 | | | | 37,099 | |
Offering expense | | | 53,719 | | | | — | |
Organizational expense | | | 5,992 | | | | — | |
Reports to shareholders | | | 2,624 | | | | 8,315 | |
Trustees fees and expenses | | | 437 | | | | 2,339 | |
Miscellaneous | | | 2,128 | | | | 3,428 | |
| | | | | | | | |
Total expenses before offsets | | | 264,901 | | | | 468,070 | |
| | | | | | | | |
Expense reimbursements | | | (186,328 | ) | | | (40,082 | ) |
Expense reductions | | | — | | | | (692 | ) |
| | | | | | | | |
Net expenses | | | 78,573 | | | | 427,296 | |
| | | | | | | | |
NET INVESTMENT INCOME (LOSS) | | | 198,128 | | | | 168,860 | |
| | | | | | | | |
NET REALIZED AND UNREALIZED GAIN (LOSS) ON INVESTMENTS: | | | | | | | | |
Net realized gain on investments | | | 275,588 | | | | 2,160,564 | |
Net realized loss on foreign currency transactions | | | (4,563 | ) | | | — | |
Net change in unrealized appreciation (depreciation) on investments | | | 171,374 | | | | (1,925,238 | ) |
Net change in unrealized appreciation (depreciation) on translation of assets and liabilities denominated in foreign currency | | | (136 | ) | | | — | |
| | | | | | | | |
NET REALIZED AND UNREALIZED GAIN ON INVESTMENTS | | | 442,263 | | | | 235,326 | |
| | | | | | | | |
NET INCREASE IN NET ASSETS RESULTING FROM OPERATIONS | | $ | 640,391 | | | $ | 404,186 | |
| | | | | | | | |
| (a) | The commencement of investment operations for the AMG Managers Value Partners Asia Dividend Fund was December 16, 2015. |
The accompanying notes are an integral part of these financial statements.
116
This page intentionally left blank.
AMG Funds
Statements of Changes in Net Assets
| | | | | | | | | | | | |
| | | AMG Managers
Fairpointe Focused
Equity Fund | | | AMG River
Road Focused
Absolute Value
Fund | |
| | | Year Ended
October 31, 2016 | | | Period Ended
October 31, 2015(a) | | | Period Ended
October 31, 2016(b) | |
NET ASSETS at Beginning of Year | | $ | 6,456,792 | | | $ | — | | | $ | — | |
| | | | | | | | | | | | |
Increase (decrease) in net assets from operations: | | | | | | | | | | | | |
Net investment income | | | 66,906 | | | | 42,552 | | | | 62,755 | |
Net realized gain (loss) on investments | | | (14,597 | ) | | | (137,629 | ) | | | 711,183 | |
Net change in unrealized appreciation (depreciation) on investments | | | 297,720 | | | | (320,441 | ) | | | 508,194 | |
| | | | | | | | | | | | |
Net increase (decrease) in net assets from operations | | | 350,029 | | | | (415,518 | ) | | | 1,282,132 | |
| | | | | | | | | | | | |
Distributions to shareholders from: | | | | | | | | | | | | |
Net investment income: | | | | | | | | | | | | |
Class N | | | (21,065 | ) | | | — | | | | — | |
Class I | | | (46,607 | ) | | | — | | | | — | |
Class R | | | — | | | | — | | | | — | |
Net realized gain on investments: | | | | | | | | | | | | |
Class N | | | — | | | | — | | | | — | |
Class I | | | — | | | | — | | | | — | |
Class R | | | — | | | | — | | | | — | |
| | | | | | | | | | | | |
Total distributions | | | (67,672 | ) | | | — | | | | — | |
| | | | | | | | | | | | |
Capital share transactions: | | | | | | | | | | | | |
Net increase (decrease) from capital share transactions | | | 295,591 | | | | 6,872,310 | | | | 10,518,837 | |
| | | | | | | | | | | | |
Total increase (decrease) in net assets | | | 577,948 | | | | 6,456,792 | | | | 11,800,969 | |
| | | | | | | | | | | | |
NET ASSETS at End of Year | | $ | 7,034,740 | | | $ | 6,456,792 | | | $ | 11,800,969 | |
| | | | | | | | | | | | |
Undistributed (distributions in excess of) net investment income (loss) | | $ | 54,543 | | | $ | 54,030 | | | $ | 77,538 | |
| | | | | | | | | | | | |
| (a) | The commencement of investment operations for the AMG Managers Fairpointe Focused Equity Fund was December 23, 2014. |
| (b) | The commencement of investment operations for the AMG River Road Focused Absolute Value Fund was November 3, 2015. |
The accompanying notes are an integral part of these financial statements.
118
| | | | | | | | | | | | | | | | | | | | | | |
AMG Managers
Montag & Caldwell
Growth Fund | | | AMG River Road Dividend
All Cap Value Fund | | | AMG River Road Dividend
All Cap Value Fund II | |
| Year Ended October 31, | | | Year Ended October 31, | | | Year Ended October 31, | |
| 2016 | | | 2015 | | | 2016 | | | 2015 | | | 2016 | | | 2015 | |
| $ | 2,185,832,613 | | | $ | 4,136,667,896 | | | $ | 849,977,579 | | | $ | 1,138,258,945 | | | $ | 124,343,937 | | | $ | 132,696,953 | |
| | | | | | | | | | | | | | | | | | | | | | |
| | 6,345,072 | | | | 13,058,911 | | | | 17,015,871 | | | | 17,625,101 | | | | 2,615,674 | | | | 2,517,501 | |
| | 114,108,879 | | | | 646,002,403 | | | | 59,263,397 | | | | 78,461,890 | | | | 4,771,695 | | | | 1,871,086 | |
| | (147,303,621 | ) | | | (401,880,540 | ) | | | (25,544,317 | ) | | | (92,867,978 | ) | | | 1,173,678 | | | | (4,861,779 | ) |
| | | | | | | | | | | | | | | | | | | | | | |
| | (26,849,670 | ) | | | 257,180,774 | | | | 50,734,951 | | | | 3,219,013 | | | | 8,561,047 | | | | (473,192 | ) |
| | | | | | | | | | | | | | | | | | | | | | |
| | (2,341,331 | ) | | | (2,061,261 | ) | | | (4,651,630 | ) | | | (4,291,181 | ) | | | (57,390 | ) | | | (90,999 | ) |
| | (5,950,061 | ) | | | (15,765,431 | ) | | | (10,931,278 | ) | | | (14,028,198 | ) | | | (2,436,119 | ) | | | (2,543,708 | ) |
| | (3,417 | ) | | | (2,777 | ) | | | — | | | | — | | | | — | | | | — | |
| | (195,686,596 | ) | | | (212,615,826 | ) | | | (19,557,150 | ) | | | (24,073,946 | ) | | | (41,705 | ) | | | (214,191 | ) |
| | (256,099,119 | ) | | | (439,875,741 | ) | | | (49,288,884 | ) | | | (65,111,598 | ) | | | (1,625,842 | ) | | | (3,926,742 | ) |
| | (1,528,281 | ) | | | (1,298,521 | ) | | | — | | | | — | | | | — | | | | — | |
| | | | | | | | | | | | | | | | | | | | | | |
| | (461,608,805 | ) | | | (671,619,557 | ) | | | (84,428,942 | ) | | | (107,504,923 | ) | | | (4,161,056 | ) | | | (6,775,640 | ) |
| | | | | | | | | | | | | | | | | | | | | | |
| | (352,589,552 | ) | | | (1,536,396,500 | ) | | | 34,577,649 | | | | (183,995,456 | ) | | | (10,817,938 | ) | | | (1,104,184 | ) |
| | | | | | | | | | | | | | | | | | | | | | |
| | (841,048,027 | ) | | | (1,950,835,283 | ) | | | 883,658 | | | | (288,281,366 | ) | | | (6,417,947 | ) | | | (8,353,016 | ) |
| | | | | | | | | | | | | | | | | | | | | | |
| $ | 1,344,784,586 | | | $ | 2,185,832,613 | | | $ | 850,861,237 | | | $ | 849,977,579 | | | $ | 117,925,990 | | | $ | 124,343,937 | |
| | | | | | | | | | | | | | | | | | | | | | |
| $ | 4,018,189 | | | $ | 5,987,336 | | | $ | (374,380 | ) | | $ | (3,666,927 | ) | | $ | (158,107 | ) | | $ | (328,499 | ) |
| | | | | | | | | | | | | | | | | | | | | | |
119
AMG Funds
Statements of Changes in Net Assets – continued
| | | | | | | | | | | | | | | | |
| | | | | | AMG Managers | |
| | | AMG Managers | | | Montag & Caldwell Mid Cap | |
| | | Fairpointe Mid Cap Fund | | | Growth Fund | |
| | | Year Ended October 31, | | | Year Ended October 31, | |
| | | 2016 | | | 2015 | | | 2016 | | | 2015 | |
NET ASSETS at Beginning of Year | | $ | 4,700,395,942 | | | $ | 5,963,929,210 | | | $ | 11,053,000 | | | $ | 11,500,265 | |
| | | | | | | | | | | | | | | | |
Increase (decrease) in net assets from operations: | | | | | | | | | | | | | | | | |
Net investment income (loss) | | | 22,055,241 | | | | 23,029,830 | | | | (50,872 | ) | | | (51,489 | ) |
Net realized gain (loss) on investments | | | 157,821,250 | | | | 314,132,084 | | | | 629,604 | | | | 1,246,022 | |
Net change in unrealized appreciation (depreciation) on investments | | | (27,081,901 | ) | | | (558,847,097 | ) | | | (611,887 | ) | | | (713,635 | ) |
| | | | | | | | | | | | | | | | |
Net increase (decrease) in net assets from operations | | | 152,794,590 | | | | (221,685,183 | ) | | | (33,155 | ) | | | 480,898 | |
| | | | | | | | | | | | | | | | |
Distributions to shareholders from: | | | | | | | | | | | | | | | | |
Net investment income: | | | | | | | | | | | | | | | | |
Class N | | | (5,351,086 | ) | | | (2,292,874 | ) | | | — | | | | — | |
Class I | | | (15,653,440 | ) | | | (4,564,241 | ) | | | — | | | | — | |
Net realized gain on investments: | | | | | | | | | | | | | | | | |
Class N | | | (95,369,480 | ) | | | (388,644,763 | ) | | | (556,661 | ) | | | (403,184 | ) |
Class I | | | (139,128,106 | ) | | | (533,671,049 | ) | | | (693,830 | ) | | | (315,621 | ) |
| | | | | | | | | | | | | | | | |
Total distributions | | | (255,502,112 | ) | | | (929,172,927 | ) | | | (1,250,491 | ) | | | (718,805 | ) |
| | | | | | | | | | | | | | | | |
Capital share transactions: | | | | | | | | | | | | | | | | |
Net increase (decrease) from capital share transactions | | | (1,086,708,672 | ) | | | (112,675,158 | ) | | | (1,571,391 | ) | | | (209,358 | ) |
| | | | | | | | | | | | | | | | |
Total increase (decrease) in net assets | | | (1,189,416,194 | ) | | | (1,263,533,268 | ) | | | (2,855,037 | ) | | | (447,265 | ) |
| | | | | | | | | | | | | | | | |
NET ASSETS at End of Year | | $ | 3,510,979,748 | | | $ | 4,700,395,942 | | | $ | 8,197,963 | | | $ | 11,053,000 | |
| | | | | | | | | | | | | | | | |
Undistributed (distributions in excess of) net investment income (loss) | | $ | 13,117,515 | | | $ | 12,066,800 | | | $ | (45,628 | ) | | $ | (44,348 | ) |
| | | | | | | | | | | | | | | | |
The accompanying notes are an integral part of these financial statements.
120
| | | | | | | | | | | | | | | | | | | | | | |
AMG Managers
LMCG Small Cap
Growth Fund | | | AMG River Road
Select Value Fund | | | AMG River Road
Small Cap Value Fund | |
| Year Ended October 31, | | | Year Ended October 31, | | | Year Ended October 31, | |
| 2016 | | | 2015 | | | 2016 | | | 2015 | | | 2016 | | | 2015 | |
| $ | 231,382,604 | | | $ | 52,181,137 | | | $ | 97,111,333 | | | $ | 184,553,976 | | | $ | 270,438,198 | | | $ | 299,221,337 | |
| | | | | | | | | | | | | | | | | | | | | | |
| | (1,188,638 | ) | | | (1,224,794 | ) | | | (124,066 | ) | | | (384,137 | ) | | | (219,950 | ) | | | (643,900 | ) |
| | (34,954,281 | ) | | | 605,946 | | | | 3,630,244 | | | | 9,998,759 | | | | 14,928,166 | | | | 16,135,358 | |
| | 2,727,088 | | | | (11,741,432 | ) | | | (1,228,248 | ) | | | (4,782,442 | ) | | | 3,659,498 | | | | (468,319 | ) |
| | | | | | | | | | | | | | | | | | | | | | |
| | (33,415,831 | ) | | | (12,360,280 | ) | | | 2,277,930 | | | | 4,832,180 | | | | 18,367,714 | | | | 15,023,139 | |
| | | | | | | | | | | | | | | | | | | | | | |
| | — | | | | — | | | | — | | | | — | | | | — | | | | — | |
| | — | | | | — | | | | (153,030 | ) | | | — | | | | — | | | | — | |
| | (26,929 | ) | | | (1,601,490 | ) | | | (697,557 | ) | | | (1,302,384 | ) | | | (1,286,224 | ) | | | (6,051,268 | ) |
| | (13,737 | ) | | | (873,314 | ) | | | (7,272,173 | ) | | | (23,636,785 | ) | | | (13,941,244 | ) | | | (35,176,931 | ) |
| | | | | | | | | | | | | | | | | | | | | | |
| | (40,666 | ) | | | (2,474,804 | ) | | | (8,122,760 | ) | | | (24,939,169 | ) | | | (15,227,468 | ) | | | (41,228,199 | ) |
| | | | | | | | | | | | | | | | | | | | | | |
| | (86,089,728 | ) | | | 194,036,551 | | | | (51,412,101 | ) | | | (67,335,654 | ) | | | (5,060,384 | ) | | | (2,578,079 | ) |
| | | | | | | | | | | | | | | | | | | | | | |
| | (119,546,225 | ) | | | 179,201,467 | | | | (57,256,931 | ) | | | (87,442,643 | ) | | | (1,920,138 | ) | | | (28,783,139 | ) |
| | | | | | | | | | | | | | | | | | | | | | |
| $ | 111,836,379 | | | $ | 231,382,604 | | | $ | 39,854,402 | | | $ | 97,111,333 | | | $ | 268,518,060 | | | $ | 270,438,198 | |
| | | | | | | | | | | | | | | | | | | | | | |
| $ | (983,642 | ) | | $ | (1,161,099 | ) | | $ | — | | | $ | (404,126 | ) | | $ | — | | | $ | — | |
| | | | | | | | | | | | | | | | | | | | | | |
121
AMG Funds
Statements of Changes in Net Assets – continued
| | | | | | | | | | | | | | | | |
| | | AMG Managers | | | | | | | |
| | | Silvercrest | | | AMG GW&K | |
| | | Small Cap Fund | | | U.S. Small Cap Growth Fund | |
| | | Year Ended October 31, | | | Year Ended October 31, | |
| | | 2016 | | | 2015 | | | 2016 | | | 2015 | |
NET ASSETS at Beginning of Year | | $ | 164,463,697 | | | $ | 68,888,134 | | | $ | 548,685,895 | | | $ | 835,868,756 | |
| | | | | | | | | | | | | | | | |
Increase (decrease) in net assets from operations: | | | | | | | | | | | | | | | | |
Net investment income (loss) | | | 671,845 | | | | 289,585 | | | | (892,635 | ) | | | (3,068,930 | ) |
Net realized gain (loss) on investments, purchased and written options and capital gain distributions received | | | 1,621,595 | | | | 5,949,673 | | | | 57,625,496 | | | | 146,503,032 | |
Net change in unrealized appreciation (depreciation) on investments, purchased and written options | | | 9,200,867 | | | | (3,498,719 | ) | | | (74,735,996 | ) | | | (162,319,947 | ) |
| | | | | | | | | | | | | | | | |
Net increase (decrease) in net assets from operations | | | 11,494,307 | | | | 2,740,539 | | | | (18,003,135 | ) | | | (18,885,845 | ) |
| | | | | | | | | | | | | | | | |
Distributions to shareholders from: | | | | | | | | | | | | | | | | |
Net investment income: | | | | | | | | | | | | | | | | |
Class N | | | (50,273 | ) | | | (10,817 | ) | | | — | | | | — | |
Class I | | | (577,200 | ) | | | (144,060 | ) | | | — | | | | — | |
Net realized gain on investments: | | | | | | | | | | | | | | | | |
Class N | | | (734,281 | ) | | | (132,428 | ) | | | (58,589,159 | ) | | | (42,602,557 | ) |
Class I | | | (5,513,361 | ) | | | (1,405,279 | ) | | | (97,356,917 | ) | | | (51,414,056 | ) |
| | | | | | | | | | | | | | | | |
Total distributions | | | (6,875,115 | ) | | | (1,692,584 | ) | | | (155,946,076 | ) | | | (94,016,613 | ) |
| | | | | | | | | | | | | | | | |
Capital share transactions: | | | | | | | | | | | | | | | | |
Net increase (decrease) from capital share transactions | | | 33,109,349 | | | | 94,527,608 | | | | (332,727,603 | ) | | | (174,280,403 | ) |
| | | | | | | | | | | | | | | | |
Total increase (decrease) in net assets | | | 37,728,541 | | | | 95,575,563 | | | | (506,676,814 | ) | | | (287,182,861 | ) |
| | | | | | | | | | | | | | | | |
NET ASSETS at End of Year | | $ | 202,192,238 | | | $ | 164,463,697 | | | $ | 42,009,081 | | | $ | 548,685,895 | |
| | | | | | | | | | | | | | | | |
Undistributed (distributions in excess of) net investment income (loss) | | $ | 256,102 | | | $ | 212,459 | | | $ | (603,111 | ) | | $ | (2,699,597 | ) |
| | | | | | | | | | | | | | | | |
The accompanying notes are an integral part of these financial statements.
122
| | | | | | | | | | | | | | | | | | | | | | |
| AMG Managers | | | AMG Managers | | | AMG Managers | |
| DoubleLine Core Plus | | | Anchor Capital | | | Lake Partners | |
| Bond Fund | | | Enhanced Equity Fund | | | LASSO Alternatives Fund | |
| Year Ended October 31, | | | Year Ended October 31, | | | Year Ended October 31, | |
| 2016 | | | 2015 | | | 2016 | | | 2015 | | | 2016 | | | 2015 | |
| $ | 492,337,589 | | | $ | 207,345,624 | | | $ | 168,469,585 | | | $ | 210,964,549 | | | $ | 209,739,030 | | | $ | 521,542,660 | |
| | | | | | | | | | | | | | | | | | | | | | |
| | 19,598,374 | | | | 12,120,905 | | | | 2,830,632 | | | | 3,895,072 | | | | 637,553 | | | | (312,051 | ) |
| | 7,058,091 | | | | 725,979 | | | | (3,252,645 | ) | | | 1,727,822 | | | | 679,033 | | | | 16,102,822 | |
| | 7,311,823 | | | | (9,455,664 | ) | | | (2,493,861 | ) | | | (8,554,292 | ) | | | (3,892,607 | ) | | | (22,840,249 | ) |
| | | | | | | | | | | | | | | | | | | | | | |
| | 33,968,288 | | | | 3,391,220 | | | | (2,915,874 | ) | | | (2,931,398 | ) | | | (2,576,021 | ) | | | (7,049,478 | ) |
| | | | | | | | | | | | | | | | | | | | | | |
| | (8,449,442 | ) | | | (3,720,662 | ) | | | (1,722,852 | ) | | | (1,707,469 | ) | | | — | | | | (15,074 | ) |
| | (11,766,309 | ) | | | (9,249,014 | ) | | | (1,427,024 | ) | | | (2,146,798 | ) | | | (335,854 | ) | | | (1,016,136 | ) |
| | — | | | | — | | | | (318,424 | ) | | | — | | | | (2,460,419 | ) | | | (1,747,938 | ) |
| | — | | | | — | | | | (272,247 | ) | | | — | | | | (8,718,084 | ) | | | (13,332,770 | ) |
| | | | | | | | | | | | | | | | | | | | | | |
| | (20,215,751 | ) | | | (12,969,676 | ) | | | (3,740,547 | ) | | | (3,854,267 | ) | | | (11,514,357 | ) | | | (16,111,918 | ) |
| | | | | | | | | | | | | | | | | | | | | | |
| | 201,126,053 | | | | 294,570,421 | | | | (99,570,514 | ) | | | (35,709,299 | ) | | | (92,964,601 | ) | | | (288,642,234 | ) |
| | | | | | | | | | | | | | | | | | | | | | |
| | 214,878,590 | | | | 284,991,965 | | | | (106,226,935 | ) | | | (42,494,964 | ) | | | (107,054,979 | ) | | | (311,803,630 | ) |
| | | | | | | | | | | | | | | | | | | | | | |
| $ | 707,216,179 | | | $ | 492,337,589 | | | $ | 62,242,650 | | | $ | 168,469,585 | | | $ | 102,684,051 | | | $ | 209,739,030 | |
| | | | | | | | | | | | | | | | | | | | | | |
| $ | 417,962 | | | $ | (599,281 | ) | | $ | 48,923 | | | $ | 368,674 | | | $ | (472,938 | ) | | $ | (1,030,882 | ) |
| | | | | | | | | | | | | | | | | | | | | | |
123
AMG Funds
Statements of Changes in Net Assets – continued
| | | | | | | | | | | | | | | | |
| | | AMG | | | AMG Managers | |
| | | River Road | | | Guardian Capital | |
| | | Long-Short Fund | | | Global Dividend Fund | |
| | | Year Ended October 31, | | | Year Ended October 31, | |
| | | 2016 | | | 2015 | | | 2016 | | | 2015 | |
NET ASSETS at Beginning of Year | | $ | 77,070,545 | | | $ | 219,410,621 | | | $ | 4,345,783 | | | $ | 4,263,024 | |
| | | | | | | | | | | | | | | | |
Increase (decrease) in net assets from operations: | | | | | | | | | | | | | | | | |
Net investment income (loss) | | | (824,629 | ) | | | (1,585,959 | ) | | | 122,429 | | | | 107,411 | |
Net realized gain (loss) on investments and foreign currency transactions | | | (765,605 | ) | | | 7,121,809 | | | | (201,443 | ) | | | (82,953 | ) |
Net change in unrealized appreciation (depreciation) on investments, securities sold short, and translation of assets and liabilities denominated in foreign currency | | | 498,635 | | | | 2,054,254 | | | | (226,865 | ) | | | (18,854 | ) |
| | | | | | | | | | | | | | | | |
Net increase (decrease) in net assets from operations | | | (1,091,599 | ) | | | 7,590,104 | | | | (305,879 | ) | | | 5,604 | |
| | | | | | | | | | | | | | | | |
Distributions to shareholders from: | | | | | | | | | | | | | | | | |
Net investment income: | | | | | | | | | | | | | | | | |
Class N | | | — | | | | — | | | | (23,942 | ) | | | (22,159 | ) |
Class I | | | — | | | | — | | | | (95,299 | ) | | | (80,811 | ) |
Net realized gain on investments: | | | | | | | | | | | | | | | | |
Class N | | | (688,352 | ) | | | (2,666,296 | ) | | | — | | | | — | |
Class I | | | (1,158,800 | ) | | | (2,591,487 | ) | | | — | | | | — | |
| | | | | | | | | | | | | | | | |
Total distributions | | | (1,847,152 | ) | | | (5,257,783 | ) | | | (119,241 | ) | | | (102,970 | ) |
| | | | | | | | | | | | | | | | |
Capital share transactions: | | | | | | | | | | | | | | | | |
Net increase (decrease) from capital share transactions | | | (27,870,287 | ) | | | (144,672,397 | ) | | | 25,063,021 | | | | 180,125 | |
| | | | | | | | | | | | | | | | |
Total increase (decrease) in net assets | | | (30,809,038 | ) | | | (142,340,076 | ) | | | 24,637,901 | | | | 82,759 | |
| | | | | | | | | | | | | | | | |
NET ASSETS at End of Year | | $ | 46,261,507 | | | $ | 77,070,545 | | | $ | 28,983,684 | | | $ | 4,345,783 | |
| | | | | | | | | | | | | | | | |
Undistributed (distributions in excess of) net investment income (loss) | | $ | (717,392 | ) | | $ | (23,229 | ) | | $ | 26,396 | | | $ | 25,313 | |
| | | | | | | | | | | | | | | | |
| (a) | The commencement of investment operations for the AMG Managers Value Partners Asia Dividend Fund was December 16, 2015. |
The accompanying notes are an integral part of these financial statements.
124
| | | | | | | | | | | | | | | | | | |
| | | | AMG Managers | | | AMG Managers | |
| AMG Managers | | | Value Partners | | | Montag & Caldwell | |
| Pictet International Fund | | | Asia Dividend Fund | | | Balanced Fund | |
| Year Ended October 31, | | | Period Ended | | | Year Ended October 31, | |
| 2016 | | | 2015 | | | October 31, 2016(a) | | | 2016 | | | 2015 | |
| $ | 50,859,091 | | | $ | 9,450,969 | | | $ | — | | | $ | 30,124,934 | | | $ | 22,379,687 | |
| | | | | | | | | | | | | | | | | | |
| | 15,997,232 | | | | 433,841 | | | | 198,128 | | | | 168,860 | | | | 106,468 | |
| | 26,038,832 | | | | 299,417 | | | | 271,025 | | | | 2,160,564 | | | | 1,390,086 | |
| | 26,658,010 | | | | 944,133 | | | | 171,238 | | | | (1,925,238 | ) | | | (109,152 | ) |
| | | | | | | | | | | | | | | | | | |
| | 68,694,074 | | | | 1,677,391 | | | | 640,391 | | | | 404,186 | | | | 1,387,402 | |
| | | | | | | | | | | | | | | | | | |
| | (2,108 | ) | | | (3,516 | ) | | | (15,227 | ) | | | (207,163 | ) | | | (156,641 | ) |
| | (384,729 | ) | | | (122,686 | ) | | | (150,172 | ) | | | (27,438 | ) | | | (20,244 | ) |
| | (7,188 | ) | | | (2,589 | ) | | | — | | | | (1,154,068 | ) | | | (1,709,309 | ) |
| | (581,130 | ) | | | (59,646 | ) | | | — | | | | (170,597 | ) | | | (163,800 | ) |
| | | | | | | | | | | | | | | | | | |
| | (975,155 | ) | | | (188,437 | ) | | | (165,399 | ) | | | (1,559,266 | ) | | | (2,049,994 | ) |
| | | | | | | | | | | | | | | | | | |
| | 1,217,603,116 | | | | 39,919,168 | | | | 7,615,889 | | | | (505,817 | ) | | | 8,407,839 | |
| | | | | | | | | | | | | | | | | | |
| | 1,285,322,035 | | | | 41,408,122 | | | | 8,090,881 | | | | (1,660,897 | ) | | | 7,745,247 | |
| | | | | | | | | | | | | | | | | | |
| $ | 1,336,181,126 | | | $ | 50,859,091 | | | $ | 8,090,881 | | | $ | 28,464,037 | | | $ | 30,124,934 | |
| | | | | | | | | | | | | | | | | | |
| $ | 17,081,975 | | | $ | 364,480 | | | $ | 90,750 | | | $ | (325,337 | ) | | $ | (310,864 | ) |
| | | | | | | | | | | | | | | | | | |
125
| | |
| AMG Funds | | |
| |
| AMG Managers Fairpointe Focused Equity Fund – Class N | | October 31, 2016 |
| |
| Financial Highlights | | |
| | | | | | | | |
| | | Year
Ended
10/31/16 | | | Period
Ended
10/31/15(a) | |
Net Asset Value, Beginning of Year | | $ | 9.33 | | | $ | 10.00 | |
| | | | | | | | |
Income from Investment Operations: | | | | | | | | |
Net investment income(b) | | | 0.08 | | | | 0.06 | |
Net realized and unrealized gain (loss) on investments | | | 0.33 | | | | (0.73 | ) |
| | | | | | | | |
Total from investment operations | | | 0.41 | | | | (0.67 | ) |
| | | | | | | | |
Less Distributions: | | | | | | | | |
Distributions from and in excess of net investment income | | | (0.09 | ) | | | — | |
| | | | | | | | |
Total distributions | | | (0.09 | ) | | | — | |
| | | | | | | | |
Net increase (decrease) in net asset value | | | 0.32 | | | | (0.67 | ) |
| | | | | | | | |
Net Asset Value, End of Year | | $ | 9.65 | | | $ | 9.33 | |
| | | | | | | | |
Total Return(c) | | | 4.43% | | | | (6.70 | )%(d) |
Ratios/Supplemental Data: | | | | | | | | |
Net Assets, End of Period (in 000’s) | | $ | 546 | | | $ | 2,295 | |
Ratios of expenses to average net assets: | | | | | | | | |
Before expense reimbursement and/or fee waiver | | | 2.63 | % | | | 3.78 | %(e) |
After expense reimbursement and/or fee waiver | | | 1.15 | %(f) | | | 1.15 | %(e) |
Ratios of net investment income (loss) to average net assets: | | | | | | | | |
Before expense reimbursement and/or fee waiver | | | (0.61 | )% | | | (1.93 | )%(e) |
After expense reimbursement and/or fee waiver | | | 0.87 | % | | | 0.70 | %(e) |
Portfolio Turnover | | | 31 | % | | | 1 | %(d)(g) |
| (a) | The commencement of investment operations for AMG Managers Fairpointe Focused Equity Fund Class N shares was December 23, 2014. |
| (b) | Per share numbers have been calculated using average shares. |
| (c) | The total return is calculated using the published Net Asset Value as of fiscal year end. |
| (f) | Effective October 1, 2016, the Fund’s expense cap was reduced to 0.82% from 1.15%. The expense ratio shown reflects the weighted average expense ratio for the full fiscal year ended October 31, 2016 (See Note F). |
| (g) | Portfolio turnover rate excludes securities received from processing a subscription in-kind. |
The accompanying notes are an integral part of these financial statements.
126
| | |
| AMG Funds | | |
| |
| AMG Managers Fairpointe Focused Equity Fund – Class I | | October 31, 2016 |
| |
| Financial Highlights | | |
| | | | | | | | |
| | | Year
Ended
10/31/16 | | | Period
Ended
10/31/15(a) | |
Net Asset Value, Beginning of Year | | $ | 9.35 | | | $ | 10.00 | |
| | | | | | | | |
Income from Investment Operations: | | | | | | | | |
Net investment income(b) | | | 0.10 | | | | 0.08 | |
Net realized and unrealized gain (loss) on investments | | | 0.32 | | | | (0.73 | ) |
| | | | | | | | |
Total from investment operations | | | 0.42 | | | | (0.65 | ) |
| | | | | | | | |
Less Distributions: | | | | | | | | |
Distributions from and in excess of net investment income | | | (0.10 | ) | | | — | |
| | | | | | | | |
Total distributions | | | (0.10 | ) | | | — | |
| | | | | | | | |
Net increase (decrease) in net asset value | | | 0.32 | | | | (0.65 | ) |
| | | | | | | | |
Net Asset Value, End of Year | | $ | 9.67 | | | $ | 9.35 | |
| | | | | | | | |
Total Return(c) | | | 4.65% | | | | (6.50 | )%(d) |
Ratios/Supplemental Data: | | | | | | | | |
Net Assets, End of Period (in 000’s) | | $ | 6,489 | | | $ | 4,162 | |
Ratios of expenses to average net assets: | | | | | | | | |
Before expense reimbursement and/or fee waiver | | | 2.51 | % | | | 3.53 | %(e) |
After expense reimbursement and/or fee waiver | | | 0.90 | %(f) | | | 0.90 | %(e) |
Ratios of net investment income (loss) to average net assets: | | | | | | | | |
Before expense reimbursement and/or fee waiver | | | (0.52 | )% | | | (1.68 | )%(e) |
After expense reimbursement and/or fee waiver | | | 1.10 | % | | | 0.95 | %(e) |
Portfolio Turnover | | | 31 | % | | | 1 | %(d)(g) |
| (a) | The commencement of investment operations for AMG Managers Fairpointe Focused Equity Fund Class I shares was December 23, 2014. |
| (b) | Per share numbers have been calculated using average shares. |
| (c) | The total return is calculated using the published Net Asset Value as of fiscal year end. |
| (f) | Effective October 1, 2016, the Fund’s expense cap was reduced to 0.82% from 0.90%. The expense ratio shown reflects the weighted average expense ratio for the full fiscal year ended October 31, 2016 (See Note F). |
| (g) | Portfolio turnover rate excludes securities received from processing a subscription in-kind. |
The accompanying notes are an integral part of these financial statements.
127
| | |
| AMG Funds | | |
| |
| AMG River Road Focused Absolute Value Fund – Class N | | October 31, 2016 |
| |
| Financial Highlights | | |
| | | | |
| | | Period
Ended
10/31/16(a) | |
Net Asset Value, Beginning of Year | | $ | 10.00 | |
| | | | |
Income from Investment Operations: | | | | |
Net investment income(b) | | | 0.04 | |
Net realized and unrealized gain on investments | | | 0.81 | |
| | | | |
Total from investment operations | | | 0.85 | |
| | | | |
Net increase in net asset value | | | 0.85 | |
| | | | |
Net Asset Value, End of Year | | $ | 10.85 | |
| | | | |
Total Return(c) | | | 8.50 | %(d) |
Ratios/Supplemental Data: | | | | |
Net Assets, End of Period (in 000’s) | | $ | 489 | |
Ratios of expenses to average net assets: | | | | |
Before expense reimbursement and/or fee waiver | | | 3.15 | %(e) |
After expense reimbursement and/or fee waiver | | | 1.12 | %(e)(f) |
Ratios of net investment income (loss) to average net assets: | | | | |
Before expense reimbursement and/or fee waiver | | | (1.64 | )%(e) |
After expense reimbursement and/or fee waiver | | | 0.39 | %(e) |
Portfolio Turnover | | | 146 | %(d)(g) |
| (a) | The commencement of investment operations for AMG River Road Focused Absolute Value Fund Class N shares was November 3, 2015. |
| (b) | Per share numbers have been calculated using average shares. |
| (c) | The total return is calculated using the published Net Asset Value as of fiscal year end. |
| (f) | Effective October 1, 2016, the Fund’s expense cap was reduced to 0.71% from 1.00%. The expense ratio shown reflects the weighted average expense ratio for the full fiscal year ended October 31, 2016 (See Note F). |
| (g) | Portfolio turnover rate excludes securities delivered from processing a subscription in-kind. |
The accompanying notes are an integral part of these financial statements.
128
| | |
| AMG Funds | | |
| |
| AMG River Road Focused Absolute Value Fund – Class I | | October 31, 2016 |
| |
| Financial Highlights | | |
| | | | |
| | | Period
Ended
10/31/16(a) | |
Net Asset Value, Beginning of Year | | $ | 10.00 | |
| | | | |
Income from Investment Operations: | | | | |
Net investment income(b) | | | 0.08 | |
Net realized and unrealized gain on investments | | | 0.80 | |
| | | | |
Total from investment operations | | | 0.88 | |
| | | | |
Net increase in net asset value | | | 0.88 | |
| | | | |
Net Asset Value, End of Year | | $ | 10.88 | |
| | | | |
Total Return(c) | | | 8.80 | %(d) |
Ratios/Supplemental Data: | | | | |
Net Assets, End of Period (in 000’s) | | $ | 11,312 | |
Ratios of expenses to average net assets: | | | | |
Before expense reimbursement and/or fee waiver | | | 2.90 | %(e) |
After expense reimbursement and/or fee waiver | | | 0.75 | %(e)(f) |
Ratios of net investment income (loss) to average net assets: | | | | |
Before expense reimbursement and/or fee waiver | | | (1.35 | )%(e) |
After expense reimbursement and/or fee waiver | | | 0.81 | %(e) |
Portfolio Turnover | | | 146 | %(d)(g) |
| (a) | The commencement of investment operations for AMG River Road Focused Absolute Value Fund Class I shares was November 3, 2015. |
| (b) | Per share numbers have been calculated using average shares. |
| (c) | The total return is calculated using the published Net Asset Value as of fiscal year end. |
| (f) | Effective October 1, 2016, the Fund’s expense cap was reduced to 0.71% from 0.75%. The expense ratio shown reflects the weighted average expense ratio for the full fiscal year ended October 31, 2016 (See Note F). |
| (g) | Portfolio turnover rate excludes securities delivered from processing a subscription in-kind. |
The accompanying notes are an integral part of these financial statements.
129
| | |
| AMG Funds | | |
| |
| AMG Managers Montag & Caldwell Growth Fund – Class N | | October 31, 2016 |
| |
| Financial Highlights | | |
| | | | | | | | | | | | | | | | | | | | |
| | | Year
Ended
10/31/16 | | | Year
Ended
10/13/15 | | | Year
Ended
10/31/14 | | | Year
Ended
10/31/13 | | | Year
Ended
10/31/12 | |
Net Asset Value, Beginning of Year | | $ | 26.67 | | | $ | 29.59 | | | $ | 28.68 | | | $ | 25.31 | | | $ | 24.72 | |
| | | | | | | | | | | | | | | | | | | | |
Income from Investment Operations: | | | | | | | | | | | | | | | | | | | | |
Net investment income(a) | | | 0.05 | | | | 0.07 | | | | 0.10 | | | | 0.23 | | | | 0.15 | |
Net realized and unrealized gain (loss) on investments | | | (0.33 | ) | | | 2.06 | | | | 2.93 | | | | 5.07 | | | | 2.45 | |
| | | | | | | | | | | | | | | | | | | | |
Total from investment operations | | | (0.28 | ) | | | 2.13 | | | | 3.03 | | | | 5.30 | | | | 2.60 | |
| | | | | | | | | | | | | | | | | | | | |
Less Distributions: | | | | | | | | | | | | | | | | | | | | |
Distributions from and in excess of net investment income | | | (0.08 | ) | | | (0.05 | ) | | | (0.16 | ) | | | (0.22 | ) | | | (0.13 | ) |
Distributions from net realized gain on investments | | | (6.75 | ) | | | (5.00 | ) | | | (1.96 | ) | | | (1.71 | ) | | | (1.88 | ) |
| | | | | | | | | | | | | | | | | | | | |
Total distributions | | | (6.83 | ) | | | (5.05 | ) | | | (2.12 | ) | | | (1.93 | ) | | | (2.01 | ) |
| | | | | | | | | | | | | | | | | | | | |
Net increase (decrease) in net asset value | | | (7.11 | ) | | | (2.92 | ) | | | 0.91 | | | | 3.37 | | | | 0.59 | |
| | | | | | | | | | | | | | | | | | | | |
Net Asset Value, End of Year | | $ | 19.56 | | | $ | 26.67 | | | $ | 29.59 | | | $ | 28.68 | | | $ | 25.31 | |
| | | | | | | | | | | | | | | | | | | | |
Total Return(b) | | | (1.77 | )% | | | 7.93 | % | | | 10.98 | % | | | 22.61 | % | | | 11.40 | % |
Ratios/Supplemental Data: | | | | | | | | | | | | | | | | | | | | |
Net Assets, End of Period (in 000’s) | | $ | 519,008 | | | $ | 835,725 | | | $ | 1,344,317 | | | $ | 2,190,074 | | | $ | 1,908,663 | |
Ratios of expenses to average net assets: | | | | | | | | | | | | | | | | | | | | |
Before expense reimbursement and/or fee waiver | | | 1.12 | % | | | 1.05 | % | | | 1.03 | % | | | 1.04 | % | | | 1.05 | % |
After expense reimbursement and/or fee waiver | | | 1.12 | % | | | 1.05 | % | | | 1.03 | % | | | 1.04 | % | | | 1.05 | % |
Ratios of net investment income to average net assets: | | | | | | | | | | | | | | | | | | | | |
Before expense reimbursement and/or fee waiver | | | 0.25 | % | | | 0.28 | % | | | 0.34 | % | | | 0.88 | % | | | 0.60 | % |
After expense reimbursement and/or fee waiver | | | 0.25 | % | | | 0.28 | % | | | 0.34 | % | | | 0.88 | % | | | 0.60 | % |
Portfolio Turnover | | | 64 | % | | | 12 | % | | | 47 | % | | | 51 | % | | | 46 | % |
| (a) | Per share numbers have been calculated using average shares. |
| (b) | The total return is calculated using the published Net Asset Value as of fiscal year end. |
The accompanying notes are an integral part of these financial statements.
130
| | |
| AMG Funds | | |
| |
| AMG Managers Montag & Caldwell Growth Fund – Class I | | October 31, 2016 |
| |
| Financial Highlights | | |
| | | | | | | | | | | | | | | | | | | | |
| | | Year
Ended
10/31/16 | | | Year
Ended
10/31/15 | | | Year
Ended
10/31/14 | | | Year
Ended
10/31/13 | | | Year
Ended
10/31/12 | |
Net Asset Value, Beginning of Year | | $ | 26.82 | | | $ | 29.80 | | | $ | 28.87 | | | $ | 25.46 | | | $ | 24.85 | |
| | | | | | | | | | | | | | | | | | | | |
Income from Investment Operations: | | | | | | | | | | | | | | | | | | | | |
Net investment income(a) | | | 0.10 | | | | 0.14 | | | | 0.17 | | | | 0.30 | | | | 0.21 | |
Net realized and unrealized gain (loss) on investments | | | (0.31 | ) | | | 2.06 | | | | 2.96 | | | | 5.10 | | | | 2.47 | |
| | | | | | | | | | | | | | | | | | | | |
Total from investment operations | | | (0.21 | ) | | | 2.20 | | | | 3.13 | | | | 5.40 | | | | 2.68 | |
| | | | | | | | | | | | | | | | | | | | |
Less Distributions: | | | | | | | | | | | | | | | | | | | | |
Distributions from and in excess of net investment income | | | (0.16 | ) | | | (0.18 | ) | | | (0.24 | ) | | | (0.28 | ) | | | (0.19 | ) |
Distributions from net realized gain on investments | | | (6.75 | ) | | | (5.00 | ) | | | (1.96 | ) | | | (1.71 | ) | | | (1.88 | ) |
| | | | | | | | | | | | | | | | | | | | |
Total distributions | | | (6.91 | ) | | | (5.18 | ) | | | (2.20 | ) | | | (1.99 | ) | | | (2.07 | ) |
| | | | | | | | | | | | | | | | | | | | |
Net increase (decrease) in net asset value | | | (7.12 | ) | | | (2.98 | ) | | | 0.93 | | | | 3.41 | | | | 0.61 | |
| | | | | | | | | | | | | | | | | | | | |
Net Asset Value, End of Year | | $ | 19.70 | | | $ | 26.82 | | | $ | 29.80 | | | $ | 28.87 | | | $ | 25.46 | |
| | | | | | | | | | | | | | | | | | | | |
Total Return(b) | | | (1.51 | )% | | | 8.21 | % | | | 11.26 | % | | | 22.95 | % | | | 11.67 | % |
Ratios/Supplemental Data: | | | | | | | | | | | | | | | | | | | | |
Net Assets, End of Period (in 000’s) | | $ | 820,318 | | | $ | 1,344,231 | | | $ | 2,784,650 | | | $ | 3,035,623 | | | $ | 2,406,145 | |
Ratios of expenses to average net assets: | | | | | | | | | | | | | | | | | | | | |
Before expense reimbursement and/or fee waiver | | | 0.87 | % | | | 0.80 | % | | | 0.78 | % | | | 0.79 | % | | | 0.80 | % |
After expense reimbursement and/or fee waiver | | | 0.87 | % | | | 0.80 | % | | | 0.78 | % | | | 0.79 | % | | | 0.80 | % |
Ratios of net investment income to average net assets: | | | | | | | | | | | | | | | | | | | | |
Before expense reimbursement and/or fee waiver | | | 0.50 | % | | | 0.53 | % | | | 0.59 | % | | | 1.13 | % | | | 0.85 | % |
After expense reimbursement and/or fee waiver | | | 0.50 | % | | | 0.53 | % | | | 0.59 | % | | | 1.13 | % | | | 0.85 | % |
Portfolio Turnover | | | 64 | % | | | 12 | % | | | 47 | % | | | 51 | % | | | 46 | % |
| (a) | Per share numbers have been calculated using average shares. |
| (b) | The total return is calculated using the published Net Asset Value as of fiscal year end. |
The accompanying notes are an integral part of these financial statements.
131
| | |
| AMG Funds | | |
| |
| AMG Managers Montag & Caldwell Growth Fund – Class R | | October 31, 2016 |
| |
| Financial Highlights | | |
| | | | | | | | | | | | | | | | | | | | |
| | | Year
Ended
10/31/16 | | | Year
Ended
10/31/15 | | | Year
Ended
10/31/14 | | | Year
Ended
10/31/13 | | | Year
Ended
10/31/12 | |
Net Asset Value, Beginning of Year | | $ | 26.22 | | | $ | 29.21 | | | $ | 28.33 | | | $ | 25.02 | | | $ | 24.45 | |
| | | | | | | | | | | | | | | | | | | | |
Income from Investment Operations: | | | | | | | | | | | | | | | | | | | | |
Net investment income (loss)(a) | | | (0.00 | )(b) | | | 0.01 | | | | 0.03 | | | | 0.16 | | | | 0.09 | |
Net realized and unrealized gain (loss) on investments | | | (0.31 | ) | | | 2.01 | | | | 2.91 | | | | 5.01 | | | | 2.43 | |
| | | | | | | | | | | | | | | | | | | | |
Total from investment operations | | | (0.31 | ) | | | 2.02 | | | | 2.94 | | | | 5.17 | | | | 2.52 | |
| | | | | | | | | | | | | | | | | | | | |
Less Distributions: | | | | | | | | | | | | | | | | | | | | |
Distributions from and in excess of net investment income | | | (0.02 | ) | | | (0.01 | ) | | | (0.10 | ) | | | (0.15 | ) | | | (0.07 | ) |
Distributions from net realized gain on investments | | | (6.75 | ) | | | (5.00 | ) | | | (1.96 | ) | | | (1.71 | ) | | | (1.88 | ) |
| | | | | | | | | | | | | | | | | | | | |
Total distributions | | | (6.77 | ) | | | (5.01 | ) | | | (2.06 | ) | | | (1.86 | ) | | | (1.95 | ) |
| | | | | | | | | | | | | | | | | | | | |
Net increase (decrease) in net asset value | | | (7.08 | ) | | | (2.99 | ) | | | 0.88 | | | | 3.31 | | | | 0.57 | |
| | | | | | | | | | | | | | | | | | | | |
Net Asset Value, End of Year | | $ | 19.14 | | | $ | 26.22 | | | $ | 29.21 | | | $ | 28.33 | | | $ | 25.02 | |
| | | | | | | | | | | | | | | | | | | | |
Total Return(c) | | | (2.02 | )% | | | 7.66 | % | | | 10.74 | % | | | 22.30 | % | | | 11.10 | % |
Ratios/Supplemental Data: | | | | | | | | | | | | | | | | | | | | |
Net Assets, End of Period (in 000’s) | | $ | 5,458 | | | $ | 5,877 | | | $ | 7,701 | | | $ | 10,099 | | | $ | 8,771 | |
Ratios of expenses to average net assets: | | | | | | | | | | | | | | | | | | | | |
Before expense reimbursement and/or fee waiver | | | 1.37 | % | | | 1.30 | % | | | 1.28 | % | | | 1.29 | % | | | 1.30 | % |
After expense reimbursement and/or fee waiver | | | 1.37 | % | | | 1.30 | % | | | 1.28 | % | | | 1.29 | % | | | 1.30 | % |
Ratios of net investment income (loss) to average net assets: | | | | | | | | | | | | | | | | | | | | |
Before expense reimbursement and/or fee waiver | | | (0.02 | )% | | | 0.03 | % | | | 0.09 | % | | | 0.63 | % | | | 0.35 | % |
After expense reimbursement and/or fee waiver | | | (0.02 | )% | | | 0.03 | % | | | 0.09 | % | | | 0.63 | % | | | 0.35 | % |
Portfolio Turnover | | | 64 | % | | | 12 | % | | | 47 | % | | | 51 | % | | | 46 | % |
| (a) | Per share numbers have been calculated using average shares. |
| (b) | Less than $(0.005) per share. |
| (c) | The total return is calculated using the published Net Asset Value as of fiscal year end. |
The accompanying notes are an integral part of these financial statements.
132
| | |
| AMG Funds | | |
| |
| AMG River Road Dividend All Cap Value Fund – Class N | | October 31, 2016 |
| |
| Financial Highlights | | |
| | | | | | | | | | | | | | | | | | | | |
| | | Year
Ended
10/31/16 | | | Year
Ended
10/31/15 | | | Year
Ended
10/31/14 | | | Year
Ended
10/31/13 | | | Year
Ended
10/31/12 | |
Net Asset Value, Beginning of Year | | $ | 12.67 | | | $ | 14.05 | | | $ | 13.99 | | | $ | 11.67 | | | $ | 10.68 | |
| | | | | | | | | | | | | | | | | | | | |
Income from Investment Operations: | | | | | | | | | | | | | | | | | | | | |
Net investment income | | | 0.24 | (a) | | | 0.21 | | | | 0.42 | | | | 0.30 | | | | 0.31 | (a) |
Net realized and unrealized gain (loss) on investments | | | 0.65 | | | | (0.20 | ) | | | 0.89 | | | | 2.73 | | | | 1.05 | |
| | | | | | | | | | | | | | | | | | | | |
Total from investment operations | | | 0.89 | | | | 0.01 | | | | 1.31 | | | | 3.03 | | | | 1.36 | |
| | | | | | | | | | | | | | | | | | | | |
Less Distributions: | | | | | | | | | | | | | | | | | | | | |
Distributions from and in excess of net investment income | | | (0.22 | ) | | | (0.22 | ) | | | (0.44 | ) | | | (0.27 | ) | | | (0.30 | ) |
Distributions from net realized gain on investments | | | (1.16 | ) | | | (1.17 | ) | | | (0.81 | ) | | | (0.44 | ) | | | (0.07 | ) |
| | | | | | | | | | | | | | | | | | | | |
Total distributions | | | (1.38 | ) | | | (1.39 | ) | | | (1.25 | ) | | | (0.71 | ) | | | (0.37 | ) |
| | | | | | | | | | | | | | | | | | | | |
Net increase (decrease) in net asset value | | | (0.49 | ) | | | (1.38 | ) | | | 0.06 | | | | 2.32 | | | | 0.99 | |
| | | | | | | | | | | | | | | | | | | | |
Net Asset Value, End of Year | | $ | 12.18 | | | $ | 12.67 | | | $ | 14.05 | | | $ | 13.99 | | | $ | 11.67 | |
| | | | | | | | | | | | | | | | | | | | |
Total Return(b) | | | 7.88 | % | | | (0.23 | )% | | | 9.89 | % | | | 27.47 | % | | | 12.96 | % |
Ratios/Supplemental Data: | | | | | | | | | | | | | | | | | | | | |
Net Assets, End of Period (in 000’s) | | $ | 295,797 | | | $ | 214,789 | | | $ | 349,937 | | | $ | 449,130 | | | $ | 338,166 | |
Ratios of expenses to average net assets: | | | | | | | | | | | | | | | | | | | | |
Before expense reimbursement and/or fee waiver | | | 1.10 | % | | | 1.10 | % | | | 1.09 | % | | | 1.09 | % | | | 1.12 | % |
After expense reimbursement and/or fee waiver | | | 1.10 | %(c) | | | 1.10 | % | | | 1.09 | % | | | 1.09 | % | | | 1.12 | % |
Ratios of net investment income to average net assets: | | | | | | | | | | | | | | | | | | | | |
Before expense reimbursement and/or fee waiver | | | 2.00 | % | | | 1.62 | % | | | 2.96 | % | | | 2.38 | % | | | 2.74 | % |
After expense reimbursement and/or fee waiver | | | 2.00 | % | | | 1.62 | % | | | 2.96 | % | | | 2.38 | % | | | 2.74 | % |
Portfolio Turnover | | | 47 | % | | | 27 | % | | | 32 | % | | | 35 | % | | | 28 | % |
| (a) | Per share numbers have been calculated using average shares. |
| (b) | The total return is calculated using the published Net Asset Value as of fiscal year end. |
| (c) | Effective October 1, 2016, the Fund’s expense cap was reduced to 0.99% from 1.30%. The expense ratio shown reflects the weighted average expense ratio for the full fiscal year ended October 31, 2016 (See Note F). |
The accompanying notes are an integral part of these financial statements.
133
| | |
| AMG Funds | | |
| |
| AMG River Road Dividend All Cap Value Fund – Class I | | October 31, 2016 |
| |
| Financial Highlights | | |
| | | | | | | | | | | | | | | | | | | | |
| | | Year
Ended
10/31/16 | | | Year
Ended
10/31/15 | | | Year
Ended
10/31/14 | | | Year
Ended
10/31/13 | | | Year
Ended
10/31/12 | |
Net Asset Value, Beginning of Year | | $ | 12.66 | | | $ | 14.04 | | | $ | 13.98 | | | $ | 11.66 | | | $ | 10.67 | |
| | | | | | | | | | | | | | | | | | | | |
Income from Investment Operations: | | | | | | | | | | | | | | | | | | | | |
Net investment income | | | 0.28 | (a) | | | 0.25 | | | | 0.44 | | | | 0.34 | | | | 0.34 | (a) |
Net realized and unrealized gain (loss) on investments | | | 0.64 | | | | (0.20 | ) | | | 0.90 | | | | 2.72 | | | | 1.05 | |
| | | | | | | | | | | | | | | | | | | | |
Total from investment operations | | | 0.92 | | | | 0.05 | | | | 1.34 | | | | 3.06 | | | | 1.39 | |
| | | | | | | | | | | | | | | | | | | | |
Less Distributions: | | | | | | | | | | | | | | | | | | | | |
Distributions from and in excess of net investment income | | | (0.25 | ) | | | (0.26 | ) | | | (0.47 | ) | | | (0.30 | ) | | | (0.33 | ) |
Distributions from net realized gain on investments | | | (1.16 | ) | | | (1.17 | ) | | | (0.81 | ) | | | (0.44 | ) | | | (0.07 | ) |
| | | | | | | | | | | | | | | | | | | | |
Total distributions | | | (1.41 | ) | | | (1.43 | ) | | | (1.28 | ) | | | (0.74 | ) | | | (0.40 | ) |
| | | | | | | | | | | | | | | | | | | | |
Net increase (decrease) in net asset value | | | (0.49 | ) | | | (1.38 | ) | | | 0.06 | | | | 2.32 | | | | 0.99 | |
| | | | | | | | | | | | | | | | | | | | |
Net Asset Value, End of Year | | $ | 12.17 | | | $ | 12.66 | | | $ | 14.04 | | | $ | 13.98 | | | $ | 11.66 | |
| | | | | | | | | | | | | | | | | | | | |
Total Return(b) | | | 8.15 | % | | | 0.02 | % | | | 10.18 | % | | | 27.81 | % | | | 13.25 | % |
Ratios/Supplemental Data: | | | | | | | | | | | | | | | | | | | | |
Net Assets, End of Period (in 000’s) | | $ | 555,064 | | | $ | 635,189 | | | $ | 788,322 | | | $ | 779,859 | | | $ | 586,043 | |
Ratios of expenses to average net assets: | | | | | | | | | | | | | | | | | | | | |
Before expense reimbursement and/or fee waiver | | | 0.85 | % | | | 0.85 | % | | | 0.84 | % | | | 0.84 | % | | | 0.87 | % |
After expense reimbursement and/or fee waiver | | | 0.85 | %(c) | | | 0.85 | % | | | 0.84 | % | | | 0.84 | % | | | 0.87 | % |
Ratios of net investment income to average net assets: | | | | | | | | | | | | | | | | | | | | |
Before expense reimbursement and/or fee waiver | | | 2.30 | % | | | 1.87 | % | | | 3.21 | % | | | 2.63 | % | | | 2.99 | % |
After expense reimbursement and/or fee waiver | | | 2.30 | % | | | 1.87 | % | | | 3.21 | % | | | 2.63 | % | | | 2.99 | % |
Portfolio Turnover | | | 47 | % | | | 27 | % | | | 32 | % | | | 35 | % | | | 28 | % |
| (a) | Per share numbers have been calculated using average shares. |
| (b) | The total return is calculated using the published Net Asset Value as of fiscal year end. |
| (c) | Effective October 1, 2016, the Fund’s expense cap was reduced to 0.99% from 1.05%. The expense ratio shown reflects the weighted average expense ratio for the full fiscal year ended October 31, 2016 (See Note F). |
The accompanying notes are an integral part of these financial statements.
134
| | |
| AMG Funds | | |
| |
| AMG River Road Dividend All Cap Value Fund II – Class N | | October 31, 2016 |
| |
| Financial Highlights | | |
| | | | | | | | | | | | | | | | | | | | |
| | | Year
Ended
10/31/16 | | | Year
Ended
10/31/15 | | | Year
Ended
10/31/14 | | | Year
Ended
10/31/13 | | | Period
Ended
10/31/12(a) | |
Net Asset Value, Beginning of Year | | $ | 12.99 | | | $ | 13.69 | | | $ | 12.89 | | | $ | 10.44 | | | $ | 10.00 | |
| | | | | | | | | | | | | | | | | | | | |
Income from Investment Operations: | | | | | | | | | | | | | | | | | | | | |
Net investment income | | | 0.26 | (b) | | | 0.22 | (b) | | | 0.36 | | | | 0.22 | | | | 0.09 | (b) |
Net realized and unrealized gain (loss) on investments | | | 0.71 | | | | (0.26 | ) | | | 0.96 | | | | 2.46 | | | | 0.41 | |
| | | | | | | | | | | | | | | | | | | | |
Total from investment operations | | | 0.97 | | | | (0.04 | ) | | | 1.32 | | | | 2.68 | | | | 0.50 | |
| | | | | | | | | | | | | | | | | | | | |
Less Distributions: | | | | | | | | | | | | | | | | | | | | |
Distributions from and in excess of net investment income | | | (0.25 | ) | | | (0.23 | ) | | | (0.38 | ) | | | (0.23 | ) | | | (0.06 | ) |
Distributions from net realized gain on investments | | | (0.19 | ) | | | (0.43 | ) | | | (0.14 | ) | | | (0.00 | )(c) | | | — | |
| | | | | | | | | | | | | | | | | | | | |
Total distributions | | | (0.44 | ) | | | (0.66 | ) | | | (0.52 | ) | | | (0.23 | ) | | | (0.06 | ) |
| | | | | | | | | | | | | | | | | | | | |
Net increase (decrease) in net asset value | | | 0.53 | | | | (0.70 | ) | | | 0.80 | | | | 2.45 | | | | 0.44 | |
| | | | | | | | | | | | | | | | | | | | |
Net Asset Value, End of Year | | $ | 13.52 | | | $ | 12.99 | | | $ | 13.69 | | | $ | 12.89 | | | $ | 10.44 | |
| | | | | | | | | | | | | | | | | | | | |
Total Return(d) | | | 7.61 | % | | | (0.47 | )% | | | 10.46 | % | | | 25.99 | % | | | 5.09 | %(e) |
Ratios/Supplemental Data: | | | | | | | | | | | | | | | | | | | | |
Net Assets, End of Period (in 000’s) | | $ | 3,394 | | | $ | 2,930 | | | $ | 7,037 | | | $ | 3,634 | | | $ | 1,049 | |
Ratios of expenses to average net assets: | | | | | | | | | | | | | | | | | | | | |
Before expense reimbursement and/or fee waiver, or recoupment | | | 1.18 | % | | | 1.15 | % | | | 1.17 | % | | | 1.37 | % | | | 4.99 | %(f) |
After expense reimbursement and/or fee waiver, or recoupment | | | 1.18 | %(g) | | | 1.15 | % | | | 1.25 | % | | | 1.30 | % | | | 1.30 | %(f) |
Ratios of net investment income (loss) to average net assets: | | | | | | | | | | | | | | | | | | | | |
Before expense reimbursement and/or fee waiver, or recoupment | | | 1.99 | % | | | 1.62 | % | | | 2.81 | % | | | 1.68 | % | | | (1.24 | )%(f) |
After expense reimbursement and/or fee waiver, or recoupment | | | 1.99 | % | | | 1.62 | % | | | 2.72 | % | | | 1.76 | % | | | 2.45 | %(f) |
Portfolio Turnover | | | 34 | % | | | 35 | % | | | 29 | % | | | 28 | % | | | 6 | %(e)(h) |
| (a) | The commencement of investment operations for AMG River Road Dividend All Cap Value Fund II Class N shares was June 26, 2012. |
| (b) | Per share numbers have been calculated using average shares. |
| (c) | Less than $(0.005) per share. |
| (d) | The total return is calculated using the published Net Asset Value as of fiscal year end. |
| (g) | Effective October 1, 2016, the Fund’s expense cap was reduced to 0.99% from 1.30%. The expense ratio shown reflects the weighted average expense ratio for the full fiscal year ended October 31, 2016 (See Note F). |
| (h) | Portfolio turnover excludes securities received from processing a subscription in-kind. |
The accompanying notes are an integral part of these financial statements.
135
| | |
| AMG Funds | | |
| |
| AMG River Road Dividend All Cap Value Fund II – Class I | | October 31, 2016 |
| |
| Financial Highlights | | |
| | | | | | | | | | | | | | | | | | | | |
| | | Year
Ended
10/31/16 | | | Year
Ended
10/31/15 | | | Year
Ended
10/31/14 | | | Year
Ended
10/31/13 | | | Period
Ended
10/31/12(a) | |
Net Asset Value, Beginning of Year | | $ | 13.00 | | | $ | 13.69 | | | $ | 12.89 | | | $ | 10.45 | | | $ | 10.00 | |
| | | | | | | | | | | | | | | | | | | | |
Income from Investment Operations: | | | | | | | | | | | | | | | | | | | | |
Net investment income | | | 0.29 | (b) | | | 0.25 | (b) | | | 0.39 | | | | 0.25 | | | | 0.10 | (b) |
Net realized and unrealized gain (loss) on investments | | | 0.71 | | | | (0.25 | ) | | | 0.96 | | | | 2.45 | | | | 0.42 | |
| | | | | | | | | | | | | | | | | | | | |
Total from investment operations | | | 1.00 | | | | — | | | | 1.35 | | | | 2.70 | | | | 0.52 | |
| | | | | | | | | | | | | | | | | | | | |
Less Distributions: | | | | | | | | | | | | | | | | | | | | |
Distributions from and in excess of net investment income | | | (0.28 | ) | | | (0.26 | ) | | | (0.41 | ) | | | (0.26 | ) | | | (0.07 | ) |
Distributions from net realized gain on investments | | | (0.19 | ) | | | (0.43 | ) | | | (0.14 | ) | | | (0.00 | )(c) | | | — | |
| | | | | | | | | | | | | | | | | | | | |
Total distributions | | | (0.47 | ) | | | (0.69 | ) | | | (0.55 | ) | | | (0.26 | ) | | | (0.07 | ) |
| | | | | | | | | | | | | | | | | | | | |
Net increase (decrease) in net asset value | | | 0.53 | | | | (0.69 | ) | | | 0.80 | | | | 2.44 | | | | 0.45 | |
| | | | | | | | | | | | | | | | | | | | |
Net Asset Value, End of Year | | $ | 13.53 | | | $ | 13.00 | | | $ | 13.69 | | | $ | 12.89 | | | $ | 10.45 | |
| | | | | | | | | | | | | | | | | | | | |
Total Return(d) | | | 7.87 | % | | | (0.13 | )% | | | 10.73 | % | | | 26.30 | % | | | 5.17 | %(e) |
Ratios/Supplemental Data: | | | | | | | | | | | | | | | | | | | | |
Net Assets, End of Period (in 000’s) | | $ | 114,532 | | | $ | 121,414 | | | $ | 125,660 | | | $ | 86,240 | | | $ | 9,370 | |
Ratios of expenses to average net assets: | | | | | | | | | | | | | | | | | | | | |
Before expense reimbursement and/or fee waiver, or recoupment | | | 0.93 | % | | | 0.90 | % | | | 0.92 | % | | | 1.12 | % | | | 4.74 | %(f) |
After expense reimbursement and/or fee waiver, or recoupment | | | 0.93 | %(g) | | | 0.90 | % | | | 1.00 | % | | | 1.05 | % | | | 1.05 | %(f) |
Ratios of net investment income (loss) to average net assets: | | | | | | | | | | | | | | | | | | | | |
Before expense reimbursement and/or fee waiver, or recoupment | | | 2.24 | % | | | 1.87 | % | | | 3.06 | % | | | 1.93 | % | | | (0.99 | )%(f) |
After expense reimbursement and/or fee waiver, or recoupment | | | 2.24 | % | | | 1.87 | % | | | 2.97 | % | | | 2.01 | % | | | 2.70 | %(f) |
Portfolio Turnover | | | 34 | % | | | 35 | % | | | 29 | % | | | 28 | % | | | 6 | %(e)(h) |
| (a) | The commencement of investment operations for AMG River Road Dividend All Cap Value Fund II Class I shares was June 26, 2012. |
| (b) | Per share numbers have been calculated using average shares. |
| (c) | Less than $(0.005) per share. |
| (d) | The total return is calculated using the published Net Asset Value as of fiscal year end. |
| (g) | Effective October 1, 2016, the Fund’s expense cap was reduced to 0.99% from 1.05%. The expense ratio shown reflects the weighted average expense ratio for the full fiscal year ended October 31, 2016 (See Note F) |
| (h) | Portfolio turnover excludes securities received from processing a subscription in-kind. |
The accompanying notes are an integral part of these financial statements.
136
| | |
| AMG Funds | | |
| |
| AMG Managers Fairpointe Mid Cap Fund – Class N | | October 31, 2016 |
| |
| Financial Highlights | | |
| | | | | | | | | | | | | | | | | | | | |
| | | Year
Ended
10/31/16 | | | Year
Ended
10/31/15 | | | Year
Ended
10/31/14 | | | Year
Ended
10/31/13 | | | Year
Ended
10/31/12 | |
Net Asset Value, Beginning of Year | | $ | 37.56 | | | $ | 46.89 | | | $ | 45.40 | | | $ | 32.79 | | | $ | 29.76 | |
| | | | | | | | | | | | | | | | | | | | |
Income from Investment Operations: | | | | | | | | | | | | | | | | | | | | |
Net investment income (loss) | | | 0.16 | (a) | | | 0.12 | | | | (0.06 | ) | | | 0.17 | | | | 0.16 | |
Net realized and unrealized gain (loss) on investments | | | 1.92 | | | | (1.83 | ) | | | 5.82 | | | | 13.48 | | | | 3.13 | |
| | | | | | | | | | | | | | | | | | | | |
Total from investment operations | | | 2.08 | | | | (1.71 | ) | | | 5.76 | | | | 13.65 | | | | 3.29 | |
| | | | | | | | | | | | | | | | | | | | |
Less Distributions: | | | | | | | | | | | | | | | | | | | | |
Distributions from and in excess of net investment income | | | (0.11 | ) | | | (0.04 | ) | | | — | | | | (0.30 | ) | | | (0.05 | ) |
Distributions from net realized gain on investments | | | (2.05 | ) | | | (7.58 | ) | | | (4.27 | ) | | | (0.74 | ) | | | (0.21 | ) |
| | | | | | | | | | | | | | | | | | | | |
Total distributions | | | (2.16 | ) | | | (7.62 | ) | | | (4.27 | ) | | | (1.04 | ) | | | (0.26 | ) |
| | | | | | | | | | | | | | | | | | | | |
Net increase (decrease) in net asset value | | | (0.08 | ) | | | (9.33 | ) | | | 1.49 | | | | 12.61 | | | | 3.03 | |
| | | | | | | | | | | | | | | | | | | | |
Net Asset Value, End of Year | | $ | 37.48 | | | $ | 37.56 | | | $ | 46.89 | | | $ | 45.40 | | | $ | 32.79 | |
| | | | | | | | | | | | | | | | | | | | |
Total Return(b) | | | 6.01 | % | | | (5.02 | )% | | | 13.32 | % | | | 42.88 | % | | | 11.15 | % |
Ratios/Supplemental Data: | | | | | | | | | | | | | | | | | | | | |
Net Assets, End of Period (in 000’s) | | $ | 1,374,982 | | | $ | 1,861,753 | | | $ | 2,432,815 | | | $ | 2,370,432 | | | $ | 1,561,510 | |
Ratios of expenses to average net assets: | | | | | | | | | | | | | | | | | | | | |
Before expense reimbursement and/or fee waiver | | | 1.12 | % | | | 1.11 | % | | | 1.10 | % | | | 1.11 | % | | | 1.11 | %(c) |
After expense reimbursement and/or fee waiver | | | 1.12 | % | | | 1.11 | % | | | 1.10 | % | | | 1.11 | % | | | 1.11 | %(c) |
Ratios of net investment income (loss) to average net assets: | | | | | | | | | | | | | | | | | | | | |
Before expense reimbursement and/or fee waiver | | | 0.44 | % | | | 0.27 | % | | | (0.12 | )% | | | 0.42 | % | | | 0.50 | % |
After expense reimbursement and/or fee waiver | | | 0.44 | % | | | 0.27 | % | | | (0.12 | )% | | | 0.42 | % | | | 0.50 | % |
Portfolio Turnover | | | 24 | % | | | 32 | % | | | 50 | % | | | 37 | % | | | 28 | %(d) |
| (a) | Per share numbers have been calculated using average shares. |
| (b) | The total return is calculated using the published Net Asset Value as of fiscal year end. |
| (c) | Ratios of expenses to average net assets include interest expense of less than 0.005% for the fiscal year ended October 31, 2012, which is not included in the contractual expense limitation. The interest expense is a result of utilizing the line of credit, as discussed in Note G to the Financial Statements. |
| (d) | Portfolio turnover rate excludes securities delivered from processing a redemption in-kind. |
The accompanying notes are an integral part of these financial statements.
137
| | |
| AMG Funds | | |
| |
| AMG Managers Fairpointe Mid Cap Fund – Class I | | October 31, 2016 |
| |
| Financial Highlights | | |
| | | | | | | | | | | | | | | | | | | | |
| | | Year
Ended
10/31/16 | | | Year
Ended
10/31/15 | | | Year
Ended
10/31/14 | | | Year
Ended
10/31/13 | | | Year
Ended
10/31/12 | |
Net Asset Value, Beginning of Year | | $ | 38.44 | | | $ | 47.74 | | | $ | 46.10 | | | $ | 33.28 | | | $ | 30.20 | |
| | | | | | | | | | | | | | | | | | | | |
Income from Investment Operations: | | | | | | | | | | | | | | | | | | | | |
Net investment income | | | 0.25 | (a) | | | 0.23 | | | | 0.05 | | | | 0.28 | | | | 0.24 | |
Net realized and unrealized gain (loss) on investments | | | 1.98 | | | | (1.89 | ) | | | 5.92 | | | | 13.67 | | | | 3.18 | |
| | | | | | | | | | | | | | | | | | | | |
Total from investment operations | | | 2.23 | | | | (1.66 | ) | | | 5.97 | | | | 13.95 | | | | 3.42 | |
| | | | | | | | | | | | | | | | | | | | |
Less Distributions: | | | | | | | | | | | | | | | | | | | | |
Distributions from and in excess of net investment income | | | (0.23 | ) | | | (0.06 | ) | | | (0.06 | ) | | | (0.39 | ) | | | (0.13 | ) |
Distributions from net realized gain on investment | | | (2.05 | ) | | | (7.58 | ) | | | (4.27 | ) | | | (0.74 | ) | | | (0.21 | ) |
| | | | | | | | | | | | | | | | | | | | |
Total distributions | | | (2.28 | ) | | | (7.64 | ) | | | (4.33 | ) | | | (1.13 | ) | | | (0.34 | ) |
| | | | | | | | | | | | | | | | | | | | |
Net increase (decrease) in net asset value | | | (0.05 | ) | | | (9.30 | ) | | | 1.64 | | | | 12.82 | | | | 3.08 | |
| | | | | | | | | | | | | | | | | | | | |
Net Asset Value, End of Year | | $ | 38.39 | | | $ | 38.44 | | | $ | 47.74 | | | $ | 46.10 | | | $ | 33.28 | |
| | | | | | | | | | | | | | | | | | | | |
Total Return(b) | | | 6.26 | % | | | (4.78 | )% | | | 13.61 | % | | | 43.23 | % | | | 11.46 | % |
Ratios/Supplemental Data: | | | | | | | | | | | | | | | | | | | | |
Net Assets, End of Period (in 000’s) | | $ | 2,135,998 | | | $ | 2,838,642 | | | $ | 3,531,114 | | | $ | 2,521,876 | | | $ | 1,464,222 | |
Ratios of expenses to average net assets: | | | | | | | | | | | | | | | | | | | | |
Before expense reimbursement and/or fee waiver | | | 0.87 | % | | | 0.86 | % | | | 0.85 | % | | | 0.86 | % | | | 0.86 | %(c) |
After expense reimbursement and/or fee waiver | | | 0.87 | % | | | 0.86 | % | | | 0.85 | % | | | 0.86 | % | | | 0.86 | %(c) |
Ratios of net investment income to average net assets: | | | | | | | | | | | | | | | | | | | | |
Before expense reimbursement and/or fee waiver | | | 0.68 | % | | | 0.52 | % | | | 0.13 | % | | | 0.67 | % | | | 0.75 | % |
After expense reimbursement and/or fee waiver | | | 0.68 | % | | | 0.52 | % | | | 0.13 | % | | | 0.67 | % | | | 0.75 | % |
Portfolio Turnover | | | 24 | % | | | 32 | % | | | 50 | % | | | 37 | % | | | 28 | %(d) |
| (a) | Per share numbers have been calculated using average shares. |
| (b) | The total return is calculated using the published Net Asset Value as of fiscal year end. |
| (c) | Ratios of expenses to average net assets include interest expense of less than 0.005% for the fiscal year ended October 31, 2012, which is not included in the contractual expense limitation. The interest expense is a result of utilizing the line of credit, as discussed in Note G to the Financial Statements. |
| (d) | Portfolio turnover rate excludes securities delivered from processing a redemption in-kind. |
The accompanying notes are an integral part of these financial statements.
138
| | |
| AMG Funds | | |
| |
| AMG Managers Montag & Caldwell Mid Cap Growth Fund – Class N | | October 31, 2016 |
| |
| Financial Highlights | | |
| | | | | | | | | | | | | | | | | | | | |
| | | Year
Ended
10/31/16 | | | Year
Ended
10/31/15 | | | Year
Ended
10/31/14 | | | Year
Ended
10/31/13 | | | Year
Ended
10/31/12 | |
Net Asset Value, Beginning of Year | | $ | 11.57 | | | $ | 11.99 | | | $ | 12.77 | | | $ | 10.36 | | | $ | 9.71 | |
| | | | | | | | | | | | | | | | | | | | |
Income from Investment Operations: | | | | | | | | | | | | | | | | | | | | |
Net investment loss | | | (0.07 | )(a) | | | (0.08 | ) | | | (0.06 | )(a) | | | (0.07 | ) | | | (0.07 | )(a) |
Net realized and unrealized gain on investments | | | 0.02 | | | | 0.65 | | | | 1.20 | | | | 2.58 | | | | 0.72 | |
| | | | | | | | | | | | | | | | | | | | |
Total from investment operations | | | (0.05 | ) | | | 0.57 | | | | 1.14 | | | | 2.51 | | | | 0.65 | |
| | | | | | | | | | | | | | | | | | | | |
Less Distributions: | | | | | | | | | | | | | | | | | | | | |
Distributions from net realized gain on investments | | | (1.33 | ) | | | (0.99 | ) | | | (1.92 | ) | | | (0.10 | ) | | | — | |
| | | | | | | | | | | | | | | | | | | | |
Total distributions | | | (1.33 | ) | | | (0.99 | ) | | | (1.92 | ) | | | (0.10 | ) | | | — | |
| | | | | | | | | | | | | | | | | | | | |
Net increase (decrease) in net asset value | | | (1.38 | ) | | | (0.42 | ) | | | (0.78 | ) | | | 2.41 | | | | 0.65 | |
| | | | | | | | | | | | | | | | | | | | |
Net Asset Value, End of Year | | $ | 10.19 | | | $ | 11.57 | | | $ | 11.99 | | | $ | 12.77 | | | $ | 10.36 | |
| | | | | | | | | | | | | | | | | | | | |
Total Return(b) | | | (0.60 | )% | | | 4.81 | % | | | 9.75 | % | | | 24.51 | % | | | 6.70 | % |
Ratios/Supplemental Data: | | | | | | | | | | | | | | | | | | | | |
Net Assets, End of Period (in 000’s) | | $ | 4,216 | | | $ | 4,890 | | | $ | 7,633 | | | $ | 11,402 | | | $ | 7,369 | |
Ratios of expenses to average net assets: | | | | | | | | | | | | | | | | | | | | |
Before expense reimbursement and/or fee waiver | | | 2.12 | % | | | 2.10 | % | | | 2.16 | % | | | 1.85 | % | | | 2.50 | % |
After expense reimbursement and/or fee waiver | | | 1.25 | %(d) | | | 1.25 | % | | | 1.25 | % | | | 1.25 | % | | | 1.25 | %(c) |
Ratios of net investment loss to average net assets: | | | | | | | | | | | | | | | | | | | | |
Before expense reimbursement and/or fee waiver | | | (1.51 | )% | | | (1.46 | )% | | | (1.45 | )% | | | (1.18 | )% | | | (1.88 | )% |
After expense reimbursement and/or fee waiver | | | (0.64 | )% | | | (0.60 | )% | | | (0.55 | )% | | | (0.58 | )% | | | (0.63 | )% |
Portfolio Turnover | | | 39 | % | | | 58 | % | | | 33 | % | | | 74 | % | | | 37 | % |
| (a) | Per share numbers have been calculated using average shares. |
| (b) | The total return is calculated using the published Net Asset Value as of fiscal year end. |
| (c) | Effective September 30, 2011, the Adviser implemented a voluntary expense limitation of 1.25%. Subsequently, on February 29, 2012, the Investment Manager removed the voluntary expense limitation and replaced it with a contractual expense limitation of 1.25%. |
| (d) | Effective October 1, 2016, the Fund’s expense cap was reduced to 0.95% from 1.25%. The expense ratio shown reflects the weighted average expense ratio for the full fiscal year ended October 31, 2016 (See Note F). |
The accompanying notes are an integral part of these financial statements.
139
| | |
| AMG Funds | | |
| |
| AMG Managers Montag & Caldwell Mid Cap Growth Fund – Class I | | October 31, 2016 |
| |
| Financial Highlights | | |
| | | | | | | | | | | | |
| | | Year
Ended
10/31/16 | | | Year
Ended
10/31/15 | | | Period
Ended
10/31/14(a) | |
Net Asset Value, Beginning of Year | | $ | 11.61 | | | $ | 12.00 | | | $ | 11.36 | |
| | | | | | | | | | | | |
Income from Investment Operations: | | | | | | | | | | | | |
Net investment loss | | | (0.04 | )(b) | | | (0.04 | ) | | | (0.04 | )(b) |
Net realized and unrealized gain on investments | | | 0.01 | | | | 0.64 | | | | 0.68 | |
| | | | | | | | | | | | |
Total from investment operations | | | (0.03 | ) | | | 0.60 | | | | 0.64 | |
| | | | | | | | | | | | |
Less Distributions: | | | | | | | | | | | | |
Distributions from net realized gain on investments | | | (1.33 | ) | | | (0.99 | ) | | | — | |
| | | | | | | | | | | | |
Total distributions | | | (1.33 | ) | | | (0.99 | ) | | | — | |
| | | | | | | | | | | | |
Net increase (decrease) in net asset value | | | (1.36 | ) | | | (0.39 | ) | | | 0.64 | |
| | | | | | | | | | | | |
Net Asset Value, End of Year | | $ | 10.25 | | | $ | 11.61 | | | $ | 12.00 | |
| | | | | | | | | | | | |
Total Return(c) | | | (0.41 | )% | | | 5.08 | % | | | 5.63 | %(d) |
Ratios/Supplemental Data: | | | | | | | | | | | | |
Net Assets, End of Period (in 000’s) | | $ | 3,982 | | | $ | 6,163 | | | $ | 3,867 | |
Ratios of expenses to average net assets: | | | | | | | | | | | | |
Before expense reimbursement and/or fee waiver | | | 1.86 | % | | | 1.85 | % | | | 2.27 | %(f) |
After expense reimbursement and/or fee waiver | | | 1.00 | %(e) | | | 1.00 | % | | | 1.00 | %(f) |
Ratios of net investment loss to average net assets: | | | | | | | | | | | | |
Before expense reimbursement and/or fee waiver | | | (1.24 | )% | | | (1.21 | )% | | | (1.95 | )%(f) |
After expense reimbursement and/or fee waiver | | | (0.38 | )% | | | (0.35 | )% | | | (0.68 | )%(f) |
Portfolio Turnover | | | 39 | % | | | 58 | % | | | 33 | %(d) |
| (a) | The commencement of investment operations for AMG Managers Montag & Caldwell Mid Cap Growth Fund Class I shares was May 13, 2014. |
| (b) | Per share numbers have been calculated using average shares. |
| (c) | The total return is calculated using the published Net Asset Value as of fiscal year end. |
| (e) | Effective October 1, 2016, the Fund’s expense cap was reduced to 0.95% from 1.00%. The expense ratio shown reflects the weighted average expense ratio for the full fiscal year ended October 31, 2016 (See Note F). |
The accompanying notes are an integral part of these financial statements.
140
| | |
| AMG Funds | | |
| |
| AMG Managers LMCG Small Cap Growth Fund – Class N | | October 31, 2016 |
| |
| Financial Highlights | | |
| | | | | | | | | | | | | | | | | | | | |
| | | Year
Ended
10/31/16 | | | Year
Ended
10/31/15 | | | Year
Ended
10/31/14 | | | Year
Ended
10/31/13 | | | Year
Ended
10/31/12 | |
Net Asset Value, Beginning of Year | | $ | 14.47 | | | $ | 14.76 | | | $ | 14.71 | | | $ | 11.42 | | | $ | 9.95 | |
| | | | | | | | | | | | | | | | | | | | |
Income from Investment Operations: | | | | | | | | | | | | | | | | | | | | |
Net investment income (loss)(a) | | | (0.11 | ) | | | (0.15 | ) | | | (0.13 | ) | | | 0.00 | (b) | | | (0.12 | ) |
Net realized and unrealized gain (loss) on investments | | | (2.17 | ) | | | 0.40 | | | | 2.21 | | | | 4.18 | | | | 1.59 | |
| | | | | | | | | | | | | | | | | | | | |
Total from investment operations | | | (2.28 | ) | | | 0.25 | | | | 2.08 | | | | 4.18 | | | | 1.47 | |
| | | | | | | | | | | | | | | | | | | | |
Less Distributions: | | | | | | | | | | | | | | | | | | | | |
Distributions from net realized gain on investments | | | (0.00 | )(b) | | | (0.54 | ) | | | (2.03 | ) | | | (0.89 | ) | | | — | |
| | | | | | | | | | | | | | | | | | | | |
Total distributions | | | (0.00 | )(b) | | | (0.54 | ) | | | (2.03 | ) | | | (0.89 | ) | | | — | |
| | | | | | | | | | | | | | | | | | | | |
Net increase (decrease) in net asset value | | | (2.28 | ) | | | (0.29 | ) | | | 0.05 | | | | 3.29 | | | | 1.47 | |
| | | | | | | | | | | | | | | | | | | | |
Net Asset Value, End of Year | | $ | 12.19 | | | $ | 14.47 | | | $ | 14.76 | | | $ | 14.71 | | | $ | 11.42 | |
| | | | | | | | | | | | | | | | | | | | |
Total Return(c) | | | (15.74 | )% | | | 1.65 | % | | | 15.18 | % | | | 39.31 | % | | | 14.77 | % |
Ratios/Supplemental Data: | | | | | | | | | | | | | | | | | | | | |
Net Assets, End of Period (in 000’s) | | $ | 53,816 | | | $ | 154,394 | | | $ | 37,099 | | | $ | 32,045 | | | $ | 5,659 | |
Ratios of expenses to average net assets: | | | | | | | | | | | | | | | | | | | | |
Before expense reimbursement and/or fee waiver | | | 1.51 | % | | | 1.53 | % | | | 1.67 | % | | | 2.03 | % | | | 2.86 | % |
After expense reimbursement and/or fee waiver | | | 1.35 | %(d) | | | 1.35 | % | | | 1.35 | % | | | 1.35 | % | | | 1.35 | % |
Ratios of net investment income (loss) to average net assets: | | | | | | | | | | | | | | | | | | | | |
Before expense reimbursement and/or fee waiver | | | (1.00 | )% | | | (1.18 | )% | | | (1.22 | )% | | | (0.66 | )% | | | (2.68 | )% |
After expense reimbursement and/or fee waiver | | | (0.84 | )% | | | (1.00 | )% | | | (0.90 | )% | | | 0.02 | % | | | (1.17 | )% |
Portfolio Turnover | | | 138 | % | | | 79 | % | | | 144 | % | | | 186 | %(e) | | | 168 | %(f) |
| (a) | Per share numbers have been calculated using average shares. |
| (b) | Less than $0.005 or $(0.005) per share. |
| (c) | The total return is calculated using the published Net Asset Value as of fiscal year end. |
| (d) | Effective October 1, 2016, the Fund’s expense cap was reduced to 1.03% from 1.35%. The expense ratio shown reflects the weighted average expense ratio for the full fiscal year ended October 31, 2016 (See Note F). |
| (e) | Portfolio turnover rate excludes securities received from the reorganization. |
| (f) | Portfolio turnover rate excludes securities delivered from processing a redemption in-kind. |
The accompanying notes are an integral part of these financial statements.
141
| | |
| AMG Funds | | |
| |
| AMG Managers LMCG Small Cap Growth Fund – Class I | | October 31, 2016 |
| |
| Financial Highlights | | |
| | | | | | | | | | | | | | | | | | | | |
| | | Year
Ended
10/31/16 | | | Year
Ended
10/31/15 | | | Year
Ended
10/31/14 | | | Year
Ended
10/31/13 | | | Year
Ended
10/31/12 | |
Net Asset Value, Beginning of Year | | $ | 14.64 | | | $ | 14.89 | | | $ | 14.81 | | | $ | 11.46 | | | $ | 9.97 | |
| | | | | | | | | | | | | | | | | | | | |
Income from Investment Operations: | | | | | | | | | | | | | | | | | | | | |
Net investment income (loss)(a) | | | (0.08 | ) | | | (0.12 | ) | | | (0.09 | ) | | | 0.04 | | | | (0.10 | ) |
Net realized and unrealized gain (loss) on investments | | | (2.20 | ) | | | 0.41 | | | | 2.23 | | | | 4.20 | | | | 1.59 | |
| | | | | | | | | | | | | | | | | | | | |
Total from investment operations | | | (2.28 | ) | | | 0.29 | | | | 2.14 | | | | 4.24 | | | | 1.49 | |
| | | | | | | | | | | | | | | | | | | | |
Less Distributions: | | | | | | | | | | | | | | | | | | | | |
Distributions from and in excess of net investment income | | | — | | | | — | | | | (0.03 | ) | | | — | | | | — | |
Distributions from net realized gain on investments | | | (0.00 | )(b) | | | (0.54 | ) | | | (2.03 | ) | | | (0.89 | ) | | | — | |
| | | | | | | | | | | | | | | | | | | | |
Total distributions | | | (0.00 | )(b) | | | (0.54 | ) | | | (2.06 | ) | | | (0.89 | ) | | | — | |
| | | | | | | | | | | | | | | | | | | | |
Net increase (decrease) in net asset value | | | (2.28 | ) | | | (0.25 | ) | | | 0.08 | | | | 3.35 | | | | 1.49 | |
| | | | | | | | | | | | | | | | | | | | |
Net Asset Value, End of Year | | $ | 12.36 | | | $ | 14.64 | | | $ | 14.89 | | | $ | 14.81 | | | $ | 11.46 | |
| | | | | | | | | | | | | | | | | | | | |
Total Return(c) | | | (15.56 | )% | | | 1.91 | % | | | 15.51 | % | | | 39.72 | % | | | 14.95 | % |
Ratios/Supplemental Data: | | | | | | | | | | | | | | | | | | | | |
Net Assets, End of Period (in 000’s) | | $ | 58,020 | | | $ | 76,989 | | | $ | 15,083 | | | $ | 8,496 | | | $ | 755 | |
Ratios of expenses to average net assets: | | | | | | | | | | | | | | | | | | | | |
Before expense reimbursement and/or fee waiver | | | 1.25 | % | | | 1.28 | % | | | 1.42 | % | | | 1.78 | % | | | 2.61 | % |
After expense reimbursement and/or fee waiver | | | 1.10 | %(d) | | | 1.10 | % | | | 1.10 | % | | | 1.10 | % | | | 1.10 | % |
Ratios of net investment income (loss) to average net assets: | | | | | | | | | | | | | | | | | | | | |
Before expense reimbursement and/or fee waiver | | | (0.74 | )% | | | (0.93 | )% | | | (0.97 | )% | | | (0.41 | )% | | | (2.43 | )% |
After expense reimbursement and/or fee waiver | | | (0.59 | )% | | | (0.75 | )% | | | (0.65 | )% | | | 0.27 | % | | | (0.92 | )% |
Portfolio Turnover | | | 138 | % | | | 79 | % | | | 144 | % | | | 186 | %(e) | | | 168 | %(f) |
| (a) | Per share numbers have been calculated using average shares. |
| (b) | Less than $0.005 or $(0.005) per share. |
| (c) | The total return is calculated using the published Net Asset Value as of fiscal year end. |
| (d) | Effective October 1, 2016, the Fund’s expense cap was reduced to 1.03% from 1.10%. The expense ratio shown reflects the weighted average expense ratio for the full fiscal year ended October 31, 2016 (See Note F). |
| (e) | Portfolio turnover rate excludes securities received from the reorganization. |
| (f) | Portfolio turnover rate excludes securities delivered from processing a redemption in-kind. |
The accompanying notes are an integral part of these financial statements.
142
| | |
| AMG Funds | | |
| |
| AMG River Road Select Value Fund – Class N | | October 31, 2016 |
| |
| Financial Highlights | | |
| | | | | | | | | | | | | | | | | | | | |
| | | Year
Ended
10/31/16 | | | Year
Ended
10/31/15 | | | Year
Ended
10/31/14 | | | Year
Ended
10/31/13 | | | Year
Ended
10/31/12 | |
Net Asset Value, Beginning of Year | | $ | 7.63 | | | $ | 8.77 | | | $ | 10.28 | | | $ | 8.50 | | | $ | 9.54 | |
| | | | | | | | | | | | | | | | | | | | |
Income from Investment Operations: | | | | | | | | | | | | | | | | | | | | |
Net investment income (loss)(a) | | | (0.04 | ) | | | (0.04 | ) | | | (0.03 | ) | | | 0.07 | | | | 0.01 | |
Net realized and unrealized gain on investments | | | 0.56 | | | | 0.33 | | | | 0.03 | | | | 2.34 | | | | 1.01 | |
| | | | | | | | | | | | | | | | | | | | |
Total from investment operations | | | 0.52 | | | | 0.29 | | | | — | | | | 2.41 | | | | 1.02 | |
| | | | | | | | | | | | | | | | | | | | |
Less Distributions: | | | | | | | | | | | | | | | | | | | | |
Distributions from net investment income | | | — | | | | — | | | | (0.02 | ) | | | (0.12 | ) | | | — | |
Distributions from net realized gain on investments | | | (1.11 | ) | | | (1.43 | ) | | | (1.49 | ) | | | (0.51 | ) | | | (2.06 | ) |
| | | | | | | | | | | | | | | | | | | | |
Total distributions | | | (1.11 | ) | | | (1.43 | ) | | | (1.51 | ) | | | (0.63 | ) | | | (2.06 | ) |
| | | | | | | | | | | | | | | | | | | | |
Net increase (decrease) in net asset value | | | (0.59 | ) | | | (1.14 | ) | | | (1.51 | ) | | | 1.78 | | | | (1.04 | ) |
| | | | | | | | | | | | | | | | | | | | |
Net Asset Value, End of Year | | $ | 7.04 | | | $ | 7.63 | | | $ | 8.77 | | | $ | 10.28 | | | $ | 8.50 | |
| | | | | | | | | | | | | | | | | | | | |
Total Return(b) | | | 8.55 | % | | | 3.26 | % | | | (0.23 | )% | | | 30.44 | % | | | 12.87 | % |
Ratios/Supplemental Data: | | | | | | | | | | | | | | | | | | | | |
Net Assets, End of Period (in 000’s) | | $ | 4,942 | | | $ | 5,038 | | | $ | 8,388 | | | $ | 19,099 | | | $ | 6,270 | |
Ratios of expenses to average net assets: | | | | | | | | | | | | | | | | | | | | |
Before expense reimbursement and/or fee waiver, or recoupment | | | 1.62 | % | | | 1.49 | % | | | 1.45 | % | | | 1.46 | % | | | 1.43 | %(c) |
After expense reimbursement and/or fee waiver, or recoupment | | | 1.50 | %(d) | | | 1.49 | % | | | 1.45 | % | | | 1.46 | % | | | 1.43 | %(c) |
Ratios of net investment income (loss) to average net assets: | | | | | | | | | | | | | | | | | | | | |
Before expense reimbursement and/or fee waiver, or recoupment | | | (0.65 | )% | | | (0.52 | )% | | | (0.36 | )% | | | 0.78 | % | | | 0.07 | % |
After expense reimbursement and/or fee waiver, or recoupment | | | (0.52 | )% | | | (0.52 | )% | | | (0.36 | )% | | | 0.78 | % | | | 0.07 | % |
Portfolio Turnover | | | 65 | % | | | 59 | % | | | 64 | % | | | 71 | % | | | 39 | % |
| (a) | Per share numbers have been calculated using average shares. |
| (b) | The total return is calculated using the published Net Asset Value as of fiscal year end. |
| (c) | Ratios of expenses to average net assets include interest expense of less than 0.005% for the fiscal year ended October 31, 2012, which is not included in the contractual expense limitation. The interest expense is a result of utilizing the line of credit, as discussed in Note G to the Financial Statements. |
| (d) | Effective October 1, 2016, the Fund’s expense cap was reduced to 1.19% from 1.50%. The expense ratio shown reflects the weighted average expense ratio for the full fiscal year ended October 31, 2016 (See Note F). |
The accompanying notes are an integral part of these financial statements.
143
| | |
| AMG Funds | | |
| |
| AMG River Road Select Value Fund – Class I | | October 31, 2016 |
| |
| Financial Highlights | | |
| | | | | | | | | | | | | | | | | | | | |
| | | Year
Ended
10/31/16 | | | Year
Ended
10/31/15 | | | Year
Ended
10/31/14 | | | Year
Ended
10/31/13 | | | Year
Ended
10/31/12 | |
Net Asset Value, Beginning of Year | | $ | 7.76 | | | $ | 8.88 | | | $ | 10.38 | | | $ | 8.58 | | | $ | 9.59 | |
| | | | | | | | | | | | | | | | | | | | |
Income from Investment Operations: | | | | | | | | | | | | | | | | | | | | |
Net investment income (loss)(a) | | | (0.02 | ) | | | (0.02 | ) | | | (0.01 | ) | | | 0.10 | | | | 0.03 | |
Net realized and unrealized gain on investments | | | 0.55 | | | | 0.33 | | | | 0.04 | | | | 2.36 | | | | 1.02 | |
| | | | | | | | | | | | | | | | | | | | |
Total from investment operations | | | 0.53 | | | | 0.31 | | | | 0.03 | | | | 2.46 | | | | 1.05 | |
| | | | | | | | | | | | | | | | | | | | |
Less Distributions: | | | | | | | | | | | | | | | | | | | | |
Distributions from net investment income | | | (0.02 | ) | | | — | | | | (0.04 | ) | | | (0.15 | ) | | | — | |
Distributions from net realized gain on investments | | | (1.11 | ) | | | (1.43 | ) | | | (1.49 | ) | | | (0.51 | ) | | | (2.06 | ) |
| | | | | | | | | | | | | | | | | | | | |
Total distributions | | | (1.13 | ) | | | (1.43 | ) | | | (1.53 | ) | | | (0.66 | ) | | | (2.06 | ) |
| | | | | | | | | | | | | | | | | | | | |
Net increase (decrease) in net asset value | | | (0.60 | ) | | | (1.12 | ) | | | (1.50 | ) | | | 1.80 | | | | (1.01 | ) |
| | | | | | | | | | | | | | | | | | | | |
Net Asset Value, End of Year | | $ | 7.16 | | | $ | 7.76 | | | $ | 8.88 | | | $ | 10.38 | | | $ | 8.58 | |
| | | | | | | | | | | | | | | | | | | | |
Total Return(b) | | | 8.64 | % | | | 3.60 | % | | | 0.00 | % | | | 30.74 | % | | | 13.18 | % |
Ratios/Supplemental Data: | | | | | | | | | | | | | | | | | | | | |
Net Assets, End of Period (in 000’s) | | $ | 34,913 | | | $ | 92,073 | | | $ | 176,166 | | | $ | 198,220 | | | $ | 156,510 | |
Ratios of expenses to average net assets: | | | | | | | | | | | | | | | | | | | | |
Before expense reimbursement and/or fee waiver, or recoupment | | | 1.38 | % | | | 1.24 | % | | | 1.20 | % | | | 1.21 | % | | | 1.18 | %(c) |
After expense reimbursement and/or fee waiver, or recoupment | | | 1.25 | %(d) | | | 1.24 | % | | | 1.20 | % | | | 1.21 | % | | | 1.18 | %(c) |
Ratios of net investment income (loss) to average net assets: | | | | | | | | | | | | | | | | | | | | |
Before expense reimbursement and/or fee waiver, or recoupment | | | (0.37 | )% | | | (0.27 | )% | | | (0.11 | )% | | | 1.03 | % | | | 0.32 | % |
After expense reimbursement and/or fee waiver, or recoupment | | | (0.24 | )% | | | (0.27 | )% | | | (0.11 | )% | | | 1.03 | % | | | 0.32 | % |
Portfolio Turnover | | | 65 | % | | | 59 | % | | | 64 | % | | | 71 | % | | | 39 | % |
| (a) | Per share numbers have been calculated using average shares. |
| (b) | The total return is calculated using the published Net Asset Value as of fiscal year end. |
| (c) | Ratios of expenses to average net assets include interest expense of less than 0.005% for the fiscal year ended October 31, 2012, which is not included in the contractual expense limitation. The interest expense is a result of utilizing the line of credit, as discussed in Note G to the Financial Statements. |
| (d) | Effective October 1, 2016, the Fund’s expense cap was reduced to 1.19% from 1.25%. The expense ratio shown reflects the weighted average expense ratio for the full fiscal year ended October 31, 2016 (See Note F). |
The accompanying notes are an integral part of these financial statements.
144
| | |
| AMG Funds | | |
| |
| AMG River Road Small Cap Value Fund – Class N | | October 31, 2016 |
| |
| Financial Highlights | | |
| | | | | | | | | | | | | | | | | | | | |
| | | Year
Ended
10/31/16 | | | Year
Ended
10/31/15 | | | Year
Ended
10/31/14 | | | Year
Ended
10/31/13 | | | Year
Ended
10/31/12 | |
Net Asset Value, Beginning of Year | | $ | 12.20 | | | $ | 13.53 | | | $ | 17.05 | | | $ | 13.56 | | | $ | 12.20 | |
| | | | | | | | | | | | | | | | | | | | |
Income from Investment Operations: | | | | | | | | | | | | | | | | | | | | |
Net investment income (loss) | | | (0.04 | )(a) | | | (0.06 | )(a) | | | (0.04 | )(a) | | | 0.16 | | | | 0.03 | (a) |
Net realized and unrealized gain on investments | | | 0.85 | | | | 0.72 | | | | 0.14 | | | | 3.98 | | | | 1.33 | |
| | | | | | | | | | | | | | | | | | | | |
Total from investment operations | | | 0.81 | | | | 0.66 | | | | 0.10 | | | | 4.14 | | | | 1.36 | |
| | | | | | | | | | | | | | | | | | | | |
Less Distributions: | | | | | | | | | | | | | | | | | | | | |
Distributions from and in excess of net investment income | | | — | | | | — | | | | (0.04 | ) | | | (0.22 | ) | | | — | |
Distributions from net realized gain on investments | | | (0.72 | ) | | | (1.99 | ) | | | (3.58 | ) | | | (0.43 | ) | | | — | |
| | | | | | | | | | | | | | | | | | | | |
Total distributions | | | (0.72 | ) | | | (1.99 | ) | | | (3.62 | ) | | | (0.65 | ) | | | — | |
| | | | | | | | | | | | | | | | | | | | |
Net increase (decrease) in net asset value | | | 0.09 | | | | (1.33 | ) | | | (3.52 | ) | | | 3.49 | | | | 1.36 | |
| | | | | | | | | | | | | | | | | | | | |
Net Asset Value, End of Year | | $ | 12.29 | | | $ | 12.20 | | | $ | 13.53 | | | $ | 17.05 | | | $ | 13.56 | |
| | | | | | | | | | | | | | | | | | | | |
Total Return(b) | | | 7.22 | % | | | 5.15 | % | | | (0.05 | )% | | | 31.98 | % | | | 11.15 | % |
Ratios/Supplemental Data: | | | | | | | | | | | | | | | | | | | | |
Net Assets, End of Period (in 000’s) | | $ | 21,765 | | | $ | 25,246 | | | $ | 49,049 | | | $ | 56,793 | | | $ | 49,154 | |
Ratios of expenses to average net assets: | | | | | | | | | | | | | | | | | | | | |
Before expense reimbursement and/or fee waiver | | | 1.34 | % | | | 1.34 | % | | | 1.33 | % | | | 1.34 | % | | | 1.37 | % |
After expense reimbursement and/or fee waiver | | | 1.34 | % | | | 1.34 | % | | | 1.33 | % | | | 1.34 | % | | | 1.37 | % |
Ratios of net investment income (loss) to average net assets: | | | | | | | | | | | | | | | | | | | | |
Before expense reimbursement and/or fee waiver | | | (0.32 | )% | | | (0.45 | )% | | | (0.26 | )% | | | 1.03 | % | | | 0.22 | % |
After expense reimbursement and/or fee waiver | | | (0.31 | )% | | | (0.45 | )% | | | (0.26 | )% | | | 1.03 | % | | | 0.22 | % |
Portfolio Turnover | | | 57 | % | | | 61 | % | | | 66 | % | | | 56 | % | | | 27 | % |
| (a) | Per share numbers have been calculated using average shares. |
| (b) | The total return is calculated using the published Net Asset Value as of fiscal year end. |
The accompanying notes are an integral part of these financial statements.
145
| | |
| AMG Funds | | |
| |
| AMG River Road Small Cap Value Fund – Class I | | October 31, 2016 |
| |
| Financial Highlights | | |
| | | | | | | | | | | | | | | | | | | | |
| | | Year
Ended
10/31/16 | | | Year
Ended
10/31/15 | | | Year
Ended
10/31/14 | | | Year
Ended
10/31/13 | | | Year
Ended
10/31/12 | |
Net Asset Value, Beginning of Year | | $ | 12.31 | | | $ | 13.60 | | | $ | 17.13 | | | $ | 13.62 | | | $ | 12.22 | |
| | | | | | | | | | | | | | | | | | | | |
Income from Investment Operations: | | | | | | | | | | | | | | | | | | | | |
Net investment income (loss) | | | (0.01 | )(a) | | | (0.03 | )(a) | | | (0.00 | )(a)(b) | | | 0.19 | | | | 0.06 | (a) |
Net realized and unrealized gain on investments | | | 0.86 | | | | 0.73 | | | | 0.13 | | | | 4.01 | | | | 1.34 | |
| | | | | | | | | | | | | | | | | | | | |
Total from investment operations | | | 0.85 | | | | 0.70 | | | | 0.13 | | | | 4.20 | | | | 1.40 | |
| | | | | | | | | | | | | | | | | | | | |
Less Distributions: | | | | | | | | | | | | | | | | | | | | |
Distributions from and in excess of net investment income | | | — | | | | — | | | | (0.08 | ) | | | (0.26 | ) | | | — | |
Distributions from net realized gain on investments | | | (0.72 | ) | | | (1.99 | ) | | | (3.58 | ) | | | (0.43 | ) | | | — | |
| | | | | | | | | | | | | | | | | | | | |
Total distributions | | | (0.72 | ) | | | (1.99 | ) | | | (3.66 | ) | | | (0.69 | ) | | | — | |
| | | | | | | | | | | | | | | | | | | | |
Net increase (decrease) in net asset value | | | 0.13 | | | | (1.29 | ) | | | (3.53 | ) | | | 3.51 | | | | 1.40 | |
| | | | | | | | | | | | | | | | | | | | |
Net Asset Value, End of Year | | $ | 12.44 | | | $ | 12.31 | | | $ | 13.60 | | | $ | 17.13 | | | $ | 13.62 | |
| | | | | | | | | | | | | | | | | | | | |
Total Return(c) | | | 7.50 | % | | | 5.45 | % | | | 0.16 | % | | | 32.36 | % | | | 11.46 | % |
Ratios/Supplemental Data: | | | | | | | | | | | | | | | | | | | | |
Net Assets, End of Period (in 000’s) | | $ | 246,753 | | | $ | 245,192 | | | $ | 250,173 | | | $ | 252,804 | | | $ | 240,075 | |
Ratios of expenses to average net assets: | | | | | | | | | | | | | | | | | | | | |
Before expense reimbursement and/or fee waiver | | | 1.09 | % | | | 1.09 | % | | | 1.08 | % | | | 1.09 | % | | | 1.12 | % |
After expense reimbursement and/or fee waiver | | | 1.09 | % | | | 1.09 | % | | | 1.08 | % | | | 1.09 | % | | | 1.12 | % |
Ratios of net investment income (loss) to average net assets: | | | | | | | | | | | | | | | | | | | | |
Before expense reimbursement and/or fee waiver | | | (0.07 | )% | | | (0.20 | )% | | | (0.01 | )% | | | 1.28 | % | | | 0.47 | % |
After expense reimbursement and/or fee waiver | | | (0.06 | )% | | | (0.20 | )% | | | (0.01 | )% | | | 1.28 | % | | | 0.47 | % |
Portfolio Turnover | | | 57 | % | | | 61 | % | | | 66 | % | | | 56 | % | | | 27 | % |
| (a) | Per share numbers have been calculated using average shares. |
| (b) | Represents less than $(0.005) per share. |
| (c) | The total return is calculated using the published Net Asset Value as of fiscal year end. |
The accompanying notes are an integral part of these financial statements.
146
| | |
| AMG Funds | | |
| |
| AMG Managers Silvercrest Small Cap Fund – Class N | | October 31, 2016 |
| |
| Financial Highlights | | |
| | | | | | | | | | | | | | | | | | | | |
| | | Year
Ended
10/31/16 | | | Year
Ended
10/31/15 | | | Year
Ended
10/31/14 | | | Year
Ended
10/31/13 | | | Period
Ended
10/31/12(a) | |
Net Asset Value, Beginning of Year | | $ | 15.20 | | | $ | 15.20 | | | $ | 14.54 | | | $ | 10.90 | | | $ | 10.00 | |
| | | | | | | | | | | | | | | | | | | | |
Income from Investment Operations: | | | | | | | | | | | | | | | | | | | | |
Net investment income | | | 0.02 | (b) | | | 0.01 | (b) | | | 0.01 | | | | 0.01 | (b) | | | 0.01 | |
Net realized and unrealized gain on investments | | | 0.80 | | | | 0.31 | | | | 1.16 | | | | 3.77 | | | | 0.89 | |
| | | | | | | | | | | | | | | | | | | | |
Total from investment operations | | | 0.82 | | | | 0.32 | | | | 1.17 | | | | 3.78 | | | | 0.90 | |
| | | | | | | | | | | | | | | | | | | | |
Less Distributions: | | | | | | | | | | | | | | | | | | | | |
Distributions from and in excess of net investment income | | | (0.04 | ) | | | (0.02 | ) | | | (0.00 | )(c) | | | (0.11 | ) | | | — | |
Distributions from net realized gain on investments | | | (0.55 | ) | | | (0.30 | ) | | | (0.51 | ) | | | (0.03 | ) | | | — | |
| | | | | | | | | | | | | | | | | | | | |
Total distributions | | | (0.59 | ) | | | (0.32 | ) | | | (0.51 | ) | | | (0.14 | ) | | | — | |
| | | | | | | | | | | | | | | | | | | | |
Net increase in net asset value | | | 0.23 | | | | 0.00 | (c) | | | 0.66 | | | | 3.64 | | | | 0.90 | |
| | | | | | | | | | | | | | | | | | | | |
Net Asset Value, End of Year | | $ | 15.43 | | | $ | 15.20 | | | $ | 15.20 | | | $ | 14.54 | | | $ | 10.90 | |
| | | | | | | | | | | | | | | | | | | | |
Total Return(d) | | | 5.73 | % | | | 2.14 | % | | | 8.18 | % | | | 35.09 | % | | | 9.00 | %(e) |
Ratios/Supplemental Data: | | | | | | | | | | | | | | | | | | | | |
Net Assets, End of Period (in 000’s) | | $ | 20,228 | | | $ | 19,061 | | | $ | 6,673 | | | $ | 4,049 | | | $ | 750 | |
Ratios of expenses to average net assets: | | | | | | | | | | | | | | | | | | | | |
Before expense reimbursement and/or fee waiver | | | 1.45 | % | | | 1.47 | % | | | 1.61 | % | | | 2.05 | % | | | 5.10 | %(f) |
After expense reimbursement and/or fee waiver | | | 1.40 | %(g) | | | 1.40 | % | | | 1.40 | % | | | 1.40 | % | | | 1.40 | %(f) |
Ratios of net investment income (loss) to average net assets: | | | | | | | | | | | | | | | | | | | | |
Before expense reimbursement and/or fee waiver | | | 0.11 | % | | | (0.03 | )% | | | (0.17 | )% | | | (0.61 | )% | | | (3.51 | )%(f) |
After expense reimbursement and/or fee waiver | | | 0.16 | % | | | 0.04 | % | | | 0.04 | % | | | 0.04 | % | | | 0.19 | %(f) |
Portfolio Turnover | | | 32 | % | | | 36 | % | | | 32 | % | | | 37 | % | | | 26 | %(e)(h) |
| (a) | The commencement of investment operations for AMG Managers Silvercrest Small Cap Fund Class N shares was December 26, 2011. |
| (b) | Per share numbers have been calculated using average shares. |
| (c) | Represents less than $(0.005) per share. |
| (d) | The total return is calculated using the published Net Asset Value as of fiscal year end. |
| (g) | Effective October 1, 2016, the Fund’s expense cap was reduced to 1.08% from 1.40%. The expense ratio shown reflects the weighted average expense ratio for the full fiscal year ended October 31, 2016 (See Note F). |
| (h) | Portfolio turnover rate excludes securities delivered from processing a redemption in-kind. |
The accompanying notes are an integral part of these financial statements.
147
| | |
| AMG Funds | | |
| |
| AMG Managers Silvercrest Small Cap Fund – Class I | | October 31, 2016 |
| |
| Financial Highlights | | |
| | | | | | | | | | | | | | | | | | | | |
| | | Year
Ended
10/31/16 | | | Year
Ended
10/31/15 | | | Year
Ended
10/31/14 | | | Year
Ended
10/31/13 | | | Period
Ended
10/31/12(a) | |
Net Asset Value, Beginning of Year | | $ | 15.30 | | | $ | 15.27 | | | $ | 14.59 | | | $ | 10.93 | | | $ | 10.00 | |
| | | | | | | | | | | | | | | | | | | | |
Income from Investment Operations: | | | | | | | | | | | | | | | | | | | | |
Net investment income | | | 0.06 | (b) | | | 0.04 | (b) | | | 0.05 | | | | 0.04 | (b) | | | 0.03 | |
Net realized and unrealized gain on investments | | | 0.81 | | | | 0.32 | | | | 1.17 | | | | 3.78 | | | | 0.90 | |
| | | | | | | | | | | | | | | | | | | | |
Total from investment operations | | | 0.87 | | | | 0.36 | | | | 1.22 | | | | 3.82 | | | | 0.93 | |
| | | | | | | | | | | | | | | | | | | | |
Less Distributions: | | | | | | | | | | | | | | | | | | | | |
Distributions from and in excess of net investment income | | | (0.06 | ) | | | (0.03 | ) | | | (0.03 | ) | | | (0.13 | ) | | | — | |
Distributions from net realized gain on investments | | | (0.55 | ) | | | (0.30 | ) | | | (0.51 | ) | | | (0.03 | ) | | | — | |
| | | | | | | | | | | | | | | | | | | | |
Total distributions | | | (0.61 | ) | | | (0.33 | ) | | | (0.54 | ) | | | (0.16 | ) | | | — | |
| | | | | | | | | | | | | | | | | | | | |
Net increase in net asset value | | | 0.26 | | | | 0.03 | | | | 0.68 | | | | 3.66 | | | | 0.93 | |
| | | | | | | | | | | | | | | | | | | | |
Net Asset Value, End of Year | | $ | 15.56 | | | $ | 15.30 | | | $ | 15.27 | | | $ | 14.59 | | | $ | 10.93 | |
| | | | | | | | | | | | | | | | | | | | |
Total Return(c) | | | 6.04 | % | | | 2.37 | % | | | 8.47 | % | | | 35.39 | % | | | 9.30 | %(d) |
Ratios/Supplemental Data: | | | | | | | | | | | | | | | | | | | | |
Net Assets, End of Period (in 000’s) | | $ | 181,964 | | | $ | 145,402 | | | $ | 62,215 | | | $ | 29,219 | | | $ | 4,962 | |
Ratios of expenses to average net assets: | | | | | | | | | | | | | | | | | | | | |
Before expense reimbursement and/or fee waiver | | | 1.21 | % | | | 1.22 | % | | | 1.36 | % | | | 1.80 | % | | | 4.85 | %(e) |
After expense reimbursement and/or fee waiver | | | 1.15 | %(f) | | | 1.15 | % | | | 1.15 | % | | | 1.15 | % | | | 1.15 | %(e) |
Ratios of net investment income (loss) to average net assets: | | | | | | | | | | | | | | | | | | | | |
Before expense reimbursement and/or fee waiver | | | 0.34 | % | | | 0.22 | % | | | 0.08 | % | | | (0.36 | )% | | | (3.26 | )%(e) |
After expense reimbursement and/or fee waiver | | | 0.40 | % | | | 0.29 | % | | | 0.29 | % | | | 0.29 | % | | | 0.44 | %(e) |
Portfolio Turnover | | | 32 | % | | | 36 | % | | | 32 | % | | | 37 | % | | | 26 | %(d)(g) |
| (a) | The commencement of investment operations for AMG Managers Silvercrest Small Cap Fund Class I shares was December 26, 2011. |
| (b) | Per share numbers have been calculated using average shares. |
| (c) | The total return is calculated using the published Net Asset Value as of fiscal year end. |
| (f) | Effective October 1, 2016, the Fund’s expense cap was reduced to 1.08% from 1.15%. The expense ratio shown reflects the weighted average expense ratio for the full fiscal year ended October 31, 2016 (See Note F). |
| (g) | Portfolio turnover rate excludes securities delivered from processing a redemption in-kind. |
The accompanying notes are an integral part of these financial statements.
148
| | |
| AMG Funds | | |
| |
| AMG GW&K U.S. Small Cap Growth Fund – Class N | | October 31, 2016 |
| |
| Financial Highlights | | |
| | | | | | | | | | | | | | | | | | | | |
| | | Year
Ended
10/31/16 | | | Year
Ended
10/31/15 | | | Year
Ended
10/31/14 | | | Year
Ended
10/31/13 | | | Year
Ended
10/31/12 | |
Net Asset Value, Beginning of Year | | $ | 18.59 | | | $ | 22.07 | | | $ | 24.06 | | | $ | 20.52 | | | $ | 20.57 | |
| | | | | | | | | | | | | | | | | | | | |
Income from Investment Operations: | | | | | | | | | | | | | | | | | | | | |
Net investment loss(a) | | | (0.06 | ) | | | (0.12 | ) | | | (0.13 | ) | | | (0.03 | ) | | | (0.12 | ) |
Net realized and unrealized gain (loss) on investments | | | (0.62 | ) | | | (0.62 | ) | | | 0.30 | | | | 5.55 | | | | 2.09 | |
| | | | | | | | | | | | | | | | | | | | |
Total from investment operations | | | (0.68 | ) | | | (0.74 | ) | | | 0.17 | | | | 5.52 | | | | 1.97 | |
| | | | | | | | | | | | | | | | | | | | |
Less Distributions: | | | | | | | | | | | | | | | | | | | | |
Distributions from net realized gain on investments | | | (14.33 | ) | | | (2.74 | ) | | | (2.16 | ) | | | (1.98 | ) | | | (2.02 | ) |
| | | | | | | | | | | | | | | | | | | | |
Total distributions | | | (14.33 | ) | | | (2.74 | ) | | | (2.16 | ) | | | (1.98 | ) | | | (2.02 | ) |
| | | | | | | | | | | | | | | | | | | | |
Net increase (decrease) in net asset value | | | (15.01 | ) | | | (3.48 | ) | | | (1.99 | ) | | | 3.54 | | | | (0.05 | ) |
| | | | | | | | | | | | | | | | | | | | |
Net Asset Value, End of Year | | $ | 3.58 | | | $ | 18.59 | | | $ | 22.07 | | | $ | 24.06 | | | $ | 20.52 | |
| | | | | | | | | | | | | | | | | | | | |
Total Return(b) | | | (4.39 | )% | | | (4.12 | )% | | | 0.57 | % | | | 29.52 | % | | | 10.70 | % |
Ratios/Supplemental Data: | | | | | | | | | | | | | | | | | | | | |
Net Assets, End of Period (in 000’s) | | $ | 30,977 | | | $ | 241,283 | | | $ | 336,350 | | | $ | 533,627 | | | $ | 389,125 | |
Ratios of expenses to average net assets: | | | | | | | | | | | | | | | | | | | | |
Before expense reimbursement and/or fee waiver | | | 1.39 | % | | | 1.31 | % | | | 1.31 | % | | | 1.31 | % | | | 1.28 | %(d) |
After expense reimbursement and/or fee waiver | | | 1.36 | %(c) | | | 1.31 | % | | | 1.31 | % | | | 1.31 | % | | | 1.28 | %(d) |
Ratios of net investment loss to average net assets: | | | | | | | | | | | | | | | | | | | | |
Before expense reimbursement and/or fee waiver | | | (0.81 | )% | | | (0.58 | )% | | | (0.57 | )% | | | (0.16 | )% | | | (0.59 | )% |
After expense reimbursement and/or fee waiver | | | (0.76 | )% | | | (0.58 | )% | | | (0.57 | )% | | | (0.16 | )% | | | (0.59 | )% |
Portfolio Turnover | | | 106 | %(e) | | | 65 | % | | | 70 | % | | | 71 | %(e)(f) | | | 48 | %(e) |
| (a) | Per share numbers have been calculated using average shares. |
| (b) | The total return is calculated using the published Net Asset Value as of fiscal year end. |
| (c) | Effective October 1, 2016, the Fund’s expense cap was reduced to 1.03% from 1.35%. On January 12, 2016, the Investment Manager agreed to an expense cap of 1.35%. The expense ratio shown reflects the weighted average expense ratio for the full fiscal year ended October 31, 2016 (See Note F). |
| (d) | Ratios of expenses to average net assets include interest expense of less than 0.005% for the fiscal year ended October 31, 2012, which is not included in the contractual expense limitation. The interest expense is a result of utilizing the line of credit, as discussed in Note G to the Financial Statements. |
| (e) | Portfolio turnover rate excludes securities delivered from processing a redemption in-kind. |
| (f) | Portfolio turnover rate excludes securities received from processing a subscription in-kind. |
The accompanying notes are an integral part of these financial statements.
149
| | |
| AMG Funds | | |
| |
| AMG GW&K U.S. Small Cap Growth Fund – Class I | | October 31, 2016 |
| |
| Financial Highlights | | |
| | | | | | | | | | | | | | | | | | | | |
| | | Year
Ended
10/31/16 | | | Year
Ended
10/31/15 | | | Year
Ended
10/31/14 | | | Year
Ended
10/31/13 | | | Year
Ended
10/31/12 | |
Net Asset Value, Beginning of Year | | $ | 19.30 | | | $ | 22.76 | | | $ | 24.69 | | | $ | 20.96 | | | $ | 20.91 | |
| | | | | | | | | | | | | | | | | | | | |
Income from Investment Operations: | | | | | | | | | | | | | | | | | | | | |
Net investment income (loss)(a) | | | (0.05 | ) | | | (0.07 | ) | | | (0.07 | ) | | | 0.02 | | | | (0.07 | ) |
Net realized and unrealized gain (loss) on investments | | | (0.65 | ) | | | (0.65 | ) | | | 0.30 | | | | 5.69 | | | | 2.14 | |
| | | | | | | | | | | | | | | | | | | | |
Total from investment operations | | | (0.70 | ) | | | (0.72 | ) | | | 0.23 | | | | 5.71 | | | | 2.07 | |
| | | | | | | | | | | | | | | | | | | | |
Less Distributions: | | | | | | | | | | | | | | | | | | | | |
Distributions from net realized gain on investments | | | (14.33 | ) | | | (2.74 | ) | | | (2.16 | ) | | | (1.98 | ) | | | (2.02 | ) |
| | | | | | | | | | | | | | | | | | | | |
Total distributions | | | (14.33 | ) | | | (2.74 | ) | | | (2.16 | ) | | | (1.98 | ) | | | (2.02 | ) |
| | | | | | | | | | | | | | | | | | | | |
Net increase (decrease) in net asset value | | | (15.03 | ) | | | (3.46 | ) | | | (1.93 | ) | | | 3.73 | | | | 0.05 | |
| | | | | | | | | | | | | | | | | | | | |
Net Asset Value, End of Year | | $ | 4.27 | | | $ | 19.30 | | | $ | 22.76 | | | $ | 24.69 | | | $ | 20.96 | |
| | | | | | | | | | | | | | | | | | | | |
Total Return(b) | | | (4.27 | )% | | | (3.93 | )% | | | 0.86 | % | | | 29.84 | % | | | 10.98 | % |
Ratios/Supplemental Data: | | | | | | | | | | | | | | | | | | | | |
Net Assets, End of Period (in 000’s) | | $ | 11,032 | | | $ | 307,403 | | | $ | 469,518 | | | $ | 792,172 | | | $ | 635,663 | |
Ratios of expenses to average net assets: | | | | | | | | | | | | | | | | | | | | |
Before expense reimbursement and/or fee waiver | | | 1.16 | % | | | 1.06 | % | | | 1.06 | % | | | 1.06 | % | | | 1.03 | %(d) |
After expense reimbursement and/or fee waiver | | | 1.11 | %(c) | | | 1.06 | % | | | 1.06 | % | | | 1.06 | % | | | 1.03 | %(d) |
Ratios of net investment income (loss) to average net assets: | | | | | | | | | | | | | | | | | | | | |
Before expense reimbursement and/or fee waiver | | | (0.57 | )% | | | (0.33 | )% | | | (0.32 | )% | | | 0.09 | % | | | (0.34 | )% |
After expense reimbursement and/or fee waiver | | | (0.53 | )% | | | (0.33 | )% | | | (0.32 | )% | | | 0.09 | % | | | (0.34 | )% |
Portfolio Turnover | | | 106 | %(e) | | | 65 | % | | | 70 | % | | | 71 | %(e)(f) | | | 48 | %(e) |
| (a) | Per share numbers have been calculated using average shares. |
| (b) | The total return is calculated using the published Net Asset Value as of fiscal year end. |
| (c) | Effective October 1, 2016, the Fund’s expense cap was reduced to 1.03% from 1.10%. On January 12, 2016, the Investment Manager agreed to an expense cap of 1.10%. The expense ratio shown reflects the weighted average expense ratio for the full fiscal year ended October 31, 2016 (See Note F). |
| (d) | Ratios of expenses to average net assets include interest expense of less than 0.005% for the fiscal year ended October 31, 2012, which is not included in the contractual expense limitation. The interest expense is a result of utilizing the line of credit, as discussed in Note G to the Financial Statements. |
| (e) | Portfolio turnover rate excludes securities delivered from processing a redemption in-kind. |
| (f) | Portfolio turnover rate excludes securities received from processing a subscription in-kind. |
The accompanying notes are an integral part of these financial statements.
150
| | |
| AMG Funds | | |
| |
| AMG Managers DoubleLine Core Plus Bond Fund – Class N | | October 31, 2016 |
| |
| Financial Highlights | | |
| | | | | | | | | | | | | | | | | | | | |
| | | Year
Ended
10/31/16 | | | Year
Ended
10/31/15 | | | Year
Ended
10/31/14 | | | Year
Ended
10/31/13 | | | Year
Ended
10/31/12 | |
Net Asset Value, Beginning of Year | | $ | 10.60 | | | $ | 10.86 | | | $ | 10.65 | | | $ | 11.10 | | | $ | 10.44 | |
| | | | | | | | | | | | | | | | | | | | |
Income from Investment Operations: | | | | | | | | | | | | | | | | | | | | |
Net investment income | | | 0.31 | (a) | | | 0.38 | | | | 0.40 | | | | 0.30 | | | | 0.33 | (a) |
Net realized and unrealized gain (loss) on investments | | | 0.17 | | | | (0.27 | ) | | | 0.22 | | | | (0.33 | ) | | | 0.72 | |
| | | | | | | | | | | | | | | | | | | | |
Total from investment operations | | | 0.48 | | | | 0.11 | | | | 0.62 | | | | (0.03 | ) | | | 1.05 | |
| | | | | | | | | | | | | | | | | | | | |
Less Distributions: | | | | | | | | | | | | | | | | | | | | |
Distributions from and in excess of net investment income | | | (0.31 | ) | | | (0.37 | ) | | | (0.41 | ) | | | (0.36 | ) | | | (0.37 | ) |
Distributions from net realized gain on investments | | | — | | | | — | | | | — | | | | (0.06 | ) | | | (0.02 | ) |
| | | | | | | | | | | | | | | | | | | | |
Total distributions | | | (0.31 | ) | | | (0.37 | ) | | | (0.41 | ) | | | (0.42 | ) | | | (0.39 | ) |
| | | | | | | | | | | | | | | | | | | | |
Net increase (decrease) in net asset value | | | 0.17 | | | | (0.26 | ) | | | 0.21 | | | | (0.45 | ) | | | 0.66 | |
| | | | | | | | | | | | | | | | | | | | |
Net Asset Value, End of Year | | $ | 10.77 | | | $ | 10.60 | | | $ | 10.86 | | | $ | 10.65 | | | $ | 11.10 | |
| | | | | | | | | | | | | | | | | | | | |
Total Return(b) | | | 4.62 | % | | | 1.04 | % | | | 5.96 | % | | | (0.28 | )% | | | 10.25 | % |
Ratios/Supplemental Data: | | | | | | | | | | | | | | | | | | | | |
Net Assets, End of Period (in 000’s) | | $ | 308,703 | | | $ | 188,286 | | | $ | 49,147 | | | $ | 66,368 | | | $ | 71,546 | |
Ratios of expenses to average net assets: | | | | | | | | | | | | | | | | | | | | |
Before expense reimbursement and/or fee waiver | | | 1.02 | % | | | 1.05 | % | | | 1.08 | % | | | 1.04 | % | | | 1.35 | % |
After expense reimbursement and/or fee waiver | | | 0.94 | %(c) | | | 0.94 | % | | | 0.94 | % | | | 0.94 | % | | | 0.94 | % |
Ratios of net investment income to average net assets: | | | | | | | | | | | | | | | | | | | | |
Before expense reimbursement and/or fee waiver | | | 2.76 | % | | | 3.21 | % | | | 3.58 | % | | | 2.66 | % | | | 2.59 | % |
After expense reimbursement and/or fee waiver | | | 2.84 | % | | | 3.32 | % | | | 3.72 | % | | | 2.77 | % | | | 3.01 | % |
Portfolio Turnover | | | 78 | % | | | 59 | % | | | 117 | % | | | 125 | % | | | 119 | % |
| (a) | Per share numbers have been calculated using average shares. |
| (b) | The total return is calculated using the published Net Asset Value as of fiscal year end. |
| (c) | Effective October 1, 2016, the Fund’s expense cap was reduced to 0.61% from 0.94%. The expense ratio shown reflects the weighted average expense ratio for the full fiscal year ended October 31, 2016 (See Note F). |
The accompanying notes are an integral part of these financial statements.
151
| | |
| AMG Funds | | |
| |
| AMG Managers DoubleLine Core Plus Bond Fund – Class I | | October 31, 2016 |
| |
| Financial Highlights | | |
| | | | | | | | | | | | | | | | | | | | |
| | | Year
Ended
10/31/16 | | | Year
Ended
10/31/15 | | | Year
Ended
10/31/14 | | | Year
Ended
10/31/13 | | | Year
Ended
10/31/12 | |
Net Asset Value, Beginning of Year | | $ | 10.60 | | | $ | 10.86 | | | $ | 10.65 | | | $ | 11.10 | | | $ | 10.44 | |
| | | | | | | | | | | | | | | | | | | | |
Income from Investment Operations: | | | | | | | | | | | | | | | | | | | | |
Net investment income | | | 0.33 | (a) | | | 0.41 | | | | 0.44 | | | | 0.33 | | | | 0.35 | (a) |
Net realized and unrealized gain (loss) on investments | | | 0.17 | | | | (0.27 | ) | | | 0.21 | | | | (0.33 | ) | | | 0.73 | |
| | | | | | | | | | | | | | | | | | | | |
Total from investment operations | | | 0.50 | | | | 0.14 | | | | 0.65 | | | | — | | | | 1.08 | |
| | | | | | | | | | | | | | | | | | | | |
Less Distributions: | | | | | | | | | | | | | | | | | | | | |
Distributions from and in excess of net investment income | | | (0.34 | ) | | | (0.40 | ) | | | (0.44 | ) | | | (0.39 | ) | | | (0.40 | ) |
Distributions from net realized gain on investments | | | — | | | | — | | | | — | | | | (0.06 | ) | | | (0.02 | ) |
| | | | | | | | | | | | | | | | | | | | |
Total distributions | | | (0.34 | ) | | | (0.40 | ) | | | (0.44 | ) | | | (0.45 | ) | | | (0.42 | ) |
| | | | | | | | | | | | | | | | | | | | |
Net increase (decrease) in net asset value | | | 0.16 | | | | (0.26 | ) | | | 0.21 | | | | (0.45 | ) | | | 0.66 | |
| | | | | | | | | | | | | | | | | | | | |
Net Asset Value, End of Year | | $ | 10.76 | | | $ | 10.60 | | | $ | 10.86 | | | $ | 10.65 | | | $ | 11.10 | |
| | | | | | | | | | | | | | | | | | | | |
Total Return(b) | | | 4.79 | % | | | 1.28 | % | | | 6.22 | % | | | (0.03 | )% | | | 10.52 | % |
Ratios/Supplemental Data: | | | | | | | | | | | | | | | | | | | | |
Net Assets, End of Period (in 000’s) | | $ | 398,514 | | | $ | 304,051 | | | $ | 158,198 | | | $ | 110,018 | | | $ | 105,335 | |
Ratios of expenses to average net assets: | | | | | | | | | | | | | | | | | | | | |
Before expense reimbursement and/or fee waiver | | | 0.77 | % | | | 0.80 | % | | | 0.83 | % | | | 0.79 | % | | | 1.10 | % |
After expense reimbursement and/or fee waiver | | | 0.69 | %(c) | | | 0.69 | % | | | 0.69 | % | | | 0.69 | % | | | 0.69 | % |
Ratios of net investment income to average net assets: | | | | | | | | | | | | | | | | | | | | |
Before expense reimbursement and/or fee waiver | | | 3.02 | % | | | 3.46 | % | | | 3.83 | % | | | 2.91 | % | | | 2.84 | % |
After expense reimbursement and/or fee waiver | | | 3.11 | % | | | 3.57 | % | | | 3.97 | % | | | 3.02 | % | | | 3.26 | % |
Portfolio Turnover | | | 78 | % | | | 59 | % | | | 117 | % | | | 125 | % | | | 119 | % |
| (a) | Per share numbers have been calculated using average shares. |
| (b) | The total return is calculated using the published Net Asset Value as of fiscal year end. |
| (c) | Effective October 1, 2016, the Fund’s expense cap was reduced to 0.61% from 0.69%. The expense ratio shown reflects the weighted average expense ratio for the full fiscal year ended October 31, 2016 (See Note F). |
The accompanying notes are an integral part of these financial statements.
152
| | |
| AMG Funds | | |
| |
| AMG Managers Anchor Capital Enhanced Equity Fund – Class N | | October 31, 2016 |
| |
| Financial Highlights | | |
| | | | | | | | | | | | | | | | | | | | |
| | | Year
Ended
10/31/16 | | | Year
Ended
10/31/15 | | | Year
Ended
10/31/14 | | | Year
Ended
10/31/13 | | | Year
Ended
10/31/12 | |
Net Asset Value, Beginning of Year | | $ | 9.14 | | | $ | 9.49 | | | $ | 9.39 | | | $ | 8.68 | | | $ | 9.61 | |
| | | | | | | | | | | | | | | | | | | | |
Income from Investment Operations: | | | | | | | | | | | | | | | | | | | | |
Net investment income | | | 0.22 | (a) | | | 0.18 | | | | 0.17 | | | | 0.20 | | | | 0.16 | |
Net realized and unrealized gain (loss) on investments | | | (0.37 | ) | | | (0.36 | ) | | | 0.09 | | | | 0.86 | | | | 0.11 | |
| | | | | | | | | | | | | | | | | | | | |
Total from investment operations | | | (0.15 | ) | | | (0.18 | ) | | | 0.26 | | | | 1.06 | | | | 0.27 | |
| | | | | | | | | | | | | | | | | | | | |
Less Distributions: | | | | | | | | | | | | | | | | | | | | |
Distributions from and in excess of net investment income | | | (0.26 | ) | | | (0.17 | ) | | | (0.16 | ) | | | (0.20 | ) | | | (0.16 | ) |
Distributions from net realized gain on investments | | | (0.04 | ) | | | — | | | | — | | | | (0.15 | ) | | | (1.04 | ) |
| | | | | | | | | | | | | | | | | | | | |
Total distributions | | | (0.30 | ) | | | (0.17 | ) | | | (0.16 | ) | | | (0.35 | ) | | | (1.20 | ) |
| | | | | | | | | | | | | | | | | | | | |
Net increase (decrease) in net asset value | | | (0.45 | ) | | | (0.35 | ) | | | 0.10 | | | | 0.71 | | | | (0.93 | ) |
| | | | | | | | | | | | | | | | | | | | |
Net Asset Value, End of Year | | $ | 8.69 | | | $ | 9.14 | | | $ | 9.49 | | | $ | 9.39 | | | $ | 8.68 | |
| | | | | | | | | | | | | | | | | | | | |
Total Return(b) | | | (1.74 | )% | | | (1.86 | )% | | | 2.68 | % | | | 12.60 | % | | | 3.12 | % |
Ratios/Supplemental Data: | | | | | | | | | | | | | | | | | | | | |
Net Assets, End of Period (in 000’s) | | $ | 46,652 | | | $ | 84,994 | | | $ | 101,980 | | | $ | 101,663 | | | $ | 106,191 | |
Ratios of expenses to average net assets: | | | | | | | | | | | | | | | | | | | | |
Before earnings credit, expense reimbursement and/or fee waiver, or recoupment | | | 1.24 | % | | | 1.19 | % | | | 1.19 | % | | | 1.23 | %(c) | | | 1.22 | %(c)(d) |
After earnings credit, expense reimbursement and/or fee waiver, or recoupment | | | 1.24 | %(e) | | | 1.19 | % | | | 1.19 | % | | | 1.23 | %(c) | | | 1.27 | %(c)(d) |
Ratios of net investment income to average net assets: | | | | | | | | | | | | | | | | | | | | |
Before earnings credit, expense reimbursement and/or fee waiver, or recoupment | | | 2.49 | % | | | 1.78 | % | | | 1.81 | % | | | 2.24 | % | | | 1.82 | % |
After earnings credit, expense reimbursement and/or fee waiver, or recoupment | | | 2.49 | % | | | 1.78 | % | | | 1.81 | % | | | 2.24 | % | | | 1.78 | % |
Portfolio Turnover | | | 35 | % | | | 33 | % | | | 41 | % | | | 78 | % | | | 56 | % |
| (a) | Per share numbers have been calculated using average shares. |
| (b) | The total return is calculated using the published Net Asset Value as of fiscal year end. |
| (c) | Ratios of expenses to average net assets include Earnings Credits of less than 0.005% for each of the fiscal years ended October 31, 2013 and October 31, 2012, which is not included in the contractual expense limitation. |
| (d) | Ratios of expenses to average net assets include interest expense of less than 0.005% for the fiscal year ended October 31, 2012, which is not included in the contractual expense limitation. The interest expense is a result of utilizing the line of credit, as discussed in Note G to the Financial Statements. |
| (e) | Effective October 1, 2016, the Fund’s expense cap was reduced to 1.07% from 1.40%. The expense ratio shown reflects the weighted average expense ratio for the full fiscal year ended October 31, 2016 (See Note F). |
The accompanying notes are an integral part of these financial statements.
153
| | |
| AMG Funds | | |
| |
| AMG Managers Anchor Capital Enhanced Equity Fund – Class I | | October 31, 2016 |
| |
| Financial Highlights | | |
| | | | | | | | | | | | | | | | | | | | |
| | | Year
Ended
10/31/16 | | | Year
Ended
10/31/15 | | | Year
Ended
10/31/14 | | | Year
Ended
10/31/13 | | | Year
Ended
10/31/12 | |
Net Asset Value, Beginning of Year | | $ | 9.15 | | | $ | 9.50 | | | $ | 9.40 | | | $ | 8.69 | | | $ | 9.62 | |
| | | | | | | | | | | | | | | | | | | | |
Income from Investment Operations: | | | | | | | | | | | | | | | | | | | | |
Net investment income | | | 0.25 | (a) | | | 0.19 | | | | 0.18 | | | | 0.22 | | | | 0.18 | |
Net realized and unrealized gain (loss) on investments | | | (0.38 | ) | | | (0.35 | ) | | | 0.10 | | | | 0.86 | | | | 0.11 | |
| | | | | | | | | | | | | | | | | | | | |
Total from investment operations | | | (0.13 | ) | | | (0.16 | ) | | | 0.28 | | | | 1.08 | | | | 0.29 | |
| | | | | | | | | | | | | | | | | | | | |
Less Distributions: | | | | | | | | | | | | | | | | | | | | |
Distributions from and in excess of net investment income | | | (0.28 | ) | | | (0.19 | ) | | | (0.18 | ) | | | (0.22 | ) | | | (0.18 | ) |
Distributions from net realized gain on investments | | | (0.04 | ) | | | — | | | | — | | | | (0.15 | ) | | | (1.04 | ) |
| | | | | | | | | | | | | | | | | | | | |
Total distributions | | | (0.32 | ) | | | (0.19 | ) | | | (0.18 | ) | | | (0.37 | ) | | | (1.22 | ) |
| | | | | | | | | | | | | | | | | | | | |
Net increase (decrease) in net asset value | | | (0.45 | ) | | | (0.35 | ) | | | 0.10 | | | | 0.71 | | | | (0.93 | ) |
| | | | | | | | | | | | | | | | | | | | |
Net Asset Value, End of Year | | $ | 8.70 | | | $ | 9.15 | | | $ | 9.50 | | | $ | 9.40 | | | $ | 8.69 | |
| | | | | | | | | | | | | | | | | | | | |
Total Return(b) | | | (1.47 | )% | | | (1.60 | )% | | | 2.94 | % | | | 12.88 | % | | | 3.46 | % |
Ratios/Supplemental Data: | | | | | | | | | | | | | | | | | | | | |
Net Assets, End of Period (in 000’s) | | $ | 15,591 | | | $ | 83,475 | | | $ | 108,985 | | | $ | 58,099 | | | $ | 71,618 | |
Ratios of expenses to average net assets: | | | | | | | | | | | | | | | | | | | | |
Before earnings credit, expense reimbursement and/or fee waiver, or recoupment | | | 1.00 | % | | | 0.94 | % | | | 0.94 | % | | | 0.98 | %(c) | | | 0.97 | %(c)(d) |
After earnings credit, expense reimbursement and/or fee waiver, or recoupment | | | 1.00 | %(e) | | | 0.94 | % | | | 0.94 | % | | | 0.98 | %(c) | | | 1.02 | %(c)(d) |
Ratios of net investment income to average net assets: | | | | | | | | | | | | | | | | | | | | |
Before earnings credit, expense reimbursement and/or fee waiver, or recoupment | | | 2.78 | % | | | 2.03 | % | | | 2.06 | % | | | 2.49 | % | | | 2.07 | % |
After earnings credit, expense reimbursement and/or fee waiver, or recoupment | | | 2.78 | % | | | 2.03 | % | | | 2.06 | % | | | 2.49 | % | | | 2.03 | % |
Portfolio Turnover | | | 35 | % | | | 33 | % | | | 41 | % | | | 78 | % | | | 56 | % |
| (a) | Per share numbers have been calculated using average shares. |
| (b) | The total return is calculated using the published Net Asset Value as of fiscal year end. |
| (c) | Ratios of expenses to average net assets include Earnings Credits of less than 0.005% for each of the fiscal years ended October 31, 2013 and October 31, 2012, which is not included in the contractual expense limitation. |
| (d) | Ratios of expenses to average net assets include interest expense of less than 0.005% for the fiscal year ended October 31, 2012, which is not included in the contractual expense limitation. The interest expense is a result of utilizing the line of credit, as discussed in Note G to the Financial Statements. |
| (e) | Effective October 1, 2016, the Fund’s expense cap was reduced to 1.07% from 1.15%. The expense ratio shown reflects the weighted average expense ratio for the full fiscal year ended October 31, 2016 (See Note F). |
The accompanying notes are an integral part of these financial statements.
154
| | |
| AMG Funds | | |
| |
| AMG Managers Lake Partners LASSO Alternatives Fund – Class N | | October 31, 2016 |
| |
| Financial Highlights | | |
| | | | | | | | | | | | | | | | | | | | |
| | | Year
Ended
10/31/16 | | | Year
Ended
10/31/15 | | | Year
Ended
10/31/14 | | | Year
Ended
10/31/13 | | | Year
Ended
10/31/12 | |
Net Asset Value, Beginning of Year | | $ | 12.76 | | | $ | 13.64 | | | $ | 13.34 | | | $ | 12.39 | | | $ | 11.94 | |
| | | | | | | | | | | | | | | | | | | | |
Income from Investment Operations: | | | | | | | | | | | | | | | | | | | | |
Net investment income (loss)(a) | | | 0.02 | | | | (0.04 | ) | | | (0.07 | ) | | | 0.00 | (b) | | | 0.04 | |
Net realized and unrealized gain (loss) on investments | | | (0.17 | ) | | | (0.34 | ) | | | 0.50 | (c) | | | 1.11 | | | | 0.59 | |
| | | | | | | | | | | | | | | | | | | | |
Total from investment operations | | | (0.15 | ) | | | (0.38 | ) | | | 0.43 | | | | 1.11 | | | | 0.63 | |
| | | | | | | | | | | | | | | | | | | | |
Less Distributions: | | | | | | | | | | | | | | | | | | | | |
Distributions from and in excess of net investment income | | | — | | | | (0.00 | )(b) | | | (0.09 | ) | | | (0.16 | ) | | | (0.18 | ) |
Distributions from net realized gain on investments | | | (0.80 | ) | | | (0.50 | ) | | | (0.04 | ) | | | — | | | | — | |
| | | | | | | | | | | | | | | | | | | | |
Total distributions | | | (0.80 | ) | | | (0.50 | ) | | | (0.13 | ) | | | (0.16 | ) | | | (0.18 | ) |
| | | | | | | | | | | | | | | | | | | | |
Net increase (decrease) in net asset value | | | (0.95 | ) | | | (0.88 | ) | | | 0.30 | | | | 0.95 | | | | 0.45 | |
| | | | | | | | | | | | | | | | | | | | |
Net Asset Value, End of Year | | $ | 11.81 | | | $ | 12.76 | | | $ | 13.64 | | | $ | 13.34 | | | $ | 12.39 | |
| | | | | | | | | | | | | | | | | | | | |
Total Return(d) | | | (1.18 | )% | | | (2.87 | )% | | | 3.27 | % | | | 9.05 | % | | | 5.34 | % |
Ratios/Supplemental Data: | | | | | | | | | | | | | | | | | | | | |
Net Assets, End of Period (in 000’s) | | $ | 32,630 | | | $ | 40,667 | | | $ | 44,386 | | | $ | 54,388 | | | $ | 33,719 | |
Ratios of expenses to average net assets: | | | | | | | | | | | | | | | | | | | | |
Before earnings credit, expense reimbursement and/or fee waiver, or recoupment (e) | | | 1.47 | % | | | 1.43 | %(f) | | | 1.41 | % | | | 1.43 | %(g) | | | 1.41 | %(g)(h) |
After earnings credit, expense reimbursement and/or fee waiver, or recoupment (e) | | | 1.40 | %(i) | | | 1.41 | %(f) | | | 1.43 | % | | | 1.45 | %(g) | | | 1.45 | %(g)(h) |
Ratios of net investment income (loss) to average net assets: | | | | | | | | | | | | | | | | | | | | |
Before earnings credit, expense reimbursement and/or fee waiver, or recoupment | | | 0.06 | % | | | (0.33 | )% | | | (0.51 | )% | | | (0.00 | )%(b) | | | 0.36 | %(h) |
After earnings credit, expense reimbursement and/or fee waiver, or recoupment | | | 0.13 | % | | | (0.31 | )% | | | (0.53 | )% | | | (0.03 | )% | | | 0.32 | %(h) |
Portfolio Turnover | | | 30 | % | | | 73 | % | | | 46 | % | | | 44 | % | | | 46 | % |
| (a) | Per share numbers have been calculated using average shares. |
| (b) | Represents less than ($0.005) or $0.005 per share or less than 0.005%. |
| (c) | Includes capital contribution of less than $0.005 per share. |
| (d) | The total return is calculated using the published Net Asset Value as of fiscal year end. |
| (e) | Does not include expenses of the underlying funds in which the Fund invests. |
| (f) | Effective February 28, 2015, the contractual expense limitation was decreased from 1.45% to 1.40%, excluding interest, taxes, investment- related costs (such as brokerage commissions), extraordinary expenses and acquired fund fees and expenses. |
| (g) | Ratios of expenses to average net assets includes Earnings Credits of less than 0.005% for each of the fiscal years ended October 31, 2013 and October 31, 2012, which is not included in the contractual expense limitation. |
| (h) | Ratios of expenses and net investment income to average net assets include advisory fee waiver of less than 0.005% for the fiscal year ended October 31, 2012. |
| (i) | Effective October 1, 2016, the Fund’s expense cap was reduced to 1.09% from 1.40%. The expense ratio shown reflects the weighted average expense ratio for the full fiscal year ended October 31, 2016 (See Note F). |
The accompanying notes are an integral part of these financial statements.
155
| | |
| AMG Funds | | |
| |
| AMG Managers Lake Partners LASSO Alternatives Fund – Class I | | October 31, 2016 |
| |
| Financial Highlights | | |
| | | | | | | | | | | | | | | | | | | | |
| | | Year
Ended
10/31/16 | | | Year
Ended
10/31/15 | | | Year
Ended
10/31/14 | | | Year
Ended
10/31/13 | | | Year
Ended
10/31/12 | |
Net Asset Value, Beginning of Year | | $ | 12.81 | | | $ | 13.69 | | | $ | 13.38 | | | $ | 12.42 | | | $ | 11.97 | |
| | | | | | | | | | | | | | | | | | | | |
Income from Investment Operations: | | | | | | | | | | | | | | | | | | | | |
Net investment income (loss)(a) | | | 0.07 | | | | (0.01 | ) | | | (0.04 | ) | | | 0.03 | | | | 0.07 | |
Net realized and unrealized gain (loss) on investments | | | (0.19 | ) | | | (0.33 | )(b) | | | 0.51 | (b) | | | 1.11 | | | | 0.59 | |
| | | | | | | | | | | | | | | | | | | | |
Total from investment operations | | | (0.12 | ) | | | (0.34 | ) | | | 0.47 | | | | 1.14 | | | | 0.66 | |
| | | | | | | | | | | | | | | | | | | | |
Less Distributions: | | | | | | | | | | | | | | | | | | | | |
Distributions from and in excess of net investment income | | | (0.03 | ) | | | (0.04 | ) | | | (0.12 | ) | | | (0.18 | ) | | | (0.21 | ) |
Distributions from net realized gain on investments | | | (0.80 | ) | | | (0.50 | ) | | | (0.04 | ) | | | — | | | | — | |
| | | | | | | | | | | | | | | | | | | | |
Total distributions | | | (0.83 | ) | | | (0.54 | ) | | | (0.16 | ) | | | (0.18 | ) | | | (0.21 | ) |
| | | | | | | | | | | | | | | | | | | | |
Net increase (decrease) in net asset value | | | (0.95 | ) | | | (0.88 | ) | | | 0.31 | | | | 0.96 | | | | 0.45 | |
| | | | | | | | | | | | | | | | | | | | |
Net Asset Value, End of Year | | $ | 11.86 | | | $ | 12.81 | | | $ | 13.69 | | | $ | 13.38 | | | $ | 12.42 | |
| | | | | | | | | | | | | | | | | | | | |
Total Return(c) | | | (0.91 | )% | | | (2.62 | )% | | | 3.56 | % | | | 9.31 | % | | | 5.56 | % |
Ratios/Supplemental Data: | | | | | | | | | | | | | | | | | | | | |
Net Assets, End of Period (in 000’s) | | $ | 70,054 | | | $ | 169,072 | | | $ | 477,157 | | | $ | 416,475 | | | $ | 253,343 | |
Ratios of expenses to average net assets: | | | | | | | | | | | | | | | | | | | | |
Before earnings credit, expense reimbursement and/or fee waiver, or recoupment(d) | | | 1.22 | % | | | 1.18 | %(e) | | | 1.16 | % | | | 1.18 | %(f) | | | 1.16 | %(f)(g) |
After earnings credit, expense reimbursement and/or fee waiver, or recoupment(d) | | | 1.15 | %(h) | | | 1.16 | %(e) | | | 1.18 | % | | | 1.20 | %(f) | | | 1.20 | %(f)(g) |
Ratios of net investment income (loss) to average net assets: | | | | | | | | | | | | | | | | | | | | |
Before earnings credit, expense reimbursement and/or fee waiver, or recoupment | | | 0.49 | % | | | (0.08 | )% | | | (0.26 | )% | | | 0.25 | % | | | 0.61 | %(g) |
After earnings credit, expense reimbursement and/or fee waiver, or recoupment | | | 0.57 | % | | | (0.06 | )% | | | (0.28 | )% | | | 0.22 | % | | | 0.57 | %(g) |
Portfolio Turnover | | | 30 | % | | | 73 | % | | | 46 | % | | | 44 | % | | | 46 | % |
| (a) | Per share numbers have been calculated using average shares. |
| (b) | Includes capital contribution of less than $0.005 per share. |
| (c) | The total return is calculated using the published Net Asset Value as of fiscal year end. |
| (d) | Does not include expenses of the underlying funds in which the Fund invests. |
| (e) | Effective February 28, 2015, the contractual expense limitation was decreased from 1.20% to 1.15%, excluding interest, taxes, investment-related costs (such as brokerage commissions), extraordinary expenses and acquired fund fees and expenses. |
| (f) | Ratios of expenses to average net assets include Earnings Credits of less than 0.005% for each of the fiscal years ended October 31, 2013 and October 31, 2012, which is not included in the contractual expense limitation. |
| (g) | Ratios of expenses and net investment income to average net assets include advisory fee waiver of less than 0.005% for the fiscal year ended October 31, 2012. |
| (h) | Effective October 1, 2016, the Fund’s expense cap was reduced to 1.09% from 1.15%. The expense ratio shown reflects the weighted average expense ratio for the full fiscal year ended October 31, 2016 (See Note F). |
The accompanying notes are an integral part of these financial statements.
156
| | |
| AMG Funds | | |
| |
| AMG River Road Long-Short Fund – Class N | | October 31, 2016 |
| |
| Financial Highlights | | |
| | | | | | | | | | | | | | | | | | | | |
| | | Year
Ended
10/31/16 | | | Year
Ended
10/31/15 | | | Year
Ended
10/31/14 | | | Year
Ended
10/31/13 | | | Year
Ended
10/31/12 | |
Net Asset Value, Beginning of Year | | $ | 11.48 | | | $ | 11.35 | | | $ | 12.02 | | | $ | 10.73 | | | $ | 9.91 | |
| | | | | | | | | | | | | | | | | | | | |
Income from Investment Operations: | | | | | | | | | | | | | | | | | | | | |
Net investment loss | | | (0.19 | )(a) | | | (0.14 | )(a) | | | (0.19 | ) | | | (0.17 | )(a) | | | (0.18 | ) |
Net realized and unrealized gain (loss) on investments | | | 0.13 | | | | 0.57 | | | | (0.19 | ) | | | 2.02 | | | | 1.00 | |
| | | | | | | | | | | | | | | | | | | | |
Total from investment operations | | | (0.06 | ) | | | 0.43 | | | | (0.38 | ) | | | 1.85 | | | | 0.82 | |
| | | | | | | | | | | | | | | | | | | | |
Less Distributions: | | | | | | | | | | | | | | | | | | | | |
Distributions from net realized gain on investments | | | (0.38 | ) | | | (0.30 | ) | | | (0.29 | ) | | | (0.56 | ) | | | — | |
| | | | | | | | | | | | | | | | | | | | |
Total distributions | | | (0.38 | ) | | | (0.30 | ) | | | (0.29 | ) | | | (0.56 | ) | | | — | |
| | | | | | | | | | | | | | | | | | | | |
Net increase (decrease) in net asset value | | | (0.44 | ) | | | 0.13 | | | | (0.67 | ) | | | 1.29 | | | | 0.82 | |
| | | | | | | | | | | | | | | | | | | | |
Net Asset Value, End of Year | | $ | 11.04 | | | $ | 11.48 | | | $ | 11.35 | | | $ | 12.02 | | | $ | 10.73 | |
| | | | | | | | | | | | | | | | | | | | |
Total Return(b) | | | (0.52 | )% | | | 3.79 | % | | | (3.27 | )% | | | 18.14 | % | | | 8.17 | % |
Ratios/Supplemental Data: | | | | | | | | | | | | | | | | | | | | |
Net Assets, End of Period (in 000’s) | | $ | 8,713 | | | $ | 27,983 | | | $ | 109,140 | | | $ | 108,966 | | | $ | 7,506 | |
Ratios of expenses to average net assets: | | | | | | | | | | | | | | | | | | | | |
Before expense reimbursement and/or fee waiver, or recoupment including interest and dividend expense for securities sold short | | | 3.62 | % | | | 2.87 | % | | | 2.53 | % | | | 2.54 | % | | | 5.03 | % |
After expense reimbursement and/or fee waiver, or recoupment including interest and dividend expense for securities sold short | | | 3.46 | %(c) | | | 2.89 | % | | | 2.58 | % | | | 2.38 | % | | | 3.11 | % |
After expense reimbursement and/or fee waiver, or recoupment excluding interest and dividend expense for securities sold short | | | 1.70 | %(c) | | | 1.70 | % | | | 1.70 | % | | | 1.70 | % | | | 1.70 | % |
Ratios of net investment loss to average net assets: | | | | | | | | | | | | | | | | | | | | |
Before expense reimbursement and/or fee waiver, or recoupment | | | (1.91 | )% | | | (1.16 | )% | | | (1.55 | )% | | | (1.62 | )% | | | (3.63 | )% |
After expense reimbursement and/or fee waiver, or recoupment | | | (1.75 | )% | | | (1.19 | )% | | | (1.59 | )% | | | (1.46 | )% | | | (1.71 | )% |
Portfolio Turnover | | | 298 | % | | | 279 | % | | | 303 | % | | | 291 | % | | | 278 | % |
| (a) | Per share numbers have been calculated using average shares. |
| (b) | The total return is calculated using the published Net Asset Value as of fiscal year end. |
| (c) | Effective October 1, 2016, the Fund’s expense cap was reduced to 1.37% from 1.70%. The expense ratio shown reflects the weighted average expense ratio for the full fiscal year ended October 31, 2016 (See Note F). |
The accompanying notes are an integral part of these financial statements.
157
| | |
| AMG Funds | | |
| |
| AMG River Road Long-Short Fund – Class I | | October 31, 2016 |
| |
| Financial Highlights | | |
| | | | | | | | | | | | | | | | |
| | | Year
Ended
10/31/16 | | | Year
Ended
10/31/15 | | | Year
Ended
10/31/14 | | | Period
Ended
10/31/13(a) | |
Net Asset Value, Beginning of Year | | $ | 11.56 | | | $ | 11.40 | | | $ | 12.05 | | | $ | 10.96 | |
| | | | | | | | | | | | | | | | |
Income from Investment Operations: | | | | | | | | | | | | | | | | |
Net investment income (loss) | | | (0.18 | )(b) | | | (0.11 | )(b) | | | (0.16 | ) | | | (0.10 | )(b) |
Net realized and unrealized gain (loss) on investments | | | 0.15 | | | | 0.57 | | | | (0.20 | ) | | | 1.19 | |
| | | | | | | | | | | | | | | | |
Total from investment operations | | | (0.03 | ) | | | 0.46 | | | | (0.36 | ) | | | 1.09 | |
| | | | | | | | | | | | | | | | |
Less Distributions: | | | | | | | | | | | | | | | | |
Distributions from net realized gain on investments | | | (0.38 | ) | | | (0.30 | ) | | | (0.29 | ) | | | — | |
| | | | | | | | | | | | | | | | |
Total distributions | | | (0.38 | ) | | | (0.30 | ) | | | (0.29 | ) | | | — | |
| | | | | | | | | | | | | | | | |
Net increase (decrease) in net asset value | | | (0.41 | ) | | | 0.16 | | | | (0.65 | ) | | | 1.09 | |
| | | | | | | | | | | | | | | | |
Net Asset Value, End of Year | | $ | 11.15 | | | $ | 11.56 | | | $ | 11.40 | | | $ | 12.05 | |
| | | | | | | | | | | | | | | | |
Total Return(c) | | | (0.24 | )% | | | 4.04 | % | | | (3.01 | )% | | | 9.85 | %(d) |
Ratios/Supplemental Data: | | | | | | | | | | | | | | | | |
Net Assets, End of Period (in 000’s) | | $ | 37,549 | | | $ | 49,088 | | | $ | 110,271 | | | $ | 71,175 | |
Ratios of expenses to average net assets: | | | | | | | | | | | | | | | | |
Before expense reimbursement and/or fee waiver, or recoupment including interest and dividend expense for securities sold short | | | 3.39 | % | | | 2.62 | % | | | 2.28 | % | | | 2.20 | %(e) |
After expense reimbursement and/or fee waiver, or recoupment including interest and dividend expense for securities sold short | | | 3.24 | %(f) | | | 2.64 | % | | | 2.33 | % | | | 2.10 | %(e) |
After expense reimbursement and/or fee waiver, or recoupment excluding interest and dividend expense for securities sold short | | | 1.45 | %(f) | | | 1.45 | % | | | 1.45 | % | | | 1.45 | %(e) |
Ratios of net investment income (loss) to average net assets: | | | | | | | | | | | | | | | | |
Before expense reimbursement and/or fee waiver, or recoupment | | | (1.81 | )% | | | (0.91 | )% | | | (1.30 | )% | | | (1.44 | )%(e) |
After expense reimbursement and/or fee waiver, or recoupment | | | (1.67 | )% | | | (0.94 | )% | | | (1.34 | )% | | | (1.33 | )%(e) |
Portfolio Turnover | | | 298 | % | | | 279 | % | | | 303 | % | | | 291 | %(d) |
| (a) | The commencement of investment operations for AMG River Road Long-Short Fund Class I shares was March 1, 2013. |
| (b) | Per share numbers have been calculated using average shares. |
| (c) | The total return is calculated using the published Net Asset Value as of fiscal year end. |
| (f) | Effective October 1, 2016, the Fund’s expense cap was reduced to 1.37% from 1.45%. The expense ratio shown reflects the weighted average expense ratio for the full fiscal year ended October 31, 2016 (See Note F). |
The accompanying notes are an integral part of these financial statements.
158
| | |
| AMG Funds | | |
| |
| AMG Managers Guardian Capital Global Dividend Fund – Class N | | October 31, 2016 |
| |
| Financial Highlights | | |
| | | | | | | | | | | | |
| | | Year
Ended
10/31/16 | | | Year
Ended
10/31/15 | | | Period
Ended
10/31/14(a) | |
Net Asset Value, Beginning of Year | | $ | 10.30 | | | $ | 10.51 | | | $ | 10.00 | |
| | | | | | | | | | | | |
Income from Investment Operations: | | | | | | | | | | | | |
Net investment income | | | 0.22 | (b) | | | 0.24 | | | | 0.13 | |
Net realized and unrealized gain (loss) on investments | | | (0.62 | ) | | | (0.23 | ) | | | 0.49 | |
| | | | | | | | | | | | |
Total from investment operations | | | (0.40 | ) | | | 0.01 | | | | 0.62 | |
| | | | | | | | | | | | |
Less Distributions: | | | | | | | | | | | | |
Distributions from and in excess of net investment income | | | (0.23 | ) | | | (0.22 | ) | | | (0.11 | ) |
| | | | | | | | | | | | |
Total Distributions | | | (0.23 | ) | | | (0.22 | ) | | | (0.11 | ) |
| | | | | | | | | | | | |
Net increase (decrease) in net asset value | | | (0.63 | ) | | | (0.21 | ) | | | 0.51 | |
| | | | | | | | | | | | |
Net Asset Value, End of Year | | $ | 9.67 | | | $ | 10.30 | | | $ | 10.51 | |
| | | | | | | | | | | | |
Total Return(c) | | | (3.91 | )% | | | 0.07 | % | | | 6.17 | %(d) |
Ratios/Supplemental Data: | | | | | | | | | | | | |
Net Assets, End of Period (in 000’s) | | $ | 997 | | | $ | 1,054 | | | $ | 1,052 | |
Ratios of expenses to average net assets: | | | | | | | | | | | | |
Before expense reimbursement and/or fee waiver | | | 3.34 | % | | | 4.10 | % | | | 5.21 | %(e) |
After expense reimbursement and/or fee waiver | | | 1.30 | %(f) | | | 1.30 | % | | | 1.30 | %(e) |
Ratios of net investment income (loss) to average net assets: | | | | | | | | | | | | |
Before expense reimbursement and/or fee waiver | | | 0.20 | % | | | (0.53 | )% | | | (1.74 | )%(e) |
After expense reimbursement and/or fee waiver | | | 2.24 | % | | | 2.28 | % | | | 2.17 | %(e) |
Portfolio Turnover | | | 36 | % | | | 28 | % | | | 16 | %(d) |
| (a) | The commencement of investment operations for AMG Managers Guardian Capital Global Dividend Fund Class N shares was April 11, 2014. |
| (b) | Per share numbers have been calculated using average shares. |
| (c) | The total return is calculated using the published Net Asset Value as of fiscal year end. |
| (f) | Effective October 1, 2016, the Fund’s expense cap was reduced to 1.05% from 1.30%. The expense ratio shown reflects the weighted average expense ratio for the full fiscal year ended October 31, 2016 (See Note F). |
The accompanying notes are an integral part of these financial statements.
159
| | |
| AMG Funds | | |
| |
| AMG Managers Guardian Capital Global Dividend Fund – Class I | | October 31, 2016 |
| |
| Financial Highlights | | |
| | | | | | | | | | | | |
| | | Year
Ended
10/31/16 | | | Year
Ended
10/31/15 | | | Period
Ended
10/31/14(a) | |
Net Asset Value, Beginning of Year | | $ | 10.28 | | | $ | 10.52 | | | $ | 10.00 | |
| | | | | | | | | | | | |
Income from Investment Operations: | | | | | | | | | | | | |
Net investment income | | | 0.23 | (b) | | | 0.27 | | | | 0.14 | |
Net realized and unrealized gain (loss) on investments | | | (0.60 | ) | | | (0.25 | ) | | | 0.50 | |
| | | | | | | | | | | | |
Total from investment operations | | | (0.37 | ) | | | 0.02 | | | | 0.64 | |
| | | | | | | | | | | | |
Less Distributions: | | | | | | | | | | | | |
Distributions from and in excess of net investment income | | | (0.26 | ) | | | (0.26 | ) | | | (0.12 | ) |
| | | | | | | | | | | | |
Total Distributions | | | (0.26 | ) | | | (0.26 | ) | | | (0.12 | ) |
| | | | | | | | | | | | |
Net increase (decrease) in net asset value | | | (0.63 | ) | | | (0.24 | ) | | | 0.52 | |
| | | | | | | | | | | | |
Net Asset Value, End of Year | | $ | 9.65 | | | $ | 10.28 | | | $ | 10.52 | |
| | | | | | | | | | | | |
Total Return(c) | | | (3.68 | )% | | | 0.14 | % | | | 6.39 | %(d) |
Ratios/Supplemental Data: | | | | | | | | | | | | |
Net Assets, End of Period (in 000’s) | | $ | 27,986 | | | $ | 3,292 | | | $ | 3,211 | |
Ratios of expenses to average net assets: | | | | | | | | | | | | |
Before expense reimbursement and/or fee waiver | | | 2.82 | % | | | 3.85 | % | | | 4.96 | %(e) |
After expense reimbursement and/or fee waiver | | | 1.05 | % | | | 1.05 | % | | | 1.05 | %(e) |
Ratios of net investment income (loss) to average net assets: | | | | | | | | | | | | |
Before expense reimbursement and/or fee waiver | | | 0.55 | % | | | (0.28 | )% | | | (1.49 | )%(e) |
After expense reimbursement and/or fee waiver | | | 2.32 | % | | | 2.52 | % | | | 2.42 | %(e) |
Portfolio Turnover | | | 36 | % | | | 28 | % | | | 16 | %(d) |
| (a) | The commencement of investment operations for AMG Managers Guardian Capital Global Dividend Fund Class I shares was April 11, 2014. |
| (b) | Per share numbers have been calculated using average shares. |
| (c) | The total return is calculated using the published Net Asset Value as of fiscal year end. |
The accompanying notes are an integral part of these financial statements.
160
| | |
| AMG Funds | | |
| |
| AMG Managers Pictet International Fund – Class N | | October 31, 2016 |
| |
| Financial Highlights | | |
| | | | | | | | | | | | |
| | | Year
Ended
10/31/16 | | | Year
Ended
10/31/15 | | | Period
Ended
10/31/14(a) | |
Net Asset Value, Beginning of Year | | $ | 9.56 | | | $ | 9.34 | | | $ | 10.00 | |
| | | | | | | | | | | | |
Income from Investment Operations: | | | | | | | | | | | | |
Net investment income | | | 0.13 | (b) | | | 0.10 | (b) | | | 0.09 | |
Net realized and unrealized gain (loss) on investments | | | 0.00 | (c) | | | 0.17 | (d) | | | (0.75 | ) |
| | | | | | | | | | | | |
Total from investment operations | | | 0.13 | | | | 0.27 | | | | (0.66 | ) |
| | | | | | | | | | | | |
Less Distributions: | | | | | | | | | | | | |
Distributions from and in excess of net investment income | | | (0.02 | ) | | | (0.03 | ) | | | — | |
| | | | | | | | | | | | |
Distributions from net realized gain on investments | | | (0.06 | ) | | | (0.02 | ) | | | — | |
| | | | | | | | | | | | |
Total distributions | | | (0.08 | ) | | | (0.05 | ) | | | — | |
| | | | | | | | | | | | |
Net increase (decrease) in net asset value | | | 0.05 | | | | 0.22 | | | | (0.66 | ) |
| | | | | | | | | | | | |
Net Asset Value, End of Year | | $ | 9.61 | | | $ | 9.56 | | | $ | 9.34 | |
| | | | | | | | | | | | |
Total Return(e) | | | 1.42 | %(f) | | | 3.02 | % | | | (6.60 | )%(g) |
Ratios/Supplemental Data: | | | | | | | | | | | | |
Net Assets, End of Period (in 000’s) | | $ | 131 | | | $ | 1,056 | | | $ | 984 | |
Ratios of expenses to average net assets: | | | | | | | | | | | | |
Before expense reimbursement and/or fee waiver, or recoupment | | | 1.41 | % | | | 1.92 | % | | | 3.26 | %(h) |
After expense reimbursement and/or fee waiver, or recoupment | | | 1.40 | %(i) | | | 1.40 | % | | | 1.40 | %(h) |
Ratios of net investment income (loss) to average net assets: | | | | | | | | | | | | |
Before expense reimbursement and/or fee waiver, or recoupment | | | 1.88 | % | | | 0.53 | % | | | (0.25 | )%(h) |
After expense reimbursement and/or fee waiver, or recoupment | | | 1.88 | % | | | 1.06 | % | | | 1.61 | %(h) |
Portfolio Turnover | | | 38 | % | | | 53 | % | | | 26 | %(g) |
| (a) | The commencement of investment operations for AMG Managers Pictet International Fund Class N shares was April 11, 2014. |
| (b) | Per share numbers have been calculated using average shares. |
| (d) | Includes capital contribution of $0.01 per share. |
| (e) | The total return is calculated using the published Net Asset Value as of fiscal year end. |
| (f) | The total return would have been 1.32% had the capital contribution not been included. |
| (i) | Effective October 1, 2016, the Fund’s expense cap was reduced to 1.08% from 1.40%. The expense ratio shown reflects the weighted average expense ratio for the full fiscal year ended October 31, 2016 (See Note F). |
The accompanying notes are an integral part of these financial statements.
161
| | |
| AMG Funds | | |
| |
| AMG Managers Pictet International Fund – Class I | | October 31, 2016 |
| |
| Financial Highlights | | |
| | | | | | | | | | | | |
| | | Year
Ended
10/31/16 | | | Year
Ended
10/31/15 | | | Period
Ended
10/31/14(a) | |
Net Asset Value, Beginning of Year | | $ | 9.60 | | | $ | 9.36 | | | $ | 10.00 | |
| | | | | | | | | | | | |
Income from Investment Operations: | | | | | | | | | | | | |
Net investment income | | | 0.15 | (b) | | | 0.12 | (b) | | | 0.10 | |
Net realized and unrealized gain (loss) on investments | | | 0.00 | (c) | | | 0.19 | (d) | | | (0.74 | ) |
| | | | | | | | | | | | |
Total from investment operations | | | 0.15 | | | | 0.31 | | | | (0.64 | ) |
| | | | | | | | | | | | |
Less Distributions: | | | | | | | | | | | | |
Distributions from and in excess of net investment income | | | (0.04 | ) | | | (0.05 | ) | | | — | |
Distributions from net realized gain on investments | | | (0.06 | ) | | | (0.02 | ) | | | — | |
| | | | | | | | | | | | |
Total distributions | | | (0.10 | ) | | | (0.07 | ) | | | — | |
| | | | | | | | | | | | |
Net increase (decrease) in net asset value | | | 0.05 | | | | 0.24 | | | | (0.64 | ) |
| | | | | | | | | | | | |
Net Asset Value, End of Year | | $ | 9.65 | | | $ | 9.60 | | | $ | 9.36 | |
| | | | | | | | | | | | |
Total Return(e) | | | 1.67 | %(f) | | | 3.43 | % | | | (6.40 | )%(g) |
Ratios/Supplemental Data: | | | | | | | | | | | | |
Net Assets, End of Period (in 000’s) | | $ | 1,336,050 | | | $ | 49,803 | | | $ | 8,467 | |
Ratios of expenses to average net assets: | | | | | | | | | | | | |
Before expense reimbursement and/or fee waiver, or recoupment | | | 1.15 | % | | | 1.67 | % | | | 3.01 | %(h) |
After expense reimbursement and/or fee waiver, or recoupment | | | 1.15 | %(i) | | | 1.15 | % | | | 1.15 | %(h) |
Ratios of net investment income to average net assets: | | | | | | | | | | | | |
Before expense reimbursement and/or fee waiver, or recoupment | | | 2.13 | % | | | 0.78 | % | | | 0.00 | %(h)(c) |
After expense reimbursement and/or fee waiver, or recoupment | | | 2.13 | % | | | 1.31 | % | | | 1.86 | %(h) |
Portfolio Turnover | | | 38 | % | | | 53 | % | | | 26 | %(g) |
| (a) | The commencement of investment operations for AMG Managers Pictet International Fund Class I shares was April 11, 2014. |
| (b) | Per share numbers have been calculated using average shares. |
| (d) | Includes capital contribution of $0.01 per share. |
| (e) | The total return is calculated using the published Net Asset Value as of fiscal year end. |
| (f) | The total return would have been 1.57% had the capital contribution not been included. |
| (i) | Effective October 1, 2016, the Fund’s expense cap was reduced to 1.08% from 1.15%. The expense ratio shown reflects the weighted average expense ratio for the full fiscal year ended October 31, 2016 (See Note F). |
The accompanying notes are an integral part of these financial statements.
162
| | |
| AMG Funds | | |
| |
| AMG Managers Value Partners Asia Dividend Fund – Class N | | October 31, 2016 |
| |
| Financial Highlights | | |
| | | | |
| | | Year
Ended
10/31/16(a) | |
Net Asset Value, Beginning of Year | | $ | 10.00 | |
| | | | |
Income from Investment Operations: | | | | |
Net investment income(b) | | | 0.24 | |
Net realized and unrealized gain on investments | | | 0.59 | |
| | | | |
Total from investment operations | | | 0.83 | |
| | | | |
Less Distributions: | | | | |
Distributions from and in excess of net investment income | | | (0.20 | ) |
| | | | |
Net increase in net asset value | | | 0.63 | |
| | | | |
Net Asset Value, End of Year | | $ | 10.63 | |
| | | | |
Total Return(c) | | | 8.39 | %(d) |
| | | | |
Ratios/Supplemental Data: | | | | |
Net Assets, End of Period (in 000’s) | | $ | 808 | |
Ratios of expenses to average net assets: | | | | |
Before expense reimbursement and/or fee waiver | | | 4.18 | %(e) |
After expense reimbursement and/or fee waiver | | | 1.40 | %(e)(f) |
Ratios of net investment income (loss) to average net assets: | | | | |
Before expense reimbursement and/or fee waiver | | | (0.05 | )%(e) |
After expense reimbursement and/or fee waiver | | | 2.74 | %(e) |
Portfolio Turnover | | | 51 | %(d) |
| (a) | The commencement of investment operations for AMG Managers Value Partners Asia Dividend Fund Class N shares was December 16, 2015. |
| (b) | Per share numbers have been calculated using average shares. |
| (c) | The total return is calculated using the published Net Asset Value as of fiscal year end. |
| (f) | Effective October 1, 2016, the Fund’s expense cap was reduced to 1.15% from 1.40%. The expense ratio shown reflects the weighted average expense ratio for the full fiscal period ended October 31, 2016 (See Note F). |
The accompanying notes are an integral part of these financial statements.
163
| | |
| AMG Funds | | |
| |
| AMG Managers Value Partners Asia Dividend Fund – Class I | | October 31, 2016 |
| |
| Financial Highlights | | |
| | | | |
| | | Year
Ended
10/31/16(a) | |
Net Asset Value, Beginning of Year | | $ | 10.00 | |
| | | | |
Income from Investment Operations: | | | | |
Net investment income(b) | | | 0.27 | |
Net realized and unrealized gain on investments | | | 0.58 | |
| | | | |
Total from investment operations | | | 0.85 | |
| | | | |
Less Distributions: | | | | |
Distribution from and in excess of net investment income | | | (0.22 | ) |
| | | | |
Net increase in net asset value | | | 0.63 | |
| | | | |
Net Asset Value, End of Year | | $ | 10.63 | |
| | | | |
Total Return(c) | | | 8.60 | %(d) |
Ratios/Supplemental Data: | | | | |
Net Assets, End of Period (in 000’s) | | $ | 7,283 | |
Ratios of expenses to average net assets: | | | | |
Before expense reimbursement and/or fee waiver | | | 3.94 | %(e) |
After expense reimbursement and/or fee waiver | | | 1.15 | %(e) |
Ratios of net investment income to average net assets: | | | | |
Before expense reimbursement and/or fee waiver | | | 0.20 | %(e) |
After expense reimbursement and/or fee waiver | | | 2.99 | %(e) |
Portfolio Turnover | | | 51 | %(d) |
| (a) | The commencement of investment operations for AMG Managers Value Partners Asia Dividend Fund Class I shares was December 16, 2015. |
| (b) | Per share numbers have been calculated using average shares. |
| (c) | The total return is calculated using the published Net Asset Value as of fiscal year end. |
The accompanying notes are an integral part of these financial statements.
164
| | |
| AMG Funds | | |
| |
| AMG Managers Montag & Caldwell Balanced Fund – Class N | | October 31, 2016 |
| |
| Financial Highlights | | |
| | | | | | | | | | | | | | | | | | | | |
| | | Year
Ended
10/31/16 | | | Year
Ended
10/31/15 | | | Year
Ended
10/31/14 | | | Year
Ended
10/31/13 | | | Year
Ended
10/31/12 | |
Net Asset Value, Beginning of Year | | $ | 23.83 | | | $ | 24.68 | | | $ | 23.81 | | | $ | 21.46 | | | $ | 20.09 | |
| | | | | | | | | | | | | | | | | | | | |
Income from Investment Operations: | | | | | | | | | | | | | | | | | | | | |
Net investment income(a) | | | 0.11 | | | | 0.10 | | | | 0.12 | | | | 0.21 | | | | 0.16 | |
Net realized and unrealized gain (loss) on investments | | | (0.17 | ) | | | 1.31 | | | | 1.70 | | | | 2.43 | | | | 1.45 | |
| | | | | | | | | | | | | | | | | | | | |
Total from investment operations | | | (0.06 | ) | | | 1.41 | | | | 1.82 | | | | 2.64 | | | | 1.61 | |
| | | | | | | | | | | | | | | | | | | | |
Less Distributions: | | | | | | | | | | | | | | | | | | | | |
Distributions from and in excess of net investment income | | | (0.15 | ) | | | (0.18 | ) | | | (0.21 | ) | | | (0.29 | ) | | | (0.24 | ) |
Distributions from net realized gain on investments | | | (1.04 | ) | | | (2.08 | ) | | | (0.74 | ) | | | — | | | | — | |
| | | | | | | | | | | | | | | | | | | | |
Total distributions | | | (1.19 | ) | | | (2.26 | ) | | | (0.95 | ) | | | (0.29 | ) | | | (0.24 | ) |
| | | | | | | | | | | | | | | | | | | | |
Net increase (decrease) in net asset value | | | (1.25 | ) | | | (0.85 | ) | | | 0.87 | | | | 2.35 | | | | 1.37 | |
| | | | | | | | | | | | | | | | | | | | |
Net Asset Value, End of Year | | $ | 22.58 | | | $ | 23.83 | | | $ | 24.68 | | | $ | 23.81 | | | $ | 21.46 | |
| | | | | | | | | | | | | | | | | | | | |
Total Return(b) | | | (0.28 | )% | | | 6.01 | % | | | 7.83 | % | | | 12.40 | % | | | 8.03 | % |
Ratios/Supplemental Data: | | | | | | | | | | | | | | | | | | | | |
Net Assets, End of Period (in 000’s) | | $ | 25,373 | | | $ | 26,607 | | | $ | 20,446 | | | $ | 22,425 | | | $ | 31,536 | |
Ratios of expenses to average net assets: | | | | | | | | | | | | | | | | | | | | |
Before expense reimbursement and/or fee waiver | | | 1.31 | % | | | 1.44 | % | | | 1.43 | % | | | 1.37 | % | | | 1.42 | % |
After expense reimbursement and/or fee waiver | | | 1.20 | %(c) | | | 1.20 | % | | | 1.20 | % | | | 1.20 | % | | | 1.22 | % |
Ratios of net investment income to average net assets: | | | | | | | | | | | | | | | | | | | | |
Before expense reimbursement and/or fee waiver | | | 0.35 | % | | | 0.19 | % | | | 0.26 | % | | | 0.77 | % | | | 0.57 | % |
After expense reimbursement and/or fee waiver | | | 0.46 | % | | | 0.43 | % | | | 0.50 | % | | | 0.94 | % | | | 0.77 | % |
Portfolio Turnover | | | 85 | % | | | 36 | % | | | 27 | % | | | 35 | % | | | 35 | % |
| (a) | Per share numbers have been calculated using average shares. |
| (b) | The total return is calculated using the published Net Asset Value as of fiscal year end. |
| (c) | Effective October 1, 2016, the Fund’s expense cap was reduced to 1.04% from 1.35%. The expense ratio shown reflects the weighted average expense ratio for the full fiscal year ended October 31, 2016 (See Note F). |
The accompanying notes are an integral part of these financial statements.
165
| | |
| AMG Funds | | |
| |
| AMG Managers Montag & Caldwell Balanced Fund – Class I | | October 31, 2016 |
| |
| Financial Highlights | | |
| | | | | | | | | | | | | | | | | | | | |
| | | Year
Ended
10/31/16 | | | Year
Ended
10/31/15 | | | Year
Ended
10/31/14 | | | Year
Ended
10/31/13 | | | Year
Ended
10/31/12 | |
Net Asset Value, Beginning of Year | | $ | 23.75 | | | $ | 24.60 | | | $ | 23.76 | | | $ | 21.41 | | | $ | 20.05 | |
| | | | | | | | | | | | | | | | | | | | |
Income from Investment Operations: | | | | | | | | | | | | | | | | | | | | |
Net investment income(a) | | | 0.13 | | | | 0.12 | | | | 0.14 | | | | 0.23 | | | | 0.19 | |
Net realized and unrealized gain (loss) on investments | | | (0.17 | ) | | | 1.31 | | | | 1.70 | | | | 2.43 | | | | 1.44 | |
| | | | | | | | | | | | | | | | | | | | |
Total from investment operations | | | (0.04 | ) | | | 1.43 | | | | 1.84 | | | | 2.66 | | | | 1.63 | |
| | | | | | | | | | | | | | | | | | | | |
Less Distributions: | | | | | | | | | | | | | | | | | | | | |
Distributions from and in excess of net investment income | | | (0.17 | ) | | | (0.20 | ) | | | (0.26 | ) | | | (0.31 | ) | | | (0.27 | ) |
Distributions from net realized gain on investments | | | (1.04 | ) | | | (2.08 | ) | | | (0.74 | ) | | | — | | | | — | |
| | | | | | | | | | | | | | | | | | | | |
Total distributions | | | (1.21 | ) | | | (2.28 | ) | | | (1.00 | ) | | | (0.31 | ) | | | (0.27 | ) |
| | | | | | | | | | | | | | | | | | | | |
Net increase (decrease) in net asset value | | | (1.25 | ) | | | (0.85 | ) | | | 0.84 | | | | 2.35 | | | | 1.36 | |
| | | | | | | | | | | | | | | | | | | | |
Net Asset Value, End of Year | | $ | 22.50 | | | $ | 23.75 | | | $ | 24.60 | | | $ | 23.76 | | | $ | 21.41 | |
| | | | | | | | | | | | | | | | | | | | |
Total Return(b) | | | (0.19 | )% | | | 6.13 | % | | | 7.92 | % | | | 12.53 | % | | | 8.14 | % |
Ratios/Supplemental Data: | | | | | | | | | | | | | | | | | | | | |
Net Assets, End of Period (in 000’s) | | $ | 3,091 | | | $ | 3,518 | | | $ | 1,934 | | | $ | 1,839 | | | $ | 1,930 | |
Ratios of expenses to average net assets: | | | | | | | | | | | | | | | | | | | | |
Before expense reimbursement and/or fee waiver | | | 1.22 | % | | | 1.34 | % | | | 1.33 | % | | | 1.27 | % | | | 1.30 | % |
After expense reimbursement and/or fee waiver | | | 1.10 | %(c) | | | 1.10 | % | | | 1.10 | % | | | 1.10 | % | | | 1.10 | % |
Ratios of net investment income to average net assets: | | | | | | | | | | | | | | | | | | | | |
Before expense reimbursement and/or fee waiver | | | 0.43 | % | | | 0.29 | % | | | 0.36 | % | | | 0.87 | % | | | 0.69 | % |
After expense reimbursement and/or fee waiver | | | 0.55 | % | | | 0.53 | % | | | 0.60 | % | | | 1.04 | % | | | 0.89 | % |
Portfolio Turnover | | | 85 | % | | | 36 | % | | | 27 | % | | | 35 | % | | | 35 | % |
| (a) | Per share numbers have been calculated using average shares. |
| (b) | The total return is calculated using the published Net Asset Value as of fiscal year end. |
| (c) | Effective October 1, 2016, the Fund’s expense cap was reduced to 1.04% from 1.10%. The expense ratio shown reflects the weighted average expense ratio for the full fiscal year ended October 31, 2016 (See Note F). |
The accompanying notes are an integral part of these financial statements.
166
AMG Funds
October 31, 2016
Notes to Financial Statements
Note (A) Summary of Significant Accounting Policies: AMG Funds IV (formerly, the Aston Funds) (the “Trust”), is an open-end management investment company, organized as a Delaware Statutory Trust, and registered under the Investment Company Act of 1940, as amended (the “1940 Act”). Currently, the Trust consists of a number of different funds, (each a “Fund” and collectively, the “Funds”), each having distinct investment management objectives, strategies, risks and policies. Included in this report are:
Funds
AMG Managers Fairpointe Focused Equity Fund, formerly the ASTON/ Fairpointe Focused Equity Fund (the “Fairpointe Focused Equity”)
AMG River Road Focused Absolute Value Fund, formerly the ASTON/River Road Focused Absolute Value Fund (the “River Road Focused Absolute Value”)
AMG Managers Montag & Caldwell Growth Fund, formerly the ASTON/ Montag & Caldwell Growth Fund (the “Montag & Caldwell Growth”)
AMG River Road Dividend All Cap Value Fund, formerly the ASTON/River Road Dividend All Cap Value Fund (the “River Road Dividend All Cap Value”)
AMG River Road Dividend All Cap Value Fund II, formerly the ASTON/ River Road Dividend All Cap Value Fund II (the “River Road Dividend All Cap Value II”)
AMG Managers Fairpointe Mid Cap Fund, formerly the ASTON/Fairpointe Mid Cap Fund (the “Fairpointe Mid Cap”)
AMG Managers Montag & Caldwell Mid Cap Growth Fund, formerly the ASTON/Montag & Caldwell Mid Cap Growth Fund (the “Montag & Caldwell Mid Cap Growth”)
AMG Managers LMCG Small Cap Growth Fund, formerly the Aston/LMCG Small Cap Growth Fund (the “LMCG Small Cap Growth”)
AMG River Road Select Value Fund, formerly the ASTON/River Road Select Value Fund (the “River Road Select Value”)
AMG River Road Small Cap Value Fund, formerly the ASTON/River Road Small Cap Value Fund (the “River Road Small Cap Value”)
AMG Managers Silvercrest Small Cap Fund, formerly the ASTON/ Silvercrest Small Cap Fund (the “Silvercrest Small Cap”)
AMG GW&K U.S. Small Cap Growth Fund, formerly the ASTON Small Cap Fund and formerly, ASTON/TAMRO Small Cap Fund, (“GW&K U.S. Small Cap Growth”)
AMG Managers DoubleLine Core Plus Bond Fund, formerly the ASTON/ DoubleLine Core Plus Fixed Income Fund (the “DoubleLine Core Plus Bond”)
AMG Managers Anchor Capital Enhanced Equity Fund, formerly the ASTON/Anchor Capital Enhanced Equity Fund (the “Anchor Capital Enhanced Equity”)
AMG Managers Lake Partners LASSO Alternatives Fund, formerly the ASTON/Lake Partners LASSO Alternatives Fund (the “Lake Partners LASSO Alternatives”)
AMG River Road Long-Short Fund, formerly the ASTON/River Road Long-Short Fund (the “River Road Long-Short”)
AMG Managers Guardian Capital Global Dividend Fund, formerly the ASTON/Guardian Capital Global Dividend Fund (the “Guardian Capital Global Dividend”)
AMG Managers Pictet International Fund, formerly the ASTON/Pictet International Fund (the “Pictet International”)
Funds
AMG Managers Value Partners Asia Dividend Fund, formerly the ASTON/Value Partners Asia Dividend Fund (the “Value Partners Asia Dividend”)
AMG Managers Montag & Caldwell Balanced Fund, formerly the ASTON/Montag & Caldwell Balanced Fund (the “Montag & Caldwell Balanced”)
Each Fund, except Montag & Caldwell Growth, is authorized to issue two classes of shares (Class N shares and Class I shares). Montag & Caldwell Growth is authorized to issue three classes of shares (Class N shares, Class I shares and Class R shares). Each class represents an interest in the same assets of the Fund. Although all share classes generally have identical voting rights, each share class votes separately when required by law. Different share classes may pay different amounts to the extent the net asset value per share and/or the expenses of such share classes differ. Each share class has its own expense structure. Please refer to a current prospectus for additional information on each share class.
The Funds’ financial statements are prepared in accordance with accounting principles generally accepted in the United States of America (“U.S. GAAP”), which require management to make estimates and assumptions that affect the reported amounts of assets and liabilities and disclosure of contingent assets and liabilities at the date of the financial statements and the reported amounts of income and expenses during the reporting period. Actual results could differ from those estimates and such differences could be material. The following is a summary of significant accounting policies followed by the Funds in the preparation of their financial statements:
(1) Valuation of Investments: Equity securities, including short positions, traded on a national securities exchange or reported on the NASDAQ national market system (“NMS”) are valued at the last quoted sales price on the primary exchange or, if applicable, the NASDAQ official closing price or the official closing price of the relevant exchange or, lacking any sales, at the last quoted bid price. Equity securities traded in the over-the-counter market (other than NMS securities) are valued at the exchange mean, or the mean between the last quoted bid and ask prices (the “exchange mean price”). Foreign equity securities (securities principally traded in markets other than U.S. markets) are valued at the official closing price on the primary exchange or, for markets that either do not offer an official closing price or where the official closing price may not be representative of the overall market, the last quoted sale price.
Fixed income securities purchased with a remaining maturity exceeding 60 days are valued at the mean between the evaluated bid and ask price provided by an authorized pricing service or, if an evaluated price is not available, by reference to other securities which are considered comparable in credit rating, interest rate, due date and other features (generally referred to as “matrix pricing”) or other similar pricing methodologies. Investments in certain mortgage-backed and stripped mortgage-backed securities, preferred stocks, convertible securities, derivatives and other debt securities not traded on an organized securities market are valued on the basis of valuations provided by dealers or by a pricing service which uses information with respect to
AMG Funds
October 31, 2016
Notes to Financial Statements – continued
transactions in such securities and various relationships between such securities and yield to maturity in determining value.
Fixed income securities purchased with a remaining maturity of 60 days or less are valued at amortized cost, provided that the amortized cost value is approximately the same as the fair value of the security valued without the use of amortized cost. Investments in other open-end regulated investment companies are valued at their end of day net asset value per share.
The Funds’ portfolio investments are generally valued based on independent market quotations or prices or, if none, “evaluative” or other market based valuations provided by third-party pricing services approved by the Board of Trustees of the Trust (the “Board”). Under certain circumstances, the value of certain Fund portfolio investments (including derivatives) may be based on an evaluation of fair value, pursuant to procedures established by and under the general supervision of the Board. The Valuation Committee, which is comprised of the Independent Trustees of the Board, and the Pricing Committee, which is comprised of representatives from AMG Funds LLC (the “Investment Manager”) are the committees appointed by the Board to make fair value determinations. Each Fund may use the fair value of a portfolio investment to calculate its net asset value (“NAV”) in the event that the market quotation, price or market based valuation for the portfolio investment is not readily available or otherwise not determinable pursuant to the Board’s valuation procedures, if the Investment Manager or the Pricing Committee believes the quotation, price or market based valuation to be unreliable, or in certain other circumstances. When determining the fair value of an investment, the Pricing Committee and, if required under the Trust’s securities valuation procedures, the Valuation Committee, seeks to determine the price that the Fund might reasonably expect to receive from current sale of that portfolio investment in an arms-length transaction. Fair value determinations shall be based upon consideration of all available facts and information, including, but not limited to (i) attributes specific to the investment; (ii) fundamental and analytical data relating to the investment; and (iii) the value of other comparable securities or relevant financial instruments, including derivative securities, traded on other markets or among dealers.
The values assigned to fair value portfolio investments are based on available information and do not necessarily represent amounts that might ultimately be realized in the future, since such amounts depend on future developments inherent in long-term investments. Because of the inherent uncertainty of valuation, those estimated values may differ significantly from the values that would have been used had a ready market for the investments existed, and the differences could be material. The Board will be presented with a quarterly report showing as of the most recent quarter end, all outstanding securities fair valued by the Fund, including a comparison with the prior quarter end and the percentage of the Fund that the security represents at each quarter end.
With respect to foreign equity securities and certain foreign fixed income securities, the Board has adopted a policy that securities
held in a Fund that can be fair valued by the applicable fair value pricing service are fair valued on each business day provided that each individual price exceeds a pre-established confidence level.
U.S. GAAP defines fair value as the price that a fund would receive to sell an asset or pay to transfer a liability in an orderly transaction between market participants at the measurement date. U.S. GAAP also establishes a framework for measuring fair value, and a three-level hierarchy for fair value measurements based upon the transparency of inputs to the valuation of an asset or liability. Inputs may be observable or unobservable and refer broadly to the assumptions that market participants would use in pricing the asset or liability. Observable inputs reflect the assumptions market participants would use in pricing the asset or liability based on market data obtained from sources independent of the Funds. Unobservable inputs reflect the Funds’ own assumptions about the assumptions that market participants would use in pricing the asset or liability developed based on the best information available in the circumstances. The inputs and valuation techniques used to measure fair value of the Funds’ net assets are summarized into three levels as described in the hierarchy below:
• Level 1 – unadjusted quoted prices in active markets for identical assets or liabilities
• Level 2 – other significant observable inputs (including quoted prices for similar securities, interest rates, prepayment speeds, credit risk, etc.)
• Level 3 – significant unobservable inputs (including the Funds’ own assumptions in determining the fair value of investments)
The inputs or methodology used for valuing securities are not necessarily an indication of the risk associated with investing in those securities. Transfers in and out of the levels are recognized at the market value at the end of the period.
(2) Investment Companies: Lake Partners LASSO Alternatives primarily invests, and certain other Funds in this Trust, may invest in securities of other investment companies, including open-end funds, closed end funds and exchange-traded funds (“ETFs”). Open-end funds are investment companies that issue new shares continuously and redeem shares daily. Closed-end funds are investment companies that typically issue a fixed number of shares that trade on a securities exchange or over-the-counter. An ETF is an investment company. Typically, an ETF seeks to track the performance of an index by holding in its portfolio shares of all the companies, or a representative sample of the companies, that are components of a particular index; however, some ETFs are actively managed. ETFs are traded on securities exchanges based on their market values. The risks of investment in other investment companies typically reflect the risks of the types of securities in which investment companies invest. Investments in ETFs and closed-end funds are subject to the additional risk that shares of the fund may trade at a premium or discount to their NAV per share. When a
AMG Funds
October 31, 2016
Notes to Financial Statements – continued
Fund invests in another investment company, shareholders of the Fund bear their proportionate shares of the other investment company’s fees and expenses, as well as their share of the Fund’s fees and expenses. The Trust has obtained an exemptive order from the Securities and Exchange Commission (“SEC”) that allows the Funds to invest in both affiliated and unaffiliated investment companies in excess of the limits of the 1940 Act, subject to the terms and conditions of such order. Prior to its investment in shares of an unaffiliated investment company in excess of the limits of the 1940 Act, the Trust, on behalf of a Fund, and the underlying fund must execute an agreement that is designed to ensure that each party understands the terms and conditions of the order and agrees to fulfill its responsibilities under the order. For the fiscal year ended October 31, 2016, Lake Partners LASSO Alternatives relied on such exemptive order.
(3) Repurchase Agreements and Joint Repurchase Agreements: The Funds may enter into repurchase agreements for temporary cash management purposes provided that the value of the underlying collateral, including accrued interest, will equal or exceed the value of the repurchase agreement during the term of the agreement. The underlying collateral for all repurchase agreements is held in safekeeping by the Funds’ custodian or at the Federal Reserve Bank. If the seller defaults and the value of the collateral declines, or if bankruptcy proceedings commence with respect to the seller of the security, realization of the collateral by the Funds may be delayed or limited.
(4) Securities Transacted on a When Issued Basis: The Funds may enter into To-Be-Announced (“TBA”) sale commitments to hedge their portfolio positions or to sell mortgage-backed securities they own under delayed delivery arrangements. Proceeds of TBA sale commitments are not received until the contractual settlement date. During the time a TBA sale commitment is outstanding, equivalent deliverable securities, with the same counterparty, or an offsetting TBA purchase commitment deliverable on or before the sale commitment date, are held as “cover” for the transaction. Unsettled TBA sale commitments are valued at the current market value of the underlying securities according to the procedures described under “Valuation of Investments,” in footnote A1 above.
Each contract is marked-to-market daily and the change in market value is recorded by the Funds as an unrealized gain or loss. If the TBA sale commitment is closed through the acquisition of an offsetting purchase commitment, the Funds realize a gain or loss. If the Funds deliver securities under the commitment, the Funds realize a gain or a loss from the sale of the securities based upon the unit price established at the date the commitment was entered into.
(5) Mortgage-Backed Securities: Montag & Caldwell Balanced and DoubleLine Core Plus Bond may invest in mortgage-backed securities (“MBS”). These securities represent interests in pools of mortgage loans and they provide holders with payments consisting of both principal and interest as the mortgages in the underlying mortgage pools are paid. The timely payment of principal and interest on MBS issued or guaranteed by Ginnie Mae
(formerly known as the Government National Mortgage Association) is backed by Ginnie Mae and the full faith and credit of the U.S. government. MBS issued by U.S. government agencies or instrumentalities other than Ginnie Mae are not “full faith and credit” obligations. Certain obligations, such as those issued by the Federal Home Loan Banks, Fannie Mae (formerly known as the Federal National Mortgage Association) and Fred-die Mac (formerly known as the Federal Home Loan Mortgage Corporation) are supported only by the credit of the issuer. MBS issued by private issuers are not government securities and are not guaranteed by any government agency. They are secured by the underlying collateral of the private issuer. Yields on privately issued MBS tend to be higher than those of government-backed issues. However, risk of loss due to default and sensitivity to interest rate fluctuations are also higher. Montag & Caldwell Balanced and DoubleLine Core Plus Bond may also invest in collateralized mortgage obligations (“CMOs”), collateralized loan obligations (“CLOs”) and real estate mortgage investment conduits (“REMICs”). A CMO and/or REMIC is a bond that is collateralized by a pool of MBS. A CLO is a bond that is collateralized by a financial institution’s receivables from loans. These MBS pools are divided into classes with each class having its own characteristics. The different classes are retired in sequence as the underlying mortgages are repaid.
(6) Delayed Delivery Transactions and When-Issued Securities: DoubleLine Core Plus Bond may enter into securities transactions on a delayed delivery or when issued basis. Payment and delivery may take place after the customary settlement period for that security. The price of the underlying securities and the date when the securities will be delivered and paid for are fixed at the time the transaction is negotiated. During the time a delayed delivery sell is outstanding, the contract is marked to market daily and equivalent deliverable securities are held for the transaction. The value of the securities purchased on a delayed delivery or when-issued basis are identified as such in the Fund’s Schedule of Investments. With respect to purchase commitments, the Fund identifies securities as segregated in its records with a value at least equal to the amount of the commitment. Delayed delivery or when-issued securities that have been purchased from and sold to different brokers are reflected as an investment in securities and a forward sale commitment in the Fund’s Statement of Assets and Liabilities. Losses may arise due to changes in the value of the underlying securities or if the counterparty does not perform under the contract, or if the issuer does not issue the securities due to political, economic, or other factors.
(7) Stripped Securities: DoubleLine Core Plus Bond may invest in stripped securities (“STRIPS”), for hedging purposes to protect the Fund’s portfolio against interest rate fluctuations. Interest-only STRIPS will most likely move differently than typical fixed-income securities in relation to changes in interest rates. STRIPS are usually structured with two classes that receive different proportions of the interest and principal distributions from a pool of underlying assets. A common type of STRIP will have one class receiving all of the interest from the underlying assets (“interest-only” or “IO” class), while the other class will receive the entire principal (“principal only” or “PO” class).
AMG Funds
October 31, 2016
Notes to Financial Statements – continued
However, in some instances, one class will receive some of the interest and most of the principal while the other class will receive most of the interest and the remainder of the principal. STRIPS are unusually volatile in response to changes in interest rates. The yield to maturity on an IO class of STRIPS is extremely sensitive not only to changes in prevailing interest rates but also to the rate of principal payments (including prepayments) on the underlying assets. A rapid rate of principal prepayments may have a measurably adverse effect on the Fund’s yield to maturity to the extent it invests in IOs. Conversely, POs tend to increase in value if prepayments are greater than anticipated and decline if prepayments are slower than anticipated. Thus, if the underlying assets experience greater than anticipated repayments of principal, the Fund may fail to fully recover its initial investment in these securities, even if the STRIPS were rated of the highest credit quality by Standard & Poor’s Corporation or Moody’s Investors Service, Inc. These risks are managed by investing in a variety of such securities and by using certain hedging techniques. In addition the secondary market for STRIPS may be less liquid than that of other mortgage-backed or asset-backed securities, potentially limiting the Fund’s ability to buy or sell those securities at any particular time.
(8) Securities Sold Short and Due to/from Brokers: River Road Long-Short utilizes short sales as part of its overall portfolio management strategy. A short sale involves the sale of a security that is borrowed from a broker or other financial institution. A gain, limited to the price at which the Fund sold the security short, or a loss, unlimited in size, will be recognized upon closing a short sale. Short sales expose the Fund to the risk that it will be required to acquire, convert or exchange securities to replace the borrowed securities at a time when the securities sold short have appreciated in value, thus resulting in a loss to the Fund. The Fund must segregate liquid assets, or otherwise cover its position in a permissible manner. The Investment Manager determines the liquidity of assets, in accordance with procedures established by the Board. Cash segregated as collateral for short sales is shown in the Statement of Assets and Liabilities as segregated cash. Security positions segregated as collateral for short sales are included in unaffiliated investments at value in the Statement of Assets and Liabilities.
Due to/from brokers represents cash balances on deposit with, or cash balances owed to, Bank of America Merrill Lynch (the “Prime Broker”). When the Fund has cash balances on deposit with the Prime Broker, the Fund is subject to credit risk should the Prime Broker be unable to meet their obligations to the Fund; and when the Fund has cash balances owed to the Prime Broker, the amount is payable upon demand and the Fund must segregate liquid assets.
The Fund has entered into a Special Custody Agreement with the Prime Broker for securities sold short, which provides the right, in the event of default (including bankruptcy or insolvency) for the non-defaulting party to liquidate the collateral and calculate net exposure to the defaulting party or request additional collateral. For financial reporting purposes, the Fund does not offset financial assets and financial liabilities that are subject to a Special Custody Agreement in the Statement of Assets and Liabilities. As
of October 31, 2016, the value of securities sold short was $14,266,905 and the Fund owed the Prime Broker $11,422,556 relating to margin; which both were collateralized with cash of $3,839,023 and securities worth $27,678,191.
(9) Options Contracts: In the normal course of pursuing its investment objectives and mitigating price volatility risk, Anchor Capital Enhanced Equity may write and/or purchase call and put options on securities for hedging purposes, to seek capital appreciation, to mitigate risk and/or to increase exposure. Writing put options or purchasing call options tends to increase the Fund’s exposure to the underlying instrument. Writing call options or purchasing put options tends to decrease the Fund’s exposure to the underlying instrument. When the Fund writes or purchases a call or put option, an amount equal to the premium received or paid by the Fund is included in the Fund’s Statement of Assets and Liabilities as a liability or an investment and subsequently adjusted to the current market value based on the quoted daily settlement price of the option written or purchased. Premiums received or paid from writing or purchasing options that expire unexercised are treated by the Fund on the expiration date as realized gains or losses. The difference between the premium and the amount paid or received on a closing purchase or sale transaction, including brokerage commissions, is also treated as a realized gain or loss. If an option is exercised, the premium paid or received is added to the cost of the purchase or proceeds from the sale in determining whether the Fund has realized a gain or loss on investment transactions. If the Fund writes a covered call option, the Fund forgoes, in exchange for the premium, the opportunity to profit during the option period from an increase in the market value of the underlying security above the exercise price. If the Fund writes a put option, it accepts the risk of a decline in the market value of the underlying security below the exercise price. There is the risk the Fund may not be able to enter into a closing transaction because of an illiquid market. The risk associated with purchasing put and call options is limited to the premium paid. Options were traded during the period in Anchor Capital Enhanced Equity. See the Schedule of Investments for open options contracts held by Anchor Capital Enhanced Equity at October 31, 2016.
For the fiscal year ended October 31, 2016, the average* volume of derivative activity is as follows:
| | | | | | | | |
Funds | | Purchased
Options
(Premium Paid) | | | Written Options
(Premiums Received) | |
Anchor Capital Enhanced Equity | | $ | 1,016,707 | | | $ | 3,139,131 | |
| * | estimated based on quarterly holdings |
(10) Forward Foreign Currency Contracts: A forward foreign currency contract is an agreement between a fund and another party to buy or sell a currency at a set price at a future date. The market value of the contract will fluctuate with changes in currency exchange rates. The contract is marked-to-market daily, and the change in market value is recorded as an unrealized gain or loss. Gain or loss is realized on the settlement date. Risks may arise upon entering into these contracts from the potential inability of counterparties to meet the terms of their
AMG Funds
October 31, 2016
Notes to Financial Statements – continued
contracts and from unanticipated movements in the value of a foreign currency relative to the U.S. dollar.
During the fiscal year ended October 31, 2016, the Funds did not invest in forward foreign currency contracts.
(11) Disclosures about Derivative Instruments: The following is a table summarizing the fair value of derivatives held at October 31, 2016, by primary risk exposure:
| | | | | | | | |
| | | Asset Derivative
Investments Value | | | Liability Derivative
Investments Value | |
| | | Equity
Contracts (a) | | | Equity
Contracts (a) | |
Anchor Capital Enhanced Equity | | $ | 267,750 | | | $ | (1,705,114 | ) |
| (a) | Statement of Assets and Liabilities location: Unaffiliated investments at value for purchased options and call options written, at value for written options. |
The effect of derivative instruments on the Statement of Operations for the fiscal year ended October 31, 2016:
| | | | | | | | |
| | | Amount of
Realized Gain (Loss)
on Derivatives
Investments Value | | | Change in Unrealized
Appreciation on
Derivatives
Investments Value | |
| | | Equity
Contracts (a) | | | Equity
Contracts (b) | |
Anchor Capital Enhanced Equity | | $ | (10,827,504 | ) | | $ | 2,453,611 | |
| (a) | Statement of Operations location: Net realized loss on purchased options and net realized loss on written options. |
| (b) | Statement of Operations location: Net change in unrealized appreciation (depreciation) on purchased options and net change in unrealized appreciation (depreciation) on written options. |
(12) Security Transactions: Security transactions are accounted for as of trade date. Realized gains and losses on securities sold are determined on the basis of identified cost.
(13) Investment Income and Expenses: Dividend income and expenses is recorded on the ex-dividend date. Dividends from foreign securities are recorded as soon as the Trust becomes aware of the ex-dividend date except for Korean securities where dividends are recorded on confirmation date. Interest income and expenses, which includes amortization of premium and accretion of discount on debt securities, is accrued as earned. Dividend and interest income on foreign securities is recorded gross of any withholding tax. Non-cash dividends included in dividend income, if any, are reported at the fair market value of the securities received. Distributions received in excess of income from return of capital including real estate investment trusts (“REITs”) are recorded as a reduction of the cost of the related investment and/or as a realized gain. If the Funds no longer own the applicable securities, any distributions received in excess of income are recorded as an adjustment to realized gain. Other income and expenses are recorded on an accrual basis. Expenses that cannot be directly attributed to a Fund are apportioned among the Funds in the Trust and other trusts within the AMG Funds family of mutual funds (collectively the “AMG Funds family”) and other affiliated funds based upon their relative average net assets or number of shareholders. Investment income, realized and unrealized gains and losses,
the common expenses of each Fund, and certain Fund level expense reductions, if any, are allocated on a pro-rata basis to each class based on the relative net assets of each class to the total net assets of each Fund.
Certain Funds had certain portfolio trades directed to various brokers under a brokerage recapture program. Credits received from the brokerage recapture program are earned and paid on a monthly basis, and are recorded as expense offsets, which serve to reduce a Fund’s overall expense ratio. For the fiscal year ended October 31, 2016, the impact on the expense ratios, if any, were as follows:
| | | | | | | | |
| | | Credits
Received | | | Expense
Reduction | |
River Road Focused Absolute Value | | $ | 148 | | | | 0.002 | % |
Montag & Caldwell Growth | | | 32,876 | | | | 0.002 | % |
River Road Dividend All Cap Value | | | 739 | | | | 0.000 | % |
River Road Dividend All Cap Value II | | | 82 | | | | 0.000 | % |
Montag & Caldwell Mid Cap Growth | | | 323 | | | | 0.003 | % |
River Road Select Value | | | 447 | | | | 0.001 | % |
River Road Small Cap Value | | | 3,854 | | | | 0.001 | % |
Silvercrest Small Cap | | | 2,437 | | | | 0.001 | % |
GW&K U.S. Small Cap Growth | | | 23,119 | | | | 0.016 | % |
River Road Long-Short | | | 115 | | | | 0.000 | % |
Montag & Caldwell Balanced | | | 692 | | | | 0.002 | % |
(14) Foreign Securities: Certain Funds invest in securities of foreign entities and in instruments denominated in foreign currencies which involve risks not typically associated with investments in domestic securities. Non-domestic securities carry special risks, such as exposure to currency fluctuations, less developed or less efficient trading markets, political instability, a lack of company information, differing auditing and legal standards, and, potentially, less liquidity. A Fund’s investments in emerging markets countries are exposed to additional risks. A Fund’s performance will be influenced by political, social and economic factors affecting companies in emerging markets countries. Emerging markets countries generally have economic structures that are less diverse and mature, and political systems that are less stable, than those of developed countries. Realized gains in certain countries may be subject to foreign taxes at the Fund level and the fund would pay such foreign taxes at the appropriate rate for each jurisdiction.
(15) Foreign Currency Translation: The books and records of the Funds are maintained in U.S. dollars. The values of investments, assets and liabilities denominated in currencies other than U.S. dollars are translated into U.S. dollars based upon current foreign exchange rates. Purchases and sales of foreign investments, income and expenses are converted into U.S. dollars based on currency exchange rates prevailing on the respective dates of such transactions. Net realized and unrealized gain (loss) on foreign currency transactions represent: (1) foreign exchange gains and losses from the sale and holdings of foreign currencies; (2) gains and losses between trade date and settlement date on investment securities transactions and forward foreign currency contracts; and (3) gains and losses from the difference between amounts of interest and dividends recorded and the amounts actually received.
AMG Funds
October 31, 2016
Notes to Financial Statements – continued
The Funds do not isolate the net realized and unrealized gain or loss resulting from changes in exchange rates from the fluctuations in market prices of securities held. Such fluctuations are included with the net realized and unrealized gain or loss on investments.
(16) Federal Income Taxes: Each Fund currently qualifies or intends to qualify as a regulated investment company and intends to comply with the requirements under Subchapter M of the Internal Revenue Code of 1986, as amended, to distribute substantially all of its taxable income and gains to its shareholders and to meet certain diversification and income requirements with respect to regulated investment companies. Therefore, no provision for federal income or excise tax is included in the accompanying financial statements.
Additionally, based on each Fund’s understanding of the tax rules and rates related to income, gains and transactions for the foreign jurisdictions in which it invests, each Fund will provide for foreign taxes and, where appropriate, deferred foreign taxes.
Management has analyzed the Funds’ tax positions taken on federal income tax returns as of October 31, 2016 and for all open tax years (generally, the three prior taxable years), and has concluded that no provision for federal income tax is required in the Funds’ financial statements. Additionally, Management is not aware of any tax position for which it is reasonably possible that the total amounts of unrecognized tax benefits will change materially in the next twelve months.
Net capital losses incurred in taxable years beginning after the enactment of the Regulated Investment Company Modernization Act of 2010, may be carried forward for an unlimited time period, and retain their tax character as either short-term or long-term capital losses.
At October 31, 2016, the following Funds had net realized capital loss carryforwards available to offset future net realized capital gains through the fiscal year ended:
| | | | | | | | | | | | | | | | | | | | | | | | |
| | | Capital Loss Carryforwards: | |
| | | 2017 | | | 2018 | | | 2019 | | | Post Enactment
Short-Term | | | Post Enactment
Long-Term | | | Total | |
Fairpointe Focused Equity | | $ | — | | | $ | — | | | $ | — | | | $ | 138,622 | | | $ | 8,883 | | | $ | 147,505 | |
LMCG Small Cap Growth | | | — | | | | — | | | | — | | | | 30,255,640 | | | | 4,173,478 | | | | 34,429,118 | |
Anchor Capital Enhanced Equity | | | — | | | | — | | | | — | | | | 3,768,177 | | | | — | | | | 3,768,177 | |
Guardian Capital Global Dividend | | | — | | | | — | | | | — | | | | 247,545 | | | | 57,327 | | | | 304,872 | |
River Road Long-Short | | | — | | | | — | | | | — | | | | 2,659,289 | | | | 450,310 | | | | 3,109,599 | |
For the fiscal year ended October 31, 2016, the following Funds utilized capital loss carryovers as follows:
| | | | | | | | | | | | | | | | |
| | | Utilized Capital Loss
Carryovers (with Expiration
Year) | | | | |
| | | 2017 | | | 2018 | | | 2019 | | | No Expiration | |
Montag & Caldwell Growth | | $ | 2,530,371 | | | $ | — | | | $ | — | | | $ | — | |
DoubleLine Core Plus Bond | | | — | | | | — | | | | — | | | | 4,061,163 | |
(17) Organizational and Offering Costs: The Investment Manager incurred and directly paid organizational and offering costs on behalf of the River Road Focused Absolute Value in the amount of $60,431, which will be repaid by the Fund for the full amount thereof. Organizational costs in the amount of $6,638 were expensed. Offering costs of $53,793 were deferred and have fully amortized on the straight-line method over a period of one year from the commencement of operations. The amount of organizational and offering costs owed by the River Road Focused Absolute Value to the Investment Manager is reflected as Due to Affiliate on the Statement of Assets and Liabilities.
The Investment Manager incurred and directly paid organizational and offering costs on behalf of the Value Partners Asia Dividend in the amount of $67,433, which will be repaid by the Fund for the full amount thereof. Organizational costs in the amount of $5,992 were expensed. Offering costs of $61,441 were deferred and are being amortized on the straight-line method over a period of one year from the commencement of operations. The amount of
organizational and offering costs owed by the Value Partners Asia Dividend to the Investment Manager is reflected as Due to Affiliate on the Statement of Assets and Liabilities.
(18) Commitments and Contingencies: Under the Trust’s organizational documents, its trustees and officers are indemnified against certain liabilities arising out of the performance of their duties to the Trust. In addition, in the normal course of business, the Funds may enter into contracts and agreements that contain a variety of representations and warranties which provide general indemnifications. The maximum exposure to the Funds under these arrangements is unknown, as this would involve future claims that may be made against the Funds that have not yet occurred. However, based on experience, the Funds had no prior claims or losses and expect the risks of loss to be remote.
Note (B) Dividends from Net Investment Income and Distributions of Capital Gains: Dividends and distributions to shareholders are recorded on the ex-dividend date. River Road Dividend All Cap
AMG Funds
October 31, 2016
Notes to Financial Statements – continued
Value, River Road Dividend All Cap Value II and DoubleLine Core Plus Bond distribute dividends from net investment income to shareholders monthly and net realized gains from investment transactions, if any, are generally distributed annually, usually in December.
Anchor Capital Enhanced Equity, Guardian Capital Global Dividend, Value Partners Asia Dividend and Montag & Caldwell Balanced distribute dividends from net investment income to shareholders quarterly and net realized gains from investment transactions, if any, are generally distributed annually, usually in December.
The following Funds distribute dividends from net investment income to shareholders annually and net realized gains from investment transactions, if any, are generally distributed annually, usually in December: Fairpointe Focused Equity, River Road Focused Absolute Value, Montag & Caldwell Growth, Fair-pointe Mid Cap, Montag & Caldwell Mid Cap Growth, LMCG Small Cap Growth, River Road Select Value, River Road Small Cap Value, Silvercrest Small Cap, GW&K U.S. Small Cap Growth, Lake Partners LASSO Alternatives, River Road Long-Short and Pictet International.
Distributions are determined in accordance with federal income tax regulations, which may differ from net investment income and net realized capital gains for financial statement purposes (U.S. GAAP). Differences may be permanent or temporary. Permanent differences are reclassified among capital accounts in the financial statements to reflect their tax character. Permanent book and tax basis differences, if any, relating to shareholder distributions will result in reclassifications to paid-in capital. Temporary differences arise when certain items of income, expense and gain or loss are recognized in different periods for financial statement and tax purposes; these differences will reverse at some time in the future. Permanent differences are primarily due to net operating losses, gains/losses not recognized from security sales in connection with redemptions in-kind, CLCF expired, paydowns, tax adjustments on passive foreign investment companies sold, redesignation of dividends paid by a fund, distributions received from regulated investment companies, distributions in excess of net investment income paid by a fund, and expenses disallowed for tax purposes. Temporary differences are primarily due to differences between book and tax treatment of losses for excise tax purposes, wash sale loss deferrals, amortization, contribution in-kind, mark-to-market of passive foreign investment companies, gains/losses on foreign currency, and partnerships.
The tax character of distributions paid during the fiscal years ended October 31, 2016 and 2015 was as follows:
| | | | | | | | | | | | | | | | | | | | |
| | | Distributions Paid in 2016 | | | Distributions Paid in 2015 | |
| | | Ordinary
Income | | | Short-Term
Capital Gains | | | Long-Term
Capital Gains | | | Ordinary Income | | | Long-Term
Capital Gains | |
Fairpointe Focused Equity | | $ | 67,672 | | | $ | — | | | $ | — | | | $ | — | | | $ | — | |
Montag & Caldwell Growth | | | 8,294,809 | | | | — | | | | 453,313,996 | | | | 44,398,227 | | | | 627,221,330 | |
River Road Dividend All Cap Value | | | 15,720,202 | | | | — | | | | 68,846,034 | | | | 18,975,031 | | | | 89,326,656 | |
River Road Dividend All Cap Value II | | | 2,501,192 | | | | — | | | | 1,667,547 | | | | 3,652,872 | | | | 3,141,523 | |
Fairpointe Mid Cap | | | 21,004,526 | | | | — | | | | 234,497,586 | | | | 158,253,393 | | | | 770,919,534 | |
Montag & Caldwell Mid Cap Growth | | | — | | | | — | | | | 1,250,491 | | | | 22,455 | | | | 696,350 | |
LMCG Small Cap Growth | | | — | | | | 15,280 | | | | 25,386 | | | | 1,396,041 | | | | 1,078,763 | |
River Road Select Value | | | — | | | | 153,030 | | | | 7,969,730 | | | | 7,895,744 | | | | 17,043,425 | |
River Road Small Cap Value | | | — | | | | 1,533,976 | | | | 13,693,492 | | | | 9,289,576 | | | | 31,938,623 | |
Silvercrest Small Cap | | | 628,202 | | | | 37,746 | | | | 6,209,167 | | | | 494,555 | | | | 1,198,029 | |
GW&K U.S. Small Cap Growth | | | — | | | | — | | | | 155,946,076 | | | | — | | | | 94,016,613 | |
DoubleLine Core Plus Bond | | | 20,343,204 | | | | — | | | | — | | | | 12,876,362 | | | | — | |
Anchor Capital Enhanced Equity | | | 3,150,383 | | | | — | | | | 590,164 | | | | 3,854,267 | | | | — | |
Lake Partners LASSO Alternatives | | | 335,854 | | | | — | | | | 11,178,503 | | | | 1,031,209 | | | | 15,080,709 | |
River Road Long-Short | | | — | | | | 1,302,075 | | | | 545,077 | | | | 4,922,443 | | | | 335,340 | |
Guardian Capital Global Dividend | | | 119,241 | | | | — | | | | — | | | | 102,970 | | | | — | |
Pictet International | | | 386,837 | | | | 588,318 | | | | — | | | | 188,437 | | | | — | |
Value Partners Asia Dividend | | | 165,399 | | | | — | | | | — | | | | — | | | | — | |
Montag & Caldwell Balanced | | | 234,601 | | | | — | | | | 1,324,665 | | | | 241,984 | | | | 1,808,010 | |
As of October 31, 2016, the most recent tax year end, the components of distributable earnings (excluding unrealized appreciation/ depreciation) on a tax cost basis were as follows:
| | | | | | | | | | | | | | | | | | | | |
| | | Capital Loss
Carryforward | | | Undistributed
Ordinary
Income | | | Undistributed
Short-Term
Capital Gains | | | Undistributed
Long-Term
Capital Gains | | | Late-Year
Deferral | |
Fairpointe Focused Equity | | $ | (147,505 | ) | | $ | 55,033 | | | $ | — | | | $ | — | | | $ | — | |
River Road Focused Absolute Value | | | — | | | | 92,852 | | | | 860,993 | | | | 48,011 | | | | — | |
Montag & Caldwell Growth | | | — | | | | 3,868,221 | | | | — | | | | 112,649,261 | | | | — | |
River Road Dividend All Cap Value | | | — | | | | 4,357,902 | | | | — | | | | 59,246,147 | | | | — | |
AMG Funds
October 31, 2016
Notes to Financial Statements – continued
| | | | | | | | | | | | | | | | | | | | |
| | | Capital Loss
Carryforward | | | Undistributed
Ordinary
Income | | | Undistributed
Short-Term
Capital Gains | | | Undistributed
Long-Term
Capital Gains | | | Late-Year
Deferral | |
River Road Dividend All Cap Value II | | $ | — | | | $ | 302,084 | | | $ | — | | | $ | 4,773,360 | | | $ | — | |
Fairpointe Mid Cap | | | — | | | | 13,117,515 | | | | — | | | | 157,664,965 | | | | — | |
Montag & Caldwell Mid Cap Growth | | | — | | | | — | | | | — | | | | 589,362 | | | | (40,947 | ) |
LMCG Small Cap Growth | | | (34,429,118 | ) | | | — | | | | — | | | | — | | | | (980,059 | ) |
River Road Select Value | | | — | | | | — | | | | 50,404 | | | | 2,961,540 | | | | — | |
River Road Small Cap Value | | | — | | | | — | | | | 8,588,530 | | | | 5,674,347 | | | | — | |
Silvercrest Small Cap | | | — | | | | 264,902 | | | | — | | | | 1,776,065 | | | | — | |
GW&K U.S. Small Cap Growth | | | — | | | | — | | | | — | | | | 58,484 | | | | (603,111 | ) |
DoubleLine Core Plus Bond | | | — | | | | 1,663,296 | | | | 1,345,891 | | | | — | | | | — | |
Anchor Capital Enhanced Equity | | | (3,768,177 | ) | | | 48,923 | | | | — | | | | — | | | | — | |
Lake Partners LASSO Alternatives | | | — | | | | — | | | | — | | | | 387,607 | | | | (357,455 | ) |
River Road Long-Short | | | (3,109,599 | ) | | | — | | | | — | | | | — | | | | (635,063 | ) |
Guardian Capital Global Dividend | | | (304,872 | ) | | | 38,164 | | | | — | | | | — | | | | — | |
Pictet International | | | — | | | | 18,782,276 | | | | 27,967,062 | | | | 622,295 | | | | — | |
Value Partners Asia Dividend | | | — | | | | 115,033 | | | | 226,480 | | | | — | | | | — | |
Montag & Caldwell Balanced | | | — | | | | 18,742 | | | | — | | | | 2,148,240 | | | | — | |
Note (C) Shares of Beneficial Interest: The Trust’s Declaration of Trust authorizes for each Fund the issuance of an unlimited number of shares of beneficial interest, without par value. Each Fund records sales and repurchases of its capital stock on the trade date. The cost of securities contributed to the Funds in connection with the issuance of shares in an in kind purchase is based on the valuation of those securities in accordance with the Funds’ policy on investment valuation.
| | | | | | | | | | | | | | | | | | | | | | | | | | | | | | | | | | | | | | | | |
| | | Fairpointe Focused Equity | | | River Road
Focused Absolute Value | | | Montag & Caldwell Growth | |
| | | 2016 | | | 2015 (a) | | | 2016 (b) | | | 2016 | | | 2015 | |
| | | Shares | | | Amount | | | Shares | | | Amount | | | Shares | | | Amount | | | Shares | | | Amount | | | Shares | | | Amount | |
Class N: | | | | | | | | | | | | | | | | | | | | | | | | | | | | | | | | | | | | | | | | |
Proceeds from sale of shares | | | 17,363 | | | $ | 149,301 | | | | 263,764 | | | $ | 2,662,257 | (c) | | | 79,891 | | | $ | 823,215 | (d) | | | 6,885,996 | | | $ | 138,793,971 | | | | 7,138,882 | | | $ | 186,556,494 | |
Reinvestment of distributions | | | 2,394 | | | | 21,065 | | | | — | | | | — | | | | — | | | | — | | | | 9,531,891 | | | | 192,258,234 | | | | 8,194,054 | | | | 209,112,111 | |
Cost of shares repurchased | | | (209,166 | ) | | | (2,022,877 | ) | | | (17,767 | ) | | | (173,637 | ) | | | (34,843 | ) | | | (376,833 | ) | | | (21,230,999 | ) | | | (438,292,746 | ) | | | (29,417,908 | ) | | | (769,717,997 | ) |
| | | | | | | | | | | | | | | | | | | | | | | | | | | | | | | | | | | | | | | | |
Net increase (decrease) | | | (189,409 | ) | | $ | (1,852,511 | ) | | | 245,997 | | | $ | 2,488,620 | | | | 45,048 | | | $ | 446,382 | | | | (4,813,112 | ) | | $ | (107,240,541 | ) | | | (14,084,972 | ) | | $ | (374,049,392 | ) |
| | | | | | | | | | | | | | | | | | | | | | | | | | | | | | | | | | | | | | | | |
Class I: | | | | | | | | | | | | | | | | | | | | | | | | | | | | | | | | | | | | | | | | |
Proceeds from sale of shares | | | 220,622 | | | $ | 2,101,495 | | | | 445,153 | | | $ | 4,383,700 | (c) | | | 1,211,166 | | | $ | 11,864,367 | (d) | | | 16,816,934 | | | $ | 343,661,135 | | | | 9,136,847 | | | $ | 241,907,926 | |
Reinvestment of distributions | | | 5,296 | | | | 46,607 | | | | — | | | | — | | | | — | | | | — | | | | 9,866,673 | | | | 199,997,475 | | | | 14,272,154 | | | | 365,652,584 | |
Cost of shares repurchased | | | — | | | | — | | | | (1 | ) | | | (10 | ) | | | (171,275 | ) | | | (1,791,912 | ) | | | (35,152,702 | ) | | | (790,240,872 | ) | | | (66,732,284 | ) | | | (1,768,877,865 | ) |
| | | | | | | | | | | | | | | | | | | | | | | | | | | | | | | | | | | | | | | | |
Net increase (decrease) | | | 225,918 | | | $ | 2,148,102 | | | | 445,152 | | | $ | 4,383,690 | | | | 1,039,891 | | | $ | 10,072,455 | | | | (8,469,095 | ) | | $ | (246,582,262 | ) | | | (43,323,283 | ) | | $ | (1,161,317,355 | ) |
| | | | | | | | | | | | | | | | | | | | | | | | | | | | | | | | | | | | | | | | |
Class R: | | | | | | | | | | | | | | | | | | | | | | | | | | | | | | | | | | | | | | | | |
Proceeds from sale of shares | | | — | | | $ | — | | | | — | | | $ | — | | | | — | | | $ | — | | | | 61,438 | | | $ | 1,369,978 | | | | 35,243 | | | $ | 914,418 | |
Reinvestment of distributions | | | — | | | | — | | | | — | | | | — | | | | — | | | | — | | | | 66,520 | | | | 1,315,758 | | | | 43,433 | | | | 1,092,345 | |
Cost of shares repurchased | | | — | | | | — | | | | — | | | | — | | | | — | | | | — | | | | (66,927 | ) | | | (1,452,485 | ) | | | (118,215 | ) | | | (3,036,516 | ) |
| | | | | | | | | | | | | | | | | | | | | | | | | | | | | | | | | | | | | | | | |
Net increase (decrease) | | | — | | | $ | — | | | | — | | | $ | — | | | | — | | | $ | — | | | | 61,031 | | | $ | 1,233,251 | | | | (39,539 | ) | | $ | (1,029,753 | ) |
| | | | | | | | | | | | | | | | | | | | | | | | | | | | | | | | | | | | | | | | |
| | | | | | | | | | | | | | | | | | | | | | | | | | | | | | | | | | | | | | | | | | | | | | | | |
| | | River Road Dividend All Cap Value | | | River Road Dividend All Cap Value II | | | Fairpointe Mid Cap | |
| | | 2016 | | | 2015 | | | 2016 | | | 2015 | | | 2016 | | | 2015 | |
| | | Shares | | | Amount | | | Shares | | | Amount | | | Shares | | | Amount | | | Shares | | | Amount | | | Shares | | | Amount | | | Shares | | | Amount | |
Class N: | | | | | | | | | | | | | | | | | | | | | | | | | | | | | | | | | | | | | | | | | | | | | | | | |
Proceeds from sale of shares | | | 13,306,940 | | | $ | 160,818,056 | | | | 3,166,753 | | | $ | 41,437,554 | | | | 54,504 | | | $ | 731,061 | | | | 73,197 | | | $ | 974,246 | | | | 6,721,809 | | | $ | 235,715,950 | | | | 10,093,808 | | | $ | 416,140,464 | |
Reinvestment of distributions | | | 2,090,827 | | | | 23,932,444 | | | | 2,107,691 | | | | 27,956,925 | | | | 7,583 | | | | 98,773 | | | | 22,350 | | | | 304,395 | | | | 2,786,316 | | | | 96,573,724 | | | | 9,137,627 | | | | 374,916,825 | |
Cost of shares repurchased | | | (8,055,733 | ) | | | (95,895,185 | ) | | | (13,241,566 | ) | | | (177,421,338 | ) | | | (36,513 | ) | | | (472,861 | ) | | | (384,147 | ) | | | (5,131,502 | ) | | | (22,391,843 | ) | | | (793,563,705 | ) | | | (21,538,445 | ) | | | (876,287,601 | ) |
| | | | | | | | | | | | | | | | | | | | | | | | | | | | | | | | | | | | | | | | | | | | | | | | |
Net increase (decrease) | | | 7,342,034 | | | $ | 88,855,315 | | | | (7,967,122 | ) | | $ | (108,026,859 | ) | | | 25,574 | | | $ | 356,973 | | | | (288,600 | ) | | $ | (3,852,861 | ) | | | (12,883,718 | ) | | $ | (461,274,031 | ) | | | (2,307,010 | ) | | $ | (85,230,312 | ) |
| | | | | | | | | | | | | | | | | | | | | | | | | | | | | | | | | | | | | | | | | | | | | | | | |
Class I: | | | | | | | | | | | | | | | | | | | | | | | | | | | | | | | | | | | | | | | | | | | | | | | | |
Proceeds from sale of shares | | | 11,327,948 | | | $ | 136,478,192 | | | | 6,894,934 | | | $ | 90,897,533 | | | | 1,028,192 | | | $ | 13,465,509 | | | | 1,954,180 | | | $ | 26,220,994 | | | | 18,281,929 | | | $ | 662,488,962 | | | | 21,809,966 | | | $ | 915,244,322 | |
Reinvestment of distributions | | | 4,402,905 | | | | 50,321,034 | | | | 4,086,211 | | | | 54,080,077 | | | | 288,126 | | | | 3,759,968 | | | | 444,366 | | | | 6,012,510 | | | | 3,759,518 | | | | 133,199,701 | | | | 10,047,970 | | | | 421,110,375 | |
Cost of shares repurchased | | | (20,268,357 | ) | | | (241,076,892 | ) | | | (16,988,277 | ) | | | (220,946,207 | ) | | | (2,187,747 | ) | | | (28,400,388 | ) | | | (2,238,283 | ) | | | (29,484,827 | ) | | | (40,242,836 | ) | | | (1,421,123,304 | ) | | | (31,979,189 | ) | | | (1,363,799,543 | ) |
| | | | | | | | | | | | | | | | | | | | | | | | | | | | | | | | | | | | | | | | | | | | | | | | |
Net increase (decrease) | | | (4,537,504 | ) | | $ | (54,277,666 | ) | | | (6,007,132 | ) | | $ | (75,968,597 | ) | | | (871,429 | ) | | $ | (11,174,911 | ) | | | 160,263 | | | $ | 2,748,677 | | | | (18,201,389 | ) | | $ | (625,434,641 | ) | | | (121,253 | ) | | $ | (27,444,846 | ) |
| | | | | | | | | | | | | | | | | | | | | | | | | | | | | | | | | | | | | | | | | | | | | | | | |
AMG Funds
October 31, 2016
Notes to Financial Statements – continued
| | | | | | | | | | | | | | | | | | | | | | | | | | | | | | | | | | | | | | | | | | | | | | | | |
| | | Montag & Caldwell Mid Cap Growth | | | LMCG Small Cap Growth | | | River Road Select Value | |
| | | 2016 | | | 2015 | | | 2016 | | | 2015 | | | 2016 | | | 2015 | |
| | | Shares | | | Amount | | | Shares | | | Amount | | | Shares | | | Amount | | | Shares | | | Amount | | | Shares | | | Amount | | | Shares | | | Amount | |
Class N: | | | | | | | | | | | | | | | | | | | | | | | | | | | | | | | | | | | | | | | | | | | | | | | | |
Proceeds from sale of shares | | | 12,426 | | | $ | 122,976 | | | | 22,197 | | | $ | 254,809 | | | | 1,114,051 | | | $ | 14,417,787 | | | | 10,550,961 | | | $ | 163,893,120 | | | | 141,827 | | | $ | 960,698 | | | | 73,126 | | | $ | 563,077 | |
Reinvestment of distributions | | | 53,656 | | | | 553,193 | | | | 34,984 | | | | 401,617 | | | | 1,863 | | | | 26,618 | | | | 105,407 | | | | 1,532,620 | | | | 100,813 | | | | 635,124 | | | | 156,298 | | | | 1,186,303 | |
Cost of shares repurchased | | | (74,744 | ) | | | (736,302 | ) | | | (271,296 | ) | | | (3,272,973 | ) | | | (7,368,417 | ) | | | (92,674,265 | ) | | | (2,502,649 | ) | | | (38,253,671 | ) | | | (200,434 | ) | | | (1,392,341 | ) | | | (525,281 | ) | | | (4,058,556 | ) |
| | | | | | | | | | | | | | | | | | | | | | | | | | | | | | | | | | | | | | | | | | | | | | | | |
Net increase (decrease) | | | (8,662 | ) | | $ | (60,133 | ) | | | (214,115 | ) | | $ | (2,616,547 | ) | | | (6,252,503 | ) | | $ | (78,229,860 | ) | | | 8,153,719 | | | $ | 127,172,069 | | | | 42,206 | | | $ | 203,481 | | | | (295,857 | ) | | $ | (2,309,176 | ) |
| | | | | | | | | | | | | | | | | | | | | | | | | | | | | | | | | | | | | | | | | | | | | | | | |
Class I: | | | | | | | | | | | | | | | | | | | | | | | | | | | | | | | | | | | | | | | | | | | | | | | | |
Proceeds from sale of shares | | | 11,713 | | | $ | 120,040 | | | | 194,128 | | | $ | 2,248,304 | | | | 3,981,494 | | | $ | 51,076,318 | | | | 5,014,447 | | | $ | 78,735,146 | | | | 412,100 | | | $ | 2,938,365 | | | | 725,982 | | | $ | 5,734,516 | |
Reinvestment of distributions | | | 67,037 | | | | 693,830 | | | | 27,469 | | | | 315,621 | | | | 738 | | | | 10,674 | | | | 52,633 | | | | 772,122 | | | | 1,133,203 | | | | 7,252,502 | | | | 2,999,976 | | | | 23,099,814 | |
Cost of shares repurchased | | | (221,127 | ) | | | (2,325,128 | ) | | | (13,014 | ) | | | (156,736 | ) | | | (4,547,748 | ) | | | (58,946,860 | ) | | | (820,163 | ) | | | (12,642,786 | ) | | | (8,536,883 | ) | | | (61,806,449 | ) | | | (11,708,876 | ) | | | (93,860,808 | ) |
| | | | | | | | | | | | | | | | | | | | | | | | | | | | | | | | | | | | | | | | | | | | | | | | |
Net increase (decrease) | | | (142,377 | ) | | $ | (1,511,258 | ) | | | 208,583 | | | $ | 2,407,189 | | | | (565,516 | ) | | $ | (7,859,868 | ) | | | 4,246,917 | | | $ | 66,864,482 | | | | (6,991,580 | ) | | $ | (51,615,582 | ) | | | (7,982,918 | ) | | $ | (65,026,478 | ) |
| | | | | | | | | | | | | | | | | | | | | | | | | | | | | | | | | | | | | | | | | | | | | | | | |
| | | |
| | | River Road Small Cap Value | | | Silvercrest Small Cap | | | GW&K U.S. Small Cap Growth | |
| | | 2016 | | | 2015 | | | 2016 | | | 2015 | | | 2016 | | | 2015 | |
| | | Shares | | | Amount | | | Shares | | | Amount | | | Shares | | | Amount | | | Shares | | | Amount | | | Shares | | | Amount | | | Shares | | | Amount | |
Class N: | | | | | | | | | | | | | | | | | | | | | | | | | | | | | | | | | | | | | | | | | | | | | | | | |
Proceeds from sale of shares | | | 471,028 | | | $ | 5,575,217 | | | | 397,814 | | | $ | 4,898,671 | | | | 361,591 | | | $ | 5,273,540 | | | | 1,007,117 | | | $ | 14,949,946 | | | | 1,153,211 | | | $ | 7,338,783 | | | | 941,849 | | | $ | 19,025,334 | |
Reinvestment of distributions | | | 114,605 | | | | 1,280,134 | | | | 503,817 | | | | 6,025,655 | | | | 55,211 | | | | 784,554 | | | | 9,374 | | | | 143,245 | | | | 10,933,982 | | | | 56,843,888 | | | | 2,105,009 | | | | 41,973,876 | |
Cost of shares repurchased | | | (884,374 | ) | | | (10,279,537 | ) | | | (2,457,631 | ) | | | (30,860,654 | ) | | | (359,930 | ) | | | (5,188,836 | ) | | | (201,402 | ) | | | (2,969,906 | ) | | | (16,404,588 | ) | | | (207,677,409 | ) | | | (6,664,523 | ) | | | (133,982,290 | ) |
| | | | | | | | | | | | | | | | | | | | | | | | | | | | | | | | | | | | | | | | | | | | | | | | |
Net increase (decrease) | | | (298,741 | ) | | $ | (3,424,186 | ) | | | (1,556,000 | ) | | $ | (19,936,328 | ) | | | 56,872 | | | $ | 869,258 | | | | 815,089 | | | $ | 12,123,285 | | | | (4,317,395 | ) | | $ | (143,494,738 | ) | | | (3,617,665 | ) | | $ | (72,983,080 | ) |
| | | | | | | | | | | | | | | | | | | | | | | | | | | | | | | | | | | | | | | | | | | | | | | | |
Class I: | | | | | | | | | | | | | | | | | | | | | | | | | | | | | | | | | | | | | | | | | | | | | | | | |
Proceeds from sale of shares | | | 3,313,689 | | | $ | 38,510,584 | | | | 4,076,490 | | | $ | 51,083,192 | | | | 3,803,977 | | | $ | 55,865,834 | | | | 7,917,658 | | | $ | 120,581,732 | | | | 2,555,143 | | | $ | 28,714,382 | | | | 2,927,154 | | | $ | 60,349,910 | |
Reinvestment of distributions | | | 1,196,902 | | | | 13,501,050 | | | | 2,833,551 | | | | 34,115,956 | | | | 425,913 | | | | 6,090,561 | | | | 100,934 | | | | 1,549,338 | | | | 14,542,368 | | | | 88,178,272 | | | | 2,381,469 | | | | 49,177,354 | |
Cost of shares repurchased | | | (4,595,113 | ) | | | (53,647,832 | ) | | | (5,385,952 | ) | | | (67,840,899 | ) | | | (2,034,956 | ) | | | (29,716,304 | ) | | | (2,591,868 | ) | | | (39,726,747 | ) | | | (30,445,627 | ) | | | (306,125,519 | )(e) | | | (10,007,368 | ) | | | (210,824,587 | ) |
| | | | | | | | | | | | | | | | | | | | | | | | | | | | | | | | | | | | | | | | | | | | | | | | |
Net increase (decrease) | | | (84,522 | ) | | $ | (1,636,198 | ) | | | 1,524,089 | | | $ | 17,358,249 | | | | 2,194,934 | | | $ | 32,240,091 | | | | 5,426,724 | | | $ | 82,404,323 | | | | (13,348,116 | ) | | $ | (189,232,865 | ) | | | (4,698,745 | ) | | $ | (101,297,323 | ) |
| | | | | | | | | | | | | | | | | | | | | | | | | | | | | | | | | | | | | | | | | | | | | | | | |
| | | |
| | | DoubleLine Core Plus Bond | | | Anchor Capital Enhanced Equity | | | Lake Partners LASSO Alternatives | |
| | | 2016 | | | 2015 | | | 2016 | | | 2015 | | | 2016 | | | 2015 | |
| | | Shares | | | Amount | | | Shares | | | Amount | | | Shares | | | Amount | | | Shares | | | Amount | | | Shares | | | Amount | | | Shares | | | Amount | |
Class N: | | | | | | | | | | | | | | | | | | | | | | | | | | | | | | | | | | | | | | | | | | | | | | | | |
Proceeds from sale of shares | | | 22,657,884 | | | $ | 238,831,911 | | | | 17,140,542 | | | $ | 184,596,263 | | | | 936,508 | | | $ | 8,243,124 | | | | 2,092,810 | | | $ | 19,879,836 | | | | 489,315 | | | $ | 5,828,383 | | | | 2,643,650 | | | $ | 34,958,681 | |
Reinvestment of distributions | | | 783,701 | | | | 8,367,108 | | | | 330,780 | | | | 3,553,381 | | | | 225,962 | | | | 1,994,161 | | | | 175,479 | | | | 1,660,101 | | | | 206,436 | | | | 2,444,199 | | | | 133,278 | | | | 1,751,278 | |
Cost of shares repurchased | | | (12,532,368 | ) | | | (133,778,257 | ) | | | (4,242,057 | ) | | | (45,659,902 | ) | | | (5,091,447 | ) | | | (45,119,676 | ) | | | (3,722,695 | ) | | | (35,314,017 | ) | | | (1,121,075 | ) | | | (13,344,999 | ) | | | (2,843,208 | ) | | | (36,889,708 | ) |
| | | | | | | | | | | | | | | | | | | | | | | | | | | | | | | | | | | | | | | | | | | | | | | | |
Net increase (decrease) | | | 10,909,217 | | | $ | 113,420,762 | | | | 13,229,265 | | | $ | 142,489,742 | | | | (3,928,977 | ) | | $ | (34,882,391 | ) | | | (1,454,406 | ) | | $ | (13,774,080 | ) | | | (425,324 | ) | | $ | (5,072,417 | ) | | | (66,280 | ) | | $ | (179,749 | ) |
| | | | | | | | | | | | | | | | | | | | | | | | | | | | | | | | | | | | | | | | | | | | | | | | |
Class I: | | | | | | | | | | | | | | | | | | | | | | | | | | | | | | | | | | | | | | | | | | | | | | | | |
Proceeds from sale of shares | | | 20,257,212 | | | $ | 215,384,722 | | | | 18,070,549 | | | $ | 194,716,457 | | | | 639,900 | | | $ | 5,695,114 | | | | 4,045,214 | | | $ | 38,797,603 | | | | 1,608,291 | | | $ | 19,329,625 | | | | 6,903,527 | | | $ | 91,358,414 | |
Reinvestment of distributions | | | 977,499 | | | | 10,425,030 | | | | 742,838 | | | | 7,995,114 | | | | 165,836 | | | | 1,466,552 | | | | 165,598 | | | | 1,570,561 | | | | 384,769 | | | | 4,563,357 | | | | 804,316 | | | | 10,592,840 | |
Cost of shares repurchased | | | (12,902,219 | ) | | | (138,104,461 | ) | | | (4,697,945 | ) | | | (50,630,892 | ) | | | (8,133,770 | ) | | | (71,849,789 | ) | | | (6,567,499 | ) | | | (62,303,383 | ) | | | (9,289,112 | ) | | | (111,785,166 | ) | | | (29,352,862 | ) | | | (390,414,611 | ) |
Capital contribution | | | — | | | | — | | | | — | | | | — | | | | — | | | | — | | | | — | | | | — | | | | — | | | | — | | | | — | | | | 872 | |
| | | | | | | | | | | | | | | | | | | | | | | | | | | | | | | | | | | | | | | | | | | | | | | | |
Net increase (decrease) | | | 8,332,492 | | | $ | 87,705,291 | | | | 14,115,442 | | | $ | 152,080,679 | | | | (7,328,034 | ) | | $ | (64,688,123 | ) | | | (2,356,687 | ) | | $ | (21,935,219 | ) | | | (7,296,052 | ) | | $ | (87,892,184 | ) | | | (21,645,019 | ) | | $ | (288,462,485 | ) |
| | | | | | | | | | | | | | | | | | | | | | | | | | | | | | | | | | | | | | | | | | | | | | | | |
| | | |
| | | River Road Long-Short | | | Guardian Capital Global Dividend | | | Pictet International | |
| | | 2016 | | | 2015 | | | 2016 | | | 2015 | | | 2016 | | | 2015 | |
| | | Shares | | | Amount | | | Shares | | | Amount | | | Shares | | | Amount | | | Shares | | | Amount | | | Shares | | | Amount | | | Shares | | | Amount | |
Class N: | | | | | | | | | | | | | | | | | | | | | | | | | | | | | | | | | | | | | | | | | | | | | | | | |
Proceeds from sale of shares | | | 104,231 | | | $ | 1,143,023 | | | | 2,159,459 | | | $ | 24,668,308 | | | | 1,166 | | | $ | 11,595 | | | | 3,342 | | | $ | 35,451 | | | | 7,362 | | | $ | 68,989 | | | | 6,850 | | | $ | 66,599 | |
Reinvestment of distributions | | | 61,918 | | | | 683,579 | | | | 231,451 | | | | 2,640,850 | | | | 69 | | | | 692 | | | | 32 | | | | 339 | | | | 97 | | | | 915 | | | | 34 | | | | 305 | |
Cost of shares repurchased | | | (1,814,546 | ) | | | (19,872,053 | ) | | | (9,572,482 | ) | | | (109,558,808 | ) | | | (409 | ) | | | (3,920 | ) | | | (1,156 | ) | | | (12,441 | ) | | | (104,219 | ) | | | (979,005 | ) | | | (1,762 | ) | | | (17,102 | ) |
Capital contribution | | | — | | | | — | | | | — | | | | — | | | | — | | | | — | | | | — | | | | 107 | | | | ��� | | | | 96 | (f) | | | — | | | | 1,022 | |
| | | | | | | | | | | | | | | | | | | | | | | | | | | | | | | | | | | | | | | | | | | | | | | | |
Net increase (decrease) | | | (1,648,397 | ) | | $ | (18,045,451 | ) | | | (7,181,572 | ) | | $ | (82,249,650 | ) | | | 826 | | | $ | 8,367 | | | | 2,218 | | | $ | 23,456 | | | | (96,760 | ) | | $ | (909,005 | ) | | | 5,122 | | | $ | 50,824 | |
| | | | | | | | | | | | | | | | | | | | | | | | | | | | | | | | | | | | | | | | | | | | | | | | |
Class I: | | | | | | | | | | | | | | | | | | | | | | | | | | | | | | | | | | | | | | | | | | | | | | | | |
Proceeds from sale of shares | | | 2,591,251 | | | $ | 28,866,703 | | | | 1,845,983 | | | $ | 21,197,504 | | | | 2,574,130 | | | $ | 24,999,875 | | | | 10,042 | | | $ | 106,476 | | | | 146,143,544 | | | $ | 1,339,299,965 | | | | 5,060,181 | | | $ | 47,089,385 | |
Reinvestment of distributions | | | 102,909 | | | | 1,144,342 | | | | 160,137 | | | | 1,835,170 | | | | 6,791 | | | | 67,637 | | | | 5,543 | | | | 57,526 | | | | 7,456 | | | | 70,238 | | | | 5,369 | | | | 47,892 | |
Cost of shares repurchased | | | (3,571,926 | ) | | | (39,835,881 | ) | | | (7,436,665 | ) | | | (85,455,421 | ) | | | (1,319 | ) | | | (12,858 | ) | | | (731 | ) | | | (7,667 | ) | | | (12,838,794 | ) | | | (121,477,160 | ) | | | (781,788 | ) | | | (7,291,209 | ) |
Capital contribution | | | — | | | | — | | | | — | | | | — | | | | — | | | | — | | | | — | | | | 334 | | | | — | | | | 619,078 | (f) | | | — | | | | 22,276 | |
| | | | | | | | | | | | | | | | | | | | | | | | | | | | | | | | | | | | | | | | | | | | | | | | |
Net increase (decrease) | | | (877,766 | ) | | $ | (9,824,836 | ) | | | (5,430,545 | ) | | $ | (62,422,747 | ) | | | 2,579,602 | | | $ | 25,054,654 | | | | 14,854 | | | $ | 156,669 | | | | 133,312,206 | | | $ | 1,218,512,121 | | | | 4,283,762 | | | $ | 39,868,344 | |
| | | | | | | | | | | | | | | | | | | | | | | | | | | | | | | | | | | | | | | | | | | | | | | | |
AMG Funds
October 31, 2016
Notes to Financial Statements – continued
| | | | | | | | | | | | | | | | | | | | | | | | |
| | | Value Partners Asia Dividend | | | Montag & Caldwell Balanced | |
| | | 2016 (g) | | | 2016 | | | 2015 | |
| | | Shares | | | Amount | | | Shares | | | Amount | | | Shares | | | Amount | |
Class N: | | | | | | | | | | | | | | | | | | | | | | | | |
Proceeds from sale of shares | | | 75,011 | | | $ | 750,122 | | | | 813,318 | | | $ | 18,188,595 | | | | 377,132 | | | $ | 8,907,085 | |
Reinvestment of distributions | | | 1,033 | | | | 10,659 | | | | 58,085 | | | | 1,325,502 | | | | 78,257 | | | | 1,812,107 | |
Cost of shares repurchased | | | (1 | ) | | | (11 | ) | | | (864,228 | ) | | | (19,777,162 | ) | | | (167,264 | ) | | | (3,919,684 | ) |
| | | | | | | | | | | | | | | | | | | | | | | | |
Net increase (decrease) | | | 76,043 | | | $ | 760,770 | | | | 7,175 | | | $ | (263,065 | ) | | | 288,125 | | | $ | 6,799,508 | |
| | | | | | | | | | | | | | | | | | | | | | | | |
Class I: | | | | | | | | | | | | | | | | | | | | | | | | |
Proceeds from sale of shares | | | 675,001 | | | $ | 6,750,010 | | | | 54,898 | | | $ | 1,259,171 | | | | 94,050 | | | $ | 2,184,522 | |
Reinvestment of distributions | | | 10,194 | | | | 105,120 | | | | 4,977 | | | | 113,182 | | | | 3,852 | | | | 88,941 | |
Cost of shares repurchased | | | (1 | ) | | | (11 | ) | | | (70,649 | ) | | | (1,615,105 | ) | | | (28,359 | ) | | | (665,132 | ) |
| | | | | | | | | | | | | | | | | | | | | | | | |
Net increase (decrease) | | | 685,194 | | | $ | 6,855,119 | | | | (10,774 | ) | | $ | (242,752 | ) | | | 69,543 | | | $ | 1,608,331 | |
| | | | | | | | | | | | | | | | | | | | | | | | |
| (a) | The commencement of investment operations for Fairpointe Focused Equity was December 23, 2014. |
| (b) | The commencement of investment operations for River Road Focused Absolute Value was November 3, 2015. |
| (c) | Fairpointe Focused Equity had a subscription in-kind in the amount of $2,333,718 on December 23, 2014. The subscription was comprised of securities, cash and dividends accrued in the amounts of $2,305,531, $26,148 and $2,039, respectively. |
| (d) | River Road Focused Absolute Value had a subscription in-kind in the amount of $3,663,463 on November 3, 2015. The subscription was comprised of securities, cash and dividends accrued in the amounts of $3,632,219, $26,056 and $5,188, respectively. |
| (e) | GW&K U.S. Small Cap Growth had a redemption in-kind on December 1, 2015, in the amount of $142,509,610. The redemption was comprised of securities and cash in the amount of $134,464,305 and $8,045,305, respectively. |
| (f) | See Note (F) Agreements and Transactions With Affiliates. |
| (g) | The commencement of investment operations for the Value Partners Asia Dividend was December 16, 2015. |
At October 31, 2016, certain affiliated and unaffiliated shareholders of record, including omnibus accounts, individually or collectively held greater than 10% of the net assets of the Funds as follows:
| | | | | | | | | | | | | | | | | | |
| | | Number of
Shareholders | | | Collectively
Own | | | | | Number of
Shareholders | | | Collectively
Own | |
Fairpointe Focused Equity | | | 2 | | | | 91 | % | | Silvercrest Small Cap | | | 4 | | | | 57 | % |
River Road Focused Absolute Value | | | 2 | | | | 89 | % | | GW&K U.S. Small Cap Growth | | | 2 | | | | 37 | % |
Montag & Caldwell Growth | | | 3 | | | | 49 | % | | DoubleLine Core Plus Bond | | | 3 | | | | 74 | % |
River Road Dividend All Cap Value | | | 3 | | | | 63 | % | | Anchor Capital Enhanced Equity | | | 1 | | | | 77 | % |
River Road Dividend All Cap Value II | | | 3 | | | | 82 | % | | Lake Partners LASSO Alternatives | | | 3 | | | | 62 | % |
Fairpointe Mid Cap | | | 3 | | | | 57 | % | | River Road Long-Short | | | 2 | | | | 74 | % |
Montag & Caldwell Mid Cap Growth | | | 4 | | | | 75 | % | | Guardian Capital Global Dividend | | | 2 | | | | 96 | % |
LMCG Small Cap Growth | | | 2 | | | | 40 | % | | Pictet International | | | 1 | | | | 21 | % |
River Road Select Value | | | 3 | | | | 68 | % | | Value Partners Asia Dividend | | | 1 | | | | 100 | % |
River Road Small Cap Value | | | 3 | | | | 80 | % | | Montag & Caldwell Balanced | | | 1 | | | | 10 | % |
Transactions by these shareholders may have a material impact on their respective Fund.
Note (D) Investment Transactions: Purchases and proceeds from sales and maturities of investment securities (other than short-term investments) for the fiscal year ended October 31, 2016 were as follows:
| | | | | | | | | | | | | | | | |
| | | Purchases | | | Proceeds from Sales | |
| | | U.S. Government | | | Other | | | U.S. Government | | | Other | |
Fairpointe Focused Equity | | $ | — | | | $ | 2,339,904 | | | $ | — | | | $ | 2,054,130 | |
River Road Focused Absolute Value | | | — | | | | 17,858,648 | | | | — | | | | 10,985,142 | |
Montag & Caldwell Growth | | | — | | | | 974,335,226 | | | | — | | | | 1,730,503,373 | |
River Road Dividend All Cap Value | | | — | | | | 362,404,674 | | | | — | | | | 413,352,585 | |
River Road Dividend All Cap Value II | | | — | | | | 39,412,609 | | | | — | | | | 50,917,675 | |
Fairpointe Mid Cap | | | — | | | | 889,571,469 | | | | — | | | | 1,958,815,967 | |
Montag & Caldwell Mid Cap Growth | | | — | | | | 3,800,169 | | | | — | | | | 6,827,926 | |
LMCG Small Cap Growth | | | — | | | | 223,762,836 | | | | — | | | | 311,558,668 | |
River Road Select Value | | | — | | | | 31,093,620 | | | | — | | | | 91,111,563 | |
River Road Small Cap Value | | | — | | | | 137,982,130 | | | | — | | | | 163,476,850 | |
Silvercrest Small Cap | | | — | | | | 77,462,097 | | | | — | | | | 56,498,158 | |
GW&K U.S. Small Cap Growth | | | — | | | | 167,407,579 | | | | — | | | | 509,065,139 | |
DoubleLine Core Plus Bond | | | 382,120,395 | | | | 267,829,193 | | | | 269,373,531 | | | | 189,697,254 | |
Anchor Capital Enhanced Equity | | | — | | | | 38,901,795 | | | | — | | | | 146,911,538 | |
Lake Partners LASSO Alternatives | | | — | | | | 41,225,215 | | | | — | | | | 137,840,453 | |
AMG Funds
October 31, 2016
Notes to Financial Statements – continued
| | | | | | | | | | | | | | | | |
| | | Purchases | | | Proceeds from Sales | |
| | | U.S. Government | | | Other | | | U.S. Government | | | Other | |
River Road Long-Short | | $ | — | | | $ | 139,430,139 | | | $ | — | | | $ | 170,030,561 | |
Guardian Capital Global Dividend | | | — | | | | 27,430,112 | | | | — | | | | 2,364,283 | |
Pictet International | | | — | | | | 1,479,170,527 | | | | — | | | | 277,416,638 | |
Value Partners Asia Dividend | | | — | | | | 10,419,039 | | | | — | | | | 3,183,064 | |
Montag & Caldwell Balanced | | | 1,667,209 | | | | 26,838,454 | | | | 3,185,773 | | | | 25,683,696 | |
Note (E) Redemption Fees: In accordance with the prospectus, certain Funds may assess a redemption fee on a Fund’s share redemptions and exchanges within specified time periods. The redemption fees are indicated in the following table for the fiscal year ended October 31, 2016 and are included in the Cost of Shares Repurchased in the Statements of Changes in Net Assets:
| | | | | | |
Fund Name | | Time Period | | Amount | |
Pictet International | | 2% Within 90 Days | | $ | 331 | |
Note (F) Agreements and Transactions with Affiliates: For each of the Funds, the Trust has entered into an investment advisory agreement under which the Investment Manager, a subsidiary and the U.S. retail distribution arm of Affiliated Managers Group, Inc. (“AMG”), serves as investment manager to the Funds and is responsible for the Funds’ overall administration and operations. The Investment Manager selects one or more subadvisors for the Funds (subject to Board approval), who serves pursuant to a subadvisory agreement with the Investment Manager, and monitors each subadvisor’s investment performance, security holdings and investment strategies. The investment portfolios of River Road Focused Absolute Value, River Road Dividend All Cap Value, River Road Dividend All Cap Value II, River Road Select Value, River Road Small Cap Value and River Road Long-Short are managed by River Road Asset Management, LLC. The investment portfolio of GW&K U.S. Small Cap Growth is managed by GW&K Investment Management, LLC. AMG indirectly owns a majority interest in River Road Asset Management, LLC and GW&K Investment Management, LLC. The investment portfolio of Value Partners Asia Dividend is managed by Value Partners Hong Kong Limited. AMG indirectly owns a minority interest in Value Partners Hong Kong Limited. Prior to September 30, 2016, Aston Asset Management, LLC (“Aston”), a wholly-owned subsidiary of the Investment Manager, served as investment manager to each of the Funds under a similar investment management agreement. On October 1, 2016, Aston merged with and into the Investment Manager.
Investment management fees are paid directly by the Funds to the Investment Manager based on average daily net assets. The investment management fee rates are reflected in the table below.
The Investment Manager is contractually obligated to waive management fees and/or reimburse ordinary operating expenses, not including interest, taxes, brokerage commissions, other investment-related costs, shareholder servicing fees, distribution and service (12b-1) fees, extraordinary expenses, such as litigation and other expenses not incurred in the ordinary course of the Fund’s business, and acquired fund fees and expenses, through February 28, 2018, to the extent that operating expenses exceed the expense cap (as shown in the table below) based on the Fund’s average daily net assets (the “Operating Expense Limit”). Prior to February 28, 2018, the arrangement may be amended or terminated only by a vote of the Board.
The Investment Management fees and contractual expense limitations for the fiscal year ended October 31, 2016 were as follows:
| | | | | | | | | | |
| | | Investment Management Fees Effective 10/1/2016 | | Investment Management Fees Prior to 10/1/2016 | | Contractual
Expense Limitation
effective 10/1/2016 (a) | | Contractual
Expense Limitations
Prior to 10/01/2016 |
Fund Name | | | | | Class N | | Class I |
Fairpointe Focused Equity | | 0.70% | | 0.80% | | 0.82% | | 1.15% | | 0.90% |
River Road Focused Absolute Value (b) | | 0.60% | | 0.70% | | 0.71% | | 1.00% | | 0.75% |
Montag & Caldwell Growth | | 0.70% on first $800,000,000 0.50% over $800,000,000 up to $6 billion 0.45% over $6 billion up to $12 billion 0.40% over $12 billion | | 0.80% on first $800,000,000 0.60% over $800,000,000 up to $6 billion 0.55% over $6 billion up to $12 billion 0.50% over $12 billion | | N/A | | N/A | | N/A |
River Road Dividend All Cap Value | | 0.60% | | 0.70% | | 0.99% | | 1.30% | | 1.05% |
River Road Dividend All Cap Value II | | 0.60% | | 0.70% | | 0.99% | | 1.30% | | 1.05% |
Fairpointe Mid Cap | | 0.70% on first $100,000,000 0.65% next $300,000,000 0.60% over $400,000,000 | | 0.80% on first $100,000,000 0.75% next $300,000,000 0.70% over $400,000,000 | | N/A | | N/A | | N/A |
Montag & Caldwell Mid Cap Growth | | 0.75% | | 0.85% | | 0.95% | | 1.25% | | 1.00% |
LMCG Small Cap Growth | | 0.90% | | 1.00% | | 1.03% | | 1.35% | | 1.10% |
River Road Select Value | | 0.90% | | 1.00% | | 1.19% | | 1.50% | | 1.25% |
River Road Small Cap Value | | 0.80% | | 0.90% | | N/A | | N/A | | N/A |
177
AMG Funds
October 31, 2016
Notes to Financial Statements – continued
| | | | | | | | | | | | | | |
| | | Investment
Management Fees Effective
10/1/2016 | | Investment
Management Fees Prior to
10/01/2016 | | Contractual
Expense Limitation
effective 10/01/2016 (a) | | Contractual
Expense Limitations
Prior to 10/01/2016 | |
Fund Name | | | | | Class N | | | Class I | |
Silvercrest Small Cap | | 0.90% | | 1.00% | | 1.08% | | | 1.40 | % | | | 1.15 | % |
GW&K U.S. Small Cap Growth (c) | | 0.80% | | 0.90% | | 1.03% | | | 1.35 | % | | | 1.10 | % |
DoubleLine Core Plus Bond | | 0.45% | | 0.55% | | 0.61% | | | 0.94 | % | | | 0.69 | % |
Anchor Capital Enhanced Equity | | 0.60% | | 0.70% | | 1.07% | | | 1.40 | % | | | 1.15 | % |
Lake Partners LASSO Alternatives | | 0.90% | | 1.00% | | 1.09% | | | 1.40 | % | | | 1.15 | % |
River Road Long-Short | | 1.10% | | 1.20% | | 1.37% | | | 1.70 | % | | | 1.45 | % |
Guardian Capital Global Dividend | | 0.70% | | 0.80% | | 1.05% | | | 1.30 | % | | | 1.05 | % |
Pictet International | | 0.80% | | 0.90% | | 1.08% | | | 1.40 | % | | | 1.15 | % |
Value Partners Asia Dividend (d) | | 0.80% | | 0.90% | | 1.15% | | | 1.40 | % | | | 1.15 | % |
Montag & Caldwell Balanced | | 0.65% | | 0.75% | | 1.04% | | | 1.35 | % | | | 1.10 | % |
| (a) | The expense limitation is at the fund level and excludes shareholder servicing fees and 12b-1 fees. |
| (b) | The commencement of investment operations for River Road Focused Absolute Value was November 3, 2015. |
| (c) | Effective January 12, 2016, the Investment Manager has agreed to a contractual expense limitation. |
| (d) | The commencement of investment operations for Value Partners Asia Dividend was December 16, 2015. |
For a period of up to three years from the end of the fiscal year during which fees were waived or expenses were reimbursed (the “Recovery Period”), the Investment Manager is entitled to be reimbursed by the Fund for such fees waived and expenses reimbursed from the commencement of operations through the completion of the first three full fiscal years to the extent that the Fund’s total annual operating expenses, not including interest, taxes, brokerage commissions, other investment-related costs, shareholder servicing fees, distribution and service (12b-1) fees, extraordinary expenses, such as litigation and other expenses not incurred in the ordinary course of the Fund’s business, and acquired fund fees and expenses, are at or below the Operating Expense Limit during the Recovery Period.
The cumulative reimbursement amounts as of October 31, 2016 that are entitled to be recouped for each Fund are as follows:
| | | | | | | | | | | | |
| | | Expiration | |
| | | 2017 | | | 2018 | | | 2019 | |
Fairpointe Focused Equity Fund | | | N/A | | | $ | 128,683 | | | $ | 103,052 | |
River Road Focused Absolute Value Fund | | | N/A | | | | N/A | | | | 170,129 | |
River Road Dividend All Cap Value Fund II | | | — | | | | — | | | | N/A | |
LMCG Small Cap Growth Fund | | $ | 131,012 | | | | N/A | | | | N/A | |
Silvercrest Small Cap Fund | | | 108,554 | | | | 77,805 | | | | N/A | |
DoubleLine Core Plus Bond Fund | | | 183,865 | | | | N/A | | | | N/A | |
River Road Long-Short Fund | | | — | | | | N/A | | | | N/A | |
Guardian Capital Global Dividend Fund | | | 89,764 | | | | 122,164 | | | | 96,649 | |
Pictet International Fund | | | — | | | | 120,411 | | | | — | |
Value Partners Asia Dividend Fund | | | N/A | | | | N/A | | | | 186,218 | |
| | | | | | | | | | | | |
Totals | | $ | 513,195 | | | $ | 449,063 | | | $ | 556,048 | |
| | | | | | | | | | | | |
Through the fiscal year ended October 31, 2016, the Investment Manager recaptured prior year fee waivers and expense reimbursements of $156,874 from Pictet International.
During the fiscal year ended October 31, 2016, the following Fund was reimbursed by the Investment Manager and its sub-adviser for losses incurred on executed transactions not meeting the Fund’s investment guidelines and the cost of correcting the Fund’s net asset value:
| | | | |
| | | Capital Contribution | |
Pictet International | | $ | 619,174 | |
Administration. Effective October 1, 2016, each Fund has entered into an Amended and Restated Administration Agreement under which the Investment Manager serves as the Funds’ administrator (the “Administrator”) and is responsible for all non-portfolio management aspects of managing the Funds’ operations, including administration and shareholder services to each Fund, as further described in each Fund’s prospectus. Each Fund pays a fee to the Administrator at the rate of 0.15% per annum of each Fund’s respective average daily net assets for these services. Prior to October 1, 2016, under the terms of the prior administration agreement between the Trust and Aston, the Funds’ administration fees were accrued daily and paid monthly, based on a specified percentage of average daily net assets of the Trust, and a base fee was charged at a fixed annual rate of $12,000 per Fund. The asset-based fee was allocated to each Fund based on the relative net assets of each Fund. The asset-based administration fee arrangement prior to October 1, 2016 was as follows:
| | | | |
Administration Fees at Trust Level | | Annual Rate | |
First $ 7.4 billion | | | 0.0437 | % |
Over $ 7.4 billion | | | 0.0412 | % |
The Investment Manager has agreed, through at least October 1, 2018, to waive a portion of the administrative fee in an amount equal to 0.0061% of the average daily net assets of Montag & Caldwell Growth, 0.0053% of the average daily net assets of River Road Dividend All Cap Value, 0.0065% of the average daily net assets of Fairpointe Mid Cap, 0.0022% of the average daily net assets of River Road Small Cap Value, 0.0052% of the average daily net assets of DoubleLine Core Plus Bond and 0.0055% of the average daily net assets of Pictet International.
Distribution Services. Effective October 1, 2016, the Funds are distributed by AMG Distributors, Inc. (the “Distributor”), a wholly owned subsidiary of the Investment Manager. Prior to October 1, 2016, the Funds’ distributor was Foreside Funds
178
AMG Funds
October 31, 2016
Notes to Financial Statements – continued
Distributors LLC. The Distributor serves as the distributor and underwriter for each Fund and is a registered broker-dealer and member of the Financial Industry Regulatory Authority, Inc. (“FINRA”). Shares of each Fund will be continuously offered and will be sold directly to prospective purchasers and through brokers, dealers or other financial intermediaries who have executed selling agreements with the Distributor. Subject to the reimbursement arrangement discussed below, generally the Distributor bears all or a portion of the expenses of providing services pursuant to the distribution agreement, including the payment of the expenses relating to the distribution of prospectuses for sales purposes and any advertising or sales literature.
The Trust has adopted a distribution and service plan (the “Plan”) with respect to the Class N and Class R shares in accordance with the requirements of Rule 12b-1 under the 1940 Act and the requirements of the applicable rules of FINRA regarding asset based sales charges. Pursuant to the Plan, the Funds may make payments to reimburse the Distributor for its expenditures in financing any activity primarily intended to result in the sale of each such class of the Fund’s shares and for maintenance and personal service provided to existing shareholders of that class. The Plan authorizes payments to the Distributor up to 0.25% and 0.50% annually of each Fund’s average daily net assets attributable to the Class N and Class R shares, respectively. The Plan further provides for periodic payments by the Trust or the Distributor to brokers, dealers and other financial intermediaries for providing shareholder services and for promotional and other sales related costs. The portion of payments made under the plan by Class R shares of Montag & Caldwell Growth for shareholder servicing may not exceed an annual rate of 0.25% of the average daily net asset value of Class R shares of that class owned by clients of such broker, dealer or financial intermediary. The Funds made payments to the previous distributor at the same rates.
Shareholder Servicing Fees. Effective October 1, 2016, for each of the Class N, Class I and Class R shares, the Board has approved reimbursement payments to the Investment Manager for shareholder servicing expenses (“shareholder servicing fees”) incurred. Shareholder servicing fees include payments to financial intermediaries such as broker-dealers (including fund supermarket platforms), banks, and trust companies who provide shareholder recordkeeping, account servicing and other services. The Class N, Class I and Class R shares may reimburse the Investment Manager for the actual amount incurred up to a maximum annual rate of 0.15% of each respective Class’s average daily net asset value.
Prior to October 1, 2016, the Funds were authorized to reimburse Aston for shareholder servicing payments made to certain financial intermediaries at an annual rate of up to 0.09% of eligible assets of each Fund, which are allocated on a pro-rata basis to each class based on relative net assets of each class based on the relative net assets of each class to the total net assets of each Fund.
Effective October 1, 2016, the Investment Manager has agreed, through at least October 1, 2017, to waive a portion of share-
holder servicing fees paid by the various share classes of each Fund, as necessary, to ensure the total net expense ratio for each share class of each Fund does not increase due to the changes in the methodology of shareholder servicing reimbursements described above.
The impact on the annualized expense ratios for the fiscal year ended October 31, 2016, were as follows:
| | | | |
Fund | | Actual
Amount
Incurred | |
Fairpointe Focused Equity | | | | |
Class N | | | 0.08 | % |
Class I | | | 0.08 | % |
River Road Focused Absolute Value | | | | |
Class N | | | 0.04 | % |
Class I | | | 0.04 | % |
Montag & Caldwell Growth | | | | |
Class N | | | 0.06 | % |
Class I | | | 0.06 | % |
Class R | | | 0.05 | % |
River Road Dividend All Cap Value | | | | |
Class N | | | 0.06 | % |
Class I | | | 0.06 | % |
River Road Dividend All Cap Value II | | | | |
Class N | | | 0.06 | % |
Class I | | | 0.06 | % |
Fairpointe Mid Cap | | | | |
Class N | | | 0.08 | % |
Class I | | | 0.08 | % |
Montag & Caldwell Mid Cap Growth | | | | |
Class N | | | 0.05 | % |
Class I | | | 0.05 | % |
LMCG Small Cap Growth | | | | |
Class N | | | 0.07 | % |
Class I | | | 0.06 | % |
River Road Select Value | | | | |
Class N | | | 0.06 | % |
Class I | | | 0.06 | % |
River Road Small Cap Value | | | | |
Class N | | | 0.09 | % |
Class I | | | 0.09 | % |
Silvercrest Small Cap | | | | |
Class N | | | 0.07 | % |
Class I | | | 0.07 | % |
GW&K U.S. Small Cap Growth | | | | |
Class N | | | 0.07 | % |
Class I | | | 0.07 | % |
DoubleLine Core Plus Bond | | | | |
Class N | | | 0.08 | % |
Class I | | | 0.08 | % |
Anchor Capital Enhanced Equity | | | | |
Class N | | | 0.08 | % |
Class I | | | 0.08 | % |
Lake Partners LASSO Alternatives | | | | |
Class N | | | 0.06 | % |
Class I | | | 0.06 | % |
River Road Long-Short | | | | |
Class N | | | 0.08 | % |
Class I | | | 0.08 | % |
Pictet International | | | | |
Class N | | | 0.07 | % |
Class I | | | 0.07 | % |
Montag & Caldwell Balanced | | | | |
Class N | | | 0.06 | % |
Class I | | | 0.06 | % |
179
AMG Funds
October 31, 2016
Notes to Financial Statements – continued
Trustees. The Board provides supervision of the affairs of the Trust and, other Trusts within the AMG Funds family. The Trustees of the Trust who are not affiliated with the Investment Manager receive an annual retainer and per meeting fees for regular, special and telephonic meetings, and they are reimbursed for out-of-pocket expenses incurred while carrying out their duties as Board members. The Chairman of the Board and the Audit Committee Chair receive additional annual retainers. Certain Trustees and Officers of the Funds are Officers and/or Directors of AMG, the Distributor or the Investment Manager.
InterFund Loans. The SEC granted an exemptive order that permits GW&K U.S. Small Cap Growth and certain other funds in the AMG Funds family to lend and borrow money for certain temporary purposes directly to and from other eligible funds in the AMG Funds family. Participation in this interfund lending program is voluntary for both the borrowing and lending funds, and an interfund loan is only made if it benefits each participating fund. The Administrator administers the program according to procedures approved by the Board, and the Board monitors the operation of the program. An interfund loan must comply with certain conditions set out in the exemptive order, which are designed to assure fairness and protect all participating funds. For the period from June 23, 2016 (the date GW&K U.S. Small Cap Growth was approved to participate in the interfund lending program), to October 31, 2016, the GW&K U.S. Small Cap Growth did not borrow from nor lend to any other fund in the AMG Funds family.
Note (G) Credit Agreement: Effective July 6, 2010, and as amended July 29, 2015 and July 27, 2016, the Trust entered
into a Credit Agreement with The Bank of New York Mellon (the “Bank”) which provides the Trust with a revolving line of credit facility of up to $50 million. The facility is shared by each Fund of the Trust and is available for temporary, emergency purposes including liquidity needs in meeting redemptions. The interest rate on outstanding Alternate Base Rate Loans is equal to the greater of the Prime Rate plus 1.25%, or 0.50% plus the Federal Funds Effective Rate plus 1.25%. The interest rate on outstanding Overnight Loans is equal to the greater of the Federal Funds Effective Rate plus 1.25%, or the One-Month LIBOR Rate plus 1.25%. Effective July 27, 2016, the Trust pays a commitment fee on the unutilized commitment amount of 0.175% per annum, which is allocated to the Funds based on average daily net assets and included in Miscellaneous Expense on the Statement of Operations. Prior to July 27, 2016, the Trust paid a commitment fee of 0.15% per annum. The Funds did not utilize the line of credit during the fiscal year ended October 31, 2016.
Note (H) Subsequent Events: No material events or transactions occurred through the issuance of the Funds’ financial statements, which require additional disclosure in or adjustment of the Funds’ financial statements except for the following: Effective January 1, 2017, the management fee and Operating Expense Limit for River Road Select Value will be reduced to 0.75% and 1.04%, respectively; the management fee and Operating Expense Limit for River Road Long-Short will be reduced to 0.85% and 1.12%, respectively; and on December 7, 2016, the Board approved a plan to liquidate and terminate Anchor Capital Enhanced Equity on, or about January 31, 2017.
AMG Funds
Report of Independent Registered Public Accounting Firm
To the Board of Trustees and Shareholders of
AMG Funds IV (formerly, the Aston Funds):
In our opinion, the accompanying statements of assets and liabilities, including the schedules of portfolio investments, and the related statements of operations and of changes in net assets and the financial highlights present fairly, in all material respects, the financial position of the twenty funds listed in Note A (the “Funds”) comprising AMG Funds IV (formerly, the Aston Funds) at October 31, 2016, the results of each of their operations, the changes in each of their net assets and the financial highlights for each of the periods indicated, in conformity with accounting principles generally accepted in the United States of America. These financial statements and financial highlights (hereafter referred to as “financial statements”) are the responsibility of the Funds’ management. Our responsibility is to express an opinion on these financial statements based on our audits. We conducted our audits of these financial statements in accordance with the standards of the Public Company Accounting Oversight Board (United States). Those standards require that we plan and perform the audit to obtain reasonable assurance about whether the financial statements are free of material misstatement. An audit includes examining, on a test basis, evidence supporting the amounts and disclosures in the financial statements, assessing the accounting principles used and significant estimates made by management, and evaluating the overall financial statement presentation. We believe that our audits, which included confirmation of securities at October 31, 2016 by correspondence with the custodian and brokers, and the application of alternative auditing procedures where securities purchased had not been received, provide a reasonable basis for our opinion. The statements of changes in net assets for the period ended October 31, 2015 and the financial highlights for the periods ended from October 31, 2012 through October 31, 2015 for the Funds were audited by another independent registered public accounting firm whose report dated December 22, 2015 expressed an unqualified opinion on those statements and financial highlights.
PricewaterhouseCoopers LLP
Boston, Massachusetts
December 29, 2016
AMG Funds
October 31, 2016
Additional Information (unaudited)
SHAREHOLDER VOTING RESULTS
A meeting of shareholders of Aston Small Cap Fund (the “Fund”) was held on June 3, 2016, as adjourned to June 30, 2016. With respect to the proposals to approve (1) a new subadvisory agreement between Aston Asset Management, LLC and GW&K Investment Management, LLC with respect to the Fund and (2) amend the fundamental investment restrictions of the Fund with respect to (a) borrowing and issuing senior securities and (b) lending. The proposals and results of the votes are summarized below.
Proposal 1. Approval of a new subadvisory agreement between Aston Asset Management, LLC and GW&K Investment Management, LLC with respect to the Fund.
| | | | | | | | |
For | | Against | | | Abstain | |
7,403,087 | | | 337,189 | | | | 623,847 | |
Proposal 2a. Amend the fundamental investment restrictions of the Fund with respect to borrowing and issuing senior securities.
| | | | | | | | |
For | | Against | | | Abstain | |
7,318,324 | | | 386,317 | | | | 659,483 | |
Proposal 2b. Amend the fundamental investment restrictions of the Fund with respect to lending.
| | | | | | | | |
For | | Against | | | Abstain | |
7,304,852 | | | 439,491 | | | | 619,780 | |
TRUSTEE CONSIDERATIONS DISCLOSURE
ASTON/Anchor Capital Enhanced Equity Fund, ASTON/Barings International Fund, ASTON/Cornerstone Large Cap Value Fund, ASTON/ DoubleLine Core Plus Fixed Income Fund, ASTON/Fairpointe Mid Cap Fund, ASTON/Guardian Capital Global Dividend Fund, ASTON/Harrison Street Real Estate Fund, ASTON/Herndon Large Cap Value Fund, ASTON/Lake Partners LASSO Alternatives Fund, ASTON/LMCG Emerging Markets Fund, ASTON/LMCG Small Cap Growth Fund, ASTON/ Montag & Caldwell Balanced Fund, ASTON/Montag & Caldwell Growth Fund, ASTON/Montag & Caldwell Mid Cap Growth Fund, ASTON/Pictet International Fund, ASTON/River Road Dividend All Cap Value Fund, ASTON/River Road Dividend All Cap Value Fund II, ASTON/River Road Independent Value Fund, ASTON/River Road Long-Short Fund, ASTON/River Road Select Value Fund, ASTON/River Road Small Cap Value Fund, ASTON/Silvercrest Small Cap Fund, ASTON/ TAMRO Small Cap Fund and ASTON/TCH Fixed Income Fund: Approval of Investment Advisory and Sub-Investment Advisory Agreements on December 10, 2015
At an in-person meeting held on December 10, 2015, the Board of Trustees (the “Board” or the “Trustees”), and separately a majority of the Trustees who are not “interested persons” of the Trust (the “Independent Trustees”), approved the continuance of the Investment Advisory Agreement (the “Investment Advisory Agreement”) with Aston Asset Management, LLC (the “Investment Adviser”) for each of ASTON/Anchor Capital
Enhanced Equity Fund, ASTON/Barings International Fund, ASTON/Cornerstone Large Cap Value Fund, ASTON/DoubleLine Core Plus Fixed Income Fund, ASTON/Fairpointe Mid Cap Fund, ASTON/Guardian Capital Global Dividend Fund, ASTON/Harrison Street Real Estate Fund, ASTON/Herndon Large Cap Value Fund, ASTON/Lake Partners LASSO Alternatives Fund, ASTON/ LMCG Emerging Markets Fund, ASTON/LMCG Small Cap Growth Fund, ASTON/Montag & Caldwell Balanced Fund, ASTON/ Montag & Caldwell Growth Fund, ASTON/Montag & Caldwell Mid Cap Growth Fund, ASTON/Pictet International Fund, ASTON/River Road Dividend All Cap Value Fund, ASTON/River Road Dividend All Cap Value Fund II, ASTON/River Road Independent Value Fund, ASTON/River Road Long-Short Fund, ASTON/River Road Select Value Fund, ASTON/River Road Small Cap Value Fund, ASTON/Silvercrest Small Cap Fund, ASTON/ TAMRO Small Cap Fund and ASTON/TCH Fixed Income Fund (each a “Fund”) and the continuance of the Sub-Investment Advisory Agreement (each, a “Subadvisory Agreement”) for each Fund’s Subadviser. The Independent Trustees were separately represented by independent legal counsel in connection with their consideration of the approval of the continuance of these agreements. In considering the Investment Advisory and Sub-advisory Agreements, the Trustees reviewed a variety of materials relating to each Fund, the Investment Adviser and each Subadviser, including comparative performance, fee and expense information for an appropriate peer group of similar mutual funds (each a “Peer Group”), performance information for relevant benchmark indices (each a “Fund Benchmark”) and, with respect to each Subadviser, comparative gross performance information versus a relevant performance composite that utilizes the same investment strategy and approach, and, as to all other matters, other information provided to them on a periodic basis throughout the year, as well as information provided in connection with the meeting of December 10, 2015, regarding the nature, extent and quality of services provided by the Investment Adviser and the Subadvisers under their respective agreements. Prior to voting, the Independent Trustees: (a) reviewed the foregoing information with their independent legal counsel and with management; (b) received materials from their independent legal counsel discussing the legal standards applicable to their consideration of the Investment Advisory Agreement and the Subadvisory Agreements; and (c) met with their independent legal counsel in private sessions at which no representatives of management were present. During the review process, the Trustees noted certain instances where clarification or follow-up was appropriate. In those instances where clarification or follow-up was requested, the Board determined that either information responsive to its requests had been provided, or where any request was outstanding in whole or in part, given the totality of the information provided with respect to the Investment Advisory Agreement and the Subadvisory Agreements, the Board had received sufficient information to reach its conclusion regarding the advisability of each approval requested.
Nature, Extent and Quality of Services. In considering the nature, extent and quality of the services provided by the Investment Adviser, the Trustees reviewed information relating to the Investment Adviser’s operations and personnel. Among
AMG Funds
October 31, 2016
Additional Information (unaudited) – continued
other things, the Investment Adviser provided financial information, biographical information on its supervisory and professional staff and descriptions of its organizational and management structure. The Trustees also took into account information provided periodically throughout the previous year by the Investment Adviser in Board meetings relating to the performance of its duties with respect to the Funds and the Trustees’ knowledge of the Investment Adviser’s management and the quality of the performance of the Investment Adviser’s duties. In the course of their deliberations regarding the Investment Advisory Agreement, the Trustees evaluated, among other things: (a) the extent and quality of the Investment Adviser’s oversight of the operation and management of the Funds; (b) the quality of the search, selection and monitoring services performed by the Investment Adviser in overseeing the portfolio management responsibilities of the Subadvisers; (c) the Investment Adviser’s ability to oversee the Funds’ other service providers; and (d) the Investment Adviser’s compliance program. The Trustees also took into account that, in performing its functions under the Investment Advisory Agreement and overseeing each Subadviser, the Investment Adviser performs periodic detailed analysis and reviews of the performance by each Subadviser of its obligations to a Fund, including, without limitation, analysis and review of portfolio and other compliance matters and review of each Subadviser’s investment performance in respect of a Fund; prepares and presents periodic reports to the Board regarding the investment performance of each Sub-adviser and other information regarding each Subadviser, at such times and in such forms as the Board may reasonably request; reviews and considers any changes in the personnel of each Subadviser responsible for performing the Subadviser’s obligations and makes appropriate reports to the Board; reviews and considers any changes in the ownership or senior management of each Subadviser and makes appropriate reports to the Board; performs periodic in-person or telephonic diligence meetings, including with respect to compliance matters, with representatives of each Subadviser; assists the Board and management of the Trust in developing and reviewing information with respect to the initial approval of each Subadvisory Agreement and annual consideration of each Subadvisory Agreement thereafter; prepares recommendations with respect to the continued retention of any Subadviser or the replacement of any Subadviser, including at the request of the Board; identifies potential successors to or replacements of any Subadviser or potential additional sub-advisers, performs appropriate due diligence, and develops and presents to the Board a recommendation as to any such successor, replacement or additional subadviser, including at the request of the Board; designates and compensates from its own resources such personnel as the Investment Adviser may consider necessary or appropriate to the performance of its services; and performs such other review and reporting functions as the Board shall reasonably request consistent with the Investment Advisory Agreement and applicable law. With respect to ASTON/River Road Dividend All Cap Value Fund, ASTON/River Road Dividend All Cap Value Fund II, ASTON/River Road Independent Value Fund, ASTON/River Road Long-Short Fund, ASTON/River Road Select Value Fund and ASTON/River Road Small Cap Value Fund, the Trustees noted the affiliation of the Subadviser with the Investment Adviser and its control persons, noting any potential
conflicts of interest. The Trustees also took into account the financial condition of the Investment Adviser with respect to its ability to provide the services required under the Investment Advisory Agreement and the Investment Adviser’s undertakings to maintain contractual expense limitations for certain Funds, as described below. The Trustees also considered the Investment Adviser’s risk management processes.
For each Fund, the Trustees also reviewed information relating to each Subadviser’s operations and personnel and the investment philosophy, strategies and techniques (for each Sub-adviser, its “Investment Strategy”) used in managing the Fund. Among other things, the Trustees reviewed biographical information on portfolio management and other professional staff, information regarding each Subadviser’s organizational and management structure and each Subadviser’s brokerage policies and practices. The Trustees considered specific information provided regarding the experience of the individuals at each Subadviser with portfolio management responsibility for a Fund, including the information set forth in the Fund’s prospectus and statement of additional information. In the course of their deliberations, the Trustees evaluated, among other things: (a) the services rendered by each Subadviser in the past; (b) the qualifications and experience of the Subadviser’s personnel; and (c) the Subadviser’s compliance program. The Trustees also took into account the financial condition of each Subadviser with respect to its ability to provide the services required under its Subadvisory Agreement(s). The Trustees also considered each Subadviser’s risk management processes.
Performance. As noted above, the Board considered each Fund’s net performance during relevant time periods as compared to the Fund’s Peer Group and Fund Benchmark and considered the gross performance of the Fund as compared to the Subadviser’s relevant performance composite that utilizes the same investment strategy and approach and noted that the Board reviews on a quarterly basis detailed information about both the Fund’s performance results and portfolio composition, as well as each Subadviser’s Investment Strategy. The Board noted the Investment Adviser’s expertise and resources in monitoring the performance, investment style and risk-adjusted performance of each Subadviser. The Board was mindful of the Investment Adviser’s attention to monitoring each Subadviser’s performance with respect to the Funds and its discussions with management regarding the factors that contributed to the performance of the Funds.
Advisory Fees and Profitability. In considering the reasonableness of the advisory fee charged by the Investment Adviser for managing each Fund, the Trustees noted that the Investment Adviser, and not the Fund, is responsible for paying the fees charged by the Fund’s Subadviser and, therefore, that the fees paid to the Investment Adviser cover the cost of providing portfolio management services as well as the cost of providing search, selection and monitoring services in operating a “manager-of-managers” complex of mutual funds. The Trustees also considered the amount of the advisory fee retained by the Investment Adviser after payment of the subadvisory fee with respect to each Fund. The Trustees considered that the Investment Adviser had undertaken to lower the contractual
AMG Funds
October 31, 2016
Additional Information (unaudited) – continued
advisory fees for ASTON/Cornerstone Large Cap Value Fund and ASTON/Herndon Large Cap Value Fund. The Trustees concluded that, in light of the additional high-quality oversight services provided by the Investment Adviser and the fact that the sub-advisory fees are paid out of the advisory fee, the advisory fee payable by each Fund to the Investment Adviser can reasonably be expected to exceed the median advisory fee for the Peer Group, which consists of many funds that do not operate with a manager-of-managers structure. In this regard, the Trustees also noted that the Investment Adviser has undertaken to maintain contractual expense limitations for ASTON/Anchor Capital Enhanced Equity Fund, ASTON/Barings International Fund, ASTON/DoubleLine Core Plus Fixed Income Fund, ASTON/ Guardian Capital Global Dividend Fund, ASTON/Harrison Street Real Estate Fund, ASTON/Lake Partners LASSO Alternatives Fund, ASTON/LMCG Emerging Markets Fund, ASTON/LMCG Small Cap Growth Fund, ASTON/Montag & Caldwell Balanced Fund, ASTON/Montag & Caldwell Mid Cap Growth Fund, ASTON/ Pictet International Fund, ASTON/River Road Dividend All Cap Value Fund, ASTON/River Road Dividend All Cap Value Fund II, ASTON/River Road Independent Value Fund, ASTON/River Road Long-Short Fund, ASTON/River Road Select Value Fund, ASTON/ Silvercrest Small Cap Fund and ASTON/TCH Fixed Income Fund. The Trustees also considered that the Investment Adviser had undertaken to lower the contractual expense limitations for ASTON/Cornerstone Large Cap Value Fund and ASTON/Herndon Large Cap Value Fund.
In addition, in considering the reasonableness of the advisory fee payable to the Investment Adviser, the Trustees also reviewed information provided by the Investment Adviser setting forth all revenues and other benefits, both direct and indirect (including any so-called “fallout benefits” such as reputational value derived from the Investment Adviser serving as Investment Adviser to a Fund), received by the Investment Adviser and its affiliates attributable to managing each Fund and all the mutual funds in the Aston Funds Family of Funds, the cost of providing such services and the resulting profitability to the Investment Adviser and its affiliates from these relationships. The Trustees also noted the current asset levels of each Fund and the willingness of the Investment Adviser to maintain contractual expense limitations, as described above, as a means of limiting total expenses. The Trustees also considered management’s discussion of the current asset levels of the Funds, and considered the impact on profitability of the current asset levels and any future growth of assets of the Funds. The Board took into account management’s discussion of the current advisory fee structure, and, as noted above, the services the Investment Adviser provides in performing its functions under the Investment Advisory Agreement and monitoring each Subadviser. In this regard, the Trustees noted that, unlike a mutual fund that is managed by a single investment adviser, the Funds operate in a manager-of-managers structure. Based on the foregoing, the Trustees concluded that the profitability to the Investment Adviser is reasonable and that the Investment Adviser is not realizing material benefits from economies of scale that would warrant adjustments to the advisory fees for any Fund at this time. With respect to economies of scale, the Trustees also noted that, as a Fund’s assets increase over time, the Fund may realize other economies
of scale to the extent that the increase in assets is proportionally greater than the increase in certain other expenses.
Subadvisory Fees and Profitability. In considering the reasonableness of the fee payable by the Investment Adviser to each of Anchor Capital Advisors LLC, Baring International Investment Limited, Cornerstone Investment Partners, LLC, DoubleLine Capital LP, Fairpointe Capital LLC, Guardian Capital LP, Harrison Street Securities, LLC, Herndon Capital Management, LLC, Lake Partners, Inc., LMCG Investments, LLC, Montag & Caldwell, LLC, Pictet Asset Management Limited, Silvercrest Asset Management Group LLC, TAMRO Capital Partners, LLC and Taplin, Canida & Habacht, LLC (each, an “Unaffiliated Subadviser” and collectively, the “Unaffiliated Subadvisers”), the Trustees relied on the ability of the Investment Adviser to negotiate the terms of the Subadvisory Agreement at arm’s length as part of the manager-of-managers structure, noting that the Investment Adviser is not affiliated with the Unaffiliated Subadvisers. In addition, the Trustees considered other potential benefits of the subadvisory relationship to the Unaffiliated Subadvisers, including, among others, the indirect benefits that each Unaffiliated Subadviser may receive from its relationship with a Fund, including any so-called “fallout benefits” to the Unaffiliated Subadvisers, such as reputational value derived from the Unaffiliated Subadvisers serving as Subadviser to a Fund. In addition, the Trustees noted that the subadvisory fees are paid by the Investment Adviser out of its advisory fee. As a consequence of all of the foregoing, the Board determined that profitability information with respect to the Unaffiliated Sub-advisers was not material to its considerations in light of the fee model used by the Investment Adviser and the unaffiliated status of the Unaffiliated Subadvisers. For similar reasons, the Trustees did not consider potential economies of scale in the management of a Fund by each of the Unaffiliated Subadvisers to be a material factor in their deliberations at this time.
In considering the reasonableness of the fees payable by the Investment Adviser to River Road, the Trustees noted that River Road is an affiliate of the Investment Adviser and its control persons and noted that, because River Road is an affiliate of the Investment Adviser, a portion of River Road’s revenues might be shared directly or indirectly with the Investment Adviser or its parent company. The Trustees also noted that the subadvisory fees are paid by the Investment Adviser out of its advisory fee. The Board also took into account management’s discussion of the current subadvisory fee structure, and the services River Road provides in performing its functions under the Subadvisory Agreements for the Funds it serves as Subadviser. The Trustees also noted that, at the time of the initial negotiation of the subadvisory fees, River Road was not affiliated with the Investment Adviser and such fees were negotiated at arm’s length. As a consequence of all of the foregoing, the Board determined that profitability information with respect to River was not material to its considerations in light of the fee model used by the Investment Adviser and the unaffiliated status of River Road at the time of the initial negotiation of the subadvisory fees. Also with respect to economies of
AMG Funds
October 31, 2016
Additional Information (unaudited) – continued
scale, the Trustees noted that, as the assets of each Fund for which River Road serves as Subadviser increase over time, the Fund may realize other economies of scale to the extent the increase in assets is proportionally greater than the increase in certain other expenses.
In addition to the foregoing, the Trustees considered the specific factors and related conclusions set forth below with respect to each Fund, the Investment Adviser and each Subadviser.
ASTON/Anchor Capital Enhanced Equity Fund
Fund Performance. Among other information relating to the Fund’s performance, the Trustees noted that the Fund’s performance for Class I shares for the 1-year, 3-year and 5-year periods ended June 30, 2015 was at, below and above, respectively, the median performance of the Peer Group and below the performance of the Fund Benchmark, the S&P 500 Index, and that the Fund’s performance for Class N shares for the 1-year, 3-year and 5-year periods ended June 30, 2015 was below, below and above, respectively, the median performance of the Peer Group and below the performance of the Fund Benchmark. The Trustees also took into account management’s discussion of the Fund’s performance, including the effect on relative performance of the Subadviser’s Investment Strategy. The Trustees concluded that the Fund’s overall performance has been satisfactory.
Advisory and Subadvisory Fees. The Trustees noted that the Fund’s advisory fee as of June 30, 2015 was lower than the average for the Fund’s Peer Group and that total expenses for Class I shares as of June 30, 2015 were lower than the average for comparable share classes of the Fund’s Peer Group. The Trustees took into account the fact that the Investment Adviser has contractually agreed, through February 28, 2017, to reimburse the Fund for operating expenses (subject to certain excluded expenses) in excess of 1.15% of average daily net assets for Class I shares and 1.40% of average daily net assets for Class N shares and that the Fund was currently operating below these thresholds. The Trustees also took into account management’s discussion of the Fund’s expenses, including fees and expenses relative to comparably sized funds, and the current size of the Fund. The Trustees concluded that, in light of the nature, extent and quality of the services provided by the Investment Adviser and the Subadviser, the foregoing expense reimbursement arrangement and the considerations noted above with respect to the Investment Adviser and the Subadviser, the Fund’s advisory and subadvisory fees are reasonable.
ASTON/Barings International Fund
Fund Performance. Among other information relating to the Fund’s performance, the Trustees noted that the Fund’s performance for both Class I shares and Class N shares for the 1-year, 3-year and 5-year periods ended June 30, 2015 was above, below and below, respectively, the median performance of the Peer Group and above, below and below, respectively, the performance of the Fund Benchmark, the MSCI EAFE Index. The Trustees also took into account management’s discussion of the Fund’s performance, including its more recent improved performance. The Trustees concluded that the Fund’s performance has been satisfactory.
Advisory and Subadvisory Fees. The Trustees noted that the Fund’s advisory fee as of June 30, 2015 was higher than the
average for the Fund’s Peer Group and that total expenses for Class I shares (net of applicable expense waivers/ reimbursements) as of June 30, 2015 were higher than the average for comparable share classes of the Fund’s Peer Group. The Trustees took into account the fact that the Investment Adviser has contractually agreed, through February 28, 2017, to reimburse the Fund for operating expenses (subject to certain excluded expenses) in excess of 1.15% of average daily net assets for Class I shares and 1.40% of average daily net assets for Class N shares. The Trustees also took into account management’s discussion of the Fund’s expenses, including fees and expenses relative to comparably sized funds, and the current size of the Fund. The Trustees concluded that, in light of the nature, extent and quality of the services provided by the Investment Adviser and the Subadviser, the foregoing expense reimbursement arrangement and the considerations noted above with respect to the Investment Adviser and the Subadviser, the Fund’s advisory and subadvisory fees are reasonable.
ASTON/Cornerstone Large Cap Value Fund
Fund Performance. Among other information relating to the Fund’s performance, the Trustees noted that the Fund’s performance for Class I shares for the 1-year, 3-year and 5-year periods ended June 30, 2015 and for Class N shares for the 1-year, 3-year, 5-year and 10-year periods ended June 30, 2015 was below the median performance of the Peer Group and below the performance of the Fund Benchmark, the Russell 1000® Value Index. The Trustees also took into account management’s discussion of the Fund’s performance, including the reasons given for the Fund’s underperformance, the long-term focus of the Subadviser and the Subadviser’s view that certain issues affecting the Fund’s recent underperformance were short-term in nature. The Trustees concluded that the Fund’s performance is being appropriately monitored.
Advisory and Subadvisory Fees. The Trustees noted that the Fund’s advisory fee as of June 30, 2015 was higher than the average for the Fund’s Peer Group and that total expenses for Class I shares (net of applicable expense waivers/ reimbursements) as of June 30, 2015 were higher than the average for comparable share classes of the Fund’s Peer Group. The Trustees took into account the fact that the Investment Adviser has agreed, effective January 1, 2016, to reduce the Fund’s advisory fee from 0.80% to 0.70% of average daily net assets and to reduce the contractual expense limits (subject to certain excluded expenses) for the Fund from 1.05% to 0.89% of average daily net assets for Class I shares and from 1.30% to 1.14% of average daily net assets for Class N shares, and that management would maintain these expense limits through February 28, 2017. The Trustees also took into account management’s discussion of the Fund’s expenses, including fees and expenses relative to comparably sized funds, and the current size of the Fund. The Trustees concluded that, in light of the nature, extent and quality of the services provided by the Investment Adviser and the Subadviser, the foregoing reductions in the Fund’s advisory fee and expense limits and the considerations noted above with respect to the Investment Adviser and the Subadviser, the Fund’s advisory and subadvisory fees are reasonable.
AMG Funds
October 31, 2016
Additional Information (unaudited) – continued
ASTON/DoubleLine Core Plus Fixed Income Fund
Fund Performance. Among other information relating to the Fund’s performance, the Trustees noted that the Fund’s performance for both Class I shares and Class N shares for the 1-year and 3-year periods ended June 30, 2015 was above the median performance of the Peer Group and above the performance of the Fund Benchmark, the Barclays U.S. Aggregate Bond Index. The Trustees also took into account management’s discussion of the Fund’s performance, including that the Fund ranked in the top quintile relative to its Peer Group for the 1-year and 3-year periods. The Trustees concluded that the Fund’s overall performance has been satisfactory.
Advisory and Subadvisory Fees. The Trustees noted that the Fund’s advisory fee as of June 30, 2015 was higher than the average for the Fund’s Peer Group and that total expenses for Class I shares (net of applicable expense waivers/ reimbursements) as of June 30, 2015 were higher than the average for comparable share classes of the Fund’s Peer Group. The Trustees took into account the fact that the Investment Adviser has contractually agreed, through February 28, 2017, to reimburse the Fund for operating expenses (subject to certain excluded expenses) in excess of 0.69% of average daily net assets for Class I shares and 0.94% of average daily net assets for Class N shares. The Trustees also took into account management’s discussion of the Fund’s expenses, including fees and expenses relative to comparably sized funds, and the current size of the Fund. The Trustees concluded that, in light of the nature, extent and quality of the services provided by the Investment Adviser and the Subadviser, the foregoing expense reimbursement arrangement and the considerations noted above with respect to the Investment Adviser and the Subadviser, the Fund’s advisory and subadvisory fees are reasonable.
ASTON/Fairpointe Mid Cap Fund
Fund Performance. Among other information relating to the Fund’s performance, the Trustees noted that the Fund’s performance for both Class I shares and Class N shares for the 1-year, 3-year, 5-year and 10-year periods ended June 30, 2015 was below, above, above and above, respectively, the median performance of the Peer Group and below, above, below and above, respectively, the performance of the Fund Benchmark, the S&P MidCap 400 Index. The Trustees also took into account management’s discussion of the Fund’s performance, including that the Fund ranked in the top quintile relative to its Peer Group for the 3-year and 10-year periods, with 5-year returns above the median, as well as the reasons given for the Fund’s recent underperformance. The Trustees concluded that the Fund’s overall performance has been satisfactory.
Advisory and Subadvisory Fees. The Trustees noted that the Fund’s advisory fee as of June 30, 2015 was lower than the average for the Fund’s Peer Group and that total expenses for Class I shares as of June 30, 2015 were lower than the average for comparable share classes of the Fund’s Peer Group. The Trustees took into account management’s discussion of the Fund’s expenses, including fees and expenses relative to comparably sized funds, and the current size of the Fund. The Trustees concluded that, in light of the nature, extent and quality of
the services provided by the Investment Adviser and the Sub-adviser and the considerations noted above with respect to the Investment Adviser and the Subadviser, the Fund’s advisory and subadvisory fees are reasonable.
ASTON/Guardian Capital Global Dividend Fund
Fund Performance. Among other information relating to the Fund’s performance, the Trustees noted that the Fund’s performance for both Class I shares and Class N shares for the 1-year period ended June 30, 2015 was below the median performance of the Peer Group and below the performance of the Fund Benchmark, the MSCI World Index. The Trustees also took into account management’s discussion of the Fund’s performance, including the reasons given for the Fund’s underperformance. The Trustees concluded that the Fund’s performance has been satisfactory, in view of its relatively short performance history.
Advisory and Subadvisory Fees. The Trustees noted that the Fund’s advisory fee as of June 30, 2015 was slightly higher than the average for the Fund’s Peer Group and that total expenses for Class I shares (net of applicable expense waivers/ reimbursements) as of June 30, 2015 were slightly lower than the average for comparable share classes of the Fund’s Peer Group. The Trustees took into account the fact that the Investment Adviser has contractually agreed, through February 28, 2017, to reimburse the Fund for operating expenses (subject to certain excluded expenses) in excess of 1.05% of average daily net assets for Class I shares and 1.30% of average daily net assets for Class N shares. The Trustees also took into account management’s discussion of the Fund’s expenses, including fees and expenses relative to comparably sized funds, and the current size of the Fund. The Trustees also considered that the Fund was relatively new and was still in the process of reaching scale. The Trustees concluded that, in light of the nature, extent and quality of the services provided by the Investment Adviser and the Subadviser, the foregoing expense reimbursement arrangement and the considerations noted above with respect to the Investment Adviser and the Subadviser, the Fund’s advisory and subadvisory fees are reasonable.
ASTON/Harrison Street Real Estate Fund
Fund Performance. Among other information relating to the Fund’s performance, the Trustees noted that the Fund’s performance for Class I shares for the 1-year, 3-year and 5-year periods ended June 30, 2015 and for Class N shares for the 1-year, 3-year, 5-year and 10-year periods ended June 30, 2015 was below the median performance of the Peer Group and below the performance of the Fund Benchmark, the MSCI U.S. REIT Index. The Trustees also took into account management’s discussion of the Fund’s performance and the Subadviser’s investment approach. The Trustees concluded that the Fund’s performance is being appropriately monitored.
Advisory and Subadvisory Fees. The Trustees noted that the Fund’s advisory fee as of June 30, 2015 was higher than the average for the Fund’s Peer Group and that total expenses for Class N shares (net of applicable expense waivers/ reimbursements) as of June 30, 2015 were higher than the average for comparable share classes of the Fund’s Peer Group. The
AMG Funds
October 31, 2016
Additional Information (unaudited) – continued
Trustees took into account the fact that the Investment Adviser has contractually agreed, through February 28, 2017, to limit the Fund’s net annual operating expenses (subject to certain excluded expenses) to 1.12% of average daily net assets for Class I shares and 1.37% of average daily net assets for Class N shares. The Trustees also took into account management’s discussion of the Fund’s expenses, including fees and expenses relative to comparably sized funds, and the current size of the Fund. The Trustees concluded that, in light of the nature, extent and quality of the services provided by the Investment Adviser and the Subadviser, the foregoing expense limitation arrangement and the considerations noted above with respect to the Investment Adviser and the Subadviser, the Fund’s advisory and subadvisory fees are reasonable.
ASTON/Herndon Large Cap Value Fund
Fund Performance. Among other information relating to the Fund’s performance, the Trustees noted that the Fund’s performance for Class I shares for the 1-year and 3-year periods ended June 30, 2015 and for Class N shares for the 1-year, 3-year and 5-year periods ended June 30, 2015 was below the median performance of the Peer Group and below the performance of the Fund Benchmark, the Russell 1000® Value Index. The Trustees also took into account management’s discussion of the Fund’s performance, including that much of the Fund’s recent underperformance can be attributed to underperformance during the fourth quarter of 2014 and the allocation of the portfolio’s assets among market sectors. The Trustees concluded that the Fund’s performance is being appropriately monitored.
Advisory and Subadvisory Fees. The Trustees noted that the Fund’s advisory fee as of June 30, 2015 was higher than the average for the Fund’s Peer Group and that total expenses for Class I shares (net of applicable expense waivers/reimbursements) as of June 30, 2015 were higher than the average for comparable share classes of the Fund’s Peer Group. The Trustees took into account the fact that the Investment Adviser has agreed, effective January 1, 2016, to reduce the Fund’s advisory fee from 0.80% to 0.70% of average daily net assets and to reduce the thresholds for reimbursing the Fund for operating expenses (subject to certain excluded expenses) pursuant to the contractual expense reimbursement agreement from 1.05% to 0.89% of average daily net assets for Class I shares and from 1.30% to 1.14% of average daily net assets for Class N shares, and that management would maintain these thresholds through February 28, 2017. The Trustees also took into account management’s discussion of the Fund’s expenses, including fees and expenses relative to comparably sized funds, and the current size of the Fund. The Trustees concluded that, in light of the nature, extent and quality of the services provided by the Investment Adviser and the Subadviser, the foregoing reductions in the Fund’s advisory fee and the thresholds for reimbursing the Fund for operating expenses pursuant to the contractual expense reimbursement agreement and the considerations noted above with respect to the Investment Adviser and the Subadviser, the Fund’s advisory and subadvisory fees are reasonable.
ASTON/Lake Partners LASSO Alternatives Fund
Fund Performance. Among other information relating to the Fund’s performance, the Trustees noted that the Fund’s perform-
ance for Class I shares for the 1-year, 3-year and 5-year periods ended June 30, 2015 was below, above and above, respectively, the median performance of the Peer Group and below, below and above the performance of the Fund Benchmark, the HFRX Equity Hedge Index, and that the Fund’s performance for Class N shares for the 1-year, 3-year and 5-year periods ended June 30, 2015 was below, below and above, respectively, the median performance of the Peer Group and below, below and above, respectively, the performance of the Fund Benchmark. The Trustees also took into account management’s discussion of the Fund’s performance, including management’s statement that the Fund’s recent underperformance was primarily attributable to four underlying manager allocations. The Trustees concluded that the Fund’s overall performance has been satisfactory.
Advisory and Subadvisory Fees. The Trustees noted that the Fund’s advisory fee as of June 30, 2015 was slightly lower than the average for the Fund’s Peer Group and that total expenses for Class I shares (net of applicable expense waivers/ reimbursements) as of June 30, 2015 were lower than the average for comparable share classes of the Fund’s Peer Group. The Trustees took into account the fact that the Investment Adviser has contractually agreed, through February 28, 2017, to reimburse the Fund for operating expenses (subject to certain excluded expenses) in excess of 1.15% of average daily net assets for Class I shares and 1.40% of average daily net assets for Class N shares. The Trustees considered that the Fund operates as a fund of funds, and that the Fund’s Peer Group includes both funds of funds and non-funds of funds. The Trustees also took into account management’s discussion of the Fund’s expenses, including fees and expenses relative to comparably sized funds, and the current size of the Fund. The Trustees concluded that, in light of the nature, extent and quality of the services provided by the Investment Adviser and the Subadviser, the foregoing expense reimbursement arrangement and the considerations noted above with respect to the Investment Adviser and the Subadviser, the Fund’s advisory and subadvisory fees are reasonable.
The Board considered that the Fund, as a fund of funds, invests primarily in other investment companies. The Board noted that the Fund historically has invested in underlying funds outside of the Aston Funds Family of Funds. In approving the continuance of the Investment Advisory Agreement for the Fund, the Board, including a majority of the Independent Trustees, found that the advisory fees charged with respect to the Fund under the Investment Advisory Agreement are based on services provided that will be in addition to, rather than duplicative of, the services provided under that agreement of any underlying fund in which the Fund may invest.
ASTON/LMCG Emerging Markets Fund
Fund Performance. Among other information relating to the Fund’s performance, the Trustees noted that the Fund’s performance for both Class I shares and Class N shares for the 1-year period ended June 30, 2015 was above the median performance of the Peer Group and below the performance of the Fund Benchmark, the MSCI Emerging Markets Index. The
AMG Funds
October 31, 2016
Additional Information (unaudited) – continued
Trustees also took into account management’s discussion of the Fund’s performance, including the fact that the Fund ranked in the second quartile relative to its Peer Group for the 1-year period. The Trustees concluded that the Fund’s overall performance has been satisfactory.
Advisory and Subadvisory Fees. The Trustees noted that the Fund’s advisory fee as of June 30, 2015 was higher than the average for the Fund’s Peer Group and that total expenses for Class I shares (net of applicable expense waivers/
reimbursements) as of June 30, 2015 were lower than the average for comparable share classes of the Fund’s Peer Group. The Trustees took into account the fact that the Investment Adviser has contractually agreed, through February 28, 2017, to reimburse the Fund for operating expenses (subject to certain excluded expenses) in excess of 1.18% of average daily net assets for Class I shares and 1.43% of average daily net assets for Class N shares. The Trustees also took into account management’s discussion of the Fund’s expenses, including fees and expenses relative to comparably sized funds, and the current size of the Fund. The Trustees also considered that the Fund was relatively new and was still in the process of reaching scale. The Trustees concluded that, in light of the nature, extent and quality of the services provided by the Investment Adviser and the Subadviser, the foregoing expense reimbursement arrangement and the considerations noted above with respect to the Investment Adviser and the Subadviser, the Fund’s advisory and subadvisory fees are reasonable.
ASTON/LMCG Small Cap Growth Fund
Fund Performance. Among other information relating to the Fund’s performance, the Trustees noted that the Fund’s performance for both Class I shares and Class N shares for the 1-year and 3-year periods ended June 30, 2015 was above the median performance of the Peer Group and above the performance of the Fund Benchmark, the Russell 2000® Growth Index. The Trustees also took into account management’s discussion of the Fund’s performance, including the fact that the Fund ranked in the top decile relative to its Peer Group for the 1-year and 3-year periods and had significantly outperformed the Fund Benchmark during both periods. The Trustees concluded that the Fund’s overall performance has been satisfactory.
Advisory and Subadvisory Fees. The Trustees noted that the Fund’s advisory fee as of June 30, 2015 was higher than the average for the Fund’s Peer Group and that total expenses for Class N shares (net of applicable expense waivers/ reimbursements) as of June 30, 2015 were lower than the average for comparable share classes of the Fund’s Peer Group. The Trustees took into account the fact that the Investment Adviser has contractually agreed, through February 28, 2017, to reimburse the Fund for operating expenses (subject to certain excluded expenses) in excess of 1.10% of average daily net assets for Class I shares and 1.35% of average daily net assets for Class N shares. The Trustees also took into account management’s discussion of the Fund’s expenses, including fees and expenses relative to comparably sized funds, and the current size of the Fund. The Trustees concluded that, in light of the nature, extent and quality of the services provided by the Investment Adviser and the Subadviser, the foregoing expense reimburse-
ment arrangement and the considerations noted above with respect to the Investment Adviser and the Subadviser, the Fund’s advisory and subadvisory fees are reasonable.
ASTON/Montag & Caldwell Balanced Fund
Fund Performance. Among other information relating to the Fund’s performance, the Trustees noted that the Fund’s performance for both Class I shares and Class N shares for the 1-year, 3-year, 5-year and 10-year periods ended June 30, 2015 was above, below, below and above, respectively, the median performance of the Peer Group and above, below, below and below, respectively, the performance of the Fund Benchmark, a Composite Index (60% S&P 500 Index and 40% Barclays U.S. Government Credit Bond Index). The Trustees also took into account management’s discussion of the Fund’s performance, including the fact that the Fund ranked in the top decile relative to its Peer Group for the 1-year period. The Trustees concluded that the Fund’s overall performance has been satisfactory.
Advisory and Subadvisory Fees. The Trustees noted that the Fund’s advisory fee as of June 30, 2015 was higher than the average for the Fund’s Peer Group and that total expenses for Class N shares (net of applicable expense waivers/ reimbursements) as of June 30, 2015 were higher than the average for comparable share classes of the Fund’s Peer Group. The Trustees took into account the fact that the Investment Adviser has contractually agreed, through February 28, 2017, to limit the Fund’s net annual operating expenses (subject to certain excluded expenses) to 1.10% of average daily net assets for Class I shares and 1.35% of average daily net assets for Class N shares. The Trustees also took into account management’s discussion of the Fund’s expenses, including fees and expenses relative to comparably sized funds, and the current size of the Fund. The Trustees concluded that, in light of the nature, extent and quality of the services provided by the Investment Adviser and the Subadviser, the foregoing expense limitation arrangement and the considerations noted above with respect to the Investment Adviser and the Subadviser, the Fund’s advisory and subadvisory fees are reasonable.
ASTON/Montag & Caldwell Growth Fund
Fund Performance. Among other information relating to the Fund’s performance, the Trustees noted that the Fund’s performance for Class I shares for the 1-year, 3-year, 5-year and 10-year periods ended June 30, 2015 was below, below, below and above, respectively, the median performance of the Peer Group and below the performance of the Fund Benchmark, the Russell 1000® Growth Index, and that the Fund’s performance for both Class N shares and Class R shares for the 1-year, 3-year, 5-year and 10-year periods ended June 30, 2015 was below the median performance of the Peer Group and below the performance of the Fund Benchmark. The Trustees also took into account management’s discussion of the Fund’s performance, including management’s statement that most of the Fund’s recent underperformance can be explained by the Fund’s cash position and not owning one particular stock in the Fund Benchmark. The Trustees concluded that the Fund’s performance is being appropriately monitored.
AMG Funds
October 31, 2016
Additional Information (unaudited) – continued
Advisory and Subadvisory Fees. The Trustees noted that the Fund’s advisory fee as of June 30, 2015 was slightly higher than the average for the Fund’s Peer Group and that total expenses for Class I shares as of June 30, 2015 were lower than the average for comparable share classes of the Fund’s Peer Group. The Trustees took into account management’s discussion of the Fund’s expenses, including fees and expenses relative to comparably sized funds, and the current size of the Fund. The Trustees concluded that, in light of the nature, extent and quality of the services provided by the Investment Adviser and the Sub-adviser, the foregoing expense reimbursement arrangement and the considerations noted above with respect to the Investment Adviser and the Subadviser, the Fund’s advisory and subadvisory fees are reasonable.
ASTON/Montag & Caldwell Mid Cap Growth Fund
Fund Performance. Among other information relating to the Fund’s performance, the Trustees noted that the Fund’s performance for Class I shares for the 1-year period ended June 30, 2015 was above the median performance of the Peer Group and above the performance of the Fund Benchmark, the Russell Midcap® Growth Index, and that the Fund’s performance for Class N shares for the 1-year, 3-year and 5-year periods ended June 30, 2015 was above, below and below, respectively, the median performance of the Peer Group and above, below and below, respectively, the performance of the Fund Benchmark. The Trustees also took into account management’s discussion of the Fund’s performance, including the fact that the Fund ranked in the top quintile relative to its Peer Group for the 1-year period. The Trustees concluded that the Fund’s overall performance has been satisfactory.
Advisory and Subadvisory Fees. The Trustees noted that the Fund’s advisory fee as of June 30, 2015 was higher than the average for the Fund’s Peer Group and that total expenses for Class I shares (net of applicable expense waivers/ reimbursements) as of June 30, 2015 were slightly higher than the average for comparable share classes of the Fund’s Peer Group. The Trustees took into account the fact that the Investment Adviser has contractually agreed, through February 28, 2017, to reimburse the Fund for operating expenses (subject to certain excluded expenses) in excess of 1.00% of average daily net assets for Class I shares and 1.25% of average daily net assets for Class N shares. The Trustees also took into account management’s discussion of the Fund’s expenses, including fees and expenses relative to comparably sized funds, and the current size of the Fund. The Trustees concluded that, in light of the nature, extent and quality of the services provided by the Investment Adviser and the Subadviser, the foregoing expense reimbursement arrangement and the considerations noted above with respect to the Investment Adviser and the Subadviser, the Fund’s advisory and subadvisory fees are reasonable.
ASTON/Pictet International Fund
Fund Performance. Among other information relating to the Fund’s performance, the Trustees noted that the Fund’s performance for Class I shares for the 1-year period ended June 30, 2015 was below the median performance of the Peer Group and above the performance of the Fund Benchmark, the MSCI EAFE
Index, and that the Fund’s performance for Class N shares for the 1-year period ended June 30, 2015 was below the median performance of the Peer Group and below the performance of the Fund Benchmark. The Trustees also took into account management’s discussion of the Fund’s performance, including management’s statement that the Fund performed broadly in line with the Fund Benchmark and that the performance for Class I shares was only slightly below the Peer Group median. The Trustees concluded that the Fund’s overall performance has been satisfactory.
Advisory and Subadvisory Fees. The Trustees noted that the Fund’s advisory fee as of June 30, 2015 was higher than the average for the Fund’s Peer Group and that total expenses for Class I shares (net of applicable expense waivers/ reimbursements) as of June 30, 2015 were higher than the average for comparable share classes of the Fund’s Peer Group. The Trustees took into account the fact that the Investment Adviser has contractually agreed, through February 28, 2017, to reimburse the Fund for operating expenses (subject to certain excluded expenses) in excess of 1.15% of average daily net assets for Class I shares and 1.40% of average daily net assets for Class N shares. The Trustees also took into account management’s discussion of the Fund’s expenses, including fees and expenses relative to comparably sized funds, and the current size of the Fund. The Trustees also considered that the Fund was relatively new and was still in the process of reaching scale. The Trustees concluded that, in light of the nature, extent and quality of the services provided by the Investment Adviser and the Subadviser, the foregoing expense reimbursement arrangement and the considerations noted above with respect to the Investment Adviser and the Subadviser, the Fund’s advisory and subadvisory fees are reasonable.
ASTON/River Road Dividend All Cap Value Fund
Fund Performance. Among other information relating to the Fund’s performance, the Trustees noted that the Fund’s performance for Class I shares for the 1-year, 3-year and 5-year periods ended June 30, 2015 was below the median performance of the Peer Group and below the performance of the Fund Benchmark, the Russell 3000® Value Index, and that the Fund’s performance for Class N shares for the 1-year, 3-year, 5-year and 10-year periods ended June 30, 2015 was below, below, below and above, respectively, the median performance of the Peer Group and below, below, below and above, respectively, the performance of the Fund Benchmark. The Trustees took into account management’s discussion of the Fund’s performance, including the reasons given for the Fund’s recent underperformance relative to the Peer Group and Fund Benchmark. The Trustees also noted that the Fund’s 10-year performance results ranked in the top decilerelative to its Peer Group. The Trustees concluded that the Fund’s performance is being appropriately monitored.
Advisory and Subadvisory Fees. The Trustees noted that the Fund’s advisory fee as of June 30, 2015 was higher than the average for the Fund’s Peer Group and that total expenses for Class I shares (net of applicable expense waivers/reimbursements) as of June 30, 2015 were lower than the average for comparable
AMG Funds
October 31, 2016
Additional Information (unaudited) – continued
share classes of the Fund’s Peer Group. The Trustees took into account the fact that the Investment Adviser has contractually agreed, through February 28, 2017, to limit the Fund’s net annual operating expenses (subject to certain excluded expenses) to 1.05% of average daily net assets for Class I shares and 1.30% of average daily net assets for Class N shares. The Trustees also took into account management’s discussion of the Fund’s expenses, including fees and expenses relative to comparably sized funds, and the current size of the Fund. The Trustees concluded that, in light of the nature, extent and quality of the services provided by the Investment Adviser and the Subadviser (which is an affiliate of the Investment Adviser), the foregoing expense limitation arrangement and the considerations noted above with respect to the Investment Adviser and the Subadviser, the Fund’s advisory and subadvisory fees are reasonable.
ASTON/River Road Dividend All Cap Value Fund II
Fund Performance. Among other information relating to the Fund’s performance, the Trustees noted that the Fund’s performance for both Class I shares and Class N shares for the 1-year and 3-year periods ended June 30, 2015 was below the median performance of the Peer Group and below the performance of the Fund Benchmark, the Russell 3000® Value Index. The Trustees also took into account management’s discussion of the Fund’s performance, including the reasons given for the Fund’s under-performance relative to the Peer Group and Fund Benchmark, noting management’s statement that the most significant negative impact on performance came from the Fund’s being underweight certain market sectors. The Trustees concluded that the Fund’s performance is being appropriately monitored.
Advisory and Subadvisory Fees. The Trustees noted that the Fund’s advisory fee as of June 30, 2015 was higher than the average for the Fund’s Peer Group and that total expenses for Class I shares as of June 30, 2015 were slightly higher than the average for comparable share classes of the Fund’s Peer Group. The Trustees took into account the fact that the Investment Adviser has contractually agreed, through February 28, 2017, to reimburse the Fund for operating expenses (subject to certain excluded expenses) in excess of 1.05% of average daily net assets for Class I shares and 1.30% of average daily net assets for Class N shares and that the Fund was currently operating below these thresholds. The Trustees also took into account management’s discussion of the Fund’s expenses, including fees and expenses relative to comparably sized funds, and the current size of the Fund. The Trustees concluded that, in light of the nature, extent and quality of the services provided by the Investment Adviser and the Subadviser (which is an affiliate of the Investment Adviser), the foregoing expense reimbursement arrangement and the considerations noted above with respect to the Investment Adviser and the Subadviser, the Fund’s advisory and subadvisory fees are reasonable.
ASTON/River Road Independent Value Fund
Fund Performance. Among other information relating to the Fund’s performance, the Trustees noted that the Fund’s performance for both Class I shares and Class N shares for the 1-year and 3-year periods ended June 30, 2015 was below the median
performance of the Peer Group and below the performance of the Fund Benchmark, the Russell 2000® Value Index. The Trustees also took into account management’s discussion of the Fund’s performance, including the reasons given for the Fund’s underperformance relative to the Peer Group and Fund Benchmark, noting that management indicated that the Fund is positioned in a contrarian manner and holds a meaningful cash position as a result of the Subadviser’s evaluation of the small-cap market. The Trustees also noted the Fund’s long-term investment focus. The Trustees concluded the Fund’s performance is being appropriately monitored.
Advisory and Subadvisory Fees. The Trustees noted that the Fund’s advisory fee as of June 30, 2015 was higher than the average for the Fund’s Peer Group and that total expenses for Class N shares (net of applicable expense waivers/ reimbursements) as of June 30, 2015 were higher than the average for comparable share classes of the Fund’s Peer Group. The Trustees took into account the fact that the Investment Adviser has contractually agreed, through February 28, 2017, to reimburse the Fund for operating expenses (subject to certain excluded expenses) in excess of 1.17% of average daily net assets for Class I shares and 1.42% of average daily net assets for Class N shares. The Trustees also took into account management’s discussion of the Fund’s expenses, including fees and expenses relative to comparably sized funds, and the current size of the Fund. The Trustees concluded that, in light of the nature, extent and quality of the services provided by the Investment Adviser and the Subadviser (which is an affiliate of the Investment Adviser), the foregoing expense reimbursement arrangement and the considerations noted above with respect to the Investment Adviser and the Subadviser, the Fund’s advisory and subadvisory fees are reasonable.
ASTON/River Road Long-Short Fund
Fund Performance. Among other information relating to the Fund’s performance, the Trustees noted that the Fund’s performance for Class I shares for the 1-year period ended June 30, 2015 and for Class N shares for the 1-year and 3-year periods ended June 30, 2015 was below the median performance of the Peer Group, and that the Fund’s performance for both Class I shares and Class N shares for the 1-year and 3-year periods ended June 30, 2015 was below the performance of the Fund Benchmark, the Russell 3000® Index. The Trustees also took into account management’s discussion of the Fund’s performance, including the reasons given for the Fund’s underperformance relative to the Peer Group and Fund Benchmark, noting that management stated that the Fund narrowly missed ranking above the median of the Peer Group for the 3-year period. The Trustees noted that while the Fund’s long portfolio underperformed the Fund Benchmark for the 1-year period, the Fund’s short portfolio outperformed the Fund Benchmark for that period. The Trustees also noted that the Fund’s investment objective is to provide absolute return while minimizing volatility over a full market cycle. The Trustees concluded that the Fund’s overall performance has been satisfactory in light of all factors considered and that the Fund’s performance is being appropriately monitored.
AMG Funds
October 31, 2016
Additional Information (unaudited) – continued
Advisory and Subadvisory Fees. The Trustees noted that the Fund’s advisory fee as of June 30, 2015 was slightly lower than the average for the Fund’s Peer Group and that total expenses for Class I shares (net of applicable expense waivers/ reimbursements) as of June 30, 2015 were lower than the average for comparable share classes of the Fund’s Peer Group. The Trustees took into account the fact that the Investment Adviser has contractually agreed, through February 28, 2017, to reimburse the Fund for operating expenses (subject to certain excluded expenses) in excess of 1.45% of average daily net assets for Class I shares and 1.70% of average daily net assets for Class N shares. The Trustees also took into account management’s discussion of the Fund’s expenses, including fees and expenses relative to comparably sized funds, and the current size of the Fund. The Trustees concluded that, in light of the nature, extent and quality of the services provided by the Investment Adviser and the Subadviser (which is an affiliate of the Investment Adviser), the foregoing expense reimbursement arrangement and the considerations noted above with respect to the Investment Adviser and the Subadviser, the Fund’s advisory and subadvisory fees are reasonable.
ASTON/River Road Select Value Fund
Fund Performance. Among other information relating to the Fund’s performance, the Trustees noted that the Fund’s performance for both Class I shares and Class N shares for the 1-year, 3-year and 5-year periods ended June 30, 2015 was below the median performance of the Peer Group and above, below and below, respectively, the performance of the Fund Benchmark, the Russell 2500® Index. The Trustees also took into account management’s discussion of the Fund’s performance, including the reasons given for the Fund’s underperformance relative to the Peer Group and Fund Benchmark for the 3-year and 5-year periods as well as the Fund’s more recent improved performance and the fact that the Fund outperformed the Fund Benchmark for the 1-year period. The Trustees concluded that the Fund’s overall performance has been satisfactory.
Advisory and Subadvisory Fees. The Trustees noted that the Fund’s advisory fee as of June 30, 2015 was higher than the average for the Fund’s Peer Group and that total expenses for Class I shares (net of applicable expense waivers/ reimbursements) as of June 30, 2015 were higher than the average for comparable share classes of the Fund’s Peer Group. The Trustees took into account the fact that the Investment Adviser has contractually agreed, through February 28, 2017, to reimburse the Fund for operating expenses (subject to certain excluded expenses) in excess of 1.25% of average daily net assets for Class I shares and 1.50% of average daily net assets for Class N shares. The Trustees also took into account management’s discussion of the Fund’s expenses, including fees and expenses relative to comparably sized funds, and the current size of the Fund. The Trustees concluded that, in light of the nature, extent and quality of the services provided by the Investment Adviser and the Subadviser (which is an affiliate of the Investment Adviser), the foregoing expense reimbursement arrangement and the considerations noted above with respect to the Investment Adviser and the Subadviser, the Fund’s advisory and subadvisory fees are reasonable.
ASTON/River Road Small Cap Value Fund
Fund Performance. Among other information relating to the Fund’s performance, the Trustees noted that the Fund’s performance for Class I shares for the 1-year, 3-year and 5-year periods ended June 30, 2015 was below the median performance of the Peer Group and above, below and below, respectively, the performance of the Fund Benchmark, the Russell 2000® Value Index, and that the Fund’s performance for Class N shares for the 1-year, 3-year, 5-year and 10-year periods ended June 30, 2015 was below the median performance of the Peer Group and above, below, below and above, respectively, the performance of the Fund Benchmark. The Trustees also took into account management’s discussion of the Fund’s performance, including the reasons given for the Fund’s underperformance relative to the Peer Group and Fund Benchmark for the 3-year and 5-year periods as well as the Fund’s more recent improved performance and the fact that the Fund outperformed the Fund Benchmark for the 1-year and 10-year periods. The Trustees concluded that the Fund’s overall performance has been satisfactory.
Advisory and Subadvisory Fees. The Trustees noted that the Fund’s advisory fee as of June 30, 2015 was higher than the average for the Fund’s Peer Group and that total expenses for Class I shares as of June 30, 2015 were higher than the average for comparable share classes of the Fund’s Peer Group. The Trustees took into account management’s discussion of the Fund’s expenses, including fees and expenses relative to comparably sized funds, and the current size of the Fund. The Trustees concluded that, in light of the nature, extent and quality of the services provided by the Investment Adviser and the Subadviser (which is an affiliate of the Investment Adviser) and the considerations noted above with respect to the Investment Adviser and the Subadviser, the Fund’s advisory and subadvisory fees are reasonable.
ASTON/Silvercrest Small Cap Fund
Fund Performance. Among other information relating to the Fund’s performance, the Trustees noted that the Fund’s performance for both Class I shares and Class N shares for the 1-year and 3-year periods ended June 30, 2015 was below the median performance of the Peer Group and above the performance of the Fund Benchmark, the Russell 2000® Value Index. The Trustees also took into account management’s discussion of the Fund’s performance, including the Fund’s outperformance of the Fund Benchmark for the 1-year and 3-year periods. The Trustees concluded that the Fund’s overall performance has been satisfactory.
Advisory and Subadvisory Fees. The Trustees noted that the Fund’s advisory fee as of June 30, 2015 was higher than the average for the Fund’s Peer Group and that total expenses for Class I shares (net of applicable expense waivers/ reimbursements) as of June 30, 2015 were higher than the average for comparable share classes of the Fund’s Peer Group. The Trustees took into account the fact that the Investment Adviser has contractually agreed, through February 28, 2017, to reimburse the Fund for operating expenses (subject to certain excluded expenses) in excess of 1.15% of average daily
AMG Funds
October 31, 2016
Additional Information (unaudited) – continued
net assets for Class I shares and 1.40% of average daily net assets for Class N shares. The Trustees also took into account management’s discussion of the Fund’s expenses, including fees and expenses relative to comparably sized funds, and the current size of the Fund. The Trustees concluded that, in light of the nature, extent and quality of the services provided by the Investment Adviser and the Subadviser, the foregoing expense reimbursement arrangement and the considerations noted above with respect to the Investment Adviser and the Subadviser, the Fund’s advisory and subadvisory fees are reasonable.
ASTON/TAMRO Small Cap Fund
Fund Performance. Among other information relating to the Fund’s performance, the Trustees noted that the Fund’s performance for both Class I shares and Class N shares for the 1-year, 3-year, 5-year and 10-year periods ended June 30, 2015 was below the median performance of the Peer Group and below, below, below and above, respectively, the performance of the Fund Benchmark, the Russell 2000® Index. The Trustees also took into account management’s discussion of the Fund’s performance, including the reasons given for the Fund’s recent underperformance relative to the Peer Group and Fund Benchmark, noting management’s description of the Subadviser’s investment approach. The Trustees considered certain updates regarding the Subadviser’s organization and steps taken by management to address performance. The Trustees concluded that the Fund’s performance is being addressed.
Advisory and Subadvisory Fees. The Trustees noted that the Fund’s advisory fee as of June 30, 2015 was higher than the average for the Fund’s Peer Group and that total expenses for Class I shares as of June 30, 2015 were higher than the average for comparable share classes of the Fund’s Peer Group. The Trustees took into account management’s discussion of the Fund’s expenses, including fees and expenses relative to comparably sized funds, and the current size of the Fund. The Trustees concluded that, in light of the nature, extent and quality of the services provided by the Investment Adviser and the Sub-adviser and the considerations noted above with respect to the Investment Adviser and the Subadviser, the Fund’s advisory and subadvisory fees are reasonable.
ASTON/TCH Fixed Income Fund
Fund Performance. Among other information relating to the Fund’s performance, the Trustees noted that the Fund’s performance for both Class I shares and Class N shares for the 1-year, 3-year, 5-year and 10-year periods ended June 30, 2015 was below, above, above and above, respectively, the median performance of the Peer Group and below, above, above and above, respectively, the performance of the Fund Benchmark, the Barclays U.S. Aggregate Bond Index. The Trustees also took into account management’s discussion of the Fund’s
performance, including the reasons given for the Fund’s recent underperformance relative to the Peer Group and the fact that the Fund ranked in the top quintile relative to its Peer Group for the 3-year, 5-year and 10-year periods. The Trustees concluded that the Fund’s overall performance has been satisfactory.
Advisory and Subadvisory Fees. The Trustees noted that the Fund’s advisory fee as of June 30, 2015 was higher than the average for the Fund’s Peer Group and that total expenses for Class N shares (net of applicable expense waivers/ reimbursements) as of June 30, 2015 were higher than the average for comparable share classes of the Fund’s Peer Group. The Trustees took into account the fact that the Investment Adviser has contractually agreed, through February 28, 2017, to limit the Fund’s net annual operating expenses (subject to certain excluded expenses) to 0.69% of average daily net assets for Class I shares and 0.94% of average daily net assets for Class N shares. The Trustees also took into account management’s discussion of the Fund’s expenses, including fees and expenses relative to comparably sized funds, and the current size of the Fund. The Trustees concluded that, in light of the nature, extent and quality of the services provided by the Investment Adviser and the Subadviser, the foregoing expense limitation arrangement and the considerations noted above with respect to the Investment Adviser and the Subadviser, the Fund’s advisory and subadvisory fees are reasonable.
* * * * *
After consideration of the foregoing, the Trustees also reached the following conclusions (in addition to the conclusions discussed above) regarding the Investment Advisory Agreement and each Subadvisory Agreement: (a) the Investment Adviser and each Subadviser have demonstrated that they possess the capability and resources to perform the duties required of them under the Investment Advisory Agreement and the applicable Subadvisory Agreement; (b) each Subadviser’s Investment Strategy is appropriate for pursuing the applicable Fund’s investment objective(s); and (c) the Investment Adviser and each Subadviser maintain appropriate compliance programs.
Based on all of the above-mentioned factors and their related conclusions, with no single factor or conclusion being determinative and with each Trustee not necessarily attributing the same weight to each factor, the Trustees concluded that approval of the continuance of the Investment Advisory Agreement and Subadvisory Agreement with respect to each Fund would be in the best interests of the applicable Fund. Accordingly, on December 10, 2015, the Trustees, and separately a majority of the Independent Trustees, voted to approve the continuance of the Investment Advisory Agreement for each Fund and the continuance of the Subadvisory Agreement for each Fund.
ASTON/Anchor Capital Enhanced Equity Fund, ASTON/ DoubleLine Core Plus Fixed Income Fund, ASTON/Fairpointe Focused Equity Fund, ASTON/Fairpointe Mid Cap Fund, ASTON/ Guardian Capital Global Dividend Fund, ASTON/Lake Partners LASSO Alternatives Fund, ASTON/LMCG Small Cap Growth Fund, ASTON/Montag & Caldwell Balanced Fund, ASTON/ Montag & Caldwell Growth Fund, ASTON/Montag & Caldwell Mid Cap Growth Fund, ASTON/Pictet International Fund, ASTON/River Road Dividend All Cap Value Fund, ASTON/River Road Dividend All Cap Value Fund II, ASTON/River Road Focused Absolute Value Fund, ASTON/River Road Long-Short Fund, ASTON/River Road Select Value Fund, ASTON/River Road
AMG Funds
October 31, 2016
Additional Information (unaudited) – continued
Small Cap Value Fund, ASTON/Silvercrest Small Cap Fund, ASTON Small Cap Fund (formerly, ASTON/TAMRO Small Cap Fund) and ASTON/Value Partners Asia Dividend Fund: Approval of Investment Advisory and Sub-Investment Advisory Agreements on June 22-23, 2016
At an in-person meeting held on June 22-23, 2016, the Board of Trustees (the “Board” or the “Trustees”), and separately a majority of the Trustees who are not “interested persons” of the Trust (the “Independent Trustees”), approved (i) the Investment Advisory Agreement, as amended at any time prior to the date of the meeting, with Aston Asset Management, LLC (the “Investment Adviser”) for each of ASTON/Anchor Capital Enhanced Equity Fund, ASTON/DoubleLine Core Plus Fixed Income Fund, ASTON/Fairpointe Focused Equity Fund, ASTON/ Fairpointe Mid Cap Fund, ASTON/Guardian Capital Global Dividend Fund, ASTON/Lake Partners LASSO Alternatives Fund, ASTON/LMCG Small Cap Growth Fund, ASTON/Montag & Cald-well Balanced Fund, ASTON/Montag & Caldwell Growth Fund, ASTON/Montag & Caldwell Mid Cap Growth Fund, ASTON/Pictet International Fund, ASTON/River Road Dividend All Cap Value Fund, ASTON/River Road Dividend All Cap Value Fund II, ASTON/River Road Long-Short Fund, ASTON/River Road Select Value Fund, ASTON/River Road Small Cap Value Fund, ASTON/ Silvercrest Small Cap Fund and ASTON Small Cap Fund (formerly, ASTON/TAMRO Small Cap Fund) and separately an amendment, to be effective October 1, 2016, to such Investment Advisory Agreement for each of ASTON/Anchor Capital Enhanced Equity Fund, ASTON/DoubleLine Core Plus Fixed Income Fund, ASTON/Fairpointe Focused Equity Fund, ASTON/Fairpointe Mid Cap Fund, ASTON/Guardian Capital Global Dividend Fund, ASTON/Lake Partners LASSO Alternatives Fund, ASTON/LMCG Small Cap Growth Fund, ASTON/Montag & Caldwell Balanced Fund, ASTON/Montag & Caldwell Growth Fund, ASTON/Montag & Caldwell Mid Cap Growth Fund, ASTON/Pictet International Fund, ASTON/River Road Dividend All Cap Value Fund, ASTON/ River Road Dividend All Cap Value Fund II, ASTON/River Road Focused Absolute Value Fund, ASTON/River Road Long-Short Fund, ASTON/River Road Select Value Fund, ASTON/River Road Small Cap Value Fund, ASTON/Silvercrest Small Cap Fund, ASTON Small Cap Fund and ASTON/Value Partners Asia Dividend Fund (each, a “Fund,” and collectively, the “Funds”) (collectively, the “Investment Advisory Agreement”) and (ii) each Sub-Investment Advisory Agreement, as amended at any time prior to the date of the meeting, with the applicable Subadviser for each of ASTON/Anchor Capital Enhanced Equity Fund, ASTON/DoubleLine Core Plus Fixed Income Fund, ASTON/ Fairpointe Focused Equity Fund, ASTON/Fairpointe Mid Cap Fund, ASTON/Guardian Capital Global Dividend Fund, ASTON/ Lake Partners LASSO Alternatives Fund, ASTON/LMCG Small Cap Growth Fund, ASTON/Montag & Caldwell Balanced Fund, ASTON/Montag & Caldwell Growth Fund, ASTON/Montag & Caldwell Mid Cap Growth Fund, ASTON/Pictet International Fund, ASTON/River Road Dividend All Cap Value Fund, ASTON/
River Road Dividend All Cap Value Fund II, ASTON/River Road Long-Short Fund, ASTON/River Road Select Value Fund, ASTON/River Road Small Cap Value Fund and ASTON/ Silvercrest Small Cap Fund and separately an amendment, to be effective October 1, 2016, to each Sub-Investment Advisory Agreement for each Fund (collectively, the “Subadvisory Agreements”).1 The Independent Trustees were separately represented by independent legal counsel in connection with their consideration of the approval of these agreements. In considering the Investment Advisory Agreement and the Sub-advisory Agreements, the Trustees reviewed a variety of materials relating to each Fund, the Investment Adviser and each Subadviser, including comparative performance, fee and expense information for an appropriate peer group of similar mutual funds (each, a “Peer Group”), performance information for relevant benchmark indices (each, a “Fund Benchmark”) and, with respect to each Subadviser, comparative gross performance information versus a relevant performance composite that utilizes the same investment strategy and approach, and, as to all other matters, other information provided to them on a periodic basis throughout the year, as well as information provided in connection with the meeting of June 22-23, 2016, regarding the nature, extent and quality of services provided by the Investment Adviser and the Subadvisers under their respective agreements. Prior to voting, the Independent Trustees: (a) reviewed the foregoing information with their independent legal counsel and with management; (b) received materials from their independent legal counsel discussing the legal standards applicable to their consideration of the Investment Advisory Agreement and the Subadvisory Agreements; and (c) met with their independent legal counsel in private sessions at which no representatives of management were present.
Nature, Extent and Quality of Services. In considering the nature, extent and quality of the services provided by the Investment Adviser, the Trustees reviewed information relating to the Investment Adviser’s operations and personnel. Among other things, the Investment Adviser provided financial information, biographical information on its supervisory and professional staff and descriptions of its organizational and management structure. The Trustees also took into account information provided periodically throughout the previous year by the Investment Adviser in Board meetings relating to the performance of its duties with respect to the Funds and the Trustees’ knowledge of the Investment Adviser’s management and the quality of the performance of the Investment Adviser’s duties. In the course of their deliberations regarding the Investment Advisory Agreement, the Trustees evaluated, among other things: (a) the extent and quality of the Investment Adviser’s oversight of the operation and management of the Funds; (b) the quality of the search, selection and monitoring services performed by the Investment Adviser in overseeing the portfolio management responsibilities of the Subadvisers; (c) the Investment Adviser’s ability to oversee the Funds’ other service providers; and (d) the Investment
| 1 | On January 11, 2016, the Board of Trustees, and separately a majority of the Independent Trustees, approved the Sub-Investment Advisory Agreement with respect to ASTON Small Cap Fund, which was sub-sequently approved by Fund shareholders at a special meeting held on June 30, 2016, for an initial two-year period. On June 25, 2015, the Board of Trustees, and separately a majority of the Independent Trustees, approved the Investment Advisory Agreement and Sub-Investment Advisory Agreement for ASTON/River Road Focused Absolute Value Fund for an initial two-year period. On September 17, 2015, the Board of Trust-ees, and separately a majority of the Independent Trustees, approved the Investment Advisory Agreement and Sub-Investment Advisory Agreement for ASTON/Value Partners Asia Dividend Fund for an initial two-year period. |
AMG Funds
October 31, 2016
Additional Information (unaudited) – continued
Adviser’s compliance program. The Trustees also took into account that, in performing its functions under the Investment Advisory Agreement and overseeing each Subadviser, the Investment Adviser performs periodic detailed analyses and reviews of the performance by each Subadviser of its obligations to a Fund, including, without limitation, analysis and review of portfolio and other compliance matters and review of each Subadviser’s investment performance with respect to a Fund; prepares and presents periodic reports to the Board regarding the investment performance of each Subadviser and other information regarding each Subadviser, at such times and in such forms as the Board may reasonably request; reviews and considers any changes in the personnel of each Subadviser responsible for performing the Subadviser’s obligations and makes appropriate reports to the Board; reviews and considers any changes in the ownership or senior management of each Subadviser and makes appropriate reports to the Board; performs periodic in-person or telephonic diligence meetings, including with respect to compliance matters, with representatives of each Subadviser; assists the Board and management of the Trust in developing and reviewing information with respect to the initial approval of each Subadvisory Agreement and annual consideration of each Subadvisory Agreement thereafter; prepares recommendations with respect to the continued retention of any Subadviser or the replacement of any Subadviser, including at the request of the Board; identifies potential successors to or replacements of any Subadviser or potential additional subadvisers, performs appropriate due diligence, and develops and presents to the Board a recommendation as to any such successor, replacement or additional subadviser, including at the request of the Board; designates and compensates from its own resources such personnel as the Investment Adviser may consider necessary or appropriate to the performance of its services; and performs such other review and reporting functions as the Board shall reasonably request consistent with the Investment Advisory Agreement and applicable law. With respect to ASTON/River Road Dividend All Cap Value Fund, ASTON/River Road Dividend All Cap Value Fund II, ASTON/River Road Long-Short Fund, ASTON/River Road Select Value Fund and ASTON/River Road Small Cap Value Fund, the Trustees noted the affiliation of the Subadviser with the Investment Adviser and its control persons, noting any potential conflicts of interest. The Trustees also took into account the financial condition of the Investment Adviser with respect to its ability to provide the services required under the Investment Advisory Agreement and the Investment Adviser’s undertakings to maintain contractual expense limitations for certain Funds, as described below. The Trustees also considered the Investment Adviser’s risk management processes.
For each Fund, the Trustees also reviewed information relating to each Subadviser’s operations and personnel and the investment philosophy, strategies and techniques (for each Subadviser, its “Investment Strategy”) used in managing the Fund. Among other things, the Trustees reviewed biographical information on portfolio management and other professional staff, information regarding each Subadviser’s organizational and management structure and each Subadviser’s brokerage policies and practices. The Trustees considered specific information provided regarding the experience of the individuals at each Subadviser with portfolio management responsibility for a Fund, including the information
set forth in the Fund’s prospectus and statement of additional information. In the course of their deliberations, the Trustees evaluated, among other things: (a) the services rendered by each Subadviser in the past; (b) the qualifications and experience of the Subadviser’s personnel; and (c) the Subadviser’s compliance program. The Trustees also took into account the financial condition of each Subadviser with respect to its ability to provide the services required under its Subadvisory Agreement(s). The Trustees also considered each Subadviser’s risk management processes.
Performance. As noted above, the Board considered each applicable Fund’s net performance during relevant time periods as compared to the Fund’s Peer Group and the Fund Benchmark and considered the gross performance of the Fund as compared to the Subadviser’s relevant performance composite that utilizes the same investment strategy and approach and noted that the Board reviews on a quarterly basis detailed information about both the Fund’s performance results and portfolio composition, as well as each Subadviser’s Investment Strategy. The Board noted the Investment Adviser’s expertise and resources in monitoring the performance, investment style and risk-adjusted performance of each Subadviser. The Board was mindful of the Investment Adviser’s attention to monitoring each Subadviser’s performance with respect to the Funds and its discussions with management regarding the factors that contributed to the performance of the Funds.
Advisory Fees and Profitability. In considering the reasonableness of the advisory fee charged by the Investment Adviser for managing each Fund, the Trustees noted that the Investment Adviser, and not the Fund, is responsible for paying the fees charged by the Fund’s Subadviser and, therefore, that the fees paid to the Investment Adviser cover the cost of providing portfolio management services as well as the cost of providing search, selection and monitoring services in operating a “manager-of-managers” complex of mutual funds. The Trustees noted that, effective October 1, 2016, the management fee rate will be reduced and the shareholder servicing fee rate paid by each share class of each Fund will be increased, and the administrative fee rate to be paid by each Fund will be revised. The Trustees also considered the amount of the advisory fee retained by the Investment Adviser after payment of the subadvisory fee with respect to each Fund. The Trustees concluded that, in light of the additional high-quality oversight services provided by the Investment Adviser and the fact that the subadvisory fees are paid out of the advisory fee, the advisory fee payable by each Fund to the Investment Adviser can reasonably be expected to exceed the median advisory fee for the Peer Group, which consists of many funds that do not operate with a manager-of-managers structure. In this regard, the Trustees also noted that, through February 28, 2018, the Investment Adviser has undertaken to maintain contractual expense limitations for ASTON/ Anchor Capital Enhanced Equity Fund, ASTON/DoubleLine Core Plus Fixed Income Fund, ASTON/Fairpointe Focused Equity Fund, ASTON/Guardian Capital Global Dividend Fund, ASTON/ Lake Partners LASSO Alternatives Fund, ASTON/LMCG Small Cap Growth Fund, ASTON/Montag & Caldwell Balanced Fund, ASTON/Montag & Caldwell Mid Cap Growth Fund, ASTON/Pictet
AMG Funds
October 31, 2016
Additional Information (unaudited) – continued
International Fund, ASTON/River Road Dividend All Cap Value Fund, ASTON/River Road Dividend All Cap Value Fund II, ASTON/ River Road Long-Short Fund, ASTON/River Road Select Value Fund, ASTON/Silvercrest Small Cap Fund and ASTON Small Cap Fund; and that within the last year, the Investment Adviser limited the contractual expenses for ASTON Small Cap Fund. The Trustees also noted that the changes in fee rates described above would not cause an increase in total Fund expenses.
In addition, in considering the reasonableness of the advisory fee payable to the Investment Adviser, the Trustees also reviewed information provided by the Investment Adviser setting forth all revenues and other benefits, both direct and indirect (including any so-called “fallout benefits” such as reputational value derived from the Investment Adviser serving as Investment Adviser to a Fund), received by the Investment Adviser and its affiliates attributable to managing each Fund and all the mutual funds in the Aston Funds Family of Funds, the cost of providing such services, the entrepreneurial risk undertaken as Investment Adviser and sponsor of the Funds and the resulting profitability to the Investment Adviser and its affiliates from these relationships. The Trustees also noted the current asset levels of each Fund and the willingness of the Investment Adviser to maintain contractual expense limitations, as described above, as a means of limiting total expenses. The Trustees also considered management’s discussion of the current asset levels of the Funds, and the impact on profitability of both the current asset levels and any future growth of assets of the Funds. The Board took into account management’s discussion of the current and revised advisory fee structure, and, as noted above, the services the Investment Adviser provides in performing its functions under the Investment Advisory Agreement and monitoring each Subadviser. In this regard, the Trustees noted that, unlike a mutual fund that is managed by a single investment adviser, the Funds operate in a manager-of-managers structure. Based on the foregoing, the Trustees concluded that the profitability to the Investment Adviser is reasonable and that the Investment Adviser is not realizing material benefits from economies of scale that would warrant adjustments to the advisory fees for any Fund at this time (after noting the fee rate changes made at the meeting). With respect to economies of scale, the Trustees also noted that, as a Fund’s assets increase over time, the Fund may realize other economies of scale to the extent that the increase in assets is proportionally greater than the increase in certain other expenses.
Subadvisory Fees and Profitability. In considering the reasonableness of the fee payable by the Investment Adviser to each of Anchor Capital Advisors LLC, DoubleLine Capital LP, Fairpointe Capital LLC, Guardian Capital LP, Lake Partners, Inc., LMCG Investments, LLC, Montag & Caldwell, LLC, Pictet Asset Management Limited and Silvercrest Asset Management Group LLC (each, an “Unaffiliated Subadviser” and collectively, the “Unaffiliated Subadvisers”), the Trustees relied on the ability of the Investment Adviser to negotiate the terms of the Subadvisory Agreement at arm’s length as part of the manager-of-managers structure, noting that the Investment Adviser is not affiliated with the Unaffiliated Subadvisers. In addition, the Trustees considered other potential benefits of the subadvisory relationship to the Unaffiliated Subadvisers, including, among others, the
indirect benefits that each Unaffiliated Subadviser may receive from its relationship with a Fund, including any so-called “fallout benefits” to the Unaffiliated Subadvisers, such as reputational value derived from the Unaffiliated Subadvisers serving as Subadviser to a Fund. In addition, the Trustees noted that the subadvisory fees are paid by the Investment Adviser out of its advisory fee. As a consequence of all of the foregoing, the Board determined that profitability information with respect to the Unaffiliated Subadvisers was not material to its considerations in light of the fee model used by the Investment Adviser and the unaffiliated status of the Unaffiliated Sub-advisers. For similar reasons, the Trustees did not consider potential economies of scale in the management of a Fund by each of the Unaffiliated Subadvisers to be a material factor in their deliberations at this time.
In considering the reasonableness of the fees payable by the Investment Adviser to River Road, the Trustees noted that River Road is an affiliate of the Investment Adviser, and the Trustees reviewed information regarding the cost to River Road of providing subadvisory services to a Fund and the resulting profitability from such relationship. The Trustees noted that, because River Road is an affiliate of the Investment Adviser, a portion of River Road’s revenues or profits might be shared directly or indirectly with the Investment Adviser. The Trustees also noted that the subadvisory fees are paid by the Investment Adviser out of its advisory fee. With respect to each applicable Fund, the Board also took into account management’s discussion of the current and revised subadvisory fee structure, as applicable, and the services River Road provides in performing its functions under the applicable Subadvisory Agreement. Based on the foregoing, the Trustees concluded that the profitability to River Road is reasonable and that River Road is not realizing material benefits from economies of scale that would warrant adjustments to the investment advisory or subadvisory fees at this time (after noting the fee rate changes made at the meeting). Also with respect to economies of scale, the Trustees noted that as a Fund’s assets increase over time, the Fund may realize other economies of scale to the extent the increase in assets is proportionally greater than the increase in certain other expenses.
In addition to the foregoing, the Trustees considered the specific factors and related conclusions set forth below with respect to each applicable Fund, the Investment Adviser and each Subadviser.
ASTON/Anchor Capital Enhanced Equity Fund
Fund Performance. Among other information relating to the Fund’s performance, the Trustees noted that the Fund’s performance for Class N shares (which share class has the earliest inception date and the largest amount of assets of all the share classes of the Fund) for the 1-year, 3-year and 5-year periods ended March 31, 2016 and for the period from the Class N shares’ inception on January 15, 2008 through March 31, 2016 was above, below, above and above, respectively, the median performance of the Peer Group and below the performance of the Fund Benchmark, the S&P 500 Index. The Trustees also took into account management’s discussion of the Fund’s performance, including the fact that the Fund ranked in the
AMG Funds
October 31, 2016
Additional Information (unaudited) – continued
second quartile relative to its Peer Group for the 1-year and 5-year periods and for the period from the Class N shares’ inception through March 31, 2016. The Trustees concluded that the Fund’s overall performance has been satisfactory in light of all factors considered.
Advisory and Subadvisory Fees. The Trustees noted that the Fund’s advisory fees (which include both the advisory and administration fee) and total expenses (weighted average, all classes combined) (net of applicable expense waivers/reimbursements) as of March 31, 2016 were both lower than the average for the Fund’s Peer Group. The Trustees took into account the fact that the Investment Adviser has contractually agreed, through February 28, 2018, to reimburse the Fund for operating expenses (subject to certain excluded expenses) in excess of 1.15% of average daily net assets for Class I shares and 1.40% of average daily net assets for Class N shares and that the Fund was currently operating below these thresholds. The Trustees concluded that, in light of the nature, extent and quality of the services provided by the Investment Adviser and the Subadviser, the foregoing expense reimbursement arrangement and the considerations noted above with respect to the Investment Adviser and the Subadviser, the Fund’s advisory and subadvisory fees are reasonable.
ASTON/DoubleLine Core Plus Fixed Income Fund
Fund Performance. Among other information relating to the Fund’s performance, the Trustees noted that the Fund’s performance for Class I shares (which share class has the largest amount of assets of all the share classes of the Fund) for the 1-year and 3-year periods ended March 31, 2016 and for the period from the Class I shares’ inception on July 18, 2011 through March 31, 2016 was above the median performance of the Peer Group and below, above and above, respectively, the performance of the Fund Benchmark, the Barclays U.S. Aggregate Bond Index. The Trustees also took into account management’s discussion of the Fund’s performance, including the reasons given for the Fund’s recent underperformance relative to the Fund Benchmark. The Trustees also noted that the Fund ranked in the top quintile relative to its Peer Group for the 3-year period and in the top decile relative to its Peer Group since inception. The Trustees concluded that the Fund’s overall performance has been satisfactory.
Advisory and Subadvisory Fees. The Trustees noted that the Fund’s advisory fees (which include both the advisory and administration fee) and total expenses (weighted average, all classes combined) (net of applicable expense waivers/reimbursements) as of March 31, 2016 were both higher than the average for the Fund’s Peer Group. The Trustees took into account the fact that the Investment Adviser has contractually agreed, through February 28, 2018, to reimburse the Fund for operating expenses (subject to certain excluded expenses) in excess of 0.69% of average daily net assets for Class I shares and 0.94% of average daily net assets for Class N shares. The Trustees also took into account management’s discussion of the Fund’s expenses, including fees and expenses relative to comparably sized funds. The Trustees concluded that, in light of the nature, extent and quality of the services provided by the Investment Adviser and the Subadviser, the foregoing expense reimbursement
arrangement and the considerations noted above with respect to the Investment Adviser and the Subadviser, the Fund’s advisory and subadvisory fees are reasonable.
ASTON/Fairpointe Focused Equity Fund
Fund Performance. Among other information relating to the Fund’s performance, the Trustees noted that the Fund’s performance for Class I shares (which share class has the largest amount of assets of all the share classes of the Fund) for the 1-year period and for the period from the Class I shares’ inception on December 24, 2014 through March 31, 2016 was below the median performance of the Peer Group and below the performance of the Fund Benchmark, the Russell 1000® Index. The Trustees also took into account management’s discussion of the Fund’s performance, including the reasons given for the Fund’s underperformance and any actions being taken to address such performance. The Trustees concluded that the Fund’s performance is being addressed.
Advisory and Subadvisory Fees. The Trustees noted that the Fund’s advisory fees (which include both the advisory and administration fee) and total expenses (weighted average, all classes combined) (net of applicable expense waivers/ reimbursements) as of March 31, 2016 were both higher than the average for the Fund’s Peer Group. The Trustees took into account the fact that the Investment Adviser has contractually agreed, through February 28, 2018, to reimburse the Fund for operating expenses (subject to certain excluded expenses) in excess of 0.90% of average daily net assets for Class I shares and 1.15% of average daily net assets for Class N shares. The Trustees also took into account management’s discussion of the Fund’s expenses, including fees and expenses relative to comparably sized funds, and the current size of the Fund. The Trustees concluded that, in light of the nature, extent and quality of the services provided by the Investment Adviser and the Subadviser and the considerations noted above with respect to the Investment Adviser and the Subadviser, the Fund’s advisory and subadvisory fees are reasonable.
ASTON/Fairpointe Mid Cap Fund
Fund Performance. Among other information relating to the Fund’s performance, the Trustees noted that the Fund’s performance for Class N shares (which share class has the earliest inception date of all the share classes of the Fund) for the 1-year, 3-year, 5-year and 10-year periods ended March 31, 2016 was below, above, above and above, respectively, the median performance of the Peer Group and below, below, below and above, respectively, the performance of the Fund Benchmark, the S&P MidCap 400 Index. The Trustees also took into account management’s discussion of the Fund’s performance, including that the Fund ranked in the top decile relative to its Peer Group for the 10-year period, with 3-year and 5-year returns above the median, as well as the reasons given for the Fund’s recent underperformance. The Trustees concluded that the Fund’s overall performance has been satisfactory.
Advisory and Subadvisory Fees. The Trustees noted that the Fund’s advisory fees (which include both the advisory and administration fee) and total expenses (weighted average, all
AMG Funds
October 31, 2016
Additional Information (unaudited) – continued
classes combined) as of March 31, 2016 were both lower than the average for the Fund’s Peer Group. The Trustees concluded that, in light of the nature, extent and quality of the services provided by the Investment Adviser and the Subadviser and the considerations noted above with respect to the Investment Adviser and the Subadviser, the Fund’s advisory and subadvisory fees are reasonable.
ASTON/Guardian Capital Global Dividend Fund
Fund Performance. Among other information relating to the Fund’s performance, the Trustees noted that the Fund’s performance for Class I shares (which share class has the largest amount of assets of all the share classes of the Fund) for the 1-year period and for the period from the Class I shares’ inception on April 14, 2014 through March 31, 2016 was above the median performance of the Peer Group and above the performance of the Fund Benchmark, the MSCI World Index. The Trustees also took into account management’s discussion of the Fund’s performance, including the Fund’s outperformance of the Fund Benchmark and the Peer Group for all relevant periods. The Trustees also noted that the Fund ranked in the second quintile relative to its Peer Group for all relevant periods. The Trustees concluded that the Fund’s overall performance has been satisfactory.
Advisory and Subadvisory Fees. The Trustees noted that the Fund’s advisory fees (which include both the advisory and administration fee) and total expenses (weighted average, all classes combined) (net of applicable expense waivers/reimbursements) as of March 31, 2016 were higher and lower, respectively, than the average for the Fund’s Peer Group. The Trustees took into account the fact that the Investment Adviser has contractually agreed, through February 28, 2018, to reimburse the Fund for operating expenses (subject to certain excluded expenses) in excess of 1.05% of average daily net assets for Class I shares and 1.30% of average daily net assets for Class N shares. The Trustees also took into account management’s discussion of the Fund’s expenses, including fees and expenses relative to comparably sized funds, and the current size of the Fund. The Trustees concluded that, in light of the nature, extent and quality of the services provided by the Investment Adviser and the Sub-adviser, the foregoing expense reimbursement arrangement and the considerations noted above with respect to the Investment Adviser and the Subadviser, the Fund’s advisory and subadvisory fees are reasonable.
ASTON/Lake Partners LASSO Alternatives Fund
Fund Performance. Among other information relating to the Fund’s performance, the Trustees noted that the Fund’s performance for Class I shares (which share class has the earliest inception date and the largest amount of assets of all the share classes of the Fund) for the 1-year, 3-year and 5-year periods ended March 31, 2016 and for the period from the Class I shares’ inception on April 1, 2009 through March 31, 2016 was above, below, above and above, respectively, the median performance of the Peer Group and above the performance of the Fund Benchmark, the HFRX Equity Hedge Index. The Trustees also took into account management’s discussion of the Fund’s performance, including its more recent improved performance relative to the Peer Group and the Fund Benchmark. The
Trustees noted that the Fund ranked in the second quartile relative to the Peer Group for the 1-year and 5-year periods and for the period from inception through March 31, 2016. The Trustees concluded that the Fund’s overall performance has been satisfactory.
Advisory and Subadvisory Fees. The Trustees noted that the Fund’s advisory fees (which include both the advisory and administration fee) and total expenses (weighted average, all classes combined) (net of applicable expense waivers/ reimbursements) as of March 31, 2016 were both lower than the average for the Fund’s Peer Group. The Trustees took into account the fact that the Investment Adviser has contractually agreed, through February 28, 2018, to reimburse the Fund for operating expenses (subject to certain excluded expenses) in excess of 1.15% of average daily net assets for Class I shares and 1.40% of average daily net assets for Class N shares. The Trustees considered that the Fund operates as a fund of funds, and that the Fund’s Peer Group includes both funds of funds and non-funds of funds. The Trustees concluded that, in light of the nature, extent and quality of the services provided by the Investment Adviser and the Subadviser, the foregoing expense reimbursement arrangement and the considerations noted above with respect to the Investment Adviser and the Subadviser, the Fund’s advisory and subadvisory fees are reasonable.
The Board considered that the Fund, as a fund of funds, invests primarily in other investment companies. The Board noted that the Fund historically has invested in underlying funds outside of the Aston Funds Family of Funds. In approving the continuance of the Investment Advisory Agreement for the Fund, the Board, including a majority of the Independent Trustees, found that the advisory fees charged with respect to the Fund under the Investment Advisory Agreement are based on services provided that will be in addition to, rather than duplicative of, the services provided under the advisory agreement with respect to any underlying fund in which the Fund may invest.
ASTON/LMCG Small Cap Growth Fund
Fund Performance. Among other information relating to the Fund’s performance, the Trustees noted that the Fund’s performance for Class N shares (which share class has the earliest inception date and the largest amount of assets of all the share classes of the Fund) for the 1-year, 3-year and 5-year periods ended March 31, 2016 and for the period from the Class N shares’ inception on November 3, 2010 through March 31, 2016 was below the median performance of the Peer Group and below the performance of the Fund Benchmark, the Russell 2000® Growth Index. The Trustees also took into account management’s discussion of the Fund’s performance, including the reasons given for the Fund’s underperformance and any actions being taken to address such performance. The Trustees also noted that the Fund ranked in the third quartile relative to the Peer Group for the 5-year period and for the period from inception through March 31, 2016. The Trustees concluded that the Fund’s performance is being addressed.
AMG Funds
October 31, 2016
Additional Information (unaudited) – continued
Advisory and Subadvisory Fees. The Trustees noted that the Fund’s advisory fees (which include both the advisory and administration fee) and total expenses (weighted average, all classes combined) (net of applicable expense waivers/reimbursements) as of March 31, 2016 were both higher than the average for the Fund’s Peer Group. The Trustees took into account the fact that the Investment Adviser has contractually agreed, through February 28, 2018, to reimburse the Fund for operating expenses (subject to certain excluded expenses) in excess of 1.10% of average daily net assets for Class I shares and 1.35% of average daily net assets for Class N shares. The Trustees also took into account management’s discussion of the Fund’s expenses, including fees and expenses relative to comparably sized funds, and the current size of the Fund. The Trustees concluded that, in light of the nature, extent and quality of the services provided by the Investment Adviser and the Subadviser, the foregoing expense reimbursement arrangement and the considerations noted above with respect to the Investment Adviser and the Subadviser, the Fund’s advisory and subadvisory fees are reasonable.
ASTON/Montag & Caldwell Balanced Fund
Fund Performance. Among other information relating to the Fund’s performance, the Trustees noted that the Fund’s performance for Class N shares (which share class has the earliest inception date and the largest amount of assets of all the share classes of the Fund) for the 1-year, 3-year, 5-year and 10-year periods ended March 31, 2016 was above the median performance of the Peer Group and above, below, below and below, respectively, the performance of the Fund Benchmark, a Composite Index (60% S&P 500 Index and 40% Barclays U.S. Government Credit Bond Index). The Trustees also took into account management’s discussion of the Fund’s performance, including the fact that the Fund ranked in the top decile relative to its Peer Group for the 1-year period and in the top quintile relative to its Peer Group for the 10-year period. The Trustees concluded that the Fund’s overall performance has been satisfactory.
Advisory and Subadvisory Fees. The Trustees noted that the Fund’s advisory fees (which include both the advisory and administration fee) and total expenses (weighted average, all classes combined) (net of applicable expense waivers/reimbursements) as of March 31, 2016 were both higher than the average for the Fund’s Peer Group. The Trustees took into account the fact that the Investment Adviser has contractually agreed, through February 28, 2018, to limit the Fund’s net annual operating expenses (subject to certain excluded expenses) to 1.10% of average daily net assets for Class I shares and 1.35% of average daily net assets for Class N shares. The Trustees also took into account management’s discussion of the Fund’s expenses, including fees and expenses relative to comparably sized funds, and the current size of the Fund. The Trustees concluded that, in light of the nature, extent and quality of the services provided by the Investment Adviser and the Subadviser, the foregoing expense limitation arrangement and the considerations noted above with respect to the Investment Adviser and the Subadviser, the Fund’s advisory and subadvisory fees are reasonable.
ASTON/Montag & Caldwell Growth Fund
Fund Performance. Among other information relating to the Fund’s performance, the Trustees noted that the Fund’s performance for Class N shares (which share class has the earliest inception date of all the share classes of the Fund) for the 1-year, 3-year, 5-year and 10-year periods ended March 31, 2016 was above, below, below and above, respectively, the median performance of the Peer Group and below the performance of the Fund Benchmark, the Russell 1000® Growth Index. The Trustees also took into account management’s discussion of the Fund’s performance, including the fact that the Fund ranked in the top decile relative to its Peer Group for the 1-year period and that the Fund ranked in the second quartile relative to its Peer Group for the 10-year period. The Trustees concluded that the Fund’s overall performance has been satisfactory in light of all factors considered.
Advisory and Subadvisory Fees. The Trustees noted that the Fund’s advisory fees (which include both the advisory and administration fee) and total expenses (weighted average, all classes combined) as of March 31, 2016 were both lower than the average for the Fund’s Peer Group. The Trustees concluded that, in light of the nature, extent and quality of the services provided by the Investment Adviser and the Subadviser, the foregoing expense reimbursement arrangement and the considerations noted above with respect to the Investment Adviser and the Subadviser, the Fund’s advisory and subadvisory fees are reasonable.
ASTON/Montag & Caldwell Mid Cap Growth Fund
Fund Performance. Among other information relating to the Fund’s performance, the Trustees noted that the Fund’s performance for Class N shares (which share class has the earliest inception date of all the share classes of the Fund) for the 1-year, 3-year and 5-year periods ended March 31, 2016 and for the period from the Class N shares’ inception on November 2, 2007 through March 31, 2016 was above, below, above and below, respectively, the median performance of the Peer Group and above, below, below and below, respectively, the performance of the Fund Benchmark, the Russell Midcap® Growth Index. The Trustees also took into account management’s discussion of the Fund’s performance, including the fact that the Fund ranked in the top quintile relative to the Peer Group for the 1-year period. The Trustees concluded that the Fund’s overall performance has been satisfactory.
Advisory and Subadvisory Fees. The Trustees noted that the Fund’s advisory fees (which include both the advisory and administration fee) and total expenses (weighted average, all classes combined) (net of applicable expense waivers/ reimbursements) as of March 31, 2016 were higher and lower, respectively, than the average for the Fund’s Peer Group. The Trustees took into account the fact that the Investment Adviser has contractually agreed, through February 28, 2018, to reimburse the Fund for operating expenses (subject to certain excluded expenses) in excess of 1.00% of average daily net assets for Class I shares and 1.25% of average daily net assets for Class N shares. The Trustees also took into account
AMG Funds
October 31, 2016
Additional Information (unaudited) – continued
management’s discussion of the Fund’s expenses, including fees and expenses relative to comparably sized funds, and the current size of the Fund. The Trustees concluded that, in light of the nature, extent and quality of the services provided by the Investment Adviser and the Subadviser, the foregoing expense reimbursement arrangement and the considerations noted above with respect to the Investment Adviser and the Subadviser, the Fund’s advisory and subadvisory fees are reasonable.
ASTON/Pictet International Fund
Fund Performance. Among other information relating to the Fund’s performance, the Trustees noted that the Fund’s performance for Class I shares (which share class has the largest amount of assets of all the share classes of the Fund) for the 1-year period ended March 31, 2016 and for the period from the Class I shares’ inception on April 14, 2014 through March 31, 2016 was above the median performance of the Peer Group and above the performance of the Fund Benchmark, the MSCI EAFE Index. The Trustees also took into account management’s discussion of the Fund’s performance, including the fact that the Fund ranked in the top decile relative to the Peer Group for the 1-year period. The Trustees concluded that the Fund’s overall performance has been satisfactory.
Advisory and Subadvisory Fees. The Trustees noted that the Fund’s advisory fees (which include both the advisory and administration fee) and total expenses (weighted average, all classes combined) (net of applicable expense waivers/reimbursements) as of March 31, 2016 were both higher than the average for the Fund’s Peer Group. The Trustees took into account the fact that the Investment Adviser has contractually agreed, through February 28, 2018, to reimburse the Fund for operating expenses (subject to certain excluded expenses) in excess of 1.15% of average daily net assets for Class I shares and 1.40% of average daily net assets for Class N shares. The Trustees concluded that, in light of the nature, extent and quality of the services provided by the Investment Adviser and the Subadviser, the foregoing expense reimbursement arrangement and the considerations noted above with respect to the Investment Adviser and the Subadviser, the Fund’s advisory and subadvisory fees are reasonable.
ASTON/River Road Dividend All Cap Value Fund
Fund Performance. Among other information relating to the Fund’s performance, the Trustees noted that the Fund’s performance for Class N shares (which share class has the earliest inception date of all the share classes of the Fund) for the 1-year, 3-year, 5-year and 10-year periods ended March 31, 2016 was above the median performance of the Peer Group and above, below, above and above, respectively, the performance of the Fund Benchmark, the Russell 3000® Value Index. The Trustees took into account management’s discussion of the Fund’s performance, including its outperformance relative to the Peer Group during all relevant periods and its more recent improved performance relating to the Fund Benchmark. The Trustees also noted that the Fund’s 10-year performance results ranked in the top decile relative to its Peer Group and that the Fund’s 1-year and 5-year performance results ranked in the top quintile relative
to its Peer Group. The Trustees concluded that the Fund’s overall performance has been satisfactory.
Advisory and Subadvisory Fees. The Trustees noted that the Fund’s advisory fees (which include both the advisory and administration fee) and total expenses (weighted average, all classes combined) (net of applicable expense waivers/ reimbursements) as of March 31, 2016 were both lower than the average for the Fund’s Peer Group. The Trustees took into account the fact that the Investment Adviser has contractually agreed, through February 28, 2018, to limit the Fund’s net annual operating expenses (subject to certain excluded expenses) to 1.05% of average daily net assets for Class I shares and 1.30% of average daily net assets for Class N shares. The Trustees concluded that, in light of the nature, extent and quality of the services provided by the Investment Adviser and the Subadviser (which is an affiliate of the Investment Adviser), the foregoing expense limitation arrangement and the considerations noted above with respect to the Investment Adviser and the Subadviser, the Fund’s advisory and subadvisory fees are reasonable.
ASTON/River Road Dividend All Cap Value Fund II
Fund Performance. Among other information relating to the Fund’s performance, the Trustees noted that the Fund’s performance for Class I shares (which share class has the largest amount of assets of all the share classes of the Fund) for the 1-year and 3-year periods ended March 31, 2016 and for the period from the Class I shares’ inception on June 27, 2012 through March 31, 2016 was above, above and below, respectively, the median performance of the Peer Group and above, above and below, respectively, the performance of the Fund Benchmark, the Russell 3000® Value Index. The Trustees also took into account management’s discussion of the Fund’s performance, including its more recent improved performance relative to the Peer Group and the Fund Benchmark. The Trustees also noted that the Fund’s 1-year performance results ranked in the top quintile relative to the Peer Group and that the Fund’s 3-year performance results ranked in the second quintile relative to the Peer Group. The Trustees concluded that the Fund’s overall performance has been satisfactory.
Advisory and Subadvisory Fees. The Trustees noted that the Fund’s advisory fees (which include both the advisory and administration fee) and total expenses (weighted average, all classes combined) (net of applicable expense waivers/ reimbursements) as of March 31, 2016 were both lower than the average for the Fund’s Peer Group. The Trustees took into account the fact that the Investment Adviser has contractually agreed, through February 28, 2018, to reimburse the Fund for operating expenses (subject to certain excluded expenses) in excess of 1.05% of average daily net assets for Class I shares and 1.30% of average daily net assets for Class N shares and that the Fund was currently operating below these thresholds. The Trustees concluded that, in light of the nature, extent and quality of the services provided by the Investment Adviser and the Subadviser (which is an affiliate of the Investment Adviser), the foregoing expense reimbursement arrangement and
AMG Funds
October 31, 2016
Additional Information (unaudited) – continued
the considerations noted above with respect to the Investment Adviser and the Subadviser, the Fund’s advisory and subadvisory fees are reasonable.
ASTON/River Road Long-Short Fund
Fund Performance. Among other information relating to the Fund’s performance, the Trustees noted that the Fund’s performance for Class N shares (which share class has the earliest inception date of all the share classes of the Fund) for the 1-year and 3-year periods ended March 31, 2016 and for the period from the Class N shares’ inception on May 4, 2011 through March 31, 2016 was above, below and above, respectively, the median performance of the Peer Group and above, below and below, respectively, the performance of the Fund Benchmark, the Russell 3000® Index. The Trustees also took into account management’s discussion of the Fund’s performance, including its more recent improved performance relative to the Peer Group and the Fund Benchmark. The Trustees also noted that the Fund’s 1-year performance results ranked in the top quintile relative to the Peer Group. The Trustees concluded that the Fund’s overall performance has been satisfactory.
Advisory and Subadvisory Fees. The Trustees noted that the Fund’s advisory fees (which include both the advisory and administration fee) and total expenses (weighted average, all classes combined) (net of applicable expense waivers/reimbursements) as of March 31, 2016 were lower and higher, respectively, than the average for the Fund’s Peer Group. The Trustees took into account the fact that the Investment Adviser has contractually agreed, through February 28, 2018, to reimburse the Fund for operating expenses (subject to certain excluded expenses) in excess of 1.45% of average daily net assets for Class I shares and 1.70% of average daily net assets for Class N shares. The Trustees also took into account management’s discussion of the Fund’s expenses, including fees and expenses relative to comparably sized funds, and the current size of the Fund. The Trustees concluded that, in light of the nature, extent and quality of the services provided by the Investment Adviser and the Sub-adviser (which is an affiliate of the Investment Adviser), the foregoing expense reimbursement arrangement and the considerations noted above with respect to the Investment Adviser and the Subadviser, the Fund’s advisory and subadvisory fees are reasonable.
ASTON/River Road Select Value Fund
Fund Performance. Among other information relating to the Fund’s performance, the Trustees noted that the Fund’s performance for Class N shares (which share class has the earliest inception date of all the share classes of the Fund) for the 1-year, 3-year and 5-year periods ended March 31, 2016 and for the period from the Class N shares’ inception on March 29, 2007 through March 31, 2016 was above, below, above and below, respectively, the median performance of the Peer Group and above, below, below and below, respectively, the performance of the Fund Benchmark, the Russell 2500® Value Index. The Trustees also took into account management’s discussion of the Fund’s performance, including its more recent improved performance relative to the Peer Group and the Fund
Benchmark. The Trustees also noted that the Fund’s 1-year performance results ranked in the top decile relative to the Peer Group and that the Fund’s 5-year performance results ranked in the top quartile relative to the Peer Group. The Trustees concluded that the Fund’s overall performance has been satisfactory.
Advisory and Subadvisory Fees. The Trustees noted that the Fund’s advisory fees (which include both the advisory and administration fee) and total expenses (weighted average, all classes combined) (net of applicable expense waivers/ reimbursements) as of March 31, 2016 were both higher than the average for the Fund’s Peer Group. The Trustees took into account the fact that the Investment Adviser has contractually agreed, through February 28, 2018, to reimburse the Fund for operating expenses (subject to certain excluded expenses) in excess of 1.25% of average daily net assets for Class I shares and 1.50% of average daily net assets for Class N shares. The Trustees also took into account management’s discussion of the Fund’s expenses, including fees and expenses relative to comparably sized funds, and the current size of the Fund. The Trustees concluded that, in light of the nature, extent and quality of the services provided by the Investment Adviser and the Subadviser (which is an affiliate of the Investment Adviser), the foregoing expense reimbursement arrangement and the considerations noted above with respect to the Investment Adviser and the Subadviser, the Fund’s advisory and subadvisory fees are reasonable.
ASTON/River Road Small Cap Value Fund
Fund Performance. Among other information relating to the Fund’s performance, the Trustees noted that the Fund’s performance for Class N shares (which share class has the earliest inception date of all the share classes of the Fund) for the 1-year, 3-year, 5-year and 10-year periods ended March 31, 2016 was above, below, above and above, respectively, the median performance of the Peer Group and above the performance of the Fund Benchmark, the Russell 2000® Value Index. The Trustees also took into account management’s discussion of the Fund’s performance, including its more recent improved performance relative to the Peer Group and the Fund Benchmark. The Trustees also noted that the Fund’s 1-year performance results ranked in the top decile relative to the Peer Group and that Fund’s 5-year and 10-year performance results ranked in the second quartile relative to the Peer Group. The Trustees concluded that the Fund’s overall performance has been satisfactory.
Advisory and Subadvisory Fees. The Trustees noted that the Fund’s advisory fees (which include both the advisory and administration fee) and total expenses (weighted average, all classes combined) as of March 31, 2016 were higher and lower, respectively, than the average for the Fund’s Peer Group. The Trustees took into account management’s discussion of the Fund’s expenses, including fees and expenses relative to comparably sized funds, and the current size of the Fund. The Trustees concluded that, in light of the nature, extent and quality of the services provided by the Investment Adviser and the
AMG Funds
October 31, 2016
Additional Information (unaudited) – continued
Subadviser (which is an affiliate of the Investment Adviser) and the considerations noted above with respect to the Investment Adviser and the Subadviser, the Fund’s advisory and subadvisory fees are reasonable.
ASTON/Silvercrest Small Cap Fund
Fund Performance. Among other information relating to the Fund’s performance, the Trustees noted that the Fund’s performance for Class I shares (which share class has the largest amount of assets of all the share classes of the Fund) for the 1-year and 3-year periods ended March 31, 2016 and for the period from the Class I shares’ inception on December 27, 2011 through March 31, 2016 was above the median performance of the Peer Group and above the performance of the Fund Benchmark, the Russell 2000® Value Index. The Trustees also took into account management’s discussion of the Fund’s performance, including the Fund’s outperformance of the Fund Benchmark and the Peer Group for all relevant periods. The Trustees also noted that the Fund’s performance results ranked in the second quartile relative to the Peer Group for all relevant periods. The Trustees concluded that the Fund’s overall performance has been satisfactory.
Advisory and Subadvisory Fees. The Trustees noted that the Fund’s advisory fees (which include both the advisory and administration fee) and total expenses (weighted average, all classes combined) (net of applicable expense waivers/reimbursements) as of March 31, 2016 were both higher than the average for the Fund’s Peer Group. The Trustees took into account the fact that the Investment Adviser has contractually agreed, through February 28, 2018, to reimburse the Fund for operating expenses (subject to certain excluded expenses) in excess of 1.15% of average daily net assets for Class I shares and 1.40% of average daily net assets for Class N shares. The Trustees also took into account management’s discussion of the Fund’s expenses, including fees and expenses relative to comparably sized funds, and the current size of the Fund. The Trustees concluded that, in light of the nature, extent and quality of the services provided by the Investment Adviser and the Subadviser, the foregoing expense reimbursement arrangement and the considerations noted above with respect to the Investment Adviser and the Subadviser, the Fund’s advisory and subadvisory fees are reasonable.
ASTON Small Cap Fund
Fund Performance. Among other information relating to the Fund’s performance, the Trustees noted that the Fund’s performance for Class N shares (which share class has the earliest inception date of all the share classes of the Fund) for the 1-year, 3-year, 5-year and 10-year periods ended March 31, 2016 was below the median performance of the Peer Group and below the performance of the Fund Benchmark, the Russell 2000® Index. The Trustees also took into account management’s discussion of the Fund’s performance, including the reasons given for the Fund’s underperformance and any actions being taken to address such performance. The Trustees specifically noted the change in the Fund’s Subadviser in February 2016 and that the performance record largely reflects that of the prior Subadviser. The Trustees concluded that the Fund’s performance is being addressed.
Advisory and Subadvisory Fees. The Trustees noted that the Fund’s advisory fees (which include both the advisory and administration fee) and total expenses (weighted average, all classes combined) (net of applicable expense waivers/ reimbursements) as of March 31, 2016 were both lower than the average for the Fund’s Peer Group. The Trustees took into account the fact that the Investment Adviser has contractually agreed, through February 28, 2018, to reimburse the Fund for operating expenses (subject to certain excluded expenses) in excess of 1.10% of average daily net assets for Class I shares and 1.35% of average daily net assets for Class N shares. The Trustees concluded that, in light of the nature, extent and quality of the services provided by the Investment Adviser and the Subadviser and the considerations noted above with respect to the Investment Adviser and the Subadviser, the Fund’s advisory and subadvisory fees are reasonable.
* * * * *
After consideration of the foregoing, the Trustees also reached the following conclusions (in addition to the conclusions discussed above) regarding the Investment Advisory Agreement and each Subadvisory Agreement: (a) the Investment Adviser and each Subadviser have demonstrated that they possess the capability and resources to perform the duties required of them under the Investment Advisory Agreement and the applicable Subadvisory Agreement; (b) each Subadviser’s Investment Strategy is appropriate for pursuing the applicable Fund’s investment objective(s); and (c) the Investment Adviser and each Subadviser maintain appropriate compliance programs.
Based on all the above-mentioned factors and their related conclusions, with no single factor or conclusion being determinative and with each Trustee not necessarily attributing the same weight to each factor, the Trustees concluded that approval of the continuance of the Investment Advisory Agreement and Subadvisory Agreement with respect to each Fund, including the proposed amendment to be effective October 1, 2016, would be in the best interests of the applicable Fund. Accordingly, on June 22-23, 2016, the Trustees, and separately a majority of the Independent Trustees, voted to approve the Investment Advisory Agreement and the Sub-advisory Agreement for each Fund, including the proposed amendment to be effective October 1, 2016.
Tax Information: In accordance with Federal tax law, the following Funds hereby make the designations indicated below regarding their fiscal year ended October 31, 2016:
The following are the estimated percentages of the income dividends qualifying for the dividends-received deduction available to corporations:
| | | | |
Fund | | Percentage | |
Fairpointe Focused Equity | | | 100.00 | % |
Montag & Caldwell Growth | | | 100.00 | % |
River Road Dividend All Cap Value | | | 98.87 | % |
River Road Dividend All Cap Value II | | | 100.00 | % |
AMG Funds
October 31, 2016
Additional Information (unaudited) – continued
| | | | |
Fund | | Percentage | |
Fairpointe Mid Cap | | | 100.00 | % |
River Road Select Value | | | 100.00 | % |
River Road Small Cap Value | | | 99.90 | % |
Silvercrest Small Cap | | | 100.00 | % |
Anchor Capital Enhanced Equity | | | 100.00 | % |
Lake Partners LASSO Alternative | | | 100.00 | % |
River Road Long-Short | | | 100.00 | % |
Guardian Capital Global Dividend | | | 60.80 | % |
Montag & Caldwell Balanced | | | 100.00 | % |
For the fiscal year ended October 31, 2016, certain dividends may be subject to a maximum tax rate of 15%, as qualified dividend income (“QDI”) under the Jobs and Growth Tax Relief Reconciliation Act of 2003. For individual shareholders, a percentage of their ordinary income dividends (dividend income plus short-term gains, if any) may qualify for a maximum tax rate of 15%. Complete information is computed and reported in conjunction with your Form 1099-DIV.
The following percentages of ordinary dividends paid during the fiscal year ended October 31, 2016 are designated as QDI:
| | | | |
Fund | | Percentage | |
Fairpointe Focused Equity | | | 100.00 | % |
Montag & Caldwell Growth | | | 100.00 | % |
River Road Dividend All Cap Value | | | 100.00 | % |
River Road Dividend All Cap Value II | | | 100.00 | % |
Fairpointe Mid Cap | | | 100.00 | % |
River Road Select Value | | | 100.00 | % |
River Road Small Cap Value | | | 99.90 | % |
Silvercrest Small Cap | | | 100.00 | % |
Anchor Capital Enhanced Equity | | | 100.00 | % |
Lake Partners LASSO Alternative | | | 100.00 | % |
River Road Long-Short | | | 100.00 | % |
Guardian Capital Global Dividend | | | 100.00 | % |
Pictet International | | | 78.48 | % |
Value Partners Asia Dividend | | | 22.64 | % |
Montag & Caldwell Balanced | | | 100.00 | % |
Each Fund designates 100%, or if subsequently different, of “QDI” to qualify for the lower tax rates applicable to individual shareholders; and 100%, or if subsequently different, of ordinary income dividends to qualify for the “DRD” for corporate shareholders. The actual percentage of QDI and DRD for the calendar year will be designated in year-end tax statements.
The following Funds designated the listed amounts as long-term capital gain dividends during the fiscal year ended October 31, 2016. Distributable long-term gains are based on net realized long term gains determined on a tax basis and may differ from such amounts for financial reporting purposes.
| | | | |
Fund | | Amount | |
Montag & Caldwell Growth | | $ | 453,313,996 | |
River Road Dividend All Cap Value | | | 68,846,034 | |
River Road Dividend All Cap Value II | | | 1,667,547 | |
Fairpointe Mid Cap | | | 234,497,586 | |
Montag & Caldwell Mid Cap Growth | | | 1,250,491 | |
LMCG Small Cap Growth | | | 25,386 | |
River Road Select Value | | | 7,969,730 | |
River Road Small Cap Value | | | 13,693,492 | |
GW&K U.S. Small Cap Growth | | | 155,946,076 | |
Silvercrest Small Cap | | | 6,209,167 | |
| | | | |
Fund | | Amount | |
Anchor Capital Enhanced Equity | | $ | 590,164 | |
Lake Partners LASSO Alternatives | | | 11,178,503 | |
River Road Long-Short | | | 545,077 | |
Montag & Caldwell Balanced | | | 1,324,665 | |
Shareholders should not use the above tax information to prepare their tax returns. The information will be included with your Form 1099 DIV which will be sent to you separately in February 2017.
About Your Fund’s Expenses: As a shareholder of a Fund, you may incur two types of costs: (1) transaction costs, which may include sales charges (loads) on purchase payments; redemption fees; and exchange fees; and (2) ongoing costs, including management fees; distribution (12b-1) fees; and other Fund expenses. This example is intended to help you understand your ongoing costs (in dollars) of investing in the Fund and to compare these costs with the ongoing costs of investing in other mutual funds. The example is based on $1,000 invested at the beginning of the period and held for the entire period as indicated below.
Actual Expenses: The first line of the following table provides information about the actual account values and actual expenses. You may use the information in this line, together with the amount you invested, to estimate the expenses that you paid over the period. Simply divide your account value by $1,000 (for example, an $8,600 account value divided by $1,000 = 8.6), then multiply the result by the number in the first line under the heading entitled “Expenses Paid During Period” to estimate the expenses you paid on your account during this period.
Hypothetical Example for Comparison Purposes: The second line of the following table provides information about hypothetical account values and hypothetical expenses based on the Fund’s actual expense ratio and an assumed annual rate of return of 5% before expenses, which is not the Fund’s actual return. The hypothetical account values and expenses may not be used to estimate the actual ending account balance or expenses you paid for the period. You may use this information to compare the ongoing costs of investing in the Fund and other funds by comparing this 5% hypothetical example with the 5% hypothetical examples that appear in the shareholder reports of other funds.
Please note that the expenses shown in the table are meant to highlight your ongoing costs only and do not reflect any transactional costs, such as sales charges (loads), redemption fees, or exchange fees. Therefore, the second line of the table is useful in comparing ongoing costs only, and will not help you determine the relative total costs of owning different funds.
AMG Funds
October 31, 2016
Additional Information (unaudited) – continued
| | | | | | | | | | | | | | | | |
| | | Beginning
Account
Value
05/01/16 | | | Ending
Account
Value
10/31/16 | | | Expense
Ratio(1) | | | Expenses
Paid During
Period(2) | |
Fairpointe Focused Equity | |
Actual Fund Return | | | | | |
Class N | | $ | 1,000 | | | $ | 1,054.70 | | | | 1.15 | % | | $ | 5.94 | |
Class I | | | 1,000 | | | | 1,055.70 | | | | 0.90 | % | | | 4.65 | |
Hypothetical 5% Return | | | | | |
Class N | | $ | 1,000 | | | $ | 1,019.36 | | | | 1.15 | % | | $ | 5.84 | |
Class I | | | 1,000 | | | | 1,020.61 | | | | 0.90 | % | | | 4.57 | |
| |
River Road Focused Absolute Value(3) | | | | | |
Actual Fund Return | | | | | |
Class N | | $ | 1,000 | | | $ | 1,071.10 | | | | 1.00 | % | | $ | 5.21 | |
Class I | | | 1,000 | | | | 1,073.00 | | | | 0.75 | % | | | 3.91 | |
Hypothetical 5% Return | | | | | |
Class N | | $ | 1,000 | | | $ | 1,020.11 | | | | 1.00 | % | | $ | 5.08 | |
Class I | | | 1,000 | | | | 1,021.37 | | | | 0.75 | % | | | 3.81 | |
| |
Montag & Caldwell Growth | | | | | |
Actual Fund Return | | | | | |
Class N | | $ | 1,000 | | | $ | 1,005.10 | | | | 1.11 | % | | $ | 5.59 | |
Class I | | | 1,000 | | | | 1,006.70 | | | | 0.86 | % | | | 4.34 | |
Class R | | | 1,000 | | | | 1,003.70 | | | | 1.36 | % | | | 6.85 | |
Hypothetical 5% Return | | | | | |
Class N | | $ | 1,000 | | | $ | 1,019.56 | | | | 1.11 | % | | $ | 5.63 | |
Class I | | | 1,000 | | | | 1,020.81 | | | | 0.86 | % | | | 4.37 | |
Class R | | | 1,000 | | | | 1,018.30 | | | | 1.36 | % | | | 6.90 | |
| |
River Road Dividend All Cap Value | | | | | |
Actual Fund Return | | | | | |
Class N | | $ | 1,000 | | | $ | 1,020.80 | | | | 1.08 | % | | $ | 5.49 | |
Class I | | | 1,000 | | | | 1,022.20 | | | | 0.83 | % | | | 4.22 | |
Hypothetical 5% Return | | | | | |
Class N | | $ | 1,000 | | | $ | 1,019.71 | | | | 1.08 | % | | $ | 5.48 | |
Class I | | | 1,000 | | | | 1,020.96 | | | | 0.83 | % | | | 4.22 | |
| |
River Road Dividend All Cap Value II | | | | | |
Actual Fund Return | | | | | |
Class N | | $ | 1,000 | | | $ | 1,020.00 | | | | 1.17 | % | | $ | 5.94 | |
Class I | | | 1,000 | | | | 1,021.20 | | | | 0.92 | % | | | 4.67 | |
Hypothetical 5% Return | | | | | |
Class N | | $ | 1,000 | | | $ | 1,019.25 | | | | 1.17 | % | | $ | 5.94 | |
Class I | | | 1,000 | | | | 1,020.51 | | | | 0.92 | % | | | 4.67 | |
| |
Fairpointe Mid Cap | | | | | |
Actual Fund Return | | | | | |
Class N | | $ | 1,000 | | | $ | 1,044.90 | | | | 1.10 | % | | $ | 5.65 | |
Class I | | | 1,000 | | | | 1,046.10 | | | | 0.85 | % | | | 4.37 | |
Hypothetical 5% Return | | | | | |
Class N | | $ | 1,000 | | | $ | 1,019.61 | | | | 1.10 | % | | $ | 5.58 | |
Class I | | | 1,000 | | | | 1,020.86 | | | | 0.85 | % | | | 4.32 | |
| |
Montag & Caldwell Mid Cap Growth | | | | | |
Actual Fund Return | | | | | |
Class N | | $ | 1,000 | | | $ | 994.10 | | | | 1.25 | % | | $ | 6.27 | |
Class I | | | 1,000 | | | | 995.10 | | | | 1.00 | % | | | 5.02 | |
Hypothetical 5% Return | | | | | |
Class N | | $ | 1,000 | | | $ | 1,018.85 | | | | 1.25 | % | | $ | 6.34 | |
Class I | | | 1,000 | | | | 1,020.11 | | | | 1.00 | % | | | 5.08 | |
| |
LMCG Small Cap Growth | | | | | |
Actual Fund Return | | | | | |
Class N | | $ | 1,000 | | | $ | 997.50 | | | | 1.35 | % | | $ | 6.78 | |
Class I | | | 1,000 | | | | 999.20 | | | | 1.10 | % | | | 5.53 | |
Hypothetical 5% Return | | | | | |
Class N | | $ | 1,000 | | | $ | 1,018.35 | | | | 1.35 | % | | $ | 6.85 | |
Class I | | | 1,000 | | | | 1,019.61 | | | | 1.10 | % | | | 5.58 | |
| | | | | | | | | | | | | | | | |
| | | Beginning
Account
Value
05/01/16 | | | Ending
Account
Value
10/31/16 | | | Expense
Ratio(1) | | | Expenses
Paid During
Period(2) | |
River Road Select Value | |
Actual Fund Return | | | | | |
Class N | | $ | 1,000 | | | $ | 1,047.60 | | | | 1.50 | % | | $ | 7.72 | |
Class I | | | 1,000 | | | | 1,046.80 | | | | 1.25 | % | | | 6.43 | |
Hypothetical 5% Return | | | | | |
Class N | | $ | 1,000 | | | $ | 1,017.60 | | | | 1.50 | % | | $ | 7.61 | |
Class I | | | 1,000 | | | | 1,018.85 | | | | 1.25 | % | | | 6.34 | |
|
River Road Small Cap Value | |
Actual Fund Return | | | | | |
Class N | | $ | 1,000 | | | $ | 1,060.40 | | | | 1.32 | % | | $ | 6.84 | |
Class I | | | 1,000 | | | | 1,061.40 | | | | 1.07 | % | | | 5.54 | |
Hypothetical 5% Return | | | | | |
Class N | | $ | 1,000 | | | $ | 1,018.50 | | | | 1.32 | % | | $ | 6.70 | |
Class I | | | 1,000 | | | | 1,019.76 | | | | 1.07 | % | | | 5.43 | |
|
Silvercrest Small Cap | |
Actual Fund Return | | | | | |
Class N | | $ | 1,000 | | | $ | 1,067.80 | | | | 1.40 | % | | $ | 7.28 | |
Class I | | | 1,000 | | | | 1,069.40 | | | | 1.15 | % | | | 5.98 | |
Hypothetical 5% Return | |
Class N | | $ | 1,000 | | | $ | 1,018.10 | | | | 1.40 | % | | $ | 7.10 | |
Class I | | | 1,000 | | | | 1,019.36 | | | | 1.15 | % | | | 5.84 | |
|
GW&K U.S. Small Cap Growth | |
Actual Fund Return | |
Class N | | $ | 1,000 | | | $ | 1,027.40 | | | | 1.25 | % | | $ | 6.37 | |
Class I | | | 1,000 | | | | 1,027.50 | | | | 1.00 | % | | | 5.10 | |
Hypothetical 5% Return | |
Class N | | $ | 1,000 | | | $ | 1,018.85 | | | | 1.25 | % | | $ | 6.34 | |
Class I | | | 1,000 | | | | 1,020.11 | | | | 1.00 | % | | | 5.08 | |
|
DoubleLine Core Plus Bond | |
Actual Fund Return | |
Class N | | $ | 1,000 | | | $ | 1,025.20 | | | | 0.94 | % | | $ | 4.79 | |
Class I | | | 1,000 | | | | 1,026.50 | | | | 0.69 | % | | | 3.51 | |
Hypothetical 5% Return | |
Class N | | $ | 1,000 | | | $ | 1,020.41 | | | | 0.94 | % | | $ | 4.77 | |
Class I | | | 1,000 | | | | 1,021.67 | | | | 0.69 | % | | | 3.51 | |
|
Anchor Capital Enhanced Equity | |
Actual Fund Return | | | | | |
Class N | | $ | 1,000 | | | $ | 977.30 | | | | 1.20 | % | | $ | 5.96 | |
Class I | | | 1,000 | | | | 978.70 | | | | 0.95 | % | | | 4.73 | |
Hypothetical 5% Return | |
Class N | | $ | 1,000 | | | $ | 1,019.10 | | | | 1.20 | % | | $ | 6.09 | |
Class I | | | 1,000 | | | | 1,020.36 | | | | 0.95 | % | | | 4.82 | |
|
Lake Partners LASSO Alternatives | |
Actual Fund Return | |
Class N | | $ | 1,000 | | | $ | 1,004.30 | | | | 1.40 | % | | $ | 7.05 | |
Class I | | | 1,000 | | | | 1,005.90 | | | | 1.15 | % | | | 5.80 | |
Hypothetical 5% Return | |
Class N | | $ | 1,000 | | | $ | 1,018.10 | | | | 1.40 | % | | $ | 7.10 | |
Class I | | | 1,000 | | | | 1,019.36 | | | | 1.15 | % | | | 5.84 | |
|
River Road Long-Short(4) | |
Actual Fund Return | |
Class N | | $ | 1,000 | | | $ | 1,011.00 | | | | 1.70 | % | | $ | 8.59 | |
Class I | | | 1,000 | | | | 1,012.70 | | | | 1.45 | % | | | 7.34 | |
Hypothetical 5% Return | |
Class N | | $ | 1,000 | | | $ | 1,016.59 | | | | 1.70 | % | | $ | 8.62 | |
Class I | | | 1,000 | | | | 1,017.85 | | | | 1.45 | % | | | 7.35 | |
AMG Funds
October 31, 2016
Additional Information (unaudited) – continued
| | | | | | | | | | | | | | | | |
| | | Beginning
Account
Value
05/01/16 | | | Ending
Account
Value
10/31/16 | | | Expense
Ratio(1) | | | Expenses
Paid During
Period(2) | |
Guardian Capital Global Dividend | |
Actual Fund Return | | | | | |
Class N | | $ | 1,000 | | | $ | 973.60 | | | | 1.30 | % | | $ | 6.45 | |
Class I | | | 1,000 | | | | 973.90 | | | | 1.05 | % | | | 5.21 | |
Hypothetical 5% Return | | | | | |
Class N | | $ | 1,000 | | | $ | 1,018.60 | | | | 1.30 | % | | $ | 6.60 | |
Class I | | | 1,000 | | | | 1,019.86 | | | | 1.05 | % | | | 5.33 | |
|
Pictet International | |
Actual Fund Return | | | | | |
Class N | | $ | 1,000 | | | $ | 1,012.60 | | | | 1.40 | % | | $ | 7.08 | |
Class I | | | 1,000 | | | | 1,014.70 | | | | 1.15 | % | | | 5.82 | |
Hypothetical 5% Return | | | | | |
Class N | | $ | 1,000 | | | $ | 1,018.10 | | | | 1.40 | % | | $ | 7.10 | |
Class I | | | 1,000 | | | | 1,019.36 | | | | 1.15 | % | | | 5.84 | |
|
Value Partners Asia Dividend(5) | |
Actual Fund Return | | | | | |
Class N | | $ | 1,000 | | | $ | 1,067.90 | | | | 1.40 | % | | $ | 7.28 | |
Class I | | | 1,000 | | | | 1,069.90 | | | | 1.15 | % | | | 5.98 | |
Hypothetical 5% Return | | | | | |
Class N | | $ | 1,000 | | | $ | 1,018.10 | | | | 1.40 | % | | $ | 7.10 | |
Class I | | | 1,000 | | | | 1,019.36 | | | | 1.15 | % | | | 5.84 | |
|
Montag & Caldwell Balanced | |
Actual Fund Return | | | | | |
Class N | | $ | 1,000 | | | $ | 1,000.90 | | | | 1.20 | % | | $ | 6.04 | |
Class I | | | 1,000 | | | | 1,001.50 | | | | 1.10 | % | | | 5.53 | |
Hypothetical 5% Return | | | | | |
Class N | | $ | 1,000 | | | $ | 1,019.10 | | | | 1.20 | % | | $ | 6.09 | |
Class I | | | 1,000 | | | | 1,019.61 | | | | 1.10 | % | | | 5.58 | |
| (1) | Annualized, based on the Fund’s most recent fiscal half-year expenses. |
| (2) | Expenses are equal to the Fund’s annualized expense ratio multiplied by the average account value over the period, multiplied by the number of days in the most recent fiscal half-year (184) or partial year, if applicable, for the actual return and multiplied by the most recent fiscal year for the hypothetical 5% return, then divided by 366. Expense ratios do not include interest expense, if applicable. |
| (3) | The commencement of investment operations for River Road Focused Absolute Value was November 3, 2015. |
| (4) | Excludes interest expense and dividends on short positions. If included, your annualized expense ratios would be 3.62% and 3.37% for Class N and Class I, respectively and your actual and hypothetical expenses paid during the period would be $18.30 and $18.26 and $17.05 and $17.01 for Class N and Class I, respectively. |
| (5) | The commencement of investment operations for Value Partners Asia Dividend was December 16, 2015. |
AMG Funds
October 31, 2016
Additional Information (unaudited) – continued
TRUSTEES AND OFFICERS OF THE TRUST
The Trustees and Officers of the Trust, their business addresses, principal occupations for the past five years and dates of birth are listed below. The Trustees provide broad supervision over the affairs of the Trust and the Funds. The Trustees are experienced executives who meet periodically throughout the year to oversee the Funds’ activities, review contractual arrangements with companies that provide services to the Funds, and review the Funds’ performance. Unless otherwise noted, the address of each Trustee or Officer is the address of the Trust: 600 Steamboat Road, Suite 300, Greenwich, Connecticut 06830.
There is no stated term of office for Trustees. Trustees serve until their resignation, retirement or removal in accordance with the Trust’s organizational documents and policies adopted by the Board from time to time. The Chairman of the Trustees, President, Treasurer and Secretary of the Trust are elected by the Trustees annually. Other officers hold office at the pleasure of the Trustees.
Independent Trustees
The following Trustees are not “interested persons” of the Trust within the meaning of the 1940 Act:
| | |
Number of Funds Overseen in Fund Complex | | Name, Age, Principal Occupation(s) During Past 5 Years and Other Directorships Held by Trustee |
● Trustee since 2014 ● Oversees 66 Funds in Fund Complex | | Bruce B. Bingham, 67 Partner, Hamilton Partners (real estate development firm) (1987-Present); Director of The Yacktman Funds (2000-2012). |
| |
● Independent Chairman ● Trustee since 2016 ● Oversees 66 Funds in Fund Complex | | William E. Chapman, II, 75 President and Owner, Longboat Retirement Planning Solutions (1998-Present); Hewitt Associates, LLC (part time) (provider of Retirement and Investment Education Seminars) (2002-2009); Trustee Emeritus of Bowdoin College (2013-Present), Trustee of Bowdoin College (2002-2013); Director of Harding, Loevner Funds, Inc. (6 portfolios); Trustee of Third Avenue Trust (5 portfolios); Trustee of Third Avenue Variable Trust (1 portfolio). |
| |
● Trustee since 2016 ● Oversees 66 Funds in Fund Complex | | Edward J. Kaier, 71 Attorney at Law and Partner, Teeters Harvey Marrone & Kaier LLP (2007-Present); Attorney at Law and Partner, Hepburn Willcox Hamilton & Putnam, LLP (1977-2007); Trustee of Third Avenue Trust (5 portfolios); Trustee of Third Avenue Variable Trust (1 portfolio). |
| |
● Trustee since 2016 ● Oversees 68 Funds in Fund Complex | | Kurt A. Keilhacker, 53 Managing Member, TechFund Capital (1997-Present); Managing Member, TechFund Europe (2000-Present); Board Member, 6wind SA, (2002-Present); Managing Member, Elementum Ventures (2013-Present); Trustee, Gordon College (2001-2016). |
| |
● Trustee since 2016 ● Oversees 66 Funds in Fund Complex | | Steven J. Paggioli, 66 Independent Consultant (2002-Present); Formerly Executive Vice President and Director, The Wadsworth Group (1986-2001); Executive Vice President, Secretary and Director, Investment Company Administration, LLC (1990-2001); Vice President, Secretary and Director, First Fund Distributors, Inc. (1991- 2001); Trustee, Professionally Managed Portfolios (32 portfolios); Advisory Board Member, Sustainable Growth Advisors, LP; Independent Director, Chase Investment Counsel (2008-Present). |
| |
● Trustee since 2016 ● Oversees 66 Funds in Fund Complex | | Richard F. Powers III, 70 Adjunct Professor, Boston College (2010-2013); President and CEO of Van Kampen Investments Inc. (1998-2003). |
| |
● Trustee since 2016 ● Oversees 68 Funds in Fund Complex | | Eric Rakowski, 58 Professor, University of California at Berkeley School of Law (1990-Present); Director of Harding, Loevner Funds, Inc. (6 portfolios); Trustee of Third Avenue Trust (5 portfolios); Trustee of Third Avenue Variable Trust (1 portfolio). |
| |
● Trustee since 2016 ● Oversees 68 Funds in Fund Complex | | Victoria L. Sassine, 51 Lecturer, Babson College (2007-Present). |
| |
● Trustee since 2016 ● Oversees 66 Funds in Fund Complex | | Thomas R. Schneeweis, 69 Professor Emeritus, University of Massachusetts (2013-Present); Partner, S Capital Wealth Advisors (2015-Present); President, TRS Associates (1982- Present); Board Member, Chartered Alternative Investment Association (“CAIA”) (2002-Present); Director, CAIA Foundation (Education) (2010-Present); Director, Institute for Global Asset and Risk Management (Education) (2010-Present); Partner, S Capital Management, LLC (2007-2015); Director, CISDM at the University of Massachusetts, (1996-2013); President, Alternative Investment Analytics, LLC, (formerly Schneeweis Partners, LLC) (2001-2013); Professor of Finance, University of Massachusetts (1977-2013). |
AMG Funds
October 31, 2016
Additional Information (unaudited) – continued
| | |
Interested Trustees | | |
Number of Funds Overseen in Fund Complex | | Name, Age, Principal Occupation(s) During Past 5 Years and Other Directorships Held by Trustee |
● Trustee since 2016 ● Oversees 68 Funds in Fund Complex | | Christine C. Carsman, 64 Senior Vice President and Deputy General Counsel, Affiliated Managers Group, Inc. (2011-Present); Senior Vice President and Chief Regulatory Counsel, Affiliated Managers Group, Inc. (2007-2011); Vice President and Chief Regulatory Counsel, Affiliated Managers Group, Inc. (2004-2007); Secretary and Chief Legal Officer, AMG Funds, AMG Funds I, AMG Funds II and AMG Funds III (2004-2011); Senior Counsel, Vice President and Director of Operational Risk Management and Compliance, Wellington Management Company, LLP (1995-2004). |
Officers | | |
Position(s) Held with Fund and Length of Time Served | | Name, Age, Principal Occupation(s) During Past 5 Years |
● President since 2016 ● Principal Executive Officer since 2016 ● Chief Executive Officer since 2016 | | Jeffrey T. Cerutti, 48 Chief Executive Officer, AMG Funds LLC (2014-Present); Director, President and Principal, AMG Distributors, Inc. (2014-Present); President and Principal Executive Officer, AMG Funds, AMG Funds I, AMG Funds II, and AMG Funds III (2014-Present); President and Principal Executive Officer, AMG Funds IV (2016- Present); Chief Executive Officer, AMG Funds, AMG Funds I, AMG Funds II, AMG Funds III and AMG Funds IV, (2016-Present); Chief Executive Officer, Aston Asset Management, LLC (2016); President, VP Distributors, (2011-2014); Executive Vice President, Head of Distribution, Virtus Investment Partners, Inc. (2010-2014); Managing Director, Head of Sales, UBS Global Asset Management (2001-2010). |
| |
● Chief Operating Officer since 2016 | | Keitha L. Kinne, 58 Chief Operating Officer, AMG Funds LLC (2007-Present); Chief Investment Officer, AMG Funds LLC (2008-Present); Chief Operating Officer, AMG Distributors, Inc. (2007-Present); Chief Operating Officer, AMG Funds, AMG Funds I, AMG Funds II, and AMG Funds III (2007-Present); Chief Operating Officer, AMG Funds IV, (2016-Present); Chief Operating Officer and Chief Investment Officer, Aston Asset Management, LLC (2016); President and Principal Executive Officer, AMG Funds, AMG Funds I, AMG Funds II and AMG Funds III (2012-2014); Managing Partner, AMG Funds LLC (2007-2014); President, AMG Funds (2012- 2014); President, AMG Distributors, Inc. (2012-2014); Managing Director, Legg Mason & Co., LLC (2006-2007); Managing Director, Citigroup Asset Management (2004-2006). |
| |
● Secretary since 2015 ● Chief Legal Officer since 2016 | | Mark J. Duggan, 51 Senior Vice President and Senior Counsel, AMG Funds LLC (2015-Present); Secretary and Chief Legal Officer, AMG Funds, AMG Funds I, AMG Funds II and AMG Funds III (2015-Present); Secretary and Chief Legal Officer, AMG Funds IV (2016-Present); Secretary and Chief Legal Officer, Aston Funds, (2016); Attorney, K&L Gates, LLP (2009-2015). |
| |
● Chief Financial Officer since 2016 ● Treasurer since 2016 ● Principal Financial Officer since 2016 | | Donald S. Rumery, 58 Senior Vice President, Director of Mutual Funds Services, AMG Funds LLC (2005-Present); Principal Financial Officer, AMG Funds, AMG Funds I, AMG Funds II and AMG Funds III (2008-Present); Principal Financial Officer, AMG Funds IV, (2016-Present); Treasurer, AMG Funds, (1999-Present); Treasurer, AMG Funds III (1995-Present); Treasurer, (AMG Funds I and AMG Funds II (2000-Present); Treasurer and Chief Financial Officer, AMG Funds IV, (2016-Present); Chief Financial Officer, AMG Funds, AMG Funds I, AMG Funds II and AMG Funds III (2007-Present); Treasurer, Chief Financial Officer, Principal Financial Officer and Principal Accounting Officer, AMG Funds IV (2016); Treasurer and Chief Financial Officer, AMG Distributors, Inc. (2000-2012); Vice President, AMG Funds LLC, (1994-2004). |
| |
● Assistant Treasurer since 2016 | | John C. Ball, 40 Vice President, Assistant Treasurer, AMG Funds LLC (2014-Present); Assistant Treasurer, AMG Funds, AMG Funds I, AMG Funds II, and AMG Funds III (2014-Present); Assistant Treasurer, AMG Funds IV (2016-Present); Assistant Treasurer, Aston Funds, (2016); Vice President, State Street Corp. (2010-2014); Vice President, State Street International (Ireland) Limited (2007-2010). |
| |
● Chief Compliance Officer since 2016 | | Gerald F. Dillenburg, 49 Chief Compliance Officer, Code of Ethics Reporting Officer and Sarbanes Oxley Code of Ethics Compliance Officer, AMG Funds, AMG Funds I, AMG Funds II, AMG Funds III and AMG Funds IV (2016-Present); Chief Compliance Officer, Aston Funds (1996-2016); Chief Compliance Officer, Aston Asset Management, LLC (2006-2016); Treasurer, Aston Funds (1996-2010); Secretary, Aston Funds (1996-2015); Chief Financial Officer, Aston Funds (1997-2010); Chief Operating Officer, Aston Funds (2003-2016). |
| |
● Anti-Money Laundering Compliance Officer since 2016 | | Patrick J. Spellman, 42 Senior Vice President, Chief Compliance Officer, AMG Funds LLC (2011-Present); Chief Compliance Officer, AMG Distributors, Inc., (2010-Present); Anti- Money Laundering Compliance Officer, AMG Funds, AMG Funds I, AMG Funds II, and AMG Funds III (2014-Present); Anti-Money Laundering Compliance Officer, AMG Funds IV (2016-Present); Anti-Money Laundering Compliance Officer, Aston Funds, (2016); Compliance Manager, Legal and Compliance, Affiliated Managers Group, Inc. (2005-2011). |
| |
● Assistant Secretary since 2016 | | Maureen A. Meredith, 31 Vice President, Counsel, AMG Funds LLC (2015-Present); Assistant Secretary, AMG Funds, AMG Funds I, AMG Funds II, AMG Funds III and AMG Funds IV (2016-Present); Associate, Ropes & Gray LLP (2011-2015); Law Fellow, Massachusetts Appleseed Center for Law and Justice (2010-2011). |
| |
● Assistant Secretary since 2016 | | Diana M. Podgorny, 37 Vice President, Counsel, AMG Funds LLC (2016-Present); Assistant Secretary, AMG Funds, AMG Funds I, AMG Funds II, AMG Funds III and AMG Funds IV, (2016-Present); Assistant Secretary, Aston Funds (2010-2016); AMG Funds IV (2010-Present); Vice President, Counsel, Aston Asset Management, LLC (2010-2016). |
| |
● Assistant Secretary since 2016 | | Marc J. Peirce, 54 Vice President, Compliance Officer, AMG Funds LLC (2016-Present); Assistant Secretary, AMG Funds IV, (2016-Present); Vice President, Aston Asset Management, LLC (1998-2016); Assistant Secretary, Aston Funds, (2001-2016); Assistant Chief Compliance Officer, Aston Asset Management, LLC (2006-2016). |

INVESTMENT MANAGER AND
ADMINISTRATOR
AMG Funds LLC
600 Steamboat Road, Suite 300.
Greenwich, CT 06830
(800) 835-3879
DISTRIBUTOR
AMG Distributors, Inc.
600 Steamboat Road, Suite 300.
Greenwich, CT 06830
(800) 835-3879
CUSTODIAN
The Bank of New York Mellon
2 Hanson Place
Brooklyn, NY 11217
LEGAL COUNSEL
Ropes & Gray LLP
Prudential Tower, 800 Boylston Street
Boston, MA 02199-3600
TRANSFER AGENT
BNY Mellon Investment Servicing (US) Inc.
Attn: AMG Funds
P.O. Box 9769
Providence, RI 02940
(800) 548-4539
This report is prepared for the Funds’ shareholders. It is authorized for distribution to prospective investors only when preceded or accompanied by an effective prospectus. To receive a free copy of the prospectus or Statement of Additional Information, which includes additional information about Fund Trustees, please contact us by calling 800.835.3879. Distributed by AMG Distributors, Inc., member FINRA/SIPC.
Current net asset values per share for each Fund are available on the Funds’ website at www.amgfunds.com.
A description of the policies and procedures each Fund uses to vote its proxies is available: (i) without charge, upon request, by calling 800.835.3879, or (ii) on the Securities and Exchange Commission’s (SEC) Web site at www.sec.gov. For information regarding each Fund’s proxy voting record for the 12-month period ended June 30, call 800.835.3879 or visit the SEC Web site at www.sec.gov.
Each Fund files its complete schedule of portfolio holdings with the SEC for the first and third quarters of each fiscal year on Form N-Q. The Funds’ Forms N-Q are available on the SEC’s website at www.sec.gov. A Fund’s Forms N-Q may be reviewed and copied at the SEC’s Public Reference Room in Washington, DC. Information on the operation of the Public Reference Room may be obtained by calling 1-800-SEC-0330. To review a complete list of the Funds’ portfolio holdings, or to view the most recent quarterly holdings report, semiannual report, or annual report, please visit www.amgfunds.com.
AFFILIATE SUBADVISED FUNDS
BALANCED FUNDS
AMG Chicago Equity Partners
Balanced
Chicago Equity Partners, LLC
AMG FQ Global Risk-Balanced
First Quadrant, L.P.
EQUITY FUNDS
AMG Chicago Equity Partners Small
Cap Value
Chicago Equity Partners, LLC
AMG FQ Tax-Managed U.S. Equity
AMG FQ U.S. Equity
First Quadrant, L.P.
AMG Frontier Small Cap Growth
Frontier Capital Management Company, LLC
AMG GW&K Small Cap Core
AMG GW&K Small Cap Growth
AMG GW&K U.S. Small Cap Growth
GW&K Investment Management, LLC
AMG Renaissance International
Equity
AMG Renaissance Large Cap Growth
The Renaissance Group LLC
AMG River Road Dividend All Cap
Value
AMG River Road Dividend All Cap
Value II
AMG River Road Focused Absolute
Value
AMG River Road Long-Short
AMG River Road Select Value
AMG River Road Small Cap Value
River Road Asset Management, LLC
AMG SouthernSun Global
Opportunities
AMG SouthernSun Small Cap
AMG SouthernSun U.S. Equity
SouthernSun Asset Management, LLC
AMG Systematic Large Cap Value
AMG Systematic Mid Cap Value
Systematic Financial Management, L.P.
AMG TimesSquare All Cap Growth
AMG TimesSquare International
Small Cap
AMG TimesSquare Mid Cap Growth
AMG TimesSquare Small Cap
Growth
TimesSquare Capital Management, LLC
AMG Trilogy Emerging Markets
Equity
AMG Trilogy Emerging Wealth
Equity
AMG Trilogy Global Equity
AMG Trilogy International Small
Cap
Trilogy Global Advisors, L.P.
AMG Yacktman
AMG Yacktman Focused
AMG Yacktman Special
Opportunities
Yacktman Asset Management LP
FIXED INCOME FUNDS
AMG GW&K Core Bond
AMG GW&K Enhanced Core Bond
AMG GW&K Municipal Bond
AMG GW&K Municipal Enhanced
Yield
GW&K Investment Management, LLC
OPEN-ARCHITECTURE FUNDS
ALTERNATIVE FUNDS
AMG Managers Anchor Capital
Enhanced Equity
Anchor Capital Advisors LLC
AMG Managers Lake Partners
LASSO Alternatives
Lake Partners, Inc.
BALANCED FUNDS
AMG Managers Montag & Caldwell
Balanced
Montag & Caldwell, LLC
EQUITY FUNDS
AMG Managers Brandywine Advisors
Mid Cap Growth
AMG Managers Brandywine Blue
AMG Managers Brandywine
Friess Associates, LLC
AMG Managers Cadence Capital
Appreciation
AMG Managers Cadence Emerging
Companies
AMG Managers Cadence Mid Cap
Cadence Capital Management, LLC
AMG Managers CenterSquare Real
Estate
CenterSquare Investment Management, Inc.
AMG Managers Emerging
Opportunities
Lord, Abbett & Co. LLC
WEDGE Capital Management L.L.P.
Next Century Growth Investors LLC
RBC Global Asset Management (U.S.)
Inc.
AMG Managers Essex Small/Micro
Cap Growth
Essex Investment Management Co.,
LLC
AMG Managers Fairpointe Focused
Equity
AMG Managers Fairpointe Mid Cap
Fairpointe Capital LLC
AMG Managers Guardian Capital
Global Dividend
Guardian Capital LP
AMG Managers LMCG Small Cap
Growth
LMCG Investments, LLC
AMG Managers Montag & Caldwell
Growth
AMG Managers Montag & Caldwell
Mid Cap Growth
Montag & Caldwell, LLC
AMG Managers Pictet International
Pictet Asset Management Limited
AMG Managers Silvercrest Small
Cap
Silvercrest Asset Management Group
LLC
AMG Managers Skyline Special
Equities
Skyline Asset Management, L.P.
AMG Managers Special
Equity
Ranger Investment Management, L.P.
Lord, Abbett & Co. LLC
Smith Asset Management Group, L.P.
Federated MDTA LLC
AMG Managers Value Partners
Asia Dividend
Value Partners Hong Kong Limited
FIXED INCOME FUNDS
AMG Managers Amundi
Intermediate Government
AMG Managers Amundi Short
Duration Government
Amundi Smith Breeden LLC
AMG Managers Doubleline Core Plus
Bond
DoubleLine Capital LP
AMG Managers Global Income
Opportunity
AMG Managers Loomis Sayles Bond
Loomis, Sayles & Co., L.P.
AMG Managers High Yield
J.P. Morgan Investment Management Inc.
| | |
AR082-1016 | | www.amgfunds.com |
Item 2. Code of Ethics.
Registrant has adopted a Code of Ethics. See attached exhibit (a) (1).
Item 3. Audit Committee Financial Expert.
Registrant’s Board of Trustees has determined that independent Trustees Mr. Edward J. Kaier and Mr. Steven J. Paggioli each qualify as the Audit Committee Financial Expert. Mr. Kaier and Mr. Paggioli are “independent” as such term is defined in Form N-CSR.
Item 4. Principal Accountant Fees and Services.
Audit Fees
| | (a) | The aggregate fees billed for each of the last two fiscal years for professional services rendered by the principal accountant for the audit of the registrant’s annual financial statements or services that are normally provided by the accountant in connection with statutory and regulatory filings or engagements for those fiscal years are $389,373 for 2016 and $473,452 for 2015. |
Audit-Related Fees
| | (b) | There were no fees billed by PwC to the Funds in its two recent fiscal years for services rendered for assurance and related services that are reasonably related to the performance of the audit or review of the Fund’s financial statements, but are not reported as Audit Fees (“Audit-Related Fees”). |
| | | For the Funds’ two most recent fiscal years, there were no Audit-Related Fees billed by PwC for engagements related directly to the operations and financial reporting of one or more Funds by a Fund Service Provider. A Fund Service Provider is (a) any investment adviser to the Fund (not including any Subadvisor whose role is primarily portfolio management and is subcontracted with or overseen by another investment adviser) or (b) any entity that provides ongoing services to the Fund and is controlling, controlled by or under common control with a Fund investment adviser described in (a). |
Tax Fees
| | (c) | The aggregate fees billed in each of the last two fiscal years for professional services rendered by the principal accountant for tax compliance, tax advice, and tax planning are $109,701 for 2016 and $0 for 2015. |
| | | For the Funds’ two most recent fiscal years, Tax Fees billed by PwC for engagements by Fund Service Providers that related directly to the operations and financial reporting of the Funds were $0 for fiscal 2016 and $0 for fiscal 2015, respectively. |
| | | The services for which Tax Fees were charged comprise all services performed by professional staff in PwC’s tax division except those services related to the audit. Typically, this category would include fees for tax compliance, tax planning, and tax |
| | | advice. Tax compliance, tax advice, and tax planning services include preparation of original and amended tax returns, claims for refund and tax payment-planning services, assistance with tax audits and appeals, tax advice related to mergers and acquisitions and requests for rulings or technical advice from taxing authorities. |
All Other Fees
| | | There were no other fees billed by PwC to the Funds for all other non-audit services (“Other Fees”) during the Funds’ two most recent fiscal years. During the same period, there were no Other Fees billed by PwC for engagements by Fund Service Providers that related directly to the operations and financial reporting of the Funds. |
| | (e) | (1) According to policies adopted by the Audit Committee, services provided by PwC to the Funds must be pre-approved by the Audit Committee. On an annual basis, the Audit Committee reviews and pre-approves various types of services that PwC may perform for the Funds without specific approval of each engagement, subject to specified budget limitations. As contemplated by the Sarbanes-Oxley Act of 2002 and related SEC rules, the Audit Committee also pre-approves non-audit services provided by PwC to any Fund Service Provider for any engagement that relates directly to the operations and financial reporting of the Funds. Any engagement that is not already pre-approved or that will exceed a pre-approved budget must be submitted to the Audit Committee for pre-approval. The Chairman of the Audit Committee is authorized on behalf of the Board of Trustees and the Audit Committee to approve the engagement of PwC to perform non-audit services subject to certain conditions, including notification to the Audit Committee of such pre-approval not later than the next meeting of the Audit Committee following the date of such pre-approval. |
| | (g) | The aggregate non-audit fees billed by the registrant’s accountant for services rendered to the registrant, and rendered to the registrant’s investment adviser (not including any sub-adviser whose role is primarily portfolio management and is subcontracted with or overseen by another investment adviser), and any entity controlling, controlled by, or under common control with the adviser that provides ongoing services to the registrant for each of the last two fiscal years of the registrant was $142,101 for 2016 and $0 for 2015. |
| | (h) | The registrant’s audit committee of the board of trustees has considered whether the provision of non-audit services that were rendered to the registrant’s investment adviser (not including any sub-adviser whose role is primarily portfolio management and is subcontracted with or overseen by another investment adviser), and any entity controlling, controlled by, or under common control with the investment adviser that |
| | provides ongoing services to the registrant that were not pre-approved pursuant to paragraph (c)(7)(ii) of Rule 2-01 of Regulation S-X is compatible with maintaining the principal accountant’s independence. |
Item 5. Audit Committee of Listed Registrants.
Not applicable.
Item 6. Investments.
| (a) | Schedule of Investments in securities of unaffiliated issuers as of the close of the reporting period is included as part of the report to shareholders filed under Item 1 of this form. |
Item 7. Disclosure of Proxy Voting Policies and Procedures for Closed-End Management Investment Companies.
Not applicable.
Item 8. Portfolio Managers of Closed-End Management Investment Companies.
Not applicable.
Item 9. Purchases of Equity Securities by Closed-End Management Investment Company and Affiliated Purchasers.
Not applicable.
Item 10. Submission of Matters to a Vote of Security Holders.
There have been no material changes to the procedures by which the shareholders may recommend nominees to the registrant’s board of directors, where those changes were implemented after the registrant last provided disclosure in response to the requirements of Item 407(c)(2)(iv) of Regulation S-K (17 CFR 229.407) (as required by Item 22(b)(15) of Schedule 14A (17 CFR 240.14a-101)), or this Item.
Item 11. Controls and Procedures.
| | (a) | The Registrant’s principal executive and principal financial officers have concluded, based on their evaluation of the registrant’s disclosure controls and procedures as of a date within 90 days of the filing of this report, that the Registrant’s disclosure controls and procedures are reasonably designed to ensure that information required to be disclosed by the Registrant on Form N-CSR is recorded, processed, summarized and reported within the required time periods and that information required to be disclosed by the registrant in the reports that it files or submits on Form N-CSR is accumulated and communicated to the Registrant’s management, including its principal executive and principal financial officers, as appropriate to allow timely decisions regarding required disclosure. |
| | (b) | There were no changes in the Registrant’s internal control over financial reporting during the Registrant’s fourth fiscal quarter of the period covered by this report that have materially affected, or are reasonably likely to affect, the internal control over financial reporting. |
| | |
| Item 12. | | Exhibits. |
| |
| (a)(1) | | Code of ethics, or any amendment thereto, that is the subject of disclosure required by Item 2 is attached hereto. |
| |
| (a)(2) | | Certifications pursuant to Rule 30a-2(a) under the 1940 Act and Section 302 of the Sarbanes-Oxley Act of 2002 are attached hereto. |
| |
| (a)(3) | | Not applicable. |
| |
| (b) | | Certifications pursuant to Rule 30a-2(b) under the 1940 Act and Section 906 of the Sarbanes- Oxley Act of 2002 are attached hereto. |
SIGNATURES
Pursuant to the requirements of the Securities Exchange Act of 1934 and the Investment Company Act of 1940, the registrant has duly caused this report to be signed on its behalf by the undersigned, thereunto duly authorized.
| | |
| (Registrant) | | AMG Funds IV |
| | |
| By (Signature and Title)* | | /s/ Jeffrey T. Cerutti |
| | Jeffrey T. Cerutti, Principal Executive Officer |
|
| Date January 6, 2017 |
Pursuant to the requirements of the Securities Exchange Act of 1934 and the Investment Company Act of 1940, this report has been signed below by the following persons on behalf of the registrant and in the capacities and on the dates indicated.
| | |
| By (Signature and Title)* | | /s/ Jeffrey T. Cerutti |
| | Jeffrey T. Cerutti, Principal Executive Officer |
|
| Date January 6, 2017 |
| | |
| By (Signature and Title)* | | /s/ Donald S. Rumery |
| | Donald S. Rumery, Principal Financial Officer |
|
| Date January 6, 2017 |