UNITED STATES
SECURITIES AND EXCHANGE COMMISSION
Washington, D.C. 20549
FORM N-CSR
CERTIFIED SHAREHOLDER REPORT OF REGISTERED
MANAGEMENT INVESTMENT COMPANIES
Investment Company Act file number 811-08004
AMG Funds IV
(Exact name of registrant as specified in charter)
600 Steamboat Road, Suite 300,
Greenwich, Connecticut 06830
(Address of principal executive offices) (Zip code)
AMG Funds LLC
600 Steamboat Road, Suite 300,
Greenwich, Connecticut 06830
(Name and address of agent for service)
Registrant’s telephone number, including area code: (203) 299-3500
Date of fiscal year end: October 31
Date of reporting period: November 1, 2017 - October 31, 2018
(Annual Shareholder Report)
Item 1. Reports to Stockholders.
| | |
 | | ANNUAL REPORT |
AMG Funds
October 31, 2018
AMG Funds
Class N, I, R & Z Shares
Equity
Fixed Income
Alternative
International
| | | | | | | | |
amgfunds.com | | | 103118 | | | | AR082 | |
AMG Funds
Annual Report — October 31, 2018
Nothing contained herein is to be considered an offer, sale or solicitation of an offer to buy shares of any series of the AMG Funds family of mutual funds. Such offering is made only by prospectus, which includes details as to offering price and other material information.
| | |
| | Letter to Shareholders |
Dear Shareholder:
The fiscal year ended October 31, 2018, was a period of mixed results for global financial markets. The global economic expansion supported strong investor sentiment early in the year before giving way to higher volatility amid a backdrop of tightening monetary policy and uncertainty around global trade policy. U.S. equities were resilient despite the volatility as the S&P 500® Index, a broad gauge of U.S. equity performance, returned 7.35% over the full fiscal year. The U.S. bull market continued into its 10th year having gained 390% since the market bottom on March 9, 2009.
Economic conditions outside the U.S. have been mixed. At the European Central Bank’s (ECB) most recent monetary policy meeting, the governing council confirmed that the European economy showed signs of continued, though slightly slower, growth and inflation progressing toward its target level. After nine months of strength, global economic growth began to show signs of deceleration in the third quarter of 2018. Although the Purchasing Managers Index, a leading economic indicator, remained slightly above the all-important level of 50 for the five largest global economies, only the United States increased from one year prior. Global interest rate policies remain accommodative, but the ECB has continued on its path to conclude its bond buying program at the end of 2018 and the Bank of England increased its target rate.
Nine of eleven economic sectors of the S&P 500® Index were positive during the 12-month reporting period, but there was significant dispersion in performance across sectors. Information technology, consumer discretionary, and healthcare all ended the period with positive double-digit returns of 16.70%, 15.69%, and 11.32%, respectively. Financials, industrials, and materials significantly lagged the broader benchmark with returns of 0.66%, (1.09)%, and (9.53)%, respectively. Overall, corporate earnings in the third quarter were better than expected with 78% of the companies in the S&P 500® Index beating the consensus earnings per share estimate.1 Growth stocks continued to outperform value with returns of 10.71% and 3.03% for the Russell 1000® Growth and Russell 1000® Value Indexes, respectively. International equities and emerging markets demonstrated significantly weaker returns, with the MSCI All Country World Index ex-USA and MSCI Emerging Markets Index returning (8.24)% and (12.52)%, respectively, in the 12 months ending October 31, 2018. Two rounds of new U.S. tariffs for Chinese imports and signs of a slowing economy acted as a drag on the largest economy within the MSCI Emerging Markets Index. Concurrently, the U.S. Dollar strengthened against most major global currencies, particularly in emerging markets, where those with large current account deficits faced significant pressure adding to the drag on performance for emerging markets.
Tightening U.S. Federal Reserve policy and higher interest rates eroded the performance of bonds. The Bloomberg Barclays U.S. Aggregate Bond Index, a broad measure of U.S. bond market performance, turned negative with (2.05)% return for the 12 months ending October 31, 2018. The yield on the 10-year U.S. Treasury note crossed above 3% at the end of September despite market speculation that the December rate hike may not materialize. During the past year, the short end of the yield curve has risen faster than the longer end, resulting in the 2–10 year Treasury spread falling (0.5)%. Bond investors willing to accept more credit risk were rewarded with higher returns as high yield bonds performed strongly and credit spreads tightened over most of the fiscal year. The Bloomberg Barclays U.S. Corporate High Yield Bond Index ended the period with a 0.97% return.
| 1 | Source: FactSet, Based on the 74% of S&P 500® companies which had reported third quarter earnings as of November 2, 2018. |
AMG Funds appreciates the privilege of providing investment tools to you and your clients. Our foremost goal is to provide investment solutions that help our shareholders successfully reach their long-term investment goals. AMG Funds provides access to a distinctive array of actively managed return-oriented investment strategies. We thank you for your continued confidence and investment in AMG Funds. You can rest assured that under all market conditions our team is focused on delivering excellent investment management services for your benefit.
Respectfully,

| | | | | | | | | | | | | | |
Average Annual Total Returns | | Periods ended
October 31, 2018* | |
| | | | | 1 Year | | | 3 Years | | | 5 Years | |
Stocks: | | | | | | | | | | | | | | |
Large Caps | | (S&P 500® Index) | | | 7.35% | | | | 11.52% | | | | 11.34% | |
Small Caps | | (Russell 2000® Index) | | | 1.85% | | | | 10.68% | | | | 8.01% | |
International | | (MSCI All Country World Index ex USA) | | | (8.24 | )% | | | 4.37% | | | | 1.63% | |
Bonds: | | | | | | | | | | | | | | |
Investment Grade | | (Bloomberg Barclays U.S. Aggregate Bond Index) | | | (2.05 | )% | | | 1.04% | | | | 1.83% | |
High Yield | | (Bloomberg Barclays U.S. Corporate High Yield Bond Index) | | | 0.97% | | | | 6.60% | | | | 4.68% | |
Tax-exempt | | (Bloomberg Barclays Municipal Bond Index) | | | (0.51 | )% | | | 1.90% | | | | 3.25% | |
Treasury Bills | | (BofA Merrill Lynch 6-Month U.S. Treasury Bill) | | | 1.68% | | | | 1.05% | | | | 0.70% | |
| * | Source: FactSet. Past performance is no guarantee of future results. |
2
About Your Fund’s Expenses
As a shareholder of a Fund, you may incur two types of costs: (1) transaction costs, which may include sales charges (loads) on purchase payments; redemption fees; and exchange fees; and (2) ongoing costs, including management fees; distribution (12b-1) fees; and other Fund expenses. This example is intended to help you understand your ongoing costs (in dollars) of investing in the Fund and to compare these costs with the ongoing costs of investing in other mutual funds. The example is based on $1,000 invested at the beginning of the period and held for the entire period as indicated below.
ACTUAL EXPENSES
The first line of the following table provides information about the actual account values and
actual expenses. You may use the information in this line, together with the amount you invested, to estimate the expenses that you paid over the period. Simply divide your account value by $1,000 (for example, an $8,600 account value divided by $1,000 = 8.6), then multiply the result by the number in the first line under the heading entitled “Expenses Paid During Period” to estimate the expenses you paid on your account during this period.
HYPOTHETICAL EXAMPLE FOR COMPARISON PURPOSES
The second line of the following table provides information about hypothetical account values and hypothetical expenses based on the Fund’s actual expense ratio and an assumed annual rate of return of 5% before expenses, which is not the Fund’s
actual return. The hypothetical account values and expenses may not be used to estimate the actual ending account balance or expenses you paid for the period. You may use this information to compare the ongoing costs of investing in the Fund and other funds by comparing this 5% hypothetical example with the 5% hypothetical examples that appear in the shareholder reports of other funds.
Please note that the expenses shown in the table are meant to highlight your ongoing costs only and do not reflect any transactional costs, such as sales charges (loads), redemption fees, or exchange fees. Therefore, the second line of the table is useful in comparing ongoing costs only, and will not help you determine the relative total costs of owning different funds.
| | | | | | | | | | | | |
Six Months Ended
October 31, 2018 | | Expense
Ratio for
the Period | | Beginning
Account
Value
05/01/18 | | | Ending
Account
Value
10/31/18 | | | Expenses
Paid
During
the Period* |
AMG Managers Fairpointe ESG Equity Fund |
Based on Actual Fund Return | | | | | | | |
Class N | | 1.10% | | $ | 1,000 | | | $ | 952 | | | $5.41 |
Class I | | 0.90% | | $ | 1,000 | | | $ | 953 | | | $4.43 |
Based on Hypothetical 5% Annual Return |
Class N | | 1.10% | | $ | 1,000 | | | $ | 1,020 | | | $5.60 |
Class I | | 0.90% | | $ | 1,000 | | | $ | 1,021 | | | $4.58 |
| | | | | | | | | | | | | | | | |
Six Months Ended
October 31, 2018 | | Expense
Ratio for
the Period | | | Beginning
Account
Value
05/01/18 | | | Ending
Account
Value
10/31/18 | | | Expenses
Paid
During
the Period* | |
AMG River Road Focused Absolute Value Fund | |
Based on Actual Fund Return | | | | | | | | | |
Class N | | | 1.00 | % | | $ | 1,000 | | | $ | 1,062 | | | $ | 5.20 | |
Class I | | | 0.75 | % | | $ | 1,000 | | | $ | 1,063 | | | $ | 3.90 | |
Class Z | | | 0.71 | % | | $ | 1,000 | | | $ | 1,063 | | | $ | 3.69 | |
Based on Hypothetical 5% Annual Return | |
Class N | | | 1.00 | % | | $ | 1,000 | | | $ | 1,020 | | | $ | 5.09 | |
Class I | | | 0.75 | % | | $ | 1,000 | | | $ | 1,021 | | | $ | 3.82 | |
Class Z | | | 0.71 | % | | $ | 1,000 | | | $ | 1,022 | | | $ | 3.62 | |
3
About Your Fund’s Expenses (continued)
| | | | | | | | | | | | | | | | |
Six Months Ended
October 31, 2018 | | Expense Ratio for
the Period | | | Beginning
Account
Value
05/01/18 | | | Ending
Account
Value
10/31/18 | | | Expenses
Paid
During
the Period* | |
AMG Managers Montag & Caldwell Growth Fund | |
Based on Actual Fund Return | | | | | | | | | | | | | |
Class N | | | 1.12 | % | | $ | 1,000 | | | $ | 1,033 | | | $ | 5.74 | |
Class I | | | 0.96 | % | | $ | 1,000 | | | $ | 1,034 | | | $ | 4.92 | |
Class R | | | 1.46 | % | | $ | 1,000 | | | $ | 1,032 | | | $ | 7.48 | |
Based on Hypothetical 5% Annual Return | | | | | | | | | |
Class N | | | 1.12 | % | | $ | 1,000 | | | $ | 1,020 | | | $ | 5.70 | |
Class I | | | 0.96 | % | | $ | 1,000 | | | $ | 1,020 | | | $ | 4.89 | |
Class R | | | 1.46 | % | | $ | 1,000 | | | $ | 1,018 | | | $ | 7.43 | |
AMG River Road Dividend All Cap Value Fund | | | | | | | | | |
Based on Actual Fund Return | | | | | | | | | | | | | |
Class N | | | 1.11 | % | | $ | 1,000 | | | $ | 1,017 | | | $ | 5.64 | |
Class I | | | 0.83 | % | | $ | 1,000 | | | $ | 1,019 | | | $ | 4.22 | |
Class Z | | | 0.79 | % | | $ | 1,000 | | | $ | 1,018 | | | $ | 4.02 | |
Based on Hypothetical 5% Annual Return | | | | | | | | | |
Class N | | | 1.11 | % | | $ | 1,000 | | | $ | 1,020 | | | $ | 5.65 | |
Class I | | | 0.83 | % | | $ | 1,000 | | | $ | 1,021 | | | $ | 4.23 | |
Class Z | | | 0.79 | % | | $ | 1,000 | | | $ | 1,021 | | | $ | 4.02 | |
AMG River Road Dividend All Cap Value Fund II | | | | | | | | | |
Based on Actual Fund Return | | | | | | | | | | | | | |
Class N | | | 1.22 | % | | $ | 1,000 | | | $ | 1,022 | | | $ | 6.22 | |
Class I | | | 0.93 | % | | $ | 1,000 | | | $ | 1,024 | | | $ | 4.74 | |
Class Z | | | 0.86 | % | | $ | 1,000 | | | $ | 1,023 | | | $ | 4.39 | |
Based on Hypothetical 5% Annual Return | | | | | | | | | |
Class N | | | 1.22 | % | | $ | 1,000 | | | $ | 1,019 | | | $ | 6.21 | |
Class I | | | 0.93 | % | | $ | 1,000 | | | $ | 1,021 | | | $ | 4.74 | |
Class Z | | | 0.86 | % | | $ | 1,000 | | | $ | 1,021 | | | $ | 4.38 | |
| | | | | | | | | | | | | | | | |
Six Months Ended
October 31, 2018 | | Expense Ratio for
the Period | | | Beginning
Account
Value
05/01/18 | | | Ending
Account
Value
10/31/18 | | | Expenses
Paid
During
the Period* | |
AMG Managers Fairpointe Mid Cap Fund | | | | | | | | | |
Based on Actual Fund Return | | | | | | | | | | | | | |
Class N | | | 1.13 | % | | $ | 1,000 | | | $ | 951 | | | $ | 5.56 | |
Class I | | | 0.88 | % | | $ | 1,000 | | | $ | 952 | | | $ | 4.33 | |
Class Z | | | 0.80 | % | | $ | 1,000 | | | $ | 953 | | | $ | 3.94 | |
Based on Hypothetical 5% Annual Return | | | | | | | | | |
Class N | | | 1.13 | % | | $ | 1,000 | | | $ | 1,020 | | | $ | 5.75 | |
Class I | | | 0.88 | % | | $ | 1,000 | | | $ | 1,021 | | | $ | 4.48 | |
Class Z | | | 0.80 | % | | $ | 1,000 | | | $ | 1,021 | | | $ | 4.08 | |
AMG Managers LMCG Small Cap Growth Fund | | | | | | | | | |
Based on Actual Fund Return | | | | | | | | | | | | | |
Class N | | | 1.30 | % | | $ | 1,000 | | | $ | 1,036 | | | $ | 6.67 | |
Class I | | | 1.13 | % | | $ | 1,000 | | | $ | 1,037 | | | $ | 5.80 | |
Based on Hypothetical 5% Annual Return | | | | | | | | | |
Class N | | | 1.30 | % | | $ | 1,000 | | | $ | 1,019 | | | $ | 6.61 | |
Class I | | | 1.13 | % | | $ | 1,000 | | | $ | 1,020 | | | $ | 5.75 | |
AMG River Road Small-Mid Cap Value Fund | | | | | | | | | |
Based on Actual Fund Return | | | | | | | | | | | | | |
Class N | | | 1.32 | % | | $ | 1,000 | | | $ | 1,033 | | | $ | 6.76 | |
Class I | | | 1.09 | % | | $ | 1,000 | | | $ | 1,035 | | | $ | 5.59 | |
Class Z | | | 1.04 | % | | $ | 1,000 | | | $ | 1,033 | | | $ | 5.33 | |
Based on Hypothetical 5% Annual Return | | | | | | | | | |
Class N | | | 1.32 | % | | $ | 1,000 | | | $ | 1,019 | | | $ | 6.72 | |
Class I | | | 1.09 | % | | $ | 1,000 | | | $ | 1,020 | | | $ | 5.55 | |
Class Z | | | 1.04 | % | | $ | 1,000 | | | $ | 1,020 | | | $ | 5.30 | |
AMG River Road Small Cap Value Fund | | | | | | | | | |
Based on Actual Fund Return | | | | | | | | | | | | | |
Class N | | | 1.36 | % | | $ | 1,000 | | | $ | 1,012 | | | $ | 6.90 | |
Class I | | | 1.11 | % | | $ | 1,000 | | | $ | 1,013 | | | $ | 5.63 | |
Class Z | | | 1.01 | % | | $ | 1,000 | | | $ | 1,013 | | | $ | 5.12 | |
Based on Hypothetical 5% Annual Return | | | | | | | | | |
Class N | | | 1.36 | % | | $ | 1,000 | | | $ | 1,018 | | | $ | 6.92 | |
Class I | | | 1.11 | % | | $ | 1,000 | | | $ | 1,020 | | | $ | 5.65 | |
Class Z | | | 1.01 | % | | $ | 1,000 | | | $ | 1,020 | | | $ | 5.14 | |
4
About Your Fund’s Expenses (continued)
| | | | | | | | | | | | | | | | |
| | | | | | Beginning | | | Ending | | | Expenses | |
| | | Expense | | | Account | | | Account | | | Paid | |
| Six Months Ended | | Ratio for | | | Value | | | Value | | | During | |
| October 31, 2018 | | the Period | | | 05/01/18 | | | 10/31/18 | | | the Period* | |
AMG Managers Silvercrest Small Cap Fund | | | | | | | | | |
Based on Actual Fund Return | | | | | | | | | | | | | |
Class N | | | 1.38 | % | | $ | 1,000 | | | $ | 969 | | | $ | 6.85 | |
Class I | | | 1.15 | % | | $ | 1,000 | | | $ | 970 | | | $ | 5.71 | |
Class Z | | | 1.08 | % | | $ | 1,000 | | | $ | 970 | | | $ | 5.36 | |
Based on Hypothetical 5% Annual Return | | | | | | | | | |
Class N | | | 1.38 | % | | $ | 1,000 | | | $ | 1,018 | | | $ | 7.02 | |
Class I | | | 1.15 | % | | $ | 1,000 | | | $ | 1,019 | | | $ | 5.85 | |
Class Z | | | 1.08 | % | | $ | 1,000 | | | $ | 1,020 | | | $ | 5.50 | |
AMG GW&K U.S. Small Cap Growth Fund | | | | | | | | | |
Based on Actual Fund Return | | | | | | | | | | | | | |
Class N | | | 1.20 | % | | $ | 1,000 | | | $ | 993 | | | $ | 6.03 | |
Class I | | | 1.00 | % | | $ | 1,000 | | | $ | 996 | | | $ | 5.03 | |
Class Z | | | 0.90 | % | | $ | 1,000 | | | $ | 996 | | | $ | 4.53 | |
Based on Hypothetical 5% Annual Return | | | | | | | | | |
Class N | | | 1.20 | % | | $ | 1,000 | | | $ | 1,019 | | | $ | 6.11 | |
Class I | | | 1.00 | % | | $ | 1,000 | | | $ | 1,020 | | | $ | 5.09 | |
Class Z | | | 0.90 | % | | $ | 1,000 | | | $ | 1,021 | | | $ | 4.58 | |
AMG Managers DoubleLine Core Plus Bond Fund | | | | | |
Based on Actual Fund Return | | | | | | | | | | | | | |
Class N | | | 0.94 | % | | $ | 1,000 | | | $ | 1,000 | | | $ | 4.74 | |
Class I | | | 0.69 | % | | $ | 1,000 | | | $ | 1,002 | | | $ | 3.48 | |
Class Z | | | 0.61 | % | | $ | 1,000 | | | $ | 1,003 | | | $ | 3.08 | |
Based on Hypothetical 5% Annual Return | | | | | | | | | |
Class N | | | 0.94 | % | | $ | 1,000 | | | $ | 1,020 | | | $ | 4.79 | |
Class I | | | 0.69 | % | | $ | 1,000 | | | $ | 1,022 | | | $ | 3.52 | |
Class Z | | | 0.61 | % | | $ | 1,000 | | | $ | 1,022 | | | $ | 3.11 | |
AMG Managers Lake Partners LASSO Alternatives Fund | | | | | |
Based on Actual Fund Return | | | | | | | | | | | | | |
Class N | | | 1.40 | % | | $ | 1,000 | | | $ | 971 | | | $ | 6.96 | |
Class I | | | 1.15 | % | | $ | 1,000 | | | $ | 972 | | | $ | 5.72 | |
Based on Hypothetical 5% Annual Return | | | | | | | | | |
Class N | | | 1.40 | % | | $ | 1,000 | | | $ | 1,018 | | | $ | 7.12 | |
Class I | | | 1.15 | % | | $ | 1,000 | | | $ | 1,019 | | | $ | 5.85 | |
| | | | | | | | | | | | | | | | |
| | | | | | Beginning | | | Ending | | | Expenses | |
| | | Expense | | | Account | | | Account | | | Paid | |
| Six Months Ended | | Ratio for | | | Value | | | Value | | | During | |
| October 31, 2018 | | the Period | | | 05/01/18 | | | 10/31/18 | | | the Period* | |
AMG River Road Long-Short Fund** | | | | | | | | | |
Based on Actual Fund Return | | | | | | | | | | | | | |
Class N | | | 1.45 | % | | $ | 1,000 | | | $ | 992 | | | $ | 7.28 | |
Class I | | | 1.20 | % | | $ | 1,000 | | | $ | 993 | | | $ | 6.03 | |
Class Z | | | 1.12 | % | | $ | 1,000 | | | $ | 993 | | | $ | 5.63 | |
Based on Hypothetical 5% Annual Return | | | | | | | | | |
Class N | | | 1.45 | % | | $ | 1,000 | | | $ | 1,018 | | | $ | 7.37 | |
Class I | | | 1.20 | % | | $ | 1,000 | | | $ | 1,019 | | | $ | 6.11 | |
Class Z | | | 1.12 | % | | $ | 1,000 | | | $ | 1,020 | | | $ | 5.70 | |
AMG Managers Guardian Capital Global Dividend Fund | | | | | |
Based on Actual Fund Return | | | | | | | | | | | | | |
Class N | | | 1.10 | % | | $ | 1,000 | | | $ | 976 | | | $ | 5.48 | |
Class I | | | 1.05 | % | | $ | 1,000 | | | $ | 976 | | | $ | 5.23 | |
Based on Hypothetical 5% Annual Return | | | | | | | | | |
Class N | | | 1.10 | % | | $ | 1,000 | | | $ | 1,020 | | | $ | 5.60 | |
Class I | | | 1.05 | % | | $ | 1,000 | | | $ | 1,020 | | | $ | 5.35 | |
AMG Managers Pictet International Fund | | | | | | | | | |
Based on Actual Fund Return | | | | | | | | | | | | | |
Class N | | | 1.30 | % | | $ | 1,000 | | | $ | 883 | | | $ | 6.17 | |
Class I | | | 1.04 | % | | $ | 1,000 | | | $ | 883 | | | $ | 4.94 | |
Class Z | | | 0.93 | % | | $ | 1,000 | | | $ | 884 | | | $ | 4.42 | |
Based on Hypothetical 5% Annual Return | | | | | | | | | |
Class N | | | 1.30 | % | | $ | 1,000 | | | $ | 1,019 | | | $ | 6.61 | |
Class I | | | 1.04 | % | | $ | 1,000 | | | $ | 1,020 | | | $ | 5.30 | |
Class Z | | | 0.93 | % | | $ | 1,000 | | | $ | 1,021 | | | $ | 4.74 | |
AMG Managers Value Partners Asia Dividend Fund | | | | | |
Based on Actual Fund Return | | | | | | | | | | | | | |
Class N | | | 1.17 | % | | $ | 1,000 | | | $ | 824 | | | $ | 5.38 | |
Class I | | | 1.15 | % | | $ | 1,000 | | | $ | 824 | | | $ | 5.29 | |
Based on Hypothetical 5% Annual Return | | | | | | | | | |
Class N | | | 1.17 | % | | $ | 1,000 | | | $ | 1,019 | | | $ | 5.96 | |
Class I | | | 1.15 | % | | $ | 1,000 | | | $ | 1,019 | | | $ | 5.85 | |
| * | Expenses are equal to the Fund’s annualized expense ratio multiplied by the average account value over the period, multiplied by the number of days in the most recent fiscal half-year (184), then divided by 365. |
| ** | Excludes interest expense and dividends on short positions. If included, your annualized expense ratios would be 2.88%, 2.63% and 2.55% for Class N, Class I and Class Z, respectively, and your actual and hypothetical expenses paid during the period would be $14.46, $13.21 and $12.81, and $14.60, $13.34 and 12.93 for Class N, Class I and Class Z, respectively. |
5
AMG Managers Fairpointe ESG Equity Fund
Portfolio Manager’s Comments (unaudited)
OVERVIEW
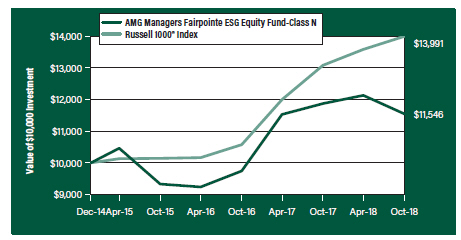
The AMG Managers Fairpointe ESG Equity Fund (the “Fund”) Class N shares returned (2.73)% for the fiscal year ended October 31, 2018, underperforming the Russell 1000® Index, which returned 6.98%. The Fund’s strategy is characterized by a long-term view, a portfolio of high-conviction investments, a focus on purchasing securities at a significant discount to fair value, and a willingness to hold (and add to) positions through volatile markets.
As of September, Fairpointe Capital LLC is proud to be a signatory of the Principles for Responsible Investment (PRI). By signing this agreement, we formally acknowledge our commitment to incorporating ESG factors into our investment analysis and decision-making process. This commitment is an extension of our long-established active ownership and engagement with our portfolio companies.
The United Nations climate report published in October highlights the impending risks of increased greenhouse gases and temperatures around the world. The concern is very real, and we are already seeing the impact globally and in the U.S. with greater destruction from hurricanes, wild fires, and floods. These changes have already exacted significant costs and over time will lead to food shortages, health issues, and changes in migration patterns. A small set of fossil fuel producers are responsible for 71%1 of global emissions. None of these companies are held, and the Fund has a very low carbon footprint as measured by MSCI ESG Research LLC.
In terms of governance, there is an increasing emphasis on the diversity of corporate boards. As an example, in October California enacted a law requiring publicly traded companies that are headquartered in the state to have at least one woman on their boards by the end of 2019 (with higher numbers required over time). We believe goal setting will help encourage accountability by pushing companies to measure and report their progress. Research indicates that board diversity is highly correlated with improved shareholder value and company performance. Diversity on key committees, such as nominating and compensation, also contributes to improved governance. Of course, we scrutinize all board members for their qualifications. Of our 42 current holdings, all have at least one female director, and ten have surpassed the 30% target espoused by The Thirty Percent Coalition (founded in 2011 as a pioneer advocacy organization working for diversity in the corporate boardroom).
As portfolio managers of an ESG Fund, our objective is to find companies that have strong ESG characteristics and that will outperform the market over the long term. We work actively with management teams in order to assess their awareness of environmental, social, and corporate governance issues. For over ten years we have served as active shareholders who use proxy voting processes, as well as regular engagement with management, to support positive changes. Corporate diversity (both at the board level and management) is a key focus, along with our attention to environmental impact policies and demonstrated commitment to employee welfare.
FISCAL YEAR REVIEW
Market volatility continued in the fiscal year, as concerns about trade wars and the global economic outlook persisted. Overall, however, U.S. equities had a strong year, driven by robust earnings reports, tax cuts, and share buybacks. For the year, the Fund returned (2.73)%, lagging the Russell 1000® Index up 6.98%.
Our largest contributors were Hormel Foods Corporation (HRL), Akamai Technologies, Inc. (AKAM), Scholastic Corporation (SCHL), Cisco Systems, Inc. (CSCO), and Tractor Supply Company (TSCO).
Hormel produces meat and other food products, including brands Skippy, SPAM, Applegate, Justin’s nut butters, Wholly Guacamole, and Jennie-O turkeys. Despite headwinds in the markets for pork and turkey, Hormel has recorded increased earnings per share in 2018. For the fiscal year ending in October 2018 earnings per share are expected to be up more than 16% from fiscal 2017. The company is committed to increasing revenues and earnings through organic growth and acquisitions while maintaining a strong balance sheet. The stock moved up during the year as the company executed this plan. We believe corporate governance has improved dramatically with board changes, adoption of majority voting, and proxy access. The community and employee marks are high. Furthermore, the company has diversified its product line to include healthier food items.
Akamai Technologies has a network of internet servers located worldwide to provide content delivery and cloud infrastructure services to its customers. After an activist acquired the stock and the company conducted an internal strategic review resulting in a 5% headcount reduction, profitability improved throughout 2018. Although the legacy content delivery business has experienced a
slowdown in revenue growth as some of the company’s largest customers have developed internal delivery networks, revenue from other clients continues to grow. Cloud security products have shown strong growth and now account for more than 20% of overall revenues. We rate Akamai highly on all three pillars of ESG with its strong corporate governance plus its usage of energy offsets with wind investments.
Scholastic performed well due to strong children’s books and education revenue gains in the quarter. A new series Dog Man has been on the New York Times Best Seller list. They have a strong franchise that generates stable recurring revenues. The company has a robust sustainable paper sourcing policy and has been proactive in addressing environmental concerns around deforestation. We believe management takes a long-term view and has very high stock ownership, which aligns interests with shareholders, although voting power is controlled by the Robinson family.
Detractors for the fiscal year were McDermott International, Inc. (MDR), General Electric Company (GE), Patterson Companies, Inc. (PDCO), International Business Machines Corporation (IBM), and Lions Gate Entertainment Corporation (LGF.B).
McDermott, an oil services provider, has declined due to persistent cost overruns on three large construction projects inherited as part of its acquisition of Chicago Bridge & Iron. The additional expenses have put pressure on McDermott’s balance sheet and delayed the paying down of debt related to the acquisition. It is our view that McDermott’s strong management team has taken the necessary steps to ensure the long-term successful integration of Chicago Bridge & Iron. We believe the combination creates a powerful, worldwide competitor with industry-leading onshore-offshore integration capabilities. McDermott scores well in our book for governance, employee treatment, and environmental impact. However, they are at risk for exposure to corruption in foreign operations due to their geographic footprint. The fund exited its position in McDermott during the period.
Our second greatest detractor for the period was General Electric. After disappointing results in the company’s power segment, a new CEO was named, Larry Culp, formerly a star performer at Danaher. We like the fact that his compensation is heavily weighted to stock appreciation. The other two core divisions of aviation and healthcare are performing
6
AMG Managers Fairpointe ESG Equity Fund
Portfolio Manager’s Comments (continued)
in line with expectations and are producing sustainable energy systems like digital wind farms, oxide fuel cells, and new locomotive engines with significantly reduced emissions. The ongoing restructuring does raise the potential for employee satisfaction.
Patterson Companies is the second largest dental products distributor and the largest animal health distributor in the U.S. Revenue has been pressured by a recent IT system implementation, which caused the sales force to divert efforts to customer service. The new CEO is conducting a strategic review of the company and has hired additional sales representatives. We believe he has a good grasp of
the issues and has a plan to improve the lagging dental results. Patterson has a top score from us for its product safety and quality, strong corporate governance with good diversity on the board.
POSITIONING AND OUTLOOK- ATTRACTIVE FUNDAMENTALS
The valuation of the Fund continues to have a significant discount to that of the market—with a P/E of 13.6x 2019 projected earnings, compared to 15.1x for the Russell 1000® Index2.
Our stock purchases and sales remain guided by a fundamental bottom-up approach with a careful eye on valuation and long-term perspective. We
integrate this fundamental investment analysis with our ESG evaluation with a focus on the carbon footprint and diversity within the company and board. We continue to believe that companies that behave responsibly with attractive valuations and sustained earnings will be recognized by the market over time.
The views expressed represent the opinions of Fairpointe Capital LLC, as of October 31, 2018, and are not intended as a forecast or guarantee of future results and are subject to change without notice.
7
AMG Managers Fairpointe ESG Equity Fund
Portfolio Manager’s Comments (continued)
CUMULATIVE TOTAL RETURN PERFORMANCE
AMG Managers Fairpointe ESG Equity Fund’s cumulative total return is based on the daily change in net asset value (NAV), and assumes that all dividends and distributions were reinvested. The graph compares a hypothetical $10,000 investment made in the AMG Managers Fairpointe ESG Equity Fund’s Class N shares on December 24, 2014, to a $10,000 investment made in the Russell 1000® Index for the same time period. The graph and table do not reflect the deduction of taxes that a shareholder would pay on a Fund distribution or redemption of shares. The listed returns for the Fund are net of expenses and the returns for the index exclude expenses.
Total returns would have been lower had certain expenses not been reduced.
The table below shows the average annual total returns for the AMG Managers Fairpointe ESG Equity Fund, the Russell 1000® Index for the same time periods ended October 31, 2018.
| | | | | | | | | | | | |
| | | One | | | Since | | | Inception | |
| Average Annual Total Returns1 | | Year | | | Inception | | | Date | |
AMG Managers Fairpointe ESG Equity
Fund2, 3, 4, 5, 6, 7, 8 | | | | | | | | | | | | |
Class N | | | (2.73 | %) | | | 3.80 | % | | | 12/24/14 | |
Class I | | | (2.54 | %) | | | 4.02 | % | | | 12/24/14 | |
Russell 1000® Index9 | | | 6.98 | % | | | 9.10 | % | | | 12/24/14 | † |
The performance data shown represents past performance. Past performance is not a guarantee of future results. Current performance may be lower or higher than the performance data quoted. The investment return and principal value of an investment will fluctuate so that an investor’s shares, when redeemed, may be worth more or less than their original cost.
Investors should carefully consider the Fund’s investment objectives, risks, charges and expenses before investing. For performance information through the most recent month end, current net asset values per share for the Fund and other information, please call 800.835.3879 or visit our website at amgfunds.com for a free prospectus. Read it carefully before investing or sending money.
Distributed by AMG Distributors, Inc., member FINRA/SIPC.
| † | Date reflects the inception date of the Fund, not the index. |
| 1 | Total return equals income yield plus share price change and assumes reinvestment of all dividends and capital gain distributions. Returns are net of fees and may reflect offsets of Fund expenses as described in the prospectus. No adjustment has been made for taxes payable by shareholders on their reinvested dividends and capital gain distributions. Returns for periods greater than one year are annualized. The listed returns on the Fund are net of expenses and based on the published NAV as of October 31, 2018. All returns are in U.S. dollars ($). |
| 2 | Applying the Fund’s ESG investment criteria may result in the selection or exclusion of securities of certain issuers for reasons other than performance, and the Fund may underperform funds that do not utilize an ESG investment strategy. The application of this strategy may affect the Fund’s exposure to certain companies, sectors, regions, countries or types of investments, which could negatively impact the Fund’s performance depending on whether such investments are in or out of favor. Applying ESG criteria to investment decisions is qualitative and subjective by nature, and there is no guarantee that the criteria utilized by the Subadviser or any judgment exercised by the Subadviser will reflect the beliefs or values of any particular investor. |
| 3 | A greater percentage of the Fund’s holdings may be focused in a smaller number of securities which may place the Fund at greater risk than a more diversified fund. |
| 4 | Investments in international securities are subject to certain risks of overseas investing including currency fluctuations and changes in political and economic conditions, which could result in significant market fluctuations. These risks are magnified in emerging markets. |
| 5 | The Fund is subject to risks associated with investments in mid-capitalization companies such as greater price volatility, and lower trading volume, less liquidity than the stocks of larger, more established companies. Growth stocks may underperform value stocks during given periods. |
| 6 | The Fund is subject to risks associated with investments in small-capitalization companies, such as erratic earnings patterns, competitive conditions, limited earnings history and a reliance on one or a limited number of products. |
| 7 | The Fund invests in growth stocks, which may be more sensitive to market movements because their prices tend to reflect future investor expectations rather than just current profits. Growth stocks may underperform value stocks during given periods. |
| 8 | The Fund invests in value stocks, which may perform differently from the market as a whole and may be undervalued by the market for a long period of time. |
| 9 | The Russell 1000® Index measures the performance of approximately 1,000 of the largest securities based on a combination of their market cap and current index membership. The Russell 1000® represents approximately 92% of the U.S. market. Unlike the Fund, the Russell 1000® Index is unmanaged, is not available for investment and does not incur expenses. |
The Russell Indices are a trademark of the London Stock Exchange Group companies.
Not FDIC insured, nor bank guaranteed. May lose value.
8
|
AMG Managers Fairpointe ESG Equity Fund Fund Snapshots (unaudited) October 31, 2018 |
PORTFOLIO BREAKDOWN
| | | | |
| | | % of | |
Sector | | Net Assets | |
Information Technology | | | 24.0 | |
Consumer Discretionary | | | 23.7 | |
Industrials | | | 14.8 | |
Consumer Staples | | | 14.5 | |
Health Care | | | 13.5 | |
Financials | | | 3.4 | |
Short-Term Investments | | | 2.5 | |
Other Assets Less Liabilities | | | 3.6 | |
TOP TEN HOLDINGS
| | | | |
| | | % of | |
Security Name | | Net Assets | |
Meredith Corp. | | | 4.2 | |
Juniper Networks, Inc. | | | 4.1 | |
Scholastic Corp. | | | 4.0 | |
Hormel Foods Corp. | | | 3.9 | |
TEGNA, Inc. | | | 3.9 | |
International Business Machines Corp. | | | 3.5 | |
Mattel, Inc. | | | 3.3 | |
Wabtec Corp. | | | 3.3 | |
Molson Coors Brewing Co., Class B | | | 3.1 | |
QUALCOMM, Inc. | | | 3.1 | |
| | | | |
Top Ten as a Group | | | 36.4 | |
| | | | |
Because a fund’s strategy may result in multiple investments in particular sectors of the economy, its performance may depend on the performance of those sectors and may fluctuate more widely than investments diversified across more sectors. For additional information on these and other risk considerations, please see the Fund’s prospectus.
Any sectors, industries, or securities discussed should not be perceived as investment recommendations. Mention of a specific security should not be considered a recommendation to buy or solicitation to sell that security. Specific securities mentioned in this report may have been sold from the Fund’s portfolio of investments by the time you receive this report.
9
AMG Managers Fairpointe ESG Equity Fund
Schedule of Portfolio Investments
October 31, 2018
| | | | | | | | |
| | | Shares | | | Value | |
Common Stocks - 93.9% | | | | | | | | |
Consumer Discretionary - 23.7% | | | | | | | | |
Lions Gate Entertainment Corp., Class B | | | 16,100 | | | $ | 286,419 | |
Magna International, Inc. (Canada) | | | 4,600 | | | | 226,504 | |
Mattel, Inc.* | | | 26,700 | | | | 362,586 | |
Meredith Corp. | | | 8,850 | | | | 456,306 | |
The New York Times Co., Class A | | | 7,900 | | | | 208,560 | |
Scholastic Corp. | | | 9,900 | | | | 429,462 | |
TEGNA, Inc. | | | 37,000 | | | | 426,980 | |
Tractor Supply Co. | | | 1,800 | | | | 165,402 | |
Total Consumer Discretionary | | | | | | | 2,562,219 | |
Consumer Staples - 14.5% | | | | | | | | |
Bunge, Ltd. | | | 4,300 | | | | 265,740 | |
Dean Foods Co. | | | 38,300 | | | | 306,017 | |
Hormel Foods Corp. | | | 9,800 | | | | 427,672 | |
Molson Coors Brewing Co., Class B | | | 5,200 | | | | 332,800 | |
Unilever PLC, Sponsored ADR (United Kingdom) | | | 4,500 | | | | 238,410 | |
Total Consumer Staples | | | | | | | 1,570,639 | |
Financials - 3.4% | | | | | | | | |
The Bank of New York Mellon Corp. | | | 2,200 | | | | 104,126 | |
Northern Trust Corp. | | | 2,800 | | | | 263,396 | |
Total Financials | | | | | | | 367,522 | |
Health Care - 13.5% | | | | | | | | |
Bristol-Myers Squibb Co. | | | 5,990 | | | | 302,735 | |
Hologic, Inc.* | | | 3,900 | | | | 152,061 | |
Patterson Cos., Inc. | | | 5,900 | | | | 133,222 | |
Quest Diagnostics, Inc. | | | 2,500 | | | | 235,275 | |
Smith & Nephew PLC, ADR (United Kingdom) | | | 7,200 | | | | 236,736 | |
Varex Imaging Corp.* | | | 6,200 | | | | 160,952 | |
Varian Medical Systems, Inc.* | | | 2,000 | | | | 238,740 | |
Total Health Care | | | | | | | 1,459,721 | |
Industrials - 14.8% | | | | | | | | |
AGCO Corp. | | | 2,900 | | | | 162,516 | |
General Electric Co. | | | 29,800 | | | | 300,980 | |
| * | Non-income producing security. |
| 1 | Yield shown represents the October 31, 2018, seven day average yield, which refers to the sum of the previous seven days’ dividends paid, expressed as an annual percentage. |
| | | | | | | | |
| | | Shares | | | Value | |
Kennametal, Inc. | | | 2,100 | | | $ | 74,445 | |
ManpowerGroup, Inc. | | | 3,200 | | | | 244,128 | |
Owens Corning | | | 5,700 | | | | 269,439 | |
Quanta Services, Inc.* | | | 5,900 | | | | 184,080 | |
Wabtec Corp. | | | 4,400 | | | | 360,888 | |
Total Industrials | | | | | | | 1,596,476 | |
Information Technology - 24.0% | | | | | | | | |
Akamai Technologies, Inc.* | | | 3,800 | | | | 274,550 | |
Cars.com, Inc.* | | | 4,900 | | | | 127,939 | |
Cisco Systems, Inc. | | | 3,200 | | | | 146,400 | |
Cree, Inc.* | | | 6,800 | | | | 263,976 | |
Hewlett Packard Enterprise Co. | | | 9,200 | | | | 140,300 | |
HP, Inc. | | | 6,700 | | | | 161,738 | |
International Business Machines Corp. | | | 3,250 | | | | 375,147 | |
Juniper Networks, Inc. | | | 15,000 | | | | 439,050 | |
QUALCOMM, Inc. | | | 5,290 | | | | 332,688 | |
Teradata Corp.* | | | 6,200 | | | | 225,680 | |
VMware, Inc., Class A* | | | 800 | | | | 113,112 | |
Total Information Technology | | | | | | | 2,600,580 | |
Total Common Stocks
(Cost $9,396,382) | | | | | | | 10,157,157 | |
Short-Term Investments - 2.5% | | | | | | | | |
Other Investment Companies - 2.5% | | | | | | | | |
Dreyfus Government Cash Management Fund, Institutional Class Shares, 2.05%1 | | | 89,290 | | | | 89,290 | |
Dreyfus Institutional Preferred Government Money Market Fund, Institutional Class Shares, 2.12%1 | | | 89,290 | | | | 89,290 | |
JPMorgan U.S. Government Money Market Fund, IM Shares, 2.09%1 | | | 91,995 | | | | 91,995 | |
Total Short-Term Investments
(Cost $270,575) | | | | | | | 270,575 | |
Total Investments - 96.4%
(Cost $9,666,957) | | | | | | | 10,427,732 | |
Other Assets, less Liabilities - 3.6% | | | | | | | 394,112 | |
Net Assets - 100.0% | | | | | | $ | 10,821,844 | |
| ADR | American Depositary Receipt |
The accompanying notes are an integral part of these financial statements.
10
| | |
| AMG Managers Fairpointe ESG Equity Fund | | |
| Schedule of Portfolio Investments (continued) | | |
The following table summarizes the inputs used to value the Fund’s investments by the fair value hierarchy levels as of October 31, 2018:
| | | | | | | | | | | | | | | | |
| | | Level 1 | | | Level 2 | | | Level 3 | | | Total | |
Investments in Securities | | | | | | | | | | | | | | | | |
Common Stocks† | | $ | 10,157,157 | | | | — | | | | — | | | $ | 10,157,157 | |
Short-Term Investments | | | | | | | | | | | | | | | | |
Other Investment Companies | | | 270,575 | | | | — | | | | — | | | | 270,575 | |
| | | | | | | | | | | | | | | | |
Total Investments in Securities | | $ | 10,427,732 | | | | — | | | | — | | | $ | 10,427,732 | |
| | | | | | | | | | | | | | | | |
| † | All common stocks held in the Fund are Level 1 securities. For a detailed breakout of common stocks by major industry classification, please refer to the Fund’s Schedule of Portfolio Investments. |
As of October 31, 2018, the Fund had no transfers between levels from the beginning of the reporting period.
The accompanying notes are an integral part of these financial statements.
11
AMG River Road Focused Absolute Value Fund
Portfolio Manager’s Comments (unaudited)
OVERVIEW
For the fiscal year ended October 31, 2018, the AMG River Road Focused Absolute Value Fund (the “Fund”) Class N shares returned 8.69%, outperforming the 2.78% return for the Russell 3000® Value Index.
PERFORMANCE REVIEW
The sector with the largest positive contribution to relative return was consumer discretionary, driven by strong stock selection and an overweight allocation. Stock selection within information technology and energy also benefited relative return. This was partially offset by negative stock selection and an overweight allocation in consumer staples. From a market cap perspective, the Fund’s mid cap holdings significantly outperformed, returning +10.84% versus +0.66% for the index. Stock selection was positive across market capitalizations.
The top contributing holdings in the Fund were Advance Auto Parts Inc. (AAP) and Premier Inc. (Cl A) (PINC). Advance Auto is a retailer of aftermarket replacement parts, accessories, batteries, and maintenance items. AAP was initially purchased when many automotive parts industry stocks were out of favor following two consecutive mild winters and renewed fears of Amazon entering the space. AAP was punished further in August 2017 when the company reported poor Q2 2017 earnings results, causing investors to lose patience with its multi-year turnaround effort. Shares continued to decline after the initial purchase in September 2017, until management began showing signs of progress on its inventory management, sales team realignment, and supply chain initiatives. Shares rebounded on these fundamental improvements, then surged higher as AAP and its industry peers posted strong same-store sales numbers following a harsh winter and a return to more normal consumer demand levels. The Fund exited the position in late August 2018 at 100% of the River Road’s assessed value.
Premier is a healthcare group purchasing organization (GPO) and data analytics provider. In mid-April, reports surfaced that Amazon was abandoning its bid to win business from large health systems and instead was focusing on small physician practices, dental offices, and ambulatory surgery centers. This decision suggested GPOs such as PINC offer as much or more value than Amazon can provide, and switching costs are high. For example, if a large health system decided to leave its GPO, it would be faced with the prospect of potentially unwinding thousands of contracts
managed by the GPO. In August, the company reported strong revenue and EBITDA growth, and provided fiscal 2019 guidance above River Road estimates. Administrative fees grew at a mid-single digit pace, and EBITDA margin expanded +130 bps with an improvement of +370 bps within the Performance Services segment, the result of aggressive cost cuts as well as a larger contribution from performance-based contracts, which are high margin. We trimmed the position as shares approached our assessed value.
The bottom contributing holdings in the Fund were Nielsen Holdings PLC (NLSN) and GCI Liberty Inc. (GLIBA). Nielsen is a provider of critical independent third-party media & marketing measurement and analytics about what consumers buy (Buy segment) and what consumers read, watch, and listen to across TV, radio, digital, and mobile platforms (Watch segment). NLSN was purchased in the Fund in January 2018, well into a period of stock price weakness caused by several quarters of poor results from the company’s U.S. Buy business as large fast moving consumer goods (FMCG) companies cut costs amid challenging market conditions. Our investment thesis for Nielsen was based on the eventual stabilization of the U.S. Buy business through product innovation and FMCG companies’ need to return to more robust advertising spending to compete with rapidly growing smaller rivals. Such a stabilization would then turn investor focus to the larger, higher margin Watch business, which was continuing to generate strong organic revenue growth. While quarterly results released in February and April revealed that mixed business trends persisted—weak domestic Buy results, strong Watch results—shares plunged 25% on the release of Q2 results in July. Not only did weaknesses in the U.S. Buy business persist, but the stronger emerging markets Buy business also showed surprising weakness as multinational FMCG companies reduced spending on tertiary products in non-core growth markets. Furthermore, new European privacy laws contributed to a surprise decline in growth for the crown-jewel Watch business. On the day of the Q2 release, CEO Mitch Barns announced he would retire at year end and the company would review strategic alternatives for the Buy business. The stock partially rebounded in August when Elliott Management disclosed an 8.4% stake in a 13D filing, which included language urging management to sell part or all of the company. In September, NLSN announced it expanded its review of strategic alternatives to include the sale of the entire company, not just the Buy business. The Fund
maintained the position, believing the exploration of selling the Buy business would allow the stock to better reflect the Watch business value, which we assessed as worth well above NLSN’s stock price.
GCI Liberty Inc. (GLIBA) owns a 6.8% economic interest in Charter Communications (CHTR) and is the largest cable provider and the second-largest wireless provider in Alaska. In March 2018, GLIBA was formed through the merger of Liberty Interactive Corp. (LVNTA) and General Communications (GCI). The merger simplified LVNTA’s corporate structure as it was no longer a tracking stock, and longer term, we believed the new GLIBA could be a logical acquisition target for Charter. Two primary factors drove the poor performance for Charter, and thus GLIBA, over the last 12 months. First was the company’s declining video subscribers as Charter’s integration of Time Warner Cable created some business disruption, including elevated churn. Second was the potential threat to Charter’s high margin internet service from the coming deployment of 5G service by wireless carriers. However, we believe Charter’s internet service is superior to its competitors, which will allow it to continue growing its base of high margin internet service subscribers. Additionally, through the company’s Mobile Virtual Network Operator (MVNO) agreement with Verizon, we believe Charter will be able to provide competitive wireless service further improving customer retention. We continued to own the position as of October 31, 2018.
POSITIONING AND OUTLOOK
The Fund invests in companies we believe represent the most attractive combination of risk (conviction) and reward (discount) available across the River Road universe of portfolio holdings. As of October 31, 2018, more than 55% of the Fund’s holdings were concentrated in the highest conviction stocks in the River Road universe and were trading at compelling discounts to assessed values.
We believe this positions the Fund attractively relative to the benchmark from the perspective of valuation, quality, and long-term earnings growth. Further, if returns do moderate in the coming year, we expect the Fund’s holdings and low volatility approach to be well positioned.
The views expressed represent the opinions of River Road Asset Management LLC , as of October 31, 2018, and are not intended as a forecast or guarantee of future results and are subject to change without notice.
12
AMG River Road Focused Absolute Value Fund
Portfolio Manager’s Comments (continued)
CUMULATIVE TOTAL RETURN PERFORMANCE
AMG River Road Focused Absolute Value Fund’s cumulative total return is based on the daily change in net asset value (NAV), and assumes that all dividends and distributions were reinvested. The graph compares a hypothetical $10,000 investment made in the AMG River Road Focused Absolute Value Fund’s Class N shares on November 3, 2015, to a $10,000 investment made in the Russell 3000® Value Index for the same time period. The graph and table do not reflect the deduction of taxes that a shareholder would pay on a Fund distribution or redemption of shares. The listed returns for the Fund are net of expenses and the returns for the index exclude expenses. Total returns would have been lower had certain expenses not been reduced.
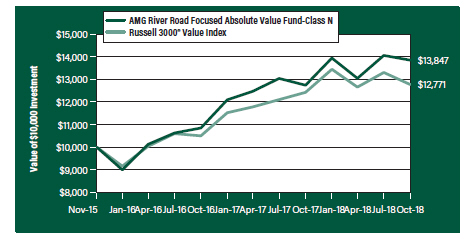
The table below shows the average annual total returns for the AMG River Road Focused Absolute Value Fund, the Russell 3000® Value Index for the same time periods ended October 31, 2018.
| | | | | | | | | | | | |
| | | One | | | Since | | | Inception | |
| Average Annual Total Returns1 | | Year | | | Inception | | | Date | |
AMG River Road Focused Absolute Value
Fund2, 3, 4, 5, 6, 7, 8, 9 | | | | | | | | | | | | |
Class N | | | 8.69 | % | | | 11.47 | % | | | 11/03/15 | |
Class I | | | 8.91 | % | | | 11.74 | % | | | 11/03/15 | |
Class Z | | | 8.96 | % | | | 6.08 | % | | | 09/29/17 | |
Russell 3000® Value Index10 | | | 2.78 | % | | | 8.51 | % | | | 11/03/15 | † |
The performance data shown represents past performance. Past performance is not a guarantee of future results. Current performance may be lower or higher than the performance data quoted. The investment return and principal value of an investment will fluctuate so that an investor’s shares, when redeemed, may be worth more or less than their original cost.
Investors should carefully consider the Fund’s investment objectives, risks, charges and expenses before investing. For performance information through the most recent month end, current net asset values per share for the Fund and other information, please call 800.835.3879 or visit our website at amgfunds.com for a free prospectus. Read it carefully before investing or sending money.
Distributed by AMG Distributors, Inc., member FINRA/SIPC.
| † | Date reflects the inception date of the Fund, not the index. |
| 1 | Total return equals income yield plus share price change and assumes reinvestment of all dividends and capital gain distributions. Returns are net of fees and may reflect offsets of Fund expenses as described in the prospectus. No adjustment has been made for taxes payable by shareholders on their reinvested dividends and |
| | capital gain distributions. Returns for periods greater than one year are annualized. The listed returns on the Fund are net of expenses and based on the published NAV as of October 31, 2018. All returns are in U.S. dollars ($). |
| 2 | The Fund is subject to risks associated with investments in small-capitalization companies, such as erratic earnings patterns, competitive conditions, limited earnings history and a reliance on one or a limited number of products. |
| 3 | The Fund is subject to risks associated with investments in mid-capitalization companies such as greater price volatility, lower trading volume, and less liquidity than the stocks of larger, more established companies. Growth stocks may underperform value stocks during given periods. |
| 4 | Active and frequent trading of a fund may result in higher transaction costs and increased tax liability. |
| 5 | A greater percentage of the Fund’s holdings may be focused in a smaller number of securities which may place the Fund at greater risk than a more diversified fund. |
| 6 | Investments in international securities are subject to certain risks of overseas investing including currency fluctuations and changes in political and economic conditions, which could result in significant market fluctuations. These risks are magnified in emerging markets. |
| 7 | The Fund is subject to the risks associated with investments in emerging markets, such as erratic earnings patterns, economic and political instability, changing exchange controls, limitations on repatriation of foreign capital and changes in local governmental attitudes toward private investment, possibly leading to nationalization or confiscation of investor assets. |
| 8 | The Fund is subject to special risk considerations similar to those associated with the direct ownership of real estate. Real estate valuations may be subject to factors such as changing general and local economic, financial, competitive, and environmental conditions. |
| 9 | The Fund invests in value stocks, which may perform differently from the market as a whole and may be undervalued by the market for a long period of time. |
| 10 | The Russell 3000® Value Index measures the performance of the broad value segment of the U.S. equity universe. It includes those Russell 3000® companies with lower price-to-book ratios and lower forecasted growth values. Unlike the Fund, the Russell 3000® Value Index is unmanaged, is not available for investment and does not incur expenses. |
The Russell Indices are a trademark of the London Stock Exchange Group companies.
Not FDIC insured, nor bank guaranteed. May lose value.
13
| | |
| AMG River Road Focused Absolute Value Fund | | |
Fund Snapshots (unaudited) October 31, 2018 | | |
PORTFOLIO BREAKDOWN
| | | | |
| | | % of | |
| Sector | | Net Assets | |
Consumer Discretionary | | | 35.1 | |
Financials | | | 26.5 | |
Information Technology | | | 12.8 | |
Health Care | | | 8.7 | |
Consumer Staples | | | 7.3 | |
Energy | | | 4.4 | |
Real Estate | | | 2.1 | |
Industrials | | | 1.8 | |
Short-Term Investments1 | | | 1.3 | |
Other Assets Less Liabilities2, 3 | | | 0.0 | |
| 1 | Includes reinvestment of cash collateral into joint repurchase agreements on security lending transactions. |
| 3 | Includes repayment of cash collateral on security lending transactions. |
TOP TEN HOLDINGS
| | | | |
| | | % of | |
Security Name | | Net Assets | |
Berkshire Hathaway, Inc., Class B | | | 7.0 | |
Comcast Corp., Class A | | | 5.0 | |
Sabre Corp. | | | 4.6 | |
Brookfield Asset Management, Inc., Class A (Canada) | | | 4.6 | |
GCI Liberty Inc., Class A | | | 4.6 | |
Discovery, Inc., Class C | | | 4.5 | |
World Fuel Services Corp. | | | 4.4 | |
Starbucks Corp. | | | 3.9 | |
Hostess Brands, Inc. | | | 3.7 | |
The Kraft Heinz Co. | | | 3.6 | |
| | | | |
Top Ten as a Group | | | 45.9 | |
| | | | |
Because a fund’s strategy may result in multiple investments in particular sectors of the economy, its performance may depend on the performance of those sectors and may fluctuate more widely than investments diversified across more sectors. For additional information on these and other risk considerations, please see the Fund’s prospectus.
Any sectors, industries, or securities discussed should not be perceived as investment recommendations. Mention of a specific security should not be considered a recommendation to buy or solicitation to sell that security. Specific securities mentioned in this report may have been sold from the Fund’s portfolio of investments by the time you receive this report.
14
AMG River Road Focused Absolute Value Fund
Schedule of Portfolio Investments
October 31, 2018
| | | | | | | | |
| | | Shares | | | Value | |
Common Stocks - 98.7% | | | | | | | | |
Consumer Discretionary - 35.1% | | | | | | | | |
Comcast Corp., Class A | | | 39,860 | | | $ | 1,520,260 | |
Discovery, Inc., Class C* | | | 46,529 | | | | 1,363,765 | |
Expedia, Inc. | | | 5,019 | | | | 629,533 | |
GCI Liberty Inc., Class A*,1 | | | 29,215 | | | | 1,382,746 | |
General Motors Co. | | | 24,110 | | | | 882,185 | |
Liberty Broadband Corp., Class C* | | | 12,380 | | | | 1,026,673 | |
Liberty Latin America, Ltd., Class C* | | | 49,927 | | | | 899,185 | |
Liberty Media Corp.-Liberty SiriusXM, Class C* | | | 20,036 | | | | 826,886 | |
LKQ Corp.* | | | 32,986 | | | | 899,528 | |
Starbucks Corp. | | | 19,965 | | | | 1,163,361 | |
Total Consumer Discretionary | | | | | | | 10,594,122 | |
Consumer Staples - 7.3% | | | | | | | | |
Hostess Brands, Inc.*,1 | | | 106,255 | | | | 1,105,052 | |
The Kraft Heinz Co. | | | 20,064 | | | | 1,102,918 | |
Total Consumer Staples | | | | | | | 2,207,970 | |
Energy - 4.4% | | | | | | | | |
World Fuel Services Corp. | | | 41,115 | | | | 1,315,680 | |
Financials - 26.5% | | | | | | | | |
Axis Capital Holdings, Ltd. (Bermuda) | | | 19,260 | | | | 1,074,515 | |
Berkshire Hathaway, Inc., Class B* | | | 10,363 | | | | 2,127,317 | |
Brookfield Asset Management, Inc., Class A (Canada) | | | 33,966 | | | | 1,384,114 | |
FGL Holdings (Bermuda)* | | | 90,590 | | | | 715,661 | |
Oaktree Capital Group LLC, (MLP) 1 | | | 20,289 | | | | 848,689 | |
U.S. Bancorp | | | 19,077 | | | | 997,155 | |
Wells Fargo & Co. | | | 16,172 | | | | 860,836 | |
Total Financials | | | | | | | 8,008,287 | |
Health Care - 8.7% | | | | | | | | |
Allergan PLC | | | 5,809 | | | | 917,880 | |
McKesson Corp. | | | 8,305 | | | | 1,036,132 | |
Premier, Inc., Class A* | | | 14,681 | | | | 660,645 | |
Total Health Care | | | | | | | 2,614,657 | |
| | | | | | | | |
| | | Shares | | | Value | |
Industrials - 1.8% | | | | | | | | |
Nielsen Holdings PLC | | | 20,473 | | | $ | 531,888 | |
Information Technology - 12.8% | | | | | | | | |
Avaya Holdings Corp.* | | | 45,020 | | | | 739,228 | |
CDK Global, Inc. | | | 11,371 | | | | 650,876 | |
Sabre Corp. | | | 56,695 | | | | 1,397,532 | |
Tech Data Corp.* | | | 15,425 | | | | 1,089,931 | |
Total Information Technology | | | | | | | 3,877,567 | |
Real Estate - 2.1% | | | | | | | | |
Iron Mountain, Inc., REIT | | | 20,515 | | | | 627,964 | |
Total Common Stocks
(Cost $28,668,218) | | | | | | | 29,778,135 | |
| | |
| | | Principal | | | | |
| | | Amount | | | | |
Short-Term Investments - 1.3% | | | | | | | | |
Joint Repurchase Agreements - 0.6%2 | | | | | | | | |
Citibank N.A., dated 10/31/18, due 11/01/18, 2.200% total to be received $185,230 (collateralized by various U.S. Treasuries, 0.000% - 8.750%, 03/07/19 - 09/09/49, totaling $188,923) | | $ | 185,219 | | | | 185,219 | |
| | |
| | | Shares | | | | |
Other Investment Companies - 0.7% | | | | | | | | |
Dreyfus Government Cash Management Fund, Institutional Class Shares, 2.05%3 | | | 67,971 | | | | 67,971 | |
Dreyfus Institutional Preferred Government Money Market Fund, Institutional Class Shares, 2.12%3 | | | 67,971 | | | | 67,971 | |
JPMorgan U.S. Government Money Market Fund, IM Shares, 2.09%3 | | | 70,031 | | | | 70,031 | |
Total Other Investment Companies | | | | | | | 205,973 | |
Total Short-Term Investments (Cost $391,192) | | | | | | | 391,192 | |
Total Investments - 100.0% (Cost $29,059,410) | | | | | | | 30,169,327 | |
Other Assets, less Liabilities - 0.0%# | | | | | | | 9,084 | |
Net Assets - 100.0% | | | | | | $ | 30,178,411 | |
| * | Non-income producing security. |
| 1 | Some or all of these securities, amounting to $1,590,837 or 5.3% of net assets, were out on loan to various brokers and are collateralized by cash and various U.S. Treasury Obligations. See Note 4 of Notes to Financial Statements. |
| 2 | Cash collateral received from brokers for securities lending was invested in these joint repurchase agreements. |
| 3 | Yield shown represents the October 31, 2018, seven day average yield, which refers to the sum of the previous seven days’ dividends paid, expressed as an annual percentage. |
| MLP | Master Limited Partnership |
| REIT | Real Estate Investment Trust |
The accompanying notes are an integral part of these financial statements.
15
AMG River Road Focused Absolute Value Fund
Schedule of Portfolio Investments (continued)
The following table summarizes the inputs used to value the Fund’s investments by the fair value hierarchy levels as of October 31, 2018:
| | | | | | | | | | | | | | | | |
| | | Level 1 | | | Level 2 | | | Level 3 | | | Total | |
Investments in Securities | | | | | | | | | | | | | | | | |
Common Stocks† | | $ | 29,778,135 | | | | — | | | | — | | | $ | 29,778,135 | |
Short-Term Investments | | | | | | | | | | | | | | | | |
Joint Repurchase Agreements | | | — | | | $ | 185,219 | | | | — | | | | 185,219 | |
Other Investment Companies | | | 205,973 | | | | — | | | | — | | | | 205,973 | |
| | | | | | | | | | | | | | | | |
Total Investments in Securities | | $ | 29,984,108 | | | $ | 185,219 | | | | — | | | $ | 30,169,327 | |
| | | | | | | | | | | | | | | | |
| † | All common stocks held in the Fund are Level 1 securities. For a detailed breakout of common stocks by major industry classification, please refer to the Fund’s Schedule of Portfolio Investments. |
As of October 31, 2018, the Fund had no transfers between levels from the beginning of the reporting period.
The accompanying notes are an integral part of these financial statements.
16
AMG Managers Montag & Caldwell Growth Fund
Portfolio Manager’s Comments (unaudited)
THE YEAR IN REVIEW
For the fiscal year ended October 31, 2018, the AMG Managers Montag & Caldwell Growth Fund (the “Fund”) Class N shares returned 8.58%, compared to the 10.71% return for its benchmark, the Russell 1000® Growth Index. The Fund is managed using fundamental valuation techniques that focus on a company’s future earnings and dividend growth rates. The process is primarily bottom up and utilizes a present valuation model in which the current price of the stock is related to the risk-adjusted present value of the company’s estimated future earnings stream. The Fund seeks to invest in growth stocks selling at a discount to estimates of fair value and at a time when relative earnings per share growth is visible for the intermediate term.
MARKET ENVIRONMENT
U.S. stock indices experienced positive returns for the 12 months ended October 31, 2018, with a bias toward large cap stocks. The Russell 1000® Index (large cap) was up 6.98%, the Russell Midcap® Index (mid cap) was up 2.80%, and the Russell 2000® Index (small cap) was up 1.85% for the 12 months ended October 31, 2018. Among all capitalization categories, growth was the dominant theme. Within growth, technology and internet-related consumer discretionary stocks led the way, resulting in unprecedented concentrations for the large cap growth index. For the full 12 months, growth outperformed value in each size segment, with the widest spread in returns between large cap growth and large cap value (10.71% vs. 3.04%). The performance advantage of growth over value in both the mid cap and small cap areas was also meaningful, though less pronounced than in large cap.
PERFORMANCE REVIEW
The reporting period began with strong performance from small cap and more cyclically oriented stocks as investors began to discount corporate tax reform,
which was eventually signed into law late in 2017. The Fund’s portfolio of larger companies, the under-allocation to technology and internet-related consumer discretionary stocks, and its over-allocation to less economically sensitive stocks detracted from relative returns during this period. This theme persisted until the end of January 2018 when the market reacted to rising interest rates due to increased wage and inflation data. The volatility was further exacerbated by the unwinding of the crowded short volatility trade. As one might expect, the Fund held up better than the index during this long-overdue correction period for many of the same reasons it had previously underperformed. This was one of the fastest corrections since the 1920s. While the market recovered rather quickly, the broad market then settled into a trading range on concerns over tariffs and a potential trade war with China. Technology and internet discretionary stocks, however, were not constrained by these overhangs and broke away from the pack in the second quarter. Again, the Fund’s underweight allocation to these stocks was a drag on the Fund’s relative performance. While these stocks fared better given their strong fundamentals and the belief that they would be largely insulated from the increasing trade tensions, valuations became increasingly stretched as they became over-owned and heavily concentrated in the index. The Fund’s risk controls around valuation and position size limits were the primary driver of the underweight positions. We entered the third quarter with a strong economic backdrop, which fueled robust corporate profit growth. This strong fundamental backdrop, in turn, produced some of the strongest quarterly results for the market since 2013 and led the market higher to a new bull market record, which was achieved on August 22. The biggest detractors to performance during this period versus the Russell 1000® Growth Index were an above-benchmark weight in financial services and a below-benchmark weight in both technology and industrials. Stock selection in the discretionary sector (primarily not owning Amazon)
was also an impediment to relative returns. On a positive note, the Fund benefited from solid stock selection in the communication services and materials sectors. The market sold off in October with Federal Reserve Chairman Powell’s more hawkish comments and the realization that a more normal monetary environment would be a headwind to price-to-earnings ratios. While equity fundamentals are still strong, the market is also discounting peak earnings growth and higher interest rates, leading to a re-pricing of risk. The Fund held up better than the index during the month, as the more fully valued momentum names sold off.
OUTLOOK
We continue to expect a choppy and range bound stock market. On the positive side, the U.S. is experiencing ongoing economic growth. However, economic activity and earnings growth appear to be peaking and the Federal Reserve seems committed to continued tightening until the unemployment rate stabilizes to prevent inflation pressures. We believe the Fed will no longer have the market’s back, earnings growth will slow, volatility will stay elevated, and, accordingly, investors will adjust risk tolerances.
We believe the balance in the Fund between less economically sensitive companies and those enjoying both cyclical and/or secular tailwinds positions our clients well for the period ahead. We expect the Fund’s holdings to generate profit growth that exceeds overall U.S. corporate profit growth this year. At the same time our holdings remain more attractively valued than the broader market, and the strength of their balance sheets should provide a buffer for the inevitable bouts of volatility that we expect.
The views expressed represent the opinions of Montag & Caldwell LLC, as of October 31, 2018, and are not intended as a forecast or guarantee of future results and are subject to change without notice.
17
AMG Managers Montag & Caldwell Growth Fund
Portfolio Manager’s Comments (continued)
CUMULATIVE TOTAL RETURN PERFORMANCE
AMG Managers Montag & Caldwell Growth Fund’s cumulative total return is based on the daily change in net asset value (NAV), and assumes that all dividends and distributions were reinvested. The graph compares a hypothetical $10,000 investment made in the AMG Managers Montag & Caldwell Growth Fund’s Class N shares on October 31, 2008, to a $10,000 investment made in the Russell 1000® Growth Index for the same time period. The graph and table do not reflect the deduction of taxes that a shareholder would pay on a Fund distribution or redemption of shares. The listed returns for the Fund are net of expenses and the returns for the index exclude expenses. Total returns would have been lower had certain expenses not been reduced.
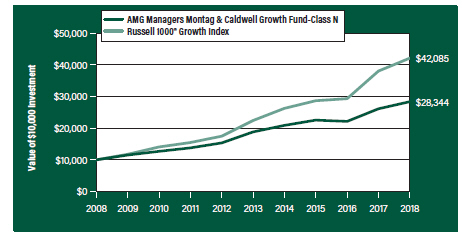
The table below shows the average annual total returns for the AMG Managers Montag & Caldwell Growth Fund, the Russell 1000® Growth Index for the same time periods ended October 31, 2018.
| | | | | | | | | | | | |
| Average Annual Total Returns1 | | One Year | | | Five Years | | | Ten Years | |
AMG Managers Montag & Caldwell Growth Fund2, 3 | | | | | | | | | | | | |
Class N | | | 8.58 | % | | | 8.55 | % | | | 10.98 | % |
Class I | | | 8.75 | % | | | 8.79 | % | | | 11.24 | % |
Class R | | | 8.20 | % | | | 8.28 | % | | | 10.70 | % |
Russell 1000® Growth Index4 | | | 10.71 | % | | | 13.43 | % | | | 15.45 | % |
The performance data shown represents past performance. Past performance is not a guarantee of future results. Current performance may be lower or higher than the performance data quoted. The investment return and principal value of an investment will fluctuate so that an investor’s shares, when redeemed, may be worth more or less than their original cost.
Investors should carefully consider the Fund’s investment objectives, risks, charges and expenses before investing. For performance information through the most recent month end, current net asset values per share for the Fund and other information, please call 800.835.3879 or visit our website at amgfunds.com for a free prospectus. Read it carefully before investing or sending money.
Distributed by AMG Distributors, Inc., member FINRA/SIPC.
| 1 | Total return equals income yield plus share price change and assumes reinvestment of all dividends and capital gain distributions. Returns are net of fees and may reflect offsets of Fund expenses as described in the prospectus. No adjustment has been made for taxes payable by shareholders on their reinvested dividends and capital gain distributions. Returns for periods greater than one year are annualized. The listed returns on the Fund are net of expenses and based on the published NAV as of October 31, 2018. All returns are in U.S. dollars ($). |
| 2 | The Fund invests in growth stocks, which may be more sensitive to market movements because their prices |
| | tend to reflect future investor expectations rather than just current profits. Growth stocks may underperform value stocks during given periods. |
| 3 | Investments in international securities are subject to certain risks of overseas investing including currency fluctuations and changes in political and economic conditions, which could result in significant market fluctuations. These risks are magnified in emerging markets. |
| 4 | The Russell 1000® Growth Index is a market capitalization weighted index that measures the performance of those Russell 1000® companies with higher price-to-book ratios and higher forecasted growth values. Unlike the Fund, the Russell 1000® Growth Index is unmanaged, is not available for investment and does not incur expenses. |
The Russell Indices are a trademark of the London Stock Exchange Group companies.
Not FDIC insured, nor bank guaranteed. May lose value.
18
AMG Managers Montag & Caldwell Growth Fund
Fund Snapshots (unaudited)
October 31, 2018
PORTFOLIO BREAKDOWN
| | | | |
| | | % of | |
Sector | | Net Assets | |
Information Technology | | | 28.2 | |
Health Care | | | 21.0 | |
Consumer Discretionary | | | 13.1 | |
Financials | | | 9.6 | |
Communication Services | | | 6.9 | |
Consumer Staples | | | 6.0 | |
Materials | | | 4.4 | |
Industrials | | | 4.4 | |
Real Estate | | | 1.8 | |
Short-Term Investments | | | 4.8 | |
Other Assets Less Liabilities | | | (0.2 | ) |
TOP TEN HOLDINGS
| | | | |
| | | % of | |
Security Name | | Net Assets | |
UnitedHealth Group, Inc. | | | 4.9 | |
Microsoft Corp. | | | 4.9 | |
Visa, Inc., Class A | | | 4.7 | |
Thermo Fisher Scientific, Inc. | | | 4.5 | |
Becton Dickinson & Co. | | | 4.5 | |
Alphabet, Inc., Class A | | | 4.3 | |
Abbott Laboratories | | | 4.3 | |
Apple, Inc. | | | 4.2 | |
S&P Global, Inc. | | | 3.6 | |
Intercontinental Exchange, Inc. | | | 3.3 | |
| | | | |
Top Ten as a Group | | | 43.2 | |
| | | | |
Because a fund’s strategy may result in multiple investments in particular sectors of the economy, its performance may depend on the performance of those sectors and may fluctuate more widely than investments diversified across more sectors. For additional information on these and other risk considerations, please see the Fund’s prospectus.
Any sectors, industries, or securities discussed should not be perceived as investment recommendations. Mention of a specific security should not be considered a recommendation to buy or solicitation to sell that security. Specific securities mentioned in this report may have been sold from the Fund’s portfolio of investments by the time you receive this report.
19
AMG Managers Montag & Caldwell Growth Fund
Schedule of Portfolio Investments
October 31, 2018
| | | | | | | | |
| | | Shares | | | Value | |
Common Stocks - 95.4% | | | | | | | | |
Communication Services - 6.9% | | | | | | | | |
Activision Blizzard, Inc. | | | 223,200 | | | $ | 15,411,960 | |
Alphabet, Inc., Class A* | | | 23,557 | | | | 25,690,793 | |
Total Communication Services | | | | | | | 41,102,753 | |
Consumer Discretionary - 13.1% | | | | | | | | |
Aramark | | | 237,100 | | | | 8,516,632 | |
Booking Holdings, Inc.* | | | 8,280 | | | | 15,521,522 | |
Dollar Tree, Inc.* | | | 160,880 | | | | 13,562,184 | |
Lowe’s Cos., Inc. | | | 162,900 | | | | 15,511,338 | |
Starbucks Corp. | | | 117,900 | | | | 6,870,033 | |
Ulta Beauty, Inc.* | | | 65,838 | | | | 18,073,848 | |
Total Consumer Discretionary | | | | | | | 78,055,557 | |
Consumer Staples - 6.0% | | | | | | | | |
Mondelez International, Inc., Class A | | | 408,600 | | | | 17,153,028 | |
Monster Beverage Corp.* | | | 352,500 | | | | 18,629,625 | |
Total Consumer Staples | | | | | | | 35,782,653 | |
Financials - 9.6% | | | | | | | | |
The Charles Schwab Corp. | | | 355,400 | | | | 16,433,696 | |
Intercontinental Exchange, Inc. | | | 255,350 | | | | 19,672,164 | |
S&P Global, Inc. | | | 116,997 | | | | 21,330,893 | |
Total Financials | | | | | | | 57,436,753 | |
Health Care - 21.0% | | | | | | | | |
Abbott Laboratories | | | 372,000 | | | | 25,645,680 | |
Becton Dickinson & Co. | | | 115,817 | | | | 26,695,819 | |
Edwards Lifesciences Corp.* | | | 69,125 | | | | 10,202,850 | |
Quest Diagnostics, Inc. | | | 73,000 | | | | 6,870,030 | |
Thermo Fisher Scientific, Inc. | | | 114,380 | | | | 26,724,887 | |
UnitedHealth Group, Inc. | | | 111,684 | | | | 29,188,613 | |
Total Health Care | | | | | | | 125,327,879 | |
Industrials - 4.4% | | | | | | | | |
Honeywell International, Inc. | | | 118,785 | | | | 17,202,444 | |
IHS Markit, Ltd. (United Kingdom)* | | | 167,700 | | | | 8,809,281 | |
Total Industrials | | | | | | | 26,011,725 | |
| | | | | | | | |
| | | Shares | | | Value | |
Information Technology - 28.2% | | | | | | | | |
Accenture PLC, Class A (Ireland) | | | 97,342 | | | $ | 15,343,046 | |
Apple, Inc. | | | 114,548 | | | | 25,069,975 | |
Facebook, Inc., Class A* | | | 57,268 | | | | 8,692,710 | |
Fidelity National Information Services, Inc. | | | 182,891 | | | | 19,038,953 | |
FleetCor Technologies, Inc.* | | | 74,643 | | | | 14,930,839 | |
Mastercard, Inc., Class A | | | 77,376 | | | | 15,294,914 | |
Microsoft Corp. | | | 272,600 | | | | 29,116,406 | |
QUALCOMM, Inc. | | | 201,900 | | | | 12,697,491 | |
Visa, Inc., Class A | | | 202,100 | | | | 27,859,485 | |
Total Information Technology | | | | | | | 168,043,819 | |
Materials - 4.4% | | | | | | | | |
Air Products & Chemicals, Inc. | | | 64,000 | | | | 9,878,400 | |
The Sherwin-Williams Co. | | | 41,033 | | | | 16,145,255 | |
Total Materials | | | | | | | 26,023,655 | |
Real Estate - 1.8% | | | | | | | | |
American Tower Corp., REIT | | | 70,500 | | | | 10,984,604 | |
Total Common Stocks
(Cost $419,319,057) | | | | | | | 568,769,398 | |
Short-Term Investments - 4.8% | | | | | | | | |
Other Investment Companies - 4.8% | | | | | | | | |
Dreyfus Government Cash Management Fund, Institutional Class Shares, 2.05%1 | | | 9,516,239 | | | | 9,516,239 | |
Dreyfus Institutional Preferred Government Money Market Fund, Institutional Class Shares, 2.12%1 | | | 9,516,239 | | | | 9,516,239 | |
JPMorgan U.S. Government Money Market Fund, IM Shares, 2.09%1 | | | 9,804,610 | | | | 9,804,610 | |
Total Short-Term Investments
(Cost $28,837,088) | | | | | | | 28,837,088 | |
Total Investments - 100.2%
(Cost $448,156,145) | | | | | | | 597,606,486 | |
Other Assets, less Liabilities - (0.2)% | | | | | | | (1,357,173 | ) |
Net Assets - 100.0% | | | | | | $ | 596,249,313 | |
| * | Non-income producing security. |
| 1 | Yield shown represents the October 31, 2018, seven day average yield, which refers to the sum of the previous seven days’ dividends paid, expressed as an annual percentage. |
| REIT | Real Estate Investment Trust |
The accompanying notes are an integral part of these financial statements.
20
AMG Managers Montag & Caldwell Growth Fund
Schedule of Portfolio Investments (continued)
The following table summarizes the inputs used to value the Fund’s investments by the fair value hierarchy levels as of October 31, 2018:
| | | | | | | | | | | | | | | | |
| | | Level 1 | | | Level 2 | | | Level 3 | | | Total | |
Investments in Securities | | | | | | | | | | | | | | | | |
Common Stocks† | | $ | 568,769,398 | | | | — | | | | — | | | $ | 568,769,398 | |
Short-Term Investments | | | | | | | | | | | | | | | | |
Other Investment Companies | | | 28,837,088 | | | | — | | | | — | | | | 28,837,088 | |
Total Investments in Securities | | $ | 597,606,486 | | | | — | | | | — | | | $ | 597,606,486 | |
| † | All common stocks held in the Fund are Level 1 securities. For a detailed breakout of common stocks by major industry classification, please refer to the Fund’s Schedule of Portfolio Investments. |
As of October 31, 2018, the Fund had no transfers between levels from the beginning of the reporting period.
The accompanying notes are an integral part of these financial statements.
21
AMG River Road Dividend All Cap Value Fund
Portfolio Manager’s Comments (unaudited)
OVERVIEW
For the fiscal year ended October 31, 2018, the AMG River Road Dividend All Cap Value Fund (the “Fund”) Class N shares returned 2.06%, while the Russell 3000® Value Index returned 2.78%.
PERFORMANCE REVIEW
Over the last 12 months, the most significant market factors affecting absolute returns were the substantial improvement in corporate earnings growth driven by tax reform and the Federal Reserve’s steady upward pressure on short-term interest rates. Despite the rise in interest rates, stocks in the Russell 3000® Value Index with lower yields underperformed those with higher yields. The Fund benefited from strong stock selection. The materials sector had the most significant positive impact on relative results in the period due to strong stock selection, while the healthcare sector had the most significant negative impact on relative results due to an underweight allocation and weak stock selection.
The two holdings with the largest positive contribution to the Fund’s total return were discount retailer Target Corp. (TGT) and Marathon Petroleum Corp. (MPC), an American petroleum refining, marketing, and transportation company. TGT reported its best growth in 13 years with comparable sales of +6.5% in Q2 2018 driven by extraordinary traffic growth. Traffic increased +6.4% (on top of a +2.1% increase year over year), which was by far the strongest since the company began reporting traffic in 2008. Sales growth helped offset expected margin headwinds, resulting in +4% operating income growth in the quarter, reversing a negative trend and substantially beating Wall Street estimates. In addition to strong results, management raised full-year 2018 guidance to reflect year-to-date performance and a more constructive outlook for the remainder of the year.
In February, MPC completed the last round of dropdowns to its affiliated MLP (master limited partnership), MPLX LP, and exchanged its general partner units for limited partner units, resulting in a 64% ownership in the MLP. This was the final step of the firm’s strategic plan to unlock shareholder value—a key point in our investment thesis. Even though this event had played out, MPC remained an attractive investment. The firm enjoyed high utilization rates in both its midstream and refining
segments, and additionally benefited from the wide crack spreads that persisted in the wake of last year’s hurricanes. The firm’s retail segment, Speedway, recorded its sixth straight year of record EBITDA, topping $1 billion for the second year in a row. Additionally, the market began to focus on likely positive impacts on complex refiners such as MPC that will result from the International Marine Organization policy to reduce sulfur content in marine fuel by 2020. The firm announced a +15% dividend increase in February and reported its best quarter ever for Q2 2018, primarily driven by record numbers from its refining and midstream segments.
The two holdings with the lowest contribution to the Fund’s total return during the period were Iron Mountain Inc. (IRM), a global REIT focused on records storage and data management services, and industrial conglomerate General Electric Co. (GE). Similar to most other REITs in Q4 2017, IRM’s stock price declined as interest rates increased. Q4 results exceeded our expectations as organic growth in its key storage segment continued to benefit from ongoing pricing strength. However, for the first time, IRM guided to marginally negative organic storage volumes of -25 bps in North American markets for 2018. The firm also completed a string of data center acquisitions, which diluted FFO generation and introduced execution risk, as success ultimately depended on scaling up these properties. We were aware of these risks and trimmed IRM, our largest position at the time, in Q4 as the stock price approached our assessed value.
In Q4 2017, GE reported very weak results, primarily driven by the Power segment’s -50% decline in operating profit. The result in Power was driven by lower industrywide demand and poor execution by GE. Management did not anticipate—or respond quickly enough to—the sharp drop in demand. The poor result significantly raised the risk of a dividend cut and we lowered our conviction in both the dividend and the valuation. Shortly thereafter, GE announced a -50% dividend cut and management provided a tough outlook for 2018. We were encouraged by the decision to effectively remove half the board by reducing the board to 12 from 18 members and bringing in three new directors with relevant industry experience. We were also pleased to see the firm move forward with simplification plans, announcing a $20 billion divestiture plan including strategic alternatives for GE’s stake in Baker Hughes (BHGE). We understood there was
some risk to the dividend if the new management team decided to clear the decks, but our original projections for free cash flow and earnings showed that the dividend could be supported if there was the will to do so. Unfortunately, those projections were too optimistic and the dividend policy was more tenuous than we expected. Consistent with our sell discipline, we exited the position in Q4 due to accumulated unrealized losses and the dividend cut.
POSITIONING AND OUTLOOK
Based on average weight, the Fund is significantly overweight in consumer discretionary and industrials and significantly underweight in financials and health care. Despite the addition of four positions to the Fund, the overweight in consumer discretionary decreased during the period. This was due to the elimination of six holdings. The industrials sector ended the period at 6.3% overweight versus the benchmark due to the addition of two new positions to the Fund. The underweight in financials decreased to -7.9%, primarily due to the reduction in the benchmark weight in that sector. Health care ended the period at -12.7% underweight following two eliminations in that sector.
While the 2016 election result and the tax reform that followed appear responsible for extending the market cycle, as yet there does not appear to be a third factor that will drive the market in 2019. In fact, the very opposite may prove true. We believe that the sharp drop in earnings growth that is expected in Q1 2019, continued monetary tightening, and likely gridlock in Congress bodes ill for growth stocks after two years of strong outperformance. Therefore, we cannot escape the conclusion that we may have reached the final stage of the current market cycle. It is impossible to point to the exact event that will ultimately bring value strategies roaring back to the fore, but we consider that it is inevitable nonetheless. As we saw in recent months, the near-term relative success of dividend stocks and the Fund will likely remain tied to broad perceptions of risk.
The views expressed represent the opinions of River Road Asset Management LLC, as of October 31, 2018, and are not intended as a forecast or guarantee of future results and are subject to change without notice.
22
AMG River Road Dividend All Cap Value Fund
Portfolio Manager’s Comments (continued)
CUMULATIVE TOTAL RETURN PERFORMANCE
AMG River Road Dividend All Cap Value Fund’s cumulative total return is based on the daily change in net asset value (NAV), and assumes that all dividends and distributions were reinvested. The graph compares a hypothetical $10,000 investment made in the AMG River Road Dividend All Cap Value Fund’s Class N shares on October 31, 2008, to a $10,000 investment made in the Russell 3000® Value Index for the same time period. The graph and table do not reflect the deduction of taxes that a shareholder would pay on a Fund distribution or redemption of shares. The listed returns for the Fund are net of expenses and the returns for the index exclude expenses. Total returns would have been lower had certain expenses not been reduced.
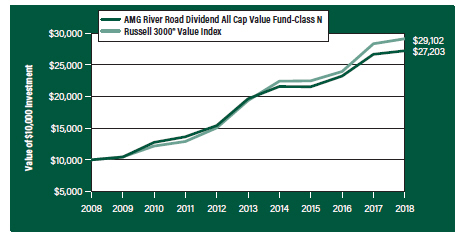
The table below shows the average annual total returns for the AMG River Road Dividend All Cap Value Fund, the Russell 3000® Value Index for the same time periods ended October 31, 2018.
| | | | | | | | | | | | | | | | | | | | |
| | | One | | | Five | | | Ten | | | Since | | | Inception | |
| Average Annual Total Returns1 | | Year | | | Years | | | Years | | | Inception | | | Date | |
AMG River Road Dividend All Cap
Value Fund2, 3, 4, 5, 6, 7 | |
Class N | | | 2.06 | % | | | 6.74 | % | | | 10.52 | % | | | 7.84 | % | | | 06/28/05 | |
Class I | | | 2.38 | % | | | 7.02 | % | | | 10.81 | % | | | 6.37 | % | | | 06/28/07 | |
Class Z | | | 2.42 | % | | | — | | | | — | | | | 2.77 | % | | | 09/29/17 | |
Russell 3000® Value Index8 | | | 2.78 | % | | | 8.50 | % | | | 11.27 | % | | | 7.08 | % | | | 06/28/05 | † |
The performance data shown represents past performance. Past performance is not a guarantee of future results. Current performance may be lower or higher than the performance data quoted. The investment return and principal value of an investment will fluctuate so that an investor’s shares, when redeemed, may be worth more or less than their original cost.
Investors should carefully consider the Fund’s investment objectives, risks, charges and expenses before investing. For performance information through the most recent month end, current net asset values per share for the Fund and other information, please call 800.835.3879 or visit our website at amgfunds.com for a free prospectus. Read it carefully before investing or sending money.
Distributed by AMG Distributors, Inc., member FINRA/SIPC.
| † | Date reflects the inception date of the Fund, not the index. |
| 1 | Total return equals income yield plus share price change and assumes reinvestment of all dividends and capital gain distributions. Returns are net of fees and may reflect offsets of Fund expenses as described in the prospectus. No adjustment has been made for taxes payable by shareholders on their reinvested dividends and |
| | capital gain distributions. Returns for periods greater than one year are annualized. The listed returns on the Fund are net of expenses and based on the published NAV as of October 31, 2018. All returns are in U.S. dollars ($). |
| 2 | An issuer of a security may be unwilling or unable to pay income on a security. Common stocks do not assure dividend payments and are paid only when declared by an issuer’s board of directors. |
| 3 | Investments in international securities are subject to certain risks of overseas investing including currency fluctuations and changes in political and economic conditions, which could result in significant market fluctuations. These risks are magnified in emerging markets. |
| 4 | The Fund is subject to risks associated with investments in mid-capitalization companies such as greater price volatility, lower trading volume, and less liquidity than the stocks of larger, more established companies. Growth stocks may underperform value stocks during given periods. |
| 5 | The Fund is subject to special risk considerations similar to those associated with the direct ownership of real estate. Real estate valuations may be subject to factors such as changing general and local economic, financial, competitive, and environmental conditions. |
| 6 | The Fund is subject to risks associated with investments in small-capitalization companies, such as erratic earnings patterns, competitive conditions, limited earnings history and a reliance on one or a limited number of products. |
| 7 | The Fund invests in value stocks, which may perform differently from the market as a whole and may be undervalued by the market for a long period of time. |
| 8 | The Russell 3000® Value Index measures the performance of the broad value segment of the U.S. equity universe. It includes those Russell 3000® companies with lower price-to-book ratios and lower forecasted growth values. Unlike the Fund, the Russell 3000® Value Index is unmanaged, is not available for investment and does not incur expenses. |
The Russell Indices are a trademark of the London Stock Exchange Group companies.
Not FDIC insured, nor bank guaranteed. May lose value.
23
| | |
| AMG River Road Dividend All Cap Value Fund | | |
Fund Snapshots (unaudited) October 31, 2018 | | |
| | | | |
| PORTFOLIO BREAKDOWN | |
| |
| | | % of | |
Sector | | Net Assets | |
Consumer Discretionary | | | 16.8 | |
Financials | | | 15.4 | |
Industrials | | | 14.1 | |
Energy | | | 12.7 | |
Consumer Staples | | | 10.7 | |
Real Estate | | | 8.6 | |
Information Technology | | | 8.3 | |
Materials | | | 4.7 | |
Utilities | | | 3.8 | |
Communication Services | | | 2.1 | |
Health Care | | | 1.9 | |
Short-Term Investments1 | | | 1.5 | |
Other Assets Less Liabilities2 | | | (0.6 | ) |
| 1 | Includes reinvestment of cash collateral into joint repurchase agreements on security lending transactions. |
| 2 | Includes repayment of cash collateral on security lending transactions. |
| | | | |
| TOP TEN HOLDINGS | |
| |
| | | % of | |
Security Name | | Net Assets | |
U.S. Bancorp | | | 3.0 | |
Marathon Petroleum Corp. | | | 3.0 | |
Fastenal Co. | | | 2.9 | |
BB&T Corp. | | | 2.9 | |
Target Corp. | | | 2.8 | |
Corning, Inc. | | | 2.7 | |
Walmart, Inc. | | | 2.5 | |
Linde PLC (United Kingdom) | | | 2.4 | |
Iron Mountain, Inc. | | | 2.3 | |
Comcast Corp., Class A | | | 2.3 | |
| | | | |
Top Ten as a Group | | | 26.8 | |
| | | | |
Because a fund’s strategy may result in multiple investments in particular sectors of the economy, its performance may depend on the performance of those sectors and may fluctuate more widely than investments diversified across more sectors. For additional information on these and other risk considerations, please see the Fund’s prospectus.
Any sectors, industries, or securities discussed should not be perceived as investment recommendations. Mention of a specific security should not be considered a recommendation to buy or solicitation to sell that security. Specific securities mentioned in this report may have been sold from the Fund’s portfolio of investments by the time you receive this report.
24
| | |
| AMG River Road Dividend All Cap Value Fund | | |
Schedule of Portfolio Investments October 31, 2018 | | |
| | | | | | | | |
| | | Shares | | | Value | |
Common Stocks - 99.1% | | | | | | | | |
Communication Services - 2.1% | | | | | | | | |
Verizon Communications, Inc. | | | 306,075 | | | $ | 17,473,822 | |
Consumer Discretionary - 16.8% | | | | | | | | |
Cedar Fair LP, (MLP) 1 | | | 237,318 | | | | 12,164,921 | |
Cinemark Holdings, Inc. | | | 425,256 | | | | 17,677,892 | |
Comcast Corp., Class A | | | 512,729 | | | | 19,555,484 | |
Extended Stay America, Inc., (Units) | | | 905,563 | | | | 14,742,566 | |
The Interpublic Group of Cos., Inc. | | | 539,563 | | | | 12,496,279 | |
Meredith Corp.1 | | | 157,693 | | | | 8,130,651 | |
Omnicom Group, Inc.1 | | | 212,695 | | | | 15,807,492 | |
Polaris Industries, Inc.1 | | | 63,825 | | | | 5,679,148 | |
Starbucks Corp. | | | 208,444 | | | | 12,146,032 | |
Target Corp. | | | 285,916 | | | | 23,911,155 | |
Total Consumer Discretionary | | | | | | | 142,311,620 | |
Consumer Staples - 10.7% | | | | | | | | |
Kimberly-Clark Corp. | | | 162,761 | | | | 16,975,972 | |
The Kraft Heinz Co. | | | 200,674 | | | | 11,031,050 | |
PepsiCo, Inc. | | | 127,388 | | | | 14,315,864 | |
Unilever PLC, Sponsored ADR (United Kingdom) | | | 263,442 | | | | 13,957,157 | |
Walgreens Boots Alliance, Inc. | | | 168,609 | | | | 13,449,940 | |
Walmart, Inc. | | | 206,276 | | | | 20,685,357 | |
Total Consumer Staples | | | | | | | 90,415,340 | |
Energy - 12.7% | | | | | | | | |
Chevron Corp. | | | 85,469 | | | | 9,542,614 | |
Exxon Mobil Corp. | | | 184,752 | | | | 14,721,039 | |
Kinder Morgan, Inc. | | | 878,435 | | | | 14,950,964 | |
Magellan Midstream Partners LP, (MLP) | | | 209,653 | | | | 12,931,397 | |
Marathon Petroleum Corp. | | | 356,683 | | | | 25,128,317 | |
Occidental Petroleum Corp. | | | 164,219 | | | | 11,014,168 | |
Spectra Energy Partners LP, (MLP) 1 | | | 121,572 | | | | 4,194,234 | |
TransMontaigne Partners LP, (MLP) | | | 239,653 | | | | 9,102,021 | |
Valero Energy Corp. | | | 60,932 | | | | 5,550,296 | |
Total Energy | | | | | | | 107,135,050 | |
Financials - 15.4% | | | | | | | | |
Axis Capital Holdings, Ltd. (Bermuda) | | | 164,970 | | | | 9,203,676 | |
BB&T Corp. | | | 496,212 | | | | 24,393,782 | |
CNA Financial Corp.1 | | | 246,315 | | | | 10,682,682 | |
Lazard, Ltd., Class A | | | 106,180 | | | | 4,219,593 | |
MetLife, Inc. | | | 130,674 | | | | 5,382,462 | |
PNC Financial Services Group, Inc. | | | 95,278 | | | | 12,242,270 | |
Thomson Reuters Corp. (Canada) | | | 270,598 | | | | 12,609,867 | |
U.S. Bancorp | | | 489,318 | | | | 25,576,652 | |
| | | | | | | | |
| | | Shares | | | Value | |
Wells Fargo & Co. | | | 237,068 | | | $ | 12,619,130 | |
WesBanco, Inc. | | | 331,073 | | | | 13,276,027 | |
Total Financials | | | | | | | 130,206,141 | |
Health Care - 1.9% | | | | | | | | |
Amgen, Inc. | | | 82,583 | | | | 15,921,177 | |
Industrials - 14.1% | | | | | | | | |
Aircastle, Ltd. | | | 687,945 | | | | 13,366,771 | |
Emerson Electric Co. | | | 153,394 | | | | 10,412,385 | |
Fastenal Co.1 | | | 482,375 | | | | 24,798,899 | |
Illinois Tool Works, Inc. | | | 64,443 | | | | 8,220,994 | |
Johnson Controls International PLC | | | 308,634 | | | | 9,867,029 | |
KAR Auction Services, Inc. | | | 280,883 | | | | 15,993,478 | |
MSC Industrial Direct Co, Inc., Class A | | | 108,705 | | | | 8,811,627 | |
Nielsen Holdings PLC | | | 310,608 | | | | 8,069,596 | |
Union Pacific Corp. | | | 33,370 | | | | 4,879,361 | |
United Parcel Service, Inc., Class B | | | 136,117 | | | | 14,501,905 | |
Total Industrials | | | | | | | 118,922,045 | |
Information Technology - 8.3% | | | | | | | | |
Cisco Systems, Inc. | | | 394,369 | | | | 18,042,382 | |
Corning, Inc. | | | 713,795 | | | | 22,805,750 | |
CSG Systems International, Inc. | | | 147,953 | | | | 5,193,150 | |
Intel Corp. | | | 166,274 | | | | 7,794,925 | |
QUALCOMM, Inc.1 | | | 264,604 | | | | 16,640,946 | |
Total Information Technology | | | | | | | 70,477,153 | |
Materials - 4.7% | | | | | | | | |
Linde PLC (United Kingdom)1 | | | 119,973 | | | | 19,851,932 | |
LyondellBasell Industries NV, Class A | | | 75,852 | | | | 6,771,308 | |
RPM International, Inc.1 | | | 212,200 | | | | 12,980,274 | |
Total Materials | | | | | | | 39,603,514 | |
Real Estate - 8.6% | | | | | | | | |
The GEO Group Inc., REIT | | | 463,868 | | | | 10,256,121 | |
Iron Mountain, Inc., REIT 1 | | | 645,891 | | | | 19,770,724 | |
Ryman Hospitality Properties, Inc., REIT | | | 158,996 | | | | 12,336,500 | |
Sabra Health Care REIT, Inc. | | | 566,885 | | | | 12,273,060 | |
Ventas, Inc., REIT | | | 243,362 | | | | 14,124,730 | |
Weyerhaeuser Co., REIT | | | 149,844 | | | | 3,990,346 | |
Total Real Estate | | | | | | | 72,751,481 | |
Utilities - 3.8% | | | | | | | | |
AmeriGas Partners LP, (MLP) 1 | | | 298,130 | | | | 10,628,334 | |
Black Hills Corp.1 | | | 154,235 | | | | 9,176,983 | |
National Fuel Gas Co.1 | | | 226,796 | | | | 12,312,755 | |
Total Utilities | | | | | | | 32,118,072 | |
Total Common Stocks
(Cost $702,764,819) | | | | | | | 837,335,415 | |
The accompanying notes are an integral part of these financial statements.
25
AMG River Road Dividend All Cap Value Fund
Schedule of Portfolio Investments (continued)
| | | | | | | | |
| | | Principal | | | | |
| | | Amount | | | Value | |
Short-Term Investments - 1.5% | | | | | | | | |
Joint Repurchase Agreements - 1.2%2 | | | | | | | | |
Citigroup Global Markets, Inc., dated 10/31/18, due 11/01/18, 2.220% total to be received $2,536,924 (collateralized by various U.S. Government Agency Obligations and U.S. Treasuries, 0.000% - 6.500%, 10/01/19 -09/09/49, totaling $2,587,503) | | $ | 2,536,768 | | | $ | 2,536,768 | |
HSBC Securities USA, Inc., dated 10/31/18, due 11/01/18, 2.210% total to be received $2,536,924 (collateralized by various U.S. Government Agency Obligations, 2.500% - 5.000%, 07/01/23 - 01/01/57, totaling $2,587,503) | | | 2,536,768 | | | | 2,536,768 | |
Merrill Lynch, Pierce, Fenner & Smith, Inc., dated 10/31/18, due 11/01/18, 2.200% total to be received $533,433 (collateralized by various U.S. Treasuries, 0.125% - 2.500%, 04/30/20 -09/09/49, totaling $544,068) | | | 533,400 | | | | 533,400 | |
Nomura Securities International, Inc., dated 10/31/18, due 11/01/18, 2.210% total to be received $2,536,924 (collateralized by various U.S. Government Agency Obligations and U.S. Treasuries, 0.000% - 9.500%, 11/08/18 -09/20/68, totaling $2,587,503) | | | 2,536,768 | | | | 2,536,768 | |
RBC Dominion Securities, Inc. dated 10/31/18, due 11/01/18, 2.220% total to be received $2,536,924 (collateralized by various U.S. Government Agency Obligations and U.S. Treasuries, 0.000% - 7.000%, 11/29/18 -09/09/49, totaling $2,587,503) | | | 2,536,768 | | | | 2,536,768 | |
Total Joint Repurchase Agreements | | | | | | | 10,680,472 | |
| | | | | | | | |
| | | Shares | | | Value | |
Other Investment Companies - 0.3% | | | | | | | | |
Dreyfus Government Cash Management Fund, Institutional Class Shares, 2.05%3 | | | 766,296 | | | $ | 766,296 | |
Dreyfus Institutional Preferred Government Money Market Fund, Institutional Class Shares, 2.12%3 | | | 766,296 | | | | 766,296 | |
JPMorgan U.S. Government Money Market Fund, IM Shares, 2.09%3 | | | 789,517 | | | | 789,517 | |
Total Other Investment Companies | | | | | | | 2,322,109 | |
Total Short-Term Investments
(Cost $13,002,581) | | | | | | | 13,002,581 | |
Total Investments - 100.6%
(Cost $715,767,400) | | | | | | | 850,337,996 | |
Other Assets, less Liabilities - (0.6)% | | | | | | | (5,315,730 | ) |
Net Assets - 100.0% | | | | | | $ | 845,022,266 | |
| 1 | Some or all of these securities, amounting to $85,917,603 or 10.2% of net assets, were out on loan to various brokers and are collateralized by cash and various U.S. Treasury Obligations. See Note 4 of Notes to Financial Statements. |
| 2 | Cash collateral received from brokers for securities lending was invested in these joint repurchase agreements. |
| 3 | Yield shown represents the October 31, 2018, seven day average yield, which refers to the sum of the previous seven days’ dividends paid, expressed as an annual percentage. |
| ADR | American Depositary Receipt |
| MLP | Master Limited Partnership |
| REIT | Real Estate Investment Trust |
The accompanying notes are an integral part of these financial statements.
26
| | |
| AMG River Road Dividend All Cap Value Fund | | |
| Schedule of Portfolio Investments (continued) | | |
The following table summarizes the inputs used to value the Fund’s investments by the fair value hierarchy levels as of October 31, 2018:
| | | | | | | | | | | | | | | | |
| | | Level 1 | | | Level 2 | | | Level 3 | | | Total | |
Investments in Securities | | | | | | | | | | | | | | | | |
Common Stocks† | | $ | 837,335,415 | | | | — | | | | — | | | $ | 837,335,415 | |
Short-Term Investments | | | | | | | | | | | | | | | | |
Joint Repurchase Agreements | | | — | | | $ | 10,680,472 | | | | — | | | | 10,680,472 | |
Other Investment Companies | | | 2,322,109 | | | | — | | | | — | | | | 2,322,109 | |
| | | | | | | | | | | | | | | | |
Total Investments in Securities | | $ | 839,657,524 | | | $ | 10,680,472 | | | | — | | | $ | 850,337,996 | |
| | | | | | | | | | | | | | | | |
| † | All common stocks held in the Fund are Level 1 securities. For a detailed breakout of common stocks by major industry classification, please refer to the Fund’s Schedule of Portfolio Investments. |
As of October 31, 2018, the Fund had no transfers between levels from the beginning of the reporting period.
The accompanying notes are an integral part of these financial statements.
27
AMG River Road Dividend All Cap Value Fund II
Portfolio Manager’s Comments (unaudited)
OVERVIEW
For the fiscal year ended October 31, 2018, the AMG River Road Dividend All Cap Value Fund II (the “Fund”) Class N shares returned 2.56%, while the Russell 3000® Value Index returned 2.78%.
PERFORMANCE REVIEW
Over the last 12 months, the most significant market factors affecting absolute returns were the substantial improvement in corporate earnings growth driven by tax reform and the Federal Reserve’s steady upward pressure on short-term interest rates. Despite the rise in interest rates, stocks in the Russell 3000® Value Index with lower yields underperformed those with higher yields. The Fund benefited from strong stock selection. The materials sector had the most significant positive impact on relative results in the period, due to strong stock selection, while the healthcare sector had the most significant negative impact on relative results due to an underweight allocation and weak stock selection.
The two holdings with the largest positive contribution to the Fund’s total return were discount retailer Target Corp. (TGT) and Union Pacific Corp. (UNP), one of the largest railroads in North America. TGT reported its best growth in 13 years with comparable sales of +6.5% in Q2 2018 driven by extraordinary traffic growth. Traffic increased +6.4% (on top of a +2.1% increase year over year), which was by far the strongest since the company began reporting traffic in 2008. Sales growth helped offset expected margin headwinds, resulting in +4% operating income growth in the quarter, reversing a negative trend and substantially beating Wall Street estimates. In addition to strong results, management raised full-year 2018 earnings guidance to reflect year-to-date performance and a more constructive outlook for the remainder of the year.
UNP was a top contributor over the trailing 12-month period with strong operating results, benefits from tax reform, and a strategic shift in operations to improve profitability. The company reported strong results throughout the period with volume growth rising to the mid-single digits and core pricing consistently rising by low-single digits. Tax reform provided substantial benefits to UNP as it
consistently paid a corporate tax rate above 37%. Finally, in September the company announced a new operating plan that implements precision scheduled railroading principles in order to improve profitability.
The two holdings with the lowest contribution to the Fund’s total return during the period were industrial conglomerate General Electric Co. (GE) and Iron Mountain Inc. (IRM), a global REIT (real estate investment trust) focused on records storage and data management services. In Q4 2017, GE reported very weak results, primarily driven by the Power segment’s -50% decline in operating profit. The result in Power was driven by lower industrywide demand and poor execution by GE. Management did not anticipate—or respond quickly enough to—the sharp drop in demand. The poor result significantly raised the risk of a dividend cut and we lowered our conviction in both the dividend and the valuation. Shortly thereafter, GE announced a -50% dividend cut and management provided a tough outlook for 2018. We were encouraged by the decision to effectively remove half the board by reducing the board to 12 from 18 members and bringing in three new directors with relevant industry experience. We were also pleased to see the firm move forward with simplification plans, announcing a $20 billion divestiture plan including strategic alternatives for GE’s stake in Baker Hughes (BHGE). We understood there was some risk to the dividend if the new management team decided to clear the decks, but our original projections for FCF (free cash flow) and earnings showed that the dividend could be supported if there was the will to do so. Unfortunately, those projections were too optimistic and the dividend policy was more tenuous than we expected. Consistent with our sell discipline, we exited the position in Q4 due to accumulated unrealized losses and the dividend cut.
Similar to most other REITs in Q4 2017, IRM’s stock price declined as interest rates increased. Q4 results exceeded our expectations as organic growth in its key storage segment continued to benefit from ongoing pricing strength. However, for the first time, IRM guided to marginally negative organic storage volumes of -25 bps in North American markets for 2018. The firm also completed a string of data center acquisitions, which diluted FFO (funds from
operations) generation and introduced execution risk as success ultimately depended on scaling up these properties. We were aware of these risks and trimmed IRM, our largest position at the time, in Q4 as the stock price approached our assessed value.
POSITIONING AND OUTLOOK
Based on average weight, the Fund is significantly overweight in consumer discretionary and industrials and significantly underweight in financials and healthcare. Despite the addition of four positions to the Fund, the overweight in consumer discretionary decreased during the period to +1.7% versus the Russell 3000 Value benchmark. This was due to the elimination of six holdings. The industrials sector ended the period at 6.0% overweight versus the benchmark due to the addition of two new positions to the Fund. The underweight in financials decreased to -9.5%, primarily due to the reduction in the benchmark weight in that sector. Healthcare ended the period at -12.6% underweight following two eliminations in that sector.
While the 2016 election result and the tax reform that followed appear responsible for extending the market cycle, as yet there does not appear to be a third factor that will drive the market in 2019. In fact, the very opposite may prove true. We believe that the sharp drop in earnings growth that is expected in Q1 2019, continued monetary tightening, and likely gridlock in Congress bodes ill for growth stocks after two years of strong outperformance. Therefore, we cannot escape the conclusion that we may have reached the final stage of the current market cycle. It is impossible to point to the exact event that will ultimately bring value strategies roaring back to the fore, but we consider that it is inevitable nonetheless. As we saw in recent months, the near-term relative success of dividend stocks and the Fund will likely remain tied to broad perceptions of risk.
The views expressed represent the opinions of River Road Asset Management LLC , as of October 31, 2018, and are not intended as a forecast or guarantee of future results and are subject to change without notice.
28
AMG River Road Dividend All Cap Value Fund II
Portfolio Manager’s Comments (continued)
CUMULATIVE TOTAL RETURN PERFORMANCE
AMG River Road Dividend All Cap Value Fund II’s cumulative total return is based on the daily change in net asset value (NAV), and assumes that all dividends and distributions were reinvested. The graph compares a hypothetical $10,000 investment made in the AMG River Road Dividend All Cap Value Fund II’s Class N shares on June 27, 2012, to a $10,000 investment made in the Russell 3000® Value Index for the same time period. The graph and table do not reflect the deduction of taxes that a shareholder would pay on a Fund distribution or redemption of shares. The listed returns for the Fund are net of expenses and the returns for the index exclude expenses. Total returns would have been lower had certain expenses not been reduced.
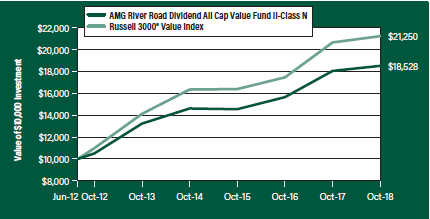
The table below shows the average annual total returns for the AMG River Road Dividend All Cap Value Fund II, the Russell 3000® Value Index for the same time periods ended October 31, 2018.
| | | | | | | | | | | | | | | | |
| Average Annual Total Returns1 | | One
Year | | | Five
Years | | | Since
Inception | | | Inception
Date | |
AMG River Road Dividend All Cap Value Fund II2, 3, 4, 5, 6, 7 | | | | | | | | | | | | | | | | |
Class N | | | 2.56 | % | | | 6.95 | % | | | 10.20 | % | | | 06/27/12 | |
Class I | | | 2.86 | % | | | 7.25 | % | | | 10.50 | % | | | 06/27/12 | |
Class Z | | | 2.93 | % | | | — | | | | 3.30 | % | | | 09/29/17 | |
Russell 3000® Value Index8 | | | 2.78 | % | | | 8.50 | % | | | 12.61 | % | | | 06/27/12 | † |
The performance data shown represents past performance. Past performance is not a guarantee of future results. Current performance may be lower or higher than the performance data quoted. The investment return and principal value of an investment will fluctuate so that an investor’s shares, when redeemed, may be worth more or less than their original cost.
Investors should carefully consider the Fund’s investment objectives, risks, charges and expenses before investing. For performance information through the most recent month end, current net asset values per share for the Fund and other information, please call 800.835.3879 or visit our website at amgfunds.com for a free prospectus. Read it carefully before investing or sending money.
Distributed by AMG Distributors, Inc., member FINRA/SIPC.
| † | Date reflects the inception date of the Fund, not the index. |
| 1 | Total return equals income yield plus share price change and assumes reinvestment of all dividends and capital gain distributions. Returns are net of fees and may reflect offsets of Fund expenses as described in the prospectus. No adjustment has been made for taxes payable by shareholders on their reinvested dividends and |
| | capital gain distributions. Returns for periods greater than one year are annualized. The listed returns on the Fund are net of expenses and based on the published NAV as of October 31, 2018. All returns are in U.S. dollars ($). |
| 2 | An issuer of a security may be unwilling or unable to pay income on a security. Common stocks do not assure dividend payments and are paid only when declared by an issuer’s board of directors. |
| 3 | Investments in international securities are subject to certain risks of overseas investing including currency fluctuations and changes in political and economic conditions, which could result in significant market fluctuations. These risks are magnified in emerging markets. |
| 4 | The Fund is subject to risks associated with investments in mid-capitalization companies such as greater price volatility, lower trading volume, and less liquidity than the stocks of larger, more established companies. Growth stocks may underperform value stocks during given periods. |
| 5 | The Fund is subject to special risk considerations similar to those associated with the direct ownership of real estate. Real estate valuations may be subject to factors such as changing general and local economic, financial, competitive, and environmental conditions. |
| 6 | The Fund is subject to risks associated with investments in small-capitalization companies, such as erratic earnings patterns, competitive conditions, limited earnings history and a reliance on one or a limited number of products. |
| 7 | The Fund invests in value stocks, which may perform differently from the market as a whole and may be undervalued by the market for a long period of time. |
| 8 | The Russell 3000® Value Index measures the performance of the broad value segment of the U.S. equity universe. It includes those Russell 3000® companies with lower price-to-book ratios and lower forecasted growth values. Unlike the Fund, the Russell 3000® Value Index is unmanaged, is not available for investment and does not incur expenses. |
The Russell Indices are a trademark of the London Stock Exchange Group companies.
Not FDIC insured, not bank guaranteed. May lose value.
29
| | |
| AMG River Road Dividend All Cap Value Fund II | | |
| |
Fund Snapshots (unaudited) October 31, 2018 | | |
PORTFOLIO BREAKDOWN
| | | | |
| | | % of | |
Sector | | Net Assets | |
Consumer Discretionary | | | 16.7 | |
Industrials | | | 13.8 | |
Financials | | | 13.7 | |
Energy | | | 12.1 | |
Consumer Staples | | | 11.2 | |
Real Estate | | | 8.9 | |
Information Technology | | | 8.7 | |
Materials | | | 4.9 | |
Utilities | | | 3.6 | |
Communication Services | | | 2.2 | |
Health Care | | | 2.0 | |
Short-Term Investments1 | | | 2.0 | |
Other Assets Less Liabilities2 | | | 0.2 | |
| 1 | Includes reinvestment of cash collateral into joint repurchase agreements on security lending transactions. |
| 2 | Includes repayment of cash collateral on security lending transactions. |
TOP TEN HOLDINGS
| | | | |
| | | % of | |
Security Name | | Net Assets | |
Fastenal Co. | | | 3.1 | |
U.S. Bancorp | | | 3.1 | |
Marathon Petroleum Corp. | | | 3.0 | |
BB&T Corp. | | | 3.0 | |
Target Corp. | | | 3.0 | |
Corning, Inc. | | | 2.8 | |
Walmart, Inc. | | | 2.6 | |
Linde PLC (United Kingdom) | | | 2.5 | |
Iron Mountain, Inc. | | | 2.4 | |
Comcast Corp., Class A | | | 2.4 | |
| | | | |
Top Ten as a Group | | | 27.9 | |
| | | | |
Because a fund’s strategy may result in multiple investments in particular sectors of the economy, its performance may depend on the performance of those sectors and may fluctuate more widely than investments diversified across more sectors. For additional information on these and other risk considerations, please see the Fund’s prospectus.
Any sectors, industries, or securities discussed should not be perceived as investment recommendations. Mention of a specific security should not be considered a recommendation to buy or solicitation to sell that security. Specific securities mentioned in this report may have been sold from the Fund’s portfolio of investments by the time you receive this report.
30
| | |
| AMG River Road Dividend All Cap Value Fund II | | |
Schedule of Portfolio Investments October 31, 2018 | | |
| | | | | | | | |
| | | Shares | | | Value | |
Common Stocks - 97.8% | | | | | | | | |
Communication Services - 2.2% | | | | | | | | |
Verizon Communications, Inc. | | | 32,697 | | | $ | 1,866,672 | |
Consumer Discretionary - 16.7% | | | | | | | | |
Cedar Fair LP, (MLP) | | | 10,299 | | | | 527,927 | |
Cinemark Holdings, Inc. | | | 45,396 | | | | 1,887,112 | |
Comcast Corp., Class A | | | 54,295 | | | | 2,070,811 | |
Extended Stay America, Inc., (Units) | | | 95,692 | | | | 1,557,866 | |
The Interpublic Group of Cos., Inc. | | | 57,595 | | | | 1,333,900 | |
Meredith Corp. | | | 16,899 | | | | 871,312 | |
Omnicom Group, Inc. | | | 22,598 | | | | 1,679,483 | |
Polaris Industries, Inc.1 | | | 6,999 | | | | 622,771 | |
Starbucks Corp. | | | 22,498 | | | | 1,310,959 | |
Target Corp. | | | 30,997 | | | | 2,592,279 | |
Total Consumer Discretionary | | | | | | | 14,454,420 | |
Consumer Staples - 11.2% | | | | | | | | |
Kimberly-Clark Corp. | | | 17,798 | | | | 1,856,331 | |
The Kraft Heinz Co. | | | 21,998 | | | | 1,209,230 | |
PepsiCo, Inc. | | | 13,699 | | | | 1,539,494 | |
Unilever PLC, Sponsored ADR (United Kingdom) | | | 27,598 | | | | 1,462,142 | |
Walgreens Boots Alliance, Inc. | | | 17,599 | | | | 1,403,872 | |
Walmart, Inc. | | | 22,398 | | | | 2,246,072 | |
Total Consumer Staples | | | | | | | 9,717,141 | |
Energy - 12.1% | | | | | | | | |
Chevron Corp. | | | 9,199 | | | | 1,027,068 | |
Exxon Mobil Corp. | | | 19,498 | | | | 1,553,601 | |
Kinder Morgan, Inc. | | | 95,043 | | | | 1,617,632 | |
Magellan Midstream Partners LP, (MLP) | | | 22,998 | | | | 1,418,517 | |
Marathon Petroleum Corp. | | | 37,797 | | | | 2,662,799 | |
Occidental Petroleum Corp. | | | 17,499 | | | | 1,173,658 | |
Spectra Energy Partners LP, (MLP) | | | 13,177 | | | | 454,606 | |
Valero Energy Corp. | | | 6,499 | | | | 591,994 | |
Total Energy | | | | | | | 10,499,875 | |
Financials - 13.7% | | | | | | | | |
Axis Capital Holdings, Ltd. (Bermuda) | | | 17,199 | | | | 959,532 | |
BB&T Corp. | | | 52,895 | | | | 2,600,318 | |
CNA Financial Corp. | | | 15,599 | | | | 676,529 | |
Lazard, Ltd., Class A | | | 11,555 | | | | 459,196 | |
MetLife, Inc. | | | 13,799 | | | | 568,381 | |
PNC Financial Services Group, Inc. | | | 10,299 | | | | 1,323,318 | |
Thomson Reuters Corp. (Canada) | | | 28,898 | | | | 1,346,647 | |
U.S. Bancorp | | | 50,996 | | | | 2,665,561 | |
| | | | | | | | |
| | | Shares | | | Value | |
Wells Fargo & Co. | | | 24,698 | | | $ | 1,314,674 | |
Total Financials | | | | | | | 11,914,156 | |
Health Care - 2.0% | | | | | | | | |
Amgen, Inc. | | | 8,899 | | | | 1,715,638 | |
Industrials - 13.8% | | | | | | | | |
Aircastle, Ltd. | | | 33,397 | | | | 648,904 | |
Emerson Electric Co. | | | 16,599 | | | | 1,126,740 | |
Fastenal Co. | | | 52,196 | | | | 2,683,396 | |
Illinois Tool Works, Inc. | | | 6,999 | | | | 892,862 | |
Johnson Controls International PLC | | | 32,897 | | | | 1,051,717 | |
KAR Auction Services, Inc. | | | 29,897 | | | | 1,702,335 | |
MSC Industrial Direct Co, Inc., Class A | | | 11,760 | | | | 953,266 | |
Nielsen Holdings PLC | | | 32,897 | | | | 854,664 | |
Union Pacific Corp. | | | 3,700 | | | | 541,014 | |
United Parcel Service, Inc., Class��B | | | 14,499 | | | | 1,544,724 | |
Total Industrials | | | | | | | 11,999,622 | |
Information Technology - 8.7% | | | | | | | | |
Cisco Systems, Inc. | | | 41,596 | | | | 1,903,017 | |
Corning, Inc. | | | 77,993 | | | | 2,491,877 | |
CSG Systems International, Inc. | | | 15,799 | | | | 554,545 | |
Intel Corp. | | | 17,698 | | | | 829,682 | |
QUALCOMM, Inc. | | | 28,498 | | | | 1,792,239 | |
Total Information Technology | | | | | | | 7,571,360 | |
Materials - 4.9% | | | | | | | | |
Linde PLC (United Kingdom)1 | | | 12,999 | | | | 2,150,944 | |
LyondellBasell Industries NV, Class A | | | 8,099 | | | | 722,998 | |
RPM International, Inc. | | | 22,998 | | | | 1,406,788 | |
Total Materials | | | | | | | 4,280,730 | |
Real Estate - 8.9% | | | | | | | | |
The GEO Group Inc., REIT | | | 49,996 | | | | 1,105,412 | |
Iron Mountain, Inc., REIT | | | 67,894 | | | | 2,078,235 | |
Ryman Hospitality Properties, Inc., REIT | | | 16,899 | | | | 1,311,193 | |
Sabra Health Care REIT, Inc. | | | 59,795 | | | | 1,294,562 | |
Ventas, Inc., REIT | | | 26,198 | | | | 1,520,532 | |
Weyerhaeuser Co., REIT | | | 16,199 | | | | 431,379 | |
Total Real Estate | | | | | | | 7,741,313 | |
Utilities - 3.6% | | | | | | | | |
AmeriGas Partners LP, (MLP) 1 | | | 21,098 | | | | 752,143 | |
Black Hills Corp.1 | | | 17,698 | | | | 1,053,031 | |
National Fuel Gas Co. | | | 24,698 | | | | 1,340,854 | |
Total Utilities | | | | | | | 3,146,028 | |
Total Common Stocks
(Cost $73,194,558) | | | | | | | 84,906,955 | |
The accompanying notes are an integral part of these financial statements.
31
| | |
| AMG River Road Dividend All Cap Value Fund II | | |
| Schedule of Portfolio Investments (continued) | | |
| | | | | | | | |
| | | Principal
Amount | | | Value | |
Short-Term Investments - 2.0% | | | | | | | | |
Joint Repurchase Agreements - 0.5%2 | | | | | |
Mizuho Securities USA, LLC, dated 10/31/18, due 11/01/18, 2.200% total to be received $452,748 (collateralized by various U.S. Treasuries, 0.000% - 2.750%, 03/07/19 - 09/09/49, totaling $461,775) | | $ | 452,720 | | | $ | 452,720 | |
| | |
| | | Shares | | | | |
Other Investment Companies - 1.5% | | | | | |
Dreyfus Government Cash Management Fund, Institutional Class Shares, 2.05%3 | | | 410,810 | | | | 410,810 | |
Dreyfus Institutional Preferred Government Money Market Fund, Institutional Class Shares, 2.12%3 | | | 410,810 | | | | 410,810 | |
JPMorgan U.S. Government Money Market Fund, IM Shares, 2.09%3 | | | 423,258 | | | | 423,258 | |
Total Other Investment Companies | | | | | | | 1,244,878 | |
Total Short-Term Investments
(Cost $1,697,598) | | | | | | | 1,697,598 | |
| | | | |
| | | Value | |
Total Investments - 99.8%
(Cost $74,892,156) | | $ | 86,604,553 | |
Other Assets, less Liabilities - 0.2% | | | 186,399 | |
Net Assets - 100.0% | | $ | 86,790,952 | |
| 1 | Some or all of these securities, amounting to $4,203,798 or 4.8% of net assets, were out on loan to various brokers and are collateralized by cash and various U.S. Treasury Obligations. See Note 4 of Notes to Financial Statements. |
| 2 | Cash collateral received from brokers for securities lending was invested in these joint repurchase agreements. |
| 3 | Yield shown represents the October 31, 2018, seven day average yield, which refers to the sum of the previous seven days’ dividends paid, expressed as an annual percentage. |
ADR American Depositary Receipt
LP Limited Partnership
MLP Master Limited Partnership
REIT Real Estate Investment Trust
The following table summarizes the inputs used to value the Fund’s investments by the fair value hierarchy levels as of October 31, 2018:
| | | | | | | | | | | | | | | | |
| | | Level 1 | | | Level 2 | | | Level 3 | | | Total | |
Investments in Securities | | | | | | | | | | | | | | | | |
Common Stocks† | | $ | 84,906,955 | | | | — | | | | — | | | $ | 84,906,955 | |
Short-Term Investments | | | | | | | | | | | | | | | | |
Joint Repurchase Agreements | | | — | | | $ | 452,720 | | | | — | | | | 452,720 | |
Other Investment Companies | | | 1,244,878 | | | | — | | | | — | | | | 1,244,878 | |
| | | | | | | | | | | | | | | | |
Total Investments in Securities | | $ | 86,151,833 | | | $ | 452,720 | | | | — | | | $ | 86,604,553 | |
| | | | | | | | | | | | | | | | |
| † | All common stocks held in the Fund are Level 1 securities. For a detailed breakout of common stocks by major industry classification, please refer to the Fund’s Schedule of Portfolio Investments. |
As of October 31, 2018, the Fund had no transfers between levels from the beginning of the reporting period.
The accompanying notes are an integral part of these financial statements.
32
AMG Managers Fairpointe Mid Cap Fund
Portfolio Manager’s Comments (unaudited)
OVERVIEW
For the fiscal year ended October 31, 2018, the AMG Managers Fairpointe Mid Cap Fund (the “Fund”) Class N shares returned (2.82)%, while the S&P MidCap 400® Index returned 1.02% and the Russell Midcap® Index returned 2.79%.
PERFORMANCE REVIEW
Market volatility continued in the fiscal year, as concerns about trade wars and the global economic outlook persisted.
The top five contributors to performance were Time, Inc. (TIME), Akamai Technologies, Inc. (AKAM), Hormel Foods Corporation (HRL), The New York Times Company (NYT), and Unisys Corporation (UIS).
Time, the leading U.S. consumer magazine company, was acquired by Meredith Corporation (MDP) on January 31, 2018. As Time shareholders, we received $18.50 per share in the all-cash transaction. Following the merger, we initiated a position in Meredith. We believe the synergies in the merger will be substantial, especially in sales and marketing. Meredith management will retain the Time properties that are best positioned to enhance Meredith’s earnings power, such as People magazine, a top brand which is aligned with their traditionally female-focused properties. The process of divesting properties that do not fit their audience profile and target advertising, such as TIME, Sports Illustrated, Fortune, and Money, is underway.
Akamai Technologies has a network of internet servers located worldwide to provide content delivery and cloud infrastructure services to its customers. After an activist acquired the stock and the company conducted an internal strategic review resulting in a 5% headcount reduction, profitability has improved throughout 2018. Cloud security products have shown strong growth and now account for more than 20% of overall revenues.
Hormel produces meat and other food products, including brands Skippy, SPAM, Applegate, Justin’s nut butters, Wholly Guacamole, and Jennie-O turkeys. Despite headwinds in the markets for pork and turkey, Hormel has recorded increased earnings per share in 2018. The company is committed to increasing revenues and earnings through organic growth and acquisitions while maintaining a strong balance sheet. The stock moved up during the year as the company executed this plan.
The New York Times Company, a global media organization, has been successful in growing digital subscriptions and total revenue, offsetting declining
print advertising. Digital-only subscribers have more than doubled over the last two and a half years and continue to grow at a double-digit year-over-year rate. For the long term, New York Times management continues to focus on improving online content and reallocating expenses to growth areas.
Unisys stock has enjoyed strong returns because of management’s sustained focus on long-term strategic goals. The company has been signing new service contracts, increasing the backlog, and improving the future revenues and earnings outlook. The company has made changes to its pension plans to reduce its significant future pension obligations. In early September, the stock was added to the S&P SmallCap 600® Index, which boosted the stock’s returns even further.
Detractors from performance included McDermott International, Inc. (MDR), Lions Gate Entertainment Corporation (LGF.A/B), Copa Holdings, S.A. (CPA), Patterson Companies, Inc. (PDCO), and Stericycle, Inc. (STRL).
McDermott, an oil services provider, has declined due to cost overruns on three large construction projects inherited as part of its acquisition of Chicago Bridge & Iron. The additional expenses have put pressure on McDermott’s balance sheet and delayed the paying down of debt related to the acquisition. It is our view that McDermott’s strong management team has taken the necessary steps to ensure the long-term successful integration of Chicago Bridge & Iron. We believe the combination creates a powerful, worldwide competitor with industry-leading onshore-offshore integration capabilities.
Lions Gate Entertainment produces and distributes motion pictures and television programming. The company has a library of more than 16,000 film and television titles including The Hunger Games, Divergent, Mad Men, and Orange Is the New Black, as well as an extensive library aimed at young adults, such as the Twilight Series. The company acquired distribution platform STARZ last year. In early February, Lions Gate announced lower earnings guidance for the coming three years citing a delayed movie release schedule. Lions Gate’s long-term fundamentals remain intact, supported by TV production strength and direct Starz subscriber growth outside of traditional cable bundles.
Copa Holdings has experienced a more difficult 2018 after being among our top performers last year. Copa is a well-run airline that maintains a strong presence in Latin America. The company controls the majority
of gates in both the new and the existing airport terminals of Panama City and has a growing presence in North America. Despite these strengths, Copa’s stock price has suffered due to weakness in Latin American currencies and higher fuel prices. We believe these are temporary setbacks that do not affect the company’s strong long-term prospects, as it continues to grow and improve profitability.
Patterson Companies is the second largest dental products distributor and the largest animal health distributor in the U.S. Revenue has been pressured by a recent IT system implementation, which caused the sales force to divert efforts to customer service. The new CEO has hired additional sales representatives and is conducting a strategic review of the company. We believe he has a good grasp of the issues and has a plan to improve the dental results.
Stericycle is a leading provider of medical waste disposal and secure document destruction. While the company’s business transformation and ERP implementation are in the early stages, management is acting with a sense of urgency that we believe will lead to long-term appreciation in the stock.
POSITIONING AND OUTLOOK - ATTRACTIVE FUNDAMENTALS
The consensus long-term earnings growth rate for the Fund has improved to 11.4% from 10.1% a year ago, according to Zacks, which compares favorably to the 11.2% rate for the S&P MidCap 400® Index and is slightly below the 11.5% for the Russell MidCap® Index. This stronger earnings outlook is not yet reflected in the valuation of the portfolio, which continues to have a significant discount to that of the market—with a P/E of 12.1x 2019 projected earnings compared to 14.1x for the S&P MidCap 400® Index, 14.6x for the Russell MidCap® Index and 15.2x for the S&P 500® Index.1
We have not changed our philosophy or process. Our stock purchases and sales remain guided by a fundamental bottom-up approach with a careful eye on valuation and long-term perspective. We continue to believe that attractive valuations, low debt levels, geographic diversification, and sustained earnings will be recognized by the market over time.
The views expressed represent the opinions of Fairpointe Capital LLC, as of October 31, 2018, and are not intended as a forecast or guarantee of future results and are subject to change without notice.
33
AMG Managers Fairpointe Mid Cap Fund
Portfolio Manager’s Comments (continued)
CUMULATIVE TOTAL RETURN PERFORMANCE
AMG Managers Fairpointe Mid Cap Fund’s cumulative total return is based on the daily change in net asset value (NAV), and assumes that all dividends and distributions were reinvested. The graph compares a hypothetical $10,000 investment made in the AMG Managers Fairpointe Mid Cap Fund’s Class N shares on October 31, 2008, to a $10,000 investment made in the S&P MidCap 400® Index and Russell Midcap® Index for the same time period. The graph and table do not reflect the deduction of taxes that a shareholder would pay on a Fund distribution or redemption of shares. The listed returns for the Fund are net of expenses and the returns for the index exclude expenses. Total returns would have been lower had certain expenses not been reduced.
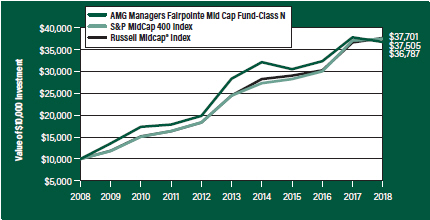
The table below shows the average annual total returns for the AMG Managers Fairpointe Mid Cap Fund, the S&P MidCap 400® Index and Russell Midcap® Index for the same time periods ended October 31, 2018.
| | | | | | | | | | | | | | | | | | | | |
| Average Annual Total Returns1 | | One
Year | | | Five
Years | | | Ten
Years | | | Since
Inception | | | Inception
Date | |
AMG Managers Fairpointe Mid Cap Fund2, 3, 4, 5 | | | | | | | | | | | | | | | | | | | | |
Class N | | | (2.82 | %) | | | 5.32 | % | | | 13.91 | % | | | 11.48 | % | | | 09/19/94 | |
Class I | | | (2.56 | %) | | | 5.59 | % | | | 14.20 | % | | | 8.99 | % | | | 07/06/04 | |
Class Z | | | (2.48 | %) | | | — | | | | — | | | | (4.84 | %) | | | 09/29/17 | |
S&P MidCap 400® Index6 | | | 1.02 | % | | | 8.89 | % | | | 14.13 | % | | | 11.70 | % | | | 09/19/94 | † |
Russell Midcap® Index7 | | | 2.79 | % | | | 8.97 | % | | | 14.19 | % | | | 10.80 | % | | | 09/19/94 | † |
The performance data shown represents past performance. Past performance is not a guarantee of future results. Current performance may be lower or higher than the performance data quoted. The investment return and principal value of an investment will fluctuate so that an investor’s shares, when redeemed, may be worth more or less than their original cost.
Investors should carefully consider the Fund’s investment objectives, risks, charges and expenses before investing. For performance information through the most recent month end, current net asset values per share for the Fund and other information, please call 800.835.3879 or visit our website at amgfunds.com for a free prospectus. Read it carefully before investing or sending money.
Distributed by AMG Distributors, Inc., member FINRA/SIPC.
| † | Date reflects the inception date of the Fund, not the index. |
| 1 | Total return equals income yield plus share price change and assumes reinvestment of all dividends and capital gain distributions. Returns are net of fees and may reflect offsets of Fund expenses as described in the prospectus. No adjustment has been made for taxes payable by shareholders on their reinvested dividends and |
| | capital gain distributions. Returns for periods greater than one year are annualized. The listed returns on the Fund are net of expenses and based on the published NAV as of October 31, 2018. All returns are in U.S. dollars ($). |
| 2 | The Fund is subject to risks associated with investments in mid-capitalization companies such as greater price volatility, lower trading volume, and less liquidity than the stocks of larger, more established companies. Growth stocks may underperform value stocks during given periods. |
| 3 | The Fund is subject to risks associated with investments in small-capitalization companies, such as erratic earnings patterns, competitive conditions, limited earnings history and a reliance on one or a limited number of products. |
| 4 | The Fund may invest in derivatives such as options and futures; the complexity and rapidly changing structure of derivatives markets may increase the possibility of market losses. |
| 5 | Investments in international securities are subject to certain risks of overseas investing including currency fluctuations and changes in political and economic conditions, which could result in significant market fluctuations. These risks are magnified in emerging markets. |
| 6 | The S&P MidCap 400® Index provides investors with a benchmark for mid-sized companies. The Index, which is distinct from the large-cap S&P 500®, measures the performance of mid-sized companies, reflecting the distinctive risk and return characteristics of this market segment. Unlike the Fund, the S&P MidCap 400® Index is unmanaged, is not available for investment and does not incur expenses. |
| 7 | The Russell Midcap® Index measures the performance of the 800 smallest companies in the Russell 1000® Index, which represent approximately 25% of the total market capitalization of the Russell 1000® Index. Unlike the Fund, the Russell Midcap® Index is unmanaged, is not available for investment and does not incur expenses. |
The S&P Index is proprietary data of Standard & Poor’s, a division of McGraw-Hill Companies, Inc.
The Russell Indices are a trademark of the London Stock Exchange Group companies.
Not FDIC insured, nor bank guaranteed. May lose value.
34
| | |
| AMG Managers Fairpointe Mid Cap Fund | | |
Fund Snapshots (unaudited) October 31, 2018 | | |
PORTFOLIO BREAKDOWN
| | | | |
| | | % of | |
Sector | | Net Assets | |
Consumer Discretionary | | | 32.5 | |
Information Technology | | | 21.2 | |
Industrials | | | 14.7 | |
Consumer Staples | | | 8.4 | |
Health Care | | | 7.6 | |
Financials | | | 6.8 | |
Materials | | | 4.7 | |
Energy | | | 2.6 | |
Short-Term Investments | | | 1.4 | |
Other Assets Less Liabilities | | | 0.1 | |
TOP TEN HOLDINGS
| | | | |
| | | % of | |
Security Name | | Net Assets | |
Juniper Networks, Inc. | | | 4.4 | |
TEGNA, Inc. | | | 4.2 | |
The New York Times Co., Class A | | | 3.5 | |
Teradata Corp. | | | 3.2 | |
Mattel, Inc. | | | 3.1 | |
Hormel Foods Corp. | | | 3.1 | |
Molson Coors Brewing Co., Class B | | | 3.0 | |
Varian Medical Systems, Inc. | | | 2.9 | |
Cooper Tire & Rubber Co. | | | 2.8 | |
Meredith Corp. | | | 2.7 | |
| | | | |
Top Ten as a Group | | | 32.9 | |
| | | | |
Because a fund’s strategy may result in multiple investments in particular sectors of the economy, its performance may depend on the performance of those sectors and may fluctuate more widely than investments diversified across more sectors. For additional information on these and other risk considerations, please see the Fund’s prospectus.
Any sectors, industries, or securities discussed should not be perceived as investment recommendations. Mention of a specific security should not be considered a recommendation to buy or solicitation to sell that security. Specific securities mentioned in this report may have been sold from the Fund’s portfolio of investments by the time you receive this report.
35
| | |
| AMG Managers Fairpointe Mid Cap Fund | | |
Schedule of Portfolio Investments October 31, 2018 | | |
| | | | | | | | |
| | | Shares | | | Value | |
Common Stocks - 98.5% | | | | | | | | |
Consumer Discretionary - 32.5% | | | | | | | | |
BorgWarner, Inc. | | | 610,000 | | | $ | 24,040,100 | |
Cooper Tire & Rubber Co.1 | | | 2,567,720 | | | | 79,316,871 | |
Gentex Corp. | | | 3,384,300 | | | | 71,239,515 | |
The Interpublic Group of Cos., Inc. | | | 1,106,000 | | | | 25,614,960 | |
Lear Corp. | | | 207,600 | | | | 27,590,040 | |
Lions Gate Entertainment Corp., Class A | | | 2,211,872 | | | | 42,379,468 | |
Lions Gate Entertainment Corp., Class B | | | 2,200,522 | | | | 39,147,286 | |
LKQ Corp.* | | | 2,659,500 | | | | 72,524,565 | |
Mattel, Inc.* | | | 6,570,100 | | | | 89,221,958 | |
Meredith Corp. | | | 1,506,350 | | | | 77,667,406 | |
The New York Times Co., Class A | | | 3,742,445 | | | | 98,800,548 | |
Office Depot, Inc. | | | 22,793,600 | | | | 58,351,616 | |
Scholastic Corp. | | | 1,033,414 | | | | 44,829,499 | |
TEGNA, Inc. | | | 10,275,000 | | | | 118,573,500 | |
Whirlpool Corp. | | | 519,907 | | | | 57,064,992 | |
Total Consumer Discretionary | | | | | | | 926,362,324 | |
Consumer Staples - 8.4% | | | | | | | | |
Bunge, Ltd. | | | 1,081,700 | | | | 66,849,060 | |
Hormel Foods Corp. | | | 2,009,300 | | | | 87,685,852 | |
Molson Coors Brewing Co., Class B | | | 1,317,700 | | | | 84,332,800 | |
Total Consumer Staples | | | | | | | 238,867,712 | |
Energy - 2.6% | | | | | | | | |
McDermott International, Inc.* | | | 6,988,231 | | | | 54,019,026 | |
TechnipFMC PLC (United Kingdom) | | | 781,728 | | | | 20,559,446 | |
Total Energy | | | | | | | 74,578,472 | |
Financials - 6.8% | | | | | | | | |
Cincinnati Financial Corp. | | | 749,400 | | | | 58,932,816 | |
Northern Trust Corp. | | | 824,100 | | | | 77,523,087 | |
Raymond James Financial, Inc. | | | 757,400 | | | | 58,085,006 | |
Total Financials | | | | | | | 194,540,909 | |
Health Care - 7.6% | | | | | | | | |
Patterson Cos., Inc. | | | 2,362,100 | | | | 53,336,218 | |
Quest Diagnostics, Inc. | | | 645,900 | | | | 60,785,649 | |
Varex Imaging Corp.* | | | 687,020 | | | | 17,835,039 | |
Varian Medical Systems, Inc.* | | | 700,100 | | | | 83,570,937 | |
Total Health Care | | | | | | | 215,527,843 | |
Industrials - 14.7% | | | | | | | | |
AGCO Corp. | | | 1,058,700 | | | | 59,329,548 | |
| * | Non-income producing security. |
| 1 | Affiliated issuer. See summary of affiliated investment transaction for details. |
| | | | | | | | |
| | | Shares | | | Value | |
Arconic, Inc. | | | 844,935 | | | $ | 17,177,529 | |
Copa Holdings, S.A., Class A (Panama) | | | 783,135 | | | | 56,722,468 | |
Donaldson Co., Inc. | | | 810,608 | | | | 41,567,978 | |
ManpowerGroup, Inc. | | | 435,200 | | | | 33,201,408 | |
Owens Corning | | | 948,300 | | | | 44,826,141 | |
Stericycle, Inc.* | | | 1,280,700 | | | | 63,996,579 | |
Wabtec Corp. | | | 453,500 | | | | 37,196,070 | |
Werner Enterprises, Inc. | | | 2,074,700 | | | | 66,784,593 | |
Total Industrials | | | | | | | 420,802,314 | |
Information Technology - 21.2% | | | | | | | | |
Akamai Technologies, Inc.* | | | 785,950 | | | | 56,784,887 | |
Cars.com, Inc.* | | | 2,852,300 | | | | 74,473,553 | |
Cree, Inc.* | | | 1,369,173 | | | | 53,151,296 | |
Itron, Inc.* | | | 621,098 | | | | 32,384,050 | |
Jabil, Inc. | | | 2,877,300 | | | | 71,155,629 | |
Juniper Networks, Inc. | | | 4,291,000 | | | | 125,597,570 | |
Nuance Communications, Inc.* | | | 3,794,800 | | | | 65,991,572 | |
Teradata Corp.* | | | 2,548,900 | | | | 92,779,960 | |
Unisys Corp.* | | | 1,800,088 | | | | 33,139,620 | |
Total Information Technology | | | | | | | 605,458,137 | |
Materials - 4.7% | | | | | | | | |
Domtar Corp. | | | 1,447,500 | | | | 67,033,725 | |
FMC Corp. | | | 302,000 | | | | 23,580,160 | |
Gerdau SA, Sponsored ADR (Brazil) | | | 10,202,100 | | | | 44,379,135 | |
Total Materials | | | | | | | 134,993,020 | |
Total Common Stocks
(Cost $2,366,640,627) | | | | | | | 2,811,130,731 | |
Short-Term Investments - 1.4% | | | | | | | | |
Other Investment Companies - 1.4% | | | | | | | | |
Dreyfus Government Cash Management Fund, Institutional Class Shares, 2.05%2 | | | 13,030,509 | | | | 13,030,509 | |
Dreyfus Institutional Preferred Government Money Market Fund, Institutional Class Shares, 2.12%2 | | | 13,030,509 | | | | 13,030,509 | |
JPMorgan U.S. Government Money Market Fund, IM Shares, 2.09%2 | | | 13,425,373 | | | | 13,425,373 | |
Total Short-Term Investments
(Cost $39,486,391) | | | | | | | 39,486,391 | |
Total Investments - 99.9%
(Cost $2,406,127,018) | | | | | | | 2,850,617,122 | |
Other Assets, less Liabilities - 0.1% | | | | | | | 2,472,798 | |
Net Assets - 100.0% | | | | | | $ | 2,853,089,920 | |
| 2 | Yield shown represents the October 31, 2018, seven day average yield, which refers to the sum of the previous seven days’ dividends paid, expressed as an annual percentage. |
The accompanying notes are an integral part of these financial statements.
36
| | |
| AMG Managers Fairpointe Mid Cap Fund | | |
| Schedule of Portfolio Investments (continued) | | |
ADR American Depositary Receipt
The following schedule shows the value of affiliated investments at October 31, 2018.
| | | | | | | | | | | | | | | | | | | | | | | | | | | | |
Affiliated Issuers | | Number
of shares | | | Purchases | | | Sales | | | Net realized
loss for
the period | | | Net decrease
in unrealized
appreciation
for the period | | | Amount of
Dividends or
Interest | | | Value | |
Cooper Tire & Rubber Co. | | | 2,567,720 | | | $ | 18,625,480 | | | $ | (28,869,985 | ) | | $ | (5,179,788 | ) | | $ | (25,252 | ) | | $ | 1,338,013 | | | $ | 79,316,871 | |
The following table summarizes the inputs used to value the Fund’s investments by the fair value hierarchy levels as of October 31, 2018:
| | | | | | | | | | | | | | | | |
| | | Level 1 | | | Level 2 | | | Level 3 | | | Total | |
Investments in Securities | | | | | | | | | | | | | | | | |
Common Stocks† | | $ | 2,811,130,731 | | | | — | | | | — | | | $ | 2,811,130,731 | |
Short-Term Investments | | | | | | | | | | | | | | | | |
Other Investment Companies | | | 39,486,391 | | | | — | | | | — | | | | 39,486,391 | |
| | | | | | | | | | | | | | | | |
Total Investments in Securities | | $ | 2,850,617,122 | | | | — | | | | — | | | $ | 2,850,617,122 | |
| | | | | | | | | | | | | | | | |
| † | All common stocks held in the Fund are Level 1 securities. For a detailed breakout of common stocks by major industry classification, please refer to the Fund’s Schedule of Portfolio Investments. |
As of October 31, 2018, the Fund had no transfers between levels from the beginning of the reporting period.
The accompanying notes are an integral part of these financial statements.
37
AMG Managers LMCG Small Cap Growth Fund
Portfolio Manager’s Comments (unaudited)
The AMG Managers LMCG Small Cap Growth Fund (the “Fund”) Class N shares returned 10.46% for the fiscal year ended October 31, 2018, compared with a 4.13% return for its benchmark, the Russell 2000® Growth Index.
U.S. stocks closed out 2017 with strong gains across many market segments. Volatility returned in 2018 with a backdrop of higher interest rates, tax cuts, new trade agreements with Mexico and Canada, trade wars in China, and other macroeconomic concerns. Most recently, markets sold off sharply in October as concerns around global growth and trade escalated. From a style perspective among U.S. small caps, growth stocks outperformed their value counterparts in the 12 months ending October 31: the Russell 2000® Growth Index returned 4.1% for the period, vs. (0.6%) for the Russell 2000® Value Index. From a size perspective, the strongest returns in the period were found in large caps. The Russell 2000® Index returned 1.9%, while the Russell Midcap® Index finished at 2.8% and the Russell 1000® Index returned 7.0%.
Although absolute returns were muted by the October selloff, we are pleased with fund performance in the period. Our growth strategy seeks to identify unrecognized growth potential wherever it exists, across all sectors and industries—and despite pockets of volatility in 2018,
the market also rewarded positive revisions for sales, earnings per share (EPS), and price targets, which was supportive to our strategy.
Stock selection in information technology was strong, and the portfolio benefited from our overweight to the sector as well. Holdings in semiconductors, software, and IT services/equipment companies all helped relative returns. Strength in our biotechnology holdings led performance in the healthcare sector, along with our underweight to that segment. Returns in biotech and our providers & services companies, along with healthcare equipment, were strong enough to offset weaker stock selection in pharmaceuticals. In the newly created communication services sector, stock selection in media and telecom was positive. The portfolio’s underweight to energy, materials, and real estate (along with good stock selection in each sector) helped returns as those sectors struggled in the period.
Underperformance in consumer discretionary was concentrated mainly in the specialty retail and hotels/restaurants segments. In industrials, weaker stock selection weighed on returns, although that was partially mitigated by our underweight to the sector. The portfolio had limited exposure in consumer staples, and although the two holdings (one with positive returns in the period and one with
negative returns) mostly offset one another, the portfolio was hurt on a relative basis by what we did not own in the period. Finally, in financials, poor results in bank holdings were partially offset by strong results in insurance holdings. However, the overall result in financials was negative due to our overweight.
As we enter the last two months of 2018, our portfolio is most overweight the financials and communications services sectors, and our largest underweight is in industrials. As always, these weights are fallout of our fundamental bottom-up investment process. We continue to evaluate new opportunities, and have found several new investments that should add to results in the future and are in line with the disciplined process that has resulted in long-term results for our clients. These new stocks have come across multiple industry sectors, including large sectors like healthcare and technology and smaller sectors such as energy and financials. We are confident in our companies going forward.
The views expressed represent the opinions of LMCG Investments LLC, as of October 31, 2018, and are not intended as a forecast or guarantee of future results and are subject to change without notice.
38
AMG Managers LMCG Small Cap Growth Fund
Portfolio Manager’s Comments (continued)
CUMULATIVE TOTAL RETURN PERFORMANCE
AMG Managers LMCG Small Cap Growth Fund’s cumulative total return is based on the daily change in net asset value (NAV), and assumes that all dividends and distributions were reinvested. The graph compares a hypothetical $10,000 investment made in the AMG Managers LMCG Small Cap Growth Fund’s Class N shares on November 3, 2010, to a $10,000 investment made in the Russell 2000® Growth Index for the same time period. The graph and table do not reflect the deduction of taxes that a shareholder would pay on a Fund distribution or redemption of shares. The listed returns for the Fund are net of expenses and the returns for the index exclude expenses. Total returns would have been lower had certain expenses not been reduced.
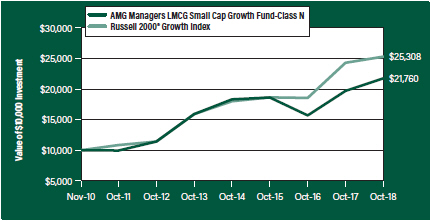
The table below shows the average annual total returns for the AMG Managers LMCG Small Cap Growth Fund, the Russell 2000® Growth Index for the same time periods ended October 31, 2018.
| | | | | | | | | | | | | | | | |
| Average Annual Total Returns1 | | One
Year | | | Five
Years | | | Since
Inception | | | Inception
Date | |
AMG Managers LMCG Small Cap Growth Fund2, 3, 4, 5, 6, 7, 8 | | | | | | | | | | | | | | | | |
Class N | | | 10.46 | % | | | 6.46 | % | | | 10.21 | % | | | 11/03/10 | |
Class I | | | 10.68 | % | | | 6.70 | % | | | 8.13 | % | | | 06/01/11 | |
Russell 2000® Growth Index9 | | | 4.13 | % | | | 8.75 | % | | | 12.31 | % | | | 11/03/10 | † |
The performance data shown represents past performance. Past performance is not a guarantee of future results. Current performance may be lower or higher than the performance data quoted. The investment return and principal value of an investment will fluctuate so that an investor’s shares, when redeemed, may be worth more or less than their original cost.
Investors should carefully consider the Fund’s investment objectives, risks, charges and expenses before investing. For performance information through the most recent month end, current net asset values per share for the Fund and other information, please call 800.835.3879 or visit our website at amgfunds.com for a free prospectus. Read it carefully before investing or sending money.
Distributed by AMG Distributors, Inc., member FINRA/SIPC.
| † | Date reflects the inception date of the Fund, not the index. |
| 1 | Total return equals income yield plus share price change and assumes reinvestment of all dividends and capital gain distributions. Returns are net of fees and may reflect offsets of Fund expenses as described in the prospectus. No adjustment has been made for taxes payable by shareholders on their reinvested dividends and capital gain distributions. Returns for periods greater than one year are annualized. The listed returns on the Fund are net of expenses and based on the published NAV as of October 31, 2018. All returns are in U.S. dollars ($). |
| 2 | The Fund is subject to risks associated with investments in small-capitalization companies, such as erratic earnings patterns, competitive conditions, limited earnings history and a reliance on one or a limited number of products. |
| 3 | Active and frequent trading of a fund may result in higher transaction costs and increased tax liability. |
| 4 | The Fund invests in growth stocks, which may be more sensitive to market movements because their prices tend to reflect future investor expectations rather than just current profits. Growth stocks may underperform value stocks during given periods. |
| 5 | Investments in international securities are subject to certain risks of overseas investing including currency fluctuations and changes in political and economic conditions, which could result in significant market fluctuations. These risks are magnified in emerging markets. |
| 6 | Investing in initial public offerings (IPOs) is risky and the prices of stocks purchased in IPOs tend to fluctuate more widely than stocks of companies that have been publicly traded for a longer period of time. Stocks purchased in IPOs generally do not have a trading history, and information about the companies may be available for very limited periods. |
| 7 | The Fund is subject to risks associated with investments in mid-capitalization companies such as greater price volatility, lower trading volume, and less liquidity than the stocks of larger, more established companies. Growth stocks may underperform value stocks during given periods. |
| 8 | The Fund is subject to special risk considerations similar to those associated with the direct ownership of real estate. Real estate valuations may be subject to factors such as changing general and local economic, financial, competitive, and environmental conditions. |
| 9 | The Russell 2000® Growth Index measures the performance of the Russell 2000® companies with higher price-to-book ratios and higher forecasted growth values. Unlike the Fund, the Russell 2000® Growth Index is unmanaged, is not available for investment and does not incur expenses. |
The Russell Indices are a trademark of the London Stock Exchange Group companies.
Not FDIC insured, nor bank guaranteed. May lose value.
39
| | |
| AMG Managers LMCG Small Cap Growth Fund | | |
Fund Snapshots (unaudited) October 31, 2018 | | |
PORTFOLIO BREAKDOWN
| | | | |
Sector | | % of
Net Assets | |
Information Technology | | | 30.2 | |
Health Care | | | 29.3 | |
Consumer Discretionary | | | 21.0 | |
Industrials | | | 6.3 | |
Financials | | | 4.6 | |
Consumer Staples | | | 3.7 | |
Materials | | | 1.4 | |
Communication Services | | | 1.0 | |
Real Estate | | | 0.8 | |
Short-Term Investments1 | | | 8.9 | |
Other Assets Less Liabilities2 | | | (7.2 | ) |
| 1 | Includes reinvestment of cash collateral into joint repurchase agreements on security lending transactions. |
| 2 | Includes repayment of cash collateral on security lending transactions. |
TOP TEN HOLDINGS
| | | | |
Security Name | | % of
Net Assets | |
Sinclair Broadcast Group, Inc., Class A | | | 5.5 | |
GTT Communications, Inc. | | | 4.6 | |
Mimecast, Ltd. | | | 4.2 | |
Marriott Vacations Worldwide Corp. | | | 4.1 | |
LHC Group, Inc. | | | 3.9 | |
Red Rock Resorts, Inc., Class A | | | 3.8 | |
Carbonite, Inc. | | | 3.2 | |
Gray Television, Inc. | | | 3.2 | |
Addus HomeCare Corp. | | | 2.7 | |
AtriCure, Inc. | | | 2.6 | |
| | | | |
Top Ten as a Group | | | 37.8 | |
| | | | |
Because a fund’s strategy may result in multiple investments in particular sectors of the economy, its performance may depend on the performance of those sectors and may fluctuate more widely than investments diversified across more sectors. For additional information on these and other risk considerations, please see the Fund’s prospectus.
Any sectors, industries, or securities discussed should not be perceived as investment recommendations. Mention of a specific security should not be considered a recommendation to buy or solicitation to sell that security. Specific securities mentioned in this report may have been sold from the Fund’s portfolio of investments by the time you receive this report.
40
| | |
| AMG Managers LMCG Small Cap Growth Fund | | |
Schedule of Portfolio Investments October 31, 2018 | | |
| | | | | | | | |
| | | Shares | | | Value | |
Common Stocks - 98.3% | | | | | | | | |
Communication Services - 1.0% | | | | | |
Boingo Wireless, Inc.* | | | 34,033 | | | $ | 1,066,254 | |
Consumer Discretionary - 21.0% | | | | | |
BJ’s Restaurants, Inc. | | | 29,333 | | | | 1,794,593 | |
Five Below, Inc.* | | | 3,727 | | | | 424,207 | |
Gray Television, Inc.*,1 | | | 189,689 | | | | 3,283,517 | |
Marriott Vacations Worldwide Corp. | | | 47,385 | | | | 4,193,099 | |
Ollie’s Bargain Outlet Holdings, Inc.* | | | 18,786 | | | | 1,745,219 | |
Red Rock Resorts, Inc.,
Class A1 | | | 168,634 | | | | 3,902,191 | |
Sinclair Broadcast Group, Inc., Class A | | | 198,185 | | | | 5,676,018 | |
Wingstop, Inc. | | | 10,349 | | | | 648,054 | |
Total Consumer Discretionary | | | | | | | 21,666,898 | |
Consumer Staples - 3.7% | | | | | |
Central Garden & Pet Co., Class A* | | | 86,836 | | | | 2,574,687 | |
Freshpet, Inc.* | | | 32,870 | | | | 1,252,347 | |
Total Consumer Staples | | | | | | | 3,827,034 | |
Financials - 4.6% | | | | | | | | |
Ameris Bancorp. | | | 34,456 | | | | 1,477,818 | |
Health Insurance Innovations, Inc., Class A*,1 | | | 16,161 | | | | 790,273 | |
Kinsale Capital Group, Inc. | | | 15,830 | | | | 945,209 | |
Western Alliance Bancorp.* | | | 31,570 | | | | 1,522,937 | |
Total Financials | | | | | | | 4,736,237 | |
Health Care - 29.3% | | | | | | | | |
Addus HomeCare Corp.* | | | 42,467 | | | | 2,781,588 | |
Agios Pharmaceuticals, Inc.*,1 | | | 22,517 | | | | 1,419,922 | |
Allogene Therapeutics, Inc.* | | | 22,553 | | | | 541,498 | |
AtriCure, Inc.* | | | 82,811 | | | | 2,634,218 | |
Bluebird Bio, Inc.*,1 | | | 2,667 | | | | 305,905 | |
Blueprint Medicines Corp.* | | | 22,177 | | | | 1,347,696 | |
CryoLife, Inc.* | | | 38,394 | | | | 1,189,446 | |
Immunomedics, Inc.*,1 | | | 31,264 | | | | 704,378 | |
iRhythm Technologies, Inc.* | | | 25,576 | | | | 1,976,002 | |
LHC Group, Inc.* | | | 43,933 | | | | 4,016,794 | |
Ligand Pharmaceuticals, Inc.*,1 | | | 7,512 | | | | 1,238,053 | |
Loxo Oncology, Inc.* | | | 4,101 | | | | 626,059 | |
Medidata Solutions, Inc.* | | | 35,992 | | | | 2,530,238 | |
Molina Healthcare, Inc.*,1 | | | 13,504 | | | | 1,711,902 | |
Myriad Genetics, Inc.* | | | 35,820 | | | | 1,612,975 | |
Penumbra, Inc.*,1 | | | 2,784 | | | | 378,624 | |
R1 RCM, Inc.* | | | 159,217 | | | | 1,348,568 | |
Sarepta Therapeutics, Inc.*,1 | | | 11,857 | | | | 1,585,992 | |
Tactile Systems Technology, Inc.*,1 | | | 7,282 | | | | 476,825 | |
| | | | | | | | |
| | | Shares | | | Value | |
Tandem Diabetes Care, Inc.* | | | 14,934 | | | $ | 561,668 | |
Teladoc Health, Inc.* | | | 16,651 | | | | 1,154,580 | |
Total Health Care | | | | | | | 30,142,931 | |
Industrials - 6.3% | | | | | | | | |
Curtiss-Wright Corp. | | | 20,788 | | | | 2,275,455 | |
Insperity, Inc. | | | 11,067 | | | | 1,215,710 | |
MasTec, Inc.* | | | 54,643 | | | | 2,377,517 | |
SiteOne Landscape Supply, Inc.*,1 | | | 9,585 | | | | 652,163 | |
Total Industrials | | | | | | | 6,520,845 | |
Information Technology - 30.2% | | | | | |
2U, Inc.*,1 | | | 39,445 | | | | 2,481,485 | |
Altair Engineering, Inc., Class A* | | | 41,062 | | | | 1,566,105 | |
Appian Corp.*,1 | | | 70,042 | | | | 1,800,780 | |
Apptio, Inc., Class A* | | | 82,250 | | | | 2,130,275 | |
Carbonite, Inc.* | | | 97,403 | | | | 3,332,157 | |
Envestnet, Inc.*,1 | | | 48,615 | | | | 2,528,952 | |
Euronet Worldwide, Inc.*,1 | | | 9,562 | | | | 1,063,103 | |
Everbridge, Inc.* | | | 8,627 | | | | 438,510 | |
Fair Isaac Corp.* | | | 2,634 | | | | 507,598 | |
GTT Communications, Inc.*,1 | | | 132,779 | | | | 4,766,766 | |
HubSpot, Inc.* | | | 3,197 | | | | 433,673 | |
Instructure, Inc.* | | | 19,273 | | | | 719,654 | |
Mimecast, Ltd.* | | | 125,462 | | | | 4,373,605 | |
Paylocity Holding Corp.* | | | 18,988 | | | | 1,249,221 | |
RealPage, Inc.*,1 | | | 41,906 | | | | 2,221,018 | |
Zuora, Inc., Class A* | | | 71,353 | | | | 1,457,028 | |
Total Information Technology | | | | | | | 31,069,930 | |
Materials - 1.4% | | | | | | | | |
Ingevity Corp.* | | | 15,328 | | | | 1,396,074 | |
Real Estate - 0.8% | | | | | | | | |
National Storage Affiliates Trust, REIT | | | 30,714 | | | | 817,914 | |
Total Common Stocks
(Cost $96,815,184) | | | | | | | 101,244,117 | |
| | | Principal
Amount | | | | |
Short-Term Investments - 8.9% | | | | | |
Joint Repurchase Agreements - 5.7%2 | | | | | | | | |
Citigroup Global Markets, Inc., dated 10/31/18, due 11/01/18, 2.220% total to be received $1,405,850 (collateralized by various U.S. Government Agency Obligations and U.S. Treasuries, 0.000% - 6.500%, 10/01/19 - 09/09/49, totaling $1,433,878) | | $ | 1,405,763 | | | | 1,405,763 | |
The accompanying notes are an integral part of these financial statements.
41
| | |
| AMG Managers LMCG Small Cap Growth Fund | | |
| Schedule of Portfolio Investments (continued) | | |
| | | | | | | | |
| | | Principal
Amount | | | Value | |
Joint Repurchase Agreements - 5.7%2 (continued) | | | | | |
HSBC Securities USA, Inc., dated 10/31/18, due 11/01/18, 2.210% total to be received $1,405,849 (collateralized by various U.S. Government Agency Obligations, 2.500% - 5.000%, 07/01/23 - 01/01/57, totaling $1,433,878) | | $ | 1,405,763 | | | $ | 1,405,763 | |
Merrill Lynch, Pierce, Fenner & Smith, Inc., dated 10/31/18, due 11/01/18, 2.200% total to be received $295,629 (collateralized by various U.S. Treasuries, 0.125% - 2.500%, 04/30/20 -09/09/49, totaling $301,523) | | | 295,611 | | | | 295,611 | |
Nomura Securities International, Inc., dated 10/31/18, due 11/01/18, 2.210% total to be received $1,405,849 (collateralized by various U.S. Government Agency Obligations and U.S. Treasuries, 0.000% - 9.500%, 11/08/18 -09/20/68, totaling $1,433,878) | | | 1,405,763 | | | | 1,405,763 | |
RBC Dominion Securities, Inc., dated 10/31/18, due 11/01/18, 2.220% total to be received $1,405,850 (collateralized by various U.S. Government Agency Obligations and U.S. Treasuries, 0.000% - 7.000%, 11/29/18 -09/09/49, totaling $1,433,878) | | | 1,405,763 | | | | 1,405,763 | |
Total Joint Repurchase Agreements | | | | | | | 5,918,663 | |
| | | | | | | | |
| | |
Shares | | | Value | |
Other Investment Companies - 3.2% | | | | | |
Dreyfus Government Cash Management Fund, Institutional Class Shares, 2.05%3 | | | 1,076,862 | | | $ | 1,076,862 | |
Dreyfus Institutional Preferred Government Money Market Fund, Institutional Class Shares, 2.12%3 | | | 1,076,861 | | | | 1,076,861 | |
JPMorgan U.S. Government Money Market Fund, IM Shares, 2.09%3 | | | 1,109,494 | | | | 1,109,494 | |
Total Other Investment Companies | | | | | | | 3,263,217 | |
Total Short-Term Investments
(Cost $9,181,880) | | | | | | | 9,181,880 | |
Total Investments - 107.2%
(Cost $105,997,064) | | | | | | | 110,425,997 | |
Other Assets, less Liabilities - (7.2)% | | | | (7,392,086 | ) |
Net Assets - 100.0% | | | | | | $ | 103,033,911 | |
| * | Non-income producing security. |
| 1 | Some or all of these securities, amounting to $20,576,918 or 20.0% of net assets, were out on loan to various brokers and are collateralized by cash and various U.S. Treasury Obligations. See Note 4 of Notes to Financial Statements. |
| 2 | Cash collateral received from brokers for securities lending was invested in these joint repurchase agreements. |
| 3 | Yield shown represents the October 31, 2018, seven day average yield, which refers to the sum of the previous seven days’ dividends paid, expressed as an annual percentage. |
REIT Real Estate Investment Trust
The following table summarizes the inputs used to value the Fund’s investments by the fair value hierarchy levels as of October 31, 2018:
| | | | | | | | | | | | | | | | |
| | | Level 1 | | | Level 2 | | | Level 3 | | | Total | |
Investments in Securities | | | | | | | | | | | | | | | | |
Common Stocks† | | $ | 101,244,117 | | | | — | | | | — | | | $ | 101,244,117 | |
Short-Term Investments | | | | | | | | | | | | | | | | |
Joint Repurchase Agreements | | | — | | | $ | 5,918,663 | | | | — | | | | 5,918,663 | |
Other Investment Companies | | | 3,263,217 | | | | — | | | | — | | | | 3,263,217 | |
| | | | | | | | | | | | | | | | |
Total Investments in Securities | | $ | 104,507,334 | | | $ | 5,918,663 | | | | — | | | $ | 110,425,997 | |
| | | | | | | | | | | | | | | | |
| † | All common stocks held in the Fund are Level 1 securities. For a detailed breakout of common stocks by major industry classification, please refer to the Fund’s Schedule of Portfolio Investments. |
During the fiscal year ended October 31, 2018, a Level 3 security transferred from Level 3 to Level 2 and was subsequently sold, generating a realized gain of $398,566.
As of October 31, 2018, the Fund had no transfers between levels from the beginning of the reporting period.
The accompanying notes are an integral part of these financial statements.
42
| | |
| AMG River Road Small-Mid Cap Value Fund | | |
| Portfolio Manager’s Comments (unaudited) | | |
OVERVIEW
For the fiscal year ended October 31, 2018, the AMG River Road Small-Mid Cap Value Fund (the “Fund”) Class N shares returned 7.09%, outperforming the Russell 2500® Value Index return of 0.27%.
PERFORMANCE REVIEW
The sector with the largest positive contribution to relative return was information technology, which benefited from strong stock selection. The sector with the largest negative contribution to relative return was real estate, which lagged due to poor stock selection.
The top contributing holdings in the Fund were Advance Auto Parts Inc. (AAP) and Premier Inc. (PINC). Advance is an automotive retailer of aftermarket replacement parts, accessories, batteries, and maintenance items. During 2018, AAP demonstrated continued progress on its multi-year turnaround effort to close its margin gap with peers. SG&A expense improved on lower labor costs and free cash flow improved dramatically from better inventory management and lower capital expenditures. We significantly trimmed the position. Premier is the second-largest healthcare group purchasing organization (GPO) in the U.S. and also provides data analytics software to hospitals and other outpatient facilities. Earlier in the year, investor sentiment improved when it was reported Amazon (AMZN) had abandoned its efforts to sell pharmaceutical products to large health systems. This decision supported our view that GPOs such as PINC have high switching costs and offer more value
than AMZN can provide. During fiscal 2018, PINC reported strong revenue, EBITDA (Earnings Before Interest, Taxes, Depreciation and Amortization), and free cash flow growth. The company maintained a 98% retention rate in its GPO business and a 97% renewal rate in its software segment. The position was trimmed as the stock approached our assessed value.
The bottom contributing holdings in the Fund were Avaya Holdings Corp. (AVYA) and GCI Liberty Inc. (GLIBA). Avaya provides communications networks for companies via on-premise, cloud, or hybrid formats and is also the largest provider of software for call centers. AVYA recently emerged from bankruptcy, shedding more than $4 billion of debt and pension obligations. The previous debt holders received all of the new AVYA equity. When interest rates started to rise in October, AVYA significantly underperformed despite no company specific news. We took no action on the position. GCI Liberty owns a 6.5% economic interest in Charter Communications (CHTR) and owns 100% of the largest cable provider in Alaska. During most of 2018, investor sentiment for the cable industry was poor due to continued fears of cord-cutting. However, cord-cutting has little impact on company profitability. By year end, CHTR will complete the final integration and network upgrades associated with its acquisitions of Time Warner Cable and Bright House Networks in 2016. With this massive undertaking behind the company, we expect CHTR to gain broadband market share,
improve churn, and use significantly increasing levels of free cash flow for share repurchases. We maintained the position in GLIBA.
OUTLOOK AND POSITIONING
The macro challenges we expected in 2019 appear to have arrived early as competitive and inflationary pressures, combined with higher interest rates, erode the benefits of tax reform. While the economy is still strong and overall earnings growth remains healthy, credit spreads are beginning to widen and smaller cap earnings growth appears well below absolute and relative expectations. To maintain current valuations, the market (and small caps in particular) is likely to require a steady stream of good news and will show little tolerance for disappointment. Thus, while not a high confidence prediction, we believe small caps have likely seen their highs for the year and, perhaps, the foreseeable future.
In response, we continue to position the Fund in shares of high-quality companies we believe will perform well in a period of slowing economic growth, while also avoiding superficial safe havens, like most utilities, that we believe are less attractive investments longer term. If returns moderate over the coming months, we expect the Fund’s holdings and low volatility approach will be well positioned.
The views expressed represent the opinions of River Road Asset Management LLC , as of October 31, 2018, and are not intended as a forecast or guarantee of future results and are subject to change without notice.
43
AMG River Road Small-Mid Cap Value Fund
Portfolio Manager’s Comments (continued)
CUMULATIVE TOTAL RETURN PERFORMANCE
AMG River Road Small-Mid Cap Value Fund’s cumulative total return is based on the daily change in net asset value (NAV), and assumes that all dividends and distributions were reinvested. The graph compares a hypothetical $10,000 investment made in the AMG River Road Small-Mid Cap Value Fund’s Class N shares on October 31, 2008, to a $10,000 investment made in the Russell 2500® Value Index and Russell 2000® Value Index for the same time period. The graph and table do not reflect the deduction of taxes that a shareholder would pay on a Fund distribution or redemption of shares. The listed returns for the Fund are net of expenses and the returns for the index exclude expenses. Total returns would have been lower had certain expenses not been reduced.
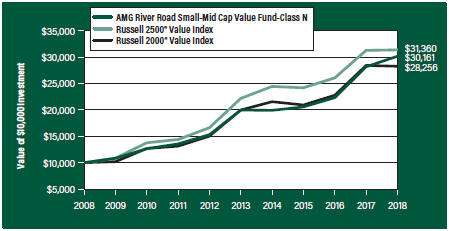
The table below shows the average annual total returns for the AMG River Road Small-Mid Cap Value Fund, the Russell 2500® Value Index and Russell 2000® Value Index for the same time periods ended October 31, 2018.
| | | | | | | | | | | | | | | | | | | | |
| | | One | | | Five | | | Ten | | | Since | | | Inception | |
| Average Annual Total Returns1 | | Year | | | Years | | | Years | | | Inception | | | Date | |
AMG River Road Small-Mid Cap Value Fund2, 3, 4, 5, 6 | | | | | | | | | | | | | | | | | |
Class N | | | 7.09 | % | | | 8.61 | % | | | 11.67 | % | | | 6.83 | % | | | 03/29/07 | |
Class I | | | 7.32 | % | | | 8.87 | % | | | 11.96 | % | | | 6.79 | % | | | 06/28/07 | |
Class Z | | | 7.37 | % | | | — | | | | — | | | | 5.49 | % | | | 09/29/17 | |
Russell 2500® Value Index7 | | | 0.27 | % | | | 7.17 | % | | | 12.11 | % | | | 6.30 | % | | | 03/29/07 | † |
Russell 2000® Value Index8 | | | (0.59 | %) | | | 7.18 | % | | | 10.95 | % | | | 5.73 | % | | | 03/29/07 | † |
The performance data shown represents past performance. Past performance is not a guarantee of future results. Current performance may be lower or higher than the performance data quoted. The investment return and principal value of an investment will fluctuate so that an investor’s shares, when redeemed, may be worth more or less than their original cost.
Investors should carefully consider the Fund’s investment objectives, risks, charges and expenses before investing. For performance information through the most recent month end, current net asset values per share for the Fund and other information, please call 800.835.3879 or visit our website at amgfunds.com for a free prospectus. Read it carefully before investing or sending money.
Distributed by AMG Distributors, Inc., member FINRA/SIPC.
| † | Date reflects the inception date of the Fund, not the index. |
| 1 | Total return equals income yield plus share price change and assumes reinvestment of all dividends and capital gain distributions. Returns are net of fees and may reflect offsets of Fund expenses as described in the |
| | prospectus. No adjustment has been made for taxes payable by shareholders on their reinvested dividends and capital gain distributions. Returns for periods greater than one year are annualized. The listed returns on the Fund are net of expenses and based on the published NAV as of October 31, 2018. All returns are in U.S. dollars ($). |
| 2 | Investments in international securities are subject to certain risks of overseas investing including currency fluctuations and changes in political and economic conditions, which could result in significant market fluctuations. These risks are magnified in emerging markets. |
| 3 | The Fund is subject to risks associated with investments in mid-capitalization companies such as greater price volatility, lower trading volume, and less liquidity than the stocks of larger, more established companies. Growth stocks may underperform value stocks during given periods. |
| 4 | The Fund is subject to special risk considerations similar to those associated with the direct ownership of real estate. Real estate valuations may be subject to factors such as changing general and local economic, financial, competitive, and environmental conditions. |
| 5 | The Fund is subject to risks associated with investments in small-capitalization companies, such as erratic earnings patterns, competitive conditions, limited earnings history and a reliance on one or a limited number of products. |
| 6 | The Fund invests in value stocks, which may perform differently from the market as a whole and may be undervalued by the market for a long period of time. |
| 7 | The Russell 2500® Value Index measures the performance of the Russell 2500® companies with lower price-to-book ratios and lower forecasted growth values. Unlike the Fund, the Russell 2500® Value Index is unmanaged, is not available for investment and does not incur expenses. |
| 8 | The Russell 2000® Value Index is an unmanaged, market-value weighted, value-oriented index comprised of small stocks that have relatively low price-to-book ratios and lower forecasted growth values. Unlike the Fund, the Russell 2000® Value Index is unmanaged, is not available for investment and does not incur expenses. |
The Russell Indices are a trademark of the London Stock Exchange Group companies.
Not FDIC insured, nor bank guaranteed. May lose value.
44
| | |
| AMG River Road Small-Mid Cap Value Fund | | |
Fund Snapshots (unaudited) October 31, 2018 | | |
PORTFOLIO BREAKDOWN
| | | | |
Sector | | % of
Net Assets | |
Consumer Discretionary | | | 28.6 | |
Information Technology | | | 19.3 | |
Industrials | | | 16.5 | |
Financials | | | 14.4 | |
Consumer Staples | | | 6.1 | |
Health Care | | | 5.8 | |
Energy | | | 1.8 | |
Materials | | | 0.7 | |
Real Estate | | | 0.5 | |
Short-Term Investments1 | | | 8.0 | |
Other Assets Less Liabilities2 | | | (1.7 | ) |
| 1 | Includes reinvestment of cash collateral into joint repurchase agreements on security lending transactions. |
| 2 | Includes repayment of cash collateral on security lending transactions. |
TOP TEN HOLDINGS
| | | | |
Security Name | | % of
Net Assets | |
GCI Liberty Inc., Class A | | | 4.0 | |
White Mountains Insurance Group, Ltd. | | | 3.8 | |
Premier, Inc., Class A | | | 3.2 | |
Cannae Holdings, Inc. | | | 3.2 | |
Liberty Expedia Holdings, Inc., Class A | | | 3.1 | |
Liberty Broadband Corp., Class C | | | 3.1 | |
Hostess Brands, Inc. | | | 3.0 | |
Sabre Corp. | | | 3.0 | |
Discovery, Inc., Class C | | | 2.7 | |
Nielsen Holdings PLC | | | 2.4 | |
| | | | |
Top Ten as a Group | | | 31.5 | |
| | | | |
Because a fund’s strategy may result in multiple investments in particular sectors of the economy, its performance may depend on the performance of those sectors and may fluctuate more widely than investments diversified across more sectors. For additional information on these and other risk considerations, please see the Fund’s prospectus.
Any sectors, industries, or securities discussed should not be perceived as investment recommendations. Mention of a specific security should not be considered a recommendation to buy or solicitation to sell that security. Specific securities mentioned in this report may have been sold from the Fund’s portfolio of investments by the time you receive this report.
45
| | |
| AMG River Road Small-Mid Cap Value Fund | | |
Schedule of Portfolio Investments October 31, 2018 | | |
| | | | | | | | |
| | | Shares | | | Value | |
Common Stocks - 93.7% | | | | | | | | |
Consumer Discretionary - 28.6% | | | | | |
Advance Auto Parts, Inc. | | | 4,033 | | | $ | 644,312 | |
AMC Networks, Inc., Class A*,1 | | | 7,530 | | | | 441,107 | |
Asbury Automotive Group, Inc.* | | | 10,284 | | | | 669,488 | |
Biglari Holdings, Inc., Class A* | | | 201 | | | | 150,750 | |
Biglari Holdings, Inc., Class B* | | | 986 | | | | 140,505 | |
Discovery, Inc., Class C* | | | 64,010 | | | | 1,876,133 | |
Entercom Communications Corp., Class A1 | | | 67,470 | | | | 437,880 | |
Extended Stay America, Inc., (Units) | | | 48,330 | | | | 786,812 | |
GCI Liberty Inc., Class A* | | | 58,272 | | | | 2,758,014 | |
The Interpublic Group of Cos., Inc. | | | 21,357 | | | | 494,628 | |
J Alexander’s Holdings, Inc.* | | | 20,241 | | | | 213,543 | |
Liberty Broadband Corp., Class C* | | | 25,703 | | | | 2,131,550 | |
Liberty Expedia Holdings, Inc., Class A* | | | 49,945 | | | | 2,168,612 | |
Liberty Latin America, Ltd., Class A*,1 | | | 35,780 | | | | 643,324 | |
Liberty Latin America, Ltd., Class C* | | | 60,240 | | | | 1,084,923 | |
LKQ Corp.* | | | 58,133 | | | | 1,585,287 | |
Motorcar Parts of America, Inc.*,1 | | | 42,880 | | | | 908,198 | |
Murphy USA, Inc.* | | | 14,436 | | | | 1,163,975 | |
PICO Holdings, Inc. | | | 43,032 | | | | 491,426 | |
Sleep Number Corp.*,1 | | | 29,546 | | | | 1,074,588 | |
Total Consumer Discretionary | | | | | | | 19,865,055 | |
Consumer Staples - 6.1% | | | | | | | | |
Casey’s General Stores, Inc. | | | 7,586 | | | | 956,670 | |
Hostess Brands, Inc.*,1 | | | 200,422 | | | | 2,084,389 | |
Ingles Markets, Inc., Class A1 | | | 36,903 | | | | 1,215,585 | |
Total Consumer Staples | | | | | | | 4,256,644 | |
Energy - 1.8% | | | | | | | | |
PBF Energy, Inc., Class A | | | 17,274 | | | | 722,917 | |
World Fuel Services Corp. | | | 16,840 | | | | 538,880 | |
Total Energy | | | | | | | 1,261,797 | |
Financials - 14.4% | | | | | | | | |
Axis Capital Holdings, Ltd. (Bermuda) | | | 22,740 | | | | 1,268,665 | |
Cannae Holdings, Inc.* | | | 120,775 | | | | 2,230,714 | |
Capital Southwest Corp., BDC | | | 21,897 | | | | 416,043 | |
FGL Holdings (Bermuda)*,1 | | | 124,460 | | | | 983,234 | |
Genworth Financial, Inc., Class A* | | | 161,250 | | | | 690,150 | |
Jefferies Financial Group, Inc. | | | 38,728 | | | | 831,490 | |
Oaktree Specialty Lending Corp. | | | 200,420 | | | | 911,911 | |
White Mountains Insurance Group, Ltd. | | | 2,952 | | | | 2,617,450 | |
Total Financials | | | | | | | 9,949,657 | |
| | | | | | | | |
| | | Shares | | | Value | |
Health Care - 5.8% | | | | | | | | |
Computer Programs & Systems, Inc. | | | 30,354 | | | $ | 758,850 | |
Patterson Cos., Inc. | | | 46,170 | | | | 1,042,519 | |
Premier, Inc., Class A* | | | 49,587 | | | | 2,231,415 | |
Total Health Care | | | | | | | 4,032,784 | |
Industrials - 16.5% | | | | | | | | |
Air Transport Services Group, Inc.* | | | 50,398 | | | | 987,801 | |
Argan, Inc.1 | | | 17,161 | | | | 755,427 | |
Armstrong Flooring, Inc.* | | | 37,525 | | | | 583,514 | |
Armstrong World Industries, Inc.* | | | 24,531 | | | | 1,514,789 | |
Colfax Corp.* | | | 24,464 | | | | 685,726 | |
Cubic Corp. | | | 8,273 | | | | 542,791 | |
Forward Air Corp. | | | 11,411 | | | | 684,546 | |
Kansas City Southern | | | 8,733 | | | | 890,417 | |
MSC Industrial Direct Co, Inc., Class A | | | 8,570 | | | | 694,684 | |
Nielsen Holdings PLC | | | 63,596 | | | | 1,652,224 | |
Resources Connection, Inc. | | | 26,008 | | | | 424,451 | |
UniFirst Corp. | | | 10,058 | | | | 1,501,659 | |
WageWorks, Inc.* | | | 13,200 | | | | 525,492 | |
Total Industrials | | | | | | | 11,443,521 | |
Information Technology - 19.3% | | | | | |
ACI Worldwide, Inc.* | | | 36,570 | | | | 917,541 | |
Avaya Holdings Corp.* | | | 89,440 | | | | 1,468,605 | |
Cars.com, Inc.*,1 | | | 38,039 | | | | 993,198 | |
CDK Global, Inc. | | | 21,388 | | | | 1,224,249 | |
Conduent, Inc.* | | | 79,946 | | | | 1,526,969 | |
CSG Systems International, Inc. | | | 38,859 | | | | 1,363,951 | |
Dolby Laboratories, Inc., Class A | | | 8,210 | | | | 564,930 | |
NCR Corp.*,1 | | | 42,403 | | | | 1,138,520 | |
Sabre Corp. | | | 83,950 | | | | 2,069,367 | |
Sykes Enterprises, Inc.* | | | 29,871 | | | | 916,144 | |
Tech Data Corp.* | | | 16,763 | | | | 1,184,474 | |
Total Information Technology | | | | | | | 13,367,948 | |
Materials - 0.7% | | | | | | | | |
Compass Minerals International, Inc.1 | | | 10,100 | | | | 489,951 | |
Real Estate - 0.5% | | | | | | | | |
Newmark Group, Inc., Class A | | | 32,100 | | | | 312,654 | |
Total Common Stocks
(Cost $62,080,159) | | | | | | | 64,980,011 | |
The accompanying notes are an integral part of these financial statements.
46
| | |
| AMG River Road Small-Mid Cap Value Fund | | |
| Schedule of Portfolio Investments (continued) | | |
| | | | | | | | |
| | | Principal
Amount | | | Value | |
Short-Term Investments - 8.0% | | | | | | | | |
Joint Repurchase Agreements - 2.5%2 | | | | | | | | |
Mizuho Securities USA, LLC dated 10/31/18, due 11/01/18, 2.220% total to be received $758,472 (collateralized by various U.S. Government Agency Obligations, 2.000% - 7.500%, 03/01/31 - 02/15/48, totaling $773,594) | | $ | 758,425 | | | $ | 758,425 | |
RBC Dominion Securities, Inc. dated 10/31/18, due 11/01/18, 2.220% total to be received $1,000,062 (collateralized by various U.S. Government Agency Obligations and U.S. Treasuries, 0.000% - 7.000%, 11/29/18 -09/09/49, totaling $1,020,000) | | | 1,000,000 | | | | 1,000,000 | |
Total Joint Repurchase Agreements | | | | | | | 1,758,425 | |
| | |
| | | Shares | | | | |
Other Investment Companies - 5.5% | | | | | | | | |
Dreyfus Government Cash Management Fund, Institutional Class Shares, 2.05%3 | | | 1,262,273 | | | | 1,262,273 | |
Dreyfus Institutional Preferred Government Money Market Fund, Institutional Class Shares, 2.12%3 | | | 1,262,273 | | | | 1,262,273 | |
JPMorgan U.S. Government Money Market Fund, IM Shares, 2.09%3 | | | 1,300,524 | | | | 1,300,524 | |
Total Other Investment Companies | | | | | | | 3,825,070 | |
Total Short-Term Investments
(Cost $5,583,495) | | | | | | | 5,583,495 | |
| | | | |
| | |
Value | |
Total Investments - 101.7%
(Cost $67,663,654) | | $ | 70,563,506 | |
Other Assets, less Liabilities - (1.7)% | | | (1,187,321 | ) |
Net Assets - 100.0% | | $ | 69,376,185 | |
| * | Non-income producing security. |
| 1 | Some or all of these securities, amounting to $6,449,277 or 9.3% of net assets, were out on loan to various brokers and are collateralized by cash and various U.S. Treasury Obligations. See Note 4 of Notes to Financial Statements. |
| 2 | Cash collateral received from brokers for securities lending was invested in these joint repurchase agreements. |
| 3 | Yield shown represents the October 31, 2018, seven day average yield, which refers to the sum of the previous seven days’ dividends paid, expressed as an annual percentage. |
BDC Business Development Company
The following table summarizes the inputs used to value the Fund’s investments by the fair value hierarchy levels as of October 31, 2018:
| | | | | | | | | | | | | | | | |
| | | Level 1 | | | Level 2 | | | Level 3 | | | Total | |
Investments in Securities | | | | | | | | | | | | | | | | |
Common Stocks† | | $ | 64,980,011 | | | | — | | | | — | | | $ | 64,980,011 | |
Short-Term Investments | | | | | | | | | | | | | | | | |
Joint Repurchase Agreements | | | — | | | $ | 1,758,425 | | | | — | | | | 1,758,425 | |
Other Investment Companies | | | 3,825,070 | | | | — | | | | — | | | | 3,825,070 | |
| | | | | | | | | | | | | | | | |
Total Investments in Securities | | $ | 68,805,081 | | | $ | 1,758,425 | | | | — | | | $ | 70,563,506 | |
| | | | | | | | | | | | | | | | |
| † | All common stocks held in the Fund are Level 1 securities. For a detailed breakout of common stocks by major industry classification, please refer to the Fund’s Schedule of Portfolio Investments. |
As of October 31, 2018, the Fund had no transfers between levels from the beginning of the reporting period.
The accompanying notes are an integral part of these financial statements.
47
AMG River Road Small Cap Value Fund
Portfolio Manager’s Comments (unaudited)
OVERVIEW
For the fiscal year ended October 31, 2018, the AMG River Road Small Cap Value Fund (the “Fund”) Class N shares returned 5.41%, outperforming the (0.59)% return for the Russell 2000® Value Index.
PERFORMANCE REVIEW
The sector with the largest positive contribution to relative return was information technology, which benefited from strong stock selection. The sector with the largest negative contribution to relative return was consumer discretionary, which lagged due to poor stock selection. The Fund’s cash position, which averaged approximately 7% during the period, was slightly additive to relative performance.
The top contributing holdings in the Fund were Premier Inc. (PINC) and Mitel Networks Corp. (MITL). Premier is the second-largest healthcare group purchasing organization (GPO) in the U.S. and also provides data analytics software to hospitals and other outpatient facilities. Earlier in the year, investor sentiment improved when it was reported Amazon (AMZN) had abandoned its efforts to sell pharmaceutical products to large health systems. This decision supported our view that GPOs such as PINC have high switching costs and offer more value than AMZN can provide. During fiscal 2018, PINC reported strong revenue, EBITDA (Earnings Before Interest, Taxes, Depreciation and Amortization), and free cash flow growth. The company maintained a 98% retention rate in its GPO business and a 97% renewal rate in its software segment. The position was trimmed as the stock approached our assessed
value. Mitel provides unified communications and collaboration products and services for businesses. In April 2018, MITL agreed to be acquired by private equity firm Searchlight Capital Partners for $11.15/share, which equated to 8.7x ‘18e EBITDA and was 93% of our $12/share assessed valuation. The bid was a +24% premium to the trailing three-month average price. We believe Searchlight was likely drawn to MITL after seeing evidence of its successful migration of customers from on-premise to cloud, which was a key element of our investment thesis. We exited the position.
The bottom contributing holdings in the Fund were Avaya Holdings Corp. (AVYA) and Motorcar Parts of America Inc. (MPAA). Avaya provides communications networks for companies via on-premise, cloud, or hybrid formats and is also the largest provider of software for call centers. AVYA recently emerged from bankruptcy, shedding more than $4 billion of debt and pension obligations. The previous debt holders received all of the new AVYA equity. When interest rates started to rise in October, AVYA significantly underperformed despite no company-specific news. We took no action on the position. Motorcar Parts of America is a remanufacturer of starters, alternators, and other auto parts. Despite market share gains in virtually all of its product lines, MPAA sales have been weak in 2018 as its major customers (O’Reilly, Advance Auto, AutoZone) reduced in-store inventories. This slowdown in MPAA revenues caused margin pressure due to manufacturing inefficiencies. As we analyze the average age of vehicles, miles driven, and historical replacement rates, we believe demand
is a “when” not “if” story. Recent industry reports from its customers suggest increasing growth tailwinds for 2019. We took no action on the position.
OUTLOOK AND POSITIONING
The macro challenges we expected in 2019 appear to have arrived early as competitive and inflationary pressures, combined with higher interest rates, erode the benefits of tax reform. While the economy is still strong and overall earnings growth remains healthy, credit spreads are beginning to widen and small cap earnings growth appears well below absolute and relative expectations. To maintain current valuations, the market (and small caps in particular) is likely to require a steady stream of good news and will show little tolerance for disappointment. Thus, while not a high confidence prediction, we believe small caps have likely seen their highs for the year and, perhaps, the foreseeable future.
In response, we continue to position the Fund in shares of high-quality companies we believe will perform well in a period of slowing economic growth, while also avoiding superficial safe havens, like most utilities, that we believe are less attractive investments longer term. If returns moderate over the coming months, we expect the Fund’s holdings and low volatility approach will be well positioned.
The views expressed represent the opinions of River Road Asset Management LLC, as of October 31, 2018, and are not intended as a forecast or guarantee of future results and are subject to change without notice.
48
AMG River Road Small Cap Value Fund
Portfolio Manager’s Comments (continued)
CUMULATIVE TOTAL RETURN PERFORMANCE
AMG River Road Small Cap Value Fund’s cumulative total return is based on the daily change in net asset value (NAV), and assumes that all dividends and distributions were reinvested. The graph compares a hypothetical $10,000 investment made in the AMG River Road Small Cap Value Fund’s Class N shares on October 31, 2008, to a $10,000 investment made in the Russell 2000® Value Index for the same time period. The graph and table do not reflect the deduction of taxes that a shareholder would pay on a Fund distribution or redemption of shares. The listed returns for the Fund are net of expenses and the returns for the index exclude expenses. Total returns would have been lower had certain expenses not been reduced.
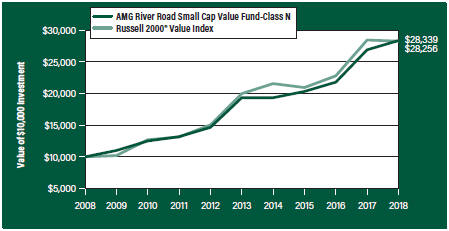
The table below shows the average annual total returns for the AMG River Road Small Cap Value Fund, the Russell 2000® Value Index for the same time periods ended October 31, 2018.
| | | | | | | | | | | | | | | | | | | | |
| | | One | | | Five | | | Ten | | | Since | | | Inception | |
| Average Annual Total Returns1 | | Year | | | Years | | | Years | | | Inception | | | Date | |
AMG River Road Small Cap Value Fund2, 3, 4, 5, 6 | | | | | | | | | | | | | | | | | | | | |
Class N | | | 5.41 | % | | | 7.95 | % | | | 10.98 | % | | | 7.97 | % | | | 06/28/05 | |
Class I | | | 5.60 | % | | | 8.22 | % | | | 11.25 | % | | | 6.19 | % | | | 12/13/06 | |
Class Z | | | 5.71 | % | | | — | | | | — | | | | 5.24 | % | | | 09/29/17 | |
Russell 2000® Value Index7 | | | (0.59 | %) | | | 7.18 | % | | | 10.95 | % | | | 7.00 | % | | | 06/28/05 | † |
The performance data shown represents past performance. Past performance is not a guarantee of future results. Current performance may be lower or higher than the performance data quoted. The investment return and principal value of an investment will fluctuate so that an investor’s shares, when redeemed, may be worth more or less than their original cost.
Investors should carefully consider the Fund’s investment objectives, risks, charges and expenses before investing. For performance information through the most recent month end, current net asset values per share for the Fund and other information, please call 800.835.3879 or visit our website at amgfunds.com for a free prospectus. Read it carefully before investing or sending money.
Distributed by AMG Distributors, Inc., member FINRA/SIPC.
| † | Date reflects the inception date of the Fund, not the index. |
| 1 | Total return equals income yield plus share price change and assumes reinvestment of all dividends and capital gain distributions. Returns are net of fees and may reflect offsets of Fund expenses as described in the prospectus. No adjustment has been made for taxes payable by shareholders on their reinvested dividends and |
| | capital gain distributions. Returns for periods greater than one year are annualized. The listed returns on the Fund are net of expenses and based on the published NAV as of October 31, 2018. All returns are in U.S. dollars ($). |
| 2 | The Fund is subject to risks associated with investments in small-capitalization companies, such as erratic earnings patterns, competitive conditions, limited earnings history and a reliance on one or a limited number of products. |
| 3 | The Fund is subject to risks associated with investments in mid-capitalization companies such as greater price volatility, lower trading volume, and less liquidity than the stocks of larger, more established companies. Growth stocks may underperform value stocks during given periods. |
| 4 | The Fund invests in value stocks, which may perform differently from the market as a whole and may be undervalued by the market for a long period of time. |
| 5 | The Fund is subject to special risk considerations similar to those associated with the direct ownership of real estate. Real estate valuations may be subject to factors such as changing general and local economic, financial, competitive, and environmental conditions. |
| 6 | Investments in international securities are subject to certain risks of overseas investing including currency fluctuations and changes in political and economic conditions, which could result in significant market fluctuations. These risks are magnified in emerging markets. |
| 7 | The Russell 2000® Value Index is an unmanaged, market-value weighted, value-oriented index comprised of small stocks that have relatively low price-to-book ratios and lower forecasted growth values. Unlike the Fund, the Russell 2000® Value Index is unmanaged, is not available for investment and does not incur expenses. |
The Russell Indices are a trademark of the London Stock Exchange Group companies.
Not FDIC insured, nor bank guaranteed. May lose value.
49
| | |
| AMG River Road Small Cap Value Fund | | |
Fund Snapshots (unaudited) October 31, 2018 | | |
PORTFOLIO BREAKDOWN
| | | | |
Sector | | % of
Net Assets | |
Information Technology | | | 20.1 | |
Industrials | | | 19.4 | |
Consumer Discretionary | | | 19.2 | |
Financials | | | 15.7 | |
Consumer Staples | | | 7.1 | |
Health Care | | | 7.0 | |
Energy | | | 4.1 | |
Materials | | | 0.6 | |
Real Estate | | | 0.6 | |
Short-Term Investments1 | | | 8.4 | |
Other Assets Less Liabilities2 | | | (2.2 | ) |
| 1 | Includes reinvestment of cash collateral into joint repurchase agreements on security lending transactions. |
| 2 | Includes repayment of cash collateral on security lending transactions. |
TOP TEN HOLDINGS
| | | | |
Security Name | | % of
Net Assets | |
White Mountains Insurance Group, Ltd. | | | 4.5 | |
Premier, Inc., Class A | | | 4.2 | |
Cannae Holdings, Inc. | | | 3.8 | |
Liberty Expedia Holdings, Inc., Class A | | | 3.2 | |
UniFirst Corp. | | | 3.1 | |
Hostess Brands, Inc. | | | 3.0 | |
Liberty Latin America, Ltd., Class C | | | 2.7 | |
Armstrong World Industries, Inc. | | | 2.6 | |
Ingles Markets, Inc., Class A | | | 2.3 | |
Avaya Holdings Corp. | | | 2.3 | |
| | | | |
Top Ten as a Group | | | 31.7 | |
| | | | |
Because a fund’s strategy may result in multiple investments in particular sectors of the economy, its performance may depend on the performance of those sectors and may fluctuate more widely than investments diversified across more sectors. For additional information on these and other risk considerations, please see the Fund’s prospectus.
Any sectors, industries, or securities discussed should not be perceived as investment recommendations. Mention of a specific security should not be considered a recommendation to buy or solicitation to sell that security. Specific securities mentioned in this report may have been sold from the Fund’s portfolio of investments by the time you receive this report.
50
| | |
| AMG River Road Small Cap Value Fund | | |
Schedule of Portfolio Investments October 31, 2018 | | |
| | | | | | | | |
| | | Shares | | | Value | |
Common Stocks - 93.8% | | | | | | | | |
Consumer Discretionary - 19.2% | | | | | |
AMC Networks, Inc., Class A*,1 | | | 64,654 | | | $ | 3,787,431 | |
Asbury Automotive Group, Inc.*,1 | | | 86,946 | | | | 5,660,185 | |
Biglari Holdings, Inc., Class A* | | | 1,584 | | | | 1,188,000 | |
Biglari Holdings, Inc., Class B* | | | 10,743 | | | | 1,530,877 | |
Entercom Communications Corp., Class A1 | | | 320,662 | | | | 2,081,096 | |
Extended Stay America, Inc., (Units) | | | 333,538 | | | | 5,429,999 | |
J Alexander’s Holdings, Inc.* | | | 306,645 | | | | 3,235,105 | |
Liberty Expedia Holdings, Inc., Class A* | | | 265,287 | | | | 11,518,762 | |
Liberty Latin America, Ltd., Class C* | | | 545,846 | | | | 9,830,686 | |
Motorcar Parts of America, Inc.*,1 | | | 248,872 | | | | 5,271,109 | |
Murphy USA, Inc.* | | | 99,927 | | | | 8,057,114 | |
PICO Holdings, Inc. | | | 384,456 | | | | 4,390,487 | |
Sleep Number Corp.* | | | 191,953 | | | | 6,981,331 | |
Total Consumer Discretionary | | | | | | | 68,962,182 | |
Consumer Staples - 7.1% | | | | | | | | |
Casey’s General Stores, Inc. | | | 51,771 | | | | 6,528,841 | |
Hostess Brands, Inc.* | | | 1,042,950 | | | | 10,846,680 | |
Ingles Markets, Inc., Class A | | | 249,525 | | | | 8,219,353 | |
Total Consumer Staples | | | | | | | 25,594,874 | |
Energy - 4.1% | | | | | | | | |
Evolution Petroleum Corp. | | | 242,002 | | | | 2,492,621 | |
Gran Tierra Energy, Inc. (Canada)* | | | 657,120 | | | | 2,004,216 | |
PBF Energy, Inc., Class A | | | 124,130 | | | | 5,194,840 | |
QEP Resources, Inc.* | | | 122,690 | | | | 1,093,168 | |
World Fuel Services Corp. | | | 122,531 | | | | 3,920,992 | |
Total Energy | | | | | | | 14,705,837 | |
Financials - 15.7% | | | | | | | | |
American National Insurance Co. | | | 35,085 | | | | 4,323,875 | |
Cannae Holdings, Inc.* | | | 737,564 | | | | 13,622,807 | |
Capital Southwest Corp., BDC | | | 264,977 | | | | 5,034,563 | |
FGL Holdings (Bermuda)*,1 | | | 600,477 | | | | 4,743,768 | |
First Citizens BancShares, Inc., Class A | | | 7,185 | | | | 3,065,337 | |
Genworth Financial, Inc., Class A* | | | 875,400 | | | | 3,746,712 | |
Oaktree Specialty Lending Corp. | | | 1,268,750 | | | | 5,772,813 | |
White Mountains Insurance Group, Ltd. | | | 18,199 | | | | 16,136,507 | |
Total Financials | | | | | | | 56,446,382 | |
Health Care - 7.0% | | | | | | | | |
Computer Programs & Systems, Inc. | | | 187,126 | | | | 4,678,150 | |
Patterson Cos., Inc. | | | 239,882 | | | | 5,416,536 | |
Premier, Inc., Class A* | | | 335,817 | | | | 15,111,765 | |
Total Health Care | | | | | | | 25,206,451 | |
| | | | | | | | |
| | | Shares | | | Value | |
Industrials - 19.4% | | | | | | | | |
Air Transport Services Group, Inc.* | | | 286,708 | | | $ | 5,619,477 | |
Argan, Inc. | | | 101,628 | | | | 4,473,664 | |
Armstrong Flooring, Inc.* | | | 235,612 | | | | 3,663,767 | |
Armstrong World Industries, Inc.* | | | 148,954 | | | | 9,197,909 | |
Barrett Business Services, Inc. | | | 48,456 | | | | 3,048,851 | |
Colfax Corp.* | | | 128,094 | | | | 3,590,475 | |
Cubic Corp. | | | 67,187 | | | | 4,408,139 | |
Forward Air Corp. | | | 88,612 | | | | 5,315,834 | |
Kelly Services, Inc., Class A | | | 118,734 | | | | 2,789,062 | |
Resources Connection, Inc. | | | 268,383 | | | | 4,380,011 | |
SP Plus Corp.* | | | 101,029 | | | | 3,228,887 | |
UniFirst Corp. | | | 75,517 | | | | 11,274,688 | |
Viad Corp. | | | 91,930 | | | | 4,402,528 | |
WageWorks, Inc.* | | | 100,746 | | | | 4,010,698 | |
Total Industrials | | | | | | | 69,403,990 | |
Information Technology - 20.1% | | | | | |
ACI Worldwide, Inc.* | | | 200,591 | | | | 5,032,828 | |
Avaya Holdings Corp.* | | | 498,206 | | | | 8,180,543 | |
Cars.com, Inc.*,1 | | | 291,922 | | | | 7,622,083 | |
Computer Services, Inc. | | | 150,753 | | | | 7,548,203 | |
Conduent, Inc.* | | | 387,640 | | | | 7,403,924 | |
CSG Systems International, Inc. | | | 200,860 | | | | 7,050,186 | |
Ituran Location and Control, Ltd. (Israel) | | | 193,193 | | | | 6,591,745 | |
NCR Corp.*,1 | | | 209,790 | | | | 5,632,861 | |
OSI Systems, Inc.*,1 | | | 52,533 | | | | 3,633,182 | |
Sykes Enterprises, Inc.* | | | 188,145 | | | | 5,770,407 | |
Tech Data Corp.* | | | 80,322 | | | | 5,675,553 | |
TTEC Holdings, Inc. | | | 82,028 | | | | 2,044,138 | |
Total Information Technology | | | | | | | 72,185,653 | |
Materials - 0.6% | | | | | | | | |
Compass Minerals International, Inc.1 | | | 41,170 | | | | 1,997,157 | |
Real Estate - 0.6% | | | | | | | | |
Newmark Group, Inc., Class A | | | 198,332 | | | | 1,931,754 | |
Total Common Stocks
(Cost $290,000,125) | | | | | | | 336,434,280 | |
The accompanying notes are an integral part of these financial statements.
51
| | |
| AMG River Road Small Cap Value Fund | | |
| Schedule of Portfolio Investments (continued) | | |
| | | | | | | | |
| | | Principal
Amount | | | Value | |
Short-Term Investments - 8.4% | | | | | | | | |
Joint Repurchase Agreements - 1.8%2 | | | | | | | | |
Citigroup Global Markets, Inc., dated 10/31/18, due 11/01/18, 2.220% total to be received $1,581,239 (collateralized by various U.S. Government Agency Obligations and U.S. Treasuries, 0.000% - 6.500%, 10/01/19 - 09/09/49, totaling $1,612,764) | | $ | 1,581,141 | | | $ | 1,581,141 | |
HSBC Securities USA, Inc., dated 10/31/18, due 11/01/18, 2.210% total to be received $1,581,238 (collateralized by various U.S. Government Agency Obligations, 2.500% - 5.000%, 07/01/23 - 01/01/57, totaling $1,612,764) | | | 1,581,141 | | | | 1,581,141 | |
Merrill Lynch, Pierce, Fenner & Smith, Inc., dated 10/31/18, due 11/01/18, 2.200% total to be received $332,494 (collateralized by various U.S. Treasuries, 0.125% - 2.500%, 04/30/20 -09/09/49, totaling $339,123) | | | 332,474 | | | | 332,474 | |
Nomura Securities International, Inc., dated 10/31/18, due 11/01/18, 2.210% total to be received $1,581,238 (collateralized by various U.S. Government Agency Obligations and U.S. Treasuries, 0.000% - 9.500%, 11/08/18 -09/20/68, totaling $1,612,764) | | | 1,581,141 | | | | 1,581,141 | |
RBC Dominion Securities, Inc. dated 10/31/18, due 11/01/18, 2.220% total to be received $1,581,239 (collateralized by various U.S. Government Agency Obligations and U.S. Treasuries, 0.000% - 7.000%, 11/29/18 - 09/09/49, totaling $1,612,764) | | | 1,581,141 | | | | 1,581,141 | |
Total Joint Repurchase Agreements | | | | | | | 6,657,038 | |
| | | | | | | | |
| | |
Shares | | | Value | |
Other Investment Companies - 6.6% | | | | | | | | |
Dreyfus Government Cash Management Fund, Institutional Class Shares, 2.05%3 | | | 7,763,052 | | | $ | 7,763,051 | |
Dreyfus Institutional Preferred Government Money Market Fund, Institutional Class Shares, 2.12%3 | | | 7,763,052 | | | | 7,763,052 | |
JPMorgan U.S. Government Money Market Fund, IM Shares, 2.09%3 | | | 7,998,296 | | | | 7,998,296 | |
Total Other Investment Companies | | | | | | | 23,524,399 | |
Total Short-Term Investments
(Cost $30,181,438) | | | | | | | 30,181,437 | |
Total Investments - 102.2%
(Cost $320,181,563) | | | | | | | 366,615,717 | |
Other Assets, less Liabilities - (2.2)% | | | | | | | (7,763,814 | ) |
Net Assets - 100.0% | | | | | | $ | 358,851,903 | |
| * | Non-income producing security. |
| 1 | Some or all of these securities, amounting to $25,100,431 or 7.0% of net assets, were out on loan to various brokers and are collateralized by cash and various U.S. Treasury Obligations. See Note 4 of Notes to Financial Statements. |
| 2 | Cash collateral received from brokers for securities lending was invested in these joint repurchase agreements. |
| 3 | Yield shown represents the October 31, 2018, seven day average yield, which refers to the sum of the previous seven days’ dividends paid, expressed as an annual percentage. |
BDC Business Development Company
The accompanying notes are an integral part of these financial statements.
52
| | |
| AMG River Road Small Cap Value Fund | | |
| Schedule of Portfolio Investments (continued) | | |
The following table summarizes the inputs used to value the Fund’s investments by the fair value hierarchy levels as of October 31, 2018:
| | | | | | | | | | | | | | | | |
| | | Level 1 | | | Level 2 | | | Level 3 | | | Total | |
Investments in Securities | | | | | | | | | | | | | | | | |
Common Stocks† | | $ | 336,434,280 | | | | — | | | | — | | | $ | 336,434,280 | |
Short-Term Investments | | | | | | | | | | | | | | | | |
Joint Repurchase Agreements | | | — | | | $ | 6,657,038 | | | | — | | | | 6,657,038 | |
Other Investment Companies | | | 23,524,399 | | | | — | | | | — | | | | 23,524,399 | |
| | | | | | | | | | | | | | | | |
Total Investments in Securities | | $ | 359,958,679 | | | $ | 6,657,038 | | | | — | | | $ | 366,615,717 | |
| | | | | | | | | | | | | | | | |
| † | All common stocks held in the Fund are Level 1 securities. For a detailed breakout of common stocks by major industry classification, please refer to the Fund’s Schedule of Portfolio Investments. |
As of October 31, 2018, the Fund had no transfers between levels from the beginning of the reporting period.
The accompanying notes are an integral part of these financial statements.
53
AMG Managers Silvercrest Small Cap Fund
Portfolio Manager’s Comments (unaudited)
REVIEW AND OUTLOOK
The AMG Managers Silvercrest Small Cap Fund (the “Fund”) Class N shares returned (6.43)% for the fiscal year ended October 31, 2018, compared with an (0.59)% return for its benchmark, the Russell 2000® Value Index.
We saw a larger than usual impact from our various sector over/under weightings versus the Russell 2000® Value Index, with our overweight allocation in the poorly performing materials and technology sectors having the greatest negative impact. As is typical for us, the bulk of our performance relative to the index was from stock selection—unfortunately, negative for the fiscal year. We performed extremely poorly in consumer discretionary, costing us almost 2% of relative performance. Lithia Motors (-20%) was our worst contributor to return in the sector, severely lagging the 25% return within the specialty retailing subsector as the company reported disappointing progress in leveraging selling, general and administrative (SG&A) expenses after completing some large acquisitions. In the energy sector, our two services companies, Select Energy (-41%) and Forum Energy Technologies (-38%), were our worst offenders in a generally tough environment for services companies. On the positive side, our best sector contribution to return was in producer durables, where our best performer was Insperity, Inc. (+150%), our single best performer over the
fiscal year. Insperity, a workplace solutions company, reported strong earnings results and was in an investor sweet spot given its domestic orientation in a strong employment environment. We exited our position in Insperity during the period. We also performed relatively well in the small consumer staples sector, with food company Lancaster Colony gaining 39%.
Our largest individual contributors to return, aside from the aforementioned Insperity, included hazardous waste disposal company U.S. Ecology (+49%), where a solid economy tends to generate greater volumes, and ICU Medical (+33%), a medical devices company which had reported several strong earnings reports.
Our largest detractors from return included MACOM Technology Solutions (-66%), our single worst absolute performer. MACOM reported several weaker-than-expected quarters, suffering from weak demand from some Chinese customers. Dana Corp. (-48%), despite posting reasonable quarterly results, declined in an adverse sentiment environment for auto and heavy truck related names. QTS Realty (-31%), a data-center REIT (real estate investment trust), suffered from poor communication of a strategic move away from some lower margin business, after having given no indication of an upcoming change at a high-profile Investor Day just three months prior.
We are disappointed in our results for the fiscal year in what we have found to be a challenging environment, manifested in a more bifurcated market sentiment with winners continuing to move higher, without much heed to valuation—until an adverse data point impacts that rosy sentiment—and losers that continue to languish, as investors seem unwilling to look through the valley to better times, instead embracing a “why bother?” attitude. As we write this, sentiment appears to be shifting a bit, as some of the market darlings, the “FAANG” stocks for example, have come under pressure.1 We would expect to make up some ground in an environment where valuation matters again. We will continue to focus on building a diversified portfolio of what we believe to be higher-quality companies as measured by return on invested capital (ROIC) and balance sheet strength available at reasonable valuations.
| 1 | FAANG stocks refers to Facebook Inc., Apple Inc. Amazon.com Inc., Netflix and Alphabet (formerly Google Inc.). |
The views expressed represent the opinions of Silvercrest Asset Management Group LLC, as of October 31, 2018, and are not intended as a forecast or guarantee of future results and are subject to change without notice.
54
AMG Managers Silvercrest Small Cap Fund
Portfolio Manager’s Comments (continued)
CUMULATIVE TOTAL RETURN PERFORMANCE
AMG Managers Silvercrest Small Cap Fund’s cumulative total return is based on the daily change in net asset value (NAV), and assumes that all dividends and distributions were reinvested. The graph compares a hypothetical $10,000 investment made in the AMG Managers Silvercrest Small Cap Fund’s Class N shares on December 27, 2011, to a $10,000 investment made in the Russell 2000® Value Index and Russell 2000® Index for the same time period. The graph and table do not reflect the deduction of taxes that a shareholder would pay on a Fund distribution or redemption of shares. The listed returns for the Fund are net of expenses and the returns for the index exclude expenses. Total returns would have been lower had certain expenses not been reduced.
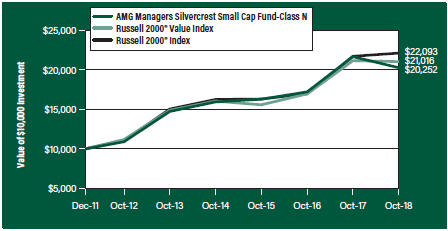
The table below shows the average annual total returns for the AMG Managers Silvercrest Small Cap Fund, the Russell 2000® Value Index and Russell 2000® Index for the same time periods ended October 31, 2018.
| | | | | | | | | | | | | | | | |
| | | One | | | Five | | | Since | | | Inception | |
| Average Annual Total Returns1 | | Year | | | Years | | | Inception | | | Date | |
AMG Managers Silvercrest Small Cap Fund2, 3, 4, 5 | | | | | | | | | | | | | | | | |
Class N | | | (6.43 | %) | | | 6.58 | % | | | 10.85 | % | | | 12/27/11 | |
Class I | | | (6.16 | %) | | | 6.86 | % | | | 11.14 | % | | | 12/27/11 | |
Class Z | | | (6.14 | %) | | | — | | | | (4.72 | %) | | | 09/29/17 | |
Russell 2000® Value Index6 | | | (0.59 | %) | | | 7.18 | % | | | 11.45 | % | | | 12/27/11 | † |
Russell 2000® Index7 | | | 1.85 | % | | | 8.01 | % | | | 12.34 | % | | | 12/27/11 | † |
The performance data shown represents past performance. Past performance is not a guarantee of future results. Current performance may be lower or higher than the performance data quoted. The investment return and principal value of an investment will fluctuate so that an investor’s shares, when redeemed, may be worth more or less than their original cost.
Investors should carefully consider the Fund’s investment objectives, risks, charges and expenses before investing. For performance information through the most recent month end, current net asset values per share for the Fund and other information, please call 800.835.3879 or visit our website at amgfunds.com for a free prospectus. Read it carefully before investing or sending money.
Distributed by AMG Distributors, Inc., member FINRA/SIPC.
| † | Date reflects the inception date of the Fund, not the index. |
| 1 | Total return equals income yield plus share price change and assumes reinvestment of all dividends and capital gain distributions. Returns are net of fees and may reflect offsets of Fund expenses as described in the prospectus. No adjustment has been made for taxes payable by shareholders on their reinvested dividends and |
| | capital gain distributions. Returns for periods greater than one year are annualized. The listed returns on the Fund are net of expenses and based on the published NAV as of October 31, 2018. All returns are in U.S. dollars ($). |
| 2 | The Fund is subject to risks associated with investments in small-capitalization companies, such as erratic earnings patterns, competitive conditions, limited earnings history and a reliance on one or a limited number of products. |
| 3 | The Fund is subject to risks associated with investments in mid-capitalization companies such as greater price volatility, lower trading volume, and less liquidity than the stocks of larger, more established companies. Growth stocks may underperform value stocks during given periods. |
| 4 | The Fund is subject to special risk considerations similar to those associated with the direct ownership of real estate. Real estate valuations may be subject to factors such as changing general and local economic, financial, competitive, and environmental conditions. |
| 5 | The Fund invests in value stocks, which may perform differently from the market as a whole and may be undervalued by the market for a long period of time. |
| 6 | The Russell 2000® Value Index is an unmanaged, market-value weighted, value-oriented index comprised of small stocks that have relatively low price-to-book ratios and lower forecasted growth values. Unlike the Fund, the Russell 2000® Value Index is unmanaged, is not available for investment and does not incur expenses. |
| 7 | The Russell 2000® Index is composed of the 2,000 smallest stocks in the Russell 3000® Index and is widely regarded in the industry as the premier measure of small-cap stock performance. Unlike the Fund, the Russell 2000® Index is unmanaged, is not available for investment and does not incur expenses. |
The Russell Indices are a trademark of the London Stock Exchange Group companies.
Not FDIC insured, nor bank guaranteed. May lose value.
55
| | |
| AMG Managers Silvercrest Small Cap Fund | | |
Fund Snapshots (unaudited) October 31, 2018 | | |
PORTFOLIO BREAKDOWN
| | | | |
| | | % of
Net Assets | |
Sector |
Financials | | | 21.4 | |
Industrials | | | 16.8 | |
Information Technology | | | 14.8 | |
Consumer Discretionary | | | 13.3 | |
Real Estate | | | 7.7 | |
Health Care | | | 6.9 | |
Materials | | | 5.6 | |
Energy | | | 5.0 | |
Utilities | | | 3.5 | |
Consumer Staples | | | 3.2 | |
Short-Term Investments1 | | | 3.8 | |
Other Assets Less Liabilities2 | | | (2.0 | ) |
| 1 | Includes reinvestment of cash collateral into joint repurchase agreements on security lending transactions. |
| 2 | Includes repayment of cash collateral on security lending transactions. |
TOP TEN HOLDINGS
| | | | |
| | | % of
Net Assets | |
Security Name |
IBERIABANK Corp. | | | 3.2 | |
BancorpSouth Bank | | | 3.1 | |
Independent Bank Corp. | | | 3.1 | |
Selective Insurance Group, Inc. | | | 2.8 | |
Glacier Bancorp, Inc. | | | 2.7 | |
Matador Resources Co. | | | 2.6 | |
Pebblebrook Hotel Trust, 0.380%, 01/01/00 | | | 2.6 | |
CVB Financial Corp. | | | 2.6 | |
Wolverine World Wide, Inc. | | | 2.6 | |
US Ecology, Inc. | | | 2.4 | |
| | | | |
Top Ten as a Group | | | 27.7 | |
| | | | |
Because a fund’s strategy may result in multiple investments in particular sectors of the economy, its performance may depend on the performance of those sectors and may fluctuate more widely than investments diversified across more sectors. For additional information on these and other risk considerations, please see the Fund’s prospectus.
Any sectors, industries, or securities discussed should not be perceived as investment recommendations. Mention of a specific security should not be considered a recommendation to buy or solicitation to sell that security. Specific securities mentioned in this report may have been sold from the Fund’s portfolio of investments by the time you receive this report.
56
| | |
| AMG Managers Silvercrest Small Cap Fund | | |
| |
Schedule of Portfolio Investments October 31, 2018 | | |
| | | | | | | | |
| | | Shares | | | Value | |
Common Stocks - 98.2% | | | | | | | | |
Consumer Discretionary - 13.3% | | | | | |
Carter’s, Inc.1 | | | 27,520 | | | $ | 2,641,370 | |
Dana, Inc. | | | 149,865 | | | | 2,333,398 | |
La-Z-Boy, Inc. | | | 159,795 | | | | 4,442,301 | |
Lithia Motors, Inc., Class A | | | 14,095 | | | | 1,255,583 | |
Meredith Corp.1 | | | 85,065 | | | | 4,385,951 | |
Murphy USA, Inc.* | | | 33,270 | | | | 2,682,560 | |
Oxford Industries, Inc. | | | 36,200 | | | | 3,221,076 | |
Stoneridge, Inc.* | | | 87,260 | | | | 2,217,277 | |
Visteon Corp.* | | | 29,330 | | | | 2,318,243 | |
Wolverine World Wide, Inc. | | | 172,560 | | | | 6,068,935 | |
Total Consumer Discretionary | | | | | | | 31,566,694 | |
Consumer Staples - 3.2% | | | | | | | | |
J&J Snack Foods Corp. | | | 27,984 | | | | 4,369,982 | |
Lancaster Colony Corp.1 | | | 19,509 | | | | 3,343,452 | |
Total Consumer Staples | | | | | | | 7,713,434 | |
Energy - 5.0% | | | | | | | | |
Callon Petroleum Co.*,1 | | | 347,820 | | | | 3,467,765 | |
Forum Energy Technologies, Inc.*,1 | | | 60,110 | | | | 538,586 | |
Matador Resources Co.*,1 | | | 214,785 | | | | 6,194,399 | |
Select Energy Services, Inc., Class A*,1 | | | 187,075 | | | | 1,788,437 | |
Total Energy | | | | | | | 11,989,187 | |
Financials - 21.4% | | | | | | | | |
BancorpSouth Bank | | | 258,850 | | | | 7,428,995 | |
CVB Financial Corp.1 | | | 278,990 | | | | 6,095,931 | |
FCB Financial Holdings, Inc., Class A* | | | 140,335 | | | | 5,491,309 | |
Glacier Bancorp, Inc. | | | 151,540 | | | | 6,425,296 | |
Horace Mann Educators Corp. | | | 94,099 | | | | 3,696,209 | |
IBERIABANK Corp. | | | 100,659 | | | | 7,498,089 | |
Independent Bank Corp.1 | | | 94,503 | | | | 7,413,760 | |
Selective Insurance Group, Inc. | | | 104,300 | | | | 6,763,855 | |
Total Financials | | | | | | | 50,813,444 | |
Health Care - 6.9% | | | | | | | | |
Allscripts Healthcare Solutions, Inc.* | | | 311,470 | | | | 3,709,608 | |
AMN Healthcare Services, Inc.* | | | 72,190 | | | | 3,654,258 | |
ICU Medical, Inc.* | | | 9,376 | | | | 2,388,348 | |
Integer Holdings Corp.* | | | 45,390 | | | | 3,380,193 | |
Natus Medical, Inc.*,1 | | | 109,225 | | | | 3,263,643 | |
Total Health Care | | | | | | | 16,396,050 | |
Industrials - 16.8% | | | | | | | | |
Advanced Disposal Services, Inc.* | | | 191,010 | | | | 5,174,461 | |
Altra Industrial Motion Corp. | | | 113,295 | | | | 3,656,030 | |
| | | | | | | | |
| | | Shares | | | Value | |
BMC Stock Holdings, Inc.* | | | 161,595 | | | $ | 2,705,100 | |
CIRCOR International, Inc.1 | | | 32,540 | | | | 1,057,875 | |
EMCOR Group, Inc. | | | 27,256 | | | | 1,934,631 | |
ESCO Technologies, Inc. | | | 72,320 | | | | 4,427,430 | |
Forward Air Corp. | | | 47,210 | | | | 2,832,128 | |
Gibraltar Industries, Inc.* | | | 95,890 | | | | 3,417,520 | |
Knoll, Inc. | | | 150,835 | | | | 2,994,075 | |
Mueller Water Products, Inc., Class A | | | 318,475 | | | | 3,267,554 | |
Standex International Corp. | | | 33,295 | | | | 2,700,890 | |
US Ecology, Inc. | | | 81,224 | | | | 5,679,994 | |
Total Industrials | | | | | | | 39,847,688 | |
Information Technology - 14.8% | | | | | |
ACI Worldwide, Inc.* | | | 153,987 | | | | 3,863,534 | |
Brooks Automation, Inc. | | | 177,915 | | | | 5,520,703 | |
Entegris, Inc. | | | 64,520 | | | | 1,712,361 | |
Littelfuse, Inc. | | | 14,108 | | | | 2,555,805 | |
MACOM Technology Solutions Holdings, Inc.*,1 | | | 41,605 | | | | 585,382 | |
Methode Electronics, Inc. | | | 103,535 | | | | 3,064,636 | |
MKS Instruments, Inc. | | | 28,710 | | | | 2,115,640 | |
Plexus Corp.* | | | 68,855 | | | | 4,021,132 | |
Rogers Corp.* | | | 31,200 | | | | 3,839,472 | |
Semtech Corp.* | | | 85,130 | | | | 3,825,742 | |
SYNNEX Corp. | | | 51,880 | | | | 4,026,407 | |
Total Information Technology | | | | | | | 35,130,814 | |
Materials - 5.6% | | | | | | | | |
HB Fuller Co.1 | | | 101,815 | | | | 4,526,695 | |
Ingevity Corp.* | | | 26,620 | | | | 2,424,550 | |
Minerals Technologies, Inc. | | | 64,290 | | | | 3,519,877 | |
PH Glatfelter Co. | | | 159,268 | | | | 2,850,897 | |
Total Materials | | | | | | | 13,322,019 | |
Real Estate - 7.7% | | | | | | | | |
EastGroup Properties, Inc., REIT 1 | | | 35,983 | | | | 3,446,812 | |
Pebblebrook Hotel Trust, REIT 1 | | | 183,055 | | | | 6,170,783 | |
Physicians Realty Trust, REIT | | | 236,095 | | | | 3,914,455 | |
QTS Realty Trust, Inc., Class A, REIT | | | 121,040 | | | | 4,638,253 | |
Total Real Estate | | | | | | | 18,170,303 | |
Utilities - 3.5% | | | | | | | | |
MGE Energy, Inc. | | | 39,268 | | | | 2,453,465 | |
ONE Gas, Inc. | | | 52,035 | | | | 4,106,082 | |
Portland General Electric Co. | | | 37,469 | | | | 1,689,102 | |
Total Utilities | | | | | | | 8,248,649 | |
Total Common Stocks
(Cost $225,053,648) | | | | | | | 233,198,282 | |
The accompanying notes are an integral part of these financial statements.
57
| | |
| AMG Managers Silvercrest Small Cap Fund | | |
| Schedule of Portfolio Investments (continued) | | |
| | | | | | | | |
| | | Principal | | | | |
| | | Amount | | | Value | |
Short-Term Investments - 3.8% | | | | | | | | |
Joint Repurchase Agreements - 2.7%2 | | | | | | | | |
Citigroup Global Markets, Inc., dated 10/31/18, due 11/01/18, 2.220% total to be received $1,522,220 (collateralized by various U.S. Government Agency Obligations and U.S. Treasuries, 0.000% - 6.500%, 10/01/19 - 09/09/49, totaling $1,552,569) | | $ | 1,522,126 | | | $ | 1,522,126 | |
HSBC Securities USA, Inc., dated 10/31/18, due 11/01/18, 2.210% total to be received $1,522,219 (collateralized by various U.S. Government Agency Obligations, 2.500% - 5.000%, 07/01/23 - 01/01/57, totaling $1,552,569) | | | 1,522,126 | | | | 1,522,126 | |
Merrill Lynch, Pierce, Fenner & Smith, Inc., dated 10/31/18, due 11/01/18, 2.200% total to be received $320,075 (collateralized by various U.S. Treasuries, 0.125% - 2.500%, 04/30/20 -09/09/49, totaling $326,456) | | | 320,055 | | | | 320,055 | |
Nomura Securities International, Inc., dated 10/31/18, due 11/01/18, 2.210% total to be received $1,522,219 (collateralized by various U.S. Government Agency Obligations and U.S. Treasuries, 0.000% - 9.500%, 11/08/18 -09/20/68, totaling $1,552,568) | | | 1,522,126 | | | | 1,522,126 | |
RBC Dominion Securities, Inc., dated 10/31/18, due 11/01/18, 2.220% total to be received $1,522,220 (collateralized by various U.S. Government Agency Obligations and U.S. Treasuries, 0.000% - 7.000%, 11/29/18 -09/09/49, totaling $1,552,568) | | | 1,522,126 | | | | 1,522,126 | |
Total Joint Repurchase Agreements | | | | | | | 6,408,559 | |
| | | | | | | | |
| | |
| | | Shares | | | Value | |
Other Investment Companies - 1.1% | | | | | |
Dreyfus Government Cash Management Fund, Institutional Class Shares, 2.05%3 | | | 874,788 | | | $ | 874,788 | |
Dreyfus Institutional Preferred Government Money Market Fund, Institutional Class Shares, 2.12%3 | | | 874,789 | | | | 874,789 | |
JPMorgan U.S. Government Money Market Fund, IM Shares, 2.09%3 | | | 901,297 | | | | 901,297 | |
Total Other Investment Companies | | | | | | | 2,650,874 | |
Total Short-Term Investments
(Cost $9,059,433) | | | | | | | 9,059,433 | |
Total Investments - 102.0%
(Cost $234,113,081) | | | | | | | 242,257,715 | |
Other Assets, less Liabilities - (2.0)% | | | | | | | (4,762,033 | ) |
Net Assets - 100.0% | | | | | | $ | 237,495,682 | |
| * | Non-income producing security. |
| 1 | Some or all of these securities, amounting to $26,468,951 or 11.1% of net assets, were out on loan to various brokers and are collateralized by cash and various U.S. Treasury Obligations. See Note 4 of Notes to Financial Statements. |
| 2 | Cash collateral received from brokers for securities lending was invested in these joint repurchase agreements. |
| 3 | Yield shown represents the October 31, 2018, seven day average yield, which refers to the sum of the previous seven days’ dividends paid, expressed as an annual percentage. |
REIT Real Estate Investment Trust
The accompanying notes are an integral part of these financial statements.
58
| | |
| AMG Managers Silvercrest Small Cap Fund | | |
| Schedule of Portfolio Investments (continued) | | |
The following table summarizes the inputs used to value the Fund’s investments by the fair value hierarchy levels as of October 31, 2018:
| | | | | | | | | | | | | | | | |
| | | Level 1 | | | Level 2 | | | Level 3 | | | Total | |
Investments in Securities | | | | | | | | | | | | | | | | |
Common Stocks† | | $ | 233,198,282 | | | | — | | | | — | | | $ | 233,198,282 | |
Short-Term Investments | | | | | | | | | | | | | | | | |
Joint Repurchase Agreements | | | — | | | $ | 6,408,559 | | | | — | | | | 6,408,559 | |
Other Investment Companies | | | 2,650,874 | | | | — | | | | — | | | | 2,650,874 | |
| | | | | | | | | | | | | | | | |
Total Investments in Securities | | $ | 235,849,156 | | | $ | 6,408,559 | | | | — | | | $ | 242,257,715 | |
| | | | | | | | | | | | | | | | |
| † | All common stocks held in the Fund are Level 1 securities. For a detailed breakout of common stocks by major industry classification, please refer to the Fund’s Schedule of Portfolio Investments. |
As of October 31, 2018, the Fund had no transfers between levels from the beginning of the reporting period.
The accompanying notes are an integral part of these financial statements.
59
| | |
| AMG GW&K U.S. Small Cap Growth Fund | | |
| Portfolio Manager’s Comments (unaudited) | | |
THE YEAR IN REVIEW
For the fiscal year ending October 31, 2018, the AMG GW&K U.S. Small Cap Growth Fund (the “Fund”) Class N shares returned 3.41% compared to the return of 4.13% for the Russell 2000® Growth Index.
We began our commentary at this time a year ago by noting that the preceding 12-month period had begun with a bang—specifically, the election of then-candidate Trump and the ensuing rally in U.S. equities. As we wrote last year, stocks quickly surged in the aftermath of the election on a snap back from the sharp decline leading up to the time when voters cast their ballots. The Russell 2000® Growth Index built on that strong start and ended October of 2017 with a gain of 31.0% over the prior 12 months. The move higher continued for much of the most recent measurement period, such that the benchmark boasted another robust gain of 22.1% from the start of November 2017 through the end of August 2018. As usual, the rally provided investors with a few anxious moments of volatility, but nothing that rose to the level of a correction. However, the markets (if not the electorate) eventually saw fit to provide this period with a bang to call its own. This version came at the end of the fiscal year and in the opposite direction of the prior year’s. Specifically, the benchmark index rolled over modestly in September with a dip of 2.3% before the decline picked up speed with a drop of 12.7% in October.
The timing of this fall swoon seemed somewhat apropos in that it arrived just as we lapped some of the momentous events of the financial crisis of a decade earlier. It is worth noting that while recent market activity has certainly given investors a scare, the contrast between conditions then and now is striking. Back then, corporate earnings were falling, investor confidence was flagging, financial markets were seizing up, and elected politicians nearly made things worse with their prioritization of the party line and reelection over country. Today, corporate earnings continue to rise, investors are still fairly upbeat, financial market liquidity remains ample, and…okay, maybe things in Washington are still problematic.
The recent market volatility certainly has been unpleasant, but one silver lining is that it might have wrung out some of the excesses that had built up of late. A prime example can be found in the style factors during the rally and subsequent selloff. The performance of unprofitable companies provides the most dramatic example. These stocks outpaced the Index by more than 1,000 basis points (10%) during the run up, before turning tail and leading the market lower in the downdraft. Other style factors that support this conclusion can be found in the outperformance of micro-caps and
underperformance of high return on equity (ROE) stocks in the first ten months of the fiscal year. Both of these characteristics then reversed course to finish the period with micro-caps underperforming and high ROE outperforming.
At the sector level, there were a number of strong performances over the past 12 months with consumer staples, healthcare, and consumer discretionary leading the charge. Each of these sectors finished with robust double-digit gains for the fiscal year (19.5%, 12.1%, and 11.0%, respectively). The consumer groups benefited from some mean reversion, as both were laggards in the preceding fiscal year. The healthcare sector continued its outperformance from the prior year, but with a notable shift in internal leadership. Specifically, the healthcare providers & services, healthcare technology, and healthcare equipment & supplies industries all took the baton from biotechnology, which drove the sector’s performance in the year prior. Rounding out the sectors to finish in the plus column were the newly created communication services sector, information technology, and, by a nose, financials. At the other end of the spectrum, the energy and materials sectors were the big losers as both declined by double digits (-16.8% and -15.3%, respectively). The industrials and real estate sectors, along with the miniscule utilities sector, rounded out the groups in the minus column for the period. The net result of these winning and losing groups, not to mention the rally and subsequent pullback, was that the Index posted a modest gain of 4.1% during the fiscal year.
The return of the Fund was slightly lower during the measurement period at 3.4% (for Class N shares) net of fees. Our discussion of market activity noted the stark contrast in results before August 31 versus after August 31. The same distinction applies to our relative performance. The Fund’s investment strategy focuses on high quality companies with strong management teams that we believe are well positioned to be the ultimate winners in their respective segments. This approach is designed with the goal of outperforming over the long term, with the additional potential benefit that we typically have done better than the Index during historical periods of market duress. Such was the case at the end of the fiscal year when we outperformed during the selloff. Conversely, sharp market rallies have typically been good for the Fund’s absolute performance and more challenging for relative results. This also turned out to be the case for the first ten months of the fiscal year.
Looking at attribution more closely, four sectors in which we own stocks contributed positively to relative results for the fiscal year as a
whole: consumer discretionary, materials, energy, and information technology. Consumer discretionary was the best of the bunch with seven of our ten holdings posting gains of better than 20%. The star performer was Five Below, which more than doubled as investors gained a greater appreciation for the company’s growth potential and strong execution. There were an equal number of sectors in which we own at least one stock that detracted from relative performance: healthcare, financials, real estate, and consumer staples. Of this cohort, the healthcare sector had the biggest drag on relative results. The two largest detractors in this sector were a pair of biopharma stocks: Portola Pharmaceuticals and Dova Pharmaceuticals. Since our initial purchase, Portola has received clearance from the FDA for its two lead drug candidates. Unfortunately, initial sales of one of the therapies were below plan, leading to a pullback in the stock. While disappointed with the stumble out of the gate, we continue to believe that the company’s drugs have significant value and are optimistic that a recent change in management may catalyze improved execution. As with Portola, Dova received positive news from the FDA only to see the stock subsequently sell off. In this case, we believe the main culprit was that the FDA also blessed a competitive product. Our view of the landscape is that Dova has a superior therapy and is well positioned as the first to market. To that end, we followed the lead of Dova’s CEO and added to our position on weakness.
A theme of our recent trading activity has been the sale of stocks that exceeded our market cap threshold or were beneficiaries of acquisition offers. In total, we exited 18 positions during the period. We sold nine stocks that had grown too large and four others left the Fund after they agreed to acquisition terms. Fundamental factors drove the sales of the remaining five stocks. The number of forced sales due to market cap or M&A (mergers and acquisitions) activity was higher than usual, but our overall turnover remained fairly modest. Some of the proceeds from the aforementioned liquidations were recycled into a number of new ideas. This group consisted of 17 new stocks for the Fund in the information technology, health care, financials, and industrials sectors. Rounding out the trading activity was a series of additions and trims to some of the existing holdings.
The views expressed represent the opinions of GW&K Investment Management LLC, as of October 31, 2018, and are not intended as a forecast or guarantee of future results and are subject to change without notice.
60
AMG GW&K U.S. Small Cap Growth Fund
Portfolio Manager’s Comments (continued)
CUMULATIVE TOTAL RETURN PERFORMANCE
AMG GW&K U.S. Small Cap Growth Fund’s cumulative total return is based on the daily change in net asset value (NAV), and assumes that all dividends and distributions were reinvested. The graph compares a hypothetical $10,000 investment made in the AMG GW&K U.S. Small Cap Growth Fund’s Class N shares on October 31, 2008, to a $10,000 investment made in the Russell 2000® Growth Index for the same time period. The graph and table do not reflect the deduction of taxes that a shareholder would pay on a Fund distribution or redemption of shares. The listed returns for the Fund are net of expenses and the returns for the index exclude expenses. Total returns would have been lower had certain expenses not been reduced.
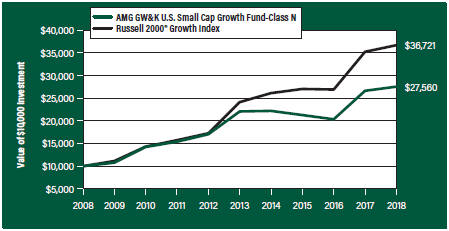
The table below shows the average annual total returns for the AMG GW&K U.S. Small Cap Growth Fund, the Russell 2000® Growth Index for the same time periods ended October 31, 2018.
| | | | | | | | | | | | | | | | | | | | |
| | | One | | | Five | | | Ten | | | Since | | | Inception | |
| Average Annual Total Returns1 | | Year | | | Years | | | Years | | | Inception | | | Date | |
AMG GW&K U.S. Small Cap Growth Fund2, 3, 4 | | | | | | | | | | | | | | | | | | | | |
Class N | | | 3.41 | % | | | 4.53 | % | | | 10.67 | % | | | 9.55 | % | | | 11/30/00 | |
Class I | | | 3.78 | % | | | 4.84 | % | | | 10.97 | % | | | 7.84 | % | | | 01/04/05 | |
Class Z | | | 3.78 | % | | | — | | | | — | | | | 11.47 | % | | | 02/24/17 | |
Russell 2000® Growth Index5 | | | 4.13 | % | | | 8.75 | % | | | 13.89 | % | | | 7.26 | % | | | 11/30/00 | † |
The performance data shown represents past performance. Past performance is not a guarantee of future results. Current performance may be lower or higher than the performance data quoted. The investment return and principal value of an investment will fluctuate so that an investor’s shares, when redeemed, may be worth more or less than their original cost.
Investors should carefully consider the Fund’s investment objectives, risks, charges and expenses before investing. For performance information through the most recent month end, current net asset values per share for the Fund and other information, please call 800.835.3879 or visit our website at amgfunds.com for a free prospectus. Read it carefully before investing or sending money.
Distributed by AMG Distributors, Inc., member FINRA/SIPC.
| † | Date reflects the inception date of the Fund, not the index. |
| 1 | Total return equals income yield plus share price change and assumes reinvestment of all dividends and capital gain distributions. Returns are net of fees and may reflect offsets of Fund expenses as described in the prospectus. No adjustment has been made for taxes payable by shareholders on their reinvested dividends and capital gain distributions. Returns for periods greater than one year are annualized. The listed returns on the Fund are net of expenses and based on the published NAV as of October 31, 2018. All returns are in U.S. dollars ($). |
| 2 | The Fund is subject to risks associated with investments in small-capitalization companies, such as erratic earnings patterns, competitive conditions, limited earnings history and a reliance on one or a limited number of products. |
| 3 | The Fund invests in growth stocks, which may be more sensitive to market movements because their prices tend to reflect future investor expectations rather than just current profits. Growth stocks may underperform value stocks during given periods. |
| 4 | Companies that are in similar businesses may be similarly affected by particular economic or market events; to the extent the Fund has substantial holdings within a particular sector, the risks associated with that sector increase. |
| 5 | The Russell 2000® Growth Index measures the performance of the Russell 2000® companies with higher price-to-book ratios and higher forecasted growth values. Unlike the Fund, the Russell 2000® Growth Index is unmanaged, is not available for investment and does not incur expenses. |
The Russell Indices are a trademark of London Stock Exchange Group companies.
Not FDIC insured, nor bank guaranteed. May lose value.
61
| | |
| AMG GW&K U.S. Small Cap Growth Fund | | |
| Fund Snapshots (unaudited) | | |
| October 31, 2018 | | |
PORTFOLIO BREAKDOWN
| | | | |
Sector | | % of
Net Assets | |
Health Care | | | 28.1 | |
Information Technology | | | 22.3 | |
Industrials | | | 17.8 | |
Consumer Discretionary | | | 15.4 | |
Financials | | | 6.9 | |
Materials | | | 3.4 | |
Real Estate | | | 2.9 | |
Energy | | | 1.5 | |
Consumer Staples | | | 0.8 | |
Short-Term Investments1 | | | 8.4 | |
Other Assets Less Liabilities2 | | | (7.5 | ) |
| 1 | Includes reinvestment of cash collateral into joint repurchase agreements on security lending transactions. |
| 2 | Includes repayment of cash collateral on security lending transactions. |
TOP TEN HOLDINGS
| | | | |
Security Name | | % of
Net Assets | |
Grand Canyon Education, Inc. | | | 3.6 | |
Five Below, Inc. | | | 2.6 | |
Exponent, Inc. | | | 2.5 | |
EPAM Systems, Inc. | | | 2.4 | |
Fox Factory Holding Corp. | | | 2.3 | |
Globus Medical, Inc., Class A | | | 2.3 | |
ICU Medical, Inc. | | | 2.1 | |
Balchem Corp. | | | 2.0 | |
HubSpot, Inc. | | | 2.0 | |
Catalent, Inc. | | | 2.0 | |
| | | | |
Top Ten as a Group | | | 23.8 | |
| | | | |
Because a fund’s strategy may result in multiple investments in particular sectors of the economy, its performance may depend on the performance of those sectors and may fluctuate more widely than investments diversified across more sectors. For additional information on these and other risk considerations, please see the Fund’s prospectus.
Any sectors, industries, or securities discussed should not be perceived as investment recommendations. Mention of a specific security should not be considered a recommendation to buy or solicitation to sell that security. Specific securities mentioned in this report may have been sold from the Fund’s portfolio of investments by the time you receive this report.
62
| | |
| AMG GW&K U.S. Small Cap Growth Fund | | |
| Schedule of Portfolio Investments | | |
| October 31, 2018 | | |
| | | | | | | | |
| | | Shares | | | Value | |
Common Stocks - 99.1% | | | | | | | | |
Consumer Discretionary - 15.4% | | | | | | | | |
Chuy’s Holdings, Inc.* | | | 14,093 | | | $ | 343,446 | |
Dave & Buster’s Entertainment, Inc.1 | | | 10,052 | | | | 598,597 | |
Five Below, Inc.* | | | 7,758 | | | | 883,016 | |
Fox Factory Holding Corp.*,1 | | | 14,661 | | | | 787,736 | |
Grand Canyon Education, Inc.* | | | 10,009 | | | | 1,248,122 | |
Lithia Motors, Inc., Class A | | | 2,986 | | | | 265,993 | |
Oxford Industries, Inc. | | | 5,231 | | | | 465,454 | |
Pool Corp. | | | 2,972 | | | | 433,169 | |
Spartan Motors, Inc. | | | 36,132 | | | | 243,168 | |
Total Consumer Discretionary | | | | | | | 5,268,701 | |
Consumer Staples - 0.8% | | | | | | | | |
PriceSmart, Inc. | | | 4,142 | | | | 290,561 | |
Energy - 1.5% | | | | | | | | |
Matador Resources Co.*,1 | | | 17,841 | | | | 514,534 | |
Financials - 6.9% | | | | | | | | |
Ameris Bancorp. | | | 12,018 | | | | 515,452 | |
Encore Capital Group, Inc.*,1 | | | 9,739 | | | | 247,468 | |
Heritage Insurance Holdings, Inc. | | | 12,122 | | | | 169,223 | |
Houlihan Lokey, Inc. | | | 8,693 | | | | 357,978 | |
Pinnacle Financial Partners, Inc. | | | 10,130 | | | | 529,799 | |
Stifel Financial Corp. | | | 5,397 | | | | 246,751 | |
Texas Capital Bancshares, Inc.* | | | 4,899 | | | | 319,562 | |
Total Financials | | | | | | | 2,386,233 | |
Health Care - 28.1% | | | | | | | | |
Acadia Healthcare Co., Inc.*,1 | | | 6,788 | | | | 281,702 | |
Aimmune Therapeutics, Inc.*,1 | | | 18,577 | | | | 493,777 | |
Amicus Therapeutics, Inc.*,1 | | | 41,271 | | | | 461,410 | |
Amneal Pharmaceuticals, Inc.*,1 | | | 25,850 | | | | 476,932 | |
AtriCure, Inc.* | | | 15,074 | | | | 479,504 | |
Biohaven Pharmaceutical Holding Co., Ltd.* | | | 9,881 | | | | 356,210 | |
Bruker Corp. | | | 8,967 | | | | 280,936 | |
Cardiovascular Systems, Inc.* | | | 18,632 | | | | 522,628 | |
Catalent, Inc.* | | | 16,700 | | | | 673,678 | |
Dova Pharmaceuticals, Inc.*,1 | | | 15,734 | | | | 292,023 | |
Global Blood Therapeutics, Inc.*,1 | | | 10,891 | | | | 382,165 | |
Globus Medical, Inc., Class A* | | | 14,748 | | | | 779,432 | |
GW Pharmaceuticals PLC, ADR (United Kingdom)* | | | 2,500 | | | | 343,725 | |
ICU Medical, Inc.* | | | 2,824 | | | | 719,357 | |
LHC Group, Inc.* | | | 4,071 | | | | 372,211 | |
Medidata Solutions, Inc.* | | | 9,152 | | | | 643,386 | |
| | | | | | | | |
| | | Shares | | | Value | |
Portola Pharmaceuticals, Inc.*,1 | | | 12,170 | | | $ | 239,627 | |
Retrophin, Inc.* | | | 13,889 | | | | 356,392 | |
Syneos Health, Inc.*,1 | | | 13,754 | | | | 627,595 | |
Wright Medical Group NV (Netherlands)* | | | 16,398 | | | | 442,418 | |
Zogenix, Inc.*,1 | | | 9,629 | | | | 402,107 | |
Total Health Care | | | | | | | 9,627,215 | |
Industrials - 17.8% | | | | | | | | |
AAR Corp. | | | 14,077 | | | | 669,784 | |
Cubic Corp. | | | 5,239 | | | | 343,731 | |
Dycom Industries, Inc.*,1 | | | 3,509 | | | | 238,191 | |
Exponent, Inc. | | | 16,989 | | | | 857,265 | |
Healthcare Services Group, Inc.1 | | | 8,408 | | | | 341,281 | |
JELD-WEN Holding, Inc.*,1 | | | 8,325 | | | | 135,365 | |
John Bean Technologies Corp. | | | 4,980 | | | | 517,771 | |
Knight-Swift Transportation Holdings, Inc.1 | | | 8,386 | | | | 268,352 | |
Ritchie Bros. Auctioneers, Inc. (Canada) | | | 17,633 | | | | 592,645 | |
SiteOne Landscape Supply, Inc.*,1 | | | 9,137 | | | | 621,681 | |
Sun Hydraulics Corp. | | | 7,318 | | | | 339,555 | |
Thermon Group Holdings, Inc.* | | | 15,323 | | | | 330,670 | |
WageWorks, Inc.* | | | 9,430 | | | | 375,408 | |
Woodward, Inc. | | | 6,310 | | | | 464,668 | |
Total Industrials | | | | | | | 6,096,367 | |
Information Technology - 22.3% | | | | | | | | |
Apptio, Inc., Class A* | | | 9,718 | | | | 251,696 | |
Blackbaud, Inc. | | | 4,798 | | | | 344,112 | |
Bottomline Technologies de, Inc.* | | | 6,758 | | | | 450,353 | |
Cabot Microelectronics Corp. | | | 4,543 | | | | 443,488 | |
EPAM Systems, Inc.* | | | 6,897 | | | | 823,985 | |
ExlService Holdings, Inc.* | | | 5,326 | | | | 341,397 | |
Forrester Research, Inc. | | | 10,551 | | | | 424,994 | |
HubSpot, Inc.* | | | 5,006 | | | | 679,064 | |
MACOM Technology Solutions Holdings, Inc.*,1 | | | 11,240 | | | | 158,147 | |
MAXIMUS, Inc. | | | 4,615 | | | | 299,836 | |
Mimecast, Ltd.* | | | 16,227 | | | | 565,673 | |
Paylocity Holding Corp.* | | | 9,121 | | | | 600,071 | |
Power Integrations, Inc. | | | 7,613 | | | | 428,764 | |
Rapid7, Inc.* | | | 17,771 | | | | 644,021 | |
Rogers Corp.*,1 | | | 4,144 | | | | 509,961 | |
Silicon Laboratories, Inc.* | | | 8,241 | | | | 671,889 | |
Total Information Technology | | | | | | | 7,637,451 | |
Materials - 3.4% | | | | | | | | |
Balchem Corp. | | | 7,324 | | | | 685,893 | |
The accompanying notes are an integral part of these financial statements.
63
| | |
| AMG GW&K U.S. Small Cap Growth Fund | | |
| Schedule of Portfolio Investments (continued) | | |
| | | | | | | | |
| | |
| | | Shares | | | Value | |
Materials - 3.4% (continued) | | | | | | | | |
PolyOne Corp. | | | 14,737 | | | $ | 476,152 | |
Total Materials | | | | | | | 1,162,045 | |
Real Estate - 2.9% | | | | | | | | |
QTS Realty Trust, Inc., Class A, REIT | | | 13,253 | | | | 507,855 | |
STAG Industrial, Inc., REIT | | | 18,673 | | | | 494,088 | |
Total Real Estate | | | | | | | 1,001,943 | |
Total Common Stocks | | | | | | | | |
(Cost $28,035,982) | | | | | | | 33,985,050 | |
| | |
| | | Principal
Amount | | | | |
Short-Term Investments - 8.4% | | | | | | | | |
Joint Repurchase Agreements - 7.2%2 | | | | | | | | |
Mizuho Securities USA, LLC, dated 10/31/18, due 11/01/18, 2.200% total to be received $460,667 (collateralized by various U.S. Treasuries, 0.000% - 2.750%, 03/07/19 - 09/09/49, totaling $469,852) | | $ | 460,639 | | | | 460,639 | |
Nomura Securities International, Inc., dated 10/31/18, due 11/01/18, 2.210% total to be received $1,000,061 (collateralized by various U.S. Government Agency Obligations and U.S. Treasuries, 0.000% - 9.500%, 11/08/18 -09/20/68, totaling $1,020,000) | | | 1,000,000 | | | | 1,000,000 | |
| | | | | | | | |
| | | Principal
Amount | | | Value | |
RBC Dominion Securities, Inc. dated 10/31/18, due 11/01/18, 2.220% total to be received $1,000,062 (collateralized by various U.S. Government Agency Obligations and U.S. Treasuries, 0.000% - 7.000%, 11/29/18 -09/09/49, totaling $1,020,000) | | $ | 1,000,000 | | | $ | 1,000,000 | |
Total Joint Repurchase Agreements | | | | | | | 2,460,639 | |
| | |
| | | Shares | | | | |
Other Investment Companies - 1.2% | | | | | | | | |
Dreyfus Government Cash Management Fund, Institutional Class Shares, 2.05%3 | | | 137,402 | | | | 137,402 | |
Dreyfus Institutional Preferred Government Money Market Fund, Institutional Class Shares, 2.12%3 | | | 137,403 | | | | 137,403 | |
JPMorgan U.S. Government Money Market Fund, IM Shares, 2.09%3 | | | 141,566 | | | | 141,566 | |
Total Other Investment Companies | | | | | | | 416,371 | |
Total Short-Term Investments
(Cost $2,877,010) | | | | | | | 2,877,010 | |
Total Investments - 107.5%
(Cost $30,912,992) | | | | | | | 36,862,060 | |
Other Assets, less Liabilities - (7.5)% | | | | | | | (2,564,477 | ) |
Net Assets - 100.0% | | | | | | $ | 34,297,583 | |
| * | Non-income producing security. |
| 1 | Some or all of these securities, amounting to $5,928,787 or 17.3% of net assets, were out on loan to various brokers and are collateralized by cash and various U.S. Treasury Obligations. See Note 4 of Notes to Financial Statements. |
| 2 | Cash collateral received from brokers for securities lending was invested in these joint repurchase agreements. |
| 3 | Yield shown represents the October 31, 2018, seven day average yield, which refers to the sum of the previous seven days’ dividends paid, expressed as an annual percentage. |
ADR American Depositary Receipt
REIT Real Estate Investment Trust
The following table summarizes the inputs used to value the Fund’s investments by the fair value hierarchy levels as of October 31, 2018:
| | | | | | | | | | | | | | | | |
| | | Level 1 | | | Level 2 | | | Level 3 | | | Total | |
Investments in Securities | | | | | | | | | | | | | | | | |
Common Stocks† | | $ | 33,985,050 | | | | — | | | | — | | | $ | 33,985,050 | |
Short-Term Investments | | | | | | | | | | | | | | | | |
Joint Repurchase Agreements | | | — | | | $ | 2,460,639 | | | | — | | | | 2,460,639 | |
Other Investment Companies | | | 416,371 | | | | — | | | | — | | | | 416,371 | |
| | | | | | | | | | | | | | | | |
Total Investments in Securities | | $ | 34,401,421 | | | $ | 2,460,639 | | | | — | | | $ | 36,862,060 | |
| | | | | | | | | | | | | | | | |
| † | All common stocks held in the Fund are Level 1 securities. For a detailed breakout of common stocks by major industry classification, please refer to the Fund’s Schedule of Portfolio Investments. |
As of October 31, 2018, the Fund had no transfers between levels from the beginning of the reporting period.
The accompanying notes are an integral part of these financial statements.
64
| | |
| AMG Managers DoubleLine Core Plus Bond Fund | | |
| Portfolio Manager’s Comments (unaudited) | | |
OVERVIEW
For the fiscal year ended October 31, 2018, the AMG Managers DoubleLine Core Plus Bond Fund (the “Fund”) Class N shares returned (1.33)%, while the Bloomberg Barclays U.S. Aggregate Bond Index returned (2.05)%.
MARKET REVIEW AND OUTLOOK
At the beginning of 2018, DoubleLine acknowledged that global equities were at elevated valuations, credit spreads were near cycle tights, and government bonds were relatively unattractive. Confirming these relative valuations were (amongst other items) leading economic indicators signaling an expanding domestic economy, along with sentiment and confidence measures at multi-cycle highs for CEOs, consumers, homebuilders, and small businesses. Depressed levels of both implied forward-looking and realized volatility raised questions about exactly how much further risk markets could run. With a combination of increased growth expectations, rising but contained inflation, increased deficit spending, and the U.S. Federal Reserve (the Fed) making overtures and actions toward tighter monetary policy, we expected higher U.S. Treasury (UST) rates to follow. This did indeed happen, with the 10-year Treasury note’s yield beginning 2018 at 2.41% and closing at 3.14% on October 31, 2018.
One of the major stories continuing to play out across financial markets is a shifting of global monetary policies. Heading into 2018, this situation was diverging with the Fed embarking on a tightening regime while other major world economies were still employing easing measures. Since the beginning of the year, the European Central Bank (ECB), Bank of England (BoE), and Bank of Japan (BoJ) have all begun to employ or suggest tightening stances, albeit at a slower pace than the Fed. This relative central bank policy convergence—at least in sentiment—has been perhaps surprisingly contemporaneous with both increased risk-market volatility and a rally in the U.S. Dollar (USD). This strength suggests that while the U.S. economy continues to generate meaningful levels of inflation close to the Fed’s stated policy target along with steady gross domestic policy (GDP) growth, the Fed will likely continue pursuing its
projected hiking path. U.S. economic growth has outshined most of the developed world as the benefits from domestic fiscal stimulus continue to percolate through the economy. Meanwhile, economic momentum for other developed and emerging countries continued to decelerate, as seen in regional economic momentum measures. The other story that continues to cast a shadow across global markets is the ongoing trade tensions between the U.S. and China. The Trump administration moved forward with 10% tariffs on an additional $200 billion of Chinese imports after the initial 25% tariffs on $50 billion, while maintaining the threat of additional tariffs.
Going forward, we believe we have reached an inflection point for U.S. government bonds, which could lead to an acceleration of higher global bond yields. The technical backdrop for bonds is poor, as the Fed will likely continue to reduce its balance sheet over the coming months simultaneous with demand for U.S. Treasuries from Japanese and European investors declining as hedging costs remain high. At the same time, the supply of UST is projected to markedly increase as the U.S. budget deficit grows. Rising UST yields are a headwind for U.S. corporate credit given relatively long duration and the prospect of rolling over debt into a higher rate regime. Layer on higher spreads which materialized near the end of this period and corporate treasurers probably share our hesitance. Within credit we prefer floating-rate debt, which should outperform as the Fed continues to hike rates. We also continue to like securitized credit, which typically performs better in a rising rate environment as amortizing principal can be reinvested at higher yields. Over the long term, we believe the USD will depreciate. Among other factors, this is based on the view that the USD being the reserve currency of choice has allowed the U.S. to comfortably run both current account and budget deficits. But as the budget deficit grows and the U.S becomes less involved in global trade, foreigners will likely start to diversify away from U.S. Dollars, and at least the premise will begin to be questioned more closely.
In conclusion, while our internal models do not forecast a recession in the short term, we continue to monitor for signals that would update this view. Consistent with the belief that we are in the late
stages of the credit cycle and see upward yield pressures, we remain defensive toward both interest and credit risk.
PERFORMANCE AND POSITIONING
The Fund outperformed the Bloomberg Barclays U.S. Aggregate Bond Index’s return of (2.05)% over the trailing 12-month period ending October 31, 2018. The outperformance can largely be attributed to a combination of maintaining a duration that averaged 1.3 years shorter than the benchmark index as well as strong performance from collateralized loan obligations (CLOs), bank loans, and commercial mortgage-backed securities (CMBS). The floating-rate structures of CLOs and bank loans resulted in these securities benefiting from short rates that rose in line with the Federal Reserve’s hiking cycle and occurred alongside a stable economy. CMBS holdings provided a balance of lower fixed-rate interest rate risk and higher expected yield relative to the overall benchmark. Spreads within the securitized space were generally flat to tighter on the year, helping offset losses due to interest rate sensitivity. In response to our outlook with regard to rate hikes from the Fed, the targeted allocation to bank loans doubled year-over-year. At fiscal year-end, DoubleLine was targeting a combined 9.5% between these two sectors (CLOs and bank loans). As the year exhibited a positive attitude toward risk assets, the sectors that detracted from performance included global sovereign bonds, investment grade credit, and U.S. Treasuries. While on the more conservative end of the risk/reward spectrum within the bond market, all three of these sectors maintain longer durations with relatively little compensating yield. As the 10-year UST proceeded to rise by 76bps (.76%) over this measurement period, these sectors experienced price losses that more than offset their interest carry. The Fund trimmed fixed-rate corporate credit sectors over the course of the year. As DoubleLine continues to have a view toward higher rates while also believing we are in the late stages of the credit cycle, it is likely the Fund continues to be defensively positioned with respect to both these types of risk.
The views expressed represent the opinions of DoubleLine Capital LP, as of October 31, 2018, and are not intended as a forecast or guarantee of future results and are subject to change without notice.
65
AMG Managers DoubleLine Core Plus Bond Fund
Portfolio Manager’s Comments (continued)
CUMULATIVE TOTAL RETURN PERFORMANCE
AMG Managers Doubleline Core Plus Bond Fund’s cumulative total return is based on the daily change in net asset value (NAV), and assumes that all dividends and distributions were reinvested. The graph compares a hypothetical $10,000 investment made in the AMG Managers Doubleline Core Plus Bond Fund’s Class N shares on July 18, 2011, to a $10,000 investment made in the Bloomberg Barclays U.S. Aggregate Bond Index for the same time period. The graph and table do not reflect the deduction of taxes that a shareholder would pay on a Fund distribution or redemption of shares. The listed returns for the Fund are net of expenses and the returns for the index exclude expenses. Total returns would have been lower had certain expenses not been reduced.
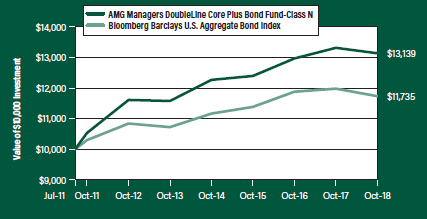
The table below shows the average annual total returns for the AMG Managers Doubleline Core Plus Bond Fund, the Bloomberg Barclays U.S. Aggregate Bond Index for the same time periods ended October 31, 2018.
| | | | | | | | | | | | | | | | |
| | | One | | | Five | | | Since | | | Inception | |
| Average Annual Total Returns1 | | Year | | | Years | | | Inception | | | Date | |
AMG Managers DoubleLine Core Plus Bond Fund2, 3, 4, 5, 6, 7, 8, 9, 10 | | | | | | | | | | | | | | | | |
Class N | | | (1.33 | %) | | | 2.56 | % | | | 3.82 | % | | | 07/18/11 | |
Class I | | | (0.98 | %) | | | 2.82 | % | | | 4.08 | % | | | 07/18/11 | |
Class Z | | | (0.91 | %) | | | — | | | | (0.69 | %) | | | 09/29/17 | |
Bloomberg Barclays U.S. Aggregate Bond Index11 | | | (2.05 | %) | | | 1.83 | % | | | 2.22 | % | | | 07/18/11 | † |
The performance data shown represents past performance. Past performance is not a guarantee of future results. Current performance may be lower or higher than the performance data quoted. The investment return and principal value of an investment will fluctuate so that an investor’s shares, when redeemed, may be worth more or less than their original cost.
Investors should carefully consider the Fund’s investment objectives, risks, charges and expenses before investing. For performance information through the most recent month end, current net asset values per share for the Fund and other information, please call 800.835.3879 or visit our website at amgfunds.com for a free prospectus. Read it carefully before investing or sending money.
Distributed by AMG Distributors, Inc., member FINRA/SIPC.
| † | Date reflects the inception date of the Fund, not the index. |
| 1 | Total return equals income yield plus share price change and assumes reinvestment of all dividends and capital gain distributions. Returns are net of fees and may reflect offsets of Fund expenses as described in the prospectus. No adjustment has been made for taxes payable by shareholders on their reinvested dividends and |
| | capital gain distributions. Returns for periods greater than one year are annualized. The listed returns on the Fund are net of expenses and based on the published NAV as of October 31, 2018. All returns are in U.S. dollars ($). |
| 2 | The Fund is subject to the risks associated with investments in debt securities, such as default risk and fluctuations in the perception of the debtor’s ability to pay its creditors. Changing interest rates may adversely affect the value of an investment. An increase in interest rates typically causes the value of bonds and other fixed income securities to fall. |
| 3 | Investments in international securities are subject to certain risks of overseas investing including currency fluctuations and changes in political and economic conditions, which could result in significant market fluctuations. These risks are magnified in emerging markets. |
| 4 | The Fund is subject to the risks associated with investments in emerging markets, such as erratic earnings patterns, economic and political instability, changing exchange controls, limitations on repatriation of foreign capital and changes in local governmental attitudes toward private investment, possibly leading to nationalization or confiscation of investor assets. |
| 5 | To the extent that the Fund invests in asset-backed or mortgage-backed securities, its exposure to prepayment and extension risks may be greater than investments in other fixed income securities. |
| 6 | The Fund may invest in derivatives, such as options and futures; the complexity and rapidly changing structure of derivatives markets may increase the possibility of market losses. |
| 7 | Bank loans are subject to the credit risk of nonpayment of principal or interest. |
| 8 | High-yield bonds (also known as “junk bonds”) may be subject to greater levels of interest rate, credit, and liquidity risk than investments in higher rated securities. These securities are considered predominantly speculative with respect to the issuer’s continuing ability to make principal and interest payments. The issuers of the Fund’s holdings may be involved in bankruptcy proceedings, reorganizations, or financial restructurings, and are not as strong financially as higher rated issuers. |
| 9 | Factors unique to the municipal bond market may negatively affect the value in municipal bonds. |
66
| | |
| AMG Managers DoubleLine Core Plus Bond Fund | | |
| Portfolio Manager’s Comments (continued) | | |
| 10 | Obligations of certain government agencies are not backed by the full faith and credit of the U.S. government. If one of these agencies defaulted on a loan, there is no guarantee that the U.S. government would provide financial support. Additionally, debt securities of the U.S. government may be affected by changing interest rates and subject to prepayment risk. |
| 11 | The Bloomberg Barclays U.S. Aggregate Bond Index is an index of the U.S. investment-grade fixed-rate bond market, including both government and corporate bonds. Unlike the Fund, the Bloomberg Barclays U.S. Aggregate Bond Index is unmanaged, is not available for investment and does not incur expenses. |
Not FDIC insured, nor bank guaranteed. May lose value.
67
| | |
| AMG Managers DoubleLine Core Plus Bond Fund | | |
| Fund Snapshots (unaudited) | | |
| October 31, 2018 | | |
PORTFOLIO BREAKDOWN
| | | | |
Category | | % of
Net Assets | |
U.S. Government and Agency Obligations | | | 32.5 | |
Corporate Bonds and Notes | | | 27.5 | |
Mortgage-Backed Securities | | | 16.7 | |
Asset-Backed Securities | | | 10.1 | |
Floating Rate Senior Loan Interests | | | 4.3 | |
Investment Companies | | | 3.5 | |
Foreign Government Obligations | | | 1.9 | |
Municipal Bonds | | | 0.1 | |
Common Stocks1 | | | 0.0 | |
Short-Term Investments2 | | | 4.6 | |
Other Assets Less Liabilities3, 4 | | | (1.2 | ) |
| 2 | Includes reinvestment of cash collateral into joint repurchase agreements on security lending transactions. |
| 3 | Includes repayment of cash collateral on security lending transactions. |
| 4 | Includes payable for delayed delivery securities. |
| | | | |
Rating | | % of Market Value1 | |
U.S. Government and Agency Obligations | | | 34.9 | |
Aaa | | | 2.8 | |
Aa | | | 2.2 | |
A | | | 7.7 | |
Baa | | | 19.7 | |
Ba | | | 7.7 | |
B | | | 8.4 | |
Caa & lower | | | 5.8 | |
N/R | | | 10.8 | |
| 1 | Includes market value of fixed-income securities only. |
| | | | |
TOP TEN HOLDINGS | | | | |
Security Name | | % of
Net Assets | |
DoubleLine Global Bond Fund, Class I | | | 3.5 | |
Fannie Mae, 3.500%, 03/01/46 | | | 1.4 | |
U.S. Treasury Notes, 2.250%, 10/31/24 | | | 1.1 | |
Fannie Mae REMICS, Series 2013-5, Class EZ, 2.000%, 08/25/42 | | | 1.1 | |
Lehman XS Trust, Series 2007-12N, Class 1A3A, 2.481%, 07/25/47 | | | 1.0 | |
U.S. Treasury Notes, 2.250%, 08/15/27 | | | 1.0 | |
U.S. Treasury Notes, 1.625%, 11/30/20 | | | 1.0 | |
RALI Trust, Series 2006-QO10, Class A1, 2.441%, 01/25/37 | | | 1.0 | |
U.S. Treasury Notes, 1.125%, 06/30/21 | | | 1.0 | |
U.S. Treasury Notes, 2.125%, 09/30/24 | | | 1.0 | |
| | | | |
Top Ten as a Group | | | 13.1 | |
| | | | |
Credit quality ratings shown above reflect the highest rating assigned by either Standard & Poor’s (“S&P”) or Moody’s Investors Service, Inc. (“Moody’s”). These rating agencies are independent, nationally recognized statistical rating organizations and are widely used. Investment grade ratings are credit ratings of BBB/Baa or higher. Below investment grade ratings are credit ratings of BB/Ba or lower. Investments designated N/R are not rated by either rating agency. Unrated investments do not necessarily indicate low credit quality. Credit quality ratings are subject to change.
Because a fund’s strategy may result in multiple investments in particular sectors of the economy, its performance may depend on the performance of those sectors and may fluctuate more widely than investments diversified across more sectors. For additional information on these and other risk considerations, please see the Fund’s prospectus.
Any sectors, industries, or securities discussed should not be perceived as investment recommendations. Mention of a specific security should not be considered a recommendation to buy or solicitation to sell that security. Specific securities mentioned in this report may have been sold from the Fund’s portfolio of investments by the time you receive this report.
68
| | |
| AMG Managers DoubleLine Core Plus Bond Fund | | |
| Schedule of Portfolio Investments | | |
| October 31, 2018 | | |
| | | | | | | | |
| | | Principal
Amount | | | Value | |
Corporate Bonds and Notes - 27.5% | | | | | | | | |
Financials - 8.3% | | | | | | | | |
A.S.P AMC Merger Sub, Inc.
8.000%, 05/15/251 | | $ | 305,000 | | | $ | 230,275 | |
AerCap Ireland Capital DAC/AerCap Global Aviation Trust (Ireland)
3.500%, 01/15/25 | | | 485,000 | | | | 452,805 | |
Air Lease Corp.
3.750%, 02/01/22 | | | 430,000 | | | | 427,907 | |
2.750%, 01/15/23 | | | 70,000 | | | | 66,282 | |
Alexandria Real Estate Equities, Inc.
4.000%, 01/15/24 | | | 365,000 | | | | 364,832 | |
Alliant Holdings Intermediate LLC
8.250%, 08/01/231 | | | 175,000 | | | | 181,323 | |
Ally Financial, Inc.
4.125%, 03/30/20 | | | 545,000 | | | | 545,681 | |
American Express Co.
2.500%, 08/01/22 | | | 990,000 | | | | 947,119 | |
American Tower Corp.
4.400%, 02/15/26 | | | 1,300,000 | | | | 1,290,211 | |
3.600%, 01/15/28 | | | 525,000 | | | | 484,439 | |
AssuredPartners, Inc.
7.000%, 08/15/251 | | | 165,000 | | | | 163,144 | |
Athene Global Funding
3.000%, 07/01/221 | | | 485,000 | | | | 469,597 | |
AXA Equitable Holdings, Inc.
3.900%, 04/20/231 | | | 465,000 | | | | 459,994 | |
Banco Bilbao Vizcaya Argentaria Colombia SA
(Colombia)
4.875%, 04/21/25 | | | 300,000 | | | | 294,753 | |
Banco BTG Pactual SA/Cayman Islands (Cayman Islands)
5.500%, 01/31/23 | | | 300,000 | | | | 290,816 | |
Banco BTG Pactual SA/Luxembourg
(Luxembourg)
8.750%, 07/31/292,3 | | | 200,000 | | | | 204,500 | |
Banco de Credito e Inversiones (Chile)
4.000%, 02/11/23 | | | 700,000 | | | | 697,282 | |
Banco de Reservas de la Republica Dominicana (Dominican Republic)
7.000%, 02/01/231 | | | 300,000 | | | | 304,875 | |
7.000%, 02/01/23 | | | 200,000 | | | | 203,250 | |
Banco do Brasil SA/Cayman (Cayman Islands)
6.250%, 12/06/322,3,4 | | | 1,800,000 | | | | 1,559,115 | |
Banco Internacional del Peru SAA
Interbank (Peru)
(3 Month LIBOR + 6.740%)
8.500%, 04/23/703 | | | 500,000 | | | | 529,380 | |
Banco Macro S.A. (Argentina)
6.750%, 11/04/263 | | | 800,000 | | | | 662,000 | |
| | | | | | | | |
| | | Principal
Amount | | | Value | |
Banco Mercantil del Norte SA/Grand Cayman (Cayman Islands)
6.875%, 09/21/242,3 | | $ | 200,000 | | | $ | 197,452 | |
7.625%, 09/21/242,3 | | | 600,000 | | | | 589,506 | |
5.750%, 10/04/313 | | | 400,000 | | | | 367,504 | |
Banco Santander Chile (Chile)
3.875%, 09/20/22 | | | 150,000 | | | | 149,248 | |
Banco Santander Mexico, S.A. Institucion de Banca Multiple Grupo Financiero Santand (Mexico)
5.950%, 10/01/281,3 | | | 550,000 | | | | 551,776 | |
Banco Santander, S.A. (Spain)
(3 month LIBOR + 1.090%)
3.400%, 02/23/235 | | | 600,000 | | | | 600,778 | |
Bancolombia SA (Colombia)
4.875%, 10/18/273,4 | | | 600,000 | | | | 578,880 | |
Banistmo, S.A. (Panama)
3.650%, 09/19/221 | | | 200,000 | | | | 190,250 | |
Bank of Montreal (Canada)
3.803%, 12/15/323 | | | 375,000 | | | | 344,183 | |
Bantrab Senior Trust (Cayman Islands)
9.000%, 11/14/20 | | | 150,000 | | | | 151,502 | |
Barclays PLC (United Kingdom)
(3 month LIBOR + 1.380%)
3.695%, 05/16/245 | | | 440,000 | | | | 436,593 | |
BBVA Banco Continental, S.A. (Peru)
5.000%, 08/26/22 | | | 300,000 | | | | 306,828 | |
BBVA Bancomer SA/Texas
5.350%, 11/12/293 | | | 400,000 | | | | 381,252 | |
5.125%, 01/18/333 | | | 1,300,000 | | | | 1,151,813 | |
BDO Unibank, Inc., EMTN (Philippines)
2.625%, 10/24/21 | | | 300,000 | | | | 289,068 | |
2.950%, 03/06/23 | | | 2,050,000 | | | | 1,933,019 | |
BNP Paribas S.A. (France)
3.375%, 01/09/251 | | | 620,000 | | | | 582,189 | |
BOC Aviation, Ltd. (Singapore)
(3 month LIBOR + 1.125%)
3.499%, 09/26/231,5 | | | 500,000 | | | | 500,960 | |
Boston Properties LP
4.125%, 05/15/21 | | | 486,000 | | | | 492,761 | |
Brighthouse Financial Inc.
3.700%, 06/22/27 | | | 515,000 | | | | 444,619 | |
Capital One Financial Corp.
(3 month LIBOR + 0.720%)
3.240%, 01/30/235 | | | 120,000 | | | | 119,019 | |
The Charles Schwab Corp.
3.550%, 02/01/24 | | | 485,000 | | | | 482,210 | |
Citigroup, Inc.
(3 month LIBOR + 1.100%)
3.412%, 05/17/245 | | | 715,000 | | | | 719,723 | |
Credit Agricole SA/London (United Kingdom)
3.750%, 04/24/231 | | | 545,000 | | | | 533,027 | |
The accompanying notes are an integral part of these financial statements.
69
| | |
| AMG Managers DoubleLine Core Plus Bond Fund | | |
| Schedule of Portfolio Investments (continued) | | |
| | | | | | | | |
| | | Principal
Amount | | | Value | |
Financials - 8.3% (continued) | | | | | | | | |
Credit Suisse Group AG (Switzerland)
(3 month LIBOR + 1.240%)
3.574%, 06/12/241,5 | | $ | 680,000 | | | $ | 681,803 | |
Credito Real SAB de CV SOFOM ER (Mexico)
9.125%, 01/15/282,3 | | | 400,000 | | | | 394,404 | |
Crown Castle International Corp.
3.700%, 06/15/26 | | | 600,000 | | | | 567,759 | |
4.000%, 03/01/27 | | | 775,000 | | | | 740,906 | |
3.650%, 09/01/27 | | | 510,000 | | | | 472,562 | |
DBS Group Holdings, Ltd., GMTN (Singapore)
3.600%, 07/27/262,3 | | | 1,379,000 | | | | 1,327,632 | |
Discover Financial Services
4.100%, 02/09/27 | | | 610,000 | | | | 576,085 | |
Global Bank Corp. (Panama)
5.125%, 10/30/194 | | | 800,000 | | | | 809,960 | |
4.500%, 10/20/214 | | | 900,000 | | | | 893,790 | |
The Goldman Sachs Group, Inc.
(3 month LIBOR + 0.780%), 3.307%, 10/31/225 | | | 245,000 | | | | 245,956 | |
(3 month LIBOR + 1.170%), 3.484%, 05/15/265 | | | 360,000 | | | | 359,168 | |
HSBC Holdings PLC (United Kingdom)
(3 month LIBOR + 1.380%)
3.714%, 09/12/265 | | | 750,000 | | | | 755,681 | |
Icahn Enterprises, LP/Icahn Enterprises
Finance Corp.
6.375%, 12/15/25 | | | 240,000 | | | | 239,100 | |
Industrial Senior Trust (Cayman Islands)
5.500%, 11/01/22 | | | 500,000 | | | | 489,380 | |
Interoceanica IV Finance, Ltd. (Cayman Islands)
0.000%, 11/30/256 | | | 1,505,475 | | | | 1,294,392 | |
Itau Unibanco Holding SA/Cayman Island (Cayman Islands)
6.500%, 10/01/232,3,4 | | | 1,000,000 | | | | 974,700 | |
Liberty Mutual Group, Inc.
6.500%, 05/01/421 | | | 609,000 | | | | 711,828 | |
Lloyds Banking Group PLC (United Kingdom)
(3 Month LIBOR + 1.205%)
3.574%, 11/07/285 | | | 630,000 | | | | 567,440 | |
Macquarie Group, Ltd. (Australia)
(3 Month LIBOR + 1.023%),
3.189%, 11/28/231,5 | | | 185,000 | | | | 176,671 | |
(3 Month LIBOR + 1.330%),
4.150%, 03/27/241,4,5 | | | 295,000 | | | | 292,505 | |
Malayan Banking Bhd (Malaysia)
3.905%, 10/29/263 | | | 1,800,000 | | | | 1,776,096 | |
MGM Growth Properties Operating
Partnership LP/MGP Finance Co-Issuer, Inc.
4.500%, 01/15/28 | | | 180,000 | | | | 162,000 | |
Mitsubishi UFJ Financial Group, Inc. (Japan)
(3 month LIBOR + 0.740%)
3.061%, 03/02/235 | | | 470,000 | | | | 470,434 | |
| | | | | | | | |
| | | Principal
Amount | | | Value | |
Morgan Stanley
(3 Month LIBOR + 1.340%)
3.591%, 07/22/285 | | $ | 485,000 | | | $ | 454,805 | |
MPT Operating Partnership LP/MPT
Finance Corp.
5.250%, 08/01/26 | | | 5,000 | | | | 4,850 | |
5.000%, 10/15/27 | | | 205,000 | | | | 193,151 | |
Nationstar Mortgage Holdings Inc.
8.125%, 07/15/231 | | | 135,000 | | | | 137,700 | |
Navient Corp.
6.500%, 06/15/22 | | | 190,000 | | | | 193,563 | |
NFP Corp.
6.875%, 07/15/251 | | | 200,000 | | | | 194,500 | |
Royal Bank of Scotland Group PLC
(United Kingdom)
(3 Month LIBOR + 1.480%)
3.498%, 05/15/235 | | | 285,000 | | | | 274,345 | |
S.P.A.RC EM SPC Panama Metro Line 2 SP (Cayman Islands)
0.000%, 12/05/226 | | | 1,400,000 | | | | 1,270,514 | |
Springleaf Finance Corp.
6.875%, 03/15/25 | | | 165,000 | | | | 158,400 | |
Sprint Capital Corp.
6.875%, 11/15/28 | | | 155,000 | | | | 152,675 | |
Sumitomo Mitsui Financial Group, Inc. (Japan)
(3 month LIBOR + 0.740%)
3.189%, 01/17/235 | | | 735,000 | | | | 735,387 | |
SURA Asset Management SA (Curaçao)
4.875%, 04/17/24 | | | 200,000 | | | | 198,200 | |
Synchrony Financial
3.950%, 12/01/27 | | | 55,000 | | | | 48,586 | |
Tempo Acquisition LLC/Tempo Acquisition
Finance Corp.
6.750%, 06/01/251 | | | 170,000 | | | | 162,299 | |
TerraForm Power Operating LLC
4.250%, 01/31/231 | | | 155,000 | | | | 147,250 | |
Unifin Financiera SAB de CV (Mexico)
8.875%, 10/01/232,3 | | | 1,200,000 | | | | 1,106,412 | |
Union Bank of the Philippines, EMTN
(Philippines)
3.369%, 11/29/22 | | | 500,000 | | | | 476,469 | |
United Overseas Bank, Ltd., EMTN (Singapore)
3.500%, 09/16/263 | | | 1,500,000 | | | | 1,478,040 | |
3.875%, 01/20/272,3 | | | 600,000 | | | | 557,977 | |
Welltower, Inc.
3.950%, 09/01/234 | | | 485,000 | | | | 484,386 | |
Westpac Banking Corp. (Australia)
(3 month LIBOR + 0.720%)
3.034%, 05/15/235 | | | 750,000 | | | | 752,087 | |
Willis North America, Inc.
4.500%, 09/15/28 | | | 495,000 | | | | 490,937 | |
Total Financials | | | | | | | 47,576,525 | |
The accompanying notes are an integral part of these financial statements.
70
| | |
| AMG Managers DoubleLine Core Plus Bond Fund | | |
| Schedule of Portfolio Investments (continued) | | |
| | | | | | | | |
| | | Principal
Amount | | | Value | |
Industrials - 16.2% | | | | | | | | |
AbbVie, Inc.
4.700%, 05/14/45 | | $ | 518,000 | | | $ | 470,002 | |
Adani Ports & Special Economic Zone, Ltd. (India)
3.950%, 01/19/22 | | | 700,000 | | | | 685,047 | |
Aeropuerto Internacional de Tocumen SA (Panama)
5.750%, 10/09/23 | | | 1,650,308 | | | | 1,691,565 | |
Ajecorp BV (Netherlands)
6.500%, 05/14/22 | | | 200,000 | | | | 152,500 | |
AK Steel Corp.
6.375%, 10/15/254 | | | 125,000 | | | | 111,875 | |
Albertsons Cos LLC/Safeway, Inc./New
Albertson’s, Inc./Albertson’s LLC
5.750%, 03/15/25 | | | 215,000 | | | | 190,275 | |
Alibaba Group Holding, Ltd. (China)
2.800%, 06/06/23 | | | 200,000 | | | | 191,642 | |
Altice US Finance I Corp.
5.375%, 07/15/231 | | | 200,000 | | | | 200,462 | |
American Axle & Manufacturing, Inc.
6.250%, 03/15/26 | | | 190,000 | | | | 180,025 | |
Anglo American Capital PLC (United Kingdom)
4.500%, 03/15/281 | | | 615,000 | | | | 581,083 | |
Anheuser-Busch InBev Finance, Inc.
4.900%, 02/01/46 | | | 140,000 | | | | 132,684 | |
Anheuser-Busch InBev Worldwide, Inc.
4.600%, 04/15/48 | | | 385,000 | | | | 347,945 | |
Apache Corp.
4.375%, 10/15/28 | | | 255,000 | | | | 245,018 | |
APT Pipelines, Ltd. (Australia)
4.250%, 07/15/271 | | | 1,000,000 | | | | 961,660 | |
Ardagh Packaging Finance PLC/Ardagh Holdings
USA, Inc. (Ireland)
6.000%, 02/15/251 | | | 200,000 | | | | 188,000 | |
Arrow Electronics, Inc.
3.875%, 01/12/28 | | | 245,000 | | | | 224,072 | |
Ascend Learning LLC
6.875%, 08/01/251 | | | 290,000 | | | | 289,275 | |
AstraZeneca PLC (United Kingdom)
2.375%, 06/12/22 | | | 525,000 | | | | 501,063 | |
AT&T, Inc.
5.250%, 03/01/37 | | | 735,000 | | | | 705,086 | |
Avantor, Inc.
9.000%, 10/01/251 | | | 175,000 | | | | 177,187 | |
Avolon Holdings Funding, Ltd. (Ireland)
5.125%, 10/01/231 | | | 90,000 | | | | 88,538 | |
B&G Foods, Inc.
5.250%, 04/01/254 | | | 175,000 | | | | 167,344 | |
Banff Merger Sub, Inc.
9.750%, 09/01/261 | | | 35,000 | | | | 33,906 | |
| | | | | | | | |
| | | Principal
Amount | | | Value | |
BAT Capital Corp.
(3 month LIBOR + 0.880%)
3.194%, 08/15/221,5 | | $ | 110,000 | | | $ | 110,557 | |
Bausch Health Cos., Inc.
7.000%, 03/15/241 | | | 90,000 | | | | 94,472 | |
9.250%, 04/01/261 | | | 160,000 | | | | 168,200 | |
8.500%, 01/31/271,4 | | | 50,000 | | | | 51,000 | |
Beacon Escrow Corp.
4.875%, 11/01/251 | | | 180,000 | | | | 162,450 | |
Becton Dickinson and Co.
2.894%, 06/06/22 | | | 780,000 | | | | 753,837 | |
Bharat Petroleum Corp., Ltd. (India)
4.625%, 10/25/22 | | | 200,000 | | | | 199,696 | |
Bharti Airtel International Netherlands BV
(Netherlands)
Series REGs
5.125%, 03/11/23 | | | 1,300,000 | | | | 1,263,852 | |
Bharti Airtel, Ltd. (India)
4.375%, 06/10/254 | | | 1,200,000 | | | | 1,079,413 | |
BlueLine Rental Finance Corp.
9.250%, 03/15/241 | | | 180,000 | | | | 188,100 | |
Boyne USA, Inc.
7.250%, 05/01/251 | | | 190,000 | | | | 199,025 | |
BPRL International Singapore Pte, Ltd., EMTN (Singapore)
4.375%, 01/18/27 | | | 1,500,000 | | | | 1,385,422 | |
Braskem Finance, Ltd. (Cayman Islands)
6.450%, 02/03/24 | | | 200,000 | | | | 210,800 | |
Builders FirstSource, Inc.
5.625%, 09/01/241 | | | 191,000 | | | | 178,824 | |
Burlington Northern Santa Fe LLC
4.550%, 09/01/44 | | | 470,000 | | | | 472,149 | |
C&W Senior Financing DAC (Ireland)
7.500%, 10/15/261 | | | 500,000 | | | | 502,500 | |
6.875%, 09/15/27 | | | 1,500,000 | | | | 1,436,250 | |
Camelot Finance, S.A. (Luxembourg)
7.875%, 10/15/241 | | | 120,000 | | | | 119,100 | |
Camposol S.A. (Peru)
10.500%, 07/15/211 | | | 200,000 | | | | 209,500 | |
Canacol Energy, Ltd. (Canada)
7.250%, 05/03/251 | | | 200,000 | | | | 192,750 | |
7.250%, 05/03/25 | | | 1,300,000 | | | | 1,252,875 | |
CB Escrow Corp.
8.000%, 10/15/251 | | | 145,000 | | | | 132,675 | |
CCO Holdings LLC/CCO Holdings Capital Corp.
5.750%, 02/15/261 | | | 145,000 | | | | 143,913 | |
5.000%, 02/01/281 | | | 170,000 | | | | 159,163 | |
CDK Global Inc.
5.875%, 06/15/26 | | | 75,000 | | | | 75,656 | |
Celgene Corp.
4.350%, 11/15/47 | | | 555,000 | | | | 464,597 | |
The accompanying notes are an integral part of these financial statements.
71
| | |
| AMG Managers DoubleLine Core Plus Bond Fund | | |
| Schedule of Portfolio Investments (continued) | | |
| | | | | | | | |
| | | Principal
Amount | | | Value | |
Industrials - 16.2% (continued) | | | | | | | | |
Celulosa Arauco y Constitucion, S.A. (Chile)
4.750%, 01/11/22 | | $ | 200,000 | | | $ | 202,750 | |
Cemex SAB de CV (Mexico)
7.750%, 04/16/26 | | | 200,000 | | | | 211,500 | |
Cengage Learning, Inc.
9.500%, 06/15/241,4 | | | 130,000 | | | | 112,288 | |
Centene Corp.
4.750%, 01/15/25 | | | 175,000 | | | | 173,287 | |
5.375%, 06/01/261 | | | 30,000 | | | | 30,525 | |
Charter Communications Operating LLC/Charter | | | | | | | | |
Communications Operating Capital
4.908%, 07/23/25 | | | 545,000 | | | | 549,615 | |
Cheniere Energy Partners LP
5.250%, 10/01/25 | | | 195,000 | | | | 191,831 | |
Cincinnati Bell, Inc.
7.000%, 07/15/241 | | | 35,000 | | | | 31,675 | |
CNOOC Finance 2012, Ltd. (Hong Kong)
3.875%, 05/02/22 | | | 400,000 | | | | 399,493 | |
CNOOC Finance 2015 USA LLC
3.750%, 05/02/23 | | | 590,000 | | | | 583,295 | |
CNX Midstream Partners LP/CNX Midstream
Finance Corp.
6.500%, 03/15/261 | | | 195,000 | | | | 190,612 | |
Colombia Telecomunicaciones SA ESP
(Colombia)
8.500%, 03/18/252,3 | | | 200,000 | | | | 206,400 | |
Comcast Corp.
3.950%, 10/15/25 | | | 495,000 | | | | 494,060 | |
Comunicaciones Celulares SA Via Comcel Trust (Cayman Islands)
6.875%, 02/06/24 | | | 500,000 | | | | 513,000 | |
Corning, Inc.
4.375%, 11/15/57 | | | 545,000 | | | | 444,739 | |
Cosan Overseas, Ltd. (Cayman Islands)
8.250%, 04/05/412 | | | 2,000,000 | | | | 2,032,500 | |
CRC Escrow Issuer LLC/CRC Finco, Inc.
5.250%, 10/15/251 | | | 115,000 | | | | 107,309 | |
Crown Americas LLC/Crown Americas Capital Corp. VI
4.750%, 02/01/261,4 | | | 110,000 | | | | 104,088 | |
CSC Holdings LLC
5.250%, 06/01/24 | | | 135,000 | | | | 130,444 | |
CSI Compressco, LP/CSI Compressco
Finance, Inc.
7.500%, 04/01/251 | | | 150,000 | | | | 151,125 | |
CSX Corp.
3.800%, 11/01/46 | | | 555,000 | | | | 480,187 | |
CVS Health Corp.
5.050%, 03/25/48 | | | 490,000 | | | | 479,475 | |
| | | | | | | | |
| | | Principal
Amount | | | Value | |
Daimler Finance North America LLC
(3 month LIBOR + 0.840%)
3.422%, 05/04/231,5 | | $ | 975,000 | | | $ | 978,554 | |
Dana Financing Luxembourg Sarl (Luxembourg)
5.750%, 04/15/251 | | | 155,000 | | | | 148,800 | |
Delek & Avner Tamar Bond, Ltd. (Israel)
5.082%, 12/30/231 | | | 100,000 | | | | 100,318 | |
Delek & Avner Tamar Bond, Ltd. (Israel)
5.412%, 12/30/251 | | | 300,000 | | | | 301,270 | |
Delta Air Lines, Inc.
3.800%, 04/19/23 | | | 500,000 | | | | 488,251 | |
Delta Merger Sub, Inc.
6.000%, 09/15/261,4 | | | 45,000 | | | | 44,269 | |
Digicel Group, Ltd. (Jamaica)
7.125%, 04/01/221 | | | 300,000 | | | | 188,250 | |
7.125%, 04/01/22 | | | 1,300,000 | | | | 817,388 | |
DISH DBS Corp.
5.875%, 11/15/24 | | | 25,000 | | | | 21,344 | |
DJO Finco Inc./DJO Finance LLC/DJO
Finance Corp.
8.125%, 06/15/211 | | | 160,000 | | | | 162,000 | |
Dollar Tree, Inc.
4.000%, 05/15/25 | | | 510,000 | | | | 490,760 | |
Embarq Corp.
7.995%, 06/01/36 | | | 125,000 | | | | 119,688 | |
Embotelladora Andina S.A. (Chile)
5.000%, 10/01/23 | | | 825,000 | | | | 852,377 | |
Empresa de Transporte de Pasajeros Metro S.A. (Chile)
5.000%, 01/25/471 | | | 1,150,000 | | | | 1,152,886 | |
ENA Norte Trust (Panama)
4.950%, 04/25/23 | | | 1,065,194 | | | | 1,061,210 | |
Enable Midstream Partners LP
4.400%, 03/15/27 | | | 525,000 | | | | 498,287 | |
Energy Transfer LP
4.750%, 01/15/26 | | | 400,000 | | | | 394,467 | |
4.200%, 04/15/27 | | | 30,000 | | | | 28,356 | |
Envision Healthcare Corp.
8.750%, 10/15/261,4 | | | 10,000 | | | | 9,725 | |
EP Energy LLC/Everest Acquisition Finance, Inc.
7.750%, 05/15/261 | | | 130,000 | | | | 129,797 | |
EQT Corp.
3.900%, 10/01/27 | | | 540,000 | | | | 492,305 | |
EQT Midstream Partners LP
Series 5Y
4.750%, 07/15/23 | | | 630,000 | | | | 635,930 | |
ESAL GmbH (American Samoa)
6.250%, 02/05/23 | | | 1,100,000 | | | | 1,084,875 | |
Expedia, Inc.
3.800%, 02/15/28 | | | 520,000 | | | | 470,602 | |
The accompanying notes are an integral part of these financial statements.
72
| | |
| AMG Managers DoubleLine Core Plus Bond Fund | | |
| Schedule of Portfolio Investments (continued) | | |
| | | | | | | | |
| | | Principal
Amount | | | Value | |
Industrials - 16.2% (continued) | | | | | | | | |
Exterran Energy Solutions, LP/EES Finance Corp
8.125%, 05/01/25 | | $ | 95,000 | | | $ | 95,950 | |
Extraction Oil & Gas, Inc.
5.625%, 02/01/261 | | | 90,000 | | | | 76,500 | |
FedEx Corp.
4.750%, 11/15/45 | | | 490,000 | | | | 466,973 | |
Fermaca Enterprises S de RL de CV (Mexico)
6.375%, 03/30/381 | | | 225,446 | | | | 230,914 | |
Fidelity National Information Services, Inc.
3.625%, 10/15/20 | | | 368,000 | | | | 368,886 | |
First Data Corp.
5.750%, 01/15/241 | | | 135,000 | | | | 136,350 | |
Flex Acquisition Co, Inc.
7.875%, 07/15/261 | | | 50,000 | | | | 48,390 | |
Ford Motor Co.
7.450%, 07/16/31 | | | 400,000 | | | | 422,339 | |
Foresight Energy LLC/Foresight Energy
Finance Corp.
11.500%, 04/01/231 | | | 180,000 | | | | 160,650 | |
Fresnillo PLC (Mexico)
5.500%, 11/13/23 | | | 400,000 | | | | 415,600 | |
Frontdoor, Inc.
6.750%, 08/15/261 | | | 85,000 | | | | 86,913 | |
Frontier Communications Corp.
8.500%, 04/15/20 | | | 80,000 | | | | 80,600 | |
8.500%, 04/01/261,4 | | | 90,000 | | | | 83,925 | |
FTS International, Inc.
6.250%, 05/01/22 | | | 117,000 | | | | 111,735 | |
General Motors Co.
(3 month LIBOR + 0.800%)
3.389%, 08/07/205 | | | 210,000 | | | | 210,450 | |
General Motors Financial Co, Inc.
(3 month LIBOR + 0.990%)
3.398%, 01/05/235 | | | 540,000 | | | | 535,453 | |
Genesys Telecommunications Laboratories Inc.
10.000%, 11/30/241 | | | 220,000 | | | | 239,250 | |
Geopark, Ltd. (Chile)
6.500%, 09/21/24 | | | 600,000 | | | | 599,250 | |
GLP Capital LP/GLP Financing II Inc.
5.750%, 06/01/28 | | | 335,000 | | | | 340,862 | |
GLP Capital, LP/GLP Financing II, Inc.
5.300%, 01/15/29 | | | 145,000 | | | | 143,006 | |
GNL Quintero SA (Chile)
4.634%, 07/31/29 | | | 250,000 | | | | 242,500 | |
Gohl Capital, Ltd. (Isle of Man)
4.250%, 01/24/27 | | | 1,500,000 | | | | 1,406,367 | |
Golden Nugget, Inc.
6.750%, 10/15/241 | | | 220,000 | | | | 220,000 | |
| | | | | | | | |
| | | Principal
Amount | | | Value | |
Gran Tierra Energy International Holdings, Ltd. (Cayman Islands)
6.250%, 02/15/25 | | $ | 1,126,000 | | | $ | 1,080,960 | |
Gray Television, Inc.
5.125%, 10/15/241 | | | 55,000 | | | | 52,456 | |
Grupo Idesa SA de CV (Mexico)
7.875%, 12/18/201 | | | 600,000 | | | | 510,000 | |
7.875%, 12/18/20 | | | 600,000 | | | | 510,000 | |
GTT Communications, Inc.
7.875%, 12/31/241,4 | | | 180,000 | | | | 170,100 | |
Guanay Finance, Ltd. (Cayman Islands)
6.000%, 12/15/20 | | | 1,002,832 | | | | 1,012,861 | |
Gulfport Energy Corp.
6.375%, 05/15/25 | | | 200,000 | | | | 190,750 | |
GW Honos Security Corp. (Canada)
8.750%, 05/15/251 | | | 185,000 | | | | 174,825 | |
Halfmoon Parent, Inc.
(3 month LIBOR + 0.890%)
3.326%, 07/15/231,5 | | | 465,000 | | | | 464,930 | |
Hasbro, Inc.
3.500%, 09/15/27 | | | 515,000 | | | | 473,507 | |
HCA, Inc.
5.250%, 04/15/25 | | | 55,000 | | | | 56,306 | |
5.375%, 09/01/26 | | | 175,000 | | | | 174,125 | |
Hess Infrastructure Partners, LP/Hess
Infrastructure Partners Finance Corp.
5.625%, 02/15/261 | | | 175,000 | | | | 176,312 | |
Hexion, Inc.
6.625%, 04/15/20 | | | 75,000 | | | | 66,563 | |
10.375%, 02/01/221 | | | 190,000 | | | | 171,712 | |
Hi-Crush Partners LP
9.500%, 08/01/261,4 | | | 30,000 | | | | 23,963 | |
Hilcorp Energy I, LP/Hilcorp Finance Co.
6.250%, 11/01/281 | | | 50,000 | | | | 48,188 | |
Hilton Domestic Operating Co, Inc.
4.250%, 09/01/24 | | | 150,000 | | | | 144,420 | |
5.125%, 05/01/261 | | | 515,000 | | | | 504,700 | |
Indian Oil Corp., Ltd. (India)
5.625%, 08/02/21 | | | 450,000 | | | | 466,593 | |
5.750%, 08/01/23 | | | 1,700,000 | | | | 1,771,101 | |
Indigo Natural Resources LLC
6.875%, 02/15/261 | | | 185,000 | | | | 175,750 | |
Informatica LLC
7.125%, 07/15/231 | | | 240,000 | | | | 246,074 | |
Intelsat Jackson Holdings S.A. (Luxembourg)
5.500%, 08/01/23 | | | 60,000 | | | | 53,850 | |
Intelsat Jackson Holdings SA (Luxembourg)
8.500%, 10/15/241 | | | 70,000 | | | | 68,863 | |
The Interpublic Group of Cos, Inc.
5.400%, 10/01/48 | | | 485,000 | | | | 458,347 | |
IRB Holding Corp.
6.750%, 02/15/261 | | | 185,000 | | | | 177,600 | |
The accompanying notes are an integral part of these financial statements.
73
| | |
| AMG Managers DoubleLine Core Plus Bond Fund | | |
| Schedule of Portfolio Investments (continued) | | |
| | | | | | | | |
| | | Principal | | | | |
| | | Amount | | | Value | |
Industrials - 16.2% (continued) | | | | | | | | |
Iridium Communications, Inc.
10.250%, 04/15/231 | | $ | 155,000 | | | $ | 169,337 | |
JBS Investments GmbH (American Samoa)
7.250%, 04/03/24 | | | 200,000 | | | | 202,650 | |
JBS Investments II GmbH (Austria)
7.000%, 01/15/261 | | | 400,000 | | | | 395,400 | |
JBS USA LUX, S.A./JBS USA Finance, Inc.
6.750%, 02/15/281 | | | 195,000 | | | | 190,369 | |
Jeld-Wen, Inc.
4.625%, 12/15/251 | | | 155,000 | | | | 139,694 | |
KAR Auction Services, Inc.
5.125%, 06/01/251 | | | 160,000 | | | | 152,000 | |
Kinder Morgan Energy Partners L.P., MTN
6.950%, 01/15/38 | | | 605,000 | | | | 694,830 | |
Kratos Defense & Security Solutions, Inc.
6.500%, 11/30/251 | | | 60,000 | | | | 62,055 | |
The Kroger Co.
3.400%, 04/15/22 | | | 495,000 | | | | 489,799 | |
Kronos Acquisition Holdings, Inc.
(Canada) 9.000%, 08/15/231 | | | 120,000 | | | | 105,300 | |
Latam Finance, Ltd. (Cayman Islands)
6.875%, 04/11/24 | | | 500,000 | | | | 488,625 | |
Level 3 Communications, Inc.
5.750%, 12/01/22 | | | 125,000 | | | | 124,974 | |
Level 3 Financing, Inc.
5.375%, 01/15/24 | | | 180,000 | | | | 178,650 | |
Live Nation Entertainment, Inc.
5.625%, 03/15/261 | | | 130,000 | | | | 130,325 | |
Lockheed Martin Corp.
4.700%, 05/15/46 | | | 435,000 | | | | 442,686 | |
Marathon Petroleum Corp.
5.125%, 12/15/261 | | | 465,000 | | | | 478,109 | |
MARB BondCo PLC (United Kingdom)
6.875%, 01/19/254 | | | 1,400,000 | | | | 1,319,955 | |
Marriott Ownership Resorts, Inc./ILG LLC
6.500%, 09/15/261 | | | 30,000 | | | | 30,375 | |
Marvell Technology Group, Ltd.
4.200%, 06/22/23 | | | 490,000 | | | | 484,948 | |
Masonite International Corp.
5.750%, 09/15/261 | | | 145,000 | | | | 138,113 | |
Match Group, Inc.
5.000%, 12/15/271 | | | 115,000 | | | | 110,113 | |
Matterhorn Merger Sub LLC/Matterhorn
Finance Sub, Inc.
8.500%, 06/01/261 | | | 75,000 | | | | 69,375 | |
McDonald’s Corp., MTN
4.450%, 03/01/47 | | | 245,000 | | | | 230,007 | |
MEG Energy Corp. (Canada)
7.000%, 03/31/241 | | | 55,000 | | | | 54,175 | |
| | | | | | | | |
| | | Principal | | | | |
| | | Amount | | | Value | |
Microchip Technology, Inc.
4.333%, 06/01/231 | | $ | 505,000 | | | $ | 494,283 | |
Millicom International Cellular SA (Luxembourg)
5.125%, 01/15/28 | | | 200,000 | | | | 182,200 | |
Millicom International Cellular, S.A. (Luxembourg)
6.000%, 03/15/25 | | | 200,000 | | | | 198,750 | |
Minerva Luxembourg SA (Luxembourg)
6.500%, 09/20/26 | | | 700,000 | | | | 649,250 | |
5.875%, 01/19/28 | | | 800,000 | | | | 694,760 | |
The Mosaic Co.
4.050%, 11/15/27 | | | 495,000 | | | | 470,703 | |
Moss Creek Resources Holdings, Inc.
7.500%, 01/15/261 | | | 150,000 | | | | 145,080 | |
Nabors Industries, Inc.
5.750%, 02/01/25 | | | 190,000 | | | | 175,842 | |
Netflix, Inc.
5.875%, 02/15/25 | | | 55,000 | | | | 56,031 | |
New Red Finance, Inc. (Canada)
5.000%, 10/15/251 | | | 200,000 | | | | 188,000 | |
Nexa Resources, S.A. (Brazil)
5.375%, 05/04/27 | | | 300,000 | | | | 292,503 | |
OAS Finance, Ltd. (Virgin Islands, British)
8.875%, 08/26/222,7 | | | 600,000 | | | | 18,750 | |
8.875%, 08/25/351,2,7 | | | 400,000 | | | | 12,500 | |
Odebrecht Finance, Ltd. (Cayman Islands)
7.125%, 06/26/42 | | | 400,000 | | | | 68,000 | |
ONGC Videsh Vankorneft Pte, Ltd. (Singapore)
3.750%, 07/27/26 | | | 2,500,000 | | | | 2,275,677 | |
Oracle Corp.
4.125%, 05/15/45 | | | 235,000 | | | | 216,325 | |
Owens Corning
4.400%, 01/30/48 | | | 295,000 | | | | 231,527 | |
Packaging Corp of America
3.400%, 12/15/27 | | | 255,000 | | | | 234,735 | |
Par Petroleum LLC/Petroleum Finance Corp.
7.750%, 12/15/251 | | | 160,000 | | | | 158,800 | |
Peabody Energy Corp.
6.000%, 03/31/221 | | | 190,000 | | | | 190,528 | |
Penske Truck Leasing Co. LP/PTL Finance Corp.
4.200%, 04/01/271 | | | 245,000 | | | | 238,277 | |
Pesquera Exalmar S.A (Peru)
7.375%, 01/31/20 | | | 200,000 | | | | 199,500 | |
Petrobras Global Finance BV (Netherlands)
5.750%, 02/01/29 | | | 1,700,000 | | | | 1,576,750 | |
Petronas Capital, Ltd. (Malaysia)
3.500%, 03/18/25 | | | 300,000 | | | | 291,027 | |
PetSmart, Inc.
7.125%, 03/15/231 | | | 150,000 | | | | 105,750 | |
5.875%, 06/01/251 | | | 40,000 | | | | 31,500 | |
Pilgrim’s Pride Corp.
5.750%, 03/15/251 | | | 320,000 | | | | 300,000 | |
The accompanying notes are an integral part of these financial statements.
74
| | |
| AMG Managers DoubleLine Core Plus Bond Fund | | |
| Schedule of Portfolio Investments (continued) | | |
| | | | | | | | |
| | | Principal | | | | |
| | | Amount | | | Value | |
Industrials – 16.2% (continued) | | | | | | | | |
Polaris Intermediate Corp., PIK
8.500%, 12/01/221,8 | | $ | 115,000 | | | $ | 118,306 | |
Post Holdings, Inc.
5.500%, 03/01/251 | | | 225,000 | | | | 218,391 | |
Prime Security Services Borrower LLC
9.250%, 05/15/231 | | | 215,000 | | | | 227,728 | |
QEP Resources, Inc.
5.250%, 05/01/23 | | | 155,000 | | | | 149,188 | |
5.625%, 03/01/264 | | | 170,000 | | | | 160,650 | |
Radiate Holdco LLC/Radiate Finance, Inc.
6.875%, 02/15/231 | | | 10,000 | | | | 9,650 | |
6.625%, 02/15/251,4 | | | 155,000 | | | | 145,313 | |
Raizen Fuels Finance SA (Luxembourg)
5.300%, 01/20/27 | | | 200,000 | | | | 191,700 | |
Refinitiv US Holdings, Inc.
6.250%, 05/15/261 | | | 90,000 | | | | 89,663 | |
8.250%, 11/15/261 | | | 5,000 | | | | 4,863 | |
Reliance Holding USA, Inc.
5.400%, 02/14/22 | | | 1,500,000 | | | | 1,548,138 | |
Resideo Funding, Inc.
6.125%, 11/01/261 | | | 50,000 | | | | 50,387 | |
Reynolds American, Inc.
4.000%, 06/12/22 | | | 410,000 | | | | 411,162 | |
Riverbed Technology, Inc.
8.875%, 03/01/231,4 | | | 120,000 | | | | 110,550 | |
Royal Caribbean Cruises, Ltd.
3.700%, 03/15/28 | | | 315,000 | | | | 289,629 | |
Sabine Pass Liquefaction LLC
5.000%, 03/15/27 | | | 615,000 | | | | 618,319 | |
SACI Falabella (Chile)
3.750%, 04/30/23 | | | 900,000 | | | | 880,294 | |
SBA Tower Trust
3.168%, 04/11/221 | | | 400,000 | | | | 392,992 | |
Schweitzer-Mauduit International, Inc.
6.875%, 10/01/261 | | | 85,000 | | | | 86,275 | |
Select Medical Corp.
6.375%, 06/01/21 | | | 195,000 | | | | 197,437 | |
Shire Acquisitions Investments (Ireland)
2.875%, 09/23/23 | | | 535,000 | | | | 504,424 | |
Sinopec Group Overseas Development 2016, Ltd. (China)
2.750%, 09/29/26 | | | 300,000 | | | | 266,264 | |
Sirius XM Radio, Inc.
5.375%, 07/15/261 | | | 165,000 | | | | 161,783 | |
Six Flags Entertainment Corp.
4.875%, 07/31/241 | | | 125,000 | | | | 118,438 | |
Smithfield Foods, Inc.
4.250%, 02/01/271 | | | 530,000 | | | | 493,990 | |
| | | | | | | | |
| | | Principal | | | | |
| | | Amount | | | Value | |
Sophia LP/Sophia Finance, Inc.
9.000%, 09/30/231 | | $ | 280,000 | | | $ | 291,200 | |
Sprint Corp.
7.125%, 06/15/24 | | | 235,000 | | | | 240,875 | |
Sprint Spectrum Co. LLC/Sprint Spectrum
Co. II LLC/Sprint Spectrum Co. III LLC
4.738%, 03/20/251 | | | 525,000 | | | | 525,656 | |
Stars Group Holdings BV/Stars Group US
Co-Borrower LLC (Netherlands)
7.000%, 07/15/261 | | | 105,000 | | | | 106,838 | |
Stevens Holding Co, Inc.
6.125%, 10/01/261 | | | 110,000 | | | | 109,876 | |
SunCoke Energy Partners LP/SunCoke
Energy Partners Finance Corp.
7.500%, 06/15/251 | | | 185,000 | | | | 188,700 | |
Sunoco Logistics Partners Operations LP
3.900%, 07/15/26 | | | 1,000,000 | | | | 930,397 | |
Sunoco LP/Sunoco Finance Corp.
5.500%, 02/15/261 | | | 155,000 | | | | 148,025 | |
Sydney Airport Finance Co. Pty, Ltd. (Australia)
3.375%, 04/30/251 | | | 990,000 | | | | 939,336 | |
Tapstone Energy LLC/Tapstone Energy
Finance Corp.
9.750%, 06/01/221 | | | 60,000 | | | | 53,400 | |
Targa Resources Partners, LP/Targa Resources Partners Finance Corp.
5.875%, 04/15/261 | | | 175,000 | | | | 176,859 | |
Team Health Holdings, Inc.
6.375%, 02/01/251,4 | | | 140,000 | | | | 121,100 | |
Telesat Canada/Telesat LLC (Canada)
8.875%, 11/15/241 | | | 215,000 | | | | 229,512 | |
Tempur Sealy International Inc.
5.500%, 06/15/26 | | | 200,000 | | | | 184,000 | |
Tenet Healthcare Corp.
7.000%, 08/01/254 | | | 195,000 | | | | 192,001 | |
Tervita Escrow Corp. (Canada)
7.625%, 12/01/211 | | | 295,000 | | | | 300,900 | |
Teva Pharmaceutical Finance
Netherlands III (Netherlands)
2.800%, 07/21/23 | | | 710,000 | | | | 627,030 | |
T-Mobile USA, Inc.
4.500%, 02/01/26 | | | 160,000 | | | | 149,950 | |
TransDigm, Inc.
6.375%, 06/15/26 | | | 165,000 | | | | 162,112 | |
Transocean Guardian, Ltd. (Cayman Islands)
5.875%, 01/15/241 | | | 80,000 | | | | 79,500 | |
Transocean Proteus, Ltd. (Cayman Islands)
6.250%, 12/01/241 | | | 216,750 | | | | 216,750 | |
Transocean, Inc.
7.250%, 11/01/251,4 | | | 70,000 | | | | 68,250 | |
The accompanying notes are an integral part of these financial statements.
75
| | |
| AMG Managers DoubleLine Core Plus Bond Fund | | |
| Schedule of Portfolio Investments (continued) | | |
| | | | | | | | |
| | | Principal | | | | |
| | | Amount | | | Value | |
Industrials – 16.2% (continued) | | | | | | | | |
Transportadora de Gas Internacional S.A. ESP (Colombia)
5.700%, 03/20/22 | | $ | 200,000 | | | $ | 203,800 | |
Trident Merger Sub, Inc.
6.625%, 11/01/251 | | | 155,000 | | | | 145,313 | |
Triumph Group, Inc.
7.750%, 08/15/25 | | | 190,000 | | | | 179,075 | |
Uber Technologies, Inc.
8.000%, 11/01/261,9 | | | 95,000 | | | | 95,713 | |
United Rentals North America, Inc.
6.500%, 12/15/26 | | | 65,000 | | | | 65,894 | |
UPL Corp, Ltd. (Mauritius)
3.250%, 10/13/21 | | | 1,100,000 | | | | 1,063,590 | |
USA Compression Partners, LP/USA Compression
Finance Corp.
6.875%, 04/01/261 | | | 230,000 | | | | 234,887 | |
Vedanta Resources PLC (India)
6.125%, 08/09/24 | | | 800,000 | | | | 709,875 | |
Verizon Communications, Inc.
4.400%, 11/01/34 | | | 500,000 | | | | 473,626 | |
Verscend Escrow Corp.
9.750%, 08/15/261 | | | 110,000 | | | | 110,550 | |
Viking Cruises, Ltd.
5.875%, 09/15/271 | | | 175,000 | | | | 167,125 | |
Vine Oil & Gas LP/Vine Oil & Gas Finance Corp.
8.750%, 04/15/231 | | | 135,000 | | | | 126,225 | |
Vizient, Inc.
10.375%, 03/01/241 | | | 155,000 | | | | 169,725 | |
Votorantim Cimentos SA (Brazil)
7.250%, 04/05/41 | | | 200,000 | | | | 205,940 | |
VTR Finance BV (Chile)
6.875%, 01/15/24 | | | 800,000 | | | | 813,000 | |
Waste Pro USA, Inc.
5.500%, 02/15/261 | | | 195,000 | | | | 185,250 | |
Weatherford International, Ltd.
9.875%, 02/15/244 | | | 65,000 | | | | 50,700 | |
WellCare Health Plans, Inc.
5.250%, 04/01/25 | | | 225,000 | | | | 225,000 | |
5.375%, 08/15/261 | | | 10,000 | | | | 10,000 | |
WestRock Co.
3.750%, 03/15/251 | | | 500,000 | | | | 481,889 | |
Whiting Petroleum Corp.
6.625%, 01/15/26 | | | 175,000 | | | | 175,875 | |
YPF SA (Argentina)
8.500%, 07/28/25 | | | 1,050,000 | | | | 998,550 | |
6.950%, 07/21/274 | | | 700,000 | | | | 594,265 | |
Zimmer Biomet Holdings, Inc.
2.700%, 04/01/20 | | | 515,000 | | | | 509,431 | |
Total Industrials | | | | | | | 92,424,667 | |
| | | | | | | | |
| | | Principal | | | | |
| | | Amount | | | Value | |
Utilities – 3.0% | | | | | | | | |
AES Andres/Dominican Power Partners/Empresa
Generadora De Electricidad IT (Netherlands)
7.950%, 05/11/261 | | $ | 1,000,000 | | | $ | 1,028,750 | |
American Electric Power Co, Inc.
Series F
2.950%, 12/15/22 | | | 1,300,000 | | | | 1,266,956 | |
American Water Capital Corp.
3.400%, 03/01/25 | | | 775,000 | | | | 754,009 | |
Calpine Corp.
5.750%, 01/15/25 | | | 95,000 | | | | 85,244 | |
Cometa Energia SA de CV (Mexico)
6.375%, 04/24/35 | | | 700,000 | | | | 678,860 | |
Duke Energy Corp.
3.950%, 08/15/47 | | | 350,000 | | | | 309,357 | |
Duke Energy Progress LLC
4.150%, 12/01/44 | | | 365,000 | | | | 348,359 | |
Duquesne Light Holdings, Inc.
3.616%, 08/01/271 | | | 500,000 | | | | 464,111 | |
Edison International
4.125%, 03/15/28 | | | 490,000 | | | | 479,063 | |
Empresa Electrica Angamos S.A. (Chile)
4.875%, 05/25/29 | | | 373,035 | | | | 364,991 | |
Empresa Electrica Guacolda SA (Chile)
4.560%, 04/30/25 | | | 800,000 | | | | 729,947 | |
Enel Finance International NV (Netherlands)
4.250%, 09/14/231 | | | 505,000 | | | | 493,102 | |
Energuate Trust (Guatemala)
5.875%, 05/03/27 | | | 400,000 | | | | 380,004 | |
Eversource Energy
Series K
2.750%, 03/15/224 | | | 1,000,000 | | | | 978,239 | |
Exelon Corp.
3.400%, 04/15/26 | | | 1,000,000 | | | | 942,156 | |
Fortis, Inc. (Canada)
2.100%, 10/04/21 | | | 455,000 | | | | 434,549 | |
Inkia Energy, Ltd. (Peru)
5.875%, 11/09/27 | | | 1,000,000 | | | | 948,510 | |
Israel Electric Corp, Ltd. (Israel)
Series 6
5.000%, 11/12/241 | | | 200,000 | | | | 202,500 | |
ITC Holdings Corp.
3.250%, 06/30/26 | | | 1,000,000 | | | | 936,980 | |
Mexico Generadora de Energia S de rl (Mexico)
5.500%, 12/06/32 | | | 351,884 | | | | 343,178 | |
NextEra Energy Capital Holdings, Inc.
3.550%, 05/01/27 | | | 240,000 | | | | 228,636 | |
NextEra Energy Operating Partners LP
4.500%, 09/15/271 | | | 110,000 | | | | 101,888 | |
The accompanying notes are an integral part of these financial statements.
76
| | |
| AMG Managers DoubleLine Core Plus Bond Fund | | |
| Schedule of Portfolio Investments (continued) | | |
| | | | | | | | |
| | | Principal | | | | |
| | | Amount | | | Value | |
Utilities – 3.0% (continued) | | | | | | | | |
NGL Energy Partners LP/NGL
Energy Finance Corp.
7.500%, 11/01/23 | | $ | 25,000 | | | $ | 24,656 | |
Orazul Energy Egenor S en C por A (Peru)
5.625%, 04/28/27 | | | 200,000 | | | | 182,602 | |
Pampa Energia SA (Argentina)
7.500%, 01/24/274 | | | 1,600,000 | | | | 1,408,000 | |
PSEG Power LLC
3.850%, 06/01/23 | | | 370,000 | | | | 367,761 | |
Southern California Edison Co.
Series C
4.125%, 03/01/48 | | | 240,000 | | | | 223,044 | |
The Southern Co.
1.850%, 07/01/19 | | | 110,000 | | | | 109,071 | |
Superior Plus LP/Superior General Partner, Inc. (Canada)
7.000%, 07/15/261 | | | 225,000 | | | | 225,281 | |
Transelec, S.A. (Chile)
4.625%, 07/26/231 | | | 300,000 | | | | 303,750 | |
4.625%, 07/26/23 | | | 200,000 | | | | 202,500 | |
Vistra Operations Co. LLC
5.500%, 09/01/261 | | | 110,000 | | | | 108,488 | |
Xcel Energy, Inc.
3.300%, 06/01/25 | | | 1,300,000 | | | | 1,250,004 | |
Total Utilities | | | | | | | 16,904,546 | |
Total Corporate Bonds and Notes
(Cost $163,511,077) | | | | | | | 156,905,738 | |
Asset-Backed Securities – 10.1% | | | | | | | | |
Adams Mill CLO, Ltd.
Series 2014-1A, Class D1
(3 month LIBOR + 3.500%), 5.936%, 07/15/261,5 | | | 250,000 | | | | 250,820 | |
AIMCO CLO Series
Series 2018-AA, Class D
(3 month LIBOR + 2.550%), 4.999%, 04/17/311,5 | | | 500,000 | | | | 486,613 | |
ALM VII R, Ltd.
Series 2013-7RA, Class CR
(3 month LIBOR + 4.040%), 6.476%, 10/15/281,5 | | | 1,000,000 | | | | 1,011,258 | |
ALM XIX, Ltd. | | | | | | | | |
Series 2016-19A, Class B
(3 month LIBOR + 3.000%),
5.436%, 07/15/281,5 | | | 500,000 | | | | 502,102 | |
Series 2016-19A, Class C
(3 month LIBOR + 4.350%),
6.786%, 07/15/281,5 | | | 500,000 | | | | 502,932 | |
Apidos CLO XII
Series 2013-12A, Class DR
(3 month LIBOR + 2.600%), 5.036%, 04/15/311,5 | | | 500,000 | | | | 494,667 | |
Apidos CLO XVI
Series 2013-16A, Class BR
(3 month LIBOR + 1.950%), 4.400%, 01/19/251,5 | | | 500,000 | | | | 500,319 | |
| | | | | | | | |
| | | Principal | | | | |
| | | Amount | | | Value | |
Atrium IX
Series 9A, Class DR
(3 month LIBOR + 3.600%), 5.911%, 05/28/301,5 | | $ | 1,000,000 | | | $ | 1,006,238 | |
Babson CLO, Ltd. | | | | | | | | |
Series 2015-2A, Class DR
(3 month LIBOR + 2.950%),
5.419%, 10/20/301,5 | | | 500,000 | | | | 500,275 | |
Series 2015-IA, Class DR
(3 month LIBOR + 2.600%),
5.069%, 01/20/311,5 | | | 500,000 | | | | 494,678 | |
Barings CLO, Ltd. | | | | | | | | |
Series 2017-1A, Class D
(3 month LIBOR + 3.600%),
6.045%, 07/18/291,5 | | | 1,000,000 | | | | 1,003,897 | |
Series 2018-1A, Class C
(3 month LIBOR + 2.600%),
5.036%, 04/15/311,5 | | | 350,000 | | | | 344,037 | |
Series 2018-3A, Class D
(3 month LIBOR + 2.900%),
5.369%, 07/20/291,5 | | | 500,000 | | | | 498,570 | |
Bayview Financial Acquisition Trust
Series 2007-A, Class 1A5
6.101%, 05/28/3710 | | | 180,546 | | | | 185,777 | |
Blackbird Capital Aircraft Lease
Securitization, Ltd.
Series 2016-1A, Class B
5.682%, 12/16/411,10 | | | 890,625 | | | | 915,076 | |
BlueMountain CLO, Ltd. | | | | | | | | |
Series 2013-1A, Class CR
(3 month LIBOR + 4.150%),
6.619%, 01/20/291,5 | | | 1,000,000 | | | | 1,003,470 | |
Series 2016-2A, Class C
(3 month LIBOR + 4.100%),
6.422%, 08/20/281,5 | | | 1,000,000 | | | | 1,002,007 | |
CAL Funding
Series 2018-1A, Class A
3.960%, 02/25/431 | | | 700,000 | | | | 680,922 | |
Canyon Capital CLO 2014-1 Ltd.
Series 2014-1A, Class CR
(3 month LIBOR + 2.750%), 5.270%, 01/30/311,5 | | | 500,000 | | | | 493,660 | |
Canyon Capital CLO, Ltd.
Series 2017-1A, Class D
(3 month LIBOR + 3.600%), 6.036%, 07/15/301,5 | | | 500,000 | | | | 501,626 | |
Castle Aircraft Securitiz
Series 2015-1A, Class A
4.703%, 12/15/401,10 | | | 1,238,372 | | | | 1,243,403 | |
CLI Funding V LLC
Series 2013-2A, Class NOTE
3.220%, 06/18/281 | | | 684,650 | | | | 670,915 | |
Cook Park CLO
Series 2018-1A, Class D
(3 month LIBOR + 2.600%), 5.049%, 04/17/301,5 | | | 750,000 | | | | 734,788 | |
Credit Suisse Commercial Mortgage Trust
Series 2015-PR2, Class A1
7.250%, 07/26/551,10 | | | 2,110,041 | | | | 2,171,221 | |
The accompanying notes are an integral part of these financial statements.
77
| | |
| AMG Managers DoubleLine Core Plus Bond Fund | | |
| Schedule of Portfolio Investments (continued) | | |
| | | | | | | | |
| | | Principal | | | | |
| | | Amount | | | Value | |
Asset-Backed Securities - 10.1% (continued) | | | | | | | | |
Credit-Based Asset Servicing &
Securitization LLC
Series 2007-MX1, Class A4
6.231%, 12/25/361,10 | | $ | 100,000 | | | $ | 106,230 | |
Dorchester Park CLO DAC
Series 2015-1A, Class ER
(3 month LIBOR + 5.000%),
7.469%, 04/20/281,5 | | | 500,000 | | | | 494,991 | |
Dryden 40 Senior Loan Fund
Series 2015-40A, Class DR
(3 month LIBOR + 3.100%), 5.414%, 08/15/311 | | | 500,000 | | | | 502,500 | |
Dryden 57 CLO, Ltd.
Series 2018-57A, Class D
(3 month LIBOR + 2.550%), 4.864%, 05/15/311,5 | | | 500,000 | | | | 488,944 | |
ECAF I, Ltd.
Series 2015-1A, Class A1 3.473%, 06/15/401 | | | 487,419 | | | | 482,891 | |
Gilbert Park CLO, Ltd. | | | | | | | | |
Series 2017-1A, Class D
(3 month LIBOR + 2.950%),
5.386%, 10/15/301,5 | | | 500,000 | | | | 500,625 | |
Series 2017-1A, Class E
(3 month LIBOR + 6.400%),
8.836%, 10/15/301,5 | | | 1,000,000 | | | | 1,017,809 | |
Global SC Finance II SRL
Series 2014-1A, Class A1
3.190%, 07/17/291 | | | 790,625 | | | | 772,956 | |
Global SC Finance IV, Ltd.
Series 2018-1A, Class A
4.290%, 05/17/381 | | | 476,000 | | | | 475,465 | |
GSAA Home Equity Trust
Series 2006-15, Class AF3B
5.933%, 09/25/363 | | | 757,000 | | | | 102,865 | |
Halcyon Loan Advisors Funding, Ltd.
Series 2013-2A, Class C
(3 month LIBOR + 2.700%), 5.241%, 08/01/251,5 | | | 250,000 | | | | 250,502 | |
Invitation Homes Trust | | | | | | | | |
Series 2018-SFR1, Class C
(1 month LIBOR + 1.250%),
3.540%, 03/17/371,5 | | | 1,745,000 | | | | 1,753,236 | |
Series 2018-SFR1, Class D
(1 month LIBOR + 1.450%),
3.740%, 03/17/371,5 | | | 1,150,000 | | | | 1,149,453 | |
LCM XIV, L.P.
Series 14A, Class DR
(3 month LIBOR + 2.750%), 5.219%, 07/20/311,5 | | | 500,000 | | | | 496,518 | |
LCM XVIII L.P.
Series 19A, Class D
(3 month LIBOR + 3.450%), 5.886%, 07/15/271,5 | | | 1,000,000 | | | | 1,002,994 | |
Madison Park Funding XIV, Ltd.
Series 2014-14A, Class DRR
(3 month LIBOR + 2.950%), 5.419%, 10/22/301 | | | 500,000 | | | | 500,000 | |
| | | | | | | | |
| | | Principal | | | | |
| | | Amount | | | Value | |
Madison Park Funding XV, Ltd.
Series 2014-15A, Class CR
(3 month LIBOR + 3.450%), 5.959%, 01/27/261,5 | | $ | 500,000 | | | $ | 502,363 | |
Magnetite IX, Ltd.
Series 2014-9A, Class BR
(3 month LIBOR + 2.000%), 4.490%, 07/25/261,5 | | | 500,000 | | | | 501,262 | |
Mosaic Solar Loan Trust
Series 2018-1A, Class A
4.010%, 06/22/431 | | | 1,347,352 | | | | 1,335,287 | |
Mosaic Solar Loans LLC
Series 2017-1A, Class A
4.450%, 06/20/421 | | | 591,315 | | | | 596,815 | |
Myers Park CLO, Ltd.
Series 2018-1A, Class D
(3 month LIBOR + 3.050%), 5.469%, 10/20/301 | | | 1,000,000 | | | | 1,006,876 | |
Neuberger Berman Loan Advisers CLO, 27 Ltd.
Series 2018-27A, Class D
(3 month LIBOR + 2.600%), 5.036%, 01/15/301,5 | | | 500,000 | | | | 488,506 | |
Octagon Investment Partners 27, Ltd.
Series 2016-1A, Class DR
(3 month LIBOR + 2.950%), 5.386%, 07/15/301,5 | | | 500,000 | | | | 502,439 | |
Octagon Investment Partners XV, Ltd.
Series 2013-1A, Class DR
(3 month LIBOR + 3.700%), 6.150%, 07/19/301,5 | | | 1,000,000 | | | | 1,005,595 | |
Octagon Investment Partners XVI, Ltd.
Series 2013-1A, Class DR
(3 month LIBOR + 3.000%), 5.336%, 07/17/301,5 | | | 500,000 | | | | 502,705 | |
Octagon Investment Partners XXI, Ltd.
Series 2014-1A, Class C
(3 month LIBOR + 3.650%), 5.969%, 11/14/261,5 | | | 250,000 | | | | 250,855 | |
Octagon Investment Partners XXII, Ltd.
Series 2014-1A, Class ERR
(3 month LIBOR + 5.450%), 7.919%, 01/22/301,5 | | | 500,000 | | | | 494,096 | |
Octagon Investment Partners XXX, Ltd. | | | | | | | | |
Series 2017-1A, Class C
(3 month LIBOR + 3.500%),
5.969%, 03/17/301,5 | | | 500,000 | | | | 503,601 | |
Series 2017-1A, Class D
(3 month LIBOR + 6.200%),
8.669%, 03/17/301,5 | | | 250,000 | | | | 252,513 | |
OHA Credit Funding 1, Ltd.
Series 2018-1A, Class D
(3 month LIBOR + 3.050%), 5.689%, 10/20/301 | | | 500,000 | | | | 497,528 | |
OneMain Financial Issuance Trust
Series 2015-1A, Class A
3.190%, 03/18/261 | | | 617,435 | | | | 618,657 | |
PRPM LLC
Series 2017-2A, Class A1
3.470%, 09/25/221,10 | | | 3,136,964 | | | | 3,109,851 | |
SpringCastle America Funding LLC
Series 2016-AA, Class A
3.050%, 04/25/291 | | | 905,491 | | | | 900,377 | |
The accompanying notes are an integral part of these financial statements.
78
| | |
| AMG Managers DoubleLine Core Plus Bond Fund | | |
| Schedule of Portfolio Investments (continued) | | |
| | | | | | | | |
| | | Principal | | | | |
| | | Amount | | | Value | |
Asset-Backed Securities - 10.1% (continued) | | | | | | | | |
Springleaf Funding Trust
Series 2015-AA, Class A
3.160%, 11/15/241 | | $ | 739,867 | | | $ | 739,794 | |
Sprite 2017-1, Ltd.
Series 2017-1, Class A
4.250%, 12/15/371 | | | 467,505 | | | | 465,249 | |
Symphony CLO XIV, Ltd.
Series 2014-14A, Class D2
(3 month LIBOR + 3.600%), 6.036%, 07/14/261,5 | | | 750,000 | | | | 753,452 | |
TAL Advantage VI LLC
Series 2017-1A, Class A
4.500%, 04/20/42 | | | 851,986 | | | | 859,789 | |
TCI-Cent CLO, Ltd.
Series 2016-1A, Class C
(3 month LIBOR + 4.000%), 6.509%, 12/21/291,5 | | | 1,000,000 | | | | 1,007,621 | |
TCI-Flatiron CLO, Ltd.
Series 2016-1A, Class C
(3 month LIBOR + 3.050%), 5.499%, 07/17/281,5 | | | 750,000 | | | | 751,945 | |
TCI-Symphony CLO, Ltd.
Series 2016-1A, Class D
(3 month LIBOR + 3.800%), 6.236%, 10/13/291,5 | | | 1,000,000 | | | | 1,003,385 | |
THL Credit Wind River CLO, Ltd.
Series 2013-1A, Class CR
(3 month LIBOR + 3.650%), 6.119%, 07/20/301,5 | | | 250,000 | | | | 252,219 | |
Thunderbolt Aircraft Lease, Ltd.
Series 2017-A, Class A
4.212%, 05/17/321,10 | | | 449,405 | | | | 449,724 | |
Towd Point Mortgage Trust
Series 2015-6, Class A1B
2.750%, 04/25/551,3 | | | 2,597,406 | | | | 2,551,136 | |
Trinity Rail Leasing 2010 LLC
Series 2010-1A, Class A
5.194%, 10/16/401 | | | 925,883 | | | | 957,463 | |
Triton Container Finance V LLC
Series 2018-1A, Class A
3.950%, 03/20/431 | | | 470,833 | | | | 464,757 | |
Vantage Data Centers Issuer LLC
Series 2018-1A, Class A2
4.072%, 02/16/431 | | | 695,333 | | | | 694,138 | |
VB-S1 Issuer LLC
Series 2018-1A, Class D
4.122%, 02/15/481 | | | 1,500,000 | | | | 1,474,599 | |
VOLT LXII LLC
Series 2017-NPL9, Class A1
3.125%, 09/25/471,10 | | | 3,653,173 | | | | 3,629,674 | |
Westcott Park CLO, Ltd.
Series 2016-1A, Class D
(3 month LIBOR + 4.350%), 6.819%, 07/20/281,5 | | | 1,000,000 | | | | 1,013,262 | |
Total Asset-Backed Securities
(Cost $57,468,892) | | | | | | | 57,434,783 | |
| | | | | | | | |
| | | Principal | | | | |
| | | Amount | | | Value | |
Mortgage-Backed Securities - 16.7% | | | | | | | | |
Alternative Loan Trust | | | | | | | | |
Series 2007-18CB, Class 2A17
6.000%, 08/25/37 | | $ | 47,235 | | | $ | 42,517 | |
Series 2007-23CB, Class A3
(1 month LIBOR + 0.500%), 2.781%, 09/25/375 | | | 204,517 | | | | 138,764 | |
Series 2007-23CB, Class A4
(1 month LIBOR + 6.500%), 4.219%, 09/25/375,11 | | | 195,280 | | | | 31,614 | |
Series 2007-J2, Class 2A1
6.000%, 07/25/37 | | | 788,996 | | | | 770,867 | |
Banc of America Funding Trust | | | | | | | | |
Series 2006-B, Class 7A1
3.773%, 03/20/363 | | | 290,481 | | | | 274,596 | |
Series 2010-R9, Class 3A3
5.500%, 12/26/351 | | | 397,233 | | | | 335,413 | |
BBCMS Mortgage Trust | | | | | | | | |
Series 2017-DELC, Class C
(1 month LIBOR + 1.200%), 3.480%, 08/15/361,5 | | | 132,000 | | | | 132,204 | |
Series 2017-DELC, Class D
(1 month LIBOR + 1.700%), 3.980%, 08/15/361,5 | | | 150,000 | | | | 149,958 | |
Series 2017-DELC, Class E
(1 month LIBOR + 2.500%), 4.780%, 08/15/361,5 | | | 314,000 | | | | 314,986 | |
Series 2017-DELC, Class F
(1 month LIBOR + 3.500%), 5.780%, 08/15/361,5 | | | 301,000 | | | | 302,217 | |
BBCMS Trust
Series 2015-STP, Class D
4.284%, 09/10/281,3 | | | 630,000 | | | | 623,815 | |
Bear Stearns Asset Backed
Securities I Trust
Series 2004-AC2, Class 2A
5.000%, 05/25/34 | | | 75,615 | | | | 75,301 | |
Bear Stearns Commercial Mortgage
Securities Trust
Series 2007-T26, Class AJ
5.465%, 01/12/453 | | | 450,000 | | | | 412,549 | |
BHMS
Series 2018-ATLS, Class C
(1 month LIBOR + 1.900%), 4.180%, 07/15/351,5 | | | 125,000 | | | | 125,239 | |
BX Trust | | | | | | | | |
Series 2017-SLCT, Class D
(1 month LIBOR + 2.050%),
4.330%, 07/15/341,5 | | | 296,121 | | | | 296,303 | |
Series 2017-SLCT, Class E (1 month LIBOR + 3.150%),
5.430%, 07/15/341,5 | | | 486,484 | | | | 488,153 | |
CFCRE Commercial Mortgage Trust | | | | | | | | |
Series 2016-C3, Class XA
1.056%, 01/10/483,11 | | | 8,950,107 | | | | 537,602 | |
Series 2016-C4, Class C
4.875%, 05/10/583 | | | 858,000 | | | | 868,585 | |
The accompanying notes are an integral part of these financial statements.
79
| | |
| AMG Managers DoubleLine Core Plus Bond Fund | | |
| Schedule of Portfolio Investments (continued) | | |
| | | | | | | | |
| | | Principal | | | | |
| | | Amount | | | Value | |
Mortgage-Backed Securities - 16.7% (continued) | | | | | | | | |
CHT 2017-COSMO Mortgage Trust | | | | | | | | |
Series 2017-CSMO, Class E (1 month LIBOR + 3.000%),
5.280%, 11/15/361,5 | | $ | 609,000 | | | $ | 611,431 | |
Series 2017-CSMO, Class F
(1 month LIBOR + 3.741%),
6.021%, 11/15/361,5 | | | 325,000 | | | | 326,472 | |
Citicorp Mortgage Securities Trust
Series Series 2007-2, Class 3A1
5.500%, 02/25/37 | | | 1,781 | | | | 1,781 | |
Citigroup Commercial Mortgage Trust | | | | | | | | |
Series 2012-GC8, Class XA
1.803%, 09/10/451,3,11 | | | 680,627 | | | | 35,589 | |
Series 2014-GC25, Class XA
1.015%, 10/10/473,11 | | | 4,745,131 | | | | 231,182 | |
Series 2015-GC27, Class C
4.428%, 02/10/483 | | | 761,000 | | | | 740,369 | |
Series 2015-GC27, Class D
4.428%, 02/10/481,3 | | | 392,700 | | | | 359,833 | |
Series 2015-GC31, Class C
4.059%, 06/10/483 | | | 780,000 | | | | 730,592 | |
Series 2015-GC35, Class C
4.499%, 11/10/483 | | | 235,000 | | | | 228,758 | |
Series 2015-GC35, Class XA
0.876%, 11/10/483,11 | | | 7,388,629 | | | | 303,906 | |
Series 2016-GC36, Class XA
1.304%, 02/10/493,11 | | | 7,575,847 | | | | 540,207 | |
Series 2016-P3, Class XA
1.704%, 04/15/493,11 | | | 5,464,315 | | | | 492,924 | |
Series 2016-P4, Class XA
1.997%, 07/10/493,11 | | | 5,146,915 | | | | 561,308 | |
Citigroup Mortgage Loan Trust | | | | | | | | |
Series 2006-AR2, Class 1A2
3.909%, 03/25/363 | | | 946,786 | | | | 938,543 | |
Series 2010-7, Class 11A1
5.164%, 07/25/361,3 | | | 1,257,573 | | | | 1,270,035 | |
COBALT Commercial Mortgage Trust
Series 2007-C2, Class AJFX
5.568%, 04/15/473 | | | 49,270 | | | | 49,701 | |
COMM Mortgage Trust | | | | | | | | |
Series 2016-DC2, Class C
4.641%, 02/10/493 | | | 453,000 | | | | 442,680 | |
Series 2016-DC2, Class XA
1.042%, 02/10/493,11 | | | 6,652,194 | | | | 374,868 | |
Series 2016-GCT, Class E
3.461%, 08/10/291,3 | | | 780,000 | | | | 747,471 | |
Commercial Mortgage Pass Through Certificates | | | | | | | | |
Series 2012-CR3, Class XA
1.876%, 10/15/453,11 | | | 1,496,597 | | | | 89,017 | |
Series 2013-CR10, Class XA
0.710%, 08/10/463,11 | | | 16,983,154 | | | | 474,861 | |
Series 2014-CR20, Class C
4.503%, 11/10/473 | | | 300,000 | | | | 293,987 | |
Series 2015-CR23, Class D
4.252%, 05/10/483 | | | 350,000 | | | | 293,602 | |
| | | | | | | | |
| | | Principal | | | | |
| | | Amount | | | Value | |
Commercial Mortgage Pass Through Certificates | | | | | | | | |
Series 2015-CR25, Class C
4.545%, 08/10/483 | | $ | 470,000 | | | $ | 457,096 | |
Series 2015-CR26, Class B
4.492%, 10/10/483 | | | 600,000 | | | | 604,472 | |
Series 2015-CR26, Class XA
1.023%, 10/10/483,11 | | | 7,930,612 | | | | 397,685 | |
Series 2015-LC23, Class C
4.646%, 10/10/483 | | | 585,000 | | | | 583,777 | |
Series 2016-CR28, Class C
4.647%, 02/10/493 | | | 807,000 | | | | 806,867 | |
Commercial Mortgage Trust
Series 2018-HCLV, Class C
(1 month LIBOR + 1.700%), 3.980%, 09/15/331 | | | 600,000 | | | | 598,562 | |
Core Industrial Trust
Series 2015-CALW, Class D
3.850%, 02/10/341,3 | | | 500,000 | | | | 497,218 | |
Countrywide Alternative Loan Trust | | | | | | | | |
Series 2005-86CB, Class A5
5.500%, 02/25/36 | | | 806,027 | | | | 706,434 | |
Series 2006-J1, Class 2A1
7.000%, 02/25/36 | | | 450,071 | | | | 173,293 | |
Countrywide Home Loan Mortgage Pass
Through Trust | | | | | | | | |
Series 2005-HYB8, Class 4A1
3.497%, 12/20/353 | | | 377,405 | | | | 367,084 | |
Series 2007-14, Class A15
6.500%, 09/25/37 | | | 923,123 | | | | 823,543 | |
Series 2007-2, Class A13
6.000%, 03/25/37 | | | 366,626 | | | | 299,457 | |
Series 2007-7, Class A4
5.750%, 06/25/37 | | | 63,688 | | | | 53,715 | |
Credit Suisse First Boston Mortgage
Securities Corp.
Series 2005-9, Class 5A9
5.500%, 10/25/35 | | | 1,043,333 | | | | 920,650 | |
Credit Suisse Mortgage Capital Certificates
Series 2007-1, Class 5A4
6.000%, 02/25/37 | | | 566,792 | | | | 494,407 | |
CSAIL Commercial Mortgage Trust
Series 2016-C6, Class XA
1.797%, 01/15/493,11 | | | 6,899,772 | | | | 630,899 | |
CSMC Trust | | | | | | | | |
Series 2013-IVR4, Class A11
3.487%, 07/27/431,3 | | | 2,723,031 | | | | 2,652,535 | |
Series 2013-IVR4, Class A2
3.000%, 07/25/431,3 | | | 2,723,031 | | | | 2,570,286 | |
Series 2017-CHOP, Class D
(1 month LIBOR + 1.900%),
4.180%, 07/15/321,5 | | | 261,000 | | | | 260,881 | |
Series 2017-CHOP, Class E
(1 month LIBOR + 3.300%),
5.580%, 07/15/321,5 | | | 261,000 | | | | 261,435 | |
DBJPM | | | | | | | | |
Series 2016-C1, Class C
3.350%, 05/10/493 | | | 534,000 | | | | 489,777 | |
The accompanying notes are an integral part of these financial statements.
80
AMG Managers DoubleLine Core Plus Bond Fund
Schedule of Portfolio Investments (continued)
| | | | | | | | |
| | | Principal
Amount | | | Value | |
Mortgage-Backed Securities - 16.7% (continued) | | | | | |
DBJPM
Series 2016-C1, Class XA
1.485%, 05/10/493,11 | | $ | 7,598,927 | | | $ | 623,515 | |
First Horizon Alternative Mortgage Securities Trust
Series 2006-AA7, Class A1
3.928%, 01/25/373 | | | 1,931,768 | | | | 1,763,300 | |
FREMF Mortgage Trust
Series 2016-KF22, Class B
(1 month LIBOR + 5.050%),
7.311%, 07/25/231,5 | | | 308,038 | | | | 319,195 | |
Great Wolf Trust | | | | | | | | |
Series 2017-WOLF, Class D
(1 month LIBOR + 2.100%),
4.530%, 09/15/341,5 | | | 274,000 | | | | 274,508 | |
Series 2017-WOLF, Class E
(1 month LIBOR + 3.100%),
5.530%, 09/15/341,5 | | | 425,000 | | | | 426,494 | |
Series 2017-WOLF, Class F
(1 month LIBOR + 4.070%),
6.500%, 09/15/341,5 | | | 226,000 | | | | 227,154 | |
GS Mortgage Securities Trust | | | | | | | | |
Series 2014-GC26, Class C
4.509%, 11/10/473 | | | 391,000 | | | | 378,653 | |
Series 2014-GC26, Class D
4.509%, 11/10/471,3 | | | 1,500,000 | | | | 1,303,984 | |
Series 2015-GC34, Class XA
1.343%, 10/10/483,11 | | | 6,354,560 | | | | 423,762 | |
Series 2015-GS1, Class XA
0.810%, 11/10/483,11 | | | 10,564,926 | | | | 473,519 | |
Series 2016-GS2, Class XA
1.661%, 05/10/493,11 | | | 7,288,951 | | | | 637,226 | |
Series 2017-GS7, Class XA
1.137%, 08/10/503,11 | | | 10,341,682 | | | | 771,786 | |
Series 2018-3PCK, Class A
(1 month LIBOR + 1.450%),
3.730%, 09/15/211 | | | 750,000 | | | | 750,938 | |
GSR Mortgage Loan Trust | | | | | | | | |
Series 2006-2F, Class 2A17
5.750%, 02/25/36 | | | 2,497,951 | | | | 2,406,536 | |
Series 2006-AR1, Class 3A1
3.995%, 01/25/363 | | | 289,665 | | | | 286,265 | |
HSI Asset Loan Obligation Trust
Series 2007-2, Class 1A1
5.500%, 09/25/37 | | | 10,387 | | | | 9,952 | |
JP Morgan Chase Commercial Mortgage Securities Corp. | | | | | | | | |
Series 2017-MAUI, Class C
(1 month LIBOR + 1.250%), 3.527%,
07/15/341,5 | | | 223,000 | | | | 223,404 | |
Series 2017-MAUI, Class D
(1 month LIBOR + 1.950%),
4.227%, 07/15/341,5 | | | 209,000 | | | | 209,917 | |
| | | | | | | | |
| | | Principal
Amount | | | Value | |
JP Morgan Chase Commercial Mortgage Securities Corp. | | | | | | | | |
Series 2017-MAUI, Class E
(1 month LIBOR + 2.950%),
5.227%, 07/15/341,5 | | $ | 185,000 | | | $ | 186,545 | |
Series 2017-MAUI, Class F
(1 month LIBOR + 3.750%),
6.027%, 07/15/341,5 | | | 260,000 | | | | 262,552 | |
JP Morgan Chase Commercial Mortgage Securities Trust | | | | | | | | |
Series 2006-A2, Class 2A1
3.705%, 04/25/363 | | | 1,578,362 | | | | 1,514,198 | |
Series 2006-LDP8, Class X
0.286%, 05/15/453,11 | | | 44,432 | | | | 58 | |
Series 2006-LDP9, Class AM
5.372%, 05/15/47 | | | 102,537 | | | | 102,807 | |
Series 2007-LDPX, Class AM
5.464%, 01/15/493 | | | 56,778 | | | | 56,877 | |
Series 2011-C4, Class XA
1.201%, 07/15/461,3,11 | | | 264,093 | | | | 6,378 | |
Series 2012-C8, Class XA
1.785%, 10/15/453,11 | | | 1,513,562 | | | | 81,445 | |
Series 2012-CBX, Class XA
2.066%, 06/15/453,11 | | | 581,695 | | | | 21,430 | |
Series 2015-JP1, Class XA
1.124%, 01/15/493,11 | | | 8,225,352 | | | | 379,945 | |
Series 2016-JP2, Class B
3.460%, 08/15/49 | | | 320,000 | | | | 303,373 | |
Series 2016-JP2, Class C
3.792%, 08/15/493 | | | 246,000 | | | | 230,067 | |
JPMBB Commercial Mortgage Securities Trust | | | | | | | | |
Series 2014-C18, Class XA
0.932%, 02/15/473,11 | | | 5,141,842 | | | | 181,461 | |
Series 2014-C21, Class XA
1.021%, 08/15/473,11 | | | 3,511,875 | | | | 158,774 | |
Series 2014-C23, Class C
4.451%, 09/15/473 | | | 330,824 | | | | 328,645 | |
Series 2014-C25, Class C
4.445%, 11/15/473 | | | 450,000 | | | | 441,854 | |
Series 2014-C25, Class XA
0.947%, 11/15/473,11 | | | 6,319,235 | | | | 244,834 | |
Series 2014-C26, Class XA
1.090%, 01/15/483,11 | | | 4,985,198 | | | | 204,129 | |
Series 2015-C27, Class D
3.843%, 02/15/481,3 | | | 263,000 | | | | 238,908 | |
Series 2015-C28, Class XA
1.146%, 10/15/483,11 | | | 7,699,879 | | | | 332,838 | |
Series 2015-C33, Class C
4.617%, 12/15/483 | | | 670,000 | | | | 663,612 | |
Series 2016-C1, Class C
4.744%, 03/15/493 | | | 755,000 | | | | 752,446 | |
JPMDB Commercial Mortgage Securities Trust
Series 2016-C2, Class XA
1.691%, 06/15/493,11 | | | 7,624,485 | | | | 600,441 | |
Lehman XS Trust
Series 2007-12N, Class 1A3A (1 month LIBOR + 0.200%),
2.481%, 07/25/475 | | | 6,145,953 | | | | 5,888,663 | |
The accompanying notes are an integral part of these financial statements.
81
| | |
AMG Managers DoubleLine Core Plus Bond Fund Schedule of Portfolio Investments (continued) | | |
| | | | | | | | |
| | | Principal
Amount | | | Value | |
Mortgage-Backed Securities - 16.7% (continued) | | | | | |
LSTAR Commercial Mortgage Trust
Series 2016-4, Class C
4.555%, 03/10/491,3 | | $ | 588,000 | | | $ | 522,544 | |
Morgan Stanley Bank of America Merrill Lynch Trust | | | | | | | | |
Series 2012-C5, Class XA
1.469%, 08/15/451,3,11 | | | 683,453 | | | | 29,328 | |
Series 2014-C14, Class XA
1.146%, 02/15/473,11 | | | 5,258,360 | | | | 154,852 | |
Series 2014-C18, Class C
4.489%, 10/15/473 | | | 300,000 | | | | 293,918 | |
Series 2014-C19, Class C
4.000%, 12/15/47 | | | 413,500 | | | | 391,863 | |
Series 2015-C25, Class C
4.528%, 10/15/483 | | | 785,000 | | | | 776,391 | |
Series 2015-C26, Class D
3.060%, 10/15/481 | | | 453,000 | | | | 384,991 | |
Series 2015-C27, Class C
4.532%, 12/15/473 | | | 80,000 | | | | 77,417 | |
Series 2016-C28, Class XA
1.267%, 01/15/493,11 | | | 8,347,469 | | | | 547,662 | |
Series 2016-C29, Class C
4.751%, 05/15/493 | | | 844,000 | | | | 838,299 | |
Morgan Stanley Capital I Trust | | | | | | | | |
Series 2011-C1, Class XA
0.393%, 09/15/471,3,11 | | | 497,240 | | | | 3,328 | |
Series 2014-CPT, Class E
3.446%, 07/13/291,3 | | | 250,000 | | | | 244,949 | |
Series 2016-UB11, Class XA
1.646%, 08/15/493,11 | | | 2,789,489 | | | | 239,707 | |
Morgan Stanley Mortgage Loan Trust | | | | | | | | |
Series 2005-3AR, Class 2A2
3.706%, 07/25/353 | | | 436,603 | | | | 390,584 | |
Series 2005-9AR, Class 2A
4.180%, 12/25/353 | | | 4,359,106 | | | | 4,143,257 | |
Series 2007-14AR, Class 1A3
4.051%, 10/25/373 | | | 1,008,192 | | | | 978,517 | |
MSCG Trust
Series 2016-SNR, Class C
5.205%, 11/15/341 | | | 804,100 | | | | 796,088 | |
Natixis Commercial Mortgage Securities Trust | | | | | | | | |
Series 2018-FL1, Class A
(1 month LIBOR + 0.950%), 3.108%,
06/15/351,5 | | | 584,000 | | | | 584,335 | |
Series 2018-FL1, Class C
(1 month LIBOR + 2.200%), 4.358%,
06/15/351,5 | | | 584,000 | | | | 583,857 | |
Nomura Asset Acceptance Corp. Alternative Loan Trust
Series 2005-AP3, Class A3
5.318%, 08/25/353 | | | 210,660 | | | | 139,983 | |
PR Mortgage Loan Trust
Series 2014-1, Class APT
5.911%, 10/25/491,3 | | | 2,027,308 | | | | 1,781,175 | |
| | | | | | | | |
| | | Principal
Amount | | | Value | |
RALI Trust | | | | | | | | |
Series 2005-QA10, Class A31
4.747%, 09/25/353 | | $ | 931,252 | | | $ | 825,663 | |
Series 2006-QO10, Class A1
(1 month LIBOR + 0.160%), 2.441%,
01/25/375 | | | 5,775,424 | | | | 5,594,985 | |
Series 2006-QS7, Class A2
6.000%, 06/25/36 | | | 2,829,505 | | | | 2,585,107 | |
Residential Asset Securitization Trust | | | | | | | | |
Series 2006-A6, Class 1A1
6.500%, 07/25/36 | | | 197,783 | | | | 107,173 | |
Series 2007-A1, Class A8
6.000%, 03/25/37 | | | 377,821 | | | | 244,255 | |
Seasoned Credit Risk Transfer Trust
Series 2018-2, Class HV
3.000%, 11/25/573 | | | 4,937,187 | | | | 4,644,244 | |
Sequoia Mortgage Trust
Series 2013-1, Class 2A1
1.855%, 02/25/433 | | | 1,202,137 | | | | 1,061,734 | |
Structured Adjustable Rate Mortgage Loan Trust
Series 2006-1, Class 2A2
4.016%, 02/25/363 | | | 121,757 | | | | 118,251 | |
UBS Commercial Mortgage Trust
Series 2018-C8, Class C
4.705%, 02/15/513 | | | 917,000 | | | | 903,719 | |
UBS-Barclays Commercial Mortgage Trust
Series 2012-C3, Class XA
1.838%, 08/10/491,3,11 | | | 1,391,086 | | | | 80,417 | |
Washington Mutual Mortgage Pass Through Certificates WMALT Trust
Series 2005-8, Class 2CB1
5.500%, 10/25/35 | | | 1,245,022 | | | | 1,218,060 | |
Wells Fargo Commercial Mortgage Trust | | | | | | | | |
Series 2014-LC16, Class D
3.938%, 08/15/501 | | | 725,000 | | | | 597,532 | |
Series 2015-C26, Class D
3.586%, 02/15/481 | | | 471,800 | | | | 406,352 | |
Series 2015-C28, Class C
4.129%, 05/15/483 | | | 400,000 | | | | 378,261 | |
Series 2015-C31, Class C
4.610%, 11/15/483 | | | 585,000 | | | | 574,152 | |
Series 2015-C31, Class XA
1.078%, 11/15/483,11 | | | 8,257,285 | | | | 470,100 | |
Series 2015-LC22, Class C
4.542%, 09/15/583 | | | 480,000 | | | | 471,450 | |
Series 2015-NXS1, Class XA
1.159%, 05/15/483,11 | | | 4,351,358 | | | | 210,116 | |
Series 2015-NXS3, Class C
4.638%, 09/15/573 | | | 610,000 | | | | 591,796 | |
Series 2016-C32, Class C
4.722%, 01/15/593 | | | 558,000 | | | | 546,874 | |
Series 2016-C33, Class C
3.896%, 03/15/59 | | | 517,000 | | | | 490,468 | |
Series 2016-C33, Class XA
1.776%, 03/15/593,11 | | | 5,204,192 | | | | 467,573 | |
The accompanying notes are an integral part of these financial statements.
82
| | |
AMG Managers DoubleLine Core Plus Bond Fund Schedule of Portfolio Investments (continued) | | |
| | | | | | | | |
| | | Principal
Amount | | | Value | |
Mortgage-Backed Securities - 16.7% (continued) | | | | | |
Wells Fargo Commercial Mortgage Trust | | | | | | | | |
Series 2016-NXS6, Class XA
1.644%, 11/15/493,11 | | $ | 6,219,302 | | | $ | 532,151 | |
Series 2017-C39, Class XA
1.141%, 09/15/503,11 | | | 13,728,567 | | | | 1,010,579 | |
Series 2017-C41, Class C
4.511%, 11/15/503 | | | 1,238,000 | | | | 1,212,316 | |
Wells Fargo Mortgage Backed Securities Trust | | | | | | | | |
Series 2007-13, Class A6 6.000%, 09/25/37 | | | 139,500 | | | | 139,475 | |
Series 2007-8, Class 1A16 6.000%, 07/25/37 | | | 150,085 | | | | 149,324 | |
WFRBS Commercial Mortgage Trust | | | | | | | | |
Series 2012-C8, Class XA
1.839%, 08/15/451,3,11 | | | 692,098 | | | | 38,094 | |
Series 2012-C9, Class XA
1.887%, 11/15/451,3,11 | | | 1,108,722 | | | | 67,212 | |
Series 2014-C21, Class XA
1.073%, 08/15/473,11 | | | 5,951,831 | | | | 259,118 | |
Total Mortgage-Backed Securities
(Cost $94,849,145) | | | | | | | 95,301,857 | |
Municipal Bonds - 0.1% | | | | | | | | |
State of California
7.550%, 04/01/39 | | | 305,000 | | | | 434,149 | |
Missouri Highway & Transportation Commission, Build America Bonds
5.063%, 05/01/24 | | | 220,000 | | | | 234,885 | |
Total Municipal Bonds
(Cost $688,099) | | | | | | | 669,034 | |
U.S. Government and Agency Obligations -32.5% | | | | | | | | |
Fannie Mae - 9.4% | | | | | | | | |
Fannie Mae, | | | | | | | | |
3.000%, 03/01/45 to 04/01/45 | | | 6,291,294 | | | | 5,955,581 | |
3.500%, 12/01/31 to 03/01/46 | | | 9,049,431 | | | | 8,862,080 | |
4.000%, 09/01/31 to 06/01/42 | | | 388,310 | | | | 388,753 | |
4.500%, 03/01/42 | | | 80,759 | | | | 81,746 | |
Fannie Mae REMICS, | | | | | | | | |
Series 2007-57, Class SX
(6.620% - 1 month LIBOR),
4.339%, 10/25/365,11 | | | 118,537 | | | | 14,432 | |
Series 2009-86, Class CI
(5.800% - 1 month LIBOR),
3.519%, 09/25/365,11 | | | 141,332 | | | | 12,301 | |
Series 2010-156, Class ZC
4.000%, 01/25/41 | | | 360,847 | | | | 335,453 | |
Series 2011-121, Class JP
4.500%, 12/25/41 | | | 140,544 | | | | 144,240 | |
Series 2011-18, Class UZ
4.000%, 03/25/41 | | | 476,858 | | | | 489,570 | |
Series 2012-105, Class Z
3.500%, 10/25/42 | | | 1,236,898 | | | | 1,164,007 | |
| | | | | | | | |
| | | Principal
Amount | | | Value | |
Fannie Mae REMICS, | | | | | | | | |
Series 2012-127, Class PA
2.750%, 11/25/42 | | $ | 1,579,927 | | | $ | 1,504,061 | |
Series 2012-20, Class ZT
3.500%, 03/25/42 | | | 4,544,602 | | | | 4,336,453 | |
Series 2012-31, Class Z
4.000%, 04/25/42 | | | 1,951,036 | | | | 1,984,219 | |
Series 2013-5, Class EZ
2.000%, 08/25/42 | | | 7,058,514 | | | | 6,046,435 | |
Series 2013-8, Class Z
3.000%, 02/25/43 | | | 5,658,365 | | | | 5,087,333 | |
Series 2014-73, Class CZ
3.000%, 11/25/44 | | | 5,636,640 | | | | 4,914,002 | |
Series 2015-9, Class HA
3.000%, 01/25/45 | | | 4,447,458 | | | | 4,361,677 | |
Series 2015-95, Class AP
3.000%, 08/25/42 | | | 3,114,407 | | | | 3,027,070 | |
Series 2016-24, Class NZ
3.000%, 05/25/46 | | | 5,863,949 | | | | 5,233,186 | |
Total Fannie Mae | | | | | | | 53,942,599 | |
Freddie Mac - 5.1% | | | | | | | | |
Freddie Mac Gold, | | | | | | | | |
3.000%, 07/01/45 to 08/01/45 | | | 6,611,267 | | | | 6,277,330 | |
3.500%, 10/01/42 | | | 608,720 | | | | 589,116 | |
4.000%, 10/01/41 | | | 123,687 | | | | 122,759 | |
5.000%, 07/01/35 | | | 19,447 | | | | 20,598 | |
Freddie Mac Multifamily Structured Pass Through Certificates, | | | | | | | | |
Series K050, Class A2
3.334%, 08/25/253 | | | 569,000 | | | | 563,282 | |
Series K053, Class A2
2.995%, 12/25/25 | | | 766,000 | | | | 741,429 | |
Series K722, Class X1
1.309%, 03/25/233,11 | | | 5,319,103 | | | | 242,021 | |
Freddie Mac REMICS, | | | | | | | | |
Series 2909, Class Z
5.000%, 12/15/34 | | | 262,786 | | | | 277,301 | |
Series 3301, Class MS
(6.100% - 1 month LIBOR), 3.821%,
04/15/375,11 | | | 69,280 | | | | 7,134 | |
Series 3382, Class SB
(6.000% - 1 month LIBOR), 3.721%,
11/15/375,11 | | | 22,224 | | | | 1,749 | |
Series 3384, Class S
(6.390% - 1 month LIBOR), 4.111%, 11/15/375,11 | | | 24,806 | | | | 2,021 | |
Series 3500, Class SA
(5.520% - 1 month LIBOR), 3.241%,
01/15/395,11 | | | 61,725 | | | | 4,648 | |
Series 3626, Class AZ
5.500%, 08/15/36 | | | 125,141 | | | | 130,525 | |
Series 3738, Class BP
4.000%, 12/15/38 | | | 662,361 | | | | 669,676 | |
Series 3792, Class SE
(9.860% - 2 times 1-Month LIBOR), 5.301%,
01/15/415 | | | 903,021 | | | | 833,317 | |
Series 3795, Class VZ
4.000%, 01/15/41 | | | 136,272 | | | | 138,954 | |
The accompanying notes are an integral part of these financial statements.
83
| | |
| AMG Managers DoubleLine Core Plus Bond Fund | | |
| Schedule of Portfolio Investments (continued) | | |
| | | | | | | | |
| | | Principal
Amount | | | Value | |
Freddie Mac - 5.1% (continued) | | | | | | | | |
Freddie Mac REMICS, | | | | | | | | |
Series 3872, Class BA
4.000%, 06/15/41 | | $ | 32,869 | | | $ | 32,353 | |
Series 3888, Class ZG
4.000%, 07/15/41 | | | 198,106 | | | | 200,925 | |
Series 3894, Class ZA
4.500%, 07/15/41 | | | 377,987 | | | | 384,421 | |
Series 3957, Class DZ
3.500%, 11/15/41 | | | 443,127 | | | | 429,021 | |
Series 3957, Class HZ
4.000%, 11/15/41 | | | 593,154 | | | | 595,786 | |
Series 4016, Class KZ
4.000%, 03/15/42 | | | 2,341,243 | | | | 2,346,813 | |
Series 4075, Class S
(5.500% - 1 month LIBOR), 3.221%,
07/15/425,11 | | | 3,158,646 | | | | 384,244 | |
Series 4215, Class KC
2.250%, 03/15/38 | | | 1,871,004 | | | | 1,827,774 | |
Series 4316, Class BZ
3.000%, 03/15/44 | | | 3,441,615 | | | | 3,034,796 | |
Series 4323, Class GA
3.000%, 06/15/40 | | | 1,832,407 | | | | 1,811,038 | |
Series 4511, Class QA
3.000%, 01/15/41 | | | 2,840,504 | | | | 2,791,446 | |
Series 4750, Class PA
3.000%, 07/15/46 | | | 4,782,687 | | | | 4,567,368 | |
Total Freddie Mac | | | | | | | 29,027,845 | |
Ginnie Mae - 0.3% | | | | | | | | |
Ginnie Mae, | | | | | | | | |
Series 2004-35, Class SA
(32.500% - 6.5 times 1-Month LIBOR),
17.682%, 03/20/345 | | | 20,789 | | | | 29,131 | |
Series 2008-69, Class SB
(7.630% - 1 month LIBOR), 5.350%,
08/20/385,11 | | | 242,705 | | | | 37,790 | |
Series 2009-32, Class ZE
4.500%, 05/16/39 | | | 271,427 | | | | 282,951 | |
Series 2009-35, Class DZ
4.500%, 05/20/39 | | | 304,863 | | | | 316,559 | |
Series 2009-75, Class GZ
4.500%, 09/20/39 | | | 318,795 | | | | 324,986 | |
Series 2010-98, Class IA
5.746%, 03/20/393,11 | | | 64,255 | | | | 8,371 | |
Series 2011-89, Class SA
(5.450% - 1 month LIBOR), 3.170%,
06/20/415,11 | | | 548,635 | | | | 54,177 | |
Series 2014-156, Class PS
(6.250% - 1 month LIBOR), 3.970%,
10/20/445,11 | | | 2,210,121 | | | | 288,334 | |
Series 2014-5, Class PS
(6.150% - 1 month LIBOR), 3.870%,
07/20/435,11 | | | 2,084,864 | | | | 225,303 | |
Total Ginnie Mae | | | | | | | 1,567,602 | |
U.S. Treasury Obligations - 17.7% | | | | | | | | |
U.S. Treasury Bonds,
3.000%, 08/15/48 | | | 1,150,000 | | | | 1,066,625 | |
| | | | | | | | |
| | | Principal
Amount | | | Value | |
U.S. Treasury Bonds, | | | | | | | | |
3.125%, 02/15/43 | | $ | 3,930,000 | | | $ | 3,759,981 | |
3.750%, 11/15/43 | | | 3,420,000 | | | | 3,629,809 | |
2.750%, 11/15/42 | | | 670,000 | | | | 600,069 | |
3.625%, 08/15/43 | | | 4,040,000 | | | | 4,200,890 | |
U.S. Treasury Notes, | | | | | | | | |
1.375%, 02/15/20 | | | 2,550,000 | | | | 2,504,678 | |
1.625%, 11/30/20 | | | 5,825,000 | | | | 5,677,896 | |
1.750%, 10/31/20 | | | 4,990,000 | | | | 4,881,916 | |
2.000%, 09/30/20 to 05/31/21 | | | 9,890,000 | | | | 9,695,746 | |
2.500%, 03/31/23 | | | 5,470,000 | | | | 5,364,019 | |
2.625%, 02/28/23 | | | 4,590,000 | | | | 4,526,708 | |
2.750%, 08/15/21 to 11/15/47 | | | 19,200,000 | | | | 18,725,033 | |
3.000%, 09/30/25 | | | 3,640,000 | | | | 3,625,070 | |
1.125%, 01/31/19 to 06/30/21 | | | 6,275,000 | | | | 6,014,937 | |
1.875%, 01/31/22 to 08/31/24 | | | 6,595,000 | | | | 6,220,012 | |
2.125%, 09/30/24 | | | 5,650,000 | | | | 5,373,900 | |
2.250%, 10/31/24 to 11/15/27 | | | 15,880,000 | | | | 14,969,762 | |
Total U.S. Treasury Obligations | | | | | | | 100,837,051 | |
Total U.S. Government and Agency Obligations
(Cost $192,012,028) | | | | | | | 185,375,097 | |
Foreign Government Obligations - 1.9% | | | | | |
Argentine Republic Government International Bond (Argentina) | | | | | | | | |
5.875%, 01/11/28 | | | 450,000 | | | | 349,875 | |
6.625%, 07/06/284 | | | 350,000 | | | | 280,612 | |
6.875%, 01/26/27 | | | 1,400,000 | | | | 1,175,475 | |
Costa Rica Government (Costa Rica)
9.995%, 08/01/20 | | | 500,000 | | | | 519,500 | |
Fondo MIVIVIENDA S.A. (Peru)
3.500%, 01/31/23 | | | 300,000 | | | | 288,750 | |
Israel Government International Bond (Israel)
2.875%, 03/16/26 | | | 1,100,000 | | | | 1,038,741 | |
Mexico Government International Bond (Mexico) | | | | | | | | |
3.750%, 01/11/28 | | | 560,000 | | | | 516,466 | |
4.150%, 03/28/27 | | | 406,000 | | | | 387,070 | |
Panama Government International Bond (Panama)
4.000%, 09/22/24 | | | 500,000 | | | | 498,750 | |
Perusahaan Penerbit SBSN Indonesia III (Indonesia) | | | | | | | | |
4.150%, 03/29/271 | | | 1,200,000 | | | | 1,128,900 | |
4.150%, 03/29/27 | | | 800,000 | | | | 752,600 | |
Philippine Government International Bond (Philippines)
4.200%, 01/21/24 | | | 1,500,000 | | | | 1,517,874 | |
Provincia De Buenos Aires/Argentina (Argentina)
7.875%, 06/15/27 | | | 1,500,000 | | | | 1,179,765 | |
S.P.A.RC EM SPC Panama Metro Line 2 SP (Cayman Islands)
0.000%, 12/05/221,6 | | | 1,396,000 | | | | 1,266,870 | |
Total Foreign Government Obligations
(Cost $11,895,703) | | | | | | | 10,901,248 | |
The accompanying notes are an integral part of these financial statements.
84
| | |
| AMG Managers DoubleLine Core Plus Bond Fund | | |
| Schedule of Portfolio Investments (continued) | | |
| | | | | | | | |
| | | Principal
Amount | | | Value | |
Floating Rate Senior Loan Interests - 4.3% | | | | | | | | |
Financials - 0.6% | | | | | | | | |
Acrisure LLC First Lien Term Loan B-2,
(1 month LIBOR + 4.250%), 6.552%, 11/22/235 | | $ | 437,789 | | | $ | 439,869 | |
AlixPartners LLP 2017 Refinancing Term Loan,
(1 month LIBOR + 2.750%), 5.052%, 04/04/245 | | | 457,677 | | | | 458,678 | |
AssuredPartners, Inc. 2017 September
Refinancing Term Loan,
(1 month LIBOR + 3.250%), 5.552%, 10/22/245 | | | 500,483 | | | | 499,779 | |
Asurion LLC Replacement B-6 Term Loan,
(1 month LIBOR + 3.000%), 5.302%, 11/03/235 | | | 447,676 | | | | 448,796 | |
Canyon Valor Cos, Inc.,
(3 month LIBOR + 2.750%), 5.136%, 06/16/235 | | | 438,669 | | | | 438,511 | |
Forest City Enterprises LP,
(USD LIBOR + 4.000%), 0.000%, 10/24/255,12 | | | 135,000 | | | | 135,731 | |
TKC Holdings Inc Initial Term Loan (First Lien),
(1 month LIBOR + 3.750%), 6.060%, 02/01/235 | | | 447,727 | | | | 448,511 | |
UFC Holdings, LLC Term Loan (First Lien),
(1 month LIBOR + 3.250%), 5.560%, 08/18/235 | | | 447,716 | | | | 450,834 | |
Total Financials | | | | | | | 3,320,709 | |
Industrials - 3.6% | | | | | | | | |
Almonde Inc First Lien Dollar Term Loan,
(3 month LIBOR + 3.500%), 5.886%, 06/13/245 | | | 379,263 | | | | 377,604 | |
Alterra Mountain Company Initial Term Loan,
(1 month LIBOR + 3.000%), 5.302%, 07/31/245 | | | 468,043 | | | | 469,432 | |
Applied Systems, Inc. Initial Term Loan
(First Lien),
(3 month LIBOR + 3.250%), 5.386%, 09/19/245 | | | 147,688 | | | | 148,201 | |
Auris Luxembourg Iii, S.A.,
(USD LIBOR + 3.750%), 0.000%, 07/24/255,12 | | | 190,000 | | | | 191,603 | |
BCP Renaissance Parent LLC Initial Term Loan,
(3 month LIBOR + 3.500%), 6.027%, 10/31/245 | | | 124,425 | | | | 125,047 | |
BJ’s Wholesale Club, Inc.,
(1 month LIBOR + 3.000%), 5.280%, 02/05/245 | | | 365,635 | | | | 366,879 | |
Boxer Parent Co., Inc., Initial Dollar Term Loan,
(3 month LIBOR + 4.250%), 6.648%, 10/02/255 | | | 315,000 | | | | 318,773 | |
Brookfield Wec Holdings Inc. First Lien
Term Loan,
(1 month LIBOR + 3.750%), 6.052%, 07/31/255 | | | 235,000 | | | | 236,909 | |
CH Hold Corp First Lien Initial Term Loan,
(1 month LIBOR + 3.000%), 5.302%, 02/01/245 | | | 447,728 | | | | 448,847 | |
Change Healthcare Holdings LLC Closing Date
Term Loan,
(1 month LIBOR + 2.750%), 5.230%, 03/01/245 | | | 443,182 | | | | 443,212 | |
CHG Healthcare Services Inc. New Term Loan,
(1 month LIBOR + 3.000%), 5.302%, 06/07/235 | | | 450,000 | | | | 452,049 | |
Concentra Inc. First Lien Term B-1 Loan,
(1 month LIBOR + 2.750%), 5.030%, 06/01/225 | | | 450,000 | | | | 451,688 | |
Cvent Inc. First Lien Term Loan,
(1 month LIBOR + 3.750%), 6.052%, 11/30/245 | | | 447,750 | | | | 448,869 | |
| | | | | | | | |
| | | Principal
Amount | | | Value | |
Cyxtera DC Holdings Inc., Initial Term Loan (First Lien),
(1 month LIBOR + 3.000%), 5.280%, 05/01/245 | | $ | 447,733 | | | $ | 447,453 | |
EG America LLC Additional Facility Loan,
(3 month LIBOR + 4.000%), 6.386%, 02/07/255 | | | 512,750 | | | | 513,391 | |
Envision Healthcare Corp.,
(1 month LIBOR + 3.750%), 6.052%, 10/10/255 | | | 375,000 | | | | 367,995 | |
Equian LLC 2018 Incremental Term Loan B,
(1 month LIBOR + 3.250%), 5.537%, 05/20/245 | | | 447,733 | | | | 448,153 | |
Equinox Holdings Inc. Term B-1 Loan,
(1 month LIBOR + 3.000%), 5.302%, 03/08/245 | | | 447,739 | | | | 448,159 | |
Explorer Holdings, Inc. Initial Term Loan,
(3 month LIBOR + 3.750%), 6.136%, 05/02/235 | | | 447,710 | | | | 451,627 | |
Filtration Group Corporation Initial Dollar
Term Loan,
(1 month LIBOR + 3.000%), 5.302%, 03/29/255 | | | 447,750 | | | | 450,175 | |
Garda World Security Corporation New
Incremental Term B Loan,
(3 month LIBOR + 3.500%), 5.821%, 05/24/245 | | | 447,727 | | | | 449,756 | |
Gates Global LLC Initial B-2 Dollar Term Loan,
(1 month LIBOR + 2.750%), 5.052%, 04/01/245 | | | 447,739 | | | | 449,018 | |
Gentiva Health Services Inc. First Lien Closing
Date Initial Term Loan,
(1 month LIBOR + 3.750%), 6.063%, 07/02/255 | | | 381,177 | | | | 382,596 | |
Gobp Holdings, Inc.,
(1 month LIBOR + 3.750%), 6.030%, 10/22/255 | | | 185,000 | | | | 185,347 | |
Greeneden US Holdings II LLC Tranche B-3 Dollar Term Loan,
(1 month LIBOR + 3.500%), 5.802%, 12/01/235 | | | 457,694 | | | | 459,239 | |
Hyland Software, Inc., 2018 Refinancing Term
Loan,
(1 month LIBOR + 3.500%), 5.552%, 07/01/245 | | | 50,000 | | | | 50,313 | |
Hyland Software, Inc., Senior Secured First Lien
Term-3 Loan,
(1 month LIBOR + 3.250%), 5.492%, 07/01/225 | | | 447,727 | | | | 451,155 | |
Informatica LLC Dollar Term B-1 Loan,
(1 month LIBOR + 3.250%), 5.552%, 08/05/225 | | | 472,612 | | | | 474,606 | |
IRB Holding Corp Term B Loan,
(1 month LIBOR + 3.250%), 5.460%, 02/05/255 | | | 447,750 | | | | 447,910 | |
Jaguar Holding Company II 2018 Term Loan,
(1 month LIBOR + 2.500%), 4.802%, 08/18/225 | | | 523,647 | | | | 522,706 | |
Kronos Incorporated 2018 New Incremental
Term Loan,
(3 month LIBOR + 3.000%), 5.343%, 11/01/235 | | | 447,750 | | | | 448,986 | |
Life Time Inc New 2017 Refinancing Term Loan,
(3 month LIBOR + 2.750%), 5.063%, 06/10/225 | | | 447,739 | | | | 448,508 | |
Messer Industries USA, Inc.,
(USD LIBOR + 2.500%), 0.000%, 10/01/255,12 | | | 145,000 | | | | 145,236 | |
Milacron LLC Term B Loan,
(1 month LIBOR + 2.500%), 4.802%, 09/28/235 | | | 437,324 | | | | 438,144 | |
The accompanying notes are an integral part of these financial statements.
85
| | |
| AMG Managers DoubleLine Core Plus Bond Fund | | |
| Schedule of Portfolio Investments (continued) | | |
| | | | | | | | |
| | | Principal
Amount | | | Value | |
Industrials - 3.6% (continued) | | | | | | | | |
Mitchell International, Inc. Initial Term Loan
(First Lien),
(1 month LIBOR + 3.250%), 5.552%, 11/29/245 | | $ | 318,400 | | | $ | 317,206 | |
MLN US Holdings, LLC Term Loan (First Lien),
(USD LIBOR + 4.500%), 0.000%, 07/11/255,12 | | | 295,000 | | | | 296,844 | |
MPH Acquisition Holdings LLC Initial Term Loan,
(3 month LIBOR + 2.750%), 5.136%, 06/07/235 | | | 457,106 | | | | 456,714 | |
National Vision Inc. First Lien New Term Loan,
(1 month LIBOR + 2.500%), 4.802%, 11/20/245 | | | 289,051 | | | | 289,502 | |
Pisces Midco, Inc.,
(USD LIBOR + 3.750%), 0.000%, 04/12/255,12 | | | 285,000 | | | | 284,347 | |
PODS LLC Tranche B-4 Term Loan,
(1 month LIBOR + 2.750%), 5.034%, 12/06/245 | | | 523,678 | | | | 521,322 | |
Prime Security Services Borrower, Term B-1 Loan (First Lien),
(1 month LIBOR + 2.750%), 5.052%, 05/02/225 | | | 379,248 | | | | 379,959 | |
Refinitiv US Holdings, Inc.,
(1 month LIBOR + 3.750%), 6.052%, 10/01/255 | | | 305,000 | | | | 302,713 | |
Science Applications International Corp.,
(USD LIBOR + 1.750%), 0.000%, 11/05/255,12 | | | 140,000 | | | | 140,197 | |
Scientific Games International, Inc. Initial Term B-5 Loan,
(2 month LIBOR + 2.750%), 5.044%, 08/14/245 | | | 497,500 | | | | 493,561 | |
SCS Holdings I Inc. New Tranche B Term Loan (First Lien),
(1 month LIBOR + 4.250%), 6.552%, 10/30/225 | | | 276,145 | | | | 278,043 | |
Securus Technologies Holdings Inc Initial Term Loan (First Lien),
(1 month LIBOR + 4.500%), 6.802%, 11/01/245 | | | 447,744 | | | | 450,095 | |
Select Medical Corp.,
(3 month LIBOR + 2.500%), 4.780%, 03/06/255 | | | 447,727 | | | | 450,246 | |
Solera LLC Dollar Term Loan,
(1 month LIBOR + 2.750%), 5.052%, 03/03/235 | | | 448,849 | | | | 449,049 | |
Sophia LP Term B Loan,
(3 month LIBOR + 3.250%), 5.636%, 09/30/225 | | | 462,614 | | | | 463,819 | |
StandardAero Aviation Holdings Inc Initial
Term Loan,
(1 month LIBOR + 3.750%), 6.050%, 07/07/225 | | | 447,692 | | | | 450,171 | |
Starfruit US Holdco LLC,
(1 month LIBOR + 3.250%), 5.506%, 10/01/255 | | | 190,000 | | | | 189,911 | |
Tenneco Inc. Term Loan,
(1 month LIBOR + 2.750%), 5.052%, 10/01/255 | | | 295,000 | | | | 294,539 | |
VeriFone Systems, Inc.,
(3 month LIBOR + 4.000%), 6.322%, 08/20/255 | | | 175,000 | | | | 175,350 | |
Verscend Holding Corp.,
(1 month LIBOR + 4.500%), 6.802%, 08/27/255 | | | 270,000 | | | | 272,194 | |
Vertafore Inc. Initial Term Loan (First Lien),
(1 month LIBOR + 3.250%), 5.552%, 07/02/255 | | | 465,000 | | | | 463,962 | |
| | | | | | | | |
| | | Principal
Amount | | | Value | |
Web.com Group, Inc.,
(3 month LIBOR + 3.750%), 6.170%, 10/10/255 | | $ | 185,000 | | | $ | 185,347 | |
Yak Access LLC First Lien Initial Term Loan,
(1 month LIBOR + 5.000%), 7.283%, 07/11/255 | | | 26,200 | | | | 24,103 | |
Total Industrials | | | | | | | 20,588,780 | |
Utilities - 0.1% | | | | | | | | |
Exgen Renewables IV LLC Loan,
(3 month LIBOR + 3.000%), 5.320%, 11/28/245 | | | 450,000 | | | | 454,500 | |
Pike Corporation Initial Term Loan (2018),
(1 month LIBOR + 3.500%), 5.810%, 03/21/255 | | | 510,153 | | | | 513,933 | |
Total Utilities | | | | | | | 968,433 | |
Total Floating Rate Senior Loan Interests | | | | | | | | |
(Cost $24,877,728) | | | | | | | 24,877,922 | |
| | |
| | | Shares | | | | |
Common Stocks - 0.0%# | | | | | | | | |
Energy - 0.0%# | | | | | | | | |
Frontera Energy Corp. (Colombia)* | | | 17,242 | | | | 224,663 | |
SandRidge Energy, Inc.* | | | 864 | | | | 7,733 | |
Total Energy | | | | | | | 232,396 | |
Total Common Stocks | | | | | | | | |
(Cost $340,428) | | | | | | | 232,396 | |
Investment Companies - 3.5% | | | | | | | | |
DoubleLine Global Bond Fund,
Class I %13 (Cost 21,201,656) | | | 2,034,321 | | | | 20,139,780 | |
| | |
| | | Principal
Amount | | | | |
Short-Term Investments - 4.6% | | | | | | | | |
Joint Repurchase Agreements - 1.2%14 | | | | | | | | |
Citigroup Global Markets, Inc., dated 10/31/18, due 11/01/18, 2.220% total to be received $1,635,514 (collateralized by various U.S. Government Agency Obligations and U.S. Treasuries, 0.000% - 6.500%, 10/01/19 - 09/09/49, totaling $1,668,121) | | $ | 1,635,413 | | | | 1,635,413 | |
| | |
HSBC Securities USA, Inc., dated 10/31/18, due 11/01/18, 2.210% total to be received $1,635,513 (collateralized by various U.S. Government Agency Obligations, 2.500% - 5.000%, 07/01/23 - 01/01/57, totaling $1,668,121) | | | 1,635,413 | | | | 1,635,413 | |
| | |
Merrill Lynch, Pierce, Fenner & Smith, Inc., dated 10/31/18, due 11/01/18, 2.200% total to be received $343,883 (collateralized by various U.S. Treasuries, 0.125% - 2.500%, 04/30/20 -09/09/49, totaling $350,739) | | | 343,862 | | | | 343,862 | |
| | |
Nomura Securities International, Inc., dated 10/31/18, due 11/01/18, 2.210% total to be received $1,635,513 (collateralized by various U.S. Government Agency Obligations and U.S. Treasuries, 0.000% - 9.500%, 11/08/18 -09/20/68, totaling $1,668,121) | | | 1,635,413 | | | | 1,635,413 | |
The accompanying notes are an integral part of these financial statements.
86
| | |
| AMG Managers DoubleLine Core Plus Bond Fund | | |
| Schedule of Portfolio Investments (continued) | | |
| | | | | | | | |
| | | Principal | | | | |
| | | Amount | | | Value | |
Joint Repurchase Agreements - 1.2%14
(continued) | | | | | | | | |
RBC Dominion Securities, Inc., dated 10/31/18, due 11/01/18, 2.220% total to be received $1,635,514 (collateralized by various U.S. Government Agency Obligations and U.S. Treasuries, 0.000% - 7.000%, 11/29/18 -09/09/49, totaling $1,668,121) | | $ | 1,635,413 | | | $ | 1,635,413 | |
Total Joint Repurchase Agreements | | | | | | | 6,885,514 | |
U.S. Government and Agency
Obligation -0.1% | | | | | | | | |
United States Treasury Bill, 2.359%, 03/07/1915 | | | 390,000 | | | | 386,849 | |
| | |
| | | Shares | | | | |
Other Investment Companies - 3.3% | | | | | | | | |
Dreyfus Government Cash Management Fund, Institutional Class Shares, 2.05%16 | | | 6,162,674 | | | | 6,162,674 | |
| | | | | | | | |
| | | Shares | | | Value | |
Dreyfus Institutional Preferred Government Money Market Fund, Institutional Class Shares, 2.12%16 | | | 6,162,674 | | | $ | 6,162,674 | |
JPMorgan U.S. Government Money Market Fund, IM Shares, 2.09%16 | | | 6,349,421 | | | | 6,349,421 | |
Total Other Investment Companies | | | | | | | 18,674,769 | |
Total Short-Term Investments
(Cost $25,947,121) | | | | | | | 25,947,132 | |
Total Investments - 101.2%
(Cost $592,791,877) | | | | | | | 577,784,987 | |
Other Assets, less Liabilities - (1.2)% | | | | | | | (6,667,416 | ) |
Net Assets - 100.0% | | | | | | $ | 571,117,571 | |
| * | Non-income producing security. |
| 1 | Security exempt from registration under Rule 144A of the Securities Act of 1933. This security may be resold in transactions exempt from registration, normally to qualified buyers. At October 31, 2018, the value of these securities amounted to $116,716,735 or 20.4% of net assets. |
| 2 | Perpetuity Bond. The date shown is the final call date. |
| 3 | Certain variable rate securities are not based on a published reference rate and spread but are determined by the issuer or agent and are based on current market conditions. These securities do not indicate a reference rate and spread in their description above. |
| 4 | Some or all of these securities, amounting to $6,656,442 or 1.2% of net assets, were out on loan to various brokers and are collateralized by cash. See Note 4 of Notes to Financial Statements. |
| 5 | Variable rate security. The rate shown is based on the latest available information as of October 31, 2018. |
| 7 | Security is in default. Issuer has failed to make a timely payment of either principal or either interest or has failed to comply with some provision of the bond indenture. |
| 8 | Payment-in-Kind Security: The security may pay interest/dividends in additional par/shares and/or in cash. Rates shown are the current rate and possible payment rates. |
| 9 | All or part of the security is delayed delivery transaction. The market value for delayed delivery security at October 31, 2018, amounted to $95,713, or 0.0% of net assets. |
| 10 | Step Coupon. Security becomes interest bearing at a future date. |
| 11 | Interest only security. This type of security represents the right to receive the monthly interest payments on an underlying pool of mortgages. Payments of principal on the pool reduce the value of the “interest only” holding. |
| 12 | Loan will settle after October 31, 2018, at which time the interest rate will be known. |
| 13 | Affiliated issuer. See summary of affiliated investment transaction for details. |
| 14 | Cash collateral received from brokers for securities lending was invested in these joint repurchase agreements. |
| 15 | Represents yield to maturity at October 31, 2018. |
| 16 | Yield shown represents the October 31, 2018, seven day average yield, which refers to the sum of the previous seven days’ dividends paid, expressed as an annual percentage. |
| CLO | Collateralized Loan Obligation |
| EMTN | European Medium Term Note |
| GMTN | Global Medium-Term Notes |
| REMIC | LIBOR London Interbank Offered Rate |
| REMICS | Real Estate Mortgage Investment Conduit |
The following schedule shows the value of affiliated investments at October 31, 2018.
| | | | | | | | | | | | | | | | | | | | | | | | | | | | |
| | | | | | | | | | | | | | | Net increase | | | | | | | |
| | | | | | | | | | | | | | | /decrease in | | | | | | | |
| | | | | | | | | | | | | | | unrealized | | | | | | | |
| | | | | | | | | | | | Net realized | | | appreciation | | | Amount of | | | | |
| Affiliated | | Number | | | | | | | | | loss for | | | /depreciation | | | Dividends or | | | | |
| Issuers | | of shares | | | Purchases | | | Sales | | | the period | | | for the period | | | Interest | | | Value | |
DoubleLine Floating Rate Fund | | | — | | | $ | 2,200,000 | | | $ | (13,752,870 | ) | | $ | (129,494 | ) | | $ | 87,860 | | | $ | 323,371 | | | | — | |
DoubleLine Global Bond Fund | | | 2,034,321 | | | | 4,600,000 | | | | (1,000,000 | ) | | | (26,549 | ) | | | (1,050,469 | ) | | | 320,070 | | | $ | 20,139,780 | |
The accompanying notes are an integral part of these financial statements.
87
| | |
| AMG Managers DoubleLine Core Plus Bond Fund | | |
| Schedule of Portfolio Investments (continued) | | |
The following table summarizes the inputs used to value the Fund’s investments by the fair value hierarchy levels as of October 31, 2018:
| | | | | | | | | | | | | | | | |
| | | Level 1 | | | Level 2 | | | Level 3 | | | Total | |
Investments in Securities | | | | | | | | | | | | | | | | |
Corporate Bonds and Notes† | | | — | | | $ | 156,905,738 | | | | — | | | $ | 156,905,738 | |
Asset-Backed Securities | | | — | | | | 57,434,783 | | | | — | | | | 57,434,783 | |
Mortgage-Backed Securities | | | — | | | | 95,301,857 | | | | — | | | | 95,301,857 | |
Municipal Bonds | | | — | | | | 669,034 | | | | — | | | | 669,034 | |
U.S. Government and Agency Obligations† | | | — | | | | 185,375,097 | | | | — | | | | 185,375,097 | |
Foreign Government Obligations | | | — | | | | 10,901,248 | | | | — | | | | 10,901,248 | |
Floating Rate Senior Loan Interests | | | — | | | | 24,877,922 | | | | — | | | | 24,877,922 | |
Common Stocks†† | | $ | 232,396 | | | | — | | | | — | | | | 232,396 | |
Investment Companies | | | 20,139,780 | | | | — | | | | — | | | | 20,139,780 | |
Short-Term Investments | | | | | | | | | | | | | | | | |
Joint Repurchase Agreements | | | — | | | | 6,885,514 | | | | — | | | | 6,885,514 | |
U.S. Government and Agency Obligation | | | — | | | | 386,849 | | | | — | | | | 386,849 | |
Other Investment Companies | | | 18,674,769 | | | | — | | | | — | | | | 18,674,769 | |
| | | | | | | | | | | | | | | | |
Total Investments in Securities | | $ | 39,046,945 | | | $ | 538,738,042 | | | | — | | | $ | 577,784,987 | |
| | | | | | | | | | | | | | | | |
| † | All corporate bonds and notes and U.S. government and agency obligations held in the Fund are Level 2 securities. For a detailed breakout of corporate bonds and notes and U.S. government and agency obligations by major industry or agency classification, please refer to the Fund’s Schedule of Portfolio Investments. |
| †† | All common stocks held in the Fund are Level 1 securities. For a detailed breakout of common stocks by major industry classification, please refer to the Fund’s Schedule of Portfolio Investments. |
As of October 31, 2018, the Fund had no transfers between levels from the beginning of the reporting period.
The accompanying notes are an integral part of these financial statements.
88
| | |
| AMG Managers Lake Partners LASSO Alternatives Fund |
| Portfolio Manager’s Comments (unaudited) | | |
For the fiscal year ended October 31, 2018, the AMG Managers Lake Partners LASSO Alternatives Fund (the “Fund”) Class I shares returned (3.07)%. In comparison, the Fund’s benchmark, the HFRX Equity Hedge® Index, was down (2.99)%. However, the Fund has outperformed since its inception with a cumulative gain of 45.0% versus 18.8% for the benchmark and 34.0% for its peer group, the Morningstar Multialternative Category.
MARKET REVIEW
Throughout the fiscal year, financial markets experienced a tug of war between optimism about earnings and economic growth in the U.S. on one hand, and anxiety over tighter monetary policy and increasing international tensions over trade tariffs on the other. Nevertheless, U.S. equity markets exhibited a solid uptrend from early February through September, led by large capitalization growth stocks, while value stocks, particularly small caps, lagged consistently. This uptrend came to a screeching halt
and went into reverse in October, as investor sentiment was undermined by the realization that a strong U.S. economy, accompanied by a ballooning federal budget deficit due to tax cuts, implied that interest rates and bond yields would trend higher. Indeed, the yield on the 10-year U.S. Treasury note had already climbed from 2.38% at the end of October 2017 to 3.14% by the end of October 2018.
PERFORMANCE AND POSITIONING REVIEW
The Fund had been flat for the fiscal year until October, when equity markets went into a sharp tailspin in reaction to the U.S. Federal Reserve’s hawkish policy tone and the Trump administration’s escalating trade war, especially against China. Although the Fund held up reasonably in October and its overall exposure to equities was limited, it was not immune to the correction.
Regarding the Fund’s performance attribution by strategy, long-biased equity contributed the most to performance, followed by convertible arbitrage and
strategic fixed income. Positive returns by these groups were offset primarily by declines in global macro and managed futures.
Equity-related strategies have continued to be the largest segment of the Fund, with an allocation of 40% at the end of the fiscal year versus 45% a year earlier. This broad category encompasses a diverse mix of long-biased, hedged, and multi-asset funds, as well as global/international equities. Global macro, which includes discretionary and systematic approaches, was the next largest allocation at 24%, an increase from 21% a year earlier. Alternative fixed income accounted for 20%, versus 15% a year earlier, while arbitrage-related funds were 11%, versus 15% a year earlier.
The views expressed represent the opinions of Lake Partners Inc., as of October 31, 2018, and are not intended as a forecast or guarantee of future results and are subject to change without notice.
89
AMG Managers Lake Partners LASSO Alternatives Fund
Portfolio Manager’s Comments (continued)
CUMULATIVE TOTAL RETURN PERFORMANCE
AMG Managers Lake Partners LASSO Alternatives Fund’s cumulative total return is based on the daily change in net asset value (NAV), and assumes that all dividends and distributions were reinvested. The graph compares a hypothetical $10,000 investment made in the AMG Managers Lake Partners LASSO Alternatives Fund’s Class I shares on April 1, 2009, to a $10,000 investment made in the HFRX Equity Hedge Index for the same time period. The graph and table do not reflect the deduction of taxes that a shareholder would pay on a Fund distribution or redemption of shares. The listed returns for the Fund are net of expenses and the returns for the index exclude expenses. Total returns would have been lower had certain expenses not been reduced.
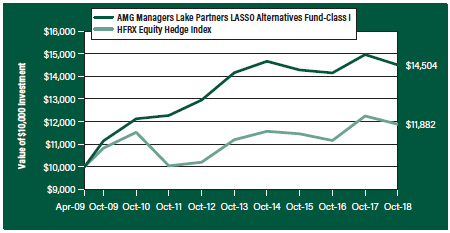
The table below shows the average annual total returns for the AMG Managers Lake Partners LASSO Alternatives Fund, the HFRX Equity Hedge Index for the same time periods ended October 31, 2018.
| | | | | | | | | | | | | | | | |
| | | One | | | Five | | | Since | | | Inception | |
| Average Annual Total Returns1 | | Year | | | Years | | | Inception | | | Date | |
AMG Managers Lake Partners LASSO Alternatives Fund2, 3, 4, 5, 6, 7, 8, 9 | | | | | | | | | | | | | |
Class N | | | (3.30 | %) | | | 0.23 | % | | | 2.35 | % | | | 03/03/10 | |
Class I | | | (3.07 | %) | | | 0.48 | % | | | 3.96 | % | | | 04/01/09 | |
HFRX Equity Hedge Index10 | | | (2.99 | %) | | | 1.19 | % | | | 1.81 | % | | | 04/01/09 | † |
The performance data shown represents past performance. Past performance is not a guarantee of future results. Current performance may be lower or higher than the performance data quoted. The investment return and principal value of an investment will fluctuate so that an investor’s shares, when redeemed, may be worth more or less than their original cost.
Investors should carefully consider the Fund’s investment objectives, risks, charges and expenses before investing. For performance information through the most recent month end, current net asset values per share for the Fund and other information, please call 800.835.3879 or visit our website at amgfunds.com for a free prospectus. Read it carefully before investing or sending money.
Distributed by AMG Distributors, Inc., member FINRA/SIPC.
| † | Date reflects the inception date of the Fund, not the index. |
| 1 | Total return equals income yield plus share price change and assumes reinvestment of all dividends and capital gain distributions. Returns are net of fees and may reflect offsets of Fund expenses as described in the prospectus. No adjustment has been made for taxes payable by shareholders on their reinvested dividends and capital gain distributions. Returns for periods greater than one year are annualized. The listed returns on the Fund are net of expenses and based on the published NAV as of October 31, 2018. All returns are in U.S. dollars ($). |
| 2 | The Fund may suffer significant losses on assets that it sells short. Unlike the possible loss on a security that is purchased, there is no limit on the amount of loss on an appreciating security that is sold short. |
| 3 | Alternative investments are speculative, subject to high return volatility and involve aggressive investment techniques and a high degree of risk including, but not limited to, the risks associated with leverage, derivative instruments such as options and futures, commodities, and distressed securities may be illiquid on a long term basis and short sales. There can be no assurance that these types of strategies will achieve their objectives or avoid substantial losses. |
| 4 | The Fund is subject to currency risk resulting from fluctuations in exchange rates that may affect the total loss or gain on a non-U.S. Dollar investment when converted back to U.S. Dollars. |
| 5 | The Fund is subject to the risks associated with investments in debt securities, such as default risk and fluctuations in the perception of the debtor’s ability to pay its creditors. Changing interest rates may adversely affect the value of an investment. An increase in interest rates typically causes the value of bonds and other fixed income securities to fall. |
| 6 | The Fund may invest in derivatives such as options and futures; the complexity and rapidly changing structure of derivatives markets may increase the possibility of market losses. |
| 7 | A greater percentage of the Fund’s holdings may be focused in a smaller number of securities which may place the Fund at greater risk than a more diversified fund. |
| 8 | The Fund is subject to the risks of any underlying fund in which the Fund invests. There are expenses associated with the underlying funds in addition to the Fund’s expenses. |
| 9 | Investments in international securities are subject to certain risks of overseas investing including currency fluctuations and changes in political and economic conditions, which could result in significant market fluctuations. These risks are magnified in emerging markets. |
| 10 | The HFRX Equity Hedge Index is an unmanaged index designed to measure daily performance representative of long-short equity hedge funds. Source: Hedge Fund Research, Inc. (HFR). Indices are adjusted for the reinvestment of capital gains, income, and dividends. Unlike the Fund, the HFRX Equity Hedge Index is unmanaged, is not available for investment and does not incur expenses. |
Not FDIC insured, nor bank guaranteed. May lose value.
90
| | |
| AMG Managers Lake Partners LASSO Alternatives Fund | | |
Fund Snapshots (unaudited) October 31, 2018 | | |
PORTFOLIO BREAKDOWN
| | | | |
Category | | %of
Net Assets | |
Investment Companies | | | 79.3 | |
Exchange Traded Funds | | | 15.3 | |
Short-Term Investments | | | 7.3 | |
Other Assets Less Liabilities | | | (1.9 | ) |
TOP TEN HOLDINGS
| | | | |
Security Name | | %of
Net Assets | |
Western Asset Macro Opportunities Fund, Class IS | | | 9.8 | |
Calamos Market Neutral Income Fund, Class I | | | 7.7 | |
PIMCO Mortgage Opportunities Fund, Institutional Class | | | 7.4 | |
Metropolitan West Unconstrained Bond Fund, Class I | | | 7.4 | |
ProShares Large Cap Core Plus | | | 5.7 | |
PIMCO Preferred and Capital Security Fund, Institutional Class | | | 5.1 | |
Boston Partners Long/Short Equity Fund, Institutional Class | | | 5.0 | |
BlackRock Total Factor Fund, Institutional Class | | | 4.9 | |
361 Managed Futures Fund, Class I | | | 4.9 | |
361 Global Long/Short Equity Fund, Class Y | | | 4.9 | |
| | | | |
Top Ten as a Group | | | 62.8 | |
| | | | |
Because a fund’s strategy may result in multiple investments in particular sectors of the economy, its performance may depend on the performance of those sectors and may fluctuate more widely than investments diversified across more sectors. For additional information on these and other risk considerations, please see the Fund’s prospectus.
Any sectors, industries, or securities discussed should not be perceived as investment recommendations. Mention of a specific security should not be considered a recommendation to buy or solicitation to sell that security. Specific securities mentioned in this report may have been sold from the Fund’s portfolio of investments by the time you receive this report.
91
| | |
AMG Managers Lake Partners LASSO Alternatives Fund |
Schedule of Portfolio Investments October 31, 2018 | | |
| | | | | | | | |
| | | Shares | | | Value | |
Investment Companies - 79.3% | | | | | | | | |
Long/Short Strategies - 24.4% | | | | | | | | |
361 Global Long/Short Equity Fund, Class Y | | | 115,901 | | | $ | 1,320,107 | |
Balter European L/S Small Cap Fund, Institutional Class | | | 123,683 | | | | 1,286,307 | |
Boston Partners Long/Short Equity Fund,
Institutional Class* | | | 67,379 | | | | 1,342,190 | |
Diamond Hill Long-Short Fund, Class I | | | 107 | | | | 2,776 | |
FPA Crescent Fund | | | 38,699 | | | | 1,307,636 | |
Neuberger Berman US Equity Index PutWrite
Strategy Fund, Institutional Class | | | 123,110 | | | | 1,311,126 | |
Total Long/Short Strategies | | | | | | | 6,570,142 | |
Strategic Fixed Income - 19.8% | | | | | | | | |
Metropolitan West Unconstrained Bond Fund,
Class I | | | 171,024 | | | | 1,999,277 | |
PIMCO Mortgage Opportunities Fund, Institutional
Class | | | 182,924 | | | | 2,003,013 | |
PIMCO Preferred and Capital Security Fund,
Institutional Class | | | 136,740 | | | | 1,359,195 | |
Total Strategic Fixed Income | | | | | | | 5,361,485 | |
Global Macro - 14.7% | | | | | | | | |
BlackRock Total Factor Fund, Institutional Class | | | 137,006 | | | | 1,330,328 | |
Western Asset Macro Opportunities Fund,
Class IS | | | 254,406 | | | | 2,643,281 | |
Total Global Macro | | | | | | | 3,973,609 | |
Arbitrage - 10.6% | | | | | | | | |
BlackRock Event Driven Equity Fund, Class IS | | | 84,767 | | | | 790,873 | |
Calamos Market Neutral Income Fund, Class I | | | 155,300 | | | | 2,074,812 | |
Total Arbitrage | | | | | | | 2,865,685 | |
Managed Futures - 9.8% | | | | | | | | |
361 Managed Futures Fund, Class I* | | | 115,859 | | | | 1,330,062 | |
| * | Non-income producing security. |
| 1 | Yield shown represents the October 31, 2018, seven day average yield, which refers to the sum of the previous seven days’ dividends paid, expressed as an annual percentage. |
| | | | | | | | |
| | | Shares | | | Value | |
WisdomTree Managed Futures Strategy Fund * | | | 32,500 | | | $ | 1,313,325 | |
Total Managed Futures | | | | | | | 2,643,387 | |
Total Investment Companies
(cost $21,072,780) | | | | | | | 21,414,308 | |
Exchange Traded Funds - 15.3% | | | | | | | | |
Long/Short Strategies - 10.5% | | | | | | | | |
ProShares Large Cap Core Plus | | | 22,985 | | | | 1,542,753 | |
WisdomTree Dynamic Long/Short U.S. Equity
Fund | | | 38,975 | | | | 1,280,329 | |
Total Long/Short Strategies | | | | | | | 2,823,082 | |
Hedged International Equity - 4.8% | | | | | | | | |
IQ 50 Percent Hedged FTSE International | | | 66,000 | | | | 1,292,280 | |
Total Exchange Traded Funds
(cost $3,580,500) | | | | | | | 4,115,362 | |
Short-Term Investments - 7.3% | | | | | | | | |
Other Investment Companies - 7.3% | | | | | | | | |
Money Market Fund - 7.3% | | | | | | | | |
Dreyfus Government Cash Management Fund,
Institutional Class Shares, 2.05%1 | | | 654,352 | | | | 654,352 | |
Dreyfus Institutional Preferred Government
Money Market Fund, Institutional
Class Shares, 2.12%1 | | | 654,352 | | | | 654,352 | |
JPMorgan U.S. Government Money Market Fund,
IM Shares, 2.09%1 | | | 674,180 | | | | 674,180 | |
Total Short-Term Investments
(cost $1,982,884) | | | | | | | 1,982,884 | |
Total Investments - 101.9%
(cost $26,636,164) | | | | | | | 27,512,554 | |
Other Assets, less Liabilities - (1.9%) | | | | | | | (511,765 | ) |
Net Assets - 100.0% | | | | | | $ | 27,000,789 | |
The accompanying notes are an integral part of these financial statements.
92
| | |
AMG Managers Lake Partners LASSO Alternatives Fund |
| Schedule of Portfolio Investments (continued) | | |
The following table summarizes the inputs used to value the Fund’s investments by the fair value hierarchy levels as of October 31, 2018:
| | | | | | | | | | | | | | | | |
| | | Level 1 | | | Level 2 | | | Level 3 | | | Total | |
Investments in Securities | | | | | | | | | | | | | | | | |
Investment Companies† | | $ | 21,414,308 | | | | — | | | | — | | | $ | 21,414,308 | |
Exchange Traded Funds† | | | 4,115,362 | | | | — | | | | — | | | | 4,115,362 | |
Short-Term Investments | | | | | | | | | | | | | | | | |
Other Investment Companies | | | 1,982,884 | | | | — | | | | — | | | | 1,982,884 | |
| | | | | | | | | | | | | | | | |
Total Investments in Securities | | $ | 27,512,554 | | | | — | | | | — | | | $ | 27,512,554 | |
| | | | | | | | | | | | | | | | |
| † | All investment companies and exchange traded funds held in the Fund are level 1 securities. For a detailed breakout of investment companies and exchange traded funds, please refer to the Fund’s Schedule of Portfolio Investments. |
As of October 31, 2018, the Fund had no transfers between levels from the beginning of the reporting period.
The accompanying notes are an integral part of these financial statements.
93
AMG River Road Long-Short Fund
Portfolio Manager’s Comments (unaudited)
OVERVIEW
For the fiscal year ended October 31, 2018, the AMG River Road Long-Short Fund (the “Fund”) Class N shares returned (1.14)%, underperforming the 6.60% return for the Russell 3000® Index. The secondary benchmark, which is a blend of 50% Russell 3000®/50% ICE BofA Merrill Lynch 3-Month U.S. Treasury-Bill Index, returned 4.34%. During the period, the Fund had a 57% average net market exposure.
PERFORMANCE REVIEW AND POSITIONING
The holdings with the largest positive contribution to total return during the period were Premier Inc. (PINC, long), Tractor Supply Co. (TSCO, long), and TJX Companies Inc. (TJX, long). Premier is a healthcare group purchasing organization (GPO) and data analytics software provider. PINC rose after reporting
strength in administrative fees and expanding EBITDA margins. Tractor Supply is the largest operator of rural lifestyle retail stores in the United States. The stock increased after reporting stronger same-store sales than the market was expecting. TJX is the leading off-price apparel and home fashions retailer in the United States. As investors gradually realized that TJX is well protected from the Amazon risk, the stock rose.
The holdings with the largest negative contribution to the Fund’s total return were Nielsen Holdings PLC (NLSN, long), General Electric Co. (GE, long), and Alexander & Baldwin Inc. (ALEX, long). Nielsen provides critical third-party media & marketing measurement. The stock declined after reporting continued weakness in its Buy business, which provides analytics about what consumers buy. General Electric is a leading industrial conglomerate and declined as the Power segment’s results
continued to deteriorate faster than management and River Road expected. Alexander & Baldwin is a Hawaiian landowner and commercial real estate operator. Despite posting solid operating results, the REIT moved lower as interest rates rose.
The Fund ended October within its normal net market exposure range (50–70%) at 51%. The Fund’s largest relative exposures on the long side are an overweight to the consumer discretionary sector and an underweight to the information technology sector. The largest sector exposures on the short side are in the industrials and consumer discretionary sectors.
The views expressed represent the opinions of River Road Asset Management LLC, as of October 31, 2018, and are not intended as a forecast or guarantee of future results and are subject to change without notice.
94
AMG River Road Long-Short Fund
Portfolio Manager’s Comments (continued)
CUMULATIVE TOTAL RETURN PERFORMANCE
AMG River Road Long-Short Fund’s cumulative total return is based on the daily change in net asset value (NAV), and assumes that all dividends and distributions were reinvested. The graph compares a hypothetical $10,000 investment made in the AMG River Road Long-Short Fund’s Class N shares on May 4, 2011, to a $10,000 investment made in the Russell 3000® Index and the 50% Russell 3000®/50% ICE BofA Merrill Lynch U.S. T-Bill (0-3 mo) Index for the same time period. The graph and table do not reflect the deduction of taxes that a shareholder would pay on a Fund distribution or redemption of shares. The listed returns for the Fund are net of expenses and the returns for the index exclude expenses. Total returns would have been lower had certain expenses not been reduced.
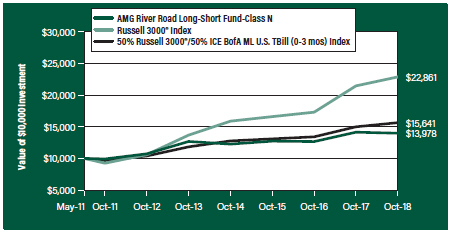
The table below shows the average annual total returns for the AMG River Road Long-Short Fund, the Russell 3000® Index and the 50% Russell 3000®/50% ICE BofA Merrill Lynch U.S. T-Bill (0-3 mo) Index for the same time periods ended October 31, 2018.
| | | | | | | | | | | | | | | | |
| | | One | | | Five | | | Since | | | Inception | |
| Average Annual Total Returns1 | | Year | | | Years | | | Inception | | | Date | |
AMG River Road Long-Short Fund2, 3, 4, 5, 6, 7, 8 | | | | | | | | | | | | | | | | |
Class N | | | (1.14 | %) | | | 1.98 | % | | | 4.57 | % | | | 05/04/11 | |
Class I | | | (0.88 | %) | | | 2.23 | % | | | 3.68 | % | | | 03/04/13 | |
Class Z | | | (0.88 | %) | | | — | | | | (1.10 | %) | | | 09/29/17 | |
Russell 3000® Index9, 11 | | | 6.60 | % | | | 10.81 | % | | | 11.66 | % | | | 05/04/11 | † |
50% Russell 3000®/50% ICE BofA Merrill Lynch U.S. T-Bill
(0-3 mo) Index10, 11 | | | 4.34 | % | | | 5.75 | % | | | 6.15 | % | | | 05/04/11 | † |
The performance data shown represents past performance. Past performance is not a guarantee of future results. Current performance may be lower or higher than the performance data quoted. The investment return and principal value of an investment will fluctuate so that an investor’s shares, when redeemed, may be worth more or less than their original cost.
Investors should carefully consider the Fund’s investment objectives, risks, charges and expenses before investing. For performance information through the most recent month end, current net asset values per share for the Fund and other information, please call 800.835.3879 or visit our website at amgfunds.com for a free prospectus. Read it carefully before investing or sending money.
Distributed by AMG Distributors, Inc., member FINRA/SIPC.
| † | Date reflects the inception date of the Fund, not the index. |
| 1 | Total return equals income yield plus share price change and assumes reinvestment of all dividends and capital gain distributions. Returns are net of fees and may reflect offsets of Fund expenses as described in the prospectus. No adjustment has been made for taxes payable by shareholders on their reinvested dividends and capital gain distributions. Returns for periods greater than one year are annualized. The listed returns on the Fund are net of expenses and based on the published NAV as of October 31, 2018. All returns are in U.S. dollars ($). |
| 2 | The Fund may suffer significant losses on assets that it sells short. Unlike the possible loss on a security that is purchased, there is no limit on the amount of loss on an appreciating security that is sold short. |
| 3 | Active and frequent trading of a fund may result in higher transaction costs and increased tax liability. |
| 4 | The Fund may invest in derivatives such as options and futures; the complexity and rapidly changing structure of derivatives markets may increase the possibility of market losses. |
| 5 | A greater percentage of the Fund’s holdings may be focused in a smaller number of securities which may place the Fund at greater risk than a more diversified fund. |
| 6 | Investments in international securities are subject to certain risks of overseas investing including currency fluctuations and changes in political and economic conditions, which could result in significant market fluctuations. These risks are magnified in emerging markets. |
| 7 | The Fund is subject to special risk considerations similar to those associated with the direct ownership of real estate. Real estate valuations may be subject to factors such as changing general and local economic, financial, competitive, and environmental conditions. |
| 8 | The Fund invests in value stocks, which may perform differently from the market as a whole and may be undervalued by the market for a long period of time. |
| 9 | The Russell 3000® Index is composed of the 3,000 largest U.S. companies as measured by market capitalization, and represents about 98% of the U.S. stock market. |
95
| | |
| AMG River Road Long-Short Fund | | |
| Portfolio Manager’s Comments (continued) | | |
| 10 | The secondary benchmark is composed of 50% Russell 3000® Index and 50% ICE BofAML U.S. Treasury Bill Index (0-3 months). The Russell 3000® Index is composed of the 3,000 largest U.S. companies as measured by market capitalization, and represents about 98% of the U.S. stock market. The ICE BofAML 0-3 Month U.S. Treasury Bill Index: Is a subset of The Bank of America Merrill Lynch 0-1 Year U.S. Treasury Index including all securities with a remaining term to final maturity less than 3 months. |
| 11 | Unlike the Fund, the indices are unmanaged, are not available for investment and do not incur expenses. |
The Russell Indices are a trademark of London Stock Exchange Group companies.
Not FDIC insured, nor bank guaranteed. May lose value.
96
AMG River Road Long-Short Fund
Fund Snapshots (unaudited)
October 31, 2018
PORTFOLIO BREAKDOWN
| | | | | | | | | | | | |
Sector | | Long
Exposure1 | | | Short
Exposure1 | | | Net
Exposure1 | |
Consumer Discretionary | | | 30.6 | % | | | (8.9 | )% | | | 21.7 | % |
Financials | | | 21.9 | | | | (1.5 | ) | | | 20.4 | |
Consumer Staples | | | 8.5 | | | | (0.6 | ) | | | 7.9 | |
Health Care | | | 8.1 | | | | (1.2 | ) | | | 6.9 | |
Real Estate | | | 4.6 | | | | (1.0 | ) | | | 3.6 | |
Communication Services | | | 4.2 | | | | (2.9 | ) | | | 1.3 | |
Industrials | | | 2.0 | | | | (8.6 | ) | | | (6.6 | ) |
Materials | | | 1.5 | | | | (1.4 | ) | | | 0.1 | |
Information Technology | | | — | | | | (3.1 | ) | | | (3.1 | ) |
Exchange Traded Funds | | | — | | | | (0.8 | ) | | | (0.8 | ) |
Short Term Investments | | | 19.2 | | | | — | | | | 19.2 | |
Other Assets2 | | | 29.4 | | | | — | | | | 29.4 | |
| 1 | As a percentage of net assets. |
| 2 | Includes collateral for short sales. |
TOP TEN HOLDINGS
| | | | |
Security Name | | % of
Net Assets | |
McKesson Corp. | | | 5.7 | |
Nestle SA, Sponsored ADR (Switzerland) | | | 5.1 | |
Berkshire Hathaway, Inc., Class B | | | 5.1 | |
Alphabet, Inc., Class C | | | 4.2 | |
Wells Fargo & Co. | | | 4.1 | |
Comcast Corp., Class A | | | 4.0 | |
Hostess Brands, Inc. | | | 3.4 | |
Brookfield Property Partners LP | | | 3.2 | |
GCI Liberty Inc., Class A | | | 3.2 | |
Liberty Media Corp.-Liberty SiriusXM, Class C | | | 3.1 | |
| | | | |
Top Ten as a Group | | | 41.1 | |
| | | | |
Because a fund’s strategy may result in multiple investments in particular sectors of the economy, its performance may depend on the performance of those sectors and may fluctuate more widely than investments diversified across more sectors. For additional information on these and other risk considerations, please see the Fund’s prospectus.
Any sectors, industries, or securities discussed should not be perceived as investment recommendations. Mention of a specific security should not be considered a recommendation to buy or solicitation to sell that security. Specific securities mentioned in this report may have been sold from the Fund’s portfolio of investments by the time you receive this report.
97
AMG River Road Long-Short Fund
Schedule of Portfolio Investments
October 31, 2018
| | | | | | | | |
| | | Shares | | | Value | |
Long Positions - 100.7% | | | | | | | | |
Common Stocks - 81.4% | | | | | | | | |
Communication Services - 4.2% | | | | | | | | |
Alphabet, Inc., Class C* | | | 1,121 | | | $ | 1,207,059 | |
Consumer Discretionary - 30.6% | | | | | | | | |
Asbury Automotive Group, Inc.* | | | 6,949 | | | | 452,380 | |
Comcast Corp., Class A1 | | | 29,962 | | | | 1,142,751 | |
Dollar Tree, Inc.* | | | 10,384 | | | | 875,371 | |
Expedia, Inc.1 | | | 3,882 | | | | 486,919 | |
GCI Liberty Inc., Class A* | | | 19,342 | | | | 915,457 | |
General Motors Co.1 | | | 14,288 | | | | 522,798 | |
Liberty Broadband Corp., Class C* | | | 8,910 | | | | 738,906 | |
Liberty Global PLC, Class C (United Kingdom)*,1 | | | 30,524 | | | | 764,321 | |
Liberty Latin America, Ltd., Class C*,1 | | | 33,603 | | | | 605,190 | |
Liberty Media Corp.-Liberty SiriusXM, Class C* | | | 21,800 | | | | 899,686 | |
LKQ Corp.* | | | 30,094 | | | | 820,663 | |
Yum China Holdings, Inc. (China) | | | 15,596 | | | | 562,704 | |
Total Consumer Discretionary | | | | | | | 8,787,146 | |
Consumer Staples - 8.5% | | | | | | | | |
Hostess Brands, Inc.*,1 | | | 94,849 | | | | 986,428 | |
Nestle SA, Sponsored ADR (Switzerland)1 | | | 17,306 | | | | 1,458,550 | |
Total Consumer Staples | | | | | | | 2,444,978 | |
Financials - 21.9% | | | | | | | | |
Axis Capital Holdings, Ltd. (Bermuda) | | | 13,176 | | | | 735,089 | |
Berkshire Hathaway, Inc., Class B*,1 | | | 7,053 | | | | 1,447,840 | |
The Blackstone Group LP, (MLP) 1 | | | 22,387 | | | | 724,444 | |
Brookfield Asset Management, Inc., Class A (Canada) | | | 18,023 | | | | 734,437 | |
Cannae Holdings, Inc.*,1 | | | 41,726 | | | | 770,679 | |
Oaktree Capital Group LLC, (MLP) | | | 16,904 | | | | 707,094 | |
Wells Fargo & Co. | | | 22,223 | | | | 1,182,930 | |
Total Financials | | | | | | | 6,302,513 | |
Health Care - 8.1% | | | | | | | | |
Allergan PLC1 | | | 4,441 | | | | 701,722 | |
McKesson Corp.1 | | | 13,169 | | | | 1,642,965 | |
Total Health Care | | | | | | | 2,344,687 | |
Industrials - 2.0% | | | | | | | | |
Carlisle Cos., Inc. | | | 5,887 | | | | 568,626 | |
Materials - 1.5% | | | | | | | | |
DowDuPont, Inc.1 | | | 8,321 | | | | 448,668 | |
Real Estate - 4.6% | | | | | | | | |
Alexander & Baldwin, Inc., REIT 1 | | | 19,736 | | | | 385,642 | |
| | | | | | | | |
| | | Shares | | | Value | |
Brookfield Property Partners LP1 | | | 48,103 | | | $ | 928,869 | |
Total Real Estate | | | | | | | 1,314,511 | |
Total Common Stocks
(Cost $23,595,796) | | | | | | | 23,418,188 | |
Short-Term Investments - 19.2% | | | | | | | | |
Other Investment Companies - 19.2% | | | | | | | | |
Dreyfus Government Cash Management Fund, Institutional Class Shares, 2.05%2 | | | 1,820,307 | | | | 1,820,307 | |
Dreyfus Institutional Preferred Government Money Market Fund, Institutional Class Shares, 2.12%2 | | | 1,820,307 | | | | 1,820,307 | |
JPMorgan U.S. Government Money Market Fund, IM Shares, 2.09%2 | | | 1,875,467 | | | | 1,875,467 | |
Total Short-Term Investments
(Cost $5,516,081) | | | | | | | 5,516,081 | |
Total Investments - 100.7%
(Cost $29,111,877) | | | | | | | 28,934,269 | |
Short Sales - (30.0%)3 | | | | | | | | |
Common Stocks - (29.2%) | | | | | | | | |
Communication Services - (2.9%) | | | | | | | | |
Consolidated Communications Holdings, Inc. | | | (17,619 | ) | | | (220,590 | ) |
Sprint Corp. * | | | (65,508 | ) | | | (400,909 | ) |
Viacom, Inc., Class B | | | (7,162 | ) | | | (229,041 | ) |
Total Communication Services | | | | | | | (850,540 | ) |
Consumer Discretionary - (8.9%) | | | | | | | | |
Best Buy Co., Inc. | | | (3,145 | ) | | | (220,653 | ) |
Brinker International, Inc. | | | (8,416 | ) | | | (364,833 | ) |
The Cato Corp, Class A | | | (8,769 | ) | | | (169,066 | ) |
The Children’s Place, Inc. | | | (2,513 | ) | | | (375,442 | ) |
Dave & Buster’s Entertainment, Inc. | | | (5,105 | ) | | | (304,003 | ) |
Dillard’s, Inc., Class A | | | (4,354 | ) | | | (306,609 | ) |
Dorman Products, Inc. * | | | (3,772 | ) | | | (298,026 | ) |
IMAX Corp. (Canada)* | | | (7,478 | ) | | | (144,774 | ) |
Service Corp International | | | (5,240 | ) | | | (217,303 | ) |
Tesla, Inc. * | | | (494 | ) | | | (166,636 | ) |
Total Consumer Discretionary | | | | | | | (2,567,345 | ) |
Consumer Staples - (0.6%) | | | | | | | | |
Dean Foods Co. | | | (20,519 | ) | | | (163,947 | ) |
Financials - (1.5%) | | | | | | | | |
Canadian Imperial Bank of Commerce (Canada) | | | (1,680 | ) | | | (145,074 | ) |
Mercury General Corp. | | | (4,700 | ) | | | (278,757 | ) |
Total Financials | | | | | | | (423,831 | ) |
Health Care - (1.2%) | | | | | | | | |
Prestige Consumer Healthcare, Inc. * | | | (9,224 | ) | | | (333,540 | ) |
The accompanying notes are an integral part of these financial statements.
98
AMG River Road Long-Short Fund
Schedule of Portfolio Investments (continued)
| | | | | | | | |
| | | Shares | | | Value | |
Industrials - (8.6%) | | | | | | | | |
ACCO Brands Corp. | | | (14,158 | ) | | $ | (114,255 | ) |
ADT, Inc. | | | (24,958 | ) | | | (193,175 | ) |
Caterpillar, Inc. | | | (1,865 | ) | | | (226,262 | ) |
Deere & Co. | | | (2,083 | ) | | | (282,122 | ) |
Echo Global Logistics, Inc. * | | | (3,042 | ) | | | (78,210 | ) |
Ennis, Inc. | | | (8,523 | ) | | | (165,005 | ) |
Griffon Corp. | | | (21,716 | ) | | | (263,198 | ) |
Healthcare Services Group, Inc. | | | (5,409 | ) | | | (219,551 | ) |
MasTec, Inc. * | | | (5,738 | ) | | | (249,660 | ) |
Matthews International Corp., Class A | | | (5,157 | ) | | | (214,634 | ) |
Quad/Graphics, Inc. | | | (5,995 | ) | | | (92,503 | ) |
Snap-on, Inc. | | | (1,401 | ) | | | (215,670 | ) |
United Rentals, Inc. * | | | (1,269 | ) | | | (152,369 | ) |
Total Industrials | | | | | | | (2,466,614 | ) |
Information Technology - (3.1%) | | | | | | | | |
Canon, Inc., Sponsored ADR (Japan) | | | (12,573 | ) | | | (354,307 | ) |
International Business Machines Corp. | | | (1,180 | ) | | | (136,207 | ) |
| | | | | | | | |
| | | Shares | | | Value | |
Stratasys, Ltd. * | | | (21,863 | ) | | $ | (416,709 | ) |
Total Information Technology | | | | | | | (907,223 | ) |
Materials - (1.4%) | | | | | | | | |
Domtar Corp. | | | (4,992 | ) | | | (231,179 | ) |
Teck Resources, Ltd., Class B (Canada) | | | (7,731 | ) | | | (159,800 | ) |
Total Materials | | | | | | | (390,979 | ) |
Real Estate - (1.0%) | | | | | | | | |
Realty Income Corp., REIT | | | (2,480 | ) | | | (149,470 | ) |
The St Joe Co.* | | | (9,853 | ) | | | (149,667 | ) |
Total Real Estate | | | | | | | (299,137 | ) |
Total Common Stocks
(Proceeds $(8,417,622)) | | | | | | | (8,403,156 | ) |
Exchange Traded Funds - (0.8%) | | | | | | | | |
United States Natural Gas Fund, L.P.*
(Proceeds $(190,929)) | | | (8,363 | ) | | | (223,292 | ) |
Total Short Sales - (30.0%)
(Proceeds $(8,608,551)) | | | | | | | (8,626,448 | ) |
Other Assets, less Liabilities - 29.4% | | | | | | | 8,439,519 | |
Net Assets - 100.0% | | | | | | $ | 28,747,340 | |
| * | Non-income producing security. |
| 1 | Security position is either entirely or partially held in a segregated account as collateral for securities sold short. As of October 31, 2018, value of securities held in the segregated account was $2,512,682. |
| 2 | Yield shown represents the October 31, 2018, seven day average yield, which refers to the sum of the previous seven days’ dividends paid, expressed as an annual percentage. |
| 3 | The Fund is contractually responsible to the lender for any dividends payable on securities while those securities are outstanding in short position. These dividends and interest amounts are recorded as interest and dividend expense on the Statement of Operations. |
| ADR | American Depositary Receipt |
| MLP | Master Limited Partnership |
| REIT | Real Estate Investment Trust |
The accompanying notes are an integral part of these financial statements.
99
AMG River Road Long-Short Fund
Schedule of Portfolio Investments (continued)
The following table summarizes the inputs used to value the Fund’s investments by the fair value hierarchy levels as of October 31, 2018:
| | | | | | | | | | | | | | | | |
| | | Level 1 | | | Level 2 | | | Level 3 | | | Value | |
Investments in Securities | | | | | | | | | | | | | | | | |
Assets | | | | | | | | | | | | | | | | |
Common Stocks† | | $ | 23,418,188 | | | | — | | | | — | | | $ | 23,418,188 | |
Short-Term Investments | | | | | | | | | | | | | | | | |
Other Investment Companies | | | 5,516,081 | | | | — | | | | — | | | | 5,516,081 | |
| | | | | | | | | | | | | | | | |
Total Assets | | | 28,934,269 | | | | — | | | | — | | | | 28,934,269 | |
| | | | | | | | | | | | | | | | |
Liabilities | | | | | | | | | | | | | | | | |
Common Stocks† | | | (8,403,156 | ) | | | — | | | | — | | | | (8,403,156 | ) |
Exchange Traded Funds† | | | (223,292 | ) | | | — | | | | — | | | | (223,292 | ) |
| | | | | | | | | | | | | | | | |
Total Liabilities | | | (8,626,448 | ) | | | — | | | | — | | | | (8,626,448 | ) |
| | | | | | | | | | | | | | | | |
Net Investments in Securities | | $ | 20,307,821 | | | | — | | | | — | | | $ | 20,307,821 | |
| | | | | | | | | | | | | | | | |
| † | All common stocks and exchange traded funds held or shorted in the Fund are Level 1 securities. For a detailed breakout of common stocks and exchange traded funds by major industry classification, please refer to the Fund’s Schedule of Portfolio Investments. |
As of October 31, 2018, the Fund had no transfers between levels from the beginning of the reporting period.
The accompanying notes are an integral part of these financial statements.
100
AMG Managers Guardian Capital Global Dividend Fund
Portfolio Manager’s Comments (unaudited)
The AMG Managers Guardian Capital Global Dividend Fund (the “Fund”) Class N shares returned (3.19)% for the fiscal year ended October 31, 2018, compared with a 1.16% return for its benchmark, the MSCI World Index.
GLOBAL MARKETS REVIEW
The soft start to the year for the world’s major economies gave rise to concerns about the durability of the economic expansion as it approached its ninth birthday. As we have seen consistently throughout this cycle, which now stands within a year of the run that ended with the tech bubble bursting, the stumbling out of the starting gates this year once again was followed by the global economy finding its footing in the spring, led by a four-year best performance of the U.S. economy and an outsized rebound in Japan from the unexpected contraction in activity over the first three months of the year.
The robust pace of growth recorded in the three months ended June (which represented the strongest quarter among the aggregated G7 since 2010) has not been expected to be sustained through the second half of this year. The data, however, remain consistent with continued above-trend and broad-based growth momentum being maintained through year-end. The forward-looking composite manufacturing and nonmanufacturing purchasing managers’ indexes (PMI) remain well in growth territory, although there are some differences in strength across regions with the U.S. looking to remain atop the leaderboard while momentum moderates more materially in Europe and Asia.
That economies have absorbed whatever slack remained is an important consideration for policymakers who are tasked with maintaining the value of their respective currencies. It is when the economy hits capacity constraints (and demand for inputs and outputs to production starts to outstrip supply), not before, that price pressures become more prominent and inflation accelerates.
It is not a coincidence that after being largely absent for the bulk of this cycle, inflationary pressures are becoming increasingly evident. Importantly, though, the upward price pressures that are resulting from the economic cycle are being met with downward structural pressures that are helping keep underlying inflation from moving in any sort of aggressive manner—these include the disinflationary impacts of technological innovation, the inflation-suppressing effect of aging demographics, the continued downward price
pressures associated with globalization, and the increased credibility of central banks in combatting inflation and keeping inflation expectations well anchored.
An environment in which economies are running against capacity constraints, and price pressures are firming, is one in which a reduction in monetary policy support is justified, if not encouraged, in order to keep risks to the inflation outlook balanced. As such, an increasing number of central banks are taking steps to normalize their monetary policy stances. The Fed, the Bank of Canada (BOC), and Bank of England (BOE) have all begun their tightening cycles and are expected to make further moves before the year is out. The European Central Bank (ECB) has indicated it will likely follow suit next year (policymakers for the aggregated Eurozone have pledged to keep rates at their current levels “through the summer of 2019”).
That said, the fact that inflation remains within target range for economies and expectations are well anchored, combined with the balance of risks facing the outlook, suggests that process will continue to be quite gradual and the ultimate terminal point for rates this go-around will be lower than previous cycles.
Higher policy rates, of course, are just one part of the normalization process. Central banks have amassed substantial asset holdings through their respective quantitative easing (QE) programs as the balance sheets of the Fed, ECB, BOE, and Bank of Japan (BOJ) cumulatively stand at more than $15 trillion , meaning that nearly one-fifth of the global bond market is held by a small group that is economically insensitive to price. While the Fed has seen its holdings decrease by almost $250 billion since it stopped reinvesting the proceeds from maturing assets last fall, the ECB is continuing to buy bonds until the end of the year and the BOJ’s asset purchase program continues to go full steam ahead, meaning that the overall tally has held roughly steady.
PERFORMANCE REVIEW
The AMG Managers Guardian Capital Global Dividend Fund underperformed the index during the year; the MSCI World Index was up 1.16% in U.S. Dollars and the Fund was down (3.19)%.
The portfolio outperformed in three of the 11 sectors, led by real estate and energy. Information technology, materials, consumer discretionary, , and communication services were the largest detractors from relative performance.
Real estate was the largest contributor to relative performance during the period, primarily as a result of stock selection. Tag Immobilien, Medical Properties Trust, and Icade were the largest contributors to relative performance in the sector.
The energy sector was a contributor to relative performance due to positive stock selection. Equinor and Targa Resources were the largest contributors to relative performance in the sector.
The financials sector also contributed to relative performance due to an underweight position in the sector. The portfolio’s holdings in JPMorgan Chase, Bank of America, NN Group, and Royal Bank of Canada contributed to outperformance in the sector.
The information technology sector was the largest detractor from relative performance, primarily due to stock selection. Lam Research, Broadcom, and Infineon Technologies were the largest detractors from relative performance.
The materials sector also detracted from relative performance due to stock selection and an overweight position in the sector. The largest detractors from relative performance in the sector were BASF and Boliden.
The consumer discretionary sector was a detractor from relative performance, driven by stock selection as well as an underweight position in the sector. PulteGroup, Taylor Wimpey, and Six Flags Entertainment were the largest detractors from relative performance.
POSITIONING
Based on the economic backdrop and outlook on economies and valuations, our core view on uses of cash investment is to own stocks that deploy cash in a shareholder friendly way that reflects the current late stage of the economic cycle of rising interest rates, deregulation, increased capex, and marginal expansion. We look to position in stocks with low price to book values, high cash/assets, strategic M&A/assets ratio, sustainable net buyback yields, and growing dividend yields. We also continue to emphasize higher yielding names that have the lowest probability of a dividend cut.
101
AMG Managers Guardian Capital Global Dividend Fund
Portfolio Manager’s Comments (continued)
The Fund has an overweight in the yield-friendly, defensive sectors: utilities (+4.8%), energy (+4.0%), and real estate (+3.9%). Underweight sectors are financials (-7.3%), consumer discretionary (-4.0%), and communication services (-3.6%).
Geographically, the Fund portfolio is overweight North America and Europe. The Fund portfolio does not have a weight in Emerging Markets (EM) at this time. The dividend yield at the end of the period was 3.12% and the portfolio has a large cap, high-quality bias.
The current market environment requires continued immunization to rising interest rates on a relative basis to our peer group. We continue to find yield outside of the traditionally defensive sectors favored by our peer group. The holdings in the portfolio were consolidated into high conviction names during the period.
OUTLOOK
One of the main signs of the continued overall health of the global economy is the underlying strength in the job market. Across the world, unemployment rates have fallen materially and now find themselves not just hitting their cyclical lows, but generational lows as well in many countries. Demand for labor
being such that people can readily find work and get paid has significant implications for global growth being sustained, since it is consumers that drive the economy. This is increasingly the case worldwide with the rise of the middle class within the EM.
While it may be the case that investor sentiment can be swayed by political machinations, consumers’ confidence is influenced by their own individual economic situations. As such, it should be expected that these low unemployment rates around the world are being met with a concomitant improvement in global consumer sentiment despite the increased volatility and uncertainty in the political backdrop.
While the backdrop appears to be positive for equities, the uncertainties prevailing over the outlook do suggest that there are benefits to managing risks. In particular, the resultant likelihood of increased volatility over the coming months—and with it, market corrections—would suggest adding exposure to income strategies. History shows that dividend stocks outperform in periods of heightened volatility and flat-to-down markets, with the cash flow cushion mitigating the downside risks while also providing an opportunity to generate income as investors wait. There are some attractive relative
valuations in stock markets overseas and some of the highest yielding equities can be found in international markets. Adding international exposure is beneficial from a risk management standpoint as well.
In conclusion, we believe we should have an unwavering discipline when it comes to choosing stocks, and it should be based on model fundamentals that cover all three facets of investing: relative opportunities, intrinsic conviction, and objective non-human analysis through machine learning methods. We believe fundamentals continue to prevail as companies continue to deliver double-digit earnings growth, buybacks, and divided increases on the backs of a U.S. tax catalyst and low interest rates in and outside the U.S. Yield for yield’s sake is not the right approach and we feel that stocks exhibiting consistent earnings strength, or those that signal shareholder-friendly activities like dividend increases or buybacks with respect to cash flow usage, should allow for the best opportunities to buy.
The views expressed represent the opinions of Guardian Capital LP, as of October 31, 2018, and are not intended as a forecast or guarantee of future results and are subject to change without notice.
102
AMG Managers Guardian Capital Global Dividend Fund
Portfolio Manager’s Comments (continued)
CUMULATIVE TOTAL RETURN PERFORMANCE
AMG Managers Guardian Capital Global Dividend Fund’s cumulative total return is based on the daily change in net asset value (NAV), and assumes that all dividends and distributions were reinvested. The graph compares a hypothetical $10,000 investment made in the AMG Managers Guardian Capital Global Dividend Fund’s Class N shares on April 14, 2014, to a $10,000 investment made in the MSCI World Index for the same time period. The graph and table do not reflect the deduction of taxes that a shareholder would pay on a Fund distribution or redemption of shares. The listed returns for the Fund are net of expenses and the returns for the index exclude expenses. Total returns would have been lower had certain expenses not been reduced.
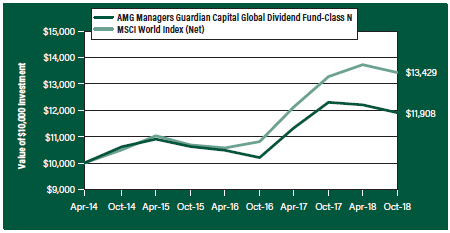
The table below shows the average annual total returns for the AMG Managers Guardian Capital Global Dividend Fund, the MSCI World Index for the same time periods ended October 31, 2018.
| | | | | | | | | | | | |
| | | One | | | Since | | | Inception | |
| Average Annual Total Returns1 | | Year | | | Inception | | | Date | |
AMG Managers Guardian Capital Global Dividend Fund2, 3, 4, 5, 6, 7, 8 | | | | | | | | | | | | |
Class N | | | (3.19 | %) | | | 3.92 | % | | | 04/14/14 | |
Class I | | | (3.18 | %) | | | 4.07 | % | | | 04/14/14 | |
MSCI World Index9, 10 | | | 1.16 | % | | | 6.70 | % | | | 04/14/14 | † |
The performance data shown represents past performance. Past performance is not a guarantee of future results. Current performance may be lower or higher than the performance data quoted. The investment return and principal value of an investment will fluctuate so that an investor’s shares, when redeemed, may be worth more or less than their original cost.
Investors should carefully consider the Fund’s investment objectives, risks, charges and expenses before investing. For performance information through the most recent month end, current net asset values per share for the Fund and other information, please call 800.835.3879 or visit our website at amgfunds.com for a free prospectus. Read it carefully before investing or sending money.
Distributed by AMG Distributors, Inc., member FINRA/SIPC.
| † | Date reflects the inception date of the Fund, not the index. |
| 1 | Total return equals income yield plus share price change and assumes reinvestment of all dividends and capital gain distributions. Returns are net of fees and may reflect offsets of Fund expenses as described in the prospectus. No adjustment has been made for taxes payable by shareholders on their reinvested dividends and capital gain distributions. Returns for periods greater than one year are annualized. The listed returns on the Fund are net of expenses and based on the published NAV as of October 31, 2018. All returns are in U.S. dollars ($). |
| 2 | A short-term redemption fee of 2% will be charged on shares held for less than 90 days. |
| 3 | Investments in international securities are subject to certain risks of overseas investing including currency fluctuations and changes in political and economic conditions, which could result in significant market fluctuations. These risks are magnified in emerging markets. |
| 4 | The Fund is subject to the risks associated with investments in emerging markets, such as erratic earnings patterns, economic and political instability, changing exchange controls, limitations on repatriation of foreign capital and changes in local governmental attitudes toward private investment, possibly leading to nationalization or confiscation of investor assets. |
| 5 | An issuer of a security may be unwilling or unable to pay income on a security. Common stocks do not assure dividend payments and are paid only when declared by an issuer’s board of directors. |
| 6 | The Fund is subject to risks associated with investments in mid-capitalization companies such as greater price volatility, lower trading volume, and less liquidity than the stocks of larger, more established companies. Growth stocks may underperform value stocks during given periods. |
| 7 | The Fund is subject to special risk considerations similar to those associated with the direct ownership of real estate. Real estate valuations may be subject to factors such as changing general and local economic, financial, competitive, and environmental conditions. |
| 8 | The Fund is subject to risks associated with investments in small-capitalization companies, such as erratic earnings patterns, competitive conditions, limited earnings history and a reliance on one or a limited number of products. |
| 9 | The MSCI World Index is a free float-adjusted market capitalization weighted index that is designed to measure the equity market performance of developed markets. Please go to msci.com for most current list of countries represented by the index. Unlike the Fund, the MSCI World Index is unmanaged, is not available for investment and does not incur expenses. |
| 10 | All MSCI data is provided ‘as is.’ The products described herein are not sponsored or endorsed and have not been reviewed or passed on by MSCI. In no event shall MSCI, its affiliates, or any MSCI data provider have any liability of any kind in connection with the MSCI data or the products described herein. Copying or redistributing the MSCI data is strictly prohibited. |
Not FDIC insured, nor bank guaranteed. May lose value.
103
AMG Managers Guardian Capital Global Dividend Fund
Fund Snapshots (unaudited)
October 31, 2018
PORTFOLIO BREAKDOWN
| | | | |
| | | % of | |
Sector | | Net Assets | |
Health Care | | | 15.8 | |
Information Technology | | | 15.7 | |
Energy | | | 10.3 | |
Consumer Staples | | | 9.3 | |
Financials | | | 9.2 | |
Industrials | | | 7.9 | |
Utilities | | | 7.9 | |
Real Estate | | | 6.9 | |
Consumer Discretionary | | | 6.2 | |
Communication Services | | | 4.6 | |
Materials | | | 3.9 | |
Short-Term Investments | | | 2.1 | |
Other Assets Less Liabilities | | | 0.2 | |
TOP TEN HOLDINGS
| | | | |
| | | % of | |
Security Name | | Net Assets | |
Microsoft Corp. | | | 3.3 | |
Apple, Inc. | | | 3.0 | |
Nestle SA (Switzerland) | | | 2.9 | |
TAG Immobilien AG (Germany) | | | 2.9 | |
Bank of America Corp. | | | 2.6 | |
Mastercard, Inc., Class A | | | 2.5 | |
Johnson & Johnson | | | 2.4 | |
Royal Dutch Shell PLC, Class A (Netherlands) | | | 2.2 | |
Accenture PLC, Class A (Ireland) | | | 2.2 | |
Novartis AG, Sponsored ADR (Switzerland) | | | 2.2 | |
| | | | |
Top Ten as a Group | | | 26.2 | |
| | | | |
Because a fund’s strategy may result in multiple investments in particular sectors of the economy, its performance may depend on the performance of those sectors and may fluctuate more widely than investments diversified across more sectors. For additional information on these and other risk considerations, please see the Fund’s prospectus.
Any sectors, industries, or securities discussed should not be perceived as investment recommendations. Mention of a specific security should not be considered a recommendation to buy or solicitation to sell that security. Specific securities mentioned in this report may have been sold from the Fund’s portfolio of investments by the time you receive this report.
104
AMG Managers Guardian Capital Global Dividend Fund
Schedule of Portfolio Investments
October 31, 2018
| | | | | | | | |
| | | Shares | | | Value | |
Common Stocks - 97.7% | | | | | | | | |
Communication Services - 4.6% | | | | | | | | |
AT&T, Inc. | | | 14,349 | | | $ | 440,227 | |
BCE, Inc. (Canada) | | | 7,570 | | | | 292,979 | |
Telenor ASA (Norway) | | | 13,217 | | | | 242,339 | |
TELUS Corp. (Canada) | | | 21,064 | | | | 721,307 | |
Total Communication Services | | | | | | | 1,696,852 | |
Consumer Discretionary - 6.2% | | | | | | | | |
Darden Restaurants, Inc. | | | 7,246 | | | | 772,061 | |
The Home Depot, Inc. | | | 1,576 | | | | 277,187 | |
McDonald’s Corp. | | | 2,968 | | | | 525,039 | |
Six Flags Entertainment Corp.1 | | | 8,153 | | | | 439,121 | |
The TJX Cos., Inc. | | | 2,387 | | | | 262,283 | |
Total Consumer Discretionary | | | | | | | 2,275,691 | |
Consumer Staples - 9.3% | | | | | | | | |
Altria Group, Inc. | | | 8,593 | | | | 558,889 | |
Costco Wholesale Corp. | | | 3,350 | | | | 765,910 | |
Nestle SA (Switzerland) | | | 12,790 | | | | 1,079,771 | |
The Procter & Gamble Co. | | | 3,318 | | | | 294,240 | |
Swedish Match AB (Sweden) | | | 6,400 | | | | 326,008 | |
Unilever NV (United Kingdom) | | | 6,911 | | | | 371,674 | |
Total Consumer Staples | | | | | | | 3,396,492 | |
Energy - 10.3% | | | | | | | | |
BP PLC (United Kingdom) | | | 57,384 | | | | 414,526 | |
Chevron Corp. | | | 3,096 | | | | 345,668 | |
Energy Transfer Equity LP, (MLP) | | | 16,681 | | | | 259,223 | |
Eni SpA (Italy) | | | 19,100 | | | | 339,210 | |
Enterprise Products Partners LP, (MLP) | | | 8,906 | | | | 238,859 | |
Equinor ASA, Sponsored ADR (Norway) | | | 14,333 | | | | 368,358 | |
Royal Dutch Shell PLC, Class A (Netherlands) | | | 25,670 | | | | 817,798 | |
Suncor Energy, Inc. (Canada) | | | 7,279 | | | | 244,172 | |
Targa Resources Corp. | | | 5,799 | | | | 299,634 | |
TOTAL SA (France) | | | 7,585 | | | | 445,051 | |
Total Energy | | | | | | | 3,772,499 | |
Financials - 9.2% | | | | | | | | |
Allianz SE (Germany) | | | 1,600 | | | | 333,310 | |
AXA SA (France) | | | 11,875 | | | | 297,190 | |
Bank of America Corp. | | | 34,407 | | | | 946,193 | |
JPMorgan Chase & Co. | | | 7,179 | | | | 782,655 | |
NN Group NV (Netherlands) | | | 6,646 | | | | 285,365 | |
Royal Bank of Canada (Canada) | | | 9,790 | | | | 713,325 | |
Total Financials | | | | | | | 3,358,038 | |
| | | | | | | | |
| | | Shares | | | Value | |
Health Care - 15.8% | | | | | | | | |
AbbVie, Inc. | | | 2,235 | | | $ | 173,995 | |
Amgen, Inc. | | | 2,142 | | | | 412,956 | |
AstraZeneca PLC (United Kingdom) | | | 7,866 | | | | 601,668 | |
Fresenius Medical Care AG & Co. KGaA, ADR (Germany) | | | 9,291 | | | | 363,092 | |
Johnson & Johnson | | | 6,328 | | | | 885,857 | |
Medtronic PLC (Ireland) | | | 4,697 | | | | 421,884 | |
Novartis AG, Sponsored ADR (Switzerland) | | | 9,059 | | | | 792,300 | |
Novo Nordisk, Sponsored ADR (Denmark) | | | 11,973 | | | | 516,994 | |
Pfizer, Inc. | | | 10,145 | | | | 436,844 | |
Stryker Corp. | | | 2,763 | | | | 448,214 | |
UnitedHealth Group, Inc. | | | 2,894 | | | | 756,347 | |
Total Health Care | | | | | | | 5,810,151 | |
Industrials - 7.9% | | | | | | | | |
Ferrovial SA (Spain) | | | 25,599 | | | | 512,515 | |
Illinois Tool Works, Inc. | | | 2,233 | | | | 284,864 | |
Lockheed Martin Corp. | | | 1,057 | | | | 310,599 | |
Raytheon Co. | | | 3,779 | | | | 661,476 | |
Republic Services, Inc. | | | 6,473 | | | | 470,458 | |
Sojitz Corp. (Japan) | | | 102,201 | | | | 343,698 | |
Waste Management, Inc. | | | 3,706 | | | | 331,576 | |
Total Industrials | | | | | | | 2,915,186 | |
Information Technology - 15.7% | | | | | | | | |
Accenture PLC, Class A (Ireland) | | | 5,166 | | | | 814,265 | |
Analog Devices, Inc. | | | 3,181 | | | | 266,281 | |
Apple, Inc. | | | 5,082 | | | | 1,112,247 | |
Broadcom, Inc. | | | 1,233 | | | | 275,563 | |
Mastercard, Inc., Class A | | | 4,576 | | | | 904,538 | |
Microsoft Corp. | | | 11,447 | | | | 1,222,654 | |
Paychex, Inc. | | | 10,640 | | | | 696,814 | |
Texas Instruments, Inc. | | | 4,976 | | | | 461,922 | |
Total Information Technology | | | | | | | 5,754,284 | |
Materials - 3.9% | | | | | | | | |
Air Products & Chemicals, Inc. | | | 1,600 | | | | 246,960 | |
BASF SE (Germany) | | | 3,335 | | | | 255,922 | |
BHP Billiton Ltd. (Australia) | | | 18,800 | | | | 433,785 | |
Stora Enso OYJ, Class R (Finland) | | | 32,621 | | | | 490,134 | |
Total Materials | | | | | | | 1,426,801 | |
Real Estate - 6.9% | | | | | | | | |
Digital Realty Trust, Inc., REIT | | | 3,183 | | | | 328,677 | |
LEG Immobilien AG (Germany) | | | 6,800 | | | | 743,298 | |
Medical Properties Trust, Inc., REIT 1 | | | 27,427 | | | | 407,565 | |
The accompanying notes are an integral part of these financial statements.
105
AMG Managers Guardian Capital Global Dividend Fund
Schedule of Portfolio Investments (continued)
| | | | | | | | |
| | | Shares | | | Value | |
Real Estate - 6.9% (continued) | | | | | | | | |
TAG Immobilien AG (Germany) | | | 45,748 | | | $ | 1,043,604 | |
Total Real Estate | | | | | | | 2,523,144 | |
Utilities - 7.9% | | | | | | | | |
American Water Works Co., Inc. | | | 4,325 | | | | 382,892 | |
Duke Energy Corp. | | | 9,120 | | | | 753,586 | |
Exelon Corp. | | | 17,519 | | | | 767,507 | |
Iberdrola SA (Spain) | | | 78,200 | | | | 553,327 | |
WEC Energy Group, Inc. | | | 6,578 | | | | 449,935 | |
Total Utilities | | | | | | | 2,907,247 | |
Total Common Stocks
(Cost $33,194,341) | | | | | | | 35,836,385 | |
Short-Term Investments - 2.1% | | | | | | | | |
Other Investment Companies - 2.1% | | | | | | | | |
Dreyfus Government Cash Management Fund, Institutional Class Shares, 2.05%2 | | | 251,528 | | | | 251,528 | |
Dreyfus Institutional Preferred Government Money Market Fund, Institutional Class Shares, 2.12%2 | | | 251,527 | | | | 251,527 | |
JPMorgan U.S. Government Money Market Fund, IM Shares, 2.09%2 | | | 259,150 | | | | 259,150 | |
Total Short-Term Investments
(Cost $762,205) | | | | | | | 762,205 | |
| | | | | | | | |
| | | | | | Value | |
Total Investments - 99.8%
(Cost $33,956,546) | | | | | | $ | 36,598,590 | |
Other Assets, less Liabilities - 0.2% | | | | | | | 79,140 | |
Net Assets - 100.0% | | | | | | $ | 36,677,730 | |
| 1 | Some or all of these securities, amounting to $838,183 or 2.3% of net assets, were out on loan to various brokers and are collateralized by various U.S. Treasury Obligations. See Note 4 of Notes to Financial Statements. |
| 2 | Yield shown represents the October 31, 2018, seven day average yield, which refers to the sum of the previous seven days’ dividends paid, expressed as an annual percentage. |
| ADR | American Depositary Receipt |
| MLP | Master Limited Partnership |
| REIT | Real Estate Investment Trust |
The accompanying notes are an integral part of these financial statements.
106
AMG Managers Guardian Capital Global Dividend Fund
Schedule of Portfolio Investments (continued)
The following table summarizes the inputs used to value the Fund’s investments by the fair value hierarchy levels as of October 31, 2018:
| | | | | | | | | | | | | | | | |
| | | Level 1 | | | Level 21 | | | Level 3 | | | Total | |
Investments in Securities | | | | | | | | | | | | | | | | |
Common Stocks | | | | | | | | | | | | | | | | |
Health Care | | $ | 5,208,483 | | | $ | 601,668 | | | | — | | | $ | 5,810,151 | |
Information Technology | | | 5,754,284 | | | | — | | | | — | | | | 5,754,284 | |
Energy | | | 1,755,914 | | | | 2,016,585 | | | | — | | | | 3,772,499 | |
Consumer Staples | | | 1,990,713 | | | | 1,405,779 | | | | — | | | | 3,396,492 | |
Financials | | | 2,442,173 | | | | 915,865 | | | | — | | | | 3,358,038 | |
Industrials | | | 2,058,973 | | | | 856,213 | | | | — | | | | 2,915,186 | |
Utilities | | | 2,353,920 | | | | 553,327 | | | | — | | | | 2,907,247 | |
Real Estate | | | 736,242 | | | | 1,786,902 | | | | — | | | | 2,523,144 | |
Consumer Discretionary | | | 2,275,691 | | | | — | | | | — | | | | 2,275,691 | |
Communication Services | | | 1,454,513 | | | | 242,339 | | | | — | | | | 1,696,852 | |
Materials | | | 246,960 | | | | 1,179,841 | | | | — | | | | 1,426,801 | |
Short-Term Investments | | | | | | | | | | | | | | | | |
Other Investment Companies | | | 762,205 | | | | — | | | | — | | | | 762,205 | |
| | | | | | | | | | | | | | | | |
Total Investments in Securities | | $ | 27,040,071 | | | $ | 9,558,519 | | | | — | | | $ | 36,598,590 | |
| | | | | | | | | | | | | | | | |
| 1 | An external pricing service is used to reflect any impact on security value due to market movements between the time the Fund valued such foreign securities and the earlier closing of foreign markets. As a result, certain international equity securities may be level 2 and could result in transfers between level 1 and level 2. (See Note 1(a) in the Notes to Financial Statements.) |
As of October 31, 2018, the Fund had no transfers between levels from the beginning of the reporting period.
| | | | |
Country | | % of Long-Term
Investments | |
Australia | | | 1.2 | |
Canada | | | 5.5 | |
Denmark | | | 1.4 | |
Finland | | | 1.4 | |
France | | | 2.1 | |
Germany | | | 7.6 | |
Ireland | | | 3.5 | |
Italy | | | 0.9 | |
Japan | | | 1.0 | |
| | | | |
Country | | % of Long-Term
Investments | |
Netherlands | | | 3.1 | |
Norway | | | 1.7 | |
Spain | | | 3.0 | |
Sweden | | | 0.9 | |
Switzerland | | | 5.2 | |
United Kingdom | | | 3.9 | |
United States | | | 57.6 | |
| | | | |
| | | 100.0 | |
| | | | |
The accompanying notes are an integral part of these financial statements.
107
AMG Managers Pictet International Fund
Portfolio Manager’s Comments (unaudited)
OVERVIEW
For the fiscal year ended October 31, 2018, the AMG Managers Pictet International Fund (the “Fund”) Class N shares returned (10.80)%, underperforming the (6.85)% return for the MSCI EAFE Index.
MARKET COMMENTARY
Early in the period, international markets continued on the seemingly relentless upward trajectory that had characterized the whole of 2017. However, in late January the mood changed. Higher-than-expected U.S. wage and inflation data (and the implications for the trajectory of U.S. Federal Reserve (the “Fed”) rate increases) prompted a sharp setback from what proved to be the period high. A positive season of year-end 2017 earnings releases had restored some composure by mid-March, when tit-for-tat sanctions raised the specter of a U.S.-China trade war, and the market fell again. News and developments relating to these three factors—U.S./global interest rate policy, corporate profitability, and U.S.-China trade tensions—became the drivers of market direction for the rest of what proved ultimately to be a weak period for international equities. In the 12 months to the end of October, the MSCI EAFE Index fell 6.9% (in U.S. Dollar terms).
From March to September international markets tracked broadly sideways, but were volatile—sporadically buoyed by healthy corporate results, or the prospect of positive developments in U.S.-China trade talks, then depressed again by an escalation of trade sanctions, emerging market concerns, or geopolitical developments in Europe. This was in stark contrast to the upward march of U.S. equities and the strengthening of the U.S. Dollar (USD).
The latter has largely been a by-product of the steady progression of 25 basis point (.25%) interest rate hikes by the Fed since late 2016. The increasing returns available on USD have been sucking liquidity away from other regions, and by August emerging market economies that already had significant fiscal imbalances reached a tipping point. Turkey and Argentina were the highest profile examples as both suffered sharp currency devaluations (and stock market upheavals).
In Europe the mood was partly driven by the external factors described above, and partly by internal developments. These include cracks developing in Germany’s political stability, the glacial progress of negotiations to determine the U.K.’s ongoing relationship with the European Union (EU) post Brexit (the U.K.’s departure from the EU scheduled to take
place at the end of March 2019), and rising tensions between the EU and Italy’s new populist coalition government over the latter’s plans to set a budget that will breach EU fiscal rules.
The period ended with a sharp global market setback in October, as the negatives intensified and the positives became less supportive. Early in the month the primary catalyst was the suggestion by Fed Chairman Jerome Powell that in response to the “remarkably positive” progression of the U.S. economy, interest rates may need to rise further and faster than is currently expected. At the same time, the reports of calendar Q3 corporate earnings mildly disappointed, suggesting that the U.S.-China trade dispute was beginning to distort both import/export levels and cross-border investment.
PERFORMANCE REVIEW
The Fund underperformed the benchmark over the period, but the pattern of performance was mixed. By the end of August it looked as though the Fund had weathered the change of market environment well—performance was broadly in line with that of the benchmark index. All the underperformance was generated in the final two months of the period as several holdings in China or emerging market exposed stocks, and positions in the IT sector weakened significantly. At an aggregate level, the main drivers were weak stock selection in the Pacific ex Japan region (largely holdings in China) and Europe, and within the consumer, energy, and IT sectors. While failing to offset these effects, notable positive contributions were made by stock selection in Japan and within the health care and materials sectors. At an individual stock level the main negatives were:
1. JD.com (ecommerce, China) outpaced the rising market through to its high point in January and materially underperformed thereafter. The reasons were several. At a broad level JD has suffered from negative sentiment toward Chinese companies in the context of the U.S.-China trade dispute, despite having a purely domestic focus with its franchise. At a company-specific level JD has frustrated investors with low margins that are a product of a very significant capital investment in its logistics capability. For us this is an investment for the future and is constructing a meaningful economic moat that we believe will give them an advantage over competitors for years. In the short term, JD is also being unfavorably compared with larger ecommerce rival Alibaba in terms of its progress in monetizing the value of goods traded across its platform. Alibaba has been more aggressive in tying merchants into the use of bolt-on services. Finally, and somewhat
from left field, Richard Liu, JD’s founder, CEO, Chairman, and largest shareholder, was arrested on suspicion of rape while attending an executive leadership course at the University of Minneapolis. He was questioned, released without charge, and allowed to return to China. It looks unlikely that the case will go any further, but the episode was unsettling and negatively impacted the stock. While we are keeping a close watch on developments on all fronts, we believe that the bulk of these concerns relate either to one-offs, or are short term in nature. Longer term, we believe that JD.com will generate significant and attractive returns from an expanding position in a rapidly growing market.
2. Anheuser-Busch Inbev (global brewer, Belgium) underperformed steadily through the review period, and then more sharply toward the end on news that it is to halve its dividend payment. Sentiment towards ABI has deteriorated for several reasons. For some time investors have been overly (in our view) focused on the craft brewery challenge that ABI faces in the North American market. Volumes are in decline, but the key for us is that so far cash generation has been stable. ABI recognizes the market is ex-growth and is managing its operations and product mix accordingly. The true growth story for ABI is the emerging market (EM) exposure that was increased through its 2016 acquisition of SABMiller. Unfortunately, in the short term, this is also the problem. Weakening sentiment towards EMs through the period had an impact, but the EM currency weakness has ultimately driven the dividend cut. The rich price paid for SABMiller left ABI with high debt, mainly in USD. While predominantly fixed rate and long term in nature, the group generates most of its cash in non-USD currencies. As these have weakened, ABI’s ability to pay down debt and also maintain dividends has been squeezed. Rightly, management has chosen accelerated debt reduction over cash payouts. While not the ride we anticipated when initiating the ABI position for the Fund in 2016, we believe this recent move should bring closer the point when the group is recognized for the high quality of its dominant global brewing franchise, and its industry-leading growth potential.
3. Dignity (funeral services and crematoria, U.K.) was a clear mistake on our part. The holding was added in early 2017, but in December 2017 and then again in January 2018 the price declined sharply. Dignity comprises two related businesses: a relatively stable and regulated crematorium operation, and a larger funeral services operation. It was the latter that we got wrong by misreading the competitive landscape, and therefore Dignity’s pricing power within it. Our thesis was predicated on the group’s role as a
108
AMG Managers Pictet International Fund
Portfolio Manager’s Comments (continued)
consolidator in a highly fragmented market, a history of steady price rises, and the tailwind of favorable demographic trends. Even on conservative assumptions about future pricing, Dignity appeared cheap. What we missed was rising supply as the operators of small funeral service businesses acquired by Dignity jumped ship to re-establish their old franchises. This led to price pressures which were exacerbated by a growth in price comparison websites. A December 2017 statement from the company talked of a price review, and in January Dignity cut its “basic funeral” price by 20% in response to a similar move by the largest player in the market (Dignity was number two). Re-basing our forecasts for the true environment we believed the cumulative 60% price decline in the stock was disproportionate, and retained the position, but the damage was done.
Two stand-out positive contributions over the period were:
1. Livanova (surgical devices, U.K.), a specialist producer of devices and implants for cardiac surgery and neuro-modulation. Its stock performed well throughout the period as management continued executing a strategy of small bolt-on acquisitions that complement and strengthen its core franchises. In mid-2017 this performance accelerated on news that the U.S. Centers for Medicare & Medicaid Services (CMS) is to reconsider a prior decision not to cover the cost of a Livanova surgical implant for the management of treatment-resistant depression (TRD). This is a very rare move by the CMS, and suggests a high likelihood that approval will now be given. TRD represents a significant addressable market in the U.S. and (as its name implies) there are no other effective treatments. A coverage extension decision would be a major bonus for Livanova’s base business of legacy products and, at the margin, reduce our investment thesis reliance on the success of promising pipeline products. It would also underpin confidence in the group’s decision to make its neuromodulation expertise an area of core strategic focus. We remain holders.
2. Safran (aerospace, France) performed well throughout the period. Safran’s main activity is jet engine manufacture for narrow-bodied jets, and it has a dominant 75% share in the market for Boeing 737 and Airbus A320 jets. However, the group is going through a major model transition as it winds down production of its old CFM56 generation engine and ramps up production of its new LEAP generation. By Q3 2017 when we acquired the stock for the Fund, investors had become concerned by
delays in the LEAP program, extended dual production costs, and by Safran’s acquisition of troubled airline interiors business Zodiac. We looked through what we felt were short-term issues to a group generating high maintenance spares margins from a 25-year CFM56 installed base, and rapidly establishing a LEAP base in a fast growing sector of the airline market. Through 2018 each quarterly release has pointed to the CFM56/Leap transition going smoothly, better-than-expected revenues from the legacy installed base, and improvements at Zodiac. Industry data showing rising air passenger numbers and record demand for narrow-bodied jets has also been supportive. We remain holders.
FUND ACTIVITY
While there were a number of changes at the stock level through the period, the net effect on overall Fund “shape” was relatively modest. The only meaningful changes were a further increase in the overweight positions in the consumer sectors (particularly consumer discretionary, which is now close to the maximum 10% overweight we allow ourselves relative to the Index) and a decrease in the previously significant underweight in financials. As the world’s central banks rein in ultra-low interest-rate policies we have very selectively begun to identify value in sector, resulting in the addition of Nordea (Sweden), Shinsei Bank (Japan), and Julius Baer (Switzerland) to the Fund. The overall regional exposure has also changed little; the Fund remains underweight in Japan, broadly neutral in Europe, and overweight in the Pacific ex Japan.
The bulk of the stock level activity over the period was taking profit in successful positions that reached or were approaching our assessment of their intrinsic value, and using the proceeds either to fund new positions or to add to existing positions that had been weak and had moved further away from our price targets. As a result, the number of holdings in the Fund declined modestly to end the period at 64. Also, and as is consistent with our purely bottom up approach to stock selection and portfolio construction, there is little in the way of a pattern that can be ascribed to the new positions. Aside from the financials acquisitions mentioned above, the only common thread is that we believe we have identified stable and long-term growth in free cash generation, and that the prevailing market price is undervaluing this progression.
One notable by-product of this activity is a reduction in the weighting of the Fund in companies that we define as small cap (companies with a market
capitalization below US$3 billion). This is largely due to the stronger performance of a number of holdings that have either been sold or have moved up through this size threshold to become “mid cap.” The historically significant tilt of the Fund away from mega/large cap in favor of mid and smaller cap names is not because we believe large companies are inherently bad. The reason is that further down the size spectrum we tend to find less complex companies that we can value with more confidence, and where our view will be one of a few, rather than one of hundreds. Pricing anomalies that we can exploit are therefore more likely. We don’t see any reason why this part of the market is likely to become less attractive to our approach. Indeed, it is worth noting that while the specific small cap weighting has declined, the overall weighting to companies in the mid and small cap space (i.e. sub-US$10 billion market capitalization) has been (and remains) fairly constant over time at a little less than half the value of the Fund.
MARKET OUTLOOK AND STRATEGY
As we have moved through 2018 an undercurrent of robust economic improvement has faltered. Leading indicators have weakened and now suggest that both corporate profitability and growth have peaked rather than being in the virtuous circle that was evident at the start of the year. Similarly, while we believe that all parties will end up losing in such an event, trade tensions between the U.S. and China still have the potential to escalate into a full-blown trade war. After a long period of providing the steady tailwind for growth, the pace of that growth is now a problem; led by the Fed, central banks are now moving more aggressively to close the door on an era of easy monetary policy. The ongoing crises in Argentina and Turkey are a product of the particular structural imbalances in those countries, but they are also an indirect effect of recent Fed tightening. Given the recent statements of Fed intentions, there may yet be a further spillover to other EM economies. In addition (and notwithstanding the “known unknown” of Brexit), European politics had looked set for a period of greater stability. This too has changed in the aftermath of Italian elections that returned a shaky, populist/anti-EU coalition.
Although these developments might be seen as tipping the scales to the negative side, we remain reluctant (as ever) to speculate on what they mean for the direction of equity markets. The fact is that a considerable amount of “heat” has already come out of equity prices, and the combination of greater volatility and falling correlations has increased
109
AMG Managers Pictet International Fund
Portfolio Manager’s Comments (continued)
valuation spreads right across the opportunity set. For stock picking approaches like ours this is an interesting and exciting environment.
The series of sell-offs in equity markets since the start of the year had given us the opportunity to add several compelling new positions to the Fund. At an aggregate level the weighted average upside of the Fund is now close to 40%,1 the highest level we have seen since July 2016. We continue to have a significant overweight in consumer discretionary
and we are beginning to see more opportunity in specific financials, although we remain underweight in the sector. The stock level changes made over the period had no material impact on the regional positioning of the Fund. It remains broadly neutral in Europe, underweight in Japan, and overweight in the Pacific ex Japan region.
As always, we continue to run a very active Fund (active share close to 90%) and remain enthusiastic about the prospects of the companies we have
invested in. We believe that their cash generation ability and bright prospects for growth will, over the long term, deliver attractive returns.
| 1 | Based on proprietary Pictet estimates |
The views expressed represent the opinions of Pictet Asset Management Limited, as of October 31, 2018, and are not intended as a forecast or guarantee of future results and are subject to change without notice.
110
AMG Managers Pictet International Fund
Portfolio Manager’s Comments (continued)
CUMULATIVE TOTAL RETURN PERFORMANCE
AMG Managers Pictet International Fund’s cumulative total return is based on the daily change in net asset value (NAV), and assumes that all dividends and distributions were reinvested. The graph compares a hypothetical $10,000 investment made in the AMG Managers Pictet International Fund’s Class N shares on April 14, 2014, to a $10,000 investment made in the MSCI EAFE Index for the same time period. The graph and table do not reflect the deduction of taxes that a shareholder would pay on a Fund distribution or redemption of shares. The listed returns for the Fund are net of expenses and the returns for the index exclude expenses. Total returns would have been lower had certain expenses not been reduced.
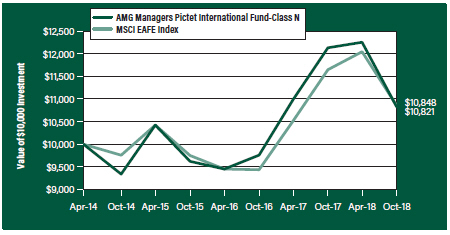
The table below shows the average annual total returns for the AMG Managers Pictet International Fund, the MSCI EAFE Index for the same time periods ended October 31, 2018.
| | | | | | | | | | | | |
| | | One | | | Since | | | Inception | |
| Average Annual Total Returns1 | | Year | | | Inception | | | Date | |
AMG Managers Pictet International Fund2, 3, 4, 5, 6, 7 | | | | | | | | | | | | |
Class N
| | | (10.80 | %) | | | 1.75 | % | | | 04/14/14 | |
Class I | | | (10.57 | %) | | | 2.04 | % | | | 04/14/14 | |
Class Z | | | (10.52 | %) | | | (8.33 | %) | | | 09/29/17 | |
MSCI EAFE Index8, 9 | | | (6.85 | %) | | | 1.81 | % | | | 04/14/14 | † |
The performance data shown represents past performance. Past performance is not a guarantee of future results. Current performance may be lower or higher than the performance data quoted. The investment return and principal value of an investment will fluctuate so that an investor’s shares, when redeemed, may be worth more or less than their original cost.
Investors should carefully consider the Fund’s investment objectives, risks, charges and expenses before investing. For performance information through the most recent month end, current net asset values per share for the Fund and other information, please call 800.835.3879 or visit our website at amgfunds.com for a free prospectus. Read it carefully before investing or sending money.
Distributed by AMG Distributors, Inc., member FINRA/SIPC.
| † | Date reflects the inception date of the Fund, not the index. |
| 1 | Total return equals income yield plus share price change and assumes reinvestment of all dividends and capital gain distributions. Returns are net of fees and may reflect offsets of Fund expenses as described in the prospectus. No adjustment has been made for taxes payable by shareholders on their reinvested dividends and capital gain distributions. Returns for periods greater than one year are annualized. The listed returns on the Fund are net of expenses and based on the published NAV as of October 31, 2018. All returns are in U.S. dollars ($). |
| 2 | A short-term redemption fee of 2% will be charged on shares held for less than 90 days. |
| 3 | Investments in international securities are subject to certain risks of overseas investing including currency fluctuations and changes in political and economic conditions, which could result in significant market fluctuations. These risks are magnified in emerging markets. |
| 4 | The Fund is subject to the risks associated with investments in emerging markets, such as erratic earnings patterns, economic and political instability, changing exchange controls, limitations on repatriation of foreign capital and changes in local governmental attitudes toward private investment, possibly leading to nationalization or confiscation of investor assets. |
| 5 | Investing in initial public offerings (IPOs) is risky and the prices of stocks purchased in IPOs tend to fluctuate more widely than stocks of companies that have been publicly traded for a longer period of time. Stocks purchased in IPOs generally do not have a trading history, and information about the companies may be available for very limited periods. |
| 6 | The Fund is subject to risks associated with investments in mid-capitalization companies such as greater price volatility, lower trading volume, and less liquidity than the stocks of larger, more established companies. Growth stocks may underperform value stocks during given periods. |
| 7 | The Fund is subject to risks associated with investments in small-capitalization companies, such as erratic earnings patterns, competitive conditions, limited earnings history and a reliance on one or a limited number of products. |
| 8 | The MSCI EAFE Index (Europe, Australasia, Far East) is a free float-adjusted market capitalization index that is designed to measure the equity market performance of developed markets, excluding the U.S. & Canada. Please go to msci.com for most current list of countries represented by the index. Unlike the Fund, the MSCI EAFE Index is unmanaged, is not available for investment and does not incur expenses. |
| 9 | All MSCI data is provided “as is.” The products described herein are not sponsored or endorsed and have not been reviewed or passed on by MSCI. In no event shall MSCI, its affiliates, or any MSCI data provider have any liability of any kind in connection with the MSCI data or the products described herein. Copying or redistributing the MSCI data is strictly prohibited. |
Not FDIC insured, nor bank guaranteed. May lose value.
111
AMG Managers Pictet International Fund
Fund Snapshots (unaudited)
October 31, 2018
PORTFOLIO BREAKDOWN
| | | | |
| | | % of | |
Sector | | Net Assets | |
Consumer Discretionary | | | 20.2 | |
Financials | | | 16.3 | |
Industrials | | | 16.2 | |
Consumer Staples | | | 15.2 | |
Health Care | | | 10.1 | |
Information Technology | | | 6.4 | |
Communication Services | | | 5.7 | |
Energy | | | 3.6 | |
Materials | | | 3.3 | |
Real Estate | | | 1.0 | |
Utilities | | | 0.7 | |
Short-Term Investments1 | | | 3.3 | |
Other Assets Less Liabilities2 | | | (2.0 | ) |
| 1 | Includes reinvestment of cash collateral into joint repurchase agreements on security lending transactions. |
| 2 | Includes repayment of cash collateral on security lending transactions. |
TOP TEN HOLDINGS
| | | | |
| | | % of | |
Security Name | | Net Assets | |
Safran SA (France) | | | 3.5 | |
Royal Dutch Shell PLC, Class B (Netherlands) | | | 2.9 | |
LivaNova PLC (United Kingdom) | | | 2.9 | |
Japan Tobacco, Inc. (Japan) | | | 2.8 | |
Anheuser-Busch InBev SA/NV (Belgium) | | | 2.7 | |
Nestle SA (Switzerland) | | | 2.7 | |
GlaxoSmithKline PLC (United Kingdom) | | | 2.6 | |
JD.com, Inc., ADR (China) | | | 2.5 | |
Asahi Group Holdings, Ltd. (Japan) | | | 2.4 | |
Prudential PLC (United Kingdom) | | | 2.4 | |
| | | | |
Top Ten as a Group | | | 27.4 | |
| | | | |
Because a fund’s strategy may result in multiple investments in particular sectors of the economy, its performance may depend on the performance of those sectors and may fluctuate more widely than investments diversified across more sectors. For additional information on these and other risk considerations, please see the Fund’s prospectus.
Any sectors, industries, or securities discussed should not be perceived as investment recommendations. Mention of a specific security should not be considered a recommendation to buy or solicitation to sell that security. Specific securities mentioned in this report may have been sold from the Fund’s portfolio of investments by the time you receive this report.
112
AMG Managers Pictet International Fund
Schedule of Portfolio Investments
October 31, 2018
| | | | | | | | |
| | | Shares | | | Value | |
Common Stocks - 98.7% | | | | | | | | |
Communication Services - 5.7% | | | | | | | | |
Inmarsat PLC (United Kingdom) | | | 5,725,680 | | | $ | 33,297,330 | |
PCCW, Ltd. (Hong Kong) | | | 59,337,309 | | | | 32,580,310 | |
SoftBank Group Corp. (Japan) | | | 306,100 | | | | 24,224,393 | |
Total Communication Services | | | | | | | 90,102,033 | |
Consumer Discretionary - 20.2% | | | | | | | | |
ABC-Mart, Inc. (Japan) | | | 284,800 | | | | 16,650,841 | |
Bandai Namco Holdings, Inc. (Japan) | | | 397,600 | | | | 14,144,526 | |
Cie Financiere Richemont SA (Switzerland) | | | 254,371 | | | | 18,592,140 | |
Cineworld Group PLC (United Kingdom) | | | 8,423,250 | | | | 31,664,939 | |
Ctrip.com International, Ltd., ADR (China)* | | | 789,159 | | | | 26,263,212 | |
Dignity PLC (United Kingdom) | | | 1,148,272 | | | | 14,622,315 | |
Gestamp Automocion SA (Spain)1,2 | | | 3,109,627 | | | | 19,716,445 | |
Informa PLC (United Kingdom) | | | 3,657,401 | | | | 33,375,908 | |
JD.com, Inc., ADR (China)*,2 | | | 1,655,098 | | | | 38,927,905 | |
KOMEDA Holdings Co., Ltd. (Japan) | | | 830,800 | | | | 16,343,289 | |
Matas A/S (Denmark) | | | 704,928 | | | | 6,806,452 | |
MGM China Holdings, Ltd. (Macau) | | | 17,420,000 | | | | 24,723,787 | |
Pandora A/S (Denmark) | | | 267,163 | | | | 16,714,672 | |
Sony Corp. (Japan) | | | 461,900 | | | | 24,996,528 | |
Vivendi SA (France) | | | 635,242 | | | | 15,320,883 | |
Total Consumer Discretionary | | | | | | | 318,863,842 | |
Consumer Staples - 15.2% | | | | | | | | |
Ain Holdings, Inc. (Japan) | | | 219,300 | | | | 17,199,221 | |
Anheuser-Busch InBev SA/NV (Belgium) | | | 584,544 | | | | 43,233,435 | |
Asahi Group Holdings, Ltd. (Japan) | | | 878,800 | | | | 38,618,931 | |
cocokara fine, Inc. (Japan) | | | 358,400 | | | | 19,727,778 | |
Danone SA (France) | | | 312,434 | | | | 22,124,392 | |
Japan Tobacco, Inc. (Japan) | | | 1,695,100 | | | | 43,556,149 | |
Nestle SA (Switzerland) | | | 500,968 | | | | 42,293,276 | |
Ontex Group NV (Belgium) | | | 723,963 | | | | 13,875,736 | |
Total Consumer Staples | | | | | | | 240,628,918 | |
Energy - 3.6% | | | | | | | | |
Royal Dutch Shell PLC, Class B (Netherlands) | | | 1,410,428 | | | | 45,998,197 | |
Z Energy, Ltd. (New Zealand) | | | 2,748,588 | | | | 10,962,200 | |
Total Energy | | | | | | | 56,960,397 | |
Financials - 16.3% | | | | | | | | |
Banco Bilbao Vizcaya Argentaria SA (Spain) | | | 5,670,792 | | | | 31,297,474 | |
BPER Banca (Italy) | | | 2,966,517 | | | | 11,257,873 | |
Julius Baer Group, Ltd. (Switzerland) | | | 585,094 | | | | 26,683,085 | |
Mizrahi Tefahot Bank, Ltd. (Israel) | | | 791,403 | | | | 13,319,740 | |
Moscow Exchange MICEX-RTS PJSC (Russia)* | | | 18,989,135 | | | | 25,312,834 | |
| | | | | | | | |
| | | Shares | | | Value | |
Nordea Bank Abp (Finland) | | | 2,379,783 | | | $ | 20,682,401 | |
Prudential PLC (United Kingdom) | | | 1,905,522 | | | | 38,155,465 | |
Saga PLC (United Kingdom) | | | 12,421,986 | | | | 18,910,443 | |
Shinsei Bank, Ltd. (Japan) | | | 1,725,800 | | | | 26,289,106 | |
Sompo Holdings, Inc. (Japan) | | | 665,800 | | | | 27,461,280 | |
Standard Chartered PLC (United Kingdom) | | | 2,680,323 | | | | 18,785,609 | |
Total Financials | | | | | | | 258,155,310 | |
Health Care - 10.1% | | | | | | | | |
GlaxoSmithKline PLC (United Kingdom) | | | 2,086,000 | | | | 40,401,161 | |
Grifols SA, ADR (Spain) | | | 886,258 | | | | 18,097,388 | |
LivaNova PLC (United Kingdom)* | | | 408,096 | | | | 45,702,671 | |
Miraca Holdings, Inc. (Japan) | | | 565,300 | | | | 13,761,679 | |
Orpea (France) | | | 201,348 | | | | 24,788,383 | |
Primary Health Care, Ltd. (Australia) | | | 9,311,422 | | | | 17,529,492 | |
Total Health Care | | | | | | | 160,280,774 | |
Industrials - 16.2% | | | | | | | | |
Bollore SA (France) | | | 4,270,892 | | | | 18,069,159 | |
Bollore SA, non-voting shares (France)* | | | 26,979 | | | | 122,231 | |
CK Hutchison Holdings, Ltd. (Hong Kong) | | | 3,346,748 | | | | 33,708,861 | |
Elis SA (France) | | | 1,231,458 | | | | 24,831,196 | |
FANUC Corp. (Japan) | | | 173,800 | | | | 30,235,476 | |
Fujitec Co., Ltd. (Japan) | | | 1,130,900 | | | | 12,321,378 | |
Jardine Strategic Holdings, Ltd. (Hong Kong) | | | 704,700 | | | | 23,672,668 | |
Knorr-Bremse AG (Germany)* | | | 195,111 | | | | 17,679,303 | |
Obrascon Huarte Lain SA (Spain) | | | 1,641,019 | | | | 1,873,218 | |
Safran SA (France) | | | 427,965 | | | | 55,304,688 | |
SEEK, Ltd. (Australia) | | | 1,224,331 | | | | 15,555,117 | |
Vinci SA (France)2 | | | 254,485 | | | | 22,648,883 | |
Total Industrials | | | | | | | 256,022,178 | |
Information Technology - 6.4% | | | | | | | | |
ams AG (Austria) | | | 245,606 | | | | 9,568,142 | |
ASML Holding NV (Netherlands) | | | 196,990 | | | | 33,930,190 | |
Nokia OYJ (Finland) | | | 3,748,990 | | | | 21,176,373 | |
Siltronic AG (Germany) | | | 134,043 | | | | 12,276,234 | |
Sophos Group PLC (United Kingdom)1 | | | 4,303,133 | | | | 24,098,601 | |
Total Information Technology | | | | | | | 101,049,540 | |
Materials - 3.3% | | | | | | | | |
KAZ Minerals PLC (United Kingdom) | | | 2,214,151 | | | | 14,619,382 | |
Oci NV (Netherlands)* | | | 1,319,158 | | | | 37,480,870 | |
Total Materials | | | | | | | 52,100,252 | |
Real Estate - 1.0% | | | | | | | | |
Merlin Properties Socimi SA, REIT (Spain) | | | 1,211,139 | | | | 15,175,583 | |
The accompanying notes are an integral part of these financial statements.
113
AMG Managers Pictet International Fund
Schedule of Portfolio Investments (continued)
| | | | | | | | |
| | | Shares | | | Value | |
Utilities - 0.7% | | | | | | | | |
Rubis SCA (France) | | | 200,983 | | | $ | 10,369,481 | |
Total Common Stocks
(Cost $1,642,433,672) | | | | | | | 1,559,708,308 | |
| | |
| | | Principal | | | | |
| | | Amount | | | | |
Short-Term Investments - 3.3% | | | | | | | | |
Joint Repurchase Agreements - 1.8%3 | | | | | | | | |
Citigroup Global Markets, Inc., dated 10/31/18, due 11/01/18, 2.220% total to be received $6,967,990 (collateralized by various U.S. Government Agency Obligations and U.S. Treasuries, 0.000% - 6.500%, 10/01/19 -09/09/49, totaling $7,106,911) | | $ | 6,967,560 | | | | 6,967,560 | |
HSBC Securities USA, Inc., dated 10/31/18, due 11/01/18, 2.210% total to be received $6,967,988 (collateralized by various U.S. Government Agency Obligations, 2.500% - 5.000%, 07/01/23 - 01/01/57, totaling $7,106,911) | | | 6,967,560 | | | | 6,967,560 | |
Merrill Lynch, Pierce, Fenner & Smith, Inc., dated 10/31/18, due 11/01/18, 2.200% total to be received $1,464,809 (collateralized by various U.S. Treasuries, 0.125% - 2.500%, 04/30/20 -09/09/49, totaling $1,494,013) | | | 1,464,719 | | | | 1,464,719 | |
Nomura Securities International, Inc., dated 10/31/18, due 11/01/18, 2.210% total to be received $6,967,988 (collateralized by various U.S. Government Agency Obligations and U.S. Treasuries, 0.000% - 9.500%, 11/08/18 -09/20/68, totaling $7,106,911) | | | 6,967,560 | | | | 6,967,560 | |
| | | | | | | | |
| | | Principal | | | | |
| | | Amount | | | Value | |
RBC Dominion Securities, Inc., dated 10/31/18, due 11/01/18, 2.220% total to be received $6,967,990 (collateralized by various U.S. Government Agency Obligations and U.S. Treasuries, 0.000% - 7.000%, 11/29/18 -09/09/49, totaling $7,106,911) | | $ | 6,967,560 | | | $ | 6,967,560 | |
Total Joint Repurchase Agreements | | | | | | | 29,334,959 | |
| | |
| | | Shares | | | | |
Other Investment Companies - 1.5% | | | | | | | | |
Dreyfus Government Cash Management Fund, Institutional Class Shares, 2.05%4 | | | 7,800,076 | | | | 7,800,076 | |
Dreyfus Institutional Preferred Government Money Market Fund, Institutional Class Shares, 2.12%4 | | | 7,800,075 | | | | 7,800,075 | |
JPMorgan U.S. Government Money Market Fund, IM Shares, 2.09%4 | | | 8,036,441 | | | | 8,036,441 | |
Total Other Investment Companies | | | | | | | 23,636,592 | |
Total Short-Term Investments
(Cost $52,971,551) | | | | | | | 52,971,551 | |
Total Investments - 102.0%
(Cost $1,695,405,223) | | | | | | | 1,612,679,859 | |
Other Assets, less Liabilities - (2.0)% | | | | | | | (32,287,585 | ) |
Net Assets - 100.0% | | | | | | $ | 1,580,392,274 | |
| * | Non-income producing security. |
| 1 | Security exempt from registration under Rule 144A of the Securities Act of 1933. This security may be resold in transactions exempt from registration, normally to qualified buyers. At October 31, 2018, the value of these securities amounted to $43,815,046 or 2.8% of net assets. |
| 2 | Some or all of these securities, amounting to $27,022,240 or 1.7% of net assets, were out on loan to various brokers and are collateralized by cash and various U.S. Treasury Obligations. See Note 4 of Notes to Financial Statements. |
| 3 | Cash collateral received from brokers for securities lending was invested in these joint repurchase agreements. |
| 4 | Yield shown represents the October 31, 2018, seven day average yield, which refers to the sum of the previous seven days’ dividends paid, expressed as an annual percentage. |
| ADR | American Depositary Receipt |
| REIT | Real Estate Investment Trust |
The accompanying notes are an integral part of these financial statements.
114
AMG Managers Pictet International Fund
Schedule of Portfolio Investments (continued)
The following table summarizes the inputs used to value the Fund’s investments by the fair value hierarchy levels as of October 31, 2018:
| | | | | | | | | | | | | | | | |
| | | Level 1 | | | Level 21 | | | Level 3 | | | Total | |
Investments in Securities | | | | | | | | | | | | | | | | |
Common Stocks | | | | | | | | | | | | | | | | |
Consumer Discretionary | | $ | 88,712,241 | | | $ | 230,151,601 | | | | — | | | $ | 318,863,842 | |
Financials | | | 18,910,443 | | | | 239,244,867 | | | | — | | | | 258,155,310 | |
Industrials | | | 17,801,534 | | | | 238,220,644 | | | | — | | | | 256,022,178 | |
Consumer Staples | | | — | | | | 240,628,918 | | | | — | | | | 240,628,918 | |
Health Care | | | 63,800,059 | | | | 96,480,715 | | | | — | | | | 160,280,774 | |
Information Technology | | | — | | | | 101,049,540 | | | | — | | | | 101,049,540 | |
Communication Services | | | — | | | | 90,102,033 | | | | — | | | | 90,102,033 | |
Energy | | | — | | | | 56,960,397 | | | | — | | | | 56,960,397 | |
Materials | | | — | | | | 52,100,252 | | | | — | | | | 52,100,252 | |
Real Estate | | | — | | | | 15,175,583 | | | | — | | | | 15,175,583 | |
Utilities | | | — | | | | 10,369,481 | | | | — | | | | 10,369,481 | |
Short-Term Investments | | | | | | | | | | | | | | | | |
Joint Repurchase Agreements | | | — | | | | 29,334,959 | | | | — | | | | 29,334,959 | |
Other Investment Companies | | | 23,636,592 | | | | — | | | | — | | | | 23,636,592 | |
| | | | | | | | | | | | | | | | |
Total Investments in Securities | | $ | 212,860,869 | | | $ | 1,399,818,990 | | | | — | | | $ | 1,612,679,859 | |
| | | | | | | | | | | | | | | | |
| 1 | An external pricing service is used to reflect any impact on security value due to market movements between the time the Fund valued such foreign securities and the earlier closing of foreign markets. As a result, certain international equity securities may be level 2 and could result in transfers between level 1 and level 2. (See Note 1(a) in the Notes to Financial Statements.) |
As of October 31, 2018, the Fund had transfers between Level 1 and Level 2 as follows:
| | | | | | | | | | | | | | | | |
| | | Transfer | | | Transfer | | | Transfer | | | Transfer | |
| | | into | | | out of | | | into | | | out of | |
| | | Level 11 | | | Level 11 | | | Level 21 | | | Level 21 | |
Assets: | | | | | | | | | | | | | | | | |
Common Stocks | | $ | 7,893,675 | | | $ | (80,871,525 | ) | | $ | 80,871,525 | | | $ | (7,893,675 | ) |
| 1 | An external pricing service is used to reflect any impact on security value due to market movements between the time the Fund valued such foreign securities and the earlier closing of foreign markets. As a result, certain international equity securities may be level 2 and could result in transfers between level 1 and level 2. (See Note 1(a) in the Notes to Financial Statements.) |
The accompanying notes are an integral part of these financial statements.
115
AMG Managers Pictet International Fund
Schedule of Portfolio Investments (continued)
| | | | |
| | | % of Long-Term | |
Country | | Investments | |
Australia | | | 2.1 | |
Austria | | | 0.6 | |
Belgium | | | 3.7 | |
China | | | 4.2 | |
Denmark | | | 1.5 | |
Finland | | | 2.7 | |
France | | | 12.4 | |
Germany | | | 1.9 | |
Hong Kong | | | 5.8 | |
Israel | | | 0.9 | |
Italy | | | 0.7 | |
Japan | | | 20.9 | |
Macau | | | 1.6 | |
Netherlands | | | 7.5 | |
New Zealand | | | 0.7 | |
Russia | | | 1.6 | |
Spain | | | 5.5 | |
Switzerland | | | 5.6 | |
United Kingdom | | | 20.1 | |
| | | | |
| | | 100.0 | |
| | | | |
The accompanying notes are an integral part of these financial statements.
116
AMG Managers Value Partners Asia Dividend Fund
Portfolio Manager’s Comments (unaudited)
OVERVIEW
For the fiscal year ending October 31, 2018, the AMG Managers Value Partners Asia Dividend Fund (the “Fund”) Class N shares returned (14.13)%, while the MSCI AC Asia ex Japan Index (the “Index”) returned (13.63)%.
MARKET REVIEW
A positive start turned sour in the middle of 2018, as geopolitical concerns, higher U.S. interest rates, an escalating U.S.-China trade dispute, and softer economic data shook the Asia ex-Japan equities market. Against this backdrop, the Index lost -13.6% over the period, while the Fund declined by -14.1%.
TRADE TENSIONS ESCALATE
The ongoing saga between the U.S. and China escalated since the middle of the year, with the U.S. imposing an additional 10% tariff on US$170-190 billion of Chinese exports in September, which could rise further to 25%. To complicate matters, the U.S. has vowed to slap a tariff on US$267 billion of Chinese exports if China retaliates, which Beijing did by introducing duties of 5% and 10% on US$60 billion of American goods.
Markets were hit by the constant back and forth between the two sides, and it is worth highlighting that the scope of the trade war is beginning to widen, with US$78 billion of Chinese consumer goods targeted by the latest round of tariffs. In comparison, only US$3.7 billion of Chinese consumer goods had duties imposed on them by the U.S. in July.
Consequently, there could be a more visible macro impact on China’s exports, which adds pressure to an already jittery market environment. But with the duties now encompassing Chinese consumer goods, we could also possibly see the trade war having a more direct impact on stateside consumers, which would lead to higher inflationary pressure on the U.S., further complicating the situation.
CHINA’S POLICY SHIFT
There has been an obvious change in the policy stance of the Chinese authorities compared to last year as a result of trade uncertainties and a moderating economy. In line with our expectations, China’s economy moderated in 2018 because of softer economic activity and domestic demand. The latest statistics showed the Chinese economy growing by 6.5%1 in the third quarter, down from the 6.9% increase in 2017. In its bid to support the economy and maintain market confidence, China’s policies have turned much softer since its deleveraging efforts in 2016. In addition, it implemented a number of supporting policies this
year, including reserve requirement ratio (RRR) cuts for banks, liquidity injection, additional special deductions of personal income tax, value-added tax (VAT) rebates, and other tax relief.
Additionally, the most recent Politburo meeting held on October 31 gave a strong indication of China’s shift in policy stance. Unlike previous meetings, the term “deleveraging” was completely omitted. The State Council also released on the same day as the Politburo meeting guidance on stepping up infrastructure spending, increasing investments in the three biggest city clusters and announcing favorable policies for infrastructure financing. While the impact of these supporting policies will take time to materialize, this reflects the government’s willingness to step up stimulus measures if required.
We maintain our view that trade tensions will continue to be a key drag on market sentiment. However, the aggressive stance currently adopted by the U.S. is unlikely to be sustainable due to the risk of falling into a lose-lose situation.
KOREA: EXPORTS RISING FIRMLY
Elsewhere in the region, South Korea’s October headline exports accelerated 22.7%2 year-on-year, although that was mainly due to an increase in working days compared to the same period last year. Still, this was the sixth consecutive month in which total export value exceeded the US$50 billion mark. Meanwhile, the country’s Consumer Price Index (CPI) inflation rose 2.0% YoY, which was in line with the Bank of Korea’s (BoK) target. BoK is expected to raise key interest rates once by the end of the year.
ASEAN: CHALLENGING OUTLOOK
The near-term outlook for ASEAN markets remains challenging as the region continues to be impacted by slowing trade, rising political uncertainties, and capital outflows. The greenback’s strong performance prompted all of the region’s currencies to weaken in October, with the exception of the Philippine Peso. The earnings outlook in ASEAN continued to be mixed, with Malaysia the only country that did not experience a negative earnings revision, while Singapore saw the steepest downward revision over the month. The lack of significant tailwinds means we maintain our view of favoring North Asia over ASEAN equities in spite of the latter’s relative outperformance in October.
FUND PERFORMANCE REVIEW
For the period ending October 31, 2018, the Fund lost (14.1)%, while the Index declined by 13.6%. Since its inception on December 16, 2015, the Fund delivered a return of 6.8% as of October 31, 2018, compared with the Index which rose 8.5%.
In this volatile period, the Fund’s main detractors were our positions in the technology and consumer discretionary sectors. Despite already trimming our underweight positions in the technology sector, the expectation of slowing demand for technology hardware weighed on our Taiwan and South Korea hardware holdings’ performances. Within consumer discretionary, our exposures in China auto and home appliance companies also dragged on the Fund’s performance because of concerns over slower consumption growth and the uncertain macro growth outlook.
Against the backdrop of broad-based market corrections, our holdings in a Korean sports apparel company generated positive returns. The stock benefited from a recovery in sales and margins for its Korea business, while its rapidly growing Mainland China joint venture also boosted sales. Another investment that proved to be resilient against the volatile environment was our key holdings in a China property developer thanks to its solid earnings, healthy balance sheet, and cash flow generation capabilities.
OUTLOOK
Corporate earnings within the Asia ex Japan region are expected to moderate, while the negative impact from the ongoing trade dispute on individual sectors is slowly materializing. We are closely monitoring how the actual implementation of tariffs will change over time and whether it will lead to any potential disruptions to the operating efficiency of individual companies in the Fund, while at the same time focusing on companies with non-U.S. exposures.
As a result of the recent selloffs, valuations continued to trend lower, with major indices such as the MSCI China Index dropping below 10x PE on a forward basis (9.8x).3 Another key index, the CSI 300, is currently trading at 9.1x PE on a forward basis, which is close to its historical low. Although regional valuations have yet to reach the previous low, we believe the recent increase in share buybacks across Hong Kong/China indicates that companies believe share prices are currently dislocated. We shall remain nimble in order to adapt to the changing market environments.
| 1 | National Bureau of Statistics of China |
| 2 | South Korea Ministry of Trade, Industry and Energy |
| 3 | CICC Strategic Research |
The views expressed represent the opinions of Value Partners Hong Kong Limited, as of October 31, 2018, and are not intended as a forecast or guarantee of future results and are subject to change without notice.
AMG Managers Value Partners Asia Dividend Fund
Portfolio Manager’s Comments (continued)
CUMULATIVE TOTAL RETURN PERFORMANCE
AMG Managers Value Partners Asia Dividend Fund’s cumulative total return is based on the daily change in net asset value (NAV), and assumes that all dividends and distributions were reinvested. The graph compares a hypothetical $10,000 investment made in the AMG Managers Value Partners Asia Dividend Fund’s Class N shares on December 16, 2015, to a $10,000 investment made in the MSCI All Country Asia Ex-Japan Index for the same time period. The graph and table do not reflect the deduction of taxes that a shareholder would pay on a Fund distribution or redemption of shares. The listed returns for the Fund are net of expenses and the returns for the index exclude expenses. Total returns would have been lower had certain expenses not been reduced.
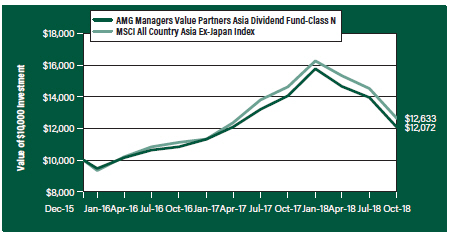
The table below shows the average annual total returns for the AMG Managers Value Partners Asia Dividend Fund, the MSCI All Country Asia Ex-Japan Index for the same time periods ended October 31, 2018.
| | | | | | | | | | | | |
| Average Annual Total Returns1 | | One Year | | | Since Inception | | | Inception Date | |
AMG Managers Value Partners Asia Dividend Fund2, 3, 4, 5, 6, 7, 8, 9, 10, 11, 12 | | | | | | | | | | | | |
Class N | | | (14.13 | %) | | | 6.77 | % | | | 12/16/15 | |
Class I | | | (14.10 | %) | | | 6.87 | % | | | 12/16/15 | |
MSCI All Country Asia Ex-Japan Index13, 14 | | | (13.63 | %) | | | 8.47 | % | | | 12/16/15 | † |
The performance data shown represents past performance. Past performance is not a guarantee of future results. Current performance may be lower or higher than the performance data quoted. The investment return and principal value of an investment will fluctuate so that an investor’s shares, when redeemed, may be worth more or less than their original cost.
Investors should carefully consider the Fund’s investment objectives, risks, charges and expenses before investing. For performance information through the most recent month end, current net asset values per share for the Fund and other information, please call 800.835.3879 or visit our website at amgfunds.com for a free prospectus. Read it carefully before investing or sending money.
Distributed by AMG Distributors, Inc., member FINRA/SIPC.
| † | Date reflects the inception date of the Fund, not the index. |
| 1 | Total return equals income yield plus share price change and assumes reinvestment of all dividends and capital gain distributions. Returns are net of fees and may reflect offsets of Fund expenses as described in the prospectus. No adjustment has been made for taxes payable by shareholders on their reinvested dividends and capital gain distributions. Returns for periods greater than one year are annualized. The listed returns on the Fund are net of expenses and based on the published NAV as of October 31, 2018. All returns are in U.S. dollars ($). |
| 2 | The Fund is subject to the risks associated with investments in debt securities, such as default risk and |
| | fluctuations in the perception of the debtor’s ability to pay its creditors. Changing interest rates may adversely affect the value of an investment. An increase in interest rates typically causes the value of bonds and other fixed income securities to fall. |
| 3 | The Fund may invest in derivatives such as options and futures; the complexity and rapidly changing structure of derivatives markets may increase the possibility of market losses. |
| 4 | A short-term redemption fee of 2% will be charged on shares held for less than 90 days. |
| 5 | The Fund is subject to the risks associated with investments in emerging markets, such as erratic earnings patterns, economic and political instability, changing exchange controls, limitations on repatriation of foreign capital and changes in local governmental attitudes toward private investment, possibly leading to nationalization or confiscation of investor assets. |
| 6 | High-yield bonds (also known as “junk bonds”) may be subject to greater levels of interest rate, credit, and liquidity risk than investments in higher rated securities. These securities are considered predominantly speculative with respect to the issuer’s continuing ability to make principal and interest payments. The issuers of the Fund’s holdings may be involved in bankruptcy proceedings, reorganizations, or financial restructurings, and are not as strong financially as higher-rated issuers. |
| 7 | Investments in international securities are subject to certain risks of overseas investing including currency fluctuations and changes in political and economic conditions, which could result in significant market fluctuations. These risks are magnified in emerging markets. |
| 8 | The Fund is subject to risks associated with investments in mid-capitalization companies such as greater price volatility, lower trading volume, and less liquidity than the stocks of larger, more established companies. Growth stocks may underperform value stocks during given periods. |
| 9 | The Fund is subject to special risk considerations similar to those associated with the direct ownership of real estate. Real estate valuations may be subject to factors such as changing general and local economic, financial, competitive, and environmental conditions. |
| 10 | The Fund may suffer significant losses on assets that it sells short. Unlike the possible loss on a security that is purchased, there is no limit on the amount of loss on an appreciating security that is sold short. |
| 11 | The Fund is subject to risks associated with investments in small-capitalization companies, such as erratic earnings patterns, competitive conditions, limited earnings history and a reliance on one or a limited number of products. |
118
AMG Managers Value Partners Asia Dividend Fund
Portfolio Manager’s Comments (continued)
| 12 | The Fund invests in value stocks, which may perform differently from the market as a whole and may be undervalued by the market for a long period of time. |
| 13 | The MSCI All Country (AC) Asia ex-Japan Index captures large and mid cap representation across certain Developed and Emerging Markets countries in Asia (excluding Japan). The index covers a significant portion of the free float-adjusted market |
| | capitalization in each country. Please go to msci.com for most current list of countries represented by the index. Unlike the Fund, the MSCI All Country (AC) Asia ex-Japan Index is unmanaged, is not available for investment and does not incur expenses. |
| 14 | All MSCI data is provided ‘as is.’ The products described herein are not sponsored or endorsed and have not been reviewed or passed on by MSCI. |
In no event shall MSCI, its affiliates, or any MSCI data provider have any liability of any kind in connection with the MSCI data or the products described herein. Copying or redistributing the MSCI data is strictly prohibited.
Not FDIC insured, nor bank guaranteed. May lose value.
AMG Managers Value Partners Asia Dividend Fund
Fund Snapshots (unaudited)
October 31, 2018
PORTFOLIO BREAKDOWN
| | | | |
| | | % of | |
Sector | | Net Assets | |
Financials | | | 21.9 | |
Consumer Discretionary | | | 16.0 | |
Real Estate | | | 16.0 | |
Industrials | | | 15.5 | |
Information Technology | | | 10.1 | |
Utilities | | | 4.6 | |
Communication Services | | | 3.7 | |
Consumer Staples | | | 3.0 | |
Health Care | | | 1.6 | |
Energy | | | 1.6 | |
Materials | | | 1.1 | |
Short-Term Investments | | | 1.9 | |
Other Assets Less Liabilities | | | 3.0 | |
TOP TEN HOLDINGS
| | | | |
| | | % of | |
Security Name | | Net Assets | |
China Construction Bank Corp., Class H (China) | | | 5.6 | |
Longfor Group Holdings, Ltd. (China) | | | 4.6 | |
Ping An Insurance Group Co. of China, Ltd., Class H (China) | | | 3.7 | |
Far East Horizon, Ltd. (Hong Kong) | | | 3.7 | |
Taiwan Semiconductor Manufacturing Co., Ltd. (Taiwan) | | | 3.5 | |
China Resources Power Holdings Co., Ltd. (Hong Kong) | | | 3.1 | |
Samsung Electronics Co., Ltd. (South Korea) | | | 2.5 | |
Qingdao Port International Co., Ltd., Class H (China) | | | 2.4 | |
Far East Consortium International, Ltd. (Hong Kong) | | | 2.3 | |
China Lilang, Ltd. (China) | | | 2.1 | |
| | | | |
Top Ten as a Group | | | 33.5 | |
| | | | |
Because a fund’s strategy may result in multiple investments in particular sectors of the economy, its performance may depend on the performance of those sectors and may fluctuate more widely than investments diversified across more sectors. For additional information on these and other risk considerations, please see the Fund’s prospectus.
Any sectors, industries, or securities discussed should not be perceived as investment recommendations. Mention of a specific security should not be considered a recommendation to buy or solicitation to sell that security. Specific securities mentioned in this report may have been sold from the Fund’s portfolio of investments by the time you receive this report.
120
AMG Managers Value Partners Asia Dividend Fund
Schedule of Portfolio Investments
October 31, 2018
| | | | | | | | |
| | | Shares | | | Value | |
Common Stocks - 90.3% | | | | | | | | |
Communication Services - 3.7% | | | | | | | | |
China Telecom Corp., Ltd., Class H (China) | | | 150,000 | | | $ | 70,970 | |
HKBN, Ltd. (Hong Kong) | | | 70,500 | | | | 105,840 | |
Link Net (Indonesia) | | | 213,400 | | | | 61,623 | |
Sarana Menara Nusantara (Indonesia) | | | 317,200 | | | | 10,101 | |
XL Axiata (Indonesia)* | | | 406,500 | | | | 70,246 | |
Total Communication Services | | | | | | | 318,780 | |
Consumer Discretionary - 13.7% | | | | | | | | |
Asian Pay Television Trust (Singapore) | | | 43,200 | | | | 9,835 | |
Basso Industry Corp. (Taiwan) | | | 25,000 | | | | 35,339 | |
Bestway Global Holding, Inc. (China)1 | | | 177,000 | | | | 74,586 | |
China Lilang, Ltd. (China) | | | 224,000 | | | | 184,700 | |
China Yongda Automobiles Services Holdings, Ltd. (China) | | | 261,000 | | | | 140,045 | |
China ZhengTong Auto Services Holdings, Ltd. (China) | | | 54,000 | | | | 25,915 | |
Chow Sang Sang Holdings International, Ltd. (Hong Kong) | | | 67,000 | | | | 108,506 | |
EGL Holdings Co., Ltd. (Hong Kong) | | | 74,000 | | | | 5,756 | |
Fila Korea, Ltd. (South Korea) | | | 4,870 | | | | 180,358 | |
Golden Eagle Retail Group, Ltd. (China) | | | 64,000 | | | | 66,353 | |
Haier Electronics Group Co., Ltd. (Hong Kong) | | | 47,000 | | | | 98,699 | |
Jinmao Hotel and Jinmao China Hotel Investments and Management, Ltd. (Hong Kong) | | | 78,500 | | | | 39,326 | |
Kangwon Land, Inc. (South Korea) | | | 5,642 | | | | 142,867 | |
Nameson Holdings, Ltd. (Hong Kong) | | | 314,000 | | | | 28,973 | |
Skyworth Digital Holdings, Ltd. (Hong Kong) | | | 111,225 | | | | 25,757 | |
Wonderful Sky Financial Group Holdings, Ltd. (Hong Kong)* | | | 174,000 | | | | 26,630 | |
Total Consumer Discretionary | | | | | | | 1,193,645 | |
Consumer Staples - 3.0% | | | | | | | | |
BGF retailCo., Ltd. (South Korea) | | | 1,197 | | | | 177,082 | |
Convenience Retail Asia, Ltd. (Hong Kong) | | | 170,000 | | | | 71,587 | |
Lotte Confectionery Co., Ltd. (South Korea) | | | 90 | | | | 12,573 | |
Total Consumer Staples | | | | | | | 261,242 | |
Energy - 1.6% | | | | | | | | |
PetroChina Co., Ltd., Class H (China) | | | 122,000 | | | | 87,721 | |
Pryce Corp. (Philippines) | | | 222,500 | | | | 23,647 | |
S-Oil Corp. (South Korea) | | | 231 | | | | 25,207 | |
Total Energy | | | | | | | 136,575 | |
Financials - 21.9% | | | | | | | | |
Bangkok Bank PCL, NVDR (Thailand) | | | 9,800 | | | | 61,252 | |
Bank Negara Indonesia Persero (Indonesia) | | | 96,700 | | | | 46,691 | |
| | | | | | | | |
| | | Shares | | | Value | |
BFI Finance Indonesia (Indonesia) | | | 593,200 | | | $ | 20,680 | |
China Construction Bank Corp., Class H (China) | | | 616,000 | | | | 488,825 | |
Chongqing Rural Commercial Bank Co., Ltd., Class H (China) | | | 82,000 | | | | 45,296 | |
DBS Group Holdings, Ltd. (Singapore) | | | 7,900 | | | | 134,043 | |
Dongbu Insurance Co., Ltd. (South Korea) | | | 1,683 | | | | 106,041 | |
Far East Horizon, Ltd. (Hong Kong) | | | 331,000 | | | | 320,788 | |
Fubon Financial Holding Co., Ltd. (Taiwan) | | | 62,000 | | | | 97,272 | |
HSBC Holdings (United Kingdom) | | | 16,800 | | | | 138,051 | |
Hyundai Marine & Fire Insurance Co., | | | | | | | | |
Ltd. (South Korea) | | | 2,015 | | | | 74,136 | |
Metropolitan Bank & Trust Co. (Philippines) | | | 34,619 | | | | 42,472 | |
Ping An Insurance Group Co. of China, Ltd., Class H (China) | | | 34,500 | | | | 326,164 | |
Total Financials | | | | | | | 1,901,711 | |
Health Care - 1.6% | | | | | | | | |
Shanghai Pharmaceuticals Holding Co., Ltd., Class H (China) | | | 61,900 | | | | 137,078 | |
Industrials - 15.5% | | | | | | | | |
Acset Indonusa (Indonesia) | | | 339,100 | | | | 30,826 | |
Asia Aviation PCL, NVDR (Thailand) | | | 56,000 | | | | 6,772 | |
BOC Aviation, Ltd. (Singapore)1 | | | 16,500 | | | | 118,273 | |
CB Industrial Product Holding (Malaysia) | | | 36,500 | | | | 9,439 | |
China Communications Construction Co., Ltd., Class H (China) | | | 44,000 | | | | 40,344 | |
China Machinery Engineering Corp., Class H (China) | | | 167,000 | | | | 76,194 | |
China State Construction International Holdings, Ltd. (Hong Kong) | | | 114,000 | | | | 81,523 | |
EEI Corp. (Philippines)* | | | 35,100 | | | | 5,826 | |
FSE Engineering Holdings, Ltd. (Hong Kong) | | | 67,000 | | | | 25,642 | |
Garuda Maintenance Facility Aero Asia (Indonesia) | | | 1,280,900 | | | | 21,089 | |
Guangdong Provincial Expressway Development Co., Ltd., Class B (China) | | | 60,818 | | | | 42,796 | |
Haitian International Holdings, Ltd. (China) | | | 71,000 | | | | 139,440 | |
Kerry TJ Logistics Co., Ltd. (Taiwan) | | | 29,000 | | | | 34,194 | |
PP Persero (Indonesia) | | | 412,800 | | | | 36,225 | |
Qilu Expressway Co., Ltd. (China)* | | | 110,000 | | | | 24,968 | |
Qingdao Port International Co., Ltd., Class H (China)*,1 | | | 358,000 | | | | 209,696 | |
SITC International Holdings Co., Ltd. (Hong Kong) | | | 239,000 | | | | 175,599 | |
TK Group Holdings, Ltd. (China) | | | 306,000 | | | | 162,919 | |
Total Bangun Persada (Indonesia) | | | 369,700 | | | | 12,402 | |
TURVO International Co., Ltd. (Taiwan) | | | 18,381 | | | | 38,891 | |
Waskita Karya Persero (Indonesia) | | | 191,400 | | | | 18,172 | |
The accompanying notes are an integral part of these financial statements.
121
AMG Managers Value Partners Asia Dividend Fund
Schedule of Portfolio Investments (continued)
| | | | | | | | |
| | | Shares | | | Value | |
Industrials - 15.5% (continued) | | | | | | | | |
Zhejiang Expressway Co., Ltd., Class H (China) | | | 40,000 | | | $ | 33,636 | |
Total Industrials | | | | | | | 1,344,866 | |
Information Technology - 7.6% | | | | | | | | |
Catcher Technology Co., Ltd. (Taiwan) | | | 1,000 | | | | 10,111 | |
Chipbond Technology Corp. (Taiwan) | | | 10,000 | | | | 18,418 | |
FLEXium Interconnect, Inc. (Taiwan) | | | 37,148 | | | | 93,916 | |
King Yuan Electronics Co., Ltd. (Taiwan) | | | 113,000 | | | | 66,181 | |
KoMiCo, Ltd. (South Korea) | | | 667 | | | | 14,187 | |
MediaTek, Inc. (Taiwan) | | | 5,000 | | | | 36,933 | |
Powertech Technology, Inc. (Taiwan) | | | 4,000 | | | | 8,774 | |
Primax Electronics, Ltd. (Taiwan) | | | 6,000 | | | | 8,109 | |
SDI Corp. (Taiwan) | | | 4,000 | | | | 8,705 | |
Taiwan Semiconductor Manufacturing Co., | | | | | | | | |
Ltd. (Taiwan) | | | 40,000 | | | | 300,295 | |
TechWing, Inc. (South Korea) | | | 2,516 | | | | 22,395 | |
Tokai Carbon Korea Co., Ltd. (South Korea) | | | 346 | | | | 17,153 | |
Transtech Optelecom Science Holdings, | | | | | | | | |
Ltd. (Hong Kong)* | | | 196,000 | | | | 34,242 | |
Wistron Neweb Corp. (Taiwan) | | | 9,000 | | | | 21,001 | |
Total Information Technology | | | | | | | 660,420 | |
Materials - 1.1% | | | | | | | | |
Lee & Man Chemical Co., Ltd. (Hong Kong) | | | 102,000 | | | | 62,060 | |
Samyang Packaging Corp. (South Korea)* | | | 2,792 | | | | 39,320 | |
Total Materials | | | | | | | 101,380 | |
Real Estate - 16.0% | | | | | | | | |
AP Thailand PCL (Thailand) | | | 174,500 | | | | 43,271 | |
Bekasi Fajar Industrial Estate (Indonesia) | | | 2,970,600 | | | | 27,375 | |
CapitaLand Retail China Trust, REIT (Singapore) | | | 31,540 | | | | 31,230 | |
China Vanke Co., Ltd., Class H (China) | | | 15,200 | | | | 46,936 | |
CIFI Holdings Group Co., Ltd. (China) | | | 142,000 | | | | 59,577 | |
City Developments, Ltd. (Singapore) | | | 3,300 | | | | 18,859 | |
CK Asset Holdings, Ltd. (Hong Kong) | | | 28,000 | | | | 182,217 | |
CSI Properties, Ltd. (Hong Kong) | | | 2,250,000 | | | | 88,004 | |
Far East Consortium International, Ltd. (Hong Kong) | | | 423,231 | | | | 197,606 | |
Hopefluent Group Holdings, Ltd. (China) | | | 140,000 | | | | 46,419 | |
Longfor Group Holdings, Ltd. (China) | | | 163,500 | | | | 397,335 | |
Mah Sing Group (Malaysia) | | | 175,500 | | | | 40,282 | |
Puradelta Lestari (Indonesia) | | | 2,572,800 | | | | 22,005 | |
| * | Non-income producing security. |
| | | | | | | | |
| | | Shares | | | Value | |
Supalai PCL (Thailand) | | | 87,600 | | | $ | 57,900 | |
Times Property Holdings, Ltd. (China) | | | 148,000 | | | | 129,686 | |
Total Real Estate | | | | | | | 1,388,702 | |
Utilities - 4.6% | | | | | | | | |
CGN New Energy Holdings Co., Ltd. (Hong Kong) | | | 318,000 | | | | 41,857 | |
China Longyuan Power Group Corp., Ltd., Class H (China) | | | 115,000 | | | | 87,515 | |
China Resources Power Holdings Co., Ltd. (Hong Kong) | | | 154,000 | | | | 270,955 | |
Total Utilities | | | | | | | 400,327 | |
Total Common Stocks
(Cost $8,562,544) | | | | | | | 7,844,726 | |
Preferred Stock - 2.5% | | | | | | | | |
Information Technology - 2.5% | | | | | | | | |
Samsung Electronics Co., Ltd. (South Korea)
(Cost $181,841) | | | 6,850 | | | | 216,122 | |
Participation Notes - 2.3% | | | | | | | | |
Consumer Discretionary - 2.3% | | | | | | | | |
Midea Group Co., Ltd. (HSBC Securities) (China) | | | 21,500 | | | | 115,098 | |
Qingdao Haier Co, Ltd. (HSBC Securities) (China) | | | 44,800 | | | | 81,775 | |
Total Participation Notes
(Cost $189,977) | | | | | | | 196,873 | |
Warrants - 0.0%# | | | | | | | | |
Energy - 0.0%# | | | | | | | | |
Ezion Holdings, Ltd. (exercise price 0.45 Singapore Dollar), 04/24/20 (Singapore)*
(Cost $0) | | | 18,520 | | | | 20 | |
Short-Term Investments - 1.9% | | | | | | | | |
Other Investment Companies - 1.9% | | | | | | | | |
Dreyfus Government Cash Management Fund, Institutional Class Shares, 2.05%2 | | | 54,831 | | | | 54,831 | |
Dreyfus Institutional Preferred Government Money Market Fund, Institutional Class Shares, 2.12%2 | | | 54,830 | | | | 54,830 | |
JPMorgan U.S. Government Money Market Fund, IM Shares, 2.09%2 | | | 56,492 | | | | 56,492 | |
Total Short-Term Investments
(Cost $166,153) | | | | | | | 166,153 | |
Total Investments - 97.0%
(Cost $9,100,515) | | | | | | | 8,423,894 | |
Other Assets, less Liabilities - 3.0% | | | | | | | 263,100 | |
Net Assets - 100.0% | | | | | | $ | 8,686,994 | |
| 1 | Security exempt from registration under Rule 144A of the Securities Act of 1933. This security may be resold in transactions exempt from registration, normally to qualified buyers. At October 31, 2018, the value of these securities amounted to $402,555 or 4.6% of net assets. |
The accompanying notes are an integral part of these financial statements.
122
AMG Managers Value Partners Asia Dividend Fund
Schedule of Portfolio Investments (continued)
| 2 | Yield shown represents the October 31, 2018, seven day average yield, which refers to the sum of the previous seven days’ dividends paid, expressed as an annual percentage. |
NVDR Non-Voting Depositary Receipt
REIT Real Estate Investment Trust
The following table summarizes the inputs used to value the Fund’s investments by the fair value hierarchy levels as of October 31, 2018:
| | | | | | | | | | | | | | | | |
| | | Level 1 | | | Level 21 | | | Level 3 | | | Total | |
Investments in Securities | | | | | | | | | | | | | | | | |
Common Stocks | | | | | | | | | | | | | | | | |
Financials | | $ | 447,509 | | | $ | 1,454,202 | | | | — | | | $ | 1,901,711 | |
Real Estate | | | — | | | | 1,388,702 | | | | — | | | | 1,388,702 | |
Industrials | | | 43,196 | | | | 1,301,670 | | | | — | | | | 1,344,866 | |
Consumer Discretionary | | | 114,262 | | | | 1,079,383 | | | | — | | | | 1,193,645 | |
Information Technology | | | 34,242 | | | | 626,178 | | | | — | | | | 660,420 | |
Utilities | | | — | | | | 400,327 | | | | — | | | | 400,327 | |
Communication Services | | | 61,623 | | | | 257,157 | | | | — | | | | 318,780 | |
Consumer Staples | | | — | | | | 261,242 | | | | — | | | | 261,242 | |
Health Care | | | — | | | | 137,078 | | | | — | | | | 137,078 | |
Energy | | | — | | | | 136,575 | | | | — | | | | 136,575 | |
Materials | | | — | | | | 101,380 | | | | — | | | | 101,380 | |
Preferred Stock | | | | | | | | | | | | | | | | |
Information Technology | | | — | | | | 216,122 | | | | — | | | | 216,122 | |
Participation Notes | | | | | | | | | | | | | | | | |
Consumer Discretionary | | | — | | | | 196,873 | | | | — | | | | 196,873 | |
Warrants | | | | | | | | | | | | | | | | |
Energy | | | 20 | | | | — | | | | — | | | | 20 | |
Short-Term Investments | | | | | | | | | | | | | | | | |
Other Investment Companies | | | 166,153 | | | | — | | | | — | | | | 166,153 | |
| | | | | | | | | | | | | | | | |
Total Investments in Securities | | $ | 867,005 | | | $ | 7,556,889 | | | | — | | | $ | 8,423,894 | |
| | | | | | | | | | | | | | | | |
| 1 | An external pricing service is used to reflect any impact on security value due to market movements between the time the Fund valued such foreign securities and the earlier closing of foreign markets. As a result, certain international equity securities may be level 2 and could result in transfers between level 1 and level 2. (See Note 1(a) in the Notes to Financial Statements.) |
As of October 31, 2018, the Fund had transfers between Level 1 and Level 2 as follows:
| | | | | | | | | | | | | | | | |
| | | Transfer
into
Level 11 | | | Transfer
out of
Level 11 | | | Transfer
into
Level 21 | | | Transfer
out of
Level 21 | |
Assets: | | | | | | | | | | | | | | | | |
Common Stocks | | $ | 382,657 | | | $ | (207,440 | ) | | $ | 207,440 | | | $ | (382,657 | ) |
| 1 | An external pricing service is used to reflect any impact on security value due to market movements between the time the Fund valued such foreign securities and the earlier closing of foreign markets. As a result, certain international equity securities may be level 2 and could result in transfers between level 1 and level 2. (See Note 1(a) in the Notes to Financial Statements.) |
The accompanying notes are an integral part of these financial statements.
123
AMG Managers Value Partners Asia Dividend Fund
Schedule of Portfolio Investments (continued)
| | | | |
Country | | % of Long-Term
Investments | |
China | | | 40.5 | |
Hong Kong | | | 24.1 | |
Indonesia | | | 4.6 | |
Malaysia | | | 0.6 | |
Philippines | | | 0.9 | |
Singapore | | | 3.8 | |
South Korea | | | 12.4 | |
Taiwan | | | 9.4 | |
Thailand | | | 2.0 | |
United Kingdom | | | 1.7 | |
| | | | |
| | | 100.0 | |
| | | | |
The accompanying notes are an integral part of these financial statements.
124
Statement of Assets and Liabilities
October 31, 2018
| | | | | | | | | | | | | | | | | | | | |
| | | AMG
Managers
Fairpointe ESG
Equity Fund | | | AMG
River Road
Focused Absolute
Value Fund | | | AMG
Managers
Montag & Caldwell
Growth Fund | | | AMG
River Road
Dividend All Cap
Value Fund | | | AMG
River Road
Dividend All
Cap
Value Fund II | |
Assets: | | | | | | | | | | | | | | | | | | | | |
Investments at Value1 (including securities on loan valued at $0, $1,590,837, $0, $85,917,603, and $4,203,798, respectively) | | $ | 10,427,732 | | | $ | 30,169,327 | | | $ | 597,606,486 | | | $ | 850,337,996 | | | $ | 86,604,553 | |
Receivable for investments sold | | | 460,172 | | | | 148,820 | | | | 879,537 | | | | 9,246,926 | | | | 907,408 | |
Dividend, interest and other receivables | | | 12,435 | | | | 1,105 | | | | 471,796 | | | | 1,100,634 | | | | 100,934 | |
Receivable for Fund shares sold | | | — | | | | 71,632 | | | | 39,366 | | | | 924,078 | | | | 192,110 | |
Receivable from affiliate | | | 5,701 | | | | 6,587 | | | | — | | | | — | | | | 3,714 | |
Prepaid expenses and other assets | | | 4,274 | | | | 25,629 | | | | 25,212 | | | | 28,887 | | | | 21,238 | |
Total assets | | | 10,910,314 | | | | 30,423,100 | | | | 599,022,397 | | | | 861,638,521 | | | | 87,829,957 | |
Liabilities: | | | | | | | | | | | | | | | | | | | | |
Payable upon return of securities loaned | | | — | | | | 185,219 | | | | — | | | | 10,680,472 | | | | 452,720 | |
Payable for investments purchased | | | 51,896 | | | | — | | | | — | | | | 4,096,775 | | | | 445,830 | |
Payable for Fund shares repurchased | | | — | | | | 11,647 | | | | 2,130,188 | | | | 1,102,477 | | | | 46,899 | |
Accrued expenses: | | | | | | | | | | | | | | | | | | | | |
Investment advisory and management fees | | | 6,670 | | | | 15,320 | | | | 368,015 | | | | 440,419 | | | | 45,289 | |
Administrative fees | | | 1,429 | | | | 3,830 | | | | 78,860 | | | | 110,105 | | | | 11,322 | |
Distribution fees | | | 71 | | | | 1,960 | | | | 8,738 | | | | 21,908 | | | | 470 | |
Shareholder service fees | | | 762 | | | | 1,019 | | | | 36,802 | | | | 68,614 | | | | — | |
Professional fees | | | 22,651 | | | | 20,218 | | | | 45,924 | | | | 37,692 | | | | 25,654 | |
Custody fees | | | 3,626 | | | | 3,841 | | | | 13,952 | | | | 16,388 | | | | 5,305 | |
Other | | | 1,365 | | | | 1,635 | | | | 90,605 | | | | 41,405 | | | | 5,516 | |
Total liabilities | | | 88,470 | | | | 244,689 | | | | 2,773,084 | | | | 16,616,255 | | | | 1,039,005 | |
Net Assets | | $ | 10,821,844 | | | $ | 30,178,411 | | | $ | 596,249,313 | | | $ | 845,022,266 | | | $ | 86,790,952 | |
1 Investments at cost | | $ | 9,666,957 | | | $ | 29,059,410 | | | $ | 448,156,145 | | | $ | 715,767,400 | | | $ | 74,892,156 | |
The accompanying notes are an integral part of these financial statements.
125
Statement of Assets and Liabilities (continued)
| | | | | | | | | | | | | | | | | | | | |
| | | AMG
Managers
Fairpointe ESG
Equity Fund | | | AMG
River Road
Focused Absolute
Value Fund | | | AMG
Managers
Montag & Caldwell
Growth Fund | | | AMG
River Road
Dividend All Cap
Value Fund | | | AMG
River Road
Dividend All
Cap
Value Fund II | |
Net Assets Represent: | | | | | | | | | | | | | | | | | | | | |
Paid-in capital | | $ | 10,177,736 | | | $ | 27,368,815 | | | $ | 341,805,390 | | | $ | 667,500,754 | | | $ | 66,455,346 | |
Total distributable earnings | | | 644,108 | | | | 2,809,596 | | | | 254,443,923 | | | | 177,521,512 | | | | 20,335,606 | |
Net Assets | | $ | 10,821,844 | | | $ | 30,178,411 | | | $ | 596,249,313 | | | $ | 845,022,266 | | | $ | 86,790,952 | |
Class N: | | | | | | | | | | | | | | | | | | | | |
Net Assets | | $ | 664,043 | | | $ | 9,184,453 | | | $ | 179,434,134 | | | $ | 100,420,059 | | | $ | 2,176,373 | |
Shares outstanding | | | 58,937 | | | | 770,893 | | | | 8,745,627 | | | | 8,167,595 | | | | 154,128 | |
Net asset value, offering and redemption price per share | | $ | 11.27 | | | $ | 11.91 | | | $ | 20.52 | | | $ | 12.29 | | | $ | 14.12 | |
Class I: | | | | | | | | | | | | | | | | | | | | |
Net Assets | | $ | 10,157,801 | | | $ | 20,927,910 | | | $ | 416,208,436 | | | $ | 743,983,643 | | | $ | 84,438,324 | |
Shares outstanding | | | 905,924 | | | | 1,746,757 | | | | 20,182,312 | | | | 60,540,992 | | | | 5,966,728 | |
Net asset value, offering and redemption price per share | | $ | 11.21 | | | $ | 11.98 | | | $ | 20.62 | | | $ | 12.29 | | | $ | 14.15 | |
Class R: | | | | | | | | | | | | | | | | | | | | |
Net Assets | | | — | | | | — | | | $ | 606,743 | | | | — | | | | — | |
Shares outstanding | | | — | | | | — | | | | 30,433 | | | | — | | | | — | |
Net asset value, offering and redemption price per share | | | — | | | | — | | | $ | 19.94 | | | | — | | | | — | |
Class Z: | | | | | | | | | | | | | | | | | | | | |
Net Assets | | | — | | | $ | 66,048 | | | | — | | | $ | 618,564 | | | $ | 176,255 | |
Shares outstanding | | | — | | | | 5,512 | | | | — | | | | 50,338 | | | | 12,454 | |
Net asset value, offering and redemption price per share | | | — | | | $ | 11.98 | | | | — | | | $ | 12.29 | | | $ | 14.15 | |
The accompanying notes are an integral part of these financial statements.
126
Statement of Assets and Liabilities (continued)
| | | | | | | | | | | | | | | | | | | | |
| | | AMG
Managers
Fairpointe
Mid
Cap Fund | | | AMG
Managers
LMCG Small
Cap
Growth Fund | | | AMG
River Road
Small-Mid Cap
Value Fund | | | AMG
River Road
Small Cap
Value Fund | | | AMG Managers
Silvercrest
Small
Cap Fund | |
Assets: | | | | | | | | | | | | | | | | | | | | |
Investments at Value1 (including securities on loan valued at $0, $20,576,918, $6,449,277, $25,100,431,and $26,468,951, respectively) | | $ | 2,771,300,251 | | | $ | 110,425,997 | | | $ | 70,563,506 | | | $ | 366,615,717 | | | $ | 242,257,715 | |
Affiliated Investments at value2 | | | 79,316,871 | | | | — | | | | — | | | | — | | | | — | |
Receivable for investments sold | | | 37,108,700 | | | | 1,039,653 | | | | 589,963 | | | | 3,035,902 | | | | 1,187,574 | |
Dividend, interest and other receivables | | | 1,143,933 | | | | 26,404 | | | | 11,023 | | | | 71,965 | | | | 76,398 | |
Receivable for Fund shares sold | | | 3,737,401 | | | | 107,669 | | | | 921,360 | | | | 340,289 | | | | 762,235 | |
Receivable from affiliate | | | — | | | | 6,110 | | | | — | | | | — | | | | 7,058 | |
Prepaid expenses and other assets | | | 62,227 | | | | 19,153 | | | | 16,607 | | | | 23,628 | | | | 12,620 | |
Total assets | | | 2,892,669,383 | | | | 111,624,986 | | | | 72,102,459 | | | | 370,087,501 | | | | 244,303,600 | |
Liabilities: | | | | | | | | | | | | | | | | | | | | |
Payable upon return of securities loaned | | | — | | | | 5,918,663 | | | | 1,758,425 | | | | 6,657,038 | | | | 6,408,559 | |
Payable for investments purchased | | | 21,761,687 | | | | 2,400,283 | | | | 801,099 | | | | 3,597,445 | | | | — | |
Payable for Fund shares repurchased | | | 15,127,151 | | | | 110,052 | | | | 74,210 | | | | 596,433 | | | | 114,718 | |
Accrued expenses: | | | | | | | | | | | | | | | | | | | | |
Investment advisory and management fees | | | 1,530,851 | | | | 81,186 | | | | 47,918 | | | | 250,017 | | | | 188,252 | |
Administrative fees | | | 377,404 | | | | 13,531 | | | | 8,657 | | | | 46,878 | | | | 31,375 | |
Distribution fees | | | 197,964 | | | | 12,122 | | | | 2,313 | | | | 6,168 | | | | 3,045 | |
Shareholder service fees | | | 186,896 | | | | 9,456 | | | | 2,754 | | | | 31,236 | | | | 12,579 | |
Professional fees | | | 73,377 | | | | 23,818 | | | | 22,798 | | | | 28,456 | | | | 25,784 | |
Custody fees | | | 58,849 | | | | 6,311 | | | | 4,496 | | | | 8,949 | | | | 8,115 | |
Other | | | 265,284 | | | | 15,653 | | | | 3,604 | | | | 12,978 | | | | 15,491 | |
Total liabilities | | | 39,579,463 | | | | 8,591,075 | | | | 2,726,274 | | | | 11,235,598 | | | | 6,807,918 | |
Net Assets | | $ | 2,853,089,920 | | | $ | 103,033,911 | | | $ | 69,376,185 | | | $ | 358,851,903 | | | $ | 237,495,682 | |
1 Investments at cost | | $ | 2,328,525,004 | | | $ | 105,997,064 | | | $ | 67,663,654 | | | $ | 320,181,563 | | | $ | 234,113,081 | |
2 Affiliated Investments at cost | | $ | 77,602,014 | | | | — | | | | — | | | | — | | | | — | |
The accompanying notes are an integral part of these financial statements.
127
Statement of Assets and Liabilities (continued)
| | | | | | | | | | | | | | | | | | | | |
| | | AMG
Managers
Fairpointe
Mid
Cap Fund | | | AMG
Managers
LMCG Small
Cap
Growth Fund | | | AMG
River Road
Small-Mid Cap
Value Fund | | | AMG
River Road
Small Cap
Value Fund | | | AMG Managers
Silvercrest
Small
Cap Fund | |
Net Assets Represent: | | | | | | | | | | | | | | | | | | | | |
Paid-in capital | | $ | 2,219,259,031 | | | $ | 101,164,809 | | | $ | 62,334,425 | | | $ | 280,982,167 | | | $ | 209,913,333 | |
Total distributable earnings | | | 633,830,889 | | | | 1,869,102 | | | | 7,041,760 | | | | 77,869,736 | | | | 27,582,349 | |
Net Assets | | $ | 2,853,089,920 | | | $ | 103,033,911 | | | $ | 69,376,185 | | | $ | 358,851,903 | | | $ | 237,495,682 | |
Class N: | | | | | | | | | | | | | | | | | | | | |
Net Assets | | $ | 893,684,512 | | | $ | 37,232,399 | | | $ | 17,839,651 | | | $ | 28,444,030 | | | $ | 12,745,344 | |
Shares outstanding | | | 23,355,027 | | | | 2,203,016 | | | | 2,341,086 | | | | 2,145,438 | | | | 763,689 | |
Net asset value, offering and redemption price per share | | $ | 38.27 | | | $ | 16.90 | | | $ | 7.62 | | | $ | 13.26 | | | $ | 16.69 | |
Class I: | | | | | | | | | | | | | | | | | | | | |
Net Assets | | $ | 1,754,202,599 | | | $ | 65,801,512 | | | $ | 51,400,453 | | | $ | 330,244,780 | | | $ | 191,477,210 | |
Shares outstanding | | | 44,603,794 | | | | 3,825,783 | | | | 6,606,127 | | | | 24,445,302 | | | | 11,351,257 | |
Net asset value, offering and redemption price per share | | $ | 39.33 | | | $ | 17.20 | | | $ | 7.78 | | | $ | 13.51 | | | $ | 16.87 | |
Class Z: | | | | | | | | | | | | | | | | | | | | |
Net Assets | | $ | 205,202,809 | | | | — | | | $ | 136,081 | | | $ | 163,093 | | | $ | 33,273,128 | |
Shares outstanding | | | 5,216,586 | | | | — | | | | 17,506 | | | | 12,070 | | | | 1,972,249 | |
Net asset value, offering and redemption price per share | | $ | 39.34 | | | | — | | | $ | 7.77 | | | $ | 13.51 | | | $ | 16.87 | |
The accompanying notes are an integral part of these financial statements.
128
Statement of Assets and Liabilities (continued)
| | | | | | | | | | | | | | | | | | | | |
| | | AMG
GW&K
U.S. Small Cap
Growth Fund | | | AMG Managers
DoubleLine
Core Plus
Bond Fund | | | AMG Managers
Lake Partners
LASSO
Alternatives Fund | | | AMG
River Road
Long-Short Fund | | | AMG
Managers
Guardian Capital
Global
Dividend Fund | |
Assets: | | | | | | | | | | | | | | | | | | | | |
Investments at Value1 (including securities on loan valued at $5,928,787, $6,656,442, $0, $0, and $838,183, respectively) | | $ | 36,862,060 | | | $ | 557,645,207 | | | $ | 27,512,554 | | | $ | 28,934,269 | | | $ | 36,598,590 | |
Affiliated Investments at value2 | | | — | | | | 20,139,780 | | | | — | | | | — | | | | — | |
Cash | | | — | | | | 3,449 | | | | — | | | | — | | | | — | |
Due from broker | | | — | | | | — | | | | — | | | | 8,561,963 | | | | — | |
Foreign currency3 | | | — | | | | — | | | | — | | | | 84,775 | | | | — | |
Receivable for investments sold | | | — | | | | 663,251 | | | | 428,280 | | | | 1,150,778 | | | | — | |
Segregated cash | | | — | | | | — | | | | — | | | | 105,718 | | | | — | |
Dividend, interest and other receivables | | | 10,223 | | | | 3,544,106 | | | | 13,586 | | | | 57,607 | | | | 133,698 | |
Receivable for Fund shares sold | | | 3,059 | | | | 500,175 | | | | 3,720 | | | | 14,971 | | | | — | |
Receivable from affiliate | | | — | | | | 30,200 | | | | — | | | | 35,111 | | | | 1,293 | |
Prepaid expenses and other assets | | | 17,017 | | | | 33,108 | | | | 8,172 | | | | 12,306 | | | | 9,395 | |
Total assets | | | 36,892,359 | | | | 582,559,276 | | | | 27,966,312 | | | | 38,957,498 | | | | 36,742,976 | |
Liabilities: | | | | | | | | | | | | | | | | | | | | |
Payable upon return of securities loaned | | | 2,460,639 | | | | 6,885,514 | | | | — | | | | — | | | | — | |
Payable for investments purchased | | | — | | | | 1,744,571 | | | | 875,872 | | | | 1,333,644 | | | | — | |
Payable for delayed delivery investments purchased | | | — | | | | 95,000 | | | | — | | | | — | | | | — | |
Payable for Fund shares repurchased | | | 61,285 | | | | 2,176,604 | | | | 16,545 | | | | 138,502 | | | | — | |
Interest and dividends payable | | | — | | | | — | | | | — | | | | 46,980 | | | | — | |
Due to custodian | | | — | | | | — | | | | 6,008 | | | | — | | | | — | |
Accrued expenses: | | | | | | | | | | | | | | | | | | | | |
Investment advisory and management fees | | | 26,292 | | | | 219,146 | | | | 22,971 | | | | 21,674 | | | | 22,364 | |
Administrative fees | | | 4,601 | | | | 73,049 | | | | 3,510 | | | | 3,825 | | | | 4,792 | |
Distribution fees | | | 4,722 | | | | 21,599 | | | | 1,923 | | | | 816 | | | | 48 | |
Shareholder service fees | | | 2,988 | | | | 60,513 | | | | 1,404 | | | | 2,035 | | | | — | |
Professional fees | | | 22,541 | | | | 52,178 | | | | 24,385 | | | | 29,450 | | | | 25,996 | |
Custody fees | | | 3,976 | | | | 52,948 | | | | 4,185 | | | | 4,431 | | | | 10,131 | |
Other | | | 7,732 | | | | 60,583 | | | | 8,720 | | | | 2,353 | | | | 1,915 | |
Securities sold short, at value4 | | | — | | | | — | | | | — | | | | 8,626,448 | | | | — | |
Total liabilities | | | 2,594,776 | | | | 11,441,705 | | | | 965,523 | | | | 10,210,158 | | | | 65,246 | |
Net Assets | | $ | 34,297,583 | | | $ | 571,117,571 | | | $ | 27,000,789 | | | $ | 28,747,340 | | | $ | 36,677,730 | |
1 Investments at cost | | $ | 30,912,992 | | | $ | 571,590,221 | | | $ | 26,636,164 | | | $ | 29,111,877 | | | $ | 33,956,546 | |
2 Affiliated Investments at cost | | | — | | | $ | 21,201,656 | | | | — | | | | — | | | | — | |
3 Foreign currency at cost | | | — | | | | — | | | | — | | | $ | 87,149 | | | | — | |
4 Proceeds | | | — | | | | — | | | | — | | | $ | 8,608,551 | | | | — | |
The accompanying notes are an integral part of these financial statements.
129
Statement of Assets and Liabilities (continued)
| | | | | | | | | | | | | | | | | | | | |
| | | AMG
GW&K
U.S. Small Cap
Growth Fund | | | AMG Managers
DoubleLine
Core Plus
Bond Fund | | | AMG Managers
Lake Partners
LASSO
Alternatives Fund | | | AMG
River Road
Long-Short Fund | | | AMG
Managers
Guardian Capital
Global
Dividend Fund | |
Net Assets Represent: | | | | | | | | | | | | | | | | | | | | |
Paid-in capital | | $ | 23,452,817 | | | $ | 599,568,033 | | | $ | 25,638,921 | | | $ | 28,072,052 | | | $ | 33,777,598 | |
Total distributable earnings (loss) | | | 10,844,766 | | | | (28,450,462 | ) | | | 1,361,868 | | | | 675,288 | | | | 2,900,132 | |
Net Assets | | $ | 34,297,583 | | | $ | 571,117,571 | | | $ | 27,000,789 | | | $ | 28,747,340 | | | $ | 36,677,730 | |
Class N: | | | | | | | | | | | | | | | | | | | | |
Net Assets | | $ | 24,762,131 | | | $ | 102,138,446 | | | $ | 8,980,168 | | | $ | 3,748,904 | | | $ | 1,105,982 | |
Shares outstanding | | | 6,004,561 | | | | 9,980,895 | | | | 784,065 | | | | 307,649 | | | | 102,439 | |
Net asset value, offering and redemption price per share | | $ | 4.12 | | | $ | 10.23 | | | $ | 11.45 | | | $ | 12.19 | | | $ | 10.80 | |
Class I: | | | | | | | | | | | | | | | | | | | | |
Net Assets | | $ | 9,380,679 | | | $ | 467,024,129 | | | $ | 18,020,621 | | | $ | 24,925,140 | | | $ | 35,571,748 | |
Shares outstanding | | | 1,841,084 | | | | 45,666,184 | | | | 1,562,513 | | | | 2,015,400 | | | | 3,312,949 | |
Net asset value, offering and redemption price per share | | $ | 5.10 | | | $ | 10.23 | | | $ | 11.53 | | | $ | 12.37 | | | $ | 10.74 | |
Class Z: | | | | | | | | | | | | | | | | | | | | |
Net Assets | | $ | 154,773 | | | $ | 1,954,996 | | | | — | | | $ | 73,296 | | | | — | |
Shares outstanding | | | 30,335 | | | | 190,992 | | | | — | | | | 5,920 | | | | — | |
Net asset value, offering and redemption price per share | | $ | 5.10 | | | $ | 10.24 | | | | — | | | $ | 12.38 | | | | — | |
The accompanying notes are an integral part of these financial statements.
130
Statement of Assets and Liabilities (continued)
| | | | | | | | |
| | | AMG
Managers
Pictet
International Fund | | | AMG
Managers
Value Partners
Asia
Dividend Fund | |
Assets: | | | | | | | | |
Investments at Value1 (including securities on loan valued at $27,022,240, and $0, respectively) | | $ | 1,612,679,859 | | | $ | 8,423,894 | |
Foreign currency2 | | | — | | | | 285,289 | |
Receivable for investments sold | | | 14,254,357 | | | | 9,326 | |
Dividend, interest and other receivables | | | 5,253,720 | | | | 5,224 | |
Receivable for Fund shares sold | | | 4,297,386 | | | | 30 | |
Prepaid expenses and other assets | | | 56,950 | | | | 17,990 | |
Total assets | | | 1,636,542,272 | | | | 8,741,753 | |
Liabilities: | | | | | | | | |
Payable upon return of securities loaned | | | 29,334,959 | | | | — | |
Payable for investments purchased | | | 5,400,437 | | | | — | |
Payable for Fund shares repurchased | | | 19,628,765 | | | | — | |
Due to custodian | | | 727 | | | | — | |
Accrued expenses: | | | | | | | | |
Investment advisory and management fees | | | 1,144,066 | | | | 8,011 | |
Administrative fees | | | 245,157 | | | | 1,150 | |
Distribution fees | | | 17,435 | | | | — | |
Shareholder service fees | | | 32,500 | | | | — | |
Professional fees | | | 55,634 | | | | 21,871 | |
Custody fees | | | 159,410 | | | | 22,855 | |
Other | | | 130,908 | | | | 872 | |
Total liabilities | | | 56,149,998 | | | | 54,759 | |
Net Assets | | $ | 1,580,392,274 | | | $ | 8,686,994 | |
1 Investments at cost | | $ | 1,695,405,223 | | | $ | 9,100,515 | |
2 Foreign currency at cost | | | — | | | $ | 286,014 | |
The accompanying notes are an integral part of these financial statements.
131
Statement of Assets and Liabilities (continued)
| | | | | | | | |
| | | AMG
Managers
Pictet
International Fund | | | AMG
Managers
Value Partners
Asia
Dividend Fund | |
Net Assets Represent: | | | | | | | | |
Paid-in capital | | $ | 1,550,612,973 | | | $ | 8,720,438 | |
Total distributable earnings (loss) | | | 29,779,301 | | | | (33,444 | ) |
Net Assets | | $ | 1,580,392,274 | | | $ | 8,686,994 | |
Class N: | | | | | | | | |
Net Assets | | $ | 82,838,927 | | | $ | 892,937 | |
Shares outstanding | | | 8,366,319 | | | | 88,389 | |
Net asset value, offering and redemption price per share | | $ | 9.90 | | | $ | 10.10 | |
Class I: | | | | | | | | |
Net Assets | | $ | 208,183,926 | | | $ | 7,794,057 | |
Shares outstanding | | | 20,959,893 | | | | 770,838 | |
Net asset value, offering and redemption price per share | | $ | 9.93 | | | $ | 10.11 | |
Class Z: | | | | | | | | |
Net Assets | | $ | 1,289,369,421 | | | | — | |
Shares outstanding | | | 130,049,570 | | | | — | |
Net asset value, offering and redemption price per share | | $ | 9.91 | | | | — | |
The accompanying notes are an integral part of these financial statements.
132
Statement of Operations
For the fiscal year ended October 31, 2018
| | | | | | | | | | | | | | | | | | | | |
| | | AMG
Managers
Fairpointe ESG
Equity Fund | | | AMG
River Road
Focused Absolute
Value Fund | | | AMG
Managers
Montag & Caldwell
Growth Fund | | | AMG
River Road
Dividend All Cap
Value Fund | | | AMG
River Road
Dividend All
Cap
Value Fund II | |
Investment Income: | | | | | | | | | | | | | | | | | | | | |
Dividend income | | $ | 192,458 | | | $ | 387,322 | | | $ | 8,340,960 | | | $ | 26,210,001 | | | $ | 3,233,533 | |
Securities lending income | | | — | | | | 2,434 | | | | — | | | | 181,389 | | | | 33,167 | |
Foreign withholding tax | | | (567 | ) | | | (1,865 | ) | | | — | | | | (58,668 | ) | | | (7,565 | ) |
Total investment income | | | 191,891 | | | | 387,891 | | | | 8,340,960 | | | | 26,332,722 | | | | 3,259,135 | |
Expenses: | | | | | | | | | | | | | | | | | | | | |
Investment advisory and management fees | | | 70,246 | | | | 164,128 | | | | 5,180,286 | | | | 5,475,875 | | | | 644,577 | |
Administrative fees | | | 15,053 | | | | 41,032 | | | | 1,115,089 | | | | 1,368,969 | | | | 161,144 | |
Distribution fees - Class N | | | 1,587 | | | | 22,618 | | | | 422,078 | | | | 291,509 | | | | 6,384 | |
Distribution fees - Class R | | | — | | | | — | | | | 3,556 | | | | — | | | | — | |
Shareholder servicing fees - Class N | | | 600 | | | | 3,619 | | | | 159,148 | | | | 82,241 | | | | 2,449 | |
Shareholder servicing fees - Class I | | | 7,428 | | | | 7,297 | | | | 360,729 | | | | 445,535 | | | | 67,977 | |
Shareholder servicing fees - Class R | | | — | | | | — | | | | 498 | | | | — | | | | — | |
Professional fees | | | 36,993 | | | | 35,283 | | | | 67,981 | | | | 71,007 | | | | 33,471 | |
Registration fees | | | 31,751 | | | | 20,936 | | | | 33,186 | | | | 38,798 | | | | 25,622 | |
Custodian fees | | | 6,553 | | | | 6,358 | | | | 47,718 | | | | 58,574 | | | | 11,919 | |
Reports to shareholders | | | 4,176 | | | | 7,064 | | | | 120,146 | | | | 99,768 | | | | 13,599 | |
Trustee fees and expenses | | | 606 | | | | 1,759 | | | | 55,829 | | | | 63,360 | | | | 7,904 | |
Transfer agent fees | | | 439 | | | | 1,043 | | | | 68,942 | | | | 28,151 | | | | 3,350 | |
Miscellaneous | | | 1,664 | | | | 3,534 | | | | 29,636 | | | | 36,542 | | | | 10,187 | |
Total expenses before offsets | | | 177,096 | | | | 314,671 | | | | 7,664,822 | | | | 8,060,329 | | | | 988,583 | |
Expense reimbursements | | | (85,192 | ) | | | (86,585 | ) | | | — | | | | — | | | | — | |
Expense reductions | | | — | | | | (3,155 | ) | | | (35,817 | ) | | | (15,426 | ) | | | (6,575 | ) |
Fee waivers | | | — | | | | — | | | | (42,140 | ) | | | (44,480 | ) | | | — | |
Net expenses | | | 91,904 | | | | 224,931 | | | | 7,586,865 | | | | 8,000,423 | | | | 982,008 | |
Net investment income | | | 99,987 | | | | 162,960 | | | | 754,095 | | | | 18,332,299 | | | | 2,277,127 | |
Net Realized and Unrealized Gain (Loss): | | | | | | | | | | | | | | | | | | | | |
Net realized gain (loss) on investments | | | (65,003 | ) | | | 1,739,736 | | | | 131,657,896 | | | | 47,243,403 | | | | 8,793,061 | |
Net change in unrealized appreciation/depreciation on investments | | | (606,423 | ) | | | 146,591 | | | | (60,460,282 | ) | | | (42,248,243 | ) | | | (7,291,620 | ) |
Net realized and unrealized gain (loss) | | | (671,426 | ) | | | 1,886,327 | | | | 71,197,614 | | | | 4,995,160 | | | | 1,501,441 | |
Net increase (decrease) in net assets resulting from operations | | $ | (571,439 | ) | | $ | 2,049,287 | | | $ | 71,951,709 | | | $ | 23,327,459 | | | $ | 3,778,568 | |
The accompanying notes are an integral part of these financial statements.
133
Statement of Operations (continued)
| | | | | | | | | | | | | | | | | | | | |
| | | AMG
Managers
Fairpointe
Mid
Cap Fund | | | AMG
Managers
LMCG Small
Cap
Growth Fund | | | AMG
River Road
Small-Mid Cap
Value Fund | | | AMG
River Road
Small Cap
Value Fund | | | AMG Managers
Silvercrest
Small
Cap Fund | |
Investment Income: | | | | | | | | | | | | | | | | | | | | |
Dividend income | | $ | 48,859,554 | | | $ | 587,800 | | | $ | 490,136 | | | $ | 3,476,304 | | | $ | 3,153,757 | |
Dividends from affiliated securities | | | 1,338,013 | | | | — | | | | — | | | | — | | | | — | |
Securities lending income | | | — | | | | 54,528 | | | | 6,409 | | | | 32,160 | | | | 28,142 | |
Foreign withholding tax | | | (310,611 | ) | | | — | | | | — | | | | (40,600 | ) | | | — | |
Total investment income | | | 49,886,956 | | | | 642,328 | | | | 496,545 | | | | 3,467,864 | | | | 3,181,899 | |
Expenses: | | | | | | | | | | | | | | | | | | | | |
Investment advisory and management fees | | | 23,072,482 | | | | 1,001,717 | | | | 385,879 | | | | 2,742,262 | | | | 2,435,416 | |
Administrative fees | | | 5,705,621 | | | | 166,953 | | | | 77,176 | | | | 514,174 | | | | 405,903 | |
Distribution fees - Class N | | | 2,932,330 | | | | 89,388 | | | | 18,199 | | | | 76,856 | | | | 44,644 | |
Shareholder servicing fees - Class N | | | 945,617 | | | | 30,090 | | | | 4,795 | | | | 30,771 | | | | 12,862 | |
Shareholder servicing fees - Class I | | | 1,934,378 | | | | 47,822 | | | | 20,798 | | | | 311,842 | | | | 167,849 | |
Professional fees | | | 205,095 | | | | 27,272 | | | | 30,032 | | | | 52,121 | | | | 38,516 | |
Registration fees | | | 91,164 | | | | 21,417 | | | | 26,857 | | | | 37,160 | | | | 38,208 | |
Custodian fees | | | 229,635 | | | | 19,198 | | | | 8,478 | | | | 24,477 | | | | 24,008 | |
Reports to shareholders | | | 632,685 | | | | 22,402 | | | | 9,607 | | | | 31,687 | | | | 40,132 | |
Trustee fees and expenses | | | 269,218 | | | | 7,845 | | | | 3,362 | | | | 22,505 | | | | 18,222 | |
Transfer agent fees | | | 137,057 | | | | 12,473 | | | | 3,333 | | | | 10,035 | | | | 7,589 | |
Miscellaneous | | | 154,503 | | | | 9,496 | | | | 4,106 | | | | 15,005 | | | | 15,103 | |
Total expenses before offsets | | | 36,309,785 | | | | 1,456,073 | | | | 592,622 | | | | 3,868,895 | | | | 3,248,452 | |
Expense reimbursements | | | — | | | | (138,373 | ) | | | (13,744 | ) | | | — | | | | (97,719 | ) |
Expense reductions | | | — | | | | (7,905 | ) | | | (6,012 | ) | | | (23,820 | ) | | | (64,120 | ) |
Fee waivers | | | (230,889 | ) | | | — | | | | — | | | | (6,854 | ) | | | — | |
Net expenses | | | 36,078,896 | | | | 1,309,795 | | | | 572,866 | | | | 3,838,221 | | | | 3,086,613 | |
Net investment income (loss) | | | 13,808,060 | | | | (667,467 | ) | | | (76,321 | ) | | | (370,357 | ) | | | 95,286 | |
Net Realized and Unrealized Gain (Loss): | | | | | | | | | | | | | | | | | | | | |
Net realized gain on investments | | | 183,848,226 | | | | 21,869,038 | | | | 4,462,548 | | | | 32,294,367 | | | | 23,131,258 | |
Net realized loss on affiliated investments | | | (5,179,788 | ) | | | — | | | | — | | | | — | | | | — | |
Net change in unrealized appreciation/depreciation on investments | | | (207,979,264 | ) | | | (9,890,828 | ) | | | (2,114,772 | ) | | | (14,979,042 | ) | | | (38,560,552 | ) |
Net change in unrealized appreciation/depreciation on affiliated investments | | | (25,252 | ) | | | — | | | | — | | | | — | | | | — | |
Net realized and unrealized gain (loss) | | | (29,336,078 | ) | | | 11,978,210 | | | | 2,347,776 | | | | 17,315,325 | | | | (15,429,294 | ) |
Net increase (decrease) in net assets resulting from operations | | $ | (15,528,018 | ) | | $ | 11,310,743 | | | $ | 2,271,455 | | | $ | 16,944,968 | | | $ | (15,334,008 | ) |
The accompanying notes are an integral part of these financial statements.
134
Statement of Operations (continued)
| | | | | | | | | | | | | | | | | | | | |
| | | AMG
GW&K
U.S. Small Cap
Growth Fund | | | AMG Managers
DoubleLine
Core Plus
Bond Fund | | | AMG Managers
Lake Partners
LASSO
Alternatives Fund | | | AMG
River Road
Long-Short Fund* | | | AMG
Managers
Guardian Capital
Global
Dividend Fund | |
Investment Income: | | | | | | | | | | | | | | | | | | | | |
Dividend income* (see Note 1d) | | $ | 167,921 | | | $ | 284,047 | | | $ | 640,775 | | | $ | 843,886 | | | $ | 1,315,027 | |
Interest income | | | — | | | | 23,444,447 | | | | — | | | | 56,352 | | | | — | |
Dividends from affiliated securities | | | — | | | | 643,441 | | | | — | | | | — | | | | — | |
Securities lending income | | | 11,880 | | | | 32,157 | | | | — | | | | 89,601 | | | | 1,605 | |
Foreign withholding tax | | | (1,876 | ) | | | (3,298 | ) | | | — | | | | (8,801 | ) | | | (111,948 | ) |
Total investment income | | | 177,925 | | | | 24,400,794 | | | | 640,775 | | | | 981,038 | | | | 1,204,684 | |
Expenses: | | | | | | | | | | | | | | | | | | | | |
Investment advisory and management fees | | | 263,233 | | | | 2,940,916 | | | | 334,644 | | | | 289,468 | | | | 267,257 | |
Administrative fees | | | 56,407 | | | | 980,305 | | | | 55,774 | | | | 51,082 | | | | 57,269 | |
Distribution fees - Class N | | | 55,518 | | | | 344,517 | | | | 21,654 | | | | 11,898 | | | | 404 | |
Shareholder servicing fees - Class N | | | 31,987 | | | | 110,944 | | | | 5,194 | | | | 3,807 | | | | — | |
Shareholder servicing fees - Class I | | | 10,329 | | | | 414,224 | | | | 17,116 | | | | 23,383 | | | | — | |
Professional fees | | | 23,994 | | | | 94,751 | | | | 25,363 | | | | 72,109 | | | | 29,518 | |
Registration fees | | | 27,657 | | | | 41,417 | | | | 25,168 | | | | 33,353 | | | | 26,294 | |
Custodian fees | | | 5,822 | | | | 209,907 | | | | 8,617 | | | | 12,035 | | | | 34,127 | |
Reports to shareholders | | | 9,511 | | | | 106,633 | | | | 13,864 | | | | 6,995 | | | | 4,717 | |
Trustee fees and expenses | | | 2,549 | | | | 45,684 | | | | 2,970 | | | | 2,389 | | | | 2,601 | |
Transfer agent fees | | | 7,031 | | | | 19,391 | | | | 2,366 | | | | 1,411 | | | | 1,092 | |
Miscellaneous | | | 2,803 | | | | 25,807 | | | | 3,026 | | | | 3,548 | | | | 2,840 | |
Interest and dividend expense (see Note 12) | | | — | | | | — | | | | — | | | | 577,295 | | | | — | |
Total expenses before offsets | | | 496,841 | | | | 5,334,496 | | | | 515,756 | | | | 1,088,773 | | | | 426,119 | |
Expense reimbursements | | | (60,565 | ) | | | (340,790 | ) | | | (66,249 | ) | | | (90,974 | ) | | | (24,750 | ) |
Expense reductions | | | (17,723 | ) | | | — | | | | — | | | | (6,456 | ) | | | — | |
Fee waivers | | | — | | | | (168,898 | ) | | | — | | | | — | | | | — | |
Net expenses | | | 418,553 | | | | 4,824,808 | | | | 449,507 | | | | 991,343 | | | | 401,369 | |
Net investment income (loss) | | | (240,628 | ) | | | 19,575,986 | | | | 191,268 | | | | (10,305 | ) | | | 803,315 | |
Net Realized and Unrealized Gain (Loss): | | | | | | | | | | | | | | | | | | | | |
Net realized gain (loss) on investments | | | 5,691,728 | | | | (7,100,480 | ) | | | 334,547 | | | | 3,614,462 | | | | 308,045 | |
Net realized loss on affiliated investments | | | — | | | | (156,043 | ) | | | — | | | | — | | | | — | |
Net realized loss on short sales | | | — | | | | — | | | | — | | | | (1,594,837 | ) | | | — | |
Net realized loss on foreign currency transactions | | | — | | | | — | | | | — | | | | (25,406 | ) | | | (15,876 | ) |
Capital gain distribution received | | | — | | | | — | | | | 675,806 | | | | — | | | | — | |
Net change in unrealized appreciation/depreciation on investments | | | (4,046,445 | ) | | | (18,671,944 | ) | | | (2,036,544 | ) | | | (2,271,341 | ) | | | (2,313,567 | ) |
Net change in unrealized appreciation/depreciation on affiliated investments | | | — | | | | (962,609 | ) | | | — | | | | — | | | | — | |
Net change in unrealized appreciation/depreciation on short sales | | | — | | | | — | | | | — | | | | (123,436 | ) | | | — | |
Net change in unrealized appreciation/depreciation on foreign currency translations | | | — | | | | — | | | | — | | | | 4,969 | | | | (2,239 | ) |
Net realized and unrealized gain (loss) | | | 1,645,283 | | | | (26,891,076 | ) | | | (1,026,191 | ) | | | (395,589 | ) | | | (2,023,637 | ) |
Net increase (decrease) in net assets resulting from operations | | $ | 1,404,655 | | | $ | (7,315,090 | ) | | $ | (834,923 | ) | | $ | (405,894 | ) | | $ | (1,220,322 | ) |
The accompanying notes are an integral part of these financial statements.
135
Statement of Operations (continued)
| | | | | | | | |
| | | AMG
Managers
Pictet
International Fund | | | AMG
Managers
Value Partners
Asia
Dividend Fund | |
Investment Income: | | | | | | | | |
Dividend income | | $ | 53,924,739 | | | $ | 385,898 | |
Securities lending income | | | 361,386 | | | | 26 | |
Foreign withholding tax | | | (4,461,298 | ) | | | (27,158 | ) |
Total investment income | | | 49,824,827 | | | | 358,766 | |
Expenses: | | | | | | | | |
Investment advisory and management fees | | | 14,673,952 | | | | 83,573 | |
Administrative fees | | | 3,144,418 | | | | 15,670 | |
Distribution fees - Class N | | | 50,240 | | | | 326 | |
Shareholder servicing fees - Class N | | | 22,550 | | | | — | |
Shareholder servicing fees - Class I | | | 288,080 | | | | — | |
Professional fees | | | 132,793 | | | | 30,206 | |
Registration fees | | | 86,039 | | | | 12,841 | |
Custodian fees | | | 657,579 | | | | 89,111 | |
Reports to shareholders | | | 265,423 | | | | 2,528 | |
Trustee fees and expenses | | | 142,816 | | | | 719 | |
Transfer agent fees | | | 162,686 | | | | 381 | |
Miscellaneous | | | 80,046 | | | | 1,645 | |
Total expenses before offsets | | | 19,706,622 | | | | 237,000 | |
Expense reimbursements | | | — | | | | (116,538 | ) |
Fee waivers | | | (106,306 | ) | | | — | |
Net expenses | | | 19,600,316 | | | | 120,462 | |
Net investment income | | | 30,224,511 | | | | 238,304 | |
Net Realized and Unrealized Loss: | | | | | | | | |
Net realized gain on investments | | | 146,289,804 | | | | 670,833 | |
Net realized loss on foreign currency transactions | | | (1,718,151 | ) | | | (3,093 | ) |
Net change in unrealized appreciation/depreciation on investments | | | (398,615,208 | ) | | | (2,330,224 | ) |
Net change in unrealized appreciation/depreciation on foreign currency translations | | | (53,302 | ) | | | (1,953 | ) |
Net realized and unrealized loss | | | (254,096,857 | ) | | | (1,664,437 | ) |
Net decrease in net assets resulting from operations | | $ | (223,872,346 | ) | | $ | (1,426,133 | ) |
The accompanying notes are an integral part of these financial statements.
136
Statements of Changes in Net Assets
For the fiscal years ended October 31,
| | | | | | | | | | | | | | | | | | | | | | | | |
| | | AMG
Managers
Fairpointe ESG
Equity Fund | | | AMG
River Road
Focused Absolute
Value Fund | | | AMG
Managers
Montag & Caldwell
Growth Fund | |
| | | 2018 | | | 2017 | | | 2018 | | | 20171 | | | 2018 | | | 2017 | |
Increase (Decrease) in Net Assets Resulting From Operations: | | | | | | | | | | | | | | | | | | | | | | | | |
Net investment income | | $ | 99,987 | | | $ | 126,340 | | | $ | 162,960 | | | $ | 79,888 | | | $ | 754,095 | | | $ | 367,209 | |
Net realized gain (loss) on investments | | | (65,003 | ) | | | 9,113 | | | | 1,739,736 | | | | 1,785,151 | | | | 131,657,896 | | | | 93,131,174 | |
Net change in unrealized appreciation/depreciation on investments | | | (606,423 | ) | | | 1,389,919 | | | | 146,591 | | | | 455,132 | | | | (60,460,282 | ) | | | 73,415,699 | |
Net increase (decrease) in net assets resulting from operations | | | (571,439 | ) | | | 1,525,372 | | | | 2,049,287 | | | | 2,320,171 | | | | 71,951,709 | | | | 166,914,082 | |
Distributions to Shareholders:2 | | | | | | | | | | | | | | | | | | | | | | | | |
Class N | | | (9,243 | ) | | | (874 | ) | | | (584,246 | ) | | | (74,500 | ) | | | (21,977,990 | ) | | | (40,518,753 | ) |
Class I | | | (111,123 | ) | | | (68,181 | ) | | | (1,352,550 | ) | | | (955,281 | ) | | | (53,210,522 | ) | | | (77,336,352 | ) |
Class R | | | — | | | | — | | | | — | | | | — | | | | (65,328 | ) | | | (543,680 | ) |
Class Z | | | — | | | | — | | | | (4,840 | ) | | | — | | | | — | | | | — | |
Total distributions to shareholders | | | (120,366 | ) | | | (69,055 | ) | | | (1,941,636 | ) | | | (1,029,781 | ) | | | (75,253,840 | ) | | | (118,398,785 | ) |
Capital Share Transactions:3 | | | | | | | | | | | | | | | | | | | | | | | | |
Net increase (decrease) from capital share transactions | | | 4,959,826 | | | | (1,937,234 | ) | | | 5,456,211 | | | | 11,523,190 | | | | (302,907,352 | ) | | | (490,841,087 | ) |
Total increase (decrease) in net assets | | | 4,268,021 | | | | (480,917 | ) | | | 5,563,862 | | | | 12,813,580 | | | | (306,209,483 | ) | | | (442,325,790 | ) |
Net Assets: | | | | | | | | | | | | | | | | | | | | | | | | |
Beginning of year | | | 6,553,823 | | | | 7,034,740 | | | | 24,614,549 | | | | 11,800,969 | | | | 902,458,796 | | | | 1,344,784,586 | |
End of year4 | | $ | 10,821,844 | | | $ | 6,553,823 | | | $ | 30,178,411 | | | $ | 24,614,549 | | | $ | 596,249,313 | | | $ | 902,458,796 | |
| 1 | Commencement of operations for Class Z shares was on October 2, 2017. |
| 2 | See Note 1(d) of the Notes to Financial Statements. |
| 3 | See Note 1(g) of the Notes to Financial Statements. |
| 4 | The Securities and Exchange Commission eliminated the requirement to disclose end of year undistributed (distributions in excess of) net investment income for the fiscal year ended October 31, 2018. See Note 1(d) of the Notes to Financial Statements. |
The accompanying notes are an integral part of these financial statements.
137
Statements of Changes in Net Assets (continued)
For the fiscal years ended October 31,
| | | | | | | | | | | | | | | | | | | | | | | | |
| | | AMG
River Road
Dividend All Cap
Value Fund | | | AMG
River Road
Dividend All
Cap Value Fund II | | | AMG
Managers
Fairpointe
Mid Cap Fund | |
| | | 2018 | | | 20171 | | | 2018 | | | 20171 | | | 2018 | | | 20171 | |
Increase (Decrease) in Net Assets Resulting From Operations: | | | | | | | | | | | | | | | | | | | | | | | | |
Net investment income | | $ | 18,332,299 | | | $ | 17,286,874 | | | $ | 2,277,127 | | | $ | 2,435,356 | | | $ | 13,808,060 | | | $ | 4,188,835 | |
Net realized gain on investments | | | 47,243,403 | | | | 42,526,733 | | | | 8,793,061 | | | | 6,085,039 | | | | 178,668,438 | | | | 312,147,791 | |
Net change in unrealized appreciation/depreciation on investments | | | (42,248,243 | ) | | | 64,504,761 | | | | (7,291,620 | ) | | | 9,399,851 | | | | (208,004,516 | ) | | | 275,789,998 | |
Net increase (decrease) in net assets resulting from operations | | | 23,327,459 | | | | 124,318,368 | | | | 3,778,568 | | | | 17,920,246 | | | | (15,528,018 | ) | | | 592,126,624 | |
Distributions to Shareholders:2 | | | | | | | | | | | | | | | | | | | | | | | | |
Class N | | | (8,404,188 | ) | | | (25,103,133 | ) | | | (200,402 | ) | | | (189,278 | ) | | | (84,025,015 | ) | | | (65,838,322 | ) |
Class I | | | (54,573,572 | ) | | | (50,709,040 | ) | | | (8,474,655 | ) | | | (6,578,445 | ) | | | (168,619,081 | ) | | | (109,955,735 | ) |
Class Z | | | (182,603 | ) | | | (234 | ) | | | (23,529 | ) | | | (102 | ) | | | (7,084,279 | ) | | | — | |
Total distributions to shareholders | | | (63,160,363 | ) | | | (75,812,407 | ) | | | (8,698,586 | ) | | | (6,767,825 | ) | | | (259,728,375 | ) | | | (175,794,057 | ) |
Capital Share Transactions:3 | | | | | | | | | | | | | | | | | | | | | | | | |
Net increase (decrease) from capital share transactions | | | (39,958,807 | ) | | | 25,446,779 | | | | (30,576,474 | ) | | | (6,790,967 | ) | | | (841,850,349 | ) | | | 42,884,347 | |
Total increase (decrease) in net assets | | | (79,791,711 | ) | | | 73,952,740 | | | | (35,496,492 | ) | | | 4,361,454 | | | | (1,117,106,742 | ) | | | 459,216,914 | |
Net Assets: | | | | | | | | | | | | | | | | | | | | | | | | |
Beginning of year | | | 924,813,977 | | | | 850,861,237 | | | | 122,287,444 | | | | 117,925,990 | | | | 3,970,196,662 | | | | 3,510,979,748 | |
End of year4 | | $ | 845,022,266 | | | $ | 924,813,977 | | | $ | 86,790,952 | | | $ | 122,287,444 | | | $ | 2,853,089,920 | | | $ | 3,970,196,662 | |
| 1 | Commencement of operations for Class Z shares was on October 2, 2017. |
| 2 | See Note 1(d) of the Notes to Financial Statements. |
| 3 | See Note 1(g) of the Notes to Financial Statements. |
| 4 | The Securities and Exchange Commission eliminated the requirement to disclose end of year undistributed (distributions in excess of) net investment income for the fiscal year ended October 31, 2018. See Note 1(d) of the Notes to Financial Statements. |
The accompanying notes are an integral part of these financial statements.
138
Statements of Changes in Net Assets (continued)
For the fiscal years ended October 31,
| | | | | | | | | | | | | | | | | | | | | | | | |
| | | AMG
Managers
LMCG Small
Cap Growth Fund | | | AMG
River Road
Small-Mid Cap Value Fund | | | AMG
River Road
Small Cap Value Fund | |
| | | 2018 | | | 2017 | | | 2018 | | | 20171 | | | 2018 | | | 20171 | |
Increase in Net Assets Resulting From Operations: | | | | | | | | | | | | | | | | | | | | | | | | |
Net investment loss | | $ | (667,467 | ) | | $ | (688,770 | ) | | $ | (76,321 | ) | | $ | (40,149 | ) | | $ | (370,357 | ) | | $ | (401,545 | ) |
Net realized gain on investments | | | 21,869,038 | | | | 11,137,262 | | | | 4,462,548 | | | | 6,362,384 | | | | 32,294,367 | | | | 41,224,676 | |
Net change in unrealized appreciation/depreciation on investments | | | (9,890,828 | ) | | | 17,761,836 | | | | (2,114,772 | ) | | | 3,424,682 | | | | (14,979,042 | ) | | | 20,988,302 | |
Net increase in net assets resulting from operations | | | 11,310,743 | | | | 28,210,328 | | | | 2,271,455 | | | | 9,746,917 | | | | 16,944,968 | | | | 61,811,433 | |
Distributions to Shareholders:2 | | | | | | | | | | | | | | | | | | | | | | | | |
Class N | | | — | | | | — | | | | (1,015,313 | ) | | | (394,462 | ) | | | (4,305,561 | ) | | | (1,206,779 | ) |
Class I | | | — | | | | — | | | | (5,151,226 | ) | | | (2,748,422 | ) | | | (36,602,318 | ) | | | (13,057,219 | ) |
Class Z | | | — | | | | — | | | | (17,688 | ) | | | — | | | | (20,634 | ) | | | — | |
Total distributions to shareholders | | | — | | | | — | | | | (6,184,227 | ) | | | (3,142,884 | ) | | | (40,928,513 | ) | | | (14,263,998 | ) |
Capital Share Transactions:3 | | | | | | | | | | | | | | | | | | | | | | | | |
Net increase (decrease) from capital share transactions | | | (33,831,195 | ) | | | (14,492,344 | ) | | | 28,882,067 | | | | (2,051,545 | ) | | | 71,449,859 | | | | (4,679,906 | ) |
Total increase (decrease) in net assets | | | (22,520,452 | ) | | | 13,717,984 | | | | 24,969,295 | | | | 4,552,488 | | | | 47,466,314 | | | | 42,867,529 | |
Net Assets: | | | | | | | | | | | | | | | | | | | | | | | | |
Beginning of year | | | 125,554,363 | | | | 111,836,379 | | | | 44,406,890 | | | | 39,854,402 | | | | 311,385,589 | | | | 268,518,060 | |
End of year4 | | $ | 103,033,911 | | | $ | 125,554,363 | | | $ | 69,376,185 | | | $ | 44,406,890 | | | $ | 358,851,903 | | | $ | 311,385,589 | |
| 1 | Commencement of operations for Class Z shares was on October 2, 2017. |
| 2 | See Note 1(d) of the Notes to Financial Statements. |
| 3 | See Note 1(g) of the Notes to Financial Statements. |
| 4 | The Securities and Exchange Commission eliminated the requirement to disclose end of year undistributed (distributions in excess of) net investment income for the fiscal year ended October 31, 2018. See Note 1(d) of the Notes to Financial Statements. |
The accompanying notes are an integral part of these financial statements.
139
Statements of Changes in Net Assets (continued)
For the fiscal years ended October 31,
| | | | | | | | | | | | | | | | | | | | | | | | |
| | | AMG Managers
Silvercrest
Small Cap Fund | | | AMG
GW&K
U.S. Small Cap
Growth Fund | | | AMG Managers
DoubleLine
Core Plus
Bond Fund | |
| | | 2018 | | | 20171 | | | 2018 | | | 20175 | | | 2018 | | | 20171 | |
Increase (Decrease) in Net Assets Resulting From Operations: | | | | | | | | | | | | | | | | | | | | | | | | |
Net investment income (loss) | | $ | 95,286 | | | $ | 238,344 | | | $ | (240,628 | ) | | $ | (256,697 | ) | | $ | 19,575,986 | | | $ | 18,128,484 | |
Net realized gain (loss) on investments | | | 23,131,258 | | | | 20,362,183 | | | | 5,691,728 | | | | 5,923,460 | | | | (7,256,523 | ) | | | (1,427,843 | ) |
Net change in unrealized appreciation/depreciation on investments | | | (38,560,552 | ) | | | 34,036,455 | | | | (4,046,445 | ) | | | 5,001,575 | | | | (19,634,553 | ) | | | 612,732 | |
Net increase (decrease) in net assets resulting from operations | | | (15,334,008 | ) | | | 54,636,982 | | | | 1,404,655 | | | | 10,668,338 | | | | (7,315,090 | ) | | | 17,313,373 | |
Distributions to Shareholders:2 | | | | | | | | | | | | | | | | | | | | | | | | |
From net investment income and/or realized gain on investments: | | | | | | | | | | | | | | | | | | | | | | | | |
Class N | | | (1,953,748 | ) | | | (172,910 | ) | | | (3,811,310 | ) | | | (44,632 | ) | | | (3,953,588 | ) | | | (7,036,071 | ) |
Class I | | | (19,107,515 | ) | | | (2,065,321 | ) | | | (1,248,740 | ) | | | (14,009 | ) | | | (16,432,493 | ) | | | (14,250,715 | ) |
Class Z | | | (16,089 | ) | | | — | | | | (18,241 | ) | | | — | | | | (57,102 | ) | | | (659 | ) |
From paid in capital: | | | | | | | | | | | | | | | | | | | | | | | | |
Class N | | | — | | | | — | | | | — | | | | — | | | | — | | | | (992,351 | ) |
Class I | | | — | | | | — | | | | — | | | | — | | | | — | | | | (1,912,231 | ) |
Class Z | | | — | | | | — | | | | — | | | | — | | | | — | | | | (115 | ) |
Total distributions to shareholders | | | (21,077,352 | ) | | | (2,238,231 | ) | | | (5,078,291 | ) | | | (58,641 | ) | | | (20,443,183 | ) | | | (24,192,142 | ) |
Capital Share Transactions:3 | | | | | | | | | | | | | | | | | | | | | | | | |
Net increase (decrease) from capital share transactions | | | 6,623,865 | | | | 12,692,188 | | | | 1,359,286 | | | | (16,006,845 | ) | | | (79,966,857 | ) | | | (21,494,709 | ) |
Total increase (decrease) in net assets | | | (29,787,495 | ) | | | 65,090,939 | | | | (2,314,350 | ) | | | (5,397,148 | ) | | | (107,725,130 | ) | | | (28,373,478 | ) |
Net Assets: | | | | | | | | | | | | | | | | | | | | | | | | |
Beginning of year | | | 267,283,177 | | | | 202,192,238 | | | | 36,611,933 | | | | 42,009,081 | | | | 678,842,701 | | | | 707,216,179 | |
End of year4 | | $ | 237,495,682 | | | $ | 267,283,177 | | | $ | 34,297,583 | | | $ | 36,611,933 | | | $ | 571,117,571 | | | $ | 678,842,701 | |
| 1 | Commencement of operations for Class Z shares was on October 2, 2017. |
| 2 | See Note 1(d) of the Notes to Financial Statements. |
| 3 | See Note 1(g) of the Notes to Financial Statements. |
| 4 | The Securities and Exchange Commission eliminated the requirement to disclose end of year undistributed (distributions in excess of) net investment income for the fiscal year ended October 31, 2018. See Note 1(d) of the Notes to Financial Statements. |
| 5 | Commencement of operations for Class Z shares was on February 24, 2017. |
The accompanying notes are an integral part of these financial statements.
140
Statements of Changes in Net Assets (continued)
For the fiscal years ended October 31,
| | | | | | | | | | | | | | | | | | | | | | | | |
| | | AMG Managers
Lake Partners
LASSO Alternatives Fund | | | AMG
River Road
Long-Short Fund | | | AMG
Managers
Guardian Capital
Global Dividend Fund | |
| | | 2018 | | | 2017 | | | 2018 | | | 20171 | | | 2018 | | | 2017 | |
Increase (Decrease) in Net Assets Resulting From Operations: | | | | | | | | | | | | | | | | | | | | | | | | |
Net investment income (loss) | | $ | 191,268 | | | $ | (180,464 | ) | | $ | (10,305 | ) | | $ | (821,219 | ) | | $ | 803,315 | | | $ | 761,972 | |
Net realized gain on investments | | | 1,010,353 | | | | 2,171,889 | | | | 1,994,219 | | | | 3,197,701 | | | | 292,169 | | | | 449,753 | |
Net change in unrealized appreciation/depreciation on investments | | | (2,036,544 | ) | | | 2,210,908 | | | | (2,389,808 | ) | | | 2,291,428 | | | | (2,315,806 | ) | | | 4,967,436 | |
Net increase (decrease) in net assets resulting from operations | | | (834,923 | ) | | | 4,202,333 | | | | (405,894 | ) | | | 4,667,910 | | | | (1,220,322 | ) | | | 6,179,161 | |
Distributions to Shareholders:2 | | | | | | | | | | | | | | | | | | | | | | | | |
Class N | | | (382,672 | ) | | | (123,358 | ) | | | — | | | | — | | | | (33,506 | ) | | | (16,721 | ) |
Class I | | | (1,681,535 | ) | | | (263,958 | ) | | | — | | | | — | | | | (1,038,506 | ) | | | (665,170 | ) |
Total distributions to shareholders | | | (2,064,207 | ) | | | (387,316 | ) | | | — | | | | — | | | | (1,072,012 | ) | | | (681,891 | ) |
Capital Share Transactions:3 | | | | | | | | | | | | | | | | | | | | | | | | |
Net increase (decrease) from capital share transactions | | | (20,224,713 | ) | | | (56,374,436 | ) | | | (5,409,284 | ) | | | (16,366,899 | ) | | | 1,523,548 | | | | 2,965,562 | |
Total increase (decrease) in net assets | | | (23,123,843 | ) | | | (52,559,419 | ) | | | (5,815,178 | ) | | | (11,698,989 | ) | | | (768,786 | ) | | | 8,462,832 | |
Net Assets: | | | | | | | | | | | | | | | | | | | | | | | | |
Beginning of year | | | 50,124,632 | | | | 102,684,051 | | | | 34,562,518 | | | | 46,261,507 | | | | 37,446,516 | | | | 28,983,684 | |
End of year4 | | $ | 27,000,789 | | | $ | 50,124,632 | | | $ | 28,747,340 | | | $ | 34,562,518 | | | $ | 36,677,730 | | | $ | 37,446,516 | |
| 1 | Commencement of operations for Class Z shares was on October 2, 2017. |
| 2 | See Note 1(d) of the Notes to Financial Statements. |
| 3 | See Note 1(g) of the Notes to Financial Statements. |
| 4 | The Securities and Exchange Commission eliminated the requirement to disclose end of year undistributed (distributions in excess of) net investment income for the fiscal year ended October 31, 2018. See Note 1(d) of the Notes to Financial Statements. |
The accompanying notes are an integral part of these financial statements.
141
Statements of Changes in Net Assets (continued)
For the fiscal years ended October 31,
| | | | | | | | | | | | | | | | |
| | | AMG
Managers
Pictet International Fund | | | AMG
Managers
Value Partners
Asia Dividend Fund | |
| | | 2018 | | | 20171 | | | 2018 | | | 2017 | |
Increase (Decrease) in Net Assets Resulting From Operations: | | | | | | | | | | | | | | | | |
Net investment income | | $ | 30,224,511 | | | $ | 21,331,461 | | | $ | 238,304 | | | $ | 245,017 | |
Net realized gain on investments | | | 144,571,653 | | | | 54,291,175 | | | | 667,740 | | | | 663,433 | |
Net change in unrealized appreciation/depreciation on investments | | | (398,668,510 | ) | | | 289,075,134 | | | | (2,332,177 | ) | | | 1,483,557 | |
Net increase (decrease) in net assets resulting from operations | | | (223,872,346 | ) | | | 364,697,770 | | | | (1,426,133 | ) | | | 2,392,007 | |
Distributions to Shareholders:2 | | | | | | | | | | | | | | | | |
Class N | | | (222,099 | ) | | | (3,667 | ) | | | (106,815 | ) | | | (56,852 | ) |
Class I | | | (21,428,887 | ) | | | (47,609,264 | ) | | | (841,047 | ) | | | (486,557 | ) |
Class Z | | | (68,430,312 | ) | | | — | | | | — | | | | — | |
Total distributions to shareholders | | | (90,081,298 | ) | | | (47,612,931 | ) | | | (947,862 | ) | | | (543,409 | ) |
Capital Share Transactions:3 | | | | | | | | | | | | | | | | |
Net increase (decrease) from capital share transactions | | | (129,131,327 | ) | | | 370,211,280 | | | | 593,323 | | | | 528,187 | |
Total increase (decrease) in net assets | | | (443,084,971 | ) | | | 687,296,119 | | | | (1,780,672 | ) | | | 2,376,785 | |
Net Assets: | | | | | | | | | | | | | | | | |
Beginning of year | | | 2,023,477,245 | | | | 1,336,181,126 | | | | 10,467,666 | | | | 8,090,881 | |
End of year4 | | $ | 1,580,392,274 | | | $ | 2,023,477,245 | | | $ | 8,686,994 | | | $ | 10,467,666 | |
| 1 | The commencement of operations for Class Z shares was October 2, 2017. |
| 2 | See Note 1(d) of the Notes to Financial Statements. |
| 3 | See Note 1(g) of the Notes to Financial Statements. |
| 4 | The Securities and Exchange Commission eliminated the requirement to disclose end of year undistributed (distributions in excess of) net investment income for the fiscal year ended October 31, 2018. See Note 1(d) of the Notes to Financial Statements. |
The accompanying notes are an integral part of these financial statements.
142
AMG Managers Fairpointe ESG Equity Fund
Financial Highlights
For a share outstanding throughout each fiscal period
| | | | | | | | | | | | | | | | |
| | | For the fiscal years ended
October 31, | | | For the fiscal period
ended
October 31, | |
| Class N | | 2018 | | | 2017 | | | 2016 | | | 20151 | |
Net Asset Value, Beginning of Period | | $ | 11.74 | | | $ | 9.65 | | | $ | 9.33 | | | $ | 10.00 | |
Income (loss) from Investment Operations: | | | | | | | | | | | | | | | | |
Net investment income2,3 | | | 0.10 | | | | 0.17 | 4 | | | 0.08 | | | | 0.06 | |
Net realized and unrealized gain (loss) on investments | | | (0.42 | ) | | | 1.94 | | | | 0.33 | | | | (0.73 | ) |
Total income (loss) from investment operations | | | (0.32 | ) | | | 2.11 | | | | 0.41 | | | | (0.67 | ) |
Less Distributions to Shareholders from: | | | | | | | | | | | | | | | | |
Net investment income | | | (0.15 | ) | | | (0.02 | ) | | | (0.09 | ) | | | — | |
Total distributions to shareholders | | | (0.15 | ) | | | (0.02 | ) | | | (0.09 | ) | | | — | |
Net Asset Value, End of Period | | $ | 11.27 | | | $ | 11.74 | | | $ | 9.65 | | | $ | 9.33 | |
Total Return3,5 | | | (2.73 | )% | | | 21.83 | % | | | 4.43 | % | | | (6.70 | )%6 |
Ratio of net expenses to average net assets | | | 1.11 | % | | | 1.12 | % | | | 1.15 | % | | | 1.15 | %7 |
Ratio of gross expenses to average net assets8 | | | 1.96 | % | | | 1.76 | % | | | 2.63 | % | | | 3.78 | %7 |
Ratio of net investment income to average net assets3 | | | 0.80 | % | | | 1.53 | % | | | 0.87 | % | | | 0.70 | %7 |
Portfolio turnover | | | 41 | % | | | 51 | % | | | 31 | % | | | 1 | %6,9 |
Net assets end of period (000’s) omitted | | $ | 664 | | | $ | 807 | | | $ | 546 | | | $ | 2,295 | |
| | | | | | | | | | | | | | | | |
143
AMG Managers Fairpointe ESG Equity Fund
Financial Highlights
For a share outstanding throughout each fiscal period
| | | | | | | | | | | | | | | | |
| | | For the fiscal years ended
October 31, | | | For the fiscal period
ended
October 31, | |
| Class I | | 2018 | | | 2017 | | | 2016 | | | 20151 | |
Net Asset Value, Beginning of Period | | $ | 11.70 | | | $ | 9.67 | | | $ | 9.35 | | | $ | 10.00 | |
Income (loss) from Investment Operations: | | | | | | | | | | | | | | | | |
Net investment income2,3 | | | 0.12 | | | | 0.19 | 4 | | | 0.10 | | | | 0.08 | |
Net realized and unrealized gain (loss) on investments | | | (0.42 | ) | | | 1.94 | | | | 0.32 | | | | (0.73 | ) |
Total income (loss) from investment operations | | | (0.30 | ) | | | 2.13 | | | | 0.42 | | | | (0.65 | ) |
Less Distributions to Shareholders from: | | | | | | | | | | | | | | | | |
Net investment income | | | (0.19 | ) | | | (0.10 | ) | | | (0.10 | ) | | | — | |
Total distributions to shareholders | | | (0.19 | ) | | | (0.10 | ) | | | (0.10 | ) | | | — | |
Net Asset Value, End of Period | | $ | 11.21 | | | $ | 11.70 | | | $ | 9.67 | | | $ | 9.35 | |
Total Return3,5 | | | (2.54 | )% | | | 22.04 | % | | | 4.65 | % | | | (6.50 | )%6 |
Ratio of net expenses to average net assets | | | 0.90 | % | | | 0.90 | % | | | 0.90 | % | | | 0.90 | %7 |
Ratio of gross expenses to average net assets8 | | | 1.75 | % | | | 1.54 | % | | | 2.51 | % | | | 3.53 | %7 |
Ratio of net investment income to average net assets3 | | | 1.01 | % | | | 1.75 | % | | | 1.10 | % | | | 0.95 | %7 |
Portfolio turnover | | | 41 | % | | | 51 | % | | | 31 | % | | | 1 | %6,9 |
Net assets end of period (000’s) omitted | | $ | 10,158 | | | $ | 5,747 | | | $ | 6,489 | | | $ | 4,162 | |
| | | | | | | | | | | | | | | | |
| 1 | Commencement of operations was on December 23, 2014. |
| 2 | Per share numbers have been calculated using average shares. |
| 3 | Total returns and net investment income would have been lower had certain expenses not been offset. |
| 4 | Includes non-recurring dividends. Without these dividends, net investment income per share would have been $0.06 and $0.08 for Class N and Class I shares, respectively. |
| 5 | The total return is calculated using the published Net Asset Value as of fiscal year end. |
| 8 | Excludes the impact of expense reimbursement or fee waivers and expense reductions such as brokerage credits, but includes expense repayments and non-reimbursable expenses, if any, such as interest, taxes, and extraordinary expenses. (See Note 1(c) and 2 in the Notes to Financial Statements.) |
| 9 | Portfolio turnover rate excludes securities delivered from processing a redemption in-kind. |
144
AMG River Road Focused Absolute Value Fund
Financial Highlights
For a share outstanding throughout each fiscal period
| | | | | | | | | | | | |
| | | For the fiscal years ended
October 31, | | | For the fiscal period
ended
October 31, | |
| Class N | | 2018 | | | 2017 | | | 20161 | |
Net Asset Value, Beginning of Period | | $ | 11.87 | | | $ | 10.85 | | | $ | 10.00 | |
Income (loss) from Investment Operations: | | | | | | | | | | | | |
Net investment income (loss)2,3 | | | 0.05 | | | | (0.01 | ) | | | 0.04 | |
Net realized and unrealized gain on investments | | | 0.93 | | | | 1.85 | | | | 0.81 | |
Total income from investment operations | | | 0.98 | | | | 1.84 | | | | 0.85 | |
Less Distributions to Shareholders from: | | | | | | | | | | | | |
Net investment income | | | (0.07 | ) | | | (0.09 | ) | | | — | |
Net realized gain on investments | | | (0.87 | ) | | | (0.73 | ) | | | — | |
Total distributions to shareholders | | | (0.94 | ) | | | (0.82 | ) | | | — | |
Net Asset Value, End of Period | | $ | 11.91 | | | $ | 11.87 | | | $ | 10.85 | |
Total Return3,4 | | | 8.69 | % | | | 17.42 | % | | | 8.50 | %5 |
Ratio of net expenses to average net assets | | | 0.99 | %6 | | | 0.97 | %6 | | | 1.12 | %7 |
Ratio of gross expenses to average net assets8 | | | 1.32 | % | | | 1.50 | % | | | 3.15 | %7 |
Ratio of net investment income (loss) to average net assets3 | | | 0.43 | % | | | (0.09 | )% | | | 0.39 | %7 |
Portfolio turnover | | | 88 | % | | | 112 | % | | | 146 | %5,9 |
Net assets end of period (000’s) omitted | | $ | 9,184 | | | $ | 7,448 | | | $ | 489 | |
| | | | | | | | | | | | |
145
AMG River Road Focused Absolute Value Fund
Financial Highlights
For a share outstanding throughout each fiscal period
| | | | | | | | | | | | |
| | | For the fiscal years ended
October 31, | | | For the fiscal period
ended
October 31, | |
| Class I | | 2018 | | | 2017 | | | 20161 | |
Net Asset Value, Beginning of Period | | $ | 11.92 | | | $ | 10.88 | | | $ | 10.00 | |
Income from Investment Operations: | | | | | | | | | | | | |
Net investment income2,3 | | | 0.08 | | | | 0.06 | | | | 0.08 | |
Net realized and unrealized gain on investments | | | 0.93 | | | | 1.81 | | | | 0.80 | |
Total income from investment operations | | | 1.01 | | | | 1.87 | | | | 0.88 | |
Less Distributions to Shareholders from: | | | | | | | | | | | | |
Net investment income | | | (0.08 | ) | | | (0.10 | ) | | | — | |
Net realized gain on investments | | | (0.87 | ) | | | (0.73 | ) | | | — | |
Total distributions to shareholders | | | (0.95 | ) | | | (0.83 | ) | | | — | |
Net Asset Value, End of Period | | $ | 11.98 | | | $ | 11.92 | | | $ | 10.88 | |
Total Return3,4 | | | 8.91 | % | | | 17.72 | % | | | 8.80 | %5 |
Ratio of net expenses to average net assets | | | 0.74 | %6 | | | 0.73 | %6 | | | 0.75 | %7 |
Ratio of gross expenses to average net assets8 | | | 1.07 | % | | | 1.20 | % | | | 2.90 | %7 |
Ratio of net investment income to average net assets3 | | | 0.68 | % | | | 0.50 | % | | | 0.81 | %7 |
Portfolio turnover | | | 88 | % | | | 112 | % | | | 146 | %5,9 |
Net assets end of period (000’s) omitted | | $ | 20,928 | | | $ | 17,106 | | | $ | 11,312 | |
| | | | | | | | | | | | |
146
AMG River Road Focused Absolute Value Fund
Financial Highlights
For a share outstanding throughout each fiscal period
| | | | | | | | |
| | | For the fiscal years ended
October 31, | | | For the fiscal period
ended
October 31, | |
| Class Z | | 2018 | | | 201710 | |
Net Asset Value, Beginning of Period | | $ | 11.92 | | | $ | 12.18 | |
Income (loss) from Investment Operations: | | | | | | | | |
Net investment income (loss)2,3 | | | 0.08 | | | | (0.01 | ) |
Net realized and unrealized gain (loss) on investments | | | 0.93 | | | | (0.25 | ) |
Total income (loss) from investment operations | | | 1.01 | | | | (0.26 | ) |
Less Distributions to Shareholders from: | | | | | | | | |
Net investment income | | | (0.08 | ) | | | — | |
Net realized gain on investments | | | (0.87 | ) | | | — | |
Total distributions to shareholders | | | (0.95 | ) | | | — | |
Net Asset Value, End of Period | | $ | 11.98 | | | $ | 11.92 | |
Total Return3,4 | | | 8.96 | % | | | (2.13 | )%5 |
Ratio of net expenses to average net assets | | | 0.70 | %6 | | | 0.70 | %6,7 |
Ratio of gross expenses to average net assets8 | | | 1.03 | % | | | 1.32 | %7 |
Ratio of net investment income (loss) to average net assets3 | | | 0.72 | % | | | (0.59 | )%7 |
Portfolio turnover | | | 88 | % | | | 112 | %5 |
Net assets end of period (000’s) omitted | | $ | 66 | | | $ | 61 | |
| | | | | | | | |
| 1 | The commencement of operations for Class N and Class I shares was November 3, 2015. |
| 2 | Per share numbers have been calculated using average shares. |
| 3 | Total returns and net investment income (loss) would have been lower had certain expenses not been offset. |
| 4 | The total return is calculated using the published Net Asset Value as of fiscal year end. |
| 6 | Includes reduction from broker recapture amounting to 0.01% for the fiscal year ended October 31, 2018, and 0.03%, 0.02%, and less than 0.01% for Class N, Class I and Class Z, respectively, for the period ended October 31, 2017. |
| 8 | Excludes the impact of expense reimbursement or fee waivers and expense reductions such as brokerage credits, but includes expense repayments and non-reimbursable expenses, if any, such as interest, taxes, and extraordinary expenses. (See Note 1(c) and 2 in the Notes to Financial Statements.) |
| 9 | Portfolio turnover rate excludes securities received from processing a subscription in-kind. |
| 10 | The commencement of operations for Class Z shares was October 2, 2017. |
147
AMG Managers Montag & Caldwell Growth Fund
Financial Highlights
For a share outstanding throughout each fiscal year
| | | | | | | | | | | | | | | | | | | | |
| | | For the fiscal years ended October 31, | |
| Class N | | 2018 | | | 2017 | | | 2016 | | | 2015 | | | 2014 | |
Net Asset Value, Beginning of Year | | $ | 20.76 | | | $ | 19.56 | | | $ | 26.67 | | | $ | 29.59 | | | $ | 28.68 | |
Income (loss) from Investment Operations: | | | | | | | | | | | | | | | | | | | | |
Net investment income (loss)1,2 | | | (0.01 | ) | | | (0.02 | ) | | | 0.05 | | | | 0.07 | | | | 0.10 | |
Net realized and unrealized gain (loss) on investments | | | 1.71 | | | | 3.20 | | | | (0.33 | ) | | | 2.06 | | | | 2.93 | |
Total income (loss) from investment operations | | | 1.70 | | | | 3.18 | | | | (0.28 | ) | | | 2.13 | | | | 3.03 | |
Less Distributions to Shareholders from: | | | | | | | | | | | | | | | | | | | | |
Net investment income | | | — | | | | (0.04 | ) | | | (0.08 | ) | | | (0.05 | ) | | | (0.16 | ) |
Net realized gain on investments | | | (1.94 | ) | | | (1.94 | ) | | | (6.75 | ) | | | (5.00 | ) | | | (1.96 | ) |
Total distributions to shareholders | | | (1.94 | ) | | | (1.98 | ) | | | (6.83 | ) | | | (5.05 | ) | | | (2.12 | ) |
Net Asset Value, End of Year | | $ | 20.52 | | | $ | 20.76 | | | $ | 19.56 | | | $ | 26.67 | | | $ | 29.59 | |
Total Return2,3 | | | 8.58 | % | | | 17.99 | % | | | (1.77 | )% | | | 7.93 | % | | | 10.98 | % |
Ratio of net expenses to average net assets | | | 1.15 | %4 | | | 1.15 | %4 | | | 1.12 | % | | | 1.05 | % | | | 1.03 | % |
Ratio of gross expenses to average net assets5 | | | 1.16 | % | | | 1.17 | % | | | 1.12 | % | | | 1.05 | % | | | 1.03 | % |
Ratio of net investment income (loss) to average netassets2 | | | (0.03 | )% | | | (0.11 | )% | | | 0.25 | % | | | 0.28 | % | | | 0.34 | % |
Portfolio turnover | | | 33 | % | | | 42 | % | | | 64 | % | | | 12 | % | | | 47 | % |
Net assets end of year (000’s) omitted | | $ | 179,434 | | | $ | 259,324 | | | $ | 519,008 | | | $ | 835,725 | | | $ | 1,344,317 | |
| | | | | | | | | | | | | | | | | | | | |
148
AMG Managers Montag & Caldwell Growth Fund
Financial Highlights
For a share outstanding throughout each fiscal year
| | | | | | | | | | | | | | | | | | | | |
| | | For the fiscal years ended October 31, | |
| Class I | | 2018 | | | 2017 | | | 2016 | | | 2015 | | | 2014 | |
Net Asset Value, Beginning of Year | | $ | 20.84 | | | $ | 19.70 | | | $ | 26.82 | | | $ | 29.80 | | | $ | 28.87 | |
Income (loss) from Investment Operations: | | | | | | | | | | | | | | | | | | | | |
Net investment income1,2 | | | 0.03 | | | | 0.02 | | | | 0.10 | | | | 0.14 | | | | 0.17 | |
Net realized and unrealized gain (loss) on investments | | | 1.71 | | | | 3.20 | | | | (0.31 | ) | | | 2.06 | | | | 2.96 | |
Total income (loss) from investment operations | | | 1.74 | | | | 3.22 | | | | (0.21 | ) | | | 2.20 | | | | 3.13 | |
Less Distributions to Shareholders from: | | | | | | | | | | | | | | | | | | | | |
Net investment income | | | (0.02 | ) | | | (0.13 | ) | | | (0.16 | ) | | | (0.18 | ) | | | (0.24 | ) |
Net realized gain on investments | | | (1.94 | ) | | | (1.95 | ) | | | (6.75 | ) | | | (5.00 | ) | | | (1.96 | ) |
Total distributions to shareholders | | | (1.96 | ) | | | (2.08 | ) | | | (6.91 | ) | | | (5.18 | ) | | | (2.20 | ) |
Net Asset Value, End of Year | | $ | 20.62 | | | $ | 20.84 | | | $ | 19.70 | | | $ | 26.82 | | | $ | 29.80 | |
Total Return2,3 | | | 8.75 | % | | | 18.21 | % | | | (1.51 | )% | | | 8.21 | % | | | 11.26 | % |
Ratio of net expenses to average net assets | | | 0.96 | %4 | | | 0.92 | %4 | | | 0.87 | % | | | 0.80 | % | | | 0.78 | % |
Ratio of gross expenses to average net assets5 | | | 0.97 | % | | | 0.94 | % | | | 0.87 | % | | | 0.80 | % | | | 0.78 | % |
Ratio of net investment income to average net assets2 | | | 0.16 | % | | | 0.12 | % | | | 0.50 | % | | | 0.53 | % | | | 0.59 | % |
Portfolio turnover | | | 33 | % | | | 42 | % | | | 64 | % | | | 12 | % | | | 47 | % |
Net assets end of year (000’s) omitted | | $ | 416,208 | | | $ | 642,461 | | | $ | 820,318 | | | $ | 1,344,231 | | | $ | 2,784,650 | |
| | | | | | | | | | | | | | | | | | | | |
149
AMG Managers Montag & Caldwell Growth Fund
Financial Highlights
For a share outstanding throughout each fiscal year
| | | | | | | | | | | | | | | | | | | | |
| | | For the fiscal years ended October 31, | |
| Class R | | 2018 | | | 2017 | | | 2016 | | | 2015 | | | 2014 | |
Net Asset Value, Beginning of Year | | $ | 20.29 | | | $ | 19.14 | | | $ | 26.22 | | | $ | 29.21 | | | $ | 28.33 | |
Income (loss) from Investment Operations: | | | | | | | | | | | | | | | | | | | | |
Net investment income (loss)1,2 | | | (0.07 | ) | | | (0.07 | ) | | | 0.00 | 6 | | | 0.01 | | | | 0.03 | |
Net realized and unrealized gain (loss) on investments | | | 1.66 | | | | 3.15 | | | | (0.31 | ) | | | 2.01 | | | | 2.91 | |
Total income (loss) from investment operations | | | 1.59 | | | | 3.08 | | | | (0.31 | ) | | | 2.02 | | | | 2.94 | |
Less Distributions to Shareholders from: | | | | | | | | | | | | | | | | | | | | |
Net investment income | | | — | | | | (0.03 | ) | | | (0.02 | ) | | | (0.01 | ) | | | (0.10 | ) |
Net realized gain on investments | | | (1.94 | ) | | | (1.90 | ) | | | (6.75 | ) | | | (5.00 | ) | | | (1.96 | ) |
Total distributions to shareholders | | | (1.94 | ) | | | (1.93 | ) | | | (6.77 | ) | | | (5.01 | ) | | | (2.06 | ) |
Net Asset Value, End of Year | | $ | 19.94 | | | $ | 20.29 | | | $ | 19.14 | | | $ | 26.22 | | | $ | 29.21 | |
Total Return2,3 | | | 8.20 | % | | | 17.77 | % | | | (2.02 | )% | | | 7.66 | % | | | 10.74 | % |
Ratio of net expenses to average net assets | | | 1.46 | %4 | | | 1.39 | %4 | | | 1.37 | % | | | 1.30 | % | | | 1.28 | % |
Ratio of gross expenses to average net assets5 | | | 1.47 | % | | | 1.41 | % | | | 1.37 | % | | | 1.30 | % | | | 1.28 | % |
Ratio of net investment income (loss) to average net assets2 | | | (0.34 | )% | | | (0.35 | )% | | | (0.02 | )% | | | 0.03 | % | | | 0.09 | % |
Portfolio turnover | | | 33 | % | | | 42 | % | | | 64 | % | | | 12 | % | | | 47 | % |
Net assets end of year (000’s) omitted | | $ | 607 | | | $ | 674 | | | $ | 5,458 | | | $ | 5,877 | | | $ | 7,701 | |
| | | | | | | | | | | | | | | | | | | | |
| 1 | Per share numbers have been calculated using average shares. |
| 2 | Total returns and net investment income (loss) would have been lower had certain expenses not been offset. |
| 3 | The total return is calculated using the published Net Asset Value as of fiscal year end. |
| 4 | Includes reduction from broker recapture amounting to less than 0.01% and 0.01% for the fiscal years ended 2018 and 2017, respectively. |
| 5 | Excludes the impact of expense reimbursement or fee waivers and expense reductions such as brokerage credits, but includes expense repayments and non-reimbursable expenses, if any, such as interest, taxes, and extraordinary expenses. (See Note 1(c) and 2 in the Notes to Financial Statements.) |
| 6 | Less than $0.005 per share. |
150
AMG River Road Dividend All Cap Value Fund
Financial Highlights
For a share outstanding throughout each fiscal year
| | | | | | | | | | | | | | | | | | | | |
| | | For the fiscal years ended October 31, | |
| Class N | | 2018 | | | 2017 | | | 2016 | | | 2015 | | | 2014 | |
Net Asset Value, Beginning of Year | | $ | 12.87 | | | $ | 12.18 | | | $ | 12.67 | | | $ | 14.05 | | | $ | 13.99 | |
Income (loss) from Investment Operations: | | | | | | | | | | | | | | | | | | | | |
Net investment income1 | | | 0.22 | 2 | | | 0.22 | 2 | | | 0.24 | 2 | | | 0.21 | | | | 0.42 | |
Net realized and unrealized gain (loss) on investments | | | 0.06 | | | | 1.54 | | | | 0.65 | | | | (0.20 | ) | | | 0.89 | |
Total income from investment operations | | | 0.28 | | | | 1.76 | | | | 0.89 | | | | 0.01 | | | | 1.31 | |
Less Distributions to Shareholders from: | | | | | | | | | | | | | | | | | | | | |
Net investment income | | | (0.28 | ) | | | (0.21 | ) | | | (0.22 | ) | | | (0.22 | ) | | | (0.44 | ) |
Net realized gain on investments | | | (0.58 | ) | | | (0.86 | ) | | | (1.16 | ) | | | (1.17 | ) | | | (0.81 | ) |
Total distributions to shareholders | | | (0.86 | ) | | | (1.07 | ) | | | (1.38 | ) | | | (1.39 | ) | | | (1.25 | ) |
Net Asset Value, End of Year | | $ | 12.29 | | | $ | 12.87 | | | $ | 12.18 | | | $ | 12.67 | | | $ | 14.05 | |
Total Return1,3 | | | 2.06 | % | | | 14.79 | % | | | 7.88 | % | | | (0.23 | )% | | | 9.89 | % |
Ratio of net expenses to average net assets | | | 1.10 | %4 | | | 1.11 | %4 | | | 1.10 | % | | | 1.10 | % | | | 1.09 | % |
Ratio of gross expenses to average net assets5 | | | 1.11 | % | | | 1.12 | % | | | 1.10 | % | | | 1.10 | % | | | 1.09 | % |
Ratio of net investment income to average net assets1 | | | 1.78 | % | | | 1.75 | % | | | 2.00 | % | | | 1.62 | % | | | 2.96 | % |
Portfolio turnover | | | 27 | % | | | 28 | % | | | 47 | % | | | 27 | % | | | 32 | % |
Net assets end of year (000’s) omitted | | $ | 100,420 | | | $ | 136,534 | | | $ | 295,797 | | | $ | 214,789 | | | $ | 349,937 | |
| | | | | | | | | | | | | | | | | | | | |
151
AMG River Road Dividend All Cap Value Fund
Financial Highlights
For a share outstanding throughout each fiscal year
| | | | | | | | | | | | | | | | | | | | |
| | | For the fiscal years ended October 31, | |
| Class I | | 2018 | | | 2017 | | | 2016 | | | 2015 | | | 2014 | |
Net Asset Value, Beginning of Year | | $ | 12.86 | | | $ | 12.17 | | | $ | 12.66 | | | $ | 14.04 | | | $ | 13.98 | |
Income (loss) from Investment Operations: | | | | | | | | | | | | | | | | | | | | |
Net investment income1 | | | 0.26 | 2 | | | 0.24 | 2 | | | 0.28 | 2 | | | 0.25 | | | | 0.44 | |
Net realized and unrealized gain (loss) on investments | | | 0.06 | | | | 1.55 | | | | 0.64 | | | | (0.20 | ) | | | 0.90 | |
Total income from investment operations | | | 0.32 | | | | 1.79 | | | | 0.92 | | | | 0.05 | | | | 1.34 | |
Less Distributions to Shareholders from: | | | | | | | | | | | | | | | | | | | | |
Net investment income | | | (0.31 | ) | | | (0.24 | ) | | | (0.25 | ) | | | (0.26 | ) | | | (0.47 | ) |
Net realized gain on investments | | | (0.58 | ) | | | (0.86 | ) | | | (1.16 | ) | | | (1.17 | ) | | | (0.81 | ) |
Total distributions to shareholders | | | (0.89 | ) | | | (1.10 | ) | | | (1.41 | ) | | | (1.43 | ) | | | (1.28 | ) |
Net Asset Value, End of Year | | $ | 12.29 | | | $ | 12.86 | | | $ | 12.17 | | | $ | 12.66 | | | $ | 14.04 | |
Total Return1,3 | | | 2.38 | % | | | 15.07 | % | | | 8.15 | % | | | 0.02 | % | | | 10.18 | % |
Ratio of net expenses to average net assets | | | 0.84 | %4 | | | 0.86 | %4 | | | 0.85 | % | | | 0.85 | % | | | 0.84 | % |
Ratio of gross expenses to average net assets5 | | | 0.85 | % | | | 0.87 | % | | | 0.85 | % | | | 0.85 | % | | | 0.84 | % |
Ratio of net investment income to average net assets1 | | | 2.04 | % | | | 1.93 | % | | | 2.30 | % | | | 1.87 | % | | | 3.21 | % |
Portfolio turnover | | | 27 | % | | | 28 | % | | | 47 | % | | | 27 | % | | | 32 | % |
Net assets end of year (000’s) omitted | | $ | 743,984 | | | $ | 788,023 | | | $ | 555,064 | | | $ | 635,189 | | | $ | 788,322 | |
| | | | | | | | | | | | | | | | | | | | |
152
AMG River Road Dividend All Cap Value Fund
Financial Highlights
For a share outstanding throughout each fiscal period
| | | | | | | | |
| | | For the fiscal years
ended
October 31, | | | For the fiscal period
ended
October 31, | |
| Class Z | | 2018 | | | 20176 | |
Net Asset Value, Beginning of Period | | $ | 12.86 | | | $ | 12.80 | |
Income from Investment Operations: | | | | | | | | |
Net investment income1 | | | 0.26 | 2 | | | 0.01 | 2 |
Net realized and unrealized gain on investments | | | 0.06 | | | | 0.07 | |
Total income from investment operations | | | 0.32 | | | | 0.08 | |
Less Distributions to Shareholders from: | | | | | | | | |
Net investment income | | | (0.31 | ) | | | (0.02 | ) |
Net realized gain on investments | | | (0.58 | ) | | | — | |
Total distributions to shareholders | | | (0.89 | ) | | | (0.02 | ) |
Net Asset Value, End of Period | | $ | 12.29 | | | $ | 12.86 | |
Total Return1,3 | | | 2.42 | % | | | 0.59 | %7 |
Ratio of net expenses to average net assets | | | 0.78 | %4 | | | 0.78 | %4,8 |
Ratio of gross expenses to average net assets5 | | | 0.79 | % | | | 0.79 | %8 |
Ratio of net investment income to average net assets1 | | | 2.10 | % | | | 0.79 | %8 |
Portfolio turnover | | | 27 | % | | | 28 | %7 |
Net assets end of period (000’s) omitted | | $ | 619 | | | $ | 257 | |
| | | | | | | | |
| 1 | Total returns and net investment income (loss) would have been lower had certain expenses not been offset. |
| 2 | Per share numbers have been calculated using average shares. |
| 3 | The total return is calculated using the published Net Asset Value as of fiscal year end. |
| 4 | Includes reduction from broker recapture amounting to less than 0.01%. |
| 5 | Excludes the impact of expense reimbursement or fee waivers and expense reductions such as brokerage credits, but includes expense repayments and non-reimbursable expenses, if any, such as interest, taxes, and extraordinary expenses. (See Note 1(c) and 2 in the Notes to Financial Statements.) |
| 6 | The commencement of operations for Class Z shares was October 2, 2017. |
153
AMG River Road Dividend All Cap Value Fund II
Financial Highlights
For a share outstanding throughout each fiscal year
| | | | | | | | | | | | | | | | | | | | |
| | | For the fiscal years ended October 31, | |
| Class N | | 2018 | | | 2017 | | | 2016 | | | 2015 | | | 2014 | |
Net Asset Value, Beginning of Year | | $ | 14.80 | | | $ | 13.52 | | | $ | 12.99 | | | $ | 13.69 | | | $ | 12.89 | |
Income (loss) from Investment Operations: | | | | | | | | | | | | | | | | | | | | |
Net investment income1 | | | 0.27 | 2 | | | 0.24 | 2 | | | 0.26 | 2 | | | 0.22 | 2 | | | 0.36 | |
Net realized and unrealized gain (loss) on investments | | | 0.12 | | | | 1.80 | | | | 0.71 | | | | (0.26 | ) | | | 0.96 | |
Total income (loss) from investment operations | | | 0.39 | | | | 2.04 | | | | 0.97 | | | | (0.04 | ) | | | 1.32 | |
Less Distributions to Shareholders from: | | | | | | | | | | | | | | | | | | | | |
Net investment income | | | (0.33 | ) | | | (0.20 | ) | | | (0.25 | ) | | | (0.23 | ) | | | (0.38 | ) |
Net realized gain on investments | | | (0.74 | ) | | | (0.56 | ) | | | (0.19 | ) | | | (0.43 | ) | | | (0.14 | ) |
Total distributions to shareholders | | | (1.07 | ) | | | (0.76 | ) | | | (0.44 | ) | | | (0.66 | ) | | | (0.52 | ) |
Net Asset Value, End of Year | | $ | 14.12 | | | $ | 14.80 | | | $ | 13.52 | | | $ | 12.99 | | | $ | 13.69 | |
Total Return1,3 | | | 2.56 | % | | | 15.33 | % | | | 7.61 | % | | | (0.47 | )% | | | 10.46 | % |
Ratio of net expenses to average net assets | | | 1.19 | %4 | | | 1.20 | %4 | | | 1.18 | % | | | 1.15 | % | | | 1.25 | % |
Ratio of gross expenses to average net assets5 | | | 1.19 | % | | | 1.20 | % | | | 1.18 | % | | | 1.15 | % | | | 1.17 | % |
Ratio of net investment income to average net assets1 | | | 1.85 | % | | | 1.69 | % | | | 1.99 | % | | | 1.62 | % | | | 2.72 | % |
Portfolio turnover | | | 28 | % | | | 27 | % | | | 34 | % | | | 35 | % | | | 29 | % |
Net assets end of year (000’s) omitted | | $ | 2,176 | | | $ | 3,090 | | | $ | 3,394 | | | $ | 2,930 | | | $ | 7,037 | |
| | | | | | | | | | | | | | | | | | | | |
154
AMG River Road Dividend All Cap Value Fund II
Financial Highlights
For a share outstanding throughout each fiscal year
| | | | | | | | | | | | | | | | | | | | |
| | | For the fiscal years ended October 31, | |
| Class I | | 2018 | | | 2017 | | | 2016 | | | 2015 | | | 2014 | |
Net Asset Value, Beginning of Year | | $ | 14.82 | | | $ | 13.53 | | | $ | 13.00 | | | $ | 13.69 | | | $ | 12.89 | |
Income (loss) from Investment Operations: | | | | | | | | | | | | | | | | | | | | |
Net investment income1 | | | 0.31 | 2 | | | 0.28 | 2 | | | 0.29 | 2 | | | 0.25 | 2 | | | 0.39 | |
Net realized and unrealized gain (loss) on investments | | | 0.12 | | | | 1.80 | | | | 0.71 | | | | (0.25 | ) | | | 0.96 | |
Total income from investment operations | | | 0.43 | | | | 2.08 | | | | 1.00 | | | | — | | | | 1.35 | |
Less Distributions to Shareholders from: | | | | | | | | | | | | | | | | | | | | |
Net investment income | | | (0.36 | ) | | | (0.23 | ) | | | (0.28 | ) | | | (0.26 | ) | | | (0.41 | ) |
Net realized gain on investments | | | (0.74 | ) | | | (0.56 | ) | | | (0.19 | ) | | | (0.43 | ) | | | (0.14 | ) |
Total distributions to shareholders | | | (1.10 | ) | | | (0.79 | ) | | | (0.47 | ) | | | (0.69 | ) | | | (0.55 | ) |
Net Asset Value, End of Year | | $ | 14.15 | | | $ | 14.82 | | | $ | 13.53 | | | $ | 13.00 | | | $ | 13.69 | |
Total Return1,3 | | | 2.86 | % | | | 15.65 | % | | | 7.87 | % | | | (0.13 | )% | | | 10.73 | % |
Ratio of net expenses to average net assets | | | 0.91 | %4 | | | 0.91 | %4 | | | 0.93 | % | | | 0.90 | % | | | 1.00 | % |
Ratio of gross expenses to average net assets5 | | | 0.91 | % | | | 0.91 | % | | | 0.93 | % | | | 0.90 | % | | | 0.92 | % |
Ratio of net investment income to average net assets1 | | | 2.13 | % | | | 1.96 | % | | | 2.24 | % | | | 1.87 | % | | | 2.97 | % |
Portfolio turnover | | | 28 | % | | | 27 | % | | | 34 | % | | | 35 | % | | | 29 | % |
Net assets end of year (000’s) omitted | | $ | 84,438 | | | $ | 118,876 | | | $ | 114,532 | | | $ | 121,414 | | | $ | 125,660 | |
| | | | | | | | | | | | | | | | | | | | |
155
AMG River Road Dividend All Cap Value Fund II
Financial Highlights
For a share outstanding throughout each fiscal period
| | | | | | | | |
| | | For the fiscal years
ended
October 31, | | | For the fiscal period
ended
October 31, | |
| Class Z | | 2018 | | | 20176 | |
Net Asset Value, Beginning of Period | | $ | 14.82 | | | $ | 14.74 | |
Income (loss) from Investment Operations: | | | | | | | | |
Net investment income (loss)1 | | | 0.32 | 2 | | | (0.01 | )2 |
Net realized and unrealized gain on investments | | | 0.12 | | | | 0.11 | |
Total income from investment operations | | | 0.44 | | | | 0.10 | |
Less Distributions to Shareholders from: | | | | | | | | |
Net investment income | | | (0.37 | ) | | | (0.02 | ) |
Net realized gain on investments | | | (0.74 | ) | | | — | |
Total distributions to shareholders | | | (1.11 | ) | | | (0.02 | ) |
Net Asset Value, End of Period | | $ | 14.15 | | | $ | 14.82 | |
Total Return1,3 | | | 2.93 | % | | | 0.65 | %7 |
Ratio of net expenses to average net assets | | | 0.84 | %4 | | | 0.90 | %4,8 |
Ratio of gross expenses to average net assets5 | | | 0.84 | % | | | 0.90 | %8 |
Ratio of net investment income (loss) to average net assets1 | | | 2.19 | % | | | (0.47 | )%8 |
Portfolio turnover | | | 28 | % | | | 27 | %7 |
Net assets end of period (000’s) omitted | | $ | 176 | | | $ | 321 | |
| | | | | | | | |
| 1 | Total returns and net investment income (loss) would have been lower had certain expenses not been offset. |
| 2 | Per share numbers have been calculated using average shares. |
| 3 | The total return is calculated using the published Net Asset Value as of fiscal year end. |
| 4 | Includes reduction from broker recapture amounting to less than 0.01%, less than 0.01% and 0.01% for Class N, Class I and Class Z, respectively, for the year ended October 31, 2018 and less than 0.01% for the period ended October 31, 2017. |
| 5 | Excludes the impact of expense reimbursement or fee waivers and expense reductions such as brokerage credits, but includes expense repayments and non-reimbursable expenses, if any, such as interest, taxes, and extraordinary expenses. (See Note 1(c) and 2 in the Notes to Financial Statements.) |
| 6 | The commencement of operations was October 2, 2017. |
156
AMG Managers Fairpointe Mid Cap Fund
Financial Highlights
For a share outstanding throughout each fiscal year
| | | | | | | | | | | | | | | | | | | | |
| | | For the fiscal years ended October 31, | |
| Class N | | 2018 | | | 2017 | | | 2016 | | | 2015 | | | 2014 | |
Net Asset Value, Beginning of Year | | $ | 41.95 | | | $ | 37.48 | | | $ | 37.56 | | | $ | 46.89 | | | $ | 45.40 | |
Income (loss) from Investment Operations: | | | | | | | | | | | | | | | | | | | | |
Net investment income (loss)1,2 | | | 0.08 | | | | (0.02 | ) | | | 0.16 | | | | 0.12 | | | | (0.06 | ) |
Net realized and unrealized gain (loss) on investments | | | (0.95 | ) | | | 6.33 | | | | 1.92 | | | | (1.83 | ) | | | 5.82 | |
Total income (loss) from investment operations | | | (0.87 | ) | | | 6.31 | | | | 2.08 | | | | (1.71 | ) | | | 5.76 | |
Less Distributions to Shareholders from: | | | | | | | | | | | | | | | | | | | | |
Net investment income | | | — | | | | (0.13 | ) | | | (0.11 | ) | | | (0.04 | ) | | | — | |
Net realized gain on investments | | | (2.81 | ) | | | (1.71 | ) | | | (2.05 | ) | | | (7.58 | ) | | | (4.27 | ) |
Total distributions to shareholders | | | (2.81 | ) | | | (1.84 | ) | | | (2.16 | ) | | | (7.62 | ) | | | (4.27 | ) |
Net Asset Value, End of Year | | $ | 38.27 | | | $ | 41.95 | | | $ | 37.48 | | | $ | 37.56 | | | $ | 46.89 | |
Total Return2,3 | | | (2.82 | )% | | | 16.87 | % | | | 6.01 | % | | | (5.02 | )% | | | 13.32 | % |
Ratio of net expenses to average net assets | | | 1.12 | % | | | 1.12 | % | | | 1.12 | % | | | 1.11 | % | | | 1.10 | % |
Ratio of gross expenses to average net assets4 | | | 1.13 | % | | | 1.13 | % | | | 1.12 | % | | | 1.11 | % | | | 1.10 | % |
Ratio of net investment income (loss) to average net assets2 | | | 0.19 | % | | | (0.05 | )% | | | 0.44 | % | | | 0.27 | % | | | (0.12 | )% |
Portfolio turnover | | | 18 | % | | | 28 | % | | | 24 | % | | | 32 | % | | | 50 | % |
Net assets end of year (000’s) omitted | | $ | 893,685 | | | $ | 1,292,107 | | | $ | 1,374,982 | | | $ | 1,861,753 | | | $ | 2,432,815 | |
| | | | | | | | | | | | | | | | | | | | |
157
AMG Managers Fairpointe Mid Cap Fund
Financial Highlights
For a share outstanding throughout each fiscal year
| | | | | | | | | | | | | | | | | | | | |
| | | For the fiscal years ended October 31, | |
| Class I | | 2018 | | | 2017 | | | 2016 | | | 2015 | | | 2014 | |
Net Asset Value, Beginning of Year | | $ | 42.97 | | | $ | 38.39 | | | $ | 38.44 | | | $ | 47.74 | | | $ | 46.10 | |
Income (loss) from Investment Operations: | | | | | | | | | | | | | | | | |
Net investment income1,2 | | | 0.19 | | | | 0.08 | | | | 0.25 | | | | 0.23 | | | | 0.05 | |
Net realized and unrealized gain (loss) on investments | | | (0.99 | ) | | | 6.49 | | | | 1.98 | | | | (1.89 | ) | | | 5.92 | |
Total income (loss) from investment operations | | | (0.80 | ) | | | 6.57 | | | | 2.23 | | | | (1.66 | ) | | | 5.97 | |
Less Distributions to Shareholders from: | | | | | | | | | | | | | | | | |
Net investment income | | | (0.03 | ) | | | (0.24 | ) | | | (0.23 | ) | | | (0.06 | ) | | | (0.06 | ) |
Net realized gain on investments | | | (2.81 | ) | | | (1.75 | ) | | | (2.05 | ) | | | (7.58 | ) | | | (4.27 | ) |
Total distributions to shareholders | | | (2.84 | ) | | | (1.99 | ) | | | (2.28 | ) | | | (7.64 | ) | | | (4.33 | ) |
Net Asset Value, End of Year | | $ | 39.33 | | | $ | 42.97 | | | $ | 38.39 | | | $ | 38.44 | | | $ | 47.74 | |
Total Return2,3 | | | (2.56 | )% | | | 17.16 | % | | | 6.26 | % | | | (4.78 | )% | | | 13.61 | % |
Ratio of net expenses to average net assets | | | 0.87 | % | | | 0.87 | % | | | 0.87 | % | | | 0.86 | % | | | 0.85 | % |
Ratio of gross expenses to average net assets4 | | | 0.88 | % | | | 0.88 | % | | | 0.87 | % | | | 0.86 | % | | | 0.85 | % |
Ratio of net investment income to average net assets2 | | | 0.44 | % | | | 0.20 | % | | | 0.68 | % | | | 0.52 | % | | | 0.13 | % |
Portfolio turnover | | | 18 | % | | | 28 | % | | | 24 | % | | | 32 | % | | | 50 | % |
Net assets end of year (000’s) omitted | | $ | 1,754,203 | | | $ | 2,668,464 | | | $ | 2,135,998 | | | $ | 2,838,642 | | | $ | 3,531,114 | |
| | | | | | | | | | | | | | | | | | | | |
158
AMG Managers Fairpointe Mid Cap Fund
Financial Highlights
For a share outstanding throughout each fiscal period
| | | | | | | | |
| | | For the fiscal years
ended
October 31, | | | For the fiscal period
ended
October 31, | |
| Class Z | | 2018 | | | 20175 | |
Net Asset Value, Beginning of Period | | $ | 42.98 | | | $ | 44.24 | |
Income (loss) from Investment Operations: | | | | | | | | |
Net investment income1,2 | | | 0.22 | | | | 0.00 | 6 |
Net realized and unrealized loss on investments | | | (0.98 | ) | | | (1.26 | ) |
Total loss from investment operations | | | (0.76 | ) | | | (1.26 | ) |
Less Distributions to Shareholders from: | | | | | | | | |
Net investment income | | | (0.07 | ) | | | — | |
Net realized gain on investments | | | (2.81 | ) | | | — | |
Total distributions to shareholders | | | (2.88 | ) | | | — | |
Net Asset Value, End of Period | | $ | 39.34 | | | $ | 42.98 | |
Total Return2,3 | | | (2.48 | )% | | | (2.85 | )%7 |
Ratio of net expenses to average net assets | | | 0.79 | % | | | 0.79 | %8 |
Ratio of gross expenses to average net assets4 | | | 0.80 | % | | | 0.80 | %8 |
Ratio of net investment income to average net assets2 | | | 0.52 | % | | | 0.01 | %8 |
Portfolio turnover | | | 18 | % | | | 28 | %7 |
Net assets end of period (000’s) omitted | | $ | 205,203 | | | $ | 9,625 | |
| | | | | | | | |
| 1 | Per share numbers have been calculated using average shares. |
| 2 | Total returns and net investment income (loss) would have been lower had certain expenses not been offset. |
| 3 | The total return is calculated using the published Net Asset Value as of fiscal year end. |
| 4 | Excludes the impact of expense reimbursement or fee waivers and expense reductions such as brokerage credits, but includes expense repayments and non-reimbursable expenses, if any, such as interest, taxes, and extraordinary expenses. (See Note 1(c) and 2 in the Notes to Financial Statements.) |
| 5 | Commencement of operations was on October 2, 2017. |
| 6 | Less than $0.005 per share. |
159
AMG Managers LMCG Small Cap Growth Fund
Financial Highlights
For a share outstanding throughout each fiscal year
| | | | | | | | | | | | | | | | | | | | |
| | | For the fiscal years ended October 31, | |
| Class N | | 2018 | | | 2017 | | | 2016 | | | 2015 | | | 2014 | |
Net Asset Value, Beginning of Year | | $ | 15.30 | | | $ | 12.19 | | | $ | 14.47 | | | $ | 14.76 | | | $ | 14.71 | |
Income (loss) from Investment Operations: | | | | | | | | | | | | | | | | | | | | |
Net investment loss1,2 | | | (0.12 | ) | | | (0.09 | )3 | | | (0.11 | ) | | | (0.15 | ) | | | (0.13 | ) |
Net realized and unrealized gain (loss) on investments | | | 1.72 | | | | 3.20 | | | | (2.17 | ) | | | 0.40 | | | | 2.21 | |
Total income (loss) from investment operations | | | 1.60 | | | | 3.11 | | | | (2.28 | ) | | | 0.25 | | | | 2.08 | |
Less Distributions to Shareholders from: | | | | | | | | | | | | | | | | | | | | |
Net investment income | | | — | | | | — | | | | — | | | | — | | | | — | |
Net realized gain on investments | | | — | | | | — | | | | (0.00 | )4 | | | (0.54 | ) | | | (2.03 | ) |
Total distributions to shareholders | | | — | | | | — | | | | (0.00 | )4 | | | (0.54 | ) | | | (2.03 | ) |
Net Asset Value, End of Year | | $ | 16.90 | | | $ | 15.30 | | | $ | 12.19 | | | $ | 14.47 | | | $ | 14.76 | |
Total Return2,5 | | | 10.46 | % | | | 25.51 | % | | | (15.74 | )% | | | 1.65 | % | | | 15.18 | % |
Ratio of net expenses to average net assets | | | 1.31 | %6 | | | 1.23 | %6 | | | 1.35 | % | | | 1.35 | % | | | 1.35 | % |
Ratio of gross expenses to average net assets7 | | | 1.43 | % | | | 1.36 | % | | | 1.51 | % | | | 1.53 | % | | | 1.67 | % |
Ratio of net investment loss to average net assets2 | | | (0.73 | )% | | | (0.65 | )% | | | (1.00 | )% | | | (1.00 | )% | | | (0.90 | )% |
Portfolio turnover | | | 161 | % | | | 151 | % | | | 138 | % | | | 79 | % | | | 144 | % |
Net assets end of year (000’s) omitted | | $ | 37,232 | | | $ | 45,902 | | | $ | 53,816 | | | $ | 154,394 | | | $ | 37,099 | |
| | | | | | | | | | | | | | | | | | | | |
160
AMG Managers LMCG Small Cap Growth Fund
Financial Highlights
For a share outstanding throughout each fiscal year
| | | | | | | | | | | | | | | | | | | | |
| | | For the fiscal years ended October 31, | |
| Class I | | 2018 | | | 2017 | | | 2016 | | | 2015 | | | 2014 | |
Net Asset Value, Beginning of Year | | $ | 15.54 | | | $ | 12.36 | | | $ | 14.64 | | | $ | 14.89 | | | $ | 14.81 | |
Income (loss) from Investment Operations: | | | | | | | | | | | | | | | | | | | | |
Net investment loss1,2 | | | (0.09 | ) | | | (0.07 | )3 | | | (0.08 | ) | | | (0.12 | ) | | | (0.09 | ) |
Net realized and unrealized gain (loss) on investments | | | 1.75 | | | | 3.25 | | | | (2.20 | ) | | | 0.41 | | | | 2.23 | |
Total income (loss) from investment operations | | | 1.66 | | | | 3.18 | | | | (2.28 | ) | | | 0.29 | | | | 2.14 | |
Less Distributions to Shareholders from: | | | | | | | | | | | | | | | | | | | | |
Net investment income | | | — | | | | — | | | | — | | | | — | | | | (0.03 | ) |
Net realized gain on investments | | | — | | | | — | | | | (0.00 | )4 | | | (0.54 | ) | | | (2.03 | ) |
Total distributions to shareholders | | | — | | | | — | | | | (0.00 | )4 | | | (0.54 | ) | | | (2.06 | ) |
Net Asset Value, End of Year | | $ | 17.20 | | | $ | 15.54 | | | $ | 12.36 | | | $ | 14.64 | | | $ | 14.89 | |
Total Return2,5 | | | 10.68 | % | | | 25.73 | % | | | (15.56 | )% | | | 1.91 | % | | | 15.51 | % |
Ratio of net expenses to average net assets | | | 1.10 | %6 | | | 1.05 | %6 | | | 1.10 | % | | | 1.10 | % | | | 1.10 | % |
Ratio of gross expenses to average net assets7 | | | 1.22 | % | | | 1.18 | % | | | 1.25 | % | | | 1.28 | % | | | 1.42 | % |
Ratio of net investment loss to average net assets2 | | | (0.52 | )% | | | (0.47 | )% | | | (0.59 | )% | | | (0.75 | )% | | | (0.65 | )% |
Portfolio turnover | | | 161 | % | | | 151 | % | | | 138 | % | | | 79 | % | | | 144 | % |
Net assets end of year (000’s) omitted | | $ | 65,802 | | | $ | 79,652 | | | $ | 58,020 | | | $ | 76,989 | | | $ | 15,083 | |
| | | | | | | | | | | | | | | | | | | | |
| 1 | Per share numbers have been calculated using average shares. |
| 2 | Total returns and net investment loss would have been lower had certain expenses not been offset. |
| 3 | Includes non-recurring dividends. Without these dividends, net investment loss per share would have been $(0.11) and $(0.09) for Class N and Class I shares, respectively. |
| 4 | Less than $0.005 or $(0.005) per share. |
| 5 | The total return is calculated using the published Net Asset Value as of fiscal year end. |
| 6 | Includes reduction from broker recapture amounting to less than 0.01% and 0.01% for the fiscal years ended 2018 and 2017, respectively. |
| 7 | Excludes the impact of expense reimbursement or fee waivers and expense reductions such as brokerage credits, but includes expense repayments and non-reimbursable expenses, if any, such as interest, taxes, and extraordinary expenses. (See Note 1(c) and 2 in the Notes to Financial Statements.) |
161
AMG River Road Small-Mid Cap Value Fund
Financial Highlights
For a share outstanding throughout each fiscal year
| | | | | | | | | | | | | | | | | | | | |
| | | For the fiscal years ended October 31, | |
| Class N | | 2018 | | | 2017 | | | 2016 | | | 2015 | | | 2014 | |
Net Asset Value, Beginning of Year | | $ | 8.23 | | | $ | 7.04 | | | $ | 7.63 | | | $ | 8.77 | | | $ | 10.28 | |
Income (loss) from Investment Operations: | | | | | | | | | | | | | | | | | | | | |
Net investment loss1,2 | | | (0.03 | ) | | | (0.03 | ) | | | (0.04 | ) | | | (0.04 | ) | | | (0.03 | ) |
Net realized and unrealized gain on investments | | | 0.57 | | | | 1.81 | | | | 0.56 | | | | 0.33 | | | | 0.03 | |
Total income from investment operations | | | 0.54 | | | | 1.78 | | | | 0.52 | | | | 0.29 | | | | — | |
Less Distributions to Shareholders from: | | | | | | | | | | | | | | | | | | | | |
Net investment income | | | (0.02 | ) | | | (0.01 | ) | | | — | | | | — | | | | (0.02 | ) |
Net realized gain on investments | | | (1.13 | ) | | | (0.58 | ) | | | (1.11 | ) | | | (1.43 | ) | | | (1.49 | ) |
Total distributions to shareholders | | | (1.15 | ) | | | (0.59 | ) | | | (1.11 | ) | | | (1.43 | ) | | | (1.51 | ) |
Net Asset Value, End of Year | | $ | 7.62 | | | $ | 8.23 | | | $ | 7.04 | | | $ | 7.63 | | | $ | 8.77 | |
Total Return2,3 | | | 7.09 | % | | | 26.18 | % | | | 8.55 | % | | | 3.26 | % | | | (0.23 | )% |
Ratio of net expenses to average net assets | | | 1.32 | %4 | | | 1.35 | %4 | | | 1.50 | % | | | 1.49 | % | | | 1.45 | % |
Ratio of gross expenses to average net assets5 | | | 1.36 | % | | | 1.46 | % | | | 1.62 | % | | | 1.49 | % | | | 1.45 | % |
Ratio of net investment loss to average net assets2 | | | (0.35 | )% | | | (0.33 | )% | | | (0.52 | )% | | | (0.52 | )% | | | (0.36 | )% |
Portfolio turnover | | | 46 | % | | | 57 | % | | | 65 | % | | | 59 | % | | | 64 | % |
Net assets end of year (000’s) omitted | | $ | 17,840 | | | $ | 7,810 | | | $ | 4,942 | | | $ | 5,038 | | | $ | 8,388 | |
| | | | | | | | | | | | | | | | | | | | |
162
AMG River Road Small-Mid Cap Value Fund
Financial Highlights
For a share outstanding throughout each fiscal year
| | | | | | | | | | | | | | | | | | | | |
| | | For the fiscal years ended October 31, | |
| Class I | | 2018 | | | 2017 | | | 2016 | | | 2015 | | | 2014 | |
Net Asset Value, Beginning of Year | | $ | 8.38 | | | $ | 7.16 | | | $ | 7.76 | | | $ | 8.88 | | | $ | 10.38 | |
Income (loss) from Investment Operations: | | | | | | | | | | | | | | | | | | | | |
Net investment loss1,2 | | | (0.01 | ) | | | 0.00 | 6 | | | (0.02 | ) | | | (0.02 | ) | | | (0.01 | ) |
Net realized and unrealized gain on investments | | | 0.57 | | | | 1.84 | | | | 0.55 | | | | 0.33 | | | | 0.04 | |
Total income from investment operations | | | 0.56 | | | | 1.84 | | | | 0.53 | | | | 0.31 | | | | 0.03 | |
Less Distributions to Shareholders from: | | | | | | | | | | | | | | | | | | | | |
Net investment income | | | (0.03 | ) | | | (0.03 | ) | | | (0.02 | ) | | | — | | | | (0.04 | ) |
Net realized gain on investments | | | (1.13 | ) | | | (0.59 | ) | | | (1.11 | ) | | | (1.43 | ) | | | (1.49 | ) |
Total distributions to shareholders | | | (1.16 | ) | | | (0.62 | ) | | | (1.13 | ) | | | (1.43 | ) | | | (1.53 | ) |
Net Asset Value, End of Year | | $ | 7.78 | | | $ | 8.38 | | | $ | 7.16 | | | $ | 7.76 | | | $ | 8.88 | |
Total Return2,3 | | | 7.32 | % | | | 26.63 | % | | | 8.64 | % | | | 3.60 | % | | | 0.00 | % |
Ratio of net expenses to average net assets | | | 1.08 | %4 | | | 1.10 | %4 | | | 1.25 | % | | | 1.24 | % | | | 1.20 | % |
Ratio of gross expenses to average net assets5 | | | 1.12 | % | | | 1.21 | % | | | 1.38 | % | | | 1.24 | % | | | 1.20 | % |
Ratio of net investment loss to average net assets2 | | | (0.11 | )% | | | (0.06 | )% | | | (0.24 | )% | | | (0.27 | )% | | | (0.11 | )% |
Portfolio turnover | | | 46 | % | | | 57 | % | | | 65 | % | | | 59 | % | | | 64 | % |
Net assets end of year (000’s) omitted | | $ | 51,400 | | | $ | 36,547 | | | $ | 34,913 | | | $ | 92,073 | | | $ | 176,166 | |
| | | | | | | | | | | | | | | | | | | | |
163
AMG River Road Small-Mid Cap Value Fund
Financial Highlights
For a share outstanding throughout each fiscal period
| | | | | | | | |
| | | For the fiscal years
ended
October 31, | | | For the fiscal period
ended
October 31, | |
| Class Z | | 2018 | | | 20177 | |
Net Asset Value, Beginning of Period | | $ | 8.37 | | | $ | 8.48 | |
Income (loss) from Investment Operations: | | | | | | | | |
Net investment loss1,2 | | | (0.01 | ) | | | (0.01 | ) |
Net realized and unrealized gain (loss) on investments | | | 0.58 | | | | (0.10 | ) |
Total income (loss) from investment operations | | | 0.57 | | | | (0.11 | ) |
Less Distributions to Shareholders from: | | | | | | | | |
Net investment income | | | (0.04 | ) | | | — | |
Net realized gain on investments | | | (1.13 | ) | | | — | |
Total distributions to shareholders | | | (1.17 | ) | | | — | |
Net Asset Value, End of Period | | $ | 7.77 | | | $ | 8.37 | |
Total Return2,3 | | | 7.37 | % | | | (1.30 | )%8 |
Ratio of net expenses to average net assets | | | 1.03 | %4 | | | 1.04 | %4,9 |
Ratio of gross expenses to average net assets5 | | | 1.07 | % | | | 1.48 | %9 |
Ratio of net investment loss to average net assets2 | | | (0.06 | )% | | | (0.71 | )%9 |
Portfolio turnover | | | 46 | % | | | 57 | %8 |
Net assets end of period (000’s) omitted | | $ | 136 | | | $ | 49 | |
| | | | | | | | |
| 1 | Per share numbers have been calculated using average shares. |
| 2 | Total returns and net investment income (loss) would have been lower had certain expenses not been offset. |
| 3 | The total return is calculated using the published Net Asset Value as of fiscal year end. |
| 4 | Includes reduction from broker recapture amounting to 0.01%. |
| 5 | Excludes the impact of expense reimbursement or fee waivers and expense reductions such as brokerage credits, but includes expense repayments and non-reimbursable expenses, if any, such as interest, taxes, and extraordinary expenses. (See Note 1(c) and 2 in the Notes to Financial Statements.) |
| 6 | Less than $0.005 per share. |
| 7 | The commencement of operations was October 2, 2017. |
164
AMG River Road Small Cap Value Fund
Financial Highlights
For a share outstanding throughout each fiscal year
| | | | | | | | | | | | | | | | | | | | |
| | | For the fiscal years ended October 31, | |
| Class N | | 2018 | | | 2017 | | | 2016 | | | 2015 | | | 2014 | |
Net Asset Value, Beginning of Year | | $ | 14.46 | | | $ | 12.29 | | | $ | 12.20 | | | $ | 13.53 | | | $ | 17.05 | |
Income (loss) from Investment Operations: | | | | | | | | | | | | | | | | |
Net investment loss1,2 | | | (0.05 | ) | | | (0.05 | ) | | | (0.04 | ) | | | (0.06 | ) | | | (0.04 | ) |
Net realized and unrealized gain on investments | | | 0.79 | | | | 2.88 | | | | 0.85 | | | | 0.72 | | | | 0.14 | |
Total income from investment operations | | | 0.74 | | | | 2.83 | | | | 0.81 | | | | 0.66 | | | | 0.10 | |
Less Distributions to Shareholders from: | | | | | | | | | | | | | | | | |
Net investment income | | | — | | | | — | | | | — | | | | — | | | | (0.04 | ) |
Net realized gain on investments | | | (1.94 | ) | | | (0.66 | ) | | | (0.72 | ) | | | (1.99 | ) | | | (3.58 | ) |
Total distributions to shareholders | | | (1.94 | ) | | | (0.66 | ) | | | (0.72 | ) | | | (1.99 | ) | | | (3.62 | ) |
Net Asset Value, End of Year | | $ | 13.26 | | | $ | 14.46 | | | $ | 12.29 | | | $ | 12.20 | | | $ | 13.53 | |
Total Return2,3 | | | 5.41 | % | | | 23.43 | % | | | 7.22 | % | | | 5.15 | % | | | (0.05 | )% |
Ratio of net expenses to average net assets | | | 1.35 | %4 | | | 1.35 | %4 | | | 1.34 | % | | | 1.34 | % | | | 1.33 | % |
Ratio of gross expenses to average net assets5 | | | 1.36 | % | | | 1.36 | % | | | 1.34 | % | | | 1.34 | % | | | 1.33 | % |
Ratio of net investment loss to average net assets2 | | | (0.34 | )% | | | (0.36 | )% | | | (0.31 | )% | | | (0.45 | )% | | | (0.26 | )% |
Portfolio turnover | | | 41 | % | | | 42 | % | | | 57 | % | | | 61 | % | | | 66 | % |
Net assets end of year (000’s) omitted | | $ | 28,444 | | | $ | 31,657 | | | $ | 21,765 | | | $ | 25,246 | | | $ | 49,049 | |
| | | | | | | | | | | | | | | | | | | | |
165
AMG River Road Small Cap Value Fund
Financial Highlights
For a share outstanding throughout each fiscal year
| | | | | | | | | | | | | | | | | | | | |
| | | For the fiscal years ended October 31, | |
| Class I | | 2018 | | | 2017 | | | 2016 | | | 2015 | | | 2014 | |
Net Asset Value, Beginning of Year | | $ | 14.68 | | | $ | 12.44 | | | $ | 12.31 | | | $ | 13.60 | | | $ | 17.13 | |
Income (loss) from Investment Operations: | | | | | | | | | | | | | | | | | | | | |
Net investment loss1,2 | | | (0.01 | ) | | | (0.01 | ) | | | (0.01 | ) | | | (0.03 | ) | | | (0.00 | )6 |
Net realized and unrealized gain on investments | | | 0.79 | | | | 2.92 | | | | 0.86 | | | | 0.73 | | | | 0.13 | |
Total income from investment operations | | | 0.78 | | | | 2.91 | | | | 0.85 | | | | 0.70 | | | | 0.13 | |
Less Distributions to Shareholders from: | | | | | | | | | | | | | | | | | | | | |
Net investment income | | | (0.01 | ) | | | — | | | | — | | | | — | | | | (0.08 | ) |
Net realized gain on investments | | | (1.94 | ) | | | (0.67 | ) | | | (0.72 | ) | | | (1.99 | ) | | | (3.58 | ) |
Total distributions to shareholders | | | (1.95 | ) | | | (0.67 | ) | | | (0.72 | ) | | | (1.99 | ) | | | (3.66 | ) |
Net Asset Value, End of Year | | $ | 13.51 | | | $ | 14.68 | | | $ | 12.44 | | | $ | 12.31 | | | $ | 13.60 | |
Total Return2,3 | | | 5.60 | % | | | 23.80 | % | | | 7.50 | % | | | 5.45 | % | | | 0.16 | % |
Ratio of net expenses to average net assets | | | 1.10 | %4 | | | 1.10 | %4 | | | 1.09 | % | | | 1.09 | % | | | 1.08 | % |
Ratio of gross expenses to average net assets5 | | | 1.11 | % | | | 1.11 | % | | | 1.09 | % | | | 1.09 | % | | | 1.08 | % |
Ratio of net investment loss to average net assets2 | | | (0.09 | )% | | | (0.11 | )% | | | (0.06 | )% | | | (0.20 | )% | | | (0.01 | )% |
Portfolio turnover | | | 41 | % | | | 42 | % | | | 57 | % | | | 61 | % | | | 66 | % |
Net assets end of year (000’s) omitted | | $ | 330,245 | | | $ | 279,574 | | | $ | 246,753 | | | $ | 245,192 | | | $ | 250,173 | |
| | | | | | | | | | | | | | | | | | | | |
166
AMG River Road Small Cap Value Fund
Financial Highlights
For a share outstanding throughout each fiscal period
| | | | | | | | |
| | | For the fiscal years
ended
October 31, | | | For the fiscal period
ended
October 31, | |
| Class Z | | 2018 | | | 20177 | |
Net Asset Value, Beginning of Period | | $ | 14.68 | | | $ | 14.68 | |
Income (loss) from Investment Operations: | | | | | | | | |
Net investment income (loss)1,2 | | | 0.00 | 6 | | | (0.01 | ) |
Net realized and unrealized gain on investments | | | 0.79 | | | | 0.01 | |
Total income from investment operations | | | 0.79 | | | | — | |
Less Distributions to Shareholders from: | | | | | | | | |
Net investment income | | | (0.02 | ) | | | — | |
Net realized gain on investments | | | (1.94 | ) | | | — | |
Total distributions to shareholders | | | (1.96 | ) | | | — | |
Net Asset Value, End of Period | | $ | 13.51 | | | $ | 14.68 | |
Total Return2,3 | | | 5.71 | % | | | 0.00 | %8 |
Ratio of net expenses to average net assets | | | 1.00 | % | | | 1.03 | %9 |
Ratio of gross expenses to average net assets5 | | | 1.01 | % | | | 1.03 | %9 |
Ratio of net investment income (loss) to average net assets2 | | | 0.01 | % | | | (0.58 | )%9 |
Portfolio turnover | | | 41 | % | | | 42 | %8 |
Net assets end of period (000’s) omitted | | $ | 163 | | | $ | 154 | |
| | | | | | | | |
| 1 | Per share numbers have been calculated using average shares. |
| 2 | Total returns and net investment income (loss) would have been lower had certain expenses not been offset. |
| 3 | The total return is calculated using the published Net Asset Value as of fiscal year end. |
| 4 | Includes reduction from broker recapture amounting to 0.01%. |
| 5 | Excludes the impact of expense reimbursement or fee waivers and expense reductions such as brokerage credits, but includes expense repayments and non-reimbursable expenses, if any, such as interest, taxes, and extraordinary expenses. (See Note 1(c) and 2 in the Notes to Financial Statements.) |
| 6 | Less than $0.005 or $(0.005) per share. |
| 7 | The commencement of operations was October 2, 2017. |
167
AMG Managers Silvercrest Small Cap Fund
Financial Highlights
For a share outstanding throughout each fiscal year
| | | | | | | | | | | | | | | | | | | | |
| | | For the fiscal years ended October 31, | |
| Class N | | 2018 | | | 2017 | | | 2016 | | | 2015 | | | 2014 | |
Net Asset Value, Beginning of Year | | $ | 19.28 | | | $ | 15.43 | | | $ | 15.20 | | | $ | 15.20 | | | $ | 14.54 | |
Income (loss) from Investment Operations: | | | | | | | | | | | | | | | | | | | | |
Net investment income (loss)1 | | | (0.04 | )2 | | | (0.02 | )2 | | | 0.02 | 2 | | | 0.01 | 2 | | | 0.01 | |
Net realized and unrealized gain (loss) on investments | | | (1.07 | ) | | | 4.00 | | | | 0.80 | | | | 0.31 | | | | 1.16 | |
Total income (loss) from investment operations | | | (1.11 | ) | | | 3.98 | | | | 0.82 | | | | 0.32 | | | | 1.17 | |
Less Distributions to Shareholders from: | | | | | | | | | | | | | | | | | | | | |
Net investment income | | | — | | | | — | | | | (0.04 | ) | | | (0.02 | ) | | | (0.00 | )3 |
Net realized gain on investments | | | (1.48 | ) | | | (0.13 | ) | | | (0.55 | ) | | | (0.30 | ) | | | (0.51 | ) |
Total distributions to shareholders | | | (1.48 | ) | | | (0.13 | ) | | | (0.59 | ) | | | (0.32 | ) | | | (0.51 | ) |
Net Asset Value, End of Year | | $ | 16.69 | | | $ | 19.28 | | | $ | 15.43 | | | $ | 15.20 | | | $ | 15.20 | |
Total Return1,4 | | | (6.43 | )% | | | 25.83 | % | | | 5.73 | % | | | 2.14 | % | | | 8.18 | % |
Ratio of net expenses to average net assets | | | 1.37 | %5 | | | 1.37 | %5 | | | 1.40 | % | | | 1.40 | % | | | 1.40 | % |
Ratio of gross expenses to average net assets6 | | | 1.43 | % | | | 1.43 | % | | | 1.45 | % | | | 1.47 | % | | | 1.61 | % |
Ratio of net investment income (loss) to average net assets1 | | | (0.19 | )% | | | (0.12 | )% | | | 0.16 | % | | | 0.04 | % | | | 0.04 | % |
Portfolio turnover | | | 34 | % | | | 40 | % | | | 32 | % | | | 36 | % | | | 32 | % |
Net assets end of year (000’s) omitted | | $ | 12,745 | | | $ | 25,451 | | | $ | 20,228 | | | $ | 19,061 | | | $ | 6,673 | |
| | | | | | | | | | | | | | | | | | | | |
168
AMG Managers Silvercrest Small Cap Fund
Financial Highlights
For a share outstanding throughout each fiscal year
| | | | | | | | | | | | | | | | | | | | |
| | | For the fiscal years ended October 31, | |
| Class I | | 2018 | | | 2017 | | | 2016 | | | 2015 | | | 2014 | |
Net Asset Value, Beginning of Year | | $ | 19.44 | | | $ | 15.56 | | | $ | 15.30 | | | $ | 15.27 | | | $ | 14.59 | |
Income (loss) from Investment Operations: | | | | | | | | | | | | | | | | | | | | |
Net investment income1 | | | 0.01 | 2 | | | 0.02 | 2 | | | 0.06 | 2 | | | 0.04 | 2 | | | 0.05 | |
Net realized and unrealized gain (loss) on investments | | | (1.08 | ) | | | 4.03 | | | | 0.81 | | | | 0.32 | | | | 1.17 | |
Total income (loss) from investment operations | | | (1.07 | ) | | | 4.05 | | | | 0.87 | | | | 0.36 | | | | 1.22 | |
Less Distributions to Shareholders from: | | | | | | | | | | | | | | | | | | | | |
Net investment income | | | (0.02 | ) | | | (0.04 | ) | | | (0.06 | ) | | | (0.03 | ) | | | (0.03 | ) |
Net realized gain on investments | | | (1.48 | ) | | | (0.13 | ) | | | (0.55 | ) | | | (0.30 | ) | | | (0.51 | ) |
Total distributions to shareholders | | | (1.50 | ) | | | (0.17 | ) | | | (0.61 | ) | | | (0.33 | ) | | | (0.54 | ) |
Net Asset Value, End of Year | | $ | 16.87 | | | $ | 19.44 | | | $ | 15.56 | | | $ | 15.30 | | | $ | 15.27 | |
Total Return1,4 | | | (6.16 | )% | | | 26.07 | % | | | 6.04 | % | | | 2.37 | % | | | 8.47 | % |
Ratio of net expenses to average net assets | | | 1.13 | %5 | | | 1.12 | %5 | | | 1.15 | % | | | 1.15 | % | | | 1.15 | % |
Ratio of gross expenses to average net assets6 | | | 1.19 | % | | | 1.18 | % | | | 1.21 | % | | | 1.22 | % | | | 1.36 | % |
Ratio of net investment income to average net assets1 | | | 0.05 | % | | | 0.12 | % | | | 0.40 | % | | | 0.29 | % | | | 0.29 | % |
Portfolio turnover | | | 34 | % | | | 40 | % | | | 32 | % | | | 36 | % | | | 32 | % |
Net assets end of year (000’s) omitted | | $ | 191,477 | | | $ | 241,626 | | | $ | 181,964 | | | $ | 145,402 | | | $ | 62,215 | |
| | | | | | | | | | | | | | | | | | | | |
169
AMG Managers Silvercrest Small Cap Fund
Financial Highlights
For a share outstanding throughout each fiscal period
| | | | | | | | |
| | | For the fiscal years
ended
October 31, | | | For the fiscal
period ended
October 31, | |
| Class Z | | 2018 | | | 20177 | |
Net Asset Value, Beginning of Period | | $ | 19.45 | | | $ | 19.24 | |
Income (loss) from Investment Operations: | | | | | | | | |
Net investment income (loss)1 | | | 0.02 | 2 | | | (0.01 | )2 |
Net realized and unrealized gain (loss) on investments | | | (1.09 | ) | | | 0.22 | |
Total income (loss) from investment operations | | | (1.07 | ) | | | 0.21 | |
Less Distributions to Shareholders from: | | | | | | | | |
Net investment income | | | (0.03 | ) | | | — | |
Net realized gain on investments | | | (1.48 | ) | | | — | |
Total distributions to shareholders | | | (1.51 | ) | | | — | |
Net Asset Value, End of Period | | $ | 16.87 | | | $ | 19.45 | |
Total Return1,4 | | | (6.14 | )% | | | 1.09 | %8 |
Ratio of net expenses to average net assets | | | 1.06 | %5 | | | 1.08 | %5,9 |
Ratio of gross expenses to average net assets6 | | | 1.12 | % | | | 1.08 | %9 |
Ratio of net investment income (loss) to average net assets1 | | | 0.12 | % | | | (0.44 | )%9 |
Portfolio turnover | | | 34 | % | | | 40 | %8 |
Net assets end of period (000’s) omitted | | $ | 33,273 | | | $ | 206 | |
| | | | | | | | |
| 1 | Total returns and net investment income (loss) would have been lower had certain expenses not been offset. |
| 2 | Per share numbers have been calculated using average shares. |
| 3 | Less than $(0.005) per share. |
| 4 | The total return is calculated using the published Net Asset Value as of fiscal year end. |
| 5 | Includes reduction from broker recapture amounting to 0.02% for the fiscal year ended October 31, 2018, and 0.03%, 0.03% and 0.01% for Class N, Class I and Class Z, respectively, for the fiscal period ended 2017. |
| 6 | Excludes the impact of expense reimbursement or fee waivers and expense reductions such as brokerage credits, but includes expense repayments and non-reimbursable expenses, if any, such as interest, taxes, and extraordinary expenses. (See Note 1(c) and 2 in the Notes to Financial Statements.) |
| 7 | The commencement of operations was October 2, 2017. |
170
AMG GW&K U.S. Small Cap Growth Fund
Financial Highlights
For a share outstanding throughout each fiscal year
| | | | | | | | | | | | | | | | | | | | |
| | | For the fiscal years ended October 31, | |
| Class N | | 2018 | | | 2017 | | | 2016 | | | 2015 | | | 2014 | |
Net Asset Value, Beginning of Year | | $ | 4.68 | | | $ | 3.58 | | | $ | 18.59 | | | $ | 22.07 | | | $ | 24.06 | |
Income (loss) from Investment Operations: | | | | | | | | | | | | | | | | | | | | |
Net investment loss1,2 | | | (0.03 | ) | | | (0.03 | ) | | | (0.06 | ) | | | (0.12 | ) | | | (0.13 | ) |
Net realized and unrealized gain (loss) on investments | | | 0.19 | | | | 1.14 | | | | (0.62 | ) | | | (0.62 | ) | | | 0.30 | |
Total income (loss) from investment operations | | | 0.16 | | | | 1.11 | | | | (0.68 | ) | | | (0.74 | ) | | | 0.17 | |
Less Distributions to Shareholders from: | | | | | | | | | | | | | | | | | | | | |
Net realized gain on investments | | | (0.72 | ) | | | (0.01 | ) | | | (14.33 | ) | | | (2.74 | ) | | | (2.16 | ) |
Total distributions to shareholders | | | (0.72 | ) | | | (0.01 | ) | | | (14.33 | ) | | | (2.74 | ) | | | (2.16 | ) |
Net Asset Value, End of Year | | $ | 4.12 | | | $ | 4.68 | | | $ | 3.58 | | | $ | 18.59 | | | $ | 22.07 | |
Total Return2,3 | | | 3.41 | % | | | 30.91 | % | | | (4.39 | )% | | | (4.12 | )% | | | 0.57 | % |
Ratio of net expenses to average net assets | | | 1.17 | %4 | | | 1.23 | %4 | | | 1.36 | % | | | 1.31 | % | | | 1.31 | % |
Ratio of gross expenses to average net assets5 | | | 1.38 | % | | | 1.51 | % | | | 1.39 | % | | | 1.31 | % | | | 1.31 | % |
Ratio of net investment loss to average net assets2 | | | (0.70 | )% | | | (0.72 | )% | | | (0.76 | )% | | | (0.58 | )% | | | (0.57 | )% |
Portfolio turnover | | | 36 | % | | | 24 | % | | | 106 | %6 | | | 65 | % | | | 70 | %6,7 |
Net assets end of year (000’s) omitted | | $ | 24,762 | | | $ | 26,671 | | | $ | 30,977 | | | $ | 241,283 | | | $ | 336,350 | |
| | | | | | | | | | | | | | | | | | | | |
171
AMG GW&K U.S. Small Cap Growth Fund
Financial Highlights
For a share outstanding throughout each fiscal year
| | | | | | | | | | | | | | | | | | | | |
| | | For the fiscal years ended October 31, | |
| Class I | | 2018 | | | 2017 | | | 2016 | | | 2015 | | | 2014 | |
Net Asset Value, Beginning of Year | | $ | 5.61 | | | $ | 4.27 | | | $ | 19.30 | | | $ | 22.76 | | | $ | 24.69 | |
Income (loss) from Investment Operations: | | | | | | | | | | | | | | | | | | | | |
Net investment loss1,2 | | | (0.03 | ) | | | (0.02 | ) | | | (0.05 | ) | | | (0.07 | ) | | | (0.07 | ) |
Net realized and unrealized gain (loss) on investments | | | 0.24 | | | | 1.37 | | | | (0.65 | ) | | | (0.65 | ) | | | 0.30 | |
Total income (loss) from investment operations | | | 0.21 | | | | 1.35 | | | | (0.70 | ) | | | (0.72 | ) | | | 0.23 | |
Less Distributions to Shareholders from: | | | | | | | | | | | | | | | | | | | | |
Net realized gain on investments | | | (0.72 | ) | | | (0.01 | ) | | | (14.33 | ) | | | (2.74 | ) | | | (2.16 | ) |
Total distributions to shareholders | | | (0.72 | ) | | | (0.01 | ) | | | (14.33 | ) | | | (2.74 | ) | | | (2.16 | ) |
Net Asset Value, End of Year | | $ | 5.10 | | | $ | 5.61 | | | $ | 4.27 | | | $ | 19.30 | | | $ | 22.76 | |
Total Return2,3 | | | 3.78 | % | | | 31.57 | % | | | (4.27 | )% | | | (3.93 | )% | | | 0.86 | % |
Ratio of net expenses to average net assets | | | 0.95 | %4 | | | 1.00 | %4 | | | 1.11 | % | | | 1.06 | % | | | 1.06 | % |
Ratio of gross expenses to average net assets5 | | | 1.16 | % | | | 1.28 | % | | | 1.16 | % | | | 1.06 | % | | | 1.06 | % |
Ratio of net investment loss to average net assets2 | | | (0.48 | )% | | | (0.49 | )% | | | (0.53 | )% | | | (0.33 | )% | | | (0.32 | )% |
Portfolio turnover | | | 36 | % | | | 24 | % | | | 106 | %6 | | | 65 | % | | | 70 | %6,7 |
Net assets end of year (000’s) omitted | | $ | 9,381 | | | $ | 9,798 | | | $ | 11,032 | | | $ | 307,403 | | | $ | 469,518 | |
| | | | | | | | | | | | | | | | | | | | |
172
AMG GW&K U.S. Small Cap Growth Fund
Financial Highlights
For a share outstanding throughout each fiscal period
| | | | | | | | |
| | | For the fiscal years
ended
October 31, | | | For the fiscal period
ended
October 31, | |
| Class Z | | 2018 | | | 20178 | |
Net Asset Value, Beginning of Period | | $ | 5.61 | | | $ | 4.85 | |
Income (loss) from Investment Operations: | | | | | | | | |
Net investment loss1,2 | | | (0.02 | ) | | | (0.02 | ) |
Net realized and unrealized gain on investments | | | 0.23 | | | | 0.78 | |
Total income from investment operations | | | 0.21 | | | | 0.76 | |
Less Distributions to Shareholders from: | | | | | | | | |
Net realized gain on investments | | | (0.72 | ) | | | — | |
Total distributions to shareholders | | | (0.72 | ) | | | — | |
Net Asset Value, End of Period | | $ | 5.10 | | | $ | 5.61 | |
Total Return2,3 | | | 3.78 | % | | | 15.67 | %9 |
Ratio of net expenses to average net assets | | | 0.85 | %4 | | | 0.89 | %4,10 |
Ratio of gross expenses to average net assets5 | | | 1.06 | % | | | 1.13 | %10 |
Ratio of net investment loss to average net assets2 | | | (0.38 | )% | | | (0.47 | )%10 |
Portfolio turnover | | | 36 | % | | | 24 | %9 |
Net assets end of period (000’s) omitted | | $ | 155 | | | $ | 143 | |
| | | | | | | | |
| 1 | Per share numbers have been calculated using average shares. |
| 2 | Total returns and net investment loss would have been lower had certain expenses not been offset. |
| 3 | The total return is calculated using the published Net Asset Value as of fiscal year end. |
| 4 | Includes reduction from broker recapture amounting to 0.05% for the fiscal year ended October 31, 2018, and 0.05%, 0.05% and 0.01% for Class N, Class I and Class Z, respectively for the fiscal period ended 2017. |
| 5 | Excludes the impact of expense reimbursement or fee waivers and expense reductions such as brokerage credits, but includes expense repayments and non-reimbursable expenses, if any, such as interest, taxes, and extraordinary expenses. (See Note 1(c) and 2 in the Notes to Financial Statements.) |
| 6 | Portfolio turnover rate excludes securities delivered from processing a redemption in-kind. |
| 7 | Portfolio turnover rate excludes securities received from processing a subscription in-kind. |
| 8 | The commencement of operations for Class Z shares was February 24, 2017. |
173
AMG Managers DoubleLine Core Plus Bond Fund
Financial Highlights
For a share outstanding throughout each fiscal year
| | | | | | | | | | | | | | | | | | | | |
| | | For the fiscal years ended October 31, | |
| Class N | | 2018 | | | 2017 | | | 2016 | | | 2015 | | | 2014 | |
Net Asset Value, Beginning of Year | | $ | 10.68 | | | $ | 10.77 | | | $ | 10.60 | | | $ | 10.86 | | | $ | 10.65 | |
Income (loss) from Investment Operations: | | | | | | | | | | | | | | | | | | | | |
Net investment income1,2 | | | 0.29 | | | | 0.27 | | | | 0.31 | | | | 0.38 | | | | 0.40 | |
Net realized and unrealized gain (loss) on investments | | | (0.43 | ) | | | 0.01 | | | | 0.17 | | | | (0.27 | ) | | | 0.22 | |
Total income (loss) from investment operations | | | (0.14 | ) | | | 0.28 | | | | 0.48 | | | | 0.11 | | | | 0.62 | |
Less Distributions to Shareholders from: | | | | | | | | | | | | | | | | | | | | |
Net investment income | | | (0.31 | ) | | | (0.30 | ) | | | (0.31 | ) | | | (0.37 | ) | | | (0.41 | ) |
Net realized gain on investments | | | — | | | | (0.02 | ) | | | — | | | | — | | | | — | |
Paid in capital | | | — | | | | (0.05 | ) | | | — | | | | — | | | | — | |
Total distributions to shareholders | | | (0.31 | ) | | | (0.37 | ) | | | (0.31 | ) | | | (0.37 | ) | | | (0.41 | ) |
Net Asset Value, End of Year | | $ | 10.23 | | | $ | 10.68 | | | $ | 10.77 | | | $ | 10.60 | | | $ | 10.86 | |
Total Return2,3 | | | (1.33 | )% | | | 2.68 | % | | | 4.62 | % | | | 1.04 | % | | | 5.96 | % |
Ratio of net expenses to average net assets | | | 0.94 | % | | | 0.94 | % | | | 0.94 | % | | | 0.94 | % | | | 0.94 | % |
Ratio of gross expenses to average net assets4 | | | 1.01 | % | | | 1.02 | % | | | 1.02 | % | | | 1.05 | % | | | 1.08 | % |
Ratio of net investment income to average net assets2 | | | 2.80 | % | | | 2.58 | % | | | 2.84 | % | | | 3.32 | % | | | 3.72 | % |
Portfolio turnover | | | 69 | % | | | 106 | % | | | 78 | % | | | 59 | % | | | 117 | % |
Net assets end of year (000’s) omitted | | $ | 102,138 | | | $ | 169,646 | | | $ | 308,703 | | | $ | 188,286 | | | $ | 49,147 | |
| | | | | | | | | | | | | | | | | | | | |
174
AMG Managers DoubleLine Core Plus Bond Fund
Financial Highlights
For a share outstanding throughout each fiscal year
| | | | | | | | | | | | | | | | | | | | |
| | | For the fiscal years ended October 31, | |
| Class I | | 2018 | | | 2017 | | | 2016 | | | 2015 | | | 2014 | |
Net Asset Value, Beginning of Year | | $ | 10.67 | | | $ | 10.76 | | | $ | 10.60 | | | $ | 10.86 | | | $ | 10.65 | |
Income (loss) from Investment Operations: | | | | | | | | | | | | | | | | | | | | |
Net investment income1,2 | | | 0.32 | | | | 0.30 | | | | 0.33 | | | | 0.41 | | | | 0.44 | |
Net realized and unrealized gain (loss) on investments | | | (0.42 | ) | | | 0.01 | | | | 0.17 | | | | (0.27 | ) | | | 0.21 | |
Total income (loss) from investment operations | | | (0.10 | ) | | | 0.31 | | | | 0.50 | | | | 0.14 | | | | 0.65 | |
Less Distributions to Shareholders from: | | | | | | | | | | | | | | | | | | | | |
Net investment income | | | (0.34 | ) | | | (0.33 | ) | | | (0.34 | ) | | | (0.40 | ) | | | (0.44 | ) |
Net realized gain on investments | | | — | | | | (0.02 | ) | | | — | | | | — | | | | — | |
Paid in capital | | | — | | | | (0.05 | ) | | | — | | | | — | | | | — | |
Total distributions to shareholders | | | (0.34 | ) | | | (0.40 | ) | | | (0.34 | ) | | | (0.40 | ) | | | (0.44 | ) |
Net Asset Value, End of Year | | $ | 10.23 | | | $ | 10.67 | | | $ | 10.76 | | | $ | 10.60 | | | $ | 10.86 | |
Total Return2,3 | | | (0.98 | )% | | | 2.95 | % | | | 4.79 | % | | | 1.28 | % | | | 6.22 | % |
Ratio of net expenses to average net assets | | | 0.69 | % | | | 0.68 | % | | | 0.69 | % | | | 0.69 | % | | | 0.69 | % |
Ratio of gross expenses to average net assets4 | | | 0.76 | % | | | 0.76 | % | | | 0.77 | % | | | 0.80 | % | | | 0.83 | % |
Ratio of net investment income to average net assets2 | | | 3.05 | % | | | 2.83 | % | | | 3.11 | % | | | 3.57 | % | | | 3.97 | % |
Portfolio turnover | | | 69 | % | | | 106 | % | | | 78 | % | | | 59 | % | | | 117 | % |
Net assets end of year (000’s) omitted | | $ | 467,024 | | | $ | 507,600 | | | $ | 398,514 | | | $ | 304,051 | | | $ | 158,198 | |
| | | | | | | | | | | | | | | | | | | | |
175
AMG Managers DoubleLine Core Plus Bond Fund
Financial Highlights
For a share outstanding throughout each fiscal period
| | | | | | | | |
| | | For the fiscal years
ended
October 31, | | | For the fiscal period
ended
October 31, | |
| Class Z | | 2018 | | | 20175 | |
Net Asset Value, Beginning of Period | | $ | 10.68 | | | $ | 10.69 | |
Income (loss) from Investment Operations: | | | | | | | | |
Net investment income1,2 | | | 0.33 | | | | 0.03 | |
Net realized and unrealized loss on investments | | | (0.43 | ) | | | (0.01 | ) |
Total income (loss) from investment operations | | | (0.10 | ) | | | 0.02 | |
Less Distributions to Shareholders from: | | | | | | | | |
Net investment income | | | (0.34 | ) | | | (0.03 | ) |
Paid in capital | | | — | | | | (0.00 | )6 |
Total distributions to shareholders | | | (0.34 | ) | | | (0.03 | ) |
Net Asset Value, End of Period | | $ | 10.24 | | | $ | 10.68 | |
Total Return2,3 | | | (0.91 | )% | | | 0.17 | %7 |
Ratio of net expenses to average net assets | | | 0.61 | % | | | 0.60 | %8 |
Ratio of gross expenses to average net assets4 | | | 0.68 | % | | | 0.63 | %8 |
Ratio of net investment income to average net assets2 | | | 3.13 | % | | | 2.74 | %8 |
Portfolio turnover | | | 69 | % | | | 106 | %7 |
Net assets end of period (000’s) omitted | | $ | 1,955 | | | $ | 1,597 | |
| | | | | | | | |
| 1 | Per share numbers have been calculated using average shares. |
| 2 | Total returns and net investment income (loss) would have been lower had certain expenses not been offset. |
| 3 | The total return is calculated using the published Net Asset Value as of fiscal year end. |
| 4 | Excludes the impact of expense reimbursement or fee waivers and expense reductions such as brokerage credits, but includes expense repayments and non-reimbursable expenses, if any, such as interest, taxes, and extraordinary expenses. (See Note 1(c) and 2 in the Notes to Financial Statements.) |
| 5 | The commencement of operations was October 2, 2017. |
| 6 | Less than $(0.005) per share. |
176
AMG Managers Lake Partners LASSO Alternatives Fund
Financial Highlights
For a share outstanding throughout each fiscal year
| | | | | | | | | | | | | | | | | | | | |
| | | For the fiscal years ended October 31, | |
| Class N | | 2018 | | | 2017 | | | 2016 | | | 2015 | | | 2014 | |
Net Asset Value, Beginning of Year | | $ | 12.41 | | | $ | 11.81 | | | $ | 12.76 | | | $ | 13.64 | | | $ | 13.34 | |
Income (loss) from Investment Operations: | | | | | | | | | | | | | | | | | | | | |
Net investment income (loss)1,2 | | | 0.04 | | | | (0.05 | ) | | | 0.02 | | | | (0.04 | ) | | | (0.07 | ) |
Net realized and unrealized gain (loss) on investments | | | (0.42 | ) | | | 0.70 | | | | (0.17 | ) | | | (0.34 | ) | | | 0.50 | 3 |
Total income (loss) from investment operations | | | (0.38 | ) | | | 0.65 | | | | (0.15 | ) | | | (0.38 | ) | | | 0.43 | |
Less Distributions to Shareholders from: | | | | | | | | | | | | | | | | | | | | |
Net investment income | | | — | | | | — | | | | — | | | | — | | | | (0.09 | ) |
Net realized gain on investments | | | (0.58 | ) | | | (0.05 | ) | | | (0.80 | ) | | | (0.50 | ) | | | (0.04 | ) |
Total distributions to shareholders | | | (0.58 | ) | | | (0.05 | ) | | | (0.80 | ) | | | (0.50 | ) | | | (0.13 | ) |
Net Asset Value, End of Year | | $ | 11.45 | | | $ | 12.41 | | | $ | 11.81 | | | $ | 12.76 | | | $ | 13.64 | |
Total Return2,4 | | | (3.30 | )% | | | 5.51 | % | | | (1.18 | )% | | | (2.87 | )% | | | 3.27 | % |
Ratio of net expenses to average net assets5 | | | 1.40 | % | | | 1.40 | % | | | 1.40 | % | | | 1.41 | % | | | 1.43 | % |
Ratio of gross expenses to average net assets5,6 | | | 1.58 | % | | | 1.49 | % | | | 1.47 | % | | | 1.43 | % | | | 1.41 | % |
Ratio of net investment income (loss) to average net assets2 | | | 0.32 | % | | | (0.42 | )% | | | 0.13 | % | | | (0.31 | )% | | | (0.53 | )% |
Portfolio turnover | | | 41 | % | | | 29 | % | | | 30 | % | | | 73 | % | | | 46 | % |
Net assets end of year (000’s) omitted | | $ | 8,980 | | | $ | 8,880 | | | $ | 32,630 | | | $ | 40,667 | | | $ | 44,386 | |
| | | | | | | | | | | | | | | | | | | | |
177
AMG Managers Lake Partners LASSO Alternatives Fund
Financial Highlights
For a share outstanding throughout each fiscal year
| | | | | | | | | | | | | | | | | | | | |
| | | For the fiscal years ended October 31, | |
| Class I | | 2018 | | | 2017 | | | 2016 | | | 2015 | | | 2014 | |
Net Asset Value, Beginning of Year | | $ | 12.49 | | | $ | 11.86 | | | $ | 12.81 | | | $ | 13.69 | | | $ | 13.38 | |
Income (loss) from Investment Operations: | | | | | | | | | | | | | | | | | | | | |
Net investment income (loss)1,2 | | | 0.07 | | | | (0.02 | ) | | | 0.07 | | | | (0.01 | ) | | | (0.04 | ) |
Net realized and unrealized gain (loss) on investments | | | (0.42 | ) | | | 0.70 | | | | (0.19 | ) | | | (0.33 | )3 | | | 0.51 | 3 |
Total income (loss) from investment operations | | | (0.35 | ) | | | 0.68 | | | | (0.12 | ) | | | (0.34 | ) | | | 0.47 | |
Less Distributions to Shareholders from: | | | | | | | | | | | | | | | | | | | | |
Net investment income | | | (0.03 | ) | | | — | | | | (0.03 | ) | | | (0.04 | ) | | | (0.12 | ) |
Net realized gain on investments | | | (0.58 | ) | | | (0.05 | ) | | | (0.80 | ) | | | (0.50 | ) | | | (0.04 | ) |
Total distributions to shareholders | | | (0.61 | ) | | | (0.05 | ) | | | (0.83 | ) | | | (0.54 | ) | | | (0.16 | ) |
Net Asset Value, End of Year | | $ | 11.53 | | | $ | 12.49 | | | $ | 11.86 | | | $ | 12.81 | | | $ | 13.69 | |
Total Return2,4 | | | (3.07 | )% | | | 5.74 | % | | | (0.91 | )% | | | (2.62 | )% | | | 3.56 | % |
Ratio of net expenses to average net assets5 | | | 1.15 | % | | | 1.15 | % | | | 1.15 | % | | | 1.16 | % | | | 1.18 | % |
Ratio of gross expenses to average net assets5,6 | | | 1.33 | % | | | 1.24 | % | | | 1.22 | % | | | 1.18 | % | | | 1.16 | % |
Ratio of net investment income (loss) to average net assets2 | | | 0.57 | % | | | (0.17 | )% | | | 0.57 | % | | | (0.06 | )% | | | (0.28 | )% |
Portfolio turnover | | | 41 | % | | | 29 | % | | | 30 | % | | | 73 | % | | | 46 | % |
Net assets end of year (000’s) omitted | | $ | 18,021 | | | $ | 41,245 | | | $ | 70,054 | | | $ | 169,072 | | | $ | 477,157 | |
| | | | | | | | | | | | | | | | | | | | |
| 1 | Per share numbers have been calculated using average shares. |
| 2 | Total returns and net investment income (loss) would have been lower had certain expenses not been offset. |
| 3 | Includes capital contribution of less than $0.01 per share. |
| 4 | The total return is calculated using the published Net Asset Value as of fiscal year end. |
| 5 | Does not include expenses of the underlying funds in which the Fund invests. |
| 6 | Excludes the impact of expense reimbursement or fee waivers and expense reductions such as brokerage credits, but includes expense repayments and non-reimbursable expenses, if any, such as interest, taxes, and extraordinary expenses. (See Note 1(c) and 2 in the Notes to Financial Statements.) |
178
AMG River Road Long-Short Fund
Financial Highlights
For a share outstanding throughout each fiscal year
| | | | | | | | | | | | | | | | | | | | |
| | | For the fiscal years ended October 31, | |
| Class N | | 2018 | | | 2017 | | �� | 2016 | | | 2015 | | | 2014 | |
Net Asset Value, Beginning of Year | | $ | 12.33 | | | $ | 11.04 | | | $ | 11.48 | | | $ | 11.35 | | | $ | 12.02 | |
Income (loss) from Investment Operations: | | | | | | | | | | | | | | | | | | | | |
Net investment loss1 | | | (0.03 | )2,3 | | | (0.25 | )2 | | | (0.19 | )2 | | | (0.14 | )2 | | | (0.19 | ) |
Net realized and unrealized gain (loss) on investments | | | (0.11 | ) | | | 1.54 | | | | 0.13 | | | | 0.57 | | | | (0.19 | ) |
Total income (loss) from investment operations | | | (0.14 | ) | | | 1.29 | | | | (0.06 | ) | | | 0.43 | | | | (0.38 | ) |
Less Distributions to Shareholders from: | | | | | | | | | | | | | | | | | | | | |
Net realized gain on investments | | | — | | | | — | | | | (0.38 | ) | | | (0.30 | ) | | | (0.29 | ) |
Total distributions to shareholders | | | — | | | | — | | | | (0.38 | ) | | | (0.30 | ) | | | (0.29 | ) |
Net Asset Value, End of Year | | $ | 12.19 | | | $ | 12.33 | | | $ | 11.04 | | | $ | 11.48 | | | $ | 11.35 | |
Total Return1,4 | | | (1.14 | )% | | | 11.69 | % | | | (0.52 | )% | | | 3.79 | % | | | (3.27 | )% |
Ratio of net expenses to average net assets5 | | | 3.12 | %6 | | | 3.60 | %6 | | | 3.46 | % | | | 2.89 | % | | | 2.58 | % |
Ratio of gross expenses to average net assets7 | | | 3.41 | % | | | 3.75 | % | | | 3.62 | % | | | 2.87 | % | | | 2.53 | % |
Ratio of net investment loss to average net assets1 | | | (0.25 | )% | | | (2.23 | )% | | | (1.75 | )% | | | (1.19 | )% | | | (1.59 | )% |
Portfolio turnover | | | 189 | % | | | 186 | % | | | 298 | % | | | 279 | % | | | 303 | % |
Net assets end of year (000’s) omitted | | $ | 3,749 | | | $ | 5,508 | | | $ | 8,713 | | | $ | 27,983 | | | $ | 109,140 | |
| | | | | | | | | | | | | | | | | | | | |
179
AMG River Road Long-Short Fund
Financial Highlights
For a share outstanding throughout each fiscal year
| | | | | | | | | | | | | | | | | | | | |
| | | For the fiscal years ended October 31, | |
| Class I | | 2018 | | | 2017 | | | 2016 | | | 2015 | | | 2014 | |
Net Asset Value, Beginning of Year | | $ | 12.48 | | | $ | 11.15 | | | $ | 11.56 | | | $ | 11.40 | | | $ | 12.05 | |
Income (loss) from Investment Operations: | | | | | | | | | | | | | | | | | | | | |
Net investment loss1 | | | 0.00 | 2,3,8 | | | (0.24 | )2 | | | (0.18 | )2 | | | (0.11 | )2 | | | (0.16 | ) |
Net realized and unrealized gain (loss) on investments | | | (0.11 | ) | | | 1.57 | | | | 0.15 | | | | 0.57 | | | | (0.20 | ) |
Total income (loss) from investment operations | | | (0.11 | ) | | | 1.33 | | | | (0.03 | ) | | | 0.46 | | | | (0.36 | ) |
Less Distributions to Shareholders from: | | | | | | | | | | | | | | | | | | | | |
Net realized gain on investments | | | — | | | | — | | | | (0.38 | ) | | | (0.30 | ) | | | (0.29 | ) |
Total distributions to shareholders | | | — | | | | — | | | | (0.38 | ) | | | (0.30 | ) | | | (0.29 | ) |
Net Asset Value, End of Year | | $ | 12.37 | | | $ | 12.48 | | | $ | 11.15 | | | $ | 11.56 | | | $ | 11.40 | |
Total Return1,4 | | | (0.88 | )% | | | 11.93 | % | | | (0.24 | )% | | | 4.04 | % | | | (3.01 | )% |
Ratio of net expenses to average net assets5 | | | 2.87 | %6 | | | 3.35 | %6 | | | 3.24 | % | | | 2.64 | % | | | 2.33 | % |
Ratio of gross expenses to average net assets7 | | | 3.16 | % | | | 3.50 | % | | | 3.39 | % | | | 2.62 | % | | | 2.28 | % |
Ratio of net investment loss to average net assets1 | | | 0.00 | %9 | | | (1.98 | )% | | | (1.67 | )% | | | (0.94 | )% | | | (1.34 | )% |
Portfolio turnover | | | 189 | % | | | 186 | % | | | 298 | % | | | 279 | % | | | 303 | % |
Net assets end of year (000’s) omitted | | $ | 24,925 | | | $ | 29,030 | | | $ | 37,549 | | | $ | 49,088 | | | $ | 110,271 | |
| | | | | | | | | | | | | | | | | | | | |
180
AMG River Road Long-Short Fund
Financial Highlights
For a share outstanding throughout each fiscal period
| | | | | | | | |
| | | For the fiscal years
ended
October 31, | | | For the fiscal period
ended
October 31, | |
| Class Z | | 2018 | | | 201710 | |
Net Asset Value, Beginning of Period | | $ | 12.49 | | | $ | 12.53 | |
Income (loss) from Investment Operations: | | | | | | | | |
Net investment income (loss)1 | | | 0.01 | 2,3 | | | (0.02 | )2 |
Net realized and unrealized loss on investments | | | (0.12 | ) | | | (0.02 | ) |
Total loss from investment operations | | | (0.11 | ) | | | (0.04 | ) |
Net Asset Value, End of Period | | $ | 12.38 | | | $ | 12.49 | |
Total Return1,4 | | | (0.88 | )% | | | (0.32 | )%11 |
Ratio of net expenses to average net assets5 | | | 2.79 | %6 | | | 3.38 | %6,12 |
Ratio of gross expenses to average net assets7 | | | 3.08 | % | | | 3.38 | %12 |
Ratio of net investment income (loss) to average net assets1 | | | 0.09 | % | | | (2.74 | )%12 |
Portfolio turnover | | | 189 | % | | | 186 | %11 |
Net assets end of period (000’s) omitted | | $ | 73 | | | $ | 25 | |
| | | | | | | | |
| 1 | Total returns and net investment income (loss) would have been lower had certain expenses not been offset. |
| 2 | Per share numbers have been calculated using average shares. |
| 3 | Includes non-recurring dividends. Without these dividends, net investment loss per share would have been $(0.17), $(0.14), and $(0.13) for Class N, Class I and Class Z shares, respectively. |
| 4 | The total return is calculated using the published Net Asset Value as of fiscal year end. |
| 5 | Expense ratio includes dividend and interest expense related to securities sold short. Excluding such dividend and interest expense, the ratio of expenses to average net assets would be 1.45%, 1.20% and 1.12% for Class N, Class I and Class Z, respectively, for the fiscal year ended October 31, 2018, 1.48%, 1.23% and 1.12% for Class N, Class I and Class Z, respectively, for the fiscal year ended October 31, 2017, and 1.70% and 1.45% for Class N and Class I, respectively, for each of the fiscal periods ended 2016, 2015, and 2014. |
| 6 | Includes reduction from brokerage recapture amounting to 0.02% for the fiscal year ended October 31, 2018, and 0.02%, 0.02%, and less than 0.01% for Class N, Class I, and Class Z, respectively, for the fiscal period ended 2017. |
| 7 | Excludes the impact of expense reimbursement or fee waivers and expense reductions such as brokerage credits, but includes expense repayments and non-reimbursable expenses, if any, such as interest, taxes, and extraordinary expenses. (See Note 1(c) and 2 in the Notes to Financial Statements.) |
| 8 | Less than $0.005 per share. |
| 10 | Commencement of operations was on October 2, 2017. |
181
AMG Managers Guardian Capital Global Dividend Fund
Financial Highlights
For a share outstanding throughout each fiscal period
| | | | | | | | | | | | | | | | | | | | |
| | | For the fiscal years ended October 31, | | | For the fiscal period
ended
October 31, | |
| Class N | | 2018 | | | 2017 | | | 2016 | | | 2015 | | | 20141 | |
Net Asset Value, Beginning of Period | | $ | 11.47 | | | $ | 9.67 | | | $ | 10.30 | | | $ | 10.51 | | | $ | 10.00 | |
Income (loss) from Investment Operations: | | | | | | | | | | | | | | | | | | | | |
Net investment income2 | | | 0.24 | 3 | | | 0.24 | 3,4 | | | 0.22 | 3 | | | 0.24 | | | | 0.13 | |
Net realized and unrealized gain (loss) on investments | | | (0.59 | ) | | | 1.73 | | | | (0.62 | ) | | | (0.23 | ) | | | 0.49 | |
Total income (loss) from investment operations | | | (0.35 | ) | | | 1.97 | | | | (0.40 | ) | | | 0.01 | | | | 0.62 | |
Less Distributions to Shareholders from: | | | | | | | | | | | | | | | | | | | | |
Net investment income | | | (0.27 | ) | | | (0.17 | ) | | | (0.23 | ) | | | (0.22 | ) | | | (0.11 | ) |
Net realized gain on investments | | | (0.05 | ) | | | — | | | | — | | | | — | | | | — | |
Total distributions to shareholders | | | (0.32 | ) | | | (0.17 | ) | | | (0.23 | ) | | | (0.22 | ) | | | (0.11 | ) |
Net Asset Value, End of Period | | $ | 10.80 | | | $ | 11.47 | | | $ | 9.67 | | | $ | 10.30 | | | $ | 10.51 | |
Total Return2,5 | | | (3.19 | )% | | | 20.51 | % | | | (3.91 | )% | | | 0.07 | % | | | 6.17 | %6 |
Ratio of net expenses to average net assets | | | 1.08 | % | | | 1.07 | % | | | 1.30 | % | | | 1.30 | % | | | 1.30 | %7 |
Ratio of gross expenses to average net assets8 | | | 1.14 | % | | | 1.12 | % | | | 3.34 | % | | | 4.10 | % | | | 5.21 | %7 |
Ratio of net investment income to average net assets2 | | | 2.07 | % | | | 2.27 | % | | | 2.24 | % | | | 2.28 | % | | | 2.17 | %7 |
Portfolio turnover | | | 74 | % | | | 34 | % | | | 36 | % | | | 28 | % | | | 16 | %6 |
Net assets end of period (000’s) omitted | | $ | 1,106 | | | $ | 1,167 | | | $ | 997 | | | $ | 1,054 | | | $ | 1,052 | |
| | | | | | | | | | | | | | | | | | | | |
182
AMG Managers Guardian Capital Global Dividend Fund
Financial Highlights
For a share outstanding throughout each fiscal period
| | | | | | | | | | | | | | | | | | | | |
| | | For the fiscal years ended October 31, | | | For the fiscal period
ended
October 31, | |
| Class I | | 2018 | | | 2017 | | | 2016 | | | 2015 | | | 20141 | |
Net Asset Value, Beginning of Period | | $ | 11.41 | | | $ | 9.65 | | | $ | 10.28 | | | $ | 10.52 | | | $ | 10.00 | |
Income (loss) from Investment Operations: | | | | | | | | | | | | | | | | | | | | |
Net investment income2 | | | 0.24 | 3 | | | 0.24 | 3,4 | | | 0.23 | 3 | | | 0.27 | | | | 0.14 | |
Net realized and unrealized gain (loss) on investments | | | (0.59 | ) | | | 1.74 | | | | (0.60 | ) | | | (0.25 | ) | | | 0.50 | |
Total income (loss) from investment operations | | | (0.35 | ) | | | 1.98 | | | | (0.37 | ) | | | 0.02 | | | | 0.64 | |
Less Distributions to Shareholders from: | | | | | | | | | | | | | | | | | | | | |
Net investment income | | | (0.27 | ) | | | (0.22 | ) | | | (0.26 | ) | | | (0.26 | ) | | | (0.12 | ) |
Net realized gain on investments | | | (0.05 | ) | | | — | | | | — | | | | — | | | | — | |
Total distributions to shareholders | | | (0.32 | ) | | | (0.22 | ) | | | (0.26 | ) | | | (0.26 | ) | | | (0.12 | ) |
Net Asset Value, End of Period | | $ | 10.74 | | | $ | 11.41 | | | $ | 9.65 | | | $ | 10.28 | | | $ | 10.52 | |
Total Return2,5 | | | (3.18 | )% | | | 20.66 | % | | | (3.68 | )% | | | 0.14 | % | | | 6.39 | %6 |
Ratio of net expenses to average net assets | | | 1.05 | % | | | 1.05 | % | | | 1.05 | % | | | 1.05 | % | | | 1.05 | %7 |
Ratio of gross expenses to average net assets8 | | | 1.11 | % | | | 1.10 | % | | | 2.82 | % | | | 3.85 | % | | | 4.96 | %7 |
Ratio of net investment income to average net assets2 | | | 2.11 | % | | | 2.28 | % | | | 2.32 | % | | | 2.52 | % | | | 2.42 | %7 |
Portfolio turnover | | | 74 | % | | | 34 | % | | | 36 | % | | | 28 | % | | | 16 | %6 |
Net assets end of period (000’s) omitted | | $ | 35,572 | | | $ | 36,280 | | | $ | 27,986 | | | $ | 3,292 | | | $ | 3,211 | |
| | | | | | | | | | | | | | | | | | | | |
| 1 | Commencement of operations was on April 11, 2014. |
| 2 | Total returns and net investment income would have been lower had certain expenses not been offset. |
| 3 | Per share numbers have been calculated using average shares. |
| 4 | Includes non-recurring dividends. Without these dividends, net investment income per share would have been $0.23 for Class N and Class I. |
| 5 | The total return is calculated using the published Net Asset Value as of fiscal year end. |
| 8 | Excludes the impact of expense reimbursement or fee waivers and expense reductions such as brokerage credits, but includes expense repayments and non-reimbursable expenses, if any, such as interest, taxes, and extraordinary expenses. (See Note 1(c) and 2 in the Notes to Financial Statements.) |
183
AMG Managers Pictet International Fund
Financial Highlights
For a share outstanding throughout each fiscal period
| | | | | | | | | | | | | | | | | | | | |
| | | For the fiscal years ended October 31, | | | For the fiscal period
ended
October 31, | |
| Class N | | 2018 | | | 2017 | | | 2016 | | | 2015 | | | 20141 | |
Net Asset Value, Beginning of Period | | $ | 11.60 | | | $ | 9.61 | | | $ | 9.56 | | | $ | 9.34 | | | $ | 10.00 | |
Income (loss) from Investment Operations: | | | | | | | | | | | | | | | | | | | | |
Net investment income2 | | | 0.12 | 3 | | | 0.04 | 3 | | | 0.13 | 3 | | | 0.10 | 3 | | | 0.09 | |
Net realized and unrealized gain (loss) on investments | | | (1.31 | ) | | | 2.22 | | | | 0.00 | 4 | | | 0.17 | 5 | | | (0.75 | ) |
Total income (loss) from investment operations | | | (1.19 | ) | | | 2.26 | | | | 0.13 | | | | 0.27 | | | | (0.66 | ) |
Less Distributions to Shareholders from: | | | | | | | | | | | | | | | | | | | | |
Net investment income | | | (0.18 | ) | | | (0.07 | ) | | | (0.02 | ) | | | (0.03 | ) | | | — | |
Net realized gain on investments | | | (0.33 | ) | | | (0.20 | ) | | | (0.06 | ) | | | (0.02 | ) | | | — | |
Total distributions to shareholders | | | (0.51 | ) | | | (0.27 | ) | | | (0.08 | ) | | | (0.05 | ) | | | — | |
Net Asset Value, End of Period | | $ | 9.90 | | | $ | 11.60 | | | $ | 9.61 | | | $ | 9.56 | | | $ | 9.34 | |
Total Return2,6 | | | (10.80 | )% | | | 24.30 | % | | | 1.42 | %7 | | | 3.02 | % | | | (6.60 | )%8 |
Ratio of net expenses to average net assets | | | 1.27 | % | | | 1.30 | % | | | 1.40 | % | | | 1.40 | % | | | 1.40 | %9 |
Ratio of gross expenses to average net assets10 | | | 1.28 | % | | | 1.31 | % | | | 1.41 | % | | | 1.92 | % | | | 3.26 | %9 |
Ratio of net investment income to average net assets2 | | | 1.10 | % | | | 0.38 | % | | | 1.88 | % | | | 1.06 | % | | | 1.61 | %9 |
Portfolio turnover | | | 51 | % | | | 34 | % | | | 38 | % | | | 53 | % | | | 26 | %8 |
Net assets end of period (000’s) omitted | | $ | 82,839 | | | $ | 4,006 | | | $ | 131 | | | $ | 1,056 | | | $ | 984 | |
| | | | | | | | | | | | | | | | | | | | |
184
AMG Managers Pictet International Fund
Financial Highlights
For a share outstanding throughout each fiscal period
| | | | | | | | | | | | | | | | | | | | |
| | | For the fiscal years ended October 31, | | | For the fiscal period
ended
October 31, | |
| Class I | | 2018 | | | 2017 | | | 2016 | | | 2015 | | | 20141 | |
Net Asset Value, Beginning of Period | | $ | 11.59 | | | $ | 9.65 | | | $ | 9.60 | | | $ | 9.36 | | | $ | 10.00 | |
Income (loss) from Investment Operations: | | | | | | | | | | | | | | | | | | | | |
Net investment income2 | | | 0.16 | 3 | | | 0.13 | 3 | | | 0.15 | 3 | | | 0.12 | 3 | | | 0.10 | |
Net realized and unrealized gain (loss) on investments | | | (1.32 | ) | | | 2.16 | | | | 0.00 | 4 | | | 0.19 | 5 | | | (0.74 | ) |
Total income (loss) from investment operations | | | (1.16 | ) | | | 2.29 | | | | 0.15 | | | | 0.31 | | | | (0.64 | ) |
Less Distributions to Shareholders from: | | | | | | | | | | | | | | | | | | | | |
Net investment income | | | (0.17 | ) | | | (0.14 | ) | | | (0.04 | ) | | | (0.05 | ) | | | — | |
Net realized gain on investments | | | (0.33 | ) | | | (0.21 | ) | | | (0.06 | ) | | | (0.02 | ) | | | — | |
Total distributions to shareholders | | | (0.50 | ) | | | (0.35 | ) | | | (0.10 | ) | | | (0.07 | ) | | | — | |
Net Asset Value, End of Period | | $ | 9.93 | | | $ | 11.59 | | | $ | 9.65 | | | $ | 9.60 | | | $ | 9.36 | |
Total Return2,6 | | | (10.57 | )% | | | 24.55 | % | | | 1.67 | %11 | | | 3.43 | % | | | (6.40 | )%8 |
Ratio of net expenses to average net assets | | | 1.00 | % | | | 1.06 | % | | | 1.15 | % | | | 1.15 | % | | | 1.15 | %9 |
Ratio of gross expenses to average net assets10 | | | 1.01 | % | | | 1.07 | % | | | 1.15 | % | | | 1.67 | % | | | 3.01 | %9 |
Ratio of net investment income to average net assets2 | | | 1.38 | % | | | 1.28 | % | | | 2.13 | % | | | 1.31 | % | | | 1.86 | %9 |
Portfolio turnover | | | 51 | % | | | 34 | % | | | 38 | % | | | 53 | % | | | 26 | %8 |
Net assets end of period (000’s) omitted | | $ | 208,184 | | | $ | 2,019,217 | | | $ | 1,336,050 | | | $ | 49,803 | | | $ | 8,467 | |
| | | | | | | | | | | | | | | | | | | | |
185
AMG Managers Pictet International Fund
Financial Highlights
For a share outstanding throughout each fiscal period
| | | | | | | | |
| | | For the fiscal years
ended
October 31, | | | For the fiscal period
ended
October 31, | |
| Class Z | | 2018 | | | 201712 | |
Net Asset Value, Beginning of Period | | $ | 11.59 | | | $ | 11.40 | |
Income (loss) from Investment Operations: | | | | | | | | |
Net investment income2 | | | 0.16 | 3 | | | 0.00 | 3,4 |
Net realized and unrealized gain (loss) on investments | | | (1.31 | ) | | | 0.19 | |
Total income (loss) from investment operations | | | (1.15 | ) | | | 0.19 | |
Less Distributions to Shareholders from: | | | | | | | | |
Net investment income | | | (0.20 | ) | | | — | |
Net realized gain on investments | | | (0.33 | ) | | | — | |
Total distributions to shareholders | | | (0.53 | ) | | | — | |
Net Asset Value, End of Period | | $ | 9.91 | | | $ | 11.59 | |
Total Return2,6 | | | (10.52 | )% | | | 1.67 | %8 |
Ratio of net expenses to average net assets | | | 0.91 | % | | | 0.94 | %9 |
Ratio of gross expenses to average net assets10 | | | 0.92 | % | | | 0.95 | %9 |
Ratio of net investment income (loss) to average net assets2 | | | 1.46 | % | | | (0.36 | )%9 |
Portfolio turnover | | | 51 | % | | | 34 | %8 |
Net assets end of period (000’s) omitted | | $ | 1,289,369 | | | $ | 254 | |
| | | | | | | | |
| 1 | The commencement of operations for Class N and Class I Shares was April 11, 2014. |
| 2 | Total returns and net investment income (loss) would have been lower had certain expenses not been offset. |
| 3 | Per share numbers have been calculated using average shares. |
| 4 | Less than $0.005 per share. |
| 5 | Includes capital contribution of $0.01 per share. |
| 6 | The total return is calculated using the published Net Asset Value as of fiscal year end. |
| 7 | The total return would have been 1.32% had the capital contribution not been included. |
| 10 | Excludes the impact of expense reimbursement or fee waivers and expense reductions such as brokerage credits, but includes expense repayments and non-reimbursable expenses, if any, such as interest, taxes, and extraordinary expenses. (See Note 1(c) and 2 in the Notes to Financial Statements.) |
| 11 | The total return would have been 1.57% had the capital contribution not been included. |
| 12 | The commencement of operations for Class Z Shares was October 2, 2017. |
186
AMG Managers Value Partners Asia Dividend Fund
Financial Highlights
For a share outstanding throughout each fiscal period
| | | | | | | | | | | | |
| | | For the fiscal year
ended
October 31, | | | For the fiscal period
ended
October 31, | |
| Class N | | 2018 | | | 2017 | | | 20161 | |
Net Asset Value, Beginning of Period | | $ | 12.91 | | | $ | 10.63 | | | $ | 10.00 | |
Income (loss) from Investment Operations: | | | | | | | | | | | | |
Net investment income2,3 | | | 0.28 | | | | 0.31 | | | | 0.24 | |
Net realized and unrealized gain (loss) on investments | | | (1.94 | ) | | | 2.68 | | | | 0.59 | |
Total income (loss) from investment operations | | | (1.66 | ) | | | 2.99 | | | | 0.83 | |
Less Distributions to Shareholders from: | | | | | | | | | | | | |
Net investment income | | | (0.40 | ) | | | (0.41 | ) | | | (0.20 | ) |
Net realized gain on investments | | | (0.75 | ) | | | (0.30 | ) | | | — | |
Total distributions to shareholders | | | (1.15 | ) | | | (0.71 | ) | | | (0.20 | ) |
Net Asset Value, End of Period | | $ | 10.10 | | | $ | 12.91 | | | $ | 10.63 | |
Total Return3,4 | | | (14.13 | )% | | | 29.71 | % | | | 8.39 | %5 |
Ratio of net expenses to average net assets | | | 1.18 | % | | | 1.17 | % | | | 1.40 | %6 |
Ratio of gross expenses to average net assets7 | | | 2.30 | % | | | 2.25 | % | | | 4.18 | %6 |
Ratio of net investment income to average net assets3 | | | 2.26 | % | | | 2.69 | % | | | 2.74 | %6 |
Portfolio turnover | | | 65 | % | | | 86 | % | | | 51 | %5 |
Net assets end of period (000’s) omitted | | $ | 893 | | | $ | 1,195 | | | $ | 808 | |
| | | | | | | | | | | | |
187
AMG Managers Value Partners Asia Dividend Fund
Financial Highlights
For a share outstanding throughout each fiscal period
| | | | | | | | | | | | |
| | | For the fiscal year
ended
October 31, | | | For the fiscal period
ended
October 31, | |
| Class I | | 2018 | | | 2017 | | | 20161 | |
Net Asset Value, Beginning of Period | | $ | 12.91 | | | $ | 10.63 | | | $ | 10.00 | |
Income (loss) from Investment Operations: | | | | | | | | | | | | |
Net investment income2,3 | | | 0.28 | | | | 0.31 | | | | 0.27 | |
Net realized and unrealized gain (loss) on investments | | | (1.92 | ) | | | 2.67 | | | | 0.58 | |
Total income (loss) from investment operations | | | (1.64 | ) | | | 2.98 | | | | 0.85 | |
Less Distributions to Shareholders from: | | | | | | | | | | | | |
Net investment income | | | (0.41 | ) | | | (0.40 | ) | | | (0.22 | ) |
Net realized gain on investments | | | (0.75 | ) | | | (0.30 | ) | | | — | |
Total distributions to shareholders | | | (1.16 | ) | | | (0.70 | ) | | | (0.22 | ) |
Net Asset Value, End of Period | | $ | 10.11 | | | $ | 12.91 | | | $ | 10.63 | |
Total Return3,4 | | | (14.10 | )% | | | 29.79 | % | | | 8.60 | %5 |
Ratio of net expenses to average net assets | | | 1.15 | % | | | 1.15 | % | | | 1.15 | %6 |
Ratio of gross expenses to average net assets7 | | | 2.27 | % | | | 2.23 | % | | | 3.94 | %6 |
Ratio of net investment income to average net assets3 | | | 2.28 | % | | | 2.71 | % | | | 2.99 | %6 |
Portfolio turnover | | | 65 | % | | | 86 | % | | | 51 | %5 |
Net assets end of period (000’s) omitted | | $ | 7,794 | | | $ | 9,273 | | | $ | 7,283 | |
| | | | | | | | | | | | |
| 1 | The commencement of operations was on December 16, 2015. |
| 2 | Per share numbers have been calculated using average shares. |
| 3 | Total returns and net investment income would have been lower had certain expenses not been offset. |
| 4 | The total return is calculated using the published Net Asset Value as of fiscal year end. |
| 7 | Excludes the impact of expense reimbursement or fee waivers and expense reductions such as brokerage credits, but includes expense repayments and non-reimbursable expenses, if any, such as interest, taxes, and extraordinary expenses. (See Note 1(c) and 2 in the Notes to Financial Statements.) |
188
Notes to Financial Statements
October 31, 2018
1. SUMMARY OF SIGNIFICANT ACCOUNTING POLICIES
AMG Funds IV (the “Trust”) is an open-end management investment company, organized as a Delaware Statutory Trust, and registered under the Investment Company Act of 1940, as amended (the “1940 Act”). Currently, the Trust consists of a number of different funds, (each a “Fund” and collectively, the “Funds”), each having distinct investment management objectives, strategies, risks, and policies. Included in this report are:
|
Funds |
AMG Managers Fairpointe ESG Equity Fund (the “Fairpointe ESG Equity”) |
AMG River Road Focused Absolute Value Fund (the “River Road Focused Absolute Value”) |
AMG Managers Montag & Caldwell Growth Fund (the “Montag & Caldwell Growth”) |
AMG River Road Dividend All Cap Value Fund (the “River Road Dividend All Cap Value”) |
AMG River Road Dividend All Cap Value Fund II (the “River Road Dividend All Cap Value II”) |
AMG Managers Fairpointe Mid Cap Fund (the “Fairpointe Mid Cap”) |
AMG Managers LMCG Small Cap Growth Fund (the “LMCG Small Cap Growth”) |
AMG River Road Small-Mid Cap Value Fund (the “River Road Small-Mid Cap Value”) |
AMG River Road Small Cap Value Fund (the “River Road Small Cap Value”) |
AMG Managers Silvercrest Small Cap Fund (the “Silvercrest Small Cap”) |
AMG GW&K U.S. Small Cap Growth Fund (the “GW&K U.S. Small Cap Growth”) |
AMG Managers DoubleLine Core Plus Bond Fund (the “DoubleLine Core Plus Bond”) |
AMG Managers Lake Partners LASSO Alternatives Fund (the “Lake Partners LASSO Alternatives”) |
AMG River Road Long-Short Fund (the “River Road Long-Short”) |
AMG Managers Guardian Capital Global Dividend Fund (the “Guardian Capital Global Dividend”) |
AMG Managers Pictet International Fund (the “Pictet International”) |
AMG Managers Value Partners Asia Dividend Fund (the “Value Partners Asia Dividend”) |
Effective October 1, 2017, Fairpointe ESG Equity changed its principle investment strategy to prefer investment in companies it deems to have strong environmental, social and governance (ESG) records and seek to avoid those with inferior ESG records relative to the market and peers.
Each Fund is authorized to issue two classes of shares (Class N shares and Class I shares). Montag & Caldwell Growth is also authorized to issue Class R shares. Effective February 24, 2017, GW&K U.S. Small Cap Growth began issuing Class Z shares, and effective October 2, 2017, River Road Focused Absolute Value, River Road Dividend All Cap Value, River Road Dividend All Cap Value II, Fairpointe Mid Cap, River Road Small-Mid Cap, River Road Small Cap Value, Silvercrest Small Cap, DoubleLine Core Plus Bond, River Road Long-Short and Pictet International began issuing Class Z shares. Each class represents an interest in the same assets of the respective Fund. Although all share classes generally have identical voting rights, each share class votes separately when required by law. Different share classes may have different net asset values per share to the extent the share classes pay different distribution amounts and/or the expenses of such share classes differ. Each share class has its own expense structure. Please refer to a current prospectus for additional information on each share class.
The Funds’ financial statements are prepared in accordance with accounting principles generally accepted in the United States of America (“U.S. GAAP”), including accounting and reporting guidance pursuant to Accounting Standards Codification Topic 946 applicable to investment companies. U.S. GAAP requires management to make estimates and assumptions that affect the reported amounts of assets and liabilities and disclosure of contingent assets and liabilities at the date of the financial statements and the reported amounts of income and expenses during the reporting period. Actual results could differ from those estimates and such differences could be material. The following is a summary of significant accounting policies followed by the Funds in the preparation of their financial statements:
a. VALUATION OF INVESTMENTS
Equity securities, including securities sold short, traded on a national securities exchange or reported on the NASDAQ national market system (“NMS”) are valued at the last quoted sales price on the primary exchange or, if applicable, the NASDAQ official closing price or the official closing price of the relevant exchange or, lacking any sales, at the last quoted bid price or the mean between the last quoted bid and ask prices (the “exchange mean price”). Equity securities and securities sold short traded in the over-the-counter market (other than NMS securities) are valued at the exchange mean price. Foreign equity securities (securities principally traded in markets other than U.S. markets) are valued at the official closing price on the primary exchange or, for markets that either do not offer an official closing price or where the official closing price may not be representative of the overall market, the last quoted sale price.
Fixed income securities purchased with a remaining maturity exceeding 60 days are valued at the evaluated bid price or the mean price provided by an authorized pricing service or, if an evaluated price is not available, by reference to other securities which are considered comparable in credit rating, interest rate, due date and other features (generally referred to as “matrix pricing”) or other similar pricing methodologies. Investments in certain mortgage-backed and stripped mortgage-backed securities, preferred stocks, convertible securities, derivatives and other debt securities not traded on an organized securities market are valued on the basis of valuations provided by dealers or by a pricing service which uses information with respect to transactions in such securities and various relationships between such securities and yield to maturity in determining value.
Fixed income securities purchased with a remaining maturity of 60 days or less are valued at amortized cost, provided that the amortized cost value is approximately the same as the fair value of the security valued without the use of amortized cost. Investments in other open-end regulated investment companies are valued at their end of day net asset value per share.
The Funds’ portfolio investments are generally valued based on independent market quotations or prices or, if none, “evaluative” or other market based valuations provided by third party pricing services approved by the Board of Trustees of the Trust (the “Board”). Under certain circumstances, the value of certain Fund portfolio investments may be based on an evaluation of fair value, pursuant to procedures established by and under the general supervision of the Board. The Valuation Committee, which is comprised of the Independent Trustees of the Board, and the Pricing Committee, which is comprised of representatives from AMG Funds LLC (the “Investment Manager”) are the committees appointed by the Board to make fair value determinations. Each Fund may use the fair value of a
189
Notes to Financial Statements (continued)
portfolio investment to calculate its net asset value (“NAV”) in the event that the market quotation, price or market based valuation for the portfolio investment is not readily available or otherwise not determinable pursuant to the Board’s valuation procedures, if the Investment Manager or the Pricing Committee believes the quotation, price or market based valuation to be unreliable, or in certain other circumstances. When determining the fair value of an investment, the Pricing Committee and, if required under the Trust’s securities valuation procedures, the Valuation Committee, seeks to determine the price that the Fund might reasonably expect to receive from current sale of that portfolio investment in an arms-length transaction. Fair value determinations shall be based upon consideration of all available facts and information, including, but not limited to (i) attributes specific to the investment; (ii) fundamental and analytical data relating to the investment; and (iii) the value of other comparable securities or relevant financial instruments, including derivative securities, traded on other markets or among dealers.
The values assigned to fair value portfolio investments are based on available information and do not necessarily represent amounts that might ultimately be realized in the future, since such amounts depend on future developments inherent in long-term investments. Because of the inherent uncertainty of valuation, those estimated values may differ significantly from the values that would have been used had a ready market for the investments existed, and the differences could be material. The Board will be presented with a quarterly report showing as of the most recent quarter end, all outstanding securities fair valued by the Fund, including a comparison with the prior quarter end and the percentage of the Fund that the security represents at each quarter end.
With respect to foreign equity securities and certain foreign fixed income securities, the Board has adopted a policy that securities held in a Fund that can be fair valued by the applicable fair value pricing service are fair valued on each business day provided that each individual price exceeds a pre-established confidence level.
U.S. GAAP defines fair value as the price that a fund would receive to sell an asset or pay to transfer a liability in an orderly transaction between market participants at the measurement date. U.S. GAAP also establishes a framework for measuring fair value, and a three level hierarchy for fair value measurements based upon the transparency of inputs to the valuation of an asset or liability. Inputs may be observable or unobservable and refer broadly to the assumptions that market participants would use in pricing the asset or liability. Observable inputs reflect the assumptions market participants would use in pricing the asset or liability based on market data obtained from sources independent of the Funds. Unobservable inputs reflect the Funds’ own assumptions about the assumptions that market participants would use in pricing the asset or liability developed based on the best information available in the circumstances. Each investment is assigned a level based upon the observability of the inputs which are significant to the overall valuation.
The three-tier hierarchy of inputs is summarized below:
Level 1 – inputs are quoted prices in active markets for identical investments (e.g., equity securities, open-end investment companies)
Level 2 – other observable inputs (including, but not limited to: quoted prices for similar assets or liabilities in markets that are active, quoted prices for identical or similar assets or liabilities in markets that are not active, inputs other than quoted prices that are observable for the assets or liabilities (such as interest rates, yield curves, volatilities, prepayment speeds, loss severities, credit risks and default rates) or other market corroborated inputs) (e.g., debt securities, government securities, foreign currency exchange contracts, swaps, foreign securities utilizing international fair value pricing, fair valued securities with observable inputs)
Level 3 – inputs are significant unobservable inputs (including the Fund’s own assumptions used to determine the fair value of investments) (e.g., fair valued securities with unobservable inputs)
Changes in inputs or methodologies used for valuing investments may result in a transfer in or out of levels within the fair value hierarchy. The inputs or methodologies used for valuing investments may not necessarily be an indication of the risk associated with investing in those investments. Transfers between different levels of the fair value disclosure hierarchy are deemed to have occurred as of the beginning of the reporting period.
b. SECURITY TRANSACTIONS
Security transactions are accounted for as of trade date. Realized gains and losses on securities sold are determined on the basis of identified cost.
c. INVESTMENT INCOME AND EXPENSES
Dividend income is recorded on the ex-dividend date. Dividends from foreign securities are recorded on the ex-dividend date, and if after the fact, as soon as the Funds become aware of the ex-dividend date, except for Korean securities where dividends are recorded on confirmation date. Dividends declared on short positions are recorded on ex-date as dividend expense. Interest income, which includes amortization of premium and accretion of discount on debt securities, is accrued as earned. Dividend and interest income on foreign securities is recorded gross of any withholding tax. Non-cash dividends included in dividend income, if any, are reported at the fair market value of the securities received. Upon notification from issuers, distributions received from a real estate investment trust (“REIT”) may be redesignated as a reduction of cost of investments and/or realized gain. Other income and expenses are recorded on an accrual basis. Expenses that cannot be directly attributed to a Fund are apportioned among the funds in the Trust and other trusts within the AMG Funds family of mutual funds (collectively the “AMG Funds Family”) based upon their relative average net assets or number of shareholders. Investment income, realized and unrealized capital gains and losses, the common expenses of each Fund, and certain fund level expense reductions, if any, are allocated on a pro-rata basis to each class based on the relative net assets of each class to the total net assets of each Fund.
The following Funds had certain portfolio trades directed to various brokers under a brokerage recapture program. Credits received from the brokerage recapture program are earned and paid on a monthly basis, and are recorded as expense offsets, which serve to reduce the Funds’ overall expense ratio. For the fiscal year ended October 31, 2018, the impact on the expense were as follows:
| | | | |
| | | Reductions | |
River Road Focused Absolute Value | | $ | 3,155 | |
Montag & Caldwell Growth | | | 35,817 | |
River Road Dividend All Cap Value | | | 15,426 | |
River Road Dividend All Cap Value II | | | 6,575 | |
LMCG Small Cap Growth | | | 7,905 | |
River Road Small-Mid Cap Value | | | 6,012 | |
River Road Small Cap Value | | | 23,820 | |
Silvercrest Small Cap | | | 64,120 | |
GW&K U.S. Small Cap Growth | | | 17,723 | |
River Road Long-Short | | | 6,456 | |
190
Notes to Financial Statements (continued)
d. DIVIDENDS AND DISTRIBUTIONS
Fund distributions resulting from either net investment income or realized net capital gains, if any, will normally be declared and paid at least annually in December. Distributions to shareholders are recorded on the ex-dividend date. Distributions are determined in accordance with federal income tax regulations, which may differ from net investment income and net realized capital gains for financial statement purposes (U.S. GAAP). Differences may be permanent or temporary. Permanent differences are reclassified among capital accounts in the financial statements to reflect their tax character. Permanent book and tax basis differences, if any, relating to shareholder distributions will result in reclassification to paid-in capital. Temporary differences arise when certain items of income, expense and gain or loss are recognized in different periods for financial statement and tax purposes; these differences will reverse at some time in the future. Permanent differences are primarily due to net operating losses, tax equalization utilized, amortization on securities sold, distributions received from investments in certain partnerships, net operating losses offset by short term capital gains, gains/losses on foreign currency, paydowns, tax adjustments on passive foreign investment companies sold, redesignation of dividends paid by a fund, distributions received from regulated investment companies, and distributions in excess of net investment income paid by a fund. Temporary differences are primarily due to differences between book and tax treatment of losses for excise tax purposes, wash sale loss deferrals, amortization, mark-to-market of passive foreign investment companies, gains/losses on foreign currency, non-deductible organizational expense, premiums outstanding, and distributions received from investments in certain partnerships.
Dividend Income on the Statement of Operations for River Road Long-Short incudes non-recurring dividends of $380,948.
The distributions disclosed on the Statements of Changes in Net Assets for the fiscal year ended October 31, 2017 were from the following sources:
| | | | | | | | |
| | | Net Investment | | | Realized Gain on | |
| Fund | | Income | | | Investments | |
Fairpointe ESG Equity | | | | | |
Class N | | $ | 874 | | | | — | |
Class I | | | 68,181 | | | | — | |
| | | | | | | | |
Total | | | 69,055 | | | | — | |
| | | | | | | | |
River Road Focused Absolute Value | | | | | |
Class N | | | 7,854 | | | $ | 66,646 | |
Class I | | | 112,913 | | | | 842,368 | |
| | | | | | | | |
Total | | | 120,767 | | | | 909,014 | |
| | | | | | | | |
| | | | | | | | |
| | | Net Investment | | | Realized Gain on | |
| Fund | | Income | | | Investments | |
Montag & Caldwell Growth | | | | | |
Class N | | $ | 828,374 | | | $ | 39,690,379 | |
Class I | | | 4,910,866 | | | | 72,425,486 | |
Class R | | | 8,072 | | | | 535,608 | |
| | | | | | | | |
Total | | | 5,747,312 | | | | 112,651,473 | |
| | | | | | | | |
River Road Dividend All Cap Value | | | | | |
Class N | | | 4,378,159 | | | | 20,724,974 | |
Class I | | | 12,190,543 | | | | 38,518,497 | |
Class Z | | | 234 | | | | — | |
| | | | | | | | |
Total | | | 16,568,936 | | | | 59,243,471 | |
| | | | | | | | |
River Road Dividend All Cap Value II | | | | | |
Class N | | | 50,019 | | | | 139,259 | |
Class I | | | 1,944,514 | | | | 4,633,931 | |
Class Z | | | 102 | | | | — | |
| | | | | | | | |
Total | | | 1,994,635 | | | | 4,773,190 | |
| | | | | | | | |
Fairpointe Mid Cap | | | | | |
Class N | | | 4,738,012 | | | | 61,100,310 | |
Class I | | | 13,393,786 | | | | 96,561,949 | |
| | | | | | | | |
Total | | | 18,131,798 | | | | 157,662,259 | |
| | | | | | | | |
River Road Small-Mid Cap Value | | | | | |
Class N | | | 6,217 | | | | 388,245 | |
Class I | | | 124,646 | | | | 2,623,776 | |
| | | | | | | | |
Total | | | 130,863 | | | | 3,012,021 | |
| | | | | | | | |
River Road Small Cap Value | | | | | |
Class N | | | — | | | | 1,206,779 | |
Class I | | | — | | | | 13,057,219 | |
| | | | | | | | |
Total | | | — | | | | 14,263,998 | |
| | | | | | | | |
Silvercrest Small Cap | | | | | |
Class N | | | — | | | | 172,910 | |
Class I | | | 462,292 | | | | 1,603,029 | |
| | | | | | | | |
Total | | | 462,292 | | | | 1,775,939 | |
| | | | | | | | |
GW&K U.S. Small Cap Growth | | | | | |
Class N | | | — | | | | 44,632 | |
Class I | | | — | | | | 14,009 | |
| | | | | | | | |
Total | | | — | | | | 58,641 | |
| | | | | | | | |
191
Notes to Financial Statements (continued)
| | | | | | | | |
| Fund | | Net Investment
Income | | | Realized Gain on
Investments | |
DoubleLine Core Plus Bond | | | | | |
Class N | | $ | 6,469,092 | | | $ | 566,979 | |
Class I | | | 13,470,209 | | | | 780,506 | |
Class Z | | | 659 | | | | — | |
| | | | | | | | |
Total | | | 19,939,960 | | | | 1,347,485 | |
| | | | | | | | |
Lake Partners LASSO Alternatives | | | | | |
Class N | | | — | | | | 123,358 | |
Class I | | | — | | | | 263,958 | |
| | | | | | | | |
Total | | | — | | | | 387,316 | |
| | | | | | | | |
Guardian Capital Global Dividend | | | | | |
Class N | | | 16,721 | | | | — | |
Class I | | | 665,170 | | | | — | |
| | | | | | | | |
Total | | | 681,891 | | | | — | |
| | | | | | | | |
Pictet International | | | | | |
Class N | | | 946 | | | | 2,721 | |
Class I | | | 19,015,823 | | | | 28,593,441 | |
| | | | | | | | |
Total | | | 19,016,769 | | | | 28,596,162 | |
| | | | | | | | |
| | | | | | | | |
| Fund | | Net Investment Income | | | Realized Gain on
Investments | |
Value Partners Asia Dividend | | | | | |
Class N | | $ | 33,987 | | | $ | 22,865 | |
Class I | | | 282,917 | | | | 203,640 | |
| | | | | | | | |
Total | | | 316,904 | | | | 226,505 | |
| | | | | | | | |
At the fiscal year end October 31, 2017, undistributed (distribution in excess of) net investment income was as follows:
| | | | |
Fairpointe ESG Equity | | $ | 111,828 | |
River Road Focused Absolute Value | | | 56,005 | |
Montag & Caldwell Growth | | $ | (565,119 | ) |
River Road Dividend All Cap Value | | | 2,235,531 | |
River Road Dividend All Cap Value II | | | 409,437 | |
Fairpointe Mid Cap | | | — | |
LMCG Small Cap Growth | | | (826,039 | ) |
River Road Small-Mid Cap Value | | | — | |
River Road Small Cap Value | | | — | |
Silvercrest Small Cap | | | 43,263 | |
GW&K U.S. Small Cap Growth | | | — | |
DoubleLine Core Plus Bond | | | (858,405 | ) |
Lake Partners LASSO Alternatives | | | (461,196 | ) |
River Road Long-Short | | | (757,484 | ) |
Guardian Capital Global Dividend | | | 110,120 | |
Pictet International | | | 18,585,148 | |
Value Partners Asia Dividend | | | 78,243 | |
The tax character of distributions paid during the fiscal years ended October 31, 2018 and October 31, 2017 were as follows:
| | | | | | | | | | | | | | | | | | | | | | | | |
| | | Fairpointe ESG Equity | | | River Road Focused Absolute Value | | | Montag & Caldwell Growth | |
| Distributions paid from: | | 2018 | | | 2017 | | | 2018 | | | 2017 | | | 2018 | | | 2017 | |
Ordinary income | | $ | 120,366 | | | $ | 69,055 | | | $ | 151,316 | | | $ | 114,198 | | | $ | 188,976 | | | $ | 4,950,517 | |
Short-term capital gains | | | — | | | | — | | | | 910,064 | | | | 867,539 | | | | 346,008 | | | | 796,795 | |
Long-term capital gains | | | — | | | | — | | | | 880,256 | | | | 48,044 | | | | 74,718,856 | | | | 112,651,473 | |
| | | | | | | | | | | | | | | | | | | | | | | | |
| | $ | 120,366 | | | $ | 69,055 | | | $ | 1,941,636 | | | $ | 1,029,781 | | | $ | 75,253,840 | | | $ | 118,398,785 | |
| | | | | | | | | | | | | | | | | | | | | | | | |
| | | |
| | | River Road Dividend All Cap Value | | | River Road Dividend All Cap Value II | | | Fairpointe Mid Cap | |
| Distributions paid from: | | 2018 | | | 2017 | | | 2018 | | | 2017 | | | 2018 | | | 2017 | |
Ordinary income | | $ | 21,817,357 | | | $ | 16,568,936 | | | $ | 2,717,745 | | | $ | 1,994,635 | | | $ | 2,121,795 | | | $ | 17,306,350 | |
Short-term capital gains | | | 3,102,255 | | | | — | | | | 318,039 | | | | — | | | | — | | | | — | |
Long-term capital gains | | | 38,240,751 | | | | 59,243,471 | | | | 5,662,802 | | | | 4,773,190 | | | | 257,606,580 | | | | 158,487,707 | |
| | | | | | | | | | | | | | | | | | | | | | | | |
| | $ | 63,160,363 | | | $ | 75,812,407 | | | $ | 8,698,586 | | | $ | 6,767,825 | | | $ | 259,728,375 | | | $ | 175,794,057 | |
| | | | | | | | | | | | | | | | | | | | | | | | |
192
Notes to Financial Statements (continued)
| | | | | | | | | | | | | | | | | | | | | | | | |
| | | LMCG Small Cap Growth | | | River Road Small-Mid Cap Value | | | River Road Small Cap Value | |
| Distributions paid from: | | 2018 | | | 2017 | | | 2018 | | | 2017 | | | 2018 | | | 2017 | |
Ordinary income | | | — | | | | — | | | | — | | | | — | | | | — | | | | — | |
Short-term capital gains | | | — | | | | — | | | $ | 1,297,400 | | | $ | 180,261 | | | $ | 8,295,795 | | | $ | 8,589,024 | |
Long-term capital gains | | | — | | | | — | | | | 4,886,827 | | | | 2,962,623 | | | | 32,632,718 | | | | 5,674,974 | |
| | | | | | | | | | | | | | | | | | | | | | | | |
| | | — | | | | — | | | $ | 6,184,227 | | | $ | 3,142,884 | | | $ | 40,928,513 | | | $ | 14,263,998 | |
| | | | | | | | | | | | | | | | | | | | | | | | |
| | | |
| | | Silvercrest Small Cap | | | GW&K U.S. Small Cap Growth | | | DoubleLine Core Plus Bond | |
| Distributions paid from: | | 2018 | | | 2017 | | | 2018 | | | 2017 | | | 2018 | | | 2017 | |
Ordinary income | | $ | 153,570 | | | $ | 451,183 | | | | — | | | | — | | | $ | 20,443,183 | | | $ | 20,629,001 | |
Short-term capital gains | | | 620,025 | | | | — | | | $ | 374,767 | | | | — | | | | — | | | | 658,444 | |
Long-term capital gains | | | 20,303,757 | | | | 1,787,048 | | | | 4,703,524 | | | $ | 58,641 | | | | — | | | | — | |
Paid in capital | | | — | | | | — | | | | — | | | | — | | | | — | | | | 2,904,697 | |
| | | | | | | | | | | | | | | | | | | | | | | | |
| | $ | 21,077,352 | | | $ | 2,238,231 | | | $ | 5,078,291 | | | $ | 58,641 | | | $ | 20,443,183 | | | $ | 24,192,142 | |
| | | | | | | | | | | | | | | | | | | | | | | | |
| | | |
| | | Lake Partners LASSO Alternatives | | | River Road Long-Short | | | Guardian Capital Global Dividend | |
| Distributions paid from: | | 2018 | | | 2017 | | | 2018 | | | 2017 | | | 2018 | | | 2017 | |
Ordinary income | | $ | 71,492 | | | | — | | | | — | | | | — | | | $ | 906,570 | | | $ | 681,891 | |
Short-term capital gains | | | — | | | | — | | | | — | | | | — | | | | 38,051 | | | | — | |
Long-term capital gains | | | 1,992,715 | | | $ | 387,316 | | | | — | | | | — | | | | 127,391 | | | | — | |
| | | | | | | | | | | | | | | | | | | | | | | | |
| | $ | 2,064,207 | | | $ | 387,316 | | | | — | | | | — | | | $ | 1,072,012 | | | $ | 681,891 | |
| | | | | | | | | | | | | | | | | | | | | | | | |
| | | | | | | | | | | | | | | | |
| | | Pictet International | | | Value Partners Asia Dividend | |
| Distributions paid from: | | 2018 | | | 2017 | | | 2018 | | | 2017 | |
Ordinary income | | $ | 32,906,014 | | | $ | 19,016,769 | | | $ | 336,176 | | | $ | 316,904 | |
Short-term capital gains | | | 25,626,511 | | | | 27,968,749 | | | | 411,155 | | | | 226,505 | |
Long-term capital gains | | | 31,548,773 | | | | 627,413 | | | | 200,531 | | | | — | |
| | | | | | | | | | | | | | | | |
| | $ | 90,081,298 | | | $ | 47,612,931 | | | $ | 947,862 | | | $ | 543,409 | |
| | | | | | | | | | | | | | | | |
As of October 31, 2018, the components of distributable earnings (excluding unrealized appreciation/depreciation) on a tax basis consisted of:
| | | | | | | | | | | | |
| | | | | | River Road | | | | |
| | | Fairpointe ESG | | | Focused Absolute | | | Montag & Caldwell | |
| | | Equity | | | Value | | | Growth | |
Capital loss carryforward | | $ | 205,846 | | | | — | | | | — | |
Undistributed ordinary income | | | 91,866 | | | $ | 143,013 | | | | — | |
Undistributed short-term capital gains | | | — | | | | 1,400,396 | | | $ | 12,228,160 | |
Undistributed long-term capital gains | | | — | | | | 462,299 | | | | 93,548,228 | |
Late-year loss deferral | | | — | | | | — | | | | — | |
193
Notes to Financial Statements (continued)
| | | | | | | | | | | | |
| | | River Road | | | River Road | | | | |
| | | Dividend All Cap Value | | | Dividend All Cap Value II | | | Fairpointe Mid Cap | |
Capital loss carryforward | | | — | | | | — | | | | — | |
Undistributed ordinary income | | $ | 4,945,025 | | | $ | 596,254 | | | $ | 10,932,714 | |
Undistributed short-term capital gains | | | — | | | | — | | | | — | |
Undistributed long-term capital gains | | | 46,640,932 | | | | 8,647,787 | | | | 178,444,715 | |
Late-year loss deferral | | | — | | | | — | | | | — | |
| | | |
| | | | | | River Road | | | | |
| | | LMCG Small | | | Small-Mid Cap | | | River Road | |
| | | Cap Growth | | | Value | | | Small Cap Value | |
Capital loss carryforward | | $ | 1,727,269 | | | | — | | | | — | |
Undistributed ordinary income | | | — | | | | — | | | | — | |
Undistributed short-term capital gains | | | — | | | $ | 1,268,090 | | | $ | 6,339,594 | |
Undistributed long-term capital gains | | | — | | | | 2,991,534 | | | | 25,359,094 | |
Late-year loss deferral | | | 302,779 | | | | — | | | | — | |
| | | |
| | | | | | GW&K | | | DoubleLine | |
| | | Silvercrest | | | U.S. Small Cap | | | Core Plus | |
| | | Small Cap | | | Growth | | | Bond | |
Capital loss carryforward | | | — | | | | — | | | $ | 13,171,328 | |
Undistributed ordinary income | | | — | | | | — | | | | 873,373 | |
Undistributed short-term capital gains | | $ | 4,673,890 | | | | — | | | | — | |
Undistributed long-term capital gains | | | 15,847,678 | | | $ | 5,212,377 | | | | — | |
Late-year loss deferral | | | — | | | | 113,263 | | | | — | |
| | | |
| | | Lake Partners | | | | | | | |
| | | LASSO | | | River Road | | | Guardian Capital | |
| | | Alternatives | | | Long-Short | | | Global Dividend | |
Capital loss carryforward | | | — | | | | — | | | | — | |
Undistributed ordinary income | | | — | | | | — | | | $ | 45,241 | |
Undistributed short-term capital gains | | | — | | | $ | 303,466 | | | | — | |
Undistributed long-term capital gains | | $ | 582,486 | | | | 1,291,622 | | | | 257,561 | |
Late-year loss deferral | | | — | | | | — | | | | — | |
| | | |
| | | | | | Pictet | | | Value Partners | |
| | | | | | International | | | Asia Dividend | |
Capital loss carryforward | | | | | | | — | | | | — | |
Undistributed ordinary income | | | | | | $ | 27,903,549 | | | | — | |
Undistributed short-term capital gains | | | | | | | — | | | $ | 250,377 | |
Undistributed long-term capital gains | | | | | | | 105,598,392 | | | | 409,440 | |
Late-year loss deferral | | | | | | | — | | | | — | |
At October 31, 2018, the cost of investments and the aggregate gross unrealized appreciation and depreciation for federal income tax purposes were as follows:
| | | | | | | | | | | | | | | | |
| Fund | | Cost | | | Appreciation | | | Depreciation | | | Net | |
Fairpointe ESG Equity | | $ | 9,669,225 | | | $ | 1,338,822 | | | $ | (580,315 | ) | | $ | 758,507 | |
River Road Focused Absolute Value | | | 29,363,165 | | | | 2,370,756 | | | | (1,564,594 | ) | | | 806,162 | |
Montag & Caldwell Growth | | | 448,938,951 | | | | 154,427,894 | | | | (5,760,359 | ) | | | 148,667,535 | |
194
Notes to Financial Statements (continued)
| | | | | | | | | | | | | | | | |
| Fund | | Cost | | | Appreciation | | | Depreciation | | | Net | |
River Road Dividend All Cap Value | | $ | 724,402,441 | | | $ | 169,646,154 | | | $ | (43,710,599 | ) | | | 125,935,555 | |
River Road Dividend All Cap Value II | | | 75,505,629 | | | | 14,860,399 | | | | (3,761,475 | ) | | | 11,098,924 | |
Fairpointe Mid Cap | | | 2,406,163,662 | | | | 696,151,712 | | | | (251,698,252 | ) | | | 444,453,460 | |
LMCG Small Cap Growth | | | 106,524,060 | | | | 11,584,008 | | | | (7,682,071 | ) | | | 3,901,937 | |
River Road Small-Mid Cap Value | | | 67,781,370 | | | | 6,310,141 | | | | (3,528,005 | ) | | | 2,782,136 | |
River Road Small Cap Value | | | 320,444,669 | | | | 65,295,740 | | | | (19,124,692 | ) | | | 46,171,048 | |
Silvercrest Small Cap | | | 235,189,858 | | | | 24,991,734 | | | | (17,923,877 | ) | | | 7,067,857 | |
GW&K U.S. Small Cap Growth | | | 31,116,408 | | | | 8,865,145 | | | | (3,119,493 | ) | | | 5,745,652 | |
DoubleLine Core Plus Bond | | | 593,850,564 | | | | 3,449,143 | | | | (19,514,720 | ) | | | (16,065,577 | ) |
Lake Partners LASSO Alternatives | | | 26,733,172 | | | | 1,141,085 | | | | (361,703 | ) | | | 779,382 | |
River Road Long-Short | | | 21,208,449 | | | | 1,610,802 | | | | (2,513,799 | ) | | | (902,997 | ) |
Guardian Capital Global Dividend | | | 33,996,515 | | | | 3,654,868 | | | | (1,054,980 | ) | | | 2,599,888 | |
Pictet International | | | 1,716,319,200 | | | | 125,801,719 | | | | (229,507,596 | ) | | | (103,705,877 | ) |
Value Partners Asia Dividend | | | 9,109,973 | | | | 844,077 | | | | (1,530,917 | ) | | | (686,840 | ) |
e. FEDERAL TAXES
Each Fund currently qualifies as an investment company and intends to comply with the requirements under Subchapter M of the Internal Revenue Code of 1986, as amended, and to distribute substantially all of its taxable income and gains to its shareholders and to meet certain diversification and income requirements with respect to investment companies. Therefore, no provision for federal income or excise tax is included in the accompanying financial statements.
Additionally, based on each Fund’s understanding of the tax rules and rates related to income, gains and transactions for the foreign jurisdictions in which it invests, each Fund will provide for foreign taxes, and where appropriate, deferred foreign taxes.
Management has analyzed the Funds’ tax positions taken on federal income tax returns as of October 31, 2018, and for all open tax years (generally, the three prior taxable years), and has concluded that no provision for federal income tax is required in the Funds’ financial statements. Additionally, Management is not aware of any tax position for which it is reasonably possible that the total amounts of unrecognized tax benefits will change materially in the next twelve months.
Net capital losses incurred may be carried forward for an unlimited time period, and retain their tax character as either short-term or long-term capital losses.
f. CAPITAL LOSS CARRYOVERS AND DEFERRALS
As of October 31, 2018, the following Funds had accumulated net realized capital loss carryovers from securities transactions for federal income tax purposes as shown in the following chart. These amounts may be used to offset future realized capital gains, if any, for an unlimited time period.
| | | | | | | | |
| | | Capital Loss Carryover | |
| Fund | | Short-Term | | | Long-Term | |
FairPointe ESG Equity Fund | | $ | 205,846 | | | | — | |
LCMG Small Cap Growth | | | 1,727,269 | | | | — | |
DoubleLine Core Plus Bond Fund | | | 5,918,602 | | | $ | 7,252,726 | |
As of October 31, 2018, the Funds not listed above had no accumulated net realized capital loss carryovers from securities transactions for federal income tax purposes. Should the Funds incur capital losses for the fiscal year ended October 31, 2019, such amounts may be used to offset future realized capital gains, if any, for an unlimited time period.
For the fiscal year ended October 31, 2018, the following Funds utilized capital loss carryovers in the amount of:
| | | | | | | | |
| | | Capital Loss Carryover Utilized | |
| Fund | | Short-Term | | | Long-Term | |
LCMG Small Cap Growth | | $ | 20,277,877 | | | $ | 1,031,752 | |
River Road Long-Short Fund | | | 21,660 | | | | — | |
g. CAPITAL STOCK
The Trust’s Declaration of Trust authorizes for each Fund the issuance of an unlimited number of shares of beneficial interest, without par value. Each Fund records sales and repurchases of its capital stock on the trade date. Guardian Capital Global Dividend, Pictet International and Value Partners Asia Dividend will deduct a 2.00% redemption fee from the proceeds of any redemption (including a redemption by exchange) of shares if the redemption occurs within 90 days of the purchase of those shares. For the fiscal year ended October 31, 2017, Pictet International and Value Partners Asia Dividend had redemption fees amounting to $16,629 and $282, respectively.
195
Notes to Financial Statements (continued)
For the fiscal year ended October 31, 2018, Guardian Capital Global Dividend, Pictet International and Value Partners Asia Dividend had redemption fees amounting to $190, $125,630 and $19, respectively. These amounts are netted against the cost of shares repurchased in the Statements of Changes in Net Assets.
For the fiscal years ended October 31, 2018 and October 31, 2017, the capital stock transactions by class for the Funds were as follows:
| | | | | | | | | | | | | | | | | | | | | | | | | | | | | | | | |
| | | Fairpointe ESG Equity | | | River Road Focused Absolute Value | |
| | | October 31, 2018 | | | October 31, 2017 | | | October 31, 2018 | | | October 31, 2017 | |
| | | Shares | | | Amount | | | Shares | | | Amount | | | Shares | | | Amount | | | Shares | | | Amount | |
Class N: | | | | | | | | | | | | | | | | | | | | | | | | | | | | | | | | |
Proceeds from sale of shares | | | 8,773 | | | $ | 107,345 | | | | 88,201 | | | $ | 961,090 | | | | 345,357 | | | $ | 4,132,526 | | | | 647,479 | | | $ | 7,753,495 | |
Reinvestment of distributions | | | 748 | | | | 9,243 | | | | 82 | | | | 874 | | | | 51,795 | | | | 584,247 | | | | 6,633 | | | | 74,093 | |
Cost of shares repurchased | | | (19,289 | ) | | | (236,085 | ) | | | (76,166 | ) | | | (853,127 | ) | | | (253,622 | ) | | | (2,931,767 | ) | | | (71,797 | ) | | | (828,931 | ) |
| | | | | | | | | | | | | | | | | | | | | | | | | | | | | | | | |
Net increase (decrease) | | | (9,768 | ) | | $ | (119,497 | ) | | | 12,117 | | | $ | 108,837 | | | | 143,530 | | | $ | 1,785,006 | | | | 582,315 | | | $ | 6,998,657 | |
| | | | | | | | | | | | | | | | | | | | | | | | | | | | | | | | |
Class I: | | | | | | | | | | | | | | | | | | | | | | | | | | | | | | | | |
Proceeds from sale of shares | | | 412,889 | | | $ | 5,059,710 | | | | 272,498 | | | $ | 3,060,629 | | | | 506,084 | | | $ | 5,975,162 | | | | 719,816 | | | $ | 8,242,714 | |
Reinvestment of distributions | | | 9,049 | | | | 111,123 | | | | 6,396 | | | | 68,181 | | | | 119,483 | | | | 1,352,549 | | | | 81,254 | | | | 908,302 | |
Cost of shares repurchased | | | (7,327 | ) | | | (91,510 | ) | | | (458,651 | ) | | | (5,174,881 | ) | | | (314,384 | ) | | | (3,661,346 | ) | | | (405,387 | ) | | | (4,688,032 | ) |
| | | | | | | | | | | | | | | | | | | | | | | | | | | | | | | | |
Net increase (decrease) | | | 414,611 | | | $ | 5,079,323 | | | | (179,757 | ) | | $ | (2,046,071 | ) | | | 311,183 | | | $ | 3,666,365 | | | | 395,683 | | | $ | 4,462,984 | |
| | | | | | | | | | | | | | | | | | | | | | | | | | | | | | | | |
Class Z:1 | | | | | | | | | | | | | | | | | | | | | | | | | | | | | | | | |
Proceeds from sale of shares | | | — | | | | — | | | | — | | | | — | | | | — | | | | — | | | | 5,906 | | | $ | 71,500 | |
Reinvestment of distributions | | | — | | | | — | | | | — | | | | — | | | | 427 | | | $ | 4,840 | | | | — | | | | — | |
Cost of shares repurchased | | | — | | | | — | | | | — | | | | — | | | | — | | | | — | | | | (821 | ) | | | (9,951 | ) |
| | | | | | | | | | | | | | | | | | | | | | | | | | | | | | | | |
Net increase | | | — | | | | — | | | | — | | | | — | | | | 427 | | | $ | 4,840 | | | | 5,085 | | | $ | 61,549 | |
| | | | | | | | | | | | | | | | | | | | | | | | | | | | | | | | |
196
Notes to Financial Statements (continued)
| | | | | | | | | | | | | | | | | | | | | | | | | | | | | | | | |
| | | Montag & Caldwell Growth | | | River Road Dividend All Cap Value | |
| | | October 31, 2018 | | | October 31, 2017 | | | October 31, 2018 | | | October 31, 2017 | |
| | | Shares | | | Amount | | | Shares | | | Amount | | | Shares | | | Amount | | | Shares | | | Amount | |
Class N: | | | | | | | | | | | | | | | | | | | | | | | | | | | | | | | | |
Proceeds from sale of shares | | | 534,645 | | | $ | 11,026,782 | | | | 1,593,399 | | | $ | 30,026,822 | | | | 954,322 | | | $ | 12,023,431 | | | | 5,980,618 | | | $ | 75,919,541 | |
Reinvestment of distributions | | | 1,063,852 | | | | 20,957,885 | | | | 2,190,601 | | | | 38,861,264 | | | | 660,797 | | | | 8,289,573 | | | | 1,997,056 | | | | 24,865,471 | |
Cost of shares repurchased | | | (5,342,480 | ) | | | (111,440,545 | ) | | | (17,821,873 | ) | | | (347,708,108 | ) | | | (4,057,839 | ) | | | (51,163,298 | ) | | | (21,657,253 | ) | | | (270,192,230 | ) |
| | | | | | | | | | | | | | | | | | | | | | | | | | | | | | | | |
Net decrease | | | (3,743,983 | ) | | $ | (79,455,878 | ) | | | (14,037,873 | ) | | $ | (278,820,022 | ) | | | (2,442,720 | ) | | $ | (30,850,294 | ) | | | (13,679,579 | ) | | $ | (169,407,218 | ) |
| | | | | | | | | | | | | | | | | | | | | | | | | | | | | | | | |
Class I: | | | | | | | | | | | | | | | | | | | | | | | | | | | | | | | | |
Proceeds from sale of shares | | | 3,812,515 | | | $ | 79,045,937 | | | | 9,700,745 | | | $ | 190,872,936 | | | | 11,123,981 | | | $ | 139,902,240 | | | | 24,499,792 | | | $ | 306,814,880 | |
Reinvestment of distributions | | | 2,312,557 | | | | 45,742,378 | | | | 3,487,749 | | | | 61,975,608 | | | | 4,272,488 | | | | 53,560,954 | | | | 3,741,774 | | | | 46,603,083 | |
Cost of shares repurchased | | | (16,764,310 | ) | | | (348,176,399 | ) | | | (24,013,174 | ) | | | (459,956,099 | ) | | | (16,140,415 | ) | | | (203,004,384 | ) | | | (12,575,939 | ) | | | (158,820,333 | ) |
| | | | | | | | | | | | | | | | | | | | | | | | | | | | | | | | |
Net increase (decrease) | | | (10,639,238 | ) | | $ | (223,388,084 | ) | | | (10,824,680 | ) | | $ | (207,107,555 | ) | | | (743,946 | ) | | $ | (9,541,190 | ) | | | 15,665,627 | | | $ | 194,597,630 | |
| | | | | | | | | | | | | | | | | | | | | | | | | | | | | | | | |
Class R: | | | | | | | | | | | | | | | | | | | | | | | | | | | | | | | | |
Proceeds from sale of shares | | | 5,292 | | | $ | 105,496 | | | | 41,235 | | | $ | 780,021 | | | | — | | | | — | | | | — | | | | — | |
Reinvestment of distributions | | | 1,879 | | | | 36,074 | | | | 27,055 | | | | 469,668 | | | | — | | | | — | | | | — | | | | — | |
Cost of shares repurchased | | | (9,961 | ) | | | (204,960 | ) | | | (320,225 | ) | | | (6,163,199 | ) | | | — | | | | — | | | | — | | | | — | |
| | | | | | | | | | | | | | | | | | | | | | | | | | | | | | | | |
Net decrease | | | (2,790 | ) | | $ | (63,390 | ) | | | (251,935 | ) | | $ | (4,913,510 | ) | | | — | | | | — | | | | — | | | | — | |
| | | | | | | | | | | | | | | | | | | | | | | | | | | | | | | | |
Class Z:1 | | | | | | | | | | | | | | | | | | | | | | | | | | | | | | | | |
Proceeds from sale of shares | | | — | | | | — | | | | — | | | | — | | | | 251,380 | | | $ | 3,195,307 | | | | 19,980 | | | $ | 256,133 | |
Reinvestment of distributions | | | — | | | | — | | | | — | | | | — | | | | 1,709 | | | | 21,471 | | | | 18 | | | | 234 | |
Cost of shares repurchased | | | — | | | | — | | | | — | | | | — | | | | (222,749 | ) | | | (2,784,101 | ) | | | — | | | | — | |
| | | | | | | | | | | | | | | | | | | | | | | | | | | | | | | | |
Net increase | | | — | | | | — | | | | — | | | | — | | | | 30,340 | | | $ | 432,677 | | | | 19,998 | | | $ | 256,367 | |
| | | | | | | | | | | | | | | | | | | | | | | | | | | | | | | | |
197
Notes to Financial Statements (continued)
| | | | | | | | | | | | | | | | | | | | | | | | | | | | | | | | |
| | | River Road Dividend All Cap Value II | | | Fairpointe Mid Cap | |
| | | October 31, 2018 | | | October 31, 2017 | | | October 31, 2018 | | | October 31, 2017 | |
| | | Shares | | | Amount | | | Shares | | | Amount | | | Shares | | | Amount | | | Shares | | | Amount | |
Class N: | | | | | | | | | | | | | | | | | | | | | | | | | | | | | | | | |
Proceeds from sale of shares | | | 4,348 | | | $ | 64,163 | | | | 27,314 | | | $ | 393,482 | | | | 3,794,347 | | | $ | 162,654,871 | | | | 7,305,104 | | | $ | 309,293,225 | |
Reinvestment of distributions | | | 13,908 | | | | 200,402 | | | | 13,295 | | | | 189,278 | | | | 1,896,462 | | | | 81,377,192 | | | | 1,525,543 | | | | 63,599,870 | |
Cost of shares repurchased | | | (72,926 | ) | | | (1,057,300 | ) | | | (82,903 | ) | | | (1,202,400 | ) | | | (13,139,539 | ) | | | (553,934,059 | ) | | | (14,716,260 | ) | | | (623,654,945 | ) |
| | | | | | | | | | | | | | | | | | | | | | | | | | | | | | | | |
Net decrease | | | (54,670 | ) | | $ | (792,735 | ) | | | (42,294 | ) | | $ | (619,640 | ) | | | (7,448,730 | ) | | $ | (309,901,996 | ) | | | (5,885,613 | ) | | $ | (250,761,850 | ) |
| | | | | | | | | | | | | | | | | | | | | | | | | | | | | | | | |
Class I: | | | | | | | | | | | | | | | | | | | | | | | | | | | | | | | | |
Proceeds from sale of shares | | | 714,224 | | | $ | 10,217,669 | | | | 1,000,176 | | | $ | 14,381,093 | | | | 13,948,944 | | | $ | 602,613,915 | | | | 23,047,039 | | | $ | 1,002,859,544 | |
Reinvestment of distributions | | | 575,938 | | | | 8,307,708 | | | | 453,032 | | | | 6,458,281 | | | | 3,724,484 | | | | 163,915,906 | | | | 2,326,071 | | | | 99,113,891 | |
Cost of shares repurchased | | | (3,344,871 | ) | | | (48,175,390 | ) | | | (1,899,080 | ) | | | (27,331,967 | ) | | | (35,171,978 | ) | | | (1,514,381,967 | ) | | | (18,908,575 | ) | | | (818,033,752 | ) |
| | | | | | | | | | | | | | | | | | | | | | | | | | | | | | | | |
Net increase (decrease) | | | (2,054,709 | ) | | $ | (29,650,013 | ) | | | (445,872 | ) | | $ | (6,492,593 | ) | | | (17,498,550 | ) | | $ | (747,852,146 | ) | | | 6,464,535 | | | $ | 283,939,683 | |
| | | | | | | | | | | | | | | | | | | | | | | | | | | | | | | | |
Class Z:1 | | | | | | | | | | | | | | | | | | | | | | | | | | | | | | | | |
Proceeds from sale of shares | | | 2,278 | | | $ | 33,368 | | | | 28,471 | | | $ | 422,148 | | | | 7,991,905 | | | $ | 346,133,605 | | | | 235,275 | | | $ | 10,195,777 | |
Reinvestment of distributions | | | 1,632 | | | | 23,529 | | | | 7 | | | | 102 | | | | 36,921 | | | | 1,624,158 | | | | — | | | | — | |
Cost of shares repurchased | | | (13,143 | ) | | | (190,623 | ) | | | (6,791 | ) | | | (100,984 | ) | | | (3,036,213 | ) | | | (131,853,970 | ) | | | (11,302 | ) | | | (489,263 | ) |
| | | | | | | | | | | | | | | | | | | | | | | | | | | | | | | | |
Net increase (decrease) | | | (9,233 | ) | | $ | (133,726 | ) | | | 21,687 | | | $ | 321,266 | | | | 4,992,613 | | | $ | 215,903,793 | | | | 223,973 | | | $ | 9,706,514 | |
| | | | | | | | | | | | | | | | | | | | | | | | | | | | | | | | |
| | | | | | | | | | | | | | | | |
| | | LMCG Small Cap Growth | |
| | | October 31, 2018 | | | October 31, 2017 | |
| | | Shares | | | Amount | | | Shares | | | Amount | |
Class N: | | | | | | | | | | | | | | | | |
Proceeds from sale of shares | | | 530,613 | | | $ | 9,552,619 | | | | 592,230 | | | $ | 8,766,397 | |
Cost of shares repurchased | | | (1,327,776 | ) | | | (22,567,317 | ) | | | (2,005,892 | ) | | | (28,161,175 | ) |
| | | | | | | | | | | | | | | | |
Net decrease | | | (797,163 | ) | | $ | (13,014,698 | ) | | | (1,413,662 | ) | | $ | (19,394,778 | ) |
| | | | | | | | | | | | | | | | |
Class I: | | | | | | | | | | | | | | | | |
Proceeds from sale of shares | | | 1,318,884 | | | $ | 23,153,350 | | | | 3,523,420 | | | $ | 49,198,752 | |
Cost of shares repurchased | | | (2,619,482 | ) | | | (43,969,847 | ) | | | (3,091,429 | ) | | | (44,296,318 | ) |
| | | | | | | | | | | | | | | | |
Net increase (decrease) | | | (1,300,598 | ) | | $ | (20,816,497 | ) | | | 431,991 | | | $ | 4,902,434 | |
| | | | | | | | | | | | | | | | |
198
Notes to Financial Statements (continued)
| | | | | | | | | | | | | | | | | | | | | | | | | | | | | | | | |
| | | River Road Small-Mid Cap Value | | | River Road Small Cap Value | |
| | | October 31, 2018 | | | October 31, 2017 | | | October 31, 2018 | | | October 31, 2017 | |
| | | Shares | | | Amount | | | Shares | | | Amount | | | Shares | | | Amount | | | Shares | | | Amount | |
Class N: | | | | | | | | | | | | | | | | | | | | | | | | | | | | | | | | |
Proceeds from sale of shares | | | 1,868,113 | | | $ | 14,965,056 | | | | 385,856 | | | $ | 3,108,607 | | | | 514,388 | | | $ | 6,981,510 | | | | 944,431 | | | $ | 12,965,444 | |
Reinvestment of distributions | | | 125,130 | | | | 917,204 | | | | 47,035 | | | | 349,943 | | | | 329,745 | | | | 4,286,683 | | | | 89,002 | | | | 1,200,640 | |
Cost of shares repurchased | | | (601,269 | ) | | | (4,706,768 | ) | | | (186,000 | ) | | | (1,432,561 | ) | | | (887,258 | ) | | | (12,019,368 | ) | | | (615,238 | ) | | | (8,425,533 | ) |
| | | | | | | | | | | | | | | | | | | | | | | | | | | | | | | | |
Net increase (decrease) | | | 1,391,974 | | | $ | 11,175,492 | | | | 246,891 | | | $ | 2,025,989 | | | | (43,125 | ) | | $ | (751,175 | ) | | | 418,195 | | | $ | 5,740,551 | |
| | | | | | | | | | | | | | | | | | | | | | | | | | | | | | | | |
Class I: | | | | | | | | | | | | | | | | | | | | | | | | | | | | | | | | |
Proceeds from sale of shares | | | 2,610,047 | | | $ | 20,648,002 | | | | 535,556 | | | $ | 4,333,931 | | | | 6,805,339 | | | $ | 93,808,922 | | | | 3,656,695 | | | $ | 50,889,911 | |
Reinvestment of distributions | | | 675,443 | | | | 5,045,558 | | | | 356,000 | | | | 2,691,359 | | | | 2,767,209 | | | | 36,582,499 | | | | 928,655 | | | | 12,685,426 | |
Cost of shares repurchased | | | (1,042,654 | ) | | | (8,084,673 | ) | | | (1,402,176 | ) | | | (11,152,559 | ) | | | (4,176,601 | ) | | | (58,213,101 | ) | | | (5,367,339 | ) | | | (74,149,737 | ) |
| | | | | | | | | | | | | | | | | | | | | | | | | | | | | | | | |
Net increase (decrease) | | | 2,242,836 | | | $ | 17,608,887 | | | | (510,620 | ) | | $ | (4,127,269 | ) | | | 5,395,947 | | | $ | 72,178,320 | | | | (781,989 | ) | | $ | (10,574,400 | ) |
| | | | | | | | | | | | | | | | | | | | | | | | | | | | | | | | |
Class Z:1 | | | | | | | | | | | | | | | | | | | | | | | | | | | | | | | | |
Proceeds from sale of shares | | | 9,228 | | | $ | 80,000 | | | | 8,855 | | | $ | 75,000 | | | | 2,080 | | | $ | 29,536 | | | | 17,320 | | | $ | 254,624 | |
Reinvestment of distributions | | | 2,371 | | | | 17,688 | | | | — | | | | — | | | | 1,562 | | | | 20,634 | | | | — | | | | — | |
Cost of shares repurchased | | | — | | | | — | | | | (2,948 | ) | | | (25,265 | ) | | | (2,080 | ) | | | (27,456 | ) | | | (6,812 | ) | | | (100,681 | ) |
| | | | | | | | | | | | | | | | | | | | | | | | | | | | | | | | |
Net increase | | | 11,599 | | | $ | 97,688 | | | | 5,907 | | | $ | 49,735 | | | | 1,562 | | | $ | 22,714 | | | | 10,508 | | | $ | 153,943 | |
| | | | | | | | | | | | | | | | | | | | | | | | | | | | | | | | |
| | |
| | | Silvercrest Small Cap | | | GW&K U.S. Small Cap Growth | |
| | | October 31, 2018 | | | October 31, 2017 | | | October 31, 2018 | | | October 31, 2017 | |
| | | Shares | | | Amount | | | Shares | | | Amount | | | Shares | | | Amount | | | Shares | | | Amount | |
Class N: | | | | | | | | | | | | | | | | | | | | | | | | | | | | | | | | |
Proceeds from sale of shares | | | 119,787 | | | $ | 2,187,349 | | | | 644,208 | | | $ | 11,387,511 | | | | 1,317,348 | | | $ | 5,851,857 | | | | 1,523,840 | | | $ | 6,465,730 | |
Reinvestment of distributions | | | 106,704 | | | | 1,953,748 | | | | 9,537 | | | | 172,910 | | | | 922,543 | | | | 3,782,425 | | | | 11,295 | | | | 43,938 | |
Cost of shares repurchased | | | (783,060 | ) | | | (14,267,961 | ) | | | (644,356 | ) | | | (11,580,225 | ) | | | (1,932,354 | ) | | | (8,729,716 | ) | | | (4,499,264 | ) | | | (18,748,206 | ) |
| | | | | | | | | | | | | | | | | | | | | | | | | | | | | | | | |
Net increase (decrease) | | | (556,569 | ) | | $ | (10,126,864 | ) | | | 9,389 | | | $ | (19,804 | ) | | | 307,537 | | | $ | 904,566 | | | | (2,964,129 | ) | | $ | (12,238,538 | ) |
| | | | | | | | | | | | | | | | | | | | | | | | | | | | | | | | |
Class I: | | | | | | | | | | | | | | | | | | | | | | | | | | | | | | | | |
Proceeds from sale of shares | | | 3,725,270 | | | $ | 68,983,519 | | | | 4,944,964 | | | $ | 88,696,627 | | | | 470,866 | | | $ | 2,564,067 | | | | 425,289 | | | $ | 2,183,766 | |
Reinvestment of distributions | | | 1,034,516 | | | | 19,107,515 | | | | 113,141 | | | | 2,064,810 | | | | 236,822 | | | | 1,198,317 | | | | 2,888 | | | | 13,402 | |
Cost of shares repurchased | | | (5,835,136 | ) | | | (107,793,516 | ) | | | (4,327,524 | ) | | | (78,254,984 | ) | | | (613,767 | ) | | | (3,333,040 | ) | | | (1,262,888 | ) | | | (6,088,383 | ) |
| | | | | | | | | | | | | | | | | | | | | | | | | | | | | | | | |
Net increase (decrease) | | | (1,075,350 | ) | | $ | (19,702,482 | ) | | | 730,581 | | | $ | 12,506,453 | | | | 93,921 | | | $ | 429,344 | | | | (834,711 | ) | | $ | (3,891,215 | ) |
| | | | | | | | | | | | | | | | | | | | | | | | | | | | | | | | |
Class Z:1 | | | | | | | | | | | | | | | | | | | | | | | | | | | | | | | | |
Proceeds from sale of shares | | | 2,144,119 | | | $ | 39,852,797 | | | | 15,810 | | | $ | 306,839 | | | | 1,261 | | | $ | 7,135 | | | | 35,770 | | | $ | 172,252 | |
Reinvestment of distributions | | | 872 | | | | 16,089 | | | | — | | | | — | | | | 3,605 | | | | 18,241 | | | | — | | | | — | |
Cost of shares repurchased | | | (183,354 | ) | | | (3,415,675 | ) | | | (5,198 | ) | | | (101,300 | ) | | | — | | | | — | | | | (10,301 | ) | | | (49,344 | ) |
| | | | | | | | | | | | | | | | | | | | | | | | | | | | | | | | |
Net increase | | | 1,961,637 | | | $ | 36,453,211 | | | | 10,612 | | | $ | 205,539 | | | | 4,866 | | | $ | 25,376 | | | | 25,469 | | | $ | 122,908 | |
| | | | | | | | | | | | | | | | | | | | | | | | | | | | | | | | |
199
Notes to Financial Statements (continued)
| | | | | | | | | | | | | | | | | | | | | | | | | | | | | | | | |
| | | DoubleLine Core Plus Bond | | | Lake Partners LASSO Alternatives | |
| | | October 31, 2018 | | | October 31, 2017 | | | October 31, 2018 | | | October 31, 2017 | |
| | | Shares | | | Amount | | | Shares | | | Amount | | | Shares | | | Amount | | | Shares | | | Amount | |
Class N: | | | | | | | | | | | | | | | | | | | | | | | | | | | | | | | | |
Proceeds from sale of shares | | | 3,208,660 | | | $ | 33,620,666 | | | | 5,970,051 | | | $ | 63,317,627 | | | | 389,445 | | | $ | 4,622,204 | | | | 345,295 | | | $ | 4,172,790 | |
Reinvestment of distributions | | | 375,842 | | | | 3,927,700 | | | | 755,186 | | | | 7,984,132 | | | | 31,511 | | | | 377,495 | | | | 10,180 | | | | 122,769 | |
Cost of shares repurchased | | | (9,494,394 | ) | | | (99,246,564 | ) | | | (19,500,094 | ) | | | (206,673,345 | ) | | | (352,351 | ) | | | (4,214,665 | ) | | | (2,402,154 | ) | | | (29,008,523 | ) |
| | | | | | | | | | | | | | | | | | | | | | | | | | | | | | | | |
Net increase (decrease) | | | (5,909,892 | ) | | $ | (61,698,198 | ) | | | (12,774,857 | ) | | $ | (135,371,586 | ) | | | 68,605 | | | $ | 785,034 | | | | (2,046,679 | ) | | $ | (24,712,964 | ) |
| | | | | | | | | | | | | | | | | | | | | | | | | | | | | | | | |
Class I: | | | | | | | | | | | | | | | | | | | | | | | | | | | | | | | | |
Proceeds from sale of shares | | | 15,144,066 | | | $ | 159,105,577 | | | | 22,185,109 | | | $ | 235,853,686 | | | | 273,645 | | | $ | 3,298,867 | | | | 1,126,021 | | | $ | 13,576,530 | |
Reinvestment of distributions | | | 1,435,849 | | | | 14,975,472 | | | | 1,358,488 | | | | 14,390,670 | | | | 65,700 | | | | 791,029 | | | | 10,176 | | | | 123,226 | |
Cost of shares repurchased | | | (18,483,535 | ) | | | (192,781,692 | ) | | | (12,994,909 | ) | | | (137,962,662 | ) | | | (2,079,030 | ) | | | (25,099,643 | ) | | | (3,741,362 | ) | | | (45,361,228 | ) |
| | | | | | | | | | | | | | | | | | | | | | | | | | | | | | | | |
Net increase (decrease) | | | (1,903,620 | ) | | $ | (18,700,643 | ) | | | 10,548,688 | | | $ | 112,281,694 | | | | (1,739,685 | ) | | $ | (21,009,747 | ) | | | (2,605,165 | ) | | $ | (31,661,472 | ) |
| | | | | | | | | | | | | | | | | | | | | | | | | | | | | | | | |
Class Z:1 | | | | | | | | | | | | | | | | | | | | | | | | | | | | | | | | |
Proceeds from sale of shares | | | 72,697 | | | $ | 756,674 | | | | 163,536 | | | $ | 1,744,375 | | | | — | | | | — | | | | — | | | | — | |
Reinvestment of distributions | | | 5,475 | | | | 57,102 | | | | 73 | | | | 774 | | | | — | | | | — | | | | — | | | | — | |
Cost of shares repurchased | | | (36,721 | ) | | | (381,792 | ) | | | (14,068 | ) | | | (149,966 | ) | | | — | | | | — | | | | — | | | | — | |
| | | | | | | | | | | | | | | | | | | | | | | | | | | | | | | | |
Net increase | | | 41,451 | | | $ | 431,984 | | | | 149,541 | | | $ | 1,595,183 | | | | — | | | | — | | | | — | | | | — | |
| | | | | | | | | | | | | | | | | | | | | | | | | | | | | | | | |
| | |
| | | River Road Long-Short | | | Guardian Capital Global Dividend | |
| | | October 31, 2018 | | | October 31, 2017 | | | October 31, 2018 | | | October 31, 2017 | |
| | | Shares | | | Amount | | | Shares | | | Amount | | | Shares | | | Amount | | | Shares | | | Amount | |
Class N: | | | | | | | | | | | | | | | | | | | | | | | | | | | | | | | | |
Proceeds from sale of shares | | | 21,068 | | | $ | 263,257 | | | | 124,722 | | | $ | 1,462,085 | | | | 14,187 | | | $ | 161,560 | | | | 99,578 | | | $ | 1,071,014 | |
Reinvestment of distributions | | | — | | | | — | | | | — | | | | — | | | | 2,237 | | | | 25,508 | | | | 768 | | | | 8,393 | |
Cost of shares repurchased | | | (160,145 | ) | | | (1,980,544 | ) | | | (467,341 | ) | | | (5,484,160 | ) | | | (15,649 | ) | | | (178,428 | ) | | | (101,832 | ) | | | (1,065,121 | ) |
| | | | | | | | | | | | | | | | | | | | | | | | | | | | | | | | |
Net increase (decrease) | | | (139,077 | ) | | $ | (1,717,287 | ) | | | (342,619 | ) | | $ | (4,022,075 | ) | | | 775 | | | $ | 8,640 | | | | (1,486 | ) | | $ | 14,286 | |
| | | | | | | | | | | | | | | | | | | | | | | | | | | | | | | | |
Class I: | | | | | | | | | | | | | | | | | | | | | | | | | | | | | | | | |
Proceeds from sale of shares | | | 676,485 | | | $ | 8,599,175 | | | | 847,233 | | | $ | 10,107,303 | | | | 111,234 | | | $ | 1,260,962 | | | | 344,631 | | | $ | 3,660,623 | |
Reinvestment of distributions | | | — | | | | — | | | | — | | | | — | | | | 70,180 | | | | 796,330 | | | | 45,392 | | | | 481,171 | |
Cost of shares repurchased | | | (986,687 | ) | | | (12,341,172 | ) | | | (1,890,230 | ) | | | (22,477,127 | ) | | | (47,342 | ) | | | (542,384 | ) | | | (110,943 | ) | | | (1,190,518 | ) |
| | | | | | | | | | | | | | | | | | | | | | | | | | | | | | | | |
Net increase (decrease) | | | (310,202 | ) | | $ | (3,741,997 | ) | | | (1,042,997 | ) | | $ | (12,369,824 | ) | | | 134,072 | | | $ | 1,514,908 | | | | 279,080 | | | $ | 2,951,276 | |
| | | | | | | | | | | | | | | | | | | | | | | | | | | | | | | | |
Class Z:1 | | | | | | | | | | | | | | | | | | | | | | | | | | | | | | | | |
Proceeds from sale of shares | | | 3,925 | | | $ | 50,000 | | | | 1,995 | | | $ | 25,000 | | | | — | | | | — | | | | — | | | | — | |
| | | | | | | | | | | | | | | | | | | | | | | | | | | | | | | | |
Net increase | | | 3,925 | | | $ | 50,000 | | | | 1,995 | | | $ | 25,000 | | | | — | | | | — | | | | — | | | | — | |
| | | | | | | | | | | | | | | | | | | | | | | | | | | | | | | | |
200
Notes to Financial Statements (continued)
| | | | | | | | | | | | | | | | | | | | | | | | | | | | | | | | |
| | | Pictet International | | | Value Partners Asia Dividend | |
| | | October 31, 2018 | | | October 31, 2017 | | | October 31, 2018 | | | October 31, 2017 | |
| | | Shares | | | Amount | | | Shares | | | Amount | | | Shares | | | Amount | | | Shares | | | Amount | |
Class N: | | | | | | | | | | | | | | | | | | | | | | | | | | | | | | | | |
Proceeds from sale of shares | | | 8,747,423 | | | $ | 95,768,145 | | | | 348,926 | | | $ | 3,906,238 | | | | 3,643 | | | $ | 46,906 | | | | 14,410 | | | $ | 166,466 | |
Reinvestment of distributions | | | 19,707 | | | | 222,100 | | | | 396 | | | | 3,668 | | | | 6,979 | | | | 84,795 | | | | 3,872 | | | | 40,610 | |
Cost of shares repurchased | | | (746,267 | ) | | | (8,057,404 | ) | | | (17,490 | ) | | | (191,463 | ) | | | (14,842 | ) | | | (180,643 | ) | | | (1,716 | ) | | | (19,730 | ) |
| | | | | | | | | | | | | | | | | | | | | | | | | | | | | | | | |
Net increase (decrease) | | | 8,020,863 | | | $ | 87,932,841 | | | | 331,832 | | | $ | 3,718,443 | | | | (4,220 | ) | | $ | (48,942 | ) | | | 16,566 | | | $ | 187,346 | |
| | | | | | | | | | | | | | | | | | | | | | | | | | | | | | | | |
Class I: | | | | | | | | | | | | | | | | | | | | | | | | | | | | | | | | |
Proceeds from sale of shares | | | 16,627,610 | | | $ | 184,401,813 | | | | 55,029,309 | | | $ | 564,088,083 | | | | 244 | | | $ | 3,054 | | | | — | | | | — | |
Reinvestment of distributions | | | 1,873,692 | | | | 21,135,242 | | | | 1,273,736 | | | | 11,756,503 | | | | 52,868 | | | | 641,995 | | | | 32,781 | | | $ | 340,841 | |
Cost of shares repurchased | | | (171,793,280 | ) | | | (1,979,453,800 | ) | | | (20,551,993 | ) | | | (209,601,749 | ) | | | (249 | ) | | | (2,784 | ) | | | — | | | | — | |
| | | | | | | | | | | | | | | | | | | | | | | | | | | | | | | | |
Net increase (decrease) | | | (153,291,978 | ) | | $ | (1,773,916,745 | ) | | | 35,751,052 | | | $ | 366,242,837 | | | | 52,863 | | | $ | 642,265 | | | | 32,781 | | | $ | 340,841 | |
| | | | | | | | | | | | | | | | | | | | | | | | | | | | | | | | |
Class Z:1 | | | | | | | | | | | | | | | | | | | | | | | | | | | | | | | | |
Proceeds from sale of shares | | | 191,849,252 | | | $ | 2,203,485,726 | | | | 21,930 | | | $ | 250,000 | | | | — | | | | — | | | | — | | | | — | |
Reinvestment of distributions | | | 238,202 | | | | 2,679,750 | | | | — | | | | — | | | | — | | | | — | | | | — | | | | — | |
Cost of shares repurchased | | | (62,059,814 | ) | | | (649,312,899 | ) | | | — | | | | — | | | | — | | | | — | | | | — | | | | — | |
| | | | | | | | | | | | | | | | | | | | | | | | | | | | | | | | |
Net increase | | | 130,027,640 | | | $ | 1,556,852,577 | | | | 21,930 | | | $ | 250,000 | | | | — | | | | — | | | | — | | | | — | |
| | | | | | | | | | | | | | | | | | | | | | | | | | | | | | | | |
| 1 | Commencement of operations was October 2, 2017, except for GW&K U.S. Small Cap Growth which was February 27, 2017. |
At October 31, 2018, certain affiliated and unaffiliated shareholders of record, including individually or collectively held greater than 10% of the net assets of the Funds as follows:
| | | | | | | | |
| | | Number of
Shareholders | | | Collectively
Own | |
River Road Small Mid-Cap Value | | | 1 | | | | 11 | % |
Guardian Capital Global Dividend | | | 1 | | | | 77 | % |
Value Partners Asia Dividend | | | 1 | | | | 90 | % |
Transactions by these shareholders may have a material impact on their respective Fund.
h. REPURCHASE AGREEMENTS AND JOINT REPURCHASE AGREEMENTS
The Funds may enter into third-party repurchase agreements for temporary cash management purposes and third-party or bilateral joint repurchase agreements for reinvestment of cash collateral on securities lending transactions under the securities lending program offered by The Bank of New York Mellon (“BNYM”) (the “Program”) (collectively, “Repurchase Agreements”). The value of the underlying collateral, including accrued interest, must equal or exceed the value of the Repurchase Agreements during the term of the agreement. For joint repurchase agreements, the Funds participate on a pro rata basis with other clients of BNYM in its share of the underlying collateral under such joint repurchase agreements and in its share of proceeds from any repurchase or other disposition of the underlying collateral. The underlying collateral for all Repurchase Agreements is
held in safekeeping by the Funds’ custodian or at the Federal Reserve Bank. If the seller defaults and the value of the collateral declines, or if bankruptcy proceedings commence with respect to the seller of the security, realization of the collateral by the Funds may be delayed or limited. Pursuant to the Program, the Funds are indemnified for such losses by BNYM on joint repurchase agreements.
At October 31, 2018, the market value of Repurchase Agreements outstanding is as follows:
| | | | |
| | | Market Value | |
River Road Focused Absolute Value | | $ | 185,219 | |
River Road Dividend All Cap Value | | | 10,680,472 | |
River Road Dividend All Cap Value II | | | 452,720 | |
LMCG Small Cap Growth | | | 5,918,663 | |
River Road Small-Mid Cap Value | | | 1,758,425 | |
River Road Small Cap Value | | | 6,657,038 | |
Silvercrest Small Cap | | | 6,408,559 | |
GW&K U.S. Small Cap Growth | | | 2,460,639 | |
DoubleLine Core Plus Bond | | | 6,885,514 | |
Pictet International | | | 29,334,959 | |
201
Notes to Financial Statements (continued)
i. FOREIGN CURRENCY TRANSLATION
The books and records of the Funds are maintained in U.S. dollars. The value of investments, assets and liabilities denominated in currencies other than U.S. dollars are translated into U.S. dollars based upon current foreign exchange rates. Purchases and sales of foreign investments, income and expenses are converted into U.S. dollars based on currency exchange rates prevailing on the respective dates of such transactions. Net realized and unrealized gain (loss) on foreign currency transactions represent: (1) foreign exchange gains and losses from the sale and holdings of foreign currencies; (2) gains and losses between trade date and settlement date on investment securities transactions and foreign currency exchange contracts; and (3) gains and losses from the difference between amounts of interest and dividends recorded and the amounts actually received.
The Funds do not isolate the net realized and unrealized gain or loss resulting from changes in exchange rates from the fluctuations in market prices of securities held. Such fluctuations are included with the net realized and unrealized gain or loss on investments.
j. SECURITIES TRANSACTED ON A WHEN ISSUED BASIS
DoubleLine Core Plus Bond may enter into To-Be-Announced (“TBA”) sale commitments to hedge their portfolio positions or to sell mortgage-backed securities they own under delayed delivery arrangements. Proceeds of TBA sale commitments are not received until the contractual settlement date. During the time a TBA sale commitment is outstanding, equivalent deliverable securities, with the same counterparty, or an offsetting TBA purchase commitment deliverable on or before the sale commitment date, are held as “cover” for the transaction. Unsettled TBA sale commitments are valued at the current market value of the underlying securities according to the procedures described under “Valuation of Investments,” in Footnote 1a above.
Each TBA contract is marked-to-market daily and the change in market value is recorded by the Fund as an unrealized gain or loss. If the TBA sale commitment is closed through the acquisition of an offsetting purchase commitment with the same broker, the Fund realizes a gain or loss. If the Fund delivers securities under the commitment, the Fund realizes a gain or a loss from the sale of the securities based upon the unit price established at the date the commitment was entered into.
k. DELAYED DELIVERY TRANSACTIONS AND WHEN-ISSUED SECURITIES
DoubleLine Core Plus Bond may enter into securities transactions on a delayed delivery or when issued basis. Payment and delivery may take place after the customary settlement period for that security. The price of the underlying securities and the date when the securities will be delivered and paid for are fixed at the time the transaction is negotiated. During the time a delayed delivery sell is outstanding, the contract is marked to market daily and equivalent deliverable securities are held for the transaction. The value of the securities purchased on a delayed delivery or when-issued basis are identified as such in the Fund’s Schedules of Portfolio Investments. With respect to purchase commitments, the Fund identifies securities as segregated in it’s records with a value at least equal to the amount of the commitment. Delayed delivery or when-issued securities that have been purchased from and sold to different brokers are reflected as an investment in securities and a forward sale commitment in the Fund’s Statement of Assets and Liabilities. For financial reporting purposes, the Fund does offset the receivable and payable for delayed delivery investments purchased and sold on TBA commitments. Losses may arise due to changes in the value of the underlying securities or if the counterparty does not perform under the contract, or if the issuer does not issue the securities due to political, economic, or other factors.
2. AGREEMENTS AND TRANSACTIONS WITH AFFILIATES
For each of the Funds, the Trust has entered into an investment advisory agreement under which the Investment Manager, a subsidiary and the U.S. retail distribution arm of Affiliated Managers Group, Inc. (“AMG”), serves as investment manager to the Funds and is responsible for the Funds’ overall administration and operations. The Investment Manager selects one or more subadvisors for the Funds (subject to Board approval) and monitors each subadvisor’s investment performance, security holdings and investment strategies. The investment portfolios of River Road Focused Absolute Value, River Road Dividend All Cap Value, River Road Dividend All Cap Value II, River Road Small-Mid Cap, River Road Small Cap Value and River Road Long-Short are managed by River Road Asset Management, LLC. The investment portfolio of GW&K U.S. Small Cap Growth is managed by GW&K Investment Management, LLC. AMG indirectly owns a majority interest in River Road Asset Management, LLC and GW&K Investment Management, LLC. The investment portfolio of Value Partners Asia Dividend is managed by Value Partners Hong Kong Limited. AMG indirectly owns a minority interest in Value Partners Hong Kong Limited.
Investment management fees are paid directly by the Funds to the Investment Manager based on average daily net assets. For the fiscal year ended October 31, 2018, the Funds’ investment management fees were paid at the following annual rate of each Fund’s respective average daily net assets:
| | | | |
Fairpointe ESG Equity | | | 0.70 | % |
River Road Focused Absolute Value | | | 0.60 | % |
Montag & Caldwell Growth | | | | |
on first $800 million | | | 0.70 | % |
over $800 million up to $6 billion | | | 0.50 | % |
over $6 billion up to $12 billion | | | 0.45 | % |
over $12 billion | | | 0.40 | % |
River Road Dividend All Cap Value | | | 0.60 | % |
River Road Dividend All Cap Value II | | | 0.60 | % |
Fairpointe Mid Cap | | | | |
on first $100 million | | | 0.70 | % |
next $300 million | | | 0.65 | % |
over $400 million | | | 0.60 | % |
LMCG Small Cap Growth | | | 0.90 | % |
River Road Small-Mid Cap Value | | | 0.75 | % |
River Road Small Cap Value | | | 0.80 | % |
Silvercrest Small Cap | | | 0.90 | % |
GW&K U.S. Small Cap Growth2 | | | 0.70 | % |
DoubleLine Core Plus Bond | | | 0.45 | % |
Lake Partners LASSO Alternatives | | | 0.90 | % |
River Road Long-Short1 | | | 0.85 | % |
Guardian Capital Global Dividend | | | 0.70 | % |
Pictet International3 | | | 0.70 | % |
Value Partners Asia Dividend | | | 0.80 | % |
| 1 | Prior to January 1, 2017, the annual rate for the investment management fees were 0.90% and 1.10% of the average daily net assets for River Road Small-Mid Cap Value and River Road Long-Short, respectively. |
202
Notes to Financial Statements (continued)
| 2 | Prior to February 27, 2017, the annual rate for GW&K U.S. Small Cap Growth’s investment management fee was 0.80% of the Fund’s average daily net assets. |
| 3 | Prior to July 1, 2017, the annual rate for Pictet International’s investment management fee was 0.80% of the Fund’s average daily net assets. |
The Investment Manager has contractually agreed, through at least March 1, 2019 for Fairpointe ESG Equity, River Road Focused Absolute Value, River Road Dividend All Cap Value, River Road Dividend All Cap Value II, LMCG Small Cap Growth, River Road Small-Mid Cap Value, Silvercrest Small Cap, GW&K U.S. Small Cap Growth, DoubleLine Core Plus Bond, Lake Partners LASSO Alternatives, River Road Long-Short, Guardian Capital Global Dividend, Pictet International and Value Partners Asia Dividend, to waive management fees and/or reimburse fund expenses in order to limit total annual Fund operating expenses after fee waiver and expense reimbursements (exclusive of taxes, interest (including interest incurred in connection with bank and custody overdrafts), shareholder servicing fees, distribution and service 12b-1 fees, brokerage commissions and other transaction costs, dividends payable with respect to securities sold short, acquired fund fees and expenses and extraordinary expenses). The percentages of the Funds’ average daily net assets subject to later reimbursement by the Funds in certain circumstances are as follows:
| | | | |
Fairpointe ESG Equity | | | 0.82 | % |
River Road Focused Absolute Value | | | 0.71 | % |
Montag & Caldwell Growth | | | N/A | |
River Road Dividend All Cap Value | | | 0.99 | % |
River Road Dividend All Cap Value II | | | 0.99 | % |
Fairpointe Mid Cap | | | N/A | |
LMCG Small Cap Growth | | | 1.03 | % |
River Road Small-Mid Cap Value1 | | | 1.04 | % |
River Road Small Cap Value | | | N/A | |
Silvercrest Small Cap | | | 1.08 | % |
GW&K U.S. Small Cap Growth2 | | | 0.90 | % |
DoubleLine Core Plus Bond | | | 0.61 | % |
Lake Partners LASSO Alternatives | | | 1.09 | % |
River Road Long-Short1 | | | 1.12 | % |
Guardian Capital Global Dividend | | | 1.05 | % |
Pictet International3 | | | 0.98 | % |
Value Partners Asia Dividend | | | 1.15 | % |
| 1 | Prior to January 1, 2017, the expense cap was 1.19% and 1.37% of the average daily net assets for River Road Small-Mid Cap Value and River Road Long-Short, respectively. |
| 2 | Prior to February 27, 2017, the expense cap was 1.03% of the average daily net assets for GW&K U.S. Small Cap Growth. |
| 3 | Prior to July 1, 2017, the expense cap was 1.08% of the average daily net assets for Pictet International. |
The contractual expense limitation may only be terminated in the event the Investment Manager or a successor ceases to be the investment manager of the Fund or a successor fund, by mutual agreement between the Investment Manager and the Board, or in the event of the Fund’s liquidation unless the Fund is reorganized or is a party to a merger in which the surviving entity is successor to the accounting and performance information of the Fund.
Prior to November 1, 2017 (July 1, 2017 for Pictet International), for a period of up to three years from the end of the fiscal year during which fees were waived or expenses were reimbursed (the “Recovery Period”), the Investment Manager is entitled to be reimbursed by the Fund for such fees waived and expenses reimbursed from the commencement of operations through the completion of the first three full fiscal years to the extent that the Fund’s total annual operating expenses, not including interest, taxes, brokerage commissions, other investment-related costs, shareholder servicing fees, distribution and service (12b-1) fees, extraordinary expenses, such as litigation and other expenses not incurred in the ordinary course of the Fund’s business, and acquired fund fees and expenses, are at or below the Operating Expense Limit during the Recovery Period.
Effective November 1, 2017 (July 1, 2017 for Pictet International), in general, for a period of up to 36 months, the Investment Manager may recover from each Fund fees waived and expenses paid pursuant to this contractual agreement, provided that such repayment would not cause the Fund’s total annual operating expenses after fee waiver and expense reimbursements (exclusive of the items noted in the parenthetical above) to exceed the contractual expense limitation amount.
At October 31, 2018, each Fund’s expiration of reimbursement are as follows:
| | | | | | | | | | | | |
| | | | | | River Road | | | | |
| Expiration | | Fairpointe ESG | | | Focused Absolute | | | LMCG Small | |
| Period | | Equity | | | Value | | | Cap Growth | |
Less than 1 year | | $ | 103,052 | | | $ | 170,129 | | | | — | |
Within 2 years | | | 46,791 | | | | 81,771 | | | | — | |
Within 3 years | | | 85,192 | | | | 86,585 | | | $ | 138,373 | |
| | | | | | | | | | | | |
Total Amount Subject to Recoupment | | $ | 235,035 | | | $ | 338,485 | | | $ | 138,373 | |
| | | | | | | | | | | | |
| | | |
| | | River Road | | | | | | GW&K | |
| Expiration | | Small-Mid Cap | | | Silvercrest | | | U.S. Small Cap | |
| Period | | Value | | | Small Cap | | | Growth | |
Within 3 years | | $ | 13,744 | | | $ | 97,719 | | | $ | 60,565 | |
| | | | | | | | | | | | |
Total Amount Subject to Recoupment | | $ | 13,744 | | | $ | 97,719 | | | $ | 60,565 | |
| | | | | | | | | | | | |
| | | |
| | | DoubleLine | | | Lake Partners | | | | |
| Expiration | | Core Plus | | | LASSO | | | River Road | |
| Period | | Bond | | | Alternatives | | | Long-Short | |
Within 3 years | | $ | 340,790 | | | $ | 66,249 | | | $ | 90,974 | |
| | | | | | | | | | | | |
Total Amount Subject to Recoupment | | $ | 340,790 | | | $ | 66,249 | | | $ | 90,974 | |
| | | | | | | | | | | | |
203
Notes to Financial Statements (continued)
| | | | | | | | |
| Expiration | | Guardian Capital | | | Value Partners | |
| Period | | Global Dividend | | | Asia Dividend | |
Less than 1 year | | $ | 96,649 | | | $ | 186,218 | |
Within 2 years | | | 16,939 | | | | 97,734 | |
Within 3 years | | | 24,750 | | | | 116,538 | |
| | | | | | | | |
Total Amount Subject to Recoupment | | $ | 138,338 | | | $ | 400,490 | |
| | | | | | | | |
The Trust, on behalf of the Funds, has entered into an amended and restated Administration Agreement under which the Investment Manager serves as the Funds’ administrator (the “Administrator”) and is responsible for all non-portfolio management aspects of managing the Funds’ operations, including administration and shareholder services to each Fund. Each Fund pays a fee to the Administrator at the rate of 0.15% per annum of the Fund’s average daily net assets for this service.
The Investment Manager had agreed, through October 1, 2018, to waive a portion of the administrative fee in an amount equal to 0.0061% of the average daily net assets of Montag & Caldwell Growth, 0.0053% of the average daily net assets of River Road Dividend All Cap Value, 0.0065% of the average daily net assets of Fairpointe Mid Cap, 0.0022% of the average daily net assets of River Road Small Cap Value, 0.0052% of the average daily net assets of DoubleLine Core Plus Bond and 0.0055% of the average daily net assets of Pictet International. These waivers expired on October 1, 2018.
The Funds are distributed by AMG Distributors, Inc. (the “Distributor”), a wholly-owned subsidiary of the Investment Manager. The Distributor serves as the distributor and underwriter for each Fund and is a registered broker-dealer and member of the Financial Industry Regulatory Authority, Inc. (“FINRA”). Shares of each Fund will be continuously offered and will be sold directly to prospective purchasers and through brokers, dealers or other financial intermediaries who have executed selling agreements with the Distributor. Generally the Distributor bears all or a portion of the expenses of providing services pursuant to the distribution agreement, including the payment of the expenses relating to the distribution of prospectuses for sales purposes and any advertising or sales literature.
The Trust has adopted a distribution and service plan (the “Plan”) with respect to the Class N and Class R shares, in accordance with the requirements of Rule 12b-1 under the 1940 Act and the requirements of the applicable rules of FINRA regarding asset based sales charges. Pursuant to the Plan, each Fund may make payments to the Distributor for its expenditures in financing any activity primarily intended to result in the sale of each such class of the Fund’s shares and for maintenance and personal service provided to existing shareholders of that class. The Plan authorizes payments to the Distributor of up to 0.25% and 0.50% annually of each Fund’s average daily net assets attributable to the Class N and Class R shares, respectively.
The impact on the annualized expense ratios for the fiscal year ended October 31, 2018, were as follows:
| | | | |
| Fund | | Actual Amount Incurred | |
AMG Managers Fairpointe ESG Equity Fund | | | | |
Class N | | | 0.21 | % |
AMG River Road Focused Absolute Value Fund | | | | |
Class N | | | 0.25 | % |
AMG Managers Montag & Caldwell Growth Fund | | | | |
Class N | | | 0.19 | % |
Class R | | | 0.50 | % |
AMG River Road Dividend All Cap Value Fund | | | | |
Class N | | | 0.25 | % |
AMG River Road Dividend All Cap Value Fund II | | | | |
Class N | | | 0.25 | % |
AMG Managers Fairpointe Mid Cap Fund | | | | |
Class N | | | 0.25 | % |
AMG Managers LMCG Small Cap Growth Fund | | | | |
Class N | | | 0.21 | % |
AMG River Road Small-Mid Cap Value Fund | | | | |
Class N | | | 0.23 | % |
AMG River Road Small Cap Value Fund | | | | |
Class N | | | 0.25 | % |
AMG Managers Silvercrest Small Cap Fund | | | | |
Class N | | | 0.24 | % |
AMG GW&K U.S. Small Cap Growth Fund | | | | |
Class N | | | 0.20 | % |
AMG Managers DoubleLine Core Plus Bond Fund | | | | |
Class N | | | 0.25 | % |
AMG Managers Lake Partners LASSO Alternatives Fund | | | | |
Class N | | | 0.25 | % |
AMG River Road Long-Short Fund | | | | |
Class N | | | 0.25 | % |
AMG Managers Guardian Capital Global Dividend Fund | | | | |
Class N | | | 0.03 | % |
AMG Managers Pictet International Fund | | | | |
Class N | | | 0.25 | % |
AMG Managers Value Partners Asia Dividend Fund | | | | |
Class N | | | 0.03 | % |
The Plan further provides for periodic payments by the Trust or the Distributor to brokers, dealers and other financial intermediaries for providing shareholder services and for promotional and other sales related costs. The portion of payments made under the plan by Class R shares of Montag & Caldwell Growth for shareholder servicing may not exceed an annual rate of 0.25% of the average daily net asset value of Class R shares of that class owned by clients of such broker, dealer or financial intermediary.
For each of the Class N, Class I and Class R shares, the Board has approved reimbursement payments to the Investment Manager for shareholder servicing
204
Notes to Financial Statements (continued)
expenses (“shareholder servicing fees”) incurred. Shareholder servicing fees include payments to financial intermediaries such as broker-dealers (including fund supermarket platforms), banks, and trust companies who provide shareholder recordkeeping, account servicing and other services. The Class N, Class I and Class R shares may reimburse the Investment Manager for the actual amount incurred up to a maximum annual rate of 0.15% of each respective Class’s average daily net assets as shown in the table below.
The Investment Manager has agreed, through at least October 1, 2019, to waive a portion of shareholder servicing fees paid by the various share classes of each Fund, as necessary, to ensure the total net expense ratio for each share class of each Fund does not increase due to the changes in the methodology of shareholder servicing reimbursements described above.
The impact on the annualized expense ratios for the fiscal year ended October 31, 2018, were as follows:
| | | | |
| | | Actual | |
| Fund | | Amount | |
| | Incurred | |
Fairpointe ESG Equity | | | | |
Class N | | | 0.08 | % |
Class I | | | 0.08 | % |
River Road Focused Absolute Value | | | | |
Class N | | | 0.04 | % |
Class I | | | 0.04 | % |
Montag & Caldwell Growth | | | | |
Class N | | | 0.07 | % |
Class I | | | 0.07 | % |
Class R | | | 0.07 | % |
River Road Dividend All Cap Value | | | | |
Class N | | | 0.07 | % |
Class I | | | 0.06 | % |
River Road Dividend All Cap Value II | | | | |
Class N | | | 0.10 | % |
Class I | | | 0.07 | % |
Fairpointe Mid Cap | | | | |
Class N | | | 0.08 | % |
Class I | | | 0.08 | % |
LMCG Small Cap Growth | | | | |
Class N | | | 0.07 | % |
Class I | | | 0.07 | % |
River Road Small-Mid Cap Value | | | | |
Class N | | | 0.06 | % |
Class I | | | 0.05 | % |
River Road Small Cap Value | | | | |
Class N | | | 0.10 | % |
Class I | | | 0.10 | % |
| | | | |
| Fund | | Actual Amount | |
| | Incurred | |
Silvercrest Small Cap | | | | |
Class N | | | 0.07 | % |
Class I | | | 0.07 | % |
GW&K U.S. Small Cap Growth | | | | |
Class N | | | 0.12 | % |
Class I | | | 0.10 | % |
DoubleLine Core Plus Bond | | | | |
Class N | | | 0.08 | % |
Class I | | | 0.08 | % |
Lake Partners LASSO Alternatives | | | | |
Class N | | | 0.06 | % |
Class I | | | 0.06 | % |
River Road Long-Short | | | | |
Class N | | | 0.08 | % |
Class I | | | 0.08 | % |
Pictet International | | | | |
Class N | | | 0.11 | % |
Class I | | | 0.09 | % |
Guardian Capital Global Dividend and Value Partners Asia Dividend did not incur any shareholder servicing fees for the fiscal year ended October 31, 2018.
The Board provides supervision of the affairs of the Trust and other trusts within the AMG Funds family. The Trustees of the Trust who are not affiliated with the Investment Manager receive an annual retainer and per meeting fees for regular, special and telephonic meetings, and they are reimbursed for out-of-pocket expenses incurred while carrying out their duties as Board members. The Chairman of the Board and the Audit Committee Chair receive additional annual retainers. Certain Trustees and Officers of the Funds are Officers and/or Directors of the Investment Manager, AMG and/or the Distributor.
The Securities and Exchange Commission (the “SEC”) granted an exemptive order that permits the Funds to lend and borrow money for certain temporary purposes directly to and from other eligible funds in the AMG Funds family. Participation in this interfund lending program is voluntary for both the borrowing and lending funds, and an interfund loan is only made if it benefits each participating fund. The Administrator manages the program according to procedures approved by the Board, and the Board monitors the operation of the program. An interfund loan must comply with certain conditions set out in the exemptive order, which are designed to assure fairness and protect all participating funds. For the fiscal year ended October 31, 2018, River Road Long-Short lent a maximum of $1,077,273 for two days earning interest of $133. The interest earned is included in the Statement of Operations as interest income. At October 31, 2018, the Funds had no interfund loans outstanding.
205
Notes to Financial Statements (continued)
3. PURCHASES AND SALES OF SECURITIES
Purchases and sales of securities (excluding short-term securities) for the fiscal year ended October 31, 2018, were as follows:
| | | | | | | | |
| | | Long Term Securities | |
| Fund | | Purchases | | | Sales | |
Fairpointe ESG Equity | | $ | 8,333,105 | | | $ | 3,900,954 | |
River Road Focused Absolute Value | | | 27,382,887 | | | | 23,782,653 | |
Montag & Caldwell Growth | | | 233,862,286 | | | | 592,036,198 | |
River Road Dividend All Cap Value | | | 243,577,568 | | | | 302,074,259 | |
River Road Dividend All Cap Value II | | | 29,953,413 | | | | 67,171,986 | |
Fairpointe Mid Cap | | | 643,438,969 | | | | 1,630,971,471 | |
LMCG Small Cap Growth | | | 175,919,700 | | | | 209,379,297 | |
River Road Small-Mid Cap Value | | | 42,515,285 | | | | 22,615,772 | |
River Road Small Cap Value | | | 166,680,657 | | | | 131,940,131 | |
Silvercrest Small Cap | | | 90,003,557 | | | | 100,445,497 | |
GW&K U.S. Small Cap Growth | | | 13,255,911 | | | | 15,759,244 | |
DoubleLine Core Plus Bond | | | 193,293,189 | | | | 235,979,127 | |
Lake Partners LASSO Alternatives | | | 14,988,788 | | | | 35,806,243 | |
River Road Long-Short | | | 86,980,377 | | | | 92,950,320 | |
Guardian Capital Global Dividend | | | 28,415,215 | | | | 27,690,367 | |
Pictet International | | | 1,040,185,379 | | | | 1,232,109,233 | |
Value Partners Asia Dividend | | | 6,489,959 | | | | 6,450,925 | |
| |
| | | U.S. Government Obligations | |
| Fund | | Purchases | | | Sales | |
DoubleLine Core Plus Bond | | $ | 236,058,935 | | | $ | 257,594,175 | |
4. PORTFOLIO SECURITIES LOANED
The Funds participate in the Program providing for the lending of securities to qualified brokers. Securities lending income includes earnings of such temporary cash investments, plus or minus any rebate to a borrower. These earnings (after any rebate) are then divided between BNYM, as a fee for its services under the Program, and the Funds, according to agreed-upon rates. Collateral on all securities loaned is accepted in cash and non-cash and, effective October 1, 2018, may also be accepted in U.S. Government and Agency Obligations. Collateral is maintained at a minimum level of 102% (105% in the case of certain foreign securities) of the market value, plus interest, if applicable, of investments on loan. It is the Funds’ policy to obtain additional collateral from or return excess collateral to the borrower by the end of the next business day, following the valuation date of the securities loaned. Therefore, the value of the collateral held may be temporarily less than the value of the securities on loan. Lending securities entails a risk of loss to the Funds if and to the extent that the market value of the securities loaned were to increase and the borrower did not increase the collateral accordingly, and the borrower fails to return the securities. Under the terms of the Program, the Funds are indemnified for such losses by BNYM. Cash collateral is held in separate omnibus accounts managed by BNYM, who is authorized to exclusively enter into joint repurchase agreements for that cash collateral. Non-cash collateral is held in
separate omnibus accounts managed by BNYM that cannot be sold or pledged. BNYM bears the risk of any deficiency in the amount of the cash collateral available for return to the borrower due to any loss on the collateral invested.
The value of securities loaned on positions held and cash and non-cash collateral received at October 31, 2018 were as follows:
| | | | | | | | | | | | | | | | |
| Fund | | Securities
Loaned | | | Cash
Collateral
Received | | | Non-Cash
Collateral
Received | | | Total
Collateral
Received | |
River Road Focused Absolute Value | | $ | 1,590,837 | | | $ | 185,219 | | | $ | 1,419,962 | | | $ | 1,605,181 | |
River Road Dividend All Cap Value | | | 85,917,603 | | | | 10,680,472 | | | | 77,952,289 | | | | 88,632,761 | |
River Road Dividend All Cap Value II | | | 4,203,798 | | | | 452,720 | | | | 3,914,025 | | | | 4,366,745 | |
LMCG Small Cap Growth | | | 20,576,918 | | | | 5,918,663 | | | | 14,744,299 | | | | 20,662,962 | |
River Road Small-Mid Cap Value | | | 6,449,277 | | | | 1,758,425 | | | | 4,682,840 | | | | 6,441,265 | |
River Road Small Cap Value | | | 25,100,431 | | | | 6,657,038 | | | | 18,684,582 | | | | 25,341,620 | |
Silvercrest Small Cap | | | 26,468,951 | | | | 6,408,559 | | | | 20,852,816 | | | | 27,261,375 | |
GW&K U.S. Small Cap Growth | | | 5,928,787 | | | | 2,460,639 | | | | 3,555,631 | | | | 6,016,270 | |
DoubleLine Core Plus Bond | | | 6,656,442 | | | | 6,885,514 | | | | — | | | | 6,885,514 | |
Guardian Capital Global Dividend | | | 838,183 | | | | — | | | | 857,891 | | | | 857,891 | |
Pictet International | | | 27,022,240 | | | | 29,334,959 | | | | 3,808,335 | | | | 33,143,294 | |
5. FOREIGN SECURITIES
Certain Funds invest in securities of foreign entities and in instruments denominated in foreign currencies which involve risks not typically associated with investments in domestic securities. Non-domestic securities carry special risks, such as exposure to currency fluctuations, less developed or less efficient trading markets, political instability, a lack of company information, differing auditing and legal standards, and, potentially, less liquidity. A Fund’s investments in emerging market countries are exposed to additional risks. A Fund’s performance will be influenced by political, social and economic factors affecting companies in emerging market countries. Emerging market countries generally have economic structures that are less diverse and mature, and political systems that are less stable, than those of developed countries. Realized gains in certain countries may be subject to foreign taxes at the Fund level and would pay such foreign taxes at the appropriate rate for each jurisdiction.
6. COMMITMENTS AND CONTINGENCIES
Under the Trust’s organizational documents, its trustees and officers are indemnified against certain liabilities arising out of the performance of their duties to the Trust. In addition, in the normal course of business, the Funds may enter into contracts and agreements that contain a variety of representations and warranties, which provide general indemnifications. The maximum exposure to the Funds under these arrangements is unknown, as this would involve future claims that may be made against a Fund that have not yet occurred. However, based on experience, the Funds had no prior claims or losses and expect the risks of loss to be remote.
206
Notes to Financial Statements (continued)
7. RISKS ASSOCIATED WITH HIGH YIELD SECURITIES
Investing in high yield securities involves greater risks and considerations not typically associated with U.S. Government and other high quality/investment grade securities. High yield securities are generally below investment grade securities and do not have an established retail secondary market. Economic downturns may disrupt the high yield market and impair the issuer’s ability to repay principal and interest. Also, an increase in interest rates would likely have an adverse impact on the value of such obligations and could cause the securities to become less liquid.
8. MORTGAGE-BACKED SECURITIES
DoubleLine Core Plus Bond may invest in mortgage-backed securities (“MBS”). These securities represent interests in pools of mortgage loans and they provide holders with payments consisting of both principal and interest as the mortgages in the underlying mortgage pools are paid. The timely payment of principal and interest on MBS issued or guaranteed by Ginnie Mae (formerly known as the Government National Mortgage Association) is backed by Ginnie Mae and the full faith and credit of the U.S. government. MBS issued by U.S. government agencies or instrumentalities other than Ginnie Mae are not “full faith and credit” obligations. Certain obligations, such as those issued by the Federal Home Loan Banks, Fannie Mae and Freddie Mac are supported only by the credit of the issuer. MBS issued by private issuers are not government securities and are not guaranteed by any government agency. They are secured by the underlying collateral of the private issuer. Yields on privately issued MBS tend to be higher than those of government-backed issues. However, risk of loss due to default and sensitivity to interest rate fluctuations are also higher. DoubleLine Core Plus Bond may also invest in collateralized mortgage obligations (“CMOs”), collateralized loan obligations (“CLOs”) and real estate mortgage investment conduits (“REMICs”). A CMO and/or REMIC is a bond that is collateralized by a pool of MBS. A CLO is a bond that is collateralized by a financial institution’s receivables from loans. These MBS pools are divided into classes with each class having its own characteristics. The different classes are retired in sequence as the underlying mortgages are repaid.
9. FLOATING RATE SENIOR LOAN INTERESTS
Doubleline Core Plus Bond may invest in Floating Rate Senior Loan Interests. These are senior, secured loans made to companies whose debt is below investment grade as well as investments with similar economic characteristics. Senior Loans typically hold a first lien priority and, unless otherwise indicated, are required to pay interest at floating rates that are periodically reset by reference to a base lending rate plus a spread. In some instances, the rates shown represent the weighted average rate as of October 31, 2018. Senior Loans are generally not registered under the Securities Act of 1933 (the “1933 Act”) and often incorporate certain restrictions on resale and cannot be sold publicly. Senior Loans often require prepayments from excess cash flow or permit the borrower to repay at its election. The degree to which borrowers repay, whether as a contractual requirement or at their election, cannot be predicted. As a result, the actual maturity may be substantially less than the stated maturity. The interest rate on this Senior Loan is subject to a base lending rate plus a spread. These base lending rates are primarily the London Interbank Offered Rate (“LIBOR”) and secondarily the prime rate offered by one or more major U.S. banks (“Prime”). The interest rate is subject to a minimum floor, which may be less than or greater than the prevailing period end LIBOR/Prime rate.
10. STRIPPED SECURITIES
DoubleLine Core Plus Bond may invest in stripped securities (“STRIPS”) for hedging purposes to protect the Fund’s portfolio against interest rate fluctuations. Interest-only STRIPS will most likely move differently than typical fixed-income securities in relation to changes in interest rates. STRIPS are usually structured with two classes that receive different proportions of the interest and principal distributions from a pool of underlying assets. A common type of STRIP will have one class receiving all of the interest from the underlying assets (“interest-only” or “IO” class), while the other class will receive the entire principal (“principal only” or “PO” class). However, in some instances, one class will receive some of the interest and most of the principal while the other class will receive most of the interest and the remainder of the principal. STRIPS are unusually volatile in response to changes in interest rates. The yield to maturity on an IO class of STRIPS is extremely sensitive not only to changes in prevailing interest rates but also to the rate of principal payments (including prepayments) on the underlying assets. A rapid rate of principal prepayments may have a measurably adverse effect on a Funds’ yield to maturity to the extent it invests in IOs. Conversely, POs tend to increase in value if prepayments are greater than anticipated and decline if prepayments are slower than anticipated. Thus, if the underlying assets experience greater than anticipated repayments of principal, a Fund may fail to fully recover its initial investment in these securities, even if the STRIPS were rated of the highest credit quality by Standard & Poor’s Corporation or Moody’s Investors Service, Inc. These risks are managed by investing in a variety of such securities and by using certain hedging techniques. In addition, the secondary market for STRIPS may be less liquid than that of other mortgage-backed or asset-backed securities, potentially limiting a Fund’s ability to buy or sell those securities at any particular time.
11. INVESTMENT COMPANIES
Lake Partners LASSO Alternatives primarily invests, and certain other Funds in this Trust, may invest in securities of other investment companies, including open-end funds, closed end funds and exchange-traded funds (“ETFs”). Open-end funds are investment companies that issue new shares continuously and redeem shares daily. Closed-end funds are investment companies that typically issue a fixed number of shares that trade on a securities exchange or over-the-counter. An ETF is an investment company. Typically, an ETF seeks to track the performance of an index by holding in its portfolio shares of all the companies, or a representative sample of the companies, that are components of a particular index; however, some ETFs are actively managed. ETFs are traded on securities exchanges based on their market values. The risks of investment in other investment companies typically reflect the risks of the types of securities in which investment companies invest. Investments in ETFs and closed-end funds are subject to the additional risk that shares of the fund may trade at a premium or discount to their NAV per share. When a Fund invests in another investment company, shareholders of the Fund bear their proportionate shares of the other investment company’s fees and expenses, as well as their share of the Fund’s fees and expenses. The Trust has obtained an exemptive order from the SEC that allows the Funds to invest in both affiliated and unaffiliated investment companies in excess of the limits of the 1940 Act, subject to the terms and conditions of such order. Prior to its investment in shares of an unaffiliated investment company in excess of the limits of the 1940 Act, the Trust, on behalf of a Fund, and the underlying fund must execute an agreement that is designed to ensure that each party understands the terms and conditions of the order and agrees to fulfill its responsibilities under the order. For the fiscal year ended October 31, 2018, Lake Partners LASSO Alternatives relied on such exemptive order.
207
Notes to Financial Statements (continued)
12. SECURITIES SOLD SHORT AND DUE TO/FROM BROKERS
River Road Long-Short utilizes short sales as part of its overall portfolio management strategy. A short sale involves the sale of a security that is borrowed from a broker or other financial institution. A gain, limited to the price at which the Fund sold the security short, or a loss, unlimited in size, will be recognized upon closing a short sale. Short sales expose the Fund to the risk that it will be required to acquire, convert or exchange securities to replace the borrowed securities at a time when the securities sold short have appreciated in value, thus resulting in a loss to the Fund. The Fund must segregate liquid assets, or otherwise cover its position in a permissible manner. The Investment Manager determines the liquidity of assets, in accordance with procedures established by the Board. Cash segregated as collateral for short sales is shown in the Statement of Assets and Liabilities as segregated cash. Security positions segregated as collateral for short sales are included in unaffiliated investments at value in the Statement of Assets and Liabilities. Due to/from brokers represents cash balances on deposit with, or cash balances owed to the Prime Broker. When the Fund has cash balances on deposit with the Prime Broker, the Fund is subject to credit risk should the Prime Broker be unable to meet their obligations to the Fund; and when the Fund has cash balances owed to the Prime Broker, the amount is payable upon demand and the Fund must segregate liquid assets. The Fund has entered into a Special Custody and Pledge Agreement with the Prime Broker for securities sold short, which provides the right, in the event of default (including bankruptcy or insolvency) for the non-defaulting party to liquidate the collateral and calculate net exposure to the defaulting party or request additional collateral. For financial reporting purposes, the Fund does not offset financial assets and financial liabilities that are subject to a Special Custody and Pledge Agreement in the Statement of Assets and Liabilities. As of October 31, 2018, the value of securities sold short was $8,626,448, and the Fund had $8,561,963 of cash deposited with the Prime Broker, segregated cash of $105,718, and securities segregated as collateral worth $2,512,682. For the fiscal year ended October 31, 2018, the Fund had interest and dividend expense in the amounts of $269,525 and $307,770 respectively. These amounts are included in the Statement of Operations as interest and dividend expense.
13. CREDIT AGREEMENT
Effective July 6, 2010, and as amended July 25, 2018, the Trust entered into a Credit Agreement with The Bank of New York Mellon (the “Bank”) which provides the Trust with a revolving line of credit facility of up to $50 million. The facility is
shared by each Fund of the Trust and is available for temporary, emergency purposes including liquidity needs in meeting redemptions. The interest rate on outstanding Alternate Base Rate Loans is equal to the greater of the Prime Rate plus 1.25%, or 0.50% plus the Federal Funds Effective Rate plus 1.25%. The interest rate on outstanding Overnight Loans is equal to the greater of the Federal Funds Effective Rate plus 1.25%, or the One-Month LIBOR Rate plus 1.25%. Effective July 27, 2016, the Trust pays a commitment fee on the unutilized commitment amount of 0.175% per annum, which is allocated to the Funds based on average daily net assets and included in Miscellaneous Expense on the Statement of Operations. River Road Focused Absolute Value, River Road Dividend All Cap Value, River Road Dividend All Cap Value II, Fairpointe Mid Cap, LMCG Small Cap Growth, Silvercrest Small Cap, Lake Partners LASSO Alternatives, Guardian Capital Global Dividend and Pictet International utilized the line of credit during the fiscal year ended October 31, 2018. River Road Focused Absolute Value borrowed a maximum of $868,674 for five days paying interest of $334. River Road Dividend All Cap Value borrowed a maximum of $1,819,034 for three days paying interest of $482. River Road Dividend All Cap Value II borrowed a maximum of $10,723,804 for five days paying interest of $4,082. Fairpointe Mid Cap borrowed a maximum of $28,556,467 for fourteen days paying interest of $12,869. LMCG Small Cap Growth borrowed a maximum of $15,670,190 for five days paying interest of $3,991. Silvercrest Small Cap borrowed a maximum of $8,496,946 for eight days paying interest of $2,879. Lake Partners LASSO Alternatives borrowed a maximum of $3,311,917 for one day paying interest of $252. Guardian Capital Global Dividend borrowed a maximum of $1,017,866 for one day paying interest of $79. Pictet International borrowed a maximum of $25,794,517 for seven days paying interest of $4,158. The interest expense amount is included in the Statement of Operations as miscellaneous expense. At October 31, 2018, the Funds had no loans outstanding.
14. MASTER NETTING AGREEMENTS
The Funds may enter into master netting agreements with their counterparties for the securities lending and short-sale programs and Repurchase Agreements, which provide the right, in the event of default (including bankruptcy or insolvency) for the non-defaulting party to liquidate the collateral and calculate net exposure to the defaulting party or request additional collateral. For financial reporting purposes, the Funds do not offset financial assets and financial liabilities that are subject to master netting agreements in the Statement of Assets and Liabilities. For securities lending and short sale transactions, see Note 4 and Note 11, respectively.
208
Notes to Financial Statements (continued)
The following table is a summary of the Funds’ open Repurchase Agreements that are subject to a master netting agreement as of October 31, 2018:
| | | | | | | | | | | | | | | | |
| | | | | | Gross Amount Not Offset in the | | | | |
| | | | | | Statement of Assets and Liabilities | | | | |
| | | Net Amounts of Assets | | | Financial | | | Cash Collateral | | | | |
| Fund | | Presented in the Statement | | | Instruments | | | Net Amount | |
| | of Assets and Liabilities | | | Collateral | | | Received | |
River Road Focused Absolute Value Fund | | | | | | | | | | | | | | | | |
Citibank N.A. | | $ | 185,219 | | | $ | 185,219 | | | | — | | | | — | |
River Road Dividend All Cap Value Fund | | | | | | | | | | | | | | | | |
Citigroup Global Markets, Inc. | | $ | 2,536,768 | | | $ | 2,536,768 | | | | — | | | | — | |
HSBC Securities USA, Inc. | | | 2,536,768 | | | | 2,536,768 | | | | — | | | | — | |
Merrill Lynch, Pierce, Fenner & Smith, Inc. | | | 533,400 | | | | 533,400 | | | | — | | | | — | |
Nomura Securities International, Inc. | | | 2,536,768 | | | | 2,536,768 | | | | — | | | | — | |
RBC Dominion Securities, Inc. | | | 2,536,768 | | | | 2,536,768 | | | | — | | | | — | |
| | | | | | | | | | | | | | | | |
Totals | | $ | 10,680,472 | | | $ | 10,680,472 | | | | — | | | | — | |
| | | | | | | | | | | | | | | | |
River Road Dividend All Cap Value II | | | | | | | | | | | | | | | | |
Mizuho Securities USA LLC | | $ | 452,720 | | | $ | 452,720 | | | | | | | | | |
LMCG Small Cap Growth Fund | | | | | | | | | | | | | | | | |
Citigroup Global Markets, Inc. | | $ | 1,405,763 | | | $ | 1,405,763 | | | | — | | | | — | |
HSBC Securities USA, Inc. | | | 1,405,763 | | | | 1,405,763 | | | | — | | | | — | |
Merrill Lynch, Pierce, Fenner & Smith, Inc. | | | 295,611 | | | | 295,611 | | | | — | | | | — | |
Nomura Securities International, Inc. | | | 1,405,763 | | | | 1,405,763 | | | | — | | | | — | |
RBC Dominion Securities, Inc. | | | 1,405,763 | | | | 1,405,763 | | | | — | | | | — | |
| | | | | | | | | | | | | | | | |
Totals | | $ | 5,918,663 | | | $ | 5,918,663 | | | | — | | | | — | |
| | | | | | | | | | | | | | | | |
River Road Small-Mid Cap Value | | | | | | | | | | | | | | | | |
Mizuho Securities USA LLC | | $ | 758,425 | | | $ | 758,425 | | | | — | | | | — | |
RBC Dominion Securities, Inc. | | | 1,000,000 | | | | 1,000,000 | | | | — | | | | — | |
| | | | | | | | | | | | | | | | |
Totals | | $ | 1,758,425 | | | $ | 1,758,425 | | | | — | | | | — | |
| | | | | | | | | | | | | | | | |
River Road Small Cap Value | | | | | | | | | | | | | | | | |
Citigroup Global Markets, Inc. | | $ | 1,581,141 | | | $ | 1,581,141 | | | | — | | | | — | |
HSBC Securities USA, Inc. | | | 1,581,141 | | | | 1,581,141 | | | | — | | | | — | |
Merrill Lynch, Pierce, Fenner & Smith, Inc. | | | 332,474 | | | | 332,474 | | | | — | | | | — | |
Nomura Securities International, Inc. | | | 1,581,141 | | | | 1,581,141 | | | | — | | | | — | |
RBC Dominion Securities, Inc. | | | 1,581,141 | | | | 1,581,141 | | | | — | | | | — | |
| | | | | | | | | | | | | | | | |
Totals | | $ | 6,657,038 | | | $ | 6,657,038 | | | | — | | | | — | |
| | | | | | | | | | | | | | | | |
209
Notes to Financial Statements (continued)
| | | | | | | | | | | | | | | | |
| | | | | | Gross Amount Not Offset in the | | | | |
| | | | | | Statement of Assets and Liabilities | | | | |
| | | Net Amounts of Assets | | | Financial | | | Cash Collateral | | | | |
| Fund | | Presented in the Statement | | | Instruments | | | Net Amount | |
| | of Assets and Liabilities | | | Collateral | | | Received | |
Silvercrest Small Cap | | | | | | | | | | | | | | | | |
Citigroup Global Markets, Inc. | | $ | 1,522,126 | | | $ | 1,522,126 | | | | — | | | | — | |
HSBC Securities USA, Inc. | | | 1,522,126 | | | | 1,522,126 | | | | — | | | | — | |
Merrill Lynch, Pierce, Fenner & Smith, Inc. | | | 320,055 | | | | 320,055 | | | | — | | | | — | |
Nomura Securities International, Inc. | | | 1,522,126 | | | | 1,522,126 | | | | — | | | | — | |
RBC Dominion Securities, Inc. | | | 1,522,126 | | | | 1,522,126 | | | | — | | | | — | |
| | | | | | | | | | | | | | | | |
Totals | | $ | 6,408,559 | | | $ | 6,408,559 | | | | — | | | | — | |
| | | | | | | | | | | | | | | | |
GW&K U.S. Small Cap Growth | | | | | | | | | | | | | | | | |
Mizuho Securities USA, LLC | | $ | 460,639 | | | $ | 460,639 | | | | — | | | | — | |
Nomura Securities International, Inc. | | | 1,000,000 | | | | 1,000,000 | | | | — | | | | — | |
RBC Dominion Securities, Inc. | | | 1,000,000 | | | | 1,000,000 | | | | — | | | | — | |
| | | | | | | | | | | | | | | | |
Totals | | $ | 2,460,639 | | | $ | 2,460,639 | | | | — | | | | — | |
| | | | | | | | | | | | | | | | |
DoubleLine Core Plus Bond | | | | | | | | | | | | | | | | |
Citigroup Global Markets, Inc. | | $ | 1,635,413 | | | $ | 1,635,413 | | | | — | | | | — | |
HSBC Securities USA, Inc. | | | 1,635,413 | | | | 1,635,413 | | | | — | | | | — | |
Merrill Lynch, Pierce, Fenner & Smith, Inc. | | | 343,862 | | | | 343,862 | | | | — | | | | — | |
Nomura Securities International, Inc. | | | 1,635,413 | | | | 1,635,413 | | | | — | | | | — | |
RBC Dominion Securities, Inc. | | | 1,635,413 | | | | 1,635,413 | | | | — | | | | — | |
| | | | | | | | | | | | | | | | |
Totals | | $ | 6,885,514 | | | $ | 6,885,514 | | | | — | | | | — | |
| | | | | | | | | | | | | | | | |
Pictet International | �� | | | | | | | | | | | | | | | |
Citigroup Global Markets, Inc. | | $ | 6,967,560 | | | $ | 6,967,560 | | | | — | | | | — | |
HSBC Securities USA, Inc. | | | 6,967,560 | | | | 6,967,560 | | | | — | | | | — | |
Merrill Lynch, Pierce, Fenner & Smith, Inc. | | | 1,464,719 | | | | 1,464,719 | | | | — | | | | — | |
Nomura Securities International, Inc. | | | 6,967,560 | | | | 6,967,560 | | | | — | | | | — | |
RBC Dominion Securities, Inc. | | | 6,967,560 | | | | 6,967,560 | | | | — | | | | — | |
| | | | | | | | | | | | | | | | |
Totals | | $ | 29,334,959 | | | $ | 29,334,959 | | | | — | | | | — | |
| | | | | | | | | | | | | | | | |
15. REGULATORY UPDATES
In August 2018, the FASB issued Accounting Standards Update No. 2018-13, Fair Value Measurement (Topic 820), Disclosure Framework - Changes to the Disclosure Requirements for Fair Value Measurement (“ASU 2018-13”) which is effective for periods starting after December 15, 2019. The primary focus of the update is to improve the effectiveness of ASC 820’s disclosure in the notes to financial statements. Management is currently evaluating the impact, if any, of applying ASU 2018-13.
Effective November 15, 2018, the SEC amended existing rules intended to modernize reporting and disclosure of information. These amendments relate to Regulation S-X which sets forth the form and content of financial statements. The amendment requires collapsing the components of distributable earnings on the Statement of Assets and Liabilities and collapsing the distributions paid to shareholders on the Statements of Changes in Net Assets. Management has adopted these amendments and there was no significant impact on the financial statements and accompanying notes.
210
Notes to Financial Statements (continued)
16. SUBSEQUENT EVENTS
The Funds have determined that no material events or transactions occurred through the issuance date of the Funds’ financial statements, which require an additional disclosure in or adjustment of the Funds’ financial statements except for the Board approved plan to liquidate Guardian Capital Global Dividend Fund and Lake Partners LASSO Alternatives Fund. The liquidation is expected to occur on or about January 25, 2019.
211
Report of Independent Registered Public Accounting Firm
To the Board of Trustees of AMG Funds IV and Shareholders of AMG Managers Fairpointe ESG Equity Fund, AMG River Road Focused Absolute Value Fund, AMG Managers Montag & Caldwell Growth Fund, AMG River Road Dividend All Cap Value Fund, AMG River Road Dividend All Cap Value Fund II, AMG Managers Fairpointe Mid Cap Fund, AMG Managers LMCG Small Cap Growth Fund, AMG River Road Small-Mid Cap Value Fund, AMG River Road Small Cap Value Fund, AMG Managers Silvercrest Small Cap Fund, AMG GW&K U.S. Small Cap Growth Fund, AMG Managers DoubleLine Core Plus Bond Fund, AMG Managers Lake Partners LASSO Alternatives Fund, AMG River Road Long-Short Fund, AMG Managers Guardian Capital Global Dividend Fund, AMG Managers Pictet International Fund and AMG Managers Value Partners Asia Dividend Fund:
OPINIONS ON THE FINANCIAL STATEMENTS
We have audited the accompanying statements of assets and liabilities, including the schedules of portfolio investments, of AMG Funds IV and Shareholders of AMG Managers Fairpointe ESG Equity Fund, AMG River Road Focused Absolute Value Fund, AMG Managers Montag & Caldwell Growth Fund, AMG River Road Dividend All Cap Value Fund, AMG River Road Dividend All Cap Value Fund II, AMG Managers Fairpointe Mid Cap Fund, AMG Managers LMCG Small Cap Growth Fund, AMG River Road Small-Mid Cap Value Fund, AMG River Road Small Cap Value Fund, AMG Managers Silvercrest Small Cap Fund, AMG GW&K U.S. Small Cap Growth Fund, AMG Managers DoubleLine Core Plus Bond Fund, AMG Managers Lake Partners LASSO Alternatives Fund, AMG River Road Long-Short Fund, AMG Managers Guardian Capital Global Dividend Fund, AMG Managers Pictet International Fund and AMG Managers Value Partners Asia Dividend Fund (constituting AMG Funds IV, hereafter collectively referred to as the “Funds”) as of October 31, 2018, the related statements of operations for the year ended October 31, 2018, the statements of changes in net assets for each of the two years in the period ended October 31, 2018, including the related notes, and the financial highlights for each of the periods indicated therein (collectively referred to as the “financial statements”). In our opinion, the financial statements present fairly, in all material respects, the financial position of each of the Funds as of October 31, 2018, the results of each of their operations for the year then ended, the changes in each of their net assets for each of the two years in the period ended October 31, 2018 and each of the financial highlights for each of the periods indicated therein in conformity with accounting principles generally accepted in the United States of America.
BASIS FOR OPINIONS
These financial statements are the responsibility of the Funds’ management. Our responsibility is to express an opinion on the Funds’ financial statements based on our audits. We are a public accounting firm registered with the Public Company Accounting Oversight Board (United States) (“PCAOB”) and are required to be independent with respect to the Funds in accordance with the U.S. federal securities laws and the applicable rules and regulations of the Securities and Exchange Commission and the PCAOB.
We conducted our audits of these financial statements in accordance with the standards of the PCAOB. Those standards require that we plan and perform the audit to obtain reasonable assurance about whether the financial statements are free of material misstatement, whether due to error or fraud.
212
Report of Independent Registered Public Accounting Firm
Our audits included performing procedures to assess the risks of material misstatement of the financial statements, whether due to error or fraud, and performing procedures that respond to those risks. Such procedures included examining, on a test basis, evidence regarding the amounts and disclosures in the financial statements. Our audits also included evaluating the accounting principles used and significant estimates made by management, as well as evaluating the overall presentation of the financial statements. Our procedures included confirmation of securities owned as of October 31, 2018 by correspondence with the custodian, transfer agent, agent banks, and brokers; when replies were not received from brokers, we performed other auditing procedures. We believe that our audits provide a reasonable basis for our opinions. The financial highlights for the periods ended from October 31, 2014 through October 31, 2015 for the Funds were audited by another independent registered public accounting firm whose report dated December 22, 2015 expressed an unqualified opinion on those financial highlights.
PricewaterhouseCoopers LLP
Boston, Massachusetts
December 26, 2018
We have served as the auditor of one or more investment companies in the AMG Funds Family since 1993.
213
Other Information (unaudited)
TAX INFORMATION
The Funds each hereby designates the maximum amount allowable of its net taxable income as qualified dividends as provided in the Jobs and Growth Tax Relief Reconciliation Act of 2003. The 2017/2018 Form 1099-DIV you receive for each Fund will show the tax status of all distributions paid to you during the year.
In accordance with federal tax law, the following Funds elect to provide foreign taxes paid and the income sourced from foreign countries. Accordingly, each Fund hereby makes the following designations regarding its taxable period ended October 31, 2018:
AMG Managers Pictet International Fund
| • | | The total amount of taxes paid and income sourced from foreign countries was $4,461,298 and $53,619,922, respectively. |
AMG Managers Value Partners Asia Dividend Fund
| • | | The total amount of taxes paid and income sourced from foreign countries was $27,158 and $379,224, respectively. |
Pursuant to section 852 of the Internal Revenue Code, the Funds each hereby designates as a capital gain distribution with respect to the taxable period ended October 31, 2018, or if subsequently determined to be different, the net capital gains of such period as follows:
| | | | |
| Fund | | Amount | |
River Road Focused Absolute Value | | $ | 880,256 | |
Montag & Caldwell Growth | | | 100,074,818 | |
River Road Dividend All Cap Value | | | 38,745,478 | |
River Road Dividend All Cap Value II | | | 5,756,921 | |
Fairpointe Mid Cap | | | 257,609,647 | |
River Road Small-Mid Cap Value | | | 4,886,827 | |
River Road Small Cap Value | | | 32,632,718 | |
| | | | |
| Fund | | Amount | |
Silvercrest Small Cap | | $ | 22,942,700 | |
GW&K U.S. Small Cap Growth | | | 5,101,398 | |
Lake Partners LASSO Alternatives | | | 1,992,715 | |
Guardian Capital Global Dividend | | | 127,391 | |
Pictet International | | | 74,102,778 | |
Value Partners Asia Dividend | | | 200,531 | |
214
AMG Funds
Trustees and Officers
The Trustees and Officers of the Trust, their business addresses, principal occupations for the past five years and ages are listed below. The Trustees provide broad supervision over the affairs of the Trust and the Funds. The Trustees are experienced executives who meet periodically throughout the year to oversee the Funds’ activities, review contractual arrangements with companies that provide services to the Funds, and
review the Funds’ performance. Unless otherwise noted, the address of each Trustee or Officer is the address of the Trust: 600 Steamboat Road, Suite 300, Greenwich, Connecticut 06830.
There is no stated term of office for Trustees. Trustees serve until their resignation, retirement or removal in
accordance with the Trust’s organizational documents and policies adopted by the Board from time to time. The Chairman of the Trustees, President, Treasurer and Secretary of the Trust are elected by the Trustees annually. Other officers hold office at the pleasure of the Trustees.
Independent Trustees
The following Trustees are not “interested persons” of the Trust within the meaning of the 1940 Act:
| | |
Number of Funds Overseen in Fund Complex | | Name, Age, Principal Occupation(s) During Past 5 Years and Other Directorships Held by Trustee |
• Trustee since 2016 | | Bruce B. Bingham, 70 |
• Oversees 59 Funds in Fund Complex | | Partner, Hamilton Partners (real estate development firm) (1987-Present); Director of The Yacktman Funds (2000-2012). |
| |
• Trustee since 2016 | | Edward J. Kaier, 73 |
• Oversees 59 Funds in Fund Complex | | Attorney at Law and Partner, Teeters Harvey Marrone & Kaier LLP (2007-Present); Attorney at Law and Partner, Hepburn Willcox Hamilton & Putnam, LLP (1977-2007); Trustee of Third Avenue Trust (5 portfolios); Trustee of Third Avenue Variable Trust (1 portfolio). |
| |
• Trustee since 2013 | | Kurt A. Keilhacker, 55 |
• Oversees 61 Funds in Fund Complex | | Managing Partner, TechFund Capital (1997-Present); Managing Partner, TechFund Europe (2000-Present); Board Member, 6wind SA, (2002-Present); Managing Partner, Elementum Ventures (2013-Present); Director, MetricStory, Inc. (2017-Present); Trustee, Gordon College (2001-2016). |
| |
• Trustee since 2000 | | Steven J. Paggioli, 68 |
• Oversees 59 Funds in Fund Complex | | Independent Consultant (2002-Present); Trustee, Professionally Managed Portfolios (32 portfolios); Advisory Board Member, Sustainable Growth Advisors, LP; Independent Director, Chase Investment Counsel (2008–Present); Executive Vice President, Secretary and Director, Investment Company Administration, LLC (1990-2001). |
| |
• Trustee since 2013 | | Richard F. Powers III, 72 |
• Oversees 59 Funds in Fund Complex | | Adjunct Professor, U.S. Naval War College (2016-Present); Adjunct Professor, Boston College (2010-2013); President and CEO of Van Kampen Investments Inc. (1998-2003). |
| |
• Independent Chairman | | Eric Rakowski, 60 |
• Trustee since 2000 • Oversees 61 Funds in Fund Complex | | Professor of Law, University of California at Berkeley School of Law - Boalt Hall (1990-Present); Director of Harding, Loevner Funds, Inc. (9 portfolios); Trustee of Third Avenue Trust (5 portfolios); Trustee of Third Avenue Variable Trust (1 portfolio). |
| |
• Trustee since 2013 | | Victoria L. Sassine, 53 |
• Oversees 61 Funds in Fund Complex | | Adjunct Professor, Babson College (2007 – Present). |
| |
• Trustee since 2016 | | Thomas R. Schneeweis, 71 |
• Oversees 59 Funds in Fund Complex | | Professor Emeritus, University of Massachusetts (2013-Present); Partner, S Capital Wealth Advisors (2015-Present); President, TRS Associates (1982-Present); Board Member, Chartered Alternative Investment Association (“CAIA”) (2002-Present); Director, CAIA Foundation (Education) (2010-Present); Director, Institute for Global Asset and Risk Management (Education) (2010-Present); Partner, S Capital Management, LLC (2007-2015); Director, CISDM at the University of Massachusetts, (1996-2013); President, Alternative Investment Analytics, LLC, (formerly Schneeweis Partners, LLC) (2001-2013); Professor of Finance, University of Massachusetts (1977-2013). |
215
AMG Funds
Trustees and Officers (continued)
Interested Trustees
Each Trustee in the following table is an “interested person” of the Trust within the meaning of the 1940 Act. Ms. Carsman is an interested person of the Trust within the meaning of the 1940 Act by virtue of her position with, and interest in securities of, AMG.
| | |
Number of Funds Overseen in Fund Complex | | Name, Age, Principal Occupation(s) During Past 5 Years and Other Directorships Held by Trustee |
• Trustee since 2011 | | Christine C. Carsman, 66 |
• Oversees 61 Funds in Fund Complex | | Executive Vice President, Deputy General Counsel and Chief Regulatory Counsel, Affiliated Managers Group, Inc. (2017-Present); Director (2010-Present) and Chair of the Board of Directors (2015-Present), AMG Funds plc; Director of Harding, Loevner Funds, Inc. (9 portfolios); Senior Vice President and Deputy General Counsel, Affiliated Managers Group, Inc. (2011-2016); Senior Vice President and Chief Regulatory Counsel, Affiliated Managers Group, Inc. (2007-2011); Vice President and Chief Regulatory Counsel, Affiliated Managers Group, Inc. (2004-2007); Secretary and Chief Legal Officer, AMG Funds, AMG Funds I, AMG Funds II and AMG Funds III (2004-2011); Senior Counsel, Vice President and Director of Operational Risk Management and Compliance, Wellington Management Company, LLP (1995-2004). |
| |
| Officers | | |
| |
Position(s) Held with Fund and Length of Time Served | | Name, Age, Principal Occupation(s) During Past 5 Years |
• President since 2018 • Principal Executive Officer since 2018 • Chief Executive Officer since 2018 • Chief Operating Officer since 2007 | | Keitha L. Kinne, 60 Chief Operating Officer, AMG Funds LLC (2007-Present); Chief Investment Officer, AMG Funds LLC (2008-Present); President and Principal, AMG Distributors, Inc. (2018-Present); Chief Operating Officer, AMG Distributors, Inc. (2007-Present); President, Chief Executive Officer and Principal Executive Officer, AMG Funds, AMG Funds I, AMG Funds II, AMG Funds III and AMG Funds IV (2018-Present); Chief Operating Officer, AMG Funds, AMG Funds I, AMG Funds II, and AMG Funds III (2007-Present); Chief Operating Officer, AMG Funds IV (2016-Present); Chief Operating Officer and Chief Investment Officer, Aston Asset Management, LLC (2016); President and Principal Executive Officer, AMG Funds, AMG Funds I, AMG Funds II and AMG Funds III (2012-2014); Managing Partner, AMG Funds LLC (2007-2014); President and Principal, AMG Distributors, Inc. (2012-2014); Managing Director, Legg Mason & Co., LLC (2006-2007); Managing Director, Citigroup Asset Management (2004-2006). |
| |
• Secretary since 2015 | | Mark J. Duggan, 53 |
• Chief Legal Officer since 2015 | | Senior Vice President and Senior Counsel, AMG Funds LLC (2015-Present); Secretary and Chief Legal Officer, AMG Funds, AMG Funds I, AMG Funds II, AMG Funds III and AMG Funds IV (2015-Present); Attorney, K&L Gates, LLP (2009-2015). |
| |
• Chief Financial Officer since 2017 • Treasurer since 2017 • Principal Financial Officer since 2017 • Principal Accounting Officer since 2017 | | Thomas G. Disbrow, 52 Vice President, Mutual Fund Treasurer & CFO, AMG Funds, AMG Funds LLC (2017-Present); Chief Financial Officer, Principal Financial Officer, Treasurer and Principal Accounting Officer, AMG Funds, AMG Funds I, AMG Funds II, AMG Funds III and AMG Funds IV (2017-Present); Managing Director - Global Head of Traditional Funds Product Control, UBS Asset Management (Americas), Inc. (2015-2017); Managing Director - Head of North American Funds Treasury, UBS Asset Management (Americas), Inc. (2011-2015). |
| |
• Chief Compliance Officer since 2016 | | Gerald F. Dillenburg, 51 Vice President, Chief Compliance Officer AMG Funds, AMG Funds LLC (2017-Present); Chief Compliance Officer AMG Funds, AMG Funds LLC (2016-2017); Chief Compliance Officer and Sarbanes-Oxley Code of Ethics Compliance Officer, AMG Funds, AMG Funds I, AMG Funds II and AMG Funds III (2016-Present); Chief Compliance Officer, AMG Funds IV (1996-Present); Sarbanes-Oxley Code of Ethics Compliance Officer, AMG Funds IV (2016-Present); Chief Compliance Officer, Aston Asset Management, LLC (2006-2016); Chief Operating Officer, Aston Funds (2003-2016); Secretary, Aston Funds (1996-2015); Chief Financial Officer, Aston Funds (1997-2010); Chief Financial Officer, Aston Asset Management, LLC (2006-2010); Treasurer, Aston Funds (1996-2010). |
| |
• Deputy Treasurer since 2017 | | John A. Starace, 48 |
| | Director, Mutual Fund Accounting, AMG Funds LLC (2017-Present); Vice President, Deputy Treasurer of Mutual Funds Services, AMG Funds LLC (2014-2017); Deputy Treasurer, AMG Funds, AMG Funds I, AMG Funds II, AMG Funds III and AMG Funds IV (2017-Present); Vice President, Citi Hedge Fund Services (2010-2014); Audit Senior Manager (2005-2010) and Audit Manager (2001-2005), Deloitte & Touche LLP. |
| |
• Controller since 2017 | | Christopher R. Townsend, 51 |
| | Vice President, Business Finance, AMG Funds LLC (2017-Present); Head of Business Finance, AMG Funds LLC (2015-2017); Chief Financial Officer and Financial and Operations Principal, AMG Distributors, Inc. (2016-Present); Controller, AMG Funds, AMG Funds I, AMG Funds II, AMG Funds III and AMG Funds IV (2017-Present); Treasurer, Chief Financial Officer, Principal Financial Officer, Principal Accounting Officer, AMG Funds, AMG Funds I, AMG Funds II, AMG Funds III and AMG Funds IV (2017); Chief Financial Officer, Aston Asset Management LLC (2016); Head of Finance and Accounting, Allianz Asset Management (2006-2015). |
216
AMG Funds
Trustees and Officers (continued)
| | |
Position(s) Held with Fund and Length of Time Served | | Name, Age, Principal Occupation(s) During Past 5 Years |
• Anti-Money Laundering Compliance Officer since 2014 | | Patrick J. Spellman, 44 Vice President, Chief Compliance Officer, AMG Funds LLC (2017-Present); Senior Vice President, Chief Compliance Officer, AMG Funds LLC (2011-2017); Chief Compliance Officer, AMG Distributors, Inc., (2010-Present); Anti-Money Laundering Compliance Officer, AMG Funds, AMG Funds I, AMG Funds II, and AMG Funds III (2014-Present); Anti-Money Laundering Officer, AMG Funds IV, (2016-Present); Compliance Manager, Legal and Compliance, Affiliated Managers Group, Inc. (2005-2011). |
| |
• Assistant Secretary since 2016 | | Maureen A. Meredith, 33 |
| | Director, Counsel, AMG Funds LLC (2017-Present); Vice President, Counsel, AMG Funds LLC (2015-2017); Assistant Secretary, AMG Funds, AMG Funds I, AMG Funds II, AMG Funds III and AMG Funds IV (2016-Present); Associate, Ropes & Gray LLP (2011-2015); Law Fellow, Massachusetts Appleseed Center for Law and Justice (2010-2011). |
217
Annual Renewal of Investment Management and Subadvisory Agreements
AMG Managers DoubleLine Core Plus Bond Fund, AMG Managers Fairpointe ESG Equity Fund (formerly AMG Managers Fairpointe Focused Equity Fund), AMG Managers Fairpointe Mid Cap Fund, AMG Managers Guardian Capital Global Dividend Fund, AMG Managers Lake Partners LASSO Alternatives Fund, AMG Managers LMCG Small Cap Growth Fund, AMG Managers Montag & Caldwell Growth Fund, AMG Managers Pictet International Fund, AMG River Road Dividend All Cap Value Fund, AMG River Road Dividend All Cap Value Fund II, AMG River Road Focused Absolute Value Fund, AMG River Road Long-Short Fund, AMG River Road Small-Mid Cap Value Fund, AMG River Road Small Cap Value Fund, AMG Managers Silvercrest Small Cap Fund, AMG GW&K U.S. Small Cap Growth Fund and AMG Managers Value Partners Asia Dividend Fund: Approval of Investment Advisory and Sub-Investment Advisory Agreements on June 27-28, 2018
At an in-person meeting held on June 27-28, 2018, the Board of Trustees (the “Board” or the “Trustees”), and separately a majority of the Trustees who are not “interested persons” of AMG Funds IV (the “Trust”) (the “Independent Trustees”), approved (i) the Investment Advisory Agreement, as amended pursuant to letter agreements at any time prior to the date of the meeting, with AMG Funds LLC (the “Investment Manager”) for each of AMG Managers DoubleLine Core Plus Bond Fund, AMG Managers Fairpointe ESG Equity Fund (formerly AMG Managers Fairpointe Focused Equity Fund), AMG Managers Fairpointe Mid Cap Fund, AMG Managers Guardian Capital Global Dividend Fund, AMG Managers Lake Partners LASSO Alternatives Fund, AMG Managers LMCG Small Cap Growth Fund, AMG Managers Montag & Caldwell Growth Fund, AMG Managers Pictet International Fund, AMG River Road Dividend All Cap Value Fund, AMG River Road Dividend All Cap Value Fund II, AMG River Road Focused Absolute Value Fund, AMG River Road Long-Short Fund, AMG River Road Small-Mid Cap Value Fund, AMG River Road Small Cap Value Fund, AMG Managers Silvercrest Small Cap Fund, AMG GW&K U.S. Small Cap Growth Fund and AMG Managers Value Partners Asia Dividend Fund (each, a “Fund,” and collectively, the “Funds”) and separately Amendment No. 1 thereto dated October 1, 2016 (collectively, the “Investment Advisory Agreement”) and (ii) each Sub-Investment Advisory Agreement, as amended at any time prior to the date of the meeting, with the applicable Subadviser for each Fund (collectively,
the “Subadvisory Agreements”). The Independent Trustees were separately represented by independent legal counsel in connection with their consideration of the approval of these agreements. In considering the Investment Advisory Agreement and the Subadvisory Agreements, the Trustees reviewed a variety of materials relating to each Fund, the Investment Manager and each Subadviser, including comparative performance, fee and expense information for an appropriate peer group of similar mutual funds (each, a “Peer Group”), performance information for the relevant benchmark index for each Fund (each, a “Fund Benchmark”) and other information provided to them on a periodic basis throughout the year, as well as information provided in connection with the meetings of June 27-28, 2018, regarding the nature, extent and quality of services provided by the Investment Manager and the Subadvisers under their respective agreements and other relevant matters. Prior to voting, the Independent Trustees: (a) reviewed the foregoing information with their independent legal counsel; (b) received materials from their independent legal counsel discussing the legal standards applicable to their consideration of the Investment Advisory Agreement and the Subadvisory Agreements; and (c) met with their independent legal counsel in private sessions at which no representatives of management were present.
NATURE, EXTENT AND QUALITY OF SERVICES
In considering the nature, extent and quality of the services provided by the Investment Manager, the Trustees reviewed information relating to the Investment Manager’s operations and personnel. Among other things, the Investment Manager provided financial information, biographical information on its supervisory and professional staff and descriptions of its organizational and management structure. The Trustees also took into account information provided periodically throughout the previous year by the Investment Manager in Board meetings relating to the performance of its duties with respect to the Funds and the Trustees’ knowledge of the Investment Manager’s management and the quality of the performance of the Investment Manager’s duties under the Investment Management Agreement and Administration Agreement. In the course of their deliberations regarding the Investment Manager, the Trustees evaluated, among other things: (a) the extent and quality of the Investment Manager’s oversight of the operation and management of the Funds; (b) the quality of the search, selection and
monitoring services performed by the Investment Manager in overseeing the portfolio management responsibilities of the Subadvisers; (c) the Investment Manager’s ability to supervise the Funds’ other service providers; and (d) the Investment Manager’s compliance program. The Trustees also took into account that, in performing its functions under the Investment Advisory Agreement and supervising each Subadviser, the Investment Manager: performs periodic detailed analyses and reviews of the performance by each Subadviser of its obligations to a Fund, including, without limitation, analysis and review of portfolio and other compliance matters and review of each Subadviser’s investment performance with respect to a Fund; prepares and presents periodic reports to the Board regarding the investment performance of each Subadviser and other information regarding each Subadviser, at such times and in such forms as the Board may reasonably request; reviews and considers any changes in the personnel of each Subadviser responsible for performing the Subadviser’s obligations and makes appropriate reports to the Board; reviews and considers any changes in the ownership or senior management of each Subadviser and makes appropriate reports to the Board; performs periodic in-person or telephonic diligence meetings, including with respect to compliance matters, with representatives of each Subadviser; assists the Board and management of the Trust in developing and reviewing information with respect to the initial approval of each Subadvisory Agreement and annual consideration of each Subadvisory Agreement thereafter; prepares recommendations with respect to the continued retention of any Subadviser or the replacement of any Subadviser, including at the request of the Board; identifies potential successors to or replacements of any Subadviser or potential additional subadvisers, performs appropriate due diligence, and develops and presents to the Board a recommendation as to any such successor, replacement or additional subadviser, including at the request of the Board; designates and compensates from its own resources such personnel as the Investment Manager may consider necessary or appropriate to the performance of its services; and performs such other review and reporting functions as the Board shall reasonably request consistent with the Investment Advisory Agreement and applicable law. With respect to AMG GW&K U.S. Small Cap Growth Fund, AMG River Road Dividend All Cap Value Fund, AMG River Road Dividend All Cap Value Fund II, AMG River Road
218
Annual Renewal of Investment Management and Subadvisory Agreements (continued)
Focused Absolute Value Fund, AMG River Road Long-Short Fund, AMG River Road Small-Mid Cap Value Fund and AMG River Road Small Cap Value Fund, the Trustees noted the affiliation of the Subadviser with the Investment Manager, noting any potential conflicts of interest. The Trustees also took into account the financial condition of the Investment Manager with respect to its ability to provide the services required under the Investment Advisory Agreement and the Investment Manager’s undertaking to maintain contractual expense limitations for certain Funds, as described below. The Trustees also considered the Investment Manager’s risk management processes.
For each Fund, the Trustees also reviewed information relating to each Subadviser’s operations and personnel and the investment philosophy, strategies and techniques (for each Subadviser, its “Investment Strategy”) used in managing the Fund. Among other things, the Trustees reviewed biographical information on portfolio management and other professional staff, information regarding each Subadviser’s organizational and management structure and each Subadviser’s brokerage policies and practices. The Trustees considered specific information provided regarding the experience of the individuals at each Subadviser with portfolio management responsibility for a Fund, including the information set forth in the Fund’s prospectus and statement of additional information. In the course of their deliberations, the Trustees evaluated, among other things: (a) the services rendered by each Subadviser in the past; (b) the qualifications and experience of the Subadviser’s personnel; and (c) the Subadviser’s compliance program. The Trustees also took into account the financial condition of each Subadviser with respect to its ability to provide the services required under its Subadvisory Agreement(s). The Trustees also considered each Subadviser’s risk management processes.
PERFORMANCE
As noted above, the Board considered each Fund’s net performance during relevant time periods as compared to the Fund’s Peer Group and Fund Benchmark and considered the gross performance of the Fund as compared to the Subadviser’s relevant performance composite that utilizes the same investment strategy and approach and noted that the Board reviews on a quarterly basis detailed information about both the Fund’s performance results and portfolio composition, as well as each Subadviser’s Investment Strategy. The Board noted
the Investment Manager’s expertise and resources in monitoring the performance, investment style and risk-adjusted performance of each Subadviser. The Board was mindful of the Investment Manager’s attention to monitoring each Subadviser’s performance with respect to the Funds and its discussions with management regarding the factors that contributed to the performance of the Funds.
ADVISORY FEES AND PROFITABILITY
In considering the reasonableness of the advisory fee charged by the Investment Manager for managing each Fund, the Trustees noted that the Investment Manager, and not the Fund, is responsible for paying the fees charged by the Fund’s Subadviser and, therefore, that the fees paid to the Investment Manager cover the cost of providing portfolio management services as well as the cost of providing search, selection and monitoring services in operating a “manager-of-managers” complex of mutual funds. The Trustees also considered the amount of the advisory fee retained by the Investment Manager after payment of the subadvisory fee with respect to each Fund. The Trustees also noted any payments that were made from River Road Asset Management, LLC (“River Road”) and GW&K Investment Management, LLC (“GW&K”) to the Investment Manager, and any other payments made or to be made from the Investment Manager to River Road and GW&K. The Trustees concluded that, in light of the high quality supervisory services provided by the Investment Manager and the fact that the subadvisory fees are paid out of the advisory fee, the advisory fee payable by each Fund to the Investment Manager can reasonably be expected to exceed the median advisory fee for the Peer Group, which consists of many funds that do not operate with a manager-of-managers structure. In this regard, the Trustees also noted that the Investment Manager has undertaken to maintain contractual expense limitations for AMG GW&K U.S. Small Cap Growth Fund, AMG Managers DoubleLine Core Plus Bond Fund, AMG Managers Fairpointe ESG Equity Fund, AMG Managers Guardian Capital Global Dividend Fund, AMG Managers Lake Partners LASSO Alternatives Fund, AMG Managers LMCG Small Cap Growth Fund, AMG Managers Pictet International Fund, AMG River Road Dividend All Cap Value Fund, AMG River Road Dividend All Cap Value Fund II, AMG River Road Focused Absolute Value Fund, AMG River
Road Long-Short Fund, AMG River Road Small-Mid Cap Value Fund, AMG Managers Silvercrest Small Cap Fund and AMG Managers Value Partners Asia Dividend Fund.
In addition, in considering the reasonableness of the advisory fee payable to the Investment Manager, the Trustees also reviewed information provided by the Investment Manager setting forth all revenues and other benefits, both direct and indirect (including any so-called “fallout benefits” such as reputational value derived from the Investment Manager serving as Investment Manager to a Fund), received by the Investment Manager and its affiliates attributable to managing each Fund and all the mutual funds in the AMG Funds Family of Funds, the cost of providing such services, the significant risks undertaken as Investment Manager and sponsor of the Funds, including investment, operational, enterprise, entrepreneurial, litigation, regulatory and compliance risks, and the resulting profitability to the Investment Manager and its affiliates from these relationships. The Trustees also noted the current asset levels of each Fund and the willingness of the Investment Manager to maintain contractual expense limitations for certain Funds, as described above, from time to time as a means of limiting total expenses. The Trustees also considered management’s discussion of the current asset levels of the Funds, and the impact on profitability of both the current asset levels and any future growth of assets of the Funds. The Board took into account management’s discussion of the advisory fee structure, and, as noted above, the services the Investment Manager provides in performing its functions under the Investment Advisory Agreement and supervising each Subadviser. In this regard, the Trustees noted that, unlike a mutual fund that is managed by a single investment adviser, the Funds operate in a manager-of-managers structure. Based on the foregoing, the Trustees concluded that the profitability to the Investment Manager is reasonable and that the Investment Manager is not realizing material benefits from economies of scale that would warrant adjustments to the advisory fees for any Fund at this time. With respect to economies of scale, the Trustees also noted that, as a Fund’s assets increase over time, the Fund may realize other economies of scale to the extent that the increase in assets is proportionally greater than the increase in certain other expenses.
219
Annual Renewal of Investment Management and Subadvisory Agreements (continued)
SUBADVISORY FEES AND PROFITABILITY
In considering the reasonableness of the fee payable by the Investment Manager to each of DoubleLine Capital LP, Fairpointe Capital LLC, Guardian Capital LP, Lake Partners, Inc., LMCG Investments, LLC, Montag & Caldwell, LLC, Pictet Asset Management Limited, Silvercrest Asset Management Group LLC and Value Partners Hong Kong, Limited (each, an “Unaffiliated Subadviser” and collectively, the “Unaffiliated Subadvisers”), the Trustees relied on the ability of the Investment Manager to negotiate the terms of the Subadvisory Agreement at arm’s length as part of the manager-of-managers structure, noting that the Investment Manager is not affiliated with the Unaffiliated Subadvisers. In addition, the Trustees considered other potential benefits of the subadvisory relationship to the Unaffiliated Subadvisers, including, among others, the indirect benefits that each Unaffiliated Subadviser may receive from its relationship with a Fund, including any so-called “fallout benefits” to the Unaffiliated Subadvisers, such as reputational value derived from the Unaffiliated Subadvisers serving as Subadviser to a Fund. In addition, the Trustees noted that the subadvisory fees are paid by the Investment Manager out of its advisory fee. As a consequence of all of the foregoing, the cost of services to be provided by each Unaffiliated Subadviser and the profitability to each Unaffiliated Subadviser of its relationship with a Fund were not material factors in the Trustees’ deliberations. For similar reasons, the Trustees did not consider potential economies of scale in the management of a Fund by each of the Unaffiliated Subadvisers to be a material factor in their deliberations at this time.
In considering the reasonableness of the fees payable by the Investment Manager to each of GW&K and River Road, the Trustees noted that each of GW&K and River Road is an affiliate of the Investment Manager, and the Trustees reviewed information regarding the cost to GW&K and River Road, respectively, of providing subadvisory services to a Fund and the resulting profitability from such relationship. The Trustees noted that, because each of GW&K and River Road is an affiliate of the Investment Manager, a portion of GW&K’s and River Road’s revenues or profits might be shared directly or indirectly with the Investment Manager. The Trustees also noted that the subadvisory fees are paid by the Investment Manager out of its advisory fee. With respect to each applicable Fund, the Board also took into account management’s discussion of the subadvisory fee structure, and the services each
of GW&K and River Road provides in performing its functions under the applicable Subadvisory Agreement. Based on the foregoing, the Trustees concluded that the profitability to each of GW&K and River Road is reasonable and that neither GW&K nor River Road is realizing material benefits from economies of scale that would warrant adjustments to the subadvisory fees at this time. Also with respect to economies of scale, the Trustees noted that as a Fund’s assets increase over time, the Fund may realize other economies of scale to the extent the increase in assets is proportionally greater than the increase in certain other expenses.
In addition to the foregoing, the Trustees considered the specific factors and related conclusions set forth below with respect to each applicable Fund, the Investment Manager and each Subadviser.
AMG Managers DoubleLine Core Plus Bond Fund
FUND PERFORMANCE
Among other information relating to the Fund’s performance, the Trustees noted that the Fund’s performance for Class I shares (which share class has the largest amount of assets of all the share classes of the Fund) for the 1-year, 3-year and 5-year periods ended March 31, 2018 and for the period from the Class I shares’ inception on July 18, 2011 through March 31, 2018 was above the median performance of the Peer Group and above the performance of the Fund Benchmark, the Bloomberg Barclays U.S. Aggregate Bond Index. The Trustees also took into account management’s discussion of the Fund’s performance, including the fact that the Fund outperformed the Fund Benchmark and its Peer Group for all relevant time periods. The Trustees also noted that Class I shares of the Fund ranked in the top decile relative to its Peer Group for all relevant time periods. The Trustees concluded that the Fund’s overall performance has been satisfactory.
ADVISORY AND SUBADVISORY FEES
The Trustees noted that the Fund’s management fees (which include both the advisory and administration fees) and total expenses (weighted average, all classes combined) (net of applicable expense waivers/reimbursements) as of March 31, 2018 were both higher than the average for the Fund’s Peer Group. The Trustees took into account the fact that the Investment Manager has contractually agreed, through March 1, 2019, to limit the Fund’s net annual operating expenses (subject to certain excluded expenses) to 0.61%. The Trustees also took into account management’s discussion of the Fund’s
expenses, including fees and expenses relative to comparably sized funds. The Trustees concluded that, in light of the nature, extent and quality of the services provided by the Investment Manager and the Subadviser, the foregoing expense reimbursement arrangement and the considerations noted above with respect to the Investment Manager and the Subadviser, the Fund’s advisory and subadvisory fees are reasonable.
AMG Managers Fairpointe ESG Equity Fund
FUND PERFORMANCE
Among other information relating to the Fund’s performance, the Trustees noted that the Fund’s performance for Class I shares (which share class has the largest amount of assets of all the share classes of the Fund) for the 1-year and 3-year periods ended March 31, 2018 and for the period from the Class I shares’ inception on December 24, 2014 through March 31, 2018 was below the median performance of the Peer Group and below the performance of the Fund Benchmark, the Russell 1000® Index. The Trustees took into account management’s discussion of the Fund’s performance, including the reasons for the Fund’s underperformance. The Trustees also noted that the Fund changed its investment strategy to follow an ESG mandate in 2017 and took into account the Fund’s relatively short performance history with its current investment strategy. The Trustees concluded that the Fund’s overall performance has been satisfactory in light of the Fund’s investment objective, strategies and policies.
ADVISORY AND SUBADVISORY FEES
The Trustees noted that the Fund’s management fees (which include both the advisory and administration fees) and total expenses (weighted average, all classes combined) (net of applicable expense waivers/reimbursements) as of March 31, 2018 were both higher than the average for the Fund’s Peer Group. The Trustees took into account the fact that the Investment Manager has contractually agreed, through March 1, 2019, to limit the Fund’s net annual operating expenses (subject to certain excluded expenses) to 0.82%. The Trustees also took into account management’s discussion of the Fund’s expenses, including fees and expenses relative to comparably sized funds, and the current size of the Fund. The Trustees concluded that, in light of the nature, extent and quality of the services provided by the Investment Manager and the Subadviser, the foregoing expense reimbursement arrangement and
220
Annual Renewal of Investment Management and Subadvisory Agreements (continued)
the considerations noted above with respect to the Investment Manager and the Subadviser, the Fund’s advisory and subadvisory fees are reasonable.
AMG Managers Fairpointe Mid Cap Fund
FUND PERFORMANCE
Among other information relating to the Fund’s performance, the Trustees noted that the Fund’s performance for Class N shares (which share class has the earliest inception date of all the share classes of the Fund) for the 1-year, 3-year, 5-year and 10-year periods ended March 31, 2018 was below, below, below and above, respectively, the median performance of the Peer Group and below the performance of the Fund Benchmark, the S&P MidCap 400® Index. The Trustees also took into account management’s discussion of the Fund’s performance, including the reasons for the Fund’s underperformance. The Trustees concluded that the Fund’s overall performance has been satisfactory in light of the Fund’s investment objective, strategies and policies.
ADVISORY AND SUBADVISORY FEES
The Trustees noted that the Fund’s management fees (which include both the advisory and administration fees) and total expenses (weighted average, all classes combined) as of March 31, 2018 were both lower than the average for the Fund’s Peer Group. The Trustees concluded that, in light of the nature, extent and quality of the services provided by the Investment Manager and the Subadviser and the considerations noted above with respect to the Investment Manager and the Subadviser, the Fund’s advisory and subadvisory fees are reasonable.
AMG Managers Guardian Capital Global Dividend Fund
FUND PERFORMANCE
Among other information relating to the Fund’s performance, the Trustees noted that the Fund’s performance for Class I shares (which share class has the largest amount of assets of all the share classes of the Fund) for the 1-year and 3-year periods ended March 31, 2018 and for the period from the Class I shares’ inception on April 14, 2014 through March 31, 2018 was below the median performance of the Peer Group and below the performance of the Fund Benchmark, the MSCI World Index. The Trustees took into account management’s discussion of the Fund’s performance, including the reasons for the Fund’s underperformance and any actions being
taken to address such underperformance. The Trustees concluded that the Fund’s performance is being addressed.
ADVISORY AND SUBADVISORY FEES
The Trustees noted that the Fund’s management fees (which include both the advisory and administration fees) and total expenses (weighted average, all classes combined) (net of applicable expense waivers/reimbursements) as of March 31, 2018 were both lower than the average for the Fund’s Peer Group. The Trustees took into account the fact that the Investment Manager has contractually agreed, through March 1, 2019, to limit the Fund’s net annual operating expenses (subject to certain excluded expenses) to 1.05%. The Trustees concluded that, in light of the nature, extent and quality of the services provided by the Investment Manager and the Subadviser, the foregoing expense reimbursement arrangement and the considerations noted above with respect to the Investment Manager and the Subadviser, the Fund’s advisory and subadvisory fees are reasonable.
AMG Managers Lake Partners LASSO Alternatives Fund
FUND PERFORMANCE
Among other information relating to the Fund’s performance, the Trustees noted that the Fund’s performance for Class I shares (which share class has the earliest inception date and the largest amount of assets of all the share classes of the Fund) for the 1-year, 3-year and 5-year periods ended March 31, 2018 and for the period from the Class I shares’ inception on April 1, 2009 through March 31, 2018 was above, below, below, and below, respectively, the median performance of the Peer Group and below, below, below and above, respectively, the performance of the Fund Benchmark, the HFRX Equity Hedge Index. The Trustees took into account management’s discussion of the Fund’s performance, including the reasons for the Fund’s underperformance and any actions being taken to address such underperformance. The Trustees also noted the Fund’s more recent improved performance relative to its Peer Group. The Trustees concluded that the Fund’s performance is being addressed.
ADVISORY AND SUBADVISORY FEES
The Trustees noted that the Fund’s management fees (which include both the advisory and administration fees) and total expenses (weighted average, all
classes combined) (net of applicable expense waivers/reimbursements) as of March 31, 2018 were both lower than the average for the Fund’s Peer Group. The Trustees took into account the fact that the Investment Manager has contractually agreed, through March 1, 2019, to limit the Fund’s net annual operating expenses (subject to certain excluded expenses) to 1.09%. The Trustees concluded that, in light of the nature, extent and quality of the services provided by the Investment Manager and the Subadviser, the foregoing expense reimbursement arrangement and the considerations noted above with respect to the Investment Manager and the Subadviser, the Fund’s advisory and subadvisory fees are reasonable.
The Board considered that the Fund, as a fund of funds, invests primarily in other investment companies. The Board noted that the Fund historically has invested in underlying funds outside of the AMG Funds Family of Funds. In approving the continuance of the Investment Advisory Agreement for the Fund, the Board, and separately a majority of the Independent Trustees, found that the advisory fees charged with respect to the Fund under the Investment Advisory Agreement are for services provided in addition to, and are not duplicative of, the services provided under the advisory contracts of any underlying funds in which the Fund is eligible to invest.
AMG Managers LMCG Small Cap Growth Fund
FUND PERFORMANCE
Among other information relating to the Fund’s performance, the Trustees noted that the Fund’s performance for Class N shares (which share class has the earliest inception date of all the share classes of the Fund) for the 1-year, 3-year and 5-year periods ended March 31, 2018 and for the period from the Class N shares’ inception on November 3, 2010 through March 31, 2018 was below the median performance of the Peer Group and below the performance of the Fund Benchmark, the Russell 2000® Growth Index. The Trustees also took into account management’s discussion of the Fund’s performance, including the reasons for the Fund’s underperformance. The Trustees concluded that the Fund’s overall performance has been satisfactory in light of the Fund’s investment objective, strategies and policies.
221
Annual Renewal of Investment Management and Subadvisory Agreements (continued)
ADVISORY AND SUBADVISORY FEES
The Trustees noted that the Fund’s management fees (which include both the advisory and administration fees) and total expenses (weighted average, all classes combined) (net of applicable expense waivers/reimbursements) as of March 31, 2018 were higher and lower, respectively, than the average for the Fund’s Peer Group. The Trustees took into account the fact that the Investment Manager has contractually agreed, through March 1, 2019, to limit the Fund’s net annual operating expenses (subject to certain excluded expenses) to 1.03%. The Trustees also took into account management’s discussion of the Fund’s expenses, including fees and expenses relative to comparably sized funds. The Trustees concluded that, in light of the nature, extent and quality of the services provided by the Investment Manager and the Subadviser, the foregoing expense reimbursement arrangement and the considerations noted above with respect to the Investment Manager and the Subadviser, the Fund’s advisory and subadvisory fees are reasonable.
AMG Managers Montag & Caldwell Growth Fund
FUND PERFORMANCE
Among other information relating to the Fund’s performance, the Trustees noted that the Fund’s performance for Class N shares (which share class has the earliest inception date of all the share classes of the Fund) for the 1-year, 3-year, 5-year and 10-year periods ended March 31, 2018 was below the median performance of the Peer Group and below the performance of the Fund Benchmark, the Russell 1000® Growth Index. The Trustees also took into account management’s discussion of the Fund’s performance, including the reasons for the Fund’s underperformance. The Trustees concluded that the Fund’s overall performance has been satisfactory in light of the Fund’s investment objective, strategies and policies.
ADVISORY AND SUBADVISORY FEES
The Trustees noted that the Fund’s management fees (which include both the advisory and administration fees) and total expenses (weighted average, all classes combined) as of March 31, 2018 were higher and lower, respectively, than the average for the Fund’s Peer Group. The Trustees also took into account management’s discussion of the Fund’s expenses and competitiveness with comparably sized funds. The Trustees concluded that, in light of the nature, extent and quality of the services
provided by the Investment Manager and the Subadviser and the considerations noted above with respect to the Investment Manager and the Subadviser, the Fund’s advisory and subadvisory fees are reasonable.
AMG Managers Pictet International Fund
FUND PERFORMANCE
Among other information relating to the Fund’s performance, the Trustees noted that the Fund’s performance for Class I shares (which share class has one of the earliest inception dates and the largest amount of assets of all the share classes of the Fund with that inception date) for the 1-year and 3-year periods ended March 31, 2018 and for the period from the Class I shares’ inception on April 14, 2014 through March 31, 2018 was below, above and above, respectively, the median performance of the Peer Group and below, above, and above, respectively, the performance of the Fund Benchmark, the MSCI EAFE Index. The Trustees also took into account management’s discussion of the Fund’s performance, including the fact that Class I shares of the Fund ranked in the top decile relative to the Peer Group for the 3-year period and in the first quartile relative to the Peer Group for the period from inception through March 31, 2018. The Trustees concluded that the Fund’s overall performance has been satisfactory in light of the Fund’s investment objective, strategies and policies.
ADVISORY AND SUBADVISORY FEES
The Trustees noted that the Fund’s management fees (which include both the advisory and administration fees) and total expenses (weighted average, all classes combined) (net of applicable expense waivers/reimbursements) as of March 31, 2018 were both lower than the average for the Fund’s Peer Group. The Trustees took into account the fact that the Investment Manager has contractually agreed, through March 1, 2019 to limit the Fund’s net annual operating expenses (subject to certain excluded expenses) to 0.98%. The Trustees noted that the Investment Manager replaced the Fund’s expense limitation in 2017 with a lower expense limitation, subject to later reimbursement by the Fund in certain circumstances. The Trustees concluded that, in light of the nature, extent and quality of the services provided by the Investment Manager and the Subadviser, the foregoing expense reimbursement arrangement and the considerations noted above with respect to the Investment Manager and the Subadviser, the Fund’s advisory and subadvisory fees are reasonable.
AMG River Road Dividend All Cap Value Fund
FUND PERFORMANCE
Among other information relating to the Fund’s performance, the Trustees noted that the Fund’s performance for Class N shares (which share class has the earliest inception date of all the share classes of the Fund) for the 1-year, 3-year, 5-year and 10-year periods ended March 31, 2018 was below, below, below and above, respectively, the median performance of the Peer Group and below the performance of the Fund Benchmark, the Russell 3000® Value Index. The Trustees took into account management’s discussion of the Fund’s performance, including the reasons for the Fund’s underperformance. The Trustees concluded that the Fund’s overall performance has been satisfactory in light of the Fund’s investment objective, strategies and policies.
ADVISORY AND SUBADVISORY FEES
The Trustees noted that the Fund’s management fees (which include both the advisory and administration fees) and total expenses (weighted average, all classes combined) (net of applicable expense waivers/reimbursements) as of March 31, 2018 were both lower than the average for the Fund’s Peer Group. The Trustees took into account the fact that the Investment Manager has contractually agreed, through March 1, 2019, to limit the Fund’s net annual operating expenses (subject to certain excluded expenses) to 0.99%. The Trustees concluded that, in light of the nature, extent and quality of the services provided by the Investment Manager and the Subadviser (which is an affiliate of the Investment Manager), the foregoing expense limitation arrangement and the considerations noted above with respect to the Investment Manager and the Subadviser, the Fund’s advisory and subadvisory fees are reasonable.
AMG River Road Dividend All Cap Value Fund II
FUND PERFORMANCE
Among other information relating to the Fund’s performance, the Trustees noted that the Fund’s performance for Class I shares (which share class has the largest amount of assets of all the share classes of the Fund) for the 1-year, 3-year and 5-year periods ended March 31, 2018 and for the period from
222
Annual Renewal of Investment Management and Subadvisory Agreements (continued)
the Class I shares’ inception on June 27, 2012 through March 31, 2018 was below the median performance of the Peer Group and below the performance of the Fund Benchmark, the Russell 3000® Value Index. The Trustees also took into account management’s discussion of the Fund’s performance, including the reasons for the Fund’s underperformance. The Trustees concluded that the Fund’s overall performance has been satisfactory in light of the Fund’s investment objective, strategies and policies.
ADVISORY AND SUBADVISORY FEES
The Trustees noted that the Fund’s management fees (which include both the advisory and administration fees) and total expenses (weighted average, all classes combined) (net of applicable expense waivers/reimbursements) as of March 31, 2018 were both lower than the average for the Fund’s Peer Group. The Trustees took into account the fact that the Investment Manager has contractually agreed, through March 1, 2019, to limit the Fund’s net annual operating expenses (subject to certain excluded expenses) to 0.99%. The Trustees concluded that, in light of the nature, extent and quality of the services provided by the Investment Manager and the Subadviser (which is an affiliate of the Investment Manager), the foregoing expense reimbursement arrangement and the considerations noted above with respect to the Investment Manager and the Subadviser, the Fund’s advisory and subadvisory fees are reasonable.
AMG River Road Focused Absolute Value Fund
FUND PERFORMANCE
Among other information relating to the Fund’s performance, the Trustees noted that the Fund’s performance for Class I shares (which share class has the largest amount of assets of all the share classes of the Fund) for the 1-year period ended March 31, 2018 and for the period from the Fund’s inception on November 3, 2015 through March 31, 2018 was above the median performance of the Peer Group and above the performance of the Fund Benchmark, the Russell 3000® Value Index. The Trustees also took into account management’s discussion of the Fund’s performance, including the fact that the Class I shares of the Fund outperformed its Peer Group and the Fund Benchmark for all relevant time periods. The Trustees noted that Class I shares of the Fund ranked in the top quintile relative to its Peer Group for the period from inception through March 31, 2018. The Trustees concluded that the Fund’s overall performance has been satisfactory.
ADVISORY AND SUBADVISORY FEES
The Trustees noted that the Fund’s management fees (which include both the advisory and administration fees) and total expenses (weighted average, all classes combined) (net of applicable expense waivers/reimbursements) as of March 31, 2018 were both lower than the average for the Fund’s Peer Group. The Trustees took into account the fact that the Investment Manager has contractually agreed, through March 1, 2019, to limit the Fund’s net annual operating expenses (subject to certain excluded expenses) to 0.71%. The Trustees concluded that, in light of the nature, extent and quality of the services provided by the Investment Manager and the Subadviser, the foregoing expense reimbursement arrangement and the considerations noted above with respect to the Investment Manager and the Subadviser, the Fund’s advisory and subadvisory fees are reasonable.
AMG River Road Long-Short Fund
FUND PERFORMANCE
Among other information relating to the Fund’s performance, the Trustees noted that the Fund’s performance for Class N shares (which share class has the earliest inception date of all the share classes of the Fund) for the 1-year, 3-year and 5-year periods ended March 31, 2018 and for the period from the Class N shares’ inception on May 4, 2011 through March 31, 2018 was below, below, below and above, respectively, the median performance of the Peer Group and below the performance of the Fund Benchmark, the Russell 3000® Index. The Trustees also took into account management’s discussion of the Fund’s performance, including the reasons for the Fund’s underperformance. The Trustees concluded that the Fund’s overall performance has been satisfactory in light of the Fund’s investment objective, strategies and policies.
ADVISORY AND SUBADVISORY FEES
The Trustees noted that the Fund’s management fees (which include both the advisory and administration fees) and total expenses (weighted average, all classes combined) (net of applicable expense waivers/reimbursements) as of March 31, 2018 were both lower than the average for the Fund’s Peer Group. The Trustees took into account the fact that the Investment Manager has contractually agreed, through March 1, 2019, to limit the Fund’s net annual operating expenses (subject to certain excluded
expenses) to 1.12%. The Trustees noted that the Investment Manager reduced the Fund’s expense limitation in 2017. The Trustees concluded that, in light of the nature, extent and quality of the services provided by the Investment Manager and the Subadviser (which is an affiliate of the Investment Manager), the foregoing expense reimbursement arrangement and the considerations noted above with respect to the Investment Manager and the Subadviser, the Fund’s advisory and subadvisory fees are reasonable.
AMG River Road Small-Mid Cap Value Fund
FUND PERFORMANCE
Among other information relating to the Fund’s performance, the Trustees noted that the Fund’s performance for Class N shares (which share class has the earliest inception date of all the share classes of the Fund) for the 1-year, 3-year, 5-year and 10-year periods ended March 31, 2018 was above the median performance of the Peer Group and above, above, above and below, respectively, the performance of the Fund Benchmark, the Russell 2500® Value Index. The Trustees also took into account management’s discussion of the Fund’s performance, noting that Class N shares of the Fund ranked in the top decile relative to its Peer Group for the 1-year and 3-year periods. The Trustees concluded that the Fund’s overall performance has been satisfactory.
ADVISORY AND SUBADVISORY FEES
The Trustees noted that the Fund’s management fees (which include both the advisory and administration fees) and total expenses (weighted average, all classes combined) (net of applicable expense waivers/reimbursements) as of March 31, 2018 were both higher than the average for the Fund’s Peer Group. The Trustees took into account the fact that the Investment Manager has contractually agreed, through March 1, 2019, to limit the Fund’s net annual operating expenses (subject to certain excluded expenses) to 1.04%. The Trustees noted that the Investment Manager reduced the Fund’s expense limitation in 2017. The Trustees also took into account management’s discussion of the Fund’s expenses, including fees and expenses relative to comparably sized funds, and the current size of the Fund. The Trustees concluded that, in light of the nature, extent and quality of the services provided by the Investment Manager and the Subadviser (which is
223
Annual Renewal of Investment Management and Subadvisory Agreements (continued)
an affiliate of the Investment Manager), the foregoing expense reimbursement arrangement and the considerations noted above with respect to the Investment Manager and the Subadviser, the Fund’s advisory and subadvisory fees are reasonable.
AMG River Road Small Cap Value Fund
FUND PERFORMANCE
Among other information relating to the Fund’s performance, the Trustees noted that the Fund’s performance for Class N shares (which share class has the earliest inception date of all the share classes of the Fund) for the 1-year, 3-year, 5-year and 10-year periods ended March 31, 2018 was above, above, above and below, respectively, the median performance of the Peer Group and above, above, above and below, respectively, the performance of the Fund Benchmark, the Russell 2000® Value Index. The Trustees also took into account management’s discussion of the Fund’s performance. The Trustees also noted that Class N shares of the Fund ranked in the top decile relative to its Peer Group for the 3-year period and in the top quintile relative to its Peer Group for the 1-year period. The Trustees concluded that the Fund’s overall performance has been satisfactory.
ADVISORY AND SUBADVISORY FEES
The Trustees noted that the Fund’s management fees (which include both the advisory and administration fees) and total expenses (weighted average, all classes combined) as of March 31, 2018 were both higher than the average for the Fund’s Peer Group. The Trustees took into account management’s discussion of the Fund’s expenses, including fees and expenses relative to comparably sized funds. The Trustees concluded that, in light of the nature, extent and quality of the services provided by the Investment Manager and the Subadviser (which is an affiliate of the Investment Manager) and the considerations noted above with respect to the Investment Manager and the Subadviser, the Fund’s advisory and subadvisory fees are reasonable.
AMG Managers Silvercrest Small Cap Fund
FUND PERFORMANCE
Among other information relating to the Fund’s performance, the Trustees noted that the Fund’s performance for Class I shares (which share class has the largest amount of assets of all the share classes of the Fund) for the 1-year, 3-year and 5-year periods ended March 31, 2018 and for the period from
the Class I shares’ inception on December 27, 2011 through March 31, 2018 was below, above, above and below, respectively, the median performance of the Peer Group and below, below, above and above, respectively, the performance of the Fund Benchmark, the Russell 2000® Value Index. The Trustees also took into account management’s discussion of the Fund’s performance, including the Class I shares’ outperformance of the Peer Group for the 3-year and 5-year periods and the reasons for the Fund’s more recent underperformance. The Trustees concluded that the Fund’s overall performance has been satisfactory in light of the Fund’s investment objective, strategies and policies.
ADVISORY AND SUBADVISORY FEES
The Trustees noted that the Fund’s management fees (which include both the advisory and administration fees) and total expenses (weighted average, all classes combined) (net of applicable expense waivers/reimbursements) as of March 31, 2018 were both higher than the average for the Fund’s Peer Group. The Trustees took into account the fact that the Investment Manager has contractually agreed, through March 1, 2019, to limit the Fund’s net annual operating expenses (subject to certain excluded expenses) to 1.08%. The Trustees also took into account management’s discussion of the Fund’s expenses, including fees and expenses relative to comparably sized funds. The Trustees concluded that, in light of the nature, extent and quality of the services provided by the Investment Manager and the Subadviser, the foregoing expense reimbursement arrangement and the considerations noted above with respect to the Investment Manager and the Subadviser, the Fund’s advisory and subadvisory fees are reasonable.
AMG GW&K U.S. Small Cap Growth Fund
FUND PERFORMANCE
Among other information relating to the Fund’s performance, the Trustees noted that the Fund’s performance for Class N shares (which share class has the earliest inception date and the largest amount of assets of all the share classes of the Fund) for the 1-year, 3-year, 5-year and 10-year periods ended March 31, 2018 was above, below, below and below, respectively, the median performance of the Peer Group and below the performance of the Fund Benchmark, the Russell 2000® Growth Index. The Trustees also took into account management’s discussion of the Fund’s performance, including the reasons for the Fund’s
underperformance. The Trustees also noted the Fund’s more recent improved performance relative to its Peer Group. The Trustees specifically noted the change in the Fund’s Subadviser in February 2016 and that the performance record prior to that time reflects that of the prior Subadviser. The Trustees concluded that the Fund’s overall performance has been satisfactory in light of the Fund’s investment objective, strategies and policies.
ADVISORY AND SUBADVISORY FEES
The Trustees noted that the Fund’s management fees (which include both the advisory and administration fees) and total expenses (weighted average, all classes combined) (net of applicable expense waivers/reimbursements) as of March 31, 2018 were lower and higher, respectively, than the average for the Fund’s Peer Group. The Trustees took into account the fact that the Investment Manager has contractually agreed, through March 1, 2019, to limit the Fund’s net annual operating expenses (subject to certain excluded expenses) to 0.90%. The Trustees noted that the Investment Manager reduced the Fund’s expense limitation in 2017. The Trustees also took into account management’s discussion of the Fund’s expenses, including fees and expenses relative to comparably sized funds, and the current size of the Fund. The Trustees concluded that, in light of the nature, extent and quality of the services provided by the Investment Manager and the Subadviser, the foregoing expense reimbursement arrangement and the considerations noted above with respect to the Investment Manager and the Subadviser, the Fund’s advisory and subadvisory fees are reasonable.
AMG Managers Value Partners Asia Dividend Fund
FUND PERFORMANCE
Among other information relating to the Fund’s performance, the Trustees noted that the Fund’s performance for Class I shares (which share class has the largest amount of assets of all the share classes of the Fund) for the 1-year period ended March 31, 2018 and for the period from the Fund’s inception on December 16, 2015 through March 31, 2018 was above the median performance of the Peer Group and below the performance of the Fund Benchmark, the MSCI AC Asia ex Japan Index. The Trustees also took into account management’s discussion of the Fund’s performance, including the Class I shares’ outperformance of the Peer Group for all relevant time periods. The Trustees concluded
224
Annual Renewal of Investment Management and Subadvisory Agreements (continued)
that the Fund’s overall performance has been satisfactory in light of the Fund’s investment objective, strategies and policies.
ADVISORY AND SUBADVISORY FEES
The Trustees noted that the Fund’s management fees (which include both the advisory and administration fees) and total expenses (weighted average, all classes combined) (net of applicable expense waivers/reimbursements) as of March 31, 2018 were both lower than the average for the Fund’s Peer Group. The Trustees took into account the fact that the Investment Manager has contractually agreed, through March 1, 2019, to limit the Fund’s net annual operating expenses (subject to certain excluded expenses) to 1.15%. The Trustees concluded that, in light of the nature, extent and quality of the services provided by the Investment Manager and the
Subadviser, the foregoing expense reimbursement arrangement and the considerations noted above with respect to the Investment Manager and the Subadviser, the Fund’s advisory and subadvisory fees are reasonable.
* * * *
After consideration of the foregoing, the Trustees also reached the following conclusions (in addition to the conclusions discussed above) regarding the Investment Advisory Agreement and each Subadvisory Agreement: (a) the Investment Manager and each Subadviser have demonstrated that they possess the capability and resources to perform the duties required of them under the Investment Advisory Agreement and the applicable Subadvisory Agreement; (b) each Subadviser’s Investment
Strategy is appropriate for pursuing the applicable Fund’s investment objective(s); and (c) the Investment Manager and each Subadviser maintain appropriate compliance programs.
Based on all of the above-mentioned factors and their related conclusions, with no single factor or conclusion being determinative and with each Trustee not necessarily attributing the same weight to each factor, the Trustees concluded that approval of the Investment Advisory Agreement and each Subadvisory Agreement would be in the best interests of the applicable Fund and its shareholders. Accordingly, on June 27-28, 2018, the Trustees, and separately a majority of the Independent Trustees, voted to approve the Investment Advisory and the Subadvisory Agreements for each Fund.
225
THIS PAGE INTENTIONALLY LEFT BLANK
THIS PAGE INTENTIONALLY LEFT BLANK
THIS PAGE INTENTIONALLY LEFT BLANK
INVESTMENT MANAGER AND ADMINISTRATOR
AMG Funds LLC
600 Steamboat Road, Suite 300
Greenwich, CT 06830
800.835.3879
DISTRIBUTOR
AMG Distributors, Inc.
600 Steamboat Road, Suite 300
Greenwich, CT 06830
800.835.3879
CUSTODIAN
The Bank of New York Mellon
111 Sanders Creek Parkway
East Syracuse, NY 13057
LEGAL COUNSEL
Ropes & Gray LLP
Prudential Tower, 800 Boylston Street
Boston, MA 02199-3600
TRANSFER AGENT
BNY Mellon Investment Servicing (US) Inc.
Attn: AMG Funds
P.O. Box 9769
Providence, RI 02940
800.548.4539
This report is prepared for the Funds’ shareholders. It is authorized for distribution to prospective investors only when preceded or accompanied by an effective prospectus. To receive a free copy of the prospectus or Statement of Additional Information, which includes additional information about Fund Trustees, please contact us by calling 800.835.3879. Distributed by AMG Distributors, Inc., member FINRA/SIPC.
Current net asset values per share for each Fund are available on the Funds’ website at amgfunds.com.
A description of the policies and procedures each Fund uses to vote its proxies is available: (i) without charge, upon request, by calling 800.835.3879, or (ii) on the Securities and Exchange Commission’s (SEC) website at sec.gov. For information regarding each Fund’s proxy voting record for the 12-month period ended June 30, call 800.835.3879 or visit the SEC website at sec.gov.
Each Fund files its complete schedule of portfolio holdings with the SEC for the first and third quarters of each fiscal year on Form N-Q. The Fund’s Forms N-Q are available on the SEC’s website at sec.gov. To review a complete list of the Funds’ portfolio holdings, or to view the most recent quarterly holdings report, semiannual report, or annual report, please visit amgfunds.com.
AFFILIATE SUBADVISED FUNDS
BALANCED FUNDS
AMG Chicago Equity Partners Balanced
Chicago Equity Partners, LLC
AMG FQ Global Risk-Balanced
First Quadrant, L.P.
EQUITY FUNDS
AMG FQ Tax-Managed U.S. Equity
AMG FQ Long-Short Equity
First Quadrant, L.P.
AMG Frontier Small Cap Growth
Frontier Capital Management Co., LLC
AMG GW&K Small Cap Core
AMG GW&K Small/Mid Cap
AMG GW&K U.S. Small Cap Growth
GW&K Investment Management, LLC
AMG Renaissance International Equity
AMG Renaissance Large Cap Growth
The Renaissance Group LLC
AMG River Road Dividend All Cap Value
AMG River Road Dividend All Cap Value II
AMG River Road Focused Absolute Value
AMG River Road Long-Short
AMG River Road Small-Mid Cap Value
AMG River Road Small Cap Value
River Road Asset Management, LLC
AMG SouthernSun Small Cap
AMG SouthernSun Global Opportunities
AMG SouthernSun U.S. Equity
SouthernSun Asset Management, LLC
AMG Systematic Mid Cap Value
Systematic Financial Management L.P.
AMG TimesSquare Emerging Markets Small Cap
AMG TimesSquare Global Small Cap
AMG TimesSquare International Small Cap
AMG TimesSquare Mid Cap Growth
AMG TimesSquare Small Cap Growth
TimesSquare Capital Management, LLC
AMG Trilogy Emerging Markets Equity
AMG Trilogy Emerging Wealth Equity
Trilogy Global Advisors, L.P.
AMG Yacktman
AMG Yacktman Focused
AMG Yacktman Focused Fund - Security Selection Only
AMG Yacktman Special Opportunities
Yacktman Asset Management LP
FIXED INCOME FUNDS
AMG GW&K Core Bond
AMG GW&K Enhanced Core Bond
AMG GW&K Municipal Bond
AMG GW&K Municipal Enhanced Yield
GW&K Investment Management, LLC
OPEN-ARCHITECTURE FUNDS
ALTERNATIVE FUNDS
AMG Managers Lake Partners LASSO Alternative
Lake Partners, Inc.
EQUITY FUNDS
AMG Managers Brandywine
AMG Managers Brandywine Advisors Mid Cap Growth
AMG Managers Brandywine Blue
Friess Associates, LLC
AMG Managers Cadence Emerging Companies
AMG Managers Cadence Mid Cap
Cadence Capital Management LLC
AMG Managers CenterSquare Real Estate
CenterSquare Investment Management LLC
AMG Managers Emerging Opportunities
Lord, Abbett & Co. LLC
WEDGE Capital Management L.L.P.
Next Century Growth Investors LLC
RBC Global Asset Management (U.S.) Inc.
AMG Managers Essex Small/Micro Cap Growth
Essex Investment Management Company, LLC
AMG Managers Fairpointe ESG Equity
AMG Managers Fairpointe Mid Cap
Fairpointe Capital LLC
AMG Managers Guardian Capital Global Dividend
Guardian Capital LP
AMG Managers LMCG Small Cap Growth
LMCG Investments, LLC
AMG Managers Montag & Caldwell Growth
Montag & Caldwell, LLC
AMG Managers Pictet International
Pictet Asset Management Limited
AMG Managers Silvercrest Small Cap
Silvercrest Asset Management Group LLC
AMG Managers Skyline Special Equities
Skyline Asset Management, L.P.
AMG Managers Special Equity
Ranger Investment Management, L.P.
Lord, Abbett & Co. LLC
Smith Asset Management Group, L.P.
Federated MDTA LLC
AMG Managers Value Partners Asia Dividend
Value Partners Hong Kong Limited
FIXED INCOME FUNDS
AMG Managers Amundi Intermediate Government
AMG Managers Amundi Short Duration Government
Amundi Pioneer Institutional Asset Management, Inc.
AMG Managers Doubleline Core Plus Bond
DoubleLine Capital LP
AMG Managers Global Income Opportunity
AMG Managers Loomis Sayles Bond
Loomis, Sayles & Company, L.P.
| | |
| amgfunds.com | | | 103118 AR082 |
Registrant has adopted a Code of Ethics. See attached exhibit (a) (1).
| Item 3. | Audit Committee Financial Expert. |
Registrant’s Board of Trustees has determined that independent Trustee Mr. Steven J. Paggioli qualifies as the Audit Committee Financial Expert. Mr. Paggioli is “independent” as such term is defined in Form N-CSR.
| Item 4. | Principal Accountant Fees and Services. |
The aggregate fees billed for each of the last two fiscal years for professional services rendered by the principal accountant for the audit of the registrant’s annual financial statements or services that are normally provided by the accountant in connection with statutory and regulatory filings or engagements for those fiscal years are $496,037 for 2018 and $488,480 for 2017.
There were no fees billed by PwC to the Funds in its two recent fiscal years for services rendered for assurance and related services that are reasonably related to the performance of the audit or review of the Fund’s financial statements, but are not reported as Audit Fees (“Audit-Related Fees”).
For the Funds’ two most recent fiscal years, there were no Audit-Related Fees billed by PwC for engagements related directly to the operations and financial reporting of one or more Funds by a Fund Service Provider. A Fund Service Provider is (a) any investment adviser to the Fund (not including any Subadvisor whose role is primarily portfolio management and is subcontracted with or overseen by another investment adviser) or (b) any entity that provides ongoing services to the Fund and is controlling, controlled by or under common control with a Fund investment adviser described in (a). Tax Fees
The aggregate fees billed in each of the last two fiscal years for professional services rendered by the principal accountant for tax compliance, tax advice, and tax planning are $98,939 for 2018 and $105,265 for 2017.
For the Funds’ two most recent fiscal years, Tax Fees billed by PwC for engagements by Fund Service Providers that related directly to the operations and financial reporting of the Funds were $0 for fiscal 2018 and $0 for fiscal 2017, respectively.
The services for which Tax Fees were charged comprise all services performed by professional staff in PwC’s tax division except those services related to the audit. Typically, this category would include fees for tax compliance, tax planning, and tax
advice. Tax compliance, tax advice, and tax planning services include preparation of original and amended tax return, claims for refund and tax payment-planning services, assistance with tax audits and appeals, tax advice related to mergers and acquisitions and requests for rulings or technical advice from taxing authorities.
There were no other fees billed by PwC to the Funds for all other non-audit services (“Other Fees”) during the Funds’ two most recent fiscal years. During the same period, there were no Other Fees billed by PwC for engagements by Fund Service Providers that related directly to the operations and financial reporting of the Funds.
| | (e) | (1) According to policies adopted by the Audit Committee, services provided by PwC to the Funds must be pre-approved by the Audit Committee. On an annual basis, the Audit Committee reviews and pre-approves various types of services that PwC may perform for the Funds without specific approval of each engagement, subject to specified budget limitations. As contemplated by the Sarbanes-Oxley Act of 2002 and related SEC rules, the Audit Committee also pre-approves non-audit services provided by PwC to any Fund Service Provider for any engagement that relates directly to the operations and financial reporting of the Funds. Any engagement that is not already pre-approved or that will exceed a pre-approved budget must be submitted to the Audit Committee for pre-approval. The Chairman of the Audit Committee is authorized on behalf of the Board of Trustees and the Audit Committee to approve the engagement of PwC to perform non-audit services subject to certain conditions, including notification to the Audit Committee of such pre-approval not later than the next meeting of the Audit Committee following the date of such pre-approval. |
(e)(2) None.
| | (g) | The aggregate non-audit fees billed by the registrant’s accountant for services rendered to the Funds and Fund Service Providers for each of the last two fiscal years of the registrant was $148,439 for 2018 and $186,115 for 2017. For the fiscal year ended October 31, 2018, this amount reflects the amounts disclosed above in Item 4(b),(c),(d), plus $49,500 in fees billed to the Fund Service Providers for non-audit services that did not relate directly to the operations and financial reporting of the Funds. For the fiscal year ended October 31, 2017, this amount reflects the amounts disclosed above in Item 4(b),(c),(d), plus $80,850 in fees billed to the Fund Service Providers for non-audit services that did not relate directly to the operations and financial reporting of the Funds. |
| | (h) | The registrant’s audit committee of the board of trustees has considered whether the provision of non-audit services that were rendered to the registrant’s investment adviser (not including any sub-adviser whose role is primarily portfolio management and is subcontracted with or overseen by another investment adviser), and any entity controlling, controlled by, or under common control with the investment adviser that provides ongoing services to the registrant that were not pre-approved pursuant to paragraph (c)(7)(ii) of Rule 2-01 of Regulation S-X is compatible with maintaining the principal accountant’s independence. |
| Item 5. | Audit Committee of Listed Registrants. |
Not applicable.
| (a) | Schedule of Investments in securities of unaffiliated issuers as of the close of the reporting period is included as part of the report to shareholders filed under Item 1 of this form. |
| Item 7. | Disclosure of Proxy Voting Policies and Procedures for Closed-End Management Investment Companies. |
Not applicable.
| Item 8. | Portfolio Managers of Closed-End Management Investment Companies. |
Not applicable.
| Item 9. | Purchases of Equity Securities by Closed-End Management Investment Company and Affiliated Purchasers. |
Not applicable.
| Item 10. | Submission of Matters to a Vote of Security Holders. |
There have been no material changes to the procedures by which the shareholders may recommend nominees to the registrant’s board of directors, where those changes were implemented after the registrant last provided disclosure in response to the requirements of Item 407(c)(2)(iv) of Regulation S-K (17 CFR 229.407) (as required by Item 22(b)(15) of Schedule 14A (17 CFR 240.14a-101)), or this Item.
| Item 11. | Controls and Procedures. |
| | (a) | The Registrant’s principal executive and principal financial officers have concluded, based on their evaluation of the registrant’s disclosure controls and procedures as of a date within 90 days of the filing of this report, that the Registrant’s disclosure controls and procedures are reasonably designed to ensure that information required to be disclosed by the Registrant on Form N-CSR is recorded, processed, summarized and reported within the required time periods and that information required to be disclosed by the registrant in the reports that it files or submits on Form N-CSR is accumulated and communicated to the Registrant’s management, including its principal executive and principal financial officers, as appropriate to allow timely decisions regarding required disclosure. |
| | (b) | There were no changes in the Registrant’s internal control over financial reporting during the Registrant’s fourth fiscal quarter of the period covered by this report that have materially affected, or are reasonably likely to affect, the internal control over financial reporting. |
| Item 12. | DISCLOSURE OF SECURITIES LENDING ACTIVITIES FOR CLOSED-END MANAGEMENT INVESTMENT COMPANIES |
Not applicable.
(a)(1) Any Code of Ethics or amendments hereto. Filed herewith.
(a)(2) Certifications pursuant to Rule 30a-2(a) under the Investment Company Act of 1940 - Filed herewith.
(a)(3) Not applicable.
(b) Certifications pursuant to Rule 30a-2(b) under the Investment Company Act of 1940 - Filed herewith.
SIGNATURES
Pursuant to the requirements of the Securities Exchange Act of 1934 and the Investment Company Act of 1940, the registrant has duly caused this report to be signed on its behalf by the undersigned, thereunto duly authorized.
| | |
| AMG FUNDS IV |
| |
| By: | | /s/ Keitha L. Kinne
|
| | Keitha L. Kinne, Principal Executive Officer |
| |
| Date: | | January 7, 2019 |
Pursuant to the requirements of the Securities Exchange Act of 1934 and the Investment Company Act of 1940, this report has been signed below by the following persons on behalf of the registrant and in the capacities and on the dates indicated.
| | |
| By: | | /s/ Keitha L. Kinne |
| | Keitha L. Kinne, Principal Executive Officer |
| |
| Date: | | January 7, 2019 |
| |
| By: | | /s/ Thomas Disbrow |
| | Thomas Disbrow, Principal Financial Officer |
| |
| Date: | | January 7, 2019 |