UNITED STATES
SECURITIES AND EXCHANGE COMMISSION
Washington, DC 20549
FORM N-CSR
CERTIFIED SHAREHOLDER REPORT OF REGISTERED
MANAGEMENT INVESTMENT COMPANIES
Investment Company Act file number 811-08034
Franklin Real Estate Securities Trust
(Exact name of registrant as specified in charter)
One Franklin Parkway,
San Mateo, CA 94403-1906
(Address of principal executive offices) (Zip code)
Craig S. Tyle,
One Franklin Parkway,
San Mateo, CA 94403-1906
(Name and address of agent for service)
Registrant’s telephone number, including area code: 650 312-2000
Date of fiscal year end: 4/30
Date of reporting period: 4/30/18
Item 1. Reports to Stockholders.
Franklin Templeton Investments
Why choose Franklin Templeton Investments?
Successful investing begins with ambition. And achievement only comes when you reach for it. That’s why we continually strive to deliver better outcomes for investors. No matter what your goals are, our deep, global investment expertise allows us to offer solutions that can help.
During our more than 70 years of experience, we’ve managed through all kinds of markets—up, down and those in between. We’re always preparing for what may come next. It’s because of this, combined with our strength as one of the world’s largest asset managers that we’ve earned the trust of millions of investors around the world.
Dear Shareholder:
During the 12 months ended April 30, 2018, mostly upbeat economic data, better US corporate earnings and generally supportive monetary policies, combined with the passage of the US Tax Reform bill aided US markets. However, investor sentiment was dampened by Korean peninsula tensions, US political uncertainties, and a potentially quicker pace of US Federal Reserve interest rate hikes due to strong US economic growth and rising inflation.
The US Federal Reserve began reducing its balance sheet in October 2017 and raised its federal funds rate target in June and December 2017 and March 2018. It maintained its forecast of three rate increases in 2018. The 10-year US Treasury yield began the period at 2.29% and ended the period at 2.95%. Increased capital investment by leading US companies, particularly in information technology encouraged equity investors, while US-China trade disputes, protectionist US trade policies and the potential for tougher consumer data privacy regulations caused concerns. Within this environment, US stocks, as measured by the Standard & Poor’s® 500 Index, generated a double-digit positive total return.
We are committed to our long-term perspective and disciplined investment approach as we conduct a rigorous, fundamental analysis of securities with a regular emphasis on investment risk management.
We believe active, professional investment management serves investors well. We also recognize the important role of financial advisors in today’s markets and encourage investors to continue to seek their advice. Amid changing markets and
economic conditions, we are confident investors with a well-diversified portfolio and a patient, long-term outlook should be well positioned for the years ahead.
In addition, Franklin Real Estate Securities Fund’s annual report includes more detail about prevailing conditions and a discussion about investment decisions during the period. Please remember all securities markets fluctuate, as do mutual fund share prices.
We thank you for investing with Franklin Templeton, welcome your questions and comments, and look forward to serving your future investment needs.
Sincerely,

Edward B. Jamieson
President and Chief Executive Officer –
Investment Management
Franklin Real Estate Securities Trust
This letter reflects our analysis and opinions as of April 30, 2018, unless otherwise indicated. The information is not a complete analysis of every aspect of any market, country, industry, security or fund. Statements of fact are from sources considered reliable.
| | |
| | Not FDIC Insured | May Lose Value | No Bank Guarantee |
| | | | |
| | | |
franklintempleton.com | | Not part of the annual report | | 1 |
Contents
Visit franklintempleton.com for fund updates, to access your account, or to find helpful financial planning tools.
| | | | |
| | | |
2 | | Annual Report | | franklintempleton.com |
Annual Report
Franklin Real Estate Securities Fund
This annual report for Franklin Real Estate Securities Fund covers the fiscal year ended April 30, 2018. The reorganization of Franklin Global Real Estate Fund, as approved by shareholders, was completed on April 27, 2018. Shares of Franklin Global Real Estate Fund share classes A, C, R6 and Advisor were exchanged for shares in Franklin Real Estate Securities Fund share classes A, C, R and Advisor, respectively. We welcome the former shareholders of Franklin Global Real Estate Fund that now own shares of Franklin Real Estate Securities Fund.
Your Fund’s Goal and Main Investments
The Fund seeks to maximize total return by investing at least 80% of its net assets in equity securities of companies operating in the real estate industry predominantly in the US, including real estate investment trusts (REITs) and companies that derive at least half of their assets or revenues from the ownership, construction, management, operation, development or sale of commercial or residential real estate.1
Performance Overview
The Fund’s Class A shares had a -2.66% cumulative total return for the 12 months under review. In comparison, the Standard & Poor’s (S&P®) US Property Index, which tracks the investable universe of publicly traded US property companies, had a -3.19% total return.2 You can find the Fund’s long-term performance data in the Performance Summary beginning on page 7.
Performance data represent past performance, which does not guarantee future results. Investment return and principal value will fluctuate, and you may have a gain or loss when you sell your shares. Current performance may differ from figures shown. For most recent month-end performance, go to franklintempleton.com or call (800) 342-5236.
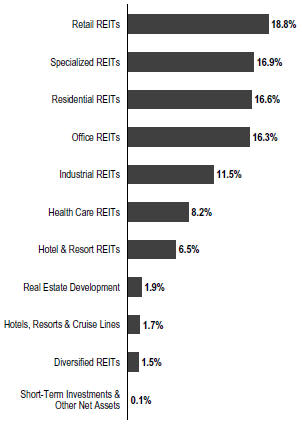
Portfolio Composition
Based on Total Net Assets as of 4/30/18
Economic and Market Overview
The US economy grew during the 12 months under review. The economy strengthened in 2017’s second and third quarters but moderated in the next two quarters. The slower growth in 2018’s first quarter reflected a slowdown in consumer spending, residential fixed investment, exports, and state and local government spending. The manufacturing and services sectors expanded during the period. The unemployment rate declined from 4.4% in April 2017 to 3.9% at period-end.3
1. A REIT is a type of real estate company that is dedicated to owning and usually operating income-producing real estate properties such as apartments, hotels, industrial properties, office buildings or shopping centers. Equity REITs generally receive income from rents received, are generally operated by experienced property management teams and typically concentrate on a specific geographic region or property type.
2. Source: Morningstar.
The index is unmanaged and includes reinvestment of any income or distributions. It does not reflect any fees, expenses or sales charges. One cannot invest directly in an index, and an index is not representative of the Fund’s portfolio.
3. Source: Bureau of Labor Statistics.
The dollar value, number of shares or principal amount, and names of all portfolio holdings are listed in the Fund’s Statement of Investments (SOI). The SOI begins on page 15.
| | | | |
| | | |
franklintempleton.com | | Annual Report | | 3 |
FRANKLIN REAL ESTATE SECURITIES FUND
Annual inflation, as measured by the Consumer Price Index, increased from 2.2% in April 2017 to 2.5% at period-end.3
The US Federal Reserve (Fed) raised its target range for the federal funds rate 0.25% at its June and December 2017 meetings and began reducing its balance sheet in October as part of its ongoing effort to normalize monetary policy. In February 2018, new Fed Chair Jerome Powell spoke before Congress and indicated the Fed saw signs of a continued strong labor market and economic growth. He reiterated the Fed’s intention to gradually raise interest rates in an effort to keep the economy from overheating and as inflation increases toward the Fed’s target. However, he noted there was no evidence of the economy overheating and he had yet to see a clear upward move in wages. At its March meeting, the Fed raised its target range for the federal funds rate 0.25% to 1.50%–1.75% and maintained its forecast of three rate increases in 2018. Additionally, the Fed upgraded its economic forecasts for 2018 and 2019, and its rate projections indicated the number of rate hikes would increase in 2019 and 2020.
US equity markets rose overall during the period, benefiting from mostly upbeat economic data and better US corporate earnings. Markets were also supported in 2017 by the prospect for reforms in the European Union with Emmanuel Macron’s election as France’s president, the Fed’s indication of gradual rate hikes and the passage of the US tax reform bill. However, concerns about political uncertainties in the US, tensions between the US and North Korea, and the progress of the US tax reform bill curbed market sentiment at times. After reaching new all-time highs in January 2018, US stocks declined in February amid concerns that strong economic growth and rising inflation would lead the Fed to increase its target rate faster than expected. In March, markets were pressured further by a broad sell-off in information technology stocks due to a potential for tighter regulation in the sector arising from concerns about consumer data privacy. The Trump administration’s protectionist policies and escalating trade tensions between the US and China also dampened investor sentiment. However, stocks rebounded amid the prospects for trade negotiations between the US and China, easing tensions in the Korean peninsula and strong first-quarter 2018 earnings results from many companies. In this environment, the broad US stock market, as measured by the Standard & Poor’s 500 Index, generated a +13.27% total return for the period.2
Top 10 Holdings
4/30/18
| | |
Company Sector/Industry | | % of Total Net Assets |
Simon Property Group Inc. | | 7.3% |
Retail REITs | | |
Prologis Inc. | | 6.3% |
Industrial REITs | | |
Equity Residential | | 4.3% |
Residential REITs | | |
AvalonBay Communities Inc. | | 3.8% |
Residential REITs | | |
Digital Realty Trust Inc. | | 3.4% |
Specialized REITs | | |
Alexandria Real Estate Equities Inc. | | 3.4% |
Office REITs | | |
Host Hotels & Resorts Inc. | | 3.2% |
Hotel & Resort REITs | | |
Boston Properties Inc. | | 3.1% |
Office REITs | | |
Welltower Inc. | | 2.9% |
Health Care REITs | | |
Equity Lifestyle Properties Inc. | | 2.9% |
Residential REITs | | |
Investment Strategy
We are research-driven, fundamental investors with an active investment strategy. We use a bottom-up security selection process that incorporates macro-level views in our evaluation process. We analyze individual stock and real estate market fundamentals to provide regional, property type and company-size perspectives in identifying local cyclical and thematic trends that highlight investment opportunities.
Manager’s Discussion
During the 12 months under review, security selection in the specialty sector supported the Fund’s performance relative to the S&P US Property Index with holdings such as American Tower.4 American Tower owns and operates a portfolio of more than 150,000 communications sites in the US and overseas. These sites are leased to wireless service providers, broadcasters and other communication service providers. As the largest owner of towers in the US, American Tower has continued to benefit from the positive trends pertaining to its industry, namely the increased spending (adding equipment to tower sites) by national wireless carriers required to support the significant growth in the nation’s mobile data usage. Furthermore, new spectrum deployments and preparations for
4. Specialty sector holdings can be found under office REITs and specialized REITs in the SOI.
| | | | |
| | | |
4 | | Annual Report | | franklintempleton.com |
FRANKLIN REAL ESTATE SECURITIES FUND
next-generation technology (5G) are helping drive new business to record levels. These positive dynamics helped American Tower’s 2017 financial and operating performance.
Stock selection in the diversified sector also boosted relative results over the period, as did the Fund’s positioning in the industrial property sector.5 Shares of Rexford Industrial Realty, a small capitalization industrial REIT based in Los Angeles, performed well during the period. Similar to other industrial players, Rexford has continued to benefit from strong fundamentals in industrial real estate with healthy and steady tenant demand both from traditional and ecommerce businesses. We continue to like the company’s focused and unique strategy to grow through acquisitions of properties built to fill in remaining spaces in highly fragmented markets in Southern California’s urban centers, where it does not face competition from larger industrial players. We also think this core market remains less susceptible to any pick-up in supply given lack of available land and difficulty of getting construction permits. Rexford’s recent core results have remained strong with increased occupancy, above average same-store net operating income growth and double-digit percentage rate increases for new rentals. For all these reasons, we believe the company’s earnings growth should continue to accelerate with strong internal and external growth (through acquisitions) over the next one to two years.
Other individual contributors over the 12-month period included the Fund’s investment in Equity LifeStyle Properties, a manufactured homes REIT focusing on owning and operating manufactured housing and resort communities in the US. The stock’s performance reflected continued strength in manufactured housing fundamentals with steady demand and no signs of any near-term supply pressures. The company has a unique business in what we view as an attractive real estate asset class with visible and predictable cash flow characteristics. It has continued to generate strong core results with predictable and stable cash flow growth. We also believe that the company, backed by a strong balance sheet and high-quality management, remains well positioned to take advantage of any consolidation opportunities within the highly fragmented manufactured-housing industry.
Conversely, stock selection in the triple-net leasing sector detracted from relative performance over the reporting period
with holdings such as Gramercy Property Trust, an owner and acquirer of industrial and office single tenant net-lease assets across the US.6 The company performed well earlier in the period as it appeared to be executing on its strategy of transforming itself to a predominantly industrial net-lease-exposure, at a time of accelerating fundamentals for industrial real estate. However, Gramercy’s performance began to deteriorate later in 2017, as operating metrics fell short of expectations. In addition, recent external growth initiatives complicated the company’s overall situation.
Security selection in the health care property sector also hampered relative results.7 Shares of HCP, one of the largest healthcare REITs, focusing on the life-science, senior housing and medical office segments, declined due to continued weakness in the company’s senior housing portfolio as it continues to face increased supply pressures and other operational challenges. As a result, the rent coverage ratio (the ratio of debt payments to rent collected) for one of its largest senior housing operators, Brookdale, steadily deteriorated. Additionally, analysts expect HCP’s earnings to be negatively impacted from additional asset sales. We like the company’s recently announced simplification strategy under a new management team to focus on private-pay and the life-science, senior housing and medical office segments. HCP had already exited the riskier skilled-nursing facility. Nevertheless, we think the stock will likely remain under pressure in the near term as the company goes through a transition in the next 12 months.
Relative Fund returns were pressured further by stock selection in the residential sector.8 Shares of American Homes 4 Rent, an owner of approximately 50,000 single family homes for rent across the US, declined over the period. After strong performance in 2016 and early 2017, operating metrics began to show slippage as 2017 progressed. Additionally, investors questioned the company’s external growth strategy and the viability of proposed in-house build-to-rent strategy. As a result of this change in the company’s fundamentals and overall message, we exited our position during the latter part of 2017.
5. Diversified sector holdings can be found under diversified REITs and real estate development in the SOI. Industrial property sector holdings can be found under industrial REITs in the SOI.
6. Triple-net leasing sector holdings can be found under diversified REITs and retail REITs in the SOI.
7. Health care property sector holdings can be found under health care REITs in the SOI.
8. Residential sector holdings can be found under residential REITs in the SOI.
| | | | |
| | | |
franklintempleton.com | | Annual Report | | 5 |
FRANKLIN REAL ESTATE SECURITIES FUND
Thank you for your continued participation in Franklin Real Estate Securities Fund. We look forward to serving your future investment needs.
| | |
 | | 
Wilson Magee |
| | |
 | | 
Daniel Scher |
| | |
 | | 
Murat Sensoy, CFA |
| |
| | Portfolio Management Team |
The foregoing information reflects our analysis, opinions and portfolio holdings as of April 30, 2018, the end of the reporting period. The way we implement our main investment strategies and the resulting portfolio holdings may change depending on factors such as market and economic conditions. These opinions may not be relied upon as investment advice or an offer for a particular security. The information is not a complete analysis of every aspect of any market, country, industry, security or the Fund. Statements of fact are from sources considered reliable, but the investment manager makes no representation or warranty as to their completeness or accuracy. Although historical performance is no guarantee of future results, these insights may help you understand our investment management philosophy.
CFA® is a trademark owned by CFA Institute.
| | | | |
| | | |
6 | | Annual Report | | franklintempleton.com |
FRANKLIN REAL ESTATE SECURITIES FUND
Performance Summary as of April 30, 2018
The performance table and graphs do not reflect any taxes that a shareholder would pay on Fund dividends, capital gain distributions, if any, or any realized gains on the sale of Fund shares. Total return reflects reinvestment of the Fund’s dividends and capital gain distributions, if any, and any unrealized gains or losses. Your dividend income will vary depending on dividends or interest paid by securities in the Fund’s portfolio, adjusted for operating expenses of each class. Capital gain distributions are net profits realized from the sale of portfolio securities.
Performance as of 4/30/181
Cumulative total return excludes sales charges. Average annual total return includes maximum sales charges. Sales charges will vary depending on the size of the investment and the class of share purchased. The maximum is 5.75% and the minimum is 0%. Class A: 5.75% maximum initial sales charge; Advisor Class: no sales charges. For other share classes, visit franklintempleton.com.
| | | | |
Share Class | | Cumulative Total Return2 | | Average Annual Total Return3 |
| | |
A | | | | |
1-Year | | -2.66% | | -8.27% |
5-Year | | +23.08% | | +3.01% |
10-Year | | +52.80% | | +3.71% |
| | |
Advisor | | | | |
1-Year | | -2.42% | | -2.42% |
5-Year | | +24.69% | | +4.51% |
10-Year | | +56.76% | | +4.60% |
Performance data represent past performance, which does not guarantee future results. Investment return and principal value will fluctuate, and you may have a gain or loss when you sell your shares. Current performance may differ from figures shown. For most recent month-end performance, go to franklintempleton.com or call (800) 342-5236.
See page 9 for Performance Summary footnotes.
| | | | |
| | | |
franklintempleton.com | | Annual Report | | 7 |
FRANKLIN REAL ESTATE SECURITIES FUND
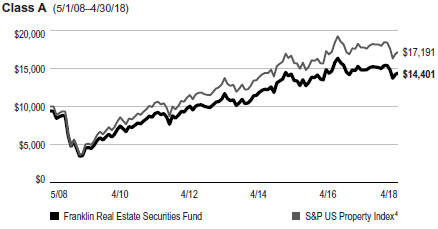
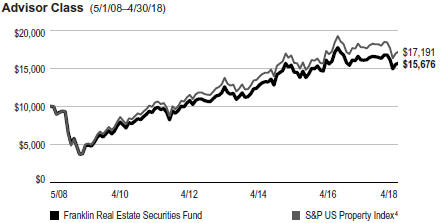
PERFORMANCE SUMMARY
Total Return Index Comparison for a Hypothetical $10,000 Investment
Total return represents the change in value of an investment over the periods shown. It includes any applicable maximum sales charge, Fund expenses, account fees and reinvested distributions. The unmanaged index includes reinvestment of any income or distributions. It differs from the Fund in composition and does not pay management fees or expenses. One cannot invest directly in an index.
See page 9 for Performance Summary footnotes.
| | | | |
| | | |
8 | | Annual Report | | franklintempleton.com |
FRANKLIN REAL ESTATE SECURITIES FUND
PERFORMANCE SUMMARY
Distributions (5/1/17–4/30/18)
| | | | | | | | | | | | |
Share Class | | Net Investment
Income | | | Long-Term
Capital Gain | | | Total | |
| | | |
A | | | $0.3776 | | | | $1.9596 | | | | $2.3372 | |
C | | | $0.2642 | | | | $1.9596 | | | | $2.2238 | |
R6 | | | $0.4605 | | | | $1.9596 | | | | $2.4201 | |
Advisor | | | $0.4072 | | | | $1.9596 | | | | $2.3668 | |
Total Annual Operating Expenses5
| | | | |
Share Class | | | |
| |
A | | | 1.00% | |
Advisor | | | 0.75% | |
Each class of shares is available to certain eligible investors and has different annual fees and expenses, as described in the prospectus.
All investments involve risks, including possible loss of principal. The Fund’s concentration in real estate securities involves special risks, such as declines in the value of real estate and increased susceptibility to adverse economic or regulatory developments affecting the sector. The Fund’s investments in REITs involve additional risks; since REITs typically are invested in a limited number of projects or in a particular market segment, they are more susceptible to adverse developments affecting a single project or market segment than more broadly diversified investments. The Fund is actively managed but there is no guarantee that the manager’s investment decisions will produce the desired results. The Fund’s prospectus also includes a description of the main investment risks.
1. The Fund has a fee waiver associated with any investment it makes in a Franklin Templeton money fund and/or other Franklin Templeton fund, contractually guaranteed through 8/31/18. Fund investment results reflect the fee waiver; without this waiver, the results would have been lower.
2. Cumulative total return represents the change in value of an investment over the periods indicated.
3. Average annual total return represents the average annual change in value of an investment over the periods indicated. Return for less than one year, if any, has not been annualized.
4. Source: Morningstar. The S&P US Property Index measures the investable universe of publicly traded property companies in the US.
5. Figures are as stated in the Fund’s current prospectus and may differ from the expense ratios disclosed in the Your Fund’s Expenses and Financial Highlights sections in this report. In periods of market volatility, assets may decline significantly, causing total annual Fund operating expenses to become higher than the figures shown.
See www.franklintempletondatasources.com for additional data provider information.
| | | | |
| | | |
franklintempleton.com | | Annual Report | | 9 |
FRANKLIN REAL ESTATE SECURITIES FUND
Your Fund’s Expenses
As a Fund shareholder, you can incur two types of costs: (1) transaction costs, including sales charges (loads) on Fund purchases and redemptions; and (2) ongoing Fund costs, including management fees, distribution and service (12b-1) fees, and other Fund expenses. All mutual funds have ongoing costs, sometimes referred to as operating expenses. The table below shows ongoing costs of investing in the Fund and can help you understand these costs and compare them with those of other mutual funds. The table assumes a $1,000 investment held for the six months indicated.
Actual Fund Expenses
The table below provides information about actual account values and actual expenses in the columns under the heading “Actual.” In these columns the Fund’s actual return, which includes the effect of Fund expenses, is used to calculate the “Ending Account Value.” You can estimate the expenses you paid during the period by following these steps (of course, your account value and expenses will differ from those in this illustration): Divide your account value by $1,000 (if your account had an $8,600 value, then $8,600 ÷ $1,000 = 8.6). Then multiply the result by the number in the row for your class of shares under the headings “Actual” and “Expenses Paid During Period” (if Actual Expenses Paid During Period were $7.50, then 8.6 x $7.50 = $64.50). In this illustration, the actual expenses paid this period are $64.50.
Hypothetical Example for Comparison with Other Funds
Under the heading “Hypothetical” in the table, information is provided about hypothetical account values and hypothetical expenses based on the Fund’s actual expense ratio and an assumed rate of return of 5% per year before expenses, which is not the Fund’s actual return. This information may not be used to estimate the actual ending account balance or expenses you paid for the period, but it can help you compare ongoing costs of investing in the Fund with those of other funds. To do so, compare this 5% hypothetical example for the class of shares you hold with the 5% hypothetical examples that appear in the shareholder reports of other funds.
Please note that expenses shown in the table are meant to highlight ongoing costs and do not reflect any transactional costs. Therefore, information under the heading “Hypothetical” is useful in comparing ongoing costs only, and will not help you compare total costs of owning different funds. In addition, if transactional costs were included, your total costs would have been higher.
| | | | | | | | | | | | | | | | | | |
| | | | | | | Actual (actual return after expenses) | | | | Hypothetical (5% annual return before expenses) | | | | |
Share Class | | Beginning Account Value 11/1/17 | | | | Ending Account Value 4/30/18 | | Expenses Paid During Period 11/1/17–4/30/181,2 | | | | Ending Account Value 4/30/18 | | Expenses Paid During
Period 11/1/17–4/30/181,2 | | | | Net Annualized
Expense Ratio2 |
A | | $1,000 | | | | $960.50 | | $5.30 | | | | $1,019.39 | | $5.46 | | | | 1.09% |
C | | $1,000 | | | | $956.70 | | $8.93 | | | | $1,015.67 | | $9.20 | | | | 1.84% |
R6 | | $1,000 | | | | $962.60 | | $3.07 | | | | $1,021.67 | | $3.16 | | | | 0.63% |
Advisor | | $1,000 | | | | $962.00 | | $4.09 | | | | $1,020.63 | | $4.21 | | | | 0.84% |
1. Expenses are equal to the annualized expense ratio for the six-month period as indicated above—in the far right column—multiplied by the simple average account value over the period indicated, and then multiplied by 181/365 to reflect the one-half year period.
2. Reflects expenses after fee waivers and expense reimbursements. Does not include acquired fund fees and expenses.
| | | | |
| | | |
10 | | Annual Report | | franklintempleton.com |
FRANKLIN REAL ESTATE SECURITIES TRUST
Financial Highlights
Franklin Real Estate Securities Fund
| | | | | | | | | | | | | | | | | | | | |
| | | | | | Year Ended April 30, | | | | |
| | | 2018 | | | 2017 | | | 2016 | | | 2015 | | | 2014 | |
| | | | | | |
Class A | | | | | | | | | | | | | | | | | | | | |
| | | | | |
Per share operating performance | | | | | | | | | | | | | | | | | | | | |
(for a share outstanding throughout the year) | | | | | | | | | | | | | | | | | | | | |
| | | | | |
Net asset value, beginning of year | | | $22.40 | | | | $22.65 | | | | $21.49 | | | | $19.31 | | | | $19.29 | |
| | | | | |
Income from investment operationsa: | | | | | | | | | | | | | | | | | | | | |
| | | | | |
Net investment incomeb | | | 0.37 | | | | 0.24 | | | | 0.48 | c | | | 0.30 | | | | 0.26 | |
| | | | | |
Net realized and unrealized gains (losses) | | | (0.79 | ) | | | 0.40 | | | | 1.05 | | | | 2.17 | | | | — | d |
| | | | | |
Total from investment operations | | | (0.42 | ) | | | 0.64 | | | | 1.53 | | | | 2.47 | | | | 0.26 | |
| | | | | |
Less distributions from: | | | | | | | | | | | | | | | | | | | | |
| | | | | |
Net investment income | | | (0.38 | ) | | | (0.45 | ) | | | (0.37 | ) | | | (0.29 | ) | | | (0.24 | ) |
| | | | | |
Net realized gains | | | (1.96 | ) | | | (0.44 | ) | | | — | | | | — | | | | — | |
| | | | | |
Total distributions | | | (2.34 | ) | | | (0.89 | ) | | | (0.37 | ) | | | (0.29 | ) | | | (0.24 | ) |
| | | | | |
Net asset value, end of year | | | $19.64 | | | | $22.40 | | | | $22.65 | | | | $21.49 | | | | $19.31 | |
| | | | | |
Total returne | | | (2.66)% | | | | 2.92% | | | | 7.17% | | | | 12.95% | | | | 1.49% | |
| | | | | |
Ratios to average net assets | | | | | | | | | | | | | | | | | | | | |
| | | | | |
Expenses before waiver and payments by affiliates | | | 1.11% | | | | 1.00% | | | | 1.00% | | | | 0.99% | | | | 1.05% | |
| | | | | |
Expenses net of waiver and payments by affiliates | | | 1.11% | f,g | | | 1.00% | f,g | | | 1.00% | g | | | 0.99% | g | | | 1.04% | |
| | | | | |
Net investment income | | | 1.72% | | | | 1.04% | | | | 2.21% | c | | | 1.41% | | | | 1.43% | |
| | | | | |
Supplemental data | | | | | | | | | | | | | | | | | | | | |
| | | | | |
Net assets, end of year (000’s) | | | $327,085 | | | | $333,601 | | | | $364,981 | | | | $381,925 | | | | $303,815 | |
| | | | | |
Portfolio turnover rate | | | 19.84% | | | | 39.66% | | | | 24.21% | | | | 24.12% | | | | 17.04% | |
aThe amount shown for a share outstanding throughout the period may not correlate with the Statement of Operations for the period due to the timing of sales and repurchases of the Fund’s shares in relation to income earned and/or fluctuating fair value of the investments of the Fund.
bBased on average daily shares outstanding.
cNet investment income per share includes approximately $0.11 per share related to income received in the form of a special dividend in connection with certain Fund holdings. Excluding this amount, the ratio of net investment income to average net assets would have been 1.71%.
dAmount rounds to less than $0.01 per share.
eTotal return does not reflect sales commissions or contingent deferred sales charges, if applicable.
fBenefit of expense reduction rounds to less than 0.01%.
gBenefit of waiver and payments by affiliates rounds to less than 0.01%.
| | | | |
| | | |
franklintempleton.com | | The accompanying notes are an integral part of these financial statements. | Annual Report | | 11 |
FRANKLIN REAL ESTATE SECURITIES TRUST
FINANCIAL HIGHLIGHTS
Franklin Real Estate Securities Fund (continued)
| | | | | | | | | | | | | | | | | | | | |
| | | | | | Year Ended April 30, | | | | |
| | | 2018 | | | 2017 | | | 2016 | | | 2015 | | | 2014 | |
| | | | | | |
Class C | | | | | | | | | | | | | | | | | | | | |
| | | | | |
Per share operating performance | | | | | | | | | | | | | | | | | | | | |
(for a share outstanding throughout the year) | | | | | | | | | | | | | | | | | | | | |
| | | | | |
Net asset value, beginning of year | | | $21.56 | | | | $21.86 | | | | $20.75 | | | | $18.66 | | | | $18.65 | |
| | | | | |
Income from investment operationsa: | | | | | | | | | | | | | | | | | | | | |
| | | | | |
Net investment incomeb | | | 0.20 | | | | 0.07 | | | | 0.30 | c | | | 0.13 | | | | 0.12 | |
| | | | | |
Net realized and unrealized gains (losses) | | | (0.77 | ) | | | 0.38 | | | | 1.02 | | | | 2.11 | | | | — | d |
| | | | | |
Total from investment operations | | | (0.57 | ) | | | 0.45 | | | | 1.32 | | | | 2.24 | | | | 0.12 | |
| | | | | |
Less distributions from: | | | | | | | | | | | | | | | | | | | | |
| | | | | |
Net investment income | | | (0.26 | ) | | | (0.31 | ) | | | (0.21 | ) | | | (0.15 | ) | | | (0.11 | ) |
| | | | | |
Net realized gains | | | (1.96 | ) | | | (0.44 | ) | | | — | | | | — | | | | — | |
| | | | | |
Total distributions | | | (2.22 | ) | | | (0.75 | ) | | | (0.21 | ) | | | (0.15 | ) | | | (0.11 | ) |
| | | | | |
Net asset value, end of year | | | $18.77 | | | | $21.56 | | | | $21.86 | | | | $20.75 | | | | $18.66 | |
| | | | | |
Total returne | | | (3.43)% | | | | 2.14% | | | | 6.40% | | | | 12.07% | | | | 0.73% | |
| | | | | |
Ratios to average net assets | | | | | | | | | | | | | | | | | | | | |
| | | | | |
Expenses before waiver and payments by affiliates | | | 1.86% | | | | 1.75% | | | | 1.75% | | | | 1.74% | | | | 1.80% | |
| | | | | |
Expenses net of waiver and payments by affiliates | | | 1.86% | f,g | | | 1.75% | f,g | | | 1.75% | g | | | 1.74% | g | | | 1.79% | |
| | | | | |
Net investment income | | | 0.97% | | | | 0.29% | | | | 1.46% | c | | | 0.66% | | | | 0.68% | |
| | | | | |
Supplemental data | | | | | | | | | | | | | | | | | | | | |
| | | | | |
Net assets, end of year (000’s) | | | $61,867 | | | | $72,637 | | | | $82,147 | | | | $89,328 | | | | $68,914 | |
| | | | | |
Portfolio turnover rate | | | 19.84% | | | | 39.66% | | | | 24.21% | | | | 24.12% | | | | 17.04% | |
aThe amount shown for a share outstanding throughout the period may not correlate with the Statement of Operations for the period due to the timing of sales and repurchases of the Fund’s shares in relation to income earned and/or fluctuating fair value of the investments of the Fund.
bBased on average daily shares outstanding.
cNet investment income per share includes approximately $0.11 per share related to income received in the form of a special dividend in connection with certain Fund holdings. Excluding this amount, the ratio of net investment income to average net assets would have been 0.96%.
dAmount rounds to less than $0.01 per share.
eTotal return does not reflect sales commissions or contingent deferred sales charges, if applicable.
fBenefit of expense reduction rounds to less than 0.01%.
gBenefit of waiver and payments by affiliates rounds to less than 0.01%.
| | | | |
| | | |
12 | | Annual Report | The accompanying notes are an integral part of these financial statements. | | franklintempleton.com |
FRANKLIN REAL ESTATE SECURITIES TRUST
FINANCIAL HIGHLIGHTS
Franklin Real Estate Securities Fund (continued)
| | | | | | | | | | | | | | | | | | | | |
| | | | | | Year Ended April 30, | | | | |
| | | 2018 | | | 2017 | | | 2016 | | | 2015 | | | 2014a | |
| | | | | | |
Class R6 | | | | | | | | | | | | | | | | | | | | |
| | | | | |
Per share operating performance | | | | | | | | | | | | | | | | | | | | |
(for a share outstanding throughout the year) | | | | | | | | | | | | | | | | | | | | |
| | | | | |
Net asset value, beginning of year | | | $22.61 | | | | $22.83 | | | | $21.67 | | | | $19.46 | | | | $19.30 | |
| | | | | |
Income from investment operationsb: | | | | | | | | | | | | | | | | | | | | |
| | | | | |
Net investment incomec | | | 0.43 | | | | 0.35 | | | | 0.58 | d | | | 0.41 | | | | 0.34 | |
| | | | | |
Net realized and unrealized gains (losses) | | | (0.75 | ) | | | 0.41 | | | | 1.05 | | | | 2.19 | | | | 0.14 | |
| | | | | |
Total from investment operations | | | (0.32 | ) | | | 0.76 | | | | 1.63 | | | | 2.60 | | | | 0.48 | |
| | | | | |
Less distributions from: | | | | | | | | | | | | | | | | | | | | |
| | | | | |
Net investment income | | | (0.46 | ) | | | (0.54 | ) | | | (0.47 | ) | | | (0.39 | ) | | | (0.32 | ) |
| | | | | |
Net realized gains | | | (1.96 | ) | | | (0.44 | ) | | | — | | | | — | | | | — | |
| | | | | |
Total distributions | | | (2.42 | ) | | | (0.98 | ) | | | (0.47 | ) | | | (0.39 | ) | | | (0.32 | ) |
| | | | | |
Net asset value, end of year | | | $19.87 | | | | $22.61 | | | | $22.83 | | | | $21.67 | | | | $19.46 | |
| | | | | |
Total return | | | (2.19)% | | | | 3.42% | | | | 7.66% | | | | 13.47% | | | | 2.69% | |
| | | | | |
Ratios to average net assets | | | | | | | | | | | | | | | | | | | | |
| | | | | |
Expenses before waiver and payments by affiliates | | | 0.76% | | | | 0.55% | | | | 0.54% | | | | 0.54% | | | | 0.57% | |
| | | | | |
Expenses net of waiver and payments by affiliates | | | 0.60% | e | | | 0.55% | e,f | | | 0.54% | f | | | 0.54% | f | | | 0.56% | |
| | | | | |
Net investment income | | | 2.23% | | | | 1.49% | | | | 2.67% | d | | | 1.86% | | | | 1.91% | |
| | | | | |
Supplemental data | | | | | | | | | | | | | | | | | | | | |
| | | | | |
Net assets, end of year (000’s) | | | $3,794 | | | | $2,422 | | | | $104,392 | | | | $106,725 | | | | $97,224 | |
| | | | | |
Portfolio turnover rate | | | 19.84% | | | | 39.66% | | | | 24.21% | | | | 24.12% | | | | 17.04% | |
aFor the year May 1,2013 (effective date) to April 30, 2014.
bThe amount shown for a share outstanding throughout the period may not correlate with the Statement of Operations for the period due to the timing of sales and repurchases of the Fund’s shares in relation to income earned and/or fluctuating fair value of the investments of the Fund.
cBased on average daily shares outstanding.
dNet investment income per share includes approximately $0.11 per share related to income received in the form of a special dividend in connection with certain Fund holdings. Excluding this amount, the ratio of net investment income to average net assets would have been 2.17%.
eBenefit of expense reduction rounds to less than 0.01%.
fBenefit of waiver and payments by affiliates rounds to less than 0.01%.
| | | | |
| | | |
franklintempleton.com | | The accompanying notes are an integral part of these financial statements. | Annual Report | | 13 |
FRANKLIN REAL ESTATE SECURITIES TRUST
FINANCIAL HIGHLIGHTS
Franklin Real Estate Securities Fund (continued)
| | | | | | | | | | | | | | | | | | | | |
| | | | | | Year Ended April 30, | | | | |
| | | 2018 | | | 2017 | | | 2016 | | | 2015 | | | 2014 | |
| | | | | | |
Advisor Class | | | | | | | | | | | | | | | | | | | | |
| | | | | |
Per share operating performance | | | | | | | | | | | | | | | | | | | | |
(for a share outstanding throughout the year) | | | | | | | | | | | | | | | | | | | | |
| | | | | |
Net asset value, beginning of year | | | $22.59 | | | | $22.83 | | | | $21.67 | | | | $19.46 | | | | $19.43 | |
| | | | | |
Income from investment operationsa: | | | | | | | | | | | | | | | | | | | | |
| | | | | |
Net investment incomeb | | | 0.44 | | | | 0.30 | | | | 0.54 | c | | | 0.33 | | | | 0.29 | |
| | | | | |
Net realized and unrealized gains (losses) | | | (0.81 | ) | | | 0.41 | | | | 1.04 | | | | 2.23 | | | | 0.03 | |
| | | | | |
Total from investment operations | | | (0.37 | ) | | | 0.71 | | | | 1.58 | | | | 2.56 | | | | 0.32 | |
| | | | | |
Less distributions from: | | | | | | | | | | | | | | | | | | | | |
| | | | | |
Net investment income | | | (0.41 | ) | | | (0.51 | ) | | | (0.42 | ) | | | (0.35 | ) | | | (0.29 | ) |
| | | | | |
Net realized gains | | | (1.96 | ) | | | (0.44 | ) | | | — | | | | — | | | | — | |
| | | | | |
Total distributions | | | (2.37 | ) | | | (0.95 | ) | | | (0.42 | ) | | | (0.35 | ) | | | (0.29 | ) |
| | | | | |
Net asset value, end of year | | | $19.85 | | | | $22.59 | | | | $22.83 | | | | $21.67 | | | | $19.46 | |
| | | | | |
Total return | | | (2.42)% | | | | 3.18% | | | | 7.44% | | | | 13.24% | | | | 1.79% | |
| | | | | |
Ratios to average net assets | | | | | | | | | | | | | | | | | | | | |
| | | | | |
Expenses before waiver and payments by affiliates | | | 0.86% | | | | 0.75% | | | | 0.75% | | | | 0.74% | | | | 0.80% | |
| | | | | |
Expenses net of waiver and payments by affiliates | | | 0.86% | d,e | | | 0.75% | d,e | | | 0.75% | e | | | 0.74% | e | | | 0.79% | |
| | | | | |
Net investment income | | | 1.97% | | | | 1.29% | | | | 2.46% | c | | | 1.66% | | | | 1.68% | |
| | | | | |
Supplemental data | | | | | | | | | | | | | | | | | | | | |
| | | | | |
Net assets, end of year (000’s) | | | $71,000 | | | | $50,521 | | | | $22,346 | | | | $17,644 | | | | $12,402 | |
| | | | | |
Portfolio turnover rate | | | 19.84% | | | | 39.66% | | | | 24.21% | | | | 24.12% | | | | 17.04% | |
aThe amount shown for a share outstanding throughout the period may not correlate with the Statement of Operations for the period due to the timing of sales and repurchases of the Fund’s shares in relation to income earned and/or fluctuating fair value of the investments of the Fund.
bBased on average daily shares outstanding.
cNet investment income per share includes approximately $0.11 per share related to income received in the form of a special dividend in connection with certain Fund holdings. Excluding this amount, the ratio of net investment income to average net assets would have been 1.96%.
dBenefit of expense reduction rounds to less than 0.01%.
eBenefit of waiver and payments by affiliates rounds to less than 0.01%.
| | | | |
| | | |
14 | | Annual Report | The accompanying notes are an integral part of these financial statements. | | franklintempleton.com |
FRANKLIN REAL ESTATE SECURITIES TRUST
Statement of Investments, April 30, 2018
Franklin Real Estate Securities Fund
| | | | | | | | |
| | | Shares | | | Value | |
| | |
Common Stocks 99.9% | | | | | | | | |
Diversified REITs 1.5% | | | | | | | | |
VEREIT Inc. | | | 555,200 | | | $ | 3,775,360 | |
Washington REIT | | | 116,700 | | | | 3,351,624 | |
| | | | | | | | |
| | |
| | | | | | | 7,126,984 | |
| | | | | | | | |
Health Care REITs 8.2% | | | | | | | | |
HCP Inc. | | | 349,254 | | | | 8,158,573 | |
Physicians Realty Trust | | | 264,300 | | | | 3,948,642 | |
Ventas Inc. | | | 238,929 | | | | 12,285,729 | |
Welltower Inc. | | | 255,558 | | | | 13,657,020 | |
| | | | | | | | |
| | |
| | | | | | | 38,049,964 | |
| | | | | | | | |
Hotel & Resort REITs 6.5% | | | | | | | | |
Host Hotels & Resorts Inc. | | | 751,020 | | | | 14,689,951 | |
LaSalle Hotel Properties | | | 72,100 | | | | 2,131,997 | |
MGM Growth Properties LLC, A | | | 110,100 | | | | 3,079,497 | |
Ryman Hospitality Properties Inc. | | | 45,600 | | | | 3,574,128 | |
Sunstone Hotel Investors Inc. | | | 430,834 | | | | 6,721,011 | |
| | | | | | | | |
| | |
| | | | | | | 30,196,584 | |
| | | | | | | | |
Hotels, Resorts & Cruise Lines 1.7% | | | | | | | | |
Hilton Worldwide Holdings Inc. | | | 102,436 | | | | 8,076,054 | |
| | | | | | | | |
Industrial REITs 11.5% | | | | | | | | |
First Industrial Realty Trust Inc. | | | 335,100 | | | | 10,424,961 | |
Gramercy Property Trust | | | 157,600 | | | | 3,703,600 | |
Prologis Inc. | | | 451,281 | | | | 29,292,650 | |
Rexford Industrial Realty Inc. | | | 323,300 | | | | 9,876,815 | |
| | | | | | | | |
| | |
| | | | | | | 53,298,026 | |
| | | | | | | | |
Office REITs 16.3% | | | | | | | | |
Alexandria Real Estate Equities Inc. | | | 127,284 | | | | 15,855,768 | |
Boston Properties Inc. | | | 118,032 | | | | 14,330,265 | |
Brandywine Realty Trust | | | 461,100 | | | | 7,428,321 | |
Cousins Properties Inc. | | | 560,400 | | | | 4,981,956 | |
Highwoods Properties Inc. | | | 147,966 | | | | 6,513,463 | |
Kilroy Realty Corp. | | | 164,230 | | | | 11,770,364 | |
SL Green Realty Corp. | | | 101,459 | | | | 9,916,603 | |
Vornado Realty Trust | | | 67,470 | | | | 4,589,984 | |
| | | | | | | | |
| | |
| | | | | | | 75,386,724 | |
| | | | | | | | |
Real Estate Development 1.9% | | | | | | | | |
a Howard Hughes Corp. | | | 64,110 | | | | 8,674,083 | |
| | | | | | | | |
Residential REITs 16.6% | | | | | | | | |
AvalonBay Communities Inc. | | | 107,620 | | | | 17,542,060 | |
Camden Property Trust | | | 134,400 | | | | 11,477,760 | |
Equity Lifestyle Properties Inc. | | | 150,202 | | | | 13,392,010 | |
Equity Residential | | | 326,767 | | | | 20,164,792 | |
Essex Property Trust Inc. | | | 32,563 | | | | 7,805,025 | |
Invitation Homes Inc. | | | 107,700 | | | | 2,492,178 | |
Mid-America Apartment Communities Inc. | | | 42,400 | | | | 3,877,904 | |
| | | | | | | | |
| | |
| | | | | | | 76,751,729 | |
| | | | | | | | |
| | | | |
| | | |
franklintempleton.com | | Annual Report | | 15 |
FRANKLIN REAL ESTATE SECURITIES TRUST
STATEMENT OF INVESTMENTS
Franklin Real Estate Securities Fund (continued)
| | | | | | | | |
| | | Shares | | | Value | |
| | |
Common Stocks (continued) | | | | | | | | |
Retail REITs 18.8% | | | | | | | | |
Agree Realty Corp. | | | 95,100 | | | $ | 4,648,488 | |
Federal Realty Investment Trust | | | 25,200 | | | | 2,919,420 | |
GGP Inc. | | | 302,116 | | | | 6,039,299 | |
Kimco Realty Corp. | | | 130,800 | | | | 1,897,908 | |
The Macerich Co. | | | 48,600 | | | | 2,800,332 | |
Realty Income Corp. | | | 234,924 | | | | 11,866,011 | |
Regency Centers Corp. | | | 172,081 | | | | 10,126,967 | |
Retail Properties of America Inc., A | | | 428,900 | | | | 4,949,506 | |
Simon Property Group Inc. | | | 217,695 | | | | 34,034,437 | |
Taubman Centers Inc. | | | 39,900 | | | | 2,233,602 | |
Weingarten Realty Investors | | | 214,460 | | | | 5,891,216 | |
| | | | | | | | |
| | |
| | | | | | | 87,407,186 | |
| | | | | | | | |
Specialized REITs 16.9% | | | | | | | | |
American Tower Corp. | | | 68,200 | | | | 9,299,752 | |
Coresite Realty Corp. | | | 96,831 | | | | 10,080,107 | |
CubeSmart | | | 271,647 | | | | 7,997,288 | |
CyrusOne Inc. | | | 102,800 | | | | 5,509,052 | |
Digital Realty Trust Inc. | | | 151,027 | | | | 15,962,043 | |
Extra Space Storage Inc. | | | 96,800 | | | | 8,672,312 | |
Iron Mountain Inc. | | | 107,600 | | | | 3,651,944 | |
Public Storage | | | 64,888 | | | | 13,093,101 | |
Weyerhaeuser Co. | | | 111,900 | | | | 4,115,682 | |
| | | | | | | | |
| | |
| | | | | | | 78,381,281 | |
| | | | | | | | |
Total Common Stocks (Cost $311,994,368) | | | | | | | 463,348,615 | |
| | | | | | | | |
| | |
Short Term Investments (Cost $893,053) 0.2% | | | | | | | | |
| | |
Money Market Funds 0.2% | | | | | | | | |
b,c Institutional Fiduciary Trust Money Market Portfolio, 1.30% | | | 893,053 | | | | 893,053 | |
| | | | | | | | |
Total Investments (Cost $312,887,421) 100.1% | | | | | | | 464,241,668 | |
Other Assets, less Liabilities (0.1)% | | | | | | | (495,002 | ) |
| | | | | | | | |
Net Assets 100.0% | | | | | | $ | 463,746,666 | |
| | | | | | | | |
See Abbreviations on page 28.
aNon-income producing.
bSee Note 3(f) regarding investments in affiliated management investment companies.
cThe rate shown is the annualized seven-day effective yield at period end.
| | | | |
| | | |
16 | | Annual Report | The accompanying notes are an integral part of these financial statements. | | franklintempleton.com |
FRANKLIN REAL ESTATE SECURITIES TRUST
Financial Statements
Statement of Assets and Liabilities
April 30, 2018
Franklin Real Estate Securities Fund
| | | | |
Assets: | | | | |
Investments in securities: | | | | |
Cost - Unaffiliated issuers | | | $311,994,368 | |
Cost - Non-controlled affiliates (Note 3f) | | | 893,053 | |
| | | | |
| |
Value - Unaffiliated issuers | | | $463,348,615 | |
Value - Non-controlled affiliates (Note 3f) | | | 893,053 | |
Cash | | | 212,908 | |
Receivables: | | | | |
Capital shares sold | | | 300,433 | |
Dividends | | | 232,111 | |
European Union tax reclaims | | | 44,534 | |
Other assets | | | 427 | |
| | | | |
| |
Total assets | | | 465,032,081 | |
| | | | |
| |
Liabilities: | | | | |
Payables: | | | | |
Capital shares redeemed | | | 509,423 | |
Management fees | | | 244,676 | |
Distribution fees | | | 117,948 | |
Transfer agent fees | | | 253,196 | |
Accrued expenses and other liabilities | | | 160,172 | |
| | | | |
| |
Total liabilities | | | 1,285,415 | |
| | | | |
| |
Net assets, at value | | | $463,746,666 | |
| | | | |
| |
Net assets consist of: | | | | |
Paid-in capital | | | $328,441,382 | |
Undistributed net investment income | | | 178,298 | |
Net unrealized appreciation (depreciation) | | | 151,349,025 | |
Accumulated net realized gain (loss) | | | (16,222,039 | ) |
| | | | |
| |
Net assets, at value | | | $463,746,666 | |
| | | | |
| | | | |
| | | |
franklintempleton.com | | The accompanying notes are an integral part of these financial statements. | Annual Report | | 17 |
FRANKLIN REAL ESTATE SECURITIES TRUST
FINANCIAL STATEMENTS
Statement of Assets and Liabilities (continued)
April 30, 2018
Franklin Real Estate Securities Fund
| | | | |
Class A: | | | | |
Net assets, at value | | | $327,085,093 | |
| | | | |
Shares outstanding | | | 16,658,204 | |
| | | | |
Net asset value per sharea | | | $19.64 | |
| | | | |
Maximum offering price per share (net asset value per share ÷ 94.25%) | | | $20.84 | |
| | | | |
Class C: | | | | |
Net assets, at value | | | $ 61,867,439 | |
| | | | |
Shares outstanding | | | 3,295,497 | |
| | | | |
Net asset value and maximum offering price per sharea | | | $18.77 | |
| | | | |
Class R6: | | | | |
Net assets, at value | | | $ 3,793,938 | |
| | | | |
Shares outstanding | | | 190,951 | |
| | | | |
Net asset value and maximum offering price per share | | | $19.87 | |
| | | | |
Advisor Class: | | | | |
Net assets, at value | | | $ 71,000,196 | |
| | | | |
Shares outstanding | | | 3,577,414 | |
| | | | |
Net asset value and maximum offering price per share | | | $19.85 | |
| | | | |
aRedemption price is equal to net asset value less contingent deferred sales charges, if applicable.
| | | | |
| | | |
18 | | Annual Report | The accompanying notes are an integral part of these financial statements. | | franklintempleton.com |
FRANKLIN REAL ESTATE SECURITIES TRUST
FINANCIAL STATEMENTS
Statement of Operations
for the year ended April 30, 2018
Franklin Real Estate Securities Fund
| | | | | | | | |
Investment income: | | | | | | | | |
Dividends: | | | | | | | | |
Unaffiliated issuers | | | | | | | $ 11,471,320 | |
Non-controlled affiliates (Note 3f) | | | | | | | 14,908 | |
| | | | |
| | |
Total investment income | | | | | | | 11,486,228 | |
| | | | |
| | |
Expenses: | | | | | | | | |
Management fees (Note 3a) | | | | | | | 2,085,041 | |
Distribution fees: (Note 3c) | | | | | | | | |
Class A | | | | | | | 760,874 | |
Class C | | | | | | | 623,304 | |
Transfer agent fees: (Note 3e) | | | | | | | | |
Class A | | | | | | | 815,017 | |
Class C | | | | | | | 166,964 | |
Class R6 | | | | | | | 5,240 | |
Advisor Class | | | | | | | 100,633 | |
Custodian fees (Note 4) | | | | | | | 5,475 | |
Reports to shareholders | | | | | | | 54,207 | |
Registration and filing fees | | | | | | | 90,904 | |
Professional fees | | | | | | | 68,716 | |
Trustees’ fees and expenses | | | | | | | 23,826 | |
Other | | | | | | | 68,154 | |
| | | | |
| | |
Total expenses | | | | | | | 4,868,355 | |
Expense reductions (Note 4) | | | | | | | (19 | ) |
Expenses waived/paid by affiliates (Note 3f and 3g) | | | | | | | (12,102 | ) |
| | | | |
| | |
Net expenses | | | | | | | 4,856,234 | |
| | | | |
| | |
Net investment income | | | | | | | 6,629,994 | |
| | | | |
| | |
Realized and unrealized gains (losses): | | | | | | | | |
Net realized gain (loss) from: | | | | | | | | |
Investments: | | | | | | | | |
Unaffiliated issuers | | | | | | | 22,857,335 | |
Capital gain distributions from REITs | | | | | | | 2,241,450 | |
| | | | |
| | |
Net realized gain (loss) | | | | | | | 25,098,785 | |
| | | | |
| | |
Net change in unrealized appreciation (depreciation) on: | | | | | | | | |
Investments: | | | | | | | | |
Unaffiliated issuers | | | | | | | (41,540,020 | ) |
Translation of other assets and liabilities
denominated in foreign currencies | | | | | | | (1,044 | ) |
| | | | |
| | |
Net change in unrealized appreciation (depreciation) | | | | | | | (41,541,064 | ) |
| | | | |
| | |
Net realized and unrealized gain (loss) | | | | | | | (16,442,279 | ) |
| | | | |
| | |
Net increase (decrease) in net assets resulting from operations | | | | | | | $ (9,812,285 | ) |
| | | | |
| | | | |
| | | |
franklintempleton.com | | The accompanying notes are an integral part of these financial statements. | Annual Report | | 19 |
FRANKLIN REAL ESTATE SECURITIES TRUST
FINANCIAL STATEMENTS
Statements of Changes in Net Assets
Franklin Real Estate Securities Fund
| | | | | | | | |
| | | Year Ended April 30, | |
| | | | |
| | | 2018 | | | 2017 | |
| |
| | |
Increase (decrease) in net assets: | | | | | | | | |
Operations: | | | | | | | | |
Net investment income | | $ | 6,629,994 | | | $ | 5,467,001 | |
Net realized gain (loss) | | | 25,098,785 | | | | 62,146,445 | |
Net change in unrealized appreciation (depreciation) | | | (41,541,064 | ) | | | (53,279,510 | ) |
| | | | |
| | |
Net increase (decrease) in net assets resulting from operations | | | (9,812,285 | ) | | | 14,333,936 | |
| | | | |
| | |
Distributions to shareholders from: | | | | | | | | |
Net investment income: | | | | | | | | |
Class A | | | (5,096,570 | ) | | | (7,182,116 | ) |
Class C | | | (746,031 | ) | | | (1,156,716 | ) |
Class R6 | | | (65,584 | ) | | | (1,852,446 | ) |
Advisor Class | | | (601,479 | ) | | | (593,315 | ) |
Net realized gains: | | | | | | | | |
Class A | | | (26,106,102 | ) | | | (7,036,543 | ) |
Class C | | | (5,470,675 | ) | | | (1,582,188 | ) |
Class R6 | | | (306,066 | ) | | | (1,152,496 | ) |
Advisor Class | | | (2,766,735 | ) | | | (598,113 | ) |
| | | | |
| | |
Total distributions to shareholders | | | (41,159,242 | ) | | | (21,153,933 | ) |
| | | | |
| | |
Capital share transactions: (Note 2) | | | | | | | | |
Class A | | | 31,999,748 | | | | (26,964,280 | ) |
Class C | | | (2,737,100 | ) | | | (8,328,265 | ) |
Class R6 | | | 1,851,328 | | | | (101,370,904 | ) |
Advisor Class | | | 24,423,054 | | | | 28,798,605 | |
| | | | |
| | |
Total capital share transactions | | | 55,537,030 | | | | (107,864,844 | ) |
| | | | |
| | |
Net increase (decrease) in net assets | | | 4,565,503 | | | | (114,684,841 | ) |
Net assets: | | | | | | | | |
Beginning of year | | | 459,181,163 | | | | 573,866,004 | |
| | | | |
| | |
End of year | | $ | 463,746,666 | | | $ | 459,181,163 | |
| | | | |
Undistributed net investment income included in net assets: | | | | | | | | |
End of year | | $ | 178,298 | | | $ | — | |
| | | | |
| | | | |
| | | |
20 | | Annual Report | The accompanying notes are an integral part of these financial statements. | | franklintempleton.com |
FRANKLIN REAL ESTATE SECURITIES TRUST
Notes to Financial Statements
Franklin Real Estate Securities Fund
1. Organization and Significant Accounting Policies
Franklin Real Estate Securities Trust (Trust) is registered under the Investment Company Act of 1940 (1940 Act) as an open-end management investment company, consisting of one fund, Franklin Real Estate Securities Fund (Fund) and applies the specialized accounting and reporting guidance in U.S. Generally Accepted Accounting Principles (U.S. GAAP). The Fund offers four classes of shares: Class A, Class C, Class R6, and Advisor Class. Each class of shares may differ by its initial sales load, contingent deferred sales charges, voting rights on matters affecting a single class, its exchange privilege and fees due to differing arrangements for distribution and transfer agent fees.
The following summarizes the Fund’s significant accounting policies.
a. Financial Instrument Valuation
The Fund’s investments in financial instruments are carried at fair value daily. Fair value is the price that would be received to sell an asset or paid to transfer a liability in an orderly transaction between market participants on the measurement date. The Fund calculates the net asset value (NAV) per share as of 4 p.m. Eastern time each day the New York Stock Exchange (NYSE) is open for trading. Under compliance policies and procedures approved by the Fund’s Board of Trustees (the Board), the Fund’s administrator has responsibility for oversight of valuation, including leading the cross-functional Valuation Committee (VC). The VC provides administration and oversight of the Fund’s valuation policies and procedures, which are approved annually by the Board. Among other things, these procedures allow the Fund to utilize independent pricing services, quotations from securities and financial instrument dealers, and other market sources to determine fair value.
Equity securities listed on an exchange or on the NASDAQ National Market System are valued at the last quoted sale price or the official closing price of the day, respectively. Over-the-counter securities are valued within the range of the most recent quoted bid and ask prices. Securities that trade in multiple markets or on multiple exchanges are valued according to the broadest and most representative market. Certain equity securities are valued based upon fundamental characteristics or relationships to similar securities.
Investments in open-end mutual funds are valued at the closing NAV.
The Fund has procedures to determine the fair value of financial instruments for which market prices are not reliable or readily available. Under these procedures, the VC convenes on a regular basis to review such financial instruments and considers a number of factors, including significant unobservable valuation inputs, when arriving at fair value. The VC primarily employs a market-based approach which may use related or comparable assets or liabilities, recent transactions, market multiples, book values, and other relevant information for the investment to determine the fair value of the investment. An income-based valuation approach may also be used in which the anticipated future cash flows of the investment are discounted to calculate fair value. Discounts may also be applied due to the nature or duration of any restrictions on the disposition of the investments. Due to the inherent uncertainty of valuations of such investments, the fair values may differ significantly from the values that would have been used had an active market existed. The VC employs various methods for calibrating these valuation approaches including a regular review of key inputs and assumptions, transactional back-testing or disposition analysis, and reviews of any related market activity.
b. Income and Deferred Taxes
It is the Fund’s policy to qualify as a regulated investment company under the Internal Revenue Code. The Fund intends to distribute to shareholders substantially all of its taxable income and net realized gains to relieve it from federal income and excise taxes. As a result, no provision for U.S. federal income taxes is required.
The Fund may recognize an income tax liability related to its uncertain tax positions under U.S. GAAP when the uncertain tax position has a less than 50% probability that it will be sustained upon examination by the tax authorities based on its technical merits. As of April 30, 2018, the Fund has determined that no tax liability is required in its financial statements related to uncertain tax positions for any open tax years (or expected to be taken in future tax years). Open tax years are those that remain subject to examination and are based on the statute of limitations in each jurisdiction in which the Fund invests.
The Fund may be subject to foreign taxation related to income received, capital gains on the sale of securities and certain foreign currency transactions in the foreign jurisdictions in
| | | | |
| | | |
franklintempleton.com | | Annual Report | | 21 |
FRANKLIN REAL ESTATE SECURITIES TRUST
NOTES TO FINANCIAL STATEMENTS
Franklin Real Estate Securities Fund (continued)
1. Organization and Significant Accounting Policies (continued)
b. Income and Deferred Taxes (continued)
which it invests. Foreign taxes, if any, are recorded based on the tax regulations and rates that exist in the foreign markets in which the Fund invests. When a capital gain tax is determined to apply, the Fund records an estimated deferred tax liability in an amount that would be payable if the securities were disposed of on the valuation date.
As a result of several court cases, in certain countries across the European Union, the Fund filed additional tax reclaims for previously withheld taxes on dividends earned in those countries (EU reclaims). These additional filings are subject to various administrative proceedings by the local jurisdictions’ tax authorities within the European Union, as well as a number of related judicial proceedings. Income recognized, if any, for EU reclaims is reflected as other income in the Statement of Operations and any related receivable, if any, is reflected as European Union tax reclaims in the Statement of Assets and Liabilities. When uncertainty exists as to the ultimate resolution of these proceedings, the likelihood of receipt of these EU reclaims, and the potential timing of payment, no amounts are reflected in the financial statements. For U.S. income tax purposes, EU reclaims received by the Fund, if any, reduce the amounts of foreign taxes Fund shareholders can use as tax credits in their individual income tax returns.
c. Security Transactions, Investment Income, Expenses and Distributions
Security transactions are accounted for on trade date. Realized gains and losses on security transactions are determined on a specific identification basis. Estimated expenses are accrued daily. Dividend income is recorded on the ex-dividend date. Distributions to shareholders are recorded on the ex-dividend date. Distributable earnings are determined according to income tax regulations (tax basis) and may differ from earnings recorded in accordance with U.S. GAAP. These differences may be permanent or temporary. Permanent differences are
reclassified among capital accounts to reflect their tax character. These reclassifications have no impact on net assets or the results of operations. Temporary differences are not reclassified, as they may reverse in subsequent periods.
Realized and unrealized gains and losses and net investment income, excluding class specific expenses, are allocated daily to each class of shares based upon the relative proportion of net assets of each class. Differences in per share distributions by class are generally due to differences in class specific expenses.
Distributions received by the Fund from certain securities may be a return of capital (ROC). Such distributions reduce the cost basis of the securities, and any distributions in excess of the cost basis are recognized as capital gains. For U.S. Real Estate Investment Trust (REIT) securities, the Fund records ROC estimates, if any, on the ex-dividend date and are adjusted once actual tax designations are known.
d. Accounting Estimates
The preparation of financial statements in accordance with U.S. GAAP requires management to make estimates and assumptions that affect the reported amounts of assets and liabilities at the date of the financial statements and the amounts of income and expenses during the reporting period. Actual results could differ from those estimates.
e. Guarantees and Indemnifications
Under the Fund’s organizational documents, its officers and trustees are indemnified by the Fund against certain liabilities arising out of the performance of their duties to the Fund. Additionally, in the normal course of business, the Fund enters into contracts with service providers that contain general indemnification clauses. The Fund’s maximum exposure under these arrangements is unknown as this would involve future claims that may be made against the Fund that have not yet occurred. Currently, the Fund expects the risk of loss to be remote.
| | | | |
| | | |
22 | | Annual Report | | franklintempleton.com |
FRANKLIN REAL ESTATE SECURITIES TRUST
NOTES TO FINANCIAL STATEMENTS
Franklin Real Estate Securities Fund (continued)
2. Shares of Beneficial Interest
At April 30, 2018, there were an unlimited number of shares authorized ($0.01 par value). Transactions in the Fund’s shares were as follows:
| | | | | | | | | | | | | | | | |
| | | Year Ended April 30, | |
| | | | |
| | | 2018 | | | | | | 2017 | |
| | | | |
| | | Shares | | | Amount | | | Shares | | | Amount | |
| |
| | | | |
Class A Shares: | | | | | | | | | | | | | | | | |
Shares sold | | | 1,167,951 | | | $ | 36,468,248 | | | | 2,955,684 | | | $ | 69,381,222 | |
Shares issued in reinvestment of distributions | | | 1,411,660 | | | | 30,063,174 | | | | 617,945 | | | | 13,730,198 | |
Shares issued on reorganization (Note 8) | | | 3,403,143 | | | | 55,821,593 | | | | — | | | | — | |
Shares redeemed | | | (4,217,066 | ) | | | (90,353,267 | ) | | | (4,795,254 | ) | | | (110,075,700) | |
| | | | |
| | | | |
Net increase (decrease) | | | 1,765,688 | | | $ | 31,999,748 | | | | (1,221,625 | ) | | $ | (26,964,280) | |
| | | | |
| | | | |
Class C Shares: | | | | | | | | | | | | | | | | |
Shares sold | | | 200,892 | | | $ | 6,169,649 | | | | 637,356 | | | $ | 14,522,004 | |
Shares issued in reinvestment of distributions | | | 300,854 | | | | 6,131,970 | | | | 124,497 | | | | 2,659,425 | |
Shares issued on reorganization (Note 8) | | | 620,962 | | | | 9,736,747 | | | | — | | | | — | |
Shares redeemed | | | (1,195,640 | ) | | | (24,775,466 | ) | | | (1,151,295 | ) | | | (25,509,694) | |
| | | | |
| | | | |
Net increase (decrease) | | | (72,932 | ) | | $ | (2,737,100 | ) | | | (389,442 | ) | | $ | (8,328,265) | |
| | | | |
| | | | |
Class R6 Shares: | | | | | | | | | | | | | | | | |
Shares sold | | | 159,221 | | | $ | 3,520,551 | | | | 99,150 | | | $ | 2,311,501 | |
Shares issued in reinvestment of distributions | | | 17,280 | | | | 371,650 | | | | 132,605 | | | | 3,004,941 | |
Shares issued on reorganization (Note 8) | | | 1,294 | | | | 21,474 | | | | — | | | | — | |
Shares redeemed | | | (93,987 | ) | | | (2,062,347 | ) | | | (4,697,016 | ) | | | (106,687,346) | |
| | | | |
| | | | |
Net increase (decrease) | | | 83,808 | | | $ | 1,851,328 | | | | (4,465,261 | ) | | $ | (101,370,904) | |
| | | | |
| | | | |
Advisor Class Shares: | | | | | | | | | | | | | | | | |
Shares sold | | | 597,550 | | | $ | 21,705,441 | | | | 1,837,014 | | | $ | 42,222,651 | |
Shares issued in reinvestment of distributions | | | 147,792 | | | | 3,181,528 | | | | 48,881 | | | | 1,090,920 | |
Shares issued on reorganization (Note 8) | | | 2,472,800 | | | | 40,993,171 | | | | — | | | | — | |
Shares redeemed | | | (1,876,860 | ) | | | (41,457,086 | ) | | | (628,503 | ) | | | (14,514,966) | |
| | | | |
| | | | |
Net increase (decrease) | | | 1,341,282 | | | $ | 24,423,054 | | | | 1,257,392 | | | $ | 28,798,605 | |
| | | | |
3. Transactions with Affiliates
Franklin Resources, Inc. is the holding company for various subsidiaries that together are referred to as Franklin Templeton Investments. Certain officers and trustees of the Trust are also officers and/or directors of the following subsidiaries:
| | | | |
| Subsidiary | | Affiliation | | |
| Franklin Templeton Institutional, LLC (FT Institutional) | | Investment manager | | |
| Franklin Templeton Services, LLC (FT Services) | | Administrative manager | | |
| Franklin Templeton Distributors, Inc. (Distributors) | | Principal underwriter | | |
| Franklin Templeton Investor Services, LLC (Investor Services) | | Transfer agent | | |
| | | | |
| | | |
franklintempleton.com | | Annual Report | | 23 |
FRANKLIN REAL ESTATE SECURITIES TRUST
NOTES TO FINANCIAL STATEMENTS
Franklin Real Estate Securities Fund (continued)
3. Transactions with Affiliates (continued)
a. Management Fees
The Fund pays an investment management fee to FT Institutional based on the average daily net assets of the Fund as follows:
| | |
| Annualized Fee Rate | | Net Assets |
| 0.625% | | Up to and including $100 million |
| 0.500% | | Over $100 million, up to and including $250 million |
| 0.450% | | Over $250 million, up to and including $7.5 billion |
| 0.440% | | Over $7.5 billion, up to and including $10 billion |
| 0.430% | | Over $10 billion, up to and including $12.5 billion |
| 0.420% | | Over $12.5 billion, up to and including $15 billion |
| 0.400% | | In excess of $15 billion |
For the year ended April 30, 2018, the gross effective investment management fee rate was 0.513% of the Fund’s average daily net assets.
b. Administrative Fees
Under an agreement with FT Institutional, FT Services provides administrative services to the Fund. The fee is paid by FT Institutional based on the Fund’s average daily net assets, and is not an additional expense of the Fund.
c. Distribution Fees
The Board has adopted distribution plans for each share class, with the exception of Class R6 and Advisor Class shares, pursuant to Rule 12b-1 under the 1940 Act. Under the Fund’s Class A reimbursement distribution plan, the Fund reimburses Distributors for costs incurred in connection with the servicing, sale and distribution of the Fund’s shares up to the maximum annual plan rate. Under the Class A reimbursement distribution plan, costs exceeding the maximum for the current plan year cannot be reimbursed in subsequent periods. In addition, under the Fund’s Class C compensation distribution plan, the Fund pays Distributors for costs incurred in connection with the servicing, sale and distribution of the Fund’s shares up to the maximum annual plan rate. The plan year, for purposes of monitoring compliance with the maximum annual plan rate, is February 1 through January 31.
The maximum annual plan rates, based on the average daily net assets, for each class, are as follows:
| | | | |
Class A | | | 0.25 | % |
Class C | | | 1.00 | % |
d. Sales Charges/Underwriting Agreements
Front-end sales charges and contingent deferred sales charges (CDSC) do not represent expenses of the Fund. These charges are deducted from the proceeds of sales of Fund shares prior to investment or from redemption proceeds prior to remittance, as applicable. Distributors has advised the Fund of the following commission transactions related to the sales and redemptions of the Fund’s shares for the year:
| | | | |
Sales charges retained net of commissions paid to unaffiliated brokers/dealers | | $ | 38,015 | |
| |
CDSC retained | | $ | 4,605 | |
| | | | |
| | | |
24 | | Annual Report | | franklintempleton.com |
FRANKLIN REAL ESTATE SECURITIES TRUST
NOTES TO FINANCIAL STATEMENTS
Franklin Real Estate Securities Fund (continued)
e. Transfer Agent Fees
Each class of shares pays transfer agent fees to Investor Services for its performance of shareholder servicing obligations. Effective November 1, 2017, the fees are based on an annualized asset based fee of 0.02% plus a transaction based fee. Prior to November 1, 2017, the fees were account based fees that varied based on fund or account type. In addition, each class reimburses Investor Services for out of pocket expenses incurred and, except for Class R6 reimburses shareholder servicing fees paid to third parties. These fees are allocated daily based upon their relative proportion of such classes’ aggregate net assets. Class R6 pays Investor Services transfer agent fees specific to that class.
For the year ended April 30, 2018, the Fund paid transfer agent fees of $1,087,854, of which $405,386 was retained by Investor Services.
f. Investments in Affiliated Management Investment Companies
The Fund invests in one or more affiliated management investment companies for purposes other than exercising a controlling influence over the management or policies. Management fees paid by the Fund are waived on assets invested in the affiliated management investment companies, as noted in the Statement of Operations, in an amount not to exceed the management and administrative fees paid directly or indirectly by each affiliate. During the year ended April 30, 2018, the Fund held investments in affiliated management investment companies as follows:
| | | | | | | | | | | | | | | | | | | | | | | | | | | | | | | | |
| | | Number of
Shares Held
at Beginning
of Year | | | Gross
Additions | | | Gross
Reductions | | | Number of
Shares
Held at End
of Year | | | Value at End
of Year | | | Dividend
Income | | | Realized
Gain
(Loss) | | | Net Change in
Unrealized
Appreciation
(Depreciation) | |
| Non-Controlled Affiliates | | | | | | | | | | | | | | | | | | | | | | | | | | | | | | | | |
Institutional Fiduciary Trust Money Market Portfolio, 1.30% | | | 2,122,603 | | | | 75,463,762 | | | | (76,693,312 | ) | | | 893,053 | | | | 893,053 | | | | 14,908 | | | | — | | | | $— | |
g. Waiver and Expense Reimbursements
Investor Services has voluntarily agreed in advance to waive or limit its fees so that the Class R6 transfer agent fees do not exceed 0.02%. Investor Services may discontinue this waiver in the future.
4. Expense Offset Arrangement
The Fund has entered into an arrangement with its custodian whereby credits realized as a result of uninvested cash balances are used to reduce a portion of the Fund’s custodian expenses. During the year ended April 30, 2018, the custodian fees were reduced as noted in the Statement of Operations.
5. Income Taxes
The tax character of distributions paid during the years ended April 30, 2018 and 2017, was as follows:
| | | | | | | | |
| | | 2018 | | | 2017 | |
Distributions paid from: | | | | | | | | |
Ordinary income | | | $ 6,509,664 | | | | $10,784,593 | |
Long term capital gain | | | 34,649,578 | | | | 10,369,340 | |
| | | $41,159,242 | | | | $21,153,933 | |
| | | | |
| | | |
franklintempleton.com | | Annual Report | | 25 |
FRANKLIN REAL ESTATE SECURITIES TRUST
NOTES TO FINANCIAL STATEMENTS
Franklin Real Estate Securities Fund (continued)
5. Income Taxes (continued)
At April 30, 2018, the cost of investments, net unrealized appreciation (depreciation), undistributed ordinary income and undistributed long term capital gains for income tax purposes were as follows:
| | | | |
Cost of investments | | $ | 338,845,217 | |
| |
Unrealized appreciation | | $ | 157,245,091 | |
Unrealized depreciation | | | (31,848,640 | ) |
| |
Net unrealized appreciation (depreciation) | | $ | 125,396,451 | |
| |
Undistributed ordinary income | | | 178,300 | |
Undistributed long term capital gains | | | 9,735,752 | |
| |
Distributable earnings | | $ | 9,914,052 | |
Differences between income and/or capital gains as determined on a book basis and a tax basis are primarily due to differing treatments of wash sales.
The Fund utilized a tax accounting practice to treat a portion of the proceeds from capital shares redeemed as a distribution from realized capital gains.
6. Investment Transactions
Purchases and sales of investments (excluding short term securities) for the year ended April 30, 2018, aggregated $82,159,157 and $186,130,857, respectively.
7. Concentration of Risk
The Fund invests a large percentage of its total assets in REIT securities. Such concentration may subject the Fund to special risks associated with real estate securities. These securities may be more sensitive to economic or regulatory developments due to a variety of factors such as local, regional, national and global economic conditions, interest rates and tax considerations.
8. Reorganization
On April 27, 2018, the Fund, pursuant to a plan of reorganization approved on April 6, 2018, by shareholders of Franklin Global Real Estate Fund (Acquired Fund), a series of Franklin Global Trust, acquired 100% of the Acquired Fund’s net assets, primarily made up of investment securities, which included $21,681,623 of unrealized appreciation, through a tax-free exchange of 6,498,199 shares of the Fund (valued at $106,572,985). Immediately after the completion of the reorganization, the combined net assets of the Fund were $467,811,832.
The primary purpose for the reorganization was to combine the Acquired Fund with a larger fund that had lower annual fund operating expense ratios, better overall historical performance, similar investment goals and similar principal investment strategies/risks. The estimated cost of the reorganization was $231,500 of which the Fund and the Acquired Fund each paid 25% and FT Institutional paid 50%. The allocated portion of the Fund’s reorganization expenses are included with other expenses in the Statement of Operations.
| | | | |
| | | |
26 | | Annual Report | | franklintempleton.com |
FRANKLIN REAL ESTATE SECURITIES TRUST
NOTES TO FINANCIAL STATEMENTS
Franklin Real Estate Securities Fund (continued)
Assuming the reorganization had been completed on May 1, 2017, the Fund’s pro forma results of operations, would have been as follows:
| | | | | | |
| Period | | Net Investment
Income | | Net Realized
and Unrealized
Gain (Loss) | | Net Increase
(Decrease) in Net
Assets from
Operations |
For the period May 1, 2017, through April 30, 2018 | | $8,948,763 | | $(12,823,963) | | $(3,875,200) |
Subsequent to the reorganization, the Fund has been managed as a single entity. Accordingly, it is impracticable to identify the amounts of investment income and net investment income attributable to the Acquired Fund’s assets after the completion of the reorganization.
9. Credit Facility
The Fund, together with other U.S. registered and foreign investment funds (collectively, Borrowers), managed by Franklin Templeton Investments, are borrowers in a joint syndicated senior unsecured credit facility totaling $2 billion (Global Credit Facility) which matures on February 8, 2019. This Global Credit Facility provides a source of funds to the Borrowers for temporary and emergency purposes, including the ability to meet future unanticipated or unusually large redemption requests.
Under the terms of the Global Credit Facility, the Fund shall, in addition to interest charged on any borrowings made by the Fund and other costs incurred by the Fund, pay its share of fees and expenses incurred in connection with the implementation and maintenance of the Global Credit Facility, based upon its relative share of the aggregate net assets of all of the Borrowers, including an annual commitment fee of 0.15% based upon the unused portion of the Global Credit Facility. These fees are reflected in other expenses in the Statement of Operations. During the year ended April 30, 2018, the Fund did not use the Global Credit Facility.
10. Fair Value Measurements
The Fund follows a fair value hierarchy that distinguishes between market data obtained from independent sources (observable inputs) and the Fund’s own market assumptions (unobservable inputs). These inputs are used in determining the value of the Fund’s financial instruments and are summarized in the following fair value hierarchy:
| | • | | Level 1 – quoted prices in active markets for identical financial instruments |
| | • | | Level 2 – other significant observable inputs (including quoted prices for similar financial instruments, interest rates, prepayment speed, credit risk, etc.) |
| | • | | Level 3 – significant unobservable inputs (including the Fund’s own assumptions in determining the fair value of financial instruments) |
The input levels are not necessarily an indication of the risk or liquidity associated with financial instruments at that level.
For movements between the levels within the fair value hierarchy, the Fund has adopted a policy of recognizing the transfers as of the date of the underlying event which caused the movement.
At April 30, 2018, all of the Fund’s investments in financial instruments carried at fair value were valued using Level 1 inputs. For detailed categories, see the accompanying Statement of Investments.
| | | | |
| | | |
franklintempleton.com | | Annual Report | | 27 |
FRANKLIN REAL ESTATE SECURITIES TRUST
NOTES TO FINANCIAL STATEMENTS
Franklin Real Estate Securities Fund (continued)
11. Subsequent Events
The Fund has evaluated subsequent events through the issuance of the financial statements and determined that no events have occurred that require disclosure.
Abbreviations
REIT Real Estate Investment Trust
| | | | |
| | | |
28 | | Annual Report | | franklintempleton.com |
FRANKLIN REAL ESTATE SECURITIES TRUST
Report of Independent Registered Public Accounting Firm
To the Board of Trustees of Franklin Real Estate Securities Trust and Shareholders of Franklin Real Estate Securities Fund
Opinion on the Financial Statements
We have audited the accompanying statement of assets and liabilities, including the statement of investments, of Franklin Real Estate Securities Fund (the “Fund”) as of April 30, 2018, the related statement of operations for the year ended April 30, 2018, the statement of changes in net assets for each of the two years in the period ended April 30, 2018, including the related notes, and the financial highlights for each of the periods indicated therein (collectively referred to as the “financial statements”). In our opinion, the financial statements present fairly, in all material respects, the financial position of the Fund as of April 30, 2018, the results of its operations for the year then ended, the changes in its net assets for each of the two years in the period ended April 30, 2018 and the financial highlights for each of the periods indicated therein in conformity with accounting principles generally accepted in the United States of America.
Basis for Opinion
These financial statements are the responsibility of the Fund’s management. Our responsibility is to express an opinion on the Fund’s financial statements based on our audits. We are a public accounting firm registered with the Public Company Accounting Oversight Board (United States) (“PCAOB”) and are required to be independent with respect to the Fund in accordance with the U.S. federal securities laws and the applicable rules and regulations of the Securities and Exchange Commission and the PCAOB.
We conducted our audits of these financial statements in accordance with the standards of the PCAOB. Those standards require that we plan and perform the audit to obtain reasonable assurance about whether the financial statements are free of material misstatement, whether due to error or fraud.
Our audits included performing procedures to assess the risks of material misstatement of the financial statements, whether due to error or fraud, and performing procedures that respond to those risks. Such procedures included examining, on a test basis, evidence regarding the amounts and disclosures in the financial statements. Our audits also included evaluating the accounting principles used and significant estimates made by management, as well as evaluating the overall presentation of the financial statements. Our procedures included confirmation of securities owned as of April 30, 2018 by correspondence with the custodian and transfer agent. We believe that our audits provide a reasonable basis for our opinion.
PricewaterhouseCoopers LLP
San Francisco, California
June 18, 2018
We have served as the auditor of one or more investment companies in the Franklin Templeton Group of Funds since 1948.
| | | | |
| | | |
franklintempleton.com | | Annual Report | | 29 |
FRANKLIN REAL ESTATE SECURITIES TRUST
Tax Information (unaudited)
Under Section 852(b)(3)(C) of the Internal Revenue Code (Code), the Fund hereby reports the maximum amount allowable but no less than $36,663,518 as a long term capital gain dividend for the fiscal year ended April 30, 2018.
Under Section 854(b)(1)(B) of the Code, the Fund hereby reports the maximum amount allowable but no less than $42,890 as qualified dividends for purposes of the maximum rate under Section 1(h)(11) of the Code for the fiscal year ended April 30, 2018. Distributions, including qualified dividend income, paid during calendar year 2018 will be reported to shareholders on Form 1099-DIV by mid-February 2019. Shareholders are advised to check with their tax advisors for information on the treatment of these amounts on their individual income tax returns.
| | | | |
| | | |
30 | | Annual Report | | franklintempleton.com |
FRANKLIN REAL ESTATE SECURITIES FUND
Special Meeting of Shareholders
MEETING OF SHAREHOLDERS: OCTOBER 30, 2017 AND RECONVENED ON DECEMBER 15, 2017 AND DECEMBER 29, 2017
(UNAUDITED)
A Special Meeting of Shareholders of Franklin Real Estate Securities Trust was held at the offices of Franklin Templeton Investments, One Franklin Parkway, San Mateo, California on October 30, 2017 and reconvened on December 15, 2017 and December 29, 2017. The purpose of the meeting was to elect Trustees of Franklin Real Estate Securities Trust and to vote on the following proposals for the Fund: to approve the use of a “manager of managers” structure whereby the Fund’s investment manager would be able to hire and replace subadvisers without shareholder approval and to approve an amended fundamental investment restriction regarding investments in commodities. At the meeting, (i) the following persons were elected by the shareholders to serve as Trustees of Franklin Real Estate Securities Trust: Harris J. Ashton, Terrence J. Checki, Mary C. Choksi, Edith E. Holiday, Gregory E. Johnson, Rupert H. Johnson, Jr., J. Michael Luttig, Larry D. Thompson, and John B. Wilson; and (ii) sufficient votes were not received to pass the proposals to use a “manager of managers” structure and to approve an amended fundamental investment restriction regarding investments in commodities. No other business was transacted at the meeting.
In connection with the meeting, management is aware that some shareholders received from the proxy solicitor numerous calls and mailings that may have been distracting. Management is taking steps to ensure that, in the future, for any new shareholder meeting solicitations that occur, such activity is not repeated. Management apologizes for any inconvenience that may have been caused as a result of such calls and mailings.
The results of the voting at the meeting are as follows:
Proposal 1. To elect a Board of Trustees:
| | | | | | |
| Name | | For | | | Withheld |
| | |
Harris J. Ashton | | | 11,476,077 | | | 501,540 |
| | |
Terrence J. Checki | | | 11,480,204 | | | 497,413 |
| | |
Mary C. Choksi | | | 11,484,330 | | | 493,287 |
| | |
Edith E. Holiday | | | 11,493,778 | | | 483,839 |
| | |
Gregory E. Johnson | | | 11,475,567 | | | 502,050 |
| | |
Rupert H. Johnson, Jr. | | | 11,481,608 | | | 496,009 |
| | |
J. Michael Luttig | | | 11,487,075 | | | 490,542 |
| | |
Larry D. Thompson | | | 11,486,401 | | | 491,216 |
| | |
John B. Wilson | | | 11,488,115 | | | 489,502 |
Total Trust Shares Outstanding*: 19,450,926
* As of the record date.
| | | | |
| | | |
franklintempleton.com | | Annual Report | | 31 |
FRANKLIN REAL ESTATE SECURITIES FUND
SPECIAL MEETING OF SHAREHOLDERS
| Proposal 2. | To approve the use of a “manager of managers” structure whereby the Fund’s investment manager would be able to hire and replace subadvisers without shareholder approval: |
| | | | |
| | | Shares | |
| |
For | | | 7,570,757 | |
| |
Against | | | 579,257 | |
| |
Abstain | | | 447,701 | |
| |
Broker Non-Votes | | | 3,379,900 | |
| |
Total Fund Shares Voted | | | 11,977,617 | |
| |
Total Fund Shares Outstanding* | | | 19,450,926 | |
| Proposal 3. | To approve an amended fundamental investment restriction regarding investments in commodities: |
| | | | |
| | | Shares | |
| |
For | | | 7,683,805 | |
| |
Against | | | 393,198 | |
| |
Abstain | | | 520,714 | |
| |
Broker Non-Votes | | | 3,379,900 | |
| |
Total Fund Shares Voted | | | 11,977,617 | |
| |
Total Fund Shares Outstanding* | | | 19,450,926 | |
| | | | |
| | | |
32 | | Annual Report | | franklintempleton.com |
FRANKLIN REAL ESTATE SECURITIES TRUST
Board Members and Officers
The name, year of birth and address of the officers and board members, as well as their affiliations, positions held with the Trust, principal occupations during at least the past five years and number of US registered portfolios overseen in the Franklin Templeton Investments fund complex, are shown below. Generally, each board member serves until that person’s successor is elected and qualified.
Independent Board Members
| | | | | | | | |
Name, Year of Birth and Address | | Position | | Length of Time Served | | Number of Portfolios in
Fund Complex Overseen
by Board Member* | | Other Directorships Held
During at Least the Past 5 Years |
|
| | | | |
Harris J. Ashton (1932) One Franklin Parkway San Mateo, CA 94403-1906 | | Trustee | | Since 1993 | | 138 | | Bar-S Foods (meat packing company) (1981-2010). |
|
| Principal Occupation During at Least the Past 5 Years: |
Director of various companies; and formerly, Director, RBC Holdings, Inc. (bank holding company) (until 2002); and President, Chief Executive Officer and Chairman of the Board, General Host Corporation (nursery and craft centers) (until 1998). |
|
| | | | |
Terrence J. Checki (1945) One Franklin Parkway San Mateo, CA 94403-1906 | | Trustee | | Since December 2017 | | 112 | | Hess Corporation (exploration of oil and gas) (2014-present). |
|
| Principal Occupation During at Least the Past 5 Years: |
Member of the Council on Foreign Relations (1996-present); Member of the National Committee on U.S.-China Relations (1999-present); member of the Board of Trustees of the Economic Club of New York (2013 -present); member of the Board of Trustees of the Foreign Policy Association (2005-present) and member of various other boards of trustees and advisory boards; and formerly, Executive Vice President of the Federal Reserve Bank of New York and Head of its Emerging Markets and Internal Affairs Group and Member of Management Committee (1995-2014); and Visiting Fellow at the Council on Foreign Relations (2014). |
|
| | | | |
Mary C. Choksi (1950) One Franklin Parkway San Mateo, CA 94403-1906 | | Trustee | | Since 2014 | | 138 | | Avis Budget Group Inc. (car rental) (2007-present), Omnicom Group Inc. (advertising and marketing communications services) (2011-present) and White Mountains Insurance Group, Ltd. (holding company) (2017-present). |
|
| Principal Occupation During at Least the Past 5 Years: |
Director of various companies; and formerly, Founder and Senior Advisor, Strategic Investment Group (investment management group) (2015-2017), Founding Partner and Senior Managing Director, Strategic Investment Group (1987-2015); Founding Partner and Managing Director, Emerging Markets Management LLC (investment management firm) (1987-2011); and Loan Officer/Senior Loan Officer/Senior Pension Investment Officer, World Bank Group (international financial institution) (1977-1987). |
|
| | | | |
Edith E. Holiday (1952) One Franklin Parkway San Mateo, CA 94403-1906 | | Trustee | | Since 2005 | | 138 | | Hess Corporation (exploration of oil and gas) (1993-present), Canadian National Railway (railroad) (2001-present), White Mountains Insurance Group, Ltd. (holding company) (2004-present), Santander Consumer USA Holdings, Inc. (consumer finance) (2016-present), RTI International Metals, Inc. (manufacture and distribution of titanium) (1999-2015) and H.J. Heinz Company (processed foods and allied products) (1994-2013). |
|
| Principal Occupation During at Least the Past 5 Years: |
Director or Trustee of various companies and trusts; and formerly, Assistant to the President of the United States and Secretary of the Cabinet (1990-1993); General Counsel to the United States Treasury Department (1989-1990); and Counselor to the Secretary and Assistant Secretary for Public Affairs and Public Liaison – United States Treasury Department (1988-1989). |
|
| | | | |
J. Michael Luttig (1954) One Franklin Parkway San Mateo, CA 94403-1906 | | Trustee | | Since 2009 | | 138 | | Boeing Capital Corporation (aircraft financing) (2006-2013). |
|
| Principal Occupation During at Least the Past 5 Years: |
Executive Vice President, General Counsel and member of the Executive Council, The Boeing Company (aerospace company) (2006-present); and formerly, Federal Appeals Court Judge, U.S. Court of Appeals for the Fourth Circuit (1991-2006). |
|
| | | | |
| | | |
franklintempleton.com | | Annual Report | | 33 |
FRANKLIN REAL ESTATE SECURITIES TRUST
Independent Board Members (continued)
| | | | | | | | |
Name, Year of Birth and Address | | Position | | Length of Time Served | | Number of Portfolios in
Fund Complex Overseen
by Board Member* | | Other Directorships Held
During at Least the Past 5 Years |
|
| | | | |
Larry D. Thompson (1945) One Franklin Parkway San Mateo, CA 94403-1906 | | Trustee | | Since 2007 | | 138 | | The Southern Company (energy company) (2014-present; previously 2010-2012), Graham Holdings Company (education and media organization) (2011-present) and Cbeyond, Inc. (business communications provider) (2010-2012). |
|
| Principal Occupation During at Least the Past 5 Years: |
Director of various companies; Counsel, Finch McCranie, LLP (law firm) (2015-present); Independent Compliance Monitor and Auditor, Volkswagen AG (manufacturer of automobiles and commercial vehicles) (2017 – present); John A. Sibley Professor of Corporate and Business Law, University of Georgia School of Law (2015-present; previously 2011-2012); and formerly, Executive Vice President — Government Affairs, General Counsel and Corporate Secretary, PepsiCo, Inc. (consumer products) (2012-2014); Senior Vice President — Government Affairs, General Counsel and Secretary, PepsiCo, Inc. (2004-2011); Senior Fellow of The Brookings Institution (2003-2004); Visiting Professor, University of Georgia School of Law (2004); and Deputy Attorney General, U.S. Department of Justice (2001-2003). |
|
| | | | |
John B. Wilson (1959) One Franklin Parkway San Mateo, CA 94403-1906 | | lead Independent Trustee | | Trustee since 2006 and Lead Independent Trustee since 2008 | | 112 | | None |
|
| Principal Occupation During at Least the Past 5 Years: |
President and Founder, Hyannis Port Capital, Inc. (real estate and private equity investing) (2002-present); Senior Advisor, McKinsey & Co. (consulting) (2017-present); serves on private and non-profit boards; and formerly, President, Staples International and Head of Global Transformation (office supplies) (2012-2016); Chief Operating Officer and Executive Vice President, Gap, Inc. (retail) (1996-2000); Chief Financial Officer and Executive Vice President – Finance and Strategy, Staples, Inc. (1992-1996); Senior Vice President – Corporate Planning, Northwest Airlines, Inc. (airlines) (1990-1992); and Vice President and Partner, Bain & Company (consulting firm) (1986-1990). |
|
Interested Board Members and Officers |
Name, Year of Birth and Address | | Position | | Length of
Time Served | | Number of Portfolios in
Fund Complex Overseen
by Board Member* | | Other Directorships Held
During at Least the Past 5 Years |
|
| | | | |
**Gregory E. Johnson (1961) One Franklin Parkway San Mateo, CA 94403-1906 | | Trustee | | Since 2007 | | 152 | | None |
|
| Principal Occupation During at Least the Past 5 Years: |
Chairman of the Board, Member - Office of the Chairman, Director and Chief Executive Officer, Franklin Resources, Inc.; officer and/or director or trustee, as the case may be, of some of the other subsidiaries of Franklin Resources, Inc. and of 43 of the investment companies in Franklin Templeton Investments; Vice Chairman, Investment Company Institute; and formerly, President, Franklin Resources, Inc. (1994-2015). |
|
| | | | |
**Rupert H. Johnson, Jr. (1940) One Franklin Parkway San Mateo, CA 94403-1906 | | Chairman of the Board and Trustee | | Chairman of the Board and Trustee since 2013 | | 138 | | None |
|
| Principal Occupation During at Least the Past 5 Years: |
Vice Chairman, Member – Office of the Chairman and Director, Franklin Resources, Inc.; Director, Franklin Advisers, Inc.; Senior Vice President, Franklin Advisory Services, LLC; and officer and/or director or trustee, as the case may be, of some of the other subsidiaries of Franklin Resources, Inc. and of 41 of the investment companies in Franklin Templeton Investments. |
|
| | | | |
Alison E. Baur (1964) One Franklin Parkway San Mateo, CA 94403-1906 | | Vice President | | Since 2012 | | Not Applicable | | Not Applicable |
|
| Principal Occupation During at Least the Past 5 Years: |
Deputy General Counsel, Franklin Templeton Investments; and officer of some of the other subsidiaries of Franklin Resources, Inc. and of 45 of the investment companies in Franklin Templeton Investments. |
|
| | | | |
| | | |
34 | | Annual Report | | franklintempleton.com |
FRANKLIN REAL ESTATE SECURITIES TRUST
Interested Board Members and Officers (continued)
| | | | | | | | |
Name, Year of Birth and Address | | Position | | Length of
Time Served | | Number of Portfolios in
Fund Complex Overseen
by Board Member* | | Other Directorships Held
During at Least the Past 5 Years |
|
| | | | |
Gaston Gardey (1967) One Franklin Parkway San Mateo, CA 94403-1906 | | Chief Financial Officer, Chief Accounting Officer and Treasurer | | Since 2009 | | Not Applicable | | Not Applicable |
|
| Principal Occupation During at Least the Past 5 Years: |
Treasurer, U.S. Fund Administration & Reporting, Franklin Templeton Investments; and officer of 28 of the investment companies in Franklin Templeton Investments. |
|
| | | | |
Aliya S. Gordon (1973) One Franklin Parkway San Mateo, CA 94403-1906 | | Vice President | | Since 2009 | | Not Applicable | | Not Applicable |
|
| Principal Occupation During at Least the Past 5 Years: |
Senior Associate General Counsel, Franklin Templeton Investments; and officer of 45 of the investment companies in Franklin Templeton Investments. |
|
| | | | |
Steven J. Gray (1955) One Franklin Parkway San Mateo, CA 94403-1906 | | Vice President | | Since 2009 | | Not Applicable | | Not Applicable |
|
| Principal Occupation During at Least the Past 5 Years: |
Senior Associate General Counsel, Franklin Templeton Investments; Vice President, Franklin Templeton Distributors, Inc. and FASA, LLC; and officer of 45 of the investment companies in Franklin Templeton Investments. |
|
| | | | |
Matthew T. Hinkle (1971) One Franklin Parkway San Mateo, CA 94403-1906 | | Chief Executive Officer – Finance and Administration | | Since June 2017 | | Not Applicable | | Not Applicable |
|
| Principal Occupation During at Least the Past 5 Years: |
Senior Vice President, Franklin Templeton Services, LLC; officer of 45 of the investment companies in Franklin Templeton Investments; and formerly, Vice President, Global Tax (2012-April 2017) and Treasurer/Assistant Treasurer, Franklin Templeton Investments (2009-2017). |
|
| | | | |
Edward B. Jamieson (1948) One Franklin Parkway San Mateo, CA 94403-1906 | | President and Chief Executive Officer – Investment Management | | Since 2010 | | Not Applicable | | Not Applicable |
|
| Principal Occupation During at Least the Past 5 Years: |
President and Director, Franklin Advisers, Inc.; Executive Vice President, Franklin Templeton Institutional, LLC; and officer and/or trustee, as the case may be, of some of the other subsidiaries of Franklin Resources, Inc. and of 10 of the investment companies in Franklin Templeton Investments. |
|
| | | | |
Robert Lim (1948) One Franklin Parkway San Mateo, CA 94403-1906 | | Vice President – AML Compliance | | Since 2016 | | Not Applicable | | Not Applicable |
|
| Principal Occupation During at Least the Past 5 Years: |
Vice President, Franklin Templeton Companies, LLC; Chief Compliance Officer, Franklin Templeton Distributors, Inc. and Franklin Templeton Investor Services, LLC; and officer of 45 of the investment companies in Franklin Templeton Investments. |
|
| | | | |
Kimberly H. Novotny (1972) 300 S.E. 2nd Street Fort Lauderdale, FL 33301-1923 | | Vice President | | Since 2013 | | Not Applicable | | Not Applicable |
|
| Principal Occupation During at Least the Past 5 Years: |
Associate General Counsel, Franklin Templeton Investments; Vice President and Corporate Secretary, Fiduciary Trust International of the South; Vice President, Templeton Investment Counsel, LLC; Assistant Secretary, Franklin Resources, Inc.; and officer of 45 of the investment companies in Franklin Templeton Investments. |
|
| | | | |
| | | |
franklintempleton.com | | Annual Report | | 35 |
FRANKLIN REAL ESTATE SECURITIES TRUST
Interested Board Members and Officers (continued)
| | | | | | | | |
Name, Year of Birth and Address | | Position | | Length of
Time Served | | Number of Portfolios in
Fund Complex Overseen
by Board Member* | | Other Directorships Held
During at Least the Past 5 Years |
|
| | | | |
Robert C. Rosselot (1960) 300 S.E. 2nd Street Fort Lauderdale, FL 33301-1923 | | Chief Compliance Officer | | Since 2013 | | Not Applicable | | Not Applicable |
|
| Principal Occupation During at Least the Past 5 Years: |
Director, Global Compliance, Franklin Templeton Investments; Vice President, Franklin Templeton Companies, LLC; officer of 45 of the investment companies in Franklin Templeton Investments; and formerly, Senior Associate General Counsel, Franklin Templeton Investments (2007-2013); and Secretary and Vice President, Templeton Group of Funds (2004-2013). |
|
| | | | |
Karen L. Skidmore (1952) One Franklin Parkway San Mateo, CA 94403-1906 | | Vice President and Secretary | | Since 2006 | | Not Applicable | | Not Applicable |
|
| Principal Occupation During at Least the Past 5 Years: |
Senior Associate General Counsel, Franklin Templeton Investments; and officer of 45 of the investment companies in Franklin Templeton Investments. |
|
| | | | |
Navid J. Tofigh (1972) One Franklin Parkway San Mateo, CA 94403-1906 | | Vice President | | Since 2015 | | Not Applicable | | Not Applicable |
|
| Principal Occupation During at Least the Past 5 Years: |
Associate General Counsel, Franklin Templeton Investments; and officer of 45 of the investment companies in Franklin Templeton Investments. |
|
| | | | |
Craig S. Tyle (1960) One Franklin Parkway San Mateo, CA 94403-1906 | | Vice President | | Since 2005 | | Not Applicable | | Not Applicable |
|
| Principal Occupation During at Least the Past 5 Years: |
General Counsel and Executive Vice President, Franklin Resources, Inc.; and officer of some of the other subsidiaries of Franklin Resources, Inc. and of 45 of the investment companies in Franklin Templeton Investments. |
|
| | | | |
Lori A. Weber (1964) 300 S.E. 2nd Street Fort Lauderdale, FL 33301-1923 | | Vice President | | Since 2011 | | Not Applicable | | Not Applicable |
|
| Principal Occupation During at Least the Past 5 Years: |
Senior Associate General Counsel, Franklin Templeton Investments; Assistant Secretary, Franklin Resources, Inc.; Vice President and Secretary, Templeton Investment Counsel, LLC; and officer of 45 of the investment companies in Franklin Templeton Investments. |
|
*We base the number of portfolios on each separate series of the US registered investment companies within the Franklin Templeton Investments fund complex. These portfolios have a common investment manager or affiliated investment managers.
**Gregory E. Johnson is considered to be an interested person of the Fund under the federal securities laws due to his position as an officer and director of Franklin Resources, Inc. (Resources), which is the parent company of the Fund’s investment manager and distributor. Rupert H. Johnson, Jr. is considered to be an interested person of the Fund under the federal securities laws due to his position as officer and director and major shareholder of Resources.
Note 1: Rupert H. Johnson, Jr. is the uncle of Gregory E. Johnson.
Note 2: Officer information is current as of the date of this report. It is possible that after this date, information about officers may change.
The Sarbanes-Oxley Act of 2002 and Rules adopted by the Securities and Exchange Commission require the Fund to disclose whether the Fund’s Audit Committee includes at least one member who is an audit committee financial expert within the meaning of such Act and Rules. The Fund’s Board has determined that there is at least one such financial expert on the Audit Committee and has designated John B. Wilson as its audit committee financial expert. The Board believes that Mr. Wilson qualifies as such an expert in view of his extensive business background and experience, including service as chief financial officer of Staples, Inc. from 1992 to 1996. Mr. Wilson has been a Member and Chairman of the Fund’s Audit Committee since 2006. As a result of such background and experience, the Board believes that Mr. Wilson has acquired an understanding of generally accepted accounting principles and financial statements, the general application of such principles in connection with the accounting estimates, accruals and reserves, and analyzing and evaluating financial statements that present a breadth and level of complexity of accounting issues generally comparable to those of the Fund, as well as an understanding of internal controls and procedures for financial reporting and an understanding of audit committee functions. Mr. Wilson is an independent Board member as that term is defined under the relevant Securities and Exchange Commission Rules and Releases.
The Statement of Additional Information (SAI) includes additional information about the board members and is available, without charge, upon request. Shareholders may call (800) DIAL BEN/342-5236 to request the SAI.
| | | | |
| | | |
36 | | Annual Report | | franklintempleton.com |
FRANKLIN REAL ESTATE SECURITIES TRUST
FRANKLIN REAL ESTATE SECURITIES FUND
Shareholder Information
Board Approval of Investment Management Agreements
FRANKLIN REAL ESTATE SECURITIES TRUST
Franklin Real Estate Securities Fund
(Fund)
At an in-person meeting held on April 17, 2018 (Meeting), the Board of Trustees (Board) of Franklin Real Estate Securities Trust (Trust), including a majority of the trustees who are not “interested persons” as defined in the Investment Company Act of 1940 (Independent Trustees), reviewed and approved the continuance of the investment management agreement between Franklin Templeton Institutional, LLC (Manager) and the Trust, on behalf of the Fund (Management Agreement) for an additional one-year period. The Independent Trustees received advice from and met separately with Independent Trustee counsel in considering whether to approve the continuation of the Management Agreement.
In considering the continuation of the Management Agreement, the Board reviewed and considered information provided by the Manager at the Meeting and throughout the year at meetings of the Board and its committees. The Board also reviewed and considered information provided in response to a detailed set of requests for information submitted to the Manager by Independent Trustee counsel on behalf of the Independent Trustees in connection with the annual contract renewal process. In addition, prior to the Meeting, the Independent Trustees held a telephonic contract renewal meeting at which the Independent Trustees conferred amongst themselves and Independent Trustee counsel about contract renewal matters. The Board reviewed and considered all of the factors it deemed relevant in approving the continuance of the Management Agreement, including, but not limited to: (i) the nature, extent and quality of the services provided by the Manager; (ii) the investment performance of the Fund; (iii) the costs of the services provided and profits realized by the Manager and its affiliates from the relationship with the Fund; (iv) the extent to which economies of scale are realized as the Fund grows; and (v) whether fee levels reflect these economies of scale for the benefit of Fund investors.
In approving the continuance of the Management Agreement, the Board, including a majority of the Independent Trustees, determined that the terms of the Management Agreement are fair and reasonable and that the continuance of such Management Agreement is in the interests of the Fund and its shareholders. While attention was given to all information
furnished, the following discusses some primary factors relevant to the Board’s determination.
Nature, Extent and Quality of Services
The Board reviewed and considered information regarding the nature, extent and quality of investment management services provided by the Manager and its affiliates to the Fund and its shareholders. This information included, among other things, the qualifications, background and experience of the senior management and investment personnel of the Manager; the structure of investment personnel compensation; oversight of third-party service providers; investment performance reports and related financial information for the Fund; reports on expenses, shareholder services, marketing support payments made to financial intermediaries and third party servicing arrangements; legal and compliance matters; risk controls; pricing and other services provided by the Manager and its affiliates; and management fees charged by the Manager and its affiliates to U.S. funds and other accounts, including management’s explanation of differences among accounts where relevant. The Board also reviewed and considered an annual report on payments made by Franklin Templeton Investments (FTI) or the Fund to financial intermediaries, as well as a memorandum relating to third-party servicing arrangements in response to a guidance update in 2016 from the U.S. Securities and Exchange Commission (SEC) relating to mutual fund distribution and sub-accounting fees. The Board noted management’s continuing efforts and expenditures in establishing effective business continuity plans and developing strategies to address areas of heightened concern in the mutual fund industry, such as cybersecurity and liquidity risk management. The Board also recognized management’s commitment to facilitating Board oversight of particular areas, including derivatives and payments to intermediaries, by enhanced reporting.
The Board also reviewed and considered the benefits provided to Fund shareholders of investing in a fund that is part of the Franklin Templeton family of funds. The Board noted the financial position of Franklin Resources, Inc. (FRI), the Manager’s parent, and its commitment to the mutual fund business as evidenced by its continued introduction of new funds, reassessment of the fund offerings in response to the market environment and project initiatives and capital investments relating to the services provided to the Fund by the FTI organization.
Following consideration of such information, the Board was satisfied with the nature, extent and quality of services provided
| | | | |
| | | |
franklintempleton.com | | Annual Report | | 37 |
FRANKLIN REAL ESTATE SECURITIES TRUST
FRANKLIN REAL ESTATE SECURITIES FUND
SHAREHOLDER INFORMATION
by the Manager and its affiliates to the Fund and its shareholders.
Fund Performance
The Board reviewed and considered the performance results of the Fund over various time periods ended January 31, 2018. The Board considered the performance returns for the Fund in comparison to the performance returns of mutual funds deemed comparable to the Fund included in a universe (Performance Universe) selected by Broadridge Financial Solutions, Inc. (Broadridge), an independent provider of investment company data. The Board received a description of the methodology used by Broadridge to select the mutual funds included in a Performance Universe. The Board also reviewed and considered Fund performance reports provided and discussions that occurred with portfolio managers at Board meetings throughout the year. A summary of the Fund’s performance results is below.
The Performance Universe for the Fund included the Fund and all retail and institutional real estate funds. The Board noted that the Fund’s annualized total return for the one-, three-, five-and 10-year periods was below the median of its Performance Universe. The Board discussed this performance with management and management explained that the Fund’s Performance Universe included funds with broader investment universes than the Fund’s as defined by its benchmark. Management further explained that the Fund’s underperformance over the one-year period was primarily due to competitors’ positioning in sectors which have smaller weights in or are not included in the Fund’s benchmark, such as “specialty” or “non-traditional” real estate investment trusts (REITS), including data centers and telecommunication towers. Management also explained that it has recently increased the Fund’s positioning in non-traditional REITs to mitigate this effect. The Board noted that the Fund outperformed its benchmark over the one-year period. The Board further noted that the Fund’s annualized total return for the five- and 10-year periods, while below the median, exceeded 6.9% and 5.5%, respectively, and for the five-year period was only seven basis points below the median. The Board also noted that the Franklin Global Real Estate Fund is expected to reorganize into the Fund on or about April 27, 2018.
Comparative Fees and Expenses
The Board reviewed and considered information regarding the Fund’s actual total expense ratio and its various components, including, as applicable, management fees; transfer agent
expenses; underlying fund expenses; Rule 12b-1 and non-Rule 12b-1 service fees; and other non-management fees. The Board also noted the quarterly and annual reports it receives on all marketing support payments made by FTI to financial intermediaries. The Board considered the actual total expense ratio and, separately, the contractual management fee rate, without the effect of fee waivers (Management Rate), if any, of the Fund in comparison to the median expense ratio and median Management Rate, respectively, of other mutual funds deemed comparable to and with a similar expense structure as the Fund selected by Broadridge (Expense Group). Broadridge fee and expense data is based upon information taken from each fund’s most recent annual report, which reflects historical asset levels that may be quite different from those currently existing, particularly in a period of market volatility. While recognizing such inherent limitation and the fact that expense ratios and Management Rates generally increase as assets decline and decrease as assets grow, the Board believed the independent analysis conducted by Broadridge to be an appropriate measure of comparative fees and expenses. The Broadridge Management Rate includes administrative charges, and the actual total expense ratio, for comparative consistency, was shown for Class A shares for funds with multiple classes of shares. The Board received a description of the methodology used by Broadridge to select the mutual funds included in an Expense Group.
The Expense Group for the Fund included the Fund and seven other real estate funds. The Board noted that the Management Rate and actual total expense ratio for the Fund were below the medians of its Expense Group. The Board concluded that the Management Rate charged to the Fund is reasonable.
Profitability
The Board reviewed and considered information regarding the profits realized by the Manager and its affiliates in connection with the operation of the Fund. In this respect, the Board considered the Fund profitability analysis provided by the Manager that addresses the overall profitability of FTI’s U.S. fund business, as well as its profits in providing investment management and other services to each of the individual funds during the 12-month period ended September 30, 2017, being the most recent fiscal year-end for FRI. The Board noted that although management continually makes refinements to its methodologies used in calculating profitability in response to organizational and product related changes, the overall methodology has remained consistent with that used in the Fund’s profitability report presentations from prior years.
| | | | |
| | | |
38 | | Annual Report | | franklintempleton.com |
FRANKLIN REAL ESTATE SECURITIES TRUST
FRANKLIN REAL ESTATE SECURITIES FUND
SHAREHOLDER INFORMATION
Additionally, PricewaterhouseCoopers LLP, auditor to Franklin Resources, Inc. and certain Franklin Templeton funds, has been engaged by the Manager to periodically review and assess the allocation methodologies to be used solely by the Fund’s Board with respect to the profitability analysis.
The Board noted management’s belief that costs incurred in establishing the infrastructure necessary for the type of mutual fund operations conducted by the Manager and its affiliates may not be fully reflected in the expenses allocated to the Fund in determining its profitability, as well as the fact that the level of profits, to a certain extent, reflected operational cost savings and efficiencies initiated by management. The Board also noted management’s expenditures in improving shareholder services provided to the Fund, as well as the need to implement systems and meet additional regulatory and compliance requirements resulting from recent SEC and other regulatory requirements.
The Board also considered the extent to which the Manager and its affiliates might derive ancillary benefits from fund operations, including revenues generated from transfer agent services, potential benefits resulting from personnel and systems enhancements necessitated by fund growth, as well as increased leverage with service providers and counterparties. Based upon its consideration of all these factors, the Board concluded that the level of profits realized by the Manager and its affiliates from providing services to the Fund was not excessive in view of the nature, extent and quality of services provided to the Fund.
Economies of Scale
The Board reviewed and considered the extent to which the Manager may realize economies of scale, if any, as the Fund grows larger and whether the Fund’s management fee structure reflects any economies of scale for the benefit of shareholders. With respect to possible economies of scale, the Board noted the existence of management fee breakpoints, which operate generally to share any economies of scale with a Fund’s shareholders by reducing the Fund’s effective management fees as the Fund grows in size. The Board considered the Manager’s view that any analyses of potential economies of scale in managing a particular fund are inherently limited in light of the joint and common costs and investments the Manager incurs across the Franklin Templeton family of funds as a whole. The Board noted that the Fund had experienced a decrease in assets and would not be expected to demonstrate additional economies of scale in the near term.
Conclusion
Based on its review, consideration and evaluation of all factors it believed relevant, including the above-described factors and conclusions, the Board unanimously approved the continuation of the Management Agreement for an additional one-year period
Proxy Voting Policies and Procedures
The Fund’s investment manager has established Proxy Voting Policies and Procedures (Policies) that the Fund uses to determine how to vote proxies relating to portfolio securities. Shareholders may view the Fund’s complete Policies online at franklintempleton.com. Alternatively, shareholders may request copies of the Policies free of charge by calling the Proxy Group collect at (954) 527-7678 or by sending a written request to: Franklin Templeton Companies, LLC, 300 S.E. 2nd Street, Fort Lauderdale, FL 33301, Attention: Proxy Group. Copies of the Fund’s proxy voting records are also made available online at franklintempleton.com and posted on the US Securities and Exchange Commission’s website at sec.gov and reflect the most recent 12-month period ended June 30.
Quarterly Statement of Investments
The Trust, on behalf of the Fund, files a complete statement of investments with the US Securities and Exchange Commission for the first and third quarters for each fiscal year on Form N-Q. Shareholders may view the filed Form N-Q by visiting the Commission’s website at sec.gov. The filed form may also be viewed and copied at the Commission’s Public Reference Room in Washington, DC. Information regarding the operations of the Public Reference Room may be obtained by calling (800) SEC-0330.
Householding of Reports and Prospectuses
You will receive the Fund’s financial reports every six months as well as an annual updated summary prospectus (prospectus available upon request). To reduce Fund expenses, we try to identify related shareholders in a household and send only one copy of the financial reports and summary prospectus. This process, called “householding,” will continue indefinitely unless you instruct us otherwise. If you prefer not to have these documents householded, please call us at (800) 632-2301. At any time you may view current prospectuses/summary prospectuses and financial reports on our website. If you choose, you may receive these documents through electronic delivery.
| | | | |
| | | |
franklintempleton.com | | Annual Report | | 39 |
This page intentionally left blank.
| | | | |
| |  | | Annual Report and Shareholder Letter |
| | | Franklin Real Estate Securities Fund |
| | | Investment Manager |
| | | Franklin Templeton Institutional, LLC |
| | | Distributor |
| | | Franklin Templeton Distributors, Inc. |
| | | (800) DIAL BEN® / 342-5236 |
| | | franklintempleton.com |
| | | Shareholder Services |
| | | (800) 632-2301 |
Authorized for distribution only when accompanied or preceded by a summary prospectus and/or prospectus. Investors should carefully consider a fund’s investment goals, risks, charges and expenses before investing. A prospectus contains this and other information; please read it carefully before investing.
To help ensure we provide you with quality service, all calls to and from our service areas are monitored and/or recorded.
| | |
| © 2018 Franklin Templeton Investments. All rights reserved. | | 192 A 06/18 |
Item 2. Code of Ethics.
(a) The Registrant has adopted a code of ethics that applies to its principal executive officers and principal financial and accounting officer.
(c) N/A
(d) N/A
(f) Pursuant to Item 12(a)(1), the Registrant is attaching as an exhibit a copy of its code of ethics that applies to its principal executive officers and principal financial and accounting officer.
Item 3. Audit Committee Financial Expert.
(a)(1) The Registrant has an audit committee financial expert serving on its audit committee.
(2) The audit committee financial expert is John B. Wilson and he is “independent” as defined under the relevant Securities and Exchange Commission Rules and Releases.
Item 4. Principal Accountant Fees and Services.
(a) Audit Fees
The aggregate fees paid to the principal accountant for professional services rendered by the principal accountant for the audit of the registrant’s annual financial statements or for services that are normally provided by the principal accountant in connection with statutory and regulatory filings or engagements were $35,486 for the fiscal year ended April 30, 2018 and $33,137 for the fiscal year ended April 30, 2017.
(b) Audit-Related Fees
There were no fees paid to the principal accountant for assurance and related services rendered by the principal accountant to the registrant that are reasonably related to the performance of the audit of the registrant’s financial statements and are not reported under paragraph (a) of Item 4.
There were no fees paid to the principal accountant for assurance and related services rendered by the principal accountant to the registrant’s investment adviser and any entity controlling, controlled by or under common control with the investment adviser that provides ongoing services to the registrant that are reasonably related to the performance of the audit of their financial statements.
(c) Tax Fees
There were no fees paid to the principal accountant for professional services rendered by the principal accountant to the registrant for tax compliance, tax advice and tax planning.
The aggregate fees paid to the principal accountant for professional services rendered by the principal accountant to the registrant’s investment adviser and any entity controlling, controlled by or under
common control with the investment adviser that provides ongoing services to the registrant for tax compliance, tax advice and tax planning were $16,250 for the fiscal year ended April 30, 2018 and $16,250 for the fiscal year ended April 30, 2017. The services for which these fees were paid included tax compliance services related to year-end.
(d) All Other Fees
The aggregate fees paid to the principal accountant for products and services rendered by the principal accountant to the registrant not reported in paragraphs (a)-(c) of Item 4 were $147 for the fiscal year ended April 30, 2018 and $0 for the fiscal year ended April 30, 2017. The services for which these fees were paid include review of materials provided to the fund Board in connection with the investment management contract renewal process.
The aggregate fees paid to the principal accountant for products and services rendered by the principal accountant to the registrant’s investment adviser and any entity controlling, controlled by or under common control with the investment adviser that provides ongoing services to the registrant other than services reported in paragraphs (a)-(c) of Item 4 were $65,225 for the fiscal year ended April 30, 2018 and $3,717 for the fiscal year ended April 30, 2017. The services for which these fees were paid included compliance examination for Investment Advisor Act rule 204-2 and 206-4(2), account maintenance project, training on partnership tax accounting and capital account maintenance and benchmarking services in connection with the ICI TA survey.
(e) (1) The registrant’s audit committee is directly responsible for approving the services to be provided by the auditors, including:
(i) pre-approval of all audit and audit related services;
(ii) pre-approval of all non-audit related services to be provided to the Fund by the auditors;
(iii) pre-approval of all non-audit related services to be provided to the registrant by the auditors to the registrant’s investment adviser or to any entity that controls, is controlled by or is under common control with the registrant’s investment adviser and that provides ongoing services to the registrant where the non-audit services relate directly to the operations or financial reporting of the registrant; and
(iv) establishment by the audit committee, if deemed necessary or appropriate, as an alternative to committee pre-approval of services to be provided by the auditors, as required by paragraphs (ii) and (iii) above, of policies and procedures to permit such services to be pre-approved by other means, such as through establishment of guidelines or by action of a designated member or members of the committee; provided the policies and procedures are detailed as to the particular service and the committee is informed of each service and such policies and procedures do not include delegation of audit committee responsibilities, as contemplated under the Securities Exchange Act of 1934, to management; subject, in the case of (ii)
through (iv), to any waivers, exceptions or exemptions that may be available under applicable law or rules.
(e) (2) None of the services provided to the registrant described in paragraphs (b)-(d) of Item 4 were approved by the audit committee pursuant to paragraph (c)(7)(i)(C) of Rule 2-01 of regulation S-X.
(f) No disclosures are required by this Item 4(f).
(g) The aggregate non-audit fees paid to the principal accountant for services rendered by the principal accountant to the registrant and the registrant’s investment adviser and any entity controlling, controlled by or under common control with the investment adviser that provides ongoing services to the registrant were $81,622 for the fiscal year ended April 30, 2018 and $19,967 for the fiscal year ended April 30, 2017.
(h) The registrant’s audit committee of the board has considered whether the provision of non-audit services that were rendered to the registrant’s investment adviser (not including any sub-adviser whose role is primarily portfolio management and is subcontracted with or overseen by another investment adviser), and any entity controlling, controlled by, or under common control with the investment adviser that provides ongoing services to the registrant that were not pre-approved pursuant to paragraph (c)(7)(ii) of Rule 2-01 of Regulation S-X is compatible with maintaining the principal accountant’s independence.
Item 5. Audit Committee of Listed Registrants. N/A
Item 6. Schedule of Investments. N/A
Item 7. Disclosure of Proxy Voting Policies and Procedures for Closed-End Management Investment Companies. N/A
Item 8. Portfolio Managers of Closed-End Management Investment Companies. N/A
Item 9. Purchases of Equity Securities by Closed-End Management Investment Company and Affiliated Purchasers. N/A
Item 10. Submission of Matters to a Vote of Security Holders.
There have been no changes to the procedures by which shareholders may recommend nominees to the Registrant’s Board of Trustees that would require disclosure herein.
Item 11. Controls and Procedures.
(a) Evaluation of Disclosure Controls and Procedures. The Registrant maintains disclosure controls and procedures that are designed to ensure that information required to be disclosed in the Registrant’s
filings under the Securities Exchange Act of 1934 and the Investment Company Act of 1940 is recorded, processed, summarized and reported within the periods specified in the rules and forms of the Securities and Exchange Commission. Such information is accumulated and communicated to the Registrant’s management, including its principal executive officer and principal financial officer, as appropriate, to allow timely decisions regarding required disclosure. The Registrant’s management, including the principal executive officer and the principal financial officer, recognizes that any set of controls and procedures, no matter how well designed and operated, can provide only reasonable assurance of achieving the desired control objectives.
Within 90 days prior to the filing date of this Shareholder Report on Form N-CSR, the Registrant had carried out an evaluation, under the supervision and with the participation of the Registrant’s management, including the Registrant’s principal executive officer and the Registrant’s principal financial officer, of the effectiveness of the design and operation of the Registrant’s disclosure controls and procedures. Based on such evaluation, the Registrant’s principal executive officer and principal financial officer concluded that the Registrant’s disclosure controls and procedures are effective.
(b) Changes in Internal Controls. There have been no changes in the Registrant’s internal controls or in other factors that could materially affect the internal controls over financial reporting subsequent to the date of their evaluation in connection with the preparation of this Shareholder Report on Form N-CSR.
Item 12. Exhibits.
(a) (1) Code of Ethics
(a) (2) Certifications pursuant to Section 302 of the Sarbanes-Oxley Act of 2002 of Matthew T. Hinkle, Chief Executive Officer - Finance and Administration, and Gaston Gardey, Chief Financial Officer and Chief Accounting Officer
(b) Certifications pursuant to Section 906 of the Sarbanes-Oxley Act of 2002 of Matthew T. Hinkle, Chief Executive Officer - Finance and Administration, and Gaston Gardey, Chief Financial Officer and Chief Accounting Officer
SIGNATURES
Pursuant to the requirements of the Securities Exchange Act of 1934 and the Investment Company Act of 1940, the registrant has duly caused this report to be signed on its behalf by the undersigned, thereunto duly authorized.
FRANKLIN REAL ESTATE SECURITIES TRUST
| | |
| By | | /s/ MATTHEW T. HINKLE |
| | Matthew T. Hinkle |
| | Chief Executive Officer – |
| | Finance and Administration |
Date June 26, 2018
Pursuant to the requirements of the Securities Exchange Act of 1934 and the Investment Company Act of 1940, this report has been signed below by the following persons on behalf of the registrant and in the capacities and on the dates indicated.
| | |
| By | | /s/ MATTHEW T. HINKLE |
| | Matthew T. Hinkle |
| | Chief Executive Officer – |
| | Finance and Administration |
Date June 26, 2018
| | |
| By | | /s/ GASTON GARDEY |
| | Gaston Gardey |
| | Chief Financial Officer and |
| | Chief Accounting Officer |
Date June 26, 2018