UNITED STATES
SECURITIES AND EXCHANGE COMMISSION
Washington, D.C. 20549
FORM N-CSR
CERTIFIED SHAREHOLDER REPORT OF REGISTERED
MANAGEMENT INVESTMENT COMPANIES
Investment Company Act file number: 811-8056
Praxis Mutual Funds
(Exact name of registrant as specified in charter)
1110 N. Main Street
Goshen, IN 46527
(Address of principal executive offices) (Zip code)
Anthony Zacharski
Dechert LLP
200 Clarendon Street, 27th Floor
Boston, MA 02116
(Name and Address of Agent for Service)
Registrant’s telephone number, including area code: (800) 977-2947
Date of fiscal year end: December 31
Date of reporting period: December 31, 2016
Item 1. Reports to Stockholders.
The following is a copy of the report transmitted to shareholders pursuant to Rule 30e-1 under the Investment Company Act of 1940 (17 CFR 270.30e-1).

Table of Contents
Message from the President | 1 |
Stewardship investing report | 2 |
Praxis Impact Bond Fund | |
Portfolio managers’ letter | 4 |
Performance review | 5 |
Schedule of portfolio investments | 6 |
Praxis International Index Fund | |
Portfolio managers’ letter | 13 |
Performance review | 14 |
Schedule of portfolio investments | 15 |
Praxis Value Index Fund | |
Portfolio managers’ letter | 25 |
Performance review | 26 |
Schedule of portfolio investments | 27 |
Praxis Growth Index Fund | |
Portfolio managers’ letter | 31 |
Performance review | 32 |
Schedule of portfolio investments | 33 |
Praxis Small Cap Fund | |
Portfolio managers’ letter | 37 |
Performance review | 38 |
Schedule of portfolio investments | 39 |
Praxis Genesis Conservative Portfolio | |
Portfolio managers’ letter | 41 |
Performance review | 42 |
Schedule of portfolio investments | 43 |
Praxis Genesis Balanced Portfolio | |
Performance review | 44 |
Schedule of portfolio investments | 45 |
Praxis Genesis Growth Portfolio | |
Performance review | 46 |
Schedule of portfolio investments | 47 |
Financial Statements | |
Statements of Assets and Liabilities | 48 |
Statements of Operations | 50 |
Statements of Changes in Net Assets | 52 |
Financial Highlights | 55 |
Notes to Financial Statements | 63 |
Report of Independent Registered Public Accounting Firm | 73 |
Additional Fund Information (unaudited) | 74 |
Management of the Trust (unaudited) | 82 |
Message from the President | Annual report to shareholders |
Dear Praxis shareholder:
This past year will likely go down as the year that populist ideals won out over the status quo in Western societies, with the United Kingdom’s “Brexit” vote to leave the European Union and the United States’ election of Donald Trump. The outcomes of both of these events were deemed as low-probability events, and economic pundits, when they predicted the market impacts of them occurring, largely got it wrong.
In the case of the Brexit vote at the end of June, U.K. markets initially reacted negatively, but eventually gained their footing and improved through the rest of the year. As for the U.S. election, the story is still being written. Many feared that President Trump’s isolationist rhetoric meant that markets would fall in the wake of his victory. Instead, investors focused on the pro-growth aspects of his campaign themes, choosing to boost stock prices in advance of anticipated infrastructure spending and tax cuts.
With these two political events as backdrop and as the economy continued to improve, the U.S. Federal Reserve resumed raising its Federal Funds interest rate target range in December, which it hadn’t done since December 2015. Markets shrugged off this nod toward a less accommodative stance, choosing instead to focus on the strength of the economy and the possibilities offered by a new presidential administration.
During the year, Praxis Mutual Funds® was busy reshaping the fund line-up and honing our company selection process.
At the end of April, we changed the name of the Praxis Intermediate Income Fund to the Praxis Impact Bond Fund. The “Intermediate Income” descriptor served this fund well since its inception in 1994, but we believe Praxis Impact Bond Fund better reflects the Fund’s unique investing philosophy and the difference it seeks to make on the climate and communities. The Fund makes an impact through a combination of approaches including company screening; active integration of environmental, social and governance (ESG) data; positive impact bond investments and community development investing.
The Impact Bond Fund’s investment strategies haven’t changed. It remains focused on investors who want current income in a diversified bond mutual fund with an intermediate-term average maturity. But, we believe the new name will inspire existing and future shareholders to explore the power that impact fixed income can have on the world we share.
At the end of the year, we changed both the name and the strategy of the Small Cap Fund to use an optimized equity index strategy like those used for the other Praxis equity funds. The Praxis Small Cap Index Fund targets the Standard & Poor’s SmallCap 600 Index while observing the same company selection filters that have been used in the past. As an index fund, with a wide and stable range of holdings, the Fund is an even stronger platform for shareholder advocacy on the themes of environmental sustainability and modern slavery.
With this change in strategy for the Small Cap Index Fund, Praxis now offers a range of optimized index strategies covering U.S. and global equity markets in our four equity funds. And, in an effort to return more value to shareholders, we also reduced the expense ratio of the International Index Fund.
This year Praxis also enhanced its methodology for integrating social and governance themes into our company selection process, which we now call Values + ESG. Values, because “Praxis” – putting belief into action – is at the core of who we are. This means there are certain products and practices that we simply intend to avoid as a reflection of the values we hold. ESG, because we believe that companies that pay attention to their environmental, social and governance impacts ultimately perform better for their shareholders. Our new screens are designed to avoid holdings that pose the most ESG risk.
For many investors today, making money isn’t enough. Like you, they also want their investments to make a difference – to have impact. They want to invest in what matters. That’s why shareholder advocacy, company screening, positive investments and community development investing are essential to our work at Praxis. Our goal is to invest in ways that make a real impact on communities locally and around the world – and we are able to do that because of you.
Thank you for entrusting your investments with Praxis Mutual Funds.
Sincerely,

Chad M. Horning
President
Praxis Mutual Funds are advised by Everence Capital Management Inc. and distributed through FINRA member BHIL Distributors LLC.
The views expressed are those of the Praxis Mutual Funds president as of Dec. 31, 2016, are subject to change, and may differ from the views of portfolio managers or the firm as a whole. These opinions are not intended to be a forecast of future events, a guarantee of future results, or investment advice. All data referenced are from sources deemed to be reliable but cannot be guaranteed. Securities and sectors referenced should not be construed as a solicitation or recommendation or be used as the sole basis for any investment decision.
1
Message from the Vice President of Stewardship Investing | Annual report to shareholders |
Reflecting values, delivering impact
From its inception, Praxis Mutual Funds has been committed to integrating values and beliefs, while also delivering competitive financial products – a commitment we call stewardship investing. Over the years, these efforts have grown in sophistication, breadth and impact. And although many still associate the integration of values and investing primarily with negative screening, we are delighted to report that this effort has grown to encompass so much more.
Our objective today – as it was at our founding almost 20 years ago – is to continuously understand how the investments we hold can positively reflect our values, while financially sustaining the individuals, families and institutions that depend on them.
Our stewardship investing efforts to both reflect our values and deliver global impact took some significant steps forward in 2016, including:
● | Introduction of Values + ESG screening – The launch of this new approach to company restrictions capped a three-year process to bring together traditional values-based screens with new integrated environmental, social and governance (ESG) screens. The result helps give Praxis portfolios a positive social tilt while reducing ESG risks. |
● | Robust shareholder advocacy – Long a core commitment for Praxis, 2016 corporate engagement activities provided a range of meaningful impact for communities around the world including: |
– | Success with PPG on the elimination of lead paint. |
– | Progress with Mondelez on the well-being of Ghanaian cocoa communities and the elimination of child slavery. |
– | Integration of changing energy generation models in the sustainability reporting and planning at Duke Energy. |
– | An unprecedented vote at Southern Company on a resolution asking the company to publicly respond to the strategic threats to the company posed by climate change. |
Details on these engagements, and many more, can be found at everence.com/inspiring-stories. |
● | Active ESG integration – For more than three years, our fixed income team has worked to integrate emerging corporate environmental, social and governance data into the active investment process for the Praxis Impact Bond Fund. In 2016, these efforts included the integration of new ESG bond information developed by an independent third party consultant. |
● | Positive impact investments – The active management of the Praxis Impact Bond Fund, along with our investment team’s deep commitment to sustainable, responsible and impact investing and ESG, have helped position this fund at the forefront of the industry in the inclusion of market-rate, positive impact bonds that benefit the climate and communities. Today, these investments account for nearly 25 percent of the portfolio and include: |
– | Suzano Bahia Sul Green Bond – This green bond from Brazilian paper manufacturer Suzano will be used to advance the company’s sustainable forestry efforts, restoration of native forests, conservation of native plant and animal species, water management, energy efficiency and renewable energy. |
– | Starbucks Corporate Sustainability Bond – The first of its kind in the U.S., this bond’s proceeds will help Starbucks enhance the sustainability programs in its coffee supply chain management, including fair pay for workers and protection for the environment. |
– | Axis Bank Green Bond – This Indian bank is the first company in India to issue a certified green bond. The bond will finance climate solutions around the world. |
– | Banco Nacional Costa Rica Green Bond – This Central American nation’s first green bond will finance wind, solar, small hydro and wastewater projects across the country, based on Costa Rican environmental protection standards. |
More stories about positive impact bonds can be found at everence.com/inspiring-stories. |
● | Values-driven proxy voting – How we communicate with corporations through resolutions on their annual proxy fulfills our fiduciary duty as part owners of these companies. It also gives us another important means through which we can articulate our support for the values and concerns we want the company to take seriously. In 2016, we cast over 8,600 votes at 740 company meetings, voting with management’s recommendation approximately 87% of the time. Praxis consistently supported proposals, even when opposed by management, seeking disclosure of risks and plans for mitigating climate change, the pursuit of gender pay equity, and the restraint of executive compensation at America’s largest banks and many more. Check out our live proxy voting record and annual proxy voting report at everence.com/proxy-voting. |
2
Message from the Vice President of Stewardship Investing, continued | Annual report to shareholders |
● | Community development investing with the Calvert Foundation – In 2016, Praxis continued to build its relationship with the Calvert Foundation. The goal of this strategic relationship is to support our industry-leading commitment of channeling approximately 1 percent of all Fund assets to opening doors of economic opportunity to marginalized communities and individuals. The results of this new relationship – managing a CDI pool of nearly $10 million – can be seen through an interactive community investment map (everence.com/Praxis-community-development-investments) and a $1 million investment in the Foundation’s Benefit Chicago initiative. More targeted commitments will be announced in 2017. |
At Praxis Mutual Funds, we seek to provide the financial performance you need, along with the values and global impact you desire. As we’ve learned over the past two decades, the pursuit of responsible, stewardship investing can take many forms – and we’re committed to exploring ways to deliver impact as they emerge.
Mark A. Regier
Vice President of Stewardship Investing
Praxis Mutual Funds
The views expressed are those of the Praxis Mutual Funds Vice President of Stewardship Investing as of Dec. 31, 2016, are subject to change, and may differ from the views of portfolio managers or the firm as a whole. These opinions are not intended to be a forecast of future events, a guarantee of future results, or investment advice. All data referenced are from sources deemed to be reliable but cannot be guaranteed. Securities and sectors referenced should not be construed as a solicitation or recommendation or be used as the sole basis for any investment decision.
3
Praxis Impact Bond Fund
Annual report to shareholders
Portfolio managers’ commentary
As many investors will have noticed, the name of the Fund changed from the Praxis Intermediate Income Fund to the Praxis Impact Bond Fund, effective April 29, 2016. The “Intermediate Income” name served this fund well since its inception in 1994, but we believe the name “Praxis Impact Bond Fund” better reflects the Fund’s unique investing philosophy and the difference it seeks to make on the climate and communities.
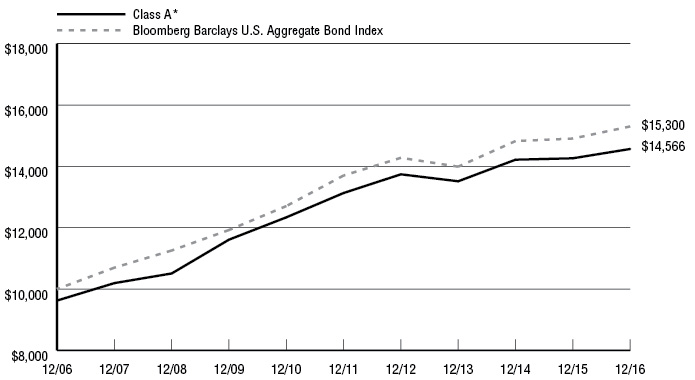
For the year ended December 31, 2016, the Praxis Impact Bond Fund’s Class I Shares had a return of 2.55 percent, and the Class A Shares (Without Load) returned 2.13 percent. The Bloomberg Barclays U.S. Aggregate Bond Index, the Fund’s benchmark, returned 2.65 percent. Over the last five years, the Class I Shares returned 2.48 percent (annually) versus 2.23 percent for the Fund’s benchmark. Over the last 10 years, the Class I Shares returned 4.59 percent (annually) versus 4.34 percent for the Bloomberg Barclays U.S. Aggregate Bond Index.
The Fund benefited somewhat from its short duration versus the index as Treasury rates rose across the yield curve in 2016. During the first half of the year, the yield on the 10-year Treasury moved much lower. By July 8 it reached 1.36 percent, down from 2.27 percent at the beginning of the year. This is the lowest yield since at least 1962 – the earliest year that 10-year Treasury data is available.
The Fund also benefited from corporate sector selection and a higher yield versus the index. The Fund had more weight in utilities, BBB-rated bonds, and high-yield securities versus the index. On the negative side, the Fund was still underweight mortgage-backed securities, which was generally helpful, but our security selection in mortgage-backed securities hurt the fund versus the index.
It is never easy to make calls on what will happen in the next year, and this next year will be especially difficult to predict because of the major policy changes expected from the new U.S. president. Will these changes drive interest rates higher because of strong growth, or will interest rates move lower because of general market fear? This is impossible to tell at this point, but we will stay nimble. Interest rates rose dramatically after the election as investors focused on the pro-growth aspects of the president-elect’s policy pronouncements and we would expect interest rates to continue this climb.
The U.S. Federal Reserve’s objectives are maximum employment, stable prices and moderate long-term interest rates. The unemployment rate is at the longer-run normal rate of unemployment. We expect the unemployment rate to stay below 5 percent for the year. The rate of inflation as measured by the price index for personal consumption expenditures is still below 2 percent, which is the rate most consistent with the Fed’s longer-term mandate. We expect inflation to rise modestly in 2017, above their 2 percent mandate as the effects of low oil prices wear off. Unless inflation moves much higher than expected, the Federal Reserve will likely increase the federal funds rate only a few times in 2017. We expect economic growth to continue at a moderate pace, but this is where policy changes could have a large effect. The U.S. dollar continued to strengthen over the past five months creating a drag on exports, hurting growth.
It was another exciting year for the global green bond market with issuance of over $80 billion, which was more than twice the amount of issuance in the previous year. Green bonds fund projects that have positive environmental benefits.
We were able to increase the holdings of positive impact bonds – fixed income investments, which are intended to have a positive impact on the climate, community or both – in the Fund to nearly 24 percent of the portfolio by December 31, 2016. The positive impact bond market has grown over the past couple of years to include bonds that have more credit risk and pay higher yields, which is attractive to us. Of the 96 bonds that are a part of the Fund’s positive impact holdings, 67 provide clear benefits to the climate. The remaining positive impact bonds produce benefits to communities by funding affordable housing, education, sustainability and more.
As we start 2017, we are positioned for higher interest rates, and we are looking for more opportunities to enhance financial return and make a positive impact on society.
Benjamin J. Bailey, CFA®
Praxis Impact Bond Fund Co-Manager
Praxis Mutual Funds
Delmar King
Praxis Impact Bond Fund Co-Manager
Praxis Mutual Funds
The views expressed are those of the portfolio managers as of Dec. 31, 2016, are subject to change, and may differ from the views of other portfolio managers or the firm as a whole. These opinions are not intended to be a forecast of future events, a guarantee of future results, or investment advice. All data referenced are from sources deemed to be reliable but cannot be guaranteed. Securities and sectors referenced should not be construed as a solicitation or recommendation or be used as the sole basis for any investment decision.
4
Praxis Impact Bond Fund
Performance Review
Growth of $10,000 investment from 12/31/06 to 12/31/16
This chart represents historical performance of a hypothetical investment of $10,000 in Class A Shares (adjusted for the maximum sales charge of 3.75%) of the Fund and Index from 12/31/06 to 12/31/16, and includes the reinvestment of dividends and capital gains.
Annualized | |||||||
Inception Date | One | Three | Five | Ten | Expense Ratio** | ||
Praxis Impact Bond Fund | |||||||
Class A * | 5/12/99 | -1.69% | 1.23% | 1.33% | 3.83% | 0.98% | 0.93% |
Class A (Without Load) | 5/12/99 | 2.13% | 2.53% | 2.10% | 4.23% | ||
Class I | 5/1/06 | 2.55% | 2.92% | 2.48% | 4.59% | 0.54% | 0.54% |
Bloomberg Barclays U.S. Aggregate Bond Index1 |
| 2.65% | 3.03% | 2.23% | 4.34% |
|
|
Past performance does not guarantee future results. The performance data quoted represents past performance and current returns may be lower or higher. The investment return and principal value will fluctuate so that an investor’s shares, when redeemed, may be worth more or less than the original cost. These performance figures do not reflect the deduction of taxes that a shareholder would pay on fund distributions or the redemption of fund shares. To obtain performance information current to the most recent month end, please visit www.praxismutualfunds.com. Indexes are unmanaged, do not incur fees, and it is not possible to invest directly in an index.
The total returns shown reflect any expenses that were contractually or voluntarily reduced, reimbursed or paid by any party during the periods presented. In such instances, and without activity, the total returns would have been lower.
* | The total return figures shown reflect the maximum sales charge applicable to Class A Shares. Class A Shares have a maximum sales charge on purchases of 3.75%. |
** | Reflects the expense ratios as reported in the Prospectus dated April 30, 2016. Contractual fee waivers are in effect from May 1, 2016 through April 30, 2017 for Class A. |
1 | Bloomberg Barclays U.S. Aggregate Bond Index is an unmanaged index composed of the Bloomberg Barclays U.S. Government/Credit Index and the Bloomberg Barclays U.S. Mortgage-Backed Securities Index and includes Treasury issues, agency issues, corporate bond issues and mortgage-backed securities, and is intended to be generally representative of the bond market as a whole. |
The above index is for illustrative purposes only and does not reflect the deduction of expenses associated with a mutual fund, such as investment management and fund accounting fees. The Fund’s performance reflects the deduction of these services. An investor cannot invest directly in an index, although they can invest in its underlying securities.
5
Schedule of Investments
Praxis Impact Bond Fund
December 31, 2016
| COUPON | MATURITY | PRINCIPAL AMOUNT | FAIR VALUE | |||||||||
ASSET BACKED SECURITIES—2.9% | |||||||||||||
CarMax Auto Owner Trust | 1.320 | % | 07/15/19 | $ | 1,500,000 | $ | 1,499,901 | ||||||
CarMax Auto Owner Trust | 1.380 | % | 11/15/19 | 694,246 | 694,491 | ||||||||
CLI Funding LLC (a) | 2.830 | % | 03/18/28 | 609,000 | 586,618 | ||||||||
Cronos Containers Program I Ltd. (a) | 3.270 | % | 11/18/29 | 768,519 | 743,390 | ||||||||
Domino's Pizza Master Issuer LLC (a) | 5.216 | % | 01/25/42 | 582,000 | 593,618 | ||||||||
Fairway Outdoor Funding LLC (a) | 4.212 | % | 10/15/19 | 440,964 | 442,334 | ||||||||
Ford Credit Auto Owner Trust | 0.900 | % | 10/15/18 | 1,091,601 | 1,091,215 | ||||||||
Global SC Finance II SRL (a) | 2.980 | % | 04/17/28 | 728,333 | 704,237 | ||||||||
Honda Auto Receivables Owners Trust | 1.040 | % | 02/18/20 | 1,577,717 | 1,577,715 | ||||||||
SBA Tower Trust | 2.898 | % | 10/15/19 | 525,000 | 528,984 | ||||||||
SolarCity LMC Series I LLC (a) (b) | 4.800 | % | 12/21/26 | 712,116 | 668,191 | ||||||||
SolarCity LMC Series IV LLC (a) (b) | 4.180 | % | 08/21/45 | 239,612 | 221,917 | ||||||||
Spruce ABS Trust | 4.320 | % | 06/15/28 | 623,400 | 615,764 | ||||||||
Textainer Marine Containers III Ltd. (a) | 3.270 | % | 10/20/24 | 391,667 | 372,705 | ||||||||
Toyota Auto Receivables Owner Trust | 0.670 | % | 01/17/17 | 218,062 | 217,967 | ||||||||
Toyota Auto Receivables Owner Trust | 1.270 | % | 05/15/19 | 1,200,000 | 1,199,979 | ||||||||
Toyota Motor Credit Corp. | 1.300 | % | 04/15/20 | 1,000,000 | 996,794 | ||||||||
Trip Rail Master Funding LLC (a) (c) | 2.684 | % | 07/15/41 | 397,089 | 397,089 | ||||||||
Verizon Owner Trust (a) | 1.420 | % | 01/20/21 | 200,000 | 198,608 | ||||||||
TOTAL ASSET BACKED SECURITIES (COST $13,499,884) | 13,351,517 | ||||||||||||
COMMERCIAL MORTGAGE BACKED SECURITIES—1.3% | |||||||||||||
Bear Stearns Commercial Mortgage Securities | 5.742 | % | 09/01/42 | 556,062 | 565,567 | ||||||||
Commercial Mortgage Pass Through Certificates | 3.391 | % | 05/15/45 | 1,000,000 | 1,042,999 | ||||||||
Commercial Mortgage Pass Through Certificates | 2.853 | % | 10/15/45 | 1,000,000 | 1,010,685 | ||||||||
FHLMC Multifamily Structured Pass Through Certificates | 5.085 | % | 03/25/19 | 1,140,000 | 1,209,822 | ||||||||
ML-CFC Commercial Mortgage Trust | 5.419 | % | 08/12/48 | 128,912 | 128,876 | ||||||||
OBP Depositor LLC Trust (a) | 4.646 | % | 07/15/45 | 1,040,000 | 1,105,955 | ||||||||
RBSCF Trust (a) (c) | 6.013 | % | 12/16/49 | 512,031 | 516,132 | ||||||||
RBSCF Trust (a) (c) | 6.140 | % | 02/16/51 | 478,136 | 477,405 | ||||||||
TOTAL COMMERCIAL MORTGAGE BACKED SECURITIES (COST $6,154,192) | 6,057,441 | ||||||||||||
FOREIGN BONDS—2.1% | |||||||||||||
Hashemite Kingdom of Jordan | 2.503 | % | 10/30/20 | 5,000,000 | 5,128,670 | ||||||||
Hashemite Kingdom of Jordan | 3.000 | % | 06/30/25 | 1,450,000 | 1,479,058 | ||||||||
Ukraine Government AID Bonds | 1.847 | % | 05/29/20 | 1,000,000 | 995,833 | ||||||||
Ukraine Government AID Bonds | 1.471 | % | 09/29/21 |
| 2,000,000 |
| 1,952,488 | ||||||
TOTAL FOREIGN BONDS (COST $9,478,204) | 9,556,049 | ||||||||||||
MUNICIPAL BONDS—2.6% | |||||||||||||
American Municipal Power Ohio, Inc., Rev. Taxable-Hydroelectric Projects | 7.334 | % | 02/15/28 | 1,000,000 | 1,284,530 | ||||||||
Bridgeport Connecticut Housing Authority | 1.850 | % | 12/15/18 | 145,000 | 144,572 | ||||||||
Cincinnati, Ohio Water System Rev. | 6.458 | % | 12/01/34 | 600,000 | 670,980 | ||||||||
Columbus Multi-High School Building Corp. | 6.446 | % | 01/15/30 | 1,000,000 | 1,049,980 | ||||||||
Findlay City School District | 6.250 | % | 12/01/37 | 270,000 | 274,266 | ||||||||
Houston Independent School District | 6.168 | % | 02/15/34 | 1,000,000 | 1,062,750 | ||||||||
Indianapolis Public School Multi-School Building | 5.731 | % | 07/15/29 | 1,500,000 | 1,615,455 | ||||||||
LL&P Wind Energy, Inc., Washington | 5.733 | % | 12/01/17 | 230,000 | 231,136 | ||||||||
Massachusetts St. | 3.277 | % | 06/01/46 | 1,500,000 | 1,360,950 | ||||||||
New Jersey St. Housing and Mortgage Finance | 2.600 | % | 07/01/23 | 370,000 | 365,205 | ||||||||
Osceola County Housing Finance Authority Rev. | 3.350 | % | 07/01/23 | 260,000 | 262,644 | ||||||||
St. Paul Housing & Redevelopment Authority Rev. | 2.993 | % | 07/01/21 | 1,250,000 | 1,262,350 | ||||||||
State of Hawaii, Department of Business Economic Development & Tourism | 1.467 | % | 07/01/22 | 717,958 | 704,755 | ||||||||
Warm Springs Reservation Confederated Tribe | 8.250 | % | 11/01/19 | 895,000 | 974,109 | ||||||||
Wisconsin Department of Transportation | 5.837 | % | 07/01/30 | 800,000 | 855,152 | ||||||||
TOTAL MUNICIPAL BONDS (COST $11,885,197) | 12,118,834 | ||||||||||||
CORPORATE BONDS—45.2% | |||||||||||||
AIRLINES—0.3% | |||||||||||||
British Airways | 4.625 | % | 06/20/24 | 702,484 | 747,268 | ||||||||
Southwest Airlines Co. | 2.650 | % | 11/05/20 | 680,000 | 681,720 | ||||||||
1,428,988 | |||||||||||||
BANKS—3.0% | |||||||||||||
Axis Bank/Dubai (a) | 2.875 | % | 06/01/21 | 500,000 | 488,644 | ||||||||
Bank of America Corp. | 5.650 | % | 05/01/18 | 1,250,000 | 1,309,702 | ||||||||
Bank of America Corp. | 1.950 | % | 05/12/18 | 1,000,000 | 1,001,404 | ||||||||
Bank of America Corp. | 2.151 | % | 11/09/20 | 1,000,000 | 987,001 | ||||||||
Bank of America Corp. | 3.300 | % | 01/11/23 | 500,000 | 501,670 | ||||||||
Citigroup, Inc. | 2.400 | % | 02/18/20 | 1,250,000 | 1,247,464 | ||||||||
Discover Bank/Greenwood DE | 3.100 | % | 06/04/20 | 1,000,000 | 1,011,986 | ||||||||
JPMorgan Chase & Co. | 2.250 | % | 01/23/20 | 500,000 | 498,823 | ||||||||
JPMorgan Chase & Co. | 4.625 | % | 05/10/21 | 500,000 | 538,365 | ||||||||
Manufacturers & Traders Trust Co. | 6.625 | % | 12/04/17 | 600,000 | 626,374 | ||||||||
Manufacturers & Traders Trust Co. | 2.100 | % | 02/06/20 | 500,000 | 498,601 | ||||||||
Mitsubishi UFJ Financial Group | 2.527 | % | 09/13/23 | 1,250,000 | 1,203,395 | ||||||||
See accompanying notes to financial statements.
6
Schedule of Investments, continued
Praxis Impact Bond Fund
December 31, 2016
| COUPON | MATURITY | PRINCIPAL AMOUNT | FAIR | |||||||||
CORPORATE BONDS—45.2%, continued | |||||||||||||
BANKS—3.0%, continued | |||||||||||||
Sumitomo Mitsui Banking Corp. | 2.450 | % | 10/20/20 | $ | 1,250,000 | $ | 1,238,408 | ||||||
US Bank, N.A. | 2.800 | % | 01/27/25 | 1,250,000 | 1,219,826 | ||||||||
Wells Fargo & Co. | 2.600 | % | 07/22/20 | 500,000 | 502,890 | ||||||||
Wells Fargo & Co. | 3.500 | % | 03/08/22 | 1,250,000 | 1,286,064 | ||||||||
14,160,617 | |||||||||||||
BIOTECHNOLOGY—0.7% | |||||||||||||
Amgen, Inc. | 5.700 | % | 02/01/19 | 1,000,000 | 1,074,811 | ||||||||
Biogen, Inc. | 2.900 | % | 09/15/20 | 1,000,000 | 1,012,754 | ||||||||
Celgene Corp. | 2.875 | % | 08/15/20 | 835,000 | 844,565 | ||||||||
Gilead Sciences, Inc. | 3.650 | % | 03/01/26 | 500,000 | 506,968 | ||||||||
3,439,098 | |||||||||||||
BUILDING PRODUCTS—0.2% | |||||||||||||
Masco Corp. | 3.500 | % | 04/01/21 | 250,000 | 250,625 | ||||||||
Owens Corning | 4.200 | % | 12/01/24 | 750,000 | 768,285 | ||||||||
1,018,910 | |||||||||||||
CAPITAL MARKETS—2.2% | |||||||||||||
Bank of New York Mellon Corp. (The), Perpetual Bond (c) | 4.950 | % | 12/29/49 | 1,000,000 | 1,005,000 | ||||||||
Goldman Sachs Group, Inc. | 6.000 | % | 06/15/20 | 1,200,000 | 1,330,729 | ||||||||
Goldman Sachs Group, Inc. | 3.500 | % | 01/23/25 | 1,000,000 | 986,699 | ||||||||
ING Bank NV (a) | 2.000 | % | 11/26/18 | 1,000,000 | 999,601 | ||||||||
Jefferies Group LLC | 8.500 | % | 07/15/19 | 900,000 | 1,020,742 | ||||||||
Morgan Stanley | 2.200 | % | 12/07/18 | 910,000 | 913,351 | ||||||||
Morgan Stanley | 5.625 | % | 09/23/19 | 1,500,000 | 1,625,940 | ||||||||
Raymond James Financial, Inc. | 8.600 | % | 08/15/19 | 1,000,000 | 1,147,228 | ||||||||
State Street Corp. | 7.350 | % | 06/15/26 | 1,000,000 | 1,280,042 | ||||||||
10,309,332 | |||||||||||||
CHEMICALS—1.0% | |||||||||||||
Ecolab, Inc. | 4.350 | % | 12/08/21 | 500,000 | 540,329 | ||||||||
Ecolab, Inc. | 5.500 | % | 12/08/41 | 1,100,000 | 1,293,590 | ||||||||
NOVA Chemicals Corp. (a) | 5.250 | % | 08/01/23 | 500,000 | 505,000 | ||||||||
Potash Corp. of Saskatchewan, Inc. | 5.875 | % | 12/01/36 | 840,000 | 924,687 | ||||||||
Solvay Finance America LLC (a) | 3.400 | % | 12/03/20 | 1,250,000 | 1,271,866 | ||||||||
4,535,472 | |||||||||||||
COMMERCIAL SERVICES & SUPPLIES—0.2% | |||||||||||||
Steelcase, Inc. | 6.375 | % | 02/15/21 | 750,000 | 838,288 | ||||||||
COMMUNICATIONS EQUIPMENT—0.1% | |||||||||||||
Juniper Networks, Inc. | 3.300 | % | 06/15/20 | 500,000 | 510,682 | ||||||||
CONSTRUCTION MATERIALS—0.2% | |||||||||||||
Martin Marietta Materials, Inc. | 6.600 | % | 04/15/18 | 1,000,000 | 1,055,895 | ||||||||
CONSUMER FINANCE—1.3% | |||||||||||||
Ally Financial, Inc. | 3.250 | % | 09/29/17 | 500,000 | 503,125 | ||||||||
American Express Credit Corp. | 2.600 | % | 09/14/20 | 1,000,000 | 1,008,359 | ||||||||
Ford Motor Credit Co. LLC | 4.250 | % | 02/03/17 | 500,000 | 500,984 | ||||||||
Ford Motor Credit Co. LLC | 3.157 | % | 08/04/20 | 1,000,000 | 1,007,434 | ||||||||
GE Capital International Funding Co. (a) | 4.418 | % | 11/15/35 |
| 1,250,000 |
| 1,309,884 | ||||||
Harley-Davidson Financial Services, Inc. | 2.700 | % | 03/15/17 | 500,000 | 501,168 | ||||||||
Hyundai Capital Services, Inc. (a) | 2.875 | % | 03/16/21 | 1,250,000 | 1,243,305 | ||||||||
6,074,259 | |||||||||||||
CONTAINERS & PACKAGING—0.3% | |||||||||||||
Newell Rubbermaid, Inc. | 3.850 | % | 04/01/23 | 185,000 | 191,902 | ||||||||
Sonoco Products Co. | 5.750 | % | 11/01/40 | 1,000,000 | 1,119,465 | ||||||||
1,311,367 | |||||||||||||
DIVERSIFIED FINANCIAL SERVICES—1.4% | |||||||||||||
AerCap Ireland Capital Ltd. | 5.000 | % | 10/01/21 | 1,000,000 | 1,051,250 | ||||||||
Brookfield Finance, Inc. | 4.250 | % | 06/02/26 | 1,000,000 | 990,501 | ||||||||
GATX Corp. | 2.600 | % | 03/30/20 | 897,000 | 885,939 | ||||||||
Moody's Corp. | 5.500 | % | 09/01/20 | 1,000,000 | 1,098,274 | ||||||||
MSCI, Inc. (a) | 5.750 | % | 08/15/25 | 500,000 | 531,250 | ||||||||
National Rural Utilities Cooperative Finance Corp. | 10.375 | % | 11/01/18 | 780,000 | 899,517 | ||||||||
S&P Global, Inc. | 3.300 | % | 08/14/20 | 750,000 | 764,691 | ||||||||
S&P Global, Inc. | 4.000 | % | 06/15/25 | 500,000 | 513,690 | ||||||||
6,735,112 | |||||||||||||
DIVERSIFIED TELECOMMUNICATION SERVICES—0.7% | |||||||||||||
AT&T, Inc. | 2.450 | % | 06/30/20 | 500,000 | 496,516 | ||||||||
AT&T, Inc. | 4.750 | % | 05/15/46 | 1,000,000 | 947,419 | ||||||||
Frontier Communications Corp. | 7.125 | % | 03/15/19 | 750,000 | 794,062 | ||||||||
Verizon Communications, Inc. | 6.000 | % | 04/01/41 | 500,000 | 574,289 | ||||||||
Verizon Communications, Inc. | 6.550 | % | 09/15/43 | 500,000 | 624,489 | ||||||||
3,436,775 | |||||||||||||
EDUCATION—0.7% | |||||||||||||
Graham Holdings Co. | 7.250 | % | 02/01/19 | 575,000 | 622,673 | ||||||||
Massachusetts Institute of Technology | 3.959 | % | 07/01/38 | 1,000,000 | 1,048,268 | ||||||||
President & Fellows of Harvard College | 3.150 | % | 07/15/46 | 1,500,000 | 1,342,050 | ||||||||
3,012,991 | |||||||||||||
ELECTRIC UTILITIES—3.5% | |||||||||||||
Electricite de France SA (a) | 3.625 | % | 10/13/25 | 1,250,000 | 1,246,954 | ||||||||
Florida Power & Light Co. | 4.050 | % | 10/01/44 | 1,300,000 | 1,331,960 | ||||||||
Georgia Power Co. | 3.250 | % | 04/01/26 | 1,000,000 | 1,004,952 | ||||||||
ITC Holdings Corp. (a) | 5.500 | % | 01/15/20 | 1,000,000 | 1,066,161 | ||||||||
MidAmerican Energy Co. | 6.750 | % | 12/30/31 | 1,500,000 | 2,030,162 | ||||||||
NextEra Energy Capital Holdings, Inc. | 2.700 | % | 09/15/19 | 500,000 | 506,329 | ||||||||
NSTAR Electric Co. | 5.500 | % | 03/15/40 | 1,250,000 | 1,480,525 | ||||||||
Oncor Electric Delivery Co. | 6.800 | % | 09/01/18 | 750,000 | 810,419 | ||||||||
Pacificorp | 8.080 | % | 10/14/22 | 500,000 | 599,255 | ||||||||
Pennsylvania Electric Co. | 5.200 | % | 04/01/20 | 500,000 | 535,447 | ||||||||
Portland General Electric Co. | 6.100 | % | 04/15/19 | 1,100,000 | 1,199,827 | ||||||||
Potomac Electric Power Co. | 6.500 | % | 11/15/37 | 1,000,000 | 1,310,427 | ||||||||
San Diego Gas and Electric Co. | 4.500 | % | 08/15/40 | 841,000 | 901,504 | ||||||||
See accompanying notes to financial statements.
7
Schedule of Investments, continued
Praxis Impact Bond Fund
December 31, 2016
| COUPON | MATURITY | PRINCIPAL AMOUNT | FAIR | |||||||||
CORPORATE BONDS—45.2%, continued | |||||||||||||
ELECTRIC UTILITIES—3.5%, continued | |||||||||||||
Southern California Edison | 4.050 | % | 03/15/42 | $ | 1,165,000 | $ | 1,174,259 | ||||||
Southern Power Co. | 2.375 | % | 06/01/20 | 240,000 | 238,172 | ||||||||
Southern Power Co. | 4.150 | % | 12/01/25 | 1,000,000 | 1,036,160 | ||||||||
16,472,513 | |||||||||||||
ELECTRICAL EQUIPMENT—0.2% | |||||||||||||
Johnson Controls, Inc. | 3.750 | % | 12/01/21 | 550,000 | 569,260 | ||||||||
Thomas & Betts Corp. | 5.625 | % | 11/15/21 | 500,000 | 564,005 | ||||||||
1,133,265 | |||||||||||||
ELECTRONIC EQUIPMENT, INSTRUMENTS & COMPONENTS—0.0% (d) | |||||||||||||
Arrow Electronics, Inc. | 3.000 | % | 03/01/18 | 165,000 | 166,880 | ||||||||
FOOD & STAPLES RETAILING—0.6% | |||||||||||||
Ahold Finance U.S.A. LLC (b) | 7.820 | % | 01/02/20 | 348,049 | 362,236 | ||||||||
Smith's Food & Drug Centers, Inc. Pass Through Trust | 9.200 | % | 07/02/18 | 539,986 | 574,658 | ||||||||
Sysco Corp. | 2.600 | % | 10/01/20 | 500,000 | 504,318 | ||||||||
Wal-Mart Stores, Inc. | 7.550 | % | 02/15/30 | 1,000,000 | 1,444,036 | ||||||||
2,885,248 | |||||||||||||
FOOD PRODUCTS—1.5% | |||||||||||||
Bunge Ltd. Finance Corp. | 3.200 | % | 06/15/17 | 1,000,000 | 1,007,529 | ||||||||
Bunge Ltd. Finance Corp. | 3.500 | % | 11/24/20 | 250,000 | 254,456 | ||||||||
Cargill, Inc. (a) | 4.760 | % | 11/23/45 | 1,250,000 | 1,341,332 | ||||||||
ConAgra Foods, Inc. | 4.950 | % | 08/15/20 | 94,000 | 99,972 | ||||||||
J.M. Smucker Co. (The) | 3.500 | % | 03/15/25 | 1,250,000 | 1,260,425 | ||||||||
Kraft Foods Group, Inc. | 5.375 | % | 02/10/20 | 1,000,000 | 1,083,105 | ||||||||
Mead Johnson Nutrition Co. | 3.000 | % | 11/15/20 | 1,000,000 | 1,012,528 | ||||||||
Wm. Wrigley Jr. Co. (a) | 3.375 | % | 10/21/20 | 680,000 | 699,009 | ||||||||
6,758,356 | |||||||||||||
FOREIGN AGENCY—3.2% | |||||||||||||
Banco Nacional de Costa Rica | 5.875 | % | 04/25/21 | 750,000 | 756,562 | ||||||||
Export Development Canada | 0.875 | % | 01/30/17 | 1,500,000 | 1,499,369 | ||||||||
Export Development Canada | 1.250 | % | 12/10/18 | 1,000,000 | 1,001,108 | ||||||||
Export-Import Bank of Korea | 2.125 | % | 02/11/21 | 1,250,000 | 1,218,777 | ||||||||
KFW | 1.750 | % | 10/15/19 | 2,500,000 | 2,503,808 | ||||||||
KFW | 1.875 | % | 11/30/20 | 1,000,000 | 996,077 | ||||||||
KFW | 2.000 | % | 11/30/21 | 1,000,000 | 991,470 | ||||||||
Kommunalbanken AS (a) | 1.375 | % | 10/26/20 | 1,000,000 | 976,397 | ||||||||
Kommunalbanken AS (a) | 2.125 | % | 02/11/25 | 1,000,000 | 952,024 | ||||||||
Kommunivest I Sverige AB (a) | 1.500 | % | 04/23/19 | 1,000,000 | 993,233 | ||||||||
Municipality Finance plc | 1.375 | % | 09/21/21 | 1,000,000 | 957,600 | ||||||||
Nacional Financiera SNC (a) | 3.375 | % | 11/05/20 | 1,000,000 | 1,001,250 | ||||||||
Svensk Exportkredit AB | 1.875 | % | 06/23/20 | 1,000,000 | 994,832 | ||||||||
14,842,507 | |||||||||||||
GAS UTILITIES—0.7% | |||||||||||||
Brooklyn Union Gas Co. (a) | 4.504 | % | 03/10/46 | 1,250,000 | 1,287,056 | ||||||||
Indiana Gas Co., Inc. | 6.550 | % | 06/30/28 | 250,000 | 283,559 | ||||||||
Laclede Group, Inc. | 2.550 | % | 08/15/19 | 1,250,000 | 1,255,919 | ||||||||
National Fuel Gas Co. | 6.500 | % | 04/15/18 | 500,000 | 522,523 | ||||||||
3,349,057 | |||||||||||||
HEALTH CARE PROVIDERS & SERVICES—0.9% | |||||||||||||
Express Scripts Holding Co. | 3.300 | % | 02/25/21 |
| 1,000,000 |
| 1,018,767 | ||||||
Howard Hughes Medical Institute | 3.500 | % | 09/01/23 | 1,500,000 | 1,564,074 | ||||||||
Laboratory Corp. of America Holdings | 2.625 | % | 02/01/20 | 1,000,000 | 999,019 | ||||||||
McKesson Corp. | 6.000 | % | 03/01/41 | 474,000 | 548,421 | ||||||||
4,130,281 | |||||||||||||
HOME BUILDERS—0.2% | |||||||||||||
DR Horton, Inc. | 3.625 | % | 02/15/18 | 750,000 | 757,500 | ||||||||
HOTELS, RESTAURANTS & LEISURE—0.5% | |||||||||||||
Brinker International, Inc. | 2.600 | % | 05/15/18 | 500,000 | 501,125 | ||||||||
Hyatt Hotels Corp. | 3.375 | % | 07/15/23 | 1,000,000 | 986,216 | ||||||||
Starbucks Corp. | 2.450 | % | 06/15/26 | 1,000,000 | 954,348 | ||||||||
2,441,689 | |||||||||||||
INDEPENDENT POWER AND RENEWABLE ELECTRICITY PRODUCERS—1.5% | |||||||||||||
FPL Energy American Wind LLC (a) | 6.639 | % | 06/20/23 | 559,221 | 573,201 | ||||||||
FPL Energy National Wind LLC (a) | 5.608 | % | 03/10/24 | 303,768 | 296,174 | ||||||||
Harper Lake Solar Funding Corp. (a) | 7.645 | % | 12/31/18 | 508,794 | 526,602 | ||||||||
Midland Cogeneration Venture LP (a) | 5.250 | % | 03/15/25 | 205,121 | 201,439 | ||||||||
Midland Cogeneration Venture LP (a) | 6.000 | % | 03/15/25 | 525,879 | 556,592 | ||||||||
NRG Yield Operating LLC | 5.375 | % | 08/15/24 | 500,000 | 502,500 | ||||||||
Salton Sea Funding Corp. | 7.475 | % | 11/30/18 | 240,760 | 237,329 | ||||||||
Solar Star Funding LLC (a) | 3.950 | % | 06/30/35 | 333,290 | 304,505 | ||||||||
Solar Star Funding LLC (a) | 5.375 | % | 06/30/35 | 488,554 | 505,310 | ||||||||
SteelRiver Transmission Co. LLC (a) | 4.710 | % | 06/30/17 | 829,177 | 834,720 | ||||||||
Tenaska Virginia Partners LP (a) | 6.119 | % | 03/30/24 | 912,224 | 978,182 | ||||||||
Topaz Solar Farms LLC (a) | 4.875 | % | 09/30/39 | 322,713 | 317,738 | ||||||||
Topaz Solar Farms LLC (a) | 5.750 | % | 09/30/39 | 744,556 | 776,581 | ||||||||
TransAlta Corp. | 6.900 | % | 05/15/18 | 500,000 | 520,856 | ||||||||
7,131,729 | |||||||||||||
INDUSTRIAL CONGLOMERATES—0.1% | |||||||||||||
Ingersoll-Rand Global Holding Co. Ltd. | 2.875 | % | 01/15/19 | 500,000 | 508,952 | ||||||||
INSURANCE—3.0% | |||||||||||||
American International Group, Inc. | 3.750 | % | 07/10/25 | 1,250,000 | 1,258,068 | ||||||||
CNA Financial Corp. | 4.500 | % | 03/01/26 | 1,250,000 | 1,307,175 | ||||||||
Fidelity National Financial, Inc. | 5.500 | % | 09/01/22 | 725,000 | 766,861 | ||||||||
Horace Mann Educators Corp. | 4.500 | % | 12/01/25 | 335,000 | 334,165 | ||||||||
Kemper Corp. | 4.350 | % | 02/15/25 | 1,250,000 | 1,242,718 | ||||||||
Liberty Mutual Group, Inc. (a) | 4.950 | % | 05/01/22 | 1,050,000 | 1,145,670 | ||||||||
Markel Corp. | 3.625 | % | 03/30/23 | 400,000 | 401,057 | ||||||||
Marsh & McLennan Cos., Inc. | 3.500 | % | 06/03/24 | 473,000 | 481,314 | ||||||||
Marsh & McLennan Cos., Inc. | 3.750 | % | 03/14/26 | 1,000,000 | 1,018,752 | ||||||||
See accompanying notes to financial statements.
8
Schedule of Investments, continued
Praxis Impact Bond Fund
December 31, 2016
| COUPON | MATURITY | PRINCIPAL AMOUNT | FAIR | |||||||||
CORPORATE BONDS—45.2%, continued | |||||||||||||
INSURANCE—3.0%, continued | |||||||||||||
OneBeacon US Holdings, Inc. | 4.600 | % | 11/09/22 | $ | 1,000,000 | $ | 996,927 | ||||||
Progressive Corp. (c) | 6.700 | % | 06/15/37 | 500,000 | 488,750 | ||||||||
Provident Cos., Inc. | 7.000 | % | 07/15/18 | 340,000 | 365,290 | ||||||||
Prudential Financial, Inc. (c) | 5.875 | % | 09/15/42 | 500,000 | 524,375 | ||||||||
RLI Corp. | 4.875 | % | 09/15/23 | 1,000,000 | 1,025,470 | ||||||||
TIAA Asset Management Finance Co. LLC (a) | 2.950 | % | 11/01/19 | 1,000,000 | 1,017,261 | ||||||||
Unum Group | 3.000 | % | 05/15/21 | 700,000 | 697,955 | ||||||||
W.R. Berkley Corp. | 6.150 | % | 08/15/19 | 710,000 | 773,409 | ||||||||
W.R. Berkley Corp. | 4.625 | % | 03/15/22 | 250,000 | 267,410 | ||||||||
14,112,627 | |||||||||||||
IT SERVICES—0.6% | |||||||||||||
Broadridge Financial Solutions, Inc. | 3.950 | % | 09/01/20 | 1,000,000 | 1,048,517 | ||||||||
Fiserv, Inc. | 2.700 | % | 06/01/20 | 1,000,000 | 1,004,829 | ||||||||
Xerox Corp. | 2.750 | % | 03/15/19 | 500,000 | 499,982 | ||||||||
2,553,328 | |||||||||||||
LIFE SCIENCES TOOLS & SERVICES—0.3% | |||||||||||||
Agilent Technologies, Inc. | 3.875 | % | 07/15/23 | 1,250,000 | 1,286,054 | ||||||||
MACHINERY—0.9% | |||||||||||||
Illinois Tool Works, Inc. | 3.900 | % | 09/01/42 | 1,000,000 | 999,319 | ||||||||
Kennametal, Inc. | 2.650 | % | 11/01/19 | 1,000,000 | 994,507 | ||||||||
Pall Corp. | 5.000 | % | 06/15/20 | 1,000,000 | 1,088,911 | ||||||||
Snap-on, Inc. | 4.250 | % | 01/15/18 | 500,000 | 514,460 | ||||||||
Valmont Industries, Inc. | 6.625 | % | 04/20/20 | 334,000 | 369,892 | ||||||||
3,967,089 | |||||||||||||
MEDIA—0.7% | |||||||||||||
Comcast Corp. | 4.750 | % | 03/01/44 | 500,000 | 536,262 | ||||||||
Omnicom Group, Inc. | 6.250 | % | 07/15/19 | 1,000,000 | 1,103,611 | ||||||||
Scripps Networks Interactive, Inc. | 2.800 | % | 06/15/20 | 1,000,000 | 1,002,209 | ||||||||
Time Warner Cable, Inc. | 4.500 | % | 09/15/42 | 500,000 | 452,828 | ||||||||
3,094,910 | |||||||||||||
METALS & MINING—0.5% | |||||||||||||
Newcrest Finance Pty. Ltd. (a) | 4.450 | % | 11/15/21 | 1,000,000 | 1,029,463 | ||||||||
Nucor Corp. | 4.125 | % | 09/15/22 | 665,000 | 707,179 | ||||||||
Reliance Steel & Aluminum Co. | 4.500 | % | 04/15/23 | 705,000 | 709,289 | ||||||||
2,445,931 | |||||||||||||
MULTILINE RETAIL—0.2% | |||||||||||||
Dollar General Corp. | 4.125 | % | 07/15/17 | 700,000 | 710,157 | ||||||||
Macy's Retail Holdings, Inc. | 9.500 | % | 04/15/21 | 405,000 | 437,138 | ||||||||
1,147,295 | |||||||||||||
MULTI-UTILITIES—0.8% | |||||||||||||
Consumers Energy Co. | 6.700 | % | 09/15/19 | 750,000 | 843,223 | ||||||||
Puget Energy, Inc. | 5.625 | % | 07/15/22 | 750,000 | 830,498 | ||||||||
Puget Sound Energy, Inc. | 6.740 | % | 06/15/18 | 1,000,000 | 1,067,074 | ||||||||
Westar Energy, Inc. | 2.550 | % | 07/01/26 | 1,260,000 | 1,185,140 | ||||||||
3,925,935 | |||||||||||||
OIL, GAS & CONSUMABLE FUELS—0.5% | |||||||||||||
ConocoPhillips Holdings Co. | 6.950 | % | 04/15/29 |
| 1,000,000 |
| 1,257,558 | ||||||
Denbury Resources, Inc. | 4.625 | % | 07/15/23 | 300,000 | 240,750 | ||||||||
Merey Sweeny LP (a) | 8.850 | % | 12/18/19 | 333,383 | 367,265 | ||||||||
Ras Laffan Liquefied Natural Gas Co. Ltd. II (a) | 5.298 | % | 09/30/20 | 427,200 | 448,560 | ||||||||
2,314,133 | |||||||||||||
PAPER & FOREST PRODUCTS—0.3% | |||||||||||||
PH Glatfelter Co. | 5.375 | % | 10/15/20 | 750,000 | 763,125 | ||||||||
Suzano Austria GMBH | 5.750 | % | 07/14/26 | 750,000 | 722,812 | ||||||||
1,485,937 | |||||||||||||
PHARMACEUTICALS—0.5% | |||||||||||||
AbbVie, Inc. | 2.000 | % | 11/06/18 | 500,000 | 500,307 | ||||||||
AbbVie, Inc. | 2.500 | % | 05/14/20 | 500,000 | 500,130 | ||||||||
Zoetis, Inc. | 3.250 | % | 02/01/23 | 1,200,000 | 1,197,377 | ||||||||
2,197,814 | |||||||||||||
PIPELINES—1.1% | |||||||||||||
Columbia Pipeline Group, Inc. (a) | 3.300 | % | 06/01/20 | 850,000 | 865,888 | ||||||||
Enbridge Energy Partners LP | 5.200 | % | 03/15/20 | 500,000 | 532,463 | ||||||||
Florida Gas Transmission Co. LLC (a) | 4.350 | % | 07/15/25 | 1,000,000 | 1,007,892 | ||||||||
Kern River Funding Corp. (a) | 4.893 | % | 04/30/18 | 457,000 | 467,640 | ||||||||
Northern Natural Gas Co. (a) | 4.100 | % | 09/15/42 | 1,000,000 | 935,721 | ||||||||
Spectra Energy Capital LLC | 6.750 | % | 07/15/18 | 800,000 | 844,067 | ||||||||
Williams Partners LP | 4.875 | % | 05/15/23 | 500,000 | 509,334 | ||||||||
5,163,005 | |||||||||||||
PROFESSIONAL SERVICES—0.5% | |||||||||||||
Dun & Bradstreet Corp. | 4.375 | % | 12/01/22 | 1,000,000 | 1,013,268 | ||||||||
Verisk Analytics, Inc. | 5.800 | % | 05/01/21 | 960,000 | 1,068,188 | ||||||||
2,081,456 | |||||||||||||
REAL ESTATE INVESTMENT TRUSTS (REITS)—1.1% | |||||||||||||
Digital Realty Trust LP | 3.950 | % | 07/01/22 | 1,250,000 | 1,284,482 | ||||||||
Health Care REIT, Inc. | 4.700 | % | 09/15/17 | 1,018,000 | 1,039,864 | ||||||||
National Retail Properties, Inc. | 3.800 | % | 10/15/22 | 750,000 | 774,171 | ||||||||
Regency Centers LP | 3.750 | % | 06/15/24 | 1,000,000 | 1,011,108 | ||||||||
Vornado Realty LP | 2.500 | % | 06/30/19 | 1,000,000 | 1,003,543 | ||||||||
5,113,168 | |||||||||||||
ROAD & RAIL—1.4% | |||||||||||||
Burlington Northern Santa Fe LLC | 7.160 | % | 01/02/20 | 518,651 | 560,330 | ||||||||
Burlington Northern Santa Fe LLC | 5.750 | % | 05/01/40 | 1,000,000 | 1,220,405 | ||||||||
Kansas City Southern (a) | 2.350 | % | 05/15/20 | 500,000 | 494,023 | ||||||||
Norfolk Southern Corp. | 4.837 | % | 10/01/41 | 1,000,000 | 1,085,890 | ||||||||
Penske Truck Leasing Co. LP/PTL Finance Corp. (a) | 3.750 | % | 05/11/17 | 1,000,000 | 1,007,776 | ||||||||
Ryder System, Inc. | 2.650 | % | 03/02/20 | 455,000 | 457,674 | ||||||||
Ryder System, Inc. | 2.500 | % | 05/11/20 | 795,000 | 791,364 | ||||||||
TTX Co. (a) | 2.600 | % | 06/15/20 | 1,000,000 | 995,715 | ||||||||
6,613,177 | |||||||||||||
See accompanying notes to financial statements.
9
Schedule of Investments, continued
Praxis Impact Bond Fund
December 31, 2016
| COUPON | MATURITY | PRINCIPAL AMOUNT | FAIR | |||||||||
CORPORATE BONDS—45.2%, continued | |||||||||||||
SEMICONDUCTORS & SEMICONDUCTOR EQUIPMENT—1.0% | |||||||||||||
Applied Materials, Inc. | 7.125 | % | 10/15/17 | $ | 500,000 | $ | 521,264 | ||||||
Intel Corp. | 4.900 | % | 07/29/45 | 1,250,000 | 1,398,354 | ||||||||
KLA-Tencor Corp. | 3.375 | % | 11/01/19 | 600,000 | 614,255 | ||||||||
Lam Research Corp. | 2.750 | % | 03/15/20 | 1,000,000 | 1,002,070 | ||||||||
Maxim Integrated Products, Inc. | 3.375 | % | 03/15/23 | 500,000 | 488,411 | ||||||||
NXP BV/NXP Funding LLC | 3.875 | % | 09/01/22 | 200,000 | 202,500 | ||||||||
Xilinx, Inc. | 2.125 | % | 03/15/19 | 500,000 | 500,503 | ||||||||
4,727,357 | |||||||||||||
SOFTWARE—0.5% | |||||||||||||
Microsoft Corp. | 4.450 | % | 11/03/45 | 1,500,000 | 1,598,129 | ||||||||
Symantec Corp. | 2.750 | % | 06/15/17 | 500,000 | 501,713 | ||||||||
2,099,842 | |||||||||||||
SPECIALTY RETAIL—0.9% | |||||||||||||
Advanced Auto Parts, Inc. | 4.500 | % | 01/15/22 | 402,000 | 419,548 | ||||||||
Gap, Inc. | 5.950 | % | 04/12/21 | 1,000,000 | 1,052,340 | ||||||||
Lowe's Cos., Inc. | 4.650 | % | 04/15/42 | 1,000,000 | 1,068,692 | ||||||||
O'Reilly Automotive, Inc. | 3.800 | % | 09/01/22 | 1,000,000 | 1,034,699 | ||||||||
Staples, Inc. | 2.750 | % | 01/12/18 | 580,000 | 582,682 | ||||||||
4,157,961 | |||||||||||||
SUPRANATIONAL—4.4% | |||||||||||||
African Development Bank | 1.375 | % | 12/17/18 | 1,000,000 | 997,880 | ||||||||
Asian Development Bank | 1.000 | % | 08/16/19 | 1,500,000 | 1,476,523 | ||||||||
Asian Development Bank | 2.125 | % | 03/19/25 | 1,000,000 | 965,248 | ||||||||
European Bank for Reconstruction & Development | 0.875 | % | 07/22/19 | 2,000,000 | 1,962,012 | ||||||||
European Bank For Reconstruction & Development | 1.625 | % | 04/10/18 | 500,000 | 500,312 | ||||||||
European Investment Bank | 2.500 | % | 10/15/24 | 1,000,000 | 994,763 | ||||||||
European Investment Bank | 2.125 | % | 04/13/26 | 1,000,000 | 953,714 | ||||||||
Inter-American Development Bank | 1.500 | % | 09/25/18 | 2,500,000 | 2,505,423 | ||||||||
Inter-American Development Bank | 2.125 | % | 11/09/20 | 3,000,000 | 3,027,585 | ||||||||
Inter-American Development Bank | 4.375 | % | 01/24/44 | 3,000,000 | 3,454,644 | ||||||||
International Bank for Reconstruction & Development | 2.125 | % | 03/03/25 | 500,000 | 481,186 | ||||||||
International Finance Corp. | 1.250 | % | 11/27/18 | 1,000,000 | 997,889 | ||||||||
Nordic Investment Bank | 2.250 | % | 09/30/21 | 1,000,000 | 1,003,081 | ||||||||
North American Development Bank | 2.300 | % | 10/10/18 | 1,000,000 | 1,011,737 | ||||||||
20,331,997 | |||||||||||||
TECHNOLOGY HARDWARE, STORAGE & PERIPHERALS—0.4% | |||||||||||||
Apple, Inc. | 2.850 | % | 02/23/23 | 1,250,000 | 1,257,791 | ||||||||
Seagate HDD Cayman | 3.750 | % | 11/15/18 | 635,000 | 650,637 | ||||||||
1,908,428 | |||||||||||||
TEXTILES, APPAREL & LUXURY GOODS—0.3% | |||||||||||||
Hanesbrands, Inc. | 4.625 | % | 05/15/24 |
| 500,000 |
| 485,000 | ||||||
Levi Strauss & Co. | 6.875 | % | 05/01/22 | 750,000 | 785,625 | ||||||||
1,270,625 | |||||||||||||
TOTAL CORPORATE BONDS (COST $206,163,270) | 210,443,832 | ||||||||||||
CORPORATE NOTES—1.0% | |||||||||||||
COMMUNITY DEVELOPMENT—1.0% | |||||||||||||
Calvert Social Investment Foundation, Inc. (b) | 1.000 | % | 06/15/17 | 1,700,000 | 1,700,000 | ||||||||
Calvert Social Investment Foundation, Inc. (b) | 1.000 | % | 12/15/17 | 1,200,000 | 1,200,000 | ||||||||
Calvert Social Investment Foundation, Inc. (b) | 1.500 | % | 06/17/19 | 1,700,000 | 1,700,000 | ||||||||
TOTAL CORPORATE NOTES (COST $4,600,000) | 4,600,000 | ||||||||||||
U.S. GOVERNMENT AGENCIES—41.3% | |||||||||||||
FEDERAL HOME LOAN BANK—3.4% | |||||||||||||
FHLB | 5.000 | % | 11/17/17 | 2,500,000 | 2,589,460 | ||||||||
FHLB | 3.375 | % | 06/12/20 | 1,000,000 | 1,055,770 | ||||||||
FHLB | 5.500 | % | 07/15/36 | 9,320,000 | 12,225,352 | ||||||||
15,870,582 | |||||||||||||
FEDERAL HOME LOAN MORTGAGE CORPORATION—16.6% | |||||||||||||
FHLMC | 6.000 | % | 09/01/17 | 8,296 | 8,345 | ||||||||
FHLMC | 4.500 | % | 06/01/18 | 37,226 | 38,194 | ||||||||
FHLMC | 4.875 | % | 06/13/18 | 6,200,000 | 6,536,195 | ||||||||
FHLMC | 3.750 | % | 03/27/19 | 3,020,000 | 3,181,398 | ||||||||
FHLMC | 5.000 | % | 04/01/19 | 29,785 | 30,563 | ||||||||
FHLMC | 1.250 | % | 10/02/19 | 2,710,000 | 2,694,149 | ||||||||
FHLMC | 1.375 | % | 05/01/20 | 4,000,000 | 3,968,984 | ||||||||
FHLMC | 5.000 | % | 12/01/21 | 98,182 | 104,734 | ||||||||
FHLMC | 2.375 | % | 01/13/22 | 9,460,000 | 9,615,210 | ||||||||
FHLMC | 5.500 | % | 04/01/22 | 68,953 | 73,275 | ||||||||
FHLMC | 4.000 | % | 11/01/24 | 568,252 | 598,387 | ||||||||
FHLMC | 4.000 | % | 10/01/25 | 254,013 | 267,254 | ||||||||
FHLMC | 6.000 | % | 04/01/27 | 194,091 | 219,270 | ||||||||
FHLMC | 2.500 | % | 10/01/27 | 1,097,025 | 1,100,630 | ||||||||
FHLMC | 7.000 | % | 02/01/30 | 126,177 | 138,480 | ||||||||
FHLMC | 7.500 | % | 07/01/30 | 211,507 | 241,967 | ||||||||
FHLMC | 7.000 | % | 03/01/31 | 68,868 | 78,501 | ||||||||
FHLMC | 6.250 | % | 07/15/32 | 8,750,000 | 12,041,225 | ||||||||
FHLMC | 3.000 | % | 11/01/32 | 1,875,391 | 1,913,309 | ||||||||
FHLMC | 3.000 | % | 11/01/32 | 1,231,332 | 1,256,225 | ||||||||
FHLMC | 5.500 | % | 11/01/33 | 68,773 | 76,197 | ||||||||
FHLMC | 2.855 | % | 05/01/34 | 62,075 | 65,152 | ||||||||
FHLMC | 2.855 | % | 05/01/34 | 129,527 | 136,588 | ||||||||
FHLMC | 5.000 | % | 07/01/35 | 160,444 | 175,557 | ||||||||
FHLMC | 4.500 | % | 10/01/35 | 298,400 | 321,669 | ||||||||
FHLMC | 5.500 | % | 03/01/36 | 78,223 | 87,665 | ||||||||
FHLMC | 5.500 | % | 06/01/36 | 114,235 | 127,343 | ||||||||
FHLMC | 6.000 | % | 06/01/36 | 113,328 | 129,960 | ||||||||
FHLMC | 5.500 | % | 12/01/36 | 95,365 | 106,447 | ||||||||
FHLMC | 6.000 | % | 08/01/37 | 58,698 | 66,510 | ||||||||
FHLMC | 5.000 | % | 03/01/38 | 470,127 | 513,969 | ||||||||
FHLMC | 4.500 | % | 06/01/39 | 501,600 | 540,060 | ||||||||
FHLMC | 5.000 | % | 06/01/39 | 761,763 | 829,650 | ||||||||
FHLMC | 4.500 | % | 07/01/39 | 534,797 | 575,226 | ||||||||
FHLMC | 4.500 | % | 11/01/39 | 512,288 | 551,404 | ||||||||
FHLMC | 4.500 | % | 09/01/40 | 785,180 | 847,248 | ||||||||
See accompanying notes to financial statements.
10
Schedule of Investments, continued
Praxis Impact Bond Fund
December 31, 2016
| COUPON | MATURITY | PRINCIPAL AMOUNT | FAIR | |||||||||
U.S. GOVERNMENT AGENCIES—41.3%, continued | |||||||||||||
FEDERAL HOME LOAN MORTGAGE CORPORATION—16.6%, continued | |||||||||||||
FHLMC | 4.500 | % | 05/01/41 | $ | 1,507,923 | $ | 1,622,945 | ||||||
FHLMC | 4.500 | % | 07/01/41 | 1,503,233 | 1,618,664 | ||||||||
FHLMC | 5.000 | % | 09/01/41 | 728,162 | 795,446 | ||||||||
FHLMC | 3.500 | % | 10/01/41 | 923,993 | 951,749 | ||||||||
FHLMC | 4.000 | % | 10/01/41 | 758,053 | 798,350 | ||||||||
FHLMC | 3.500 | % | 02/01/42 | 1,387,185 | 1,429,068 | ||||||||
FHLMC | 4.000 | % | 02/01/42 | 431,869 | 455,904 | ||||||||
FHLMC | 3.500 | % | 06/01/42 | 1,579,584 | 1,627,006 | ||||||||
FHLMC | 3.500 | % | 06/01/42 | 1,533,342 | 1,579,280 | ||||||||
FHLMC | 3.500 | % | 08/01/42 | 1,679,659 | 1,729,641 | ||||||||
FHLMC | 3.000 | % | 11/01/42 | 2,495,536 | 2,494,519 | ||||||||
FHLMC | 3.000 | % | 01/01/43 | 1,492,572 | 1,491,963 | ||||||||
FHLMC | 3.000 | % | 05/01/43 | 2,197,031 | 2,194,326 | ||||||||
FHLMC | 3.500 | % | 10/01/44 | 2,077,528 | 2,129,915 | ||||||||
FHLMC | 3.500 | % | 11/01/44 | 1,915,087 | 1,962,283 | ||||||||
FHLMC | 3.500 | % | 04/01/45 | 2,325,758 | 2,383,282 | ||||||||
FHLMC | 3.000 | % | 05/01/46 | 2,874,076 | 2,856,920 | ||||||||
77,378,201 | |||||||||||||
FEDERAL NATIONAL MORTGAGE ASSOCIATION—20.2% | |||||||||||||
FNMA | 5.000 | % | 02/13/17 | 1,800,000 | 1,808,723 | ||||||||
FNMA | 1.125 | % | 04/27/17 | 2,000,000 | 2,003,014 | ||||||||
FNMA | 5.000 | % | 07/01/18 | 31,031 | 31,757 | ||||||||
FNMA | 5.000 | % | 09/01/18 | 55,182 | 56,474 | ||||||||
FNMA | 1.875 | % | 02/19/19 | 3,000,000 | 3,036,543 | ||||||||
FNMA | 7.000 | % | 11/01/19 | 6,378 | 6,642 | ||||||||
FNMA | 7.000 | % | 11/01/19 | 7,037 | 7,327 | ||||||||
FNMA | 3.500 | % | 07/01/20 | 232,981 | 242,723 | ||||||||
FNMA | 1.250 | % | 05/06/21 | 7,000,000 | 6,801,676 | ||||||||
FNMA | 5.500 | % | 06/01/22 | 105,817 | 112,723 | ||||||||
FNMA | 2.590 | % | 07/01/22 | 2,451,862 | 2,481,708 | ||||||||
FNMA | 2.890 | % | 07/01/22 | 2,443,573 | 2,494,662 | ||||||||
FNMA | 2.190 | % | 01/01/23 | 2,000,000 | 1,965,885 | ||||||||
FNMA | 2.770 | % | 07/01/23 | 2,398,398 | 2,419,786 | ||||||||
FNMA | 2.625 | % | 09/06/24 | 10,750,000 | 10,854,060 | ||||||||
FNMA | 3.080 | % | 12/01/24 | 2,416,889 | 2,460,227 | ||||||||
FNMA | 5.000 | % | 04/01/25 | 145,516 | 158,432 | ||||||||
FNMA | 5.000 | % | 07/01/25 | 114,981 | 125,242 | ||||||||
FNMA | 3.500 | % | 10/01/25 | 255,912 | 266,991 | ||||||||
FNMA | 5.000 | % | 10/01/25 | 139,171 | 151,577 | ||||||||
FNMA | 5.500 | % | 11/01/25 | 44 | 48 | ||||||||
FNMA | 4.000 | % | 03/01/26 | 893,426 | 943,639 | ||||||||
FNMA | 2.125 | % | 04/24/26 | 2,000,000 | 1,891,382 | ||||||||
FNMA | 8.500 | % | 09/01/26 | 49,766 | 54,716 | ||||||||
FNMA | 2.500 | % | 09/01/27 | 1,334,641 | 1,338,726 | ||||||||
FNMA | 2.500 | % | 11/01/27 | 1,907,030 | 1,912,880 | ||||||||
FNMA | 2.500 | % | 01/01/28 | 1,309,698 | 1,313,716 | ||||||||
FNMA | 6.625 | % | 11/15/30 | 8,250,000 | 11,476,459 | ||||||||
FNMA | 3.000 | % | 12/01/32 | 1,845,011 | 1,882,609 | ||||||||
FNMA | 6.000 | % | 10/01/33 | 73,940 | 84,512 | ||||||||
FNMA | 2.075 | % | 02/01/34 | 147,148 | 150,889 | ||||||||
FNMA | 5.500 | % | 02/01/34 | 80,638 | 90,171 | ||||||||
FNMA | 2.786 | % | 05/01/34 | 95,943 | 101,539 | ||||||||
FNMA | 2.895 | % | 05/01/34 | 29,551 | 30,702 | ||||||||
FNMA | 6.000 | % | 11/01/34 | 186,587 | 213,522 | ||||||||
FNMA | 5.500 | % | 01/01/35 | 137,247 | 153,602 | ||||||||
FNMA | 5.000 | % | 10/01/35 | 190,790 | 208,240 | ||||||||
FNMA | 5.500 | % | 10/01/35 | 203,417 | 227,415 | ||||||||
FNMA | 6.000 | % | 10/01/35 | 108,208 | 124,064 | ||||||||
FNMA | 5.500 | % | 06/01/36 |
| 54,501 |
| 60,843 | ||||||
FNMA | 6.000 | % | 06/01/36 | 60,236 | 68,251 | ||||||||
FNMA | 5.500 | % | 11/01/36 | 72,459 | 80,844 | ||||||||
FNMA | 2.845 | % | 05/01/37 | 92,353 | 97,115 | ||||||||
FNMA | 5.625 | % | 07/15/37 | 2,750,000 | 3,667,441 | ||||||||
FNMA | 4.500 | % | 09/01/40 | 487,179 | 525,083 | ||||||||
FNMA | 4.500 | % | 10/01/40 | 484,436 | 522,303 | ||||||||
FNMA | 4.000 | % | 12/01/40 | 1,094,532 | 1,153,008 | ||||||||
FNMA | 4.000 | % | 01/01/41 | 782,802 | 826,118 | ||||||||
FNMA | 3.500 | % | 02/01/41 | 1,113,317 | 1,148,057 | ||||||||
FNMA | 4.000 | % | 10/01/41 | 690,604 | 726,237 | ||||||||
FNMA | 4.000 | % | 11/01/41 | 661,085 | 698,111 | ||||||||
FNMA | 4.000 | % | 12/01/41 | 1,768,384 | 1,866,704 | ||||||||
FNMA | 4.000 | % | 12/01/41 | 872,972 | 919,822 | ||||||||
FNMA | 4.000 | % | 01/01/42 | 1,987,977 | 2,104,616 | ||||||||
FNMA | 3.500 | % | 05/01/42 | 1,334,196 | 1,375,657 | ||||||||
FNMA | 3.000 | % | 06/01/42 | 2,067,550 | 2,066,961 | ||||||||
FNMA | 3.000 | % | 08/01/42 | 1,828,561 | 1,828,040 | ||||||||
FNMA | 3.000 | % | 08/01/42 | 1,901,394 | 1,900,851 | ||||||||
FNMA | 3.500 | % | 12/01/42 | 2,159,016 | 2,226,847 | ||||||||
FNMA | 3.000 | % | 06/01/43 | 1,823,154 | 1,822,633 | ||||||||
FNMA | 4.000 | % | 12/01/44 | 2,639,457 | 2,795,327 | ||||||||
FNMA | 3.500 | % | 05/01/45 | 2,771,533 | 2,851,854 | ||||||||
FNMA | 3.000 | % | 04/01/46 | 2,851,012 | 2,835,372 | ||||||||
93,853,098 | |||||||||||||
GOVERNMENT NATIONAL MORTGAGE ASSOCIATION—0.2% | |||||||||||||
GNMA | 7.000 | % | 12/20/30 | 27,548 | 32,937 | ||||||||
GNMA | 7.000 | % | 10/20/31 | 20,062 | 23,663 | ||||||||
GNMA | 7.000 | % | 03/20/32 | 71,526 | 85,917 | ||||||||
GNMA | 1.750 | % | 01/20/34 | 66,761 | 69,317 | ||||||||
GNMA | 5.500 | % | 10/20/38 | 36,448 | 38,430 | ||||||||
GNMA | 6.500 | % | 11/20/38 | 15,093 | 17,423 | ||||||||
GNMA | 2.250 | % | 04/16/42 | 542,573 | 544,518 | ||||||||
812,205 | |||||||||||||
OVERSEAS PRIVATE INVESTMENT CORPORATION—0.6% | |||||||||||||
OPIC | 3.280 | % | 09/15/29 | 1,100,000 | 1,102,111 | ||||||||
OPIC | 3.540 | % | 06/15/30 | 794,123 | 814,492 | ||||||||
OPIC | 3.820 | % | 06/01/33 | 967,749 | 998,278 | ||||||||
2,914,881 | |||||||||||||
SMALL BUSINESS ADMINISTRATION—0.1% | |||||||||||||
Small Business Administration | 0.849 | % | 02/25/32 | 364,989 | 363,184 | ||||||||
UNITED STATES DEPARTMENT OF HOUSING AND URBAN DEVELOPMENT—0.2% | |||||||||||||
United States Department of Housing and Urban Development | 2.350 | % | 08/01/21 | 1,000,000 | 1,004,290 | ||||||||
TOTAL U.S. GOVERNMENT AGENCIES (COST $192,292,115) | 192,196,441 | ||||||||||||
See accompanying notes to financial statements.
11
Schedule of Investments, continued
Praxis Impact Bond Fund
December 31, 2016
| SHARES | FAIR VALUE | ||||||
INVESTMENT COMPANIES—0.8% | ||||||||
Pax World High Yield Bond Fund - Institutional Class (Cost $4,199,236) | 530,984 | $ | 3,546,972 | |||||
TOTAL INVESTMENTS (Cost (e) $448,272,098—Unrealized gain/loss $3,598,988)—97.2% | $ | 451,871,086 | ||||||
Other Assets in Excess of Liabilities—2.8% | 13,037,724 | |||||||
NET ASSETS—100.0% | $ | 464,908,810 | ||||||
(a) | 144a security is restricted as to resale to institutional investors. These securities were deemed liquid under guidelines established by the Board of Trustees. At December 31, 2016, these securities were valued at $38,595,083 or 8.3% of net assets. |
(b) | Restricted and illiquid securities not registered under the Securities Act of 1933 are as follows: |
| Acquisition Date | Current Cost | Fair Value | % of Net Assets | ||||||||||
Calvert Social Investment Foundation, Inc. 1.00%, 06/15/17 | 06/10/16 | $ | 1,700,000 | $ | 1,700,000 | 0.4 | % | ||||||
Calvert Social Investment Foundation, Inc. 1.00%, 12/15/17 | 12/15/14 | 1,200,000 | 1,200,000 | 0.3 | % | ||||||||
Calvert Social Investment Foundation, Inc. 1.50%, 06/17/16 | 06/10/16 | 1,700,000 | 1,700,000 | 0.4 | % | ||||||||
SolarCity LMC 4.80%, 12/21/16 | 11/13/13 | 711,727 | 668,191 | 0.1 | % | ||||||||
SolarCity LMC 4.18%, 08/21/45 | 08/17/15 | 239,488 | 221,917 | 0.0 | % | ||||||||
$ | 5,551,215 | $ | 5,490,108 | 1.2 | % | ||||||||
(c) | Variable rate security. Rates presented are the rates in effect at December 31, 2016. |
(d) | Percentage rounds to less than 0.1%. |
(e) | Represents cost for financial reporting purposes. |
plc — Public Liability Company
REIT — Real Estate Investment Trust
See accompanying notes to financial statements.
12
Praxis International Index Fund
Annual report to shareholders
Portfolio managers’ commentary
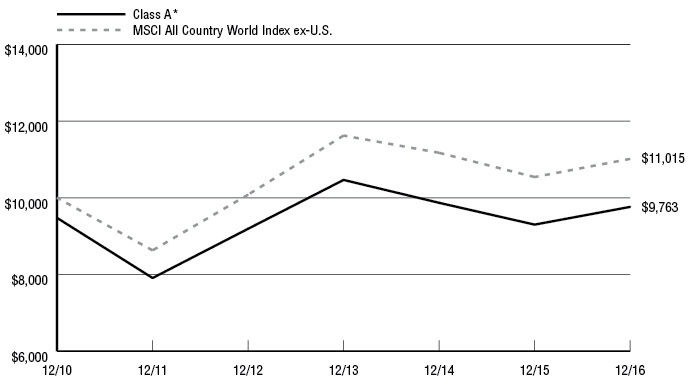
Foreign equity markets rebounded in 2016 and posted positive returns. The MSCI All Country World ex-U.S. Index, the Fund’s benchmark, posted a return of 4.50 percent for the year. The Praxis International Index Fund Class A shares (Without Load) posted a return of 4.97 percent for the year.
The Praxis International Index Fund seeks to generate performance that reflects the performance of a broad representation of both foreign developed and emerging equity markets, as measured by the MSCI All Country World ex-U.S. Index. The portfolio is constructed using optimization techniques to have characteristics similar to the benchmark index. Limitations due to the screens and the lower number of holdings versus the benchmark are expected to cause the fund’s performance to deviate from the benchmark over short periods of time, but the goal over long periods of time is for the fund to perform in line with the benchmark before fees.
During the period, these factors, including a mismatch in timing between the pricing of the securities in the portfolio and the benchmark, had a small positive contribution to the Fund’s returns. However, the results were consistent with our forecasted tracking error – a measure of variability of relative returns – for a portfolio subject to the constraints we discussed above.
Ran Leshem
Praxis International Index Fund Manager
Aperio Group LLC
Patrick Geddes
Praxis International Index Fund Manager
Aperio Group LLC
The views expressed are those of the portfolio managers as of Dec. 31, 2016, are subject to change, and may differ from the views of other portfolio managers or the firm as a whole. These opinions are not intended to be a forecast of future events, a guarantee of future results, or investment advice. All data referenced are from sources deemed to be reliable but cannot be guaranteed. Securities and sectors referenced should not be construed as a solicitation or recommendation or be used as the sole basis for any investment decision.
13
Praxis International Index Fund
Performance Review
Growth of $10,000 investment from 12/31/10 to 12/31/16
This chart represents historical performance of a hypothetical investment of $10,000 in Class A Shares (adjusted for the maximum sales charge of 5.25%) of the Fund and Index from 12/31/10 to 12/31/16, and includes the reinvestment of dividends and capital gains.
Annualized | |||||||
Inception Date | One | Three | Five | Since Inception | Expense Ratio** | ||
Praxis International Index Fund | |||||||
Class A * | 12/31/10 | -0.57% | -4.03% | 3.18% | -0.39% | 1.29% | 1.29% |
Class A (Without Load) | 12/31/10 | 4.97% | -2.29% | 4.30% | 0.50% | ||
Class I | 12/31/10 | 5.48% | -1.82% | 4.94% | 1.11% | 0.74% | 0.74% |
MSCI All Country World Index ex-U.S.1 |
| 4.50% | -1.78% | 5.00% | 1.62% |
|
|
Past performance does not guarantee future results. The performance data quoted represents past performance and current returns may be lower or higher. The investment return and principal value will fluctuate so that an investor’s shares, when redeemed, may be worth more or less than the original cost. These performance figures do not reflect the deduction of taxes that a shareholder would pay on fund distributions or the redemption of fund shares. To obtain performance information current to the most recent month end, please visit www.praxismutualfunds.com. Indexes are unmanaged, do not incur fees, and it is not possible to invest directly in an index.
The total returns shown reflect any expenses that were contractually or voluntarily reduced, reimbursed or paid by any party during the periods presented. In such instances, and without activity, the total returns would have been lower.
* | The total return figures shown reflect the maximum sales charge applicable to Class A Shares. Class A Shares have a maximum sales charge on purchases of 5.25%. |
** | Reflects the expense ratios as reported in the Prospectus dated April 30, 2016. |
1 | The MSCI All Country World Index ex-U.S. is market-capitalization-weighted index designed to provide a broad measure of stock performance throughout the world, with the exception of U.S. based companies. The index includes both developed and emerging markets. |
The above index is for illustrative purposes only and does not reflect the deduction of expenses associated with a mutual fund, such as investment management and fund accounting fees. The Fund’s performance reflects the deduction of these services. An investor cannot invest directly in an index, although they can invest in its underlying securities.
14
Schedule of Investments
Praxis International Index Fund
December 31, 2016
| SHARES | FAIR VALUE | ||||||
COMMON STOCKS—97.7% | ||||||||
AUSTRALIA—5.8% | ||||||||
BANKS—2.2% | ||||||||
Australia & New Zealand Banking Group Ltd. | 6,107 | $ | 134,056 | |||||
Australia & New Zealand Banking Group Ltd. - ADR | 36,061 | 787,572 | ||||||
Commonwealth Bank of Australia | 21,512 | 1,279,264 | ||||||
Commonwealth Bank of Australia - ADR | 613 | 36,382 | ||||||
National Australia Bank Ltd. | 4,644 | 102,779 | ||||||
National Australia Bank Ltd. - ADR | 63,688 | 701,842 | ||||||
Westpac Banking Corp. | 4,051 | 95,297 | ||||||
Westpac Banking Corp. - ADR | 48,506 | 1,138,921 | ||||||
4,276,113 | ||||||||
BIOTECHNOLOGY—0.2% | ||||||||
CSL Ltd. | 2,979 | 215,847 | ||||||
CSL Ltd. - ADR | 6,332 | 229,662 | ||||||
445,509 | ||||||||
CAPITAL MARKETS—0.3% | ||||||||
Macquarie Group Ltd. | 7,209 | 453,203 | ||||||
Macquarie Group Ltd. - ADR | 2,747 | 171,811 | ||||||
625,014 | ||||||||
CHEMICALS—0.2% | ||||||||
Orica Ltd. | 27,987 | 357,058 | ||||||
CONTAINERS & PACKAGING—0.2% | ||||||||
Amcor Ltd. | 24,949 | 269,150 | ||||||
Amcor Ltd. - ADR | 3,500 | 150,500 | ||||||
419,650 | ||||||||
DIVERSIFIED TELECOMMUNICATION SERVICES—0.2% | ||||||||
Telstra Corp. Ltd. | 17,682 | 65,073 | ||||||
Telstra Corp. Ltd. - ADR | 13,179 | 240,648 | ||||||
305,721 | ||||||||
FOOD & STAPLES RETAILING—0.6% | ||||||||
Wesfarmers Ltd. | 19,358 | 588,646 | ||||||
Woolworths Ltd. | 27,413 | 476,731 | ||||||
1,065,377 | ||||||||
INSURANCE—0.2% | ||||||||
Suncorp Group Ltd. | 46,152 | 450,263 | ||||||
METALS & MINING—0.4% | ||||||||
Alumina Ltd. - ADR | 41,858 | 218,499 | ||||||
Arcelormittal - Ny (a) | 51,331 | 374,716 | ||||||
Newcrest Mining Ltd. - ADR | 9,928 | 142,566 | ||||||
South32 Ltd. | 30,582 | 60,864 | ||||||
796,645 | ||||||||
OIL, GAS & CONSUMABLE FUELS—0.8% | ||||||||
Caltex Australia Ltd. | 12,181 | 267,739 | ||||||
Oil Search Ltd. | 60,661 | 313,854 | ||||||
Origin Energy Ltd. | 100,656 | 478,657 | ||||||
Woodside Petroleum Ltd. | 18,241 | 410,153 | ||||||
Woodside Petroleum Ltd. - ADR | 5,235 | 117,526 | ||||||
1,587,929 | ||||||||
REAL ESTATE INVESTMENT TRUSTS (REITS)—0.3% | ||||||||
Scentre Group REIT | 25,459 | 85,243 | ||||||
Shopping Centres Australasia Property Group REIT | 1 | 2 | ||||||
Westfield Corp. REIT | 72,500 |
| 490,727 | |||||
575,972 | ||||||||
TRANSPORTATION INFRASTRUCTURE—0.1% | ||||||||
Sydney Airport | 49,337 | 213,255 | ||||||
TOTAL AUSTRALIA | 11,118,506 | |||||||
AUSTRIA—0.2% | ||||||||
BANKS—0.2% | ||||||||
Erste Group Bank AG | 5,112 | 149,712 | ||||||
Erste Group Bank AG - ADR | 12,078 | 176,520 | ||||||
TOTAL AUSTRIA | 326,232 | |||||||
BELGIUM—0.2% | ||||||||
FOOD & STAPLES RETAILING—0.2% | ||||||||
Colruyt SA | 8,334 | 412,314 | ||||||
BRAZIL—1.3% | ||||||||
BANKS—0.3% | ||||||||
Banco Bradesco SA - ADR | 70,220 | 611,616 | ||||||
CHEMICALS—0.1% | ||||||||
Braskem SA - Class A - ADR | 13,824 | 293,207 | ||||||
FOOD PRODUCTS—0.2% | ||||||||
BRF SA - ADR | 21,929 | 323,672 | ||||||
OIL, GAS & CONSUMABLE FUELS—0.5% | ||||||||
Petroleo Brasileiro SA - ADR (a) | 63,920 | 646,231 | ||||||
Ultrapar Participacoes SA - ADR | 14,545 | 301,663 | ||||||
947,894 | ||||||||
WATER UTILITIES—0.2% | ||||||||
Cia de Saneamento Basico do Estado de Sao Paulo - ADR | 36,049 | 312,905 | ||||||
TOTAL BRAZIL | 2,489,294 | |||||||
CANADA—6.6% | ||||||||
AUTO COMPONENTS—0.3% | ||||||||
Magna International, Inc. - Class A | 11,430 | 496,062 | ||||||
BANKS—1.8% | ||||||||
Bank of Montreal | 7,625 | 548,390 | ||||||
Bank of Nova Scotia | 12,180 | 678,182 | ||||||
Canadian Imperial Bank of Commerce | 3,074 | 250,838 | ||||||
Royal Bank of Canada | 17,137 | 1,160,346 | ||||||
Toronto-Dominion Bank | 18,236 | 899,764 | ||||||
3,537,520 | ||||||||
CHEMICALS—0.7% | ||||||||
Agrium, Inc. | 3,521 | 354,037 | ||||||
Methanex Corp. | 9,429 | 412,990 | ||||||
Potash Corp. of Saskatchewan, Inc. | 27,225 | 492,500 | ||||||
1,259,527 | ||||||||
INDEPENDENT POWER PRODUCERS & ENERGY TRADERS—0.1% | ||||||||
TransAlta Corp. | 20,678 | 113,729 | ||||||
INSURANCE—0.6% | ||||||||
Manulife Financial Corp. | 41,223 | 734,594 | ||||||
Sun Life Financial, Inc. | 11,714 | 449,935 | ||||||
1,184,529 | ||||||||
See accompanying notes to financial statements.
15
Schedule of Investments, continued
Praxis International Index Fund
December 31, 2016
| SHARES | FAIR VALUE | ||||||
COMMON STOCKS—97.7%, continued | ||||||||
CANADA—6.6%, continued | ||||||||
MEDIA—0.1% | ||||||||
Shaw Communications, Inc. - Class B | 11,055 | $ | 221,763 | |||||
METALS & MINING—0.5% | ||||||||
Agnico Eagle Mines Ltd. | 2,205 | 92,610 | ||||||
Teck Resources Ltd. - Class B | 47,173 | 944,875 | ||||||
1,037,485 | ||||||||
OIL, GAS & CONSUMABLE FUELS—1.4% | ||||||||
Cenovus Energy, Inc. | 28,229 | 427,105 | ||||||
Enbridge, Inc. | 18,096 | 762,204 | ||||||
Encana Corp. | 36,072 | 423,485 | ||||||
Suncor Energy, Inc. | 30,429 | 994,724 | ||||||
2,607,518 | ||||||||
REAL ESTATE MANAGEMENT & DEVELOPMENT—0.3% | ||||||||
Brookfield Asset Management, Inc. - Class A | 20,511 | 677,068 | ||||||
ROAD & RAIL—0.8% | ||||||||
Canadian National Railway Co. | 12,210 | 822,954 | ||||||
Canadian Pacific Railway Ltd. | 5,165 | 737,407 | ||||||
1,560,361 | ||||||||
TOTAL CANADA | 12,695,562 | |||||||
CAYMAN ISLANDS—0.2% | ||||||||
INTERNET & DIRECT MARKETING RETAIL—0.2% | ||||||||
Ctrip.com International Ltd. - ADR (a) | 6,196 | 247,840 | ||||||
Qunar Cayman Islands Ltd. (a) | 5,690 | 171,440 | ||||||
TOTAL CAYMAN ISLANDS | 419,280 | |||||||
CHILE—0.6% | ||||||||
AIRLINES—0.1% | ||||||||
Latam Airlines Group SA - ADR (a) | 30,040 | 245,727 | ||||||
BEVERAGES—0.1% | ||||||||
Embotelladora Andina SA - Class B - ADR | 6,720 | 150,999 | ||||||
CHEMICALS—0.2% | ||||||||
Sociedad Quimica y Minera de Chile SA - ADR | 15,440 | 442,356 | ||||||
METALS & MINING—0.2% | ||||||||
Antofagasta plc | 31,044 | 258,037 | ||||||
Antofagasta plc - ADR | 3,393 | 56,405 | ||||||
314,442 | ||||||||
TOTAL CHILE | 1,153,524 | |||||||
CHINA—4.8% | ||||||||
AIRLINES—0.1% | ||||||||
China Southern Airlines Co. Ltd. - ADR | 5,546 | 142,588 | ||||||
BANKS—0.6% | ||||||||
China Construction Bank Corp. - ADR | 69,587 | 1,055,635 | ||||||
CHEMICALS—0.2% | ||||||||
Sinopec Shanghai Petrochemical Co. Ltd. - ADR | 7,041 | 381,129 | ||||||
DIVERSIFIED TELECOMMUNICATION SERVICES—0.1% | ||||||||
China Telecom Corp. Ltd. - ADR | 6,115 | 282,085 | ||||||
INSURANCE—1.1% | ||||||||
Aia Group Ltd. - ADR | 3,830 | 86,060 | ||||||
China Life Insurance Company Ltd. - ADR | 76,021 | 978,390 | ||||||
Ping An Insurance Group Co. of China Ltd. - ADR | 33,826 |
| 336,907 | |||||
Ping An Insurance Group Co. of China Ltd. - Class H | 131,769 | 659,318 | ||||||
2,060,675 | ||||||||
INTERNET SOFTWARE & SERVICES—2.5% | ||||||||
Alibaba Group Holdings Ltd. - ADR (a) | 15,369 | 1,349,552 | ||||||
Baidu, Inc. - ADR (a) | 5,149 | 846,547 | ||||||
Tencent Holdings Ltd. - ADR | 109,906 | 2,661,923 | ||||||
4,858,022 | ||||||||
ROAD & RAIL—0.1% | ||||||||
Guangshen Railway Co. - ADR | 8,797 | 265,845 | ||||||
TECHNOLOGY HARDWARE, STORAGE & PERIPHERALS—0.1% | ||||||||
Lenovo Group Ltd. - ADR | 18,577 | 222,942 | ||||||
TOTAL CHINA | 9,268,921 | |||||||
COLOMBIA—0.4% | ||||||||
BANKS—0.2% | ||||||||
BanColombia SA - ADR | 10,431 | 382,609 | ||||||
OIL, GAS & CONSUMABLE FUELS—0.2% | ||||||||
Ecopetrol SA - ADR (a) | 42,848 | 387,774 | ||||||
TOTAL COLOMBIA | 770,383 | |||||||
DENMARK—0.9% | ||||||||
BANKS—0.2% | ||||||||
Danske Bank A/S | 11,624 | 352,499 | ||||||
Danske Bank A/S - ADR | 6,614 | 100,401 | ||||||
452,900 | ||||||||
PHARMACEUTICALS—0.5% | ||||||||
Novo Nordisk A/S - ADR | 28,510 | 1,022,368 | ||||||
TEXTILES, APPAREL & LUXURY GOODS—0.2% | ||||||||
Pandora A/S | 2,460 | 321,803 | ||||||
TOTAL DENMARK | 1,797,071 | |||||||
FINLAND—0.7% | ||||||||
COMMUNICATIONS EQUIPMENT—0.2% | ||||||||
Nokia OYJ - ADR | 86,149 | 414,377 | ||||||
MACHINERY—0.3% | ||||||||
Kone OYJ - Class B | 11,250 | 504,065 | ||||||
PAPER & FOREST PRODUCTS—0.2% | ||||||||
Stora Enso OYJ - ADR | 32,308 | 344,080 | ||||||
TOTAL FINLAND | 1,262,522 | |||||||
FRANCE—6.5% | ||||||||
AUTO COMPONENTS—0.6% | ||||||||
Cie Generale des Etablissements Michelin | 1,074 | 119,484 | ||||||
Cie Generale des Etablissements Michelin - ADR | 25,215 | 560,025 | ||||||
Valeo SA | 2,793 | 160,536 | ||||||
Valeo SA - ADR | 13,056 | 373,402 | ||||||
1,213,447 | ||||||||
AUTOMOBILES—0.3% | ||||||||
Renault SA | 5,892 | 524,085 | ||||||
See accompanying notes to financial statements.
16
Schedule of Investments, continued
Praxis International Index Fund
December 31, 2016
| SHARES | FAIR VALUE | ||||||
COMMON STOCKS—97.7%, continued | ||||||||
FRANCE—6.5%, continued | ||||||||
BANKS—0.9% | ||||||||
BNP Paribas SA - ADR | 28,958 | $ | 922,312 | |||||
Credit Agricole SA | 11,014 | 136,559 | ||||||
Credit Agricole SA - ADR | 14,211 | 87,256 | ||||||
Societe Generale SA | 4,111 | 202,262 | ||||||
Societe Generale SA - ADR | 36,300 | 356,466 | ||||||
1,704,855 | ||||||||
BUILDING PRODUCTS—0.3% | ||||||||
Cie de Saint-Gobain | 13,938 | 649,222 | ||||||
CONSTRUCTION & ENGINEERING—0.5% | ||||||||
Bouygues SA | 8,092 | 289,961 | ||||||
Vinci SA | 1,494 | 101,739 | ||||||
Vinci SA - ADR | 30,694 | 520,877 | ||||||
912,577 | ||||||||
DIVERSIFIED TELECOMMUNICATION SERVICES—0.3% | ||||||||
Orange SA - ADR | 24,634 | 372,959 | ||||||
Vivendi SA | 9,270 | 176,160 | ||||||
Vivendi SA - ADR | 1,680 | 31,836 | ||||||
580,955 | ||||||||
ELECTRICAL EQUIPMENT—0.5% | ||||||||
Legrand SA | 17,254 | 979,742 | ||||||
ENERGY EQUIPMENT & SERVICES—0.2% | ||||||||
Technip SA - ADR | 26,180 | 466,528 | ||||||
FOOD & STAPLES RETAILING—0.2% | ||||||||
Carrefour SA | 1,523 | 36,692 | ||||||
Carrefour SA - ADR | 58,790 | 284,544 | ||||||
321,236 | ||||||||
FOOD PRODUCTS—0.6% | ||||||||
Danone SA - ADR | 85,545 | 1,076,156 | ||||||
HEALTH CARE EQUIPMENT & SUPPLIES—0.3% | ||||||||
Essilor International SA | 4,503 | 508,785 | ||||||
Essilor International SA - ADR | 952 | 53,817 | ||||||
562,602 | ||||||||
INSURANCE—0.5% | ||||||||
AXA SA - ADR | 34,977 | 881,420 | ||||||
MEDIA—0.2% | ||||||||
Publicis Groupe SA - ADR | 26,260 | 451,541 | ||||||
MULTI-UTILITIES—0.3% | ||||||||
Engie SA (a) | 2,524 | 32,197 | ||||||
Engie SA - ADR | 20,385 | 259,705 | ||||||
Veolia Environnement SA | 11,656 | 198,438 | ||||||
Veolia Environnement SA - ADR | 8,771 | 148,703 | ||||||
639,043 | ||||||||
PERSONAL PRODUCTS—0.5% | ||||||||
L'Oreal SA | 382 | 69,718 | ||||||
L'Oreal SA - ADR | 26,720 | 972,875 | ||||||
1,042,593 | ||||||||
SOFTWARE—0.3% | ||||||||
Dassault Systemes - ADR | 6,224 | 475,501 | ||||||
TOTAL FRANCE | 12,481,503 | |||||||
GERMANY—7.0% | ||||||||
AIR FREIGHT & LOGISTICS—0.4% | ||||||||
Deutsche Post AG | 10,161 |
| 334,048 | |||||
Deutsche Post AG - ADR | 14,832 | 485,600 | ||||||
819,648 | ||||||||
AIRLINES—0.1% | ||||||||
Deutsche Lufthansa AG - ADR | 10,201 | 131,561 | ||||||
AUTOMOBILES—1.0% | ||||||||
Bayerische Moteren Werke AG - ADR | 27,692 | 858,729 | ||||||
Daimler AG | 15,015 | 1,117,630 | ||||||
1,976,359 | ||||||||
BANKS—0.3% | ||||||||
Deutsche Bank AG | 26,653 | 482,419 | ||||||
Deutsche Bank AG - ADR | 10,181 | 184,276 | ||||||
666,695 | ||||||||
CHEMICALS—0.7% | ||||||||
BASF SE - ADR | 14,711 | 1,361,797 | ||||||
DIVERSIFIED FINANCIAL SERVICES—0.2% | ||||||||
Deutsche Boerse AG | 3,878 | 311,922 | ||||||
Deutsche Boerse AG - ADR | 15,060 | 119,682 | ||||||
431,604 | ||||||||
DIVERSIFIED TELECOMMUNICATION SERVICES—0.3% | ||||||||
Deutsche Telekom AG - ADR | 30,797 | 526,629 | ||||||
ENERGY EQUIPMENT & SERVICES—0.2% | ||||||||
E.ON SE (a) | 53,575 | 377,805 | ||||||
HEALTH CARE PROVIDERS & SERVICES—0.6% | ||||||||
Fresenius Medical Care AG & Co. KGaA - ADR | 19,354 | 816,932 | ||||||
Fresenius SE & Co. KGaA | 5,130 | 400,962 | ||||||
1,217,894 | ||||||||
INSURANCE—1.0% | ||||||||
Allianze SE - ADR | 76,050 | 1,253,304 | ||||||
Muenchener Rueckversicherungs-Gesellschaft AG | 1,682 | 318,042 | ||||||
Muenchener Rueckversicherungs-Gesellschaft AG - ADR | 18,890 | 355,699 | ||||||
1,927,045 | ||||||||
MULTI-UTILITIES—0.2% | ||||||||
RWE AG (a) | 17,185 | 213,705 | ||||||
RWE AG - ADR (a) | 5,585 | 69,053 | ||||||
282,758 | ||||||||
PHARMACEUTICALS—0.5% | ||||||||
Bayer AG - ADR | 9,846 | 1,026,741 | ||||||
SEMICONDUCTORS & SEMICONDUCTOR EQUIPMENT—0.1% | ||||||||
Infineon Technologies AG - ADR | 12,109 | 209,243 | ||||||
SOFTWARE—0.6% | ||||||||
SAP SE - ADR | 13,243 | 1,144,593 | ||||||
TEXTILES, APPAREL & LUXURY GOODS—0.6% | ||||||||
adidas AG | 1,323 | 209,082 | ||||||
adidas AG - ADR | 9,964 | 782,672 | ||||||
Puma SE | 285 | 74,887 | ||||||
1,066,641 | ||||||||
See accompanying notes to financial statements.
17
Schedule of Investments, continued
Praxis International Index Fund
December 31, 2016
| SHARES | FAIR VALUE | ||||||
COMMON STOCKS—97.7%, continued | ||||||||
GERMANY—7.0%, continued | ||||||||
TRADING COMPANIES & DISTRIBUTORS—0.2% | ||||||||
Brenntag AG | 5,521 | $ | 306,819 | |||||
TOTAL GERMANY | 13,473,832 | |||||||
HONG KONG—3.9% | ||||||||
BANKS—0.4% | ||||||||
BOC Hong Kong Holdings Ltd. | 158,000 | 565,419 | ||||||
BOC Hong Kong Holdings Ltd. - ADR | 1,754 | 125,490 | ||||||
690,909 | ||||||||
DIVERSIFIED FINANCIAL SERVICES—0.3% | ||||||||
Hong Kong Exchanges & Clearing Ltd. | 24,500 | 578,817 | ||||||
ELECTRIC UTILITIES—0.5% | ||||||||
Cheung Kong Infrastructure Holdings Ltd. | 130,000 | 1,034,377 | ||||||
INDUSTRIAL CONGLOMERATES—0.6% | ||||||||
CK Hutchison Holdings Ltd. | 53,500 | 606,447 | ||||||
CK Hutchison Holdings Ltd. - ADR | 12,111 | 137,460 | ||||||
Jardine Matheson Holdings Ltd. | 4,751 | 262,493 | ||||||
Jardine Matheson Holdings Ltd. - ADR | 3,618 | 200,690 | ||||||
1,207,090 | ||||||||
INSURANCE—0.5% | ||||||||
AIA Group Ltd. | 171,200 | 965,899 | ||||||
REAL ESTATE MANAGEMENT & DEVELOPMENT—1.6% | ||||||||
Henderson Land Development Co. Ltd. | 81,343 | 432,706 | ||||||
Sun Hung Kai Properties Ltd. | 28,000 | 353,862 | ||||||
Sun Hung Kai Properties Ltd. - ADR | 22,014 | 277,156 | ||||||
Swire Pacific Ltd. - Class A | 28,000 | 267,383 | ||||||
Swire Pacific Ltd. - Class A - ADR | 32,051 | 308,331 | ||||||
Swire Properties Ltd. | 121,150 | 334,339 | ||||||
Wharf Holdings Ltd. | 150,000 | 997,172 | ||||||
2,970,949 | ||||||||
TEXTILES, APPAREL & LUXURY GOODS—0.0% (b) | ||||||||
Li & Fung Ltd. | 122,000 | 53,649 | ||||||
Li & Fung Ltd. - ADR | 12,287 | 10,665 | ||||||
64,314 | ||||||||
TOTAL HONG KONG | 7,512,355 | |||||||
HUNGARY—0.1% | ||||||||
DIVERSIFIED TELECOMMUNICATION SERVICES—0.1% | ||||||||
Magyar Telekom Telecommunications plc - ADR | 11,582 | 98,484 | ||||||
OIL, GAS & CONSUMABLE FUELS—0.0% (b) | ||||||||
MOL Hungarian Oil & Gas plc - ADR | 796 | 28,046 | ||||||
TOTAL HUNGARY | 126,530 | |||||||
INDIA—1.5% | ||||||||
BANKS—0.8% | ||||||||
HDFC Bank Ltd. - ADR | 16,597 | 1,007,106 | ||||||
ICICI Bank Ltd. - ADR | 65,986 | 494,235 | ||||||
1,501,341 | ||||||||
IT SERVICES—0.5% | ||||||||
Infosys Ltd. - ADR | 37,297 | 553,114 | ||||||
Wipro Ltd. - ADR | 39,159 | 379,059 | ||||||
932,173 | ||||||||
PHARMACEUTICALS—0.2% | ||||||||
Dr. Reddy's Laboratories Ltd. - ADR | 10,846 |
| 491,107 | |||||
TOTAL INDIA | 2,924,621 | |||||||
INDONESIA—0.8% | ||||||||
BANKS—0.2% | ||||||||
PT Bank Mandiri - ADR | 49,403 | 417,949 | ||||||
DIVERSIFIED TELECOMMUNICATION SERVICES—0.5% | ||||||||
Telekomunikasi Indonesia Persero Tbk PT - ADR | 33,206 | 968,287 | ||||||
MACHINERY—0.1% | ||||||||
United Tractors Tbk PT - ADR | 3,369 | 105,046 | ||||||
TOTAL INDONESIA | 1,491,282 | |||||||
IRELAND—1.2% | ||||||||
CONSTRUCTION MATERIALS—0.4% | ||||||||
CRH plc - ADR | 23,753 | 816,628 | ||||||
PHARMACEUTICALS—0.4% | ||||||||
Shire plc - ADR | 3,899 | 664,312 | ||||||
PROFESSIONAL SERVICES—0.4% | ||||||||
Experian plc | 3,191 | 61,895 | ||||||
Experian plc - ADR | 37,268 | 719,645 | ||||||
781,540 | ||||||||
TOTAL IRELAND | 2,262,480 | |||||||
ISRAEL—0.6% | ||||||||
PHARMACEUTICALS—0.2% | ||||||||
Teva Pharmaceutical Industries Ltd. - ADR | 13,991 | 507,174 | ||||||
SOFTWARE—0.4% | ||||||||
Check Point Software Technologies Ltd. (a) | 8,509 | 718,670 | ||||||
TOTAL ISRAEL | 1,225,844 | |||||||
ITALY—1.1% | ||||||||
BANKS—0.4% | ||||||||
Intesa Sanpaolo SpA | 128,010 | 326,863 | ||||||
Intesa Sanpaolo SpA - ADR | 4,450 | 67,773 | ||||||
UniCredit SpA | 125,261 | 360,450 | ||||||
755,086 | ||||||||
ELECTRIC UTILITIES—0.2% | ||||||||
Enel SpA | 86,564 | 381,570 | ||||||
INSURANCE—0.1% | ||||||||
Assicurazioni Generali SpA | 16,056 | 238,618 | ||||||
TEXTILES, APPAREL & LUXURY GOODS—0.2% | ||||||||
Luxottica Group SpA - ADR | 9,316 | 500,269 | ||||||
TRANSPORTATION INFRASTRUCTURE—0.2% | ||||||||
Atlantia SpA | 13,863 | 324,798 | ||||||
TOTAL ITALY | 2,200,341 | |||||||
JAPAN—16.6% | ||||||||
AUTO COMPONENTS—0.5% | ||||||||
Bridgestone Corp. | 4,656 | 167,861 | ||||||
Bridgestone Corp. - ADR | 20,546 | 370,855 | ||||||
Denso Corp. | 7,000 | 303,213 | ||||||
See accompanying notes to financial statements.
18
Schedule of Investments, continued
Praxis International Index Fund
December 31, 2016
| SHARES | FAIR VALUE | ||||||
COMMON STOCKS—97.7%, continued | ||||||||
JAPAN—16.6%, continued | ||||||||
AUTO COMPONENTS—0.5%, continued | ||||||||
Denso Corp. - ADR | 6,048 | $ | 130,939 | |||||
972,868 | ||||||||
AUTOMOBILES—2.1% | ||||||||
Honda Motor Co. Ltd. - ADR | 32,346 | 944,180 | ||||||
Nissan Motor Co. Ltd. - ADR | 36,396 | 727,920 | ||||||
Toyota Motor Corp. - ADR | 19,586 | 2,295,479 | ||||||
3,967,579 | ||||||||
BANKS—1.4% | ||||||||
Mitsubishi UFJ Financial Group, Inc. - ADR | 188,606 | 1,161,813 | ||||||
Mizuho Financial Group, Inc. - ADR | 132,028 | 473,981 | ||||||
Sumitomo Mitsui Financial Group, Inc. - ADR | 112,145 | 856,788 | ||||||
Sumitomo Mitsui Trust Holdings, Inc. | 298 | 10,665 | ||||||
Sumitomo Mitsui Trust Holdings, Inc. - ADR | 39,737 | 140,272 | ||||||
2,643,519 | ||||||||
BUILDING PRODUCTS—0.1% | ||||||||
Asahi Glass Co. Ltd. | 3,000 | 20,430 | ||||||
Asahi Glass Co. Ltd. - ADR | 21,219 | 143,653 | ||||||
164,083 | ||||||||
CAPITAL MARKETS—0.5% | ||||||||
Daiwa Securities Group, Inc. | 16,000 | 98,599 | ||||||
Daiwa Securities Group, Inc. - ADR | 49,678 | 304,029 | ||||||
Nomura Holdings, Inc. - ADR | 94,167 | 555,585 | ||||||
958,213 | ||||||||
CHEMICALS—0.6% | ||||||||
Nitto Denko Corp. | 500 | 38,367 | ||||||
Nitto Denko Corp. - ADR | 11,626 | 455,507 | ||||||
Shin-Etsu Chemical Co. Ltd. | 5,600 | 434,403 | ||||||
Sumitomo Chemical Co. Ltd. | 38,000 | 180,759 | ||||||
1,109,036 | ||||||||
COMMERCIAL SERVICES & SUPPLIES—0.3% | ||||||||
Dai Nippon Printing Co. Ltd. | 50,000 | 494,075 | ||||||
Dai Nippon Printing Co. Ltd. - ADR | 37 | 364 | ||||||
494,439 | ||||||||
CONSTRUCTION & ENGINEERING—0.3% | ||||||||
Obayashi Corp. | 55,000 | 525,602 | ||||||
DIVERSIFIED FINANCIAL SERVICES—0.2% | ||||||||
ORIX Corp. | 2,300 | 35,892 | ||||||
ORIX Corp. - ADR | 5,614 | 436,937 | ||||||
472,829 | ||||||||
DIVERSIFIED TELECOMMUNICATION SERVICES—0.7% | ||||||||
Nippon Telegraph & Telephone Corp. - ADR | 32,480 | 1,366,433 | ||||||
ELECTRIC UTILITIES—0.2% | ||||||||
Chubu Electric Power Co., Inc. | 12,600 | 176,035 | ||||||
Tohoku Electric Power Co., Inc. | 12,700 | 160,482 | ||||||
336,517 | ||||||||
ELECTRICAL EQUIPMENT—0.3% | ||||||||
Nidec Corp. - ADR - ADR | 30,872 | 661,587 | ||||||
ELECTRONIC EQUIPMENT, INSTRUMENTS & COMPONENTS—0.6% | ||||||||
Hitachi Ltd. | 26,000 | 140,583 | ||||||
Hitachi Ltd. - ADR | 5,344 | 288,576 | ||||||
Kyocera Corp. | 2,800 | 139,228 | ||||||
Kyocera Corp. - ADR | 3,162 |
| 157,404 | |||||
Murata Manufacturing Co. Ltd. | 2,300 | 307,952 | ||||||
Murata Manufacturing Co. Ltd. - ADR | 1,592 | 53,109 | ||||||
TDK Corp. | 800 | 55,028 | ||||||
TDK Corp. - ADR | 826 | 56,622 | ||||||
1,198,502 | ||||||||
FOOD PRODUCTS—0.3% | ||||||||
Ajinomoto Co., Inc. | 7,000 | 140,976 | ||||||
Calbee, Inc. | 2,700 | 84,545 | ||||||
Meiji Holdings Co. Ltd. | 2,000 | 156,735 | ||||||
Yakult Honsha Co. Ltd. | 2,800 | 129,837 | ||||||
512,093 | ||||||||
HEALTH CARE EQUIPMENT & SUPPLIES—0.5% | ||||||||
Hoya Corp. | 9,500 | 399,149 | ||||||
Hoya Corp. - ADR | 1,734 | 72,575 | ||||||
Terumo Corp. | 11,800 | 435,616 | ||||||
907,340 | ||||||||
HOUSEHOLD DURABLES—0.8% | ||||||||
Sekisui House Ltd. | 8,000 | 133,157 | ||||||
Sekisui House Ltd. - ADR | 30,149 | 500,473 | ||||||
Sharp Corp. | 10,000 | 23,100 | ||||||
Sharp Corp. - ADR | 17,095 | 39,831 | ||||||
Sony Corp. - ADR | 29,492 | 826,661 | ||||||
1,523,222 | ||||||||
INSURANCE—0.5% | ||||||||
MS&AD Insurance Group Holdings, Inc. - ADR | 34,266 | 528,039 | ||||||
Tokio Marine Holdings, Inc. | 4,600 | 188,746 | ||||||
Tokio Marine Holdings, Inc. - ADR | 7,354 | 300,705 | ||||||
1,017,490 | ||||||||
INTERNET & DIRECT MARKETING RETAIL—0.1% | ||||||||
Rakuten, Inc. | 18,400 | 180,324 | ||||||
IT SERVICES—0.1% | ||||||||
Fujitsu Ltd. | 20,000 | 111,135 | ||||||
Fujitsu Ltd. - ADR | 1,240 | 34,522 | ||||||
145,657 | ||||||||
LEISURE PRODUCTS—0.1% | ||||||||
Shimano, Inc. | 1,600 | 251,050 | ||||||
MACHINERY—0.8% | ||||||||
FANUC Corp. | 400 | 67,810 | ||||||
FANUC Corp. - ADR | 37,420 | 623,043 | ||||||
Kubota Corp. - ADR | 7,847 | 557,922 | ||||||
Makita Corp. | 600 | 40,193 | ||||||
Makita Corp. - ADR | 4,936 | 330,268 | ||||||
1,619,236 | ||||||||
MARINE—0.1% | ||||||||
Nippon Yusen KK | 56,000 | 103,965 | ||||||
Nippon Yusen KK - ADR | 7,243 | 26,220 | ||||||
130,185 | ||||||||
METALS & MINING—0.4% | ||||||||
Nippon Steel Corp. | 21,700 | 483,996 | ||||||
Sumitomo Metal Mining Co. Ltd. | 23,000 | 296,539 | ||||||
780,535 | ||||||||
See accompanying notes to financial statements.
19
Schedule of Investments, continued
Praxis International Index Fund
December 31, 2016
| SHARES | FAIR VALUE | ||||||
COMMON STOCKS—97.7%, continued | ||||||||
JAPAN—16.6%, continued | ||||||||
OIL, GAS & CONSUMABLE FUELS—0.1% | ||||||||
Inpex Corp. | 26,239 | $ | 262,873 | |||||
PERSONAL PRODUCTS—0.5% | ||||||||
Kao Corp. | 1,000 | 47,406 | ||||||
Kao Corp. - ADR | 10,830 | 513,125 | ||||||
Shiseido Co. Ltd. | 2,100 | 53,153 | ||||||
Shiseido Co. Ltd. - ADR | 15,035 | 381,348 | ||||||
995,032 | ||||||||
PHARMACEUTICALS—0.6% | ||||||||
Astellas Pharma, Inc. | 13,000 | 180,566 | ||||||
Astellas Pharma, Inc. - ADR | 24,473 | 339,196 | ||||||
Daiichi Sankyo Co. Ltd. | 7,700 | 157,544 | ||||||
Daiichi Sankyo Co. Ltd. - ADR | 1,901 | 38,590 | ||||||
Takeda Pharmaceutical Co. Ltd. | 2,700 | 111,687 | ||||||
Takeda Pharmaceutical Co. Ltd. - ADR | 18,144 | 377,032 | ||||||
1,204,615 | ||||||||
REAL ESTATE MANAGEMENT & DEVELOPMENT—0.9% | ||||||||
Daiwa House Industry Co. Ltd. - ADR | 15,470 | 420,010 | ||||||
Mitsubishi Estate Co. Ltd. | 11,000 | 219,040 | ||||||
Mitsubishi Estate Co. Ltd. - ADR | 11,717 | 233,520 | ||||||
Mitsui Fudosan Co. Ltd. | 21,000 | 485,991 | ||||||
Sumitomo Realty & Development Co. Ltd. | 13,000 | 345,451 | ||||||
1,704,012 | ||||||||
ROAD & RAIL—0.7% | ||||||||
Central Japan Railway Co. | 1,348 | 221,774 | ||||||
East Japan Railway Co. | 3,590 | 310,211 | ||||||
East Japan Railway Co. - ADR | 29,226 | 418,809 | ||||||
Keikyu Corp. | 37,000 | 428,926 | ||||||
1,379,720 | ||||||||
SEMICONDUCTORS & SEMICONDUCTOR EQUIPMENT—0.1% | ||||||||
Rohm Co. Ltd. | 700 | 40,305 | ||||||
Rohm Co. Ltd. - ADR | 2,660 | 75,943 | ||||||
116,248 | ||||||||
SOFTWARE—0.2% | ||||||||
Nintendo Co. Ltd. | 300 | 62,985 | ||||||
Nintendo Co. Ltd. - ADR | 11,880 | 308,286 | ||||||
371,271 | ||||||||
SPECIALTY RETAIL—0.1% | ||||||||
FAST RETAILING COM., LTD. (a) | 700 | 250,511 | ||||||
TECHNOLOGY HARDWARE, STORAGE & PERIPHERALS—0.3% | ||||||||
FUJIFILM Holdings Corp. - ADR | 11,626 | 440,044 | ||||||
Seiko Epson Corp. | 1,200 | 25,410 | ||||||
Seiko Epson Corp. - ADR | 10,312 | 108,070 | ||||||
573,524 | ||||||||
TEXTILES, APPAREL & LUXURY GOODS—0.1% | ||||||||
Wacoal Holdings Corp. - ADR | 5,242 | 300,681 | ||||||
TRADING COMPANIES & DISTRIBUTORS—0.4% | ||||||||
Mitsubishi Corp. | 16,300 | 347,239 | ||||||
Mitsui & Co. Ltd. - ADR | 1,637 | 450,175 | ||||||
797,414 | ||||||||
WIRELESS TELECOMMUNICATION SERVICES—1.1% | ||||||||
KDDI Corp. - ADR | 51,612 |
| 652,892 | |||||
NTT DoCoMo, Inc. - ADR | 32,356 | 736,099 | ||||||
SoftBank Group Corp. | 6,500 | 431,813 | ||||||
SoftBank Group Corp. - ADR | 9,864 | 325,808 | ||||||
2,146,612 | ||||||||
TOTAL JAPAN | 32,040,852 | |||||||
JERSEY—0.2% | ||||||||
METALS & MINING—0.2% | ||||||||
Randgold Resources Ltd. - ADR | 6,079 | 464,071 | ||||||
LUXEMBOURG—0.3% | ||||||||
ENERGY EQUIPMENT & SERVICES—0.3% | ||||||||
Tenaris SA - ADR | 16,654 | 594,714 | ||||||
MEXICO—1.3% | ||||||||
BEVERAGES—0.3% | ||||||||
Coca-Cola Femsa SAB de CV - ADR | 7,597 | 482,713 | ||||||
CONSTRUCTION MATERIALS—0.4% | ||||||||
Cemex SAB de CV - ADR (a) | 80,149 | 643,597 | ||||||
FOOD & STAPLES RETAILING—0.1% | ||||||||
Wal-Mart de Mexico SAB de CV - ADR | 14,734 | 263,297 | ||||||
MEDIA—0.1% | ||||||||
Grupo Televisa SAB - ADR | 11,081 | 231,482 | ||||||
METALS & MINING—0.1% | ||||||||
Fresnillo plc | 14,613 | 219,876 | ||||||
TRANSPORTATION INFRASTRUCTURE—0.2% | ||||||||
Grupo Aeroportuario del Pacifico SAB de CV - ADR | 4,513 | 372,412 | ||||||
WIRELESS TELECOMMUNICATION SERVICES—0.1% | ||||||||
America Movil SAB de CV - Class L - Series L - ADR | 17,340 | 217,964 | ||||||
TOTAL MEXICO | 2,431,341 | |||||||
NETHERLANDS—2.3% | ||||||||
BANKS—0.2% | ||||||||
ING Groep NV - ADR | 33,964 | 478,892 | ||||||
CHEMICALS—0.2% | ||||||||
Akzo Nobel NV - ADR | 14,850 | 307,395 | ||||||
FOOD & STAPLES RETAILING—0.6% | ||||||||
Koninklijke Ahold Delhaize NV | 5,491 | 115,761 | ||||||
Koninklijke Ahold Delhaize NV - ADR | 49,012 | 1,028,762 | ||||||
1,144,523 | ||||||||
INDUSTRIAL CONGLOMERATES—0.5% | ||||||||
Koninklijke Philips NV - NY Registry Shares | 30,708 | 938,743 | ||||||
LIFE SCIENCES TOOLS & SERVICES—0.2% | ||||||||
QIAGEN NV (a) | 16,784 | 470,288 | ||||||
MEDIA—0.1% | ||||||||
Wolters Kluwer NV | 954 | 34,561 | ||||||
Wolters Kluwer NV - ADR | 7,337 | 266,333 | ||||||
300,894 | ||||||||
See accompanying notes to financial statements.
20
Schedule of Investments, continued
Praxis International Index Fund
December 31, 2016
| SHARES | FAIR VALUE | ||||||
COMMON STOCKS—97.7%, continued | ||||||||
NETHERLANDS—2.3%, continued | ||||||||
OIL, GAS & CONSUMABLE FUELS—0.1% | ||||||||
Koninklijke Vopak NV | 3,557 | $ | 168,004 | |||||
SEMICONDUCTORS & SEMICONDUCTOR EQUIPMENT—0.3% | ||||||||
ASML Holding NV - NY Registry Shares | 4,549 | 510,398 | ||||||
SOFTWARE—0.1% | ||||||||
Gemalto NV | 2,161 | 124,915 | ||||||
TOTAL NETHERLANDS | 4,444,052 | |||||||
NORWAY—0.7% | ||||||||
CHEMICALS—0.1% | ||||||||
Yara International ASA - ADR | 7,283 | 286,076 | ||||||
METALS & MINING—0.2% | ||||||||
Norsk Hydro ASA | 61,990 | 296,457 | ||||||
Norsk Hydro ASA - ADR | 13,201 | 62,309 | ||||||
358,766 | ||||||||
OIL, GAS & CONSUMABLE FUELS—0.4% | ||||||||
Statoil ASA - ADR | 41,206 | 751,597 | ||||||
TOTAL NORWAY | 1,396,439 | |||||||
PERU—0.4% | ||||||||
METALS & MINING—0.4% | ||||||||
Southern Copper Corp. | 24,026 | 767,390 | ||||||
PORTUGAL—0.2% | ||||||||
ELECTRIC UTILITIES—0.2% | ||||||||
EDP - Energias de Portugal SA | 82,980 | 252,757 | ||||||
EDP - Energias de Portugal SA - ADR | 1,231 | 37,730 | ||||||
TOTAL PORTUGAL | 290,487 | |||||||
RUSSIA—0.2% | ||||||||
WIRELESS TELECOMMUNICATION SERVICES—0.2% | ||||||||
Mobile TeleSystems PJSC - ADR | 37,298 | 339,785 | ||||||
SINGAPORE—1.6% | ||||||||
BANKS—1.0% | ||||||||
DBS Group Holdings Ltd. | 10,656 | 127,596 | ||||||
DBS Group Holdings Ltd. - ADR | 18,371 | 877,123 | ||||||
United Overseas Bank Ltd. | 24,187 | 340,728 | ||||||
United Overseas Bank Ltd. - ADR | 22,014 | 619,474 | ||||||
1,964,921 | ||||||||
DIVERSIFIED TELECOMMUNICATION SERVICES—0.2% | ||||||||
Singapore Telecommunications Ltd. | 86,000 | 216,764 | ||||||
Singapore Telecommunications Ltd. - ADR | 6,886 | 171,737 | ||||||
388,501 | ||||||||
INDUSTRIAL CONGLOMERATES—0.3% | ||||||||
Keppel Corporation Ltd. | 11,721 | 46,864 | ||||||
Keppel Corporation Ltd. - ADR | 49,775 | 398,200 | ||||||
445,064 | ||||||||
MACHINERY—0.1% | ||||||||
Sembcorp Marine Ltd. | 204,000 | 194,404 | ||||||
REAL ESTATE INVESTMENT TRUSTS (REITS)—0.0% (b) | ||||||||
Keppel REIT | 737 | 519 | ||||||
TOTAL SINGAPORE | 2,993,409 | |||||||
SOUTH AFRICA—0.7% | ||||||||
BANKS—0.1% | ||||||||
Standard Bank Group Ltd. - ADR | 19,275 |
| 212,989 | |||||
METALS & MINING—0.2% | ||||||||
Gold Fields Ltd. - ADR | 108,949 | 327,937 | ||||||
TRADING COMPANIES & DISTRIBUTORS—0.2% | ||||||||
Barloworld Ltd. | 45,286 | 388,725 | ||||||
WIRELESS TELECOMMUNICATION SERVICES—0.2% | ||||||||
MTN Group Ltd. - ADR | 50,154 | 453,894 | ||||||
TOTAL SOUTH AFRICA | 1,383,545 | |||||||
SOUTH KOREA—2.7% | ||||||||
BANKS—1.4% | ||||||||
KB Financial Group, Inc. - ADR | 35,152 | 1,240,514 | ||||||
Shinhan Financial Group Co. Ltd. - ADR | 30,017 | 1,129,840 | ||||||
Woori Bank - ADR | 9,632 | 308,224 | ||||||
2,678,578 | ||||||||
DIVERSIFIED TELECOMMUNICATION SERVICES—0.5% | ||||||||
KT Corp. - ADR | 71,631 | 1,009,281 | ||||||
ELECTRONIC EQUIPMENT INSTRUMENTS & COMPONENTS—0.4% | ||||||||
LG Display Co. Ltd. - ADR | 61,056 | 784,570 | ||||||
WIRELESS TELECOMMUNICATION SERVICES—0.4% | ||||||||
SK Telecom Co. Ltd. - ADR | 32,754 | 684,558 | ||||||
TOTAL SOUTH KOREA | 5,156,987 | |||||||
SPAIN—2.0% | ||||||||
BANKS—0.8% | ||||||||
Banco Bilbao Vizcaya Argentaria SA - ADR | 83,084 | 562,479 | ||||||
Banco Santander SA - ADR | 182,745 | 946,619 | ||||||
1,509,098 | ||||||||
DIVERSIFIED TELECOMMUNICATION SERVICES—0.2% | ||||||||
Telefonica SA - ADR | 41,773 | 384,312 | ||||||
ELECTRIC UTILITIES—0.2% | ||||||||
Iberdrola SA - ADR | 16,749 | 439,326 | ||||||
METALS & MINING—0.1% | ||||||||
Acerinox SA | 16,589 | 220,087 | ||||||
OIL, GAS & CONSUMABLE FUELS—0.4% | ||||||||
Repsol SA | 24,639 | 348,022 | ||||||
Repsol SA - ADR | 27,585 | 388,949 | ||||||
736,971 | ||||||||
SPECIALTY RETAIL—0.3% | ||||||||
Industria de Diseno Textil SA | 17,640 | 602,111 | ||||||
TOTAL SPAIN | 3,891,905 | |||||||
SWEDEN—2.5% | ||||||||
COMMUNICATIONS EQUIPMENT—0.1% | ||||||||
Telefonaktiebolaget LM Ericsson - ADR | 48,767 | 284,311 | ||||||
CONSTRUCTION & ENGINEERING—0.5% | ||||||||
Skanska AB - Class B | 37,142 | 877,150 | ||||||
HOUSEHOLD PRODUCTS—0.2% | ||||||||
Svenska Cellulosa AB SCA - Class B | 12,219 | 345,178 | ||||||
See accompanying notes to financial statements.
21
Schedule of Investments, continued
Praxis International Index Fund
December 31, 2016
| SHARES | FAIR VALUE | ||||||
COMMON STOCKS—97.7%, continued | ||||||||
SWEDEN—2.5%, continued | ||||||||
MACHINERY—0.9% | ||||||||
Alfa Laval AB | 23,419 | $ | 387,737 | |||||
Atlas Copco AB - Class A | 8,922 | 271,827 | ||||||
Atlas Copco AB - Class A - ADR | 18,292 | 558,638 | ||||||
Sandvik AB | 19,176 | 237,274 | ||||||
Sandvik AB - ADR | 20,116 | 246,622 | ||||||
1,702,098 | ||||||||
METALS & MINING—0.3% | ||||||||
Boliden AB | 22,985 | 600,353 | ||||||
OIL, GAS & CONSUMABLE FUELS—0.3% | ||||||||
Lundin Petroleum AB (a) | 24,270 | 527,864 | ||||||
SPECIALTY RETAIL—0.2% | ||||||||
Hennes & Mauritz AB - ADR | 65,360 | 359,480 | ||||||
Hennes & Mauritz AB - Class B | 3,195 | 88,888 | ||||||
448,368 | ||||||||
TOTAL SWEDEN | 4,785,322 | |||||||
SWITZERLAND—7.4% | ||||||||
CAPITAL MARKETS—0.9% | ||||||||
Credit Suisse Group AG - ADR | 37,853 | 541,676 | ||||||
Julius Baer Group Ltd. | 9,537 | 423,590 | ||||||
UBS Group AG | 46,462 | 728,060 | ||||||
1,693,326 | ||||||||
DIVERSIFIED TELECOMMUNICATION SERVICES—0.2% | ||||||||
Swisscom AG - ADR | 7,140 | 319,415 | ||||||
ELECTRICAL EQUIPMENT—0.7% | ||||||||
ABB Ltd. - ADR | 61,282 | 1,291,212 | ||||||
FOOD PRODUCTS—1.8% | ||||||||
Barry Callebaut AG | 397 | 485,753 | ||||||
Nestle SA - ADR | 42,995 | 3,084,462 | ||||||
3,570,215 | ||||||||
INSURANCE—0.7% | ||||||||
Swiss Re AG | 3,563 | 337,637 | ||||||
Zurich Insurance Group AG - ADR | 38,250 | 1,054,552 | ||||||
1,392,189 | ||||||||
MACHINERY—0.1% | ||||||||
Schindler Holding AG | 1,587 | 277,243 | ||||||
METALS & MINING—0.4% | ||||||||
Glencore plc (a) | 220,536 | 753,754 | ||||||
PHARMACEUTICALS—2.1% | ||||||||
Novartis AG - ADR | 28,388 | 2,067,782 | ||||||
Roche Holding AG - ADR | 67,656 | 1,930,226 | ||||||
3,998,008 | ||||||||
PROFESSIONAL SERVICES—0.2% | ||||||||
Adecco SA | 4,136 | 270,700 | ||||||
Adecco SA - ADR | 4,982 | 162,662 | ||||||
433,362 | ||||||||
TECHNOLOGY HARDWARE, STORAGE & PERIPHERALS—0.1% | ||||||||
Logitech International SA | 6,535 | 161,872 | ||||||
TRADING COMPANIES & DISTRIBUTORS—0.2% | ||||||||
Wolseley plc | 537 |
| 32,836 | |||||
Wolseley plc - ADR | 63,056 | 382,750 | ||||||
415,586 | ||||||||
TOTAL SWITZERLAND | 14,306,182 | |||||||
TAIWAN—2.6% | ||||||||
DIVERSIFIED TELECOMMUNICATION SERVICES—0.6% | ||||||||
Chunghwa Telecom Co. Ltd. - ADR | 40,566 | 1,279,857 | ||||||
ELECTRONIC EQUIPMENT, INSTRUMENTS & COMPONENTS—0.1% | ||||||||
AU Optronics Corp. - ADR | 56,975 | 201,692 | ||||||
SEMICONDUCTORS & SEMICONDUCTOR EQUIPMENT—1.9% | ||||||||
Advanced Semiconductor Engineering, Inc. - ADR | 101,549 | 511,807 | ||||||
Siliconware Precision Industries Co. Ltd. - ADR | 70,913 | 517,665 | ||||||
Taiwan Semiconductor Manufacturing Co. Ltd. - ADR | 77,900 | 2,239,625 | ||||||
United Microelectronics Corp. - ADR | 191,039 | 334,318 | ||||||
3,603,415 | ||||||||
TOTAL TAIWAN | 5,084,964 | |||||||
TURKEY—0.1% | ||||||||
BANKS—0.1% | ||||||||
Turkiye Garanti Bankasi AS - ADR | 59,610 | 124,585 | ||||||
WIRELESS TELECOMMUNICATIONS SERVICES—0.0% (b) | ||||||||
Turkcell Iletisim Hizmetleri AS - ADR (a) | 17,920 | 123,648 | ||||||
TOTAL TURKEY | 248,233 | |||||||
UNITED KINGDOM—10.7% | ||||||||
BANKS—1.7% | ||||||||
Barclays plc - ADR | 55,352 | 608,872 | ||||||
HSBC Holdings plc - ADR | 46,539 | 1,869,937 | ||||||
Lloyds Banking Group plc - ADR | 102,926 | 319,071 | ||||||
Standard Chartered plc (a) | 45,039 | 368,313 | ||||||
3,166,193 | ||||||||
CAPITAL MARKETS—0.0% (b) | ||||||||
Man Group plc | 3,940 | 5,739 | ||||||
Man Group plc - ADR | 7,608 | 10,994 | ||||||
16,733 | ||||||||
DIVERSIFIED TELECOMMUNICATION SERVICES—0.2% | ||||||||
BT Group plc - ADR | 18,204 | 419,238 | ||||||
ELECTRIC UTILITIES—0.4% | ||||||||
SSE plc | 2,983 | 57,088 | ||||||
SSE plc - ADR | 31,357 | 596,410 | ||||||
653,498 | ||||||||
ENERGY EQUIPMENT & SERVICES—0.4% | ||||||||
AMEC Foster Wheeler plc | 32,410 | 187,715 | ||||||
Subsea 7 SA | 43,347 | 548,617 | ||||||
Subsea 7 SA - ADR (a) | 3,305 | 41,627 | ||||||
777,959 | ||||||||
FOOD & STAPLES RETAILING—0.4% | ||||||||
J Sainsbury plc | 4,806 | 14,765 | ||||||
J Sainsbury plc - ADR | 18,741 | 228,865 | ||||||
Tesco plc (a) | 46,000 | 117,256 | ||||||
Tesco plc - ADR (a) | 29,931 | 227,176 | ||||||
See accompanying notes to financial statements.
22
Schedule of Investments, continued
Praxis International Index Fund
December 31, 2016
| SHARES | FAIR VALUE | ||||||
COMMON STOCKS—97.7%, continued | ||||||||
UNITED KINGDOM—10.7%, continued | ||||||||
FOOD & STAPLES RETAILING—0.4%, continued | ||||||||
WM Morrison Supermarkets plc | 29,374 | $ | 83,509 | |||||
WM Morrison Supermarkets plc - ADR | 8,054 | 114,206 | ||||||
785,777 | ||||||||
FOOD PRODUCTS—0.2% | ||||||||
Associated British Foods plc | 11,454 | 387,314 | ||||||
HEALTH CARE EQUIPMENT & SUPPLIES—0.3% | ||||||||
Smith & Nephew plc | 4,232 | 63,677 | ||||||
Smith & Nephew plc - ADR | 17,185 | 516,925 | ||||||
580,602 | ||||||||
HOTELS, RESTAURANTS & LEISURE—0.7% | ||||||||
Compass Group plc | 2,247 | 41,563 | ||||||
Compass Group plc - ADR | 47,072 | 879,305 | ||||||
Intercontinental Hotels Group plc - ADR | 9,520 | 422,022 | ||||||
1,342,890 | ||||||||
HOUSEHOLD PRODUCTS—0.7% | ||||||||
Reckitt Benckiser Group plc | 3,212 | 272,562 | ||||||
Reckitt Benckiser Group plc - ADR | 58,040 | 975,072 | ||||||
1,247,634 | ||||||||
INSURANCE—0.8% | ||||||||
Aviva plc | 41,971 | 251,574 | ||||||
Aviva plc - ADR | 22,486 | 265,560 | ||||||
Prudential plc - ADR | 26,183 | 1,041,822 | ||||||
1,558,956 | ||||||||
MEDIA—1.0% | ||||||||
Pearson plc - ADR | 23,760 | 237,363 | ||||||
RELX plc - ADR | 36,928 | 663,596 | ||||||
Sky plc | 3,176 | 38,786 | ||||||
Sky plc - ADR | 6,005 | 294,365 | ||||||
WPP plc - ADR | 6,767 | 748,836 | ||||||
1,982,946 | ||||||||
MULTILINE RETAIL—0.3% | ||||||||
Marks & Spencer Group plc | 10,719 | 46,232 | ||||||
Marks & Spencer Group plc - ADR | 25,759 | 219,209 | ||||||
Next plc | 3,908 | 239,976 | ||||||
505,417 | ||||||||
MULTI-UTILITIES—0.5% | ||||||||
National Grid plc - ADR | 16,906 | 986,127 | ||||||
OIL, GAS & CONSUMABLE FUELS—0.2% | ||||||||
Tullow Oil plc | 112,077 | 431,884 | ||||||
Tullow Oil plc - ADR (a) | 15,976 | 29,875 | ||||||
461,759 | ||||||||
PERSONAL PRODUCTS—0.6% | ||||||||
Unilever NV - NY Registry Shares - ADR | 28,732 | 1,179,736 | ||||||
PHARMACEUTICALS—1.1% | ||||||||
AstraZeneca plc - ADR | 31,680 | 865,497 | ||||||
GlaxoSmithKline plc - ADR | 28,888 | 1,112,477 | ||||||
Indivior plc - ADR | 1,963 | 36,021 | ||||||
2,013,995 | ||||||||
PROFESSIONAL SERVICES—0.1% | ||||||||
Capita plc | 32,934 |
| 215,507 | |||||
REAL ESTATE INVESTMENT TRUSTS (REIT)—0.2% | ||||||||
Land Securities Group plc REIT | 30,627 | 401,954 | ||||||
SOFTWARE—0.2% | ||||||||
Sage Group plc | 33,781 | 272,669 | ||||||
Sage Group plc - ADR | 2,320 | 75,108 | ||||||
347,777 | ||||||||
SPECIALTY RETAIL—0.1% | ||||||||
Kingfisher plc - ADR | 29,151 | 249,241 | ||||||
WATER UTILITIES—0.3% | ||||||||
Severn Trent plc | 10,914 | 298,848 | ||||||
United Utilities Group plc | 2,386 | 26,492 | ||||||
United Utilities Group plc - ADR | 12,883 | 289,997 | ||||||
615,337 | ||||||||
WIRELESS TELECOMMUNICATION SERVICES—0.3% | ||||||||
Vodafone Group plc - ADR | 26,458 | 646,369 | ||||||
TOTAL UNITED KINGDOM | 20,542,959 | |||||||
UNITED STATES—0.8% | ||||||||
HOTELS, RESTAURANTS & LEISURE—0.2% | ||||||||
Carnival plc - ADR | 7,671 | 392,678 | ||||||
IT SERVICES—0.1% | ||||||||
CGI Group, Inc. - Class A (a) | 2,630 | 126,319 | ||||||
MEDIA—0.2% | ||||||||
Thomson Reuters Corp. | 7,011 | 306,942 | ||||||
METALS & MINING—0.1% | ||||||||
Goldcorp, Inc. | 1,185 | 16,116 | ||||||
Sims Metal Management Ltd. - ADR | 21,356 | 194,126 | ||||||
210,242 | ||||||||
MULTILINE RETAIL—0.2% | ||||||||
JD.com, Inc. - ADR | 14,782 | 376,054 | ||||||
TOTAL UNITED STATES | 1,412,235 | |||||||
TOTAL COMMON STOCKS (COST $170,607,193) | 187,987,269 | |||||||
PREFERRED STOCKS—0.3% | ||||||||
BRAZIL—0.3% | ||||||||
BANKS—0.3% | ||||||||
Itau Unibanco Holding SA - ADR (Cost $594,228) | 61,571 | 632,950 | ||||||
See accompanying notes to financial statements.
23
Schedule of Investments, continued
Praxis International Index Fund
December 31, 2016
| COUPON | MATURITY | PRINCIPAL AMOUNT | FAIR | |||||||||
CORPORATE NOTES—0.9% | |||||||||||||
COMMUNITY DEVELOPMENT—0.9% | |||||||||||||
Calvert Social Investment Foundation, Inc. (c) | 1.000 | % | 06/15/17 | $ | 500,000 | $ | 500,000 | ||||||
Calvert Social Investment Foundation, Inc. (c) | 1.000 | % | 12/15/17 | 600,000 | 600,000 | ||||||||
Calvert Social Investment Foundation, Inc. (c) | 1.500 | % | 06/17/19 | 500,000 | 500,000 | ||||||||
TOTAL CORPORATE NOTES (Cost $1,600,000) | 1,600,000 | ||||||||||||
TOTAL INVESTMENTS (Cost (d) $172,801,421— Unrealized gain/loss $17,418,798)—98.9% | $ | 190,220,219 | |||||||||||
Other Assets in Excess of Liabilities—1.1% | 2,254,866 | ||||||||||||
NET ASSET—100.0% | $ | 192,475,085 | |||||||||||
(a) | Non-income producing security. |
(b) | Rounds to less than 0.1%. |
(c) | Restricted and illiquid securities not registered under the Securities Act of 1933 are as follows: |
| Acquisition Date | Current Cost | Fair Value | % of Net Assets | ||||||||||
Calvert Social Investment Foundation, Inc. 1.00%, 06/15/17 | 06/10/16 | $ | 500,000 | $ | 500,000 | 0.3 | % | ||||||
Calvert Social Investment Foundation, Inc. 1.00%, 12/15/17 | 12/15/14 | 600,000 | 600,000 | 0.3 | % | ||||||||
Calvert Social Investment Foundation, Inc. 1.50%, 06/17/16 | 06/10/16 | 500,000 | 500,000 | 0.3 | % | ||||||||
$ | 1,600,000 | $ | 1,600,000 | 0.9 | % | ||||||||
(d) | Represents cost for financial reporting purposes. |
ADR — American Depositary Receipt
plc — Public Liability Company
REIT — Real Estate Investment Trust
See accompanying notes to financial statements.
24
Praxis Value Index Fund
Annual report to shareholders
Portfolio managers’ commentary
In 2016, the Standard and Poor’s 500 Index saw large cap stock returns go back to double-digit positive returns of 11.95 percent after taking a breather in 2015 when they were 1.37 percent. Stocks dipped at the start of 2016, hitting a nadir in mid-February before starting a steady climb with pauses around the Brexit vote in June and again before the U.S. elections in early November. In terms of major asset classes, all major classes sported positive returns for the year. Small and mid-cap stocks and high yield bonds performed better than large cap stocks, while commodities, international stocks, and bonds fared worse. Notably, commodities, as measured by the Bloomberg Commodity Index, broke a five-year string of negative returns. Crude oil’s price action certainly helped, as it rose 45 percent for the year starting at about $37 per barrel and ended at about $54 per barrel, despite dropping to about $26 per barrel in mid-February.
Among the 11 stock sectors of the S&P 500 – real estate was established as its own sector, formerly its holdings were reported under financials – all sectors ended with positive returns with the exception of healthcare, which returned -2.7 percent. Energy, telecommunication services and financials were the largest winners, with returns of 27.4 percent, 23.5 percent, and 22.8 percent respectively. At the bottom of the positive returns list with mid to low single digit returns were the consumer sectors (discretionary and staples) and the new real estate sector.
The Growth and Value styles reversed fortunes in 2016, as the S&P 500 Value Index returned 17.40 percent versus the S&P 500 Growth Index returning 6.90 percent. In 2015, Growth had outperformed Value, with Growth having a positive return and Value a negative return.
In this environment, the Praxis Value Index Fund Class A Shares (Without Load) returned 16.13 percent, underperforming the 17.40 percent return of the benchmark, S&P 500 Value Index. Once again, stock-specific factors were the leading contributor to the underperformance, though to a much lesser extent than last year. We dropped Berkshire Hathaway, a top member of the benchmark, when it was added to our exclusion list after the company acquired a weapons components manufacturer. Overall, we are pleased with the performance of the Fund, and that we incorporated our Values + ESG screens and still delivered returns that adhered closely to the benchmark.
The annual mid-December reconstitution of the benchmark index and our routine updating of our Values + ESG screening list again caused some realignment of portfolio holdings near year end. This is always a good opportunity to fine tune our efforts to track benchmark returns.
Dale Snyder, CFA®
Praxis Value Index Fund Manager
Praxis Mutual Funds
The views expressed are those of the portfolio manager as of Dec. 31, 2016, are subject to change, and may differ from the views of other portfolio managers or the firm as a whole. These opinions are not intended to be a forecast of future events, a guarantee of future results, or investment advice. All data referenced are from sources deemed to be reliable but cannot be guaranteed. Securities and sectors referenced should not be construed as a solicitation or recommendation or be used as the sole basis for any investment decision.
25
Praxis Value Index Fund
Performance Review
Growth of $10,000 investment from 12/31/06 to 12/31/16
This chart represents historical performance of a hypothetical investment of $10,000 in Class A Shares (adjusted for the maximum sales charge of 5.25%) of the Fund and Index from 12/31/06 to 12/31/16, and includes the reinvestment of dividends and capital gains.
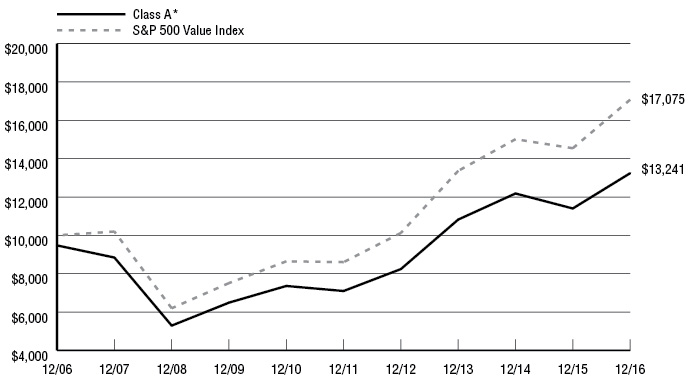
Annualized | |||||||
Inception Date | One | Three | Five | Ten | Expense Ratio** | ||
Praxis Value Index Fund | |||||||
Class A * | 5/1/01 | 10.02% | 5.05% | 12.07% | 2.85% | 0.94% | 0.94% |
Class A (Without Load) | 5/1/01 | 16.13% | 6.95% | 13.28% | 3.40% | ||
Class I | 5/1/06 | 16.75% | 7.45% | 13.91% | 3.95% | 0.45% | 0.45% |
S&P 500 Value Index1 |
| 17.40% | 8.51% | 14.69% | 5.50% |
|
|
Past performance does not guarantee future results. The performance data quoted represents past performance and current returns may be lower or higher. The investment return and principal value will fluctuate so that an investor’s shares, when redeemed, may be worth more or less than the original cost. These performance figures do not reflect the deduction of taxes that a shareholder would pay on fund distributions or the redemption of fund shares. To obtain performance information current to the most recent month end, please visit www.praxismutualfunds.com. Indexes are unmanaged, do not incur fees, and it is not possible to invest directly in an index.
The total returns shown reflect any expenses that were contractually or voluntarily reduced, reimbursed or paid by any party during the periods presented. In such instances, and without activity, the total returns would have been lower.
* | The total return figures shown reflect the maximum sales charge applicable to Class A Shares. Class A Shares have a maximum sales charge on purchases of 5.25%. |
** | Reflects the expense ratios as reported in the Prospectus dated April 30, 2016. |
1 | The S&P 500 Value Index represents the value companies (defined by book value to price ratio earnings to price ratio and sales to price ratio) of the S&P 500 Index, a universe of large capitalization companies in the U.S. equity market. |
The above index is for illustrative purposes only and does not reflect the deduction of expenses associated with a mutual fund, such as investment management and fund accounting fees. The Fund’s performance reflects the deduction of these services. An investor cannot invest directly in an index, although they can invest in its underlying securities.
26
Schedule of Investments
Praxis Value Index Fund
December 31, 2016
| SHARES | FAIR VALUE | ||||||
COMMON STOCKS—99.0% | ||||||||
AEROSPACE & DEFENSE—0.1% | ||||||||
Arconic, Inc. | 9,350 | $ | 173,349 | |||||
AIRLINES—0.5% | ||||||||
American Airlines Group, Inc. | 5,710 | 266,600 | ||||||
Delta Air Lines, Inc. | 10,350 | 509,116 | ||||||
775,716 | ||||||||
AUTO COMPONENTS—0.4% | ||||||||
Delphi Automotive plc | 4,830 | 325,301 | ||||||
Goodyear Tire & Rubber Co. | 9,590 | 296,043 | ||||||
621,344 | ||||||||
AUTOMOBILES—0.7% | ||||||||
Ford Motor Co. | 88,423 | 1,072,571 | ||||||
BANKS—14.7% | ||||||||
Bank of America Corp. | 182,000 | 4,022,200 | ||||||
BB&T Corp. | 24,794 | 1,165,814 | ||||||
Citigroup, Inc. | 53,166 | 3,159,655 | ||||||
Fifth Third Bancorp | 14,570 | 392,953 | ||||||
Huntington Bancshares, Inc. | 18,154 | 239,996 | ||||||
JPMorgan Chase & Co. | 66,385 | 5,728,362 | ||||||
KeyCorp | 19,528 | 356,776 | ||||||
M&T Bank Corp. | 3,476 | 543,751 | ||||||
PNC Financial Services Group, Inc. (The) | 10,131 | 1,184,922 | ||||||
Regions Financial Corp. | 24,860 | 356,989 | ||||||
SunTrust Banks, Inc. | 6,766 | 371,115 | ||||||
U.S. Bancorp | 18,727 | 962,006 | ||||||
Wells Fargo & Co. | 87,446 | 4,819,149 | ||||||
23,303,688 | ||||||||
BEVERAGES—2.3% | ||||||||
Coca-Cola Co. (The) | 47,220 | 1,957,741 | ||||||
PepsiCo, Inc. | 15,769 | 1,649,911 | ||||||
3,607,652 | ||||||||
BIOTECHNOLOGY—0.8% | ||||||||
Amgen, Inc. | 7,514 | 1,098,622 | ||||||
Vertex Pharmaceuticals, Inc. (a) | 2,930 | 215,853 | ||||||
1,314,475 | ||||||||
CAPITAL MARKETS—3.9% | ||||||||
Ameriprise Financial, Inc. | 1,806 | 200,357 | ||||||
Bank of New York Mellon Corp. (The) | 21,474 | 1,017,438 | ||||||
BlackRock, Inc. | 1,422 | 541,128 | ||||||
Franklin Resources, Inc. | 7,540 | 298,433 | ||||||
Goldman Sachs Group, Inc. | 7,297 | 1,747,267 | ||||||
Invesco Ltd. | 9,712 | 294,662 | ||||||
Morgan Stanley | 28,381 | 1,199,097 | ||||||
Northern Trust Corp. | 3,977 | 354,152 | ||||||
State Street Corp. | 6,240 | 484,973 | ||||||
6,137,507 | ||||||||
CHEMICALS—3.6% | ||||||||
Air Products & Chemicals, Inc. | 3,687 | 530,264 | ||||||
Dow Chemical Co. | 25,460 | 1,456,821 | ||||||
E.I. du Pont de Nemours & Co. | 9,059 | 664,931 | ||||||
Eastman Chemical Co. | 3,520 | 264,739 | ||||||
Ecolab, Inc. | 5,966 | 699,335 | ||||||
International Flavors and Fragrances, Inc. | 1,480 | 174,388 | ||||||
LyondellBasell Industries N.V. - Class A | 6,370 | 546,419 | ||||||
Mosaic Co. | 10,240 | 300,339 | ||||||
Praxair, Inc. | 9,146 |
| 1,071,820 | |||||
5,709,056 | ||||||||
COMMERCIAL SERVICES & SUPPLIES—1.4% | ||||||||
Johnson Controls International plc | 22,287 | 918,002 | ||||||
Republic Services, Inc. | 9,250 | 527,712 | ||||||
Waste Management, Inc. | 10,850 | 769,374 | ||||||
2,215,088 | ||||||||
COMMUNICATIONS EQUIPMENT—1.8% | ||||||||
Cisco Systems, Inc. | 93,175 | 2,815,749 | ||||||
CONSUMER FINANCE—1.3% | ||||||||
American Express Co. | 9,154 | 678,128 | ||||||
Capital One Financial Corp. | 10,900 | 950,916 | ||||||
Synchrony Financial | 13,930 | 505,241 | ||||||
2,134,285 | ||||||||
CONTAINERS & PACKAGING—0.4% | ||||||||
Ball Corp. | 6,254 | 469,488 | ||||||
Westrock Co. | 4,550 | 231,003 | ||||||
700,491 | ||||||||
DISTRIBUTORS—0.5% | ||||||||
Genuine Parts Co. | 7,820 | 747,123 | ||||||
DIVERSIFIED FINANCIAL SERVICES—0.3% | ||||||||
CME Group, Inc. | 3,070 | 354,124 | ||||||
Leucadia National Corp. | 8,360 | 194,370 | ||||||
548,494 | ||||||||
DIVERSIFIED TELECOMMUNICATION SERVICES—4.5% | ||||||||
AT&T, Inc. | 111,181 | 4,728,528 | ||||||
CenturyLink, Inc. | 7,688 | 182,821 | ||||||
Frontier Communications Corp. | 56,308 | 190,321 | ||||||
Verizon Communications, Inc. | 37,430 | 1,998,013 | ||||||
7,099,683 | ||||||||
ELECTRIC UTILITIES—4.8% | ||||||||
American Electric Power Co., Inc. | 15,270 | 961,399 | ||||||
Duke Energy Corp. | 21,544 | 1,672,245 | ||||||
Edison International | 5,807 | 418,046 | ||||||
Eversource Energy | 11,270 | 622,442 | ||||||
NextEra Energy, Inc. | 6,925 | 827,261 | ||||||
PPL Corp. | 21,901 | 745,729 | ||||||
Southern Co. (The) | 34,381 | 1,691,201 | ||||||
Xcel Energy, Inc. | 15,124 | 615,547 | ||||||
7,553,870 | ||||||||
ELECTRICAL EQUIPMENT—0.8% | ||||||||
Eaton Corp. plc | 6,720 | 450,845 | ||||||
Emerson Electric Co. | 8,294 | 462,390 | ||||||
Rockwell Automation, Inc. | 2,280 | 306,432 | ||||||
1,219,667 | ||||||||
ELECTRONIC EQUIPMENT, INSTRUMENTS & COMPONENTS—0.2% | ||||||||
TE Connectivity Ltd. | 3,956 | 274,072 | ||||||
ENERGY EQUIPMENT & SERVICES—1.9% | ||||||||
Baker Hughes, Inc. | 8,700 | 565,239 | ||||||
FMC Technologies, Inc. (a) | 6,180 | 219,575 | ||||||
National Oilwell Varco, Inc. | 9,526 | 356,654 | ||||||
See accompanying notes to financial statements.
27
Schedule of Investments, continued
Praxis Value Index Fund
December 31, 2016
| SHARES | FAIR VALUE | ||||||
COMMON STOCKS—99.0%, continued | ||||||||
ENERGY EQUIPMENT & SERVICES—1.9%, continued | ||||||||
Schlumberger Ltd. | 22,526 | $ | 1,891,058 | |||||
3,032,526 | ||||||||
EQUITY REAL ESTATE INVESTMENT TRUSTS (REITS)—0.2% | ||||||||
Crown Castle International Corp. | 1,960 | 170,069 | ||||||
Iron Mountain, Inc. | 5,070 | 164,674 | ||||||
334,743 | ||||||||
FOOD & STAPLES RETAILING—5.2% | ||||||||
Costco Wholesale Corp. | 8,400 | 1,344,924 | ||||||
CVS Health Corp. | 26,003 | 2,051,897 | ||||||
Kroger Co. | 23,634 | 815,609 | ||||||
Sysco Corp. | 7,993 | 442,572 | ||||||
Walgreen Boots Alliance, Inc. | 18,410 | 1,523,612 | ||||||
Wal-Mart Stores, Inc. | 28,280 | 1,954,714 | ||||||
Whole Foods Market, Inc. | 6,300 | 193,788 | ||||||
8,327,116 | ||||||||
FOOD PRODUCTS—2.6% | ||||||||
ConAgra Foods, Inc. | 6,540 | 258,657 | ||||||
General Mills, Inc. | 5,864 | 362,219 | ||||||
Hormel Foods Corp. | 5,000 | 174,050 | ||||||
J.M. Smucker Co. (The) | 2,030 | 259,962 | ||||||
Kellogg Co. | 2,689 | 198,206 | ||||||
Kraft Heinz Co. | 13,020 | 1,136,907 | ||||||
Mondelēz International, Inc. - Class A | 35,312 | 1,565,381 | ||||||
Tyson Foods, Inc. - Class A | 3,530 | 217,730 | ||||||
4,173,112 | ||||||||
HEALTH CARE EQUIPMENT & SUPPLIES—3.5% | ||||||||
Abbott Laboratories | 35,130 | 1,349,343 | ||||||
Baxter International, Inc. | 9,382 | 415,998 | ||||||
Becton, Dickinson and Co. | 1,720 | 284,746 | ||||||
Danaher Corp. | 15,190 | 1,182,390 | ||||||
DENTSPLY SIRONA, Inc. | 4,770 | 275,372 | ||||||
Medtronic plc | 28,240 | 2,011,535 | ||||||
5,519,384 | ||||||||
HEALTH CARE PROVIDERS & SERVICES—3.2% | ||||||||
AmerisourceBergen Corp. | 4,320 | 337,781 | ||||||
Anthem, Inc. | 5,470 | 786,422 | ||||||
Cardinal Health, Inc. | 8,170 | 587,995 | ||||||
Centene Corporation (a) | 3,730 | 210,782 | ||||||
Cigna Corp. | 5,445 | 726,308 | ||||||
DaVita, Inc. (a) | 5,270 | 338,334 | ||||||
Express Scripts Holding Co. (a) | 12,457 | 856,917 | ||||||
HCA Holdings, Inc. (a) | 2,520 | 186,530 | ||||||
Laboratory Corporation of America Holdings (a) | 2,670 | 342,775 | ||||||
McKesson Corp. | 3,974 | 558,148 | ||||||
UnitedHealth Group, Inc. | 1,390 | 222,456 | ||||||
5,154,448 | ||||||||
HOTELS, RESTAURANTS & LEISURE—0.9% | ||||||||
Carnival Corp. | 8,393 | 436,939 | ||||||
McDonald's Corp. | 7,590 | 923,855 | ||||||
1,360,794 | ||||||||
HOUSEHOLD DURABLES—0.7% | ||||||||
D.R. Horton, Inc. | 12,220 | 333,973 | ||||||
Leggett & Platt, Inc. | 3,240 | 158,371 | ||||||
Newell Brands, Inc. | 5,730 | 255,844 | ||||||
Whirlpool Corp. | 1,752 |
| 318,461 | |||||
1,066,649 | ||||||||
HOUSEHOLD PRODUCTS—2.0% | ||||||||
Colgate-Palmolive Co. | 6,578 | 430,464 | ||||||
Kimberly-Clark Corp. | 2,070 | 236,229 | ||||||
Procter & Gamble Co. (The) | 29,876 | 2,511,974 | ||||||
3,178,667 | ||||||||
INDEPENDENT POWER AND RENEWABLE ELECTRICITY PRODUCERS—0.1% | ||||||||
AES Corp. | 14,014 | 162,843 | ||||||
INDUSTRIAL CONGLOMERATES—1.2% | ||||||||
3M Co. | 8,955 | 1,599,095 | ||||||
Roper Technologies, Inc. | 1,890 | 346,021 | ||||||
1,945,116 | ||||||||
INSURANCE—8.1% | ||||||||
Aflac, Inc. | 10,310 | 717,576 | ||||||
Allstate Corp. | 13,209 | 979,051 | ||||||
American International Group, Inc. | 21,857 | 1,427,481 | ||||||
Aon plc | 707 | 78,852 | ||||||
Assurant, Inc. | 2,924 | 271,523 | ||||||
Chubb Corp. | 15,087 | 1,993,294 | ||||||
Cincinnati Financial Corp. | 3,262 | 247,096 | ||||||
Hartford Financial Services Group, Inc. | 9,080 | 432,662 | ||||||
Lincoln National Corp. | 4,220 | 279,659 | ||||||
Loews Corp. | 10,970 | 513,725 | ||||||
Marsh & McLennan Cos., Inc. | 3,820 | 258,194 | ||||||
MetLife, Inc. | 27,543 | 1,484,292 | ||||||
Principal Financial Group, Inc. | 6,500 | 376,090 | ||||||
Progressive Corp. | 19,043 | 676,027 | ||||||
Prudential Financial, Inc. | 12,740 | 1,325,724 | ||||||
Travelers Cos., Inc. | 8,103 | 991,969 | ||||||
Unum Group | 5,160 | 226,679 | ||||||
Willis Towers Watson plc | 2,350 | 287,358 | ||||||
XL Group plc | 8,980 | 334,595 | ||||||
12,901,847 | ||||||||
INTERNET SOFTWARE & SERVICES—0.8% | ||||||||
Alphabet, Inc. - Class C (a) | 300 | 231,546 | ||||||
eBay, Inc. (a) | 13,068 | 387,989 | ||||||
Yahoo!, Inc. (a) | 16,790 | 649,269 | ||||||
1,268,804 | ||||||||
IT SERVICES—1.3% | ||||||||
Accenture plc - Class A | 3,890 | 455,636 | ||||||
International Business Machines Corp. | 7,332 | 1,217,039 | ||||||
Paychex, Inc. | 3,684 | 224,282 | ||||||
Visa, Inc. - Class A | 3,120 | 243,422 | ||||||
2,140,379 | ||||||||
LIFE SCIENCES TOOLS & SERVICES—0.4% | ||||||||
Thermo Fisher Scientific, Inc. | 4,884 | 689,132 | ||||||
MACHINERY—2.0% | ||||||||
Deere & Co. | 4,267 | 439,672 | ||||||
Dover Corp. | 5,143 | 385,365 | ||||||
Flowserve Corp. | 3,900 | 187,395 | ||||||
Illinois Tool Works, Inc. | 3,965 | 485,554 | ||||||
Ingersoll-Rand plc | 2,625 | 196,980 | ||||||
PACCAR, Inc. | 2,996 | 191,444 | ||||||
See accompanying notes to financial statements.
28
Schedule of Investments, continued
Praxis Value Index Fund
December 31, 2016
| SHARES | FAIR VALUE | ||||||
COMMON STOCKS—99.0%, continued | ||||||||
MACHINERY—2.0%, continued | ||||||||
Parker-Hannifin Corp. | 2,627 | $ | 367,780 | |||||
Pentair plc | 4,480 | 251,194 | ||||||
Snap-on, Inc. | 2,090 | 357,954 | ||||||
Stanley Black & Decker, Inc. | 2,630 | 301,635 | ||||||
3,164,973 | ||||||||
MEDIA—1.8% | ||||||||
Charter Communications, Inc. (a) | 330 | 95,014 | ||||||
Comcast Corp. - Class A | 4,945 | 341,452 | ||||||
Omnicom Group, Inc. | 2,019 | 171,837 | ||||||
Twenty-First Century Fox, Inc. - Class B | 21,460 | 584,785 | ||||||
Viacom, Inc. - Class B | 8,590 | 301,509 | ||||||
Walt Disney Co. (The) | 12,757 | 1,329,534 | ||||||
2,824,131 | ||||||||
METALS & MINING—0.2% | ||||||||
Newmont Mining Corp. | 3,270 | 111,409 | ||||||
Nucor Corp. | 2,560 | 152,371 | ||||||
263,780 | ||||||||
MULTI-LINE RETAIL—0.5% | ||||||||
Macy's, Inc. | 3,373 | 120,787 | ||||||
Target Corp. | 9,106 | 657,727 | ||||||
778,514 | ||||||||
MULTI-UTILITIES—1.5% | ||||||||
Ameren Corporation | 5,570 | 292,202 | ||||||
Consolidated Edison, Inc. | 7,361 | 542,358 | ||||||
DTE Energy Co. | 5,910 | 582,194 | ||||||
Sempra Energy | 7,343 | 739,000 | ||||||
WEC Energy Group, Inc. | 2,940 | 172,431 | ||||||
2,328,185 | ||||||||
OIL, GAS & CONSUMABLE FUELS—7.2% | ||||||||
Apache Corp. | 5,378 | 341,342 | ||||||
ConocoPhillips | 43,487 | 2,180,438 | ||||||
EOG Resources, Inc. | 9,010 | 910,911 | ||||||
EQT Corp. | 2,798 | 182,989 | ||||||
Hess Corp. | 13,930 | 867,700 | ||||||
Kinder Morgan, Inc. | 44,101 | 913,332 | ||||||
Marathon Oil Corp. | 36,096 | 624,822 | ||||||
Marathon Petroleum Corp. | 10,896 | 548,614 | ||||||
Murphy Oil Corp. | 8,136 | 253,274 | ||||||
Noble Energy, Inc. | 10,718 | 407,927 | ||||||
Occidental Petroleum Corp. | 31,280 | 2,228,074 | ||||||
ONEOK, Inc. | 2,855 | 163,905 | ||||||
Phillips 66 | 2,510 | 216,889 | ||||||
Pioneer Natural Resources Co. | 1,110 | 199,878 | ||||||
Spectra Energy Corp. | 6,439 | 264,578 | ||||||
Tesoro Corp. | 2,430 | 212,503 | ||||||
Valero Energy Corp. | 9,450 | 645,624 | ||||||
Williams Cos., Inc. | 9,371 | 291,813 | ||||||
11,454,613 | ||||||||
PAPER & FOREST PRODUCTS—0.2% | ||||||||
International Paper Co. | 5,781 | 306,740 | ||||||
PERSONAL PRODUCTS—0.1% | ||||||||
Estée Lauder Cos., Inc. - Class A | 2,200 | 168,278 | ||||||
PHARMACEUTICALS—4.4% | ||||||||
AbbVie, Inc. | 3,278 |
| 205,269 | |||||
Bristol-Myers Squibb Co. | 15,019 | 877,710 | ||||||
Eli Lilly & Co. | 14,157 | 1,041,247 | ||||||
Johnson & Johnson | 23,521 | 2,709,855 | ||||||
Mallinckrodt plc (a) | 2,310 | 115,084 | ||||||
Merck & Co., Inc. | 24,171 | 1,422,947 | ||||||
Mylan N.V. (a) | 10,220 | 389,893 | ||||||
Perrigo Company plc | 3,340 | 277,988 | ||||||
7,039,993 | ||||||||
PROFESSIONAL SERVICES—0.2% | ||||||||
Nielsen Holdings plc | 5,930 | 248,764 | ||||||
REAL ESTATE INVESTMENT TRUSTS (REITS)—0.6% | ||||||||
HCP, Inc. | 8,647 | 256,989 | ||||||
Simon Property Group, Inc. | 989 | 175,716 | ||||||
Weyerhaeuser Co. | 16,349 | 491,941 | ||||||
924,646 | ||||||||
ROAD & RAIL—0.8% | ||||||||
CSX Corp. | 5,740 | 206,238 | ||||||
Norfolk Southern Corp. | 4,645 | 501,985 | ||||||
Union Pacific Corp. | 5,360 | 555,725 | ||||||
1,263,948 | ||||||||
SEMICONDUCTORS & SEMICONDUCTOR EQUIPMENT—1.3% | ||||||||
Intel Corp. | 50,018 | 1,814,153 | ||||||
Micron Technology, Inc. (a) | 13,970 | 306,222 | ||||||
2,120,375 | ||||||||
SOFTWARE—1.0% | ||||||||
Adobe Systems, Inc. (a) | 1,819 | 187,266 | ||||||
CA, Inc. | 7,512 | 238,656 | ||||||
Microsoft Corp. | 3,090 | 192,013 | ||||||
Oracle Corp. | 26,762 | 1,028,999 | ||||||
1,646,934 | ||||||||
SOFTWARE & SERVICES—0.1% | ||||||||
S&P Global, Inc. | 2,198 | 236,373 | ||||||
SPECIALTY RETAIL—0.6% | ||||||||
Home Depot, Inc. | 1,142 | 153,119 | ||||||
Lowe's Cos., Inc. | 8,780 | 624,434 | ||||||
Staples, Inc. | 25,360 | 229,508 | ||||||
1,007,061 | ||||||||
TECHNOLOGY HARDWARE, STORAGE & PERIPHERALS—0.7% | ||||||||
Apple, Inc. | 1,610 | 186,470 | ||||||
HP, Inc. | 32,130 | 476,809 | ||||||
Seagate Technology plc | 4,910 | 187,415 | ||||||
Western Digital Corp. | 4,475 | 304,076 | ||||||
1,154,770 | ||||||||
TEXTILES, APPAREL & LUXURY GOODS—0.5% | ||||||||
NIKE, Inc. - Class B | 11,440 | 581,495 | ||||||
VF Corp. | 5,110 | 272,619 | ||||||
854,114 | ||||||||
WATER UTILITIES—0.2% | ||||||||
American Water Works Co., Inc. | 3,640 | 263,390 | ||||||
TOTAL COMMON STOCKS (COST $127,137,412) | 157,329,022 | |||||||
See accompanying notes to financial statements.
29
Schedule of Investments, continued
Praxis Value Index Fund
December 31, 2016
| SHARES | FAIR VALUE | ||||||
RIGHTS—0.0% (b) | ||||||||
Safeway, Inc. (Casa Ley subsidiary), expiring 1/30/18 | 6,607 | $ | 322 | |||||
Safeway, Inc. (PDC subsidiary), expiring 1/30/17 | 6,607 | 6,706 | ||||||
TOTAL RIGHTS (COST $—) | 7,028 | |||||||
| COUPON | MATURITY | PRINCIPAL AMOUNT | FAIR VALUE | |||||||||
CORPORATE NOTES—0.8% | |||||||||||||
COMMUNITY DEVELOPMENT—0.8% | |||||||||||||
Calvert Social Investment Foundation, Inc. (c) | 1.000 | % | 06/15/17 | $ | 260,000 | $ | 260,000 | ||||||
Calvert Social Investment Foundation, Inc. (c) | 1.000 | % | 12/15/17 | 750,000 | 750,000 | ||||||||
Calvert Social Investment Foundation, Inc. (c) | 1.500 | % | 06/17/19 | 260,000 | 260,000 | ||||||||
TOTAL CORPORATE NOTES (COST $1,270,000) | 1,270,000 | ||||||||||||
TOTAL INVESTMENTS (Cost (d) $128,407,412— Unrealized gain/loss $30,250,726)—99.8% | $ | 158,606,050 | |||||||||||
Other Assets in Excess of Liabilities—0.2% | 260,190 | ||||||||||||
NET ASSETS—100.0% | $ | 158,866,240 | |||||||||||
(a) | Non-income producing security. |
(b) | Percentage rounds to less than 0.1%. |
(c) | Restricted and illiquid securities not registered under the Securities Act of 1933 are as follows: |
| Acquisition Date | Current Cost | Fair Value | % of Net Assets | ||||||||||
Calvert Social Investment Foundation, Inc. 1.00%, 06/15/17 | 06/10/16 | $ | 260,000 | $ | 260,000 | 0.2 | % | ||||||
Calvert Social Investment Foundation, Inc. 1.00%, 12/15/17 | 12/15/14 | 750,000 | 750,000 | 0.4 | % | ||||||||
Calvert Social Investment Foundation, Inc. 1.50%, 06/17/16 | 06/10/16 | 260,000 | 260,000 | 0.2 | % | ||||||||
$ | 1,270,000 | $ | 1,270,000 | 0.8 | % | ||||||||
(d) | Represents cost for financial reporting purposes. |
plc — Public Liability Company
See accompanying notes to financial statements.
30
Praxis Growth Index Fund
Annual report to shareholders
Portfolio managers’ commentary
In 2016, the Standard and Poor’s 500 Index (“S&P 500”) saw large cap stock returns go back to double-digit positive returns of 11.95 percent after taking a breather in 2015 when they were 1.37 percent. Stocks dipped at the start of 2016, hitting a nadir in mid-February before starting a steady climb with pauses around the Brexit vote in June and again before the U.S. elections in early November. In terms of major asset classes, all major classes sported positive returns for the year. Small and mid-cap stocks and high yield bonds performed better than large cap stocks, while commodities, international stocks, and bonds fared worse. Notably, commodities, as measured by the Bloomberg Commodity Index, broke a five-year string of negative returns. Crude oil’s price action certainly helped, as it rose 45 percent for the year starting at about $37 per barrel and ended at about $54 per barrel, despite dropping to about $26 per barrel in mid-February.
Among the 11 stock sectors of the S&P 500 – real estate was established as its own sector, formerly its holdings were reported under financials – all sectors ended with positive returns with the exception of healthcare, which returned -2.7 percent. Energy, telecommunication services and financials were the largest winners, with returns of 27.4 percent, 23.5 percent, and 22.8 percent respectively. At the bottom of the positive returns list with mid to low single digit returns were the consumer sectors (discretionary and staples) and the new real estate sector.
The Growth and Value styles reversed fortunes in 2016, as the S&P 500 Value Index returned 17.40 percent versus the S&P 500 Growth Index returning 6.90 percent. In 2015, Growth had outperformed Value, with Growth having a positive return and Value a negative return.
In this environment, the Praxis Growth Index Fund Class A Shares (Without Load) returned 7.15 percent, outperforming the 6.90 percent return of the benchmark, S&P 500 Growth Index. Fundamental factors were the leading contributor to the outperformance, specifically in the areas of momentum and dividend yield. Overall, we are pleased with the performance of the Fund, and that we incorporated our Values + ESG screens and still delivered returns that adhered closely to the benchmark.
The annual mid-December reconstitution of the benchmark index and our routine updating of our Values + ESG screening list again caused some realignment of portfolio holdings near year-end. This is always a good opportunity to fine-tune our efforts to track benchmark returns.
Dale Snyder, CFA®
Praxis Growth Index Fund Manager
Praxis Mutual Funds
The views expressed are those of the portfolio manager as of Dec. 31, 2016, are subject to change, and may differ from the views of other portfolio managers or the firm as a whole. These opinions are not intended to be a forecast of future events, a guarantee of future results, or investment advice. All data referenced are from sources deemed to be reliable but cannot be guaranteed. Securities and sectors referenced should not be construed as a solicitation or recommendation or be used as the sole basis for any investment decision.
31
Praxis Growth Index Fund
Performance Review
Growth of $10,000 investment from 5/1/07 to 12/31/16
This chart represents historical performance of a hypothetical investment of $10,000 in Class A Shares (adjusted for the maximum sales charge of 5.25%) of the Fund and Index from 5/1/07 to 12/31/16, and includes the reinvestment of dividends and capital gains.
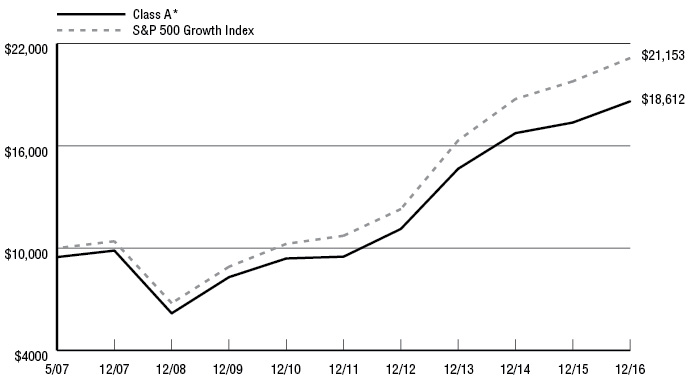
Annualized | |||||||
Inception Date | One | Three | Five | Since Inception | Expense Ratio** | ||
Praxis Growth Index Fund | |||||||
Class A * | 5/1/07 | 1.52% | 6.36% | 13.17% | 6.64% | 0.84% | 0.84% |
Class A (Without Load) | 5/1/07 | 7.15% | 8.28% | 14.40% | 7.23% | ||
Class I | 5/1/07 | 7.62% | 8.74% | 14.94% | 7.68% | 0.44% | 0.44% |
S&P 500 Growth Index1 |
| 6.90% | 9.02% | 14.54% | 8.06% |
|
|
Past performance does not guarantee future results. The performance data quoted represents past performance and current returns may be lower or higher. The investment return and principal value will fluctuate so that an investor’s shares, when redeemed, may be worth more or less than the original cost. These performance figures do not reflect the deduction of taxes that a shareholder would pay on fund distributions or the redemption of fund shares. To obtain performance information current to the most recent month end, please visit www.praxismutualfunds.com. Indexes are unmanaged, do not incur fees, and it is not possible to invest directly in an index.
The total returns shown reflect any expenses that were contractually or voluntarily reduced, reimbursed or paid by any party during the periods presented. In such instances, and without activity, the total returns would have been lower.
* | The total return figures shown reflect the maximum sales charge applicable to Class A Shares. Class A Shares have a maximum sales charge on purchases of 5.25%. |
** | Reflects the expense ratios as reported in the Prospectus dated April 30, 2016. |
1 | The S&P 500 Growth Index represents the growth companies (defined by sales growth, earnings charge to price and momentum) of the S&P 500 Index, a universe of large capitalization companies in the US equity market. |
The above index is for illustrative purposes only and does not reflect the deduction of expenses associated with a mutual fund, such as investment management and fund accounting fees. The Fund’s performance reflects the deduction of these services. An investor cannot invest directly in an index, although they can invest in its underlying securities.
32
Schedule of Investments
Praxis Growth Index Fund
December 31, 2016
| SHARES | FAIR VALUE | ||||||
COMMON STOCKS—98.5% | ||||||||
AEROSPACE & DEFENSE—0.3% | ||||||||
TransDigm Group, Inc. | 2,476 | $ | 616,425 | |||||
AIR FREIGHT & LOGISTICS—1.5% | ||||||||
C.H. Robinson Worldwide, Inc. | 3,010 | 220,513 | ||||||
FedEx Corp. | 5,481 | 1,020,562 | ||||||
United Parcel Service, Inc. - Class B | 16,427 | 1,883,191 | ||||||
3,124,266 | ||||||||
AIRLINES—0.5% | ||||||||
Southwest Airlines Co. | 13,080 | 651,907 | ||||||
United Continental Holdings, Inc. (a) | 6,113 | 445,516 | ||||||
1,097,423 | ||||||||
AUTOMOBILES—0.1% | ||||||||
Harley-Davidson, Inc. | 4,305 | 251,154 | ||||||
BANKS—1.3% | ||||||||
Citizens Financial Group, Inc. | 6,231 | 222,010 | ||||||
Comerica, Inc. | 4,494 | 306,086 | ||||||
JPMorgan Chase & Company | 2,354 | 203,127 | ||||||
KeyCorp | 18,927 | 345,796 | ||||||
PNC Financial Services Group, Inc. (The) | 2,433 | 284,564 | ||||||
U.S. Bancorp | 25,805 | 1,325,603 | ||||||
2,687,186 | ||||||||
BEVERAGES—2.4% | ||||||||
Coca-Cola Co. (The) | 53,954 | 2,236,933 | ||||||
Monster Beverage Corp. (a) | 8,550 | 379,107 | ||||||
PepsiCo, Inc. | 22,509 | 2,355,116 | ||||||
4,971,156 | ||||||||
BIOTECHNOLOGY—3.7% | ||||||||
Alexion Pharmaceuticals, Inc. (a) | 4,425 | 541,399 | ||||||
Amgen, Inc. | 9,369 | 1,369,841 | ||||||
Biogen, Inc. (a) | 4,102 | 1,163,245 | ||||||
Celgene Corp. (a) | 15,030 | 1,739,723 | ||||||
Gilead Sciences, Inc. | 27,152 | 1,944,355 | ||||||
Regeneron Pharmaceuticals, Inc. (a) | 1,227 | 450,419 | ||||||
Vertex Pharmaceuticals, Inc. (a) | 4,082 | 300,721 | ||||||
7,509,703 | ||||||||
CAPITAL MARKETS—0.8% | ||||||||
BlackRock, Inc. | 1,574 | 598,970 | ||||||
Charles Schwab Corp. | 25,758 | 1,016,668 | ||||||
1,615,638 | ||||||||
CHEMICALS—2.0% | ||||||||
Air Products & Chemicals, Inc. | 4,111 | 591,244 | ||||||
Albemarle Corporation | 3,093 | 266,245 | ||||||
E.I. du Pont de Nemours & Co. | 7,834 | 575,015 | ||||||
Ecolab, Inc. | 5,322 | 623,845 | ||||||
International Flavors and Fragrances, Inc. | 3,158 | 372,107 | ||||||
LyondellBasell Industries NV - Class A | 2,820 | 241,900 | ||||||
Praxair, Inc. | 8,079 | 946,778 | ||||||
Sherwin-Williams Co. | 1,820 | 489,107 | ||||||
4,106,241 | ||||||||
COMMERCIAL SERVICES & SUPPLIES—1.2% | ||||||||
Johnson Controls International plc | 5,457 | 224,774 | ||||||
Republic Services, Inc. | 14,451 | 824,430 | ||||||
Waste Management, Inc. | 18,252 | 1,294,249 | ||||||
2,343,453 | ||||||||
COMMUNICATIONS EQUIPMENT—0.1% | ||||||||
Juniper Networks, Inc. | 8,505 |
| 240,351 | |||||
CONSTRUCTION MATERIALS—0.4% | ||||||||
Martin Marietta Materials, Inc. | 1,776 | 393,437 | ||||||
Vulcan Materials Co. | 3,454 | 432,268 | ||||||
825,705 | ||||||||
CONSUMER FINANCE—0.6% | ||||||||
American Express Co. | 6,566 | 486,409 | ||||||
Discover Financial Services | 10,384 | 748,583 | ||||||
1,234,992 | ||||||||
DIVERSIFIED FINANCIAL SERVICES—0.9% | ||||||||
CME Group, Inc. | 3,995 | 460,823 | ||||||
Intercontinental Exchange, Inc. | 10,235 | 577,459 | ||||||
Moody's Corp. | 3,611 | 340,409 | ||||||
S&P Global, Inc. | 5,128 | 551,465 | ||||||
1,930,156 | ||||||||
DIVERSIFIED TELECOMMUNICATION SERVICES—1.6% | ||||||||
AT&T, Inc. | 7,872 | 334,796 | ||||||
Level 3 Communications, Inc. (a) | 6,264 | 353,039 | ||||||
Verizon Communications, Inc. | 49,462 | 2,640,282 | ||||||
3,328,117 | ||||||||
ELECTRIC UTILITIES—0.3% | ||||||||
NextEra Energy, Inc. | 5,360 | 640,306 | ||||||
ELECTRICAL EQUIPMENT—0.9% | ||||||||
Acuity Brands, Inc. | 1,128 | 260,410 | ||||||
Emerson Electric Co. | 10,512 | 586,044 | ||||||
Rockwell Automation, Inc. | 7,485 | 1,005,984 | ||||||
1,852,438 | ||||||||
ELECTRONIC EQUIPMENT, INSTRUMENTS & COMPONENTS—0.7% | ||||||||
Amphenol Corp. - Class A | 7,167 | 481,622 | ||||||
Corning, Inc. | 20,828 | 505,496 | ||||||
TE Connectivity Ltd. | 5,385 | 373,073 | ||||||
1,360,191 | ||||||||
ENERGY EQUIPMENT & SERVICES—0.8% | ||||||||
Baker Hughes, Inc. | 5,892 | 382,803 | ||||||
Schlumberger Ltd. | 16,042 | 1,346,726 | ||||||
1,729,529 | ||||||||
EQUITY REAL ESTATE INVESTMENT TRUSTS (REITS)—3.9% | ||||||||
American Tower Corp. | 10,594 | 1,119,574 | ||||||
AvalonBay Communities, Inc. | 2,316 | 410,280 | ||||||
Crown Castle International Corp. | 9,450 | 819,977 | ||||||
Digital Realty Trust, Inc. | 4,316 | 424,090 | ||||||
Federal Realty Investment Trust | 3,075 | 436,988 | ||||||
General Growth Properties, Inc. | 12,536 | 313,149 | ||||||
Host Hotels & Resorts, Inc. | 16,449 | 309,899 | ||||||
Iron Mountain, Inc. | 8,187 | 265,914 | ||||||
Prologis, Inc. | 13,062 | 689,543 | ||||||
Public Storage | 2,206 | 493,041 | ||||||
Realty Income Corp. | 5,555 | 319,301 | ||||||
Simon Property Group, Inc. | 5,204 | 924,595 | ||||||
UDR, Inc. | 10,721 | 391,102 | ||||||
Ventas, Inc. | 5,177 | 323,666 | ||||||
Welltower, Inc. | 9,882 | 661,402 | ||||||
7,902,521 | ||||||||
See accompanying notes to financial statements.
33
Schedule of Investments, continued
Praxis Growth Index Fund
December 31, 2016
| SHARES | FAIR VALUE | ||||||
COMMON STOCKS—98.5, continued | ||||||||
FOOD & STAPLES RETAILING—0.3% | ||||||||
Sysco Corp. | 7,878 | $ | 436,205 | |||||
Wal-Mart Stores, Inc. | 2,611 | 180,472 | ||||||
616,677 | ||||||||
FOOD PRODUCTS—0.9% | ||||||||
General Mills, Inc. | 13,762 | 850,079 | ||||||
Hershey Co. (The) | 3,303 | 341,629 | ||||||
Kellogg Co. | 8,398 | 619,017 | ||||||
1,810,725 | ||||||||
HEALTH CARE EQUIPMENT & SUPPLIES—3.2% | ||||||||
Abbott Laboratories | 10,272 | 394,548 | ||||||
Baxter International, Inc. | 7,430 | 329,446 | ||||||
Becton, Dickinson and Co. | 7,318 | 1,211,495 | ||||||
Boston Scientific Corp. (a) | 28,192 | 609,793 | ||||||
C.R. Bard, Inc. | 2,178 | 489,309 | ||||||
Danaher Corp. | 15,314 | 1,192,042 | ||||||
Edwards Lifesciences Corp. (a) | 4,070 | 381,359 | ||||||
Intuitive Surgical, Inc. (a) | 887 | 562,509 | ||||||
St. Jude Medical, Inc. | 6,717 | 538,636 | ||||||
Stryker Corp. | 6,643 | 795,898 | ||||||
6,505,035 | ||||||||
HEALTH CARE PROVIDERS & SERVICES—2.8% | ||||||||
Aetna, Inc. | 7,870 | 975,959 | ||||||
AmerisourceBergen Corp. | 5,221 | 408,230 | ||||||
Centene Corp. (a) | 2,008 | 113,472 | ||||||
HCA Holdings, Inc. (a) | 5,270 | 390,085 | ||||||
Humana, Inc. | 3,143 | 641,266 | ||||||
UnitedHealth Group, Inc. | 19,462 | 3,114,699 | ||||||
5,643,711 | ||||||||
HEALTH CARE TECHNOLOGY—0.2% | ||||||||
Cerner Corp. (a) | 8,234 | 390,045 | ||||||
HOTELS, RESTAURANTS & LEISURE—2.3% | ||||||||
Chipotle Mexican Grill, Inc. - Class A (a) | 790 | 298,083 | ||||||
Marriott International, Inc. - Class A | 8,558 | 707,575 | ||||||
McDonald's Corp. | 12,500 | 1,521,500 | ||||||
Starbucks Corp. | 31,676 | 1,758,652 | ||||||
Yum! Brands, Inc. | 6,767 | 428,554 | ||||||
4,714,364 | ||||||||
HOUSEHOLD DURABLES—0.3% | ||||||||
Mohawk Industries, Inc. (a) | 2,024 | 404,152 | ||||||
Newell Brands, Inc. | 5,827 | 260,176 | ||||||
664,328 | ||||||||
HOUSEHOLD PRODUCTS—1.9% | ||||||||
Colgate-Palmolive Co. | 13,555 | 887,039 | ||||||
Kimberly-Clark Corp. | 5,005 | 571,171 | ||||||
Procter & Gamble Co. (The) | 28,843 | 2,425,119 | ||||||
3,883,329 | ||||||||
INDUSTRIAL CONGLOMERATES—1.3% | ||||||||
3M Co. | 13,549 | 2,419,445 | ||||||
Roper Technologies, Inc. | 1,811 | 331,558 | ||||||
2,751,003 | ||||||||
INSURANCE—1.3% | ||||||||
Aflac, Inc. | 4,154 | 289,118 | ||||||
Aon plc | 6,821 | 760,746 | ||||||
Chubb Corp. | 2,780 | 367,294 | ||||||
Marsh & McLennan Cos., Inc. | 17,227 |
| 1,164,373 | |||||
2,581,531 | ||||||||
INTERNET & DIRECT MARKETING RETAIL—4.3% | ||||||||
Amazon.com, Inc. (a) | 7,761 | 5,819,741 | ||||||
Expedia, Inc. | 2,852 | 323,074 | ||||||
Netflix, Inc. (a) | 8,437 | 1,044,501 | ||||||
Priceline Group, Inc. (The) (a) | 1,030 | 1,510,042 | ||||||
8,697,358 | ||||||||
INTERNET SOFTWARE & SERVICES—7.5% | ||||||||
Akamai Technologies, Inc. (a) | 5,069 | 338,001 | ||||||
Alphabet, Inc. - Class A (a) | 6,379 | 5,055,039 | ||||||
Alphabet, Inc. - Class C (a) | 5,236 | 4,041,249 | ||||||
Equinix, Inc. | 1,753 | 626,540 | ||||||
Facebook, Inc. - Class A (a) | 46,207 | 5,316,115 | ||||||
15,376,944 | ||||||||
IT SERVICES—6.3% | ||||||||
Accenture plc - Class A | 14,553 | 1,704,593 | ||||||
Automatic Data Processing, Inc. | 8,962 | 921,115 | ||||||
Cognizant Technology Solutions Corp. - Class A (a) | 8,415 | 471,493 | ||||||
Fidelity National Information Services, Inc. | 8,241 | 623,349 | ||||||
Fiserv, Inc. (a) | 6,387 | 678,810 | ||||||
International Business Machines Corp. | 10,084 | 1,673,843 | ||||||
MasterCard, Inc. - Class A | 20,125 | 2,077,906 | ||||||
Paychex, Inc. | 12,166 | 740,666 | ||||||
PayPal Holdings, Inc. (a) | 22,112 | 872,761 | ||||||
Visa, Inc. - Class A | 38,164 | 2,977,555 | ||||||
12,742,091 | ||||||||
LEISURE PRODUCTS—0.2% | ||||||||
Hasbro, Inc. | 4,868 | 378,682 | ||||||
LIFE SCIENCES TOOLS & SERVICES—0.7% | ||||||||
Agilent Technologies, Inc. | 5,785 | 263,565 | ||||||
Illumina, Inc. (a) | 1,783 | 228,295 | ||||||
Thermo Fisher Scientific, Inc. | 6,351 | 896,126 | ||||||
1,387,986 | ||||||||
MACHINERY—1.5% | ||||||||
Deere & Co. | 4,488 | 462,443 | ||||||
Illinois Tool Works, Inc. | 8,534 | 1,045,074 | ||||||
Ingersoll-Rand plc | 6,896 | 517,476 | ||||||
PACCAR, Inc. | 4,404 | 281,415 | ||||||
Parker-Hannifin Corp. | 3,091 | 432,740 | ||||||
Xylem, Inc. | 6,063 | 300,240 | ||||||
3,039,388 | ||||||||
MEDIA—5.2% | ||||||||
CBS Corp. - Class B | 10,907 | 693,903 | ||||||
Charter Communications, Inc. (a) | 4,569 | 1,315,506 | ||||||
Comcast Corp. - Class A | 49,901 | 3,445,664 | ||||||
Discovery Communications, Inc. - Class C (a) | 13,725 | 367,556 | ||||||
Omnicom Group, Inc. | 6,116 | 520,533 | ||||||
Time Warner, Inc. | 16,206 | 1,564,365 | ||||||
Twenty-First Century Fox, Inc. - Class B | 22,965 | 625,796 | ||||||
Walt Disney Co. (The) | 19,939 | 2,078,043 | ||||||
10,611,366 | ||||||||
See accompanying notes to financial statements.
34
Schedule of Investments, continued
Praxis Growth Index Fund
December 31, 2016
| SHARES | FAIR VALUE | ||||||
COMMON STOCKS—98.5, continued | ||||||||
METALS & MINING—0.3% | ||||||||
Newmont Mining Corp. | 12,767 | $ | 434,972 | |||||
Nucor Corp. | 4,570 | 272,006 | ||||||
706,978 | ||||||||
MULTILINE RETAIL—0.1% | ||||||||
Dollar Tree, Inc. (a) | 3,886 | 299,921 | ||||||
MULTI-LINE RETAIL—0.2% | ||||||||
Target Corp. | 4,956 | 357,972 | ||||||
MULTI-UTILITIES—0.2% | ||||||||
CenterPoint Energy, Inc. | 13,201 | 325,273 | ||||||
OIL, GAS & CONSUMABLE FUELS—2.4% | ||||||||
Apache Corp. | 6,000 | 380,820 | ||||||
ConocoPhillips | 4,907 | 246,037 | ||||||
EOG Resources, Inc. | 6,985 | 706,183 | ||||||
EQT Corporation | 3,520 | 230,208 | ||||||
Noble Energy, Inc. | 9,075 | 345,394 | ||||||
Occidental Petroleum Corp. | 12,075 | 860,102 | ||||||
ONEOK, Inc. | 5,111 | 293,423 | ||||||
Pioneer Natural Resources Co. | 3,656 | 658,336 | ||||||
Spectra Energy Corp. | 18,344 | 753,755 | ||||||
Williams Cos., Inc. | 13,291 | 413,882 | ||||||
4,888,140 | ||||||||
PAPER & FOREST PRODUCTS—0.2% | ||||||||
International Paper Co. | 6,608 | 350,620 | ||||||
PHARMACEUTICALS—5.6% | ||||||||
AbbVie, Inc. | 36,696 | 2,297,904 | ||||||
Bristol-Myers Squibb Co. | 19,655 | 1,148,638 | ||||||
Eli Lilly & Co. | 12,108 | 890,543 | ||||||
Johnson & Johnson | 35,751 | 4,118,873 | ||||||
Merck & Co., Inc. | 37,284 | 2,194,909 | ||||||
Zoetis, Inc. - Class A | 14,643 | 783,840 | ||||||
11,434,707 | ||||||||
PROFESSIONAL SERVICES—0.2% | ||||||||
Nielsen Holdings plc | 10,461 | 438,839 | ||||||
ROAD & RAIL—1.0% | ||||||||
CSX Corp. | 15,035 | 540,207 | ||||||
Union Pacific Corp. | 13,604 | 1,410,463 | ||||||
1,950,670 | ||||||||
SEMICONDUCTORS & SEMICONDUCTOR EQUIPMENT—5.5% | ||||||||
Analog Devices, Inc. | 5,586 | 405,655 | ||||||
Applied Materials, Inc. | 24,367 | 786,323 | ||||||
Broadcom Corp. - Class A | 8,089 | 1,429,893 | ||||||
Intel Corp. | 47,177 | 1,711,110 | ||||||
KLA-Tencor Corp. | 4,512 | 355,004 | ||||||
Lam Research Corp. | 3,913 |
| 413,722 | |||||
Linear Technology Corp. | 6,498 | 405,150 | ||||||
Microchip Technology, Inc. | 7,002 | 449,178 | ||||||
NVIDIA Corp. | 10,929 | 1,166,561 | ||||||
QUALCOMM, Inc. | 30,537 | 1,991,012 | ||||||
Skyworks Solutions, Inc. | 3,110 | 232,193 | ||||||
Texas Instruments, Inc. | 22,211 | 1,620,737 | ||||||
Xilinx, Inc. | 4,619 | 278,849 | ||||||
11,245,387 | ||||||||
SOFTWARE—7.7% | ||||||||
Activision Blizzard, Inc. | 14,012 | 505,974 | ||||||
Adobe Systems, Inc. (a) | 10,776 | 1,109,389 | ||||||
Autodesk, Inc. (a) | 4,626 | 342,370 | ||||||
Citrix Systems, Inc. (a) | 3,452 | 308,298 | ||||||
Electronic Arts, Inc. (a) | 5,362 | 422,311 | ||||||
Intuit, Inc. | 5,164 | 591,846 | ||||||
Microsoft Corp. | 154,029 | 9,571,362 | ||||||
Oracle Corp. | 35,196 | 1,353,286 | ||||||
Red Hat, Inc. (a) | 3,789 | 264,094 | ||||||
salesforce.com, Inc. (a) | 13,105 | 897,168 | ||||||
Symantec Corp. | 13,164 | 314,488 | ||||||
15,680,586 | ||||||||
SPECIALTY RETAIL—3.7% | ||||||||
Advance Auto Parts, Inc. | 1,310 | 221,547 | ||||||
AutoZone, Inc. (a) | 659 | 520,472 | ||||||
Home Depot, Inc. (The) | 26,011 | 3,487,555 | ||||||
Lowe's Cos., Inc. | 15,097 | 1,073,699 | ||||||
O'Reilly Automotive, Inc. (a) | 2,290 | 637,559 | ||||||
Ross Stores, Inc. | 6,132 | 402,259 | ||||||
TJX Cos., Inc. | 10,035 | 753,929 | ||||||
Ulta Salon, Cosmetics & Fragrance, Inc. (a) | 1,400 | 356,916 | ||||||
7,453,936 | ||||||||
TECHNOLOGY HARDWARE, STORAGE & PERIPHERALS—6.0% | ||||||||
Apple, Inc. | 104,727 | 12,129,481 | ||||||
TEXTILES, APPAREL & LUXURY GOODS—0.6% | ||||||||
NIKE, Inc. - Class B | 16,735 | 850,640 | ||||||
Under Armour, Inc. - Class A (a) | 11,753 | 341,425 | ||||||
1,192,065 | ||||||||
TRADING COMPANIES & DISTRIBUTORS—0.4% | ||||||||
Fastenal Co. | 8,072 | 379,223 | ||||||
W.W. Grainger, Inc. | 1,898 | 440,810 | ||||||
820,033 | ||||||||
WATER UTILITIES—0.2% | ||||||||
American Water Works Co., Inc. | 6,943 | 502,395 | ||||||
TOTAL COMMON STOCKS (COST $139,568,880) | 200,938,517 | |||||||
See accompanying notes to financial statements.
35
Schedule of Investments, continued
Praxis Growth Index Fund
December 31, 2016
| COUPON | MATURITY | PRINCIPAL AMOUNT | FAIR | |||||||||
CORPORATE NOTES—0.9% | |||||||||||||
COMMUNITY DEVELOPMENT—0.9% | |||||||||||||
Calvert Social Investment Foundation, Inc. (b) | 1.000 | % | 06/15/17 | $ | 800,000 | $ | 800,000 | ||||||
Calvert Social Investment Foundation, Inc. (b) | 1.000 | % | 12/15/17 | 175,000 | 175,000 | ||||||||
Calvert Social Investment Foundation, Inc. (b) | 1.500 | % | 06/17/19 | 800,000 | 800,000 | ||||||||
TOTAL CORPORATE NOTES (Cost $1,775,000) | 1,775,000 | ||||||||||||
TOTAL INVESTMENTS (Cost (c) $141,343,880— Unrealized gain/loss $61,369,637)—99.4% | $ | 202,713,517 | |||||||||||
Other Assets in Excess of Liabilities—0.6% | 1,155,147 | ||||||||||||
NET ASSETS—100.0% | $ | 203,868,664 | |||||||||||
(a) | Non-income producing security. |
(b) | Restricted and illiquid securities not registered under the Securities Act of 1933 are as follows: |
| Acquisition Date | Current Cost | Fair Value | % of Net Assets | ||||||||||
Calvert Social Investment Foundation, Inc. 1.00%, 06/15/17 | 06/10/16 | $ | 800,000 | $ | 800,000 | 0.4 | % | ||||||
Calvert Social Investment Foundation, Inc. 1.00%, 12/15/17 | 12/15/14 | 175,000 | 175,000 | 0.1 | % | ||||||||
Calvert Social Investment Foundation, Inc. 1.50%, 06/17/16 | 06/10/16 | 800,000 | 800,000 | 0.4 | % | ||||||||
$ | 1,775,000 | $ | 1,775,000 | 0.9 | % | ||||||||
(c) | Represents cost for financial reporting purposes. |
plc — Public Liability Company
See accompanying notes to financial statements.
36
Praxis Small Cap Fund
Annual report to shareholders
Portfolio managers’ commentary
The Praxis Small Cap Fund Class I Shares gained 8.93 percent, and Class A Shares (Without Load) advanced 8.18 percent, compared to the Russell 2000’s gain of 21.31 percent in 2016. The benchmark started the year weak, losing 12.9 percent in the first six weeks, before rallying 38 percent to end the year within 3 percent of its all-time high achieved in early December.
The Presidential election was the big news for the year. Most put little odds on Donald Trump winning and if he did, thought the market was headed for a sell-off. The market saw it differently. The Trump victory led to a significant positive shift in both consumer and business confidence. As investors digested the potentially positive impact of Trump’s “America First” campaign promises – lower taxes, reduced regulation and fiscal stimulus – valuations expanded to cycle-high levels.
Despite the election fireworks, the U.S. economy continued on its slow, but modest, growth path. The Index of Leading Indicators remained positive, but hasn’t yet reflected the improved outlook. The consumer continues to be in good shape. Sentiment has improved post-election and the positive impact of more jobs and higher wages continue to flow into the economy. In addition, the industrial economy continues to improve. The Federal Reserve continues to talk about gradually raising the federal funds rate and took action during the fourth quarter. They also indicated their desire to raise the funds rate several more times in 2017. While the Fed desires faster growth and higher inflation, the unemployment rate is below 5 percent and we are starting to see some increases in inflation, especially labor costs. Both are historically consistent with tighter monetary conditions.
Our steady growth forecast remains intact but our positive outlook is not without risks. Current areas of focus include an unexpected policy mistake from President Trump, global growth (specifically China) and the strong U.S. dollar. Overall, we expect to see modest revenue growth, while profits should trend higher as easier comparisons (especially in the energy sector) should more than offset higher labor costs. A lower corporate tax rate would materially improve earnings per share. Companies continue to buy back stock, increase their dividends and remain active in mergers and acquisitions, all of which support the market. We continue to be positive on the markets although we wouldn’t be surprised if we experienced higher than normal market volatility, given the current stretched valuations.
For 2016, financials and materials were by far the best performing sectors, with all but one (healthcare) posting positive gains for the year. After lagging behind growth stocks over the past several years, value stocks significantly outperformed in 2016 (25.2 percent versus 9.7 percent), which led to the smallest, slowest-growing, highest-yielding, and cheapest-valued companies performing the best.
The Fund’s performance, while positive, significantly lagged the benchmark in 2016. Both our stock selection and sector allocation decisions detracted from our results relative to the benchmark. Our biggest challenge was that our strategy was out of favor. The factors we believe are important in building long-term wealth – higher quality, competitively advantaged companies with viable strategies to increase the value of their businesses via successful reinvestment of cash flow – have not been the characteristics outperforming the benchmark. We had a more cautiously positioned portfolio, and our growth bias and focus on larger companies worked against us.
The Fund benefitted from six of our portfolio investments being acquired and seven of our investments “graduated” out of the Fund (market cap exceeded $6 billion) this year. While not in favor during 2016, we remain confident in our higher quality investment strategy and believe it remains prudent during this period of higher valuations and potentially increased market volatility.
Our investment strategy is to identify competitively advantaged companies that generate strong financial returns with good reinvestment opportunities and purchase these stocks at attractive prices. We believe this strategy of investing in competitively advantaged companies with viable strategies to increase the value of their businesses will continue to be beneficial for our investors. Our goal is to generate superior returns over time relative to our benchmark and to minimize the risk (volatility) of the portfolio.
The management of our investment process truly maximizes our internal, research-intensive investment process. By incorporating the total research capabilities of the firm, we are constantly identifying and analyzing companies that meet our stringent criteria. We believe our consistent investment disciplines have produced a winning investment strategy, and have us well positioned going forward.
Steven R. Purvis, CFA®
Praxis Small Cap Fund Manager
Luther King Capital Management
The views expressed are those of the portfolio manager as of Dec. 31, 2016, are subject to change, and may differ from the views of other portfolio managers or the firm as a whole. These opinions are not intended to be a forecast of future events, a guarantee of future results, or investment advice. All data referenced are from sources deemed to be reliable but cannot be guaranteed. Securities and sectors referenced should not be construed as a solicitation or recommendation or be used as the sole basis for any investment decision.
37
Praxis Small Cap Fund
Performance Review
Growth of $10,000 investment from 5/1/07 to 12/31/16
This chart represents historical performance of a hypothetical investment of $10,000 in Class A Shares (adjusted for the maximum sales charge of 5.25%) of the Fund and Index from 5/1/07 to 12/31/16, and includes the reinvestment of dividends and capital gains.
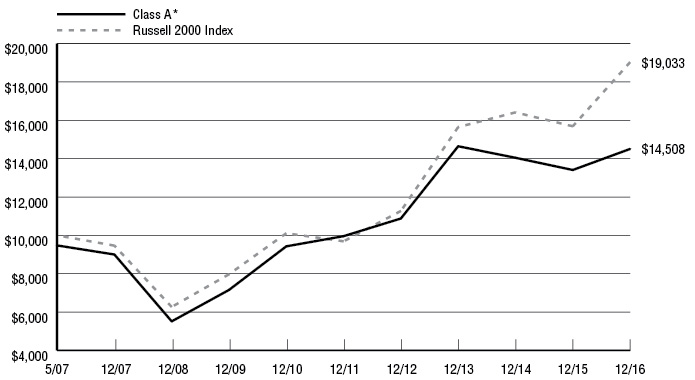
Annualized | |||||||
Inception Date | One | Three | Five | Since Inception | Expense Ratio** | ||
Praxis Small Cap Fund | |||||||
Class A * | 5/1/07 | 2.54% | -2.08% | 6.66% | 3.93% | 1.26% | 1.13% |
Class A (Without Load) | 5/1/07 | 8.18% | -0.32% | 7.82% | 4.50% | ||
Class I | 5/1/07 | 8.93% | 0.31% | 8.53% | 5.03% | 0.51% | 0.51% |
Russell 2000 Index1 |
| 21.31% | 6.74% | 14.46% | 6.88% |
|
|
Past performance does not guarantee future results. The performance data quoted represents past performance and current returns may be lower or higher. The investment return and principal value will fluctuate so that an investor’s shares, when redeemed, may be worth more or less than the original cost. These performance figures do not reflect the deduction of taxes that a shareholder would pay on fund distributions or the redemption of fund shares. To obtain performance information current to the most recent month end, please visit www.praxismutualfunds.com. Indexes are unmanaged, do not incur fees, and it is not possible to invest directly in an index.
The total returns shown reflect any expenses that were contractually or voluntarily reduced, reimbursed or paid by any party during the periods presented. In such instances, and without activity, the total returns would have been lower.
* | The total return figures shown reflect the maximum sales charge applicable to Class A Shares. Class A Shares have a maximum sales charge on purchases of 5.25%. |
** | Reflects the expense ratios as reported in the Prospectus dated April 30, 2016. Contractual fee waivers are in effect from May 1, 2016 through April 30, 2017 for Class A. |
1 | The Russell 2000 Index is a subset of the Russell 3000 Index representing approximately 10% of the total market capitalization of that index. It includes approximately 2000 of the smallest securities based on a combination of their market cap and current index membership. |
The above index is for illustrative purposes only and does not reflect the deduction of expenses associated with a mutual fund, such as investment management and fund accounting fees. The Fund’s performance reflects the deduction of these services. An investor cannot invest directly in an index, although they can invest in its underlying securities.
38
Schedule of Investments
Praxis Small Cap Fund
December 31, 2016
| SHARES | FAIR VALUE | ||||||
COMMON STOCKS—91.0% | ||||||||
AEROSPACE & DEFENSE—1.3% | ||||||||
Hexcel Corp. | 11,800 | $ | 606,992 | |||||
BANKS—11.3% | ||||||||
BancorpSouth, Inc. | 33,458 | 1,038,871 | ||||||
Bank of the Ozarks, Inc. | 9,855 | 518,274 | ||||||
Capital Bank Financial Corp. - Class A | 16,685 | 654,886 | ||||||
Hanmi Financial Corp. | 24,300 | 848,070 | ||||||
Home Bancshares, Inc. | 43,830 | 1,217,159 | ||||||
Pinnacle Financial Partners, Inc. | 16,295 | 1,129,244 | ||||||
5,406,504 | ||||||||
BUILDING PRODUCTS—1.9% | ||||||||
American Woodmark Corp. (a) | 8,725 | 656,556 | ||||||
PGT, Inc. (a) | 23,970 | 274,457 | ||||||
931,013 | ||||||||
CAPITAL MARKETS—2.2% | ||||||||
BGC Partners, Inc. - Class A | 61,175 | 625,820 | ||||||
NorthStar Asset Management Group, Inc. | 27,905 | 416,343 | ||||||
1,042,163 | ||||||||
COMMERCIAL SERVICES & SUPPLIES—3.4% | ||||||||
Healthcare Services Group, Inc. | 18,740 | 734,046 | ||||||
Team, Inc. (a) | 22,820 | 895,685 | ||||||
1,629,731 | ||||||||
COMMUNICATIONS EQUIPMENT—1.0% | ||||||||
Infinera Corp. (a) | 54,180 | 459,988 | ||||||
CONSTRUCTION & ENGINEERING—3.5% | ||||||||
EMCOR Group, Inc. | 14,630 | 1,035,219 | ||||||
MasTec, Inc. (a) | 17,265 | 660,386 | ||||||
1,695,605 | ||||||||
CONSTRUCTION MATERIALS—0.3% | ||||||||
Summit Materials, Inc. - Class A (a) | 6,105 | 145,238 | ||||||
DISTRIBUTORS—2.3% | ||||||||
Pool Corp. | 10,615 | 1,107,569 | ||||||
EQUITY REAL ESTATE INVESTMENT TRUSTS (REITS)—5.7% | ||||||||
First Industrial Realty Trust, Inc. | 28,670 | 804,193 | ||||||
Life Storage, Inc. | 4,680 | 399,017 | ||||||
Outfront Media, Inc. | 25,940 | 645,128 | ||||||
STAG Industrial, Inc. | 36,185 | 863,736 | ||||||
2,712,074 | ||||||||
FOOD & STAPLES RETAILING—0.5% | ||||||||
Sprouts Farmers Market, Inc. (a) | 13,490 | 255,231 | ||||||
FOOD PRODUCTS—3.6% | ||||||||
Post Holdings, Inc. (a) | 8,625 | 693,364 | ||||||
Snyder's-Lance, Inc. | 19,715 | 755,873 | ||||||
TreeHouse Foods, Inc. (a) | 3,715 | 268,186 | ||||||
1,717,423 | ||||||||
HEALTH CARE EQUIPMENT & SUPPLIES—4.6% | ||||||||
Cantel Medical Corp. | 11,565 | 910,744 | ||||||
Cynosure, Inc. - Class A (a) | 8,805 | 401,508 | ||||||
Neogen Corp. (a) | 13,285 | 876,810 | ||||||
2,189,062 | ||||||||
HEALTH CARE PROVIDERS & SERVICES—2.8% | ||||||||
Aceto Corp. | 21,815 |
| 479,276 | |||||
HealthEquity, Inc. (a) | 21,010 | 851,325 | ||||||
1,330,601 | ||||||||
HEALTH CARE TECHNOLOGY—1.7% | ||||||||
Omnicell, Inc. (a) | 24,160 | 819,024 | ||||||
INTERNET & DIRECT MARKETING RETAIL—2.0% | ||||||||
Nutrisystem, Inc. | 27,700 | 959,805 | ||||||
INTERNET SOFTWARE & SERVICES—3.1% | ||||||||
Criteo SA - ADR (a) | 1,890 | 77,641 | ||||||
Envestnet, Inc. (a) | 22,340 | 787,485 | ||||||
SPS Commerce, Inc. (a) | 8,880 | 620,623 | ||||||
1,485,749 | ||||||||
IT SERVICES—3.6% | ||||||||
Acxiom Corp. (a) | 32,625 | 874,350 | ||||||
Euronet Worldwide, Inc. (a) | 11,690 | 846,707 | ||||||
1,721,057 | ||||||||
LIFE SCIENCES TOOLS & SERVICES—4.8% | ||||||||
Cambrex Corp. (a) | 7,335 | 395,723 | ||||||
Charles River Laboratories International, Inc. (a) | 10,175 | 775,233 | ||||||
PRA Health Sciences, Inc. (a) | 16,325 | 899,834 | ||||||
VWR Corp. (a) | 9,309 | 233,005 | ||||||
2,303,795 | ||||||||
MACHINERY—3.6% | ||||||||
John Bean Technologies Corp. | 10,055 | 864,227 | ||||||
Kennametal, Inc. | 20,350 | 636,141 | ||||||
Toro Co. (The) | 4,510 | 252,335 | ||||||
1,752,703 | ||||||||
MARINE—1.6% | ||||||||
Kirby Corp. (a) | 11,715 | 779,047 | ||||||
METALS & MINING—1.2% | ||||||||
Ferroglobe plc | 51,590 | 558,720 | ||||||
MULTILINE RETAIL—1.8% | ||||||||
Ollie's Bargain Outlet Holdings, Inc. (a) | 31,275 | 889,774 | ||||||
PHARMACEUTICALS—1.0% | ||||||||
Akorn, Inc. (a) | 21,897 | 478,011 | ||||||
PROFESSIONAL SERVICES—1.9% | ||||||||
FTI Consulting, Inc. (a) | 19,705 | 888,301 | ||||||
ROAD & RAIL—1.8% | ||||||||
Genesee & Wyoming, Inc. - Class A (a) | 12,175 | 845,067 | ||||||
SEMICONDUCTORS & SEMICONDUCTOR EQUIPMENT—2.5% | ||||||||
Lattice Semiconductor Corp. (a) | 89,645 | 659,787 | ||||||
Rambus, Inc. (a) | 39,335 | 541,643 | ||||||
1,201,430 | ||||||||
SOFTWARE—8.2% | ||||||||
ACI Worldwide, Inc. (a) | 30,285 | 549,673 | ||||||
Callidus Software, Inc. (a) | 28,005 | 470,484 | ||||||
Fair Isaac Corp. | 4,360 | 519,799 | ||||||
Manhattan Associates, Inc. (a) | 12,315 | 653,064 | ||||||
Proofpoint, Inc. (a) | 7,435 | 525,283 | ||||||
See accompanying notes to financial statements.
39
Schedule of Investments, continued
Praxis Small Cap Fund
December 31, 2016
| SHARES | FAIR VALUE | ||||||
COMMON STOCKS—91.0%, continued | ||||||||
SOFTWARE—8.2%, continued | ||||||||
Take-Two Interactive Software, Inc. (a) | 24,650 | $ | 1,214,999 | |||||
3,933,302 | ||||||||
TEXTILES, APPAREL & LUXURY GOODS—2.6% | ||||||||
Columbia Sportswear Co. | 13,450 | 784,135 | ||||||
Oxford Industries, Inc. | 7,885 | 474,125 | ||||||
1,258,260 | ||||||||
THRIFTS & MORTGAGE FINANCE—2.4% | ||||||||
Banc of California, Inc. | 67,350 | 1,168,522 | ||||||
TRADING COMPANIES & DISTRIBUTORS—2.8% | ||||||||
MSC Industrial Direct Co., Inc. - Class A | 7,500 | 692,925 | ||||||
Watsco, Inc. | 4,260 | 630,991 | ||||||
1,323,916 | ||||||||
TOTAL COMMON STOCKS (COST $32,889,952) | 43,595,677 | |||||||
| COUPON | MATURITY | PRINCIPAL AMOUNT | FAIR VALUE | |||||||||
CORPORATE NOTES—0.9% | |||||||||||||
COMMUNITY DEVELOPMENT—0.9% | |||||||||||||
Calvert Social Investment Foundation, Inc. (Cost $440,000) (b) | 1.000 | % | 06/15/17 | $ | 440,000 | $ | 440,000 | ||||||
TOTAL INVESTMENTS (Cost (c) $33,329,952— Unrealized gain/loss $10,705,725)—91.9% | $ | 44,035,677 | |||||||||||
Other Assets in Excess of Liabilities—8.1% | 3,874,188 | ||||||||||||
NET ASSETS—100.0% | $ | 47,909,865 | |||||||||||
(a) | Non-income producing security. |
(b) | Restricted and illiquid securities not registered under the Securities Act of 1933 are as follows: |
| Acquisition Date | Current Cost | Fair Value | % of Net Assets | ||||||||||
Calvert Social Investment Foundation, Inc. 1.00%, 06/15/17 | 06/10/16 | $ | 440,000 | $ | 440,000 | 0.9 | % | ||||||
(c) | Represents cost for financial reporting purposes. |
ADR — American Depositary Receipt
plc — Public Liability Company
See accompanying notes to financial statements.
40
Praxis Genesis Portfolios
Annual report to shareholders
Portfolio managers’ commentary
In 2016, most asset classes did quite well, and domestic stocks were especially strong in the fourth quarter. The U.S. economy started slowly in 2016, as gross domestic product growth was quite weak, but economic growth was stronger in the second half of the year. After a very poor 2015, commodities and emerging market stocks bounced back with the Bloomberg Commodity Index up 11.7 percent and the MSCI Emerging Market Index up 11.2 percent. The Standard and Poor’s 500 Index (“S&P 500”) was up 12.0 percent while the Barclays Aggregate returned 2.7 percent. The S&P 500 energy and telecommunications stock sectors were very strong. Energy was up 27.4 percent while telecommunications increased 23.5 percent. The only S&P 500 sector with a loss was health care, which was down 2.7 percent.
As is normally the case, the U.S. equity market cap size and style mattered. The Russell 2000 Index increased 21.3 percent and the S&P Midcap 400 Index was up 20.7 percent, which are both about 10 percent higher than the large cap S&P 500. Style also mattered a great deal as the S&P 500 Value Index rose 17.4 percent, while the S&P 500 Growth Index increased 6.9 percent.
Overseas results were mixed with emerging market doing much better than developed markets. The MSCI Emerging Market Index was up 11.2 percent versus the developed market MSCI EAFE Index up only 1.3 percent. In general, currency hurt returns as the U.S. dollar strengthened against most other major currencies.
Bond returns were positive. Generally, interest rates were pretty similar at the start of the year versus the end of the year, but rates were very volatile throughout the year. At the start of 2016, the 10-year Treasury note yield started at 2.27 percent and it ended at 2.45 percent. In July 2016, the yield reached its lowest at 1.36 percent. By the middle of the year, U.S. interest rates were among a shrinking group of developed countries that still had positive yields. Around the middle of the year, there was about $12 trillion of debt with negative yields across the world. Negative yields on debt would have been viewed as almost impossible a decade ago, but the Swiss 5-year government bond got as low as -1.11 percent on July 11, 2016.
The asset allocation strategies pursued by the Genesis Portfolios do not lend themselves to easy benchmarking, but in 2015, the S&P Target Risk multi-asset class indexes were chosen as the best index representative. While these indexes are not completely reflective of how the Genesis portfolios are allocated, they are far superior to our previous methodology of choosing one broad bond or stock index, even though the portfolios include both bonds and stocks.
The Genesis Conservative Portfolio’s Class A Shares (Without Load) returned 4.23 percent, which underperformed the S&P Target Risk Conservative Index return of 5.09 percent and outperformed the Barclays Aggregate, which had a return of 2.65 percent.
The Genesis Balanced Portfolio’s Class A Shares (Without Load) return was 6.58 percent, which underperformed both the S&P Target Risk Growth Index’s return of 6.67 percent and the Russell 3000 benchmark return of 12.74 percent.
The Genesis Growth Portfolio’s Class A Shares (Without Load) return was 7.82 percent, which outperformed the S&P Target Risk Aggressive Index’s return of 7.66 percent and underperformed the Russell 3000 benchmark return of 12.74 percent.
The allocation to fixed income was the largest detractor on an absolute basis for each fund because of its poor performance. The biggest contributor was U.S. value stock, which performed extremely well in 2016.
The underlying investments in the Genesis Portfolios are the other Praxis Mutual Funds, including four equity funds and one fixed income fund, which are held in proportions matching the risk profile of each of the Genesis Portfolios. We take a long-term approach in assigning weights to the various underlying Funds, relying on the premise that the higher-risk equity funds are expected to generate higher long-term returns than lower-risk fixed income investments. This worked in 2016 as riskier assets were better performers relative to fixed income.
Each of the Portfolios benefited from the relative to index outperformance of the Praxis Growth Index Fund and the Praxis International Index Fund. The Praxis Impact Bond Fund and the Praxis Value Index Fund slightly underperformed their benchmarks and the Praxis Small Cap Fund underperformed its benchmark by a substantial margin. Effective January 1, 2017, the Praxis Small Cap Fund underwent a strategy change from an actively managed small cap fund to a passively managed small cap index fund. The Fund is no longer being sub-advised by Luther King Capital Management. This change in fund strategy to passive management now matches the other equity funds in the Praxis lineup.
Benjamin Bailey, CFA®
Praxis Genesis Portfolios Co-Manager
Praxis Mutual Funds
Delmar King
Praxis Genesis Portfolios Co-Manager
Praxis Mutual Funds
The views expressed are those of the portfolio managers as of Dec. 31, 2016, are subject to change, and may differ from the views of other portfolio managers or the firm as a whole. These opinions are not intended to be a forecast of future events, a guarantee of future results, or investment advice. All data referenced are from sources deemed to be reliable but cannot be guaranteed. Securities and sectors referenced should not be construed as a solicitation or recommendation or be used as the sole basis for any investment decision.
41
Praxis Genesis Conservative Portfolio
Performance Review
Growth of $10,000 investment from 12/31/09 to 12/31/16
This chart represents historical performance of a hypothetical investment of $10,000 in Class A Shares (adjusted for the maximum sales charge of 5.25%) of the Fund and Index from 12/31/09 to 12/31/16, and includes the reinvestment of dividends and capital gains.
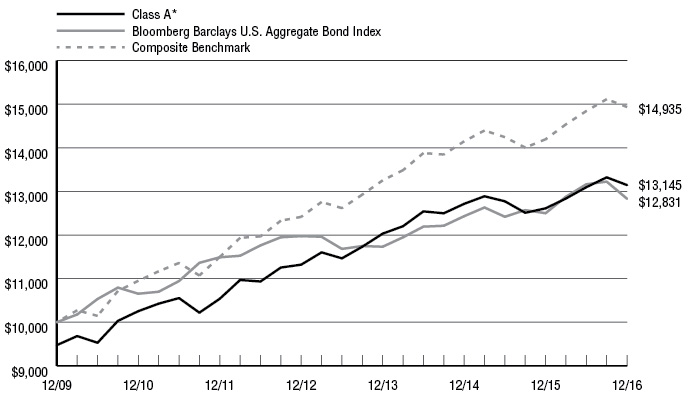
Annualized | |||||||
Inception Date | One | Three | Five | Since Inception | Expense Ratio** | ||
Praxis Genesis Conservative Portfolio | |||||||
Class A * | 12/31/09 | -1.27% | 1.15% | 3.40% | 3.99% | 1.15% | 1.12% |
Class A (Without Load) | 12/31/09 | 4.23% | 2.99% | 4.52% | 4.79% | ||
Bloomberg Barclays U.S. Aggregate Bond Index1 | 2.65% | 3.03% | 2.23% | 3.62% | |||
Conservative Composite Benchmark2 | 5.21% | 4.06% | 5.37% | 5.90% | |||
S&P Target Risk Conservative Index3 |
| 5.09% | 2.63% | 4.22% | 4.67% |
|
|
Past performance does not guarantee future results. The performance data quoted represents past performance and current returns may be lower or higher. The investment return and principal value will fluctuate so that an investor’s shares, when redeemed, may be worth more or less than the original cost. These performance figures do not reflect the deduction of taxes that a shareholder would pay on fund distributions or the redemption of fund shares. To obtain performance information current to the most recent month end, please visit www.praxismutualfunds.com. Indexes are unmanaged, do not incur fees, and it is not possible to invest directly in an index.
The total returns shown reflect any expenses that were contractually or voluntarily reduced, reimbursed or paid by any party during the periods presented. In such instances, and without activity, the total returns would have been lower.
* | The total return figures shown reflect the maximum sales charge applicable to Class A Shares. Class A Shares have a maximum sales charge on purchases of 5.25%. |
** | Reflects the expense ratios as reported in the Prospectus dated April 30, 2016. Contractual fee waivers are in effect from May 1, 2016 through April 30, 2017 for Class A. |
1 | Bloomberg Barclays U.S. Aggregate Bond Index is an unmanaged index composed of the Bloomberg Barclays Capital Government/Credit Index and the Bloomberg Barclays Capital Mortgage-Backed Securities Index and includes Treasury issues, agency issues, corporate bond issues and mortgage-backed securities, and is intended to be generally representative of the bond market as a whole. |
2 | The Conservative Composite Benchmark is comprised of unmanaged indices that correspond to the Portfolio's model allocation and consists of the Bloomberg Barclays U.S. Aggregate Bond Index (70%), the MSCI ACWI ex-USA Index (7.50%), the S&P 500 Index (20%) and the Russell 2000 Index (2.50%). |
3 | S&P Target Risk Conservative Index seeks to emphasize exposure to fixed income, in order to produce a current income stream and avoid excessive volatility of returns. Equities are included to protect long-term purchasing power. The series is comprised of four multi-asset class indices. The index is comprised exclusively of exchange traded funds. |
The above index is for illustrative purposes only and does not reflect the deduction of expenses associated with a mutual fund, such as investment management and fund accounting fees. The Fund’s performance reflects the deduction of these services. An investor cannot invest directly in an index, although they can invest in its underlying securities.
42
Schedule of Investments
Praxis Genesis Conservative Portfolio
December 31, 2016
| SHARES | FAIR VALUE | ||||||
MUTUAL FUNDS—100.0% | ||||||||
DEBT FUND—70.2% | ||||||||
Praxis Impact Bond Fund - Class I (a) | 1,479,976 | $ | 15,169,753 | |||||
EQUITY FUND—29.8% | ||||||||
Praxis Growth Index Fund - Class I (a) | 112,764 | 2,134,626 | ||||||
Praxis International Index Fund - Class I (a) | 169,545 | 1,612,374 | ||||||
Praxis Small Cap Fund - Class I (a) | 52,318 | 541,494 | ||||||
Praxis Value Index Fund - Class I (a) | 170,858 | 2,145,972 | ||||||
6,434,466 | ||||||||
TOTAL MUTUAL FUNDS (Cost (b) $20,049,220—Unrealized gain/loss $1,554,999)—100.0% | $ | 21,604,219 | ||||||
Liabilities in Excess of Other Assets—(0.0%) (c) | (8,325 | ) | ||||||
NET ASSETS—100.0% | $ | 21,595,894 | ||||||
(a) | Affiliated Fund. |
(b) | Represents cost for financial reporting purposes. |
(c) | Percentage rounds to less than 0.1%. |
See accompanying notes to financial statements.
43
Praxis Genesis Balanced Portfolio
Performance Review
Growth of $10,000 investment from 12/31/09 to 12/31/16
This chart represents historical performance of a hypothetical investment of $10,000 in Class A Shares (adjusted for the maximum sales charge of 5.25%) of the Fund and Index from 12/31/09 to 12/31/16, and includes the reinvestment of dividends and capital gains.
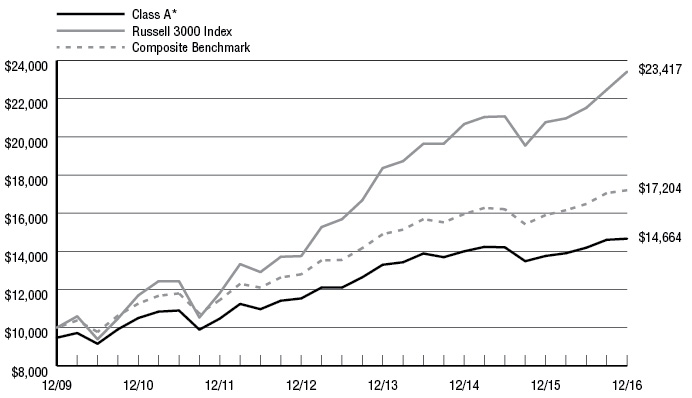
Annualized | |||||||
Inception Date | One | Three | Five | Since Inception | Expense Ratio** | ||
Praxis Genesis Balanced Portfolio | |||||||
Class A * | 12/31/09 | 1.00% | 1.48% | 5.81% | 5.63% | 1.10% | 1.10% |
Class A (Without Load) | 12/31/09 | 6.58% | 3.31% | 6.96% | 6.44% | ||
Russell 3000 Index1 | 12.74% | 8.43% | 14.67% | 12.92% | |||
Balanced Composite Benchmark2 | 8.18% | 4.91% | 8.49% | 8.06% | |||
S&P Target Risk Growth Index3 |
| 6.67% | 3.95% | 7.75% | 7.28% |
|
|
Past performance does not guarantee future results. The performance data quoted represents past performance and current returns may be lower or higher. The investment return and principal value will fluctuate so that an investor’s shares, when redeemed, may be worth more or less than the original cost. These performance figures do not reflect the deduction of taxes that a shareholder would pay on fund distributions or the redemption of fund shares. To obtain performance information current to the most recent month end, please visit www.praxismutualfunds.com. Indexes are unmanaged, do not incur fees, and it is not possible to invest directly in an index.
The total returns shown reflect any expenses that were contractually or voluntarily reduced, reimbursed or paid by any party during the periods presented. In such instances, and without activity, the total returns would have been lower.
* | The total return figures shown reflect the maximum sales charge applicable to Class A Shares. Class A Shares have a maximum sales charge on purchases of 5.25%. |
** | Reflects the expense ratios as reported in the Prospectus dated April 30, 2016. Contractual fee waivers are in effect from May 1, 2016 through April 30, 2017 for Class A. |
1 | The Russell 3000 Index is a widely recognized unmanaged market capitalization-weighted index measuring the performance of the 3,000 largest U.S. companies based on total market capitalization. |
2 | The Balanced Composite Benchmark is comprised of unmanaged indices that correspond to the Portfolio's model allocation and consists of the Bloomberg Barclays U.S. Aggregate Bond Index (40%), the MSCI ACWI ex-USA Index (15%), the S&P 500 Index (35%) and the Russell 2000 Index (10%). |
3 | S&P Target Risk Growth Index seeks to provide increased exposure to equities, while using fixed income to dampen risk. The series is comprised of four multi-asset class indices. The index is comprised exclusively of exchange trade funds. |
The above index is for illustrative purposes only and does not reflect the deduction of expenses associated with a mutual fund, such as investment management and fund accounting fees. The Fund’s performance reflects the deduction of these services. An investor cannot invest directly in an index, although they can invest in its underlying securities.
44
Schedule of Investments
Praxis Genesis Balanced Portfolio
December 31, 2016
| SHARES | FAIR VALUE | ||||||
MUTUAL FUNDS—100.0% | ||||||||
DEBT FUND—40.2% | ||||||||
Praxis Impact Bond Fund - Class I (a) | 2,496,007 | $ | 25,584,075 | |||||
EQUITY FUND—59.8% | ||||||||
Praxis Growth Index Fund - Class I (a) | 582,394 | 11,024,719 | ||||||
Praxis International Index Fund - Class I (a) | 1,001,034 | 9,519,836 | ||||||
Praxis Small Cap Fund - Class I (a) | 617,010 | 6,386,048 | ||||||
Praxis Value Index Fund - Class I (a) | 882,194 | 11,080,357 | ||||||
38,010,961 | ||||||||
TOTAL MUTUAL FUNDS (Cost (b) $54,313,654—Unrealized gain/loss $9,281,381)—100.0% | $ | 63,595,035 | ||||||
Liabilities in Excess of Other Assets—(0.0%) (c) | (29,905 | ) | ||||||
NET ASSETS—100.0% | $ | 63,565,130 | ||||||
(a) | Affiliated Fund. |
(b) | Represents cost for financial reporting purposes. |
(c) | Percentage rounds to less than 0.1%. |
See accompanying notes to financial statements.
45
Praxis Genesis Growth Portfolio
Performance Review
Growth of $10,000 investment from 12/31/09 to 12/31/16
This chart represents historical performance of a hypothetical investment of $10,000 in Class A Shares (adjusted for the maximum sales charge of 5.25%) of the Fund and Index from 12/31/09 to 12/31/16, and includes the reinvestment of dividends and capital gains.
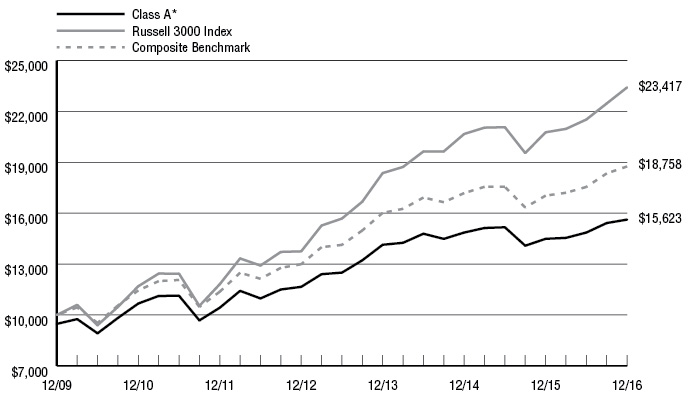
Annualized | |||||||
Inception Date | One | Three | Five | Since Inception | Expense Ratio** | ||
Praxis Genesis Growth Portfolio | |||||||
Class A * | 12/31/09 | 2.14% | 1.53% | 7.27% | 6.59% | 1.21% | 1.21% |
Class A (Without Load) | 12/31/09 | 7.82% | 3.38% | 8.43% | 7.41% | ||
Russell 3000 Index1 | 12.74% | 8.43% | 14.67% | 12.92% | |||
Growth Composite Benchmark2 | 10.10% | 5.40% | 10.53% | 9.40% | |||
S&P Target Risk Aggressive Index3 |
| 7.66% | 4.26% | 9.85% | 9.13% |
|
|
Past performance does not guarantee future results. The performance data quoted represents past performance and current returns may be lower or higher. The investment return and principal value will fluctuate so that an investor’s shares, when redeemed, may be worth more or less than the original cost. These performance figures do not reflect the deduction of taxes that a shareholder would pay on fund distributions or the redemption of fund shares. To obtain performance information current to the most recent month end, please visit www.praxismutualfunds.com. Indexes are unmanaged, do not incur fees, and it is not possible to invest directly in an index.
The total returns shown reflect any expenses that were contractually or voluntarily reduced, reimbursed or paid by any party during the periods presented. In such instances, and without activity, the total returns would have been lower.
* | The total return figures shown reflect the maximum sales charge applicable to Class A Shares. Class A Shares have a maximum sales charge on purchases of 5.25%. |
** | Reflects the expense ratios as reported in the Prospectus dated April 30, 2016. Contractual fee waivers are in effect from May 1, 2016 through April 30, 2017 for Class A. |
1 | The Russell 3000 Index is a widely recognized unmanaged market capitalization-weighted index measuring the performance of the 3,000 largest U.S. companies based on total market capitalization. |
2 | The Growth Composite Benchmark is comprised of unmanaged indices that correspond to the Portfolio's model allocation and consists of the Bloomberg Barclays U.S. Aggregate Bond Index (20%), the MSCI ACWI ex-USA Index (20%), the S&P 500 Index (45%) and the Russell 2000 Index (15%) |
3 | S&P Target Risk Aggressive Index seeks to emphasize exposure to equities, maximizing opportunities for long-term capital accumulation. It may include small allocations in fixed income to enhance portfolio efficiency. The series is comprised of four multi-asset class indices. The index is comprised exclusively of exchange traded funds. |
The above index is for illustrative purposes only and does not reflect the deduction of expenses associated with a mutual fund, such as investment management and fund accounting fees. The Fund’s performance reflects the deduction of these services. An investor cannot invest directly in an index, although they can invest in its underlying securities.
46
Schedule of Investments
Praxis Genesis Growth Portfolio
December 31, 2016
| SHARES | FAIR VALUE | ||||||
MUTUAL FUNDS—100.0% | ||||||||
DEBT FUND—20.1% | ||||||||
Praxis Impact Bond Fund - Class I (a) | 1,060,770 | $ | 10,872,897 | |||||
EQUITY FUND—79.9% | ||||||||
Praxis Growth Index Fund - Class I (a) | 636,438 | 12,047,766 | ||||||
Praxis International Index Fund - Class I (a) | 1,134,494 | 10,789,040 | ||||||
Praxis Small Cap Fund - Class I (a) | 785,616 | 8,131,124 | ||||||
Praxis Value Index Fund - Class I (a) | 963,972 | 12,107,486 | ||||||
43,075,416 | ||||||||
TOTAL MUTUAL FUNDS (Cost (b) $43,708,825—Unrealized gain/loss $10,239,488)—100.0% | $ | 53,948,313 | ||||||
Liabilities in Excess of Other Assets—(0.0%) (c) | (22,401 | ) | ||||||
NET ASSETS—100.0% | $ | 53,925,912 | ||||||
(a) | Affiliated Fund. |
(b) | Represents cost for financial reporting purposes. |
(c) | Percentage rounds to less than 0.1%. |
See accompanying notes to financial statements.
47
Statements of Assets & Liabilities
December 31, 2016
| Praxis Impact | Praxis International | Praxis Value | Praxis Growth Index Fund | Praxis Small Cap Fund | |||||||||||||||
Assets | ||||||||||||||||||||
Total investments in unaffiliated securities, at cost | $ | 448,272,098 | $ | 172,801,421 | $ | 128,407,412 | $ | 141,343,880 | $ | 33,329,952 | ||||||||||
Investments in unaffiliated securities, at fair value | $ | 451,871,086 | $ | 190,220,219 | $ | 158,606,050 | $ | 202,713,517 | $ | 44,035,677 | ||||||||||
Cash | 9,966,574 | 2,358,933 | 1,519,407 | 895,957 | 3,851,528 | |||||||||||||||
Receivable for investments sold | 252,158 | — | — | — | — | |||||||||||||||
Receivable for capital shares sold | 1,655,134 | 3,504,370 | 2,285,458 | 2,085,595 | 23,894 | |||||||||||||||
Receivable for dividends and interest | 3,730,349 | 341,524 | 274,433 | 193,983 | 34,028 | |||||||||||||||
Receivable for tax reclaims | — | 132,608 | — | 13,795 | — | |||||||||||||||
Prepaid expenses | 86,920 | 33,549 | 29,225 | 39,665 | 16,985 | |||||||||||||||
Total Assets | 467,562,221 | 196,591,203 | 162,714,573 | 205,942,512 | 47,962,112 | |||||||||||||||
| ||||||||||||||||||||
Liabilities | ||||||||||||||||||||
Distributions payable | 1,019,371 | 3,584,912 | 3,531,406 | 1,906,109 | — | |||||||||||||||
Payable for capital shares redeemed | 1,368,489 | 386,504 | 247,647 | 68,300 | 8,052 | |||||||||||||||
Accrued expenses and other payables: | ||||||||||||||||||||
Investment advisory fees | 156,771 | 97,312 | 41,323 | 51,596 | 34,825 | |||||||||||||||
Administration fees | 38,860 | 13,320 | 12,270 | 20,780 | 5,140 | |||||||||||||||
Distribution fees | 18,128 | 3,777 | 4,611 | 14,232 | 1,226 | |||||||||||||||
Other | 51,792 | 30,293 | 11,076 | 12,831 | 3,004 | |||||||||||||||
Total Liabilities | 2,653,411 | 4,116,118 | 3,848,333 | 2,073,848 | 52,247 | |||||||||||||||
| ||||||||||||||||||||
Net Assets | $ | 464,908,810 | $ | 192,475,085 | $ | 158,866,240 | $ | 203,868,664 | $ | 47,909,865 | ||||||||||
| ||||||||||||||||||||
Components of Net Assets | ||||||||||||||||||||
Paid-in capital | $ | 461,822,672 | $ | 189,286,310 | $ | 122,644,398 | $ | 135,587,455 | $ | 37,205,633 | ||||||||||
Accumulated (distributions in excess of) net investment income | 8,856 | (215,688 | ) | — | 268,352 | — | ||||||||||||||
Accumulated net realized gains (losses) on investments and foreign currency transactions | (521,706 | ) | (14,008,495 | ) | 6,023,204 | 6,643,220 | (1,493 | ) | ||||||||||||
Net unrealized appreciation on investments and foreign currency translations | 3,598,988 | 17,412,958 | 30,198,638 | 61,369,637 | 10,705,725 | |||||||||||||||
Net Assets | $ | 464,908,810 | $ | 192,475,085 | $ | 158,866,240 | $ | 203,868,664 | $ | 47,909,865 | ||||||||||
| ||||||||||||||||||||
Pricing of Class A Shares | ||||||||||||||||||||
Net assets attributable to Class A shares | $ | 83,211,478 | $ | 18,877,257 | $ | 21,675,661 | $ | 67,006,857 | $ | 5,771,132 | ||||||||||
Shares of beneficial interest outstanding (unlimited number of shares authorized, no par value) | 8,078,246 | 1,994,085 | 1,714,547 | 3,561,298 | 596,618 | |||||||||||||||
Net asset value, offering price and redemption price per share | $ | 10.30 | $ | 9.47 | $ | 12.64 | $ | 18.82 | $ | 9.67 | ||||||||||
Maximum sales charge | 3.75 | % | 5.25 | % | 5.25 | % | 5.25 | % | 5.25 | % | ||||||||||
Maximum offering price per share | $ | 10.70 | $ | 9.99 | $ | 13.34 | $ | 19.86 | $ | 10.21 | ||||||||||
| ||||||||||||||||||||
Pricing of Class I Shares | ||||||||||||||||||||
Net assets attributable to Class I shares | $ | 381,697,332 | $ | 173,597,828 | $ | 137,190,579 | $ | 136,861,807 | $ | 42,138,733 | ||||||||||
Shares of beneficial interest outstanding | 37,225,261 | 18,250,635 | 10,921,650 | 7,231,198 | 4,071,279 | |||||||||||||||
Net asset value and redemption price per share | $ | 10.25 | $ | 9.51 | $ | 12.56 | $ | 18.93 | $ | 10.35 | ||||||||||
See accompanying notes to financial statements.
48
Statements of Assets & Liabilities, continued
December 31, 2016
| Praxis Genesis Conservative Portfolio | Praxis Genesis Balanced | Praxis Genesis Growth | |||||||||
Assets | ||||||||||||
Total investments in affiliated securities, at cost | $ | 20,049,220 | $ | 54,313,654 | $ | 43,708,825 | ||||||
Investments in affiliated securities, at fair value | 21,604,219 | 63,595,035 | 53,948,313 | |||||||||
Cash | 206 | 318 | 334 | |||||||||
Receivable for investments sold | 1,883 | 36,084 | 10,610 | |||||||||
Receivable for capital shares sold | 120,832 | 587,559 | 561,256 | |||||||||
Receivable for dividends and interest | 136,140 | 606,781 | 631,538 | |||||||||
Prepaid expenses | 4,514 | 5,592 | 7,186 | |||||||||
Total Assets | 21,867,794 | 64,831,369 | 55,159,237 | |||||||||
| ||||||||||||
Liabilities | ||||||||||||
Distributions payable | 122,315 | 583,775 | 560,244 | |||||||||
Payable for capital shares redeemed | 400 | 44,750 | 11,516 | |||||||||
Payable for investments purchased | 136,140 | 606,781 | 631,537 | |||||||||
Accrued expenses and other payables: | ||||||||||||
Investment advisory fees | 3,430 | 2,701 | 2,298 | |||||||||
Administration fees | 3,654 | 10,835 | 11,715 | |||||||||
Distribution fees | 4,569 | 13,507 | 11,488 | |||||||||
Other | 1,392 | 3,890 | 4,527 | |||||||||
Total Liabilities | 271,900 | 1,266,239 | 1,233,325 | |||||||||
| ||||||||||||
Net Assets | $ | 21,595,894 | $ | 63,565,130 | $ | 53,925,912 | ||||||
| ||||||||||||
Components of Net Assets | ||||||||||||
Paid-in capital | $ | 20,129,351 | $ | 54,320,632 | $ | 43,653,669 | ||||||
Accumulated (distributions in excess of) net investment income | — | — | — | |||||||||
Accumulated net realized gains (losses) on investments | (88,456 | ) | (36,883 | ) | 32,755 | |||||||
Net unrealized appreciation on investments | 1,554,999 | 9,281,381 | 10,239,488 | |||||||||
Net Assets | $ | 21,595,894 | $ | 63,565,130 | $ | 53,925,912 | ||||||
| ||||||||||||
Pricing of Class A Shares | ||||||||||||
Net assets attributable to Class A shares | $ | 21,595,894 | $ | 63,565,130 | $ | 53,925,912 | ||||||
Shares of beneficial interest outstanding | 1,930,943 | 5,066,912 | 4,002,844 | |||||||||
Net asset value, offering price and redemption price per share | $ | 11.18 | $ | 12.55 | $ | 13.47 | ||||||
Maximum sales charge | 5.25 | % | 5.25 | % | 5.25 | % | ||||||
Maximum offering price per share | $ | 11.80 | $ | 13.25 | $ | 14.22 | ||||||
See accompanying notes to financial statements.
49
Statements of Operations
For the year ended December 31, 2016
| Praxis Impact | Praxis International | Praxis Value | Praxis Growth Index Fund | Praxis Small Cap Fund | |||||||||||||||
Investment income | ||||||||||||||||||||
Dividends | $ | 207,867 | $ | 5,464,514 | $ | 3,803,401 | $ | 2,981,389 | $ | 242,649 | ||||||||||
Foreign tax withholding | (3,108 | ) | (511,725 | ) | (1,355 | ) | — | (2,055 | ) | |||||||||||
Interest | 13,250,679 | 49,026 | 72,429 | 305,192 | 124,270 | |||||||||||||||
Total Investment Income | 13,455,438 | 5,001,815 | 3,874,475 | 3,286,581 | 364,864 | |||||||||||||||
| ||||||||||||||||||||
Expenses | ||||||||||||||||||||
Investment advisory fees | 1,837,304 | 1,075,170 | 432,630 | 577,736 | 401,985 | |||||||||||||||
Administration fees | 235,527 | 92,962 | 75,161 | 99,799 | 24,446 | |||||||||||||||
Distribution fees - Class A | 218,440 | 44,937 | 47,509 | 168,005 | 17,211 | |||||||||||||||
Transfer agent fees - Class A | 129,216 | 36,702 | 30,535 | 86,987 | 20,203 | |||||||||||||||
Transfer agent fees - Class I | 17,915 | 6,691 | 6,553 | 6,889 | 4,001 | |||||||||||||||
Registration fees - Class A | 11,128 | 7,097 | 9,085 | 10,346 | 8,106 | |||||||||||||||
Registration fees - Class I | 4,253 | 1,806 | 1,392 | 2,688 | 1,284 | |||||||||||||||
Shareholder report printing fees - Class A | 40,271 | 9,858 | 9,511 | 25,463 | 7,921 | |||||||||||||||
Shareholder report printing fees - Class I | 5,635 | 1,868 | 1,114 | 1,539 | 655 | |||||||||||||||
Professional fees | 134,727 | 64,079 | 49,911 | 63,609 | 16,568 | |||||||||||||||
Custodian fees | 35,860 | 34,253 | 16,471 | 19,429 | 9,123 | |||||||||||||||
Trustee fees and expenses | 59,545 | 22,886 | 18,150 | 24,941 | 5,603 | |||||||||||||||
Other expenses | 156,568 | 87,087 | 31,326 | 38,373 | 7,021 | |||||||||||||||
Total Expenses | 2,886,389 | 1,485,396 | 729,348 | 1,125,804 | 524,127 | |||||||||||||||
Expenses reduced by Investment Adviser | (48,214 | ) | — | — | — | (6,061 | ) | |||||||||||||
Net Expenses | 2,838,175 | 1,485,396 | 729,348 | 1,125,804 | 518,066 | |||||||||||||||
Net Investment Income (Loss) | 10,617,263 | 3,516,419 | 3,145,127 | 2,160,777 | (153,202 | ) | ||||||||||||||
| ||||||||||||||||||||
Realized and Unrealized Gains (Losses) on Investments | ||||||||||||||||||||
Net realized gains (losses) on investments | 627,949 | (5,696,909 | ) | 7,556,162 | 10,288,360 | 2,619,380 | ||||||||||||||
Net realized losses on foreign currency transactions | — | (39,632 | ) | — | — | — | ||||||||||||||
Change in unrealized appreciation (depreciation) of investments | (584,097 | ) | 12,437,244 | 12,834,166 | 1,550,024 | 1,724,520 | ||||||||||||||
Change in unrealized appreciation (depreciation) of foreign currency translations | — | (5,934 | ) | — | 1,022 | — | ||||||||||||||
Net Realized and Unrealized Gains (Losses) on Investments and Foreign Currency Transactions | 43,852 | 6,694,769 | 20,390,328 | 11,839,406 | 4,343,900 | |||||||||||||||
Net Change in Net Assets from Operations | $ | 10,661,115 | $ | 10,211,188 | $ | 23,535,455 | $ | 14,000,183 | $ | 4,190,698 | ||||||||||
See accompanying notes to financial statements.
50
Statements of Operations, continued
For the year ended December 31, 2016
| Praxis Genesis Conservative Portfolio | Praxis Genesis Balanced | Praxis Genesis Growth | |||||||||
Investment income | ||||||||||||
Dividends from affiliates | $ | 486,456 | $ | 1,197,435 | $ | 876,178 | ||||||
| ||||||||||||
Expenses | ||||||||||||
Investment advisory fees | 10,454 | 30,949 | 27,729 | |||||||||
Administration fees | 5,369 | 15,931 | 13,273 | |||||||||
Distribution fees - Class A | 52,272 | 154,747 | 128,645 | |||||||||
Transfer agent fees | 27,434 | 82,353 | 95,348 | |||||||||
Registration fees | 2,875 | 7,358 | 5,614 | |||||||||
Shareholder report printing fees | 8,003 | 23,681 | 27,706 | |||||||||
Professional fees | 10,105 | 16,106 | 14,579 | |||||||||
Custodian fees | 772 | 780 | 764 | |||||||||
Trustee fees and expenses | 555 | 1,672 | 1,369 | |||||||||
Other expenses | 3,109 | 5,706 | 658 | |||||||||
Total Expenses | 120,948 | 339,283 | 315,685 | |||||||||
Expenses recouped by Investment Adviser | 6,636 | — | — | |||||||||
Net Expenses | 127,584 | 339,283 | 315,685 | |||||||||
Net Investment Income | 358,872 | 858,152 | 560,493 | |||||||||
| ||||||||||||
Realized and Unrealized Gains (Losses) on Investments and Investments in Affiliates | ||||||||||||
Net realized losses on investments in affiliates | (10,150 | ) | (164,281 | ) | (223,922 | ) | ||||||
Distribution of realized gains received from affiliates | 56,044 | 429,255 | 513,581 | |||||||||
Change in unrealized appreciation (depreciation) of investments in affiliates | 466,687 | 2,832,421 | 3,141,548 | |||||||||
Net Realized and Unrealized Gains on Investments and Investments in Affiliates | 512,581 | 3,097,395 | 3,431,207 | |||||||||
Net Change in Net Assets from Operations | $ | 871,453 | $ | 3,955,547 | $ | 3,991,700 | ||||||
See accompanying notes to financial statements.
51
Statements of Changes in Net Assets
Praxis Impact | Praxis International | |||||||||||||||
| For the Year Ended | For the Year Ended | For the Year Ended | For the Year Ended | ||||||||||||
From Operations | ||||||||||||||||
Net investment income | $ | 10,617,263 | $ | 10,538,764 | $ | 3,516,419 | $ | 3,385,958 | ||||||||
Net realized gains (losses) from investments | 627,949 | 1,781,238 | (5,736,541 | ) | (2,724,552 | ) | ||||||||||
Net change in unrealized appreciation (depreciation) on investments and foreign currency transactions | (584,097 | ) | (9,983,446 | ) | 12,431,310 | (9,615,751 | ) | |||||||||
Net Change in Net Assets from Operations | 10,661,115 | 2,336,556 | 10,211,188 | (8,954,345 | ) | |||||||||||
| ||||||||||||||||
Distributions to Shareholders | ||||||||||||||||
From net investment income | ||||||||||||||||
Class A | (1,936,638 | ) | (1,815,811 | ) | (267,004 | ) | (255,773 | ) | ||||||||
Class I | (9,821,417 | ) | (9,735,335 | ) | (3,317,908 | ) | (3,096,088 | ) | ||||||||
From net realized gains | ||||||||||||||||
Class A | (66,864 | ) | (40,363 | ) | — | — | ||||||||||
Class I | (309,759 | ) | (178,884 | ) | — | — | ||||||||||
Change in Net Assets from Distributions to Shareholders | (12,134,678 | ) | (11,770,393 | ) | (3,584,912 | ) | (3,351,861 | ) | ||||||||
Change in Net Assets from Capital Transactions | 32,429,421 | 37,694,158 | 15,118,614 | 10,592,868 | ||||||||||||
Change in Net Assets | 30,955,858 | 28,260,321 | 21,744,890 | (1,713,338 | ) | |||||||||||
Net Assets | ||||||||||||||||
Beginning of year | 433,952,952 | 405,692,631 | 170,730,195 | 172,443,533 | ||||||||||||
End of year | $ | 464,908,810 | $ | 433,952,952 | $ | 192,475,085 | $ | 170,730,195 | ||||||||
Accumulated (Distributions in Excess of) Net Investment Income | $ | 8,856 | $ | — | $ | (215,688 | ) | $ | (214,204 | ) | ||||||
See accompanying notes to financial statements.
52
Statements of Changes in Net Assets, continued
Praxis Value | Praxis Growth Index Fund | Praxis Small Cap Fund | ||||||||||||||||||||||
| For the Year Ended | For the Year Ended | For the Year Ended | For the Year Ended | For the Year Ended | For the Year Ended | ||||||||||||||||||
From Operations | ||||||||||||||||||||||||
Net investment income (loss) | $ | 3,145,127 | $ | 2,696,512 | $ | 2,160,777 | $ | 2,288,471 | $ | (153,202 | ) | $ | (94,859 | ) | ||||||||||
Net realized gains on investments in affiliates | — | — | — | — | — | 1 | ||||||||||||||||||
Net realized gains (losses) from security transactions | 7,556,162 | 2,072,935 | 10,288,360 | 5,579,954 | 2,619,380 | 5,122,570 | ||||||||||||||||||
Net change in unrealized appreciation (depreciation) on investments and foreign currency transactions | 12,834,166 | (13,080,314 | ) | 1,551,046 | (842,306 | ) | 1,724,520 | (6,323,699 | ) | |||||||||||||||
Net Change in Net Assets from Operations | 23,535,455 | (8,310,867 | ) | 14,000,183 | 7,026,119 | 4,190,698 | (1,295,987 | ) | ||||||||||||||||
| ||||||||||||||||||||||||
Distributions to Shareholders | ||||||||||||||||||||||||
From net investment income | ||||||||||||||||||||||||
Class A | (394,778 | ) | (431,824 | ) | (439,271 | ) | (763,479 | ) | — | — | ||||||||||||||
Class I | (3,136,628 | ) | (3,438,261 | ) | (1,466,838 | ) | (1,867,184 | ) | — | — | ||||||||||||||
From net realized gains | ||||||||||||||||||||||||
Class A | (163,656 | ) | (425,723 | ) | — | — | (313,627 | ) | (1,034,253 | ) | ||||||||||||||
Class I | (1,048,199 | ) | (2,805,885 | ) | — | — | (2,140,464 | ) | (5,325,978 | ) | ||||||||||||||
Change in Net Assets from Distributions to Shareholders | (4,743,261 | ) | (7,101,693 | ) | (1,906,109 | ) | (2,630,663 | ) | (2,454,091 | ) | (6,360,231 | ) | ||||||||||||
| ||||||||||||||||||||||||
Change in Net Assets from Capital Transactions | 8,693,909 | 20,592,527 | 4,774,596 | 8,152,275 | (989,791 | ) | (6,627,874 | ) | ||||||||||||||||
Change in Net Assets | 27,486,103 | 5,179,967 | 16,868,670 | 12,547,731 | 746,816 | (14,284,092 | ) | |||||||||||||||||
| ||||||||||||||||||||||||
Net Assets | ||||||||||||||||||||||||
Beginning of year | 131,380,137 | 126,200,170 | 186,999,994 | 174,452,263 | 47,163,049 | 61,447,141 | ||||||||||||||||||
End of year | $ | 158,866,240 | $ | 131,380,137 | $ | 203,868,664 | $ | 186,999,994 | $ | 47,909,865 | $ | 47,163,049 | ||||||||||||
| ||||||||||||||||||||||||
Accumulated (Distributions in Excess of) Net Investment Income | $ | — | $ | — | $ | 268,352 | $ | — | $ | — | $ | — | ||||||||||||
See accompanying notes to financial statements.
53
Statements of Changes in Net Assets, continued
Praxis Genesis | Praxis Genesis | Praxis Genesis | ||||||||||||||||||||||
| For the Year Ended | For the Year Ended | For the Year Ended | For the Year Ended | For the Year Ended | For the Year Ended | ||||||||||||||||||
From Operations | ||||||||||||||||||||||||
Net investment income | $ | 358,872 | $ | 385,657 | $ | 858,152 | $ | 991,280 | $ | 560,493 | $ | 675,175 | ||||||||||||
Net realized losses on investments in affiliates | (10,150 | ) | (24,903 | ) | (164,281 | ) | (92,806 | ) | (223,922 | ) | (28,590 | ) | ||||||||||||
Distribution of realized gains received from affiliates | 56,044 | 120,155 | 429,255 | 1,057,300 | 513,581 | 1,268,444 | ||||||||||||||||||
Net change in unrealized appreciation (depreciation) on investments in affiliates | 466,687 | (649,450 | ) | 2,832,421 | (3,044,054 | ) | 3,141,548 | (3,208,536 | ) | |||||||||||||||
Net Change in Net Assets from Operations | 871,453 | (168,541 | ) | 3,955,547 | (1,088,280 | ) | 3,991,700 | (1,293,507 | ) | |||||||||||||||
| ||||||||||||||||||||||||
Distributions to Shareholders | ||||||||||||||||||||||||
From net investment income | ||||||||||||||||||||||||
Class A | (359,249 | ) | (392,724 | ) | (858,833 | ) | (1,035,512 | ) | (561,401 | ) | (717,504 | ) | ||||||||||||
From net realized gains | ||||||||||||||||||||||||
Class A | (116,382 | ) | (102,074 | ) | (1,007,884 | ) | (932,645 | ) | (1,276,437 | ) | (1,223,796 | ) | ||||||||||||
Change in Net Assets from Distributions to Shareholders | (475,631 | ) | (494,798 | ) | (1,866,717 | ) | (1,968,157 | ) | (1,837,838 | ) | (1,941,300 | ) | ||||||||||||
Change in Net Assets from Capital Transactions | 1,481,723 | 1,254,097 | 1,734,670 | 5,187,292 | 1,890,668 | 3,446,444 | ||||||||||||||||||
Change in Net Assets | 1,877,545 | 590,758 | 3,823,500 | 2,130,855 | 4,044,530 | 211,637 | ||||||||||||||||||
| ||||||||||||||||||||||||
Net Assets | ||||||||||||||||||||||||
Beginning of year | 19,718,349 | 19,127,591 | 59,741,630 | 57,610,775 | 49,881,382 | 49,669,745 | ||||||||||||||||||
End of year | $ | 21,595,894 | $ | 19,718,349 | $ | 63,565,130 | $ | 59,741,630 | $ | 53,925,912 | $ | 49,881,382 | ||||||||||||
| ||||||||||||||||||||||||
Accumulated (Distributions in Excess of) Net Investment Income | $ | — | $ | — | $ | — | $ | — | $ | — | $ | — | ||||||||||||
See accompanying notes to financial statements.
54
Financial Highlights
For a share outstanding throughout the year indicated
Praxis Impact Bond Fund - Class A
Year Ended December 31, | Year Ended December 31, | Year Ended December 31, | Year Ended December 31, | Year Ended December 31, | ||||||||||||||||
Net asset value at beginning of year | $ | 10.32 | $ | 10.54 | $ | 10.27 | $ | 10.73 | $ | 10.63 | ||||||||||
Net investment income | 0.20 | (a) | 0.23 | (a) | 0.24 | (a) | 0.25 | (a) | 0.27 | |||||||||||
Net realized and unrealized gains (losses) on investments | 0.02 | (0.19 | ) | 0.29 | (0.42 | ) | 0.22 | |||||||||||||
Total from investment operations | 0.22 | 0.04 | 0.53 | (0.17 | ) | 0.49 | ||||||||||||||
Less distributions: | ||||||||||||||||||||
Dividends from investment income | (0.23 | ) | (0.25 | ) | (0.26 | ) | (0.28 | ) | (0.30 | ) | ||||||||||
Distributions from net realized gains | (0.01 | ) | (0.01 | ) | — | (0.01 | ) | (0.09 | ) | |||||||||||
Total distributions | (0.24 | ) | (0.26 | ) | (0.26 | ) | (0.29 | ) | (0.39 | ) | ||||||||||
Paid-in capital from redemption fees | 0.00 | (b) | 0.00 | (b) | 0.00 | (b) | 0.00 | (b) | 0.00 | (b) | ||||||||||
Net asset value at end of year | $ | 10.30 | $ | 10.32 | $ | 10.54 | $ | 10.27 | $ | 10.73 | ||||||||||
Total return (excludes sales charge) | 2.13 | % | 0.33 | % | 5.21 | % | (1.65 | %) | 4.64 | % | ||||||||||
Net assets at end of year (in 000s) | $ | 83,211 | $ | 79,999 | $ | 74,950 | $ | 69,784 | $ | 83,494 | ||||||||||
Ratio of net expenses to average net assets | 0.94 | % | 0.93 | % | 0.93 | % | 0.94 | % | 0.96 | % | ||||||||||
Ratio of net investment income to average net assets | 1.87 | % | 2.16 | % | 2.32 | % | 2.34 | % | 2.49 | % | ||||||||||
Ratio of gross expenses to average net assets* | 0.99 | % | 0.98 | % | 0.94 | % | 0.99 | % | 1.05 | % | ||||||||||
Portfolio turnover rate | 16.05 | % | 22.67 | % | 16.48 | % | 23.68 | % | 35.75 | % | ||||||||||
Praxis Impact Bond Fund - Class I
Year Ended December 31, | Year Ended December 31, | Year Ended December 31, | Year Ended December 31, | Year Ended December 31, | ||||||||||||||||
Net asset value at beginning of year | $ | 10.27 | $ | 10.50 | $ | 10.22 | $ | 10.69 | $ | 10.60 | ||||||||||
Net investment income | 0.26 | (a) | 0.27 | (a) | 0.28 | (a) | 0.29 | (a) | 0.31 | |||||||||||
Net realized and unrealized gains (losses) on investments | 0.00 | (b) | (0.20 | ) | 0.30 | (0.43 | ) | 0.21 | ||||||||||||
Total from investment operations | 0.26 | 0.07 | 0.58 | (0.14 | ) | 0.52 | ||||||||||||||
Less distributions: | ||||||||||||||||||||
Dividends from investment income | (0.27 | ) | (0.29 | ) | (0.30 | ) | (0.32 | ) | (0.34 | ) | ||||||||||
Distributions from net realized gains | (0.01 | ) | (0.01 | ) | — | (0.01 | ) | (0.09 | ) | |||||||||||
Total distributions | (0.28 | ) | (0.30 | ) | (0.30 | ) | (0.33 | ) | (0.43 | ) | ||||||||||
Paid-in capital from redemption fees | 0.00 | (b) | 0.00 | (b) | 0.00 | (b) | 0.00 | (b) | 0.00 | (b) | ||||||||||
Net asset value at end of year | $ | 10.25 | $ | 10.27 | $ | 10.50 | $ | 10.22 | $ | 10.69 | ||||||||||
Total return (excludes sales charge) | 2.55 | % | 0.72 | % | 5.66 | % | (1.26 | %) | 4.98 | % | ||||||||||
Net assets at end of year (in 000s) | $ | 381,697 | $ | 353,954 | $ | 330,742 | $ | 292,594 | $ | 268,864 | ||||||||||
Ratio of expenses to average net assets | 0.54 | % | 0.54 | % | 0.53 | % | 0.54 | % | 0.56 | % | ||||||||||
Ratio of net investment income to average net assets | 2.41 | % | 2.55 | % | 2.73 | % | 2.73 | % | 2.89 | % | ||||||||||
Portfolio turnover rate | 16.05 | % | 22.67 | % | 16.48 | % | 23.68 | % | 35.75 | % | ||||||||||
* | During the period, certain expenses were reduced by the Adviser and/or Distributor. If such expense reductions had not occurred, the ratios would have been as indicated. |
(a) | Net investment income per share has been calculated using the average daily shares outstanding during the period. |
(b) | Amount is less than $0.005 per share. |
See accompanying notes to financial statements.
55
Financial Highlights, continued
For a share outstanding throughout the year indicated
Praxis International Index Fund - Class A
Year Ended December 31, | Year Ended December 31, | Year Ended December 31, | Year Ended December 31, | Year Ended December 31, | ||||||||||||||||
Net asset value at beginning of year | $ | 9.15 | $ | 9.85 | $ | 10.64 | $ | 9.47 | $ | 8.25 | ||||||||||
Net investment income | 0.13 | (a) | 0.14 | (a) | 0.20 | (a) | 0.14 | (a) | 0.17 | |||||||||||
Net realized and unrealized gains (losses) on investments | 0.32 | (0.71 | ) | (0.81 | ) | 1.17 | 1.17 | |||||||||||||
Total from investment operations | 0.45 | (0.57 | ) | (0.61 | ) | 1.31 | 1.34 | |||||||||||||
Less distributions: | ||||||||||||||||||||
Dividends from investment income | (0.13 | ) | (0.13 | ) | (0.18 | ) | (0.14 | ) | (0.12 | ) | ||||||||||
Paid-in capital from redemption fees | 0.00 | (b) | 0.00 | (b) | 0.00 | (b) | 0.00 | (b) | 0.00 | (b) | ||||||||||
Net asset value at end of year | $ | 9.47 | $ | 9.15 | $ | 9.85 | $ | 10.64 | $ | 9.47 | ||||||||||
Total return (excludes sales charge) | 4.97 | % | (5.76 | %) | (5.70 | %) | 13.86 | % | 16.24 | % | ||||||||||
Net assets at end of year (in 000s) | $ | 18,877 | $ | 17,631 | $ | 18,370 | $ | 19,892 | $ | 18,181 | ||||||||||
Ratio of net expenses to average net assets | 1.32 | % | 1.33 | % | 1.28 | % | 1.43 | % | 1.73 | % | ||||||||||
Ratio of net investment income to average net assets | 1.45 | % | 1.45 | % | 1.88 | % | 1.36 | % | 1.58 | % | ||||||||||
Portfolio turnover rate | 10.26 | % | 4.48 | % | 5.73 | % | 11.36 | % | 5.18 | % | ||||||||||
Praxis International Index Fund - Class I
Year Ended December 31, | Year Ended December 31, | Year Ended December 31, | Year Ended December 31, | Year Ended December 31, | ||||||||||||||||
Net asset value at beginning of year | $ | 9.19 | $ | 9.89 | $ | 10.70 | $ | 9.51 | $ | 8.27 | ||||||||||
Net investment income | 0.19 | (a) | 0.20 | (a) | 0.25 | (a) | 0.20 | (a) | 0.18 | |||||||||||
Net realized and unrealized gains (losses) on investments | 0.31 | (0.71 | ) | (0.82 | ) | 1.20 | 1.24 | |||||||||||||
Total from investment operations | 0.50 | (0.51 | ) | (0.57 | ) | 1.40 | 1.42 | |||||||||||||
Less distributions: | ||||||||||||||||||||
Dividends from investment income | (0.18 | ) | (0.19 | ) | (0.24 | ) | (0.21 | ) | (0.18 | ) | ||||||||||
Paid-in capital from redemption fees | 0.00 | (b) | 0.00 | (b) | 0.00 | (b) | 0.00 | (b) | 0.00 | (b) | ||||||||||
Net asset value at end of year | $ | 9.51 | $ | 9.19 | $ | 9.89 | $ | 10.70 | $ | 9.51 | ||||||||||
Total return (excludes sales charge) | 5.48 | % | (5.19 | %) | (5.36 | %) | 14.68 | % | 17.26 | % | ||||||||||
Net assets at end of year (in 000s) | $ | 173,598 | $ | 153,099 | $ | 154,074 | $ | 150,369 | $ | 118,838 | ||||||||||
Ratio of expenses to average net assets | 0.77 | % | 0.78 | % | 0.78 | % | 0.80 | % | 0.84 | % | ||||||||||
Ratio of net investment income to average net assets | 2.01 | % | 1.97 | % | 2.35 | % | 1.96 | % | 2.29 | % | ||||||||||
Portfolio turnover rate | 10.26 | % | 4.48 | % | 5.73 | % | 11.36 | % | 5.18 | % | ||||||||||
(a) | Net investment income per share has been calculated using the average daily shares outstanding during the period. |
(b) | Amount is less than $0.005 per share. |
See accompanying notes to financial statements.
56
Financial Highlights, continued
For a share outstanding throughout the year indicated
Praxis Value Index Fund - Class A
Year Ended December 31, | Year Ended December 31, | Year Ended December 31, | Year Ended December 31, | Year Ended December 31, | ||||||||||||||||
Net asset value at beginning of year | $ | 11.17 | $ | 12.54 | $ | 11.21 | $ | 8.71 | $ | 7.57 | ||||||||||
Net investment income | 0.19 | (a) | 0.20 | (a) | 0.18 | (a) | 0.14 | (a) | 0.28 | |||||||||||
Net realized and unrealized gains (losses) on investments | 1.61 | (1.00 | ) | 1.23 | 2.60 | 0.93 | ||||||||||||||
Total from investment operations | 1.80 | (0.80 | ) | 1.41 | 2.74 | 1.21 | ||||||||||||||
Less distributions: | ||||||||||||||||||||
Dividends from investment income | (0.23 | ) | (0.28 | ) | (0.08 | ) | (0.24 | ) | (0.07 | ) | ||||||||||
Distributions from net realized gains | (0.10 | ) | (0.29 | ) | — | — | — | |||||||||||||
Total distributions | (0.33 | ) | (0.57 | ) | (0.08 | ) | (0.24 | ) | (0.07 | ) | ||||||||||
Paid-in capital from redemption fees | 0.00 | (b) | 0.00 | (b) | 0.00 | (b) | 0.00 | (b) | 0.00 | (b) | ||||||||||
Net asset value at end of year | $ | 12.64 | $ | 11.17 | $ | 12.54 | $ | 11.21 | $ | 8.71 | ||||||||||
Total return (excludes sales charge) | 16.13 | % | (6.41 | %) | 12.57 | % | 31.33 | % | 16.12 | % | ||||||||||
Net assets at end of year (in 000s) | $ | 21,676 | $ | 17,453 | $ | 17,356 | $ | 16,275 | $ | 13,591 | ||||||||||
Ratio of expenses to average net assets | 0.94 | % | 0.94 | % | 0.87 | % | 1.03 | % | 1.21 | % | ||||||||||
Ratio of net investment income to average net assets | 1.68 | % | 1.62 | % | 1.53 | % | 1.40 | % | 1.48 | % | ||||||||||
Portfolio turnover rate | 48.26 | % | 21.38 | % | 20.53 | % | 30.38 | % | 69.58 | % | ||||||||||
Praxis Value Index Fund - Class I
Year Ended December 31, | Year Ended December 31, | Year Ended December 31, | Year Ended December 31, | Year Ended December 31, | ||||||||||||||||
Net asset value at beginning of year | $ | 11.09 | $ | 12.46 | $ | 11.14 | $ | 8.65 | $ | 7.52 | ||||||||||
Net investment income | 0.26 | (a) | 0.26 | (a) | 0.23 | (a) | 0.20 | (a) | 0.09 | |||||||||||
Net realized and unrealized gains (losses) on investments | 1.60 | (1.00 | ) | 1.22 | 2.59 | 1.18 | ||||||||||||||
Total from investment operations | 1.86 | (0.74 | ) | 1.45 | 2.79 | 1.27 | ||||||||||||||
Less distributions: | ||||||||||||||||||||
Dividends from investment income | (0.29 | ) | (0.34 | ) | (0.13 | ) | (0.30 | ) | (0.14 | ) | ||||||||||
Distributions from net realized gains | (0.10 | ) | (0.29 | ) | — | — | — | |||||||||||||
Total distributions | (0.39 | ) | (0.63 | ) | (0.13 | ) | (0.30 | ) | (0.14 | ) | ||||||||||
Paid-in capital from redemption fees | 0.00 | (b) | 0.00 | (b) | 0.00 | (b) | — | — | ||||||||||||
Net asset value at end of year | $ | 12.56 | $ | 11.09 | $ | 12.46 | $ | 11.14 | $ | 8.65 | ||||||||||
Total return (excludes sales charge) | 16.75 | % | (6.00 | %) | 13.03 | % | 32.26 | % | 16.91 | % | ||||||||||
Net assets at end of year (in 000s) | $ | 137,191 | $ | 113,927 | $ | 108,845 | $ | 93,118 | $ | 71,284 | ||||||||||
Ratio of expenses to average net assets | 0.44 | % | 0.45 | % | 0.45 | % | 0.48 | % | 0.47 | % | ||||||||||
Ratio of net investment income to average net assets | 2.25 | % | 2.11 | % | 1.94 | % | 1.95 | % | 2.24 | % | ||||||||||
Portfolio turnover rate | 48.26 | % | 21.68 | % | 20.53 | % | 30.38 | % | 69.58 | % | ||||||||||
(a) | Net investment income per share has been calculated using the average daily shares outstanding during the period. |
(b) | Amount is less than $0.005 per share. |
See accompanying notes to financial statements.
57
Financial Highlights, continued
For a share outstanding throughout the year indicated
Praxis Growth Index Fund - Class A
Year Ended December 31, | Year Ended December 31, | Year Ended December 31, | Year Ended December 31, | Year Ended December 31, | ||||||||||||||||
Net asset value at beginning of year | $ | 17.68 | $ | 17.25 | $ | 15.19 | $ | 11.63 | $ | 9.96 | ||||||||||
Net investment income | 0.15 | (a) | 0.18 | (a) | 0.12 | (a) | 0.10 | (a) | 0.02 | |||||||||||
Net realized and unrealized gains on investments | 1.11 | 0.46 | 2.05 | 3.58 | 1.70 | |||||||||||||||
Total from investment operations | 1.26 | 0.64 | 2.17 | 3.68 | 1.72 | |||||||||||||||
Less distributions: | ||||||||||||||||||||
Dividends from investment income | (0.12 | ) | (0.21 | ) | (0.11 | ) | (0.12 | ) | (0.05 | ) | ||||||||||
Paid-in capital from redemption fees | 0.00 | (b) | 0.00 | (b) | 0.00 | (b) | 0.00 | (b) | 0.00 | (b) | ||||||||||
Net asset value at end of year | $ | 18.82 | $ | 17.68 | $ | 17.25 | $ | 15.19 | $ | 11.63 | ||||||||||
Total return (excludes sales charge) | 7.15 | % | 3.70 | % | 14.26 | % | 31.72 | % | 17.15 | % | ||||||||||
Net assets at end of year (in 000s) | $ | 67,007 | $ | 64,689 | $ | 55,833 | $ | 51,724 | $ | 43,035 | ||||||||||
Ratio of net expenses to average net assets | 0.86 | % | 0.84 | % | 0.91 | % | 1.01 | % | 1.08 | % | ||||||||||
Ratio of net investment income to average net assets | 0.86 | % | 1.00 | % | 0.73 | % | 0.76 | % | 1.08 | % | ||||||||||
Ratio of gross expenses to average net assets* | 0.86 | % | 0.84 | % | 0.91 | % | 1.01 | % | 1.26 | % | ||||||||||
Portfolio turnover rate | 43.09 | % | 18.68 | % | 19.09 | % | 14.82 | % | 82.74 | % | ||||||||||
Praxis Growth Index Fund - Class I
Year Ended December 31, | Year Ended December 31, | Year Ended December 31, | Year Ended December 31, | Year Ended December 31, | ||||||||||||||||
Net asset value at beginning of year | $ | 17.79 | $ | 17.34 | $ | 15.27 | $ | 11.68 | $ | 9.96 | ||||||||||
Net investment income | 0.23 | (a) | 0.25 | (a) | 0.20 | (a) | 0.18 | (a) | 0.07 | |||||||||||
Net realized and unrealized gains on investments | 1.11 | 0.47 | 2.06 | 3.60 | 1.71 | |||||||||||||||
Total from investment operations | 1.34 | 0.72 | 2.26 | 3.78 | 1.78 | |||||||||||||||
Less distributions: | ||||||||||||||||||||
Dividends from investment income | (0.20 | ) | (0.27 | ) | (0.19 | ) | (0.19 | ) | (0.06 | ) | ||||||||||
Paid-in capital from redemption fees | 0.00 | (b) | 0.00 | (b) | 0.00 | (b) | 0.00 | (b) | 0.00 | (b) | ||||||||||
Net asset value at end of year | $ | 18.93 | $ | 17.79 | $ | 17.34 | $ | 15.27 | $ | 11.68 | ||||||||||
Total return (excludes sales charge) | 7.62 | % | 4.10 | % | 14.77 | % | 32.26 | % | 17.94 | % | ||||||||||
Net assets at end of year (in 000s) | $ | 136,862 | $ | 122,311 | $ | 118,619 | $ | 100,561 | $ | 97,072 | ||||||||||
Ratio of expenses to average net assets | 0.44 | % | 0.44 | % | 0.42 | % | 0.47 | % | 0.48 | % | ||||||||||
Ratio of net investment income to average net assets | 1.26 | % | 1.38 | % | 1.22 | % | 1.31 | % | 1.31 | % | ||||||||||
Portfolio turnover rate | 43.09 | % | 18.68 | % | 19.09 | % | 14.82 | % | 82.74 | % | ||||||||||
* | During the period, certain expenses were reduced by the Adviser and/or Distributor. If such expense reductions had not occurred, the ratios would have been as indicated. |
(a) | Net investment income per share has been calculated using the average daily shares outstanding during the period. |
(b) | Amount is less than $0.005 per share. |
See accompanying notes to financial statements.
58
Financial Highlights, continued
For a share outstanding throughout the year indicated
Praxis Small Cap Fund - Class A
Year Ended December 31, | Year Ended December 31, | Year Ended December 31, | Year Ended December 31, | Year Ended December 31, | ||||||||||||||||
Net asset value at beginning of year | $ | 9.45 | $ | 11.49 | $ | 13.80 | $ | 11.33 | $ | 10.51 | ||||||||||
Net investment loss | (0.08 | )(a) | (0.09 | )(a) | (0.12 | )(a) | (0.12 | )(a) | (0.06 | ) | ||||||||||
Net realized and unrealized gains (losses) on investments | 0.85 | (0.41 | ) | (0.43 | ) | 4.04 | 1.03 | |||||||||||||
Total from investment operations | 0.77 | (0.50 | ) | (0.55 | ) | 3.92 | 0.97 | |||||||||||||
Less distributions: | ||||||||||||||||||||
Dividends from net realized gains | (0.55 | ) | (1.54 | ) | (1.76 | ) | (1.45 | ) | (0.15 | ) | ||||||||||
Paid-in capital from redemption fees | 0.00 | (b) | 0.00 | (b) | 0.00 | (b) | 0.00 | (b) | 0.00 | (b) | ||||||||||
Net asset value at end of year | $ | 9.67 | $ | 9.45 | $ | 11.49 | $ | 13.80 | $ | 11.33 | ||||||||||
Total return (excludes sales charge) | 8.18 | % | (4.53 | %) | (4.11 | %) | 34.63 | % | 9.26 | % | ||||||||||
Net assets at end of year (in 000s) | $ | 5,771 | $ | 7,339 | $ | 7,664 | $ | 8,465 | $ | 5,710 | ||||||||||
Ratio of net expenses to average net assets | 1.67 | % | 1.68 | % | 1.69 | % | 1.69 | % | 1.72 | % | ||||||||||
Ratio of net investment loss to average net assets | (1.45 | %) | (0.75 | %) | (0.95 | %) | (0.95 | %) | (0.34 | %) | ||||||||||
Ratio of gross expenses to average net assets* | 1.76 | % | 1.81 | % | 1.70 | % | 1.90 | % | 1.91 | % | ||||||||||
Portfolio turnover rate | 60.49 | % | 75.84 | % | 73.67 | % | 49.25 | % | 49.78 | % | ||||||||||
Praxis Small Cap Fund - Class I
Year Ended December 31, | Year Ended December 31, | Year Ended December 31, | Year Ended December 31, | Year Ended December 31, | ||||||||||||||||
Net asset value at beginning of year | $ | 10.01 | $ | 12.01 | $ | 14.25 | $ | 11.59 | $ | 10.67 | ||||||||||
Net investment income (loss) | (0.02 | )(a) | (0.01 | )(a) | (0.04 | )(a) | (0.04 | )(a) | 0.06 | |||||||||||
Net realized and unrealized gains (losses) on investments | 0.91 | (0.45 | ) | (0.44 | ) | 4.15 | 1.01 | |||||||||||||
Total from investment operations | 0.89 | (0.46 | ) | (0.48 | ) | 4.11 | 1.07 | |||||||||||||
Less distributions: | ||||||||||||||||||||
Dividends from net realized gains | (0.55 | ) | (1.54 | ) | (1.76 | ) | (1.45 | ) | (0.15 | ) | ||||||||||
Paid-in capital from redemption fees | — | — | 0.00 | (b) | 0.00 | (b) | — | |||||||||||||
Net asset value at end of year | $ | 10.35 | $ | 10.01 | $ | 12.01 | $ | 14.25 | $ | 11.59 | ||||||||||
Total return (excludes sales charge) | 8.93 | % | (3.99 | %) | (3.49 | %) | 35.53 | % | 10.06 | % | ||||||||||
Net assets at end of year (in 000s) | $ | 42,139 | $ | 39,824 | $ | 53,783 | $ | 68,762 | $ | 63,520 | ||||||||||
Ratio of expenses to average net assets | 1.00 | % | 1.06 | % | 1.02 | % | 1.04 | % | 1.05 | % | ||||||||||
Ratio of net investment income (loss) to average net assets | (0.13 | %) | (0.07 | %) | (0.28 | %) | (0.31 | %) | 0.50 | % | ||||||||||
Portfolio turnover rate | 60.49 | % | 75.84 | % | 73.67 | % | 49.25 | % | 49.78 | % | ||||||||||
* | During the period, certain expenses were reduced by the Adviser and/or Distributor. If such expense reductions had not occurred, the ratios would have been as indicated. |
(a) | Net investment income (loss) per share has been calculated using the average daily shares outstanding during the period. |
(b) | Amount is less than $0.005 per share. |
See accompanying notes to financial statements.
59
Financial Highlights, continued
For a share outstanding throughout the year indicated
Praxis Genesis Conservative Portfolio - Class A
Year Ended December 31, | Year Ended December 31, | Year Ended December 31, | Year Ended December 31, | Year Ended December 31, | ||||||||||||||||
Net asset value at beginning of year | $ | 10.97 | $ | 11.34 | $ | 11.10 | $ | 10.79 | $ | 10.50 | ||||||||||
Net investment income | 0.19 | (a) | 0.22 | (a) | 0.21 | (a) | 0.23 | (a) | 0.23 | |||||||||||
Net realized and unrealized gains (losses) on investments | 0.29 | (0.31 | ) | 0.42 | 0.45 | 0.54 | ||||||||||||||
Total from investment operations | 0.48 | (0.09 | ) | 0.63 | 0.68 | 0.77 | ||||||||||||||
Less distributions: | ||||||||||||||||||||
Dividends from investment income | (0.21 | ) | (0.22 | ) | (0.21 | ) | (0.23 | ) | (0.24 | ) | ||||||||||
Distributions from net realized gains | (0.06 | ) | (0.06 | ) | (0.18 | ) | (0.14 | ) | (0.24 | ) | ||||||||||
Total distributions | (0.27 | ) | (0.28 | ) | (0.39 | ) | (0.37 | ) | (0.48 | ) | ||||||||||
Paid-in capital from redemption fees | 0.00 | (b) | 0.00 | (b) | 0.00 | (b) | 0.00 | (b) | 0.00 | (b) | ||||||||||
Net asset value at end of year | $ | 11.18 | $ | 10.97 | $ | 11.34 | $ | 11.10 | $ | 10.79 | ||||||||||
Total return (excludes sales charge) | 4.23 | % | (0.81 | %) | 5.68 | % | 6.28 | % | 7.42 | % | ||||||||||
Net assets at end of year (in 000s) | $ | 21,596 | $ | 19,718 | $ | 19,128 | $ | 18,045 | $ | 17,203 | ||||||||||
Ratio of net expenses to average net assets† | 0.58 | % | 0.60 | % | 0.60 | % | 0.61 | % | 0.61 | % | ||||||||||
Ratio of net investment income to average net assets | 1.72 | % | 1.95 | % | 1.82 | % | 2.04 | % | 2.13 | % | ||||||||||
Ratio of gross expenses to average net assets†* | 0.58 | % | 0.63 | % | 0.62 | % | 0.64 | % | 0.65 | % | ||||||||||
Portfolio turnover rate | 11.42 | % | 8.66 | % | 10.78 | % | 25.69 | % | 30.58 | % | ||||||||||
† | The ratios presented only reflect the direct income and expenses for the Fund, not the underlying funds in which it invests. |
* | During the period, certain expenses were reduced by the Adviser and/or Distributor. If such expense reductions had not occurred, the ratios would have been as indicated. |
(a) | Net investment income per share has been calculated using the average daily shares outstanding during the period. |
(b) | Amount is less than $0.005 per share. |
See accompanying notes to financial statements.
60
Financial Highlights, continued
For a share outstanding throughout the year indicated
Praxis Genesis Balanced Portfolio - Class A
Year Ended December 31, | Year Ended December 31, | Year Ended December 31, | Year Ended December 31, | Year Ended December 31, | ||||||||||||||||
Net asset value at beginning of year | $ | 12.13 | $ | 12.76 | $ | 12.50 | $ | 11.14 | $ | 10.62 | ||||||||||
Net investment income | 0.17 | (a) | 0.21 | (a) | 0.17 | (a) | 0.20 | (a) | 0.17 | |||||||||||
Net realized and unrealized gains (losses) on investments | 0.64 | (0.42 | ) | 0.49 | 1.50 | 0.90 | ||||||||||||||
Total from investment operations | 0.81 | (0.21 | ) | 0.66 | 1.70 | 1.07 | ||||||||||||||
Less distributions: | ||||||||||||||||||||
Dividends from investment income | (0.19 | ) | (0.22 | ) | (0.17 | ) | (0.19 | ) | (0.18 | ) | ||||||||||
Distributions from net realized gains | (0.20 | ) | (0.20 | ) | (0.23 | ) | (0.15 | ) | (0.37 | ) | ||||||||||
Total distributions | (0.39 | ) | (0.42 | ) | (0.40 | ) | (0.34 | ) | (0.55 | ) | ||||||||||
Paid-in capital from redemption fees | 0.00 | (b) | 0.00 | (b) | 0.00 | (b) | 0.00 | (b) | 0.00 | (b) | ||||||||||
Net asset value at end of year | $ | 12.55 | $ | 12.13 | $ | 12.76 | $ | 12.50 | $ | 11.14 | ||||||||||
Total return (excludes sales charge) | 6.58 | % | (1.66 | %) | 5.30 | % | 15.30 | % | 10.11 | % | ||||||||||
Net assets at end of year (in 000s) | $ | 63,565 | $ | 59,742 | $ | 57,611 | $ | 53,614 | $ | 44,584 | ||||||||||
Ratio of net expenses to average net assets† | 0.55 | % | 0.54 | % | 0.58 | % | 0.60 | % | 0.61 | % | ||||||||||
Ratio of net investment income to average net assets | 1.39 | % | 1.65 | % | 1.33 | % | 1.65 | % | 1.57 | % | ||||||||||
Ratio of gross expenses to average net assets†* | 0.55 | % | 0.54 | % | 0.58 | % | 0.60 | % | 0.62 | % | ||||||||||
Portfolio turnover rate | 10.29 | % | 6.53 | % | 10.26 | % | 19.91 | % | 38.48 | % | ||||||||||
† | The ratios presented only reflect the direct income and expenses for the Fund, not the underlying funds in which it invests. |
* | During the period, certain expenses were reduced by the Adviser and/or Distributor. If such expense reductions had not occurred, the ratios would have been as indicated. |
(a) | Net investment income (loss) per share has been calculated using the average daily shares outstanding during the period. |
(b) | Amount is less than $0.005 per share. |
See accompanying notes to financial statements.
61
Financial Highlights, continued
For a share outstanding throughout the year indicated
Praxis Genesis Growth Portfolio - Class A
Year Ended December 31, | Year Ended December 31, | Year Ended December 31, | Year Ended December 31, | Year Ended December 31, | ||||||||||||||||
Net asset value at beginning of year | $ | 12.93 | $ | 13.79 | $ | 13.49 | $ | 11.40 | $ | 10.68 | ||||||||||
Net investment income | 0.14 | (a) | 0.18 | (a) | 0.13 | (a) | 0.17 | (a) | 0.13 | |||||||||||
Net realized and unrealized gains (losses) on investments | 0.87 | (0.52 | ) | 0.56 | 2.26 | 1.13 | ||||||||||||||
Total from investment operations | 1.01 | (0.34 | ) | 0.69 | 2.43 | 1.26 | ||||||||||||||
Less distributions: | ||||||||||||||||||||
Dividends from investment income | (0.14 | ) | (0.19 | ) | (0.13 | ) | (0.17 | ) | (0.14 | ) | ||||||||||
Distributions from net realized gains | (0.33 | ) | (0.33 | ) | (0.26 | ) | (0.17 | ) | (0.40 | ) | ||||||||||
Total distributions | (0.47 | ) | (0.52 | ) | (0.39 | ) | (0.34 | ) | (0.54 | ) | ||||||||||
Paid-in capital from redemption fees | 0.00 | (b) | 0.00 | (b) | 0.00 | (b) | 0.00 | (b) | 0.00 | (b) | ||||||||||
Net asset value at end of year | $ | 13.47 | $ | 12.93 | $ | 13.79 | $ | 13.49 | $ | 11.40 | ||||||||||
Total return (excludes sales charge) | 7.82 | % | (2.49 | %) | 5.09 | % | 21.28 | % | 11.82 | % | ||||||||||
Net assets at end of year (in 000s) | $ | 53,925 | $ | 49,881 | $ | 49,670 | $ | 45,793 | $ | 36,294 | ||||||||||
Ratio of net expenses to average net assets† | 0.61 | % | 0.62 | % | 0.60 | % | 0.60 | % | 0.61 | % | ||||||||||
Ratio of net investment income to average net assets | 1.09 | % | 1.33 | % | 0.95 | % | 1.39 | % | 1.22 | % | ||||||||||
Ratio of gross expenses to average net assets†* | 0.61 | % | 0.62 | % | 0.60 | % | 0.66 | % | 0.74 | % | ||||||||||
Portfolio turnover rate | 9.32 | % | 7.39 | % | 8.81 | % | 20.87 | % | 45.13 | % | ||||||||||
† | The ratios presented only reflect the direct income and expenses for the Fund, not the underlying funds in which it invests. |
* | During the period, certain expenses were reduced by the Adviser and/or Distributor. If such expense reductions had not occurred, the ratios would have been as indicated. |
(a) | Net investment income per share has been calculated using the average daily shares outstanding during the period. |
(b) | Amount is less than $0.005 per share. |
See accompanying notes to financial statements.
62
Notes to Financial Statements | December 31, 2016 |
1. Organization:
The Praxis Mutual Funds (the “Trust”) is an open-end management investment company established as a Delaware business trust under a Declaration of Trust dated September 27, 1993, as amended and restated April 28, 2016, and is registered under the Investment Company Act of 1940, as amended (the “1940 Act”). As of December 31, 2016, the Trust consists of the Praxis Impact Bond Fund (formerly, Praxis Intermediate Income Fund), the Praxis International Index Fund, the Praxis Value Index Fund, the Praxis Growth Index Fund, and the Praxis Small Cap Fund, (individually a “Fund”, collectively “the Funds”), the Praxis Genesis Conservative Portfolio, the Praxis Genesis Balanced Portfolio, and the Praxis Genesis Growth Portfolio, (individually a “Portfolio”, collectively “the Portfolios”). The Funds and Portfolios are also referred to individually as the Impact Bond Fund, International Index Fund, Value Index Fund, Growth Index Fund, Small Cap Fund, Conservative Portfolio, Balanced Portfolio and Growth Portfolio in the financial statements. Each Fund and Portfolio is a diversified series of the Trust.
As of December 31, 2016, the Funds offer Class A and Class I Shares and the Portfolios offer Class A Shares. Each class of shares in a Fund or Portfolio has identical rights and privileges except with respect to fees paid under the distribution and shareholder servicing agreements, certain other class specific expenses and income, voting rights on matters affecting a single class of shares and the exchange privileges of each class of shares. Class A has a maximum sales charge on purchases of 5.25 percent as a percentage of the original purchase price, except for the Impact Bond Fund which has a maximum sales charge of 3.75 percent.
2. Significant Accounting Policies:
In October 2016, the Securities and Exchange Commission (the “SEC”) released its final rule on Investment Company Reporting Modernization (the “Rule”). The Rule, which introduces two new regulatory reporting forms for investment companies – Form N-PORT and Form N-CEN, also contains amendments to Regulation S-X which impact financial statement presentation, particularly the presentation of derivative investments. Although still evaluating the impact of the Rule, management believes that many of the Regulation S-X amendments are consistent with the Funds’ and Portfolios’ current financial statement presentation and expects that the Funds and the Portfolios will be able to comply with the Rule’s Regulation S-X amendments by the August 1, 2017 compliance date.
The following is a summary of significant accounting policies followed by the Trust in the preparation of its financial statements. The policies are in conformity with U.S. generally accepted accounting principles (“GAAP”). The preparation of financial statements requires management to make estimates and assumptions that affect the reported amounts of assets and liabilities and disclosure of contingent assets and liabilities at the date of the financial statements and the reported amounts of income and expenses for the reporting year. Actual results could differ from those estimates.
Securities Valuation:
The Funds and Portfolios record their investments at fair value. Fair value is defined as the price that would be received to sell an asset or paid to transfer a liability in an orderly transaction between market participants at the measurement date. The valuation techniques used to determine fair value are further described below.
Securities generally are valued at market values determined on the basis of the latest available bid prices in the principal market (closing sales prices if the principal market is an exchange) in which such securities are normally traded. Investments in open-end investment companies are valued at their respective net asset values as reported by such companies. The differences between the cost and market values of investments are reflected as either unrealized appreciation or depreciation.
The Funds use various independent pricing services to value most of their debt investments. A pricing service would normally consider such factors as yield, risk, quality, maturity, type of issue, trading characteristics, special circumstances and other factors it deems relevant in determining valuations of normal institutional trading units of debt securities and would not rely exclusively on quoted prices. When valuing foreign securities held by the Funds, certain pricing services might use computerized pricing models to systematically calculate adjustments to foreign security closing prices based on the latest market movements. Such pricing models utilize market data that has been obtained between the local market close and the NYSE close to compute adjustments to foreign security close prices. The methods used by the pricing service and the valuations so established are reviewed by the Pricing Committee of the Funds and Portfolios (“Pricing Committee”) under general supervision of the Board of Trustees (the “Board”). Securities for which market quotations are not readily available (e.g. an approved pricing service does not provide a price, certain stale prices or an event occurs that materially affects the furnished price) are valued at their fair value as determined in good faith in accordance with consistently applied procedures established by and under the general supervision of the Board. Short-term debt securities of sufficient credit quality maturing in less than 61 days may be valued at amortized cost, which approximates fair value. The Portfolios’ investments in the Funds (the “Underlying Funds”) are valued at the closing net asset value per share.
63
Notes to Financial Statements, continued | December 31, 2016 |
In certain circumstances, the Praxis Mutual Funds Valuation Procedures (“Valuation Procedures”) contemplate the Board’s delegation of the implementation of the Valuation Procedures to the Pricing Committee. In valuing restricted securities under the Valuation Procedures, the Pricing Committee will consider (but is not limited to) certain specific and general factors enumerated in the Valuation Procedures. The Valuation Procedures require that the Pricing Committee report to the Board at each of its regular quarterly meetings regarding valuation of restricted securities and actions taken in connection with the Valuation Procedures.
The valuation techniques described maximize the use of observable inputs and minimize the use of unobservable inputs in determining fair value. These inputs are summarized in the three broad levels listed below:
● | Level 1 — quoted prices in active markets for identical securities |
● | Level 2 — other significant observable inputs (including quoted prices for similar securities, interest rates, prepayment speeds, credit risk, etc.) |
● | Level 3 — significant unobservable inputs (including the Funds’ and Portfolios’ own assumptions in determining the fair value of investments) |
The inputs or methodology used for valuing securities is not necessarily an indication of the risks associated with investing in those securities. For example, short-term debt securities of sufficient credit quality maturing in less than 61 days may be valued using amortized cost, in accordance with rules under the 1940 Act. Generally, amortized cost approximates the current fair value of a security, but since the value is not obtained from a quoted price in an active market, such securities are reflected as Level 2.
The Trust determines transfers between fair value hierarchy levels at the reporting period end.
The aggregate value by input level, as of December 31, 2016, for each Fund’s and Portfolio’s investments are as follows:
Impact Bond Fund Valuation Inputs at Reporting Date:
Description | Level 1 | Level 2 | Level 3 | Total | ||||||||||||
Investments at Value | ||||||||||||||||
Asset Backed Securities | $ | — | $ | 13,351,517 | $ | — | $ | 13,351,517 | ||||||||
Commercial Mortgage Backed Securities | — | 6,057,441 | — | 6,057,441 | ||||||||||||
Foreign Bonds | — | 9,556,049 | — | 9,556,049 | ||||||||||||
Municipal Bonds | — | 12,118,834 | — | 12,118,834 | ||||||||||||
Corporate Bonds | — | 210,443,832 | — | 210,443,832 | ||||||||||||
Corporate Notes | — | 4,600,000 | — | 4,600,000 | ||||||||||||
U.S. Government Agencies | — | 192,196,441 | — | 192,196,441 | ||||||||||||
Investment Companies | 3,546,972 | — | — | 3,546,972 | ||||||||||||
Total Investments | $ | 3,546,972 | $ | 448,324,114 | $ | — | $ | 451,871,086 | ||||||||
International Index Fund Valuation Inputs at Reporting Date:
Description | Level 1 | Level 2 | Level 3 | Total | ||||||||||||
Investments at Value | ||||||||||||||||
Common Stocks | $ | 187,930,864 | $ | 56,405 | $ | — | $ | 187,987,269 | ||||||||
Preferred Stocks | 632,950 | — | — | 632,950 | ||||||||||||
Corporate Notes | — | 1,600,000 | — | 1,600,000 | ||||||||||||
Total Investments | $ | 188,563,814 | $ | 1,656,405 | $ | — | $ | 190,220,219 | ||||||||
Value Index Fund Valuation Inputs at Reporting Date:
Description | Level 1 | Level 2 | Level 3 | Total | ||||||||||||
Investments at Value | ||||||||||||||||
Common Stocks | $ | 157,329,022 | $ | — | $ | — | $ | 157,329,022 | ||||||||
Rights | — | 7,028 | — | 7,028 | ||||||||||||
Corporate Notes | — | 1,270,000 | — | 1,270,000 | ||||||||||||
Total Investments | $ | 157,329,022 | $ | 1,277,028 | $ | — | $ | 158,606,050 | ||||||||
Growth Index Fund Valuation Inputs at Reporting Date:
Description | Level 1 | Level 2 | Level 3 | Total | ||||||||||||
Investments at Value | ||||||||||||||||
Common Stocks | $ | 200,938,517 | $ | — | $ | — | $ | 200,938,517 | ||||||||
Corporate Notes | — | 1,775,000 | — | 1,775,000 | ||||||||||||
Total Investments | $ | 200,938,517 | $ | 1,775,000 | $ | — | $ | 202,713,517 | ||||||||
64
Notes to Financial Statements, continued | December 31, 2016 |
Small Cap Fund Valuation Inputs at Reporting Date:
Description | Level 1 | Level 2 | Level 3 | Total | ||||||||||||
Investments at Value | ||||||||||||||||
Common Stocks | $ | 43,595,677 | $ | — | $ | — | $ | 43,595,677 | ||||||||
Corporate Notes | — | 440,000 | — | 440,000 | ||||||||||||
Total Investments | $ | 43,595,677 | $ | 440,000 | $ | — | $ | 44,035,677 | ||||||||
Conservative Portfolio Valuation Inputs at Reporting Date:
Description | Level 1 | Level 2 | Level 3 | Total | ||||||||||||
Investments at Value | ||||||||||||||||
Mutual Funds | $ | 21,604,219 | $ | — | $ | — | $ | 21,604,219 | ||||||||
Total Investments | $ | 21,604,219 | $ | — | $ | — | $ | 21,604,219 | ||||||||
Balanced Portfolio Valuation Inputs at Reporting Date:
Description | Level 1 | Level 2 | Level 3 | Total | ||||||||||||
Investments at Value | ||||||||||||||||
Mutual Funds | $ | 63,595,035 | $ | — | $ | — | $ | 63,595,035 | ||||||||
Total Investments | $ | 63,595,035 | $ | — | $ | — | $ | 63,595,035 | ||||||||
Growth Portfolio Valuation Inputs at Reporting Date:
Description | Level 1 | Level 2 | Level 3 | Total | ||||||||||||
Investments at Value | ||||||||||||||||
Mutual Funds | $ | 53,948,313 | $ | — | $ | — | $ | 53,948,313 | ||||||||
Total Investments | $ | 53,948,313 | $ | — | $ | — | $ | 53,948,313 | ||||||||
During the year ended December 31, 2016, the Funds and Portfolios had no transfers in and out of Levels 1, 2, or 3.
Securities Transactions and Related Income:
Changes in holdings of portfolio securities are reflected in the calculation of each Fund’s and Portfolio’s net asset value no later than the first business day following trade date. For financial reporting purposes, security transactions are accounted for on the trade date on the last business day of the reporting period. Realized gains or losses realized on sales of securities are determined by comparing the identified cost of the security lot sold with the net sales proceeds. Interest income is recognized on the accrual basis and includes, where applicable, the pro-rata amortization of premium or accretion of discount. Dividend income is recorded on the ex-dividend date. Withholding taxes on foreign dividends have been recorded in accordance with the Funds’ understanding of the applicable country’s tax rules and rates.
Allocations:
Investment income earned, realized capital gains and losses, and unrealized appreciation and depreciation for the Funds are allocated daily to each class of shares based upon its proportionate share of total net assets of the Fund. Class specific expenses are charged directly to the class incurring the expense. Common expenses, which are not attributable to a specific class, are allocated daily to each class of shares based upon its proportionate share of total net assets of the Fund. Expenses not directly billed to a Fund or Portfolio are allocated proportionally among all Funds and Portfolios daily in relation to the net assets of each Fund or Portfolio or another reasonable measure.
The Portfolios invest in other Praxis equity and fixed income funds (the “Underlying Funds”) and, as a result, the Portfolios indirectly pay a portion of the operating expenses, including management fees, of the Underlying Funds. These expenses are deducted from the Underlying Funds before their share prices are calculated and are reflected as Acquired Fund Fees and Expenses (“AFFE”) in the Portfolios’ prospectus fee tables. Actual indirect expenses vary depending on how a Portfolio’s assets are allocated among the Underlying Funds.
Risks Associated with Foreign Securities and Currencies:
Investments in securities of foreign issuers carry certain risks not ordinarily associated with investments in securities of domestic issuers. Such risks include adverse future political and economic developments and the possible imposition of exchange controls or other foreign governmental laws and restrictions. In addition, with respect to certain countries, there is the possibility of expropriation of assets, confiscatory taxation, political or social instability or diplomatic developments which could adversely affect investments in those countries.
65
Notes to Financial Statements, continued | December 31, 2016 |
Certain countries may also impose substantial restrictions on investments on their capital markets by foreign entities, including restriction on investment in issuers or industries deemed sensitive to the relevant nation’s interests. These factors may limit the investment opportunities available or result in lack of liquidity and high price volatility with respect to securities of issuers from developing countries.
Foreign Currency Translation:
The market value of investment securities and other assets and liabilities of the International Index Fund denominated in foreign currencies are translated into U.S. dollars at the current exchange rate at the close of each business day. Purchases and sales of securities, income receipts and expense payments are translated into U.S. dollars based at the exchange rate on the date of the transaction.
Reported net realized foreign exchange gains or losses arise from sales and maturities of short-term securities, sales of foreign currencies, currency gains or losses realized between the trade and settlement dates on securities transactions, the difference between the amounts of dividends, interest, and foreign withholding taxes recorded on the Fund’s books, and the U.S. dollar equivalent of the amounts actually received or paid. Net unrealized foreign exchange gains and losses arise from the changes in the value of assets and liabilities including investments in securities at the reporting period, resulting from changes in the exchange rate.
Dividends and Distributions:
Dividends from net investment income are declared and paid monthly for the Impact Bond Fund and for each of the Portfolios. Dividends from net investment income are declared and paid annually for the International Index Fund, the Value Index Fund, the Growth Index Fund and the Small Cap Fund. To the extent the Portfolios invest in the Impact Bond Fund and receive dividends, they will be paid monthly. Distributions of net realized capital gains from the Underlying Funds are recorded on the ex-dividend date or when the Portfolios are first notified of the dividend. Distributable net realized capital gains of the Funds, if any, are declared and distributed at least annually.
The amounts of dividends from net investment income and distributions from net realized capital gains are determined in accordance with federal income tax regulations, which may differ from GAAP. These “book/tax” differences are either considered temporary or permanent in nature. To the extent these differences are permanent in nature, such amounts are reclassified within the composition of net assets based on their federal tax-basis treatment; temporary differences do not require reclassification.
Federal Income Taxes:
It is each Fund’s and Portfolio’s policy to continue to qualify as a regulated investment company by complying with the provisions available to investment companies, as defined in applicable sections of Subchapter M of the Internal Revenue Code, and to distribute timely all of its net investment company taxable income and net capital gains to shareholders. Therefore, no federal income tax provision is required. Under the applicable foreign tax law, a withholding tax may be imposed on interest, dividends and capital gains earned on foreign investments at various rates. Where available, the Funds will file for claims on foreign taxes withheld.
Redemption Fees:
The Funds and Portfolios will charge a redemption fee of two percent of the total redemption amount if a shareholder sells or exchanges shares after holding them for less than 30 days subject to certain exceptions and limitations described in the Prospectus. Amounts charged are included in Paid-in Capital Share Transactions as disclosed in Note 6 to the Financial Statements.
3. Purchases and Sales of Securities:
Purchases and sales of securities (excluding short-term debt securities having maturities one year or less and U.S. Government Securities) for the year ended December 31, 2016 were as follows:
| Purchases | Sales | ||||||
Impact Bond Fund | $ | 114,413,630 | $ | 68,740,695 | ||||
International Index Fund | 32,953,619 | 19,266,942 | ||||||
Value Index Fund | 77,422,056 | 69,791,039 | ||||||
Growth Index Fund | 88,590,336 | 83,754,575 | ||||||
Small Cap Fund | 27,002,193 | 31,603,357 | ||||||
Conservative Portfolio | 3,789,064 | 2,384,332 | ||||||
Balanced Portfolio | 7,516,793 | 6,378,726 | ||||||
Growth Portfolio | 5,885,096 | 4,809,044 | ||||||
66
Notes to Financial Statements, continued | December 31, 2016 |
4. Investment Transactions with Affiliates:
The Portfolios invest in the underlying Praxis Mutual Funds which are also advised by the Adviser. Therefore, the Underlying Funds are deemed affiliates, and the related activities in those investments were as follows:
For the year ended December 31, 2016 | ||||||||||||||||||||||||||||
Affiliate | Fair Value at December 31, 2015 | Purchase | Sales Proceeds | Realized | Dividend Income | Shares at | Fair Value at December 31, 2016 | |||||||||||||||||||||
Praxis Genesis Conservative Portfolio | ||||||||||||||||||||||||||||
Praxis Impact Bond Fund | $ | 13,808,222 | $ | 2,724,123 | $ | 1,306,700 | $ | (15,035 | ) | $ | 384,577 | 1,479,976 | $ | 15,169,753 | ||||||||||||||
Praxis International Index Fund | 1,501,187 | 249,633 | 199,408 | (9,982 | ) | 30,558 | 169,545 | 1,612,374 | ||||||||||||||||||||
Praxis Growth Index Fund | 1,972,173 | 344,572 | 326,544 | 11,278 | 22,805 | 112,764 | 2,134,626 | |||||||||||||||||||||
Praxis Value Index Fund | 1,970,993 | 341,513 | 448,544 | 25,739 | 48,516 | 170,858 | 2,145,972 | |||||||||||||||||||||
Praxis Small Cap Fund | 490,376 | 129,223 | 103,136 | (22,150 | ) | — | 52,318 | 541,494 | ||||||||||||||||||||
Total | $ | 19,742,951 | $ | 3,789,064 | $ | 2,384,332 | $ | (10,150 | ) | $ | 486,456 | 1,985,461 | $ | 21,604,219 | ||||||||||||||
For the year ended December 31, 2016 | ||||||||||||||||||||||||||||
Affiliate | Fair Value at December 31, 2015 | Purchase | Sales Proceeds | Realized | Dividend Income | Shares at | Fair Value at December 31, 2016 | |||||||||||||||||||||
Praxis Genesis Balanced Portfolio | ||||||||||||||||||||||||||||
Praxis Impact Bond Fund | $ | 23,880,711 | $ | 3,901,445 | $ | 2,125,710 | $ | (32,039 | ) | $ | 648,464 | 2,496,007 | $ | 25,584,075 | ||||||||||||||
Praxis International Index Fund | 9,088,330 | 756,232 | 656,018 | (50,597 | ) | 180,508 | 1,001,034 | 9,519,836 | ||||||||||||||||||||
Praxis Growth Index Fund | 10,444,573 | 914,152 | 1,046,825 | 46,342 | 117,837 | 582,394 | 11,024,719 | |||||||||||||||||||||
Praxis Value Index Fund | 10,439,561 | 903,913 | 1,685,988 | 102,603 | 250,626 | 882,194 | 11,080,357 | |||||||||||||||||||||
Praxis Small Cap Fund | 5,935,653 | 1,041,051 | 864,185 | (230,590 | ) | — | 617,010 | 6,386,048 | ||||||||||||||||||||
Total | $ | 59,788,828 | $ | 7,516,793 | $ | 6,378,726 | $ | (164,281 | ) | $ | 1,197,435 | 5,578,639 | $ | 63,595,035 | ||||||||||||||
For the year ended December 31, 2016 | ||||||||||||||||||||||||||||
Affiliate | Fair Value at December 31, 2015 | Purchase | Sales Proceeds | Realized | Dividend Income | Shares at | Fair Value at December 31, 2016 | |||||||||||||||||||||
Praxis Genesis Growth Portfolio | ||||||||||||||||||||||||||||
Praxis Impact Bond Fund | $ | 9,972,670 | $ | 1,884,749 | $ | 950,489 | $ | (15,203 | ) | $ | 269,200 | 1,060,770 | $ | 10,872,897 | ||||||||||||||
Praxis International Index Fund | 10,120,648 | 920,246 | 611,490 | (57,762 | ) | 204,497 | 1,134,494 | 10,789,040 | ||||||||||||||||||||
Praxis Growth Index Fund | 11,215,209 | 903,204 | 823,065 | 19,184 | 128,724 | 636,438 | 12,047,766 | |||||||||||||||||||||
Praxis Value Index Fund | 11,210,340 | 957,127 | 1,572,425 | 92,250 | 273,757 | 963,972 | 12,107,486 | |||||||||||||||||||||
Praxis Small Cap Fund | 7,435,760 | 1,219,770 | 851,575 | (262,391 | ) | — | 785,616 | 8,131,124 | ||||||||||||||||||||
Total | $ | 49,954,627 | $ | 5,885,096 | $ | 4,809,044 | $ | (223,922 | ) | $ | 876,178 | 4,581,290 | $ | 53,948,313 | ||||||||||||||
5. Related Party Transactions:
Everence Capital Management, Inc. (the “Adviser”) provides investment advisory services to the Funds and Portfolios. Under the terms of the investment advisory agreement, the Adviser is entitled to receive fees based on a percentage of the average daily net assets of each of the Funds and Portfolios as follows:
Impact Bond Fund | 0.40% |
International Index Fund | 0.60% |
Value Index Fund | 0.30% |
Growth Index Fund | 0.30% |
Small Cap Fund | 0.85% |
Conservative Portfolio | 0.05% |
Balanced Portfolio | 0.05% |
Growth Portfolio | 0.05% |
The Adviser has retained Sub-Advisers to manage the investments of certain Funds under the terms of Sub-Advisory Agreements. The Adviser (not the Funds) pays each Sub-Adviser a fee for these services. During the period ended December 31, 2016 Aperio Group LLC served as the Sub-Adviser to the International Index Fund and Luther King Capital Management Corporation served as the Sub-Adviser to the Small Cap Fund.
The Adviser has entered into an expense limitation agreement effective until April 30, 2017. Pursuant to this agreement, the Adviser has agreed to reduce its fees and/or reimburse expenses to the extent necessary in order to limit the Total Annual Fund Operating Expenses (excluding acquired fund fees and expenses (“AFFE”), brokerage costs, interest, taxes, dividends, fees paid to vendors providing fair
67
Notes to Financial Statements, continued | December 31, 2016 |
value pricing and fund compliance services, Trustees fees and expenses, legal fees and expenses, and extraordinary expenses) of certain Funds and the Portfolios. Those Funds and Portfolios have agreed to repay the Adviser for the amount of fee reduction and/or expense reimbursements by the Adviser pursuant to this expense limitation agreement provided that such repayment does not cause the Total Annual Fund Operating Expenses (excluding AFFE, brokerage costs, interest, taxes, dividends, fees paid to vendors providing fair value pricing and fund compliance services, Trustees fees and expenses, legal fees and expenses, and extraordinary expenses) to exceed the contractual expense limit in place at the time of the fee reduction and/or reimbursement and at the time of repayment, and the repayment is made within three years after the year in which the Adviser reduced and/or reimbursed the expense.
The contractual expense limits in place as of December 31, 2016 were:
Impact Bond Fund (Class A) | 0.90% |
Small Cap Fund (Class A) | 1.65% |
Conservative Portfolio (Class A) | 0.60% |
Balanced Portfolio (Class A) | 0.60% |
Growth Portfolio (Class A) | 0.60% |
For the year ended December 31, 2016, the Adviser contractually reduced investment advisory fees and/or reimbursed other operating expenses of the Funds as follows:
Impact Bond Fund (Class A) | $ | 48,214 | ||
Small Cap Fund (Class A) | 6,061 |
For the year ended December 31, 2016, the Adviser recouped investment advisory fees of the Portfolios as follows:
Conservative Portfolio (Class A) | $ | 6,636 |
As of December 31, 2016, the Funds and Portfolios had the following amounts (and year of expiration) subject to repayment to the Adviser:
| Year Waived | Year Repayment Expires | Balance | ||||
Impact Bond Fund | 2014 | 2017 | $ | 2,575 | ||
| 2015 | 2018 | 35,957 | ||||
| 2016 | 2019 | 48,214 | ||||
|
|
| $ | 86,746 | ||
Small Cap Fund | 2014 | 2017 | $ | 1,183 | ||
| 2015 | 2018 | 9,640 | ||||
| 2016 | 2019 | 6,061 | ||||
|
|
| $ | 16,884 | ||
Conservative Portfolio | 2014 | 2017 | $ | 2,698 | ||
| 2015 | 2018 | 4,872 | ||||
|
|
| $ | 7,570 | ||
U.S. Bancorp Fund Services LLC provides transfer agent, shareholder servicing and dividend disbursing services on behalf of the Trust. For these services, U.S. Bancorp Fund Services LLC receives an annual fee, paid monthly, from each Fund and Portfolio.
BHIL Distributors, LLC (“Distributor” and “Underwriter”) serves as the Funds’ and Portfolios’ principal Distributor and Underwriter and, as such, acts as exclusive agent for distribution of the Funds’ and Portfolios’ shares. Under the terms of the Underwriting Agreements between the Trust and the Underwriter, the Underwriter earned amounts from underwriting and broker commissions on the sale of shares during the year ended December 31, 2016 as follows:
Impact Bond | $ | 4,389 | ||
International Index | 747 | |||
Value Index | 4,258 | |||
Growth Index | 7,376 | |||
Small Cap | 387 | |||
Conservative Portfolio | 7,437 | |||
Balanced Portfolio | 19,339 | |||
Growth Portfolio | 17,098 |
68
Notes to Financial Statements, continued | December 31, 2016 |
The Trust has adopted a Plan of Distribution (“Rule 12b-1 Plan”) under which each Fund and Portfolio may directly incur or reimburse the Adviser or the Underwriter for expenses related to the distribution and promotion of shares. The Rule 12b-1 Plan permits Class A Shares of the Funds and Portfolios to pay a 12b-1 fee of up to 0.50% of the average daily net assets attributable to Class A Shares of the applicable Fund and Portfolio, although the Board has currently authorized the Funds and Portfolios to charge no more than 0.25%. The Distributor may use the 12b-1 fee for shareholder servicing or distribution.
Effective August 1, 2016, the Trust entered into a Management and Administration Agreement with Foreside Management Services, LLC (“Foreside”), through an assignment from Beacon Hill Fund Services, Inc. (“Beacon Hill”) to serve as business manager and administrator for the Trust on behalf of the Funds. Pursuant to the terms of the Agreement, Foreside (and previously Beacon Hill), as business manager and administrator for the Trust, performs and coordinates all management and administration services for the Trust either directly or through working with the Trust’s service providers. Services provided under the Agreement by Foreside include, but are not limited to, coordinating and monitoring activities of the third party service providers to the Funds; serving as officers of the Trust, including but not limited to Assistant Secretary, Chief Compliance Officer, Anti-Money Laundering Officer, Treasurer and others as are deemed necessary and appropriate; performing compliance services for the Trust, including maintaining the Trust compliance program as required under the 1940 Act; managing the process of filing amendments to the Trust’s registration statement and other reports to shareholders; coordinating the Board meeting preparation process; reviewing financial filings and filing with the Securities and Exchange Commission; and maintaining books and records in accordance with applicable laws and regulations. For these services, Foreside receives a monthly fee from each Fund and Portfolio.
The Chair of the Board of Trustees receives an annual retainer of $9,000. The Audit Committee Chair receives an annual retainer of $7,000. Each additional Independent Trustee receives an annual retainer of $6,000. The meeting attendance fee is $2,000 per Trustee for each quarterly in-person meeting and $1,000 for telephonic Board meetings. The Trust paid $89,000 in aggregate Trustee fees during the year ended December 31, 2016.
6. Capital Share Transactions:
Transactions in shares of the Funds and Portfolios are summarized below:
Praxis Impact Bond Fund | Praxis International Index Fund | |||||||||||||||
| Year Ended December 31, 2016 | Year Ended December 31, 2015 | Year Ended December 31, 2016 | Year Ended December 31, 2015 | ||||||||||||
Capital Transactions: | ||||||||||||||||
Class A Shares: | ||||||||||||||||
Proceeds from shares issued | $ | 29,429,619 | $ | 25,477,562 | $ | 3,792,535 | $ | 3,794,384 | ||||||||
Dividends reinvested | 1,664,625 | 1,682,011 | 261,502 | 248,626 | ||||||||||||
Cost of shares redeemed | (27,546,172 | ) | (20,465,074 | ) | (3,539,492 | ) | (3,392,694 | ) | ||||||||
Redemption fees | 2,021 | 10,474 | 375 | 392 | ||||||||||||
Class A Share Transactions | $ | 3,550,093 | $ | 6,704,973 | $ | 514,920 | $ | 650,708 | ||||||||
Class I Shares: | ||||||||||||||||
Proceeds from shares issued | $ | 86,125,619 | $ | 75,797,084 | $ | 35,441,754 | $ | 30,218,572 | ||||||||
Dividends reinvested | 5,090,725 | 5,273,696 | 1,914,089 | 1,760,826 | ||||||||||||
Cost of shares redeemed | (62,337,747 | ) | (50,081,922 | ) | (22,752,292 | ) | (22,037,352 | ) | ||||||||
Redemption fees | 731 | 327 | 143 | 114 | ||||||||||||
Class I Share Transactions | $ | 28,879,328 | $ | 30,989,185 | $ | 14,603,694 | $ | 9,942,160 | ||||||||
Net increase from capital transactions | $ | 32,429,421 | $ | 37,694,158 | $ | 15,118,614 | $ | 10,592,868 | ||||||||
Share Transactions: | ||||||||||||||||
Class A Shares: | ||||||||||||||||
Issued | 2,797,252 | 2,427,994 | 419,684 | 376,545 | ||||||||||||
Reinvested | 158,049 | 160,463 | 27,614 | 26,968 | ||||||||||||
Redeemed | (2,629,475 | ) | (1,945,403 | ) | (380,688 | ) | (341,240 | ) | ||||||||
Change in Class A Shares: | 325,826 | 643,054 | 66,610 | 62,273 | ||||||||||||
Class I Shares: | ||||||||||||||||
Issued | 8,234,526 | 7,241,195 | 3,819,634 | 3,057,635 | ||||||||||||
Reinvested | 485,957 | 505,144 | 201,271 | 190,154 | ||||||||||||
Redeemed | (5,945,448 | ) | (4,798,010 | ) | (2,434,021 | ) | (2,155,658 | ) | ||||||||
Change in Class I Shares: | 2,775,035 | 2,948,329 | 1,586,884 | 1,092,131 | ||||||||||||
Net increase from share transactions | 3,100,861 | 3,591,383 | 1,653,494 | 1,154,404 | ||||||||||||
69
Notes to Financial Statements, continued | December 31, 2016 |
Praxis Value Index Fund | Praxis Growth Index Fund | Praxis Small Cap Fund | ||||||||||||||||||||||
| Year Ended December 31, 2016 | Year Ended December 31, 2015 | Year Ended December 31, 2016 | Year Ended December 31, 2015 | Year Ended December 31, 2016 | Year Ended December 31, 2015 | ||||||||||||||||||
Capital Transactions: | ||||||||||||||||||||||||
Class A Shares: | ||||||||||||||||||||||||
Proceeds from shares issued | $ | 4,090,425 | $ | 3,221,870 | $ | 11,774,936 | $ | 12,280,368 | $ | 1,079,098 | $ | 3,041,010 | ||||||||||||
Dividends reinvested | 536,510 | 813,980 | 400,344 | 714,366 | 300,915 | 986,104 | ||||||||||||||||||
Cost of shares redeemed | (2,778,619 | ) | (1,898,850 | ) | (14,102,860 | ) | (5,438,167 | ) | (3,092,514 | ) | (2,981,353 | ) | ||||||||||||
Redemption fees | 80 | 297 | 654 | 199 | 3 | 6,093 | ||||||||||||||||||
Class A Share Transactions | $ | 1,848,396 | $ | 2,137,297 | $ | (1,926,926 | ) | $ | 7,556,766 | $ | (1,712,498 | ) | $ | 1,051,854 | ||||||||||
Class I Shares: | ||||||||||||||||||||||||
Proceeds from shares issued | $ | 28,468,317 | $ | 28,736,694 | $ | 31,920,870 | $ | 20,442,653 | $ | 5,305,383 | $ | 5,380,398 | ||||||||||||
Dividends reinvested | 2,682,677 | 4,698,231 | 982,772 | 1,142,707 | 2,125,232 | 5,274,940 | ||||||||||||||||||
Cost of shares redeemed | (24,305,718 | ) | (14,979,797 | ) | (26,202,372 | ) | (20,989,879 | ) | (6,707,908 | ) | (18,335,066 | ) | ||||||||||||
Redemption fees | 237 | 102 | 252 | 28 | — | — | ||||||||||||||||||
Class I Share Transactions | $ | 6,845,513 | $ | 18,455,230 | $ | 6,701,522 | $ | 595,509 | $ | 722,707 | $ | (7,679,728 | ) | |||||||||||
Net increase (decrease) from capital transactions | $ | 8,693,909 | $ | 20,592,527 | $ | 4,774,596 | $ | 8,152,275 | $ | (989,791 | ) | $ | (6,627,874 | ) | ||||||||||
Share Transactions: | ||||||||||||||||||||||||
Class A Shares: | ||||||||||||||||||||||||
Issued | 348,891 | 262,186 | 658,317 | 688,665 | 116,839 | 258,539 | ||||||||||||||||||
Reinvested | 42,163 | 71,448 | 21,272 | 39,976 | 31,086 | 103,052 | ||||||||||||||||||
Redeemed | (238,887 | ) | (154,999 | ) | (776,458 | ) | (307,994 | ) | (327,644 | ) | (252,274 | ) | ||||||||||||
Change in Class A Shares: | 152,167 | 178,635 | (96,869 | ) | 420,647 | (179,719 | ) | 109,317 | ||||||||||||||||
Class I Shares: | ||||||||||||||||||||||||
Issued | 2,453,620 | 2,350,086 | 1,743,165 | 1,147,457 | 549,814 | 441,067 | ||||||||||||||||||
Reinvested | 211,366 | 413,148 | 51,916 | 63,554 | 205,336 | 520,725 | ||||||||||||||||||
Redeemed | (2,012,029 | ) | (1,230,288 | ) | (1,439,842 | ) | (1,176,692 | ) | (661,323 | ) | (1,462,158 | ) | ||||||||||||
Change in Class I Shares: | 652,957 | 1,532,946 | 355,239 | 34,319 | 93,827 | (500,366 | ) | |||||||||||||||||
Net increase (decrease) from share transactions | 805,124 | 1,711,581 | 258,370 | 454,966 | (85,892 | ) | (391,049 | ) | ||||||||||||||||
Praxis Genesis | Praxis Genesis Balanced Portfolio | Praxis Genesis Growth Portfolio | ||||||||||||||||||||||
| Year Ended December 31, 2016 | Year Ended December 31, 2015 | Year Ended December 31, 2016 | Year Ended December 31, 2015 | Year Ended December 31, 2016 | Year Ended December 31, 2015 | ||||||||||||||||||
Capital Transactions: | ||||||||||||||||||||||||
Class A Shares: | ||||||||||||||||||||||||
Proceeds from shares issued | $ | 3,738,104 | $ | 2,824,534 | $ | 5,842,699 | $ | 8,644,629 | $ | 4,615,324 | $ | 6,117,121 | ||||||||||||
Dividends reinvested | 468,949 | 334,878 | 1,855,261 | 1,235,992 | 1,832,565 | 1,221,517 | ||||||||||||||||||
Cost of shares redeemed | (2,725,336 | ) | (1,905,324 | ) | (5,963,368 | ) | (4,693,372 | ) | (4,557,323 | ) | (3,892,254 | ) | ||||||||||||
Redemption fees | 6 | 9 | 78 | 43 | 102 | 60 | ||||||||||||||||||
Class A Share Transactions | $ | 1,481,723 | $ | 1,254,097 | $ | 1,734,670 | $ | 5,187,292 | $ | 1,890,668 | $ | 3,446,444 | ||||||||||||
Net increase from capital transactions | $ | 1,481,723 | $ | 1,254,097 | $ | 1,734,670 | $ | 5,187,292 | $ | 1,890,668 | $ | 3,446,444 | ||||||||||||
Share Transactions: | ||||||||||||||||||||||||
Class A Shares: | ||||||||||||||||||||||||
Issued | 334,248 | 249,570 | 473,985 | 678,098 | 351,978 | 443,572 | ||||||||||||||||||
Reinvested | 41,789 | 29,738 | 147,428 | 99,173 | 135,015 | 92,469 | ||||||||||||||||||
Redeemed | (243,237 | ) | (168,576 | ) | (479,444 | ) | (366,356 | ) | (342,563 | ) | (278,755 | ) | ||||||||||||
Change in Class A Shares: | 132,800 | 110,732 | 141,969 | 410,915 | 144,430 | 257,286 | ||||||||||||||||||
Net increase from share transactions | 132,800 | 110,732 | 141,969 | 410,915 | 144,430 | 257,286 | ||||||||||||||||||
70
Notes to Financial Statements, continued | December 31, 2016 |
7. Federal Income Tax Information:
The character of dividends paid to shareholders of the Funds and Portfolios for federal income tax purposes during the years ended December 31, 2016 and December 31, 2015 was as follows:
Praxis Impact | Praxis International | Praxis Value | ||||||||||||||||||||||
| 2016 | 2015 | 2016 | 2015 | 2016 | 2015 | ||||||||||||||||||
From ordinary income | $ | 11,758,062 | $ | 11,402,413 | $ | 3,584,912 | $ | 3,351,861 | $ | 3,531,406 | $ | 3,536,414 | ||||||||||||
From long-term capital gains | 376,616 | 367,980 | — | — | 1,211,855 | 3,565,279 | ||||||||||||||||||
Total distributions | $ | 12,134,678 | $ | 11,770,393 | $ | 3,584,912 | $ | 3,351,861 | $ | 4,743,261 | $ | 7,101,693 | ||||||||||||
Praxis Growth Index Fund | Praxis Small Cap Fund | |||||||||||||||
| 2016 | 2015 | 2016 | 2015 | ||||||||||||
From ordinary income | $ | 1,906,109 | $ | 2,630,663 | $ | — | $ | — | ||||||||
From long-term capital gains | — | — | 2,454,091 | 6,360,231 | ||||||||||||
Total distributions | $ | 1,906,109 | $ | 2,630,663 | $ | 2,454,091 | $ | 6,360,231 | ||||||||
Praxis Genesis | Praxis Genesis | Praxis Genesis | ||||||||||||||||||||||
| 2016 | 2015 | 2016 | 2015 | 2016 | 2015 | ||||||||||||||||||
From ordinary income | $ | 359,245 | $ | 391,185 | $ | 858,748 | $ | 1,005,688 | $ | 561,393 | $ | 711,578 | ||||||||||||
From long-term capital gains | 116,386 | 103,613 | 1,007,969 | 962,469 | 1,276,445 | 1,229,722 | ||||||||||||||||||
Total distributions | $ | 475,631 | $ | 494,798 | $ | 1,866,717 | $ | 1,968,157 | $ | 1,837,838 | $ | 1,941,300 | ||||||||||||
The following information is computed on a tax basis for each item as of December 31, 2016
| Praxis Impact | Praxis International Index Fund | Praxis Value | |||||||||
Tax cost of portfolio investments | $ | 448,272,098 | $ | 173,216,597 | $ | 129,814,506 | ||||||
Gross unrealized appreciation | 9,190,329 | 34,938,708 | 31,338,901 | |||||||||
Gross unrealized depreciation | (5,591,341 | ) | (17,935,086 | ) | (2,547,357 | ) | ||||||
Net unrealized appreciation (depreciation) on investments | $ | 3,598,988 | $ | 17,003,622 | $ | 28,791,544 | ||||||
Net unrealized appreciation (depreciation) on foreign currency transactions | — | (5,840 | ) | — | ||||||||
Undistributed ordinary income | 8,856 | 53,082 | 1,831,176 | |||||||||
Undistributed long-term capital gains | — | — | 5,599,122 | |||||||||
Post October capital losses | — | — | — | |||||||||
Accumulated capital and other losses | (521,705 | ) | (13,862,089 | ) | — | |||||||
Accumulated earnings | $ | 3,086,139 | $ | 3,188,775 | $ | 36,221,842 | ||||||
| Praxis Growth | Praxis Small | ||||||
Tax cost of portfolio investments | $ | 141,565,105 | $ | 33,338,262 | ||||
Gross unrealized appreciation | 62,698,885 | 10,925,700 | ||||||
Gross unrealized depreciation | (1,550,473 | ) | (228,285 | ) | ||||
Net unrealized appreciation (depreciation) on investments | $ | 61,148,412 | $ | 10,697,415 | ||||
Undistributed ordinary income | 268,352 | — | ||||||
Undistributed long-term capital gains | 6,864,446 | 6,817 | ||||||
Post October capital losses | — | — | ||||||
Accumulated capital and other losses | — | — | ||||||
Accumulated earnings | $ | 68,281,210 | $ | 10,704,232 | ||||
| Praxis Genesis Conservative Portfolio | Praxis Genesis Balanced Portfolio | Praxis Genesis | |||||||||
Tax cost of portfolio investments | $ | 20,228,537 | $ | 54,806,034 | $ | 44,325,331 | ||||||
Gross unrealized appreciation | 1,590,415 | 9,403,761 | 10,277,756 | |||||||||
Gross unrealized depreciation | (214,733 | ) | (614,760 | ) | (564,774 | ) | ||||||
Net unrealized appreciation (depreciation) on investments | $ | 1,375,682 | $ | 8,789,001 | $ | 9,712,982 | ||||||
Undistributed ordinary income | 16,188 | 56,145 | 45,268 | |||||||||
Undistributed long-term capital gains | 74,673 | 399,352 | 513,993 | |||||||||
Post October capital losses | — | — | — | |||||||||
Accumulated capital and other losses | — | — | — | |||||||||
Accumulated earnings | $ | 1,466,543 | $ | 9,244,498 | $ | 10,272,243 | ||||||
Post October capital losses listed above incurred after October 31, 2016 and within the taxable year. are deemed to arrise on the first day of the Fund’s next taxable year.
71
Notes to Financial Statements, continued | December 31, 2016 |
The difference between book basis and tax basis net unrealized appreciation (depreciation) is attributable primarily to the tax deferral on wash sales loss and nontaxable distributions, as well as investments in Passive Foreign Investment Companies.
As of the end of tax year ended December 31, 2016, the following Funds have capital loss carry forwards (“CLCFs”) as summarized in the table below. Under the provisions of the Regulated Investment Company Modernization Act of 2010, CLCFs that originated in a tax year that began before December 23, 2010 (pre-effective CLCFs) may be carried forward, subject to certain limitations, and applied to offset future capital gains, and thus reduce the amount of distributable capital gains, for up to eight succeeding tax years, after which any unutilized CLCFs expire. Pre-effective CLCFs are applied as short-term capital loss regardless of whether the originating capital loss was short term or long term. CLCFs that originate in tax years beginning after December 22, 2010 (post-effective CLCFs), are applied consistent with the character in which they originated as a new loss on the first day of the immediately succeeding tax year, and thus take precedent over the application of pre-effective CLCFs. Post-effective CLCFs can be carried forward indefinitely.
Post-effective CLCFs not subject to expiration:
| Short Term CLCF | Long Term CLCF | Total | |||||||||
Impact Bond Fund | $ | — | $ | 521,705 | $ | 521,705 | ||||||
International Index Fund | 5,839,340 | 8,022,749 | 13,862,089 | |||||||||
During the year ended December 31, 2016 the Growth Index Fund utilized $2,741,906 of capital loss
Certain reclassifications, the result of permanent differences between financial statement and income tax reporting requirements, have been made to the components of capital. Reclassifications result primarily from the difference in the tax treatment of paydown gains and losses, distribution redesignations, Passive Foreign Investment Companies, equalization and net investment losses. These reclassifications have no impact on the net assets or the net asset value per share of the Funds and Portfolsio and are designed to present each Fund’s or Portfolio’s capital accounts on a tax basis. The following reclassifications have been made to the following Funds and Portfolios for the year ended December 31, 2016:
| Paid-In | Undistributed | Accumulated | |||||||||
Impact Bond Fund | $ | — | $ | 1,149,648 | $ | (1,149,648 | ) | |||||
International Index Fund | — | 67,009 | (67,009 | ) | ||||||||
Value Index Fund | 577,960 | 386,279 | (964,239 | ) | ||||||||
Growth Index Fund | (127,539 | ) | 13,684 | 113,855 | ||||||||
Small Cap Fund | 185,278 | 153,202 | (338,480 | ) | ||||||||
Conservative Portfolio | — | 377 | (377 | ) | ||||||||
Balanced Portfolio | — | 681 | (681 | ) | ||||||||
Growth Portfolio | — | 908 | (908 | ) | ||||||||
The Funds and Portfolios have analyzed their tax positions taken on Federal income tax returns for all open tax years (tax years ended December 31, 2013 through 2016) and have concluded that no provisions for income tax is required in their financial statements.
8. Commitments and Contingencies
Under the Trust’s organizational documents, its Officers and Trustees are indemnified against certain liabilities arising out of the performance of their duties to the Trust. In addition, in the normal course of business, the Trust enters into contracts with its vendors and others that provide general indemnification. Each Fund’s and Portfolio’s maximum exposure under these arrangements is unknown, as this would involve future claims that may be made against a Fund or Portfolio. However, based on experience, the Trust expects the risk of loss to be remote.
9. Subsequent Events
The Funds and Portfolios evaluated subsequent events from December 31, 2016 through the date these financial statements were issued. There were no significant events that would have a material impact on the Funds’ and Portfolios’ financial statements, other than disclosed below:
Effective January 1, 2017, Praxis Small Cap Fund changed its name to the Praxis Small Cap Index Fund and made certain conforming changes to its principal investment strategy, and the Adviser assumed responsibility for the day-to-day management of the Fund. Also, effective January 1, 2017, the investment advisory fee is changing from 85 bps or 0.85% to 30 bps or 0.30%, of the average daily net assets of the Fund, to reflect the change from an active managed strategy to an index strategy.
Effective January 1, 2017, Praxis International Index Fund changed the investment advisory fee from 60 bps or 60% to the following tier schedule, 60 bps or 0.60%, of the average daily net assets of the fund, on net assets from $0 – $100,000,000, 51 bps or 0.51%, of the average daily net assets of the fund, on net assets from $100,000,000 to $500,000,000, and 45 bps or 0.45%, of the average daily net assets of the fund, on net assets over $500,000,000.
72
Report of Independent Registered Public Accounting Firm |
The Board of Trustees and Shareholders
of Praxis Mutual Funds
We have audited the accompanying statements of assets and liabilities, including the schedules of portfolio investments, of Praxis Mutual Funds (comprising the Praxis Impact Bond Fund (formerly, the Praxis Intermediate Income Fund), Praxis International Index Fund, Praxis Value Index Fund, Praxis Growth Index Fund, Praxis Small Cap Fund, Praxis Genesis Conservative Portfolio, Praxis Genesis Balanced Portfolio, and Praxis Genesis Growth Portfolio) (collectively, the “Funds”) as of December 31, 2016, and the related statements of operations for the year then ended, the statements of changes in net assets for each of the two years in the period then ended, and the financial highlights for each of the five years in the period then ended. These financial statements and financial highlights are the responsibility of the Funds’ management. Our responsibility is to express an opinion on these financial statements and financial highlights based on our audits.
We conducted our audits in accordance with the standards of the Public Company Accounting Oversight Board (United States). Those standards require that we plan and perform the audit to obtain reasonable assurance about whether the financial statements and financial highlights are free of material misstatement. We were not engaged to perform an audit of the Funds’ internal control over financial reporting. Our audits included consideration of internal control over financial reporting as a basis for designing audit procedures that are appropriate in the circumstances, but not for the purpose of expressing an opinion on the effectiveness of the Funds’ internal control over financial reporting. Accordingly, we express no such opinion. An audit also includes examining, on a test basis, evidence supporting the amounts and disclosures in the financial statements and financial highlights, assessing the accounting principles used and significant estimates made by management, and evaluating the overall financial statement presentation. Our procedures included confirmation of securities owned as of December 31, 2016, by correspondence with the custodian and brokers. We believe that our audits provide a reasonable basis for our opinion.
In our opinion, the financial statements and financial highlights referred to above present fairly, in all material respects, the financial position of each of the respective funds constituting the Praxis Mutual Funds at December 31, 2016, the results of their operations for the year then ended, the changes in their net assets for each of the two years in the period then ended, and the financial highlights for each of the five years in the period then ended in conformity with U.S. generally accepted accounting principles.

Cincinnati, Ohio
February 24, 2017
73
Additional Fund Information (unaudited) | December 31, 2016 |
Praxis Impact Bond Fund
Security Allocation | Percentage of Net Assets |
Asset Backed Securities | 2.9% |
Commercial Mortgage Backed Securities | 1.3% |
Corporate Bonds | 45.2% |
Corporate Notes | 1.0% |
Federal Home Loan Bank | 3.4% |
Federal Home Loan Mortgage Corporation | 16.6% |
Federal National Mortgage Association | 20.2% |
Foreign Bonds | 2.1% |
Government National Mortgage Association | 0.2% |
Investment Companies | 0.8% |
Municipal Bonds | 2.6% |
Overseas Private Investment Corporation | 0.6% |
Small Business Administration | 0.1% |
United States Deparment of Housing and Urban Development | 0.2% |
Total | 97.2% |
Praxis International Index Fund
Security Allocation | Percentage of Net Assets |
Australia | 5.8% |
Austria | 0.2% |
Belgium | 0.2% |
Brazil | 1.3% |
Canada | 6.6% |
Cayman Islands | 0.2% |
Chile | 0.6% |
China | 4.8% |
Columbia | 0.4% |
Denmark | 0.9% |
Finland | 0.7% |
France | 6.5% |
Germany | 7.0% |
Hong Kong | 3.9% |
Hungary | 0.1% |
India | 1.5% |
Indonesia | 0.8% |
Ireland | 1.2% |
Israel | 0.6% |
Italy | 1.1% |
Japan | 16.6% |
Jersey | 0.2% |
Luxembourg | 0.3% |
Mexico | 1.3% |
Netherlands | 2.3% |
Norway | 0.7% |
Peru | 0.4% |
Portugal | 0.2% |
Russia | 0.2% |
Singapore | 1.6% |
South Africa | 0.7% |
South Korea | 2.7% |
Spain | 2.0% |
Sweden | 2.5% |
Switzerland | 7.4% |
Taiwan | 2.6% |
Turkey | 0.1% |
United Kingdom | 10.7% |
United States | 0.8% |
Preferred Stocks | 0.3% |
Corporate Notes | 0.8% |
Total | 98.8% |
Praxis International Index Fund
Security Allocation | Percentage of Net Assets |
Banks | 15.5% |
Insurance | 6.1% |
Pharmaceuticals | 5.6% |
Oil, Gas, & Consumable Fuels | 4.4% |
Diversified Telecommunications Services | 3.6% |
Metals & Mining | 3.5% |
Automobiles | 3.4% |
Food Products | 3.1% |
Chemicals | 3.0% |
Real Estate Management and Development | 2.8% |
Internet Software & Services | 2.5% |
Semiconductors & Semiconductor Equipment | 2.4% |
Machinery | 2.3% |
Wireless Telecommunication Services | 2.3% |
Food & Staples Retailing | 2.1% |
Software | 1.8% |
Capital Markets | 1.7% |
Electric Utilities | 1.7% |
Media | 1.7% |
Personal Products | 1.6% |
Road and Rail | 1.6% |
Electrical Equipment | 1.5% |
Auto Components | 1.4% |
Industrial Conglomerates | 1.4% |
Construction & Engineering | 1.3% |
Diversified Financial Services | 1.2% |
Electronic Equipment, Instruments, & Components | 1.1% |
Energy Equipment & Services | 1.1% |
Health Care Equipment & Supplies | 1.1% |
Textiles, Apparel, & Luxury Goods | 1.1% |
Multi-Utilities | 1.0% |
Trading Companies and Distributors | 1.0% |
Hotels, Restaurants and Leisure | 0.9% |
Household Products | 0.9% |
Community Development | 0.8% |
Construction Materials | 0.8% |
Household Durables | 0.8% |
IT Services | 0.7% |
Professional Services | 0.7% |
Specialty Retail | 0.7% |
Health Care Providers & Services | 0.6% |
Multiline Retail | 0.5% |
Real Estate Investment Trusts (REITs) | 0.5% |
Technology Hardware, Storage, & Peripherals | 0.5% |
Transportation Infrastructure | 0.5% |
Water Utilities | 0.5% |
Air Freight & Logistics | 0.4% |
Beverages | 0.4% |
Building Products | 0.4% |
Airlines | 0.3% |
Commercial Services & Supplies | 0.3% |
Communications Equipment | 0.3% |
Internet & Direct Marketing Retail | 0.3% |
Biotechnology | 0.2% |
Containers and Packaging | 0.2% |
Life Sciences Tools & Services | 0.2% |
Paper & Forest Products | 0.2% |
Independent Power Producers & Energy Traders | 0.1% |
Leisure Products | 0.1% |
Marine | 0.1% |
Other Assets in Excess of Liabilities | 1.2% |
Total | 100.0% |
** | Amount rounds to less than 0.1% |
74
Additional Fund Information (unaudited), continued | December 31, 2016 |
Praxis Value Index Fund
Security Allocation | Percentage of Net Assets |
Common Stocks | 99.0% |
Corporate Notes | 0.8% |
Rights** | 0.0% |
Total | 99.8% |
** | Amount rounds to less than 0.1% |
Praxis Growth Index Fund
Security Allocation | Percentage of Net Assets |
Common Stocks | 98.5% |
Corporate Notes | 0.9% |
Total | 99.4% |
Praxis Small Cap Fund
Security Allocation | Percentage of Net Assets |
Common Stocks | 91.0% |
Corporate Notes | 0.9% |
Total | 91.9% |
Praxis Genesis Conservative Portfolio
Security Allocation | Percentage of Net Assets |
Mutual Funds | 100.0% |
Praxis Genesis Balanced Portfolio
Security Allocation | Percentage of Net Assets |
Mutual Funds | 100.0% |
Praxis Genesis Growth Portfolio
Security Allocation | Percentage of Net Assets |
Mutual Funds | 100.0% |
75
Additional Fund Information (unaudited), continued | December 31, 2016 |
Proxy Voting:
The Adviser and Sub-Advisers are responsible for exercising the voting rights associated with the securities purchased and held by the Funds and Portfolios. A description of the policies and procedures that the Adviser and Sub-Advisers use in fulfilling this responsibility and information regarding how those proxies were voted during the twelve month period ended June 30 are available (i) without charge, upon request, by calling (800) 977-2947; and (ii) on the Securities and Exchange Commission’s (“Commission’s”) Web site at http://www.sec.gov.
Quarterly Portfolio Disclosure:
The Trust files a complete listing of the Schedules of Portfolio Investments for each Fund and Portfolio as of the end of the first and third quarters of each fiscal year on Form N-Q. The complete listing (i) is available on the Commission’s Web site, (ii) may be reviewed and copied at the Commission’s Public Reference Room in Washington, DC; and (iii) will be made available to shareholders upon request by calling (800) 977-2947. Information on the operation of the Public Reference Room may be obtained by calling (800) SEC-0330. The Statement of Additional Information contains more information about the Funds and Portfolios and can be obtained free of charge by calling (800) 977-2947.
Dividends Received Deduction:
For corporate shareholder, the following ordinary dividends paid during the year ended December 31, 2016 qualify for the corporate dividends received deduction:
Value Index Fund | 67.3% |
Growth Index Fund | 100.0% |
Conservative Portfolio | 18.8% |
Balanced Portfolio | 39.2% |
Growth Portfolio | 63.4% |
Qualified Dividend Income:
The Funds and Portfolios designated the maximum amount allowable of their net taxable income as qualified dividend income as provided in the Jobs and Growth Tax Relief Reconciliation Act of 2003. This amount was reflected on Form 1099-DIV for the calendar year 2016.
Capital Gain Distribution:
For the year ended December 31, 2016, the following Funds designated long-term capital gain distributions:
Impact Bond Fund | $ 376,616 |
Value Index Fund | 1,789,815 |
Small Cap Fund | 2,777,581 |
Genesis Conservative Portfolio | 116,386 |
Genesis Balanced Portfolio | 1,007,969 |
Genesis Growth Portfolio | 1,276,445 |
Foreign Tax Credit:
The Funds and Portfolios intend to elect to pass through to shareholders the income tax credit for taxes paid to foreign countries, if any. As of December 31, 2016, the following Funds had foreign tax credits:
Fund | Foreign Tax | Foreign Tax | ||||||
International Index Fund - Class A | $ | 37,494 | $ | 0.0189 | ||||
International Index Fund - Class I | 465,923 | 0.0258 | ||||||
Conservative Portfolio | 4,291 | 0.0023 | ||||||
Balanced Portfolio | 25,348 | 0.0050 | ||||||
Growth Portfolio | 28,717 | 0.0072 | ||||||
76
Additional Fund Information (unaudited), continued | December 31, 2016 |
Special Meeting of Shareholders:
A Special Meeting of Shareholders of the Trust was held on April 28, 2016 for the purpose of voting on three proposals: (1) election of Trustees; (2) revisions to the Trust’s Declaration of Trust; and (3) revisions to fundamental investment policies of the Trust. At the meeting, each of the proposals set forth in the shareholder proxy were approved. The voting results for each of the proposals are as follows:
Proposal 1 - Election of Trustees
The voting results for the election of seven Trustees were as follows:
For | Withhold | |
Karen Klassen Harder | 77,863,473 | 6,710,646 |
Kenneth D. Hochstetler | 81,252,509 | 3,321,611 |
Jeffrey K. Landis | 77,931,957 | 6,642,163 |
R. Clair Sauder | 77,911,536 | 6,662,583 |
Dwight L. Short | 77,927,581 | 6,646,539 |
Candace L. Smith | 77,914,579 | 6,659,541 |
Don E. Weaver | 77,355,733 | 7,218,386 |
Proposal 2 - Approve and amended and restated Declaration of Trust
The voting results to approve an amended and restated Declaration of Trust were as follows:
For | Withhold | |
70,983,577 | 2,416,114 |
Proposal 3 - Approve updated fundamental investment policies for the Trust
The voting results to approve updated fundamental investment policies for the Trust (by Fund or Portfolio) were as follows:
Intermediate Income Fund | International Index Fund | Value Index Fund | ||||
For | Against | For | Against | For | Against | |
a) Borrowing Money | 31,317,074 | 76,827 | 16,641,587 | 16,536 | 9,553,269 | 16,110 |
b) Issuing senior securities | 31,374,627 | 33,454 | 16,645,575 | 12,762 | 9,556,843 | 12,798 |
c) Underwriting securities | 31,318,319 | 50,267 | 16,633,994 | 13,495 | 9,546,743 | 13,504 |
d) Real Estate | 30,995,112 | 415,520 | 16,644,573 | 15,656 | 9,551,227 | 18,342 |
e) Commodities | 31,380,195 | 39,373 | 16,647,199 | 10,828 | 9,558,069 | 11,587 |
f) Making Loans | 31,332,835 | 65,767 | 16,559,485 | 13,895 | 9,555,186 | 14,306 |
g) Diversification | 31,366,662 | 29,110 | 16,561,123 | 10,228 | 9,560,886 | 8,170 |
h) Concentration | 31,341,539 | 42,538 | 16,557,287 | 10,111 | 9,557,771 | 10,441 |
Growth Index Fund | Small Cap Fund | |||
For | Against | For | Against | |
a) Borrowing Money | 7,404,011 | 20,717 | 3,842,148 | 15,124 |
b) Issuing senior securities | 7,414,360 | 11,449 | 3,844,338 | 12,937 |
c) Underwriting securities | 7,397,420 | 15,233 | 3,842,313 | 8,755 |
d) Real Estate | 7,269,727 | 155,828 | 3,844,413 | 9,767 |
e) Commodities | 7,407,996 | 10,576 | 3,844,835 | 11,840 |
f) Making Loans | 7,415,044 | 12,643 | 3,844,443 | 14,191 |
g) Diversification | 7,418,229 | 5,495 | 3,850,921 | 5,882 |
h) Concentration | 7,411,756 | 11,364 | 3,845,466 | 7,184 |
Voting results to approve updated fundamental investment policies for the Trust (by Fund or Portfolio) were as follows:
Genesis Balanced Portfolio | Genesis Conservative Fund | Genesis Growth Fund | ||||
For | Against | For | Against | For | Against | |
a) Borrowing Money | 2,188,185 | 13,713 | 764,626 | 13,312 | 1,536,618 | 13,737 |
b) Issuing senior securities | 2,183,181 | 15,712 | 779,166 | 2,028 | 1,541,525 | 10,214 |
c) Underwriting securities | 2,175,960 | 14,268 | 771,148 | 6,086 | 1,530,500 | 10,210 |
d) Real Estate | 2,186,804 | 15,843 | 774,935 | 9,886 | 1,542,115 | 9,425 |
e) Commodities | 2,186,169 | 11,328 | 787,502 | 840 | 1,539,741 | 10,122 |
f) Making Loans | 2,188,092 | 15,039 | 771,438 | 8,552 | 1,541,931 | 11,077 |
g) Diversification | 2,197,492 | 5,476 | 778,371 | 1,618 | 1,539,588 | 8,495 |
h) Concentration | 2,191,066 | 10,054 | 771,176 | 3,699 | 1,540,927 | 8,893 |
77
Additional Fund Information (unaudited), continued | December 31, 2016 |
BOARD CONSIDERATION AND APPROVAL OF ADVISORY AND SUB-ADVISORY AGREEMENTS
At its November 11-12, 2016 meeting, the Funds’ Board of Trustees, which is comprised of a majority of Independent Trustees, unanimously approved a one-year renewal of each Fund’s Advisory Agreement. Also at that meeting, the Board approved a one-year renewal of the Sub-Advisory Agreement for the Praxis International Index Fund and determined not to renew the Sub-Advisory Agreement for the Praxis Small Cap Fund. In this section, the Advisory and Sub-Advisory Agreements are referred to as the “Agreements.”
In reaching its determinations, the Board considered information furnished throughout the year at regular Board meetings, as well as information prepared specifically in connection with the annual contract review process, which included meetings in October and November 2016. The Trustees reviewed and evaluated all of this information and considered factors they believed, in light of legal advice furnished to them by independent legal counsel and through the exercise of their own business judgment, to be relevant and appropriate. The Board considered each Fund and each Agreement separately. The Board’s conclusions with respect to the renewals were based in part on the Board’s evaluation of the Agreements in prior years and their experience with the nature and quality of services provided under the Agreements in prior years. The Board’s determinations were not based on any single factor, and individual Trustees may have weighed certain factors differently.
INVESTMENT ADVISORY AGREEMENT WITH EVERENCE CAPITAL MANAGEMENT, INC.
In approving the continuation of the Investment Advisory Agreement between Everence Capital Management, Inc. (the “Adviser”) and each Fund, the Board gave weight to the following factors, among others.
Nature, Quality and Extent of Services
The Board examined the nature, quality and extent of services the Adviser provides to the Funds. Among other things, the Board considered the Adviser’s experience in serving as investment adviser of the Funds, including the experience of senior personnel at the Adviser providing services to the Funds. The Board also considered the Adviser’s performance in fulfilling its responsibilities for overseeing the Funds’ legal and compliance environment, for overseeing the Sub-Advisers’ compliance with the Funds’ investment objectives and policies, and its responsiveness in implementing Board directives as they relate to the Funds. In addition, the Board considered the Adviser’s track record and experience providing portfolio management services to the Funds that the Adviser manages directly, the composition and qualifications of the portfolio managers responsible for the day-to-day portfolio management of each Fund that will be managed directly, and the Adviser’s infrastructure and resources available to the portfolio managers. The Board also considered that the Adviser is responsible for developing and integrating key elements of the Funds’ socially responsible investing, including the stewardship investing screening process for the Funds and shareholder advocacy on behalf of the Funds. Based on these and other considerations, within the context of its overall determinations regarding the Agreements, the Board concluded that it was satisfied with the nature, quality and extent of services provided to the Funds by the Adviser. The Board also observed that there is a range of investment options available to shareholders of the Funds, including other mutual funds, and that the Funds’ shareholders have demonstrated their support for the Funds by investing in the Funds.
Investment Performance of the Funds and Everence
In evaluating each Fund’s investment performance, the Board considered performance in light of the Fund’s investment objectives, strategies, and risks, as disclosed in the Fund’s prospectus. The Board reviewed historical performance information for the Funds, and considered each Fund’s historical performance relative to its benchmark and peer group. The Board evaluated Fund performance gross of fees and net of fees. The Board also considered the impact of the Funds’ social investing screens on Fund performance. Based on these and other considerations, within the context of its overall determinations regarding the Agreements, among other conclusions, the Board reached the following conclusions with regard to performance, for the periods ended September 30, 2016 :
Impact Bond Fund: the Fund’s gross performance was in line with expectations. The Board noted that the Fund’s gross performance exceeded its benchmark for the three- and five-year periods and equaled its benchmark for the one-year period, and measured against its peer group, Class A ranked between the 67th and 79th percentiles and Class I ranked between the 45th and 72nd percentiles over those periods;
Value Index Fund: the Fund’s gross performance was in line with expectations. The Board noted that the Fund’s gross performance trailed its benchmark for the one-, three- and five-year periods, and measured against its peer group, Class A ranked between the 41st and 52nd percentiles and Class I ranked between the 33rd and 37th percentiles over those periods;
Growth Index Fund: the Fund’s gross performance was strong. The Board noted that the Fund’s gross performance exceeded its benchmark for the one-, three- and five-year periods, and measured against its peer group, Class A ranked between the 7th and 20th percentiles and Class I ranked between the 5th and 12th percentiles over those periods;
78
Additional Fund Information (unaudited), continued | December 31, 2016 |
Conservative Portfolio: the Fund’s gross performance was in line with expectations. The Board noted that the Fund’s gross performance exceeded its benchmark for the one-, three- and five-year periods and, measured against its peer group, ranked between 39th and 62nd percentiles over those periods;
Balanced Portfolio: the Fund’s gross performance was in line with expectations. The Board noted that the Fund’s gross performance trailed its benchmark for the one-, three- and five-year periods and, measured against its peer group, ranked between the 67th and 78th percentiles over those periods; and
Growth Portfolio: the Fund’s gross performance was in line with expectations. The Board noted that the Fund’s gross performance trailed its benchmark for the one-, three- and five-year periods and, measured against its peer group, ranked between the 39th and 62nd percentiles over those periods.
The Board also noted that the benchmark index for each of the Genesis Portfolios does not represent the mix of asset classes in which those Funds invest.
Costs of Services and Profitability of Everence and Affiliates
The Board then reviewed information regarding the costs of providing the advisory services to the Funds and the profits to be realized by the Adviser and its affiliates from their relationship with the Funds. Representatives of the Adviser addressed the Board’s questions regarding guidelines for manager selection, fund-related expenses, expense allocations and compensation levels and expense waivers and reimbursements. In its review of the Funds’ total and net expenses, the Board considered the Adviser’s fees, as well as other Fund expenses, such as transfer agent, custodial, legal, compliance and audit fees. The Board also noted the effects of any current expense waivers and reimbursements on fees and expense levels, as well as proposed changes to the current expense limitations and the duration of those waivers and reimbursements. As part of its review, the Board considered the expense ratios and profitability information by Fund compared with peer group fund expense ratios. In addition, the Board reviewed the fee structures and other information provided by the Adviser regarding its services to other clients. Based on these and other considerations, within the context of its overall determinations regarding the Agreements, the Board concluded that the costs to each Fund of the services provided to the Fund by the Adviser were fair.
Economies of Scale
The Board considered the extent to which economies of scale would be realized as the Funds grow and whether the investment advisory fee rates reflect those economies of scale for the benefit of Fund shareholders. The Board noted that the Adviser had agreed to implement breakpoints for the International Index Fund. The Adviser represented to the Board that it would consider breakpoints for the other Funds as they grow in size but that current asset levels do not warrant breakpoints. The Board then considered the information provided regarding the expense levels of peer group funds. Based on these and other considerations, within the context of its overall determinations regarding the Agreements, the Board acknowledged the Adviser’s statement that current asset levels did not warrant breakpoints at this time.
Other Benefits
The Board discussed the extent to which the Adviser and its affiliates might derive other benefits, including soft dollar credits or other similar benefits from the Adviser’s relationship with the Funds. The Board noted that the Adviser does not generate soft dollar credits on Fund brokerage transactions. Based on these and other considerations, within the context of its overall determinations regarding the Agreements, the Board concluded that such benefits were not material or were reasonable in relation to the services provided. In addition, the Board noted that the Funds benefit from their association with the Adviser and its affiliates, particularly in light of its commitment to socially responsible investing.
SUB-INVESTMENT ADVISORY AGREEMENT WITH APERIO GROUP, LLC
In approving the continuation of the Sub-Investment Advisory Agreement between Everence Capital Management, Inc. and Aperio Group, LLC (“Aperio”) with respect to portfolio management of Praxis International Index Fund, the Board gave weight to the following factors, among others.
Nature, Quality and Extent of Services
The Board considered the nature, quality and extent of services Aperio provides to the International Index Fund. Among other things, the Board considered Aperio’s experience in providing the investment strategy used by the Fund and in serving as Sub-Adviser to the Fund, including the experience of senior personnel at Aperio providing portfolio management and other services to the Funds. The Board considered Aperio’s compliance capabilities, its compliance record with respect to the International Index Fund, and the quality of communication among the Adviser, Aperio and the Board. The Board also considered Aperio’s compliance with the Fund’s investment objective and policies, and its responsiveness in implementing Board directives as they relate to the Fund. In addition, the Board considered Aperio’s track record and experience providing portfolio management services to the Fund. The Board also considered
79
Additional Fund Information (unaudited), continued | December 31, 2016 |
Aperio’s responsiveness in addressing Board questions and requests. Based on these and other considerations, within the context of its overall determinations regarding the Agreements, the Board concluded that it was generally satisfied with the nature, quality and extent of services provided to the International Index Fund by Aperio.
Investment Performance of the International Index Fund and Aperio
The Board reviewed historical performance data for the International Index Fund, and considered the Fund’s historical performance relative to its benchmark and peer groups. The Board also considered the impact of the Fund’s social investing screens on Fund performance. Based on these and other considerations, within the context of its overall determinations regarding the Agreements, the Board concluded that, for the periods ended September 30, 2016, the Fund’s gross performance was in line with expectations. The Board noted that the Fund’s gross performance exceeded its benchmark for the one-, three- and five-year periods and, measured against its peer group, Class A ranked between the 25th and 83rd percentiles and Class I ranked between the 19th and 70th percentiles over those periods
Costs of Services and Profitability of Aperio and Affiliates
The Board considered the costs of the services provided by Aperio to the International Index Fund and the profits to be realized by Aperio and its affiliates from their relationship with the International Index Fund. Based on these and other considerations, within the context of its overall determinations regarding the Agreements, the Board concluded that the costs to the International Index Fund of the services provided by Aperio were fair.
Economies of Scale
The Board noted that Aperio’s sub-advisory fee schedule currently incorporates breakpoints.
Other Benefits
The Board considered the extent to which Aperio or its affiliates would derive other benefits, including soft dollar credits or other similar benefits, from Aperio’s relationship with the International Index Fund. Within the context of its overall determinations regarding the Agreements, the Board concluded that Aperio did not derive material benefits from its relationship with the International Index Fund other than its sub-advisory fees.
SUB-INVESTMENT ADVISORY AGREEMENT WITH LUTHER KING CAPITAL MANAGEMENT
The Board determined not to approve a renewal of the Praxis Small Cap Fund’s Sub-Investment Advisory Agreement with Luther King Capital Management Corporation (“Luther King Capital Management”) due, in principal, to the Fund’s disappointing investment performance and availability of an attractive, lower-cost alternative. As a result, effective January 1, 2017, responsibility for providing day-to-day portfolio management services to the Small Cap Fund reverted to the Adviser in accordance with the terms of the existing Advisory Agreement and the following related changes were implemented: (i) the name of the Fund was changed to “Praxis Small Cap Index Fund,” (ii) the fee to be paid by the Fund to the Adviser pursuant to the Advisory Agreement was reduced from 0.85% to 0.30% of the Fund’s average daily net assets, (iii) the Fund’s principal investment strategy was modified, (iv) the Fund’s 80% policy was replaced with a new policy; (v) the Fund’s primary benchmark index was changed; and (vi) a new portfolio management team became responsible for the Fund. Additional information about these changes is contained in the Supplement dated November 14, 2016 to the Small Cap Fund’s Summary Prospectus and Prospectus dated April 30, 2016. Additional information about the factors the Board considered in approving the continuation of the Advisory Agreement between the Adviser and the Fund is provided above in the section titled, “Investment Advisory Agreement with Everence Capital Management, Inc.” The Board acknowledged that Luther King Capital Management had managed the Fund’s investments in accordance with the Fund’s investment strategy, demonstrated a strong compliance culture and had been consistently responsive to the Adviser and the Board.
80
Additional Fund Information (unaudited), continued | December 31, 2016 |
Expense Comparison:
As a shareholder of the Praxis Mutual Funds, you incur two types of costs: (1) transaction costs, including sales charges (loads); redemption fees; and exchange fees; (2) ongoing costs, including management fees; distribution and service 12b-1 fees; and other Fund expenses. This example is intended to help you understand your ongoing costs (in dollars) of investing in the Praxis Mutual Funds and to compare these costs with the ongoing costs of investing in other mutual funds.
The example is based on an investment of $1,000 invested at the beginning of the period and held for the entire period from July 1, 2016 through December 31, 2016.
The Actual Expense example below provides information about actual account values and actual expenses. You may use this information, together with the amount you invested, to estimate the expenses that you paid over the period. Simply divide your account value by $1,000 (for example, an $8,600 account value divided by $1,000 = 8.6), then multiply the result by the number in the table under the heading entitled “Expenses paid during the period” to estimate the expenses you paid on your account during this period.
The Hypothetical Expense example below provides information about hypothetical account values and hypothetical expenses based on each Fund’s actual expense ratio and an assumed rate of return of 5% per year before expenses, which is not each Fund’s actual return. The hypothetical account values and expenses may not be used to estimate the actual ending account balance or expenses you paid for the period. You may use this information to compare the ongoing costs of investing in this Fund and other funds. To do so, compare this 5% hypothetical example with the 5% hypothetical examples that appear in the shareholder reports of the other funds.
Account Value at | Account Value at | Expenses Paid | Expense Ratio During | ||||
Actual | Hypothetical | Actual | Hypothetical | Actual | Hypothetical | Actual | |
Praxis Impact Bond Fund | |||||||
Class A | 1,000.00 | 1,000.00 | 976.70 | 1,020.46 | 4.62 | 4.72 | 0.93% |
Class I | 1,000.00 | 1,000.00 | 978.70 | 1,022.42 | 2.69 | 2.75 | 0.54% |
Praxis International Index Fund | |||||||
Class A | 1,000.00 | 1,000.00 | 1,049.70 | 1,018.45 | 6.85 | 6.75 | 1.33% |
Class I | 1,000.00 | 1,000.00 | 1,052.50 | 1,021.32 | 3.92 | 3.86 | 0.76% |
Praxis Value Index Fund | |||||||
Class A | 1,000.00 | 1,000.00 | 1,101.20 | 1,020.41 | 4.96 | 4.77 | 0.94% |
Class I | 1,000.00 | 1,000.00 | 1,103.80 | 1,022.97 | 2.27 | 2.19 | 0.43% |
Praxis Growth Index Fund | |||||||
Class A | 1,000.00 | 1,000.00 | 1,053.60 | 1,020.71 | 4.54 | 4.47 | 0.88% |
Class I | 1,000.00 | 1,000.00 | 1,056.00 | 1,023.03 | 2.17 | 2.14 | 0.42% |
Praxis Small Cap Fund | |||||||
Class A | 1,000.00 | 1,000.00 | 1,077.30 | 1,016.69 | 8.77 | 8.52 | 1.68% |
Class I | 1,000.00 | 1,000.00 | 1,080.70 | 1,020.36 | 4.97 | 4.82 | 0.95% |
Praxis Genesis Conservative Portfolio | |||||||
Class A | 1,000.00 | 1,000.00 | 1,003.60 | 1,021.97 | 3.17 | 3.20 | 0.63% |
Praxis Genesis Balanced Portfolio | |||||||
Class A | 1,000.00 | 1,000.00 | 1,033.30 | 1,022.47 | 2.71 | 2.69 | 0.53% |
Praxis Genesis Growth Portfolio | |||||||
Class A | 1,000.00 | 1,000.00 | 1,051.40 | 1,022.07 | 3.15 | 3.10 | 0.61% |
* | Expenses are equal to average account value times the Fund’s annualized expense ratio multiplied by the number of days in the most recent fiscal half-year divided by the number of days in the fiscal year. |
** | Annualized |
81
Management of the Trust (unaudited) |
Listed below is basic information regarding the Trustee and principal officers of the Trust. The Trust’s Statement of Additional Information includes additional information about Trustees and is available, without charge, upon request by calling (800) 977-2947.
Management of the Trust
Name, Age and Address | Position with the Company, Term of Office and Length of Time Served | Principal Occupation During the Past Five Years | Number of Portfolios in Fund Complex Overseen by Trustee | Other Trusteeships Held by Trustee |
Interested Trustees1 | ||||
Kenneth D. Hochstetler 1110 North Main Street Goshen, IN 46528 Age: 55 | Trustee, Indefinite, since 11/14/14 | President and CEO of Everence Financial (September 2014 - Present); Senior Executive Vice President, Univest Corporation 1992 - September 2014 | 8 | N/A |
1 | These Trustees are “interested” persons under the Investment Company Act of 1940 because of their affiliation with the Adviser. |
Independent Trustees | ||||
Laura Berry 1110 North Main Street Goshen, IN 46528 Age: 59 | Trustee, Indefinite, since 1/1/17 | Retired; Executive Director, Interfaith Center on Corporate Responsibility (2002 - 2016) | 8 | N/A |
Karen Klassen Harder, Ph.D. 1110 North Main Street Goshen, IN 46528 Age: 60 | Trustee, Indefinite, since 11/14/14 | Professor, Bluffton University | 8 | N/A |
Jeffrey K. Landis | Trustee, Indefinite, since 4/28/16 | Partner, Landis, Hunsberger, Gringrich & Welk, LLP (Law Firm) (1994 - present) | 8 | N/A |
R. Clair Sauder 1110 North Main Street Goshen, IN 46528 Age: 73 | Trustee, Indefinite, since 6/30/02 | Retired; Partner, Encore Enterprises, LLC, retail home furnishings (May 2001 - October 2008); Partner, C&D Enterprises Unlimited, commercial real estate (1981 - present) | 8 | N/A |
Dwight L. Short 1110 North Main Street Goshen, IN 46528 Age: 71 | Trustee, Indefinite, since 1/1/14 | Consultant, DLS Consulting, Consulting and Writing (2005 - present) | 8 | N/A |
Candace L. Smith 1110 North Main Street Goshen, IN 46528 Age: 58 | Trustee, Indefinite, since 11/16/07 | Managing Director of Risk, MicroVest Capital Management, LLC (2015 - present); COO, MicroVest Capital Management LLC (2011 - 2014); CFO, MicroVest Capital Management LLC (2005 - 2011) | 8 | N/A |
82
Management of the Trust (unaudited), continued |
Name, Age and Address | Position with the Company, Term of Office and Length of Time Served | Principal Occupation During the Past Five Years |
Officers | ||
Chad Horning 1110 North Main Street Goshen, IN 46528 Age: 48 | President, Indefinite, since 3/10/15 | Chief Investment Officer and Senior Vice President, Everence (2009 - present) |
Marlo J. Kauffman 1110 North Main Street Goshen, IN 46528 Age: 60 | Vice President, Secretary, Indefinite, since 12/2/93 | Vice President of Financial Services Operations, Everence Financial (1981 - present); President, Everence Securities, Inc. (2004 - present); OSJ Principal, ProEquities, Inc., a broker-dealer (1994 - Present); Assistant Secretary, Everence Financial (1990 - Present) |
Trent M. Statczar 325 John H. McConnell Blvd Columbus, OH 43215 Age: 45 | Treasurer, Indefinite, since 1/1/09 | Director, Foreside Financial Group, LLC, 2008 to present: Vice President, Citi Fund Services Ohio, Inc. from 2004 to 2007. |
Rodney L. Ruehle 325 John H. McConnell Blvd Columbus, OH 43215 Age: 48 | Chief Compliance Officer, Indefinite, since 5/15/15 | Director, Foreside Financial Group, LLC, 2008 to present: Vice President, Citi Fund Services Ohio, Inc. from 2004 to 2007. |
83
For more information about the Praxis Mutual Funds, the following documents are available free upon request:
Annual/Semi-Annual Reports:
The Praxis Mutual Funds’ annual and semi-annual reports to shareholders contain additional information on each Fund’s or Portfolio’s investments. In the annual report, you will find a discussion of the market conditions and investment strategies that significantly affected the Funds’ or Portfolio’s performance during their last fiscal year.
Statement Of Additional Information (SAI):
The SAI provides more detailed information about the Praxis Mutual Funds, including their operations and investment policies. It is incorporated by reference and is legally considered a part of this prospectus.
You can get free copies of reports and the SAI, or request other information and discuss your questions about the Funds or Portfolios, by contacting the broker that sells the Praxis Mutual Funds, or by contacting the Praxis Mutual Funds at:
Praxis Mutual Funds
c/o U.S. Bancorp Fund Services LLC
P.O. Box 701
Milwaukee, WI 53201-0701
Telephone: 1-800-977-2947
Internet: http://www.praxismutualfunds.com(1)
You can review and get copies of the Praxis Mutual Funds’ reports and SAI at the Public Reference Room of the Securities and Exchange Commission. You can get text-only copies:
● | For a duplicating fee, by writing the Public Reference Section of the Commission, Washington, DC 20549-1520 or calling (202) 551-8090, or by electronic request, by e-mailing the SEC at the following address: publicinfo@sec.gov. |
● | Free from the Commission’s Web site at http://www.sec.gov. |
(1) | The Funds’ site is not a part of this prospectus. |
Investment Company Act file no. 811-08056


| Item 2. | Code of Ethics. |
As of the end of the period covered by this report, the registrant has adopted a code of ethics that applies to the registrant’s principal executive officer, principal financial officer, principal accounting officer or controller, or persons performing similar functions. The code of ethics is included as Exhibit 12(a)(1).
During the period covered by the report, with respect to the registrant’s code of ethics that applies to its principal executive officer, principal financial officer, principal accounting officer or controller, or persons performing similar functions; there have been no amendments to, nor any waivers granted from, a provision that relates to any element of the code of ethics definition enumerated in paragraph (b) of this Item 2.
| Item 3. | Audit Committee Financial Expert. |
The registrant’s Board of Trustees has determined that the registrant has at least one audit committee financial expert serving on its audit committee. Mr. R. Clair Sauder is the registrant’s “audit committee financial expert” and is “independent” (as each term is defined in Item 3 of Form N-CSR).
| Item 4. | Principal Accountant Fees and Services. |
| (a) | Audit Fees. Audit fees totaled $144,000 for the December 31, 2016 fiscal year and $134,000 for the December 31, 2015 fiscal year, including fees associated with the annual audit and filing of the registrant’s Form N-SAR. |
| (b) | Audit-Related Fees. There were no audit-related fees for the December 31, 2016 fiscal year and the December 31, 2015 fiscal year. |
| (c) | Tax Fees. Tax fees totaled $48,770 for the December 31, 2016 fiscal year and $49,970 for the December 31, 2015 fiscal year and consisted of fees for tax compliance services during both years. |
| (d) | All Other Fees. There were no other fees for the December 31, 2016 or December 31, 2015 fiscal years. |
| (e) | (1) Audit Committee Pre-Approval Policies. |
(A) Audit Services
Before an auditor is engaged by the funds to render audit services, the committee shall review and approve the engagement (see also “delegation” below).
(B) Permissible Non-Audit Services
The committee shall review and approve in advance any proposal (except as set forth in (1) through (3) below) that the funds employ their auditor to render “permissible non-audit services” to the funds. (a “permissible non-audit service” is defined as a non-audit service that is not prohibited by rule 2-01(c)(4) of regulation s-x or other applicable law or regulation.) The committee shall also review and approve in advance any proposal (except as set forth in (1) through (3) below) that the adviser, and any entity controlling, controlled by, or under common control with the adviser that provides ongoing services to the funds (an “adviser-affiliated service provider”), employ the funds’ auditor to render non-audit services, if such engagement would relate directly to the operations and financial reporting of the funds. As a part of its review, the committee shall consider whether the provision of such services is consistent with the auditor’s independence (see also “delegation” below). Pre-approval by the committee of non-audit services is not required so Long as:
(1) (a) with respect to the funds, the aggregate amount of all such permissible non-audit services provided to the funds constitutes no more than 5% of the total amount of revenues paid to the auditor by the funds during the fiscal year in which the services are provided; (b) with respect to the adviser and any adviser-affiliated service provider, the aggregate amount of all such non-audit services provided constitutes no more than 5% of the total amount of revenues (of the type that would have to be pre-approved by the committee) paid to the auditor by the funds, the adviser and any adviser-affiliated service provider during the fiscal year in which the services are provided;
(2) such services were not recognized by the funds at the time of the engagement to be non-audit services; and
(3) such services are promptly brought to the attention of the committee and approved prior to the completion of the audit by the committee or its delegate(s) (as defined below).
(C) Delegation
The committee may delegate to one or more of its members (“delegates”) authority to pre-approve the auditor’s provision of audit services or permissible non-audit services to the funds, or the provision of non- audit services to the adviser or any adviser-affiliated service provider. Any pre-approval determination made by a delegate shall be presented to the full committee at its next meeting. The committee shall communicate any pre-approval made by it or a delegate to the fund administrator/fund accounting agent, who will ensure that the appropriate disclosure is made in the funds’ periodic reports and other documents as required under the federal securities laws.
| (e) | (2) 0.0% for fiscal years ended December 31, 2016 and December 31, 2015. |
| (f) | Not applicable |
| (g) | The aggregate non-audit fees for services to the registrant, its investment adviser and any entity controlling, controlled by, or under common control with the adviser that provides ongoing services to the registrant were $72,870 for the December 31, 2016 fiscal year and $66,048 for December 31, 2015 fiscal year. |
| (h) | The audit committee considered the non-audit services rendered to the registrant’s investment adviser and any entity controlling, controlled by, or under common control with the investment adviser, and believes the services are compatible with the principal accountant’s independence. |
| Item 5. | Audit Committee of Listed Registrants. |
Not applicable.
| Item 6. | Investments |
(a) Schedule I – Investments in Securities of Unaffiliated Issuers
The complete schedule of investments is included in the report to shareholders in Item 1 of this Form N-CSR.
(b) The Registrant made no divestments of securities in accordance with Section 13(c) of the Investment Company Act of 1940.
| Item 7. | Disclosure of Proxy Voting Policies and Procedures For Closed-End Management Investment Companies. |
Not applicable.
| Item 8. | Portfolio Managers of Closed-End Management Investment Companies. |
Not applicable.
| Item 9. | Purchase of Equity Securities by Closed-End Management Investment Company and Affiliated Purchasers. |
Not applicable.
| Item 10. | Submission of Matters to a Vote Of Security Holders. |
Not applicable.
| Item 11. | Controls and Procedures. |
(a) The Registrant’s principal executive officer and principal financial officer have concluded, based on their evaluation of the Registrant’s disclosure controls and procedures as conducted within 90 days of the filing date of this report, that those disclosure controls and procedures provide reasonable assurance that the material information required to be disclosed by the Registrant on this report is recorded, processed, summarized and reported within the time periods specified in the Securities and Exchange Commission’s rules and forms.
| (b) | There have not been any changes in registrant’s control over financial reporting (as defined in Rule 30a-3(d) under the Investment Company Act of 1940) that occurred during the second fiscal quarter of the period covered by this report that has materially affected, or is reasonably likely to materially affect, the registrant’s control over financial reporting. |
| Item 12. | Exhibits. |
| (a)(1) | Code of Ethics for Senior Financial Officers is filed herewith. | |
| (a)(2) | Certifications pursuant to Rule 30a-2(a) under the 1940 Act and Section 302 of the Sarbanes-Oxley Act of 2002 are attached hereto. | |
| (a)(3) | Any written solicitation to purchase securities under Rule 23c-1 under the 1940 Act – Not applicable. | |
| (b) | Certification required by Rule 30a-2(b) under the 1940 Act and Section 906 of the Sarbanes-Oxley Act of 2002 is furnished herewith. | |
SIGNATURES
Pursuant to the requirements of the Securities Exchange Act of 1934 and the Investment Company Act of 1940, the registrant has duly caused this report to be signed on its behalf by the undersigned, thereunto duly authorized.
Praxis Mutual Funds
| By: | /s/ Trent Statczar | |
Trent Statczar | ||
Treasurer and Chief Financial Officer | ||
March 3, 2017 |
Pursuant to the requirements of the Securities Exchange Act of 1934 and the Investment Company Act of 1940, this report has been signed below by the following persons on behalf of the registrant and in the capacities and on the dates indicated.
| By: | /s/ Chad Horning | |
Chad Horning | ||
President and Chief Executive Officer | ||
March 3, 2017 |
| By: | /s/ Trent Statczar | |
Trent Statczar | ||
| Treasurer and Chief Financial Officer | ||
March 3, 2017 |