UNITED STATES
SECURITIES AND EXCHANGE COMMISSION
Washington, D.C. 20549
FORM N-CSR
CERTIFIED SHAREHOLDER REPORT OF REGISTERED
MANAGEMENT INVESTMENT COMPANIES
Investment Company Act file number: 811-8056
Praxis Mutual Funds
(Exact name of registrant as specified in charter)
1110 N. Main Street
Goshen, IN 46527
(Address of principal executive offices) (Zip code)
Anthony Zacharski
Dechert LLP
200 Clarendon Street, 27th Floor
Boston, MA 02116
(Name and Address of Agent for Service)
Registrant’s telephone number, including area code: (800) 977-2947
Date of fiscal year end: December 31
Date of reporting period: December 31, 2017
| Item 1. | Reports to Stockholders. |
The following is a copy of the report transmitted to shareholders pursuant to Rule 30e-1 under the Investment Company Act of 1940 (17 CFR 270.30e-1).
Table of Contents
Message from the President | 1 |
Stewardship Investing Report | 2 |
Praxis Impact Bond Fund | |
Portfolio Managers’ Commentary | 4 |
Performance Review | 5 |
Schedule of Investments | 6 |
Praxis International Index Fund | |
Portfolio Managers’ Commentary | 13 |
Performance Review | 14 |
Schedule of Investments | 15 |
Praxis Value Index Fund | |
Portfolio Manager’s Commentary | 25 |
Performance Review | 26 |
Schedule of Investments | 27 |
Praxis Growth Index Fund | |
Portfolio Manager’s Commentary | 31 |
Performance Review | 32 |
Schedule of Investments | 33 |
Praxis Small Cap Index Fund | |
Portfolio Manager’s Commentary | 37 |
Performance Review | 38 |
Schedule of Investments | 39 |
Praxis Genesis Portfolios | |
Portfolio Managers’ Commentary | 45 |
Praxis Genesis Conservative Portfolio | |
Performance Review | 46 |
Schedule of Investments | 47 |
Praxis Genesis Balanced Portfolio | |
Performance Review | 48 |
Schedule of Investments | 49 |
Praxis Genesis Growth Portfolio | |
Performance Review | 50 |
Schedule of Investments | 51 |
Financial Statements | |
Statements of Assets and Liabilities | 52 |
Statements of Operations | 54 |
Statements of Changes in Net Assets | 56 |
Financial Highlights | 59 |
Notes to Financial Statements | 67 |
Report of Independent Registered Public Accounting Firm | 78 |
Additional Fund Information (unaudited) | 79 |
Management of the Trust (unaudited) | 86 |
Message from the President | Annual report to shareholders |
Dear Praxis shareholder:
Despite the many risks that might have sidetracked the rally in risk assets during the year, investors focused on a long list of positives. Economies across the globe grew in synchrony, corporations generated strong profits, and the U.S. regulatory backdrop improved. And, as the year drew to a close, the U.S. Congress passed a wide-ranging tax bill that is expected to result in lower taxes for most individuals and corporations.
While U.S. equities generated strong returns, non-U.S. markets sailed to even stronger gains, with emerging markets outshining developed markets. In the U.S., large cap companies performed better than smaller ones, and growth strategies easily beat valuation- oriented strategies.
The benchmark 10-year U.S. Treasury traded in a narrow range for most of the year, highlighting the bond market’s cautious approach to the economic recovery entering its ninth year. The 10-year U.S. Treasury ended the year at 2.41 percent, down slightly from where it started the year.
The administration’s campaign to reduce regulations has been cheered by financial markets, but we are concerned that with less regulatory oversight of companies, there could be adverse environmental and social effects. And so, the Praxis® team has continued to work diligently to make a difference at the companies in which we invest on your behalf. We do this in several ways, including actively voting proxy ballots at annual shareholder meetings. In 2017, there was an industry-wide emphasis on environmental and diversity-related resolutions, many of which Praxis supported. Support for these types of resolutions has increasingly included large institutional investors that in the past would have often voted with management against these initiatives.
And, we pursued direct discussions with companies, encouraging them to address the challenges of environmental sustainability and modern slavery that exist as a result of their activities, both directly and through their suppliers. These discussions focus on areas that we believe are in the financial interest of shareholders like Praxis, but we must be patient since the engagements often last several years before meaningful changes are made.
Many of our investors tell us their priorities involve more than making money. They want their investments to matter – to make an impact. They want to be catalysts for change, and that’s a big reason shareholder advocacy, positive investments, company screening and community development investing are so important to our work at Praxis. Because of you, we’re able to invest in ways that impact communities near you and around the world.
Thank you for entrusting your investments with Praxis Mutual Funds.
Sincerely,

Chad M. Horning
President
Praxis Mutual Funds are advised by Everence Capital Management and distributed through FINRA member Foreside Financial Services, LLC.
The views expressed are those of the Praxis Mutual Funds’ President as of Dec. 31, 2017, are subject to change, and may differ from the views of portfolio managers or Everence Capital Management as a whole. These opinions are not intended to be a forecast of future events, a guarantee of future results, or investment advice. All data referenced are from sources deemed to be reliable but cannot be guaranteed. Securities and sectors referenced should not be construed as a solicitation or recommendation or be used as the sole basis for any investment decision.
1
Message from the Vice President of Stewardship Investing | Annual report to shareholders |
Impact: A shared goal for our diverse marketplace
In a world where there seems to be equal and opposing viewpoints on just about everything, one reassuring bright spot has been growing interest throughout the investor community in seeing an investment portfolio as more than just a way to save for the future. If managed carefully and thoughtfully, it can also be a way to save the future!
For decades faith-based and socially-concerned investors have pursued the integration of their values with their investments; much of that time focused on values-based avoidance screens. And while such screens remain important to many (and can be more financially material than many think), the movement to managing an investment portfolio for impact — utilizing a wide range of tools and strategies — has been gaining increased attention in many circles.
Praxis Mutual Funds (“Praxis”) has been pursuing a strategy of total portfolio impact for more than 15 years, seeking to provide our diverse shareholders with the opportunity to make a real difference in the world while providing financially for themselves, their family or institution.
We call this work “stewardship investing”. And in 2017 these efforts to reflect our values while delivering global impact yielded some exciting results:
| | ● | Values + ESG screening — This innovative approach to company restrictions brings together traditional values-based screens with new integrated environmental, social and governance (ESG) screens. The result helps provide Praxis a positive social tilt while addressing long term risks related to ESG-related issues. |
| | ● | Robust shareholder advocacy — An historic strength for Praxis, in 2017 corporate engagement activities provided a range of meaningful impact for communities around the world including: |
| | ○ | Strong resolution support and productive dialogues with AES, DTE Energy, Duke Energy and The Southern Company on climate risk and the coming transition to a low-carbon economy. |
| | ○ | A commitment from Yum! Brands on the phase-out of certain antibiotics in poultry used in their restaurant chains, which include KFC, Taco Bell, and Pizza Hut. |
| | ○ | New policies from Target and CVS removing a large number of chemicals of concern from hundreds of beauty and personal care products. |
| | | Details on these engagements, and many more, can be found at praxismutualfunds.com/how-we-invest/shareholder-advocacy. |
| | ● | Active ESG integration —The Praxis fixed income team works to integrate emerging corporate environmental, social and governance data into the active investment process for the Praxis Impact Bond Fund. In 2017, this approach helped the team avoid Equifax during its security debacle and has led to a focus on higher ESG-rated utilities that are investing in renewable energy and leading the transition to a new energy future. |
| | ● | Positive impact investments —The active management of the Praxis Impact Bond Fund, along with the deep Socially Responsible Investing/ESG commitments of our investment team, have helped position this fund at the forefront of industry in the inclusion of market-rate, positive impact bonds that benefit the climate and communities. Today, these investments account for nearly 27 percent of the portfolio and include: |
| | ○ | International Finance Corporation — This innovative social bond from a member of the World Bank Group will be used to support women and emerging market communities by funding companies that buy from smaller- scale farmers, provide utilities for low-income households, and/or offer affordable health services, education or housing to low-income people. |
| | ○ | Kaiser Foundation Hospitals — This unique green bond will help Kaiser’s health facilities pay for green projects, furthering the organization’s work to meet its long-term environmental stewardship goals. These goals include becoming “carbon net positive” by using clean energy, supporting sustainable agriculture and reducing waste. |
| | ○ | Mexico City Airport Trust — This green bond provides financing for a new airport and is the largest green bond issues to date from Latin America. The project, currently under construction, has goals to be carbon neutral, operate with 100 percent clean energy, and achieve significant reductions in energy and water consumption. |
| | | More stories about positive impact bonds can be found at praxismutualfunds.com/how-we-invest/positive-investing. |
2
Message from the Vice President of Stewardship Investing, continued | Annual report to shareholders |
| | ● | Values-driven proxy voting — How we communicate with corporations through resolutions on their annual proxy is our responsibility as part-owners of these companies. It also provides us an important means of articulating our support for the values and concerns we want taken seriously. In 2017, we cast more than 13,000 votes at 1,074 company meetings, voting with management’s recommendation approximately 88 percent of the time. Praxis consistently supported resolutions, even opposed by management, addressing diversity and gender equity, assessment of climate risk, transparency in political spending and many more. Check out our live proxy voting record and annual proxy voting report at praxismutualfunds.com/how-we-invest/proxy-voting. |
| | ● | Community development investing — Praxis continued to build out its relationship with the Calvert Foundation in 2017. The goal of this strategic partnership is to support of our industry-leading commitment of channeling approximately 1 percent of all Fund assets to opening doors of economic opportunity to marginalized communities and individuals. The impact of this partnership, now encompassing CDI investments of more than $12 million, can be explored through an interactive community investment map (praxismutualfunds.com/how-we-invest/community-development-investing). |
At Praxis Mutual Funds, we seek to provide the financial performance you need along with the values and global impact so many now desire. As we’ve learned over the past two decades, the pursuit of responsible, stewardship investing can take many forms and serve the goals of many different investors. We’re delighted you’ve chosen to join us on this impact journey.
Mark A. Regier
Vice President of Stewardship Investing
Praxis Mutual Funds
The views expressed are those of the Vice President of Stewardship Investing as of Dec. 31, 2017, are subject to change, and may differ from the views of portfolio managers or Everence Capital Management as a whole. These opinions are not intended to be a forecast of future events, a guarantee of future results, or investment advice. All data referenced are from sources deemed to be reliable but cannot be guaranteed. Securities and sectors referenced should not be construed as a solicitation or recommendation or be used as the sole basis for any investment decision.
3
Praxis Impact Bond Fund
Annual Report to Shareholders
Portfolio Managers’ Commentary (unaudited)
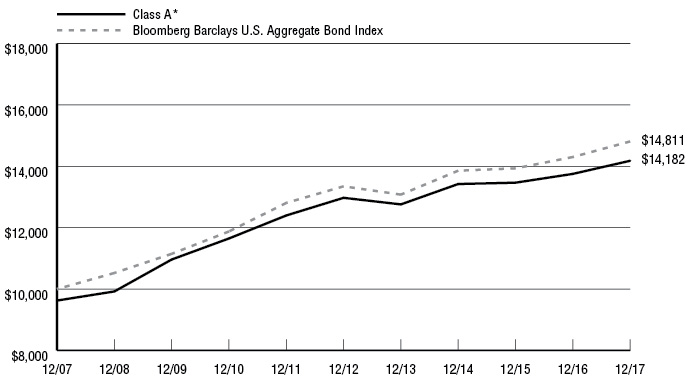
For the year ended December 31, 2017, the Praxis Impact Bond Fund’s Class I Shares had a return of 3.58 percent, and the Class A Shares (Without Load) returned 3.11 percent. The Bloomberg Barclays U.S. Aggregate Bond Index, the Fund’s benchmark, returned 3.54 percent. Over the last five years, the Class I Shares returned 2.20 percent (average annual return) versus 2.10 percent for the Fund’s benchmark and over the last 10 years, the Class I Shares returned 4.33 percent (average annual return) versus 4.01 percent for the Fund’s benchmark.
It is always difficult to know what the future holds, but the crystal ball to start the year for 2017 seemed extra foggy. It seemed like the new administration might benefit stock markets, but the market was unsure of what exactly to expect. It turned out that stocks moved higher across the board and that helped corporate bond spreads to tighten. There is generally a good relationship between higher stock prices and higher corporate bond prices and 2017 was no different. The Praxis Impact Bond Fund (the “Fund”) had a higher weight to corporate bonds, especially utilities and BBB rated bonds, and this led to our outperforming the index. The Fund also holds some lower-rated bonds and these bonds did well also. The Fund does not own U.S. Treasuries and that also benefited performance.
The year ended on an economic high note with the unemployment rate at 4.1 percent, the Consumer Price Index (CPI) inflation rate above 2 percent and Gross Domestic Product (GDP) just below 3 percent. There was relative economic strength throughout the year and this allowed the Federal Reserve (“Fed”) to increase the Fed funds rate three times in 2017. These increases led to a dramatic increase in short term interest rates. The 6-month Treasury bill moved higher by over 0.90 percent. Oddly, while short term interest rates were increasing, long term interest rates decreased. This yield curve flattening generally happens when economic growth is slowing or expected to slow. Economic growth was slightly better than expected throughout the year, but it wasn’t enough to move long-term interest rates higher. The portfolio managers expected that interest rates would move higher, but the 30- year Treasury rate moving lower was unexpected and that detracted from performance for the Fund.
Consistently low inflation is one explanation why long-term rates have remained low. The inflation measures that the Fed watches for higher inflation have not been able to stay above 2 percent. The public looks at the CPI and many investors look at core CPI, which excludes food and energy, and those have been around the Fed’s 2 percent target for well over a year. The Fed looks at many different inflation data points, but the core Personal Consumption Expenditures (PCE) data is the inflation indicator that the Fed looks at most closely and that has not breached 2 percent since 2012. Whether this lack of inflation in that indicator persists in 2018 is the question that many bond investors are asking.
We expect inflation to rise modestly in 2018, moving above the Fed’s 2 percent target. With tight labor markets and solid wage growth compared to the prior five years, it seems like these are the ingredients for stronger inflation. Unless inflation moves much higher than expected, in our view the Fed will likely just increase the federal funds rate a few more times in 2018. We expect economic growth to continue at a solid pace for 2018 and the unemployment rate to continue its downward trend below 4 percent.
The overall economy wasn’t the only thing showing strong growth in 2017. The global green bond market continued its strong growth trajectory. After record breaking growth to about $85 billion in 2016, the green bond market grew to over $130 billion in 2017. About 33 percent of the issuance was in U.S. dollars, about 40 percent in Euros and about 20 percent in the Chinese renminbi. Green bonds fund projects that have positive environmental benefits.
We were able to increase the holdings of positive impact bonds –fixed income investments which have a positive impact on the climate and/or community – in the Fund to over 27 percent of the portfolio by December 31, 2017. We bought new bonds that supported women-owned enterprises and low-income communities in emerging markets, one that supported a Community Development Financial Institution (CDFI) for low income people and places, and an innovative green airport construction project.
The positive impact bond market has continued to grow in terms of number of bonds and the risk and return available from that part of the market. There are 113 bonds in the Fund that we define as positive impact holdings and 78 of those provide clear benefits to the climate. The remaining positive impact bonds produce benefits to communities by funding affordable housing, health care, sustainability and social bonds, and more.
As we start 2018, we are positioned for higher interest rates, and we continue to look for more opportunities to enhance the financial return and to make a positive impact on society.
Benjamin J. Bailey, CFA®
Praxis Impact Bond Fund Co-Manager
Praxis Mutual Funds
Delmar King
Praxis Impact Bond Fund Co-Manager
Praxis Mutual Funds
The views expressed are those of the portfolio managers as of Dec. 31, 2017, are subject to change, and may differ from the views of other portfolio managers or Everence Capital Management as a whole. These opinions are not intended to be a forecast of future events, a guarantee of future results, or investment advice. All data referenced are from sources deemed to be reliable but cannot be guaranteed. Securities and sectors referenced should not be construed as a solicitation or recommendation or be used as the sole basis for any investment decision.
4
Praxis Impact Bond Fund
Performance Review (unaudited)
Growth of $10,000 investment from 12/31/07 to 12/31/17
This chart represents historical performance of a hypothetical investment of $10,000 in Class A Shares (adjusted for the maximum sales charge of 3.75%) of the Fund and Index from 12/31/07 to 12/31/17, and includes the reinvestment of dividends and capital gains.
| | | | Average Annual Returns | | |
| Inception Date | One
Year Ended | Three
Years Ended | Five
Years Ended | Ten
Years Ended | Expense
Ratio**
Gross / Net |
Praxis Impact Bond Fund | | | | | | | |
Class A * | 5/12/99 | -0.75% | 0.56% | 1.02% | 3.56% | 0.99% | 0.94% |
Class A (Without Load) | 5/12/99 | 3.11% | 1.85% | 1.79% | 3.95% | | |
Class I * | 5/1/06 | 3.58% | 2.24% | 2.20% | 4.33% | 0.54% | 0.54% |
Bloomberg Barclays U.S. Aggregate Bond Index 1 | | 3.54% | 2.24% | 2.10% | 4.01% | | |
Past performance does not guarantee future results. The performance data quoted represents past performance and current returns may be lower or higher. The investment return and principal value will fluctuate so that an investor’s shares, when redeemed, may be worth more or less than the original cost. These performance figures do not reflect the deduction of taxes that a shareholder would pay on fund distributions or the redemption of fund shares. To obtain performance information current to the most recent month end, please visit www.praxismutualfunds.com. Indexes are unmanaged, do not incur fees, and it is not possible to invest directly in an index.
The total returns shown reflect any expenses that were contractually or voluntarily reduced, reimbursed or paid by any party during the periods presented. In such instances, and without activity, the total returns would have been lower.
| * | The total return figures shown reflect the maximum sales charge applicable to Class A Shares. Class A Shares have a maximum sales charge on purchases of 3.75%. |
| ** | Reflects the expense ratios as reported in the Prospectus dated April 30, 2017. Contractual fee waivers are in effect from May 1, 2017 through April 30, 2018 for Class A. |
| 1 | Bloomberg Barclays U.S. Aggregate Bond Index is an unmanaged index composed of the Bloomberg Barclays U.S. Government/Credit Index and the Bloomberg Barclays U.S. Mortgage-Backed Securities Index and includes Treasury issues, agency issues, corporate bond issues and mortgage-backed securities, and is intended to be generally representative of the bond market as a whole. |
The above index is for illustrative purposes only and does not reflect the deduction of expenses associated with a mutual fund, such as investment management and fund accounting fees. The Fund’s performance reflects the deduction of these services. An investor cannot invest directly in an index, although they can invest in its underlying securities.
5
Schedule of Investments
Praxis Impact Bond Fund
December 31, 2017
| | | COUPON | | | MATURITY | | | PRINCIPAL AMOUNT | | | FAIR
VALUE | |
| ASSET BACKED SECURITIES—2.5% | | | | | | | | | |
| Ally Auto Receivables Trust | | | 1.490 | % | | | 11/15/19 | | | $ | 779,674 | | | $ | 778,891 | |
| Bank of The West Auto Trust (a) | | | 1.650 | % | | | 03/16/20 | | | | 1,844,780 | | | | 1,843,844 | |
| Cal Funding II Ltd.(a) | | | 3.620 | % | | | 06/25/42 | | | | 712,500 | | | | 710,011 | |
| CarMax Auto Owner Trust | | | 1.320 | % | | | 07/15/19 | | | | 678,120 | | | | 677,641 | |
| CarMax Auto Owner Trust | | | 1.380 | % | | | 11/15/19 | | | | 233,445 | | | | 233,120 | |
| CLI Funding LLC | | | 2.830 | % | | | 03/18/28 | | | | 509,000 | | | | 501,763 | |
| Cronos Containers Program I Ltd. (b) | | | 3.270 | % | | | 11/18/29 | | | | 657,407 | | | | 653,077 | |
| Fairway Outdoor Funding LLC (b) | | | 4.212 | % | | | 10/15/19 | | | | 426,506 | | | | 431,462 | |
| Global SC Finance II SRL (b) | | | 2.980 | % | | | 04/17/28 | | | | 613,333 | | | | 607,099 | |
| Hyundai Auto Receivables Trust | | | 1.320 | % | | | 08/15/19 | | | | 425,462 | | | | 425,437 | |
| SBA Tower Trust | | | 2.898 | % | | | 10/15/19 | | | | 525,000 | | | | 526,262 | |
| SolarCity LMC Series I LLC (b)(c) | | | 4.800 | % | | | 12/21/26 | | | | 641,773 | | | | 660,349 | |
| SolarCity LMC Series IV LLC (b)(c) | | | 4.180 | % | | | 08/21/45 | | | | 233,699 | | | | 236,848 | |
| Spruce ABS Trust | | | 4.320 | % | | | 06/15/28 | | | | 443,019 | | | | 445,216 | |
| TCF Auto Receivables Owner Trust | | | 2.330 | % | | | 05/15/20 | | | | 2,000,000 | | | | 2,001,495 | |
| Textainer Marine Containers Ltd. | | | 3.720 | % | | | 05/20/42 | | | | 704,063 | | | | 708,244 | |
| Toyota Auto Receivables Owner Trust | | | 1.270 | % | | | 05/15/19 | | | | 357,306 | | | | 356,872 | |
| Toyota Motor Credit Corp. | | | 1.300 | % | | | 04/15/20 | | | | 974,831 | | | | 971,170 | |
| Verizon Owner Trust (b) | | | 1.420 | % | | | 01/20/21 | | | | 200,000 | | | | 198,686 | |
| TOTAL ASSET BACKED SECURITIES (COST $12,969,536) | | | | | | | | | | | | | | | 12,967,487 | |
| | | | | | | | | | | | | | | | | |
| COMMERCIAL MORTGAGE BACKED SECURITIES—0.6% |
| Commercial Mortgage Pass Through Certificates | | | 3.391 | % | | | 05/15/45 | | | | 946,721 | | | | 969,833 | |
| Commercial Mortgage Pass Through Certificates | | | 2.853 | % | | | 10/15/45 | | | | 1,000,000 | | | | 1,003,744 | |
| OBP Depositor LLC Trust (b) | | | 4.646 | % | | | 07/15/45 | | | | 1,040,000 | | | | 1,087,408 | |
| TOTAL COMMERCIAL MORTGAGE BACKED SECURITIES(COST $3,118,370) | | | | | | | | | | | | | | | 3,060,985 | |
| | | | | | | | | | | | | | | | | |
| MUNICIPAL BONDS—2.2% |
| American Municipal Power Ohio, Inc., Rev. Taxable-Hydroelectric Projects | | | 7.334 | % | | | 02/15/28 | | | | 1,000,000 | | | | 1,278,860 | |
| Bridgeport Connecticut Housing Authority | | | 1.850 | % | | | 12/15/18 | | | | 75,000 | | | | 74,474 | |
| Cincinnati, Ohio Water System Rev. | | | 6.458 | % | | | 12/01/34 | | | | 600,000 | | | | 645,390 | |
| Columbus Multi-High School Building Corp. | | | 6.446 | % | | | 01/15/30 | | | | 1,000,000 | | | | 1,038,390 | |
| Findlay City School District | | | 6.250 | % | | | 12/01/37 | | | | 270,000 | | | | 278,748 | |
| Houston Independent School District | | | 6.168 | % | | | 02/15/34 | | | | 1,000,000 | | | | 1,047,250 | |
| Indianapolis Public School Multi-School Building | | | 5.731 | % | | | 07/15/29 | | | | 1,500,000 | | | | 1,575,450 | |
| Massachusetts St. | | | 3.277 | % | | | 06/01/46 | | | | 1,500,000 | | | | 1,480,545 | |
| New Jersey St. Housing and Mortgage Finance | | | 2.600 | % | | | 07/01/23 | | | | 320,000 | | | | 320,208 | |
| Osceola County Housing Finance Authority Rev. | | | 3.350 | % | | | 07/01/23 | | | | 230,000 | | | | 241,560 | |
| St. of Hawaii, Department of Business Economic Development & Tourism | | | 1.467 | % | | | 07/01/22 | | | | 530,031 | | | | 525,600 | |
| St. Paul Housing & Redevelopment Authority Rev. | | | 2.993 | % | | | 07/01/21 | | | | 1,250,000 | | | | 1,249,825 | |
| Warm Springs Reservation Confederated Tribe | | | 8.250 | % | | | 11/01/19 | | | | 795,000 | | | | 837,827 | |
| Wisconsin Department of Transportation | | | 5.837 | % | | | 07/01/30 | | | | 800,000 | | | | 840,640 | |
| TOTAL MUNICIPAL BONDS (COST $11,164,692) | | | | | | | | | | | | | | | 11,434,767 | |
| | | | | | | | | | | | | | | | | |
| CORPORATE BONDS—35.4% |
| AIRLINES—0.5% | | | | | | | | | | | | | | | | |
| British Airways, Series 2013-1 (b) | | | 4.625 | % | | | 06/20/24 | | | | 661,652 | | | | 700,689 | |
| Delta Air Lines, Inc. | | | 4.950 | % | | | 05/23/19 | | | | 676,088 | | | | 693,801 | |
| Delta Air Lines, Inc. | | | 2.875 | % | | | 03/13/20 | | | | 435,000 | | | | 437,524 | |
| Southwest Airlines Co. | | | 2.650 | % | | | 11/05/20 | | | | 680,000 | | | | 682,764 | |
| | | | | | | | | | | | | | | | 2,514,778 | |
| BANKS—2.9% | | | | | | | | | | | | | | | | |
| Axis Bank/Dubai (b) | | | 2.875 | % | | | 06/01/21 | | | | 500,000 | | | | 495,071 | |
| Bank of America Corp. | | | 1.950 | % | | | 05/12/18 | | | | 1,000,000 | | | | 1,000,078 | |
| Bank of America Corp. | | | 2.151 | % | | | 11/09/20 | | | | 1,000,000 | | | | 995,420 | |
| Bank of America Corp. | | | 3.300 | % | | | 01/11/23 | | | | 500,000 | | | | 511,500 | |
| Bank of America Corp. | | | 4.100 | % | | | 07/24/23 | | | | 1,000,000 | | | | 1,061,953 | |
| Citigroup, Inc. | | | 2.400 | % | | | 02/18/20 | | | | 1,250,000 | | | | 1,248,537 | |
| Citigroup, Inc. | | | 3.700 | % | | | 01/12/26 | | | | 1,250,000 | | | | 1,286,887 | |
| Commonwealth Bank of Australia (b) | | | 2.250 | % | | | 03/10/20 | | | | 1,500,000 | | | | 1,495,381 | |
| Discover Bank/Greenwood DE | | | 3.100 | % | | | 06/04/20 | | | | 1,000,000 | | | | 1,011,868 | |
| JPMorgan Chase & Co. | | | 2.250 | % | | | 01/23/20 | | | | 1,500,000 | | | | 1,498,996 | |
| JPMorgan Chase & Co. | | | 4.625 | % | | | 05/10/21 | | | | 500,000 | | | | 533,836 | |
| Mitsubishi UFJ Financial Group | | | 2.527 | % | | | 09/13/23 | | | | 1,250,000 | | | | 1,217,542 | |
| Sumitomo Mitsui Banking Corp. | | | 2.450 | % | | | 10/20/20 | | | | 1,250,000 | | | | 1,252,086 | |
| Toronto-Dominion Bank | | | 1.850 | % | | | 09/11/20 | | | | 1,575,000 | | | | 1,557,587 | |
| | | | | | | | | | | | | | | | 15,166,742 | |
| BIOTECHNOLOGY—0.7% | | | | | | | | | | | | | | | | |
| Amgen, Inc. | | | 5.700 | % | | | 02/01/19 | | | | 1,000,000 | | | | 1,037,954 | |
| Biogen, Inc. | | | 2.900 | % | | | 09/15/20 | | | | 1,000,000 | | | | 1,013,622 | |
| Celgene Corp. | | | 2.875 | % | | | 08/15/20 | | | | 1,250,000 | | | | 1,261,650 | |
| Gilead Sciences, Inc. | | | 3.650 | % | | | 03/01/26 | | | | 500,000 | | | | 518,700 | |
| | | | | | | | | | | | | | | | 3,831,926 | |
| BUILDING MATERIALS—0.2% | | | | | | | | | | | | | | | | |
| Carlisle Cos. Inc. | | | 3.500 | % | | | 12/01/24 | | | | 1,250,000 | | | | 1,259,877 | |
| | | | | | | | | | | | | | | | | |
| BUILDING PRODUCTS—0.2% | | | | | | | | | | | | | | | | |
| Masco Corp. | | | 3.500 | % | | | 04/01/21 | | | | 250,000 | | | | 253,912 | |
| Owens Corning | | | 4.200 | % | | | 12/01/24 | | | | 750,000 | | | | 785,753 | |
| | | | | | | | | | | | | | | | 1,039,665 | |
| CAPITAL MARKETS—1.9% | | | | | | | | | | | | | | | | |
| Bank of New York Mellon Corp. (The), Perpetual Bond | | | 4.950 | % | | | 12/29/49 | | | | 1,000,000 | | | | 1,035,050 | |
See accompanying notes to financial statements.
6
Schedule of Investments, continued
Praxis Impact Bond Fund
December 31, 2017
| | | COUPON | | | MATURITY | | | PRINCIPAL AMOUNT | | | FAIR
VALUE | |
| CORPORATE BONDS—35.4%, continued |
| CAPITAL MARKETS—1.9%, continued |
| Goldman Sachs Group, Inc. | | | 6.000 | % | | | 06/15/20 | | | $ | 1,200,000 | | | $ | 1,297,459 | |
| Goldman Sachs Group, Inc. | | | 3.272 | % | | | 09/29/25 | | | | 1,500,000 | | | | 1,493,956 | |
| ING Bank N.V. (b) | | | 2.000 | % | | | 11/26/18 | | | | 1,515,000 | | | | 1,514,239 | |
| Jefferies Group LLC | | | 8.500 | % | | | 07/15/19 | | | | 900,000 | | | | 977,556 | |
| Morgan Stanley | | | 2.200 | % | | | 12/07/18 | | | | 910,000 | | | | 911,042 | |
| Morgan Stanley | | | 5.625 | % | | | 09/23/19 | | | | 1,500,000 | | | | 1,580,722 | |
| State Street Corp. | | | 7.350 | % | | | 06/15/26 | | | | 1,000,000 | | | | 1,276,953 | |
| | | | | | | | | | | | | | | | 10,086,977 | |
| CHEMICALS—1.1% | | | | | | | | | | | | | | | | |
| Avery Dennison Corp. | | | 5.375 | % | | | 04/15/20 | | | | 1,250,000 | | | | 1,318,210 | |
| Ecolab, Inc. | | | 5.500 | % | | | 12/08/41 | | | | 150,000 | | | | 187,793 | |
| Ecolab, Inc. (b) | | | 3.950 | % | | | 12/01/47 | | | | 1,220,000 | | | | 1,247,094 | |
| NOVA Chemicals Corp. (b) | | | 5.250 | % | | | 08/01/23 | | | | 500,000 | | | | 514,375 | |
| Potash Corp. of Saskatchewan, Inc. | | | 5.875 | % | | | 12/01/36 | | | | 840,000 | | | | 1,033,905 | |
| Solvay Finance America LLC (b) | | | 3.400 | % | | | 12/03/20 | | | | 1,250,000 | | | | 1,276,384 | |
| | | | | | | | | | | | | | | | 5,577,761 | |
| COMMERCIAL SERVICES & SUPPLIES—0.2% | | | | | | | | | | | | | | | | |
| Steelcase, Inc. | | | 6.375 | % | | | 02/15/21 | | | | 750,000 | | | | 820,796 | |
| | | | | | | | | | | | | | | | | |
| COMMUNICATIONS EQUIPMENT—0.1% | | | | | | | | | | | | | | | | |
| Juniper Networks, Inc. | | | 3.300 | % | | | 06/15/20 | | | | 500,000 | | | | 506,484 | |
| | | | | | | | | | | | | | | | | |
| CONSTRUCTION MATERIALS—0.2% | | | | | | | | | | | | | | | | |
| Martin Marietta Materials, Inc. | | | 6.600 | % | | | 04/15/18 | | | | 1,000,000 | | | | 1,012,939 | |
| | | | | | | | | | | | | | | | | |
| CONSUMER FINANCE—0.9% | | | | | | | | | | | | | | | | |
| American Express Credit Corp. | | | 2.600 | % | | | 09/14/20 | | | | 1,000,000 | | | | 1,005,061 | |
| Ford Motor Credit Co. LLC | | | 3.157 | % | | | 08/04/20 | | | | 1,000,000 | | | | 1,012,213 | |
| GE Capital International Funding Co. | | | 4.418 | % | | | 11/15/35 | | | | 1,250,000 | | | | 1,352,821 | |
| Hyundai Capital Services, Inc. (b) | | | 2.875 | % | | | 03/16/21 | | | | 1,250,000 | | | | 1,238,670 | |
| | | | | | | | | | | | | | | | 4,608,765 | |
| CONSUMER SERVICES—0.3% | | | | | | | | | | | | | | | | |
| Local Initiatives Support Corp. | | | 4.649 | % | | | 03/01/37 | | | | 1,500,000 | | | | 1,547,232 | |
| | | | | | | | | | | | | | | | | |
| CONTAINERS & PACKAGING—0.3% | | | | | | | | | | | | | | | | |
| Newell Rubbermaid, Inc. | | | 3.850 | % | | | 04/01/23 | | | | 185,000 | | | | 191,431 | |
| Sonoco Products Co. | | | 5.750 | % | | | 11/01/40 | | | | 1,000,000 | | | | 1,201,695 | |
| | | | | | | | | | | | | | | | 1,393,126 | |
| DIVERSIFIED FINANCIAL SERVICES—1.5% | | | | | | | | | | | | | | | | |
| AerCap Ireland Capital Ltd. | | | 5.000 | % | | | 10/01/21 | | | | 1,000,000 | | | | 1,065,986 | |
| Brookfield Finance, Inc. | | | 4.250 | % | | | 06/02/26 | | | | 1,000,000 | | | | 1,032,153 | |
| GATX Corp. | | | 2.600 | % | | | 03/30/20 | | | | 897,000 | | | | 896,772 | |
| Genpact Luxembourg S. a. r.l. (b) | | | 3.700 | % | | | 04/01/22 | | | | 1,100,000 | | | | 1,093,275 | |
| Moody's Corp. | | | 5.500 | % | | | 09/01/20 | | | | 1,000,000 | | | | 1,076,865 | |
| MSCI, Inc. (b) | | | 5.750 | % | | | 08/15/25 | | | | 500,000 | | | | 536,875 | |
| National Rural Utilities Cooperative Finance Corp. | | | 10.375 | % | | | 11/01/18 | | | | 780,000 | | | | 833,293 | |
| S&P Global, Inc. | | | 3.300 | % | | | 08/14/20 | | | | 750,000 | | | | 763,951 | |
| S&P Global, Inc. | | | 4.000 | % | | | 06/15/25 | | | | 500,000 | | | | 525,210 | |
| | | | | | | | | | | | | | | | 7,824,380 | |
| DIVERSIFIED TELECOMMUNICATION SERVICES—0.8% | | | | | | | | | | | | | | | | |
| AT&T, Inc. | | | 5.250 | % | | | 03/01/37 | | | | 500,000 | | | | 528,812 | |
| AT&T, Inc. | | | 4.750 | % | | | 05/15/46 | | | | 1,000,000 | | | | 978,047 | |
| AT&T, Inc. (b) | | | 4.100 | % | | | 02/15/28 | | | | 507,000 | | | | 508,677 | |
| Frontier Communications Corp. | | | 7.125 | % | | | 03/15/19 | | | | 750,000 | | | | 720,000 | |
| Verizon Communications, Inc. | | | 5.500 | % | | | 03/16/47 | | | | 1,250,000 | | | | 1,424,266 | |
| | | | | | | | | | | | | | | | 4,159,802 | |
| EDUCATION—1.1% | | | | | | | | | | | | | | | | |
| Graham Holdings Co. | | | 7.250 | % | | | 02/01/19 | | | | 575,000 | | | | 596,562 | |
| Massachusetts Institute of Technology | | | 3.959 | % | | | 07/01/38 | | | | 1,500,000 | | | | 1,654,058 | |
| President & Fellows of Harvard College | | | 3.150 | % | | | 07/15/46 | | | | 1,500,000 | | | | 1,463,713 | |
| University of Notre Dame, Series 2017 | | | 3.394 | % | | | 02/15/48 | | | | 2,000,000 | | | | 1,994,678 | |
| | | | | | | | | | | | | | | | 5,709,011 | |
| ELECTRIC UTILITIES—3.6% | | | | | | | | | | | | | | | | |
| Caledonia Generating LLC (b) | | | 1.950 | % | | | 02/28/22 | | | | 462,655 | | | | 456,194 | |
| Electricite de France S.A. (b) | | | 3.625 | % | | | 10/13/25 | | | | 1,250,000 | | | | 1,280,657 | |
| Florida Power & Light Co. | | | 4.050 | % | | | 10/01/44 | | | | 1,300,000 | | | | 1,421,451 | |
| Georgia Power Co. | | | 3.250 | % | | | 04/01/26 | | | | 1,000,000 | | | | 1,002,703 | |
| ITC Holdings Corp. (b) | | | 5.500 | % | | | 01/15/20 | | | | 1,250,000 | | | | 1,312,098 | |
| MidAmerican Energy Co. | | | 3.950 | % | | | 08/01/47 | | | | 1,750,000 | | | | 1,870,088 | |
| NextEra Energy Capital Holdings, Inc. | | | 2.700 | % | | | 09/15/19 | | | | 1,250,000 | | | | 1,257,649 | |
| Niagara Mohawk Power Corp. (b) | | | 4.881 | % | | | 08/15/19 | | | | 840,000 | | | | 871,991 | |
| NSTAR Electric Co. | | | 5.500 | % | | | 03/15/40 | | | | 1,250,000 | | | | 1,603,457 | |
| Oncor Electric Delivery Co. | | | 6.800 | % | | | 09/01/18 | | | | 811,000 | | | | 835,312 | |
| Pacificorp | | | 8.080 | % | | | 10/14/22 | | | | 500,000 | | | | 609,655 | |
| Pennsylvania Electric Co. | | | 5.200 | % | | | 04/01/20 | | | | 500,000 | | | | 527,733 | |
| Portland General Electric Co. | | | 6.100 | % | | | 04/15/19 | | | | 1,100,000 | | | | 1,149,895 | |
| Potomac Electric Power Co. | | | 6.500 | % | | | 11/15/37 | | | | 1,000,000 | | | | 1,385,241 | |
| San Diego Gas and Electric Co. | | | 4.500 | % | | | 08/15/40 | | | | 841,000 | | | | 980,312 | |
| Southern California Edison | | | 4.050 | % | | | 03/15/42 | | | | 1,165,000 | | | | 1,250,937 | |
| Southern Power Co. | | | 4.150 | % | | | 12/01/25 | | | | 1,000,000 | | | | 1,053,831 | |
| | | | | | | | | | | | | | | | 18,869,204 | |
| ELECTRICAL EQUIPMENT—0.5% | | | | | | | | | | | | | | | | |
| Johnson Controls, Inc. | | | 3.750 | % | | | 12/01/21 | | | | 550,000 | | | | 568,913 | |
| Legrand | | | 8.500 | % | | | 02/15/25 | | | | 1,000,000 | | | | 1,297,245 | |
| Thomas & Betts Corp. | | | 5.625 | % | | | 11/15/21 | | | | 500,000 | | | | 554,767 | |
| | | | | | | | | | | | | | | | 2,420,925 | |
| ELECTRONIC EQUIPMENT, INSTRUMENTS & COMPONENTS—0.0% (d) | | | | | | | | | | | | | | | | |
| Arrow Electronics, Inc. | | | 3.000 | % | | | 03/01/18 | | | | 165,000 | | | | 165,209 | |
| | | | | | | | | | | | | | | | | |
| FOOD & STAPLES RETAILING—0.3% | | | | | | | | | | | | | | | | |
| Ahold Finance U.S.A., LLC, Series 2000-1, CV (a) | | | 7.820 | % | | | 01/02/20 | | | | 195,889 | | | | 201,074 | |
| Kroger Co. | | | 5.000 | % | | | 04/15/42 | | | | 1,000,000 | | | | 1,062,465 | |
See accompanying notes to financial statements.
7
Schedule of Investments, continued
Praxis Impact Bond Fund
December 31, 2017
| | | COUPON | | | MATURITY | | | PRINCIPAL AMOUNT | | | FAIR
VALUE | |
| CORPORATE BONDS—35.4%, continued |
| FOOD & STAPLES RETAILING—0.3%, continued |
| Smith's Food & Drug Centers, Inc., Pass Through Trust, Series 1994-A3 | | | 9.200 | % | | | 07/02/18 | | | $ | 313,566 | | | $ | 320,265 | |
| | | | | | | | | | | | | | | | 1,583,804 | |
| FOOD PRODUCTS—1.4% | | | | | | | | | | | | | | | | |
| Bunge Ltd. Finance Corp. | | | 3.500 | % | | | 11/24/20 | | | | 1,250,000 | | | | 1,276,077 | |
| Cargill, Inc. (b) | | | 4.760 | % | | | 11/23/45 | | | | 1,250,000 | | | | 1,480,773 | |
| J.M. Smucker Co. (The) | | | 3.500 | % | | | 03/15/25 | | | | 1,250,000 | | | | 1,276,977 | |
| Kraft Foods Group, Inc. | | | 5.375 | % | | | 02/10/20 | | | | 1,000,000 | | | | 1,059,497 | |
| Mead Johnson Nutrition Co. | | | 3.000 | % | | | 11/15/20 | | | | 1,000,000 | | | | 1,014,978 | |
| Wm. Wrigley Jr. Co. (b) | | | 3.375 | % | | | 10/21/20 | | | | 1,430,000 | | | | 1,464,510 | |
| | | | | | | | | | | | | | | | 7,572,812 | |
| GAS UTILITIES—0.6% | | | | | | | | | | | | | | | | |
| Brooklyn Union Gas Co. (b) | | | 4.504 | % | | | 03/10/46 | | | | 1,250,000 | | | | 1,424,607 | |
| Indiana Gas Co., Inc. | | | 6.550 | % | | | 06/30/28 | | | | 250,000 | | | | 290,281 | |
| Laclede Group, Inc. | | | 2.550 | % | | | 08/15/19 | | | | 1,250,000 | | | | 1,240,306 | |
| | | | | | | | | | | | | | | | 2,955,194 | |
| HEALTH CARE PROVIDERS & SERVICES—1.0% | | | | | | | | | | | | | | | | |
| Express Scripts Holding Co. | | | 3.300 | % | | | 02/25/21 | | | | 1,000,000 | | | | 1,015,695 | |
| Howard Hughes Medical Institute | | | 3.500 | % | | | 09/01/23 | | | | 1,500,000 | | | | 1,571,586 | |
| Kaiser Foundation Hospital | | | 3.150 | % | | | 05/01/27 | | | | 820,000 | | | | 820,772 | |
| Laboratory Corp. of America Holdings | | | 2.625 | % | | | 02/01/20 | | | | 1,000,000 | | | | 1,002,633 | |
| McKesson Corp. | | | 6.000 | % | | | 03/01/41 | | | | 474,000 | | | | 579,014 | |
| | | | | | | | | | | | | | | | 4,989,700 | |
| HOTELS, RESTAURANTS & LEISURE—0.5% | | | | | | | | | | | | | | | | |
| Brinker International, Inc. | | | 2.600 | % | | | 05/15/18 | | | | 500,000 | | | | 500,000 | |
| Hyatt Hotels Corp. | | | 3.375 | % | | | 07/15/23 | | | | 1,000,000 | | | | 1,021,831 | |
| Starbucks Corp. | | | 2.450 | % | | | 06/15/26 | | | | 1,000,000 | | | | 963,996 | |
| | | | | | | | | | | | | | | | 2,485,827 | |
| INDEPENDENT POWER AND RENEWABLE ELECTRICITY PRODUCERS—0.9% |
| FPL Energy National Wind LLC (b) | | | 5.608 | % | | | 03/10/24 | | | | 258,175 | | | | 259,789 | |
| Harper Lake Solar Funding Corp. (b) | | | 7.645 | % | | | 12/31/18 | | | | 264,206 | | | | 276,418 | |
| Midland Cogeneration Venture, L.P., CV (b) | | | 5.250 | % | | | 03/15/25 | | | | 187,212 | | | | 191,135 | |
| Midland Cogeneration Venture, L.P., CV (b) | | | 6.000 | % | | | 03/15/25 | | | | 476,969 | | | | 500,173 | |
| Solar Star Funding LLC (b) | | | 3.950 | % | | | 06/30/35 | | | | 323,238 | | | | 316,705 | |
| Solar Star Funding LLC (b) | | | 5.375 | % | | | 06/30/35 | | | | 487,619 | | | | 533,241 | |
| Tenaska Virginia Partners, L.P. (b) | | | 6.119 | % | | | 03/30/24 | | | | 839,705 | | | | 912,406 | |
| Topaz Solar Farms LLC (b) | | | 4.875 | % | | | 09/30/39 | | | | 306,234 | | | | 313,624 | |
| Topaz Solar Farms LLC (b) | | | 5.750 | % | | | 09/30/39 | | | | 710,635 | | | | 779,945 | |
| TransAlta Corp. | | | 6.900 | % | | | 05/15/18 | | | | 500,000 | | | | 507,752 | |
| | | | | | | | | | | | | | | | 4,591,188 | |
| INDUSTRIAL CONGLOMERATES—0.1% | | | | | | | | | | | | | | | | |
| Ingersoll-Rand Global Holding Co. Ltd. | | | 2.875 | % | | | 01/15/19 | | | | 600,000 | | | | 603,073 | |
| | | | | | | | | | | | | | | | | |
| INSURANCE—3.5% | | | | | | | | | | | | | | | | |
| American International Group, Inc. | | | 3.750 | % | | | 07/10/25 | | | | 1,250,000 | | | | 1,288,780 | |
| Anthem, Inc. | | | 2.500 | % | | | 11/21/20 | | | | 1,500,000 | | | | 1,496,868 | |
| Athene Global Funding (b) | | | 2.750 | % | | | 04/20/20 | | | | 1,550,000 | | | | 1,550,781 | |
| Fidelity National Financial, Inc. | | | 5.500 | % | | | 09/01/22 | | | | 725,000 | | | | 799,833 | |
| Horace Mann Educators Corp. | | | 4.500 | % | | | 12/01/25 | | | | 1,235,000 | | | | 1,286,894 | |
| Kemper Corp. | | | 4.350 | % | | | 02/15/25 | | | | 1,250,000 | | | | 1,272,502 | |
| Liberty Mutual Group, Inc. (b) | | | 4.950 | % | | | 05/01/22 | | | | 1,050,000 | | | | 1,132,993 | |
| Markel Corp. | | | 3.625 | % | | | 03/30/23 | | | | 400,000 | | | | 407,231 | |
| Marsh & McLennan Cos., Inc. | | | 3.750 | % | | | 03/14/26 | | | | 1,000,000 | | | | 1,044,379 | |
| OneBeacon US Holdings, Inc. | | | 4.600 | % | | | 11/09/22 | | | | 1,000,000 | | | | 1,030,775 | |
| Provident Cos., Inc. | | | 7.000 | % | | | 07/15/18 | | | | 340,000 | | | | 348,748 | |
| Prudential Financial, Inc. | | | 5.875 | % | | | 09/15/42 | | | | 500,000 | | | | 546,250 | |
| RLI Corp. | | | 4.875 | % | | | 09/15/23 | | | | 1,000,000 | | | | 1,054,267 | |
| Sammons Financial Group (b) | | | 4.450 | % | | | 05/12/27 | | | | 800,000 | | | | 820,437 | |
| StanCorp Financial Group, Inc. | | | 5.000 | % | | | 08/15/22 | | | | 1,250,000 | | | | 1,340,139 | |
| TIAA Asset Management Finance Co. LLC (b) | | | 2.950 | % | | | 11/01/19 | | | | 1,250,000 | | | | 1,261,951 | |
| Unum Group | | | 3.000 | % | | | 05/15/21 | | | | 700,000 | | | | 704,888 | |
| W.R. Berkley Corp. | | | 6.150 | % | | | 08/15/19 | | | | 710,000 | | | | 750,028 | |
| W.R. Berkley Corp. | | | 4.625 | % | | | 03/15/22 | | | | 250,000 | | | | 266,056 | |
| | | | | | | | | | | | | | | | 18,403,800 | |
| IT SERVICES—0.4% | | | | | | | | | | | | | | | | |
| Broadridge Financial Solutions, Inc. | | | 3.950 | % | | | 09/01/20 | | | | 1,000,000 | | | | 1,036,348 | |
| Fiserv, Inc. | | | 2.700 | % | | | 06/01/20 | | | | 1,000,000 | | | | 1,006,247 | |
| Xerox Corp. | | | 4.070 | % | | | 03/17/22 | | | | 250,000 | | | | 252,406 | |
| | | | | | | | | | | | | | | | 2,295,001 | |
| LIFE SCIENCES TOOLS & SERVICES—0.2% | | | | | | | | | | | | | | | | |
| Agilent Technologies, Inc. | | | 3.875 | % | | | 07/15/23 | | | | 1,250,000 | | | | 1,294,658 | |
| | | | | | | | | | | | | | | | | |
| MACHINERY—0.8% | | | | | | | | | | | | | | | | |
| Illinois Tool Works, Inc. | | | 3.900 | % | | | 09/01/42 | | | | 1,000,000 | | | | 1,071,668 | |
| Kennametal, Inc. | | | 2.650 | % | | | 11/01/19 | | | | 1,000,000 | | | | 1,000,792 | |
| Pall Corp. | | | 5.000 | % | | | 06/15/20 | | | | 1,000,000 | | | | 1,062,214 | |
| Snap-on, Inc. | | | 4.250 | % | | | 01/15/18 | | | | 500,000 | | | | 500,107 | |
| Valmont Industries, Inc. | | | 6.625 | % | | | 04/20/20 | | | | 562,000 | | | | 611,450 | |
| | | | | | | | | | | | | | | | 4,246,231 | |
| MEDIA—0.4% | | | | | | | | | | | | | | | | |
| Comcast Corp. | | | 4.750 | % | | | 03/01/44 | | | | 500,000 | | | | 573,384 | |
| Scripps Networks Interactive, Inc. | | | 2.800 | % | | | 06/15/20 | | | | 1,000,000 | | | | 999,855 | |
| Time Warner Cable, Inc. | | | 4.500 | % | | | 09/15/42 | | | | 500,000 | | | | 469,108 | |
| | | | | | | | | | | | | | | | 2,042,347 | |
| METALS & MINING—0.5% | | | | | | | | | | | | | | | | |
| Newcrest Finance Property Ltd. (b) | | | 4.450 | % | | | 11/15/21 | | | | 1,000,000 | | | | 1,051,086 | |
| Nucor Corp. | | | 4.125 | % | | | 09/15/22 | | | | 665,000 | | | | 705,635 | |
See accompanying notes to financial statements.
8
Schedule of Investments, continued
Praxis Impact Bond Fund
December 31, 2017
| | | COUPON | | | MATURITY | | | PRINCIPAL AMOUNT | | | FAIR
VALUE | |
| CORPORATE BONDS—35.4%, continued |
| METALS & MINING—0.5%, continued |
| Reliance Steel & Aluminum Co. | | | 4.500 | % | | | 04/15/23 | | | $ | 905,000 | | | $ | 953,954 | |
| | | | | | | | | | | | | | | | 2,710,675 | |
| MULTI-LINE RETAIL—0.1% | | | | | | | | | | | | | | | | |
| Macy's Retail Holdings, Inc. | | | 9.500 | % | | | 04/15/21 | | | | 315,000 | | | | 345,145 | |
| | | | | | | | | | | | | | | | | |
| MULTI-UTILITIES—1.1% | | | | | | | | | | | | | | | | |
| Avangrid, Inc. | | | 3.150 | % | | | 12/01/24 | | | | 1,800,000 | | | | 1,790,583 | |
| Consumers Energy Co. | | | 6.700 | % | | | 09/15/19 | | | | 750,000 | | | | 803,708 | |
| Puget Energy, Inc. | | | 5.625 | % | | | 07/15/22 | | | | 750,000 | | | | 828,324 | |
| Puget Sound Energy, Inc. | | | 6.740 | % | | | 06/15/18 | | | | 1,000,000 | | | | 1,020,518 | |
| Westar Energy, Inc. | | | 2.550 | % | | | 07/01/26 | | | | 1,260,000 | | | | 1,214,229 | |
| | | | | | | | | | | | | | | | 5,657,362 | |
| OIL, GAS & CONSUMABLE FUELS—0.3% | | | | | | | | | | | | | | | | |
| ConocoPhillips Holdings Co. | | | 6.950 | % | | | 04/15/29 | | | | 1,000,000 | | | | 1,313,409 | |
| | | | | | | | | | | | | | | | | |
| PAPER & FOREST PRODUCTS—0.4% | | | | | | | | | | | | | | | | |
| Fibria Overseas Finance Ltd. | | | 5.500 | % | | | 01/17/27 | | | | 800,000 | | | | 858,000 | |
| Klabin Finance SA (b) | | | 4.875 | % | | | 09/19/27 | | | | 750,000 | | | | 740,250 | |
| PH Glatfelter Co. | | | 5.375 | % | | | 10/15/20 | | | | 750,000 | | | | 759,375 | |
| | | | | | | | | | | | | | | | 2,357,625 | |
| PHARMACEUTICALS—0.3% | | | | | | | | | | | | | | | | |
| AbbVie, Inc. | | | 2.500 | % | | | 05/14/20 | | | | 500,000 | | | | 501,541 | |
| Zoetis, Inc. | | | 3.250 | % | | | 02/01/23 | | | | 1,200,000 | | | | 1,218,466 | |
| | | | | | | | | | | | | | | | 1,720,007 | |
| PIPELINES—0.6% | | | | | | | | | | | | | | | | |
| Columbia Pipeline Group, Inc. | | | 3.300 | % | | | 06/01/20 | | | | 850,000 | | | | 862,141 | |
| Florida Gas Transmission Co. LLC (b) | | | 4.350 | % | | | 07/15/25 | | | | 1,000,000 | | | | 1,068,093 | |
| Northern Natural Gas Co. (b) | | | 4.100 | % | | | 09/15/42 | | | | 1,000,000 | | | | 1,027,335 | |
| | | | | | | | | | | | | | | | 2,957,569 | |
| PROFESSIONAL SERVICES—0.4% | | | | | | | | | | | | | | | | |
| Dun & Bradstreet Corp. | | | 4.625 | % | | | 12/01/22 | | | | 1,000,000 | | | | 1,014,183 | |
| Verisk Analytics, Inc. | | | 5.800 | % | | | 05/01/21 | | | | 960,000 | | | | 1,044,597 | |
| | | | | | | | | | | | | | | | 2,058,780 | |
| REAL ESTATE INVESTMENT TRUSTS (REITS)—0.8% | | | | | | | | | | | | | | | | |
| Digital Realty Trust, L.P. | | | 3.950 | % | | | 07/01/22 | | | | 1,250,000 | | | | 1,305,831 | |
| National Retail Properties, Inc. | | | 3.800 | % | | | 10/15/22 | | | | 750,000 | | | | 774,724 | |
| Regency Centers, L.P. | | | 3.750 | % | | | 06/15/24 | | | | 1,000,000 | | | | 1,019,363 | |
| Vornado Realty L.P. | | | 3.500 | % | | | 01/15/25 | | | | 567,000 | | | | 565,594 | |
| Welltower Inc | | | 5.250 | % | | | 01/15/22 | | | | 400,000 | | | | 434,673 | |
| | | | | | | | | | | | | | | | 4,100,185 | |
| ROAD & RAIL—1.1% | | | | | | | | | | | | | | | | |
| Burlington Northern Santa Fe LLC | | | 7.160 | % | | | 01/02/20 | | | | 372,138 | | | | 386,971 | |
| Burlington Northern Santa Fe LLC | | | 5.750 | % | | | 05/01/40 | | | | 1,000,000 | | | | 1,303,037 | |
| Kansas City Southern | | | 2.350 | % | | | 05/15/20 | | | | 500,000 | | | | 498,014 | |
| Norfolk Southern Corp. | | | 4.837 | % | | | 10/01/41 | | | | 1,000,000 | | | | 1,165,498 | |
| Ryder System, Inc. | | | 2.650 | % | | | 03/02/20 | | | | 455,000 | | | | 456,591 | |
| Ryder System, Inc. | | | 2.500 | % | | | 05/11/20 | | | | 795,000 | | | | 795,776 | |
| TTX Co. (b) | | | 2.600 | % | | | 06/15/20 | | | | 1,000,000 | | | | 995,645 | |
| | | | | | | | | | | | | | | | 5,601,532 | |
| SEMICONDUCTORS & SEMICONDUCTOR EQUIPMENT—0.8% | | | | | | | | | | | | | | | | |
| Intel Corp. (b) | | | 3.734 | % | | | 12/08/47 | | | | 1,361,000 | | | | 1,413,317 | |
| KLA-Tencor Corp. | | | 3.375 | % | | | 11/01/19 | | | | 600,000 | | | | 609,892 | |
| Lam Research Corp. | | | 2.750 | % | | | 03/15/20 | | | | 1,000,000 | | | | 1,007,079 | |
| Maxim Integrated Products, Inc. | | | 3.375 | % | | | 03/15/23 | | | | 500,000 | | | | 504,665 | |
| NXP BV/NXP Funding LLC (b) | | | 3.875 | % | | | 09/01/22 | | | | 200,000 | | | | 202,250 | |
| Xilinx, Inc. | | | 2.125 | % | | | 03/15/19 | | | | 600,000 | | | | 598,084 | |
| | | | | | | | | | | | | | | | 4,335,287 | |
| SOFTWARE—0.3% | | | | | | | | | | | | | | | | |
| Microsoft Corp. | | | 4.450 | % | | | 11/03/45 | | | | 1,500,000 | | | | 1,758,145 | |
| | | | | | | | | | | | | | | | | |
| SPECIALTY RETAIL—0.7% | | | | | | | | | | | | | | | | |
| Advanced Auto Parts, Inc. | | | 4.500 | % | | | 01/15/22 | | | | 402,000 | | | | 421,278 | |
| Gap, Inc. | | | 5.950 | % | | | 04/12/21 | | | | 1,000,000 | | | | 1,078,287 | |
| Lowe's Cos., Inc. | | | 4.650 | % | | | 04/15/42 | | | | 1,000,000 | | | | 1,142,759 | |
| O'Reilly Automotive, Inc. | | | 3.800 | % | | | 09/01/22 | | | | 1,000,000 | | | | 1,051,993 | |
| | | | | | | | | | | | | | | | 3,694,317 | |
| TECHNOLOGY HARDWARE, STORAGE & PERIPHERALS—0.6% | | | | | | | | | | | | | | | | |
| Apple, Inc. | | | 2.850 | % | | | 02/23/23 | | | | 1,250,000 | | | | 1,266,934 | |
| Apple, Inc. | | | 3.000 | % | | | 06/20/27 | | | | 1,000,000 | | | | 995,613 | |
| Seagate HDD Cayman | | | 3.750 | % | | | 11/15/18 | | | | 635,000 | | | | 644,207 | |
| Seagate HDD Cayman (b) | | | 4.250 | % | | | 03/01/22 | | | | 305,000 | | | | 308,720 | |
| | | | | | | | | | | | | | | | 3,215,474 | |
| TEXTILES, APPAREL & LUXURY GOODS—0.1% | | | | | | | | | | | | | | | | |
| Hanesbrands, Inc. (b) | | | 4.625 | % | | | 05/15/24 | | | | 500,000 | | | | 510,000 | |
| | | | | | | | | | | | | | | | | |
| TRANSPORTATION SERVICES—0.2% | | | | | | | | | | | | | | | | |
| Mexico City Airport Trust (b) | | | 4.250 | % | | | 10/31/26 | | | | 1,000,000 | | | | 1,022,500 | |
| TOTAL CORPORATE BONDS (COST $178,835,763) | | | | | | | | | | | | | | | 184,937,246 | |
| | | | | | | | | | | | | | | | | |
| CORPORATE NOTES—0.9% |
| COMMUNITY DEVELOPMENT—0.9% | | | | | | | | | | | | | | | | |
| Calvert Social Investment Foundation, Inc. (c) | | | 1.000 | % | | | 06/15/18 | | | | 1,100,000 | | | | 1,100,000 | |
| Calvert Social Investment Foundation, Inc. (c) | | | 1.000 | % | | | 12/17/18 | | | | 1,200,000 | | | | 1,200,000 | |
| Calvert Social Investment Foundation, Inc. (c) | | | 1.500 | % | | | 06/17/19 | | | | 1,700,000 | | | | 1,700,000 | |
| Calvert Social Investment Foundation, Inc. (c) | | | 1.500 | % | | | 06/15/20 | | | | 850,000 | | | | 850,000 | |
| TOTAL CORPORATE NOTES (COST $4,850,000) | | | | | | | | | | | | | | | 4,850,000 | |
| | | | | | | | | | | | | | | | | |
| FOREIGN GOVERNMENTS—9.5% |
| FOREIGN AGENCY—3.9% | | | | | | | | | | | | | | | | |
| Banco Nacional de Costa Rica (b) | | | 5.875 | % | | | 04/25/21 | | | | 750,000 | | | | 780,938 | |
| Bank Nederlandse Gemeenten (b) | | | 1.625 | % | | | 11/25/19 | | | | 1,500,000 | | | | 1,485,069 | |
| Export Development Canada | | | 1.250 | % | | | 12/10/18 | | | | 1,000,000 | | | | 993,087 | |
| Export Development Canada | | | 1.625 | % | | | 06/01/20 | | | | 1,000,000 | | | | 989,672 | |
| Export-Import Bank of Korea | | | 2.125 | % | | | 02/11/21 | | | | 1,250,000 | | | | 1,217,711 | |
See accompanying notes to financial statements.
9
Schedule of Investments, continued
Praxis Impact Bond Fund
December 31, 2017
| | | COUPON | | | MATURITY | | | PRINCIPAL AMOUNT | | | FAIR
VALUE | |
| FOREIGN GOVERNMENTS—9.5%, continued |
| FOREIGN AGENCY—3.9%, continued | | | | | | |
| KFW | | | 1.750 | % | | | 10/15/19 | | | $ | 2,500,000 | | | $ | 2,488,091 | |
| KFW | | | 1.875 | % | | | 11/30/20 | | | | 1,000,000 | | | | 992,500 | |
| KFW | | | 2.000 | % | | | 11/30/21 | | | | 1,000,000 | | | | 989,599 | |
| KFW | | | 2.000 | % | | | 09/29/22 | | | | 1,500,000 | | | | 1,475,786 | |
| Kommunalbanken A.S. (b) | | | 1.375 | % | | | 10/26/20 | | | | 1,000,000 | | | | 977,650 | |
| Kommunalbanken A.S. (b) | | | 2.125 | % | | | 02/11/25 | | | | 1,000,000 | | | | 967,620 | |
| Kommunivest I Sverige AB (b) | | | 1.500 | % | | | 04/23/19 | | | | 1,000,000 | | | | 993,335 | |
| Kommunivest I Sverige AB (b) | | | 1.875 | % | | | 06/01/21 | | | | 1,500,000 | | | | 1,477,067 | |
| Municipality Finance plc (b) | | | 1.375 | % | | | 09/21/21 | | | | 1,000,000 | | | | 965,352 | |
| Nacional Financiera SNC (b) | | | 3.375 | % | | | 11/05/20 | | | | 1,000,000 | | | | 1,025,000 | |
| Neder Waterschapsbank (b) | | | 2.125 | % | | | 11/15/21 | | | | 1,500,000 | | | | 1,486,125 | |
| Ras Laffan Liquefied Natural Gas Co. Ltd. II (b) | | | 5.298 | % | | | 09/30/20 | | | | 325,700 | | | | 337,165 | |
| Svensk Exportkredit AB | | | 1.875 | % | | | 06/23/20 | | | | 1,000,000 | | | | 993,426 | |
| | | | | | | | | | | | | | | | 20,635,193 | |
| SUPRANATIONAL—5.6% | | | | | | | | | | | | | | | | |
| African Development Bank | | | 1.375 | % | | | 12/17/18 | | | | 1,000,000 | | | | 994,677 | |
| Asian Development Bank | | | 1.000 | % | | | 08/16/19 | | | | 1,500,000 | | | | 1,476,071 | |
| Asian Development Bank | | | 2.125 | % | | | 03/19/25 | | | | 1,000,000 | | | | 975,348 | |
| Bank Nederlandse Gemeenten (b) | | | 2.125 | % | | | 12/14/20 | | | | 1,500,000 | | | | 1,495,053 | |
| European Bank for Reconstruction & Development | | | 1.625 | % | | | 04/10/18 | | | | 500,000 | | | | 500,030 | |
| European Bank for Reconstruction & Development | | | 0.875 | % | | | 07/22/19 | | | | 2,000,000 | | | | 1,966,128 | |
| European Bank for Reconstruction & Development | | | 1.875 | % | | | 07/15/21 | | | | 1,500,000 | | | | 1,478,279 | |
| European Investment Bank | | | 2.500 | % | | | 10/15/24 | | | | 1,000,000 | | | | 999,172 | |
| European Investment Bank | | | 2.125 | % | | | 04/13/26 | | | | 1,000,000 | | | | 965,532 | |
| European Investment Bank | | | 2.375 | % | | | 05/24/27 | | | | 1,000,000 | | | | 981,893 | |
| Inter-American Development Bank | | | 1.500 | % | | | 09/25/18 | | | | 2,500,000 | | | | 2,494,055 | |
| Inter-American Development Bank | | | 2.125 | % | | | 11/09/20 | | | | 3,000,000 | | | | 3,002,535 | |
| Inter-American Development Bank | | | 4.375 | % | | | 01/24/44 | | | | 3,000,000 | | | | 3,661,992 | |
| International Bank for Reconstruction & Development | | | 2.125 | % | | | 03/03/25 | | | | 500,000 | | | | 488,162 | |
| International Finance Corp. | | | 1.250 | % | | | 11/27/18 | | | | 1,000,000 | | | | 994,010 | |
| International Finance Corp., Series GMTN | | | 1.750 | % | | | 03/30/20 | | | | 3,000,000 | | | | 2,980,526 | |
| International Finance Corp., Series GMTN | | | 2.000 | % | | | 10/24/22 | | | | 2,000,000 | | | | 1,971,664 | |
| Nordic Investment Bank | | | 2.250 | % | | | 09/30/21 | | | | 1,000,000 | | | | 999,232 | |
| North American Development Bank | | | 2.300 | % | | | 10/10/18 | | | | 1,000,000 | | | | 1,002,964 | |
| | | | | | | | | | | | | | | | 29,427,323 | |
| TOTAL FOREIGN GOVERNMENTS (COST $49,901,007) | | | | | | | | | | | | | | | 50,062,516 | |
| | | | | | | | | | | | | | | | | |
| U.S. GOVERNMENT AGENCIES—45.3% |
| FEDERAL HOME LOAN BANK—3.9% | | | | | | | | | | | | | | | | |
| FHLB | | | 3.375 | % | | | 06/12/20 | | | | 1,000,000 | | | | 1,031,235 | |
| FHLB | | | 5.500 | % | | | 07/15/36 | | | | 14,120,000 | | | | 19,365,411 | |
| | | | | | | | | | | | | | | | 20,396,646 | |
| FEDERAL HOME LOAN MORTGAGE CORPORATION—16.3% | | | | | | | | | | | | | | | | |
| FHLMC | | | 4.500 | % | | | 06/01/18 | | | | 10,045 | | | | 10,187 | |
| FHLMC | | | 4.875 | % | | | 06/13/18 | | | | 6,200,000 | | | | 6,289,943 | |
| FHLMC | | | 5.085 | % | | | 03/25/19 | | | | 1,140,000 | | | | 1,169,627 | |
| FHLMC | | | 3.750 | % | | | 03/27/19 | | | | 3,020,000 | | | | 3,090,620 | |
| FHLMC | | | 5.000 | % | | | 04/01/19 | | | | 13,906 | | | | 14,205 | |
| FHLMC | | | 1.250 | % | | | 10/02/19 | | | | 2,710,000 | | | | 2,677,727 | |
| FHLMC | | | 1.375 | % | | | 05/01/20 | | | | 4,000,000 | | | | 3,940,196 | |
| FHLMC | | | 5.000 | % | | | 12/01/21 | | | | 66,050 | | | | 69,361 | |
| FHLMC | | | 2.375 | % | | | 01/13/22 | | | | 13,460,000 | | | | 13,581,019 | |
| FHLMC | | | 5.500 | % | | | 04/01/22 | | | | 40,675 | | | | 41,983 | |
| FHLMC | | | 4.000 | % | | | 11/01/24 | | | | 398,939 | | | | 413,694 | |
| FHLMC | | | 4.000 | % | | | 10/01/25 | | | | 179,555 | | | | 186,077 | |
| FHLMC | | | 6.000 | % | | | 04/01/27 | | | | 136,822 | | | | 152,830 | |
| FHLMC | | | 2.500 | % | | | 10/01/27 | | | | 915,270 | | | | 919,951 | |
| FHLMC | | | 7.000 | % | | | 02/01/30 | | | | 78,761 | | | | 84,361 | |
| FHLMC | | | 7.500 | % | | | 07/01/30 | | | | 178,396 | | | | 206,186 | |
| FHLMC | | | 7.000 | % | | | 03/01/31 | | | | 61,785 | | | | 70,356 | |
| FHLMC | | | 6.250 | % | | | 07/15/32 | | | | 12,000,000 | | | | 16,833,408 | |
| FHLMC | | | 3.000 | % | | | 11/01/32 | | | | 1,056,883 | | | | 1,075,144 | |
| FHLMC | | | 3.000 | % | | | 11/01/32 | | | | 1,608,407 | | | | 1,636,217 | |
| FHLMC | | | 5.500 | % | | | 11/01/33 | | | | 58,306 | | | | 64,620 | |
| FHLMC (H15T1Y + 2.231) (a) | | | 3.231 | % | | | 05/01/34 | | | | 114,924 | | | | 121,392 | |
| FHLMC (H15T1Y + 2.231) (a) | | | 3.231 | % | | | 05/01/34 | | | | 40,859 | | | | 42,957 | |
| FHLMC | | | 5.000 | % | | | 07/01/35 | | | | 109,075 | | | | 117,527 | |
| FHLMC | | | 4.500 | % | | | 10/01/35 | | | | 223,284 | | | | 238,252 | |
| FHLMC | | | 5.500 | % | | | 03/01/36 | | | | 62,113 | | | | 68,891 | |
| FHLMC | | | 5.500 | % | | | 06/01/36 | | | | 86,916 | | | | 96,393 | |
| FHLMC | | | 6.000 | % | | | 06/01/36 | | | | 90,030 | | | | 102,415 | |
| FHLMC | | | 5.500 | % | | | 12/01/36 | | | | 72,404 | | | | 80,146 | |
| FHLMC | | | 6.000 | % | | | 08/01/37 | | | | 48,533 | | | | 54,770 | |
| FHLMC | | | 5.000 | % | | | 03/01/38 | | | | 361,518 | | | | 392,636 | |
| FHLMC | | | 4.500 | % | | | 06/01/39 | | | | 415,585 | | | | 443,463 | |
| FHLMC | | | 5.000 | % | | | 06/01/39 | | | | 588,900 | | | | 641,492 | |
| FHLMC | | | 4.500 | % | | | 07/01/39 | | | | 429,945 | | | | 458,684 | |
| FHLMC | | | 4.500 | % | | | 11/01/39 | | | | 404,969 | | | | 432,036 | |
| FHLMC | | | 4.500 | % | | | 09/01/40 | | | | 621,104 | | | | 662,735 | |
| FHLMC | | | 4.500 | % | | | 05/01/41 | | | | 1,248,782 | | | | 1,332,467 | |
| FHLMC | | | 4.500 | % | | | 07/01/41 | | | | 1,233,588 | | | | 1,316,012 | |
| FHLMC | | | 5.000 | % | | | 09/01/41 | | | | 549,047 | | | | 601,298 | |
| FHLMC | | | 3.500 | % | | | 10/01/41 | | | | 792,714 | | | | 818,038 | |
| FHLMC | | | 4.000 | % | | | 10/01/41 | | | | 614,966 | | | | 645,662 | |
| FHLMC | | | 3.500 | % | | | 02/01/42 | | | | 1,156,156 | | | | 1,193,127 | |
| FHLMC | | | 4.000 | % | | | 02/01/42 | | | | 349,883 | | | | 367,345 | |
| FHLMC | | | 3.500 | % | | | 06/01/42 | | | | 1,327,125 | | | | 1,369,566 | |
| FHLMC | | | 3.500 | % | | | 06/01/42 | | | | 1,350,699 | | | | 1,393,894 | |
| FHLMC | | | 3.500 | % | | | 08/01/42 | | | | 1,423,788 | | | | 1,469,318 | |
| FHLMC | | | 3.000 | % | | | 11/01/42 | | | | 2,211,248 | | | | 2,223,322 | |
| FHLMC | | | 3.000 | % | | | 01/01/43 | | | | 1,339,703 | | | | 1,347,294 | |
| FHLMC | | | 3.000 | % | | | 05/01/43 | | | | 1,949,906 | | | | 1,961,359 | |
| FHLMC | | | 3.500 | % | | | 10/01/44 | | | | 1,754,509 | | | | 1,806,971 | |
| FHLMC | | | 3.500 | % | | | 11/01/44 | | | | 1,600,115 | | | | 1,647,034 | |
See accompanying notes to financial statements.
10
Schedule of Investments, continued
Praxis Impact Bond Fund
December 31, 2017
| | | COUPON | | | MATURITY | | | PRINCIPAL AMOUNT | | | FAIR
VALUE | |
| U.S. GOVERNMENT AGENCIES—45.3%, continued |
| FEDERAL HOME LOAN MORTGAGE CORPORATION—16.3%, continued |
| FHLMC | | | 3.500 | % | | | 04/01/45 | | | $ | 1,965,043 | | | $ | 2,020,982 | |
| FHLMC | | | 3.000 | % | | | 05/01/46 | | | | 2,672,274 | | | | 2,675,973 | |
| FHLMC | | | 3.000 | % | | | 12/01/46 | | | | 4,759,386 | | | | 4,766,531 | |
| | | | | | | | | | | | | | | | 85,437,694 | |
| FEDERAL NATIONAL MORTGAGE ASSOCIATION—22.1% |
| FNMA | | | 5.000 | % | | | 07/01/18 | | | | 7,751 | | | | 7,890 | |
| FNMA | | | 5.000 | % | | | 09/01/18 | | | | 15,888 | | | | 16,174 | |
| FNMA | | | 1.875 | % | | | 02/19/19 | | | | 3,000,000 | | | | 3,000,777 | |
| FNMA | | | 7.000 | % | | | 11/01/19 | | | | 2,972 | | | | 3,038 | |
| FNMA | | | 7.000 | % | | | 11/01/19 | | | | 1,112 | | | | 1,117 | |
| FNMA | | | 3.500 | % | | | 07/01/20 | | | | 127,708 | | | | 131,854 | |
| FNMA | | | 1.250 | % | | | 05/06/21 | | | | 7,000,000 | | | | 6,808,564 | |
| FNMA | | | 1.875 | % | | | 04/05/22 | | | | 13,000,000 | | | | 12,838,072 | |
| FNMA | | | 5.500 | % | | | 06/01/22 | | | | 74,067 | | | | 77,269 | |
| FNMA | | | 2.890 | % | | | 07/01/22 | | | | 2,401,147 | | | | 2,432,857 | |
| FNMA | | | 2.190 | % | | | 01/01/23 | | | | 2,000,000 | | | | 1,974,643 | |
| FNMA | | | 2.770 | % | | | 07/01/23 | | | | 2,352,430 | | | | 2,385,556 | |
| FNMA | | | 2.670 | % | | | 12/01/23 | | | | 2,458,563 | | | | 2,467,465 | |
| FNMA | | | 2.646 | % | | | 07/25/24 | | | | 3,000,000 | | | | 2,974,453 | |
| FNMA | | | 2.625 | % | | | 09/06/24 | | | | 16,750,000 | | | | 16,973,026 | |
| FNMA | | | 3.080 | % | | | 12/01/24 | | | | 2,372,441 | | | | 2,434,252 | |
| FNMA | | | 5.000 | % | | | 04/01/25 | | | | 111,682 | | | | 119,897 | |
| FNMA | | | 5.000 | % | | | 07/01/25 | | | | 87,773 | | | | 94,229 | |
| FNMA | | | 3.500 | % | | | 10/01/25 | | | | 190,382 | | | | 196,562 | |
| FNMA | | | 5.000 | % | | | 10/01/25 | | | | 107,951 | | | | 115,954 | |
| FNMA | | | 5.500 | % | | | 11/01/25 | | | | 33 | | | | 37 | |
| FNMA | | | 4.000 | % | | | 03/01/26 | | | | 689,076 | | | | 721,330 | |
| FNMA | | | 2.125 | % | | | 04/24/26 | | | | 2,000,000 | | | | 1,929,982 | |
| FNMA | | | 8.500 | % | | | 09/01/26 | | | | 19,500 | | | | 19,811 | |
| FNMA | | | 1.875 | % | | | 09/24/26 | | | | 7,500,000 | | | | 7,069,778 | |
| FNMA | | | 2.877 | % | | | 09/25/26 | | | | 1,960,443 | | | | 1,963,749 | |
| FNMA | | | 2.746 | % | | | 04/25/27 | | | | 997,888 | | | | 1,002,524 | |
| FNMA | | | 2.500 | % | | | 09/01/27 | | | | 1,117,221 | | | | 1,122,818 | |
| FNMA | | | 2.500 | % | | | 11/01/27 | | | | 1,607,185 | | | | 1,615,237 | |
| FNMA | | | 2.500 | % | | | 01/01/28 | | | | 1,084,568 | | | | 1,089,999 | |
| FNMA | | | 6.625 | % | | | 11/15/30 | | | | 5,050,000 | | | | 7,101,845 | |
| FNMA | | | 3.000 | % | | | 12/01/32 | | | | 1,585,193 | | | | 1,623,119 | |
| FNMA | | | 6.000 | % | | | 10/01/33 | | | | 49,325 | | | | 55,696 | |
| FNMA (6MO LIBOR + 145) (a) | | | 2.824 | % | | | 02/01/34 | | | | 136,443 | | | | 139,477 | |
| FNMA | | | 5.500 | % | | | 02/01/34 | | | | 62,599 | | | | 69,419 | |
| FNMA (H15T1Y + 2.205) (a) | | | 3.060 | % | | | 05/01/34 | | | | 81,126 | | | | 85,616 | |
| FNMA (12MO LIBOR + 1.645) (a) | | | 3.520 | % | | | 06/01/33 | | | | 14,636 | | | | 15,197 | |
| FNMA | | | 6.000 | % | | | 11/01/34 | | | | 148,904 | | | | 169,110 | |
| FNMA | | | 5.500 | % | | | 01/01/35 | | | | 111,299 | | | | 123,329 | |
| FNMA | | | 5.000 | % | | | 10/01/35 | | | | 135,556 | | | | 146,728 | |
| FNMA | | | 5.500 | % | | | 10/01/35 | | | | 166,671 | | | | 184,939 | |
| FNMA | | | 6.000 | % | | | 10/01/35 | | | | 86,899 | | | | 98,748 | |
| FNMA | | | 5.500 | % | | | 06/01/36 | | | | 43,520 | | | | 48,079 | |
| FNMA | | | 6.000 | % | | | 06/01/36 | | | | 46,562 | | | | 52,800 | |
| FNMA | | | 5.500 | % | | | 11/01/36 | | | | 55,681 | | | | 61,505 | |
| FNMA (12MO LIBOR + 1.631) (a) | | | 3.314 | % | | | 05/01/37 | | | | 40,977 | | | | 43,003 | |
| FNMA | | | 5.625 | % | | | 07/15/37 | | | | 2,750,000 | | | | 3,859,757 | |
| FNMA | | | 4.500 | % | | | 09/01/40 | | | | 379,395 | | | | 406,681 | |
| FNMA | | | 4.500 | % | | | 10/01/40 | | | | 390,897 | | | | 419,105 | |
| FNMA | | | 4.000 | % | | | 12/01/40 | | | | 953,684 | | | | 1,001,808 | |
| FNMA | | | 4.000 | % | | | 01/01/41 | | | | 649,024 | | | | 681,748 | |
| FNMA | | | 3.500 | % | | | 02/01/41 | | | | 957,412 | | | | 988,570 | |
| FNMA | | | 4.000 | % | | | 10/01/41 | | | | 567,263 | | | | 595,708 | |
| FNMA | | | 4.000 | % | | | 11/01/41 | | | | 548,351 | | | | 575,897 | |
| FNMA | | | 4.000 | % | | | 12/01/41 | | | | 1,391,992 | | | | 1,461,927 | |
| FNMA | | | 4.000 | % | | | 12/01/41 | | | | 724,254 | | | | 760,647 | |
| FNMA | | | 4.000 | % | | | 01/01/42 | | | | 1,688,182 | | | | 1,785,392 | |
| FNMA | | | 3.500 | % | | | 05/01/42 | | | | 1,161,062 | | | | 1,198,932 | |
| FNMA | | | 3.000 | % | | | 06/01/42 | | | | 1,843,629 | | | | 1,853,576 | |
| FNMA | | | 3.000 | % | | | 08/01/42 | | | | 1,598,566 | | | | 1,607,195 | |
| FNMA | | | 3.000 | % | | | 08/01/42 | | | | 1,659,043 | | | | 1,668,008 | |
| FNMA | | | 3.500 | % | | | 12/01/42 | | | | 1,868,412 | | | | 1,930,395 | |
| FNMA | | | 3.000 | % | | | 06/01/43 | | | | 1,627,043 | | | | 1,635,669 | |
| FNMA | | | 4.000 | % | | | 12/01/44 | | | | 2,280,820 | | | | 2,414,553 | |
| FNMA | | | 3.500 | % | | | 05/01/45 | | | | 2,334,108 | | | | 2,410,977 | |
| FNMA | | | 3.000 | % | | | 04/01/46 | | | | 2,644,148 | | | | 2,645,493 | |
| FNMA | | | 3.500 | % | | | 11/01/46 | | | | 4,082,606 | | | | 4,193,936 | |
| | | | | | | | | | | | | | | | 115,703,498 | |
| GOVERNMENT NATIONAL MORTGAGE ASSOCIATION—0.1% | | | | | | | | | | | | | | | | |
| GNMA | | | 7.000 | % | | | 12/20/30 | | | | 22,624 | | | | 26,208 | |
| GNMA | | | 7.000 | % | | | 10/20/31 | | | | 16,742 | | | | 19,735 | |
| GNMA | | | 7.000 | % | | | 03/20/32 | | | | 63,914 | | | | 75,526 | |
| GNMA | | | 2.375 | % | | | 01/20/34 | | | | 55,662 | | | | 57,875 | |
| GNMA | | | 5.500 | % | | | 10/20/38 | | | | 26,221 | | | | 27,291 | |
| GNMA | | | 6.500 | % | | | 11/20/38 | | | | 14,754 | | | | 16,954 | |
| GNMA | | | 2.250 | % | | | 04/16/42 | | | | 385,179 | | | | 383,530 | |
| | | | | | | | | | | | | | | | 607,119 | |
| OVERSEAS PRIVATE INVESTMENT CORPORATION—0.5% | | | | | | | | | | | | | | | | |
| OPIC | | | 3.280 | % | | | 09/15/29 | | | | 1,087,815 | | | | 1,106,747 | |
| OPIC | | | 3.540 | % | | | 06/15/30 | | | | 735,300 | | | | 765,330 | |
| OPIC | | | 3.820 | % | | | 06/01/33 | | | | 923,884 | | | | 969,463 | |
| | | | | | | | | | | | | | | | 2,841,540 | |
| SMALL BUSINESS ADMINISTRATION—0.1% | | | | | | | | | | | | | | | | |
| SBA (Prime - 265) (a) | | | 1.599 | % | | | 02/25/32 | | | | 328,672 | | | | 326,619 | |
| | | | | | | | | | | | | | | | | |
| UNITED STATES AGENCY OF INTERNATIONAL DEVELOPMENT—2.1% |
| Hashemite Kingdom of Jordan AID Bond | | | 2.503 | % | | | 10/30/20 | | | | 5,000,000 | | | | 5,063,110 | |
| Hashemite Kingdom of Jordan AID Bond | | | 3.000 | % | | | 06/30/25 | | | | 1,450,000 | | | | 1,492,241 | |
| Iraq Aid | | | 2.149 | % | | | 01/18/22 | | | | 1,500,000 | | | | 1,491,394 | |
| Ukraine Government AID Bond | | | 1.847 | % | | | 05/29/20 | | | | 1,000,000 | | | | 995,676 | |
| Ukraine Government AID Bond | | | 1.471 | % | | | 09/29/21 | | | | 2,000,000 | | | | 1,947,820 | |
| | | | | | | | | | | | | | | | 10,990,241 | |
| UNITED STATES DEPARTMENT OF HOUSING AND URBAN DEVELOPMENT—0.2% |
| United States Department of Housing and Urban Development | | | 2.350 | % | | | 08/01/21 | | | | 1,000,000 | | | | 1,005,875 | |
| TOTAL U.S. GOVERNMENT AGENCIES (COST $235,680,662) | | | | | | | | | | | | | | | 237,309,232 | |
See accompanying notes to financial statements.
11
Schedule of Investments, continued
Praxis Impact Bond Fund
December 31, 2017
| | | SHARES | | | FAIR
VALUE | |
| INVESTMENT COMPANIES—0.7% | | | | | | |
| Pax High Yield Bond Fund - Institutional Class (Cost $4,199,236) | | | 530,984 | | | $ | 3,584,141 | |
| | | | | | | | | |
| TOTAL INVESTMENTS (COST $500,719,266—Unrealized gain/loss $7,487,108)—97.1% | | | | | | $ | 508,206,374 | |
| Other Assets in Excess of Liabilities—2.9% | | | | | | | 15,496,210 | |
| NET ASSETS—100.0% | | | | | | $ | 523,702,584 | |
(a) | Variable rate security. Rates presented are the rates in effect at December 31, 2017. The benchmark on which the rate is calculated is shown parenthetically; otherwise, the rate fluctuations may be based on index changes, prepayment of underlying positions and/or other variables. |
(b) | 144a security is restricted as to resale to institutional investors. These securities were deemed liquid under guidelines established by the Board of Trustees. At December 31, 2017, these securities were valued at $51,965,657 or 9.9% of net assets. |
(c) | Restricted and illiquid securities not registered under the Securities Act of 1933 are as follows: |
| | | Acquisition
Date | | Current
Cost | | | Fair
Value | | | % of Net Assets | |
| Calvert Social Investment Foundation, Inc. 1.00%, 06/15/18 | | 06/15/17 | | $ | 1,100,000 | | | $ | 1,100,000 | | | | 0.2 | % |
| Calvert Social Investment Foundation, Inc. 1.00%, 12/17/18 | | 12/15/17 | | | 1,200,000 | | | | 1,200,000 | | | | 0.2 | % |
| Calvert Social Investment Foundation, Inc. 1.50%, 06/17/19 | | 06/10/16 | | | 1,700,000 | | | | 1,700,000 | | | | 0.3 | % |
| Calvert Social Investment Foundation, Inc. 1.50%, 06/15/20 | | 06/15/17 | | | 850,000 | | | | 850,000 | | | | 0.2 | % |
| SolarCity LMC Series I LLC 4.80%, 12/21/26 | | 11/13/13 | | | 641,485 | | | | 660,349 | | | | 0.1 | % |
| SolarCity LMC Series I LLC 4.18%, 08/21/45 | | 08/17/15 | | | 233,576 | | | | 236,848 | | | | 0.0 | % |
| | | | | $ | 5,725,061 | | | $ | 5,747,197 | | | | 1.1 | % |
(d) | Percentage rounds to less than 0.1%. |
H15T1Y | —U.S. Treasury yield curve rate for Treasury note with a constant maturity of 1 year |
LIBOR | —London interbank offered rate |
plc | —Public Liability Company |
See accompanying notes to financial statements.
12
Praxis International Index Fund
Annual Report to Shareholders
Portfolio Managers’ Commentary (unaudited)
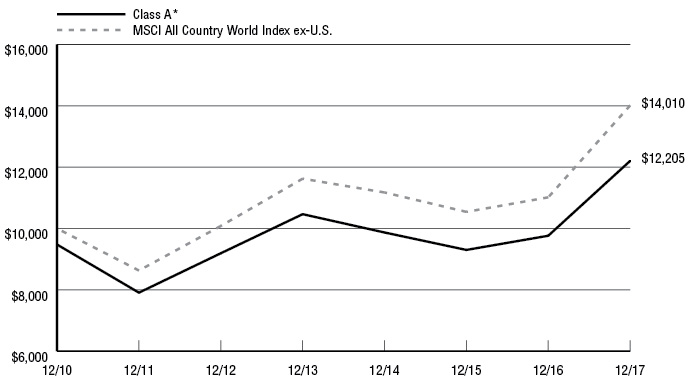
Foreign equity markets rose sharply in 2017, led by a surge in emerging market stock returns. Growth in the world’s largest economies, combined with strong corporate earnings and other fundamentals, buoyed returns and dampened volatility throughout the period. The MSCI All Country World ex US Index (the “Index”) posted a return of 27.19 percent for the year. The Index recorded positive returns in ten of ten market sectors, led by financials and technology companies. The Praxis International Index Fund (the “Fund”) closely tracked the Index. The Class I Shares returned 25.67 percent and the Class A Shares (Without Load) returned 24.97 percent.
The Praxis International Index Fund seeks to generate performance that reflects the performance of both foreign developed and emerging equity markets, as measured by the MSCI All Country World ex US Index. The portfolio is constructed using optimization techniques to have characteristics similar to the target benchmark index. Limitations due to the screens and the lower number of holdings versus the benchmark are expected to cause the Fund’s performance to deviate from the benchmark over short periods of time, but the goal over long periods of time is for the Fund to perform in line with the benchmark before fees.
During the period, these factors, including a mismatch in timing between the pricing of the securities in the portfolio and the benchmark, had a small negative contribution to the Fund’s returns relative to the benchmark. While there were no significant over/under exposures to any single factor, the Fund’s overweight to the telecommunications industry and underweight to the basic materials and energy industries detracted from relative returns. However, the results were consistent with our forecasted tracking error – a measure of variability of relative returns – for a portfolio subject to the constraints we discussed above.
Ran Leshem
Praxis International Index Fund Portfolio Manager
Aperio Group LLC
Michael T. Branch, CFA®
Praxis International Index Fund Portfolio Manager
Aperio Group LLC
The views expressed are those of the portfolio managers as of Dec. 31, 2017, are subject to change, and may differ from the views of other portfolio managers or Everence Capital Management as a whole. These opinions are not intended to be a forecast of future events, a guarantee of future results, or investment advice. All data referenced are from sources deemed to be reliable but cannot be guaranteed. Securities and sectors referenced should not be construed as a solicitation or recommendation or be used as the sole basis for any investment decision.
13
Praxis International Index Fund
Performance Review (unaudited)
Growth of $10,000 investment from 12/31/10 to 12/31/17
This chart represents historical performance of a hypothetical investment of $10,000 in Class A Shares (adjusted for the maximum sales charge of 5.25%) of the Fund and Index from 12/31/10 to 12/31/17, and includes the reinvestment of dividends and capital gains.
| | | | Average Annual Returns | | |
| Inception Date | One
Year Ended | Three
Years Ended | Five
Years Ended | Since Inception | Expense
Ratio**
Gross / Net |
Praxis International Index Fund | | | | | | | |
Class A * | 12/31/10 | 18.47% | 5.40% | 4.70% | 2.89% | 1.27% | 1.27% |
Class A (Without Load) | 12/31/10 | 24.97% | 7.32% | 5.83% | 3.68% | | |
Class I ** | 12/31/10 | 25.67% | 7.92% | 6.41% | 4.30% | 0.72% | 0.72% |
MSCI All Country World Index ex-U.S. 1 | | 27.19% | 7.83% | 6.80% | 4.93% | | |
Past performance does not guarantee future results. The performance data quoted represents past performance and current returns may be lower or higher. The investment return and principal value will fluctuate so that an investor’s shares, when redeemed, may be worth more or less than the original cost. These performance figures do not reflect the deduction of taxes that a shareholder would pay on fund distributions or the redemption of fund shares. To obtain performance information current to the most recent month end, please visit www.praxismutualfunds.com. Indexes are unmanaged, do not incur fees, and it is not possible to invest directly in an index.
The total returns shown reflect any expenses that were contractually or voluntarily reduced, reimbursed or paid by any party during the periods presented. In such instances, and without activity, the total returns would have been lower.
| * | The total return figures shown reflect the maximum sales charge applicable to Class A Shares. Class A Shares have a maximum sales charge on purchases of 5.25%. |
| ** | Reflects the expense ratios as reported in the Prospectus dated April 30, 2017. |
| 1 | The MSCI All Country World Index ex-U.S. is market-capitalization-weighted index designed to provide a broad measure of stock performance throughout the world, with the exception of U.S. based companies. The index includes both developed and emerging markets. |
The above index is for illustrative purposes only and does not reflect the deduction of expenses associated with a mutual fund, such as investment management and fund accounting fees. The Fund’s performance reflects the deduction of these services. An investor cannot invest directly in an index, although they can invest in its underlying securities.
14
Schedule of Investments
Praxis International Index Fund
December 31, 2017
| | | SHARES | | | FAIR
VALUE | |
| COMMON STOCKS—98.6% | | | | | | |
| AUSTRALIA—5.0% | | | | | | |
| BANKS—1.9% | | | | | | |
| Australia & New Zealand Banking Group Ltd. (a) | | | 6,107 | | | $ | 136,256 | |
| Australia & New Zealand Banking Group Ltd. - ADR | | | 36,061 | | | | 805,603 | |
| Commonwealth Bank of Australia (a) | | | 21,512 | | | | 1,342,678 | |
| Commonwealth Bank of Australia - ADR | | | 613 | | | | 38,334 | |
| National Australia Bank Ltd. (a) | | | 4,644 | | | | 106,662 | |
| National Australia Bank Ltd. - ADR | | | 63,688 | | | | 729,865 | |
| Westpac Banking Corp. (a) | | | 17,091 | | | | 415,759 | |
| Westpac Banking Corp. - ADR | | | 78,609 | | | | 1,916,487 | |
| | | | | | | | 5,491,644 | |
| BIOTECHNOLOGY—0.3% | | | | | | | | |
| CSL Ltd. (a) | | | 3,640 | | | | 400,057 | |
| CSL Ltd. - ADR | | | 8,710 | | | | 480,531 | |
| | | | | | | | 880,588 | |
| CAPITAL MARKETS—0.3% | | | | | | | | |
| Macquarie Group Ltd. (a) | | | 7,209 | | | | 557,640 | |
| Macquarie Group Ltd. - ADR | | | 2,747 | | | | 213,085 | |
| | | | | | | | 770,725 | |
| CHEMICALS—0.1% | | | | | | | | |
| Orica Ltd. (a) | | | 27,987 | | | | 393,512 | |
| | | | | | | | | |
| CONTAINERS & PACKAGING—0.2% | | | | | | | | |
| Amcor Ltd. (a) | | | 24,949 | | | | 298,980 | |
| Amcor Ltd. - ADR | | | 3,500 | | | | 168,070 | |
| | | | | | | | 467,050 | |
| DIVERSIFIED TELECOMMUNICATION SERVICES—0.1% |
| Telstra Corp. Ltd. (a) | | | 17,682 | | | | 49,990 | |
| Telstra Corp. Ltd. - ADR | | | 10,910 | | | | 154,377 | |
| | | | | | | | 204,367 | |
| FOOD & STAPLES RETAILING—0.4% | | | | | | | | |
| Wesfarmers Ltd. (a) | | | 19,358 | | | | 669,432 | |
| Woolworths Ltd. (a) | | | 27,413 | | | | 582,489 | |
| | | | | | | | 1,251,921 | |
| INSURANCE—0.2% | | | | | | | | |
| Suncorp Group Ltd. (a) | | | 46,152 | | | | 497,492 | |
| | | | | | | | | |
| METALS & MINING—0.3% | | | | | | | | |
| Alumina Ltd. - ADR | | | 41,858 | | | | 314,354 | |
| Newcrest Mining Ltd. - ADR | | | 9,928 | | | | 177,215 | |
| Sims Metal Management Ltd. - ADR | | | 21,356 | | | | 259,902 | |
| | | | | | | | 751,471 | |
| OIL, GAS & CONSUMABLE FUELS—0.7% | | | | | | | | |
| Caltex Australia Ltd. (a) | | | 12,181 | | | | 322,725 | |
| Oil Search Ltd. (a) | | | 60,661 | | | | 367,319 | |
| Origin Energy Ltd. (a)(b) | | | 100,656 | | | | 737,406 | |
| Woodside Petroleum Ltd. (a) | | | 18,241 | | | | 469,356 | |
| Woodside Petroleum Ltd. - ADR | | | 5,235 | | | | 134,749 | |
| | | | | | | | 2,031,555 | |
| REAL ESTATE INVESTMENT TRUSTS (REITS)—0.4% |
| Scentre Group REIT (a) | | | 25,459 | | | | 83,055 | |
| Shopping Centres Australasia Property Group REIT (a) | | | 1 | | | | 2 | |
| Westfield Corp. REIT (a) | | | 123,771 | | | | 914,544 | |
| | | | | | | | 997,601 | |
| TRANSPORTATION INFRASTRUCTURE—0.1% | | | | | | | | |
| Sydney Airport (a) | | | 49,337 | | | | 270,747 | |
| TOTAL AUSTRALIA | | | | | | | 14,008,673 | |
| | | | | | | | | |
| AUSTRIA—0.2% | | | | | | | | |
| BANKS—0.2% | | | | | | | | |
| Erste Group Bank AG (a) | | | 5,112 | | | | 221,515 | |
| Erste Group Bank AG - ADR | | | 12,078 | | | | 263,300 | |
| TOTAL AUSTRIA | | | | | | | 484,815 | |
| | | | | | | | | |
| BELGIUM—0.2% | | | | | | | | |
| FOOD & STAPLES RETAILING—0.2% | | | | | | | | |
| Colruyt S.A. (a) | | | 8,334 | | | | 433,517 | |
| | | | | | | | | |
| BRAZIL—1.2% | | | | | | | | |
| BANKS—0.6% | | | | | | | | |
| Banco Bradesco S.A. - ADR | | | 77,242 | | | | 790,958 | |
| Itau Unibanco Holding S.A. - ADR | | | 61,571 | | | | 800,423 | |
| | | | | | | | 1,591,381 | |
| CHEMICALS—0.1% | | | | | | | | |
| Braskem S.A. - ADR | | | 13,824 | | | | 363,018 | |
| | | | | | | | | |
| OIL, GAS & CONSUMABLE FUELS—0.4% | | | | | | | | |
| Petroleo Brasileiro S.A. - ADR (b) | | | 63,920 | | | | 657,737 | |
| Ultrapar Participacoes S.A. - ADR | | | 14,545 | | | | 330,608 | |
| | | | | | | | 988,345 | |
| WATER UTILITIES—0.1% | | | | | | | | |
| Cia de Saneamento Basico do Estado de Sao Paulo - ADR | | | 36,049 | | | | 376,712 | |
| TOTAL BRAZIL | | | | | | | 3,319,456 | |
| | | | | | | | | |
| CANADA—6.6% | | | | | | | | |
| AUTO COMPONENTS—0.3% | | | | | | | | |
| Magna International, Inc. - Class A | | | 15,982 | | | | 905,700 | |
| | | | | | | | | |
| BANKS—1.6% | | | | | | | | |
| Bank of Montreal | | | 7,625 | | | | 610,153 | |
| Bank of Nova Scotia | | | 12,180 | | | | 785,975 | |
| Canadian Imperial Bank of Commerce | | | 6,759 | | | | 658,394 | |
| Royal Bank of Canada | | | 17,137 | | | | 1,399,236 | |
| Toronto-Dominion Bank | | | 18,236 | | | | 1,068,265 | |
| | | | | | | | 4,522,023 | |
| CHEMICALS—0.6% | | | | | | | | |
| Agrium, Inc. | | | 9,767 | | | | 1,123,205 | |
| Methanex Corp. | | | 9,429 | | | | 570,926 | |
| | | | | | | | 1,694,131 | |
| INDEPENDENT POWER PRODUCERS & ENERGY TRADERS—0.0% (c) |
| TransAlta Corp. | | | 20,678 | | | | 123,034 | |
| | | | | | | | | |
| INSURANCE—0.4% | | | | | | | | |
| Manulife Financial Corp. | | | 30,520 | | | | 636,647 | |
| Sun Life Financial, Inc. | | | 11,714 | | | | 483,320 | |
| | | | | | | | 1,119,967 | |
| MEDIA—0.2% | | | | | | | | |
| Shaw Communications, Inc. - Class B | | | 30,240 | | | | 690,379 | |
See accompanying notes to financial statements.
15
Schedule of Investments, continued
Praxis International Index Fund
December 31, 2017
| | | SHARES | | | FAIR
VALUE | |
| COMMON STOCKS—98.6%, continued | | | | | | |
| CANADA—6.6%, continued | | | | | | |
| METALS & MINING—0.4% | | | | | | |
| Agnico Eagle Mines Ltd. | | | 9,204 | | | $ | 425,041 | |
| Teck Resources Ltd. - Class B | | | 24,575 | | | | 643,128 | |
| | | | | | | | 1,068,169 | |
| OIL, GAS & CONSUMABLE FUELS—1.7% | | | | | | | | |
| Enbridge, Inc. | | | 51,813 | | | | 2,026,406 | |
| Encana Corp. | | | 36,072 | | | | 480,840 | |
| Suncor Energy, Inc. | | | 60,339 | | | | 2,215,648 | |
| | | | | | | | 4,722,894 | |
| ROAD & RAIL—0.9% | | | | | | | | |
| Canadian National Railway Co. | | | 18,951 | | | | 1,563,458 | |
| Canadian Pacific Railway Ltd. | | | 5,165 | | | | 943,955 | |
| | | | | | | | 2,507,413 | |
| SOFTWARE—0.3% | | | | | | | | |
| Open Text Corp. | | | 21,239 | | | | 757,595 | |
| | | | | | | | | |
| WIRELESS TELECOMMUNICATION SERVICES—0.2% | | | | | | | | |
| Rogers Communications, Inc. - Class B | | | 12,894 | | | | 656,692 | |
| TOTAL CANADA | | | | | | | 18,767,997 | |
| | | | | | | | | |
| CAYMAN ISLANDS—0.9% | | | | | | | | |
| DIVERSIFIED CONSUMER SERVICES—0.3% | | | | | | | | |
| TAL Education Group - ADR | | | 27,222 | | | | 808,766 | |
| | | | | | | | | |
| INTERNET & DIRECT MARKETING RETAIL—0.2% | | | | | | | | |
| Ctrip.com International Ltd. - ADR (b) | | | 13,813 | | | | 609,153 | |
| | | | | | | | | |
| INTERNET SOFTWARE & SERVICES—0.4% | | | | | | | | |
| SINA Corp. (b) | | | 4,823 | | | | 483,795 | |
| Weibo Corp. - ADR (b) | | | 6,202 | | | | 641,659 | |
| | | | | | | | 1,125,454 | |
| TOTAL CAYMAN ISLANDS | | | | | | | 2,543,373 | |
| | | | | | | | | |
| CHILE—0.7% | | | | | | | | |
| AIRLINES—0.1% | | | | | | | | |
| Latam Airlines Group S.A. - ADR | | | 30,040 | | | | 417,556 | |
| | | | | | | | | |
| BEVERAGES—0.1% | | | | | | | | |
| Embotelladora Andina S.A. - Class B - ADR | | | 6,720 | | | | 194,410 | |
| | | | | | | | | |
| CHEMICALS—0.3% | | | | | | | | |
| Sociedad Quimica y Minera de Chile S.A. - ADR | | | 15,440 | | | | 916,673 | |
| | | | | | | | | |
| METALS & MINING—0.2% | | | | | | | | |
| Antofagasta plc (a) | | | 31,044 | | | | 418,526 | |
| TOTAL CHILE | | | | | | | 1,947,165 | |
| | | | | | | | | |
| CHINA—6.2% | | | | | | | | |
| AIRLINES—0.1% | | | | | | | | |
| China Southern Airlines Co. Ltd. - ADR | | | 5,546 | | | | 287,394 | |
| | | | | | | | | |
| BANKS—0.4% | | | | | | | | |
| China Construction Bank Corp. - ADR | | | 69,587 | | | | 1,283,880 | |
| | | | | | | | | |
| CHEMICALS—0.1% | | | | | | | | |
| Sinopec Shanghai Petrochemical Co. Ltd. - ADR | | | 7,041 | | | | 401,337 | |
| | | | | | | | | |
| DIVERSIFIED TELECOMMUNICATION SERVICES—0.1% |
| China Telecom Corp. Ltd. - ADR | | | 6,115 | | | | 290,279 | |
| | | | | | | | | |
| INSURANCE—1.5% | | | | | | | | |
| AIA Group Ltd. - ADR | | | 20,771 | | | | 711,095 | |
| China Life Insurance Co. Ltd. - ADR | | | 90,790 | | | | 1,417,232 | |
| Ping An Insurance Group Co. of China Ltd. - ADR | | | 33,826 | | | | 706,625 | |
| Ping An Insurance Group Co. of China Ltd. - Class H (a) | | | 131,769 | | | | 1,366,715 | |
| | | | | | | | 4,201,667 | |
| INTERNET SOFTWARE & SERVICES—3.8% | | | | | | | | |
| Alibaba Group Holdings Ltd. - ADR (b) | | | 17,583 | | | | 3,031,837 | |
| Baidu, Inc. - ADR (b) | | | 5,149 | | | | 1,205,947 | |
| NetEase, Inc. - ADR | | | 2,394 | | | | 826,098 | |
| Tencent Holdings Ltd. - ADR | | | 109,906 | | | | 5,706,319 | |
| | | | | | | | 10,770,201 | |
| ROAD & RAIL—0.1% | | | | | | | | |
| Guangshen Railway Co. - ADR | | | 8,797 | | | | 294,700 | |
| | | | | | | | | |
| TECHNOLOGY HARDWARE, STORAGE & PERIPHERALS—0.1% |
| Lenovo Group Ltd. - ADR | | | 18,577 | | | | 208,805 | |
| TOTAL CHINA | | | | | | | 17,738,263 | |
| | | | | | | | | |
| COLOMBIA—0.4% | | | | | | | | |
| BANKS—0.2% | | | | | | | | |
| BanColombia S.A. - ADR | | | 10,431 | | | | 413,693 | |
| | | | | | | | | |
| OIL, GAS & CONSUMABLE FUELS—0.2% | | | | | | | | |
| Ecopetrol S.A. - ADR | | | 42,848 | | | | 626,866 | |
| TOTAL COLOMBIA | | | | | | | 1,040,559 | |
| | | | | | | | | |
| DENMARK—1.0% | | | | | | | | |
| BANKS—0.2% | | | | | | | | |
| Danske Bank A/S (a) | | | 11,624 | | | | 452,415 | |
| Danske Bank A/S - ADR | | | 6,614 | | | | 129,304 | |
| | | | | | | | 581,719 | |
| PHARMACEUTICALS—0.7% | | | | | | | | |
| Novo Nordisk A/S - ADR | | | 39,423 | | | | 2,115,832 | |
| | | | | | | | | |
| TEXTILES, APPAREL & LUXURY GOODS—0.1% | | | | | | | | |
| Pandora A/S (a) | | | 2,460 | | | | 267,390 | |
| TOTAL DENMARK | | | | | | | 2,964,941 | |
| | | | | | | | | |
| FINLAND—0.5% | | | | | | | | |
| COMMUNICATIONS EQUIPMENT—0.1% | | | | | | | | |
| Nokia OYJ - ADR | | | 86,149 | | | | 401,454 | |
| | | | | | | | | |
| MACHINERY—0.2% | | | | | | | | |
| Kone OYJ - Class B (a) | | | 11,250 | | | | 604,111 | |
| | | | | | | | | |
| PAPER & FOREST PRODUCTS—0.2% | | | | | | | | |
| Stora Enso OYJ - ADR | | | 32,308 | | | | 509,820 | |
| TOTAL FINLAND | | | | | | | 1,515,385 | |
| | | | | | | | | |
| FRANCE—6.4% | | | | | | | | |
| AUTO COMPONENTS—0.6% | | | | | | | | |
| Cie Generale des Etablissements Michelin (a) | | | 1,074 | | | | 153,630 | |
| Cie Generale des Etablissements Michelin - ADR | | | 25,215 | | | | 721,653 | |
| Valeo S.A. (a) | | | 2,793 | | | | 208,038 | |
| Valeo S.A. - ADR | | | 13,056 | | | | 487,446 | |
| | | | | | | | 1,570,767 | |
| AUTOMOBILES—0.2% | | | | | | | | |
| Renault S.A. (a) | | | 5,892 | | | | 591,383 | |
See accompanying notes to financial statements.
16
Schedule of Investments, continued
Praxis International Index Fund
December 31, 2017
| | | SHARES | | | FAIR
VALUE | |
| COMMON STOCKS—98.6%, continued | | | | | | |
| FRANCE—6.4%, continued | | | | | | |
| BANKS—0.7% | | | | | | |
| BNP Paribas S.A. - ADR | | | 29,644 | | | $ | 1,107,203 | |
| Credit Agricole S.A. (a) | | | 11,014 | | | | 181,850 | |
| Credit Agricole S.A. - ADR | | | 14,211 | | | | 116,743 | |
| Societe Generale S.A. (a) | | | 4,111 | | | | 211,929 | |
| Societe Generale S.A. - ADR | | | 36,300 | | | | 376,068 | |
| | | | | | | | 1,993,793 | |
| BUILDING PRODUCTS—0.3% | | | | | | | | |
| Cie de Saint-Gobain (a) | | | 13,938 | | | | 767,038 | |
| | | | | | | | | |
| CONSTRUCTION & ENGINEERING—0.5% | | | | | | | | |
| Bouygues S.A. (a) | | | 8,092 | | | | 419,844 | |
| Vinci S.A. (a) | | | 1,494 | | | | 152,514 | |
| Vinci S.A. - ADR | | | 30,694 | | | | 782,697 | |
| | | | | | | | 1,355,055 | |
| DIVERSIFIED TELECOMMUNICATION SERVICES—0.5% |
| Orange S.A. - ADR | | | 40,170 | | | | 698,958 | |
| Vivendi S.A. (a) | | | 12,138 | | | | 325,754 | |
| Vivendi S.A. - ADR | | | 11,623 | | | | 311,729 | |
| | | | | | | | 1,336,441 | |
| ELECTRICAL EQUIPMENT—0.5% | | | | | | | | |
| Legrand S.A. (a) | | | 17,254 | | | | 1,326,370 | |
| | | | | | | | | |
| FOOD & STAPLES RETAILING—0.1% | | | | | | | | |
| Carrefour S.A. (a) | | | 1,523 | | | | 32,834 | |
| Carrefour S.A. - ADR | | | 58,790 | | | | 255,148 | |
| | | | | | | | 287,982 | |
| FOOD PRODUCTS—0.9% | | | | | | | | |
| Danone S.A. - ADR | | | 153,190 | | | | 2,568,996 | |
| | | | | | | | | |
| HEALTH CARE EQUIPMENT & SUPPLIES—0.2% | | | | | | | | |
| Essilor International S.A. (a) | | | 4,503 | | | | 620,204 | |
| Essilor International S.A. - ADR | | | 952 | | | | 65,669 | |
| | | | | | | | 685,873 | |
| INSURANCE—0.4% | | | | | | | | |
| AXA S.A. (a) | | | 4,355 | | | | 129,043 | |
| AXA S.A. - ADR | | | 34,977 | | | | 1,037,593 | |
| | | | | | | | 1,166,636 | |
| MEDIA—0.2% | | | | | | | | |
| Publicis Groupe S.A. - ADR | | | 26,260 | | | | 446,157 | |
| | | | | | | | | |
| MULTI-UTILITIES—0.5% | | | | | | | | |
| Engie S.A. (a) | | | 21,648 | | | | 372,134 | |
| Engie S.A. - ADR | | | 26,565 | | | | 455,988 | |
| Veolia Environnement S.A. (a) | | | 14,792 | | | | 377,155 | |
| Veolia Environnement S.A. - ADR (b) | | | 11,774 | | | | 300,237 | |
| | | | | | | | 1,505,514 | |
| PERSONAL PRODUCTS—0.6% | | | | | | | | |
| L'Oreal S.A. (a) | | | 1,380 | | | | 305,759 | |
| L'Oreal S.A. - ADR | | | 32,890 | | | | 1,456,369 | |
| | | | | | | | 1,762,128 | |
| SOFTWARE—0.2% | | | | | | | | |
| Dassault Systemes - ADR | | | 6,224 | | | | 659,993 | |
| TOTAL FRANCE | | | | | | | 18,024,126 | |
| | | | | | | | | |
| GERMANY—6.6% | | | | | | | | |
| AIR FREIGHT & LOGISTICS—0.4% | | | | | | | | |
| Deutsche Post AG (a) | | | 10,161 | | | | 482,952 | |
| Deutsche Post AG - ADR | | | 14,832 | | | | 705,781 | |
| | | | | | | | 1,188,733 | |
| AIRLINES—0.1% | | | | | | | | |
| Deutsche Lufthansa AG - ADR | | | 10,201 | | | | 375,397 | |
| | | | | | | | | |
| AUTOMOBILES—0.9% | | | | | | | | |
| Bayerische Moteren Werke AG - ADR | | | 27,692 | | | | 960,082 | |
| Daimler AG (a) | | | 15,015 | | | | 1,269,581 | |
| Daimler AG - ADR | | | 2,549 | | | | 215,556 | |
| | | | | | | | 2,445,219 | |
| BANKS—0.2% | | | | | | | | |
| Deutsche Bank AG | | | 32,333 | | | | 615,297 | |
| | | | | | | | | |
| CHEMICALS—0.9% | | | | | | | | |
| BASF SE (a) | | | 4,371 | | | | 479,163 | |
| BASF SE - ADR | | | 72,776 | | | | 1,999,157 | |
| | | | | | | | 2,478,320 | |
| DIVERSIFIED FINANCIAL SERVICES—0.2% | | | | | | | | |
| Deutsche Boerse AG (a) | | | 3,878 | | | | 448,827 | |
| Deutsche Boerse AG - ADR | | | 15,060 | | | | 173,717 | |
| | | | | | | | 622,544 | |
| DIVERSIFIED TELECOMMUNICATION SERVICES—0.2% |
| Deutsche Telekom AG - ADR | | | 38,043 | | | | 671,878 | |
| | | | | | | | | |
| HEALTH CARE PROVIDERS & SERVICES—0.5% | | | | | | | | |
| Fresenius Medical Care AG & Co. KGaA - ADR | | | 19,354 | | | | 1,017,053 | |
| Fresenius SE & Co. KGaA (a) | | | 5,130 | | | | 398,939 | |
| | | | | | | | 1,415,992 | |
| INSURANCE—0.9% | | | | | | | | |
| Allianze SE - ADR | | | 76,050 | | | | 1,746,488 | |
| Muenchener Rueckversicherungs-Gesellschaft AG (a) | | | 1,682 | | | | 363,201 | |
| Muenchener Rueckversicherungs-Gesellschaft AG - ADR | | | 18,890 | | | | 408,780 | |
| | | | | | | | 2,518,469 | |
| MULTI-UTILITIES—0.4% | | | | | | | | |
| E.ON SE (a) | | | 53,575 | | | | 580,505 | |
| RWE AG (a)(b) | | | 17,185 | | | | 349,696 | |
| RWE AG - ADR (b) | | | 5,585 | | | | 113,320 | |
| | | | | | | | 1,043,521 | |
| PHARMACEUTICALS—0.6% | | | | | | | | |
| Bayer AG - ADR | | | 51,088 | | | | 1,588,326 | |
| | | | | | | | | |
| SEMICONDUCTORS & SEMICONDUCTOR EQUIPMENT—0.1% |
| Infineon Technologies AG - ADR | | | 12,109 | | | | 330,273 | |
| | | | | | | | | |
| SOFTWARE—0.6% | | | | | | | | |
| SAP SE - ADR | | | 16,215 | | | | 1,821,917 | |
| | | | | | | | | |
| TEXTILES, APPAREL & LUXURY GOODS—0.5% | | | | | | | | |
| adidas AG (a) | | | 1,323 | | | | 264,567 | |
| adidas AG - ADR | | | 9,804 | | | | 978,635 | |
| Puma SE (a) | | | 285 | | | | 123,923 | |
| | | | | | | | 1,367,125 | |
See accompanying notes to financial statements.
17
Schedule of Investments, continued
Praxis International Index Fund
December 31, 2017
| | | SHARES | | | FAIR
VALUE | |
| COMMON STOCKS—98.6%, continued | | | | | | |
| GERMANY—6.6%, continued | | | | | | |
| TRADING COMPANIES & DISTRIBUTORS—0.1% | | | | | | |
| Brenntag AG (a) | | | 5,521 | | | $ | 348,038 | |
| TOTAL GERMANY | | | | | | | 18,831,049 | |
| | | | | | | | | |
| HONG KONG—3.3% | | | | | | | | |
| BANKS—0.3% | | | | | | | | |
| BOC Hong Kong Holdings Ltd. (a) | | | 158,000 | | | | 798,496 | |
| BOC Hong Kong Holdings Ltd. - ADR | | | 1,754 | | | | 178,154 | |
| | | | | | | | 976,650 | |
| DIVERSIFIED FINANCIAL SERVICES—0.3% | | | | | | | | |
| Hong Kong Exchanges & Clearing Ltd. (a) | | | 24,500 | | | | 749,412 | |
| | | | | | | | | |
| ELECTRIC UTILITIES—0.1% | | | | | | | | |
| CK Infrastructure Holdings Ltd. (a) | | | 41,518 | | | | 356,272 | |
| | | | | | | | | |
| INDUSTRIAL CONGLOMERATES—0.6% | | | | | | | | |
| CK Hutchison Holdings Ltd. (a) | | | 60,500 | | | | 758,082 | |
| CK Hutchison Holdings Ltd. - ADR | | | 36,503 | | | | 458,295 | |
| Jardine Matheson Holdings Ltd. (a) | | | 4,751 | | | | 288,255 | |
| Jardine Matheson Holdings Ltd. - ADR | | | 3,618 | | | | 219,739 | |
| | | | | | | | 1,724,371 | |
| INSURANCE—0.6% | | | | | | | | |
| AIA Group Ltd. (a) | | | 193,200 | | | | 1,643,289 | |
| | | | | | | | | |
| MEDIA—0.0% (c) | | | | | | | | |
| I-CABLE Communications Ltd. (a)(b) | | | 114,973 | | | | 3,369 | |
| | | | | | | | | |
| REAL ESTATE MANAGEMENT & DEVELOPMENT—1.4% |
| Henderson Land Development Co. Ltd. (a) | | | 89,476 | | | | 588,304 | |
| Sun Hung Kai Properties Ltd. (a) | | | 28,000 | | | | 466,173 | |
| Sun Hung Kai Properties Ltd. - ADR | | | 22,014 | | | | 366,423 | |
| Swire Pacific Ltd. - Class A (a) | | | 28,000 | | | | 259,065 | |
| Swire Pacific Ltd. - Class A - ADR | | | 32,051 | | | | 294,389 | |
| Swire Properties Ltd. (a) | | | 121,150 | | | | 390,348 | |
| Wharf Holdings Ltd. (a) | | | 150,000 | | | | 517,273 | |
| Wharf Real Estate Investment Co., Ltd. (b) | | | 150,000 | | | | 998,354 | |
| | | | | | | | 3,880,329 | |
| TOTAL HONG KONG | | | | | | | 9,333,692 | |
| | | | | | | | | |
| HUNGARY—0.0% (c) | | | | | | | | |
| DIVERSIFIED TELECOMMUNICATION SERVICES—0.0% (c) |
| Magyar Telekom Telecommunications plc - ADR | | | 11,582 | | | | 101,574 | |
| | | | | | | | | |
| OIL, GAS & CONSUMABLE FUELS—0.0% (c) | | | | | | | | |
| MOL Hungarian Oil & Gas plc - ADR | | | 6,368 | | | | 37,037 | |
| TOTAL HUNGARY | | | | | | | 138,611 | |
| | | | | | | | | |
| INDIA—1.4% | | | | | | | | |
| BANKS—0.8% | | | | | | | | |
| HDFC Bank Ltd. - ADR | | | 16,597 | | | | 1,687,417 | |
| ICICI Bank Ltd. - ADR | | | 72,584 | | | | 706,242 | |
| | | | | | | | 2,393,659 | |
| IT SERVICES—0.4% | | | | | | | | |
| Infosys Ltd. - ADR | | | 37,297 | | | | 604,957 | |
| Wipro Ltd. - ADR | | | 78,318 | | | | 428,400 | |
| | | | | | | | 1,033,357 | |
| PHARMACEUTICALS—0.2% | | | | | | | | |
| Dr. Reddy's Laboratories Ltd. - ADR | | | 10,846 | | | | 407,376 | |
| TOTAL INDIA | | | | | | | 3,834,392 | |
| | | | | | | | | |
| INDONESIA—0.6% | | | | | | | | |
| BANKS—0.2% | | | | | | | | |
| PT Bank Mandiri - ADR | | | 49,403 | | | | 582,461 | |
| | | | | | | | | |
| DIVERSIFIED TELECOMMUNICATION SERVICES—0.4% |
| Telekomunikasi Indonesia Persero Tbk PT - ADR | | | 33,206 | | | | 1,069,897 | |
| | | | | | | | | |
| MACHINERY—0.0% (c) | | | | | | | | |
| United Tractors Tbk PT - ADR | | | 3,369 | | | | 175,806 | |
| TOTAL INDONESIA | | | | | | | 1,828,164 | |
| | | | | | | | | |
| IRELAND—0.8% | | | | | | | | |
| BIOTECHNOLOGY—0.2% | | | | | | | | |
| Shire plc - ADR | | | 3,955 | | | | 613,499 | |
| | | | | | | | | |
| CONSTRUCTION MATERIALS—0.3% | | | | | | | | |
| CRH plc - ADR | | | 23,753 | | | | 857,246 | |
| | | | | | | | | |
| PROFESSIONAL SERVICES—0.3% | | | | | | | | |
| Experian plc (a) | | | 3,191 | | | | 70,333 | |
| Experian plc - ADR | | | 37,268 | | | | 816,915 | |
| | | | | | | | 887,248 | |
| TOTAL IRELAND | | | | | | | 2,357,993 | |
| | | | | | | | | |
| ISRAEL—0.6% | | | | | | | | |
| PHARMACEUTICALS—0.3% | | | | | | | | |
| Taro Pharmaceutical Industries Ltd. (b) | | | 3,950 | | | | 413,604 | |
| Teva Pharmaceutical Industries Ltd. - ADR | | | 26,006 | | | | 492,814 | |
| | | | | | | | 906,418 | |
| SOFTWARE—0.3% | | | | | | | | |
| Check Point Software Technologies Ltd. (b) | | | 8,509 | | | | 881,703 | |
| TOTAL ISRAEL | | | | | | | 1,788,121 | |
| | | | | | | | | |
| ITALY—0.9% | | | | | | | | |
| BANKS—0.3% | | | | | | | | |
| Intesa Sanpaolo SpA (a) | | | 128,010 | | | | 424,688 | |
| Intesa Sanpaolo SpA - ADR | | | 12,596 | | | | 251,353 | |
| Unicredit SpA (a) | | | 5,798 | | | | 108,149 | |
| | | | | | | | 784,190 | |
| ELECTRIC UTILITIES—0.2% | | | | | | | | |
| Enel SpA (a) | | | 86,564 | | | | 532,266 | |
| | | | | | | | | |
| INSURANCE—0.1% | | | | | | | | |
| Assicurazioni Generali SpA (a) | | | 16,056 | | | | 292,221 | |
| | | | | | | | | |
| TEXTILES, APPAREL & LUXURY GOODS—0.2% | | | | | | | | |
| Luxottica Group SpA - ADR | | | 9,316 | | | | 569,860 | |
| | | | | | | | | |
| TRANSPORTATION INFRASTRUCTURE—0.1% | | | | | | | | |
| Atlantia SpA (a) | | | 13,863 | | | | 437,018 | |
| TOTAL ITALY | | | | | | | 2,615,555 | |
| | | | | | | | | |
| JAPAN—16.3% | | | | | | | | |
| AUTO COMPONENTS—0.4% | | | | | | | | |
| Bridgestone Corp. (a) | | | 4,656 | | | | 215,471 | |
| Bridgestone Corp. - ADR | | | 20,546 | | | | 477,489 | |
| Denso Corp. (a) | | | 7,000 | | | | 419,324 | |
| Denso Corp. - ADR | | | 6,048 | | | | 181,470 | |
| | | | | | | | 1,293,754 | |
| AUTOMOBILES—2.1% | | | | | | | | |
| Honda Motor Co. Ltd. - ADR | | | 49,827 | | | | 1,698,104 | |
| Nissan Motor Co. Ltd. - ADR | | | 36,396 | | | | 724,280 | |
See accompanying notes to financial statements.
18
Schedule of Investments, continued
Praxis International Index Fund
December 31, 2017
| | | SHARES | | | FAIR
VALUE | |
| COMMON STOCKS—98.6%, continued | | | | | | |
| JAPAN—16.3%, continued | | | | | | |
| AUTOMOBILES—2.1%, continued | | | | | | |
| Toyota Motor Corp. - ADR | | | 27,232 | | | $ | 3,463,093 | |
| | | | | | | | 5,885,477 | |
| BANKS—1.6% | | | | | | | | |
| Mitsubishi UFJ Financial Group, Inc. - ADR | | | 269,546 | | | | 1,959,599 | |
| Mizuho Financial Group, Inc. - ADR | | | 132,028 | | | | 480,582 | |
| Sumitomo Mitsui Financial Group, Inc. - ADR | | | 213,385 | | | | 1,854,316 | |
| Sumitomo Mitsui Trust Holdings, Inc. (a) | | | 298 | | | | 11,790 | |
| Sumitomo Mitsui Trust Holdings, Inc. - ADR | | | 39,737 | | | | 160,140 | |
| | | | | | | | 4,466,427 | |
| BUILDING PRODUCTS—0.1% | | | | | | | | |
| Asahi Glass Co. Ltd. (a) | | | 600 | | | | 25,932 | |
| Asahi Glass Co. Ltd. - ADR | | | 21,219 | | | | 184,605 | |
| | | | | | | | 210,537 | |
| CAPITAL MARKETS—0.3% | | | | | | | | |
| Daiwa Securities Group, Inc. (a) | | | 16,000 | | | | 100,095 | |
| Daiwa Securities Group, Inc. - ADR | | | 49,678 | | | | 313,468 | |
| Nomura Holdings, Inc. - ADR | | | 94,167 | | | | 548,052 | |
| | | | | | | | 961,615 | |
| CHEMICALS—0.5% | | | | | | | | |
| Nitto Denko Corp. (a) | | | 500 | | | | 44,220 | |
| Nitto Denko Corp. - ADR | | | 11,626 | | | | 515,962 | |
| Shin-Etsu Chemical Co. Ltd. (a) | | | 5,600 | | | | 567,358 | |
| Sumitomo Chemical Co. Ltd. (a) | | | 38,000 | | | | 271,891 | |
| | | | | | | | 1,399,431 | |
| COMMERCIAL SERVICES & SUPPLIES—0.2% | | | | | | | | |
| Dai Nippon Printing Co. Ltd. (a) | | | 25,000 | | | | 556,532 | |
| Dai Nippon Printing Co. Ltd. - ADR | | | 37 | | | | 412 | |
| | | | | | | | 556,944 | |
| CONSTRUCTION & ENGINEERING—0.2% | | | | | | | | |
| Obayashi Corp. (a) | | | 55,000 | | | | 664,348 | |
| | | | | | | | | |
| DIVERSIFIED FINANCIAL SERVICES—0.4% | | | | | | | | |
| ORIX Corp. (a) | | | 20,100 | | | | 338,874 | |
| ORIX Corp. - ADR | | | 9,867 | | | | 836,524 | |
| | | | | | | | 1,175,398 | |
| DIVERSIFIED TELECOMMUNICATION SERVICES—0.4% |
| Nippon Telegraph & Telephone Corp. - ADR | | | 32,480 | | | | 1,534,355 | |
| | | | | | | | | |
| ELECTRIC UTILITIES—0.1% | | | | | | | | |
| Chubu Electric Power Co., Inc. (a) | | | 12,600 | | | | 156,273 | |
| Tohoku Electric Power Co., Inc. (a) | | | 12,700 | | | | 162,125 | |
| | | | | | | | 318,398 | |
| ELECTRICAL EQUIPMENT—0.4% | | | | | | | | |
| Nidec Corp. - ADR | | | 30,872 | | | | 1,085,151 | |
| | | | | | | | | |
| ELECTRONIC EQUIPMENT, INSTRUMENTS & COMPONENTS—0.5% |
| Hitachi Ltd. (a) | | | 26,000 | | | | 201,695 | |
| Hitachi Ltd. - ADR | | | 5,344 | | | | 417,046 | |
| Kyocera Corp. (a) | | | 2,800 | | | | 182,787 | |
| Kyocera Corp. - ADR | | | 3,162 | | | | 207,143 | |
| Murata Manufacturing Co. Ltd. (a) | | | 2,300 | | | | 307,915 | |
| Murata Manufacturing Co. Ltd. - ADR | | | 1,592 | | | | 53,475 | |
| TDK Corp. (a) | | | 800 | | | | 63,571 | |
| TDK Corp. - ADR | | | 826 | | | | 66,010 | |
| | | | | | | | 1,499,642 | |
| FOOD PRODUCTS—0.2% | | | | | | | | |
| Ajinomoto Co., Inc. (a) | | | 7,000 | | | | 131,688 | |
| Meiji Holdings Co. Ltd. (a) | | | 2,000 | | | | 170,202 | |
| Yakult Honsha Co. Ltd. (a) | | | 5,100 | | | | 384,788 | |
| | | | | | | | 686,678 | |
| HEALTH CARE EQUIPMENT & SUPPLIES—0.4% | | | | | | | | |
| Hoya Corp. (a) | | | 9,500 | | | | 473,088 | |
| Hoya Corp. - ADR | | | 1,734 | | | | 86,700 | |
| Terumo Corp. (a) | | | 11,800 | | | | 558,205 | |
| | | | | | | | 1,117,993 | |
| HOUSEHOLD DURABLES—0.9% | | | | | | | | |
| Sekisui House Ltd. (a) | | | 8,000 | | | | 144,296 | |
| Sekisui House Ltd. - ADR | | | 30,149 | | | | 545,697 | |
| Sony Corp. - ADR | | | 38,785 | | | | 1,743,386 | |
| | | | | | | | 2,433,379 | |
| INSURANCE—0.4% | | | | | | | | |
| MS&AD Insurance Group Holdings, Inc. - ADR | | | 34,266 | | | | 580,466 | |
| Tokio Marine Holdings, Inc. (a) | | | 4,600 | | | | 209,203 | |
| Tokio Marine Holdings, Inc. - ADR | | | 7,354 | | | | 336,445 | |
| | | | | | | | 1,126,114 | |
| INTERNET & DIRECT MARKETING RETAIL—0.1% | | | | | | | | |
| Rakuten, Inc. (a) | | | 18,400 | | | | 168,174 | |
| | | | | | | | | |
| IT SERVICES—0.1% | | | | | | | | |
| Fujitsu Ltd. (a) | | | 20,000 | | | | 141,778 | |
| Fujitsu Ltd. - ADR | | | 1,240 | | | | 44,280 | |
| | | | | | | | 186,058 | |
| LEISURE PRODUCTS—0.1% | | | | | | | | |
| Shimano, Inc. (a) | | | 1,600 | | | | 224,874 | |
| | | | | | | | | |
| MACHINERY—0.9% | | | | | | | | |
| FANUC Corp. (a) | | | 1,100 | | | | 263,863 | |
| FANUC Corp. - ADR | | | 43,920 | | | | 1,055,837 | |
| Kubota Corp. - ADR | | | 7,847 | | | | 774,342 | |
| Makita Corp. (a) | | | 1,200 | | | | 50,320 | |
| Makita Corp. - ADR | | | 9,872 | | | | 416,796 | |
| | | | | | | | 2,561,158 | |
| MARINE—0.1% | | | | | | | | |
| Nippon Yusen KK (a) | | | 5,600 | | | | 136,245 | |
| Nippon Yusen KK - ADR (b) | | | 7,243 | | | | 35,350 | |
| | | | | | | | 171,595 | |
| METALS & MINING—0.2% | | | | | | | | |
| Sumitomo Metal Mining Co. Ltd. (a) | | | 11,500 | | | | 526,082 | |
| | | | | | | | | |
| OIL, GAS & CONSUMABLE FUELS—0.1% | | | | | | | | |
| Inpex Corp. (a) | | | 26,239 | | | | 326,542 | |
| | | | | | | | | |
| PERSONAL PRODUCTS—0.6% | | | | | | | | |
| Kao Corp. (a) | | | 1,000 | | | | 67,564 | |
| Kao Corp. - ADR | | | 11,651 | | | | 787,316 | |
| Shiseido Co. Ltd. (a) | | | 2,100 | | | | 101,180 | |
| Shiseido Co. Ltd. - ADR | | | 15,035 | | | | 728,596 | |
| | | | | | | | 1,684,656 | |
| PHARMACEUTICALS—0.5% | | | | | | | | |
| Astellas Pharma, Inc. (a) | | | 17,800 | | | | 226,098 | |
| Astellas Pharma, Inc. - ADR | | | 24,473 | | | | 310,320 | |
See accompanying notes to financial statements.
19
Schedule of Investments, continued
Praxis International Index Fund
December 31, 2017
| | | SHARES | | | FAIR
VALUE | |
| COMMON STOCKS—98.6%, continued | | | | | | |
| JAPAN—16.3%, continued | | | | | | |
| PHARMACEUTICALS—0.5%, continued | | | | | | |
| Daiichi Sankyo Co. Ltd. (a) | | | 7,700 | | | $ | 200,198 | |
| Daiichi Sankyo Co. Ltd. - ADR | | | 1,901 | | | | 49,700 | |
| Takeda Pharmaceutical Co. Ltd. (a) | | | 2,700 | | | | 152,854 | |
| Takeda Pharmaceutical Co. Ltd. - ADR | | | 18,144 | | | | 516,197 | |
| | | | | | | | 1,455,367 | |
| REAL ESTATE MANAGEMENT & DEVELOPMENT—0.7% |
| Daiwa House Industry Co. Ltd. - ADR | | | 15,470 | | | | 593,816 | |
| Mitsubishi Estate Co. Ltd. (a) | | | 11,000 | | | | 190,977 | |
| Mitsubishi Estate Co. Ltd. - ADR | | | 11,717 | | | | 202,938 | |
| Mitsui Fudosan Co. Ltd. (a) | | | 21,000 | | | | 469,633 | |
| Sumitomo Realty & Development Co. Ltd. (a) | | | 13,000 | | | | 426,609 | |
| | | | | | | | 1,883,973 | |
| RETAIL—0.4% | | | | | | | | |
| Japan Retail Fund Investment Corp. (a) | | | 607 | | | | 1,112,542 | |
| | | | | | | | | |
| ROAD & RAIL—0.5% | | | | | | | | |
| Central Japan Railway Co. (a) | | | 1,348 | | | | 241,217 | |
| East Japan Railway Co. (a) | | | 3,590 | | | | 350,059 | |
| East Japan Railway Co. - ADR | | | 29,226 | | | | 475,507 | |
| Keikyu Corp. (a) | | | 18,500 | | | | 354,949 | |
| | | | | | | | 1,421,732 | |
| SEMICONDUCTORS & SEMICONDUCTOR EQUIPMENT—0.1% |
| Rohm Co. Ltd. (a) | | | 700 | | | | 77,107 | |
| Rohm Co. Ltd. - ADR | | | 2,660 | | | | 146,486 | |
| | | | | | | | 223,593 | |
| SOFTWARE—0.4% | | | | | | | | |
| Nintendo Co. Ltd. (a) | | | 300 | | | | 108,019 | |
| Nintendo Co. Ltd. - ADR | | | 22,464 | | | | 1,012,455 | |
| | | | | | | | 1,120,474 | |
| SPECIALTY RETAIL—0.1% | | | | | | | | |
| Fast Retailing Co. Ltd. (a) | | | 700 | | | | 278,305 | |
| | | | | | | | | |
| TECHNOLOGY HARDWARE, STORAGE & PERIPHERALS—1.0% |
| Canon, Inc. - ADR | | | 57,457 | | | | 2,148,892 | |
| FUJIFILM Holdings Corp. - ADR | | | 11,626 | | | | 476,085 | |
| Seiko Epson Corp. (a) | | | 1,200 | | | | 28,247 | |
| Seiko Epson Corp. - ADR | | | 10,312 | | | | 120,960 | |
| | | | | | | | 2,774,184 | |
| TEXTILES, APPAREL & LUXURY GOODS—0.1% | | | | | | | | |
| Wacoal Holdings Corporation - ADR (b) | | | 2,621 | | | | 414,148 | |
| | | | | | | | | |
| TRADING COMPANIES & DISTRIBUTORS—0.3% | | | | | | | | |
| Mitsubishi Corp. (a) | | | 16,300 | | | | 449,413 | |
| Mitsui & Co. Ltd. - ADR | | | 1,637 | | | | 534,480 | |
| | | | | | | | 983,893 | |
| WIRELESS TELECOMMUNICATION SERVICES—0.9% |
| KDDI Corp. - ADR | | | 51,612 | | | | 638,466 | |
| NTT DoCoMo, Inc. - ADR | | | 25,031 | | | | 594,987 | |
| Softbank Group Corp. (a) | | | 7,200 | | | | 569,978 | |
| Softbank Group Corp. - ADR | | | 15,592 | | | | 619,860 | |
| | | | | | | | 2,423,291 | |
| TOTAL JAPAN | | | | | | | 46,356,282 | |
| | | | | | | | | |
| JERSEY—0.3% | | | | | | | | |
| METALS & MINING—0.2% | | | | | | | | |
| Randgold Resources Ltd. - ADR | | | 4,722 | | | | 466,958 | |
| | | | | | | | | |
| TRADING COMPANIES & DISTRIBUTORS—0.1% | | | | | | | | |
| Ferguson plc - ADR | | | 63,056 | | | | 452,112 | |
| TOTAL JERSEY | | | | | | | 919,070 | |
| | | | | | | | | |
| LUXEMBOURG—0.6% | | | | | | | | |
| ENERGY EQUIPMENT & SERVICES—0.2% | | | | | | | | |
| Tenaris S.A. - ADR | | | 20,102 | | | | 640,450 | |
| | | | | | | | | |
| MEDIA—0.4% | | | | | | | | |
| RTL Group S.A. (a) | | | 12,091 | | | | 970,552 | |
| TOTAL LUXEMBOURG | | | | | | | 1,611,002 | |
| | | | | | | | | |
| MEXICO—1.0% | | | | | | | | |
| BANKS—0.1% | | | | | | | | |
| Grupo Financiero Banorte S.A.B. de C.V. - ADR | | | 5,851 | | | | 160,089 | |
| | | | | | | | | |
| BEVERAGES—0.2% | | | | | | | | |
| Coca-Cola Femsa S.A.B. de C.V. - ADR | | | 7,597 | | | | 528,903 | |
| | | | | | | | | |
| CONSTRUCTION MATERIALS—0.2% | | | | | | | | |
| Cemex S.A.B. de C.V. (b) | | | 83,354 | | | | 625,155 | |
| | | | | | | | | |
| FOOD & STAPLES RETAILING—0.2% | | | | | | | | |
| Wal-Mart de Mexico S.A.B. de C.V. - ADR | | | 29,614 | | | | 723,174 | |
| | | | | | | | | |
| METALS & MINING—0.1% | | | | | | | | |
| Fresnillo plc (a) | | | 14,613 | | | | 280,754 | |
| | | | | | | | | |
| TRANSPORTATION INFRASTRUCTURE—0.2% | | | | | | | | |
| Grupo Aeroportuario del Pacifico S.A.B. de C.V. - ADR | | | 4,513 | | | | 463,756 | |
| TOTAL MEXICO | | | | | | | 2,781,831 | |
| | | | | | | | | |
| NETHERLANDS—3.4% | | | | | | | | |
| AUTOMOBILES—0.5% | | | | | | | | |
| Ferrari N.V. | | | 8,603 | | | | 901,939 | |
| Fiat Chrysler Automobiles N.V. | | | 26,965 | | | | 481,056 | |
| | | | | | | | 1,382,995 | |
| BANKS—0.5% | | | | | | | | |
| ING Groep N.V. - ADR | | | 71,517 | | | | 1,320,204 | |
| | | | | | | | | |
| CHEMICALS—0.2% | | | | | | | | |
| Akzo Nobel NV - ADR | | | 19,227 | | | | 560,275 | |
| | | | | | | | | |
| FOOD & STAPLES RETAILING—0.4% | | | | | | | | |
| Koninklijke Ahold Delhaize N.V. (a) | | | 5,491 | | | | 120,699 | |
| Koninklijke Ahold Delhaize N.V. - ADR | | | 49,012 | | | | 1,078,754 | |
| | | | | | | | 1,199,453 | |
| HEALTH CARE EQUIPMENT & SUPPLIES—0.4% | | | | | | | | |
| Koninklijke Philips N.V. - NY Registry Shares | | | 30,708 | | | | 1,160,762 | |
| | | | | | | | | |
| LIFE SCIENCES TOOLS & SERVICES—0.2% | | | | | | | | |
| QIAGEN N.V. | | | 16,162 | | | | 499,891 | |
| | | | | | | | | |
| MEDIA—0.2% | | | | | | | | |
| Wolters Kluwer N.V. (a) | | | 954 | | | | 49,728 | |
| Wolters Kluwer N.V. - ADR | | | 7,337 | | | | 382,845 | |
| | | | | | | | 432,573 | |
See accompanying notes to financial statements.
20
Schedule of Investments, continued
Praxis International Index Fund
December 31, 2017
| | | SHARES | | | FAIR
VALUE | |
| COMMON STOCKS—98.6%, continued | | | | | | |
| NETHERLANDS—3.4%, continued | | | | | | |
| OIL, GAS & CONSUMABLE FUELS—0.1% | | | | | | |
| Koninklijke Vopak NV (a) | | | 3,557 | | | $ | 155,800 | |
| | | | | | | | | |
| SEMICONDUCTORS & SEMICONDUCTOR EQUIPMENT—0.6% |
| ASML Holding NV - NY Registry Shares | | | 6,611 | | | | 1,149,124 | |
| NXP Semiconductors NV (b) | | | 5,879 | | | | 688,372 | |
| | | | | | | | 1,837,496 | |
| SOFTWARE—0.0% (c) | | | | | | | | |
| Gemalto NV (a) | | | 2,161 | | | | 127,965 | |
| | | | | | | | | |
| TRADING COMPANIES & DISTRIBUTORS—0.3% | | | | | | | | |
| AerCap Holdings NV (b) | | | 18,140 | | | | 954,345 | |
| TOTAL NETHERLANDS | | | | | | | 9,631,759 | |
| | | | | | | | | |
| NORWAY—1.3% | | | | | | | | |
| CHEMICALS—0.1% | | | | | | | | |
| Yara International ASA - ADR | | | 7,283 | | | | 333,853 | |
| | | | | | | | | |
| METALS & MINING—0.2% | | | | | | | | |
| Norsk Hydro ASA (a) | | | 61,990 | | | | 469,945 | |
| Norsk Hydro ASA - ADR | | | 13,201 | | | | 100,328 | |
| | | | | | | | 570,273 | |
| OIL, GAS & CONSUMABLE FUELS—1.0% | | | | | | | | |
| Statoil ASA - ADR | | | 133,829 | | | | 2,866,617 | |
| TOTAL NORWAY | | | | | | | 3,770,743 | |
| | | | | | | | | |
| PERU—0.4% | | | | | | | | |
| METALS & MINING—0.4% | | | | | | | | |
| Southern Copper Corp. | | | 24,026 | | | | 1,140,034 | |
| | | | | | | | | |
| PORTUGAL—0.1% | | | | | | | | |
| ELECTRIC UTILITIES—0.1% | | | | | | | | |
| EDP - Energias de Portugal S.A. | | | 82,980 | | | | 287,219 | |
| EDP - Energias de Portugal S.A. - ADR | | | 1,231 | | | | 42,666 | |
| TOTAL PORTUGAL | | | | | | | 329,885 | |
| | | | | | | | | |
| RUSSIA—0.7% | | | | | | | | |
| WIRELESS TELECOMMUNICATION SERVICES—0.7% | | | | | | | | |
| Mobile TeleSystems PJSC - ADR | | | 183,318 | | | | 1,868,010 | |
| | | | | | | | | |
| SINGAPORE—1.5% | | | | | | | | |
| BANKS—1.1% | | | | | | | | |
| DBS Group Holdings Ltd. (a) | | | 10,656 | | | | 197,089 | |
| DBS Group Holdings Ltd. - ADR | | | 19,975 | | | | 1,491,334 | |
| United Overseas Bank Ltd. (a) | | | 24,187 | | | | 476,781 | |
| United Overseas Bank Ltd. - ADR | | | 22,014 | | | | 872,525 | |
| | | | | | | | 3,037,729 | |
| DIVERSIFIED TELECOMMUNICATION SERVICES—0.1% |
| Singapore Telecommunications Ltd. (a) | | | 86,000 | | | | 229,278 | |
| Singapore Telecommunications Ltd. - ADR | | | 6,886 | | | | 183,512 | |
| | | | | | | | 412,790 | |
| INDUSTRIAL CONGLOMERATES—0.2% | | | | | | | | |
| Keppel Corp. Ltd. (a) | | | 11,721 | | | | 64,137 | |
| Keppel Corp. Ltd. - ADR | | | 49,775 | | | | 545,435 | |
| | | | | | | | 609,572 | |
| MACHINERY—0.1% | | | | | | | | |
| Sembcorp Marine Ltd. (a) | | | 204,000 | | | | 279,535 | |
| | | | | | | | | |
| REAL ESTATE INVESTMENT TRUSTS (REITS)—0.0% |
| Keppel REIT | | | 737 | | | | 694 | |
| TOTAL SINGAPORE | | | | | | | 4,340,320 | |
| | | | | | | | | |
| SOUTH AFRICA—2.2% | | | | | | | | |
| BANKS—0.1% | | | | | | | | |
| Standard Bank Group Ltd. - ADR | | | 19,275 | | | | 305,605 | |
| | | | | | | | | |
| MEDIA—0.9% | | | | | | | | |
| Naspers Ltd. - Class N - ADR | | | 43,870 | | | | 2,483,042 | |
| | | | | | | | | |
| METALS & MINING—0.8% | | | | | | | | |
| Glencore plc (a) | | | 220,536 | | | | 1,154,197 | |
| Gold Fields Ltd. - ADR | | | 273,785 | | | | 1,177,275 | |
| | | | | | | | 2,331,472 | |
| TRADING COMPANIES & DISTRIBUTORS—0.2% | | | | | | | | |
| Barloworld Ltd. | | | 45,286 | | | | 583,910 | |
| | | | | | | | | |
| WIRELESS TELECOMMUNICATION SERVICES—0.2% |
| MTN Group Ltd. - ADR | | | 50,154 | | | | 545,174 | |
| TOTAL SOUTH AFRICA | | | | | | | 6,249,203 | |
| | | | | | | | | |
| SOUTH KOREA—2.4% | | | | | | | | |
| BANKS—1.4% | | | | | | | | |
| KB Financial Group, Inc. - ADR (b) | | | 35,152 | | | | 2,056,744 | |
| Shinhan Financial Group Co. Ltd. - ADR (b) | | | 30,017 | | | | 1,392,789 | |
| Woori Bank - ADR | | | 9,632 | | | | 430,454 | |
| | | | | | | | 3,879,987 | |
| DIVERSIFIED TELECOMMUNICATION SERVICES—0.4% |
| KT Corp. - ADR (b) | | | 71,631 | | | | 1,118,160 | |
| | | | | | | | | |
| ELECTRONIC EQUIPMENT INSTRUMENTS & COMPONENTS—0.3% |
| LG Display Co. Ltd. - ADR (b) | | | 61,056 | | | | 840,131 | |
| | | | | | | | | |
| WIRELESS TELECOMMUNICATION SERVICES—0.3% |
| SK Telecom Co. Ltd. - ADR | | | 32,754 | | | | 914,164 | |
| TOTAL SOUTH KOREA | | | | | | | 6,752,442 | |
| | | | | | | | | |
| SPAIN—2.0% | | | | | | | | |
| BANKS—0.8% | | | | | | | | |
| Banco Bilbao Vizcaya Argentaria SA - ADR | | | 102,689 | | | | 872,857 | |
| Banco Santander SA - ADR | | | 230,491 | | | | 1,507,411 | |
| | | | | | | | 2,380,268 | |
| DIVERSIFIED TELECOMMUNICATION SERVICES—0.4% |
| Telefónica SA - ADR | | | 103,466 | | | | 1,001,551 | |
| | | | | | | | | |
| ELECTRIC UTILITIES—0.2% | | | | �� | | | | |
| Iberdrola SA - ADR | | | 16,749 | | | | 518,130 | |
| | | | | | | | | |
| METALS & MINING—0.1% | | | | | | | | |
| Acerinox SA (a) | | | 16,589 | | | | 236,723 | |
| | | | | | | | | |
| OIL, GAS & CONSUMABLE FUELS—0.3% | | | | | | | | |
| Repsol SA (a) | | | 24,639 | | | | 435,005 | |
| Repsol SA - ADR | | | 27,585 | | | | 488,806 | |
| | | | | | | | 923,811 | |
See accompanying notes to financial statements.
21
Schedule of Investments, continued
Praxis International Index Fund
December 31, 2017
| | | SHARES | | | FAIR
VALUE | |
| COMMON STOCKS—98.6%, continued | | | | | | |
| SPAIN—2.0%, continued | | | | | | |
| SPECIALTY RETAIL—0.2% | | | | | | |
| Industria de Diseno Textil SA (a) | | | 17,640 | | | $ | 613,328 | |
| TOTAL SPAIN | | | | | | | 5,673,811 | |
| | | | | | | | | |
| SWEDEN—2.1% | | | | | | | | |
| COMMUNICATIONS EQUIPMENT—0.1% | | | | | | | | |
| Telefonaktiebolaget LM Ericsson - ADR | | | 68,485 | | | | 457,480 | |
| | | | | | | | | |
| CONSTRUCTION & ENGINEERING—0.3% | | | | | | | | |
| Skanska AB - Class B (a) | | | 37,142 | | | | 769,602 | |
| | | | | | | | | |
| HOUSEHOLD PRODUCTS—0.2% | | | | | | | | |
| Essity Aktiebolag AB - Class B (a)(b) | | | 12,219 | | | | 347,236 | |
| Svenska Cellulosa AB SCA - Class B | | | 12,219 | | | | 125,941 | |
| | | | | | | | 473,177 | |
| MACHINERY—0.9% | | | | | | | | |
| Alfa Laval AB (a) | | | 23,419 | | | | 553,931 | |
| Atlas Copco AB - Class A (a) | | | 8,922 | | | | 385,035 | |
| Atlas Copco AB - Class A - ADR | | | 18,292 | | | | 788,294 | |
| Sandvik AB (a) | | | 19,176 | | | | 335,667 | |
| Sandvik AB - ADR | | | 20,116 | | | | 352,030 | |
| | | | | | | | 2,414,957 | |
| METALS & MINING—0.3% | | | | | | | | |
| Boliden AB (a) | | | 22,985 | | | | 786,028 | |
| | | | | | | | | |
| OIL, GAS & CONSUMABLE FUELS—0.2% | | | | | | | | |
| Lundin Petroleum AB (a)(b) | | | 24,270 | | | | 555,565 | |
| | | | | | | | | |
| SPECIALTY RETAIL—0.1% | | | | | | | | |
| Hennes & Mauritz AB - ADR | | | 65,360 | | | | 266,669 | |
| Hennes & Mauritz AB - Class B (a) | | | 3,195 | | | | 66,084 | |
| | | | | | | | 332,753 | |
| TOTAL SWEDEN | | | | | | | 5,789,562 | |
| | | | | | | | | |
| SWITZERLAND—6.1% | | | | | | | | |
| CAPITAL MARKETS—0.6% | | | | | | | | |
| Credit Suisse Group AG - ADR | | | 18,311 | | | | 326,852 | |
| Julius Baer Group Ltd. (a) | | | 9,537 | | | | 583,279 | |
| UBS Group AG | | | 46,462 | | | | 854,436 | |
| | | | | | | | 1,764,567 | |
| DIVERSIFIED TELECOMMUNICATION SERVICES—0.1% |
| Swisscom AG - ADR | | | 7,140 | | | | 380,776 | |
| | | | | | | | | |
| ELECTRICAL EQUIPMENT—0.6% | | | | | | | | |
| ABB Ltd. - ADR | | | 61,282 | | | | 1,643,583 | |
| | | | | | | | | |
| FOOD PRODUCTS—2.1% | | | | | | | | |
| Barry Callebaut AG (a) | | | 397 | | | | 827,603 | |
| Nestlé S.A. - ADR | | | 60,374 | | | | 5,190,353 | |
| | | | | | | | 6,017,956 | |
| INSURANCE—0.5% | | | | | | | | |
| Swiss Re AG (a) | | | 3,563 | | | | 333,255 | |
| Zurich Insurance Group AG - ADR | | | 38,250 | | | | 1,163,183 | |
| | | | | | | | 1,496,438 | |
| MACHINERY—0.2% | | | | | | | | |
| Schindler Holding AG (a) | | | 1,587 | | | | 358,912 | |
| | | | | | | | | |
| PHARMACEUTICALS—1.8% | | | | | | | | |
| Novartis AG - ADR | | | 31,455 | | | | 2,640,962 | |
| Roche Holding AG - ADR | | | 80,784 | | | | 2,551,159 | |
| | | | | | | | 5,192,121 | |
| PROFESSIONAL SERVICES—0.2% | | | | | | | | |
| Adecco S.A. (a) | | | 4,136 | | | | 316,112 | |
| Adecco S.A. - ADR | | | 4,982 | | | | 190,960 | |
| | | | | | | | 507,072 | |
| TRADING COMPANIES & DISTRIBUTORS—0.0% (c) | | | | | | | | |
| Ferguson plc (a) | | | 537 | | | | 38,535 | |
| TOTAL SWITZERLAND | | | | | | | 17,399,960 | |
| | | | | | | | | |
| TAIWAN—2.2% | | | | | | | | |
| DIVERSIFIED TELECOMMUNICATION SERVICES—0.5% |
| Chunghwa Telecom Co. Ltd. - ADR | | | 40,566 | | | | 1,437,659 | |
| | | | | | | | | |
| SEMICONDUCTORS & SEMICONDUCTOR EQUIPMENT—1.7% | | | | | | | | |
| Advanced Semiconductor Engineering, Inc. - ADR | | | 101,549 | | | | 658,038 | |
| Siliconware Precision Industries Co. Ltd. - ADR | | | 70,913 | | | | 596,378 | |
| Taiwan Semiconductor Manufacturing Co. Ltd. - ADR | | | 77,900 | | | | 3,088,735 | |
| United Microelectronics Corp. - ADR | | | 191,039 | | | | 456,583 | |
| | | | | | | | 4,799,734 | |
| TOTAL TAIWAN | | | | | | | 6,237,393 | |
| | | | | | | | | |
| TURKEY—0.1% | | | | | | | | |
| BANKS—0.1% | | | | | | | | |
| Turkiye Garanti Bankasi A.S. - ADR | | | 59,610 | | | | 168,696 | |
| | | | | | | | | |
| UNITED KINGDOM—10.3% | | | | | | | | |
| BANKS—1.6% | | | | | | | | |
| HSBC Holdings plc - ADR | | | 60,926 | | | | 3,146,219 | |
| Lloyds Banking Group plc - ADR | | | 269,987 | | | | 1,012,451 | |
| Standard Chartered plc (a) | | | 45,039 | | | | 472,948 | |
| | | | | | | | 4,631,618 | |
| COMMERCIAL BANKS—0.2% | | | | | | | | |
| Barclays plc - ADR | | | 64,161 | | | | 699,355 | |
| | | | | | | | | |
| DIVERSIFIED TELECOMMUNICATION SERVICES—0.2% |
| BT Group plc - ADR | | | 38,538 | | | | 702,162 | |
| | | | | | | | | |
| ELECTRIC UTILITIES—0.3% | | | | | | | | |
| SSE plc (a) | | | 8,585 | | | | 152,612 | |
| SSE plc - ADR | | | 39,878 | | | | 711,424 | |
| | | | | | | | 864,036 | |
| ENERGY EQUIPMENT & SERVICES—0.3% | | | | | | | | |
| John Wood Group plc (a) | | | 24,307 | | | | 212,662 | |
| Subsea 7 S.A. (a) | | | 42,228 | | | | 632,677 | |
| Subsea 7 S.A. - ADR | | | 2,780 | | | | 41,839 | |
| | | | | | | | 887,178 | |
| EQUITY REAL ESTATE INVESTMENT TRUSTS (REITS)—0.1% |
| Land Securities Group plc (a) | | | 28,712 | | | | 389,688 | |
See accompanying notes to financial statements.
22
Schedule of Investments, continued
Praxis International Index Fund
December 31, 2017
| | | SHARES | | | FAIR
VALUE | |
| COMMON STOCKS—98.6%, continued | | | | | | |
| UNITED KINGDOM—10.3%, continued | | | | | | |
| FOOD & STAPLES RETAILING—0.3% | | | | | | |
| J Sainsbury plc (a) | | | 4,806 | | | $ | 15,649 | |
| J Sainsbury plc - ADR | | | 18,741 | | | | 244,383 | |
| Tesco plc (a)(b) | | | 46,000 | | | | 130,131 | |
| Tesco plc - ADR | | | 29,931 | | | | 254,114 | |
| WM Morrison Supermarkets plc | | | 29,374 | | | | 87,205 | |
| WM Morrison Supermarkets plc - ADR | | | 8,054 | | | | 118,837 | |
| | | | | | | | 850,319 | |
| FOOD PRODUCTS—0.2% | | | | | | | | |
| Associated British Foods plc (a) | | | 11,454 | | | | 435,467 | |
| | | | | | | | | |
| HEALTH CARE EQUIPMENT & SUPPLIES—0.3% | | | | | | | | |
| Smith & Nephew plc (a) | | | 4,232 | | | | 73,222 | |
| Smith & Nephew plc - ADR | | | 24,332 | | | | 851,863 | |
| | | | | | | | 925,085 | |
| HOTELS, RESTAURANTS & LEISURE—0.6% | | | | | | | | |
| Compass Group plc (a) | | | 2,160 | | | | 46,571 | |
| Compass Group plc - ADR | | | 45,261 | | | | 993,705 | |
| Intercontinental Hotels Group plc (a) | | | 9,114 | | | | 578,830 | |
| | | | | | | | 1,619,106 | |
| HOUSEHOLD PRODUCTS—0.7% | | | | | | | | |
| Reckitt Benckiser Group plc (a) | | | 5,677 | | | | 529,590 | |
| Reckitt Benckiser Group plc - ADR | | | 70,985 | | | | 1,349,425 | |
| | | | | | | | 1,879,015 | |
| INSURANCE—0.7% | | | | | | | | |
| Aviva plc (a) | | | 41,971 | | | | 286,236 | |
| Aviva plc - ADR | | | 22,486 | | | | 309,857 | |
| Prudential plc - ADR | | | 26,183 | | | | 1,329,573 | |
| | | | | | | | 1,925,666 | |
| MEDIA—0.8% | | | | | | | | |
| Pearson plc - ADR | | | 52,078 | | | | 511,406 | |
| RELX plc (a) | | | 4,710 | | | | 110,433 | |
| RELX plc - ADR | | | 48,463 | | | | 1,148,573 | |
| WPP plc - ADR | | | 6,767 | | | | 612,819 | |
| | | | | | | | 2,383,231 | |
| MULTI-LINE RETAIL—0.2% | | | | | | | | |
| Marks & Spencer Group plc (a) | | | 10,719 | | | | 45,474 | |
| Marks & Spencer Group plc - ADR | | | 25,759 | | | | 217,148 | |
| Next plc (a) | | | 3,908 | | | | 238,173 | |
| | | | | | | | 500,795 | |
| MULTI-UTILITIES—0.5% | | | | | | | | |
| National Grid plc | | | 23,905 | | | | 1,405,853 | |
| | | | | | | | | |
| OIL, GAS & CONSUMABLE FUELS—0.1% | | | | | | | | |
| Tullow Oil plc (a)(b) | | | 112,077 | | | | 312,033 | |
| Tullow Oil plc - ADR | | | 15,976 | | | | 21,567 | |
| | | | | | | | 333,600 | |
| PERSONAL PRODUCTS—0.8% | | | | | | | | |
| Unilever N.V. - NY Registry Shares - ADR | | | 42,041 | | | | 2,367,749 | |
| | | | | | | | | |
| PHARMACEUTICALS—1.1% | | | | | | | | |
| AstraZeneca plc - ADR | | | 48,500 | | | | 1,682,950 | |
| GlaxoSmithKline plc - ADR | | | 42,881 | | | | 1,520,989 | |
| | | | | | | | 3,203,939 | |
| | | | | | | | | |
| PROFESSIONAL SERVICES—0.1% | | | | | | | | |
| Capita plc (a) | | | 32,934 | | | | 177,934 | |
| | | | | | | | | |
| SOFTWARE—0.2% | | | | | | | | |
| Sage Group plc (a) | | | 33,781 | | | | 363,137 | |
| Sage Group plc - ADR | | | 2,320 | | | | 100,897 | |
| | | | | | | | 464,034 | |
| SPECIALTY RETAIL—0.1% | | | | | | | | |
| Kingfisher plc - ADR | | | 29,151 | | | | 274,603 | |
| | | | | | | | | |
| WATER UTILITIES—0.2% | | | | | | | | |
| Severn Trent plc (a) | | | 10,914 | | | | 317,996 | |
| United Utilities Group plc (a) | | | 2,386 | | | | 26,693 | |
| United Utilities Group plc - ADR | | | 12,883 | | | | 288,966 | |
| | | | | | | | 633,655 | |
| WIRELESS TELECOMMUNICATION SERVICES—0.7% |
| Vodafone Group plc - ADR | | | 58,711 | | | | 1,872,881 | |
| TOTAL UNITED KINGDOM | | | | | | | 29,426,969 | |
| | | | | | | | | |
| UNITED STATES—2.1% | | | | | | | | |
| DIVERSIFIED CONSUMER SERVICES—0.2% | | | | | | | | |
| New Oriental Education & Technology Group, Inc. - ADR | | | 7,334 | | | | 689,396 | |
| | | | | | | | | |
| HOTELS, RESTAURANTS & LEISURE—0.5% | | | | | | | | |
| Carnival plc - ADR | | | 7,671 | | | | 508,434 | |
| Yum China Holdings, Inc. | | | 21,920 | | | | 877,239 | |
| | | | | | | | 1,385,673 | |
| INTERNET & DIRECT MARKETING RETAIL—0.4% | | | | | | | | |
| JD.com, Inc. - ADR (b) | | | 25,659 | | | | 1,062,796 | |
| | | | | | | | | |
| IT SERVICES—0.2% | | | | | | | | |
| CGI Group, Inc. - Class A (b) | | | 9,434 | | | | 512,549 | |
| | | | | | | | | |
| MEDIA—0.2% | | | | | | | | |
| Thomson Reuters Corp. | | | 14,688 | | | | 640,250 | |
| | | | | | | | | |
| SEMICONDUCTORS & SEMICONDUCTOR EQUIPMENT—0.3% |
| STMicroelectronics NV - NY Registry Shares | | | 37,925 | | | | 828,282 | |
| | | | | | | | | |
| TEXTILES, APPAREL & LUXURY GOODS—0.3% | | | | | | | | |
| Gildan Activewear, Inc. | | | 25,642 | | | | 828,237 | |
| TOTAL UNITED STATES | | | | | | | 5,947,183 | |
| TOTAL COMMON STOCKS (COST $208,279,431) | | | | | | | 279,910,002 | |
| | | | | | | | | |
| RIGHTS—0.0% (c) | | | | | | | | |
| SPAIN—0.0% (c) | | | | | | | | |
| Repsol S.A. (Cost $0) | | | 24,639 | | | | 11,203 | |
See accompanying notes to financial statements.
23
Schedule of Investments, continued
Praxis International Index Fund
December 31, 2017
| | | COUPON | | | MATURITY | | | PRINCIPAL AMOUNT | | | FAIR
VALUE | |
| CORPORATE NOTES—0.8% | | | | | | | | | |
| COMMUNITY DEVELOPMENT—0.8% |
| Calvert Social Investment Foundation, Inc. (d) | | | 1.000 | % | | | 06/15/18 | | | $ | 750,000 | | | $ | 750,000 | |
| Calvert Social Investment Foundation, Inc. (d) | | | 1.000 | % | | | 12/17/18 | | | | 600,000 | | | | 600,000 | |
| Calvert Social Investment Foundation, Inc. (d) | | | 1.500 | % | | | 06/17/19 | | | | 500,000 | | | | 500,000 | |
| Calvert Social Investment Foundation, Inc. (d) | | | 1.500 | % | | | 06/15/20 | | | | 500,000 | | | | 500,000 | |
| TOTAL CORPORATE NOTES (COST $2,350,000) | | | | | | | | | | | | | | | 2,350,000 | |
| | | | | | | | | | | | | | | | | |
| TOTAL INVESTMENTS (COST $210,629,431—Unrealized gain/loss $71,641,774)—99.4% | | | | | | | | | | | $ | 282,271,205 | |
| Other Assets in Excess of Liabilities—0.6% | | | | | | | | | | | | | | | 1,610,628 | |
| NET ASSETS—100.0% | | | | | | | | | | | | | | $ | 283,881,833 | |
| (a) | This security has been fair valued by the Pricing Committee under the guidelines established by the Board of Trustees (Note 2). |
| (b) | Non-income producing security. |
| (c) | Percentage rounds to less than 0.1% |
| (d) | Restricted and illiquid securities not registered under the Securities Act of 1933 are as follows: |
| | | Acquisition
Date | | Current
Cost | | | Fair
Value | | | % of Net Assets | |
| Calvert Social Investment Foundation, Inc. 1.00%, 06/15/18 | | 06/15/17 | | $ | 750,000 | | | $ | 750,000 | | | | 0.3 | % |
| Calvert Social Investment Foundation, Inc. 1.00%, 12/17/18 | | 12/15/17 | | | 600,000 | | | | 600,000 | | | | 0.2 | % |
| Calvert Social Investment Foundation, Inc. 1.50%, 06/17/19 | | 06/10/16 | | | 500,000 | | | | 500,000 | | | | 0.2 | % |
| Calvert Social Investment Foundation, Inc. 1.50%, 06/15/20 | | 06/15/17 | | | 500,000 | | | | 500,000 | | | | 0.2 | % |
| | | | | $ | 2,350,000 | | | $ | 2,350,000 | | | | 0.8 | % |
ADR — American Depositary Receipt
plc — Public Liability Company
REIT — Real Estate Investment Trust
See accompanying notes to financial statements.
24
Praxis Value Index Fund
Annual Report to Shareholders
Portfolio Manager’s Commentary (unaudited)
2017 was a banner year for U.S. large cap stock returns with the S&P 500 returning 21.82 percent, the second straight year of double digit positive returns and the largest since the 32.37 percent returns during 2013. Looking back on a chart of the S&P 500 for 2017 one sees a steady upward trend throughout the year. In terms of major asset classes, as well as U.S. large cap stocks performed, international stocks performed even better with returns approaching 30 percent. Commodities and bonds were on the other end of the spectrum with low single digits returns, and for the second straight year all major classes reported positive returns. Crude oil experienced another year of volatility as the price hit a high of $60.42 per barrel on the last day of the year, having started the year at $53.72 per barrel and dipping as low as $42.53 per barrel in mid-June.
In a review of sector breakouts for large cap stocks, energy (2016’s top performing sector) was the only sector with a negative return in 2017, down 1 percent. This is largely a result of dropping oil prices through the first half of the year with prices not fully recovering until late in the year. All other sectors had double digit positive returns led by technology with an astounding 38 percent gain, followed by basic materials with a 26 percent gain.
2017 saw a return to the growth style outperforming the value style after a one year hiatus. The S&P 500 Growth Index returned 27.43 percent, nearly doubling the S&P 500 Value Index return of 15.36 percent. Growth has outperformed value in four of the last five years.
In this environment, the Praxis Value Index Fund Class A Shares (Without Load) returned 16.31 percent, outperforming the 15.36 percent return of the benchmark (S&P 500 Value Index), and was remarkably close to its 16.13 percent return in 2016. The Praxis Value Index Fund Class I Shares returned 16.91 percent. Stock specific factors were once again the leading contributor to relative performance. Not owning General Electric (military weapons screen) was a big positive contributor to relative performance as GE tumbled by 43 percent during the year. The Praxis Value Index Fund (the “Fund”) underweight allocation to the energy sector was also a positive contributor to relative performance. Wells Fargo, a top member of the benchmark that was dropped mid-year when it was added to our exclusion list due to governance concerns, was a top detractor to relative performance. We continue to be pleased with the performance of the Fund, being able to incorporate our Values + ESG screens and deliver returns that parallel benchmark returns.
The annual mid-December reconstitution of the benchmark index and our routine updating of our Values + ESG screening list again caused some realignment of portfolio holdings near year end. This is always a good opportunity to fine tune our efforts to track benchmark returns.
Dale Snyder, CFA®
Praxis Value Index Fund Manager
Praxis Mutual Funds
The views expressed are those of the portfolio manager as of Dec. 31, 2017, are subject to change, and may differ from the views of other portfolio managers or Everence Capital Management as a whole. These opinions are not intended to be a forecast of future events, a guarantee of future results, or investment advice. All data referenced are from sources deemed to be reliable but cannot be guaranteed. Securities and sectors referenced should not be construed as a solicitation or recommendation or be used as the sole basis for any investment decision.
25
Praxis Value Index Fund
Performance Review (unaudited)
Growth of $10,000 investment from 12/31/07 to 12/31/17
This chart represents historical performance of a hypothetical investment of $10,000 in Class A Shares (adjusted for the maximum sales charge of 5.25%) of the Fund and Index from 12/31/07 to 12/31/17, and includes the reinvestment of dividends and capital gains.
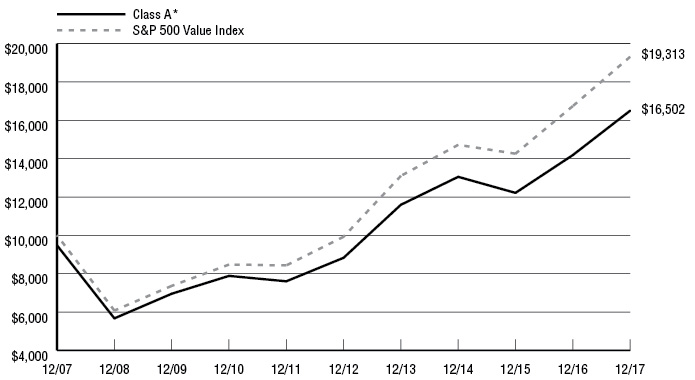
| | | | Average Annual Returns | | |
| Inception Date | One
Year Ended | Three
Years Ended | Five
Years Ended | Ten
Years Ended | Expense
Ratio**
Gross / Net |
Praxis Value Index Fund | | | | | | | |
Class A * | 5/1/01 | 10.21% | 6.21% | 12.11% | 5.14% | 0.94% | 0.94% |
Class A (Without Load) | 5/1/01 | 16.31% | 8.12% | 13.32% | 5.70% | | |
Class I ** | 5/1/06 | 16.91% | 8.66% | 13.91% | 6.30% | 0.44% | 0.44% |
S&P 500 Value Index 1 | | 15.36% | 9.47% | 14.24% | 6.80% | | |
Past performance does not guarantee future results. The performance data quoted represents past performance and current returns may be lower or higher. The investment return and principal value will fluctuate so that an investor’s shares, when redeemed, may be worth more or less than the original cost. These performance figures do not reflect the deduction of taxes that a shareholder would pay on fund distributions or the redemption of fund shares. To obtain performance information current to the most recent month end, please visit www.praxismutualfunds.com. Indexes are unmanaged, do not incur fees, and it is not possible to invest directly in an index.
The total returns shown reflect any expenses that were contractually or voluntarily reduced, reimbursed or paid by any party during the periods presented. In such instances, and without activity, the total returns would have been lower.
| * | The total return figures shown reflect the maximum sales charge applicable to Class A Shares. Class A Shares have a maximum sales charge on purchases of 5.25%. |
| ** | Reflects the expense ratios as reported in the Prospectus dated April 30, 2017. |
| 1 | The S&P 500 Value Index represents the value companies (defined by book value to price ratio earnings to price ratio and sales to price ratio) of the S&P 500 Index, a universe of large capitalization companies in the U.S. equity market. |
The above index is for illustrative purposes only and does not reflect the deduction of expenses associated with a mutual fund, such as investment management and fund accounting fees. The Fund’s performance reflects the deduction of these services. An investor cannot invest directly in an index, although they can invest in its underlying securities.
26
Schedule of Investments
Praxis Value Index Fund
December 31, 2017
| | | SHARES | | | FAIR
VALUE | |
| COMMON STOCKS—98.0% | | | | | | |
| AEROSPACE & DEFENSE—0.2% | | | | | | |
| TransDigm Group, Inc. | | | 1,320 | | | $ | 362,498 | |
| | | | | | | | | |
| AIR FREIGHT & LOGISTICS—0.8% | | | | | | | | |
| FedEx Corp. | | | 2,330 | | | | 581,428 | |
| United Parcel Service, Inc. - Class B | | | 7,830 | | | | 932,945 | |
| | | | | | | | 1,514,373 | |
| AIRLINES—0.5% | | | | | | | | |
| Delta Air Lines, Inc. | | | 11,300 | | | | 632,800 | |
| United Continental Holdings, Inc. (a) | | | 4,230 | | | | 285,102 | |
| | | | | | | | 917,902 | |
| AUTO COMPONENTS—0.4% | | | | | | | | |
| Aptiv plc (a) | | | 4,830 | | | | 409,729 | |
| Goodyear Tire & Rubber Co. (The) | | | 9,590 | | | | 309,853 | |
| | | | | | | | 719,582 | |
| AUTOMOBILES—0.6% | | | | | | | | |
| Ford Motor Co. | | | 89,723 | | | | 1,120,640 | |
| | | | | | | | | |
| BANKS—12.5% | | | | | | | | |
| Bank of America Corp. | | | 97,050 | | | | 2,864,916 | |
| BB&T Corp. | | | 25,054 | | | | 1,245,685 | |
| Citigroup, Inc. | | | 47,696 | | | | 3,549,059 | |
| Citizens Financial Group, Inc. | | | 11,030 | | | | 463,039 | |
| Fifth Third Bancorp | | | 19,490 | | | | 591,327 | |
| Huntington Bancshares, Inc. | | | 31,664 | | | | 461,028 | |
| JPMorgan Chase & Co. | | | 66,715 | | | | 7,134,502 | |
| KeyCorp | | | 30,658 | | | | 618,372 | |
| M&T Bank Corp. | | | 4,596 | | | | 785,870 | |
| People's United Financial, Inc. | | | 31,070 | | | | 581,009 | |
| PNC Financial Services Group, Inc. (The) | | | 12,861 | | | | 1,855,714 | |
| Regions Financial Corp. | | | 24,860 | | | | 429,581 | |
| SunTrust Banks, Inc. | | | 9,866 | | | | 637,245 | |
| U.S. Bancorp | | | 45,657 | | | | 2,446,302 | |
| Zions Bancorp | | | 5,120 | | | | 260,249 | |
| | | | | | | | 23,923,898 | |
| BEVERAGES—1.9% | | | | | | | | |
| Coca-Cola Co. (The) | | | 43,200 | | | | 1,982,016 | |
| PepsiCo, Inc. | | | 14,219 | | | | 1,705,142 | |
| | | | | | | | 3,687,158 | |
| BIOTECHNOLOGY—1.3% | | | | | | | | |
| Alexion Pharmaceuticals, Inc. (a) | | | 2,410 | | | | 288,212 | |
| Amgen, Inc. | | | 6,444 | | | | 1,120,612 | |
| Biogen, Inc. (a) | | | 1,360 | | | | 433,255 | |
| Gilead Sciences, Inc. | | | 10,230 | | | | 732,877 | |
| | | | | | | | 2,574,956 | |
| BUILDING PRODUCTS—0.5% | | | | | | | | |
| Johnson Controls International plc | | | 27,497 | | | | 1,047,911 | |
| | | | | | | | | |
| CAPITAL MARKETS—3.4% | | | | | | | | |
| Bank of New York Mellon Corp. (The) | | | 24,944 | | | | 1,343,484 | |
| BlackRock, Inc. | | | 992 | | | | 509,600 | |
| Franklin Resources, Inc. | | | 7,540 | | | | 326,708 | |
| Goldman Sachs Group, Inc. (The) | | | 6,567 | | | | 1,673,009 | |
| Invesco Ltd. | | | 9,712 | | | | 354,877 | |
| Morgan Stanley | | | 24,871 | | | | 1,304,981 | |
| | | | | | | | | |
| Northern Trust Corp. | | | 3,977 | | | | 397,263 | |
| State Street Corp. | | | 6,240 | | | | 609,086 | |
| | | | | | | | 6,519,008 | |
| CHEMICALS—4.7% | | | | | | | | |
| Air Products & Chemicals, Inc. | | | 4,847 | | | | 795,296 | |
| DowDuPont, Inc. | | | 68,153 | | | | 4,853,856 | |
| Eastman Chemical Co. | | | 3,520 | | | | 326,093 | |
| Ecolab, Inc. | | | 4,576 | | | | 614,008 | |
| International Flavors & Fragrances, Inc. | | | 1,480 | | | | 225,863 | |
| LyondellBasell Industries NV - Class A | | | 6,550 | | | | 722,596 | |
| Mosaic Co. (The) | | | 10,240 | | | | 262,758 | |
| Praxair, Inc. | | | 7,896 | | | | 1,221,353 | |
| | | | | | | | 9,021,823 | |
| COMMERCIAL SERVICES & SUPPLIES—0.8% | | | | | | | | |
| Republic Services, Inc. | | | 9,250 | | | | 625,392 | |
| Stericycle, Inc. (a) | | | 3,920 | | | | 266,521 | |
| Waste Management, Inc. | | | 7,680 | | | | 662,784 | |
| | | | | | | | 1,554,697 | |
| COMMUNICATIONS EQUIPMENT—1.0% | | | | | | | | |
| Cisco Systems, Inc. | | | 49,115 | | | | 1,881,105 | |
| | | | | | | | | |
| CONSUMER FINANCE—1.3% | | | | | | | | |
| American Express Co. | | | 4,674 | | | | 464,175 | |
| Capital One Financial Corp. | | | 10,660 | | | | 1,061,523 | |
| Discover Financial Services | | | 6,670 | | | | 513,056 | |
| Synchrony Financial | | | 13,930 | | | | 537,837 | |
| | | | | | | | 2,576,591 | |
| CONTAINERS & PACKAGING—0.6% | | | | | | | | |
| Ball Corp. | | | 12,508 | | | | 473,428 | |
| International Paper Co. | | | 5,781 | | | | 334,951 | |
| WestRock Co. | | | 4,550 | | | | 287,605 | |
| | | | | | | | 1,095,984 | |
| DISTRIBUTORS—0.3% | | | | | | | | |
| Genuine Parts Co. | | | 5,340 | | | | 507,353 | |
| | | | | | | | | |
| DIVERSIFIED FINANCIAL SERVICES—0.3% | | | | | | | | |
| CME Group, Inc. | | | 1,860 | | | | 271,653 | |
| Leucadia National Corp. | | | 8,360 | | | | 221,456 | |
| | | | | | | | 493,109 | |
| DIVERSIFIED TELECOMMUNICATION SERVICES—4.7% |
| AT&T, Inc. | | | 115,851 | | | | 4,504,287 | |
| CenturyLink, Inc. | | | 23,288 | | | | 388,444 | |
| Verizon Communications, Inc. | | | 76,140 | | | | 4,030,090 | |
| | | | | | | | 8,922,821 | |
| ELECTRIC UTILITIES—4.3% | | | | | | | | |
| American Electric Power Co., Inc. | | | 15,270 | | | | 1,123,414 | |
| Duke Energy Corp. | | | 23,444 | | | | 1,971,875 | |
| Edison International | | | 8,487 | | | | 536,718 | |
| Eversource Energy | | | 7,950 | | | | 502,281 | |
| NextEra Energy, Inc. | | | 6,925 | | | | 1,081,616 | |
| PPL Corp. | | | 28,101 | | | | 869,726 | |
| Southern Co. (The) | | | 30,761 | | | | 1,479,296 | |
| Xcel Energy, Inc. | | | 11,424 | | | | 549,608 | |
| | | | | | | | 8,114,534 | |
See accompanying notes to financial statements.
27
Schedule of Investments, continued
Praxis Value Index Fund
December 31, 2017
| | | SHARES | | | FAIR
VALUE | |
| COMMON STOCKS—98.0%, continued | | | | | | |
| ELECTRICAL EQUIPMENT—0.9% | | | | | | |
| Eaton Corp. plc | | | 9,150 | | | $ | 722,941 | |
| Emerson Electric Co. | | | 8,424 | | | | 587,069 | |
| Rockwell Automation, Inc. | | | 2,280 | | | | 447,678 | |
| | | | | | | | 1,757,688 | |
| ELECTRONIC EQUIPMENT, INSTRUMENTS & COMPONENTS—0.1% |
| TE Connectivity Ltd. | | | 3,066 | | | | 291,393 | |
| | | | | | | | | |
| ENERGY EQUIPMENT & SERVICES—2.1% | | | | | | | | |
| Baker Hughes, Inc. | | | 17,830 | | | | 564,141 | |
| National Oilwell Varco, Inc. | | | 9,526 | | | | 343,127 | |
| Schlumberger Ltd. | | | 38,646 | | | | 2,604,354 | |
| TechnipFMC plc | | | 13,090 | | | | 409,848 | |
| | | | | | | | 3,921,470 | |
| EQUITY REAL ESTATE INVESTMENT TRUSTS (REITS)—1.6% |
| Boston Properties, Inc. | | | 2,920 | | | | 379,688 | |
| Crown Castle International Corp. | | | 3,840 | | | | 426,278 | |
| Equity Residential | | | 5,230 | | | | 333,517 | |
| Host Hotels & Resorts, Inc. | | | 15,800 | | | | 313,630 | |
| Iron Mountain, Inc. | | | 5,070 | | | | 191,291 | |
| Public Storage | | | 1,620 | | | | 338,580 | |
| SL Green Realty Corp. | | | 2,780 | | | | 280,586 | |
| Ventas, Inc. | | | 6,840 | | | | 410,468 | |
| Welltower, Inc. | | | 7,480 | | | | 477,000 | |
| | | | | | | | 3,151,038 | |
| FOOD & STAPLES RETAILING—4.2% | | | | | | | | |
| Costco Wholesale Corp. | | | 7,430 | | | | 1,382,872 | |
| CVS Health Corp. | | | 20,473 | | | | 1,484,292 | |
| Kroger Co. (The) | | | 16,464 | | | | 451,937 | |
| Sysco Corp. | | | 7,993 | | | | 485,415 | |
| Walgreen Boots Alliance, Inc. | | | 18,410 | | | | 1,336,934 | |
| Wal-Mart Stores, Inc. | | | 28,850 | | | | 2,848,938 | |
| | | | | | | | 7,990,388 | |
| FOOD PRODUCTS—2.7% | | | | | | | | |
| Conagra Brands, Inc. | | | 6,540 | | | | 246,362 | |
| General Mills, Inc. | | | 15,974 | | | | 947,099 | |
| Hormel Foods Corp. | | | 10,080 | | | | 366,811 | |
| J.M. Smucker Co. (The) | | | 2,030 | | | | 252,207 | |
| Kellogg Co. | | | 10,489 | | | | 713,042 | |
| Kraft Heinz Co. (The) | | | 10,690 | | | | 831,254 | |
| Mondelez International, Inc. - Class A | | | 30,982 | | | | 1,326,030 | |
| Tyson Foods, Inc. - Class A | | | 5,830 | | | | 472,638 | |
| | | | | | | | 5,155,443 | |
| HEALTH CARE EQUIPMENT & SUPPLIES—2.2% | | | | | | | | |
| Abbott Laboratories | | | 4,340 | | | | 247,684 | |
| Baxter International, Inc. | | | 6,002 | | | | 387,969 | |
| Danaher Corp. | | | 20,910 | | | | 1,940,866 | |
| Dentsply Sirona, Inc. | | | 4,770 | | | | 314,009 | |
| Medtronic plc | | | 17,180 | | | | 1,387,285 | |
| | | | | | | | 4,277,813 | |
| HEALTH CARE PROVIDERS & SERVICES—2.4% | | | | | | | | |
| Aetna, Inc. | | | 3,750 | | | | 676,462 | |
| AmerisourceBergen Corp. | | | 2,260 | | | | 207,513 | |
| Anthem, Inc. | | | 2,850 | | | | 641,279 | |
| Cardinal Health, Inc. | | | 8,170 | | | | 500,576 | |
| Express Scripts Holding Co. (a) | | | 9,787 | | | | 730,502 | |
| HCA Healthcare, Inc. (a) | | | 2,520 | | | | 221,357 | |
| | | | | | | | | |
| HEALTH CARE PROVIDERS & SERVICES—2.4%, continued |
| Humana, Inc. | | | 2,550 | | | | 632,579 | |
| McKesson Corp. | | | 3,974 | | | | 619,745 | |
| UnitedHealth Group, Inc. | | | 1,390 | | | | 306,439 | |
| | | | | | | | 4,536,452 | |
| HOTELS, RESTAURANTS & LEISURE—1.1% | | | | | | | | |
| Carnival Corp. | | | 5,563 | | | | 369,216 | |
| McDonald's Corp. | | | 3,440 | | | | 592,093 | |
| Starbucks Corp. | | | 12,890 | | | | 740,273 | |
| Yum! Brands, Inc. | | | 4,510 | | | | 368,061 | |
| | | | | | | | 2,069,643 | |
| HOUSEHOLD DURABLES—0.6% | | | | | | | | |
| Leggett & Platt, Inc. | | | 7,280 | | | | 347,475 | |
| Newell Brands, Inc. | | | 14,660 | | | | 452,994 | |
| Whirlpool Corp. | | | 1,752 | | | | 295,457 | |
| | | | | | | | 1,095,926 | |
| HOUSEHOLD PRODUCTS—1.7% | | | | | | | | |
| Colgate-Palmolive Co. | | | 6,578 | | | | 496,310 | |
| Kimberly-Clark Corp. | | | 2,070 | | | | 249,766 | |
| Procter & Gamble Co. (The) | | | 28,046 | | | | 2,576,867 | |
| | | | | | | | 3,322,943 | |
| INDEPENDENT POWER AND RENEWABLE ELECTRICITY PRODUCERS—0.1% |
| AES Corp. | | | 11,694 | | | | 126,646 | |
| | | | | | | | | |
| INDUSTRIAL CONGLOMERATES—0.1% | | | | | | | | |
| Roper Technologies, Inc. | | | 1,100 | | | | 284,900 | |
| | | | | | | | | |
| INSURANCE—7.0% | | | | | | | | |
| Aflac, Inc. | | | 10,990 | | | | 964,702 | |
| Allstate Corp. (The) | | | 8,399 | | | | 879,459 | |
| American International Group, Inc. | | | 24,607 | | | | 1,466,085 | |
| Aon plc | | | 2,137 | | | | 286,358 | |
| Brighthouse Financial, Inc. (a) | | | 5,673 | | | | 332,665 | |
| Chubb Corp. | | | 16,097 | | | | 2,352,256 | |
| Cincinnati Financial Corp. | | | 3,262 | | | | 244,552 | |
| Everest Re Group Ltd. | | | 2,020 | | | | 446,945 | |
| Hartford Financial Services Group, Inc. (The) | | | 9,080 | | | | 511,022 | |
| Lincoln National Corp. | | | 4,220 | | | | 324,391 | |
| Loews Corp. | | | 6,010 | | | | 300,680 | |
| Marsh & McLennan Cos., Inc. | | | 6,280 | | | | 511,129 | |
| MetLife, Inc. | | | 24,023 | | | | 1,214,603 | |
| Principal Financial Group, Inc. | | | 3,860 | | | | 272,362 | |
| Prudential Financial, Inc. | | | 10,620 | | | | 1,221,088 | |
| Travelers Cos., Inc. (The) | | | 8,053 | | | | 1,092,309 | |
| Unum Group | | | 5,160 | | | | 283,233 | |
| Willis Towers Watson plc | | | 2,350 | | | | 354,122 | |
| XL Group Ltd. | | | 8,980 | | | | 315,737 | |
| | | | | | | | 13,373,698 | |
| INTERNET SOFTWARE & SERVICES—0.2% | | | | | | | | |
| Alphabet, Inc. - Class C (a) | | | 300 | | | | 313,920 | |
| | | | | | | | | |
| IT SERVICES—2.5% | | | | | | | | |
| Accenture plc - Class A | | | 7,630 | | | | 1,168,077 | |
| DXC Technology Co. | | | 2,460 | | | | 233,454 | |
| International Business Machines Corp. | | | 16,252 | | | | 2,493,382 | |
| MasterCard, Inc. - Class A | | | 1,890 | | | | 286,070 | |
| Paychex, Inc. | | | 3,684 | | | | 250,807 | |
| Visa, Inc. - Class A | | | 3,120 | | | | 355,742 | |
| | | | | | | | 4,787,532 | |
See accompanying notes to financial statements.
28
Schedule of Investments, continued
Praxis Value Index Fund
December 31, 2017
| | | SHARES | | | FAIR
VALUE | |
| COMMON STOCKS—98.0%, continued | | | | | | |
| LIFE SCIENCES TOOLS & SERVICES—0.5% | | | | | | |
| IQVIA Holdings Inc. (a) | | | 2,740 | | | $ | 268,246 | |
| Thermo Fisher Scientific, Inc. | | | 3,914 | | | | 743,190 | |
| | | | | | | | 1,011,436 | |
| MACHINERY—2.1% | | | | | | | | |
| Deere & Co. | | | 4,267 | | | | 667,828 | |
| Dover Corp. | | | 3,223 | | | | 325,491 | |
| Flowserve Corp. | | | 4,210 | | | | 177,367 | |
| Illinois Tool Works, Inc. | | | 5,855 | | | | 976,907 | |
| Ingersoll-Rand plc | | | 5,415 | | | | 482,964 | |
| PACCAR, Inc. | | | 6,906 | | | | 490,878 | |
| Parker-Hannifin Corp. | | | 1,567 | | | | 312,742 | |
| Pentair plc | | | 4,480 | | | | 316,377 | |
| Stanley Black & Decker, Inc. | | | 1,530 | | | | 259,626 | |
| | | | | | | | 4,010,180 | |
| MEDIA—3.4% | | | | | | | | |
| Comcast Corp. - Class A | | | 42,100 | | | | 1,686,105 | |
| Omnicom Group, Inc. | | | 6,179 | | | | 450,017 | |
| Time Warner, Inc. | | | 13,400 | | | | 1,225,698 | |
| Twenty-First Century Fox, Inc. - Class B | | | 28,250 | | | | 963,890 | |
| Viacom, Inc. - Class B | | | 11,130 | | | | 342,915 | |
| Walt Disney Co. (The) | | | 16,247 | | | | 1,746,715 | |
| | | | | | | | 6,415,340 | |
| METALS & MINING—0.6% | | | | | | | | |
| Newmont Mining Corp. | | | 13,830 | | | | 518,901 | |
| Nucor Corp. | | | 8,860 | | | | 563,319 | |
| | | | | | | | 1,082,220 | |
| MULTI-LINE RETAIL—0.5% | | | | | | | | |
| Macy's, Inc. | | | 8,583 | | | | 216,206 | |
| Target Corp. | | | 11,126 | | | | 725,971 | |
| | | | | | | | 942,177 | |
| MULTI-UTILITIES—1.3% | | | | | | | | |
| Ameren Corp. | | | 5,570 | | | | 328,574 | |
| Consolidated Edison, Inc. | | | 7,361 | | | | 625,317 | |
| DTE Energy Co. | | | 3,580 | | | | 391,867 | |
| NiSource, Inc. | | | 13,870 | | | | 356,043 | |
| Sempra Energy | | | 5,733 | | | | 612,973 | |
| WEC Energy Group, Inc. | | | 2,940 | | | | 195,304 | |
| | | | | | | | 2,510,078 | |
| OIL, GAS & CONSUMABLE FUELS—7.9% | | | | | | | | |
| Anadarko Petroleum Corp. | | | 10,690 | | | | 573,412 | |
| Andeavor | | | 2,800 | | | | 320,152 | |
| Apache Corp. | | | 12,418 | | | | 524,288 | |
| ConocoPhillips | | | 36,827 | | | | 2,021,434 | |
| Devon Energy Corp. | | | 12,570 | | | | 520,398 | |
| EOG Resources, Inc. | | | 10,870 | | | | 1,172,982 | |
| EQT Corp. | | | 5,638 | | | | 320,915 | |
| Hess Corp. | | | 13,200 | | | | 626,604 | |
| Kinder Morgan, Inc. | | | 42,891 | | | | 775,040 | |
| Marathon Oil Corp. | | | 25,286 | | | | 428,092 | |
| Marathon Petroleum Corp. | | | 8,216 | | | | 542,092 | |
| Noble Energy, Inc. | | | 17,398 | | | | 506,978 | |
| Occidental Petroleum Corp. | | | 38,870 | | | | 2,863,164 | |
| ONEOK, Inc. | | | 9,005 | | | | 481,317 | |
| Phillips 66 | | | 11,270 | | | | 1,139,960 | |
| Pioneer Natural Resources Co. | | | 4,290 | | | | 741,526 | |
| Valero Energy Corp. | | | 10,030 | | | | 921,857 | |
| Williams Cos., Inc. (The) | | | 16,591 | | | | 505,860 | |
| | | | | | | | 14,986,071 | |
| PHARMACEUTICALS—4.5% | | | | | | | | |
| AbbVie, Inc. | | | 3,278 | | | | 317,016 | |
| Bristol-Myers Squibb Co. | | | 12,669 | | | | 776,356 | |
| Eli Lilly & Co. | | | 10,287 | | | | 868,840 | |
| Johnson & Johnson | | | 26,631 | | | | 3,720,883 | |
| Merck & Co., Inc. | | | 37,641 | | | | 2,118,059 | |
| Mylan NV (a) | | | 10,220 | | | | 432,408 | |
| Perrigo Co. plc | | | 3,340 | | | | 291,115 | |
| | | | | | | | 8,524,677 | |
| PROFESSIONAL SERVICES—0.4% | | | | | | | | |
| IHS Markit Ltd. (a) | | | 6,530 | | | | 294,830 | |
| Nielsen Holdings plc | | | 11,010 | | | | 400,764 | |
| | | | | | | | 695,594 | |
| REAL ESTATE INVESTMENT TRUSTS (REITS)—0.6% |
| HCP, Inc. | | | 8,647 | | | | 225,514 | |
| Simon Property Group, Inc. | | | 3,089 | | | | 530,505 | |
| Weyerhaeuser Co. | | | 11,149 | | | | 393,113 | |
| | | | | | | | 1,149,132 | |
| ROAD & RAIL—0.8% | | | | | | | | |
| Norfolk Southern Corp. | | | 3,145 | | | | 455,711 | |
| Union Pacific Corp. | | | 7,360 | | | | 986,976 | |
| | | | | | | | 1,442,687 | |
| SEMICONDUCTORS & SEMICONDUCTOR EQUIPMENT—1.8% |
| Intel Corp. | | | 41,038 | | | | 1,894,314 | |
| QUALCOMM, Inc. | | | 17,900 | | | | 1,145,958 | |
| Texas Instruments, Inc. | | | 3,000 | | | | 313,320 | |
| | | | | | | | 3,353,592 | |
| SOFTWARE—1.0% | | | | | | | | |
| CA, Inc. | | | 7,512 | | | | 249,999 | |
| Microsoft Corp. | | | 3,090 | | | | 264,319 | |
| Oracle Corp. | | | 31,632 | | | | 1,495,561 | |
| | | | | | | | 2,009,879 | |
| SPECIALTY RETAIL—1.3% | | | | | | | | |
| AutoZone, Inc. (a) | | | 420 | | | | 298,776 | |
| Best Buy Co., Inc. | | | 4,590 | | | | 314,277 | |
| Home Depot, Inc. (The) | | | 1,142 | | | | 216,443 | |
| L Brands, Inc. | | | 6,060 | | | | 364,933 | |
| Lowe's Cos., Inc. | | | 6,060 | | | | 563,216 | |
| O'Reilly Automotive, Inc. (a) | | | 1,080 | | | | 259,783 | |
| TJX Companies, Inc. (The) | | | 6,860 | | | | 524,516 | |
| | | | | | | | 2,541,944 | |
| TECHNOLOGY HARDWARE, STORAGE & PERIPHERALS—0.7% |
| Apple, Inc. | | | 1,610 | | | | 272,460 | |
| HP, Inc. | | | 23,630 | | | | 496,466 | |
| Seagate Technology plc | | | 4,910 | | | | 205,435 | |
| Western Digital Corp. | | | 4,475 | | | | 355,897 | |
| | | | | | | | 1,330,258 | |
| TEXTILES, APPAREL & LUXURY GOODS—0.6% | | | | | | | | |
| NIKE, Inc. - Class B | | | 8,580 | | | | 536,679 | |
| PVH Corp. | | | 1,810 | | | | 248,350 | |
| VF Corp. | | | 5,110 | | | | 378,140 | |
| | | | | | | | 1,163,169 | |
See accompanying notes to financial statements.
29
Schedule of Investments, continued
Praxis Value Index Fund
December 31, 2017
| | | SHARES | | | FAIR
VALUE | |
| COMMON STOCKS—98.0%, continued | | | | | | |
| TRADING COMPANIES & DISTRIBUTORS—0.2% | | | | | | |
| W.W. Grainger, Inc. | | | 1,440 | | | $ | 340,200 | |
| | | | | | | | | |
| WATER UTILITIES—0.2% | | | | | | | | |
| American Water Works Co., Inc. | | | 3,640 | | | | 333,024 | |
| TOTAL COMMON STOCKS (COST $144,128,353) | | | | | | | 186,854,494 | |
| | | | | | | | | |
| RIGHTS—0.0% (b) | | | | | | | | |
| Safeway, Inc. (Casa Ley subsidiary), expiring 01/30/18 (Cost $—) | | | 6,607 | | | | 6,706 | |
| | | COUPON | | | MATURITY | | | PRINCIPAL AMOUNT | | | FAIR
VALUE | |
| CORPORATE NOTES—0.8% | | | | | | | | | | | | |
| COMMUNITY DEVELOPMENT—0.8% |
| Calvert Social Investment Foundation, Inc. (c) | | | 1.000 | % | | | 06/15/18 | | | $ | 300,000 | | | $ | 300,000 | |
| Calvert Social Investment Foundation, Inc. (c) | | | 1.000 | % | | | 12/17/18 | | | | 750,000 | | | | 750,000 | |
| Calvert Social Investment Foundation, Inc. (c) | | | 1.500 | % | | | 06/17/19 | | | | 260,000 | | | | 260,000 | |
| Calvert Social Investment Foundation, Inc. (c) | | | 1.500 | % | | | 06/15/20 | | | | 250,000 | | | | 250,000 | |
| TOTAL CORPORATE NOTES (COST $1,560,000) | | | | | | | | | | | | | | | 1,560,000 | |
| | | | | | | | | | | | | | | | | |
| TOTAL INVESTMENTS (COST $145,688,353—Unrealized gain/loss $42,732,847)—98.8% | | | | | | | | | $ | 188,421,200 | |
| Other Assets in Excess of Liabilities—1.2% | | | | | | | | | | | | | | | 2,226,974 | |
| NET ASSETS—100.0% | | | | | | | | | | | | | | $ | 190,648,174 | |
| (a) | Non-income producing security. |
| (b) | Percentage rounds to less than 0.1%. |
| (c) | Restricted and illiquid securities not registered under the Securities Act of 1933 are as follows: |
| | | Acquisition
Date | | Current
Cost | | | Fair
Value | | | % of Net
Assets | |
| Calvert Social Investment Foundation, Inc. 1.00%, 06/15/18 | | 06/15/17 | | $ | 300,000 | | | $ | 300,000 | | | | 0.2 | % |
| Calvert Social Investment Foundation, Inc. 1.00%, 12/17/18 | | 12/15/17 | | | 750,000 | | | | 750,000 | | | | 0.4 | % |
| Calvert Social Investment Foundation, Inc. 1.50%, 06/17/19 | | 06/10/16 | | | 260,000 | | | | 260,000 | | | | 0.1 | % |
| Calvert Social Investment Foundation, Inc. 1.50%, 06/15/20 | | 06/15/17 | | | 250,000 | | | | 250,000 | | | | 0.1 | % |
| | | | | $ | 1,560,000 | | | $ | 1,560,000 | | | | 0.8 | % |
plc —Public Liability Company
See accompanying notes to financial statements.
30
Praxis Growth Index Fund
Annual Report to Shareholders
Portfolio Manager’s Commentary (unaudited)
2017 was a banner year for U.S. large cap stock returns with the S&P 500 returning 21.82 percent, the second straight year of double digit positive returns and the largest since the 32.37 percent returns during 2013. Looking back on a chart of the S&P 500 for 2017 one sees a steady upward trend throughout the year. In terms of major asset classes, as well as U.S. large cap stocks performed, international stocks performed even better with returns approaching 30 percent. Commodities and bonds were on the other end of the spectrum with low single digits returns, and for the second straight year all major classes reported positive returns. Crude oil experienced another year of volatility as the price hit a high of $60.42 per barrel on the last day of the year, having started the year at $53.72 per barrel and dipping as low as $42.53 per barrel in mid-June.
In a review of sector breakouts for large cap stocks, energy (2016’s top performing sector) was the only sector with a negative return in 2017, down 1 percent. This is largely a result of dropping oil prices through the first half of the year with prices not fully recovering until late in the year. All other sectors had double digit positive returns led by technology with an astounding 38 percent gain, followed by basic materials with a 26 percent gain.
2017 saw a return to the growth style outperforming the value style after a one year hiatus. The S&P 500 Growth Index returned 27.43 percent, nearly doubling the S&P 500 Value Index return of 15.36 percent. Growth has outperformed value in four of the last five years.
In this environment, the Praxis Growth Index Fund Class A Shares (Without Load) returned 26.28 percent, underperforming the 27.43 percent return of the benchmark (S&P 500 Growth Index), but outdistancing nearly 4 times the 6.89 percent return in 2016. The Praxis Growth Index Fund Class I Shares returned 26.78 percent. Fundamental factors (versus stock specific factors) were once again the leading contributors to relative performance, specifically underweight allocations to the tobacco and aerospace industries. On the stock specific side, not owning General Electric (military weapons screen) was a positive contributor to relative performance as GE tumbled by 43 percent during the year. We continue to be pleased with the performance of the Praxis Growth Index Fund, being able to incorporate our Values + ESG screens and deliver returns that parallel benchmark returns, especially in years of large gains.
The annual mid-December reconstitution of the benchmark index and our routine updating of our Values + ESG screening list again caused some realignment of portfolio holdings near year end. This is always a good opportunity to fine tune our efforts to track benchmark returns.
Dale Snyder, CFA®
Praxis Growth Index Fund Manager
Praxis Mutual Funds
The views expressed are those of the portfolio manager as of Dec. 31, 2017, are subject to change, and may differ from the views of other portfolio managers or Everence Capital Management as a whole. These opinions are not intended to be a forecast of future events, a guarantee of future results, or investment advice. All data referenced are from sources deemed to be reliable but cannot be guaranteed. Securities and sectors referenced should not be construed as a solicitation or recommendation or be used as the sole basis for any investment decision.
31
Praxis Growth Index Fund
Performance Review (unaudited)
Growth of $10,000 investment from 12/31/07 to 12/31/17
This chart represents historical performance of a hypothetical investment of $10,000 in Class A Shares (adjusted for the maximum sales charge of 5.25%) of the Fund and Index from 12/31/07 to 12/31/17, and includes the reinvestment of dividends and capital gains.
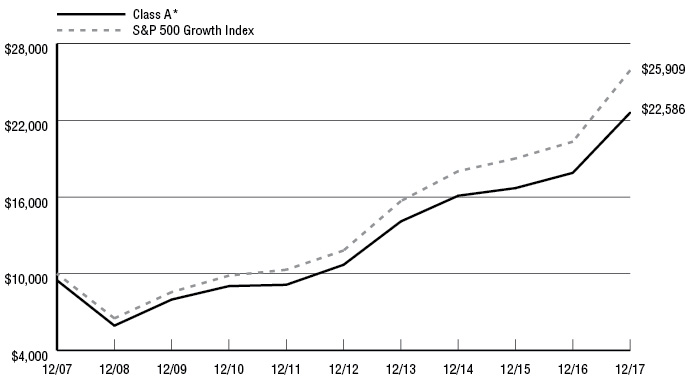
| | | | Average Annual Returns | | |
| Inception Date | One
Year Ended | Three
Years Ended | Five
Years Ended | Ten
Years Ended | Expense
Ratio**
Gross / Net |
Praxis Growth Index Fund | | | | | | | |
Class A * | 5/1/07 | 19.67% | 9.95% | 14.89% | 8.49% | 0.86% | 0.86% |
Class A (Without Load) | 5/1/07 | 26.28% | 11.95% | 16.13% | 9.08% | | |
Class I ** | 5/1/07 | 26.78% | 12.41% | 16.61% | 9.55% | 0.44% | 0.44% |
S&P 500 Growth Index 1 | | 27.43% | 12.86% | 17.00% | 9.99% | | |
Past performance does not guarantee future results. The performance data quoted represents past performance and current returns may be lower or higher. The investment return and principal value will fluctuate so that an investor’s shares, when redeemed, may be worth more or less than the original cost. These performance figures do not reflect the deduction of taxes that a shareholder would pay on fund distributions or the redemption of fund shares. To obtain performance information current to the most recent month end, please visit www.praxismutualfunds.com. Indexes are unmanaged, do not incur fees, and it is not possible to invest directly in an index.
The total returns shown reflect any expenses that were contractually or voluntarily reduced, reimbursed or paid by any party during the periods presented. In such instances, and without activity, the total returns would have been lower.
| * | The total return figures shown reflect the maximum sales charge applicable to Class A Shares. Class A Shares have a maximum sales charge on purchases of 5.25%. |
| ** | Reflects the expense ratios as reported in the Prospectus dated April 30, 2017. |
| 1 | The S&P 500 Growth Index represents the growth companies (defined by sales growth, earnings charge to price and momentum) of the S&P 500 Index, a universe of large capitalization companies in the US equity market. |
The above index is for illustrative purposes only and does not reflect the deduction of expenses associated with a mutual fund, such as investment management and fund accounting fees. The Fund’s performance reflects the deduction of these services. An investor cannot invest directly in an index, although they can invest in its underlying securities.
32
Schedule of Investments
Praxis Growth Index Fund
December 31, 2017
| | | SHARES | | | FAIR
VALUE | |
| COMMON STOCKS—98.4% | | | | | | |
| AEROSPACE & DEFENSE—0.2% | | | | | | |
| TransDigm Group, Inc. | | | 2,119 | | | $ | 581,920 | |
| | | | | | | | | |
| AIR FREIGHT & LOGISTICS—0.7% | | | | | | | | |
| FedEx Corp. | | | 3,068 | | | | 765,589 | |
| United Parcel Service, Inc. - Class B | | | 9,578 | | | | 1,141,218 | |
| | | | | | | | 1,906,807 | |
| AIRLINES—0.2% | | | | | | | | |
| Southwest Airlines Co. | | | 8,000 | | | | 523,600 | |
| | | | | | | | | |
| AUTOMOBILES—0.1% | | | | | | | | |
| Harley-Davidson, Inc. | | | 4,411 | | | | 224,432 | |
| | | | | | | | | |
| BANKS—1.8% | | | | | | | | |
| Bank of America Corp. | | | 100,541 | | | | 2,967,970 | |
| Citizens Financial Group, Inc. | | | 6,337 | | | | 266,027 | |
| Comerica, Inc. | | | 4,494 | | | | 390,124 | |
| JPMorgan Chase & Co. | | | 4,809 | | | | 514,275 | |
| PNC Financial Services Group, Inc. (The) | | | 2,433 | | | | 351,058 | |
| U.S. Bancorp | | | 4,745 | | | | 254,237 | |
| | | | | | | | 4,743,691 | |
| BEVERAGES—2.1% | | | | | | | | |
| Coca-Cola Co. (The) | | | 46,914 | | | | 2,152,414 | |
| Dr Pepper Snapple Group, Inc. | | | 3,253 | | | | 315,736 | |
| Monster Beverage Corp. (a) | | | 8,550 | | | | 541,130 | |
| PepsiCo, Inc. | | | 20,153 | | | | 2,416,748 | |
| | | | | | | | 5,426,028 | |
| BIOTECHNOLOGY—3.4% | | | | | | | | |
| Alexion Pharmaceuticals, Inc. (a) | | | 4,425 | | | | 529,186 | |
| Amgen, Inc. | | | 10,935 | | | | 1,901,596 | |
| Biogen, Inc. (a) | | | 3,308 | | | | 1,053,830 | |
| Celgene Corp. (a) | | | 19,103 | | | | 1,993,589 | |
| Gilead Sciences, Inc. | | | 20,291 | | | | 1,453,647 | |
| Incyte Corp. (a) | | | 4,067 | | | | 385,186 | |
| Regeneron Pharmaceuticals, Inc. (a) | | | 1,737 | | | | 653,042 | |
| Vertex Pharmaceuticals, Inc. (a) | | | 5,884 | | | | 881,776 | |
| | | | | | | | 8,851,852 | |
| BUILDING PRODUCTS—0.5% | | | | | | | | |
| Allegion plc | | | 6,005 | | | | 477,758 | |
| Johnson Controls International plc | | | 12,325 | | | | 469,705 | |
| Masco Corp. | | | 6,250 | | | | 274,625 | |
| | | | | | | | 1,222,088 | |
| CAPITAL MARKETS—1.8% | | | | | | | | |
| Ameriprise Financial, Inc. | | | 2,290 | | | | 388,086 | |
| BlackRock, Inc. | | | 2,081 | | | | 1,069,031 | |
| Charles Schwab Corp. (The) | | | 25,758 | | | | 1,323,188 | |
| Moody's Corp. | | | 3,611 | | | | 533,020 | |
| S&P Global, Inc. | | | 5,128 | | | | 868,683 | |
| T. Rowe Price Group, Inc. | | | 4,600 | | | | 482,678 | |
| | | | | | | | 4,664,686 | |
| CHEMICALS—1.9% | | | | | | | | |
| Air Products & Chemicals, Inc. | | | 2,486 | | | | 407,903 | |
| Albemarle Corp. | | | 3,093 | | | | 395,564 | |
| DowDuPont, Inc. | | | 10,043 | | | | 715,262 | |
| Ecolab, Inc. | | | 5,322 | | | | 714,106 | |
| International Flavors & Fragrances, Inc. | | | 3,158 | | | | 481,942 | |
| Praxair, Inc. | | | 8,079 | | | | 1,249,660 | |
| Sherwin-Williams Co. (The) | | | 2,170 | | | | 889,787 | |
| | | | | | | | 4,854,224 | |
| COMMERCIAL SERVICES & SUPPLIES—1.0% | | | | | | | | |
| Cintas Corp. | | | 1,634 | | | | 254,626 | |
| Republic Services, Inc. | | | 10,213 | | | | 690,501 | |
| Waste Management, Inc. | | | 18,252 | | | | 1,575,148 | |
| | | | | | | | 2,520,275 | |
| COMMUNICATIONS EQUIPMENT—0.8% | | | | | | | | |
| Cisco Systems, Inc. | | | 50,169 | | | | 1,921,473 | |
| Juniper Networks, Inc. | | | 8,206 | | | | 233,871 | |
| | | | | | | | 2,155,344 | |
| CONSTRUCTION MATERIALS—0.1% | | | | | | | | |
| Martin Marietta Materials, Inc. | | | 1,616 | | | | 357,201 | |
| | | | | | | | | |
| CONSUMER FINANCE—0.4% | | | | | | | | |
| American Express Co. | | | 10,373 | | | | 1,030,143 | |
| | | | | | | | | |
| CONTAINERS & PACKAGING—0.4% | | | | | | | | |
| Avery Dennison Corp. | | | 2,529 | | | | 290,481 | |
| Ball Corp. | | | 7,143 | | | | 270,363 | |
| International Paper Co. | | | 6,608 | | | | 382,867 | |
| | | | | | | | 943,711 | |
| DISTRIBUTORS—0.1% | | | | | | | | |
| Genuine Parts Co. | | | 2,808 | | | | 266,788 | |
| | | | | | | | | |
| DIVERSIFIED FINANCIAL SERVICES—0.8% | | | | | | | | |
| Cboe Global Markets, Inc. | | | 2,370 | | | | 295,279 | |
| CME Group, Inc. | | | 5,703 | | | | 832,923 | |
| Intercontinental Exchange, Inc. | | | 13,888 | | | | 979,937 | |
| | | | | | | | 2,108,139 | |
| DIVERSIFIED TELECOMMUNICATION SERVICES—0.2% | | | | | | | | |
| AT&T, Inc. | | | 7,872 | | | | 306,063 | |
| Verizon Communications, Inc. | | | 6,444 | | | | 341,081 | |
| | | | | | | | 647,144 | |
| ELECTRIC UTILITIES—0.4% | | | | | | | | |
| NextEra Energy, Inc. | | | 5,360 | | | | 837,178 | |
| Southern Co. (The) | | | 4,987 | | | | 239,825 | |
| | | | | | | | 1,077,003 | |
| ELECTRICAL EQUIPMENT—0.7% | | | | | | | | |
| AMETEK, Inc. | | | 5,587 | | | | 404,890 | |
| Emerson Electric Co. | | | 6,649 | | | | 463,369 | |
| Rockwell Automation, Inc. | | | 5,260 | | | | 1,032,801 | |
| | | | | | | | 1,901,060 | |
| ELECTRONIC EQUIPMENT, INSTRUMENTS & COMPONENTS—0.7% |
| Amphenol Corp. - Class A | | | 7,167 | | | | 629,263 | |
| Corning, Inc. | | | 20,828 | | | | 666,288 | |
| TE Connectivity Ltd. | | | 5,385 | | | | 511,790 | |
| | | | | | | | 1,807,341 | |
| ENERGY EQUIPMENT & SERVICES—0.1% | | | | | | | | |
| Baker Hughes, Inc. | | | 5,892 | | | | 186,423 | |
| | | | | | | | | |
| EQUITY REAL ESTATE INVESTMENT TRUSTS (REITS)—3.2% |
| American Tower Corp. - Class A | | | 12,382 | | | | 1,766,540 | |
| AvalonBay Communities, Inc. | | | 2,316 | | | | 413,198 | |
| Boston Properties, Inc. | | | 2,027 | | | | 263,571 | |
See accompanying notes to financial statements.
33
Schedule of Investments, continued
Praxis Growth Index Fund
December 31, 2017
| | | SHARES | | | FAIR
VALUE | |
| COMMON STOCKS—98.4%, continued | | | | | | |
| EQUITY REAL ESTATE INVESTMENT TRUSTS (REITS)—3.2%, continued |
| Crown Castle International Corp. | | | 7,128 | | | $ | 791,279 | |
| Digital Realty Trust, Inc. | | | 4,316 | | | | 491,592 | |
| Equinix, Inc. | | | 1,753 | | | | 794,495 | |
| Essex Property Trust, Inc. | | | 1,031 | | | | 248,852 | |
| Extra Space Storage, Inc. | | | 2,966 | | | | 259,377 | |
| GGP, Inc. | | | 12,536 | | | | 293,217 | |
| Iron Mountain, Inc. | | | 8,187 | | | | 308,895 | |
| Prologis, Inc. | | | 13,062 | | | | 842,630 | |
| Public Storage | | | 2,206 | | | | 461,054 | |
| Simon Property Group, Inc. | | | 5,204 | | | | 893,735 | |
| UDR, Inc. | | | 10,721 | | | | 412,973 | |
| | | | | | | | 8,241,408 | |
| FOOD & STAPLES RETAILING—0.2% | | | | | | | | |
| Wal-Mart Stores, Inc. | | | 5,256 | | | | 519,030 | |
| | | | | | | | | |
| FOOD PRODUCTS—0.3% | | | | | | | | |
| Campbell Soup Co. | | | 4,561 | | | | 219,430 | |
| General Mills, Inc. | | | 5,481 | | | | 324,968 | |
| Mondelez International, Inc. - Class A | | | 4,117 | | | | 176,208 | |
| | | | | | | | 720,606 | |
| HEALTH CARE EQUIPMENT & SUPPLIES—4.3% | | | | | | | | |
| Abbott Laboratories | | | 44,381 | | | | 2,532,824 | |
| Align Technology, Inc. (a) | | | 1,431 | | | | 317,954 | |
| Baxter International, Inc. | | | 7,430 | | | | 480,275 | |
| Becton, Dickinson and Co. | | | 8,031 | | | | 1,719,184 | |
| Boston Scientific Corp. (a) | | | 28,192 | | | | 698,880 | |
| Cooper Cos., Inc. (The) | | | 1,161 | | | | 252,959 | |
| Danaher Corp. | | | 4,771 | | | | 442,844 | |
| Edwards Lifesciences Corp. (a) | | | 4,070 | | | | 458,730 | |
| Hologic, Inc. (a) | | | 6,559 | | | | 280,397 | |
| IDEXX Laboratories, Inc. (a) | | | 2,060 | | | | 322,143 | |
| Intuitive Surgical, Inc. (a) | | | 2,661 | | | | 971,105 | |
| Medtronic plc | | | 14,731 | | | | 1,189,528 | |
| ResMed, Inc. | | | 3,458 | | | | 292,858 | |
| Stryker Corp. | | | 8,340 | | | | 1,291,365 | |
| | | | | | | | 11,251,046 | |
| HEALTH CARE PROVIDERS & SERVICES—3.1% | | | | | | | | |
| Aetna, Inc. | | | 3,898 | | | | 703,160 | |
| AmerisourceBergen Corp. | | | 2,297 | | | | 210,910 | |
| Anthem, Inc. | | | 3,101 | | | | 697,756 | |
| Centene Corp. (a) | | | 4,602 | | | | 464,250 | |
| Cigna Corp. | | | 5,474 | | | | 1,111,715 | |
| HCA Healthcare, Inc. (a) | | | 1,890 | | | | 166,018 | |
| UnitedHealth Group, Inc. | | | 21,794 | | | | 4,804,705 | |
| | | | | | | | 8,158,514 | |
| HEALTH CARE TECHNOLOGY—0.1% | | | | | | | | |
| Cerner Corp. (a) | | | 4,487 | | | | 302,379 | |
| | | | | | | | | |
| HOTELS, RESTAURANTS & LEISURE—2.8% | | | | | | | | |
| Carnival Corp. | | | 4,611 | | | | 306,032 | |
| Chipotle Mexican Grill, Inc. (a) | | | 778 | | | | 224,865 | |
| Marriott International, Inc. | | | 8,558 | | | | 1,161,578 | |
| McDonald's Corp. | | | 19,012 | | | | 3,272,346 | |
| Royal Caribbean Cruises Ltd. | | | 2,560 | | | | 305,357 | |
| Starbucks Corp. | | | 22,982 | | | | 1,319,856 | |
| Wyndham Worldwide Corp. | | | 4,075 | | | | 472,170 | |
| Yum! Brands, Inc. | | | 3,561 | | | | 290,613 | |
| | | | | | | | 7,352,817 | |
| HOUSEHOLD DURABLES—0.3% | | | | | | | | |
| D.R. Horton, Inc. | | | 5,104 | | | | 260,661 | |
| Mohawk Industries, Inc. (a) | | | 1,064 | | | | 293,558 | |
| Newell Brands, Inc. | | | 5,836 | | | | 180,332 | |
| | | | | | | | 734,551 | |
| HOUSEHOLD PRODUCTS—1.5% | | | | | | | | |
| Church & Dwight Co., Inc. | | | 4,462 | | | | 223,858 | |
| Clorox Co. (The) | | | 2,852 | | | | 424,206 | |
| Colgate-Palmolive Co. | | | 10,399 | | | | 784,605 | |
| Kimberly-Clark Corp. | | | 3,801 | | | | 458,629 | |
| Procter & Gamble Co. (The) | | | 21,860 | | | | 2,008,497 | |
| | | | | | | | 3,899,795 | |
| INDUSTRIAL CONGLOMERATES—0.3% | | | | | | | | |
| Roper Technologies, Inc. | | | 2,829 | | | | 732,711 | |
| | | | | | | | | |
| INSURANCE—1.8% | | | | | | | | |
| Aflac, Inc. | | | 4,154 | | | | 364,638 | |
| Allstate Corp. (The) | | | 6,014 | | | | 629,726 | |
| Aon plc | | | 4,556 | | | | 610,504 | |
| Arthur J. Gallagher & Co. | | | 4,367 | | | | 276,344 | |
| Chubb Corp. | | | 2,780 | | | | 406,241 | |
| Marsh & McLennan Cos., Inc. | | | 9,036 | | | | 735,440 | |
| Principal Financial Group, Inc. | | | 3,731 | | | | 263,259 | |
| Progressive Corp. (The) | | | 17,816 | | | | 1,003,397 | |
| Torchmark Corp. | | | 2,891 | | | | 262,243 | |
| Willis Towers Watson plc | | | 1,674 | | | | 252,255 | |
| | | | | | | | 4,804,047 | |
| INTERNET & DIRECT MARKETING RETAIL—5.5% | | | | | | | | |
| Amazon.com, Inc. (a) | | | 8,814 | | | | 10,307,709 | |
| Expedia, Inc. | | | 2,852 | | | | 341,584 | |
| Netflix, Inc. (a) | | | 9,792 | | | | 1,879,672 | |
| Priceline Group, Inc. (The)(a) | | | 1,030 | | | | 1,789,872 | |
| | | | | | | | 14,318,837 | |
| INTERNET SOFTWARE & SERVICES—9.7% | | | | | | | | |
| Akamai Technologies, Inc. (a) | | | 5,069 | | | | 329,688 | |
| Alphabet, Inc. - Class A (a) | | | 4,235 | | | | 4,461,149 | |
| Alphabet, Inc. - Class C (a) | | | 9,521 | | | | 9,962,774 | |
| eBay, Inc. (a) | | | 20,473 | | | | 772,651 | |
| Facebook, Inc. - Class A (a) | | | 52,985 | | | | 9,349,733 | |
| VeriSign, Inc. (a) | | | 2,251 | | | | 257,605 | |
| | | | | | | | 25,133,600 | |
| IT SERVICES—6.0% | | | | | | | | |
| Accenture plc - Class A | | | 9,729 | | | | 1,489,413 | |
| Automatic Data Processing, Inc. | | | 11,168 | | | | 1,308,778 | |
| Cognizant Technology Solutions Corp. - Class A | | | 12,602 | | | | 894,994 | |
| DXC Technology Co. | | | 2,990 | | | | 283,751 | |
| Fidelity National Information Services, Inc. | | | 4,435 | | | | 417,289 | |
| Fiserv, Inc. (a) | | | 4,410 | | | | 578,283 | |
| Gartner, Inc. - Class A (a) | | | 2,140 | | | | 263,541 | |
| MasterCard, Inc. - Class A | | | 21,816 | | | | 3,302,070 | |
| Paychex, Inc. | | | 6,525 | | | | 444,222 | |
| PayPal Holdings, Inc. (a) | | | 22,292 | | | | 1,641,137 | |
| Total System Services, Inc. | | | 3,608 | | | | 285,357 | |
See accompanying notes to financial statements.
34
Schedule of Investments, continued
Praxis Growth Index Fund
December 31, 2017
| | | SHARES | | | FAIR
VALUE | |
| COMMON STOCKS—98.4%, continued | | | | | | |
| IT SERVICES—6.0%, continued | | | | | | |
| Visa, Inc. - Class A | | | 41,463 | | | $ | 4,727,611 | |
| | | | | | | | 15,636,446 | |
| LEISURE PRODUCTS—0.2% | | | | | | | | |
| Hasbro, Inc. | | | 4,868 | | | | 442,452 | |
| | | | | | | | | |
| LIFE SCIENCES TOOLS & SERVICES—1.3% | | | | | | | | |
| Agilent Technologies, Inc. | | | 5,785 | | | | 387,421 | |
| Illumina, Inc. (a) | | | 3,249 | | | | 709,874 | |
| Mettler-Toledo International, Inc. (a) | | | 600 | | | | 371,712 | |
| Thermo Fisher Scientific, Inc. | | | 7,715 | | | | 1,464,924 | |
| Waters Corp. (a) | | | 1,646 | | | | 317,991 | |
| | | | | | | | 3,251,922 | |
| MACHINERY—1.7% | | | | | | | | |
| Deere & Co. | | | 4,488 | | | | 702,417 | |
| Dover Corp. | | | 5,463 | | | | 551,708 | |
| Illinois Tool Works, Inc. | | | 9,594 | | | | 1,600,759 | |
| Ingersoll-Rand plc | | | 2,987 | | | | 266,411 | |
| Parker-Hannifin Corp. | | | 2,881 | | | | 574,990 | |
| Stanley Black & Decker, Inc. | | | 2,002 | | | | 339,719 | |
| Xylem, Inc. | | | 6,063 | | | | 413,497 | |
| | | | | | | | 4,449,501 | |
| MEDIA—2.4% | | | | | | | | |
| CBS Corp. - Class B | | | 4,421 | | | | 260,839 | |
| Charter Communications, Inc. - Class A (a) | | | 4,569 | | | | 1,535,001 | |
| Comcast Corp. - Class A | | | 53,081 | | | | 2,125,894 | |
| Omnicom Group, Inc. | | | 6,116 | | | | 445,429 | |
| Walt Disney Co. (The) | | | 17,022 | | | | 1,830,035 | |
| | | | | | | | 6,197,198 | |
| METALS & MINING—0.1% | | | | | | | | |
| Nucor Corp. | | | 4,570 | | | | 290,561 | |
| | | | | | | | | |
| MULTI-LINE RETAIL—0.2% | | | | | | | | |
| Dollar Tree, Inc. (a) | | | 3,886 | | | | 417,007 | |
| | | | | | | | | |
| OIL, GAS & CONSUMABLE FUELS—0.5% | | | | | | | | |
| Apache Corp. | | | 5,088 | | | | 214,815 | |
| ConocoPhillips | | | 2,278 | | | | 125,039 | |
| EQT Corp. | | | 8,107 | | | | 461,451 | |
| ONEOK, Inc. | | | 5,111 | | | | 273,183 | |
| Williams Cos., Inc. (The) | | | 4,298 | | | | 131,046 | |
| | | | | | | | 1,205,534 | |
| PERSONAL PRODUCTS—0.2% | | | | | | | | |
| Estee Lauder Cos., Inc. (The) - Class A | | | 4,590 | | | | 584,032 | |
| | | | | | | | | |
| PHARMACEUTICALS—5.5% | | | | | | | | |
| AbbVie, Inc. | | | 39,364 | | | | 3,806,892 | |
| Bristol-Myers Squibb Co. | | | 24,259 | | | | 1,486,592 | |
| Eli Lilly & Co. | | | 16,118 | | | | 1,361,326 | |
| Johnson & Johnson | | | 35,751 | | | | 4,995,130 | |
| Merck & Co., Inc. | | | 27,335 | | | | 1,538,140 | |
| Zoetis, Inc. | | | 14,643 | | | | 1,054,882 | |
| | | | | | | | 14,242,962 | |
| PROFESSIONAL SERVICES—0.4% | | | | | | | | |
| Equifax, Inc. | | | 2,173 | | | | 256,240 | |
| Nielsen Holdings plc | | | 10,461 | | | | 380,780 | |
| Verisk Analytics, Inc. (a) | | | 3,035 | | | | 291,360 | |
| | | | | | | | 928,380 | |
| ROAD & RAIL—1.0% | | | | | | | | |
| CSX Corp. | | | 19,508 | | | | 1,073,135 | |
| Norfolk Southern Corp. | | | 2,628 | | | | 380,797 | |
| Union Pacific Corp. | | | 9,348 | | | | 1,253,567 | |
| | | | | | | | 2,707,499 | |
| SEMICONDUCTORS & SEMICONDUCTOR EQUIPMENT—6.4% |
| Analog Devices, Inc. | | | 10,101 | | | | 899,292 | |
| Applied Materials, Inc. | | | 24,367 | | | | 1,245,641 | |
| Broadcom Ltd. | | | 9,079 | | | | 2,332,395 | |
| Intel Corp. | | | 61,671 | | | | 2,846,733 | |
| KLA-Tencor Corp. | | | 4,512 | | | | 474,076 | |
| Lam Research Corp. | | | 3,383 | | | | 622,709 | |
| Microchip Technology, Inc. | | | 7,002 | | | | 615,336 | |
| Micron Technology, Inc. (a) | | | 24,852 | | | | 1,021,914 | |
| NVIDIA Corp. | | | 13,886 | | | | 2,686,941 | |
| QUALCOMM, Inc. | | | 11,434 | | | | 732,005 | |
| Skyworks Solutions, Inc. | | | 3,010 | | | | 285,799 | |
| Texas Instruments, Inc. | | | 24,773 | | | | 2,587,292 | |
| Xilinx, Inc. | | | 4,619 | | | | 311,413 | |
| | | | | | | | 16,661,546 | |
| SOFTWARE—9.5% | | | | | | | | |
| Activision Blizzard, Inc. | | | 14,771 | | | | 935,300 | |
| Adobe Systems, Inc. (a) | | | 10,776 | | | | 1,888,386 | |
| ANSYS, Inc. (a) | | | 1,778 | | | | 262,415 | |
| Autodesk, Inc. (a) | | | 4,626 | | | | 484,943 | |
| Citrix Systems, Inc. (a) | | | 3,452 | | | | 303,776 | |
| Electronic Arts, Inc. (a) | | | 7,552 | | | | 793,413 | |
| Intuit, Inc. | | | 5,164 | | | | 814,776 | |
| Microsoft Corp. | | | 172,600 | | | | 14,764,204 | |
| Oracle Corp. | | | 35,196 | | | | 1,664,067 | |
| Red Hat, Inc. (a) | | | 3,789 | | | | 455,059 | |
| salesforce.com, Inc. (a) | | | 15,569 | | | | 1,591,619 | |
| Symantec Corp. | | | 13,164 | | | | 369,382 | |
| Synopsys, Inc. (a) | | | 2,920 | | | | 248,901 | |
| | | | | | | | 24,576,241 | |
| SPECIALTY RETAIL—3.1% | | | | | | | | |
| Home Depot, Inc. (The) | | | 27,779 | | | | 5,264,954 | |
| Lowe's Cos., Inc. | | | 15,097 | | | | 1,403,115 | |
| O'Reilly Automotive, Inc. (a) | | | 1,115 | | | | 268,202 | |
| Ross Stores, Inc. | | | 6,132 | | | | 492,093 | |
| TJX Cos., Inc. (The) | | | 3,533 | | | | 270,133 | |
| Ulta Beauty, Inc. (a) | | | 1,400 | | | | 313,124 | |
| | | | | | | | 8,011,621 | |
| TECHNOLOGY HARDWARE, STORAGE & PERIPHERALS—7.6% |
| Apple, Inc. | | | 114,170 | | | | 19,320,989 | |
| NetApp, Inc. | | | 5,407 | | | | 299,115 | |
| | | | | | | | 19,620,104 | |
| TEXTILES, APPAREL & LUXURY GOODS—0.6% | | | | | | | | |
| NIKE, Inc. - Class B | | | 20,716 | | | | 1,295,786 | |
| VF Corp. | | | 4,295 | | | | 317,830 | |
| | | | | | | | 1,613,616 | |
| TRADING COMPANIES & DISTRIBUTORS—0.2% | | | | | | | | |
| Fastenal Co. | | | 8,032 | | | | 439,270 | |
| TOTAL COMMON STOCKS (COST $150,392,119) | | | | | | | 255,445,133 | |
See accompanying notes to financial statements.
35
Schedule of Investments, continued
Praxis Growth Index Fund
December 31, 2017
| | | COUPON | | | MATURITY | | | PRINCIPAL AMOUNT | | | FAIR
VALUE | |
| CORPORATE NOTES—0.8% | | | | | | | | | | | | |
| COMMUNITY DEVELOPMENT—0.8% |
| Calvert Social Investment Foundation, Inc. (b) | | | 1.000 | % | | | 06/15/18 | | | $ | 650,000 | | | $ | 650,000 | |
| Calvert Social Investment Foundation, Inc. (b) | | | 1.000 | % | | | 12/17/18 | | | | 175,000 | | | | 175,000 | |
| Calvert Social Investment Foundation, Inc. (b) | | | 1.500 | % | | | 06/17/19 | | | | 800,000 | | | | 800,000 | |
| Calvert Social Investment Foundation, Inc. (b) | | | 1.500 | % | | | 06/15/20 | | | | 475,000 | | | | 475,000 | |
| TOTAL CORPORATE NOTES (COST $2,100,000) | | | | | | | | | | | | | | | 2,100,000 | |
| | | | | | | | | | | | | | | | | |
| TOTAL INVESTMENTS (COST $152,492,119—Unrealized gain/loss $105,053,014)—99.2% | | | | | | | | $ | 257,545,133 | |
| Other Assets in Excess of Liabilities—0.8% | | | | | | | | | | | | | | | 1,951,814 | |
| NET ASSETS—100.0% | | | | | | | | | | | | | | $ | 259,496,947 | |
| (a) | Non-income producing security. |
| (b) | Restricted and illiquid securities not registered under the Securities Act of 1933 were as follows: |
| | | Acquisition
Date | | Current
Cost | | | Fair
Value | | | % of Net
Assets | |
| Calvert Social Investment Foundation, Inc. 1.00%, 06/15/18 | | 06/15/17 | | $ | 650,000 | | | $ | 650,000 | | | | 0.3 | % |
| Calvert Social Investment Foundation, Inc. 1.00%, 12/17/18 | | 12/15/17 | | | 175,000 | | | | 175,000 | | | | 0.1 | % |
| Calvert Social Investment Foundation, Inc. 1.50%, 06/17/19 | | 06/10/16 | | | 800,000 | | | | 800,000 | | | | 0.3 | % |
| Calvert Social Investment Foundation, Inc. 1.50%, 06/15/20 | | 06/15/17 | | | 475,000 | | | | 475,000 | | | | 0.2 | % |
| | | | | $ | 2,100,000 | | | $ | 2,100,000 | | | | 0.8 | % |
plc —Public Liability Company
See accompanying notes to financial statements.
36
Praxis Small Cap Index Fund
Annual Report to Shareholders
Portfolio Manager’s Commentary (unaudited)
2017 was a good year for U.S. Small Cap stock returns with the S&P SmallCap 600 Index (the “Index”) returning 13.23 percent. In terms of major asset classes, in 2017 international stocks were the best performers with returns approaching 30 percent while commodities and bonds were on the other end of the spectrum with low single digit returns. For the second straight year all major asset classes reported positive returns. The U.S. Small Cap return was about half of the 26.56 percent return experienced in 2016 when U.S. Small Cap stocks were the top performing major asset class. The Index for 2017 traded in a range for most of the first three quarters of the year before breaking out in September and again in November to reach the highs for the year. Crude oil experienced another year of volatility as the price hit a high of $60.42 per barrel on the last day of the year, having started the year at $53.72 per barrel and dipping as low as $42.53 per barrel in mid-June.
In a review of sector breakouts for small cap stocks, energy was the only sector with a negative return in 2017. This is largely a result of dropping oil prices through the first half of the year with prices not fully recovering until late in the year. Most other sectors had double digit positive returns led by consumer, non-cyclical.
In this environment, the Praxis Small Cap Index Fund Class A Shares (Without Load) returned 10.70 percent, underperforming the 13.23 percent return of the benchmark (S&P SmallCap 600 Index). The Praxis Small Cap Index Fund Class I shares returned 11.22 percent. Stock specific factors were the leading contributor to relative performance as annual stock returns can vary widely in the small cap space, with stocks often being acquired or “graduating” out of the small cap universe. Several gaming stocks (gambling screen) were detractors to relative performance as they had banner years. A positive contributor to relative performance was the allocation (underweight) to basic materials and energy.
2017 is the inaugural year of managing the Praxis Small Cap Index Fund (the “Fund”) as an index fund, utilizing the same methodology and processes we use to manage our Growth Index and Value Index funds. The transition involved moving to a fund with approximately 450 holdings from one with approximately 70 holdings and a change of benchmarks to the S&P SmallCap 600 Index from the Russell 2000 Index. This transition occurred during a strong move higher in the stock market and that timing had a negative impact on relative performance. While the Fund’s performance during the initial transition period did not meet our expectations, we are pleased with the performance once the transition was completed, and look forward to continuing to be able to incorporate our Values + ESG screens and still deliver returns that closely track benchmark returns.
Dale Snyder, CFA®
Praxis Value Index Fund Manager
Praxis Mutual Funds
The views expressed are those of the portfolio manager as of Dec. 31, 2017, are subject to change, and may differ from the views of other portfolio managers or Everence Capital Management as a whole. These opinions are not intended to be a forecast of future events, a guarantee of future results, or investment advice. All data referenced are from sources deemed to be reliable but cannot be guaranteed. Securities and sectors referenced should not be construed as a solicitation or recommendation or be used as the sole basis for any investment decision.
37
Praxis Small Cap Index Fund
Performance Review (unaudited)
Growth of $10,000 investment from 12/31/07 to 12/31/17
This chart represents historical performance of a hypothetical investment of $10,000 in Class A Shares (adjusted for the maximum sales charge of 5.25%) of the Fund and Index from 12/31/07 to 12/31/17, and includes the reinvestment of dividends and capital gains.
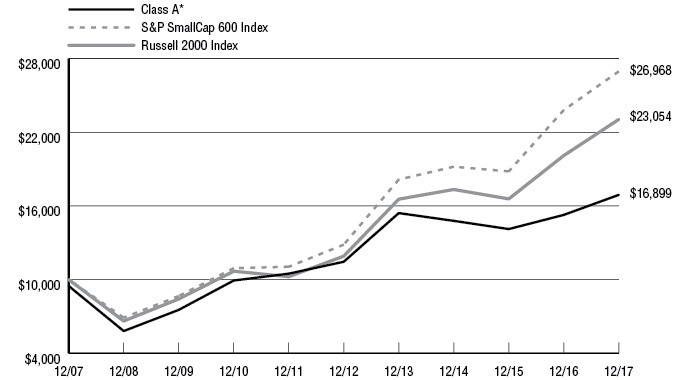
| | | | Average Annual Returns | | |
| Inception Date | One
Year Ended | Three
Years Ended | Five
Years Ended | Ten
Years Ended | Expense
Ratio**
Gross / Net |
Praxis Small Cap Index Fund | | | | | | | |
Class A * | 5/1/07 | 4.84% | 2.69% | 6.94% | 5.39% | 1.21% | 1.12% |
Class A (Without Load) | 5/1/07 | 10.70% | 4.57% | 8.10% | 5.96% | | |
Class I | 5/1/07 | 11.22% | 5.17% | 8.76% | 6.52% | 0.45% | 0.45% |
S&P SmallCap 600 Index 1 | | 13.23% | 12.00% | 15.99% | 10.43% | | |
Russell 2000 Index 2 | | 14.63% | 9.94% | 14.11% | 8.71% | | |
Past performance does not guarantee future results. The performance data quoted represents past performance and current returns may be lower or higher. The investment return and principal value will fluctuate so that an investor’s shares, when redeemed, may be worth more or less than the original cost. These performance figures do not reflect the deduction of taxes that a shareholder would pay on fund distributions or the redemption of fund shares. To obtain performance information current to the most recent month end, please visit www.praxismutualfunds.com. Indexes are unmanaged, do not incur fees, and it is not possible to invest directly in an index.
The total returns shown reflect any expenses that were contractually or voluntarily reduced, reimbursed or paid by any party during the periods presented. In such instances, and without activity, the total returns would have been lower.
The returns include the Fund’s performance when the Fund’s portfolio was managed by a sub-adviser and pursued a different investment strategy prior to January 1, 2017.
| * | The total return figures shown reflect the maximum sales charge applicable to Class A Shares. Class A Shares have a maximum sales charge on purchases of 5.25%. |
| ** | Reflects the expense ratios as reported in the Prospectus dated April 30, 2017. Contractual fee waivers are in effect from May 1, 2017 through April 30, 2018 for Class A. |
| 1 | The S&P SmallCap 600 Index measures the small-cap segment of the U.S. equity market. The Index is designed to track companies that meet specific inclusion criteria to ensure they are liquid and financially viable. |
| 2 | The Russell 2000 Index is an unmanaged index consisting of the 2,000 smallest of the 3,000 largest stocks. Returns are adjusted for the reinvestment of capital gains distributions and income dividends. You cannot invest directly in an index. Prior to January 1, 2017 the Russell 2000 Index served as the Fund’s primary Index. The primary Index was changed due to the change in investment strategy of the Fund. |
The above index is for illustrative purposes only and does not reflect the deduction of expenses associated with a mutual fund, such as investment management and fund accounting fees. The Fund’s performance reflects the deduction of these services. An investor cannot invest directly in an index, although they can invest in its underlying securities.
38
Schedule of Investments
Praxis Small Cap Index Fund
December 31, 2017
| | | SHARES | | | FAIR
VALUE | |
| COMMON STOCKS—98.4% | | | | | | |
| AEROSPACE & DEFENSE—0.3% | | | | | | |
| Axon Enterprise, Inc. (a) | | | 3,650 | | | $ | 96,725 | |
| Engility Holdings, Inc. (a) | | | 2,850 | | | | 80,854 | |
| | | | | | | | 177,579 | |
| AIR FREIGHT & LOGISTICS—0.8% | | | | | | | | |
| Echo Global Logistics, Inc. (a) | | | 4,470 | | | | 125,160 | |
| Forward Air Corp. | | | 3,800 | | | | 218,272 | |
| Hub Group, Inc. - Class A (a) | | | 2,260 | | | | 108,254 | |
| | | | | | | | 451,686 | |
| AUTO COMPONENTS—1.3% | | | | | | | | |
| American Axle & Manufacturing Holdings, Inc. (a) | | | 5,900 | | | | 100,477 | |
| Cooper-Standard Holdings, Inc. (a) | | | 1,190 | | | | 145,775 | |
| Dorman Products, Inc. (a) | | | 2,250 | | | | 137,565 | |
| Fox Factory Holding Corp. (a) | | | 3,770 | | | | 146,464 | |
| Gentherm, Inc. (a) | | | 2,520 | | | | 80,010 | |
| Standard Motor Products, Inc. | | | 1,500 | | | | 67,365 | |
| | | | | | | | 677,656 | |
| AUTOMOBILES—0.8% | | | | | | | | |
| LCI Industries | | | 1,700 | | | | 221,000 | |
| Winnebago Industries, Inc. | | | 3,730 | | | | 207,388 | |
| | | | | | | | 428,388 | |
| BANKS—7.5% | | | | | | | | |
| Ameris Bancorp | | | 2,470 | | | | 119,054 | |
| Banc of California, Inc. | | | 4,200 | | | | 86,730 | |
| Banner Corp. | | | 1,960 | | | | 108,035 | |
| Boston Private Financial Holdings, Inc. | | | 14,160 | | | | 218,772 | |
| Central Pacific Financial Corp. | | | 2,270 | | | | 67,714 | |
| City Holding Co. | | | 1,460 | | | | 98,506 | |
| Columbia Banking System, Inc. | | | 3,710 | | | | 161,162 | |
| Community Bank System, Inc. | | | 2,710 | | | | 145,663 | |
| Customers Bancorp, Inc. (a) | | | 2,090 | | | | 54,319 | |
| CVB Financial Corp. | | | 6,370 | | | | 150,077 | |
| Fidelity Southern Corp. | | | 2,160 | | | | 47,088 | |
| First BanCorp. (a) | | | 18,890 | | | | 96,339 | |
| First Commonwealth Financial Corp. | | | 5,600 | | | | 80,192 | |
| First Financial Bancorp | | | 4,940 | | | | 130,169 | |
| First Financial Bankshares, Inc. | | | 4,410 | | | | 198,671 | |
| First Midwest Bancorp, Inc. | | | 5,580 | | | | 133,976 | |
| Glacier Bancorp, Inc. | | | 5,010 | | | | 197,344 | |
| Great Western Bancorp, Inc. | | | 3,870 | | | | 154,026 | |
| Hanmi Financial Corp. | | | 2,240 | | | | 67,984 | |
| Hope Bancorp, Inc. | | | 8,360 | | | | 152,570 | |
| Independent Bank Corp. (Massachusetts) | | | 1,730 | | | | 120,841 | |
| LegacyTexas Financial Group, Inc. | | | 3,040 | | | | 128,318 | |
| NBT Bancorp, Inc. | | | 2,980 | | | | 109,664 | |
| OFG Bancorp | | | 11,240 | | | | 105,656 | |
| Old National Bancorp | | | 9,310 | | | | 162,459 | |
| Opus Bank (a) | | | 1,980 | | | | 54,054 | |
| S&T Bancorp, Inc. | | | 2,180 | | | | 86,786 | |
| ServisFirst Bancshares, Inc. | | | 6,230 | | | | 258,545 | |
| Simmons First National Corp. - Class A | | | 1,970 | | | | 112,487 | |
| Southside Bancshares, Inc. | | | 2,307 | | | | 77,700 | |
| Tompkins Financial Corp. | | | 920 | | | | 74,842 | |
| United Community Banks, Inc. | | | 4,800 | | | | 135,072 | |
| Westamerica Bancorp. | | | 1,670 | | | | 99,448 | |
| | | | | | | | 3,994,263 | |
| BEVERAGES—0.3% | | | | | | | | |
| Coca-Cola Bottling Co. Consolidated | | | 780 | | | | 167,903 | |
| | | | | | | | | |
| BIOTECHNOLOGY—2.0% | | | | | | | | |
| Acorda Therapeutics, Inc. (a) | | | 3,480 | | | | 74,646 | |
| AMAG Pharmaceuticals, Inc. (a) | | | 2,360 | | | | 31,270 | |
| Cytokinetics, Inc. (a) | | | 3,340 | | | | 27,221 | |
| Eagle Pharmaceuticals, Inc. (a) | | | 1,210 | | | | 64,638 | |
| Emergent BioSolutions, Inc. (a) | | | 3,960 | | | | 184,021 | |
| Enanta Pharmaceuticals, Inc. (a) | | | 1,630 | | | | 95,649 | |
| Ligand Pharmaceuticals, Inc. - Class B (a) | | | 1,270 | | | | 173,901 | |
| MiMedx Group, Inc. (a) | | | 6,580 | | | | 82,974 | |
| Momenta Pharmaceuticals, Inc. (a) | | | 4,620 | | | | 64,449 | |
| Progenics Pharmaceuticals, Inc. (a) | | | 4,620 | | | | 27,489 | |
| Repligen Corp. (a) | | | 2,250 | | | | 81,630 | |
| Spectrum Pharmaceuticals, Inc. (a) | | | 7,480 | | | | 141,746 | |
| | | | | | | | 1,049,634 | |
| BUILDING PRODUCTS—3.2% | | | | | | | | |
| AAON, Inc. | | | 4,090 | | | | 150,103 | |
| American Woodmark Corp. (a) | | | 1,025 | | | | 133,506 | |
| Apogee Enterprises, Inc. | | | 1,960 | | | | 89,631 | |
| Gibraltar Industries, Inc. (a) | | | 3,370 | | | | 111,210 | |
| Insteel Industries, Inc. | | | 2,100 | | | | 59,472 | |
| Patrick Industries, Inc. (a) | | | 1,500 | | | | 104,100 | |
| PGT Innovations, Inc. (a) | | | 4,110 | | | | 69,253 | |
| Quanex Building Products Corp. | | | 5,670 | | | | 132,678 | |
| Simpson Manufacturing Co., Inc. | | | 3,990 | | | | 229,066 | |
| TopBuild Corp. (a) | | | 2,710 | | | | 205,255 | |
| Trex Co., Inc. (a) | | | 2,350 | | | | 254,717 | |
| Universal Forest Products, Inc. | | | 4,680 | | | | 176,062 | |
| | | | | | | | 1,715,053 | |
| CAPITAL MARKETS—2.8% | | | | | | | | |
| Donnelley Financial Solutions, Inc. (a) | | | 4,680 | | | | 91,213 | |
| Evercore, Inc. - Class A | | | 2,760 | | | | 248,400 | |
| Financial Engines, Inc. | | | 4,720 | | | | 143,016 | |
| Greenhill & Co., Inc. | | | 3,210 | | | | 62,595 | |
| HFF, Inc. - Class A | | | 2,570 | | | | 125,005 | |
| Interactive Brokers Group, Inc. - Class A | | | 4,980 | | | | 294,866 | |
| INTL FCStone, Inc. (a) | | | 1,800 | | | | 76,554 | |
| Investment Technology Group, Inc. | | | 2,350 | | | | 45,238 | |
| Piper Jaffray Cos. | | | 1,130 | | | | 97,462 | |
| Virtus Investment Partners, Inc. | | | 490 | | | | 56,374 | |
| Waddell & Reed Financial, Inc. - Class A | | | 5,350 | | | | 119,519 | |
| WisdomTree Investments, Inc. | | | 10,100 | | | | 126,755 | |
| | | | | | | | 1,486,997 | |
| CHEMICALS—0.9% | | | | | | | | |
| H.B. Fuller Co. | | | 4,510 | | | | 242,954 | |
| Quaker Chemical Corp. | | | 1,460 | | | | 220,153 | |
| | | | | | | | 463,107 | |
| COMMERCIAL SERVICES & SUPPLIES—3.1% | | | | | | | | |
| ABM Industries, Inc. | | | 4,080 | | | | 153,898 | |
| Brady Corp. - Class A | | | 4,820 | | | | 182,678 | |
| Essendant, Inc. | | | 3,100 | | | | 28,737 | |
| Healthcare Services Group, Inc. | | | 4,950 | | | | 260,964 | |
| Interface, Inc. | | | 4,680 | | | | 117,702 | |
| LSC Communications, Inc. | | | 3,040 | | | | 46,056 | |
| Mobile Mini, Inc. | | | 3,110 | | | | 107,295 | |
| Multi-Color Corp. | | | 1,020 | | | | 76,347 | |
See accompanying notes to financial statements.
39
Schedule of Investments, continued
Praxis Small Cap Index Fund
December 31, 2017
| | | SHARES | | | FAIR
VALUE | |
| COMMON STOCKS—98.4%, continued | | | | | | |
| COMMERCIAL SERVICES & SUPPLIES—3.1%, continued | | | |
| R.R. Donnelley & Sons Co. | | | 6,330 | | | $ | 58,869 | |
| Team, Inc. (a) | | | 2,640 | | | | 39,336 | |
| Tetra Tech, Inc. | | | 4,740 | | | | 228,231 | |
| UniFirst Corp. | | | 1,150 | | | | 189,635 | |
| US Ecology, Inc. | | | 1,490 | | | | 75,990 | |
| Viad Corp. | | | 1,980 | | | | 109,692 | |
| | | | | | | | 1,675,430 | |
| COMMUNICATIONS EQUIPMENT—1.6% | | | | | | | | |
| ADTRAN, Inc. | | | 3,230 | | | | 62,500 | |
| Applied Optoelectronics, Inc. (a) | | | 1,580 | | | | 59,756 | |
| CalAmp Corp. (a) | | | 3,190 | | | | 68,362 | |
| Harmonic, Inc. (a) | | | 14,710 | | | | 61,782 | |
| Lumentum Holdings, Inc. (a) | | | 4,670 | | | | 228,363 | |
| NETGEAR, Inc. (a) | | | 2,450 | | | | 143,937 | |
| Oclaro, Inc. (a) | | | 12,690 | | | | 85,531 | |
| Viavi Solutions, Inc. (a) | | | 15,670 | | | | 136,956 | |
| | | | | | | | 847,187 | |
| CONSTRUCTION & ENGINEERING—0.4% | | | | | | | | |
| Aegion Corp. (a) | | | 2,880 | | | | 73,238 | |
| Comfort Systems USA, Inc. | | | 2,340 | | | | 102,141 | |
| MYR Group, Inc. (a) | | | 1,530 | | | | 54,667 | |
| | | | | | | | 230,046 | |
| CONSTRUCTION MATERIALS—0.2% | | | | | | | | |
| U.S. Concrete, Inc. (a) | | | 1,100 | | | | 92,015 | |
| | | | | | | | | |
| CONSUMER FINANCE—0.9% | | | | | | | | |
| Encore Capital Group, Inc. (a) | | | 2,750 | | | | 115,775 | |
| Green Dot Corp. - Class A (a) | | | 3,100 | | | | 186,806 | |
| PRA Group, Inc. (a) | | | 3,460 | | | | 114,872 | |
| World Acceptance Corp. (a) | | | 710 | | | | 57,311 | |
| | | | | | | | 474,764 | |
| CONTAINERS & PACKAGING—0.7% | | | | | | | | |
| Ingevity Corp. (a) | | | 3,870 | | | | 272,719 | |
| Myers Industries, Inc. | | | 4,580 | | | | 89,310 | |
| | | | | | | | 362,029 | |
| DIVERSIFIED CONSUMER SERVICES—0.8% | | | | | | | | |
| American Public Education, Inc. (a) | | | 3,900 | | | | 97,695 | |
| Capella Education Co. | | | 880 | | | | 68,112 | |
| Career Education Corp. (a) | | | 4,710 | | | | 56,897 | |
| Matthews International Corp. - Class A | | | 2,810 | | | | 148,368 | |
| Strayer Education, Inc. | | | 760 | | | | 68,081 | |
| | | | | | | | 439,153 | |
| DIVERSIFIED TELECOMMUNICATION SERVICES—1.3% |
| 8x8, Inc. (a) | | | 6,310 | | | | 88,971 | |
| ATN International, Inc. | | | 1,320 | | | | 72,943 | |
| Cincinnati Bell, Inc. (a) | | | 3,160 | | | | 65,886 | |
| Cogent Communications Holdings, Inc. | | | 3,200 | | | | 144,960 | |
| Consolidated Communications Holdings, Inc. | | | 3,970 | | | | 48,394 | |
| General Communication, Inc. - Class A (a) | | | 1,440 | | | | 56,189 | |
| Iridium Communications, Inc. (a) | | | 10,490 | | | | 123,782 | |
| Vonage Holdings Corp. (a) | | | 7,960 | | | | 80,953 | |
| | | | | | | | 682,078 | |
| ELECTRIC UTILITIES—0.5% | | | | | | | | |
| ALLETE, Inc. | | | 3,670 | | | | 272,901 | |
| | | | | | | | | |
| ELECTRICAL EQUIPMENT—0.9% | | | | | | | | |
| AZZ, Inc. | | | 1,800 | | | | 91,980 | |
| Encore Wire Corp. | | | 1,700 | | | | 82,705 | |
| Franklin Electric Co., Inc. | | | 4,130 | | | | 189,567 | |
| General Cable Corp. | | | 4,630 | | | | 137,048 | |
| | | | | | | | 501,300 | |
| ELECTRONIC EQUIPMENT, INSTRUMENTS & COMPONENTS—4.9% |
| Anixter International, Inc. (a) | | | 2,180 | | | | 165,680 | |
| Badger Meter, Inc. | | | 2,110 | | | | 100,858 | |
| Benchmark Electronics, Inc. (a) | | | 3,960 | | | | 115,236 | |
| Control4 Corp. (a) | | | 5,090 | | | | 151,478 | |
| CTS Corp. | | | 2,780 | | | | 71,585 | |
| Daktronics, Inc. | | | 9,940 | | | | 90,752 | |
| Electro Scientific Industries, Inc. (a) | | | 4,390 | | | | 94,078 | |
| ePlus, Inc. (a) | | | 1,060 | | | | 79,712 | |
| Fabrinet (a) | | | 2,610 | | | | 74,907 | |
| FARO Technologies, Inc. (a) | | | 1,290 | | | | 60,630 | |
| II-VI, Inc. (a) | | | 3,780 | | | | 177,471 | |
| Insight Enterprises, Inc. (a) | | | 2,820 | | | | 107,978 | |
| Itron, Inc. (a) | | | 3,150 | | | | 214,830 | |
| KEMET Corp. (a) | | | 5,430 | | | | 81,776 | |
| Methode Electronics, Inc. | | | 2,500 | | | | 100,250 | |
| MTS Systems Corp. | | | 1,320 | | | | 70,884 | |
| OSI Systems, Inc. (a) | | | 1,360 | | | | 87,557 | |
| Plexus Corp. (a) | | | 2,470 | | | | 149,979 | |
| Rogers Corp. (a) | | | 1,610 | | | | 260,691 | |
| Sanmina Corp. (a) | | | 5,140 | | | | 169,620 | |
| ScanSource, Inc. (a) | | | 2,400 | | | | 85,920 | |
| TTM Technologies, Inc. (a) | | | 7,390 | | | | 115,801 | |
| | | | | | | | 2,627,673 | |
| ENERGY EQUIPMENT & SERVICES—2.9% | | | | | | | | |
| Archrock, Inc. | | | 4,940 | | | | 51,870 | |
| Era Group, Inc. (a) | | | 10,000 | | | | 107,500 | |
| Exterran Corp. (a) | | | 2,910 | | | | 91,490 | |
| Geospace Technologies Corp. (a) | | | 2,810 | | | | 36,446 | |
| Gulf Island Fabrication, Inc. | | | 4,240 | | | | 56,922 | |
| Helix Energy Solutions Group, Inc. (a) | | | 18,730 | | | | 141,224 | |
| Matrix Service Co. (a) | | | 8,110 | | | | 144,358 | |
| McDermott International, Inc. (a) | | | 16,190 | | | | 106,530 | |
| Newpark Resources, Inc. (a) | | | 16,660 | | | | 143,276 | |
| Noble Corp. plc (a) | | | 28,070 | | | | 126,877 | |
| Oil States International, Inc. (a) | | | 2,230 | | | | 63,109 | |
| Pioneer Energy Services Corp. (a) | | | 36,020 | | | | 109,861 | |
| SEACOR Holdings, Inc. (a) | | | 1,250 | | | | 57,775 | |
| TETRA Technologies, Inc. (a) | | | 25,210 | | | | 107,647 | |
| U.S. Silica Holdings, Inc. | | | 6,050 | | | | 196,988 | |
| | | | | | | | 1,541,873 | |
| EQUITY REAL ESTATE INVESTMENT TRUSTS (REITS)—5.0% |
| Acadia Realty Trust | | | 5,320 | | | | 145,555 | |
| Agree Realty Corp. | | | 1,980 | | | | 101,851 | |
| American Assets Trust, Inc. | | | 3,790 | | | | 144,930 | |
| CareTrust REIT, Inc. | | | 5,220 | | | | 87,487 | |
| CBL & Associates Properties, Inc. - Class B | | | 9,280 | | | | 52,525 | |
| Chesapeake Lodging Trust | | | 3,710 | | | | 100,504 | |
| DiamondRock Hospitality Co. | | | 14,040 | | | | 158,512 | |
| EastGroup Properties, Inc. | | | 2,290 | | | | 202,390 | |
| Franklin Street Properties Corp. | | | 7,520 | | | | 80,765 | |
| Government Properties Income Trust | | | 6,310 | | | | 116,987 | |
See accompanying notes to financial statements.
40
Schedule of Investments, continued
Praxis Small Cap Index Fund
December 31, 2017
| | | SHARES | | | FAIR
VALUE | |
| COMMON STOCKS—98.4%, continued | | | | | | |
| EQUITY REAL ESTATE INVESTMENT TRUSTS (REITS)—5.0%, continued |
| Hersha Hospitality Trust | | | 2,630 | | | $ | 45,762 | |
| Independence Realty Trust, Inc. | | | 16,080 | | | | 162,247 | |
| Kite Realty Group Trust | | | 5,340 | | | | 104,664 | |
| Lexington Realty Trust | | | 19,510 | | | | 188,272 | |
| LTC Properties, Inc. | | | 2,270 | | | | 98,859 | |
| National Storage Affiliates Trust | | | 4,190 | | | | 114,219 | |
| Pennsylvania Real Estate Investment Trust | | | 8,260 | | | | 98,211 | |
| PS Business Parks, Inc. | | | 1,590 | | | | 198,893 | |
| Retail Opportunity Investments Corp. | | | 7,190 | | | | 143,440 | |
| Saul Centers, Inc. | | | 1,440 | | | | 88,920 | |
| Summit Hotel Properties, Inc. | | | 9,270 | | | | 141,182 | |
| Universal Health Realty Income Trust | | | 1,650 | | | | 123,932 | |
| | | | | | | | 2,700,107 | |
| FOOD & STAPLES RETAILING—0.4% | | | | | | | | |
| Andersons, Inc. (The) | | | 1,860 | | | | 57,939 | |
| SpartanNash Co. | | | 2,920 | | | | 77,906 | |
| Supervalu, Inc. (a) | | | 2,687 | | | | 58,039 | |
| | | | | | | | 193,884 | |
| FOOD PRODUCTS—1.6% | | | | | | | | |
| B&G Foods, Inc. | | | 4,680 | | | | 164,502 | |
| Calavo Growers, Inc. | | | 1,050 | | | | 88,620 | |
| Cal-Maine Foods, Inc. (a) | | | 3,150 | | | | 140,017 | |
| Darling Ingredients, Inc. (a) | | | 11,730 | | | | 212,665 | |
| J & J Snack Foods Corp. | | | 1,600 | | | | 242,928 | |
| | | | | | | | 848,732 | |
| GAS UTILITIES—1.1% | | | | | | | | |
| Northwest Natural Gas Co. | | | 2,480 | | | | 147,932 | |
| South Jersey Industries, Inc. | | | 6,330 | | | | 197,686 | |
| Spire, Inc. | | | 3,590 | | | | 269,788 | |
| | | | | | | | 615,406 | |
| HEALTH CARE EQUIPMENT & SUPPLIES—4.2% | | | | | | | | |
| Abaxis, Inc. | | | 1,520 | | | | 75,270 | |
| Analogic Corp. | | | 950 | | | | 79,563 | |
| AngioDynamics, Inc. (a) | | | 3,020 | | | | 50,223 | |
| Anika Therapeutics, Inc. (a) | | | 950 | | | | 51,214 | |
| Haemonetics Corp. (a) | | | 3,650 | | | | 211,992 | |
| Heska Corp. (a) | | | 480 | | | | 38,501 | |
| ICU Medical, Inc. (a) | | | 1,950 | | | | 421,200 | |
| Inogen, Inc. (a) | | | 1,750 | | | | 208,390 | |
| Integer Holdings Corp. (a) | | | 2,180 | | | | 98,754 | |
| Integra LifeSciences Holdings Corp. (a) | | | 5,310 | | | | 254,137 | |
| Invacare Corp. | | | 3,570 | | | | 60,154 | |
| LeMaitre Vascular, Inc. | | | 1,550 | | | | 49,352 | |
| Meridian Bioscience, Inc. | | | 3,290 | | | | 46,060 | |
| Merit Medical Systems, Inc. (a) | | | 3,140 | | | | 135,648 | |
| Natus Medical, Inc. (a) | | | 1,410 | | | | 53,862 | |
| Neogen Corp. (a) | | | 2,365 | | | | 194,427 | |
| OraSure Technologies, Inc. (a) | | | 3,190 | | | | 60,163 | |
| Varex Imaging Corp. (a) | | | 4,550 | | | | 182,773 | |
| | | | | | | | 2,271,683 | |
| HEALTH CARE PROVIDERS & SERVICES—3.0% | | | | | | | | |
| Aceto Corp. | | | 6,755 | | | | 69,779 | |
| Amedisys, Inc. (a) | | | 2,810 | | | | 148,115 | |
| AMN Healthcare Services, Inc. (a) | | | 3,380 | | | | 166,465 | |
| Community Health Systems, Inc. (a) | | | 10,040 | | | | 42,770 | |
| CorVel Corp. (a) | | | 1,030 | | | | 54,487 | |
| | | | | | | | | |
| HEALTH CARE PROVIDERS & SERVICES—3.0%, continued |
| Cross Country Healthcare, Inc. (a) | | | 3,090 | | | | 39,428 | |
| Ensign Group, Inc. (The) | | | 3,400 | | | | 75,480 | |
| HealthEquity, Inc. (a) | | | 4,070 | | | | 189,906 | |
| HMS Holdings Corp. (a) | | | 5,890 | | | | 99,836 | |
| Kindred Healthcare, Inc. | | | 7,520 | | | | 72,944 | |
| LHC Group, Inc. (a) | | | 1,070 | | | | 65,538 | |
| Magellan Health, Inc. (a) | | | 1,600 | | | | 154,480 | |
| Providence Service Corp. (The)(a) | | | 1,220 | | | | 72,395 | |
| Select Medical Holdings Corp. (a) | | | 11,670 | | | | 205,976 | |
| Tivity Health, Inc. (a) | | | 2,400 | | | | 87,720 | |
| U.S. Physical Therapy, Inc. | | | 850 | | | | 61,370 | |
| | | | | | | | 1,606,689 | |
| HEALTH CARE SERVICES—0.3% | | | | | | | | |
| Diplomat Pharmacy, Inc. (a) | | | 7,240 | | | | 145,307 | |
| | | | | | | | | |
| HEALTH CARE TECHNOLOGY—0.5% | | | | | | | | |
| HealthStream, Inc. (a) | | | 2,180 | | | | 50,489 | |
| Omnicell, Inc. (a) | | | 2,840 | | | | 137,740 | |
| Quality Systems, Inc. (a) | | | 4,120 | | | | 55,949 | |
| | | | | | | | 244,178 | |
| HOTELS, RESTAURANTS & LEISURE—2.7% | | | | | | | | |
| Belmond Ltd. - Class A (a) | | | 6,450 | | | | 79,012 | |
| Biglari Holdings, Inc. (a) | | | 220 | | | | 91,168 | |
| Bob Evans Farms, Inc. | | | 1,500 | | | | 118,230 | |
| Chuy's Holdings, Inc. (a) | | | 2,270 | | | | 63,674 | |
| Dave & Buster's Entertainment, Inc. (a) | | | 3,440 | | | | 189,785 | |
| DineEquity, Inc. | | | 2,520 | | | | 127,840 | |
| Fiesta Restaurant Group, Inc. (a) | | | 3,740 | | | | 71,060 | |
| Marcus Corp. (The) | | | 1,880 | | | | 51,418 | |
| Marriott Vacations Worldwide Corp. | | | 1,800 | | | | 243,378 | |
| Red Robin Gourmet Burgers, Inc. (a) | | | 1,120 | | | | 63,168 | |
| Shake Shack, Inc. - Class A (a) | | | 1,400 | | | | 60,480 | |
| Sonic Corp. | | | 5,480 | | | | 150,590 | |
| Wingstop, Inc. | | | 4,060 | | | | 158,259 | |
| | | | | | | | 1,468,062 | |
| HOUSEHOLD DURABLES—2.2% | | | | | | | | |
| Cavco Industries, Inc. (a) | | | 790 | | | | 120,554 | |
| Ethan Allen Interiors, Inc. | | | 2,030 | | | | 58,058 | |
| Installed Building Products, Inc. (a) | | | 2,400 | | | | 182,280 | |
| iRobot Corp. (a) | | | 1,930 | | | | 148,031 | |
| La-Z-Boy, Inc. | | | 3,670 | | | | 114,504 | |
| LGI Homes, Inc. (a) | | | 1,640 | | | | 123,049 | |
| M/I Homes, Inc. (a) | | | 1,900 | | | | 65,360 | |
| MDC Holdings, Inc. | | | 3,402 | | | | 108,456 | |
| Meritage Homes Corp. (a) | | | 2,680 | | | | 137,216 | |
| Universal Electronics, Inc. (a) | | | 1,130 | | | | 53,392 | |
| William Lyon Homes - Class A (a) | | | 2,360 | | | | 68,629 | |
| | | | | | | | 1,179,529 | |
| HOUSEHOLD PRODUCTS—0.8% | | | | | | | | |
| Central Garden & Pet Co. - Class A (a) | | | 3,330 | | | | 125,574 | |
| WD-40 Co. | | | 2,440 | | | | 287,920 | |
| | | | | | | | 413,494 | |
| INDUSTRIAL CONGLOMERATES—0.3% | | | | | | | | |
| Raven Industries, Inc. | | | 4,490 | | | | 154,231 | |
See accompanying notes to financial statements.
41
Schedule of Investments, continued
Praxis Small Cap Index Fund
December 31, 2017
| | | SHARES | | | FAIR
VALUE | |
| COMMON STOCKS—98.4%, continued | | | | | | |
| INSURANCE—2.9% | | | | | | |
| American Equity Investment Life Holding Co. | | | 6,800 | | | $ | 208,964 | |
| AMERISAFE, Inc. | | | 1,540 | | | | 94,864 | |
| Employers Holdings, Inc. | | | 2,590 | | | | 114,996 | |
| HCI Group, Inc. | | | 980 | | | | 29,302 | |
| Horace Mann Educators Corp. | | | 3,080 | | | | 135,828 | |
| Maiden Holdings Ltd. | | | 5,990 | | | | 39,534 | |
| Navigators Group, Inc. (The) | | | 2,540 | | | | 123,698 | |
| ProAssurance Corp. | | | 3,540 | | | | 202,311 | |
| RLI Corp. | | | 2,580 | | | | 156,503 | |
| Selective Insurance Group, Inc. | | | 3,910 | | | | 229,517 | |
| Stewart Information Services Corp. | | | 1,710 | | | | 72,333 | |
| United Fire Group, Inc. | | | 1,370 | | | | 62,444 | |
| Universal Insurance Holdings, Inc. | | | 2,220 | | | | 60,717 | |
| | | | | | | | 1,531,011 | |
| INTERNET & DIRECT MARKETING RETAIL—0.6% | | | | | | | | |
| Nutrisystem, Inc. | | | 2,150 | | | | 113,090 | |
| PetMed Express, Inc. | | | 1,670 | | | | 75,985 | |
| Shutterfly, Inc. (a) | | | 2,500 | | | | 124,375 | |
| | | | | | | | 313,450 | |
| INTERNET SOFTWARE & SERVICES—1.1% | | | | | | | | |
| Blucora, Inc. (a) | | | 3,190 | | | | 70,499 | |
| LivePerson, Inc. (a) | | | 4,880 | | | | 56,120 | |
| NIC, Inc. | | | 4,840 | | | | 80,344 | |
| Shutterstock, Inc. (a) | | | 2,450 | | | | 105,424 | |
| SPS Commerce, Inc. (a) | | | 1,280 | | | | 62,195 | |
| Stamps.com, Inc. (a) | | | 1,120 | | | | 210,560 | |
| | | | | | | | 585,142 | |
| IT SERVICES—1.3% | | | | | | | | |
| Cardtronics plc - Class A (a) | | | 3,300 | | | | 61,116 | |
| CSG Systems International, Inc. | | | 2,660 | | | | 116,561 | |
| ExlService Holdings, Inc. (a) | | | 2,360 | | | | 142,426 | |
| Perficient, Inc. (a) | | | 3,200 | | | | 61,024 | |
| Sykes Enterprises, Inc. (a) | | | 3,400 | | | | 106,930 | |
| TeleTech Holdings, Inc. | | | 1,960 | | | | 78,890 | |
| Virtusa Corp. (a) | | | 2,370 | | | | 104,470 | |
| | | | | | | | 671,417 | |
| LEISURE PRODUCTS—0.3% | | | | | | | | |
| Callaway Golf Co. | | | 8,680 | | | | 120,912 | |
| Nautilus, Inc. (a) | | | 2,630 | | | | 35,111 | |
| | | | | | | | 156,023 | |
| LIFE SCIENCES TOOLS & SERVICES—0.4% | | | | | | | | |
| Cambrex Corp. (a) | | | 2,535 | | | | 121,680 | |
| Luminex Corp. | | | 4,580 | | | | 90,226 | |
| | | | | | | | 211,906 | |
| MACHINERY—5.9% | | | | | | | | |
| Actuant Corp. - Class A | | | 4,520 | | | | 114,356 | |
| Alamo Group, Inc. | | | 690 | | | | 77,880 | |
| Albany International Corp. - Class A | | | 2,090 | | | | 128,431 | |
| Astec Industries, Inc. | | | 1,530 | | | | 89,505 | |
| Barnes Group, Inc. | | | 3,690 | | | | 233,466 | |
| Briggs & Stratton Corp. | | | 3,210 | | | | 81,438 | |
| Chart Industries, Inc. (a) | | | 2,270 | | | | 106,372 | |
| CIRCOR International, Inc. | | | 1,270 | | | | 61,824 | |
| EnPro Industries, Inc. | | | 1,980 | | | | 185,150 | |
| ESCO Technologies, Inc. | | | 1,900 | | | | 114,475 | |
| Federal Signal Corp. | | | 4,870 | | | | 97,838 | |
| Greenbrier Cos., Inc. (The) | | | 2,030 | | | | 108,199 | |
| Harsco Corp. (a) | | | 6,320 | | | | 117,868 | |
| Hillenbrand, Inc. | | | 5,160 | | | | 230,652 | |
| John Bean Technologies Corp. | | | 2,085 | | | | 231,018 | |
| Lindsay Corp. | | | 840 | | | | 74,088 | |
| Lydall, Inc. (a) | | | 1,350 | | | | 68,513 | |
| Mueller Industries, Inc. | | | 4,570 | | | | 161,915 | |
| Proto Labs, Inc. (a) | | | 1,720 | | | | 177,160 | |
| SPX Corp. (a) | | | 3,480 | | | | 109,237 | |
| SPX FLOW, Inc. (a) | | | 2,860 | | | | 135,993 | |
| Standex International Corp. | | | 980 | | | | 99,813 | |
| Tennant Co. | | | 1,310 | | | | 95,171 | |
| Wabash National Corp. | | | 4,440 | | | | 96,348 | |
| Watts Water Technologies, Inc. - Class A | | | 2,220 | | | | 168,609 | |
| | | | | | | | 3,165,319 | |
| MARINE—0.2% | | | | | | | | |
| Matson, Inc. | | | 3,030 | | | | 90,415 | |
| | | | | | | | | |
| MEDIA—0.8% | | | | | | | | |
| Gannett Co., Inc. | | | 8,110 | | | | 93,995 | |
| New Media Investment Group, Inc. | | | 4,350 | | | | 72,993 | |
| Scholastic Corp. | | | 2,210 | | | | 88,643 | |
| Time, Inc. | | | 4,370 | | | | 80,627 | |
| World Wrestling Entertainment, Inc. - Class A | | | 2,990 | | | | 91,434 | |
| | | | | | | | 427,692 | |
| METALS & MINING—0.4% | | | | | | | | |
| Materion Corp. | | | 2,680 | | | | 130,248 | |
| Olympic Steel, Inc. | | | 4,480 | | | | 96,275 | |
| | | | | | | | 226,523 | |
| MORTGAGE REAL ESTATE INVESTMENT TRUSTS (REITS)—0.4% |
| Capstead Mortgage Corp. | | | 12,570 | | | | 108,731 | |
| Four Corners Property Trust, Inc. | | | 4,110 | | | | 105,627 | |
| | | | | | | | 214,358 | |
| MULTI-LINE RETAIL—0.5% | | | | | | | | |
| Ollie's Bargain Outlet Holdings, Inc. (a) | | | 4,875 | | | | 259,594 | |
| | | | | | | | | |
| MULTI-UTILITIES—0.5% | | | | | | | | |
| Avista Corp. | | | 5,040 | | | | 259,510 | |
| | | | | | | | | |
| OIL, GAS & CONSUMABLE FUELS—0.3% | | | | | | | | |
| Cloud Peak Energy, Inc. (a) | | | 22,230 | | | | 98,924 | |
| Green Plains, Inc. | | | 3,100 | | | | 52,235 | |
| | | | | | | | 151,159 | |
| PAPER & FOREST PRODUCTS—1.4% | | | | | | | | |
| Boise Cascade Co. | | | 3,890 | | | | 155,211 | |
| Clearwater Paper Corp. (a) | | | 1,730 | | | | 78,542 | |
| Deltic Timber Corp. | | | 1,350 | | | | 123,593 | |
| KapStone Paper and Packaging Corp. | | | 7,190 | | | | 163,141 | |
| Neenah Paper, Inc. | | | 2,500 | | | | 226,625 | |
| | | | | | | | 747,112 | |
| PERSONAL PRODUCTS—0.3% | | | | | | | | |
| Medifast, Inc. | | | 2,310 | | | | 161,261 | |
| | | | | | | | | |
| PHARMACEUTICALS—2.6% | | | | | | | | |
| Amphastar Pharmaceuticals, Inc. (a) | | | 3,400 | | | | 65,416 | |
See accompanying notes to financial statements.
42
Schedule of Investments, continued
Praxis Small Cap Index Fund
December 31, 2017
| | | SHARES | | | FAIR
VALUE | |
| COMMON STOCKS—98.4%, continued | | | | | | |
| PHARMACEUTICALS—2.6%, continued | | | | | | |
| Depomed, Inc. (a) | | | 4,530 | | | $ | 36,467 | |
| Impax Laboratories, Inc. (a) | | | 5,670 | | | | 94,406 | |
| Innoviva, Inc. (a) | | | 9,270 | | | | 131,541 | |
| Lannett Co., Inc. (a) | | | 2,180 | | | | 50,576 | |
| Medicines Co. (The)(a) | | | 4,760 | | | | 130,138 | |
| Nektar Therapeutics (a) | | | 10,150 | | | | 606,158 | |
| Phibro Animal Health Corp. - Class A | | | 1,640 | | | | 54,940 | |
| Sucampo Pharmaceuticals, Inc. - Class A (a) | | | 4,560 | | | | 81,852 | |
| Supernus Pharmaceuticals, Inc. (a) | | | 3,420 | | | | 136,287 | |
| | | | | | | | 1,387,781 | |
| PROFESSIONAL SERVICES—2.1% | | | | | | | | |
| Exponent, Inc. | | | 2,020 | | | | 143,622 | |
| Insperity, Inc. | | | 2,780 | | | | 159,433 | |
| Kelly Services, Inc. - Class A | | | 2,590 | | | | 70,629 | |
| Korn/Ferry International | | | 4,520 | | | | 187,038 | |
| Navigant Consulting, Inc. (a) | | | 4,350 | | | | 84,433 | |
| On Assignment, Inc. (a) | | | 3,380 | | | | 217,233 | |
| TrueBlue, Inc. (a) | | | 3,620 | | | | 99,550 | |
| WageWorks, Inc. (a) | | | 2,490 | | | | 154,380 | |
| | | | | | | | 1,116,318 | |
| REAL ESTATE INVESTMENT TRUSTS (REIT)—0.1% | | | | | | | | |
| Armada Hoffler Properties, Inc. | | | 3,020 | | | | 46,901 | |
| | | | | | | | | |
| REAL ESTATE MANAGEMENT & DEVELOPMENT—0.1% |
| RE/MAX Holdings, Inc. - Class A | | | 1,260 | | | | 61,110 | |
| | | | | | | | | |
| ROAD & RAIL—0.8% | | | | | | | | |
| ArcBest Corp. | | | 1,760 | | | | 62,920 | |
| Heartland Express, Inc. | | | 5,750 | | | | 134,205 | |
| Marten Transport Ltd. | | | 3,300 | | | | 66,990 | |
| Roadrunner Transportation Systems, Inc. (a) | | | 6,890 | | | | 53,122 | |
| Saia, Inc. (a) | | | 1,850 | | | | 130,887 | |
| | | | | | | | 448,124 | |
| SEMICONDUCTORS & SEMICONDUCTOR EQUIPMENT—3.2% |
| Advanced Energy Industries, Inc. (a) | | | 2,880 | | | | 194,342 | |
| Axcelis Technologies, Inc. (a) | | | 3,000 | | | | 86,100 | |
| Brooks Automation, Inc. | | | 5,540 | | | | 132,129 | |
| Cabot Microelectronics Corp. | | | 1,630 | | | | 153,350 | |
| CEVA, Inc. (a) | | | 1,740 | | | | 80,301 | |
| Diodes, Inc. (a) | | | 2,910 | | | | 83,430 | |
| Kulicke & Soffa Industries, Inc. (a) | | | 5,390 | | | | 131,166 | |
| MaxLinear, Inc. - Class A (a) | | | 3,800 | | | | 100,396 | |
| Nanometrics, Inc. (a) | | | 2,070 | | | | 51,584 | |
| Power Integrations, Inc. | | | 1,970 | | | | 144,893 | |
| Rambus, Inc. (a) | | | 7,285 | | | | 103,593 | |
| Rudolph Technologies, Inc. (a) | | | 2,700 | | | | 64,530 | |
| Semtech Corp. (a) | | | 4,710 | | | | 161,082 | |
| SolarEdge Technologies, Inc. (a) | | | 3,170 | | | | 119,034 | |
| Veeco Instruments, Inc. (a) | | | 3,481 | | | | 51,693 | |
| Xperi Corp. | | | 3,380 | | | | 82,472 | |
| | | | | | | | 1,740,095 | |
| SOFTWARE—2.0% | | | | | | | | |
| Agilysys, Inc. (a) | | | 6,190 | | | | 76,013 | |
| Barracuda Networks, Inc. (a) | | | 3,940 | | | | 108,350 | |
| Bottomline Technologies (de), Inc. (a) | | | 3,210 | | | | 111,323 | |
| Ebix, Inc. | | | 1,900 | | | | 150,575 | |
| MicroStrategy, Inc. - Class A (a) | | | 680 | | | | 89,284 | |
| | | | | | | | | |
| SOFTWARE—2.0%, continued | | | | | | | | |
| Monotype Imaging Holdings, Inc. | | | 3,610 | | | | 87,001 | |
| Progress Software Corp. | | | 3,880 | | | | 165,171 | |
| Qualys, Inc. (a) | | | 2,220 | | | | 131,757 | |
| Synchronoss Technologies, Inc. (a) | | | 3,140 | | | | 28,072 | |
| TiVo Corp. | | | 8,170 | | | | 127,452 | |
| | | | | | | | 1,074,998 | |
| SPECIALTY RETAIL—4.7% | | | | | | | | |
| Abercrombie & Fitch Co. - Class A | | | 5,900 | | | | 102,837 | |
| Asbury Automotive Group, Inc. (a) | | | 1,760 | | | | 112,640 | |
| Ascena Retail Group, Inc. (a) | | | 23,190 | | | | 54,497 | |
| Barnes & Noble Education, Inc. (a) | | | 3,000 | | | | 24,720 | |
| Barnes & Noble, Inc. | | | 6,220 | | | | 41,674 | |
| Caleres, Inc. | | | 3,100 | | | | 103,788 | |
| Children's Place, Inc. (The) | | | 1,390 | | | | 202,036 | |
| DSW, Inc. - Class A | | | 2,890 | | | | 61,875 | |
| Express, Inc. (a) | | | 6,430 | | | | 65,264 | |
| Finish Line, Inc. (The) - Class A | | | 8,500 | | | | 123,505 | |
| Five Below, Inc. (a) | | | 3,920 | | | | 259,974 | |
| Francesca's Holdings Corp. (a) | | | 5,970 | | | | 43,641 | |
| Genesco, Inc. (a) | | | 1,570 | | | | 51,025 | |
| Group 1 Automotive, Inc. | | | 1,380 | | | | 97,939 | |
| Guess?, Inc. | | | 9,260 | | | | 156,309 | |
| Hibbett Sports, Inc. (a) | | | 3,770 | | | | 76,908 | |
| Lithia Motors, Inc. - Class A | | | 1,650 | | | | 187,423 | |
| Lumber Liquidators Holdings, Inc. (a) | | | 2,930 | | | | 91,973 | |
| MarineMax, Inc. (a) | | | 2,510 | | | | 47,439 | |
| Monro Muffler Brake, Inc. | | | 2,320 | | | | 132,124 | |
| RH (a) | | | 2,000 | | | | 172,420 | |
| Sleep Number Corp. (a) | | | 3,400 | | | | 127,806 | |
| Tailored Brands, Inc. | | | 5,280 | | | | 115,262 | |
| Tile Shop Holdings, Inc. | | | 4,970 | | | | 47,712 | |
| Vitamin Shoppe, Inc. (a) | | | 8,290 | | | | 36,476 | |
| | | | | | | | 2,537,267 | |
| TECHNOLOGY HARDWARE, STORAGE & PERIPHERALS—0.5% |
| Cray, Inc. (a) | | | 3,130 | | | | 75,746 | |
| Electronics For Imaging, Inc. (a) | | | 3,390 | | | | 100,107 | |
| Super Micro Computer, Inc. (a) | | | 4,440 | | | | 92,907 | |
| | | | | | | | 268,760 | |
| TEXTILES, APPAREL & LUXURY GOODS—1.8% | | | | | | | | |
| Crocs, Inc. (a) | | | 6,870 | | | | 86,837 | |
| G-III Apparel Group Ltd. (a) | | | 5,110 | | | | 188,508 | |
| Movado Group, Inc. | | | 1,630 | | | | 52,486 | |
| Oxford Industries, Inc. | | | 1,855 | | | | 139,477 | |
| Steven Madden Ltd. (a) | | | 5,170 | | | | 241,439 | |
| Wolverine World Wide, Inc. | | | 7,210 | | | | 229,855 | |
| | | | | | | | 938,602 | |
| THRIFTS & MORTGAGE FINANCE—1.9% | | | | | | | | |
| BofI Holding, Inc. (a) | | | 3,910 | | | | 116,909 | |
| Dime Community Bancshares, Inc. | | | 2,440 | | | | 51,118 | |
| HomeStreet, Inc. (a) | | | 2,050 | | | | 59,348 | |
| LendingTree, Inc. (a) | | | 950 | | | | 323,427 | |
| Northwest Bancshares, Inc. | | | 7,750 | | | | 129,657 | |
| Provident Financial Services, Inc. | | | 4,170 | | | | 112,465 | |
| TrustCo Bank Corp. | | | 11,340 | | | | 104,328 | |
| Walker & Dunlop, Inc. (a) | | | 2,200 | | | | 104,500 | |
| | | | | | | | 1,001,752 | |
See accompanying notes to financial statements.
43
Schedule of Investments, continued
Praxis Small Cap Index Fund
December 31, 2017
| | | SHARES | | | FAIR
VALUE | |
| COMMON STOCKS—98.4%, continued | | | | | | |
| TRADING COMPANIES & DISTRIBUTORS—0.5% | | | | | | |
| Applied Industrial Technologies, Inc. | | | 2,920 | | | $ | 198,852 | |
| DXP Enterprises, Inc. (a) | | | 1,340 | | | | 39,624 | |
| Veritiv Corp. (a) | | | 1,190 | | | | 34,391 | |
| | | | | | | | 272,867 | |
| WATER UTILITIES—0.6% | | | | | | | | |
| American States Water Co. | | | 2,420 | | | | 140,142 | |
| California Water Service Group | | | 4,300 | | | | 195,005 | |
| | | | | | | | 335,147 | |
| TOTAL COMMON STOCKS (COST $47,730,838) | | | | | | | 52,601,631 | |
| | | COUPON | | | MATURITY | | | PRINCIPAL AMOUNT | | | FAIR
VALUE | |
| CORPORATE NOTES—0.8% | | | | | | | | | | | | |
| COMMUNITY DEVELOPMENT—0.8% |
| Calvert Social Investment Foundation, Inc. (b) | | | 1.000 | % | | | 06/15/18 | | | $ | 270,000 | | | $ | 270,000 | |
| Calvert Social Investment Foundation, Inc. (b) | | | 1.500 | % | | | 06/15/20 | | | | 175,000 | | | | 175,000 | |
| TOTAL CORPORATE NOTES (COST $445,000) | | | | | | | | | | | | | | | 445,000 | |
| | | | | | | | | | | | | | | | | |
| TOTAL INVESTMENTS (COST $48,175,838—Unrealized gain/loss $4,870,793)—99.2% | | | | | | | $ | 53,046,631 | |
| Other Assets in Excess of Liabilities—0.8% | | | | | | | | | | | | | | | 417,804 | |
| NET ASSETS—100.0% | | | | | | | | | | | | | | $ | 53,464,435 | |
| (a) | Non-income producing security. |
| (b) | Restricted and illiquid securities not registered under the Securities Act of 1933 are as follows: |
| | | Acquisition
Date | | Current
Cost | | | Fair
Value | | | % of Net
Assets | |
| Calvert Social Investment Foundation, Inc. 1.00%, 06/15/18 | | 06/15/17 | | $ | 270,000 | | | $ | 270,000 | | | | 0.5 | % |
| Calvert Social Investment Foundation, Inc. 1.50%, 06/15/20 | | 06/15/17 | | | 175,000 | | | | 175,000 | | | | 0.3 | % |
| | | | | $ | 445,000 | | | $ | 445,000 | | | | 0.8 | % |
plc —Public Liability Company
REIT —Real Estate Investment Trust
See accompanying notes to financial statements.
44
Praxis Genesis Portfolios
Annual Report to Shareholders
Portfolio Managers’ Commentary (unaudited)
In 2017, all asset classes did very well. The U.S. economy started slowly in 2017, just as it did in 2016, but economic growth was much stronger after that initial weakness. After a poor three-year period between 2013 and 2015, emerging market stocks bounced back with the MSCI Emerging Market Index up a solid 11.2 percent in 2016 and up 37.2 percent in 2017. Large growth stocks also notched a strong year with the S&P 500 Growth Index up 27.4 percent. The Standard and Poor’s (S&P) 500 Index was up 21.8 percent.
As is normally the case, in the U.S. equity market cap, size and style mattered. The S&P SmallCap 600 Index returned 13.2 percent, which was quite a bit lower than the S&P 500 Index. Style also mattered a great deal as the S&P 500 Value Index rose 15.4 percent versus 27.4 percent for the S&P Growth Index.
The developed markets internationally didn’t do as well as emerging markets in 2017. The MSCI Emerging Markets Index was up 37.2 percent while the MSCI EAFE Index was up 25.3 percent. Over the last five years, developed markets have significantly outpaced emerging markets, with an 8.4 percent annualized return versus a 4.7 percent annualized return.
The Bloomberg Barclays Aggregate Bond Index (the broad U.S. fixed income benchmark) returned 3.5 percent for 2017. The interest rate curve flattened with the 6-month U.S. Treasury bill yield increasing 0.90 percent and the yield on the 30-year U.S. Treasury note decreasing by 0.33 percent. The 10-year U.S. Treasury yield started 2017 at 2.45 percent and it ended at 2.41 percent. Around the middle of 2016 there was about $12 trillion of negative yielding debt across the world, but 2017 ended with just $8 trillion. Most European 10-year debt now has a positive yield, while the Swiss 10-year government bond was still slightly negative as of the end of the year.
The asset allocation strategies pursued by the Genesis Portfolios (the “Portfolios”) do not lend themselves to easy benchmarking with a public multi-asset class index; but we have found that the S&P Target Risk indices are the best available option.
The Genesis Conservative Portfolio’s Class A Shares (Without Load) returned 8.36 percent which underperformed both the S&P Target Risk Conservative Index return of 9.87 percent and the Conservative Composite Benchmark’s return of 8.96 percent.
The Genesis Balanced Portfolio’s Class A Shares (Without Load) return was 13.38 percent which underperformed both the S&P Target Risk Growth Index’s return of 16.04 percent and the Balanced Composite Benchmark return of 14.25 percent.
The Genesis Growth Portfolio’s Class A Shares (Without Load) return was 16.71 percent which underperformed the S&P Target Risk Aggressive Index’s return of 20.12 percent and the Growth Composite Benchmark return of 17.91 percent.
The allocation to fixed income was the largest detractor to relative performance on an absolute basis for each Portfolio because fixed income’s lower performance. The biggest positive contributor to relative performance was U.S. growth stocks which performed extremely well in 2017.
The underlying investments in the Genesis Portfolios are the Praxis Impact Bond Fund, the Praxis Growth Index Fund, the Praxis Value Index Fund, Praxis Small Cap Index Fund, and the Praxis International Index Fund (the “Funds”). These Funds are held in proportions matching the risk profile of each of the Genesis Portfolios. We take a long-term approach in assigning weights to the various underlying Funds, relying on the premise that the higher risk equity funds are expected to generate higher long-term returns than the lower risk fixed income investments. This worked again in 2017 as riskier assets were better performers than fixed income.
Each of the Portfolios benefited from the relative outperformance of the Praxis Value Index Fund and the Praxis Impact Bond Fund versus their indices. The Praxis Growth Index Fund underperformed its benchmark, and the Praxis International Index Fund and the Praxis Small Cap Index Fund underperformed their benchmarks by a wider margin.
Benjamin Bailey, CFA®
Praxis Genesis Portfolios Co-Manager
Praxis Mutual Funds
Delmar King
Praxis Genesis Portfolios Co-Manager
Praxis Mutual Funds
The views expressed are those of the portfolio manager as of Dec. 31, 2017, are subject to change, and may differ from the views of other portfolio managers or Everence Capital Management as a whole. These opinions are not intended to be a forecast of future events, a guarantee of future results, or investment advice. All data referenced are from sources deemed to be reliable but cannot be guaranteed. Securities and sectors referenced should not be construed as a solicitation or recommendation or be used as the sole basis for any investment decision.
45
Praxis Genesis Conservative Portfolio
Performance Review (unaudited)
Growth of $10,000 investment from 12/31/09 to 12/31/17
This chart represents historical performance of a hypothetical investment of $10,000 in Class A Shares (adjusted for the maximum sales charge of 5.25%) of the Fund and Index from 12/31/09 to 12/31/17, and includes the reinvestment of dividends and capital gains.
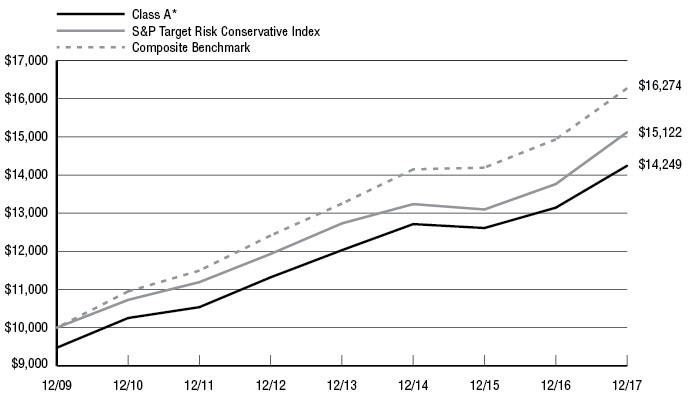
| | | | Average Annual Returns | | |
| | Inception Date | One
Year
Ended | Three
Years
Ended | Five
Years
Ended | Since Inception | Expense
Ratio**
Gross / Net |
| Praxis Genesis Conservative Portfolio | | | | | | | |
| Class A * | 12/31/09 | 2.67% | 2.00% | 3.57% | 4.53% | 1.12% | 1.12% |
| Class A (Without Load) | 12/31/09 | 8.36% | 3.86% | 4.70% | 5.23% | | |
| S&P Target Risk Conservative Index 1 | | 9.87% | 4.53% | 4.85% | 5.31% | | |
| Conservative Composite Benchmark 2 | | 8.96% | 4.78% | 5.56% | 6.28% | | |
Past performance does not guarantee future results. The performance data quoted represents past performance and current returns may be lower or higher. The investment return and principal value will fluctuate so that an investor’s shares, when redeemed, may be worth more or less than the original cost. These performance figures do not reflect the deduction of taxes that a shareholder would pay on fund distributions or the redemption of fund shares. To obtain performance information current to the most recent month end, please visit www.praxismutualfunds.com. Indexes are unmanaged, do not incur fees, and it is not possible to invest directly in an index.
The total returns shown reflect any expenses that were contractually or voluntarily reduced, reimbursed or paid by any party during the periods presented. In such instances, and without activity, the total returns would have been lower.
| * | The total return figures shown reflect the maximum sales charge applicable to Class A Shares. Class A Shares have a maximum sales charge on purchases of 5.25%. |
| ** | Reflects the expense ratios as reported in the Prospectus dated April 30, 2017. Contractual fee waivers are in effect from May 1, 2017 through April 30, 2018 for Class A. |
| 1 | S&P Target Risk Conservative Index seeks to emphasize exposure to fixed income, in order to produce a current income stream and avoid excessive volatility of returns. Equities are included to protect long-term purchasing power. The series is comprised of four multi-asset class indices. The index is comprised exclusively of exchange traded funds. |
| 2 | The Conservative Composite Benchmark is comprised of unmanaged indices that correspond to the Portfolio’s model allocation and effective January 1, 2017, consists of the Bloomberg Barclays U.S. Aggregate Bond Index (the “Barclays Aggregate Bond Index”) (70 percent), the MSCI ACWI ex USA Index (Net) (7.5 percent), the S&P 500 Index (20 percent) and the S&P Small Cap 600 Index (2.5 percent). The composite benchmark from April 30, 2013 to December 31, 2016 consisted of the Barclays Aggregate Bond Index (70 percent), the MSCI ACWI ex USA Index (Net) (7.5 percent), the S&P 500 Index (20 percent) and the Russell 2000 Index (2.5 percent). The composite benchmark prior to April 30, 2013 consisted of the Barclays Aggregate Bond Index (70 percent), the MSCI EAFE Index (7.5 percent), the Russell 1000 Index (20 percent) and the Russell 2000 Index (2.5 percent). |
The above index is for illustrative purposes only and does not reflect the deduction of expenses associated with a mutual fund, such as investment management and fund accounting fees. The Fund’s performance reflects the deduction of these services. An investor cannot invest directly in an index, although they can invest in its underlying securities.
46
Schedule of Investments
Praxis Genesis Conservative Portfolio
December 31, 2017
| | | SHARES | | FAIR
VALUE |
| MUTUAL FUNDS—100.0% | | | | | | | | |
| DEBT FUND—69.9% | | | | | | | | |
| Praxis Impact Bond Fund - Class I | | | 1,544,425 | | | $ | 15,984,801 | |
| | | | | | | | | |
| EQUITY FUND—30.1% | | | | | | | | |
| Praxis Growth Index Fund - Class I | | | 90,641 | | | | 2,103,774 | |
| Praxis International Index Fund - Class I | | | 178,603 | | | | 2,098,591 | |
| Praxis Small Cap Index Fund - Class I | | | 61,270 | | | | 573,486 | |
| Praxis Value Index Fund - Class I | | | 154,651 | | | | 2,124,902 | |
| | | | | | | | 6,900,753 | |
| TOTAL MUTUAL FUNDS (COST $20,474,199) | | | | | | | 22,885,554 | |
| | | | | | | | | |
| TOTAL INVESTMENTS (COST $20,474,199—Unrealized gain/loss $2,411,355)—100.0% | | | | | | $ | 22,885,554 | |
| Liabilities in Excess of Other Assets—(0.0%) (a) | | | | | | | (4,841 | ) |
| NET ASSETS—100.0% | | | | | | $ | 22,880,713 | |
| (a) | Percentage rounds to less than 0.1%. |
See accompanying notes to financial statements.
47
Praxis Genesis Balanced Portfolio
Performance Review (unaudited)
Growth of $10,000 investment from 12/31/09 to 12/31/17
This chart represents historical performance of a hypothetical investment of $10,000 in Class A Shares (adjusted for the maximum sales charge of 5.25%) of the Fund and Index from 12/31/09 to 12/31/17, and includes the reinvestment of dividends and capital gains.
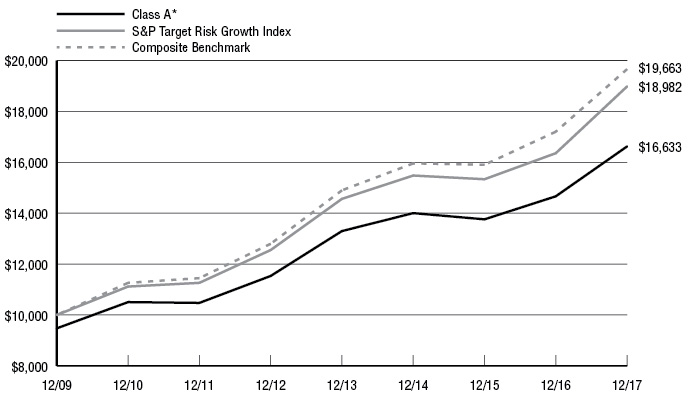
| | | | Average Annual Returns | | |
| | Inception Date | One
Year
Ended | Three
Years
Ended | Five
Years
Ended | Since Inception | Expense
Ratio**
Gross / Net |
| Praxis Genesis Balanced Portfolio | | | | | | | |
| Class A * | 12/31/09 | 7.39% | 4.00% | 6.43% | 6.57% | 1.08% | 1.08% |
| Class A (Without Load) | 12/31/09 | 13.38% | 5.89% | 7.59% | 7.28% | | |
| S&P Target Risk Growth Index 1 | | 16.04% | 7.03% | 8.62% | 8.34% | | |
| Balanced Composite Benchmark 2 | | 14.25% | 7.21% | 8.97% | 8.82% | | |
Past performance does not guarantee future results. The performance data quoted represents past performance and current returns may be lower or higher. The investment return and principal value will fluctuate so that an investor’s shares, when redeemed, may be worth more or less than the original cost. These performance figures do not reflect the deduction of taxes that a shareholder would pay on fund distributions or the redemption of fund shares. To obtain performance information current to the most recent month end, please visit www.praxismutualfunds.com. Indexes are unmanaged, do not incur fees, and it is not possible to invest directly in an index.
The total returns shown reflect any expenses that were contractually or voluntarily reduced, reimbursed or paid by any party during the periods presented. In such instances, and without activity, the total returns would have been lower.
| * | The total return figures shown reflect the maximum sales charge applicable to Class A Shares. Class A Shares have a maximum sales charge on purchases of 5.25%. |
| ** | Reflects the expense ratios as reported in the Prospectus dated April 30, 2017. Contractual fee waivers are in effect from May 1, 2017 through April 30, 2018 for Class A. |
| 1 | S&P Target Risk Growth Index seeks to provide increased exposure to equities, while using fixed income to dampen risk. The series is comprised of four multi-asset class indices. The index is comprised exclusively of exchange trade funds. |
| 2 | The Balanced Composite Benchmark is comprised of unmanaged indices that correspond to the Portfolio’s model allocation and effective January 1, 2017, consists of the Bloomberg Barclays U.S. Aggregate Bond Index (the “Barclays Aggregate Bond Index”) (40 percent), the MSCI ACWI ex USA Index (Net) (15 percent), the S&P 500 Index (35 percent) and the S&P Small Cap 600 Index (10 percent). The composite benchmark from April 30, 2013 to December 31, 2016 consisted of the Barclays Aggregate Bond Index (40 percent), the MSCI ACWI ex USA Index (Net) (15 percent), the S&P 500 Index (35 percent) and the Russell 2000 Index (10 percent). The composite benchmark prior to April 30, 2013 consisted of the Barclays Aggregate Bond Index (40 percent), the MSCI EAFE Index (15 percent), the Russell 1000 Index (35 percent) and the Russell 2000 Index (10 percent). |
The above index is for illustrative purposes only and does not reflect the deduction of expenses associated with a mutual fund, such as investment management and fund accounting fees. The Fund’s performance reflects the deduction of these services. An investor cannot invest directly in an index, although they can invest in its underlying securities.
48
Schedule of Investments
Praxis Genesis Balanced Portfolio
December 31, 2017
| | | SHARES | | FAIR
VALUE |
| MUTUAL FUNDS—100.0% | | | | | | | | |
| DEBT FUND—39.8% | | | | | | | | |
| Praxis Impact Bond Fund - Class I | | | 2,817,526 | | | $ | 29,161,390 | |
| | | | | | | | | |
| EQUITY FUND—60.2% | | | | | | | | |
| Praxis Growth Index Fund - Class I | | | 500,450 | | | | 11,615,446 | |
| Praxis International Index Fund - Class I | | | 1,139,501 | | | | 13,389,138 | |
| Praxis Small Index Cap Fund - Class I | | | 781,854 | | | | 7,318,149 | |
| Praxis Value Index Fund - Class I | | | 854,194 | | | | 11,736,630 | |
| | | | | | | | 44,059,363 | |
| TOTAL MUTUAL FUNDS (COST $59,544,125) | | | | | | $ | 73,220,753 | |
| | | | | | | | | |
| TOTAL INVESTMENTS (COST $59,544,125—Unrealized gain/loss $13,676,628)—100.0% | | | | | | $ | 73,220,753 | |
| Liabilities in Excess of Other Assets—(0.0%) (a) | | | | | | | (27,597 | ) |
| NET ASSETS—100.0% | | | | | | $ | 73,193,156 | |
| (a) | Percentage rounds to less than 0.1%. |
See accompanying notes to financial statements.
49
Praxis Genesis Growth Portfolio
Performance Review (unaudited)
Growth of $10,000 investment from 12/31/09 to 12/31/17
This chart represents historical performance of a hypothetical investment of $10,000 in Class A Shares (adjusted for the maximum sales charge of 5.25%) of the Fund and Index from 12/31/09 to 12/31/17, and includes the reinvestment of dividends and capital gains.
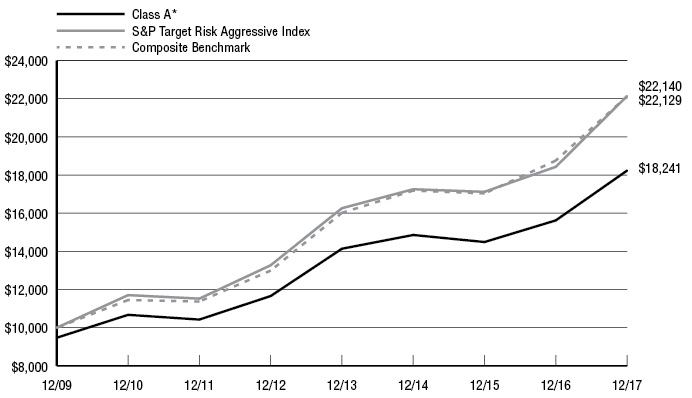
| | | | Average Annual Returns | | |
| | Inception Date | One
Year
Ended | Three
Years
Ended | Five
Years
Ended | Since Inception | Expense
Ratio**
Gross / Net |
| Praxis Genesis Growth Portfolio | | | | | | | |
| Class A * | 12/31/09 | 10.55% | 5.16% | 8.19% | 7.80% | 1.13% | 1.13% |
| Class A (Without Load) | 12/31/09 | 16.71% | 7.06% | 9.36% | 8.53% | | |
| S&P Target Risk Aggressive Index 1 | | 20.12% | 8.66% | 10.78% | 10.45% | | |
| Growth Composite Benchmark 2 | | 17.91% | 8.79% | 11.24% | 10.44% | | |
Past performance does not guarantee future results. The performance data quoted represents past performance and current returns may be lower or higher. The investment return and principal value will fluctuate so that an investor’s shares, when redeemed, may be worth more or less than the original cost. These performance figures do not reflect the deduction of taxes that a shareholder would pay on fund distributions or the redemption of fund shares. To obtain performance information current to the most recent month end, please visit www.praxismutualfunds.com. Indexes are unmanaged, do not incur fees, and it is not possible to invest directly in an index.
The total returns shown reflect any expenses that were contractually or voluntarily reduced, reimbursed or paid by any party during the periods presented. In such instances, and without activity, the total returns would have been lower.
| * | The total return figures shown reflect the maximum sales charge applicable to Class A Shares. Class A Shares have a maximum sales charge on purchases of 5.25%. |
| ** | Reflects the expense ratios as reported in the Prospectus dated April 30, 2017. Contractual fee waivers are in effect from May 1, 2017 through April 30, 2018 for Class A. |
| 1 | S&P Target Risk Aggressive Index seeks to emphasize exposure to equities, maximizing opportunities for long-term capital accumulation. It may include small allocations in fixed income to enhance portfolio efficiency. The series is comprised of four multi-asset class indices. The index is comprised exclusively of exchange traded funds. |
| 2 | The Growth Composite Benchmark is comprised of unmanaged indices that correspond to the Portfolio’s model allocation and effective January 1, 2017, consists of the Bloomberg Barclays U.S. Aggregate Bond Index (the “Barclays Aggregate Bond Index”) (20 percent), the MSCI ACWI ex USA Index (Net) (20 percent), the S&P 500 Index (45 percent) and the S&P Small Cap 600 Index (15 percent). The composite benchmark from April 30, 2013 to December 31, 2016 consisted of the Barclays Aggregate Bond Index (20 percent), the MSCI ACWI ex USA Index (Net) (20 percent), the S&P 500 Index (45 percent) and the Russell 2000 Index (15 percent). The composite benchmark prior to April 30, 2013 consisted of the Barclays Aggregate Bond Index (20 percent), the MSCI EAFE Index (20 percent), the Russell 1000 Index (45 percent) and the Russell 2000 Index (15 percent). |
The above index is for illustrative purposes only and does not reflect the deduction of expenses associated with a mutual fund, such as investment management and fund accounting fees. The Fund’s performance reflects the deduction of these services. An investor cannot invest directly in an index, although they can invest in its underlying securities.
50
Schedule of Investments
Praxis Genesis Growth Portfolio
December 31, 2017
| | | SHARES | | FAIR
VALUE |
| MUTUAL FUNDS—100.1% | | | | | | | | |
| DEBT FUND—19.9% | | | | | | | | |
| Praxis Impact Bond Fund - Class I | | | 1,248,307 | | | $ | 12,919,979 | |
| | | | | | | | | |
| EQUITY FUND—80.2% | | | | | | | | |
| Praxis Growth Index Fund - Class I | | | 567,954 | | | | 13,182,219 | |
| Praxis International Index Fund - Class I | | | 1,346,415 | | | | 15,820,372 | |
| Praxis Small Index Cap Fund - Class I | | | 1,038,878 | | | | 9,723,894 | |
| Praxis Value Index Fund - Class I | | | 969,482 | | | | 13,320,676 | |
| | | | | | | | 52,047,161 | |
| TOTAL MUTUAL FUNDS (COST $49,823,304) | | | | | | | 64,967,140 | |
| | | | | | | | | |
| TOTAL INVESTMENTS (COST $49,823,304—Unrealized gain/loss $15,143,836)—100.1% | | | | | | $ | 64,967,140 | |
| Liabilities in Excess of Other Assets—(0.1%) | | | | | | | (32,599 | ) |
| NET ASSETS—100.0% | | | | | | $ | 64,934,541 | |
See accompanying notes to financial statements.
51
Statements of Assets & Liabilities
December 31, 2017
| | | Praxis
Impact
Bond Fund | | Praxis International
Index Fund | | Praxis
Value
Index Fund | | Praxis
Growth Index
Fund | | Praxis
Small Cap
Index Fund |
| Assets | | | | | | | | | | | | | | | | | | | | |
| Total investments in unaffiliated securities, at cost | | $ | 500,719,266 | | | $ | 210,629,431 | | | $ | 145,688,353 | | | $ | 152,492,119 | | | $ | 48,175,838 | |
| Investments in unaffiliated securities, at fair value | | $ | 508,206,374 | | | $ | 282,271,205 | | | $ | 188,421,200 | | | $ | 257,545,133 | | | $ | 53,046,631 | |
| Cash | | | 11,291,376 | | | | 3,459,220 | | | | 2,037,109 | | | | 1,439,247 | | | | 174,098 | |
| Receivable for investments sold | | | 674 | | | | — | | | | — | | | | 313,217 | | | | — | |
| Receivable for capital shares sold | | | 1,228,951 | | | | 701,669 | | | | 1,388,973 | | | | 702,050 | | | | 237,961 | |
| Receivable for dividends and interest | | | 4,068,230 | | | | 259,223 | | | | 306,461 | | | | 216,646 | | | | 67,239 | |
| Receivable for tax reclaims | | | — | | | | 213,554 | | | | — | | | | 14,418 | | | | — | |
| Prepaid expenses | | | 47,921 | | | | 37,702 | | | | 25,240 | | | | 30,753 | | | | 19,490 | |
| Total Assets | | | 524,843,526 | | | | 286,942,573 | | | | 192,178,983 | | | | 260,261,464 | | | | 53,545,419 | |
| | | | | | | | | | | | | | | | | | | | | |
| Liabilities | | | | | | | | | | | | | | | | | | | | |
| Distributions payable | | | 461,295 | | | | 2,162,102 | | | | 1,193,284 | | | | 407,350 | | | | 21,631 | |
| Payable for capital shares redeemed | | | 360,275 | | | | 692,508 | | | | 236,191 | | | | 206,938 | | | | 24,978 | |
| Accrued expenses and other payables: | | | | | | | | | | | | | | | | | | | | |
| Investment advisory fees | | | 176,299 | | | | 130,186 | | | | 48,991 | | | | 66,863 | | | | 13,617 | |
| Administration fees | | | 23,304 | | | | 12,695 | | | | 8,642 | | | | 11,805 | | | | 2,401 | |
| Distribution fees | | | 19,431 | | | | 5,580 | | | | 5,302 | | | | 18,535 | | | | 1,158 | |
| Other | | | 100,338 | | | | 57,669 | | | | 38,399 | | | | 53,026 | | | | 17,199 | |
| Total Liabilities | | | 1,140,942 | | | | 3,060,740 | | | | 1,530,809 | | | | 764,517 | | | | 80,984 | |
| | | | | | | | | | | | | | | | | | | | | |
| Net Assets | | $ | 523,702,584 | | | $ | 283,881,833 | | | $ | 190,648,174 | | | $ | 259,496,947 | | | $ | 53,464,435 | |
| | | | | | | | | | | | | | | | | | | | | |
| Components of Net Assets | | | | | | | | | | | | | | | | | | | | |
| Paid-in capital | | $ | 516,501,082 | | | $ | 229,895,662 | | | $ | 139,921,753 | | | $ | 145,506,332 | | | $ | 48,564,979 | |
| Accumulated undistributed (distributions in excess of) net investment income | | | 31,414 | | | | (703,670 | ) | | | 946,904 | | | | 1,294,334 | | | | — | |
| Accumulated undistributed net realized gains (losses) on investments and foreign currency transactions | | | (317,020 | ) | | | (16,956,729 | ) | | | 7,046,670 | | | | 7,641,622 | | | | 28,663 | |
| Net unrealized appreciation: | | | | | | | | | | | | | | | | | | | | |
| investments | | | 7,487,108 | | | | 71,641,774 | | | | 42,732,847 | | | | 105,053,014 | | | | 4,870,793 | |
| foreign currency translations | | | — | | | | 4,796 | | | | — | | | | 1,645 | | | | — | |
| Net Assets | | $ | 523,702,584 | | | $ | 283,881,833 | | | $ | 190,648,174 | | | $ | 259,496,947 | | | $ | 53,464,435 | |
| | | | | | | | | | | | | | | | | | | | | |
| Pricing of Class A Shares | | | | | | | | | | | | | | | | | | | | |
| Net assets attributable to Class A shares | | $ | 91,048,495 | | | $ | 26,343,819 | | | $ | 25,057,491 | | | $ | 87,613,375 | | | $ | 5,449,131 | |
Shares of beneficial interest outstanding
(unlimited number of shares authorized,
no par value) | | | 8,761,276 | | | | 2,253,616 | | | | 1,812,663 | | | | 3,801,231 | | | | 631,777 | |
| Net asset value, offering price and redemption price per share | | $ | 10.39 | | | $ | 11.69 | | | $ | 13.82 | | | $ | 23.05 | | | $ | 8.63 | |
| Maximum sales charge | | | 3.75 | % | | | 5.25 | % | | | 5.25 | % | | | 5.25 | % | | | 5.25 | % |
Maximum offering price per share
[(100%/(100%-Maximum Sales Charge))
of net asset value adjusted to the nearest cent] | | $ | 10.79 | | | $ | 12.34 | | | $ | 14.59 | | | $ | 24.33 | | | $ | 9.11 | |
| | | | | | | | | | | | | | | | | | | | | |
| Pricing of Class I Shares | | | | | | | | | | | | | | | | | | | | |
| Net assets attributable to Class I shares | | $ | 432,654,089 | | | $ | 257,538,014 | | | $ | 165,590,683 | | | $ | 171,883,572 | | | $ | 48,015,304 | |
Shares of beneficial interest outstanding
(unlimited number of shares authorized,
no par value) | | | 41,814,283 | | | | 21,913,719 | | | | 12,052,966 | | | | 7,404,735 | | | | 5,128,142 | |
| Net asset value and redemption price per share | | $ | 10.35 | | | $ | 11.75 | | | $ | 13.74 | | | $ | 23.21 | | | $ | 9.36 | |
See accompanying notes to financial statements.
52
Statements of Assets & Liabilities, continued
December 31, 2017
| | | Praxis Genesis
Conservative
Portfolio | | Praxis Genesis Balanced
Portfolio | | Praxis Genesis Growth
Portfolio |
| Assets | | | | | | | | | | | | |
| Total investments in affiliated securities, at cost | | $ | 20,474,199 | | | $ | 59,544,125 | | | $ | 49,823,304 | |
| Investments in affiliated securities, at fair value | | $ | 22,885,554 | | | $ | 73,220,753 | | | $ | 64,967,140 | |
| Cash | | | 2,793 | | | | 708 | | | | 646 | |
| Receivable for investments sold | | | 9,009 | | | | — | | | | — | |
| Receivable for capital shares sold | | | 476 | | | | 19,788 | | | | 42,013 | |
| Receivable from Adviser | | | 2,307 | | | | — | | | | — | |
| Receivable for dividends and interest | | | 1 | | | | — | | | | — | |
| Prepaid expenses | | | 6,445 | | | | 8,394 | | | | 7,019 | |
| Total Assets | | | 22,906,585 | | | | 72,249,643 | | | | 65,016,818 | |
| | | | | | | | | | | | | |
| Liabilities | | | | | | | | | | | | |
| Distributions payable | | | 2,404 | | | | 7,964 | | | | 3,474 | |
| Payable for capital shares redeemed | | | 6,728 | | | | 4,794 | | | | 12,860 | |
| Payable for investments purchased | | | — | | | | 2,580 | | | | 24,338 | |
| Accrued expenses and other payables: | | | | | | | | | | | | |
| Investment advisory fees | | | — | | | | 3,091 | | | | 2,744 | |
| Administration fees | | | 584 | | | | 1,854 | | | | 1,645 | |
| Distribution fees | | | 4,865 | | | | 15,457 | | | | 13,718 | |
| Other | | | 11,291 | | | | 20,747 | | | | 23,498 | |
| Total Liabilities | | | 25,872 | | | | 56,487 | | | | 82,277 | |
| | | | | | | | | | | | | |
| Net Assets | | $ | 22,880,713 | | | $ | 73,193,156 | | | $ | 64,934,541 | |
| | | | | | | | | | | | | |
| Components of Net Assets | | | | | | | | | | | | |
| Paid-in capital | | $ | 20,361,251 | | | $ | 58,131,634 | | | $ | 48,179,150 | |
| Accumulated undistributed net realized gains on investments | | | 108,107 | | | | 1,384,894 | | | | 1,611,555 | |
| Net unrealized appreciation on investments | | | 2,411,355 | | | | 13,676,628 | | | | 15,143,836 | |
| Net Assets | | $ | 22,880,713 | | | $ | 73,193,156 | | | $ | 64,934,541 | |
| | | | | | | | | | | | | |
| Pricing of Class A Shares | | | | | | | | | | | | |
| Net assets attributable to Class A shares | | $ | 22,880,713 | | | $ | 73,193,156 | | | $ | 64,934,541 | |
| Shares of beneficial interest outstanding (unlimited number of shares authorized, no par value) | | | 1,947,594 | | | | 5,340,464 | | | | 4,302,427 | |
| Net asset value, offering price and redemption price per share | | $ | 11.75 | | | $ | 13.71 | | | $ | 15.09 | |
| Maximum sales charge | | | 5.25 | % | | | 5.25 | % | | | 5.25 | % |
| Maximum offering price per share [(100%/(100%-Maximum Sales Charge)) of net asset value adjusted to the nearest cent] | | $ | 12.40 | | | $ | 14.47 | | | $ | 15.93 | |
See accompanying notes to financial statements.
53
Statements of Operations
For the year ended December 31, 2017
| | | Praxis
Impact
Bond Fund | | Praxis International
Index Fund | | Praxis
Value
Index Fund | | Praxis
Growth Index
Fund | | Praxis
Small Cap
Index Fund |
| Investment income | | | | | | | | | | | | | | | | | | | | |
| Dividends | | $ | 194,489 | | | $ | 6,880,049 | | | $ | 4,398,042 | | | $ | 3,805,283 | | | $ | 663,798 | |
| Foreign tax withholding | | | — | | | | (695,037 | ) | | | — | | | | — | | | | (49 | ) |
| Interest | | | 14,261,175 | | | | 23,653 | | | | 16,062 | | | | 24,599 | | | | 4,877 | |
| Total Investment Income | | | 14,455,664 | | | | 6,208,665 | | | | 4,414,104 | | | | 3,829,882 | | | | 668,626 | |
| | | | | | | | | | | | | | | | | | | | | |
| Expenses | | | | | | | | | | | | | | | | | | | | |
| Investment advisory fees | | | 1,960,555 | | | | 1,372,658 | | | | 526,830 | | | | 707,063 | | | | 148,016 | |
| Administration fees | | | 269,559 | | | | 138,081 | | | | 96,538 | | | | 129,558 | | | | 27,136 | |
| Distribution fees - Class A | | | 218,386 | | | | 59,732 | | | | 57,914 | | | | 192,870 | | | | 13,078 | |
| Professional fees | | | 141,801 | | | | 108,698 | | | | 58,345 | | | | 75,262 | | | | 22,968 | |
| Transfer agent fees - Class A | | | 118,322 | | | | 38,821 | | | | 27,660 | | | | 87,736 | | | | 14,636 | |
| Transfer agent fees - Class I | | | 18,631 | | | | 7,742 | | | | 14,994 | | | | 18,930 | | | | 4,197 | |
| Registration fees - Class A | | | 33,529 | | | | 25,865 | | | | 21,510 | | | | 30,178 | | | | 29,033 | |
| Registration fees - Class I | | | 7,388 | | | | 7,421 | | | | 9,090 | | | | 5,308 | | | | 2,981 | |
| Pricing fees | | | 83,396 | | | | 62,705 | | | | 6,802 | | | | 6,382 | | | | 10,650 | |
| Insurance expense | | | 64,767 | | | | 25,913 | | | | 20,920 | | | | 26,237 | | | | 6,304 | |
| Trustee fees and expenses | | | 56,552 | | | | 28,431 | | | | 20,298 | | | | 25,197 | | | | 6,076 | |
| Custodian fees | | | 38,027 | | | | 36,544 | | | | 13,589 | | | | 17,393 | | | | 9,298 | |
| Shareholder report printing fees - Class A | | | 16,181 | | | | 6,160 | | | | 5,379 | | | | 16,251 | | | | 4,900 | |
| Shareholder report printing fees - Class I | | | 4,207 | | | | 1,361 | | | | 2,756 | | | | 4,003 | | | | 464 | |
| Postage & Supplies | | | 1,040 | | | | 3,361 | | | | 3,239 | | | | 3,345 | | | | 2,948 | |
| Other expenses | | | 10,864 | | | | 10,264 | | | | 11,549 | | | | 6,652 | | | | 5,492 | |
| Total Expenses | | | 3,043,205 | | | | 1,933,757 | | | | 897,413 | | | | 1,352,365 | | | | 308,177 | |
| Expenses reduced by Investment Adviser | | | (43,249 | ) | | | — | | | | — | | | | — | | | | (27,926 | ) |
| Net Expenses | | | 2,999,956 | | | | 1,933,757 | | | | 897,413 | | | | 1,352,365 | | | | 280,251 | |
| | | | | | | | | | | | | | | | | | | | | |
| Net Investment Income | | | 11,455,708 | | | | 4,274,908 | | | | 3,516,691 | | | | 2,477,517 | | | | 388,375 | |
| | | | | | | | | | | | | | | | | | | | | |
| Realized and Unrealized Gains (Losses) on Investments | | | | | | | | | | | | | | | | | | | | |
| Net realized gains (losses) on investments | | | 993,641 | | | | (2,970,815 | ) | | | 11,892,826 | | | | 8,967,490 | | | | 10,859,903 | |
| Net realized losses on foreign currency transactions | | | — | | | | (38,260 | ) | | | — | | | | — | | | | — | |
| Change in unrealized appreciation (depreciation) of investments | | | 3,888,120 | | | | 54,222,976 | | | | 12,534,209 | | | | 43,684,397 | | | | (5,834,932 | ) |
| Change in unrealized appreciation (depreciation) of foreign currency translations | | | — | | | | 10,636 | | | | — | | | | 623 | | | | — | |
Net Realized and Unrealized Gains on
Investments and Foreign Currency Transactions | | | 4,881,761 | | | | 51,224,537 | | | | 24,281,377 | | | | 52,451,746 | | | | 4,991,526 | |
| Net Change in Net Assets from Operations | | $ | 16,337,469 | | | $ | 55,499,445 | | | $ | 27,943,726 | | | $ | 55,130,027 | | | $ | 5,413,346 | |
See accompanying notes to financial statements.
54
Statements of Operations, continued
For the year ended December 31, 2017
| | | Praxis Genesis Conservative Portfolio | | Praxis Genesis Balanced
Portfolio | | Praxis Genesis Growth
Portfolio |
| Investment income | | | | | | | | | | | | |
| Dividends from affiliates | | $ | 538,926 | | | $ | 1,835,351 | | | $ | 1,714,661 | |
| | | | | | | | | | | | | |
| Expenses | | | | | | | | | | | | |
| Distribution fees - Class A | | | 55,298 | | | | 170,870 | | | | 148,752 | |
| Transfer agent fees | | | 28,664 | | | | 85,404 | | | | 103,167 | |
| Investment advisory fees | | | 11,060 | | | | 34,175 | | | | 29,751 | |
| Registration fees and filing fees | | | 17,804 | | | | 18,656 | | | | 17,523 | |
| Administration fees | | | 6,636 | | | | 20,512 | | | | 17,857 | |
| Shareholder report printing fees | | | 4,603 | | | | 15,154 | | | | 18,529 | |
| Professional fees | | | 9,668 | | | | 11,521 | | | | 11,184 | |
| Postage & Supplies | | | 2,810 | | | | 2,819 | | | | 2,818 | |
| Custodian fees | | | 756 | | | | 764 | | | | 774 | |
| Insurance expense | | | 296 | | | | 867 | | | | 721 | |
| Trustee fees and expenses | | | 275 | | | | 834 | | | | 723 | |
| Pricing fees | | | 11 | | | | 32 | | | | 26 | |
| Other expenses | | | 2,706 | | | | 2,413 | | | | 2,519 | |
| Total Expenses | | | 140,587 | | | | 364,021 | | | | 354,344 | |
| Expenses reduced by Investment Adviser | | | (6,410 | ) | | | — | | | | — | |
| Net Expenses | | | 134,177 | | | | 364,021 | | | | 354,344 | |
| | | | | | | | | | | | | |
| Net Investment Income | | | 404,749 | | | | 1,471,330 | | | | 1,360,317 | |
| | | | | | | | | | | | | |
| Realized and Unrealized Gains on Investments in Affiliates | | | | | | | | | | | | |
| Net realized gains on investments in affiliates | | | 294,727 | | | | 1,079,228 | | | | 911,216 | |
| Capital gain distributions from investments in affiliates | | | 206,053 | | | | 1,620,349 | | | | 2,003,882 | |
| Change in unrealized appreciation (depreciation) of investments in affiliates | | | 856,356 | | | | 4,395,247 | | | | 4,904,348 | |
| Net Realized and Unrealized Gains on Investments in Affiliates | | | 1,357,136 | | | | 7,094,824 | | | | 7,819,446 | |
| Net Change in Net Assets from Operations | | $ | 1,761,885 | | | $ | 8,566,154 | | | $ | 9,179,763 | |
See accompanying notes to financial statements.
55
Statements of Changes in Net Assets
| | | | Praxis
Impact
Bond Fund | | | | Praxis
International
Index Fund | |
| | | | For the Year Ended
December 31, 2017 | | | | For the Year Ended
December 31, 2016 | | | | For the Year Ended
December 31, 2017 | | | | For the Year Ended
December 31, 2016 | |
| From Operations | | | | | | | | | | | | | | | | |
| Net investment income | | $ | 11,455,708 | | | $ | 10,617,263 | | | $ | 4,274,908 | | | $ | 3,516,419 | |
| Net realized gains (losses) from investments and foreign currency transactions | | | 993,641 | | | | 627,949 | | | | (3,009,075 | ) | | | (5,736,541 | ) |
| Net change in unrealized appreciation (depreciation) on investments and foreign currency transactions | | | 3,888,120 | | | | (584,097 | ) | | | 54,233,612 | | | | 12,431,310 | |
| Net Change in Net Assets from Operations | | | 16,337,469 | | | | 10,661,115 | | | | 55,499,445 | | | | 10,211,188 | |
| | | | | | | | | | | | | | | | | |
| Distributions to Shareholders | | | | | | | | | | | | | | | | |
| From net investment income | | | | | | | | | | | | | | | | |
| Class A | | | (1,915,858 | ) | | | (1,936,638 | ) | | | (324,288 | ) | | | (267,004 | ) |
| Class I | | | (10,306,248 | ) | | | (9,821,417 | ) | | | (4,377,761 | ) | | | (3,317,908 | ) |
| From net realized gains | | | | | | | | | | | | | | | | |
| Class A | | | — | | | | (66,864 | ) | | | — | | | | — | |
| Class I | | | — | | | | (309,759 | ) | | | — | | | | — | |
| Change in Net Assets from Distributions to Shareholders | | | (12,222,106 | ) | | | (12,134,678 | ) | | | (4,702,049 | ) | | | (3,584,912 | ) |
| | | | | | | | | | | | | | | | | |
| Change in Net Assets from Capital Transactions (Note 6) | | | 54,678,411 | | | | 32,429,421 | | | | 40,609,352 | | | | 15,118,614 | |
| Change in Net Assets | | | 58,793,774 | | | | 30,955,858 | | | | 91,406,748 | | | | 21,744,890 | |
| | | | | | | | | | | | | | | | | |
| Net Assets | | | | | | | | | | | | | | | | |
| Beginning of year | | | 464,908,810 | | | | 433,952,952 | | | | 192,475,085 | | | | 170,730,195 | |
| End of year | | $ | 523,702,584 | | | $ | 464,908,810 | | | $ | 283,881,833 | | | $ | 192,475,085 | |
| | | | | | | | | | | | | | | | | |
Accumulated Undistributed (Distributions in Excess of) Net
Investment Income | | $ | 31,414 | | | $ | 8,856 | | | $ | (703,670 | ) | | $ | (215,688 | ) |
See accompanying notes to financial statements.
56
Statements of Changes in Net Assets, continued
| | | Praxis
Value
Index Fund | | Praxis
Growth Index
Fund | | Praxis
Small Cap
Index Fund |
| | | For the Year Ended
December 31, 2017 | | For the Year Ended
December 31, 2016 | | For the Year Ended
December 31, 2017 | | For the Year Ended
December 31, 2016 | | For the Year Ended
December 31, 2017 | | For the Year Ended
December 31, 2016 |
| From Operations | | | | | | | | | | | | | | | | | | | | | | | | |
| Net investment income (loss) | | $ | 3,516,691 | | | $ | 3,145,127 | | | $ | 2,477,517 | | | $ | 2,160,777 | | | $ | 388,375 | | | $ | (153,202 | ) |
| Net realized gains from investments | | | 11,892,826 | | | | 7,556,162 | | | | 8,967,490 | | | | 10,288,360 | | | | 10,859,903 | | | | 2,619,380 | |
| Net change in unrealized appreciation (depreciation) on investments and foreign currency transactions | | | 12,534,209 | | | | 12,834,166 | | | | 43,685,020 | | | | 1,551,046 | | | | (5,834,932 | ) | | | 1,724,520 | |
| Net Change in Net Assets from Operations | | | 27,943,726 | | | | 23,535,455 | | | | 55,130,027 | | | | 14,000,183 | | | | 5,413,346 | | | | 4,190,698 | |
| | | | | | | | | | | | | | | | | | | | | | | | | |
| Distributions to Shareholders | | | | | | | | | | | | | | | | | | | | | | | | |
| From net investment income | | | | | | | | | | | | | | | | | | | | | | | | |
| Class A | | | (239,329 | ) | | | (394,778 | ) | | | (310,125 | ) | | | (439,271 | ) | | | — | | | | — | |
| Class I | | | (2,330,458 | ) | | | (3,136,628 | ) | | | (1,141,411 | ) | | | (1,466,838 | ) | | | (397,085 | ) | | | — | |
| From net realized gains | | | | | | | | | | | | | | | | | | | | | | | | |
| Class A | | | (1,280,289 | ) | | | (163,656 | ) | | | (2,353,847 | ) | | | — | | | | (1,076,448 | ) | | | (313,627 | ) |
| Class I | | | (8,517,658 | ) | | | (1,048,199 | ) | | | (4,575,291 | ) | | | — | | | | (8,695,178 | ) | | | (2,140,464 | ) |
| Change in Net Assets from Distributions to Shareholders | | | (12,367,734 | ) | | | (4,743,261 | ) | | | (8,380,674 | ) | | | (1,906,109 | ) | | | (10,168,711 | ) | | | (2,454,091 | ) |
| | | | | | | | | | | | | | | | | | | | | | | | | |
| Change in Net Assets from Capital Transactions (Note 6) | | | 16,205,942 | | | | 8,693,909 | | | | 8,878,930 | | | | 4,774,596 | | | | 10,309,935 | | | | (989,791 | ) |
| Change in Net Assets | | | 31,781,934 | | | | 27,486,103 | | | | 55,628,283 | | | | 16,868,670 | | | | 5,554,570 | | | | 746,816 | |
| | | | | | | | | | | | | | | | | | | | | | | | | |
| Net Assets | | | | | | | | | | | | | | | | | | | | | | | | |
| Beginning of year | | | 158,866,240 | | | | 131,380,137 | | | | 203,868,664 | | | | 186,999,994 | | | | 47,909,865 | | | | 47,163,049 | |
| End of year | | $ | 190,648,174 | | | $ | 158,866,240 | | | $ | 259,496,947 | | | $ | 203,868,664 | | | $ | 53,464,435 | | | $ | 47,909,865 | |
| | | | | | | | | | | | | | | | | | | | | | | | | |
| Accumulated Undistributed Net Investment Income | | $ | 946,904 | | | $ | — | | | $ | 1,294,334 | | | $ | 268,352 | | | $ | — | | | $ | — | |
See accompanying notes to financial statements.
57
Statements of Changes in Net Assets, continued
| | | | Praxis Genesis
Conservative
Portfolio | | | | Praxis Genesis
Balanced
Portfolio | | | | Praxis Genesis
Growth
Portfolio | |
| | | | For the Year Ended
December 31, 2017 | | | | For the Year Ended
December 31, 2016 | | | | For the Year Ended
December 31, 2017 | | | | For the Year Ended
December 31, 2016 | | | | For the Year Ended
December 31, 2017 | | | | For the Year Ended
December 31, 2016 | |
| From Operations | | | | | | | | | | | | | | | | | | | | | | | | |
| Net investment income | | $ | 404,749 | | | $ | 358,872 | | | $ | 1,471,330 | | | $ | 858,152 | | | $ | 1,360,317 | | | $ | 560,493 | |
| Net realized gains (losses) on investments in affiliates | | | 294,727 | | | | (10,150 | ) | | | 1,079,228 | | | | (164,281 | ) | | | 911,216 | | | | (223,922 | ) |
| Distribution of realized gains received from affiliates | | | 206,053 | | | | 56,044 | | | | 1,620,349 | | | | 429,255 | | | | 2,003,882 | | | | 513,581 | |
| Net change in unrealized appreciation (depreciation) on investments in affiliates | | | 856,356 | | | | 466,687 | | | | 4,395,247 | | | | 2,832,421 | | | | 4,904,348 | | | | 3,141,548 | |
| Net Change in Net Assets from Operations | | | 1,761,885 | | | | 871,453 | | | | 8,566,154 | | | | 3,955,547 | | | | 9,179,763 | | | | 3,991,700 | |
| | | | | | | | | | | | | | | | | | | | | | | | | |
| Distributions to Shareholders | | | | | | | | | | | | | | | | | | | | | | | | |
| From net investment income | | | | | | | | | | | | | | | | | | | | | | | | |
| Class A | | | (410,499 | ) | | | (359,249 | ) | | | (1,505,328 | ) | | | (858,833 | ) | | | (1,405,774 | ) | | | (561,401 | ) |
| From net realized gains | | | | | | | | | | | | | | | | | | | | | | | | |
| Class A | | | (278,026 | ) | | | (116,382 | ) | | | (1,175,997 | ) | | | (1,007,884 | ) | | | (1,228,806 | ) | | | (1,276,437 | ) |
| Change in Net Assets from Distributions to Shareholders | | | (688,525 | ) | | | (475,631 | ) | | | (2,681,325 | ) | | | (1,866,717 | ) | | | (2,634,580 | ) | | | (1,837,838 | ) |
| | | | | | | | | | | | | | | | | | | | | | | | | |
| Change in Net Assets from Capital Transactions (Note 6) | | | 211,459 | | | | 1,481,723 | | | | 3,743,197 | | | | 1,734,670 | | | | 4,463,446 | | | | 1,890,668 | |
| Change in Net Assets | | | 1,284,819 | | | | 1,877,545 | | | | 9,628,026 | | | | 3,823,500 | | | | 11,008,629 | | | | 4,044,530 | |
| | | | | | | | | | | | | | | | | | | | | | | | | |
| Net Assets | | | | | | | | | | | | | | | | | | | | | | | | |
| Beginning of year | | | 21,595,894 | | | | 19,718,349 | | | | 63,565,130 | | | | 59,741,630 | | | | 53,925,912 | | | | 49,881,382 | |
| End of year | | $ | 22,880,713 | | | $ | 21,595,894 | | | $ | 73,193,156 | | | $ | 63,565,130 | | | $ | 64,934,541 | | | $ | 53,925,912 | |
| | | | | | | | | | | | | | | | | | | | | | | | | |
| Accumulated Undistributed Investment Income (Loss) | | $ | — | | | $ | — | | | $ | — | | | $ | — | | | $ | — | | | $ | — | |
See accompanying notes to financial statements.
58
Financial Highlights
For a share outstanding throughout the year indicated
Praxis Impact Bond Fund - Class A
| | | Year Ended December 31,
2017 | | Year Ended December 31,
2016 | | Year Ended December 31,
2015 | | Year Ended December 31,
2014 | | Year Ended December 31,
2013 |
| Net asset value at beginning of year | | $ | 10.30 | | | $ | 10.32 | | | $ | 10.54 | | | $ | 10.27 | | | $ | 10.73 | |
| Net investment income(a) | | | 0.21 | | | | 0.20 | | | | 0.23 | | | | 0.24 | | | | 0.25 | |
Net realized and unrealized gains (losses)
on investments | | | 0.11 | | | | 0.02 | | | | (0.19 | ) | | | 0.29 | | | | (0.42 | ) |
| Total from investment operations | | | 0.32 | | | | 0.22 | | | | 0.04 | | | | 0.53 | | | | (0.17 | ) |
| Less distributions: | | | | | | | | | | | | | | | | | | | | |
| Dividends from investment income | | | (0.23 | ) | | | (0.23 | ) | | | (0.25 | ) | | | (0.26 | ) | | | (0.28 | ) |
| Distributions from net realized gains | | | — | | | | (0.01 | ) | | | (0.01 | ) | | | — | | | | (0.01 | ) |
| Total distributions | | | (0.23 | ) | | | (0.24 | ) | | | (0.26 | ) | | | (0.26 | ) | | | (0.29 | ) |
| Paid-in capital from redemption fees | | | 0.00 | (b) | | | 0.00 | (b) | | | 0.00 | (b) | | | 0.00 | (b) | | | 0.00 | (b) |
| Net asset value at end of year | | $ | 10.39 | | | $ | 10.30 | | | $ | 10.32 | | | $ | 10.54 | | | $ | 10.27 | |
| Total return (excludes sales charge) | | | 3.11 | % | | | 2.13 | % | | | 0.33 | % | | | 5.21 | % | | | (1.65 | %) |
| Net assets at end of year (in 000s) | | $ | 91,048 | | | $ | 83,211 | | | $ | 79,999 | | | $ | 74,950 | | | $ | 69,784 | |
| Ratio of net expenses to average net assets | | | 0.93 | % | | | 0.94 | % | | | 0.93 | % | | | 0.93 | % | | | 0.94 | % |
| Ratio of net investment income to average net assets | | | 2.02 | % | | | 1.87 | % | | | 2.16 | % | | | 2.32 | % | | | 2.34 | % |
| Ratio of gross expenses to average net assets* | | | 0.98 | % | | | 0.99 | % | | | 0.98 | % | | | 0.94 | % | | | 0.99 | % |
| Portfolio turnover rate | | | 17.36 | % | | | 16.05 | % | | | 22.67 | % | | | 16.48 | % | | | 23.68 | % |
Praxis Impact Bond Fund - Class I
| | | Year Ended December 31,
2017 | | Year Ended December 31,
2016 | | Year Ended December 31,
2015 | | Year Ended December 31,
2014 | | Year Ended December 31,
2013 |
| Net asset value at beginning of year | | $ | 10.25 | | | $ | 10.27 | | | $ | 10.50 | | | $ | 10.22 | | | $ | 10.69 | |
| Net investment income(a) | | | 0.25 | | | | 0.26 | | | | 0.27 | | | | 0.28 | | | | 0.29 | |
Net realized and unrealized gains (losses)
on investments | | | 0.11 | | | | 0.00 | (b) | | | (0.20 | ) | | | 0.30 | | | | (0.43 | ) |
| Total from investment operations | | | 0.36 | | | | 0.26 | | | | 0.07 | | | | 0.58 | | | | (0.14 | ) |
| Less distributions: | | | | | | | | | | | | | | | | | | | | |
| Dividends from investment income | | | (0.26 | ) | | | (0.27 | ) | | | (0.29 | ) | | | (0.30 | ) | | | (0.32 | ) |
| Distributions from net realized gains | | | — | | | | (0.01 | ) | | | (0.01 | ) | | | — | | | | (0.01 | ) |
| Total distributions | | | (0.26 | ) | | | (0.28 | ) | | | (0.30 | ) | | | (0.30 | ) | | | (0.33 | ) |
| Paid-in capital from redemption fees | | | 0.00 | (b) | | | 0.00 | (b) | | | 0.00 | (b) | | | 0.00 | (b) | | | 0.00 | (b) |
| Net asset value at end of year | | $ | 10.35 | | | $ | 10.25 | | | $ | 10.27 | | | $ | 10.50 | | | $ | 10.22 | |
| Total return (excludes sales charge) | | | 3.58 | % | | | 2.55 | % | | | 0.72 | % | | | 5.66 | % | | | (1.26 | %) |
| Net assets at end of year (in 000s) | | $ | 432,654 | | | $ | 381,697 | | | $ | 353,954 | | | $ | 330,742 | | | $ | 292,594 | |
| Ratio of expenses to average net assets | | | 0.54 | % | | | 0.54 | % | | | 0.54 | % | | | 0.53 | % | | | 0.54 | % |
| Ratio of net investment income to average net assets | | | 2.41 | % | | | 2.41 | % | | | 2.55 | % | | | 2.73 | % | | | 2.73 | % |
| Portfolio turnover rate | | | 17.36 | % | | | 16.05 | % | | | 22.67 | % | | | 16.48 | % | | | 23.68 | % |
| * | During the year, certain expenses were reduced by the Adviser and/or Distributor. If such expense reductions had not occurred, the ratios would have been as indicated. |
| (a) | Net investment income per share has been calculated using the average daily shares outstanding during the year. |
| (b) | Amount is less than $0.005 per share. |
See accompanying notes to financial statements.
59
Financial Highlights, continued
For a share outstanding throughout the year indicated
Praxis International Index Fund - Class A
| | | Year Ended December 31,
2017 | | Year Ended December 31,
2016 | | Year Ended December 31,
2015 | | Year Ended December 31,
2014 | | Year Ended December 31,
2013 |
| Net asset value at beginning of year | | $ | 9.47 | | | $ | 9.15 | | | $ | 9.85 | | | $ | 10.64 | | | $ | 9.47 | |
| Net investment income(a) | | | 0.13 | | | | 0.13 | | | | 0.14 | | | | 0.20 | | | | 0.14 | |
Net realized and unrealized gains (losses)
on investments | | | 2.23 | | | | 0.32 | | | | (0.71 | ) | | | (0.81 | ) | | | 1.17 | |
| Total from investment operations | | | 2.36 | | | | 0.45 | | | | (0.57 | ) | | | (0.61 | ) | | | 1.31 | |
| Less distributions: | | | | | | | | | | | | | | | | | | | | |
| Dividends from investment income | | | (0.14 | ) | | | (0.13 | ) | | | (0.13 | ) | | | (0.18 | ) | | | (0.14 | ) |
| Paid-in capital from redemption fees | | | 0.00 | (b) | | | 0.00 | (b) | | | 0.00 | (b) | | | 0.00 | (b) | | | 0.00 | (b) |
| Net asset value at end of year | | $ | 11.69 | | | $ | 9.47 | | | $ | 9.15 | | | $ | 9.85 | | | $ | 10.64 | |
| Total return (excludes sales charge) | | | 24.97 | % | | | 4.97 | % | | | (5.76 | %) | | | (5.70 | %) | | | 13.86 | % |
| Net assets at end of year (in 000s) | | $ | 26,344 | | | $ | 18,877 | | | $ | 17,631 | | | $ | 18,370 | | | $ | 19,892 | |
| Ratio of expenses to average net assets | | | 1.26 | % | | | 1.32 | % | | | 1.33 | % | | | 1.28 | % | | | 1.43 | % |
Ratio of net investment income to average
net assets | | | 1.22 | % | | | 1.45 | % | | | 1.45 | % | | | 1.88 | % | | | 1.36 | % |
| Portfolio turnover rate | | | 5.22 | % | | | 10.26 | % | | | 4.48 | % | | | 5.73 | % | | | 11.36 | % |
Praxis International Index Fund - Class I
| | | Year Ended December 31,
2017 | | Year Ended December 31,
2016 | | Year Ended December 31,
2015 | | Year Ended December 31,
2014 | | Year Ended December 31,
2013 |
| Net asset value at beginning of year | | $ | 9.51 | | | $ | 9.19 | | | $ | 9.89 | | | $ | 10.70 | | | $ | 9.51 | |
| Net investment income(a) | | | 0.19 | | | | 0.19 | | | | 0.20 | | | | 0.25 | | | | 0.20 | |
Net realized and unrealized gains (losses)
on investments | | | 2.25 | | | | 0.31 | | | | (0.71 | ) | | | (0.82 | ) | | | 1.20 | |
| Total from investment operations | | | 2.44 | | | | 0.50 | | | | (0.51 | ) | | | (0.57 | ) | | | 1.40 | |
| Less distributions: | | | | | | | | | | | | | | | | | | | | |
| Dividends from investment income | | | (0.20 | ) | | | (0.18 | ) | | | (0.19 | ) | | | (0.24 | ) | | | (0.21 | ) |
| Paid-in capital from redemption fees | | | 0.00 | (b) | | | 0.00 | (b) | | | 0.00 | (b) | | | 0.00 | (b) | | | 0.00 | (b) |
| Net asset value at end of year | | $ | 11.75 | | | $ | 9.51 | | | $ | 9.19 | | | $ | 9.89 | | | $ | 10.70 | |
| Total return (excludes sales charge) | | | 25.67 | % | | | 5.48 | % | | | (5.19 | %) | | | (5.36 | %) | | | 14.68 | % |
| Net assets at end of year (in 000s) | | $ | 257,538 | | | $ | 173,598 | | | $ | 153,099 | | | $ | 154,074 | | | $ | 150,369 | |
| Ratio of expenses to average net assets | | | 0.72 | % | | | 0.77 | % | | | 0.78 | % | | | 0.78 | % | | | 0.80 | % |
| Ratio of net investment income to average net assets | | | 1.75 | % | | | 2.01 | % | | | 1.97 | % | | | 2.35 | % | | | 1.96 | % |
| Portfolio turnover rate | | | 5.22 | % | | | 10.26 | % | | | 4.48 | % | | | 5.73 | % | | | 11.36 | % |
| (a) | Net investment income per share has been calculated using the average daily shares outstanding during the year. |
| (b) | Amount is less than $0.005 per share. |
See accompanying notes to financial statements.
60
Financial Highlights, continued
For a share outstanding throughout the year indicated
Praxis Value Index Fund - Class A
| | | Year Ended December 31,
2017 | | Year Ended December 31,
2016 | | Year Ended December 31,
2015 | | Year Ended December 31,
2014 | | Year Ended December 31,
2013 |
| Net asset value at beginning of year | | $ | 12.64 | | | $ | 11.17 | | | $ | 12.54 | | | $ | 11.21 | | | $ | 8.71 | |
| Net investment income(a) | | | 0.21 | | | | 0.19 | | | | 0.20 | | | | 0.18 | | | | 0.14 | |
Net realized and unrealized gains (losses)
on investments | | | 1.85 | | | | 1.61 | | | | (1.00 | ) | | | 1.23 | | | | 2.60 | |
| Total from investment operations | | | 2.06 | | | | 1.80 | | | | (0.80 | ) | | | 1.41 | | | | 2.74 | |
| Less distributions: | | | | | | | | | | | | | | | | | | | | |
| Dividends from investment income | | | (0.13 | ) | | | (0.23 | ) | | | (0.28 | ) | | | (0.08 | ) | | | (0.24 | ) |
| Distributions from net realized gains | | | (0.75 | ) | | | (0.10 | ) | | | (0.29 | ) | | | — | | | | — | |
| Total distributions | | | (0.88 | ) | | | (0.33 | ) | | | (0.57 | ) | | | (0.08 | ) | | | (0.24 | ) |
| Paid-in capital from redemption fees | | | 0.00 | (b) | | | 0.00 | (b) | | | 0.00 | (b) | | | 0.00 | (b) | | | 0.00 | (b) |
| Net asset value at end of year | | $ | 13.82 | | | $ | 12.64 | | | $ | 11.17 | | | $ | 12.54 | | | $ | 11.21 | |
| Total return (excludes sales charge) | | | 16.31 | % | | | 16.13 | % | | | (6.41 | %) | | | 12.57 | % | | | 31.33 | % |
| Net assets at end of year (in 000s) | | $ | 25,057 | | | $ | 21,676 | | | $ | 17,453 | | | $ | 17,356 | | | $ | 16,275 | |
| Ratio of expenses to average net assets | | | 0.94 | % | | | 0.94 | % | | | 0.94 | % | | | 0.87 | % | | | 1.03 | % |
| Ratio of net investment income to average net assets | | | 1.58 | % | | | 1.68 | % | | | 1.62 | % | | | 1.53 | % | | | 1.40 | % |
| Portfolio turnover rate | | | 31.87 | % | | | 48.26 | % | | | 21.38 | % | | | 20.53 | % | | | 30.38 | % |
Praxis Value Index Fund - Class I
| | | Year Ended December 31,
2017 | | Year Ended December 31,
2016 | | Year Ended December 31,
2015 | | Year Ended December 31,
2014 | | Year Ended December 31,
2013 |
| Net asset value at beginning of year | | $ | 12.56 | | | $ | 11.09 | | | $ | 12.46 | | | $ | 11.14 | | | $ | 8.65 | |
| Net investment income(a) | | | 0.28 | | | | 0.26 | | | | 0.26 | | | | 0.23 | | | | 0.20 | |
Net realized and unrealized gains (losses)
on investments | | | 1.85 | | | | 1.60 | | | | (1.00 | ) | | | 1.22 | | | | 2.59 | |
| Total from investment operations | | | 2.13 | | | | 1.86 | | | | (0.74 | ) | | | 1.45 | | | | 2.79 | |
| Less distributions: | | | | | | | | | | | | | | | | | | | | |
| Dividends from investment income | | | (0.20 | ) | | | (0.29 | ) | | | (0.34 | ) | | | (0.13 | ) | | | (0.30 | ) |
| Distributions from net realized gains | | | (0.75 | ) | | | (0.10 | ) | | | (0.29 | ) | | | — | | | | — | |
| Total distributions | | | (0.95 | ) | | | (0.39 | ) | | | (0.63 | ) | | | (0.13 | ) | | | (0.30 | ) |
| Paid-in capital from redemption fees | | | 0.00 | (b) | | | 0.00 | (b) | | | 0.00 | (b) | | | 0.00 | (b) | | | — | |
| Net asset value at end of year | | $ | 13.74 | | | $ | 12.56 | | | $ | 11.09 | | | $ | 12.46 | | | $ | 11.14 | |
| Total return (excludes sales charge) | | | 16.91 | % | | | 16.75 | % | | | (6.00 | %) | | | 13.03 | % | | | 32.26 | % |
| Net assets at end of year (in 000s) | | $ | 165,591 | | | $ | 137,191 | | | $ | 113,927 | | | $ | 108,845 | | | $ | 93,118 | |
| Ratio of expenses to average net assets | | | 0.45 | % | | | 0.44 | % | | | 0.45 | % | | | 0.45 | % | | | 0.48 | % |
| Ratio of net investment income to average net assets | | | 2.07 | % | | | 2.25 | % | | | 2.11 | % | | | 1.94 | % | | | 1.95 | % |
| Portfolio turnover rate | | | 31.87 | % | | | 48.26 | % | | | 21.68 | % | | | 20.53 | % | | | 30.38 | % |
| (a) | Net investment income per share has been calculated using the average daily shares outstanding during the year. |
| (b) | Amount is less than $0.005 per share. |
See accompanying notes to financial statements.
61
Financial Highlights, continued
For a share outstanding throughout the year indicated
Praxis Growth Index Fund - Class A
| | | Year Ended December 31,
2017 | | Year Ended December 31,
2016 | | Year Ended December 31,
2015 | | Year Ended December 31,
2014 | | Year Ended December 31,
2013 |
| Net asset value at beginning of year | | $ | 18.82 | | | $ | 17.68 | | | $ | 17.25 | | | $ | 15.19 | | | $ | 11.63 | |
| Net investment income(a) | | | 0.17 | | | | 0.15 | | | | 0.18 | | | | 0.12 | | | | 0.10 | |
Net realized and unrealized gains
on investments | | | 4.78 | | | | 1.11 | | | | 0.46 | | | | 2.05 | | | | 3.58 | |
| Total from investment operations | | | 4.95 | | | | 1.26 | | | | 0.64 | | | | 2.17 | | | | 3.68 | |
| Less distributions: | | | | | | | | | | | | | | | | | | | | |
| Dividends from investment income | | | (0.08 | ) | | | (0.12 | ) | | | (0.21 | ) | | | (0.11 | ) | | | (0.12 | ) |
| Distributions from net realized gains | | | (0.64 | ) | | | — | | | | — | | | | — | | | | — | |
| Total distributions | | | (0.72 | ) | | | (0.12 | ) | | | (0.21 | ) | | | (0.11 | ) | | | (0.12 | ) |
| Paid-in capital from redemption fees | | | 0.00 | (b) | | | 0.00 | (b) | | | 0.00 | (b) | | | 0.00 | (b) | | | 0.00 | (b) |
| Net asset value at end of year | | $ | 23.05 | | | $ | 18.82 | | | $ | 17.68 | | | $ | 17.25 | | | $ | 15.19 | |
| Total return (excludes sales charge) | | | 26.28 | % | | | 7.15 | % | | | 3.70 | % | | | 14.26 | % | | | 31.72 | % |
| Net assets at end of year (in 000s) | | $ | 87,613 | | | $ | 67,007 | | | $ | 64,689 | | | $ | 55,833 | | | $ | 51,724 | |
| Ratio of expenses to average net assets | | | 0.85 | % | | | 0.86 | % | | | 0.84 | % | | | 0.91 | % | | | 1.01 | % |
Ratio of net investment income to average
net assets | | | 0.78 | % | | | 0.86 | % | | | 1.00 | % | | | 0.73 | % | | | 0.76 | % |
| Portfolio turnover rate | | | 27.49 | % | | | 43.09 | % | | | 18.68 | % | | | 19.09 | % | | | 14.82 | % |
Praxis Growth Index Fund - Class I
| | | Year Ended December 31,
2017 | | Year Ended December 31,
2016 | | Year Ended December 31,
2015 | | Year Ended December 31,
2014 | | Year Ended December 31,
2013 |
| Net asset value at beginning of year | | $ | 18.93 | | | $ | 17.79 | | | $ | 17.34 | | | $ | 15.27 | | | $ | 11.68 | |
| Net investment income(a) | | | 0.26 | | | | 0.23 | | | | 0.25 | | | | 0.20 | | | | 0.18 | |
Net realized and unrealized gains
on investments | | | 4.82 | | | | 1.11 | | | | 0.47 | | | | 2.06 | | | | 3.60 | |
| Total from investment operations | | | 5.08 | | | | 1.34 | | | | 0.72 | | | | 2.26 | | | | 3.78 | |
| Less distributions: | | | | | | | | | | | | | | | | | | | | |
| Dividends from investment income | | | (0.16 | ) | | | (0.20 | ) | | | (0.27 | ) | | | (0.19 | ) | | | (0.19 | ) |
| Distributions from net realized gains | | | (0.64 | ) | | | — | | | | — | | | | — | | | | — | |
| Total distributions | | | (0.80 | ) | | | (0.20 | ) | | | (0.27 | ) | | | (0.19 | ) | | | (0.19 | ) |
| Paid-in capital from redemption fees | | | 0.00 | (b) | | | 0.00 | (b) | | | 0.00 | (b) | | | 0.00 | (b) | | | 0.00 | (b) |
| Net asset value at end of year | | $ | 23.21 | | | $ | 18.93 | | | $ | 17.79 | | | $ | 17.34 | | | $ | 15.27 | |
| Total return (excludes sales charge) | | | 26.78 | % | | | 7.62 | % | | | 4.10 | % | | | 14.77 | % | | | 32.26 | % |
| Net assets at end of year (in 000s) | | $ | 171,884 | | | $ | 136,862 | | | $ | 122,311 | | | $ | 118,619 | | | $ | 100,561 | |
| Ratio of expenses to average net assets | | | 0.44 | % | | | 0.44 | % | | | 0.44 | % | | | 0.42 | % | | | 0.47 | % |
Ratio of net investment income to average
net assets | | | 1.18 | % | | | 1.26 | % | | | 1.38 | % | | | 1.22 | % | | | 1.31 | % |
| Portfolio turnover rate | | | 27.49 | % | | | 43.09 | % | | | 18.68 | % | | | 19.09 | % | | | 14.82 | % |
| (a) | Net investment income per share has been calculated using the average daily shares outstanding during the year. |
| (b) | Amount is less than $0.005 per share. |
See accompanying notes to financial statements.
62
Financial Highlights, continued
For a share outstanding throughout the year indicated
Praxis Small Cap Index Fund - Class A
| | | Year Ended December 31,
2017 | | Year Ended December 31,
2016 | | Year Ended December 31,
2015 | | Year Ended December 31,
2014 | | Year Ended December 31,
2013 |
| Net asset value at beginning of year | | $ | 9.67 | | | $ | 9.45 | | | $ | 11.49 | | | $ | 13.80 | | | $ | 11.33 | |
| Net investment income (loss)(a) | | | 0.02 | | | | (0.08 | ) | | | (0.09 | ) | | | (0.12 | ) | | | (0.12 | ) |
Net realized and unrealized gains (losses)
on investments | | | 1.03 | | | | 0.85 | | | | (0.41 | ) | | | (0.43 | ) | | | 4.04 | |
| Total from investment operations | | | 1.05 | | | | 0.77 | | | | (0.50 | ) | | | (0.55 | ) | | | 3.92 | |
| Less distributions: | | | | | | | | | | | | | | | | | | | | |
| Dividends from net realized gains | | | (2.09 | ) | | | (0.55 | ) | | | (1.54 | ) | | | (1.76 | ) | | | (1.45 | ) |
| Paid-in capital from redemption fees | | | 0.00 | (b) | | | 0.00 | (b) | | | 0.00 | (b) | | | 0.00 | (b) | | | 0.00 | (b) |
| Net asset value at end of year | | $ | 8.63 | | | $ | 9.67 | | | $ | 9.45 | | | $ | 11.49 | | | $ | 13.80 | |
| Total return (excludes sales charge) | | | 10.70 | % | | | 8.18 | % | | | (4.53 | %) | | | (4.11 | %) | | | 34.63 | % |
| Net assets at end of year (in 000s) | | $ | 5,449 | | | $ | 5,771 | | | $ | 7,339 | | | $ | 7,664 | | | $ | 8,465 | |
| Ratio of net expenses to average net assets | | | 1.13 | % | | | 1.67 | % | | | 1.68 | % | | | 1.69 | % | | | 1.69 | % |
| Ratio of net investment income (loss) to average net assets | | | 0.21 | % | | | (1.45 | %) | | | (0.75 | %) | | | (0.95 | %) | | | (0.95 | %) |
| Ratio of gross expenses to average net assets* | | | 1.66 | % | | | 1.76 | % | | | 1.81 | % | | | 1.70 | % | | | 1.90 | % |
| Portfolio turnover rate | | | 103.54 | % | | | 60.49 | % | | | 75.84 | % | | | 73.67 | % | | | 49.25 | % |
Praxis Small Cap Index Fund - Class I
| | | Year Ended December 31,
2017 | | Year Ended December 31,
2016 | | Year Ended December 31,
2015 | | Year Ended December 31,
2014 | | Year Ended December 31,
2013 |
| Net asset value at beginning of year | | $ | 10.35 | | | $ | 10.01 | | | $ | 12.01 | | | $ | 14.25 | | | $ | 11.59 | |
| Net investment income (loss)(a) | | | 0.09 | | | | (0.02 | ) | | | (0.01 | ) | | | (0.04 | ) | | | (0.04 | ) |
Net realized and unrealized gains (losses)
on investments | | | 1.09 | | | | 0.91 | | | | (0.45 | ) | | | (0.44 | ) | | | 4.15 | |
| Total from investment operations | | | 1.18 | | | | 0.89 | | | | (0.46 | ) | | | (0.48 | ) | | | 4.11 | |
| Less distributions: | | | | | | | | | | | | | | | | | | | | |
| Dividends from investment income | | | (0.08 | ) | | | — | | | | — | | | | — | | | | — | |
| Dividends from net realized gains | | | (2.09 | ) | | | (0.55 | ) | | | (1.54 | ) | | | (1.76 | ) | | | (1.45 | ) |
| Total distributions | | | (2.17 | ) | | | (0.55 | ) | | | (1.54 | ) | | | (1.76 | ) | | | (1.45 | ) |
| Paid-in capital from redemption fees | | | — | | | | — | | | | — | | | | 0.00 | (b) | | | 0.00 | (b) |
| Net asset value at end of year | | $ | 9.36 | | | $ | 10.35 | | | $ | 10.01 | | | $ | 12.01 | | | $ | 14.25 | |
| Total return (excludes sales charge) | | | 11.22 | % | | | 8.93 | % | | | (3.99 | %) | | | (3.49 | %) | | | 35.53 | % |
| Net assets at end of year (in 000s) | | $ | 48,015 | | | $ | 42,139 | | | $ | 39,824 | | | $ | 53,783 | | | $ | 68,762 | |
| Ratio of expenses to average net assets | | | 0.50 | % | | | 1.00 | % | | | 1.06 | % | | | 1.02 | % | | | 1.04 | % |
| Ratio of net investment income (loss) to average net assets | | | 0.85 | % | | | (0.13 | %) | | | (0.07 | %) | | | (0.28 | %) | | | (0.31 | %) |
| Portfolio turnover rate | | | 103.54 | % | | | 60.49 | % | | | 75.84 | % | | | 73.67 | % | | | 49.25 | % |
| * | During the year, certain expenses were reduced by the Adviser and/or Distributor. If such expense reductions had not occurred, the ratios would have been as indicated. |
| (a) | Net investment income (loss) per share has been calculated using the average daily shares outstanding during the year. |
| (b) | Amount is less than $0.005 per share. |
See accompanying notes to financial statements.
63
Financial Highlights, continued
For a share outstanding throughout the year indicated
Praxis Genesis Conservative Portfolio - Class A
| | | Year Ended December 31,
2017 | | Year Ended December 31,
2016 | | Year Ended December 31,
2015 | | Year Ended December 31,
2014 | | Year Ended December 31,
2013 |
| Net asset value at beginning of year | | $ | 11.18 | | | $ | 10.97 | | | $ | 11.34 | | | $ | 11.10 | | | $ | 10.79 | |
| Net investment income(a) | | | 0.21 | | | | 0.19 | | | | 0.22 | | | | 0.21 | | | | 0.23 | |
Net realized and unrealized gains (losses)
on investments | | | 0.72 | | | | 0.29 | | | | (0.31 | ) | | | 0.42 | | | | 0.45 | |
| Total from investment operations | | | 0.93 | | | | 0.48 | | | | (0.09 | ) | | | 0.63 | | | | 0.68 | |
| Less distributions: | | | | | | | | | | | | | | | | | | | | |
| Dividends from investment income | | | (0.21 | ) | | | (0.21 | ) | | | (0.22 | ) | | | (0.21 | ) | | | (0.23 | ) |
| Distributions from net realized gains | | | (0.15 | ) | | | (0.06 | ) | | | (0.06 | ) | | | (0.18 | ) | | | (0.14 | ) |
| Total distributions | | | (0.36 | ) | | | (0.27 | ) | | | (0.28 | ) | | | (0.39 | ) | | | (0.37 | ) |
| Paid-in capital from redemption fees | | | 0.00 | (b) | | | 0.00 | (b) | | | 0.00 | (b) | | | 0.00 | (b) | | | 0.00 | (b) |
| Net asset value at end of year | | $ | 11.75 | | | $ | 11.18 | | | $ | 10.97 | | | $ | 11.34 | | | $ | 11.10 | |
| Total return (excludes sales charge) | | | 8.36 | % | | | 4.23 | % | | | (0.81 | %) | | | 5.68 | % | | | 6.28 | % |
| Net assets at end of year (in 000s) | | $ | 22,881 | | | $ | 21,596 | | | $ | 19,718 | | | $ | 19,128 | | | $ | 18,045 | |
| Ratio of net expenses to average net assets† | | | 0.61 | % | | | 0.58 | % | | | 0.60 | % | | | 0.60 | % | | | 0.61 | % |
| Ratio of net investment income to average net assets* | | | 1.83 | % | | | 1.72 | % | | | 1.95 | % | | | 1.82 | % | | | 2.04 | % |
| Ratio of gross expenses to average net assets†** | | | 0.64 | % | | | 0.58 | % | | | 0.63 | % | | | 0.62 | % | | | 0.64 | % |
| Portfolio turnover rate | | | 15.88 | % | | | 11.42 | % | | | 8.66 | % | | | 10.78 | % | | | 25.69 | % |
| † | The ratios presented only reflect the direct income and expenses for the Fund, not the underlying funds in which it invests. |
| * | Recognition of net investment income by the Fund is affected by the timing of the declaration of dividends by the underlying companies in which the Fund invests. |
| ** | During the year, certain expenses were reduced by the Adviser and/or Distributor. If such expense reductions had not occurred, the ratios would have been as indicated. |
| (a) | Net investment income per share has been calculated using the average daily shares outstanding during the year. |
| (b) | Amount is less than $0.005 per share. |
See accompanying notes to financial statements.
64
Financial Highlights, continued
For a share outstanding throughout the year indicated
Praxis Genesis Balanced Portfolio - Class A
| | | Year Ended December 31,
2017 | | Year Ended December 31,
2016 | | Year Ended December 31,
2015 | | Year Ended December 31,
2014 | | Year Ended December 31,
2013 |
| Net asset value at beginning of year | | $ | 12.55 | | | $ | 12.13 | | | $ | 12.76 | | | $ | 12.50 | | | $ | 11.14 | |
| Net investment income(a) | | | 0.28 | | | | 0.17 | | | | 0.21 | | | | 0.17 | | | | 0.20 | |
| Net realized and unrealized gains (losses) on investments | | | 1.40 | | | | 0.64 | | | | (0.42 | ) | | | 0.49 | | | | 1.50 | |
| Total from investment operations | | | 1.68 | | | | 0.81 | | | | (0.21 | ) | | | 0.66 | | | | 1.70 | |
| Less distributions: | | | | | | | | | | | | | | | | | | | | |
| Dividends from investment income | | | (0.29 | ) | | | (0.19 | ) | | | (0.22 | ) | | | (0.17 | ) | | | (0.19 | ) |
| Distributions from net realized gains | | | (0.23 | ) | | | (0.20 | ) | | | (0.20 | ) | | | (0.23 | ) | | | (0.15 | ) |
| Total distributions | | | (0.52 | ) | | | (0.39 | ) | | | (0.42 | ) | | | (0.40 | ) | | | (0.34 | ) |
| Paid-in capital from redemption fees | | | 0.00 | (b) | | | 0.00 | (b) | | | 0.00 | (b) | | | 0.00 | (b) | | | 0.00 | (b) |
| Net asset value at end of year | | $ | 13.71 | | | $ | 12.55 | | | $ | 12.13 | | | $ | 12.76 | | | $ | 12.50 | |
| Total return (excludes sales charge) | | | 13.38 | % | | | 6.58 | % | | | (1.66 | %) | | | 5.30 | % | | | 15.30 | % |
| Net assets at end of year (in 000s) | | $ | 73,193 | | | $ | 63,565 | | | $ | 59,742 | | | $ | 57,611 | | | $ | 53,614 | |
| Ratio of net expenses to average net assets† | | | 0.53 | % | | | 0.55 | % | | | 0.54 | % | | | 0.58 | % | | | 0.60 | % |
| Ratio of net investment income to average net assets* | | | 2.15 | % | | | 1.39 | % | | | 1.65 | % | | | 1.33 | % | | | 1.65 | % |
| Portfolio turnover rate | | | 11.91 | % | | | 10.29 | % | | | 6.53 | % | | | 10.26 | % | | | 19.91 | % |
| † | The ratios presented only reflect the direct income and expenses for the Fund, not the underlying funds in which it invests. |
| * | Recognition of net investment income by the Fund is affected by the timing of the declaration of dividends by the underlying companies in which the Fund invests. |
| (a) | Net investment income per share has been calculated using the average daily shares outstanding during the year. |
| (b) | Amount is less than $0.005 per share. |
See accompanying notes to financial statements.
65
Financial Highlights, continued
For a share outstanding throughout the year indicated
Praxis Genesis Growth Portfolio - Class A
| | | Year Ended December 31,
2017 | | Year Ended December 31,
2016 | | Year Ended December 31,
2015 | | Year Ended December 31,
2014 | | Year Ended December 31,
2013 |
| Net asset value at beginning of year | | $ | 13.47 | | | $ | 12.93 | | | $ | 13.79 | | | $ | 13.49 | | | $ | 11.40 | |
| Net investment income(a) | | | 0.32 | | | | 0.14 | | | | 0.18 | | | | 0.13 | | | | 0.17 | |
Net realized and unrealized gains (losses)
on investments | | | 1.93 | | | | 0.87 | | | | (0.52 | ) | | | 0.56 | | | | 2.26 | |
| Total from investment operations | | | 2.25 | | | | 1.01 | | | | (0.34 | ) | | | 0.69 | | | | 2.43 | |
| Less distributions: | | | | | | | | | | | | | | | | | | | | |
| Dividends from investment income | | | (0.33 | ) | | | (0.14 | ) | | | (0.19 | ) | | | (0.13 | ) | | | (0.17 | ) |
| Distributions from net realized gains | | | (0.30 | ) | | | (0.33 | ) | | | (0.33 | ) | | | (0.26 | ) | | | (0.17 | ) |
| Total distributions | | | (0.63 | ) | | | (0.47 | ) | | | (0.52 | ) | | | (0.39 | ) | | | (0.34 | ) |
| Paid-in capital from redemption fees | | | 0.00 | (b) | | | 0.00 | (b) | | | 0.00 | (b) | | | 0.00 | (b) | | | 0.00 | (b) |
| Net asset value at end of year | | $ | 15.09 | | | $ | 13.47 | | | $ | 12.93 | | | $ | 13.79 | | | $ | 13.49 | |
| Total return (excludes sales charge) | | | 16.71 | % | | | 7.82 | % | | | (2.49 | %) | | | 5.09 | % | | | 21.28 | % |
| Net assets at end of year (in 000s) | | $ | 64,935 | | | $ | 53,925 | | | $ | 49,881 | | | $ | 49,670 | | | $ | 45,793 | |
| Ratio of net expenses to average net assets† | | | 0.60 | % | | | 0.61 | % | | | 0.62 | % | | | 0.60 | % | | | 0.60 | % |
| Ratio of net investment income to average net assets* | | | 2.29 | % | | | 1.09 | % | | | 1.33 | % | | | 0.95 | % | | | 1.39 | % |
| Ratio of gross expenses to average net assets†** | | | 0.60 | % | | | 0.61 | % | | | 0.62 | % | | | 0.60 | % | | | 0.66 | % |
| Portfolio turnover rate | | | 11.05 | % | | | 9.32 | % | | | 7.39 | % | | | 8.81 | % | | | 20.87 | % |
| † | The ratios presented only reflect the direct income and expenses for the Fund, not the underlying funds in which it invests. |
| * | Recognition of net investment income by the Fund is affected by the timing of the declaration of dividends by the underlying companies in which the Fund invests. |
| ** | During the year certain expenses were reduced by the Adviser and/or Distributor. If such expense reductions had not occurred, the ratios would have been as indicated. |
| (a) | Net investment income per share has been calculated using the average daily shares outstanding during the year. |
| (b) | Amount is less than $0.005 per share. |
See accompanying notes to financial statements.
66
| Notes to Financial Statements | December 31, 2017 |
1. Organization:
The Praxis Mutual Funds (the “Trust”) is an open-end management investment company established as a Delaware business trust under a Declaration of Trust dated September 27, 1993, as amended and restated April 28, 2016, and is registered under the Investment Company Act of 1940, as amended (the “1940 Act”). As of December 31, 2017, the Trust consists of the Praxis Impact Bond Fund, the Praxis International Index Fund, the Praxis Value Index Fund, the Praxis Growth Index Fund, and the Praxis Small Cap Index Fund (formerly the Praxis Small Cap Fund), (individually a “Fund”, collectively “the Funds”), the Praxis Genesis Conservative Portfolio, the Praxis Genesis Balanced Portfolio, and the Praxis Genesis Growth Portfolio, (individually a “Portfolio”, collectively “the Portfolios”). The Funds and Portfolios are also referred to individually as the Impact Bond Fund, International Index Fund, Value Index Fund, Growth Index Fund, Small Cap Index Fund, Conservative Portfolio, Balanced Portfolio and Growth Portfolio in the financial statements. Each Fund and Portfolio is a diversified series of the Trust. As an investment company, as defined in Financial Accounting Standards Board (“FASB”) Accounting Standards Update 2013-08, each Fund and Portfolio follows accounting and reporting guidance under FASB Accounting Standards Codification Topic 946, “Financial Services – Investment Companies.”
As of December 31, 2017, the Funds offer Class A and Class I Shares and the Portfolios offer Class A Shares. Each class of shares in a Fund or Portfolio has identical rights and privileges except with respect to fees paid under the distribution and shareholder servicing agreements, certain other class specific expenses and income, voting rights on matters affecting a single class of shares and the exchange privileges of each class of shares. Class A has a maximum sales charge on purchases of 5.25 percent as a percentage of the original purchase price, except for the Impact Bond Fund which has a maximum sales charge of 3.75 percent.
2. Significant Accounting Policies:
In October 2016, the U.S. Securities and Exchange Commission (the “SEC”) adopted amendments to Regulation S-X which impact financial statement presentation, particularly the presentation of derivative investments. The Funds and Portfolios have adopted these amendments, which were effective August 1, 2017, with these financial statements.
The following is a summary of significant accounting policies followed by the Trust in the preparation of its financial statements. The policies are in conformity with accounting principles generally accepted in the United States of America (“GAAP”). The preparation of financial statements requires management to make estimates and assumptions that affect the reported amounts of assets and liabilities and disclosure of contingent assets and liabilities at the date of the financial statements and the reported amounts of income and expenses for the reporting year. Actual results could differ from those estimates.
Securities Valuation:
The Funds and Portfolios record their investments at fair value. Fair value is defined as the price that would be received to sell an asset or paid to transfer a liability in an orderly transaction between market participants at the measurement date. The valuation techniques used to determine fair value are further described below.
Securities generally are valued at fair values determined on the basis of the latest available bid prices in the principal market (closing sales prices if the principal market is an exchange) in which such securities are normally traded. Investments in open-end investment companies are valued at their respective net asset values as reported by such companies. The differences between the cost and fair values of investments are reflected as either unrealized appreciation or depreciation.
The Funds use various independent pricing services to value most of their debt investments. A pricing service would normally consider such factors as yield, risk, quality, maturity, type of issue, trading characteristics, special circumstances and other factors it deems relevant in determining valuations of normal institutional trading units of debt securities and would not rely exclusively on quoted prices. When valuing foreign securities held by the Funds, certain pricing services might use computerized pricing models to systematically calculate adjustments to foreign security closing prices based on the latest market movements. Such pricing models utilize market data that has been obtained between the local market close and the NYSE close to compute adjustments to foreign security close prices. The methods used by the pricing service and the valuations so established are reviewed by the Pricing Committee of the Funds and Portfolios (“Pricing Committee”) under general supervision of the Board of Trustees (the “Board”). Securities for which market quotations are not readily available (e.g. an approved pricing service does not provide a price, certain stale prices or an event occurs that materially affects the furnished price) are valued at their fair value as determined in good faith in accordance with consistently applied procedures established by and under the general supervision of the Board. Short-term debt securities of sufficient credit quality maturing in less than 61 days may be valued at amortized cost, which approximates fair value. The Portfolios’ investments in the Funds (the “Underlying Funds”) are valued at the closing net asset value per share.
In certain circumstances, the Praxis Mutual Funds Valuation Procedures (“Valuation Procedures”) contemplate the Board’s delegation of the implementation of the Valuation Procedures to the Pricing Committee. In valuing restricted securities under the Valuation Procedures, the Pricing Committee will consider (but is not limited to) certain specific and general factors enumerated in the Valuation Procedures. The Valuation Procedures require that the Pricing Committee report to the Board at each of its regular quarterly meetings regarding valuation of restricted securities and actions taken in connection with the Valuation Procedures.
67
| Notes to Financial Statements, continued | December 31, 2017 |
The valuation techniques described maximize the use of observable inputs and minimize the use of unobservable inputs in determining fair value. These inputs are summarized in the three broad levels listed below:
● Level 1 — quoted prices in active markets for identical securities
● Level 2 — other significant observable inputs (including quoted prices for similar securities, interest rates, prepayment speeds, credit risk, etc.)
● Level 3 — significant unobservable inputs (including the Funds’ and Portfolios’ own assumptions in determining the fair value of investments)
The inputs or methodology used for valuing securities is not necessarily an indication of the risks associated with investing in those securities. For example, short-term debt securities of sufficient credit quality maturing in less than 61 days may be valued using amortized cost, in accordance with rules under the 1940 Act. Generally, amortized cost approximates the current fair value of a security, but since the value is not obtained from a quoted price in an active market, such securities are reflected as Level 2.
The Trust determines transfers between fair value hierarchy levels at the reporting period end.
The aggregate value by input level, as of December 31, 2017, for each Fund’s and Portfolio’s investments are as follows:
Impact Bond Fund Valuation Inputs at Reporting Date:
| Description | | Level 1 | | Level 2 | | Level 3 | | Total |
| Investments at Value | | | | | | | | | | | | | | | | |
| Asset Backed Securities | | $ | — | | | $ | 12,967,487 | | | $ | — | | | $ | 12,967,487 | |
| Commercial Mortgage Backed Securities | | | — | | | | 3,060,985 | | | | — | | | | 3,060,985 | |
| Municipal Bonds | | | — | | | | 11,434,767 | | | | — | | | | 11,434,767 | |
| Corporate Bonds | | | — | | | | 184,937,246 | | | | — | | | | 184,937,246 | |
| Corporate Notes | | | — | | | | 4,850,000 | | | | — | | | | 4,850,000 | |
| Foreign Governments | | | — | | | | 50,062,516 | | | | — | | | | 50,062,516 | |
| U.S. Government Agencies | | | — | | | | 237,309,232 | | | | — | | | | 237,309,232 | |
| Investment Companies | | | 3,584,141 | | | | — | | | | — | | | | 3,584,141 | |
| Total Investments | | $ | 3,584,141 | | | $ | 504,622,233 | | | $ | — | | | $ | 508,206,374 | |
There were no transfers in and out of Level 1, 2 or 3 during the year ended December 31, 2017.
International Index Fund Valuation Inputs at Reporting Date:
| Description | | Level 1 | | Level 2 | | Level 3 | | Total |
| Investments at Value | | | | | | | | | | | | | | | | |
| Common Stocks | | $ | 216,869,644 | | | $ | 63,040,358 | | | $ | — | | | $ | 279,910,002 | |
| Rights | | | 11,203 | | | | — | | | | — | | | | 11,203 | |
| Corporate Notes | | | — | | | | 2,350,000 | | | | — | | | | 2,350,000 | |
| Total Investments | | $ | 216,880,847 | | | $ | 65,390,358 | | | $ | — | | | $ | 282,271,205 | |
The transfers from Level 1 to Level 2 at the end of the period were as a result of the Fund’s systematic application of the fair value trigger for international securities.
The International Index Level 2 investments in Common Stock presented above totaling $63,040,358 were considered Level 1 investments at the beginning of the reporting period.
Value Index Fund Valuation Inputs at Reporting Date:
| Description | | Level 1 | | Level 2 | | Level 3 | | Total |
| Investments at Value | | | | | | | | | | | | | | | | |
| Common Stocks | | $ | 186,854,494 | | | $ | — | | | $ | — | | | $ | 186,854,494 | |
| Rights | | | — | | | | — | | | | 6,706 | | | | 6,706 | |
| Corporate Notes | | | — | | | | 1,560,000 | | | | — | | | | 1,560,000 | |
| Total Investments | | $ | 186,854,494 | | | $ | 1,560,000 | | | $ | 6,706 | | | $ | 188,421,200 | |
68
| Notes to Financial Statements, continued | December 31, 2017 |
The following table presents the Value Index Fund’s assets measured at fair value on a recurring basis using significant unobservable inputs (Level 3) for the year ended December 31, 2017.
| | | Rights |
| Value, December 31, 2016 | | $ | 6,706 | |
| Purchases | | | — | |
| Unrealized gains | | | — | |
| Value, December 31, 2017 | | $ | 6,706 | |
The following table summarizes the valuation techniques used and unobservable inputs approved and monitored by the Board to determine the fair value of Value Index Fund’s Level 3 common stocks as of December 31, 2017:
| | | Fair
Value | | Valuation
Technique | | Unobservable
Input | | Range | | Impact to
Valuation From a
Decrease in Input |
| | Rights | | | $ | 6,706 | | | Calculation of Proceeds from Sale of Business | | Estimated Value of Proceeds from
Sale of Business | | | $1.02 per share | | | Decrease in Valuation |
Growth Index Fund Valuation Inputs at Reporting Date:
| Description | | Level 1 | | Level 2 | | Level 3 | | Total |
| Investments at Value | | | | | | | | | | | | | | | | |
| Common Stocks | | $ | 255,445,133 | | | $ | — | | | $ | — | | | $ | 255,445,133 | |
| Corporate Notes | | | — | | | | 2,100,000 | | | | — | | | | 2,100,000 | |
| Total Investments | | $ | 255,445,133 | | | $ | 2,100,000 | | | $ | — | | | $ | 257,545,133 | |
There were no transfers in and out of Level 1, 2 or 3 during the year ended December 31, 2017.
Small Cap Index Fund Valuation Inputs at Reporting Date:
| Description | | Level 1 | | Level 2 | | Level 3 | | Total |
| Investments at Value | | | | | | | | | | | | | | | | |
| Common Stocks | | $ | 52,601,631 | | | $ | — | | | $ | — | | | $ | 52,601,631 | |
| Corporate Notes | | | — | | | | 445,000 | | | | — | | | | 445,000 | |
| Total Investments | | $ | 52,601,631 | | | $ | 445,000 | | | $ | — | | | $ | 53,046,631 | |
There were no transfers in and out of Level 1, 2 or 3 during the year ended December 31, 2017.
Conservative Portfolio Valuation Inputs at Reporting Date:
| Description | | Level 1 | | Level 2 | | Level 3 | | Total |
| Investments at Value | | | | | | | | | | | | | | | | |
| Mutual Funds | | $ | 22,885,554 | | | $ | — | | | $ | — | | | $ | 22,885,554 | |
| Total Investments | | $ | 22,885,554 | | | $ | — | | | $ | — | | | $ | 22,885,554 | |
There were no transfers in and out of Level 1, 2 or 3 during the year ended December 31, 2017.
Balanced Portfolio Valuation Inputs at Reporting Date:
| Description | | Level 1 | | Level 2 | | Level 3 | | Total |
| Investments at Value | | | | | | | | | | | | | | | | |
| Mutual Funds | | $ | 73,220,753 | | | $ | — | | | $ | — | | | $ | 73,220,753 | |
| Total Investments | | $ | 73,220,753 | | | $ | — | | | $ | — | | | $ | 73,220,753 | |
There were no transfers in and out of Level 1, 2 or 3 during the year ended December 31, 2017.
Growth Portfolio Valuation Inputs at Reporting Date:
| Description | | Level 1 | | Level 2 | | Level 3 | | Total |
| Investments at Value | | | | | | | | | | | | | | | | |
| Mutual Funds | | $ | 64,967,140 | | | $ | — | | | $ | — | | | $ | 64,967,140 | |
| Total Investments | | $ | 64,967,140 | | | $ | — | | | $ | — | | | $ | 64,967,140 | |
There were no transfers in and out of Level 1, 2 or 3 during the year ended December 31, 2017.
69
| Notes to Financial Statements, continued | December 31, 2017 |
Investment Transactions and Related Income:
Changes in holdings of portfolio investments are reflected in the calculation of each Fund’s and Portfolio’s net asset value no later than the first business day following trade date. For financial reporting purposes, investment transactions are accounted for on the trade date on the last business day of the reporting period. Realized gains or losses realized on sales of investments are determined by comparing the identified cost of the security lot sold with the net sales proceeds. Interest income is recognized on the accrual basis and includes, where applicable, the pro-rata amortization of premium or accretion of discount. Dividend income is recorded on the ex-dividend date. Withholding taxes on foreign dividends have been recorded in accordance with the Funds’ understanding of the applicable country’s tax rules and rates.
Allocations:
Investment income earned, realized capital gains and losses, and unrealized appreciation and depreciation for the Funds are allocated daily to each class of shares based upon its proportionate share of total net assets of the Fund. Class specific expenses are charged directly to the class incurring the expense. Common expenses, which are not attributable to a specific class, are allocated daily to each class of shares based upon its proportionate share of total net assets of the Fund. Expenses not directly billed to a Fund or Portfolio are allocated proportionally among all Funds and Portfolios daily in relation to the net assets of each Fund or Portfolio or another reasonable measure.
The Portfolios invest in other Praxis equity and fixed income funds (the “Underlying Funds”) and, as a result, the Portfolios indirectly pay a portion of the operating expenses, including management fees, of the Underlying Funds. These expenses are deducted from the Underlying Funds before their share prices are calculated and are reflected as Acquired Fund Fees and Expenses (“AFFE”) in the Portfolios’ prospectus fee tables. Actual indirect expenses vary depending on how a Portfolio’s assets are allocated among the Underlying Funds.
Risks Associated with Foreign Securities and Currencies:
Investments in securities of foreign issuers carry certain risks not ordinarily associated with investments in securities of domestic issuers. Such risks include adverse future political and economic developments and the possible imposition of exchange controls or other foreign governmental laws and restrictions. In addition, with respect to certain countries, there is the possibility of expropriation of assets, confiscatory taxation, political or social instability or diplomatic developments which could adversely affect investments in those countries.
Certain countries may also impose substantial restrictions on investments on their capital markets by foreign entities, including restriction on investment in issuers or industries deemed sensitive to the relevant nation’s interests. These factors may limit the investment opportunities available or result in lack of liquidity and high price volatility with respect to securities of issuers from developing countries.
Foreign Currency Translation:
The fair value of investment securities and other assets and liabilities of the International Index Fund denominated in foreign currencies are translated into U.S. dollars at the current exchange rate at the close of each business day. Purchases and sales of securities, income receipts and expense payments are translated into U.S. dollars based at the exchange rate on the date of the transaction.
The Funds and Portfolios do not isolate that portion of the results of operations resulting from the changes in foreign exchange rates on investments from the fluctuations arising from the changes in market prices of securities held. Such fluctuations are included with the net realized and unrealized gain or loss from investments.
Reported net realized foreign exchange gains or losses arise from sales and maturities of short-term securities, sales of foreign currencies, currency gains or losses realized between the trade and settlement dates on securities transactions, the difference between the amounts of dividends, interest, and foreign withholding taxes recorded on the Fund’s books, and the U.S. dollar equivalent of the amounts actually received or paid. Net unrealized foreign exchange gains and losses arise from the changes in the value of assets and liabilities including investments in securities at the reporting period, resulting from changes in the exchange rate.
Dividends and Distributions:
Dividends from net investment income, if any, are declared and paid monthly for the Impact Bond Fund and for each of the Portfolios. Dividends from net investment income, if any, are declared and paid annually for the International Index Fund, the Value Index Fund, the Growth Index Fund and the Small Cap Index Fund. To the extent the Portfolios invest in the Impact Bond Fund and receive dividends, they will be paid monthly. Distributions of net realized capital gains from the Underlying Funds are recorded on the ex-dividend date or when the Portfolios are first notified of the dividend. Distributable net realized capital gains of the Funds, if any, are declared and distributed at least annually.
70
| Notes to Financial Statements, continued | December 31, 2017 |
The amounts of dividends from net investment income and distributions from net realized capital gains are determined in accordance with federal income tax regulations, which may differ from GAAP. These “book/tax” differences are either considered temporary or permanent in nature. To the extent these differences are permanent in nature, such amounts are reclassified within the composition of net assets based on their federal tax-basis treatment; temporary differences do not require reclassification.
Uninvested Cash:
The Funds may maintain cash at their custodian which, at times, may exceed United States federally insured limits.
Federal Income Taxes:
It is each Fund’s and Portfolio’s policy to continue to qualify as a regulated investment company by complying with the provisions available to investment companies, as defined in applicable sections of Subchapter M of the Internal Revenue Code, and to distribute timely all of its net investment company taxable income and net capital gains to shareholders. Therefore, no federal income tax provision is required. Under the applicable foreign tax law, a withholding tax may be imposed on interest, dividends and capital gains earned on foreign investments at various rates. Where available, the Funds will file for claims on foreign taxes withheld.
Redemption Fees:
The Funds and Portfolios will charge a redemption fee of two percent of the total redemption amount if a shareholder sells or exchanges shares after holding them for less than 30 days subject to certain exceptions and limitations described in the Prospectus. Amounts charged are included in Paid-in Capital Share Transactions as disclosed in Note 6 to the Financial Statements.
3. Purchases and Sales of Securities:
Purchases and sales of securities (excluding short-term debt securities having maturities one year or less and U.S. Government Securities) for the year ended December 31, 2017 were as follows:
| | | Purchases | | Sales |
| Impact Bond Fund | | $ | 128,580,917 | | | $ | 82,188,720 | |
| International Index Fund | | | 52,324,607 | | | | 12,866,145 | |
| Value Index Fund | | | 60,074,894 | | | | 55,565,371 | |
| Growth Index Fund | | | 65,940,371 | | | | 64,105,524 | |
| Small Cap Index Fund | | | 54,511,014 | | | | 50,498,288 | |
| Conservative Portfolio | | | 3,642,873 | | | | 3,512,621 | |
| Balanced Portfolio | | | 12,288,571 | | | | 8,137,328 | |
| Growth Portfolio | | | 11,782,675 | | | | 6,579,412 | |
4. Investment Transactions with Affiliates:
The Portfolios invest in the underlying Praxis Mutual Funds which are also advised by the Adviser. Therefore, the Underlying Funds are deemed affiliates, and the related activities in those investments were as follows:
| | | For the year ended December 31, 2017 |
| Affiliate | | Fair
Value at December 31, 2016 | | Purchase
Cost | | Sales Proceeds | | Realized
Gain/(Loss) | | Change in Unrealized Appreciation (Depreciation) | | Fair
Value at December 31, 2017 | | Dividend Income | | Long-Term Capital Gain Distributions | | Shares at December 31, 2017 |
| Praxis Genesis Conservative Portfolio | | | | | | | | | | | | | | | | | | | | | | | | | | | | | | | | | | | | |
| Impact Bond - Class I | | $ | 15,169,753 | | | $ | 2,381,396 | | | $ | (1,713,668 | ) | | $ | (29,609 | ) | | $ | 176,929 | | | $ | 15,984,801 | | | $ | 392,037 | | | $ | — | | | | 1,544,425 | |
| International Index - Class I | | | 1,612,374 | | | | 447,267 | | | | (373,995 | ) | | | 29,985 | | | | 382,960 | | | | 2,098,591 | | | | 35,376 | | | | — | | | | 178,603 | |
| Growth Index - Class I | | | 2,134,626 | | | | 250,835 | | | | (721,352 | ) | | | 222,709 | | | | 216,956 | | | | 2,103,774 | | | | 14,498 | | | | 55,458 | | | | 90,641 | |
| Value Index - Class I | | | 2,145,972 | | | | 390,718 | | | | (610,424 | ) | | | 81,315 | | | | 117,321 | | | | 2,124,902 | | | | 54,953 | | | | 83,814 | | | | 154,651 | |
| Small Cap Index - Class I | | | 541,494 | | | | 172,657 | | | | (93,182 | ) | | | (9,673 | ) | | | (37,810 | ) | | | 573,486 | | | | 42,062 | | | | 66,780 | | | | 61,270 | |
| Total | | $ | 21,604,219 | | | $ | 3,642,873 | | | $ | (3,512,621 | ) | | $ | 294,727 | | | $ | 856,356 | | | $ | 22,885,554 | | | $ | 538,926 | | | $ | 206,052 | | | | 2,029,590 | |
71
| Notes to Financial Statements, continued | December 31, 2017 |
| | | For the year ended December 31, 2017 |
| Affiliate | | Fair
Value at December 31, 2016 | | Purchase
Cost | | Sales Proceeds | | Realized
Gain/(Loss) | | Change in Unrealized Appreciation (Depreciation) | | Fair
Value at December 31, 2017 | | Dividend Income | | Long-Term Capital Gain Distributions | | Shares at December 31, 2017 |
| Praxis Genesis Balanced Portfolio | | | | | | | | | | | | | | | | | | | | | | | | | | | | | | | | | | | | |
| Impact Bond - Class I | | $ | 25,584,075 | | | $ | 4,645,743 | | | $ | (1,320,542 | ) | | $ | (26,348 | ) | | $ | 278,462 | | | $ | 29,161,390 | | | $ | 688,985 | | | $ | — | | | | 2,817,526 | |
| International Index - Class I | | | 9,519,836 | | | | 2,583,746 | | | | (1,235,794 | ) | | | 68,590 | | | | 2,452,760 | | | | 13,389,138 | | | | 225,621 | | | | — | | | | 1,139,501 | |
| Growth Index - Class I | | | 11,024,719 | | | | 1,085,510 | | | | (2,798,775 | ) | | | 892,768 | | | | 1,411,224 | | | | 11,615,446 | | | | 80,007 | | | | 306,008 | | | | 500,450 | |
| Value Index - Class I | | | 11,080,357 | | | | 1,868,099 | | | | (2,236,357 | ) | | | 203,875 | | | | 820,656 | | | | 11,736,630 | | | | 303,367 | | | | 462,655 | | | | 854,194 | |
| Small Cap Index - Class I | | | 6,386,048 | | | | 2,105,473 | | | | (545,860 | ) | | | (59,657 | ) | | | (567,855 | ) | | | 7,318,149 | | | | 537,371 | | | | 851,686 | | | | 781,854 | |
| Total | | $ | 63,595,035 | | | $ | 12,288,571 | | | $ | (8,137,328 | ) | | $ | 1,079,228 | | | $ | 4,395,247 | | | $ | 73,220,753 | | | $ | 1,835,351 | | | $ | 1,620,349 | | | | 6,093,525 | |
| | | For the year ended December 31, 2017 |
| Affiliate | | Fair
Value at December 31, 2016 | | Purchase
Cost | | Sales Proceeds | | Realized
Gain/(Loss) | | Change in Unrealized Appreciation (Depreciation) | | Fair
Value at December 31, 2017 | | Dividend Income | | Long-Term Capital Gain Distributions | | Shares at December 31, 2017 |
| Praxis Genesis Growth Portfolio | | | | | | | | | | | | | | | | | | | | | | | | | | | | | | | | | | | | |
| Impact Bond - Class I | | $ | 10,872,897 | | | $ | 2,374,318 | | | $ | (435,259 | ) | | $ | (9,388 | ) | | $ | 117,411 | | | $ | 12,919,979 | | | $ | 299,116 | | | $ | — | | | | 1,248,307 | |
| International Index - Class I | | | 10,789,040 | | | | 3,081,585 | | | | (953,124 | ) | | | 46,516 | | | | 2,856,355 | | | | 15,820,372 | | | | 266,516 | | | | — | | | | 1,346,415 | |
| Growth Index - Class I | | | 12,047,766 | | | | 1,260,972 | | | | (2,667,891 | ) | | | 731,434 | | | | 1,809,938 | | | | 13,182,219 | | | | 90,765 | | | | 347,254 | | | | 567,954 | |
| Value Index - Class I | | | 12,107,486 | | | | 2,173,631 | | | | (2,078,290 | ) | | | 199,307 | | | | 918,542 | | | | 13,320,676 | | | | 344,227 | | | | 525,053 | | | | 969,482 | |
| Small Cap Index - Class I | | | 8,131,124 | | | | 2,892,169 | | | | (444,848 | ) | | | (56,653 | ) | | | (797,898 | ) | | | 9,723,894 | | | | 714,037 | | | | 1,131,576 | | | | 1,038,878 | |
| Total | | $ | 53,948,313 | | | $ | 11,782,675 | | | $ | (6,579,412 | ) | | $ | 911,216 | | | $ | 4,904,348 | | | $ | 64,967,140 | | | $ | 1,714,661 | | | $ | 2,003,883 | | | | 5,171,036 | |
5. Related Party Transactions:
Everence Capital Management, Inc. (the “Adviser”) provides investment advisory services to the Funds and Portfolios. Under the terms of the investment advisory agreement, the Adviser is entitled to receive fees based on a percentage of the average daily net assets of each of the Funds and Portfolios as follows:
| | |
| Impact Bond Fund | 0.40% |
| International Index Fund | 0.55%* |
| Value Index Fund | 0.30% |
| Growth Index Fund | 0.30% |
| Small Cap Index Fund | 0.30% |
| Conservative Portfolio | 0.05% |
| Balanced Portfolio | 0.05% |
| Growth Portfolio | 0.05% |
| * | The International Index Fund’s Investment Advisory Fee is subject to a fee breakpoint schedule as follows:
0.60% on average net assets up to and including $100 million and 0.51% over $100 million up to and including $500 million, and 0.45% over $500 million |
The Adviser has retained Aperio Group LLC (the “Sub-Adviser”) to perform the daily investment of the assets of the International Index Fund under the terms of a Sub-Advisory Agreement. The Adviser (not the Funds) pays the Sub-Adviser a fee for these services. Prior to January 1, 2017, Luther King Capital Management (“Luther King”) served as sub-adviser to the Small Cap Index Fund. Performance prior to that date includes performance of the Fund’s previous sub-adviser, Luther King, using a different investment strategy.
The Adviser has entered into an expense limitation agreement effective until April 30, 2018. Pursuant to this agreement, the Adviser has agreed to reduce its fees (but not below zero) and/or reimburse expenses to the extent necessary in order to limit the Total Annual Fund Operating Expenses (excluding AFFE), brokerage costs, interest, taxes, dividends, fees paid to vendors providing fair value pricing and fund compliance services, Trustees fees and expenses, legal fees and expenses, and extraordinary expenses) of certain Funds and the Portfolios. Those Funds and Portfolios have agreed to repay the Adviser for the amount of fee reduction and/or expense reimbursements by the Adviser pursuant to this expense limitation agreement provided that such repayment does not cause the Total Annual Fund Operating Expenses (excluding AFFE, brokerage costs, interest, taxes, dividends, fees paid to vendors providing fair value pricing and fund compliance services, Trustees fees and expenses, legal fees and expenses, and extraordinary expenses) to exceed the contractual expense limit in place at the time of the fee reduction and/or reimbursement and at the time of repayment, and the repayment is made within three years after the year in which the Adviser reduced and/or reimbursed the expense.
72
| Notes to Financial Statements, continued | December 31, 2017 |
The contractual expense limits in place as of December 31, 2017 were:
| | |
| Impact Bond Fund (Class A) | 0.90% |
| Small Cap Index Fund (Class A) | 1.10% |
| Conservative Portfolio (Class A) | 0.60% |
| Balanced Portfolio (Class A) | 0.60% |
| Growth Portfolio (Class A) | 0.60% |
For the year ended December 31, 2017, the Adviser contractually reduced investment advisory fees and/or reimbursed other operating expenses of the Funds and Portfolios as follows:
| | | |
| Impact Bond Fund (Class A) | | $ | 43,249 | |
| Small Cap Index Fund (Class A) | | | 27,926 | |
| Conservative Portfolio | | | 6,410 | |
As of December 31, 2017, the Funds and Portfolios had the following amounts (and year of expiration) subject to repayment to the Adviser:
| | | Year Waived | | Year Repayment Expires | | Balance |
| Impact Bond Fund | | | 2015 | | | | 2018 | | | $ | 35,957 | |
| | | | 2016 | | | | 2019 | | | | 48,214 | |
| | | | 2017 | | | | 2020 | | | | 43,249 | |
| | | | | | | | | | | $ | 127,420 | |
| Small Cap Index Fund | | | 2015 | | | | 2018 | | | $ | 9,640 | |
| | | | 2016 | | | | 2019 | | | | 6,061 | |
| | | | 2017 | | | | 2020 | | | | 27,926 | |
| | | | | | | | | | | $ | 43,627 | |
| Conservative Portfolio | | | 2015 | | | | 2018 | | | $ | 4,872 | |
| | | | 2017 | | | | 2020 | | | | 6,410 | |
| | | | | | | | | | | $ | 11,282 | |
U.S. Bancorp Fund Services LLC provides transfer agent, shareholder servicing and dividend disbursing services on behalf of the Trust. For these services, U.S. Bancorp Fund Services LLC receives an annual fee, paid monthly, from each Fund and Portfolio.
Foreside Financial Services, LLC (“Distributor” and “Underwriter”) serves as the Funds’ and Portfolios’ principal Distributor and Underwriter and, as such, acts as exclusive agent for distribution of the Funds’ and Portfolios’ shares. Under the terms of the Underwriting Agreements between the Trust and the Underwriter, the Underwriter earned amounts from underwriting and broker commissions on the sale of shares during the year ended December 31, 2017 as follows:
| | | |
| Impact Bond Fund | | $ | 5,672 | |
| International Index Fund | | | 716 | |
| Value Index Fund | | | 2,737 | |
| Growth Index Fund | | | 7,681 | |
| Small Cap Index Fund | | | 718 | |
| Conservative Portfolio | | | 7,657 | |
| Balanced Portfolio | | | 19,404 | |
| Growth Portfolio | | | 22,781 | |
The Trust has adopted a Plan of Distribution (“Rule 12b-1 Plan”) under which each Fund and Portfolio may directly incur or reimburse the Adviser or the Underwriter for expenses related to the distribution and promotion of shares. The Rule 12b-1 Plan permits Class A Shares of the Funds and Portfolios to pay a 12b-1 fee of up to 0.50% of the average daily net assets attributable to Class A Shares of the applicable Fund and Portfolio, although the Board has currently authorized the Funds and Portfolios to charge no more than 0.25%. The Distributor may use the 12b-1 fee for shareholder servicing or distribution.
The Trust has entered into a Management and Administration Agreement with Foreside Management Services, LLC (“Foreside”) to serve as business manager and administrator for the Trust on behalf of the Funds. Pursuant to the terms of the Agreement, Foreside, as business manager and administrator for the Trust, performs and coordinates all management and administration services for the Trust either directly or through working with the Trust’s service providers. Services provided under the Agreement by Foreside include, but are not limited to, coordinating and monitoring activities of the third party service providers to the Funds; serving as officers of the Trust, including but not limited to Assistant Secretary, Chief Compliance Officer, Anti-Money Laundering Officer, Treasurer and others as are deemed necessary and appropriate; performing compliance services for the Trust, including maintaining the Trust compliance program as required under the 1940 Act; managing the process of filing amendments to the Trust’s registration statement and other reports to
73
| Notes to Financial Statements, continued | December 31, 2017 |
shareholders; coordinating the Board meeting preparation process; reviewing financial filings and filing with the SEC; and maintaining books and records in accordance with applicable laws and regulations. For these services, Foreside receives a monthly fee from each Fund and Portfolio. These fees are included in Administration Fees on the Statements of Operations.
For the fiscal year ended December 31, 2017, the Chair of the Board of Trustees received an annual retainer of $9,000. The Audit Committee Chair received an annual retainer of $7,000. Each additional Independent Trustee received an annual retainer of $6,000. The meeting attendance fee was $2,000 per Trustee for each quarterly in-person meeting and $1,000 for telephonic Board meetings. The Trust paid $89,000 in aggregate Trustee fees during the fiscal year ended December 31, 2017.
6. Capital Share Transactions:
Transactions in shares of the Funds and Portfolios are summarized below:
| | | | Praxis Impact Bond Fund | | | | Praxis International Index Fund | |
| | | | Year Ended December 31, 2017 | | | | Year Ended December 31, 2016 | | | | Year Ended December 31, 2017 | | | | Year Ended December 31, 2016 | |
| Capital Transactions: | | | | | | | | | | | | | | | | |
| Class A Shares: | | | | | | | | | | | | | | | | |
| Proceeds from shares issued | | $ | 35,386,654 | | | $ | 29,429,619 | | | $ | 8,797,660 | | | $ | 3,792,535 | |
| Dividends reinvested | | | 1,721,957 | | | | 1,664,625 | | | | 314,802 | | | | 261,502 | |
| Cost of shares redeemed | | | (29,981,300 | ) | | | (27,546,172 | ) | | | (6,544,018 | ) | | | (3,539,492 | ) |
| Redemption fees | | | 3,158 | | | | 2,021 | | | | 1,919 | | | | 375 | |
| Class A Share Transactions | | $ | 7,130,469 | | | $ | 3,550,093 | | | $ | 2,570,363 | | | $ | 514,920 | |
| Class I Shares: | | | | | | | | | | | | | | | | |
| Proceeds from shares issued | | $ | 98,108,203 | | | $ | 86,125,619 | | | $ | 67,687,576 | | | $ | 35,441,754 | |
| Dividends reinvested | | | 5,328,571 | | | | 5,090,725 | | | | 2,222,131 | | | | 1,914,089 | |
| Cost of shares redeemed | | | (55,889,095 | ) | | | (62,337,747 | ) | | | (31,870,727 | ) | | | (22,752,292 | ) |
| Redemption fees | | | 263 | | | | 731 | | | | 9 | | | | 143 | |
| Class I Share Transactions | | $ | 47,547,942 | | | $ | 28,879,328 | | | $ | 38,038,989 | | | $ | 14,603,694 | |
| Net increase from capital transactions | | $ | 54,678,411 | | | $ | 32,429,421 | | | $ | 40,609,352 | | | $ | 15,118,614 | |
| Share Transactions: | | | | | | | | | | | | | | | | |
| Class A Shares: | | | | | | | | | | | | | | | | |
| Issued | | | 3,401,672 | | | | 2,797,252 | | | | 836,694 | | | | 419,684 | |
| Reinvested | | | 165,617 | | | | 158,049 | | | | 26,929 | | | | 27,614 | |
| Redeemed | | | (2,884,259 | ) | | | (2,629,475 | ) | | | (604,092 | ) | | | (380,688 | ) |
| Change in Class A Shares: | | | 683,030 | | | | 325,826 | | | | 259,531 | | | | 66,610 | |
| Class I Shares: | | | | | | | | | | | | | | | | |
| Issued | | | 9,474,078 | | | | 8,234,526 | | | | 6,373,028 | | | | 3,819,634 | |
| Reinvested | | | 514,796 | | | | 485,957 | | | | 189,057 | | | | 201,271 | |
| Redeemed | | | (5,399,852 | ) | | | (5,945,448 | ) | | | (2,899,001 | ) | | | (2,434,021 | ) |
| Change in Class I Shares: | | | 4,589,022 | | | | 2,775,035 | | | | 3,663,084 | | | | 1,586,884 | |
| Net increase from share transactions | | | 5,272,052 | | | | 3,100,861 | | | | 3,922,615 | | | | 1,653,494 | |
| | | Praxis Value
Index Fund | | Praxis Growth
Index Fund | | Praxis Small Cap
Index Fund |
| | | Year Ended December 31, 2017 | | Year Ended December 31, 2016 | | Year Ended December 31, 2017 | | Year Ended December 31, 2016 | | Year Ended December 31, 2017 | | Year Ended December 31, 2016 |
| Capital Transactions: | | | | | | | | | | | | | | | | | | | | | | | | |
| Class A Shares: | | | | | | | | | | | | | | | | | | | | | | | | |
| Proceeds from shares issued | | $ | 3,979,597 | | | $ | 4,090,425 | | | $ | 14,919,975 | | | $ | 11,774,936 | | | $ | 1,035,911 | | | $ | 1,079,098 | |
| Dividends reinvested | | | 1,479,976 | | | | 536,510 | | | | 2,572,401 | | | | 400,344 | | | | 1,036,464 | | | | 300,915 | |
| Cost of shares redeemed | | | (4,100,404 | ) | | | (2,778,619 | ) | | | (11,995,921 | ) | | | (14,102,860 | ) | | | (1,829,245 | ) | | | (3,092,514 | ) |
| Redemption fees | | | 70 | | | | 80 | | | | 1,010 | | | | 654 | | | | 8 | | | | 3 | |
| Class A Share Transactions | | $ | 1,359,239 | | | $ | 1,848,396 | | | $ | 5,497,465 | | | $ | (1,926,926 | ) | | $ | 243,138 | | | $ | (1,712,498 | ) |
| Class I Shares: | | | | | | | | | | | | | | | | | | | | | | | | |
| Proceeds from shares issued | | $ | 30,679,948 | | | $ | 28,468,317 | | | $ | 30,181,072 | | | $ | 31,920,870 | | | $ | 6,039,254 | | | $ | 5,305,383 | |
| Dividends reinvested | | | 9,258,756 | | | | 2,682,677 | | | | 5,133,885 | | | | 982,772 | | | | 8,949,860 | | | | 2,125,232 | |
| Cost of shares redeemed | | | (25,092,141 | ) | | | (24,305,718 | ) | | | (31,934,363 | ) | | | (26,202,372 | ) | | | (4,922,317 | ) | | | (6,707,908 | ) |
| Redemption fees | | | 140 | | | | 237 | | | | 871 | | | | 252 | | | | — | | | | — | |
| Class I Share Transactions | | $ | 14,846,703 | | | $ | 6,845,513 | | | $ | 3,381,465 | | | $ | 6,701,522 | | | $ | 10,066,797 | | | $ | 722,707 | |
74
| Notes to Financial Statements, continued | December 31, 2017 |
| | | Praxis Value Index Fund | | Praxis Growth Index Fund | | Praxis Small Cap
Index Fund |
| | | Year Ended December 31, 2017 | | Year Ended December 31, 2016 | | Year Ended December 31, 2017 | | Year Ended December 31, 2016 | | Year Ended December 31, 2017 | | Year Ended December 31, 2016 |
| Net increase (decrease) from capital transactions | | $ | 16,205,942 | | | $ | 8,693,909 | | | $ | 8,878,930 | | | $ | 4,774,596 | | | $ | 10,309,935 | | | $ | (989,791 | ) |
| Share Transactions: | | | | | | | | | | | | | | | | | | | | | | | | |
| Class A Shares: | | | | | | | | | | | | | | | | | | | | | | | | |
| Issued | | | 297,531 | | | | 348,891 | | | | 691,283 | | | | 658,317 | | | | 104,143 | | | | 116,839 | |
| Reinvested | | | 105,798 | | | | 42,163 | | | | 110,660 | | | | 21,272 | | | | 119,271 | | | | 31,086 | |
| Redeemed | | | (305,213 | ) | | | (238,887 | ) | | | (562,010 | ) | | | (776,458 | ) | | | (188,255 | ) | | | (327,644 | ) |
| Change in Class A Shares: | | | 98,116 | | | | 152,167 | | | | 239,933 | | | | (96,869 | ) | | | 35,159 | | | | (179,719 | ) |
| Class I Shares: | | | | | | | | | | | | | | | | | | | | | | | | |
| Issued | | | 2,307,544 | | | | 2,453,620 | | | | 1,408,131 | | | | 1,743,165 | | | | 576,218 | | | | 549,814 | |
| Reinvested | | | 662,890 | | | | 211,366 | | | | 218,870 | | | | 51,916 | | | | 941,733 | | | | 205,336 | |
| Redeemed | | | (1,839,118 | ) | | | (2,012,029 | ) | | | (1,453,464 | ) | | | (1,439,842 | ) | | | (461,088 | ) | | | (661,323 | ) |
| Change in Class I Shares: | | | 1,131,316 | | | | 652,957 | | | | 173,537 | | | | 355,239 | | | | 1,056,863 | | | | 93,827 | |
| Net increase (decrease) from share transactions | | | 1,229,432 | | | | 805,124 | | | | 413,470 | | | | 258,370 | | | | 1,092,022 | | | | (85,892 | ) |
| | | | Praxis Genesis
Conservative Portfolio | | | | Praxis Genesis
Balanced Portfolio | | | | Praxis Genesis
Growth Portfolio | |
| | | | Year Ended December 31, 2017 | | | | Year Ended December 31, 2016 | | | | Year Ended December 31, 2017 | | | | Year Ended December 31, 2016 | | | | Year Ended December 31, 2017 | | | | Year Ended December 31, 2016 | |
| Capital Transactions: | | | | | | | | | | | | | | | | | | | | | | | | |
| Class A Shares: | | | | | | | | | | | | | | | | | | | | | | | | |
| Proceeds from shares issued | | $ | 2,415,331 | | | $ | 3,738,104 | | | $ | 6,665,048 | | | $ | 5,842,699 | | | $ | 6,223,388 | | | $ | 4,615,324 | |
| Dividends reinvested | | | 681,292 | | | | 468,949 | | | | 2,666,495 | | | | 1,855,261 | | | | 2,628,416 | | | | 1,832,565 | |
| Cost of shares redeemed | | | (2,885,168 | ) | | | (2,725,336 | ) | | | (5,588,509 | ) | | | (5,963,368 | ) | | | (4,388,904 | ) | | | (4,557,323 | ) |
| Redemption fees | | | 4 | | | | 6 | | | | 163 | | | | 78 | | | | 546 | | | | 102 | |
| Class A Share Transactions | | $ | 211,459 | | | $ | 1,481,723 | | | $ | 3,743,197 | | | $ | 1,734,670 | | | $ | 4,463,446 | | | $ | 1,890,668 | |
| Net increase from capital transactions | | $ | 211,459 | | | $ | 1,481,723 | | | $ | 3,743,197 | | | $ | 1,734,670 | | | $ | 4,463,446 | | | $ | 1,890,668 | |
| Share Transactions: | | | | | | | | | | | | | | | | | | | | | | | | |
| Class A Shares: | | | | | | | | | | | | | | | | | | | | | | | | |
| Issued | | | 207,009 | | | | 334,248 | | | | 498,400 | | | | 473,985 | | | | 427,916 | | | | 351,978 | |
| Reinvested | | | 58,042 | | | | 41,789 | | | | 193,610 | | | | 147,428 | | | | 172,136 | | | | 135,015 | |
| Redeemed | | | (248,400 | ) | | | (243,237 | ) | | | (418,458 | ) | | | (479,444 | ) | | | (300,469 | ) | | | (342,563 | ) |
| Change in Class A Shares: | | | 16,651 | | | | 132,800 | | | | 273,552 | | | | 141,969 | | | | 299,583 | | | | 144,430 | |
| Net increase from share transactions | | | 16,651 | | | | 132,800 | | | | 273,552 | | | | 141,969 | | | | 299,583 | | | | 144,430 | |
7. Federal Income Tax Information:
The character of dividends paid to shareholders of the Funds and Portfolios for federal income tax purposes during the years ended December 31, 2017 and 2016 was as follows:
| | | Praxis Impact
Bond Fund | | Praxis International
Index Fund | | Praxis Value
Index Fund |
| | | 2017 | | 2016 | | 2017 | | 2016 | | 2017 | | 2016 |
| From ordinary income | | $ | 12,222,106 | | | $ | 11,758,062 | | | $ | 4,702,049 | | | $ | 3,584,912 | | | $ | 4,825,740 | | | $ | 3,531,406 | |
| From long-term capital gains | | | — | | | | 376,616 | | | | — | | | | — | | | | 7,541,994 | | | | 1,211,855 | |
| Total distributions | | $ | 12,222,106 | | | $ | 12,134,678 | | | $ | 4,702,049 | | | $ | 3,584,912 | | | $ | 12,367,734 | | | $ | 4,743,261 | |
| | | | Praxis Growth Index Fund | | | | Praxis Small Cap Index Fund | |
| | | | 2017 | | | | 2016 | | | | 2017 | | | | 2016 | |
| From ordinary income | | $ | 1,515,614 | | | $ | 1,906,109 | | | $ | 3,903,157 | | | $ | — | |
| From long-term capital gains | | | 6,865,060 | | | | — | | | | 6,265,554 | | | | 2,454,091 | |
| Total distributions | | $ | 8,380,674 | | | $ | 1,906,109 | | | $ | 10,168,711 | | | $ | 2,454,091 | |
75
| Notes to Financial Statements, continued | December 31, 2017 |
| | | | Praxis Genesis
Conservative Portfolio | | | | Praxis Genesis
Balanced Portfolio | | | | Praxis Genesis
Growth Portfolio | |
| | | | 2017 | | | | 2016 | | | | 2017 | | | | 2016 | | | | 2017 | | | | 2016 | |
| From ordinary income | | $ | 428,652 | | | $ | 359,249 | | | $ | 1,603,026 | | | $ | 858,748 | | | $ | 1,451,194 | | | $ | 561,393 | |
| From long-term capital gains | | | 259,873 | | | | 116,382 | | | | 1,078,299 | | | | 1,007,969 | | | | 1,183,386 | | | | 1,276,445 | |
| Total distributions | | $ | 688,525 | | | $ | 475,631 | | | $ | 2,681,325 | | | $ | 1,866,717 | | | $ | 2,634,580 | | | $ | 1,837,838 | |
The following information is computed on a tax basis for each item as of December 31, 2017:
| | | Praxis Impact
Bond Fund | | Praxis International Index Fund | | Praxis Value
Index Fund |
| Tax cost of portfolio investments | | $ | 500,719,266 | | | $ | 211,634,084 | | | $ | 147,076,897 | |
| Gross unrealized appreciation | | | 11,098,650 | | | | 80,712,965 | | | | 44,031,574 | |
| Gross unrealized depreciation | | | (3,611,542 | ) | | | (10,075,844 | ) | | | (2,687,271 | ) |
| Net unrealized appreciation (depreciation) on investments | | $ | 7,487,108 | | | $ | 70,637,121 | | | $ | 41,344,303 | |
| Net unrealized appreciation (depreciation) on foreign currency transactions | | | — | | | | 4,796 | | | | — | |
| Undistributed ordinary income | | | 31,414 | | | | 177,181 | | | | 3,526,902 | |
| Undistributed long-term capital gains | | | — | | | | — | | | | 5,855,216 | |
| Post-October capital losses | | | — | | | | — | | | | — | |
| Accumulated capital and other losses | | | (317,020 | ) | | | (16,832,927 | ) | | | — | |
| Accumulated earnings | | $ | 7,201,502 | | | $ | 53,986,171 | | | $ | 50,726,421 | |
| | | Praxis Growth
Index Fund | | Praxis Small Cap
Index Fund |
| Tax cost of portfolio investments | | $ | 152,990,367 | | | $ | 48,192,219 | |
| Gross unrealized appreciation | | | 105,859,631 | | | | 8,566,324 | |
| Gross unrealized depreciation | | | (1,304,865 | ) | | | (3,711,912 | ) |
| Net unrealized appreciation (depreciation) on investments | | $ | 104,554,766 | | | $ | 4,854,412 | |
| Net unrealized appreciation (depreciation) on foreign currency transactions | | | 1,645 | | | | — | |
| Undistributed ordinary income | | | 3,035,343 | | | | 43,707 | |
| Undistributed long-term capital gains | | | 6,398,861 | | | | 1,337 | |
| Post-October capital losses | | | — | | | | — | |
| Accumulated capital and other losses | | | — | | | | — | |
| Accumulated earnings | | $ | 113,990,615 | | | $ | 4,899,456 | |
| | | Praxis Genesis Conservative Portfolio | | Praxis Genesis Balanced Portfolio | | Praxis Genesis
Growth Portfolio |
| Tax cost of portfolio investments | | $ | 20,683,282 | | | $ | 60,104,742 | | | $ | 50,392,472 | |
| Gross unrealized appreciation | | | 2,296,637 | | | | 13,587,321 | | | | 15,224,125 | |
| Gross unrealized depreciation | | | (94,365 | ) | | | (471,310 | ) | | | (649,458 | ) |
| Net unrealized appreciation (depreciation) on investments | | $ | 2,202,272 | | | $ | 13,116,011 | | | $ | 14,574,667 | |
| Undistributed ordinary income | | | 14,323 | | | | 20,325 | | | | 32,460 | |
| Undistributed long-term capital gains | | | 302,867 | | | | 1,925,186 | | | | 2,148,265 | |
| Post-October capital losses | | | — | | | | — | | | | — | |
| Accumulated capital and other losses | | | — | | | | — | | | | — | |
| Accumulated earnings | | $ | 2,519,462 | | | $ | 15,061,522 | | | $ | 16,755,392 | |
Post October capital losses listed above incurred after October 31, 2017 and within the taxable year are deemed to arise on the first day of the Fund’s next taxable year.
The difference between book basis and tax basis net unrealized appreciation (depreciation) is attributable primarily to the tax deferral on wash sales loss and nontaxable distributions, as well as investments in Passive Foreign Investment Companies.
For the latest tax year ended December 31, 2017, the following Funds have capital loss carry forwards (“CLCFs”) as summarized below.
CLCFs not subject to expiration:
| | | Praxis Impact
Bond Fund | | Praxis International Index Fund |
| No expiration - short-term | | $ | 317,020 | | | $ | 6,607,404 | |
| No expiration - long-term | | | — | | | | 10,225,523 | |
| | | $ | 317,020 | | | $ | 16,832,927 | |
As of the latest tax year ended December 31, 2017, the Impact Bond Fund utilized $521,705 of CLCFs.
76
| Notes to Financial Statements, continued | December 31, 2017 |
Certain reclassifications, the result of permanent differences between fi nancial statement and income tax reporting requirements, have been made to the components of capital. Reclassifications result primarily from the difference in the tax treatment of paydown gains and losses, distribution redesignations, Passive Foreign Investment Companies, equalization and net investment losses. These reclassifications have no impact on the net assets or the net asset value per share of the Funds and Portfolios and are designed to present each Fund’s or Portfolio’s capital accounts on a tax basis. The following reclassifications have been made to the following Funds and Portfolios for the year ended December 31, 2017:
| | | Paid-In
Capital | | Undistributed
Net Investment
Income (Loss) | | Accumulated
Net Realized
Gains (Losses) |
| Impact Bond Fund | | $ | (1 | ) | | $ | 788,957 | | | $ | (788,956 | ) |
| International Index Fund | | | — | | | | (60,841 | ) | | | 60,841 | |
| Value Index Fund | | | 1,071,413 | | | | — | | | | (1,071,413 | ) |
| Growth Index Fund | | | 1,039,949 | | | | — | | | | (1,039,949 | ) |
| Small Cap Index Fund | | | 1,049,411 | | | | 8,710 | | | | (1,058,121 | ) |
| Conservative Portfolio | | | 20,442 | | | | 5,749 | | | | (26,191 | ) |
| Balanced Portfolio | | | 67,806 | | | | 33,998 | | | | (101,804 | ) |
| Growth Portfolio | | | 62,035 | | | | 45,457 | | | | (107,492 | ) |
The Funds and Portfolios have analyzed their tax positions taken on Federal income tax returns for the all open tax years (tax years ended December 31, 2014 through 2017) and have concluded that no provisions for income tax is required in their financial statements. The Funds and Portfolios recognize the tax benefits of uncertain tax positions only when the position is more likely than not to be sustained, assuming examination by tax authorities.
8. Commitments and Contingencies
Under the Trust’s organizational documents, its Officers and Trustees are indemnified against certain liabilities arising out of the performance of their duties to the Trust. In addition, in the normal course of business, the Trust enters into contracts with its vendors and others that provide general indemnification. Each Fund’s and Portfolio’s maximum exposure under these arrangements is unknown, as this would involve future claims that may be made against a Fund or Portfolio. However, based on experience, the Trust expects the risk of loss to be remote.
9. Subsequent Events
The Funds and Portfolios evaluated subsequent events from December 31, 2017 through the date these financial statements were issued. There were no significant events that would have a material impact on the Funds’ and Portfolios’ financial statements.
77
| Report of Independent Registered Public Accounting Firm | |
To the Shareholders and Board of Trustees of
Praxis Mutual Funds
Opinion on the Financial Statements
We have audited the accompanying statements of assets and liabilities, including the schedules of investments, of Praxis Impact Bond Fund, Praxis International Index Fund, Praxis Value Index Fund, Praxis Growth Index Fund, Praxis Small Cap Index Fund, Praxis Genesis Conservative Portfolio, Praxis Genesis Balanced Portfolio, and Praxis Genesis Growth Portfolio (the “Funds”), each a series of Praxis Mutual Funds, as of December 31, 2017, and the related statements of operations and changes in net assets, and the financial highlights for the year then ended, including the related notes (collectively referred to as the “financial statements”). In our opinion, the financial statements present fairly, in all material respects, the financial position of each of the Funds as of December 31, 2017, the results of their operations and changes in their net assets, and the financial highlights for the year then ended, in conformity with accounting principles generally accepted in the United States of America.
The financial statements and financial highlights for the years ended December 31, 2016 and prior, were audited by another registered public accounting firm, whose report dated February 24, 2017, expressed an unqualified opinion on those financial statements.
Basis for Opinion
These financial statements are the responsibility of the Funds’ management. Our responsibility is to express an opinion on the Funds’ financial statements based on our audit. We are a public accounting firm registered with the Public Company Accounting Oversight Board (United States) (“PCAOB”) and are required to be independent with respect to the Funds in accordance with the U.S. federal securities laws and the applicable rules and regulations of the Securities and Exchange Commission and the PCAOB.
We conducted our audit in accordance with the standards of the PCAOB. Those standards require that we plan and perform the audit to obtain reasonable assurance about whether the financial statements are free of material misstatement, whether due to error or fraud.
Our audit includes performing procedures to assess the risks of material misstatement of the financial statements, whether due to error or fraud, and performing procedures that respond to those risks. Such procedures include examining, on a test basis, evidence regarding the amounts and disclosures in the financial statements and confirmation of securities owned as of December 31, 2017, by correspondence with the custodian. Our audit also included evaluating the accounting principles used and significant estimates made by management, as well as evaluating the overall presentation of the financial statements. We believe that our audit provides a reasonable basis for our opinion.
We have served as the Funds’ auditor since 2017.
COHEN & COMPANY, LTD.
Cleveland, Ohio
February 26, 2018
78
| Additional Fund Information (unaudited) | December 31, 2017 |
Praxis Impact Bond Fund
| Security Allocation | Percentage of Net Assets |
| Asset Backed Security | 2.5% |
| Commercial Mortgage Backed Security | 0.6% |
| Corporate Bond | 35.4% |
| Corporate Notes | 0.9% |
| Federal Home Loan Bank | 3.9% |
| Federal Home Loan Mortgage Corporation | 16.3% |
| Federal National Mortgage Association | 22.1% |
| Foreign Governments | 9.5% |
| Government National Mortgage Association | 0.1% |
| Investment Company | 0.7% |
| Municipal Bond | 2.2% |
| Overseas Private Investment Corporation | 0.5% |
| Small Business Administration | 0.1% |
| United States Agency of International Development | 2.1% |
| United States Department of Housing and Urban Development | 0.2% |
| Total | 97.1% |
Praxis International Index Fund
| Security Allocation | Percentage of Net Assets |
| Australia | 5.0% |
| Austria | 0.2% |
| Belgium | 0.2% |
| Brazil | 1.2% |
| Canada | 6.6% |
| Cayman Islands | 0.9% |
| Chile | 0.7% |
| China | 6.2% |
| Columbia | 0.4% |
| Denmark | 1.0% |
| Finland | 0.5% |
| France | 6.4% |
| Germany | 6.6% |
| Hong Kong | 3.3% |
| Hungary** | 0.0% |
| India | 1.4% |
| Indonesia | 0.6% |
| Ireland | 0.8% |
| Israel | 0.6% |
| Italy | 0.9% |
| Japan | 16.3% |
| Jersey | 0.3% |
| Luxembourg | 0.6% |
| Mexico | 1.0% |
| Netherlands | 3.4% |
| Norway | 1.3% |
| Peru | 0.4% |
| Portugal | 0.1% |
| Russia | 0.7% |
| Singapore | 1.5% |
| South Africa | 2.2% |
| South Korea | 2.4% |
| Spain | 2.0% |
| Sweden | 2.1% |
| Switzerland | 6.1% |
| Taiwan | 2.2% |
| Turkey | 0.1% |
| United Kingdom | 10.3% |
| United States | 2.1% |
| Corporate Notes | 0.8% |
| Total | 99.4% |
| ** | Amount rounds to less than 0.1% |
Praxis International Index Fund
| Security Allocation | Percentage of Net Assets |
| Air Freight & Logistics | 0.4% |
| Airlines | 0.3% |
| Auto Components | 1.3% |
| Automobiles | 3.7% |
| Banks | 15.0% |
| Beverages | 0.4% |
| Biotechnology | 0.5% |
| Building Products | 0.4% |
| Capital Markets | 1.2% |
| Chemicals | 2.9% |
| Commercial Services & Supplies | 0.2% |
| Communications Equipment | 0.2% |
| Construction & Engineering | 1.0% |
| Construction Materials | 0.5% |
| Containers and Packaging | 0.2% |
| Diversified Consumer Services | 0.5% |
| Diversified Financial Services | 0.9% |
| Diversified Telecommunications Services | 3.5% |
| Electric Utilities | 1.0% |
| Electrical Equipment | 1.8% |
| Electronic Equipment, Instruments, & Components | 0.5% |
| Energy Equipment & Services | 0.5% |
| Food & Staples Retailing | 1.6% |
| Food Products | 3.4% |
| Health Care Equipment & Supplies | 1.3% |
| Health Care Providers & Services | 0.5% |
| Hotels, Restaurants and Leisure | 1.1% |
| Household Durables | 0.9% |
| Household Products | 0.9% |
| Independent Power Producers & Energy Traders | 0.0% |
| Industrial Conglomerates | 0.8% |
| Insurance | 5.7% |
| Internet & Direct Marketing Retail | 0.7% |
| Internet Software & Services | 4.2% |
| IT Services | 0.7% |
| Leisure Products | 0.1% |
| Life Sciences Tools & Services | 0.2% |
| Machinery | 2.3% |
| Marine | 0.1% |
| Media | 2.9% |
| Metals & Mining | 3.1% |
| Multi-Line Retail | 0.2% |
| Multi-Utilities | 1.4% |
| Oil, Gas, & Consumable Fuels | 4.8% |
| Paper & Forest Products | 0.2% |
| Personal Products | 2.0% |
| Pharmaceuticals | 5.2% |
| Professional Services | 0.6% |
| Real Estate Investment Trusts (REITs) | 2.1% |
| Real Estate Management and Development | 0.5% |
| Retail | 0.4% |
| Road and Rail | 1.5% |
| Semiconductors & Semiconductor Equipment | 2.8% |
| Software | 2.0% |
| Specialty Retail | 0.5% |
| Technology Hardware, Storage, & Peripherals | 1.1% |
| Textiles, Apparel, & Luxury Goods | 1.2% |
| Trading Companies & Distributors | 1.0% |
| Transportation Infrastructure | 0.4% |
| Water Utilities | 0.3% |
| Wireless Telecommunication Services | 3.0% |
| Other Assets in Excess of Liabilities | 1.4% |
| Total | 100.0% |
79
| Additional Fund Information (unaudited), continued | December 31, 2017 |
Praxis Value Index Fund
| Security Allocation | Percentage of Net Assets |
| Common Stocks | 98.0% |
| Corporate Notes | 0.8% |
| Rights** | 0.0% |
| Total | 98.8% |
| ** | Amount rounds to less than 0.1% |
Praxis Growth Index Fund
| Security Allocation | Percentage of Net Assets |
| Common Stocks | 98.4% |
| Corporate Notes | 0.8% |
| Total | 99.2% |
Praxis Small Cap Index Fund
| Security Allocation | Percentage of Net Assets |
| Common Stocks | 98.4% |
| Corporate Notes | 0.8% |
| Total | 99.2% |
Praxis Genesis Conservative Portfolio
| Security Allocation | Percentage of Net Assets |
| Mutual Funds | 100.0% |
Praxis Genesis Balanced Portfolio
| Security Allocation | Percentage of Net Assets |
| Mutual Funds | 100.0% |
Praxis Genesis Growth Portfolio
| Security Allocation | Percentage of Net Assets |
| Mutual Funds | 100.0% |
80
| Additional Fund Information (unaudited), continued | December 31, 2017 |
Change in Auditor:
On August 28, 2017, based on Audit Committee recommendations and approvals, the Board voted to (i) accept the resignation of Ernst & Young LLP (“EY”) as the independent registered public accounting firm for the Fund and (ii) approve Cohen & Company, Ltd. (“Cohen”) as their new independent registered public accounting firm for their fiscal year ending December 31, 2017. With respect to the Trust, the auditor-client relationship with EY ceased upon EY’s completion of the audits of the Fund’s financial statements as of and for the year ended December 31, 2016 and the issuance of EY’s report thereon.
Proxy Voting:
The Adviser and Sub-Advisers are responsible for exercising the voting rights associated with the securities purchased and held by the Funds and Portfolios. A description of the policies and procedures that the Adviser and Sub-Advisers use in fulfilling this responsibility and information regarding how those proxies were voted during the twelve month period ended June 30 are available (i) without charge, upon request, by calling (800) 977-2947; and (ii) on the Securities and Exchange Commission’s (“Commission’s”) Web site at http://www.sec.gov.
Quarterly Portfolio Disclosure:
The Trust files a complete listing of the Schedules of Portfolio Investments for each Fund and Portfolio as of the end of the first and third quarters of each fiscal year on Form N-Q. The complete listing (i) is available on the Commission’s Web site, (ii) may be reviewed and copied at the Commission’s Public Reference Room in Washington, DC; and (iii) will be made available to shareholders upon request by calling (800) 977-2947. Information on the operation of the Public Reference Room may be obtained by calling (800) SEC-0330. The Statement of Additional Information contains more information about the Funds and Portfolios and can be obtained free of charge by calling (800) 977-2947.
Dividends Received Deduction:
For corporate shareholder, the following ordinary dividends paid during the year ended December 31, 2017 qualify for the corporate dividends received deduction:
| International Index Fund | 1.1% |
| Value Index Fund | 65.6% |
| Growth Index Fund | 86.8% |
| Small Cap Index | 13.1% |
| Conservative Portfolio | 12.9% |
| Balanced Portfolio | 26.6% |
| Growth Portfolio | 28.3% |
Qualified Dividend Income:
The Funds and Portfolios designated the maximum amount allowable of their net taxable income as qualified dividend income as provided in the Jobs and Growth Tax Relief Reconciliation Act of 2003. This amount was reflected on Form 1099-DIV for the calendar year 2017.
Capital Gain Distribution:
For the year ended December 31, 2017, the following Funds designated long-term capital gain distributions:
| Value Index Fund | | $ | 8,613,407 | |
| Growth Index Fund | | | 7,913,763 | |
| Small Cap Index Fund | | | 7,314,965 | |
| Genesis Conservative Portfolio | | | 280,315 | |
| Genesis Balanced Portfolio | | | 1,146,105 | |
| Genesis Growth Portfolio | | | 1,245,421 | |
Foreign Tax Credit:
The Funds and Portfolios intend to elect to pass through to shareholders the income tax credit for taxes paid to foreign countries, if any. As of December 31, 2017, the following Funds had foreign tax credits:
81
| Additional Fund Information (unaudited), continued | December 31, 2017 |
| Fund | | Foreign Tax
Credit | | Foreign Tax
Credit per Share |
| International Index Fund - Class A | | $ | 116,469 | | | $ | 0.013 | |
| International Index Fund - Class I | | | 555,864 | | | | 0.013 | |
| Conservative Portfolio | | | 5,058 | | | | 0.003 | |
| Balanced Portfolio | | | 32,261 | | | | 0.006 | |
| Growth Portfolio | | | 38,108 | | | | 0.009 | |
BOARD CONSIDERATION AND APPROVAL OF ADVISORY AND SUB-ADVISORY AGREEMENTS
At its November 10-11, 2017 in-person meeting, the Funds’ Board of Trustees, which consists of a majority of Independent Trustees, unanimously approved a one-year renewal of each Fund’s Advisory Agreement. Also at that meeting, the Board approved a one-year renewal of the Sub-Advisory Agreement for the International Index Fund. In this section, the Advisory and Sub-Advisory Agreements are referred to as the “Agreements.”
In reaching its decision to approve the renewals, the Board considered information furnished throughout the year at regular Board meetings, as well as information prepared specifically in connection with the annual contract review process, which included meetings in October and November 2017. The Trustees reviewed and evaluated all of this information and considered factors they believed, in light of legal advice furnished to them by independent legal counsel and through the exercise of their own business judgment, to be relevant and appropriate. The Board considered each Fund and each Agreement separately. The Board’s conclusions with respect to the renewals were based in part on the Board’s evaluation of the Agreements in prior years and their experience with the nature and quality of services provided under the Agreements in prior years. The Board’s determinations were not based on any single factor, and individual Trustees may have weighed certain factors differently.
INVESTMENT ADVISORY AGREEMENT WITH EVERENCE CAPITAL MANAGEMENT, INC.
In approving the continuation of the Investment Advisory Agreement between each Fund and Everence Capital Management, Inc. (the “Adviser”), the Board gave weight to the following factors, among others.
Nature, Quality and Extent of Services
The Board examined the nature, quality and extent of services the Adviser provides to the Funds. Among other things, the Board considered the Adviser’s experience in serving as investment adviser of the Funds, including the experience of senior personnel at the Adviser providing services to the Funds. The Board also considered the Adviser’s performance in fulfilling its responsibilities for overseeing the Funds’ legal and compliance environment, for overseeing the Sub-Advisers’ compliance with the Funds’ investment objectives and policies, and its responsiveness in implementing Board directives as they relate to the Funds. In addition, the Board considered the Adviser’s track record and experience providing portfolio management services to the Funds that the Adviser manages directly, the qualifications of the portfolio managers responsible for the day-to-day portfolio management of each Fund that is managed directly, and the Adviser’s infrastructure and resources available to the portfolio managers. The Board also considered that the Adviser is responsible for developing and integrating key elements of the Funds’ socially responsible investing, including the stewardship investing screening process for the Funds and shareholder advocacy on behalf of the Funds. Based on these and other considerations, within the context of its overall determinations regarding the Agreements, the Board concluded that it was satisfied with the nature, quality and extent of services provided to the Funds by the Adviser. The Board also observed that there is a range of investment options available to shareholders of the Funds, including other mutual funds, and that the Funds’ shareholders have demonstrated their support for the Funds by investing in the Funds.
Investment Performance of the Funds and Everence
In evaluating each Fund’s investment performance, the Board considered performance in light of the Fund’s investment objectives, strategies, and risks, as disclosed in the Fund’s prospectus. The Board reviewed historical performance information for the Funds, and considered each Fund’s historical performance relative to its benchmark and peer group. The Board evaluated Fund performance gross of fees and net of fees. The Board also considered the impact of the Funds’ social investing screens on Fund performance. Based on these and other considerations, within the context of its overall determinations regarding the Agreements, among other conclusions, the Board reached the following conclusions with regard to performance, for the periods ended September 30, 2017:
Impact Bond Fund: the Fund’s performance was generally in line with expectations. The Board noted that the Fund’s gross performance exceeded its benchmark for the one-, three and five-year periods, and the Funds’s net performance as measured against its peer group in Class A ranked between the 69th and 75th percentiles and Class I ranked between the 45th and 61st percentiles over those periods;
82
| Additional Fund Information (unaudited), continued | December 31, 2017 |
Value Index Fund: the Fund’s performance was generally in line with expectations. The Board noted that the Fund’s gross performance exceeded its benchmark for the one- and five-year periods and trailed its benchmark for the three-year period, and the Fund’s net performance as measured against its peer group in Class A ranked between the 52nd and 71st percentiles and Class I ranked between the 37th and 57th percentiles over those periods;
Growth Index Fund: the Fund’s performance was generally in line with expectations. The Board noted that the Fund’s gross performance exceeded its benchmark for the 5-year period and trailed its benchmark for the one- and three-year periods, and the net performance as measured against its peer group in Class A ranked between the 40th and 63rd percentiles and Class I ranked between the 33rd and 58th percentiles over those periods;
Small Cap Index Fund: the Fund’s performance was generally in line with expectations. The Board noted that the Fund’s gross performance trailed its benchmark for the one- and three- and five-year periods, and the net performance as measured against its peer group in Class A ranked between the 92nd and 98th percentiles and Class I ranked between the 88th and 97th percentiles over those periods; and that the principal detractor from performance was a strong move higher in the stock market as the Fund transitioned to an index strategy in early 2017;
Conservative Portfolio: the Fund’s performance was generally in line with expectations. The Board noted that the Fund’s gross performance exceeded its benchmark for the three- and five-year periods and trailed its benchmark for the one-year period and, the net performance as measured against its peer group ranked between 70th and 88th percentiles over those periods;
Balanced Portfolio: the Fund’s performance was generally in line with expectations. The Board noted that the Fund’s gross performance trailed its benchmark for the one-, three- and five-year periods and, the net performance as measured against its peer group ranked between the 60th and 68th percentiles over those periods; and
Growth Portfolio: the Fund’s gross performance was generally in line with expectations. The Board noted that the Fund’s gross performance trailed its benchmark for the one-, three- and five-year periods and, the net performance as measured against its peer group ranked between the 54th and 61st percentiles over those periods.
The Board also noted that the benchmark index for each of the Genesis Portfolios does not represent the mix of asset classes in which those Funds invest.
Costs of Services and Profitability of Everence and Affiliates
The Board then reviewed information regarding the costs of providing the advisory services to the Funds and the profits to be realized by the Adviser and its affiliates from their relationship with the Funds. Representatives of the Adviser addressed the Board’s questions regarding guidelines for manager selection, fund-related expenses, expense allocations and compensation levels and expense waivers and reimbursements. In its review of the Funds’ total and net expenses, the Board considered the Adviser’s fees, as well as other Fund expenses, such as transfer agent, custodial, legal, compliance and audit fees. The Board also noted the effects of any current expense waivers and reimbursements on fees and expense levels, as well as proposed changes to the current expense limitations and the duration of those waivers and reimbursements. As part of its review, the Board considered the expense ratios and profitability information by Fund compared with peer group fund expense ratios. In addition, the Board reviewed the fee structures and other information provided by the Adviser regarding its services to other clients. Based on these and other considerations, within the context of its overall determinations regarding the Agreements, the Board concluded that the costs to each Fund of the services provided to the Fund by the Adviser were fair.
Economies of Scale
The Board considered the extent to which economies of scale would be realized as the Funds grow and whether the investment advisory fee rates reflect those economies of scale for the benefit of Fund shareholders. The Adviser represented to the Board that it would consider breakpoints as the Funds grow in size but that current asset levels do not warrant breakpoints. The Board then considered the information provided regarding the expense levels of peer group funds. Based on these and other considerations, within the context of its overall determinations regarding the Agreements, the Board acknowledged the Adviser’s statement that current asset levels did not warrant breakpoints at this time.
Other Benefits
The Board discussed the extent to which the Adviser and its affiliates might derive other benefits, including soft dollar credits or other similar benefits from the Adviser’s relationship with the Funds. The Board noted that the Adviser does not generate soft dollar credits on Fund brokerage transactions. The Board also considered other potential benefits to the Adviser and its affiliates from their relationship with the Funds. Based on these and other considerations, within the context of its overall determinations regarding the Agreements, the Board concluded that such benefits were not material or were reasonable in relation to the services provided. In addition, the Board noted that the Funds benefit from their association with the Adviser and its affiliates, particularly in light of its commitment to socially responsible investing.
83
| Additional Fund Information (unaudited), continued | December 31, 2017 |
SUB-INVESTMENT ADVISORY AGREEMENT WITH APERIO GROUP, LLC
In approving the continuation of the Sub-Investment Advisory Agreement between Everence Capital Management, Inc. and Aperio Group, LLC (“Aperio”), with respect to portfolio management of Praxis International Index Fund, the Board gave weight to the following factors, among others.
Nature, Quality and Extent of Services
The Board considered the nature, quality and extent of services Aperio provides to the International Index Fund. Among other things, the Board considered Aperio’s experience in providing the investment strategy used by the Fund and in serving as Sub-Adviser to the Fund, including the experience of senior personnel at Aperio providing portfolio management and other services to the Funds. The Board considered Aperio’s compliance capabilities, its compliance record with respect to the International Index Fund, and the quality of communication among the Adviser, Aperio and the Board. The Board also considered Aperio’s compliance with the Fund’s investment objective and policies, and its responsiveness in implementing Board directives as they relate to the Fund. In addition, the Board considered Aperio’s track record and experience providing portfolio management services to the Fund. The Board also considered Aperio’s responsiveness in addressing Board questions and requests. Based on these and other considerations, within the context of its overall determinations regarding the Agreements, the Board concluded that it was generally satisfied with the nature, quality and extent of services provided to the International Index Fund by Aperio.
Investment Performance of the International Index Fund and Aperio
The Board reviewed historical performance data for the International Index Fund and considered the Fund’s historical performance relative to its benchmark and peer groups. The Board also considered the impact of the Fund’s social investing screens on Fund performance. Based on these and other considerations, within the context of its overall determinations regarding the Agreements, the Board concluded that, for the periods ended September 30, 2017, the Fund’s performance was generally in line with expectations. The Board noted that the Fund’s gross performance exceeded its benchmark for the one-, three- and five-year periods and the net performance as measured against its peer group in Class A ranked between the 53rd and 83rd percentiles and Class I ranked between the 42nd and 68th percentiles over those periods.
Costs of Services and Profitability of Aperio and Affiliates
The Board considered the costs of the services provided by Aperio to the International Index Fund and the profits to be realized by Aperio and its affiliates from their relationship with the International Index Fund. Based on these and other considerations, within the context of its overall determinations regarding the Agreements, the Board concluded that the costs to the International Index Fund of the services provided by Aperio were fair.
Economies of Scale
The Board noted that Aperio’s sub-advisory fee schedule currently incorporates breakpoints.
Other Benefits
The Board considered the extent to which Aperio or its affiliates would derive other benefits, including soft dollar credits or other similar benefits, from Aperio’s relationship with the International Index Fund. Within the context of its overall determinations regarding the Agreements, the Board concluded that Aperio did not derive material benefits from its relationship with the International Index Fund other than receipt of sub-advisory fees and potential benefits from its association with the Praxis Mutual Funds.
84
| Additional Fund Information (unaudited), continued | December 31, 2017 |
Expense Comparison:
As a shareholder of the Praxis Mutual Funds, you incur two types of costs: (1) transaction costs, including sales charges (loads); redemption fees; and exchange fees; (2) ongoing costs, including management fees; distribution and service 12b-1 fees; and other Fund expenses. This example is intended to help you understand your ongoing costs (in dollars) of investing in the Praxis Mutual Funds and to compare these costs with the ongoing costs of investing in other mutual funds.
The example is based on an investment of $1,000 invested at the beginning of the period and held for the entire period from July 1, 2017 through December 31, 2017.
The Actual Expense example below provides information about actual account values and actual expenses. You may use this information, together with the amount you invested, to estimate the expenses that you paid over the period. Simply divide your account value by $1,000 (for example, an $8,600 account value divided by $1,000 = 8.6), then multiply the result by the number in the table under the heading entitled “Expenses paid during the period” to estimate the expenses you paid on your account during this period.
The Hypothetical Expense example below provides information about hypothetical account values and hypothetical expenses based on each Fund’s actual expense ratio and an assumed rate of return of 5% per year before expenses, which is not each Fund’s actual return. The hypothetical account values and expenses may not be used to estimate the actual ending account balance or expenses you paid for the period. You may use this information to compare the ongoing costs of investing in this Fund and other funds. To do so, compare this 5% hypothetical example with the 5% hypothetical examples that appear in the shareholder reports of the other funds.
| | Account Value at
Beginning of Period ($) | Account Value at
End of Period ($) | Expenses Paid
During Period ($)* | Expense Ratio During
Period (%)** |
| | Actual | Hypothetical | Actual | Hypothetical | Actual | Hypothetical | Actual |
| Praxis Impact Bond Fund | | | | | | | |
| Class A | 1,000.00 | 1,000.00 | 1,008.00 | 1,020.47 | 4.76 | 4.79 | 0.94% |
| Class I | 1,000.00 | 1,000.00 | 1,010.70 | 1,022.48 | 2.74 | 2.75 | 0.54% |
| Praxis International Index Fund | | | | | | | |
| Class A | 1,000.00 | 1,000.00 | 1,097.90 | 1,018.90 | 6.61 | 6.36 | 1.25% |
| Class I | 1,000.00 | 1,000.00 | 1,100.50 | 1,021.63 | 3.76 | 3.62 | 0.71% |
| Praxis Value Index Fund | | | | | | | |
| Class A | 1,000.00 | 1,000.00 | 1,102.90 | 1,020.47 | 4.98 | 4.79 | 0.94% |
| Class I | 1,000.00 | 1,000.00 | 1,105.70 | 1,022.94 | 2.39 | 2.29 | 0.45% |
| Praxis Growth Index Fund | | | | | | | |
| Class A | 1,000.00 | 1,000.00 | 1,119.50 | 1,020.97 | 4.49 | 4.28 | 0.84% |
| Class I | 1,000.00 | 1,000.00 | 1,121.50 | 1,022.99 | 2.35 | 2.24 | 0.44% |
| Praxis Small Cap Index Fund | | | | | | | |
| Class A | 1,000.00 | 1,000.00 | 1,090.10 | 1,019.41 | 6.06 | 5.85 | 1.15% |
| Class I | 1,000.00 | 1,000.00 | 1,092.20 | 1,022.74 | 2.58 | 2.50 | 0.49% |
| Praxis Genesis Conservative Portfolio | | | | | | | |
| Class A | 1,000.00 | 1,000.00 | 1,037.20 | 1,022.13 | 3.13 | 3.11 | 0.61% |
| Praxis Genesis Balanced Portfolio | | | | | | | |
| Class A | 1,000.00 | 1,000.00 | 1,065.50 | 1,022.43 | 2.86 | 2.80 | 0.55% |
| Praxis Genesis Growth Portfolio | | | | | | | |
| Class A | 1,000.00 | 1,000.00 | 1,083.40 | 1,022.13 | 3.20 | 3.11 | 0.61% |
| * | Expenses are equal to average account value times the Fund’s annualized expense ratio multiplied by the number of days in the most recent fiscal half-year divided by the number of days in the fiscal year. |
85
| Management of the Trust (unaudited) | |
Listed below is basic information regarding the Trustee and principal officers of the Trust. The Trust’s Statement of Additional Information includes additional information about Trustees and is available, without charge, upon request by calling (800) 977-2947.
Management of the Trust
| Name, Age and Address | Position with the Company, Term of Office and Length of Time Served | Principal
Occupation During the
Past Five Years | Number of
Portfolios in
Fund Complex
Overseen by Trustee | Other Trusteeships
Held by Trustee |
| Interested Trustees1 | | | | |
Kenneth D. Hochstetler 1110 North Main Street Goshen, IN 46528 Age: 55 | Trustee, Indefinite, since 11/14/14 | President and CEO of Everence Financial (August 2014 - Present); Senior Executive Vice President, Univest Corporation 1992 - July 2014 | 8 | N/A |
| 1 | These Trustees are “interested” persons under the Investment Company Act of 1940 because of their affiliation with the Adviser. |
| Independent Trustees | | | | |
Laura Berry 1110 North Main Street Goshen, IN 46528 Age: 59 | Trustee, Indefinite, since 1/1/17 | Retired; Executive Director, Interfaith Center on Corporate Responsibility (2002 - 2016) | 8 | N/A |
Andy Dula 1110 North Main Street Goshen, IN 46528 Age: 48 | Trustee, Indefinite, since 1/1/18 | Chief Financial Officer and Chief Operations Officer at EGStoltzfus (2012 – present) | 8 | N/A |
Karen Harder, Ph.D. 1110 North Main Street Goshen, IN 46528 Age: 60 | Trustee, Indefinite, since 11/14/14 | Professor, Bluffton University
(September 2001 - present) | 8 | N/A |
Jeffrey K. Landis
1110 North Main Street
Goshen, IN 46528
Age: 47 | Trustee, Indefinite, since 4/28/16 | Partner, Landis, Hunsberger, Gingrich & Weik, LLP (Law Firm) (1994 - present) | 8 | N/A |
Dwight L. Short 1110 North Main Street Goshen, IN 46528 Age: 71 | Trustee, Indefinite, since 1/1/14 | Consultant, DLS Consulting, Consulting and Writing (2005 - present) | 8 | N/A |
Candace L. Smith 1110 North Main Street Goshen, IN 46528 Age: 58 | Trustee, Indefinite, since 11/16/07 | Managing Director of Risk, MicroVest Capital Management, LLC (2015 - present); COO, MicroVest Capital Management LLC (2011 - 2014); CFO, MicroVest Capital Management LLC (2005 - 2011) | 8 | N/A |
86
| Management of the Trust (unaudited), continued | |
| Name, Age and Address | Position with the Company, Term of
Office and Length of Time Served | Principal Occupation During the Past
Five Years |
| Officers | | |
Chad Horning 1110 North Main Street Goshen, IN 46528 Age: 49 | President, Indefinite, since 3/10/15 | Chief Investment Officer and Senior Vice President, Everence (2009 - present) |
Marlo J. Kauffman 1110 North Main Street Goshen, IN 46528 Age: 61 | Vice President, Secretary, Indefinite, since 12/2/93 | Vice President of Financial Services Operations, Everence Financial (1981 - present); President, Everence Securities, Inc. (2004 - present); OSJ Principal, ProEquities, Inc., a broker-dealer (1994 - Present); Assistant Secretary, Everence Financial (1990 - Present) |
Trent M. Statczar 325 John H. McConnell Blvd Columbus, OH 43215 Age: 46 | Treasurer, Indefinite, since 1/1/09 | Director, Foreside Financial Group, LLC, 2008 to present: Senior Vice President, Citi Fund Services Ohio, Inc. from 2004 to 2007. |
Rodney L. Ruehle 325 John H. McConnell Blvd Columbus, OH 43215 Age: 49 | Chief Compliance Officer, Indefinite, since 5/15/15 | Director, Foreside Financial Group, LLC, 2008 to present: Vice President, Citi Fund Services Ohio, Inc. from 2004 to 2007. |
87
For more information about the Praxis Mutual Funds, the following documents are available free upon request:
Proxy Voting:
The Adviser and Sub-Adviser are responsible for exercising the voting rights associated with the securities purchased and held by the Funds and Portfolios. A description of the policies and procedures that the Adviser and Sub-Adviser use in fulfilling this responsibility and information regarding how those proxies were voted during the twelve month period ended June 30 are available (i) without charge, upon request, by calling (800) 977-2947; and (ii) on the Securities and Exchange Commission’s (“Commission’s”) Web site at http://www.sec.gov.
Quarterly Portfolio Disclosure:
The Trust files a complete listing of the Schedules of Portfolio Investments for each Fund and Portfolio as of the end of the first and third quarters of each fiscal year on Form N-Q. The complete listing (i) is available on the Commission’s Web site, (ii) may be reviewed and copied at the Commission’s Public Reference Room in Washington, DC; and (iii) will be made available to shareholders upon request by calling (800) 977-2947. Information on the operation of the Public Reference Room may be obtained by calling (800) SEC-0330. The Statement of Additional Information contains more information about the Funds and Portfolios and can be obtained free of charge by calling (800) 977-2947.
Annual/Semi-Annual Reports:
The Praxis Mutual Funds’ annual and semi-annual reports to shareholders contain additional information on each Fund’s or Portfolio’s investments. In the annual report you find a discussion of the market conditions and investment strategies that significantly affected the Fund’s or Portfolio’s performance during the year.
Statement of Additional Information (SAI):
The SAI provides more detailed information about the Praxis Mutual Funds, including their operations and investment policies. It is incorporated by reference and is legally considered a part of this prospectus.
You can get free copies of reports and the SAI, or request other information and discuss your questions about the Funds or Portfolios, by contacting the broker that sells the Praxis Mutual Funds, or by contacting the Praxis Mutual Funds at:
Praxis Mutual Funds
c/o U.S. Bancorp Fund Services LLC
P.O. Box 701
Milwaukee, WI 53201-0701
Telephone: 1-800-977-2947
Internet: http://www.praxismutualfunds.com(1)
You can review and get copies of the Praxis Mutual Fund’s reports and SAI at the Public Reference Room of the Securities and Exchange Commission. You can get text only copies:
| ● | For a duplicating fee, by writing the Public Reference Section of the Commission, Washington, DC 20549-1520 or calling (202) 551-8090, or by electronic request, by emailing the SEC at the following address: publicinfo@sec.gov. |
| ● | Free from the Commission’s Web site at http://www.sec.gov. |
| (1) | The Funds’ site is not a part of this prospectus. |
Investment Company Act file no. 811-08056


As of the end of the period covered by this report, the registrant has adopted a code of ethics that applies to the registrant’s principal executive officer, principal financial officer, principal accounting officer or controller, or persons performing similar functions. The code of ethics is included as Exhibit 12(a)(1).
During the period covered by the report, with respect to the registrant’s code of ethics that applies to its principal executive officer, principal financial officer, principal accounting officer or controller, or persons performing similar functions; there have been no amendments to, nor any waivers granted from, a provision that relates to any element of the code of ethics definition enumerated in paragraph (b) of this Item 2.
| Item 3. | Audit Committee Financial Expert. |
The registrant’s Board of Trustees has determined that the registrant has at least one audit committee financial expert serving on its audit committee. Ms. Candace Smith is the registrant’s “audit committee financial expert” and is “independent” (as each term is defined in Item 3 of Form N-CSR).
| Item 4. | Principal Accountant Fees and Services. |
| (a) | Audit Fees. Audit fees totaled $119,500 for the December 31, 2017 fiscal year and $144,000 for the December 31, 2016 fiscal year, including fees associated with the annual audit and filing of the registrant’s Form N-SAR. |
| (b) | Audit-Related Fees. There were no audit-related fees for the December 31, 2017 fiscal year and the December 31, 2016 fiscal year. |
| (c) | Tax Fees. Tax fees totaled $31,500 for the December 31, 2017 fiscal year and $48,770 for the December 31, 2016 fiscal year and consisted of fees for tax compliance services during both years. |
| (d) | All Other Fees. There were no other fees for the December 31, 2017 or December 31, 2016 fiscal years. |
| (e) | (1) Audit Committee Pre-Approval Policies. |
(A) Audit Services
Before an auditor is engaged by the funds to render audit services, the committee shall review and approve the engagement (see also “delegation” below).
(B) Permissible Non-Audit Services
The committee shall review and approve in advance any proposal (except as set forth in (1) through (3) below) that the funds employ their auditor to render “permissible non-audit services” to the funds. (a “permissible non-audit service” is defined as a non-audit service that is not prohibited by rule 2-01(c)(4) of regulation s-x or other applicable law or regulation.) The committee shall also review and approve in advance any proposal (except as set forth in (1) through (3) below) that the adviser, and any entity controlling, controlled by, or under common control with the adviser that provides ongoing services to the funds (an “adviser-affiliated service provider”), employ the funds’ auditor to render non-audit services, if such engagement would relate directly to the operations and financial reporting of the funds. As a part of its review, the committee shall consider whether the provision of such services is consistent with the auditor’s independence (see also “delegation” below). Pre-approval by the committee of non-audit services is not required so Long as:
(1) (a) with respect to the funds, the aggregate amount of all such permissible non-audit services provided to the funds constitutes no more than 5% of the total amount of revenues paid to the auditor by the funds during the fiscal year in which the services are provided; (b) with respect to the adviser and any adviser-affiliated service provider, the aggregate amount of all such non-audit services provided constitutes no more than 5% of the total amount of revenues (of the type that would have to be pre-approved by the committee) paid to the auditor by the funds, the adviser and any adviser-affiliated service provider during the fiscal year in which the services are provided;
(2) such services were not recognized by the funds at the time of the engagement to be non-audit services; and
(3) such services are promptly brought to the attention of the committee and approved prior to the completion of the audit by the committee or its delegate(s) (as defined below).
(C) Delegation
The committee may delegate to one or more of its members (“delegates”) authority to pre-approve the auditor’s provision of audit services or permissible non-audit services to the funds, or the provision of non- audit services to the adviser or any adviser-affiliated service provider. Any pre-approval determination made by a delegate shall be presented to the full committee at its next meeting. The committee shall communicate any pre-approval made by it or a delegate to the fund administrator/fund accounting agent, who will ensure that the appropriate disclosure is made in the funds’ periodic reports and other documents as required under the federal securities laws.
| (e) | (2) All of the services described in paragraphs (b) through (d) of Item 4 were approved by the Audit Committee. |
| (g) | The aggregate non-audit fees for services to the registrant, its investment adviser and any entity controlling, controlled by, or under common control with the adviser that provides ongoing services to the registrant were $31,500 for the December 31, 2017 fiscal year and $72,870 for December 31, 2016 fiscal year. |
| (h) | The audit committee considered the non-audit services rendered to the registrant’s investment adviser and any entity controlling, controlled by, or under common control with the investment adviser, and believes the services are compatible with the principal accountant’s independence. |
| Item 5. | Audit Committee of Listed Registrants. |
Not applicable.
| (a) | Schedule I – Investments in Securities of Unaffiliated Issuers |
The complete schedule of investments is included in the report to shareholders in Item 1 of this Form N-CSR.
| (b) | The Registrant made no divestments of securities in accordance with Section 13(c) of the Investment Company Act of 1940. |
| Item 7. | Disclosure of Proxy Voting Policies and Procedures For Closed-End Management Investment Companies. |
Not applicable.
| Item 8. | Portfolio Managers of Closed-End Management Investment Companies. |
Not applicable.
| Item 9. | Purchase of Equity Securities by Closed-End Management Investment Company and Affiliated Purchasers. |
Not applicable.
| Item 10. | Submission of Matters to a Vote Of Security Holders. |
Not applicable.
| Item 11. | Controls and Procedures. |
| (a) | The Registrant’s principal executive officer and principal financial officer have concluded, based on their evaluation of the Registrant’s disclosure controls and procedures as conducted within 90 days of the filing date of this report, that those disclosure controls and procedures provide reasonable assurance that the material information required to be disclosed by the Registrant on this report is recorded, processed, summarized and reported within the time periods specified in the Securities and Exchange Commission’s rules and forms. |
| (b) | There have not been any changes in registrant’s control over financial reporting (as defined in Rule 30a-3(d) under the Investment Company Act of 1940) that occurred during the second fiscal quarter of the period covered by this report that has materially affected, or is reasonably likely to materially affect, the registrant’s control over financial reporting. |
| Item 12. | Disclosure of Securities Lending Activities for Closed-End Management Investment Companies. |
Not applicable.
| (a)(1) | Code of Ethics for Senior Financial Officers is filed herewith. |
| (a)(2) | Certifications pursuant to Rule 30a-2(a) under the 1940 Act and Section 302 of the Sarbanes-Oxley Act of 2002 are attached hereto. |
| (a)(3) | Any written solicitation to purchase securities under Rule 23c-1 under the 1940 Act – Not applicable. |
| (b) | Certification required by Rule 30a-2(b) under the 1940 Act and Section 906 of the Sarbanes-Oxley Act of 2002 is furnished herewith. |
SIGNATURES
Pursuant to the requirements of the Securities Exchange Act of 1934 and the Investment Company Act of 1940, the registrant has duly caused this report to be signed on its behalf by the undersigned, thereunto duly authorized.
Praxis Mutual Funds
| By: | /s/ Trent Statczar | |
| | Trent Statczar | |
| | Treasurer and Chief Financial Officer | |
| | March 5, 2018 | |
Pursuant to the requirements of the Securities Exchange Act of 1934 and the Investment Company Act of 1940, this report has been signed below by the following persons on behalf of the registrant and in the capacities and on the dates indicated.
| By: | /s/ Chad Horning | |
| | Chad Horning | |
| | President and Chief Executive Officer | |
| | March 5, 2018 | |
| By: | /s/ Trent Statczar | |
| | Trent Statczar | |
| | Treasurer and Chief Financial Officer | |
| | March 5, 2018 | |